Deep-Sea Research1, Vol. 40, No. 9, pp. 1815-1838,1993. 0967-0637/93 $6.00 + 0.00 Printed in Great Britain. O 1993Pergamon Press Ltd Filling of the Marmara Sea by the Dardanelles lower layer inflow ~0KR0 BE~iKTEPE,* EMiN C)ZSOY* and UMiT IJNLUATA* (Received 16 June 1992; in revised form 22 October 1992; accepted 17 December 1992) Abstract--The sub-halocline waters of the Marmara Sea are renewed with the incoming Darda- nelles lower layer flow. As shown by observations, this inflow takes the form of a turbulent plume which first sinks down and then spreads out into the interior. A "filling box" model is developed to test the sensitivity of the Dardanelles-Marmara Sea system to the set of relevant environmental parameters. The seasonal variability of the Dardanelles inflow is shown to play a crucial role in the sub-halocline water mass characteristics of the Marmara Sea. INTRODUCTION THE Marmara Sea is a small inland basin with a surface area of 1150 km 2 and a volume of 3378 km 3 (Fig. 1). The east-west dimension of the basin is about 200 km and the width in the north-south direction is about 70 km. Three depressions occupy the northern half of the basin, with maximum depths of 1097, 1389 and 1238 m, respectively, from west to east. The sills between the western, central and eastern basins are about 10 and 30 km wide, respectively. The southern half of the basin is occupied by the relatively shallow shelf region with an average depth of 100 m. The Marmara Sea is connected to the Black Sea through the Bosphorus Strait, and to the Aegean Sea through the Dardanelles Strait. The Bosphorus is 31 km long, 0.7-3.5 km in width, and has a mean depth of 35 m. The Dardanelles is nearly 62 km long, its width varies between 1.3 and 7 km, and its average depth is 55 m. The two layer stratification and current system in the straits and in the Sea of Marmara is driven by the density differences between the adjoining seas. The Black Sea water flows into the Marmara Sea via Bosphorus and the denser Mediterranean water flows into the Marmara Sea via Dardanelles. The two different water masses are separated by a strong pycnocline at a depth of -25 m. Low salinity (=18 ppt) Black Sea waters occupy the upper 25 m of the basin and the rest of the basin is occupied by salty (~38.5 ppt) Aegean waters. The density difference between layers is given by approximately (Ap/p) = 0.01. The upper and lower layers occupy 230 and 3148 km 3, respectively, and their mean residence times are estimated as 4--5 months and 6-7 years, respectively (IJNLOATA et al., 1990). The Mediterranean water flowing in with the Dardanelles lower layer current is the only source of water that can replenish the subhalocline waters of the Marmara Sea. The inflowing dense water takes the form of a negatively buoyant plume after entering from the * Institute of Marine Sciences, Middle East Technical University, PK 28 Erdemli, Icjel, 33731 Turkey. 1815

Welcome message from author
This document is posted to help you gain knowledge. Please leave a comment to let me know what you think about it! Share it to your friends and learn new things together.
Transcript

Deep-Sea Research 1, Vol. 40, No. 9, pp. 1815-1838, 1993. 0967-0637/93 $6.00 + 0.00 Printed in Great Britain. O 1993 Pergamon Press Ltd
Filling of the Marmara Sea by the Dardanelles lower layer inflow
~ 0 K R 0 BE~iKTEPE,* EMiN C)ZSOY* and UMiT I JNLUATA*
(Received 16 June 1992; in revised form 22 October 1992; accepted 17 December 1992)
Abs t rac t - -The sub-halocline waters of the Marmara Sea are renewed with the incoming Darda- nelles lower layer flow. As shown by observat ions, this inflow takes the form of a turbulent p lume which first sinks down and then spreads out into the interior. A "filling box" model is developed to test the sensitivity of the Da rdane l l e s -Marmara Sea system to the set of relevant env i ronmenta l parameters. The seasonal variability of the Dardanel les inflow is shown to play a crucial role in the sub-halocline water mass characteristics of the Marmara Sea.
I N T R O D U C T I O N
THE Marmara Sea is a small inland basin with a surface area of 1150 km 2 and a volume of 3378 km 3 (Fig. 1). The east-west dimension of the basin is about 200 km and the width in the north-south direction is about 70 km. Three depressions occupy the northern half of the basin, with maximum depths of 1097, 1389 and 1238 m, respectively, from west to east. The sills between the western, central and eastern basins are about 10 and 30 km wide, respectively. The southern half of the basin is occupied by the relatively shallow shelf region with an average depth of 100 m.
The Marmara Sea is connected to the Black Sea through the Bosphorus Strait, and to the Aegean Sea through the Dardanelles Strait. The Bosphorus is 31 km long, 0.7-3.5 km in width, and has a mean depth of 35 m. The Dardanelles is nearly 62 km long, its width varies between 1.3 and 7 km, and its average depth is 55 m.
The two layer stratification and current system in the straits and in the Sea of Marmara is driven by the density differences between the adjoining seas. The Black Sea water flows into the Marmara Sea via Bosphorus and the denser Mediterranean water flows into the Marmara Sea via Dardanelles. The two different water masses are separated by a strong pycnocline at a depth of -25 m. Low salinity (=18 ppt) Black Sea waters occupy the upper 25 m of the basin and the rest of the basin is occupied by salty (~38.5 ppt) Aegean waters. The density difference between layers is given by approximately (Ap/p) = 0.01. The upper and lower layers occupy 230 and 3148 km 3, respectively, and their mean residence times are estimated as 4--5 months and 6-7 years, respectively ( I JNLOATA et al., 1990).
The Mediterranean water flowing in with the Dardanelles lower layer current is the only source of water that can replenish the subhalocline waters of the Marmara Sea. The inflowing dense water takes the form of a negatively buoyant plume after entering from the
* Institute of Marine Sciences, Middle East Technical University, PK 28 Erdemli , Icjel, 33731 Turkey.
1815

~].
5
N
ql.
O 1
4
qO, S
N
qo
.o N
0 e tn
¢ 0 u
O
OI
e <
53Y
DG
rdan
elle
s
I Il
l
I 0 p
,
!
rJ
!
0
58
t ll
8
65C
I 0
Bla
ck
S
ea
"US
t
N T
O0
iL
n~
thl
C~

Filling of the Marmara Sea 1817
Strait. The only exit where the subhalocline waters can flow out of the Marmara Sea is through the Bosphorus Strait.
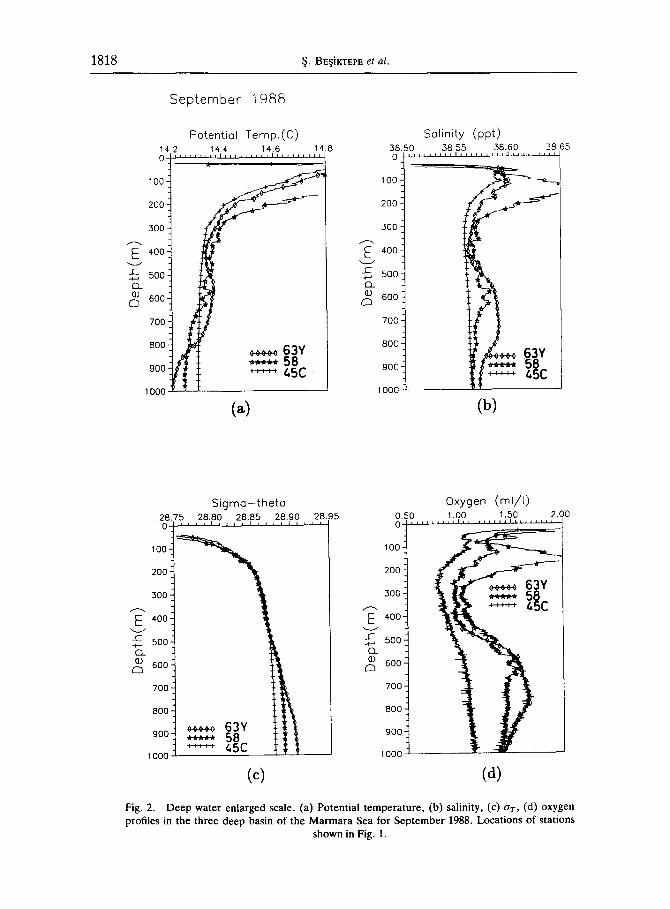
The subhalocline waters have fairly uniform properties. However, seasonality in the characteristics of the Dardanelles inflow results in a three-dimensional pattern of intrusion in the Marmara Sea, leading to small but significant salinity and temperature variations in the water column (Fig. 2). A conspicuous feature in the temperature profiles is the temperature maximum of ~15°C at around depths of 50 m, which is related to the light fluid intruding from the Dardanelles during autumn. Beneath the temperature maximum layer is the salinity maximum layer, which is formed by the Mediterranean waters entering in summer. Below the salinity maximum layer, salinity and oxygen reach minimum values at about 350 m, suggesting that this part is not directly or frequently influenced by Dardanelles intrusion. A layer of deep salinity and oxygen maxima is encountered between 500 and 800 m, formed by the sinking plume during the early winter and spring. Above the bottom in a 200 m thick layer, temperature decreases slowly while salinity and oxygen remain constant. This temperature minimum is produced by the Dardanelles plume reaching its maximum density during the winter.
As expected, the variations in the water mass characteristics are more pronounced in the western basin. Below a depth of 800 m, the western and central basins are 0.08°C colder than the eastern basin, while the upper 600 m of the water column in the eastern part is 0.02°C colder than the same depth range of the western part. The bottom water in the western part is colder and denser than the waters in the eastern part.
In this paper, we study the temporal evolution of the interior water mass properties as a function of the sinking of the turbulent plume originating from the Dardanelles. The database used in this study is the one used by BE~iKTEPE et al. (submitted), obtained during a 5-year program of the IMS-METU in the Sea of Marmara, with cruises repeated on a seasonal basis.
CHARACTERISTICS OF DARDANELLES INFLOW
Water properties at Sta. D-1 (Fig. 3) located at the Marmara end of Dardanelles can be used to characterize the inflowing water at its origin (see Fig. 1 for station positions). The Dardanelles lower layer has a thickness of 40-45 m. The salinity range observed in the lower layer of Sta. D-1 during the measurement period is 38.5-39 ppt and the temperature range is 13-17°C (Fig. 3a,b). The lower layer density (at) is always greater than 28.5 and reaches its maximum value of about 29.0 during the winter. The depth of the halocline is influenced by seasonal variations, deepening in winter due to wind mixing (Fig. 3b). Both the upper and lower layers are well aerated, with high oxygen concentrations of 4--7 ml 1-1 observed throughout the year (Fig. 3d).
The temperature and salinity of the dense bottom current upon exiting from the Dardanelles Strait have well defined temporal variations. The data are averaged for all depths below the halocline to yield lower layer properties. Four years of lower layer averaged data and the sinusoidal function fitted to these variations are given by,
T(t) = 14.85 + 1.85sin(2ar(t--3)/73, (la)
S(t) = 38.8 + 0.11sin(2n(t + 2)/73, (lb)
O(t) = 5. + 1.0sin(2n(/--3)/T), (lc)
1818 3- BE§iKTEPE et al.
S e p t e m b e r 1 9 8 8
P o t e n t i o l T e m p . ( C )
14.2 14.4 14.6 14.8 O | , , , , , , , t , , i , , , ,, , ,, , i f , , , , , , , , ,
20O
E
1000
¢~*::~ 63Y ~-:::: 58 " " ' 65C
~_~ 500"
600- Cb
700 C
800.
900'
(a)
100-
200-
300-
E 4002
_C 500 -4--' cl
6 0 0
700
800
900
1000
S a l i n i t y ( p p t )
38.50 38.55 38.60 38.65 0 I I I ' l l l l l l l l l l l l t I I I I I l l t t ~ l Z -
63Y ~ 58
~5C
(b)
S i g m a - t h e t a
%8.7~, 2p.~?, ,2p.~, ,2p.??, ?p.g5
i oo L
200-
3oo-
' ~ 400 2
c 500' .4---' Q_
600'
7002
800
900
1000
¢:::~ 63Y I~ 0
. . . . . 45C 1%
E
o_ ~o
C3
O x y g e n ( m l / I )
0.50 1.00 1.50 2.00 I , , l , l l , , , l i l , , l l l l t l
1000j . . . . . . . . . ~' l l .-~ . . ~
200 t
300 4 l I II 45C
400 -
500
600
700
800 ~
900 2
1000
(c) (a)
Fig. 2. Deep water enlarged scale. (a) Potential temperature, (b) salinity, (c) aT, (d) oxygen profiles in the three deep basin of the Marmara Sea for September 1988. Locations of stations
shown in Fig. 1.

Filling of the Marmara Sea 1819
St(].:D-1 Temperoture(C) (Nov.85-July 90) 1986 1987 1988 1989
10 "
20
~ 30
5O
6O
7O
(~)
11! o
lo
2o
j 30 t ~
4O
5O
60
-"---- 70
lo
20
"~ 3o
~ 40
50
Fig. 3.
60
70
Sto.:D-1
I i I I I
Solinity(ppt) I .!
i i i i
(Nov.85-July 90)
I.I I:1 1 l/J--.k ~ II VI
(b)
.,iy~t, ~ l r o
4O
? ~ ~ 50
6O
7O
Time secnons of the (a) potential temperature, (b) salinity, (c) o r , (d) oxygen for November 1985-July 1990 at Sta. D-1.
for temperature, salinity and dissolved oxygen respectively, where t is the time and Tis the period of the cycle, set equal to 12 months.
The lower temperature values are observed in the late-winter and early-spring months. Both salinity and temperature reach their highest values in August or September. These synchronized variations lead to opposite contributions to the density by temperature and salinity.

1 8 2 0 ~. BE~iKrEPE et al.
Sta.:D-1 Sigma-t (Nov.85-duly go) 1986 1987 1988 1989 O l l l l ~
10
20 ~ " : "
~ 40
7o i
(c)
iii ii o
20
30
, o
6O
7O
Sta.:D-10xygen(ml/I) (Nov.85-duly 90)
0 0
10 10
20 20
~ " 30 30 g C~ 40 40
50 50
60 60
70 70
(a) Fig. 3. Cont .
TEMPORAL VARIATIONS IN THE INTERIOR
Anomalies due to the Dardanelles intrusion into the Marmara Sea are characterized by small differences of +0.1, +0.05 and +0.08 from average interior temperature, salinity, and oxygen, respectively. When comparing long term measurements of water properties in the Sea of Marmara, care must be taken to recognize instrumental effects. Drifts of about 0.05 ppt are common in salinity measurements between cruises (Ozsoe et al. , 1991) and are within the limits of instrument specifications. The time evolution of interior salinity, superposed on the instrumental drift can be quite misleading in the interpre-

Filling of the Marmara Sea 1821
Fig. 4.
& qJ
0
100
200
300
400
500
600
700
800
900
1000
Cruise ovg. Temp.(C) (Moy86-MoygO)
~ ~i ~'t
: i i ! i : ! ! i : : :
: . : : i !
Cruise evg. Oxy.(ml/I) (MeyS6-Moy90)
1 0 0
200 . :: 1
300
400
600 ~""
7OO
8OO
9O0
1000
(b)
Time sections of the (a) potential temperaturc, (b) oxygen from May 1986 to May 1990 in the Marmara Sea.
tations, and therefore salinity data are not included in the following discussion. Smaller drifts occur in temperature and oxygen, so that they can be used for a better evaluation of temporal changes in the deep waters of the Marmara Sea (BE~irTEPE, 1991).
To identify the overall characteristics of the Marmara Sea, cruise-averaged profiles of temperature and oxygen are constructed by averaging data available in the region horizontally over all stations. The averages include the contribution of approximately 20 deep (>400 m) stations for a particular cruise. Temporal variations of the average potential temperature and oxygen within the Marmara Sea for the 5-year duration of this study are shown in Fig. 4a-b.
The largest seasonal variations occur between the surface and a depth of 40 m. The seasonal warming-cooling cycle in the upper layer and its effect to a depth of 50 m via

1822 ~. BE§iKTEPE et al.
diffusion is reflected on the upper 50 m temperature. The mixing between the upper and lower layers occur through an interface, the stability of which varies seasonally and spatially (ULLYOT and PERTAS, 1952; ANDERSON and CARraACR, 1974). When the density difference between the upper and lower layers become smaller in winter, the mixing is expected to be higher.
Between 50 and 300 m only small variations in the isotherm depths are observed. The oxygen has a minimum of about 0.8 ml 1-1 at depths of 250-300 m, below which it gradually increases with depth to maximum values near the bottom. The potential temperature profile has a maximum value below the thermocline of about 15°C, and by a depth of 180 m potential temperature decreases to 14.5°C.
The relatively homogeneous water mass properties below 300 m illustrate the effects of the sinking water anomalies through variations they cause in the stratification. Bottom anomalies due to sinking of the intruding waters occur in the same season, although efficiency varies from one year to another. The first cold water intrusion was observed in February 1987 with a smooth decrease of its effect continuing up to the beginning of 1988. The layer of cold water with potential temperatures less than 14.2°C appeared in February 1987 from a depth of 800 m to the bottom. Traces of this bottom water continued until the end of August 1988 and decreased between January 1988 and August 1988. This bottom intrusion ventilated the bottom water to increase the oxygen values to 1.5 ml ! -x. The 14.2°C temperature appeared once again during the winter of 1989 and continued until September 1989 with corresponding increase of oxygen to 1.6 ml 1-1.
In spite of the continuous oxygen supply from the Aegean through the Dardanelles, the subhalocline waters of the Sea of Marmara are deficient in oxygen. This is due to the consumption of oxy.g.en by organic matter sinking from the upper layer to the subhalocline part of the basin (UNLUATA and Ozsov, 1986). The deep water renewals through the Dardanelles cause a pronounced increase of oxygen in the western basin of up to 1.8 ml l- 1
near the bottom, which is partly felt in the central basin, but insignificant in the eastern basin (BE~iKTEPE et al., submitted).
An analysis of the temporal variations at Stas 63-Y, 58 and 45-C corresponding to the three deep basins from west to east (cf. Fig. 1) shows that the effects of the deep water intrusions occur with phase and magnitude differences in the three basins (Figs 5-7). The cold deep water cannot be observed at 45-C but it appears at Sta. 63-Y with a potential temperature of 14.2°C in February 1987, its effect arriving at Sta. 58 in September 1987 with a value of 14.25°C. Only a small decrease of potential temperature to 14.3°C occurs in 45-C in August 1988.
The bottom oxygen decreases from west to east. Typical deep oxygen values observed at Stas 63-Y, 58 and 45-C are 1.7, 1.5 and I ml 1-1 , respectively. Oxygen variations of the first two basins are synchronized with changes in temperature. Oxygen values increase below 500 m at Stas 63-Y and 58, while no remarkable oxygen increase is observed at 45-C (Figs 5-7).
A MODEL FOR SUBHALOCLINE WATER MASS PROPERTIES
The Filling B o x M o d e l
The Filling Box Model describes the vertical distribution of water properties within a recipient box in response to the seasonally varying properties of an incoming turbulent plume (KILLWORTH and CARMACK, 1979). The interior is assumed to be horizontally

Filling of the Marmara Sea 1823
1 O0
200
300
400
~. 500
6O0
700
800
900
1000
SLa.:63-Y Temperoture(C) (Moy 86-July 90) 1986 1987 1988 1989
Sto.:63-Y Oxygen(ml/I) (May 86-July 90)
100
20O
!
8OO
,222 (b)
Fig. 5. As in Fig. 4, but for Sta. 63-Y from May 1986 to July 1990.
homogeneous, with only vertical dependence of its variables. During the renewal process, the inflowing water descends into the basin in the form of a plume, the characteristics of which depend on the internal stratification, entrainment, initial momentum and density of the plume and bottom slope and friction (GADE and EDWARDS, 1980). Although the subdivisions of the Marmara Sea into three depressions physically affects the deep water circulation and transport between these depressions, these effects are neglected in the present model. These effects are limited to depths >700 m, and should have limited significance in the overall properties averaged between the three sub-basins.
The sinking of turbulent plumes have been investigated by KILLWORTH and CARMACK (1979), and many others, using the streamtube formulation of SMITH (1975). Although the

1824 5. BE~iKTEPE et al.
o
lOO
2oo
3oo
400
500
600
700
800
900
1000
Sta.:58 Temperature(C) (May 86-July 90)
1986 1987 1988 1989
Sto.:58 Oxygen(rnl/I) (May 86-July 90)
100 .
200 : ~ i
300
500
6O0
7OO
80O
900
1000
(b)
Fig. 6. As in Fig. 4, but for Sta. 58 from May 1985 to July 1990.
plume models provide valuable information on the T, S variations of the plume and ambient waters, some restrictions exist in the formulation as discussed by AAGARD et al. (1985) and STmESRANDT (1987).
Description o f the model
The model is similar to the one proposed by KILLWORTH and CARMACK (1979), who studied temperature variations in a river-lake system, We consider a model of the deep-sea basin and a plume descending vertically into it. We assume the interior is a horizontally homogeneous Boussinesq fluid. For the plume we make the following assumptions:

Filling of the M a r m a r a S e a 1825
Sta.:45-C Temperature(C) (May 86-May 90)
1986 1987 1988 1989 0
lO0
2oo
400 &
500
6OO
t . . . . . . . . . . . . . . ""
700 ~- I ~ ~ !~ ~ . . . . i :: :: ~ : :
800 ~! : :
900
1000
(~)
loo
200
300
~-- 400
500
6OO
7OO
8OO
9OO
1000
Sta.:45-C Oxygen(ml//I) (May 86-May 90)
".'o~ i ~ i i 'o .~iJ i i i
(b)
Fig . 7. A s in F ig . 4 , but for Sta . 4 5 - C f r o m M a y 1986 to J u l y 1990.
(1) The distributions of vertical velocity and scalar quantities are self-similar within the plume.
(2) The lateral turbulent diffusion within the plume is much greater than the longitudinal diffusion, so that the latter is neglected.
(3) The time for a particle to descend in the plume is much shorter than the time scale of change in the surroundings, i.e. the plume vertical velocity w is much larger than the compensating vertical velocity W in the interior, w >> W.
(4) Neighboring fluid particles are entrained into the plume by a turbulent entrainment mechanism. The entrainment velocity v is a small fraction of the downward plume velocity w , v = e w , where e is an entrainment coefficient.

1826 ~. BE§iKTEPE et al.
(5) We ignore frictional or pressure forces acting on the plume, based on the assumption that buoyancy forces are greater than these terms.
We then obtain the plume and interior equations by horizontally averaging the original turbulent plume equations for the plume region (MORTON et al., 1956) and the interior Boussinesq equations separately. Under the above assumptions, the plume descends into the basin due to its initial buoyancy difference with the surrounding interior water. The conservation of mass, momentum, heat, salt and oxygen for the sinking plume are (modified from KILLWORTH and CARMACK, 1979) given as follows:
(aW)z = Eal/2w, (2a)
(awZ)z = -ga[a(O - T) - fl(a - S)], (2b)
(awO)z = Eal/2wT, (2c)
(aWS)z = Eal/EwS, (2d)
(aWO)z = Eal/2wO, (2e)
where z is the vertical coordinate, pointing downward and w, 0, s, o are the cross-sectional averages over the plume area a of the velocity, temperature, salinity and oxygen within the plume region, respectively. E is a bulk entrainment coefficient obtained by horizontally integrating the original equations, hence it is proportional to e; g is the gravitational acceleration; a and fl are heat and salt expansion coefficients, respectively. T, S and O are the horizontally averaged temperature, salinity and oxygen of the ambient water sur- rounding the plume. Sinking of the plume causes compensating upward motion of the interior waters. At any given level, the conservation of mass requires that the total vertical component of the mass flux must vanish,
aw + AW = O, (3)
where A and W represent the cross-sectional area and the upward velocity of the interior. Horizontally integrated equations for the conservations of heat, salt and oxygen in the
interior imply
- A O___T = (awO) + ( A W T ) - -~z r A (4a) Ot
- A OSot = ~z (awtr)+ O-~z (A WS) -O~z (r,A OS],oz] (4b)
A OO-ot Oz (awo)+ -~z O (A W O ) - ~zO( KA_~ zOO)_J(z) ' (4c)
where K refers to a vertical eddy mixing coefficient assumed to be the same for all scalar quantities, and includes the effects of all mixing processes in the basin interior. Because oxygen is a non-conservative scalar property, J(z), a decay term representing the rate of oxygen utilization in the interior, appears in the last equation.
By using (2a), (2c--e), equations (4a--c) are simplified to
OT wOT 10__[r A OT~ (5a) -7 oz\ oz)'

Filling of the Marmara Sea 1827
as + w a S _ 1 a as I (5b) at az A az \ az/'
oo w a O - A aza (KA ~O0) - J(z), (5c)
where W is calculated from (3). Because of the vertical variations in its buoyancy, the plume can reach a level where it
may become stable and spread into the interior. At the level where the plume velocity vanishes, the plume is assumed to spread out uniformly in the form of a layer with thickness Az, where 5z is the grid-spacing used in the finite difference formulation and has a value of 10 m in the present computations. The conservation of heat for this layer is given as (KILLWORTH and CARMACK, 1979):
AAz aT = awO + A W T + diffusion, (6a) at
and by using (3), this equation is written as,
O T - aw(O - T) ~- l O (m4 -~-z~ z at -AAz A ~z " (6b)
Analogous expressions hold for S and O. Consequently, the interior is allowed to upwell only above the plume spreading region, and only diffusive mixing is allowed below the base of plume (i.e. plume spreading level).
Boundary conditions. Initial conditions required for the plume are the specification of the variables a, w, 0, p and o at z = 0. Boundary conditions required for the interior are the specification of the heat, salt, and oxygen fluxes at the top and bottom boundaries. The model applies to the lower layer of the Marmara Sea, below the halocline; we assume that the property distributions in the upper layer are known from observations, hence specified. The boundary condition at the top level of the interior is the sum of the property fluxes including diffusive and advective fluxes across the halocline, and the advective fluxes due to the Bosphorus lower layer transport. The Bosphorus outflow has been lumped into the top boundary conditions, because of its shallow sill depth. The advective components are automatically satisfied by the continuing equation (3). The remaining part of the top boundary conditions are specified by setting the interior diffusive fluxes equal to specified functions,
AKT~ = QT(t),
AKSz = as(t), (7)
AKO~ = Qo(t),
where A is the total area of the interface, K is the effective diffusion coefficient, Q r, Qs and Qo are functions representing the net fluxes of heat, salt and oxygen.
The boundary condition at the bottom specifies that, no exchange should occur across the bottom boundary, i.e.
aT - 0 , o n z = - h . ( 8 )
az

1828 ~. BE~iKTEPE et al.
Applicat ion o f the Filling B o x M o d e l at the Marrnara Sea
The model has been applied to the Marmara Sea, considering the subhalocline water mass located between 40 and 1000 m. The domain is discretized into 96 levels (Az=10 m) and the time step for integration is chosen to be At = 2 h by considering the stability criteria (BLUMBER6, 1977). The plume equations are integrated down to plume termination depth starting from initial conditions at the top level• Interior equations are solved by forward differencing in time, and centered differencing in the vertical. The horizontal area of the Sea of Marmara decreases with depth almost linearly in the range of 0-80 m and between 80 m and the bottom. Based on the geometry of the basin, the horizontal area at any depth z is approximated as
~1. × 104 - 0.5 × 104 x 2:/80 km ~, 40 m < z <80 m; A = 10. 5 x 1 0 4 - 0 • 4 5 x 1 0 4 x ( z - 8 0 ) / 1 0 0 0 k m 2, 8 0 m < z < 1 0 0 0 m .
(9)
The subhalocline volume of the Marmara Sea is calculated as 3119 km 3 by integrating (9) vertically.
The side boundary conditions are specified by the seasonal variations in the incoming turbulent plume from the Dardanelles and the outflow via Bosphorus from the lower layer of the Marmara Sea.
The boundary conditions for the plume are applied at the Dardanelles exit as follows: (i) The mass influx from the Dardanelles into the Marmara was taken as 550 km 3 y-1
(=18000 m 3 s -1) in some of the initial runs based steady state water budget calculations (IJNLOArA et al., 1990)• However, more realistic simulations of the observed features were obtained by taking 12000 m 3 s -1 mass influx and furthermore required the specification of seasonal variations. The lack of data for estimating the seasonal variations of the influx leaves room for uncertainty in the specification of this boundary condition. However, we synthesized the seasonal influx by assuming reasonably low influx during the winter and a higher influx during the autumn. The following functional form was assumed based on simulations which best produced the observed time variations in the interior:
(2~t) (m3 s_l) ' (10) (aw) = 12000 - 5000 sin T
where t is the time in months starting from January and T= 12 months. Accordingly, the maximum and minimum values of the Dardanelles influx are 17000 and 7000 m 3 s -1, respectively•
(ii) The cross-sectional area of the incoming water mass is difficult to estimate and requires adjustment together with the mass influx values to get a reasonable velocity and area of the sinking plume consistent with observations. The following time variation of the plume area at the Dardanelles exit is assumed:
• {2~rt] a = 12000 + 3000 sm/--~-- ] (m2). (11)
There is no physical basis for the assumed form; however, selection of this function resulted in more reasonable seasonal variations of the plume depth of penetration•
(iii) The inflow temperature, salinity and oxygen are determined from averages of the

Filling of the Marmara Sea 1829
lower layer properties at Sta. D-1 located at the Marmara end of the Dardanelles, approximated by equation (1).
(iv) Temperature, salinity and oxygen fluxes leaving the system were the least known boundary conditions and can only be estimated. Based on several sensitivity runs, the diffusive mean heat flux through the halocline was found to be zero; the cooling and heating from the upper layer appeared to be balanced. Well suited values were found to be QT = 0.0°C ×m3 s- l , Qs = - 1 . 0 × 10 -5 ppt × m3s -1, Qo -- 1.5 x 10 -4 ml 1-1 × m 3 S - 1 ,
appearing in (7). The model requires the specification of the initial temperature, salinity and oxygen
profiles in the interior, and can be started from uniform property distributions of the interior, but the arbitrary selection of these values increase the integration time to reach steady state. Test runs showed that the initial conditions have little effect on the final state of the model with periodic forcing. The average vertical profiles of the properties obtained during the March 1986 cruise were used as temperature, salinity and oxygen initial data for the interior.
The value of the bulk entrainment coefficient for the plume was assumed to be E = 0.255, based on laboratory experiments (TURNER, 1973). Thermal expansion (a) and salinity contraction (fl) coefficients in the temperature and salinity range of interest were chosen as 2 x 10 -4 ( °c - l ) and 7.6 x 10 -4 ppt -1, respectively.
The eddy diffusion coefficient appearing in the horizontally averaged interior equation (4) represents a parameterization of the vertical turbulent mixing processes depending on the local stratification. Observational evidence from stratified lakes, fjords and oceans suggests that the eddy diffusivity (K) can be described accurately as a decreasing function of the buoyancy frequency N = -[(g/p)(Op/Oz)] 1/2 (GARGETr, 1984). The relationship between r and N is given by
K = cN -1, (12)
where c is an empirical coefficient estimated as c -- 1 x 10 -3 cm 2 s -2 by GARGETT (1984). Figure 8 shows the depth profiles of K and N for the subhalocline waters of the Sea of Marmara obtained from equation (12) using September 1989 data. The N values were calculated from horizontally averaged profiles for each cruise and the functional depen- dence of K was determined by curve fitting to the observed data. In general, the eddy diffusivity is estimated to be between 1.0 and 3 cm 2 s -1 in the Sea of Marmara, which is reasonable in comparison to other parts of the world ocean. The synthetic eddy diffusion coefficient was constructed by applying a logarithmic fit to the average N 2 data, which yielded,
K(z) = 0.7 log(z) - 2.09. (13)
The oxygen utilization in the water column occurs mainly due to the sinking of the particulate organic carbon generated by biological production at the surface. The oxygen utilization rate is generally higher in the upper parts of the ocean and decreases with depth. SuEss (1980) has suggested the following empirical formula for open ocean regions.
( 1 2) ml 1_1 day_l, (14a) J(z) = Cprod × 6.66 x 10 -5 1 -- 0.238z + 0.21
where z denotes depth in meters, and Cprod is the primary production rate at the surface

1830 ~. BE~iKTEPE et al.
Fig. 8.
200
1--" 4 0 0 E
5:Z 4--" o_ E)
Eb 600
800
1 0 0 0
Eddy (cm**2) 0 ~ hO C~ 4~
I I I I I I i l l I i i l l t I t I I i I I I
i i i I i i i i i i i i i I i i ~ i I i i i i
o o o
N (s - 1 )
Computed eddy diffusivity and Brunt-Vaisala frequency profiles for September 1989.
(total production) in units of gC m -2 day -I. Its value is about 100 gC m -2 y-X for the Marmara Sea (POLAT, 1989). The vertical distribution of the oxygen utilization rate in the Sea of Marmara derived from the above formula is shown in Fig. 9. Since the model given in (14a) has been tested for open ocean conditions, its validity for the Marmara Sea is questionable. In our model runs, better results (in terms of consistency with observations) were obtained with a linearly decreasing oxygen utilization rate profile shown in Fig. 9. We therefore adopted this second formula, given by
where O o has a value of 0.2 ml 1-1 in our calculations. Consequently, it should be noted that, both (14a) and (14b) give the same average oxygen consumption rate of 1.5 ml 1-1 y-1 .
R e s u l t s
Time variation of property distributions are compared for runs with different model parameters presented in Table 1. For most of the runs, it was found that about 2 or 3 years of model run-time was sufficient for the interior to settle to an annually repeating cycle.

Filling of the Marmara Sea 1831
Fig. 9.
A
E
c-
el_ 13)
C~3
lOO /
200 /
300
4o0 -
5 0 0 -"
5 0 0 -
7OO --
8 0 0 -
9 0 0 .
1 0 0 0 -
1 1 0 0
0.10 0.20 0,30 0.40 0..50 2?? .... OUR ( m l / I / y r )
, , , 1 1 1 1 , l , l l t , l , , , , , , , , , l l l t l l , l l , l l l , , , , , ,
- - kineor model / - - - S u e s s model
Depth versus oxygen utilization rates computed from the Suess model (14a) and the linear model (14b).
Therefore, the model has been run for 10 years starting from the initial conditions of March 1986 for each of the cases presented below. Since we use synthetic forcing functions, the success of the simulations in producing vertical distributions and their seasonal variations will be evaluated with respect to their similarity to the observations given in Figs 4-7. However, we only simulate seasonal variations and do not attempt to produce the interannual part of the variations observed in Figs 4-7.
Sensitivity experiments (RUN-1 to RUN-5) showed that the realistic features could only be produced when seasonal variations were accounted for in the flux and area initial
Table 1. Summary o f model runs
aw* x 10 3 m 3s - ] a* x 10 2 m 2
Run No. E K m b m b QT Qs Q o J(z) Cprod O o
1 0.255 2.0 12 0 12 0 0.0 0.0 0.0 (14a) 100.0 2 0.255 2.0 12 0 12 0 0.0 - 0 . 1 1.5 (14a) 100.0 3 0.255 2.0 12 - 5 12 3 0 . 0 - 0 . 1 1.5 (14a) 100.0 4 0.51 2.0 12 - 5 12 3 0.0 - 0 . 1 1.5 (14a) 100.0 5 0.255 0.2 12 - 5 12 3 0.0 - 0 . 1 1.5 (14a) 100.0 6 0.255 Fig. 8 12 - 5 12 3 0.0 - 0 . 1 1.5 (14a) 100.0 7 0.255 Fig. 8 12 - 5 12 3 0.0 - 0 . I 1.5 (14a) 200.0 8 0.255 Fig. 8 12 - 5 12 3 0.0 - 0 . 1 1.5 (14b) 9 0.255 Fig. 8 12 - 5 12 3 0.0 - 0 . 1 1.5 (14b)
10 0.255 Fig. 8 8 - 3 12 3 0.0 - 0 . I 1.5 (14b)
0.2 0.4 0.2
*(aw,a) = m + bsin (27tt/T), m = mean and b=seasonal amplitude.

1832 % BE§iKTEPE et al.
87 89 91 93 95 45 ~ , I,~ ~ r.prj., ,<D, I., ,,~, I ~,, ~ I, ~,~ ,1~ I is-cr-~l ,.r, id ,,~, i/~ I ~/-~, vl
145
245 ,,~
._.. 345
T e m p e r o t u r e (C)
45
145
245
i 345 445 545 (b) 645 745 845 945
S o l i n i t y ( p p t )
145 245
. 0 <* <- 0 % (c) I~ 645
745
O x y g e n ( m i l l )
Fig. 10. The computed evolution of (a) temperature (°C), (b) salinity (ppt), (c) oxygen (mll -I ) for 10 years using the parameters in RUN-3 of Table 1. Dashed line on temperature section shows
plume sinking depths for the first two cycles.
conditions of the plume at the Dardanelles exit. Figure 10 shows the temporal variations of temperature, salinity and oxygen for RUN-3, in which a seasonally variable Dardanelles influx is assumed. The temperature maximum is found around 50 m, and the salinity maximum is found around 350 m. Further below, a salinity minimum is predicted between 450 and 650 m, in agreement with the observations. The maximum temperature and salinity values observed at 50 and 350 m, respectively, decreased when the entrainment coefficient was increased (RUN-4), and v ice v e r s a (RUN-5).
The dashed line at the beginning of the temperature section of Fig. 10 indicates the

Filling of the Marmara Sea 1833
E
5OO
r~
1000
(b)
o -
o-
E soo :
r-
(-3
a
I000-
-- Area x 109(cm 2 0 .5
- - t
/"
t / /
/ /
/ 5 0 2OO
--- Vel (cmls)
x~O 10 0.5
i r
/ / /
t i I
i / /
i
E
5OO -C
C2 ©
C3
1000
E 5OO
f-
O_
a
1000
Temp. (*C) 13 1/*.5
0 I I
/ / / "
I /
/ /
I/I
38.5 39.0
- - - Sol. (ppt)
1/,.5 16 I l
, /
// /i I/
38.6 38.8
(c)
Fig. 11.
E 500 c-
~-J Q_ (D
a
1000
x lO 9 O.S
0 I
t i
E v
c-
C1 ©
r'-',
1000 60
16.4 16.8 0
500
3 8 . 6 6 38.72
The computed profiles of the area, velocity, temperature and salinity of the plume in (a) winter, (b) summer, (c) autumn at the fourth year of integration of RUN-3.
sinking depth of the plume for the first two cycles. The sinking depth of the plume shows well defined seasonal variations as a result of the seasonal variations in the incoming water mass properties. Figure l la--c shows calculated plume properties in winter, summer and autumn, respectively, after 4 years of integration for RUN-3 . During winter (Fig. 11 a), the plume is capable to sink down to bottom of the basin with high velocities. In the summer (Fig. l l b ) , plume can also sink to the deeper levels, but not to the bottom as observed in

1834 ~. BE,~iKTEPE et al.
v ,m
d=
c~
45
145
245
345
445
545
645
745
845
945
87 89 91 93 95
Temperature (C)
145
245
345
_- Salinity (ppt)
45
145
245
345
445
545
645
745
845
945
Oxygen (ml/I) Fig. 12. As in Fig. 10 but for RUN-6.
(a)
(b)
(c)
winter. Plume velocities are small as compared to winter and the plume area increases greatly at termination level. During autumn (Fig. l l c ) , the plume velocity decreases rapidly with depth, and the plume terminates at shallower depths. The total change in the plume properties is proportional to the net entrainment along its length, and therefore becomes larger in the winter and summer months. Consequently, the initial plume temperature and salinity values approach to the interior values at plume termination level in winter and summer. But, the spreading water properties are considerably different than interior water properties in the autumn.
In RUN-6 (Fig. 12), a depth dependent eddy diffusivity model (Fig. 8) was used, which

Filling of the Marmara Sea 1835
Fig. 13.
87 B9 91 93 95 45 .~ 145
245
345
$45 (~)
645
745 945845 F~k~ ~'~/f~ ~~/~ ~ ~~///~ ~ '~ I Oxygen (ml/l)
145
245
345 ~ ..... ~ ,;~.,--~ , 4 5
I~ 645
745
Oxygen (ml/l)
45
145
245
345
445
e 545 (c) ¢)
645
845
945
Oxygen ( m l / I )
The computed evolution of oxygen (ml 1-1) for 10 years using the parameters in (a) RUN-7, (b) RUN-8 and (c) RUN-9 of Table I.
was of the same order of magni tude as the constant value used in RUN-3 (Fig. 10). It is noted that, the salinity m ax i m um layer becomes more pronounced and confined around 200 m. Al though the t empera tu re and salinity variations are in agreement with the observations and do not differ be tween runs, the oxygen variations differ between the two runs, with increased levels in the upper water column in the latter case. However , the monotonous increase of both runs, based on the Suess model , differed considerably from the observed structure (Figs 4-7) of high oxygen values below the halocline and near the bot tom, and an oxygen min imum near a depth of 300 m.
RUN-7, RUN-8 and R U N - 9 (Fig. 13a-c, respectively) investigated the effects of the

1836 ~;. BE§iKTEPE et al.
i
45
145
245
345
445
545
645
745
845
945
45
145.
245
345
445
545
645
745
845
945
45
145
245
345
445
545
645
745
845
945
67 89 91 93 95
Temperature (C)
_>o C
Salinity (ppt)
Oxygen (ml/I)
Fig. 14. As in Fig. 10 but for RUN-10.
(a)
(b)
(c)
oxygen consumption model. In RUN-7, increased surface production of the Suess model [equation (14a)] resulted in a dramatic decrease in the oxygen values as compared to RUN-6. In RUN-8, the oxygen consumption was modelled by (14b), with the cumulative oxygen consumption rate remaining identical with (14a), yielding a realistic oxygen minimum at a depth of 200 m. This indicates that the oxygen is also consumed in the deeper parts of the basin and can be possible by sinking large organic particles. Increasing the total interior oxygen consumption rate and retaining equation (14b) in RUN-9 resulted in an upward shift of the depth of minimum oxygen.
In the RUN-10 (Fig. 14), the influx from the Dardanelles is decreased, resulting in

Filling of the Marmara Sea 1837
dec reased seasonal osci l lat ions in the i n t e r io r , van i sh ing of the sa l in i ty m i n i m u m and m a x i m u m , and an unchanged o x y g e n m i n i m u m at 300 m.
C O N C L U S I O N
The success of the model in o b t a i n i n g c o m p a r a b l e resul t s wi th e d d y coeff ic ient va lues of 1 .0-2 .0 cm 2 s - t indicate the ex i s t ence of m o d e r a t e mix ing in the i n t e r i o r which s e e m s to smoo th rap id var ia t ions , t hough it a l lows the f o r m a t i o n of sa l in i ty and o x y g e n m i n i m u m layers be tween 500 and 700 m. A t the s ame t ime , the f o r m a t i o n of the o x y g e n m i n i m u m zone in the in te r io r seems to be a s t rong func t ion of the p a r t i c u l a r func t iona l f o rm of the var ia t ion o f the oxygen c o n s u m p t i o n r a t e wi th d e p t h . T h e t e m p e r a t u r e m a x i m u m at 50 m and the sa l in i ty max imum at 150 m s e e m to be r e l a t e d to the inf low c o n d i t i o n s f rom the D a r d a n e l l e s and become m o r e p r o n o u n c e d w h e n mix ing in the i n t e r i o r is sma l l e r .
It appea r s tha t the mode l is c a p a b l e o f r e p r o d u c i n g s o m e o f the i n t e r i o r p r o p e r t y var ia t ions qui te well. This is, o f course , e ssen t ia l ly a m a t t e r o f c a l i b r a t i on o f the b o u n d a r y condi t ions and does not express the p red i c t i ve capab i l i t i e s o f the m o d e l . B e t t e r a p p r o x i - ma t ions to the condi t ions can i m p r o v e the p r ed i c t i ve capab i l i t i e s o f the m o d e l , wh ich can be of cons ide rab l e use for o b t a i n i n g q u a n t i t a t i v e i n f o r m a t i o n on the p o o r l y k n o w n long t e rm b e h a v i o r of the M a r m a r a Sea .
The m o d e l cou ld be d e v e l o p e d fu r t he r to inc lude the effects o f ho r i z on t a l va r i a t i ons , to s imula te chemica l and b io logica l p rocesses . F u r t h e r m o r e , it cou ld be e x t e n d e d to inc lude the dynamics o f the straits and the n e i g h b o r i n g seas , to c o n t r i b u t e to t he u n d e r s t a n d i n g of the i m p o r t a n t env i ronmen ta l p r o b l e m s in the reg ion .
Acknowledgements--We are grateful to several other colleagues at the IMS-METU, and to the crew of the R.V. Bilim, for cooperation during the data collection. The field program was supported by the Turkish Scientific and Technical Research Council. (TI]BITAK).
R E F E R E N C E S
AAGARD K., J, H. Swwr and E. C. CARMACK (1985) Thermohaline circulation in the Arctic Mediterranean Seas. Journal of Geophysical Research, 90, 4833--4846.
ANDERSON J. A. and E. C. CARMACK (1974) Observations of chemical and physical fine-structure in a strong pycnocline, Sea of Marmara. Deep-Sea Research, 21,877-886.
BE§iWrEPE 5- (1991) Some aspects of the circulation and dynamics of the Marmara Sea. Ph.D thesis, Institute of Marine Sciences, Middle East Technical University, 225 pp.
BE§iKTEPE ~., H. i. SUR, E. OZSOY, M. A. LATIF, T. O~oz and O. ~INLUATA (submitted) The circulation and hydrography of the Marmara Sea.
BLUMBERG A. F. (1977) Numerical model of estuarine circulation. Journal of Hydraulics Division, ASCE, 103, 295-310.
GADE H. G. and A. EDWARDS (1980) Deep water renewals in fjords. In: Fjord oceanography, H. J. FREELAND, D. M. FARMER and C. D. LEVlNGS, editors, Plenum Press, New York, pp. 453--489.
GARGETr A. E. (1984) Vertical eddy diffusivity in the ocean interior. Journal of Marine Research, 42, 359-393. KILLWORTH P. n . and E. C. CARMACK (1979) A filling-box model of river-dominated lakes. Limnology and
Oceanography, 24,201-217. MORTON B. R., G. I. TAYLOR and J. S. TURNER (1956) Turbulent gravitational convection from maintained
instantaneous sources. Proceedings of the Royal Society of London, A234, 1-23. OzsoY E., A. HECHT, U. UNLOATA, S. BRENNER, T. OOuz, J. BISHOP, M. A. LATIF and Z. ROZENTRAUB (1991) A
review of the Levantine Basin Circulation and its variability during 1985-1988. Dynamics of Atmosphere and Oceans, 15,421-456.

1838 3. BE~;iKTEPE et al.
POLAT S. ~. (1989) The supply, use and distribution of organic carbon in the Sea of Marmara. M.Sc. Thesis, Institute of Marine Sciences, Middle East Technical University, 126 pp.
S~rrH P. C. (1975) A streamtube model for bottom boundary currents in the ocean. Deep-Sea Research, 22,853- 873.
STIGEBRANDT A. (1987) A model for the vertical circulation of the Baltic deep water. Journal of Physical Oceanography, 17, 1772-1785.
SuEss E. (1980) POC flux in the oceans, surface productivity and oxygen utilization. Nature, 288, 260-263. TURNER J. S. (1973) Buoyancy effects in fluids. Cambridge University Press, Cambridge, 387 pp. ULLYOT P. and H. PErrA§ (1952) A note on the yearly temperature and salinity cycle in the Dardanelles.
Hydrobiology, 3(B), Publication of the Hydrobiological Research Institute, Faculty of Science, University of Istanbul, Istanbul.
UNLOATA U. and E. 0zsov (1986) Oceanography of the Turkish Straits "Health of the Turkish Straits 1: Oxygen deficiency of the Sea of Marmara". First Annual Report, Institute of Marine Sciences, Middle East Technical University, Vol. 2, 81 pp.
[[]NLOATA U., Z. OOvz, M. A. LATIF and E, Ozsov (1990) On the physical oceanography of the Turkish Straits. In: The physical oceanography of sea straits, J. PRAYr, editor, NATO-ASI series, Kluwer Academic, The Netherlands, pp. 25-60.
Related Documents


![New Realities in Oil Transit Through the Turkish Straits · the Dardanelles [Canakkale Strait]), separated by the Sea of Marmara, constitute the only passage for ships either entering](https://static.cupdf.com/doc/110x72/5fa4d4c9aad09d5fc03d65b0/new-realities-in-oil-transit-through-the-turkish-straits-the-dardanelles-canakkale.jpg)