FILLET AND PJP WELDS FINAL REPORT Submitted to AMERICAN INSTITUTE OF STEEL CONSTRUCTION September 17, 2021 by Bo Dowswell, P.E., Ph.D. ARC International, LLC Birmingham, AL [email protected] Clayton Cox Auburn University Auburn Alabama [email protected] Mohamed S. Gallow, Ph.D., P.E. ICC Evaluation Service, LLC Birmingham, AL [email protected] Fouad H. Fouad, Ph.D., P.E. Civil and Environmental Engineering Department The University of Alabama at Birmingham Birmingham, AL [email protected]

Welcome message from author
This document is posted to help you gain knowledge. Please leave a comment to let me know what you think about it! Share it to your friends and learn new things together.
Transcript
FILLET AND PJP WELDS
FINAL REPORT
Submitted to
AMERICAN INSTITUTE OF STEEL CONSTRUCTION
September 17, 2021
by
Bo Dowswell, P.E., Ph.D. ARC International, LLC
Birmingham, AL [email protected]
Clayton Cox
Auburn University Auburn Alabama
Mohamed S. Gallow, Ph.D., P.E. ICC Evaluation Service, LLC
Birmingham, AL [email protected]
Fouad H. Fouad, Ph.D., P.E.
Civil and Environmental Engineering Department The University of Alabama at Birmingham
Birmingham, AL [email protected]
TABLE OF CONTENTS
Chapter Page Chapter1: Introduction 1 Chapter 2: Literature Review 3 Chapter 3: Experimental Program 40 Chapter 4: Analysis and Discussion 54 Chapter 5: Summary and Conclusions 83 Symbols 85 References 87 Appendix A: Specimen Shop Drawings A1 Appendix B: Plate Mill Test Reports B1 Appendix C: Welding Procedure Specifications C1 Appendix D: Weld Wire Mill Test Reports D1 Appendix E: All-Weld-Metal Tension Test Report E1 Appendix F: Specimen Photographs F1 Appendix G: Specimen Data G1 Appendix H: Mathematical Models H1
1
CHAPTER 1
INTRODUCTION
This report addresses several design issues related to the strength of fillet welds and partial-joint penetration (PJP) welds.
PROBLEM STATEMENT Both the AISC Specification (AISC, 2016) and AWS D1.1 Structural Welding Code (AWS, 2015) permit a 50% directional strength increase for fillet welds loaded perpendicular to the weld axis. This strength increase was established experimentally; however, theoretical analyses using various methods result in smaller transverse-to-longitudinal weld strength ratios. Of the available experimental data on fillet weld strength, the overwhelming majority is based on short welds. For end-loaded fillet welds with a length greater than 100 times the weld size, AISC Specification Section J2.2b(d) considers the detrimental effect by requiring the calculations to use a reduced weld length. This solution addresses the effect of non-uniform relative axial deformation of the connecting elements; however, any potential length effects for shorter welds are not addressed in the Specification. For PJP welds subjected to tension normal to the weld axis, AISC Specification Section J2.4(a) specifies a nominal stress equal to 60% of the weld metal strength. Theoretically, the rupture stress at the effective throat is equal to 100% of the weld metal strength. The basis of the 0.6 factor is ambiguous and recent experimental tests have shown that it may be too conservative. According to the Commentary to Specification Section J2.4, “The factor of 0.6 on FEXX for the tensile strength of PJP groove welds has been used since the early 1960s to compensate for factors such as the notch effect of the unfused area of the joint and uncertain quality in the root of the weld due to the difficulty in performing nondestructive evaluation. It does not imply that the tensile failure mode is by shear stress on the effective throat, as in fillet welds.” For a large test program on fillet welded specimens by Preece (1968) and Higgins and Preece (1969), all specimens ruptured in the weld metal “even when the mechanical properties of the weld metal exceeded those of the base metal by a substantial amount.” Based on this, the strength of fillet welds is calculated using a critical section in the weld metal coinciding with the theoretical effective throat. Calculations for the fusion zone strengths along the weld legs are not required in either the AISC Specification or AWS D1.1. Although basic theoretical calculations indicate that the strength of fillet welds with matching filler metals are not controlled by fusion zone rupture, the fusion zone could potentially control the strength of PJP welds. Factors that can potentially result in higher strength in the heat affected zone (HAZ) are constraint from the adjacent base metal and increased material strength caused by the rapid cooling after welding. AISC Steel Construction Manual (AISC, 2017) Tables 8-4 through 8-11 are used to calculate the strength of eccentrically-loaded weld groups. The tables were developed using the instantaneous center of rotation (ICR) method with 70 ksi weld metal strength. For other weld metal strengths,
2
Table 8-3 provides electrode strength coefficients, C1, that are used with Tables 8-4 through 8-11. The values for C1 are dependent on the filler metal strength; however, they are not proportional to the weld metal tensile strength ratio when FEXX ≥ 80 ksi. This results in a significant strength reduction for higher-strength welds, which is not required in either the AISC Specification or AWS D1.1.
OBJECTIVES The objectives of this research are:
1. Develop a rational explanation of the directional strength increase for fillet welds. 2. Determine if length has a significant effect on the strength of fillet welds. 3. Investigate the effect of loading angle on the strength of PJP welds. 4. Investigate the fusion zone strength of PJP welds. 5. Investigate the background of electrode strength coefficient, C1, in Manual Table 8-3.
Determine the accuracy of C1 and propose new design values if necessary.
SCOPE To meet the objectives of this research project, the available literature was reviewed, failure theories were used to derive theoretical equations, and experimental specimens with both fillet and PJP welds were tested.
3
CHAPTER 2
LITERATURE REVIEW
CODES AND SPECIFICATIONS AISC Specification (AISC, 2016) The strength of welded joints is defined by Equation J2-3 in AISC Specification Section J2.4(a). For each condition, the weld metal nominal stresses, Fnw, are listed in Table J2.5 along with the corresponding values for φ (LRFD) and Ω (ASD).
Rn = FnwAwe (Spec. Eq. J2-3) For PJP welds, Fnw = 0.60FEXX, with φ = 0.75 and Ω = 2.00 for shear loading and φ = 0.80 and Ω = 1.88 for tension loading normal to the weld axis. The effective area, Awe, of groove welds is defined in Section J2.1a as the length times the effective throat, E. The effective throat is based on the welding process, the welding position and the groove type according to Table J2.1. For example, for FCAW in the flat (F) or horizontal (H) position with a 45° bevel groove, the effective throat is equal to the groove depth, S. The weld metal nominal stress can be calculated using Equation J2-5, with φ = 0.75 and Ω = 2.00 from Table J2.5. This can be written with Equations 2.1 and 2.2, where the directional strength increase factor, kds, is calculated separately. The effective area, Awe, of fillet welds is defined in Section J2.2a as the effective length times the effective throat, E. The effective throat is the shortest distance from the root to the face of the diagrammatic weld.
( )1.50.6 1.0 0.50sinnw EXXF F= + θ (Spec. Eq. J2-5)
0.6nw EXX dsF F k= (2.1)
1.51.0 0.50sindsk = + θ (2.2) where
Awe = effective area of the weld, in.2 E = effective throat of the weld, in. FEXX = filler metal classification strength, ksi Fnw = nominal stress of the weld metal, ksi kds = directional strength increase factor w = fillet weld leg size, in. w1 = size of fillet weld Leg 1, in. w2 = size of fillet weld Leg 2, in.
4
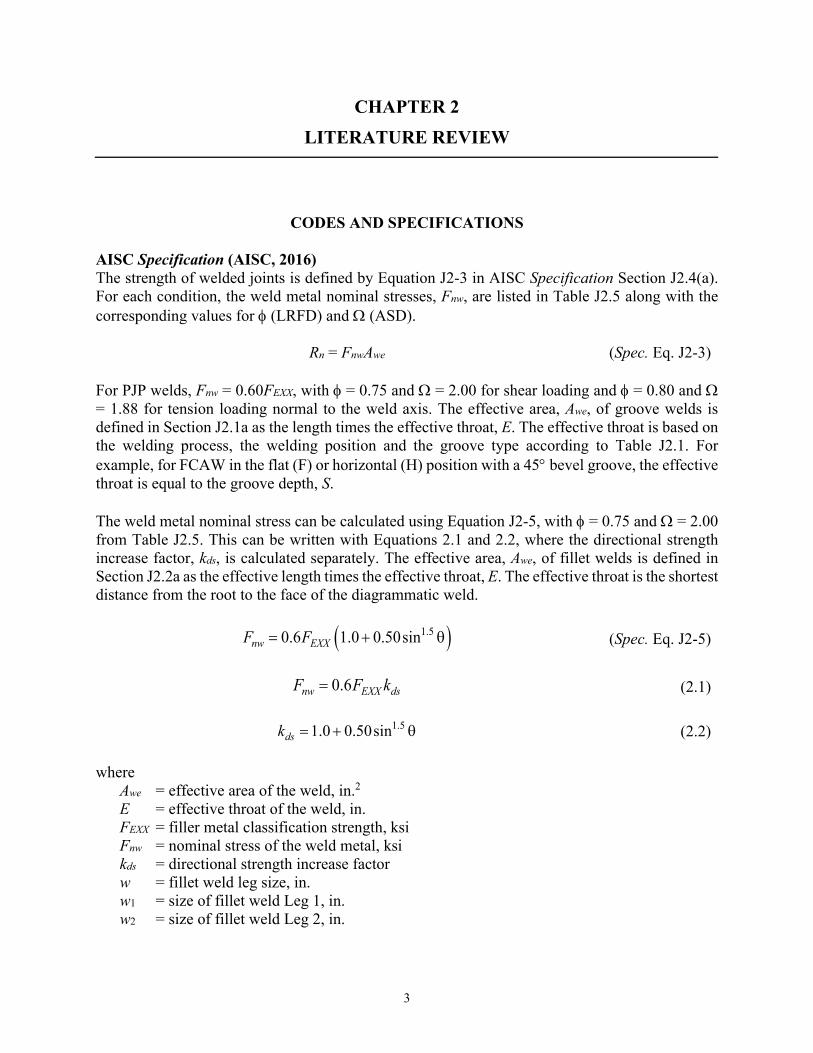
θ = angle between the line of action of the required force and the weld longitudinal axis as shown in Figure 2.1, degrees
Fig. 2.1. Loading angle for fillet welds. For equal-leg fillet welds, the effective throat is
2wE = (2.3)
For non-equal-leg fillet welds, the effective throat is
1 22 21 2
w wEw w
=+
(2.4)
Design requirements for fillet welds with high l/w ratios are in AISC Specification Section J2.2b(d). When l/w ≤ 100, the effective length is equal to the actual length. For end-loaded fillet welds with l/w > 100, the effective length is calculated with Equation J2-1. For end-loaded fillet welds with l/w > 300, the effective length is 180w.
1.2 0.002 1.0lw
β = − ≤
(Spec. Eq. J2-1)
where
l = actual length of end-loaded weld, in. w = weld leg size, in.
AWS D1.1 (2015) The requirements for PJP and fillet weld strengths in AWS D1.1 (2015) are similar to the ASD portions of the AISC Specification. Equations 2.5 through 2.10 are required to calculate the strengths of weld groups according to the Instantaneous Center of Rotation (ICR) method according to AWS D1.1 Section 2.6.4.3.
( ) ( )1.50.3 1.0 0.50sinvi EXXF F F= + θ ρ (2.5)
( ) ( ) 0.31.9 0.9F ρ = ρ − ρ (2.6)
5
i
m
∆ρ =
∆ (2.7)
( ) 0.320.209 6m w −∆ = θ+ (2.8)
( ) 0.651.087 6 0.17u w w−∆ = θ+ < (2.9)
ii u
crit
rr
∆ = ∆ (2.10)
where
Fvi = allowable stress of the weld metal, ksi rcrit = distance from the instantaneous center of rotation to the weld element with the
minimum ∆u/ri ratio, in. ri = distance from the instantaneous center of rotation to element i, in. ∆m = deformation of weld element at maximum stress, in. ∆u = deformation of weld element at ultimate stress (rupture), in. ∆i = deformation of weld element at intermediate stress levels, in.
These equations were developed by Lesik and Kennedy (1990), except that their polynomial function for F(ρ) was replaced by the simpler empirical approximation according to Equation 2.6. Also, an upper limit of 0.17w was added to the original equation for ∆u, resulting in Equation 2.9. CSA (2014) The Canadian Standard CSA (2014) specifies Equation 2.11 for the strength of linear concentrically-loaded fillet weld groups. Equation 2.12 defines Mw, which is a coefficient that accounts for any differences in the weld deformation capacity that are caused by their orientation. In the case of a single fillet weld, Mw = 1.0.
( )1.50.67 1.0 0.50sinn EXX we wR F A M= + θ (2.11)
1
2
0.85 6000.85 600wM + θ
=+ θ
(2.12)
where
φ = 0.67 θ1 = angle between the line of action of the required force and the weld longitudinal axis for
the weld segment under consideration, degrees θ2 = angle between the line of action of the required force and the weld longitudinal axis for
the weld segment in the group that is nearest to 90o

6
Eurocode 3 (CEN, 2005) The Eurocode 3 (CEN, 2005) directional method is applicable to both fillet and PJP welds. Both Equation 2.13 and 2.14 must be satisfied.
( )2 2 2
23 EXX
T T Lw M
Fσ + τ + τ ≤
β γ (2.13)
2
0.9 EXXT
M
Fσ ≤
γ (2.14)
For the simplified method, which is applicable only to fillet welds, the available stress at the theoretical effective throat is calculated with Equation 2.15.
23EXX
nww M
FF ≤β γ
(2.15)
where
βw = correlation factor (0.80 for S235 steel, 0.85 for S275 steel, 0.90 for S355 steel and 1.0 for S420 and S460 steel)
γM2 = partial safety factor, =1.25 σT = normal stress perpendicular to the plane of the throat, ksi. τL = shear stress in the plane of the throat, parallel to the weld axis, ksi. τT = shear stress in the plane of the throat, perpendicular to the weld axis, ksi.
The Eurocode 3 design requirements for fillet welds with high l/w ratios are similar to those in AISC Specification Section J2.2b(d), except the effective throat is used instead of the weld leg size. For lap joints longer than 150E, Equation 2.16 is applicable.
0.21.2 1.0150
lE
β = − ≤ (2.16)
AIJ (2012) The Architectural Institute of Japan (AIJ, 2012) specifies Equation 2.17 for the strength of fillet welds. Equations 2.18 and 2.18 are applicable to longitudinal and transverse PJP welds, respectively. Because Equation 2.19 is based on the tensile strength of the base metal, it is valid only when matching or overmatching weld metal is used.
( )1.0 0.40sin3
EXXnw
FF = + θ (2.17)
3EXX
nwFF = (2.18)
7
nw uF F= (2.19) where
Fu = specified minimum tensile stress of the weaker base metal joined, ksi
8
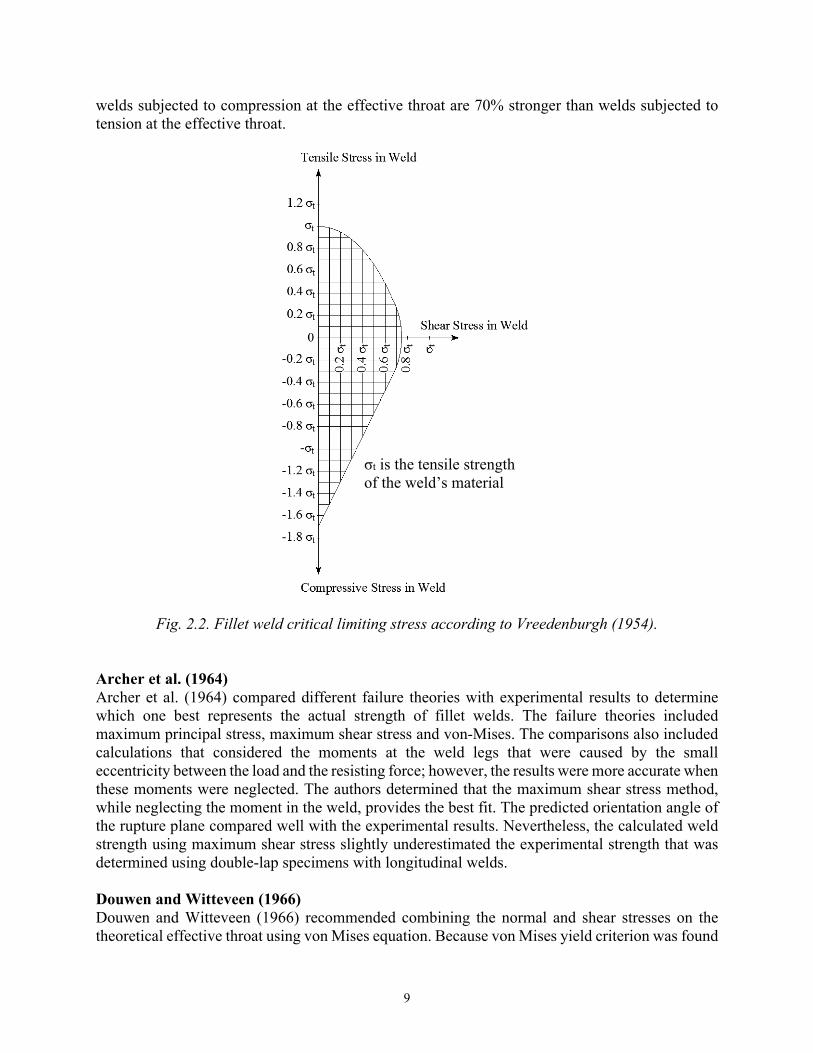
FILLET WELDS ABW (1931) ABW (1931) reported a comprehensive series of experimental tests on many different configurations for both fillet and groove welds. The specified tensile strength of the weld metal was 56 ksi; however, the actual tensile strength was not reported. The average shear rupture strength on the throat of the concentrically-loaded fillet weld specimens was 42.5 ksi and the average strength of butt welds in tension was 49.6 ksi. A conclusion from the tests on joints with combined longitudinal and transverse welds is that failure of the transverse welds always precludes failure of the longitudinal welds at loads that are less than the sum of the independent strengths. AWS (1937) The early research on fillet welded connections was primarily concerned with the elastic stress distributions, both along the weld length and in the weld cross section. The available research on fillet-welded joints prior to 1937, consisting of 150 references, was summarized in AWS (1937). The research shows highly nonlinear stresses along the length and in the weld cross section, even for the simplest configurations. Spraragen and Claussen (1942) Spraragen and Claussen (1942) reviewed 77 references on fillet welds that were published between 1932 and 1939. For longitudinally-loaded fillet welds, the rupture stress at the throat is between 0.64 and 0.84 times the uniaxial tensile strength. Although longitudinally-loaded fillet welds had high elastic stress concentrations at the end, it was shown that the rupture strength of short welds (l/w between 1.4 and 19), is unaffected by the weld length. Tests on double-lap specimens with transversely-loaded fillet welds showed that the specimens with tensile loads were approximately 20% higher than for compression-loaded specimens. Also, several research projects showed that the rupture strength of transversely-loaded T-joints varies between 75% and 100% of the strength of double-lap specimens. This effect was caused by the constraint provided by the transverse contact force at the faying surfaces of the double-lap as well as the friction resulting from these forces. A gapped T-joint designed by Kist (1936) to eliminate the transverse force that causes friction at the faying surfaces had only 64% of the strength of a double-lap specimen with similar welds. It was concluded that the rupture stress at the throat of transversely-loaded fillet welds was slightly higher than the uniaxial tensile strength measured with all-weld-metal coupons. Vreedenburgh (1954) Vreedenburgh (1954) continued the work of Kist (1936) with supplementary tests and analyses. Although Kist assumed the rupture plane was always defined by the theoretical throat, Vreedenburgh found out that the rupture planes were not always coincident with the theoretical throat. Additionally, Vreedenburgh found that the experimental behavior was not compatible with any of the available failure theories. Because of this, an empirical solution was adopted. As shown in Figure 2.2, the shear strength of the weld was assumed to be 0.75 times the weld metal uniaxial tensile strength, σt. For transversely-loaded equal-leg welds, the weld throat is oriented 45o from the load and the strength is 0.84σt. Based on this approach, the ratio of the transverse fillet weld strength to longitudinal fillet weld strength is 0.84/0.75 = 1.12. Also, according to Figure 2.2,
9
welds subjected to compression at the effective throat are 70% stronger than welds subjected to tension at the effective throat.
Fig. 2.2. Fillet weld critical limiting stress according to Vreedenburgh (1954). Archer et al. (1964) Archer et al. (1964) compared different failure theories with experimental results to determine which one best represents the actual strength of fillet welds. The failure theories included maximum principal stress, maximum shear stress and von-Mises. The comparisons also included calculations that considered the moments at the weld legs that were caused by the small eccentricity between the load and the resisting force; however, the results were more accurate when these moments were neglected. The authors determined that the maximum shear stress method, while neglecting the moment in the weld, provides the best fit. The predicted orientation angle of the rupture plane compared well with the experimental results. Nevertheless, the calculated weld strength using maximum shear stress slightly underestimated the experimental strength that was determined using double-lap specimens with longitudinal welds. Douwen and Witteveen (1966) Douwen and Witteveen (1966) recommended combining the normal and shear stresses on the theoretical effective throat using von Mises equation. Because von Mises yield criterion was found
σt is the tensile strength of the weld’s material
10
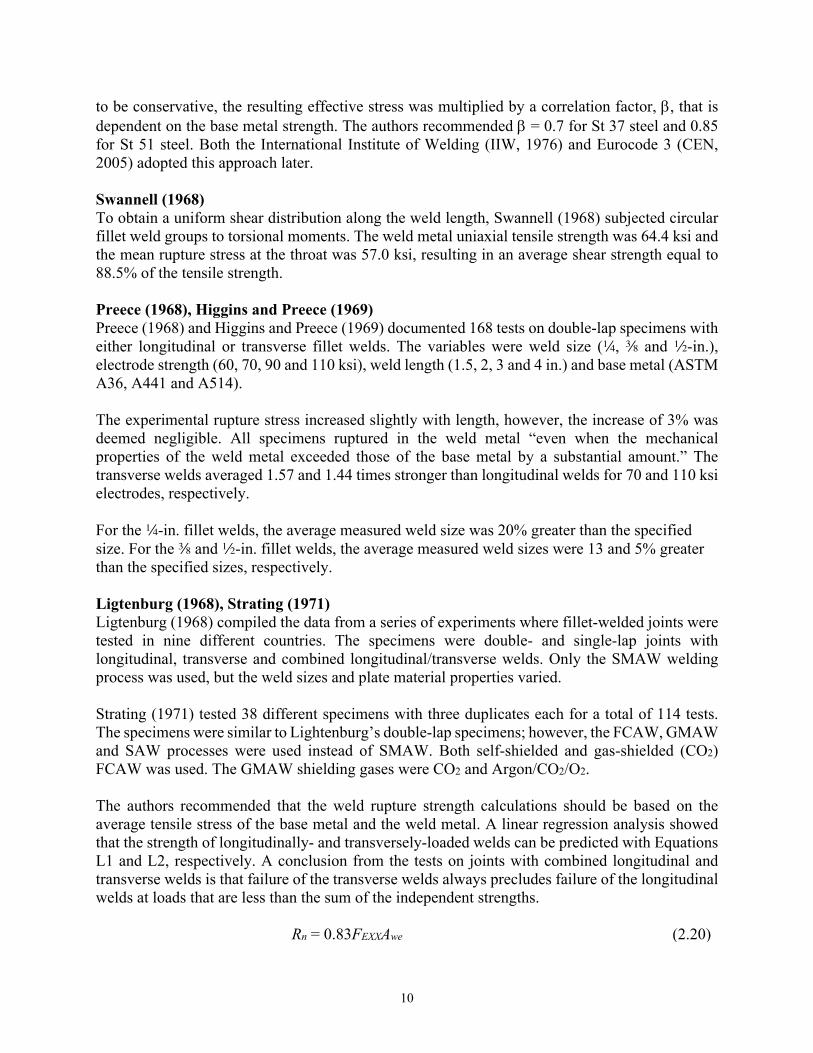
to be conservative, the resulting effective stress was multiplied by a correlation factor, β, that is dependent on the base metal strength. The authors recommended β = 0.7 for St 37 steel and 0.85 for St 51 steel. Both the International Institute of Welding (IIW, 1976) and Eurocode 3 (CEN, 2005) adopted this approach later. Swannell (1968) To obtain a uniform shear distribution along the weld length, Swannell (1968) subjected circular fillet weld groups to torsional moments. The weld metal uniaxial tensile strength was 64.4 ksi and the mean rupture stress at the throat was 57.0 ksi, resulting in an average shear strength equal to 88.5% of the tensile strength. Preece (1968), Higgins and Preece (1969) Preece (1968) and Higgins and Preece (1969) documented 168 tests on double-lap specimens with either longitudinal or transverse fillet welds. The variables were weld size (4, a and 2-in.), electrode strength (60, 70, 90 and 110 ksi), weld length (1.5, 2, 3 and 4 in.) and base metal (ASTM A36, A441 and A514). The experimental rupture stress increased slightly with length, however, the increase of 3% was deemed negligible. All specimens ruptured in the weld metal “even when the mechanical properties of the weld metal exceeded those of the base metal by a substantial amount.” The transverse welds averaged 1.57 and 1.44 times stronger than longitudinal welds for 70 and 110 ksi electrodes, respectively. For the 4-in. fillet welds, the average measured weld size was 20% greater than the specified size. For the a and 2-in. fillet welds, the average measured weld sizes were 13 and 5% greater than the specified sizes, respectively. Ligtenburg (1968), Strating (1971) Ligtenburg (1968) compiled the data from a series of experiments where fillet-welded joints were tested in nine different countries. The specimens were double- and single-lap joints with longitudinal, transverse and combined longitudinal/transverse welds. Only the SMAW welding process was used, but the weld sizes and plate material properties varied. Strating (1971) tested 38 different specimens with three duplicates each for a total of 114 tests. The specimens were similar to Lightenburg’s double-lap specimens; however, the FCAW, GMAW and SAW processes were used instead of SMAW. Both self-shielded and gas-shielded (CO2) FCAW was used. The GMAW shielding gases were CO2 and Argon/CO2/O2. The authors recommended that the weld rupture strength calculations should be based on the average tensile stress of the base metal and the weld metal. A linear regression analysis showed that the strength of longitudinally- and transversely-loaded welds can be predicted with Equations L1 and L2, respectively. A conclusion from the tests on joints with combined longitudinal and transverse welds is that failure of the transverse welds always precludes failure of the longitudinal welds at loads that are less than the sum of the independent strengths.
Rn = 0.83FEXXAwe (2.20)
11
Rn = 1.33FEXXAwe (2.21)
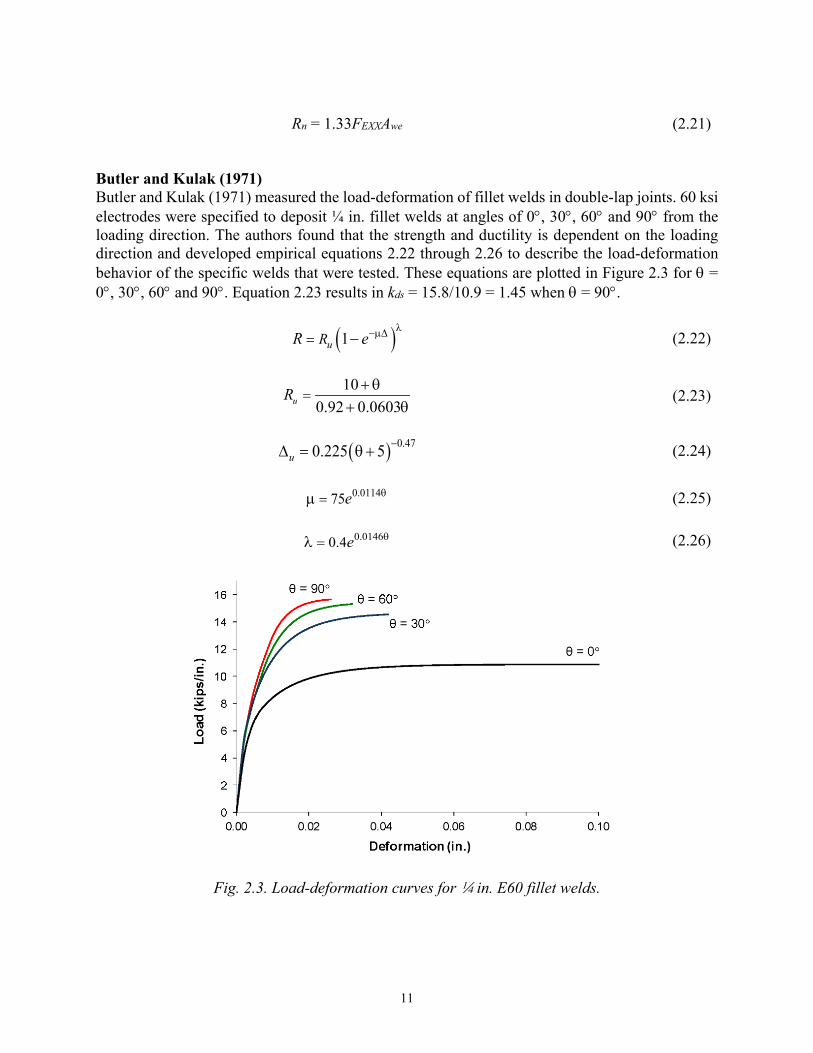
Butler and Kulak (1971) Butler and Kulak (1971) measured the load-deformation of fillet welds in double-lap joints. 60 ksi electrodes were specified to deposit ¼ in. fillet welds at angles of 0°, 30°, 60° and 90° from the loading direction. The authors found that the strength and ductility is dependent on the loading direction and developed empirical equations 2.22 through 2.26 to describe the load-deformation behavior of the specific welds that were tested. These equations are plotted in Figure 2.3 for θ = 0°, 30°, 60° and 90°. Equation 2.23 results in kds = 15.8/10.9 = 1.45 when θ = 90°.
( )1uRR eλ−µ∆= − (2.22)
10
0.92 0.0603uR =+ θ
+ θ (2.23)
( ) 0.470.225 5u−∆ = θ+ (2.24)
0.011475e θ=µ (2.25)
0.01460.4e θ=λ (2.26)
Fig. 2.3. Load-deformation curves for 4 in. E60 fillet welds.
12
Kato and Morita (1974) Kato and Morita (1974) calculated the strength of transverse fillet welds using the theory of elasticity and determined that the rupture plane is 22.5° from the loading direction. Based on this critical rupture plane, they developed a directional strength factor of
( )21.0 4
sin 22.51.46
dsk =− π
°
=
(2.27)
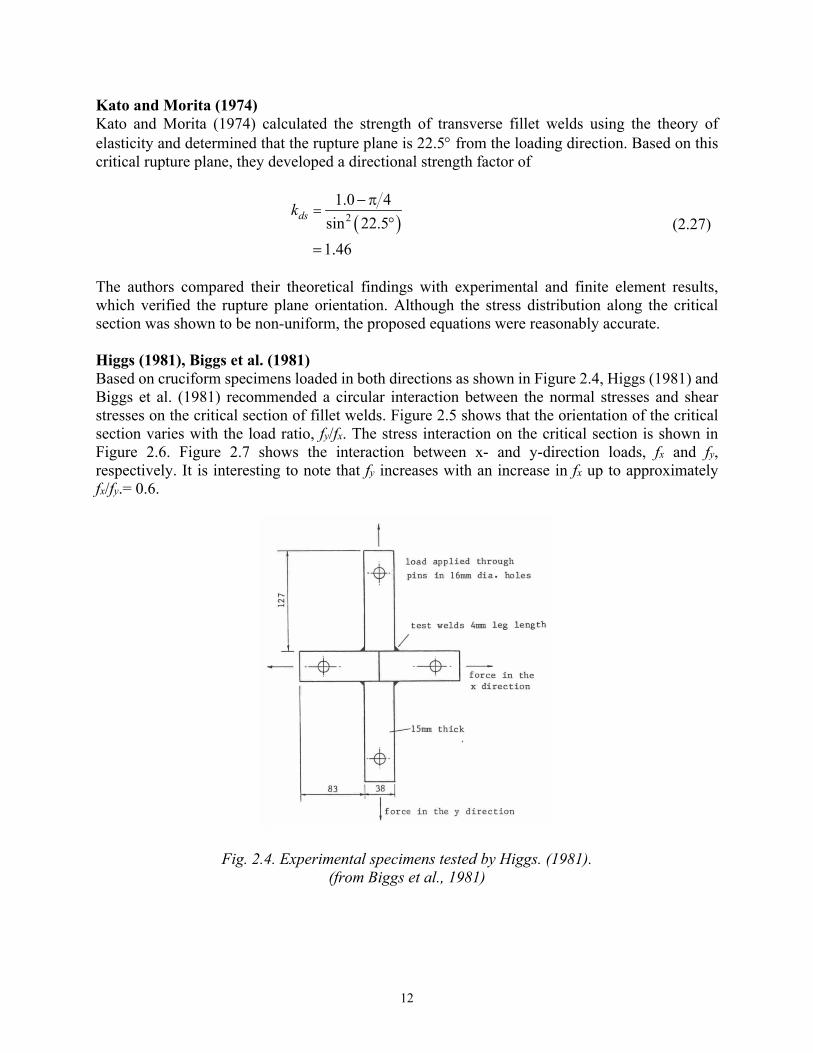
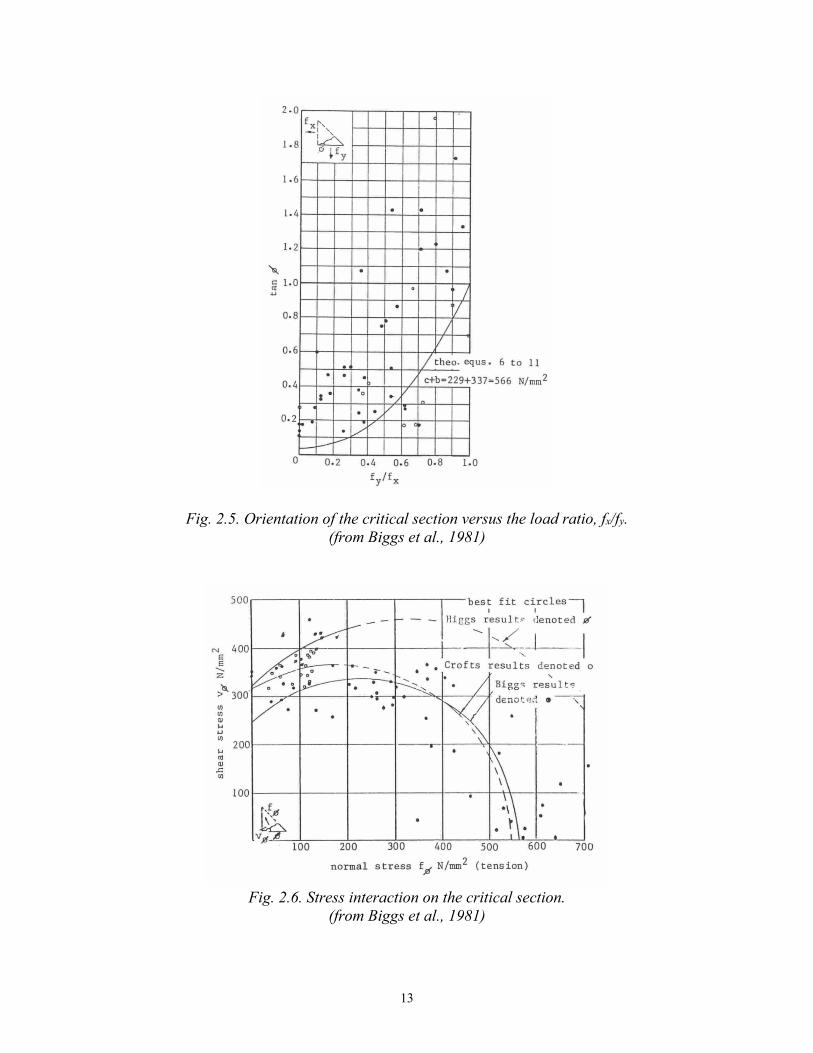
The authors compared their theoretical findings with experimental and finite element results, which verified the rupture plane orientation. Although the stress distribution along the critical section was shown to be non-uniform, the proposed equations were reasonably accurate. Higgs (1981), Biggs et al. (1981) Based on cruciform specimens loaded in both directions as shown in Figure 2.4, Higgs (1981) and Biggs et al. (1981) recommended a circular interaction between the normal stresses and shear stresses on the critical section of fillet welds. Figure 2.5 shows that the orientation of the critical section varies with the load ratio, fy/fx. The stress interaction on the critical section is shown in Figure 2.6. Figure 2.7 shows the interaction between x- and y-direction loads, fx and fy, respectively. It is interesting to note that fy increases with an increase in fx up to approximately fx/fy.= 0.6.
Fig. 2.4. Experimental specimens tested by Higgs. (1981). (from Biggs et al., 1981)
13
Fig. 2.5. Orientation of the critical section versus the load ratio, fx/fy. (from Biggs et al., 1981)
Fig. 2.6. Stress interaction on the critical section.
(from Biggs et al., 1981)

14
Fig. 2.7. Interaction between x- and y-direction loads. (from Biggs et al., 1981)
Kamtekar (1982), Kamtekar (1987) Based on von Mises yield criterion, Kamtekar (1982) derived equations to calculate the strength of longitudinally- and transversely-loaded fillet welds. The same theory was used by Kamtekar (1987) to derive equation 2.28 for the full range of loading angles (0° < θ < 90°). The theory predicts that transverse welds rupture along the leg (fusion zone) at a 41% higher load than longitudinal welds.
22 cosdsk = − θ (2.28) Pham (1983) Pham (1983) documented a series of 36 tests on transversely-loaded T-joints connected with fillet welds using the FCAW and SAW welding processes. Macro-etches showed that the theoretical throat increased by 30% for FCAW welds and 50% for SAW welds with a coefficient of variation of 0.20 for both processes. Many of the welds ruptured along the fusion zone; however, the experimental loads exceeded the expected strengths due to oversized welds and overstrength weld metals. Neis (1985) Neis (1985) used plasticity theory to derive the ultimate strength and maximum displacement of fillet welds. Although several simplifying assumptions were required, limited comparisons with
15
experimental results showed “an acceptable fit.” The ultimate (rupture) force and deformation is calculated with Equations 2.29 and 2.30 respectively.
( )2
2
1 15sin6 1 7sinu
dtu
d
R wL=+ α
σ+ α
(2.29)
( )23
2 1 7sinu ud
= εδ+ α
(2.30)
The complete load-deformation curve can be plotted with Equations 2.31 through 2.33.
ii u
uR
fRf
= (2.31)
25 75
12
i i
ie ef− δ − δ
=+
− (2.32)
25 75
12
u u
ue ef− δ − δ
=+
− (2.33)
where
Ri = strength at deformation ∆i, kips αd = angle between the weld longitudinal axis and the weld displacement direction δi = ∆i/w δu = ∆u/w εu = uniaxial engineering tensile rupture strain σtu = true tensile rupture stress, ksi σuw = uniaxial engineering tensile rupture stress, ksi
As a conservative estimate, the authors noted that the true tensile rupture stress can be calculated with Equation 2.34.
( )1 0.75tu u u= σσ + ε (2.34) Equation 2.35 provides an approximate value of the angle between the weld longitudinal axis and the weld displacement direction.
tantan4d =θ
α (2.35)
16
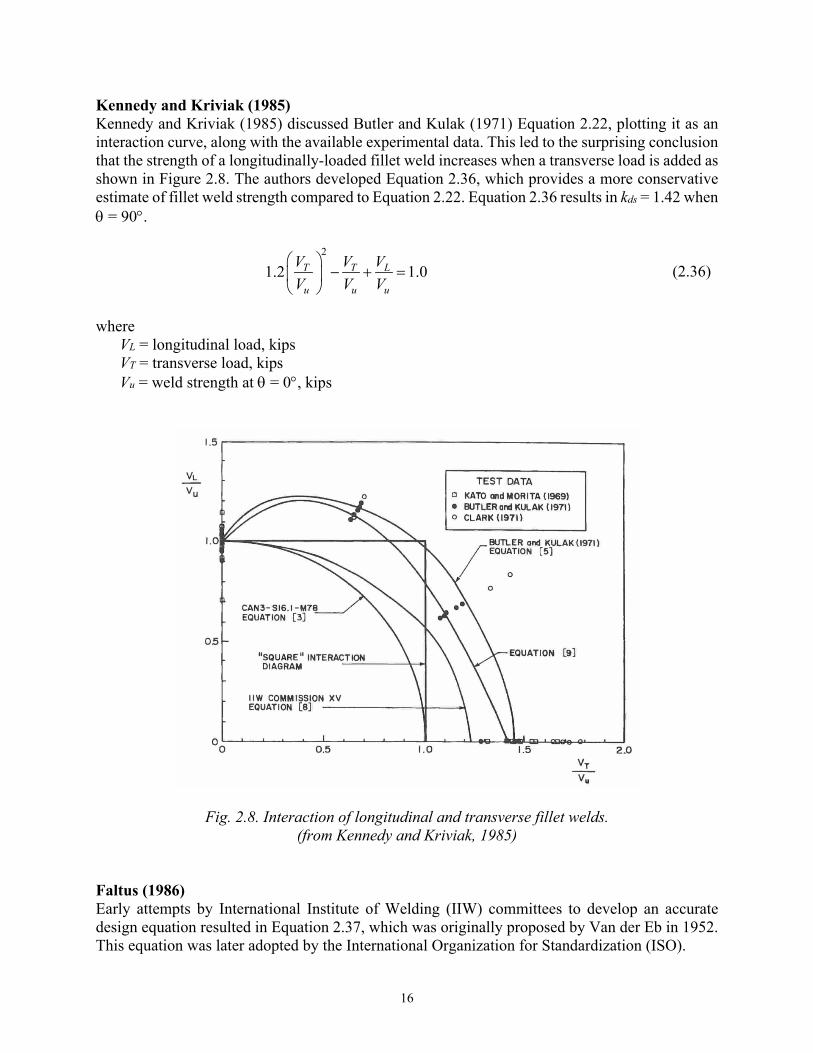
Kennedy and Kriviak (1985) Kennedy and Kriviak (1985) discussed Butler and Kulak (1971) Equation 2.22, plotting it as an interaction curve, along with the available experimental data. This led to the surprising conclusion that the strength of a longitudinally-loaded fillet weld increases when a transverse load is added as shown in Figure 2.8. The authors developed Equation 2.36, which provides a more conservative estimate of fillet weld strength compared to Equation 2.22. Equation 2.36 results in kds = 1.42 when θ = 90°.
2
1.2 1.0T T L
u u u
V V VV V V
− + =
(2.36)
where VL = longitudinal load, kips
VT = transverse load, kips Vu = weld strength at θ = 0°, kips
Fig. 2.8. Interaction of longitudinal and transverse fillet welds. (from Kennedy and Kriviak, 1985)
Faltus (1986) Early attempts by International Institute of Welding (IIW) committees to develop an accurate design equation resulted in Equation 2.37, which was originally proposed by Van der Eb in 1952. This equation was later adopted by the International Organization for Standardization (ISO).
17
( )2 2 21.8T T L EXXFσ + τ + τ = (2.37)
Equation 2.37 results in a shear rupture stress of 0.745FEXX when θ = 0° and kds = 1.13 when θ = 90°. In 1974, the 1.8 constant was changed to 3, which results in von Mises equation. Because this increased the conservative error compared to the experimental results, the stress was reduced by a correlation factor, βw, which had values of 0.70 or 0.85 depending on the steel grade. Also, a limit was added to ensure that the normal stress was not greater than the weld metal tensile strength. This resulted in Equations 2.38 and 2.39, which is the basis for the equations in Eurocode 3.
( )2 2 23w T T L EXXFβ σ + τ + τ ≤ (2.38)
EXXT Fσ ≤ (2.39)
McClellan (1989) McClellan (1989) tested 96 double-lap specimens with either longitudinal or transverse fillet welds. The joints were fabricated using the FCAW process with either CO2 or 75% argon/25% CO2 shielding gasses. The specified weld sizes were either 4 or a in. and the specified electrode strengths were either 70 or 100 ksi. By evaluating the rupture surfaces and macro-etches, the author concluded that the penetration depth was similar to that of a weld deposited with the SMAW process. The rupture surface for the transverse welds was oriented at approximately 22.5° from the load direction. The transverse welds averaged 1.51 and 1.39 times stronger than longitudinal welds for 70 and 100 ksi electrodes, respectively. Miazga and Kennedy (1989), Lesik and Kennedy (1990), Kennedy et al. (1990) Miazga and Kennedy (1989) developed an analytical model to predict the fillet weld strength in double-lap joints as a function of the loading direction. The model includes a variable failure plane angle and restraining conditions at the weld root. They validated their model by testing 42 specimens with varying load angles from 0 to 90° in 15° increments. The fracture was ductile for the cases of longitudinal loading. For transverse loading, the fracture transitioned from brittle at the weld root where the crack initiated to ductile fracture at the crack termination. The area of the rupture surface is
( )( )sin 45
sin 45wL
Aθ =°
° + α (2.40)
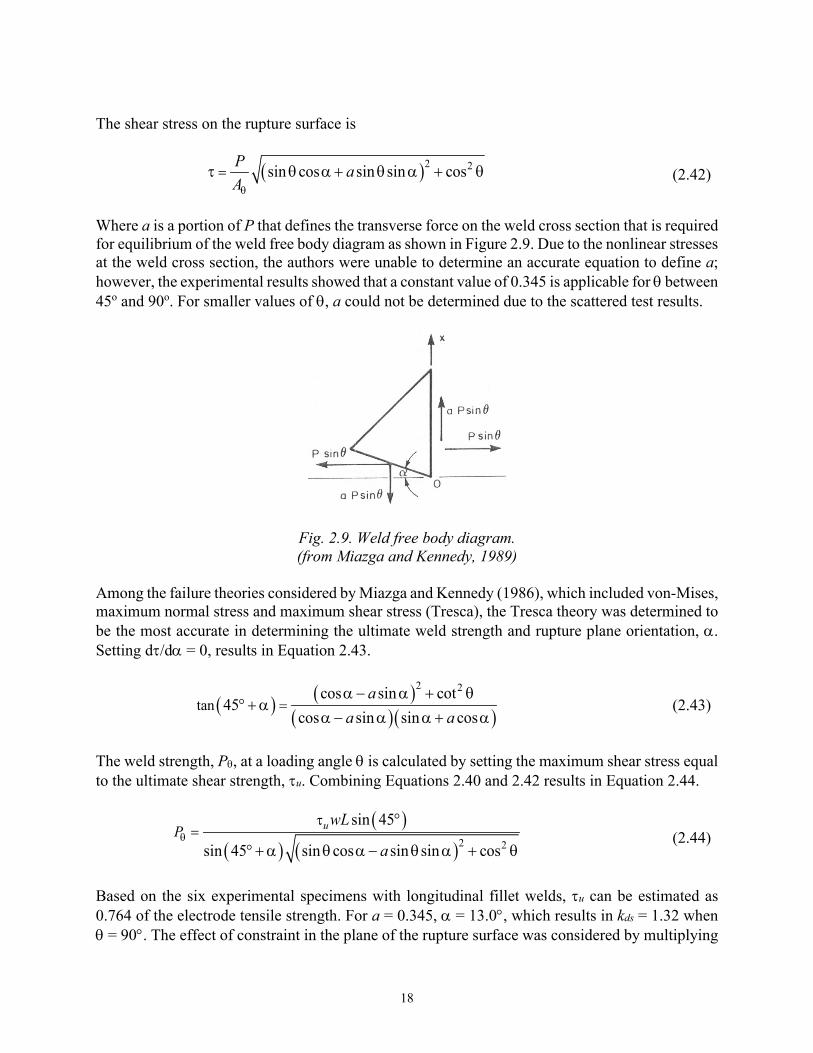
Where α is the angle between the loading direction and the rupture surface as shown in Figure 2.9. The normal stress on the rupture surface is
( )sin sin cosP aAθ
=θ
σ α + α (2.41)
18
The shear stress on the rupture surface is
( )2 2sin cos sin sin cosP aAθ
=τ θ α + θ α + θ (2.42)
Where a is a portion of P that defines the transverse force on the weld cross section that is required for equilibrium of the weld free body diagram as shown in Figure 2.9. Due to the nonlinear stresses at the weld cross section, the authors were unable to determine an accurate equation to define a; however, the experimental results showed that a constant value of 0.345 is applicable for θ between 45o and 90o. For smaller values of θ, a could not be determined due to the scattered test results.
Fig. 2.9. Weld free body diagram. (from Miazga and Kennedy, 1989)
Among the failure theories considered by Miazga and Kennedy (1986), which included von-Mises, maximum normal stress and maximum shear stress (Tresca), the Tresca theory was determined to be the most accurate in determining the ultimate weld strength and rupture plane orientation, α. Setting dτ/dα = 0, results in Equation 2.43.
( ) ( )( )( )
2 2
tancos sin cot
45cos sin sin cos
aa a
=α − α + θ
°+αα − α α + α
(2.43)
The weld strength, Pθ, at a loading angle θ is calculated by setting the maximum shear stress equal to the ultimate shear strength, τu. Combining Equations 2.40 and 2.42 results in Equation 2.44.
( )( ) ( )2 2
sin 45
sin 45 sin cos sin sin cosuPwL
aθ
τ=
°
° + α θ α − θ α + θ (2.44)
Based on the six experimental specimens with longitudinal fillet welds, τu can be estimated as 0.764 of the electrode tensile strength. For a = 0.345, α = 13.0°, which results in kds = 1.32 when θ = 90°. The effect of constraint in the plane of the rupture surface was considered by multiplying
19
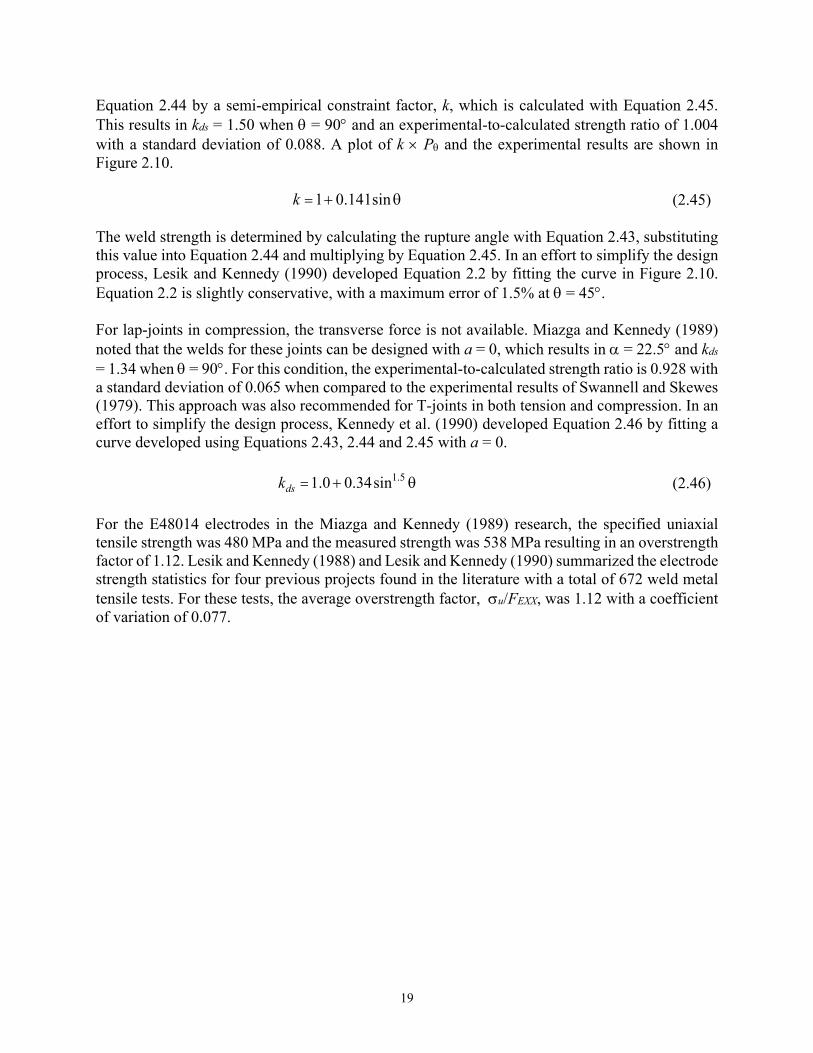
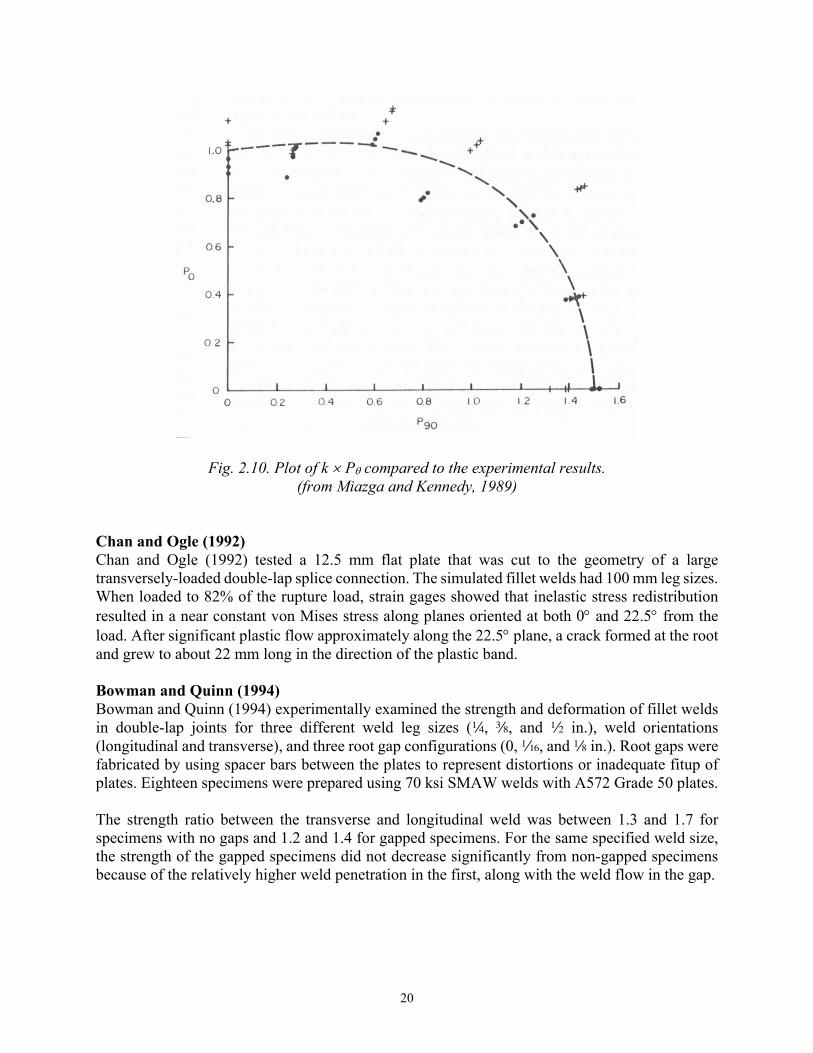
Equation 2.44 by a semi-empirical constraint factor, k, which is calculated with Equation 2.45. This results in kds = 1.50 when θ = 90° and an experimental-to-calculated strength ratio of 1.004 with a standard deviation of 0.088. A plot of k × Pθ and the experimental results are shown in Figure 2.10.
1 0.141sink = + θ (2.45) The weld strength is determined by calculating the rupture angle with Equation 2.43, substituting this value into Equation 2.44 and multiplying by Equation 2.45. In an effort to simplify the design process, Lesik and Kennedy (1990) developed Equation 2.2 by fitting the curve in Figure 2.10. Equation 2.2 is slightly conservative, with a maximum error of 1.5% at θ = 45°. For lap-joints in compression, the transverse force is not available. Miazga and Kennedy (1989) noted that the welds for these joints can be designed with a = 0, which results in α = 22.5° and kds = 1.34 when θ = 90°. For this condition, the experimental-to-calculated strength ratio is 0.928 with a standard deviation of 0.065 when compared to the experimental results of Swannell and Skewes (1979). This approach was also recommended for T-joints in both tension and compression. In an effort to simplify the design process, Kennedy et al. (1990) developed Equation 2.46 by fitting a curve developed using Equations 2.43, 2.44 and 2.45 with a = 0.
1.51.0 0.34sindsk = + θ (2.46) For the E48014 electrodes in the Miazga and Kennedy (1989) research, the specified uniaxial tensile strength was 480 MPa and the measured strength was 538 MPa resulting in an overstrength factor of 1.12. Lesik and Kennedy (1988) and Lesik and Kennedy (1990) summarized the electrode strength statistics for four previous projects found in the literature with a total of 672 weld metal tensile tests. For these tests, the average overstrength factor, σu/FEXX, was 1.12 with a coefficient of variation of 0.077.
20
Fig. 2.10. Plot of k × Pθ compared to the experimental results. (from Miazga and Kennedy, 1989)
Chan and Ogle (1992) Chan and Ogle (1992) tested a 12.5 mm flat plate that was cut to the geometry of a large transversely-loaded double-lap splice connection. The simulated fillet welds had 100 mm leg sizes. When loaded to 82% of the rupture load, strain gages showed that inelastic stress redistribution resulted in a near constant von Mises stress along planes oriented at both 0° and 22.5° from the load. After significant plastic flow approximately along the 22.5° plane, a crack formed at the root and grew to about 22 mm long in the direction of the plastic band. Bowman and Quinn (1994) Bowman and Quinn (1994) experimentally examined the strength and deformation of fillet welds in double-lap joints for three different weld leg sizes (4, a, and 2 in.), weld orientations (longitudinal and transverse), and three root gap configurations (0, z, and 8 in.). Root gaps were fabricated by using spacer bars between the plates to represent distortions or inadequate fitup of plates. Eighteen specimens were prepared using 70 ksi SMAW welds with A572 Grade 50 plates. The strength ratio between the transverse and longitudinal weld was between 1.3 and 1.7 for specimens with no gaps and 1.2 and 1.4 for gapped specimens. For the same specified weld size, the strength of the gapped specimens did not decrease significantly from non-gapped specimens because of the relatively higher weld penetration in the first, along with the weld flow in the gap.
21
Iwankiw (1997) Based on equilibrium on the theoretical effective throat (defined with α = 45°), Iwankiw (1997) derived Equation 2.47 which produces results within 10% of Equation 2.2. Equation 2.47 results in kds = 1.41 when θ = 90°.
22
1 cosdsk =+ θ
(2.47)
Mellor et al. (1999) Using experimental results from the literature and the results of finite element models, Mellor et al. (1999) simplified an empirical equation that predicts the strength of fillet welds, resulting in Equation 2.48.
Rn = KatFcEpL (2.48) Where Ep is the actual weld throat defined as the penetration depth plus the effective throat according to AISC Specification Section J2.2a. Fc is the rupture stress that considers the effect of base metal dilution. The authors developed Equation 2.49 as a simplified expression for Fc.
Fc = 0.6FEXX + 0.4Fu (2.49) Where Fu is the tensile strength of the base metal. Kat is an empirical coefficient, which can be calculated with Equation 2.50 for transversely-loaded double-lap fillet weld joints.
2
0.079 1.931 1.084atp p
E EKE E
= + −
(2.50)
The authors found that, for transversely-loaded fillet welds, double-lap joints are stronger than T-joints. The higher loads were believed to be caused by friction at the faying surfaces in the lap joints, higher stress concentrations in the T-joint, and higher rigidity of the T-joint. Based on the experimental and theoretical results, the range of Kat was 0.93-1.04 and 0.82-0.98 for double-lap and T-joints, respectively. Ng et al. (2002), Ng et al. (2004) Ng et al. (2002) tested 102 transversely-loaded fillet weld specimens in double-lap and cruciform T-joints. Both the SMAW and FCAW processes were used in the fabrication. The specified weld size for the cruciform specimens was 4 in. For the lapped specimens, two weld sizes were considered: 4 in. and 2 in. The calculated mean strength, using the measured rupture surface area, was approximately the same for both welding processes. However, the penetration for the FCAW specimens was much higher than for the SMAW specimens, resulting in higher rupture strengths for the FCAW specimens. The measured rupture surface width for the SMAW welds was similar to the theoretical
22
effective throat dimension. The measured rupture surface width of the FCAW welds was about 1.5 to 2 times the theoretical effective throat dimension. The tests showed that the rupture stress decreased nonlinearly with an increase in weld size. The average rupture stress for the lapped specimens was 13% higher than that of the cruciform specimens. Also, the lapped specimens were approximately 3.8 times as ductile as the cruciform specimens. Most of the specimens failed by ductile shear rupture at, or near, the weld shear leg (α = 0o). The test-to-predicted strength ratio ranged from 1.28 to 2.57 compared to the AISC Specification equations. Deng et al. (2003) Deng et al. (2003) investigated the strength of fillet welds in double-lap joints fabricated with both the SMAW and FCAW processes. The welds were subjected to three loading angles: θ = 0°, 45° and 90°. A reliability analysis showed that the AISC Specification equations are applicable to welds fabricated with both SMAW and FCAW processes. The FCAW process resulted in higher root penetration than the SMAW process; therefore, the calculations are more conservative for FCAW welds. The average experimental strength for the FCAW specimens was approximately 50% higher than that of SMAW specimens. However, the mean rupture stress calculated with the measured rupture surface area was approximately the same for both welding processes. Li et al. (2007) Li et al. (2007) tested 12 transversely-loaded fillet weld specimens in cruciform T-joints. The specimens were welded with the FCAW process. The tests showed that lap-joints are between 0 and 30% stronger than T-joints. A reliability analysis was performed on transversely-loaded fillet welds using 1160 experimental data points from previous and current research. This indicated that, for lap-joints, the safety index is 4.5 and for T-joints, the safety index is 4.3. The authors analyzed 1,706 measurements on weld leg or throat dimensions from 12 research projects and determined that the average measured-to-specified ratio, ρG, is 1.08 with a coefficient of variation of 0.142. For the weld uniaxial metal tensile strength, 716 specimens from eight research projects showed that the average measured-to-specified ratio, ρM1, is 1.13 with a coefficient of variation of 0.080. Based on the results of 304 specimens from eight research projects, the shear-to-tensile strength ratio of 0.60 in the AISC Specification equations is conservative. The average measured-to-specified ratio, ρM2, is 1.29 with a coefficient of variation of 0.130. This is identical to an average τu/σuw = 0.774. Gomez et al. (2008) and Kanvinde et al. (2009) The strength in fillet-welded cruciform T-joints was determined theoretically and experimentally, while changing different parameters. The FCAW process was used with two electrodes: E70T-7 (non-toughness rated) and E70T7-K2 (toughness rated), two root notch lengths (plate thickness): 1.25 and 2.5 in., and two weld sizes: 2 and c in. The experimental program consisted of eight combinations with three specimens each. The root notch length had an insignificant effect on the weld strength and ductility. Generally, the calculated strength according to the AISC Specification was accurate compared to the experimental results. The ductility of the specimens with E70T7-K2 weld material was almost
23
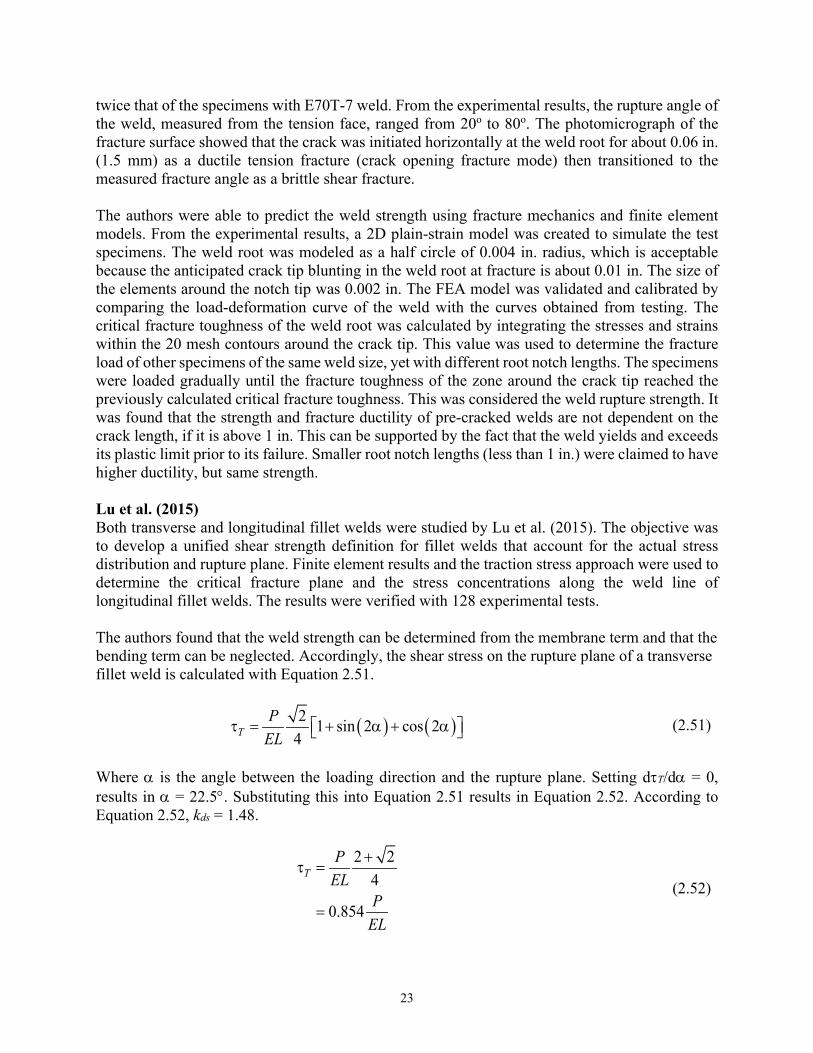
twice that of the specimens with E70T-7 weld. From the experimental results, the rupture angle of the weld, measured from the tension face, ranged from 20o to 80o. The photomicrograph of the fracture surface showed that the crack was initiated horizontally at the weld root for about 0.06 in. (1.5 mm) as a ductile tension fracture (crack opening fracture mode) then transitioned to the measured fracture angle as a brittle shear fracture. The authors were able to predict the weld strength using fracture mechanics and finite element models. From the experimental results, a 2D plain-strain model was created to simulate the test specimens. The weld root was modeled as a half circle of 0.004 in. radius, which is acceptable because the anticipated crack tip blunting in the weld root at fracture is about 0.01 in. The size of the elements around the notch tip was 0.002 in. The FEA model was validated and calibrated by comparing the load-deformation curve of the weld with the curves obtained from testing. The critical fracture toughness of the weld root was calculated by integrating the stresses and strains within the 20 mesh contours around the crack tip. This value was used to determine the fracture load of other specimens of the same weld size, yet with different root notch lengths. The specimens were loaded gradually until the fracture toughness of the zone around the crack tip reached the previously calculated critical fracture toughness. This was considered the weld rupture strength. It was found that the strength and fracture ductility of pre-cracked welds are not dependent on the crack length, if it is above 1 in. This can be supported by the fact that the weld yields and exceeds its plastic limit prior to its failure. Smaller root notch lengths (less than 1 in.) were claimed to have higher ductility, but same strength. Lu et al. (2015) Both transverse and longitudinal fillet welds were studied by Lu et al. (2015). The objective was to develop a unified shear strength definition for fillet welds that account for the actual stress distribution and rupture plane. Finite element results and the traction stress approach were used to determine the critical fracture plane and the stress concentrations along the weld line of longitudinal fillet welds. The results were verified with 128 experimental tests. The authors found that the weld strength can be determined from the membrane term and that the bending term can be neglected. Accordingly, the shear stress on the rupture plane of a transverse fillet weld is calculated with Equation 2.51.
( ) ( )2 1 sin 2 cos 24T
PEL
τ = + α + α (2.51)
Where α is the angle between the loading direction and the rupture plane. Setting dτT/dα = 0, results in α = 22.5°. Substituting this into Equation 2.51 results in Equation 2.52. According to Equation 2.52, kds = 1.48.
2 24
0.854
TP
ELP
EL
+τ =
= (2.52)
24
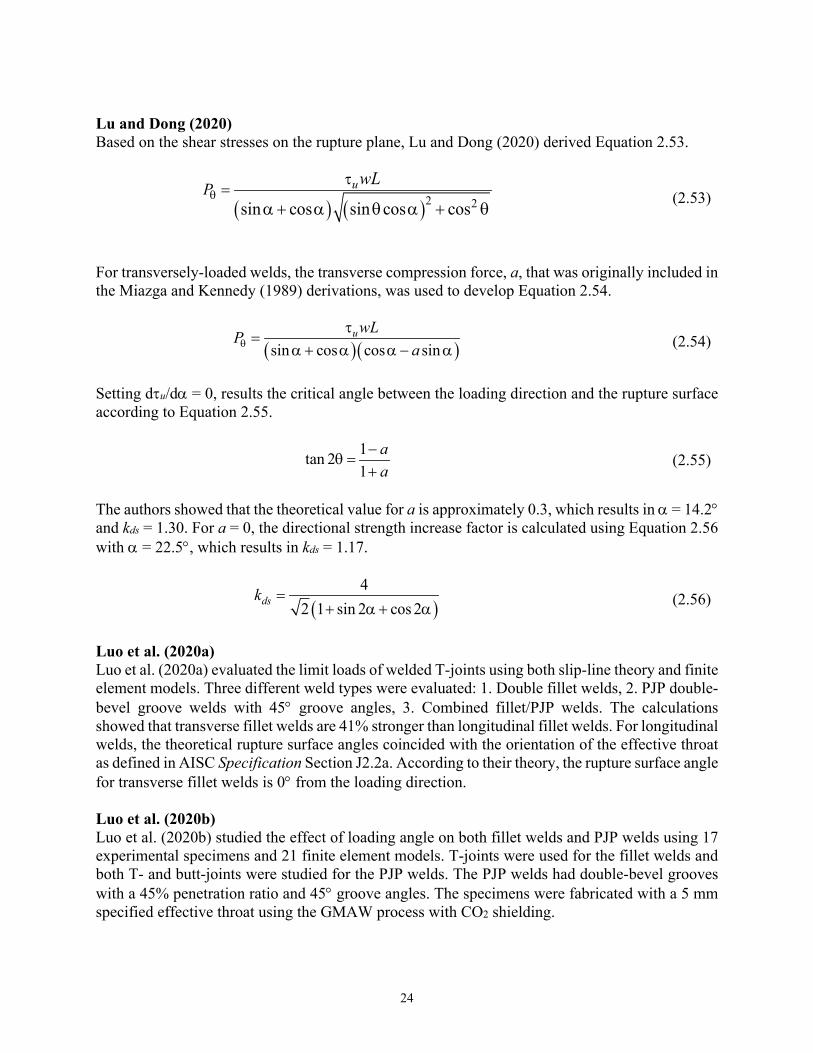
Lu and Dong (2020) Based on the shear stresses on the rupture plane, Lu and Dong (2020) derived Equation 2.53.
( ) ( )2 2sin cos sin cos cosuP wL
θτ
=α + α θ α + θ
(2.53)
For transversely-loaded welds, the transverse compression force, a, that was originally included in the Miazga and Kennedy (1989) derivations, was used to develop Equation 2.54.
( )( )sin cos cos sinuwLP
aθτ
=α + α α − α
(2.54)
Setting dτu/dα = 0, results the critical angle between the loading direction and the rupture surface according to Equation 2.55.
1tan 21
aa
−θ =
+ (2.55)
The authors showed that the theoretical value for a is approximately 0.3, which results in α = 14.2° and kds = 1.30. For a = 0, the directional strength increase factor is calculated using Equation 2.56 with α = 22.5°, which results in kds = 1.17.
( )4
2 1 sin 2 cos 2dsk =+ α + α
(2.56)
Luo et al. (2020a) Luo et al. (2020a) evaluated the limit loads of welded T-joints using both slip-line theory and finite element models. Three different weld types were evaluated: 1. Double fillet welds, 2. PJP double-bevel groove welds with 45° groove angles, 3. Combined fillet/PJP welds. The calculations showed that transverse fillet welds are 41% stronger than longitudinal fillet welds. For longitudinal welds, the theoretical rupture surface angles coincided with the orientation of the effective throat as defined in AISC Specification Section J2.2a. According to their theory, the rupture surface angle for transverse fillet welds is 0° from the loading direction. Luo et al. (2020b) Luo et al. (2020b) studied the effect of loading angle on both fillet welds and PJP welds using 17 experimental specimens and 21 finite element models. T-joints were used for the fillet welds and both T- and butt-joints were studied for the PJP welds. The PJP welds had double-bevel grooves with a 45% penetration ratio and 45° groove angles. The specimens were fabricated with a 5 mm specified effective throat using the GMAW process with CO2 shielding.
25
The research showed that the directional strength increase for fillet welds in equation 2.2 is non-conservative. The strength of fillet welds can be calculated with Equation 2.57, which has a mean test-to-predicted ratio of 1.00 and a standard deviation of 0.036.
1.51.0 0.34sindsk = + θ (2.57)
26
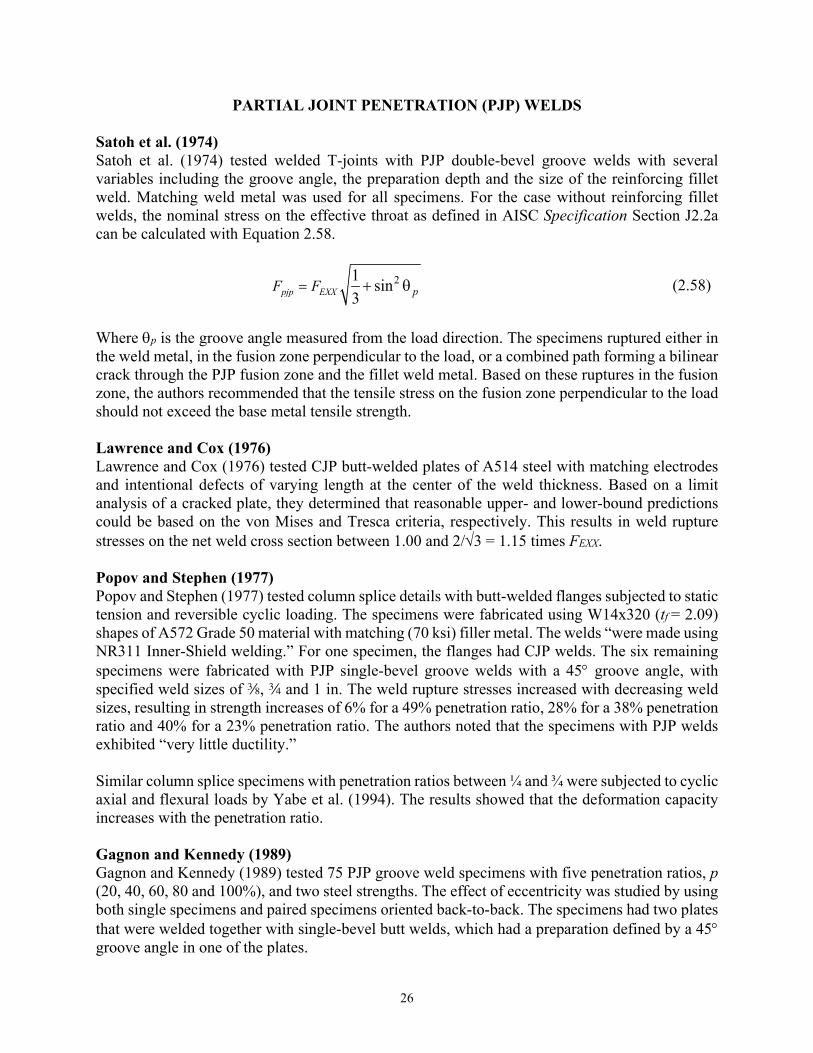
PARTIAL JOINT PENETRATION (PJP) WELDS Satoh et al. (1974) Satoh et al. (1974) tested welded T-joints with PJP double-bevel groove welds with several variables including the groove angle, the preparation depth and the size of the reinforcing fillet weld. Matching weld metal was used for all specimens. For the case without reinforcing fillet welds, the nominal stress on the effective throat as defined in AISC Specification Section J2.2a can be calculated with Equation 2.58.
21 sin3pjp EXX pF F= + θ (2.58)
Where θp is the groove angle measured from the load direction. The specimens ruptured either in the weld metal, in the fusion zone perpendicular to the load, or a combined path forming a bilinear crack through the PJP fusion zone and the fillet weld metal. Based on these ruptures in the fusion zone, the authors recommended that the tensile stress on the fusion zone perpendicular to the load should not exceed the base metal tensile strength. Lawrence and Cox (1976) Lawrence and Cox (1976) tested CJP butt-welded plates of A514 steel with matching electrodes and intentional defects of varying length at the center of the weld thickness. Based on a limit analysis of a cracked plate, they determined that reasonable upper- and lower-bound predictions could be based on the von Mises and Tresca criteria, respectively. This results in weld rupture stresses on the net weld cross section between 1.00 and 2/√3 = 1.15 times FEXX. Popov and Stephen (1977) Popov and Stephen (1977) tested column splice details with butt-welded flanges subjected to static tension and reversible cyclic loading. The specimens were fabricated using W14x320 (tf = 2.09) shapes of A572 Grade 50 material with matching (70 ksi) filler metal. The welds “were made using NR311 Inner-Shield welding.” For one specimen, the flanges had CJP welds. The six remaining specimens were fabricated with PJP single-bevel groove welds with a 45° groove angle, with specified weld sizes of a, w and 1 in. The weld rupture stresses increased with decreasing weld sizes, resulting in strength increases of 6% for a 49% penetration ratio, 28% for a 38% penetration ratio and 40% for a 23% penetration ratio. The authors noted that the specimens with PJP welds exhibited “very little ductility.” Similar column splice specimens with penetration ratios between ¼ and ¾ were subjected to cyclic axial and flexural loads by Yabe et al. (1994). The results showed that the deformation capacity increases with the penetration ratio. Gagnon and Kennedy (1989) Gagnon and Kennedy (1989) tested 75 PJP groove weld specimens with five penetration ratios, p (20, 40, 60, 80 and 100%), and two steel strengths. The effect of eccentricity was studied by using both single specimens and paired specimens oriented back-to-back. The specimens had two plates that were welded together with single-bevel butt welds, which had a preparation defined by a 45° groove angle in one of the plates.
27
The specimens ruptured at or near the fusion zone of the plate with the square preparation. The rupture stresses for all specimens were similar to or greater than the measured uniaxial tensile stress of the weld metal. Table 2.1 shows the effect of the penetration ratio on the rupture stress, where the rupture stress decreases with increasing penetration. This effect, which is caused by the transverse constraint of the weld metal by the base metal, can be calculated with Equation 2.59.
( )21.55 1.16 0.61c EXXF F p p= − + (2.59) where p = penetration ratio
Table 2.1. Average experimental rupture stresses for each penetration ratio. p 20% 40% 60% 80% 100%
σe/σuw 1.33 1.18 1.13 1.08 1.00 σe = experimental rupture stress, ksi σuw = measured weld metal uniaxial tensile stress, ksi
Khurshid et al. (2015) Khurshid et al. (2015) tested CJP and PJP butt welded joints in high-strength steel plates with specified tensile strengths of 750 and 980 MPa. Both matching and undermatching filler metals were used, and specimens with overmatching filler metal were tested for the lower-strength base metal. The CJP preparations were double-V grooves and the PJP welds had single-V grooves. The PJP welds had a 67% penetration ratio and both weld types had a 90° groove angle. All CJP specimens ruptured in the base metal. Rupture in the PJP specimens started at the root and propagated along the fusion zone. The deformation capacity of the CJP specimens was several times that of the PJP specimens. The ductility of overmatching PJP welds was slightly lower than matching welds, but the deformation capacity of the undermatching welds was significantly higher (25% to 53%). The available design strengths were compared to the experimental rupture loads, showing actual safety factors between 2.1 and 3.0 for the AWS D1.1 allowable strength equations. Ran et al. (2019) Ran et al. (2019) tested 108 butt-welded high-strength CJP specimens with mismatched tensile strength ratios between 0.696 and 1.27. The results indicated a slight increase in the rupture load (between 4 and 10%) for undermatching welds when the weld length increased from 25 mm to 100 mm. This behavior is caused by the transverse restraint in the width and thickness directions provided by the adjacent plates, which are stressed to a lower portion of the strength. The authors noted that the weld metal yields at a load equal to (2/√3)n + 1 times the yield stress, where n is the strain-hardening exponent. This results in a yield load of 1.18 times the uniaxial yield load. Similar behavior can be expected in both matched and mismatched PJP joints. Luo et al. (2020a) Luo et al. (2020a) evaluated the limit loads of welded T-joints using both slip-line theory and finite element models. Three different weld types were evaluated: 1. Double fillet welds, 2. PJP double-
28
bevel groove welds with a 45° groove angle, 3. Combined fillet/PJP welds. The calculations showed that transverse PJP welds are 183% stronger than longitudinal PJP welds. For longitudinal welds, the theoretical rupture surface angles coincided with the orientation of the effective throat as defined in AISC Specification Section J2.2a. According to the theory, the rupture surface angle for transverse PJP welds is 36° from the loading direction. Luo et al. (2020b) Luo et al. (2020b) studied the effect of loading angle on both fillet welds and PJP welds using 17 experimental specimens and 21 finite element models. T-joints were used for the fillet welds and both T- and butt-joints were studied for the PJP welds. The PJP welds had double-bevel grooves with a 45% penetration ratio and 45° groove angles. The specimens were fabricated with a 5 mm specified effective throat using the GMAW process with CO2 shielding. The research showed that the AISC Specification equations for PJP welds are over-conservative for θ > 0. Due to the effects of transverse constraint and weld reinforcement (measured dimensions were not reported), the strength of the PJP T-joints were 1.23 times the strength of the butt-joints. The authors proposed Equation 2.60 for PJP T-joints, which has a mean test-to-calculated ratio of 1.00 and a standard deviation of 0.014.
21.0 0.629 0.068dsk = + θ+ θ (2.60) They also proposed Equation 2.61 for PJP Butt-joints, which has a mean test-to-calculated ratio of 0.995 and a standard deviation of 0.038.
21.0 0.035 0.295dsk = + θ+ θ (2.61) Reynolds et al. (2020) Reynolds et al. (2020) tested six PJP welds in T-joints with single-bevel 45° groove angles and specified effective throats of d and 1w in. 1- and 2-in. thick A572 Grade 50 plates were welded in the Flat position with FCAW-G 70 ksi matching electrodes. Three specimens were loaded longitudinally and three were loaded transversely. Additionally, 15 specimens with combined PJP/fillet welds were loaded transversely. All strength calculations used the measured weld geometries and material properties. The longitudinally-loaded specimens ruptured in the weld metal at loads that were accurately predicted with the AISC Specification equations. The mean rupture load for the transversely-loaded PJP specimens was 30% higher than the strength calculated with the AISC Specification equations. The authors noted that the rupture strength is most accurately predicted using the base metal tensile strength and the fusion zone area at the transverse plate (which is identical to the effective weld area) according to Equation 2.62.
Rn = FuAwe (2.62) The mean rupture load for the combined PJP/fillet specimens was 21% higher than the strength calculated with the AISC Specification equations. These specimens ruptured along a roughly
29
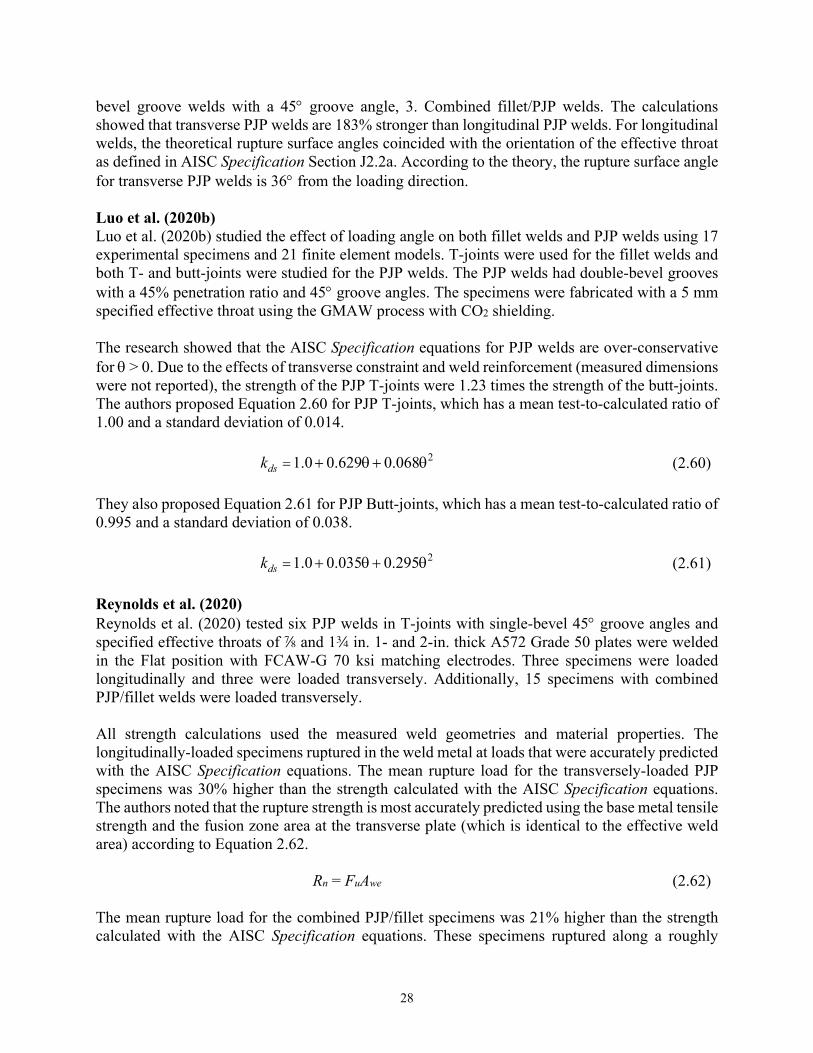
bilinear path forming a crack near the PJP fusion zone at the transverse plate and projecting diagonally through the weld metal. This rupture pattern, which is similar to that described by Satoh et al. (1974), is shown in Figure 2.11. The authors noted that the reinforcing fillet welds provided no significant increase in strength for the geometries tested and they recommended that the strength is best calculated by neglecting the reinforcing fillet. However, they noted that this may not be the case where overmatching electrodes are used.
Fig. 2.11. Rupture plane from Reynolds et al. (2020).
30
HIGH-STRENGTH WELDS Collin and Johansson (2005) Collin and Johansson (2005) tested 27 longitudinally- and transversely-loaded fillet welds in high-strength steel joints. The measured uniaxial weld metal tensile strengths were 548 and 758 MPa. The authors noted that the Eurocode 3 (CEN, 2005) directional method is over-conservative for transverse fillet welds. They recommended Equation 2.63, which compared well with the experimental rupture loads and results in kds = 1.41 when θ = 90°.
2 2 22 3 EXXT T L Fσ + τ + τ ≤ (2.63) Kuhlmann et al. (2008) Kuhlmann et al. (2008) tested both longitudinally- and transversely-loaded fillet welds as well as PJP welds in high-strength steel joints. Compared to the Eurocode 3 (CEN, 2005) directional method, the authors proposed a less conservative value of βw = 0.85 for S460 steel. For the longitudinally-loaded fillet welds, the shear rupture stress was accurately calculated with Equation 2.13. Rasche and Kuhlmann (2009) Rasche and Kuhlmann (2009) studied both the strength and ductility of fillet-welded connections in high strength steel using experimental and numerical analyses. The weld electrode was selected to match the base metal in the first part of the study. The objective was to determine a more accurate correlation factor, βw, for use in Eurocode 3 (CEN, 2005). The authors recommended βw = 0.79 for longitudinal fillet welds connecting S460M steel, instead of 1.0 as specified in Eurocode 3. In investigating different filler metals, overmatching electrodes increased the strength. For tests with S690Q base metals, changing the filler metal from 690 MPa specified strength to 890 MPa increased the weld resistance by 9%; however, the ductility was reduced by almost 50%. Consequently, they concluded that the strength is controlled by the filler metal rather than the base metal. Bjork et al. (2012) Bjork et al. (2012) tested 28 fillet welded high-strength steel joints loaded either in the transverse or longitudinal directions. Additionally, six specimens with both longitudinal and transverse welds were tested. The GMAW process was used and the measured uniaxial weld metal tensile strengths were 690, 915 and 1,245 MPa. Both double-lap and cruciform T-joints were tested. Most of the specimens with transversely-loaded T-joints ruptured along the HAZ or fusion zone and generally, the remaining specimens ruptured in the weld metal. The longitudinally-loaded welds ruptured approximately along the theoretical effective throat, which is defined at a rupture angle of 45°. For the transversely-loaded specimens that ruptured in the weld metal, the rupture angles were approximately 20° from the load direction.
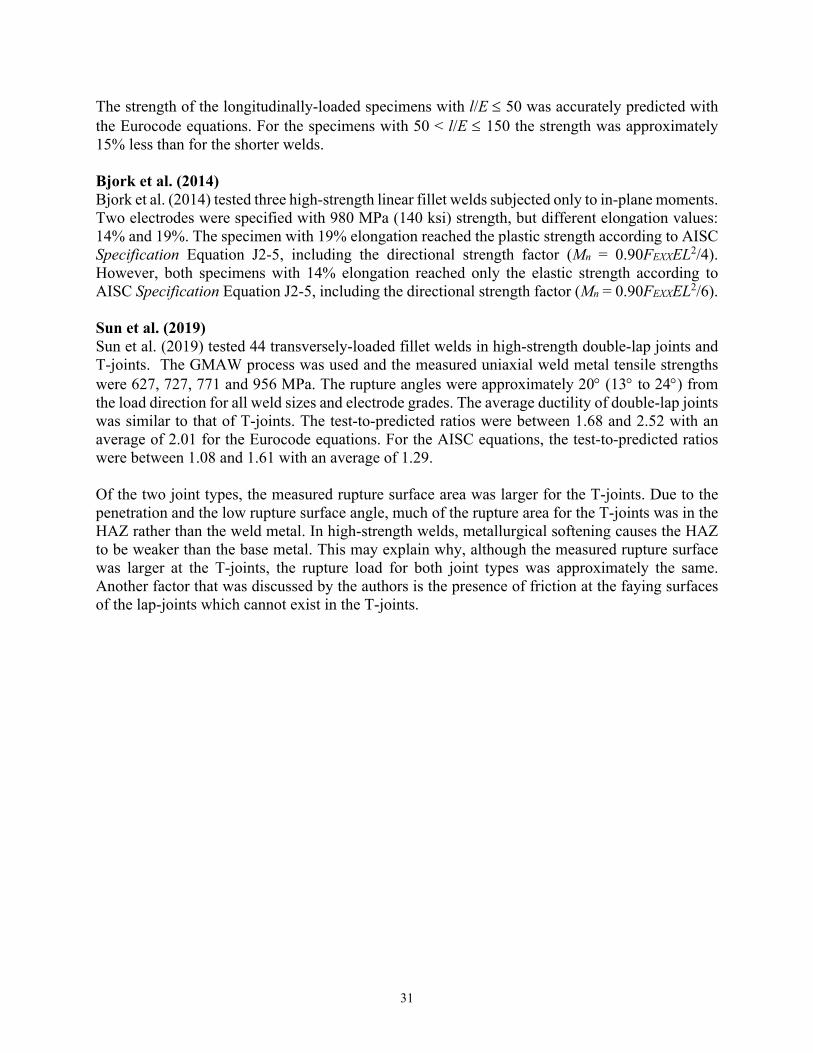
31
The strength of the longitudinally-loaded specimens with l/E ≤ 50 was accurately predicted with the Eurocode equations. For the specimens with 50 < l/E ≤ 150 the strength was approximately 15% less than for the shorter welds. Bjork et al. (2014) Bjork et al. (2014) tested three high-strength linear fillet welds subjected only to in-plane moments. Two electrodes were specified with 980 MPa (140 ksi) strength, but different elongation values: 14% and 19%. The specimen with 19% elongation reached the plastic strength according to AISC Specification Equation J2-5, including the directional strength factor (Mn = 0.90FEXXEL2/4). However, both specimens with 14% elongation reached only the elastic strength according to AISC Specification Equation J2-5, including the directional strength factor (Mn = 0.90FEXXEL2/6). Sun et al. (2019) Sun et al. (2019) tested 44 transversely-loaded fillet welds in high-strength double-lap joints and T-joints. The GMAW process was used and the measured uniaxial weld metal tensile strengths were 627, 727, 771 and 956 MPa. The rupture angles were approximately 20° (13° to 24°) from the load direction for all weld sizes and electrode grades. The average ductility of double-lap joints was similar to that of T-joints. The test-to-predicted ratios were between 1.68 and 2.52 with an average of 2.01 for the Eurocode equations. For the AISC equations, the test-to-predicted ratios were between 1.08 and 1.61 with an average of 1.29. Of the two joint types, the measured rupture surface area was larger for the T-joints. Due to the penetration and the low rupture surface angle, much of the rupture area for the T-joints was in the HAZ rather than the weld metal. In high-strength welds, metallurgical softening causes the HAZ to be weaker than the base metal. This may explain why, although the measured rupture surface was larger at the T-joints, the rupture load for both joint types was approximately the same. Another factor that was discussed by the authors is the presence of friction at the faying surfaces of the lap-joints which cannot exist in the T-joints.
32
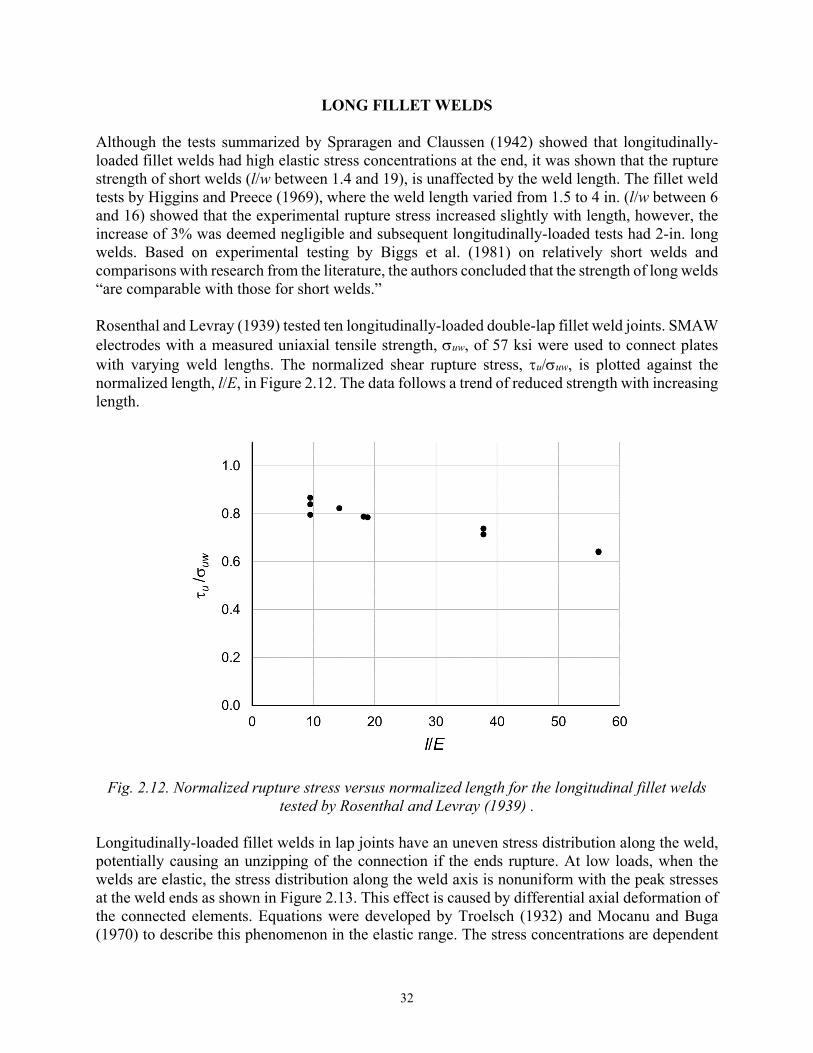
LONG FILLET WELDS Although the tests summarized by Spraragen and Claussen (1942) showed that longitudinally-loaded fillet welds had high elastic stress concentrations at the end, it was shown that the rupture strength of short welds (l/w between 1.4 and 19), is unaffected by the weld length. The fillet weld tests by Higgins and Preece (1969), where the weld length varied from 1.5 to 4 in. (l/w between 6 and 16) showed that the experimental rupture stress increased slightly with length, however, the increase of 3% was deemed negligible and subsequent longitudinally-loaded tests had 2-in. long welds. Based on experimental testing by Biggs et al. (1981) on relatively short welds and comparisons with research from the literature, the authors concluded that the strength of long welds “are comparable with those for short welds.” Rosenthal and Levray (1939) tested ten longitudinally-loaded double-lap fillet weld joints. SMAW electrodes with a measured uniaxial tensile strength, σuw, of 57 ksi were used to connect plates with varying weld lengths. The normalized shear rupture stress, τu/σuw, is plotted against the normalized length, l/E, in Figure 2.12. The data follows a trend of reduced strength with increasing length.
Fig. 2.12. Normalized rupture stress versus normalized length for the longitudinal fillet welds tested by Rosenthal and Levray (1939) .
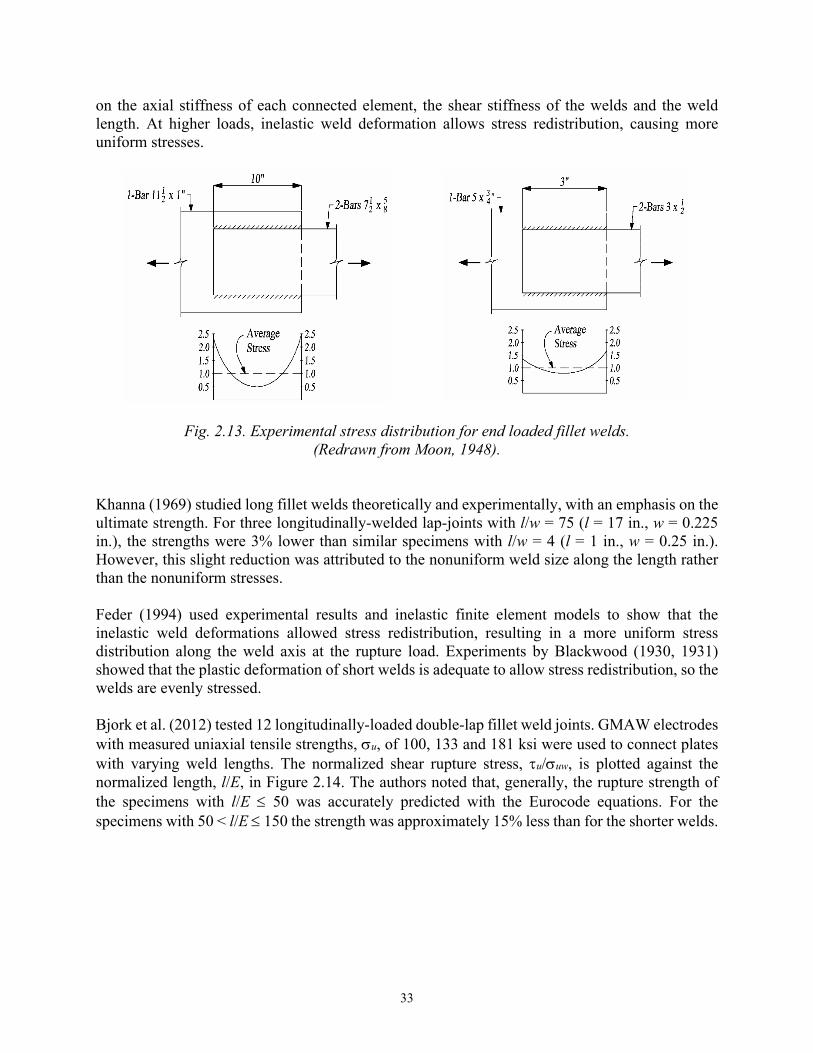
Longitudinally-loaded fillet welds in lap joints have an uneven stress distribution along the weld, potentially causing an unzipping of the connection if the ends rupture. At low loads, when the welds are elastic, the stress distribution along the weld axis is nonuniform with the peak stresses at the weld ends as shown in Figure 2.13. This effect is caused by differential axial deformation of the connected elements. Equations were developed by Troelsch (1932) and Mocanu and Buga (1970) to describe this phenomenon in the elastic range. The stress concentrations are dependent
33
on the axial stiffness of each connected element, the shear stiffness of the welds and the weld length. At higher loads, inelastic weld deformation allows stress redistribution, causing more uniform stresses.
Fig. 2.13. Experimental stress distribution for end loaded fillet welds. (Redrawn from Moon, 1948).
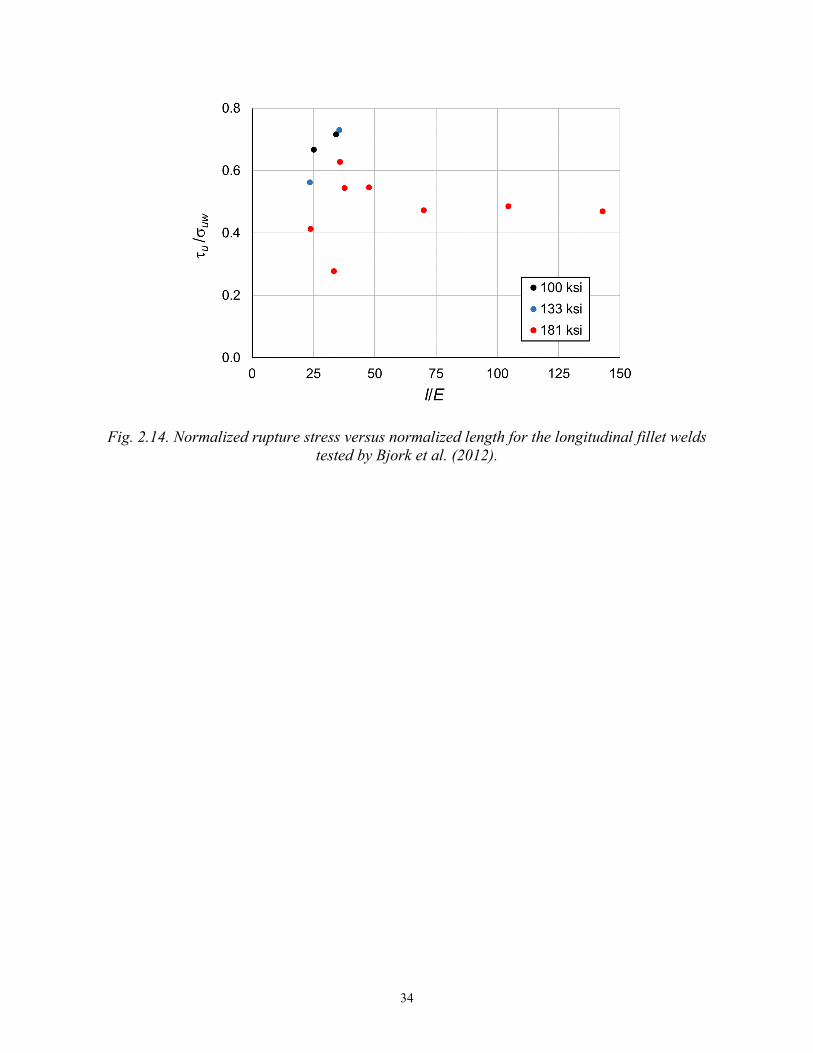
Khanna (1969) studied long fillet welds theoretically and experimentally, with an emphasis on the ultimate strength. For three longitudinally-welded lap-joints with l/w = 75 (l = 17 in., w = 0.225 in.), the strengths were 3% lower than similar specimens with l/w = 4 (l = 1 in., w = 0.25 in.). However, this slight reduction was attributed to the nonuniform weld size along the length rather than the nonuniform stresses. Feder (1994) used experimental results and inelastic finite element models to show that the inelastic weld deformations allowed stress redistribution, resulting in a more uniform stress distribution along the weld axis at the rupture load. Experiments by Blackwood (1930, 1931) showed that the plastic deformation of short welds is adequate to allow stress redistribution, so the welds are evenly stressed. Bjork et al. (2012) tested 12 longitudinally-loaded double-lap fillet weld joints. GMAW electrodes with measured uniaxial tensile strengths, σu, of 100, 133 and 181 ksi were used to connect plates with varying weld lengths. The normalized shear rupture stress, τu/σuw, is plotted against the normalized length, l/E, in Figure 2.14. The authors noted that, generally, the rupture strength of the specimens with l/E ≤ 50 was accurately predicted with the Eurocode equations. For the specimens with 50 < l/E ≤ 150 the strength was approximately 15% less than for the shorter welds.
34
Fig. 2.14. Normalized rupture stress versus normalized length for the longitudinal fillet welds tested by Bjork et al. (2012).
35
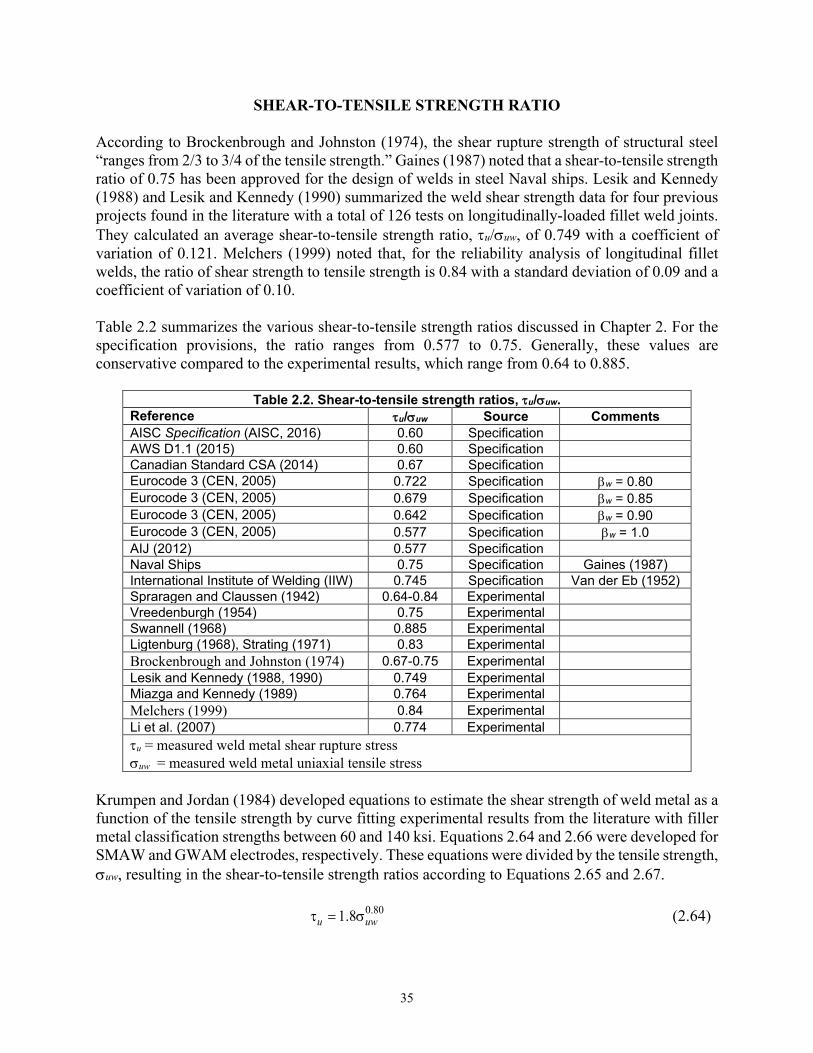
SHEAR-TO-TENSILE STRENGTH RATIO According to Brockenbrough and Johnston (1974), the shear rupture strength of structural steel “ranges from 2/3 to 3/4 of the tensile strength.” Gaines (1987) noted that a shear-to-tensile strength ratio of 0.75 has been approved for the design of welds in steel Naval ships. Lesik and Kennedy (1988) and Lesik and Kennedy (1990) summarized the weld shear strength data for four previous projects found in the literature with a total of 126 tests on longitudinally-loaded fillet weld joints. They calculated an average shear-to-tensile strength ratio, τu/σuw, of 0.749 with a coefficient of variation of 0.121. Melchers (1999) noted that, for the reliability analysis of longitudinal fillet welds, the ratio of shear strength to tensile strength is 0.84 with a standard deviation of 0.09 and a coefficient of variation of 0.10. Table 2.2 summarizes the various shear-to-tensile strength ratios discussed in Chapter 2. For the specification provisions, the ratio ranges from 0.577 to 0.75. Generally, these values are conservative compared to the experimental results, which range from 0.64 to 0.885.
Table 2.2. Shear-to-tensile strength ratios, τu/σuw. Reference τu/σuw Source Comments AISC Specification (AISC, 2016) 0.60 Specification AWS D1.1 (2015) 0.60 Specification Canadian Standard CSA (2014) 0.67 Specification Eurocode 3 (CEN, 2005) 0.722 Specification βw = 0.80 Eurocode 3 (CEN, 2005) 0.679 Specification βw = 0.85 Eurocode 3 (CEN, 2005) 0.642 Specification βw = 0.90 Eurocode 3 (CEN, 2005) 0.577 Specification βw = 1.0 AIJ (2012) 0.577 Specification Naval Ships 0.75 Specification Gaines (1987) International Institute of Welding (IIW) 0.745 Specification Van der Eb (1952) Spraragen and Claussen (1942) 0.64-0.84 Experimental Vreedenburgh (1954) 0.75 Experimental Swannell (1968) 0.885 Experimental Ligtenburg (1968), Strating (1971) 0.83 Experimental Brockenbrough and Johnston (1974) 0.67-0.75 Experimental Lesik and Kennedy (1988, 1990) 0.749 Experimental Miazga and Kennedy (1989) 0.764 Experimental Melchers (1999) 0.84 Experimental Li et al. (2007) 0.774 Experimental τu = measured weld metal shear rupture stress σuw = measured weld metal uniaxial tensile stress
Krumpen and Jordan (1984) developed equations to estimate the shear strength of weld metal as a function of the tensile strength by curve fitting experimental results from the literature with filler metal classification strengths between 60 and 140 ksi. Equations 2.64 and 2.66 were developed for SMAW and GWAM electrodes, respectively. These equations were divided by the tensile strength, σuw, resulting in the shear-to-tensile strength ratios according to Equations 2.65 and 2.67.
0.801.8u uwτ = σ (2.64)
36
0.201.8u
uw uw
τ=
σ σ (2.65)
0.752.5u uwτ = σ (2.66)
0.252.5u
uw uw
τ=
σ σ (2.67)
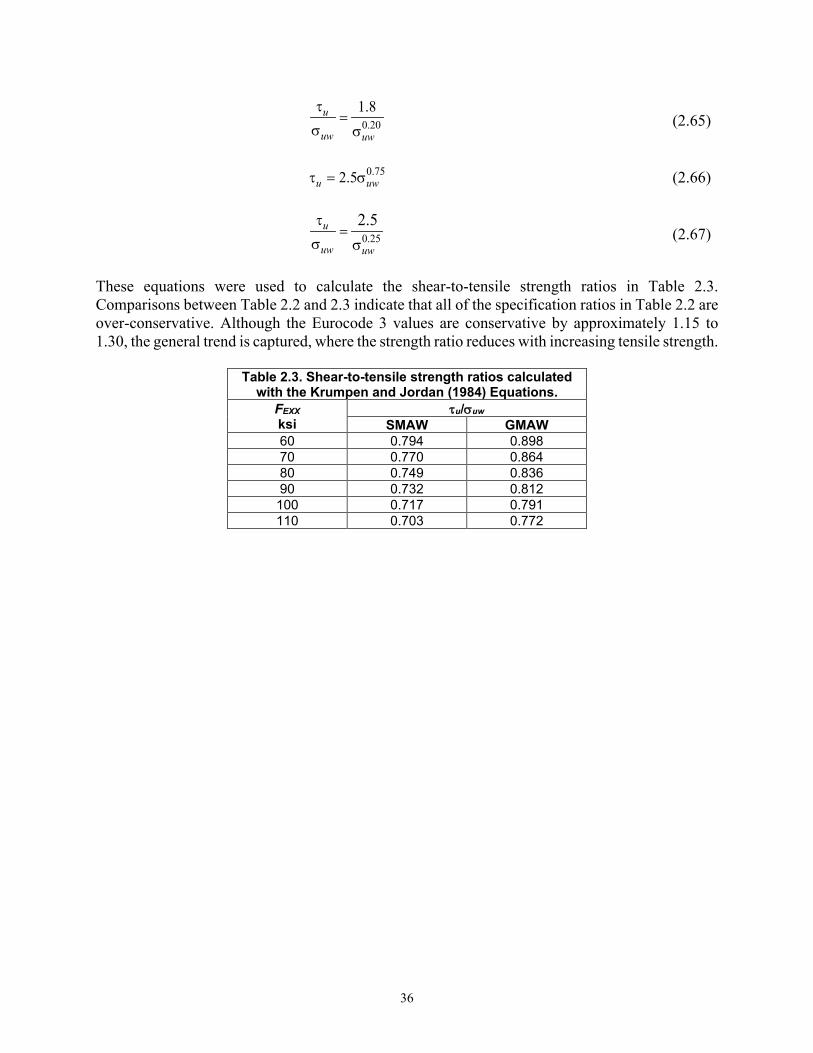
These equations were used to calculate the shear-to-tensile strength ratios in Table 2.3. Comparisons between Table 2.2 and 2.3 indicate that all of the specification ratios in Table 2.2 are over-conservative. Although the Eurocode 3 values are conservative by approximately 1.15 to 1.30, the general trend is captured, where the strength ratio reduces with increasing tensile strength.
Table 2.3. Shear-to-tensile strength ratios calculated with the Krumpen and Jordan (1984) Equations.
FEXX ksi
τu/σuw SMAW GMAW
60 0.794 0.898 70 0.770 0.864 80 0.749 0.836 90 0.732 0.812 100 0.717 0.791 110 0.703 0.772
37
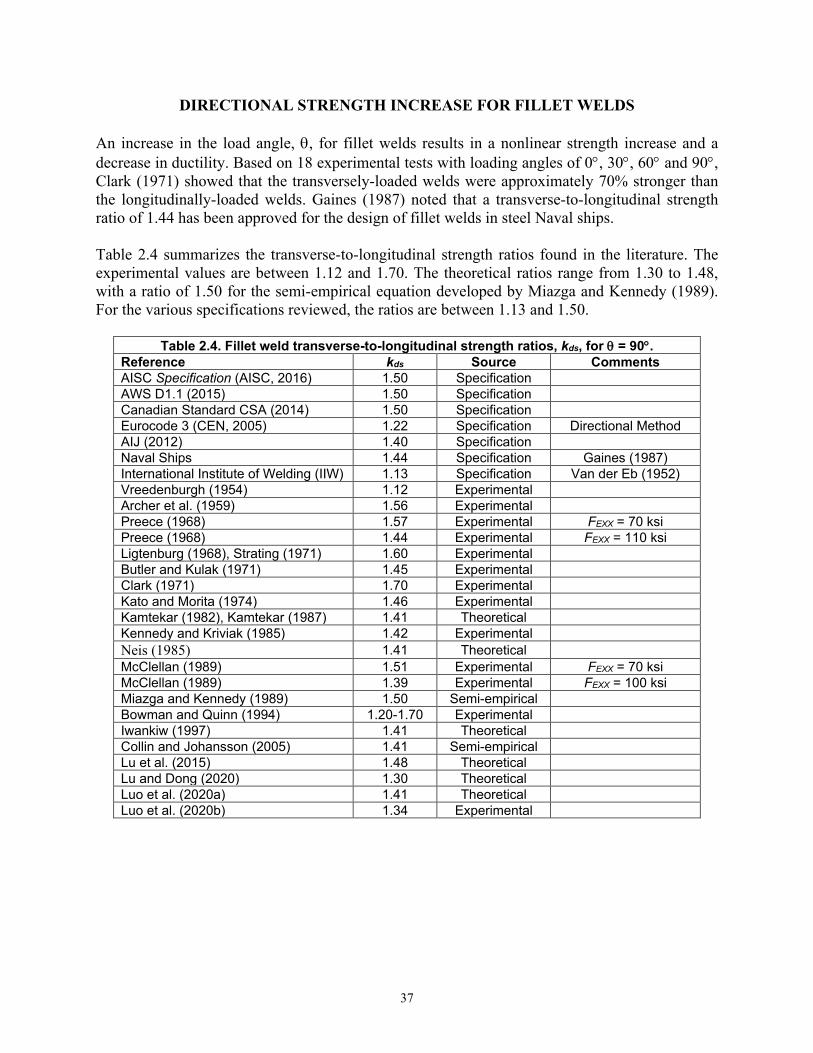
DIRECTIONAL STRENGTH INCREASE FOR FILLET WELDS An increase in the load angle, θ, for fillet welds results in a nonlinear strength increase and a decrease in ductility. Based on 18 experimental tests with loading angles of 0°, 30°, 60° and 90°, Clark (1971) showed that the transversely-loaded welds were approximately 70% stronger than the longitudinally-loaded welds. Gaines (1987) noted that a transverse-to-longitudinal strength ratio of 1.44 has been approved for the design of fillet welds in steel Naval ships. Table 2.4 summarizes the transverse-to-longitudinal strength ratios found in the literature. The experimental values are between 1.12 and 1.70. The theoretical ratios range from 1.30 to 1.48, with a ratio of 1.50 for the semi-empirical equation developed by Miazga and Kennedy (1989). For the various specifications reviewed, the ratios are between 1.13 and 1.50.
Table 2.4. Fillet weld transverse-to-longitudinal strength ratios, kds, for θ = 90°. Reference kds Source Comments AISC Specification (AISC, 2016) 1.50 Specification AWS D1.1 (2015) 1.50 Specification Canadian Standard CSA (2014) 1.50 Specification Eurocode 3 (CEN, 2005) 1.22 Specification Directional Method AIJ (2012) 1.40 Specification Naval Ships 1.44 Specification Gaines (1987) International Institute of Welding (IIW) 1.13 Specification Van der Eb (1952) Vreedenburgh (1954) 1.12 Experimental Archer et al. (1959) 1.56 Experimental Preece (1968) 1.57 Experimental FEXX = 70 ksi Preece (1968) 1.44 Experimental FEXX = 110 ksi Ligtenburg (1968), Strating (1971) 1.60 Experimental Butler and Kulak (1971) 1.45 Experimental Clark (1971) 1.70 Experimental Kato and Morita (1974) 1.46 Experimental Kamtekar (1982), Kamtekar (1987) 1.41 Theoretical Kennedy and Kriviak (1985) 1.42 Experimental Neis (1985) 1.41 Theoretical McClellan (1989) 1.51 Experimental FEXX = 70 ksi McClellan (1989) 1.39 Experimental FEXX = 100 ksi Miazga and Kennedy (1989) 1.50 Semi-empirical Bowman and Quinn (1994) 1.20-1.70 Experimental Iwankiw (1997) 1.41 Theoretical Collin and Johansson (2005) 1.41 Semi-empirical Lu et al. (2015) 1.48 Theoretical Lu and Dong (2020) 1.30 Theoretical Luo et al. (2020a) 1.41 Theoretical Luo et al. (2020b) 1.34 Experimental
38
FUSION ZONE STRENGTH Several research projects, including Preece (1968), tested experimental specimens with over-matched weld metal, showing that rupture typically occurs in the weld metal, including the specimens where the weld metal strength exceeded the base metal strength by a substantial amount. Because of this, an evaluation of the strength of fusion zones is not required by the AISC Specification. Rupture at the fusion zone has been reported in experimental specimens for both fillet and PJP welds. Under some conditions, such as single-bevel PJP welds, fusion zone rupture can be expected because the theoretical effective throat coincides with one of the fusion zones. In this case, the theoretical calculations are correct and provide an accurate estimate of the joint strength. However, unexpected fusion zone ruptures, where rupture occurs along a surface that does not coincide with the theoretical effective throat, have also occurred in tests. Unexpected fusion zone ruptures have been documented in only in a small portion of the experimental specimens. High-Strength Steel According to Bjork et al. (2018), high-strength base metals, which were defined as materials with Fy ≥ 500 MPa (72.5 ksi), are more prone to rupture at the fusion zones than lower-strength steels. According to the authors, “due to softening and other metallurgical effects,” the fusion zones “may be weaker than the adjacent base material.” Ginn et al. (2011) tested 20 double-lap longitudinal fillet weld specimens. The joints were fabricated using the GMAW process with high-strength inner plates (Fy = 460 MPa, Fu = 720 MPa) and standard-grade outer plates. The electrodes were selected to match the high-strength plates. The variables were weld size (6, 8 and 10 mm), weld length (50, 85 and 120 mm) and base metal thickness. The specimens ruptured either in the weld metal or along the fusion zone of the high-strength plate. Generally, the specimens that failed in the fusion zone had lower experimental rupture stresses. Most of the transversely-loaded fillet welded high-strength steel joints tested by Bjork et al. (2012), ruptured along the fusion zone. Generally, the remaining specimens, including the longitudinally-loaded welds, ruptured in the weld metal. For the transversely-loaded specimens that ruptured in the weld metal, the rupture angles were approximately 20° from the load direction. Tuominen et al. (2018) tested transversely-loaded T-joints with single-sided fillet welds and PJP single-bevel groove welds. There were no fusion zone ruptures for the specimens with base metal yield stresses equal to 400 MPa. However, for the 13 specimens fabricated with S960 material, which had a measured yield stress of 1041 MPa, a measured rupture stress of 1210 MPa and a measured weld metal tensile stress of 980 MPa, three specimens ruptured at the fusion zone, three specimens ruptured in the weld metal and the remaining specimens failed in the base material. Due to the penetration and the low rupture surface angle, much of the rupture area for the transversely-loaded fillet welded T-joints tested by Sun et al. (2019) was in the HAZ rather than the weld metal. The authors noted that metallurgical softening may have reduced the rupture stresses for these joints.
39
Fillet Welds Ales (1990) reported a fusion zone rupture at the top portion of a single-plate shear connection, where double fillet welds were used to connect the plate to the supporting rectangular HSS column. The fusion zone rupture of a transversely-loaded double fillet weld specimen was documented by Dubina and Stratan (2002). Due to excessive convexity, the shortest distance from the root to the face was along the fusion zone; therefore, this rupture plane would be predicted if the actual weld profile were used in the analysis. Zhao and Hancock (1995) tested nine specimens with transversely-loaded fillet welds connecting cold-formed rectangular HSS shapes to end plates in T-joints. Eight of the specimens ruptured in the base metal and one failed at the fusion zone of the HSS wall. The experimental rupture strength of the specimen that failed along the fusion zone was only 86% of the average experimental strength of the remaining specimens. PJP Welds For the PJP groove weld specimens tested by Gagnon and Kennedy (1989), the primary rupture location was at or near the fusion zone of the plate with the square preparation. The rupture stresses for all specimens were similar to or greater than the measured uniaxial tensile stress of the weld metal.
40
CHAPTER 3
EXPERIMENTAL PROGRAM
To meet the objectives of this research project, experimental specimens with both fillet and PJP welds were tested. Three different base metal strengths and three different weld metal strengths were specified. A total of 71 specimens were tested, including 18 transverse fillet weld specimens, 15 longitudinal fillet weld specimens, 17 transverse PJP weld specimens, 15 transverse PJP weld specimens and 6 skewed PJP weld specimens. The specimen shop drawings are in Appendix A. All specimens were shop welded using the Flux-Core Arc Welding (FCAW) process with CO2 gas shielding. Welding Procedure Specifications (WPS) for each filler metal classification strength are in Appendix C.
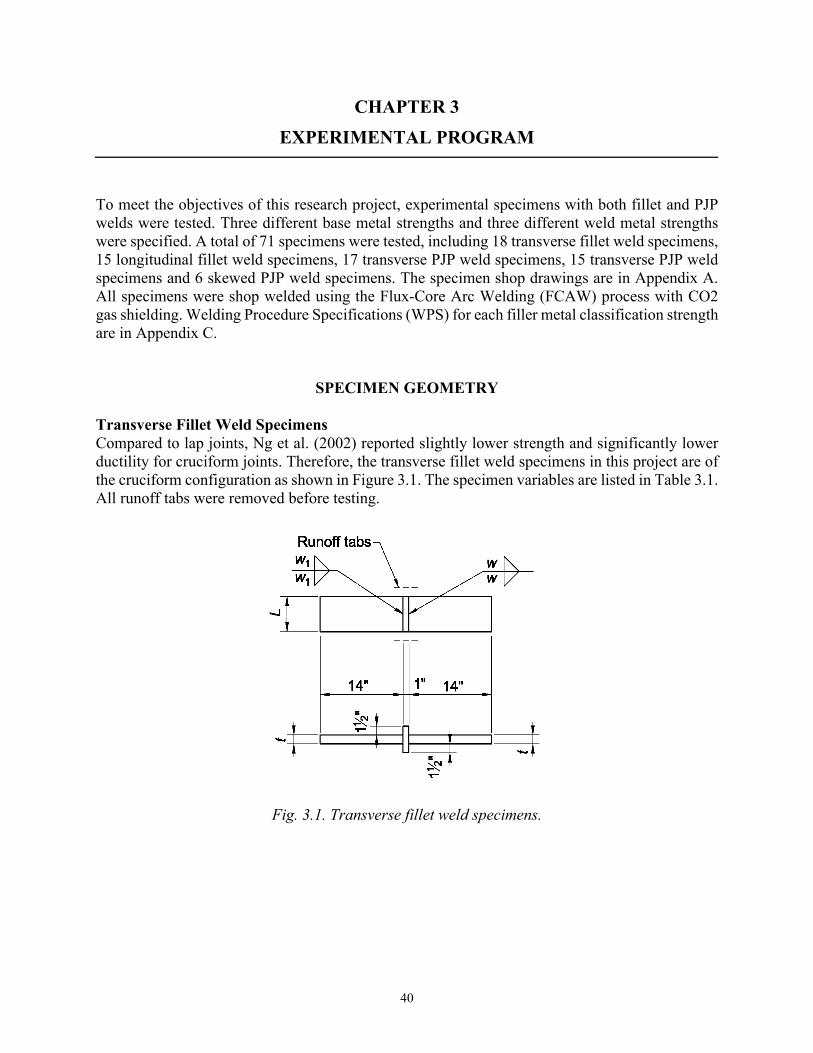
SPECIMEN GEOMETRY Transverse Fillet Weld Specimens Compared to lap joints, Ng et al. (2002) reported slightly lower strength and significantly lower ductility for cruciform joints. Therefore, the transverse fillet weld specimens in this project are of the cruciform configuration as shown in Figure 3.1. The specimen variables are listed in Table 3.1. All runoff tabs were removed before testing.
Fig. 3.1. Transverse fillet weld specimens.
41
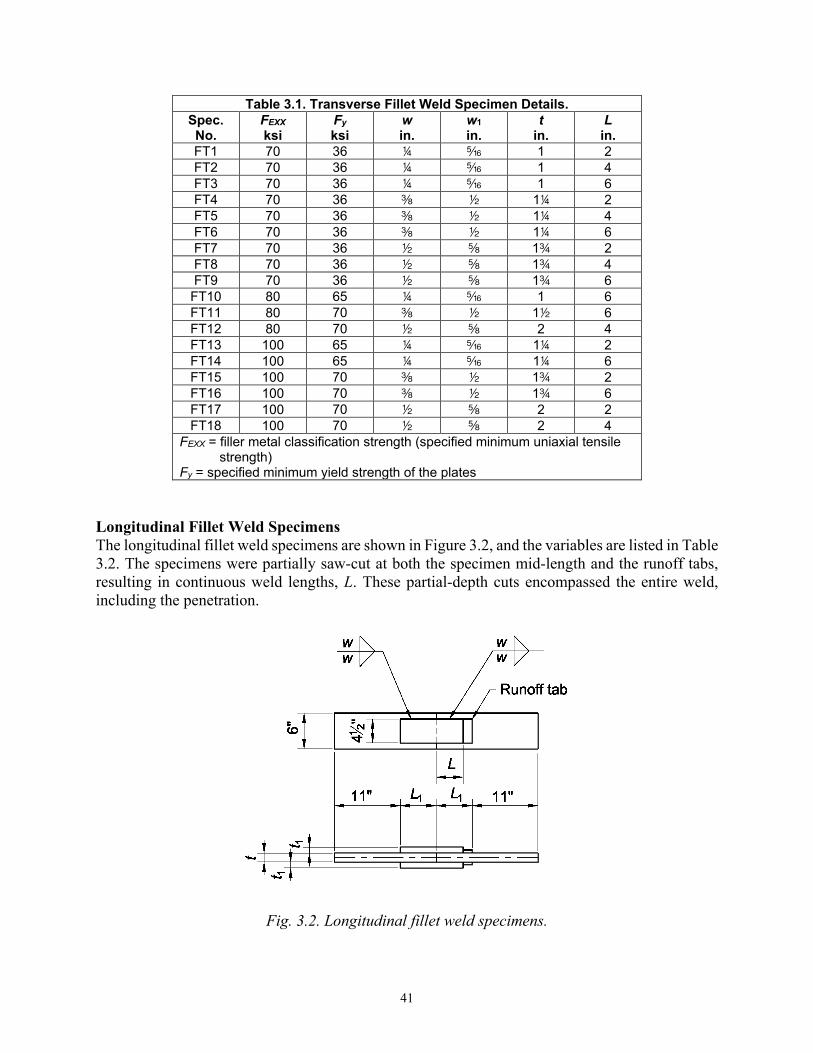
Table 3.1. Transverse Fillet Weld Specimen Details. Spec. No.
FEXX ksi
Fy ksi
w in.
w1 in.
t in.
L in.
FT1 70 36 4 c 1 2 FT2 70 36 4 c 1 4 FT3 70 36 4 c 1 6 FT4 70 36 a 2 114 2 FT5 70 36 a 2 114 4 FT6 70 36 a 2 114 6 FT7 70 36 2 s 11w 2 FT8 70 36 2 s 11w 4 FT9 70 36 2 s 11w 6
FT10 80 65 4 c 11 6 FT11 80 70 a 2 112 6 FT12 80 70 2 s 2 4 FT13 100 65 4 c 114 2 FT14 100 65 4 c 114 6 FT15 100 70 a 2 11w 2 FT16 100 70 a 2 11w 6 FT17 100 70 2 s 2 2 FT18 100 70 2 s 2 4
FEXX = filler metal classification strength (specified minimum uniaxial tensile strength)
Fy = specified minimum yield strength of the plates Longitudinal Fillet Weld Specimens The longitudinal fillet weld specimens are shown in Figure 3.2, and the variables are listed in Table 3.2. The specimens were partially saw-cut at both the specimen mid-length and the runoff tabs, resulting in continuous weld lengths, L. These partial-depth cuts encompassed the entire weld, including the penetration.
Fig. 3.2. Longitudinal fillet weld specimens.
42
Table 3.2. Longitudinal Fillet Weld Specimen Details. Spec. No.
FEXX ksi
Fy ksi
w in.
t in.
t1 in.
L in.
L1 in.
FL1 70 36 4 11 w 2 3 FL2 70 36 4 11 w 4 5 FL3 70 36 4 112 11 6 8 FL4 70 36 a 11 w 2 3 FL5 70 36 a 112 1 4 5 FL6 70 36 a 112 1 6 8 FL7 70 36 2 11 w 2 3 FL8 70 36 2 112 1 4 5 FL9 80 70 4 112 1 6 8 FL10 80 70 a 112 1 4 5 FL11 100 65 4 11 w 2 3 FL12 100 70 4 112 11 6 8 FL13 100 65 a 11 w 2 3 FL14 100 70 a 112 11 4 5 FL15 100 65 2 11 w 2 3
FEXX = filler metal classification strength (specified minimum uniaxial tensile strength) Fy = specified minimum yield strength of the plates
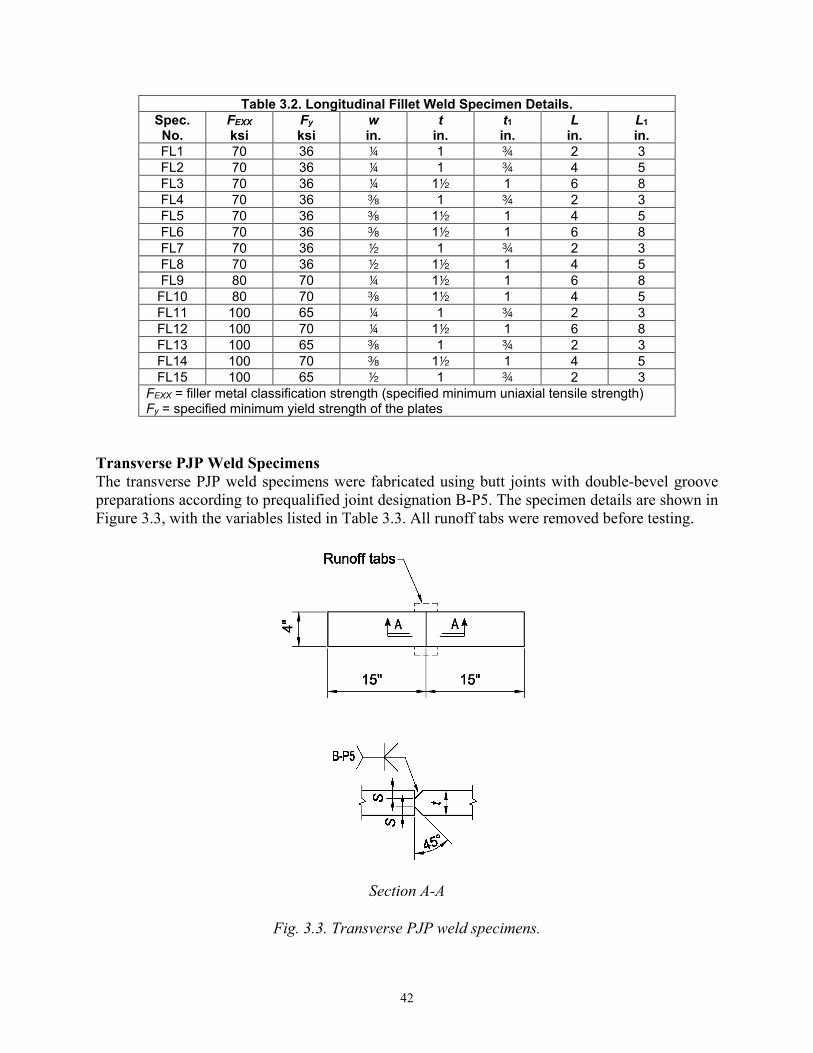
Transverse PJP Weld Specimens The transverse PJP weld specimens were fabricated using butt joints with double-bevel groove preparations according to prequalified joint designation B-P5. The specimen details are shown in Figure 3.3, with the variables listed in Table 3.3. All runoff tabs were removed before testing.
Section A-A
Fig. 3.3. Transverse PJP weld specimens.
43
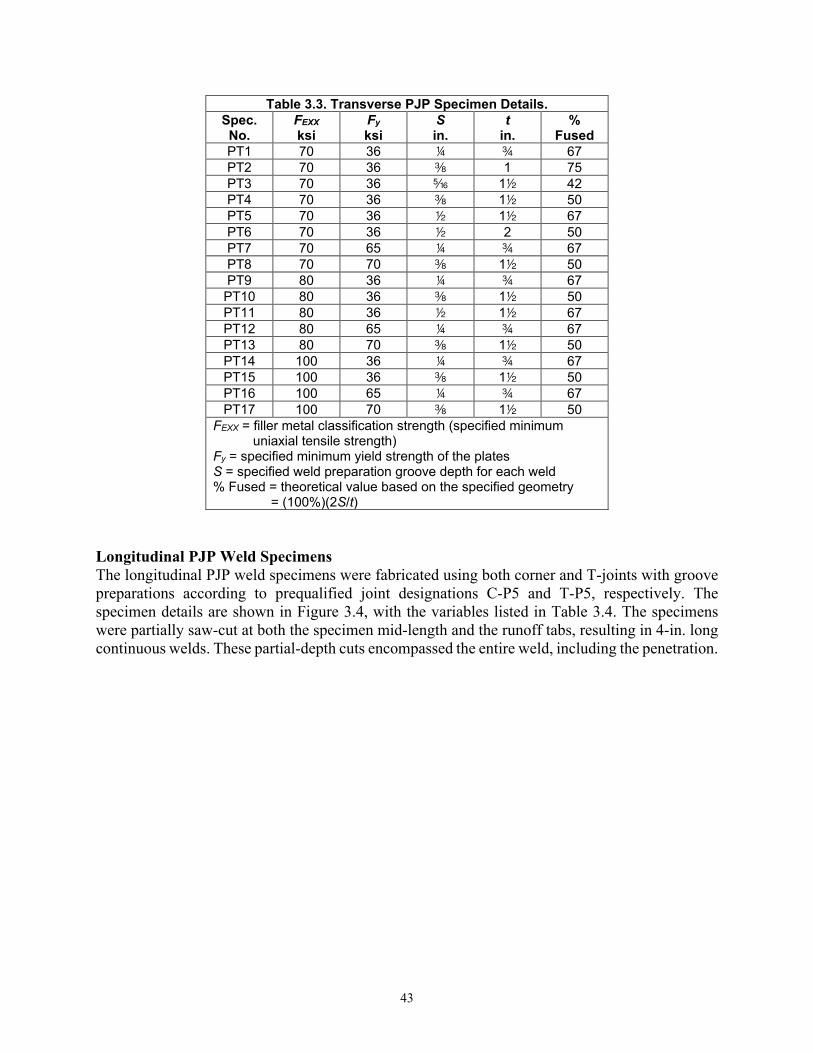
Table 3.3. Transverse PJP Specimen Details. Spec. No.
FEXX ksi
Fy ksi
S in.
t in.
% Fused
PT1 70 36 4 w 67 PT2 70 36 a 11111 75 PT3 70 36 c 112 42 PT4 70 36 a 112 50 PT5 70 36 2 112 67 PT6 70 36 2 2 50 PT7 70 65 4 w 67 PT8 70 70 a 112 50 PT9 80 36 4 w 67 PT10 80 36 a 112 50 PT11 80 36 2 112 67 PT12 80 65 4 w 67 PT13 80 70 a 112 50 PT14 100 36 4 w 67 PT15 100 36 a 112 50 PT16 100 65 4 w 67 PT17 100 70 a 112 50
FEXX = filler metal classification strength (specified minimum uniaxial tensile strength)
Fy = specified minimum yield strength of the plates S = specified weld preparation groove depth for each weld % Fused = theoretical value based on the specified geometry
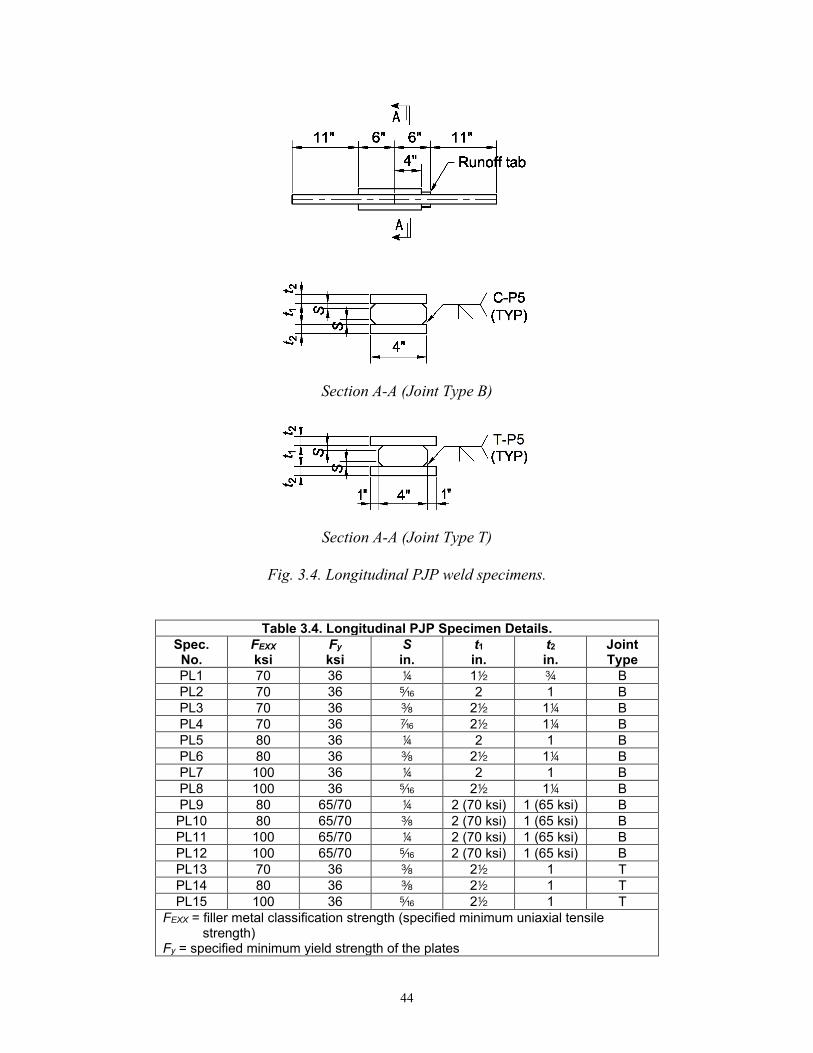
= (100%)(2S/t) Longitudinal PJP Weld Specimens The longitudinal PJP weld specimens were fabricated using both corner and T-joints with groove preparations according to prequalified joint designations C-P5 and T-P5, respectively. The specimen details are shown in Figure 3.4, with the variables listed in Table 3.4. The specimens were partially saw-cut at both the specimen mid-length and the runoff tabs, resulting in 4-in. long continuous welds. These partial-depth cuts encompassed the entire weld, including the penetration.
44
Section A-A (Joint Type B)
Section A-A (Joint Type T)
Fig. 3.4. Longitudinal PJP weld specimens.
Table 3.4. Longitudinal PJP Specimen Details. Spec. No.
FEXX ksi
Fy ksi
S in.
t1 in.
t2 in.
Joint Type
PL1 70 36 4 112 w B PL2 70 36 c 2 11111 B PL3 70 36 a 22 114 B PL4 70 36 v 22 114 B PL5 80 36 4 2 11 B PL6 80 36 a 22 114 B PL7 100 36 4 2 11 B PL8 100 36 c 22 114 B PL9 80 65/70 4 2 (70 ksi) 11 (65 ksi) B PL10 80 65/70 a 2 (70 ksi) 11 (65 ksi) B PL11 100 65/70 4 2 (70 ksi) 11 (65 ksi) B PL12 100 65/70 c 2 (70 ksi) 11 (65 ksi) B PL13 70 36 a 22 1 T PL14 80 36 a 22 1 T PL15 100 36 c 22 1 T
FEXX = filler metal classification strength (specified minimum uniaxial tensile strength)
Fy = specified minimum yield strength of the plates
45
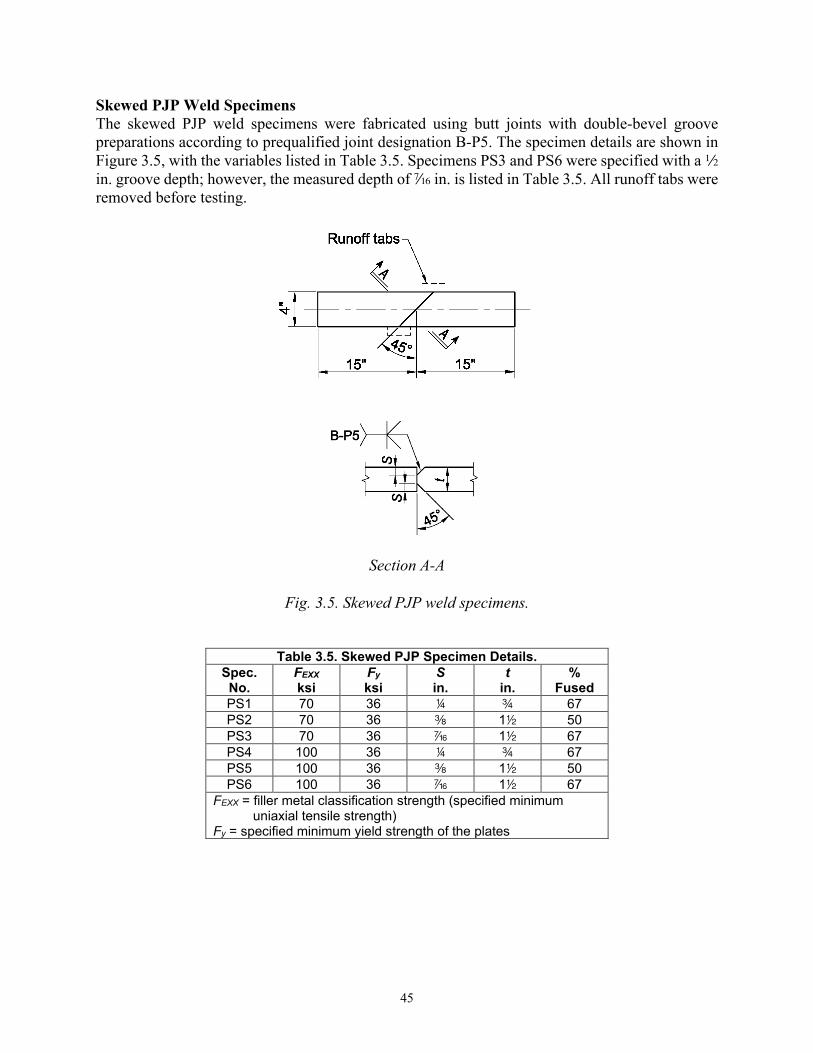
Skewed PJP Weld Specimens The skewed PJP weld specimens were fabricated using butt joints with double-bevel groove preparations according to prequalified joint designation B-P5. The specimen details are shown in Figure 3.5, with the variables listed in Table 3.5. Specimens PS3 and PS6 were specified with a 2 in. groove depth; however, the measured depth of v in. is listed in Table 3.5. All runoff tabs were removed before testing.
Section A-A
Fig. 3.5. Skewed PJP weld specimens.
Table 3.5. Skewed PJP Specimen Details. Spec. No.
FEXX ksi
Fy ksi
S in.
t in.
% Fused
PS1 70 36 4 w 67 PS2 70 36 a 111121 50 PS3 70 36 v 112 67 PS4 100 36 4 w 67 PS5 100 36 a 112 50 PS6 100 36 v 112 67
FEXX = filler metal classification strength (specified minimum uniaxial tensile strength)
Fy = specified minimum yield strength of the plates
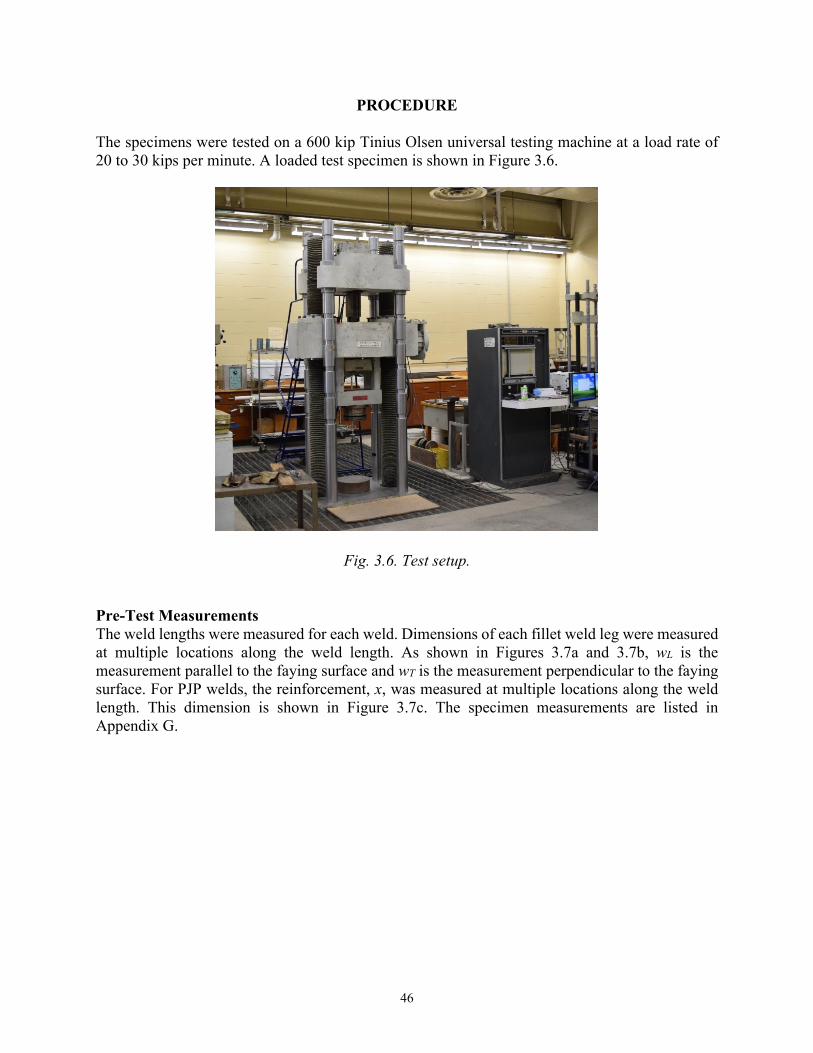
46
PROCEDURE The specimens were tested on a 600 kip Tinius Olsen universal testing machine at a load rate of 20 to 30 kips per minute. A loaded test specimen is shown in Figure 3.6.
Fig. 3.6. Test setup. Pre-Test Measurements The weld lengths were measured for each weld. Dimensions of each fillet weld leg were measured at multiple locations along the weld length. As shown in Figures 3.7a and 3.7b, wL is the measurement parallel to the faying surface and wT is the measurement perpendicular to the faying surface. For PJP welds, the reinforcement, x, was measured at multiple locations along the weld length. This dimension is shown in Figure 3.7c. The specimen measurements are listed in Appendix G.
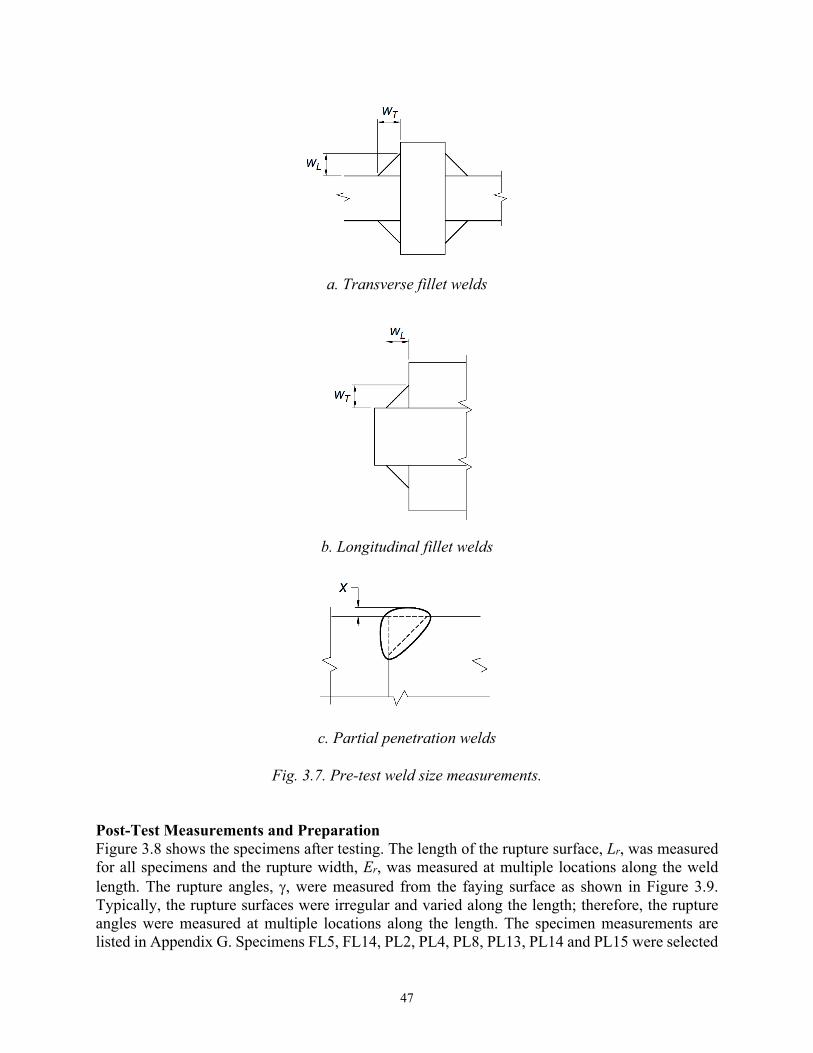
47
a. Transverse fillet welds
b. Longitudinal fillet welds
c. Partial penetration welds
Fig. 3.7. Pre-test weld size measurements. Post-Test Measurements and Preparation Figure 3.8 shows the specimens after testing. The length of the rupture surface, Lr, was measured for all specimens and the rupture width, Er, was measured at multiple locations along the weld length. The rupture angles, γ, were measured from the faying surface as shown in Figure 3.9. Typically, the rupture surfaces were irregular and varied along the length; therefore, the rupture angles were measured at multiple locations along the length. The specimen measurements are listed in Appendix G. Specimens FL5, FL14, PL2, PL4, PL8, PL13, PL14 and PL15 were selected
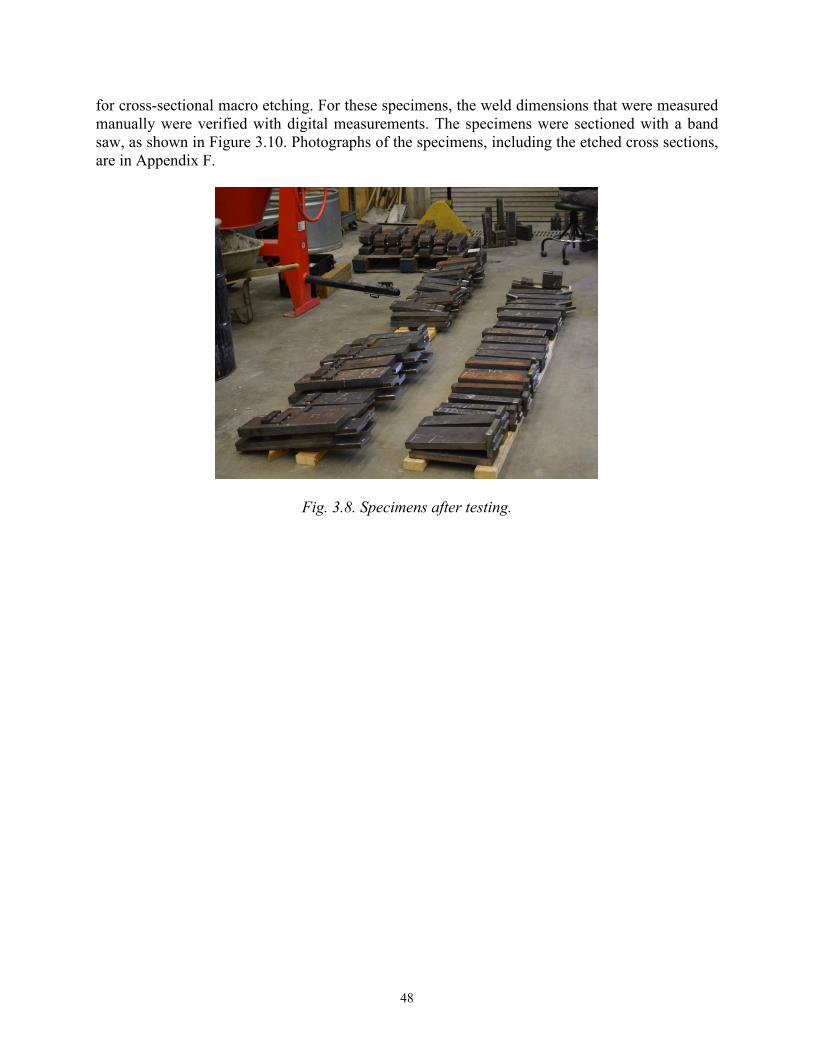
48
for cross-sectional macro etching. For these specimens, the weld dimensions that were measured manually were verified with digital measurements. The specimens were sectioned with a band saw, as shown in Figure 3.10. Photographs of the specimens, including the etched cross sections, are in Appendix F.
Fig. 3.8. Specimens after testing.
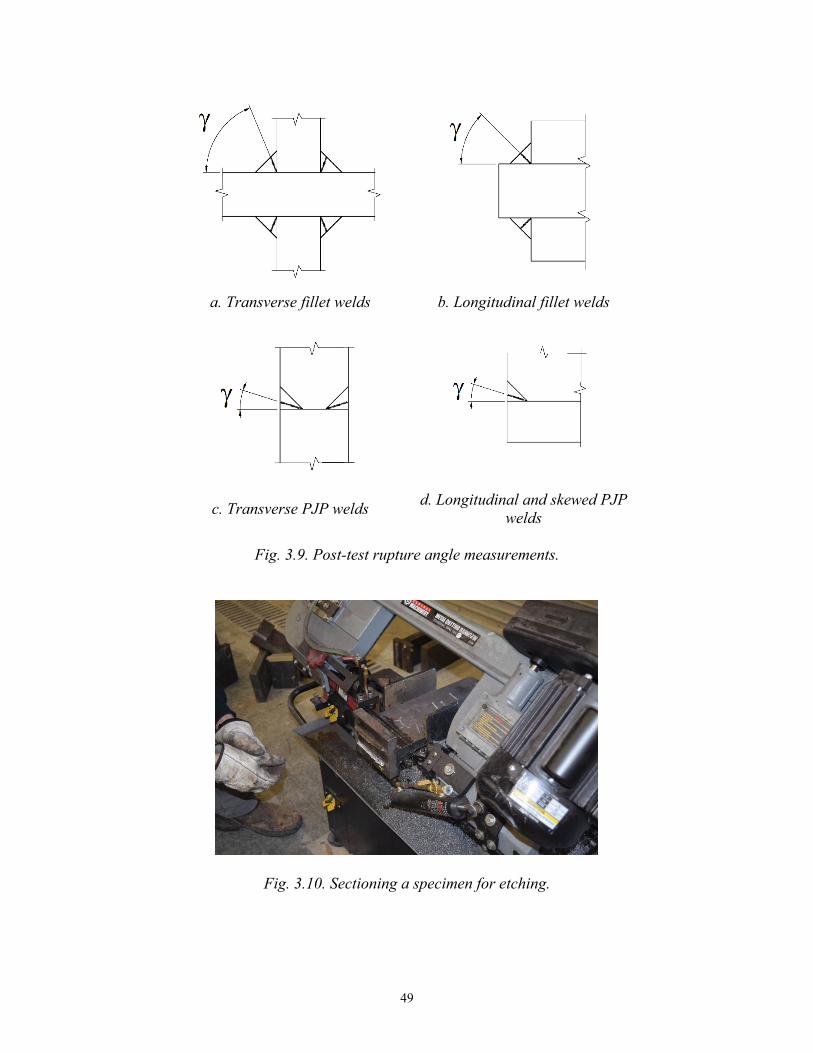
49
a. Transverse fillet welds b. Longitudinal fillet welds
c. Transverse PJP welds
d. Longitudinal and skewed PJP welds
Fig. 3.9. Post-test rupture angle measurements.
Fig. 3.10. Sectioning a specimen for etching.

50
RESULTS Material Properties Mill Test Reports (MTR) for the plates are in Appendix B. For each material grade and thickness, the measured yield and ultimate stresses from the MTRs are listed in Table 3.6. All of the values met the requirements in the corresponding ASTM standard. An ancillary test on the 2 in. A709 HPS 70WF3 plate revealed upper yield and ultimate stresses that were approximately 3% less than the values reported in the MTR.
Table 3.6. Measured tensile properties from the mill test reports.
ASTM Grade t in.
Specified Minimum Measured Fy ksi
Fu ksi
σyb ksi
σub ksi
A36 0.75 36 58 44.0 72.0 A36 1 36 58 48.5 77.0 A36 1.25 36 58 42.2 70.5 A36 1.5 36 58 44.5 71.9 A36 1.75 36 58 37.2 66.9 A36 2 36 58 42.1 70.5 A36 2.5 36 58 42.0 72.0
A572 Grade 65 0.75 65 80 72.5 94.0 A572 Grade 65 1 65 80 74.2 94.1 A572 Grade 65 1.25 65 80 70.5 91.5
A709 HPS 70W T3a 1.5 70 85 82.0 99.0 A709 HPS 70W F3a 1.75 70 85 80.0 93.0 A709 HPS 70W F3a 2 70 85 82.0 95.0
aQuenched and tempered Mill Test Reports (MTR) for each filler metal classification strength are in Appendix D. All-weld-metal tension tests, according to ASTM A370 (ASTM, 2017), were used to measure the weld metal strength. Tension coupons were machined from standard groove-welded test plates. Three test plates for each weld classification were manufactured according to AWS A5.20. Plate dimensions are shown in Figure 3.11. The same figure shows the location, where the tensile coupons were cut. Tension coupons were prepared according to AWS B4.0 (AWS, 2016) and shaped for the tension test as shown in Figure 3.12. All-weld-metal test reports are in Appendix E and the mean measured tensile strengths are listed in Table 3.7.
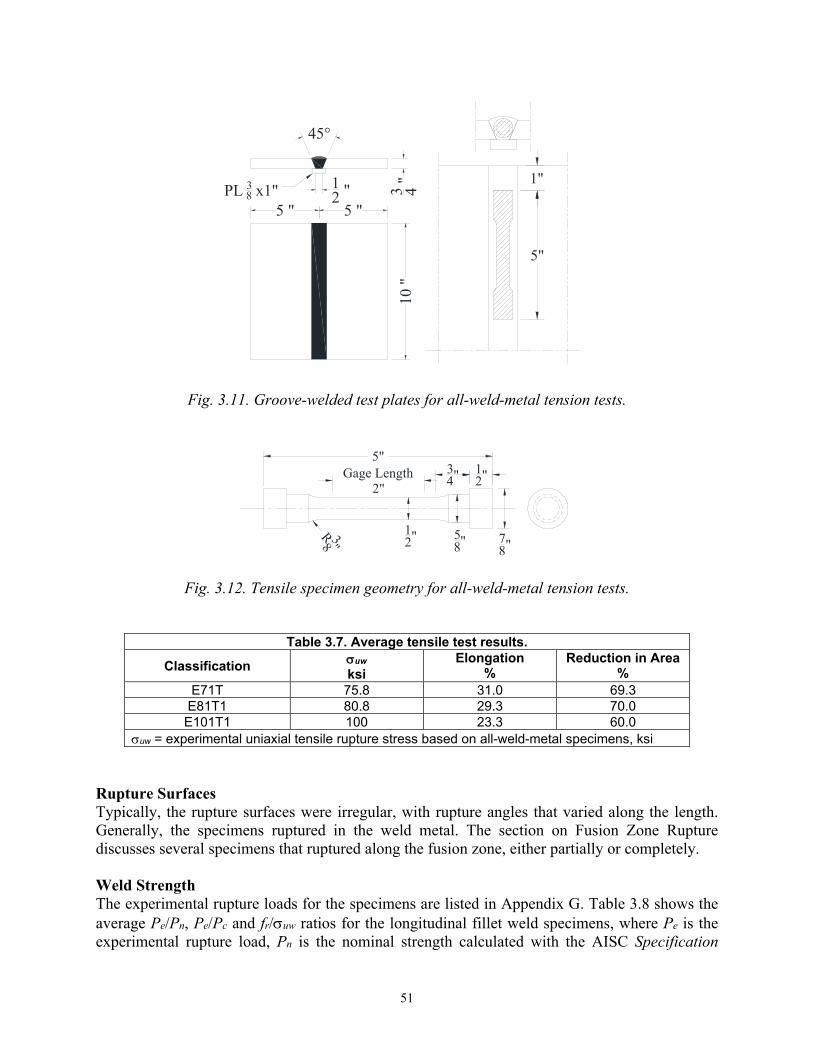
51
Fig. 3.11. Groove-welded test plates for all-weld-metal tension tests.
Fig. 3.12. Tensile specimen geometry for all-weld-metal tension tests.
Table 3.7. Average tensile test results.
Classification σuw ksi
Elongation %
Reduction in Area %
E71T 75.8 31.0 69.3 E81T1 80.8 29.3 70.0 E101T1 100 23.3 60.0
σuw = experimental uniaxial tensile rupture stress based on all-weld-metal specimens, ksi Rupture Surfaces Typically, the rupture surfaces were irregular, with rupture angles that varied along the length. Generally, the specimens ruptured in the weld metal. The section on Fusion Zone Rupture discusses several specimens that ruptured along the fusion zone, either partially or completely. Weld Strength The experimental rupture loads for the specimens are listed in Appendix G. Table 3.8 shows the average Pe/Pn, Pe/Pc and fr/σuw ratios for the longitudinal fillet weld specimens, where Pe is the experimental rupture load, Pn is the nominal strength calculated with the AISC Specification
5 " 5 "
12 "
45°
3 4 "10
"
PL 38 x1"1"
5"
R 38 "
5"12"3
4"
58" 7
8"12"
Gage Length2"
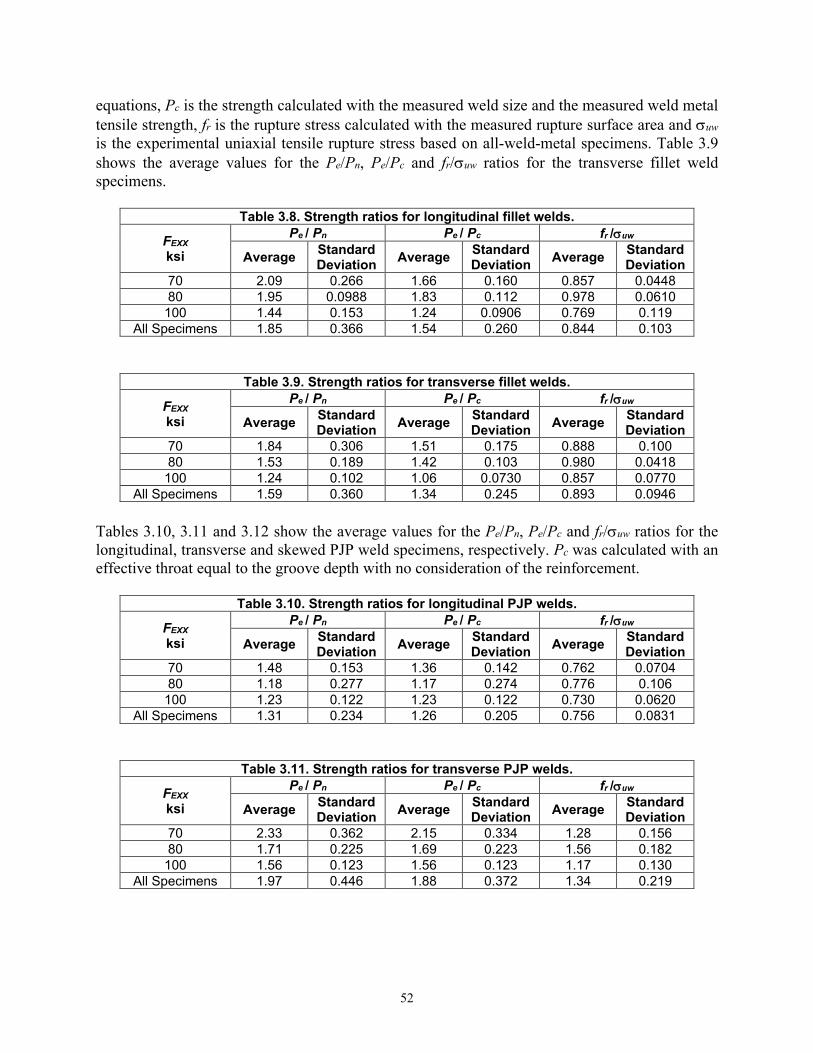
52
equations, Pc is the strength calculated with the measured weld size and the measured weld metal tensile strength, fr is the rupture stress calculated with the measured rupture surface area and σuw is the experimental uniaxial tensile rupture stress based on all-weld-metal specimens. Table 3.9 shows the average values for the Pe/Pn, Pe/Pc and fr/σuw ratios for the transverse fillet weld specimens.
Table 3.8. Strength ratios for longitudinal fillet welds.
FEXX ksi
Pe / Pn Pe / Pc fr /σuw
Average Standard Deviation Average Standard
Deviation Average Standard Deviation
70 2.09 0.266 1.66 0.160 0.857 0.0448 80 1.95 0.0988 1.83 0.112 0.978 0.0610
100 1.44 0.153 1.24 0.0906 0.769 0.119 All Specimens 1.85 0.366 1.54 0.260 0.844 0.103
Table 3.9. Strength ratios for transverse fillet welds.
FEXX ksi
Pe / Pn Pe / Pc fr /σuw
Average Standard Deviation Average Standard
Deviation Average Standard Deviation
70 1.84 0.306 1.51 0.175 0.888 0.100 80 1.53 0.189 1.42 0.103 0.980 0.0418
100 1.24 0.102 1.06 0.0730 0.857 0.0770 All Specimens 1.59 0.360 1.34 0.245 0.893 0.0946
Tables 3.10, 3.11 and 3.12 show the average values for the Pe/Pn, Pe/Pc and fr/σuw ratios for the longitudinal, transverse and skewed PJP weld specimens, respectively. Pc was calculated with an effective throat equal to the groove depth with no consideration of the reinforcement.
Table 3.10. Strength ratios for longitudinal PJP welds.
FEXX ksi
Pe / Pn Pe / Pc fr /σuw
Average Standard Deviation Average Standard
Deviation Average Standard Deviation
70 1.48 0.153 1.36 0.142 0.762 0.0704 80 1.18 0.277 1.17 0.274 0.776 0.106
100 1.23 0.122 1.23 0.122 0.730 0.0620 All Specimens 1.31 0.234 1.26 0.205 0.756 0.0831
Table 3.11. Strength ratios for transverse PJP welds.
FEXX ksi
Pe / Pn Pe / Pc fr /σuw
Average Standard Deviation Average Standard
Deviation Average Standard Deviation
70 2.33 0.362 2.15 0.334 1.28 0.156 80 1.71 0.225 1.69 0.223 1.56 0.182
100 1.56 0.123 1.56 0.123 1.17 0.130 All Specimens 1.97 0.446 1.88 0.372 1.34 0.219
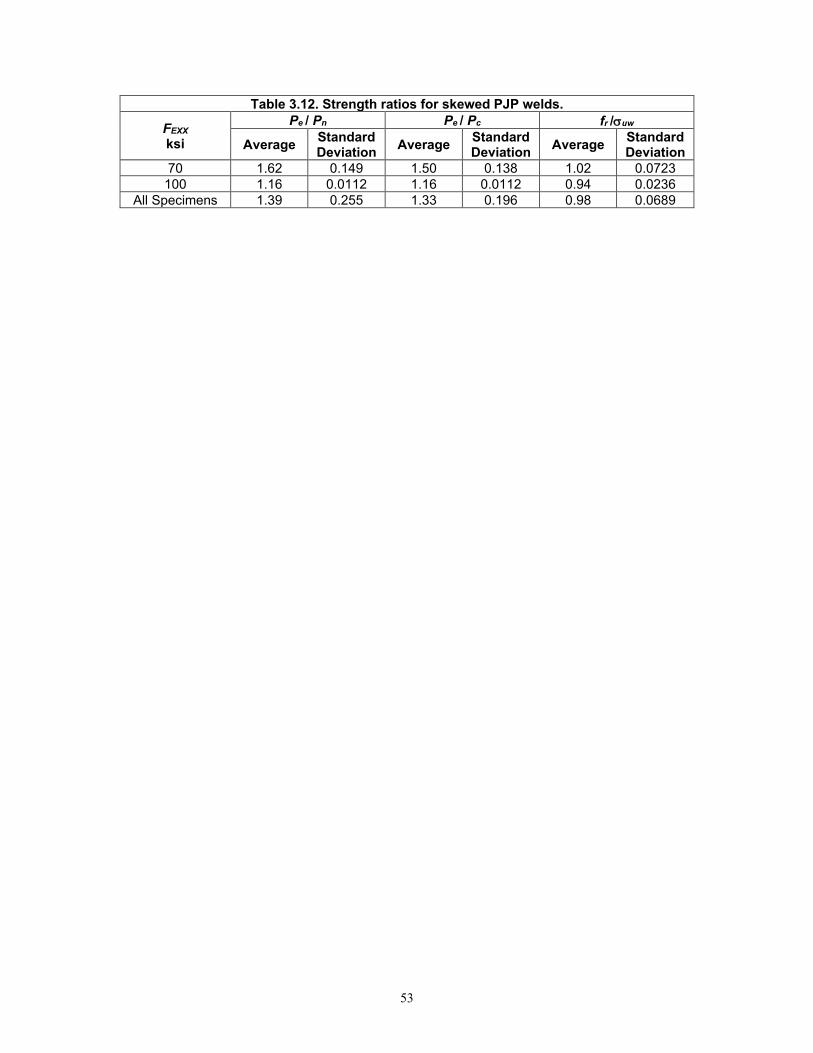
53
Table 3.12. Strength ratios for skewed PJP welds.
FEXX ksi
Pe / Pn Pe / Pc fr /σuw
Average Standard Deviation Average Standard
Deviation Average Standard Deviation
70 1.62 0.149 1.50 0.138 1.02 0.0723 100 1.16 0.0112 1.16 0.0112 0.94 0.0236
All Specimens 1.39 0.255 1.33 0.196 0.98 0.0689
54
CHAPTER 4
ANALYSIS AND DISCUSSION
ELECTRODE STRENGTH COEFFICIENT Instantaneous Center of Rotation Method Butler et al (1972) developed the Instantaneous Center of Rotation (ICR) method based on the empirical load-deformation curves from Butler and Kulak (1971), who tested linear fillet welds at angles of 0°, 30°, 60° and 90° from the loading direction. The tests by Butler and Kulak (1971) as well as the tests on eccentrically-loaded weld groups by Butler et al. (1972) used 60 ksi electrodes and ¼ in. fillet welds. According to Butler et al (1972), “Because E60 and E70 electrodes have specified ultimate elongations nearly the same, it is felt that these results could be applied to connections made using E70 electrodes by proper consideration of the increase in electrode strength. The method could be used for fillet welds made from electrodes other than E60 and E70 by ascertaining the load-deformation response for these welds.” The ICR equations in AWS D1.1 Section 2.6.4.3 were primarily developed by Lesik and Kennedy (1990). Lesik and Kennedy (1990) used linear regression to develop the load-deformation curves with the data from Miazga and Kennedy (1989), who tested 70 ksi fillet welds with varying load angles from 0 to 90° in 15° increments. Because the ICR method is iterative, considerable design effort is required to calculate the strength of a weld group using this method. AISC Manual Tables 8-4 through 8-11 provide a simpler, non-iterative design method by listing the appropriate ICR coefficients for several different weld group geometries. Background of the Electrode Strength Coefficient The values in AISC Manual Tables 8-4 through 8-11 were calculated using FEXX = 70 ksi. The strength of weld groups with other weld metal strengths can be calculated by adjusting the table coefficients by the electrode strength coefficient, C1 in Manual Table 8-3. The 6th Edition AISC Manual was the first to provide information on eccentrically-loaded weld groups. The elastic method was used to develop design tables with 60 ksi weld metal strength. The weld group strengths for other weld metal strengths were calculated with the weld metal strength ratio, FEXX/60 ksi. The 7th Edition Manual used elastic design with 70 ksi welds; therefore, the weld group strength for other weld metal strengths was calculated with the weld metal strength ratio, FEXX/70 ksi. The 8th Edition Manual was the first to publish design tables that were based on the ICR method. The development of these tables, which were also published in the 9th Edition Manual, was discussed by Tide (1980). The table coefficients were calculated with 70 ksi weld metal and C1 was used to calculate the weld group strength for other weld metal strengths, where C1 = FEXX/70 ksi.
55
For the 1st Edition LRFD Manual and the 13th Edition combined ASD/LRFD Manual, as well as all later editions, the tables were based on the ICR method with 70 ksi weld metal. However, the value of C1 included a reduction factor equal to either 0.90 (for 80 and 90 ksi welds) or 0.85 (for 100 and 110 ksi welds). These values are shown in Table 4.1.
Table 4.1. Electrode strength coefficient, C1. FEXX 60 70 80 90 100 110 C1 0.857 1.00 1.03 1.16 1.21 1.34
70ksiEXXF
0.857 1.00 1.14 1.29 1.43 1.57
1
70ksiEXX
C
F
1.00 1.00 0.90 0.90 0.85 0.85
The background of these reduction factors is ambiguous, and communication with members of past Manual Committees (Thornton, 2020; Tide, 2020) revealed no further information. It is believed that these reductions are recommended in the Manual because higher-strength welds are less ductile than E60 and E70 welds. Sufficient ductility of the critical weld segment within the weld group is required for load redistribution without rupture of the critical weld. The lower ductility of high-strength welds combined with the lack of research on eccentrically-loaded high-strength weld groups likely resulted in the 0.90 and 0.85 reduction factors recommended in the Manual. Similar factors are not required for designing higher strength welds using the AISC Specification or AWS D1.1. Ductility of High-Strength Welds To investigate the accuracy of the current electrode strength coefficients, the ductility of high-strength welds will be evaluated. Because transverse fillet welds have much less deformation capacity than longitudinal fillet welds, the ductility of transverse high-strength welds are the primary concern. In weld groups with both longitudinal and transverse welds, the longitudinal weld strength will be limited by the ductility of the transverse weld. According to Equation 2.9, the normalized rupture deformations for longitudinal and transverse welds are ∆u/w = 0.17 and ∆u/w = 0.056, respectively. Figure 4.1 shows a plot of the weld metal tensile strength versus the normalized rupture deformation, ∆u/w, of fillet welds. The data are from the 93 experimental tests on high-strength longitudinally- and transversely-loaded fillet welds by Collin and Johansson (2005), Bjork et al. (2012) and Sun et al. (2019). The red x data points represent transverse welds and the blue hollow circles represent longitudinal welds. The red and blue vertical dashed lines represent the AWS normalized rupture deformations for longitudinal and transverse welds, respectively. It can be observed that, for tensile strengths less than 120 ksi, the AWS equations provide conservative estimates of the normalized rupture deformations.

56
Fig. 4.1. Weld metal tensile strength versus normalized rupture deformation. The average normalized deformations from this data are listed in Table 4.2. The data for 60 ksi welds from Butler and Kulak (1971) are also listed. A comparison of the rupture deformations shows that, for longitudinal welds, the rupture deformation of high-strength welds is 68% of that of 60 ksi welds; however, the rupture deformation of transverse welds is independent of strength. Because the shape of the load-deformation curves for high-strength welds is similar to that of 60 ksi welds, high-strength longitudinal welds in weld groups will reach a higher proportion of their rupture load compared to 60 ksi welds. The average transverse-to-longitudinal normalized deformation ratio for lap joints is 0.103/0.284 = 0.363, which is similar to the value calculated with AWS D1.1 Equation AWS-5: 0.056/0.17 = 0.33.
Table 4.2. Average normalized deformation.
Joint Type FEXX = 60 ksi (Butler
and Kulak, 1971) High Strength Steel (FEXX ≈ 80 to 180 ksi)
Average ∆u/w Number of specimens Average ∆u/w
Longitudinal 0.420 26 0.284 Transverse (Total) -- 67 0.0966
Transverse lap-joints 0.104 36 0.103 Transverse T-joints -- 31 0.0889
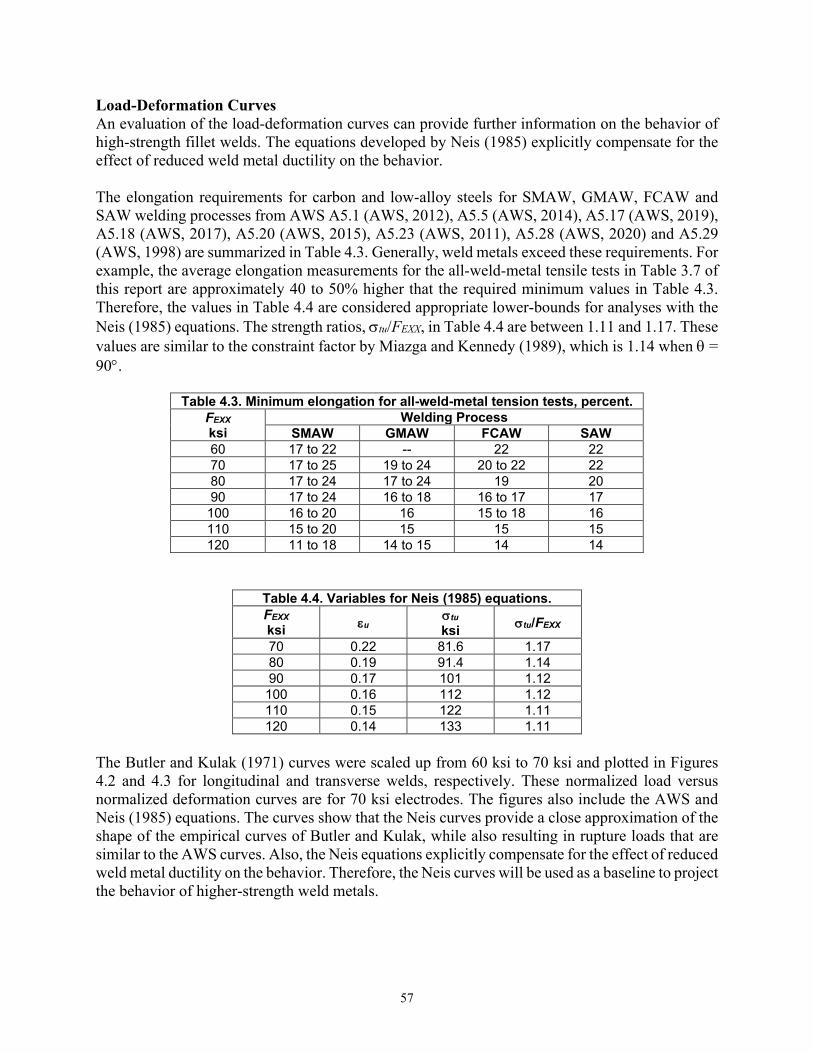
57
Load-Deformation Curves An evaluation of the load-deformation curves can provide further information on the behavior of high-strength fillet welds. The equations developed by Neis (1985) explicitly compensate for the effect of reduced weld metal ductility on the behavior. The elongation requirements for carbon and low-alloy steels for SMAW, GMAW, FCAW and SAW welding processes from AWS A5.1 (AWS, 2012), A5.5 (AWS, 2014), A5.17 (AWS, 2019), A5.18 (AWS, 2017), A5.20 (AWS, 2015), A5.23 (AWS, 2011), A5.28 (AWS, 2020) and A5.29 (AWS, 1998) are summarized in Table 4.3. Generally, weld metals exceed these requirements. For example, the average elongation measurements for the all-weld-metal tensile tests in Table 3.7 of this report are approximately 40 to 50% higher that the required minimum values in Table 4.3. Therefore, the values in Table 4.4 are considered appropriate lower-bounds for analyses with the Neis (1985) equations. The strength ratios, σtu/FEXX, in Table 4.4 are between 1.11 and 1.17. These values are similar to the constraint factor by Miazga and Kennedy (1989), which is 1.14 when θ = 90°.
Table 4.3. Minimum elongation for all-weld-metal tension tests, percent. FEXX ksi
Welding Process SMAW GMAW FCAW SAW
60 17 to 22 -- 22 22 70 17 to 25 19 to 24 20 to 22 22 80 17 to 24 17 to 24 19 20 90 17 to 24 16 to 18 16 to 17 17 100 16 to 20 16 15 to 18 16 110 15 to 20 15 15 15 120 11 to 18 14 to 15 14 14
Table 4.4. Variables for Neis (1985) equations. FEXX ksi εu σtu
ksi σtu/FEXX 70 0.22 81.6 1.17 80 0.19 91.4 1.14 90 0.17 101 1.12 100 0.16 112 1.12 110 0.15 122 1.11 120 0.14 133 1.11
The Butler and Kulak (1971) curves were scaled up from 60 ksi to 70 ksi and plotted in Figures 4.2 and 4.3 for longitudinal and transverse welds, respectively. These normalized load versus normalized deformation curves are for 70 ksi electrodes. The figures also include the AWS and Neis (1985) equations. The curves show that the Neis curves provide a close approximation of the shape of the empirical curves of Butler and Kulak, while also resulting in rupture loads that are similar to the AWS curves. Also, the Neis equations explicitly compensate for the effect of reduced weld metal ductility on the behavior. Therefore, the Neis curves will be used as a baseline to project the behavior of higher-strength weld metals.
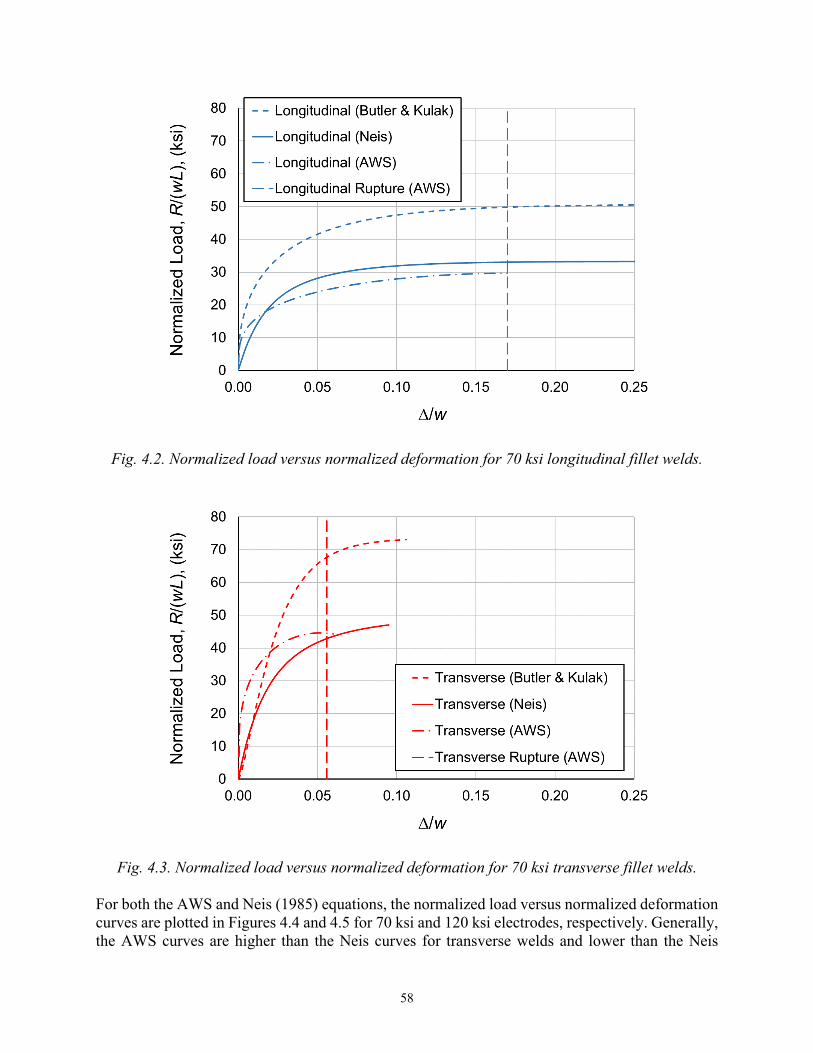
58
Fig. 4.2. Normalized load versus normalized deformation for 70 ksi longitudinal fillet welds.
Fig. 4.3. Normalized load versus normalized deformation for 70 ksi transverse fillet welds. For both the AWS and Neis (1985) equations, the normalized load versus normalized deformation curves are plotted in Figures 4.4 and 4.5 for 70 ksi and 120 ksi electrodes, respectively. Generally, the AWS curves are higher than the Neis curves for transverse welds and lower than the Neis
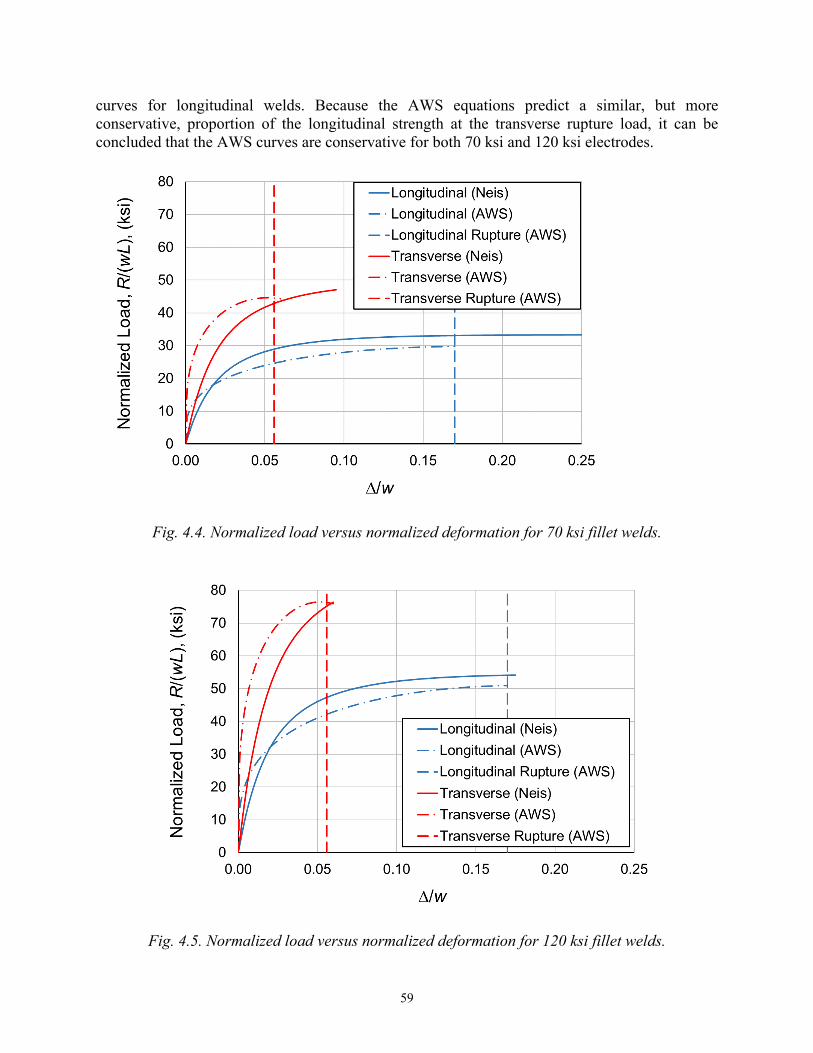
59
curves for longitudinal welds. Because the AWS equations predict a similar, but more conservative, proportion of the longitudinal strength at the transverse rupture load, it can be concluded that the AWS curves are conservative for both 70 ksi and 120 ksi electrodes.
Fig. 4.4. Normalized load versus normalized deformation for 70 ksi fillet welds.
Fig. 4.5. Normalized load versus normalized deformation for 120 ksi fillet welds.
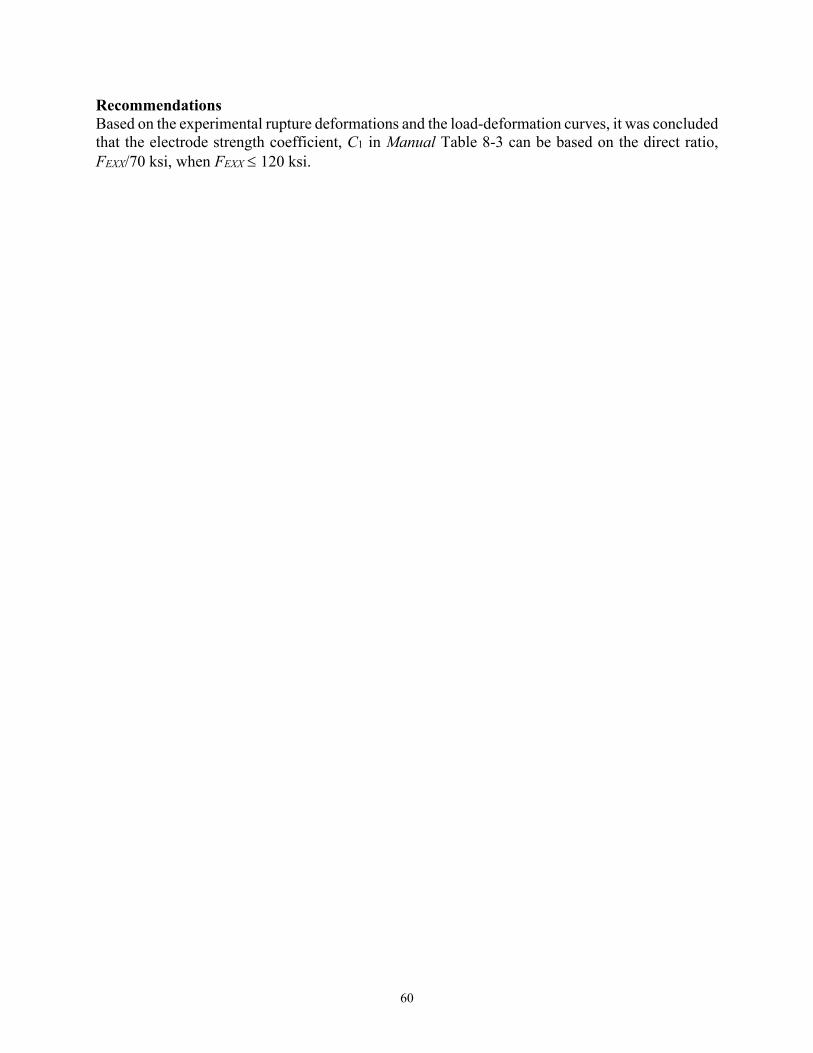
60
Recommendations Based on the experimental rupture deformations and the load-deformation curves, it was concluded that the electrode strength coefficient, C1 in Manual Table 8-3 can be based on the direct ratio, FEXX/70 ksi, when FEXX ≤ 120 ksi.
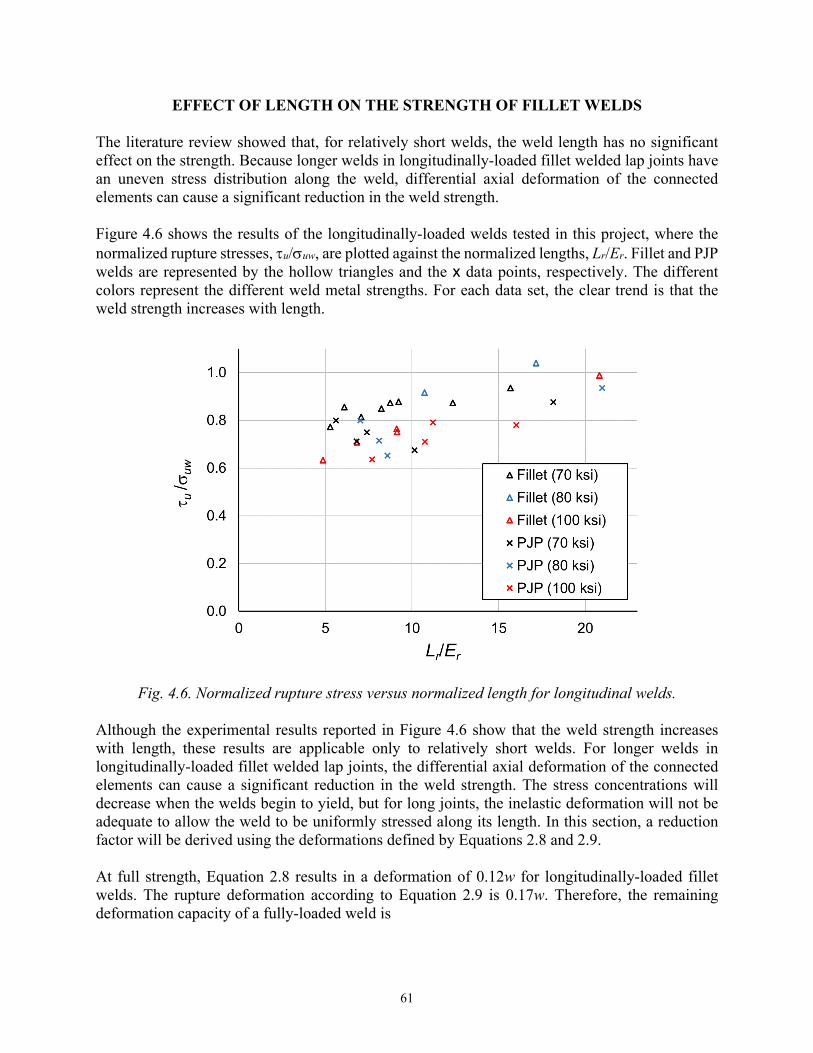
61
EFFECT OF LENGTH ON THE STRENGTH OF FILLET WELDS The literature review showed that, for relatively short welds, the weld length has no significant effect on the strength. Because longer welds in longitudinally-loaded fillet welded lap joints have an uneven stress distribution along the weld, differential axial deformation of the connected elements can cause a significant reduction in the weld strength. Figure 4.6 shows the results of the longitudinally-loaded welds tested in this project, where the normalized rupture stresses, τu/σuw, are plotted against the normalized lengths, Lr/Er. Fillet and PJP welds are represented by the hollow triangles and the x data points, respectively. The different colors represent the different weld metal strengths. For each data set, the clear trend is that the weld strength increases with length.
Fig. 4.6. Normalized rupture stress versus normalized length for longitudinal welds. Although the experimental results reported in Figure 4.6 show that the weld strength increases with length, these results are applicable only to relatively short welds. For longer welds in longitudinally-loaded fillet welded lap joints, the differential axial deformation of the connected elements can cause a significant reduction in the weld strength. The stress concentrations will decrease when the welds begin to yield, but for long joints, the inelastic deformation will not be adequate to allow the weld to be uniformly stressed along its length. In this section, a reduction factor will be derived using the deformations defined by Equations 2.8 and 2.9. At full strength, Equation 2.8 results in a deformation of 0.12w for longitudinally-loaded fillet welds. The rupture deformation according to Equation 2.9 is 0.17w. Therefore, the remaining deformation capacity of a fully-loaded weld is
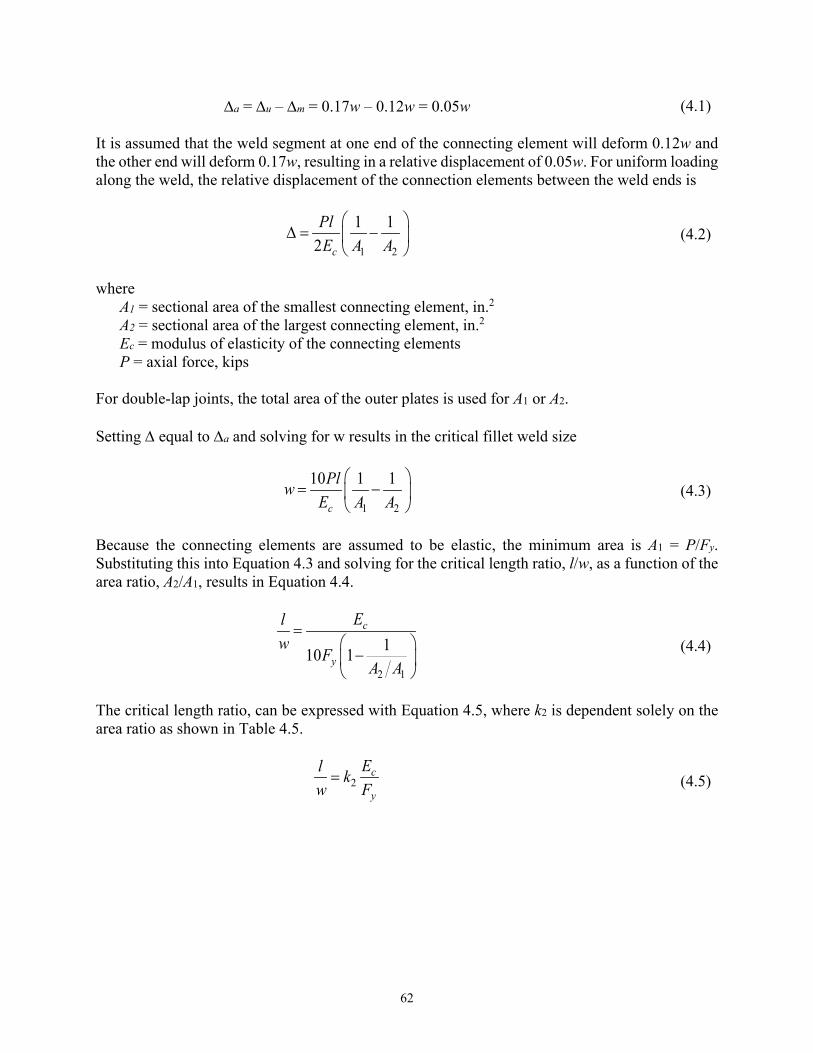
62
∆a = ∆u – ∆m = 0.17w – 0.12w = 0.05w (4.1) It is assumed that the weld segment at one end of the connecting element will deform 0.12w and the other end will deform 0.17w, resulting in a relative displacement of 0.05w. For uniform loading along the weld, the relative displacement of the connection elements between the weld ends is
1 2
1 12 c
PlE A A
∆ = −
(4.2)
where
A1 = sectional area of the smallest connecting element, in.2 A2 = sectional area of the largest connecting element, in.2 Ec = modulus of elasticity of the connecting elements P = axial force, kips
For double-lap joints, the total area of the outer plates is used for A1 or A2. Setting ∆ equal to ∆a and solving for w results in the critical fillet weld size
1 2
10 1 1
c
PlwE A A
= −
(4.3)
Because the connecting elements are assumed to be elastic, the minimum area is A1 = P/Fy. Substituting this into Equation 4.3 and solving for the critical length ratio, l/w, as a function of the area ratio, A2/A1, results in Equation 4.4.
2 1
110 1
c
y
Elw
FA A
= −
(4.4)
The critical length ratio, can be expressed with Equation 4.5, where k2 is dependent solely on the area ratio as shown in Table 4.5.
2c
y
El kw F= (4.5)
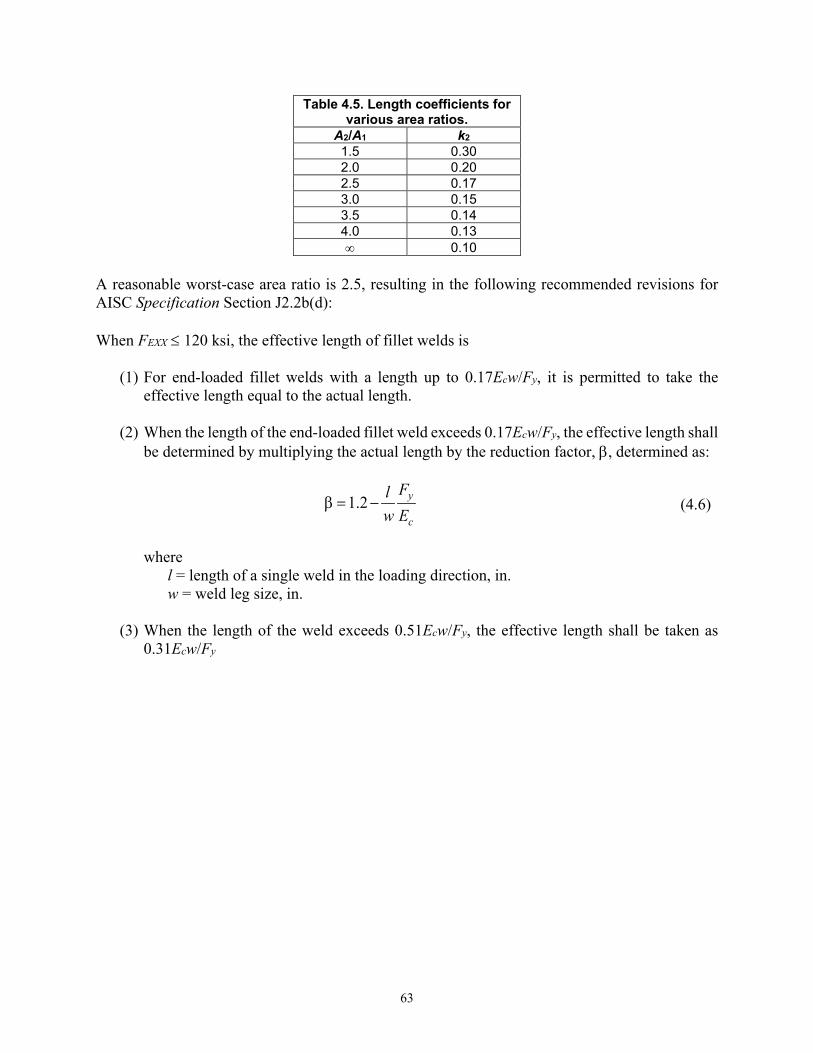
63
Table 4.5. Length coefficients for various area ratios.
A2/A1 k2 1.5 0.30 2.0 0.20 2.5 0.17 3.0 0.15 3.5 0.14 4.0 0.13 ∞ 0.10
A reasonable worst-case area ratio is 2.5, resulting in the following recommended revisions for AISC Specification Section J2.2b(d): When FEXX ≤ 120 ksi, the effective length of fillet welds is
(1) For end-loaded fillet welds with a length up to 0.17Ecw/Fy, it is permitted to take the effective length equal to the actual length.
(2) When the length of the end-loaded fillet weld exceeds 0.17Ecw/Fy, the effective length shall be determined by multiplying the actual length by the reduction factor, β, determined as:
1.2 y
c
Flw E
β = − (4.6)
where
l = length of a single weld in the loading direction, in. w = weld leg size, in.
(3) When the length of the weld exceeds 0.51Ecw/Fy, the effective length shall be taken as
0.31Ecw/Fy
64
FUSION ZONE STRENGTH Specimen Fusion Zone Ruptures All of the longitudinal fillet weld specimens ruptured in the weld metal. This was expected because all of these specimens had σub/σuw ratios between 0.940 and 1.17. Generally, the longitudinal PJP weld specimens, which had σub/σuw ratios between 0.770 and 1.17, ruptured in the weld metal. Only Weld 4 in Specimen PL4 ruptured at the fusion zone of the outside plate as shown in Figures 4.7a and b. The measured tensile stresses were 70.5 ksi for the outer plates and 75.8 ksi for the weld metal. However, the primary cause of the fusion zone rupture was the weld geometry. The average reinforcement of this weld, shown in Figure 4.7c, was 0.049 in. according to the pre-test measurements. This reinforcement created a condition where, based on digital measurements from the etched section, the shortest distance from the root to the face was along the fusion zone. In this case, the rupture strength was unaffected by the change in rupture location.
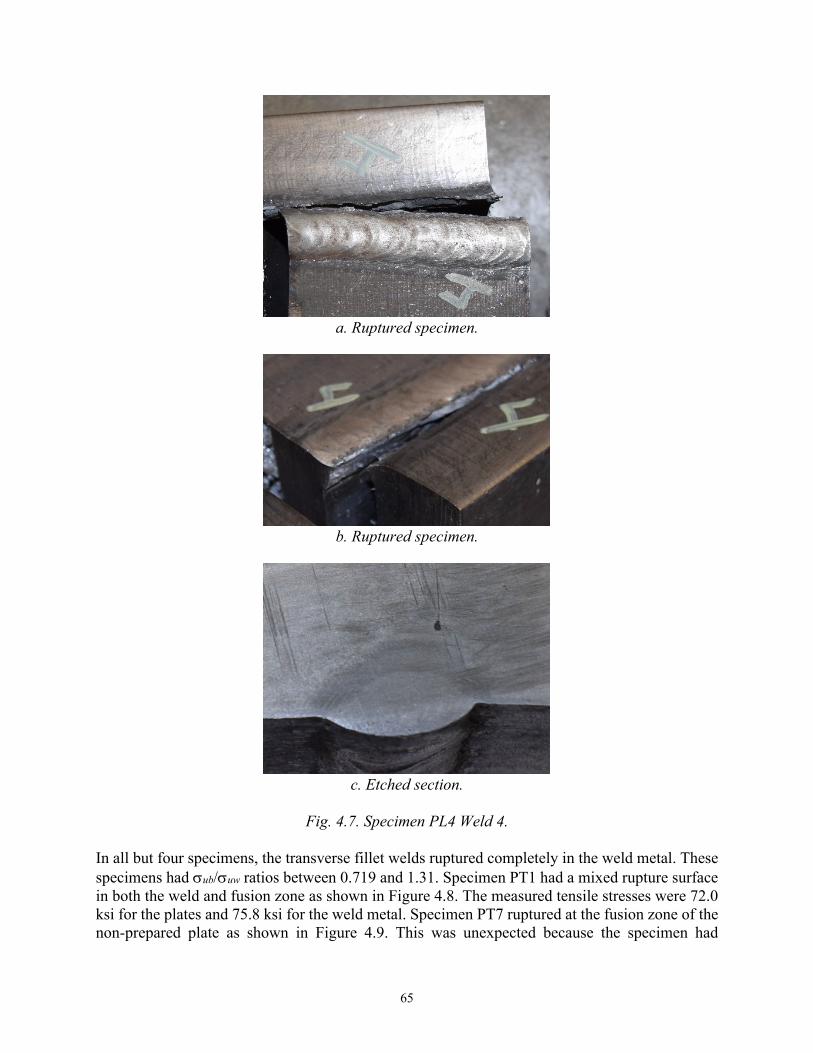
65
a. Ruptured specimen.
b. Ruptured specimen.
c. Etched section.
Fig. 4.7. Specimen PL4 Weld 4.
In all but four specimens, the transverse fillet welds ruptured completely in the weld metal. These specimens had σub/σuw ratios between 0.719 and 1.31. Specimen PT1 had a mixed rupture surface in both the weld and fusion zone as shown in Figure 4.8. The measured tensile stresses were 72.0 ksi for the plates and 75.8 ksi for the weld metal. Specimen PT7 ruptured at the fusion zone of the non-prepared plate as shown in Figure 4.9. This was unexpected because the specimen had
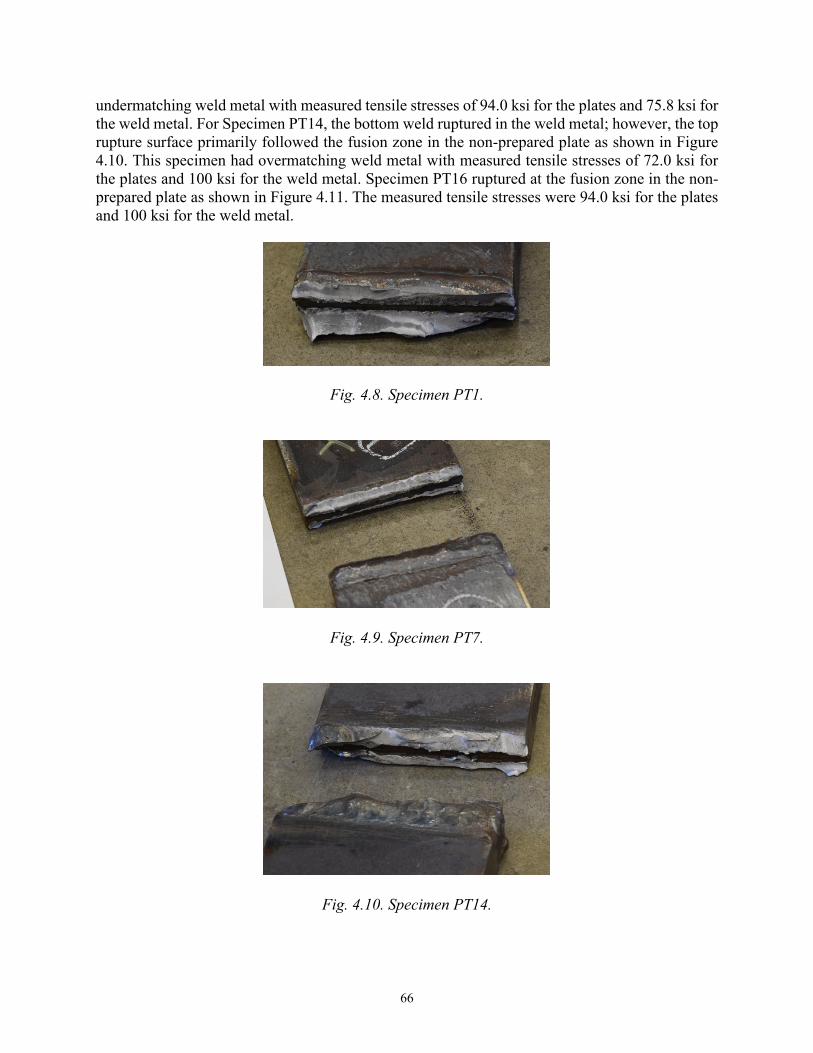
66
undermatching weld metal with measured tensile stresses of 94.0 ksi for the plates and 75.8 ksi for the weld metal. For Specimen PT14, the bottom weld ruptured in the weld metal; however, the top rupture surface primarily followed the fusion zone in the non-prepared plate as shown in Figure 4.10. This specimen had overmatching weld metal with measured tensile stresses of 72.0 ksi for the plates and 100 ksi for the weld metal. Specimen PT16 ruptured at the fusion zone in the non-prepared plate as shown in Figure 4.11. The measured tensile stresses were 94.0 ksi for the plates and 100 ksi for the weld metal.
Fig. 4.8. Specimen PT1.
Fig. 4.9. Specimen PT7.
Fig. 4.10. Specimen PT14.
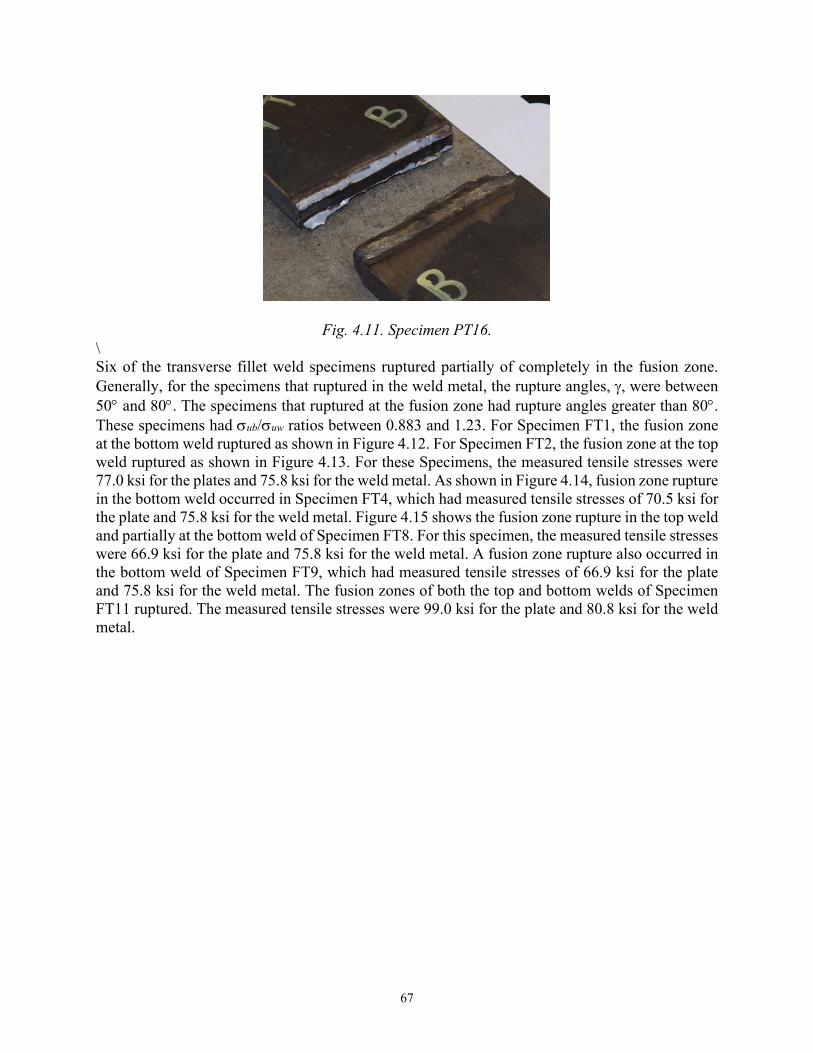
67
Fig. 4.11. Specimen PT16. \ Six of the transverse fillet weld specimens ruptured partially of completely in the fusion zone. Generally, for the specimens that ruptured in the weld metal, the rupture angles, γ, were between 50° and 80°. The specimens that ruptured at the fusion zone had rupture angles greater than 80°. These specimens had σub/σuw ratios between 0.883 and 1.23. For Specimen FT1, the fusion zone at the bottom weld ruptured as shown in Figure 4.12. For Specimen FT2, the fusion zone at the top weld ruptured as shown in Figure 4.13. For these Specimens, the measured tensile stresses were 77.0 ksi for the plates and 75.8 ksi for the weld metal. As shown in Figure 4.14, fusion zone rupture in the bottom weld occurred in Specimen FT4, which had measured tensile stresses of 70.5 ksi for the plate and 75.8 ksi for the weld metal. Figure 4.15 shows the fusion zone rupture in the top weld and partially at the bottom weld of Specimen FT8. For this specimen, the measured tensile stresses were 66.9 ksi for the plate and 75.8 ksi for the weld metal. A fusion zone rupture also occurred in the bottom weld of Specimen FT9, which had measured tensile stresses of 66.9 ksi for the plate and 75.8 ksi for the weld metal. The fusion zones of both the top and bottom welds of Specimen FT11 ruptured. The measured tensile stresses were 99.0 ksi for the plate and 80.8 ksi for the weld metal.
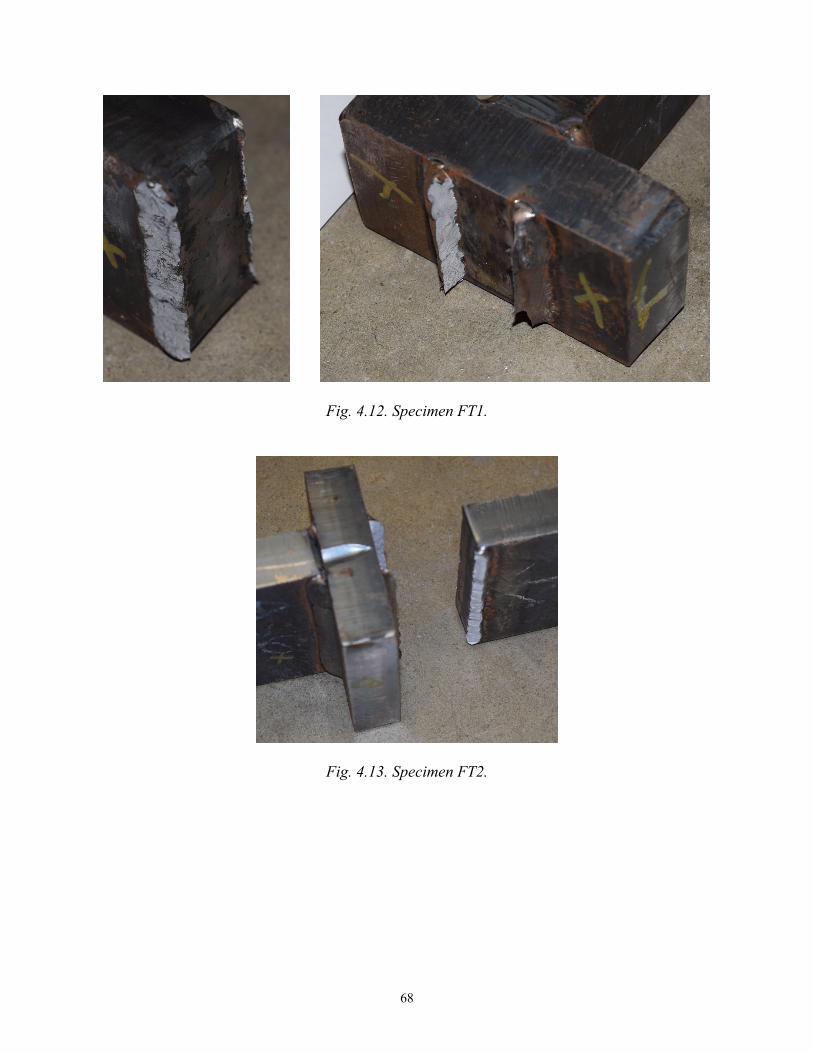
68
Fig. 4.12. Specimen FT1.
Fig. 4.13. Specimen FT2.
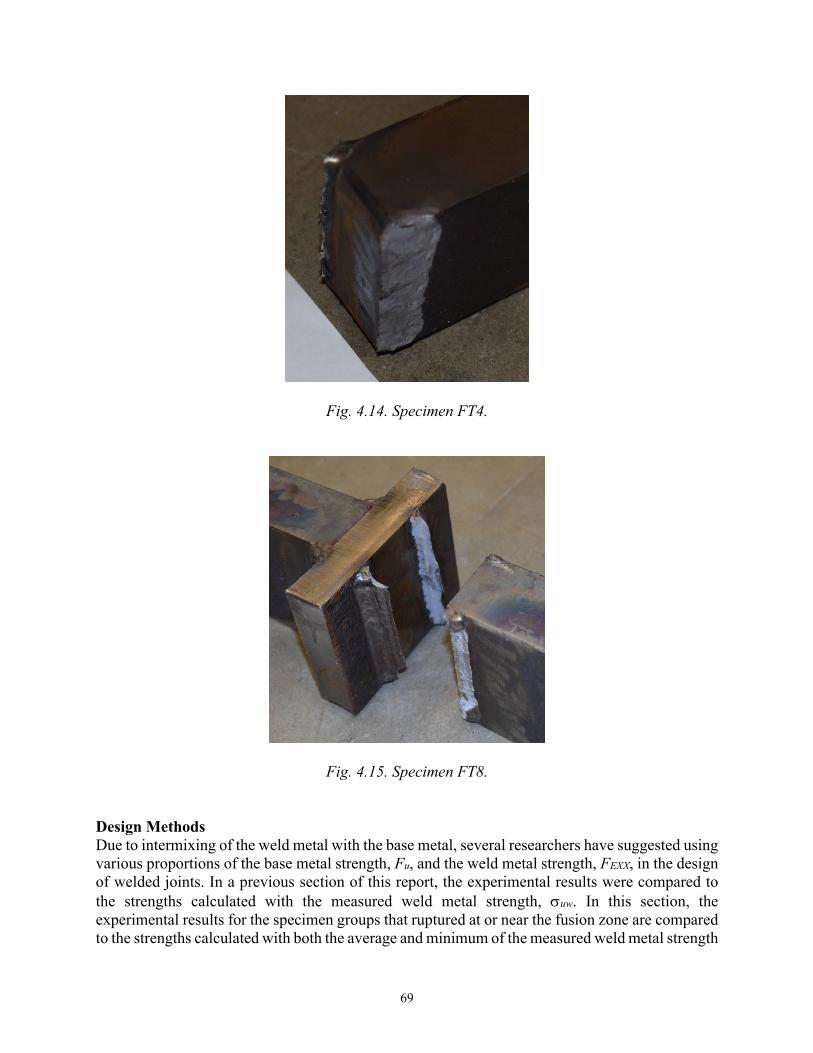
69
Fig. 4.14. Specimen FT4.
Fig. 4.15. Specimen FT8. Design Methods Due to intermixing of the weld metal with the base metal, several researchers have suggested using various proportions of the base metal strength, Fu, and the weld metal strength, FEXX, in the design of welded joints. In a previous section of this report, the experimental results were compared to the strengths calculated with the measured weld metal strength, σuw. In this section, the experimental results for the specimen groups that ruptured at or near the fusion zone are compared to the strengths calculated with both the average and minimum of the measured weld metal strength

70
and the measured base metal strength, σub. σua is the average of σuw and σub. σum is the minimum of σuw and σub. For the specimens that were fabricated from plates with different tensile strengths, the tensile strength of the plate that was the most likely to rupture in the fusion zone was used in the calculations. Tables 4.6a and 4.6b show the average values for the Pe/Pn, Pe/Pc and fr/σu ratios for the longitudinal PJP weld specimens using σua and σum, respectively. Pc was calculated with an effective throat equal to the groove depth with no consideration of the reinforcement. Because the inner and outer plates had different measured tensile stresses, the calculations were based on σub of the outer plates.
Table 4.6a. Strength ratios for longitudinal PJP welds using σua.
FEXX ksi
Pe / Pn Pe / Pc fr /σua
Average Standard Deviation Average Standard
Deviation Average Standard Deviation
70 1.62 0.168 1.38 0.125 0.775 0.0751 80 1.28 0.385 1.17 0.319 0.762 0.0989
100 1.44 0.216 1.34 0.171 0.793 0.0267 All Specimens 1.46 0.300 1.30 0.235 0.777 0.0744
Table 4.6b. Strength ratios for longitudinal PJP welds using σum.
FEXX ksi
Pe / Pn Pe / Pc fr /σum
Average Standard Deviation Average Standard
Deviation Average Standard Deviation
70 1.78 0.185 1.42 0.118 0.793 0.0797 80 1.45 0.518 1.24 0.317 0.812 0.1020
100 1.79 0.439 1.49 0.268 0.875 0.0398 All Specimens 1.68 0.424 1.38 0.262 0.824 0.0856
Tables 4.7a and 4.7b show the average values for the Pe/Pn, Pe/Pc and fr/σu ratios for the transverse PJP weld specimens using σua and σum, respectively. Pc was calculated with an effective throat equal to the groove depth with no consideration of the reinforcement.
Table 4.7a. Strength ratios for transverse PJP welds using σua.
FEXX ksi
Pe / Pn Pe / Pc fr /σua
Average Standard Deviation Average Standard
Deviation Average Standard Deviation
70 2.44 0.385 2.11 0.334 1.26 0.153 80 1.86 0.274 1.69 0.223 1.56 0.209
100 1.85 0.212 1.71 0.123 1.27 0.125 All Specimens 2.13 0.432 1.89 0.372 1.35 0.213
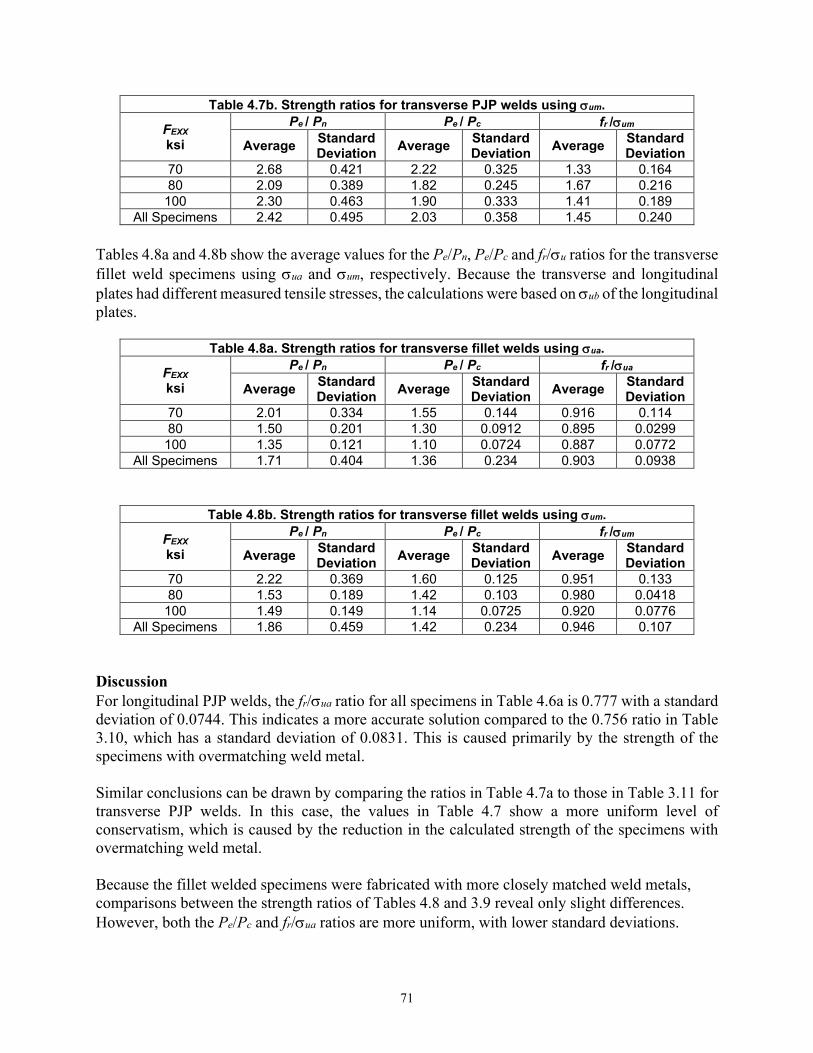
71
Table 4.7b. Strength ratios for transverse PJP welds using σum.
FEXX ksi
Pe / Pn Pe / Pc fr /σum
Average Standard Deviation Average Standard
Deviation Average Standard Deviation
70 2.68 0.421 2.22 0.325 1.33 0.164 80 2.09 0.389 1.82 0.245 1.67 0.216
100 2.30 0.463 1.90 0.333 1.41 0.189 All Specimens 2.42 0.495 2.03 0.358 1.45 0.240
Tables 4.8a and 4.8b show the average values for the Pe/Pn, Pe/Pc and fr/σu ratios for the transverse fillet weld specimens using σua and σum, respectively. Because the transverse and longitudinal plates had different measured tensile stresses, the calculations were based on σub of the longitudinal plates.
Table 4.8a. Strength ratios for transverse fillet welds using σua.
FEXX ksi
Pe / Pn Pe / Pc fr /σua
Average Standard Deviation Average Standard
Deviation Average Standard Deviation
70 2.01 0.334 1.55 0.144 0.916 0.114 80 1.50 0.201 1.30 0.0912 0.895 0.0299
100 1.35 0.121 1.10 0.0724 0.887 0.0772 All Specimens 1.71 0.404 1.36 0.234 0.903 0.0938
Table 4.8b. Strength ratios for transverse fillet welds using σum.
FEXX ksi
Pe / Pn Pe / Pc fr /σum
Average Standard Deviation Average Standard
Deviation Average Standard Deviation
70 2.22 0.369 1.60 0.125 0.951 0.133 80 1.53 0.189 1.42 0.103 0.980 0.0418
100 1.49 0.149 1.14 0.0725 0.920 0.0776 All Specimens 1.86 0.459 1.42 0.234 0.946 0.107
Discussion For longitudinal PJP welds, the fr/σua ratio for all specimens in Table 4.6a is 0.777 with a standard deviation of 0.0744. This indicates a more accurate solution compared to the 0.756 ratio in Table 3.10, which has a standard deviation of 0.0831. This is caused primarily by the strength of the specimens with overmatching weld metal. Similar conclusions can be drawn by comparing the ratios in Table 4.7a to those in Table 3.11 for transverse PJP welds. In this case, the values in Table 4.7 show a more uniform level of conservatism, which is caused by the reduction in the calculated strength of the specimens with overmatching weld metal. Because the fillet welded specimens were fabricated with more closely matched weld metals, comparisons between the strength ratios of Tables 4.8 and 3.9 reveal only slight differences. However, both the Pe/Pc and fr/σua ratios are more uniform, with lower standard deviations.
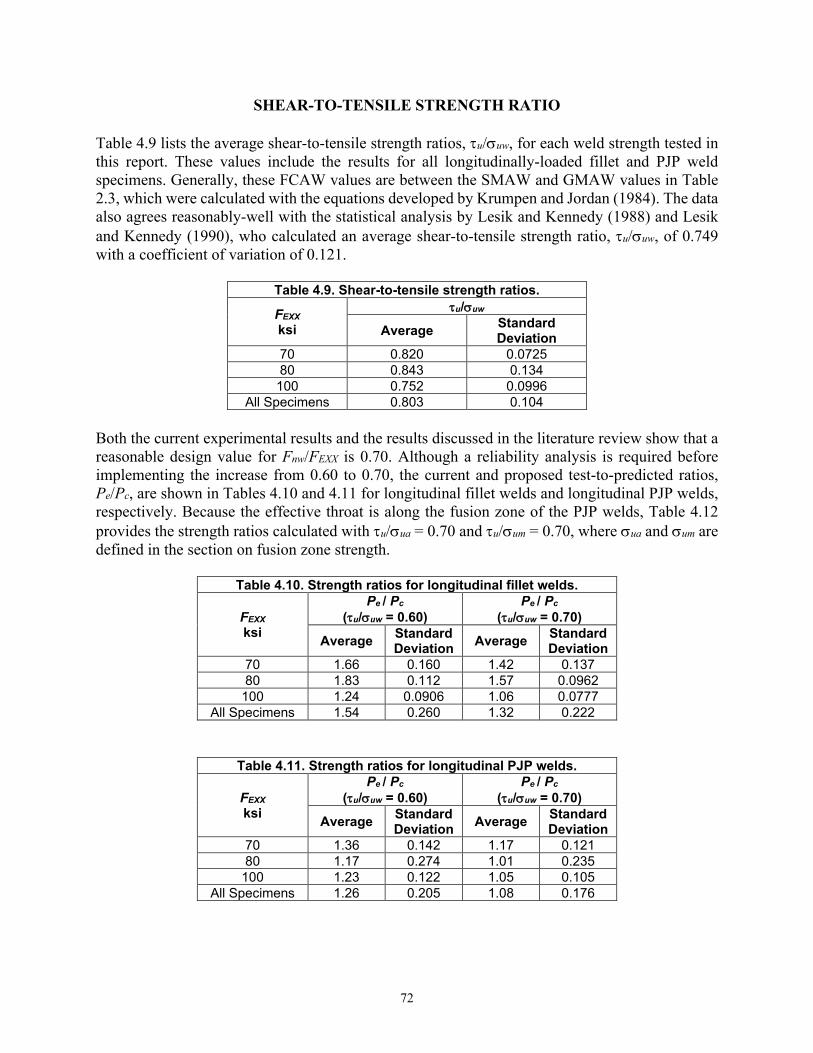
72
SHEAR-TO-TENSILE STRENGTH RATIO Table 4.9 lists the average shear-to-tensile strength ratios, τu/σuw, for each weld strength tested in this report. These values include the results for all longitudinally-loaded fillet and PJP weld specimens. Generally, these FCAW values are between the SMAW and GMAW values in Table 2.3, which were calculated with the equations developed by Krumpen and Jordan (1984). The data also agrees reasonably-well with the statistical analysis by Lesik and Kennedy (1988) and Lesik and Kennedy (1990), who calculated an average shear-to-tensile strength ratio, τu/σuw, of 0.749 with a coefficient of variation of 0.121.
Table 4.9. Shear-to-tensile strength ratios.
FEXX ksi
τu/σuw Average Standard
Deviation 70 0.820 0.0725 80 0.843 0.134 100 0.752 0.0996
All Specimens 0.803 0.104 Both the current experimental results and the results discussed in the literature review show that a reasonable design value for Fnw/FEXX is 0.70. Although a reliability analysis is required before implementing the increase from 0.60 to 0.70, the current and proposed test-to-predicted ratios, Pe/Pc, are shown in Tables 4.10 and 4.11 for longitudinal fillet welds and longitudinal PJP welds, respectively. Because the effective throat is along the fusion zone of the PJP welds, Table 4.12 provides the strength ratios calculated with τu/σua = 0.70 and τu/σum = 0.70, where σua and σum are defined in the section on fusion zone strength.
Table 4.10. Strength ratios for longitudinal fillet welds.
FEXX ksi
Pe / Pc
(τu/σuw = 0.60) Pe / Pc
(τu/σuw = 0.70) Average Standard
Deviation Average Standard Deviation
70 1.66 0.160 1.42 0.137 80 1.83 0.112 1.57 0.0962
100 1.24 0.0906 1.06 0.0777 All Specimens 1.54 0.260 1.32 0.222
Table 4.11. Strength ratios for longitudinal PJP welds.
FEXX ksi
Pe / Pc
(τu/σuw = 0.60) Pe / Pc
(τu/σuw = 0.70) Average Standard
Deviation Average Standard Deviation
70 1.36 0.142 1.17 0.121 80 1.17 0.274 1.01 0.235
100 1.23 0.122 1.05 0.105 All Specimens 1.26 0.205 1.08 0.176
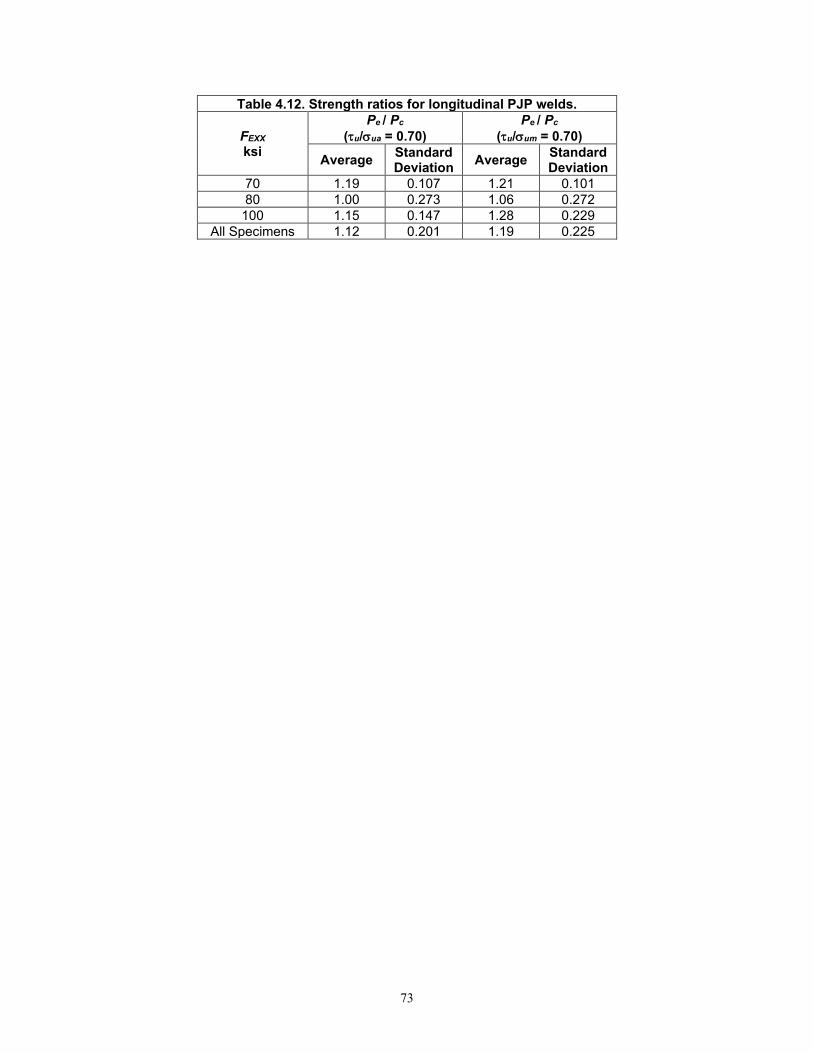
73
Table 4.12. Strength ratios for longitudinal PJP welds.
FEXX ksi
Pe / Pc
(τu/σua = 0.70) Pe / Pc
(τu/σum = 0.70) Average Standard
Deviation Average Standard Deviation
70 1.19 0.107 1.21 0.101 80 1.00 0.273 1.06 0.272
100 1.15 0.147 1.28 0.229 All Specimens 1.12 0.201 1.19 0.225
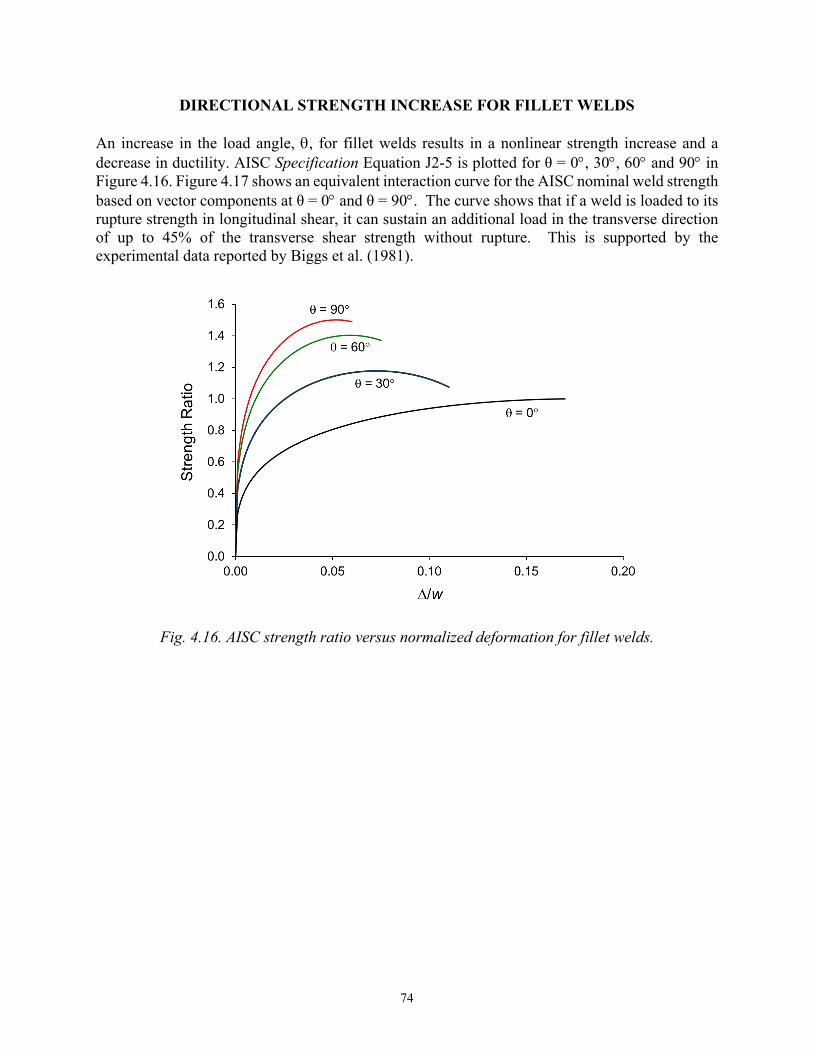
74
DIRECTIONAL STRENGTH INCREASE FOR FILLET WELDS An increase in the load angle, θ, for fillet welds results in a nonlinear strength increase and a decrease in ductility. AISC Specification Equation J2-5 is plotted for θ = 0°, 30°, 60° and 90° in Figure 4.16. Figure 4.17 shows an equivalent interaction curve for the AISC nominal weld strength based on vector components at θ = 0° and θ = 90°. The curve shows that if a weld is loaded to its rupture strength in longitudinal shear, it can sustain an additional load in the transverse direction of up to 45% of the transverse shear strength without rupture. This is supported by the experimental data reported by Biggs et al. (1981).
Fig. 4.16. AISC strength ratio versus normalized deformation for fillet welds.
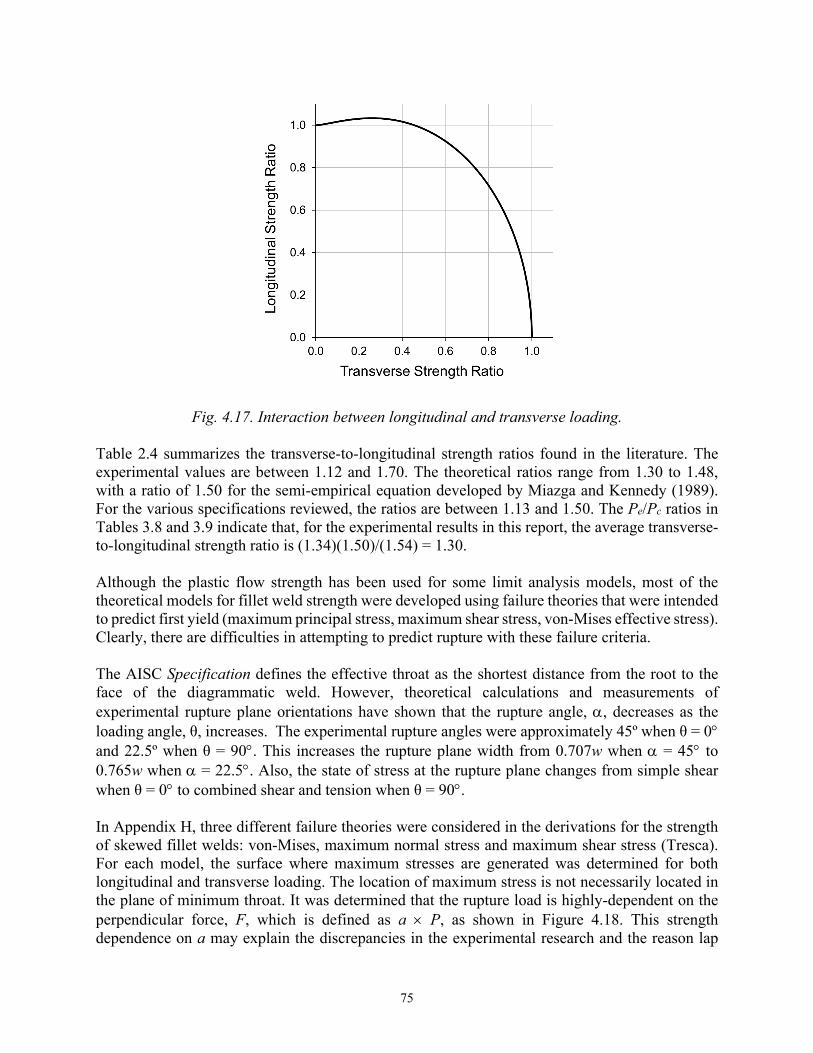
75
Fig. 4.17. Interaction between longitudinal and transverse loading. Table 2.4 summarizes the transverse-to-longitudinal strength ratios found in the literature. The experimental values are between 1.12 and 1.70. The theoretical ratios range from 1.30 to 1.48, with a ratio of 1.50 for the semi-empirical equation developed by Miazga and Kennedy (1989). For the various specifications reviewed, the ratios are between 1.13 and 1.50. The Pe/Pc ratios in Tables 3.8 and 3.9 indicate that, for the experimental results in this report, the average transverse-to-longitudinal strength ratio is (1.34)(1.50)/(1.54) = 1.30. Although the plastic flow strength has been used for some limit analysis models, most of the theoretical models for fillet weld strength were developed using failure theories that were intended to predict first yield (maximum principal stress, maximum shear stress, von-Mises effective stress). Clearly, there are difficulties in attempting to predict rupture with these failure criteria. The AISC Specification defines the effective throat as the shortest distance from the root to the face of the diagrammatic weld. However, theoretical calculations and measurements of experimental rupture plane orientations have shown that the rupture angle, α, decreases as the loading angle, θ, increases. The experimental rupture angles were approximately 45º when θ = 0° and 22.5º when θ = 90°. This increases the rupture plane width from 0.707w when α = 45° to 0.765w when α = 22.5°. Also, the state of stress at the rupture plane changes from simple shear when θ = 0° to combined shear and tension when θ = 90°. In Appendix H, three different failure theories were considered in the derivations for the strength of skewed fillet welds: von-Mises, maximum normal stress and maximum shear stress (Tresca). For each model, the surface where maximum stresses are generated was determined for both longitudinal and transverse loading. The location of maximum stress is not necessarily located in the plane of minimum throat. It was determined that the rupture load is highly-dependent on the perpendicular force, F, which is defined as a × P, as shown in Figure 4.18. This strength dependence on a may explain the discrepancies in the experimental research and the reason lap
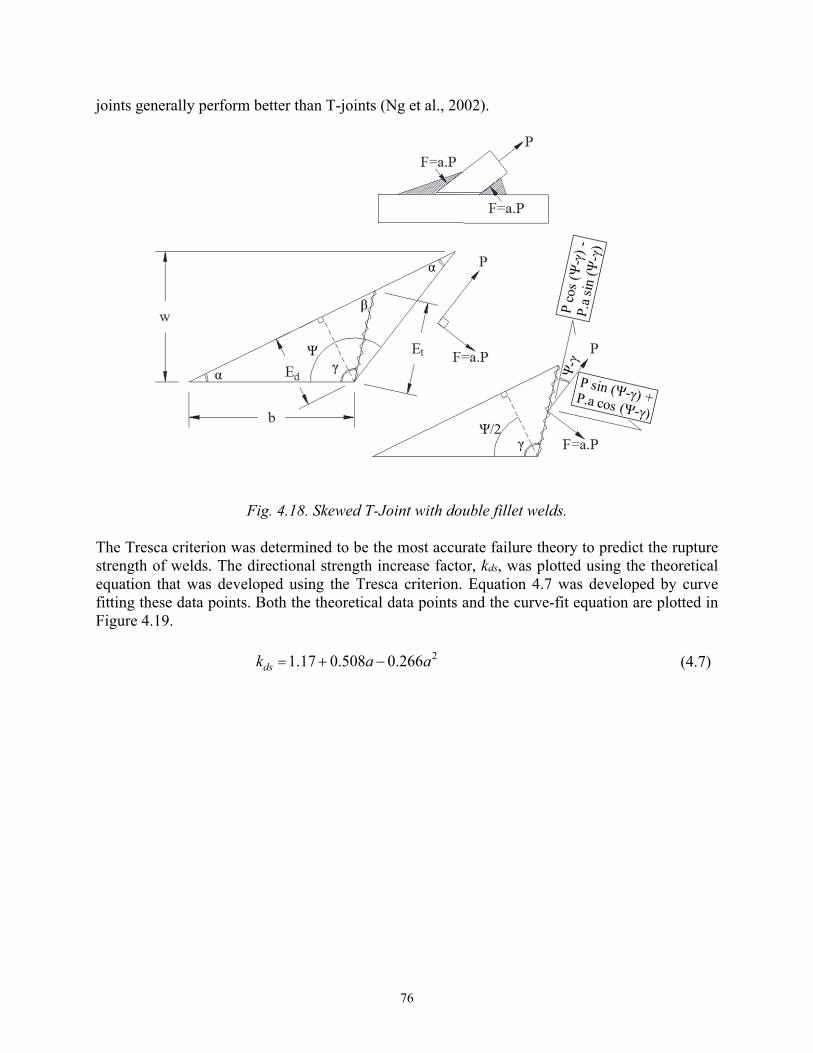
76
joints generally perform better than T-joints (Ng et al., 2002).
Fig. 4.18. Skewed T-Joint with double fillet welds. The Tresca criterion was determined to be the most accurate failure theory to predict the rupture strength of welds. The directional strength increase factor, kds, was plotted using the theoretical equation that was developed using the Tresca criterion. Equation 4.7 was developed by curve fitting these data points. Both the theoretical data points and the curve-fit equation are plotted in Figure 4.19.
21.17 0.508 0.266dsk a a= + − (4.7)
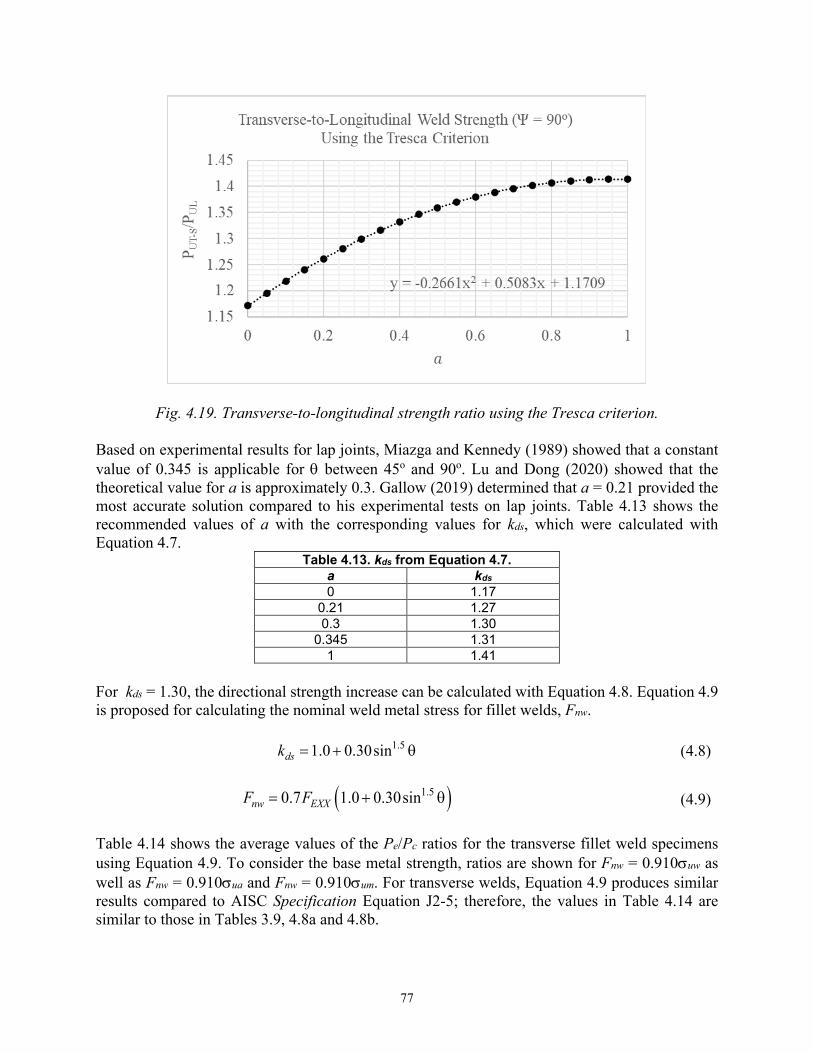
77
Fig. 4.19. Transverse-to-longitudinal strength ratio using the Tresca criterion. Based on experimental results for lap joints, Miazga and Kennedy (1989) showed that a constant value of 0.345 is applicable for θ between 45o and 90o. Lu and Dong (2020) showed that the theoretical value for a is approximately 0.3. Gallow (2019) determined that a = 0.21 provided the most accurate solution compared to his experimental tests on lap joints. Table 4.13 shows the recommended values of a with the corresponding values for kds, which were calculated with Equation 4.7.
Table 4.13. kds from Equation 4.7. a kds 0 1.17
0.21 1.27 0.3 1.30
0.345 1.31 1 1.41
For kds = 1.30, the directional strength increase can be calculated with Equation 4.8. Equation 4.9 is proposed for calculating the nominal weld metal stress for fillet welds, Fnw.
1.51.0 0.30sindsk = + θ (4.8)
( )1.50.7 1.0 0.30sinnw EXXF F= + θ (4.9) Table 4.14 shows the average values of the Pe/Pc ratios for the transverse fillet weld specimens using Equation 4.9. To consider the base metal strength, ratios are shown for Fnw = 0.910σuw as well as Fnw = 0.910σua and Fnw = 0.910σum. For transverse welds, Equation 4.9 produces similar results compared to AISC Specification Equation J2-5; therefore, the values in Table 4.14 are similar to those in Tables 3.9, 4.8a and 4.8b.
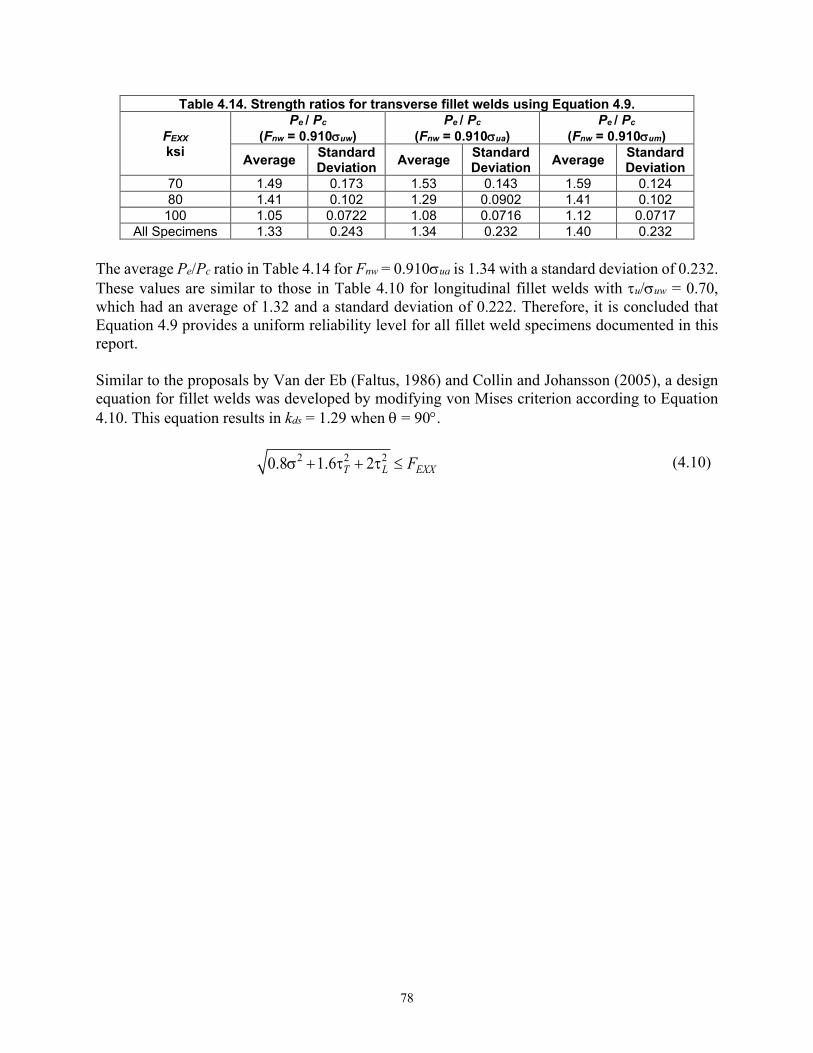
78
Table 4.14. Strength ratios for transverse fillet welds using Equation 4.9.
FEXX ksi
Pe / Pc
(Fnw = 0.910σuw) Pe / Pc
(Fnw = 0.910σua) Pe / Pc
(Fnw = 0.910σum) Average Standard
Deviation Average Standard Deviation Average Standard
Deviation 70 1.49 0.173 1.53 0.143 1.59 0.124 80 1.41 0.102 1.29 0.0902 1.41 0.102
100 1.05 0.0722 1.08 0.0716 1.12 0.0717 All Specimens 1.33 0.243 1.34 0.232 1.40 0.232
The average Pe/Pc ratio in Table 4.14 for Fnw = 0.910σua is 1.34 with a standard deviation of 0.232. These values are similar to those in Table 4.10 for longitudinal fillet welds with τu/σuw = 0.70, which had an average of 1.32 and a standard deviation of 0.222. Therefore, it is concluded that Equation 4.9 provides a uniform reliability level for all fillet weld specimens documented in this report. Similar to the proposals by Van der Eb (Faltus, 1986) and Collin and Johansson (2005), a design equation for fillet welds was developed by modifying von Mises criterion according to Equation 4.10. This equation results in kds = 1.29 when θ = 90°.
2 2 20.8 1.6 2T L EXXFσ + τ + τ ≤ (4.10)
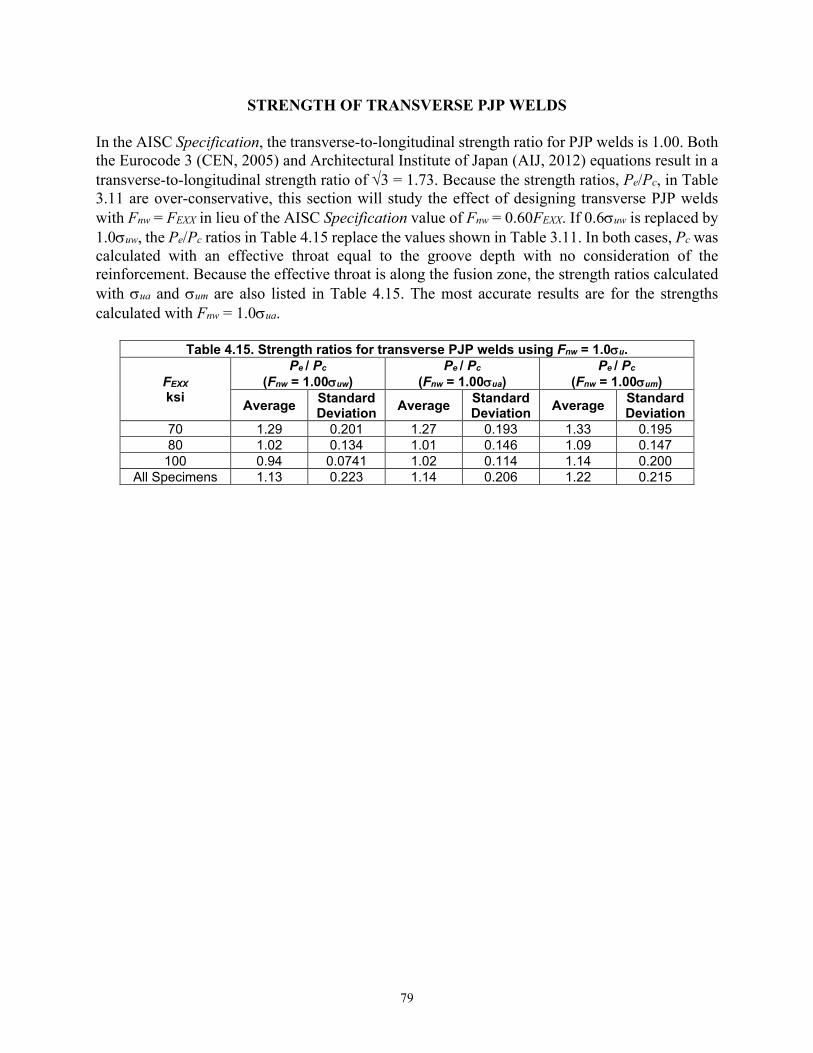
79
STRENGTH OF TRANSVERSE PJP WELDS In the AISC Specification, the transverse-to-longitudinal strength ratio for PJP welds is 1.00. Both the Eurocode 3 (CEN, 2005) and Architectural Institute of Japan (AIJ, 2012) equations result in a transverse-to-longitudinal strength ratio of √3 = 1.73. Because the strength ratios, Pe/Pc, in Table 3.11 are over-conservative, this section will study the effect of designing transverse PJP welds with Fnw = FEXX in lieu of the AISC Specification value of Fnw = 0.60FEXX. If 0.6σuw is replaced by 1.0σuw, the Pe/Pc ratios in Table 4.15 replace the values shown in Table 3.11. In both cases, Pc was calculated with an effective throat equal to the groove depth with no consideration of the reinforcement. Because the effective throat is along the fusion zone, the strength ratios calculated with σua and σum are also listed in Table 4.15. The most accurate results are for the strengths calculated with Fnw = 1.0σua.
Table 4.15. Strength ratios for transverse PJP welds using Fnw = 1.0σu.
FEXX ksi
Pe / Pc
(Fnw = 1.00σuw) Pe / Pc
(Fnw = 1.00σua) Pe / Pc
(Fnw = 1.00σum) Average Standard
Deviation Average Standard Deviation Average Standard
Deviation 70 1.29 0.201 1.27 0.193 1.33 0.195 80 1.02 0.134 1.01 0.146 1.09 0.147
100 0.94 0.0741 1.02 0.114 1.14 0.200 All Specimens 1.13 0.223 1.14 0.206 1.22 0.215
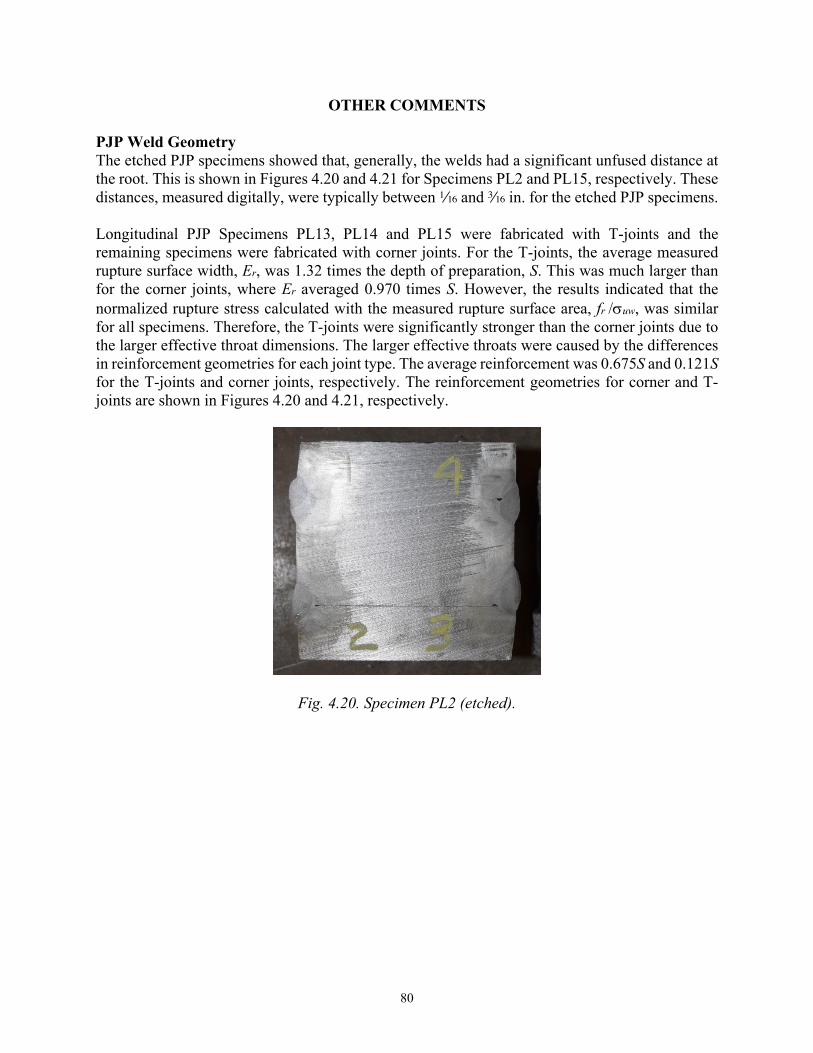
80
OTHER COMMENTS PJP Weld Geometry The etched PJP specimens showed that, generally, the welds had a significant unfused distance at the root. This is shown in Figures 4.20 and 4.21 for Specimens PL2 and PL15, respectively. These distances, measured digitally, were typically between z and x in. for the etched PJP specimens. Longitudinal PJP Specimens PL13, PL14 and PL15 were fabricated with T-joints and the remaining specimens were fabricated with corner joints. For the T-joints, the average measured rupture surface width, Er, was 1.32 times the depth of preparation, S. This was much larger than for the corner joints, where Er averaged 0.970 times S. However, the results indicated that the normalized rupture stress calculated with the measured rupture surface area, fr /σuw, was similar for all specimens. Therefore, the T-joints were significantly stronger than the corner joints due to the larger effective throat dimensions. The larger effective throats were caused by the differences in reinforcement geometries for each joint type. The average reinforcement was 0.675S and 0.121S for the T-joints and corner joints, respectively. The reinforcement geometries for corner and T-joints are shown in Figures 4.20 and 4.21, respectively.
Fig. 4.20. Specimen PL2 (etched).
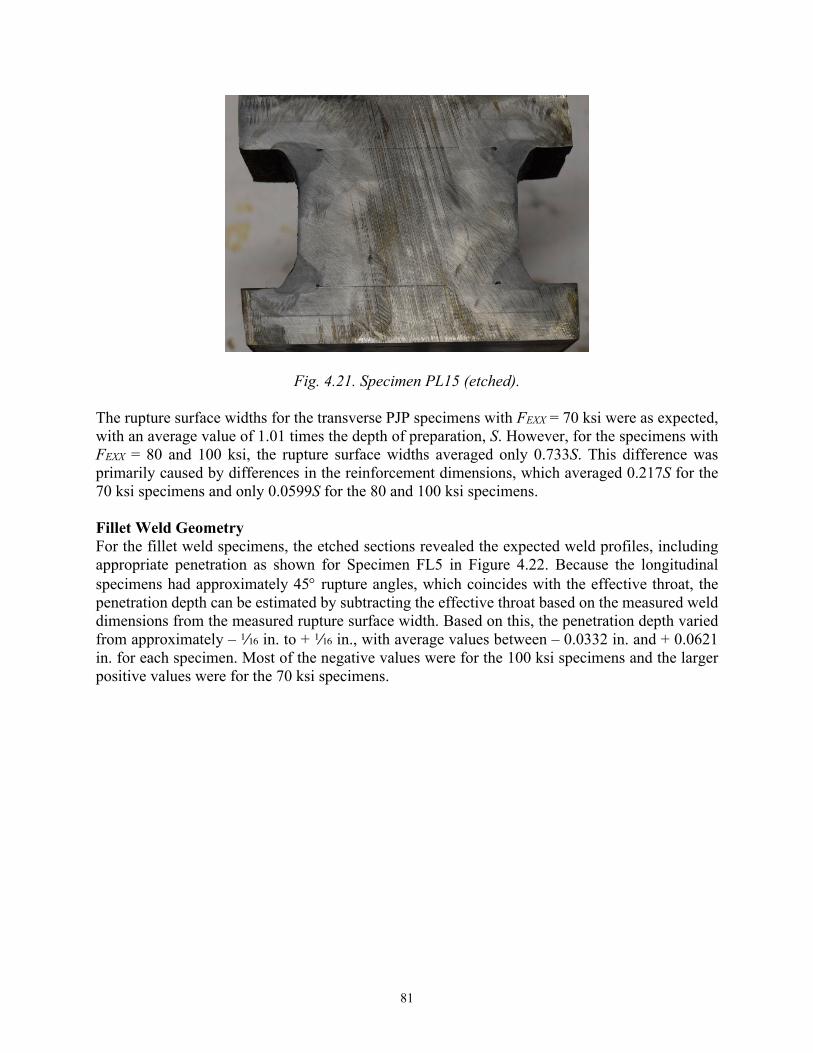
81
Fig. 4.21. Specimen PL15 (etched). The rupture surface widths for the transverse PJP specimens with FEXX = 70 ksi were as expected, with an average value of 1.01 times the depth of preparation, S. However, for the specimens with FEXX = 80 and 100 ksi, the rupture surface widths averaged only 0.733S. This difference was primarily caused by differences in the reinforcement dimensions, which averaged 0.217S for the 70 ksi specimens and only 0.0599S for the 80 and 100 ksi specimens. Fillet Weld Geometry For the fillet weld specimens, the etched sections revealed the expected weld profiles, including appropriate penetration as shown for Specimen FL5 in Figure 4.22. Because the longitudinal specimens had approximately 45° rupture angles, which coincides with the effective throat, the penetration depth can be estimated by subtracting the effective throat based on the measured weld dimensions from the measured rupture surface width. Based on this, the penetration depth varied from approximately – z in. to + z in., with average values between – 0.0332 in. and + 0.0621 in. for each specimen. Most of the negative values were for the 100 ksi specimens and the larger positive values were for the 70 ksi specimens.
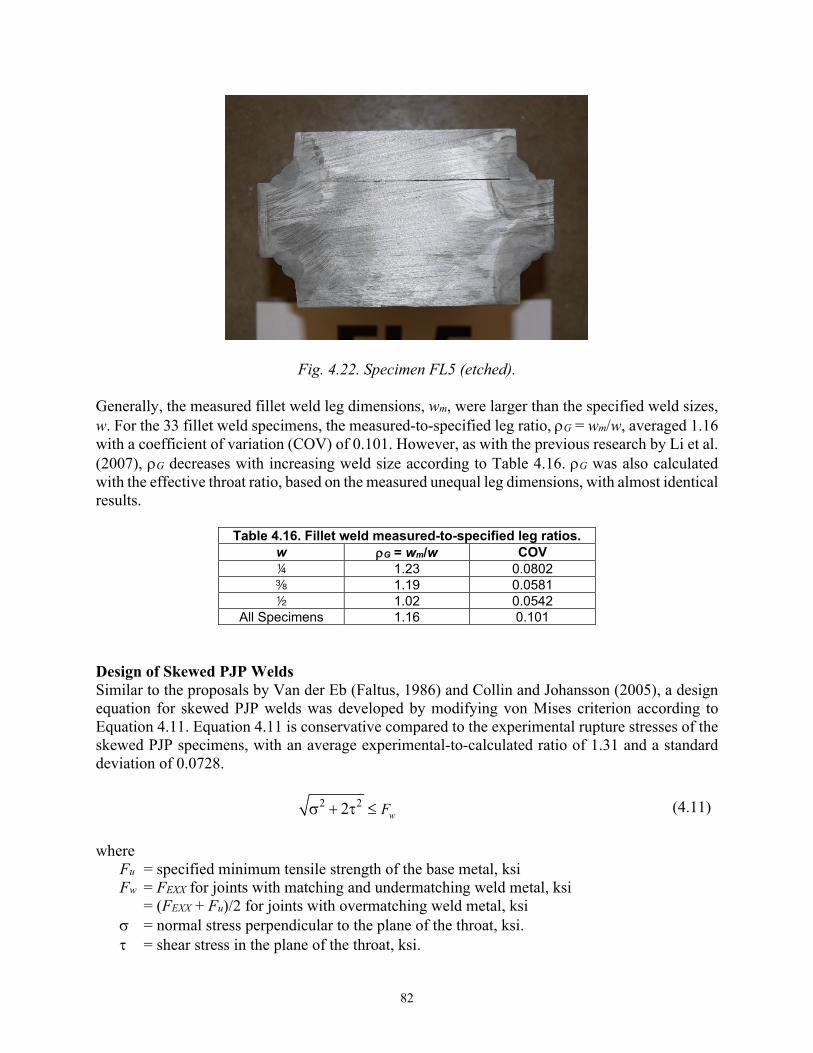
82
Fig. 4.22. Specimen FL5 (etched). Generally, the measured fillet weld leg dimensions, wm, were larger than the specified weld sizes, w. For the 33 fillet weld specimens, the measured-to-specified leg ratio, ρG = wm/w, averaged 1.16 with a coefficient of variation (COV) of 0.101. However, as with the previous research by Li et al. (2007), ρG decreases with increasing weld size according to Table 4.16. ρG was also calculated with the effective throat ratio, based on the measured unequal leg dimensions, with almost identical results.
Table 4.16. Fillet weld measured-to-specified leg ratios. w ρG = wm/w COV 4 1.23 0.0802 a 1.19 0.0581 2 1.02 0.0542
All Specimens 1.16 0.101 Design of Skewed PJP Welds Similar to the proposals by Van der Eb (Faltus, 1986) and Collin and Johansson (2005), a design equation for skewed PJP welds was developed by modifying von Mises criterion according to Equation 4.11. Equation 4.11 is conservative compared to the experimental rupture stresses of the skewed PJP specimens, with an average experimental-to-calculated ratio of 1.31 and a standard deviation of 0.0728.
2 22 wFσ + τ ≤ (4.11) where Fu = specified minimum tensile strength of the base metal, ksi Fw = FEXX for joints with matching and undermatching weld metal, ksi = (FEXX + Fu)/2 for joints with overmatching weld metal, ksi
σ = normal stress perpendicular to the plane of the throat, ksi. τ = shear stress in the plane of the throat, ksi.
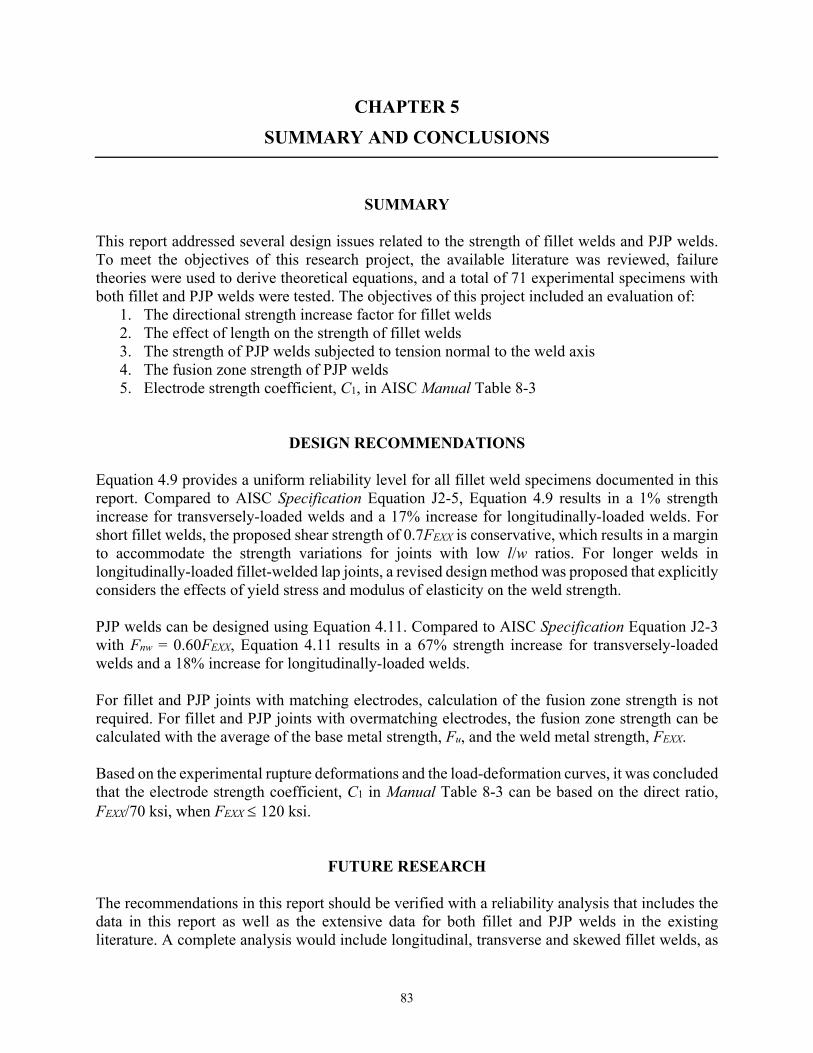
83
CHAPTER 5
SUMMARY AND CONCLUSIONS
SUMMARY This report addressed several design issues related to the strength of fillet welds and PJP welds. To meet the objectives of this research project, the available literature was reviewed, failure theories were used to derive theoretical equations, and a total of 71 experimental specimens with both fillet and PJP welds were tested. The objectives of this project included an evaluation of:
1. The directional strength increase factor for fillet welds 2. The effect of length on the strength of fillet welds 3. The strength of PJP welds subjected to tension normal to the weld axis 4. The fusion zone strength of PJP welds 5. Electrode strength coefficient, C1, in AISC Manual Table 8-3
DESIGN RECOMMENDATIONS Equation 4.9 provides a uniform reliability level for all fillet weld specimens documented in this report. Compared to AISC Specification Equation J2-5, Equation 4.9 results in a 1% strength increase for transversely-loaded welds and a 17% increase for longitudinally-loaded welds. For short fillet welds, the proposed shear strength of 0.7FEXX is conservative, which results in a margin to accommodate the strength variations for joints with low l/w ratios. For longer welds in longitudinally-loaded fillet-welded lap joints, a revised design method was proposed that explicitly considers the effects of yield stress and modulus of elasticity on the weld strength. PJP welds can be designed using Equation 4.11. Compared to AISC Specification Equation J2-3 with Fnw = 0.60FEXX, Equation 4.11 results in a 67% strength increase for transversely-loaded welds and a 18% increase for longitudinally-loaded welds. For fillet and PJP joints with matching electrodes, calculation of the fusion zone strength is not required. For fillet and PJP joints with overmatching electrodes, the fusion zone strength can be calculated with the average of the base metal strength, Fu, and the weld metal strength, FEXX. Based on the experimental rupture deformations and the load-deformation curves, it was concluded that the electrode strength coefficient, C1 in Manual Table 8-3 can be based on the direct ratio, FEXX/70 ksi, when FEXX ≤ 120 ksi.
FUTURE RESEARCH The recommendations in this report should be verified with a reliability analysis that includes the data in this report as well as the extensive data for both fillet and PJP welds in the existing literature. A complete analysis would include longitudinal, transverse and skewed fillet welds, as
84
well as joints that combine longitudinal and transverse fillet welds. It would also be beneficial to study the reliability of eccentrically-loaded fillet weld joints. For PJP welds, both longitudinal and transverse welds should be evaluated. Where adequate test results are available, high-strength welds should be included in the analysis.
85
SYMBOLS
A1 = sectional area of the smallest connecting element, in.2 A2 = sectional area of the largest connecting element, in.2 Awe = effective area of the weld, in.2 C1 = electrode strength coefficient E = effective throat of the weld, in. Ec = modulus of elasticity of the connecting elements, ksi Ep = actual weld throat defined as the penetration depth plus the effective throat according to
AISC Specification Section J2.2a, in. Er = experimental rupture surface width, in. Fc = rupture stress that considers the effect of base metal dilution, ksi FEXX = filler metal classification strength (specified minimum uniaxial tensile strength), ksi Fnw = nominal stress of the weld metal, ksi Fu = specified minimum tensile strength of the base metal, ksi Fvi = allowable stress of the weld metal, ksi Fw = FEXX for joints with matching and undermatching weld metal, ksi = (FEXX + Fu)/2 for joints with overmatching weld metal, ksi Fy = specified minimum yield strength, ksi Kat = empirical coefficient for transversely-loaded double-lap fillet weld joints L = weld length, in. Lr = experimental rupture surface length, in. Mw = coefficient that accounts for differences in the weld deformation capacity. P = axial force, kips Pe = experimental rupture load, kips Pn = nominal strength calculated with the AISC Specification equations, kips Pc = strength calculated with the measured weld size and the measured weld metal tensile
strength, kips Ri = strength at deformation ∆i, kips S = PJP weld preparation groove depth, in. VL = longitudinal load, kips VT = transverse load, kips Vu = weld strength at θ = 0°, kips a = the portion of P that defines the transverse force on the weld cross section fr = experimental rupture stress calculated with the measured rupture surface area, ksi k = constraint factor k2 = length coefficient kds = directional strength increase factor l = length of a single weld in the loading direction, in. n = strain-hardening exponent p = penetration ratio rcrit = distance from the instantaneous center of rotation to the weld element with the minimum
∆u/ri ratio, in. ri = distance from the instantaneous center of rotation to element i, in. t = thickness, in.
86
w = fillet weld leg size, in. w1 = size of fillet weld Leg 1, in. w2 = size of fillet weld Leg 2, in. wL = measured leg dimension parallel to the faying surface, in. wT = measured leg dimension perpendicular to the faying surface, in. x = measured reinforcement dimension for PJP welds, in. α = angle between the loading direction and the rupture plane, degrees αd = angle between the weld longitudinal axis and the weld displacement direction βw = correlation factor ∆ = relative displacement of connecting elements between weld ends, in. ∆a = remaining deformation capacity of a weld element at maximum strength, in. ∆m = deformation of weld element at maximum stress, in. ∆u = deformation of weld element at ultimate stress (rupture), in. ∆i = deformation of weld element at intermediate stress levels, in. δi = ∆i/w δu = ∆u/w εu = uniaxial engineering tensile rupture strain γ = experimental angle from the faying surface to the rupture surface, degrees γM2 = partial safety factor σ = normal stress perpendicular to the plane of the throat, ksi σe = experimental rupture stress, ksi σT = normal stress perpendicular to the plane of the throat, ksi. σtu = true tensile rupture stress, ksi σua = average of σuw and σub, ksi σub = experimental tensile stress of the base metal, ksi σum = minimum of σuw and σub, ksi σuw = experimental uniaxial tensile rupture stress of the weld metal, ksi τ = shear stress in the plane of the throat, ksi. τL = shear stress in the plane of the throat, parallel to the weld axis, ksi. τT = shear stress in the plane of the throat, perpendicular to the weld axis, ksi τu = shear rupture stress, ksi θ = angle between the line of action of the required force and the weld longitudinal axis,
degrees θ1 = angle between the line of action of the required force and the weld longitudinal axis for the weld segment under consideration, degrees θ2 = angle between the line of action of the required force and the weld longitudinal axis for the weld segment in the group that is nearest to 90o θp = groove angle measured from the load direction, degrees
87
REFERENCES
ABW (1931), Report of Structural Steel Welding Committee, American Bureau of Welding, American Welding Society. AIJ (2012), Recommendations for Design of Connections in Steel Structures, The Architectural Institute of Japan. AISC (2017), Steel Construction Manual, Fifteenth Edition, May, American Institute of Steel Construction, Chicago, IL. AISC (2016), Specification for Structural Steel Buildings, ANSI/AISC 360-10, July 7, American Institute of Steel Construction, Chicago, IL. Ales, J.M. (1990), The Design of Shear Tabs Welded to Tubular Columns, Master’s Thesis, The University of Wisconsin at Milwaukee, December. Archer, F.E., Fischer, H.K. and Kitchen, E.M. (1959), "Fillet Welds Subjected to Bending and Shear," Civil Engineering and Public Works Review, Vol. 54, pp. 455-458. Archer, F.E., Fischer, H.K. and Kitchen, E.M. (1964), The Strength of Fillet Welds, University of New South Wales. ASTM (2017), Standard Test Methods and Definitions for Mechanical Testing of Steel Products, ASTM A370-17, ASTM International, West Conshohocken, PA. AWS (2020), Specification for Low-Alloy Steel Electrodes and Rods for Gas Shielded Arc Welding, AWS A5.28/A5.28M, American Welding Society, Miami, FL. AWS (2019), Specification for Carbon Steel Electrodes and Fluxes for Submerged Arc Welding, AWS A5.17/A5.17M, American Welding Society, Miami, FL. AWS (2017), Specification for Carbon Steel Electrodes and Rods for Gas Shielded Arc Welding, AWS A5.18/A5.18M, American Welding Society, Miami, FL. AWS (2016), Standard Methods for Mechanical Testing of Welds, AWS B4.0:2016, American Welding Society, Miami, FL. AWS (2015), Structural Welding Code-Steel, AWS D1.1:2015, American Welding Society, Miami, FL. AWS (2015), Specification for Carbon Steel Electrodes for Flux Cored Arc Welding, AWS A5.20/A5.20M, American Welding Society, Miami, FL.
88
AWS (2014), Specification for Low-Alloy Steel Electrodes for Shielded Metal Arc Welding, AWS A5.5/A5.5M, American Welding Society, Miami, FL. AWS (2012), Specification for Carbon Steel Electrodes for Shielded Metal Arc Welding, AWS A5.1/A5.1M, American Welding Society, Miami, FL. AWS (2011), Specification for Low-Alloy Steel Electrodes and Fluxes for Submerged Arc Welding, AWS A5.23/A5.23M, American Welding Society, Miami, FL. AWS (1998), Specification for Low-Alloy Steel Electrodes for Flux Cored Arc Welding, AWS A5.29/A5.29M, American Welding Society, Miami, FL. AWS (1937), “Stress Distribution in Fillet Welds,” Welding Research Supplement, May, American Welding Society, Miami, FL. Biggs, M.S., Crofts, M.R., Higgs, J.D. Martin, L.H. and Tzogius, A. (1981), "Failure of Fillet Weld Connections Subject to Static Loading," Joints in Structural Steelwork, Proceedings of the Conference held at Teeside Polytechnic, Pentech Press, London, England. Bjork, T., Ahola, A. and Tuominen, N. (2018), “On the Design of Fillet Welds Made of Ultra-High-Strength Steel,” Welding in the World, Vol. 62. Bjork, T., Penttila, T. and Nykanen, T. (2014), “Rotation Capacity of Fillet Weld Joints Made of High-Strength Steel,” Welding in the World, Vol. 58. Bjork, T., Toivonen, J. and Nykanen, T. (2012), “Capacity of Fillet Welded Joints Made of Ultra High-Strength Steel,” Welding in the World, Vol. 56. Blackwood, R.R. (1931), “Strength of Fillet Welds in Structural Mild Steel II,” Commonwealth Engineer, Vol. 18, No. 3, pp. 89-97. Blackwood, R.R. (1930), “Strength of Fillet Welds in Structural Mild Steel,” Commonwealth Engineer, Vol. 18, No. 2, pp. 50-55. Bowman, M.D. and Quinn, B.P. (1994), "Examination of Fillet Weld Strength," Engineering Journal, American Institute of Steel Construction, Vol. 31, No. 3, pp. 98-108. Brockenbrough, R.L. and Johnston, B.G. (1974), Steel Design Manual, United States Steel Corporation. Butler, L.J., and Kulak, G.L. (1971), "Strength of Fillet Welds as a Function of Direction of Load," Welding Research Supplement, pp. 231-234. Butler, L.J., Pal, S. and Kulak, G.L. (1972), “Eccentrically Loaded Welded Connections,” Journal of the Structural Division, American Society of Civil Engineers, Vol. 98, No. ST5, May.
89
CEN (2005), Eurocode 3: Design of Steel Structures—Part 1–8: Design of Joints, EN 1993-1-8. Brussels, Belgium. Chan, S.W.K. and Ogle, M.H. (1992), ”Elastic-Plastic Behavior of a Simulated Transverse Fillet-Welded Lap Joint Subjected to In-Plane Tensile Loading,” Low Cycle Fatigue and Elasto-Plastic Behavior of Materials-3, Elsevier Applied Science. Clark, P.J. (1971), "Basis of Design for Fillet-Welded Joints Under Static Loading," Conference on Welding Product Design, Cambridge, England. Collin, P.P. and Johansson, P.B. (2005), “Design of Welds in High Strength Steel,” Proceedings of the Fourth European Conference on Steel and Composite Structures. CSA (2014), Design of Steel Structures, S16-14, Canadian Standards Association, Toronto, Canada. Deng, K.L., Grondin, G.Y. and Driver, R.G. (2003), Effect of Loading Angle on the Behavior of Fillet Welds, Structural Engineering Report No. 251, University of Alberta, June. Dieter, G.E. and Bacon, D.J. (1986), Mechanical Metallurgy, McGraw-hill. Douwen, A.A.V. and Witteveen, J. (1966), "Proposed Modification of the ISO Formula for the Calculation of Welded Joints," Lastechniek, Vol. 32, No. 6. Dubina, D. and Stratan, A. (2002), “Behavior of Welded Connections of Moment Resisting Frames Beam-to-Column Joints,” Engineering Structures, Vol. 24. Faltus, F. (1988), Joints with Fillet Welds, Elsevier. Feder, D.K. (1994), “Recommendations for the Design of Long Fillet Welds,” Welding in the World, Vol. 33, No. 5. Gagnon, D.P. and Kennedy, D.J.L. (1989), “Behavior and Ultimate Tensile Strength of Partial Joint Penetration Groove Welds,” Canadian Journal of Civil Engineering, Vol. 16. Gaines, E. (1987), "Reduced Fillet Weld Sizes for Naval Ships," Journal of Ship Production, Vol. 3, No. 4, pp. 247-255. Gallow, M.S. (2019), Behavior of Fillet Welds in Skewed Joints, Ph.D. Dissertation, The University of Alabama at Birmingham. Ginn, M., Pate, M. and Wilkinson, T. (2011), “Fillet Weld Connections to High Strength Steel,” Advances in Steel and Aluminum Structures, Research Publishing.
90
Gomez, I.R., Kwan, Y.K. Kanvinde, A.M. and Grondin, G.Y. (2008), Strength and Ductility of Welded Joints Subjected to Out-of-Plane Bending, Draft Report, American Institute of Steel Construction, June. Higgins, T.R. and Preece, F.R. (1969), “Proposed Working Stresses for Fillet Welds,” Engineering Journal, American Institute of Steel Construction, January. Higgs, J.D. (1981), "A Failure Criterion for Fillet Welds," Ph.D Dissertation, The University of Aston. IIW (1976), Design Rules for Arc-Welded Connections in Steel Submitted to Static Loads, International Institute of Welding. Iwankiw, N.R. (1997), “Rational Basis for Increased Fillet Weld Strength,” Engineering Journal, Second Quarter, American Institute of Steel Construction. Kamtekar, A.G. (1987), “The Strength of Inclined Fillet Welds,” Journal of Constructional Steel Research, Vol. 7. Kamtekar, A.G. (1982), “A New Analysis of the Strength of Some Simple Fillet Welded Connections,” Journal of Constructional Steel Research, Vol. 2, No. 2. Kanvinde, A.M., Gomez, I.R., Roberts, M., Fell, B.V. and Grondin, G.Y. (2009), "Strength and Ductility of Fillet Welds with Transverse Root Notch," Journal of Constructional Steel Research, Vol. 65, No. 4, pp. 948-958. Kato, B. and Morita, K. (1974), "Strength of Transverse Fillet Welded Joints," Welding Journal, Vol. 53, No. 2, pp. 59s-64s. Kennedy, D.J.L. and Kriviak, G.J. (1985), “The Strength of Fillet Welds Under Longitudinal and Transverse Shear: A Paradox,” Canadian Journal of Civil Engineering, Vol. 12, pp. 226-231. Kennedy, D.J.L., Miazga, G.S. and Lesik, D.F. (1990), “Discussion of Fillet Weld Shear Strength,” Welding Journal, May. Khanna, C.K. (1969), Strength of Long Fillet Welds, Master’s Thesis, Nova Scotia Technical College. Khurshid, M., Barsoum, Z. and Barsoum, I. (2015), “Load Carrying Capacities of Butt Welded Joints in High Strength Steels,” Journal of Engineering Materials and Technology, Vol. 137, October. Kist, N.C. (1936), "Berechnung der Schweissnähte unter Berücksichtigung konstanter Gestaltänderungsenergie," Vorbereich 2. Kongress Int. Ver. für Brückenbau und Hochbau. Krumpen, R.P. and Jordan, C.R. (1984), Updating of Fillet Weld Strength Parameters for
91
Commercial Shipbuilding, Report No. SSC-323, Ship Structure Committee, April. Kuhlmann, U., Gunther, H.P. and Rasche, C. (2008), “High-Strength Steel Fillet Welded Connections,” Steel Construction, Issue 1. Lawrence, F.V. and Cox, E.P. (1976), “Influence of Inadequate Joint Penetration on Tensile Behavior of A514 Steel Welds,” Welding Research Supplement, May. Lesik D.F, and Kennedy, D.J.L. (1990), “Ultimate Strength of Fillet Welded Connections Loaded in Plane,” Canadian Journal of Civil Engineering, Vol. 17, No 1, pp. 55‐67. Lesik, D.F. and Kennedy, D.J.L. (1988), Ultimate Strength of Eccentrically Loaded Fillet Welded Connections, Structural Engineering Report 159, University of Alberta, May. Li, C., Grondin, G.Y. and Driver, R.G. (2007), Reliability Analysis of Concentrically Loaded Fillet Welds, Structural Engineering Report No. 271, University of Alberta, October. Ligtenburg, F.K. (1968), International Test Series-Final Report, IIW Document XV-242-68, International Institute of Welding. Lu, H. and Dong, P. (2020), “An Analytical Shear Strength Model for Load-Carying Fillet-Welded Connections Incorporating Nonlinear Effects,” Journal of Structural Engineering, Vol. 146, No. 3. Lu, H., Dong, P. and Boppudi. S. (2015), "Strength Analysis of Fillet Welds Under Longitudinal and Transverse Shear Conditions," Marine Structures, Vol. 43, pp. 87-106. Luo, P., Asada, H. and Tanaka, T. (2020a), “Limit Analysis for Partial-Joint-Penetration Weld T-Joints with Arbitrary Loading Angles,” Engineering Structures, Vol. 213. Luo, P., Asada, H., Uang, C.M., and Tanaka, T. (2020b), “Directionality Effect on Strength of Partial-Joint Penetration Groove Weld Joints,” Journal of Structural Engineering, Vol. 146, No. 4. McClellan, R.W. (1989), “Evaluation of Fillet Weld Shear Strength of FCAW Electrodes,” Welding Journal, August. Melchers, R.E. (1999), Structural Reliability Analysis and Prediction, Second Edition, John Wiley & Sons. Mellor, B.G., Rainey, R.C.T. and Kirk, N.E. (1999), "The Static Strength of End and T Fillet Weld Connections," Materials & Design, Vol. 20, No. 4, pp. 193-205. Miazga, G.S., and Kennedy, D.J.L. (1989), "Behavior of Fillet Welds as a Function of the Angle of Loading," Canadian Journal of Civil Engineering, Vol. 16, No. 4, pp. 583-599.
92
Miazga, G.S., and Kennedy, D.J.L. (1986), Behavior of Fillet Welds as a Function of the Angle of Loading, Structural Engineering Report No. 133, University of Alberta, March. Mocanu, D. and Buga, M. (1970), “Stress Distribution Along Side Fillet Welds and in the Plates of Lap Joints,” Experimental Stress Analysis, The Institution of Mechanical Engineers, Paper 42. Moon, A.R. (1948), The Design of Welded Steel Structures, Isaac Pitman and Sons. Neis, V.V. (1985), “New Constitutive Law for Equal Leg Fillet Welds,” Journal of Structural Engineering, Vol. 111, No. 8. Ng, A.K.F., Driver, R.G. and Grondin, G.Y. (2004), “Behavior of Transverse Fillet Welds: Parametric and Reliability Analysis,” Engineering Journal, Second Quarter, American Institute of Steel Construction. Ng, A.K.F., Driver, R.G. and Grondin, G.Y. (2002), Behavior of Transverse Fillet Welds, Structural Engineering Report No. 245, The University of Alberta, October. Pham, L. (1983), “Co-ordinated Testing of Fillet Welds Part 1-Cruciform Specimens-AWRA Contract 94, AWRA Document P6-35-82,” Australian Welding Research, December. Popov, E.P. and Stephen, R.M. (1977), “Tensile Capacity of Partial Penetration Groove Welds,” Journal of the Structural Division, Vol. 103, No. ST9, September. Preece, F.R. (1968), AWS-AISC Fillet Weld Study: Longitudinal and Transverse Shear Tests, Testing Engineers Incorporated, AISC Research Report RR-731, May 31. Ran, M.M., Sun, F.F., Li, G.Q., Kanvinde, A., Wang, Y.B. and Xiao, R. (2019), “Experimental Study on the Behavior of Mismatched Butt Joints of High-Strength Steel,” Journal of Constructional Steel Research, Vol. 153. Rasche, C. and Kuhlmann, U. (2009), "Investigations on Longitudinal Fillet Welded Lap Joints of HSS," Nordic Steel Construction Conference, Malmö, Sweden, September. Reynolds, M., Huynh, Q., Rafezy, B.and Uang, C.M. (2020), “Strength of Partial-Joint-Penetration Groove Welds as Affected by Root Opening, Reinforcing and Loading Direction,” Journal of Structural Engineering, Vol. 146, No. 8. Rosenthal, D. and Levray, P. (1939), The Welding Journal, Vol. 18, No. 4. Satoh, K., Seo, K., Higuchi, G. and Yatagai, T. (1974), “Experimental Study on the Mechanical Behavior and the Tensile Strength of Partial Penetration Groove Welded Joint,” Transactions of the Japan Welding Society, Vol. 5, No. 2, September.
93
Spraragen, W. and Claussen, G.E. (1942), “Static Tests of Fillet and Plug Welds-A Review of Literature from 1932 to January 1, 1940,” Welding Research Supplement, American Welding Society, April. Strating, J. (1971), The Strength of Fillet Welds Made by Automatic and Semi-Automatic Welding Processes, Stevin Laboratory Report 6-71-6-HL 13, Delft University of Technology, March. Sun, F.F., Ran, M.M. and Wang, Y.B. (2019), “Mechanical Behavior of Transverse Fillet Welded Joints of High Strength Steel Using Digital Image Correlation Techniques,” Journal of Constructional Steel Research, Vol. 162. Swannell, P. and Skewes, I.C. (1979), “The Design of Welded Brackets Loaded In-Plane: Elastic and Ultimate Load Techniques-AWRA Report P6-8-77,” Australian Welding Research, January. Swannell, P. (1968), “Deformation of Longitudinal Fillet Welds Subjected to a Uniform Shearing Intensity,” British Welding Journal, March. Thornton, W.A. (2020), Personal Communication. Tide, R.H.R. (2020), Personal Communication. Tide, R.H.R. (1980), “Eccentrically Loaded Weld Groups-AISC Design Tables,” Engineering Journal, Fourth Quarter, American Institute of Steel Construction. Tousignant, K. and Packer, J.A. (2017), "Numerical Investigation of Fillet Welds in HSS-to-Rigid End-Plate Connections," Journal of Structural Engineering, Vol. 143, No. 12. Troelsch, H.W. (1932), “Distribution of Shear in Welded Connections,” Proceedings of the American Society of Civil Engineers, November. Tuominen, N., Bjork, T. and Ahola, A. (2018), “Effect of Bending Moment on Capacity of Fillet Weld,” Tubular Structures XVI, Taylor and Francis. Vreedenburgh, C.G.J. (1954), "New Principles for the Calculation of Welded Joints," Welding Journal, Vol. 33, pp. 743-751. Wheatley, J.M. and Baker, R.G. (1962), "Mechanical Properties of a Mild Steel Weld Metal Deposited by the Metal-Arc Process," British Welding Journal, Vol. 9. Zhao, X.L. and Hancock, G.J. (1995), “Butt Welds and Transverse Fillet Welds in Thin Cold-Formed RHS Members,” Journal of Structural Engineering, Vol. 121, No. 11. Yabe, Y., Sakamoto, S. and Yakushiji, K. (1994), “Structural Behavior of Steel Columns with Partial-Penetration Welded Joints,” Welding in the World, Vol. 33, No. 5.
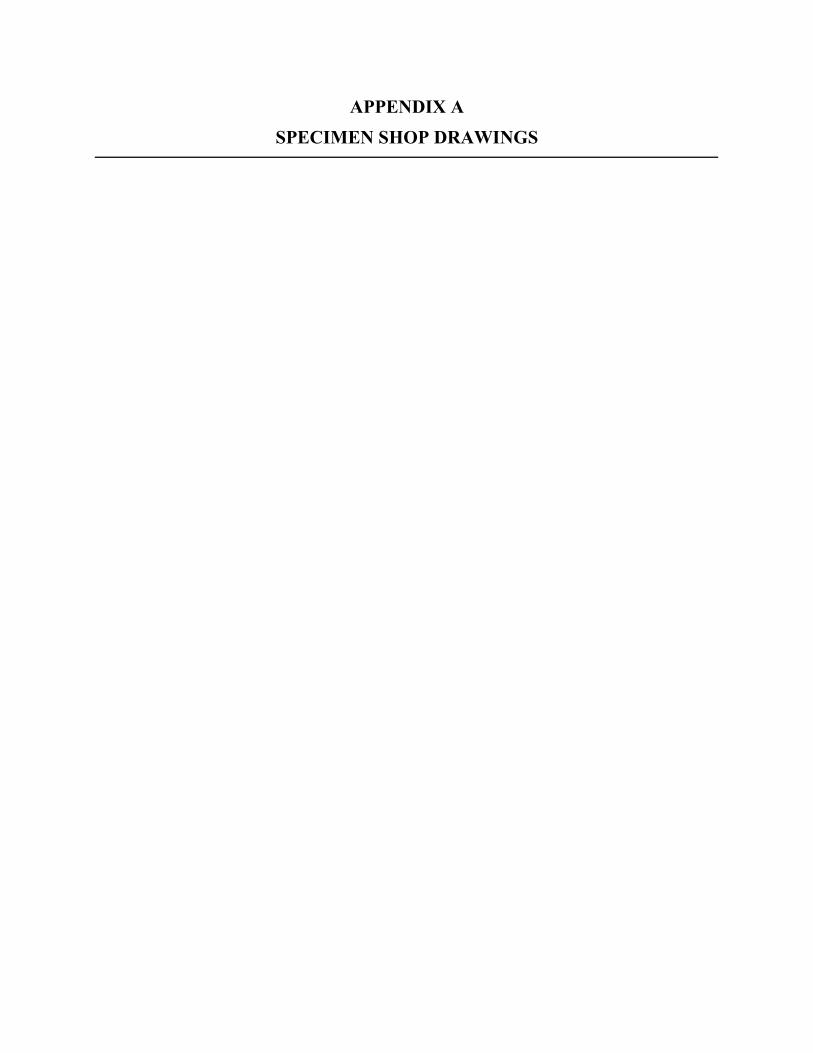
APPENDIX A
SPECIMEN SHOP DRAWINGS
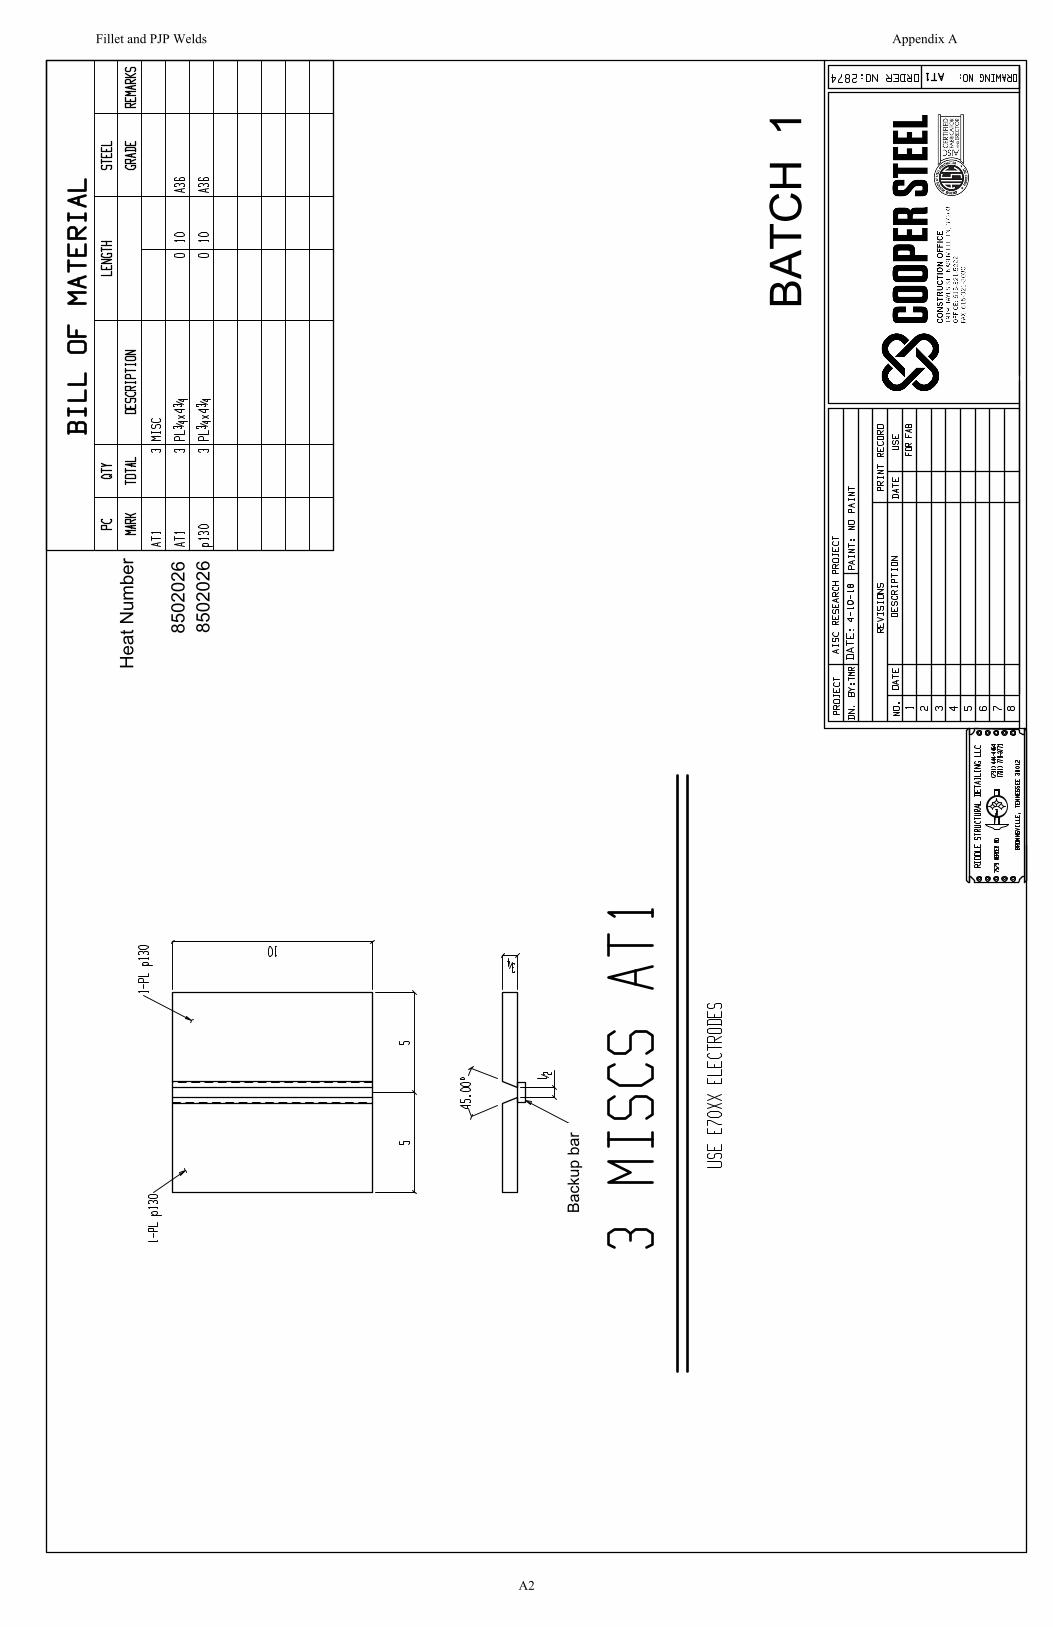
BATC
H 1
Hea
t Num
ber
8502
026
8502
026
Back
up b
ar
Fillet and PJP Welds Appendix A
A2
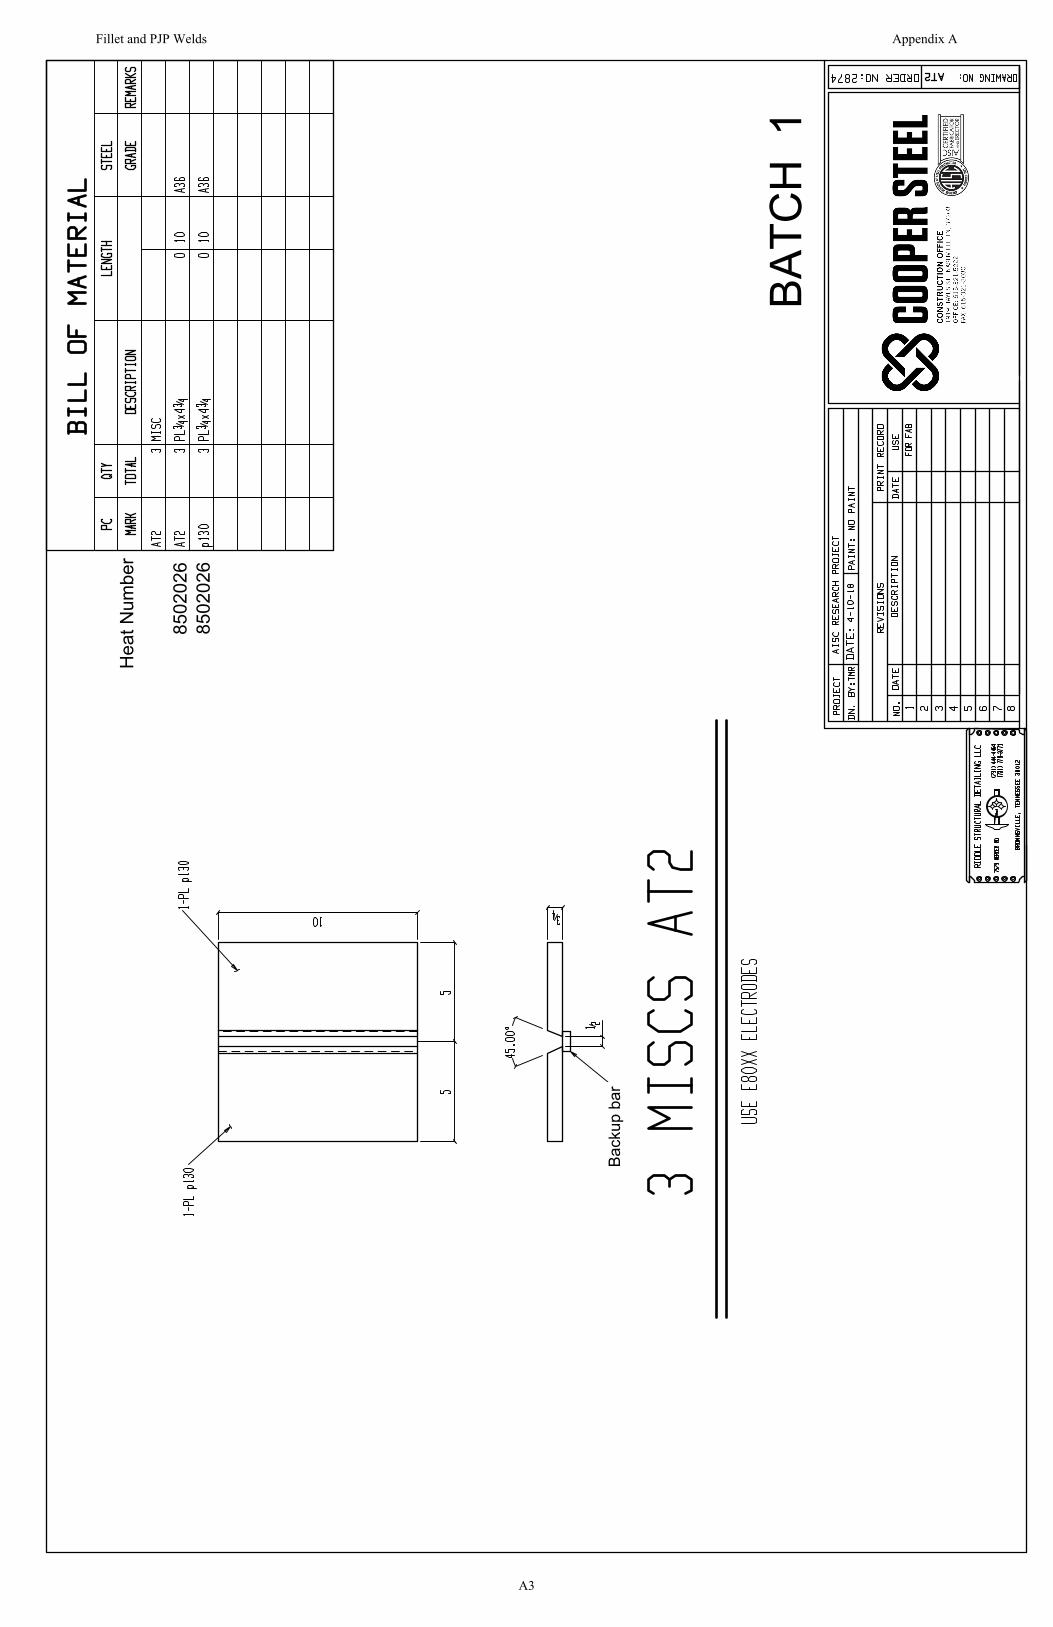
BATC
H 1
Hea
t Num
ber
8502
026
8502
026
Back
up b
ar
Fillet and PJP Welds Appendix A
A3
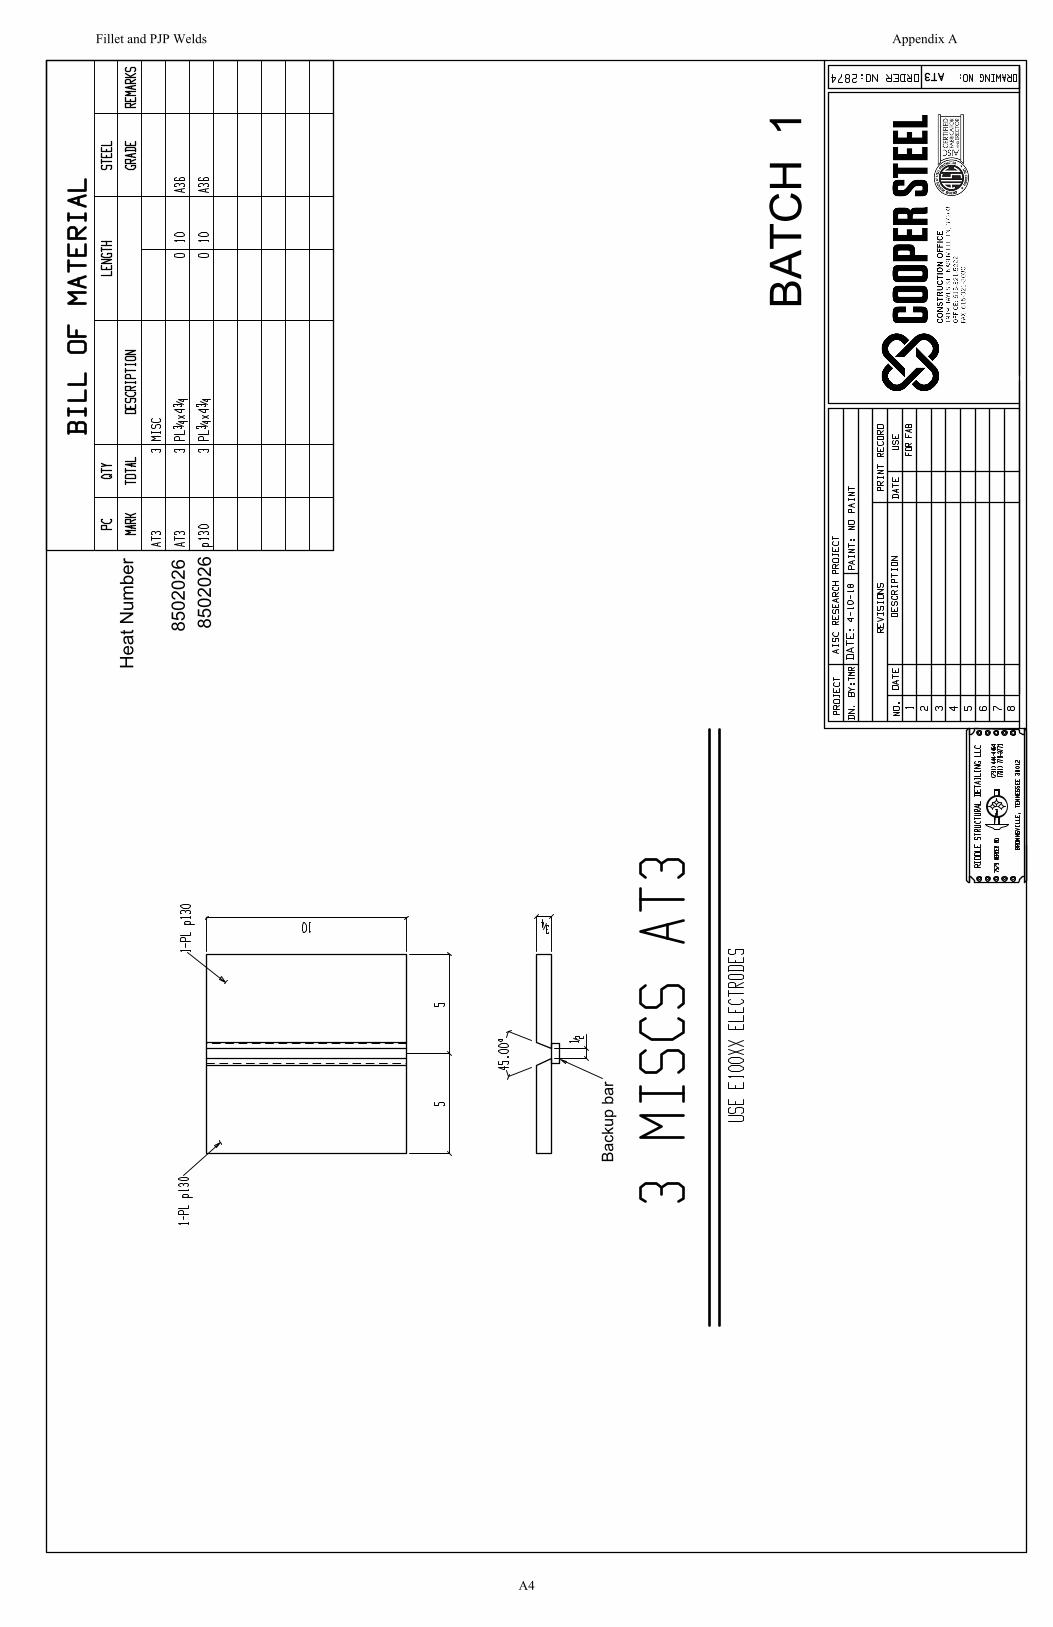
BATC
H 1
Hea
t Num
ber
8502
026
8502
026
Back
up b
ar
Fillet and PJP Welds Appendix A
A4
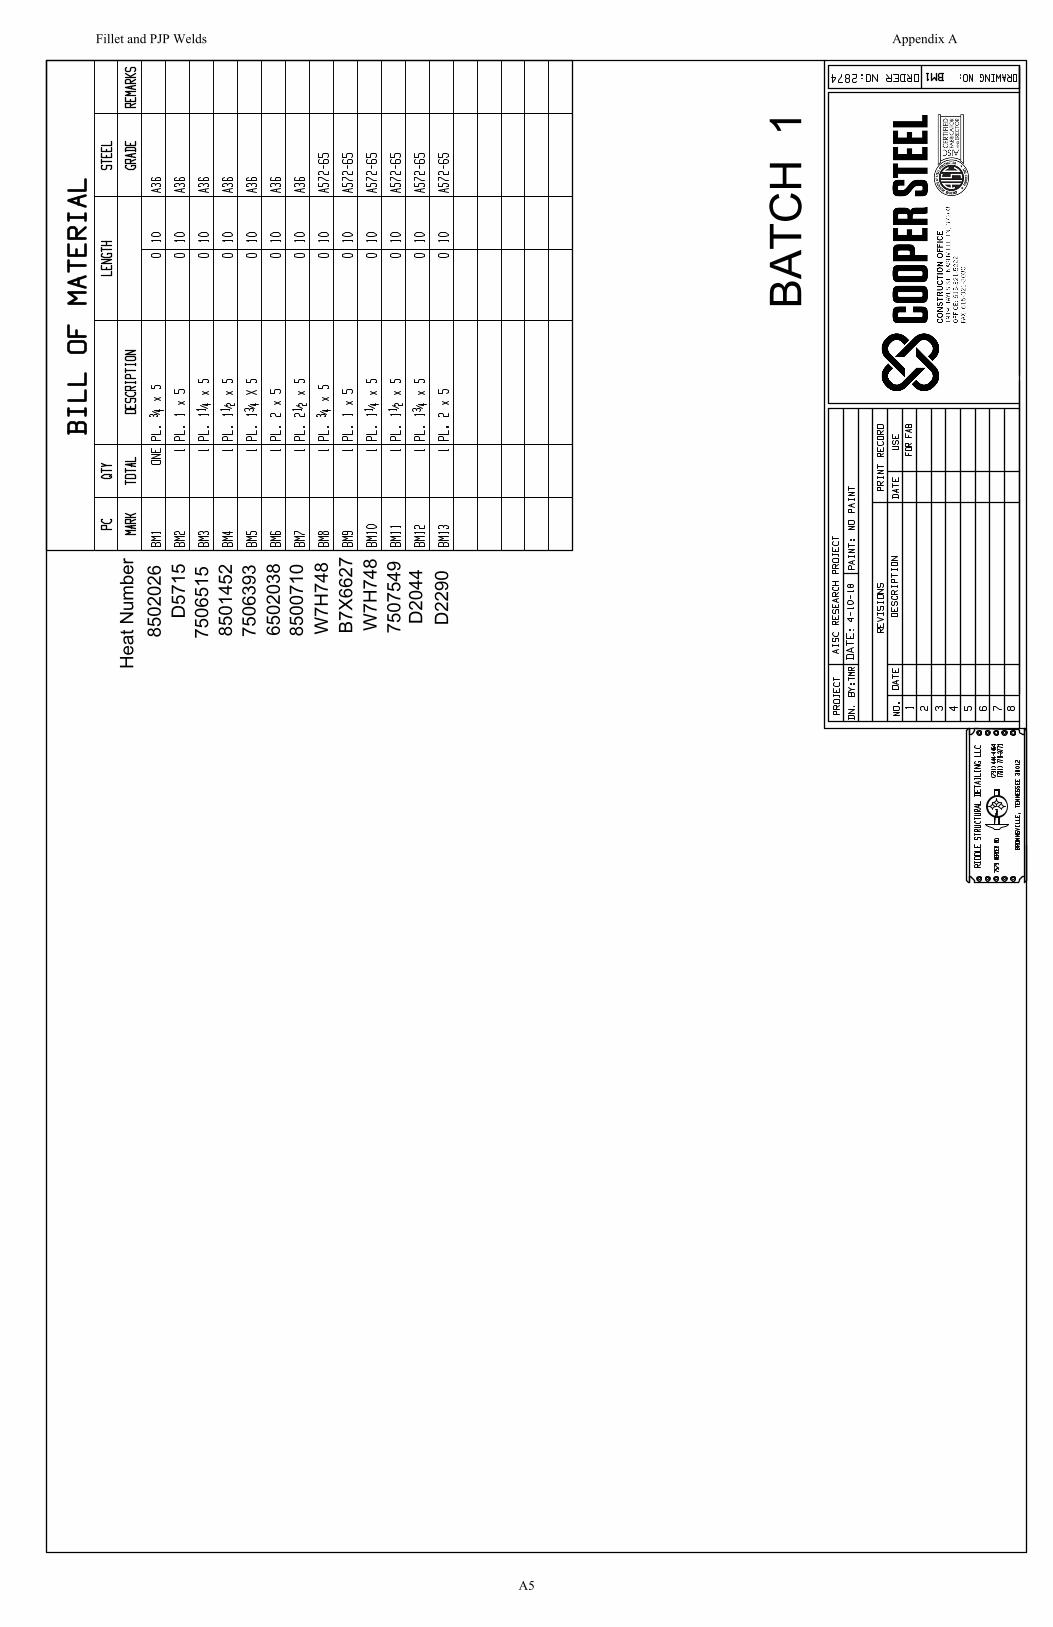
BATC
H 1
Hea
t Num
ber
8502
026
7506
515
8501
452
7506
393
6502
038
8500
710
W7H
748
B7X6
627
W7H
748
7507
549
D20
44D
2290
D57
15
Fillet and PJP Welds Appendix A
A5
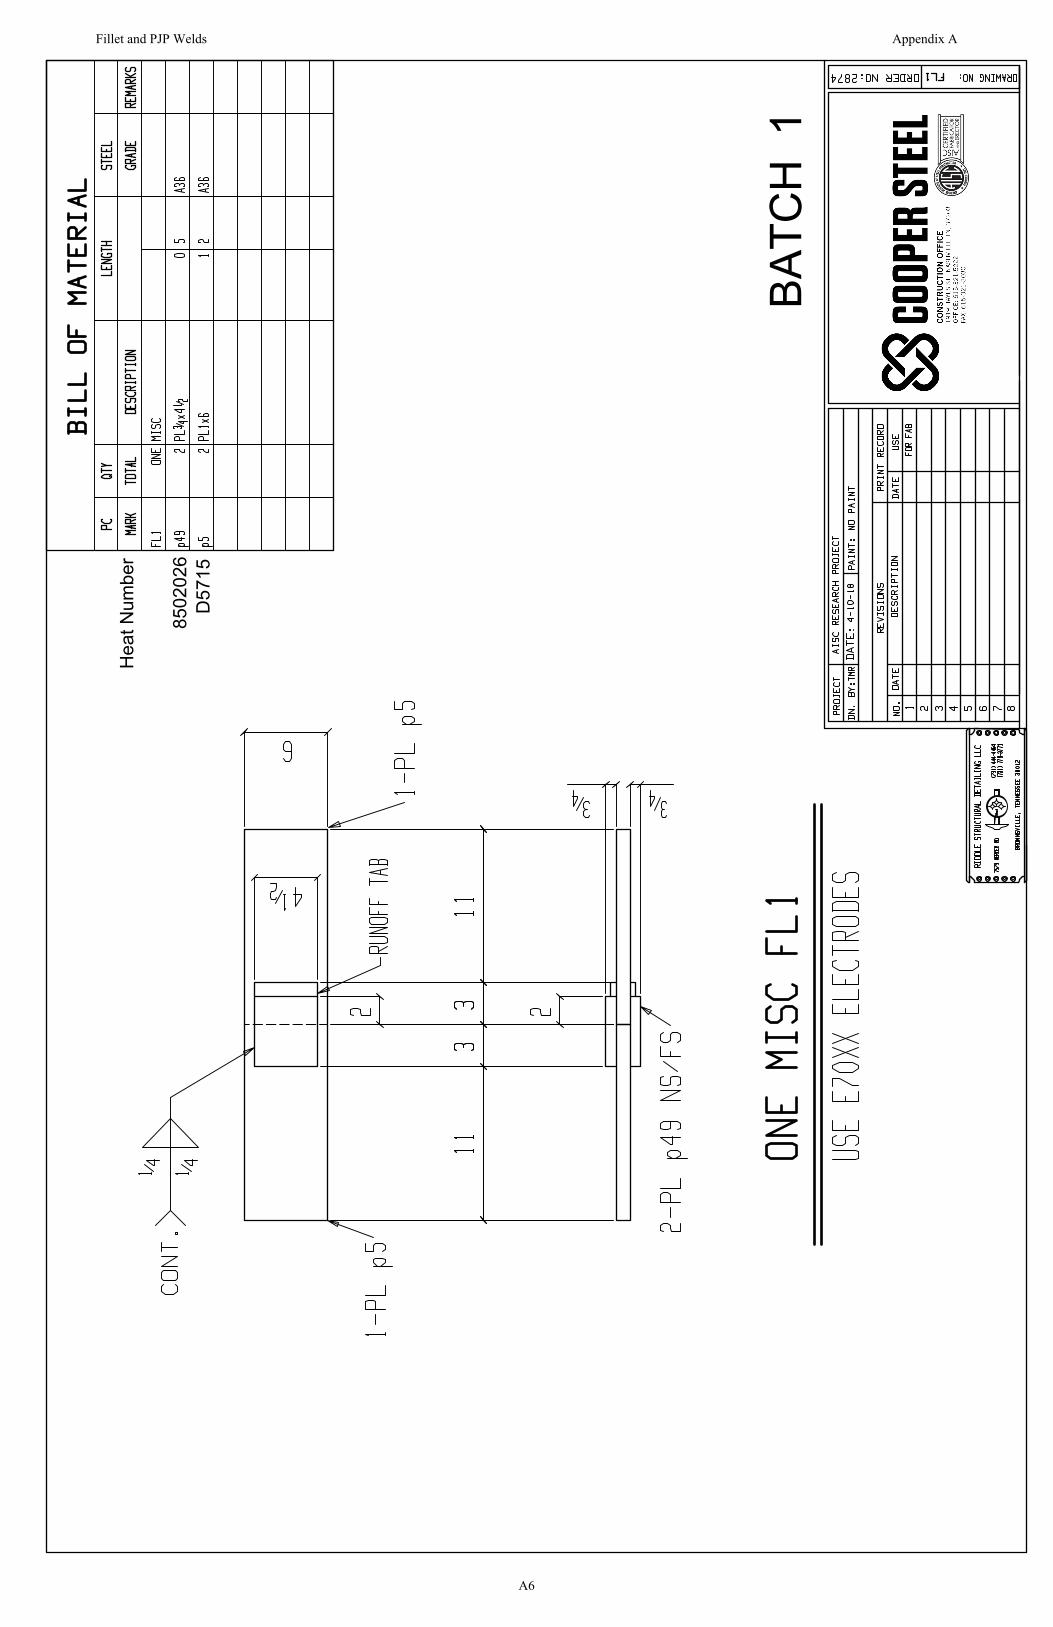
BATC
H 1
Hea
t Num
ber
8502
026
D57
15
Fillet and PJP Welds Appendix A
A6
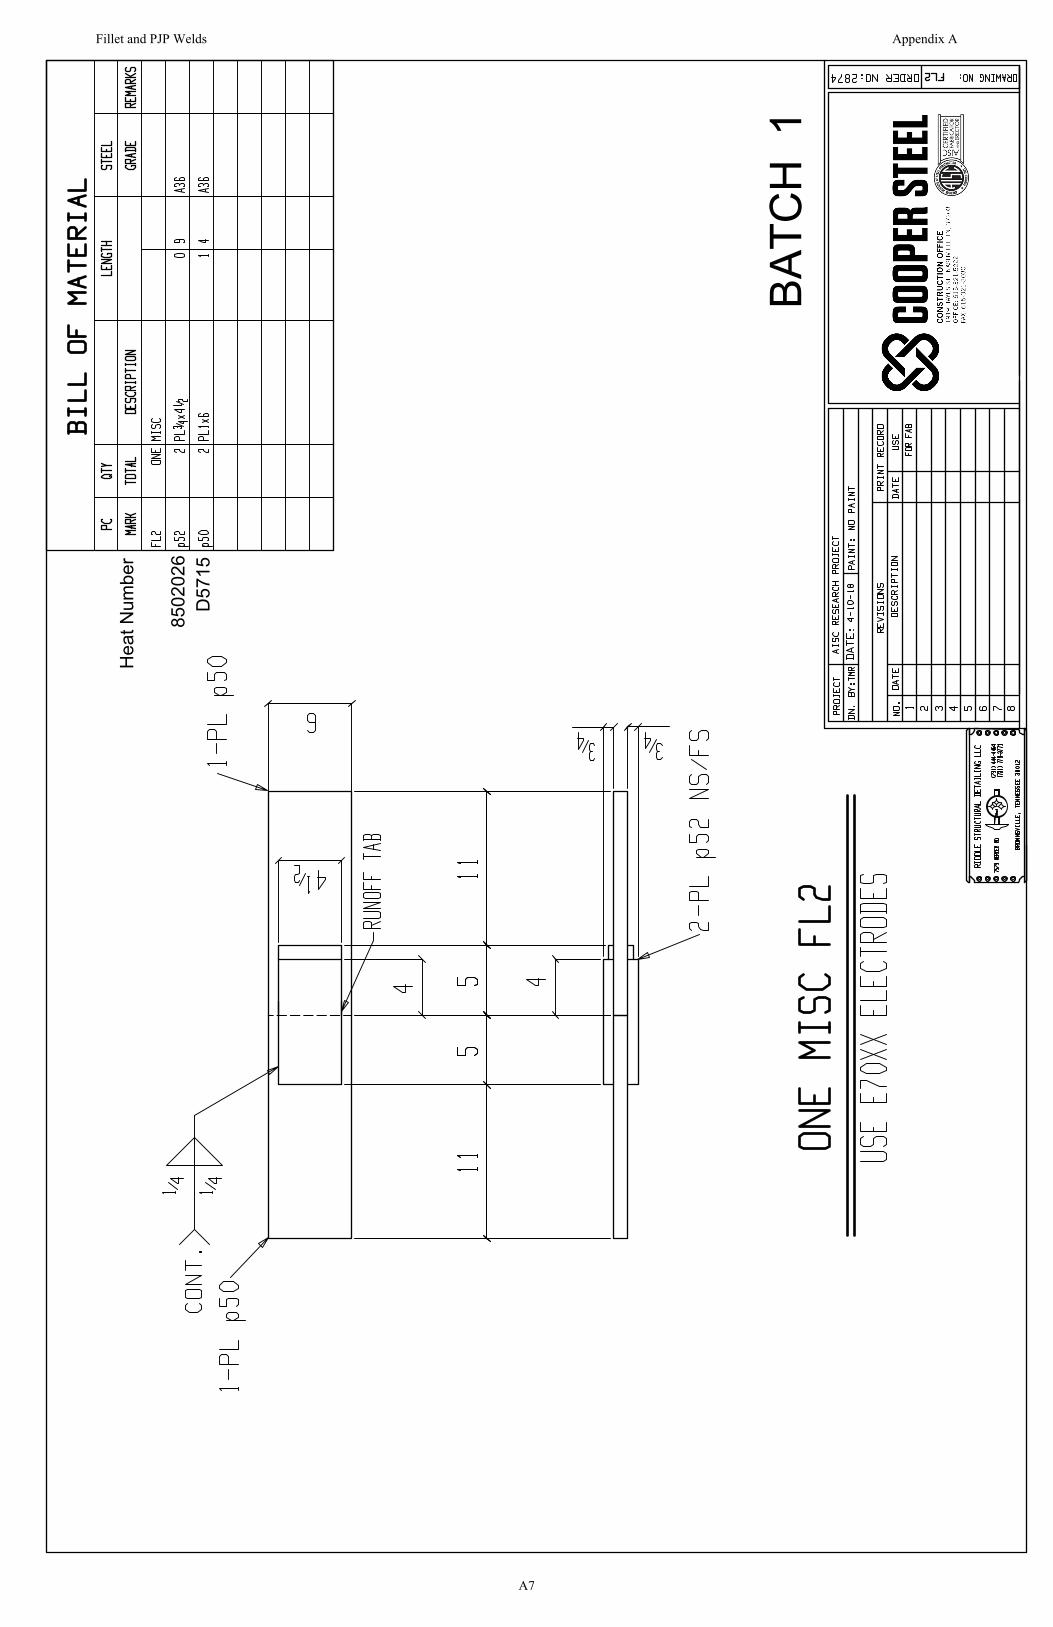
BATC
H 1
Hea
t Num
ber
8502
026
D57
15
Fillet and PJP Welds Appendix A
A7
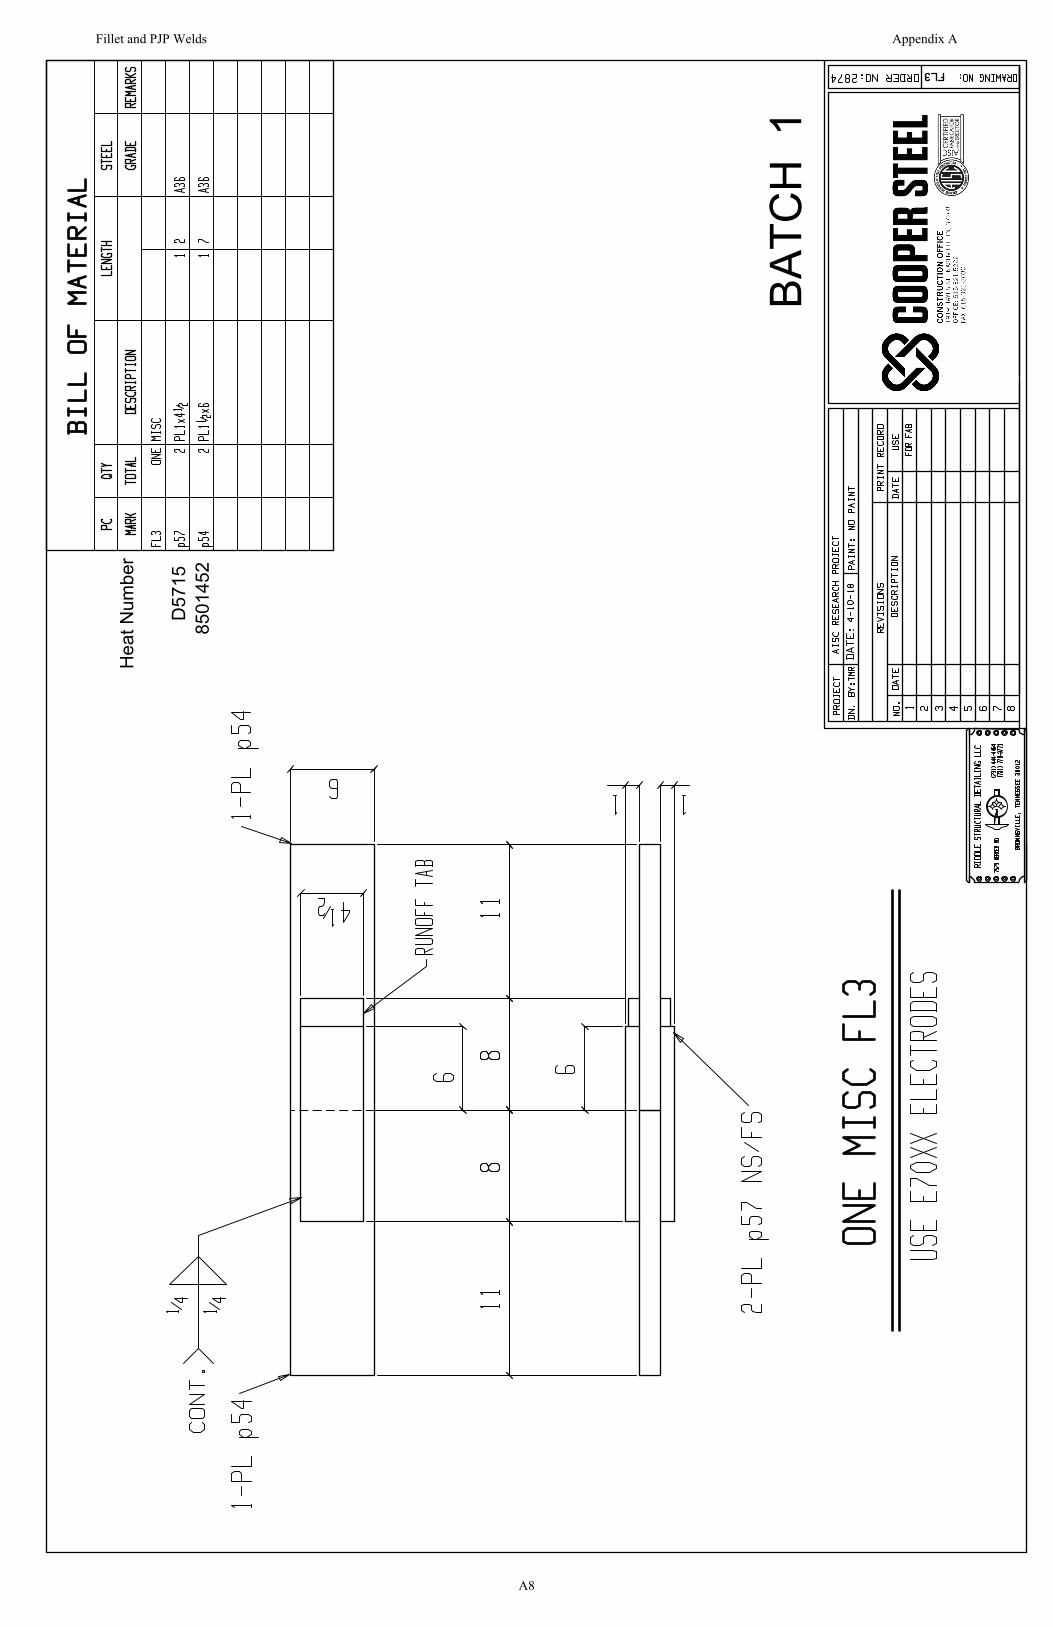
BATC
H 1
Hea
t Num
ber
8501
452
D57
15
Fillet and PJP Welds Appendix A
A8
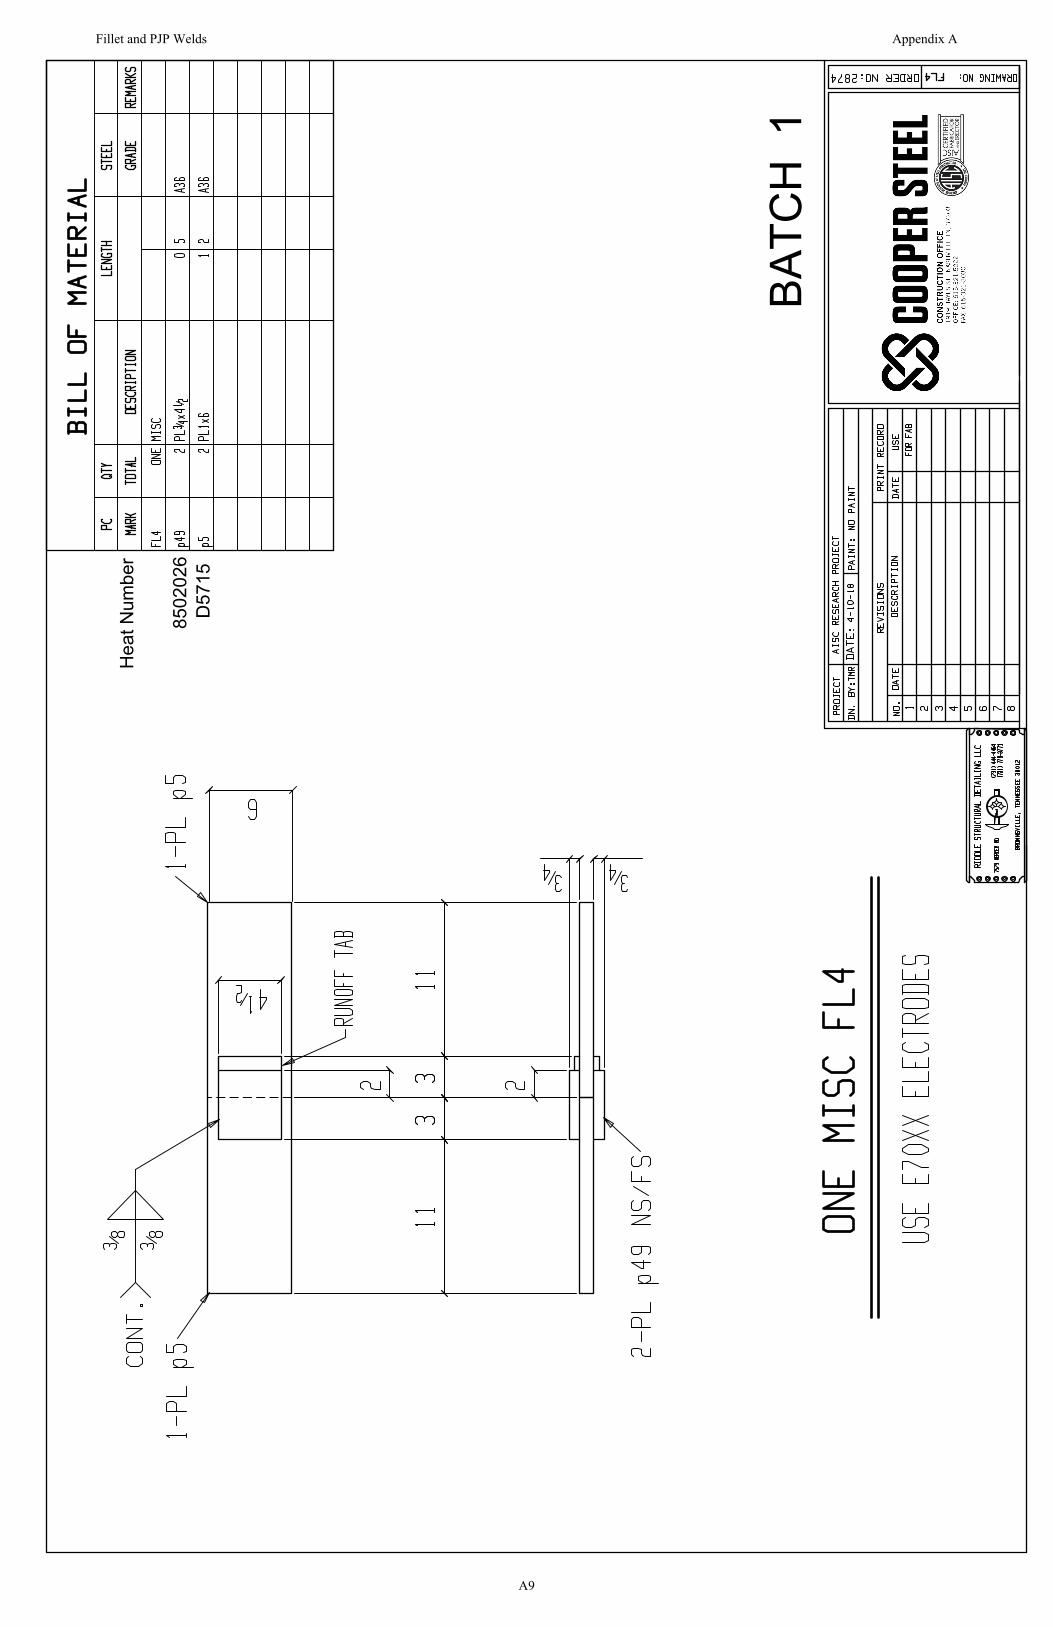
BATC
H 1
Hea
t Num
ber
8502
026
D57
15
Fillet and PJP Welds Appendix A
A9
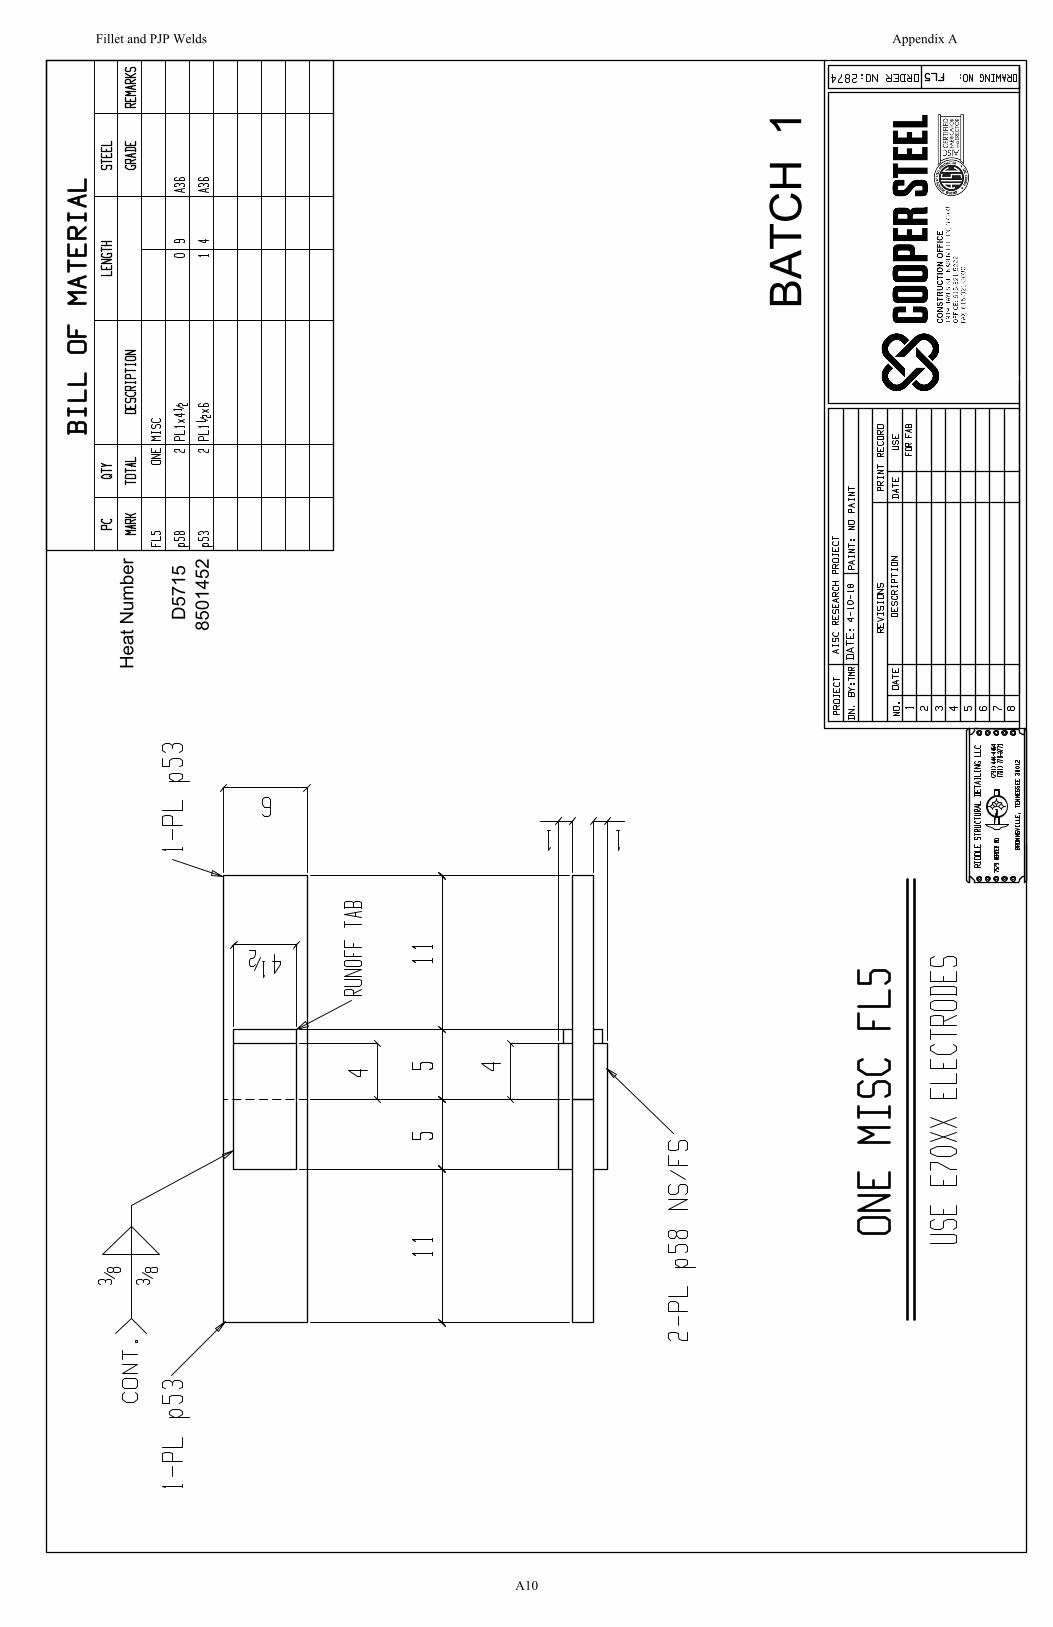
BATC
H 1
Hea
t Num
ber
8501
452
D57
15
Fillet and PJP Welds Appendix A
A10

BATC
H 1
Hea
t Num
ber
8501
452
D57
15
Fillet and PJP Welds Appendix A
A11

BATC
H 1
Hea
t Num
ber
8502
026
D57
15
Fillet and PJP Welds Appendix A
A12
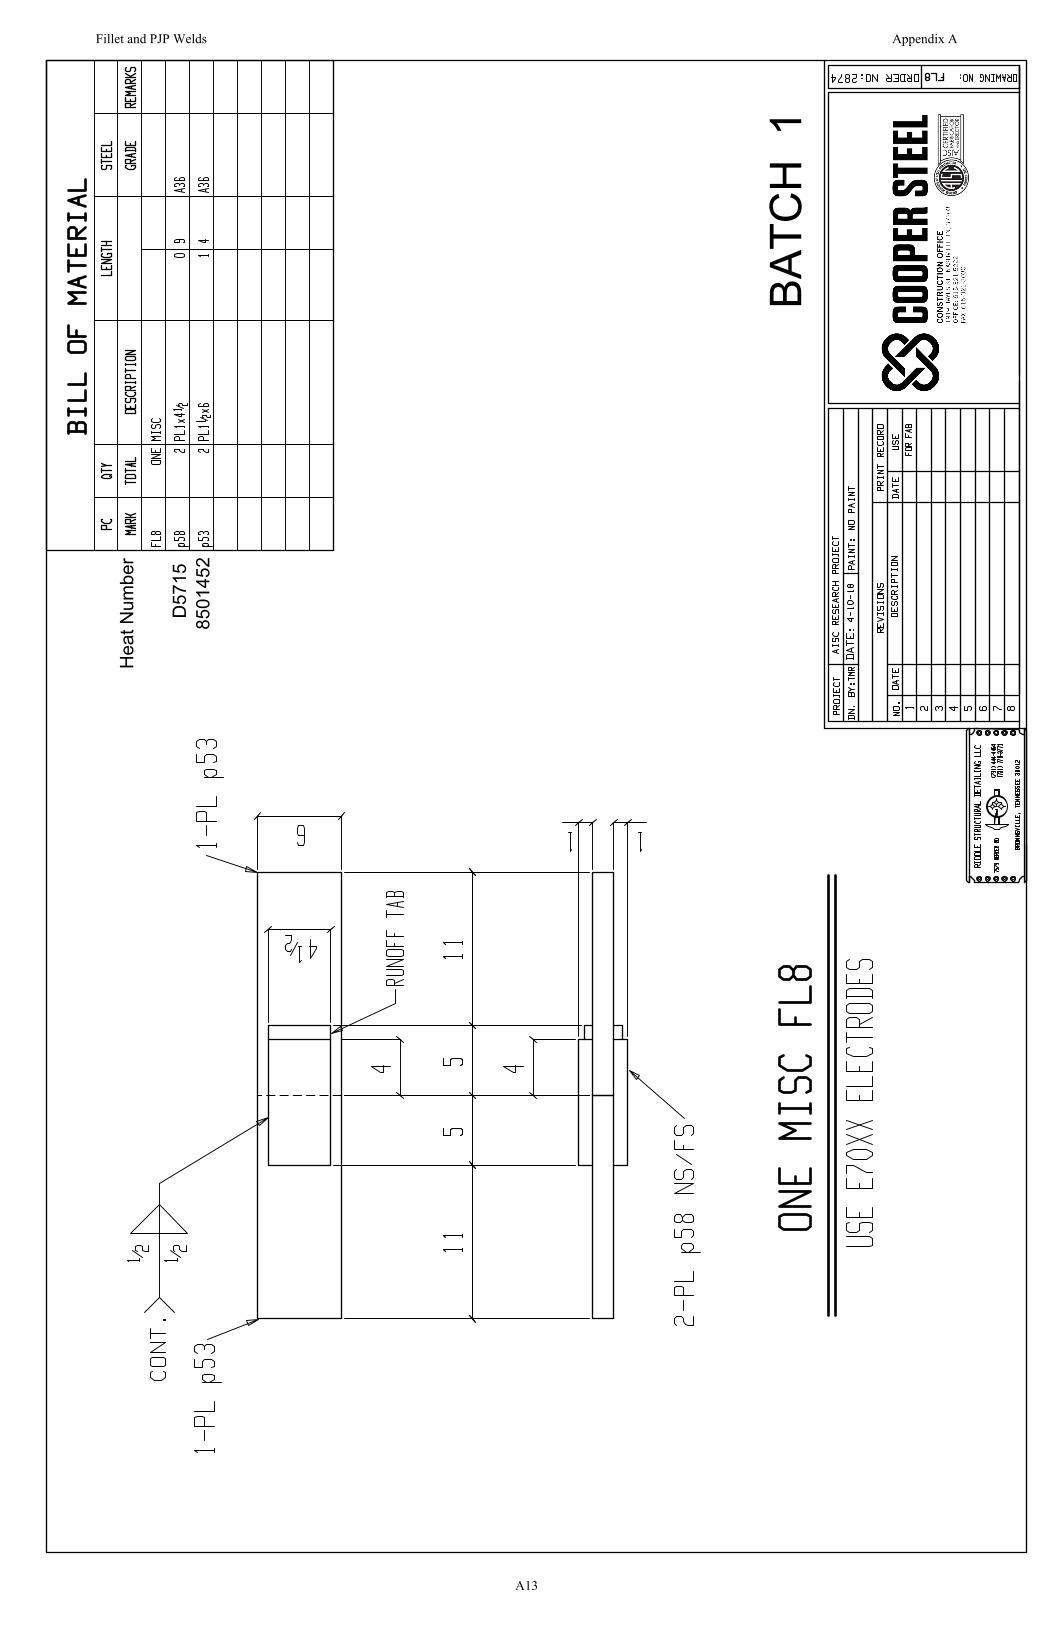
BATC
H 1
Hea
t Num
ber
8501
452
D57
15
Fillet and PJP Welds Appendix A
A13
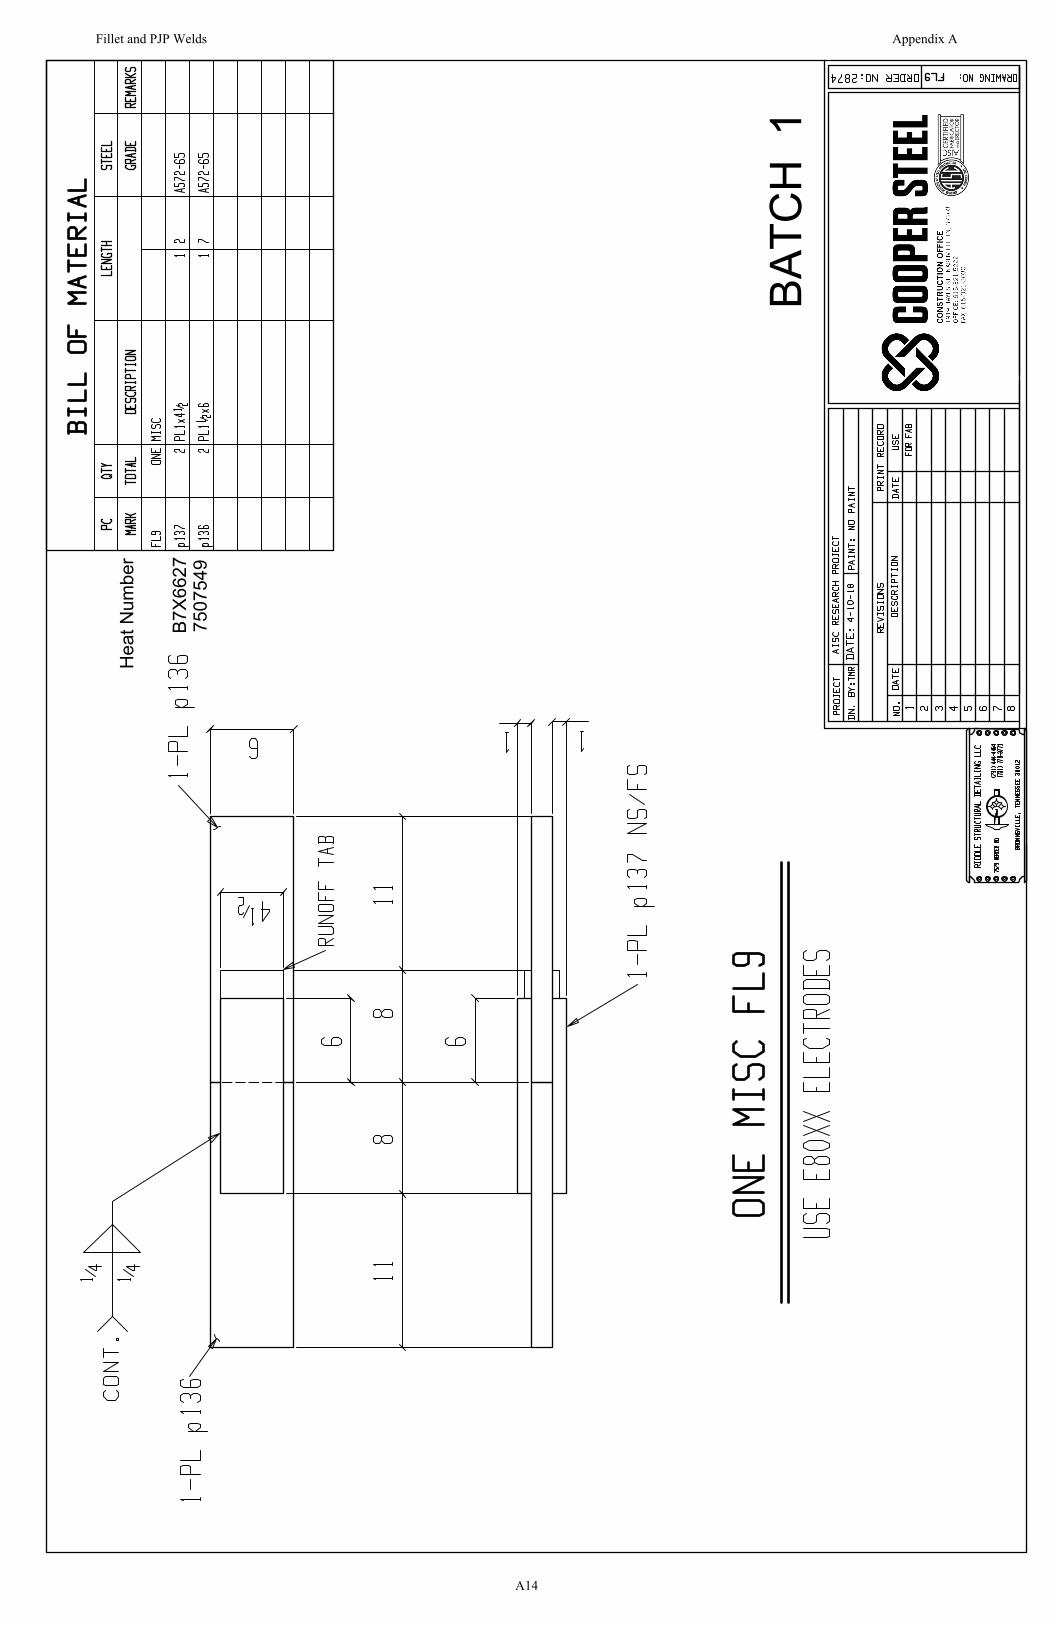
BATC
H 1
Hea
t Num
ber
B7X6
627
7507
549
Fillet and PJP Welds Appendix A
A14
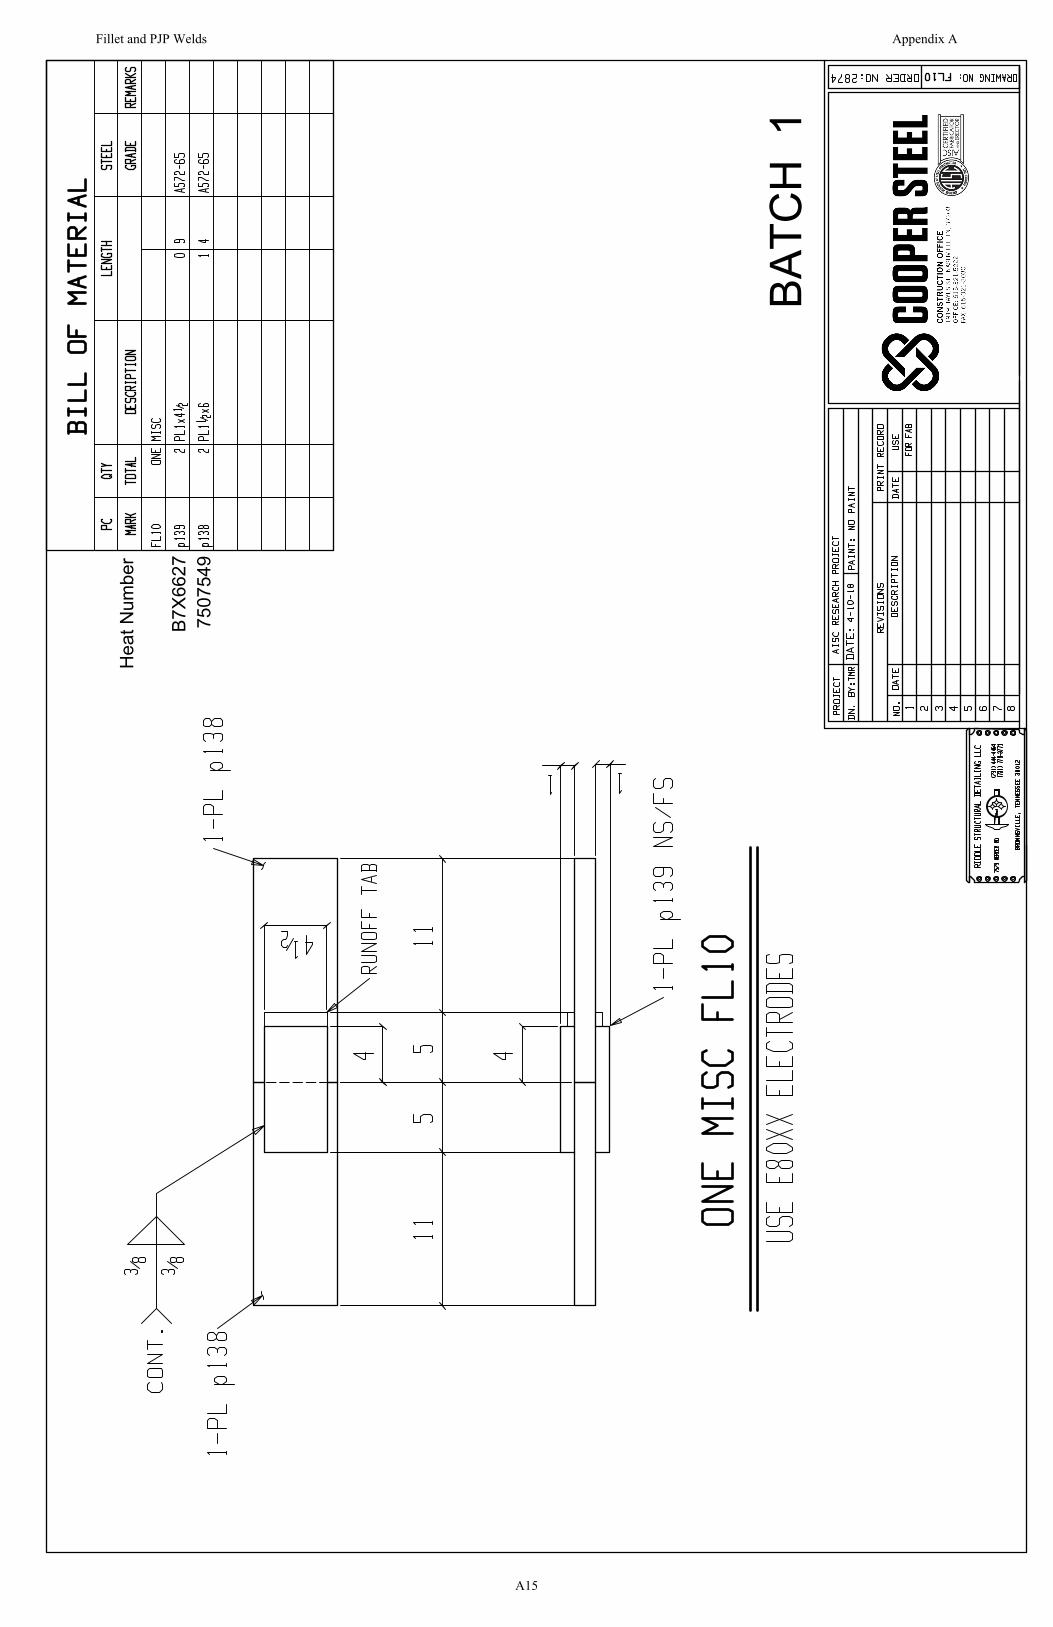
BATC
H 1
Hea
t Num
ber
B7X6
627
7507
549
Fillet and PJP Welds Appendix A
A15

BATC
H 1
Hea
t Num
ber
W7H
748
B7X6
627
Fillet and PJP Welds Appendix A
A16

BATC
H 1
Hea
t Num
ber
B7X6
627
7507
549
Fillet and PJP Welds Appendix A
A17
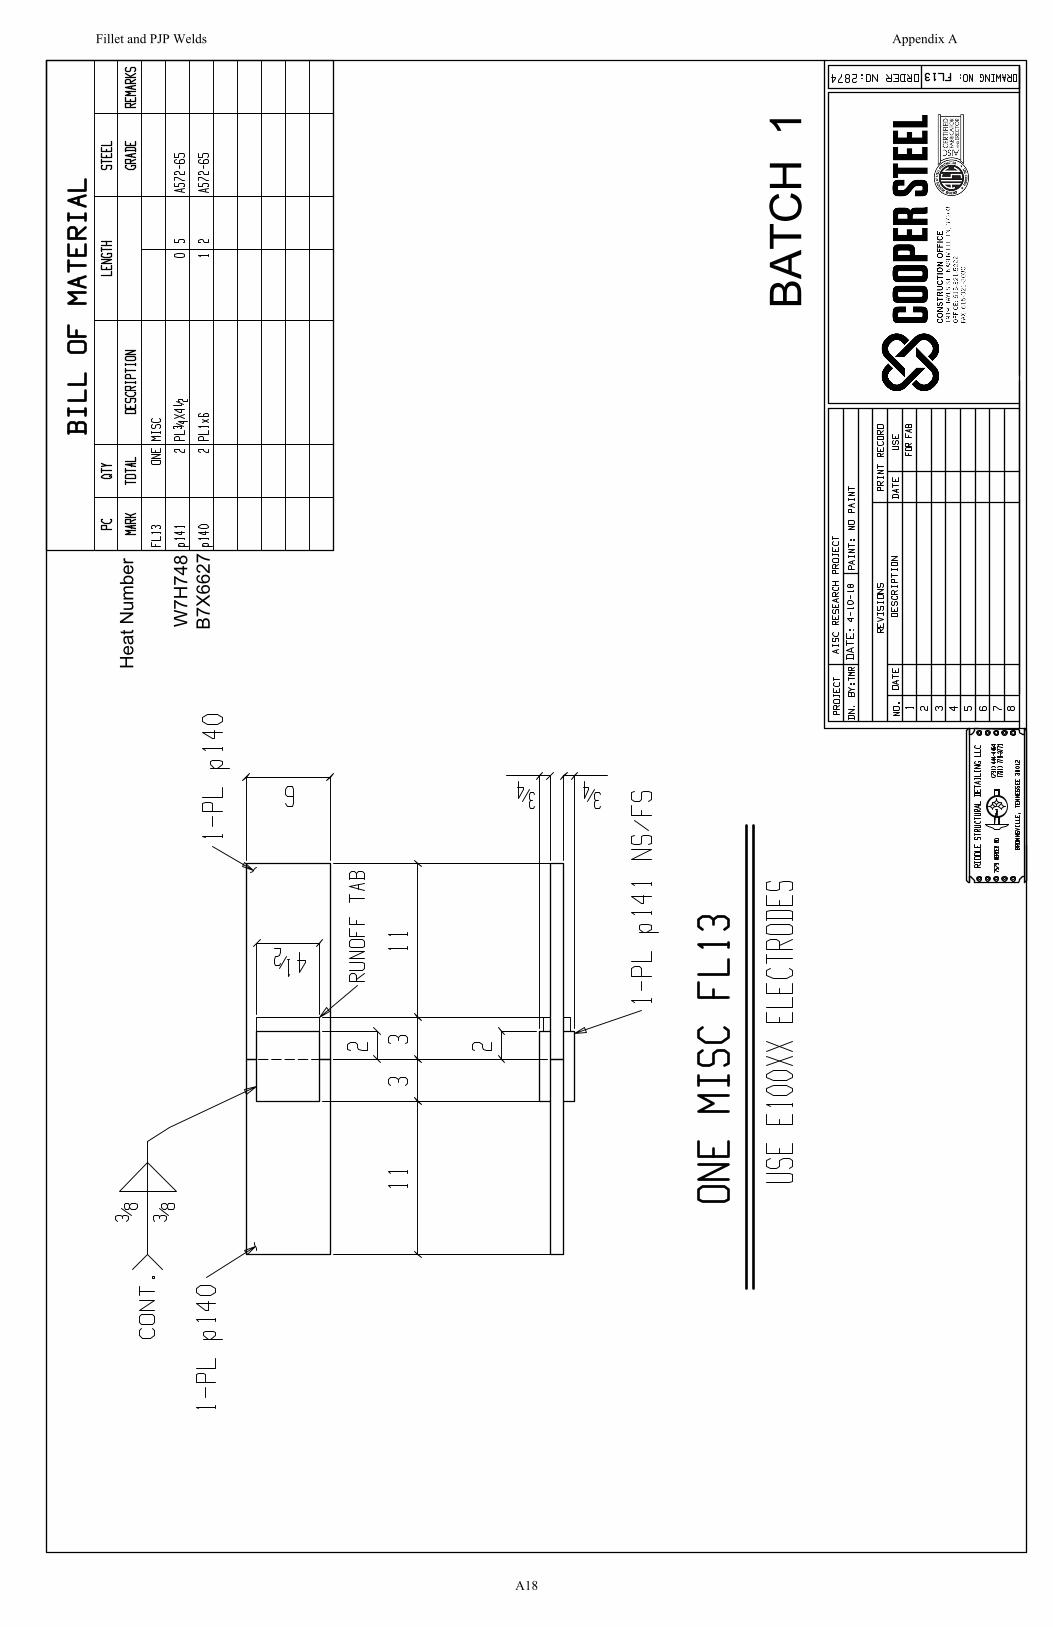
BATC
H 1
Hea
t Num
ber
W7H
748
B7X6
627
Fillet and PJP Welds Appendix A
A18

BATC
H 1
Hea
t Num
ber
B7X6
627
7507
549
Fillet and PJP Welds Appendix A
A19
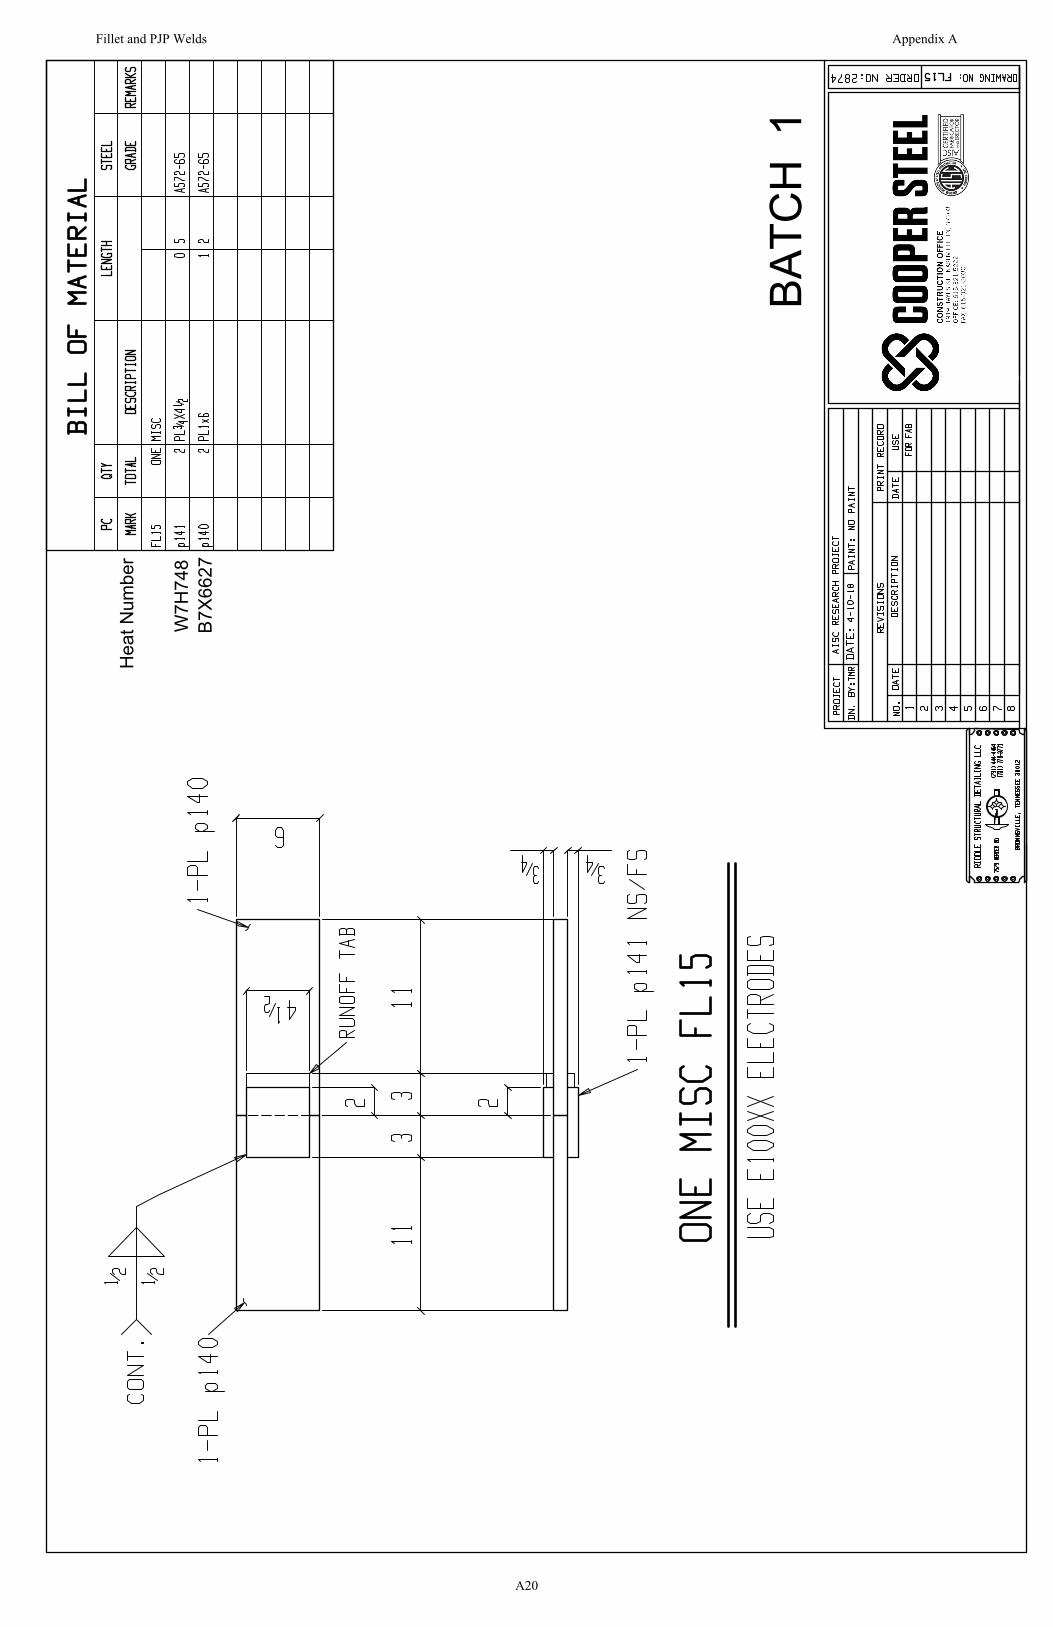
BATC
H 1
Hea
t Num
ber
W7H
748
B7X6
627
Fillet and PJP Welds Appendix A
A20
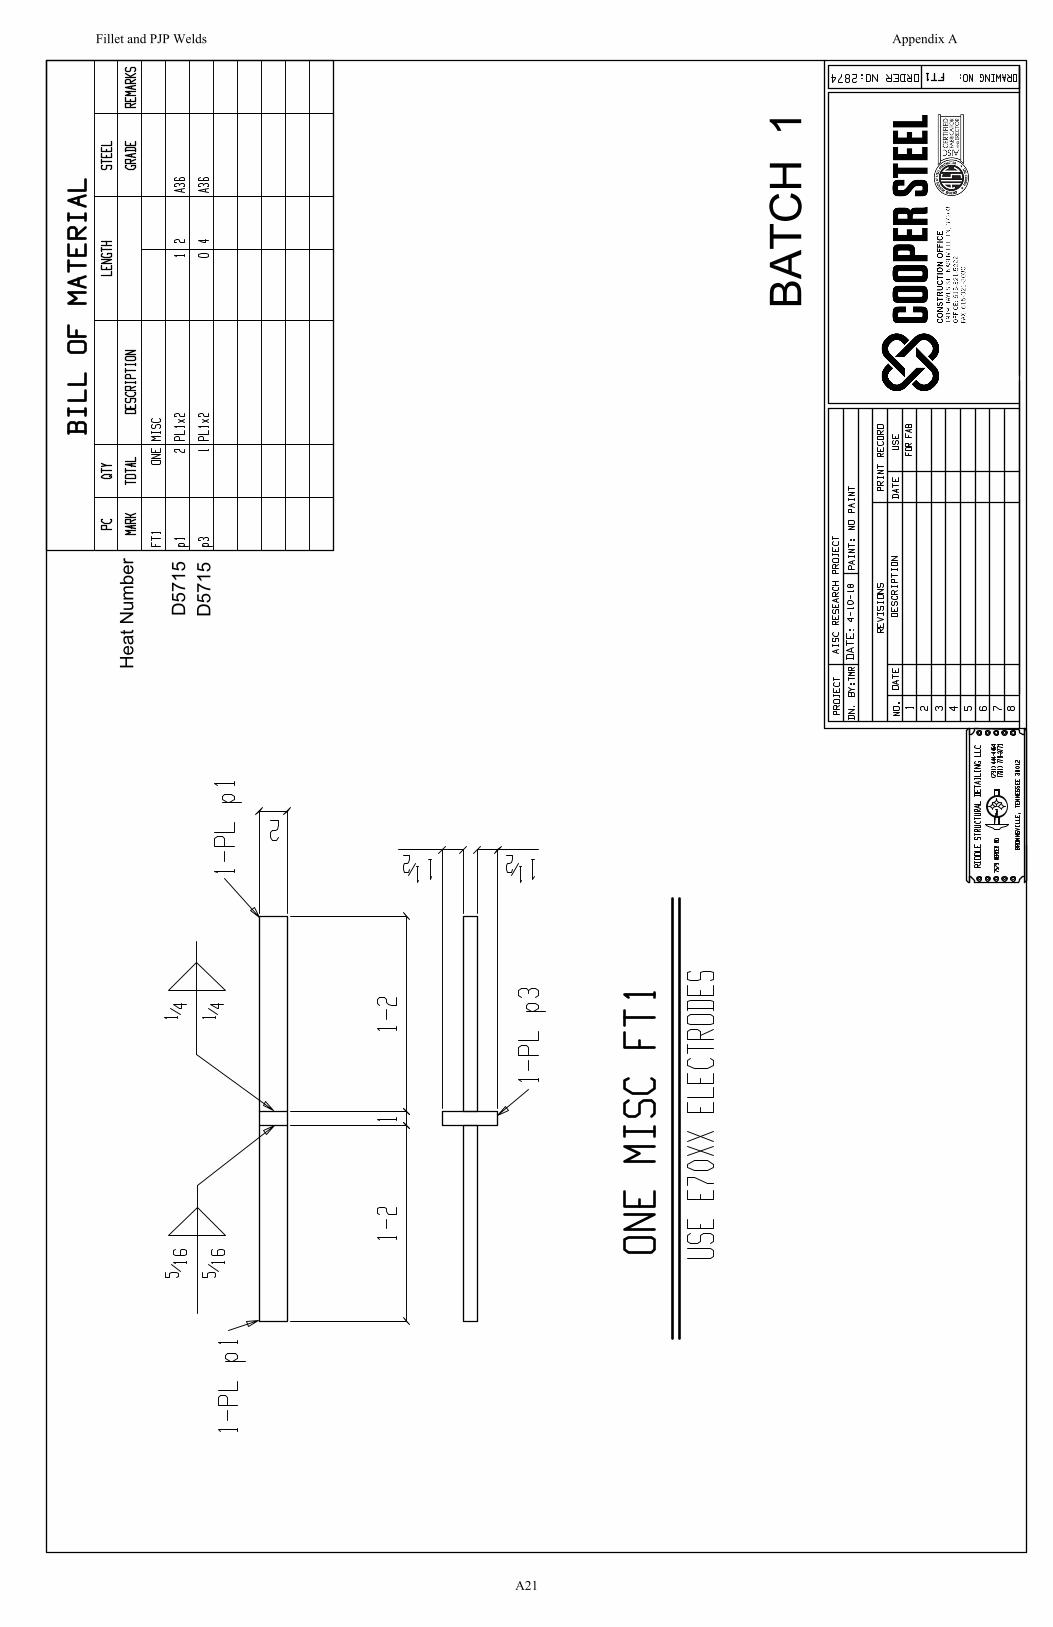
BATC
H 1
Hea
t Num
ber
D57
15D
5715
Fillet and PJP Welds Appendix A
A21
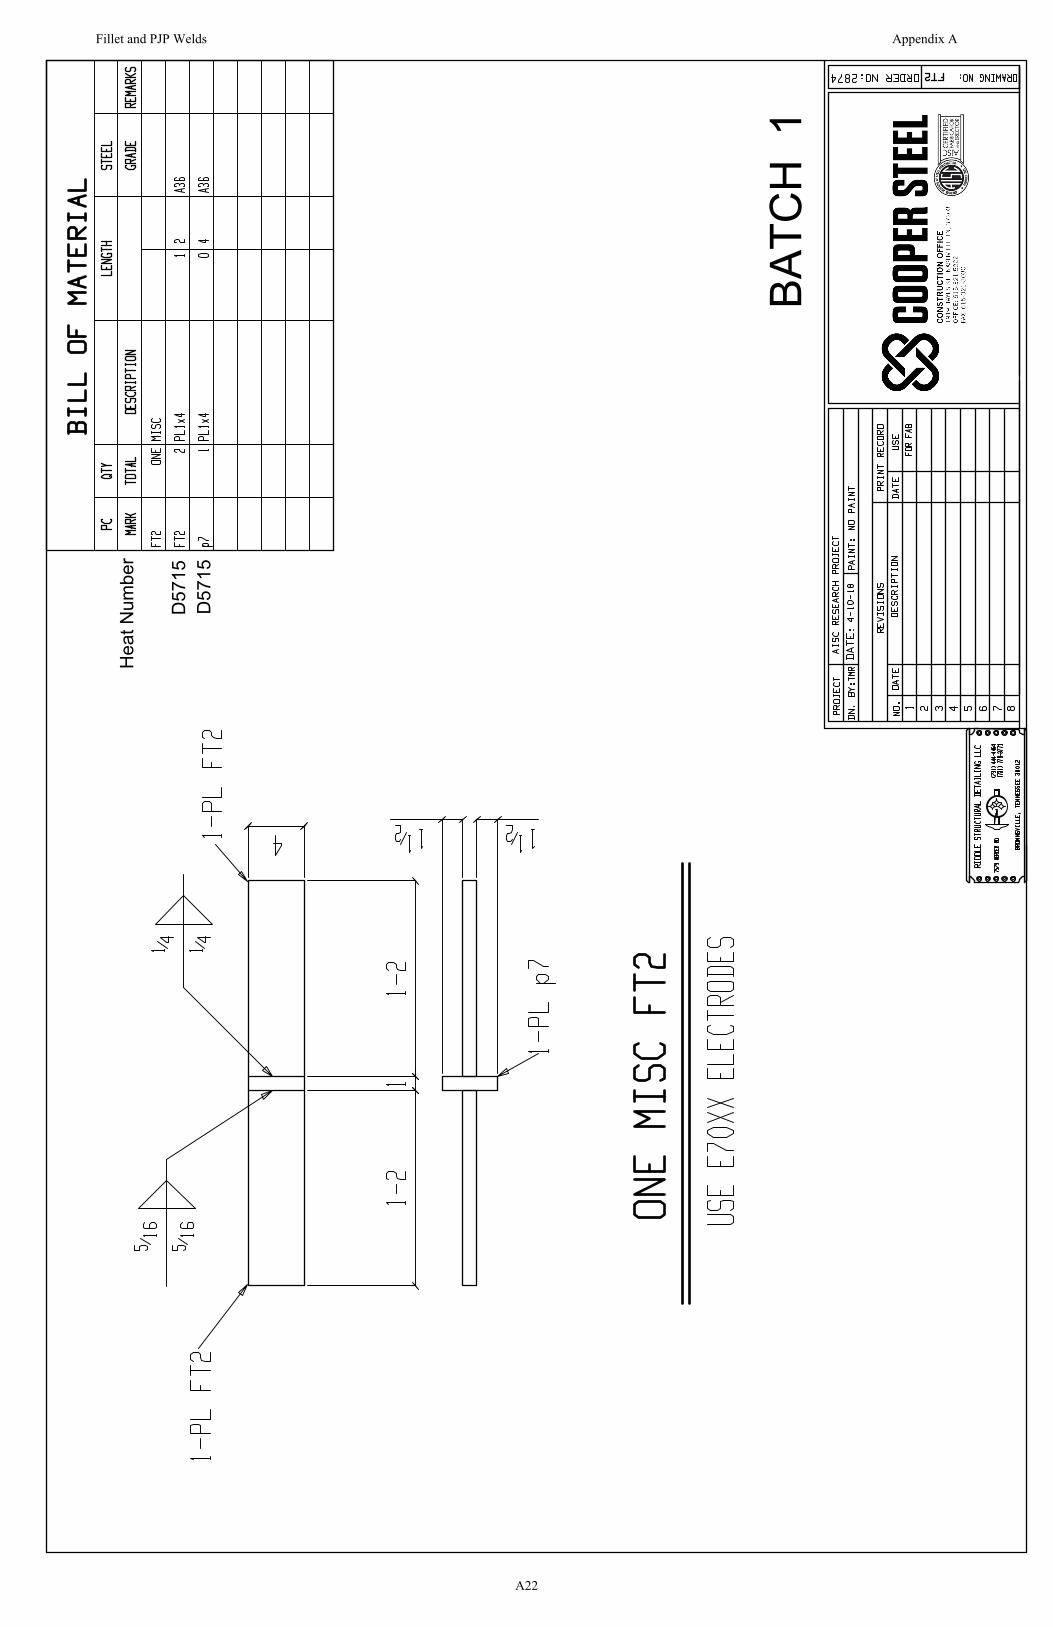
BATC
H 1
Hea
t Num
ber
D57
15D
5715
Fillet and PJP Welds Appendix A
A22
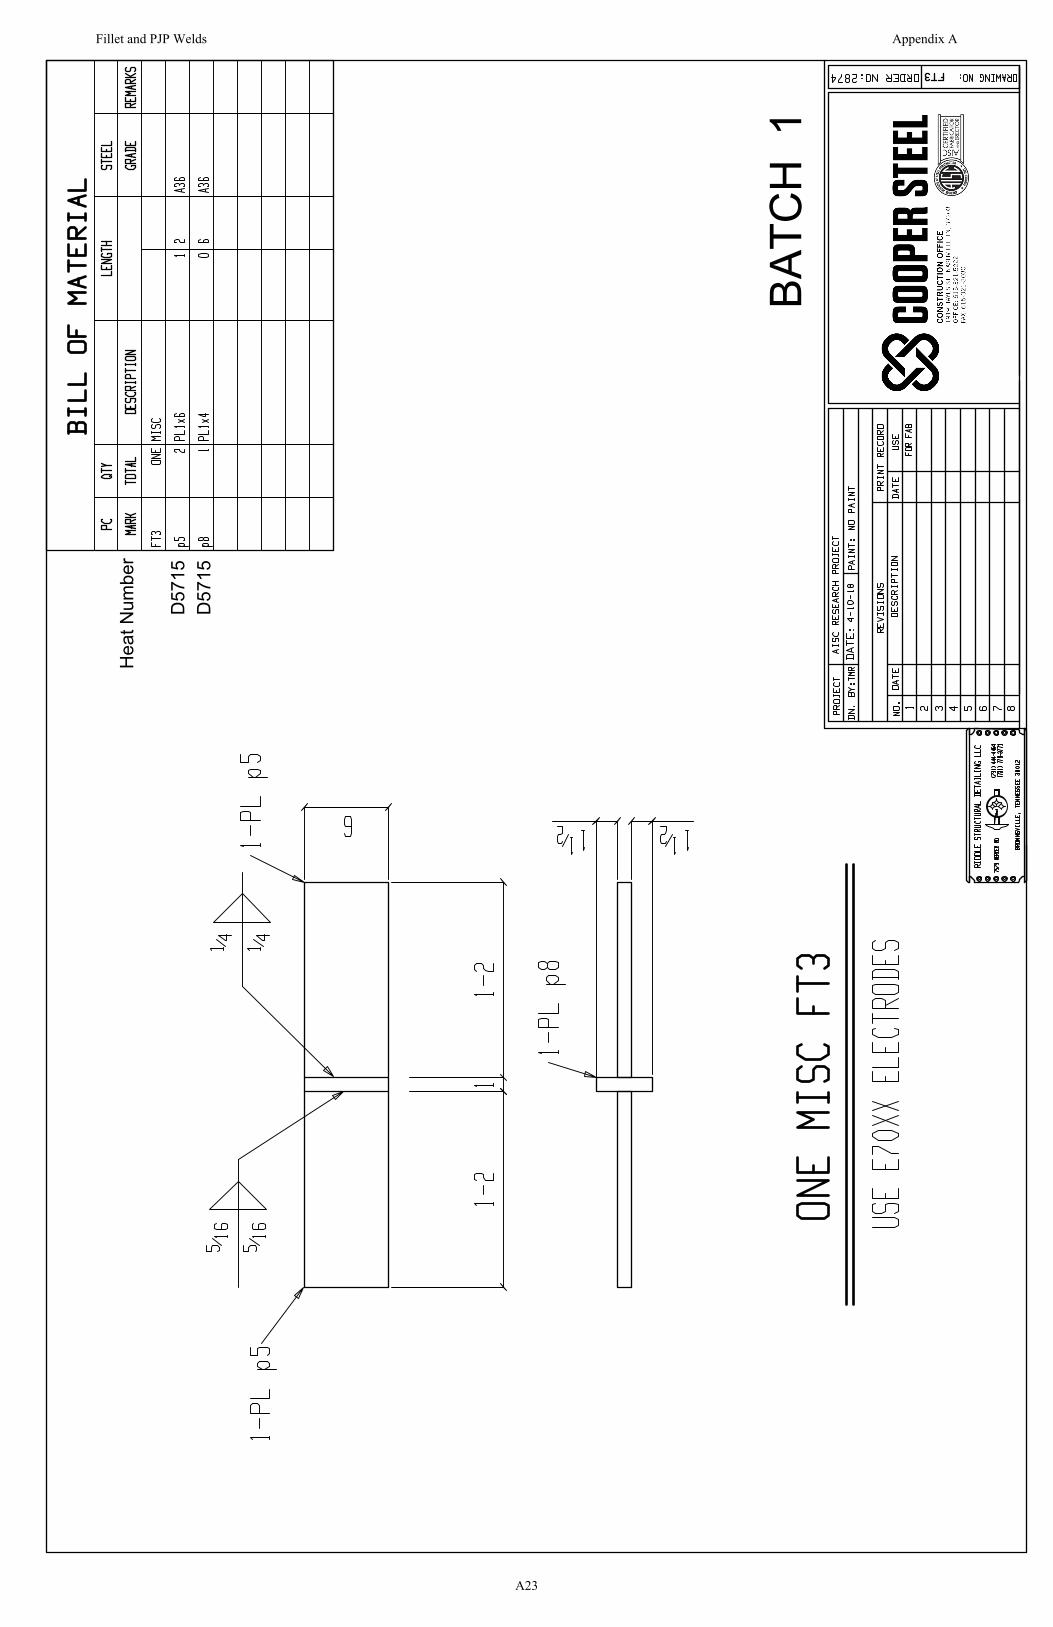
BATC
H 1
Hea
t Num
ber
D57
15D
5715
Fillet and PJP Welds Appendix A
A23

BATC
H 1
Hea
t Num
ber
7506
515
D57
15
Fillet and PJP Welds Appendix A
A24
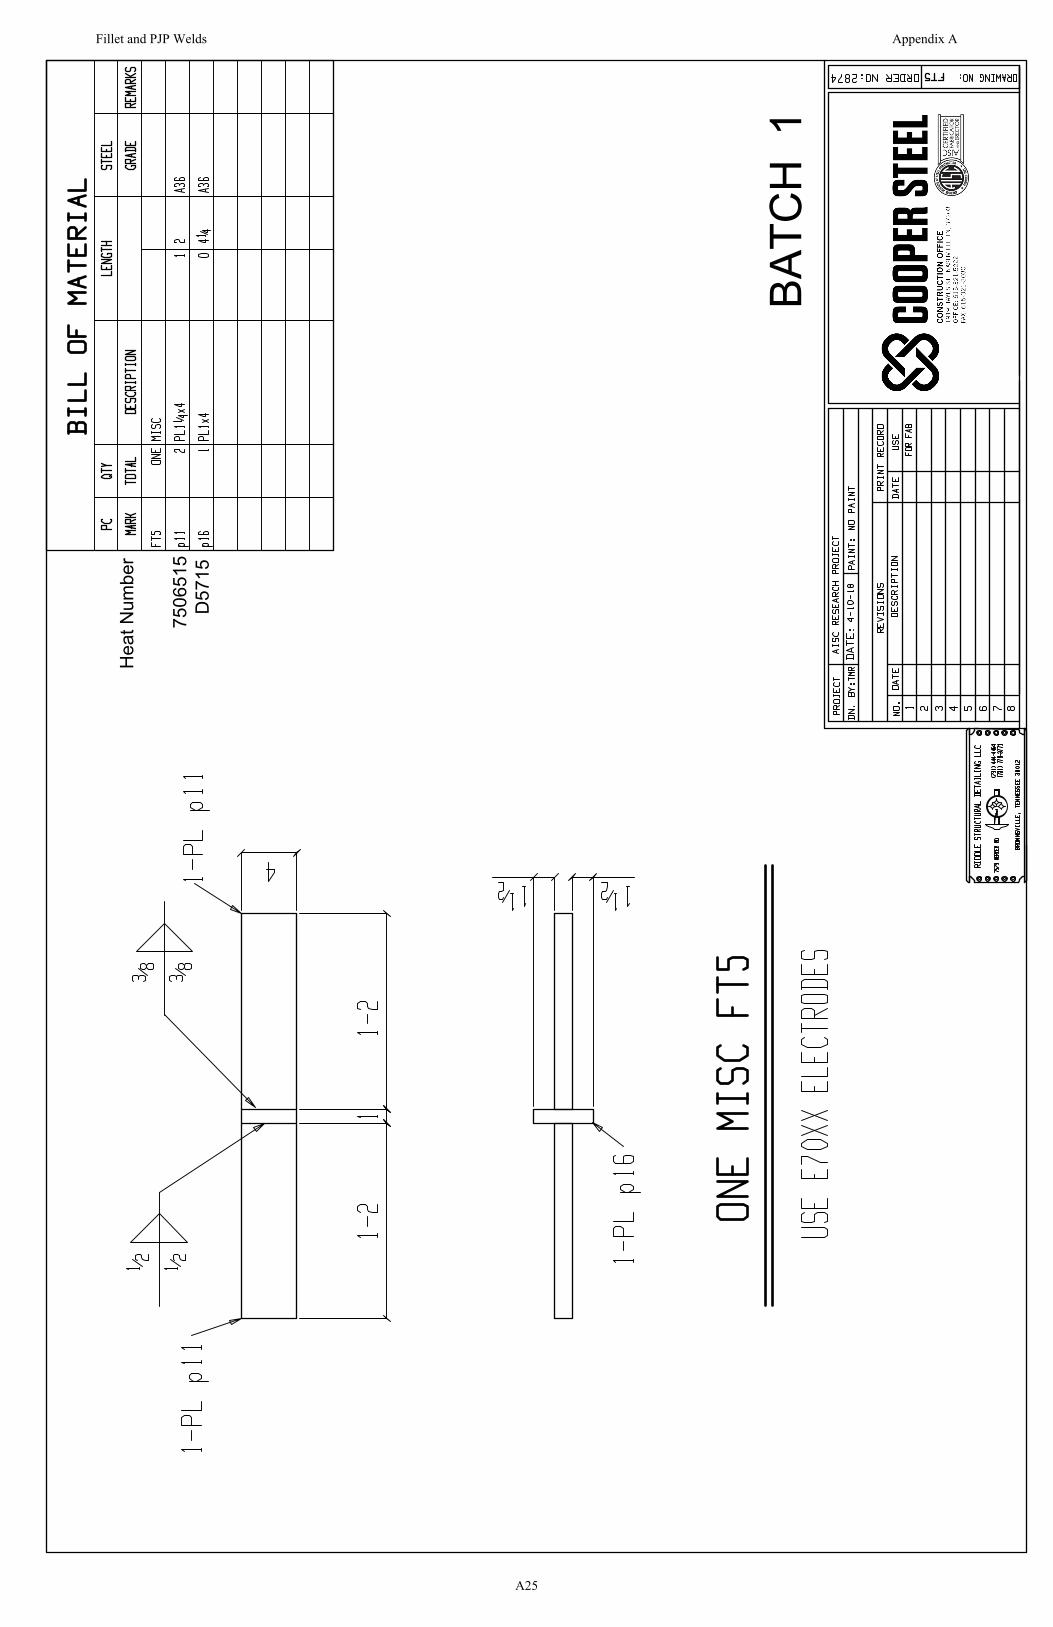
BATC
H 1
Hea
t Num
ber
7506
515
D57
15
Fillet and PJP Welds Appendix A
A25
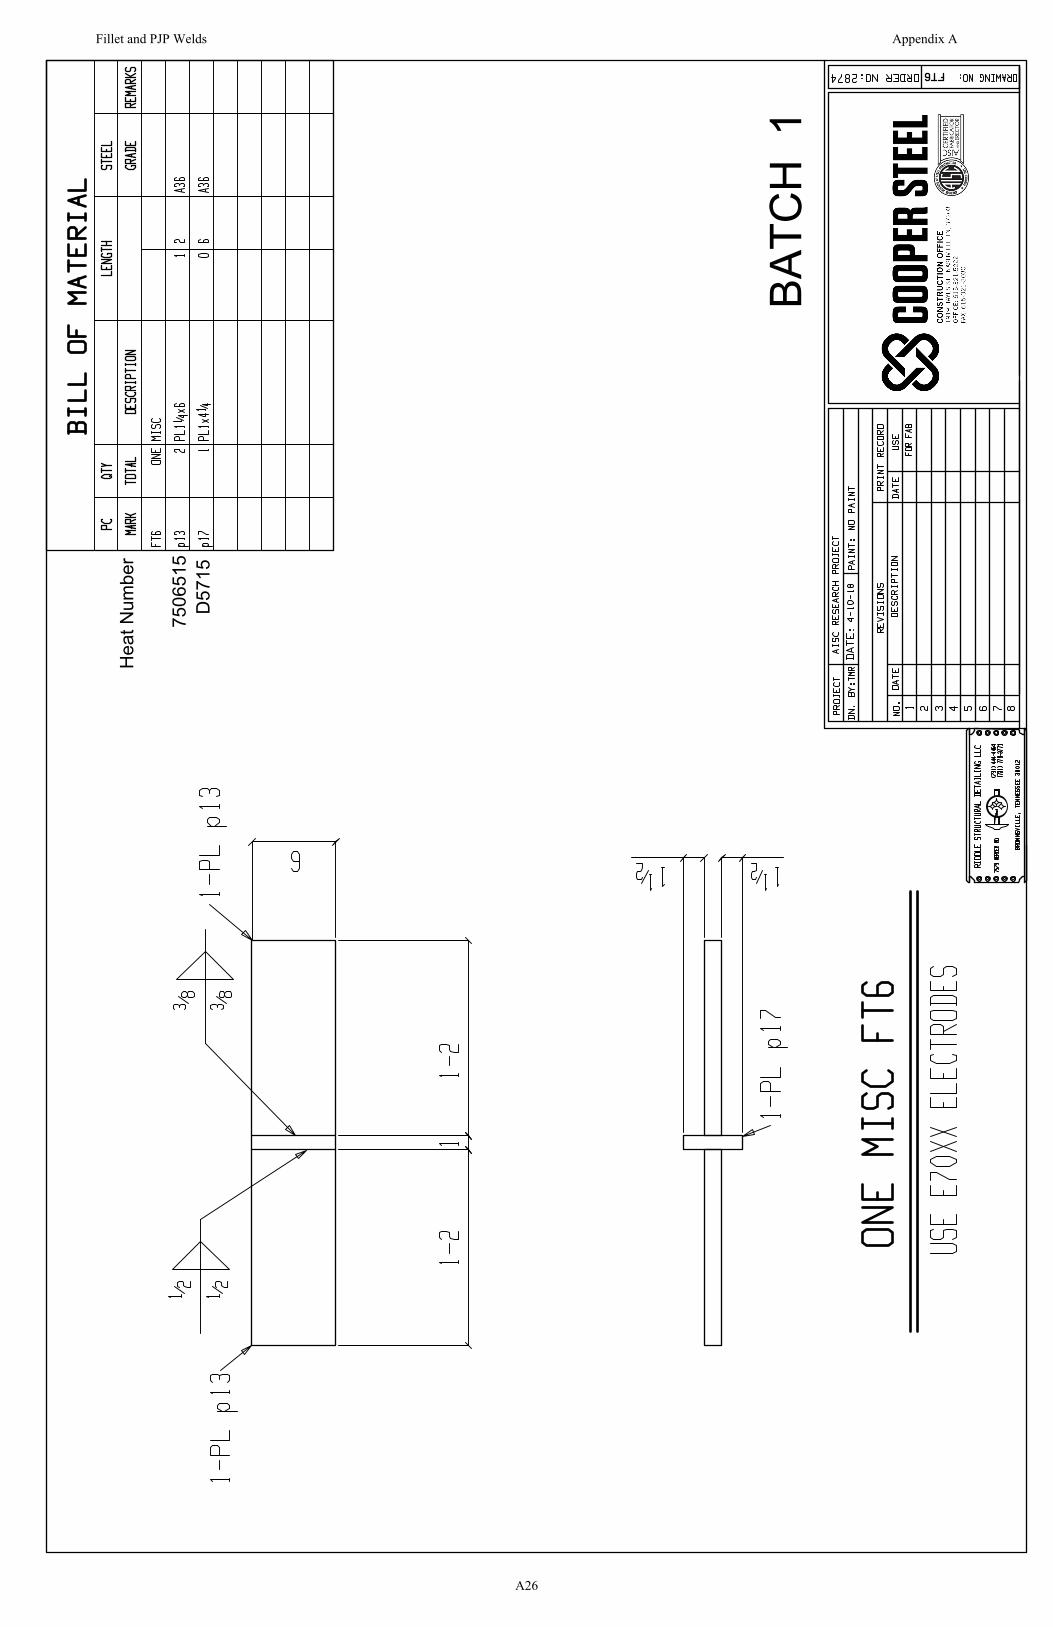
BATC
H 1
Hea
t Num
ber
7506
515
D57
15
Fillet and PJP Welds Appendix A
A26
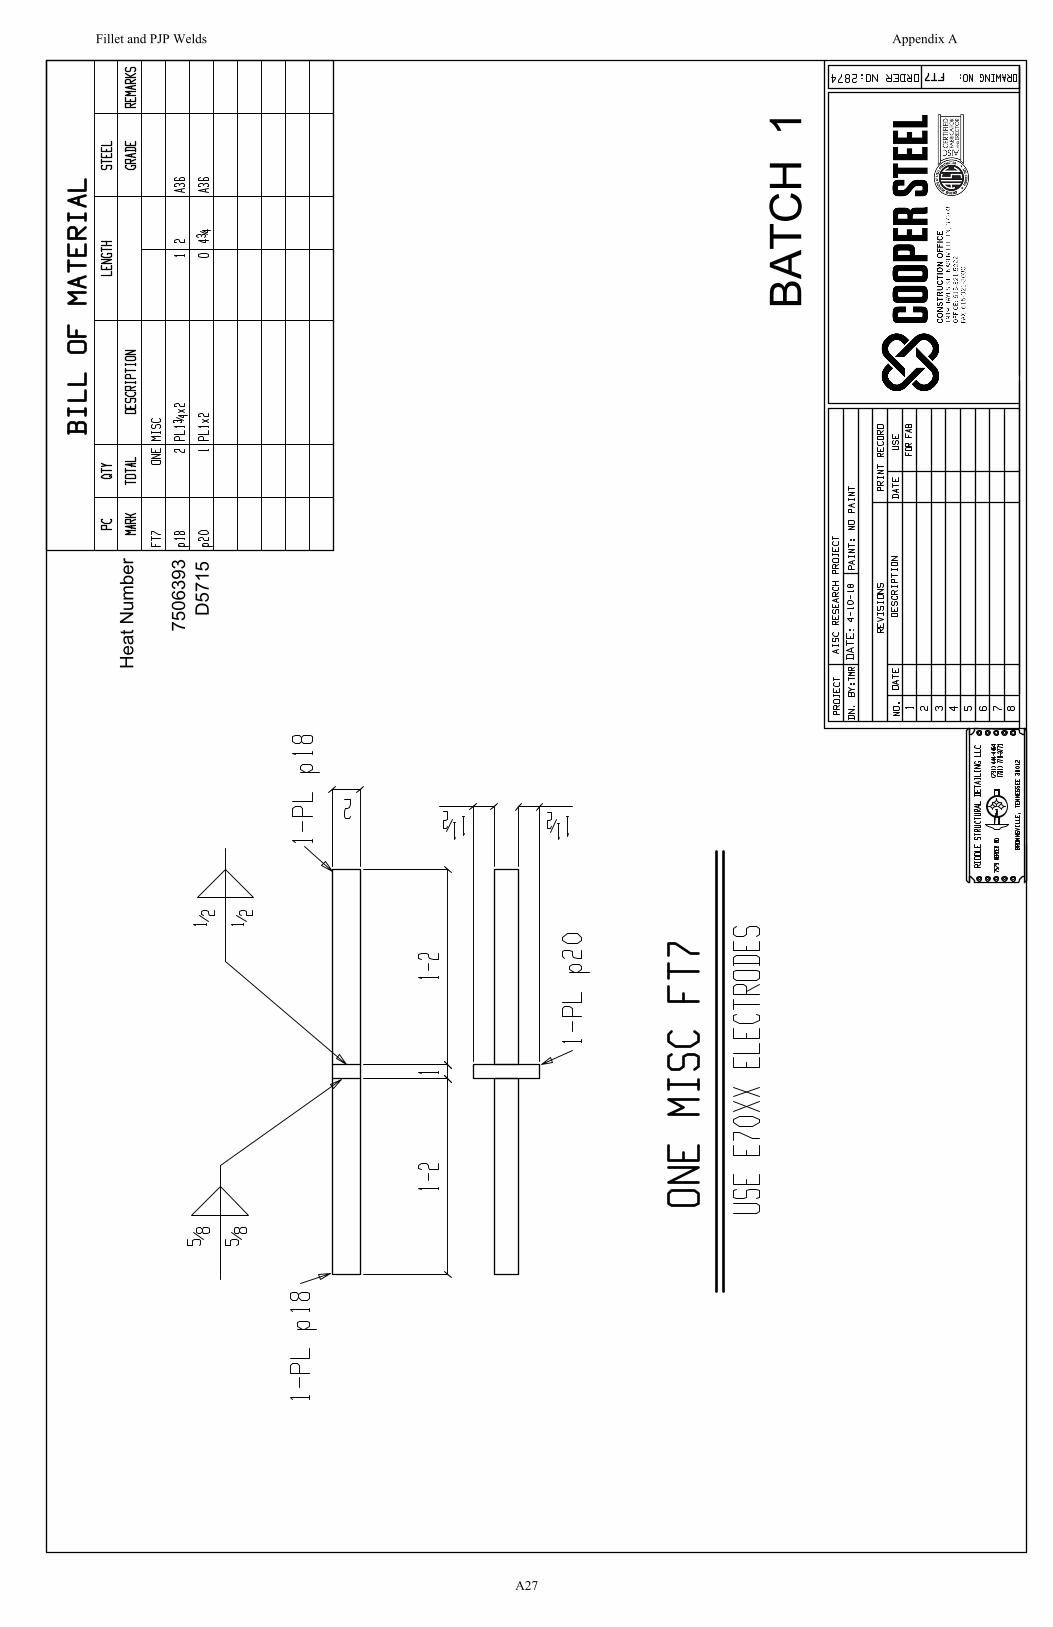
BATC
H 1
Hea
t Num
ber
7506
393
D57
15
Fillet and PJP Welds Appendix A
A27
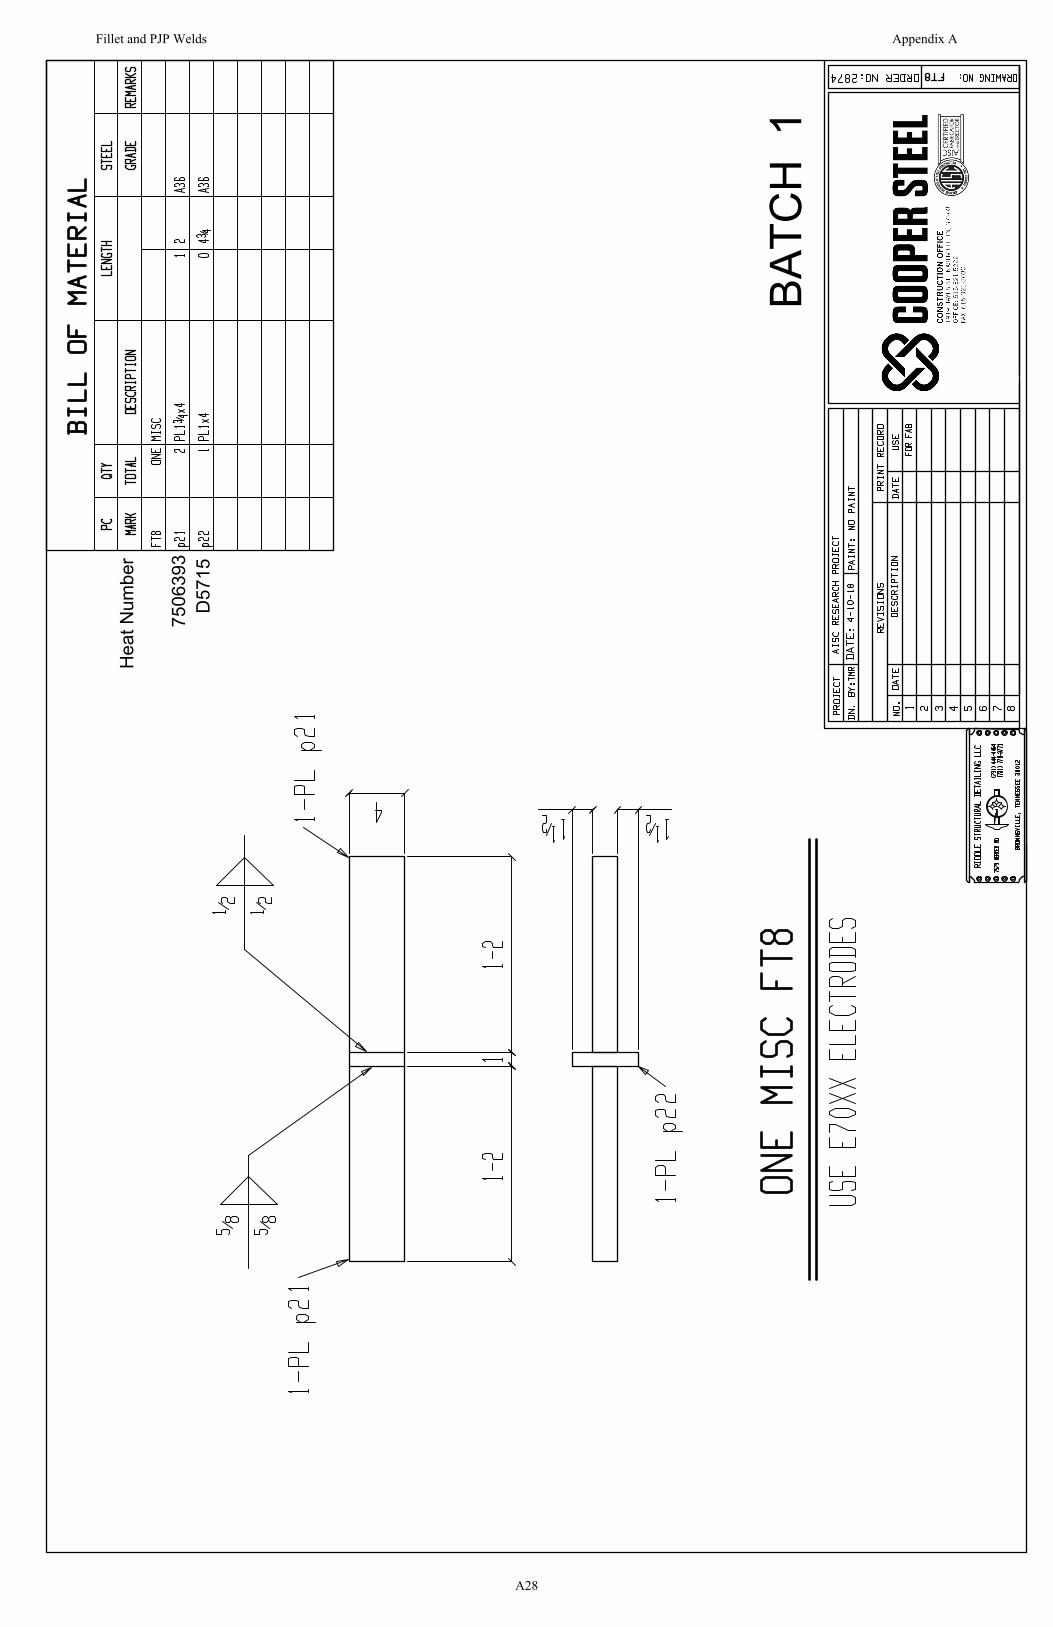
BATC
H 1
Hea
t Num
ber
7506
393
D57
15
Fillet and PJP Welds Appendix A
A28
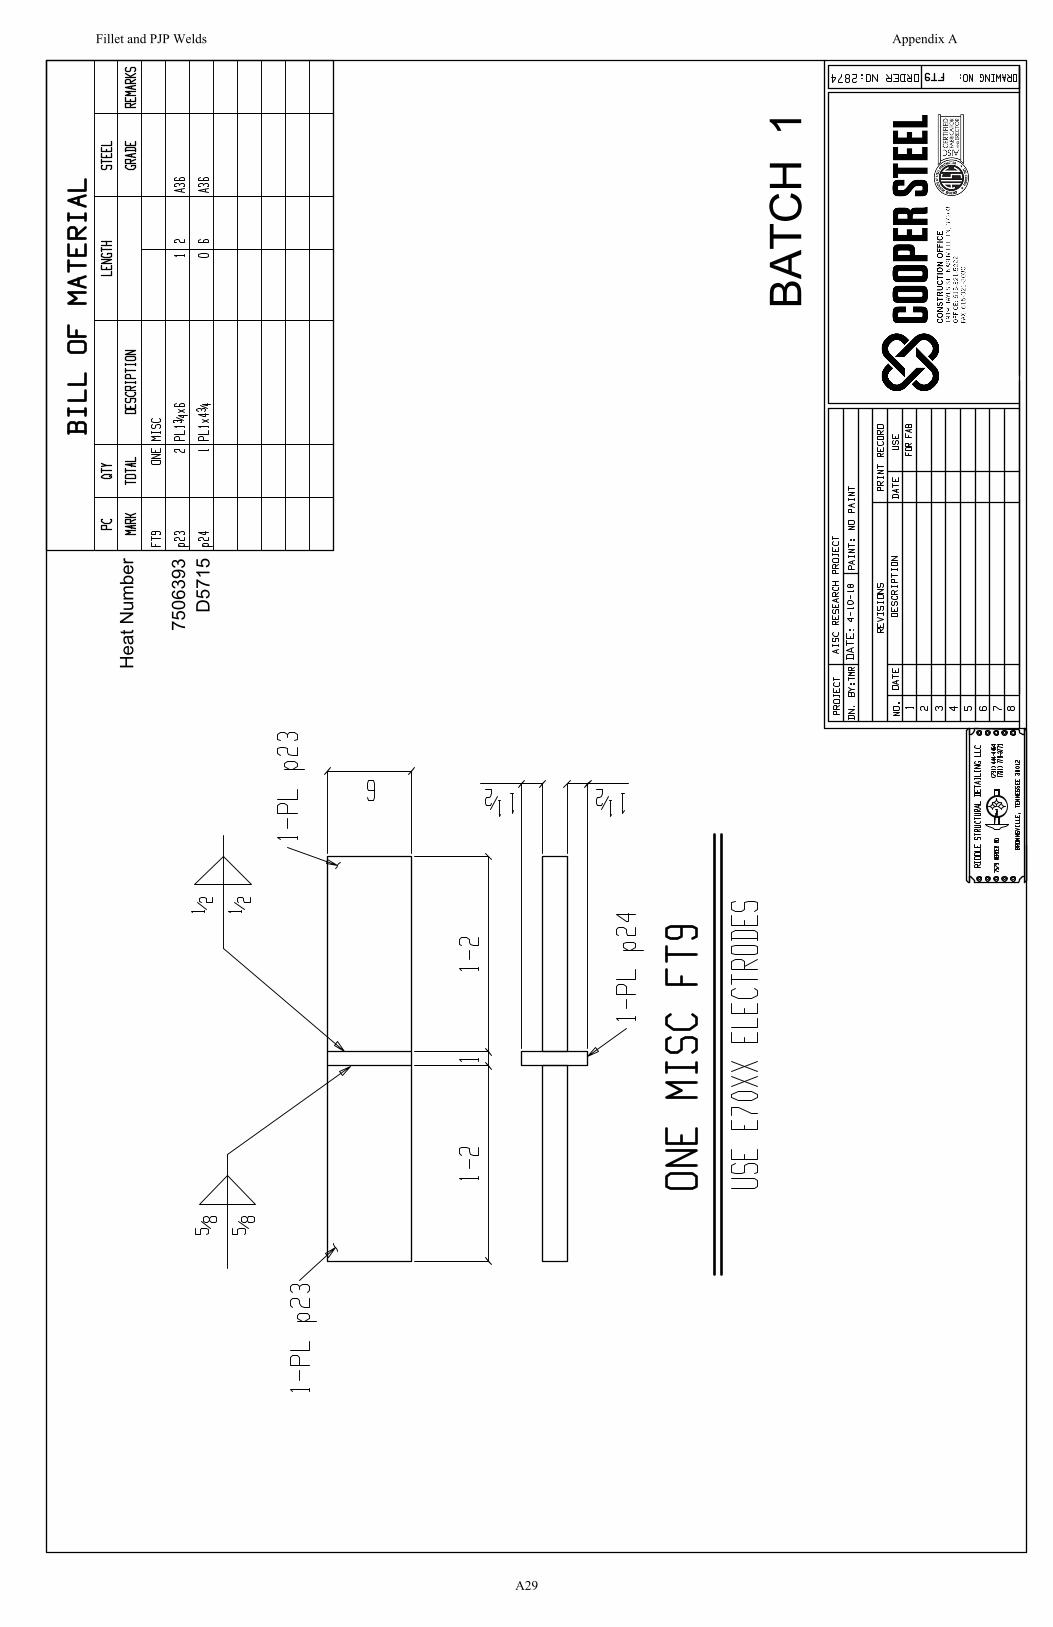
BATC
H 1
Hea
t Num
ber
7506
393
D57
15
Fillet and PJP Welds Appendix A
A29
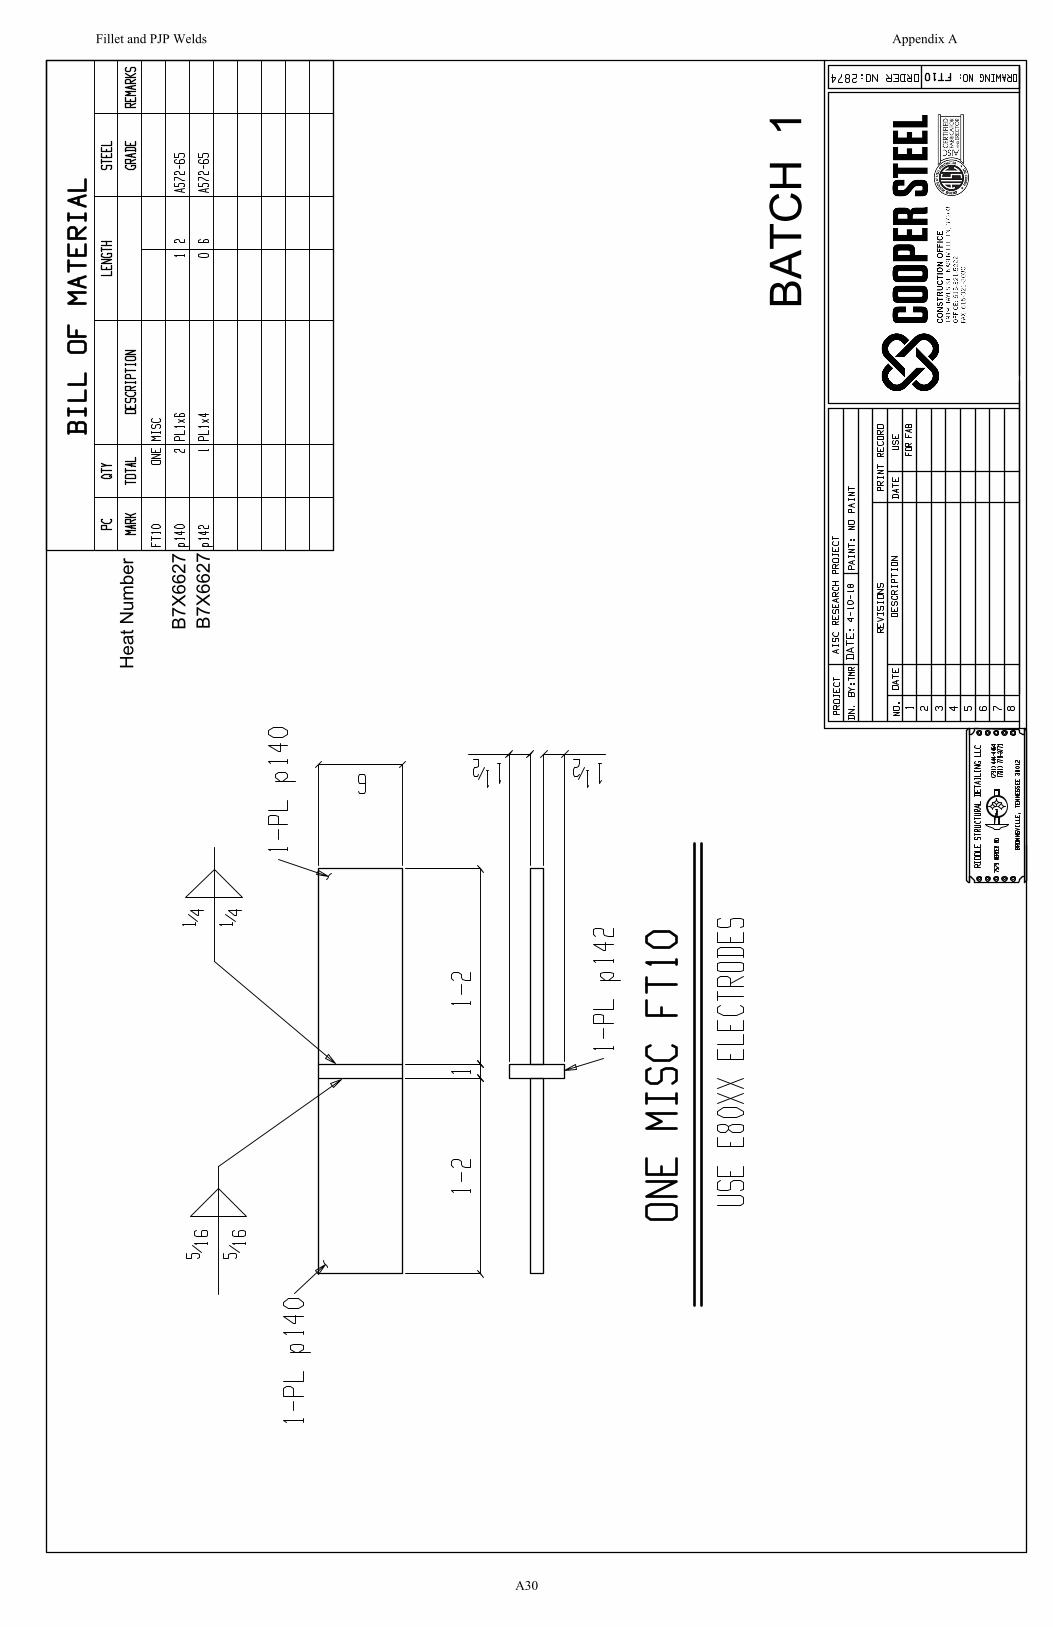
BATC
H 1
Hea
t Num
ber
B7X6
627
B7X6
627
Fillet and PJP Welds Appendix A
A30
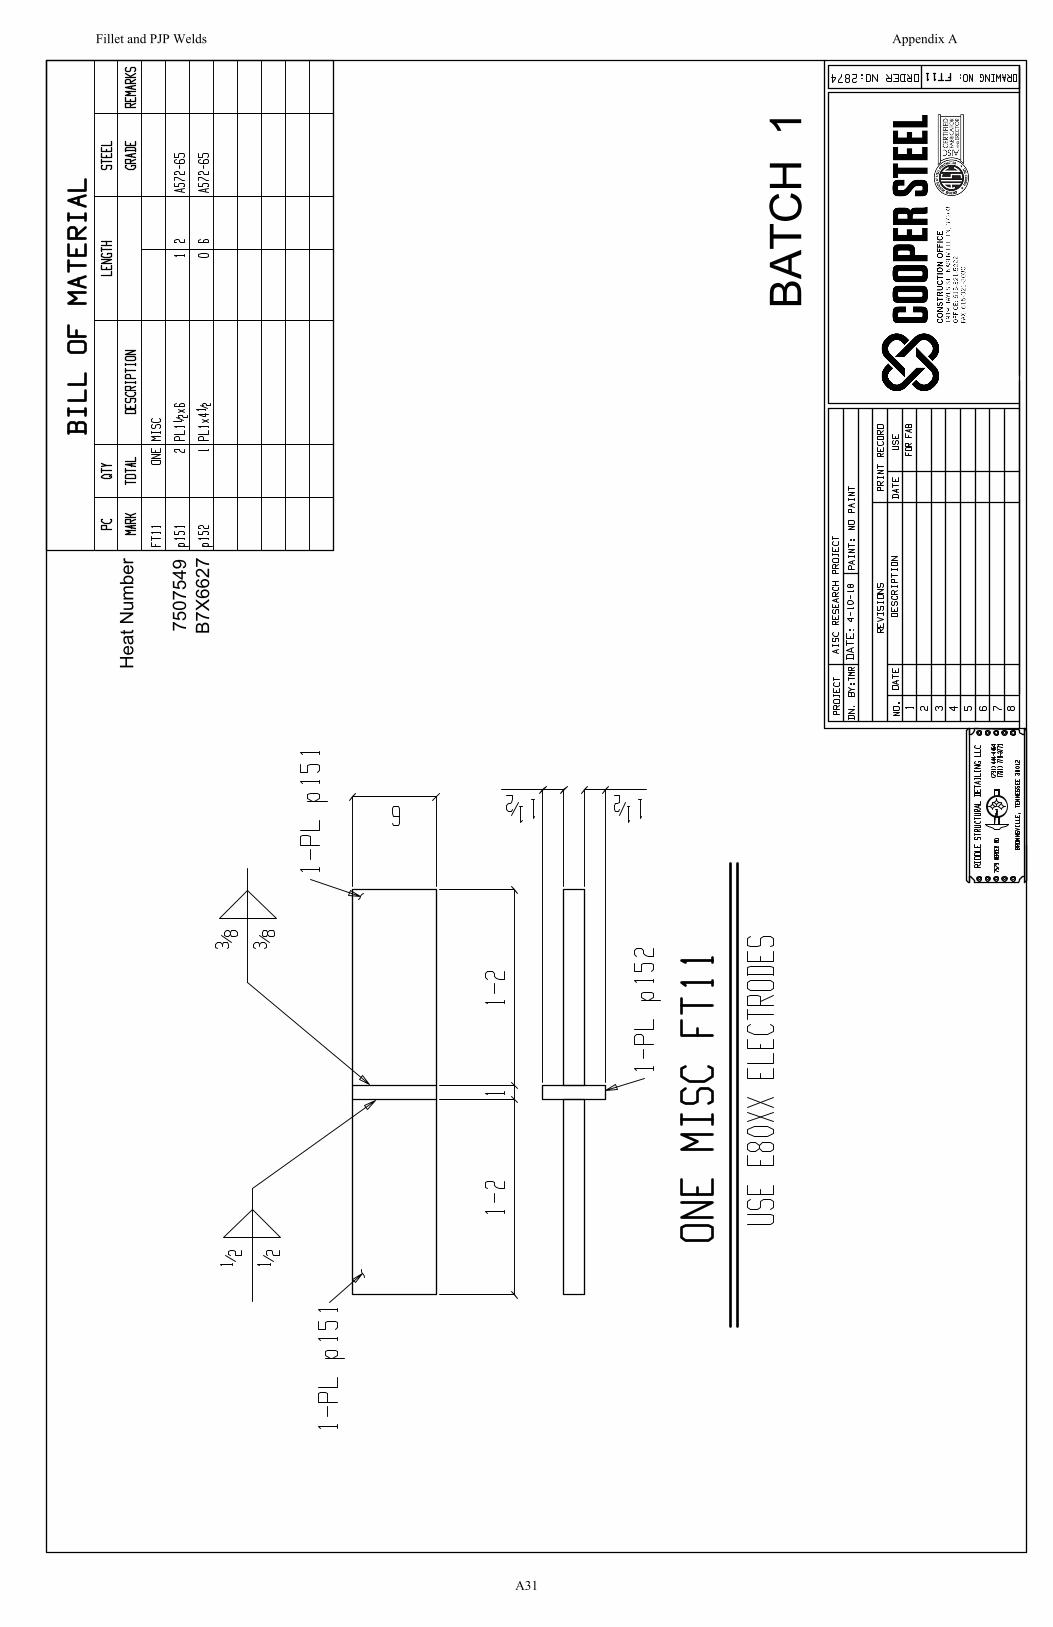
BATC
H 1
Hea
t Num
ber
B7X6
627
7507
549
Fillet and PJP Welds Appendix A
A31
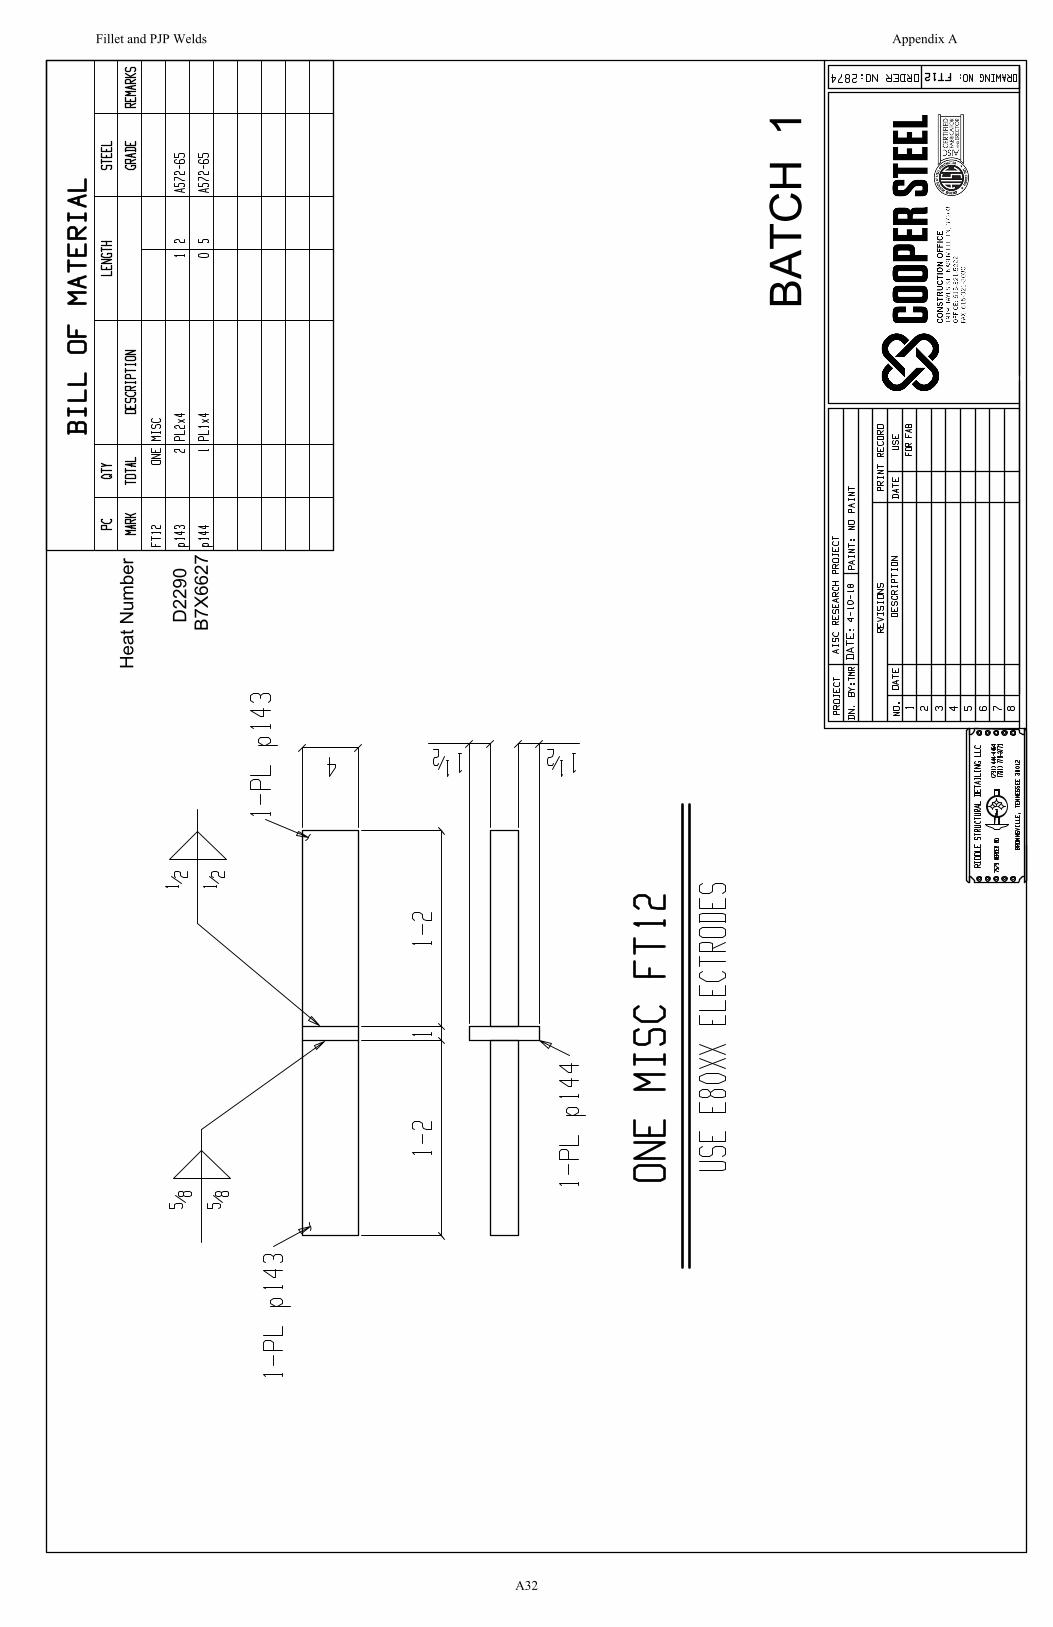
BATC
H 1
Hea
t Num
ber
B7X6
627
D22
90
Fillet and PJP Welds Appendix A
A32
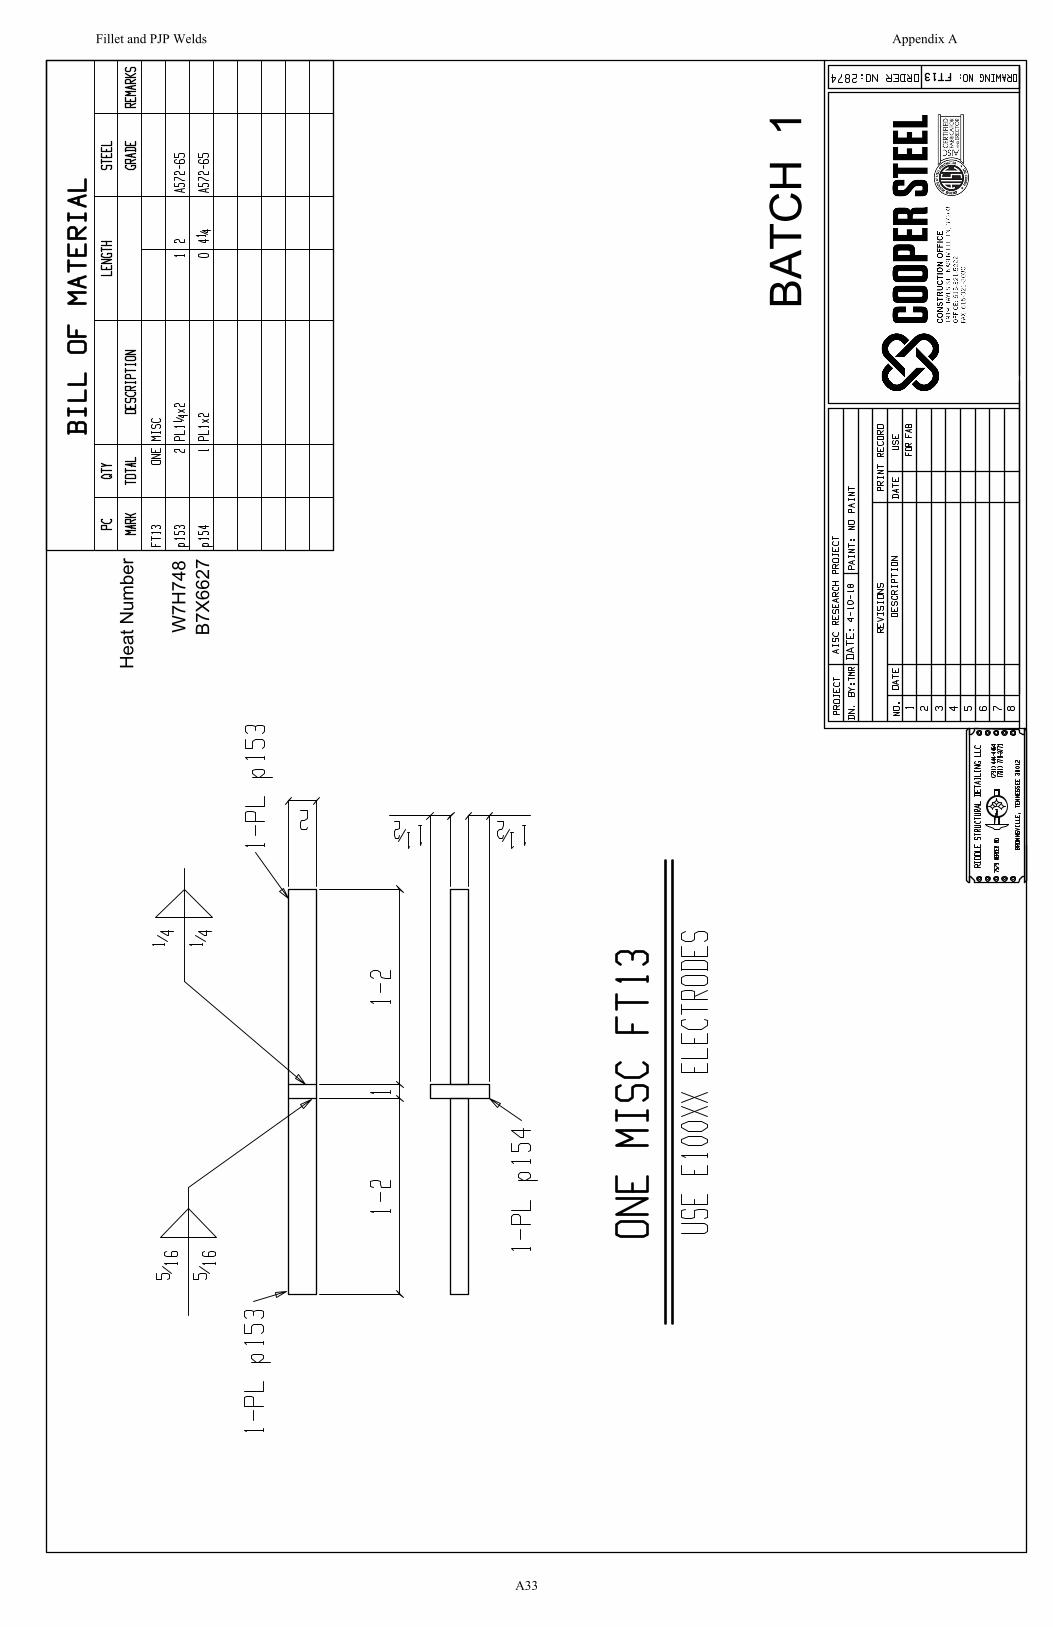
BATC
H 1
Hea
t Num
ber
B7X6
627
W7H
748
Fillet and PJP Welds Appendix A
A33
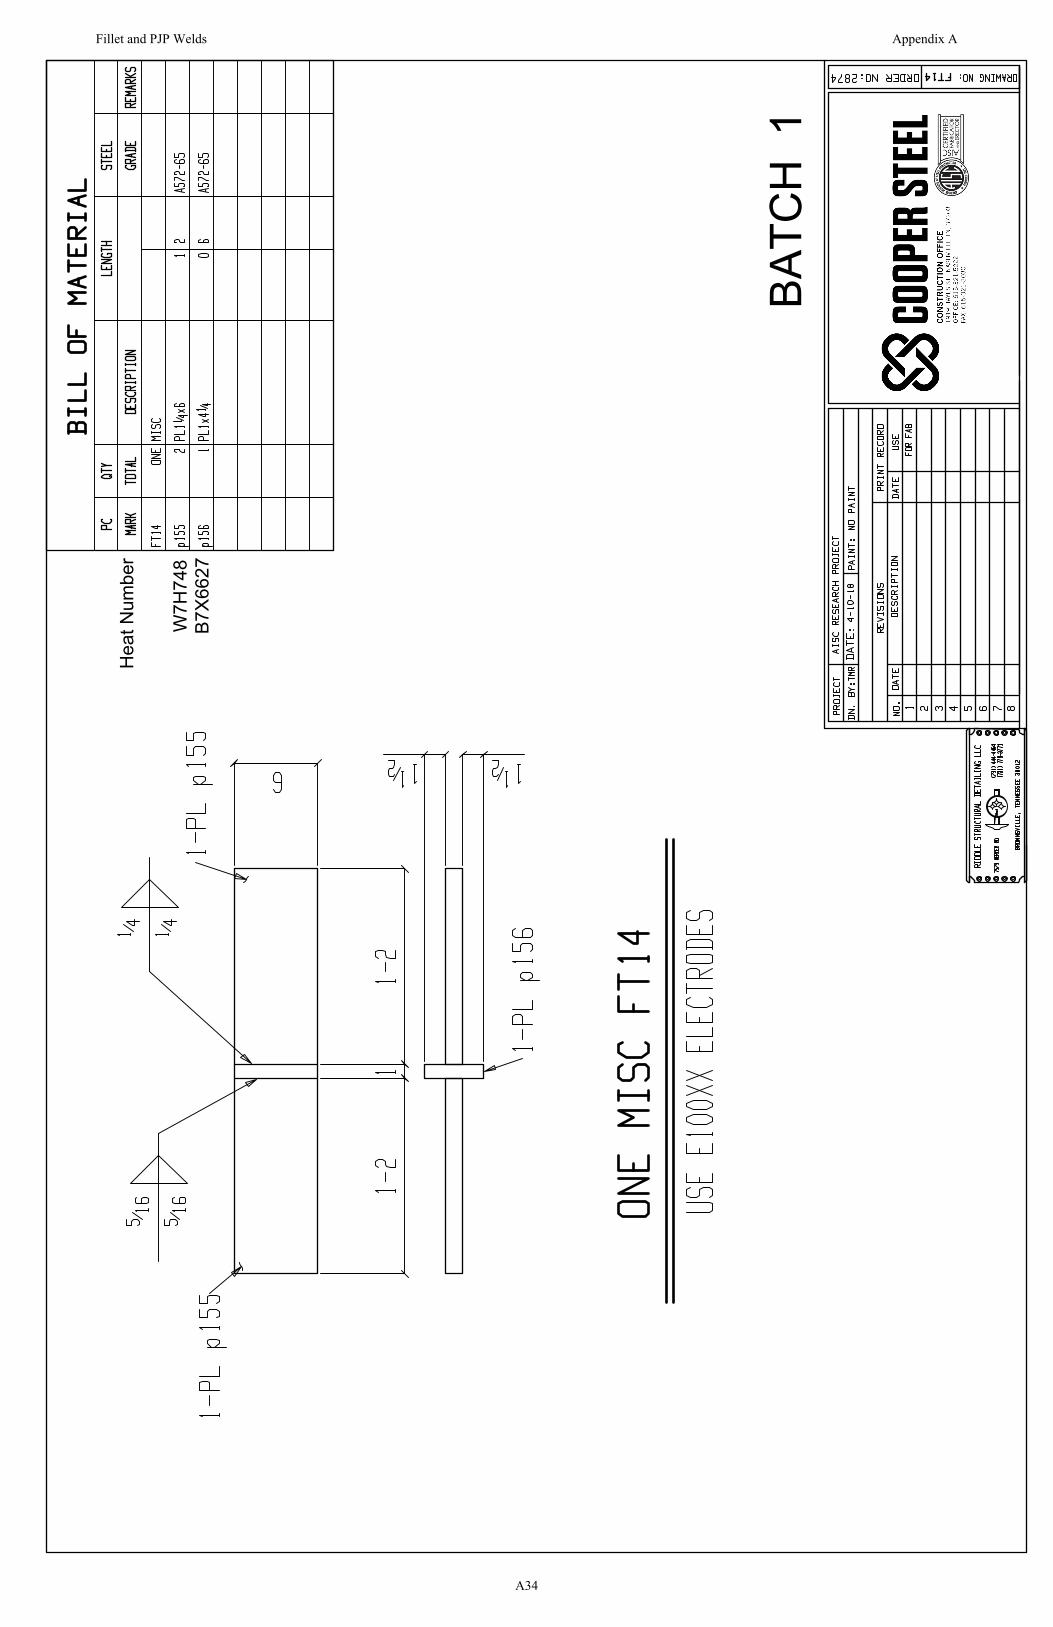
BATC
H 1
Hea
t Num
ber
B7X6
627
W7H
748
Fillet and PJP Welds Appendix A
A34
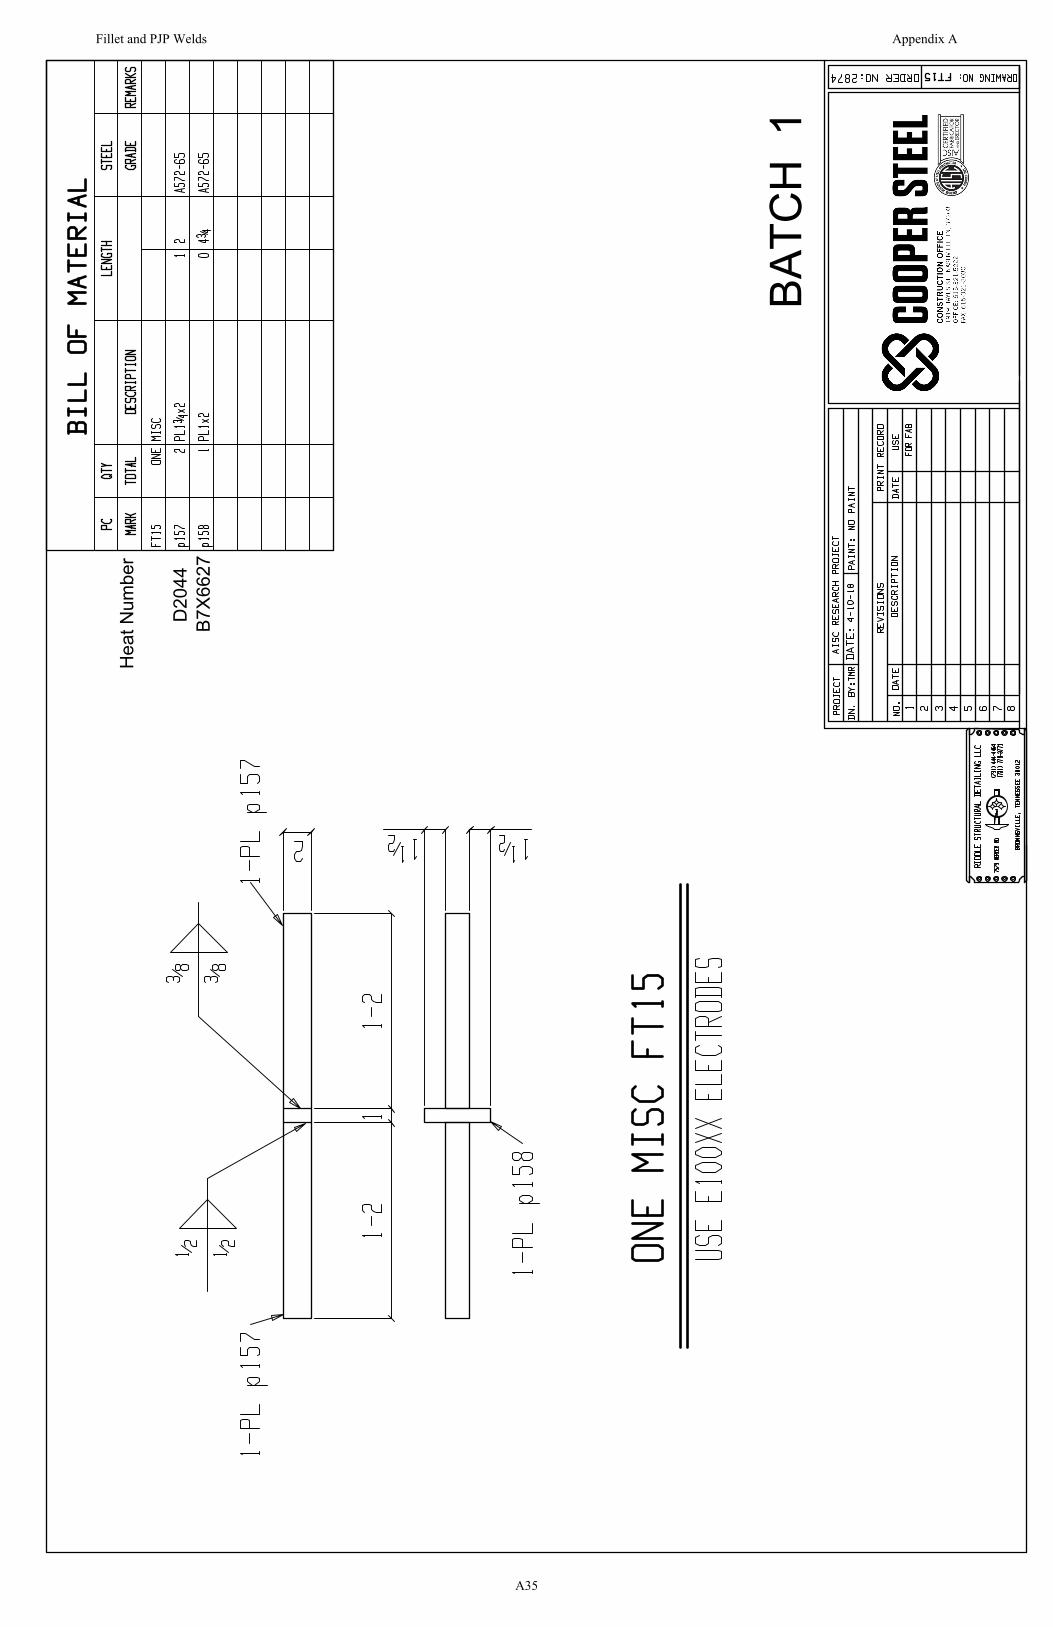
BATC
H 1
Hea
t Num
ber
B7X6
627
D20
44
Fillet and PJP Welds Appendix A
A35

BATC
H 1
Hea
t Num
ber
B7X6
627
D20
44
Fillet and PJP Welds Appendix A
A36
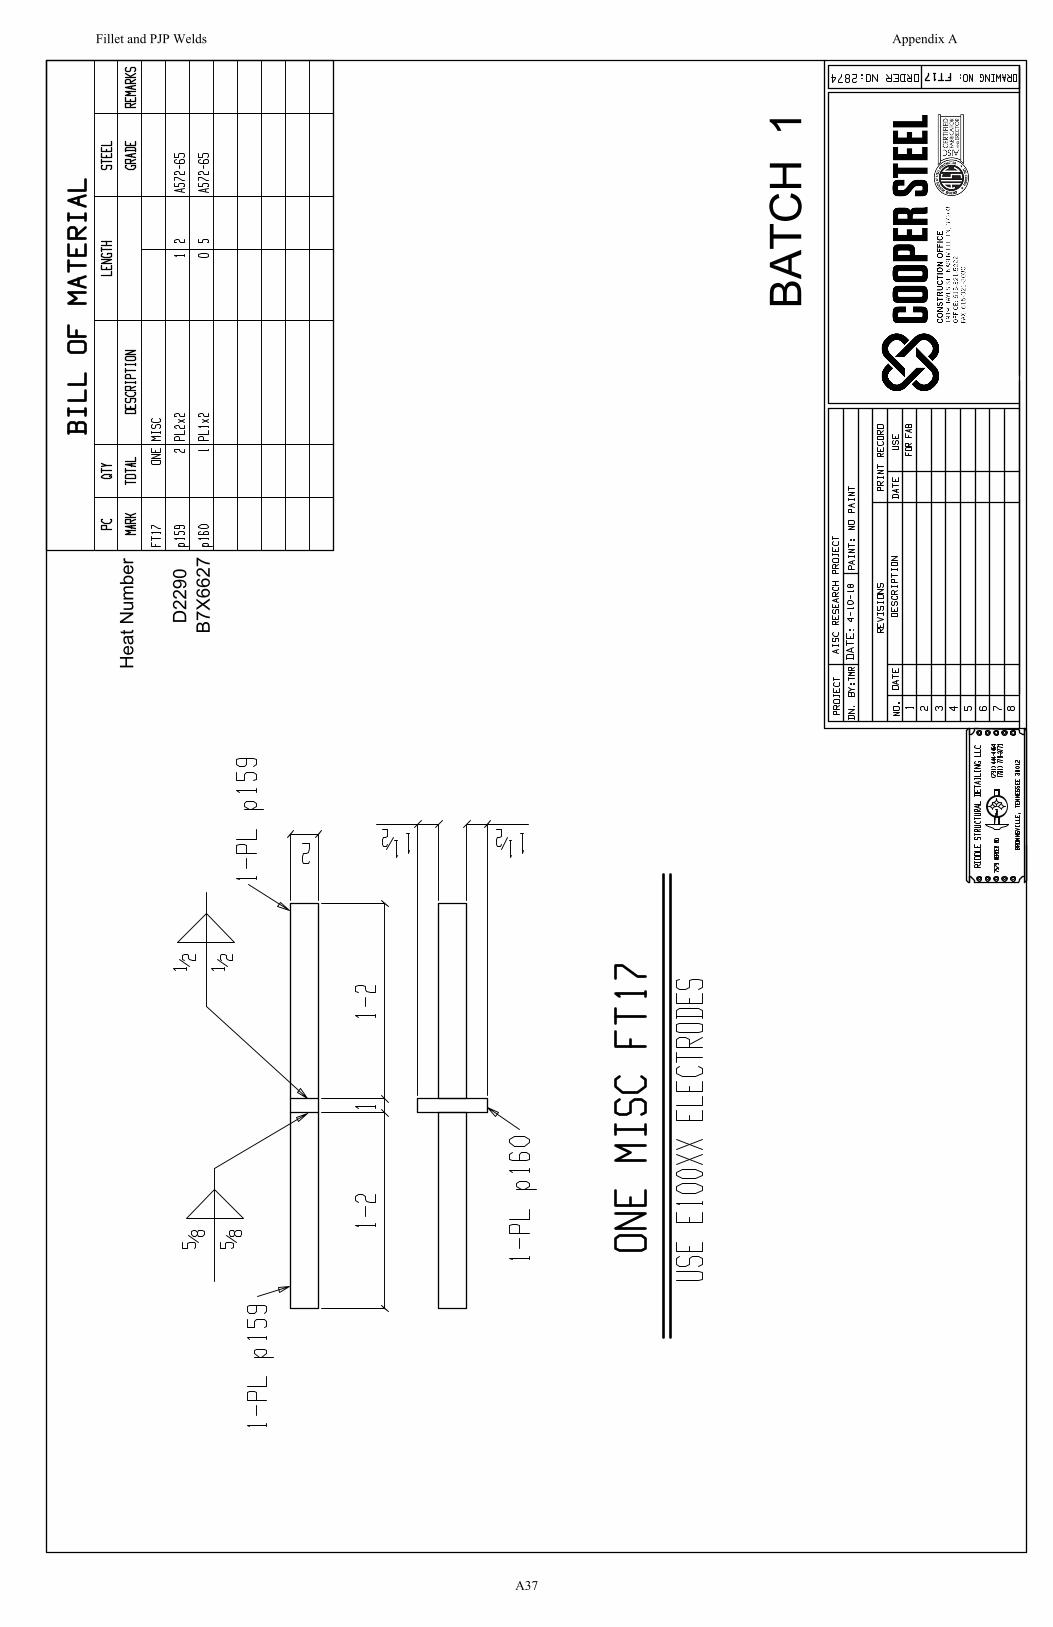
BATC
H 1
Hea
t Num
ber
B7X6
627
D22
90
Fillet and PJP Welds Appendix A
A37
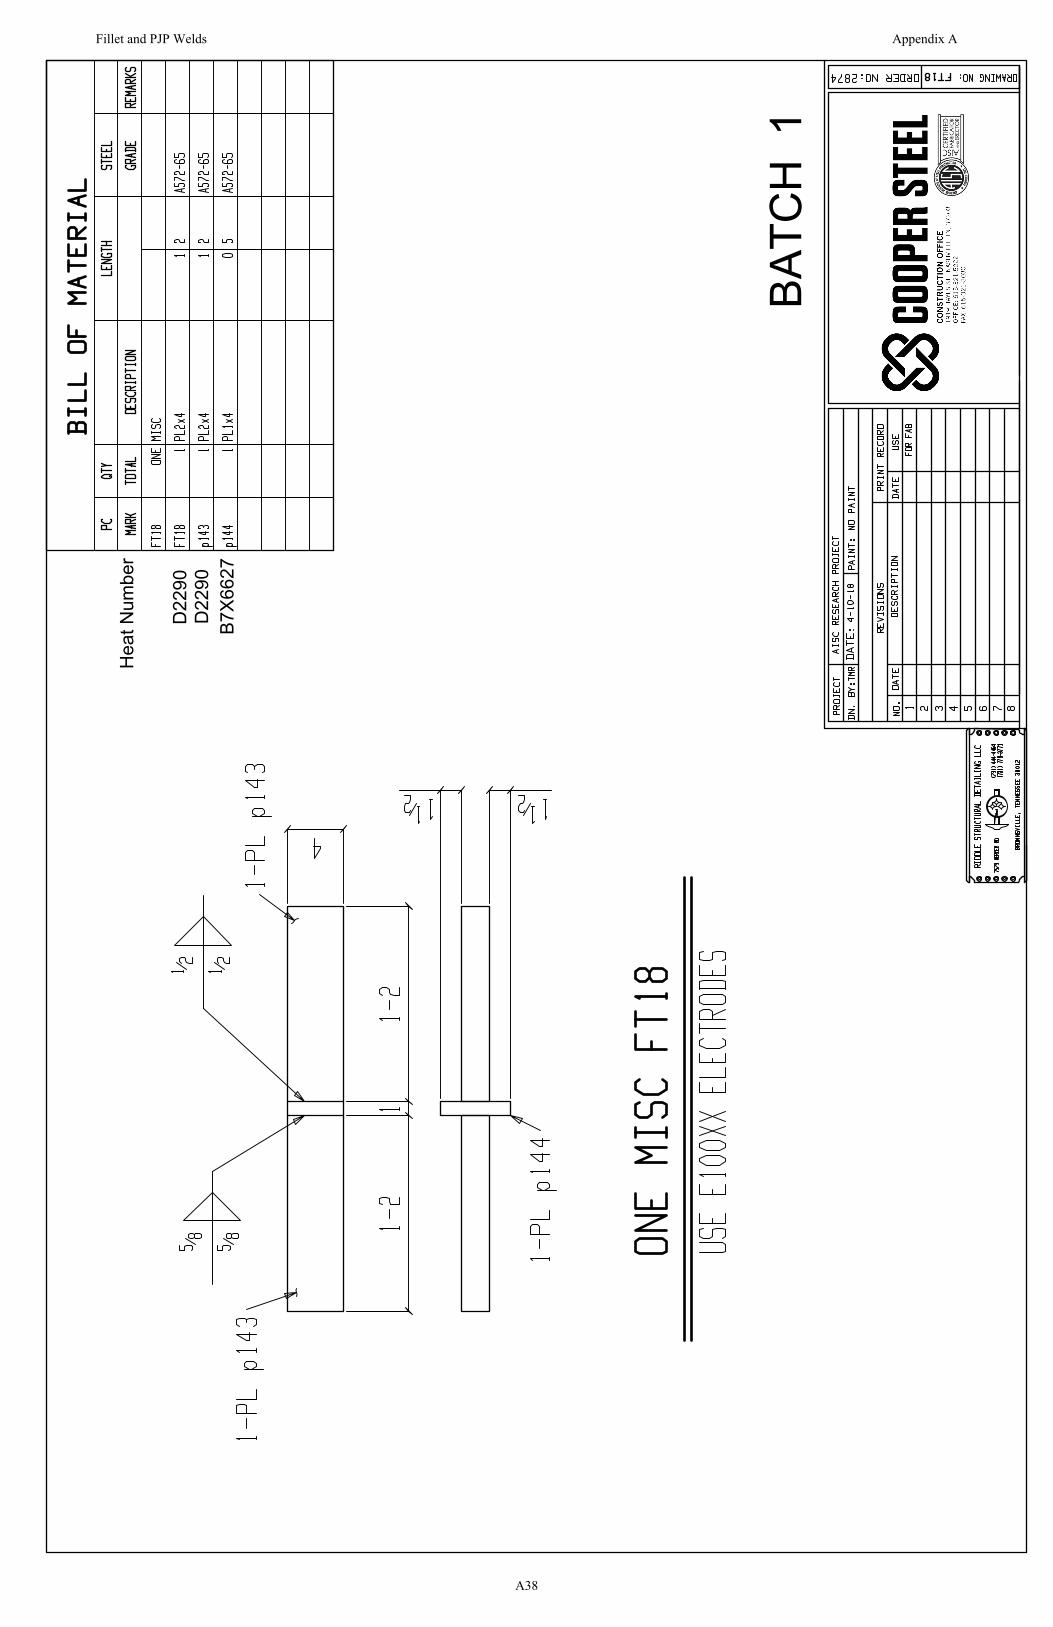
BATC
H 1
Hea
t Num
ber
B7X6
627
D22
90D
2290
Fillet and PJP Welds Appendix A
A38
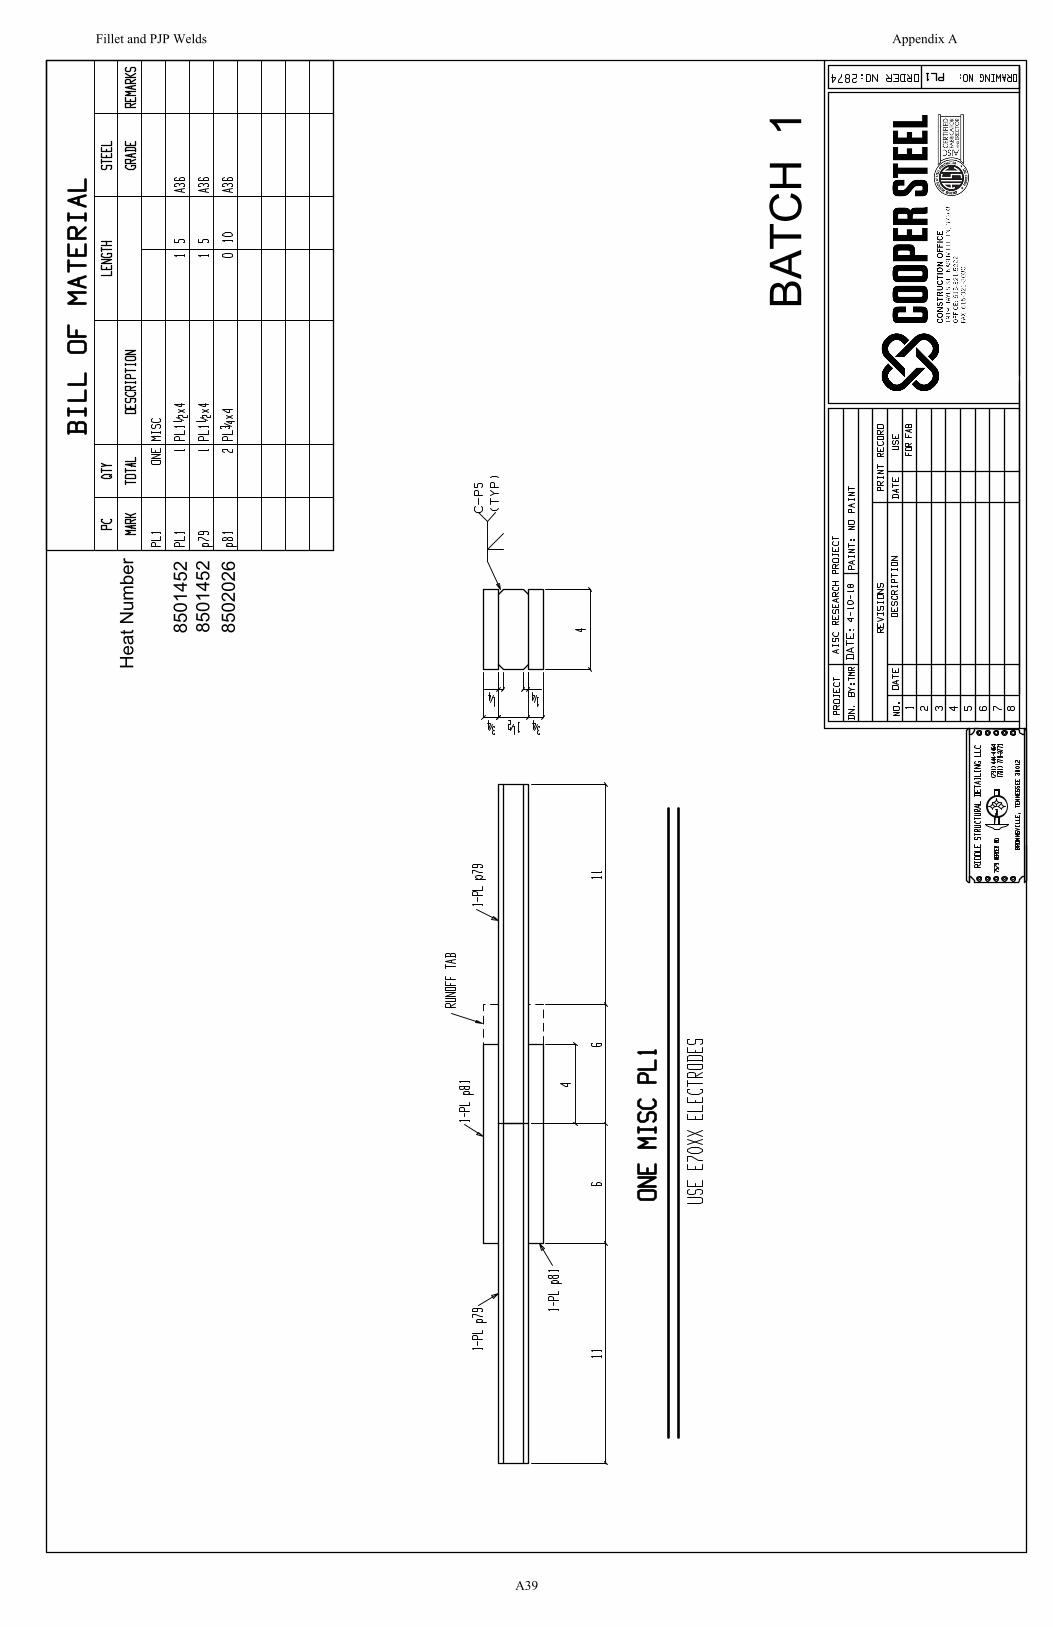
BATC
H 1
Hea
t Num
ber
8502
026
8501
452
8501
452
Fillet and PJP Welds Appendix A
A39

BATC
H 1
Hea
t Num
ber
6502
038
6502
038
D57
15
Fillet and PJP Welds Appendix A
A40
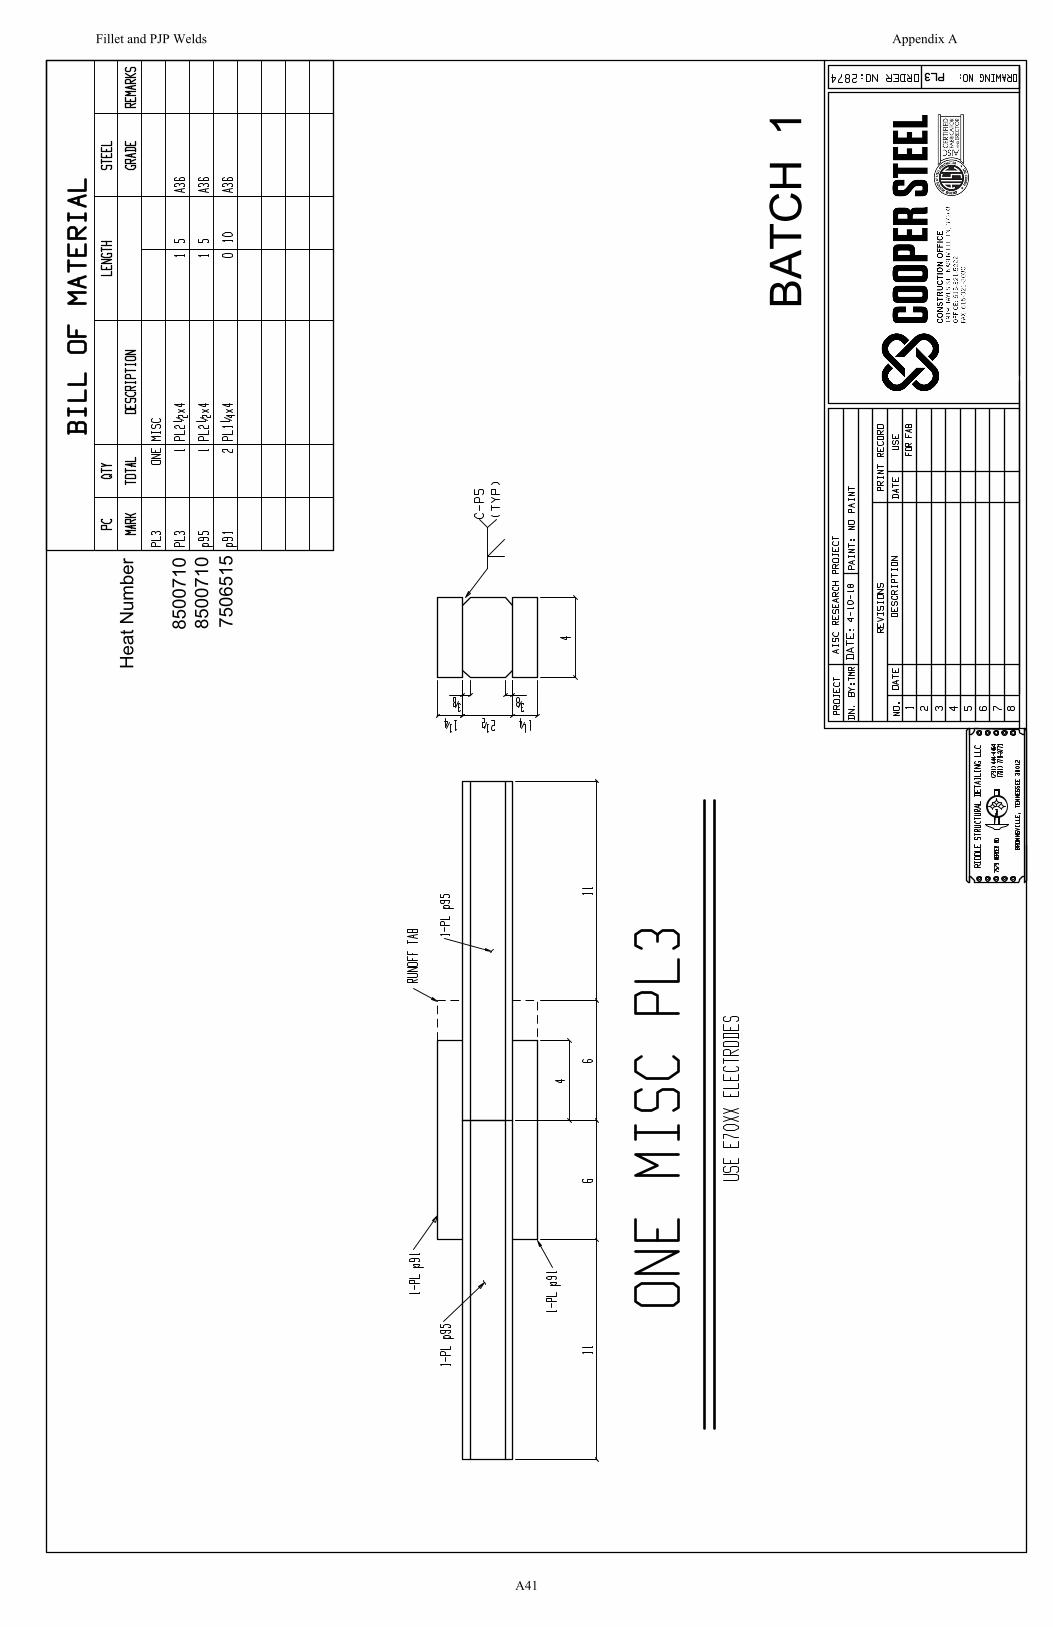
BATC
H 1
Hea
t Num
ber
7506
515
8500
710
8500
710
Fillet and PJP Welds Appendix A
A41
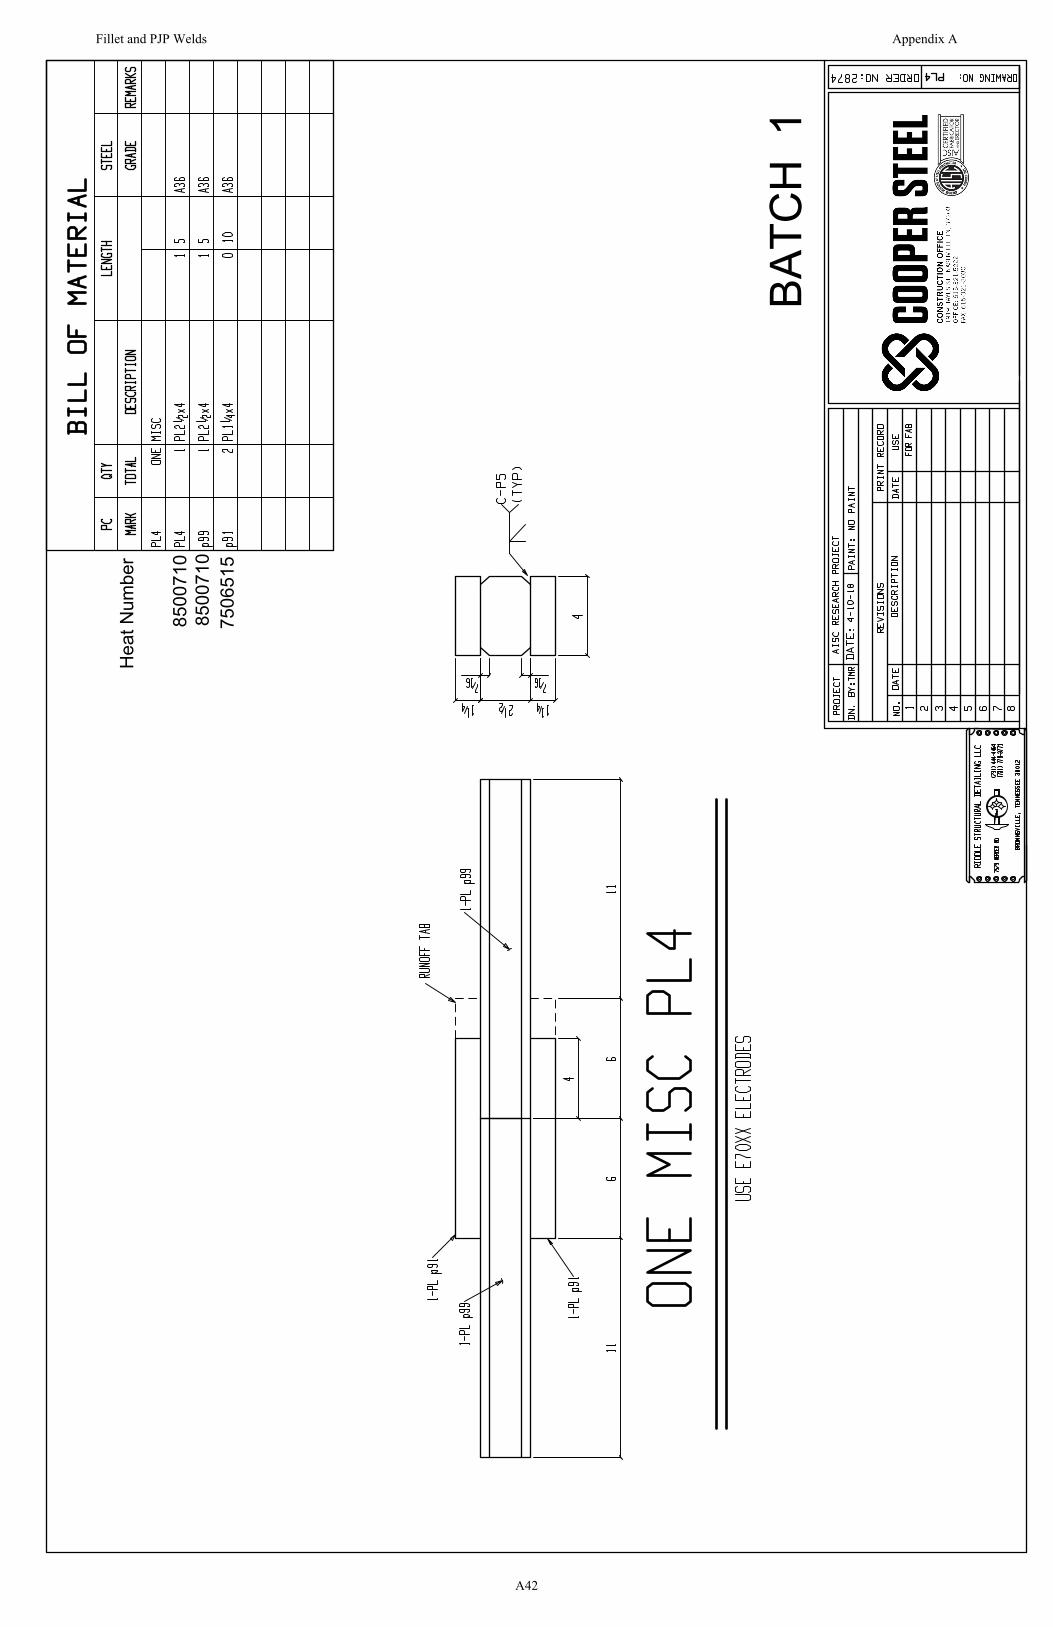
BATC
H 1
Hea
t Num
ber
7506
515
8500
710
8500
710
Fillet and PJP Welds Appendix A
A42
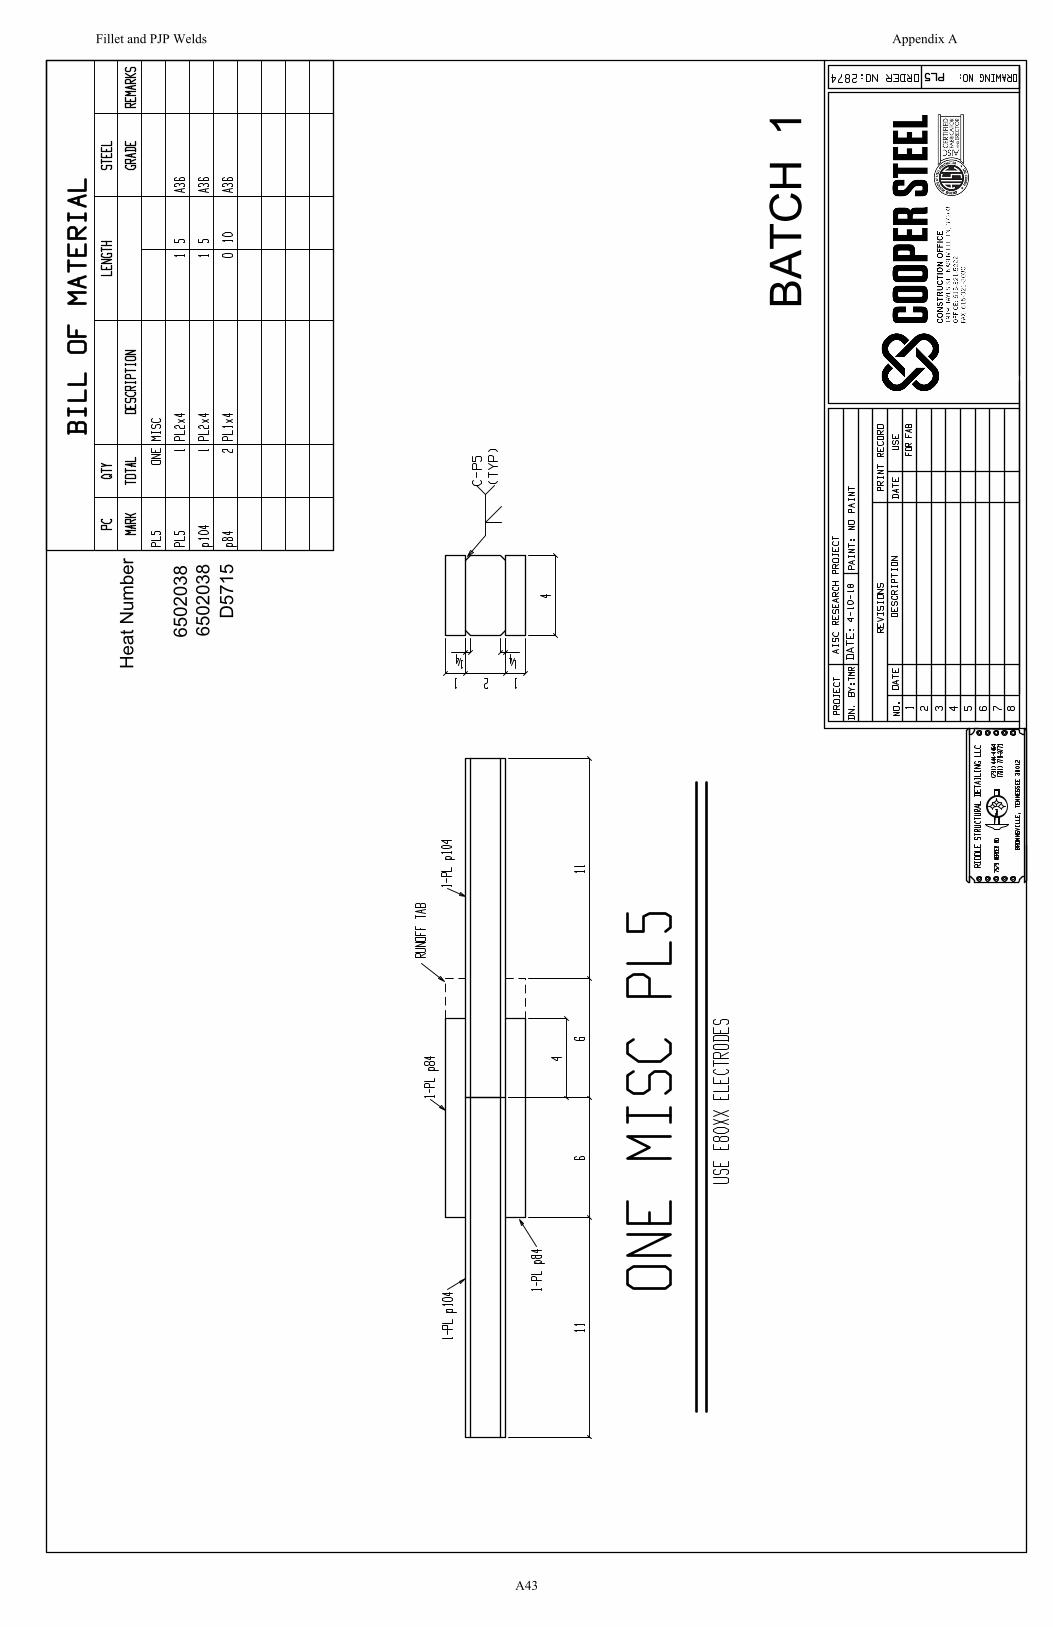
BATC
H 1
Hea
t Num
ber
6502
038
6502
038
D57
15
Fillet and PJP Welds Appendix A
A43

BATC
H 1
Hea
t Num
ber
7506
515
8500
710
8500
710
Fillet and PJP Welds Appendix A
A44

BATC
H 1
Hea
t Num
ber
6502
038
6502
038
D57
15
Fillet and PJP Welds Appendix A
A45
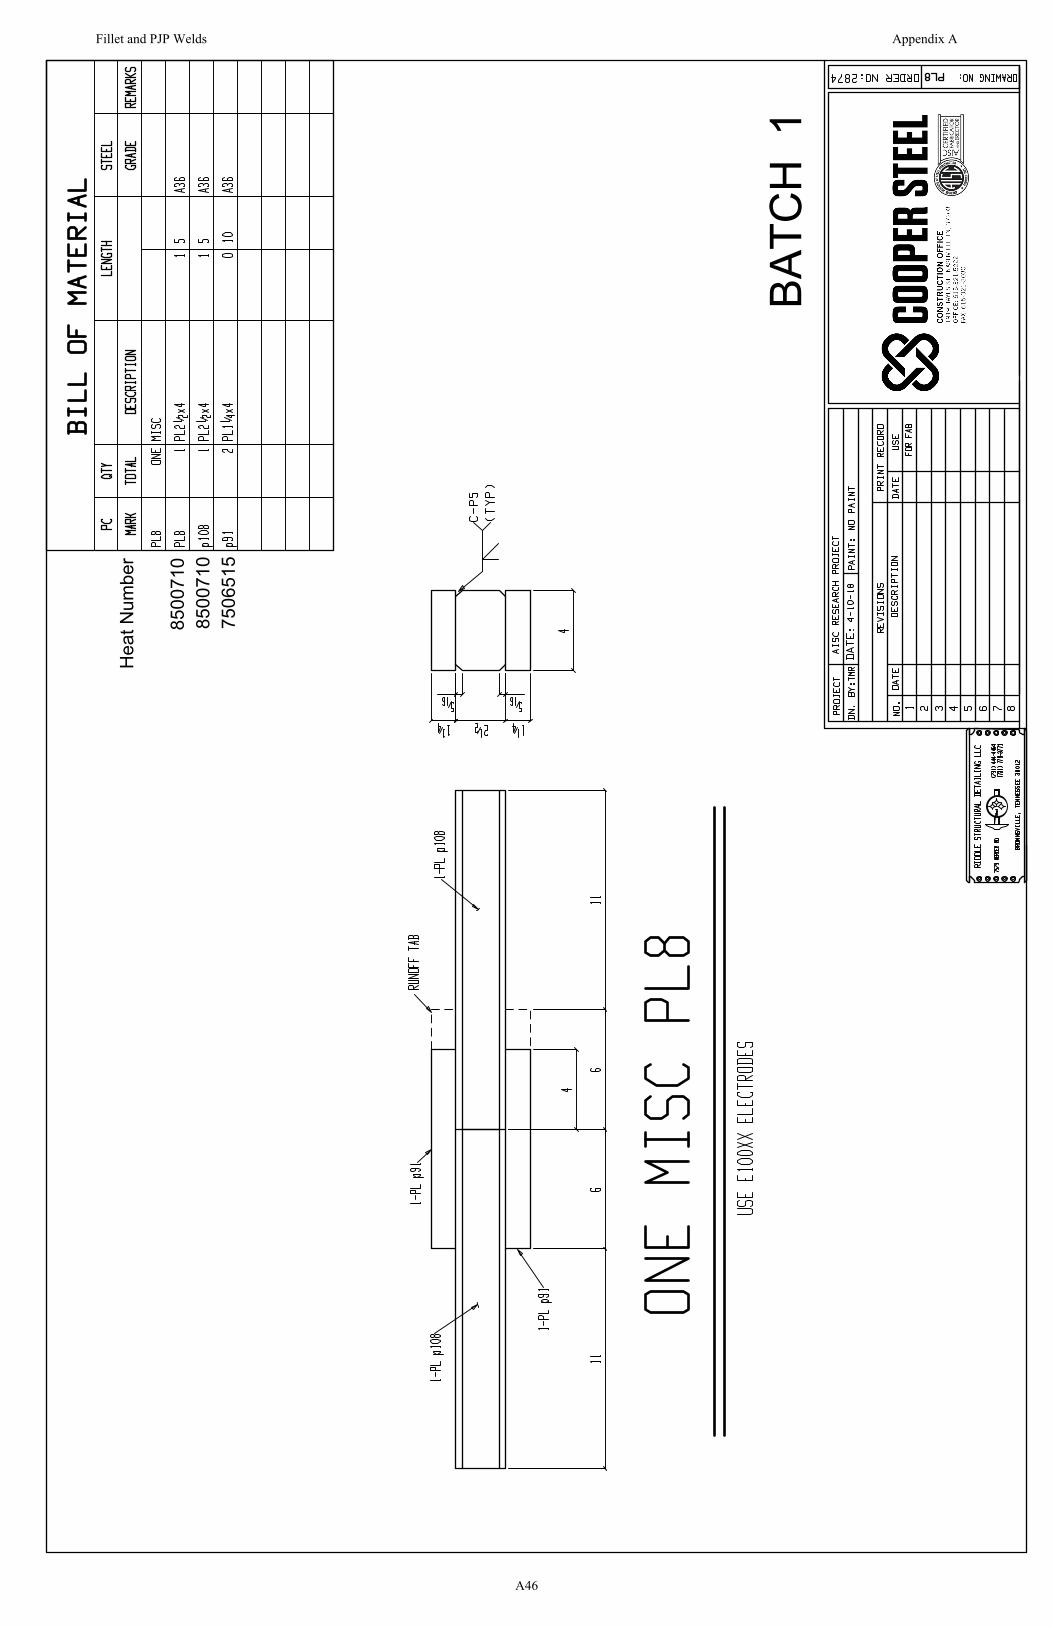
BATC
H 1
Hea
t Num
ber
7506
515
8500
710
8500
710
Fillet and PJP Welds Appendix A
A46
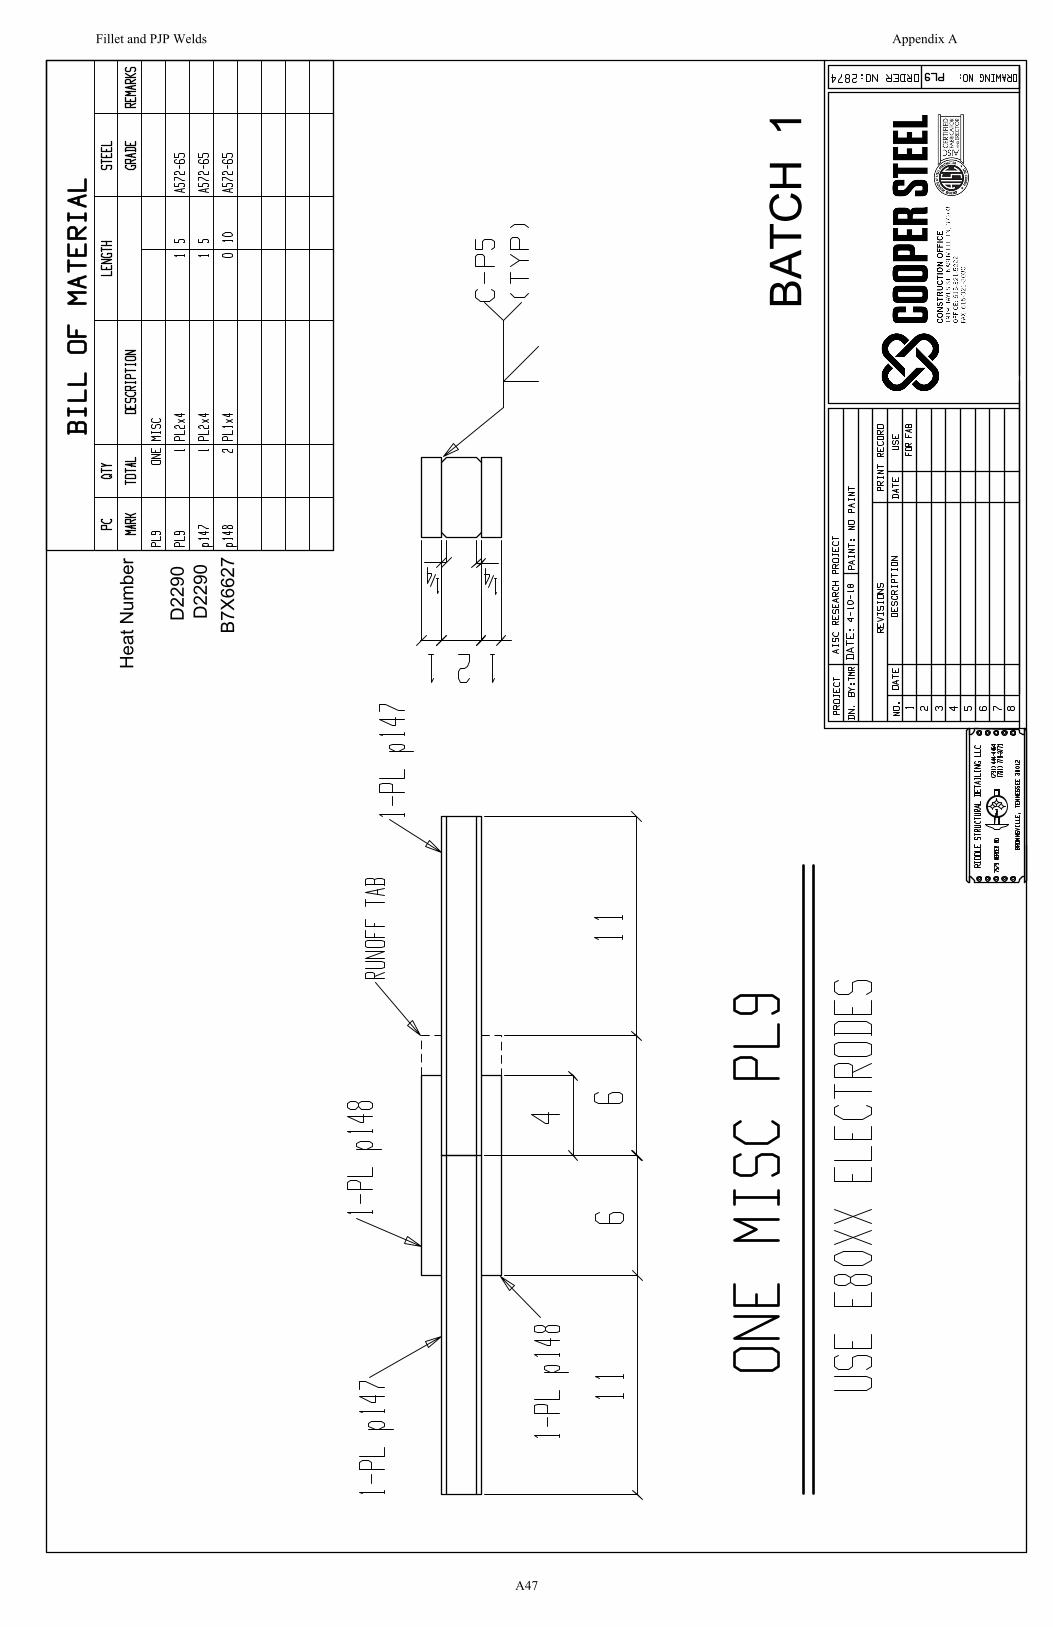
BATC
H 1
Hea
t Num
ber
B7X6
627
D22
90D
2290
Fillet and PJP Welds Appendix A
A47
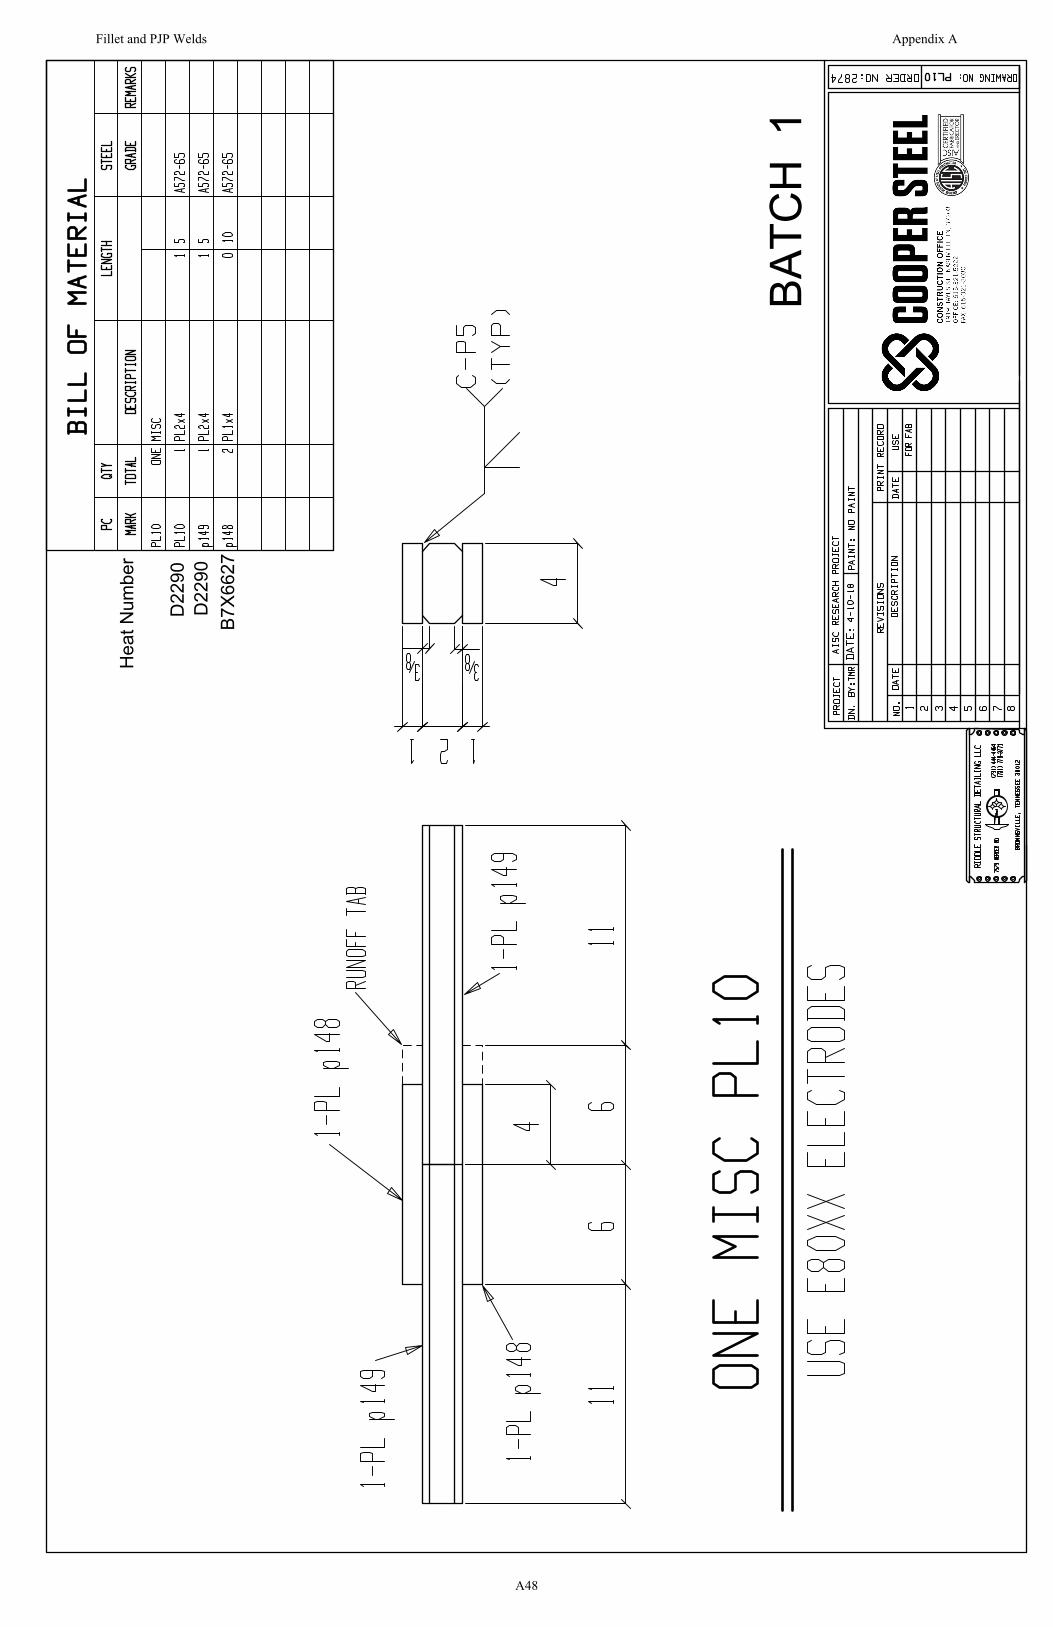
BATC
H 1
Hea
t Num
ber
B7X6
627
D22
90D
2290
Fillet and PJP Welds Appendix A
A48

BATC
H 1
Hea
t Num
ber
B7X6
627
D22
90D
2290
Fillet and PJP Welds Appendix A
A49
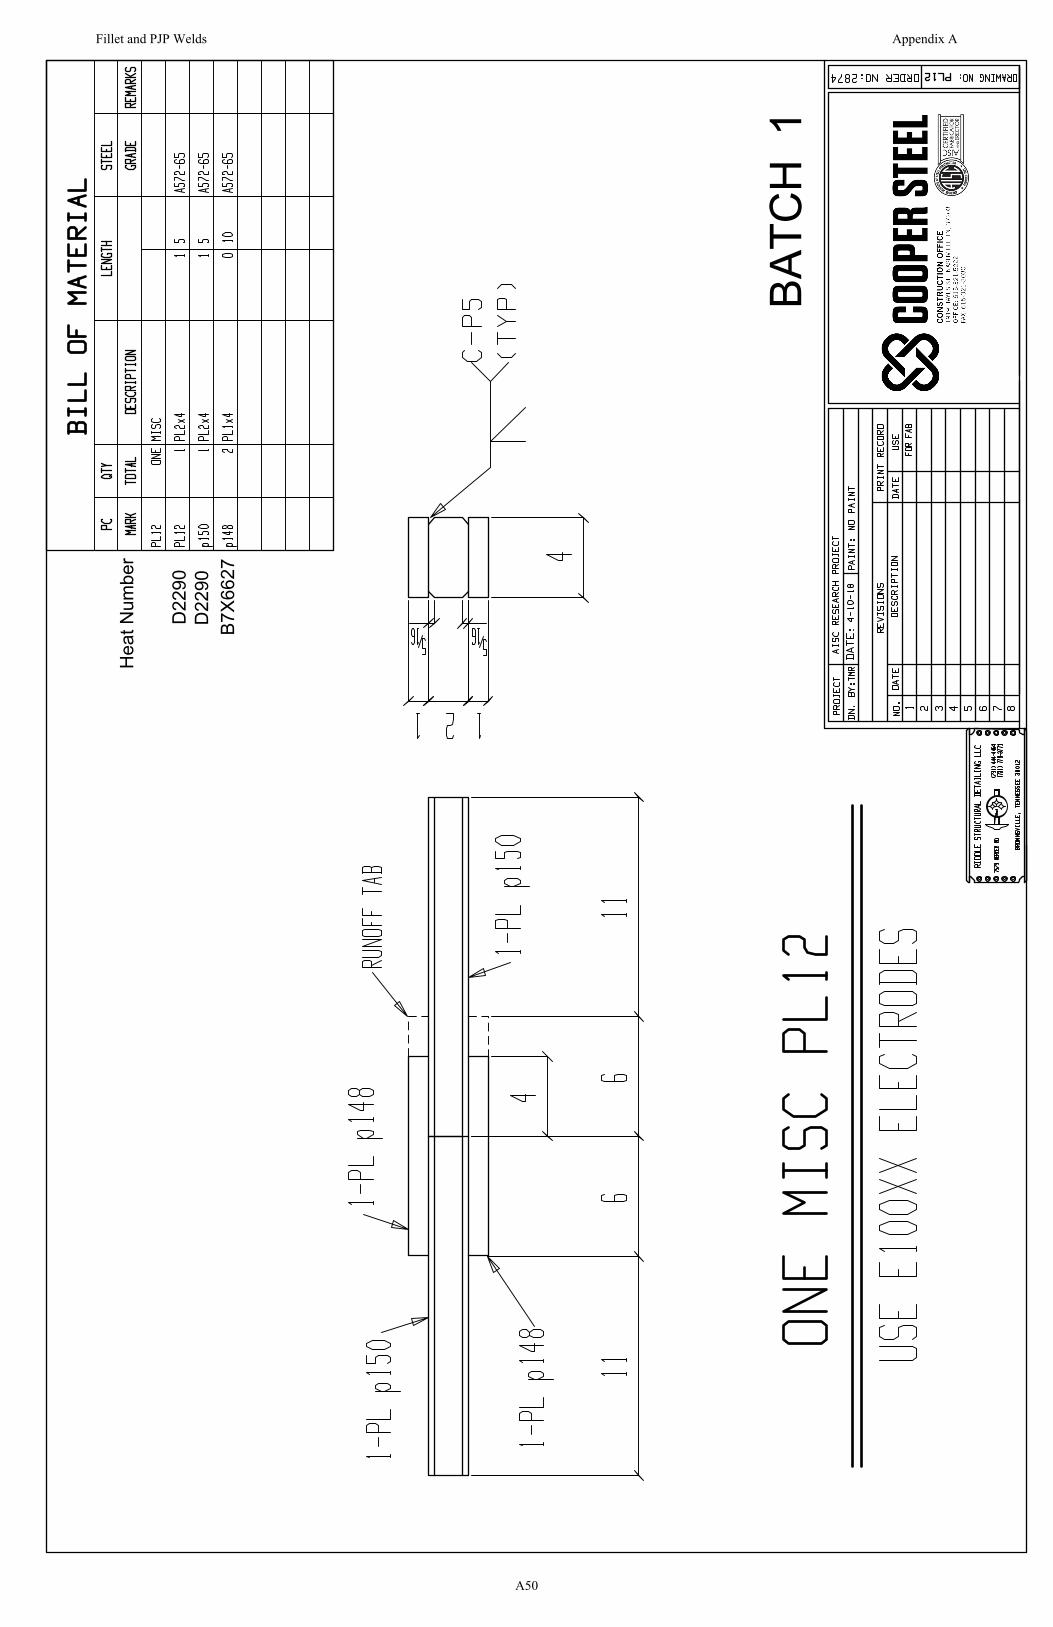
BATC
H 1
Hea
t Num
ber
B7X6
627
D22
90D
2290
Fillet and PJP Welds Appendix A
A50
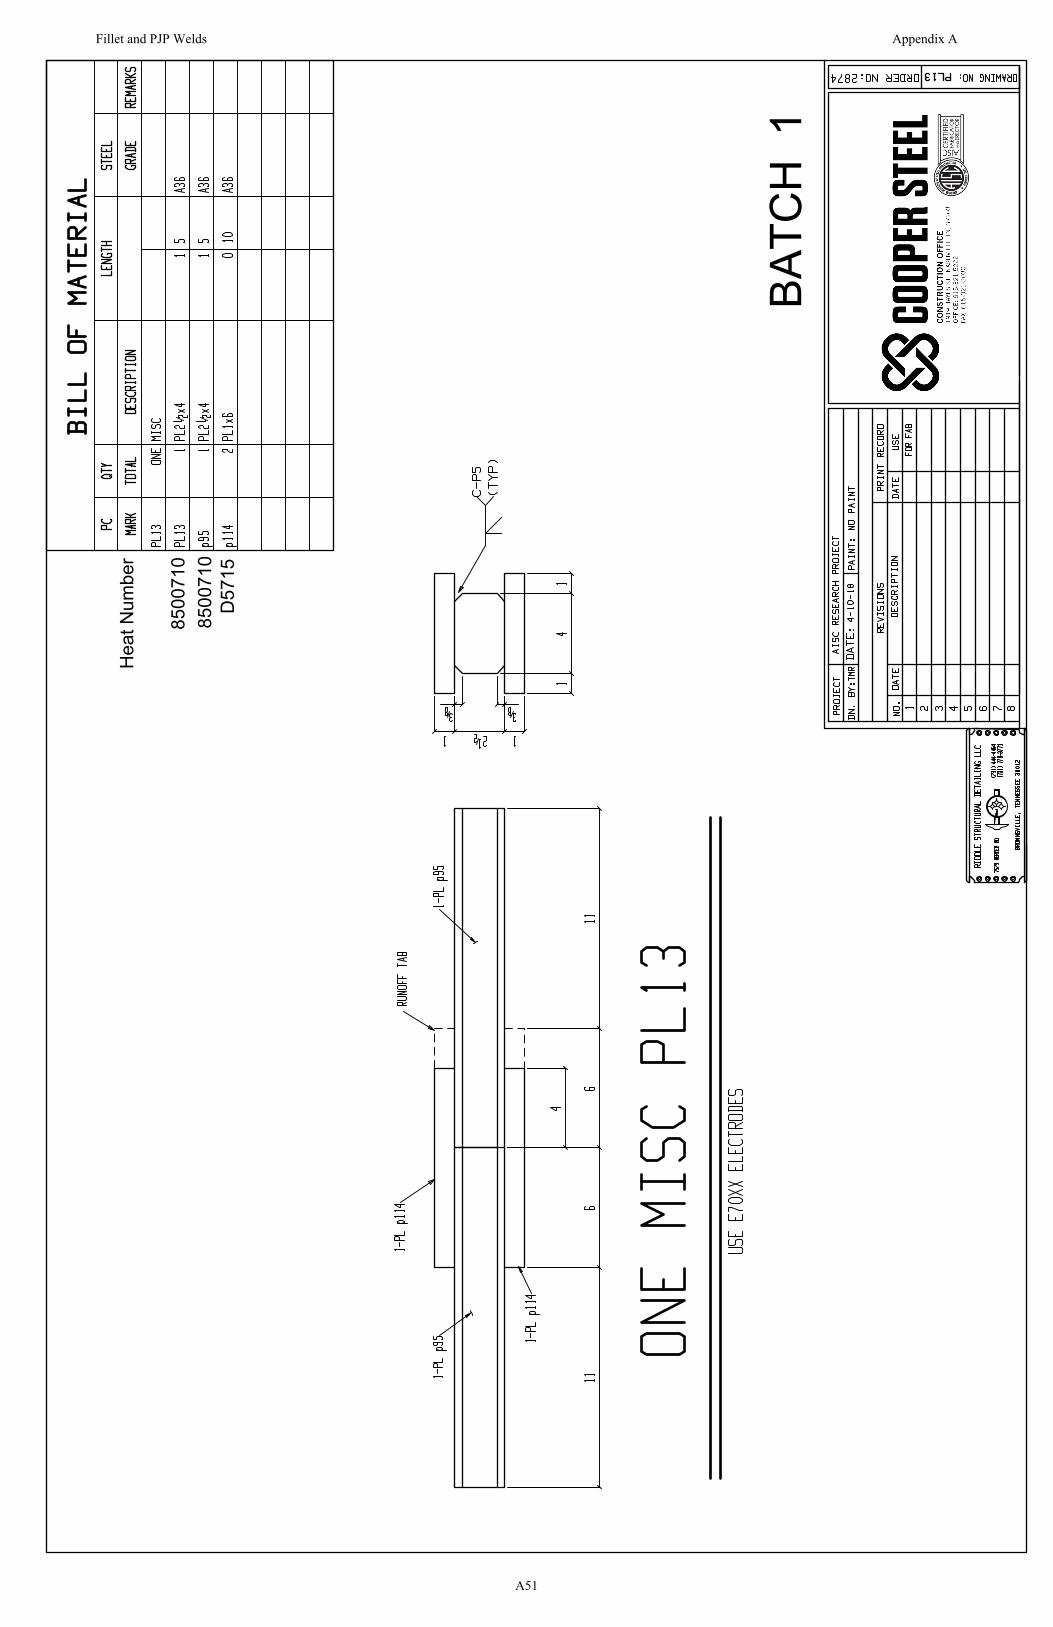
BATC
H 1
Hea
t Num
ber
8500
710
8500
710
D57
15
Fillet and PJP Welds Appendix A
A51
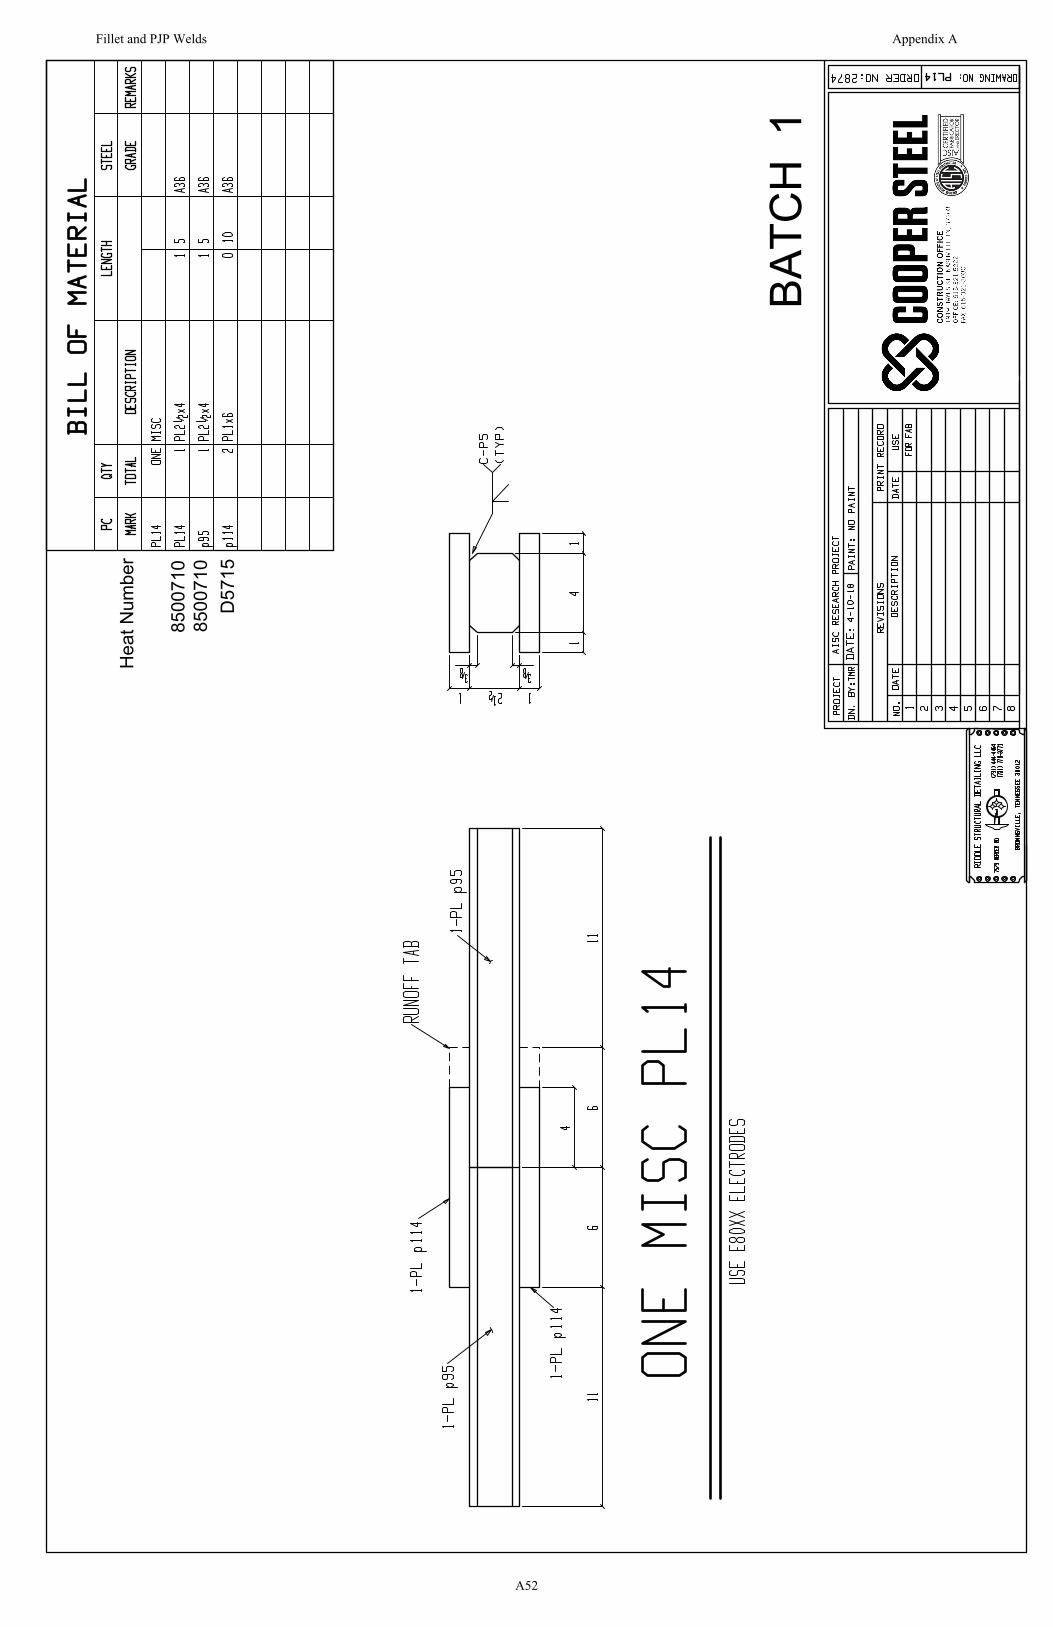
BATC
H 1
Hea
t Num
ber
8500
710
8500
710
D57
15
Fillet and PJP Welds Appendix A
A52
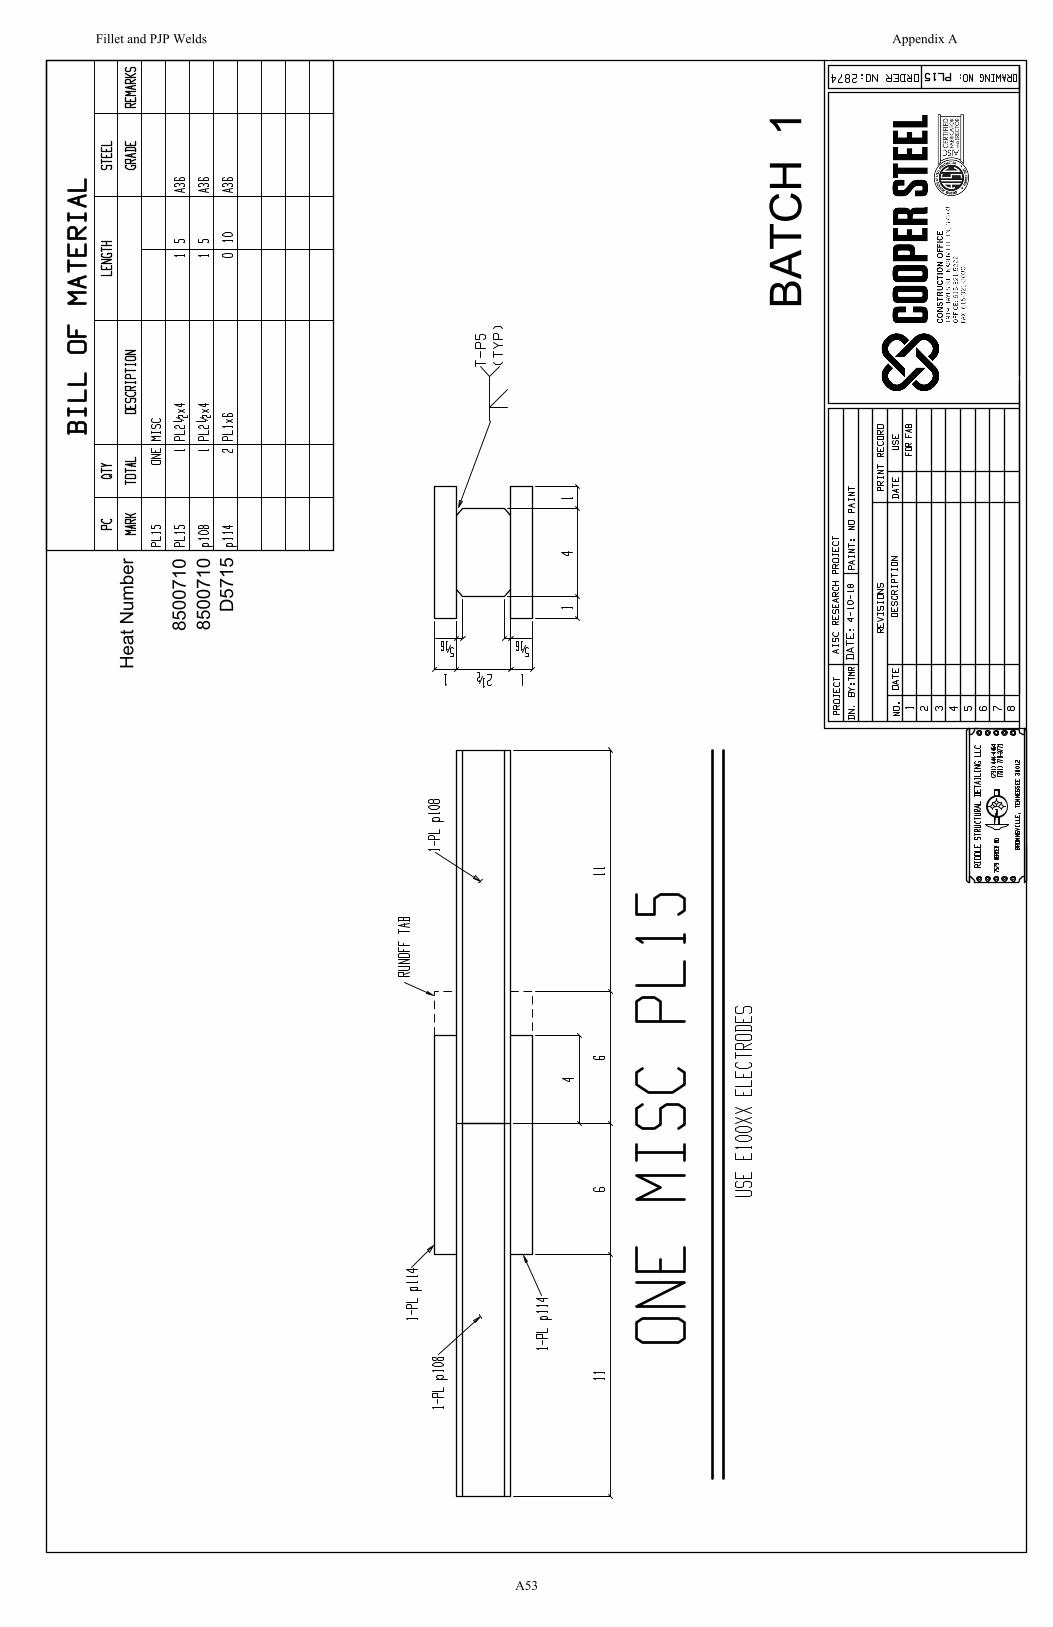
BATC
H 1
Hea
t Num
ber
8500
710
8500
710
D57
15
Fillet and PJP Welds Appendix A
A53
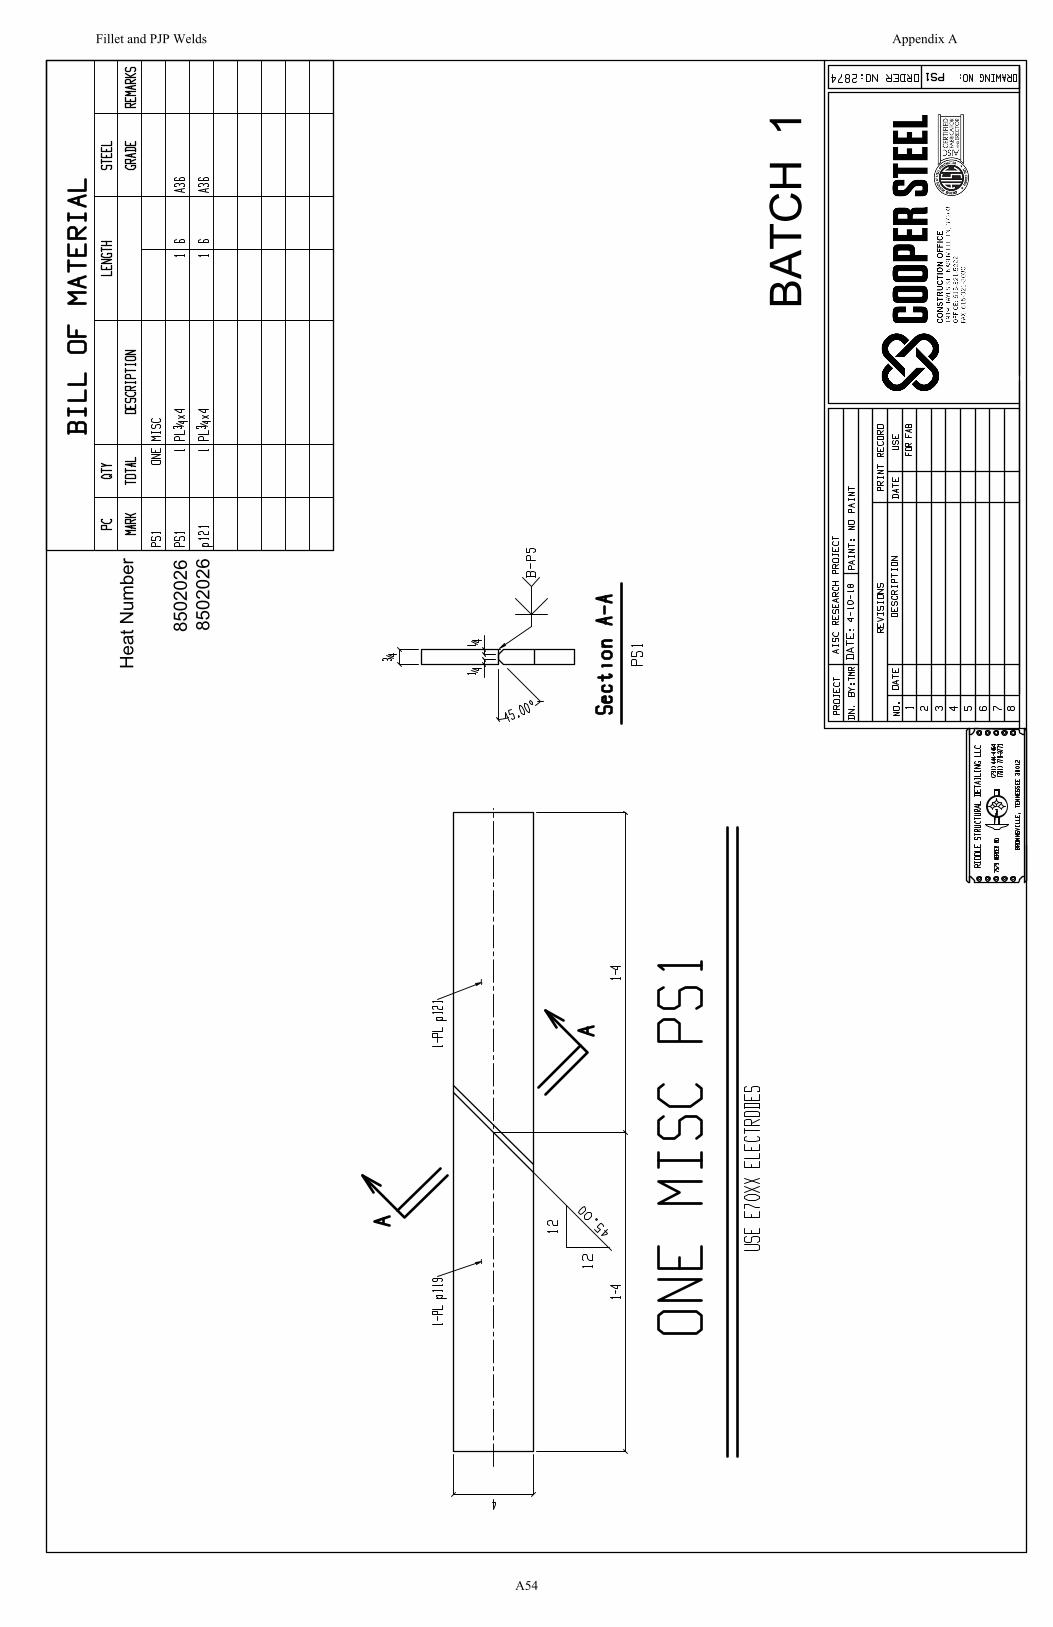
BATC
H 1
Hea
t Num
ber
8502
026
8502
026
Fillet and PJP Welds Appendix A
A54
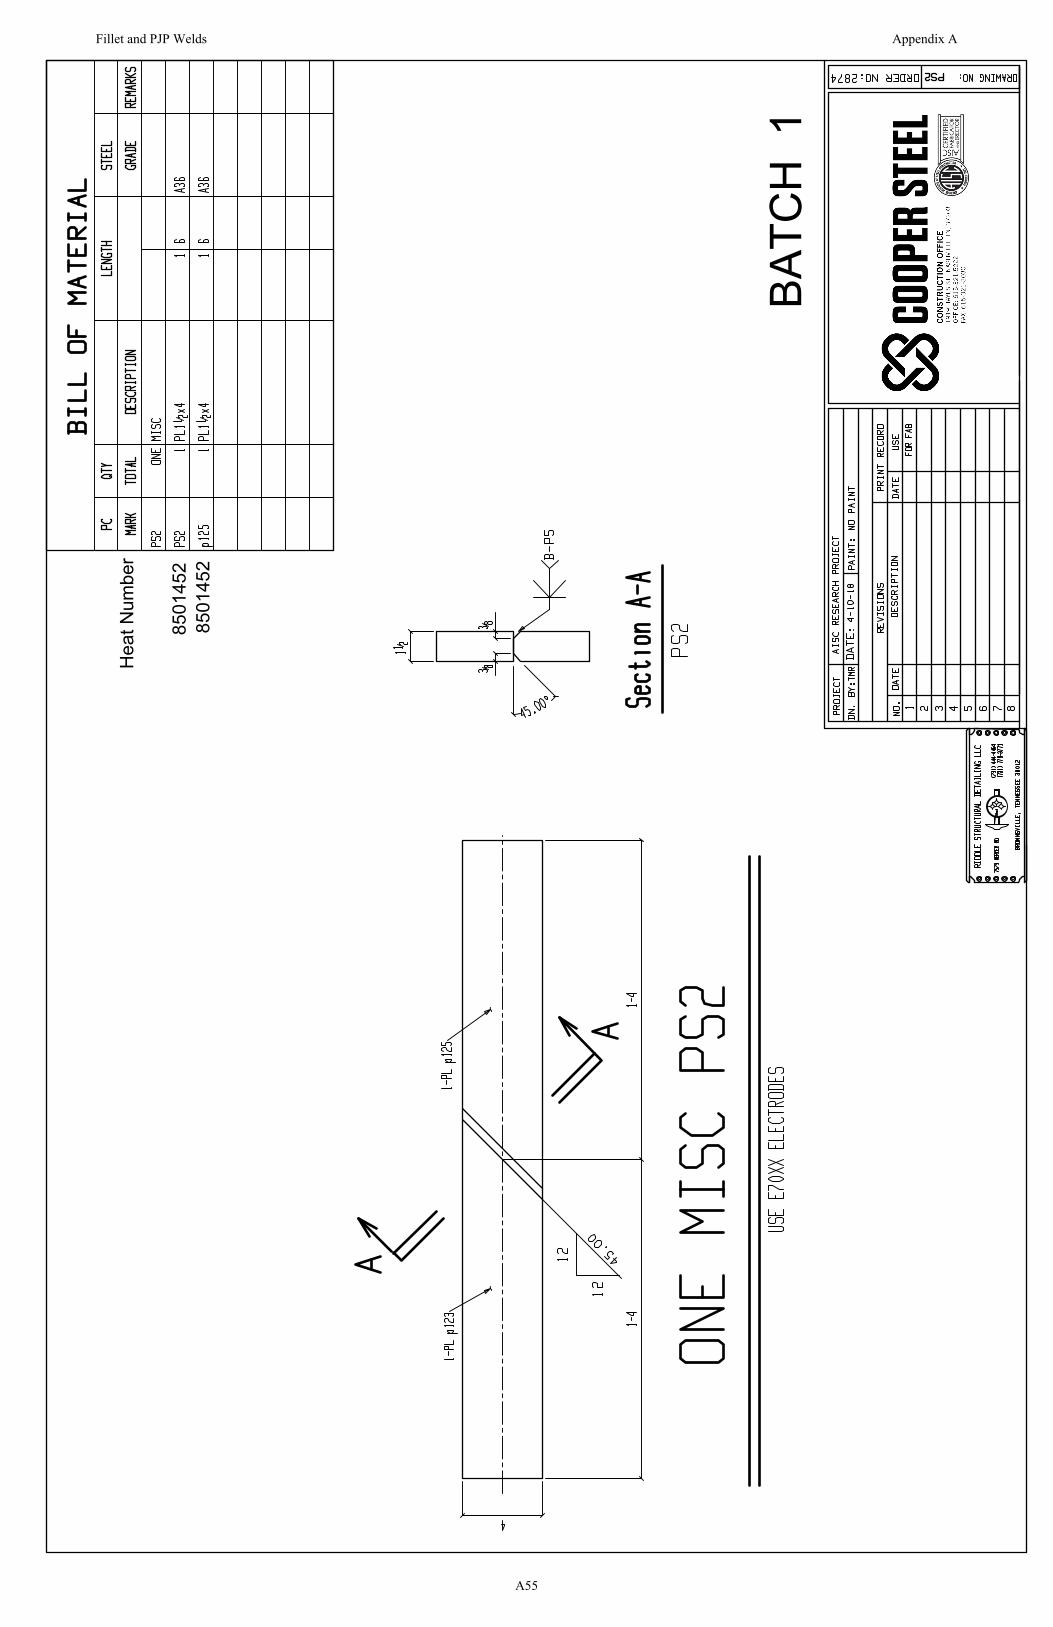
BATC
H 1
Hea
t Num
ber
8501
452
8501
452
Fillet and PJP Welds Appendix A
A55
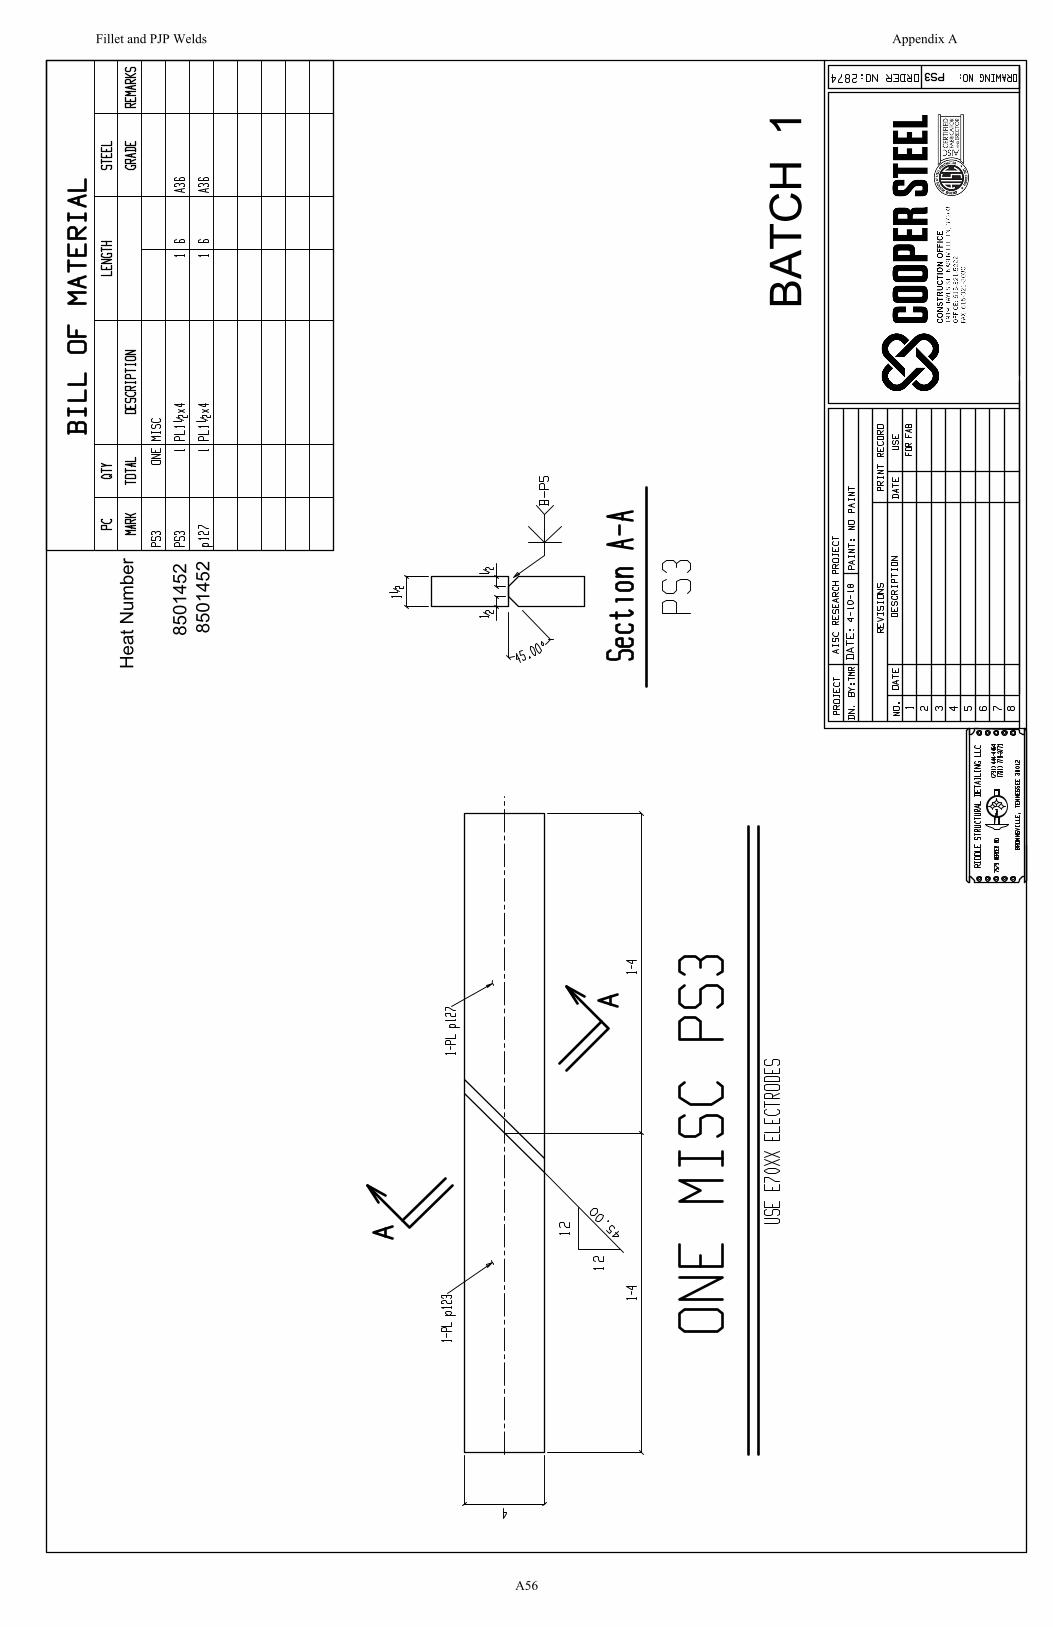
BATC
H 1
Hea
t Num
ber
8501
452
8501
452
Fillet and PJP Welds Appendix A
A56
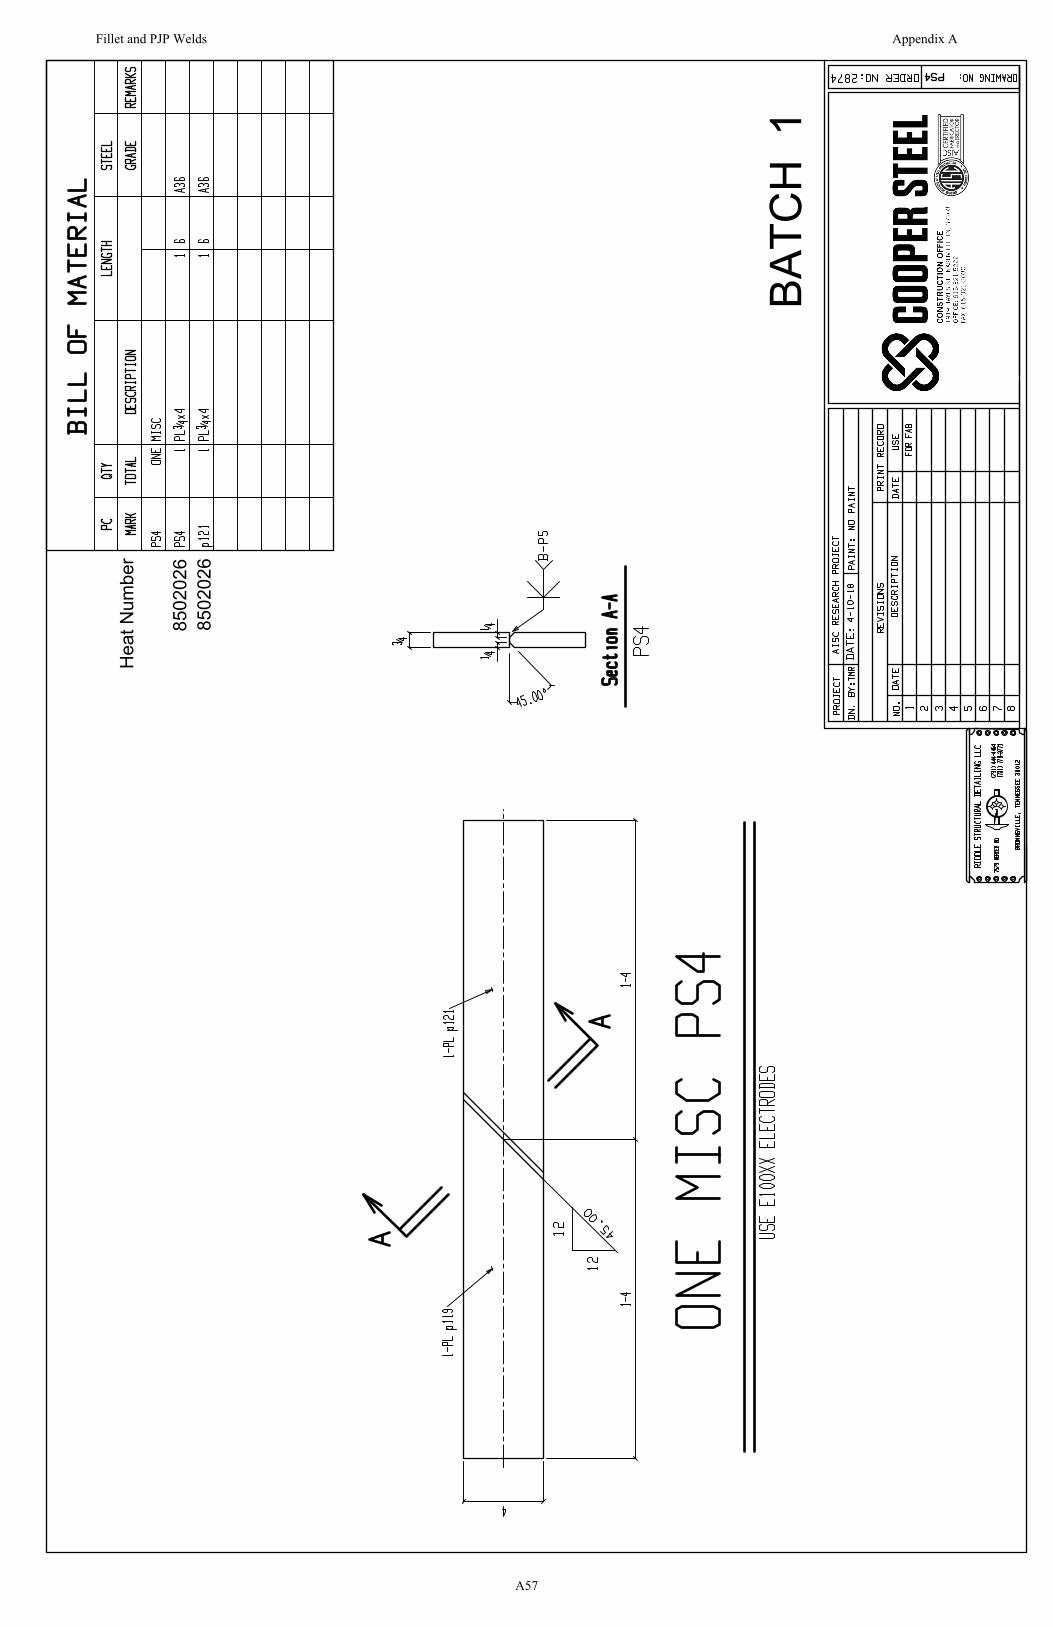
BATC
H 1
Hea
t Num
ber
8502
026
8502
026
Fillet and PJP Welds Appendix A
A57

BATC
H 1
Hea
t Num
ber
8501
452
8501
452
Fillet and PJP Welds Appendix A
A58
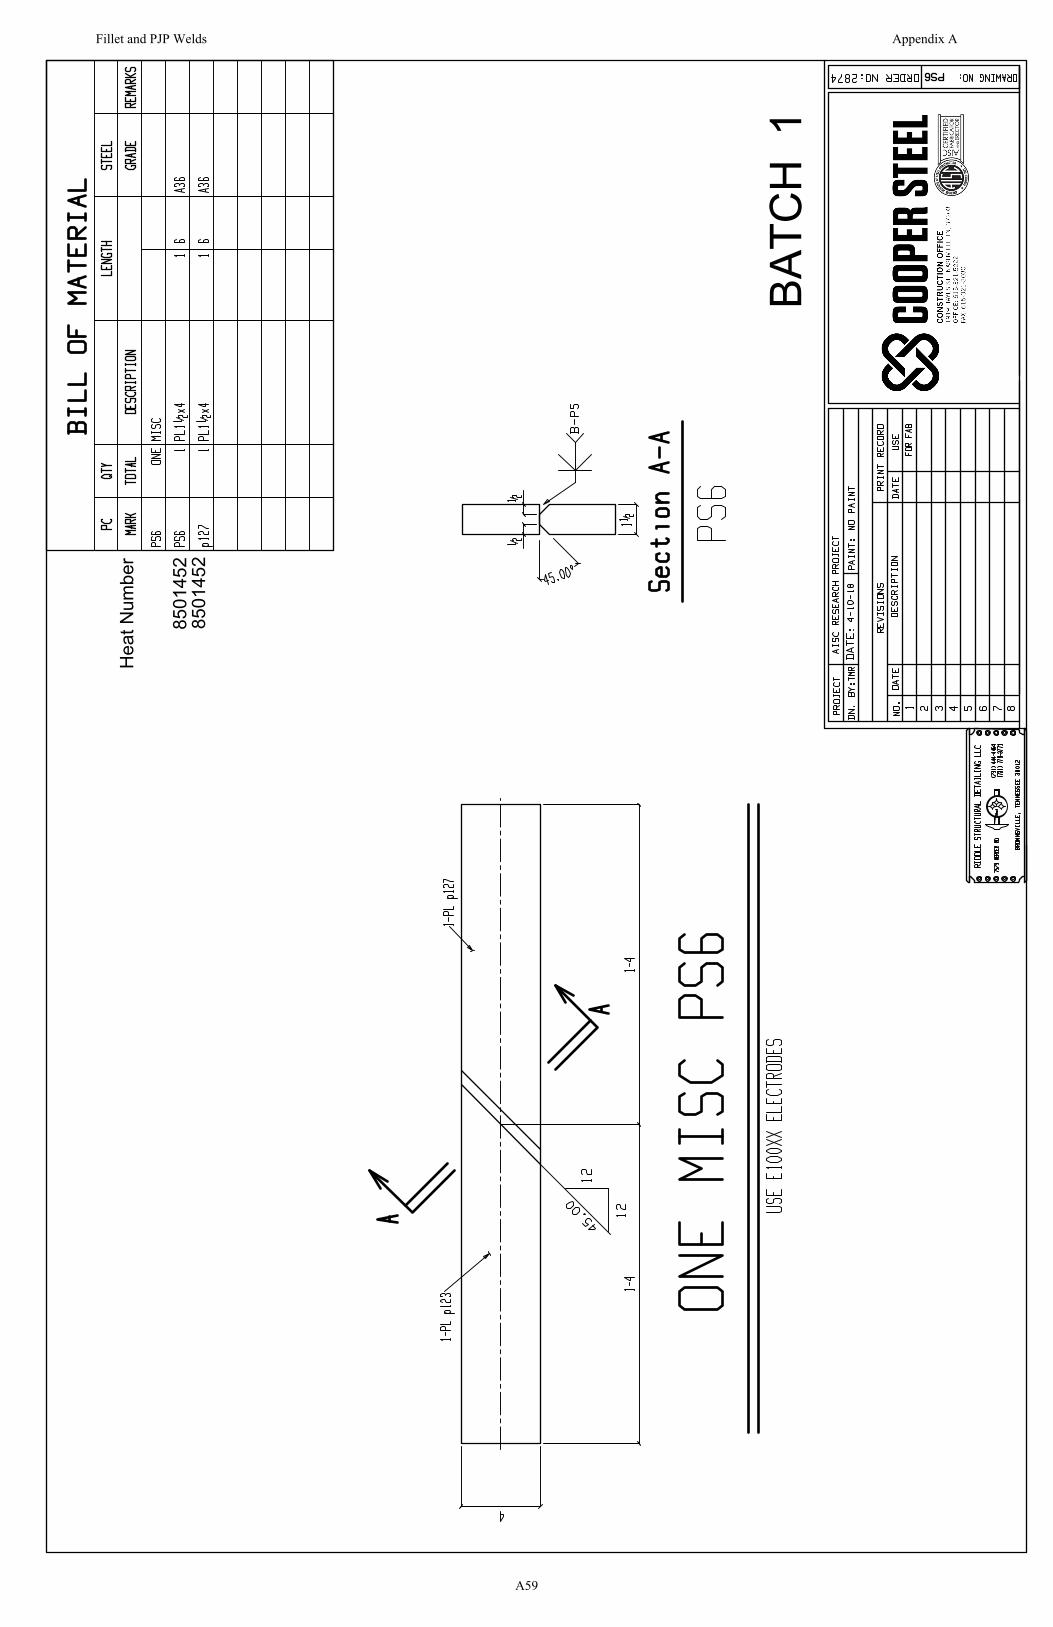
BATC
H 1
Hea
t Num
ber
8501
452
8501
452
Fillet and PJP Welds Appendix A
A59
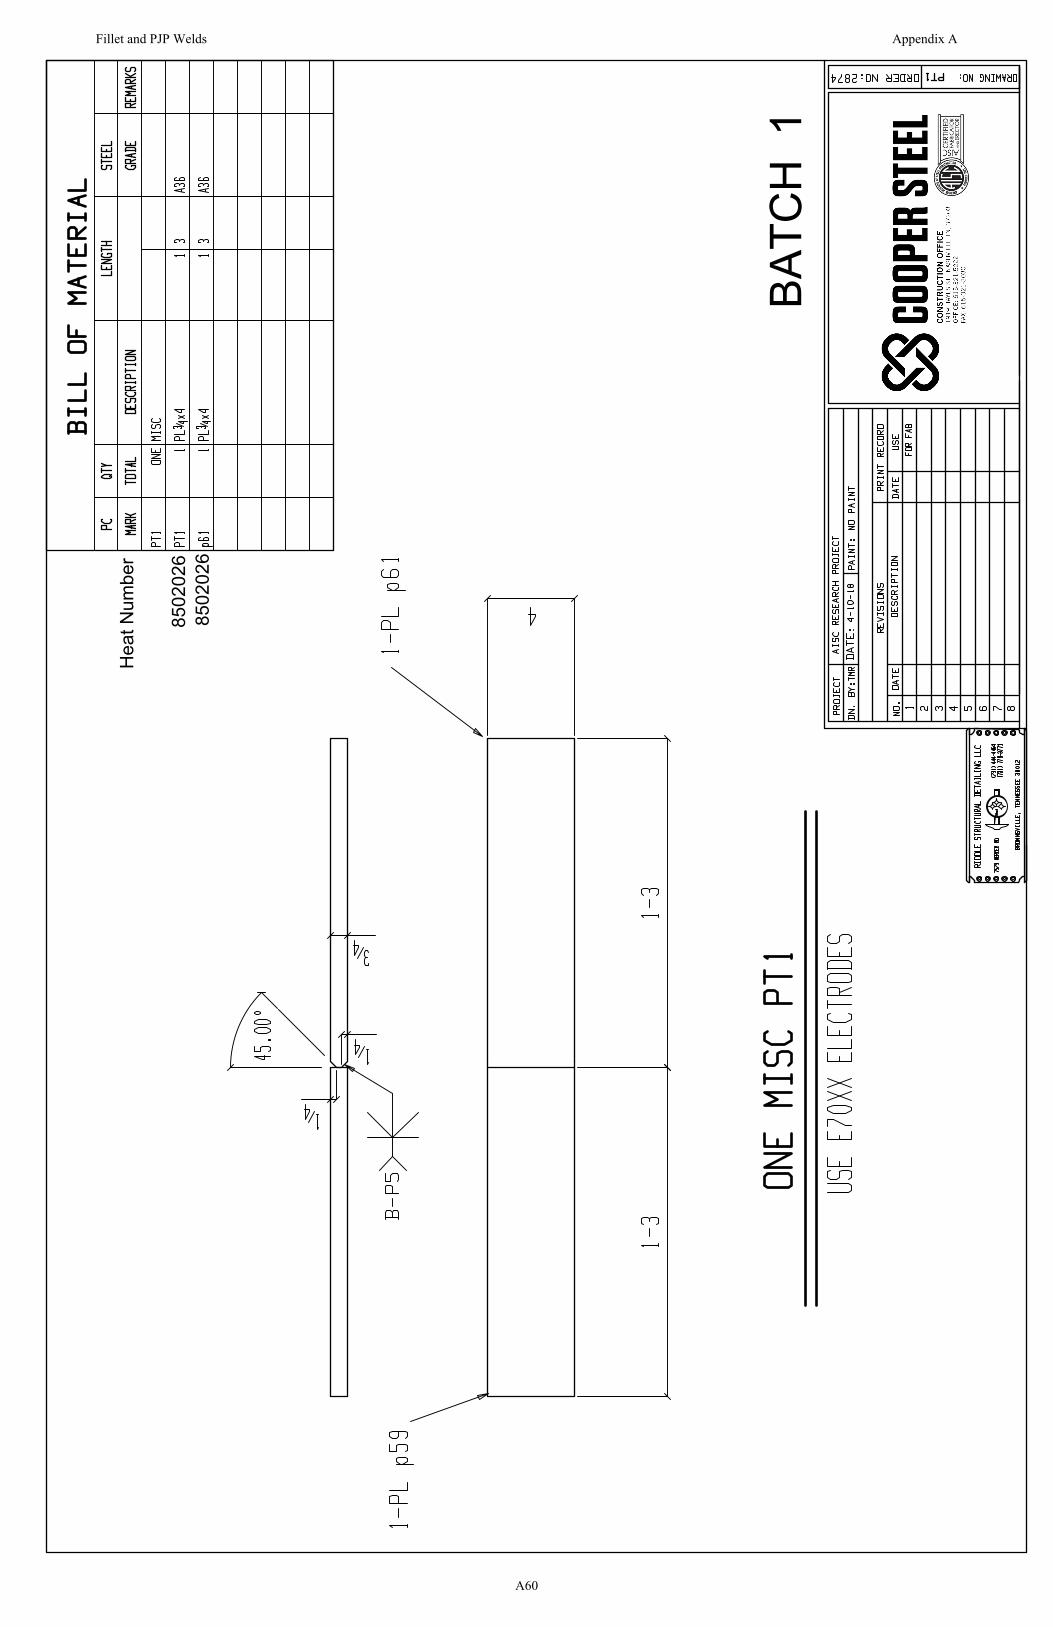
BATC
H 1
Hea
t Num
ber
8502
026
8502
026
Fillet and PJP Welds Appendix A
A60

BATC
H 1
Hea
t Num
ber
D57
15D
5715
Fillet and PJP Welds Appendix A
A61
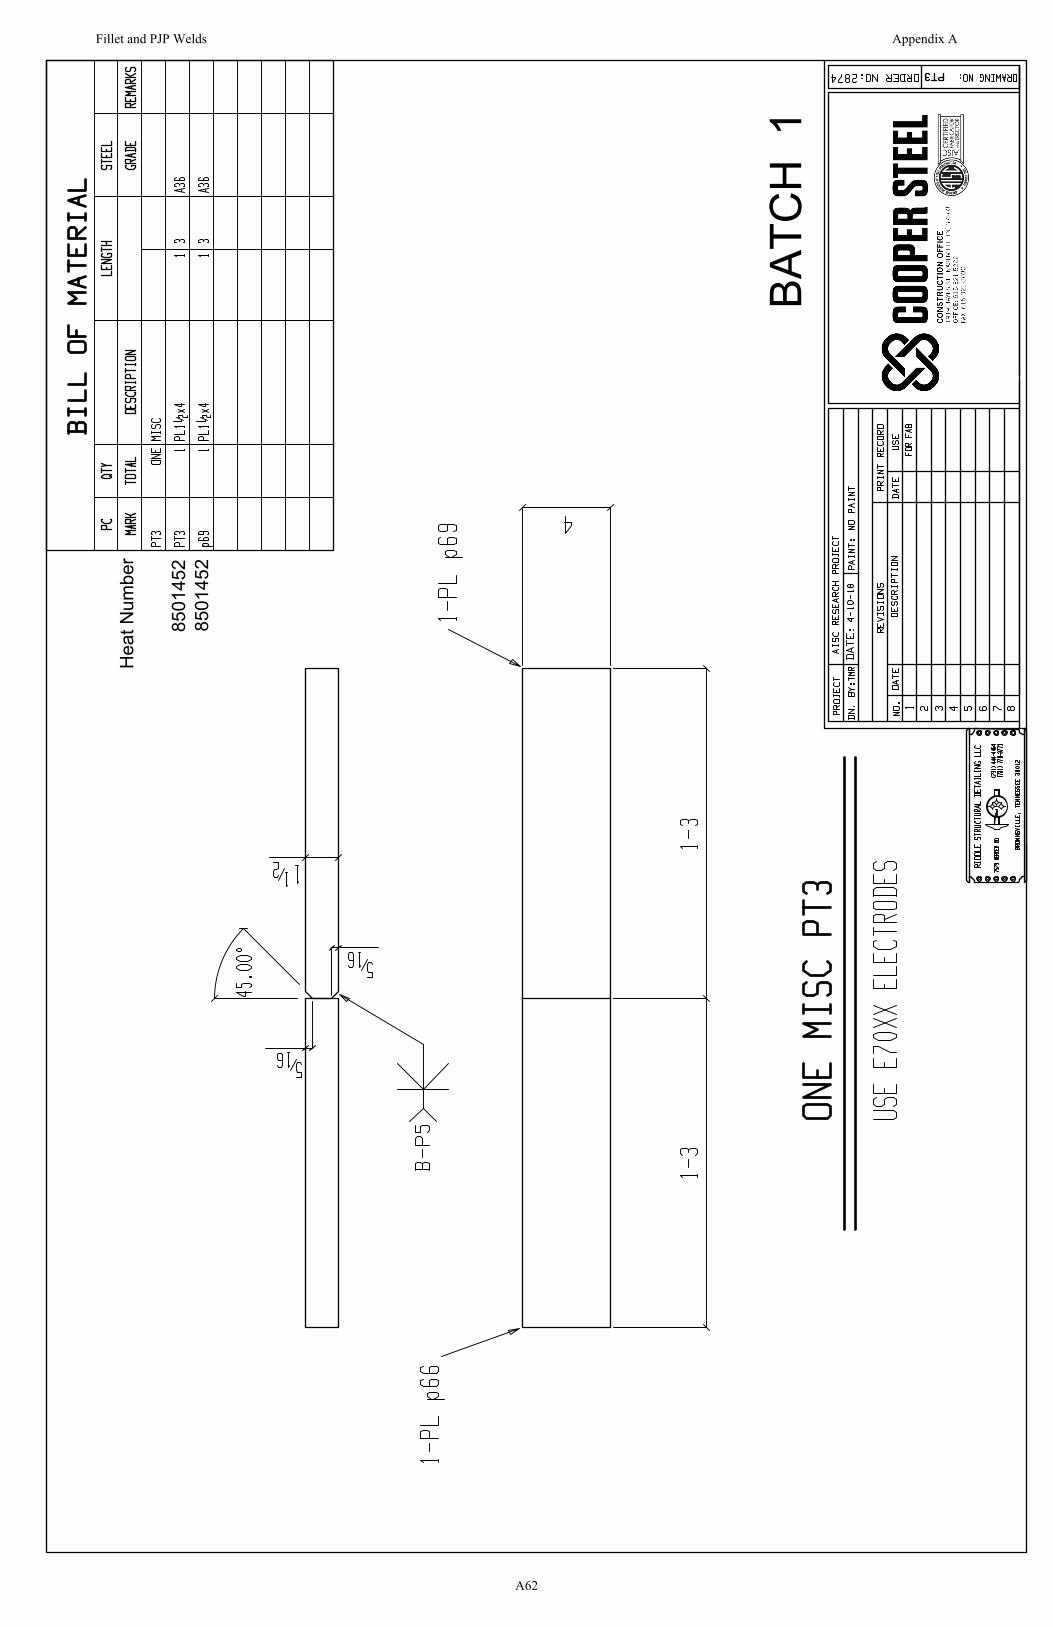
BATC
H 1
Hea
t Num
ber
8501
452
8501
452
Fillet and PJP Welds Appendix A
A62
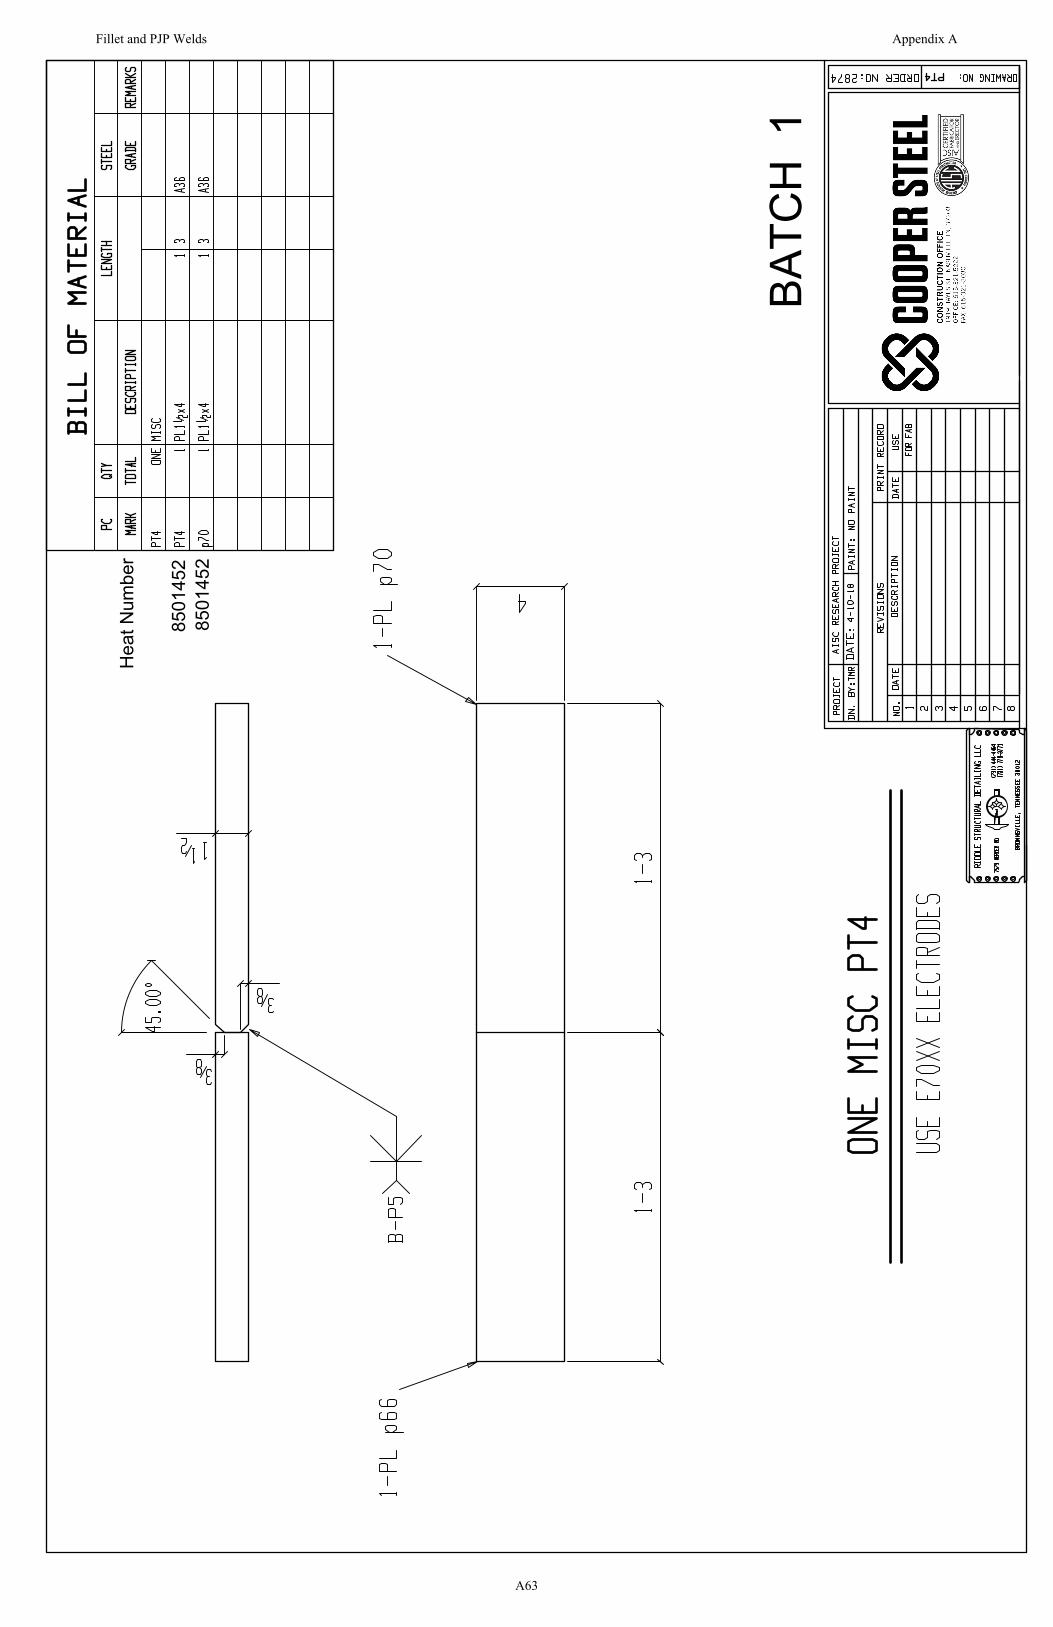
BATC
H 1
Hea
t Num
ber
8501
452
8501
452
Fillet and PJP Welds Appendix A
A63
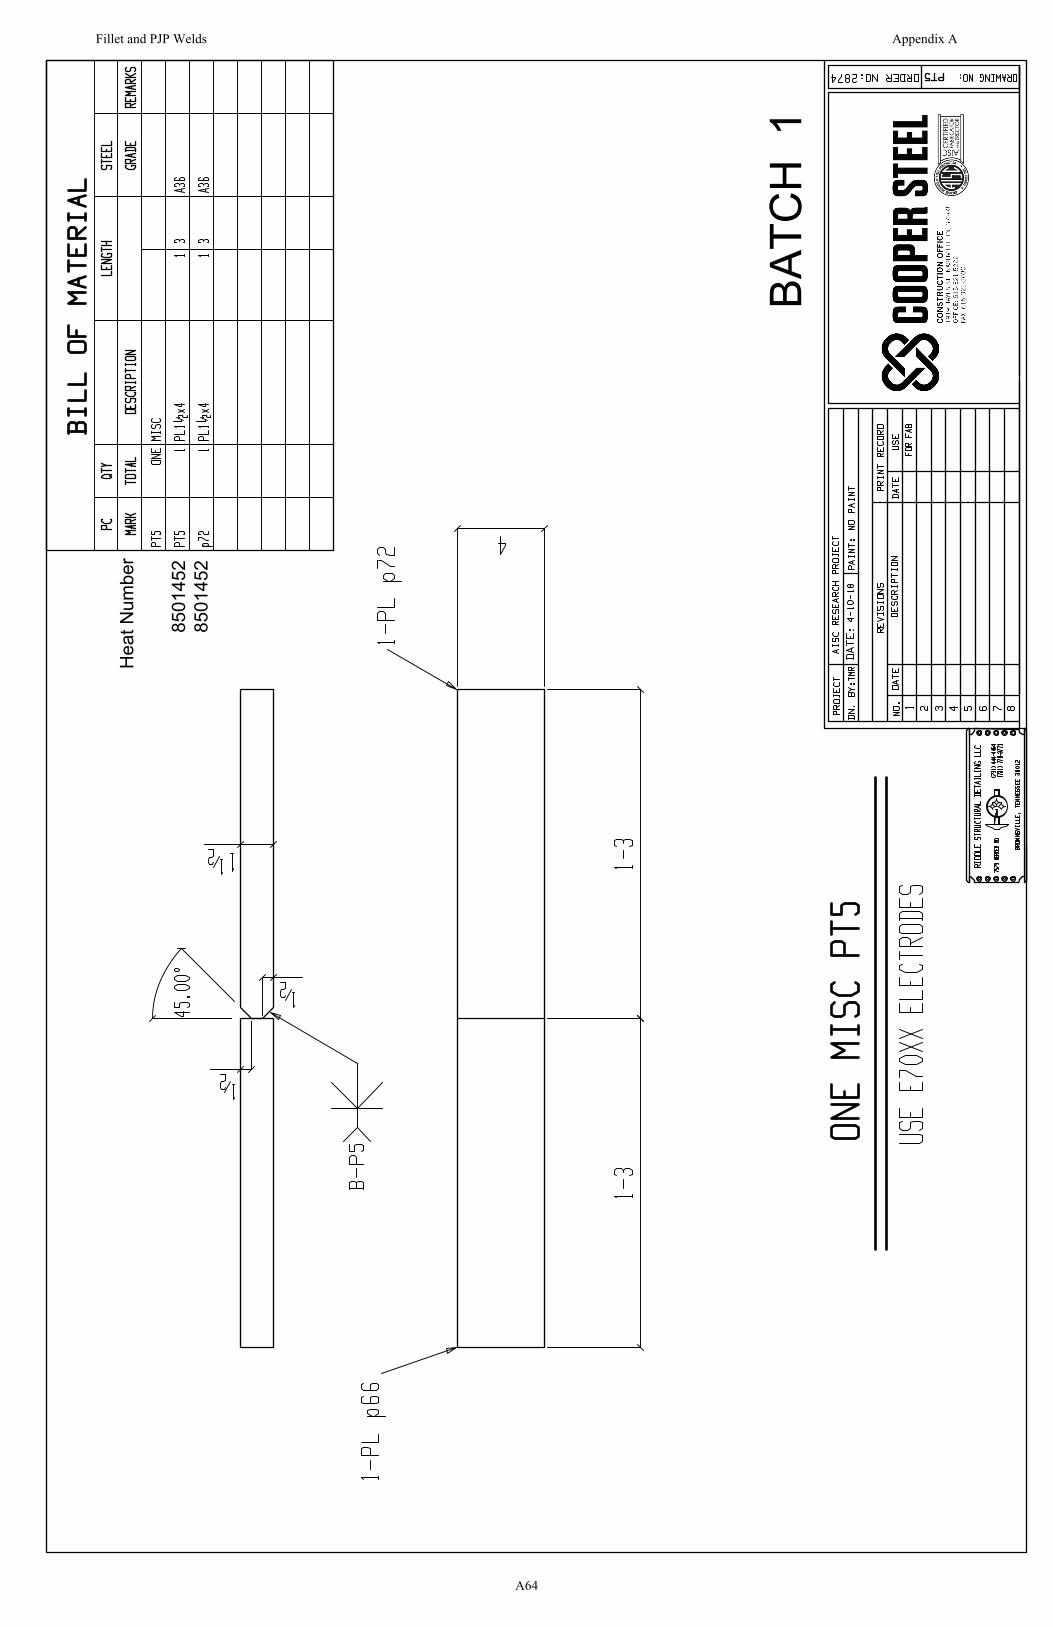
BATC
H 1
Hea
t Num
ber
8501
452
8501
452
Fillet and PJP Welds Appendix A
A64
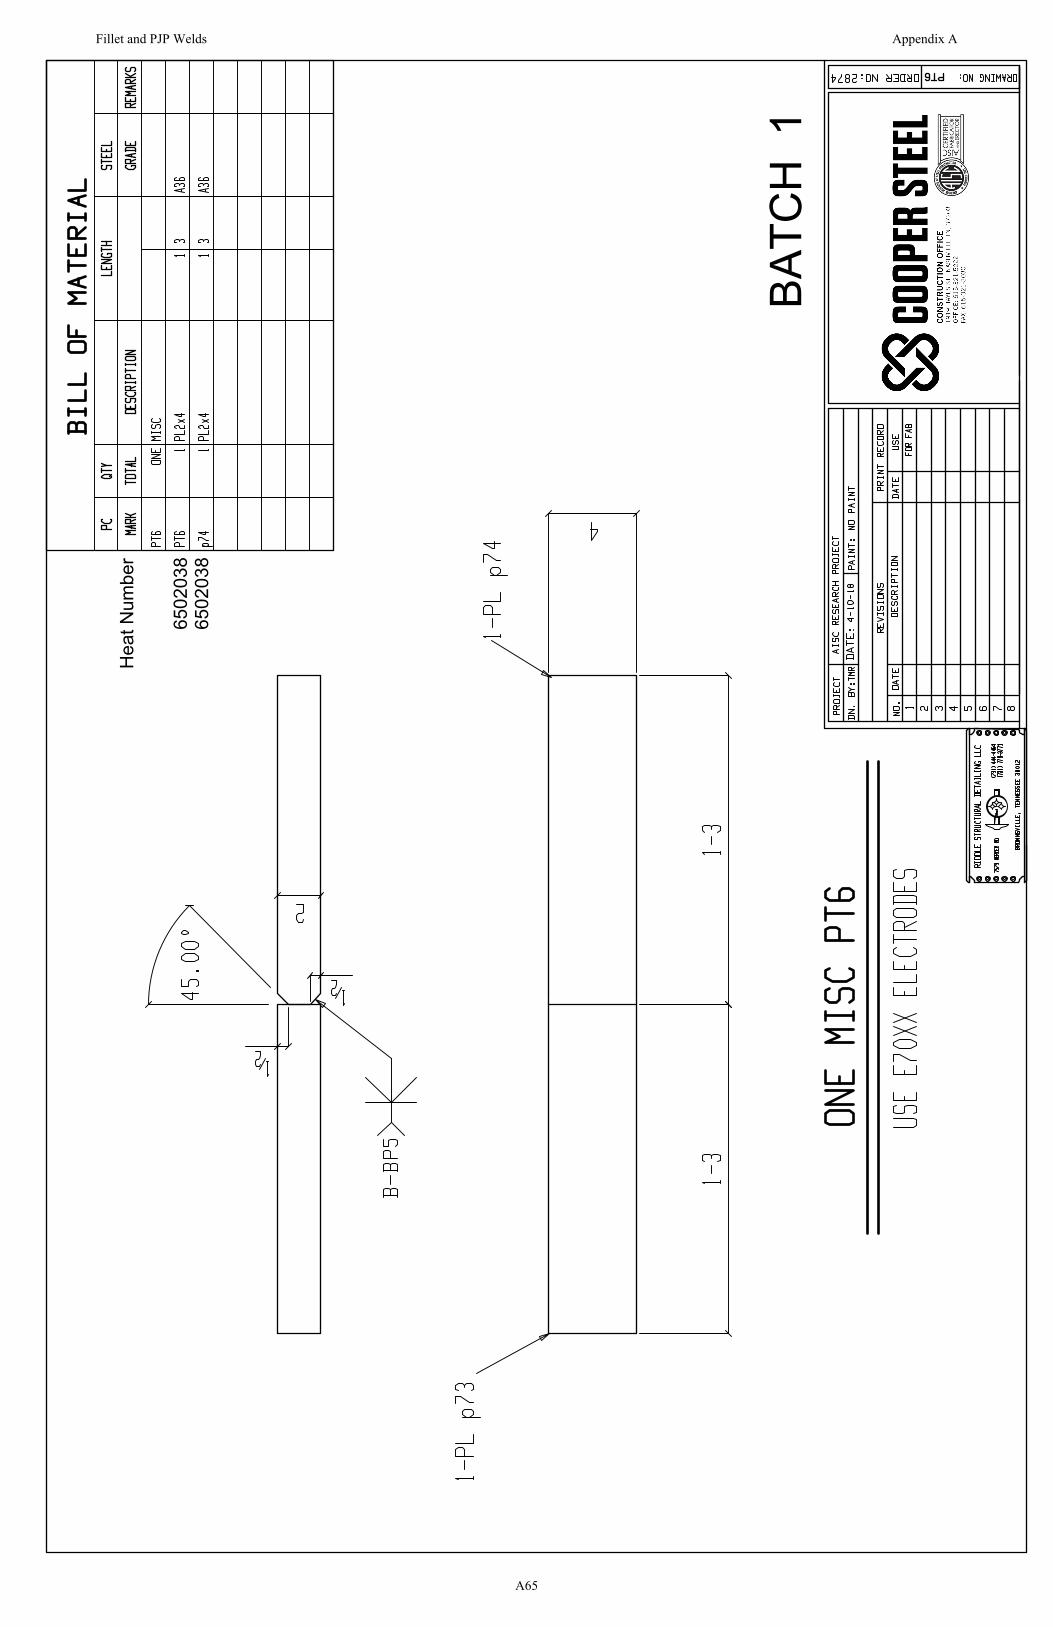
BATC
H 1
Hea
t Num
ber
6502
038
6502
038
Fillet and PJP Welds Appendix A
A65

BATC
H 1
Hea
t Num
ber
W7H
748
W7H
748
Fillet and PJP Welds Appendix A
A66

BATC
H 1
Hea
t Num
ber
7507
549
7507
549
Fillet and PJP Welds Appendix A
A67
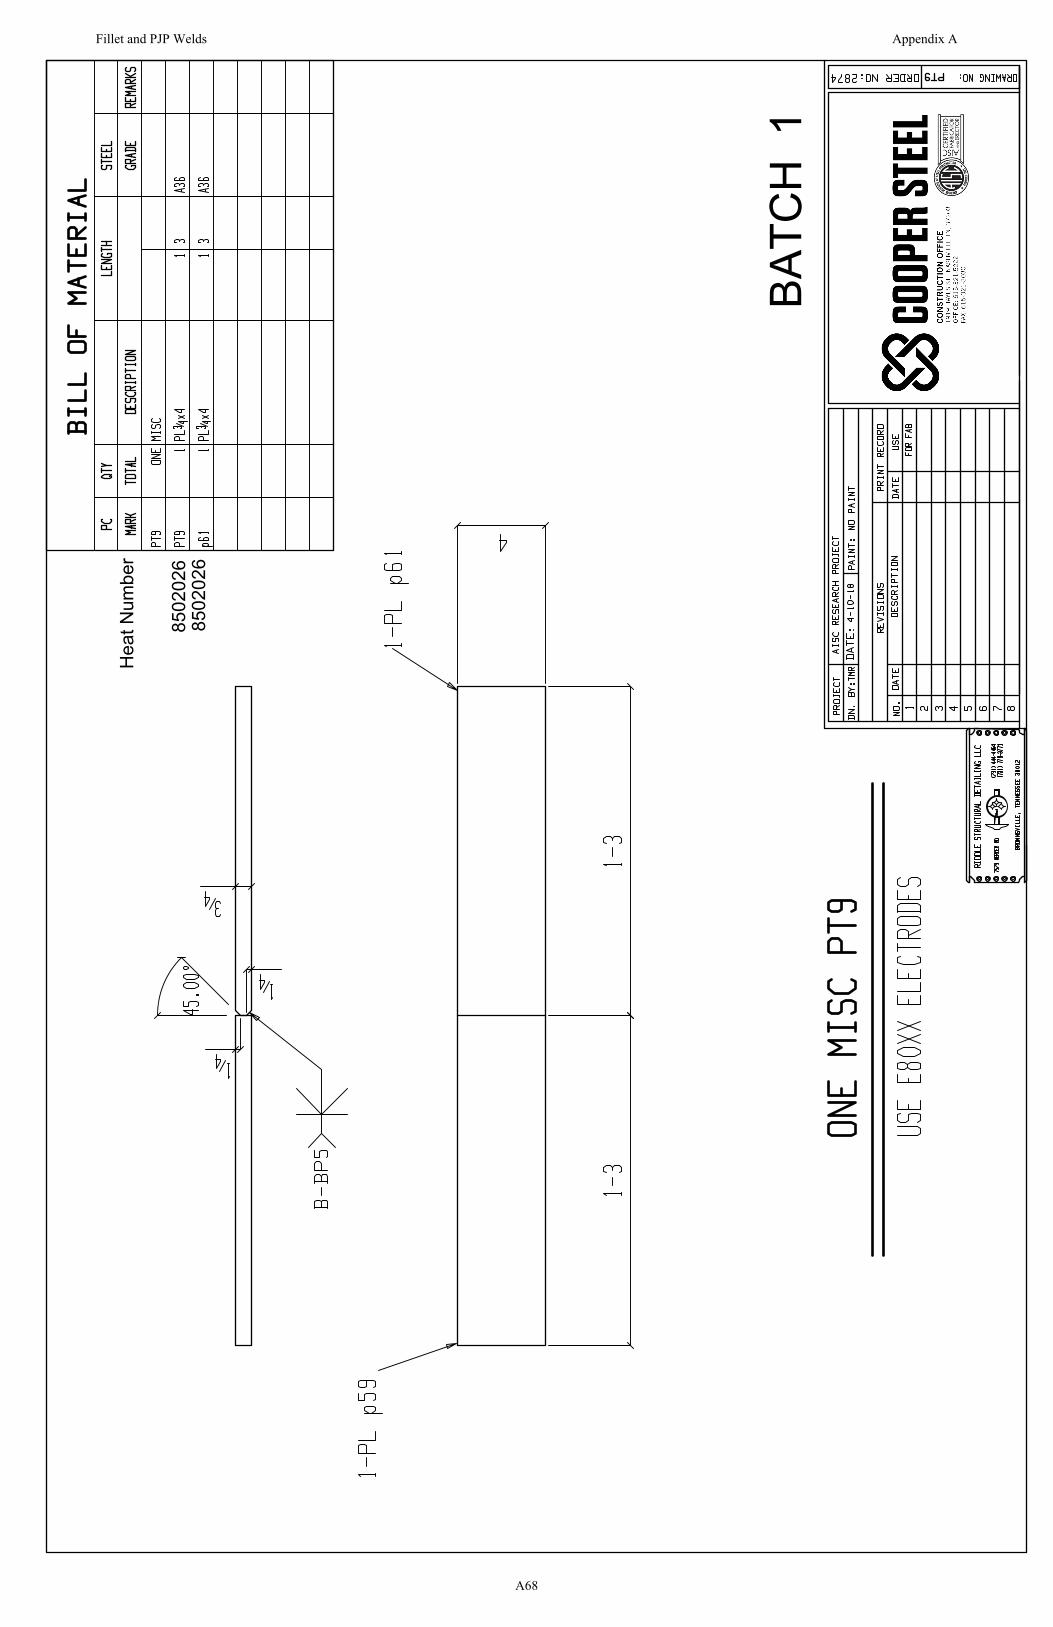
BATC
H 1
Hea
t Num
ber
8502
026
8502
026
Fillet and PJP Welds Appendix A
A68
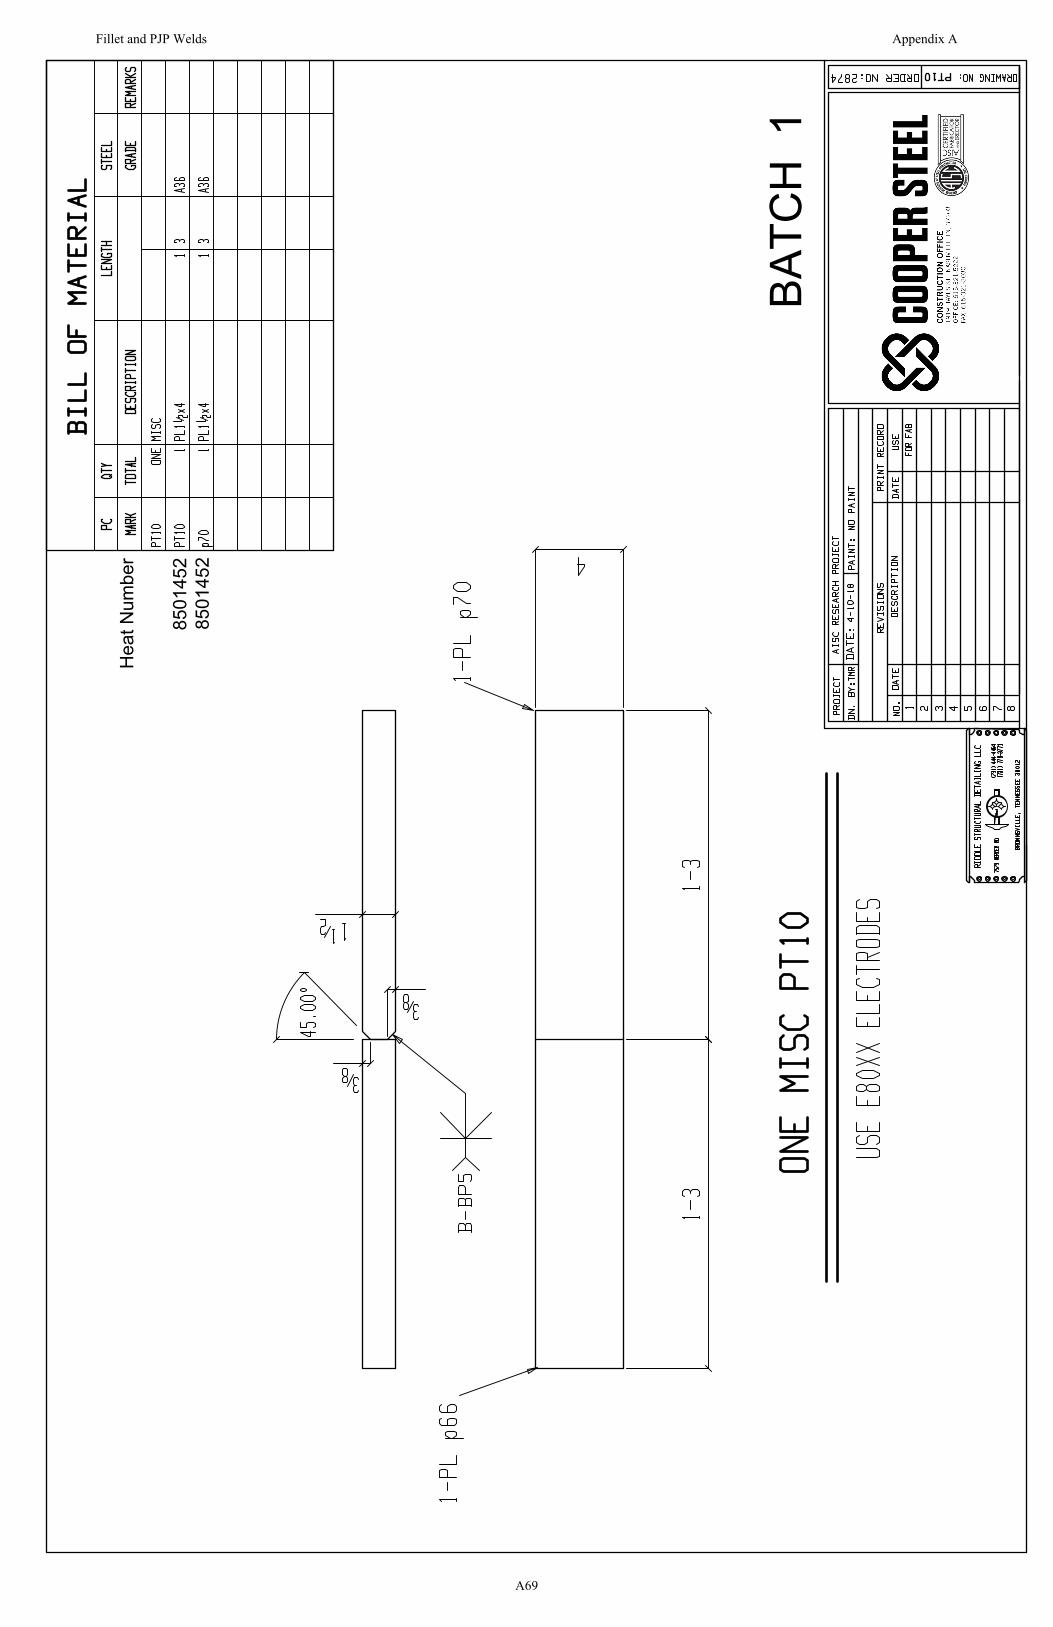
BATC
H 1
Hea
t Num
ber
8501
452
8501
452
Fillet and PJP Welds Appendix A
A69
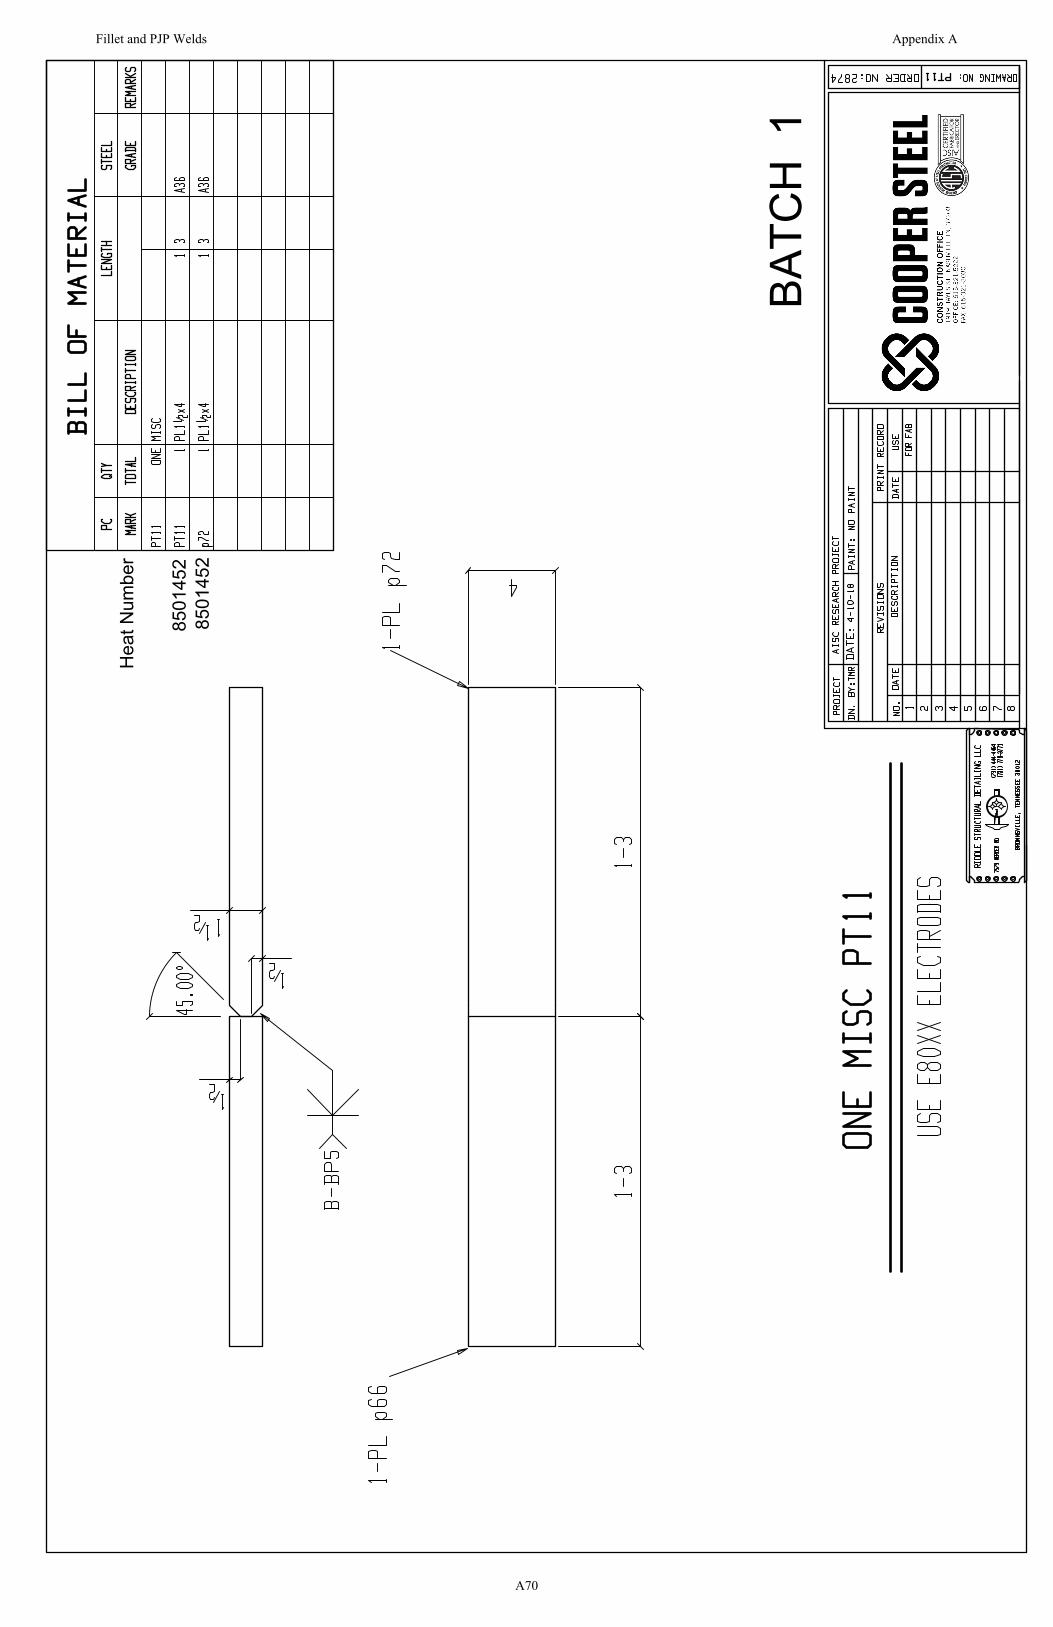
BATC
H 1
Hea
t Num
ber
8501
452
8501
452
Fillet and PJP Welds Appendix A
A70
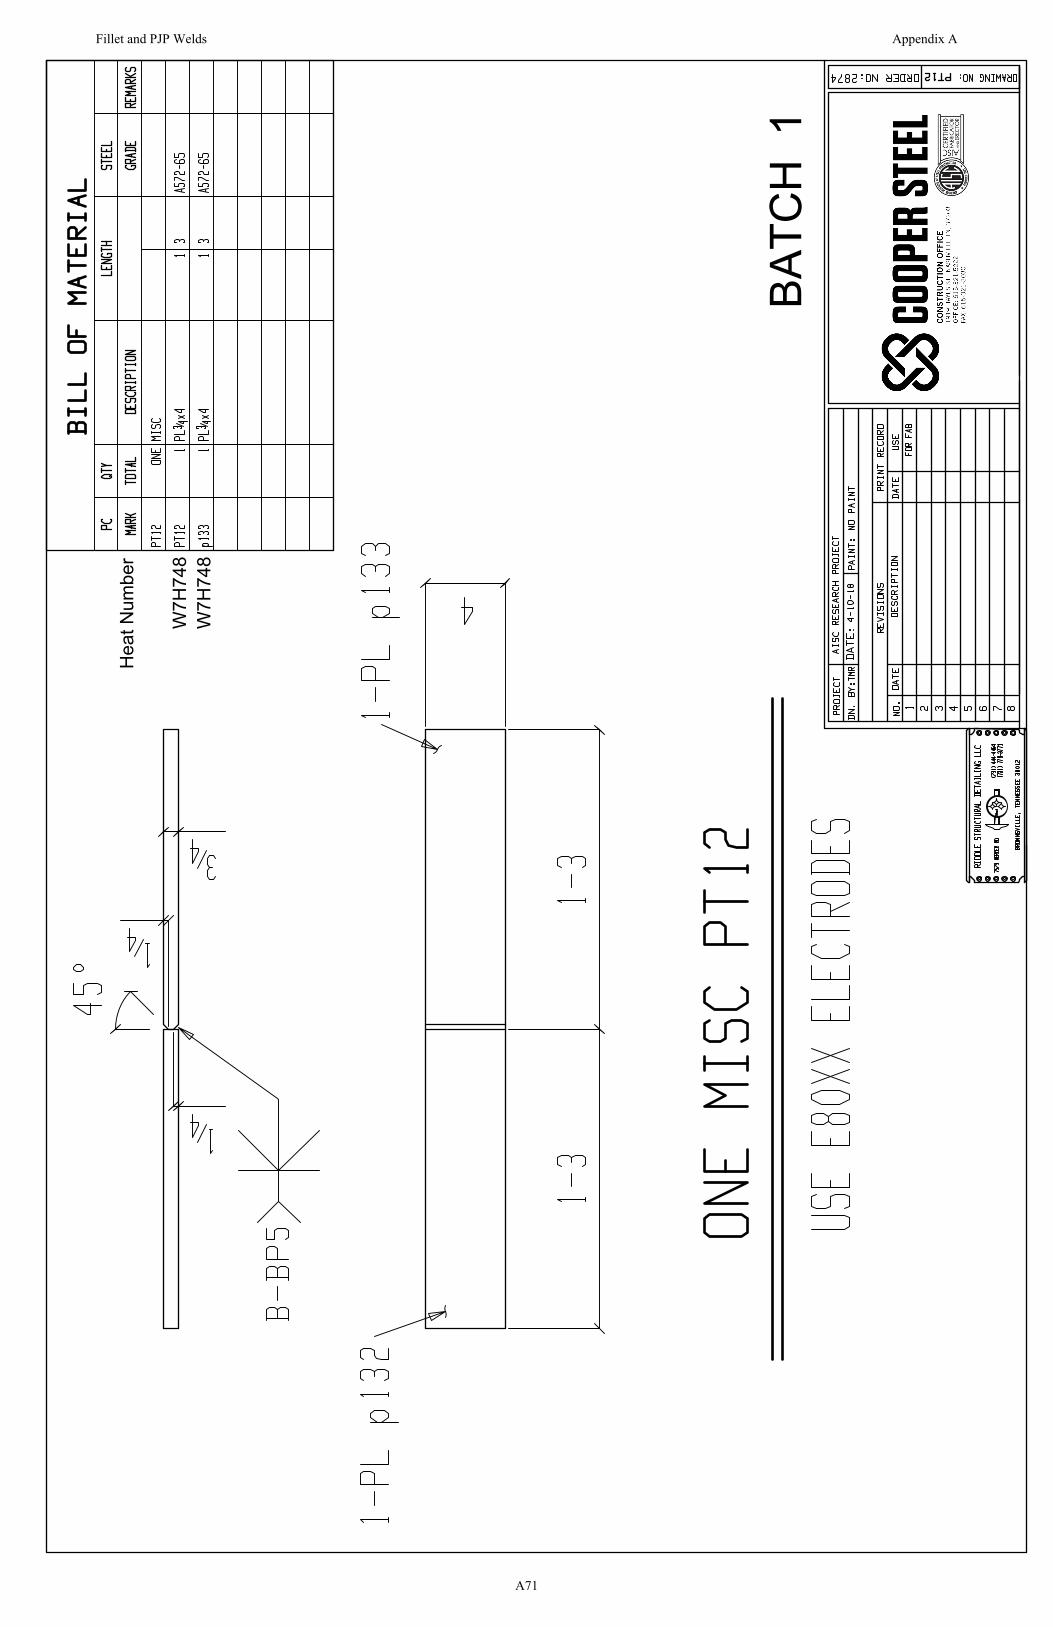
BATC
H 1
Hea
t Num
ber
W7H
748
W7H
748
Fillet and PJP Welds Appendix A
A71
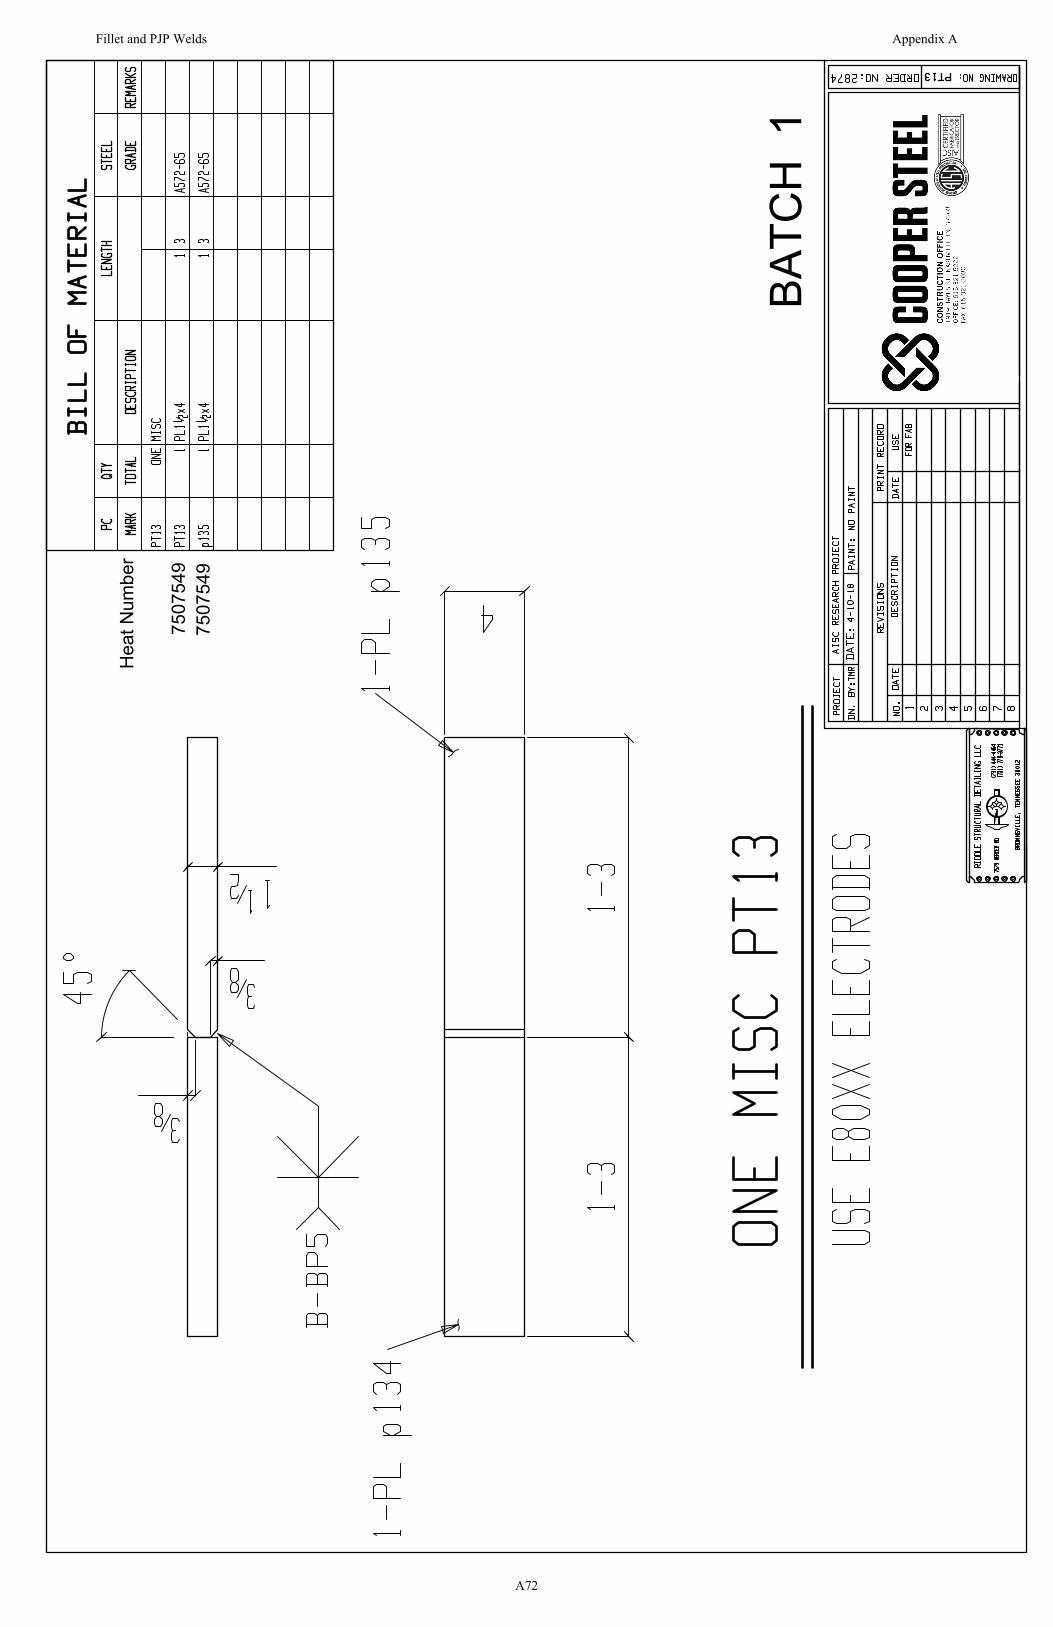
BATC
H 1
Hea
t Num
ber
7507
549
7507
549
Fillet and PJP Welds Appendix A
A72

BATC
H 1
Hea
t Num
ber
8502
026
8502
026
Fillet and PJP Welds Appendix A
A73
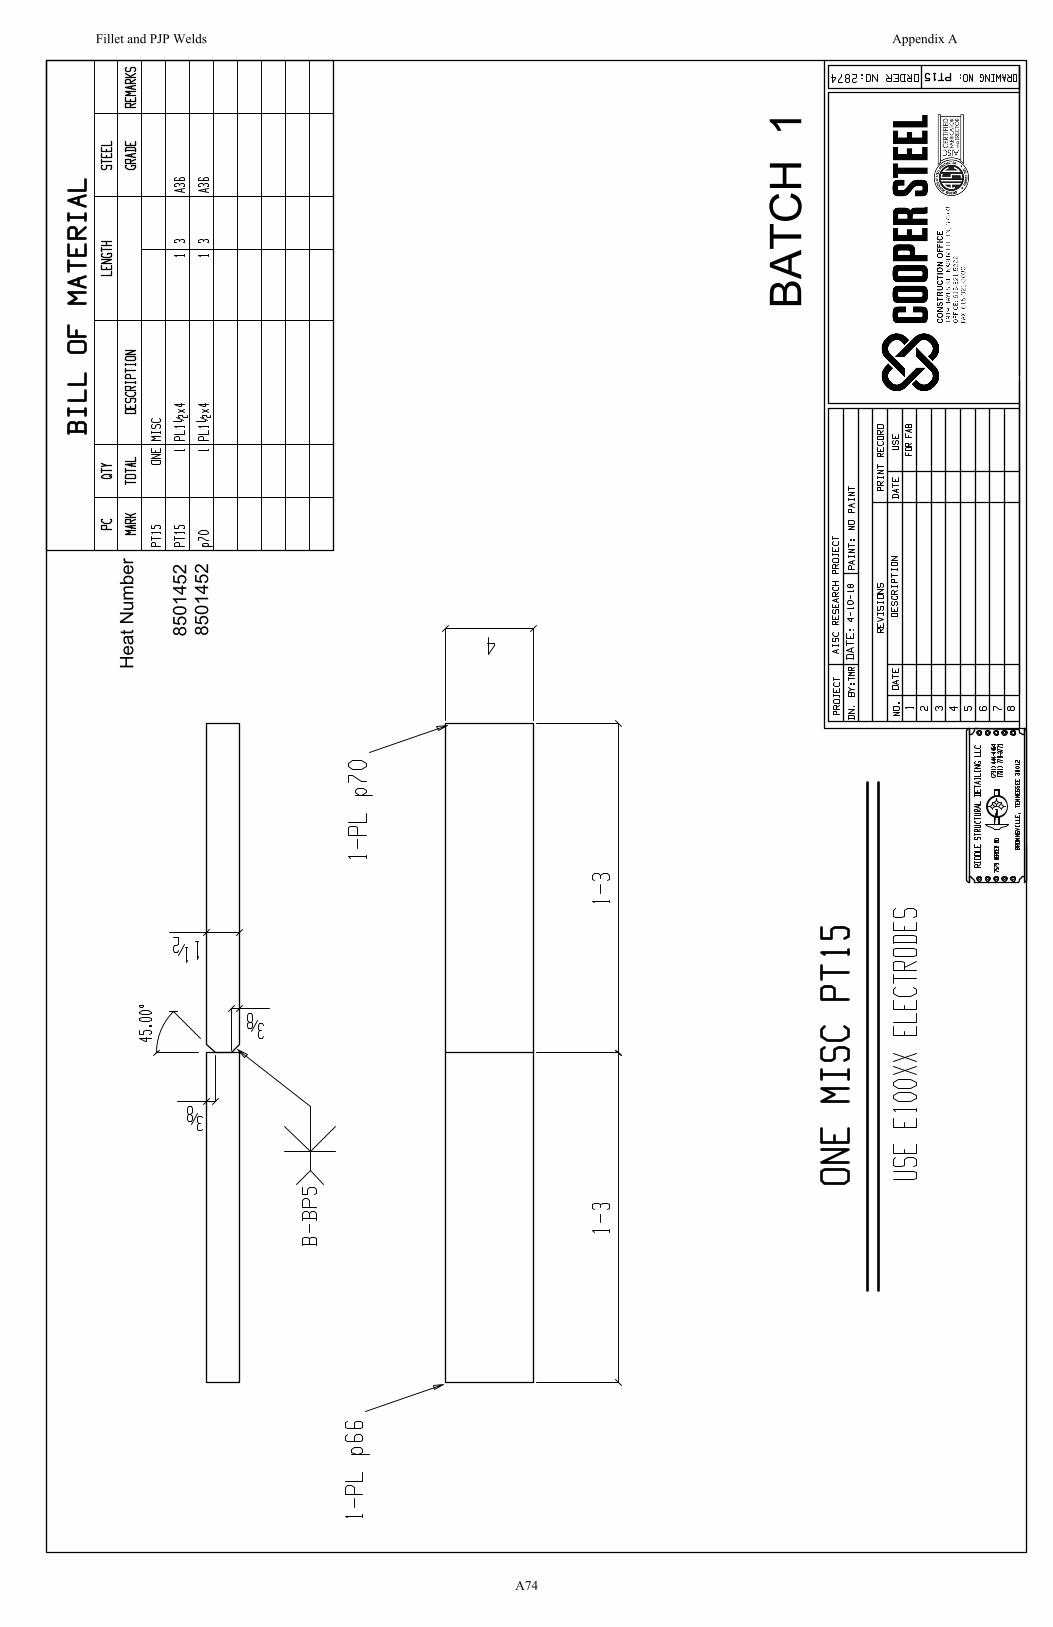
BATC
H 1
Hea
t Num
ber
8501
452
8501
452
Fillet and PJP Welds Appendix A
A74
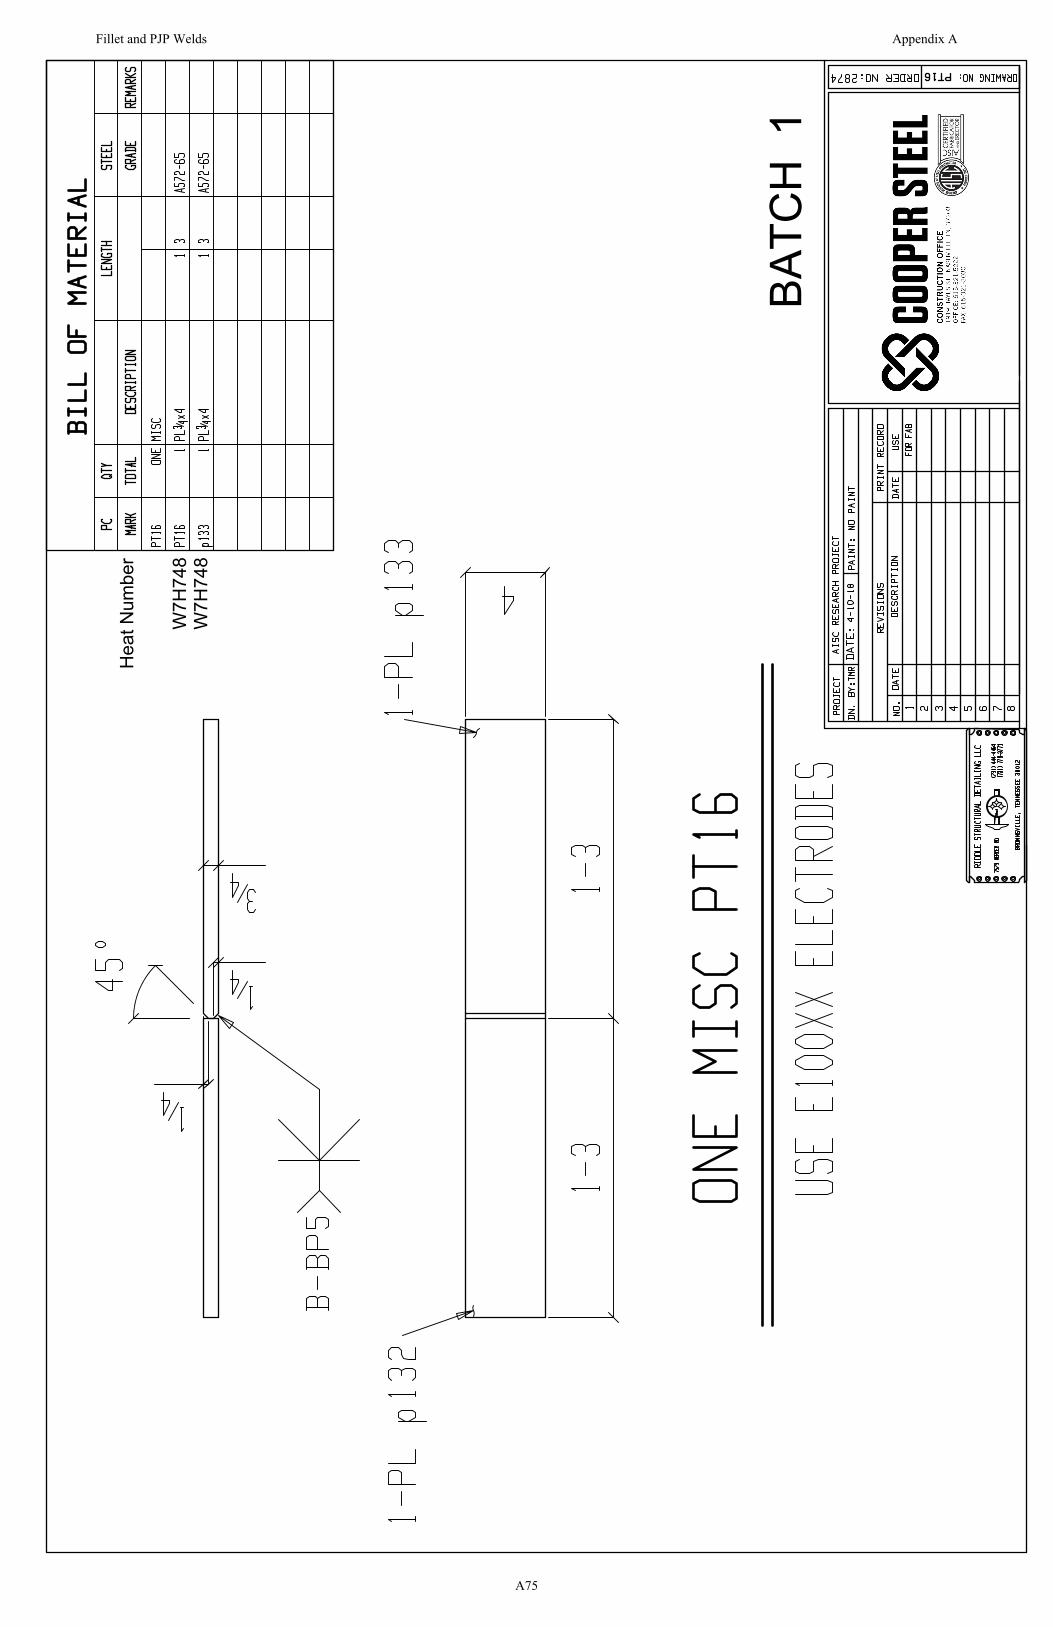
BATC
H 1
Hea
t Num
ber
W7H
748
W7H
748
Fillet and PJP Welds Appendix A
A75
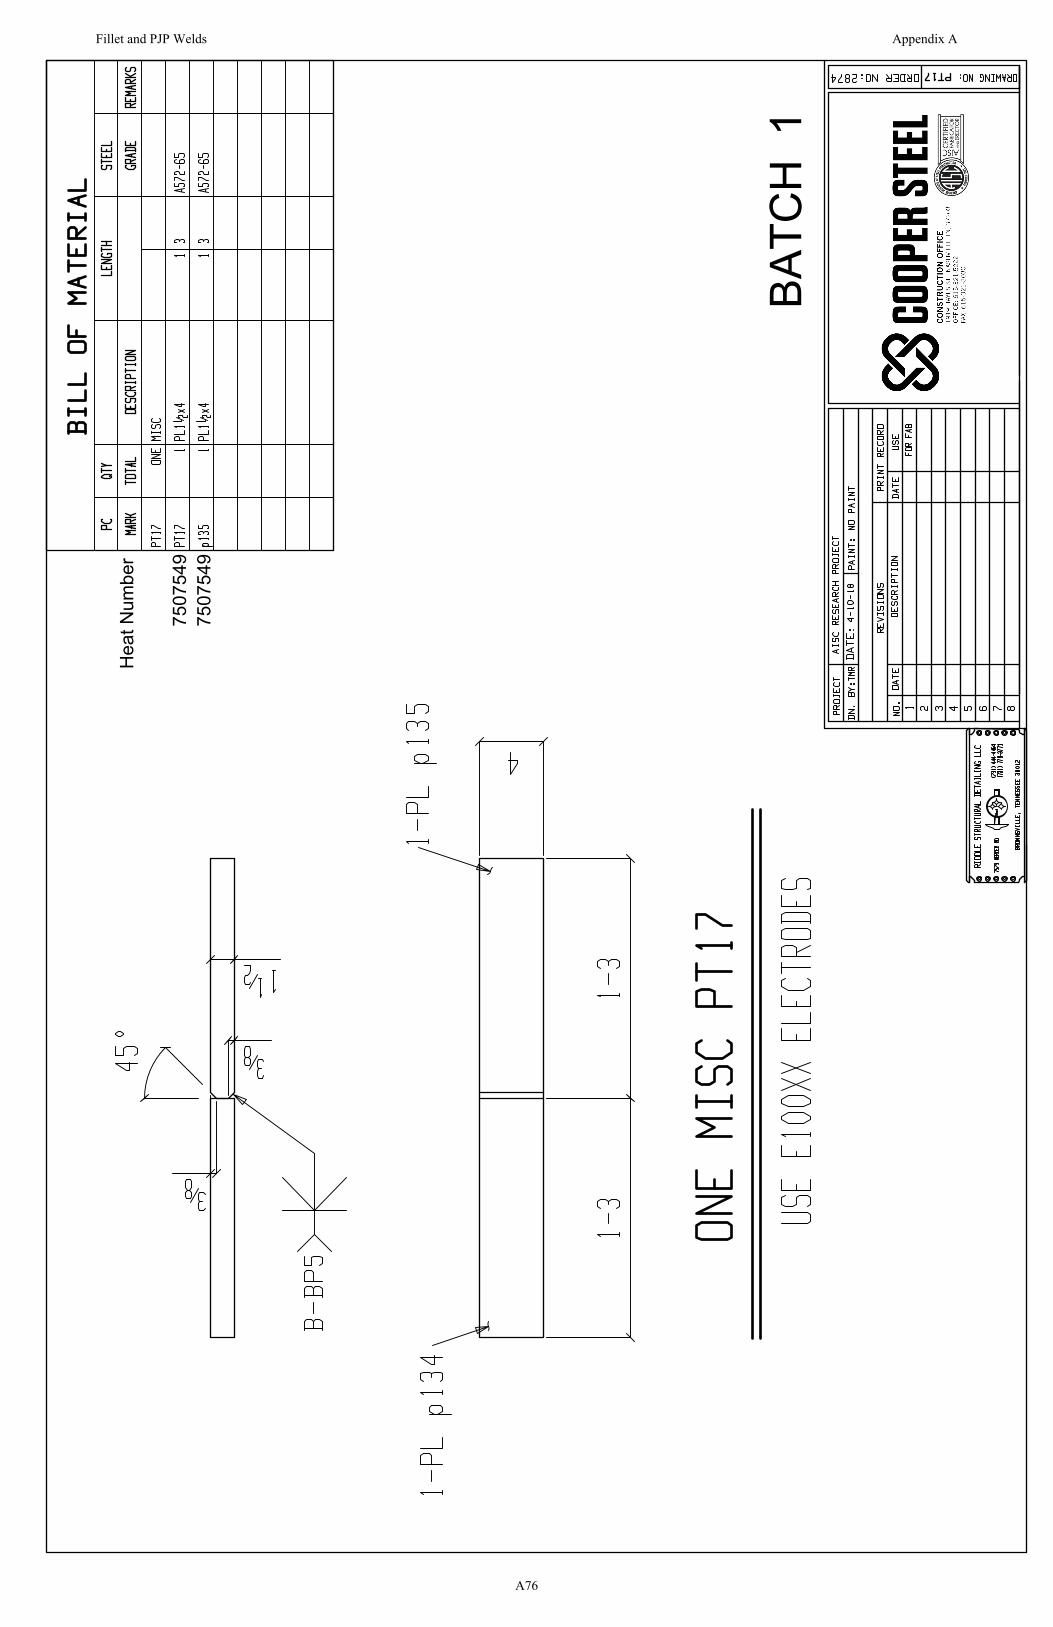
BATC
H 1
Hea
t Num
ber
7507
549
7507
549
Fillet and PJP Welds Appendix A
A76

APPENDIX B
PLATE MILL TEST REPORTS
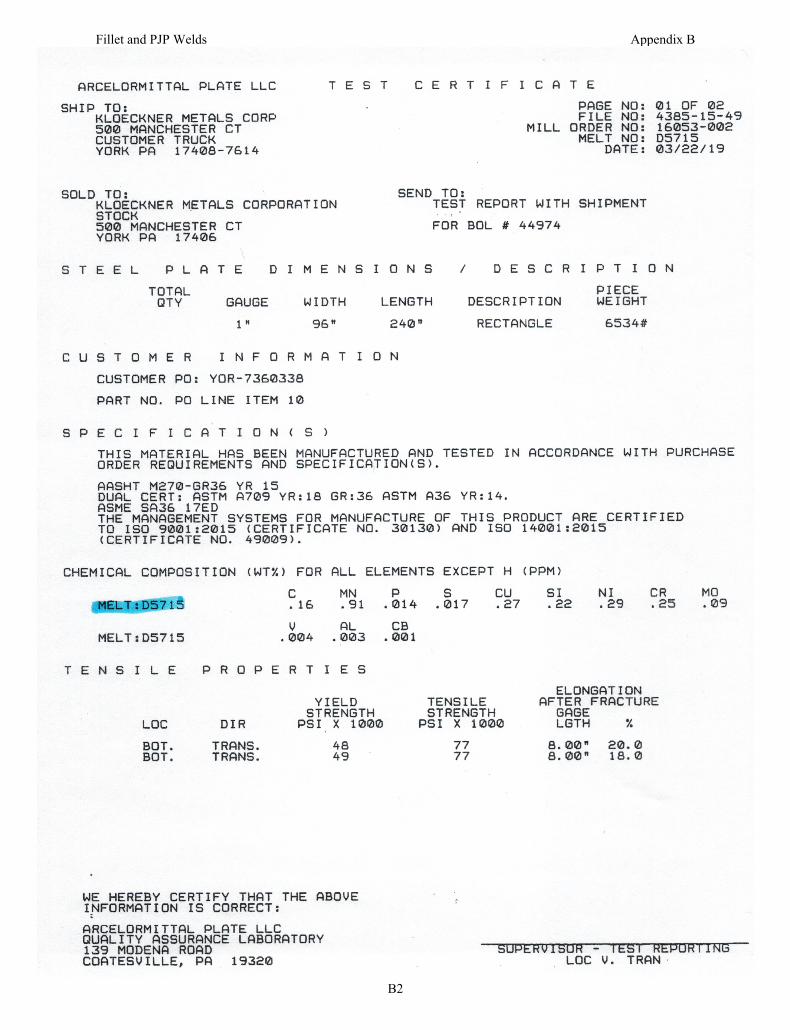
Fillet and PJP Welds Appendix B
B2
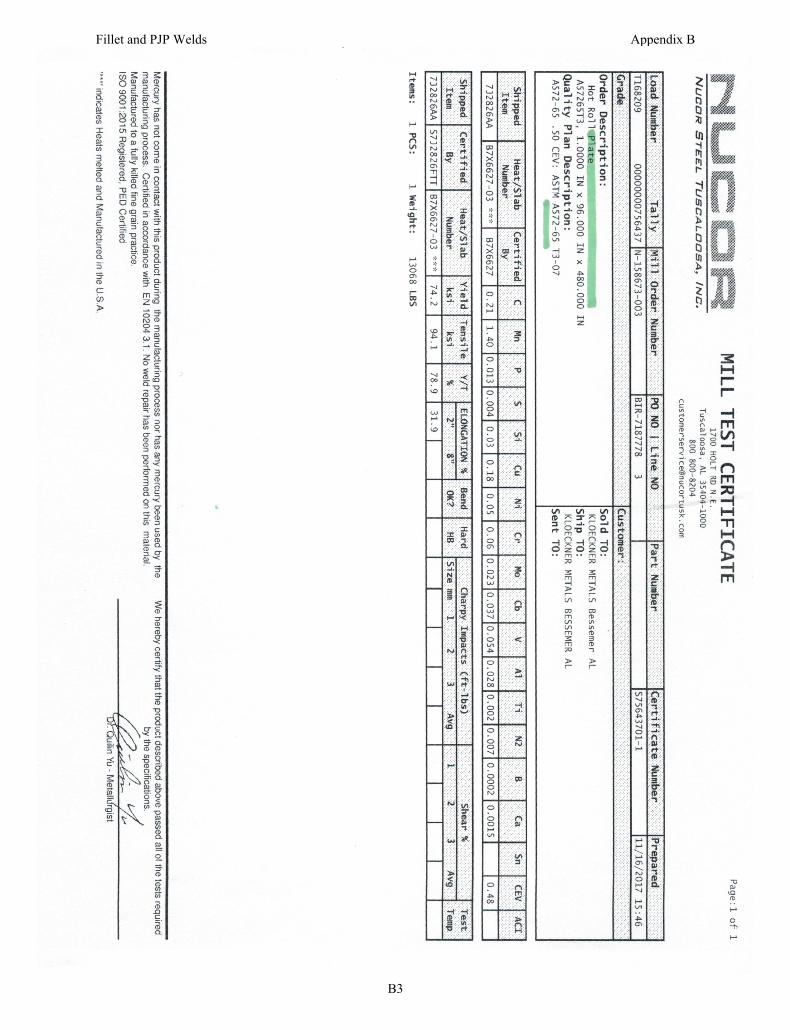
Fillet and PJP Welds Appendix B
B3
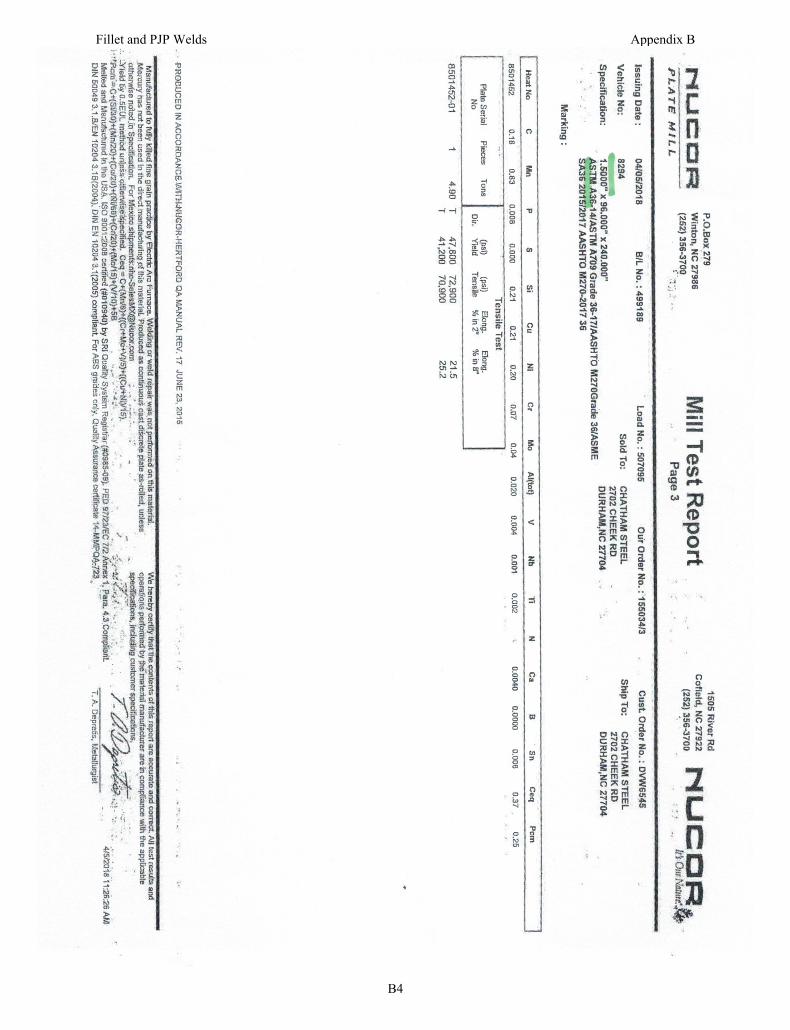
Fillet and PJP Welds Appendix B
B4
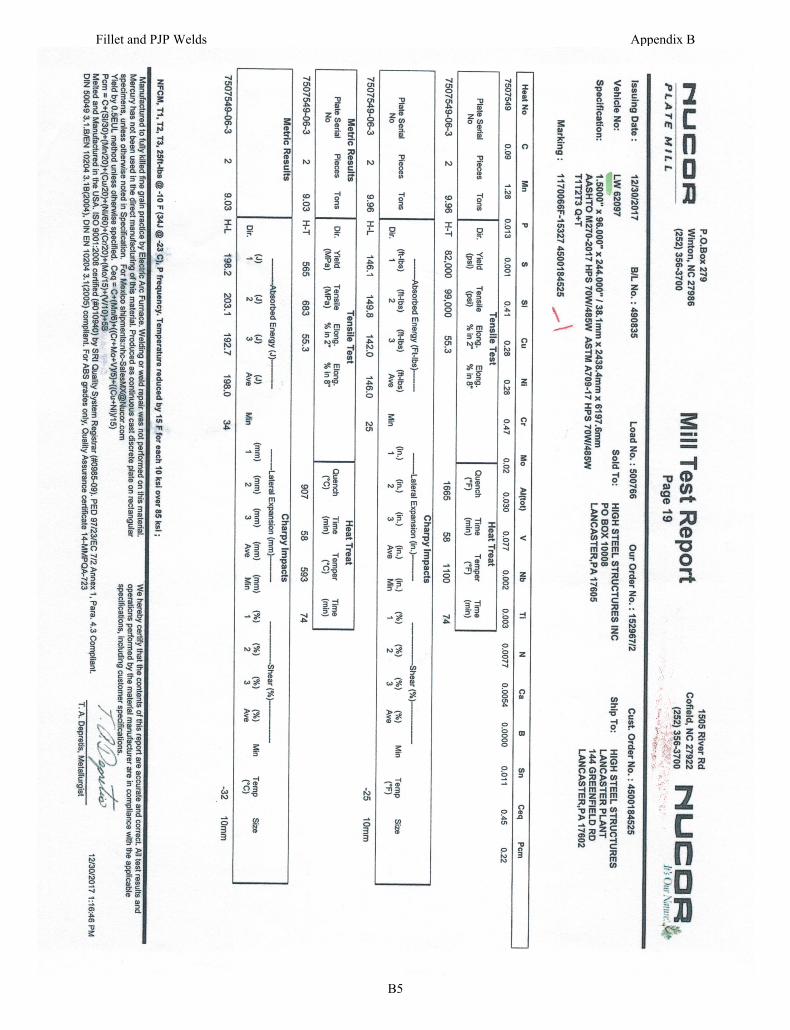
Fillet and PJP Welds Appendix B
B5
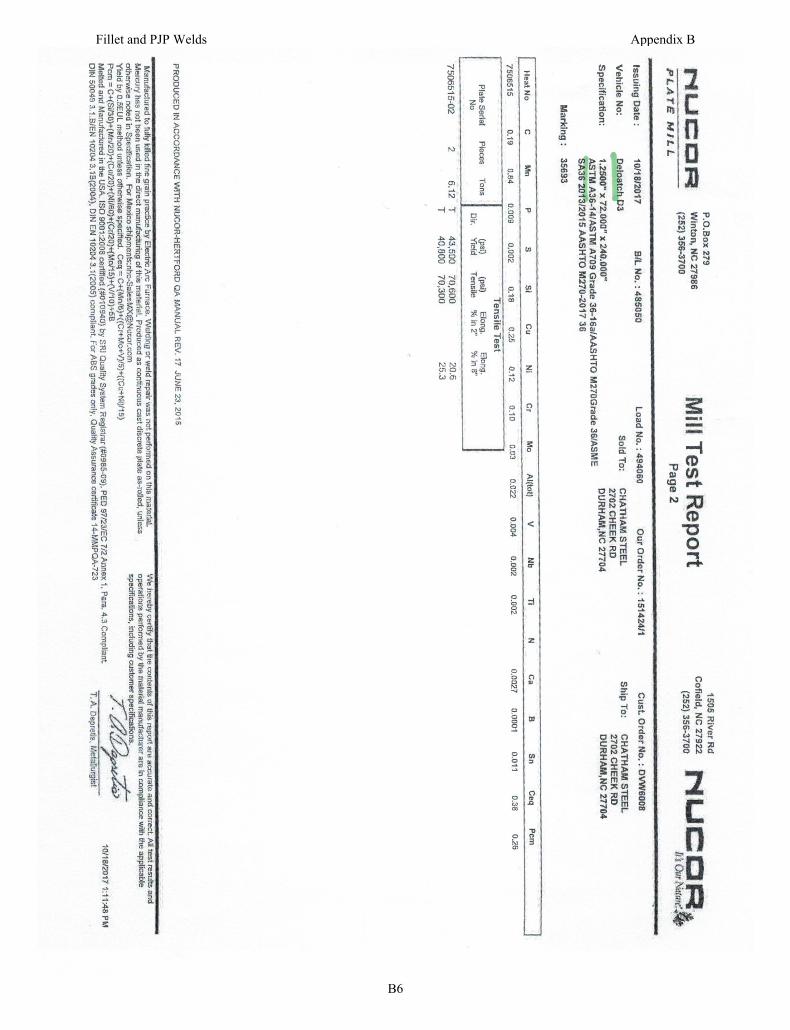
Fillet and PJP Welds Appendix B
B6
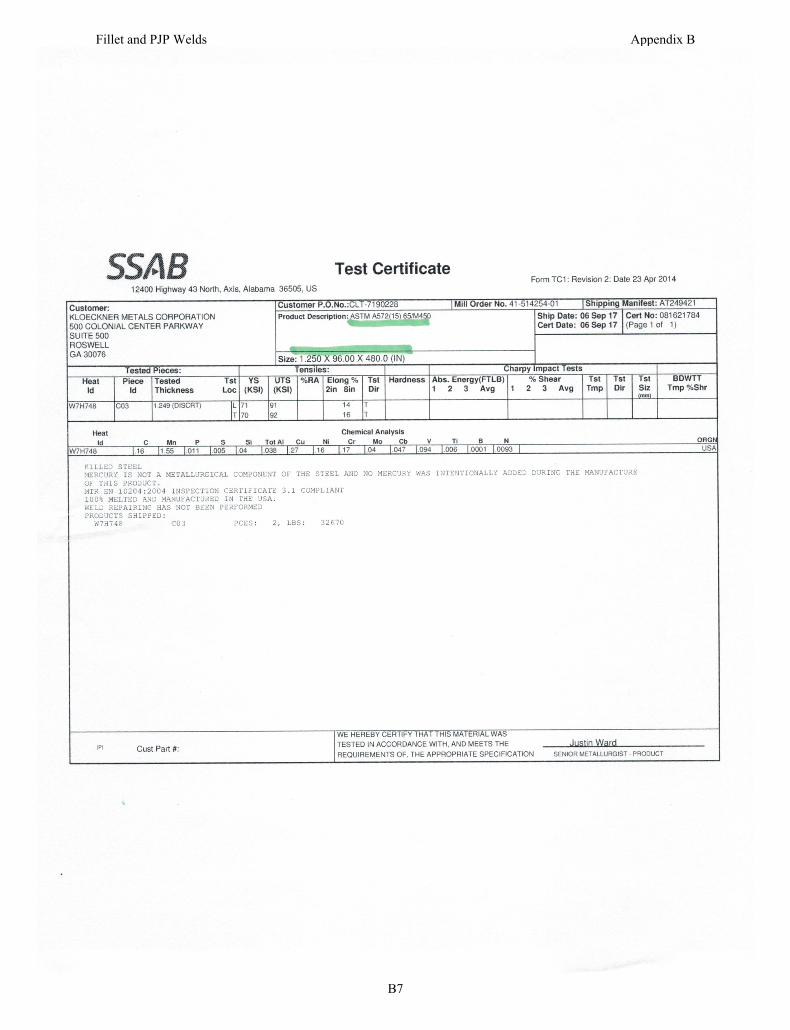
Fillet and PJP Welds Appendix B
B7
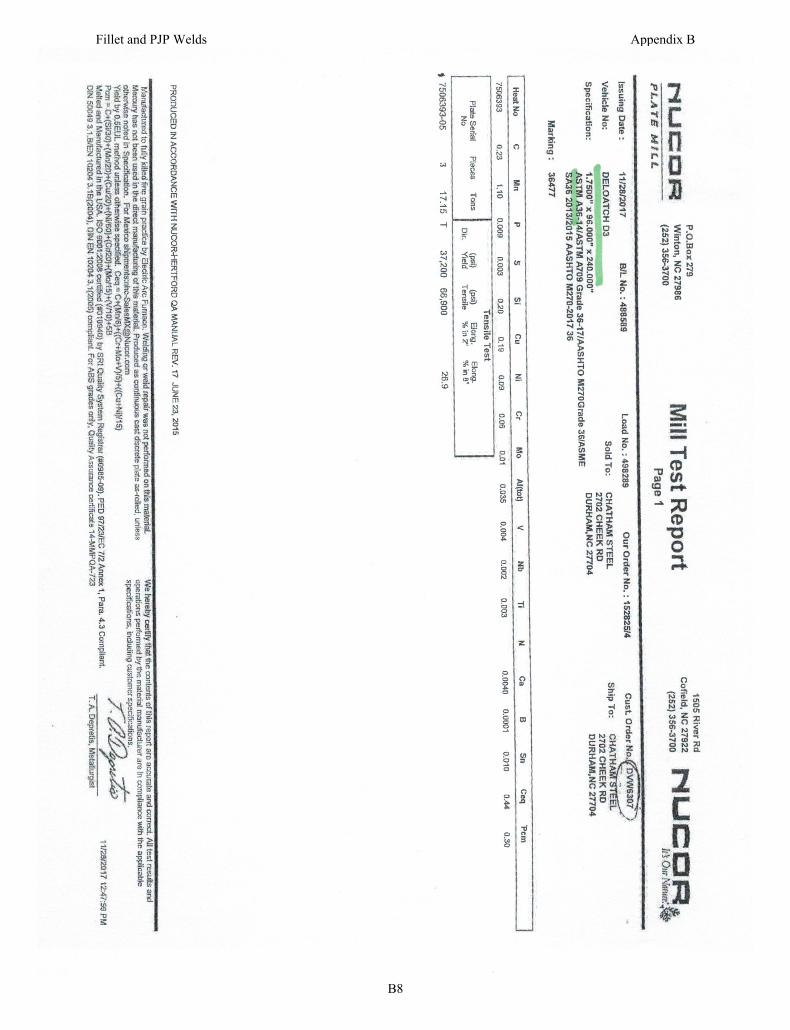
Fillet and PJP Welds Appendix B
B8

Fillet and PJP Welds Appendix B
B9
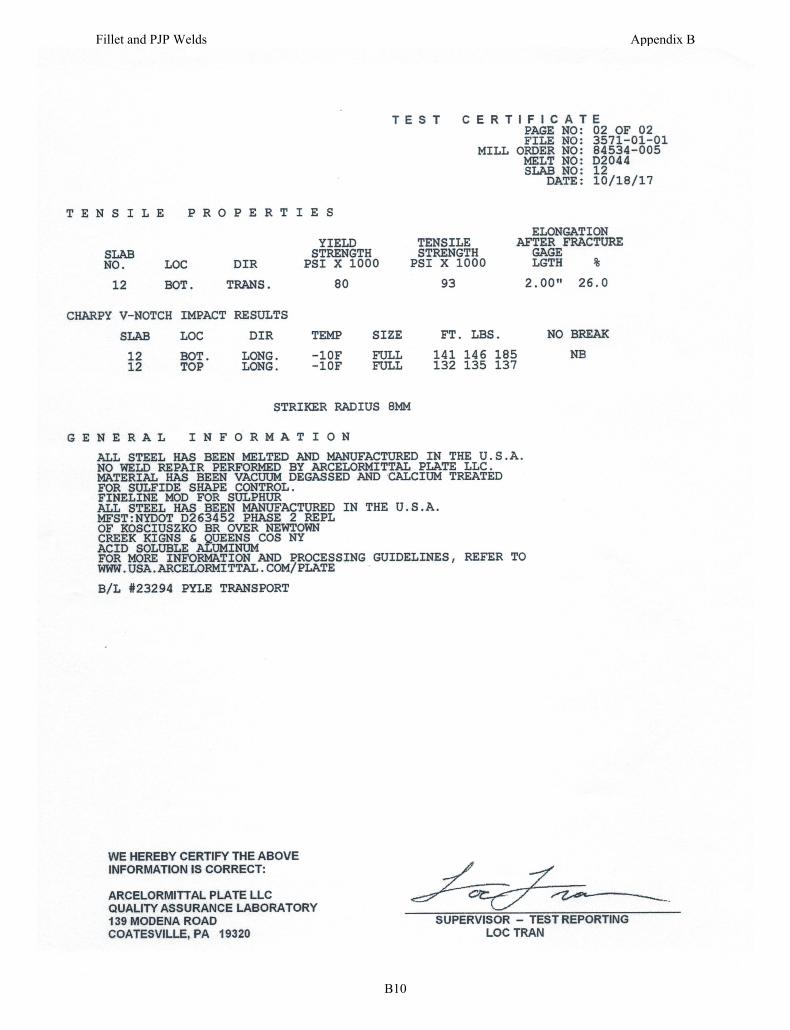
Fillet and PJP Welds Appendix B
B10
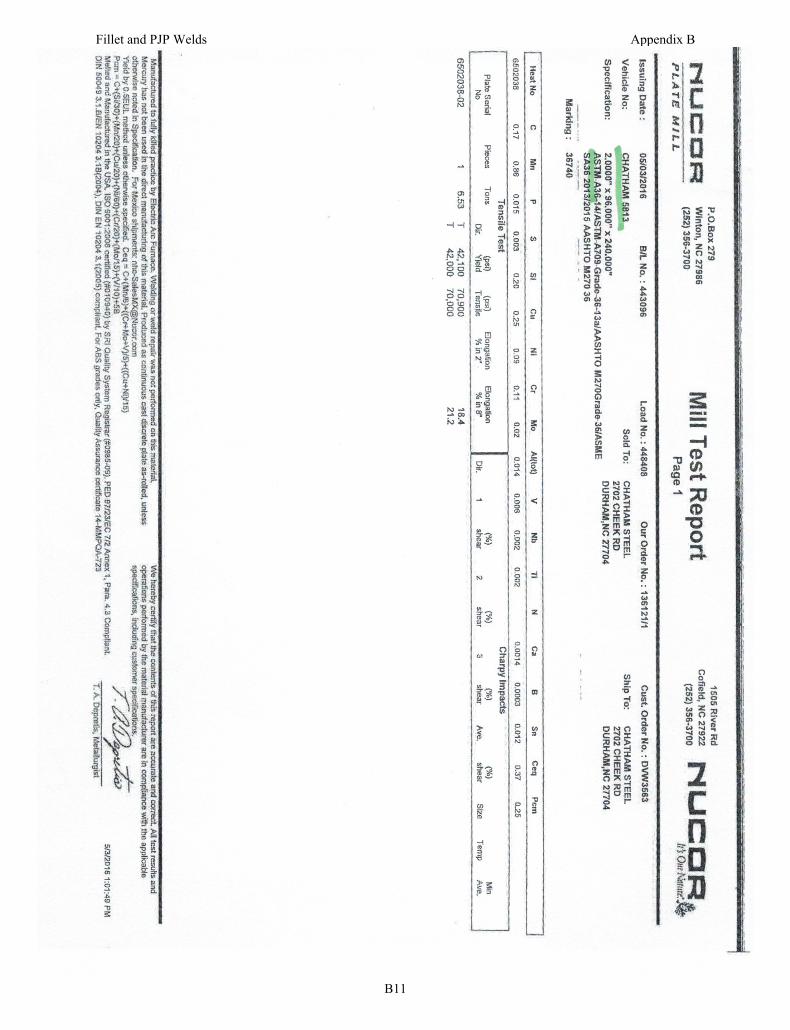
Fillet and PJP Welds Appendix B
B11
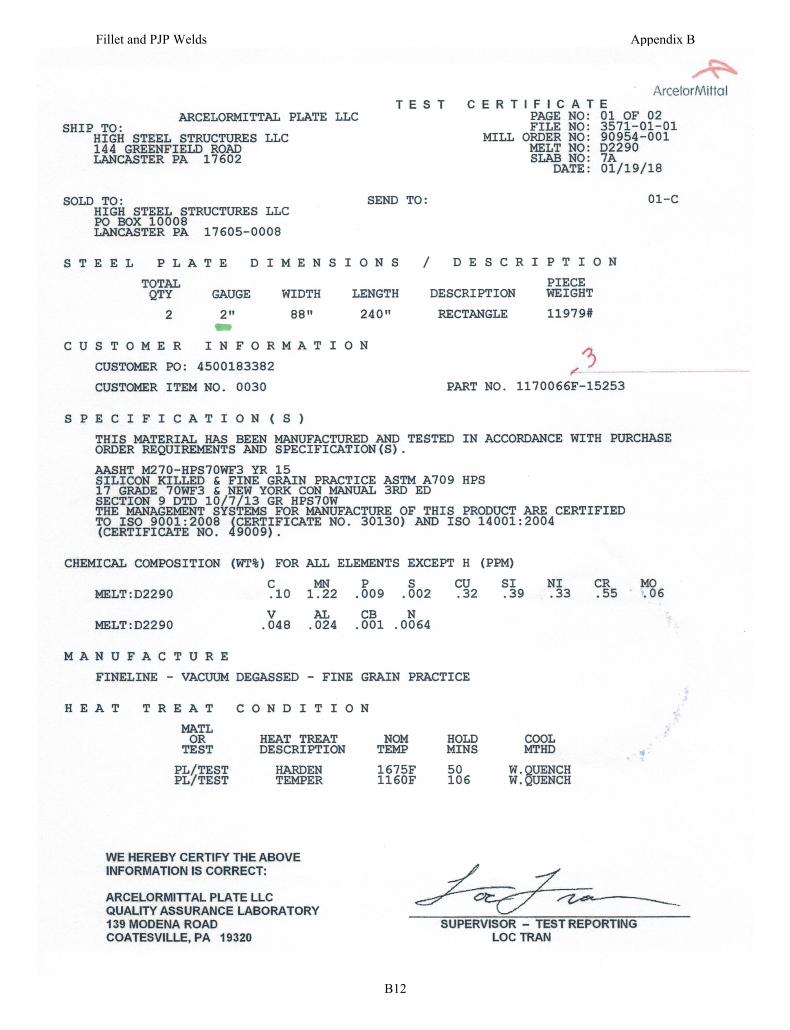
Fillet and PJP Welds Appendix B
B12
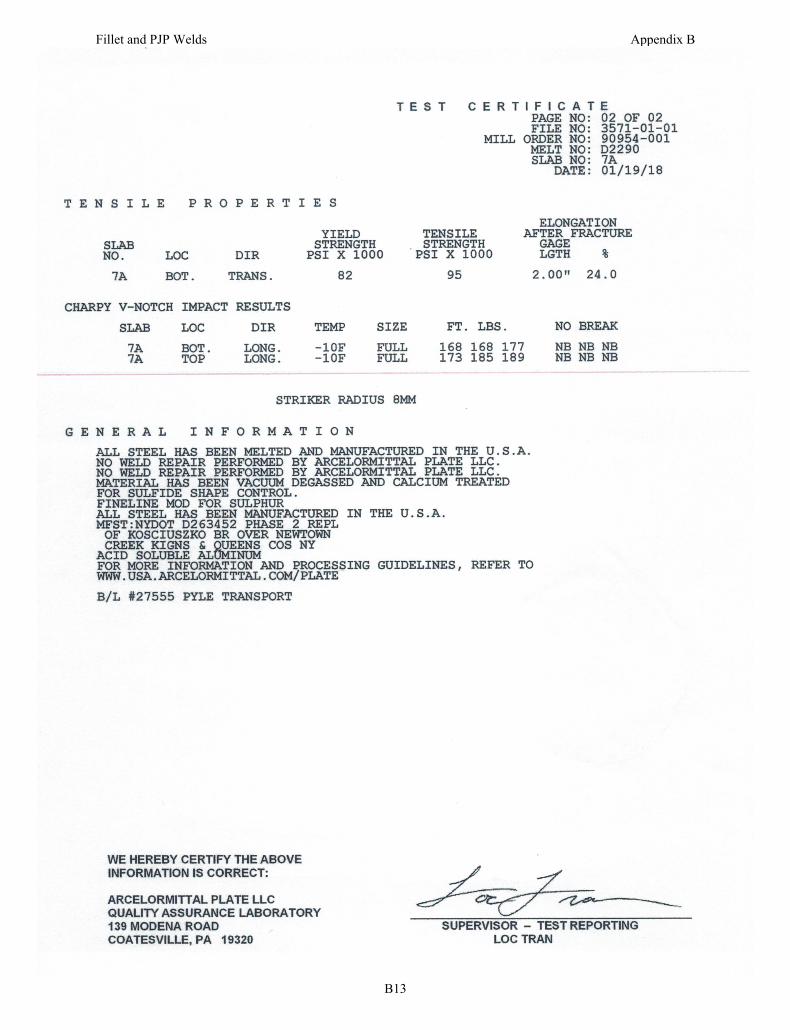
Fillet and PJP Welds Appendix B
B13
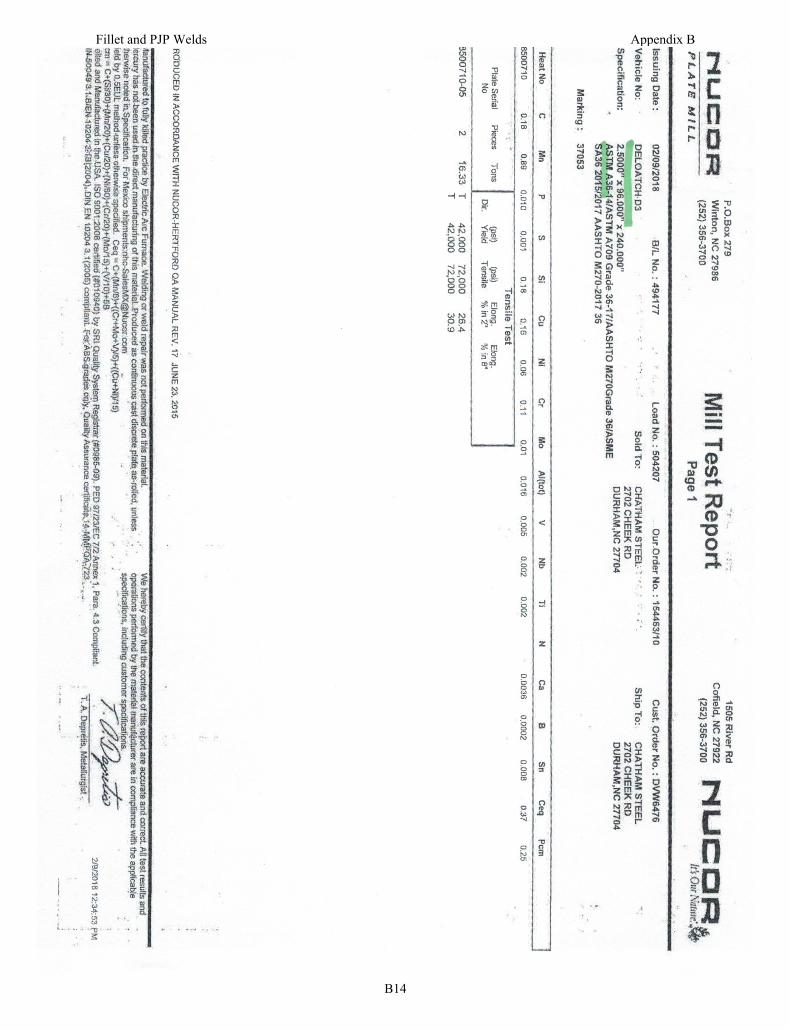
Fillet and PJP Welds Appendix B
B14
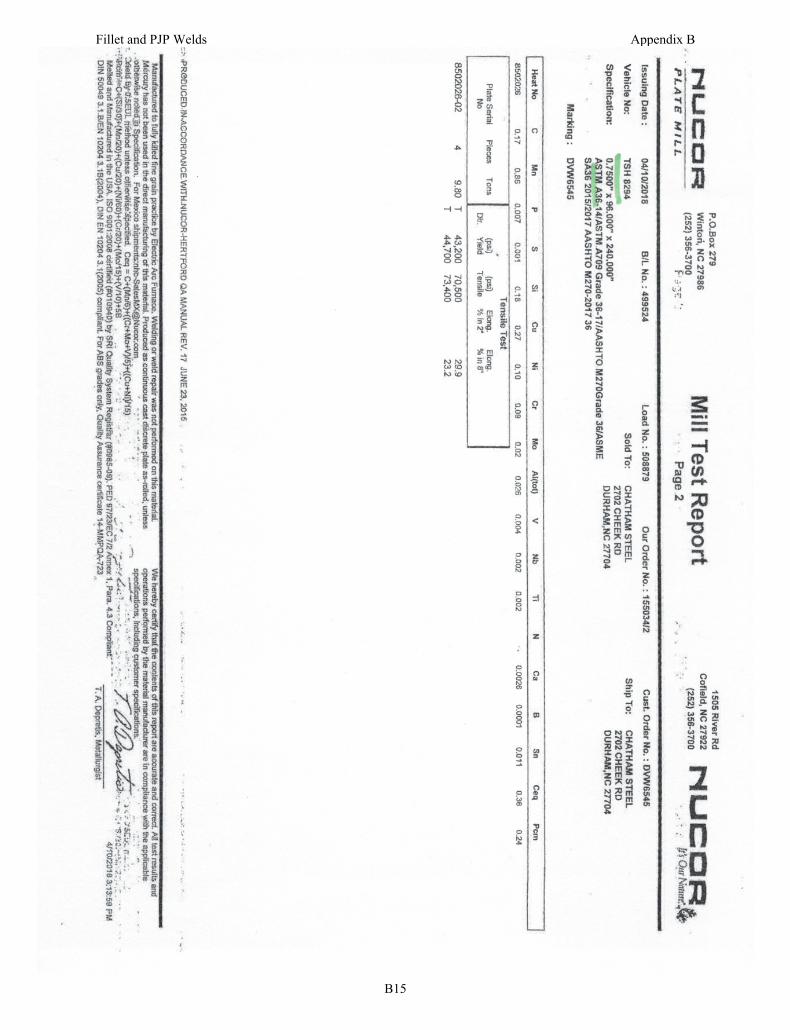
Fillet and PJP Welds Appendix B
B15
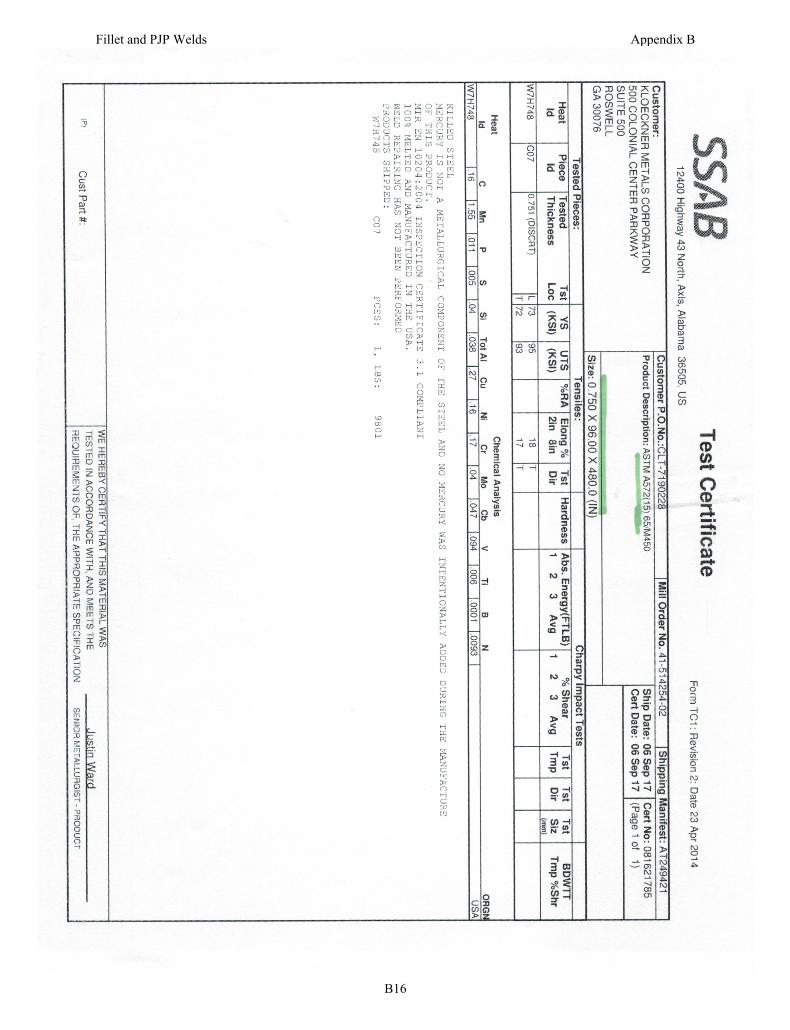
Fillet and PJP Welds Appendix B
B16
APPENDIX C
WELDING PROCEDURE SPECIFICATIONS
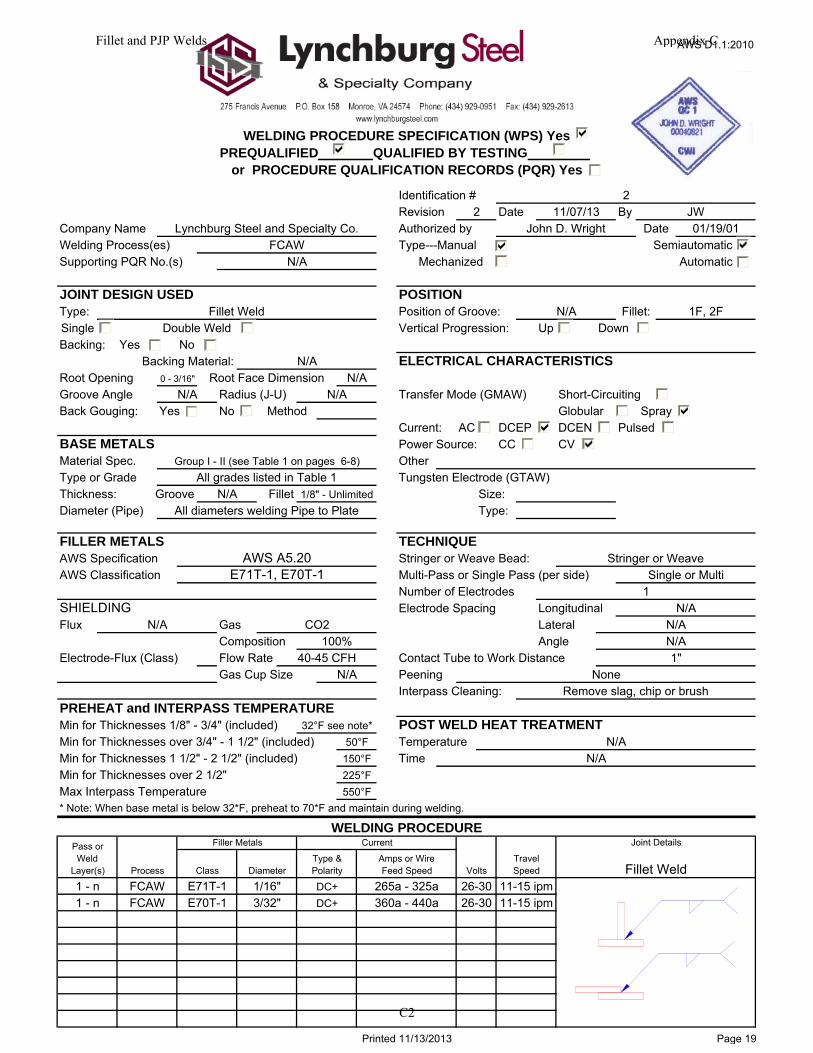
Date By
Supporting PQR No.(s)
Type:Down
Backing: Yes No
Radius (J-U)No
Current: AC DCEP DCEN PulsedPower Source: CC CV
Tungsten Electrode (GTAW)
Electrode Spacing
Fillet Weld
Joint Details
1 - n FCAW E70T-1 3/32" DC+ 360a - 440a 26-30 11-15 ipm
TravelSpeed
1 - n FCAW E71T-1 1/16" DC+ 265a - 325a 26-30
Type &Polarity
11-15 ipm
Amps or WireFeed Speed
Current
* Note: When base metal is below 32*F, preheat to 70*F and maintain during welding.
Pass orWeld
Layer(s) Process Class Diameter
Filler MetalsWELDING PROCEDURE
Volts
550°F
POST WELD HEAT TREATMENT
TimeTemperature N/A
N/A225°F
Min for Thicknesses 1 1/2" - 2 1/2" (included)50°F
150°F
32°F see note*
Min for Thicknesses over 2 1/2"
PREHEAT and INTERPASS TEMPERATURE
Max Interpass Temperature
Electrode-Flux (Class)Gas Cup Size N/A
Min for Thicknesses 1/8" - 3/4" (included)Min for Thicknesses over 3/4" - 1 1/2" (included)
CompositionFlow Rate
CO2100%
40-45 CFH
SHIELDINGFlux GasN/A
Contact Tube to Work Distance 1"
Interpass Cleaning:Peening None
Remove slag, chip or brush
AngleLateral N/A
N/A
Number of Electrodes 1Single or Multi
Longitudinal N/A
TECHNIQUEStringer or Weave Bead: Stringer or WeaveMulti-Pass or Single Pass (per side)
AWS SpecificationAWS Classification
AWS A5.20E71T-1, E70T-1
N/A Fillet
BASE METALS
FILLER METALS
Group I - II (see Table 1 on pages 6-8)All grades listed in Table 1
1/8" - UnlimitedAll diameters welding Pipe to Plate
Material Spec.Type or GradeThickness:Diameter (Pipe)
Groove
Other
Size:Type:
N/A Transfer Mode (GMAW)Globular SprayShort-Circuiting
Method
Root Face DimensionBacking Material:
Double WeldSingle
N/A
Type---Manual SemiautomaticMechanized Automatic
FCAWLynchburg Steel and Specialty Co.Company Name
Welding Process(es)N/A
Groove AngleRoot Opening
Back Gouging: Yes
0 - 3/16"
N/A
AWS D1.1:2010
WELDING PROCEDURE SPECIFICATION (WPS) YesPREQUALIFIED QUALIFIED BY TESTING .
or PROCEDURE QUALIFICATION RECORDS (PQR) Yes
2Revision 11/07/13 JW
Fillet WeldJOINT DESIGN USED
N/A
POSITIONPosition of Groove:Vertical Progression:
ELECTRICAL CHARACTERISTICS
Up
Identification #2
Fillet: 1F, 2FN/A
Authorized by 01/19/01DateJohn D. Wright
Printed 11/13/2013 Page 19
Fillet and PJP Welds Appendix C
C2

Date By
Supporting PQR No.(s)
Type:Down
Backing: Yes No
Radius (J-U)No
Current: AC DCEP DCEN PulsedPower Source: CC CV
Tungsten Electrode (GTAW)
Electrode Spacing
Fillet Weld
Joint Details
This WPS is only to show the welding parameters used - NOT for PRODUCTION
TravelSpeed(IPM)
1 FCAW E80T-1 1/16" DC+ 330 31.3
Type &Polarity
13
Amps or WireFeed Speed
Current
* Note: When base metal is below 32*F, preheat to 70*F and maintain during welding.
Pass orWeld
Layer(s) Process Class Diameter
Filler MetalsACTUAL WELDING PARAMETERS USED
Volts
550°F
POST WELD HEAT TREATMENT
TimeTemperature N/A
N/A225°F
Calculated Heat Input (kJ/in) 47.67Max Interpass Temperature
Electrode-Flux (Class)Gas Cup Size N/A
Min for Thicknesses 1/8" - 3/4" (included)Min for Thicknesses over 3/4" - 1 1/2" (included)Min for Thicknesses 1 1/2" - 2 1/2" (included)
50°F
Flow Rate
CO2
100%45 CFH
Min for Thicknesses over 2 1/2"
PREHEAT and INTERPASS TEMPERATURE
150°F
32°F see note*
SHIELDINGFlux GasN/A
CompositionContact Tube to Work Distance 1"
Interpass Cleaning:Peening None
Remove slag, chip or brush
Number of Electrodes 1Single or Multi
Longitudinal N/A
AngleLateral N/A
N/A
AWS SpecificationAWS Classification
AWS A5.29E80T-1
TECHNIQUEStringer or Weave Bead: Stringer or WeaveMulti-Pass or Single Pass (per side)
BASE METALS
FILLER METALS
1/8" - UnlimitedN/ADiameter (Pipe)
Groove
Other
N/A Fillet Size:Type:
Material Spec.Type or GradeThickness:
N/AGroove AngleRoot Opening
Transfer Mode (GMAW)Globular SprayShort-Circuiting
Method
Root Face DimensionBacking Material:
Double WeldSingle
N/A
Welding Process(es)N/A
Type---Manual SemiautomaticMechanized Automatic
Back Gouging: Yes
0 - 3/16"
N/A
COOPER STEEL275 Francis Avenue, Monroe Virginia 24574
WELDING PROCEDURE SPECIFICATION (WPS) YesPREQUALIFIED QUALIFIED BY TESTING .
or PROCEDURE QUALIFICATION RECORDS (PQR) Yes
1/4 Fillet - E80T1Revision 05/24/19 John D. Wright
N/A
POSITIONPosition of Groove:Vertical Progression:
ELECTRICAL CHARACTERISTICS
Up
Authorized by 05/24/19
Fillet WeldJOINT DESIGN USED
FCAWCooper SteelCompany Name DateAndrew Anderson
Identification #0
Fillet: 1F, 2FN/A
Fillet and PJP Welds Appendix C
C3
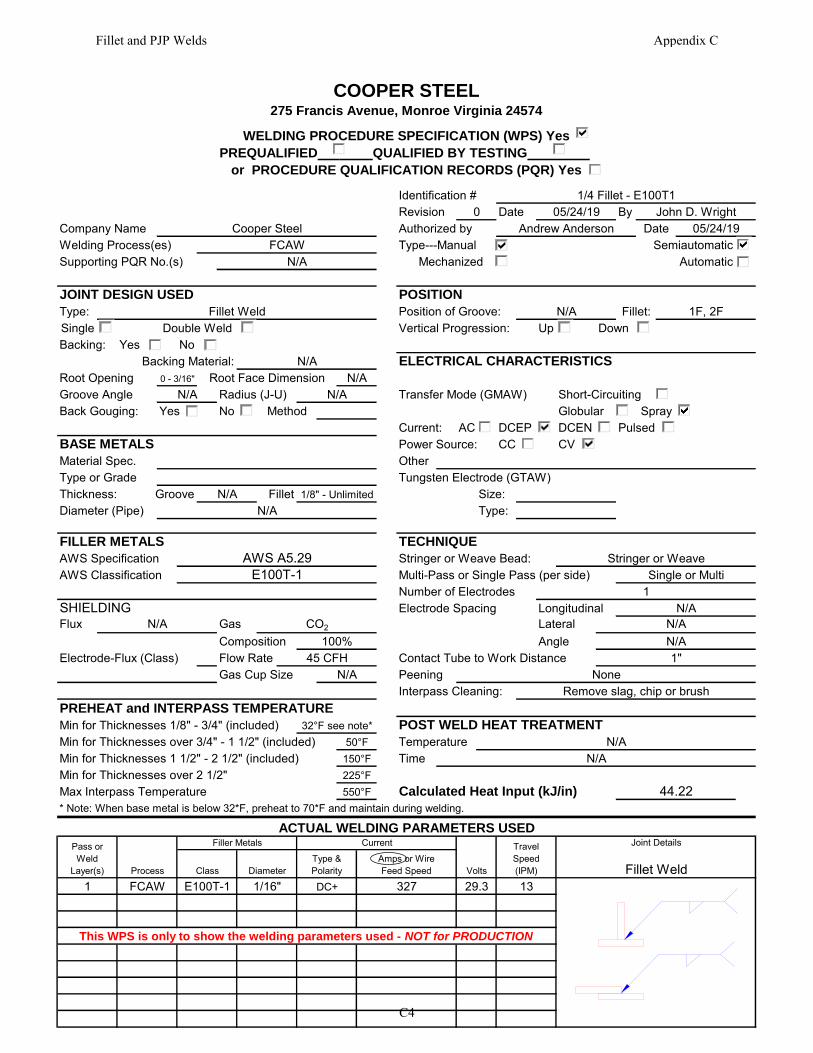
Date By
Supporting PQR No.(s)
Type:Down
Backing: Yes No
Radius (J-U)No
Current: AC DCEP DCEN PulsedPower Source: CC CV
Tungsten Electrode (GTAW)
Electrode Spacing
Identification #0
Fillet: 1F, 2FN/AFillet WeldJOINT DESIGN USED
FCAWCooper SteelCompany Name
Vertical Progression:
ELECTRICAL CHARACTERISTICS
Up
Authorized by 05/24/19DateAndrew Anderson
N/A
COOPER STEEL275 Francis Avenue, Monroe Virginia 24574
WELDING PROCEDURE SPECIFICATION (WPS) YesPREQUALIFIED QUALIFIED BY TESTING .
or PROCEDURE QUALIFICATION RECORDS (PQR) Yes
1/4 Fillet - E100T1Revision 05/24/19 John D. Wright
N/A
POSITIONPosition of Groove:
Welding Process(es)N/A
Type---Manual SemiautomaticMechanized Automatic
Method
Root Face DimensionBacking Material:
Double WeldSingle
N/AN/AGroove Angle
Root OpeningTransfer Mode (GMAW)
Globular SprayShort-Circuiting
Back Gouging: Yes
0 - 3/16"
Material Spec.Type or GradeThickness:
Other
N/A Fillet Size:Type:
BASE METALS
FILLER METALS
1/8" - UnlimitedN/ADiameter (Pipe)
Groove
AWS SpecificationAWS Classification
AWS A5.29E100T-1
TECHNIQUEStringer or Weave Bead: Stringer or WeaveMulti-Pass or Single Pass (per side)Number of Electrodes 1
Single or Multi
Longitudinal N/A
AngleLateral N/A
N/AContact Tube to Work Distance 1"
Interpass Cleaning:Peening None
Remove slag, chip or brush
SHIELDINGFlux GasN/A
CompositionFlow Rate
CO2
100%45 CFH
Min for Thicknesses over 2 1/2"
PREHEAT and INTERPASS TEMPERATURE
150°F
32°F see note*
Max Interpass Temperature
Electrode-Flux (Class)Gas Cup Size N/A
Min for Thicknesses 1/8" - 3/4" (included)Min for Thicknesses over 3/4" - 1 1/2" (included)Min for Thicknesses 1 1/2" - 2 1/2" (included)
50°F
550°F
POST WELD HEAT TREATMENT
TimeTemperature N/A
N/A225°F
Calculated Heat Input (kJ/in) 44.22
Amps or WireFeed Speed
Current
* Note: When base metal is below 32*F, preheat to 70*F and maintain during welding.
Pass orWeld
Layer(s) Process Class Diameter
Filler MetalsACTUAL WELDING PARAMETERS USED
Volts
TravelSpeed(IPM)
1 FCAW E100T-1 1/16" DC+ 327 29.3
Type &Polarity
13
This WPS is only to show the welding parameters used - NOT for PRODUCTION
Fillet Weld
Joint Details
Fillet and PJP Welds Appendix C
C4
APPENDIX D
WELD WIRE MILL TEST REPORTS
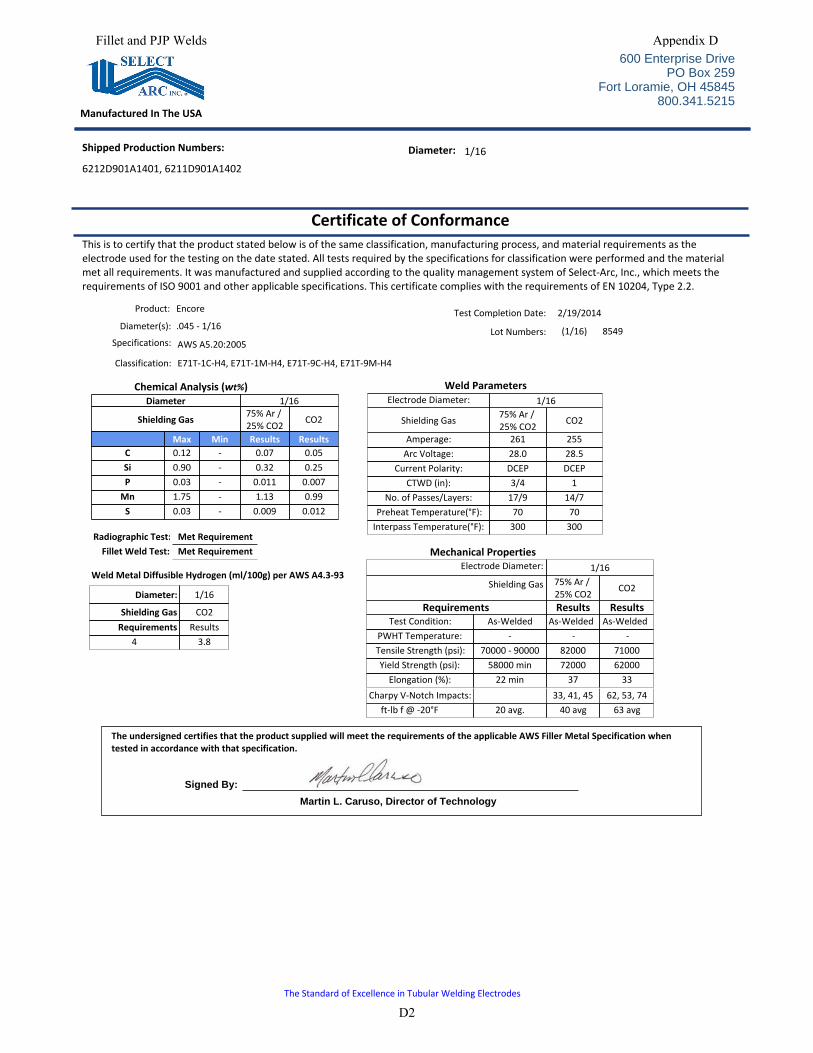
Diameter 1/16
Shielding Gas 75% Ar / 25% CO2 CO2
Max Min Results ResultsC 0.12 - 0.07 0.05Si 0.90 - 0.32 0.25P 0.03 - 0.011 0.007
Mn 1.75 - 1.13 0.99S 0.03 - 0.009 0.012
Chemical Analysis (wt%)
Radiographic Test: Met RequirementFillet Weld Test: Met Requirement
Diameter: 1/16
Shielding Gas CO2Requirements Results
4 3.8
Weld Metal Diffusible Hydrogen (ml/100g) per AWS A4.3-93
This is to certify that the product stated below is of the same classification, manufacturing process, and material requirements as the electrode used for the testing on the date stated. All tests required by the specifications for classification were performed and the material met all requirements. It was manufactured and supplied according to the quality management system of Select-Arc, Inc., which meets the requirements of ISO 9001 and other applicable specifications. This certificate complies with the requirements of EN 10204, Type 2.2.
Product: Encore
Diameter(s): .045 - 1/16Specifications:
Classification: E71T-1C-H4, E71T-1M-H4, E71T-9C-H4, E71T-9M-H4
Test Completion Date: 2/19/2014
Lot Numbers: (1/16) 8549AWS A5.20:2005
The undersigned certifies that the product supplied will meet the requirements of the applicable AWS Filler Metal Specification when tested in accordance with that specification.
Signed By:
Martin L. Caruso, Director of Technology
Electrode Diameter: 1/16Shielding Gas 75% Ar /
25% CO2 CO2
Requirements Results ResultsTest Condition: As-Welded As-Welded As-Welded
PWHT Temperature: - - -Tensile Strength (psi): 70000 - 90000 82000 71000Yield Strength (psi): 58000 min 72000 62000
Elongation (%): 22 min 37 33Charpy V-Notch Impacts: 33, 41, 45 62, 53, 74
ft-lb f @ -20°F 20 avg. 40 avg 63 avg
Mechanical Properties
Weld ParametersElectrode Diameter: 1/16
Shielding Gas 75% Ar / 25% CO2 CO2
Amperage: 261 255Arc Voltage: 28.0 28.5
Current Polarity: DCEP DCEPCTWD (in): 3/4 1
No. of Passes/Layers: 17/9 14/7Preheat Temperature(°F): 70 70
Interpass Temperature(°F): 300 300
Certificate of Conformance
Diameter: 1/16Shipped Production Numbers:
6212D901A1401, 6211D901A1402
The Standard of Excellence in Tubular Welding Electrodes
600 Enterprise DrivePO Box 259
Fort Loramie, OH 45845800.341.5215
Manufactured In The USA
Fillet and PJP Welds Appendix D
D2
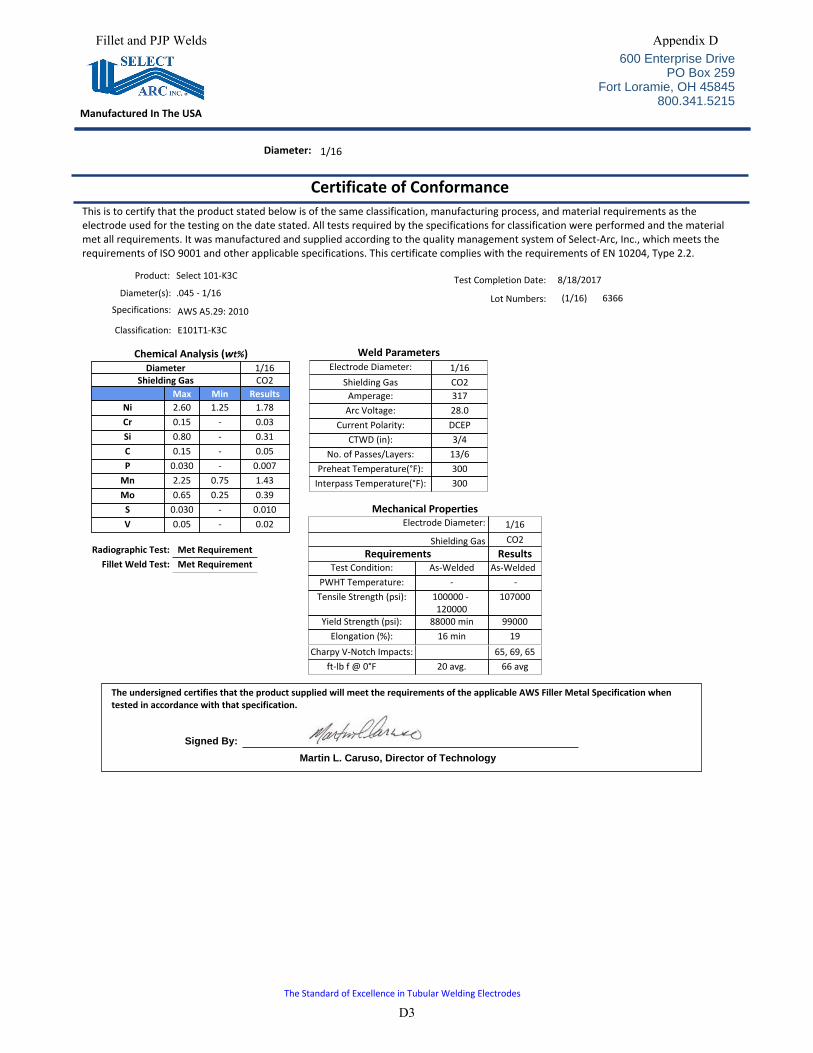
Diameter 1/16Shielding Gas CO2
Max Min ResultsNi 2.60 1.25 1.78Cr 0.15 - 0.03Si 0.80 - 0.31C 0.15 - 0.05P 0.030 - 0.007
Mn 2.25 0.75 1.43Mo 0.65 0.25 0.39
S 0.030 - 0.010V 0.05 - 0.02
Chemical Analysis (wt%)
Radiographic Test: Met RequirementFillet Weld Test: Met Requirement
This is to certify that the product stated below is of the same classification, manufacturing process, and material requirements as the electrode used for the testing on the date stated. All tests required by the specifications for classification were performed and the material met all requirements. It was manufactured and supplied according to the quality management system of Select-Arc, Inc., which meets the requirements of ISO 9001 and other applicable specifications. This certificate complies with the requirements of EN 10204, Type 2.2.
Product: Select 101-K3C
Diameter(s): .045 - 1/16Specifications:
Classification: E101T1-K3C
Test Completion Date: 8/18/2017
Lot Numbers: (1/16) 6366AWS A5.29: 2010
The undersigned certifies that the product supplied will meet the requirements of the applicable AWS Filler Metal Specification when tested in accordance with that specification.
Signed By:
Martin L. Caruso, Director of Technology
Electrode Diameter: 1/16Shielding Gas CO2
Requirements ResultsTest Condition: As-Welded As-Welded
PWHT Temperature: - -Tensile Strength (psi): 100000 -
120000107000
Yield Strength (psi): 88000 min 99000Elongation (%): 16 min 19
Charpy V-Notch Impacts: 65, 69, 65ft-lb f @ 0°F 20 avg. 66 avg
Mechanical Properties
Weld ParametersElectrode Diameter: 1/16
Shielding Gas CO2Amperage: 317
Arc Voltage: 28.0Current Polarity: DCEP
CTWD (in): 3/4No. of Passes/Layers: 13/6
Preheat Temperature(°F): 300Interpass Temperature(°F): 300
Certificate of Conformance
Diameter: 1/16
The Standard of Excellence in Tubular Welding Electrodes
600 Enterprise DrivePO Box 259
Fort Loramie, OH 45845800.341.5215
Manufactured In The USA
Fillet and PJP Welds Appendix D
D3
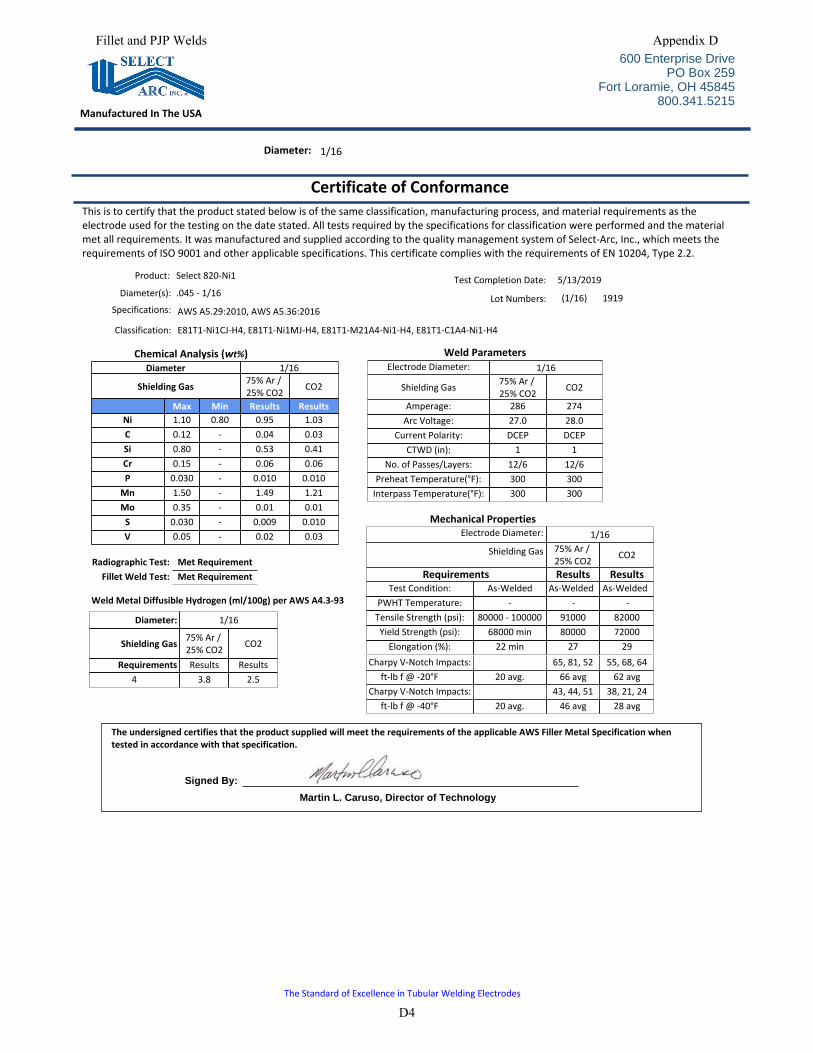
Diameter 1/16
Shielding Gas 75% Ar / 25% CO2 CO2
Max Min Results ResultsNi 1.10 0.80 0.95 1.03C 0.12 - 0.04 0.03Si 0.80 - 0.53 0.41Cr 0.15 - 0.06 0.06P 0.030 - 0.010 0.010
Mn 1.50 - 1.49 1.21Mo 0.35 - 0.01 0.01
S 0.030 - 0.009 0.010V 0.05 - 0.02 0.03
Chemical Analysis (wt%)
Radiographic Test: Met RequirementFillet Weld Test: Met Requirement
Diameter: 1/16
Shielding Gas 75% Ar / 25% CO2 CO2
Requirements Results Results4 3.8 2.5
Weld Metal Diffusible Hydrogen (ml/100g) per AWS A4.3-93
This is to certify that the product stated below is of the same classification, manufacturing process, and material requirements as the electrode used for the testing on the date stated. All tests required by the specifications for classification were performed and the material met all requirements. It was manufactured and supplied according to the quality management system of Select-Arc, Inc., which meets the requirements of ISO 9001 and other applicable specifications. This certificate complies with the requirements of EN 10204, Type 2.2.
Product: Select 820-Ni1
Diameter(s): .045 - 1/16Specifications:
Classification: E81T1-Ni1CJ-H4, E81T1-Ni1MJ-H4, E81T1-M21A4-Ni1-H4, E81T1-C1A4-Ni1-H4
Test Completion Date: 5/13/2019
Lot Numbers: (1/16) 1919AWS A5.29:2010, AWS A5.36:2016
The undersigned certifies that the product supplied will meet the requirements of the applicable AWS Filler Metal Specification when tested in accordance with that specification.
Signed By:
Martin L. Caruso, Director of Technology
Electrode Diameter: 1/16Shielding Gas 75% Ar /
25% CO2 CO2
Requirements Results ResultsTest Condition: As-Welded As-Welded As-Welded
PWHT Temperature: - - -Tensile Strength (psi): 80000 - 100000 91000 82000Yield Strength (psi): 68000 min 80000 72000
Elongation (%): 22 min 27 29Charpy V-Notch Impacts: 65, 81, 52 55, 68, 64
ft-lb f @ -20°F 20 avg. 66 avg 62 avgCharpy V-Notch Impacts: 43, 44, 51 38, 21, 24
ft-lb f @ -40°F 20 avg. 46 avg 28 avg
Mechanical Properties
Weld ParametersElectrode Diameter: 1/16
Shielding Gas 75% Ar / 25% CO2 CO2
Amperage: 286 274Arc Voltage: 27.0 28.0
Current Polarity: DCEP DCEPCTWD (in): 1 1
No. of Passes/Layers: 12/6 12/6Preheat Temperature(°F): 300 300
Interpass Temperature(°F): 300 300
Certificate of Conformance
Diameter: 1/16
The Standard of Excellence in Tubular Welding Electrodes
600 Enterprise DrivePO Box 259
Fort Loramie, OH 45845800.341.5215
Manufactured In The USA
Fillet and PJP Welds Appendix D
D4
APPENDIX E
ALL-WELD-METAL TENSION TEST REPORTS
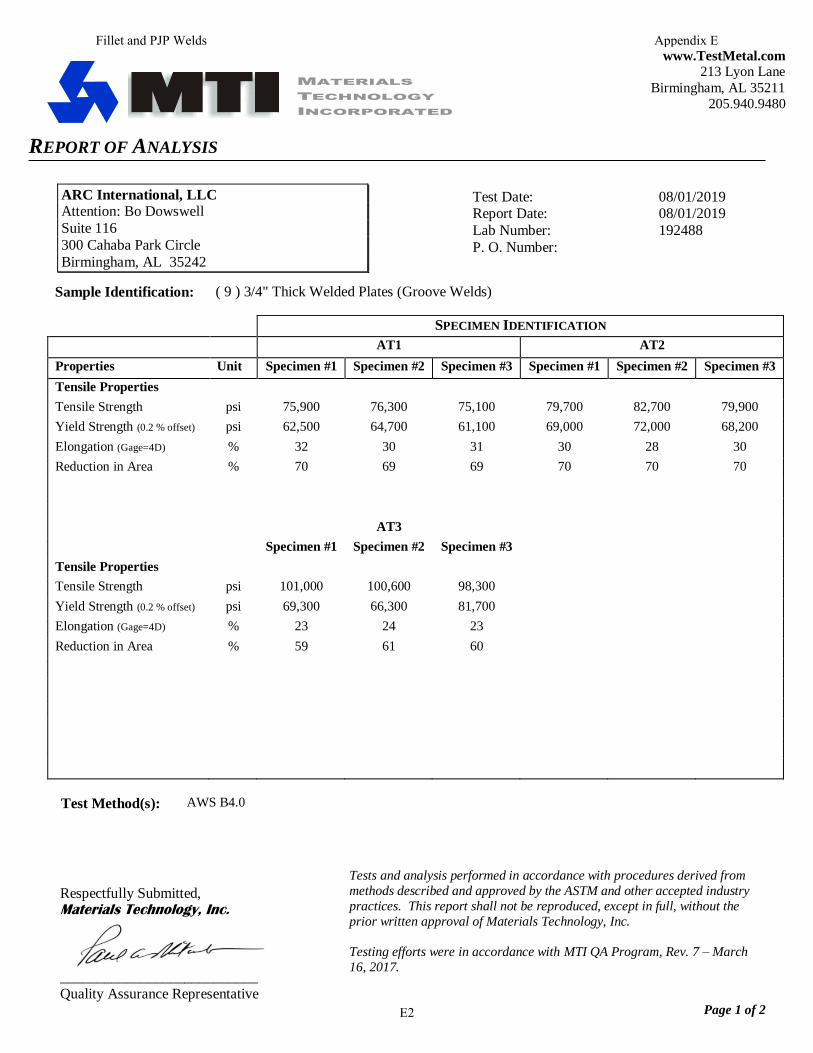
www.TestMetal.com 213 Lyon Lane
Birmingham, AL 35211
205.940.9480
REPORT OF ANALYSIS
Respectfully Submitted, Materials Technology, Inc.
___________________________
Quality Assurance Representative
Tests and analysis performed in accordance with procedures derived from
methods described and approved by the ASTM and other accepted industry
practices. This report shall not be reproduced, except in full, without the
prior written approval of Materials Technology, Inc.
Testing efforts were in accordance with MTI QA Program, Rev. 7 – March
16, 2017.
Page 1 of 2
MATERIALS
TECHNOLOGY
INCORPORATED Test Date: 08/01/2019 Report Date: 08/01/2019
Lab Number: 192488
P. O. Number:
Sample Identification: ( 9 ) 3/4" Thick Welded Plates (Groove Welds)
SPECIMEN IDENTIFICATION
AT1 AT2
Properties Unit Specimen #1 Specimen #2 Specimen #3 Specimen #1 Specimen #2 Specimen #3
Tensile Properties
Tensile Strength psi 75,900 76,300 75,100 79,700 82,700 79,900
Yield Strength (0.2 % offset) psi 62,500 64,700 61,100 69,000 72,000 68,200
Elongation (Gage=4D) % 32 30 31 30 28 30
Reduction in Area % 70 69 69 70 70 70
AT3
Specimen #1 Specimen #2 Specimen #3
Tensile Properties
Tensile Strength psi 101,000 100,600 98,300
Yield Strength (0.2 % offset) psi 69,300 66,300 81,700
Elongation (Gage=4D) % 23 24 23
Reduction in Area % 59 61 60
Test Method(s): AWS B4.0
ARC International, LLC Attention: Bo Dowswell
Suite 116
300 Cahaba Park Circle
Birmingham, AL 35242
Fillet and PJP Welds Appendix E
E2

APPENDIX F
SPECIMEN PHOTOGRAPHS
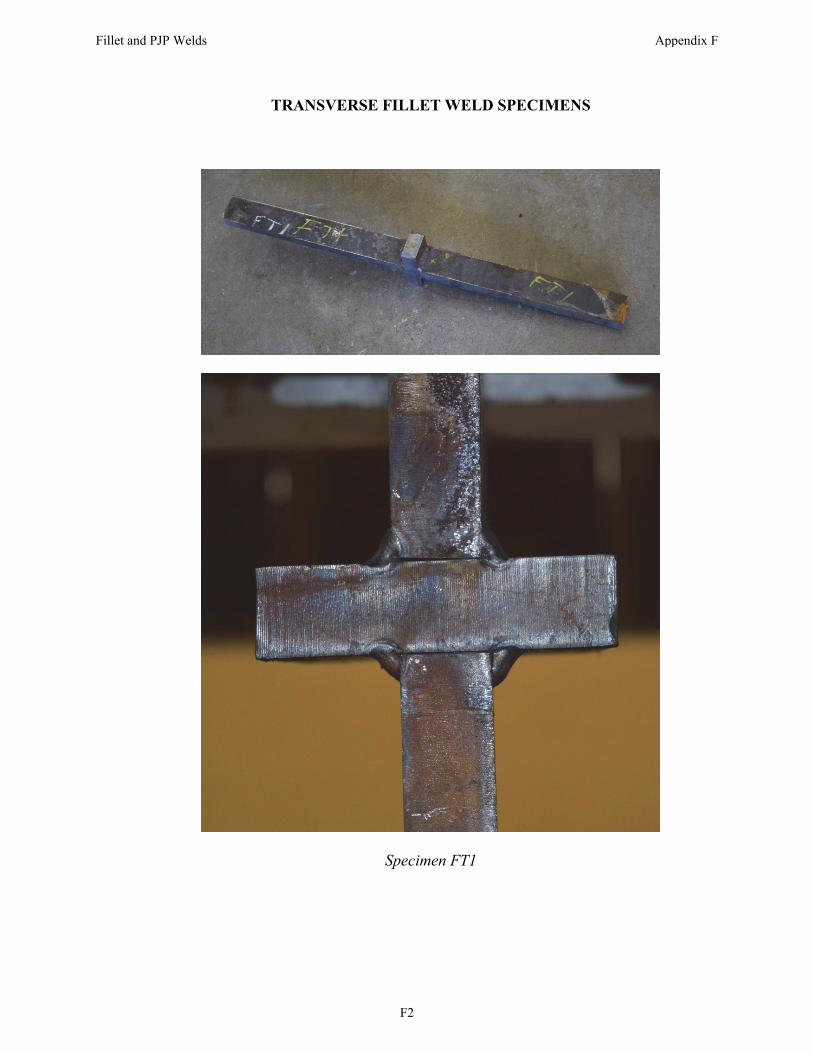
TRANSVERSE FILLET WELD SPECIMENS
Specimen FT1
Fillet and PJP Welds Appendix F
F2

Specimen FT4
Specimen FT9
Fillet and PJP Welds Appendix F
F3
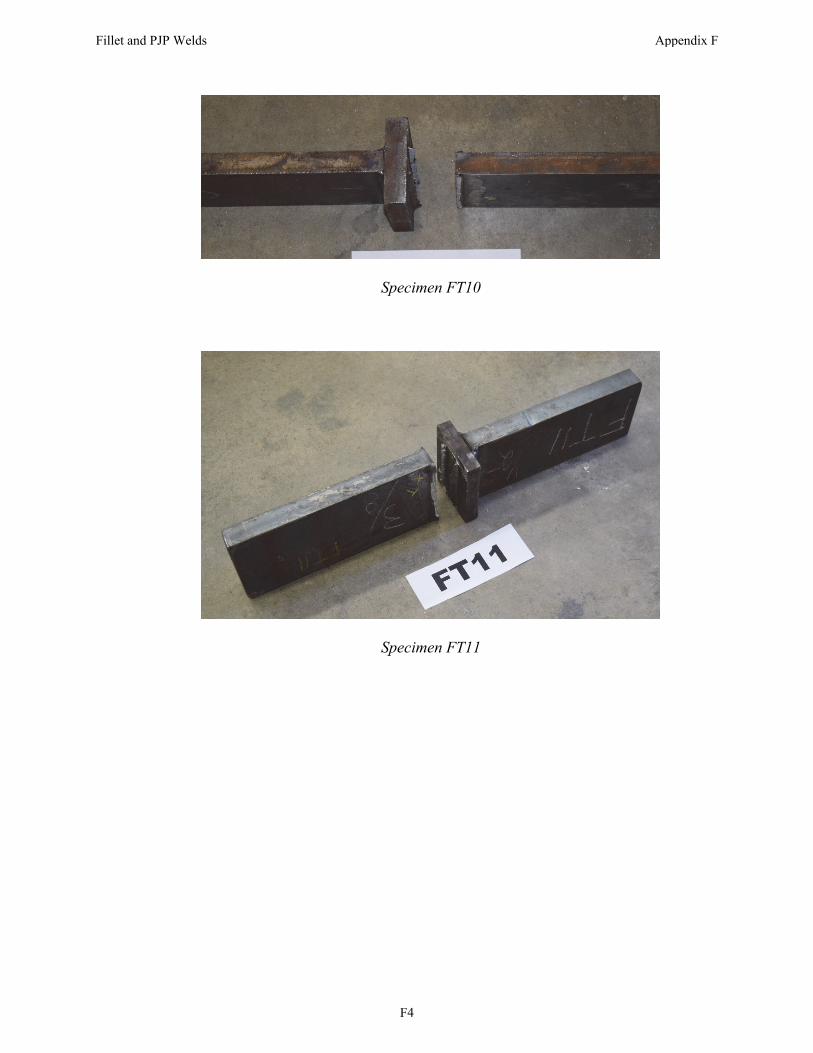
Specimen FT10
Specimen FT11
Fillet and PJP Welds Appendix F
F4
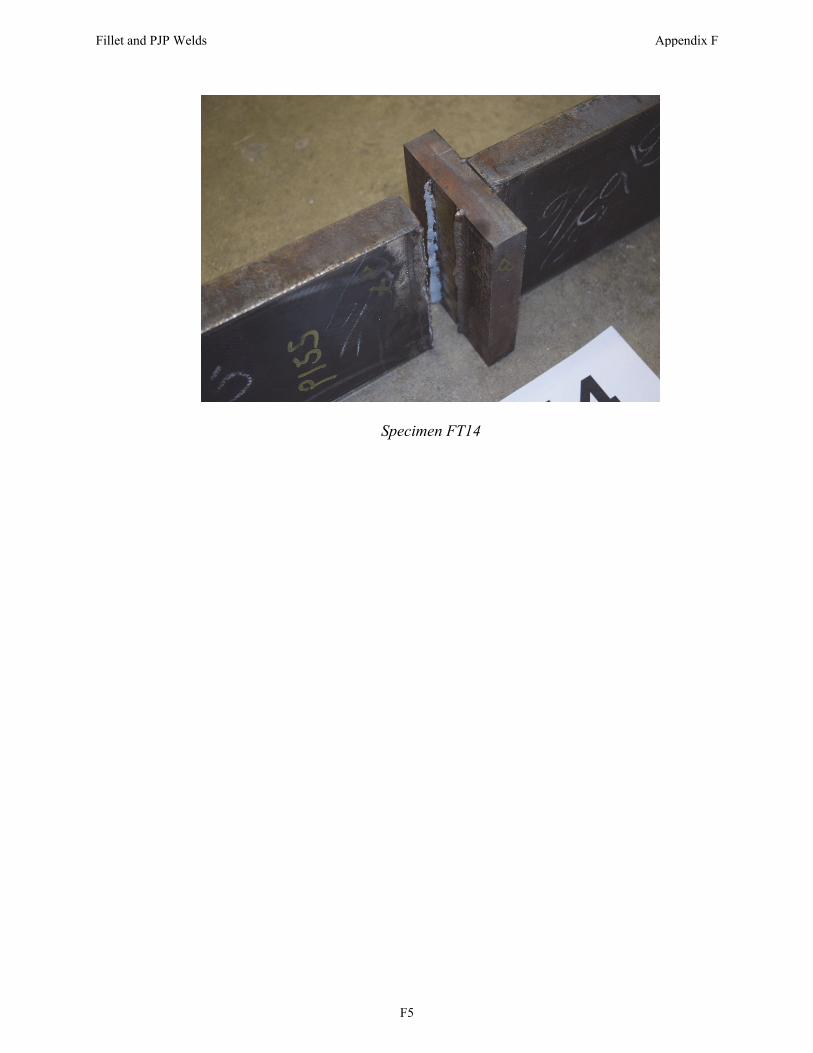
Specimen FT14
Fillet and PJP Welds Appendix F
F5
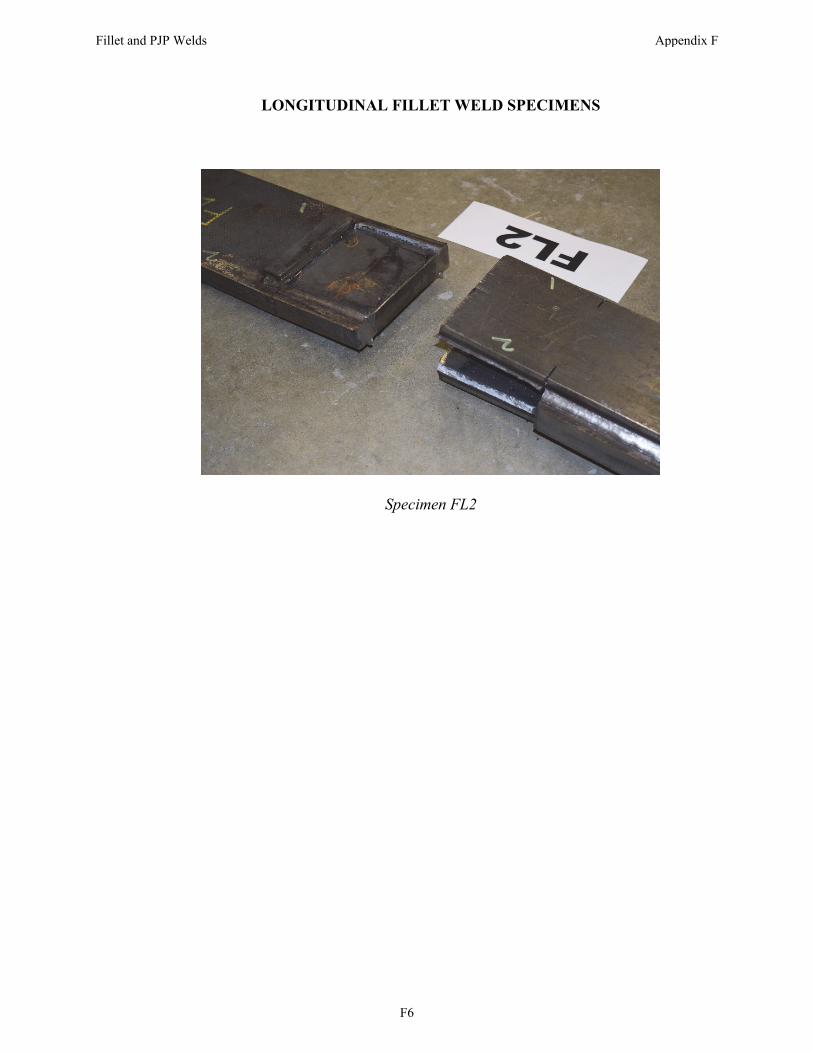
LONGITUDINAL FILLET WELD SPECIMENS
Specimen FL2
Fillet and PJP Welds Appendix F
F6
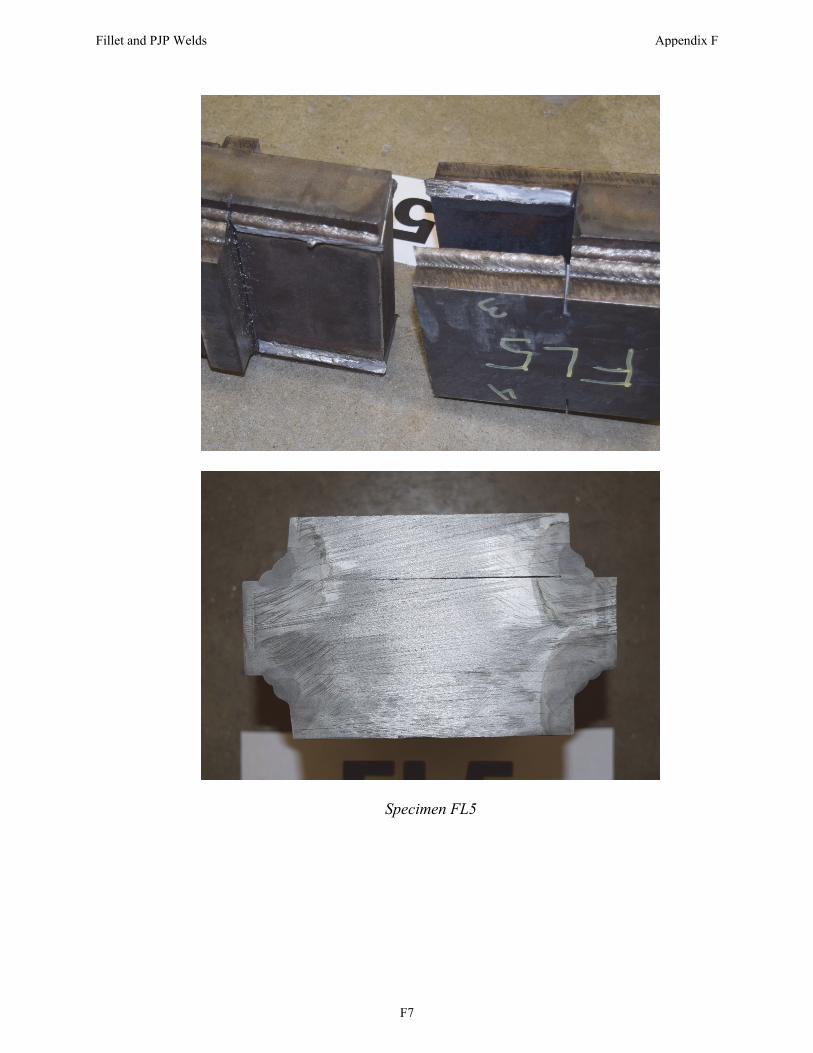
Specimen FL5
Fillet and PJP Welds Appendix F
F7
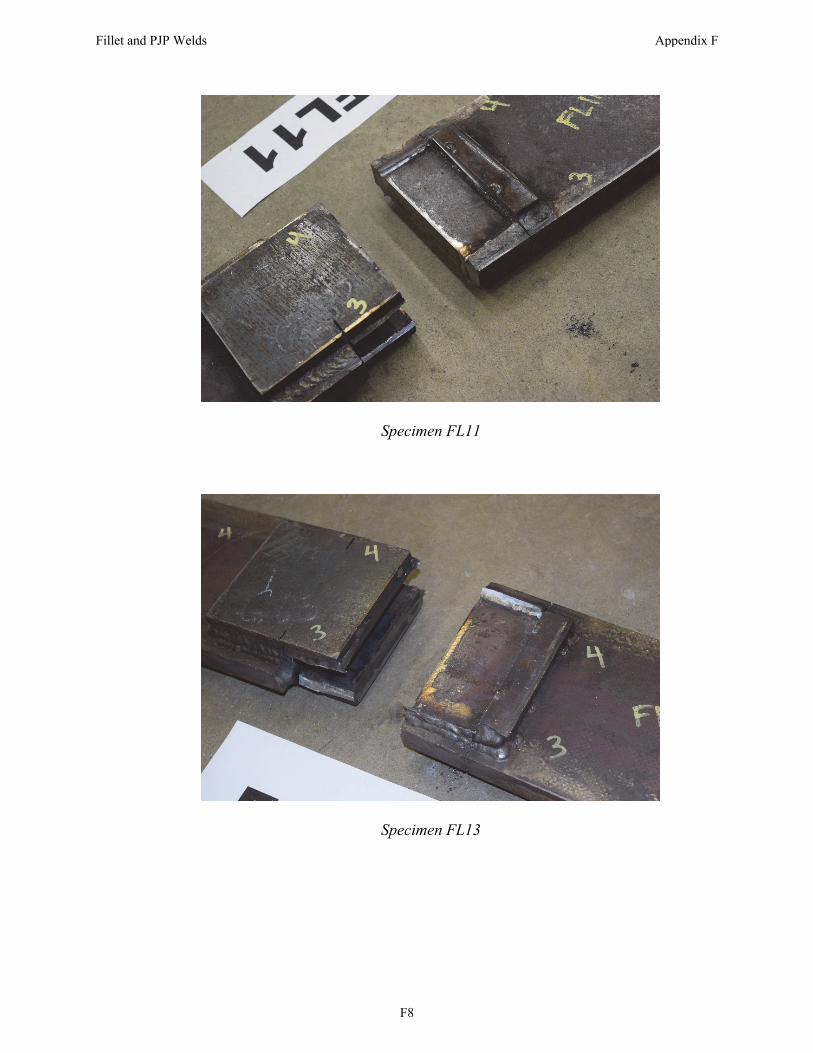
Specimen FL11
Specimen FL13
Fillet and PJP Welds Appendix F
F8
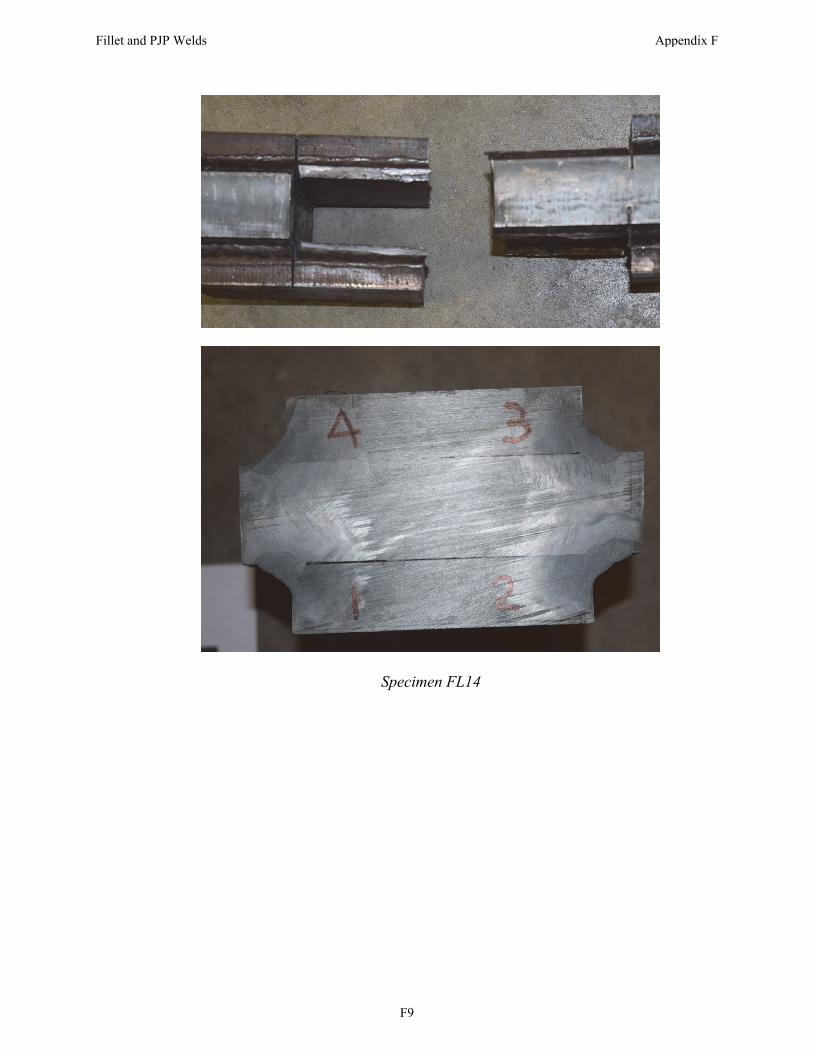
Specimen FL14
Fillet and PJP Welds Appendix F
F9
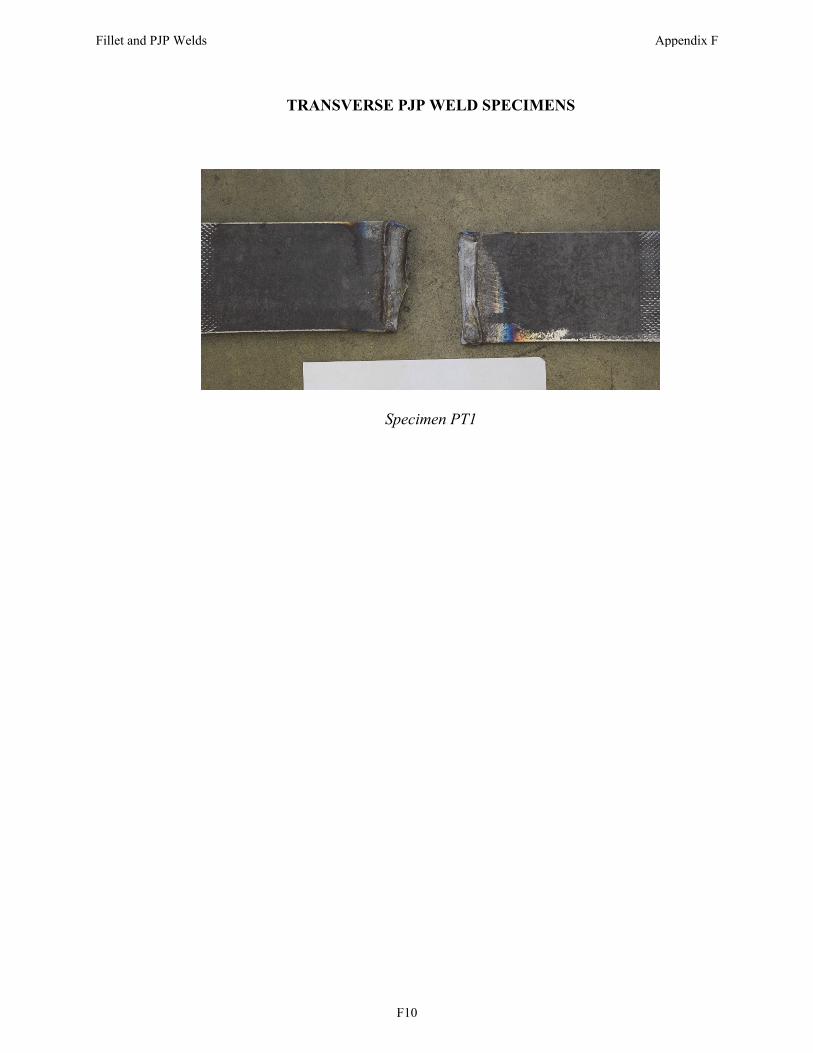
TRANSVERSE PJP WELD SPECIMENS
Specimen PT1
Fillet and PJP Welds Appendix F
F10
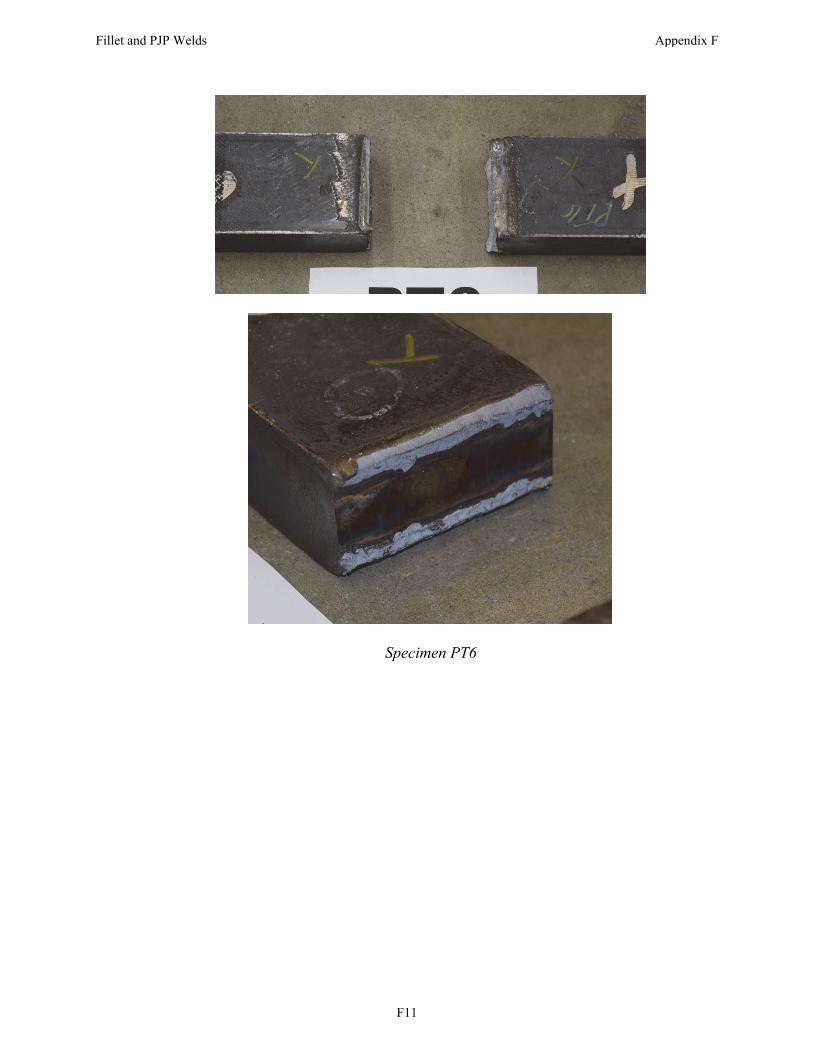
Specimen PT6
Fillet and PJP Welds Appendix F
F11
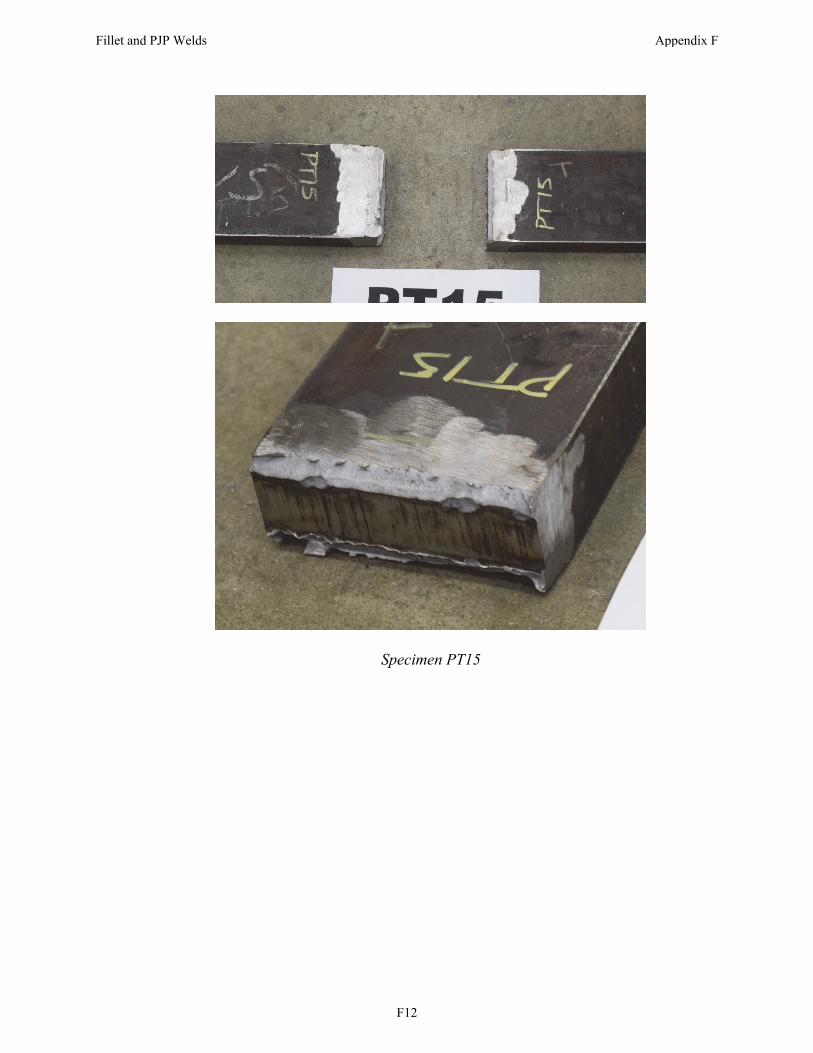
Specimen PT15
Fillet and PJP Welds Appendix F
F12
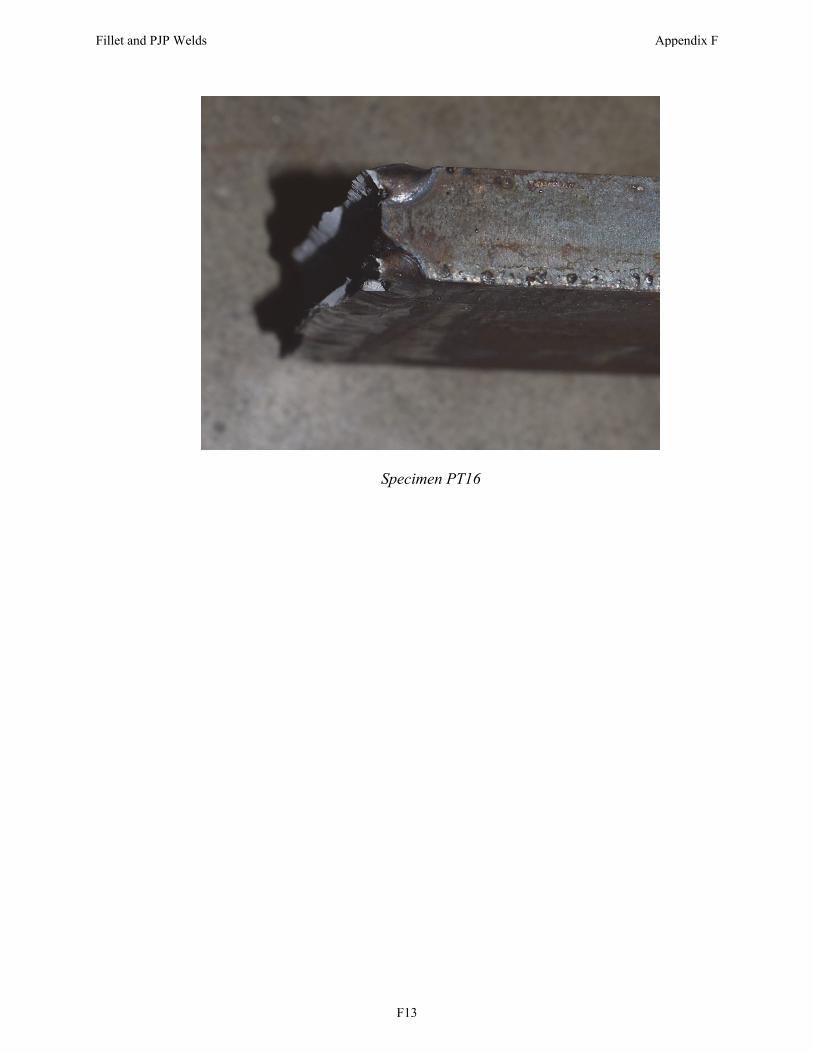
Specimen PT16
Fillet and PJP Welds Appendix F
F13
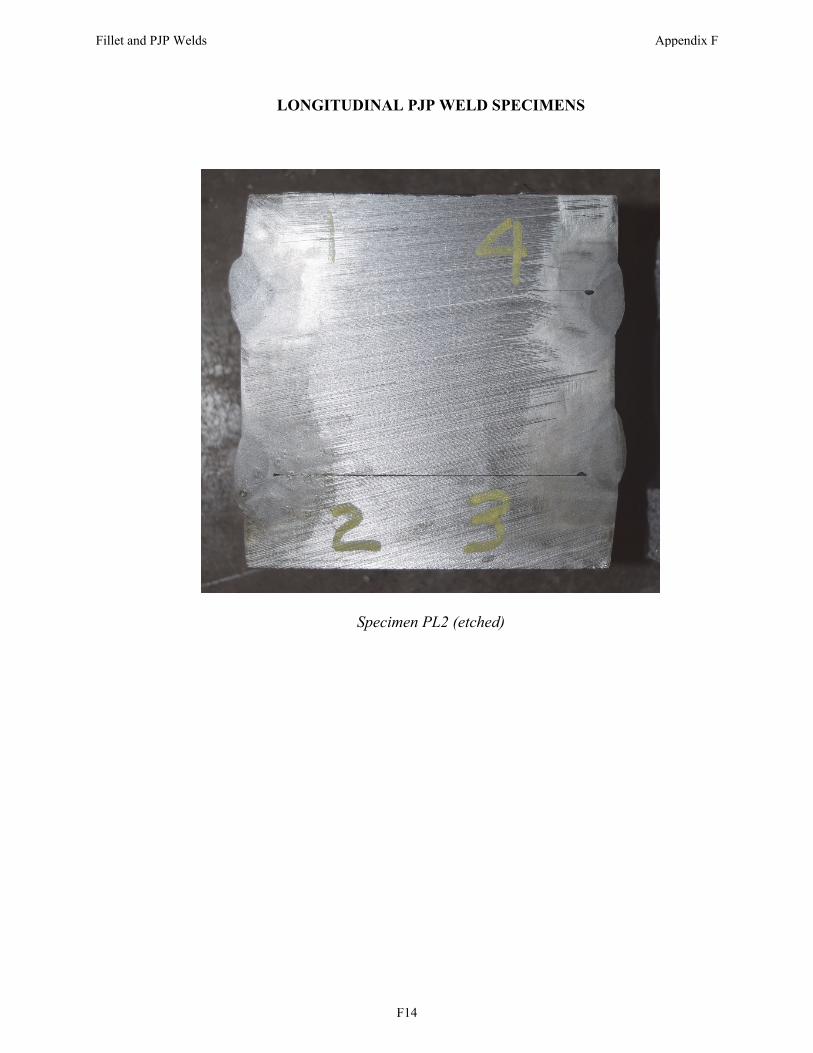
LONGITUDINAL PJP WELD SPECIMENS
Specimen PL2 (etched)
Fillet and PJP Welds Appendix F
F14
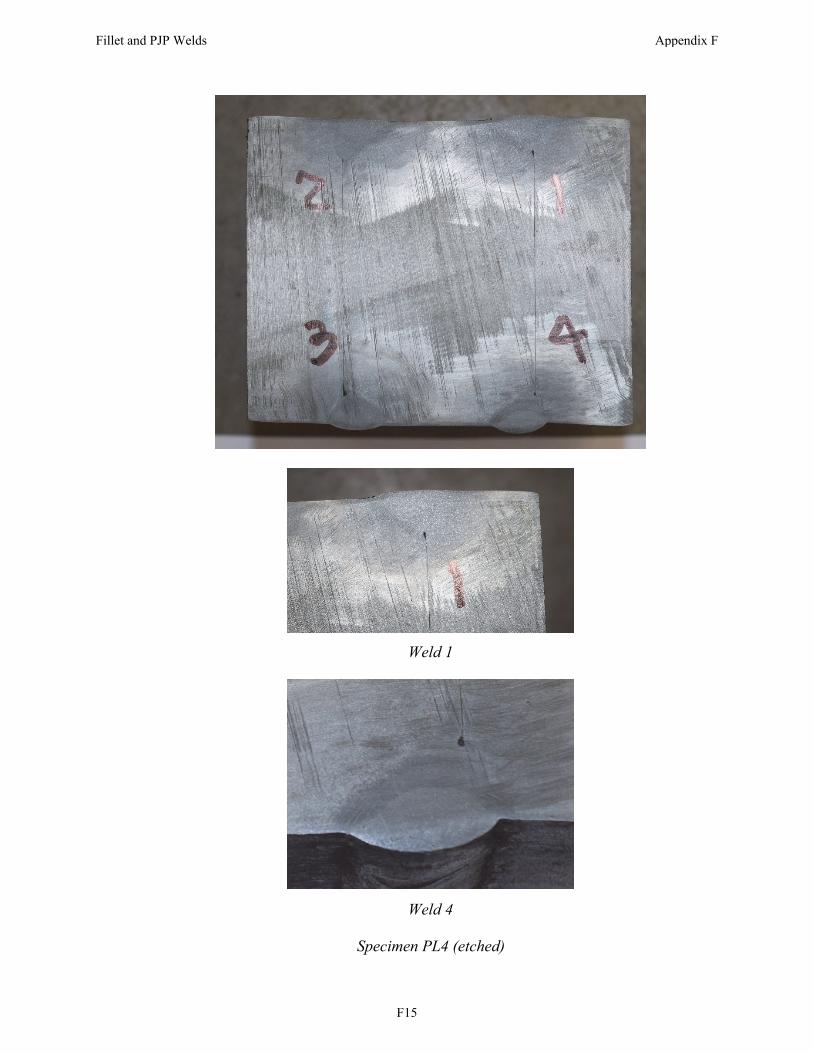
Weld 1
Weld 4
Specimen PL4 (etched)
Fillet and PJP Welds Appendix F
F15
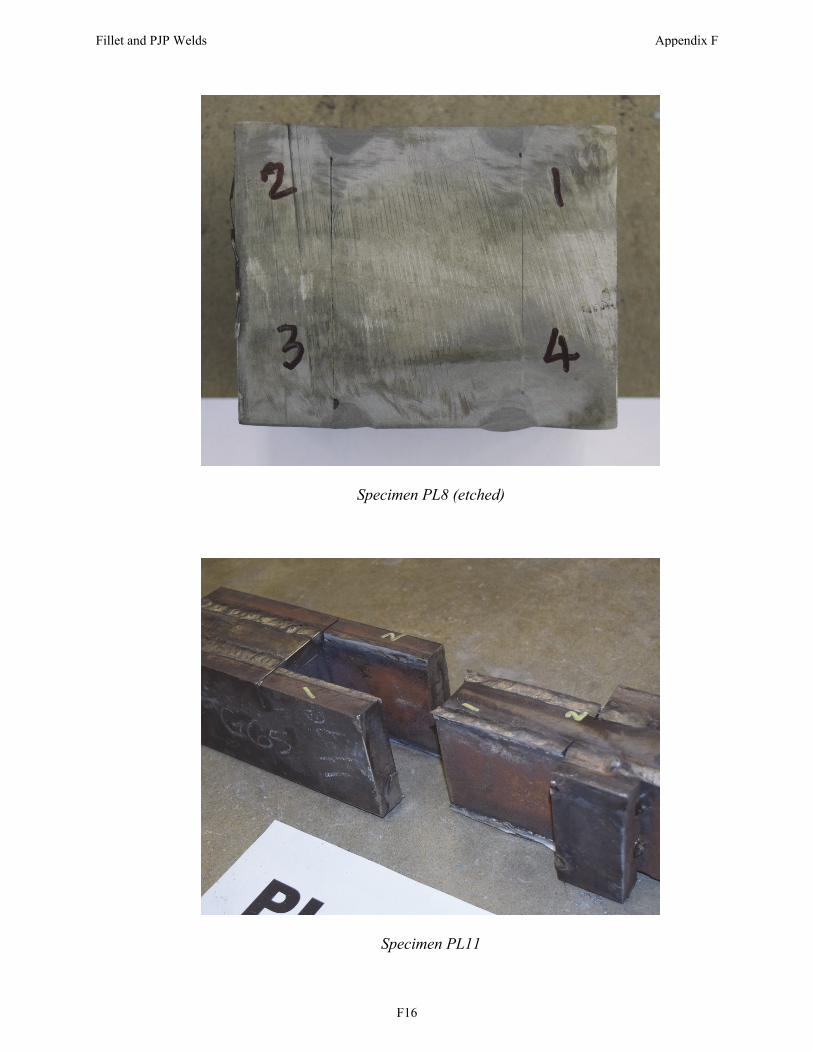
Specimen PL8 (etched)
Specimen PL11
Fillet and PJP Welds Appendix F
F16
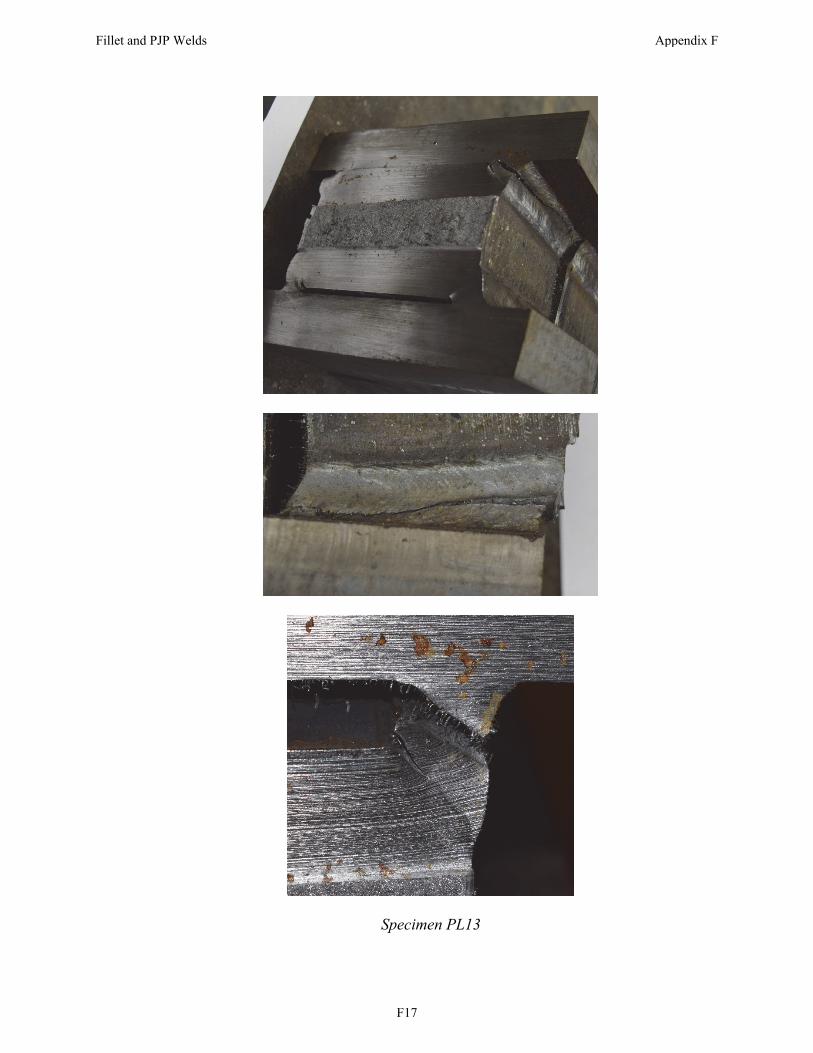
Specimen PL13
Fillet and PJP Welds Appendix F
F17
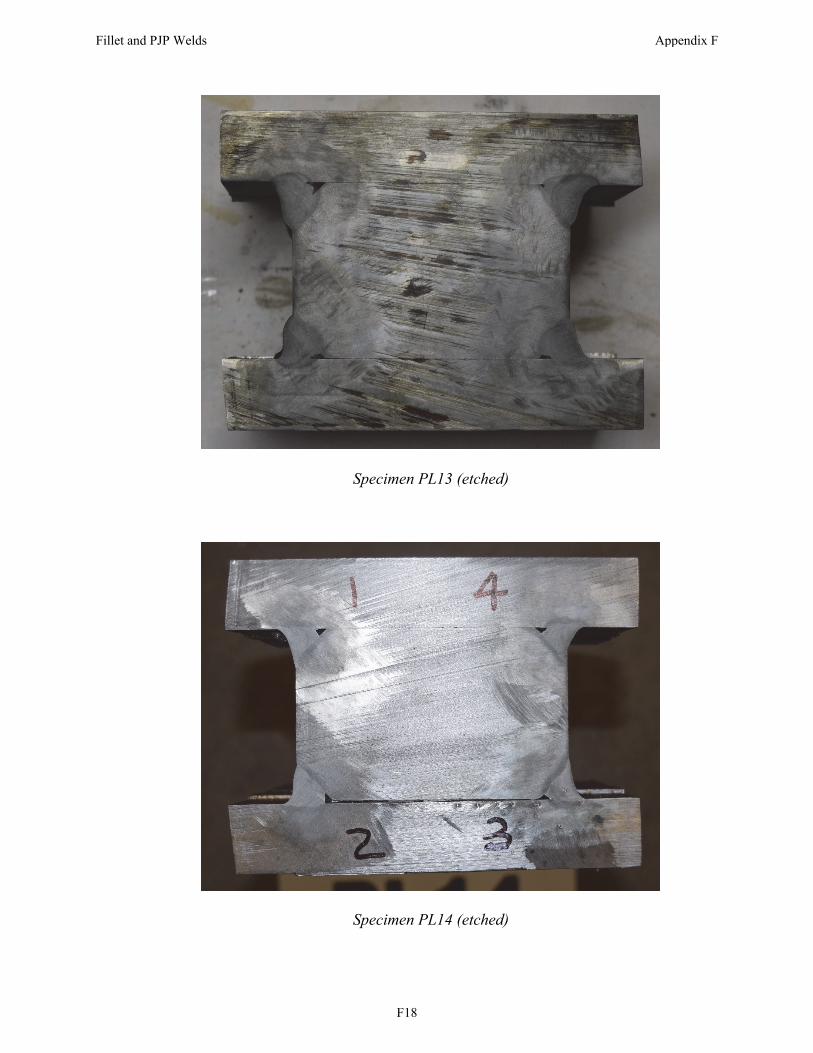
Specimen PL13 (etched)
Specimen PL14 (etched)
Fillet and PJP Welds Appendix F
F18
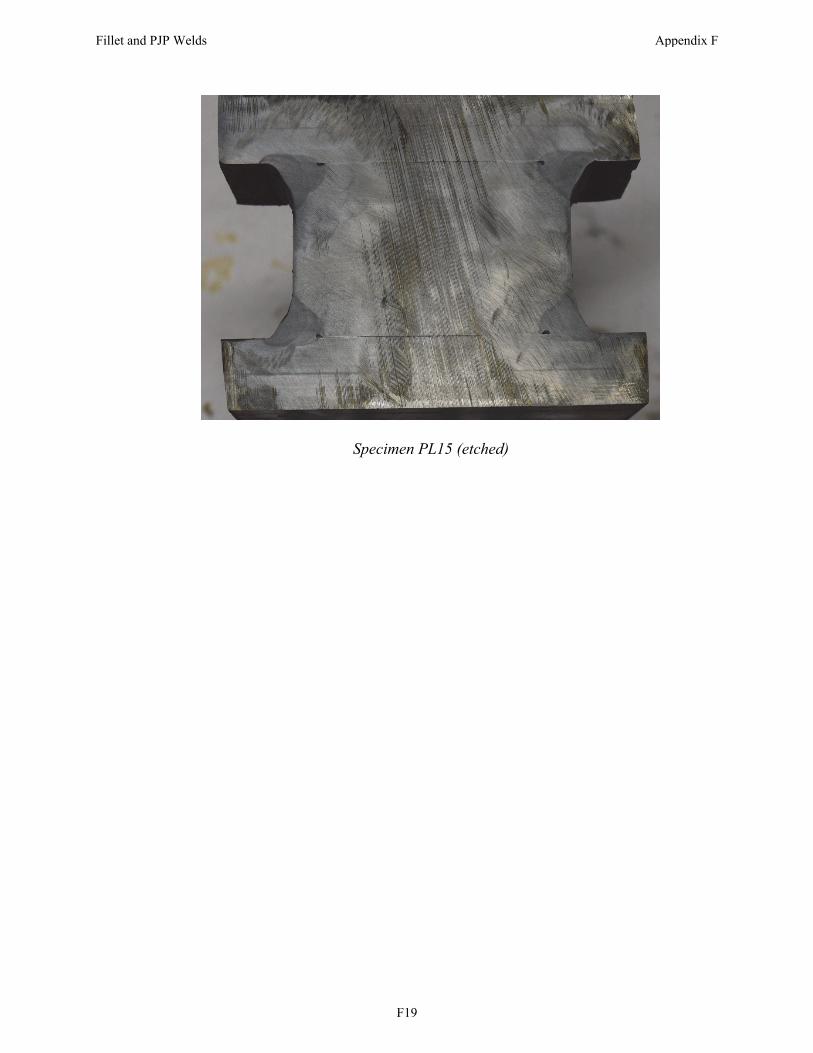
Specimen PL15 (etched)
Fillet and PJP Welds Appendix F
F19
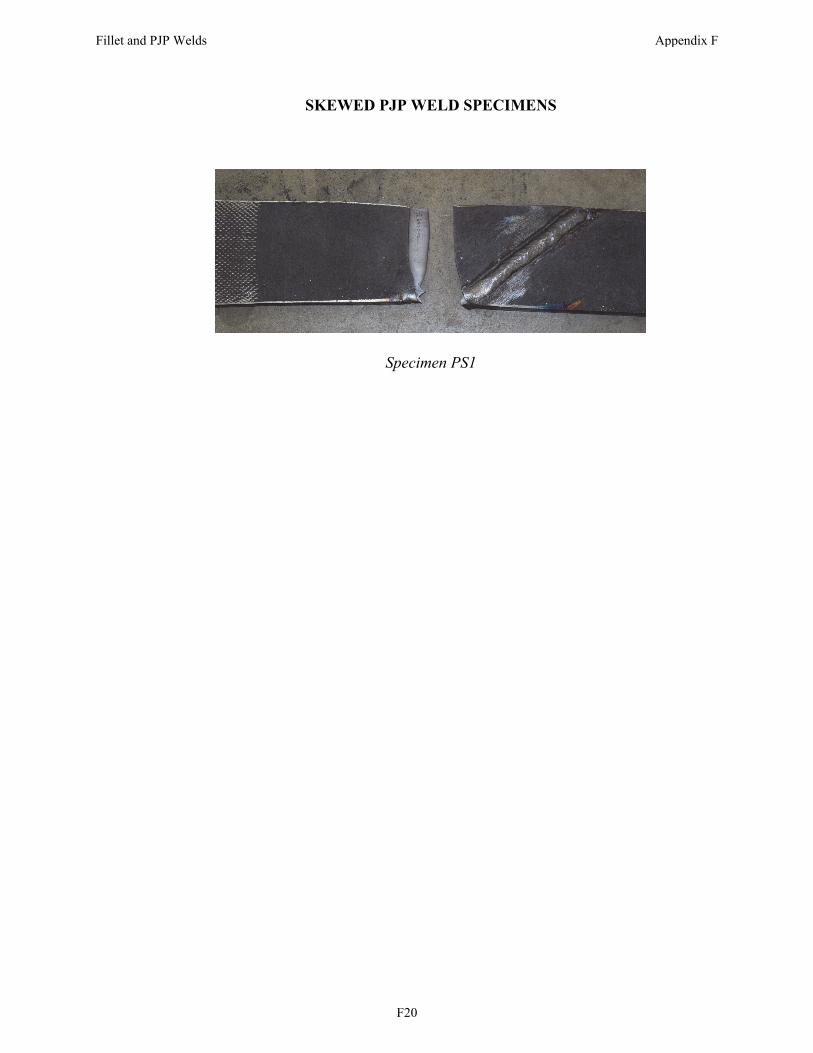
SKEWED PJP WELD SPECIMENS
Specimen PS1
Fillet and PJP Welds Appendix F
F20
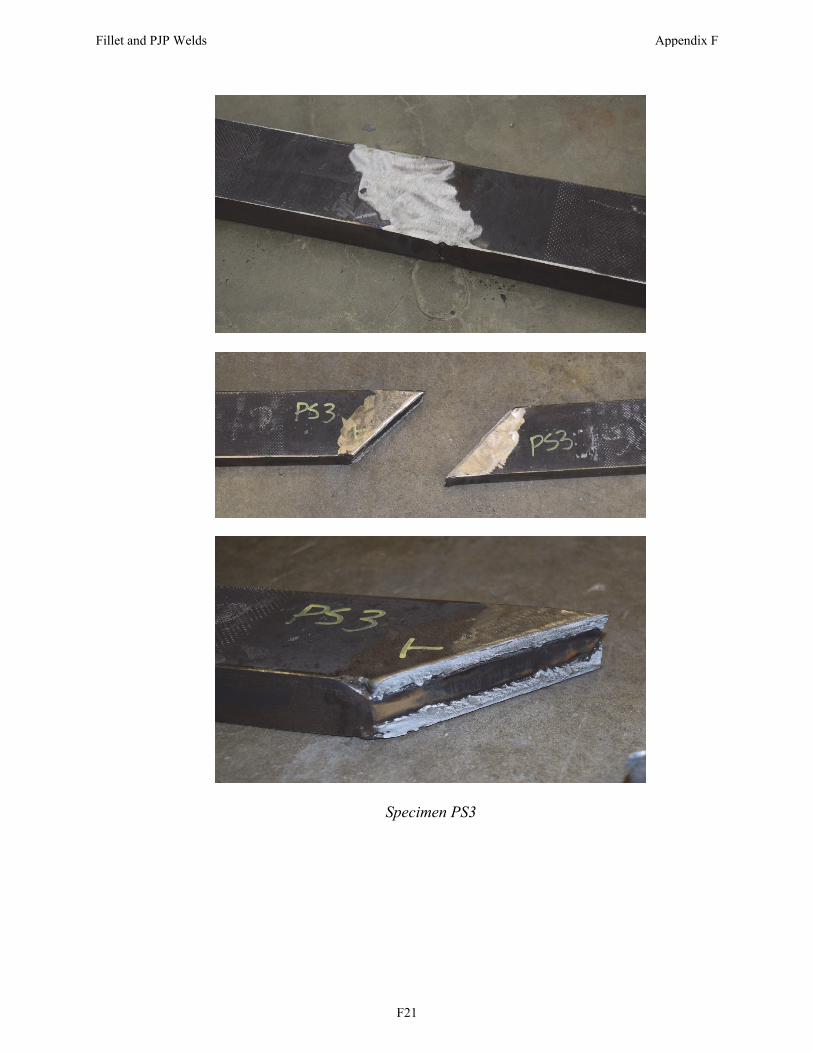
Specimen PS3
Fillet and PJP Welds Appendix F
F21

Specimen PS4
Specimen PS5
Fillet and PJP Welds Appendix F
F22
APPENDIX G
SPECIMEN DATA
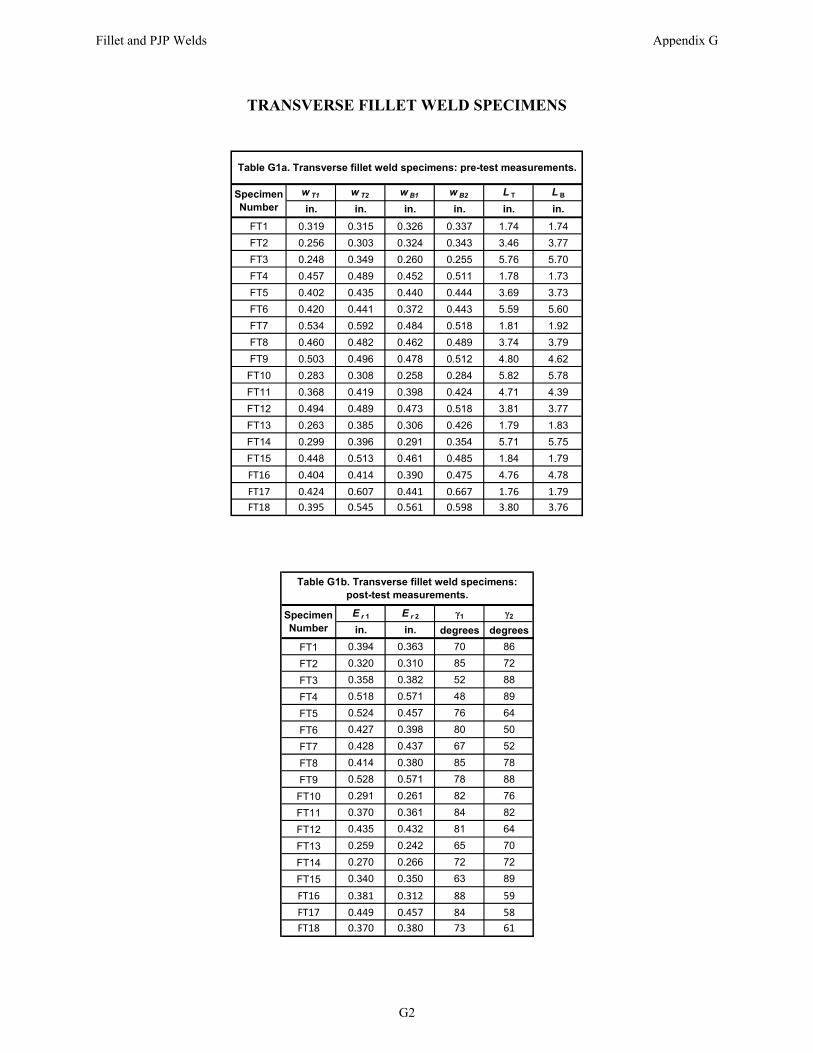
TRANSVERSE FILLET WELD SPECIMENS
w T1 w T2 w B1 w B2 L T L B
in. in. in. in. in. in.
FT1 0.319 0.315 0.326 0.337 1.74 1.74
FT2 0.256 0.303 0.324 0.343 3.46 3.77
FT3 0.248 0.349 0.260 0.255 5.76 5.70
FT4 0.457 0.489 0.452 0.511 1.78 1.73
FT5 0.402 0.435 0.440 0.444 3.69 3.73
FT6 0.420 0.441 0.372 0.443 5.59 5.60
FT7 0.534 0.592 0.484 0.518 1.81 1.92
FT8 0.460 0.482 0.462 0.489 3.74 3.79
FT9 0.503 0.496 0.478 0.512 4.80 4.62
FT10 0.283 0.308 0.258 0.284 5.82 5.78
FT11 0.368 0.419 0.398 0.424 4.71 4.39
FT12 0.494 0.489 0.473 0.518 3.81 3.77
FT13 0.263 0.385 0.306 0.426 1.79 1.83
FT14 0.299 0.396 0.291 0.354 5.71 5.75
FT15 0.448 0.513 0.461 0.485 1.84 1.79
FT16 0.404 0.414 0.390 0.475 4.76 4.78
FT17 0.424 0.607 0.441 0.667 1.76 1.79
FT18 0.395 0.545 0.561 0.598 3.80 3.76
Specimen Number
Table G1a. Transverse fillet weld specimens: pre-test measurements.
E r 1 E r 2 1 2
in. in. degrees degrees
FT1 0.394 0.363 70 86
FT2 0.320 0.310 85 72
FT3 0.358 0.382 52 88
FT4 0.518 0.571 48 89
FT5 0.524 0.457 76 64
FT6 0.427 0.398 80 50
FT7 0.428 0.437 67 52
FT8 0.414 0.380 85 78
FT9 0.528 0.571 78 88
FT10 0.291 0.261 82 76
FT11 0.370 0.361 84 82
FT12 0.435 0.432 81 64
FT13 0.259 0.242 65 70
FT14 0.270 0.266 72 72
FT15 0.340 0.350 63 89
FT16 0.381 0.312 88 59
FT17 0.449 0.457 84 58
FT18 0.370 0.380 73 61
Specimen Number
Table G1b. Transverse fillet weld specimens: post-test measurements.
Fillet and PJP Welds Appendix G
G2
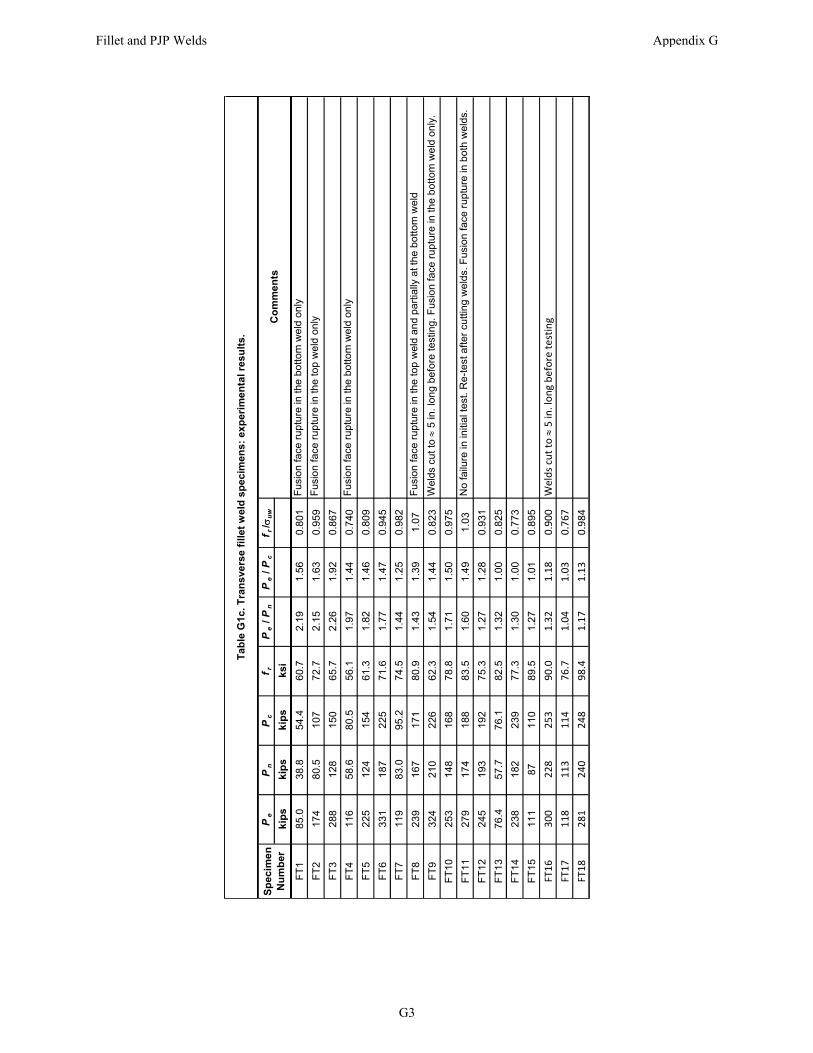
Pe
Pn
Pc
f rP
e /
Pn
Pe
/ P
cf r
/ u
w
kip
ski
ps
kip
sks
i
FT
18
5.0
38
.85
4.4
60
.72
.19
1.5
60
.80
1F
usi
on
fa
ce r
up
ture
in th
e b
otto
m w
eld
on
ly
FT
21
74
80
.51
07
72
.72
.15
1.6
30
.95
9F
usi
on
fa
ce r
up
ture
in th
e to
p w
eld
on
ly
FT
32
88
12
81
50
65
.72
.26
1.9
20
.86
7
FT
41
16
58
.68
0.5
56
.11
.97
1.4
40
.74
0F
usi
on
fa
ce r
up
ture
in th
e b
otto
m w
eld
on
ly
FT
52
25
12
41
54
61
.31
.82
1.4
60
.80
9
FT
63
31
18
72
25
71
.61
.77
1.4
70
.94
5
FT
71
19
83
.09
5.2
74
.51
.44
1.2
50
.98
2
FT
82
39
16
71
71
80
.91
.43
1.3
91
.07
Fu
sio
n f
ace
ru
ptu
re in
the
top
we
ld a
nd
pa
rtia
lly a
t th
e b
otto
m w
eld
FT
93
24
21
02
26
62
.31
.54
1.4
40
.82
3W
eld
s cu
t to
5
in. l
on
g b
efo
re t
est
ing
. Fu
sio
n fa
ce r
up
ture
in th
e b
otto
m w
eld
on
ly.
FT
10
25
31
48
16
87
8.8
1.7
11
.50
0.9
75
FT
11
27
91
74
18
88
3.5
1.6
01
.49
1.0
3N
o fa
ilure
in in
itia
l te
st.
Re
-te
st a
fte
r cu
ttin
g w
eld
s. F
usi
on
face
ru
ptu
re in
bo
th w
eld
s.
FT
12
24
51
93
19
27
5.3
1.2
71
.28
0.9
31
FT
13
76
.45
7.7
76
.18
2.5
1.3
21
.00
0.8
25
FT
14
23
81
82
23
97
7.3
1.3
01
.00
0.7
73
FT
15
11
18
71
10
89
.51
.27
1.0
10
.89
5
FT16
300
228
253
90.0
1.32
1.18
0.900
Welds cut to 5 in
. long before testing
FT17
118
113
114
76.7
1.04
1.03
0.767
FT18
281
240
248
98.4
1.17
1.13
0.984
Sp
ecim
en
Nu
mb
er
Tab
le G
1c. T
ran
sver
se f
ille
t w
eld
sp
ecim
ens:
exp
erim
enta
l res
ult
s.
Co
mm
en
ts
Fillet and PJP Welds Appendix G
G3
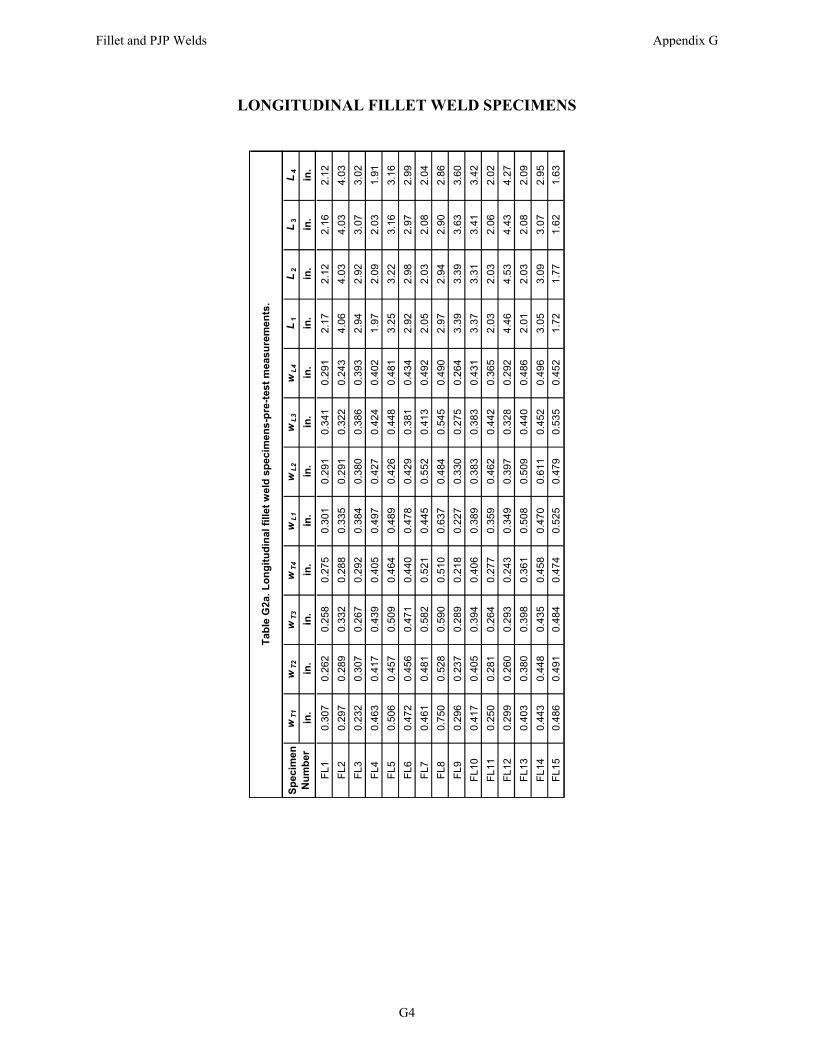
LONGITUDINAL FILLET WELD SPECIMENS
wT
1w
T2
wT
3w
T4
wL
1w
L2
wL
3w
L4
L1
L2
L3
L4
in.
in.
in.
in.
in.
in.
in.
in.
in.
in.
in.
in.
FL
10
.30
70
.26
20
.25
80
.27
50
.30
10
.291
0.3
41
0.2
91
2.1
72
.12
2.1
62.
12
FL
20
.29
70
.28
90
.33
20
.28
80
.33
50
.291
0.3
22
0.2
43
4.0
64
.03
4.0
34.
03
FL
30
.23
20
.30
70
.26
70
.29
20
.38
40
.380
0.3
86
0.3
93
2.9
42
.92
3.0
73.
02
FL
40
.46
30
.41
70
.43
90
.40
50
.49
70
.427
0.4
24
0.4
02
1.9
72
.09
2.0
31.
91
FL
50
.50
60
.45
70
.50
90
.46
40
.48
90
.426
0.4
48
0.4
81
3.2
53
.22
3.1
63.
16
FL
60
.47
20
.45
60
.47
10
.44
00
.47
80
.429
0.3
81
0.4
34
2.9
22
.98
2.9
72.
99
FL
70
.46
10
.48
10
.58
20
.52
10
.44
50
.552
0.4
13
0.4
92
2.0
52
.03
2.0
82.
04
FL
80
.75
00
.52
80
.59
00
.51
00
.63
70
.484
0.5
45
0.4
90
2.9
72
.94
2.9
02.
86
FL
90
.29
60
.23
70
.28
90
.21
80
.22
70
.330
0.2
75
0.2
64
3.3
93
.39
3.6
33.
60
FL
100
.41
70
.40
50
.39
40
.40
60
.38
90
.383
0.3
83
0.4
31
3.3
73
.31
3.4
13.
42
FL
110
.25
00
.28
10
.26
40
.27
70
.35
90
.462
0.4
42
0.3
65
2.0
32
.03
2.0
62.
02
FL
120
.29
90
.26
00
.29
30
.24
30
.34
90
.397
0.3
28
0.2
92
4.4
64
.53
4.4
34.
27
FL
130
.40
30
.38
00
.39
80
.36
10
.50
80
.509
0.4
40
0.4
86
2.0
12
.03
2.0
82.
09
FL
140
.44
30
.44
80
.43
50
.45
80
.47
00
.611
0.4
52
0.4
96
3.0
53
.09
3.0
72.
95
FL
150
.48
60
.49
10
.48
40
.47
40
.52
50
.479
0.5
35
0.4
52
1.7
21
.77
1.6
21.
63
Sp
ecim
en
Nu
mb
er
Tab
le G
2a. L
on
git
ud
inal
fill
et w
eld
sp
ecim
ens-
pre
-tes
t m
easu
rem
ents
.
Fillet and PJP Welds Appendix G
G4
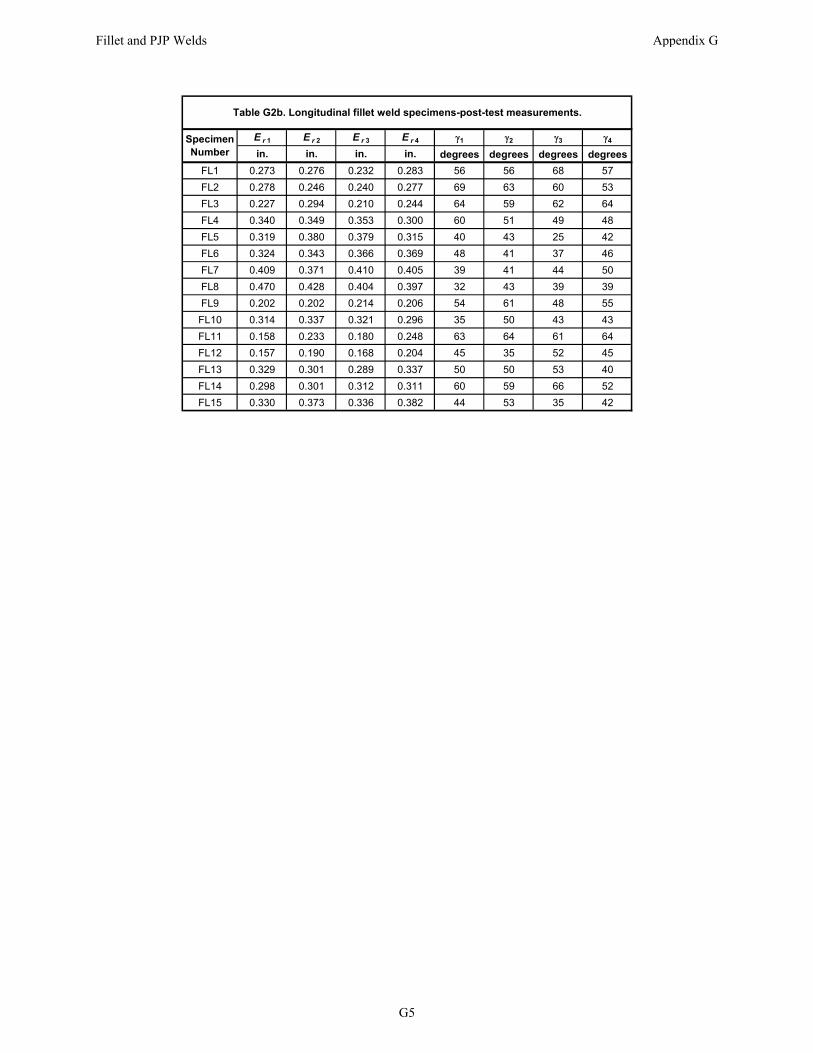
E r 1 E r 2 E r 3 E r 4 1 2 3 4
in. in. in. in. degrees degrees degrees degrees
FL1 0.273 0.276 0.232 0.283 56 56 68 57
FL2 0.278 0.246 0.240 0.277 69 63 60 53
FL3 0.227 0.294 0.210 0.244 64 59 62 64
FL4 0.340 0.349 0.353 0.300 60 51 49 48
FL5 0.319 0.380 0.379 0.315 40 43 25 42
FL6 0.324 0.343 0.366 0.369 48 41 37 46
FL7 0.409 0.371 0.410 0.405 39 41 44 50
FL8 0.470 0.428 0.404 0.397 32 43 39 39
FL9 0.202 0.202 0.214 0.206 54 61 48 55
FL10 0.314 0.337 0.321 0.296 35 50 43 43
FL11 0.158 0.233 0.180 0.248 63 64 61 64
FL12 0.157 0.190 0.168 0.204 45 35 52 45
FL13 0.329 0.301 0.289 0.337 50 50 53 40
FL14 0.298 0.301 0.312 0.311 60 59 66 52
FL15 0.330 0.373 0.336 0.382 44 53 35 42
Specimen Number
Table G2b. Longitudinal fillet weld specimens-post-test measurements.
Fillet and PJP Welds Appendix G
G5
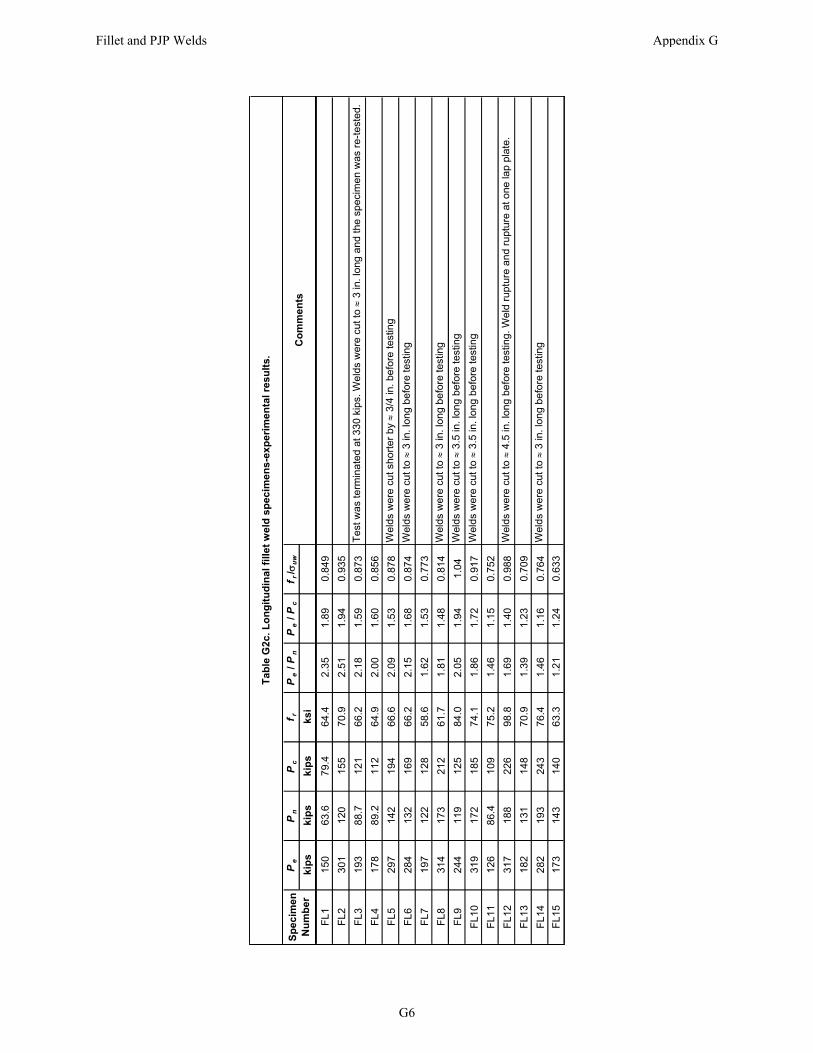
Pe
Pn
Pc
f rP
e /
Pn
Pe
/ P
cf r
/ u
w
kip
ski
ps
kip
sk
si
FL
11
50
63.
67
9.4
64
.42
.35
1.8
90
.84
9
FL
23
01
12
01
55
70
.92
.51
1.9
40
.93
5
FL
31
93
88.
71
21
66
.22
.18
1.5
90
.87
3T
est
wa
s te
rmin
ate
d a
t 33
0 k
ips.
We
lds
we
re c
ut t
o
3 in
. lo
ng a
nd
the
spe
cim
en
was
re
-te
ste
d.
FL
41
78
89.
21
12
64
.92
.00
1.6
00
.85
6
FL
52
97
14
21
94
66
.62
.09
1.5
30
.87
8W
eld
s w
ere
cu
t sh
ort
er
by
3/4
in.
befo
re te
stin
g
FL
62
84
13
21
69
66
.22
.15
1.6
80
.87
4W
eld
s w
ere
cu
t to
3
in. l
on
g b
efo
re t
estin
g
FL
71
97
12
21
28
58
.61
.62
1.5
30
.77
3
FL
83
14
17
32
12
61
.71
.81
1.4
80
.81
4W
eld
s w
ere
cu
t to
3
in. l
on
g b
efo
re t
estin
g
FL
92
44
11
91
25
84
.02
.05
1.9
41
.04
Wel
ds
we
re c
ut t
o
3.5
in. l
on
g b
efo
re te
stin
g
FL1
03
19
17
21
85
74
.11
.86
1.7
20
.91
7W
eld
s w
ere
cu
t to
3
.5 in
. lo
ng
be
fore
test
ing
FL1
11
26
86.
41
09
75
.21
.46
1.1
50
.75
2
FL1
23
17
18
82
26
98
.81
.69
1.4
00
.98
8W
eld
s w
ere
cu
t to
4
.5 in
. lo
ng
be
fore
test
ing
. We
ld r
up
ture
an
d r
upt
ure
at o
ne la
p p
late
.
FL1
31
82
13
11
48
70
.91
.39
1.2
30
.70
9
FL1
42
82
19
32
43
76
.41
.46
1.1
60
.76
4W
eld
s w
ere
cu
t to
3
in. l
on
g b
efo
re t
estin
g
FL1
51
73
14
31
40
63
.31
.21
1.2
40
.63
3
Sp
ecim
en
N
um
ber
Tab
le G
2c.
Lo
ng
itu
din
al f
illet
wel
d s
pec
imen
s-ex
per
imen
tal r
esu
lts.
Co
mm
ents
Fillet and PJP Welds Appendix G
G6
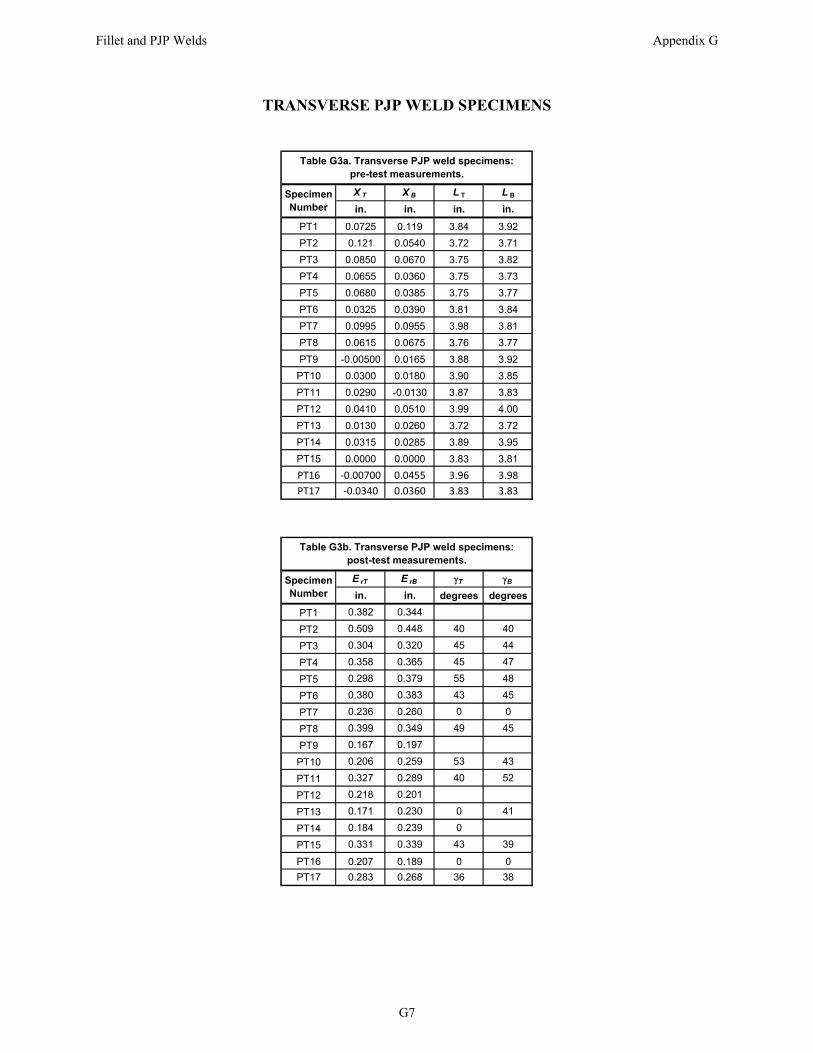
TRANSVERSE PJP WELD SPECIMENS
X T X B L T L B
in. in. in. in.
PT1 0.0725 0.119 3.84 3.92
PT2 0.121 0.0540 3.72 3.71
PT3 0.0850 0.0670 3.75 3.82
PT4 0.0655 0.0360 3.75 3.73
PT5 0.0680 0.0385 3.75 3.77
PT6 0.0325 0.0390 3.81 3.84
PT7 0.0995 0.0955 3.98 3.81
PT8 0.0615 0.0675 3.76 3.77
PT9 -0.00500 0.0165 3.88 3.92
PT10 0.0300 0.0180 3.90 3.85
PT11 0.0290 -0.0130 3.87 3.83
PT12 0.0410 0.0510 3.99 4.00
PT13 0.0130 0.0260 3.72 3.72
PT14 0.0315 0.0285 3.89 3.95
PT15 0.0000 0.0000 3.83 3.81
PT16 ‐0.00700 0.0455 3.96 3.98
PT17 ‐0.0340 0.0360 3.83 3.83
Specimen Number
Table G3a. Transverse PJP weld specimens: pre-test measurements.
E rT E rB T B
in. in. degrees degrees
PT1 0.382 0.344
PT2 0.509 0.448 40 40
PT3 0.304 0.320 45 44
PT4 0.358 0.365 45 47
PT5 0.298 0.379 55 48
PT6 0.380 0.383 43 45
PT7 0.236 0.260 0 0
PT8 0.399 0.349 49 45
PT9 0.167 0.197
PT10 0.206 0.259 53 43
PT11 0.327 0.289 40 52
PT12 0.218 0.201
PT13 0.171 0.230 0 41
PT14 0.184 0.239 0
PT15 0.331 0.339 43 39
PT16 0.207 0.189 0 0
PT17 0.283 0.268 36 38
Specimen Number
Table G3b. Transverse PJP weld specimens: post-test measurements.
Fillet and PJP Welds Appendix G
G7
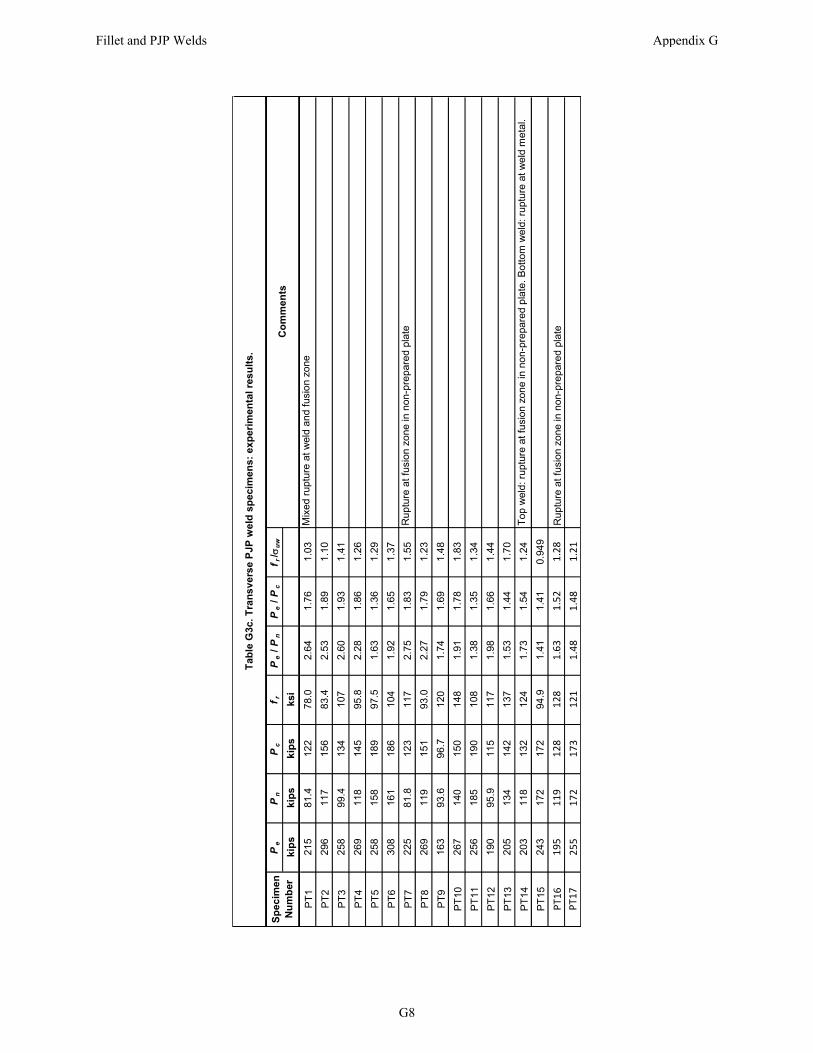
Pe
Pn
Pc
f rP
e /
Pn
Pe
/ P
cf r
/ u
w
kip
ski
ps
kip
sks
i
PT
121
581
.412
278
.02.
641.
761
.03
Mix
ed r
uptu
re a
t wel
d an
d fu
sio
n zo
ne
PT
229
611
715
683
.42.
531.
891
.10
PT
325
899
.413
410
72.
601.
931
.41
PT
426
911
814
595
.82.
281.
861
.26
PT
525
815
818
997
.51.
631.
361
.29
PT
630
816
118
610
41.
921.
651
.37
PT
722
581
.812
311
72.
751.
831
.55
Ru
ptur
e at
fus
ion
zone
in n
on-p
repa
red
plat
e
PT
826
911
915
193
.02.
271.
791
.23
PT
916
393
.696
.712
01.
741.
691
.48
PT
1026
714
015
014
81.
911.
781
.83
PT
1125
618
519
010
81.
381.
351
.34
PT
1219
095
.911
511
71.
981.
661
.44
PT
1320
513
414
213
71.
531.
441
.70
PT
1420
311
813
212
41.
731.
541
.24
Top
wel
d: r
uptu
re a
t fu
sion
zon
e in
no
n-pr
epar
ed p
late
. Bot
tom
wel
d: r
uptu
re a
t wel
d m
eta
l.
PT
1524
317
217
294
.91.
411.
410
.949
PT1
6195
119
128
128
1.63
1.52
1.28
Ru
ptur
e at
fus
ion
zone
in n
on-p
repa
red
plat
e
PT1
7255
172
173
121
1.48
1.48
1.21
Sp
ecim
en
Nu
mb
er
Tab
le G
3c. T
ran
sv
ers
e P
JP w
eld
sp
ecim
ens:
exp
erim
enta
l res
ult
s.
Co
mm
ents
Fillet and PJP Welds Appendix G
G8
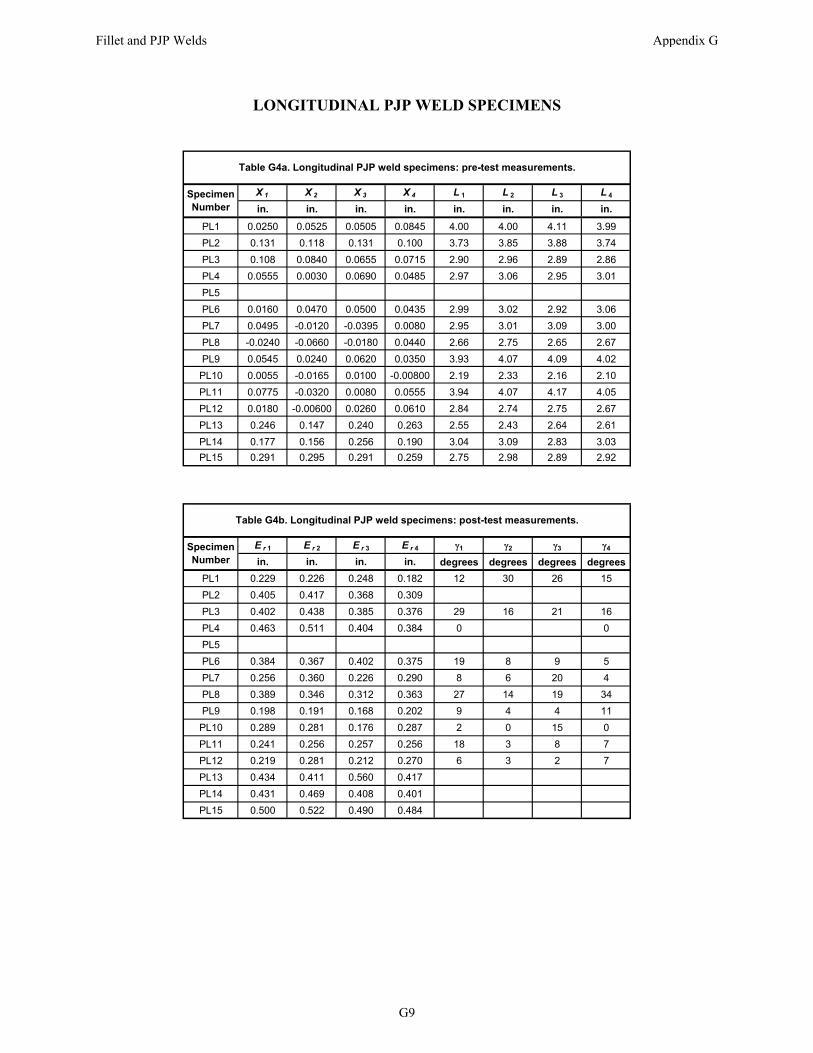
LONGITUDINAL PJP WELD SPECIMENS
X 1 X 2 X 3 X 4 L 1 L 2 L 3 L 4
in. in. in. in. in. in. in. in.
PL1 0.0250 0.0525 0.0505 0.0845 4.00 4.00 4.11 3.99
PL2 0.131 0.118 0.131 0.100 3.73 3.85 3.88 3.74
PL3 0.108 0.0840 0.0655 0.0715 2.90 2.96 2.89 2.86
PL4 0.0555 0.0030 0.0690 0.0485 2.97 3.06 2.95 3.01
PL5
PL6 0.0160 0.0470 0.0500 0.0435 2.99 3.02 2.92 3.06
PL7 0.0495 -0.0120 -0.0395 0.0080 2.95 3.01 3.09 3.00
PL8 -0.0240 -0.0660 -0.0180 0.0440 2.66 2.75 2.65 2.67
PL9 0.0545 0.0240 0.0620 0.0350 3.93 4.07 4.09 4.02
PL10 0.0055 -0.0165 0.0100 -0.00800 2.19 2.33 2.16 2.10
PL11 0.0775 -0.0320 0.0080 0.0555 3.94 4.07 4.17 4.05
PL12 0.0180 -0.00600 0.0260 0.0610 2.84 2.74 2.75 2.67
PL13 0.246 0.147 0.240 0.263 2.55 2.43 2.64 2.61
PL14 0.177 0.156 0.256 0.190 3.04 3.09 2.83 3.03
PL15 0.291 0.295 0.291 0.259 2.75 2.98 2.89 2.92
Specimen Number
Table G4a. Longitudinal PJP weld specimens: pre-test measurements.
E r 1 E r 2 E r 3 E r 4 1 2 3 4
in. in. in. in. degrees degrees degrees degrees
PL1 0.229 0.226 0.248 0.182 12 30 26 15
PL2 0.405 0.417 0.368 0.309
PL3 0.402 0.438 0.385 0.376 29 16 21 16
PL4 0.463 0.511 0.404 0.384 0 0
PL5
PL6 0.384 0.367 0.402 0.375 19 8 9 5
PL7 0.256 0.360 0.226 0.290 8 6 20 4
PL8 0.389 0.346 0.312 0.363 27 14 19 34
PL9 0.198 0.191 0.168 0.202 9 4 4 11
PL10 0.289 0.281 0.176 0.287 2 0 15 0
PL11 0.241 0.256 0.257 0.256 18 3 8 7
PL12 0.219 0.281 0.212 0.270 6 3 2 7
PL13 0.434 0.411 0.560 0.417
PL14 0.431 0.469 0.408 0.401
PL15 0.500 0.522 0.490 0.484
Specimen Number
Table G4b. Longitudinal PJP weld specimens: post-test measurements.
Fillet and PJP Welds Appendix G
G9
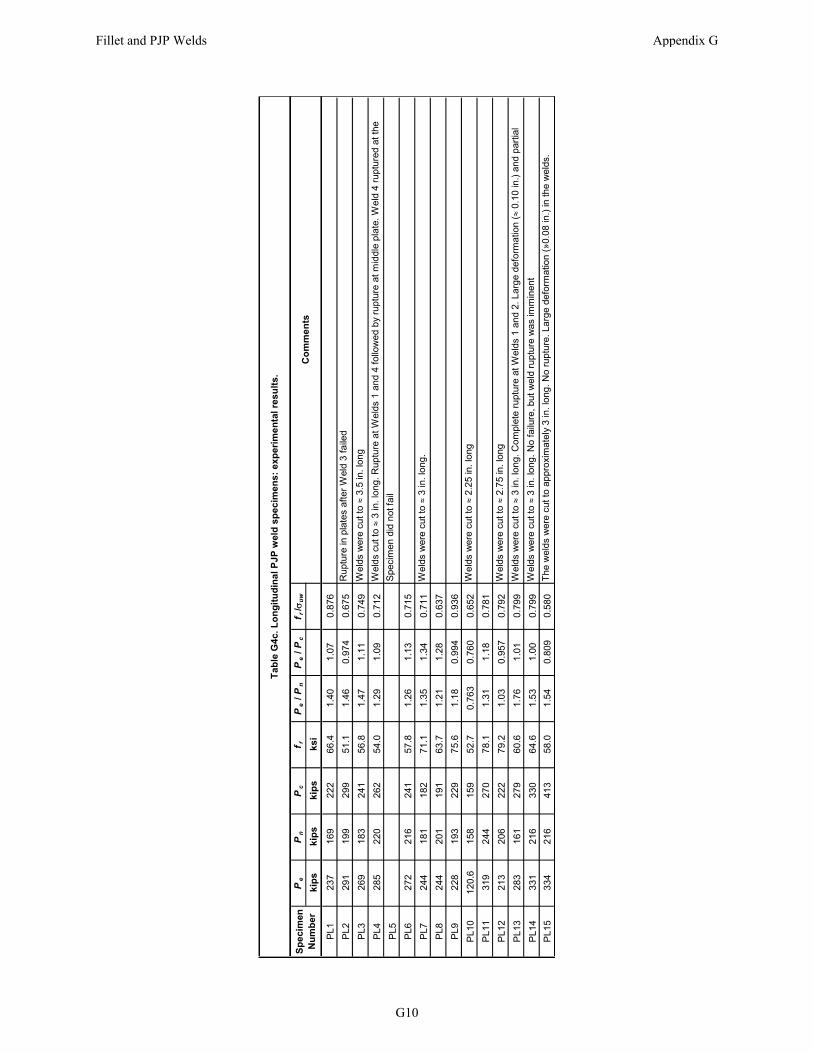
Pe
Pn
Pc
f rP
e /
Pn
Pe
/ P
cf r
/ u
w
kip
ski
ps
kip
sks
i
PL1
237
169
222
66.4
1.40
1.07
0.87
6
PL2
291
199
299
51.1
1.46
0.97
40.
675
Rup
ture
in p
late
s af
ter
Wel
d 3
faile
d
PL3
269
183
241
56.8
1.47
1.11
0.74
9W
elds
wer
e cu
t to
3.5
in. l
ong
PL4
285
220
262
54.0
1.29
1.09
0.71
2W
elds
cut
to
3 in
. lon
g. R
uptu
re a
t Wel
ds 1
and
4 f
ollo
wed
by
rupt
ure
at m
iddl
e pl
ate.
Wel
d 4
rupt
ured
at t
he
PL5
Spe
cim
en d
id n
ot f
ail
PL6
272
216
241
57.8
1.26
1.13
0.71
5
PL7
244
181
182
71.1
1.35
1.34
0.71
1W
elds
wer
e cu
t to
3 in
. lon
g.
PL8
244
201
191
63.7
1.21
1.28
0.63
7
PL9
228
193
229
75.6
1.18
0.99
40.
936
PL1
012
0.6
158
159
52.7
0.76
30.
760
0.65
2W
elds
wer
e cu
t to
2.25
in. l
ong
PL1
131
924
427
078
.11.
311.
180.
781
PL1
221
320
622
279
.21.
030.
957
0.79
2W
elds
wer
e cu
t to
2.75
in. l
ong
PL1
328
316
127
960
.61.
761.
010.
799
Wel
ds w
ere
cut t
o
3 in
. lon
g. C
ompl
ete
rupt
ure
at W
elds
1 a
nd 2
. Lar
ge d
efor
mat
ion
( 0
.10
in.)
and
par
tial
PL1
433
121
633
064
.61.
531.
000.
799
Wel
ds w
ere
cut t
o
3 in
. lon
g. N
o fa
ilure
, but
wel
d ru
ptur
e w
as im
min
ent
PL1
533
421
641
358
.01.
540.
809
0.58
0T
he w
elds
wer
e cu
t to
appr
oxim
atel
y 3
in. l
ong.
No
rupt
ure.
Lar
ge d
efor
mat
ion
(»0.
08 in
.) in
the
wel
ds.
Sp
ecim
en
Nu
mb
er
Tab
le G
4c. L
on
git
ud
inal
PJP
wel
d s
pec
imen
s: e
xper
imen
tal r
esu
lts.
Co
mm
ents
Fillet and PJP Welds Appendix G
G10
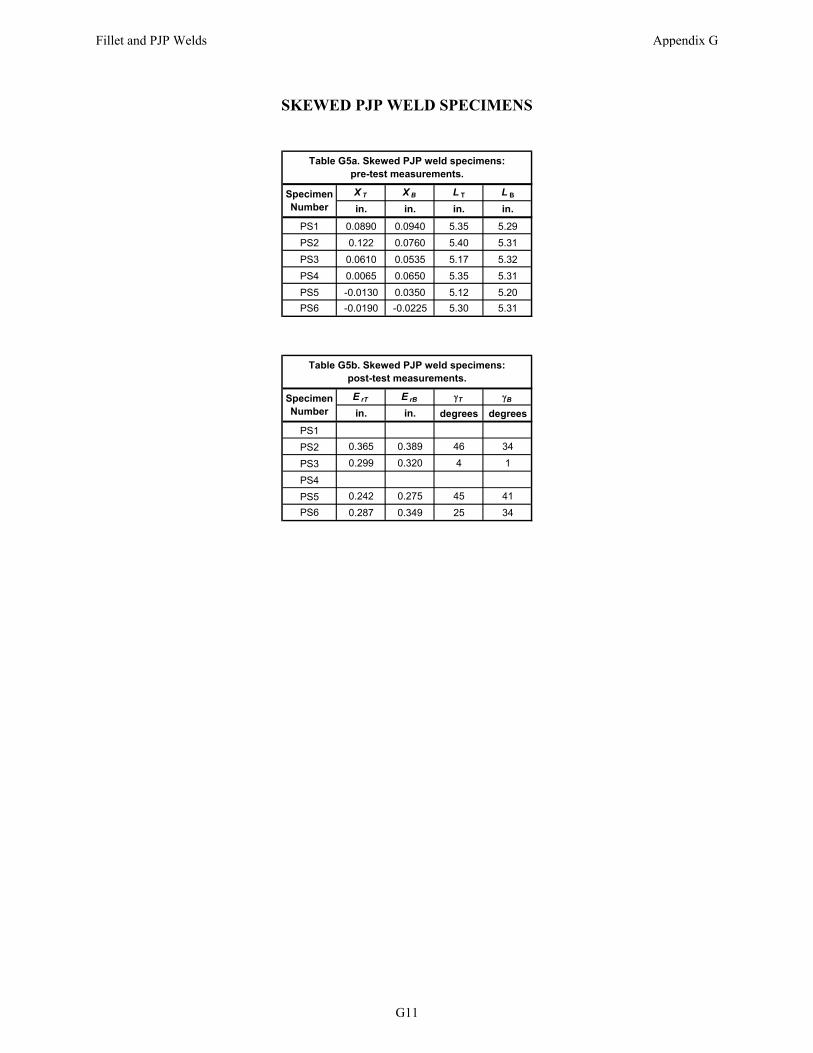
SKEWED PJP WELD SPECIMENS
X T X B L T L B
in. in. in. in.
PS1 0.0890 0.0940 5.35 5.29
PS2 0.122 0.0760 5.40 5.31
PS3 0.0610 0.0535 5.17 5.32
PS4 0.0065 0.0650 5.35 5.31
PS5 -0.0130 0.0350 5.12 5.20
PS6 -0.0190 -0.0225 5.30 5.31
Specimen Number
Table G5a. Skewed PJP weld specimens: pre-test measurements.
E rT E rB T B
in. in. degrees degrees
PS1
PS2 0.365 0.389 46 34
PS3 0.299 0.320 4 1
PS4
PS5 0.242 0.275 45 41
PS6 0.287 0.349 25 34
Specimen Number
Table G5b. Skewed PJP weld specimens: post-test measurements.
Fillet and PJP Welds Appendix G
G11
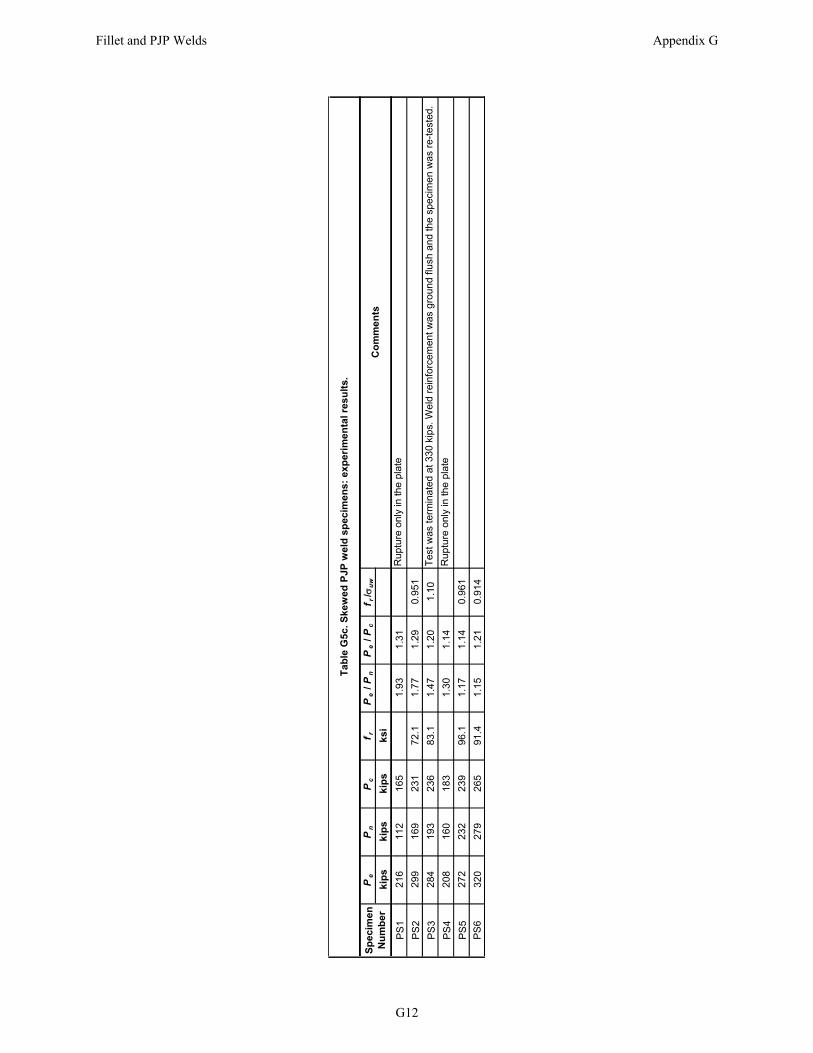
Pe
Pn
Pc
f rP
e /
Pn
Pe
/ P
cf r
/ u
w
kip
sk
ips
kip
sk
si
PS
12
16
11
21
65
1.9
31
.31
Ru
ptu
re o
nly
in th
e p
late
PS
22
99
16
92
31
72.1
1.7
71
.29
0.9
51
PS
32
84
19
32
36
83.1
1.4
71
.20
1.1
0T
est
was
term
ina
ted
at
330
kip
s. W
eld
re
info
rce
me
nt w
as
gro
un
d fl
ush
an
d th
e s
pe
cim
en
wa
s re
-te
sted
.
PS
42
08
16
01
83
1.3
01
.14
Ru
ptu
re o
nly
in th
e p
late
PS
52
72
23
22
39
96.1
1.1
71
.14
0.9
61
PS
63
20
27
92
65
91.4
1.1
51
.21
0.9
14
Sp
ec
ime
n
Nu
mb
er
Ta
ble
G5
c. S
ke
we
d P
JP
we
ld s
pe
cim
en
s:
ex
pe
rim
en
tal r
es
ult
s.
Co
mm
en
ts
Fillet and PJP Welds Appendix G
G12

APPENDIX H
MATHEMATICAL MODELS
In this Appendix, three different failure theories were considered in the derivations for the strength of skewed fillet welds: von-Mises, maximum normal stress and maximum shear stress (Tresca). The suggested models were based on the following assumptions:
Failure occurs in the weld metal and not the base metal. The weld fracture surface is where the maximum stresses are generated. The weld material is homogeneous. No weld penetration. Stresses in the fracture surface are uniform.
For each model, the surface where maximum stresses are generated was determined for both longitudinal and transverse loading. The location of maximum stress is not necessarily located in the plane of minimum throat. The following calculations show the location of maximum stresses and so the location of failure surface in the weld.
Single Fillet Welds with Transverse Loading According to the AISC Specification and AWS D1.1, the fillet weld design is mainly dependent on the allowable shear stress of the weld. Nevertheless, tensile stresses can be the controlling stresses for failure and not shear. This case is present in high obtuse dihedral of fillet weld. Consequently, the analysis due to transverse loading is conducted with respect to both allowable shear stress and allowable tensile stress of the weld and then both cases were combined to generalize the design of the fillet weld in skewed T-Joints. Figure H.1 shows the connection details in the case of transverse loading.
Fillet and PJP Welds Appendix H
H2
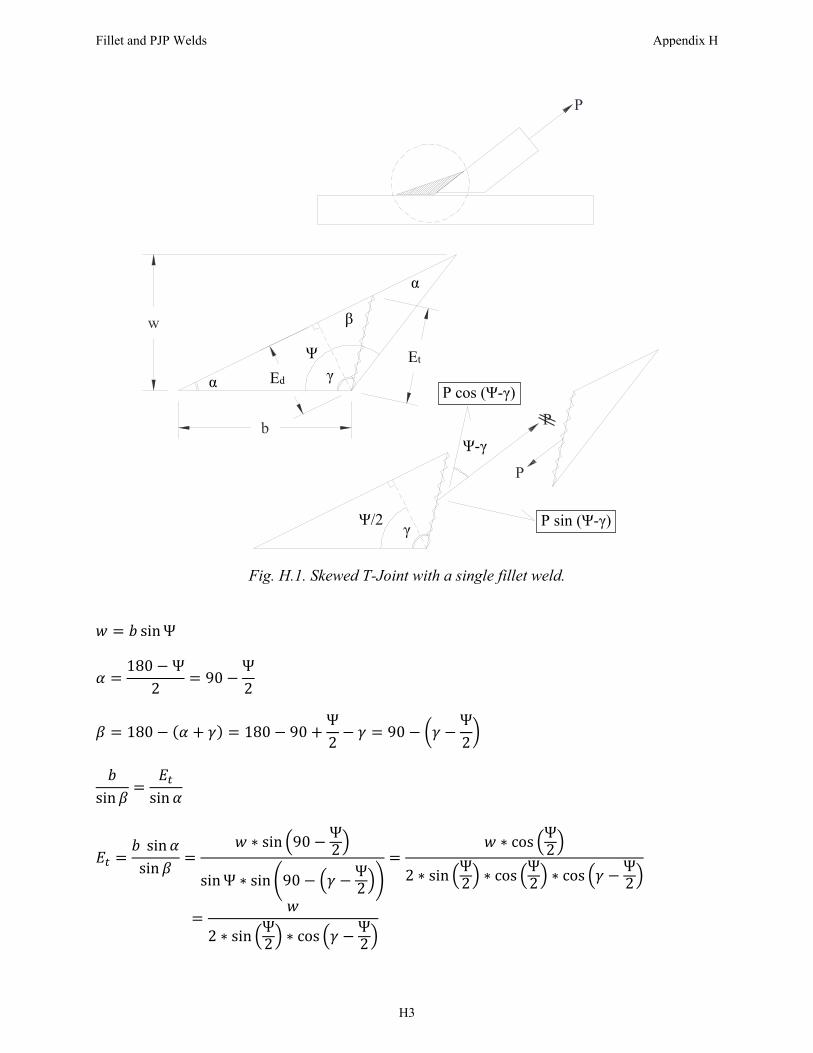
Fig. H.1. Skewed T-Joint with a single fillet weld.
𝑤 𝑏 sin Ψ
𝛼180 Ψ
290
Ψ2
𝛽 180 𝛼 𝛾 180 90Ψ2
𝛾 90 𝛾Ψ2
𝑏sin 𝛽
𝐸sin 𝛼
𝐸𝑏 sin 𝛼
sin 𝛽
𝑤 ∗ sin 90 Ψ2
sin Ψ ∗ sin 90 𝛾 Ψ2
𝑤 ∗ cos Ψ2
2 ∗ sin Ψ2 ∗ cos Ψ
2 ∗ cos 𝛾 Ψ2
𝑤
2 ∗ sin Ψ2 ∗ cos 𝛾 Ψ
2
t
b
w
t*
P
P
P
Ψ γ α
α
γ Ψ/2
Ψ-γ
P cos (Ψ-γ)
P sin (Ψ-γ)
Ed Et
β
Fillet and PJP Welds Appendix H
H3

𝐸𝐸
cos 𝛾 Ψ2
where,
Ed = design effective throat (shortest distance from the root to the face of the weld) Et = theoretical rupture plane width P = force acting on the fillet weld b = weld leg length w = weld size γ = angle of the fracture plane, measured from the horizontal surface of the base metal Ψ = dihedral angle of the skewed joint
Maximum Shear Stress (Tresca) The Tresca stress or maximum shear stress in the weld is expressed by 𝜏.
𝜏𝑃 cos Ψ 𝛾
𝐸 . 𝑙
where, 𝑙 is the weld length. Assume the unit length for 𝑙.
𝜏𝑃 cos Ψ 𝛾
𝐸𝑃 cos Ψ 𝛾
𝑤∗ 2 ∗ sin
Ψ2
∗ cos 𝛾Ψ2
2𝑃𝑤
sinΨ2
∗ cos Ψ 𝛾 ∗ cos 𝛾Ψ2
To determine the angle of shear failure (𝛾), where maximum shear stress or Tresca stress is generated, the derivative of the shear stress with respect to the failure angle should be equal to zero. 𝑑𝜏𝑑𝛾
0
2𝑃𝑤
sinΨ2
∗ cos Ψ 𝛾 ∗ sin 𝛾Ψ2
cos 𝛾Ψ2
∗ sin Ψ 𝛾 0
cos Ψ 𝛾 ∗ sin 𝛾Ψ2
cos 𝛾Ψ2
∗ sin Ψ 𝛾 0
cos Ψ 𝛾 ∗ sin 𝛾Ψ2
cos 𝛾Ψ2
∗ sin Ψ 𝛾
tan 𝛾Ψ2
tan Ψ 𝛾
Fillet and PJP Welds Appendix H
H4
𝛾Ψ2
Ψ 𝛾 𝛾 0.75Ψ
𝜏2𝑃𝑤
sinΨ2
∗ cos Ψ 0.75Ψ ∗ cos 0.75ΨΨ2
2𝑃𝑤
sinΨ2
∗ cosΨ4
∗ cosΨ4
2𝑃𝑤
∗ sinΨ2
∗ cosΨ4
The allowable transverse joint load for the weld, P, can be calculated accordingly by substituting 𝜏 with the ultimate shear stress of the fillet weld material, 𝜏 (Miazga and Kennedy, 1989) even though the Tresca theory includes comparing the maximum shear stress with the tensile yield stress divided by 2 (Boresi, Schmidt, and Sidebottom, 1993). 𝑃
𝜏 . 𝑤
2 sin Ψ2 ∗ cos Ψ
4
PUT-S is the ultimate transverse load that can be curried by the weld based on the predicted failure plane and not the weld throat based on the maximum shear stress (Tresca) criterion. The ultimate shear strength of fillet weld is equal to 1/√3 of the ultimate tensile strength of the weld (Naka and Kato, 1966).
𝜏𝐹
√30.6𝐹
𝑃𝐹 . 𝑤
2√3 sin Ψ2 ∗ cos Ψ
4
If we assumed that the shear failure happens where minimum throat is (𝛾 0.5Ψ), which is inaccurate, the nominal ultimate transverse joint load would be less conservative (higher) than the actual case (𝛾 0.75Ψ).
𝛾Ψ2
𝑎𝑛𝑑 𝐸 𝐸𝑤
2 ∗ sin Ψ2
𝜏2𝑃𝑤
sinΨ2
∗ cos Ψ 𝛾 ∗ cos 𝛾Ψ2
2𝑃𝑤
sinΨ2
∗ cosΨ2
𝑃𝑤
sin Ψ 𝑃
𝜏 . 𝑤sin Ψ
Fillet and PJP Welds Appendix H
H5
PUTH-S is the hypothetical ultimate transverse load carried by the weld based on the maximum shear stress (Tresca) criterion, assuming that the failure plane is at the throat section.
𝑃𝑃
sin Ψ
2 sin Ψ2 ∗ cos Ψ
4
cos Ψ2
cos Ψ4
cos Ψ4 sin Ψ
4
cos Ψ4
1 tanΨ4
… … … 𝐴𝑙𝑤𝑎𝑦𝑠 𝑙𝑒𝑠𝑠 𝑡ℎ𝑎𝑛 1 Maximum Normal Stress Depending on the skewness of the T-Joint the generated stresses in the fillet weld varies. For instance, the main generated stresses in the fillet weld of an acute angle is shear, while it is tension for the obtuse angle. In this section, the capacity of the fillet weld is determined based on comparing the maximum principal stress in the weld with the ultimate tensile strength of the weld material.
𝜎𝑃 sin Ψ 𝛾
𝐸 . 𝑙
where, 𝑙 is the weld length. Assume the unit length for 𝑙.
𝜎𝑃 sin Ψ 𝛾
𝐸𝑃 sin Ψ 𝛾
𝑤∗ 2 ∗ sin
Ψ2
∗ cos 𝛾Ψ2
2𝑃𝑤
sinΨ2
∗ sin Ψ 𝛾 ∗ cos 𝛾Ψ2
To determine the angle of tensile failure (𝛾), where maximum tensile stress is generated, the derivative of the tensile stress with respect to the failure angle should be equal to zero. 𝑑𝜎𝑑𝛾
0
2𝑃𝑤
sinΨ2
∗ sin Ψ 𝛾 ∗ sin 𝛾Ψ2
cos 𝛾Ψ2
∗ cos Ψ 𝛾 0
sin Ψ 𝛾 ∗ sin 𝛾Ψ2
cos 𝛾Ψ2
∗ cos Ψ 𝛾 0
cos Ψ 𝛾 𝛾Ψ2
0 1.5Ψ 2𝛾 90 𝛾 0.75Ψ 45
Fillet and PJP Welds Appendix H
H6
The above angle of failure (𝛾) equation is mathematically correct for dihedral angles, Ψ, ranging from 60o to 180o. Nevertheless, this should not be a problem and we should not be concerned about the applicability of maximum principal stress criterion to the case of dihedral angles less than 60o. As shown in the next section, for acute dihedral angles, shear forces in the weld were the ones controlling its failure.
𝜎2𝑃𝑤
sinΨ2
∗ sin Ψ 0.75Ψ 45 ∗ cos 0.75Ψ 45Ψ2
2𝑃𝑤
sinΨ2
∗ sinΨ4
45 ∗ cosΨ4
45
2𝑃𝑤
sinΨ2
∗ 0.707 sinΨ4
0.707 cosΨ4
∗ 0.707 cosΨ4
0.707 sinΨ4
𝑃𝑤
sinΨ2
∗ sinΨ4
cosΨ4
2 sinΨ4
cosΨ4
𝑃𝑤
sinΨ2
∗ 1 sinΨ2
𝑃𝑤
sinΨ2
sinΨ2
The allowable transverse joint load for the weld, P, can be calculated accordingly by substituting 𝜎 with the ultimate tensile strength of the fillet weld, 𝐹 .
𝑃𝐹 . 𝑤
sin Ψ2 sin Ψ
2
PUT-P is the ultimate transverse load carried by the weld that is calculated based on the maximum principal stress criterion and the predicted failure plane. If we assumed that the tensile failure happens where minimum throat is (𝛾 0.5Ψ), which is wrong, the allowable transverse joint load would be less conservative (higher) than the actual case (𝛾 0.75Ψ 45).
𝛾Ψ2
𝑎𝑛𝑑 𝐸 𝐸𝑤
2 ∗ sin Ψ2
𝜎2𝑃𝑤
sinΨ2
∗ sin Ψ 𝛾 ∗ cos 𝛾Ψ2
2𝑃𝑤
sinΨ2
∗ sin ΨΨ2
∗ cosΨ2
Ψ2
2𝑃𝑤
sinΨ2
𝑃𝐹 . 𝑤
2 sin Ψ2
PUTH-P is the hypothetical ultimate transverse load carried by the weld and is calculated based on the maximum principal stress criterion assuming the failure plane is located at the throat section.
Fillet and PJP Welds Appendix H
H7
𝑃𝑃
sin Ψ2 sin Ψ
2
2 sin Ψ2
0.51
2 sin Ψ2
For all values of Ψ between 0 and 180o, the above ratio will always be higher than 1. Maximum Shear and Maximum Normal Stresses in Design The allowable transverse load so that the maximum shear stress (Tresca) in the fillet weld will not exceed the ultimate shear strength of the weld material is: 𝑃
𝜏 . 𝑤
2 sin Ψ2 ∗ cos Ψ
4
The allowable transverse load so that the maximum principal stress in the fillet weld will not exceed the ultimate tensile strength of the weld is:
𝑃𝐹 . 𝑤
sin Ψ2 sin Ψ
2
𝜏𝐹
√30.6𝐹
𝑃𝑃
𝐹 . 𝑤
sin Ψ2 sin Ψ
2𝜏 . 𝑤
2 sin Ψ2 ∗ cos Ψ
4
√3 ∗2 sin Ψ
2 ∗ cos Ψ4
sin Ψ2 sin Ψ
2
2√3 sin Ψ2 ∗ cos Ψ
4
sin Ψ2 sin Ψ
2
For design purposes, the less allowable transverse load from maximum principal stress criterion and Tresca criterion is the one controlling the weld design. Figure H.2 shows the ratio between both while varying the dihedral angle.
Fillet and PJP Welds Appendix H
H8
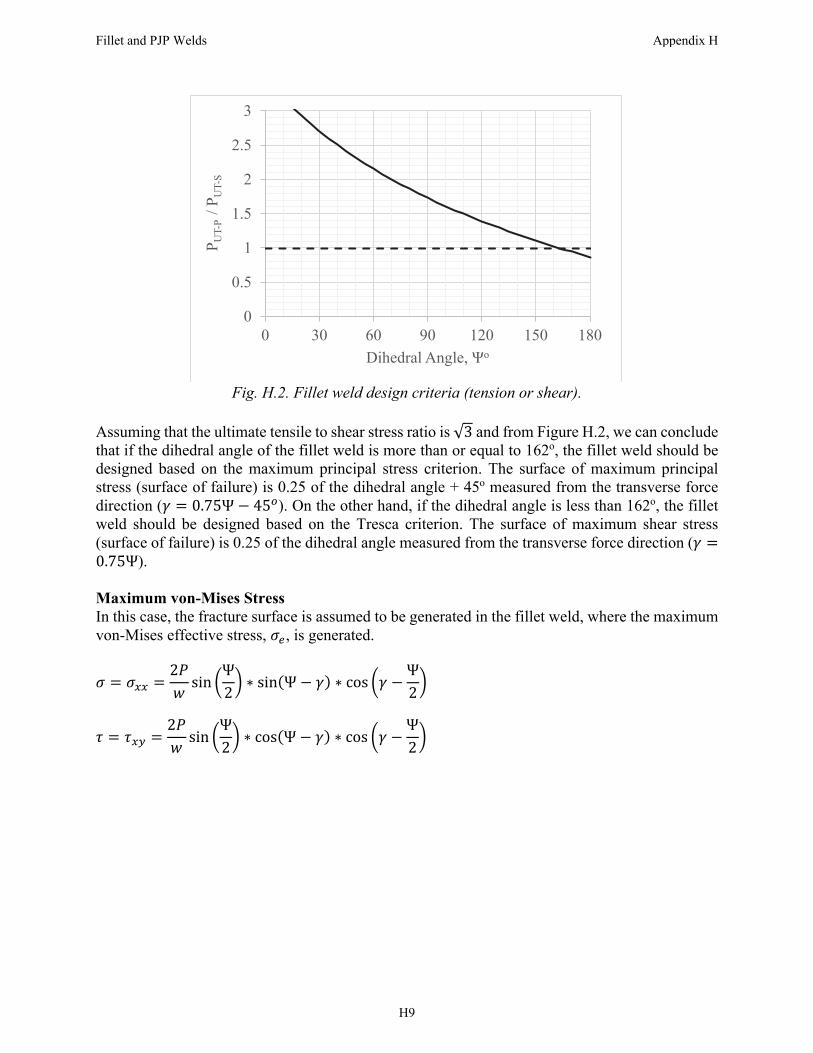
Fig. H.2. Fillet weld design criteria (tension or shear).
Assuming that the ultimate tensile to shear stress ratio is √3 and from Figure H.2, we can conclude that if the dihedral angle of the fillet weld is more than or equal to 162o, the fillet weld should be designed based on the maximum principal stress criterion. The surface of maximum principal stress (surface of failure) is 0.25 of the dihedral angle + 45o measured from the transverse force direction (𝛾 0.75Ψ 45 ). On the other hand, if the dihedral angle is less than 162o, the fillet weld should be designed based on the Tresca criterion. The surface of maximum shear stress (surface of failure) is 0.25 of the dihedral angle measured from the transverse force direction (𝛾0.75Ψ). Maximum von-Mises Stress In this case, the fracture surface is assumed to be generated in the fillet weld, where the maximum von-Mises effective stress, 𝜎 , is generated.
𝜎 𝜎2𝑃𝑤
sinΨ2
∗ sin Ψ 𝛾 ∗ cos 𝛾Ψ2
𝜏 𝜏2𝑃𝑤
sinΨ2
∗ cos Ψ 𝛾 ∗ cos 𝛾Ψ2
0
0.5
1
1.5
2
2.5
3
0 30 60 90 120 150 180
P UT-
P /
P UT-
S
Dihedral Angle, Ψo
Fillet and PJP Welds Appendix H
H9
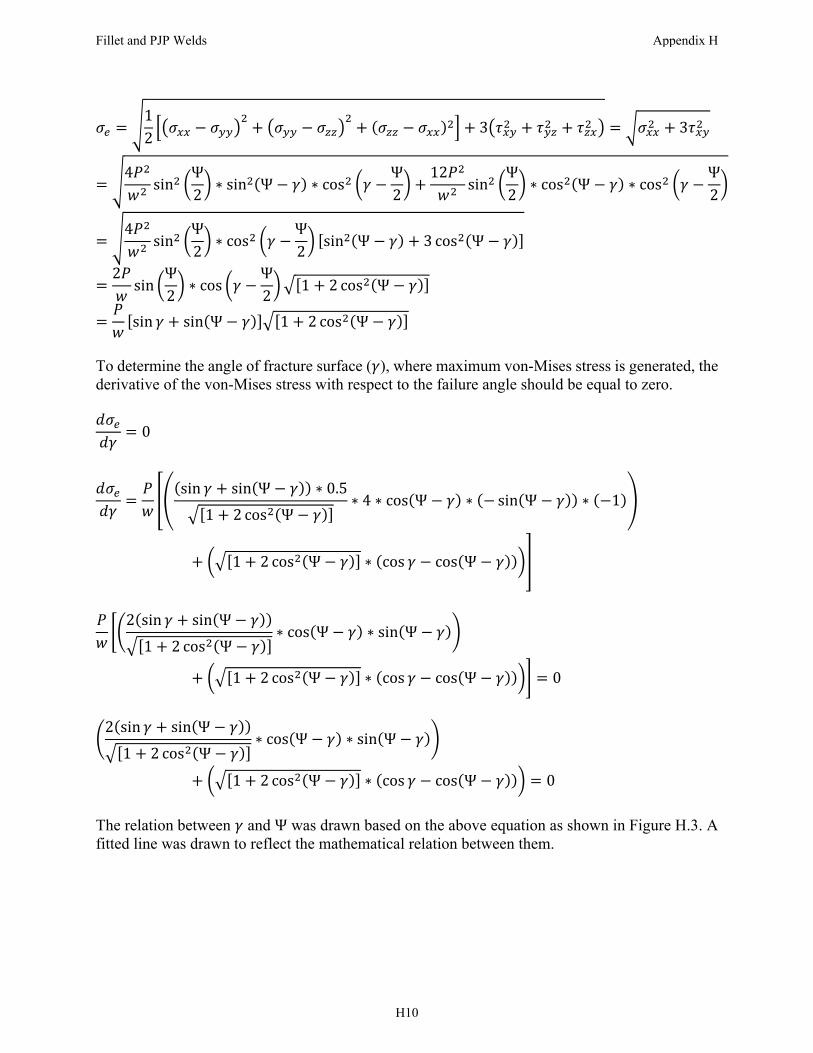
𝜎12
𝜎 𝜎 𝜎 𝜎 𝜎 𝜎 3 𝜏 𝜏 𝜏 𝜎 3𝜏
4𝑃𝑤
sinΨ2
∗ sin Ψ 𝛾 ∗ cos 𝛾Ψ2
12𝑃𝑤
sinΨ2
∗ cos Ψ 𝛾 ∗ cos 𝛾Ψ2
4𝑃𝑤
sinΨ2
∗ cos 𝛾Ψ2
sin Ψ 𝛾 3 cos Ψ 𝛾
2𝑃𝑤
sinΨ2
∗ cos 𝛾Ψ2
1 2 cos Ψ 𝛾
𝑃𝑤
sin 𝛾 sin Ψ 𝛾 1 2 cos Ψ 𝛾 To determine the angle of fracture surface (𝛾), where maximum von-Mises stress is generated, the derivative of the von-Mises stress with respect to the failure angle should be equal to zero. 𝑑𝜎𝑑𝛾
0
𝑑𝜎𝑑𝛾
𝑃𝑤
sin 𝛾 sin Ψ 𝛾 ∗ 0.5
1 2 cos Ψ 𝛾∗ 4 ∗ cos Ψ 𝛾 ∗ sin Ψ 𝛾 ∗ 1
1 2 cos Ψ 𝛾 ∗ cos 𝛾 cos Ψ 𝛾
𝑃𝑤
2 sin 𝛾 sin Ψ 𝛾
1 2 cos Ψ 𝛾∗ cos Ψ 𝛾 ∗ sin Ψ 𝛾
1 2 cos Ψ 𝛾 ∗ cos 𝛾 cos Ψ 𝛾 0
2 sin 𝛾 sin Ψ 𝛾
1 2 cos Ψ 𝛾∗ cos Ψ 𝛾 ∗ sin Ψ 𝛾
1 2 cos Ψ 𝛾 ∗ cos 𝛾 cos Ψ 𝛾 0 The relation between 𝛾 and Ψ was drawn based on the above equation as shown in Figure H.3. A fitted line was drawn to reflect the mathematical relation between them.
Fillet and PJP Welds Appendix H
H10
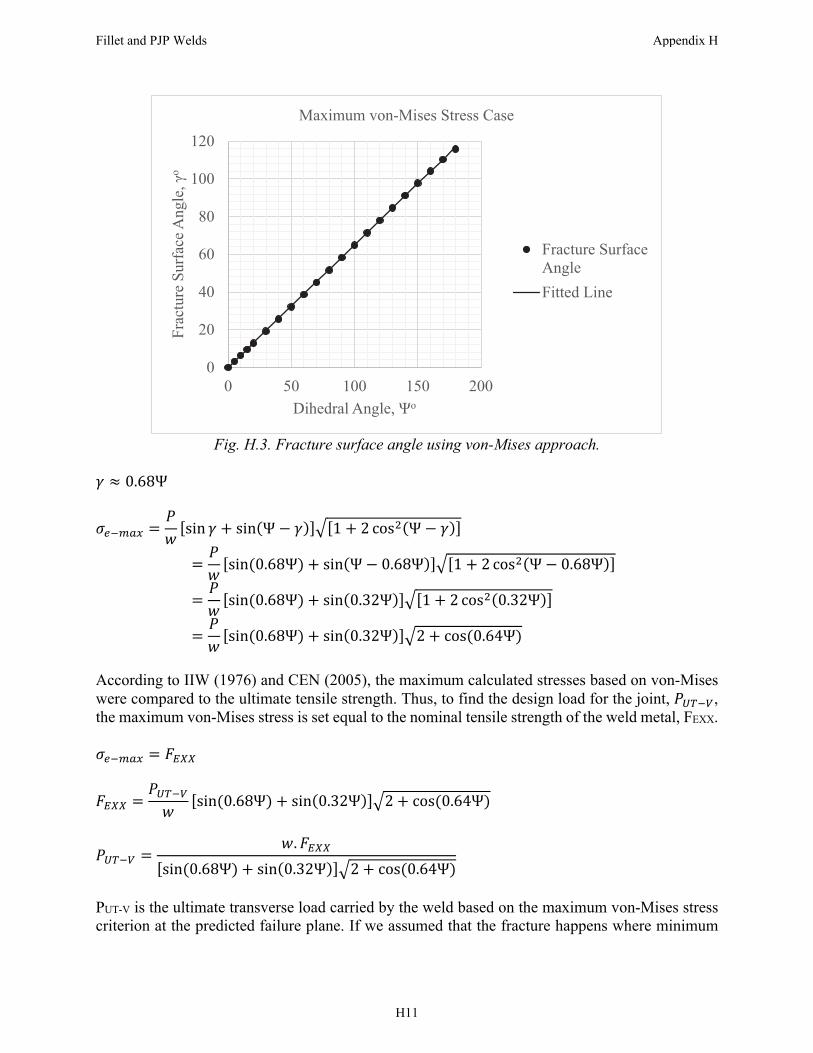
Fig. H.3. Fracture surface angle using von-Mises approach.
𝛾 0.68Ψ
𝜎𝑃𝑤
sin 𝛾 sin Ψ 𝛾 1 2 cos Ψ 𝛾
𝑃𝑤
sin 0.68Ψ sin Ψ 0.68Ψ 1 2 cos Ψ 0.68Ψ
𝑃𝑤
sin 0.68Ψ sin 0.32Ψ 1 2 cos 0.32Ψ
𝑃𝑤
sin 0.68Ψ sin 0.32Ψ 2 cos 0.64Ψ According to IIW (1976) and CEN (2005), the maximum calculated stresses based on von-Mises were compared to the ultimate tensile strength. Thus, to find the design load for the joint, 𝑃 , the maximum von-Mises stress is set equal to the nominal tensile strength of the weld metal, FEXX. 𝜎 𝐹
𝐹𝑃
𝑤sin 0.68Ψ sin 0.32Ψ 2 cos 0.64Ψ
𝑃𝑤. 𝐹
sin 0.68Ψ sin 0.32Ψ 2 cos 0.64Ψ
PUT-V is the ultimate transverse load carried by the weld based on the maximum von-Mises stress criterion at the predicted failure plane. If we assumed that the fracture happens where minimum
0
20
40
60
80
100
120
0 50 100 150 200
Frac
ture
Sur
face
Ang
le, γ
o
Dihedral Angle, Ψo
Maximum von-Mises Stress Case
Fracture SurfaceAngleFitted Line
Fillet and PJP Welds Appendix H
H11
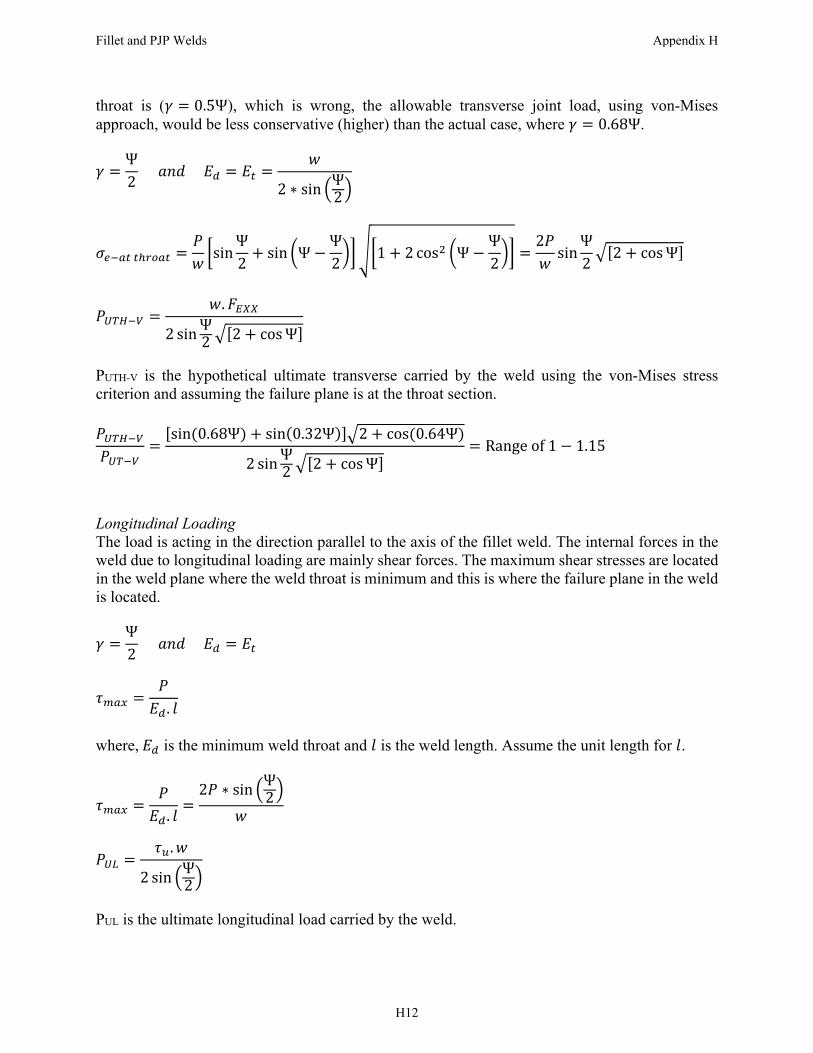
throat is (𝛾 0.5Ψ), which is wrong, the allowable transverse joint load, using von-Mises approach, would be less conservative (higher) than the actual case, where 𝛾 0.68Ψ.
𝛾Ψ2
𝑎𝑛𝑑 𝐸 𝐸𝑤
2 ∗ sin Ψ2
𝜎 𝑃𝑤
sinΨ2
sin ΨΨ2
1 2 cos ΨΨ2
2𝑃𝑤
sinΨ2
2 cos Ψ
𝑃𝑤. 𝐹
2 sin Ψ2 2 cos Ψ
PUTH-V is the hypothetical ultimate transverse carried by the weld using the von-Mises stress criterion and assuming the failure plane is at the throat section. 𝑃𝑃
sin 0.68Ψ sin 0.32Ψ 2 cos 0.64Ψ
2 sin Ψ2 2 cos Ψ
Range of 1 1.15
Longitudinal Loading The load is acting in the direction parallel to the axis of the fillet weld. The internal forces in the weld due to longitudinal loading are mainly shear forces. The maximum shear stresses are located in the weld plane where the weld throat is minimum and this is where the failure plane in the weld is located.
𝛾Ψ2
𝑎𝑛𝑑 𝐸 𝐸
𝜏𝑃
𝐸 . 𝑙
where, 𝐸 is the minimum weld throat and 𝑙 is the weld length. Assume the unit length for 𝑙.
𝜏𝑃
𝐸 . 𝑙
2𝑃 ∗ sin Ψ2
𝑤
𝑃
𝜏 . 𝑤
2 sin Ψ2
PUL is the ultimate longitudinal load carried by the weld.
Fillet and PJP Welds Appendix H
H12
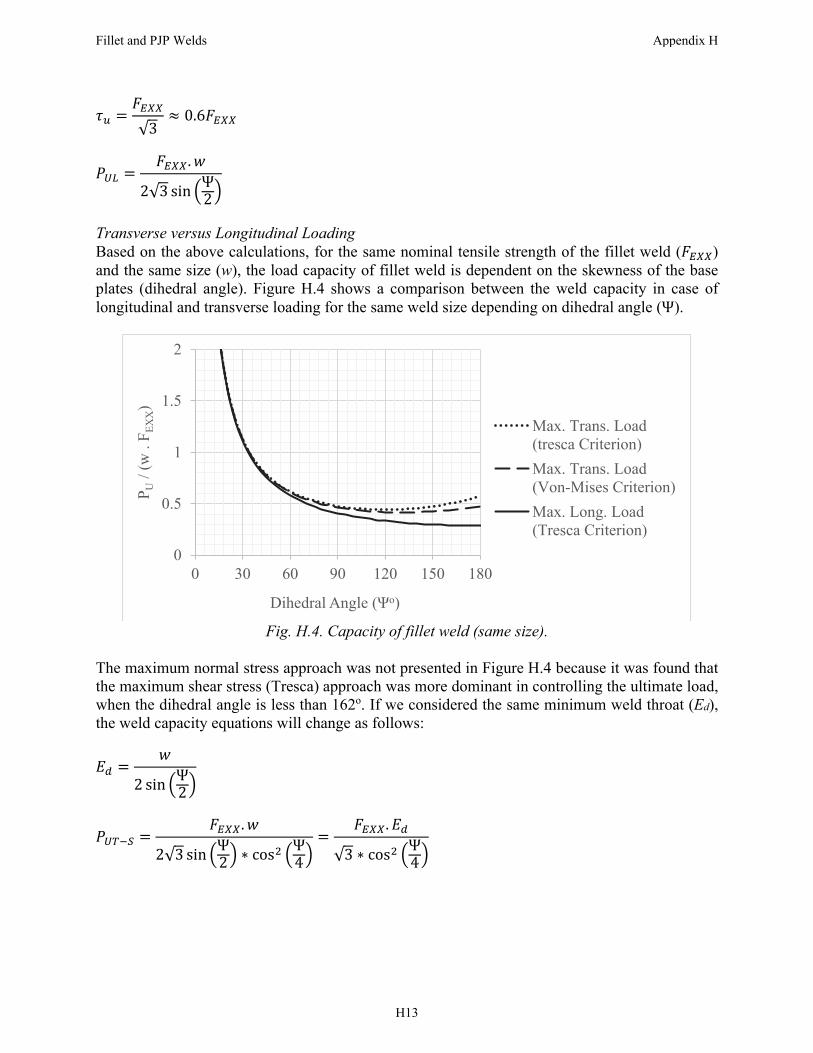
𝜏𝐹
√30.6𝐹
𝑃𝐹 . 𝑤
2√3 sin Ψ2
Transverse versus Longitudinal Loading Based on the above calculations, for the same nominal tensile strength of the fillet weld (𝐹 ) and the same size (w), the load capacity of fillet weld is dependent on the skewness of the base plates (dihedral angle). Figure H.4 shows a comparison between the weld capacity in case of longitudinal and transverse loading for the same weld size depending on dihedral angle (Ψ).
Fig. H.4. Capacity of fillet weld (same size).
The maximum normal stress approach was not presented in Figure H.4 because it was found that the maximum shear stress (Tresca) approach was more dominant in controlling the ultimate load, when the dihedral angle is less than 162o. If we considered the same minimum weld throat (Ed), the weld capacity equations will change as follows: 𝐸
𝑤
2 sin Ψ2
𝑃𝐹 . 𝑤
2√3 sin Ψ2 ∗ cos Ψ
4
𝐹 . 𝐸
√3 ∗ cos Ψ4
0
0.5
1
1.5
2
0 30 60 90 120 150 180
P U/ (
w .
F EX
X)
Dihedral Angle (Ψo)
Max. Trans. Load(tresca Criterion)Max. Trans. Load(Von-Mises Criterion)Max. Long. Load(Tresca Criterion)
Fillet and PJP Welds Appendix H
H13
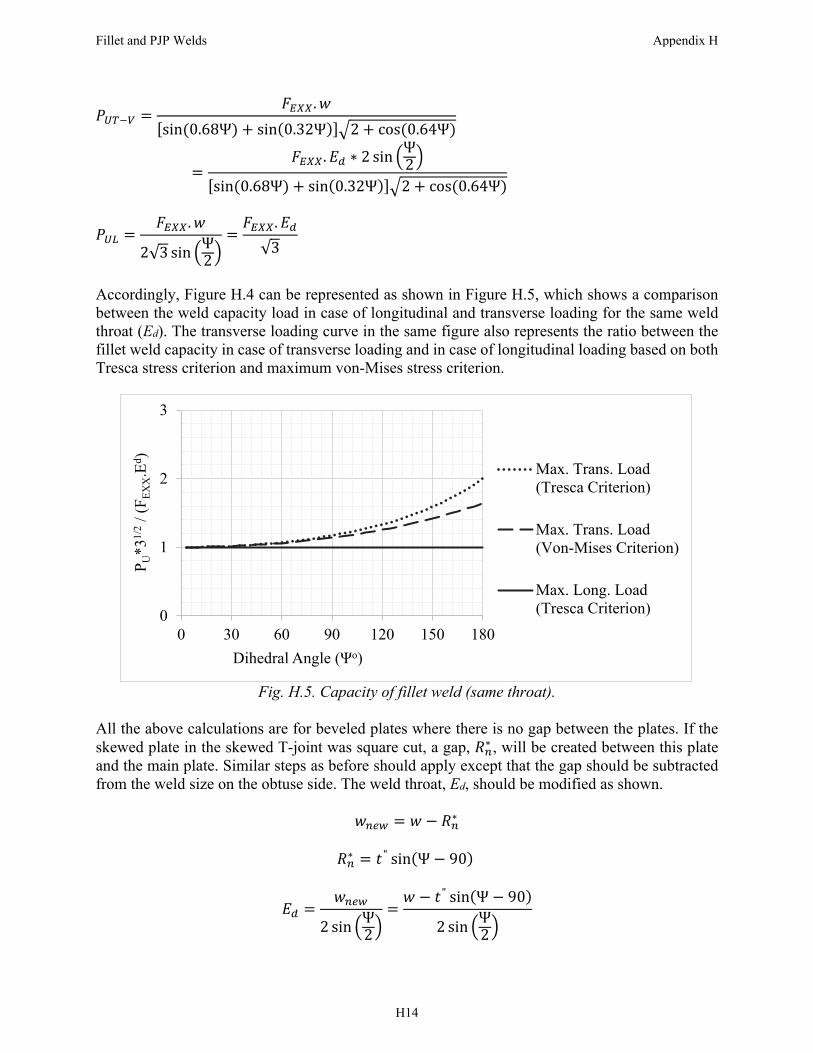
𝑃𝐹 . 𝑤
sin 0.68Ψ sin 0.32Ψ 2 cos 0.64Ψ
𝐹 . 𝐸 ∗ 2 sin Ψ2
sin 0.68Ψ sin 0.32Ψ 2 cos 0.64Ψ
𝑃𝐹 . 𝑤
2√3 sin Ψ2
𝐹 . 𝐸
√3
Accordingly, Figure H.4 can be represented as shown in Figure H.5, which shows a comparison between the weld capacity load in case of longitudinal and transverse loading for the same weld throat (Ed). The transverse loading curve in the same figure also represents the ratio between the fillet weld capacity in case of transverse loading and in case of longitudinal loading based on both Tresca stress criterion and maximum von-Mises stress criterion.
Fig. H.5. Capacity of fillet weld (same throat).
All the above calculations are for beveled plates where there is no gap between the plates. If the skewed plate in the skewed T-joint was square cut, a gap, 𝑅∗ , will be created between this plate and the main plate. Similar steps as before should apply except that the gap should be subtracted from the weld size on the obtuse side. The weld throat, Ed, should be modified as shown.
𝑤 𝑤 𝑅∗
𝑅∗ 𝑡" sin Ψ 90
𝐸𝑤
2 sin Ψ2
𝑤 𝑡" sin Ψ 90
2 sin Ψ2
0
1
2
3
0 30 60 90 120 150 180
P U*3
1/2
/ (F E
XX.E
d )
Dihedral Angle (Ψo)
Max. Trans. Load(Tresca Criterion)
Max. Trans. Load(Von-Mises Criterion)
Max. Long. Load(Tresca Criterion)
Fillet and PJP Welds Appendix H
H14
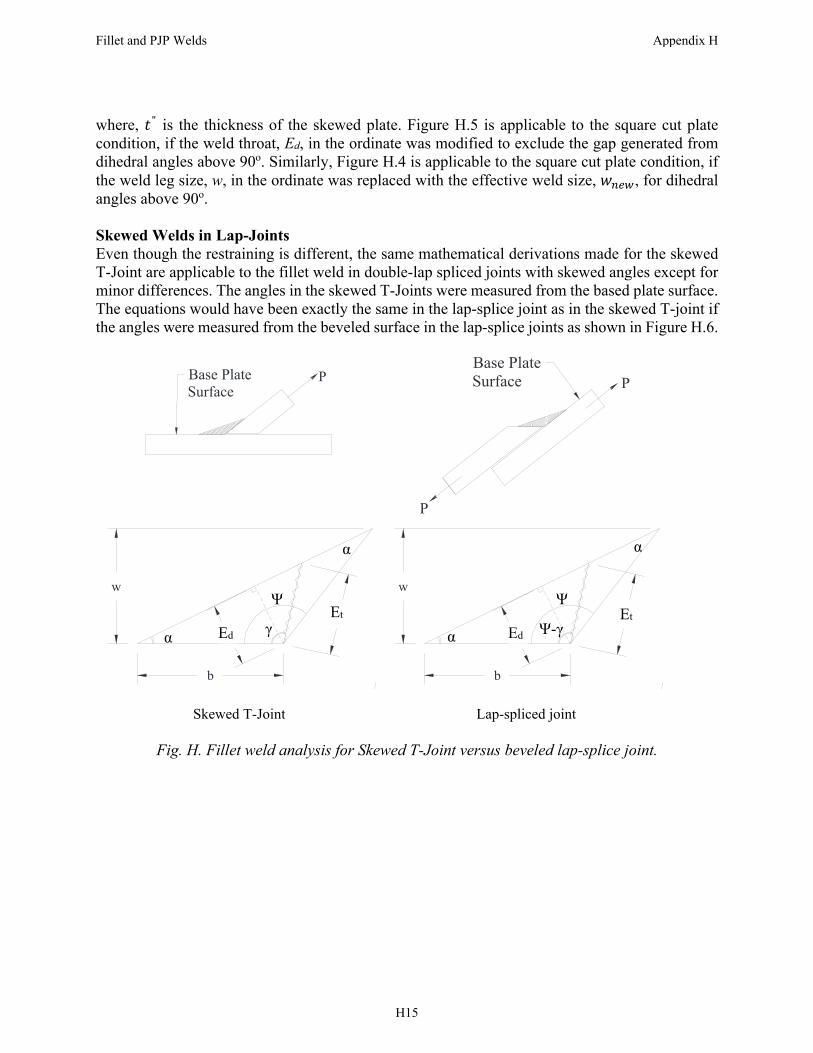
where, 𝑡" is the thickness of the skewed plate. Figure H.5 is applicable to the square cut plate condition, if the weld throat, Ed, in the ordinate was modified to exclude the gap generated from dihedral angles above 90o. Similarly, Figure H.4 is applicable to the square cut plate condition, if the weld leg size, w, in the ordinate was replaced with the effective weld size, 𝑤 , for dihedral angles above 90o. Skewed Welds in Lap-Joints Even though the restraining is different, the same mathematical derivations made for the skewed T-Joint are applicable to the fillet weld in double-lap spliced joints with skewed angles except for minor differences. The angles in the skewed T-Joints were measured from the based plate surface. The equations would have been exactly the same in the lap-splice joint as in the skewed T-joint if the angles were measured from the beveled surface in the lap-splice joints as shown in Figure H.6.
Skewed T-Joint Lap-spliced joint
Fig. H. Fillet weld analysis for Skewed T-Joint versus beveled lap-splice joint.
Base PlateSurface
PBase PlateSurface
P
P
t
b
w
t*
t
b
w
t*
α
Ψ
γ Ψ-γ
Ψ
α α
α
Ed
Et Et
Ed
Fillet and PJP Welds Appendix H
H15
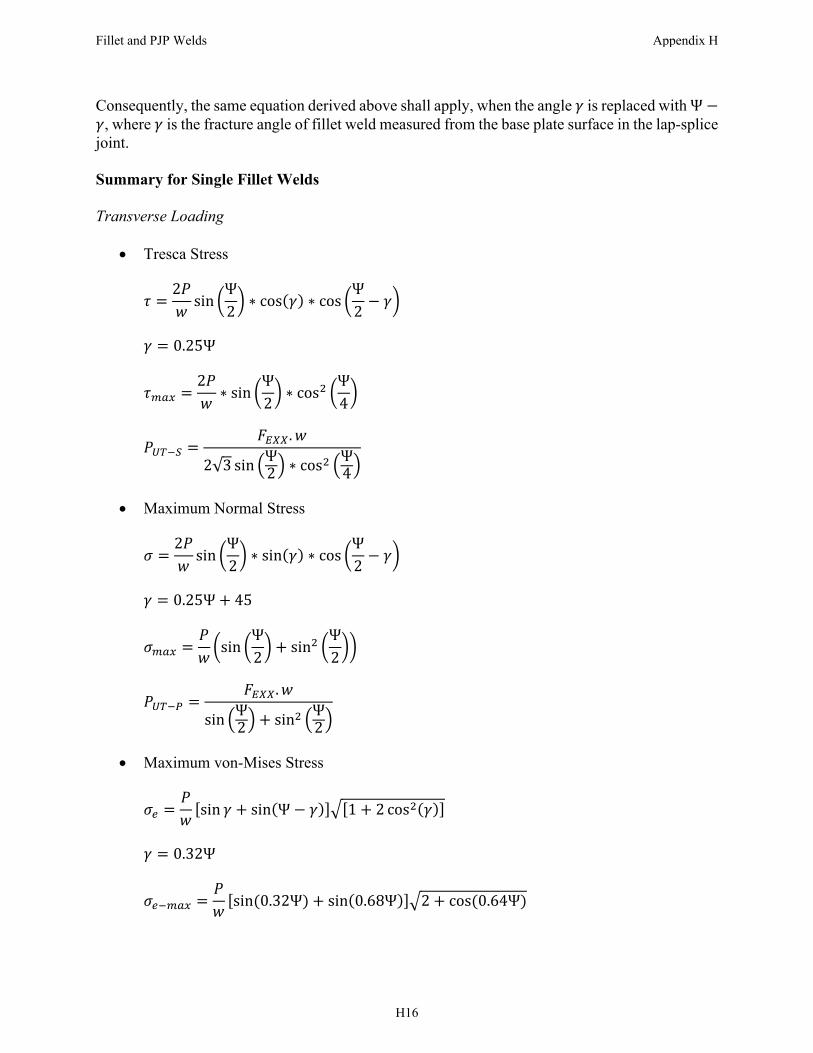
Consequently, the same equation derived above shall apply, when the angle 𝛾 is replaced with Ψ𝛾, where 𝛾 is the fracture angle of fillet weld measured from the base plate surface in the lap-splice joint. Summary for Single Fillet Welds Transverse Loading
Tresca Stress
𝜏2𝑃𝑤
sinΨ2
∗ cos 𝛾 ∗ cosΨ2
𝛾 𝛾 0.25Ψ
𝜏2𝑃𝑤
∗ sinΨ2
∗ cosΨ4
𝑃𝐹 . 𝑤
2√3 sin Ψ2 ∗ cos Ψ
4
Maximum Normal Stress
𝜎2𝑃𝑤
sinΨ2
∗ sin 𝛾 ∗ cosΨ2
𝛾 𝛾 0.25Ψ 45
𝜎𝑃𝑤
sinΨ2
sinΨ2
𝑃𝐹 . 𝑤
sin Ψ2 sin Ψ
2
Maximum von-Mises Stress
𝜎𝑃𝑤
sin 𝛾 sin Ψ 𝛾 1 2 cos 𝛾 𝛾 0.32Ψ
𝜎𝑃𝑤
sin 0.32Ψ sin 0.68Ψ 2 cos 0.64Ψ
Fillet and PJP Welds Appendix H
H16
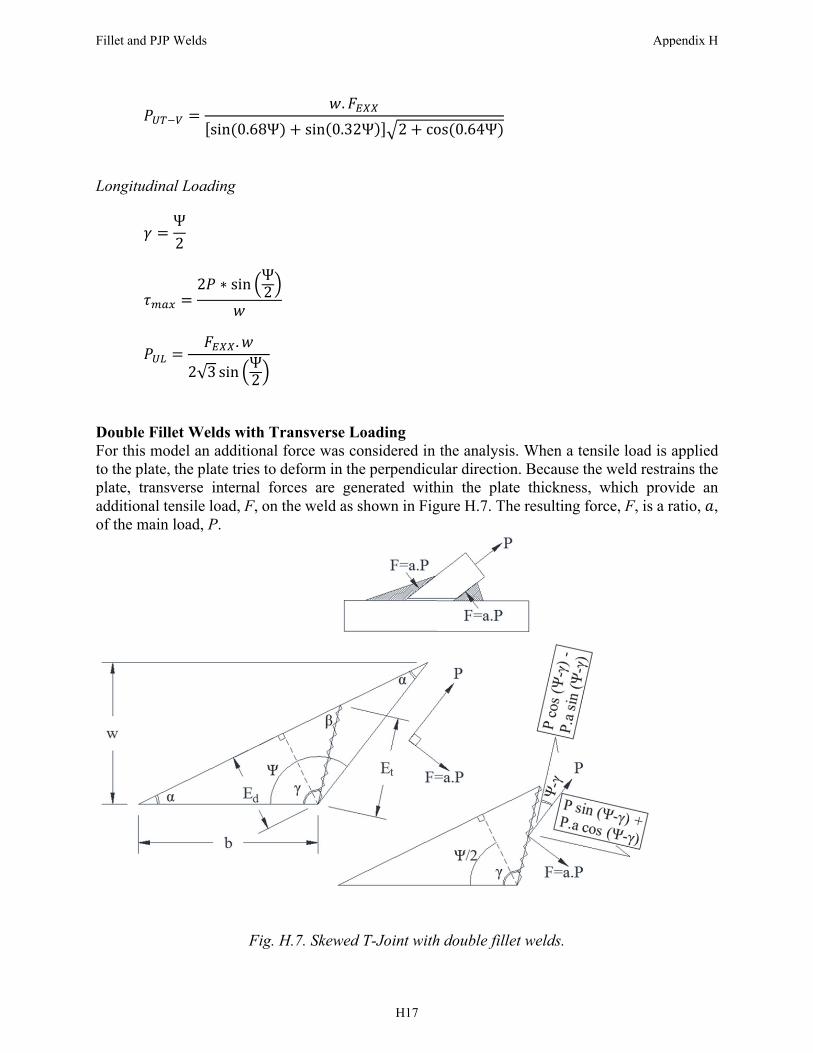
𝑃𝑤. 𝐹
sin 0.68Ψ sin 0.32Ψ 2 cos 0.64Ψ
Longitudinal Loading
𝛾Ψ2
𝜏2𝑃 ∗ sin Ψ
2𝑤
𝑃𝐹 . 𝑤
2√3 sin Ψ2
Double Fillet Welds with Transverse Loading For this model an additional force was considered in the analysis. When a tensile load is applied to the plate, the plate tries to deform in the perpendicular direction. Because the weld restrains the plate, transverse internal forces are generated within the plate thickness, which provide an additional tensile load, F, on the weld as shown in Figure H.7. The resulting force, F, is a ratio, 𝑎, of the main load, P.
Fig. H.7. Skewed T-Joint with double fillet welds.
Fillet and PJP Welds Appendix H
H17

Maximum Shear Stress (Tresca) Criterion
𝜏𝑃 cos Ψ 𝛾 𝑃. 𝑎 sin Ψ 𝛾
𝐸 . 𝑙
where, 𝑙 is the weld length. Assume the unit length for 𝑙.
𝜏𝑃 cos Ψ 𝛾 𝑎 sin Ψ 𝛾
𝐸2𝑃𝑤
∗ cos Ψ 𝛾 𝑎 sin Ψ 𝛾 ∗ sinΨ2
∗ cos 𝛾Ψ2
To determine the angle of shear failure (𝛾), where maximum shear stress or Tresca stress is generated, the derivative of the shear stress with respect to the failure angle should be equal to zero. 𝑑𝜏𝑑𝛾
0
2𝑃𝑤
cos Ψ 𝛾 𝑎 sin Ψ 𝛾 ∗ sinΨ2
∗ sin 𝛾Ψ2
2𝑃𝑤
sin Ψ 𝛾 𝑎 cos Ψ 𝛾
∗ sinΨ2
∗ cos 𝛾Ψ2
0
cos Ψ 𝛾 sin 𝛾Ψ2
𝑎 sin Ψ 𝛾 sin 𝛾Ψ2
sin Ψ 𝛾 cos 𝛾Ψ2
𝑎 cos Ψ 𝛾 cos 𝛾Ψ2
0
sin Ψ 𝛾 cos 𝛾Ψ2
cos Ψ 𝛾 sin 𝛾Ψ2
𝑎 cos Ψ 𝛾 cos 𝛾Ψ2
sin Ψ 𝛾 sin 𝛾Ψ2
0
sin Ψ 𝛾 𝛾Ψ2
𝑎. cos Ψ 𝛾 𝛾Ψ2
0 𝑎 tan 1.5Ψ 2𝛾 1.5Ψ 2𝛾 tan 𝑎 𝛾 0.75Ψ 0.5 tan 𝑎 𝛾 0.75Ψ 0.5 tan 𝑎
Fillet and PJP Welds Appendix H
H18
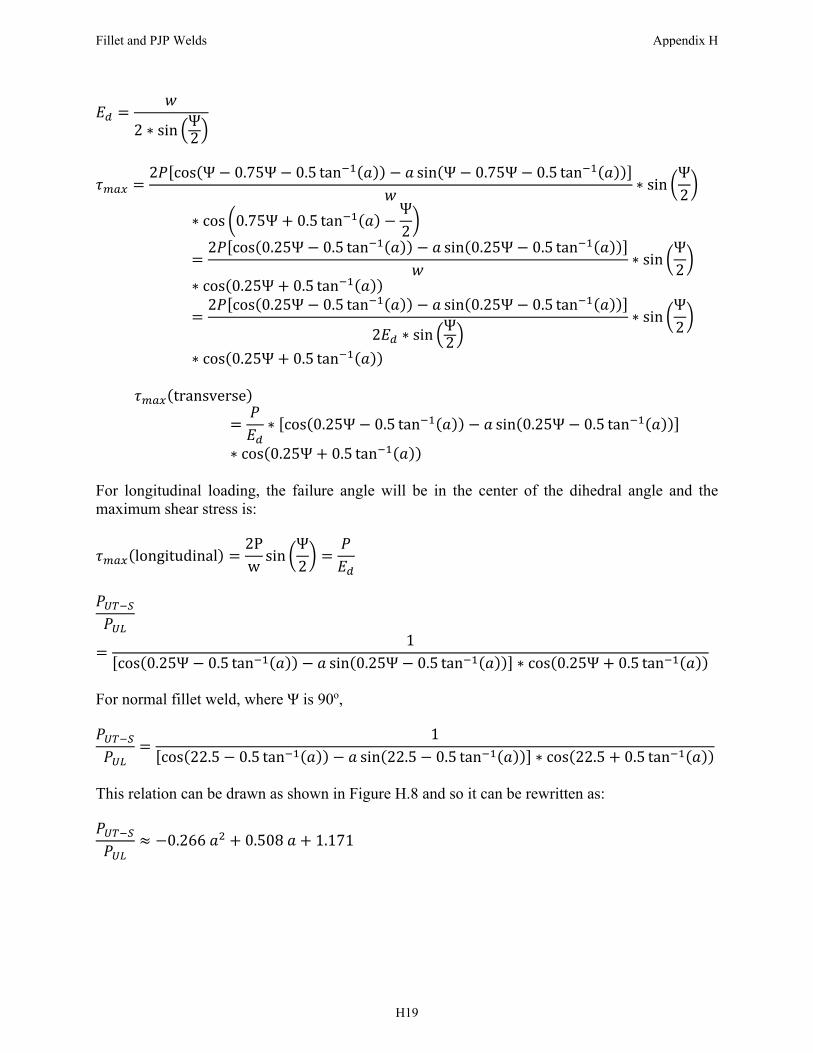
𝐸𝑤
2 ∗ sin Ψ2
𝜏2𝑃 cos Ψ 0.75Ψ 0.5 tan 𝑎 𝑎 sin Ψ 0.75Ψ 0.5 tan 𝑎
𝑤∗ sin
Ψ2
∗ cos 0.75Ψ 0.5 tan 𝑎Ψ2
2𝑃 cos 0.25Ψ 0.5 tan 𝑎 𝑎 sin 0.25Ψ 0.5 tan 𝑎𝑤
∗ sinΨ2
∗ cos 0.25Ψ 0.5 tan 𝑎2𝑃 cos 0.25Ψ 0.5 tan 𝑎 𝑎 sin 0.25Ψ 0.5 tan 𝑎
2𝐸 ∗ sin Ψ2
∗ sinΨ2
∗ cos 0.25Ψ 0.5 tan 𝑎
𝜏 transverse𝑃𝐸
∗ cos 0.25Ψ 0.5 tan 𝑎 𝑎 sin 0.25Ψ 0.5 tan 𝑎
∗ cos 0.25Ψ 0.5 tan 𝑎 For longitudinal loading, the failure angle will be in the center of the dihedral angle and the maximum shear stress is:
𝜏 longitudinal2Pw
sinΨ2
𝑃𝐸
𝑃
𝑃1
cos 0.25Ψ 0.5 tan 𝑎 𝑎 sin 0.25Ψ 0.5 tan 𝑎 ∗ cos 0.25Ψ 0.5 tan 𝑎
For normal fillet weld, where Ψ is 90o, 𝑃
𝑃1
cos 22.5 0.5 tan 𝑎 𝑎 sin 22.5 0.5 tan 𝑎 ∗ cos 22.5 0.5 tan 𝑎
This relation can be drawn as shown in Figure H.8 and so it can be rewritten as: 𝑃
𝑃0.266 𝑎 0.508 𝑎 1.171
Fillet and PJP Welds Appendix H
H19
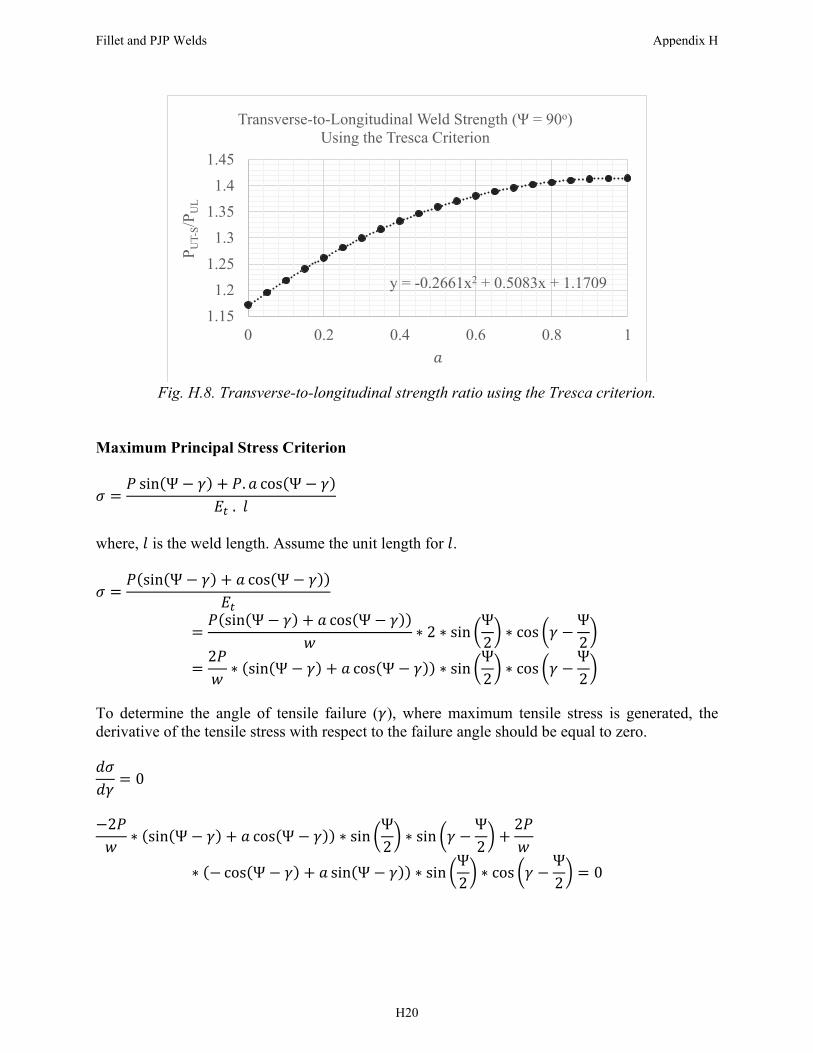
Fig. H.8. Transverse-to-longitudinal strength ratio using the Tresca criterion.
Maximum Principal Stress Criterion
𝜎𝑃 sin Ψ 𝛾 𝑃. 𝑎 cos Ψ 𝛾
𝐸 . 𝑙
where, 𝑙 is the weld length. Assume the unit length for 𝑙.
𝜎𝑃 sin Ψ 𝛾 𝑎 cos Ψ 𝛾
𝐸𝑃 sin Ψ 𝛾 𝑎 cos Ψ 𝛾
𝑤∗ 2 ∗ sin
Ψ2
∗ cos 𝛾Ψ2
2𝑃𝑤
∗ sin Ψ 𝛾 𝑎 cos Ψ 𝛾 ∗ sinΨ2
∗ cos 𝛾Ψ2
To determine the angle of tensile failure (𝛾), where maximum tensile stress is generated, the derivative of the tensile stress with respect to the failure angle should be equal to zero. 𝑑𝜎𝑑𝛾
0
2𝑃𝑤
∗ sin Ψ 𝛾 𝑎 cos Ψ 𝛾 ∗ sinΨ2
∗ sin 𝛾Ψ2
2𝑃𝑤
∗ cos Ψ 𝛾 𝑎 sin Ψ 𝛾 ∗ sinΨ2
∗ cos 𝛾Ψ2
0
y = -0.2661x2 + 0.5083x + 1.1709
1.151.2
1.251.3
1.351.4
1.45
0 0.2 0.4 0.6 0.8 1
P UT-
S/PU
L
𝑎
Transverse-to-Longitudinal Weld Strength (Ψ = 90o) Using the Tresca Criterion
Fillet and PJP Welds Appendix H
H20
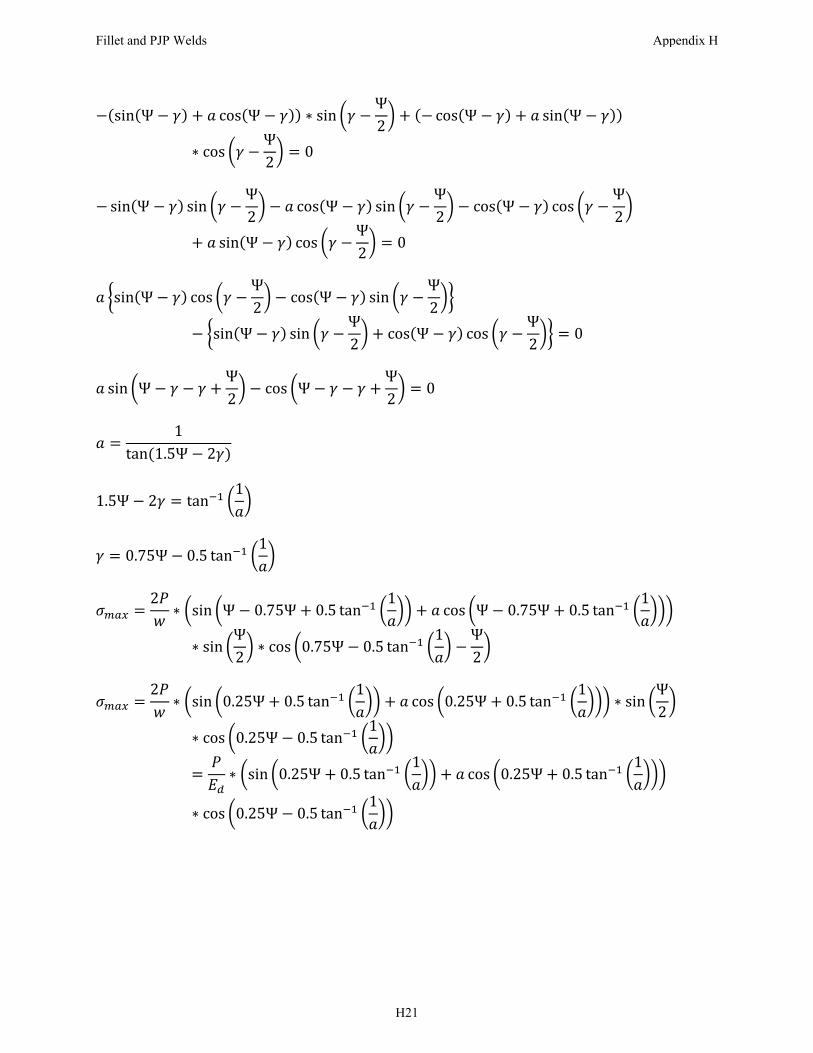
sin Ψ 𝛾 𝑎 cos Ψ 𝛾 ∗ sin 𝛾Ψ2
cos Ψ 𝛾 𝑎 sin Ψ 𝛾
∗ cos 𝛾Ψ2
0
sin Ψ 𝛾 sin 𝛾Ψ2
𝑎 cos Ψ 𝛾 sin 𝛾Ψ2
cos Ψ 𝛾 cos 𝛾Ψ2
𝑎 sin Ψ 𝛾 cos 𝛾Ψ2
0
𝑎 sin Ψ 𝛾 cos 𝛾Ψ2
cos Ψ 𝛾 sin 𝛾Ψ2
sin Ψ 𝛾 sin 𝛾Ψ2
cos Ψ 𝛾 cos 𝛾Ψ2
0
𝑎 sin Ψ 𝛾 𝛾Ψ2
cos Ψ 𝛾 𝛾Ψ2
0
𝑎1
tan 1.5Ψ 2𝛾
1.5Ψ 2𝛾 tan1𝑎
𝛾 0.75Ψ 0.5 tan1𝑎
𝜎2𝑃𝑤
∗ sin Ψ 0.75Ψ 0.5 tan1𝑎
𝑎 cos Ψ 0.75Ψ 0.5 tan1𝑎
∗ sinΨ2
∗ cos 0.75Ψ 0.5 tan1𝑎
Ψ2
𝜎2𝑃𝑤
∗ sin 0.25Ψ 0.5 tan1𝑎
𝑎 cos 0.25Ψ 0.5 tan1𝑎
∗ sinΨ2
∗ cos 0.25Ψ 0.5 tan1𝑎
𝑃𝐸
∗ sin 0.25Ψ 0.5 tan1𝑎
𝑎 cos 0.25Ψ 0.5 tan1𝑎
∗ cos 0.25Ψ 0.5 tan1𝑎
Fillet and PJP Welds Appendix H
H21
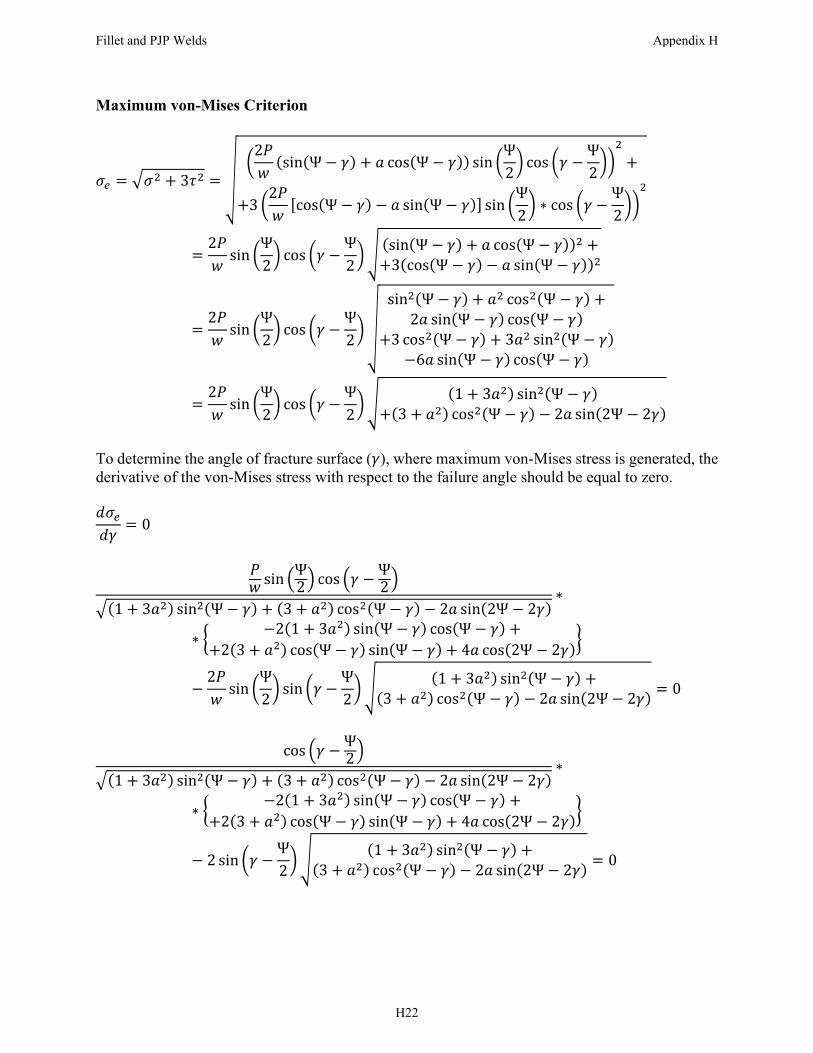
Maximum von-Mises Criterion
𝜎 𝜎 3𝜏
2𝑃𝑤
sin Ψ 𝛾 𝑎 cos Ψ 𝛾 sinΨ2
cos 𝛾Ψ2
32𝑃𝑤
cos Ψ 𝛾 𝑎 sin Ψ 𝛾 sinΨ2
∗ cos 𝛾Ψ2
2𝑃𝑤
sinΨ2
cos 𝛾Ψ2
sin Ψ 𝛾 𝑎 cos Ψ 𝛾3 cos Ψ 𝛾 𝑎 sin Ψ 𝛾
2𝑃𝑤
sinΨ2
cos 𝛾Ψ2
sin Ψ 𝛾 𝑎 cos Ψ 𝛾2𝑎 sin Ψ 𝛾 cos Ψ 𝛾
3 cos Ψ 𝛾 3𝑎 sin Ψ 𝛾6𝑎 sin Ψ 𝛾 cos Ψ 𝛾
2𝑃𝑤
sinΨ2
cos 𝛾Ψ2
1 3𝑎 sin Ψ 𝛾3 𝑎 cos Ψ 𝛾 2𝑎 sin 2Ψ 2𝛾
To determine the angle of fracture surface (𝛾), where maximum von-Mises stress is generated, the derivative of the von-Mises stress with respect to the failure angle should be equal to zero. 𝑑𝜎𝑑𝛾
0
𝑃𝑤 sin Ψ
2 cos 𝛾 Ψ2
1 3𝑎 sin Ψ 𝛾 3 𝑎 cos Ψ 𝛾 2𝑎 sin 2Ψ 2𝛾∗
∗2 1 3𝑎 sin Ψ 𝛾 cos Ψ 𝛾
2 3 𝑎 cos Ψ 𝛾 sin Ψ 𝛾 4𝑎 cos 2Ψ 2𝛾
2𝑃𝑤
sinΨ2
sin 𝛾Ψ2
1 3𝑎 sin Ψ 𝛾3 𝑎 cos Ψ 𝛾 2𝑎 sin 2Ψ 2𝛾
0
cos 𝛾 Ψ
21 3𝑎 sin Ψ 𝛾 3 𝑎 cos Ψ 𝛾 2𝑎 sin 2Ψ 2𝛾
∗
∗2 1 3𝑎 sin Ψ 𝛾 cos Ψ 𝛾
2 3 𝑎 cos Ψ 𝛾 sin Ψ 𝛾 4𝑎 cos 2Ψ 2𝛾
2 sin 𝛾Ψ2
1 3𝑎 sin Ψ 𝛾3 𝑎 cos Ψ 𝛾 2𝑎 sin 2Ψ 2𝛾
0
Fillet and PJP Welds Appendix H
H22
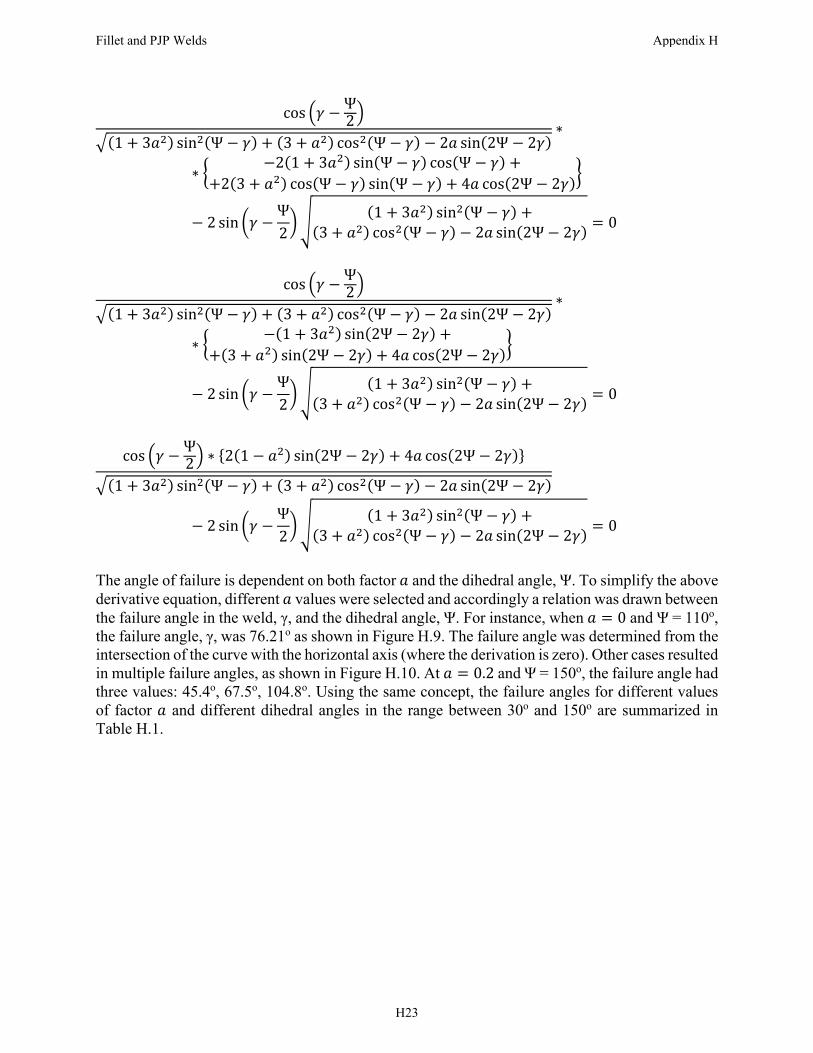
cos 𝛾 Ψ2
1 3𝑎 sin Ψ 𝛾 3 𝑎 cos Ψ 𝛾 2𝑎 sin 2Ψ 2𝛾∗
∗2 1 3𝑎 sin Ψ 𝛾 cos Ψ 𝛾
2 3 𝑎 cos Ψ 𝛾 sin Ψ 𝛾 4𝑎 cos 2Ψ 2𝛾
2 sin 𝛾Ψ2
1 3𝑎 sin Ψ 𝛾3 𝑎 cos Ψ 𝛾 2𝑎 sin 2Ψ 2𝛾
0
cos 𝛾 Ψ
21 3𝑎 sin Ψ 𝛾 3 𝑎 cos Ψ 𝛾 2𝑎 sin 2Ψ 2𝛾
∗
∗1 3𝑎 sin 2Ψ 2𝛾
3 𝑎 sin 2Ψ 2𝛾 4𝑎 cos 2Ψ 2𝛾
2 sin 𝛾Ψ2
1 3𝑎 sin Ψ 𝛾3 𝑎 cos Ψ 𝛾 2𝑎 sin 2Ψ 2𝛾
0
cos 𝛾 Ψ
2 ∗ 2 1 𝑎 sin 2Ψ 2𝛾 4𝑎 cos 2Ψ 2𝛾
1 3𝑎 sin Ψ 𝛾 3 𝑎 cos Ψ 𝛾 2𝑎 sin 2Ψ 2𝛾
2 sin 𝛾Ψ2
1 3𝑎 sin Ψ 𝛾3 𝑎 cos Ψ 𝛾 2𝑎 sin 2Ψ 2𝛾
0
The angle of failure is dependent on both factor 𝑎 and the dihedral angle, Ψ. To simplify the above derivative equation, different 𝑎 values were selected and accordingly a relation was drawn between the failure angle in the weld, γ, and the dihedral angle, Ψ. For instance, when 𝑎 0 and Ψ = 110o, the failure angle, γ, was 76.21o as shown in Figure H.9. The failure angle was determined from the intersection of the curve with the horizontal axis (where the derivation is zero). Other cases resulted in multiple failure angles, as shown in Figure H.10. At 𝑎 0.2 and Ψ = 150o, the failure angle had three values: 45.4o, 67.5o, 104.8o. Using the same concept, the failure angles for different values of factor 𝑎 and different dihedral angles in the range between 30o and 150o are summarized in Table H.1.
Fillet and PJP Welds Appendix H
H23
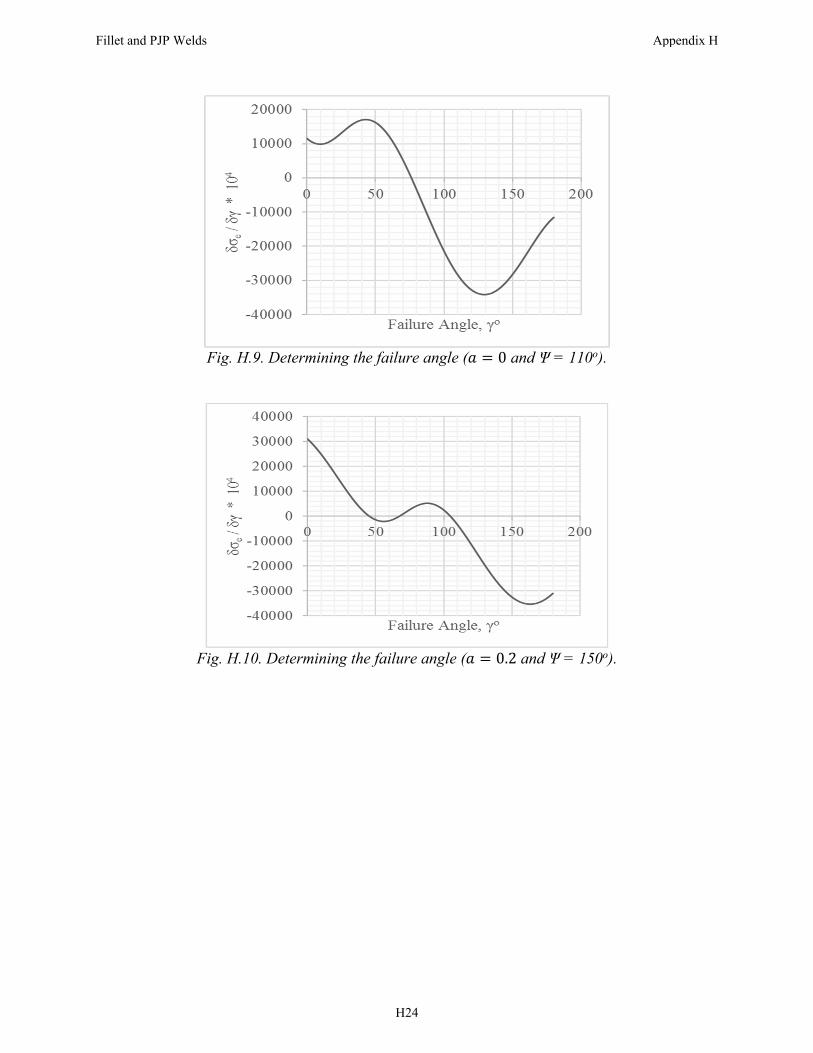
Fig. H.9. Determining the failure angle (𝑎 0 and Ψ = 110o).
Fig. H.10. Determining the failure angle (𝑎 0.2 and Ψ = 150o).
Fillet and PJP Welds Appendix H
H24
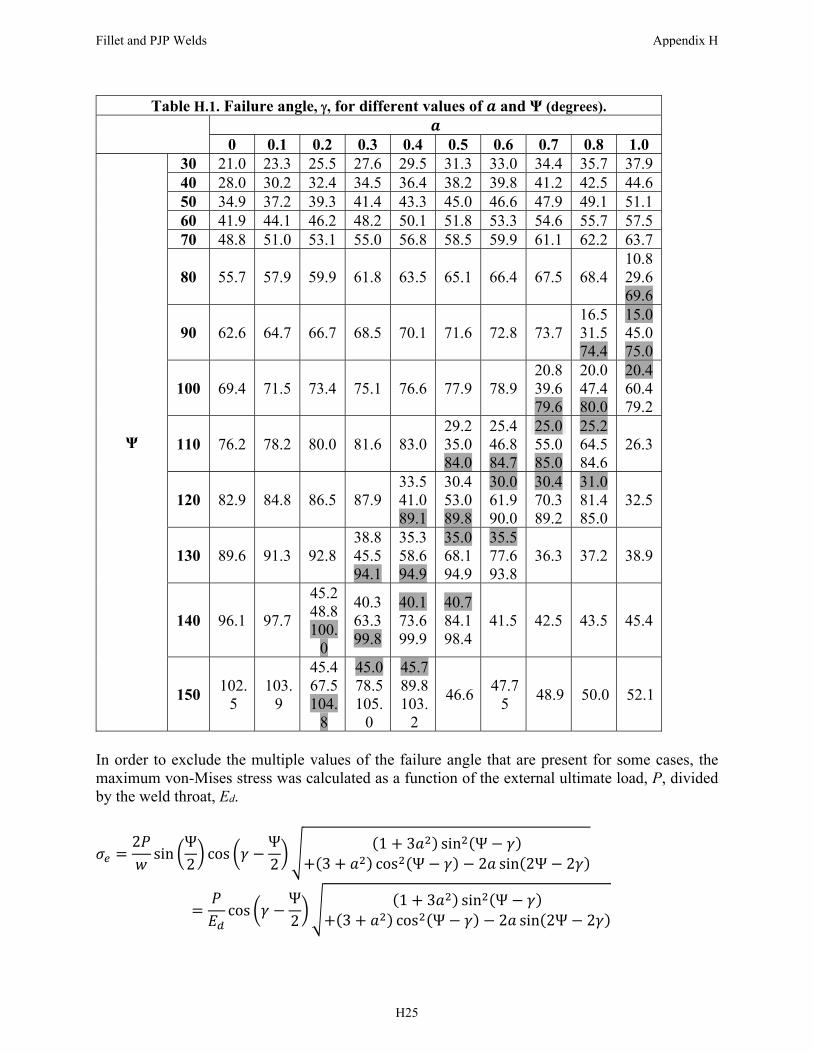
Table H.1. Failure angle, , for different values of 𝒂 and Ψ (degrees).
𝒂
0 0.1 0.2 0.3 0.4 0.5 0.6 0.7 0.8 1.0
Ψ
30 21.0 23.3 25.5 27.6 29.5 31.3 33.0 34.4 35.7 37.9 40 28.0 30.2 32.4 34.5 36.4 38.2 39.8 41.2 42.5 44.6 50 34.9 37.2 39.3 41.4 43.3 45.0 46.6 47.9 49.1 51.1 60 41.9 44.1 46.2 48.2 50.1 51.8 53.3 54.6 55.7 57.5 70 48.8 51.0 53.1 55.0 56.8 58.5 59.9 61.1 62.2 63.7
80 55.7 57.9 59.9 61.8 63.5 65.1 66.4 67.5 68.4 10.8 29.6 69.6
90 62.6 64.7 66.7 68.5 70.1 71.6 72.8 73.7 16.5 31.5 74.4
15.0 45.0 75.0
100 69.4 71.5 73.4 75.1 76.6 77.9 78.9 20.8 39.6 79.6
20.0 47.4 80.0
20.4 60.4 79.2
110 76.2 78.2 80.0 81.6 83.0 29.2 35.0 84.0
25.4 46.8 84.7
25.0 55.0 85.0
25.2 64.5 84.6
26.3
120 82.9 84.8 86.5 87.9 33.5 41.0 89.1
30.4 53.0 89.8
30.0 61.9 90.0
30.4 70.3 89.2
31.0 81.4 85.0
32.5
130 89.6 91.3 92.8 38.8 45.5 94.1
35.3 58.6 94.9
35.0 68.1 94.9
35.5 77.6 93.8
36.3 37.2 38.9
140 96.1 97.7
45.2 48.8 100.
0
40.3 63.3 99.8
40.1 73.6 99.9
40.7 84.1 98.4
41.5 42.5 43.5 45.4
150 102.
5 103.
9
45.4 67.5 104.
8
45.0 78.5 105.
0
45.7 89.8 103.
2
46.6 47.75 48.9 50.0 52.1
In order to exclude the multiple values of the failure angle that are present for some cases, the maximum von-Mises stress was calculated as a function of the external ultimate load, P, divided by the weld throat, Ed.
𝜎2𝑃𝑤
sinΨ2
cos 𝛾Ψ2
1 3𝑎 sin Ψ 𝛾3 𝑎 cos Ψ 𝛾 2𝑎 sin 2Ψ 2𝛾
𝑃𝐸
cos 𝛾Ψ2
1 3𝑎 sin Ψ 𝛾3 𝑎 cos Ψ 𝛾 2𝑎 sin 2Ψ 2𝛾
Fillet and PJP Welds Appendix H
H25
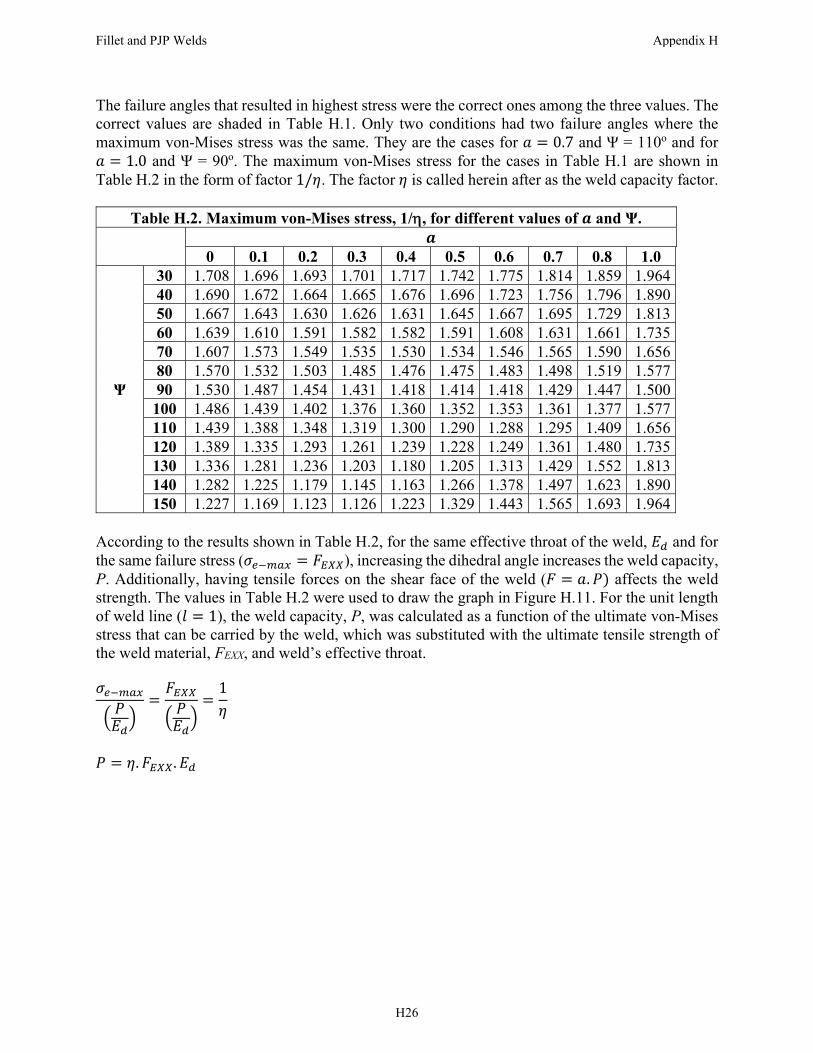
The failure angles that resulted in highest stress were the correct ones among the three values. The correct values are shaded in Table H.1. Only two conditions had two failure angles where the maximum von-Mises stress was the same. They are the cases for 𝑎 0.7 and Ψ = 110o and for 𝑎 1.0 and Ψ = 90o. The maximum von-Mises stress for the cases in Table H.1 are shown in Table H.2 in the form of factor 1/𝜂. The factor 𝜂 is called herein after as the weld capacity factor.
Table H.2. Maximum von-Mises stress, 1/, for different values of 𝒂 and Ψ.
𝒂 0 0.1 0.2 0.3 0.4 0.5 0.6 0.7 0.8 1.0
Ψ
30 1.708 1.696 1.693 1.701 1.717 1.742 1.775 1.814 1.859 1.964 40 1.690 1.672 1.664 1.665 1.676 1.696 1.723 1.756 1.796 1.890 50 1.667 1.643 1.630 1.626 1.631 1.645 1.667 1.695 1.729 1.813 60 1.639 1.610 1.591 1.582 1.582 1.591 1.608 1.631 1.661 1.735 70 1.607 1.573 1.549 1.535 1.530 1.534 1.546 1.565 1.590 1.656 80 1.570 1.532 1.503 1.485 1.476 1.475 1.483 1.498 1.519 1.577 90 1.530 1.487 1.454 1.431 1.418 1.414 1.418 1.429 1.447 1.500 100 1.486 1.439 1.402 1.376 1.360 1.352 1.353 1.361 1.377 1.577 110 1.439 1.388 1.348 1.319 1.300 1.290 1.288 1.295 1.409 1.656 120 1.389 1.335 1.293 1.261 1.239 1.228 1.249 1.361 1.480 1.735 130 1.336 1.281 1.236 1.203 1.180 1.205 1.313 1.429 1.552 1.813 140 1.282 1.225 1.179 1.145 1.163 1.266 1.378 1.497 1.623 1.890 150 1.227 1.169 1.123 1.126 1.223 1.329 1.443 1.565 1.693 1.964
According to the results shown in Table H.2, for the same effective throat of the weld, 𝐸 and for the same failure stress (𝜎 𝐹 ), increasing the dihedral angle increases the weld capacity, P. Additionally, having tensile forces on the shear face of the weld (𝐹 𝑎. 𝑃 affects the weld strength. The values in Table H.2 were used to draw the graph in Figure H.11. For the unit length of weld line (𝑙 1), the weld capacity, P, was calculated as a function of the ultimate von-Mises stress that can be carried by the weld, which was substituted with the ultimate tensile strength of the weld material, FEXX, and weld’s effective throat. 𝜎
𝑃𝐸
𝐹𝑃𝐸
1𝜂
𝑃 𝜂. 𝐹 . 𝐸
Fillet and PJP Welds Appendix H
H26
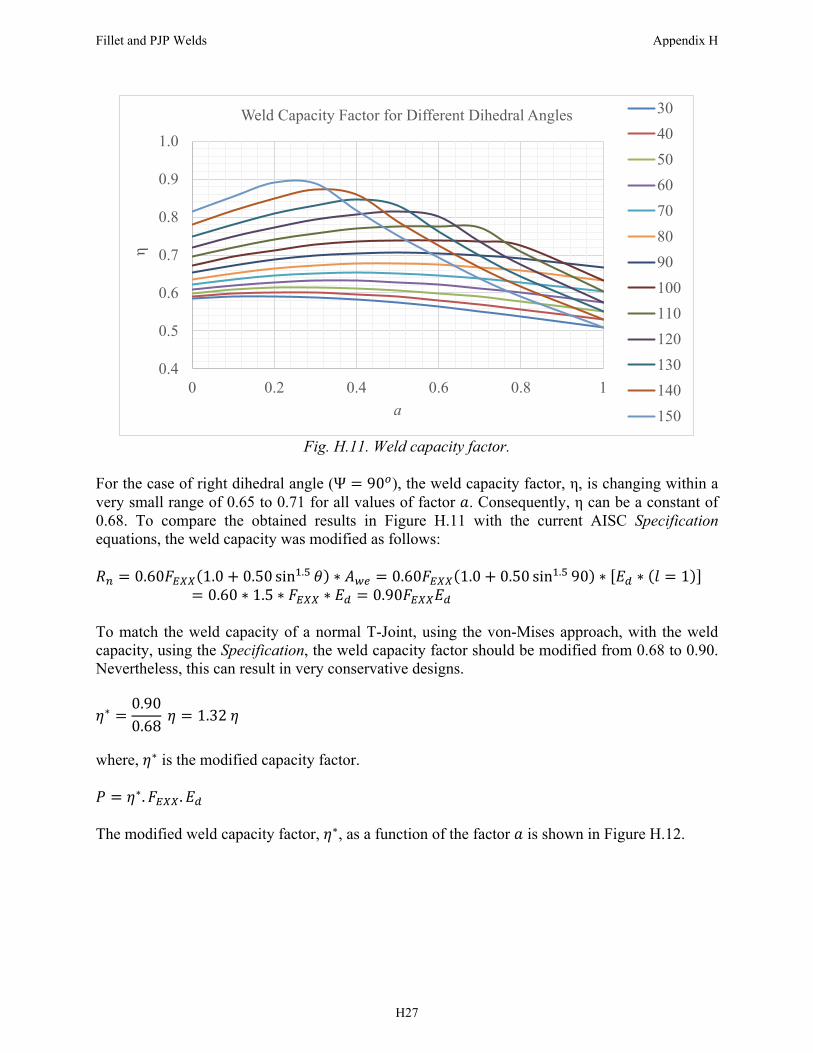
Fig. H.11. Weld capacity factor.
For the case of right dihedral angle (Ψ 90 ), the weld capacity factor, η, is changing within a very small range of 0.65 to 0.71 for all values of factor 𝑎. Consequently, η can be a constant of 0.68. To compare the obtained results in Figure H.11 with the current AISC Specification equations, the weld capacity was modified as follows: 𝑅 0.60𝐹 1.0 0.50 sin . 𝜃 ∗ 𝐴 0.60𝐹 1.0 0.50 sin . 90 ∗ 𝐸 ∗ 𝑙 1
0.60 ∗ 1.5 ∗ 𝐹 ∗ 𝐸 0.90𝐹 𝐸 To match the weld capacity of a normal T-Joint, using the von-Mises approach, with the weld capacity, using the Specification, the weld capacity factor should be modified from 0.68 to 0.90. Nevertheless, this can result in very conservative designs.
𝜂∗ 0.900.68
𝜂 1.32 𝜂 where, 𝜂∗ is the modified capacity factor. 𝑃 𝜂∗. 𝐹 . 𝐸 The modified weld capacity factor, 𝜂∗, as a function of the factor 𝑎 is shown in Figure H.12.
0.4
0.5
0.6
0.7
0.8
0.9
1.0
0 0.2 0.4 0.6 0.8 1
η
ɑ
Weld Capacity Factor for Different Dihedral Angles 30405060708090100110120130140150
Fillet and PJP Welds Appendix H
H27
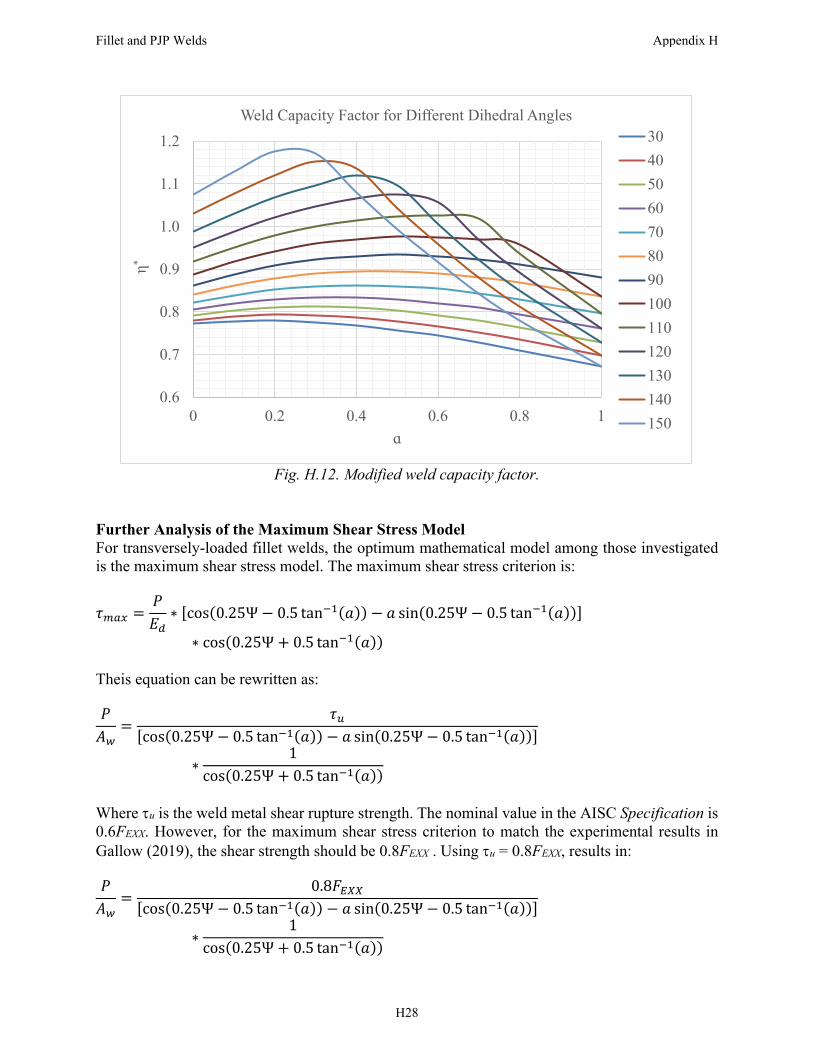
Fig. H.12. Modified weld capacity factor.
Further Analysis of the Maximum Shear Stress Model For transversely-loaded fillet welds, the optimum mathematical model among those investigated is the maximum shear stress model. The maximum shear stress criterion is:
𝜏𝑃𝐸
∗ cos 0.25Ψ 0.5 tan 𝑎 𝑎 sin 0.25Ψ 0.5 tan 𝑎
∗ cos 0.25Ψ 0.5 tan 𝑎 Theis equation can be rewritten as: 𝑃
𝐴𝜏
cos 0.25Ψ 0.5 tan 𝑎 𝑎 sin 0.25Ψ 0.5 tan 𝑎
∗1
cos 0.25Ψ 0.5 tan 𝑎
Where u is the weld metal shear rupture strength. The nominal value in the AISC Specification is 0.6FEXX. However, for the maximum shear stress criterion to match the experimental results in Gallow (2019), the shear strength should be 0.8FEXX . Using u = 0.8FEXX, results in: 𝑃
𝐴0.8𝐹
cos 0.25Ψ 0.5 tan 𝑎 𝑎 sin 0.25Ψ 0.5 tan 𝑎
∗1
cos 0.25Ψ 0.5 tan 𝑎
0.6
0.7
0.8
0.9
1.0
1.1
1.2
0 0.2 0.4 0.6 0.8 1
η*
ɑ
Weld Capacity Factor for Different Dihedral Angles30405060708090100110120130140150
Fillet and PJP Welds Appendix H
H28
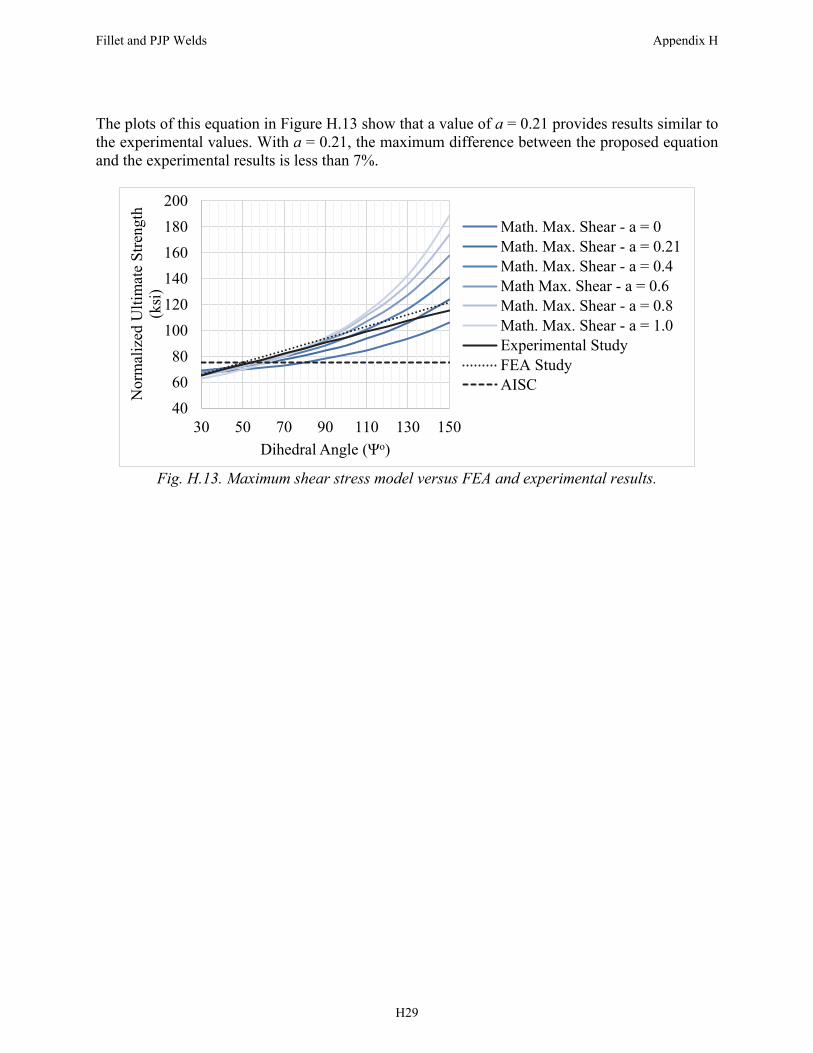
The plots of this equation in Figure H.13 show that a value of a = 0.21 provides results similar to the experimental values. With a = 0.21, the maximum difference between the proposed equation and the experimental results is less than 7%.
Fig. H.13. Maximum shear stress model versus FEA and experimental results.
406080
100120140160180200
30 50 70 90 110 130 150
Nor
mal
ized
Ulti
mat
e St
reng
th
(ksi
)
Dihedral Angle (Ψo)
Math. Max. Shear - a = 0Math. Max. Shear - a = 0.21Math. Max. Shear - a = 0.4Math Max. Shear - a = 0.6Math. Max. Shear - a = 0.8Math. Max. Shear - a = 1.0Experimental StudyFEA StudyAISC
Fillet and PJP Welds Appendix H
H29
Related Documents