STATE BOARD OF ACCOUNTS 302 West Washington Street Room E418 INDIANAPOLIS, INDIANA 46204-2769 AUDIT REPORT OF PURDUE UNIVERSITY FEDERAL AWARDS AUDIT July 1, 2011 to June 30, 2012

Welcome message from author
This document is posted to help you gain knowledge. Please leave a comment to let me know what you think about it! Share it to your friends and learn new things together.
Transcript
STATE BOARD OF ACCOUNTS 302 West Washington Street
Room E418 INDIANAPOLIS, INDIANA 46204-2769
AUDIT REPORT
OF
PURDUE UNIVERSITY
FEDERAL AWARDS AUDIT
July 1, 2011 to June 30, 2012
lwilliamson
Text Box
B41964
lwilliamson
Datefiled

-1-
TABLE OF CONTENTS Description Page Schedule of University Officials ......................................................................................................... 2 Introduction ........................................................................................................................................ 3 Report on Internal Control Over Financial Reporting and on Compliance and Other Matters Based on an Audit of Financial Statements Performed in Accordance With Government Auditing Standards .............................................. 4 Independent Auditor’s Report on Compliance With Requirements That Could Have a Direct and Material Effect on Each Major Program and on Internal Control Over Compliance in Accordance With OMB Circular A-133 ........................................... 5-6 Schedule of Expenditures of Federal Awards .................................................................................... 7-87 Notes to Schedule of Expenditures of Federal Awards ..................................................................... 88-89 Schedule of Findings and Questioned Costs ..................................................................................... 90 Auditee Prepared Schedule: Summary Schedule of Prior Audit Findings ................................................................................. 91 Exit Conference .................................................................................................................................. 92
-2-
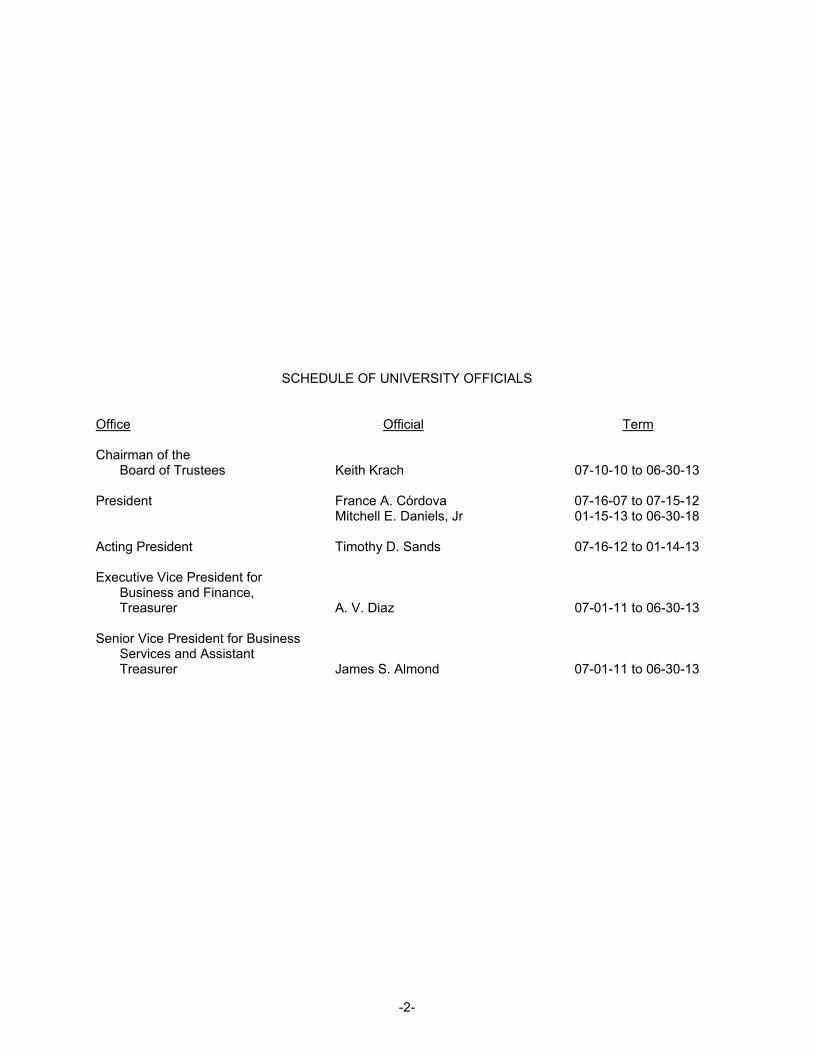
SCHEDULE OF UNIVERSITY OFFICIALS Office Official Term Chairman of the Board of Trustees Keith Krach 07-10-10 to 06-30-13 President France A. Córdova 07-16-07 to 07-15-12 Mitchell E. Daniels, Jr 01-15-13 to 06-30-18 Acting President Timothy D. Sands 07-16-12 to 01-14-13 Executive Vice President for Business and Finance, Treasurer A. V. Diaz 07-01-11 to 06-30-13 Senior Vice President for Business Services and Assistant Treasurer James S. Almond 07-01-11 to 06-30-13
-3-
PURDUE UNIVERSITY INTRODUCTION
Purdue University, founded in 1869, is the land-grant university of the State of Indiana. The Trustees of Purdue University (the "Corporation") is a statutory body corporate created in 1869 by the Indiana General Assembly, with powers (among others) ". . . to organize said university . . . and to do all acts necessary and expedient to put and keep said university in operation . . ." The Corporation's governing body is a ten member Board of Trustees, also created by Indiana statute. Specific delegations of authority to the President and Treasurer have been made by the Board of Trustees. In accordance with Executive Memorandum No C-10, "the financial and business affairs of each regional campus shall be managed by the Regional Campus Chief Business Officer, under the general supervision of the Chancellor and in accordance with the policies and procedures established by the Treasurer." The main campus of Purdue University is located in West Lafayette. Regional campuses are main-tained in the City of Hammond and Town of Westville, and two regional campuses are operated jointly with Indiana University in Fort Wayne and Indianapolis. The University's educational and general expenditures for 2011-2012 included $727.1 million of federal awards for research and development, training, student aid, construction, and other sponsored work. The University also participated in federally sponsored student loan programs.
STATE OF INDIANAAN EQUAL OPPORTUNITY EMPLOYER S I r\'l'l: I]OAI{t) Olr A(l('Ot JN I'S
302 \['l:S'l WASI llN(;'l'( )N S I'Rl:l) l
R(X)N'l lr-t lttINI)lANAl'( )l.lS. INI)lnN,\ 4(r20'l-2765
"l'clcplr()r'rc: (:i I 7) 2:i2-25 I 3
Irur: (3 l7 ) 232-,+7 I I
W'c['r Sitc: \\ \\u . itt. govisbott
REPORT ON INTERNAL CONTROL OVER FINANCIAL REPORTING AND ONCOMPLIANCE AND OTHER MATTERS BASED ON AN AUDIT OF FINANCIAL STATEMENTS
PERFORMED IN ACCORDANCE WITH GOVERNMENT AUDITING STANDARDS
TO: THE OFFICIALS OF PURDUE UNIVERSITY, WEST LAFAYETTE, INDIANA
We have audited the financial statements of Purdue University (University), as of and forthe years ended June30,2012 and 201 1, and have issued our report thereon dated October 17,2012. Our report includes a reference toother auditors. We conducted our audit in accordance with auditing standards generally accepted in the UnitedStates of America and the standards applicable to financial audits contained in Government Auditinq Standards,issued by the Comptroller General of the United States. Other auditors audited the financial statements of thediscretely presented component unit, as described in our report on the University's financial statements. This reportdoes not include the results of the other auditors' testing of internal control over financial reporting or compliance and
other matters that are reported on separately by those auditors.
lnternal Control Over Financial Reportinq
ln planning and performing our audit, we considered the University's internal control over financial reporting asa basis for designing our auditing procedures for the purpose of expressing our opinion on the financial statements,but not for the purpose of expressing an opinion on the effectiveness of the University's internal control over financialreporting. Accordingly, we do not express an opinion on the effectiveness of the University's internal control overfinancial reporting.
A deficiency in internal control exists when the design or operation of a control does not allow management oremployees, in the normal course of performing their assigned functions, to prevent, or detect and correctmisstatements on a timely basis. A materialweakness is a deficiency, or combination of deficiencies, in internalcontrol such that there is a reasonable possibility that a material misstatement of the entity's financial statements willnot be prevented, or detected and corrected on a timely basis.
Our consideration of internal control over financial reporting was for the limited purpose described in the firstparagraph of this section and was not designed to identify all deficiencies in internal control over financial reportingthat might be deficiencies, significant deficiencies or material weaknesses. We did not identify any deficiencies in
internal control over financial reporting that we consider to be material weaknesses, as defined above.
Compliance and Other Matters
As part of obtaining reasonable assurance about whether the Universi$'s financial statements are free ofmaterial misstatement, we performed tests of its compliance with certain provisions of laws, regulations, contractsand grant agreements, noncompliance with which could have a direct and material effect on the determination offinancial statement amounts. However, providing an opinion on compliance with those provisions was not anobjective of our audit and, accordingly, we do not express such an opinion. The results of our tests disclosed noinstances of noncompliance or other matters that are required to be reported under Government Auditinq Standards.
This report is intended solely for the information and use of the University's audit committee, management,federal awarding agencies, and passthrough entities and is not intended to be and should not be used by anyoneother than these specified parties. ln accordance with lndiana Code 5-1 1-5-1 , this report is a part of the publicrecords of the State Board of Accounts and of the office examined.
October 17 , 2012STATE BOARD OF ACCOUNTS
ldavid
Text Box
-4-
STATE OF INDIANAAN EQUAL OPPORTUNITY EMPLOYER
INDEPENDENT AUDITOR'S REPORT ON COMPLIANCE WITH REQUIREMENTS THATCOULD HAVE A DIRECT AND MATERIAL EFFECT ON EACH MAJOR PROGRAM AND ON
INTERNAL CONTROL OVER COMPLIANCE IN ACCORDANCE WITH OMB CIRCULAR A.133
TO: THE OFFICIALS OF PURDUE UNIVERSITY, WEST LAFAYETTE, INDIANA
Compliance
We have audited the compliance of Purdue University (University) with the types of compliancerequirements described in the U.S. Office of Management and Budoet (OMB) Circular A-133 ComplianceSupplement that could have a direct and material effect on each of the University's majorfedera! programs forthe year ended June 30, 2012. The University's major federal programs are identified in the Summary ofAuditor's Results section of the accompanying Schedule of Findings and Questioned Costs. Compliance withthe requirements of laws, regulations, contracts, and grants applicable to each of its majorfederal programs isthe responsibility of the University's management. Our responsibility is to express an opinion on theUniversity's compliance based on our audit.
We conducted our audit of compliance in accordance with auditing standards generally accepted in
the United States of America; the standards applicable to financial audits contained in Government AuditinqStandards, issued by the Comptroller General of the United States; and OMB Circular A-133, Audits ofStates, Local Governments. and Non-Profit Orqanizations. Those standards and OMB CircularA-133 requirethat we plan and perform the audit to obtain reasonable assurance about whether noncompliance with thetypes of compliance requirements referred to above that could have a direct and material etfect on a majorfedera! program occurred. An audit includes examining, on a test basis, evidence aboutthe University's com-pliance with those requirements and performing such other procedures as we considered necessary in thecircumstances. We believe that our audit provides a reasonable basis for our opinion. Our audit does notprovide a legal determination of the University's compliance with those requirements.
ln our opinion, the University complied in all material respects with the compliance requirementsreferred to above that could have a direct and materia! etfect on each of its major federal programs for theyear ended June 30,2012.
lnternal Control Over Compliance
Management of the University is responsible for establishing and maintaining effective internal controlover compliance with requirements of laws, regulations, contracts, and grants applicable to federal programs.ln planning and performing our audit, we considered the University's interna! control over compliance of therequirements that could have a direct and material effect on a majorfederal program to determine the auditingprocedures for the purpose of expressing our opinion on compliance and to test and report on internal controlover compliance in accordance with OMB Circular A-133, but not for the purpose of expressing an opinion onthe effectiveness of internal control over compliance. Accordingly, we do not express an opinion on theeffectiveness of the University's internal control over compliance.
STATE BOARD OF ACCOUNTS302 WEST WASHINGTON STREET
ROOM E4l8IN DIANAPOLIS, INDIANA 46204.27 69
'I'elephone: (3 I 7) 232-2513Fax; (317)232-4711
Web Site: wwrv.in.gov/sboa
-5-
INDEPENDENT AUDITOR'S REPORT ON COMPLIANCE WITH REQUIREMENTS THATCOULD HAVE A DIRECT AND MATERIAL EFFECT ON EACH MAJOR PROGRAM AND ON
INTERNAL CONTROL OVER COMPLIANCE IN ACCORDANCE WTH OMB CIRCULAR A.133(Continued)
A deficiency in internal control over compliance exists when the design or operation of a control overcompliance does not allow management or employees, in the normal course of performing their assignedfunctions, to prevent or detect and correct, noncompliance with a type of compliance requirement of a federalprogram on a timely basis. A material weakness in interna! control over compliance is a deficiency, orcombination of deficiencies, in internal controlovercompliance such thatthere is a reasonable possibility thatmaterial noncompliance with a type of compliance requirement of a federal program will not be prevented, ordetected and conected, on a timely basis.
Our consideration of the internal control over compliance was for the limited purpose described in thefirst paragraph of this section and was not designed to identify a!! deficiencies in internal control overcompliance that might be deficiencies, significant deficiencies, or materialweaknesses. We did not identifyany deficiencies in internal control over compliance that we consider to be material weaknesses, as definedabove.
Schedule of Exoenditures of Federal Awards
We have audited the financial statements of Purdue University as of and forthe yearended June 30,2012, and have issued our reportthereon dated October 17,2012, which contiained an unqualified opinion onthose financial statements. Our audit was performed for the purpose of forming an opinion on the financialstatements taken as a whole. The accompanying Schedule of Expenditures of Federal Awards is presentedfor purposes of additional analysis as required by OMB Circular A-133 and is not a required part of thefinancial statements. Such information is the responsibility of management and was derived from and relatesdirectly to the underlying accounting and other records used to prepare the financial statements. The infor-mation has been subjected to the auditing procedures applied in the audit of the financial statements andcertain additional procedures, including comparing and reconciling such information directly to the underlyingaccounting and other records used to prepare the financial statements or to the financial statements them-selves and other additiona! procedures in accordance with auditing standards generally accepted in theUnited States of America. ln our opinion the schedule of expenditures of federal awards is fairly stated in al!material respects in relation to the financial statements as a whole
This report is intended solely for the information and use of the University's Board of Trustees,management, others within the entity, federal awarding agencies and pass-through entities and is not in-tended to be and should not be used by anyone other than these specified parties. ln accordance withlndiana Code 5-11-5-1, this report is a part of the public records of the State Board of Accounts and of theoffice examined.
STATE BOARD OF ACCOUNTS
February 14,2013
-6-
$fr/,-9r^,,1"f 0/r^*r"

Purdue University Schedule of Expenditures of Federal Awards
Year ended June 30, 2012
CFDA Identifying Federal Awards Expenditures to Federal Awards Expenditures to Federal Awards Expenditures to Federal Awards Expenditures to
Grantor No. CFDA Title/Pass-Through Grantor Number Expended Subrecipients Expended Subrecipients Expended Subrecipients Expended Subrecipients
Department of Education
Direct Programs by CFDA
84.007* Federal Supplemental Educational Opportunity Grants - - 2,192,810 - - - 2,192,810 -
84.031 Higher Education_Institutional Aid 117,488 - - - - - 117,488 -
84.033* Federal Work-Study Program - - 2,189,400 - - - 2,189,400 -
84.038* Federal Perkins Loan Program_Federal Capital Contributions
- - 3,947,663 - - - 3,947,663 -
84.063* Federal Pell Grant Program - - 70,651,908 - - - 70,651,908 -
84.116 Fund for the Improvement of Postsecondary Education 171,460 33,250 - - 141,942 1,914 313,402 35,164
84.184 Safe and Drug-Free Schools and Communities_National Programs
- - - - 233,432 - 233,432 -
84.200 Graduate Assistance in Areas of National Need - - - - 1,187,323 - 1,187,323 -
84.206 Javits Gifted and Talented Students Education Grant Program
- - - - 283,654 - 283,654 -
84.215 Fund for the Improvement of Education - - - - 72,748 - 72,748 -
84.220 Centers for International Business Education - - - - 279,240 12,000 279,240 12,000
84.268* Federal Direct Student Loans - - 313,165,038 - - - 313,165,038 -
84.305 Education Research, Development and Dissemination 442,793 - - - - - 442,793 -
84.325 Special Education - Personnel Development to Improve Services and Results for Ch
305,099 - - - - - 305,099 -
84.327 Special Education_Technology and Media Services for Individuals with Disabilitie
102,258 37,500 - - - - 102,258 37,500
84.375* Academic Competitiveness Grants - - 4,507 - - - 4,507 -
84.376* National Science and Mathematics Access to Retain Talent (SMART) Grants
- - (623) - - - (623) -
84.379* Teacher Education Asst for College & Higher Education Grants (TEACH Grants)
- - 36,770 - - - 36,770 -
Trio Cluster
84.042 TRIO_Student Support Services - - - - 880,278 - 880,278 -
84.044 TRIO_Talent Search 542,540 - - - 89,862 - 632,402 -
84.047 TRIO_Upward Bound - - - - 1,077,417 - 1,077,417 -
84.217 TRIO_McNair Post-Baccalaureate Achievement - - - - 263,669 - 263,669 -
Total Trio Cluster 542,540 - - - 2,311,226 - 2,853,766 -
Total Direct Program 1,681,638 70,750 392,187,473 - 4,509,565 13,914 398,378,676 84,664
Pass-Through Grantors by CFDA
84.041** ARRA - Impact Aid
Grantor: *** Energy Systems Network 11066034 33,437 - - - - - 33,437 -
Total CFDA No. 84.041 33,437 - - - - - 33,437 -
84.048 Vocational Education_Basic Grants to States
Research and Development Student Financial Aid Other Total
* denotes major programs** denotes ARRA programs
ldavid
Text Box
-7-
Purdue University Schedule of Expenditures of Federal Awards
Year ended June 30, 2012
CFDA Identifying Federal Awards Expenditures to Federal Awards Expenditures to Federal Awards Expenditures to Federal Awards Expenditures to
Grantor No. CFDA Title/Pass-Through Grantor Number Expended Subrecipients Expended Subrecipients Expended Subrecipients Expended Subrecipients
Research and Development Student Financial Aid Other Total
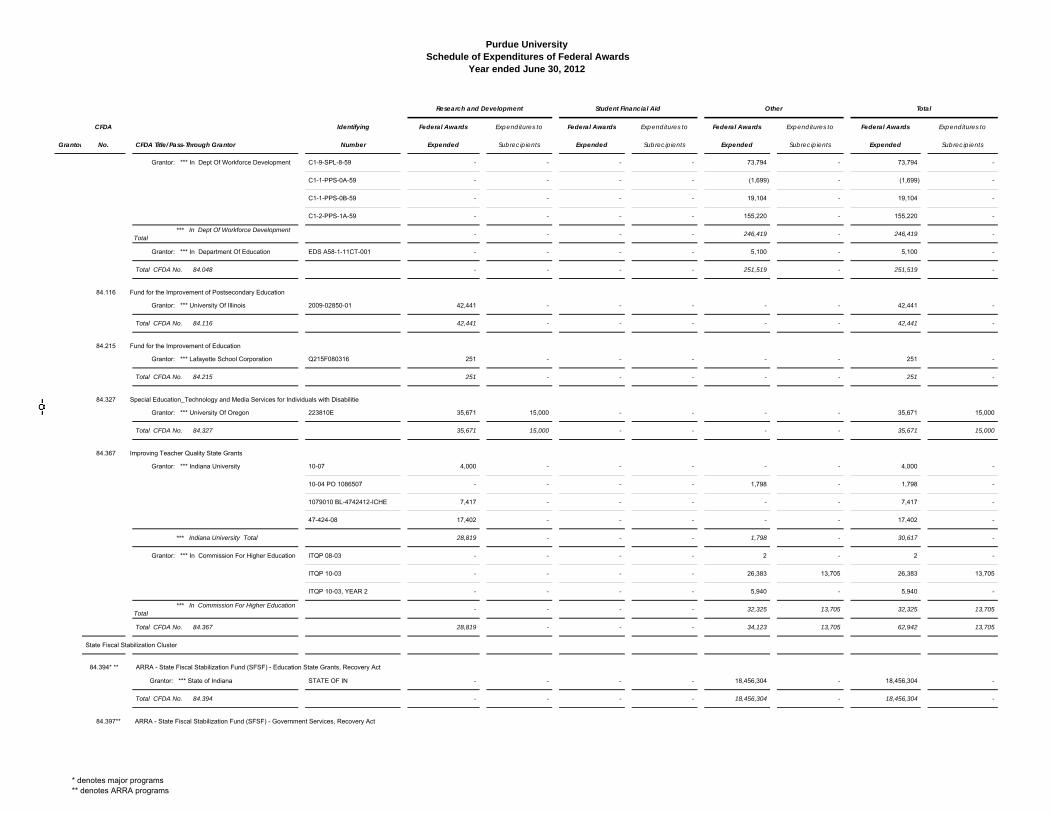
Grantor: *** In Dept Of Workforce Development C1-9-SPL-8-59 - - - - 73,794 - 73,794 -
C1-1-PPS-0A-59 - - - - (1,699) - (1,699) -
C1-1-PPS-0B-59 - - - - 19,104 - 19,104 -
C1-2-PPS-1A-59 - - - - 155,220 - 155,220 -
*** In Dept Of Workforce Development Total
- - - - 246,419 - 246,419 -
Grantor: *** In Department Of Education EDS A58-1-11CT-001 - - - - 5,100 - 5,100 -
Total CFDA No. 84.048 - - - - 251,519 - 251,519 -
84.116 Fund for the Improvement of Postsecondary Education
Grantor: *** University Of Illinois 2009-02850-01 42,441 - - - - - 42,441 -
Total CFDA No. 84.116 42,441 - - - - - 42,441 -
84.215 Fund for the Improvement of Education
Grantor: *** Lafayette School Corporation Q215F080316 251 - - - - - 251 -
Total CFDA No. 84.215 251 - - - - - 251 -
84.327 Special Education_Technology and Media Services for Individuals with Disabilitie
Grantor: *** University Of Oregon 223810E 35,671 15,000 - - - - 35,671 15,000
Total CFDA No. 84.327 35,671 15,000 - - - - 35,671 15,000
84.367 Improving Teacher Quality State Grants
Grantor: *** Indiana University 10-07 4,000 - - - - - 4,000 -
10-04 PO 1086507 - - - - 1,798 - 1,798 -
1079010 BL-4742412-ICHE 7,417 - - - - - 7,417 -
47-424-08 17,402 - - - - - 17,402 -
*** Indiana University Total 28,819 - - - 1,798 - 30,617 -
Grantor: *** In Commission For Higher Education ITQP 08-03 - - - - 2 - 2 -
ITQP 10-03 - - - - 26,383 13,705 26,383 13,705
ITQP 10-03, YEAR 2 - - - - 5,940 - 5,940 -
*** In Commission For Higher Education Total
- - - - 32,325 13,705 32,325 13,705
Total CFDA No. 84.367 28,819 - - - 34,123 13,705 62,942 13,705
State Fiscal Stabilization Cluster
84.394* ** ARRA - State Fiscal Stabilization Fund (SFSF) - Education State Grants, Recovery Act
Grantor: *** State of Indiana STATE OF IN - - - - 18,456,304 - 18,456,304 -
Total CFDA No. 84.394 - - - - 18,456,304 - 18,456,304 -
84.397** ARRA - State Fiscal Stabilization Fund (SFSF) - Government Services, Recovery Act
* denotes major programs** denotes ARRA programs
ldavid
Text Box
-8-
Purdue University Schedule of Expenditures of Federal Awards
Year ended June 30, 2012
CFDA Identifying Federal Awards Expenditures to Federal Awards Expenditures to Federal Awards Expenditures to Federal Awards Expenditures to
Grantor No. CFDA Title/Pass-Through Grantor Number Expended Subrecipients Expended Subrecipients Expended Subrecipients Expended Subrecipients
Research and Development Student Financial Aid Other Total
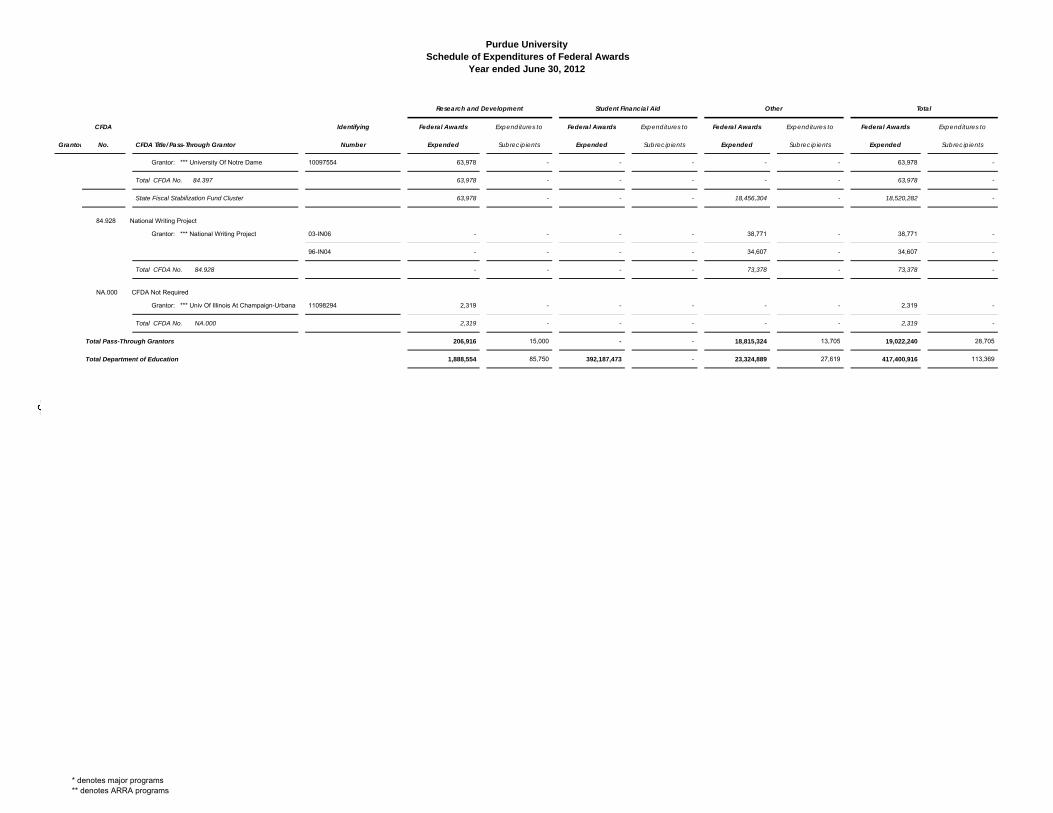
Grantor: *** University Of Notre Dame 10097554 63,978 - - - - - 63,978 -
Total CFDA No. 84.397 63,978 - - - - - 63,978 -
State Fiscal Stabilization Fund Cluster 63,978 - - - 18,456,304 - 18,520,282 -
84.928 National Writing Project
Grantor: *** National Writing Project 03-IN06 - - - - 38,771 - 38,771 -
96-IN04 - - - - 34,607 - 34,607 -
Total CFDA No. 84.928 - - - - 73,378 - 73,378 -
NA.000 CFDA Not Required
Grantor: *** Univ Of Illinois At Champaign-Urbana 11098294 2,319 - - - - - 2,319 -
Total CFDA No. NA.000 2,319 - - - - - 2,319 -
Total Pass-Through Grantors 206,916 15,000 - - 18,815,324 13,705 19,022,240 28,705
Total Department of Education 1,888,554 85,750 392,187,473 - 23,324,889 27,619 417,400,916 113,369
* denotes major programs** denotes ARRA programs
ldavid
Text Box
-9-
Purdue University Schedule of Expenditures of Federal Awards
Year ended June 30, 2012
CFDA Identifying Federal Awards Expenditures to Federal Awards Expenditures to Federal Awards Expenditures to Federal Awards Expenditures to
Grantor No. CFDA Title/Pass-Through Grantor Number Expended Subrecipients Expended Subrecipients Expended Subrecipients Expended Subrecipients
Research and Development Student Financial Aid Other Total
National Science Foundation
Direct Programs by CFDA
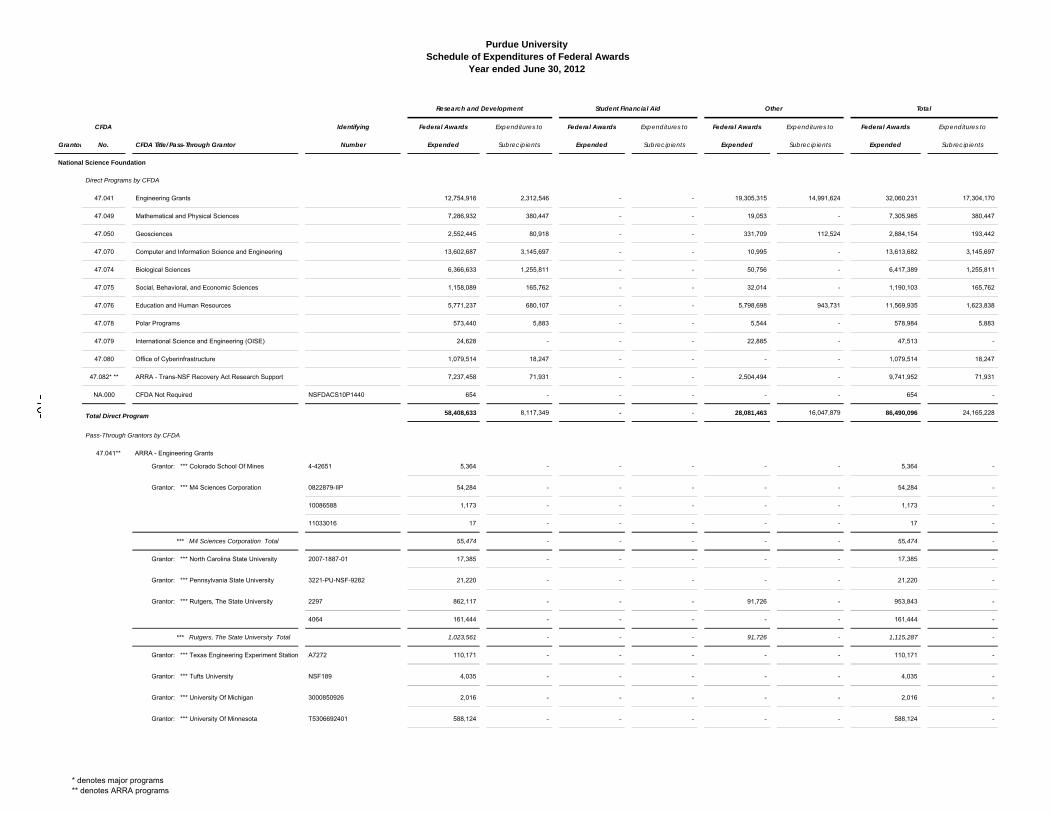
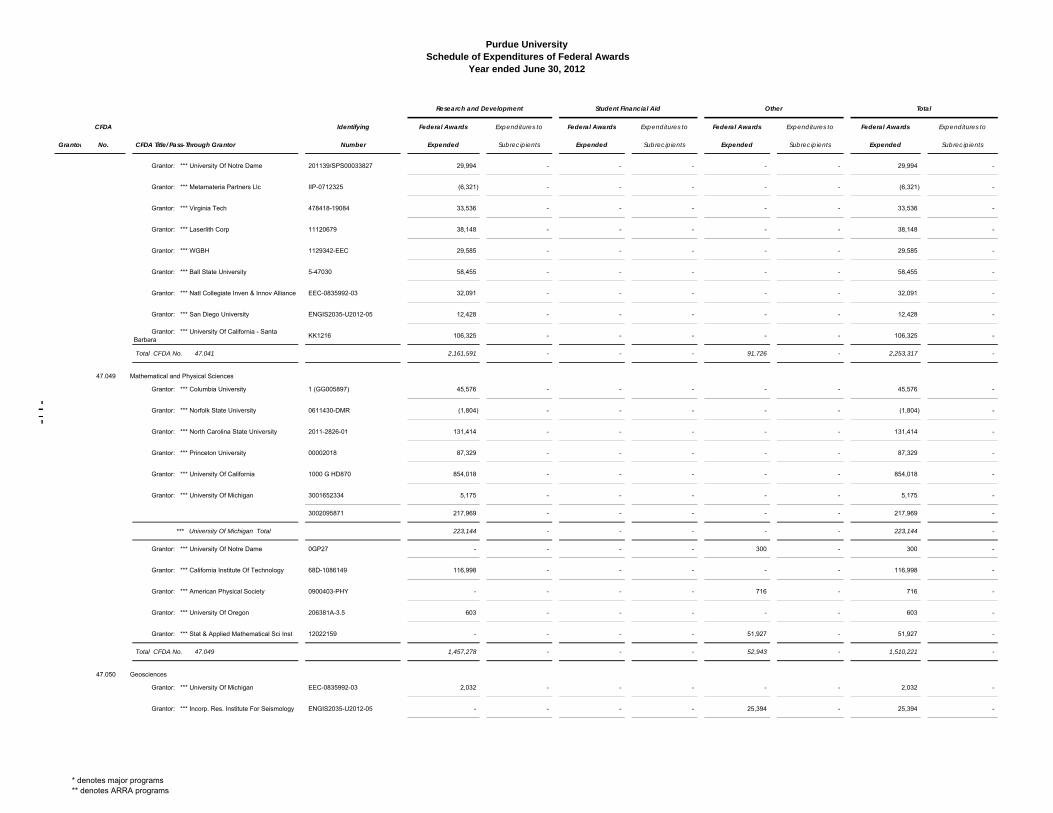
47.041 Engineering Grants 12,754,916 2,312,546 - - 19,305,315 14,991,624 32,060,231 17,304,170
47.049 Mathematical and Physical Sciences 7,286,932 380,447 - - 19,053 - 7,305,985 380,447
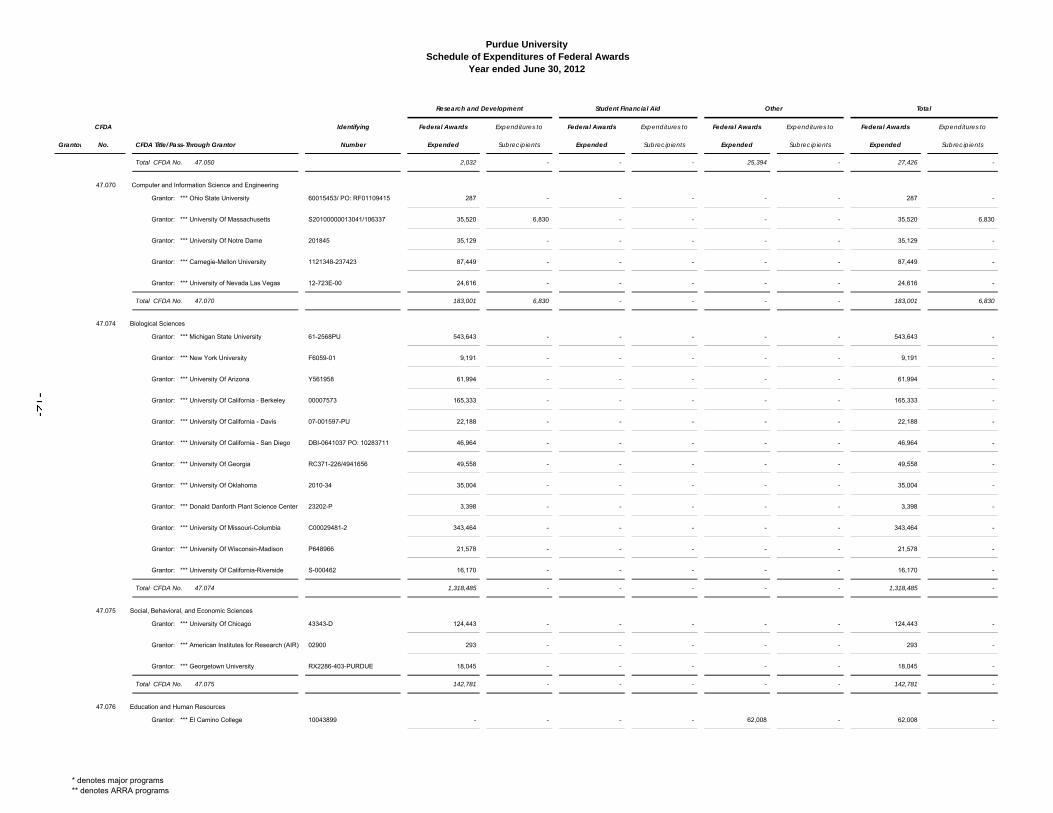
47.050 Geosciences 2,552,445 80,918 - - 331,709 112,524 2,884,154 193,442
47.070 Computer and Information Science and Engineering 13,602,687 3,145,697 - - 10,995 - 13,613,682 3,145,697
47.074 Biological Sciences 6,366,633 1,255,811 - - 50,756 - 6,417,389 1,255,811
47.075 Social, Behavioral, and Economic Sciences 1,158,089 165,762 - - 32,014 - 1,190,103 165,762
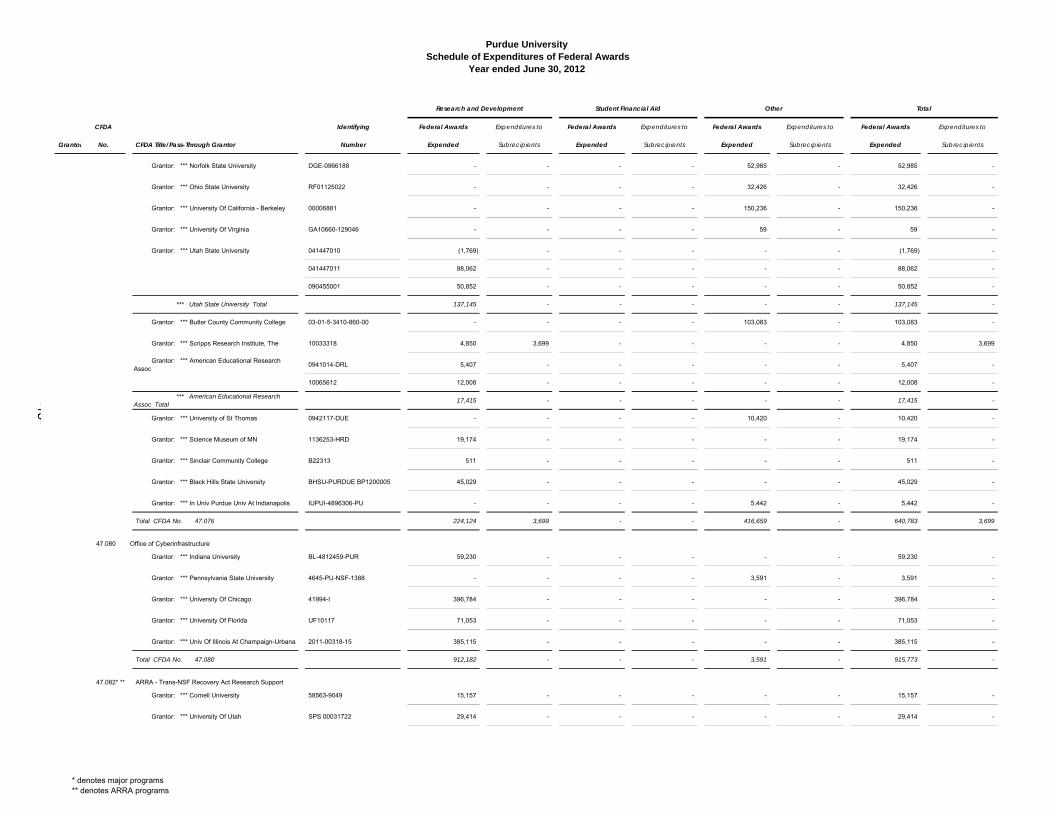
47.076 Education and Human Resources 5,771,237 680,107 - - 5,798,698 943,731 11,569,935 1,623,838
47.078 Polar Programs 573,440 5,883 - - 5,544 - 578,984 5,883
47.079 International Science and Engineering (OISE) 24,628 - - - 22,885 - 47,513 -
47.080 Office of Cyberinfrastructure 1,079,514 18,247 - - - - 1,079,514 18,247
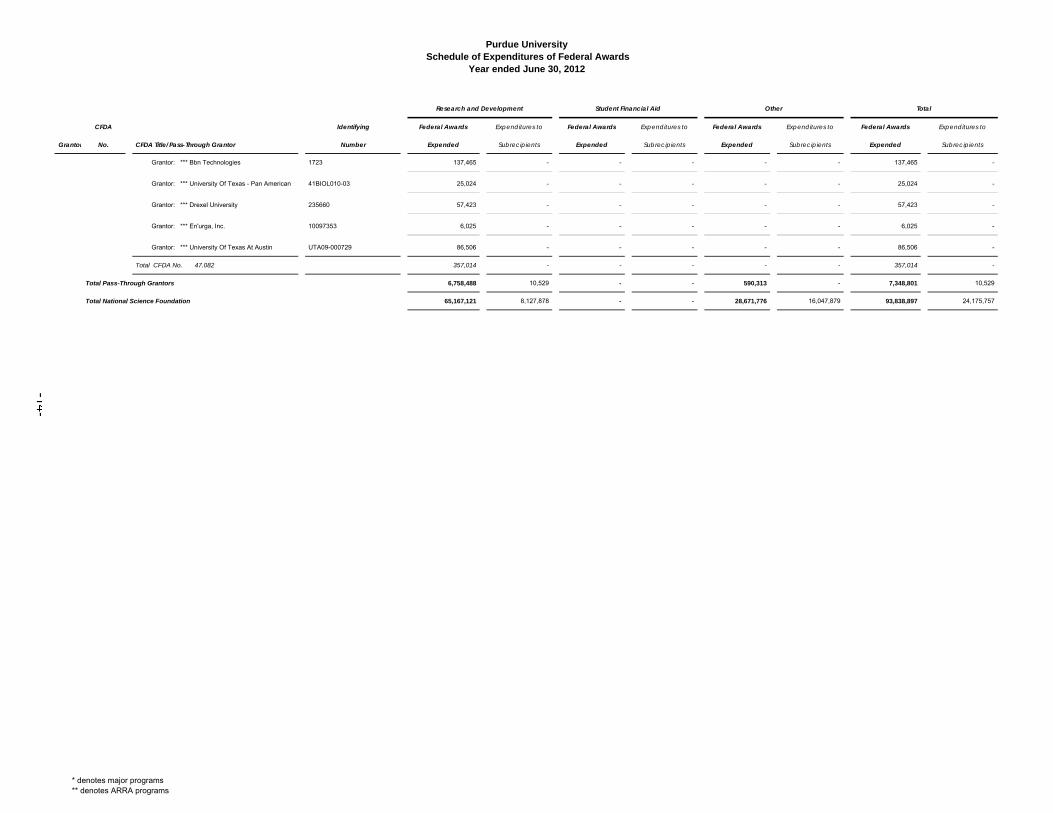
47.082* ** ARRA - Trans-NSF Recovery Act Research Support 7,237,458 71,931 - - 2,504,494 - 9,741,952 71,931
NA.000 CFDA Not Required NSFDACS10P1440 654 - - - - - 654 -
Total Direct Program 58,408,633 8,117,349 - - 28,081,463 16,047,879 86,490,096 24,165,228
Pass-Through Grantors by CFDA
47.041** ARRA - Engineering Grants
Grantor: *** Colorado School Of Mines 4-42651 5,364 - - - - - 5,364 -
Grantor: *** M4 Sciences Corporation 0822879-IIP 54,284 - - - - - 54,284 -
10086588 1,173 - - - - - 1,173 -
11033016 17 - - - - - 17 -
*** M4 Sciences Corporation Total 55,474 - - - - - 55,474 -
Grantor: *** North Carolina State University 2007-1887-01 17,385 - - - - - 17,385 -
Grantor: *** Pennsylvania State University 3221-PU-NSF-9282 21,220 - - - - - 21,220 -
Grantor: *** Rutgers, The State University 2297 862,117 - - - 91,726 - 953,843 -
4064 161,444 - - - - - 161,444 -
*** Rutgers, The State University Total 1,023,561 - - - 91,726 - 1,115,287 -
Grantor: *** Texas Engineering Experiment Station A7272 110,171 - - - - - 110,171 -
Grantor: *** Tufts University NSF189 4,035 - - - - - 4,035 -
Grantor: *** University Of Michigan 3000850926 2,016 - - - - - 2,016 -
Grantor: *** University Of Minnesota T5306692401 588,124 - - - - - 588,124 -
* denotes major programs** denotes ARRA programs
ldavid
Text Box
-10-
Purdue University Schedule of Expenditures of Federal Awards
Year ended June 30, 2012
CFDA Identifying Federal Awards Expenditures to Federal Awards Expenditures to Federal Awards Expenditures to Federal Awards Expenditures to
Grantor No. CFDA Title/Pass-Through Grantor Number Expended Subrecipients Expended Subrecipients Expended Subrecipients Expended Subrecipients
Research and Development Student Financial Aid Other Total
Grantor: *** University Of Notre Dame 201139/SPS00033827 29,994 - - - - - 29,994 -
Grantor: *** Metamateria Partners Llc IIP-0712325 (6,321) - - - - - (6,321) -
Grantor: *** Virginia Tech 478418-19084 33,536 - - - - - 33,536 -
Grantor: *** Laserlith Corp 11120679 38,148 - - - - - 38,148 -
Grantor: *** WGBH 1129342-EEC 29,585 - - - - - 29,585 -
Grantor: *** Ball State University 5-47030 58,455 - - - - - 58,455 -
Grantor: *** Natl Collegiate Inven & Innov Alliance EEC-0835992-03 32,091 - - - - - 32,091 -
Grantor: *** San Diego University ENGIS2035-U2012-05 12,428 - - - - - 12,428 -
Grantor: *** University Of California - Santa Barbara
KK1216 106,325 - - - - - 106,325 -
Total CFDA No. 47.041 2,161,591 - - - 91,726 - 2,253,317 -
47.049 Mathematical and Physical Sciences
Grantor: *** Columbia University 1 (GG005897) 45,576 - - - - - 45,576 -
Grantor: *** Norfolk State University 0611430-DMR (1,804) - - - - - (1,804) -
Grantor: *** North Carolina State University 2011-2826-01 131,414 - - - - - 131,414 -
Grantor: *** Princeton University 00002018 87,329 - - - - - 87,329 -
Grantor: *** University Of California 1000 G HD870 854,018 - - - - - 854,018 -
Grantor: *** University Of Michigan 3001652334 5,175 - - - - - 5,175 -
3002095871 217,969 - - - - - 217,969 -
*** University Of Michigan Total 223,144 - - - - - 223,144 -
Grantor: *** University Of Notre Dame 0GP27 - - - - 300 - 300 -
Grantor: *** California Institute Of Technology 68D-1086149 116,998 - - - - - 116,998 -
Grantor: *** American Physical Society 0900403-PHY - - - - 716 - 716 -
Grantor: *** University Of Oregon 206381A-3.5 603 - - - - - 603 -
Grantor: *** Stat & Applied Mathematical Sci Inst 12022159 - - - - 51,927 - 51,927 -
Total CFDA No. 47.049 1,457,278 - - - 52,943 - 1,510,221 -
47.050 Geosciences
Grantor: *** University Of Michigan EEC-0835992-03 2,032 - - - - - 2,032 -
Grantor: *** Incorp. Res. Institute For Seismology ENGIS2035-U2012-05 - - - - 25,394 - 25,394 -
* denotes major programs** denotes ARRA programs
ldavid
Text Box
-11-
Purdue University Schedule of Expenditures of Federal Awards
Year ended June 30, 2012
CFDA Identifying Federal Awards Expenditures to Federal Awards Expenditures to Federal Awards Expenditures to Federal Awards Expenditures to
Grantor No. CFDA Title/Pass-Through Grantor Number Expended Subrecipients Expended Subrecipients Expended Subrecipients Expended Subrecipients
Research and Development Student Financial Aid Other Total
Total CFDA No. 47.050 2,032 - - - 25,394 - 27,426 -
47.070 Computer and Information Science and Engineering
Grantor: *** Ohio State University 60015453/ PO: RF01109415 287 - - - - - 287 -
Grantor: *** University Of Massachusetts S20100000013041/106337 35,520 6,830 - - - - 35,520 6,830
Grantor: *** University Of Notre Dame 201845 35,129 - - - - - 35,129 -
Grantor: *** Carnegie-Mellon University 1121348-237423 87,449 - - - - - 87,449 -
Grantor: *** University of Nevada Las Vegas 12-723E-00 24,616 - - - - - 24,616 -
Total CFDA No. 47.070 183,001 6,830 - - - - 183,001 6,830
47.074 Biological Sciences
Grantor: *** Michigan State University 61-2568PU 543,643 - - - - - 543,643 -
Grantor: *** New York University F6059-01 9,191 - - - - - 9,191 -
Grantor: *** University Of Arizona Y561958 61,994 - - - - - 61,994 -
Grantor: *** University Of California - Berkeley 00007573 165,333 - - - - - 165,333 -
Grantor: *** University Of California - Davis 07-001597-PU 22,188 - - - - - 22,188 -
Grantor: *** University Of California - San Diego DBI-0641037 PO: 10283711 46,964 - - - - - 46,964 -
Grantor: *** University Of Georgia RC371-226/4941656 49,558 - - - - - 49,558 -
Grantor: *** University Of Oklahoma 2010-34 35,004 - - - - - 35,004 -
Grantor: *** Donald Danforth Plant Science Center 23202-P 3,398 - - - - - 3,398 -
Grantor: *** University Of Missouri-Columbia C00029481-2 343,464 - - - - - 343,464 -
Grantor: *** University Of Wisconsin-Madison P648966 21,578 - - - - - 21,578 -
Grantor: *** University Of California-Riverside S-000462 16,170 - - - - - 16,170 -
Total CFDA No. 47.074 1,318,485 - - - - - 1,318,485 -
47.075 Social, Behavioral, and Economic Sciences
Grantor: *** University Of Chicago 43343-D 124,443 - - - - - 124,443 -
Grantor: *** American Institutes for Research (AIR) 02900 293 - - - - - 293 -
Grantor: *** Georgetown University RX2286-403-PURDUE 18,045 - - - - - 18,045 -
Total CFDA No. 47.075 142,781 - - - - - 142,781 -
47.076 Education and Human Resources
Grantor: *** El Camino College 10043899 - - - - 62,008 - 62,008 -
* denotes major programs** denotes ARRA programs
ldavid
Text Box
-12-
Purdue University Schedule of Expenditures of Federal Awards
Year ended June 30, 2012
CFDA Identifying Federal Awards Expenditures to Federal Awards Expenditures to Federal Awards Expenditures to Federal Awards Expenditures to
Grantor No. CFDA Title/Pass-Through Grantor Number Expended Subrecipients Expended Subrecipients Expended Subrecipients Expended Subrecipients
Research and Development Student Financial Aid Other Total
Grantor: *** Norfolk State University DGE-0966188 - - - - 52,985 - 52,985 -
Grantor: *** Ohio State University RF01125022 - - - - 32,426 - 32,426 -
Grantor: *** University Of California - Berkeley 00006881 - - - - 150,236 - 150,236 -
Grantor: *** University Of Virginia GA10660-129046 - - - - 59 - 59 -
Grantor: *** Utah State University 041447010 (1,769) - - - - - (1,769) -
041447011 88,062 - - - - - 88,062 -
090455001 50,852 - - - - - 50,852 -
*** Utah State University Total 137,145 - - - - - 137,145 -
Grantor: *** Butler County Community College 03-01-5-3410-860-00 - - - - 103,083 - 103,083 -
Grantor: *** Scripps Research Institute, The 10033318 4,850 3,699 - - - - 4,850 3,699
Grantor: *** American Educational Research Assoc
0941014-DRL 5,407 - - - - - 5,407 -
10065612 12,008 - - - - - 12,008 -
*** American Educational Research Assoc Total
17,415 - - - - - 17,415 -
Grantor: *** University of St Thomas 0942117-DUE - - - - 10,420 - 10,420 -
Grantor: *** Science Museum of MN 1136253-HRD 19,174 - - - - - 19,174 -
Grantor: *** Sinclair Community College B22313 511 - - - - - 511 -
Grantor: *** Black Hills State University BHSU-PURDUE BP1200005 45,029 - - - - - 45,029 -
Grantor: *** In Univ Purdue Univ At Indianapolis IUPUI-4896306-PU - - - - 5,442 - 5,442 -
Total CFDA No. 47.076 224,124 3,699 - - 416,659 - 640,783 3,699
47.080 Office of Cyberinfrastructure
Grantor: *** Indiana University BL-4812459-PUR 59,230 - - - - - 59,230 -
Grantor: *** Pennsylvania State University 4645-PU-NSF-1388 - - - - 3,591 - 3,591 -
Grantor: *** University Of Chicago 41994-I 396,784 - - - - - 396,784 -
Grantor: *** University Of Florida UF10117 71,053 - - - - - 71,053 -
Grantor: *** Univ Of Illinois At Champaign-Urbana 2011-00318-15 385,115 - - - - - 385,115 -
Total CFDA No. 47.080 912,182 - - - 3,591 - 915,773 -
47.082* ** ARRA - Trans-NSF Recovery Act Research Support
Grantor: *** Cornell University 58563-9049 15,157 - - - - - 15,157 -
Grantor: *** University Of Utah SPS 00031722 29,414 - - - - - 29,414 -
* denotes major programs** denotes ARRA programs
ldavid
Text Box
-13-
Purdue University Schedule of Expenditures of Federal Awards
Year ended June 30, 2012
CFDA Identifying Federal Awards Expenditures to Federal Awards Expenditures to Federal Awards Expenditures to Federal Awards Expenditures to
Grantor No. CFDA Title/Pass-Through Grantor Number Expended Subrecipients Expended Subrecipients Expended Subrecipients Expended Subrecipients
Research and Development Student Financial Aid Other Total
Grantor: *** Bbn Technologies 1723 137,465 - - - - - 137,465 -
Grantor: *** University Of Texas - Pan American 41BIOL010-03 25,024 - - - - - 25,024 -
Grantor: *** Drexel University 235660 57,423 - - - - - 57,423 -
Grantor: *** En'urga, Inc. 10097353 6,025 - - - - - 6,025 -
Grantor: *** University Of Texas At Austin UTA09-000729 86,506 - - - - - 86,506 -
Total CFDA No. 47.082 357,014 - - - - - 357,014 -
Total Pass-Through Grantors 6,758,488 10,529 - - 590,313 - 7,348,801 10,529
Total National Science Foundation 65,167,121 8,127,878 - - 28,671,776 16,047,879 93,838,897 24,175,757
* denotes major programs** denotes ARRA programs
ldavid
Text Box
-14-
Purdue University Schedule of Expenditures of Federal Awards
Year ended June 30, 2012
CFDA Identifying Federal Awards Expenditures to Federal Awards Expenditures to Federal Awards Expenditures to Federal Awards Expenditures to
Grantor No. CFDA Title/Pass-Through Grantor Number Expended Subrecipients Expended Subrecipients Expended Subrecipients Expended Subrecipients
Research and Development Student Financial Aid Other Total
Department of Health and Human Services
National Institute of Health
Direct Programs by CFDA
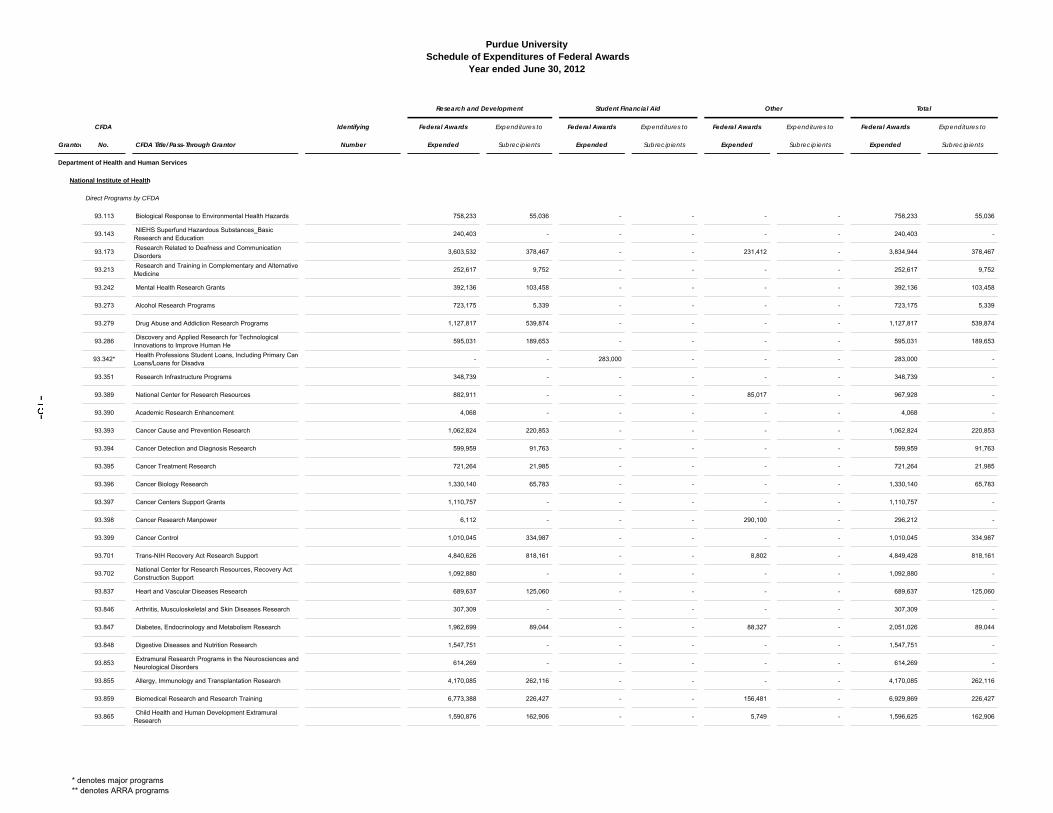
93.113 Biological Response to Environmental Health Hazards 758,233 55,036 - - - - 758,233 55,036
93.143 NIEHS Superfund Hazardous Substances_Basic Research and Education
240,403 - - - - - 240,403 -
93.173 Research Related to Deafness and Communication Disorders
3,603,532 378,467 - - 231,412 - 3,834,944 378,467
93.213 Research and Training in Complementary and Alternative Medicine
252,617 9,752 - - - - 252,617 9,752
93.242 Mental Health Research Grants 392,136 103,458 - - - - 392,136 103,458
93.273 Alcohol Research Programs 723,175 5,339 - - - - 723,175 5,339
93.279 Drug Abuse and Addiction Research Programs 1,127,817 539,874 - - - - 1,127,817 539,874
93.286 Discovery and Applied Research for Technological Innovations to Improve Human He
595,031 189,653 - - - - 595,031 189,653
93.342* Health Professions Student Loans, Including Primary CareLoans/Loans for Disadva
- - 283,000 - - - 283,000 -
93.351 Research Infrastructure Programs 348,739 - - - - - 348,739 -
93.389 National Center for Research Resources 882,911 - - - 85,017 - 967,928 -
93.390 Academic Research Enhancement 4,068 - - - - - 4,068 -
93.393 Cancer Cause and Prevention Research 1,062,824 220,853 - - - - 1,062,824 220,853
93.394 Cancer Detection and Diagnosis Research 599,959 91,763 - - - - 599,959 91,763
93.395 Cancer Treatment Research 721,264 21,985 - - - - 721,264 21,985
93.396 Cancer Biology Research 1,330,140 65,783 - - - - 1,330,140 65,783
93.397 Cancer Centers Support Grants 1,110,757 - - - - - 1,110,757 -
93.398 Cancer Research Manpower 6,112 - - - 290,100 - 296,212 -
93.399 Cancer Control 1,010,045 334,987 - - - - 1,010,045 334,987
93.701 Trans-NIH Recovery Act Research Support 4,840,626 818,161 - - 8,802 - 4,849,428 818,161
93.702 National Center for Research Resources, Recovery Act Construction Support
1,092,880 - - - - - 1,092,880 -
93.837 Heart and Vascular Diseases Research 689,637 125,060 - - - - 689,637 125,060
93.846 Arthritis, Musculoskeletal and Skin Diseases Research 307,309 - - - - - 307,309 -
93.847 Diabetes, Endocrinology and Metabolism Research 1,962,699 89,044 - - 88,327 - 2,051,026 89,044
93.848 Digestive Diseases and Nutrition Research 1,547,751 - - - - - 1,547,751 -
93.853 Extramural Research Programs in the Neurosciences and Neurological Disorders
614,269 - - - - - 614,269 -
93.855 Allergy, Immunology and Transplantation Research 4,170,085 262,116 - - - - 4,170,085 262,116
93.859 Biomedical Research and Research Training 6,773,388 226,427 - - 156,481 - 6,929,869 226,427
93.865 Child Health and Human Development Extramural Research
1,590,876 162,906 - - 5,749 - 1,596,625 162,906
* denotes major programs** denotes ARRA programs
ldavid
Text Box
-15-
Purdue University Schedule of Expenditures of Federal Awards
Year ended June 30, 2012
CFDA Identifying Federal Awards Expenditures to Federal Awards Expenditures to Federal Awards Expenditures to Federal Awards Expenditures to
Grantor No. CFDA Title/Pass-Through Grantor Number Expended Subrecipients Expended Subrecipients Expended Subrecipients Expended Subrecipients
Research and Development Student Financial Aid Other Total
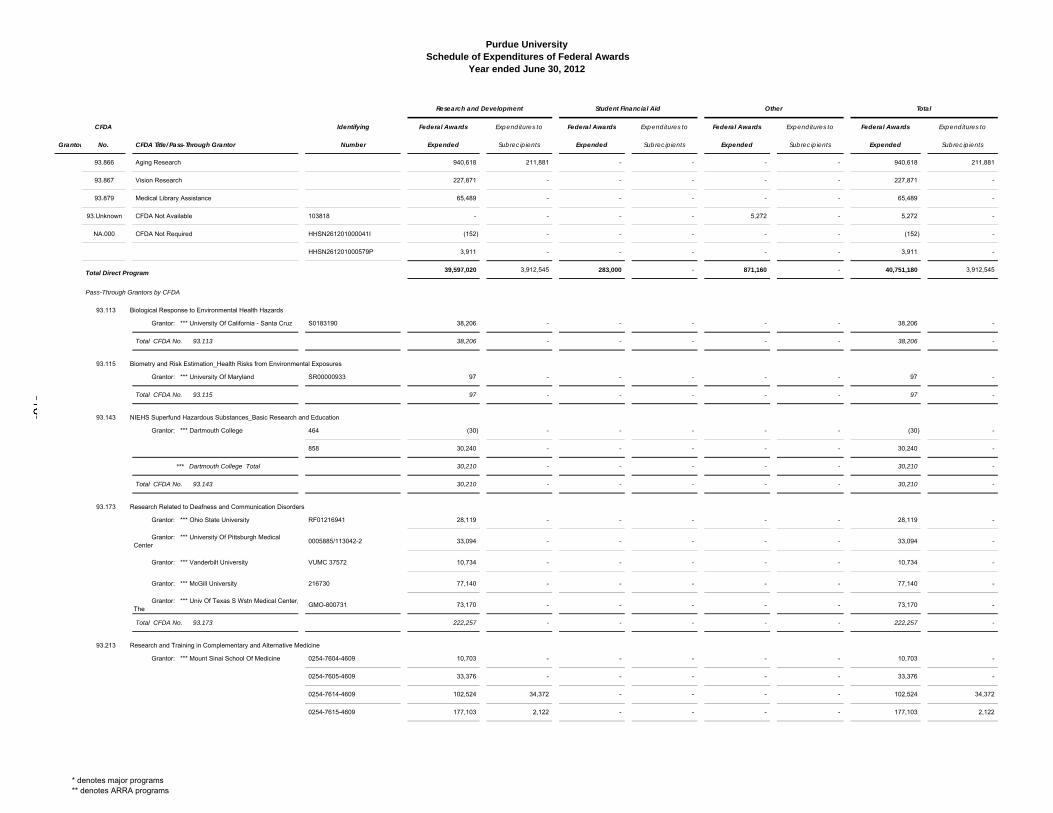
93.866 Aging Research 940,618 211,881 - - - - 940,618 211,881
93.867 Vision Research 227,871 - - - - - 227,871 -
93.879 Medical Library Assistance 65,489 - - - - - 65,489 -
93.Unknown CFDA Not Available 103818 - - - - 5,272 - 5,272 -
NA.000 CFDA Not Required HHSN261201000041I (152) - - - - - (152) -
HHSN261201000579P 3,911 - - - - - 3,911 -
Total Direct Program 39,597,020 3,912,545 283,000 - 871,160 - 40,751,180 3,912,545
Pass-Through Grantors by CFDA
93.113 Biological Response to Environmental Health Hazards
Grantor: *** University Of California - Santa Cruz S0183190 38,206 - - - - - 38,206 -
Total CFDA No. 93.113 38,206 - - - - - 38,206 -
93.115 Biometry and Risk Estimation_Health Risks from Environmental Exposures
Grantor: *** University Of Maryland SR00000933 97 - - - - - 97 -
Total CFDA No. 93.115 97 - - - - - 97 -
93.143 NIEHS Superfund Hazardous Substances_Basic Research and Education
Grantor: *** Dartmouth College 464 (30) - - - - - (30) -
858 30,240 - - - - - 30,240 -
*** Dartmouth College Total 30,210 - - - - - 30,210 -
Total CFDA No. 93.143 30,210 - - - - - 30,210 -
93.173 Research Related to Deafness and Communication Disorders
Grantor: *** Ohio State University RF01216941 28,119 - - - - - 28,119 -
Grantor: *** University Of Pittsburgh Medical Center
0005885/113042-2 33,094 - - - - - 33,094 -
Grantor: *** Vanderbilt University VUMC 37572 10,734 - - - - - 10,734 -
Grantor: *** McGill University 216730 77,140 - - - - - 77,140 -
Grantor: *** Univ Of Texas S Wstn Medical Center,The
GMO-800731 73,170 - - - - - 73,170 -
Total CFDA No. 93.173 222,257 - - - - - 222,257 -
93.213 Research and Training in Complementary and Alternative Medicine
Grantor: *** Mount Sinai School Of Medicine 0254-7604-4609 10,703 - - - - - 10,703 -
0254-7605-4609 33,376 - - - - - 33,376 -
0254-7614-4609 102,524 34,372 - - - - 102,524 34,372
0254-7615-4609 177,103 2,122 - - - - 177,103 2,122
* denotes major programs** denotes ARRA programs
ldavid
Text Box
-16-
Purdue University Schedule of Expenditures of Federal Awards
Year ended June 30, 2012
CFDA Identifying Federal Awards Expenditures to Federal Awards Expenditures to Federal Awards Expenditures to Federal Awards Expenditures to
Grantor No. CFDA Title/Pass-Through Grantor Number Expended Subrecipients Expended Subrecipients Expended Subrecipients Expended Subrecipients
Research and Development Student Financial Aid Other Total
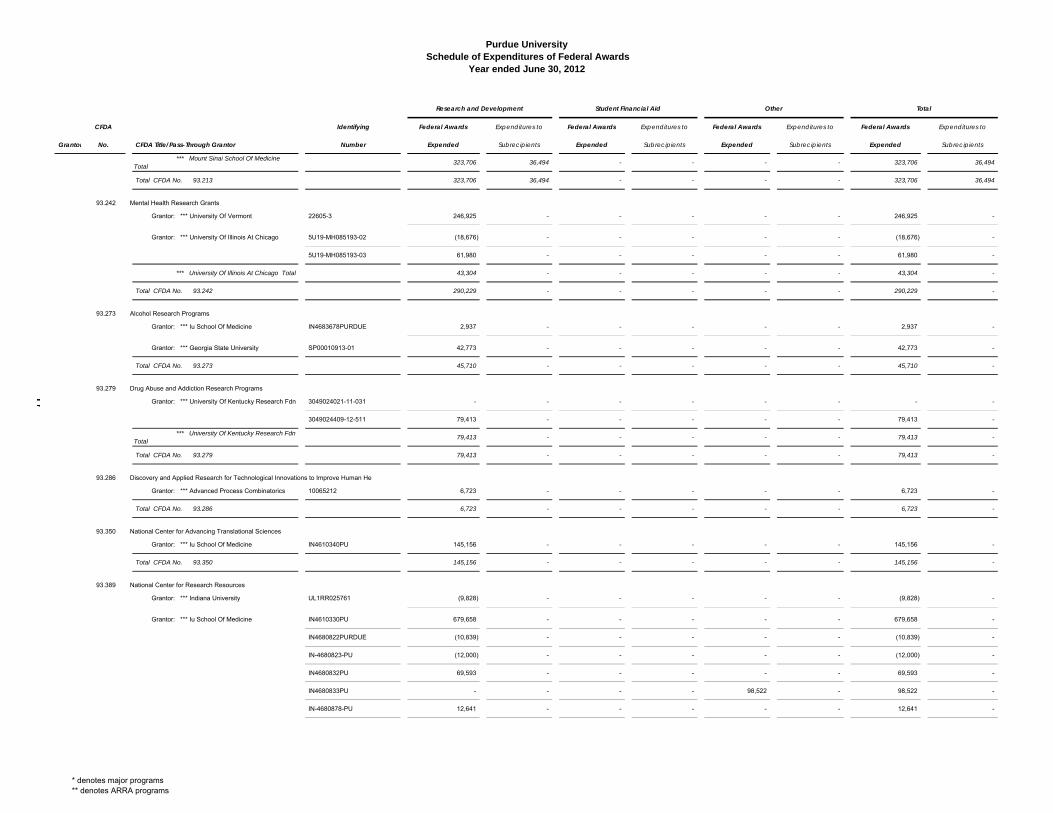
*** Mount Sinai School Of Medicine Total
323,706 36,494 - - - - 323,706 36,494
Total CFDA No. 93.213 323,706 36,494 - - - - 323,706 36,494
93.242 Mental Health Research Grants
Grantor: *** University Of Vermont 22605-3 246,925 - - - - - 246,925 -
Grantor: *** University Of Illinois At Chicago 5U19-MH085193-02 (18,676) - - - - - (18,676) -
5U19-MH085193-03 61,980 - - - - - 61,980 -
*** University Of Illinois At Chicago Total 43,304 - - - - - 43,304 -
Total CFDA No. 93.242 290,229 - - - - - 290,229 -
93.273 Alcohol Research Programs
Grantor: *** Iu School Of Medicine IN4683678PURDUE 2,937 - - - - - 2,937 -
Grantor: *** Georgia State University SP00010913-01 42,773 - - - - - 42,773 -
Total CFDA No. 93.273 45,710 - - - - - 45,710 -
93.279 Drug Abuse and Addiction Research Programs
Grantor: *** University Of Kentucky Research Fdn 3049024021-11-031 - - - - - - - -
3049024409-12-511 79,413 - - - - - 79,413 -
*** University Of Kentucky Research Fdn Total
79,413 - - - - - 79,413 -
Total CFDA No. 93.279 79,413 - - - - - 79,413 -
93.286 Discovery and Applied Research for Technological Innovations to Improve Human He
Grantor: *** Advanced Process Combinatorics 10065212 6,723 - - - - - 6,723 -
Total CFDA No. 93.286 6,723 - - - - - 6,723 -
93.350 National Center for Advancing Translational Sciences
Grantor: *** Iu School Of Medicine IN4610340PU 145,156 - - - - - 145,156 -
Total CFDA No. 93.350 145,156 - - - - - 145,156 -
93.389 National Center for Research Resources
Grantor: *** Indiana University UL1RR025761 (9,828) - - - - - (9,828) -
Grantor: *** Iu School Of Medicine IN4610330PU 679,658 - - - - - 679,658 -
IN4680822PURDUE (10,839) - - - - - (10,839) -
IN-4680823-PU (12,000) - - - - - (12,000) -
IN4680832PU 69,593 - - - - - 69,593 -
IN4680833PU - - - - 98,522 - 98,522 -
IN-4680878-PU 12,641 - - - - - 12,641 -
* denotes major programs** denotes ARRA programs
ldavid
Text Box
-17-
Purdue University Schedule of Expenditures of Federal Awards
Year ended June 30, 2012
CFDA Identifying Federal Awards Expenditures to Federal Awards Expenditures to Federal Awards Expenditures to Federal Awards Expenditures to
Grantor No. CFDA Title/Pass-Through Grantor Number Expended Subrecipients Expended Subrecipients Expended Subrecipients Expended Subrecipients
Research and Development Student Financial Aid Other Total
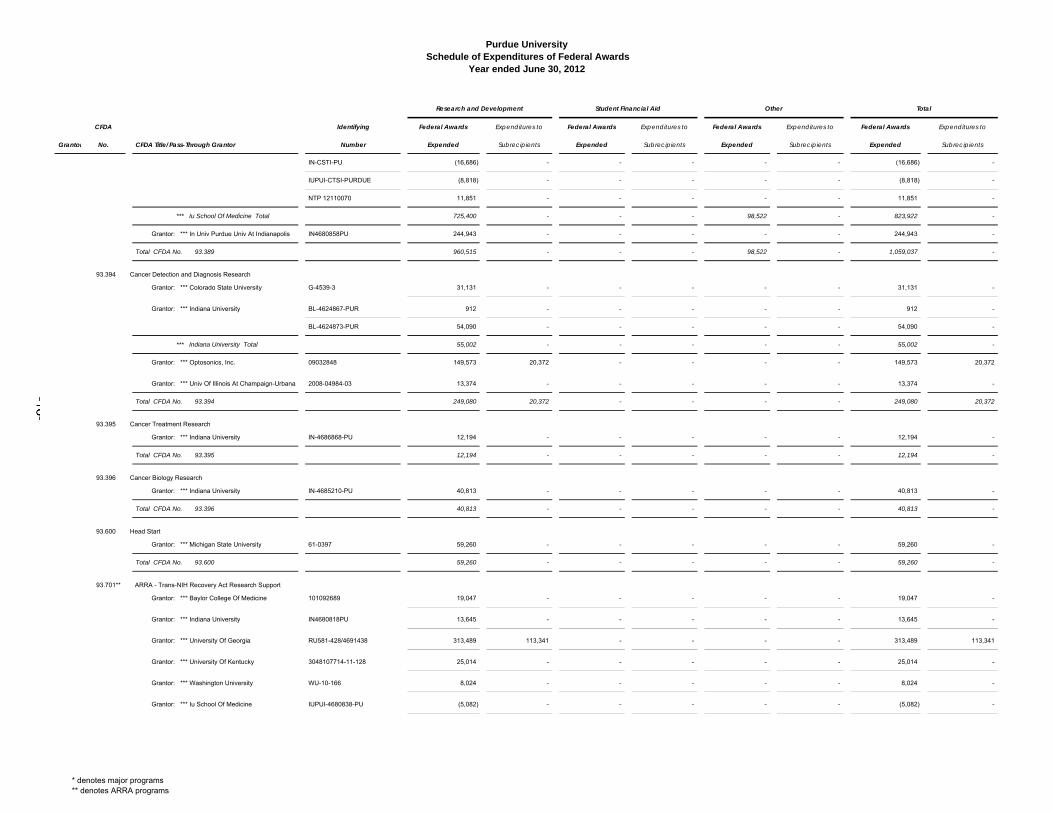
IN-CSTI-PU (16,686) - - - - - (16,686) -
IUPUI-CTSI-PURDUE (8,818) - - - - - (8,818) -
NTP 12110070 11,851 - - - - - 11,851 -
*** Iu School Of Medicine Total 725,400 - - - 98,522 - 823,922 -
Grantor: *** In Univ Purdue Univ At Indianapolis IN4680858PU 244,943 - - - - - 244,943 -
Total CFDA No. 93.389 960,515 - - - 98,522 - 1,059,037 -
93.394 Cancer Detection and Diagnosis Research
Grantor: *** Colorado State University G-4539-3 31,131 - - - - - 31,131 -
Grantor: *** Indiana University BL-4624867-PUR 912 - - - - - 912 -
BL-4624873-PUR 54,090 - - - - - 54,090 -
*** Indiana University Total 55,002 - - - - - 55,002 -
Grantor: *** Optosonics, Inc. 09032848 149,573 20,372 - - - - 149,573 20,372
Grantor: *** Univ Of Illinois At Champaign-Urbana 2008-04984-03 13,374 - - - - - 13,374 -
Total CFDA No. 93.394 249,080 20,372 - - - - 249,080 20,372
93.395 Cancer Treatment Research
Grantor: *** Indiana University IN-4686868-PU 12,194 - - - - - 12,194 -
Total CFDA No. 93.395 12,194 - - - - - 12,194 -
93.396 Cancer Biology Research
Grantor: *** Indiana University IN-4685210-PU 40,813 - - - - - 40,813 -
Total CFDA No. 93.396 40,813 - - - - - 40,813 -
93.600 Head Start
Grantor: *** Michigan State University 61-0397 59,260 - - - - - 59,260 -
Total CFDA No. 93.600 59,260 - - - - - 59,260 -
93.701** ARRA - Trans-NIH Recovery Act Research Support
Grantor: *** Baylor College Of Medicine 101092689 19,047 - - - - - 19,047 -
Grantor: *** Indiana University IN4680818PU 13,645 - - - - - 13,645 -
Grantor: *** University Of Georgia RU581-428/4691438 313,489 113,341 - - - - 313,489 113,341
Grantor: *** University Of Kentucky 3048107714-11-128 25,014 - - - - - 25,014 -
Grantor: *** Washington University WU-10-166 8,024 - - - - - 8,024 -
Grantor: *** Iu School Of Medicine IUPUI-4680838-PU (5,082) - - - - - (5,082) -
* denotes major programs** denotes ARRA programs
ldavid
Text Box
-18-
Purdue University Schedule of Expenditures of Federal Awards
Year ended June 30, 2012
CFDA Identifying Federal Awards Expenditures to Federal Awards Expenditures to Federal Awards Expenditures to Federal Awards Expenditures to
Grantor No. CFDA Title/Pass-Through Grantor Number Expended Subrecipients Expended Subrecipients Expended Subrecipients Expended Subrecipients
Research and Development Student Financial Aid Other Total
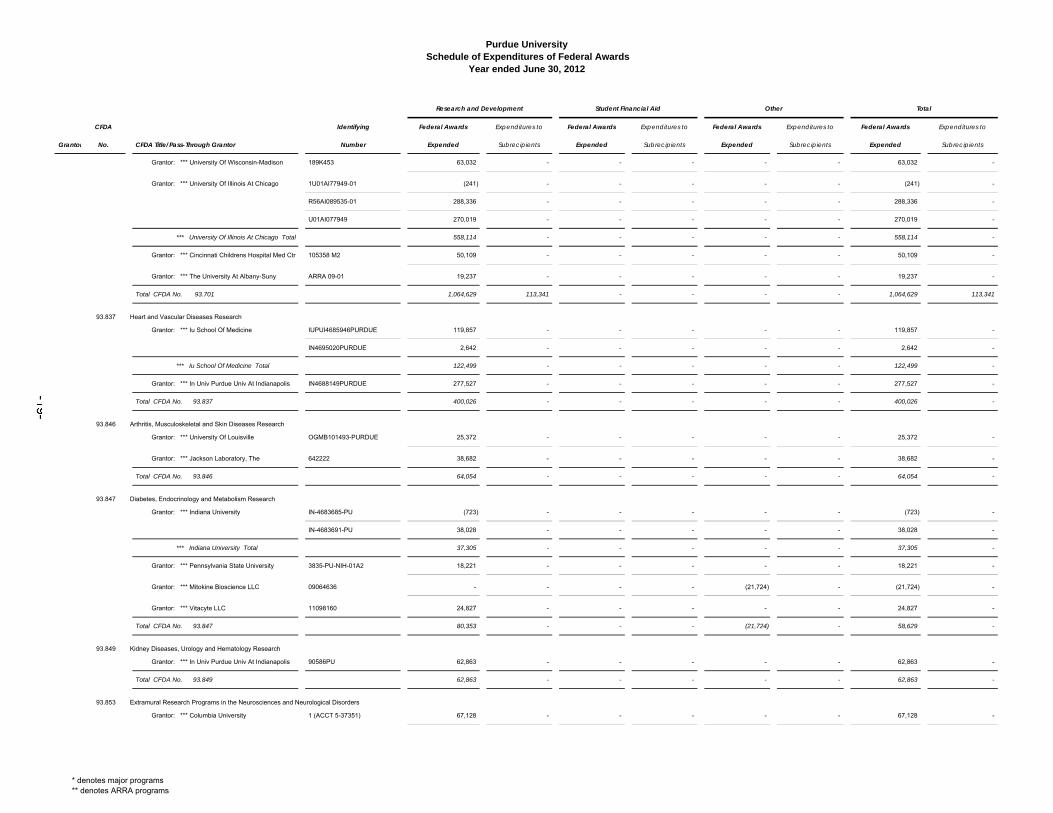
Grantor: *** University Of Wisconsin-Madison 189K453 63,032 - - - - - 63,032 -
Grantor: *** University Of Illinois At Chicago 1U01AI77949-01 (241) - - - - - (241) -
R56AI089535-01 288,336 - - - - - 288,336 -
U01AI077949 270,019 - - - - - 270,019 -
*** University Of Illinois At Chicago Total 558,114 - - - - - 558,114 -
Grantor: *** Cincinnati Childrens Hospital Med Ctr 105358 M2 50,109 - - - - - 50,109 -
Grantor: *** The University At Albany-Suny ARRA 09-01 19,237 - - - - - 19,237 -
Total CFDA No. 93.701 1,064,629 113,341 - - - - 1,064,629 113,341
93.837 Heart and Vascular Diseases Research
Grantor: *** Iu School Of Medicine IUPUI4685946PURDUE 119,857 - - - - - 119,857 -
IN4695020PURDUE 2,642 - - - - - 2,642 -
*** Iu School Of Medicine Total 122,499 - - - - - 122,499 -
Grantor: *** In Univ Purdue Univ At Indianapolis IN4688149PURDUE 277,527 - - - - - 277,527 -
Total CFDA No. 93.837 400,026 - - - - - 400,026 -
93.846 Arthritis, Musculoskeletal and Skin Diseases Research
Grantor: *** University Of Louisville OGMB101493-PURDUE 25,372 - - - - - 25,372 -
Grantor: *** Jackson Laboratory, The 642222 38,682 - - - - - 38,682 -
Total CFDA No. 93.846 64,054 - - - - - 64,054 -
93.847 Diabetes, Endocrinology and Metabolism Research
Grantor: *** Indiana University IN-4683685-PU (723) - - - - - (723) -
IN-4683691-PU 38,028 - - - - - 38,028 -
*** Indiana University Total 37,305 - - - - - 37,305 -
Grantor: *** Pennsylvania State University 3835-PU-NIH-01A2 18,221 - - - - - 18,221 -
Grantor: *** Mitokine Bioscience LLC 09064636 - - - - (21,724) - (21,724) -
Grantor: *** Vitacyte LLC 11098160 24,827 - - - - - 24,827 -
Total CFDA No. 93.847 80,353 - - - (21,724) - 58,629 -
93.849 Kidney Diseases, Urology and Hematology Research
Grantor: *** In Univ Purdue Univ At Indianapolis 90586PU 62,863 - - - - - 62,863 -
Total CFDA No. 93.849 62,863 - - - - - 62,863 -
93.853 Extramural Research Programs in the Neurosciences and Neurological Disorders
Grantor: *** Columbia University 1 (ACCT 5-37351) 67,128 - - - - - 67,128 -
* denotes major programs** denotes ARRA programs
ldavid
Text Box
-19-
Purdue University Schedule of Expenditures of Federal Awards
Year ended June 30, 2012
CFDA Identifying Federal Awards Expenditures to Federal Awards Expenditures to Federal Awards Expenditures to Federal Awards Expenditures to
Grantor No. CFDA Title/Pass-Through Grantor Number Expended Subrecipients Expended Subrecipients Expended Subrecipients Expended Subrecipients
Research and Development Student Financial Aid Other Total
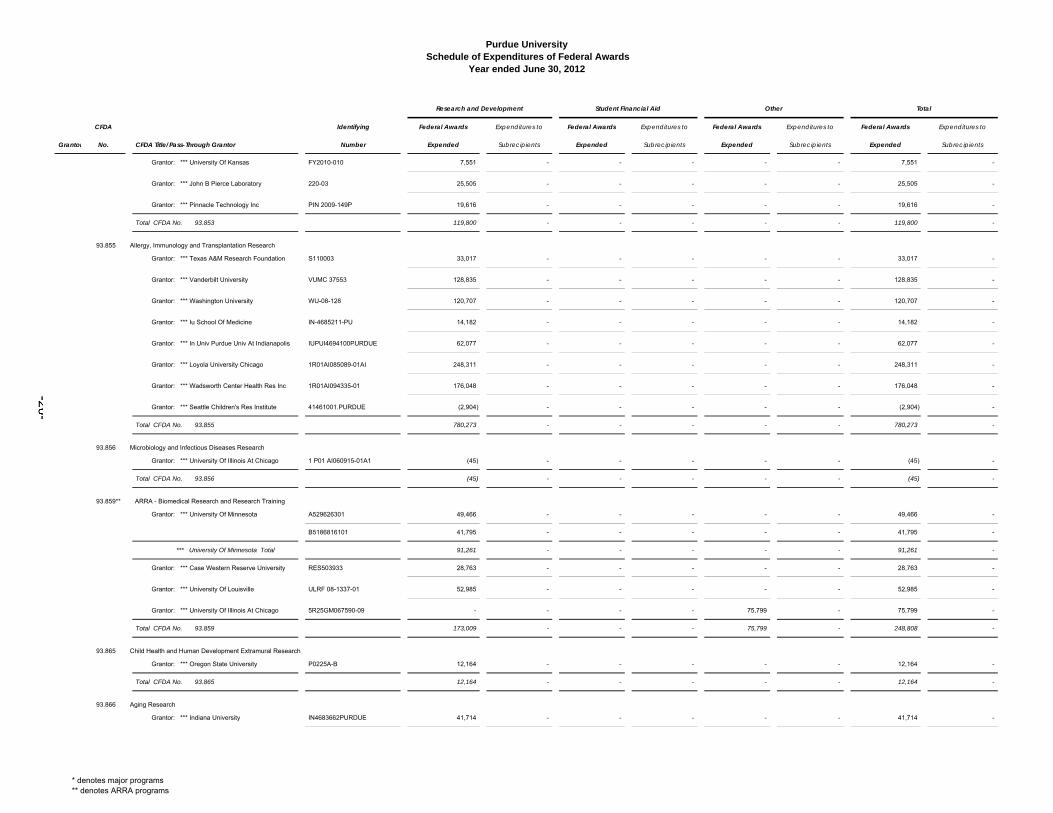
Grantor: *** University Of Kansas FY2010-010 7,551 - - - - - 7,551 -
Grantor: *** John B Pierce Laboratory 220-03 25,505 - - - - - 25,505 -
Grantor: *** Pinnacle Technology Inc PIN 2009-149P 19,616 - - - - - 19,616 -
Total CFDA No. 93.853 119,800 - - - - - 119,800 -
93.855 Allergy, Immunology and Transplantation Research
Grantor: *** Texas A&M Research Foundation S110003 33,017 - - - - - 33,017 -
Grantor: *** Vanderbilt University VUMC 37553 128,835 - - - - - 128,835 -
Grantor: *** Washington University WU-08-128 120,707 - - - - - 120,707 -
Grantor: *** Iu School Of Medicine IN-4685211-PU 14,182 - - - - - 14,182 -
Grantor: *** In Univ Purdue Univ At Indianapolis IUPUI4694100PURDUE 62,077 - - - - - 62,077 -
Grantor: *** Loyola University Chicago 1R01AI085089-01AI 248,311 - - - - - 248,311 -
Grantor: *** Wadsworth Center Health Res Inc 1R01AI094335-01 176,048 - - - - - 176,048 -
Grantor: *** Seattle Children's Res Institute 41461001.PURDUE (2,904) - - - - - (2,904) -
Total CFDA No. 93.855 780,273 - - - - - 780,273 -
93.856 Microbiology and Infectious Diseases Research
Grantor: *** University Of Illinois At Chicago 1 P01 AI060915-01A1 (45) - - - - - (45) -
Total CFDA No. 93.856 (45) - - - - - (45) -
93.859** ARRA - Biomedical Research and Research Training
Grantor: *** University Of Minnesota A529626301 49,466 - - - - - 49,466 -
B5186816101 41,795 - - - - - 41,795 -
*** University Of Minnesota Total 91,261 - - - - - 91,261 -
Grantor: *** Case Western Reserve University RES503933 28,763 - - - - - 28,763 -
Grantor: *** University Of Louisville ULRF 08-1337-01 52,985 - - - - - 52,985 -
Grantor: *** University Of Illinois At Chicago 5R25GM067590-09 - - - - 75,799 - 75,799 -
Total CFDA No. 93.859 173,009 - - - 75,799 - 248,808 -
93.865 Child Health and Human Development Extramural Research
Grantor: *** Oregon State University P0225A-B 12,164 - - - - - 12,164 -
Total CFDA No. 93.865 12,164 - - - - - 12,164 -
93.866 Aging Research
Grantor: *** Indiana University IN4683662PURDUE 41,714 - - - - - 41,714 -
* denotes major programs** denotes ARRA programs
ldavid
Text Box
ldavid
Text Box
-20-
Purdue University Schedule of Expenditures of Federal Awards
Year ended June 30, 2012
CFDA Identifying Federal Awards Expenditures to Federal Awards Expenditures to Federal Awards Expenditures to Federal Awards Expenditures to
Grantor No. CFDA Title/Pass-Through Grantor Number Expended Subrecipients Expended Subrecipients Expended Subrecipients Expended Subrecipients
Research and Development Student Financial Aid Other Total
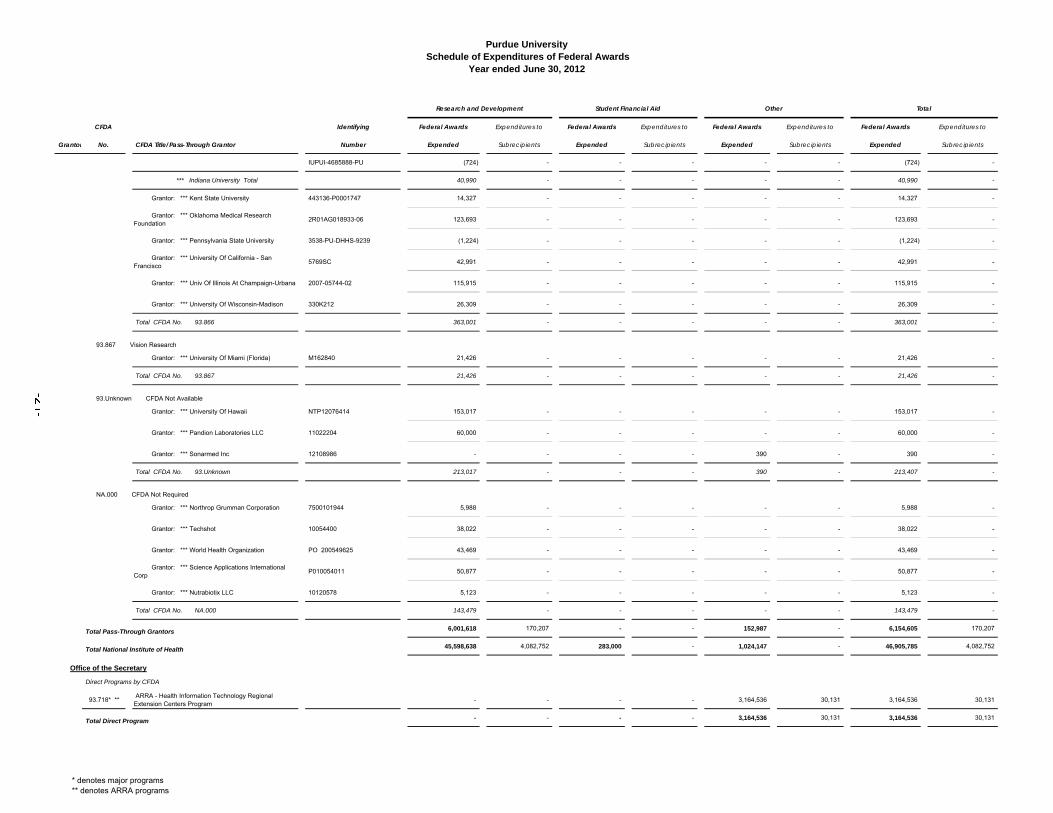
IUPUI-4685888-PU (724) - - - - - (724) -
*** Indiana University Total 40,990 - - - - - 40,990 -
Grantor: *** Kent State University 443136-P0001747 14,327 - - - - - 14,327 -
Grantor: *** Oklahoma Medical Research Foundation
2R01AG018933-06 123,693 - - - - - 123,693 -
Grantor: *** Pennsylvania State University 3538-PU-DHHS-9239 (1,224) - - - - - (1,224) -
Grantor: *** University Of California - San Francisco
5769SC 42,991 - - - - - 42,991 -
Grantor: *** Univ Of Illinois At Champaign-Urbana 2007-05744-02 115,915 - - - - - 115,915 -
Grantor: *** University Of Wisconsin-Madison 330K212 26,309 - - - - - 26,309 -
Total CFDA No. 93.866 363,001 - - - - - 363,001 -
93.867 Vision Research
Grantor: *** University Of Miami (Florida) M162840 21,426 - - - - - 21,426 -
Total CFDA No. 93.867 21,426 - - - - - 21,426 -
93.Unknown CFDA Not Available
Grantor: *** University Of Hawaii NTP12076414 153,017 - - - - - 153,017 -
Grantor: *** Pandion Laboratories LLC 11022204 60,000 - - - - - 60,000 -
Grantor: *** Sonarmed Inc 12108986 - - - - 390 - 390 -
Total CFDA No. 93.Unknown 213,017 - - - 390 - 213,407 -
NA.000 CFDA Not Required
Grantor: *** Northrop Grumman Corporation 7500101944 5,988 - - - - - 5,988 -
Grantor: *** Techshot 10054400 38,022 - - - - - 38,022 -
Grantor: *** World Health Organization PO 200549625 43,469 - - - - - 43,469 -
Grantor: *** Science Applications International Corp
P010054011 50,877 - - - - - 50,877 -
Grantor: *** Nutrabiotix LLC 10120578 5,123 - - - - - 5,123 -
Total CFDA No. NA.000 143,479 - - - - - 143,479 -
Total Pass-Through Grantors 6,001,618 170,207 - - 152,987 - 6,154,605 170,207
Total National Institute of Health 45,598,638 4,082,752 283,000 - 1,024,147 - 46,905,785 4,082,752
Office of the Secretary
Direct Programs by CFDA
93.718* ** ARRA - Health Information Technology Regional Extension Centers Program
- - - - 3,164,536 30,131 3,164,536 30,131
Total Direct Program - - - - 3,164,536 30,131 3,164,536 30,131
* denotes major programs** denotes ARRA programs
ldavid
Text Box
-21-
Purdue University Schedule of Expenditures of Federal Awards
Year ended June 30, 2012
CFDA Identifying Federal Awards Expenditures to Federal Awards Expenditures to Federal Awards Expenditures to Federal Awards Expenditures to
Grantor No. CFDA Title/Pass-Through Grantor Number Expended Subrecipients Expended Subrecipients Expended Subrecipients Expended Subrecipients
Research and Development Student Financial Aid Other Total
Pass-Through Grantors by CFDA
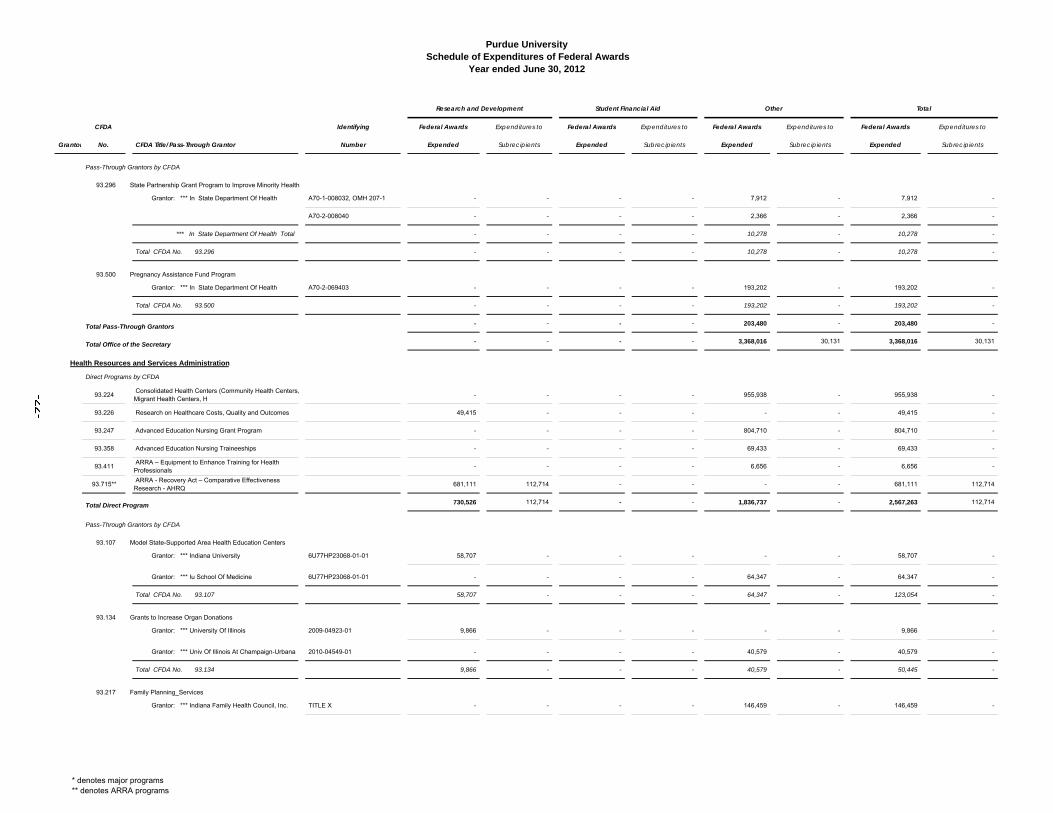
93.296 State Partnership Grant Program to Improve Minority Health
Grantor: *** In State Department Of Health A70-1-008032, OMH 207-1 - - - - 7,912 - 7,912 -
A70-2-008040 - - - - 2,366 - 2,366 -
*** In State Department Of Health Total - - - - 10,278 - 10,278 -
Total CFDA No. 93.296 - - - - 10,278 - 10,278 -
93.500 Pregnancy Assistance Fund Program
Grantor: *** In State Department Of Health A70-2-069403 - - - - 193,202 - 193,202 -
Total CFDA No. 93.500 - - - - 193,202 - 193,202 -
Total Pass-Through Grantors - - - - 203,480 - 203,480 -
Total Office of the Secretary - - - - 3,368,016 30,131 3,368,016 30,131
Health Resources and Services Administration
Direct Programs by CFDA
93.224 Consolidated Health Centers (Community Health Centers, Migrant Health Centers, H
- - - - 955,938 - 955,938 -
93.226 Research on Healthcare Costs, Quality and Outcomes 49,415 - - - - - 49,415 -
93.247 Advanced Education Nursing Grant Program - - - - 804,710 - 804,710 -
93.358 Advanced Education Nursing Traineeships - - - - 69,433 - 69,433 -
93.411 ARRA – Equipment to Enhance Training for Health Professionals
- - - - 6,656 - 6,656 -
93.715** ARRA - Recovery Act – Comparative Effectiveness Research - AHRQ
681,111 112,714 - - - - 681,111 112,714
Total Direct Program 730,526 112,714 - - 1,836,737 - 2,567,263 112,714
Pass-Through Grantors by CFDA
93.107 Model State-Supported Area Health Education Centers
Grantor: *** Indiana University 6U77HP23068-01-01 58,707 - - - - - 58,707 -
Grantor: *** Iu School Of Medicine 6U77HP23068-01-01 - - - - 64,347 - 64,347 -
Total CFDA No. 93.107 58,707 - - - 64,347 - 123,054 -
93.134 Grants to Increase Organ Donations
Grantor: *** University Of Illinois 2009-04923-01 9,866 - - - - - 9,866 -
Grantor: *** Univ Of Illinois At Champaign-Urbana 2010-04549-01 - - - - 40,579 - 40,579 -
Total CFDA No. 93.134 9,866 - - - 40,579 - 50,445 -
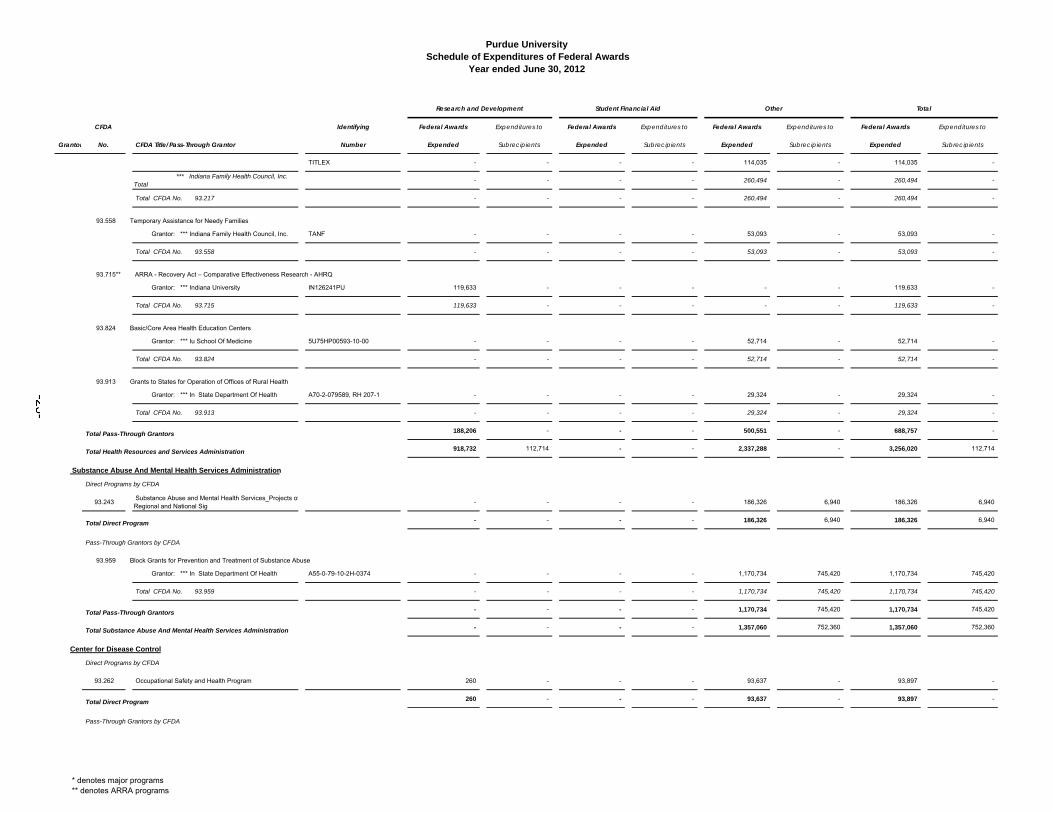
93.217 Family Planning_Services
Grantor: *** Indiana Family Health Council, Inc. TITLE X - - - - 146,459 - 146,459 -
* denotes major programs** denotes ARRA programs
ldavid
Text Box
-22-
Purdue University Schedule of Expenditures of Federal Awards
Year ended June 30, 2012
CFDA Identifying Federal Awards Expenditures to Federal Awards Expenditures to Federal Awards Expenditures to Federal Awards Expenditures to
Grantor No. CFDA Title/Pass-Through Grantor Number Expended Subrecipients Expended Subrecipients Expended Subrecipients Expended Subrecipients
Research and Development Student Financial Aid Other Total
TITLEX - - - - 114,035 - 114,035 -
*** Indiana Family Health Council, Inc. Total
- - - - 260,494 - 260,494 -
Total CFDA No. 93.217 - - - - 260,494 - 260,494 -
93.558 Temporary Assistance for Needy Families
Grantor: *** Indiana Family Health Council, Inc. TANF - - - - 53,093 - 53,093 -
Total CFDA No. 93.558 - - - - 53,093 - 53,093 -
93.715** ARRA - Recovery Act – Comparative Effectiveness Research - AHRQ
Grantor: *** Indiana University IN126241PU 119,633 - - - - - 119,633 -
Total CFDA No. 93.715 119,633 - - - - - 119,633 -
93.824 Basic/Core Area Health Education Centers
Grantor: *** Iu School Of Medicine 5U75HP00593-10-00 - - - - 52,714 - 52,714 -
Total CFDA No. 93.824 - - - - 52,714 - 52,714 -
93.913 Grants to States for Operation of Offices of Rural Health
Grantor: *** In State Department Of Health A70-2-079589, RH 207-1 - - - - 29,324 - 29,324 -
Total CFDA No. 93.913 - - - - 29,324 - 29,324 -
Total Pass-Through Grantors 188,206 - - - 500,551 - 688,757 -
Total Health Resources and Services Administration 918,732 112,714 - - 2,337,288 - 3,256,020 112,714
Substance Abuse And Mental Health Services Administration
Direct Programs by CFDA
93.243 Substance Abuse and Mental Health Services_Projects ofRegional and National Sig
- - - - 186,326 6,940 186,326 6,940
Total Direct Program - - - - 186,326 6,940 186,326 6,940
Pass-Through Grantors by CFDA
93.959 Block Grants for Prevention and Treatment of Substance Abuse
Grantor: *** In State Department Of Health A55-0-79-10-2H-0374 - - - - 1,170,734 745,420 1,170,734 745,420
Total CFDA No. 93.959 - - - - 1,170,734 745,420 1,170,734 745,420
Total Pass-Through Grantors - - - - 1,170,734 745,420 1,170,734 745,420
Total Substance Abuse And Mental Health Services Administration - - - - 1,357,060 752,360 1,357,060 752,360
Center for Disease Control
Direct Programs by CFDA
93.262 Occupational Safety and Health Program 260 - - - 93,637 - 93,897 -
Total Direct Program 260 - - - 93,637 - 93,897 -
Pass-Through Grantors by CFDA
* denotes major programs** denotes ARRA programs
ldavid
Text Box
-23-
Purdue University Schedule of Expenditures of Federal Awards
Year ended June 30, 2012
CFDA Identifying Federal Awards Expenditures to Federal Awards Expenditures to Federal Awards Expenditures to Federal Awards Expenditures to
Grantor No. CFDA Title/Pass-Through Grantor Number Expended Subrecipients Expended Subrecipients Expended Subrecipients Expended Subrecipients
Research and Development Student Financial Aid Other Total
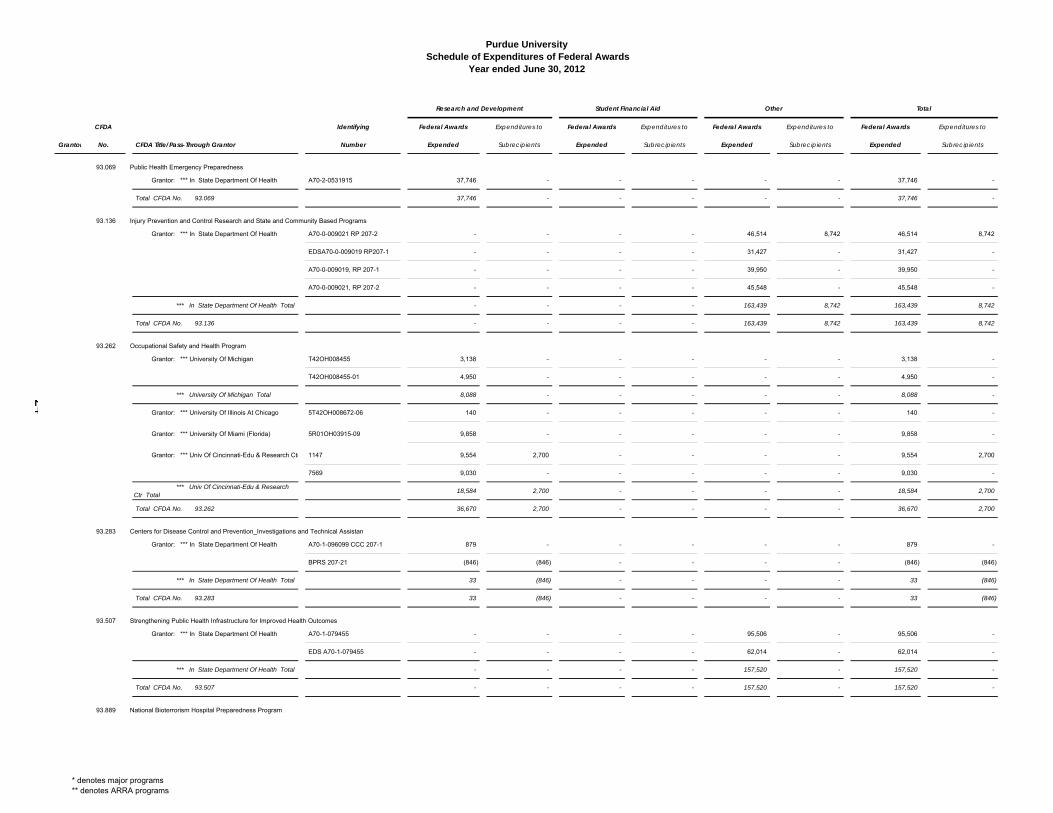
93.069 Public Health Emergency Preparedness
Grantor: *** In State Department Of Health A70-2-0531915 37,746 - - - - - 37,746 -
Total CFDA No. 93.069 37,746 - - - - - 37,746 -
93.136 Injury Prevention and Control Research and State and Community Based Programs
Grantor: *** In State Department Of Health A70-0-009021 RP 207-2 - - - - 46,514 8,742 46,514 8,742
EDSA70-0-009019 RP207-1 - - - - 31,427 - 31,427 -
A70-0-009019, RP 207-1 - - - - 39,950 - 39,950 -
A70-0-009021, RP 207-2 - - - - 45,548 - 45,548 -
*** In State Department Of Health Total - - - - 163,439 8,742 163,439 8,742
Total CFDA No. 93.136 - - - - 163,439 8,742 163,439 8,742
93.262 Occupational Safety and Health Program
Grantor: *** University Of Michigan T42OH008455 3,138 - - - - - 3,138 -
T42OH008455-01 4,950 - - - - - 4,950 -
*** University Of Michigan Total 8,088 - - - - - 8,088 -
Grantor: *** University Of Illinois At Chicago 5T42OH008672-06 140 - - - - - 140 -
Grantor: *** University Of Miami (Florida) 5R01OH03915-09 9,858 - - - - - 9,858 -
Grantor: *** Univ Of Cincinnati-Edu & Research Ctr 1147 9,554 2,700 - - - - 9,554 2,700
7569 9,030 - - - - - 9,030 -
*** Univ Of Cincinnati-Edu & Research Ctr Total
18,584 2,700 - - - - 18,584 2,700
Total CFDA No. 93.262 36,670 2,700 - - - - 36,670 2,700
93.283 Centers for Disease Control and Prevention_Investigations and Technical Assistan
Grantor: *** In State Department Of Health A70-1-096099 CCC 207-1 879 - - - - - 879 -
BPRS 207-21 (846) (846) - - - - (846) (846)
*** In State Department Of Health Total 33 (846) - - - - 33 (846)
Total CFDA No. 93.283 33 (846) - - - - 33 (846)
93.507 Strengthening Public Health Infrastructure for Improved Health Outcomes
Grantor: *** In State Department Of Health A70-1-079455 - - - - 95,506 - 95,506 -
EDS A70-1-079455 - - - - 62,014 - 62,014 -
*** In State Department Of Health Total - - - - 157,520 - 157,520 -
Total CFDA No. 93.507 - - - - 157,520 - 157,520 -
93.889 National Bioterrorism Hospital Preparedness Program
* denotes major programs** denotes ARRA programs
ldavid
Text Box
-24-
Purdue University Schedule of Expenditures of Federal Awards
Year ended June 30, 2012
CFDA Identifying Federal Awards Expenditures to Federal Awards Expenditures to Federal Awards Expenditures to Federal Awards Expenditures to
Grantor No. CFDA Title/Pass-Through Grantor Number Expended Subrecipients Expended Subrecipients Expended Subrecipients Expended Subrecipients
Research and Development Student Financial Aid Other Total
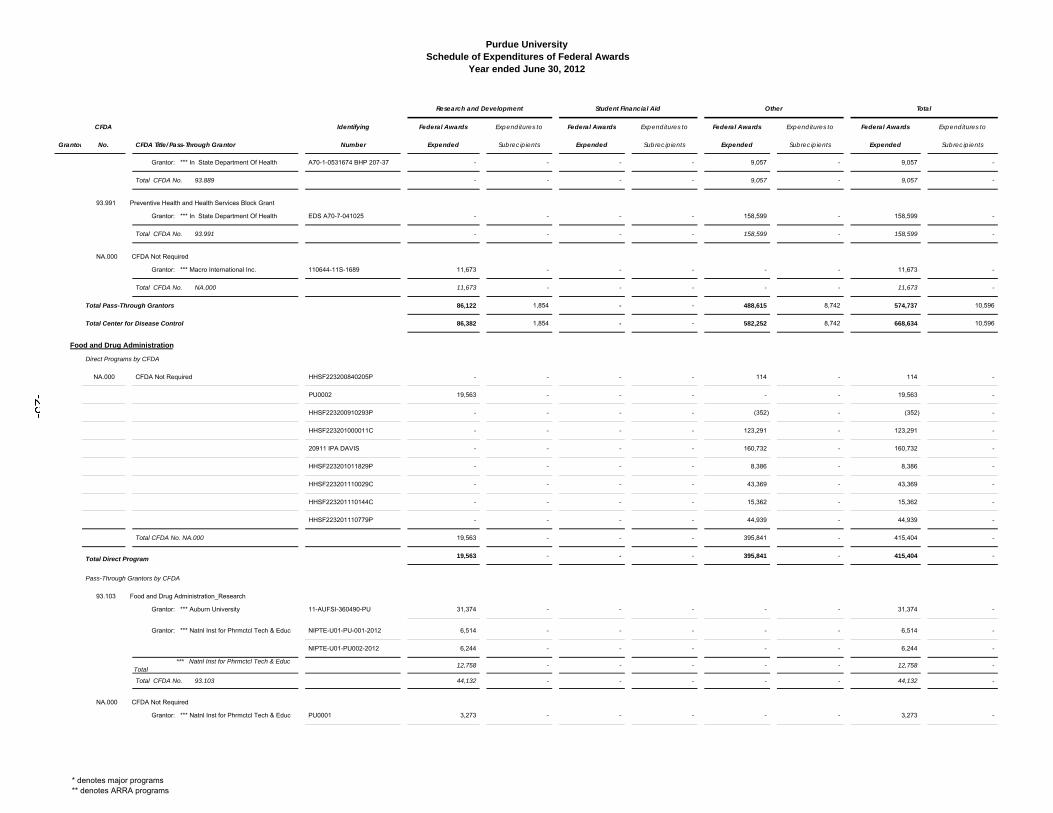
Grantor: *** In State Department Of Health A70-1-0531674 BHP 207-37 - - - - 9,057 - 9,057 -
Total CFDA No. 93.889 - - - - 9,057 - 9,057 -
93.991 Preventive Health and Health Services Block Grant
Grantor: *** In State Department Of Health EDS A70-7-041025 - - - - 158,599 - 158,599 -
Total CFDA No. 93.991 - - - - 158,599 - 158,599 -
NA.000 CFDA Not Required
Grantor: *** Macro International Inc. 110644-11S-1689 11,673 - - - - - 11,673 -
Total CFDA No. NA.000 11,673 - - - - - 11,673 -
Total Pass-Through Grantors 86,122 1,854 - - 488,615 8,742 574,737 10,596
Total Center for Disease Control 86,382 1,854 - - 582,252 8,742 668,634 10,596
Food and Drug Administration
Direct Programs by CFDA
NA.000 CFDA Not Required HHSF223200840205P - - - - 114 - 114 -
PU0002 19,563 - - - - - 19,563 -
HHSF223200910293P - - - - (352) - (352) -
HHSF223201000011C - - - - 123,291 - 123,291 -
20911 IPA DAVIS - - - - 160,732 - 160,732 -
HHSF223201011829P - - - - 8,386 - 8,386 -
HHSF223201110029C - - - - 43,369 - 43,369 -
HHSF223201110144C - - - - 15,362 - 15,362 -
HHSF223201110779P - - - - 44,939 - 44,939 -
Total CFDA No. NA.000 19,563 - - - 395,841 - 415,404 -
Total Direct Program 19,563 - - - 395,841 - 415,404 -
Pass-Through Grantors by CFDA
93.103 Food and Drug Administration_Research
Grantor: *** Auburn University 11-AUFSI-360490-PU 31,374 - - - - - 31,374 -
Grantor: *** Natnl Inst for Phrmctcl Tech & Educ NIPTE-U01-PU-001-2012 6,514 - - - - - 6,514 -
NIPTE-U01-PU002-2012 6,244 - - - - - 6,244 -
*** Natnl Inst for Phrmctcl Tech & Educ Total
12,758 - - - - - 12,758 -
Total CFDA No. 93.103 44,132 - - - - - 44,132 -
NA.000 CFDA Not Required
Grantor: *** Natnl Inst for Phrmctcl Tech & Educ PU0001 3,273 - - - - - 3,273 -
* denotes major programs** denotes ARRA programs
ldavid
Text Box
-25-
Purdue University Schedule of Expenditures of Federal Awards
Year ended June 30, 2012
CFDA Identifying Federal Awards Expenditures to Federal Awards Expenditures to Federal Awards Expenditures to Federal Awards Expenditures to
Grantor No. CFDA Title/Pass-Through Grantor Number Expended Subrecipients Expended Subrecipients Expended Subrecipients Expended Subrecipients
Research and Development Student Financial Aid Other Total
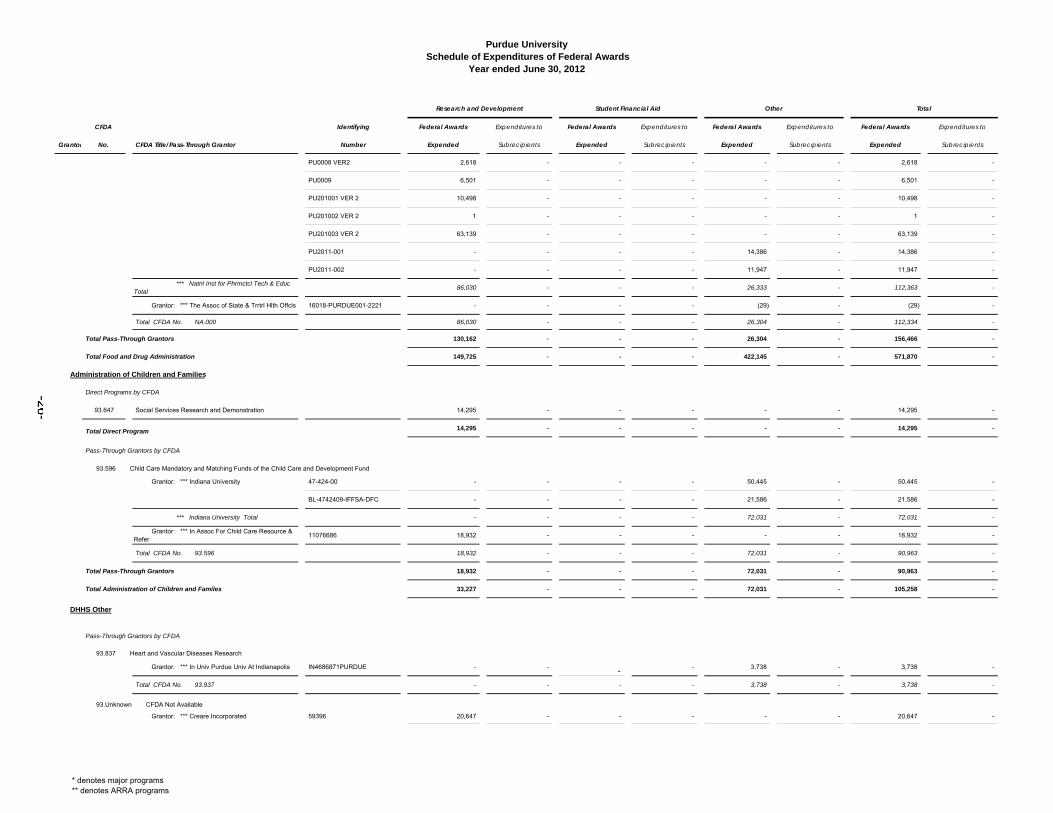
PU0008 VER2 2,618 - - - - - 2,618 -
PU0009 6,501 - - - - - 6,501 -
PU201001 VER 2 10,498 - - - - - 10,498 -
PU201002 VER 2 1 - - - - - 1 -
PU201003 VER 2 63,139 - - - - - 63,139 -
PU2011-001 - - - - 14,386 - 14,386 -
PU2011-002 - - - - 11,947 - 11,947 -
*** Natnl Inst for Phrmctcl Tech & Educ Total
86,030 - - - 26,333 - 112,363 -
Grantor: *** The Assoc of State & Trrtrl Hlth Offcls 16018-PURDUE001-2221 - - - - (29) - (29) -
Total CFDA No. NA.000 86,030 - - - 26,304 - 112,334 -
Total Pass-Through Grantors 130,162 - - - 26,304 - 156,466 -
Total Food and Drug Administration 149,725 - - - 422,145 - 571,870 -
Administration of Children and Families
Direct Programs by CFDA
93.647 Social Services Research and Demonstration 14,295 - - - - - 14,295 -
Total Direct Program 14,295 - - - - - 14,295 -
Pass-Through Grantors by CFDA
93.596 Child Care Mandatory and Matching Funds of the Child Care and Development Fund
Grantor: *** Indiana University 47-424-00 - - - - 50,445 - 50,445 -
BL-4742409-IFFSA-DFC - - - - 21,586 - 21,586 -
*** Indiana University Total - - - - 72,031 - 72,031 -
Grantor: *** In Assoc For Child Care Resource & Refer
11076686 18,932 - - - - - 18,932 -
Total CFDA No. 93.596 18,932 - - - 72,031 - 90,963 -
Total Pass-Through Grantors 18,932 - - - 72,031 - 90,963 -
Total Administration of Children and Familes 33,227 - - - 72,031 - 105,258 -
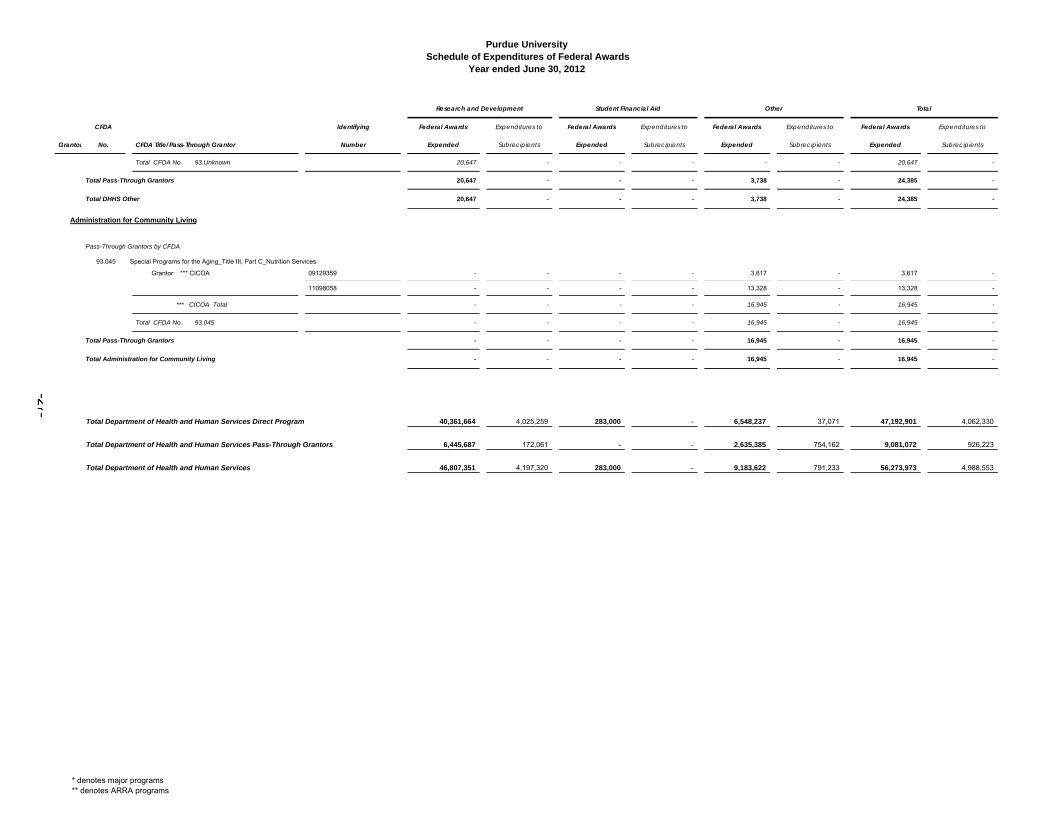
DHHS Other
Pass-Through Grantors by CFDA
93.837 Heart and Vascular Diseases Research
Grantor: *** In Univ Purdue Univ At Indianapolis IN4686871PURDUE - - - - 3,738 - 3,738 -
Total CFDA No. 93.937 - - - - 3,738 - 3,738 -
93.Unknown CFDA Not Available
Grantor: *** Creare Incorporated 59396 20,647 - - - - - 20,647 -
* denotes major programs** denotes ARRA programs
ldavid
Text Box
-26-
Purdue University Schedule of Expenditures of Federal Awards
Year ended June 30, 2012
CFDA Identifying Federal Awards Expenditures to Federal Awards Expenditures to Federal Awards Expenditures to Federal Awards Expenditures to
Grantor No. CFDA Title/Pass-Through Grantor Number Expended Subrecipients Expended Subrecipients Expended Subrecipients Expended Subrecipients
Research and Development Student Financial Aid Other Total
Total CFDA No. 93.Unknown 20,647 - - - - - 20,647 -
Total Pass-Through Grantors 20,647 - - - 3,738 - 24,385 -
Total DHHS Other 20,647 - - - 3,738 - 24,385 -
Administration for Community Living
Pass-Through Grantors by CFDA
93.045 Special Programs for the Aging_Title III, Part C_Nutrition Services
Grantor: *** CICOA 09129359 - - - - 3,617 - 3,617 -
11098058 - - - - 13,328 - 13,328 -
*** CICOA Total - - - - 16,945 - 16,945 -
Total CFDA No. 93.045 - - - - 16,945 - 16,945 -
Total Pass-Through Grantors - - - - 16,945 - 16,945 -
Total Administration for Community Living - - - - 16,945 - 16,945 -
Total Department of Health and Human Services Direct Program 40,361,664 4,025,259 283,000 - 6,548,237 37,071 47,192,901 4,062,330
Total Department of Health and Human Services Pass-Through Grantors 6,445,687 172,061 - - 2,635,385 754,162 9,081,072 926,223
Total Department of Health and Human Services 46,807,351 4,197,320 283,000 - 9,183,622 791,233 56,273,973 4,988,553
* denotes major programs** denotes ARRA programs
ldavid
Text Box
-27-
Purdue University Schedule of Expenditures of Federal Awards
Year ended June 30, 2012
CFDA Identifying Federal Awards Expenditures to Federal Awards Expenditures to Federal Awards Expenditures to Federal Awards Expenditures to
Grantor No. CFDA Title/Pass-Through Grantor Number Expended Subrecipients Expended Subrecipients Expended Subrecipients Expended Subrecipients
Research and Development Student Financial Aid Other Total
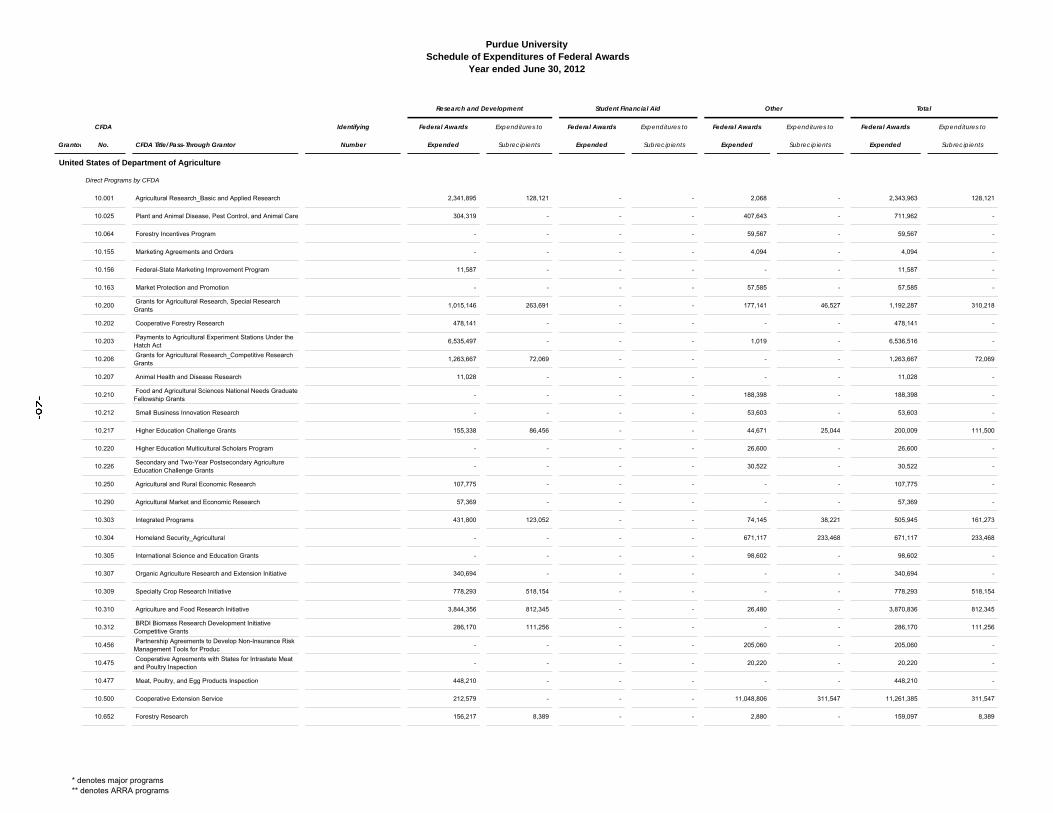
United States of Department of Agriculture
Direct Programs by CFDA
10.001 Agricultural Research_Basic and Applied Research 2,341,895 128,121 - - 2,068 - 2,343,963 128,121
10.025 Plant and Animal Disease, Pest Control, and Animal Care 304,319 - - - 407,643 - 711,962 -
10.064 Forestry Incentives Program - - - - 59,567 - 59,567 -
10.155 Marketing Agreements and Orders - - - - 4,094 - 4,094 -
10.156 Federal-State Marketing Improvement Program 11,587 - - - - - 11,587 -
10.163 Market Protection and Promotion - - - - 57,585 - 57,585 -
10.200 Grants for Agricultural Research, Special Research Grants
1,015,146 263,691 - - 177,141 46,527 1,192,287 310,218
10.202 Cooperative Forestry Research 478,141 - - - - - 478,141 -
10.203 Payments to Agricultural Experiment Stations Under the Hatch Act
6,535,497 - - - 1,019 - 6,536,516 -
10.206 Grants for Agricultural Research_Competitive Research Grants
1,263,667 72,069 - - - - 1,263,667 72,069
10.207 Animal Health and Disease Research 11,028 - - - - - 11,028 -
10.210 Food and Agricultural Sciences National Needs Graduate Fellowship Grants
- - - - 188,398 - 188,398 -
10.212 Small Business Innovation Research - - - - 53,603 - 53,603 -
10.217 Higher Education Challenge Grants 155,338 86,456 - - 44,671 25,044 200,009 111,500
10.220 Higher Education Multicultural Scholars Program - - - - 26,600 - 26,600 -
10.226 Secondary and Two-Year Postsecondary Agriculture Education Challenge Grants
- - - - 30,522 - 30,522 -
10.250 Agricultural and Rural Economic Research 107,775 - - - - - 107,775 -
10.290 Agricultural Market and Economic Research 57,369 - - - - - 57,369 -
10.303 Integrated Programs 431,800 123,052 - - 74,145 38,221 505,945 161,273
10.304 Homeland Security_Agricultural - - - - 671,117 233,468 671,117 233,468
10.305 International Science and Education Grants - - - - 98,602 - 98,602 -
10.307 Organic Agriculture Research and Extension Initiative 340,694 - - - - - 340,694 -
10.309 Specialty Crop Research Initiative 778,293 518,154 - - - - 778,293 518,154
10.310 Agriculture and Food Research Initiative 3,844,356 812,345 - - 26,480 - 3,870,836 812,345
10.312 BRDI Biomass Research Development Initiative Competitive Grants
286,170 111,256 - - - - 286,170 111,256
10.456 Partnership Agreements to Develop Non-Insurance Risk Management Tools for Produc
- - - - 205,060 - 205,060 -
10.475 Cooperative Agreements with States for Intrastate Meat and Poultry Inspection
- - - - 20,220 - 20,220 -
10.477 Meat, Poultry, and Egg Products Inspection 448,210 - - - - - 448,210 -
10.500 Cooperative Extension Service 212,579 - - - 11,048,806 311,547 11,261,385 311,547
10.652 Forestry Research 156,217 8,389 - - 2,880 - 159,097 8,389
* denotes major programs** denotes ARRA programs
ldavid
Text Box
-28-
Purdue University Schedule of Expenditures of Federal Awards
Year ended June 30, 2012
CFDA Identifying Federal Awards Expenditures to Federal Awards Expenditures to Federal Awards Expenditures to Federal Awards Expenditures to
Grantor No. CFDA Title/Pass-Through Grantor Number Expended Subrecipients Expended Subrecipients Expended Subrecipients Expended Subrecipients
Research and Development Student Financial Aid Other Total
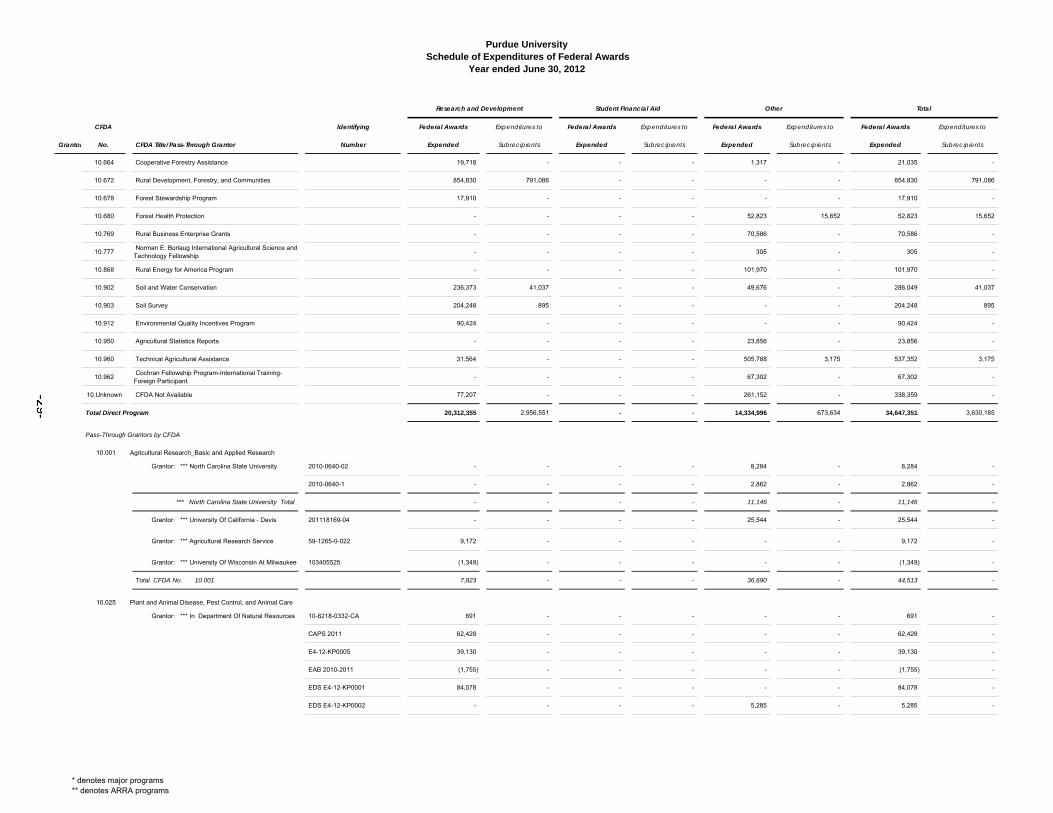
10.664 Cooperative Forestry Assistance 19,718 - - - 1,317 - 21,035 -
10.672 Rural Development, Forestry, and Communities 854,830 791,086 - - - - 854,830 791,086
10.678 Forest Stewardship Program 17,910 - - - - - 17,910 -
10.680 Forest Health Protection - - - - 52,823 15,652 52,823 15,652
10.769 Rural Business Enterprise Grants - - - - 70,586 - 70,586 -
10.777 Norman E. Borlaug International Agricultural Science and Technology Fellowship
- - - - 305 - 305 -
10.868 Rural Energy for America Program - - - - 101,970 - 101,970 -
10.902 Soil and Water Conservation 236,373 41,037 - - 49,676 - 286,049 41,037
10.903 Soil Survey 204,248 895 - - - - 204,248 895
10.912 Environmental Quality Incentives Program 90,424 - - - - - 90,424 -
10.950 Agricultural Statistics Reports - - - - 23,856 - 23,856 -
10.960 Technical Agricultural Assistance 31,564 - - - 505,788 3,175 537,352 3,175
10.962 Cochran Fellowship Program-International Training-Foreign Participant
- - - - 67,302 - 67,302 -
10.Unknown CFDA Not Available 77,207 - - - 261,152 - 338,359 -
Total Direct Program 20,312,355 2,956,551 - - 14,334,996 673,634 34,647,351 3,630,185
Pass-Through Grantors by CFDA
10.001 Agricultural Research_Basic and Applied Research
Grantor: *** North Carolina State University 2010-0640-02 - - - - 8,284 - 8,284 -
2010-0640-1 - - - - 2,862 - 2,862 -
*** North Carolina State University Total - - - - 11,146 - 11,146 -
Grantor: *** University Of California - Davis 201118169-04 - - - - 25,544 - 25,544 -
Grantor: *** Agricultural Research Service 59-1265-0-022 9,172 - - - - - 9,172 -
Grantor: *** University Of Wisconsin At Milwaukee 103405525 (1,349) - - - - - (1,349) -
Total CFDA No. 10.001 7,823 - - - 36,690 - 44,513 -
10.025 Plant and Animal Disease, Pest Control, and Animal Care
Grantor: *** In Department Of Natural Resources 10-8218-0332-CA 691 - - - - - 691 -
CAPS 2011 62,428 - - - - - 62,428 -
E4-12-KP0005 39,130 - - - - - 39,130 -
EAB 2010-2011 (1,755) - - - - - (1,755) -
EDS E4-12-KP0001 84,078 - - - - - 84,078 -
EDS E4-12-KP0002 - - - - 5,285 - 5,285 -
* denotes major programs** denotes ARRA programs
ldavid
Text Box
-29-
Purdue University Schedule of Expenditures of Federal Awards
Year ended June 30, 2012
CFDA Identifying Federal Awards Expenditures to Federal Awards Expenditures to Federal Awards Expenditures to Federal Awards Expenditures to
Grantor No. CFDA Title/Pass-Through Grantor Number Expended Subrecipients Expended Subrecipients Expended Subrecipients Expended Subrecipients
Research and Development Student Financial Aid Other Total
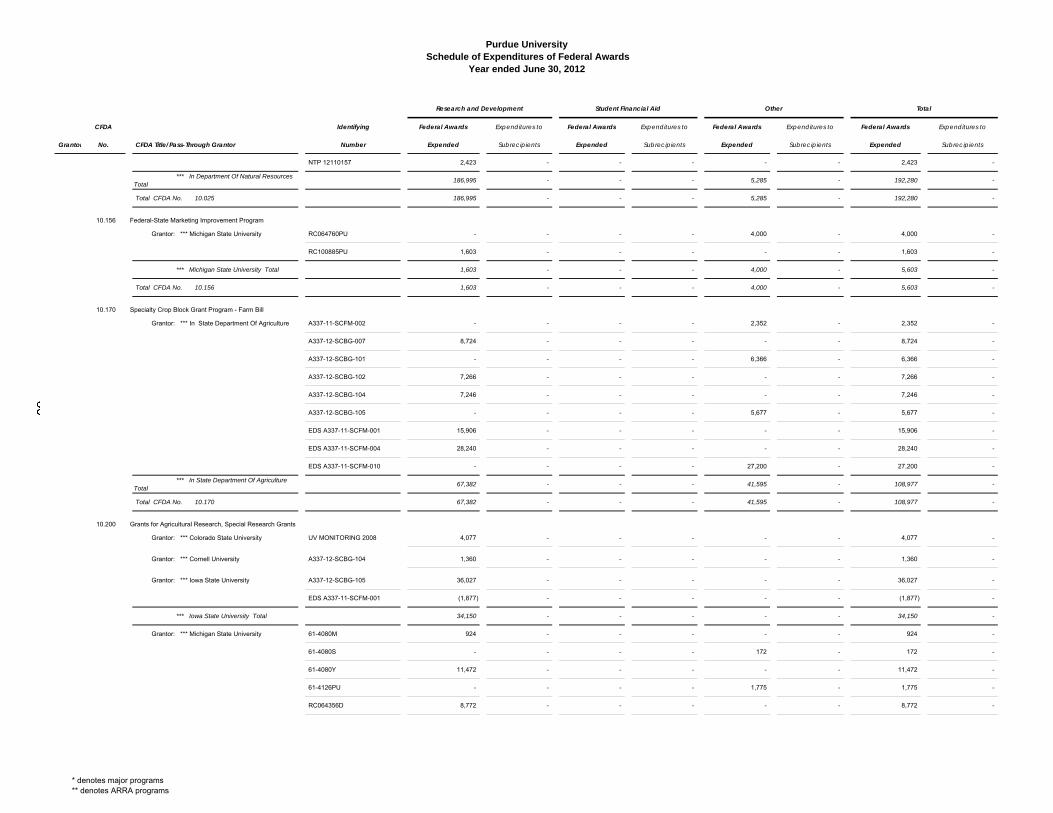
NTP 12110157 2,423 - - - - - 2,423 -
*** In Department Of Natural Resources Total
186,995 - - - 5,285 - 192,280 -
Total CFDA No. 10.025 186,995 - - - 5,285 - 192,280 -
10.156 Federal-State Marketing Improvement Program
Grantor: *** Michigan State University RC064760PU - - - - 4,000 - 4,000 -
RC100885PU 1,603 - - - - - 1,603 -
*** Michigan State University Total 1,603 - - - 4,000 - 5,603 -
Total CFDA No. 10.156 1,603 - - - 4,000 - 5,603 -
10.170 Specialty Crop Block Grant Program - Farm Bill
Grantor: *** In State Department Of Agriculture A337-11-SCFM-002 - - - - 2,352 - 2,352 -
A337-12-SCBG-007 8,724 - - - - - 8,724 -
A337-12-SCBG-101 - - - - 6,366 - 6,366 -
A337-12-SCBG-102 7,266 - - - - - 7,266 -
A337-12-SCBG-104 7,246 - - - - - 7,246 -
A337-12-SCBG-105 - - - - 5,677 - 5,677 -
EDS A337-11-SCFM-001 15,906 - - - - - 15,906 -
EDS A337-11-SCFM-004 28,240 - - - - - 28,240 -
EDS A337-11-SCFM-010 - - - - 27,200 - 27,200 -
*** In State Department Of Agriculture Total
67,382 - - - 41,595 - 108,977 -
Total CFDA No. 10.170 67,382 - - - 41,595 - 108,977 -
10.200 Grants for Agricultural Research, Special Research Grants
Grantor: *** Colorado State University UV MONITORING 2008 4,077 - - - - - 4,077 -
Grantor: *** Cornell University A337-12-SCBG-104 1,360 - - - - - 1,360 -
Grantor: *** Iowa State University A337-12-SCBG-105 36,027 - - - - - 36,027 -
EDS A337-11-SCFM-001 (1,877) - - - - - (1,877) -
*** Iowa State University Total 34,150 - - - - - 34,150 -
Grantor: *** Michigan State University 61-4080M 924 - - - - - 924 -
61-4080S - - - - 172 - 172 -
61-4080Y 11,472 - - - - - 11,472 -
61-4126PU - - - - 1,775 - 1,775 -
RC064356D 8,772 - - - - - 8,772 -
* denotes major programs** denotes ARRA programs
ldavid
Text Box
-30-
Purdue University Schedule of Expenditures of Federal Awards
Year ended June 30, 2012
CFDA Identifying Federal Awards Expenditures to Federal Awards Expenditures to Federal Awards Expenditures to Federal Awards Expenditures to
Grantor No. CFDA Title/Pass-Through Grantor Number Expended Subrecipients Expended Subrecipients Expended Subrecipients Expended Subrecipients
Research and Development Student Financial Aid Other Total
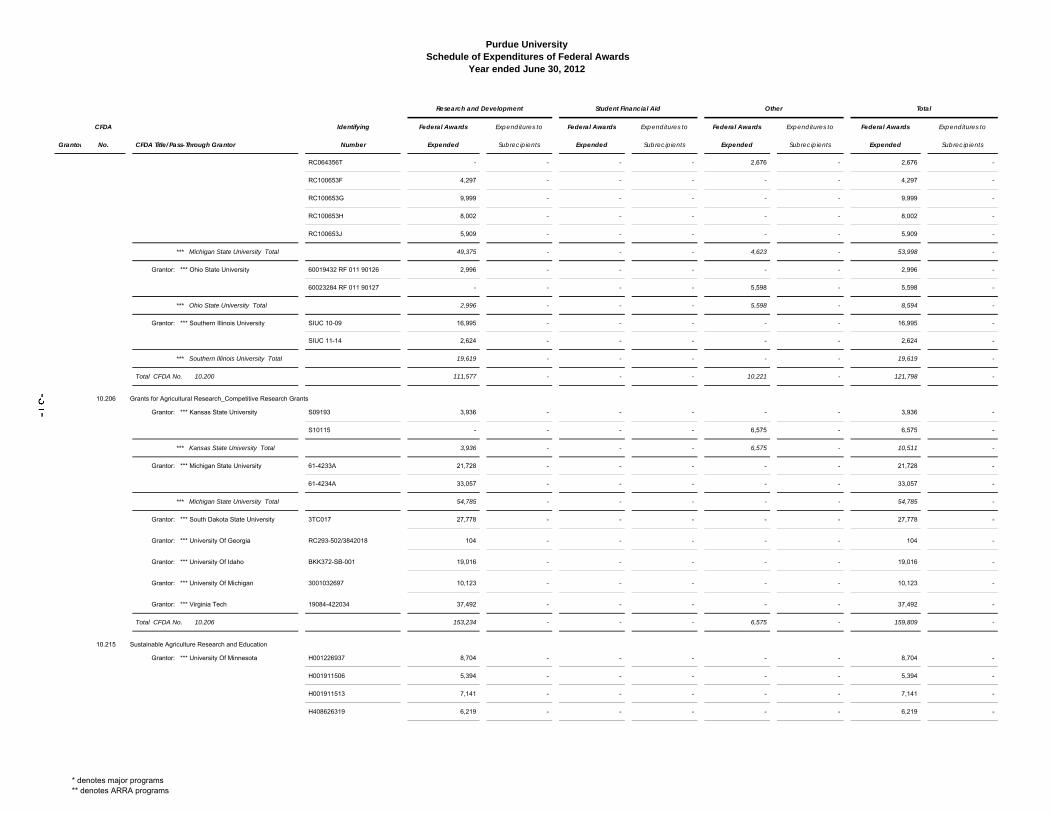
RC064356T - - - - 2,676 - 2,676 -
RC100653F 4,297 - - - - - 4,297 -
RC100653G 9,999 - - - - - 9,999 -
RC100653H 8,002 - - - - - 8,002 -
RC100653J 5,909 - - - - - 5,909 -
*** Michigan State University Total 49,375 - - - 4,623 - 53,998 -
Grantor: *** Ohio State University 60019432 RF 011 90126 2,996 - - - - - 2,996 -
60023284 RF 011 90127 - - - - 5,598 - 5,598 -
*** Ohio State University Total 2,996 - - - 5,598 - 8,594 -
Grantor: *** Southern Illinois University SIUC 10-09 16,995 - - - - - 16,995 -
SIUC 11-14 2,624 - - - - - 2,624 -
*** Southern Illinois University Total 19,619 - - - - - 19,619 -
Total CFDA No. 10.200 111,577 - - - 10,221 - 121,798 -
10.206 Grants for Agricultural Research_Competitive Research Grants
Grantor: *** Kansas State University S09193 3,936 - - - - - 3,936 -
S10115 - - - - 6,575 - 6,575 -
*** Kansas State University Total 3,936 - - - 6,575 - 10,511 -
Grantor: *** Michigan State University 61-4233A 21,728 - - - - - 21,728 -
61-4234A 33,057 - - - - - 33,057 -
*** Michigan State University Total 54,785 - - - - - 54,785 -
Grantor: *** South Dakota State University 3TC017 27,778 - - - - - 27,778 -
Grantor: *** University Of Georgia RC293-502/3842018 104 - - - - - 104 -
Grantor: *** University Of Idaho BKK372-SB-001 19,016 - - - - - 19,016 -
Grantor: *** University Of Michigan 3001032697 10,123 - - - - - 10,123 -
Grantor: *** Virginia Tech 19084-422034 37,492 - - - - - 37,492 -
Total CFDA No. 10.206 153,234 - - - 6,575 - 159,809 -
10.215 Sustainable Agriculture Research and Education
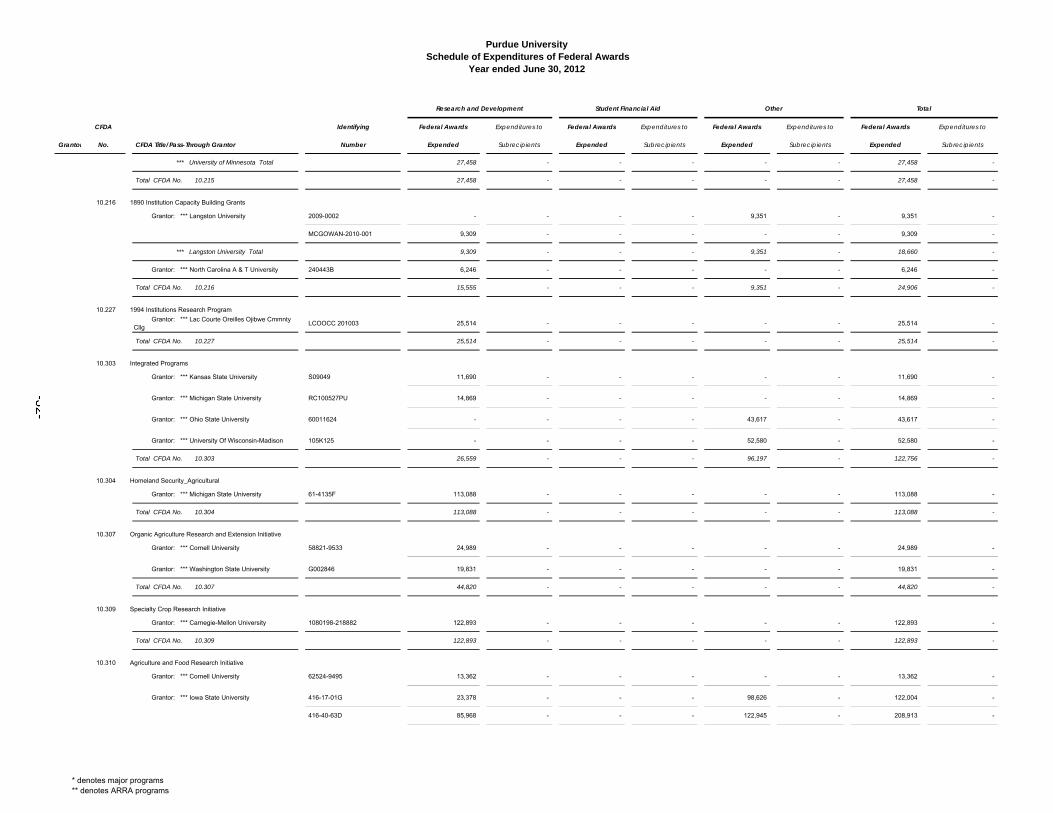
Grantor: *** University Of Minnesota H001226937 8,704 - - - - - 8,704 -
H001911506 5,394 - - - - - 5,394 -
H001911513 7,141 - - - - - 7,141 -
H408626319 6,219 - - - - - 6,219 -
* denotes major programs** denotes ARRA programs
ldavid
Text Box
-31-
Purdue University Schedule of Expenditures of Federal Awards
Year ended June 30, 2012
CFDA Identifying Federal Awards Expenditures to Federal Awards Expenditures to Federal Awards Expenditures to Federal Awards Expenditures to
Grantor No. CFDA Title/Pass-Through Grantor Number Expended Subrecipients Expended Subrecipients Expended Subrecipients Expended Subrecipients
Research and Development Student Financial Aid Other Total
*** University of Minnesota Total 27,458 - - - - - 27,458 -
Total CFDA No. 10.215 27,458 - - - - - 27,458 -
10.216 1890 Institution Capacity Building Grants
Grantor: *** Langston University 2009-0002 - - - - 9,351 - 9,351 -
MCGOWAN-2010-001 9,309 - - - - - 9,309 -
*** Langston University Total 9,309 - - - 9,351 - 18,660 -
Grantor: *** North Carolina A & T University 240443B 6,246 - - - - - 6,246 -
Total CFDA No. 10.216 15,555 - - - 9,351 - 24,906 -
10.227 1994 Institutions Research Program
Grantor: *** Lac Courte Oreilles Ojibwe Cmmnty Cllg
LCOOCC 201003 25,514 - - - - - 25,514 -
Total CFDA No. 10.227 25,514 - - - - - 25,514 -
10.303 Integrated Programs
Grantor: *** Kansas State University S09049 11,690 - - - - - 11,690 -
Grantor: *** Michigan State University RC100527PU 14,869 - - - - - 14,869 -
Grantor: *** Ohio State University 60011624 - - - - 43,617 - 43,617 -
Grantor: *** University Of Wisconsin-Madison 105K125 - - - - 52,580 - 52,580 -
Total CFDA No. 10.303 26,559 - - - 96,197 - 122,756 -
10.304 Homeland Security_Agricultural
Grantor: *** Michigan State University 61-4135F 113,088 - - - - - 113,088 -
Total CFDA No. 10.304 113,088 - - - - - 113,088 -
10.307 Organic Agriculture Research and Extension Initiative
Grantor: *** Cornell University 58821-9533 24,989 - - - - - 24,989 -
Grantor: *** Washington State University G002846 19,831 - - - - - 19,831 -
Total CFDA No. 10.307 44,820 - - - - - 44,820 -
10.309 Specialty Crop Research Initiative
Grantor: *** Carnegie-Mellon University 1080198-218882 122,893 - - - - - 122,893 -
Total CFDA No. 10.309 122,893 - - - - - 122,893 -
10.310 Agriculture and Food Research Initiative
Grantor: *** Cornell University 62524-9495 13,362 - - - - - 13,362 -
Grantor: *** Iowa State University 416-17-01G 23,378 - - - 98,626 - 122,004 -
416-40-63D 85,968 - - - 122,945 - 208,913 -
* denotes major programs** denotes ARRA programs
ldavid
Text Box
-32-
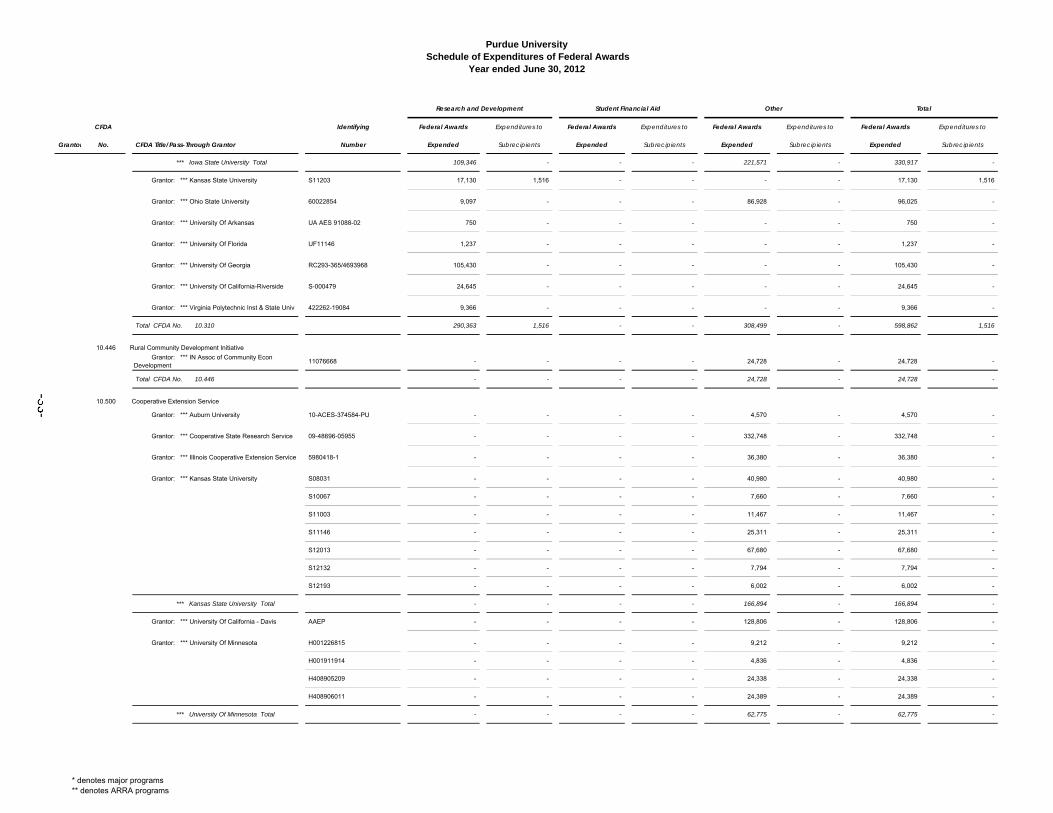
Purdue University Schedule of Expenditures of Federal Awards
Year ended June 30, 2012
CFDA Identifying Federal Awards Expenditures to Federal Awards Expenditures to Federal Awards Expenditures to Federal Awards Expenditures to
Grantor No. CFDA Title/Pass-Through Grantor Number Expended Subrecipients Expended Subrecipients Expended Subrecipients Expended Subrecipients
Research and Development Student Financial Aid Other Total
*** Iowa State University Total 109,346 - - - 221,571 - 330,917 -
Grantor: *** Kansas State University S11203 17,130 1,516 - - - - 17,130 1,516
Grantor: *** Ohio State University 60022854 9,097 - - - 86,928 - 96,025 -
Grantor: *** University Of Arkansas UA AES 91088-02 750 - - - - - 750 -
Grantor: *** University Of Florida UF11146 1,237 - - - - - 1,237 -
Grantor: *** University Of Georgia RC293-365/4693968 105,430 - - - - - 105,430 -
Grantor: *** University Of California-Riverside S-000479 24,645 - - - - - 24,645 -
Grantor: *** Virginia Polytechnic Inst & State Univ 422262-19084 9,366 - - - - - 9,366 -
Total CFDA No. 10.310 290,363 1,516 - - 308,499 - 598,862 1,516
10.446 Rural Community Development Initiative
Grantor: *** IN Assoc of Community Econ Development
11076668 - - - - 24,728 - 24,728 -
Total CFDA No. 10.446 - - - - 24,728 - 24,728 -
10.500 Cooperative Extension Service
Grantor: *** Auburn University 10-ACES-374584-PU - - - - 4,570 - 4,570 -
Grantor: *** Cooperative State Research Service 09-48696-05955 - - - - 332,748 - 332,748 -
Grantor: *** Illinois Cooperative Extension Service 5980418-1 - - - - 36,380 - 36,380 -
Grantor: *** Kansas State University S08031 - - - - 40,980 - 40,980 -
S10067 - - - - 7,660 - 7,660 -
S11003 - - - - 11,467 - 11,467 -
S11146 - - - - 25,311 - 25,311 -
S12013 - - - - 67,680 - 67,680 -
S12132 - - - - 7,794 - 7,794 -
S12193 - - - - 6,002 - 6,002 -
*** Kansas State University Total - - - - 166,894 - 166,894 -
Grantor: *** University Of California - Davis AAEP - - - - 128,806 - 128,806 -
Grantor: *** University Of Minnesota H001226815 - - - - 9,212 - 9,212 -
H001911914 - - - - 4,836 - 4,836 -
H408905209 - - - - 24,338 - 24,338 -
H408906011 - - - - 24,389 - 24,389 -
*** University Of Minnesota Total - - - - 62,775 - 62,775 -
* denotes major programs** denotes ARRA programs
ldavid
Text Box
-33-
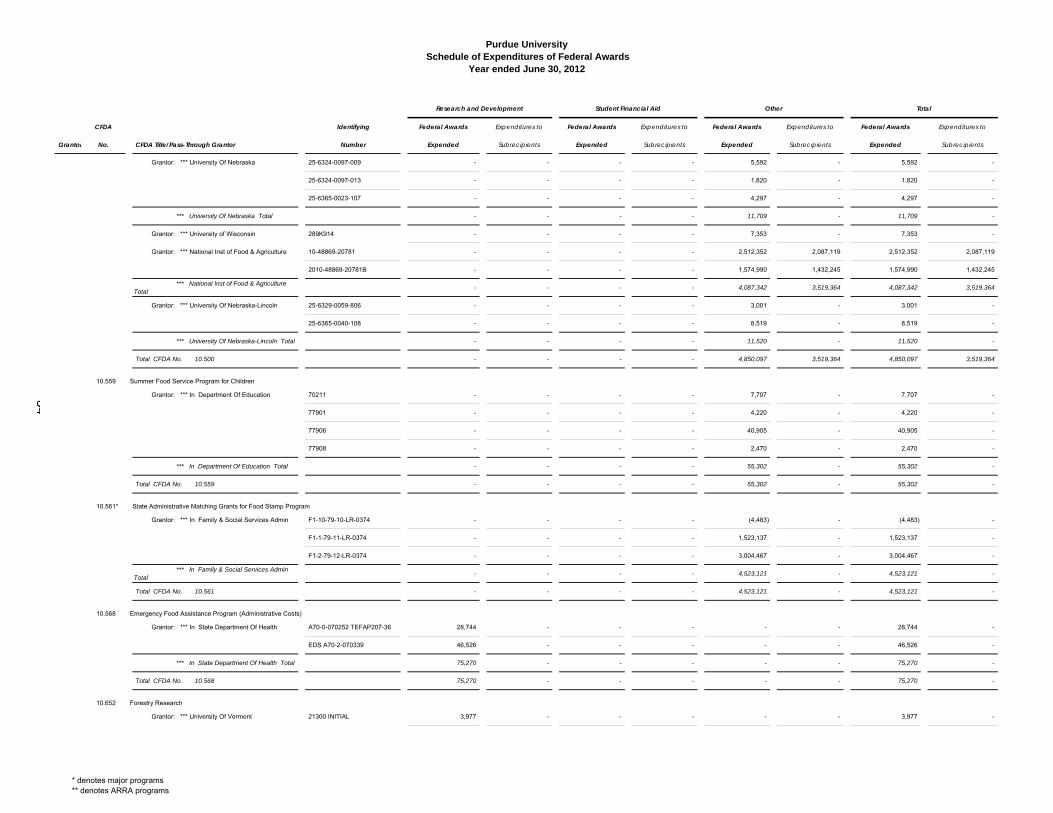
Purdue University Schedule of Expenditures of Federal Awards
Year ended June 30, 2012
CFDA Identifying Federal Awards Expenditures to Federal Awards Expenditures to Federal Awards Expenditures to Federal Awards Expenditures to
Grantor No. CFDA Title/Pass-Through Grantor Number Expended Subrecipients Expended Subrecipients Expended Subrecipients Expended Subrecipients
Research and Development Student Financial Aid Other Total
Grantor: *** University Of Nebraska 25-6324-0097-009 - - - - 5,592 - 5,592 -
25-6324-0097-013 - - - - 1,820 - 1,820 -
25-6365-0023-107 - - - - 4,297 - 4,297 -
*** University Of Nebraska Total - - - - 11,709 - 11,709 -
Grantor: *** University of Wisconsin 289K914 - - - - 7,353 - 7,353 -
Grantor: *** National Inst of Food & Agriculture 10-48869-20781 - - - - 2,512,352 2,087,119 2,512,352 2,087,119
2010-48869-20781B - - - - 1,574,990 1,432,245 1,574,990 1,432,245
*** National Inst of Food & Agriculture Total
- - - - 4,087,342 3,519,364 4,087,342 3,519,364
Grantor: *** University Of Nebraska-Lincoln 25-6329-0059-806 - - - - 3,001 - 3,001 -
25-6365-0040-108 - - - - 8,519 - 8,519 -
*** University Of Nebraska-Lincoln Total - - - - 11,520 - 11,520 -
Total CFDA No. 10.500 - - - - 4,850,097 3,519,364 4,850,097 3,519,364
10.559 Summer Food Service Program for Children
Grantor: *** In Department Of Education 70211 - - - - 7,707 - 7,707 -
77901 - - - - 4,220 - 4,220 -
77906 - - - - 40,905 - 40,905 -
77908 - - - - 2,470 - 2,470 -
*** In Department Of Education Total - - - - 55,302 - 55,302 -
Total CFDA No. 10.559 - - - - 55,302 - 55,302 -
10.561* State Administrative Matching Grants for Food Stamp Program
Grantor: *** In Family & Social Services Admin F1-10-79-10-LR-0374 - - - - (4,483) - (4,483) -
F1-1-79-11-LR-0374 - - - - 1,523,137 - 1,523,137 -
F1-2-79-12-LR-0374 - - - - 3,004,467 - 3,004,467 -
*** In Family & Social Services Admin Total
- - - - 4,523,121 - 4,523,121 -
Total CFDA No. 10.561 - - - - 4,523,121 - 4,523,121 -
10.568 Emergency Food Assistance Program (Administrative Costs)
Grantor: *** In State Department Of Health A70-0-070252 TEFAP207-36 28,744 - - - - - 28,744 -
EDS A70-2-070339 46,526 - - - - - 46,526 -
*** In State Department Of Health Total 75,270 - - - - - 75,270 -
Total CFDA No. 10.568 75,270 - - - - - 75,270 -
10.652 Forestry Research
Grantor: *** University Of Vermont 21300 INITIAL 3,977 - - - - - 3,977 -
* denotes major programs** denotes ARRA programs
ldavid
Text Box
-34-
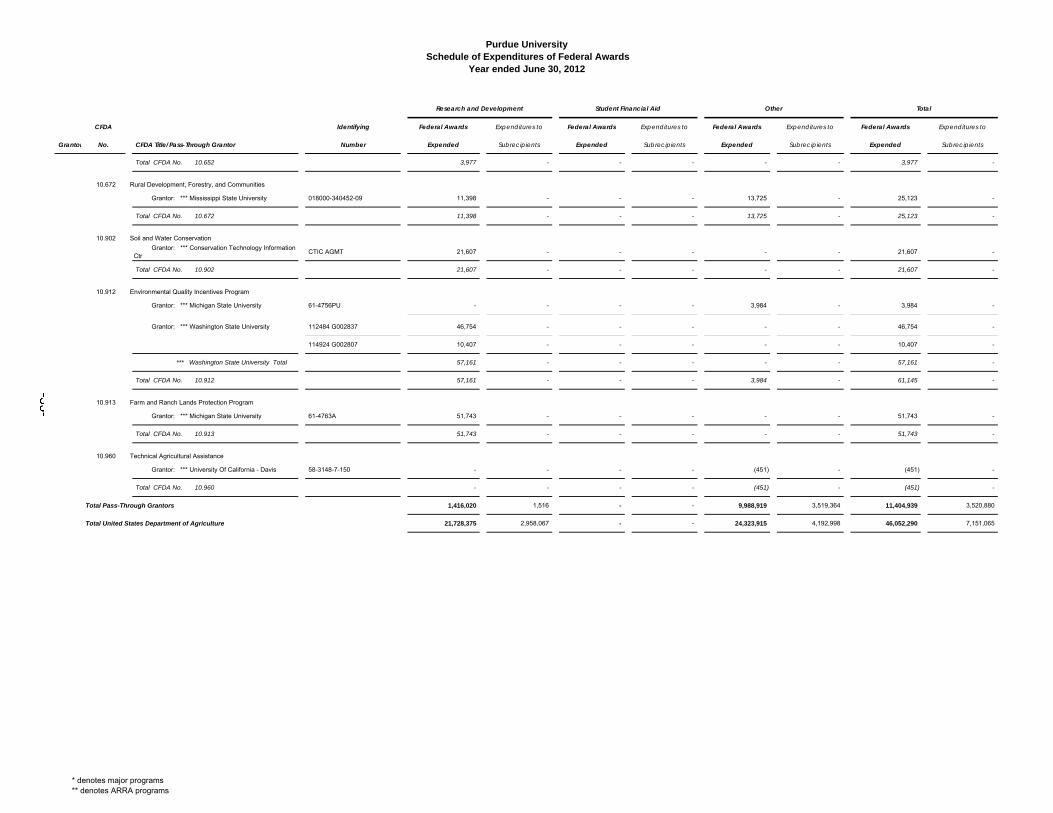
Purdue University Schedule of Expenditures of Federal Awards
Year ended June 30, 2012
CFDA Identifying Federal Awards Expenditures to Federal Awards Expenditures to Federal Awards Expenditures to Federal Awards Expenditures to
Grantor No. CFDA Title/Pass-Through Grantor Number Expended Subrecipients Expended Subrecipients Expended Subrecipients Expended Subrecipients
Research and Development Student Financial Aid Other Total
Total CFDA No. 10.652 3,977 - - - - - 3,977 -
10.672 Rural Development, Forestry, and Communities
Grantor: *** Mississippi State University 018000-340452-09 11,398 - - - 13,725 - 25,123 -
Total CFDA No. 10.672 11,398 - - - 13,725 - 25,123 -
10.902 Soil and Water Conservation
Grantor: *** Conservation Technology Information Ctr
CTIC AGMT 21,607 - - - - - 21,607 -
Total CFDA No. 10.902 21,607 - - - - - 21,607 -
10.912 Environmental Quality Incentives Program
Grantor: *** Michigan State University 61-4756PU - - - - 3,984 - 3,984 -
Grantor: *** Washington State University 112484 G002837 46,754 - - - - - 46,754 -
114924 G002807 10,407 - - - - - 10,407 -
*** Washington State University Total 57,161 - - - - - 57,161 -
Total CFDA No. 10.912 57,161 - - - 3,984 - 61,145 -
10.913 Farm and Ranch Lands Protection Program
Grantor: *** Michigan State University 61-4763A 51,743 - - - - - 51,743 -
Total CFDA No. 10.913 51,743 - - - - - 51,743 -
10.960 Technical Agricultural Assistance
Grantor: *** University Of California - Davis 58-3148-7-150 - - - - (451) - (451) -
Total CFDA No. 10.960 - - - - (451) - (451) -
Total Pass-Through Grantors 1,416,020 1,516 - - 9,988,919 3,519,364 11,404,939 3,520,880
Total United States Department of Agriculture 21,728,375 2,958,067 - - 24,323,915 4,192,998 46,052,290 7,151,065
* denotes major programs** denotes ARRA programs
ldavid
Text Box
-35-
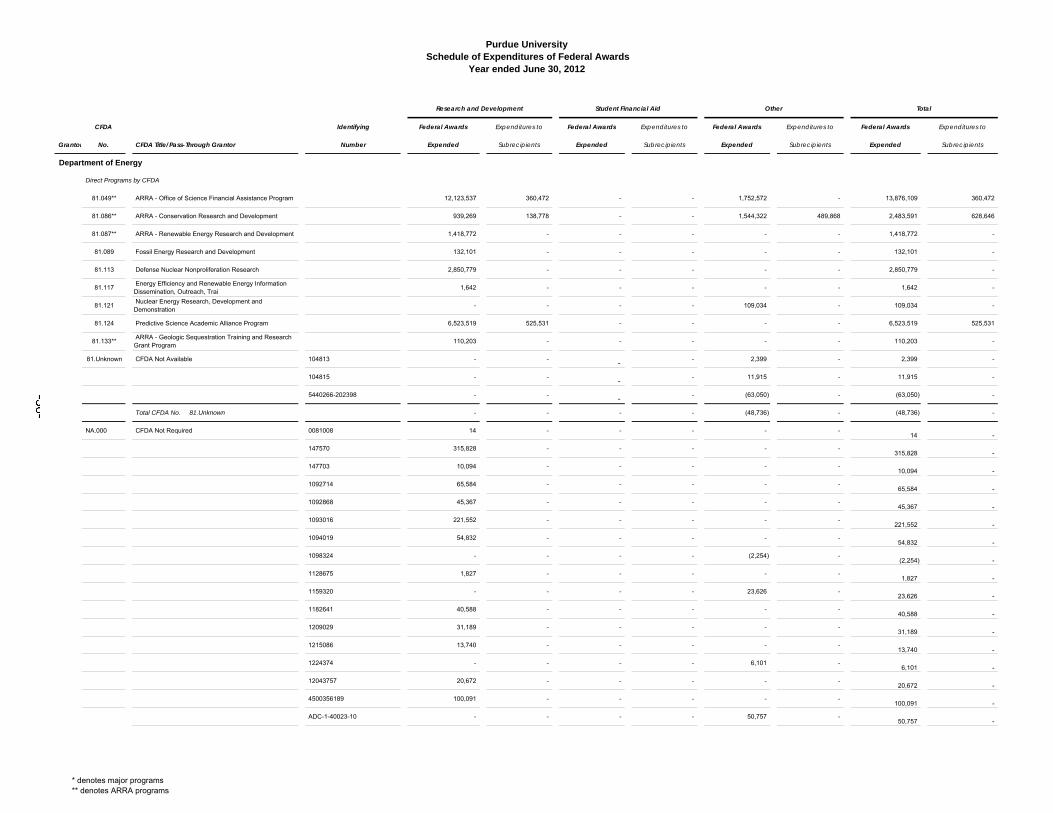
Purdue University Schedule of Expenditures of Federal Awards
Year ended June 30, 2012
CFDA Identifying Federal Awards Expenditures to Federal Awards Expenditures to Federal Awards Expenditures to Federal Awards Expenditures to
Grantor No. CFDA Title/Pass-Through Grantor Number Expended Subrecipients Expended Subrecipients Expended Subrecipients Expended Subrecipients
Research and Development Student Financial Aid Other Total
Department of Energy
Direct Programs by CFDA
81.049** ARRA - Office of Science Financial Assistance Program 12,123,537 360,472 - - 1,752,572 - 13,876,109 360,472
81.086** ARRA - Conservation Research and Development 939,269 138,778 - - 1,544,322 489,868 2,483,591 628,646
81.087** ARRA - Renewable Energy Research and Development 1,418,772 - - - - - 1,418,772 -
81.089 Fossil Energy Research and Development 132,101 - - - - - 132,101 -
81.113 Defense Nuclear Nonproliferation Research 2,850,779 - - - - - 2,850,779 -
81.117 Energy Efficiency and Renewable Energy Information Dissemination, Outreach, Trai
1,642 - - - - - 1,642 -
81.121 Nuclear Energy Research, Development and Demonstration
- - - - 109,034 - 109,034 -
81.124 Predictive Science Academic Alliance Program 6,523,519 525,531 - - - - 6,523,519 525,531
81.133** ARRA - Geologic Sequestration Training and Research Grant Program
110,203 - - - - - 110,203 -
81.Unknown CFDA Not Available 104813 - - - - 2,399 - 2,399 -
104815 - - - - 11,915 - 11,915 -
5440266-202398 - - - - (63,050) - (63,050) -
Total CFDA No. 81.Unknown - - - - (48,736) - (48,736) -
NA.000 CFDA Not Required 0081008 14 - - - - - 14 -
147570 315,828 - - - - - 315,828 -
147703 10,094 - - - - - 10,094 -
1092714 65,584 - - - - - 65,584 -
1092868 45,367 - - - - - 45,367 -
1093016 221,552 - - - - - 221,552 -
1094019 54,832 - - - - - 54,832 -
1098324 - - - - (2,254) - (2,254) -
1128675 1,827 - - - - - 1,827 -
1159320 - - - - 23,626 - 23,626 -
1182641 40,588 - - - - - 40,588 -
1209029 31,189 - - - - - 31,189 -
1215086 13,740 - - - - - 13,740 -
1224374 - - - - 6,101 - 6,101 -
12043757 20,672 - - - - - 20,672 -
4500356189 100,091 - - - - - 100,091 -
ADC-1-40023-10 - - - - 50,757 - 50,757 -
* denotes major programs** denotes ARRA programs
ldavid
Text Box
-36-
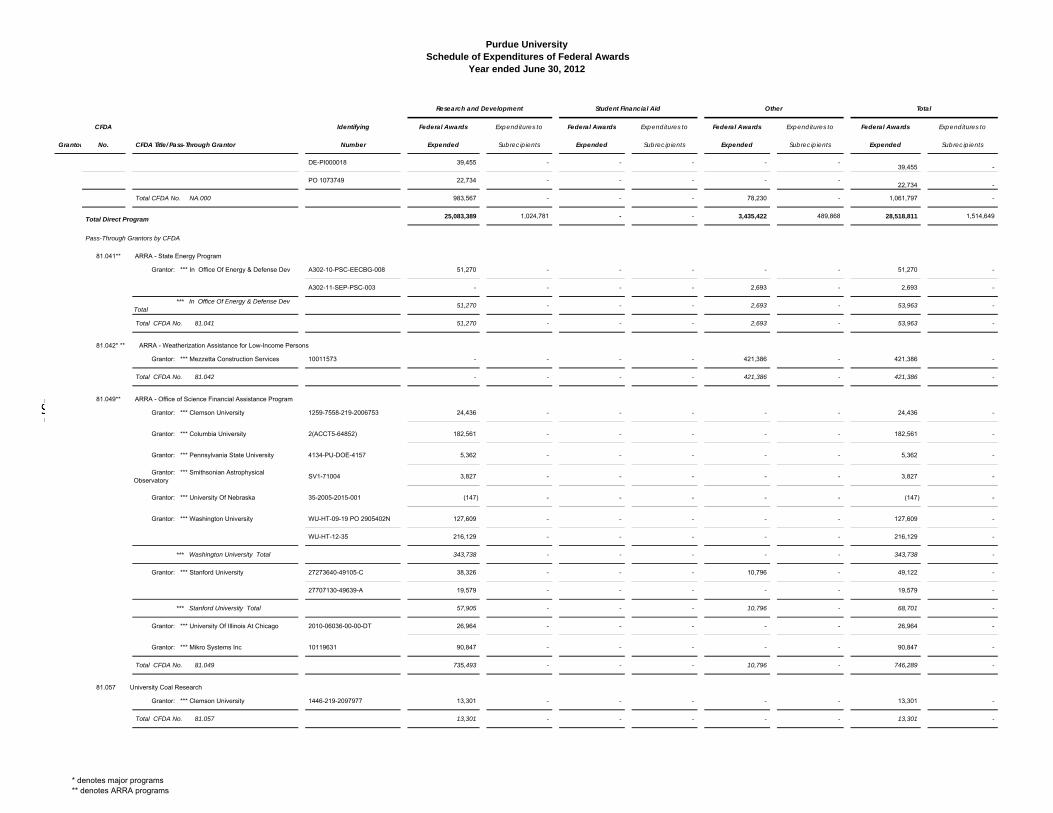
Purdue University Schedule of Expenditures of Federal Awards
Year ended June 30, 2012
CFDA Identifying Federal Awards Expenditures to Federal Awards Expenditures to Federal Awards Expenditures to Federal Awards Expenditures to
Grantor No. CFDA Title/Pass-Through Grantor Number Expended Subrecipients Expended Subrecipients Expended Subrecipients Expended Subrecipients
Research and Development Student Financial Aid Other Total
DE-PI000018 39,455 - - - - - 39,455 -
PO 1073749 22,734 - - - - - 22,734 -
Total CFDA No. NA.000 983,567 - - - 78,230 - 1,061,797 -
Total Direct Program 25,083,389 1,024,781 - - 3,435,422 489,868 28,518,811 1,514,649
Pass-Through Grantors by CFDA
81.041** ARRA - State Energy Program
Grantor: *** In Office Of Energy & Defense Dev A302-10-PSC-EECBG-008 51,270 - - - - - 51,270 -
A302-11-SEP-PSC-003 - - - - 2,693 - 2,693 -
*** In Office Of Energy & Defense Dev Total
51,270 - - - 2,693 - 53,963 -
Total CFDA No. 81.041 51,270 - - - 2,693 - 53,963 -
81.042* ** ARRA - Weatherization Assistance for Low-Income Persons
Grantor: *** Mezzetta Construction Services 10011573 - - - - 421,386 - 421,386 -
Total CFDA No. 81.042 - - - - 421,386 - 421,386 -
81.049** ARRA - Office of Science Financial Assistance Program
Grantor: *** Clemson University 1259-7558-219-2006753 24,436 - - - - - 24,436 -
Grantor: *** Columbia University 2(ACCT5-64852) 182,561 - - - - - 182,561 -
Grantor: *** Pennsylvania State University 4134-PU-DOE-4157 5,362 - - - - - 5,362 -
Grantor: *** Smithsonian Astrophysical Observatory
SV1-71004 3,827 - - - - - 3,827 -
Grantor: *** University Of Nebraska 35-2005-2015-001 (147) - - - - - (147) -
Grantor: *** Washington University WU-HT-09-19 PO 2905402N 127,609 - - - - - 127,609 -
WU-HT-12-35 216,129 - - - - - 216,129 -
*** Washington University Total 343,738 - - - - - 343,738 -
Grantor: *** Stanford University 27273640-49105-C 38,326 - - - 10,796 - 49,122 -
27707130-49639-A 19,579 - - - - - 19,579 -
*** Stanford University Total 57,905 - - - 10,796 - 68,701 -
Grantor: *** University Of Illinois At Chicago 2010-06036-00-00-DT 26,964 - - - - - 26,964 -
Grantor: *** Mikro Systems Inc 10119631 90,847 - - - - - 90,847 -
Total CFDA No. 81.049 735,493 - - - 10,796 - 746,289 -
81.057 University Coal Research
Grantor: *** Clemson University 1446-219-2097977 13,301 - - - - - 13,301 -
Total CFDA No. 81.057 13,301 - - - - - 13,301 -
* denotes major programs** denotes ARRA programs
ldavid
Text Box
-37-
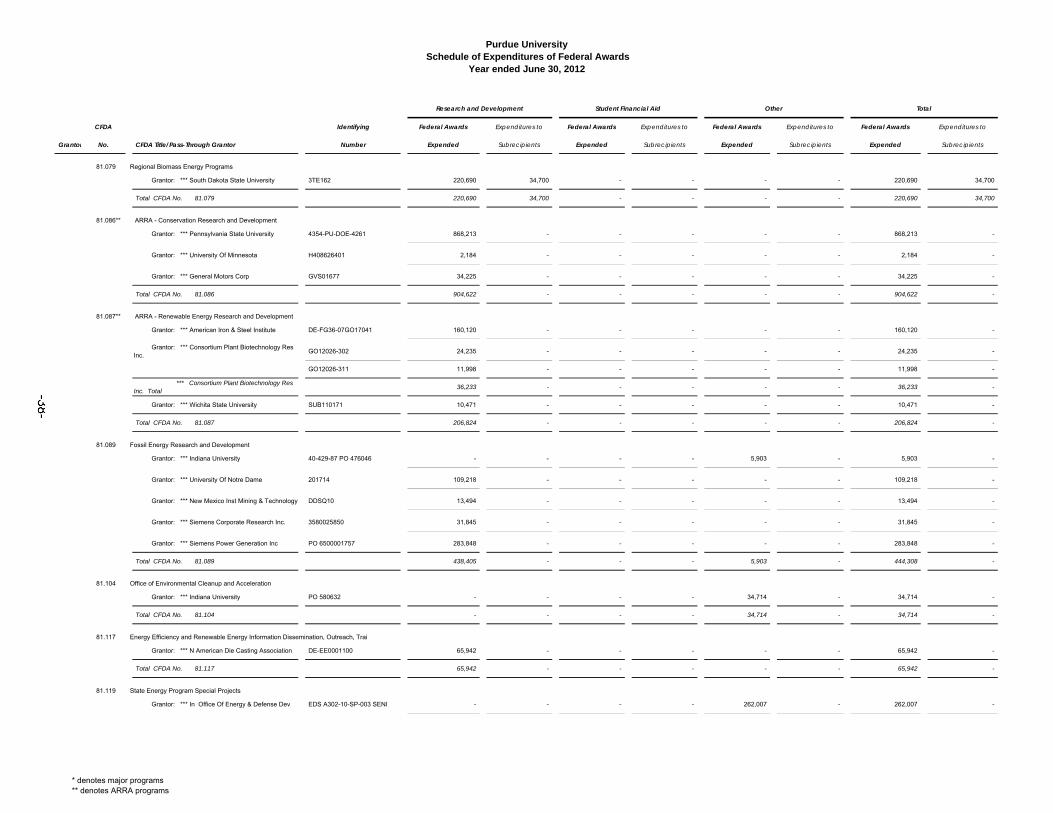
Purdue University Schedule of Expenditures of Federal Awards
Year ended June 30, 2012
CFDA Identifying Federal Awards Expenditures to Federal Awards Expenditures to Federal Awards Expenditures to Federal Awards Expenditures to
Grantor No. CFDA Title/Pass-Through Grantor Number Expended Subrecipients Expended Subrecipients Expended Subrecipients Expended Subrecipients
Research and Development Student Financial Aid Other Total
81.079 Regional Biomass Energy Programs
Grantor: *** South Dakota State University 3TE162 220,690 34,700 - - - - 220,690 34,700
Total CFDA No. 81.079 220,690 34,700 - - - - 220,690 34,700
81.086** ARRA - Conservation Research and Development
Grantor: *** Pennsylvania State University 4354-PU-DOE-4261 868,213 - - - - - 868,213 -
Grantor: *** University Of Minnesota H408626401 2,184 - - - - - 2,184 -
Grantor: *** General Motors Corp GVS01677 34,225 - - - - - 34,225 -
Total CFDA No. 81.086 904,622 - - - - - 904,622 -
81.087** ARRA - Renewable Energy Research and Development
Grantor: *** American Iron & Steel Institute DE-FG36-07GO17041 160,120 - - - - - 160,120 -
Grantor: *** Consortium Plant Biotechnology Res Inc.
GO12026-302 24,235 - - - - - 24,235 -
GO12026-311 11,998 - - - - - 11,998 -
*** Consortium Plant Biotechnology Res Inc. Total
36,233 - - - - - 36,233 -
Grantor: *** Wichita State University SUB110171 10,471 - - - - - 10,471 -
Total CFDA No. 81.087 206,824 - - - - - 206,824 -
81.089 Fossil Energy Research and Development
Grantor: *** Indiana University 40-429-87 PO 476046 - - - - 5,903 - 5,903 -
Grantor: *** University Of Notre Dame 201714 109,218 - - - - - 109,218 -
Grantor: *** New Mexico Inst Mining & Technology DDSQ10 13,494 - - - - - 13,494 -
Grantor: *** Siemens Corporate Research Inc. 3580025850 31,845 - - - - - 31,845 -
Grantor: *** Siemens Power Generation Inc PO 6500001757 283,848 - - - - - 283,848 -
Total CFDA No. 81.089 438,405 - - - 5,903 - 444,308 -
81.104 Office of Environmental Cleanup and Acceleration
Grantor: *** Indiana University PO 580632 - - - - 34,714 - 34,714 -
Total CFDA No. 81.104 - - - - 34,714 - 34,714 -
81.117 Energy Efficiency and Renewable Energy Information Dissemination, Outreach, Trai
Grantor: *** N American Die Casting Association DE-EE0001100 65,942 - - - - - 65,942 -
Total CFDA No. 81.117 65,942 - - - - - 65,942 -
81.119 State Energy Program Special Projects
Grantor: *** In Office Of Energy & Defense Dev EDS A302-10-SP-003 SENI - - - - 262,007 - 262,007 -
* denotes major programs** denotes ARRA programs
ldavid
Text Box
-38-
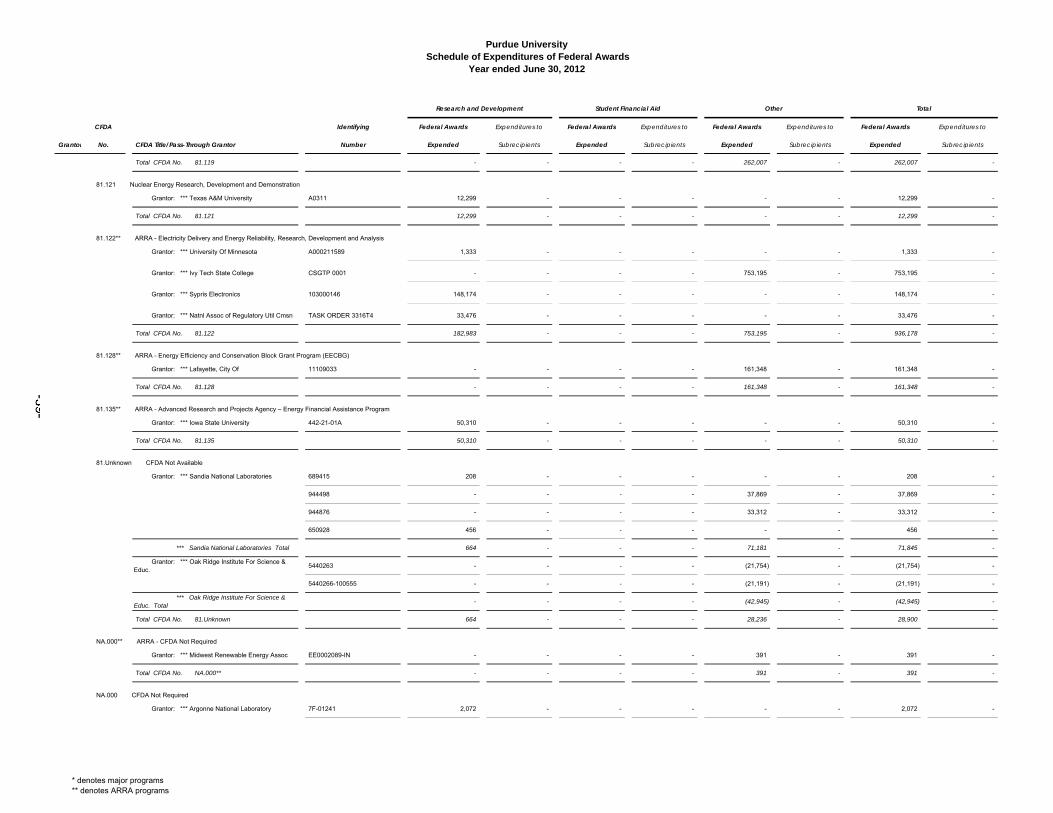
Purdue University Schedule of Expenditures of Federal Awards
Year ended June 30, 2012
CFDA Identifying Federal Awards Expenditures to Federal Awards Expenditures to Federal Awards Expenditures to Federal Awards Expenditures to
Grantor No. CFDA Title/Pass-Through Grantor Number Expended Subrecipients Expended Subrecipients Expended Subrecipients Expended Subrecipients
Research and Development Student Financial Aid Other Total
Total CFDA No. 81.119 - - - - 262,007 - 262,007 -
81.121 Nuclear Energy Research, Development and Demonstration
Grantor: *** Texas A&M University A0311 12,299 - - - - - 12,299 -
Total CFDA No. 81.121 12,299 - - - - - 12,299 -
81.122** ARRA - Electricity Delivery and Energy Reliability, Research, Development and Analysis
Grantor: *** University Of Minnesota A000211589 1,333 - - - - - 1,333 -
Grantor: *** Ivy Tech State College CSGTP 0001 - - - - 753,195 - 753,195 -
Grantor: *** Sypris Electronics 103000146 148,174 - - - - - 148,174 -
Grantor: *** Natnl Assoc of Regulatory Util Cmsn TASK ORDER 3316T4 33,476 - - - - - 33,476 -
Total CFDA No. 81.122 182,983 - - - 753,195 - 936,178 -
81.128** ARRA - Energy Efficiency and Conservation Block Grant Program (EECBG)
Grantor: *** Lafayette, City Of 11109033 - - - - 161,348 - 161,348 -
Total CFDA No. 81.128 - - - - 161,348 - 161,348 -
81.135** ARRA - Advanced Research and Projects Agency – Energy Financial Assistance Program
Grantor: *** Iowa State University 442-21-01A 50,310 - - - - - 50,310 -
Total CFDA No. 81.135 50,310 - - - - - 50,310 -
81.Unknown CFDA Not Available
Grantor: *** Sandia National Laboratories 689415 208 - - - - - 208 -
944498 - - - - 37,869 - 37,869 -
944876 - - - - 33,312 - 33,312 -
650928 456 - - - - - 456 -
*** Sandia National Laboratories Total 664 - - - 71,181 - 71,845 -
Grantor: *** Oak Ridge Institute For Science & Educ.
5440263 - - - - (21,754) - (21,754) -
5440266-100555 - - - - (21,191) - (21,191) -
*** Oak Ridge Institute For Science & Educ. Total
- - - - (42,945) - (42,945) -
Total CFDA No. 81.Unknown 664 - - - 28,236 - 28,900 -
NA.000** ARRA - CFDA Not Required
Grantor: *** Midwest Renewable Energy Assoc EE0002089-IN - - - - 391 - 391 -
Total CFDA No. NA.000** - - - - 391 - 391 -
NA.000 CFDA Not Required
Grantor: *** Argonne National Laboratory 7F-01241 2,072 - - - - - 2,072 -
* denotes major programs** denotes ARRA programs
ldavid
Text Box
-39-
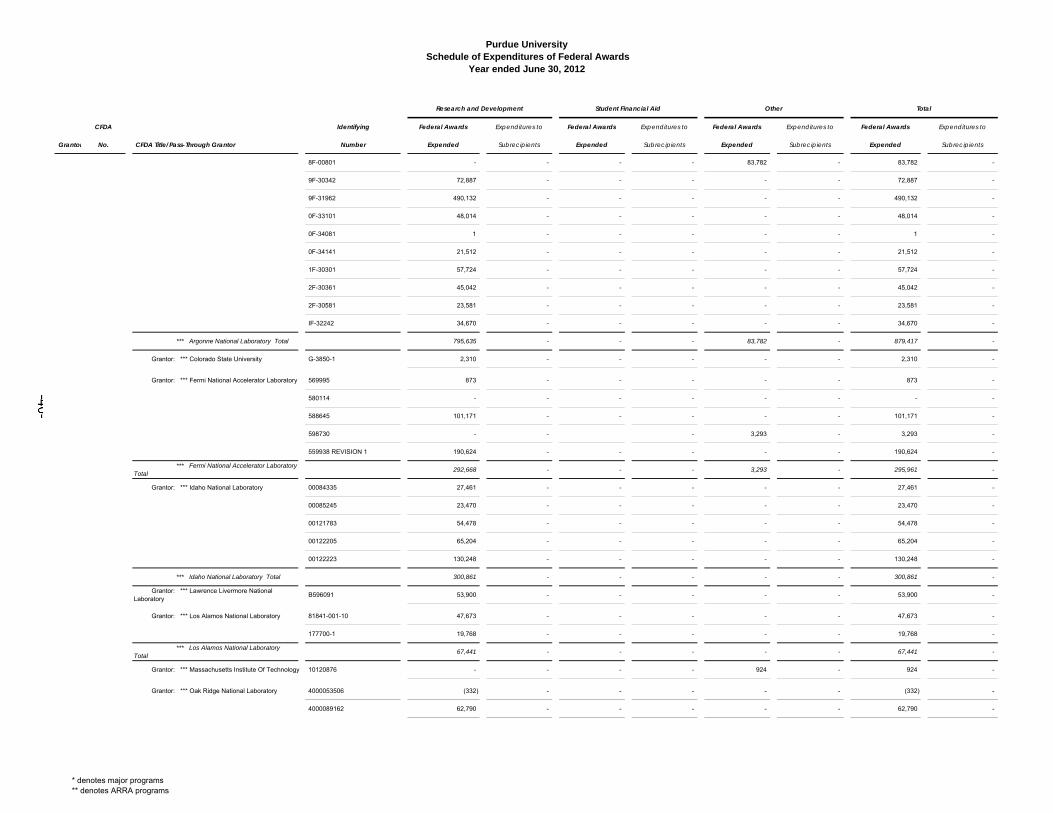
Purdue University Schedule of Expenditures of Federal Awards
Year ended June 30, 2012
CFDA Identifying Federal Awards Expenditures to Federal Awards Expenditures to Federal Awards Expenditures to Federal Awards Expenditures to
Grantor No. CFDA Title/Pass-Through Grantor Number Expended Subrecipients Expended Subrecipients Expended Subrecipients Expended Subrecipients
Research and Development Student Financial Aid Other Total
8F-00801 - - - - 83,782 - 83,782 -
9F-30342 72,887 - - - - - 72,887 -
9F-31962 490,132 - - - - - 490,132 -
0F-33101 48,014 - - - - - 48,014 -
0F-34081 1 - - - - - 1 -
0F-34141 21,512 - - - - - 21,512 -
1F-30301 57,724 - - - - - 57,724 -
2F-30361 45,042 - - - - - 45,042 -
2F-30581 23,581 - - - - - 23,581 -
IF-32242 34,670 - - - - - 34,670 -
*** Argonne National Laboratory Total 795,635 - - - 83,782 - 879,417 -
Grantor: *** Colorado State University G-3850-1 2,310 - - - - - 2,310 -
Grantor: *** Fermi National Accelerator Laboratory 569995 873 - - - - - 873 -
580114 - - - - - - - -
588645 101,171 - - - - - 101,171 -
598730 - - - 3,293 - 3,293 -
559938 REVISION 1 190,624 - - - - - 190,624 -
*** Fermi National Accelerator Laboratory Total
292,668 - - - 3,293 - 295,961 -
Grantor: *** Idaho National Laboratory 00084335 27,461 - - - - - 27,461 -
00085245 23,470 - - - - - 23,470 -
00121783 54,478 - - - - - 54,478 -
00122205 65,204 - - - - - 65,204 -
00122223 130,248 - - - - - 130,248 -
*** Idaho National Laboratory Total 300,861 - - - - - 300,861 -
Grantor: *** Lawrence Livermore National Laboratory
B596091 53,900 - - - - - 53,900 -
Grantor: *** Los Alamos National Laboratory 81841-001-10 47,673 - - - - - 47,673 -
177700-1 19,768 - - - - - 19,768 -
*** Los Alamos National Laboratory Total
67,441 - - - - - 67,441 -
Grantor: *** Massachusetts Institute Of Technology 10120876 - - - - 924 - 924 -
Grantor: *** Oak Ridge National Laboratory 4000053506 (332) - - - - - (332) -
4000089162 62,790 - - - - - 62,790 -
* denotes major programs** denotes ARRA programs
ldavid
Text Box
-40-
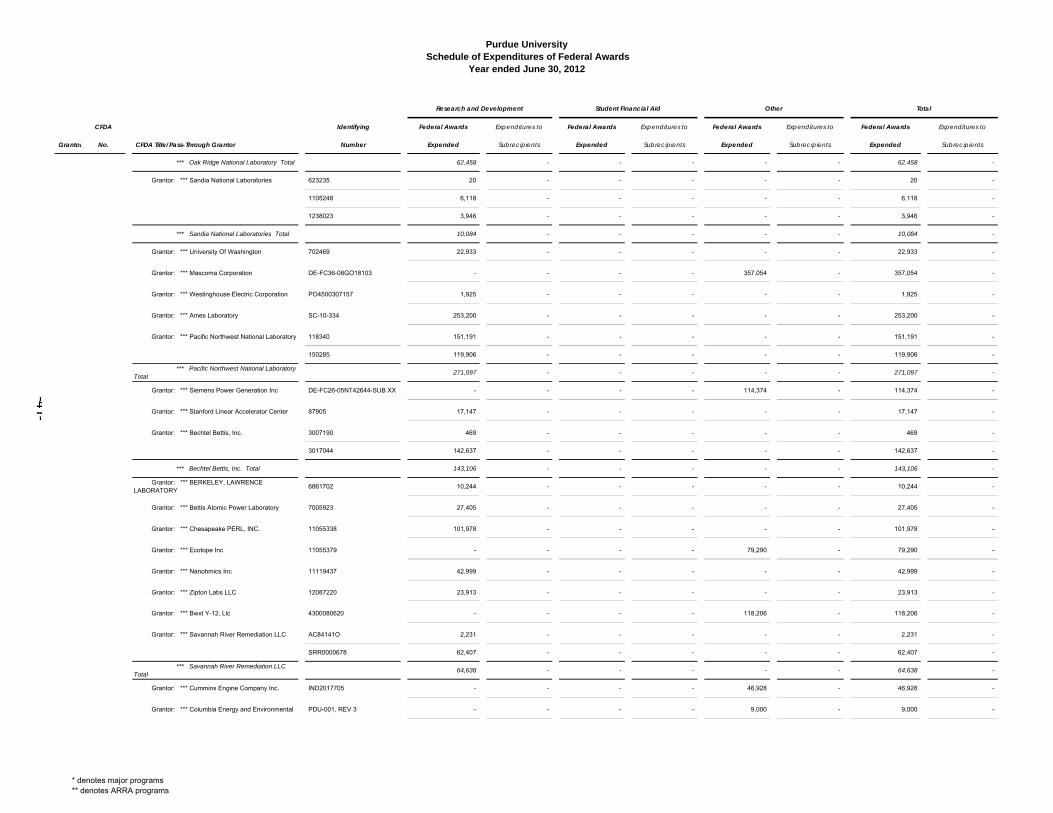
Purdue University Schedule of Expenditures of Federal Awards
Year ended June 30, 2012
CFDA Identifying Federal Awards Expenditures to Federal Awards Expenditures to Federal Awards Expenditures to Federal Awards Expenditures to
Grantor No. CFDA Title/Pass-Through Grantor Number Expended Subrecipients Expended Subrecipients Expended Subrecipients Expended Subrecipients
Research and Development Student Financial Aid Other Total
*** Oak Ridge National Laboratory Total 62,458 - - - - - 62,458 -
Grantor: *** Sandia National Laboratories 623235 20 - - - - - 20 -
1105248 6,118 - - - - - 6,118 -
1238023 3,946 - - - - - 3,946 -
*** Sandia National Laboratories Total 10,084 - - - - - 10,084 -
Grantor: *** University Of Washington 702469 22,933 - - - - - 22,933 -
Grantor: *** Mascoma Corporation DE-FC36-08GO18103 - - - - 357,054 - 357,054 -
Grantor: *** Westinghouse Electric Corporation PO4500307157 1,925 - - - - - 1,925 -
Grantor: *** Ames Laboratory SC-10-334 253,200 - - - - - 253,200 -
Grantor: *** Pacific Northwest National Laboratory 118340 151,191 - - - - - 151,191 -
150285 119,906 - - - - - 119,906 -
*** Pacific Northwest National Laboratory Total
271,097 - - - - - 271,097 -
Grantor: *** Siemens Power Generation Inc DE-FC26-05NT42644-SUB XX - - - - 114,374 - 114,374 -
Grantor: *** Stanford Linear Accelerator Center 87905 17,147 - - - - - 17,147 -
Grantor: *** Bechtel Bettis, Inc. 3007190 469 - - - - - 469 -
3017044 142,637 - - - - - 142,637 -
*** Bechtel Bettis, Inc. Total 143,106 - - - - - 143,106 -
Grantor: *** BERKELEY, LAWRENCE LABORATORY
6861702 10,244 - - - - - 10,244 -
Grantor: *** Bettis Atomic Power Laboratory 7005923 27,405 - - - - - 27,405 -
Grantor: *** Chesapeake PERL, INC. 11055338 101,978 - - - - - 101,978 -
Grantor: *** Ecotope Inc 11055379 - - - - 79,290 - 79,290 -
Grantor: *** Nanohmics Inc 11119437 42,999 - - - - - 42,999 -
Grantor: *** Zipton Labs LLC 12087220 23,913 - - - - - 23,913 -
Grantor: *** Bwxt Y-12, Llc 4300080620 - - - - 118,206 - 118,206 -
Grantor: *** Savannah River Remediation LLC AC84141O 2,231 - - - - - 2,231 -
SRR0000678 62,407 - - - - - 62,407 -
*** Savannah River Remediation LLC Total
64,638 - - - - - 64,638 -
Grantor: *** Cummins Engine Company Inc. IND2017705 - - - - 46,928 - 46,928 -
Grantor: *** Columbia Energy and Environmental PDU-001, REV 3 - - - - 9,000 - 9,000 -
* denotes major programs** denotes ARRA programs
ldavid
Text Box
-41-
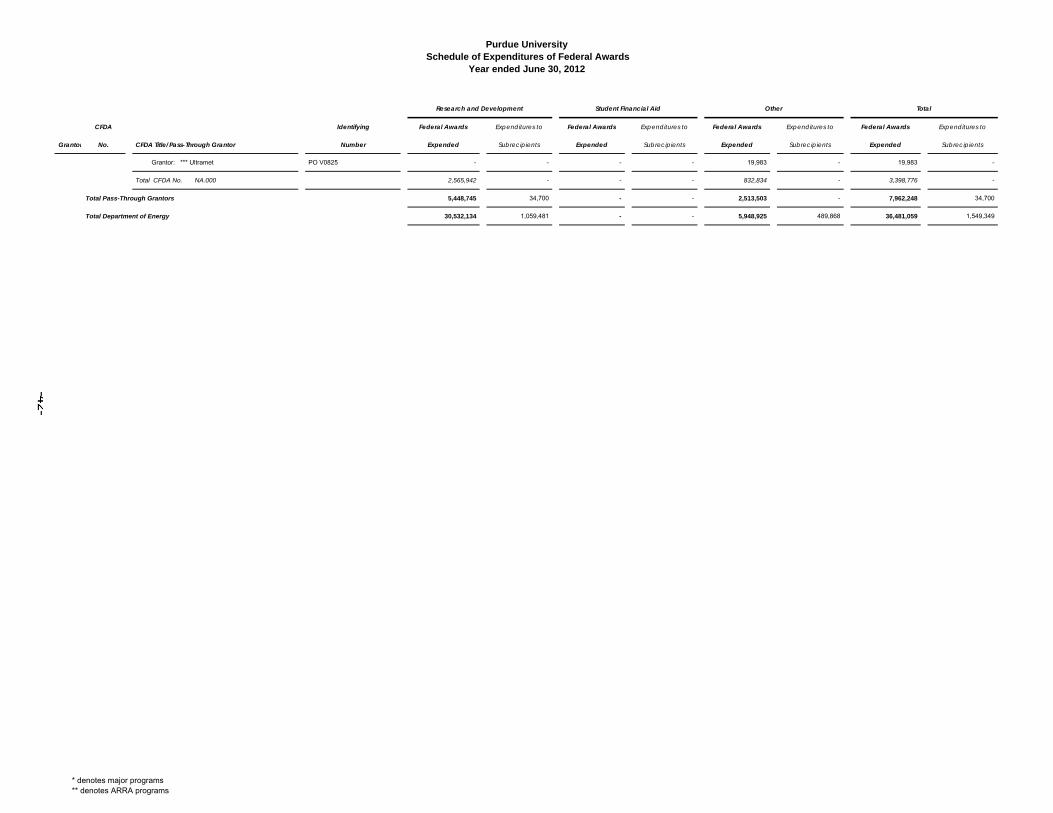
Purdue University Schedule of Expenditures of Federal Awards
Year ended June 30, 2012
CFDA Identifying Federal Awards Expenditures to Federal Awards Expenditures to Federal Awards Expenditures to Federal Awards Expenditures to
Grantor No. CFDA Title/Pass-Through Grantor Number Expended Subrecipients Expended Subrecipients Expended Subrecipients Expended Subrecipients
Research and Development Student Financial Aid Other Total
Grantor: *** Ultramet PO V0825 - - - - 19,983 - 19,983 -
Total CFDA No. NA.000 2,565,942 - - - 832,834 - 3,398,776 -
Total Pass-Through Grantors 5,448,745 34,700 - - 2,513,503 - 7,962,248 34,700
Total Department of Energy 30,532,134 1,059,481 - - 5,948,925 489,868 36,481,059 1,549,349
* denotes major programs** denotes ARRA programs
ldavid
Text Box
-42-
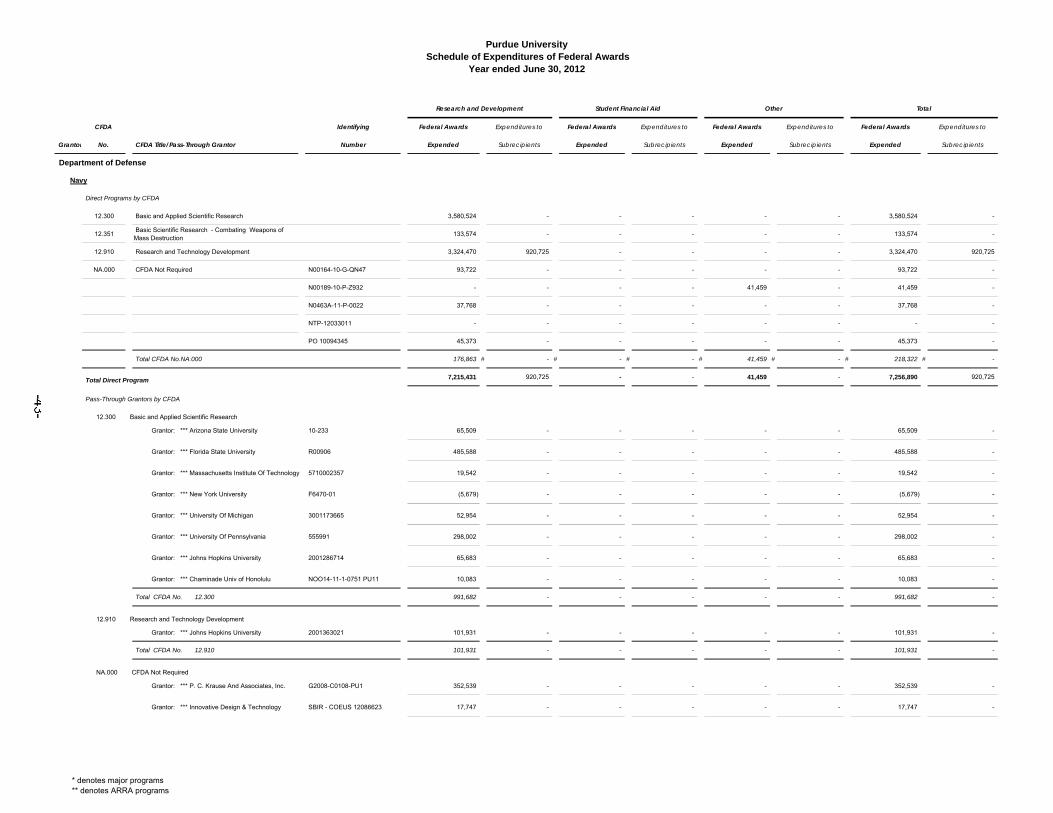
Purdue University Schedule of Expenditures of Federal Awards
Year ended June 30, 2012
CFDA Identifying Federal Awards Expenditures to Federal Awards Expenditures to Federal Awards Expenditures to Federal Awards Expenditures to
Grantor No. CFDA Title/Pass-Through Grantor Number Expended Subrecipients Expended Subrecipients Expended Subrecipients Expended Subrecipients
Research and Development Student Financial Aid Other Total
Department of Defense
Navy
Direct Programs by CFDA
12.300 Basic and Applied Scientific Research 3,580,524 - - - - - 3,580,524 -
12.351 Basic Scientific Research - Combating Weapons of Mass Destruction
133,574 - - - - - 133,574 -
12.910 Research and Technology Development 3,324,470 920,725 - - - - 3,324,470 920,725
NA.000 CFDA Not Required N00164-10-G-QN47 93,722 - - - - - 93,722 -
N00189-10-P-Z932 - - - - 41,459 - 41,459 -
N0463A-11-P-0022 37,768 - - - - - 37,768 -
NTP-12033011 - - - - - - - -
PO 10094345 45,373 - - - - - 45,373 -
Total CFDA No.NA.000 176,863 # - # - # - # 41,459 # - # 218,322 # -
Total Direct Program 7,215,431 920,725 - - 41,459 - 7,256,890 920,725
Pass-Through Grantors by CFDA
12.300 Basic and Applied Scientific Research
Grantor: *** Arizona State University 10-233 65,509 - - - - - 65,509 -
Grantor: *** Florida State University R00906 485,588 - - - - - 485,588 -
Grantor: *** Massachusetts Institute Of Technology 5710002357 19,542 - - - - - 19,542 -
Grantor: *** New York University F6470-01 (5,679) - - - - - (5,679) -
Grantor: *** University Of Michigan 3001173665 52,954 - - - - - 52,954 -
Grantor: *** University Of Pennsylvania 555991 298,002 - - - - - 298,002 -
Grantor: *** Johns Hopkins University 2001286714 65,683 - - - - - 65,683 -
Grantor: *** Chaminade Univ of Honolulu NOO14-11-1-0751 PU11 10,083 - - - - - 10,083 -
Total CFDA No. 12.300 991,682 - - - - - 991,682 -
12.910 Research and Technology Development
Grantor: *** Johns Hopkins University 2001363021 101,931 - - - - - 101,931 -
Total CFDA No. 12.910 101,931 - - - - - 101,931 -
NA.000 CFDA Not Required
Grantor: *** P. C. Krause And Associates, Inc. G2008-C0108-PU1 352,539 - - - - - 352,539 -
Grantor: *** Innovative Design & Technology SBIR - COEUS 12086623 17,747 - - - - - 17,747 -
* denotes major programs** denotes ARRA programs
ldavid
Text Box
-43-
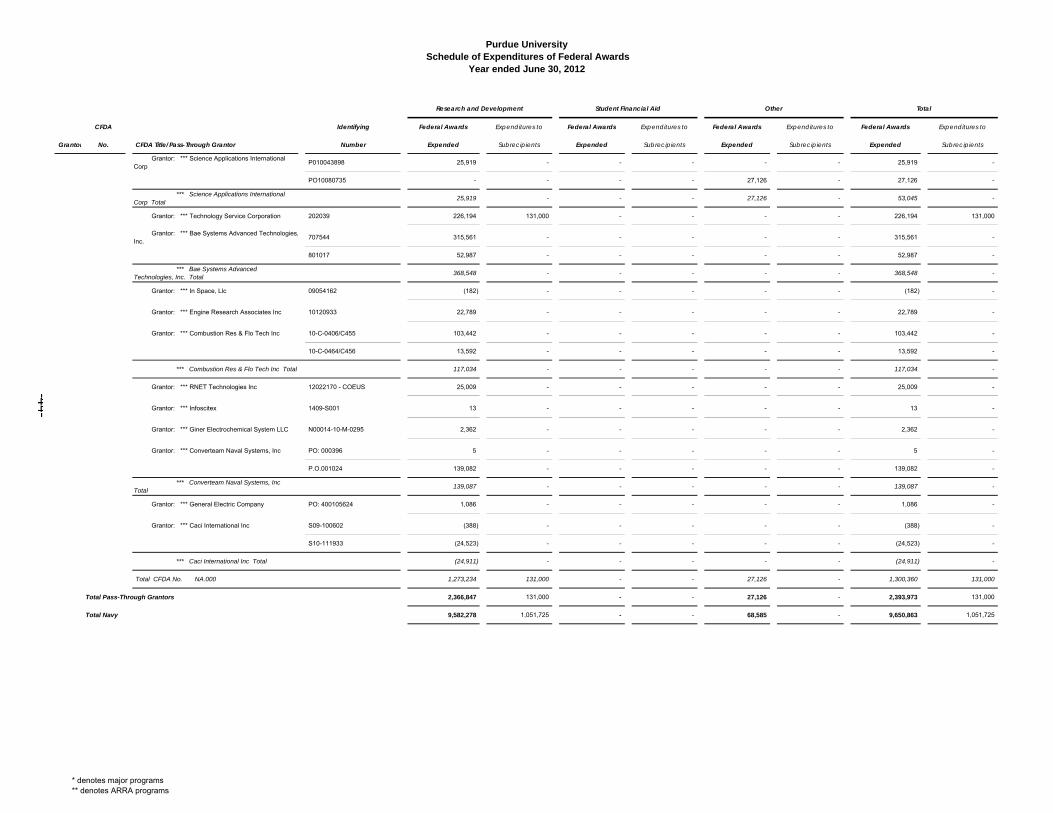
Purdue University Schedule of Expenditures of Federal Awards
Year ended June 30, 2012
CFDA Identifying Federal Awards Expenditures to Federal Awards Expenditures to Federal Awards Expenditures to Federal Awards Expenditures to
Grantor No. CFDA Title/Pass-Through Grantor Number Expended Subrecipients Expended Subrecipients Expended Subrecipients Expended Subrecipients
Research and Development Student Financial Aid Other Total
Grantor: *** Science Applications International Corp
P010043898 25,919 - - - - - 25,919 -
PO10080735 - - - - 27,126 - 27,126 -
*** Science Applications International Corp Total
25,919 - - - 27,126 - 53,045 -
Grantor: *** Technology Service Corporation 202039 226,194 131,000 - - - - 226,194 131,000
Grantor: *** Bae Systems Advanced Technologies,Inc.
707544 315,561 - - - - - 315,561 -
801017 52,987 - - - - - 52,987 -
*** Bae Systems Advanced Technologies, Inc. Total
368,548 - - - - - 368,548 -
Grantor: *** In Space, Llc 09054162 (182) - - - - - (182) -
Grantor: *** Engine Research Associates Inc 10120933 22,789 - - - - - 22,789 -
Grantor: *** Combustion Res & Flo Tech Inc 10-C-0406/C455 103,442 - - - - - 103,442 -
10-C-0464/C456 13,592 - - - - - 13,592 -
*** Combustion Res & Flo Tech Inc Total 117,034 - - - - - 117,034 -
Grantor: *** RNET Technologies Inc 12022170 - COEUS 25,009 - - - - - 25,009 -
Grantor: *** Infoscitex 1409-S001 13 - - - - - 13 -
Grantor: *** Giner Electrochemical System LLC N00014-10-M-0295 2,362 - - - - - 2,362 -
Grantor: *** Converteam Naval Systems, Inc PO: 000396 5 - - - - - 5 -
P.O.001024 139,082 - - - - - 139,082 -
*** Converteam Naval Systems, Inc Total
139,087 - - - - - 139,087 -
Grantor: *** General Electric Company PO: 400105624 1,086 - - - - - 1,086 -
Grantor: *** Caci International Inc S09-100602 (388) - - - - - (388) -
S10-111933 (24,523) - - - - - (24,523) -
*** Caci International Inc Total (24,911) - - - - - (24,911) -
Total CFDA No. NA.000 1,273,234 131,000 - - 27,126 - 1,300,360 131,000
Total Pass-Through Grantors 2,366,847 131,000 - - 27,126 - 2,393,973 131,000
Total Navy 9,582,278 1,051,725 - - 68,585 - 9,650,863 1,051,725
* denotes major programs** denotes ARRA programs
ldavid
Text Box
-44-
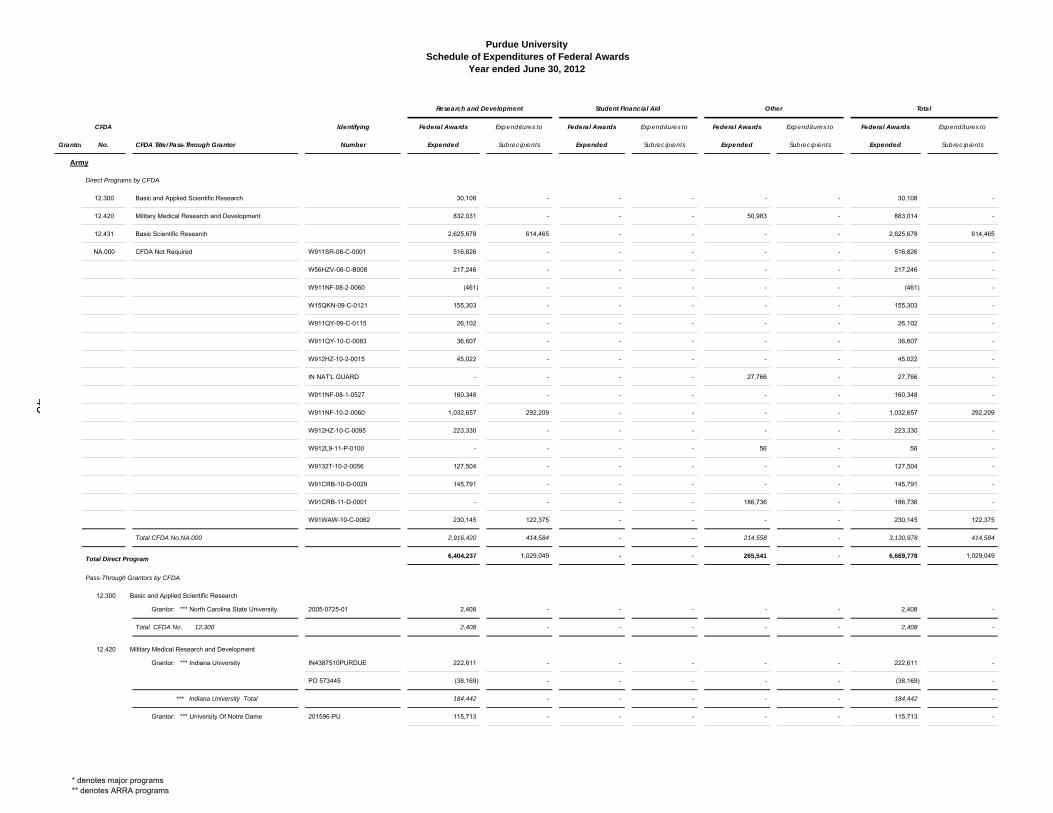
Purdue University Schedule of Expenditures of Federal Awards
Year ended June 30, 2012
CFDA Identifying Federal Awards Expenditures to Federal Awards Expenditures to Federal Awards Expenditures to Federal Awards Expenditures to
Grantor No. CFDA Title/Pass-Through Grantor Number Expended Subrecipients Expended Subrecipients Expended Subrecipients Expended Subrecipients
Research and Development Student Financial Aid Other Total
Army
Direct Programs by CFDA
12.300 Basic and Applied Scientific Research 30,108 - - - - - 30,108 -
12.420 Military Medical Research and Development 832,031 - - - 50,983 - 883,014 -
12.431 Basic Scientific Research 2,625,678 614,465 - - - - 2,625,678 614,465
NA.000 CFDA Not Required W911SR-08-C-0001 516,826 - - - - - 516,826 -
W56HZV-08-C-B008 217,246 - - - - - 217,246 -
W911NF-08-2-0060 (461) - - - - - (461) -
W15QKN-09-C-0121 155,303 - - - - - 155,303 -
W911QY-09-C-0115 26,102 - - - - - 26,102 -
W911QY-10-C-0083 36,607 - - - - - 36,607 -
W912HZ-10-2-0015 45,022 - - - - - 45,022 -
IN NAT'L GUARD - - - - 27,766 - 27,766 -
W911NF-08-1-0527 160,348 - - - - - 160,348 -
W911NF-10-2-0060 1,032,657 292,209 - - - - 1,032,657 292,209
W912HZ-10-C-0095 223,330 - - - - - 223,330 -
W912L9-11-P-0100 - - - - 56 - 56 -
W9132T-10-2-0056 127,504 - - - - - 127,504 -
W91CRB-10-D-0029 145,791 - - - - - 145,791 -
W91CRB-11-D-0001 - - - - 186,736 - 186,736 -
W91WAW-10-C-0062 230,145 122,375 - - - - 230,145 122,375
Total CFDA No.NA.000 2,916,420 414,584 - - 214,558 - 3,130,978 414,584
Total Direct Program 6,404,237 1,029,049 - - 265,541 - 6,669,778 1,029,049
Pass-Through Grantors by CFDA
12.300 Basic and Applied Scientific Research
Grantor: *** North Carolina State University 2005-0725-01 2,408 - - - - - 2,408 -
Total CFDA No. 12.300 2,408 - - - - - 2,408 -
12.420 Military Medical Research and Development
Grantor: *** Indiana University IN4387510PURDUE 222,611 - - - - - 222,611 -
PO 573445 (38,169) - - - - - (38,169) -
*** Indiana University Total 184,442 - - - - - 184,442 -
Grantor: *** University Of Notre Dame 201596-PU 115,713 - - - - - 115,713 -
* denotes major programs** denotes ARRA programs
ldavid
Text Box
-45-
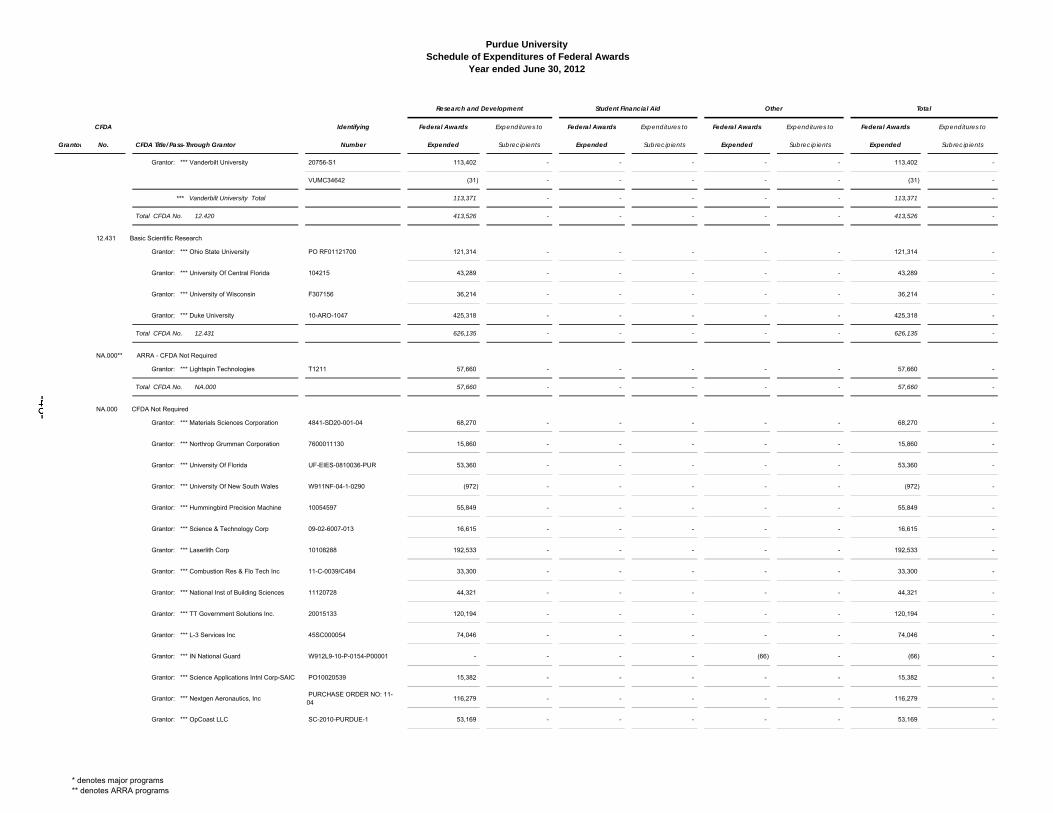
Purdue University Schedule of Expenditures of Federal Awards
Year ended June 30, 2012
CFDA Identifying Federal Awards Expenditures to Federal Awards Expenditures to Federal Awards Expenditures to Federal Awards Expenditures to
Grantor No. CFDA Title/Pass-Through Grantor Number Expended Subrecipients Expended Subrecipients Expended Subrecipients Expended Subrecipients
Research and Development Student Financial Aid Other Total
Grantor: *** Vanderbilt University 20756-S1 113,402 - - - - - 113,402 -
VUMC34642 (31) - - - - - (31) -
*** Vanderbilt University Total 113,371 - - - - - 113,371 -
Total CFDA No. 12.420 413,526 - - - - - 413,526 -
12.431 Basic Scientific Research
Grantor: *** Ohio State University PO RF01121700 121,314 - - - - - 121,314 -
Grantor: *** University Of Central Florida 104215 43,289 - - - - - 43,289 -
Grantor: *** University of Wisconsin F307156 36,214 - - - - - 36,214 -
Grantor: *** Duke University 10-ARO-1047 425,318 - - - - - 425,318 -
Total CFDA No. 12.431 626,135 - - - - - 626,135 -
NA.000** ARRA - CFDA Not Required
Grantor: *** Lightspin Technologies T1211 57,660 - - - - - 57,660 -
Total CFDA No. NA.000 57,660 - - - - - 57,660 -
NA.000 CFDA Not Required
Grantor: *** Materials Sciences Corporation 4841-SD20-001-04 68,270 - - - - - 68,270 -
Grantor: *** Northrop Grumman Corporation 7600011130 15,860 - - - - - 15,860 -
Grantor: *** University Of Florida UF-EIES-0810036-PUR 53,360 - - - - - 53,360 -
Grantor: *** University Of New South Wales W911NF-04-1-0290 (972) - - - - - (972) -
Grantor: *** Hummingbird Precision Machine 10054597 55,849 - - - - - 55,849 -
Grantor: *** Science & Technology Corp 09-02-6007-013 16,615 - - - - - 16,615 -
Grantor: *** Laserlith Corp 10108288 192,533 - - - - - 192,533 -
Grantor: *** Combustion Res & Flo Tech Inc 11-C-0039/C484 33,300 - - - - - 33,300 -
Grantor: *** National Inst of Building Sciences 11120728 44,321 - - - - - 44,321 -
Grantor: *** TT Government Solutions Inc. 20015133 120,194 - - - - - 120,194 -
Grantor: *** L-3 Services Inc 45SC000054 74,046 - - - - - 74,046 -
Grantor: *** IN National Guard W912L9-10-P-0154-P00001 - - - - (66) - (66) -
Grantor: *** Science Applications Intnl Corp-SAIC PO10020539 15,382 - - - - - 15,382 -
Grantor: *** Nextgen Aeronautics, Inc PURCHASE ORDER NO: 11-04
116,279 - - - - - 116,279 -
Grantor: *** OpCoast LLC SC-2010-PURDUE-1 53,169 - - - - - 53,169 -
* denotes major programs** denotes ARRA programs
ldavid
Text Box
-46-
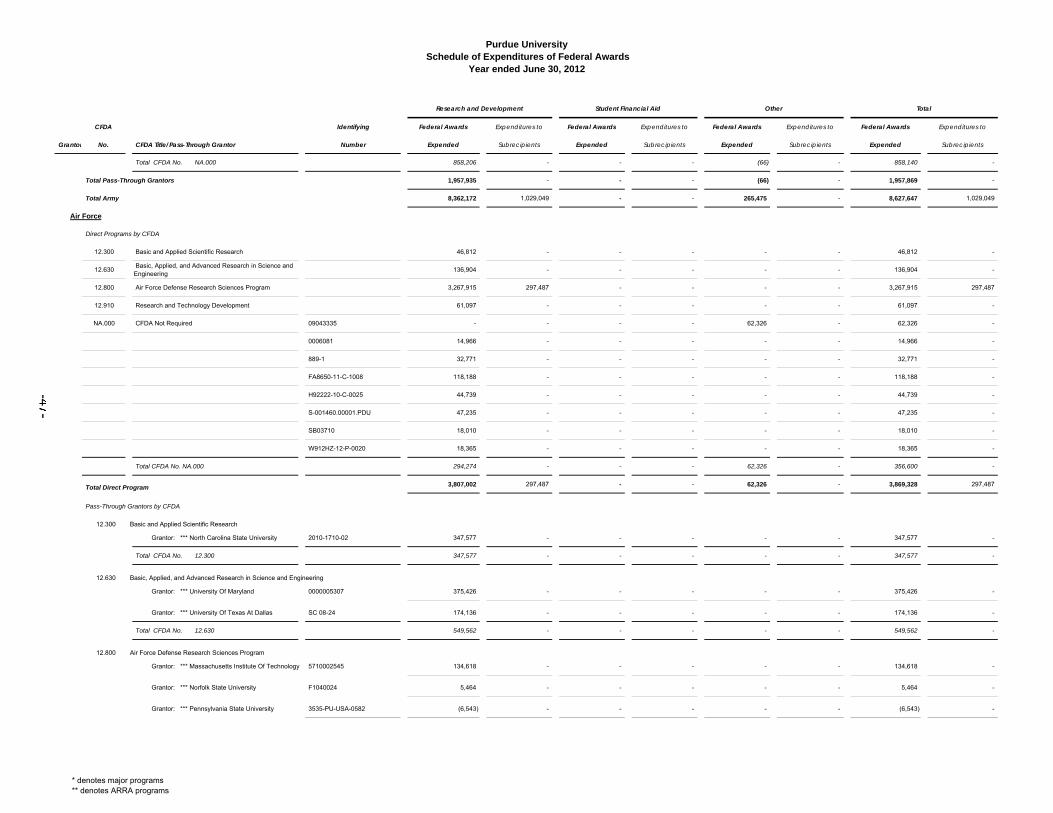
Purdue University Schedule of Expenditures of Federal Awards
Year ended June 30, 2012
CFDA Identifying Federal Awards Expenditures to Federal Awards Expenditures to Federal Awards Expenditures to Federal Awards Expenditures to
Grantor No. CFDA Title/Pass-Through Grantor Number Expended Subrecipients Expended Subrecipients Expended Subrecipients Expended Subrecipients
Research and Development Student Financial Aid Other Total
Total CFDA No. NA.000 858,206 - - - (66) - 858,140 -
Total Pass-Through Grantors 1,957,935 - - - (66) - 1,957,869 -
Total Army 8,362,172 1,029,049 - - 265,475 - 8,627,647 1,029,049
Air Force
Direct Programs by CFDA
12.300 Basic and Applied Scientific Research 46,812 - - - - - 46,812 -
12.630 Basic, Applied, and Advanced Research in Science and Engineering
136,904 - - - - - 136,904 -
12.800 Air Force Defense Research Sciences Program 3,267,915 297,487 - - - - 3,267,915 297,487
12.910 Research and Technology Development 61,097 - - - - - 61,097 -
NA.000 CFDA Not Required 09043335 - - - - 62,326 - 62,326 -
0006081 14,966 - - - - - 14,966 -
889-1 32,771 - - - - - 32,771 -
FA8650-11-C-1008 118,188 - - - - - 118,188 -
H92222-10-C-0025 44,739 - - - - - 44,739 -
S-001460.00001.PDU 47,235 - - - - - 47,235 -
SB03710 18,010 - - - - - 18,010 -
W912HZ-12-P-0020 18,365 - - - - - 18,365 -
Total CFDA No. NA.000 294,274 - - - 62,326 - 356,600 -
Total Direct Program 3,807,002 297,487 - - 62,326 - 3,869,328 297,487
Pass-Through Grantors by CFDA
12.300 Basic and Applied Scientific Research
Grantor: *** North Carolina State University 2010-1710-02 347,577 - - - - - 347,577 -
Total CFDA No. 12.300 347,577 - - - - - 347,577 -
12.630 Basic, Applied, and Advanced Research in Science and Engineering
Grantor: *** University Of Maryland 0000005307 375,426 - - - - - 375,426 -
Grantor: *** University Of Texas At Dallas SC 08-24 174,136 - - - - - 174,136 -
Total CFDA No. 12.630 549,562 - - - - - 549,562 -
12.800 Air Force Defense Research Sciences Program
Grantor: *** Massachusetts Institute Of Technology 5710002545 134,618 - - - - - 134,618 -
Grantor: *** Norfolk State University F1040024 5,464 - - - - - 5,464 -
Grantor: *** Pennsylvania State University 3535-PU-USA-0582 (6,543) - - - - - (6,543) -
* denotes major programs** denotes ARRA programs
ldavid
Text Box
-47-
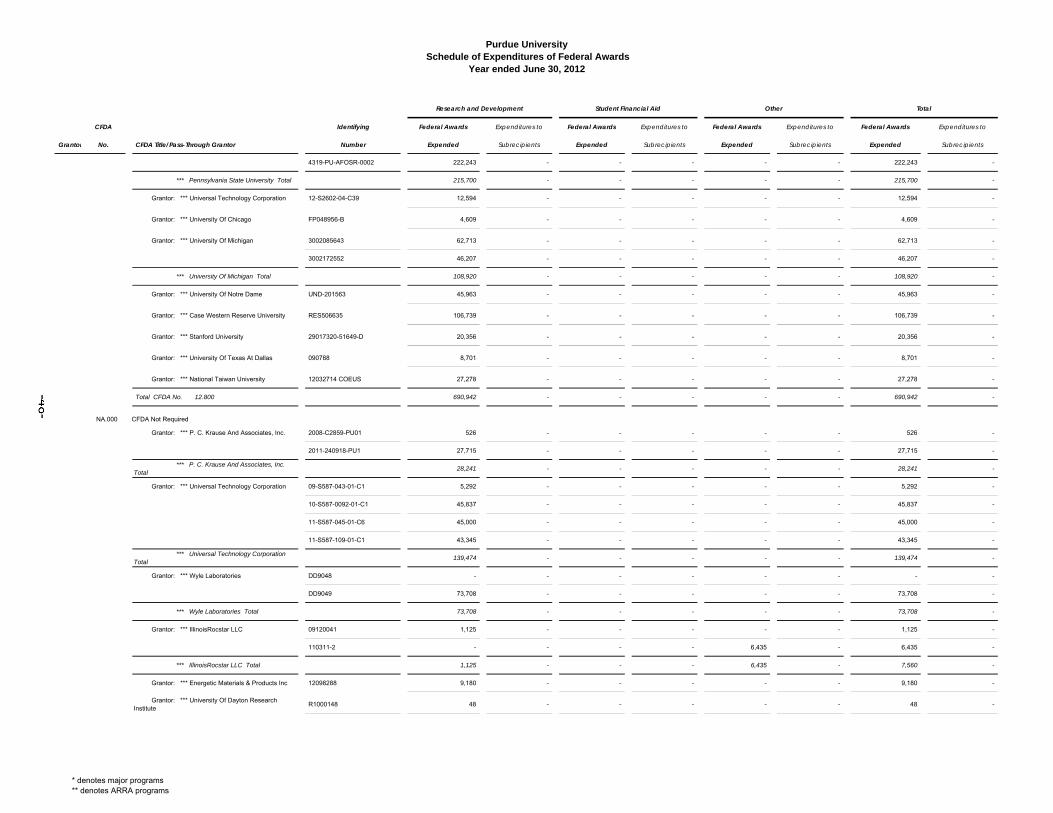
Purdue University Schedule of Expenditures of Federal Awards
Year ended June 30, 2012
CFDA Identifying Federal Awards Expenditures to Federal Awards Expenditures to Federal Awards Expenditures to Federal Awards Expenditures to
Grantor No. CFDA Title/Pass-Through Grantor Number Expended Subrecipients Expended Subrecipients Expended Subrecipients Expended Subrecipients
Research and Development Student Financial Aid Other Total
4319-PU-AFOSR-0002 222,243 - - - - - 222,243 -
*** Pennsylvania State University Total 215,700 - - - - - 215,700 -
Grantor: *** Universal Technology Corporation 12-S2602-04-C39 12,594 - - - - - 12,594 -
Grantor: *** University Of Chicago FP048956-B 4,609 - - - - - 4,609 -
Grantor: *** University Of Michigan 3002085643 62,713 - - - - - 62,713 -
3002172552 46,207 - - - - - 46,207 -
*** University Of Michigan Total 108,920 - - - - - 108,920 -
Grantor: *** University Of Notre Dame UND-201563 45,963 - - - - - 45,963 -
Grantor: *** Case Western Reserve University RES506635 106,739 - - - - - 106,739 -
Grantor: *** Stanford University 29017320-51649-D 20,356 - - - - - 20,356 -
Grantor: *** University Of Texas At Dallas 090788 8,701 - - - - - 8,701 -
Grantor: *** National Taiwan University 12032714 COEUS 27,278 - - - - - 27,278 -
Total CFDA No. 12.800 690,942 - - - - - 690,942 -
NA.000 CFDA Not Required
Grantor: *** P. C. Krause And Associates, Inc. 2008-C2859-PU01 526 - - - - - 526 -
2011-240918-PU1 27,715 - - - - - 27,715 -
*** P. C. Krause And Associates, Inc. Total
28,241 - - - - - 28,241 -
Grantor: *** Universal Technology Corporation 09-S587-043-01-C1 5,292 - - - - - 5,292 -
10-S587-0092-01-C1 45,837 - - - - - 45,837 -
11-S587-045-01-C6 45,000 - - - - - 45,000 -
11-S587-109-01-C1 43,345 - - - - - 43,345 -
*** Universal Technology Corporation Total
139,474 - - - - - 139,474 -
Grantor: *** Wyle Laboratories DD9048 - - - - - - - -
DD9049 73,708 - - - - - 73,708 -
*** Wyle Laboratories Total 73,708 - - - - - 73,708 -
Grantor: *** IllinoisRocstar LLC 09120041 1,125 - - - - - 1,125 -
110311-2 - - - - 6,435 - 6,435 -
*** IllinoisRocstar LLC Total 1,125 - - - 6,435 - 7,560 -
Grantor: *** Energetic Materials & Products Inc 12098288 9,180 - - - - - 9,180 -
Grantor: *** University Of Dayton Research Institute
R1000148 48 - - - - - 48 -
* denotes major programs** denotes ARRA programs
ldavid
Text Box
-48-
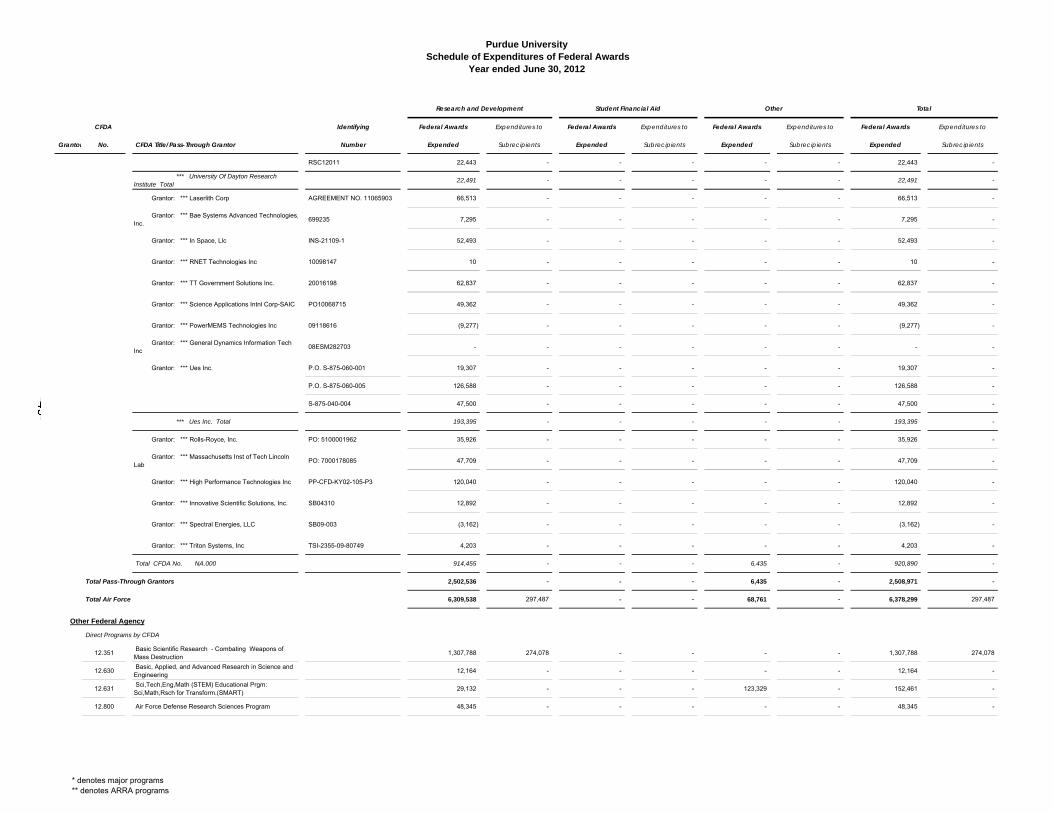
Purdue University Schedule of Expenditures of Federal Awards
Year ended June 30, 2012
CFDA Identifying Federal Awards Expenditures to Federal Awards Expenditures to Federal Awards Expenditures to Federal Awards Expenditures to
Grantor No. CFDA Title/Pass-Through Grantor Number Expended Subrecipients Expended Subrecipients Expended Subrecipients Expended Subrecipients
Research and Development Student Financial Aid Other Total
RSC12011 22,443 - - - - - 22,443 -
*** University Of Dayton Research Institute Total
22,491 - - - - - 22,491 -
Grantor: *** Laserlith Corp AGREEMENT NO. 11065903 66,513 - - - - - 66,513 -
Grantor: *** Bae Systems Advanced Technologies,Inc.
699235 7,295 - - - - - 7,295 -
Grantor: *** In Space, Llc INS-21109-1 52,493 - - - - - 52,493 -
Grantor: *** RNET Technologies Inc 10098147 10 - - - - - 10 -
Grantor: *** TT Government Solutions Inc. 20016198 62,837 - - - - - 62,837 -
Grantor: *** Science Applications Intnl Corp-SAIC PO10068715 49,362 - - - - - 49,362 -
Grantor: *** PowerMEMS Technologies Inc 09118616 (9,277) - - - - - (9,277) -
Grantor: *** General Dynamics Information Tech Inc
08ESM282703 - - - - - - - -
Grantor: *** Ues Inc. P.O. S-875-060-001 19,307 - - - - - 19,307 -
P.O. S-875-060-005 126,588 - - - - - 126,588 -
S-875-040-004 47,500 - - - - - 47,500 -
*** Ues Inc. Total 193,395 - - - - - 193,395 -
Grantor: *** Rolls-Royce, Inc. PO: 5100001962 35,926 - - - - - 35,926 -
Grantor: *** Massachusetts Inst of Tech Lincoln Lab
PO: 7000178085 47,709 - - - - - 47,709 -
Grantor: *** High Performance Technologies Inc PP-CFD-KY02-105-P3 120,040 - - - - - 120,040 -
Grantor: *** Innovative Scientific Solutions, Inc. SB04310 12,892 - - - - - 12,892 -
Grantor: *** Spectral Energies, LLC SB09-003 (3,162) - - - - - (3,162) -
Grantor: *** Triton Systems, Inc TSI-2355-09-80749 4,203 - - - - - 4,203 -
Total CFDA No. NA.000 914,455 - - - 6,435 - 920,890 -
Total Pass-Through Grantors 2,502,536 - - - 6,435 - 2,508,971 -
Total Air Force 6,309,538 297,487 - - 68,761 - 6,378,299 297,487
Other Federal Agency
Direct Programs by CFDA
12.351 Basic Scientific Research - Combating Weapons of Mass Destruction
1,307,788 274,078 - - - - 1,307,788 274,078
12.630 Basic, Applied, and Advanced Research in Science and Engineering
12,164 - - - - - 12,164 -
12.631 Sci,Tech,Eng,Math (STEM) Educational Prgm: Sci,Math,Rsch for Transform.(SMART)
29,132 - - - 123,329 - 152,461 -
12.800 Air Force Defense Research Sciences Program 48,345 - - - - - 48,345 -
* denotes major programs** denotes ARRA programs
ldavid
Text Box
-49-
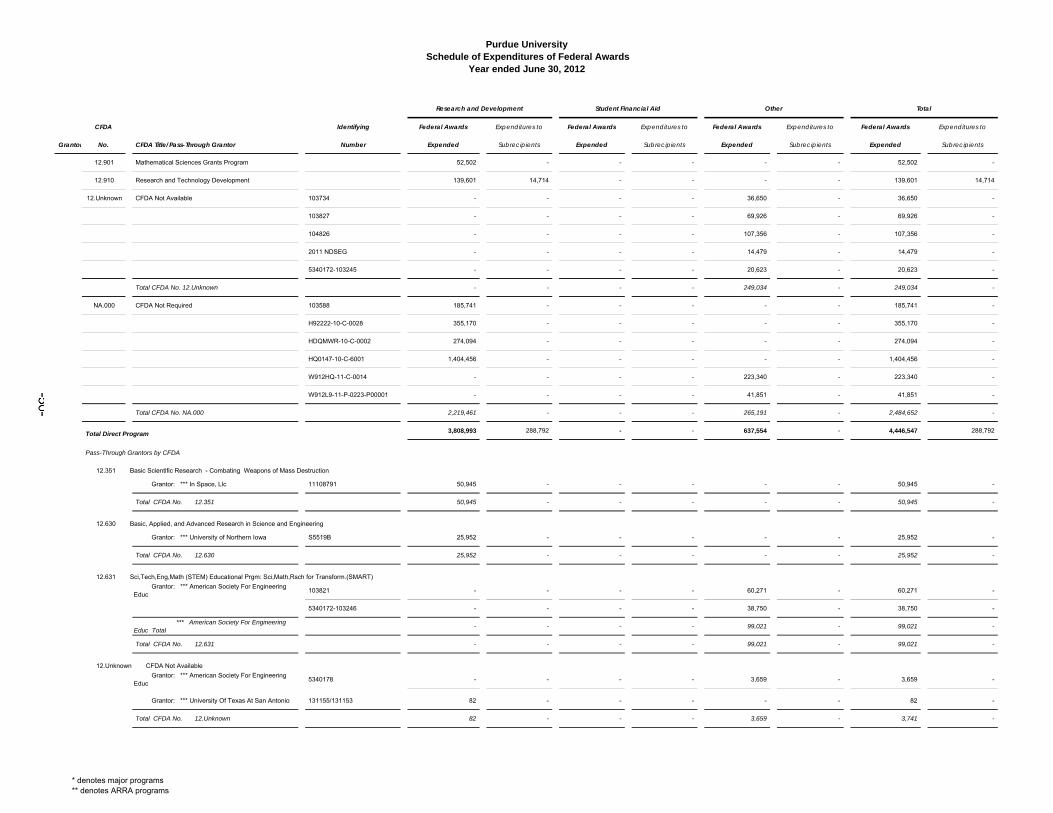
Purdue University Schedule of Expenditures of Federal Awards
Year ended June 30, 2012
CFDA Identifying Federal Awards Expenditures to Federal Awards Expenditures to Federal Awards Expenditures to Federal Awards Expenditures to
Grantor No. CFDA Title/Pass-Through Grantor Number Expended Subrecipients Expended Subrecipients Expended Subrecipients Expended Subrecipients
Research and Development Student Financial Aid Other Total
12.901 Mathematical Sciences Grants Program 52,502 - - - - - 52,502 -
12.910 Research and Technology Development 139,601 14,714 - - - - 139,601 14,714
12.Unknown CFDA Not Available 103734 - - - - 36,650 - 36,650 -
103827 - - - - 69,926 - 69,926 -
104826 - - - - 107,356 - 107,356 -
2011 NDSEG - - - - 14,479 - 14,479 -
5340172-103245 - - - - 20,623 - 20,623 -
Total CFDA No. 12.Unknown - - - - 249,034 - 249,034 -
NA.000 CFDA Not Required 103588 185,741 - - - - - 185,741 -
H92222-10-C-0028 355,170 - - - - - 355,170 -
HDQMWR-10-C-0002 274,094 - - - - - 274,094 -
HQ0147-10-C-6001 1,404,456 - - - - - 1,404,456 -
W912HQ-11-C-0014 - - - - 223,340 - 223,340 -
W912L9-11-P-0223-P00001 - - - - 41,851 - 41,851 -
Total CFDA No. NA.000 2,219,461 - - - 265,191 - 2,484,652 -
Total Direct Program 3,808,993 288,792 - - 637,554 - 4,446,547 288,792
Pass-Through Grantors by CFDA
12.351 Basic Scientific Research - Combating Weapons of Mass Destruction
Grantor: *** In Space, Llc 11108791 50,945 - - - - - 50,945 -
Total CFDA No. 12.351 50,945 - - - - - 50,945 -
12.630 Basic, Applied, and Advanced Research in Science and Engineering
Grantor: *** University of Northern Iowa S5519B 25,952 - - - - - 25,952 -
Total CFDA No. 12.630 25,952 - - - - - 25,952 -
12.631 Sci,Tech,Eng,Math (STEM) Educational Prgm: Sci,Math,Rsch for Transform.(SMART)
Grantor: *** American Society For Engineering Educ
103821 - - - - 60,271 - 60,271 -
5340172-103246 - - - - 38,750 - 38,750 -
*** American Society For Engineering Educ Total
- - - - 99,021 - 99,021 -
Total CFDA No. 12.631 - - - - 99,021 - 99,021 -
12.Unknown CFDA Not Available
Grantor: *** American Society For Engineering Educ
5340178 - - - - 3,659 - 3,659 -
Grantor: *** University Of Texas At San Antonio 131155/131153 82 - - - - - 82 -
Total CFDA No. 12.Unknown 82 - - - 3,659 - 3,741 -
* denotes major programs** denotes ARRA programs
ldavid
Text Box
-50-
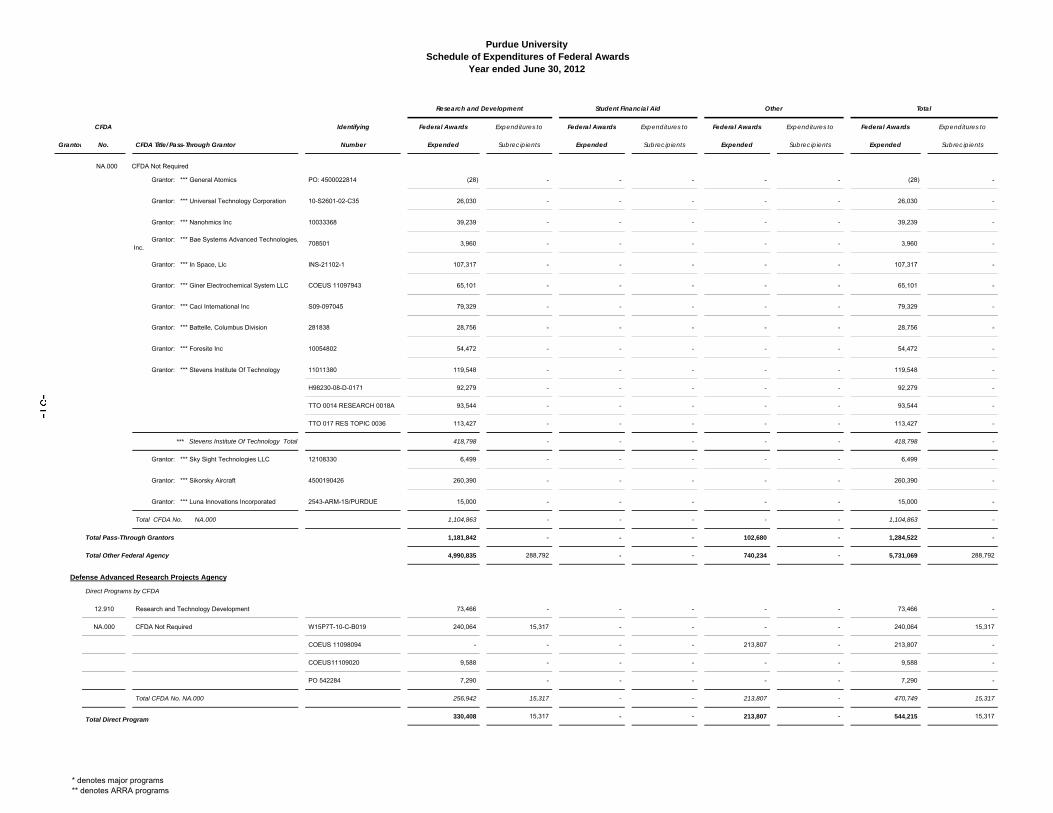
Purdue University Schedule of Expenditures of Federal Awards
Year ended June 30, 2012
CFDA Identifying Federal Awards Expenditures to Federal Awards Expenditures to Federal Awards Expenditures to Federal Awards Expenditures to
Grantor No. CFDA Title/Pass-Through Grantor Number Expended Subrecipients Expended Subrecipients Expended Subrecipients Expended Subrecipients
Research and Development Student Financial Aid Other Total
NA.000 CFDA Not Required
Grantor: *** General Atomics PO: 4500022814 (28) - - - - - (28) -
Grantor: *** Universal Technology Corporation 10-S2601-02-C35 26,030 - - - - - 26,030 -
Grantor: *** Nanohmics Inc 10033368 39,239 - - - - - 39,239 -
Grantor: *** Bae Systems Advanced Technologies,Inc.
708501 3,960 - - - - - 3,960 -
Grantor: *** In Space, Llc INS-21102-1 107,317 - - - - - 107,317 -
Grantor: *** Giner Electrochemical System LLC COEUS 11097943 65,101 - - - - - 65,101 -
Grantor: *** Caci International Inc S09-097045 79,329 - - - - - 79,329 -
Grantor: *** Battelle, Columbus Division 281838 28,756 - - - - - 28,756 -
Grantor: *** Foresite Inc 10054802 54,472 - - - - - 54,472 -
Grantor: *** Stevens Institute Of Technology 11011380 119,548 - - - - - 119,548 -
H98230-08-D-0171 92,279 - - - - - 92,279 -
TTO 0014 RESEARCH 0018A 93,544 - - - - - 93,544 -
TTO 017 RES TOPIC 0036 113,427 - - - - - 113,427 -
*** Stevens Institute Of Technology Total 418,798 - - - - - 418,798 -
Grantor: *** Sky Sight Technologies LLC 12108330 6,499 - - - - - 6,499 -
Grantor: *** Sikorsky Aircraft 4500190426 260,390 - - - - - 260,390 -
Grantor: *** Luna Innovations Incorporated 2543-ARM-1S/PURDUE 15,000 - - - - - 15,000 -
Total CFDA No. NA.000 1,104,863 - - - - - 1,104,863 -
Total Pass-Through Grantors 1,181,842 - - - 102,680 - 1,284,522 -
Total Other Federal Agency 4,990,835 288,792 - - 740,234 - 5,731,069 288,792
Defense Advanced Research Projects Agency
Direct Programs by CFDA
12.910 Research and Technology Development 73,466 - - - - - 73,466 -
NA.000 CFDA Not Required W15P7T-10-C-B019 240,064 15,317 - - - - 240,064 15,317
COEUS 11098094 - - - - 213,807 - 213,807 -
COEUS11109020 9,588 - - - - - 9,588 -
PO 542284 7,290 - - - - - 7,290 -
Total CFDA No. NA.000 256,942 15,317 - - 213,807 - 470,749 15,317
Total Direct Program 330,408 15,317 - - 213,807 - 544,215 15,317
* denotes major programs** denotes ARRA programs
ldavid
Text Box
-51-
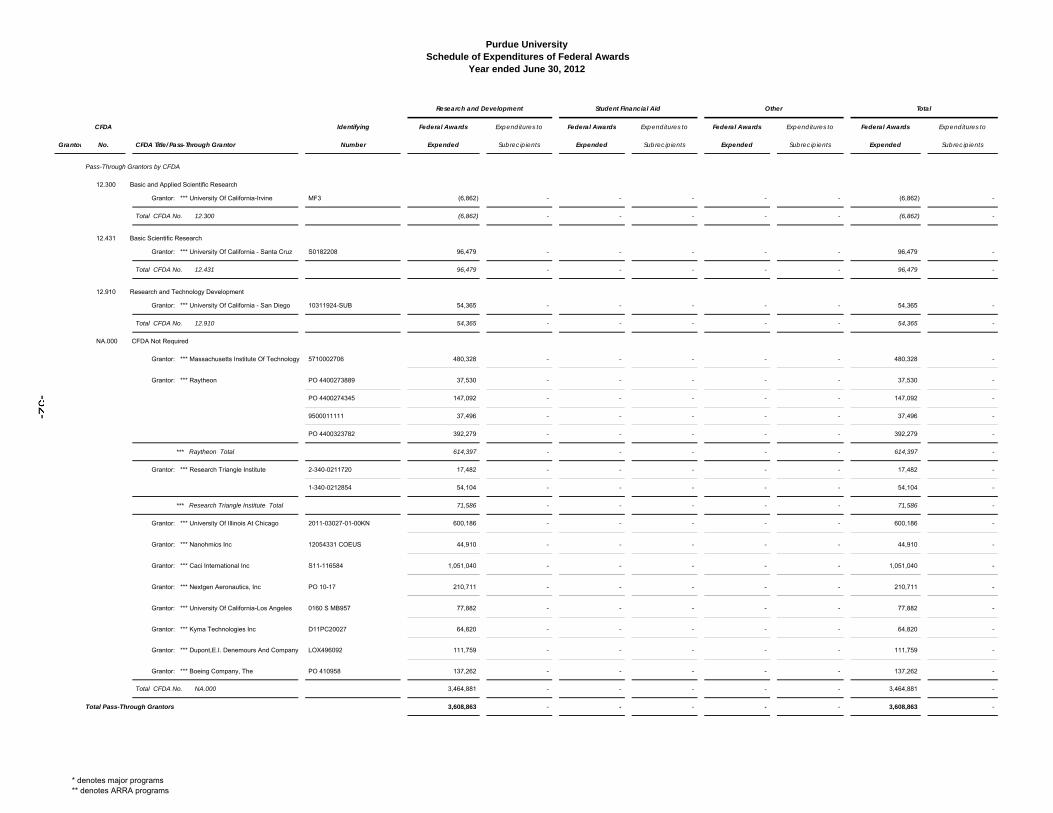
Purdue University Schedule of Expenditures of Federal Awards
Year ended June 30, 2012
CFDA Identifying Federal Awards Expenditures to Federal Awards Expenditures to Federal Awards Expenditures to Federal Awards Expenditures to
Grantor No. CFDA Title/Pass-Through Grantor Number Expended Subrecipients Expended Subrecipients Expended Subrecipients Expended Subrecipients
Research and Development Student Financial Aid Other Total
Pass-Through Grantors by CFDA
12.300 Basic and Applied Scientific Research
Grantor: *** University Of California-Irvine MF3 (6,862) - - - - - (6,862) -
Total CFDA No. 12.300 (6,862) - - - - - (6,862) -
12.431 Basic Scientific Research
Grantor: *** University Of California - Santa Cruz S0182208 96,479 - - - - - 96,479 -
Total CFDA No. 12.431 96,479 - - - - - 96,479 -
12.910 Research and Technology Development
Grantor: *** University Of California - San Diego 10311924-SUB 54,365 - - - - - 54,365 -
Total CFDA No. 12.910 54,365 - - - - - 54,365 -
NA.000 CFDA Not Required
Grantor: *** Massachusetts Institute Of Technology 5710002706 480,328 - - - - - 480,328 -
Grantor: *** Raytheon PO 4400273889 37,530 - - - - - 37,530 -
PO 4400274345 147,092 - - - - - 147,092 -
9500011111 37,496 - - - - - 37,496 -
PO 4400323782 392,279 - - - - - 392,279 -
*** Raytheon Total 614,397 - - - - - 614,397 -
Grantor: *** Research Triangle Institute 2-340-0211720 17,482 - - - - - 17,482 -
1-340-0212854 54,104 - - - - - 54,104 -
*** Research Triangle Institute Total 71,586 - - - - - 71,586 -
Grantor: *** University Of Illinois At Chicago 2011-03027-01-00KN 600,186 - - - - - 600,186 -
Grantor: *** Nanohmics Inc 12054331 COEUS 44,910 - - - - - 44,910 -
Grantor: *** Caci International Inc S11-116584 1,051,040 - - - - - 1,051,040 -
Grantor: *** Nextgen Aeronautics, Inc PO 10-17 210,711 - - - - - 210,711 -
Grantor: *** University Of California-Los Angeles 0160 S MB957 77,882 - - - - - 77,882 -
Grantor: *** Kyma Technologies Inc D11PC20027 64,820 - - - - - 64,820 -
Grantor: *** Dupont,E.I. Denemours And Company LOX496092 111,759 - - - - - 111,759 -
Grantor: *** Boeing Company, The PO 410958 137,262 - - - - - 137,262 -
Total CFDA No. NA.000 3,464,881 - - - - - 3,464,881 -
Total Pass-Through Grantors 3,608,863 - - - - - 3,608,863 -
* denotes major programs** denotes ARRA programs
ldavid
Text Box
-52-
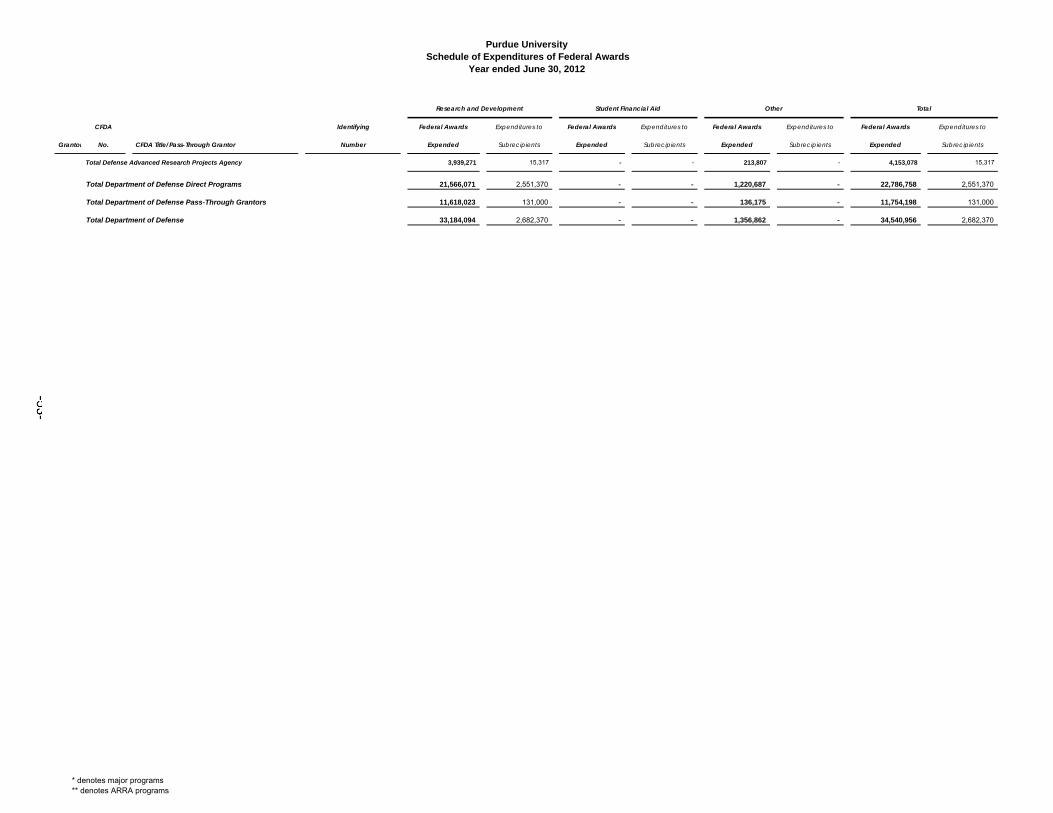
Purdue University Schedule of Expenditures of Federal Awards
Year ended June 30, 2012
CFDA Identifying Federal Awards Expenditures to Federal Awards Expenditures to Federal Awards Expenditures to Federal Awards Expenditures to
Grantor No. CFDA Title/Pass-Through Grantor Number Expended Subrecipients Expended Subrecipients Expended Subrecipients Expended Subrecipients
Research and Development Student Financial Aid Other Total
Total Defense Advanced Research Projects Agency 3,939,271 15,317 - - 213,807 - 4,153,078 15,317
Total Department of Defense Direct Programs 21,566,071 2,551,370 - - 1,220,687 - 22,786,758 2,551,370
Total Department of Defense Pass-Through Grantors 11,618,023 131,000 - - 136,175 - 11,754,198 131,000
Total Department of Defense 33,184,094 2,682,370 - - 1,356,862 - 34,540,956 2,682,370
* denotes major programs** denotes ARRA programs
ldavid
Text Box
-53-
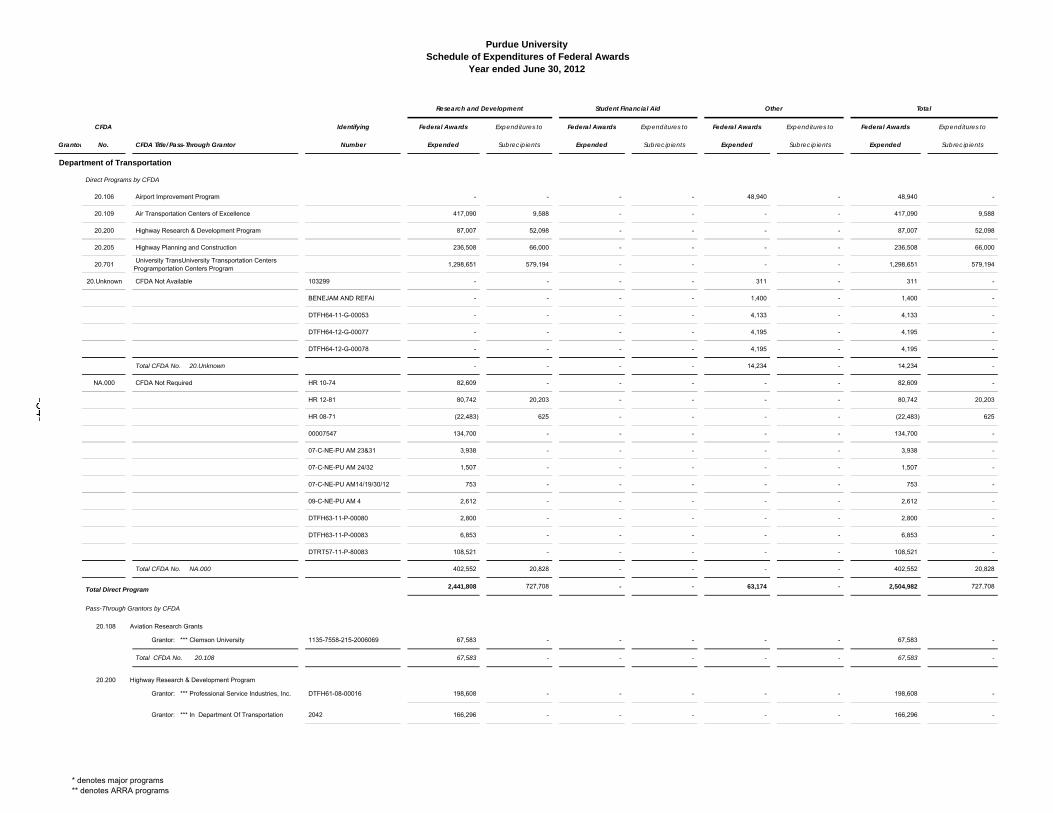
Purdue University Schedule of Expenditures of Federal Awards
Year ended June 30, 2012
CFDA Identifying Federal Awards Expenditures to Federal Awards Expenditures to Federal Awards Expenditures to Federal Awards Expenditures to
Grantor No. CFDA Title/Pass-Through Grantor Number Expended Subrecipients Expended Subrecipients Expended Subrecipients Expended Subrecipients
Research and Development Student Financial Aid Other Total
Department of Transportation
Direct Programs by CFDA
20.106 Airport Improvement Program - - - - 48,940 - 48,940 -
20.109 Air Transportation Centers of Excellence 417,090 9,588 - - - - 417,090 9,588
20.200 Highway Research & Development Program 87,007 52,098 - - - - 87,007 52,098
20.205 Highway Planning and Construction 236,508 66,000 - - - - 236,508 66,000
20.701 University TransUniversity Transportation Centers Programportation Centers Program
1,298,651 579,194 - - - - 1,298,651 579,194
20.Unknown CFDA Not Available 103299 - - - - 311 - 311 -
BENEJAM AND REFAI - - - - 1,400 - 1,400 -
DTFH64-11-G-00053 - - - - 4,133 - 4,133 -
DTFH64-12-G-00077 - - - - 4,195 - 4,195 -
DTFH64-12-G-00078 - - - - 4,195 - 4,195 -
Total CFDA No. 20.Unknown - - - - 14,234 - 14,234 -
NA.000 CFDA Not Required HR 10-74 82,609 - - - - - 82,609 -
HR 12-81 80,742 20,203 - - - - 80,742 20,203
HR 08-71 (22,483) 625 - - - - (22,483) 625
00007547 134,700 - - - - - 134,700 -
07-C-NE-PU AM 23&31 3,938 - - - - - 3,938 -
07-C-NE-PU AM 24/32 1,507 - - - - - 1,507 -
07-C-NE-PU AM14/19/30/12 753 - - - - - 753 -
09-C-NE-PU AM 4 2,612 - - - - - 2,612 -
DTFH63-11-P-00080 2,800 - - - - - 2,800 -
DTFH63-11-P-00083 6,853 - - - - - 6,853 -
DTRT57-11-P-80083 108,521 - - - - - 108,521 -
Total CFDA No. NA.000 402,552 20,828 - - - - 402,552 20,828
Total Direct Program 2,441,808 727,708 - - 63,174 - 2,504,982 727,708
Pass-Through Grantors by CFDA
20.108 Aviation Research Grants
Grantor: *** Clemson University 1135-7558-215-2006069 67,583 - - - - - 67,583 -
Total CFDA No. 20.108 67,583 - - - - - 67,583 -
20.200 Highway Research & Development Program
Grantor: *** Professional Service Industries, Inc. DTFH61-08-00016 198,608 - - - - - 198,608 -
Grantor: *** In Department Of Transportation 2042 166,296 - - - - - 166,296 -
* denotes major programs** denotes ARRA programs
ldavid
Text Box
-54-
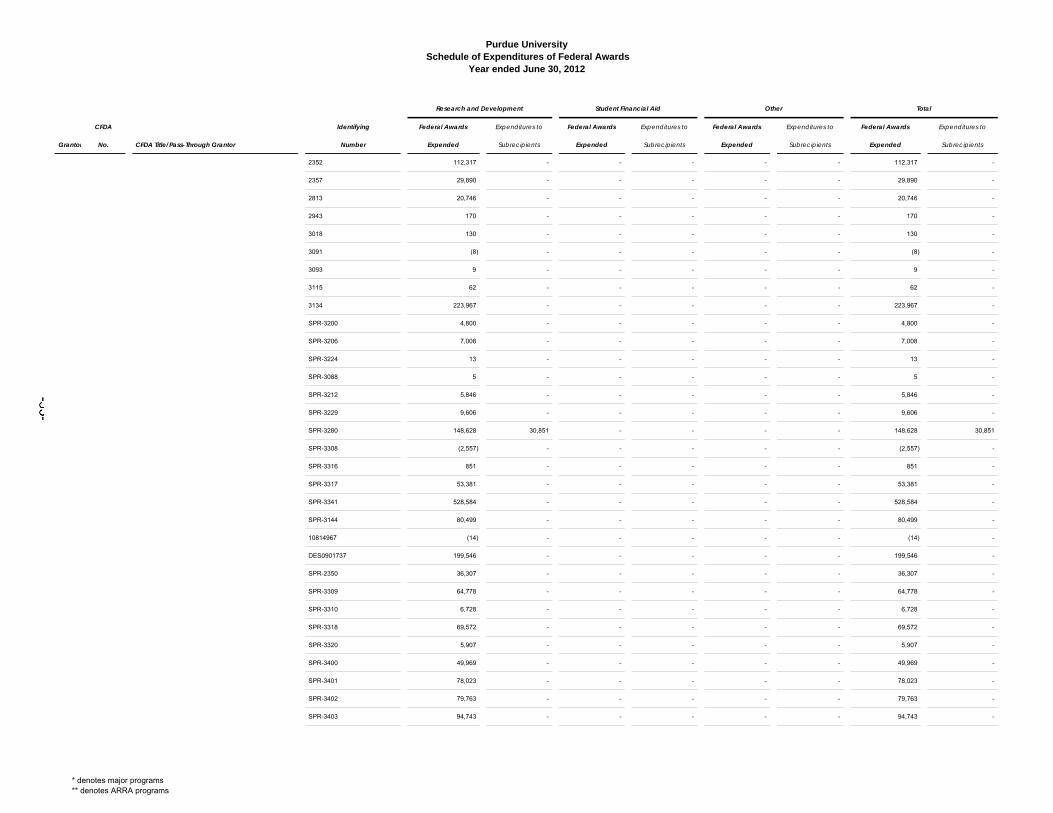
Purdue University Schedule of Expenditures of Federal Awards
Year ended June 30, 2012
CFDA Identifying Federal Awards Expenditures to Federal Awards Expenditures to Federal Awards Expenditures to Federal Awards Expenditures to
Grantor No. CFDA Title/Pass-Through Grantor Number Expended Subrecipients Expended Subrecipients Expended Subrecipients Expended Subrecipients
Research and Development Student Financial Aid Other Total
2352 112,317 - - - - - 112,317 -
2357 29,890 - - - - - 29,890 -
2813 20,746 - - - - - 20,746 -
2943 170 - - - - - 170 -
3018 130 - - - - - 130 -
3091 (8) - - - - - (8) -
3093 9 - - - - - 9 -
3115 62 - - - - - 62 -
3134 223,967 - - - - - 223,967 -
SPR-3200 4,800 - - - - - 4,800 -
SPR-3206 7,008 - - - - - 7,008 -
SPR-3224 13 - - - - - 13 -
SPR-3088 5 - - - - - 5 -
SPR-3212 5,846 - - - - - 5,846 -
SPR-3229 9,606 - - - - - 9,606 -
SPR-3280 148,628 30,851 - - - - 148,628 30,851
SPR-3308 (2,557) - - - - - (2,557) -
SPR-3316 851 - - - - - 851 -
SPR-3317 53,381 - - - - - 53,381 -
SPR-3341 528,584 - - - - - 528,584 -
SPR-3144 80,499 - - - - - 80,499 -
10814967 (14) - - - - - (14) -
DES0901737 199,546 - - - - - 199,546 -
SPR-2350 36,307 - - - - - 36,307 -
SPR-3309 64,778 - - - - - 64,778 -
SPR-3310 6,728 - - - - - 6,728 -
SPR-3318 69,572 - - - - - 69,572 -
SPR-3320 5,907 - - - - - 5,907 -
SPR-3400 49,969 - - - - - 49,969 -
SPR-3401 78,023 - - - - - 78,023 -
SPR-3402 79,763 - - - - - 79,763 -
SPR-3403 94,743 - - - - - 94,743 -
* denotes major programs** denotes ARRA programs
ldavid
Text Box
-55-
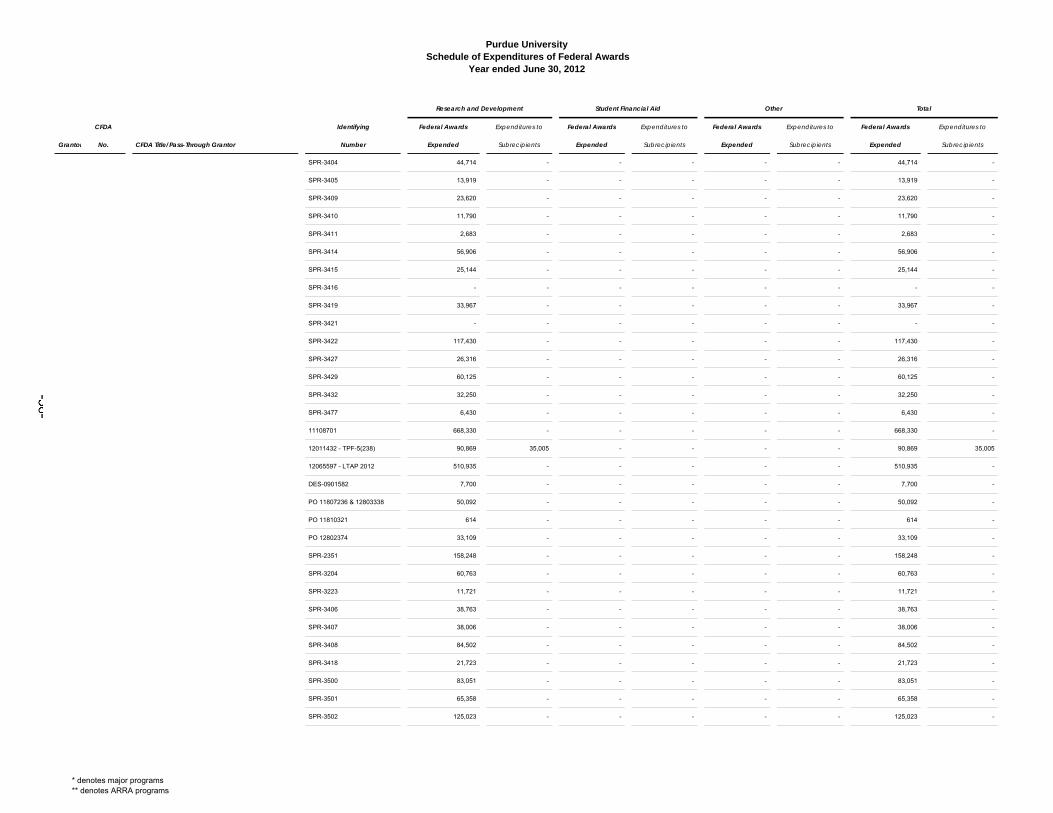
Purdue University Schedule of Expenditures of Federal Awards
Year ended June 30, 2012
CFDA Identifying Federal Awards Expenditures to Federal Awards Expenditures to Federal Awards Expenditures to Federal Awards Expenditures to
Grantor No. CFDA Title/Pass-Through Grantor Number Expended Subrecipients Expended Subrecipients Expended Subrecipients Expended Subrecipients
Research and Development Student Financial Aid Other Total
SPR-3404 44,714 - - - - - 44,714 -
SPR-3405 13,919 - - - - - 13,919 -
SPR-3409 23,620 - - - - - 23,620 -
SPR-3410 11,790 - - - - - 11,790 -
SPR-3411 2,683 - - - - - 2,683 -
SPR-3414 56,906 - - - - - 56,906 -
SPR-3415 25,144 - - - - - 25,144 -
SPR-3416 - - - - - - - -
SPR-3419 33,967 - - - - - 33,967 -
SPR-3421 - - - - - - - -
SPR-3422 117,430 - - - - - 117,430 -
SPR-3427 26,316 - - - - - 26,316 -
SPR-3429 60,125 - - - - - 60,125 -
SPR-3432 32,250 - - - - - 32,250 -
SPR-3477 6,430 - - - - - 6,430 -
11108701 668,330 - - - - - 668,330 -
12011432 - TPF-5(238) 90,869 35,005 - - - - 90,869 35,005
12065597 - LTAP 2012 510,935 - - - - - 510,935 -
DES-0901582 7,700 - - - - - 7,700 -
PO 11807236 & 12803338 50,092 - - - - - 50,092 -
PO 11810321 614 - - - - - 614 -
PO 12802374 33,109 - - - - - 33,109 -
SPR-2351 158,248 - - - - - 158,248 -
SPR-3204 60,763 - - - - - 60,763 -
SPR-3223 11,721 - - - - - 11,721 -
SPR-3406 38,763 - - - - - 38,763 -
SPR-3407 38,006 - - - - - 38,006 -
SPR-3408 84,502 - - - - - 84,502 -
SPR-3418 21,723 - - - - - 21,723 -
SPR-3500 83,051 - - - - - 83,051 -
SPR-3501 65,358 - - - - - 65,358 -
SPR-3502 125,023 - - - - - 125,023 -
* denotes major programs** denotes ARRA programs
ldavid
Text Box
-56-
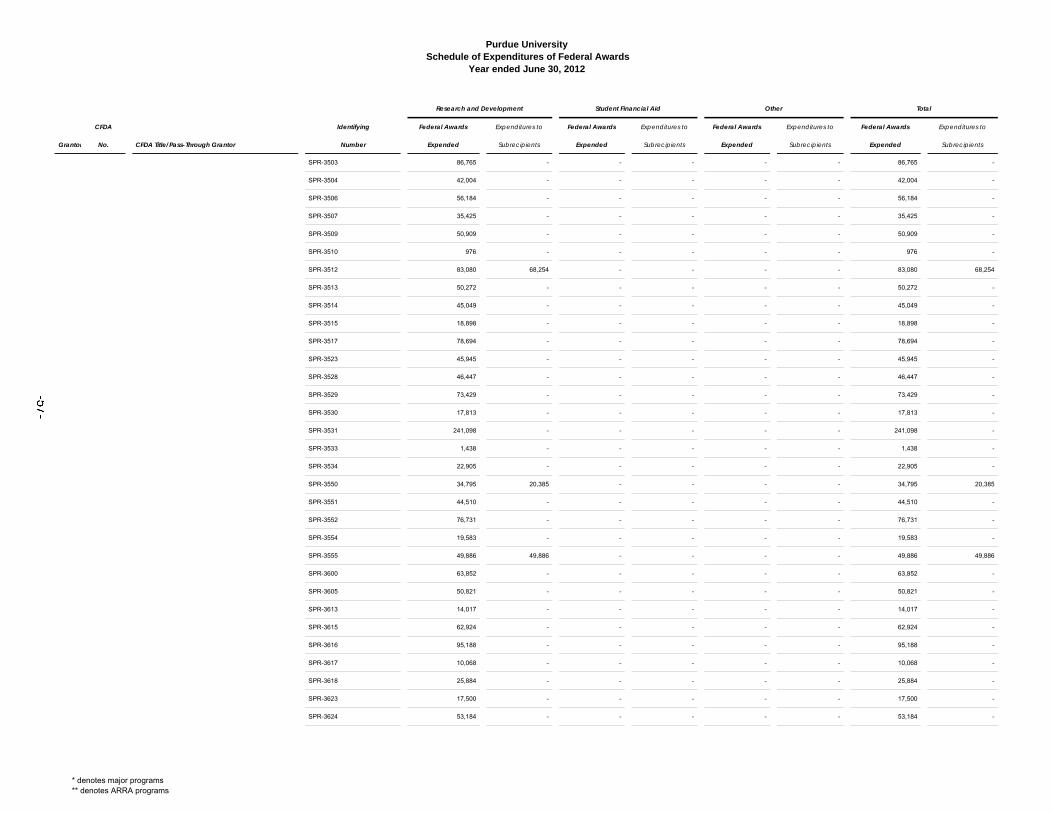
Purdue University Schedule of Expenditures of Federal Awards
Year ended June 30, 2012
CFDA Identifying Federal Awards Expenditures to Federal Awards Expenditures to Federal Awards Expenditures to Federal Awards Expenditures to
Grantor No. CFDA Title/Pass-Through Grantor Number Expended Subrecipients Expended Subrecipients Expended Subrecipients Expended Subrecipients
Research and Development Student Financial Aid Other Total
SPR-3503 86,765 - - - - - 86,765 -
SPR-3504 42,004 - - - - - 42,004 -
SPR-3506 56,184 - - - - - 56,184 -
SPR-3507 35,425 - - - - - 35,425 -
SPR-3509 50,909 - - - - - 50,909 -
SPR-3510 976 - - - - - 976 -
SPR-3512 83,080 68,254 - - - - 83,080 68,254
SPR-3513 50,272 - - - - - 50,272 -
SPR-3514 45,049 - - - - - 45,049 -
SPR-3515 18,898 - - - - - 18,898 -
SPR-3517 78,694 - - - - - 78,694 -
SPR-3523 45,945 - - - - - 45,945 -
SPR-3528 46,447 - - - - - 46,447 -
SPR-3529 73,429 - - - - - 73,429 -
SPR-3530 17,813 - - - - - 17,813 -
SPR-3531 241,098 - - - - - 241,098 -
SPR-3533 1,438 - - - - - 1,438 -
SPR-3534 22,905 - - - - - 22,905 -
SPR-3550 34,795 20,385 - - - - 34,795 20,385
SPR-3551 44,510 - - - - - 44,510 -
SPR-3552 76,731 - - - - - 76,731 -
SPR-3554 19,583 - - - - - 19,583 -
SPR-3555 49,886 49,886 - - - - 49,886 49,886
SPR-3600 63,852 - - - - - 63,852 -
SPR-3605 50,821 - - - - - 50,821 -
SPR-3613 14,017 - - - - - 14,017 -
SPR-3615 62,924 - - - - - 62,924 -
SPR-3616 95,188 - - - - - 95,188 -
SPR-3617 10,068 - - - - - 10,068 -
SPR-3618 25,884 - - - - - 25,884 -
SPR-3623 17,500 - - - - - 17,500 -
SPR-3624 53,184 - - - - - 53,184 -
* denotes major programs** denotes ARRA programs
ldavid
Text Box
-57-
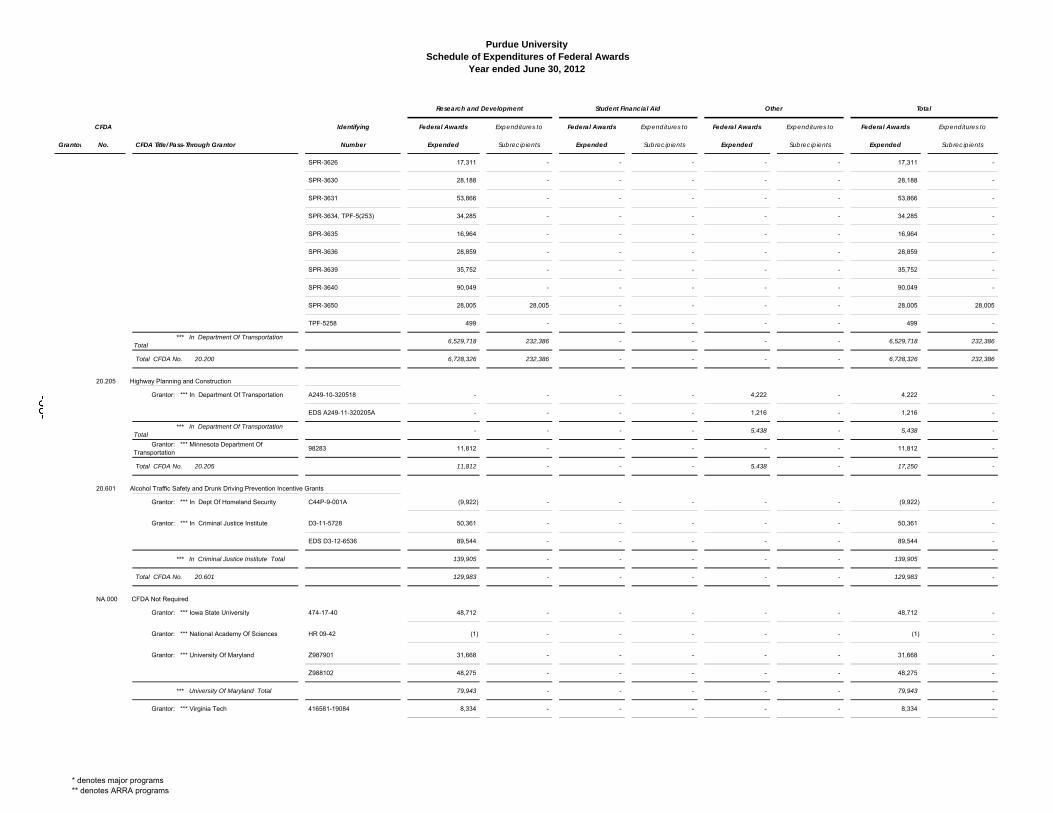
Purdue University Schedule of Expenditures of Federal Awards
Year ended June 30, 2012
CFDA Identifying Federal Awards Expenditures to Federal Awards Expenditures to Federal Awards Expenditures to Federal Awards Expenditures to
Grantor No. CFDA Title/Pass-Through Grantor Number Expended Subrecipients Expended Subrecipients Expended Subrecipients Expended Subrecipients
Research and Development Student Financial Aid Other Total
SPR-3626 17,311 - - - - - 17,311 -
SPR-3630 28,188 - - - - - 28,188 -
SPR-3631 53,866 - - - - - 53,866 -
SPR-3634, TPF-5(253) 34,285 - - - - - 34,285 -
SPR-3635 16,964 - - - - - 16,964 -
SPR-3636 28,859 - - - - - 28,859 -
SPR-3639 35,752 - - - - - 35,752 -
SPR-3640 90,049 - - - - - 90,049 -
SPR-3650 28,005 28,005 - - - - 28,005 28,005
TPF-5258 499 - - - - - 499 -
*** In Department Of Transportation Total
6,529,718 232,386 - - - - 6,529,718 232,386
Total CFDA No. 20.200 6,728,326 232,386 - - - - 6,728,326 232,386
20.205 Highway Planning and Construction
Grantor: *** In Department Of Transportation A249-10-320518 - - - - 4,222 - 4,222 -
EDS A249-11-320205A - - - - 1,216 - 1,216 -
*** In Department Of Transportation Total
- - - - 5,438 - 5,438 -
Grantor: *** Minnesota Department Of Transportation
98283 11,812 - - - - - 11,812 -
Total CFDA No. 20.205 11,812 - - - 5,438 - 17,250 -
20.601 Alcohol Traffic Safety and Drunk Driving Prevention Incentive Grants
Grantor: *** In Dept Of Homeland Security C44P-9-001A (9,922) - - - - - (9,922) -
Grantor: *** In Criminal Justice Institute D3-11-5728 50,361 - - - - - 50,361 -
EDS D3-12-6536 89,544 - - - - - 89,544 -
*** In Criminal Justice Institute Total 139,905 - - - - - 139,905 -
Total CFDA No. 20.601 129,983 - - - - - 129,983 -
NA.000 CFDA Not Required
Grantor: *** Iowa State University 474-17-40 48,712 - - - - - 48,712 -
Grantor: *** National Academy Of Sciences HR 09-42 (1) - - - - - (1) -
Grantor: *** University Of Maryland Z987901 31,668 - - - - - 31,668 -
Z988102 48,275 - - - - - 48,275 -
*** University Of Maryland Total 79,943 - - - - - 79,943 -
Grantor: *** Virginia Tech 416581-19084 8,334 - - - - - 8,334 -
* denotes major programs** denotes ARRA programs
ldavid
Text Box
-58-
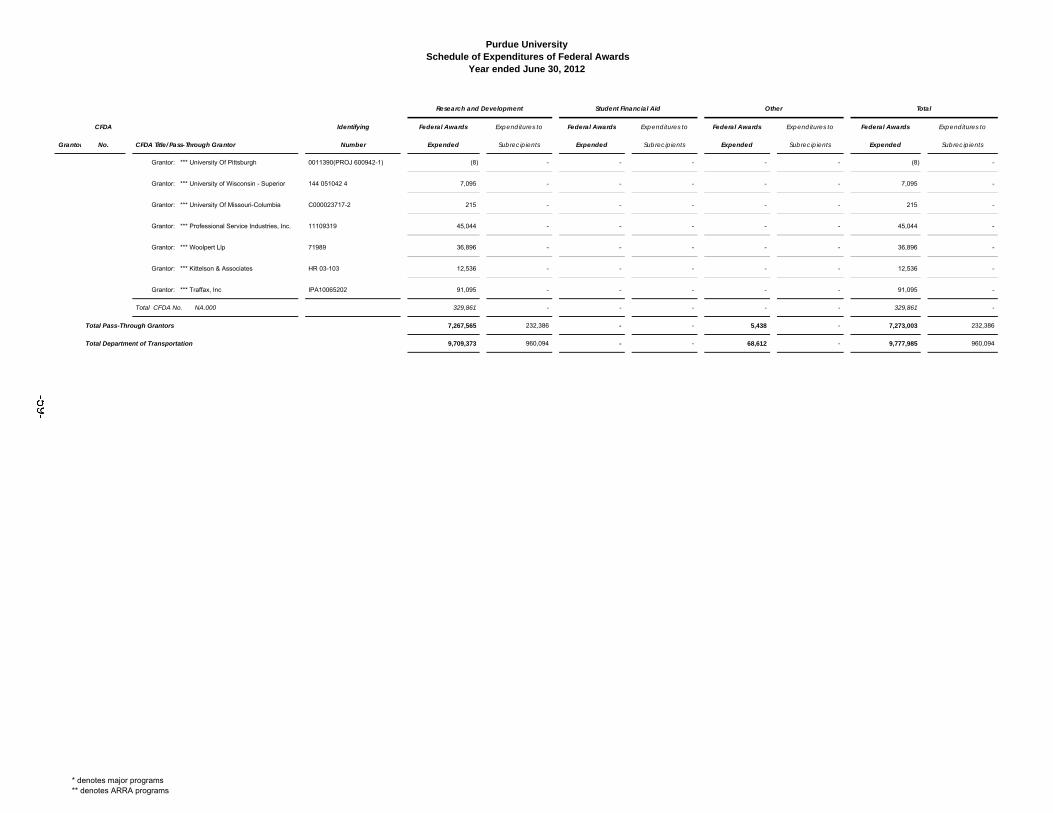
Purdue University Schedule of Expenditures of Federal Awards
Year ended June 30, 2012
CFDA Identifying Federal Awards Expenditures to Federal Awards Expenditures to Federal Awards Expenditures to Federal Awards Expenditures to
Grantor No. CFDA Title/Pass-Through Grantor Number Expended Subrecipients Expended Subrecipients Expended Subrecipients Expended Subrecipients
Research and Development Student Financial Aid Other Total
Grantor: *** University Of Pittsburgh 0011390(PROJ 600942-1) (8) - - - - - (8) -
Grantor: *** University of Wisconsin - Superior 144 051042 4 7,095 - - - - - 7,095 -
Grantor: *** University Of Missouri-Columbia C000023717-2 215 - - - - - 215 -
Grantor: *** Professional Service Industries, Inc. 11109319 45,044 - - - - - 45,044 -
Grantor: *** Woolpert Llp 71989 36,896 - - - - - 36,896 -
Grantor: *** Kittelson & Associates HR 03-103 12,536 - - - - - 12,536 -
Grantor: *** Traffax, Inc IPA10065202 91,095 - - - - - 91,095 -
Total CFDA No. NA.000 329,861 - - - - - 329,861 -
Total Pass-Through Grantors 7,267,565 232,386 - - 5,438 - 7,273,003 232,386
Total Department of Transportation 9,709,373 960,094 - - 68,612 - 9,777,985 960,094
* denotes major programs** denotes ARRA programs
ldavid
Text Box
-59-
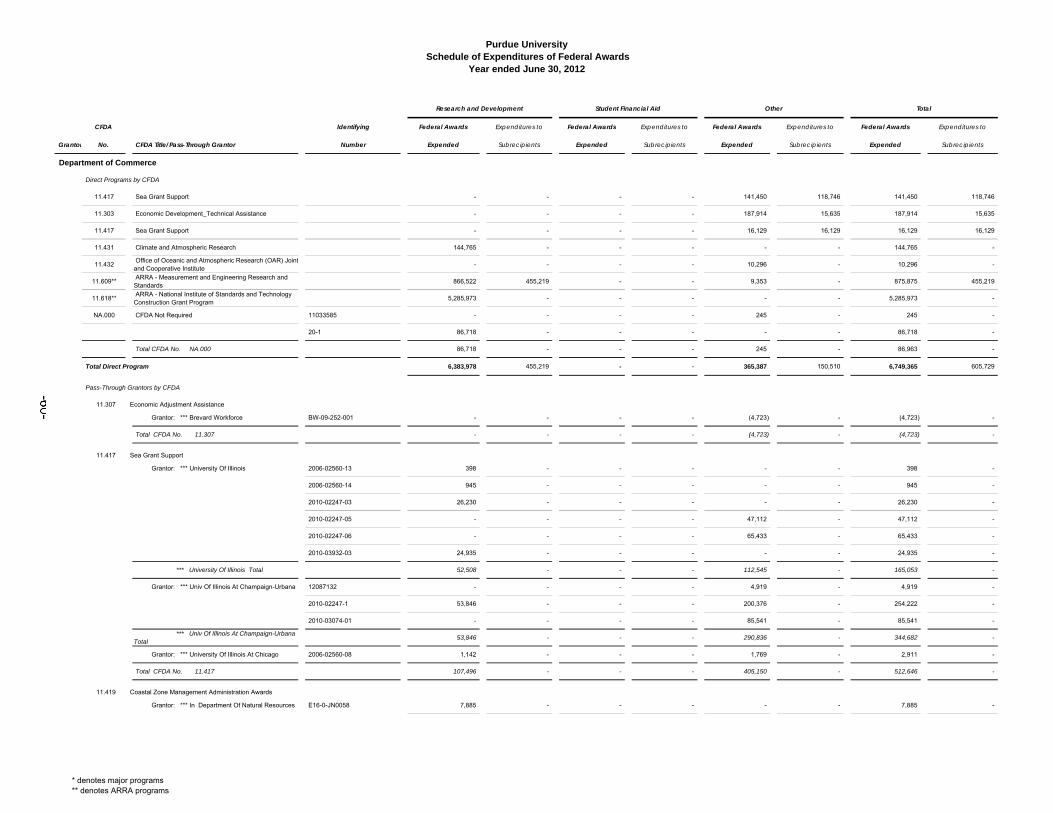
Purdue University Schedule of Expenditures of Federal Awards
Year ended June 30, 2012
CFDA Identifying Federal Awards Expenditures to Federal Awards Expenditures to Federal Awards Expenditures to Federal Awards Expenditures to
Grantor No. CFDA Title/Pass-Through Grantor Number Expended Subrecipients Expended Subrecipients Expended Subrecipients Expended Subrecipients
Research and Development Student Financial Aid Other Total
Department of Commerce
Direct Programs by CFDA
11.417 Sea Grant Support - - - - 141,450 118,746 141,450 118,746
11.303 Economic Development_Technical Assistance - - - - 187,914 15,635 187,914 15,635
11.417 Sea Grant Support - - - - 16,129 16,129 16,129 16,129
11.431 Climate and Atmospheric Research 144,765 - - - - - 144,765 -
11.432 Office of Oceanic and Atmospheric Research (OAR) Jointand Cooperative Institute
- - - - 10,296 - 10,296 -
11.609** ARRA - Measurement and Engineering Research and Standards
866,522 455,219 - - 9,353 - 875,875 455,219
11.618** ARRA - National Institute of Standards and Technology Construction Grant Program
5,285,973 - - - - - 5,285,973 -
NA.000 CFDA Not Required 11033585 - - - - 245 - 245 -
20-1 86,718 - - - - - 86,718 -
Total CFDA No. NA.000 86,718 - - - 245 - 86,963 -
Total Direct Program 6,383,978 455,219 - - 365,387 150,510 6,749,365 605,729
Pass-Through Grantors by CFDA
11.307 Economic Adjustment Assistance
Grantor: *** Brevard Workforce BW-09-252-001 - - - - (4,723) - (4,723) -
Total CFDA No. 11.307 - - - - (4,723) - (4,723) -
11.417 Sea Grant Support
Grantor: *** University Of Illinois 2006-02560-13 398 - - - - - 398 -
2006-02560-14 945 - - - - - 945 -
2010-02247-03 26,230 - - - - - 26,230 -
2010-02247-05 - - - - 47,112 - 47,112 -
2010-02247-06 - - - - 65,433 - 65,433 -
2010-03932-03 24,935 - - - - - 24,935 -
*** University Of Illinois Total 52,508 - - - 112,545 - 165,053 -
Grantor: *** Univ Of Illinois At Champaign-Urbana 12087132 - - - - 4,919 - 4,919 -
2010-02247-1 53,846 - - - 200,376 - 254,222 -
2010-03074-01 - - - - 85,541 - 85,541 -
*** Univ Of Illinois At Champaign-Urbana Total
53,846 - - - 290,836 - 344,682 -
Grantor: *** University Of Illinois At Chicago 2006-02560-08 1,142 - - - 1,769 - 2,911 -
Total CFDA No. 11.417 107,496 - - - 405,150 - 512,646 -
11.419 Coastal Zone Management Administration Awards
Grantor: *** In Department Of Natural Resources E16-0-JN0058 7,885 - - - - - 7,885 -
* denotes major programs** denotes ARRA programs
ldavid
Text Box
-60-
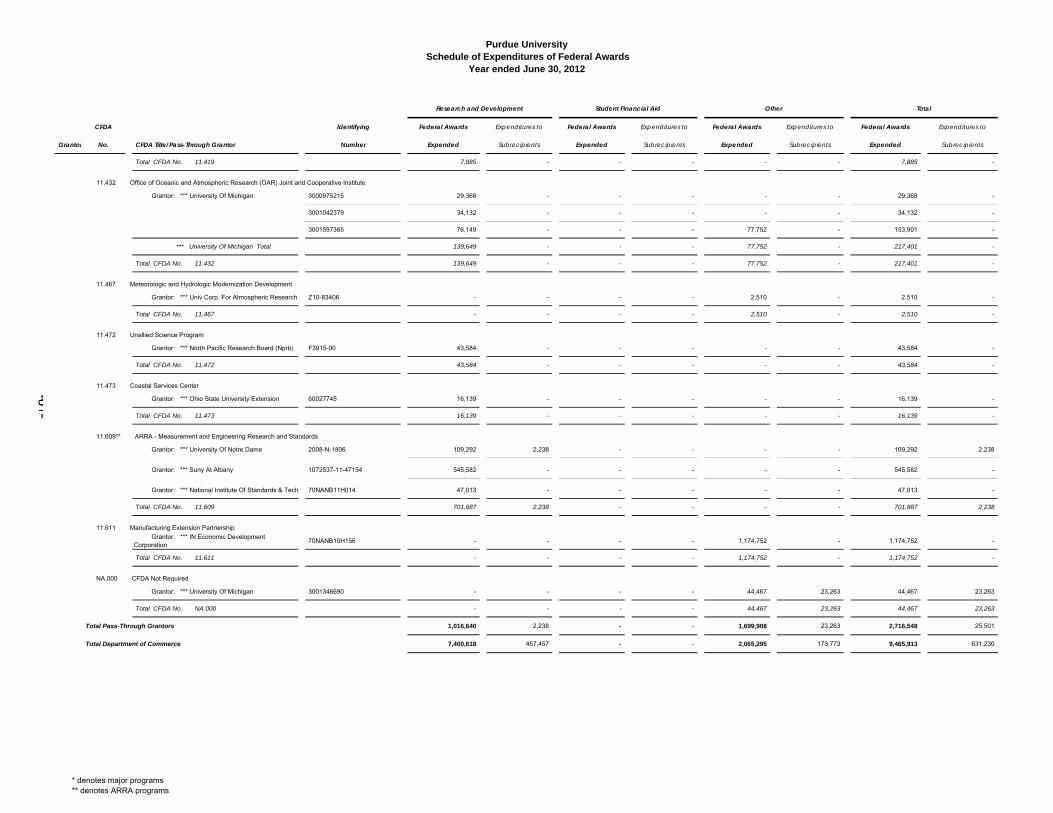
Purdue University Schedule of Expenditures of Federal Awards
Year ended June 30, 2012
CFDA Identifying Federal Awards Expenditures to Federal Awards Expenditures to Federal Awards Expenditures to Federal Awards Expenditures to
Grantor No. CFDA Title/Pass-Through Grantor Number Expended Subrecipients Expended Subrecipients Expended Subrecipients Expended Subrecipients
Research and Development Student Financial Aid Other Total
Total CFDA No. 11.419 7,885 - - - - - 7,885 -
11.432 Office of Oceanic and Atmospheric Research (OAR) Joint and Cooperative Institute
Grantor: *** University Of Michigan 3000975215 29,368 - - - - - 29,368 -
3001042379 34,132 - - - - - 34,132 -
3001597365 76,149 - - - 77,752 - 153,901 -
*** University Of Michigan Total 139,649 - - - 77,752 - 217,401 -
Total CFDA No. 11.432 139,649 - - - 77,752 - 217,401 -
11.467 Meteorologic and Hydrologic Modernization Development
Grantor: *** Univ Corp. For Atmospheric Research Z10-83406 - - - - 2,510 - 2,510 -
Total CFDA No. 11.467 - - - - 2,510 - 2,510 -
11.472 Unallied Science Program
Grantor: *** North Pacific Research Board (Nprb) F3915-00 43,584 - - - - - 43,584 -
Total CFDA No. 11.472 43,584 - - - - - 43,584 -
11.473 Coastal Services Center
Grantor: *** Ohio State University Extension 60027745 16,139 - - - - - 16,139 -
Total CFDA No. 11.473 16,139 - - - - - 16,139 -
11.609** ARRA - Measurement and Engineering Research and Standards
Grantor: *** University Of Notre Dame 2008-N-1806 109,292 2,238 - - - - 109,292 2,238
Grantor: *** Suny At Albany 1072537-11-47154 545,582 - - - - - 545,582 -
Grantor: *** National Institute Of Standards & Tech 70NANB11H014 47,013 - - - - - 47,013 -
Total CFDA No. 11.609 701,887 2,238 - - - - 701,887 2,238
11.611 Manufacturing Extension Partnership
Grantor: *** IN Economic Development Corporation
70NANB10H156 - - - - 1,174,752 - 1,174,752 -
Total CFDA No. 11.611 - - - - 1,174,752 - 1,174,752 -
NA.000 CFDA Not Required
Grantor: *** University Of Michigan 3001346690 - - - - 44,467 23,263 44,467 23,263
Total CFDA No. NA.000 - - - - 44,467 23,263 44,467 23,263
Total Pass-Through Grantors 1,016,640 2,238 - - 1,699,908 23,263 2,716,548 25,501
Total Department of Commerce 7,400,618 457,457 - - 2,065,295 173,773 9,465,913 631,230
* denotes major programs** denotes ARRA programs
ldavid
Text Box
-61-
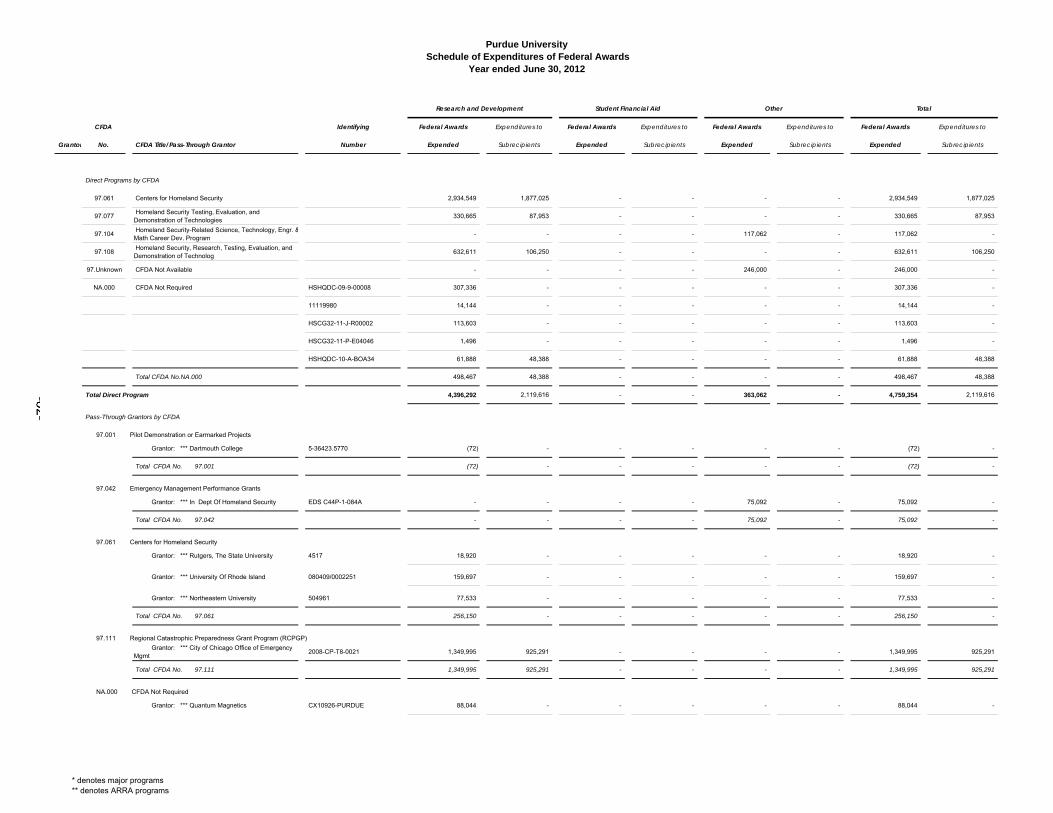
Purdue University Schedule of Expenditures of Federal Awards
Year ended June 30, 2012
CFDA Identifying Federal Awards Expenditures to Federal Awards Expenditures to Federal Awards Expenditures to Federal Awards Expenditures to
Grantor No. CFDA Title/Pass-Through Grantor Number Expended Subrecipients Expended Subrecipients Expended Subrecipients Expended Subrecipients
Research and Development Student Financial Aid Other Total
Direct Programs by CFDA
97.061 Centers for Homeland Security 2,934,549 1,877,025 - - - - 2,934,549 1,877,025
97.077 Homeland Security Testing, Evaluation, and Demonstration of Technologies
330,665 87,953 - - - - 330,665 87,953
97.104 Homeland Security-Related Science, Technology, Engr. &Math Career Dev. Program
- - - - 117,062 - 117,062 -
97.108 Homeland Security, Research, Testing, Evaluation, and Demonstration of Technolog
632,611 106,250 - - - - 632,611 106,250
97.Unknown CFDA Not Available - - - - 246,000 - 246,000 -
NA.000 CFDA Not Required HSHQDC-09-9-00008 307,336 - - - - - 307,336 -
11119980 14,144 - - - - - 14,144 -
HSCG32-11-J-R00002 113,603 - - - - - 113,603 -
HSCG32-11-P-E04046 1,496 - - - - - 1,496 -
HSHQDC-10-A-BOA34 61,888 48,388 - - - - 61,888 48,388
Total CFDA No.NA.000 498,467 48,388 - - - - 498,467 48,388
Total Direct Program 4,396,292 2,119,616 - - 363,062 - 4,759,354 2,119,616
Pass-Through Grantors by CFDA
97.001 Pilot Demonstration or Earmarked Projects
Grantor: *** Dartmouth College 5-36423.5770 (72) - - - - - (72) -
Total CFDA No. 97.001 (72) - - - - - (72) -
97.042 Emergency Management Performance Grants
Grantor: *** In Dept Of Homeland Security EDS C44P-1-084A - - - - 75,092 - 75,092 -
Total CFDA No. 97.042 - - - - 75,092 - 75,092 -
97.061 Centers for Homeland Security
Grantor: *** Rutgers, The State University 4517 18,920 - - - - - 18,920 -
Grantor: *** University Of Rhode Island 080409/0002251 159,697 - - - - - 159,697 -
Grantor: *** Northeastern University 504961 77,533 - - - - - 77,533 -
Total CFDA No. 97.061 256,150 - - - - - 256,150 -
97.111 Regional Catastrophic Preparedness Grant Program (RCPGP)
Grantor: *** City of Chicago Office of Emergency Mgmt
2008-CP-T8-0021 1,349,995 925,291 - - - - 1,349,995 925,291
Total CFDA No. 97.111 1,349,995 925,291 - - - - 1,349,995 925,291
NA.000 CFDA Not Required
Grantor: *** Quantum Magnetics CX10926-PURDUE 88,044 - - - - - 88,044 -
* denotes major programs** denotes ARRA programs
ldavid
Text Box
-62-
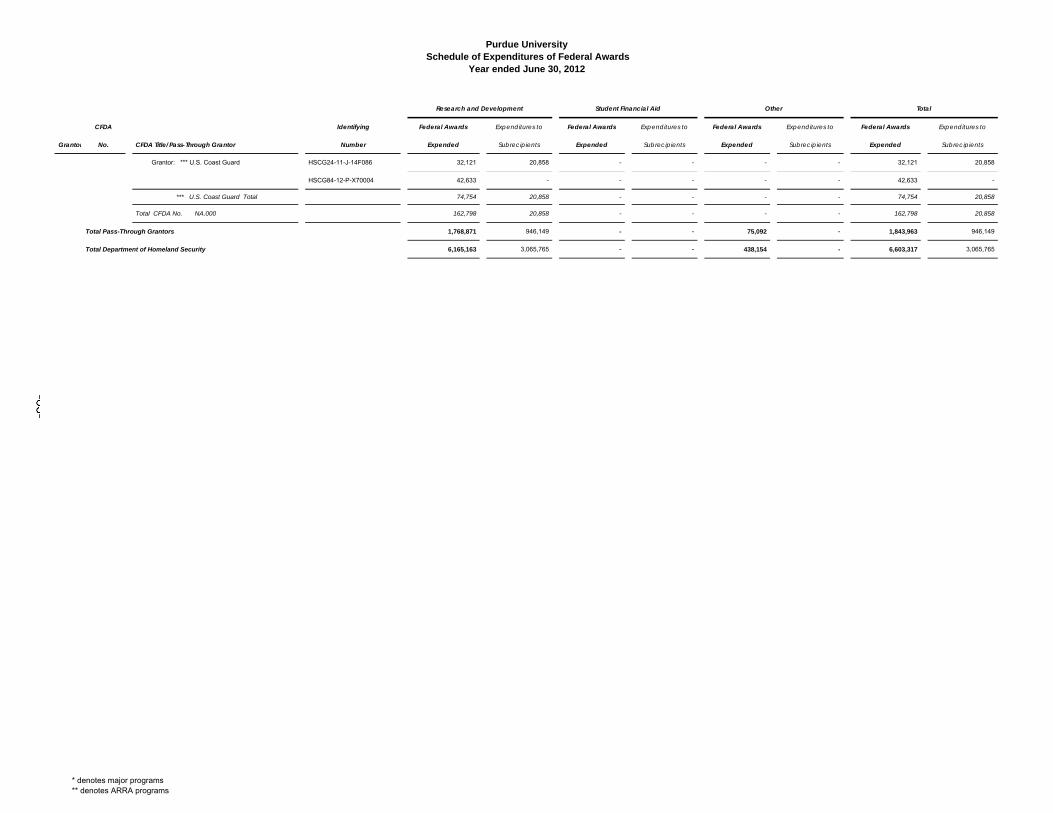
Purdue University Schedule of Expenditures of Federal Awards
Year ended June 30, 2012
CFDA Identifying Federal Awards Expenditures to Federal Awards Expenditures to Federal Awards Expenditures to Federal Awards Expenditures to
Grantor No. CFDA Title/Pass-Through Grantor Number Expended Subrecipients Expended Subrecipients Expended Subrecipients Expended Subrecipients
Research and Development Student Financial Aid Other Total
Grantor: *** U.S. Coast Guard HSCG24-11-J-14F086 32,121 20,858 - - - - 32,121 20,858
HSCG84-12-P-X70004 42,633 - - - - - 42,633 -
*** U.S. Coast Guard Total 74,754 20,858 - - - - 74,754 20,858
Total CFDA No. NA.000 162,798 20,858 - - - - 162,798 20,858
Total Pass-Through Grantors 1,768,871 946,149 - - 75,092 - 1,843,963 946,149
Total Department of Homeland Security 6,165,163 3,065,765 - - 438,154 - 6,603,317 3,065,765
* denotes major programs** denotes ARRA programs
ldavid
Text Box
-63-
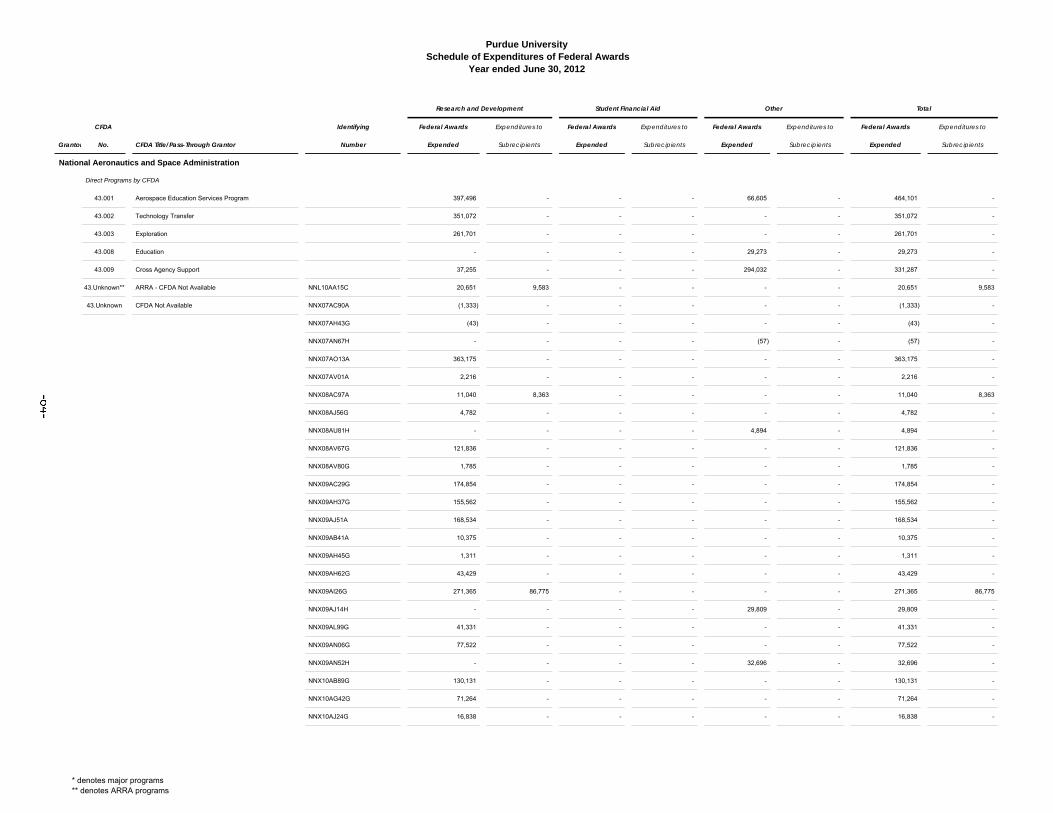
Purdue University Schedule of Expenditures of Federal Awards
Year ended June 30, 2012
CFDA Identifying Federal Awards Expenditures to Federal Awards Expenditures to Federal Awards Expenditures to Federal Awards Expenditures to
Grantor No. CFDA Title/Pass-Through Grantor Number Expended Subrecipients Expended Subrecipients Expended Subrecipients Expended Subrecipients
Research and Development Student Financial Aid Other Total
National Aeronautics and Space Administration
Direct Programs by CFDA
43.001 Aerospace Education Services Program 397,496 - - - 66,605 - 464,101 -
43.002 Technology Transfer 351,072 - - - - - 351,072 -
43.003 Exploration 261,701 - - - - - 261,701 -
43.008 Education - - - - 29,273 - 29,273 -
43.009 Cross Agency Support 37,255 - - - 294,032 - 331,287 -
43.Unknown** ARRA - CFDA Not Available NNL10AA15C 20,651 9,583 - - - - 20,651 9,583
43.Unknown CFDA Not Available NNX07AC90A (1,333) - - - - - (1,333) -
NNX07AH43G (43) - - - - - (43) -
NNX07AN67H - - - - (57) - (57) -
NNX07AO13A 363,175 - - - - - 363,175 -
NNX07AV01A 2,216 - - - - - 2,216 -
NNX08AC97A 11,040 8,363 - - - - 11,040 8,363
NNX08AJ56G 4,782 - - - - - 4,782 -
NNX08AU81H - - - - 4,894 - 4,894 -
NNX08AV67G 121,836 - - - - - 121,836 -
NNX08AV80G 1,785 - - - - - 1,785 -
NNX09AC29G 174,854 - - - - - 174,854 -
NNX09AH37G 155,562 - - - - - 155,562 -
NNX09AJ51A 168,534 - - - - - 168,534 -
NNX09AB41A 10,375 - - - - - 10,375 -
NNX09AH45G 1,311 - - - - - 1,311 -
NNX09AH62G 43,429 - - - - - 43,429 -
NNX09AI26G 271,365 86,775 - - - - 271,365 86,775
NNX09AJ14H - - - - 29,809 - 29,809 -
NNX09AL99G 41,331 - - - - - 41,331 -
NNX09AN06G 77,522 - - - - - 77,522 -
NNX09AN52H - - - - 32,696 - 32,696 -
NNX10AB89G 130,131 - - - - - 130,131 -
NNX10AG42G 71,264 - - - - - 71,264 -
NNX10AJ24G 16,838 - - - - - 16,838 -
* denotes major programs** denotes ARRA programs
ldavid
Text Box
-64-
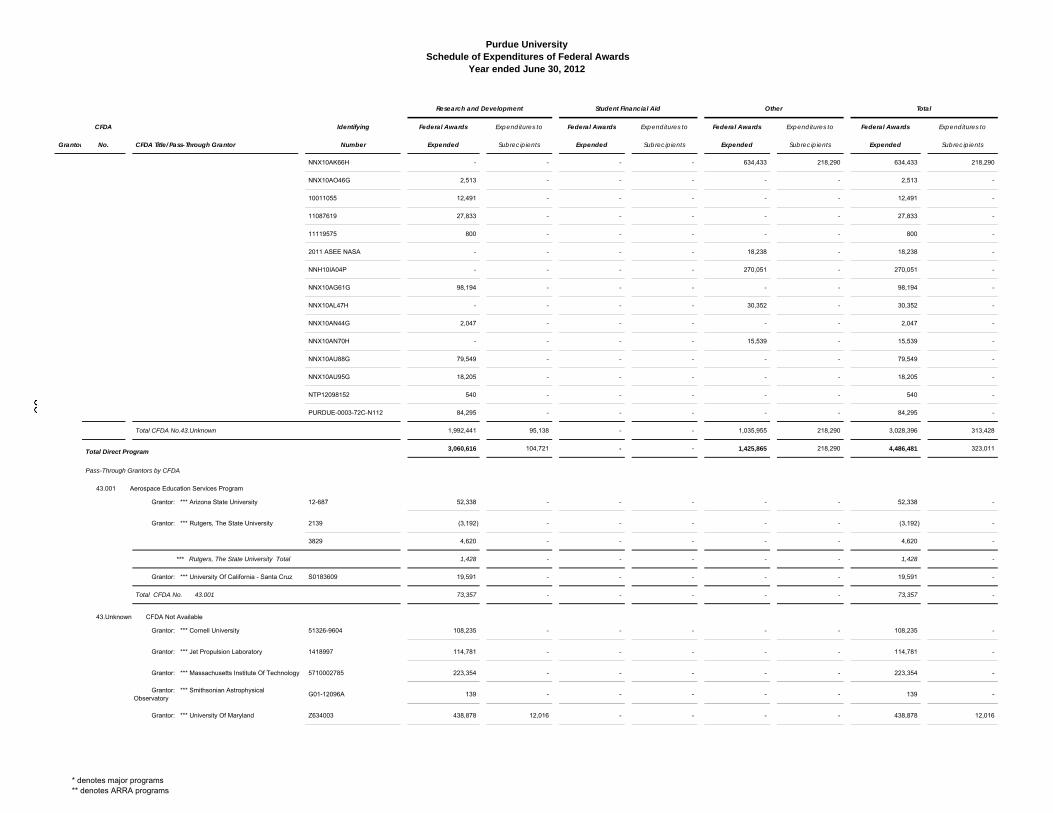
Purdue University Schedule of Expenditures of Federal Awards
Year ended June 30, 2012
CFDA Identifying Federal Awards Expenditures to Federal Awards Expenditures to Federal Awards Expenditures to Federal Awards Expenditures to
Grantor No. CFDA Title/Pass-Through Grantor Number Expended Subrecipients Expended Subrecipients Expended Subrecipients Expended Subrecipients
Research and Development Student Financial Aid Other Total
NNX10AK66H - - - - 634,433 218,290 634,433 218,290
NNX10AO46G 2,513 - - - - - 2,513 -
10011055 12,491 - - - - - 12,491 -
11087619 27,833 - - - - - 27,833 -
11119575 800 - - - - - 800 -
2011 ASEE NASA - - - - 18,238 - 18,238 -
NNH10IA04P - - - - 270,051 - 270,051 -
NNX10AG61G 98,194 - - - - - 98,194 -
NNX10AL47H - - - - 30,352 - 30,352 -
NNX10AN44G 2,047 - - - - - 2,047 -
NNX10AN70H - - - - 15,539 - 15,539 -
NNX10AU88G 79,549 - - - - - 79,549 -
NNX10AU95G 18,205 - - - - - 18,205 -
NTP12098152 540 - - - - - 540 -
PURDUE-0003-72C-N112 84,295 - - - - - 84,295 -
Total CFDA No.43.Unknown 1,992,441 95,138 - - 1,035,955 218,290 3,028,396 313,428
Total Direct Program 3,060,616 104,721 - - 1,425,865 218,290 4,486,481 323,011
Pass-Through Grantors by CFDA
43.001 Aerospace Education Services Program
Grantor: *** Arizona State University 12-687 52,338 - - - - - 52,338 -
Grantor: *** Rutgers, The State University 2139 (3,192) - - - - - (3,192) -
3829 4,620 - - - - - 4,620 -
*** Rutgers, The State University Total 1,428 - - - - - 1,428 -
Grantor: *** University Of California - Santa Cruz S0183609 19,591 - - - - - 19,591 -
Total CFDA No. 43.001 73,357 - - - - - 73,357 -
43.Unknown CFDA Not Available
Grantor: *** Cornell University 51326-9604 108,235 - - - - - 108,235 -
Grantor: *** Jet Propulsion Laboratory 1418997 114,781 - - - - - 114,781 -
Grantor: *** Massachusetts Institute Of Technology 5710002785 223,354 - - - - - 223,354 -
Grantor: *** Smithsonian Astrophysical Observatory
G01-12096A 139 - - - - - 139 -
Grantor: *** University Of Maryland Z634003 438,878 12,016 - - - - 438,878 12,016
* denotes major programs** denotes ARRA programs
ldavid
Text Box
-65-
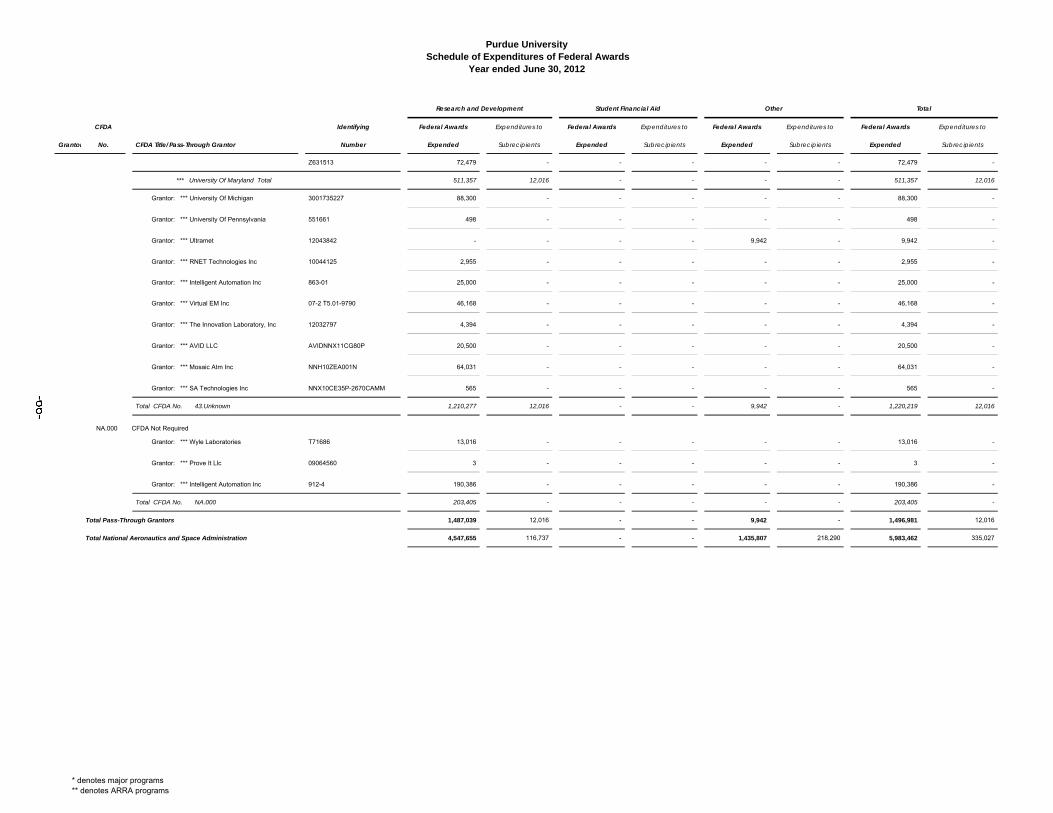
Purdue University Schedule of Expenditures of Federal Awards
Year ended June 30, 2012
CFDA Identifying Federal Awards Expenditures to Federal Awards Expenditures to Federal Awards Expenditures to Federal Awards Expenditures to
Grantor No. CFDA Title/Pass-Through Grantor Number Expended Subrecipients Expended Subrecipients Expended Subrecipients Expended Subrecipients
Research and Development Student Financial Aid Other Total
Z631513 72,479 - - - - - 72,479 -
*** University Of Maryland Total 511,357 12,016 - - - - 511,357 12,016
Grantor: *** University Of Michigan 3001735227 88,300 - - - - - 88,300 -
Grantor: *** University Of Pennsylvania 551661 498 - - - - - 498 -
Grantor: *** Ultramet 12043842 - - - - 9,942 - 9,942 -
Grantor: *** RNET Technologies Inc 10044125 2,955 - - - - - 2,955 -
Grantor: *** Intelligent Automation Inc 863-01 25,000 - - - - - 25,000 -
Grantor: *** Virtual EM Inc 07-2 T5.01-9790 46,168 - - - - - 46,168 -
Grantor: *** The Innovation Laboratory, Inc 12032797 4,394 - - - - - 4,394 -
Grantor: *** AVID LLC AVIDNNX11CG80P 20,500 - - - - - 20,500 -
Grantor: *** Mosaic Atm Inc NNH10ZEA001N 64,031 - - - - - 64,031 -
Grantor: *** SA Technologies Inc NNX10CE35P-2670CAMM 565 - - - - - 565 -
Total CFDA No. 43.Unknown 1,210,277 12,016 - - 9,942 - 1,220,219 12,016
NA.000 CFDA Not Required
Grantor: *** Wyle Laboratories T71686 13,016 - - - - - 13,016 -
Grantor: *** Prove It Llc 09064560 3 - - - - - 3 -
Grantor: *** Intelligent Automation Inc 912-4 190,386 - - - - - 190,386 -
Total CFDA No. NA.000 203,405 - - - - - 203,405 -
Total Pass-Through Grantors 1,487,039 12,016 - - 9,942 - 1,496,981 12,016
Total National Aeronautics and Space Administration 4,547,655 116,737 - - 1,435,807 218,290 5,983,462 335,027
* denotes major programs** denotes ARRA programs
ldavid
Text Box
-66-
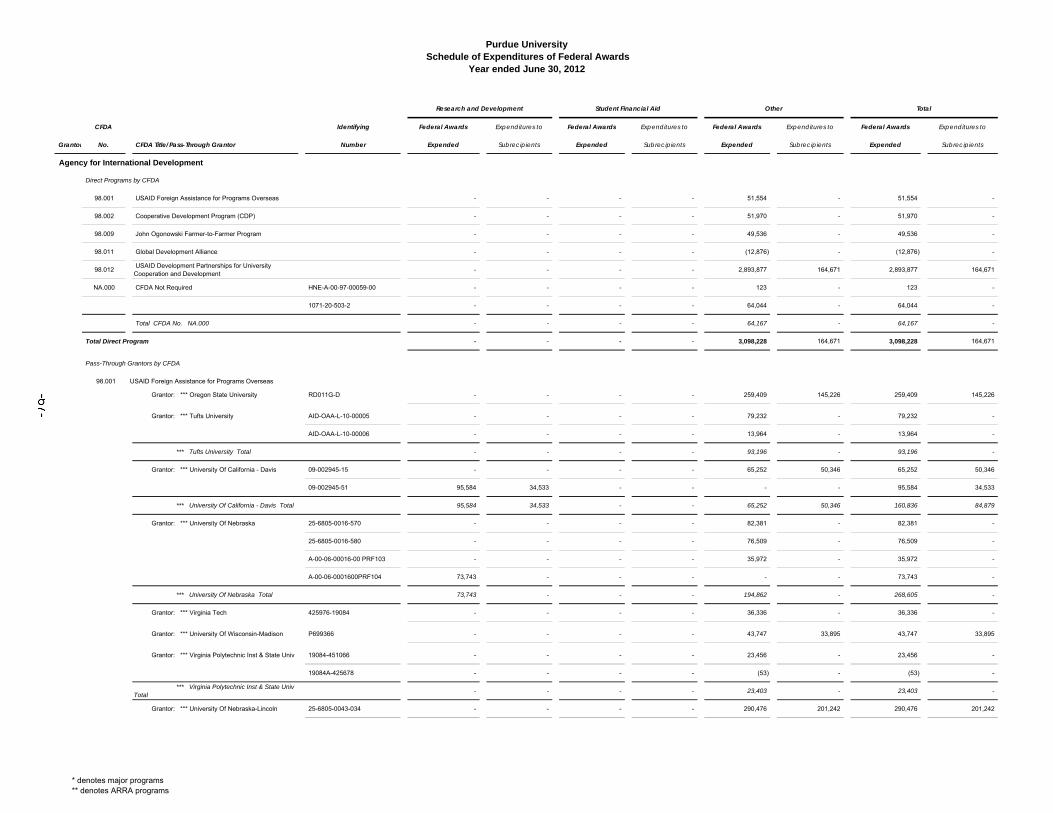
Purdue University Schedule of Expenditures of Federal Awards
Year ended June 30, 2012
CFDA Identifying Federal Awards Expenditures to Federal Awards Expenditures to Federal Awards Expenditures to Federal Awards Expenditures to
Grantor No. CFDA Title/Pass-Through Grantor Number Expended Subrecipients Expended Subrecipients Expended Subrecipients Expended Subrecipients
Research and Development Student Financial Aid Other Total
Agency for International Development
Direct Programs by CFDA
98.001 USAID Foreign Assistance for Programs Overseas - - - - 51,554 - 51,554 -
98.002 Cooperative Development Program (CDP) - - - - 51,970 - 51,970 -
98.009 John Ogonowski Farmer-to-Farmer Program - - - - 49,536 - 49,536 -
98.011 Global Development Alliance - - - - (12,876) - (12,876) -
98.012 USAID Development Partnerships for University Cooperation and Development
- - - - 2,893,877 164,671 2,893,877 164,671
NA.000 CFDA Not Required HNE-A-00-97-00059-00 - - - - 123 - 123 -
1071-20-503-2 - - - - 64,044 - 64,044 -
Total CFDA No. NA.000 - - - - 64,167 - 64,167 -
Total Direct Program - - - - 3,098,228 164,671 3,098,228 164,671
Pass-Through Grantors by CFDA
98.001 USAID Foreign Assistance for Programs Overseas
Grantor: *** Oregon State University RD011G-D - - - - 259,409 145,226 259,409 145,226
Grantor: *** Tufts University AID-OAA-L-10-00005 - - - - 79,232 - 79,232 -
AID-OAA-L-10-00006 - - - - 13,964 - 13,964 -
*** Tufts University Total - - - - 93,196 - 93,196 -
Grantor: *** University Of California - Davis 09-002945-15 - - - - 65,252 50,346 65,252 50,346
09-002945-51 95,584 34,533 - - - - 95,584 34,533
*** University Of California - Davis Total 95,584 34,533 - - 65,252 50,346 160,836 84,879
Grantor: *** University Of Nebraska 25-6805-0016-570 - - - - 82,381 - 82,381 -
25-6805-0016-580 - - - - 76,509 - 76,509 -
A-00-06-00016-00 PRF103 - - - - 35,972 - 35,972 -
A-00-06-0001600PRF104 73,743 - - - - - 73,743 -
*** University Of Nebraska Total 73,743 - - - 194,862 - 268,605 -
Grantor: *** Virginia Tech 425976-19084 - - - - 36,336 - 36,336 -
Grantor: *** University Of Wisconsin-Madison P699366 - - - - 43,747 33,895 43,747 33,895
Grantor: *** Virginia Polytechnic Inst & State Univ 19084-451066 - - - - 23,456 - 23,456 -
19084A-425678 - - - - (53) - (53) -
*** Virginia Polytechnic Inst & State Univ Total
- - - - 23,403 - 23,403 -
Grantor: *** University Of Nebraska-Lincoln 25-6805-0043-034 - - - - 290,476 201,242 290,476 201,242
* denotes major programs** denotes ARRA programs
ldavid
Text Box
-67-
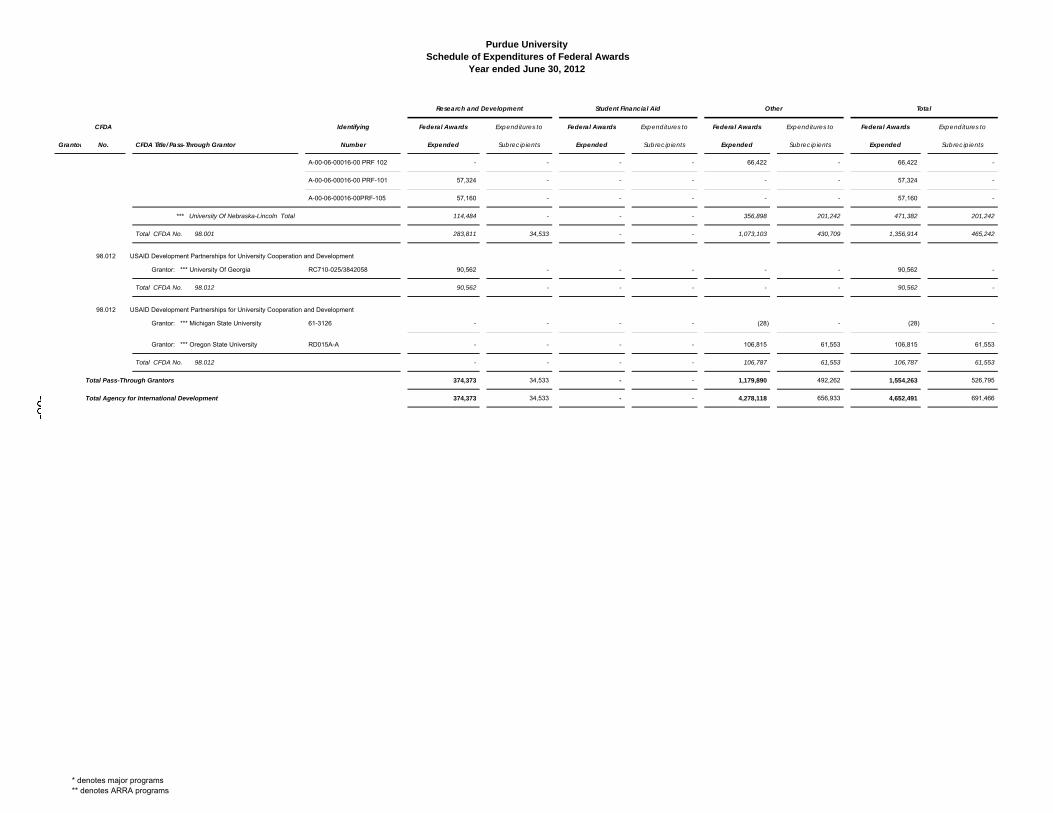
Purdue University Schedule of Expenditures of Federal Awards
Year ended June 30, 2012
CFDA Identifying Federal Awards Expenditures to Federal Awards Expenditures to Federal Awards Expenditures to Federal Awards Expenditures to
Grantor No. CFDA Title/Pass-Through Grantor Number Expended Subrecipients Expended Subrecipients Expended Subrecipients Expended Subrecipients
Research and Development Student Financial Aid Other Total
A-00-06-00016-00 PRF 102 - - - - 66,422 - 66,422 -
A-00-06-00016-00 PRF-101 57,324 - - - - - 57,324 -
A-00-06-00016-00PRF-105 57,160 - - - - - 57,160 -
*** University Of Nebraska-Lincoln Total 114,484 - - - 356,898 201,242 471,382 201,242
Total CFDA No. 98.001 283,811 34,533 - - 1,073,103 430,709 1,356,914 465,242
98.012 USAID Development Partnerships for University Cooperation and Development
Grantor: *** University Of Georgia RC710-025/3842058 90,562 - - - - - 90,562 -
Total CFDA No. 98.012 90,562 - - - - - 90,562 -
98.012 USAID Development Partnerships for University Cooperation and Development
Grantor: *** Michigan State University 61-3126 - - - - (28) - (28) -
Grantor: *** Oregon State University RD015A-A - - - - 106,815 61,553 106,815 61,553
Total CFDA No. 98.012 - - - - 106,787 61,553 106,787 61,553
Total Pass-Through Grantors 374,373 34,533 - - 1,179,890 492,262 1,554,263 526,795
Total Agency for International Development 374,373 34,533 - - 4,278,118 656,933 4,652,491 691,466
* denotes major programs** denotes ARRA programs
ldavid
Text Box
-68-
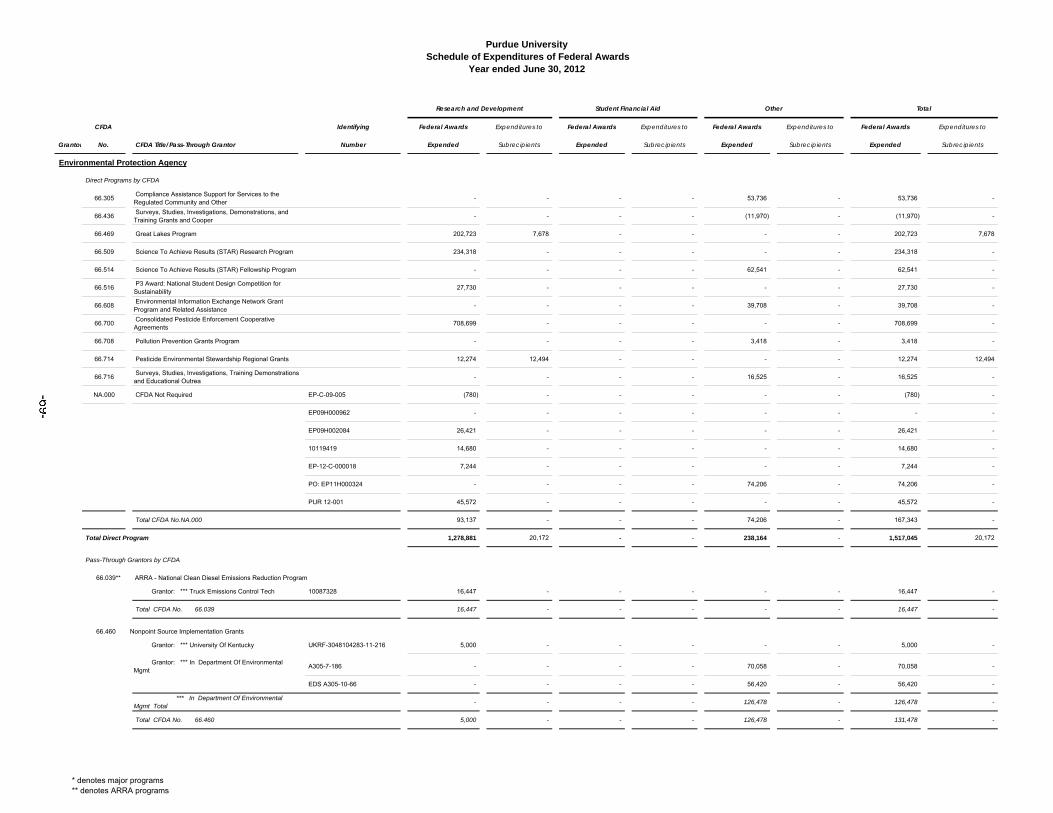
Purdue University Schedule of Expenditures of Federal Awards
Year ended June 30, 2012
CFDA Identifying Federal Awards Expenditures to Federal Awards Expenditures to Federal Awards Expenditures to Federal Awards Expenditures to
Grantor No. CFDA Title/Pass-Through Grantor Number Expended Subrecipients Expended Subrecipients Expended Subrecipients Expended Subrecipients
Research and Development Student Financial Aid Other Total
Environmental Protection Agency
Direct Programs by CFDA
66.305 Compliance Assistance Support for Services to the Regulated Community and Other
- - - - 53,736 - 53,736 -
66.436 Surveys, Studies, Investigations, Demonstrations, and Training Grants and Cooper
- - - - (11,970) - (11,970) -
66.469 Great Lakes Program 202,723 7,678 - - - - 202,723 7,678
66.509 Science To Achieve Results (STAR) Research Program 234,318 - - - - - 234,318 -
66.514 Science To Achieve Results (STAR) Fellowship Program - - - - 62,541 - 62,541 -
66.516 P3 Award: National Student Design Competition for Sustainability
27,730 - - - - - 27,730 -
66.608 Environmental Information Exchange Network Grant Program and Related Assistance
- - - - 39,708 - 39,708 -
66.700 Consolidated Pesticide Enforcement Cooperative Agreements
708,699 - - - - - 708,699 -
66.708 Pollution Prevention Grants Program - - - - 3,418 - 3,418 -
66.714 Pesticide Environmental Stewardship Regional Grants 12,274 12,494 - - - - 12,274 12,494
66.716 Surveys, Studies, Investigations, Training Demonstrations and Educational Outrea
- - - - 16,525 - 16,525 -
NA.000 CFDA Not Required EP-C-09-005 (780) - - - - - (780) -
EP09H000962 - - - - - - - -
EP09H002084 26,421 - - - - - 26,421 -
10119419 14,680 - - - - - 14,680 -
EP-12-C-000018 7,244 - - - - - 7,244 -
PO: EP11H000324 - - - - 74,206 - 74,206 -
PUR 12-001 45,572 - - - - - 45,572 -
Total CFDA No.NA.000 93,137 - - - 74,206 - 167,343 -
Total Direct Program 1,278,881 20,172 - - 238,164 - 1,517,045 20,172
Pass-Through Grantors by CFDA
66.039** ARRA - National Clean Diesel Emissions Reduction Program
Grantor: *** Truck Emissions Control Tech 10087328 16,447 - - - - - 16,447 -
Total CFDA No. 66.039 16,447 - - - - - 16,447 -
66.460 Nonpoint Source Implementation Grants
Grantor: *** University Of Kentucky UKRF-3048104283-11-216 5,000 - - - - - 5,000 -
Grantor: *** In Department Of Environmental Mgmt
A305-7-186 - - - - 70,058 - 70,058 -
EDS A305-10-66 - - - - 56,420 - 56,420 -
*** In Department Of Environmental Mgmt Total
- - - - 126,478 - 126,478 -
Total CFDA No. 66.460 5,000 - - - 126,478 - 131,478 -
* denotes major programs** denotes ARRA programs
ldavid
Text Box
-69-
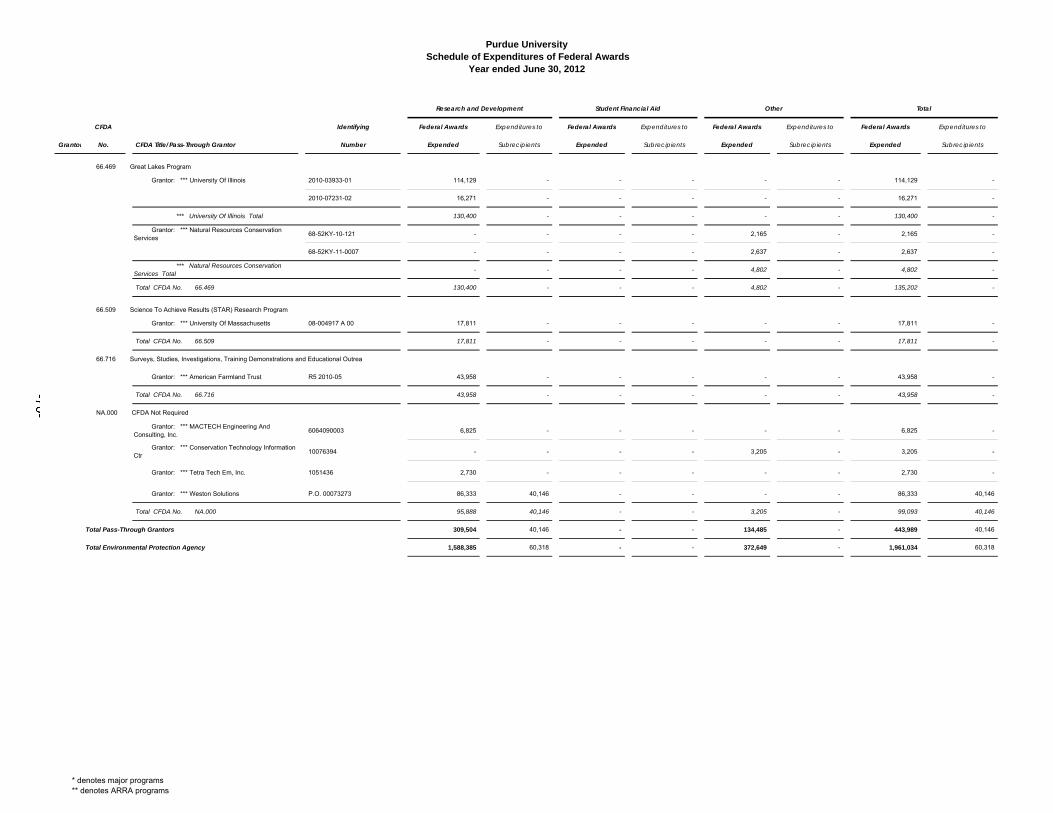
Purdue University Schedule of Expenditures of Federal Awards
Year ended June 30, 2012
CFDA Identifying Federal Awards Expenditures to Federal Awards Expenditures to Federal Awards Expenditures to Federal Awards Expenditures to
Grantor No. CFDA Title/Pass-Through Grantor Number Expended Subrecipients Expended Subrecipients Expended Subrecipients Expended Subrecipients
Research and Development Student Financial Aid Other Total
66.469 Great Lakes Program
Grantor: *** University Of Illinois 2010-03933-01 114,129 - - - - - 114,129 -
2010-07231-02 16,271 - - - - - 16,271 -
*** University Of Illinois Total 130,400 - - - - - 130,400 -
Grantor: *** Natural Resources Conservation Services
68-52KY-10-121 - - - - 2,165 - 2,165 -
68-52KY-11-0007 - - - - 2,637 - 2,637 -
*** Natural Resources Conservation Services Total
- - - - 4,802 - 4,802 -
Total CFDA No. 66.469 130,400 - - - 4,802 - 135,202 -
66.509 Science To Achieve Results (STAR) Research Program
Grantor: *** University Of Massachusetts 08-004917 A 00 17,811 - - - - - 17,811 -
Total CFDA No. 66.509 17,811 - - - - - 17,811 -
66.716 Surveys, Studies, Investigations, Training Demonstrations and Educational Outrea
Grantor: *** American Farmland Trust R5 2010-05 43,958 - - - - - 43,958 -
Total CFDA No. 66.716 43,958 - - - - - 43,958 -
NA.000 CFDA Not Required
Grantor: *** MACTECH Engineering And Consulting, Inc.
6064090003 6,825 - - - - - 6,825 -
Grantor: *** Conservation Technology Information Ctr
10076394 - - - - 3,205 - 3,205 -
Grantor: *** Tetra Tech Em, Inc. 1051436 2,730 - - - - - 2,730 -
Grantor: *** Weston Solutions P.O. 00073273 86,333 40,146 - - - - 86,333 40,146
Total CFDA No. NA.000 95,888 40,146 - - 3,205 - 99,093 40,146
Total Pass-Through Grantors 309,504 40,146 - - 134,485 - 443,989 40,146
Total Environmental Protection Agency 1,588,385 60,318 - - 372,649 - 1,961,034 60,318
* denotes major programs** denotes ARRA programs
ldavid
Text Box
-70-
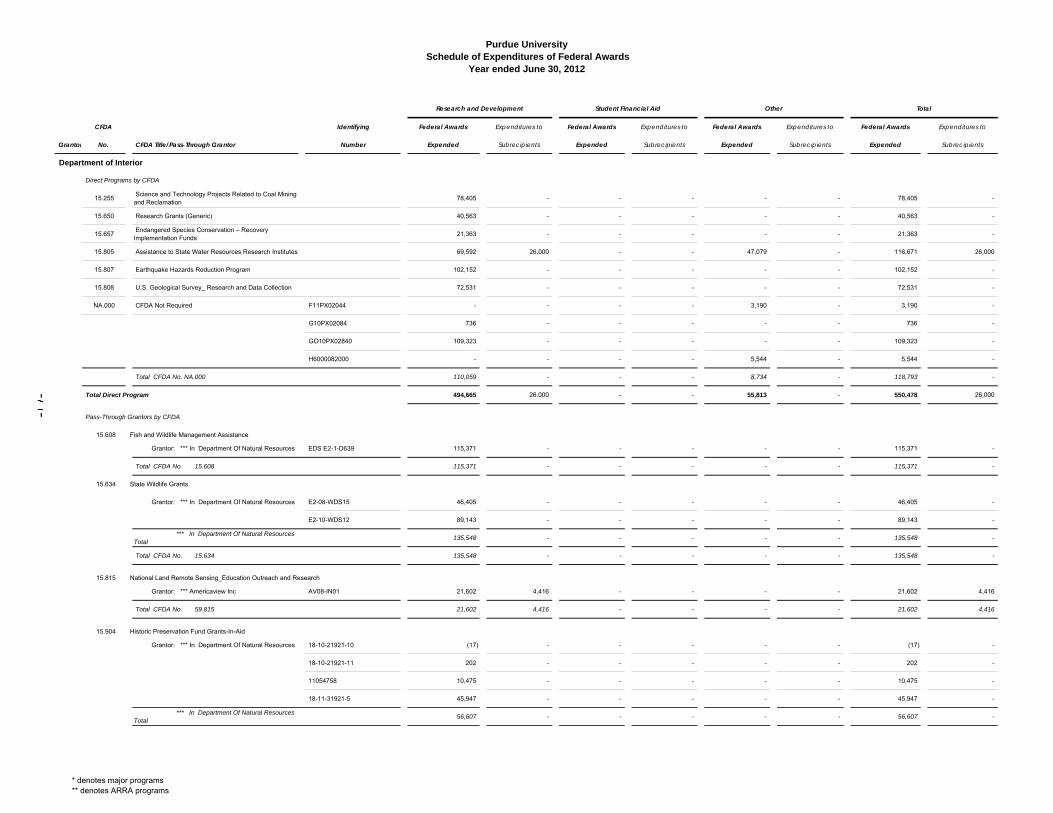
Purdue University Schedule of Expenditures of Federal Awards
Year ended June 30, 2012
CFDA Identifying Federal Awards Expenditures to Federal Awards Expenditures to Federal Awards Expenditures to Federal Awards Expenditures to
Grantor No. CFDA Title/Pass-Through Grantor Number Expended Subrecipients Expended Subrecipients Expended Subrecipients Expended Subrecipients
Research and Development Student Financial Aid Other Total
Department of Interior
Direct Programs by CFDA
15.255 Science and Technology Projects Related to Coal Mining and Reclamation
78,405 - - - - - 78,405 -
15.650 Research Grants (Generic) 40,563 - - - - - 40,563 -
15.657 Endangered Species Conservation – Recovery Implementation Funds
21,363 - - - - - 21,363 -
15.805 Assistance to State Water Resources Research Institutes 69,592 26,000 - - 47,079 - 116,671 26,000
15.807 Earthquake Hazards Reduction Program 102,152 - - - - - 102,152 -
15.808 U.S. Geological Survey_ Research and Data Collection 72,531 - - - - - 72,531 -
NA.000 CFDA Not Required F11PX02044 - - - - 3,190 - 3,190 -
G10PX02084 736 - - - - - 736 -
GO10PX02840 109,323 - - - - - 109,323 -
H6000082000 - - - - 5,544 - 5,544 -
Total CFDA No. NA.000 110,059 - - - 8,734 - 118,793 -
Total Direct Program 494,665 26,000 - - 55,813 - 550,478 26,000
Pass-Through Grantors by CFDA
15.608 Fish and Wildlife Management Assistance
Grantor: *** In Department Of Natural Resources EDS E2-1-D639 115,371 - - - - - 115,371 -
Total CFDA No. 15.608 115,371 - - - - - 115,371 -
15.634 State Wildlife Grants
Grantor: *** In Department Of Natural Resources E2-08-WDS15 46,405 - - - - - 46,405 -
E2-10-WDS12 89,143 - - - - - 89,143 -
*** In Department Of Natural Resources Total
135,548 - - - - - 135,548 -
Total CFDA No. 15.634 135,548 - - - - - 135,548 -
15.815 National Land Remote Sensing_Education Outreach and Research
Grantor: *** Americaview Inc AV08-IN01 21,602 4,416 - - - - 21,602 4,416
Total CFDA No. 59.815 21,602 4,416 - - - - 21,602 4,416
15.904 Historic Preservation Fund Grants-In-Aid
Grantor: *** In Department Of Natural Resources 18-10-21921-10 (17) - - - - - (17) -
18-10-21921-11 202 - - - - - 202 -
11054758 10,475 - - - - - 10,475 -
18-11-31921-5 45,947 - - - - - 45,947 -
*** In Department Of Natural Resources Total
56,607 - - - - - 56,607 -
* denotes major programs** denotes ARRA programs
ldavid
Text Box
-71-
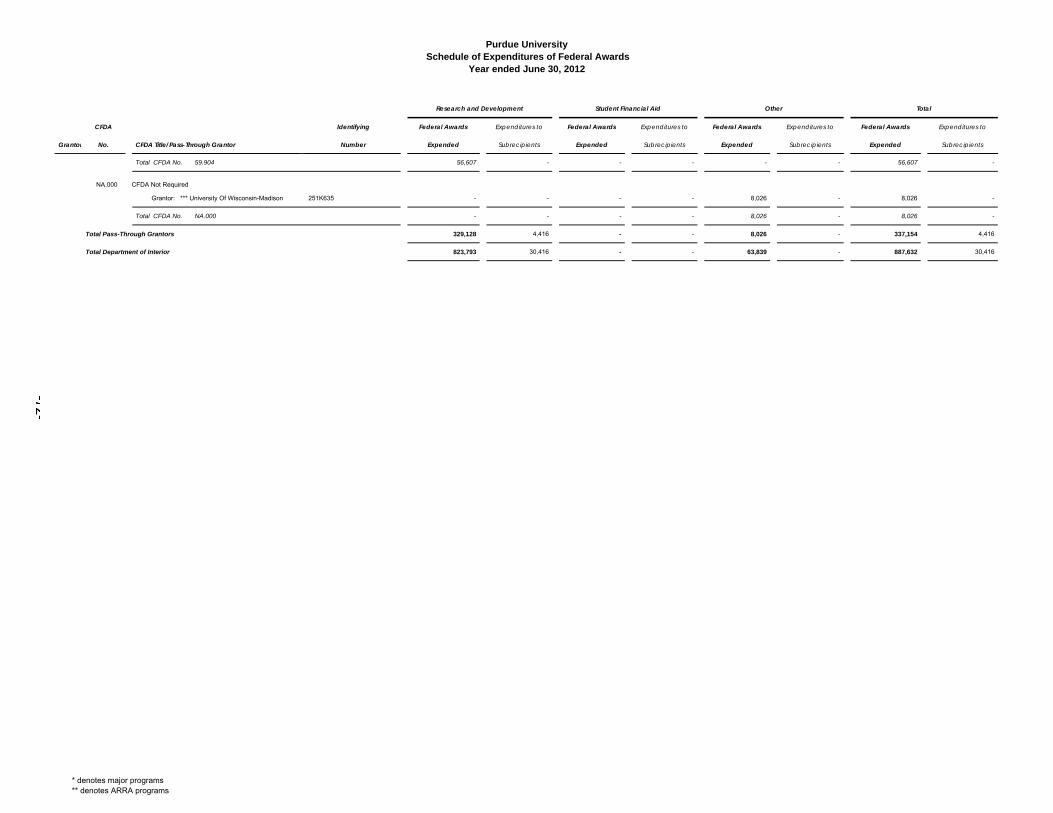
Purdue University Schedule of Expenditures of Federal Awards
Year ended June 30, 2012
CFDA Identifying Federal Awards Expenditures to Federal Awards Expenditures to Federal Awards Expenditures to Federal Awards Expenditures to
Grantor No. CFDA Title/Pass-Through Grantor Number Expended Subrecipients Expended Subrecipients Expended Subrecipients Expended Subrecipients
Research and Development Student Financial Aid Other Total
Total CFDA No. 59.904 56,607 - - - - - 56,607 -
NA.000 CFDA Not Required
Grantor: *** University Of Wisconsin-Madison 251K635 - - - - 8,026 - 8,026 -
Total CFDA No. NA.000 - - - - 8,026 - 8,026 -
Total Pass-Through Grantors 329,128 4,416 - - 8,026 - 337,154 4,416
Total Department of Interior 823,793 30,416 - - 63,839 - 887,632 30,416
* denotes major programs** denotes ARRA programs
ldavid
Text Box
-72-
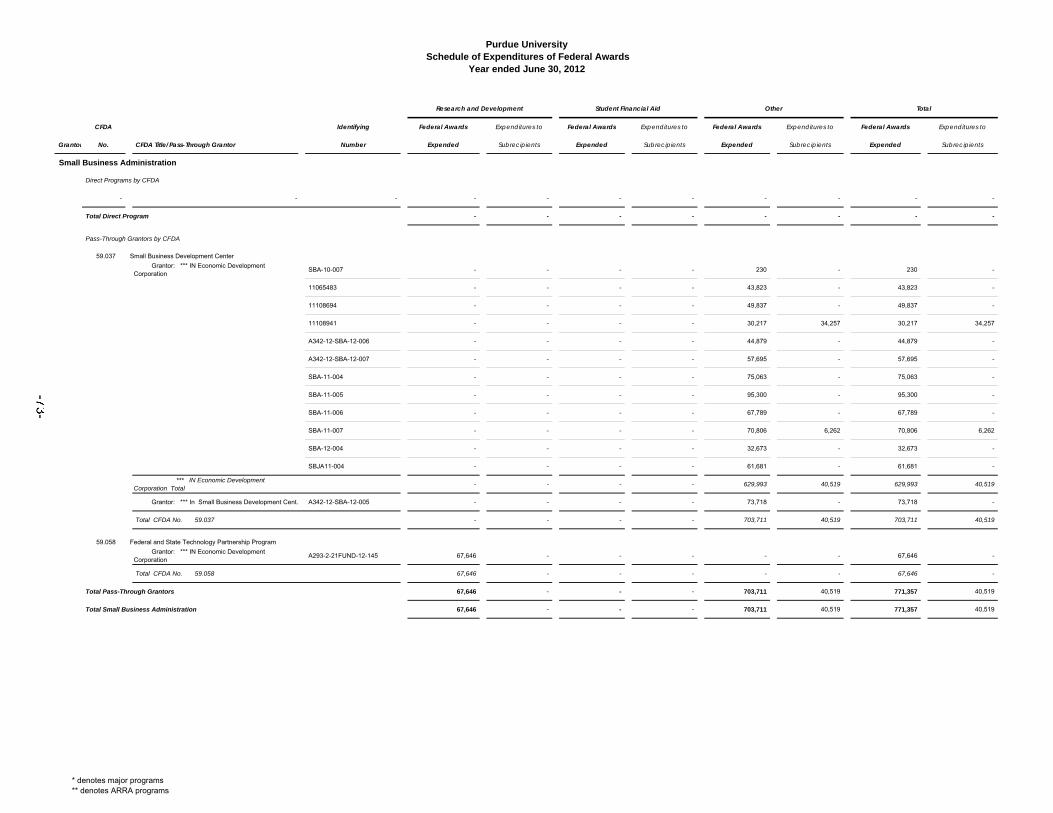
Purdue University Schedule of Expenditures of Federal Awards
Year ended June 30, 2012
CFDA Identifying Federal Awards Expenditures to Federal Awards Expenditures to Federal Awards Expenditures to Federal Awards Expenditures to
Grantor No. CFDA Title/Pass-Through Grantor Number Expended Subrecipients Expended Subrecipients Expended Subrecipients Expended Subrecipients
Research and Development Student Financial Aid Other Total
Small Business Administration
Direct Programs by CFDA
- - - - - - - - - - -
Total Direct Program - - - - - - - -
Pass-Through Grantors by CFDA
59.037 Small Business Development Center
Grantor: *** IN Economic Development Corporation
SBA-10-007 - - - - 230 - 230 -
11065483 - - - - 43,823 - 43,823 -
11108694 - - - - 49,837 - 49,837 -
11108941 - - - - 30,217 34,257 30,217 34,257
A342-12-SBA-12-006 - - - - 44,879 - 44,879 -
A342-12-SBA-12-007 - - - - 57,695 - 57,695 -
SBA-11-004 - - - - 75,063 - 75,063 -
SBA-11-005 - - - - 95,300 - 95,300 -
SBA-11-006 - - - - 67,789 - 67,789 -
SBA-11-007 - - - - 70,806 6,262 70,806 6,262
SBA-12-004 - - - - 32,673 - 32,673 -
SBJA11-004 - - - - 61,681 - 61,681 -
*** IN Economic Development Corporation Total
- - - - 629,993 40,519 629,993 40,519
Grantor: *** In Small Business Development Cent. A342-12-SBA-12-005 - - - - 73,718 - 73,718 -
Total CFDA No. 59.037 - - - - 703,711 40,519 703,711 40,519
59.058 Federal and State Technology Partnership Program
Grantor: *** IN Economic Development Corporation
A293-2-21FUND-12-145 67,646 - - - - - 67,646 -
Total CFDA No. 59.058 67,646 - - - - - 67,646 -
Total Pass-Through Grantors 67,646 - - - 703,711 40,519 771,357 40,519
Total Small Business Administration 67,646 - - - 703,711 40,519 771,357 40,519
* denotes major programs** denotes ARRA programs
ldavid
Text Box
-73-
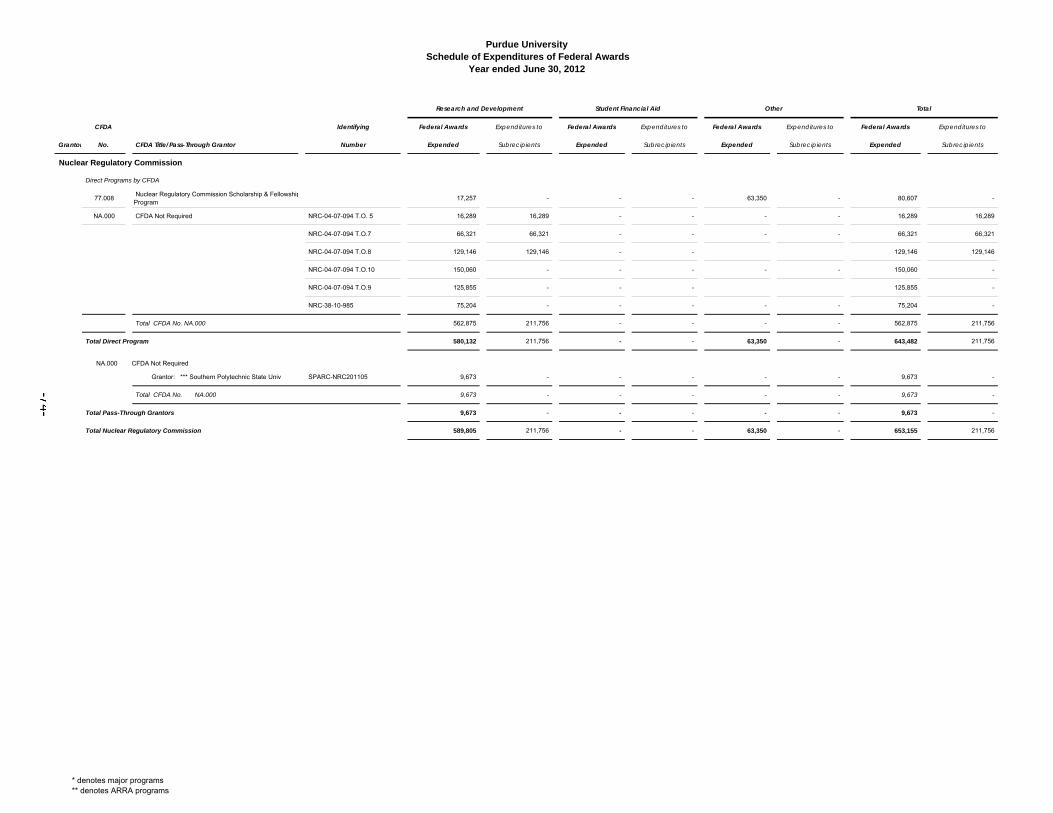
Purdue University Schedule of Expenditures of Federal Awards
Year ended June 30, 2012
CFDA Identifying Federal Awards Expenditures to Federal Awards Expenditures to Federal Awards Expenditures to Federal Awards Expenditures to
Grantor No. CFDA Title/Pass-Through Grantor Number Expended Subrecipients Expended Subrecipients Expended Subrecipients Expended Subrecipients
Research and Development Student Financial Aid Other Total
Nuclear Regulatory Commission
Direct Programs by CFDA
77.008 Nuclear Regulatory Commission Scholarship & FellowshipProgram
17,257 - - - 63,350 - 80,607 -
NA.000 CFDA Not Required NRC-04-07-094 T.O. 5 16,289 16,289 - - - - 16,289 16,289
NRC-04-07-094 T.O.7 66,321 66,321 - - - - 66,321 66,321
NRC-04-07-094 T.O.8 129,146 129,146 - - 129,146 129,146
NRC-04-07-094 T.O.10 150,060 - - - - - 150,060 -
NRC-04-07-094 T.O.9 125,855 - - - 125,855 -
NRC-38-10-985 75,204 - - - - - 75,204 -
Total CFDA No. NA.000 562,875 211,756 - - - - 562,875 211,756
Total Direct Program 580,132 211,756 - - 63,350 - 643,482 211,756
NA.000 CFDA Not Required
Grantor: *** Southern Polytechnic State Univ SPARC-NRC201105 9,673 - - - - - 9,673 -
Total CFDA No. NA.000 9,673 - - - - - 9,673 -
Total Pass-Through Grantors 9,673 - - - - - 9,673 -
Total Nuclear Regulatory Commission 589,805 211,756 - - 63,350 - 653,155 211,756
* denotes major programs** denotes ARRA programs
ldavid
Text Box
-74-
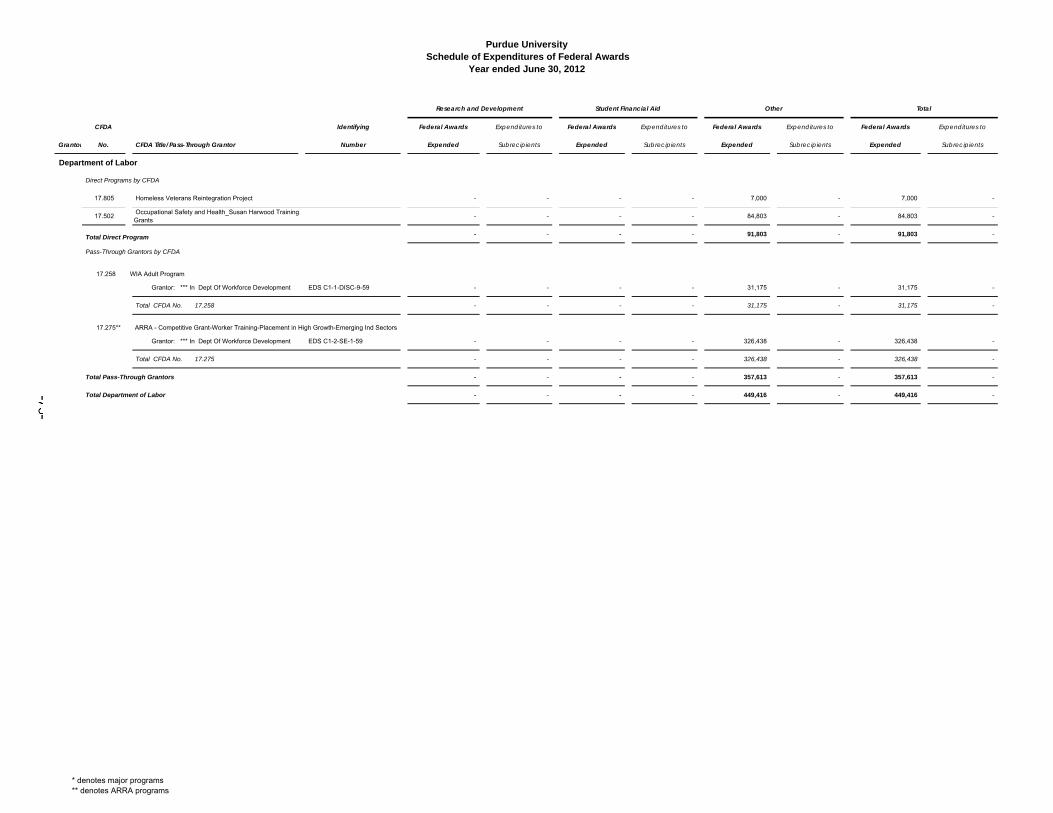
Purdue University Schedule of Expenditures of Federal Awards
Year ended June 30, 2012
CFDA Identifying Federal Awards Expenditures to Federal Awards Expenditures to Federal Awards Expenditures to Federal Awards Expenditures to
Grantor No. CFDA Title/Pass-Through Grantor Number Expended Subrecipients Expended Subrecipients Expended Subrecipients Expended Subrecipients
Research and Development Student Financial Aid Other Total
Department of Labor
Direct Programs by CFDA
17.805 Homeless Veterans Reintegration Project - - - - 7,000 - 7,000 -
17.502 Occupational Safety and Health_Susan Harwood Training Grants
- - - - 84,803 - 84,803 -
Total Direct Program - - - - 91,803 - 91,803 -
Pass-Through Grantors by CFDA
17.258 WIA Adult Program
Grantor: *** In Dept Of Workforce Development EDS C1-1-DISC-9-59 - - - - 31,175 - 31,175 -
Total CFDA No. 17.258 - - - - 31,175 - 31,175 -
17.275** ARRA - Competitive Grant-Worker Training-Placement in High Growth-Emerging Ind Sectors
Grantor: *** In Dept Of Workforce Development EDS C1-2-SE-1-59 - - - - 326,438 - 326,438 -
Total CFDA No. 17.275 - - - - 326,438 - 326,438 -
Total Pass-Through Grantors - - - - 357,613 - 357,613 -
Total Department of Labor - - - - 449,416 - 449,416 -
* denotes major programs** denotes ARRA programs
ldavid
Text Box
-75-
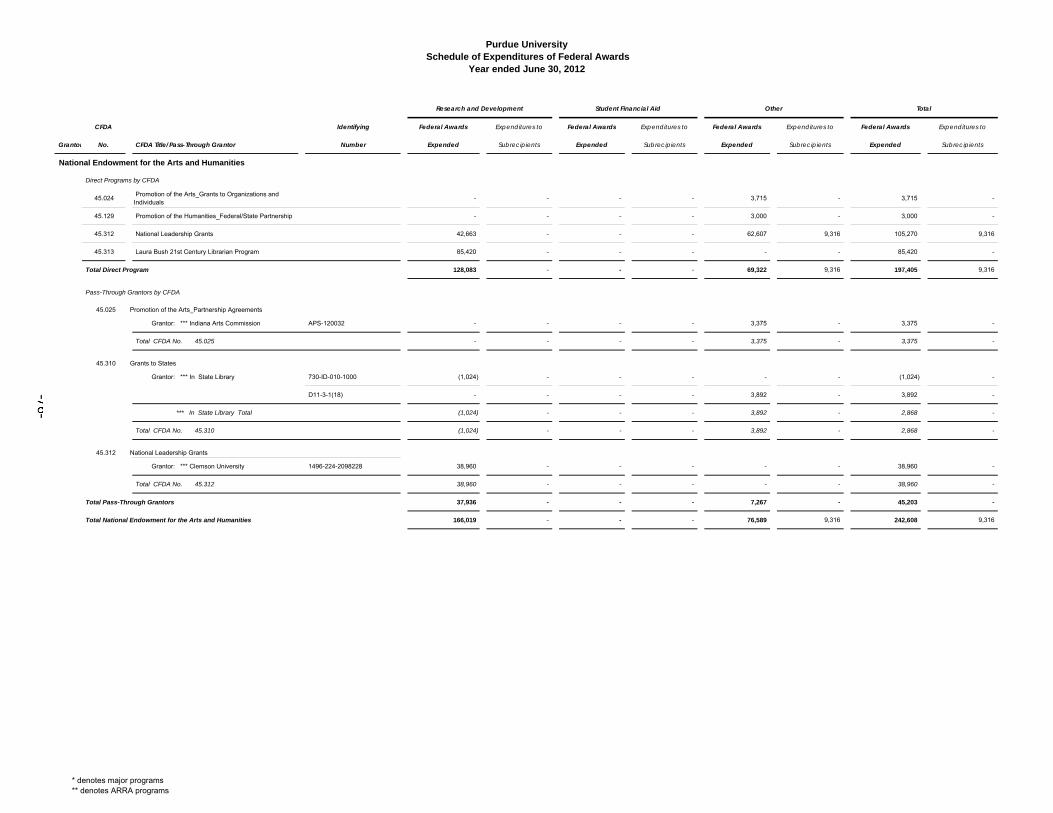
Purdue University Schedule of Expenditures of Federal Awards
Year ended June 30, 2012
CFDA Identifying Federal Awards Expenditures to Federal Awards Expenditures to Federal Awards Expenditures to Federal Awards Expenditures to
Grantor No. CFDA Title/Pass-Through Grantor Number Expended Subrecipients Expended Subrecipients Expended Subrecipients Expended Subrecipients
Research and Development Student Financial Aid Other Total
National Endowment for the Arts and Humanities
Direct Programs by CFDA
45.024 Promotion of the Arts_Grants to Organizations and Individuals
- - - - 3,715 - 3,715 -
45.129 Promotion of the Humanities_Federal/State Partnership - - - - 3,000 - 3,000 -
45.312 National Leadership Grants 42,663 - - - 62,607 9,316 105,270 9,316
45.313 Laura Bush 21st Century Librarian Program 85,420 - - - - - 85,420 -
Total Direct Program 128,083 - - - 69,322 9,316 197,405 9,316
Pass-Through Grantors by CFDA
45.025 Promotion of the Arts_Partnership Agreements
Grantor: *** Indiana Arts Commission APS-120032 - - - - 3,375 - 3,375 -
Total CFDA No. 45.025 - - - - 3,375 - 3,375 -
45.310 Grants to States
Grantor: *** In State Library 730-ID-010-1000 (1,024) - - - - - (1,024) -
D11-3-1(18) - - - - 3,892 - 3,892 -
*** In State Library Total (1,024) - - - 3,892 - 2,868 -
Total CFDA No. 45.310 (1,024) - - - 3,892 - 2,868 -
45.312 National Leadership Grants
Grantor: *** Clemson University 1496-224-2098228 38,960 - - - - - 38,960 -
Total CFDA No. 45.312 38,960 - - - - - 38,960 -
Total Pass-Through Grantors 37,936 - - - 7,267 - 45,203 -
Total National Endowment for the Arts and Humanities 166,019 - - - 76,589 9,316 242,608 9,316
* denotes major programs** denotes ARRA programs
ldavid
Text Box
-76-
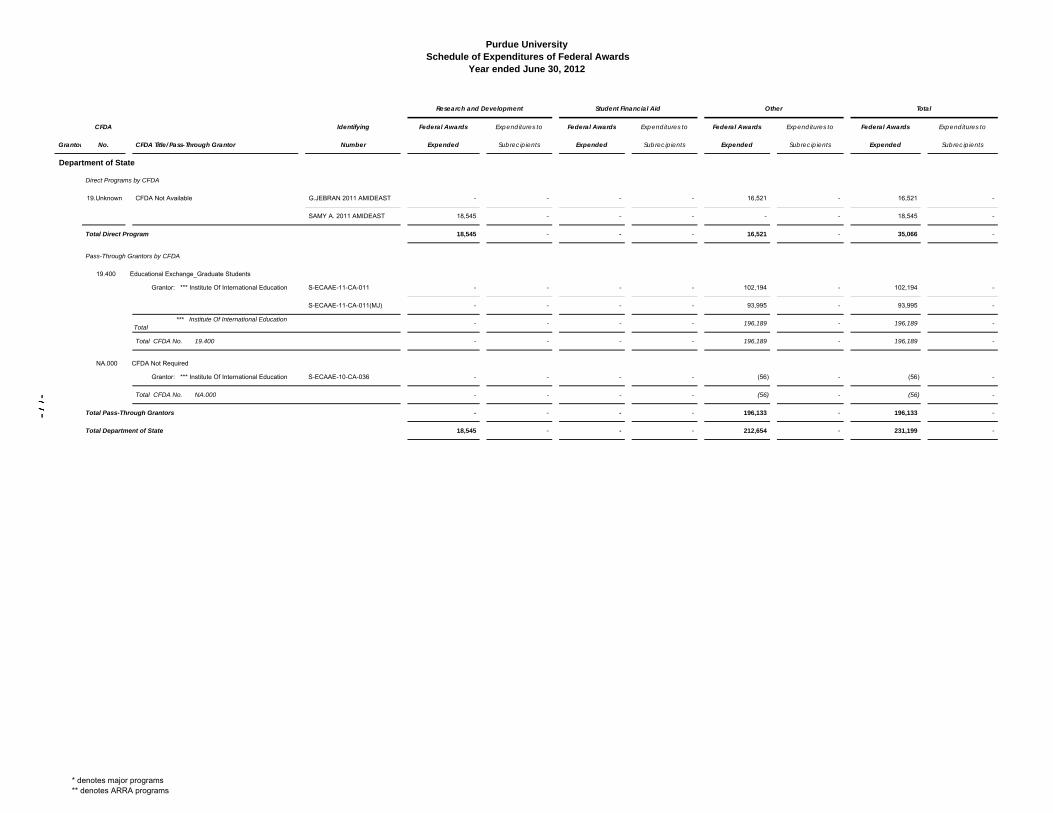
Purdue University Schedule of Expenditures of Federal Awards
Year ended June 30, 2012
CFDA Identifying Federal Awards Expenditures to Federal Awards Expenditures to Federal Awards Expenditures to Federal Awards Expenditures to
Grantor No. CFDA Title/Pass-Through Grantor Number Expended Subrecipients Expended Subrecipients Expended Subrecipients Expended Subrecipients
Research and Development Student Financial Aid Other Total
Department of State
Direct Programs by CFDA
19.Unknown CFDA Not Available G.JEBRAN 2011 AMIDEAST - - - - 16,521 - 16,521 -
SAMY A. 2011 AMIDEAST 18,545 - - - - - 18,545 -
Total Direct Program 18,545 - - - 16,521 - 35,066 -
Pass-Through Grantors by CFDA
19.400 Educational Exchange_Graduate Students
Grantor: *** Institute Of International Education S-ECAAE-11-CA-011 - - - - 102,194 - 102,194 -
S-ECAAE-11-CA-011(MJ) - - - - 93,995 - 93,995 -
*** Institute Of International Education Total
- - - - 196,189 - 196,189 -
Total CFDA No. 19.400 - - - - 196,189 - 196,189 -
NA.000 CFDA Not Required
Grantor: *** Institute Of International Education S-ECAAE-10-CA-036 - - - - (56) - (56) -
Total CFDA No. NA.000 - - - - (56) - (56) -
Total Pass-Through Grantors - - - - 196,133 - 196,133 -
Total Department of State 18,545 - - - 212,654 - 231,199 -
* denotes major programs** denotes ARRA programs
ldavid
Text Box
-77-
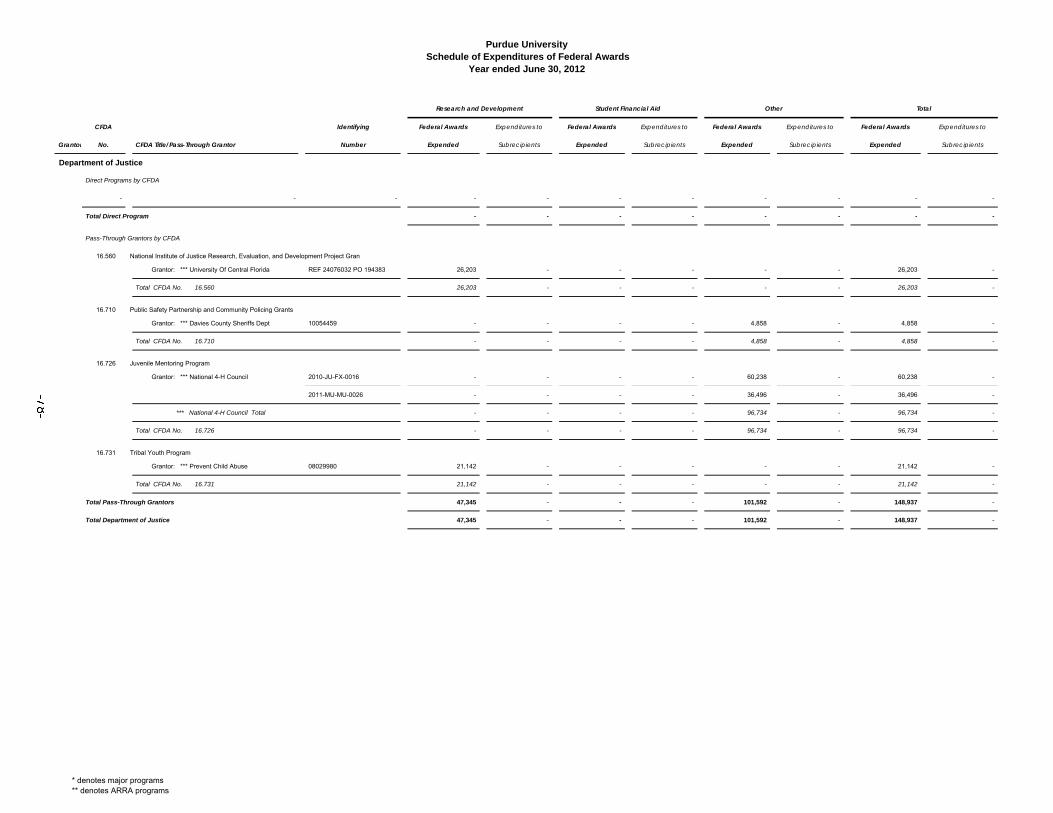
Purdue University Schedule of Expenditures of Federal Awards
Year ended June 30, 2012
CFDA Identifying Federal Awards Expenditures to Federal Awards Expenditures to Federal Awards Expenditures to Federal Awards Expenditures to
Grantor No. CFDA Title/Pass-Through Grantor Number Expended Subrecipients Expended Subrecipients Expended Subrecipients Expended Subrecipients
Research and Development Student Financial Aid Other Total
Department of Justice
Direct Programs by CFDA
- - - - - - - - - - -
Total Direct Program - - - - - - - -
Pass-Through Grantors by CFDA
16.560 National Institute of Justice Research, Evaluation, and Development Project Gran
Grantor: *** University Of Central Florida REF 24076032 PO 194383 26,203 - - - - - 26,203 -
Total CFDA No. 16.560 26,203 - - - - - 26,203 -
16.710 Public Safety Partnership and Community Policing Grants
Grantor: *** Davies County Sheriffs Dept 10054459 - - - - 4,858 - 4,858 -
Total CFDA No. 16.710 - - - - 4,858 - 4,858 -
16.726 Juvenile Mentoring Program
Grantor: *** National 4-H Council 2010-JU-FX-0016 - - - - 60,238 - 60,238 -
2011-MU-MU-0026 - - - - 36,496 - 36,496 -
*** National 4-H Council Total - - - - 96,734 - 96,734 -
Total CFDA No. 16.726 - - - - 96,734 - 96,734 -
16.731 Tribal Youth Program
Grantor: *** Prevent Child Abuse 08029980 21,142 - - - - - 21,142 -
Total CFDA No. 16.731 21,142 - - - - - 21,142 -
Total Pass-Through Grantors 47,345 - - - 101,592 - 148,937 -
Total Department of Justice 47,345 - - - 101,592 - 148,937 -
* denotes major programs** denotes ARRA programs
ldavid
Text Box
-78-
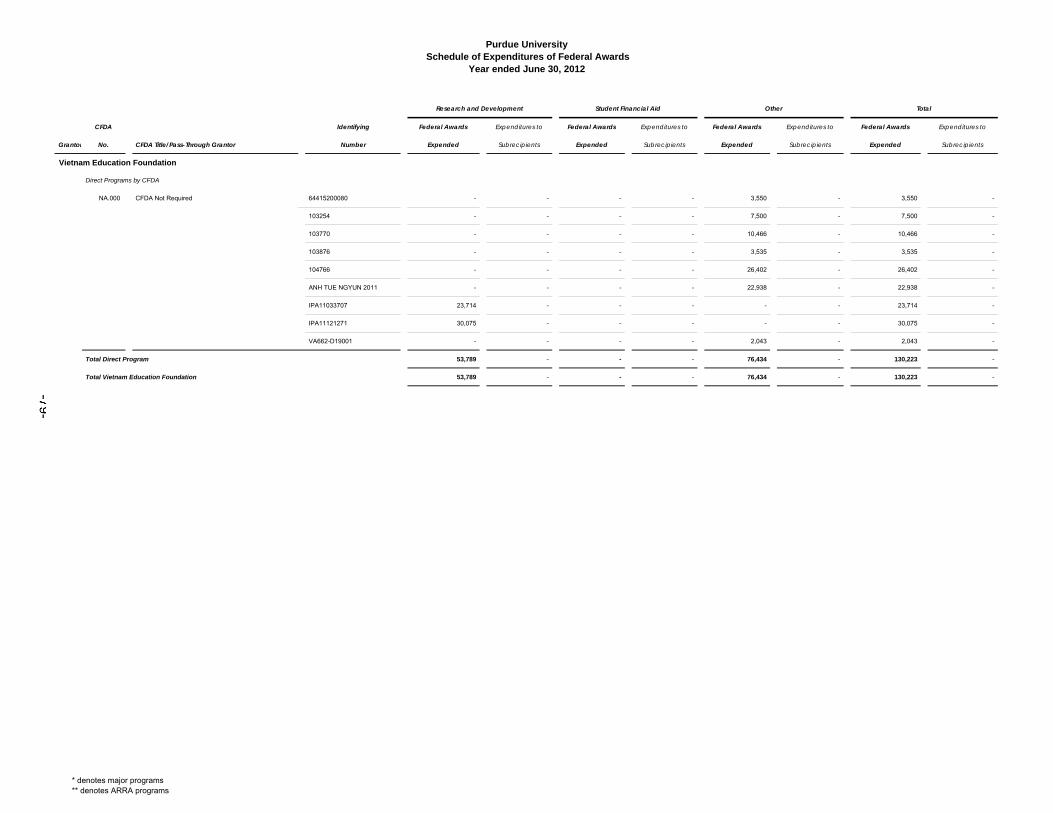
Purdue University Schedule of Expenditures of Federal Awards
Year ended June 30, 2012
CFDA Identifying Federal Awards Expenditures to Federal Awards Expenditures to Federal Awards Expenditures to Federal Awards Expenditures to
Grantor No. CFDA Title/Pass-Through Grantor Number Expended Subrecipients Expended Subrecipients Expended Subrecipients Expended Subrecipients
Research and Development Student Financial Aid Other Total
Vietnam Education Foundation
Direct Programs by CFDA
NA.000 CFDA Not Required 64415200080 - - - - 3,550 - 3,550 -
103254 - - - - 7,500 - 7,500 -
103770 - - - - 10,466 - 10,466 -
103876 - - - - 3,535 - 3,535 -
104766 - - - - 26,402 - 26,402 -
ANH TUE NGYUN 2011 - - - - 22,938 - 22,938 -
IPA11033707 23,714 - - - - - 23,714 -
IPA11121271 30,075 - - - - - 30,075 -
VA662-D19001 - - - - 2,043 - 2,043 -
Total Direct Program 53,789 - - - 76,434 - 130,223 -
Total Vietnam Education Foundation 53,789 - - - 76,434 - 130,223 -
* denotes major programs** denotes ARRA programs
ldavid
Text Box
-79-
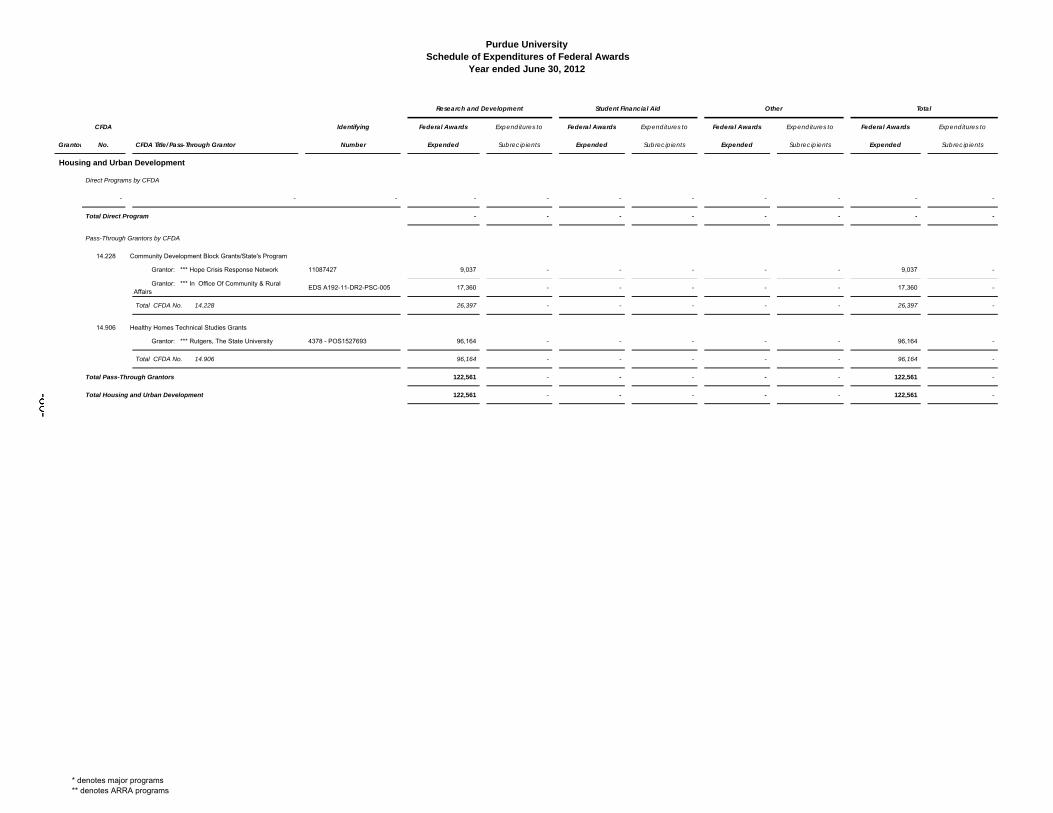
Purdue University Schedule of Expenditures of Federal Awards
Year ended June 30, 2012
CFDA Identifying Federal Awards Expenditures to Federal Awards Expenditures to Federal Awards Expenditures to Federal Awards Expenditures to
Grantor No. CFDA Title/Pass-Through Grantor Number Expended Subrecipients Expended Subrecipients Expended Subrecipients Expended Subrecipients
Research and Development Student Financial Aid Other Total
Housing and Urban Development
Direct Programs by CFDA
- - - - - - - - - - -
Total Direct Program - - - - - - - -
Pass-Through Grantors by CFDA
14.228 Community Development Block Grants/State's Program
Grantor: *** Hope Crisis Response Network 11087427 9,037 - - - - - 9,037 -
Grantor: *** In Office Of Community & Rural Affairs
EDS A192-11-DR2-PSC-005 17,360 - - - - - 17,360 -
Total CFDA No. 14.228 26,397 - - - - - 26,397 -
14.906 Healthy Homes Technical Studies Grants
Grantor: *** Rutgers, The State University 4378 - POS1527693 96,164 - - - - - 96,164 -
Total CFDA No. 14.906 96,164 - - - - - 96,164 -
Total Pass-Through Grantors 122,561 - - - - - 122,561 -
Total Housing and Urban Development 122,561 - - - - - 122,561 -
* denotes major programs** denotes ARRA programs
ldavid
Text Box
-80-
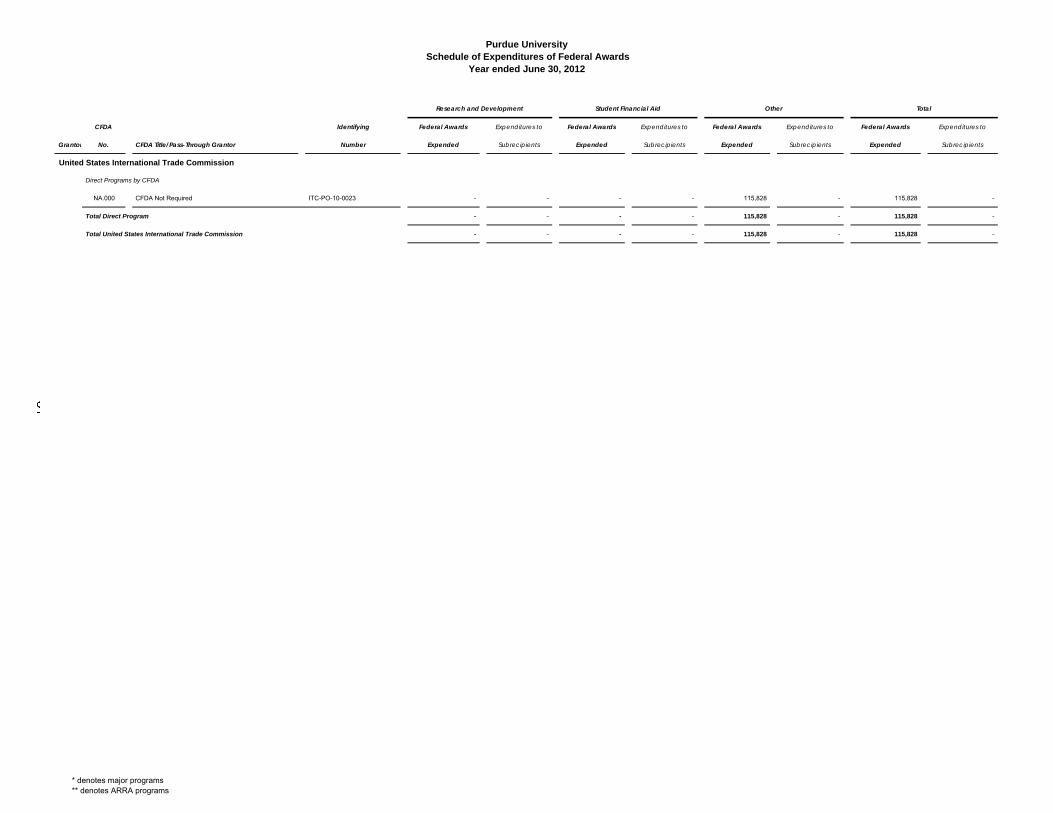
Purdue University Schedule of Expenditures of Federal Awards
Year ended June 30, 2012
CFDA Identifying Federal Awards Expenditures to Federal Awards Expenditures to Federal Awards Expenditures to Federal Awards Expenditures to
Grantor No. CFDA Title/Pass-Through Grantor Number Expended Subrecipients Expended Subrecipients Expended Subrecipients Expended Subrecipients
Research and Development Student Financial Aid Other Total
United States International Trade Commission
Direct Programs by CFDA
NA.000 CFDA Not Required ITC-PO-10-0023 - - - - 115,828 - 115,828 -
Total Direct Program - - - - 115,828 - 115,828 -
Total United States International Trade Commission - - - - 115,828 - 115,828 -
* denotes major programs** denotes ARRA programs
ldavid
Text Box
-81-
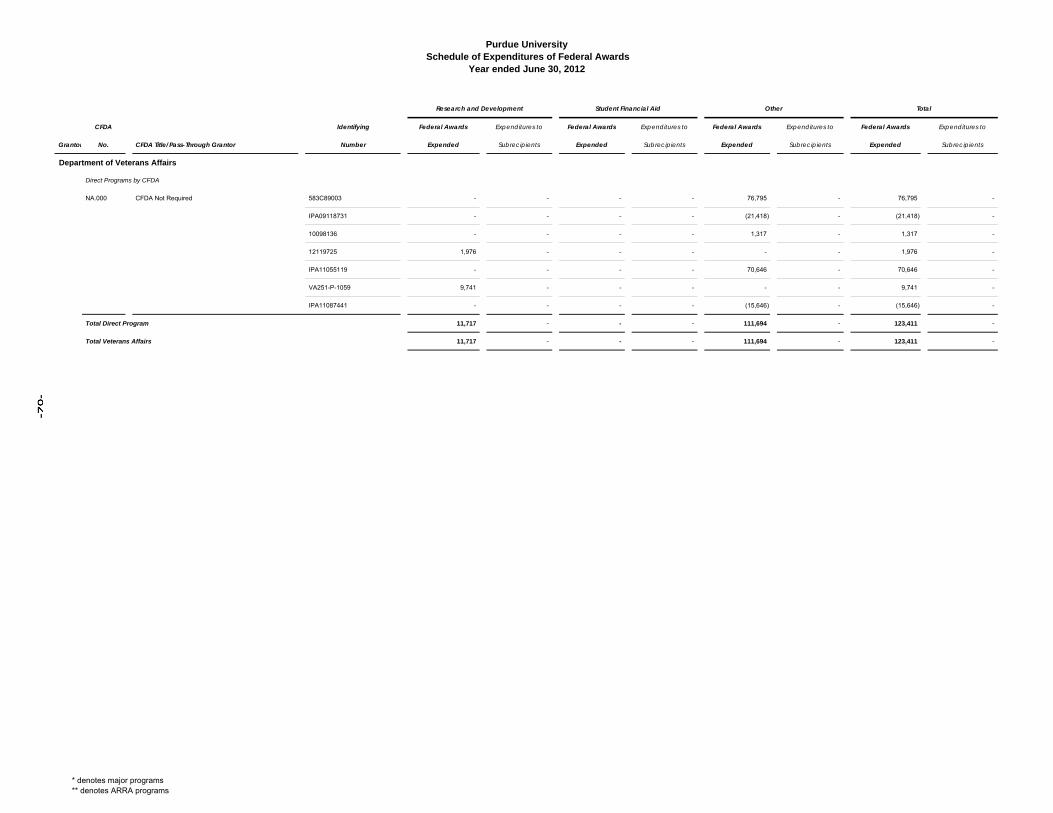
Purdue University Schedule of Expenditures of Federal Awards
Year ended June 30, 2012
CFDA Identifying Federal Awards Expenditures to Federal Awards Expenditures to Federal Awards Expenditures to Federal Awards Expenditures to
Grantor No. CFDA Title/Pass-Through Grantor Number Expended Subrecipients Expended Subrecipients Expended Subrecipients Expended Subrecipients
Research and Development Student Financial Aid Other Total
Department of Veterans Affairs
Direct Programs by CFDA
NA.000 CFDA Not Required 583C89003 - - - - 76,795 - 76,795 -
IPA09118731 - - - - (21,418) - (21,418) -
10098136 - - - - 1,317 - 1,317 -
12119725 1,976 - - - - - 1,976 -
IPA11055119 - - - - 70,646 - 70,646 -
VA251-P-1059 9,741 - - - - - 9,741 -
IPA11087441 - - - - (15,646) - (15,646) -
Total Direct Program 11,717 - - - 111,694 - 123,411 -
Total Veterans Affairs 11,717 - - - 111,694 - 123,411 -
* denotes major programs** denotes ARRA programs
ldavid
Text Box
-82-
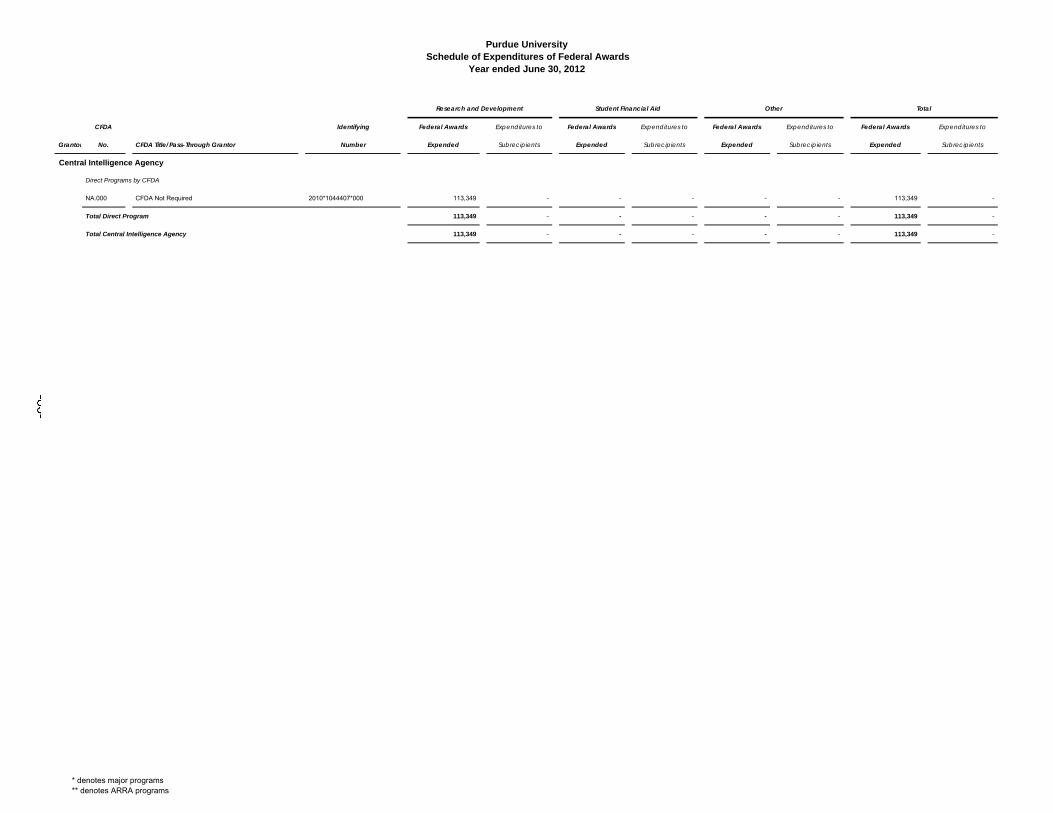
Purdue University Schedule of Expenditures of Federal Awards
Year ended June 30, 2012
CFDA Identifying Federal Awards Expenditures to Federal Awards Expenditures to Federal Awards Expenditures to Federal Awards Expenditures to
Grantor No. CFDA Title/Pass-Through Grantor Number Expended Subrecipients Expended Subrecipients Expended Subrecipients Expended Subrecipients
Research and Development Student Financial Aid Other Total
Central Intelligence Agency
Direct Programs by CFDA
NA.000 CFDA Not Required 2010*1044407*000 113,349 - - - - - 113,349 -
Total Direct Program 113,349 - - - - - 113,349 -
Total Central Intelligence Agency 113,349 - - - - - 113,349 -
* denotes major programs** denotes ARRA programs
ldavid
Text Box
-83-
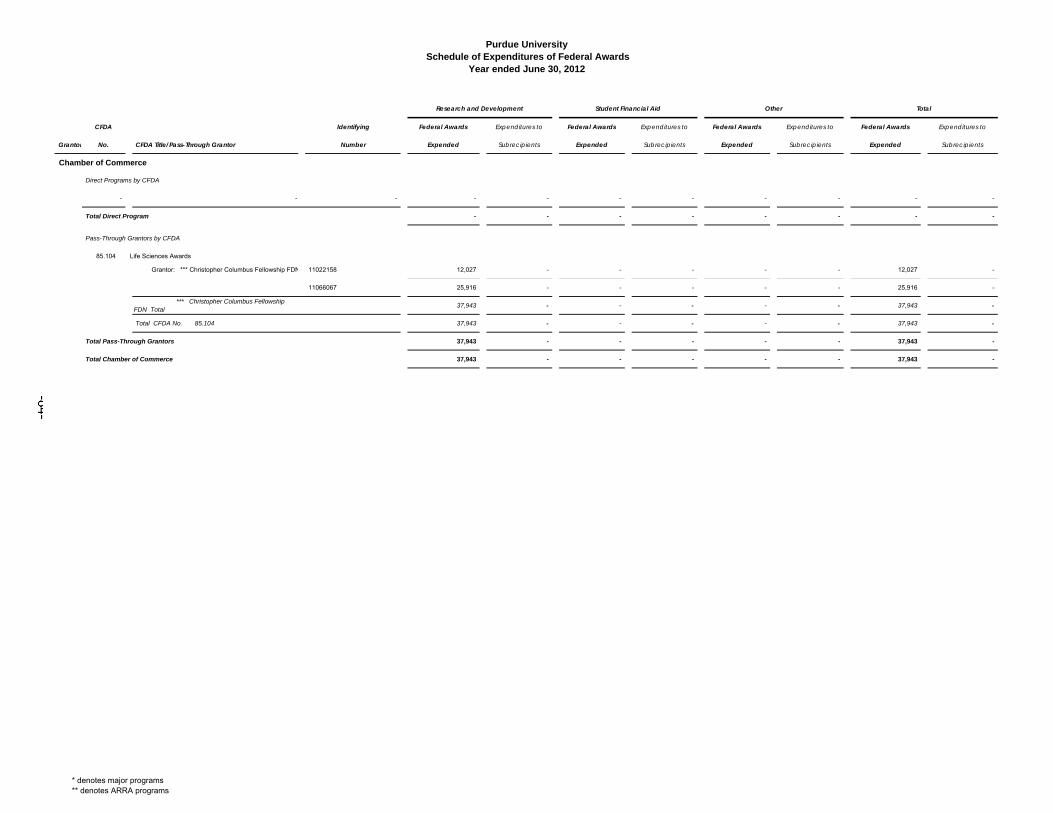
Purdue University Schedule of Expenditures of Federal Awards
Year ended June 30, 2012
CFDA Identifying Federal Awards Expenditures to Federal Awards Expenditures to Federal Awards Expenditures to Federal Awards Expenditures to
Grantor No. CFDA Title/Pass-Through Grantor Number Expended Subrecipients Expended Subrecipients Expended Subrecipients Expended Subrecipients
Research and Development Student Financial Aid Other Total
Chamber of Commerce
Direct Programs by CFDA
- - - - - - - - - - -
Total Direct Program - - - - - - - -
Pass-Through Grantors by CFDA
85.104 Life Sciences Awards
Grantor: *** Christopher Columbus Fellowship FDN 11022158 12,027 - - - - - 12,027 -
11066067 25,916 - - - - - 25,916 -
*** Christopher Columbus Fellowship FDN Total
37,943 - - - - - 37,943 -
Total CFDA No. 85.104 37,943 - - - - - 37,943 -
Total Pass-Through Grantors 37,943 - - - - - 37,943 -
Total Chamber of Commerce 37,943 - - - - - 37,943 -
* denotes major programs** denotes ARRA programs
ldavid
Text Box
-84-
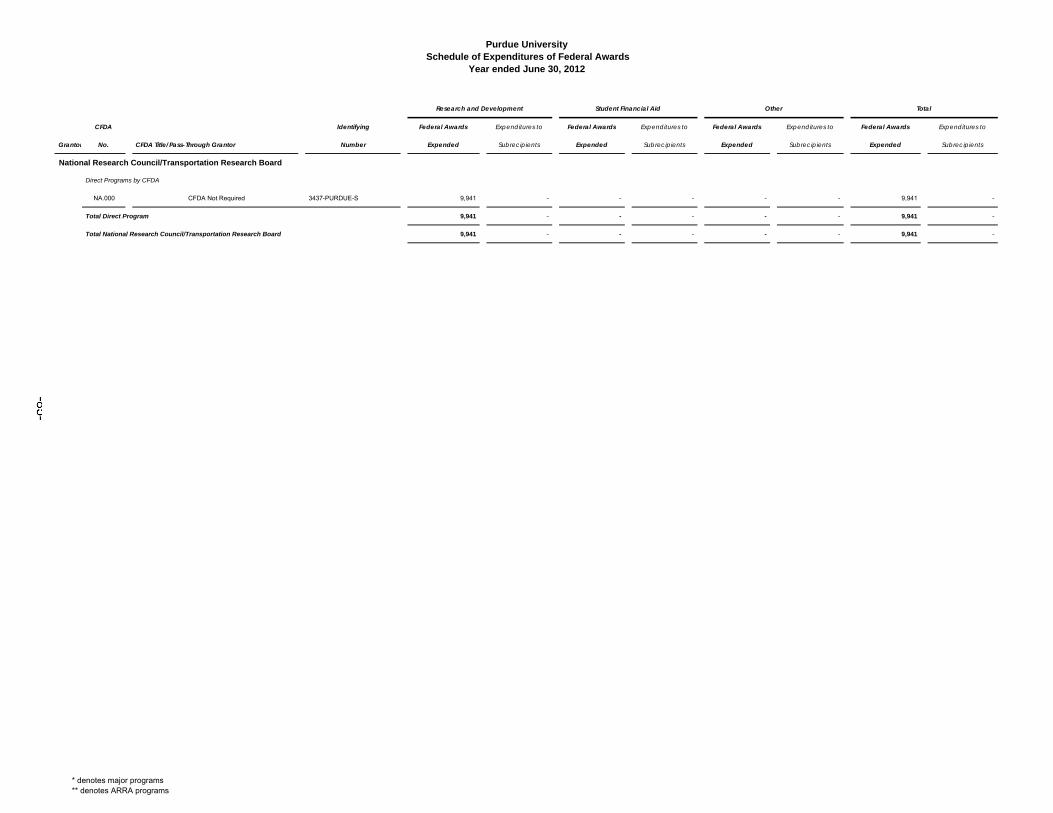
Purdue University Schedule of Expenditures of Federal Awards
Year ended June 30, 2012
CFDA Identifying Federal Awards Expenditures to Federal Awards Expenditures to Federal Awards Expenditures to Federal Awards Expenditures to
Grantor No. CFDA Title/Pass-Through Grantor Number Expended Subrecipients Expended Subrecipients Expended Subrecipients Expended Subrecipients
Research and Development Student Financial Aid Other Total
National Research Council/Transportation Research Board
Direct Programs by CFDA
NA.000 CFDA Not Required 3437-PURDUE-S 9,941 - - - - - 9,941 -
Total Direct Program 9,941 - - - - - 9,941 -
Total National Research Council/Transportation Research Board 9,941 - - - - - 9,941 -
* denotes major programs** denotes ARRA programs
ldavid
Text Box
-85-
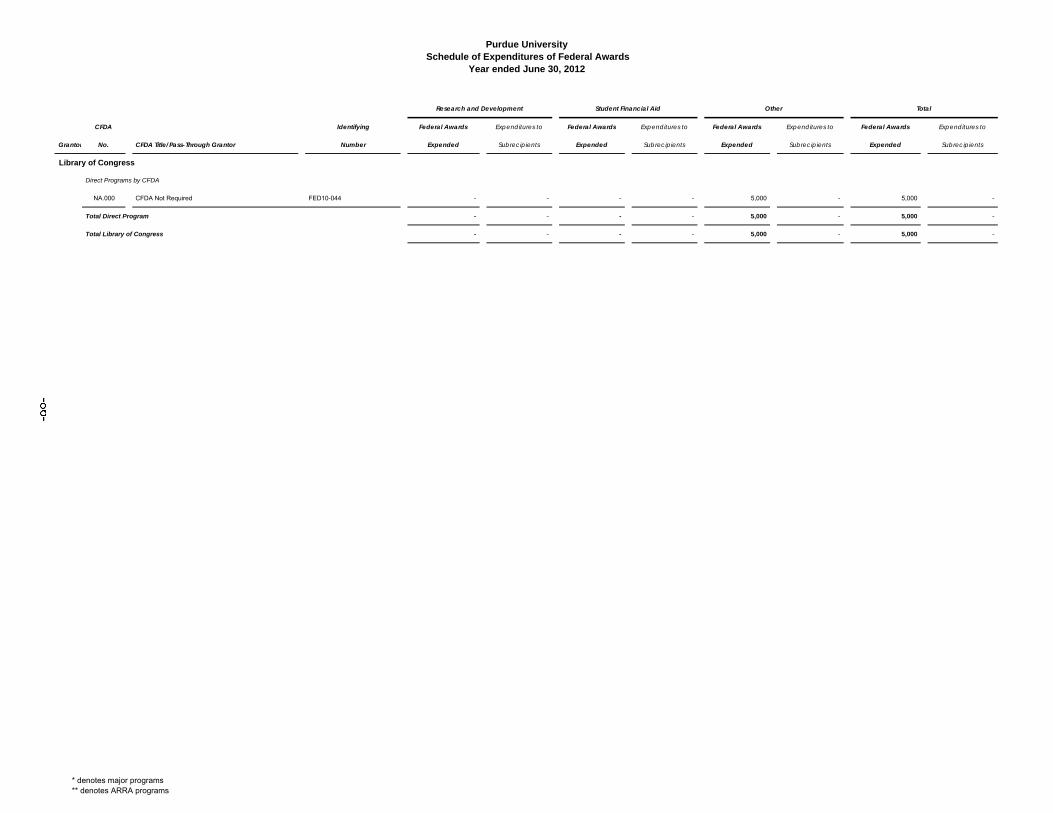
Purdue University Schedule of Expenditures of Federal Awards
Year ended June 30, 2012
CFDA Identifying Federal Awards Expenditures to Federal Awards Expenditures to Federal Awards Expenditures to Federal Awards Expenditures to
Grantor No. CFDA Title/Pass-Through Grantor Number Expended Subrecipients Expended Subrecipients Expended Subrecipients Expended Subrecipients
Research and Development Student Financial Aid Other Total
Library of Congress
Direct Programs by CFDA
NA.000 CFDA Not Required FED10-044 - - - - 5,000 - 5,000 -
Total Direct Program - - - - 5,000 - 5,000 -
Total Library of Congress - - - - 5,000 - 5,000 -
* denotes major programs** denotes ARRA programs
ldavid
Text Box
-86-
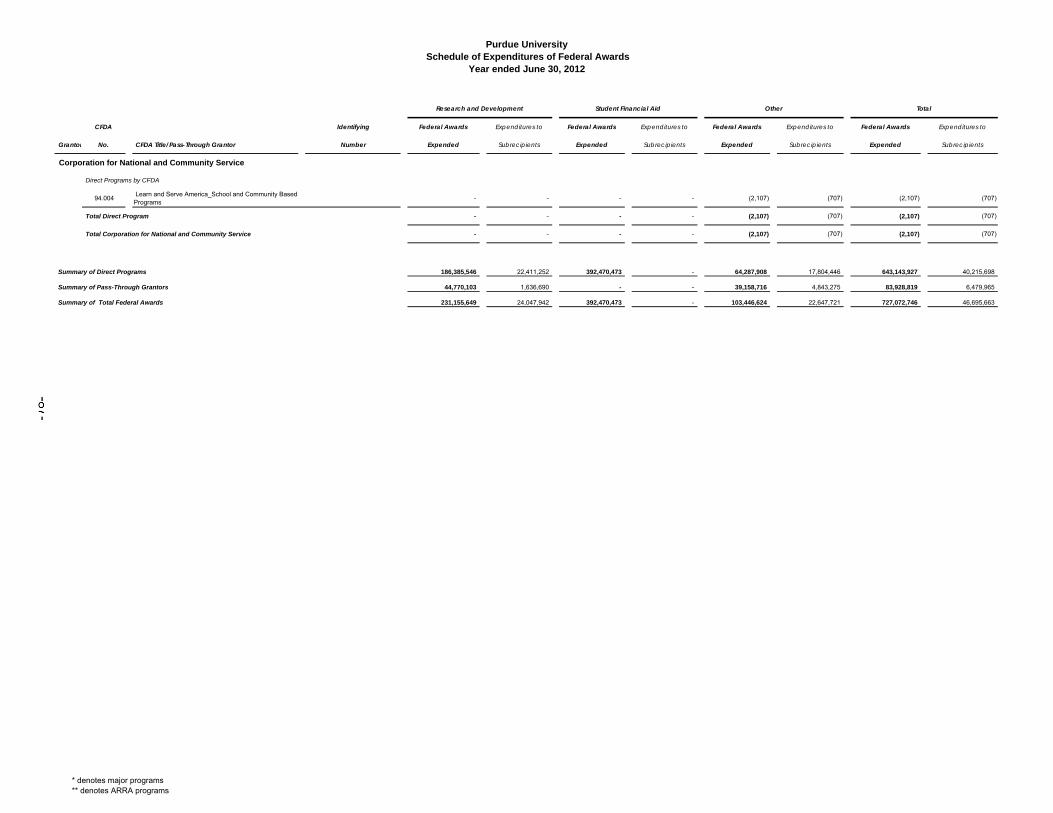
Purdue University Schedule of Expenditures of Federal Awards
Year ended June 30, 2012
CFDA Identifying Federal Awards Expenditures to Federal Awards Expenditures to Federal Awards Expenditures to Federal Awards Expenditures to
Grantor No. CFDA Title/Pass-Through Grantor Number Expended Subrecipients Expended Subrecipients Expended Subrecipients Expended Subrecipients
Research and Development Student Financial Aid Other Total
Corporation for National and Community Service
Direct Programs by CFDA
94.004 Learn and Serve America_School and Community Based Programs
- - - - (2,107) (707) (2,107) (707)
Total Direct Program - - - - (2,107) (707) (2,107) (707)
Total Corporation for National and Community Service - - - - (2,107) (707) (2,107) (707)
Summary of Direct Programs 186,385,546 22,411,252 392,470,473 - 64,287,908 17,804,446 643,143,927 40,215,698
Summary of Pass-Through Grantors 44,770,103 1,636,690 - - 39,158,716 4,843,275 83,928,819 6,479,965
Summary of Total Federal Awards 231,155,649 24,047,942 392,470,473 - 103,446,624 22,647,721 727,072,746 46,695,663
* denotes major programs** denotes ARRA programs
ldavid
Text Box
-87-
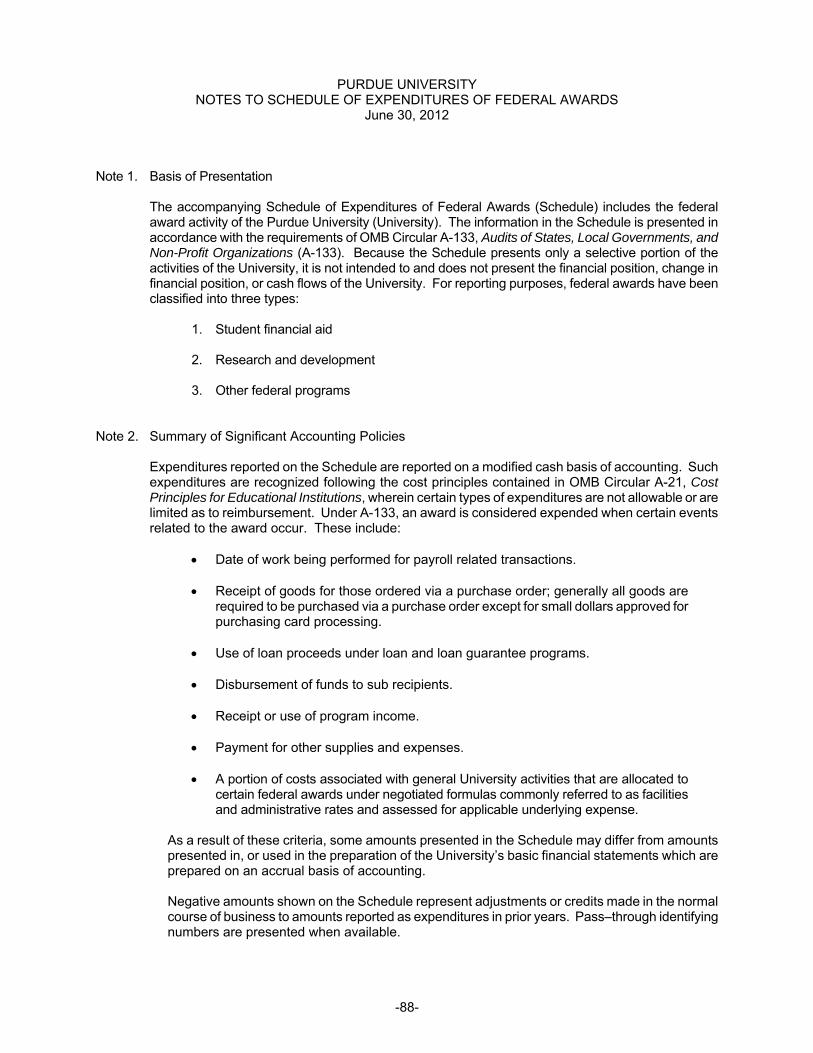
-88-
PURDUE UNIVERSITY NOTES TO SCHEDULE OF EXPENDITURES OF FEDERAL AWARDS
June 30, 2012
Note 1. Basis of Presentation
The accompanying Schedule of Expenditures of Federal Awards (Schedule) includes the federal award activity of the Purdue University (University). The information in the Schedule is presented in accordance with the requirements of OMB Circular A-133, Audits of States, Local Governments, and Non-Profit Organizations (A-133). Because the Schedule presents only a selective portion of the activities of the University, it is not intended to and does not present the financial position, change in financial position, or cash flows of the University. For reporting purposes, federal awards have been classified into three types:
1. Student financial aid 2. Research and development 3. Other federal programs
Note 2. Summary of Significant Accounting Policies
Expenditures reported on the Schedule are reported on a modified cash basis of accounting. Such expenditures are recognized following the cost principles contained in OMB Circular A-21, Cost Principles for Educational Institutions, wherein certain types of expenditures are not allowable or are limited as to reimbursement. Under A-133, an award is considered expended when certain events related to the award occur. These include:
Date of work being performed for payroll related transactions.
Receipt of goods for those ordered via a purchase order; generally all goods are required to be purchased via a purchase order except for small dollars approved for purchasing card processing.
Use of loan proceeds under loan and loan guarantee programs.
Disbursement of funds to sub recipients.
Receipt or use of program income.
Payment for other supplies and expenses.
A portion of costs associated with general University activities that are allocated to certain federal awards under negotiated formulas commonly referred to as facilities and administrative rates and assessed for applicable underlying expense.
As a result of these criteria, some amounts presented in the Schedule may differ from amounts presented in, or used in the preparation of the University’s basic financial statements which are prepared on an accrual basis of accounting. Negative amounts shown on the Schedule represent adjustments or credits made in the normal course of business to amounts reported as expenditures in prior years. Pass–through identifying numbers are presented when available.
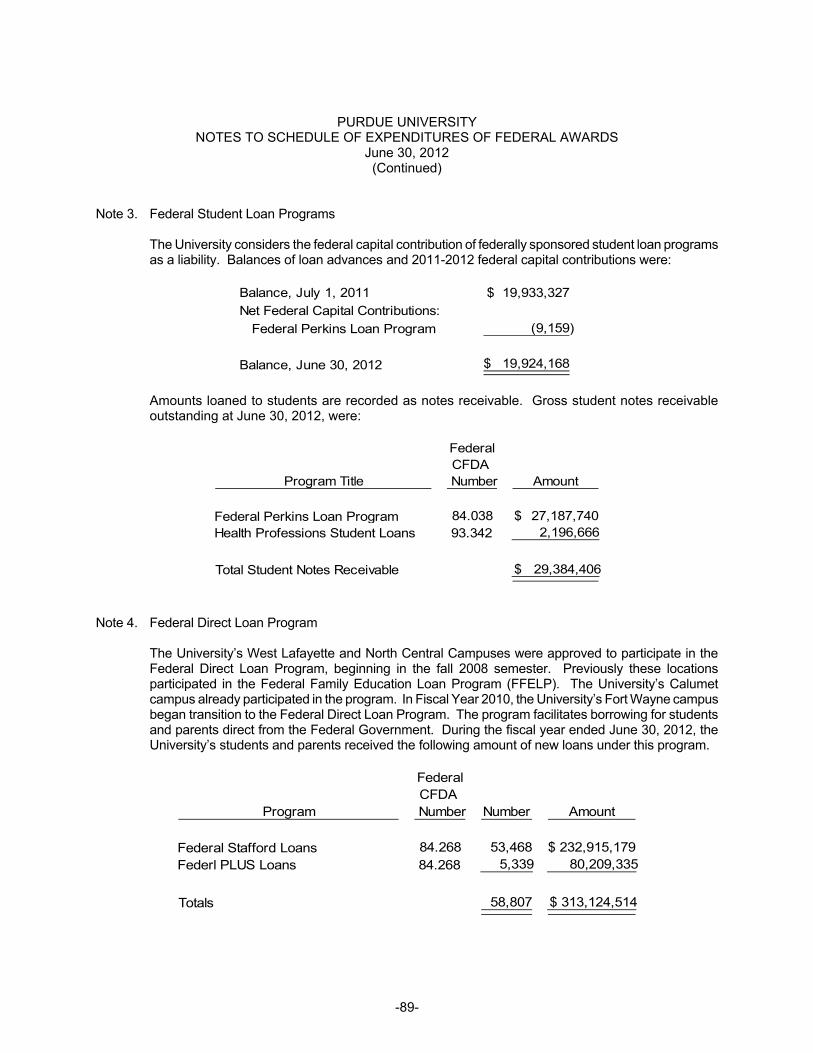
-89-
PURDUE UNIVERSITY NOTES TO SCHEDULE OF EXPENDITURES OF FEDERAL AWARDS
June 30, 2012 (Continued)
Note 3. Federal Student Loan Programs
The University considers the federal capital contribution of federally sponsored student loan programs as a liability. Balances of loan advances and 2011-2012 federal capital contributions were:
Amounts loaned to students are recorded as notes receivable. Gross student notes receivable outstanding at June 30, 2012, were:
Note 4. Federal Direct Loan Program
The University’s West Lafayette and North Central Campuses were approved to participate in the Federal Direct Loan Program, beginning in the fall 2008 semester. Previously these locations participated in the Federal Family Education Loan Program (FFELP). The University’s Calumet campus already participated in the program. In Fiscal Year 2010, the University’s Fort Wayne campus began transition to the Federal Direct Loan Program. The program facilitates borrowing for students and parents direct from the Federal Government. During the fiscal year ended June 30, 2012, the University’s students and parents received the following amount of new loans under this program.
Balance, July 1, 2011 19,933,327$
Net Federal Capital Contributions:
Federal Perkins Loan Program (9,159)
Balance, June 30, 2012 19,924,168$
FederalCFDA
Program Title Number Amount
Federal Perkins Loan Program 84.038 27,187,740$ Health Professions Student Loans 93.342 2,196,666
Total Student Notes Receivable $ 29,384,406
FederalCFDA
Program Number Number Amount
Federal Stafford Loans 84.268 53,468 232,915,179$ Federl PLUS Loans 84.268 5,339 80,209,335
Totals 58,807 $ 313,124,514
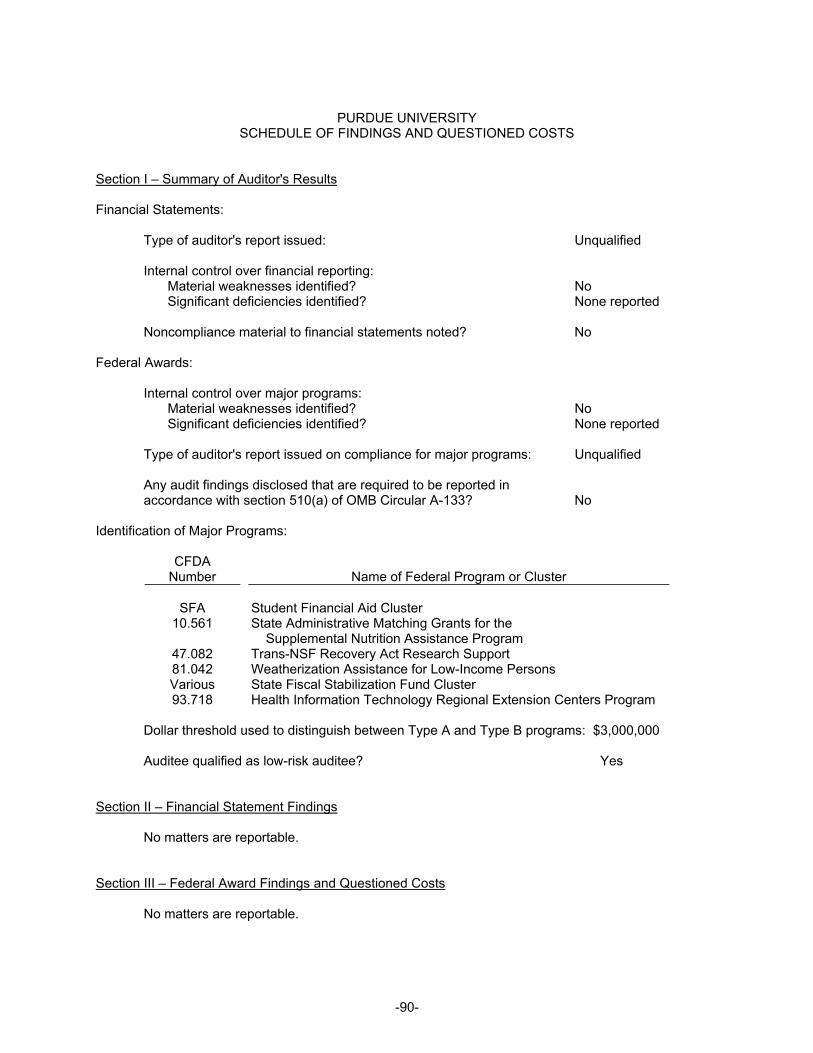
-90-
PURDUE UNIVERSITY SCHEDULE OF FINDINGS AND QUESTIONED COSTS
Section I – Summary of Auditor's Results
Financial Statements:
Type of auditor's report issued: Unqualified
Internal control over financial reporting: Material weaknesses identified? No Significant deficiencies identified? None reported
Noncompliance material to financial statements noted? No
Federal Awards:
Internal control over major programs: Material weaknesses identified? No Significant deficiencies identified? None reported
Type of auditor's report issued on compliance for major programs: Unqualified Any audit findings disclosed that are required to be reported in accordance with section 510(a) of OMB Circular A-133? No
Identification of Major Programs:
CFDA Number
Name of Federal Program or Cluster
SFA Student Financial Aid Cluster
10.561 State Administrative Matching Grants for the Supplemental Nutrition Assistance Program
47.082 Trans-NSF Recovery Act Research Support 81.042 Weatherization Assistance for Low-Income Persons Various State Fiscal Stabilization Fund Cluster 93.718 Health Information Technology Regional Extension Centers Program
Dollar threshold used to distinguish between Type A and Type B programs: $3,000,000 Auditee qualified as low-risk auditee? Yes
Section II – Financial Statement Findings No matters are reportable. Section III – Federal Award Findings and Questioned Costs No matters are reportable.
-91-
PURDUE UNIVERSITY SUMMARY SCHEDULE OF PRIOR AUDIT FINDINGS
Finding No. 2011-1 Improper Calculation of Title IV Refunds Federal Agency: U.S. Department of Education Federal Program: Student Financial Aid Cluster CFDA Number: Various Pass-Through Entity: N/A Federal Award Number: N/A Auditee Contact Person: Peggy L. Fish Title of Contact Person: Director of Audits Phone Number: 765-494-7588 Status of Finding: Corrective action was taken
-92-
PURDUE UNIVERSITY EXIT CONFERENCE
The contents of this report were discussed at an exit conference held on February 14, 2013. Those attending were: A. V. Diaz, Executive Vice President for Business and Finance, Treasurer
James S. Almond, Senior Vice President for Business Services and Assistant Treasurer Michael R. Ludwig, Director of Sponsored Program Administration Stephanie J. Willis, Sponsored Programs Assistant Director, Information and Support Services Theodore E. Malone, Executive Director, Division of Financial Aid Peggy L. Fish, Director of Audits Mary Catherine Gaisbauer, Comptroller Matthew D. Westhuis, Assistant Comptroller of Accounting and Reporting Services Jeff Arthur, University Supervisor, State Board of Accounts Leann W. Tinsley, Auditor in Charge, State Board of Accounts
2012FINANCIALREPORT

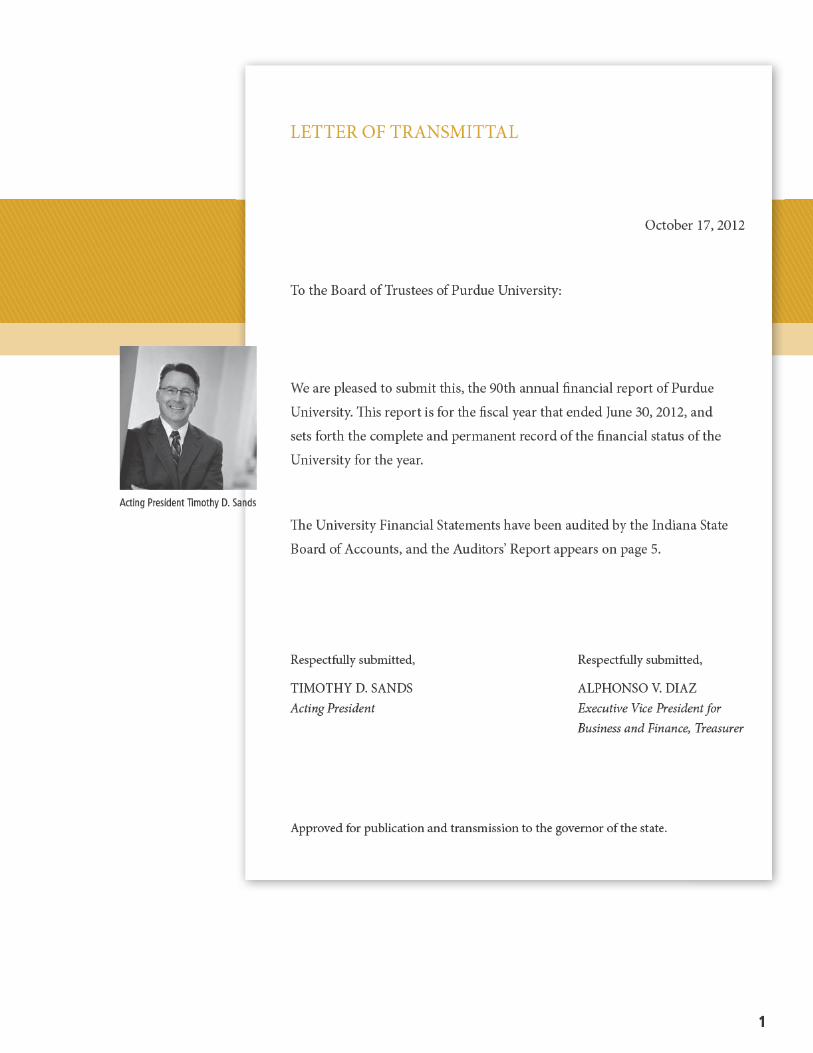
2
REPORT OF THE TREASURER
�is report presents Purdue University’s �nancial position and the results of operations for the �scal years ended June 30, 2012 and 2011. We provide this �nancial report as part of the University’s com-mitment to report annually on its �scal a�airs. �ese �nancial statements have been audited by the Indiana State Board of Accounts and their report which is an unquali�ed opinion appears on page 5.
Purdue University continues its long tradition of being a world-class research university. Purdue University is ranked 23rd among the nation’s public universities and 65th among all universities, ac-cording to U.S. News & World Report. �e university o�ers instruction in a wide range of disciplines, granting undergraduate and graduate degrees through four campuses. Purdue has departments ranked in the Top Ten in nearly every College or School on campus. From our number one Biological and Agricultural Engineering graduate program to our highly rated Speech Language Pathology, Aeronautics and Astronautics, and Pharmacy programs. In specialty rankings, Purdue ranks 10th in engineering and technology, 20th in computer science, 19th in chemistry, and 47th in overall science according to the Academic Ranking of World Universities (ARWU).
�e University continues to attract top undergraduates. �e academic quality of the freshman class at the West Lafayette campus increased for the sixth consecutive year. �e student body continues to be made up from every county in Indiana, all ��y states and more than 125 countries. Enrollment at all Purdue campuses reached an all time high of 70,274 for the fall semester of the 2013 academic year.
�e University continued its investment in its facilities with completed major construction projects in excess of $119 million during �scal year 2012, including the $42.4 million Fort Wayne Student Services and Library Complex, the $17.7 million First Street Towers West Residence Hall, and the $15.5 million Fort Wayne Parking Garage. Additional capital investments estimated at over $496 mil-lion were under way or in design as of June 30, 2012, including the $99.5 million Mackey Complex renovation and addition, the $98 million Student Fitness and Wellness Center renovation and addi-tion, the $59.6 million Windsor Residence Halls renovation, and the $53.7 million Health and Human Sciences Research Facility.
During �scal year 2012, the University launched the Innovation and Commercialization Center that will drive Purdue discoveries to the marketplace quicker, increase revenue for the University, and spur economic development in Indiana and the nation. �e center will allow faculty and sta� inventors to receive funding in order to test concepts, develop prototypes or participate in joint technology devel-opment projects with external partners. �e center is a key element of Purdue’s long-term initiative to support core activities at the University.
Purdue University continues to dedicate ourselves to the success of our students as future leaders, the development of new partnerships to expand the horizons of research and economic development lead-ing to jobs of the future, and a continued strengthening of the state of Indiana as a global leader in science, technology, engineering, mathematics and agriculture disciplines.
ALPHONSO V. DIAZExecutive Vice President for Business and Finance, Treasurer

3
Keith J. KrachChairman of BoardAppointed July 2009San Francisco, Calif.Chairman & CEO,
DocuSignTerm: 2007-2013
Bruce WhiteMerrillville, Ind.Chairman & CEO, White Lodge ServicesTerm: 2011-2014
Michael R. Bergho�Indianapolis, Ind.President,
Lenex Steel Co.Term: 2009-2015
Michael J. BirckHinsdale, Ill.Chairman and CEO,
Tellabs Inc.Term: 1999-2015
JoAnn BrouilletteWest Lafayette, Ind.Managing Partner
and President, Demeter LP
Term: 2006 -2015
John D. Hardin Jr.Danville, Ind.FarmerTerm: 1992-2013
Gary J. LehmanWest Lafayette, Ind.President and CEO,
Oerlikon Fair�eld Term: 2010-2014
�omas E. SpurgeonPeoria, Ill.Consultant,
Lincoln O�ceTerm: 2005-2014
Don �ompsonBurr Ridge, Ill.President and COO,
McDonald’s Corp.Term: 2009-2013
Miranda McCormackFowler, Ind.Student TrusteeTerm: 2011-2013
BOARD OF TRUSTEESAs of June 30, 2012
�e responsibility for making rules and regulations to govern the University is vested in a 10-member Board of Trustees appointed by the governor. �e selection of these trustees is prescribed in Indiana Code IC 21-23-3. �ree of the trustees are selected by the Purdue Alumni Association. �e remaining seven trustees are selected by the governor. Two of the trustees must be involved in agricultural pursuits, and one must be a full-time student of Purdue University. All trustees serve for a period of three years, except for the student member, who serves for two years.
4
OFFICERS OF THE UNIVERSITYAs of June 30, 2012
OFFICERS OF THE BOARD OF TRUSTEES
Keith J. Krach, ChairmanThomas E. Spurgeon, Vice ChairmanAlphonso V. Diaz, TreasurerJames S. Almond, Assistant Treasurer and Assistant Secretary Janice A. Indrutz, SecretaryThomas B. Parent, Legal Counsel
ADMINISTRATIVE OFFICERS
France A. Córdova, PresidentTimothy D. Sands, Executive Vice President for Academic A�airs and ProvostAlphonso V. Diaz, Executive Vice President for Business and Finance, Treasurer James S. Almond, Senior Vice President for Business Services and Assistant TreasurerRichard O. Buckius, Vice President for ResearchMorgan J. Burke, Director of Intercollegiate AthleticsLisa D. Calvert, Vice President for DevelopmentMelissa E. Exum, Vice President for Student A�airsPeggy L. Fish, Director of AuditsJulie K. Griffith, Vice President for Public A�airsMichael J. Gulich, Director of SustainabilityJoseph B. Hornett, Senior Vice President, Treasurer, Purdue Research FoundationLuis E. Lewin, Vice President for Human Resources William G. McCartney, Vice President for Information Technology and CIORobert E. McMains, Vice President for Physical FacilitiesJesse L. Moore, Director, Supplier Diversity DevelopmentRabindra N. Mukerjea, Executive Director of Strategic Planning and AssessmentAlysa Christmas Rollock, Vice President for Ethics and ComplianceKen L. Sandel, Director of Physical and Capital PlanningTeri L. Thompson, Vice President for Marketing and Media
REGIONAL CAMPUS STAFF
James B. Dworkin, Chancellor, Purdue University North CentralThomas L. Keon, Chancellor, Purdue University CalumetMichael A. Wartell, Chancellor, Indiana University-Purdue University Fort WayneStephen R. Turner, Vice Chancellor for Administration, Purdue University North CentralWalter J. Branson, Vice Chancellor for Financial A�airs,
Indiana University-Purdue University Fort WayneJames K. Johnston, Vice Chancellor for Administrative Services, Purdue University Calumet
5

6
7
MANAGEMENT’S DISCUSSION AND ANALYSISJune 30, 2012 and 2011
We are pleased to present this financial discussion and analysis of Purdue University (the University). It is intended to make the University’s financial statements easier to understand and communicate our financial situation in an open and accountable manner. The primary purpose of financial report-ing, whether for a commercial enterprise or for a university, is to provide information that will assist (1) management in the effective allocation and use of the organization’s resources and (2) the general public, investors, creditors and others in evaluating the effectiveness of management in achieving or-ganizational objectives. The nature of the organization, its resources and its objectives all serve to in-fluence the form and process by which the accounting is accomplished and information reported.
The following discussion and analysis provides an overview of the financial position and activities of the University for the fiscal years ended June 30, 2012 and 2011 (Fiscal Years 2012 and 2011, respec-tively), with comparative financial information for Fiscal Year 2010. Since this presentation includes highly summarized data, it should be read in conjunction with the financial statements, which have the following other parts:
• Report of Independent Auditors presents an unqualified opinion prepared by our auditors (the Indiana State Board of Accounts) on the fairness (in all material respects) of our financial statements.
• Statements of Net Assets present the assets, liabilities and net assets of the University at a point in time (June 30, 2012 and 2011). Their purpose is to present a financial snapshot of the University. They aid readers in determining the assets available to continue the University’s operations; how much the University owes to employees, vendors and investors; and a picture of net assets and their availability for expenditure by the University.
• Statements of Revenues, Expenses and Changes in Net Assets present the total revenues earned and expenses incurred by the University for operating, nonoperating and other related activities during a period of time (the years ended June 30, 2012 and 2011). Their purpose is to assess the University’s operating and nonoperating activities.
• Statements of Cash Flows present cash receipts and payments of the University during a period of time (the years ended June 30, 2012 and 2011). Their purpose is to assess the University’s ability to generate net cash flows and meet its obligations as they come due.
• Notes to the Financial Statements present additional information to support the financial state-ments and are commonly referred to as “Notes.” Their purpose is to clarify and expand on the information in the financial statements. Notes are referenced in this discussion to indicate where details of the financial highlights may be found.
The financial information presented in this report is designed to enable the user to review how the University managed its resources to meet its primary missions of discovery, learning and engagement. It should be recognized that a presentation of the financial performance of the University is not a full measure of the value of the discovery, learning and engagement functions carried out during the year. This report deals with the costs and sources of revenue used to provide the quality and diversity in higher education that the University believes necessary to meet its goals and objectives. We suggest that you combine this financial analysis and discussion with relevant nonfinancial indicators to assess
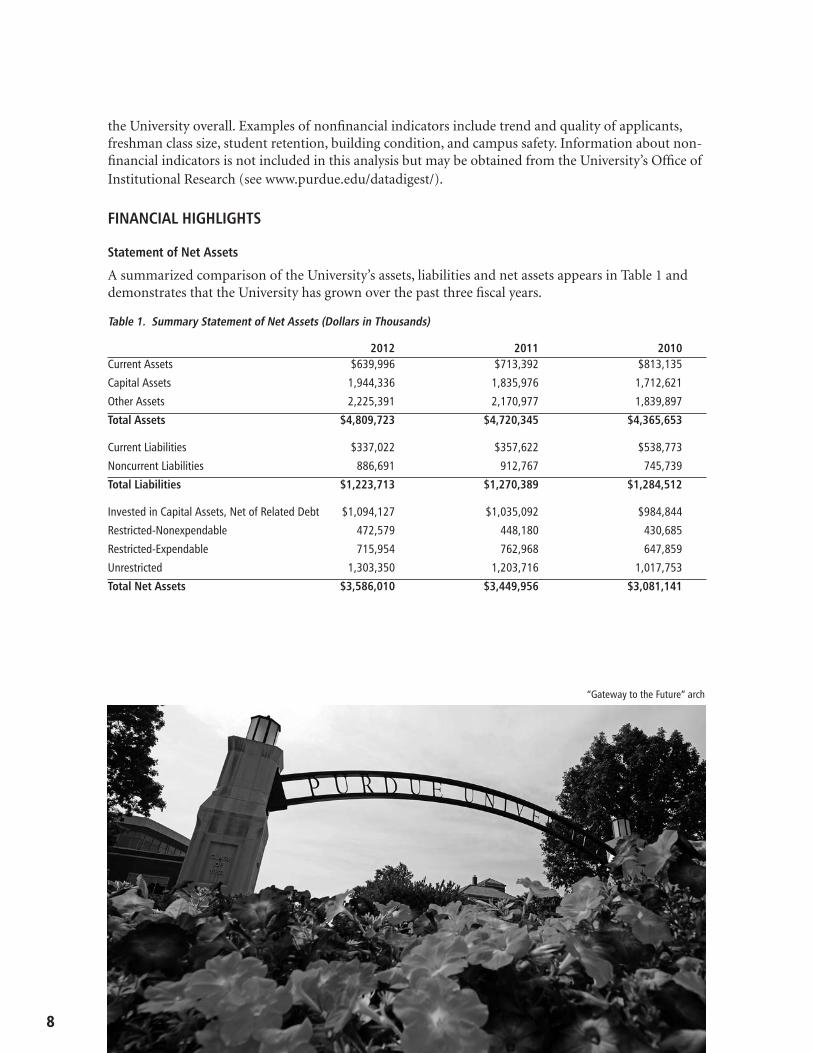
8
the University overall. Examples of nonfinancial indicators include trend and quality of applicants, freshman class size, student retention, building condition, and campus safety. Information about non-financial indicators is not included in this analysis but may be obtained from the University’s Office of Institutional Research (see www.purdue.edu/datadigest/).
FINANCIAL HIGHLIGHTS
Statement of Net Assets
A summarized comparison of the University’s assets, liabilities and net assets appears in Table 1 and demonstrates that the University has grown over the past three fiscal years.
Table 1. Summary Statement of Net Assets (Dollars in Thousands)
2012 2011 2010Current Assets $639,996 $713,392 $813,135
Capital Assets 1,944,336 1,835,976 1,712,621
Other Assets 2,225,391 2,170,977 1,839,897
Total Assets $4,809,723 $4,720,345 $4,365,653
Current Liabilities $337,022 $357,622 $538,773
Noncurrent Liabilities 886,691 912,767 745,739
Total Liabilities $1,223,713 $1,270,389 $1,284,512
Invested in Capital Assets, Net of Related Debt $1,094,127 $1,035,092 $984,844
Restricted-Nonexpendable 472,579 448,180 430,685
Restricted-Expendable 715,954 762,968 647,859
Unrestricted 1,303,350 1,203,716 1,017,753
Total Net Assets $3,586,010 $3,449,956 $3,081,141
“Gateway to the Future” arch
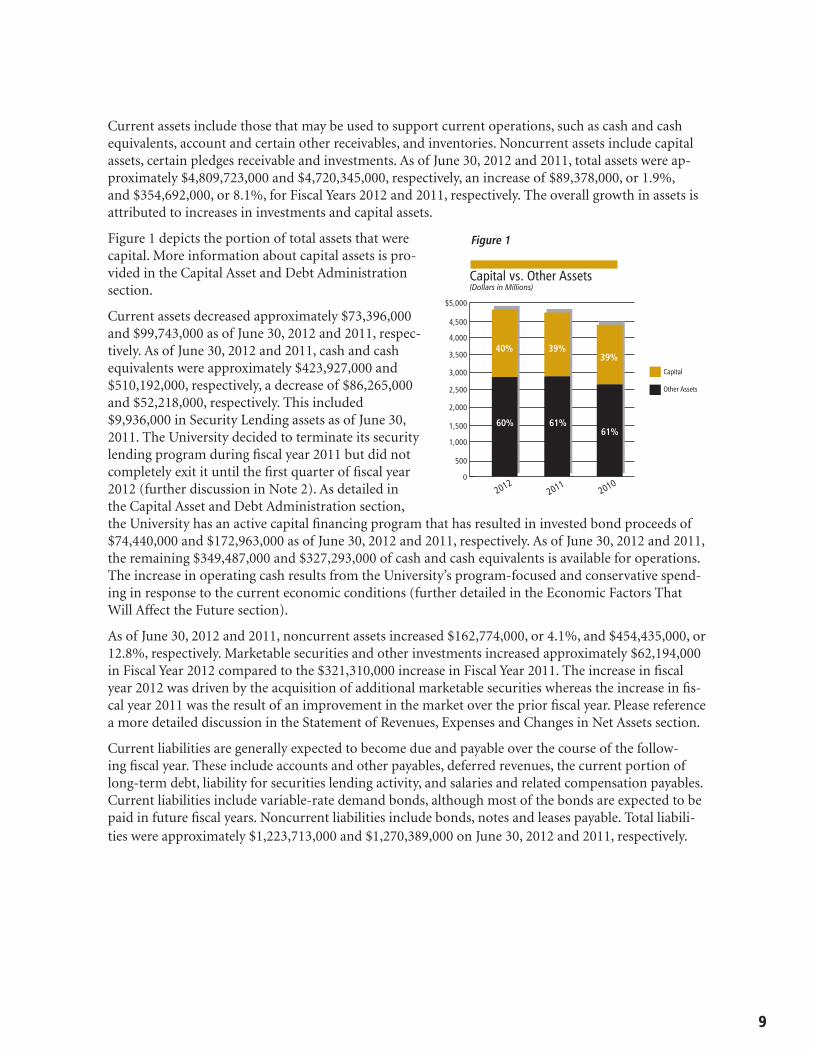
9
Current assets include those that may be used to support current operations, such as cash and cash equivalents, account and certain other receivables, and inventories. Noncurrent assets include capital assets, certain pledges receivable and investments. As of June 30, 2012 and 2011, total assets were ap-proximately $4,809,723,000 and $4,720,345,000, respectively, an increase of $89,378,000, or 1.9%, and $354,692,000, or 8.1%, for Fiscal Years 2012 and 2011, respectively. The overall growth in assets is attributed to increases in investments and capital assets.
Figure 1 depicts the portion of total assets that were capital. More information about capital assets is pro-vided in the Capital Asset and Debt Administration section.
Current assets decreased approximately $73,396,000 and $99,743,000 as of June 30, 2012 and 2011, respec-tively. As of June 30, 2012 and 2011, cash and cash equivalents were approximately $423,927,000 and $510,192,000, respectively, a decrease of $86,265,000 and $52,218,000, respectively. This included $9,936,000 in Security Lending assets as of June 30, 2011. The University decided to terminate its security lending program during fiscal year 2011 but did not completely exit it until the first quarter of fiscal year 2012 (further discussion in Note 2). As detailed in the Capital Asset and Debt Administration section, the University has an active capital financing program that has resulted in invested bond proceeds of $74,440,000 and $172,963,000 as of June 30, 2012 and 2011, respectively. As of June 30, 2012 and 2011, the remaining $349,487,000 and $327,293,000 of cash and cash equivalents is available for operations. The increase in operating cash results from the University’s program-focused and conservative spend-ing in response to the current economic conditions (further detailed in the Economic Factors That Will Affect the Future section).
As of June 30, 2012 and 2011, noncurrent assets increased $162,774,000, or 4.1%, and $454,435,000, or 12.8%, respectively. Marketable securities and other investments increased approximately $62,194,000 in Fiscal Year 2012 compared to the $321,310,000 increase in Fiscal Year 2011. The increase in fiscal year 2012 was driven by the acquisition of additional marketable securities whereas the increase in fis-cal year 2011 was the result of an improvement in the market over the prior fiscal year. Please reference a more detailed discussion in the Statement of Revenues, Expenses and Changes in Net Assets section.
Current liabilities are generally expected to become due and payable over the course of the follow-ing fiscal year. These include accounts and other payables, deferred revenues, the current portion of long-term debt, liability for securities lending activity, and salaries and related compensation payables. Current liabilities include variable-rate demand bonds, although most of the bonds are expected to be paid in future fiscal years. Noncurrent liabilities include bonds, notes and leases payable. Total liabili-ties were approximately $1,223,713,000 and $1,270,389,000 on June 30, 2012 and 2011, respectively.
20102011
2012
Capital vs. Other Assets(Dollars in Millions)
0
1,000
500
1,500
2,000
2,500
3,000
3,500
4,000
$5,000
4,500
40%
60%
39%
61%
39%
61%
Capital
Other Assets
Figure 1
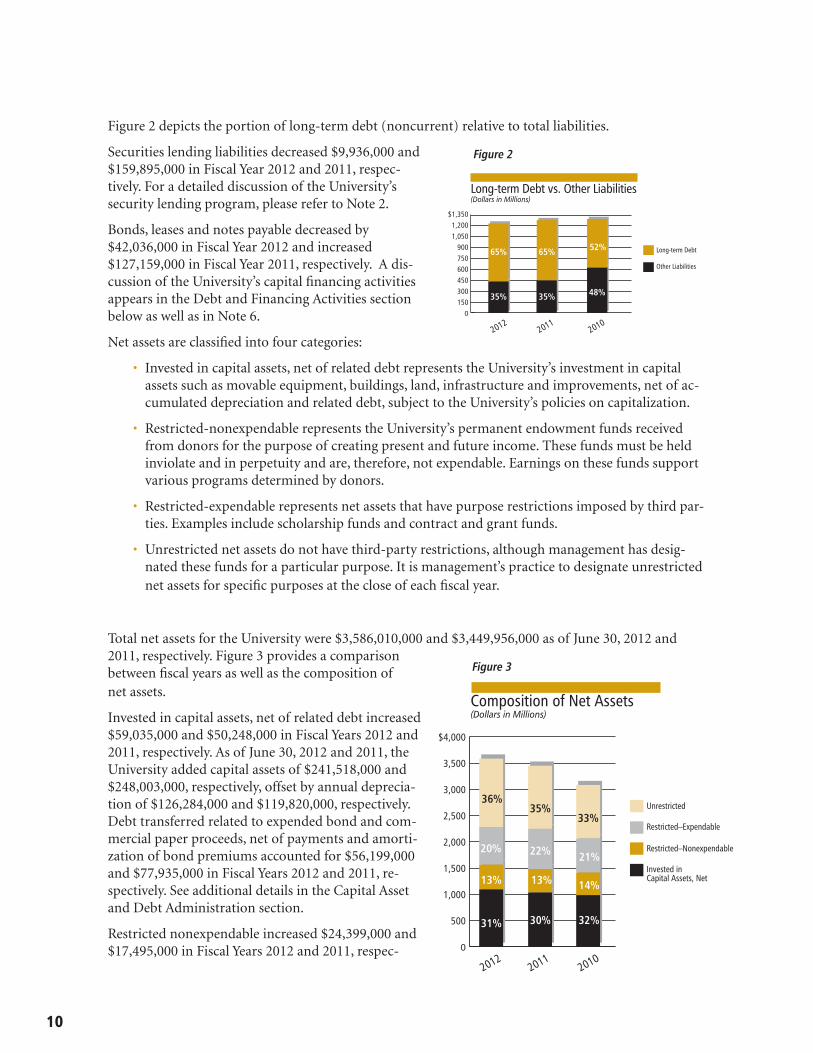
10
Figure 2 depicts the portion of long-term debt (noncurrent) relative to total liabilities.
Securities lending liabilities decreased $9,936,000 and $159,895,000 in Fiscal Year 2012 and 2011, respec-tively. For a detailed discussion of the University’s security lending program, please refer to Note 2.
Bonds, leases and notes payable decreased by $42,036,000 in Fiscal Year 2012 and increased $127,159,000 in Fiscal Year 2011, respectively. A dis-cussion of the University’s capital financing activities appears in the Debt and Financing Activities section below as well as in Note 6.
Net assets are classified into four categories:
• Invested in capital assets, net of related debt represents the University’s investment in capital assets such as movable equipment, buildings, land, infrastructure and improvements, net of ac-cumulated depreciation and related debt, subject to the University’s policies on capitalization.
• Restricted-nonexpendable represents the University’s permanent endowment funds received from donors for the purpose of creating present and future income. These funds must be held inviolate and in perpetuity and are, therefore, not expendable. Earnings on these funds support various programs determined by donors.
• Restricted-expendable represents net assets that have purpose restrictions imposed by third par-ties. Examples include scholarship funds and contract and grant funds.
• Unrestricted net assets do not have third-party restrictions, although management has desig-nated these funds for a particular purpose. It is management’s practice to designate unrestricted net assets for specific purposes at the close of each fiscal year.
Total net assets for the University were $3,586,010,000 and $3,449,956,000 as of June 30, 2012 and 2011, respectively. Figure 3 provides a comparison between fiscal years as well as the composition of net assets.
Invested in capital assets, net of related debt increased $59,035,000 and $50,248,000 in Fiscal Years 2012 and 2011, respectively. As of June 30, 2012 and 2011, the University added capital assets of $241,518,000 and $248,003,000, respectively, offset by annual deprecia-tion of $126,284,000 and $119,820,000, respectively. Debt transferred related to expended bond and com-mercial paper proceeds, net of payments and amorti-zation of bond premiums accounted for $56,199,000 and $77,935,000 in Fiscal Years 2012 and 2011, re-spectively. See additional details in the Capital Asset and Debt Administration section.
Restricted nonexpendable increased $24,399,000 and $17,495,000 in Fiscal Years 2012 and 2011, respec-
20102011
20120
300
600
900
1,200
450
150
750
1,050
$1,350
Long-term Debt vs. Other Liabilities(Dollars in Millions)
Long-term Debt
Other Liabilities
52%65%65%
35% 35% 48%
Figure 2
Figure 3
Invested in Capital Assets, Net
20102011
2012
Composition of Net Assets(Dollars in Millions)
Unrestricted
Restricted–Expendable
Restricted–Nonexpendable
0
500
1,000
1,500
2,000
2,500
3,000
3,500
$4,000
33%35%
36%
20% 22% 21%
13% 13% 14%
32%30%31%
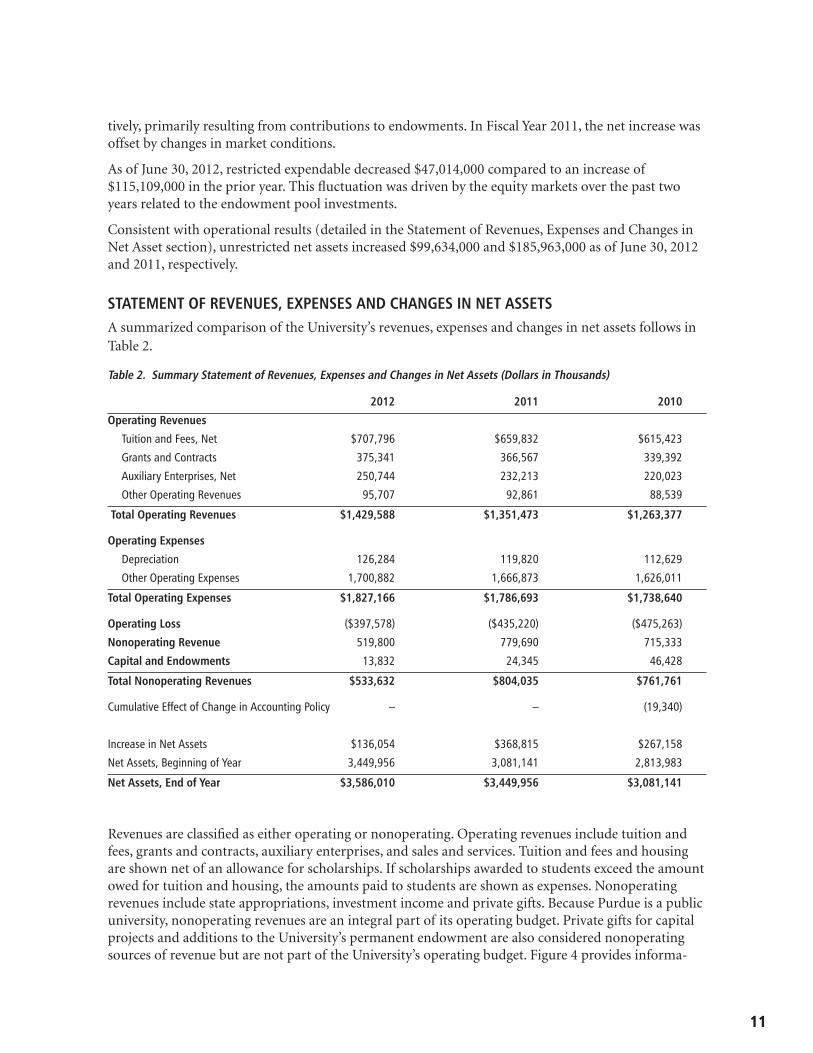
11
tively, primarily resulting from contributions to endowments. In Fiscal Year 2011, the net increase was offset by changes in market conditions.
As of June 30, 2012, restricted expendable decreased $47,014,000 compared to an increase of $115,109,000 in the prior year. This fluctuation was driven by the equity markets over the past two years related to the endowment pool investments.
Consistent with operational results (detailed in the Statement of Revenues, Expenses and Changes in Net Asset section), unrestricted net assets increased $99,634,000 and $185,963,000 as of June 30, 2012 and 2011, respectively.
STATEMENT OF REVENUES, EXPENSES AND CHANGES IN NET ASSETSA summarized comparison of the University’s revenues, expenses and changes in net assets follows in Table 2.
Table 2. Summary Statement of Revenues, Expenses and Changes in Net Assets (Dollars in Thousands)
2012 2011 2010
Operating Revenues
Tuition and Fees, Net $707,796 $659,832 $615,423
Grants and Contracts 375,341 366,567 339,392
Auxiliary Enterprises, Net 250,744 232,213 220,023
Other Operating Revenues 95,707 92,861 88,539
Total Operating Revenues $1,429,588 $1,351,473 $1,263,377
Operating Expenses
Depreciation 126,284 119,820 112,629
Other Operating Expenses 1,700,882 1,666,873 1,626,011
Total Operating Expenses $1,827,166 $1,786,693 $1,738,640
Operating Loss ($397,578) ($435,220) ($475,263)
Nonoperating Revenue 519,800 779,690 715,333
Capital and Endowments 13,832 24,345 46,428
Total Nonoperating Revenues $533,632 $804,035 $761,761
Cumulative Effect of Change in Accounting Policy – – (19,340)
Increase in Net Assets $136,054 $368,815 $267,158
Net Assets, Beginning of Year 3,449,956 3,081,141 2,813,983
Net Assets, End of Year $3,586,010 $3,449,956 $3,081,141
Revenues are classified as either operating or nonoperating. Operating revenues include tuition and fees, grants and contracts, auxiliary enterprises, and sales and services. Tuition and fees and housing are shown net of an allowance for scholarships. If scholarships awarded to students exceed the amount owed for tuition and housing, the amounts paid to students are shown as expenses. Nonoperating revenues include state appropriations, investment income and private gifts. Because Purdue is a public university, nonoperating revenues are an integral part of its operating budget. Private gifts for capital projects and additions to the University’s permanent endowment are also considered nonoperating sources of revenue but are not part of the University’s operating budget. Figure 4 provides informa-
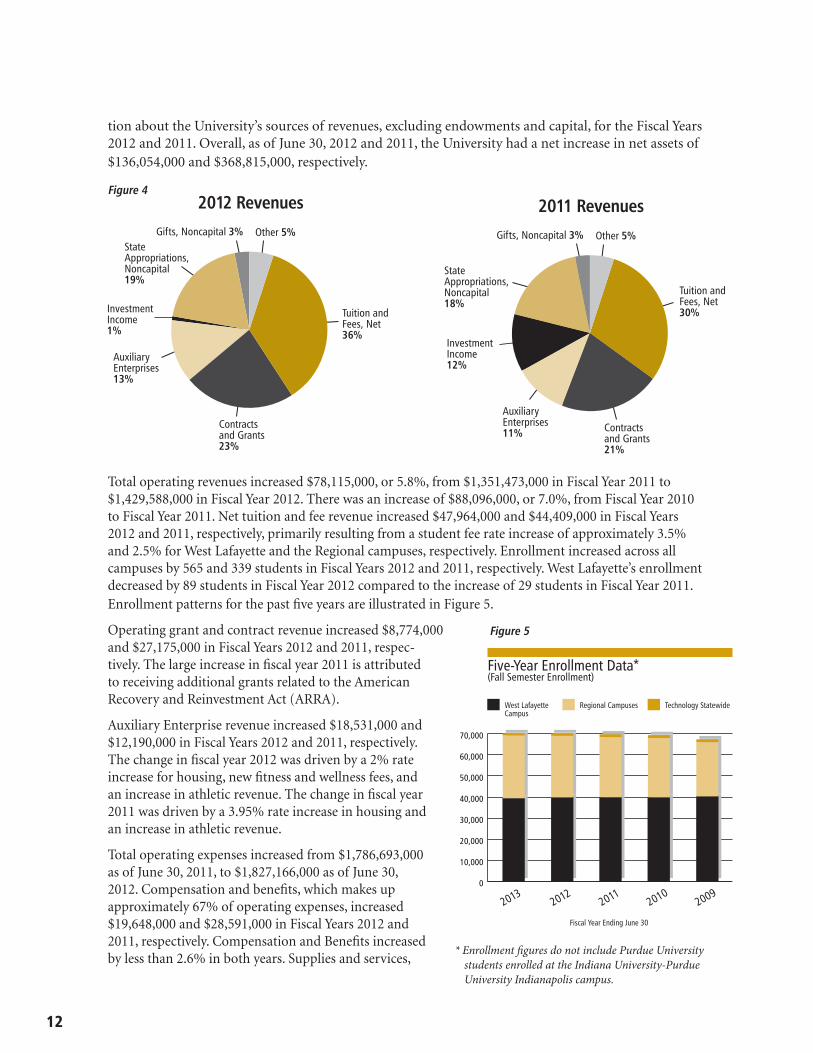
12
tion about the University’s sources of revenues, excluding endowments and capital, for the Fiscal Years 2012 and 2011. Overall, as of June 30, 2012 and 2011, the University had a net increase in net assets of $136,054,000 and $368,815,000, respectively.
Total operating revenues increased $78,115,000, or 5.8%, from $1,351,473,000 in Fiscal Year 2011 to $1,429,588,000 in Fiscal Year 2012. There was an increase of $88,096,000, or 7.0%, from Fiscal Year 2010 to Fiscal Year 2011. Net tuition and fee revenue increased $47,964,000 and $44,409,000 in Fiscal Years 2012 and 2011, respectively, primarily resulting from a student fee rate increase of approximately 3.5% and 2.5% for West Lafayette and the Regional campuses, respectively. Enrollment increased across all campuses by 565 and 339 students in Fiscal Years 2012 and 2011, respectively. West Lafayette’s enrollment decreased by 89 students in Fiscal Year 2012 compared to the increase of 29 students in Fiscal Year 2011. Enrollment patterns for the past five years are illustrated in Figure 5.
Operating grant and contract revenue increased $8,774,000 and $27,175,000 in Fiscal Years 2012 and 2011, respec-tively. The large increase in fiscal year 2011 is attributed to receiving additional grants related to the American Recovery and Reinvestment Act (ARRA).
Auxiliary Enterprise revenue increased $18,531,000 and $12,190,000 in Fiscal Years 2012 and 2011, respectively. The change in fiscal year 2012 was driven by a 2% rate increase for housing, new fitness and wellness fees, and an increase in athletic revenue. The change in fiscal year 2011 was driven by a 3.95% rate increase in housing and an increase in athletic revenue.
Total operating expenses increased from $1,786,693,000 as of June 30, 2011, to $1,827,166,000 as of June 30, 2012. Compensation and benefits, which makes up approximately 67% of operating expenses, increased $19,648,000 and $28,591,000 in Fiscal Years 2012 and 2011, respectively. Compensation and Benefits increased by less than 2.6% in both years. Supplies and services,
Other 5%Gifts, Noncapital 3%
Auxiliary Enterprises11% Contracts
and Grants21%
Tuition andFees, Net30%
2011 Revenues
Investment Income12%
StateAppropriations,Noncapital18%
Other 5%Gifts, Noncapital 3%
Auxiliary Enterprises13%
Contracts and Grants23%
Tuition andFees, Net36%
2012 Revenues
Investment Income1%
StateAppropriations,Noncapital19%
* Enrollment �gures do not include Purdue University students enrolled at the Indiana University-Purdue University Indianapolis campus.
Other 5%Gifts, Noncapital 3%
Auxiliary Enterprises11% Contracts
and Grants21%
Tuition andFees, Net30%
2011 Revenues
Investment Income12%
StateAppropriations,Noncapital18%
Other 5%Gifts, Noncapital 3%
Auxiliary Enterprises13%
Contracts and Grants23%
Tuition andFees, Net36%
2012 Revenues
Investment Income1%
StateAppropriations,Noncapital19%
Figure 4
Figure 5
Fiscal Year Ending June 30
Five-Year Enrollment Data* (Fall Semester Enrollment)
West LafayetteCampus
Regional Campuses Technology Statewide
20132012
20112010
20090
10,000
20,000
30,000
40,000
50,000
60,000
70,000
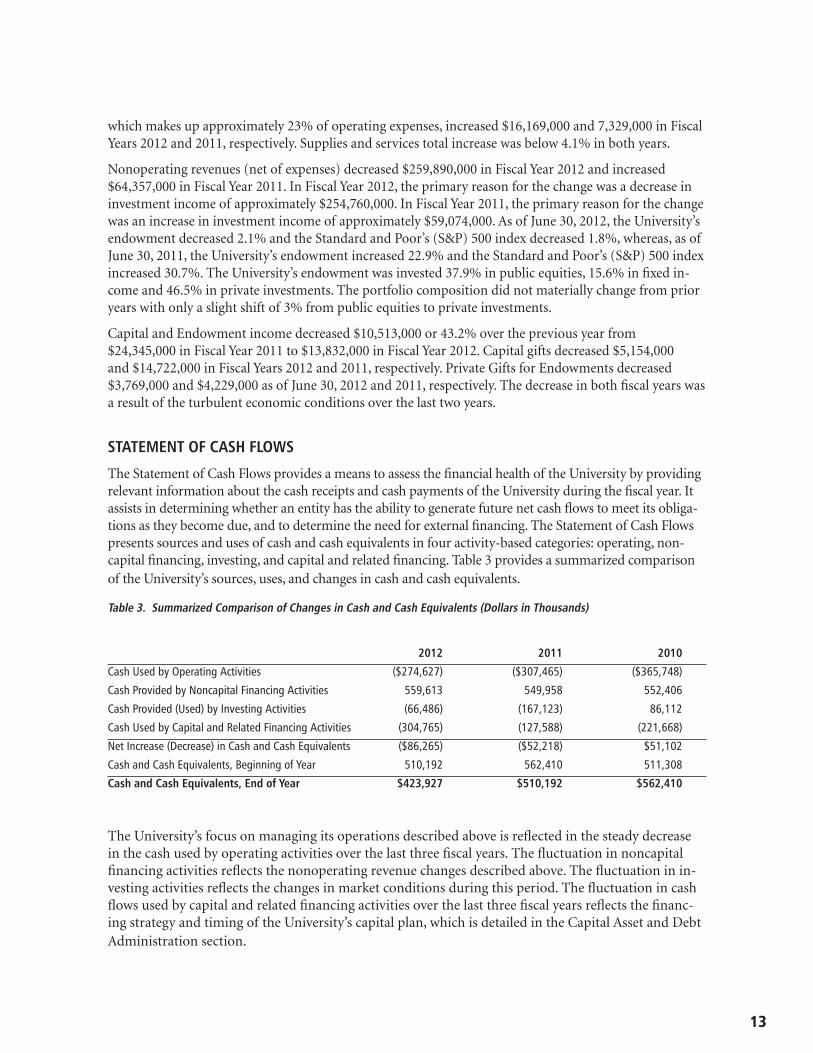
13
which makes up approximately 23% of operating expenses, increased $16,169,000 and 7,329,000 in Fiscal Years 2012 and 2011, respectively. Supplies and services total increase was below 4.1% in both years.
Nonoperating revenues (net of expenses) decreased $259,890,000 in Fiscal Year 2012 and increased $64,357,000 in Fiscal Year 2011. In Fiscal Year 2012, the primary reason for the change was a decrease in investment income of approximately $254,760,000. In Fiscal Year 2011, the primary reason for the change was an increase in investment income of approximately $59,074,000. As of June 30, 2012, the University’s endowment decreased 2.1% and the Standard and Poor’s (S&P) 500 index decreased 1.8%, whereas, as of June 30, 2011, the University’s endowment increased 22.9% and the Standard and Poor’s (S&P) 500 index increased 30.7%. The University’s endowment was invested 37.9% in public equities, 15.6% in fixed in-come and 46.5% in private investments. The portfolio composition did not materially change from prior years with only a slight shift of 3% from public equities to private investments.
Capital and Endowment income decreased $10,513,000 or 43.2% over the previous year from $24,345,000 in Fiscal Year 2011 to $13,832,000 in Fiscal Year 2012. Capital gifts decreased $5,154,000 and $14,722,000 in Fiscal Years 2012 and 2011, respectively. Private Gifts for Endowments decreased $3,769,000 and $4,229,000 as of June 30, 2012 and 2011, respectively. The decrease in both fiscal years was a result of the turbulent economic conditions over the last two years.
STATEMENT OF CASH FLOWS
The Statement of Cash Flows provides a means to assess the financial health of the University by providing relevant information about the cash receipts and cash payments of the University during the fiscal year. It assists in determining whether an entity has the ability to generate future net cash flows to meet its obliga-tions as they become due, and to determine the need for external financing. The Statement of Cash Flows presents sources and uses of cash and cash equivalents in four activity-based categories: operating, non-capital financing, investing, and capital and related financing. Table 3 provides a summarized comparison of the University’s sources, uses, and changes in cash and cash equivalents.
Table 3. Summarized Comparison of Changes in Cash and Cash Equivalents (Dollars in Thousands)
2012 2011 2010
Cash Used by Operating Activities ($274,627) ($307,465) ($365,748)
Cash Provided by Noncapital Financing Activities 559,613 549,958 552,406
Cash Provided (Used) by Investing Activities (66,486) (167,123) 86,112
Cash Used by Capital and Related Financing Activities (304,765) (127,588) (221,668)
Net Increase (Decrease) in Cash and Cash Equivalents ($86,265) ($52,218) $51,102
Cash and Cash Equivalents, Beginning of Year 510,192 562,410 511,308
Cash and Cash Equivalents, End of Year $423,927 $510,192 $562,410
The University’s focus on managing its operations described above is reflected in the steady decrease in the cash used by operating activities over the last three fiscal years. The fluctuation in noncapital financing activities reflects the nonoperating revenue changes described above. The fluctuation in in-vesting activities reflects the changes in market conditions during this period. The fluctuation in cash flows used by capital and related financing activities over the last three fiscal years reflects the financ-ing strategy and timing of the University’s capital plan, which is detailed in the Capital Asset and Debt Administration section.
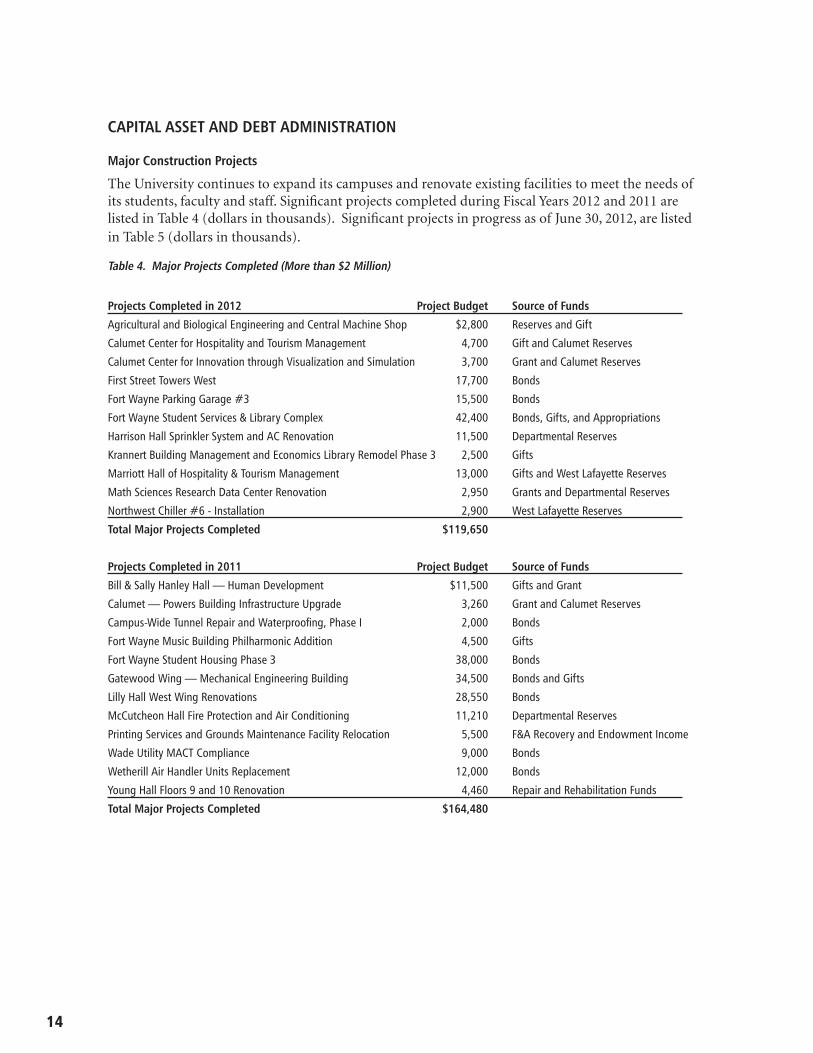
14
CAPITAL ASSET AND DEBT ADMINISTRATION
Major Construction Projects
The University continues to expand its campuses and renovate existing facilities to meet the needs of its students, faculty and staff. Significant projects completed during Fiscal Years 2012 and 2011 are listed in Table 4 (dollars in thousands). Significant projects in progress as of June 30, 2012, are listed in Table 5 (dollars in thousands).
Table 4. Major Projects Completed (More than $2 Million)
Projects Completed in 2012 Project Budget Source of Funds
Agricultural and Biological Engineering and Central Machine Shop $2,800 Reserves and Gift
Calumet Center for Hospitality and Tourism Management 4,700 Gift and Calumet Reserves
Calumet Center for Innovation through Visualization and Simulation 3,700 Grant and Calumet Reserves
First Street Towers West 17,700 Bonds
Fort Wayne Parking Garage #3 15,500 Bonds
Fort Wayne Student Services & Library Complex 42,400 Bonds, Gifts, and Appropriations
Harrison Hall Sprinkler System and AC Renovation 11,500 Departmental Reserves
Krannert Building Management and Economics Library Remodel Phase 3 2,500 Gifts
Marriott Hall of Hospitality & Tourism Management 13,000 Gifts and West Lafayette Reserves
Math Sciences Research Data Center Renovation 2,950 Grants and Departmental Reserves
Northwest Chiller #6 - Installation 2,900 West Lafayette Reserves
Total Major Projects Completed $119,650
Projects Completed in 2011 Project Budget Source of Funds
Bill & Sally Hanley Hall — Human Development $11,500 Gifts and Grant
Calumet — Powers Building Infrastructure Upgrade 3,260 Grant and Calumet Reserves
Campus-Wide Tunnel Repair and Waterproofing, Phase I 2,000 Bonds
Fort Wayne Music Building Philharmonic Addition 4,500 Gifts
Fort Wayne Student Housing Phase 3 38,000 Bonds
Gatewood Wing — Mechanical Engineering Building 34,500 Bonds and Gifts
Lilly Hall West Wing Renovations 28,550 Bonds
McCutcheon Hall Fire Protection and Air Conditioning 11,210 Departmental Reserves
Printing Services and Grounds Maintenance Facility Relocation 5,500 F&A Recovery and Endowment Income
Wade Utility MACT Compliance 9,000 Bonds
Wetherill Air Handler Units Replacement 12,000 Bonds
Young Hall Floors 9 and 10 Renovation 4,460 Repair and Rehabilitation Funds
Total Major Projects Completed $164,480
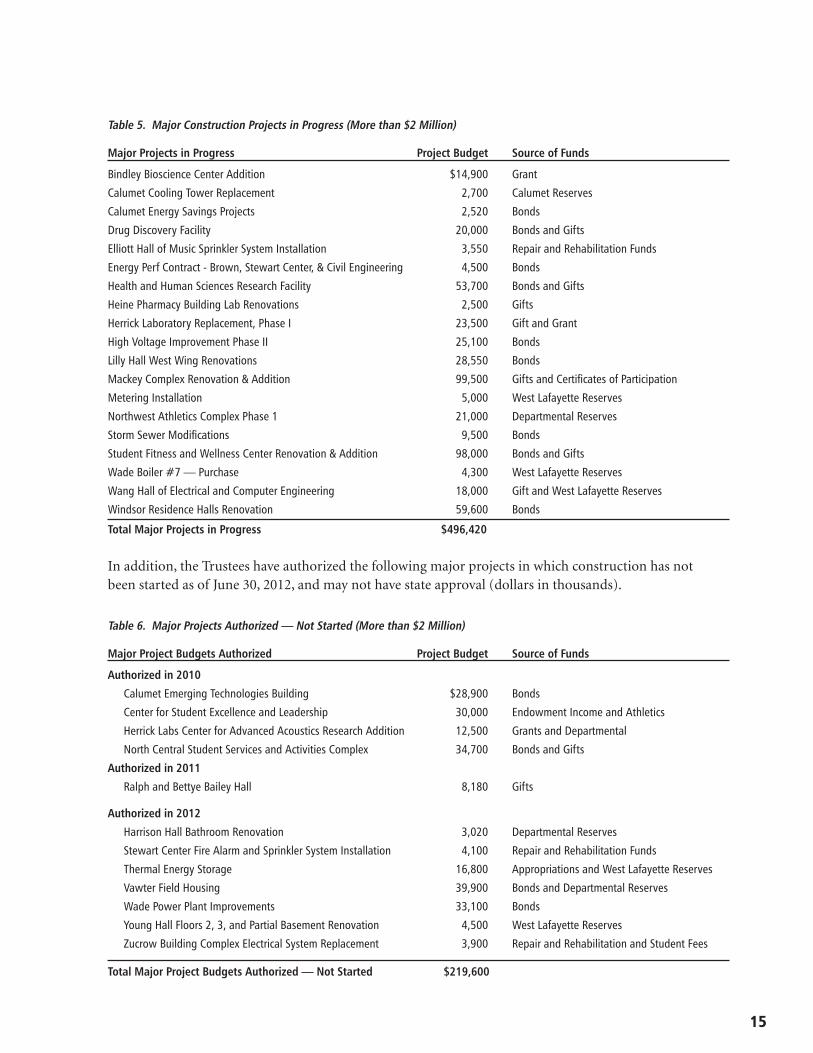
15
Table 5. Major Construction Projects in Progress (More than $2 Million)
Major Projects in Progress Project Budget Source of Funds
Bindley Bioscience Center Addition $14,900 Grant
Calumet Cooling Tower Replacement 2,700 Calumet Reserves
Calumet Energy Savings Projects 2,520 Bonds
Drug Discovery Facility 20,000 Bonds and Gifts
Elliott Hall of Music Sprinkler System Installation 3,550 Repair and Rehabilitation Funds
Energy Perf Contract - Brown, Stewart Center, & Civil Engineering 4,500 Bonds
Health and Human Sciences Research Facility 53,700 Bonds and Gifts
Heine Pharmacy Building Lab Renovations 2,500 Gifts
Herrick Laboratory Replacement, Phase I 23,500 Gift and Grant
High Voltage Improvement Phase II 25,100 Bonds
Lilly Hall West Wing Renovations 28,550 Bonds
Mackey Complex Renovation & Addition 99,500 Gifts and Certificates of Participation
Metering Installation 5,000 West Lafayette Reserves
Northwest Athletics Complex Phase 1 21,000 Departmental Reserves
Storm Sewer Modifications 9,500 Bonds
Student Fitness and Wellness Center Renovation & Addition 98,000 Bonds and Gifts
Wade Boiler #7 — Purchase 4,300 West Lafayette Reserves
Wang Hall of Electrical and Computer Engineering 18,000 Gift and West Lafayette Reserves
Windsor Residence Halls Renovation 59,600 Bonds
Total Major Projects in Progress $496,420
In addition, the Trustees have authorized the following major projects in which construction has not been started as of June 30, 2012, and may not have state approval (dollars in thousands).
Table 6. Major Projects Authorized — Not Started (More than $2 Million)
Major Project Budgets Authorized Project Budget Source of Funds
Authorized in 2010
Calumet Emerging Technologies Building $28,900 Bonds
Center for Student Excellence and Leadership 30,000 Endowment Income and Athletics
Herrick Labs Center for Advanced Acoustics Research Addition 12,500 Grants and Departmental
North Central Student Services and Activities Complex 34,700 Bonds and Gifts
Authorized in 2011
Ralph and Bettye Bailey Hall 8,180 Gifts
Authorized in 2012
Harrison Hall Bathroom Renovation 3,020 Departmental Reserves
Stewart Center Fire Alarm and Sprinkler System Installation 4,100 Repair and Rehabilitation Funds
Thermal Energy Storage 16,800 Appropriations and West Lafayette Reserves
Vawter Field Housing 39,900 Bonds and Departmental Reserves
Wade Power Plant Improvements 33,100 Bonds
Young Hall Floors 2, 3, and Partial Basement Renovation 4,500 West Lafayette Reserves
Zucrow Building Complex Electrical System Replacement 3,900 Repair and Rehabilitation and Student Fees
Total Major Project Budgets Authorized — Not Started $219,600
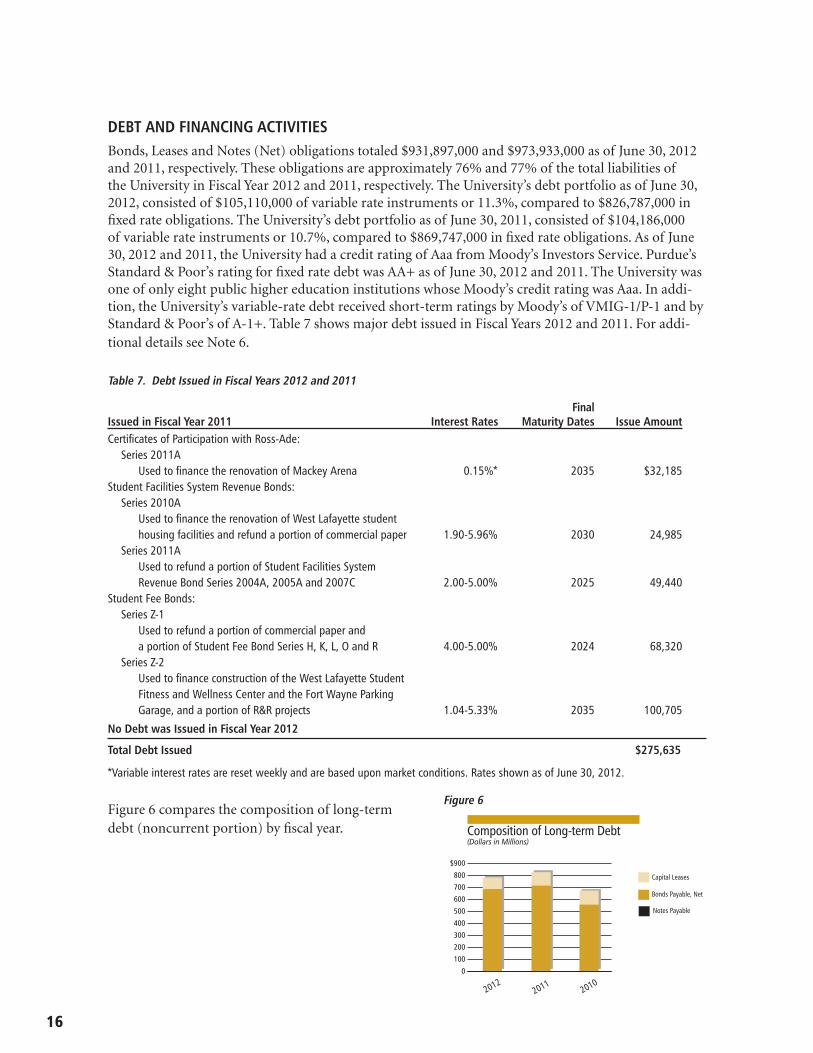
16
DEBT AND FINANCING ACTIVITIESBonds, Leases and Notes (Net) obligations totaled $931,897,000 and $973,933,000 as of June 30, 2012 and 2011, respectively. These obligations are approximately 76% and 77% of the total liabilities of the University in Fiscal Year 2012 and 2011, respectively. The University’s debt portfolio as of June 30, 2012, consisted of $105,110,000 of variable rate instruments or 11.3%, compared to $826,787,000 in fixed rate obligations. The University’s debt portfolio as of June 30, 2011, consisted of $104,186,000 of variable rate instruments or 10.7%, compared to $869,747,000 in fixed rate obligations. As of June 30, 2012 and 2011, the University had a credit rating of Aaa from Moody’s Investors Service. Purdue’s Standard & Poor’s rating for fixed rate debt was AA+ as of June 30, 2012 and 2011. The University was one of only eight public higher education institutions whose Moody’s credit rating was Aaa. In addi-tion, the University’s variable-rate debt received short-term ratings by Moody’s of VMIG-1/P-1 and by Standard & Poor’s of A-1+. Table 7 shows major debt issued in Fiscal Years 2012 and 2011. For addi-tional details see Note 6.
Table 7. Debt Issued in Fiscal Years 2012 and 2011
FinalIssued in Fiscal Year 2011 Interest Rates Maturity Dates Issue AmountCertificates of Participation with Ross-Ade:
Series 2011A Used to finance the renovation of Mackey Arena 0.15%* 2035 $32,185
Student Facilities System Revenue Bonds:Series 2010A
Used to finance the renovation of West Lafayette student housing facilities and refund a portion of commercial paper 1.90-5.96% 2030 24,985
Series 2011A Used to refund a portion of Student Facilities System Revenue Bond Series 2004A, 2005A and 2007C 2.00-5.00% 2025 49,440
Student Fee Bonds: Series Z-1
Used to refund a portion of commercial paper and a portion of Student Fee Bond Series H, K, L, O and R 4.00-5.00% 2024 68,320
Series Z-2 Used to finance construction of the West Lafayette Student Fitness and Wellness Center and the Fort Wayne Parking Garage, and a portion of R&R projects 1.04-5.33% 2035 100,705
No Debt was Issued in Fiscal Year 2012
Total Debt Issued $275,635
*Variable interest rates are reset weekly and are based upon market conditions. Rates shown as of June 30, 2012.
Figure 6 compares the composition of long-term debt (noncurrent portion) by fiscal year.
0
100
200
300
400
500
600
700
800
$900
20102011
2012
Composition of Long-term Debt(Dollars in Millions)
Capital Leases
Bonds Payable, Net
Notes Payable
Figure 6
17
ECONOMIC FACTORS THAT WILL AFFECT THE FUTUREEntering the second year of the 2011-2013 biennial period, fiscal year 2013 state operating appropria-tions for the University remained flat at fiscal year 2012 levels. Although no funds were appropriated for repair and rehabilitation projects at any of the campuses, the University continues its commitment to these important investments using other available resources.
The University has submitted its 2013-2015 legislative request to the state, based on instructions issued from the Indiana Commission for Higher Education (CHE) and the Indiana State Budget Agency. The Operating Appropriations request is calculated using a performance funding formula defined in the instructions. The formula is based on a series of metrics, many of them student-based: overall degree completion, at-risk student degree completion, high impact degree completion, student persistence incentive, on-time graduation rate metric, and an institution-defined productivity metric. No assump-tion was included for maintenance/price increases. Any adjustments for research growth on the West Lafayette campus or growth in dual credit offerings may be considered by CHE outside of the funding formula. The January 2013 legislative session will set Purdue’s operating appropriations for the next biennium. While effects of the national recession are severe and ongoing, fiscal year 2012 provided substantial financial improvement for state revenues, marking the second straight year of positive results.
Enrollment reached an all-time high at all Purdue campuses with 70,274* for the fall semester of the 2013 academic year — up from 70,259* the previous year. Enrollment at the West Lafayette campus was 39,256, a decrease of 381 students from the fall semester of the 2012 academic year. The academic quality of its freshman class at the West Lafayette campus increased for the sixth consecutive year. Cumulative SAT scores for the freshman class increased 18 points and are 32 points better than the class that came to Purdue two years ago. Purdue’s West Lafayette campus freshman class has 6,291 students, down from 6,659 last year.
The University is positioned to maintain its strong financial position into the future.
*Enrollment figures do not include Purdue University students enrolled at the Indiana University-Purdue University Indianapolis campus.
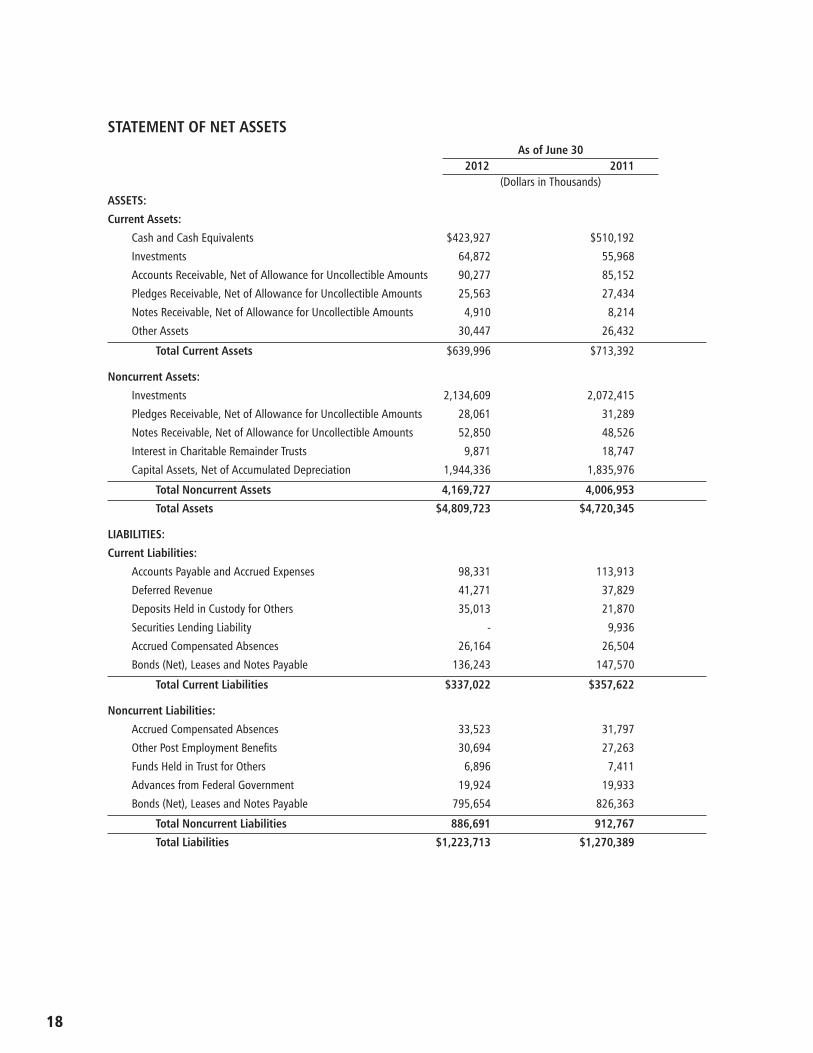
18
STATEMENT OF NET ASSETSAs of June 30
2012 2011(Dollars in Thousands)
ASSETS:
Current Assets:
Cash and Cash Equivalents $423,927 $510,192
Investments 64,872 55,968
Accounts Receivable, Net of Allowance for Uncollectible Amounts 90,277 85,152
Pledges Receivable, Net of Allowance for Uncollectible Amounts 25,563 27,434
Notes Receivable, Net of Allowance for Uncollectible Amounts 4,910 8,214
Other Assets 30,447 26,432
Total Current Assets $639,996 $713,392
Noncurrent Assets:
Investments 2,134,609 2,072,415
Pledges Receivable, Net of Allowance for Uncollectible Amounts 28,061 31,289
Notes Receivable, Net of Allowance for Uncollectible Amounts 52,850 48,526
Interest in Charitable Remainder Trusts 9,871 18,747
Capital Assets, Net of Accumulated Depreciation 1,944,336 1,835,976
Total Noncurrent Assets 4,169,727 4,006,953
Total Assets $4,809,723 $4,720,345
LIABILITIES:
Current Liabilities:
Accounts Payable and Accrued Expenses 98,331 113,913
Deferred Revenue 41,271 37,829
Deposits Held in Custody for Others 35,013 21,870
Securities Lending Liability - 9,936
Accrued Compensated Absences 26,164 26,504
Bonds (Net), Leases and Notes Payable 136,243 147,570
Total Current Liabilities $337,022 $357,622
Noncurrent Liabilities:
Accrued Compensated Absences 33,523 31,797
Other Post Employment Benefits 30,694 27,263
Funds Held in Trust for Others 6,896 7,411
Advances from Federal Government 19,924 19,933
Bonds (Net), Leases and Notes Payable 795,654 826,363
Total Noncurrent Liabilities 886,691 912,767
Total Liabilities $1,223,713 $1,270,389
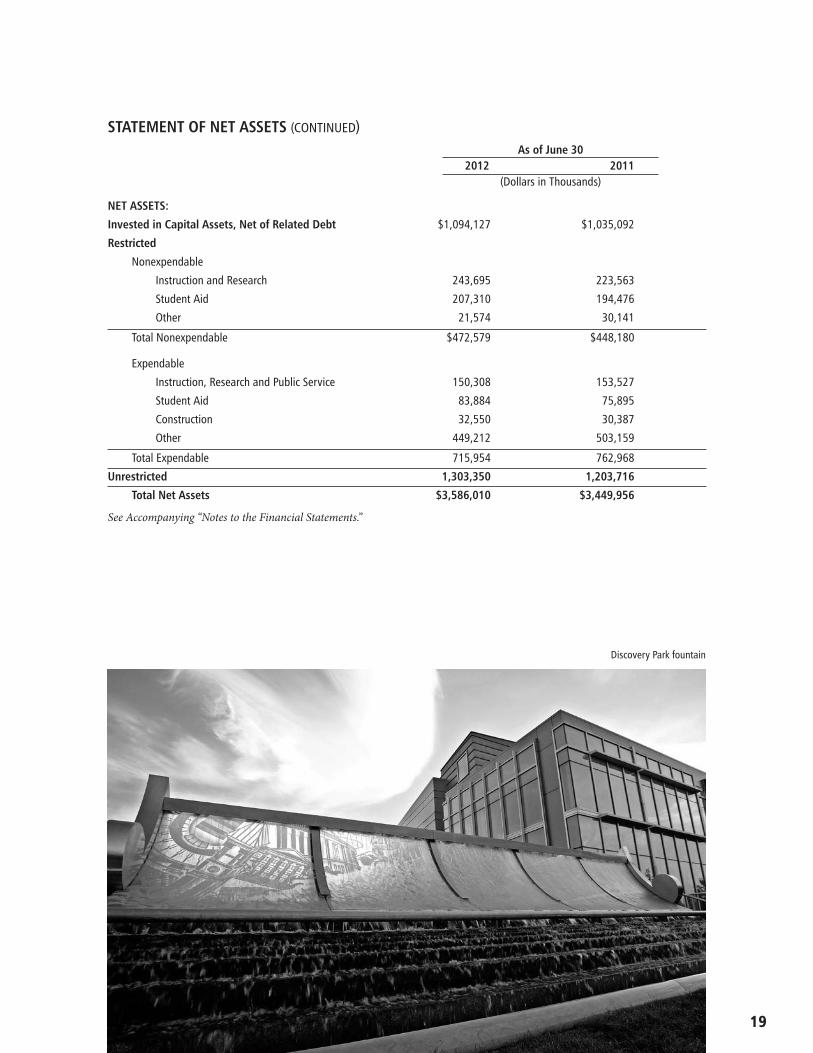
19
As of June 302012 2011
(Dollars in Thousands)
STATEMENT OF NET ASSETS (CONTINUED)
NET ASSETS:
Invested in Capital Assets, Net of Related Debt $1,094,127 $1,035,092
Restricted
Nonexpendable
Instruction and Research 243,695 223,563
Student Aid 207,310 194,476
Other 21,574 30,141
Total Nonexpendable $472,579 $448,180
Expendable
Instruction, Research and Public Service 150,308 153,527
Student Aid 83,884 75,895
Construction 32,550 30,387
Other 449,212 503,159
Total Expendable 715,954 762,968
Unrestricted 1,303,350 1,203,716
Total Net Assets $3,586,010 $3,449,956
See Accompanying “Notes to the Financial Statements.”
Discovery Park fountain
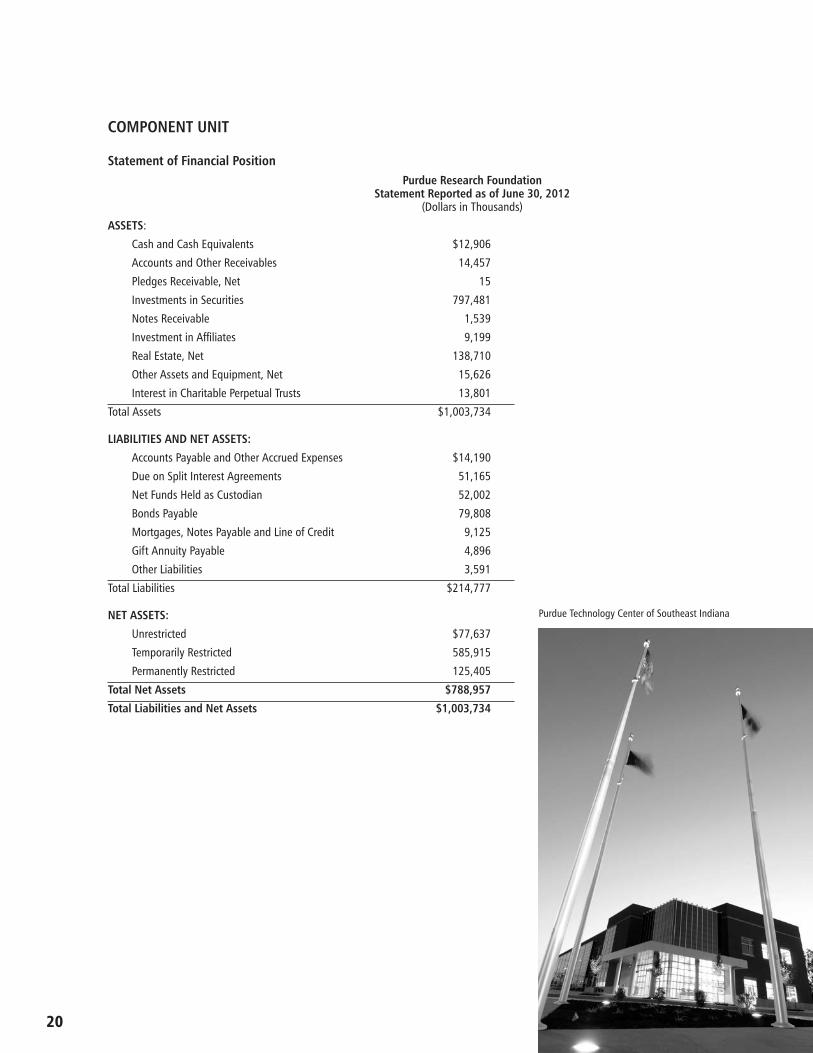
20
COMPONENT UNIT
Statement of Financial Position Purdue Research Foundation Statement Reported as of June 30, 2012 (Dollars in Thousands)
ASSETS:
Cash and Cash Equivalents $12,906
Accounts and Other Receivables 14,457
Pledges Receivable, Net 15
Investments in Securities 797,481
Notes Receivable 1,539
Investment in Affiliates 9,199
Real Estate, Net 138,710
Other Assets and Equipment, Net 15,626
Interest in Charitable Perpetual Trusts 13,801
Total Assets $1,003,734
LIABILITIES AND NET ASSETS:
Accounts Payable and Other Accrued Expenses $14,190
Due on Split Interest Agreements 51,165
Net Funds Held as Custodian 52,002
Bonds Payable 79,808
Mortgages, Notes Payable and Line of Credit 9,125
Gift Annuity Payable 4,896
Other Liabilities 3,591
Total Liabilities $214,777
NET ASSETS:
Unrestricted $77,637
Temporarily Restricted 585,915
Permanently Restricted 125,405
Total Net Assets $788,957
Total Liabilities and Net Assets $1,003,734
Purdue Technology Center of Southeast Indiana
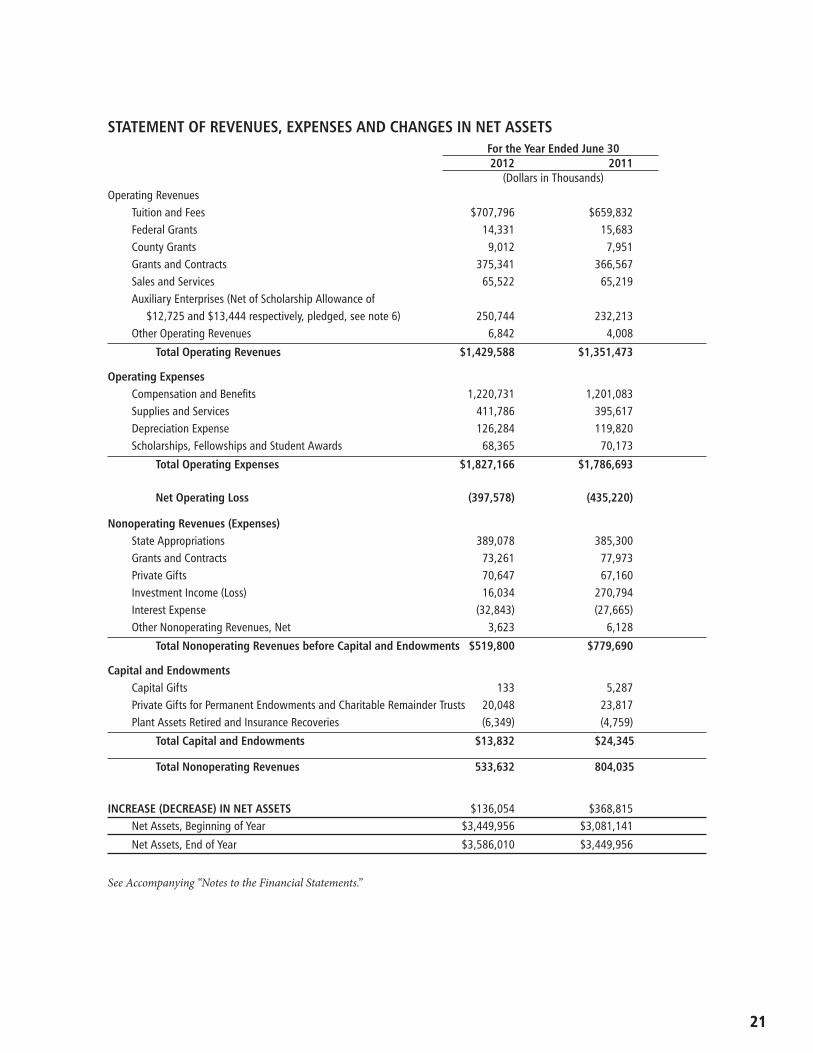
21
STATEMENT OF REVENUES, EXPENSES AND CHANGES IN NET ASSETSFor the Year Ended June 302012 2011
(Dollars in Thousands)Operating Revenues
Tuition and Fees $707,796 $659,832 Federal Grants 14,331 15,683 County Grants 9,012 7,951 Grants and Contracts 375,341 366,567 Sales and Services 65,522 65,219 Auxiliary Enterprises (Net of Scholarship Allowance of $12,725 and $13,444 respectively, pledged, see note 6) 250,744 232,213 Other Operating Revenues 6,842 4,008
Total Operating Revenues $1,429,588 $1,351,473
Operating Expenses Compensation and Benefits 1,220,731 1,201,083 Supplies and Services 411,786 395,617 Depreciation Expense 126,284 119,820 Scholarships, Fellowships and Student Awards 68,365 70,173
Total Operating Expenses $1,827,166 $1,786,693
Net Operating Loss (397,578) (435,220)
Nonoperating Revenues (Expenses) State Appropriations 389,078 385,300 Grants and Contracts 73,261 77,973 Private Gifts 70,647 67,160 Investment Income (Loss) 16,034 270,794 Interest Expense (32,843) (27,665)Other Nonoperating Revenues, Net 3,623 6,128
Total Nonoperating Revenues before Capital and Endowments $519,800 $779,690
Capital and Endowments Capital Gifts 133 5,287 Private Gifts for Permanent Endowments and Charitable Remainder Trusts 20,048 23,817 Plant Assets Retired and Insurance Recoveries (6,349) (4,759)
Total Capital and Endowments $13,832 $24,345
Total Nonoperating Revenues 533,632 804,035
INCREASE (DECREASE) IN NET ASSETS $136,054 $368,815 Net Assets, Beginning of Year $3,449,956 $3,081,141
Net Assets, End of Year $3,586,010 $3,449,956
See Accompanying “Notes to the Financial Statements.”
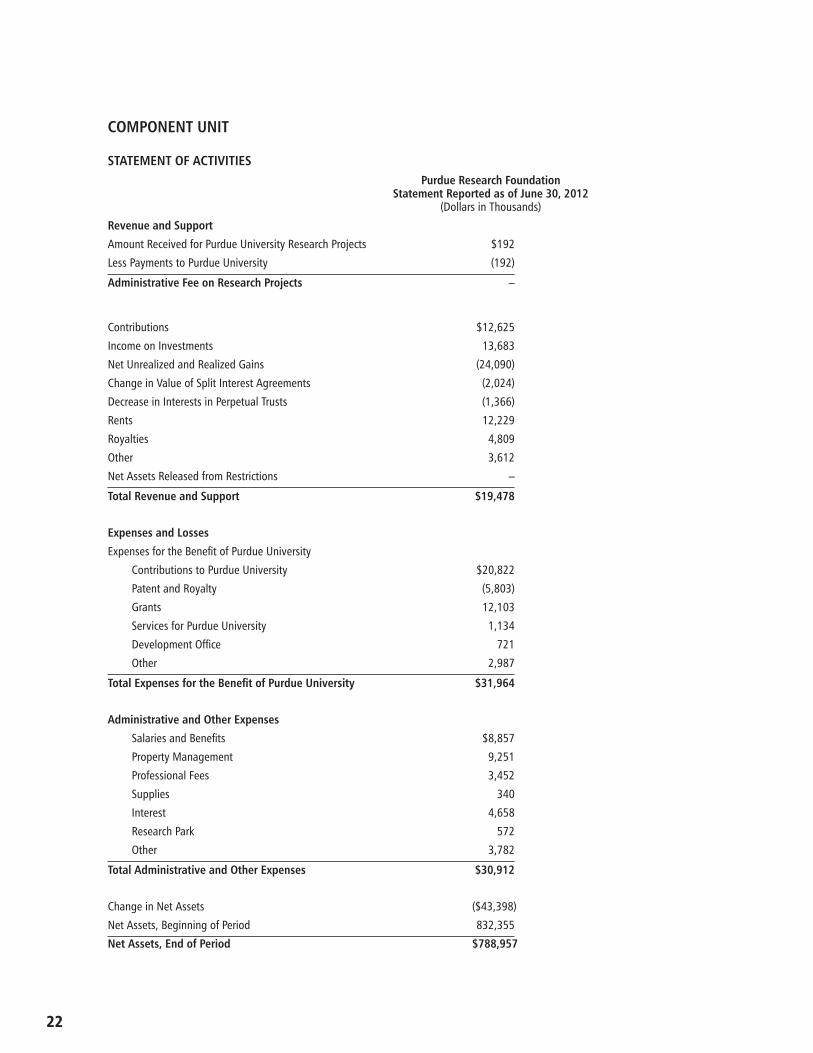
22
COMPONENT UNIT
STATEMENT OF ACTIVITIESPurdue Research Foundation
Statement Reported as of June 30, 2012(Dollars in Thousands)
Revenue and Support
Amount Received for Purdue University Research Projects $192
Less Payments to Purdue University (192)
Administrative Fee on Research Projects –
Contributions $12,625
Income on Investments 13,683
Net Unrealized and Realized Gains (24,090)
Change in Value of Split Interest Agreements (2,024)
Decrease in Interests in Perpetual Trusts (1,366)
Rents 12,229
Royalties 4,809
Other 3,612
Net Assets Released from Restrictions –
Total Revenue and Support $19,478
Expenses and Losses
Expenses for the Benefit of Purdue University
Contributions to Purdue University $20,822
Patent and Royalty (5,803)
Grants 12,103
Services for Purdue University 1,134
Development Office 721
Other 2,987
Total Expenses for the Benefit of Purdue University $31,964
Administrative and Other Expenses
Salaries and Benefits $8,857
Property Management 9,251
Professional Fees 3,452
Supplies 340
Interest 4,658
Research Park 572
Other 3,782
Total Administrative and Other Expenses $30,912
Change in Net Assets ($43,398)
Net Assets, Beginning of Period 832,355
Net Assets, End of Period $788,957
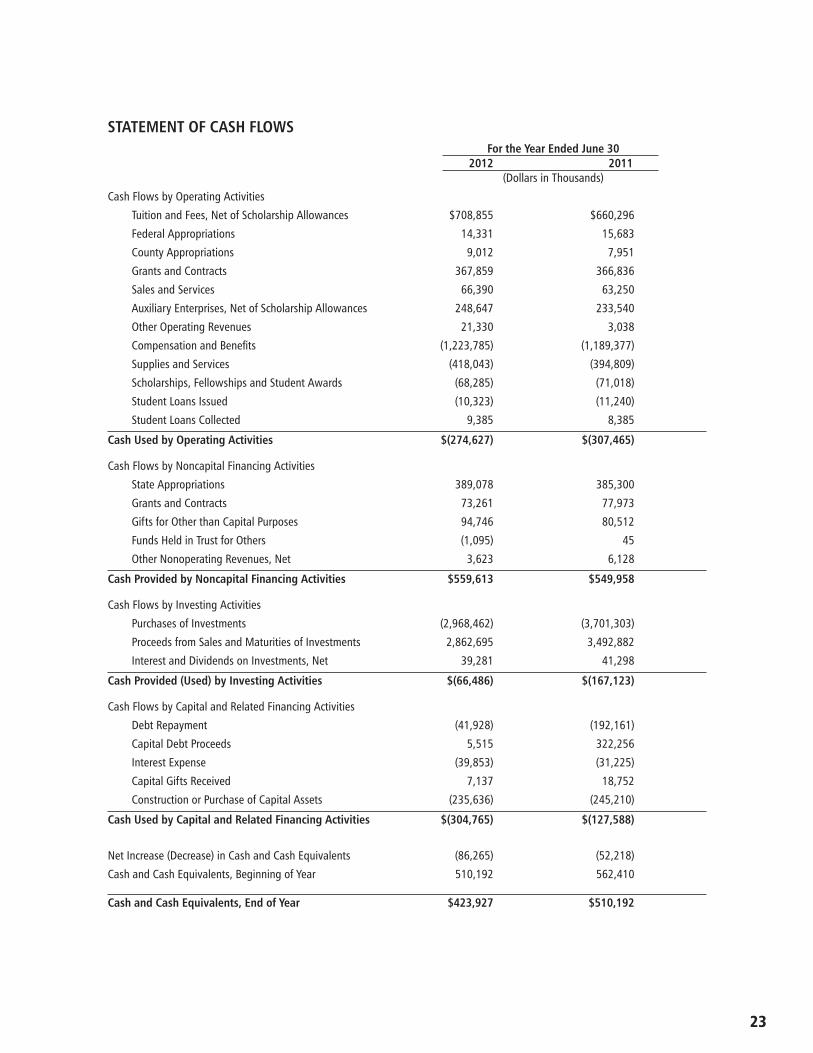
23
STATEMENT OF CASH FLOWSFor the Year Ended June 30
2012 2011(Dollars in Thousands)
Cash Flows by Operating Activities
Tuition and Fees, Net of Scholarship Allowances $708,855 $660,296
Federal Appropriations 14,331 15,683
County Appropriations 9,012 7,951
Grants and Contracts 367,859 366,836
Sales and Services 66,390 63,250
Auxiliary Enterprises, Net of Scholarship Allowances 248,647 233,540
Other Operating Revenues 21,330 3,038
Compensation and Benefits (1,223,785) (1,189,377)
Supplies and Services (418,043) (394,809)
Scholarships, Fellowships and Student Awards (68,285) (71,018)
Student Loans Issued (10,323) (11,240)
Student Loans Collected 9,385 8,385
Cash Used by Operating Activities $(274,627) $(307,465)
Cash Flows by Noncapital Financing Activities
State Appropriations 389,078 385,300
Grants and Contracts 73,261 77,973
Gifts for Other than Capital Purposes 94,746 80,512
Funds Held in Trust for Others (1,095) 45
Other Nonoperating Revenues, Net 3,623 6,128
Cash Provided by Noncapital Financing Activities $559,613 $549,958
Cash Flows by Investing Activities
Purchases of Investments (2,968,462) (3,701,303)
Proceeds from Sales and Maturities of Investments 2,862,695 3,492,882
Interest and Dividends on Investments, Net 39,281 41,298
Cash Provided (Used) by Investing Activities $(66,486) $(167,123)
Cash Flows by Capital and Related Financing Activities
Debt Repayment (41,928) (192,161)
Capital Debt Proceeds 5,515 322,256
Interest Expense (39,853) (31,225)
Capital Gifts Received 7,137 18,752
Construction or Purchase of Capital Assets (235,636) (245,210)
Cash Used by Capital and Related Financing Activities $(304,765) $(127,588)
Net Increase (Decrease) in Cash and Cash Equivalents (86,265) (52,218)
Cash and Cash Equivalents, Beginning of Year 510,192 562,410
Cash and Cash Equivalents, End of Year $423,927 $510,192
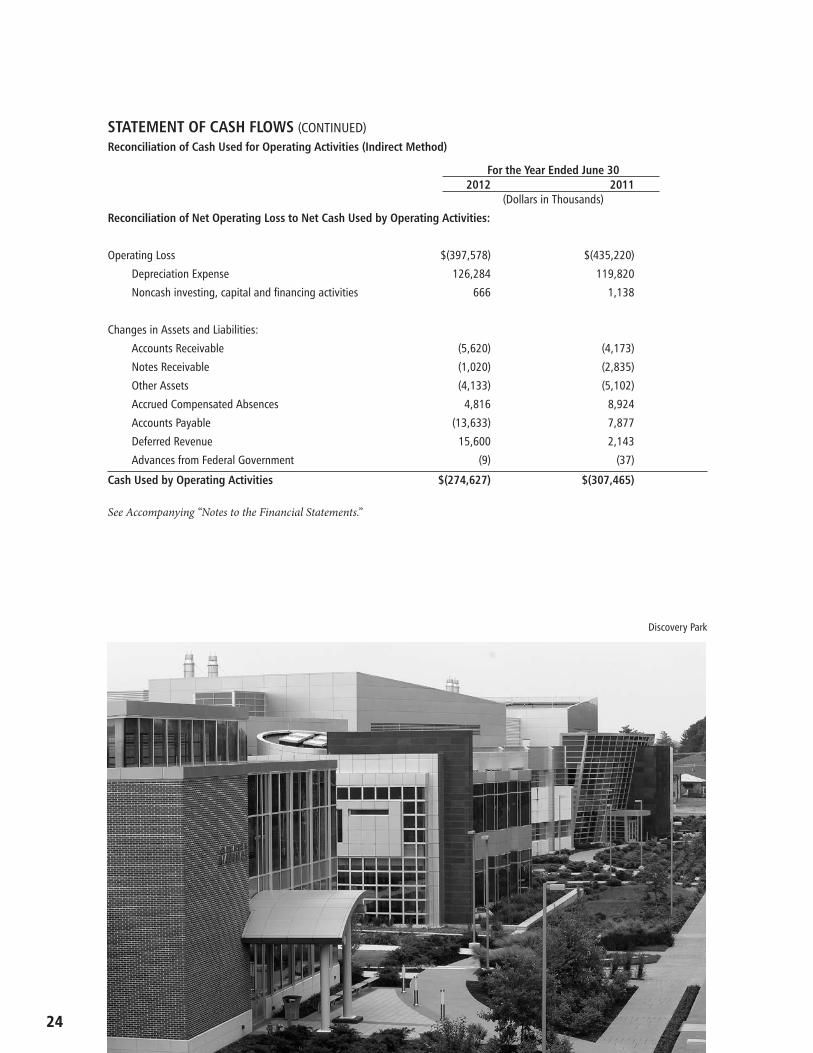
24
STATEMENT OF CASH FLOWS (CONTINUED) Reconciliation of Cash Used for Operating Activities (Indirect Method)
For the Year Ended June 302012 2011
(Dollars in Thousands)
Reconciliation of Net Operating Loss to Net Cash Used by Operating Activities:
Operating Loss $(397,578) $(435,220)
Depreciation Expense 126,284 119,820
Noncash investing, capital and financing activities 666 1,138
Changes in Assets and Liabilities:
Accounts Receivable (5,620) (4,173)
Notes Receivable (1,020) (2,835)
Other Assets (4,133) (5,102)
Accrued Compensated Absences 4,816 8,924
Accounts Payable (13,633) 7,877
Deferred Revenue 15,600 2,143
Advances from Federal Government (9) (37)
Cash Used by Operating Activities $(274,627) $(307,465)
See Accompanying “Notes to the Financial Statements.”
Discovery Park
25
NOTES TO THE FINANCIAL STATEMENTSFor the Fiscal Year Ending June 30, 2012
NOTE 1 — BASIS OF PRESENTATION AND SUMMARY OF SIGNIFICANT ACCOUNTING POLICIES
ORGANIZATION:
Established in 1869, Purdue University (the University) is the land-grant university for the state of Indiana. �e University is a comprehensive, degree-granting research university with 27 schools and colleges on its main campus in West Lafayette and the following regional campuses:
•IndianaUniversity-PurdueUniversityFortWayne
•PurdueUniversityCalumet
•PurdueUniversityNorthCentral
In addition to its academic programs o�ered at the above campuses, the University o�ers learning and other assistance programs at several other locations in the state of Indiana through:
•CollegeofTechnologyStatewideTechnologyProgram
•CollegeofAgriculturePurdueExtension
•TechnicalAssistanceProgram
�e responsibility for making rules and regulations to govern the University is vested in a 10-member Board of Trustees (the Trustees). �e selection of these trustees is prescribed in Indiana Code IC 21-23-3. �ree of the trustees are selected by the Purdue Alumni Association. �e other seven trustees are selected by the governor. Two of the trustees must be involved in agricultural pursuits, and one must be a full-time student of the University. All trustees serve for a period of three years, except for the student member, who serves for two years.
REPORTING ENTITY:
Governmental Accounting Standards Board (GASB) Statement No. 14, “�e Financial Reporting Entity,” as amended by GASB No. 39, “Determining Whether Certain Organizations Are Component Units,” de�nes the �nancial reporting entity as an entity that consists of the primary government and all of its component units. Component units are legally separate organizations for which the primary government is �nancially accountable and other organizations for which the signi�cance of their rela-tionship with the primary government are such that exclusion would cause the �nancial statements to be misleading or incomplete.
�e Purdue Foundation, Inc. was created in 1979 as a separately incorporated, not-for-pro�t entity. �e primary purpose of the foundation is the solicitation, receipt and acceptance of gi�s, dona-tions and bequests of funds and other property for the bene�t of the University. �e foundation is an exempt organization under Section 501(c)(3) of the Internal Revenue Code. �e University is the sole bene�ciary of �e Purdue Foundation. Complete �nancial statements for the foundation can be obtained by writing to: �e Purdue Foundation, 1281 Win Hentschel Blvd., West Lafayette, IN 47906.
Ross-Ade Foundation was created in 1923 as a separately incorporated, not-for-pro�t entity. �e Ross-Ade Foundation constructs athletic and parking facilities on behalf of the University. Complete �nancial statements for the foundation can be obtained by writing to: Ross-Ade Foundation, 1281 Win Hentschel Blvd., West Lafayette, IN 47906.
26
As additionally required by GASB Statement No. 39, “Determining Whether Certain Organizations Are Component Units,” organizations that raise and hold economic resources for the direct bene�t of the University are included in the reporting entity as discretely presented component units.
Purdue Research Foundation (PRF) was created in 1930 as a separately incorporated, not-for-pro�t entity. Its primary purpose is to promote the educational purpose of the University; award scholar-ships, grants or other �nancial assistance to students and faculty; seek, acquire and hold gi�s and endowments for the needs of the University; and acquire property or facilities for the future use or bene�t of the University. PRF is an exempt organization under Section 501(c)(3) of the Internal Revenue Code. PRF includes the wholly owned subsidiary McClure Park, LLC, which is a for-pro�t Indiana corporation that was formed to acquire, construct, lease, operate, convey and mort-gage real estate and personal property of every kind and any interest therein. McClure Park wholly owns single member limited liability subsidiaries and participates in several limited liability corpo-rations primarily accounted for using the equity method. PRF reports under Financial Accounting Standards Board (FASB) standards, including FASB Statement No. 117, “Financial Reporting of Not-for-Pro�t Organizations.” As such, certain revenue recognition criteria and presentation fea-tures are di�erent from GASB revenue recognition criteria and presentation features. No modi�ca-tions have been made to the foundations’ �nancial information in the University’s �nancial report for these di�erences. Complete �nancial statements for the foundation can be obtained by writing to: Purdue Research Foundation, 1281 Win Hentschel Blvd., West Lafayette, IN 47906.
�e University has an association with Indiana University-Purdue University Indianapolis for which it is not �nancially accountable or has primary access to the resources. Accordingly, this organization has not been included in the University’s �nancial statements.
RELATIONSHIP TO STATE OF INDIANA:
As one of seven public universities in the state, the University is a component unit of the state of Indiana. �e University receives funding from the state for operations, repair and maintenance, and debt service. Its nonexempt employees participate in the state’s public employees retirement program.
TAX-EXEMPT STATUS:
�e income generated by the University, as an instrument of the state, is generally excluded from federal income taxes under Section 115(a) of the Internal Revenue Code. �e University also has a determination letter from the Internal Revenue Service stating it is exempt under Section 501(a) of the Internal Revenue Code as an organization described in Section 501(c)(3). Income generated from activities unrelated to the University’s exempt purpose is subject to tax under Internal Revenue Code Section 511(a)(2)(B). �ere was no tax liability related to income generated from activities unrelated to the University’s exempt purpose as of June 30, 2012 and 2011.
BASIS OF PRESENTATION:
�e �nancial statements of the University have been prepared in accordance with the principles contained in GASB Statement No. 34, “Basic Financial Statements — and Management’s Discussion and Analysis — for State and Local Governments,” as amended by GASB Statement No. 35, “Basic Financial Statements — and Management’s Discussion and Analysis — for Public Colleges and Universities.”
During �scal year 2012, the University did not adopt any new GASB pronouncements. During �scal year 2011, the University adopted GASB Statement No. 59, “Financial Instruments Omnibus.”
BASIS OF ACCOUNTING:
For �nancial reporting purposes, the University is considered a special-purpose government engaged
27
only in business-type activities. Accordingly, the University’s �nancial statements have been prepared using the economic resources measurement focus and the accrual basis of accounting. Under the accrual basis of accounting, revenues are recognized when earned, and expenses are recorded when an obligation is incurred.
�e University applies all applicable GASB pronouncements. In addition, the University has chosen to only apply Financial Accounting Standards Board (FASB) Statements and Interpretations, Accounting Principles Board Opinions, and Accounting Research Bulletins issued on or before November 30, 1989, unless those pronouncements con�ict with, or contradict, GASB pronouncements.
SUMMARY OF SIGNIFICANT ACCOUNTING POLICIES:
Cash and Cash Equivalents. Cash and cash equivalents include cash, revolving and change funds, cash in transit, credit card deposits in transit, securities lending cash collateral, and certain investments with maturities of three months or less as of the balance sheet date. It is the University’s practice to in-vest operating cash balances and bond proceeds in investments of varying maturity dates. Investments, exclusive of endowment funds, that are included in cash equivalents represent short-term, highly liq-uid investments that are both (a) readily convertible to known amounts of cash and (b) so near their maturity date that they present insigni�cant risk of changes in value because of changes in interest rates. Cash purchases and sales of those types of investments are part of the University’s cash manage-ment activities rather than part of its operating, capital, investing and �nancing activities; details of these transactions are not reported in the Statement of Cash Flows.
Investments. Investments, exclusive of institutional physical properties, are generally reported at fair value. Fair value is generally based on quoted market price as of June 30, except for certain invest-ments, primarily private equity partnerships, hedge funds and similar alternative investments, for which quoted market prices are not available. �e estimated fair value of these investments is based on valuations provided by external investment managers within the past �scal year through June 30. Because alternative investments are not readily marketable, their estimated value may di�er from the value that would have been used had a ready market value for such investments existed. Investments, exclusive of endowment funds, may be classi�ed current or noncurrent, depending on the individual investments’ maturity date at June 30. Endowment funds are primarily included in noncurrent invest-ments, with the exception of amounts designated for distribution.
Accounts Receivable. Accounts receivable primarily represent grant, contract and student payments due the University and are shown net of an allowance for doubtful accounts.
Pledges Receivable. Pledges receivable are accrued as of the end of the �scal year, provided the pledge is veri�able, measurable and probable of collection. Pledges receivable do not include gi�s made in an-ticipation of estates, telephone solicitations or promises of endowment funds. An allowance for uncol-lectible pledges is calculated based on the University’s experience.
Notes Receivable. Notes receivable primarily represent student loan repayments due the University and are presented net of allowance for doubtful accounts.
Inventories. Inventories are composed of (1) consumable supplies and items held for resale or recharge within the University, (2) fuel for consumption, and (3) livestock and grain. �e inventory of coal is valued on the First In/First Out (FIFO) basis and limestone is valued on the First In/First Out (FIFO) basis. Oil inventory is valued using the weighted-average method. Consumable supplies and items for resale are priced on a moving-average basis. Cattle and grain inventories are valued at market. Other miscellaneous inventories are generally valued on the First In/First Out (FIFO) basis. Agricultural commodities are reported using the consumption method and are measured by physical count. Consumable supplies and items held for resale are reported using the purchase method and are mea-sured using the moving average cost method.
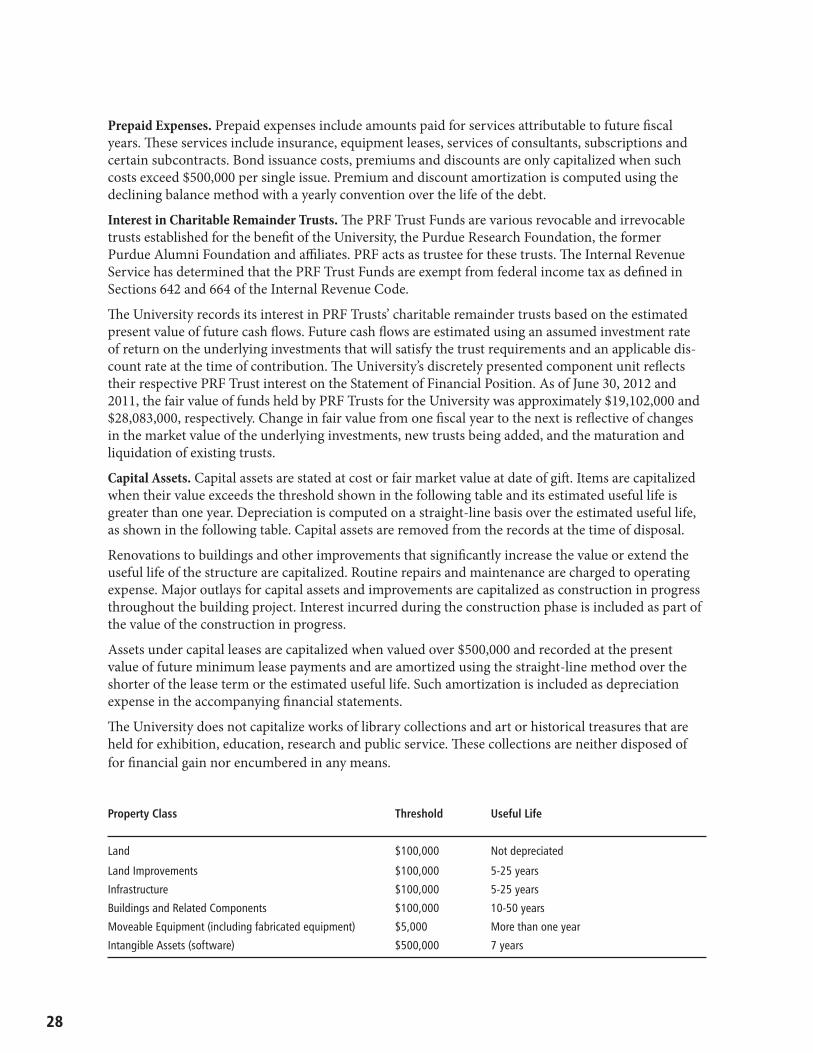
28
Prepaid Expenses. Prepaid expenses include amounts paid for services attributable to future �scal years. �ese services include insurance, equipment leases, services of consultants, subscriptions and certain subcontracts. Bond issuance costs, premiums and discounts are only capitalized when such costs exceed $500,000 per single issue. Premium and discount amortization is computed using the declining balance method with a yearly convention over the life of the debt.
Interest in Charitable Remainder Trusts. �e PRF Trust Funds are various revocable and irrevocable trusts established for the bene�t of the University, the Purdue Research Foundation, the former Purdue Alumni Foundation and a�liates. PRF acts as trustee for these trusts. �e Internal Revenue Service has determined that the PRF Trust Funds are exempt from federal income tax as de�ned in Sections 642 and 664 of the Internal Revenue Code.
�e University records its interest in PRF Trusts’ charitable remainder trusts based on the estimated present value of future cash �ows. Future cash �ows are estimated using an assumed investment rate of return on the underlying investments that will satisfy the trust requirements and an applicable dis-count rate at the time of contribution. �e University’s discretely presented component unit re�ects their respective PRF Trust interest on the Statement of Financial Position. As of June 30, 2012 and 2011, the fair value of funds held by PRF Trusts for the University was approximately $19,102,000 and $28,083,000, respectively. Change in fair value from one �scal year to the next is re�ective of changes in the market value of the underlying investments, new trusts being added, and the maturation and liquidation of existing trusts.
Capital Assets. Capital assets are stated at cost or fair market value at date of gi�. Items are capitalized when their value exceeds the threshold shown in the following table and its estimated useful life is greater than one year. Depreciation is computed on a straight-line basis over the estimated useful life, as shown in the following table. Capital assets are removed from the records at the time of disposal.
Renovations to buildings and other improvements that signi�cantly increase the value or extend the useful life of the structure are capitalized. Routine repairs and maintenance are charged to operating expense. Major outlays for capital assets and improvements are capitalized as construction in progress throughout the building project. Interest incurred during the construction phase is included as part of the value of the construction in progress.
Assets under capital leases are capitalized when valued over $500,000 and recorded at the present value of future minimum lease payments and are amortized using the straight-line method over the shorter of the lease term or the estimated useful life. Such amortization is included as depreciation expense in the accompanying �nancial statements.
�e University does not capitalize works of library collections and art or historical treasures that are held for exhibition, education, research and public service. �ese collections are neither disposed of for �nancial gain nor encumbered in any means.
Property Class Threshold Useful Life
Land $100,000 Not depreciated
Land Improvements $100,000 5-25 years
Infrastructure $100,000 5-25 years
Buildings and Related Components $100,000 10-50 years
Moveable Equipment (including fabricated equipment) $5,000 More than one year
Intangible Assets (software) $500,000 7 years
29
Accrued Compensated Absences. Liabilities for compensated absences are recorded for vacation leave based on actual amounts earned as of the balance sheet date. Exempt employees may accrue vacation bene�ts up to a maximum of 44 days. Clerical and service sta� may earn vacation up to 320 hours. For all classes of employees, vacation is payable upon termination. An estimate of sick leave liability is recorded for regular clerical and service sta� based on historical termination payments. Upon meeting the de�ni-tion of an o�cial University retiree, regular clerical and service sta� are eligible to receive cash payments for 25% of all unused sick leave up to and including 520 hours and 100% of all hours over 520. �e liabil-ity for compensated absences is expected to be funded by various sources of revenue that are available in future years when the liability is paid.
Deferred Revenue. Deferred revenue consists primarily of cash received from grant and contract sponsors that has not yet been earned under the terms of the agreement. Deferred revenue also includes amounts received in advance of an event, such as student tuition and advance ticket sales related to future �scal years.
Deposits Held In Custody for Others. Deposits of a�liates and others represent cash and invested funds held by the University as a result of agency relationships with various groups. Noncurrent deposits of af-�liates represent the portion of endowment and similar funds held by the University on behalf of others.
Funds Held In Trust for Others. �e University holds life income funds for bene�ciaries of the pooled in-come fund, charitable remainder trusts and the gi� annuity program. �ese funds generally pay lifetime income to bene�ciaries, a�er which the principal is made available to the University in accordance with donor intentions. All life income fund assets, including those held in trust, are recorded at fair value net of related liabilities for the present value of estimated future payments due to bene�ciaries.
Net Assets. University resources are classi�ed for accounting and �nancial reporting purposes into four net asset categories:
• Invested in capital assets, net of related debt: Resources resulting from capital acquisition or con-struction, net of accumulated depreciation and net of related debt. To the extent debt has been incurred but not yet expended for capital assets, such amounts are not included as a component of invested in capital assets, net of related debt.
• Restricted-nonexpendable: Net assets subject to externally imposed stipulations that the funds be maintained inviolate and in perpetuity. Such assets include the University’s permanent and term endowment funds and are categorized as instruction and research, student aid, and other.
• Restricted-expendable: Net assets that may be spent provided certain third-party restrictions are met. The following categories of restricted-expendable net assets are presented: instruction, re-search and public service; student aid; auxiliary enterprises; construction; and other. As of June 30, 2012 and 2011, approximately 89% or $401,254,000 and 88% or $443,232,000, respectively, of the “other” category results from undistributed gain on endowment funds and the fair value of funds functioning as endowments where the donor has restricted the use of the funds for a par-ticular purpose. Neither component is available for general institutional use.
• Unrestricted: Net assets not subject to externally imposed stipulations pertaining to their use. Management may designate that these funds will be spent for certain projects or programs or to fulfill certain long-term goals. Management has designated substantially all unrestricted net assets for academic and capital purposes.
Intrauniversity Transactions. Intrauniversity transactions are eliminated from the statements to avoid double counting of certain activities. Examples of these transactions are internal loans and sales and services between University departments.
30
Classi�cation of Revenues and Expenses. �e University has classi�ed revenues and expenses as operating or nonoperating based upon the following criteria:
• Operating revenues: Revenues derived from activities associated with providing goods and servic-es for instruction, research, public service, health services, or related support to entities separate from the University and that result from exchange transactions. Exchange activities are transac-tions where the amount received approximates the fair market value of the goods or services given up. Examples include student tuition and fees, grants and contracts, auxiliary operations (such as Intercollegiate Athletics and Housing and Food Services), sales and service operations, federal land-grant appropriations, and county appropriations.
• Operating expenses: Expenses paid to acquire or produce goods and services provided in return for operating revenues and to carry out the mission of the University. Examples include com-pensation and bene�ts, travel, and supplies. Graduate, sta�, sta� dependent and sta� spouse fee remissions are included with compensation and bene�ts. Expenses are reported using natural classi�cations in the Statement of Revenues, Expenses and Changes in Net Assets. Functional reporting appears in Note 8. Indirect expenses, such as depreciation, are not allocated across functional categories.
• Nonoperating revenues and expenses: Revenues and related expenses that do not meet the de�-nition of operating revenues, capital revenues or endowment additions. �ey are primarily de-rived from activities that are non-exchange transactions, and from activities de�ned as such by the GASB cash �ow standards. Examples include state appropriations, private gi�s, investment income and certain federal �nancial aid. Nonoperating expenses primarily include interest on short-term and long-term borrowings.
Application of Restricted and Unrestricted Resources. When both restricted and unrestricted resources are available for a particular expenditure, University departments may select the most appropriate fund source based on individual facts and circumstances. �e University, as a matter of policy, does not require funds to be spent in a particular order, only that the expenditure be allowable, allocable and reasonable to the fund source selected. Restricted funds are categorized as restricted until the external stipulations have been satis�ed.
Tuition and Fees. Tuition and fees assessed to students are reported net of scholarship allowances. Scholarship allowances represent amounts credited to students’ tuition and fees and include scholar-ships, Pell Grants and various other types of aid. Student loans are not included in this calculation. Aid applied to housing is shown as an allowance against auxiliary revenues. Aid remitted directly to stu-dents is shown as scholarships, fellowships and student awards expenses. Graduate and other employ-ment-related remissions are included with compensation and bene�ts expenses.
Grants and Contracts. �e University has been awarded grants and contracts for which the monies have not been received or expended. �ese awards have not been re�ected in the �nancial statements but represent commitments of sponsors — both government and other — to provide funds for speci�c research and training projects.
�e University makes commitments to share in the cost of various sponsored projects. Funds to sat-isfy these commitments are designated when grants and contracts are awarded. As sponsor dollars are spent, the University matches according to the terms of the agreement.
Gi�s. �e University receives pledges of �nancial support from many di�erent sources. Gi� income is recognized when received or pledged. In-kind gi�s of tangible or intangible property are recognized at fair value on the date of gi� and are capitalized, if appropriate, subject to the University’s policies on capitalization. Revenue from gi�s-in-kind of approximately $4,683,000 and $6,149,000 was recognized during the years ending June 30, 2012 and 2011, respectively.
31
University Hall
Student Aid. Monies received that are restricted for aid to students by donors who have not speci�ed the recipient are reported in the �nancial statements as gi�s. When aid is awarded to students, it is either re�ected as a scholarship allowance or expense.
Use of Estimates. To prepare the �nancial statements in conformity with accounting principles generally accepted, management must make estimates and assumptions. �ese estimates and assumptions may a�ect the reported amounts of assets and liabilities and disclosure of contingent assets and liabilities at the date of the �nancial statements and the reported amounts of revenues and expenses during the reporting period. Actual results could di�er from those estimates.
Reclassi�cations. Certain prior‐year amounts have been reclassi�ed to conform to the presentation used in the current year.
NOTE 2 — DEPOSITS AND INVESTMENTS
Deposits. As of June 30, 2012 and 2011, the bank balance of the University’s deposits (demand deposit accounts) was approximately $80,918,000 and $83,455,000, respectively. $250,000 was covered by fed-eral depository insurance. �e remaining balance was insured by the state of Indiana’s Public Deposit Insurance Fund, which covers all public funds held in approved depositories.
Investments. Authorization for investment activity is stated in Indiana Code IC 21-29-2-1. Additionally, the Bylaws of the Trustees, revised and amended on November 10, 2006, authorize the treasurer of the Trustees to implement investment activity. �e University had the following invest-ments (dollars in thousands):
Investment Type June 30, 2012 June 30, 2011
U.S. Agencies $153,748 $142,466
Asset-Backed Securities 31,992 39,134
Corporate Bonds 341,054 344,059
U.S. Equity 349,019 400,864
International Equity 217,786 235,930
International Fixed Income 5,868 7,138
Marketable Alternatives 246,761 251,512
Mortgage-Backed Securities 256,266 213,500
Private Equity 162,000 156,976
Real Estate 35,802 22,466
U.S. Treasuries and Securities 250,687 165,478
Securities Lending Cash Collateral - 9,936
Mutual Funds and Cash 491,507 565,660
Total $2,542,490 $2,555,119
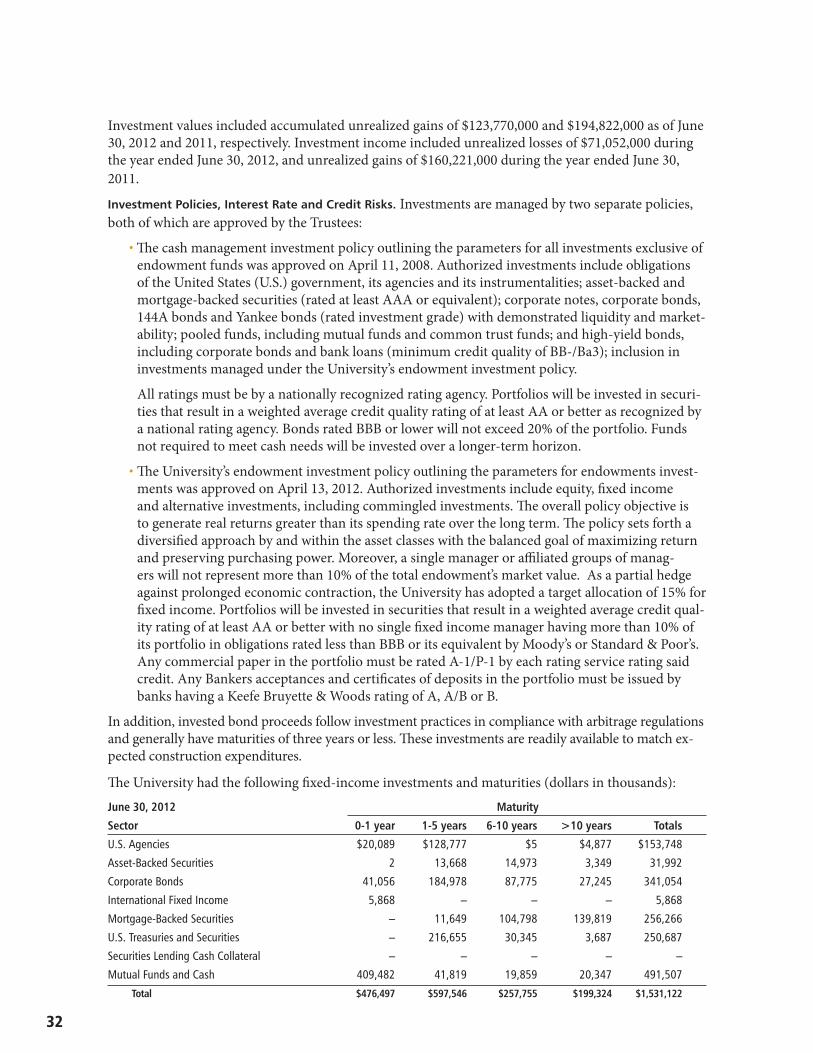
32
Investment values included accumulated unrealized gains of $123,770,000 and $194,822,000 as of June 30, 2012 and 2011, respectively. Investment income included unrealized losses of $71,052,000 during the year ended June 30, 2012, and unrealized gains of $160,221,000 during the year ended June 30, 2011.
Investment Policies, Interest Rate and Credit Risks. Investments are managed by two separate policies, both of which are approved by the Trustees:
• �e cash management investment policy outlining the parameters for all investments exclusive of endowment funds was approved on April 11, 2008. Authorized investments include obligations of the United States (U.S.) government, its agencies and its instrumentalities; asset-backed and mortgage-backed securities (rated at least AAA or equivalent); corporate notes, corporate bonds, 144A bonds and Yankee bonds (rated investment grade) with demonstrated liquidity and market-ability; pooled funds, including mutual funds and common trust funds; and high-yield bonds, including corporate bonds and bank loans (minimum credit quality of BB-/Ba3); inclusion in investments managed under the University’s endowment investment policy.
All ratings must be by a nationally recognized rating agency. Portfolios will be invested in securi-ties that result in a weighted average credit quality rating of at least AA or better as recognized by a national rating agency. Bonds rated BBB or lower will not exceed 20% of the portfolio. Funds not required to meet cash needs will be invested over a longer-term horizon.
• �e University’s endowment investment policy outlining the parameters for endowments invest-ments was approved on April 13, 2012. Authorized investments include equity, �xed income and alternative investments, including commingled investments. �e overall policy objective is to generate real returns greater than its spending rate over the long term. �e policy sets forth a diversi�ed approach by and within the asset classes with the balanced goal of maximizing return and preserving purchasing power. Moreover, a single manager or a�liated groups of manag-ers will not represent more than 10% of the total endowment’s market value. As a partial hedge against prolonged economic contraction, the University has adopted a target allocation of 15% for �xed income. Portfolios will be invested in securities that result in a weighted average credit qual-ity rating of at least AA or better with no single �xed income manager having more than 10% of its portfolio in obligations rated less than BBB or its equivalent by Moody’s or Standard & Poor’s. Any commercial paper in the portfolio must be rated A-1/P-1 by each rating service rating said credit. Any Bankers acceptances and certi�cates of deposits in the portfolio must be issued by banks having a Keefe Bruyette & Woods rating of A, A/B or B.
In addition, invested bond proceeds follow investment practices in compliance with arbitrage regulations and generally have maturities of three years or less. �ese investments are readily available to match ex-pected construction expenditures.
�e University had the following �xed-income investments and maturities (dollars in thousands):
June 30, 2012 Maturity
Sector 0-1 year 1-5 years 6-10 years >10 years Totals
U.S. Agencies $20,089 $128,777 $5 $4,877 $153,748
Asset-Backed Securities 2 13,668 14,973 3,349 31,992
Corporate Bonds 41,056 184,978 87,775 27,245 341,054
International Fixed Income 5,868 – – – 5,868
Mortgage-Backed Securities – 11,649 104,798 139,819 256,266
U.S. Treasuries and Securities – 216,655 30,345 3,687 250,687
Securities Lending Cash Collateral – – – – –
Mutual Funds and Cash 409,482 41,819 19,859 20,347 491,507
Total $476,497 $597,546 $257,755 $199,324 $1,531,122
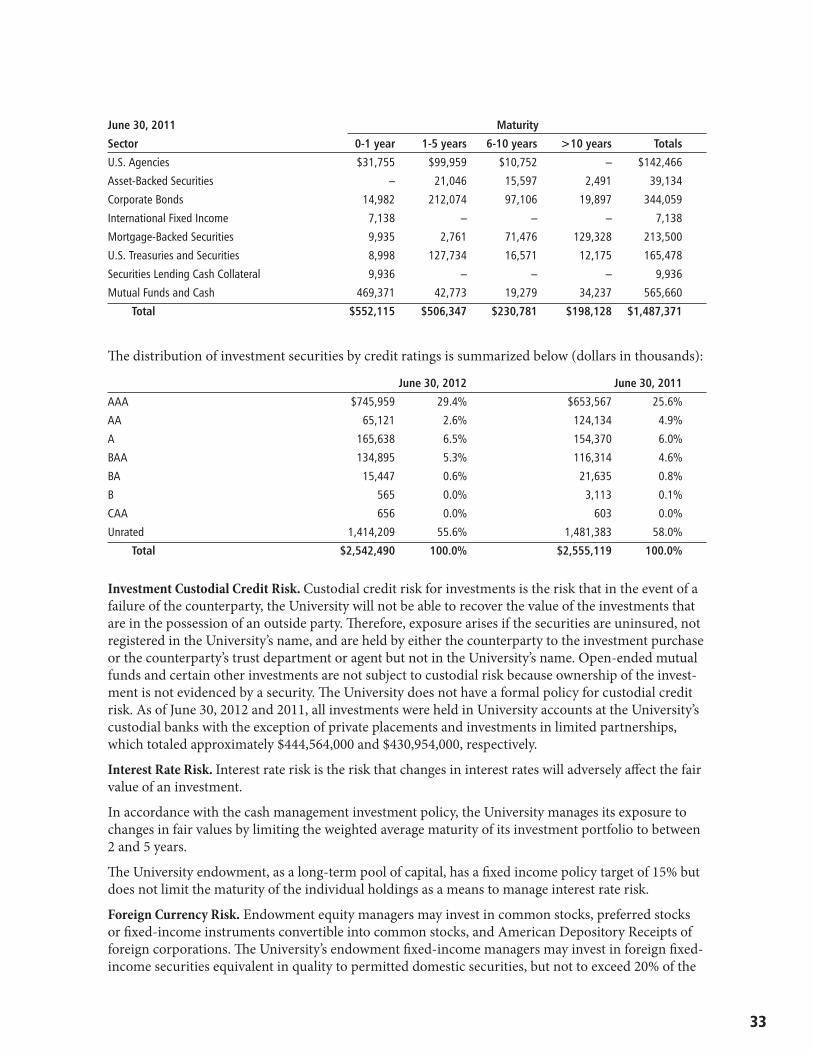
33
June 30, 2011 Maturity
Sector 0-1 year 1-5 years 6-10 years >10 years Totals
U.S. Agencies $31,755 $99,959 $10,752 – $142,466
Asset-Backed Securities – 21,046 15,597 2,491 39,134
Corporate Bonds 14,982 212,074 97,106 19,897 344,059
International Fixed Income 7,138 – – – 7,138
Mortgage-Backed Securities 9,935 2,761 71,476 129,328 213,500
U.S. Treasuries and Securities 8,998 127,734 16,571 12,175 165,478
Securities Lending Cash Collateral 9,936 – – – 9,936
Mutual Funds and Cash 469,371 42,773 19,279 34,237 565,660
Total $552,115 $506,347 $230,781 $198,128 $1,487,371
�e distribution of investment securities by credit ratings is summarized below (dollars in thousands):
June 30, 2012 June 30, 2011
AAA $745,959 29.4% $653,567 25.6%
AA 65,121 2.6% 124,134 4.9%
A 165,638 6.5% 154,370 6.0%
BAA 134,895 5.3% 116,314 4.6%
BA 15,447 0.6% 21,635 0.8%
B 565 0.0% 3,113 0.1%
CAA 656 0.0% 603 0.0%
Unrated 1,414,209 55.6% 1,481,383 58.0%
Total $2,542,490 100.0% $2,555,119 100.0%
Investment Custodial Credit Risk. Custodial credit risk for investments is the risk that in the event of a failure of the counterparty, the University will not be able to recover the value of the investments that are in the possession of an outside party. �erefore, exposure arises if the securities are uninsured, not registered in the University’s name, and are held by either the counterparty to the investment purchase or the counterparty’s trust department or agent but not in the University’s name. Open-ended mutual funds and certain other investments are not subject to custodial risk because ownership of the invest-ment is not evidenced by a security. �e University does not have a formal policy for custodial credit risk. As of June 30, 2012 and 2011, all investments were held in University accounts at the University’s custodial banks with the exception of private placements and investments in limited partnerships, which totaled approximately $444,564,000 and $430,954,000, respectively.
Interest Rate Risk. Interest rate risk is the risk that changes in interest rates will adversely a�ect the fair value of an investment.
In accordance with the cash management investment policy, the University manages its exposure to changes in fair values by limiting the weighted average maturity of its investment portfolio to between 2 and 5 years.
�e University endowment, as a long-term pool of capital, has a �xed income policy target of 15% but does not limit the maturity of the individual holdings as a means to manage interest rate risk.
Foreign Currency Risk. Endowment equity managers may invest in common stocks, preferred stocks or �xed-income instruments convertible into common stocks, and American Depository Receipts of foreign corporations. �e University’s endowment �xed-income managers may invest in foreign �xed-income securities equivalent in quality to permitted domestic securities, but not to exceed 20% of the
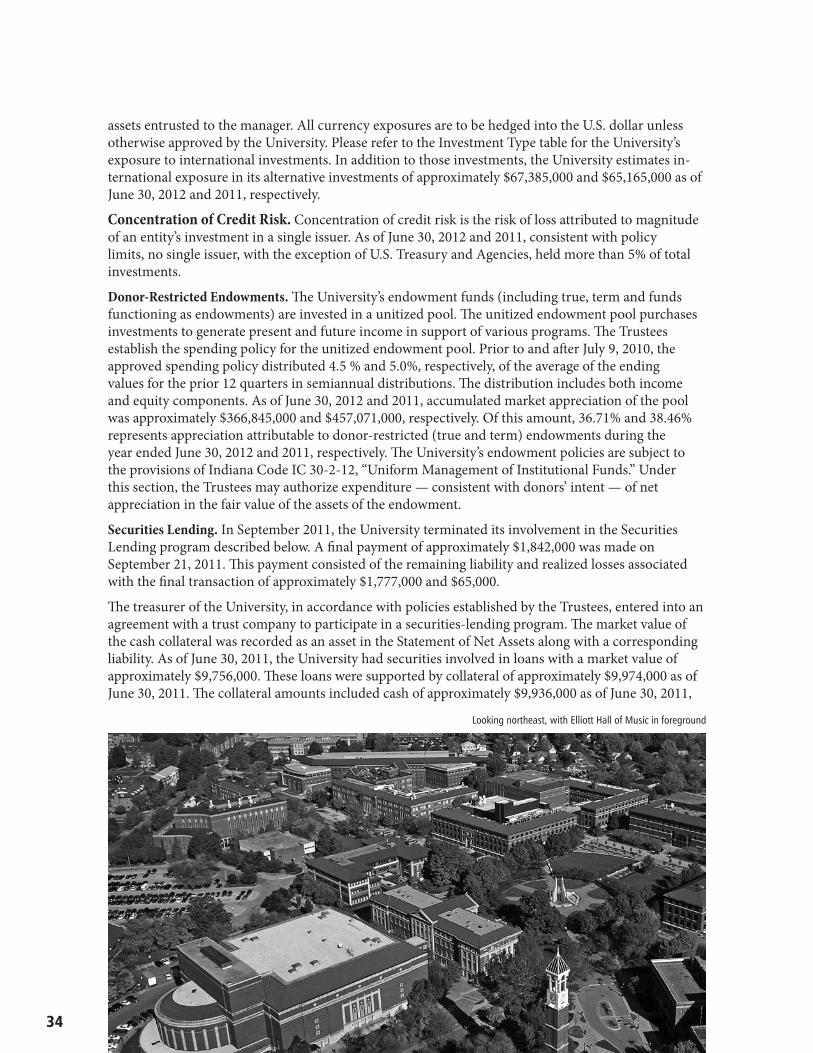
34
Looking northeast, with Elliott Hall of Music in foreground
assets entrusted to the manager. All currency exposures are to be hedged into the U.S. dollar unless otherwise approved by the University. Please refer to the Investment Type table for the University’s exposure to international investments. In addition to those investments, the University estimates in-ternational exposure in its alternative investments of approximately $67,385,000 and $65,165,000 as of June 30, 2012 and 2011, respectively.
Concentration of Credit Risk. Concentration of credit risk is the risk of loss attributed to magnitude of an entity’s investment in a single issuer. As of June 30, 2012 and 2011, consistent with policy limits, no single issuer, with the exception of U.S. Treasury and Agencies, held more than 5% of total investments. Donor-Restricted Endowments. �e University’s endowment funds (including true, term and funds functioning as endowments) are invested in a unitized pool. �e unitized endowment pool purchases investments to generate present and future income in support of various programs. �e Trustees establish the spending policy for the unitized endowment pool. Prior to and a�er July 9, 2010, the approved spending policy distributed 4.5 % and 5.0%, respectively, of the average of the ending values for the prior 12 quarters in semiannual distributions. �e distribution includes both income and equity components. As of June 30, 2012 and 2011, accumulated market appreciation of the pool was approximately $366,845,000 and $457,071,000, respectively. Of this amount, 36.71% and 38.46% represents appreciation attributable to donor-restricted (true and term) endowments during the year ended June 30, 2012 and 2011, respectively. �e University’s endowment policies are subject to the provisions of Indiana Code IC 30-2-12, “Uniform Management of Institutional Funds.” Under this section, the Trustees may authorize expenditure — consistent with donors’ intent — of net appreciation in the fair value of the assets of the endowment.
Securities Lending. In September 2011, the University terminated its involvement in the Securities Lending program described below. A �nal payment of approximately $1,842,000 was made on September 21, 2011. �is payment consisted of the remaining liability and realized losses associated with the �nal transaction of approximately $1,777,000 and $65,000.
�e treasurer of the University, in accordance with policies established by the Trustees, entered into an agreement with a trust company to participate in a securities-lending program. �e market value of the cash collateral was recorded as an asset in the Statement of Net Assets along with a corresponding liability. As of June 30, 2011, the University had securities involved in loans with a market value of approximately $9,756,000. �ese loans were supported by collateral of approximately $9,974,000 as of June 30, 2011. �e collateral amounts included cash of approximately $9,936,000 as of June 30, 2011,
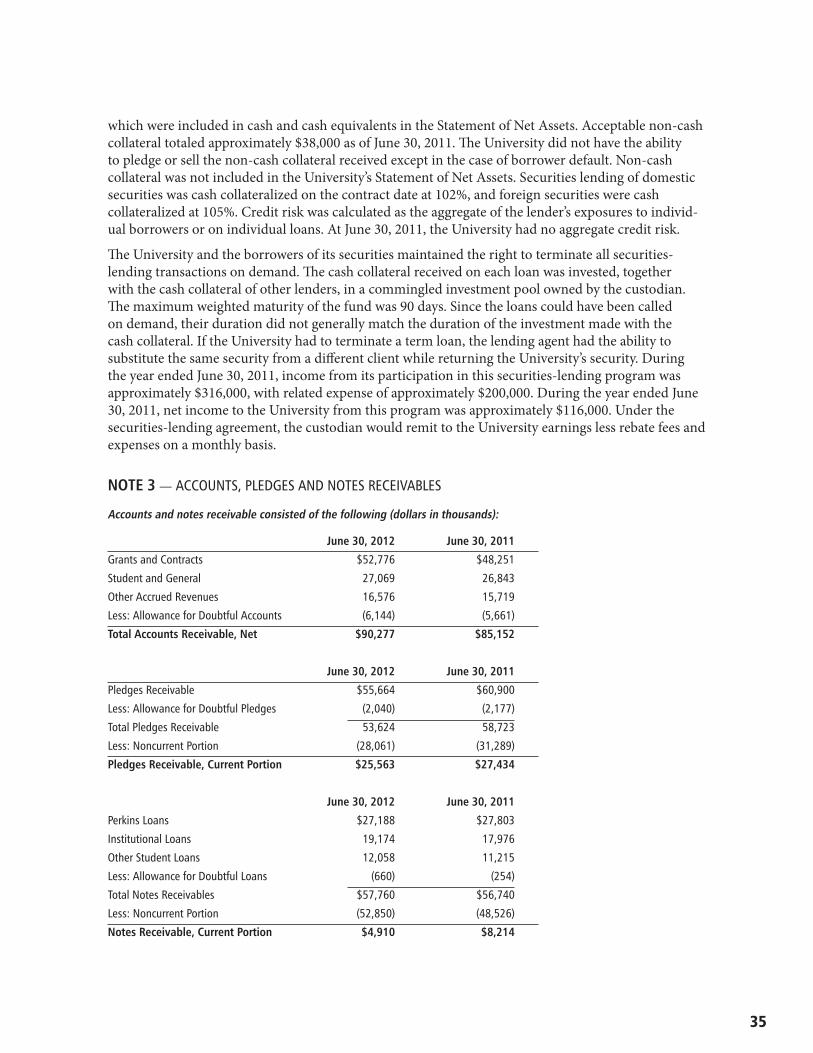
35
which were included in cash and cash equivalents in the Statement of Net Assets. Acceptable non-cash collateral totaled approximately $38,000 as of June 30, 2011. �e University did not have the ability to pledge or sell the non-cash collateral received except in the case of borrower default. Non-cash collateral was not included in the University’s Statement of Net Assets. Securities lending of domestic securities was cash collateralized on the contract date at 102%, and foreign securities were cash collateralized at 105%. Credit risk was calculated as the aggregate of the lender’s exposures to individ-ual borrowers or on individual loans. At June 30, 2011, the University had no aggregate credit risk.
�e University and the borrowers of its securities maintained the right to terminate all securities-lending transactions on demand. �e cash collateral received on each loan was invested, together with the cash collateral of other lenders, in a commingled investment pool owned by the custodian. �e maximum weighted maturity of the fund was 90 days. Since the loans could have been called on demand, their duration did not generally match the duration of the investment made with the cash collateral. If the University had to terminate a term loan, the lending agent had the ability to substitute the same security from a di�erent client while returning the University’s security. During the year ended June 30, 2011, income from its participation in this securities-lending program was approximately $316,000, with related expense of approximately $200,000. During the year ended June 30, 2011, net income to the University from this program was approximately $116,000. Under the securities-lending agreement, the custodian would remit to the University earnings less rebate fees and expenses on a monthly basis.
NOTE 3 — ACCOUNTS, PLEDGES AND NOTES RECEIVABLES
Accounts and notes receivable consisted of the following (dollars in thousands):
June 30, 2012 June 30, 2011
Grants and Contracts $52,776 $48,251
Student and General 27,069 26,843
Other Accrued Revenues 16,576 15,719
Less: Allowance for Doubtful Accounts (6,144) (5,661)
Total Accounts Receivable, Net $90,277 $85,152
June 30, 2012 June 30, 2011
Pledges Receivable $55,664 $60,900
Less: Allowance for Doubtful Pledges (2,040) (2,177)
Total Pledges Receivable 53,624 58,723
Less: Noncurrent Portion (28,061) (31,289)
Pledges Receivable, Current Portion $25,563 $27,434
June 30, 2012 June 30, 2011
Perkins Loans $27,188 $27,803
Institutional Loans 19,174 17,976
Other Student Loans 12,058 11,215
Less: Allowance for Doubtful Loans (660) (254)
Total Notes Receivables $57,760 $56,740
Less: Noncurrent Portion (52,850) (48,526)
Notes Receivable, Current Portion $4,910 $8,214
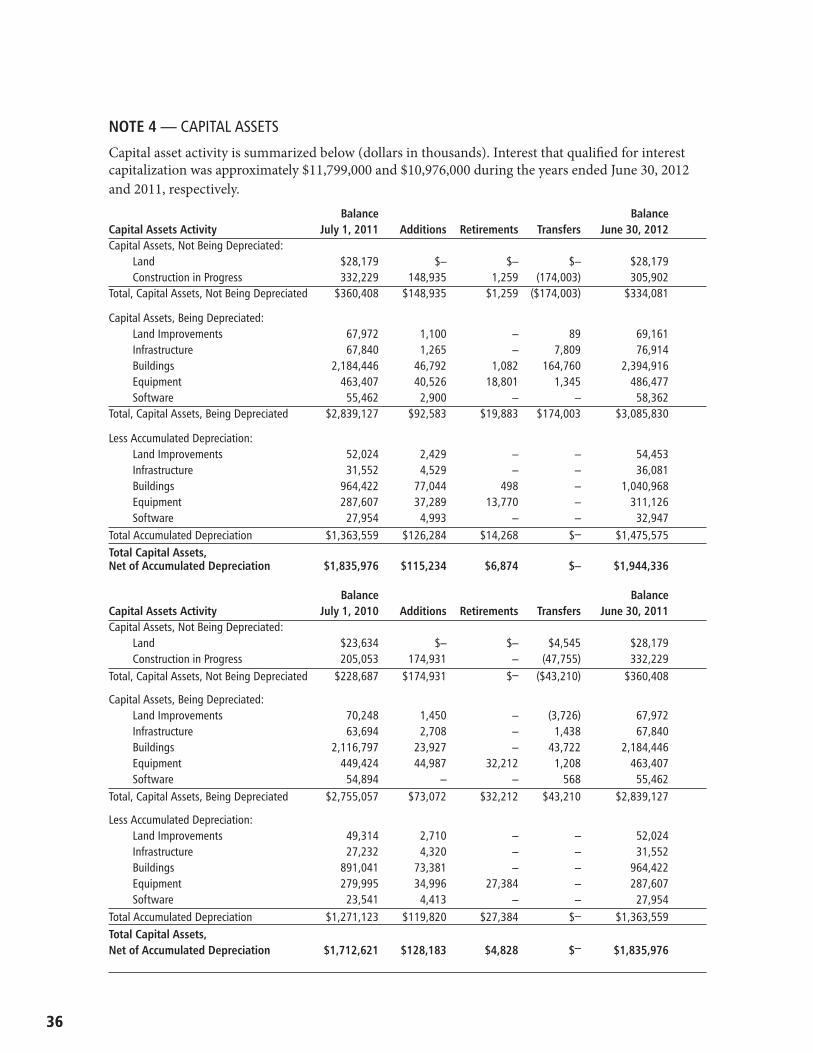
36
NOTE 4 — CAPITAL ASSETS
Capital asset activity is summarized below (dollars in thousands). Interest that quali�ed for interest capitalization was approximately $11,799,000 and $10,976,000 during the years ended June 30, 2012 and 2011, respectively.
Balance Balance Capital Assets Activity July 1, 2011 Additions Retirements Transfers June 30, 2012Capital Assets, Not Being Depreciated:
Land $28,179 $– $– $– $28,179Construction in Progress 332,229 148,935 1,259 (174,003) 305,902
Total, Capital Assets, Not Being Depreciated $360,408 $148,935 $1,259 ($174,003) $334,081
Capital Assets, Being Depreciated:Land Improvements 67,972 1,100 – 89 69,161Infrastructure 67,840 1,265 – 7,809 76,914Buildings 2,184,446 46,792 1,082 164,760 2,394,916Equipment 463,407 40,526 18,801 1,345 486,477Software 55,462 2,900 – – 58,362
Total, Capital Assets, Being Depreciated $2,839,127 $92,583 $19,883 $174,003 $3,085,830
Less Accumulated Depreciation:Land Improvements 52,024 2,429 – – 54,453Infrastructure 31,552 4,529 – – 36,081Buildings 964,422 77,044 498 – 1,040,968Equipment 287,607 37,289 13,770 – 311,126Software 27,954 4,993 – – 32,947
Total Accumulated Depreciation $1,363,559 $126,284 $14,268 $– $1,475,575Total Capital Assets, Net of Accumulated Depreciation $1,835,976 $115,234 $6,874 $– $1,944,336
Balance Balance Capital Assets Activity July 1, 2010 Additions Retirements Transfers June 30, 2011Capital Assets, Not Being Depreciated:
Land $23,634 $– $– $4,545 $28,179Construction in Progress 205,053 174,931 – (47,755) 332,229
Total, Capital Assets, Not Being Depreciated $228,687 $174,931 $– ($43,210) $360,408
Capital Assets, Being Depreciated:Land Improvements 70,248 1,450 – (3,726) 67,972Infrastructure 63,694 2,708 – 1,438 67,840Buildings 2,116,797 23,927 – 43,722 2,184,446Equipment 449,424 44,987 32,212 1,208 463,407Software 54,894 – – 568 55,462
Total, Capital Assets, Being Depreciated $2,755,057 $73,072 $32,212 $43,210 $2,839,127
Less Accumulated Depreciation:Land Improvements 49,314 2,710 – – 52,024Infrastructure 27,232 4,320 – – 31,552Buildings 891,041 73,381 – – 964,422Equipment 279,995 34,996 27,384 – 287,607Software 23,541 4,413 – – 27,954
Total Accumulated Depreciation $1,271,123 $119,820 $27,384 $– $1,363,559Total Capital Assets, Net of Accumulated Depreciation $1,712,621 $128,183 $4,828 $– $1,835,976
37
NOTE 5 — ACCOUNTS PAYABLE AND ACCRUED EXPENSES
Accounts payable and accrued expenses consisted of the following (dollars in thousands):
June 30, 2012 June 30, 2011Construction Payables $25,980 $25,640 Accrued Insurance Liabilities 26,943 28,386 Interest Payable 16,686 17,188 Accrued Salary and Wages 6,997 9,094 Vendor and Other Payables 21,725 33,605 Total Accounts Payable $98,331 $113,913
Accrued Insurance Liabilities. �e University is exposed to various risks of loss related to torts; the� of, damage to or destruction of assets; errors or omissions; job-related illnesses or injuries to employees; accident, health, and other medical bene�ts provided to employees and their dependents; and long-term disability bene�ts provided to employees. �e University handles these risks of loss through com-binations of risk retention and commercial insurance. For buildings and contents, the University’s risk retention is $250,000 per occurrence. �ere is $2,000,000 retention per occurrence or wrongful act for general, automobile, and professional and educators’ legal liability coverage. �e University retains the entire risk for medical bene�ts. �e maximum liability to the University for job-related illnesses or in-juries is $500,000 per incident, with a maximum annual aggregate liability of approximately $7,396,000 and $7,000,000 as of June 30, 2012 and 2011, respectively.
Separate funds have been established to account for these risks. All departments of the University are charged fees based on actuarial estimates of the amounts necessary to pay claims and to establish re-serves for catastrophic losses. During the years ended June 30, 2012 and 2011, the University re�ected approximately $63,000 and $73,000, respectively, of insurance proceeds as nonoperating income.
�e University accrues liabilities for claims if information indicates that a loss has been incurred as of June 30, and the amount of the loss can reasonably be estimated. Changes in the balances of accrued insurance liabilities were as follows (dollars in thousands):
June 30, 2012 June 30, 2011Beginning Liability $28,386 $26,333Claims Incurred 143,423 141,838Claims Payments (144,866) (139,785)Ending Liability $26,943 $28,386
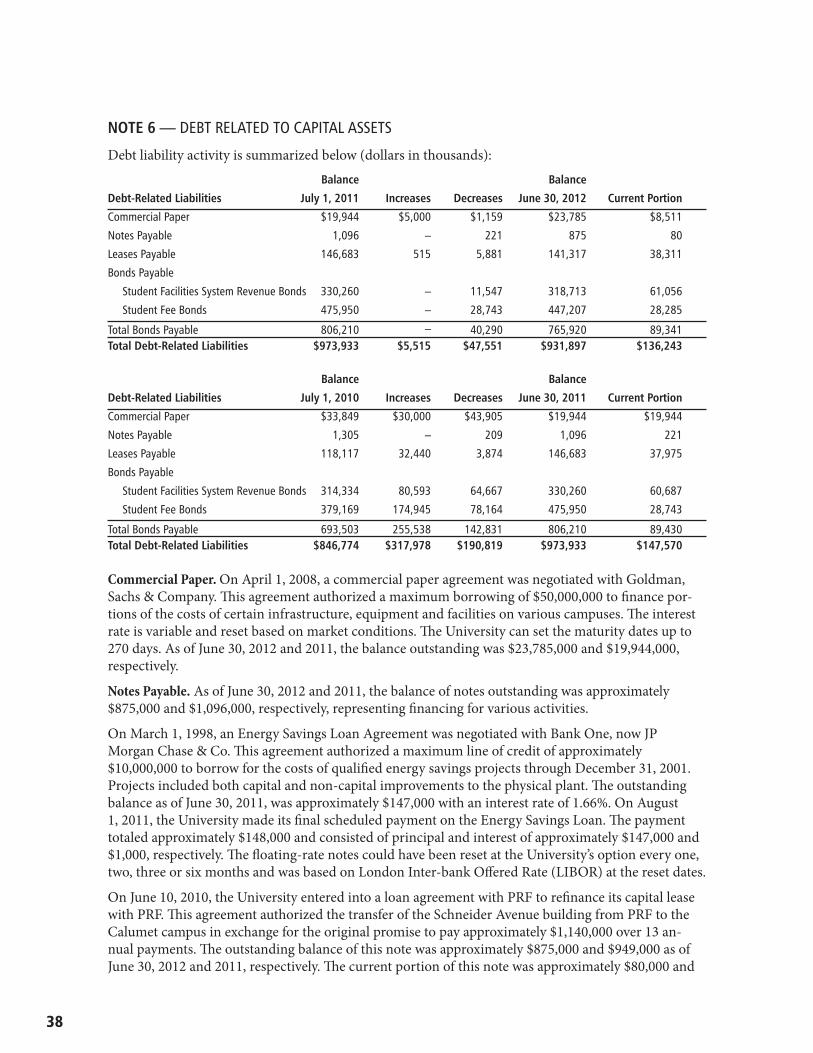
38
NOTE 6 — DEBT RELATED TO CAPITAL ASSETS
Debt liability activity is summarized below (dollars in thousands):
Balance Balance
Debt-Related Liabilities July 1, 2011 Increases Decreases June 30, 2012 Current Portion
Commercial Paper $19,944 $5,000 $1,159 $23,785 $8,511
Notes Payable 1,096 – 221 875 80
Leases Payable 146,683 515 5,881 141,317 38,311
Bonds Payable
Student Facilities System Revenue Bonds 330,260 – 11,547 318,713 61,056
Student Fee Bonds 475,950 – 28,743 447,207 28,285
Total Bonds Payable 806,210 – 40,290 765,920 89,341 Total Debt-Related Liabilities $973,933 $5,515 $47,551 $931,897 $136,243
Balance Balance
Debt-Related Liabilities July 1, 2010 Increases Decreases June 30, 2011 Current Portion
Commercial Paper $33,849 $30,000 $43,905 $19,944 $19,944
Notes Payable 1,305 – 209 1,096 221
Leases Payable 118,117 32,440 3,874 146,683 37,975
Bonds Payable
Student Facilities System Revenue Bonds 314,334 80,593 64,667 330,260 60,687
Student Fee Bonds 379,169 174,945 78,164 475,950 28,743
Total Bonds Payable 693,503 255,538 142,831 806,210 89,430 Total Debt-Related Liabilities $846,774 $317,978 $190,819 $973,933 $147,570
Commercial Paper. On April 1, 2008, a commercial paper agreement was negotiated with Goldman, Sachs & Company. �is agreement authorized a maximum borrowing of $50,000,000 to �nance por-tions of the costs of certain infrastructure, equipment and facilities on various campuses. �e interest rate is variable and reset based on market conditions. �e University can set the maturity dates up to 270 days. As of June 30, 2012 and 2011, the balance outstanding was $23,785,000 and $19,944,000, respectively.
Notes Payable. As of June 30, 2012 and 2011, the balance of notes outstanding was approximately $875,000 and $1,096,000, respectively, representing �nancing for various activities.
On March 1, 1998, an Energy Savings Loan Agreement was negotiated with Bank One, now JP Morgan Chase & Co. �is agreement authorized a maximum line of credit of approximately $10,000,000 to borrow for the costs of quali�ed energy savings projects through December 31, 2001. Projects included both capital and non-capital improvements to the physical plant. �e outstanding balance as of June 30, 2011, was approximately $147,000 with an interest rate of 1.66%. On August 1, 2011, the University made its �nal scheduled payment on the Energy Savings Loan. �e payment totaled approximately $148,000 and consisted of principal and interest of approximately $147,000 and $1,000, respectively. �e �oating-rate notes could have been reset at the University’s option every one, two, three or six months and was based on London Inter-bank O�ered Rate (LIBOR) at the reset dates.
On June 10, 2010, the University entered into a loan agreement with PRF to re�nance its capital lease with PRF. �is agreement authorized the transfer of the Schneider Avenue building from PRF to the Calumet campus in exchange for the original promise to pay approximately $1,140,000 over 13 an-nual payments. �e outstanding balance of this note was approximately $875,000 and $949,000 as of June 30, 2012 and 2011, respectively. �e current portion of this note was approximately $80,000 and
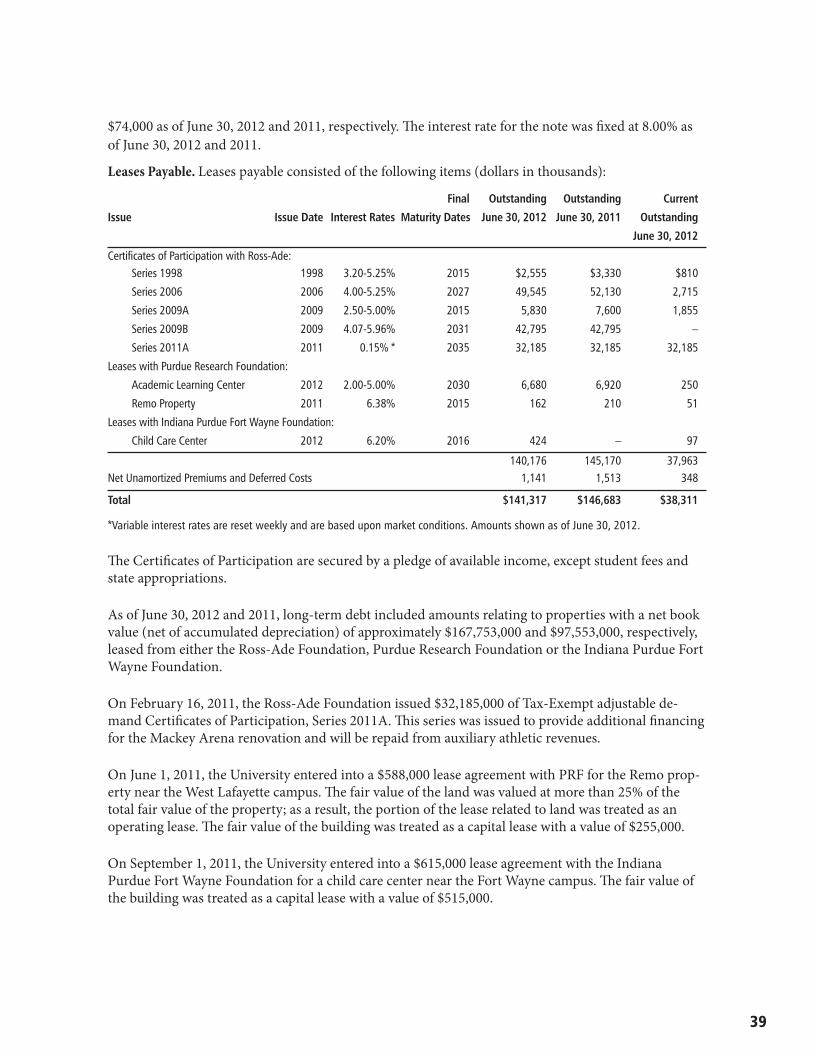
39
$74,000 as of June 30, 2012 and 2011, respectively. �e interest rate for the note was �xed at 8.00% as of June 30, 2012 and 2011.
Leases Payable. Leases payable consisted of the following items (dollars in thousands):
Final Outstanding Outstanding Current
Issue Issue Date Interest Rates Maturity Dates June 30, 2012 June 30, 2011 Outstanding
June 30, 2012
Certificates of Participation with Ross-Ade: Series 1998 1998 3.20-5.25% 2015 $2,555 $3,330 $810
Series 2006 2006 4.00-5.25% 2027 49,545 52,130 2,715
Series 2009A 2009 2.50-5.00% 2015 5,830 7,600 1,855
Series 2009B 2009 4.07-5.96% 2031 42,795 42,795 –
Series 2011A 2011 0.15% * 2035 32,185 32,185 32,185
Leases with Purdue Research Foundation:
Academic Learning Center 2012 2.00-5.00% 2030 6,680 6,920 250
Remo Property 2011 6.38% 2015 162 210 51
Leases with Indiana Purdue Fort Wayne Foundation:
Child Care Center 2012 6.20% 2016 424 – 97
140,176 145,170 37,963Net Unamortized Premiums and Deferred Costs 1,141 1,513 348
Total $141,317 $146,683 $38,311
*Variable interest rates are reset weekly and are based upon market conditions. Amounts shown as of June 30, 2012.
�e Certi�cates of Participation are secured by a pledge of available income, except student fees and state appropriations.
As of June 30, 2012 and 2011, long-term debt included amounts relating to properties with a net book value (net of accumulated depreciation) of approximately $167,753,000 and $97,553,000, respectively, leased from either the Ross-Ade Foundation, Purdue Research Foundation or the Indiana Purdue Fort Wayne Foundation.
On February 16, 2011, the Ross-Ade Foundation issued $32,185,000 of Tax-Exempt adjustable de-mand Certi�cates of Participation, Series 2011A. �is series was issued to provide additional �nancing for the Mackey Arena renovation and will be repaid from auxiliary athletic revenues.
On June 1, 2011, the University entered into a $588,000 lease agreement with PRF for the Remo prop-erty near the West Lafayette campus. �e fair value of the land was valued at more than 25% of the total fair value of the property; as a result, the portion of the lease related to land was treated as an operating lease. �e fair value of the building was treated as a capital lease with a value of $255,000.
On September 1, 2011, the University entered into a $615,000 lease agreement with the Indiana Purdue Fort Wayne Foundation for a child care center near the Fort Wayne campus. �e fair value of the building was treated as a capital lease with a value of $515,000.
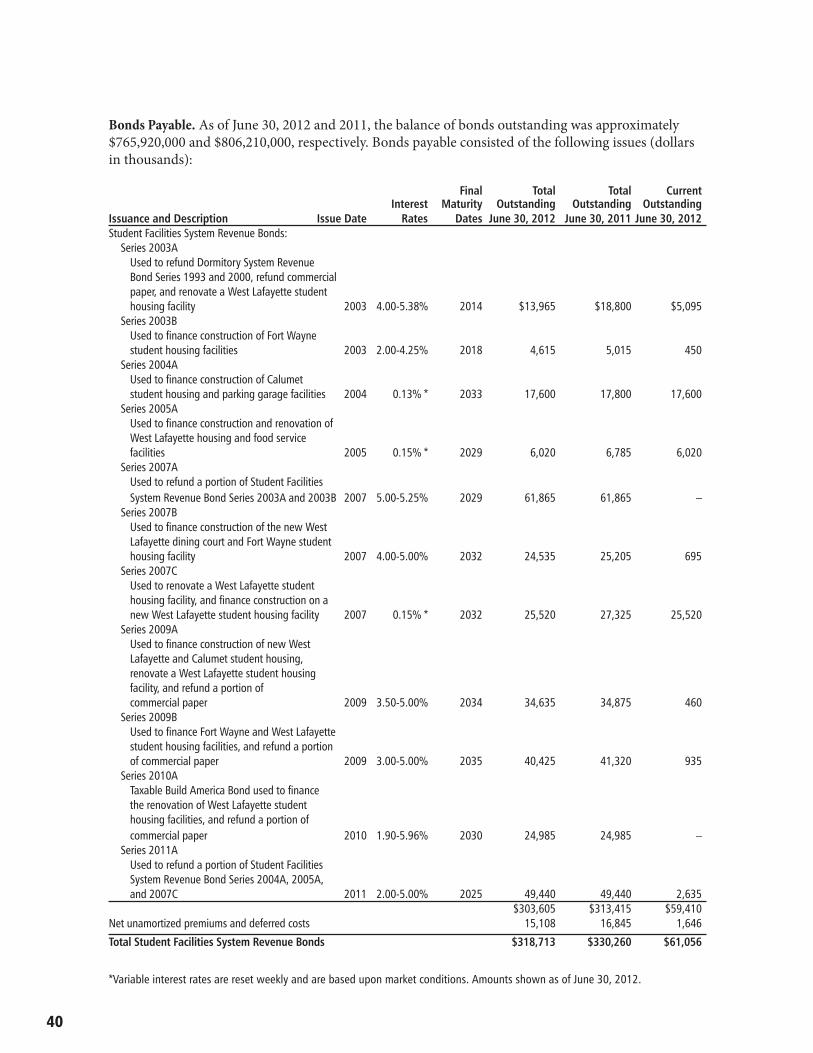
40
Bonds Payable. As of June 30, 2012 and 2011, the balance of bonds outstanding was approximately $765,920,000 and $806,210,000, respectively. Bonds payable consisted of the following issues (dollars in thousands):
Final Total Total Current Interest Maturity Outstanding Outstanding OutstandingIssuance and Description Issue Date Rates Dates June 30, 2012 June 30, 2011 June 30, 2012Student Facilities System Revenue Bonds: Series 2003A Used to refund Dormitory System Revenue Bond Series 1993 and 2000, refund commercial paper, and renovate a West Lafayette student housing facility 2003 4.00-5.38% 2014 $13,965 $18,800 $5,095 Series 2003B Used to finance construction of Fort Wayne student housing facilities 2003 2.00-4.25% 2018 4,615 5,015 450 Series 2004A Used to finance construction of Calumet student housing and parking garage facilities 2004 0.13% * 2033 17,600 17,800 17,600 Series 2005A Used to finance construction and renovation of West Lafayette housing and food service facilities 2005 0.15% * 2029 6,020 6,785 6,020 Series 2007A Used to refund a portion of Student Facilities System Revenue Bond Series 2003A and 2003B 2007 5.00-5.25% 2029 61,865 61,865 – Series 2007B Used to finance construction of the new West Lafayette dining court and Fort Wayne student housing facility 2007 4.00-5.00% 2032 24,535 25,205 695 Series 2007C Used to renovate a West Lafayette student housing facility, and finance construction on a new West Lafayette student housing facility 2007 0.15% * 2032 25,520 27,325 25,520 Series 2009A Used to finance construction of new West Lafayette and Calumet student housing, renovate a West Lafayette student housing facility, and refund a portion of commercial paper 2009 3.50-5.00% 2034 34,635 34,875 460 Series 2009B Used to finance Fort Wayne and West Lafayette student housing facilities, and refund a portion of commercial paper 2009 3.00-5.00% 2035 40,425 41,320 935 Series 2010A Taxable Build America Bond used to finance the renovation of West Lafayette student housing facilities, and refund a portion of commercial paper 2010 1.90-5.96% 2030 24,985 24,985 – Series 2011A Used to refund a portion of Student Facilities System Revenue Bond Series 2004A, 2005A, and 2007C 2011 2.00-5.00% 2025 49,440 49,440 2,635 $303,605 $313,415 $59,410 Net unamortized premiums and deferred costs 15,108 16,845 1,646
Total Student Facilities System Revenue Bonds $318,713 $330,260 $61,056
*Variable interest rates are reset weekly and are based upon market conditions. Amounts shown as of June 30, 2012.
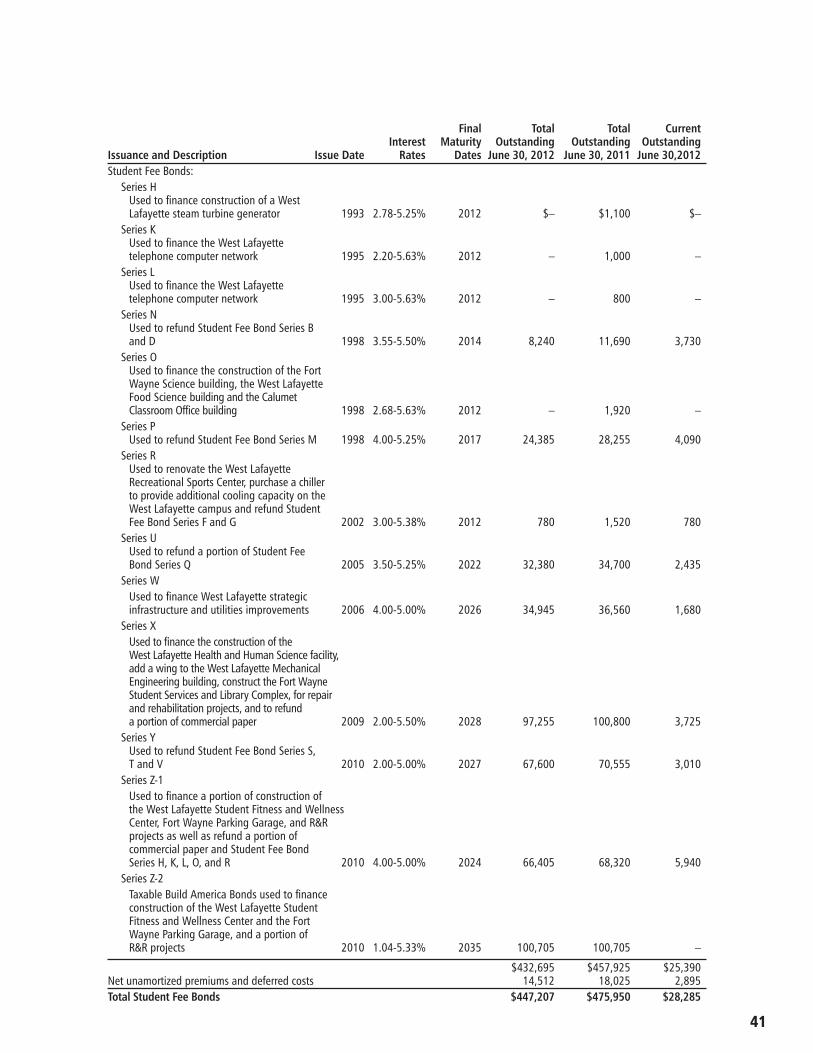
41
Final Total Total CurrentInterest Maturity Outstanding Outstanding Outstanding
Issuance and Description Issue Date Rates Dates June 30, 2012 June 30, 2011 June 30,2012Student Fee Bonds:
Series H Used to finance construction of a West Lafayette steam turbine generator 1993 2.78-5.25% 2012 $– $1,100 $–
Series K Used to finance the West Lafayette telephone computer network 1995 2.20-5.63% 2012 – 1,000 –
Series L Used to finance the West Lafayette telephone computer network 1995 3.00-5.63% 2012 – 800 –
Series N Used to refund Student Fee Bond Series B and D 1998 3.55-5.50% 2014 8,240 11,690 3,730
Series O Used to finance the construction of the Fort Wayne Science building, the West Lafayette Food Science building and the Calumet Classroom Office building 1998 2.68-5.63% 2012 – 1,920 –
Series P Used to refund Student Fee Bond Series M 1998 4.00-5.25% 2017 24,385 28,255 4,090
Series R Used to renovate the West Lafayette Recreational Sports Center, purchase a chiller to provide additional cooling capacity on the West Lafayette campus and refund Student Fee Bond Series F and G 2002 3.00-5.38% 2012 780 1,520 780
Series U Used to refund a portion of Student Fee Bond Series Q 2005 3.50-5.25% 2022 32,380 34,700 2,435
Series W Used to finance West Lafayette strategic infrastructure and utilities improvements 2006 4.00-5.00% 2026 34,945 36,560 1,680
Series X Used to finance the construction of the West Lafayette Health and Human Science facility, add a wing to the West Lafayette Mechanical Engineering building, construct the Fort Wayne Student Services and Library Complex, for repair and rehabilitation projects, and to refund a portion of commercial paper 2009 2.00-5.50% 2028 97,255 100,800 3,725
Series Y Used to refund Student Fee Bond Series S, T and V 2010 2.00-5.00% 2027 67,600 70,555 3,010
Series Z-1 Used to finance a portion of construction of the West Lafayette Student Fitness and Wellness Center, Fort Wayne Parking Garage, and R&R projects as well as refund a portion of commercial paper and Student Fee Bond Series H, K, L, O, and R 2010 4.00-5.00% 2024 66,405 68,320 5,940
Series Z-2 Taxable Build America Bonds used to finance construction of the West Lafayette Student Fitness and Wellness Center and the Fort Wayne Parking Garage, and a portion of R&R projects 2010 1.04-5.33% 2035 100,705 100,705 –
$432,695 $457,925 $25,390 Net unamortized premiums and deferred costs 14,512 18,025 2,895 Total Student Fee Bonds $447,207 $475,950 $28,285
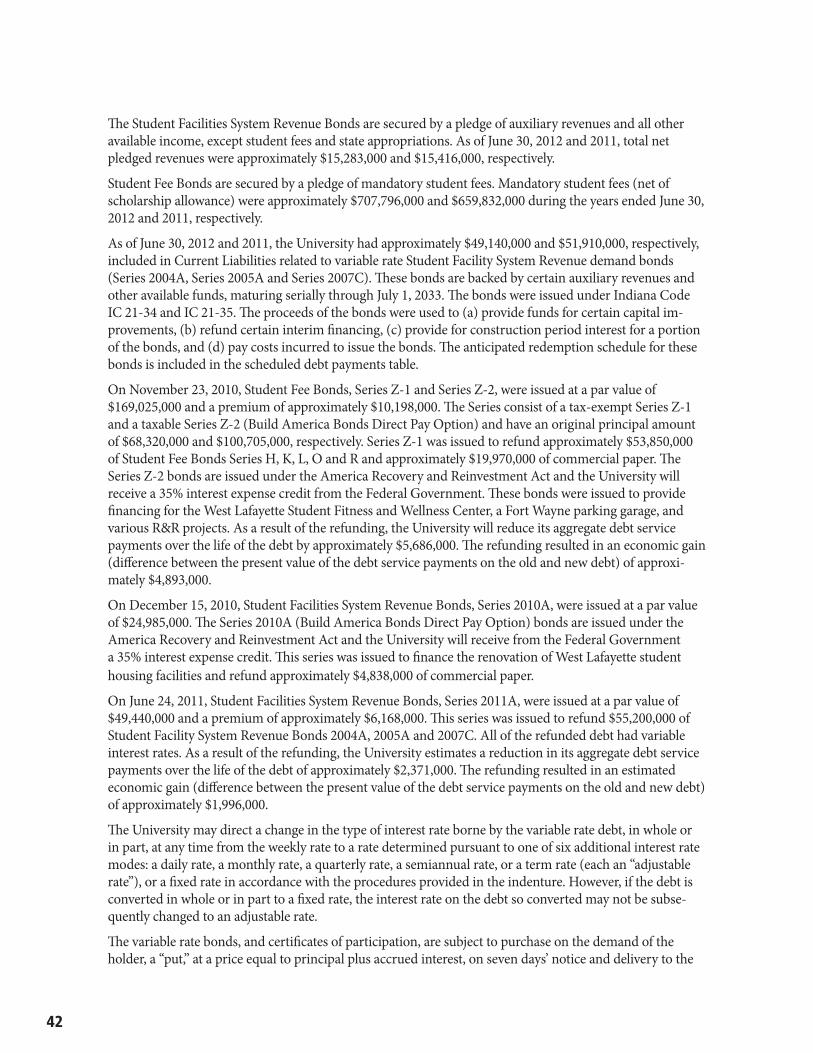
42
�e Student Facilities System Revenue Bonds are secured by a pledge of auxiliary revenues and all other available income, except student fees and state appropriations. As of June 30, 2012 and 2011, total net pledged revenues were approximately $15,283,000 and $15,416,000, respectively.
Student Fee Bonds are secured by a pledge of mandatory student fees. Mandatory student fees (net of scholarship allowance) were approximately $707,796,000 and $659,832,000 during the years ended June 30, 2012 and 2011, respectively.
As of June 30, 2012 and 2011, the University had approximately $49,140,000 and $51,910,000, respectively, included in Current Liabilities related to variable rate Student Facility System Revenue demand bonds (Series 2004A, Series 2005A and Series 2007C). �ese bonds are backed by certain auxiliary revenues and other available funds, maturing serially through July 1, 2033. �e bonds were issued under Indiana Code IC 21-34 and IC 21-35. �e proceeds of the bonds were used to (a) provide funds for certain capital im-provements, (b) refund certain interim �nancing, (c) provide for construction period interest for a portion of the bonds, and (d) pay costs incurred to issue the bonds. �e anticipated redemption schedule for these bonds is included in the scheduled debt payments table.
On November 23, 2010, Student Fee Bonds, Series Z-1 and Series Z-2, were issued at a par value of $169,025,000 and a premium of approximately $10,198,000. �e Series consist of a tax-exempt Series Z-1 and a taxable Series Z-2 (Build America Bonds Direct Pay Option) and have an original principal amount of $68,320,000 and $100,705,000, respectively. Series Z-1 was issued to refund approximately $53,850,000 of Student Fee Bonds Series H, K, L, O and R and approximately $19,970,000 of commercial paper. �e Series Z-2 bonds are issued under the America Recovery and Reinvestment Act and the University will receive a 35% interest expense credit from the Federal Government. �ese bonds were issued to provide �nancing for the West Lafayette Student Fitness and Wellness Center, a Fort Wayne parking garage, and various R&R projects. As a result of the refunding, the University will reduce its aggregate debt service payments over the life of the debt by approximately $5,686,000. �e refunding resulted in an economic gain (di�erence between the present value of the debt service payments on the old and new debt) of approxi-mately $4,893,000.
On December 15, 2010, Student Facilities System Revenue Bonds, Series 2010A, were issued at a par value of $24,985,000. �e Series 2010A (Build America Bonds Direct Pay Option) bonds are issued under the America Recovery and Reinvestment Act and the University will receive from the Federal Government a 35% interest expense credit. �is series was issued to �nance the renovation of West Lafayette student housing facilities and refund approximately $4,838,000 of commercial paper.
On June 24, 2011, Student Facilities System Revenue Bonds, Series 2011A, were issued at a par value of $49,440,000 and a premium of approximately $6,168,000. �is series was issued to refund $55,200,000 of Student Facility System Revenue Bonds 2004A, 2005A and 2007C. All of the refunded debt had variable interest rates. As a result of the refunding, the University estimates a reduction in its aggregate debt service payments over the life of the debt of approximately $2,371,000. �e refunding resulted in an estimated economic gain (di�erence between the present value of the debt service payments on the old and new debt) of approximately $1,996,000.
�e University may direct a change in the type of interest rate borne by the variable rate debt, in whole or in part, at any time from the weekly rate to a rate determined pursuant to one of six additional interest rate modes: a daily rate, a monthly rate, a quarterly rate, a semiannual rate, or a term rate (each an “adjustable rate”), or a �xed rate in accordance with the procedures provided in the indenture. However, if the debt is converted in whole or in part to a �xed rate, the interest rate on the debt so converted may not be subse-quently changed to an adjustable rate.
�e variable rate bonds, and certi�cates of participation, are subject to purchase on the demand of the holder, a “put,” at a price equal to principal plus accrued interest, on seven days’ notice and delivery to the
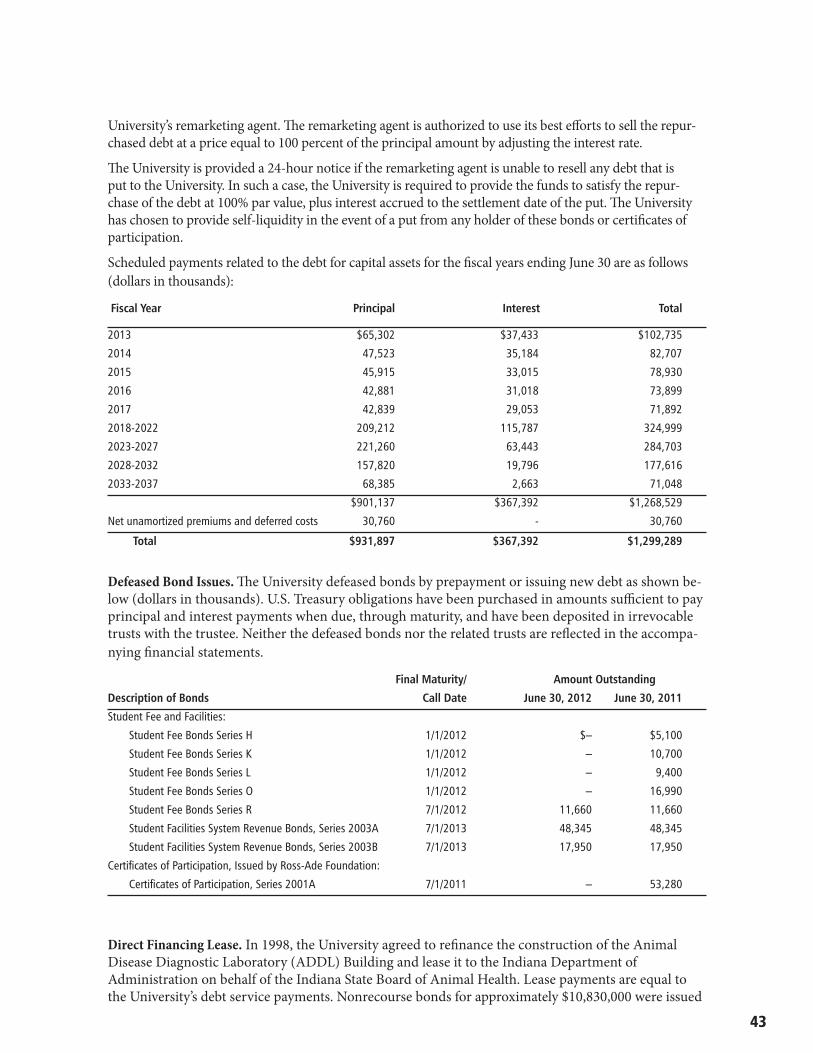
43
University’s remarketing agent. �e remarketing agent is authorized to use its best e�orts to sell the repur-chased debt at a price equal to 100 percent of the principal amount by adjusting the interest rate.
�e University is provided a 24-hour notice if the remarketing agent is unable to resell any debt that is put to the University. In such a case, the University is required to provide the funds to satisfy the repur-chase of the debt at 100% par value, plus interest accrued to the settlement date of the put. �e University has chosen to provide self-liquidity in the event of a put from any holder of these bonds or certi�cates of participation.
Scheduled payments related to the debt for capital assets for the �scal years ending June 30 are as follows (dollars in thousands):
Fiscal Year Principal Interest Total
2013 $65,302 $37,433 $102,735
2014 47,523 35,184 82,707
2015 45,915 33,015 78,930
2016 42,881 31,018 73,899
2017 42,839 29,053 71,892
2018-2022 209,212 115,787 324,999
2023-2027 221,260 63,443 284,703
2028-2032 157,820 19,796 177,616
2033-2037 68,385 2,663 71,048
$901,137 $367,392 $1,268,529
Net unamortized premiums and deferred costs 30,760 - 30,760
Total $931,897 $367,392 $1,299,289
Defeased Bond Issues. �e University defeased bonds by prepayment or issuing new debt as shown be-low (dollars in thousands). U.S. Treasury obligations have been purchased in amounts su�cient to pay principal and interest payments when due, through maturity, and have been deposited in irrevocable trusts with the trustee. Neither the defeased bonds nor the related trusts are re�ected in the accompa-nying �nancial statements.
Final Maturity/ Amount Outstanding
Description of Bonds Call Date June 30, 2012 June 30, 2011
Student Fee and Facilities:
Student Fee Bonds Series H 1/1/2012 $– $5,100
Student Fee Bonds Series K 1/1/2012 – 10,700
Student Fee Bonds Series L 1/1/2012 – 9,400
Student Fee Bonds Series O 1/1/2012 – 16,990
Student Fee Bonds Series R 7/1/2012 11,660 11,660
Student Facilities System Revenue Bonds, Series 2003A 7/1/2013 48,345 48,345
Student Facilities System Revenue Bonds, Series 2003B 7/1/2013 17,950 17,950
Certificates of Participation, Issued by Ross-Ade Foundation:
Certificates of Participation, Series 2001A 7/1/2011 – 53,280
Direct Financing Lease. In 1998, the University agreed to re�nance the construction of the Animal Disease Diagnostic Laboratory (ADDL) Building and lease it to the Indiana Department of Administration on behalf of the Indiana State Board of Animal Health. Lease payments are equal to the University’s debt service payments. Nonrecourse bonds for approximately $10,830,000 were issued
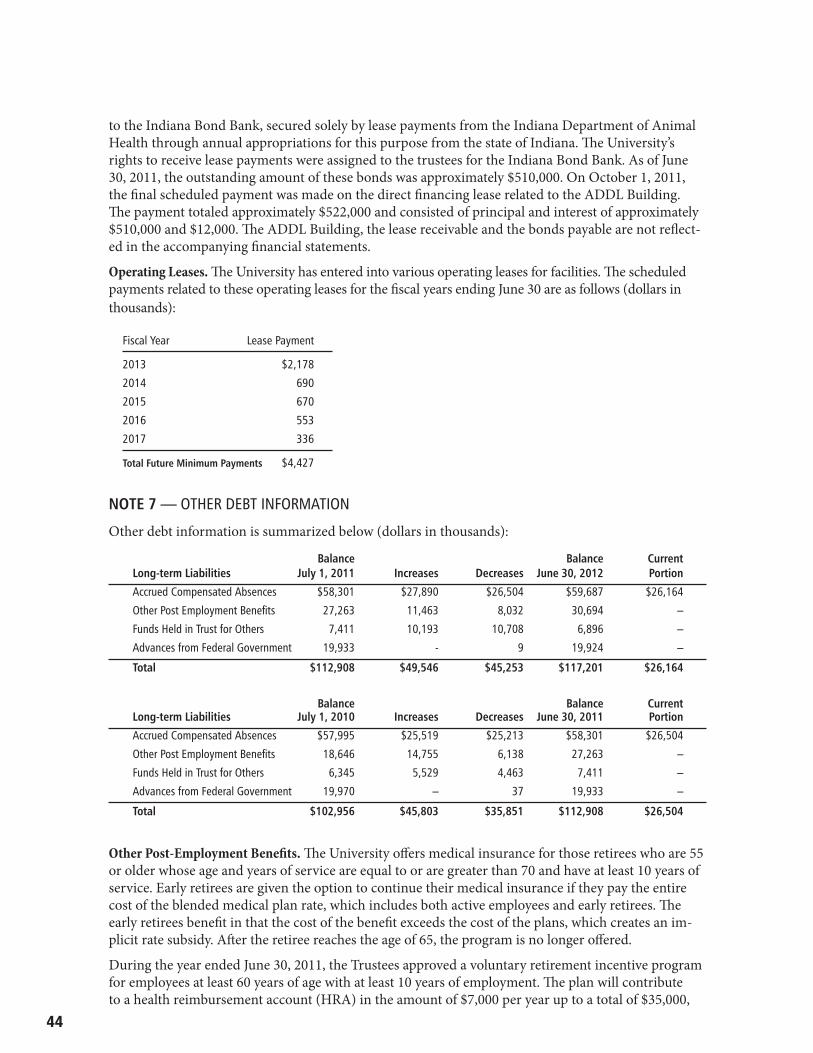
44
to the Indiana Bond Bank, secured solely by lease payments from the Indiana Department of Animal Health through annual appropriations for this purpose from the state of Indiana. �e University’s rights to receive lease payments were assigned to the trustees for the Indiana Bond Bank. As of June 30, 2011, the outstanding amount of these bonds was approximately $510,000. On October 1, 2011, the �nal scheduled payment was made on the direct �nancing lease related to the ADDL Building. �e payment totaled approximately $522,000 and consisted of principal and interest of approximately $510,000 and $12,000. �e ADDL Building, the lease receivable and the bonds payable are not re�ect-ed in the accompanying �nancial statements.
Operating Leases. �e University has entered into various operating leases for facilities. �e scheduled payments related to these operating leases for the �scal years ending June 30 are as follows (dollars in thousands):
NOTE 7 — OTHER DEBT INFORMATION
Other debt information is summarized below (dollars in thousands):
Balance Balance CurrentLong-term Liabilities July 1, 2011 Increases Decreases June 30, 2012 Portion
Accrued Compensated Absences $58,301 $27,890 $26,504 $59,687 $26,164
Other Post Employment Benefits 27,263 11,463 8,032 30,694 –
Funds Held in Trust for Others 7,411 10,193 10,708 6,896 –
Advances from Federal Government 19,933 - 9 19,924 –
Total $112,908 $49,546 $45,253 $117,201 $26,164
Balance Balance CurrentLong-term Liabilities July 1, 2010 Increases Decreases June 30, 2011 Portion
Accrued Compensated Absences $57,995 $25,519 $25,213 $58,301 $26,504
Other Post Employment Benefits 18,646 14,755 6,138 27,263 –
Funds Held in Trust for Others 6,345 5,529 4,463 7,411 –
Advances from Federal Government 19,970 – 37 19,933 –
Total $102,956 $45,803 $35,851 $112,908 $26,504
Other Post-Employment Bene�ts. �e University o�ers medical insurance for those retirees who are 55 or older whose age and years of service are equal to or are greater than 70 and have at least 10 years of service. Early retirees are given the option to continue their medical insurance if they pay the entire cost of the blended medical plan rate, which includes both active employees and early retirees. �e early retirees bene�t in that the cost of the bene�t exceeds the cost of the plans, which creates an im-plicit rate subsidy. A�er the retiree reaches the age of 65, the program is no longer o�ered.
During the year ended June 30, 2011, the Trustees approved a voluntary retirement incentive program for employees at least 60 years of age with at least 10 years of employment. �e plan will contribute to a health reimbursement account (HRA) in the amount of $7,000 per year up to a total of $35,000,
Fiscal Year Lease Payment
2013 $2,178
2014 690
2015 670
2016 553
2017 336
Total Future Minimum Payments $4,427
45
which can be used to pay health premiums and other allowable medical expenses. For the years ended June 30, 2012 and 2011, there were 509 and 491, respectively, employees participating in the voluntary retirement incentive program. For the years ending June 30, 2012 and 2011, the University had an outstanding liability associated with the health reimbursement accounts of approximately $10,150,000 and $13,412,000, respectively.
Purdue also o�ers a long-term disability program, which includes retirement bene�t payments, medi-cal and life insurance premium payments for a small required premium paid by the employee. A�er the employee reaches the age of 65, the program is no longer available. All future and existing disabil-ity income bene�t liability is fully insured through an insurance carrier.
�e post-retirement medical plans are single-employer plans administered by the University, as au-thorized by the Trustees, and are �nanced on a pay-as-you-go basis. Purdue’s annual other post-em-ployment bene�t (OPEB) cost is calculated based on the annual required contribution of the employer, an amount actuarially determined in accordance with the parameters of GASB Statement No. 45. �e actuarial assumptions included are shown on the following pages. �e annual required contribution represents a level of funding that, if paid, on an ongoing basis, is projected to cover normal costs each year and amortize any unfunded actuarial liabilities over a 20-year period.
Actuarial valuations of an ongoing plan involve estimates of the value of reported amounts and as-sumptions about the probability of occurrence of events far into the future. Examples include as-sumptions about future employment, mortality and the health-care cost trend. Amounts determined regarding the funded status of the plan and the annual required contributions of the employer are sub-ject to continual revision as actual results are compared with past expectations and new estimates are made about the future. �e Schedule of Funding Progress presents trend information about whether the actuarial value of plan assets is increasing or decreasing over time relative to the actuarial accrued liabilities for bene�ts.
Purdue Mall Fountain and Hovde Hall
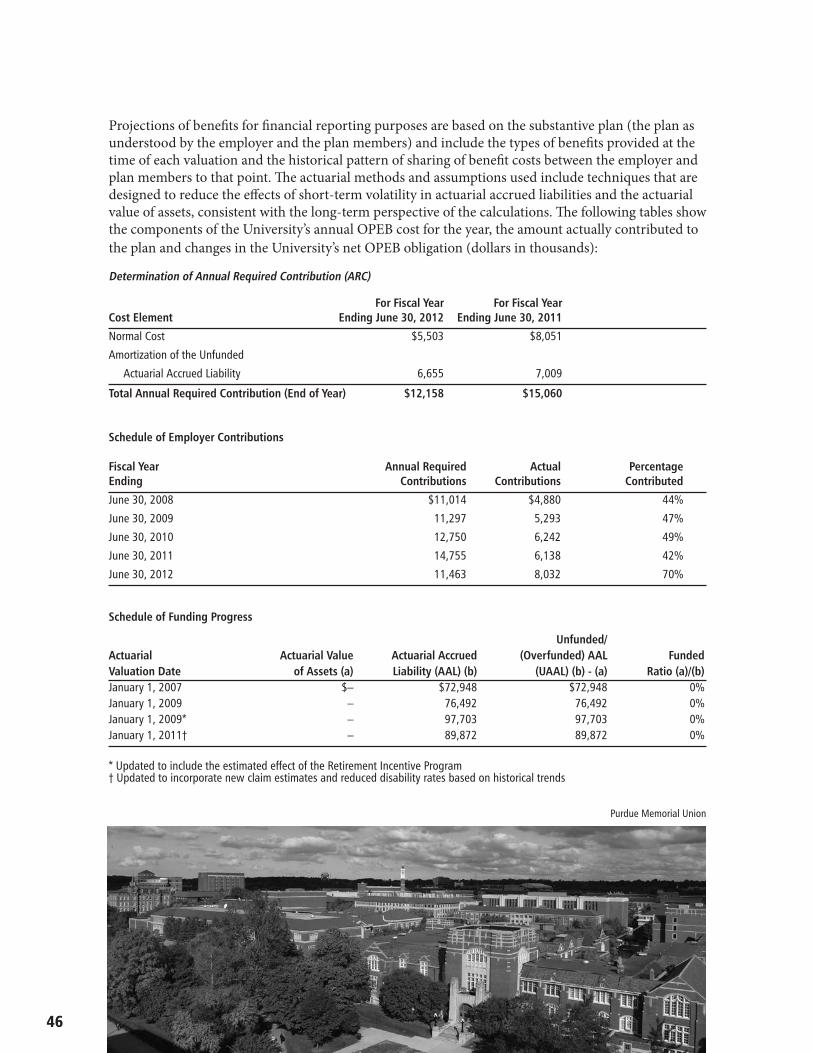
46
Projections of bene�ts for �nancial reporting purposes are based on the substantive plan (the plan as understood by the employer and the plan members) and include the types of bene�ts provided at the time of each valuation and the historical pattern of sharing of bene�t costs between the employer and plan members to that point. �e actuarial methods and assumptions used include techniques that are designed to reduce the e�ects of short-term volatility in actuarial accrued liabilities and the actuarial value of assets, consistent with the long-term perspective of the calculations. �e following tables show the components of the University’s annual OPEB cost for the year, the amount actually contributed to the plan and changes in the University’s net OPEB obligation (dollars in thousands):
Determination of Annual Required Contribution (ARC)
For Fiscal Year For Fiscal YearCost Element Ending June 30, 2012 Ending June 30, 2011
Normal Cost $5,503 $8,051
Amortization of the Unfunded
Actuarial Accrued Liability 6,655 7,009
Total Annual Required Contribution (End of Year) $12,158 $15,060
Schedule of Employer Contributions
Fiscal Year Annual Required Actual Percentage Ending Contributions Contributions Contributed
June 30, 2008 $11,014 $4,880 44%
June 30, 2009 11,297 5,293 47%
June 30, 2010 12,750 6,242 49%
June 30, 2011 14,755 6,138 42%
June 30, 2012 11,463 8,032 70%
Schedule of Funding Progress Unfunded/Actuarial Actuarial Value Actuarial Accrued (Overfunded) AAL FundedValuation Date of Assets (a) Liability (AAL) (b) (UAAL) (b) - (a) Ratio (a)/(b)January 1, 2007 $– $72,948 $72,948 0% January 1, 2009 – 76,492 76,492 0% January 1, 2009* – 97,703 97,703 0% January 1, 2011† – 89,872 89,872 0%
* Updated to include the estimated effect of the Retirement Incentive Program† Updated to incorporate new claim estimates and reduced disability rates based on historical trends
Purdue Memorial Union
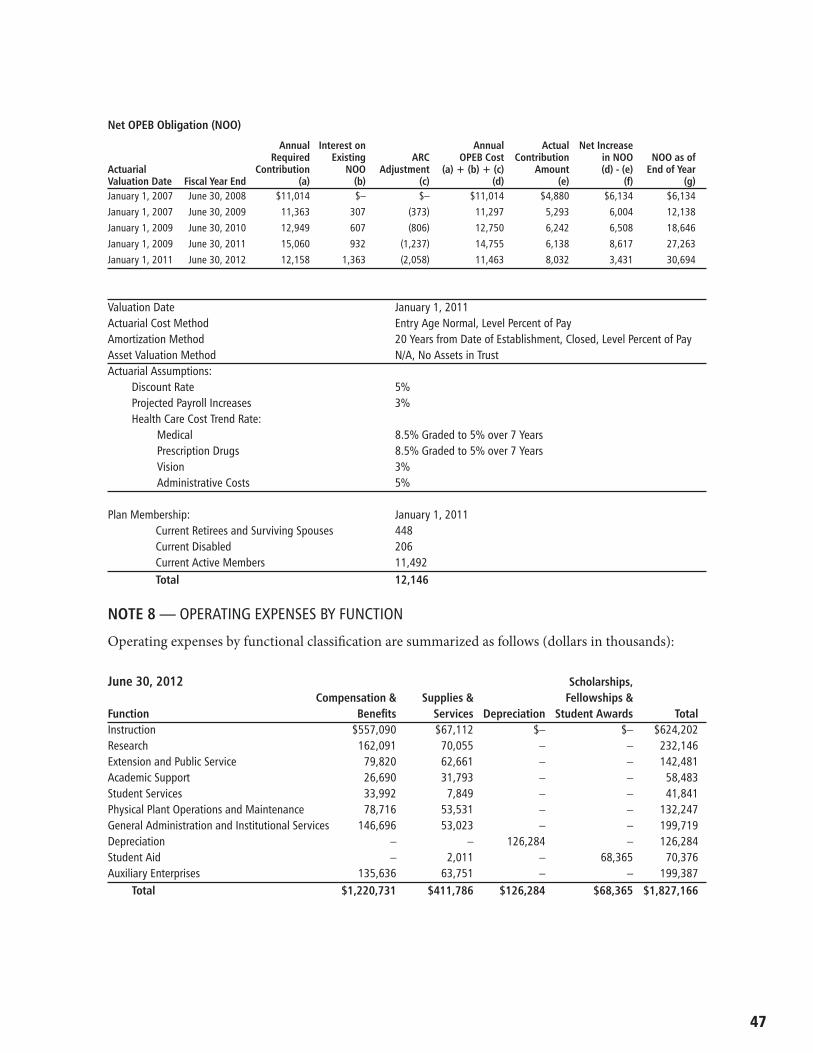
47
Net OPEB Obligation (NOO)
Annual Interest on Annual Actual Net IncreaseRequired Existing ARC OPEB Cost Contribution in NOO NOO as of
Actuarial Contribution NOO Adjustment (a) + (b) + (c) Amount (d) - (e) End of YearValuation Date Fiscal Year End (a) (b) (c) (d) (e) (f) (g)January 1, 2007 June 30, 2008 $11,014 $– $– $11,014 $4,880 $6,134 $6,134 January 1, 2007 June 30, 2009 11,363 307 (373) 11,297 5,293 6,004 12,138 January 1, 2009 June 30, 2010 12,949 607 (806) 12,750 6,242 6,508 18,646 January 1, 2009 June 30, 2011 15,060 932 (1,237) 14,755 6,138 8,617 27,263January 1, 2011 June 30, 2012 12,158 1,363 (2,058) 11,463 8,032 3,431 30,694
Valuation Date January 1, 2011 Actuarial Cost Method Entry Age Normal, Level Percent of Pay Amortization Method 20 Years from Date of Establishment, Closed, Level Percent of Pay Asset Valuation Method N/A, No Assets in Trust Actuarial Assumptions:
Discount Rate 5% Projected Payroll Increases 3% Health Care Cost Trend Rate:
Medical 8.5% Graded to 5% over 7 YearsPrescription Drugs 8.5% Graded to 5% over 7 YearsVision 3% Administrative Costs 5%
Plan Membership: January 1, 2011 Current Retirees and Surviving Spouses 448 Current Disabled 206 Current Active Members 11,492 Total 12,146
NOTE 8 — OPERATING EXPENSES BY FUNCTION
Operating expenses by functional classi�cation are summarized as follows (dollars in thousands):
June 30, 2012 Scholarships,Compensation & Supplies & Fellowships &
Function Benefits Services Depreciation Student Awards TotalInstruction $557,090 $67,112 $– $– $624,202 Research 162,091 70,055 – – 232,146 Extension and Public Service 79,820 62,661 – – 142,481 Academic Support 26,690 31,793 – – 58,483 Student Services 33,992 7,849 – – 41,841 Physical Plant Operations and Maintenance 78,716 53,531 – – 132,247 General Administration and Institutional Services 146,696 53,023 – – 199,719 Depreciation – – 126,284 – 126,284 Student Aid – 2,011 – 68,365 70,376 Auxiliary Enterprises 135,636 63,751 – – 199,387
Total $1,220,731 $411,786 $126,284 $68,365 $1,827,166
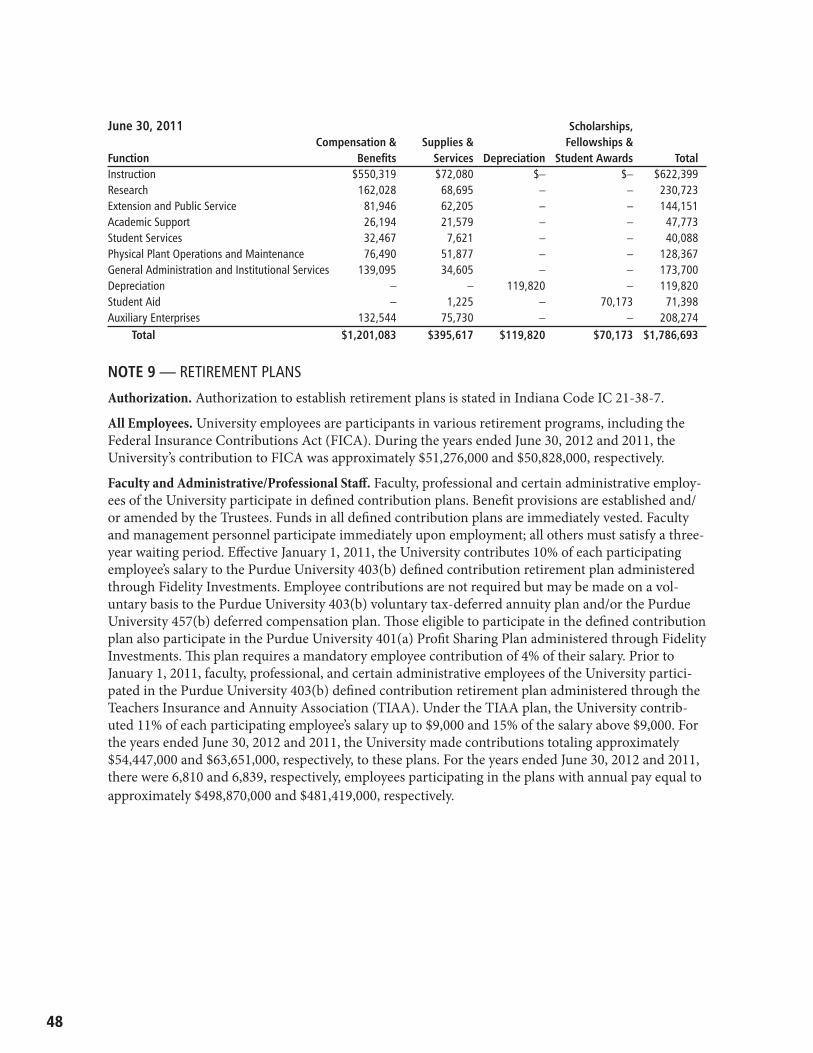
48
June 30, 2011 Scholarships,Compensation & Supplies & Fellowships &
Function Benefits Services Depreciation Student Awards TotalInstruction $550,319 $72,080 $– $– $622,399 Research 162,028 68,695 – – 230,723 Extension and Public Service 81,946 62,205 – – 144,151 Academic Support 26,194 21,579 – – 47,773 Student Services 32,467 7,621 – – 40,088 Physical Plant Operations and Maintenance 76,490 51,877 – – 128,367 General Administration and Institutional Services 139,095 34,605 – – 173,700 Depreciation – – 119,820 – 119,820 Student Aid – 1,225 – 70,173 71,398 Auxiliary Enterprises 132,544 75,730 – – 208,274
Total $1,201,083 $395,617 $119,820 $70,173 $1,786,693
NOTE 9 — RETIREMENT PLANS
Authorization. Authorization to establish retirement plans is stated in Indiana Code IC 21-38-7.
All Employees. University employees are participants in various retirement programs, including the Federal Insurance Contributions Act (FICA). During the years ended June 30, 2012 and 2011, the University’s contribution to FICA was approximately $51,276,000 and $50,828,000, respectively.
Faculty and Administrative/Professional Sta�. Faculty, professional and certain administrative employ-ees of the University participate in de�ned contribution plans. Bene�t provisions are established and/or amended by the Trustees. Funds in all de�ned contribution plans are immediately vested. Faculty and management personnel participate immediately upon employment; all others must satisfy a three-year waiting period. E�ective January 1, 2011, the University contributes 10% of each participating employee’s salary to the Purdue University 403(b) de�ned contribution retirement plan administered through Fidelity Investments. Employee contributions are not required but may be made on a vol-untary basis to the Purdue University 403(b) voluntary tax-deferred annuity plan and/or the Purdue University 457(b) deferred compensation plan. �ose eligible to participate in the de�ned contribution plan also participate in the Purdue University 401(a) Pro�t Sharing Plan administered through Fidelity Investments. �is plan requires a mandatory employee contribution of 4% of their salary. Prior to January 1, 2011, faculty, professional, and certain administrative employees of the University partici-pated in the Purdue University 403(b) de�ned contribution retirement plan administered through the Teachers Insurance and Annuity Association (TIAA). Under the TIAA plan, the University contrib-uted 11% of each participating employee’s salary up to $9,000 and 15% of the salary above $9,000. For the years ended June 30, 2012 and 2011, the University made contributions totaling approximately $54,447,000 and $63,651,000, respectively, to these plans. For the years ended June 30, 2012 and 2011, there were 6,810 and 6,839, respectively, employees participating in the plans with annual pay equal to approximately $498,870,000 and $481,419,000, respectively.
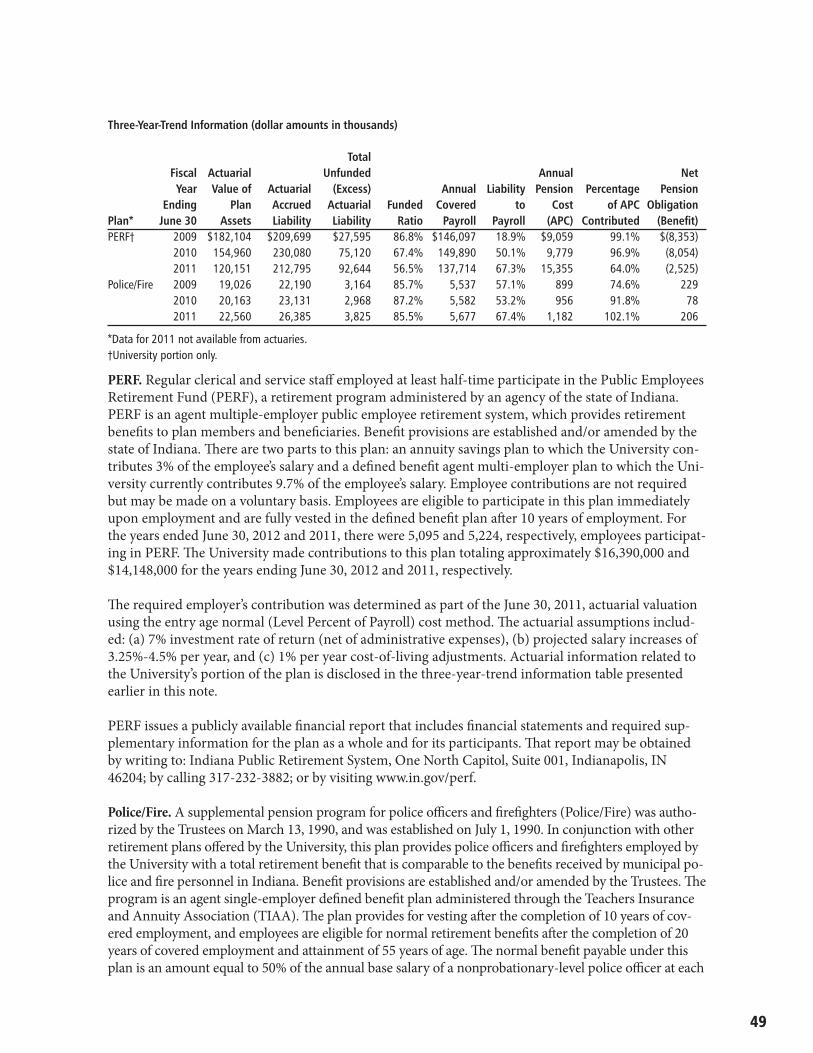
49
Three-Year-Trend Information (dollar amounts in thousands)
Total Fiscal Actuarial Unfunded Annual NetYear Value of Actuarial (Excess) Annual Liability Pension Percentage Pension
Ending Plan Accrued Actuarial Funded Covered to Cost of APC ObligationPlan* June 30 Assets Liability Liability Ratio Payroll Payroll (APC) Contributed (Benefit)PERF† 2009 $182,104 $209,699 $27,595 86.8% $146,097 18.9% $9,059 99.1% $(8,353)
2010 154,960 230,080 75,120 67.4% 149,890 50.1% 9,779 96.9% (8,054)2011 120,151 212,795 92,644 56.5% 137,714 67.3% 15,355 64.0% (2,525)
Police/Fire 2009 19,026 22,190 3,164 85.7% 5,537 57.1% 899 74.6% 2292010 20,163 23,131 2,968 87.2% 5,582 53.2% 956 91.8% 782011 22,560 26,385 3,825 85.5% 5,677 67.4% 1,182 102.1% 206
*Data for 2011 not available from actuaries. †University portion only.
PERF. Regular clerical and service sta� employed at least half-time participate in the Public Employees Retirement Fund (PERF), a retirement program administered by an agency of the state of Indiana. PERF is an agent multiple-employer public employee retirement system, which provides retirement bene�ts to plan members and bene�ciaries. Bene�t provisions are established and/or amended by the state of Indiana. �ere are two parts to this plan: an annuity savings plan to which the University con-tributes 3% of the employee’s salary and a de�ned bene�t agent multi-employer plan to which the Uni-versity currently contributes 9.7% of the employee’s salary. Employee contributions are not required but may be made on a voluntary basis. Employees are eligible to participate in this plan immediately upon employment and are fully vested in the de�ned bene�t plan a�er 10 years of employment. For the years ended June 30, 2012 and 2011, there were 5,095 and 5,224, respectively, employees participat-ing in PERF. �e University made contributions to this plan totaling approximately $16,390,000 and $14,148,000 for the years ending June 30, 2012 and 2011, respectively.
�e required employer’s contribution was determined as part of the June 30, 2011, actuarial valuation using the entry age normal (Level Percent of Payroll) cost method. �e actuarial assumptions includ-ed: (a) 7% investment rate of return (net of administrative expenses), (b) projected salary increases of 3.25%-4.5% per year, and (c) 1% per year cost-of-living adjustments. Actuarial information related to the University’s portion of the plan is disclosed in the three-year-trend information table presented earlier in this note.
PERF issues a publicly available �nancial report that includes �nancial statements and required sup-plementary information for the plan as a whole and for its participants. �at report may be obtained by writing to: Indiana Public Retirement System, One North Capitol, Suite 001, Indianapolis, IN 46204; by calling 317-232-3882; or by visiting www.in.gov/perf.
Police/Fire. A supplemental pension program for police o�cers and �re�ghters (Police/Fire) was autho-rized by the Trustees on March 13, 1990, and was established on July 1, 1990. In conjunction with other retirement plans o�ered by the University, this plan provides police o�cers and �re�ghters employed by the University with a total retirement bene�t that is comparable to the bene�ts received by municipal po-lice and �re personnel in Indiana. Bene�t provisions are established and/or amended by the Trustees. �e program is an agent single-employer de�ned bene�t plan administered through the Teachers Insurance and Annuity Association (TIAA). �e plan provides for vesting a�er the completion of 10 years of cov-ered employment, and employees are eligible for normal retirement bene�ts a�er the completion of 20 years of covered employment and attainment of 55 years of age. �e normal bene�t payable under this plan is an amount equal to 50% of the annual base salary of a nonprobationary-level police o�cer at each
50
campus, as in e�ect at the time of a member’s retirement, reduced by the amount of any pension bene�ts payable under other University retirement programs, including TIAA-CREF and PERF. For the years ending June 30, 2012 and 2011, there were 108 and 110, respectively, employees participating in Police/Fire.
Employees covered by this plan are required to make contributions equal to 3% of the current salary for a nonprobationary-level police o�cer. University contributions are to be in such additional amounts as needed to maintain the plan on an actuarially sound basis. �e pension bene�t obligation was computed as part of an actuarial valuation performed as of July 1, 2010. Because the plan was implemented on a retroactive basis to cover all current police o�cers and �re�ghters, the University has an unfunded ac-tuarial liability of approximately $3,825,000 at July 1, 2011 and $2,968,000 at July 1, 2010, which is being amortized over a 30-year period. �e actual amount contributed by the University was approximately $976,000 and $878,000 for the years ending June 30, 2012 and 2011, respectively. �e required contribu-tion was determined as part of the July 1, 2011, actuarial valuation using the projected unit credit actu-arial cost method. �e actuarial assumptions included: (a) 6.25% investment rate of return, (b) projected salary increases of 3% per year and (c) 3% per year cost-of-living adjustments.
Financial reports related to this plan may be obtained by writing to: Public Records O�cer, Purdue University, Freehafer Hall, 401 South Grant Street, West Lafayette, IN 47907-2024.
Cooperative Extension Service. As of June 30, 2012 and 2011, there were 24 and 30, respectively, sta� members with federal appointments employed by the Indiana Cooperative Extension Service and cov-ered by the Federal Civil Service Retirement System.
NOTE 10 — RELATED PARTY
Prior to �scal year 2012 the University entered into an agreement with Alfred Mann Institute for Biomedical Development (AMIP). Subsequent to �scal year end, the Certi�cate of Incorporation for the institute was amended and restated and PRF became the sole member of AMIP. �e name of the corpora-tion changed to Innovation and Commercialization Center, Inc. �e Institute’s charitable mission includes the intensive development of technology originating from the University’s inventors in order to enhance public bene�t from Purdue technology. As of June 30, 2012 and 2011, the University received approxi-mately $641,000 and $872,000, respectively, from the Institute.
In addition to items listed in Note 6, Debt Related to Capital Assets, PRF provided grants, contracts and gi�s to the University totaling approximately $34,167,000 and $31,792,000 as of June 30, 2012 and 2011, respectively.
NOTE 11 — CONTINGENT LIABILITIES AND COMMITMENTS
Legal Actions. In the normal course of its activities, the University is a party in various legal actions. Although it is involved in a number of claims, the University does not anticipate signi�cant losses or costs. A�er taking into consideration legal counsel’s evaluation of pending actions, the University believes that the outcome thereof will not have a material e�ect on the �nancial statements.
Construction Projects. As of June 30, 2012 and 2011, contractual obligations for capital construction projects were approximately $76,664,000 and $135,849,000, respectively.
Natural Gas Procurement. �e University has entered into various forward contracts to purchase natural gas at a speci�ed time in the future at a guaranteed price. �is activity allows the University to plan its natural gas costs for the year and to protect itself against an increase in the market price of the commod-ity. It is possible that the market price before or at the speci�ed time to purchase natural gas may be lower than the price at which the University is committed to buy. �is would reduce the value of the contract.
51
�e University could sell the forward contract at a loss and then buy natural gas on the open market. �e University is also exposed to the failure of the counterparty to ful�ll the contract. �e terms of the con-tract include provisions for recovering the cost in excess of the guaranteed price from the counterparty should the University have to procure natural gas on the open market.
Limited Partnership Agreements. Under the terms of various limited partnership agreements approved by the University’s Board of Trustees, the University is obligated to make periodic payments for com-mitments to venture capital, private equity, natural resources and real estate investments over the next several �scal years. As of June 30, 2012 and 2011, the University had the following unfunded commit-ments: approximately $61,299,000 and $49,805,000, respectively, to approximately 50 private equity/venture capital managers, $18,973,000 and $19,968,000, respectively, to approximately 15 private real estate managers, $41,511,000 and $38,646,000, respectively, to approximately 25 natural resource man-agers, and $125,000 and $125,000, respectively, to the Indiana Future Fund. �ese amounts are not included as liabilities in the accompanying Statement of Net Assets. Outstanding commitments are estimated to be paid based on the capital calls from the individual managers, subject to change due to market conditions, as shown in the table to the right (dollars in thousands).
NOTE 12 — SUBSEQUENT EVENTS
On August 9, 2012, Student Fee Bonds, Series AA, were issued at a par value of $54,555,000 and a premium of approximately $8,869,000. �ese bonds were issued to provide �nancing for the West Lafayette Student Fitness and Wellness Center, Health and Human Sciences facility, Drug Discovery facility, and various R&R projects and to refund approximately $14,208,000 of commercial paper, which funded initial expenditures for two of these projects.
On September 5, 2012, Student Facilities System Revenue Bonds, Series 2012A, were issued at a par value of $44,770,000 and a premium of approximately $5,748,000. �ese bonds were issued to pro-vide �nancing to construct the West Lafayette Vawter Field Housing, Harrison Street parking facility, and to refund approximately $1,064,000 of commercial paper that funded the initial expenditures for these two projects. It was also used to re�nance approximately $3,650,000 of Student Facilities System Revenue Bonds, Series 2003B.
Fiscal Year Amount
2012-2013 $30,477
2013-2014 30,477
2014-2015 30,477
2015-2016 30,477
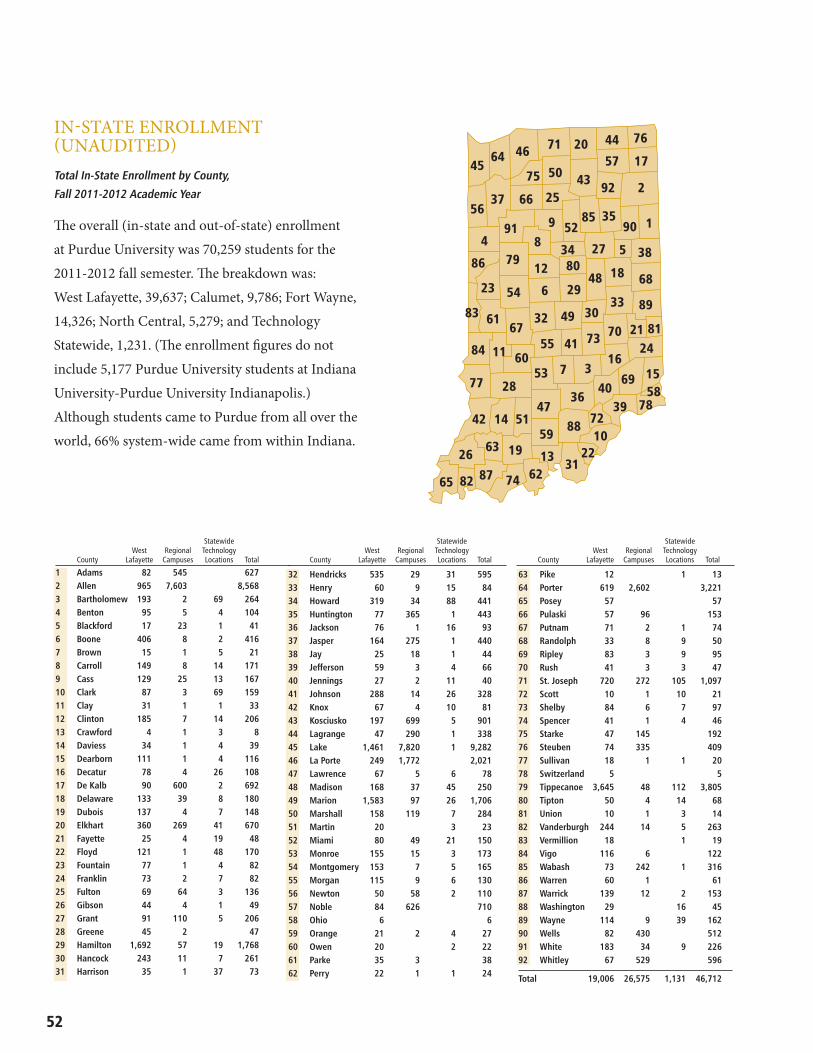
52
IN-STATE ENROLLMENT (UNAUDITED)Total In-State Enrollment by County,
Fall 2011-2012 Academic Year
�e overall (in-state and out-of-state) enrollment
at Purdue University was 70,259 students for the
2011-2012 fall semester. �e breakdown was:
West Lafayette, 39,637; Calumet, 9,786; Fort Wayne,
14,326; North Central, 5,279; and Technology
Statewide, 1,231. (�e enrollment �gures do not
include 5,177 Purdue University students at Indiana
University-Purdue University Indianapolis.)
Although students came to Purdue from all over the
world, 66% system-wide came from within Indiana.
45
56
64
37
71
75
20
50
66 25
44
57
76
17
92 2
1
46
43
4
86
23
61
11
28
26
87 74 62 82 65
63 19 13 31
10 22
78 58 15 69
39 40
72 88
36 47
59 51 14 42
83
84
77
91
79
54
67
60 53
8
12
6
32
55
9 35 85 90 52
34 80
29
49
41
7 3 16
24
27
48
30
73
5
18
33
70
38
68
89
81 21
Statewide West Regional Technology County Lafayette Campuses Locations Total
Statewide West Regional Technology County Lafayette Campuses Locations Total
Statewide West Regional Technology County Lafayette Campuses Locations Total
1 Adams 82 545 627 2 Allen 965 7,603 8,568 3 Bartholomew 193 2 69 264 4 Benton 95 5 4 104 5 Blackford 17 23 1 41 6 Boone 406 8 2 416 7 Brown 15 1 5 21 8 Carroll 149 8 14 171 9 Cass 129 25 13 167 10 Clark 87 3 69 159 11 Clay 31 1 1 33 12 Clinton 185 7 14 206 13 Crawford 4 1 3 8 14 Daviess 34 1 4 39 15 Dearborn 111 1 4 116 16 Decatur 78 4 26 108 17 De Kalb 90 600 2 692 18 Delaware 133 39 8 180 19 Dubois 137 4 7 148 20 Elkhart 360 269 41 670 21 Fayette 25 4 19 48 22 Floyd 121 1 48 170 23 Fountain 77 1 4 82 24 Franklin 73 2 7 82 25 Fulton 69 64 3 136 26 Gibson 44 4 1 49 27 Grant 91 110 5 206 28 Greene 45 2 47 29 Hamilton 1,692 57 19 1,768 30 Hancock 243 11 7 261 31 Harrison 35 1 37 73
32 Hendricks 535 29 31 595 33 Henry 60 9 15 84 34 Howard 319 34 88 441 35 Huntington 77 365 1 443 36 Jackson 76 1 16 93 37 Jasper 164 275 1 440 38 Jay 25 18 1 44 39 Jefferson 59 3 4 66 40 Jennings 27 2 11 40 41 Johnson 288 14 26 328 42 Knox 67 4 10 81 43 Kosciusko 197 699 5 901 44 Lagrange 47 290 1 338 45 Lake 1,461 7,820 1 9,282 46 La Porte 249 1,772 2,021 47 Lawrence 67 5 6 78 48 Madison 168 37 45 250 49 Marion 1,583 97 26 1,706 50 Marshall 158 119 7 284 51 Martin 20 3 23 52 Miami 80 49 21 150 53 Monroe 155 15 3 173 54 Montgomery 153 7 5 165 55 Morgan 115 9 6 130 56 Newton 50 58 2 110 57 Noble 84 626 710 58 Ohio 6 6 59 Orange 21 2 4 27 60 Owen 20 2 22 61 Parke 35 3 3862 Perry 22 1 1 24
63 Pike 12 1 13 64 Porter 619 2,602 3,221 65 Posey 57 57 66 Pulaski 57 96 153 67 Putnam 71 2 1 74 68 Randolph 33 8 9 50 69 Ripley 83 3 9 95 70 Rush 41 3 3 47 71 St. Joseph 720 272 105 1,097 72 Scott 10 1 10 21 73 Shelby 84 6 7 97 74 Spencer 41 1 4 46 75 Starke 47 145 192 76 Steuben 74 335 409 77 Sullivan 18 1 1 20 78 Switzerland 5 5 79 Tippecanoe 3,645 48 112 3,805 80 Tipton 50 4 14 68 81 Union 10 1 3 14 82 Vanderburgh 244 14 5 263 83 Vermillion 18 1 19 84 Vigo 116 6 122 85 Wabash 73 242 1 316 86 Warren 60 1 61 87 Warrick 139 12 2 153 88 Washington 29 16 45 89 Wayne 114 9 39 162 90 Wells 82 430 512 91 White 183 34 9 226 92 Whitley 67 529 596
Total 19,006 26,575 1,131 46,712
ACKNOWLEDGEMENTS
The following staff members of the Department of Accounting Services, Office of the Comptroller, prepared the 2011-12 Financial Report and the included financial statements.
JAMES S. ALMOND — Senior Vice President for Business Services and Assistant Treasurer
MARY CATHERINE GAISBAUER — Comptroller
MATTHEW D. WESTHUIS — Assistant Comptroller of Accounting and Reporting Services
STACEY L. BROWN — Endowment Accountant
LISA A. GEISLER — Property Accounting Manager
DANA HARTFIEL — Systems and Reporting Accountant
KIMBERLY K. HOEBEL — Assistant Comptroller of Managerial Accounting Services
AARON JACKSON — Accounting Intern
BARBARA B. KNOCHEL — Gift Funds Accountant
JAMES E. PARKER — Plant, Auxiliary and Agency Fund Accountant
KAY L. PARKER — Manager of Reporting
KATHY ROARK — Unrestricted/Restricted Funds Accountant
STACY L. UMLAUF — Systems and Reporting Accountant
JOANN WILEY — Accounting Manager

An equal access/equal opportunity university
Produced by Purdue Marketing and Media ODD-12-2854
Related Documents