Exhibit No.: Issues: Witness: Sponsoring Party: Type of Exhibit: FileNo.: Date Testimony Prepared: Retum on Equity Robert B. 1-IeYert Union Electric Company Rebuttal Testimony EC-2014-0223 June 6, 2014 MISSOURI PUBLIC SERVICE COMMISSION FILE NO. EC-2014-0223 REBUTTAL TESTIMONY OF ROBERT B. HEVERT ON BEHALF OF UNION ELECTRIC COMPANY d/b/a Ameren Missouri Framingham, 1\Jassachusetts June 6, 2014 \. !?.. Exhibit No 8'1 File No -O,;l.;';;I-J j Filed August 5, 2014 Data Center Missouri Public Service Commission

Welcome message from author
This document is posted to help you gain knowledge. Please leave a comment to let me know what you think about it! Share it to your friends and learn new things together.
Transcript

Exhibit No.: Issues:
Witness: Sponsoring Party: Type of Exhibit:
FileNo.: Date Testimony Prepared:
Retum on Equity Robert B. 1-IeYert Union Electric Company Rebuttal Testimony EC-2014-0223 June 6, 2014
MISSOURI PUBLIC SERVICE COMMISSION
FILE NO. EC-2014-0223
REBUTTAL TESTIMONY
OF
ROBERT B. HEVERT
ON
BEHALF OF
UNION ELECTRIC COMPANY d/b/a Ameren Missouri
Framingham, 1\Jassachusetts June 6, 2014
\. !?.. Exhibit No 8'1 Data:J-~--."1 Reporte~ File No \::..c..-~\'-\ -O,;l.;';;I-J
j
Filed August 5, 2014
Data Center Missouri Public
Service Commission
Rebuttal Testimony of Robert B. Hever1
TABLE OF CONTENTS
I. INTRODUCTION ............................................................................................................... I
II. PURPOSE AND OVERVIEW OF TESTIMONY .............................................................. 2
Ill. SUMMARY OF ISSUES SURROUNDING COST OF EQUITY ESTIMATION IN REGULA TORY PROCEEDINGS ...................................................................................... 3
IV. RESPONSE TO THE DIRECT TESTIMONY OF MR. GORMAN .................................. 8
A. Composition of1\1r. Gorman's Proxy Group ........................................................... 8
B. Application of the Constant Growth DCF Model .................................................. 10
C. Application of the Multi-Stage DCF Model ........................................................... J5
D. Application of Capital Asset Pricing Model .......................................................... 20
E. Application of the Risk Premium Model ................................................................ 26
V. COST OF EQUITY ESTIMATION ................................................................................. .33
A. Proxy Group Selection ........................................................................................... 34
B. Constant Growth Discounted Cash Flow Model ................................................... 38
C. Multi-Stage DCF Model ........................................................................................ 43
D. CAP M Analysis ...................................................................................................... 48
E. Bond Yield Plus Risk Premium Approach ............................................................. 52
VI. OTHER CONSIDERATIONS ........................................................................................... 54
A. RegulatOIJ' Environment ............. , .......................................................................... 55
B. Generation Portfolio .............................................................................................. 59
VII. CONCLUSIONS AND RECOMMENDATION .............................................................. 6I
Rcbultal Testimony of Robert B. Hcvcrt
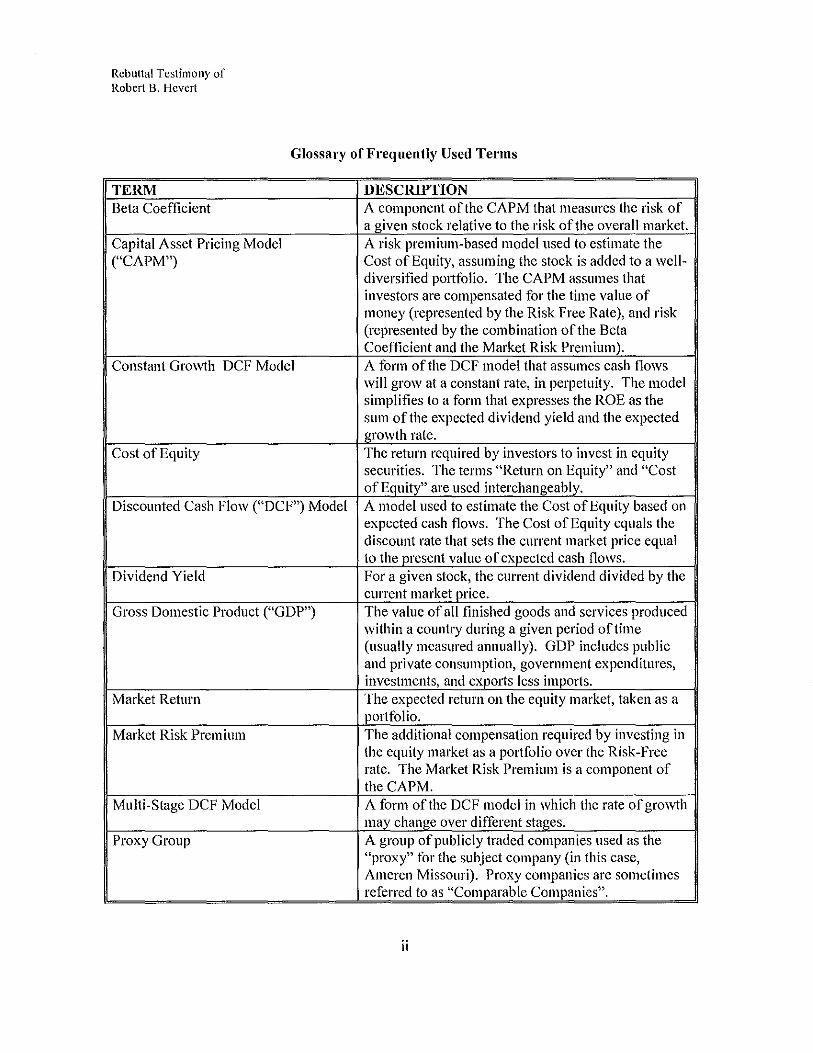
Glossary of Frequently Used Terms
TERM DESCRIPTION Beta Coefficient A component of the CAPM that measures the risk of
a given stock relative to the risk of the overall market. Capital Asset Pricing Model A risk premium-based model used to estimate the ("CAPM") Cost of Equity, assuming the stock is added to a well-
diversified portfolio. The CAPM assumes that investors are compensated for the time value of money (represented by the Risk Free Rate), and risk (represented by the combination of the Beta Coefficient and the Market Risk Premium).
Constant Growth DCF Model A form of the DCF model that assumes cash flows will grow at a constant rate, in perpetuity. The model simplifies to a form that expresses the ROE as the sum of the expected dividend yield and the expected growth rate.
Cost of Equity The return required by investors to invest in equity securities. The terms "Return on Equity" and "Cost of Equity" are used interchangeably.
Discounted Cash Flow ("DCF") Model A model used to estimate the Cost of Equity based on expected cash flows. The Cost of Equity equals the discount rate that sets the current market price equal to the present value of expected cash flows.
Dividend Yield For a given stock, the current dividend divided by the current market price.
Gross Domestic Product ("GDP") The value of all finished goods and services produced within a country during a given period of time (usually measured annually). GDP includes public and private consumption, government expenditures, investments, and exports less imports.
Market Return The expected return on the equity market, taken as a portfolio.
Market Risk Premium The additional compensation required by investing in the equity market as a portfolio over the Risk-Free rate. The Market Risk Premium is a component of theCAPM.
Multi-Stage DCF Model A form of the DCF model in which the rate of growth may change over different stages.
Proxy Group A group of publicly traded companies used as the "proxy" for the subject company (in this case, Ameren Missouri). Proxy companies are sometimes referred to as "Comparable Companies".
II
Rebuttal Testimony of Robert B. Hevet1
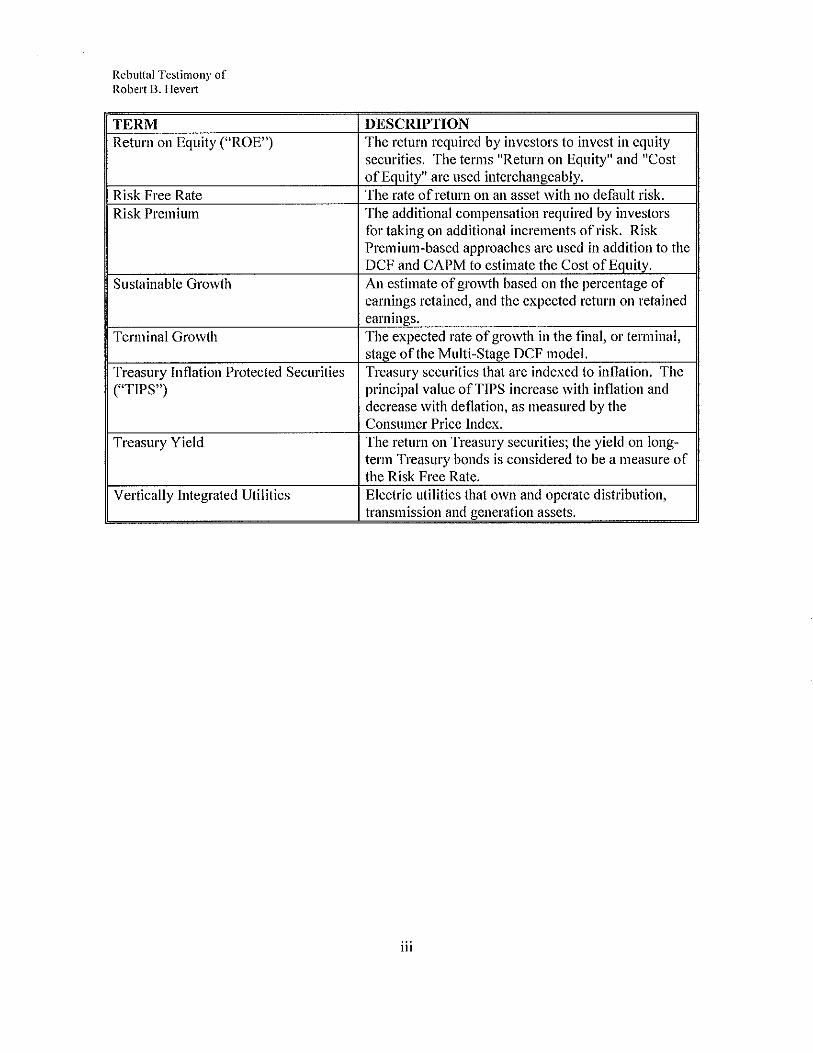
TERM Return on Equity ("ROE")
Risk Free Rate Risk Premium
Sustainable Growth
Terminal Growth
Treasury Inflation Protected Securities ("TIPS")
Treasury Yield
Vertically Integrated Utilities
DESCRIPTION The return required by investors to invest in equity securities. The terms "Return on Equity" and "Cost of Equity" are used interchangeably. The rate of return on an asset with no default risk. The additional compensation required by investors for taking on additional increments of risk. Risk Premium-based approaches are used in addition to the DCF and CAPM to estimate the Cost of Equity. An estimate of growth based on the percentage of earnings retained, and the expected return on retained earnings. The expected rate of growth in the final, or terminal, stage of the Multi-Stage DCF model. Treasury securities that are indexed to inflation. The principal value of TIPS increase with inflation and decrease with deflation, as measured by the Consumer Price Index. The return on Treasury securities; the yield on long-term Treasury bonds is considered to be a measure of the Risk Free Rate. Electric utilities that own and operate distribution, transmission and generation assets.
iii

2
3
4
5
6
Rebuttal Testimony of Robert B. Hever1
REBUTTAL TESTIMONY
OF
ROBERT B. HE VERT
FILE NO. EC-2014-0223
I. INTRODUCTION
Q. Please state your name, affiliation and business address.
A. My name is Robert B. Hevert. I am Managing Partner of Sussex Economic
7 Advisors, LLC. My business address is 161 Worcester Road, Suite 503, Framingham,
8 Massachusetts 0 1701.
9 Q. On whose behalf are you submitting this testimony?
10 A. I am submitting this rebuttal testimony ("Rebuttal Testimony") before the
11 Missouri Public Service Commission ("Commission") on behalf of Union Electric Company
12 d/b/a Ameren Missouri ("Ameren Missouri" or the "Company").
13 Q. Please describe your educational background.
14 A. 1 hold a Bachelor's degree in Business and Economics fi·om the University of
15 Delaware, and an MBA with a concentration in Finance from the University of Massachusetts. I
16 also hold the Chartered Financial Analyst designation.
17 Q. Please describe your experience in the energy and utility industries.
18 A. I have worked in regulated industries for over twenty-five years, having served as
19 an executive and manager with consulting firms, a financial officer of a publicly-traded natural
20 gas utility (at the time, Bay State Gas Company), and an analyst at a telecommunications utility.
21 In my role as a consultant, 1 have advised numerous energy and utility clients on a wide range of
22 financial and economic issues, including corporate and asset-based transactions, asset and

Rebuttal Testimony of Robert B. Hevert
enterprise valuation, transaction due diligence, and strategic matters. As an expert witness, I
2 have provided testimony in approximately I 00 proceedings regarding various financial and
3 regulatory matters before numerous state utility regulatory agencies and the Federal Energy
4 Regulatory Commission. A summary of my professional and educational background, including
5 a list of my testimony in prior proceedings, is included in Attachment A to my Rebuttal
6 Testimony.
7 II. PURPOSE AND OVERVIEW OF TESTIMONY
8 Q. What is the purpose of your Rebuttal Testimony?
9 A. On behalf of Ameren Missouri, my Rebuttal Testimony responds to Mr. Michael
I 0 P. Gorman on behalf of the Noranda Aluminum, Inc. ("Noranda") as his direct testimony relates
II to the Company's return on equity ("ROE"). In addition, my Rebuttal Testimony presents
12 evidence and provides a recommendation regarding the Company's ROE1• My analyses and
13 conclusions are supported by the data presented in Schedules RBH-1 through RBH-14, which
14 have been prepared by me or under my direction.
15 Q. How is the remainder of your Rebuttal Testimony organized?
16 A. The remainder of my Rebuttal Testimony is organized as follows:
17 Section lii- Provides a summary of issues regarding Cost of Equity estimation in
18 regulatory proceedings;
19 Section IV- Provides my response to the Direct Testimony of Mr. Gorman;
20 Section V - Explains my analyses and the analytical bases for my ROE
21 recommendation;
22 Section VI - Provides a discussion of specific business risks that have a direct
23 bearing on the Company's Cost of Equity; and
Throughout my Rebuttal Testimony, I interchangeably use the terms "ROE" and "Cost ofEquity."
2

2
Rebuttal Testimony of Robert 13. Hevert
Section VII- Summarizes my conclusions and recommendations.
III. SUMMARY OF ISSUES SURROUNDING COST OF EOUITY ESTIMATION IN
REGULATORY PROCEEDINGS
Q. Before addressing the specific aspects of this proceeding, please provide an
3 overview of the issues surrounding the Cost of Equity in regulatory proceedings, generally.
4 A. In very general terms, the Cost of Equity is the return that investors require to
5 make an equity investment in a finn. That is, investors will only provide funds to a firm if the
6 return that they expec/ is equal to, or greater than, the return that they require. From the firm's
7 perspective, that required return, whether it is provided to debt or equity investors, has a cost.
8 Individually, we speak of the "Cost of Debt" and the "Cost of Equity"; together, they are referred
9 to as the "Cost of Capital."
I 0 The Cost of Capital (including the costs of both debt and equity) is based on the
II economic principle of "opportunity costs." Investing in any asset, whether debt or equity
12 securities, implies a forgone opportunity to invest in alternative assets. For any investment to be
13 sensible, its expected return must be at least equal to the return expected on alternative,
I4 comparable investment opportunities. Because investments with like risks should offer similar
15 returns, the opportunity cost of an investment should equal the return available on an investment
16 of comparable risk.
17 Although both debt and equity have required costs, they are different in certain
I8 fundamental ways. Most noticeably, the Cost of Debt is contractually defined and can be
19 directly observed as the interest rate, or yield, on debt securities. The Cost of Equity, on the
20 other hand, is neither directly observable nor a contractual obligation. Rather, equity investors
21 have a claim on the finn's cash flows only after debt holders are paid; the uncertainty (or risk)
22 associated with those residual cash flows determines the Cost of Equity. Because equity
3

Rebuttal Testimony of Robert B. Hevert
1 investors bear that "residual risk", they take greater risks and require higher returns than debt
2 holders. In that basic sense, equity and debt investors differ: they invest in different securities,
3 face different risks, and require different returns.
4 Whereas the Cost of Debt can be directly observed, the Cost of Equity must be estimated,
5 or inferred, based on market data and various financial models. As discussed throughout my
6 Rebuttal Testimony, all of those models are subject to certain assumptions, which may be more
7 or less applicable under differing market conditions. In addition, because the Cost of Equity is
8 premised on opportunity costs, those models typically are applied to a group of "comparable" or
9 "proxy" companies. The choice of models (including their inputs), the selection of proxy
10 companies, and the interpretation of the model results all require the application of judgment.
II That judgment also should consider data and information that is not necessarily included in the
12 models, themselves. In the end, however, the estimated Cost of Equity should reflect the return
13 that investors require in light of the subject company's risks, and the returns available on
14 comparable investments.
15 Q. Please now provide a brief summary of the regulatory guidelines established
16 for the purpose of determining the ROE.
17 A. The United States Supreme Court (the "Court") established the guiding principles
18 for establishing a fair return for capital in two cases: (I) Bluefield Water Works and Improvement
19 Co. v. Public Service Comm '11 of West Virginia ("Bluefield''); and (2) Federal Power Comm '11 v.
20 Hope Natural Gas Co. ("Hope''). In those cases, the Court recognized that the fair rate of return
21 on equity should be: (I) comparable to returns investors expect to earn on other investments of
22 similar risk; (2) sufficient to assure confidence in the company's financial integrity; and (3)
23 adequate to maintain and support the company's credit and to attract capital.
4

2
Rebuttal Testimony of Robert 13. I-I evert
Q. Does Missouri precedent provide similar guidance?
A. Yes. In a recent order, the Commission cited the Hope and Blu~field decisions at
3 some length and acknowledged its authority and responsibility to set ')ust and reasonable" rates
4 for public utility service, stating that:
5 A "just and reasonable" rate is one that is fair to both the utility and its 6 customers; it is no more than is sufficient to "keep public utility plants 7 in proper repair for effective public service, [and] ... to insure to the 8 investors a reasonable return upon funds invested."'
9 Based on those standards, the authorized ROE should provide the Company with the opportunity
10 to earn a fair and reasonable return and should enable efficient access to external capital under a
11 variety of market conditions.
12 Q. Why is it important for a utility to be allowed the opportunity to eam a
13 retum adequate to attract equity capital at reasonable terms?
14 A. A return that is adequate to attract capital at reasonable terms enables the utility to
15 provide service while maintaining its financial integrity. As discussed above, and in keeping
16 with the Hope and Bluefield standards, that return should be commensurate with the returns
17 expected elsewhere in the market for investments of equivalent risk. The consequence of the
18 Commission's order in this case, therefore, should be to provide Ameren Missouri with the
19 opportunity to earn a return on equity that is: (I) adequate to attract capital at reasonable terms;
20 (2) sufficient to ensure its financial integrity; and (3) commensurate with returns on investments
21 in enterprises having corresponding risks. To the extent Ameren Missouri is provided a
22 reasonable opportunity to earn its market-based Cost of Equity, neither customers nor
23 shareholders should be disadvantaged. In fact, a return that is adequate to attract capital at
In the Matter of A!issouri Gas Fnergy and its Tar{(f Filing to Implement a General Rate Increase for Natural Gas Service, Report and Order, Missouri Public Service Commission, Case No. GR~2009·0355, February 10, 20!0, at 7.
5

Rebuttal Testimony of Robert B. 1-Icvert
reasonable terms enables Ameren Missouri to provide safe, reliable electric utility service while
2 maintaining its financial integrity.
3 Q. How is the Cost of Equity estimated in regulatory proceedings?
4 A. As noted earlier (and as discussed in more detail throughout my Rebuttal
5 Testimony), the Cost of Equity is estimated by the use of various financial models. By their very
6 nature, those models produce a range of results from which the ROE must be estimated. That
7 estimate must be based on a comprehensive review of relevant data and information, and does
8 not necessarily lend itself to a strict mathematical solution. The key consideration in
9 determining the ROE is to ensure that the overall analysis reasonably reflects investors' view of
10 the financial markets in general and the subject company (in the context of the proxy companies)
II in particular. Both practitioners and academics, however, recognize that financial models simply
12 are tools to be used in the ROE estimation process, and that strict adherence to any single
13 approach, or to the specific results of any single approach, can lead to flawed or misleading
14 conclusions. That position is consistent with the Hope and Bluefield principle that it is the
15 analytical result, as opposed to the methodology, that is controlling in arriving at ROE
16 determinations. Thus, a reasonable ROE estimate appropriately considers alternative
17 methodologies and the reasonableness of their individual and collective results in the context of
18 observable, relevant market information.
19 Q. Do the ROE decisions of other jurisdictions provide relevant data points for
20 that purpose?
21 A. Yes, I believe so. Investors have many options available to them and will allocate
22 their capital based on expected risks and returns associated with those alternatives. While I am
23 not suggesting that the Commission should be bound by decisions of other regulatory
6

Rebuttal Testimony of Robert ll. Hcvcrt
jurisdictions, the regulatory environment is one of the most important factors considered by debt
2 and equity investors in assessing the risks and prospects of utility companies. ROEs awarded by
3 regulatory commissions are important to the financial community's view of the regulatory
4 environment and, therefore, a utility's risk profile. A reasonable ROE, therefore, is important to
5 the financial community's view of the regulatory environment.
6 Q. Have you reviewed the returns recently authorized for other vertically
7 integrated electric utilities?
8 A. Yes, I have. As shown in Exhibit RBH-1, the median authorized return for
9 vertically integrated electric utilities from 2013 through 2014 has been 9.95 percent; the highest
10 return was 10.95 percent. Those returns are well above Mr. Gorman's 9.40 percent
II recommendation.
12 Q. What conclusions do you draw from that data?
13 A. The regulatory environment, (including authorized returns) is one of the most
14 important issues considered by both debt and equity investors in assessing the risks and prospects
15 of utility companies. As discussed above, the oppottunity cost of an investment should equal the
16 return available on an investment of comparable risk. As discussed in Section V, it is important
17 to recognize that utilities in Missouri are statutorily restricted from including Construction Work
18 Tn Progress ("CWTP") in rate base, rely on a historical test year, as opposed to a forecast test year
19 (or other alternative rate plans), and have a very limited ability to implement interim rates.
20 Relative to its peers, therefore, the Company is disadvantaged in its ability to earn its authorized
21 return and generate the cash flows required to fund investments in its system, and support its
22 day-to-day operations. Those factors, in addition to other operating risks discussed in Section V,
7

Rebuttal Testimony of Robert B. Hcvcrt
suggest a return above the median authorized ROE of9.95 percent, not 55 basis points below, as
2 Mr. Gorman recommends.
3 IV. RESPONSE TO THE DIRECT TESTIMONY OF MR. GORMAN
4 Q. Please briefly sununarize Mr. Gorman's recommendation regarding the
5 Company's Cost of Equity.
6 A. Mr. Gorman recommends an ROE of 9.40 percent, within a recommended range
7 of8.90 percent to 9.85 percent'. Mr. Gorman establishes his ROE recommendation by reference
8 to three versions of Discounted Cash Flow method (ranging from 8.49 percent to 9.02 percent,
9 with a point estimate of 8.90 percent), his Risk Premium estimates (ranging from 9.54 percent to
10 10.14 percent, with a point estimate of 9.85 percent), and his Capital Asset Pricing Model
II analyses (9.18 percent)'.
12 Q. What are the principal areas in which you disagree with Mr. Gorman?
13 A. The principal areas in which I disagree with Mr. Gorman's analyses and
14 conclusions include: (I) the composition of Mr. Gorman's proxy group; (2) the use of a near-
15 term estimate of Sustainable Growth in the Constant Growth DCF model; (3) the application of
16 the Multi-Stage DCF model; (4) the Market Risk Premium ("MRP") component of the CAPM
17 and, in particular, the expected market return from which the MRP is calculated; and (5) the
18 assumptions and methods underlying Mr. Gorman's Risk Premium analyses.
19 A. Composition of !tfr. Go mum's Proxy Group
20 Q. Please describe the screening criteria by which Mr. Gorman developed his
21 proxy group.
4 See Direct Testimony and Schedules of Michael P. Gorman, at 2 and 30. Ibid., at 18, 24, 29, 30.
8

1
Rebuttal Testimony of Robert B. llcvert
A. Mr. Gorman begins with the universe of Value Line Electric Utility companies, to
2 which he applies four screening criteria:
3 1. Corporate credit ratings from S&P between BBB- and A-, and credit ratings from
4 Moody's Investor Service ("Moody's") between Baa3 and A3;
5 2. A consistent history of quarterly cash dividends;
6 3. Not subject to merger or acquisition activities; and
7 4. Classified as "Regulated" by the Edison Electric Institute'.
8 Based on those criteria, Mr. Gorman arrives at a proxy group of23 companies.
9 Q. Do you agree with Mr. Gorman's screening criteria?
10 A. Not entirely. Although we do have certain criteria in common (for example, we
11 exclude companies that are party to a significant corporate transaction or that do not consistently
12 pay dividends), l do not believe that Mr. Gorman's screens render a group of companies that is
13 sufficiently comparable to Ameren Missouri. For example, Edison International ("EIX")
14 recorded a loss of $1.7 billion in 2012 as a result of placing Edison Mission Energy, the
15 subsidiary that owns and operates unregulated electric generating assets (including the Homer
16 City station), into Chapter II bankruptcy, and the divestiture of its Homer City assets'. As part
17 of its Chapter I I bankruptcy proceeding, on October 18, 20 13 EIX entered into a purchase
18 agreement with NRG Energy for Edison Mission Energy's assets, including the assumption of
19 certain related liabilities'. In addition, EIX recorded a $1.05 billion loss resulting fi·om an after-
20 tax earnings charge (recorded in the fourth quarter of 20 ll) relating to the impairment of its
21 Homer City, Fisk, Crawford, and Waukegan power plants, wind-related charges, and other
6 Ibid., at 5. See, Edison International, SEC Form I 0-K for the fiscal year ended December 31, 2012, at 35. See, NRG Energy, Inc., SEC Form 8-K, October 18,2013, at 2.
9
Rebuttal Testimony of Robert B. 1-Ievert
expenses'. Given the significant nature of those results, it is difficult to assess the degree to
2 which regulated electric utility operations would be expected to contribute to the company's
3 consolidated financial performance in the future. Therefore, I disagree with Mr. Gorman's
4 assessment of EIX as a company that is sufficiently comparable to Ameren Missouri. As
5 discussed in Section V, I have excluded EIX from my final proxy group for this reason.
6 There are other differences between Ameren Missouri and Mr. Gorman's proxy group
7 that should be considered, as well. For example, Consolidated Edison and UIL Holdings are
8 principally transmission and distribution utilities with significant natural gas operations. In
9 addition, although it occurred after Mr. Gorman filed his testimony, UIL recently agreed to
10 acquire Philadelphia Gas Works for approximately $1.9 billion'. Several of the companies in
II Mr. Gorman's proxy group derive a significant portion of their regulated net income limn natural
12 gas operations, while others (such as UNS Energy Corporation) are party to a significant
13 transaction; Schedule RBH-2 summarizes the reasons that I disagree with many [of the
14 companies included in Mr. Gorman's proxy group.
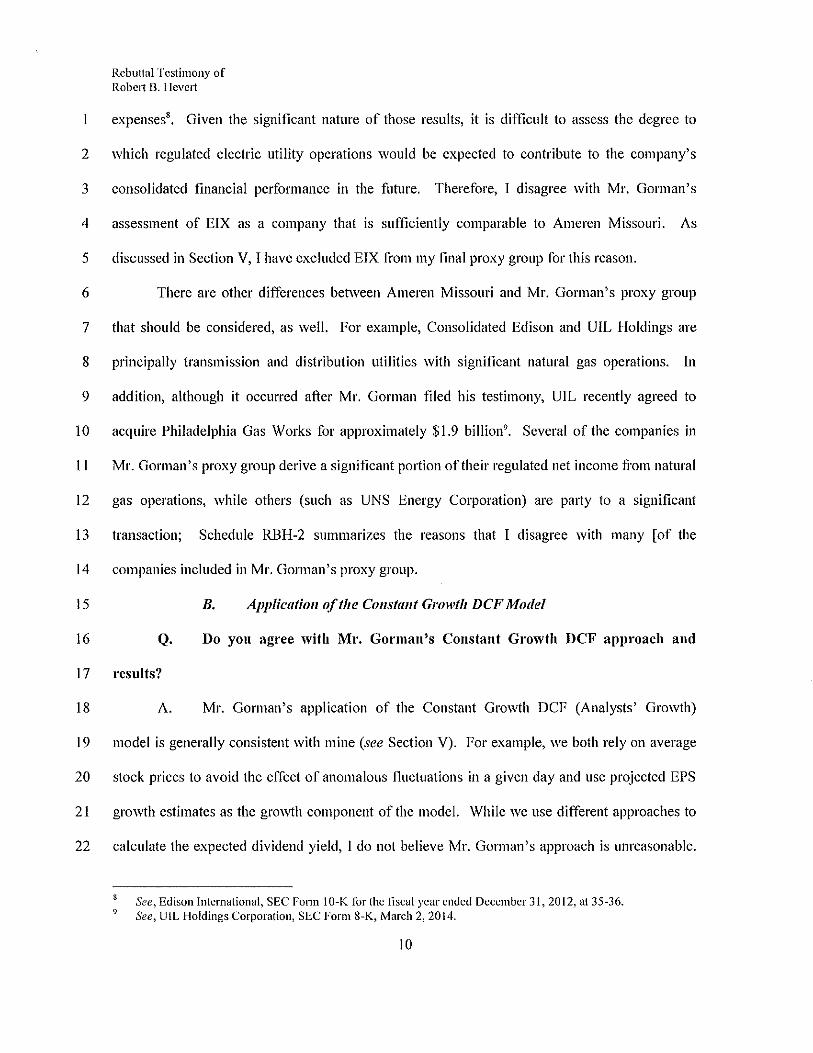
15 B. Application of the Constant Growth DCF Model
16 Q. Do you agree with Mr. Gorman's Constant Growth DCF approach and
17 results?
18 A. Mr. Gorman's application of the Constant Growth DCF (Analysts' Growth)
19 model is generally consistent with mine (see Section V). For example, we both rely on average
20 stock prices to avoid the effect of anomalous fluctuations in a given day and use projected EPS
21 growth estimates as the growth component of the model. While we use different approaches to
22 calculate the expected dividend yield, I do not believe Mr. Gorman's approach is unreasonable.
9 See, Edison International, SEC Form 10-K for the tiscal year ended December 31, 2012, at 35-36. See, UIL Holdings Corporation, SEC Form 8-K, March 2, 2014.
10

Rebuttal Testimony of Robert B. Heveti
However, I note that some of the results contained in Mr. Gorman's Constant Growth DCF
2 (Analysts' Growth) model are below any reasonable estimate of the Company's Cost of Equity.
3 For example, as shown in Mr. Gorman's Schedule MPG-3, the Constant Growth DCF estimate
4 for EIX is 4.36 percent, which is more than 10 basis points below the current cost of debt, as
5 measured by the Moody's Utility A-Rated Bond Index, a condition that is highly improbable for
6 Ameren Missouri (or, for that matter, any company10).
7 Although Mr. Gorman considers both the proxy group average and median results 11, more
8 than half of the results contained in Mr. Gorman's Constant Growth DCF (Analysts' Growth) are
9 below reasonable estimates of the Company's Cost of Equity. Of the 1,421 electric utility rate
I 0 cases provided by RRA since 1980 that disclosed the awarded ROE, for example, only three
II included an authorized ROE below 9.00 percent. In contrast, 14 the 23 results contained in
12 Mr. Gorman's Schedule MPG-3 are below 9.00 percent; nine are below 8.00 percent".
13 Conversely, only six of Mr. Gorman's estimates are as high as 10.00 percent which, as noted
14 above, is the approximate median authorized ROE for vertically integrated electric utilities since
15 January 2013. On that basis alone, Mr. Gorman's mean and median Constant Growth DCF
16 results (Analysts' Growth) model should be given little, if any weight.
17 Q. Do you agree with Mr. Gorman's Sustainable Growth Constant Growth
18 DCF approach?
19 A. No, I do not. As a practical matter, 17 of the 23 DCF estimates (that is, nearly
20 75.00 percent) contained in Mr. Gorman's Schedule MPG-6 (Constant Growth DCF Model -
21 Sustainable Growth Rate) are below 9.00 percent. Yet only one estimate is as high as 10.00
10 The 30-day average tOr the 1vfoody's Utility A-Rated Bond Index is 4.49 percent through April 15,2014. 11 See Direct Testimony and Schedules of Michael P. Gorman, at 18. 12 I note that the average DCF result including only results within the range of observed authorized returns since
1980 is 10.02 percent.
II

Rebuttal Testimony of Robert B. 1-lcvcit
percent. Again, regardless of whether we look to the mean or median, results that are
2 consistently below observable authorized returns must be called into question.
3 Moreover (and as discussed in more detail below), the Sustainable Growth method
4 assumes that the payout ratio and earned return on common equity will remain constant in
5 perpetuity, an assumption that may not hold true. Further, historical market data and
6 independent research do not support the principal assumption of the Sustainable Growth model,
7 i.e., that increased retention ratios are directly and positively related to future earnings growth,
8 for electric utilities.
9 In any case, the salient issue in assessing growth rates in the context of the DCF model is
I 0 whether investors tend to rely on a particular estimate of growth. Prior academic research
It indicates that, consistent with the approach used in my analyses (as presented later in my
12 Rebuttal Testimony), investors rely on analysts' earnings growth projections in valuing equity
13 securities". While Mr. Gorman may be of the view that analyst growth rates are not sustainable,
14 the relevant issue is whether investors rely on those projections in making their investment
15 decisions.
16 Q. Are there other concerns with Mr. Gorman's "Sustainable Growth"
17 estimate?
18 A. Yes. It is important to note that the "Sustainable Growth" model itself requires an
19 estimate of the earned return on common equity and is therefore somewhat circular. By adopting
20 Value Line's earned ROE estimates, Mr. Gorman has effectively pre-supposed the Return on
21 Common Equity projected by Value Line for the proxy group companies. In addition, the use of
22 the "Sustainable Growth" model requires the assumption that the subject company not only
13 See, for example, Roger A. Morin, PhD, New Regulatory Finance. Public Utilities Reports, Inc., 2006, at 298-303.
12

Rebuttal Testimony of Robert B. Hevet1
maintains its retention ratio and ROE in perpetuity, but also that the components of"R" (i.e., the
2 earned return on common equity) are reasonably stable over time.
3 In order to assess whether that assumption holds (that is, whether the components of "R"
4 are stable), I used the "DuPont" formula, which decomposes the Return on Common Equity into
5 three components: the Profit Margin (net income/revenues), Asset Turnover (revenues/net plant),
6 and the Equity Multiplier (net plant/equity). As Schedule RBH-3 demonstrates, based on
7 Mr. Gorman's Proxy Group, the product of those three measures is approximately equal (but for
8 rounding) to Value Line's reported Return on Common Equity, on both an historical and
9 projected basis. That analysis also shows that while all three components are expected to change
I 0 over time, the Equity Multiplier and Asset Turnover ratios are expected to decrease, indicating
11 the expectation that the companies in Mr. Gorman's Proxy Group will finance an increasing
12 amount of their net plant with common equity, while each dollar of additional assets will produce
13 somewhat less revenue.
14 The decreasing Equity Multiplier (which relates to a greater proportion of equity in the
15 capital structure) is consistent with the general observation that since the 2008 capital market
16 dislocation, most often associated with the Lehman Brothers bankruptcy in September 2008,
17 capital-intensive companies such as utilities have been focused on financial integrity and the
18 ability to access the capital markets during turbulent conditions. Given that the fimdamental
19 elements of the "R" component of the "Sustainable Growth" model are expected to change over
20 time, I do not believe it is appropriate to use that model as the estimate constant, perpetual
21 growth.
22 Q. Are there other reasons why the Sustainable Growth calculation may not
23 accurately reflect long-term growth rates?
13

1
Rebuttal Testimony of Robert B. Heve1t
A. Yes, there are. The underlying premise of that model is that future earnings will
2 increase as the retention ratio increases. That is, if future growth is modeled as "B x R" (where
3 B is the retention ratio, and R is the earned return on book equity), growth will increase as B
4 increases. There are several reasons, however, why that may not be the case. Management
5 decisions to conserve cash for capital investments, to manage the dividend payout for the
6 purpose of minimizing future dividend reductions or to signal future earnings prospects, can and
7 do influence dividend payout (and therefore earnings retention) decisions in the near-term.
8 Consequently, it is appropriate to determine whether the data relied upon by Mr. Gorman
9 supports the assumption that higher earnings retention ratios necessarily are associated with
1 0 higher future earnings growth rates.
11 Q. Did you perform any analyses to test that assumption?
12 A. Yes, I did. For each of the companies in Mr. Gorman's Proxy Group, I calculated
13 (in each year of the historical periods) the dividend payout ratio, the retention ratio, and the
14 subsequent five-year earnings growth rate. I then performed a regression analysis in which the
15 dependent variable was the five-year earnings growth rate, and the explanatory variable was the
16 earnings retention ratio. The purpose of that analysis was to determine whether the data source
17 relied upon by Mr. Gorman for his "Sustainable Growth" rate estimates empirically supports the
18 assumption (which, as noted, is central to his Sustainable Growth modeling") that higher
19 retention ratios necessarily produce higher earnings growth rates.
20 Q. What did that analysis reveal?
21 A. As shown in Table I (below), there was a significant negative relationship
22 between the five-year earnings growth rate and the earnings retention ratio. That is, on a
23 historical basis, earnings growth actually decreases as the retention ratio increases, which is
14 See Direct Testimony and Schedules of Michael P. Gorman, at 11.
14

Rebuttal Testimony of Robert B. Heve1i
exactly the opposite of the assumption underlying his model. Those findings clearly call into
2 question the reasonableness of Mr. Gorman's reliance on the Sustainable Growth rate.
3 Table 1: Regression Results 15
Co~f}icienl Standard I Stat Error
Intercept 0.175 0.0258 6.765
Retention Ratio -0.266 0.0404 -6.576
4
5 c. Application of tile Multi-Stage DCF Model
6 Q. Do you agree with Mr. Gorman's application of the Multi-Stage DCF model?
7 A. While I agree that the Multi-Stage DCF approach is a reasonable analytical
8 technique, Mr. Gorman's Multi-Stage DCF model contains several assumptions that produce
9 unreasonably low ROE estimates. In particular, Mr. Gorman's model assumes a perpetual
I 0 growth rate beginning in the eleventh year of his model (that is, calendar year 2024) based on a
II Gross Domestic Product ("GOP") growth rate projection that actually ends in 2024 16• In
12 addition, Mr. Gorman assumes that all dividends are received at year-end, rather than over the
13 course of the year. Those assumptions have the effect of unreasonably decreasing the DCF
14 result.
15 Q. How docs Mr. Gorman's assumption with regard to the timing of dividend
16 payments affect his Multi-Stage DCF model results?
17 A. Mr. Gorman notes that quarterly dividends in his Multi-Stage DCF model were
18 "annualized (multiplied by 417)." Considering that Mr. Gorman's proxy companies pay
19 dividends on a quarterly basis, assuming (as Mr. Gorman has done) that the entire dividend is
15 See also Schedule RBH-4. 16 See Direct Testimony and Schedules of Michael P. Gorman, at 16 and Schedule lviPG-8; see also and Blue Chip
Financial Forecasts, December l, 2013 at 14. 17 Ibid., at 8.
15
Rebuttal Testimony of Robert ll. Hevert
paid at the end of that year essentially defers the timing of the quarterly cash flows (that is, the
2 quarterly dividends) until year-end, even though they are paid throughout the year. A more
3 reasonable approach would be to assume that cash flows are received (on average) in the middle
4 of the year, such that half the quarterly dividend payments occur prior to the assumed dividend
5 payment date, and half occur after (i.e., the "mid-year convention"). That approach is consistent
6 with the common practice in the Constant Growth DCF model of accounting for periodic growth
7 in dividends by applying one-half of the expected annual dividend growth rate to calculate the
8 expected dividend yield.
9 Q. How would the mid-year convention affect Mr. Gorman's Multi-Stage DCF
I 0 results?
II A. Holding all other assumptions constant, simply changing Mr. Gorman's
12 methodology to reflect the mid-year convention increases the mean and median results by
13 approximately 18 and 19 basis points, respectively".
14 Q. Do you agree with the long-term growth rate in Mr. Gorman's Multi-Stage
15 DCF model?
16 A. No, I do not. The long-term growth rate represents the expected rate of growth, in
17 perpetuity, as of the beginning of the third, or terminal, stage". Mr. Gorman assumes a long-
18 term growth rate of 4.80 percent, which is the approximate average of the five year (2015-
19 2019) and ten year (2020-2024) nominal GDP growth estimates, as reported by Blue Chip".
20 Consequently, Mr. Gorman's long-term GDP growth rate projection, which he applies to years
18 See Schedule RBH-7. 19 See Direct Testimony and Schedules of Michael P. Gorman, at 14. 20 Ibid., at 16-17 and Schedule MPG-8. Mr. Gorman calculates his nominal GDP grm\1h rates based on separate
Blue Chip consensus tbrecasts for real GDP growth and growth in the GDP Chained Price Index for the periods 2015-2019 and 2020-2024. At page 29 of his Direct Testimony, Mr. Gorman points to the EIA Annual Energy Outlook, which projects real GDP gro\\1h in the range of 2.00 percent to 2.90 percent tbr the years through 2040, and Congressional Budget Office projections of real GDP growth from 2.20 percent to 2.60 percent over the coming Jive to ten years.
16

Rebuttal Testimony of Robert B. Hevert
eleven through 200 of his model (that is, from year 2024 through 2213), is based on data that
2 includes only year eleven (that is, 2024). That is, despite the fact that the Blue Chip projection
3 period ends in 2024, Mr. Gorman uses it as the measure of expected perpetual GOP growth
4 beginning in 2024.
5 Since the Blue Chip forecast is based on data that includes only a single year of
6 Mr. Gorman's terminal stage, I developed an alternative analysis (see Schedule RBH-5). In that
7 analysis, I continue to include the Blue Chip forecast, but only in the period to which it applies.
8 Given that the Blue Chip forecast terminates in 2024, I added a fourth stage, which incorporates
9 an additional estimate of long-term growth beyond the period represented by the Blue Chip
I 0 forecast. As explained below, the fourth-stage growth rate represents the combination of the
II long-term historical average real GOP growth rate, and the market's expectation of long-term
12 inflation beginning ten years from now. Limiting the Blue Chip forecast to the period to which it
13 applies, and incorporating the alternative estimate of long-term growth increases his mean and
14 median OCF results by 63 and 62 basis points, respectively.
15 Q. Are there other benchmarks that put Mr. Gorman's 4.80 percent long-term
16 growth rate in context?
17 A. Yes, there are. While Mr. Gorman suggests that the reasonableness of his ROE
18 estimates may be viewed in the context of his long-term growth projections, an alternative
19 approach is to assess his long-term growth projections in the context of recently authorized
20 ROEs. Given that Mr. Gorman's Risk Premium approach is premised on the use of authorized
21 returns as a measure of "expectational" data", it would follow that the long-term growth rate
22 assumed in his Multi-Stage OCF model should produce results that are reasonably consistent
23 with current expectations (that is, with recently authorized equity returns).
21 Ibid., at 33.
17

1
Rebuttal Testimony of Robert 13. Hcvcrt
Knowing that his average Multi-Stage OCF estimate is 8.82 percent, and that recently
2 authorized equity returns are quite a bit higher (see Schedule RBH-1, and Mr. Gorman's
3 Schedules MPG-10 and 11), it is reasonable to question the terminal growth rate used in
4 Mr. Gorman's Multi-Stage OCF analysis. As shown in Schedule RBH-6, keeping all of
5 Mr. Gorman's data and assumptions constant but for the terminal growth rate, and solving for the
6 growth rate that produces an average ROE of 9.92 percent" produces an implied growth rate of
7 6.19 percent". That, of course, is substantially above Mr. Gorman's 4.80 percent estimate,
8 although it is generally consistent with (although somewhat higher than) the assumption included
9 in my Multi-Stage analysis (5.70 percent; discussed below) and slightly lower than the long-term
10 geometric average nominal GOP growth rate (6.23 percent)".
11 Q. Is there another approach to calculating the long-term growth rate that
12 produces more reasonable results than Mr. Gorman's 4.80 percent estimate?
13 A. Yes, there is. As Mr. Gorman points out in footnote 11 of his direct testimony
14 (page 16), nominal GOP growth is the product of real GOP growth and inflation. It is possible to
15 use observable market data regarding nominal and inflation-protected Treasury yields (referred
16 to as "Treasury Inflation Protected Securities" or "TIPS") to calculate the market's forward view
17 of inflation (that is, inflation expected over the long term beginning ten years from now). In
18 particular, the difference between nominal Treasury yields and TIPS yields is commonly
19 considered to be a measure of expected inflation. Because the expected rate of inflation is easily
20 calculated, all that is needed is an estimate of long-term real GOP growth.
22
13
"
9.92 percent represents the 2013 average authorized return for vertically integrated electric utilities, as reported by Regulatory Research Associates. See Schedule RBH-6. Source: Bureau of Economic Analysis.
18

Rebuttal Testimony of Robert B. !Ievert
Q. Is there a method that can be used to estimate projected long-term real GDP
2 growth beginning ten years from now?
3 A. Yes, there is. Historical real GOP growth can be used as a measure of expected
4 real GOP growth in the terminal period. According to data provided by the Bureau of Economic
5 Analysis, over the period 1929 to 2013 the average annual real GOP growth rate was 3.27
6 percent (on a geometric average basis). Combining real GOP growth with the expected inflation
7 rate of 2.36 percent produces an expected long-term growth rate of 5.70 percent, which is the
8 growth rate I used in my Multi-Stage OCF analysis".
9 Q. With those points in mind, did you make any additional adjustments to Mr.
10 Gorman's analysis?
11 A. Yes, Schedule RBH-7 provides the incremental results of those adjustments. To
12 ensure that I correctly applied the analysis, I first recreated Mr. Gorman's Multi-Stage model and
13 replicated his results. I then adjusted Mr. Gorman's Internal Rate of Return calculation to reflect
14 the mid-year convention (as explained above). Next, I revised the long-term growth rate used in
15 the final stage of Mr. Gorman's model to the more reasonable estimate of perpetual long-term
16 nominal GOP growth described above. The cumulative effect of those adjustments is to increase
17 his median ROE estimate to 9.92 percent. Although that result remains below a reasonable
18 estimate of the Company's Cost of Equity, it is 52 basis points above Mr. Gorman's 9.40 percent
19 ROE recommendation.
20 Q. Aside from those adjustments to Mr. Gorman's model, did yon provide your
21 own Multi-Stage DCF analysis?
25 [(1.0236) X (1.0327)]- I~ .0570.
19

Rebuttal Testimony of Robert B. !Ievert
A. Yes, I did". As described in Section V, below, I included a form of the Multi-
2 Stage DCF model that addresses the concerns discussed above.
3 D. Application of Capital Asset Pricing Model
4 Q. Please summarize Mr. Gonuan's CAPM analysis.
5 A. Mr. Gorman develops a single CAPM estimate of9.18 percent, which is based on
6 Morningstar's historical Market Risk Premium estimate of 6.70 percent, Blue Chip's projected
7 30-year Treasury yield of 4.40 percent (as the risk-free rate), and a 0.71 average proxy group
8 Beta coefficient as reported by Value Line". Mr. Gorman selects the Moi·ningstar historical
9 MRP estimate as an input into his CAPM analysis after determining it falls somewhere within
10 the range of his two MRP estimates. Mr. Gorman's first MRP estimate (6.60 percent) is based
II on the long-term historical (arithmetic) average real market return from 1926 through 2012 as
12 repmied by Morningstar, which he then adjusts for current inflation forecasts". Mr. Gorman's
13 second MRP estimate (5.70 percent) represents the historical difference between the average
14 return on the S&P 500, and the average total return on long-term government bonds".
15 Q. Turning first to the expected total return on the market, do you agree with
16 Mr. Gorman's 10.98 percent estimate?
17 A. No, I do not. To put Mr. Gorman's estimate in perspective, it is important to
18 understand how often various ranges of total returns actually have occurred from 1926 to 2013.
19 To perform that analysis, I gathered the annual return on Large Company Stocks reported by
20 Morningstar, produced a histogram of those observations, and calculated the probability that a
21 given market return estimate would be observed. The results of that analysis, which are
26 See Schedule RBH-10. 27 See Direct Testimony and Schedules of Michael P. Gorman, at 25·29 and Schedule MPG·l5. 28 Ibid., at 27. 29 Ibid., at 27-28.
20

Rebuttal Testimony of Robert 13. Hevet1
I presented in Chart I, demonstrate that returns of 13.00 percent (which is consistent with my
2 analysis, described in Section V) and higher actually occurred quite often.
3 Chart 1: Frequency Distribution of Observed Market Returns, 1926- 2013"
6
5
4
3
2
1
0
1l 1l 1l 1l 1l 1l 1l 1l 1l 1l 1l ~ ~ ~ ~ 1l lHHl 1l 1l 1l 1l 1l 1l 1l 1l 0 0 0 0 0 0 0 0 0 0 0 0 0 0 0 0 0 0 0 0 0 0 0 0 0 0 0 d <.0 N "' ~ ci oii N cd <i ci 'f ~ N u:i ~ ~ ~ ~ ~ ~ ~ ~ ~ tti cri "' \Q "1 y <:' . ~ ~ ~ ';I ';I <;! " " ~
4
5 In fact, the 12.31 percent and 13.91 percent estimates, which I rely on in my CAPM
6 analysis (as shown in Schedule RBH-11), represent approximately the 50th percentile of the
7 actual returns observed from 1926 to 2013. In other words, of the 88 annual observations, 46
8 were 12.31 percent or higher and 45 were 13.91 percent or higher. By that measure, my estimate
9 is entirely consistent with historical experience, although Mr. Gorman's estimate is low relative
I 0 to that standard.
II Q. Is Mr. Gorman's use of the historical rate of S&P 500 total retum as a
12 measure of sustainable future market growth consistent with his use of the sustainable
13 growth rate in his DCF analysis?
30 See Morningstar, Inc., 20l4lbbotson Stocks. Bonds Bills and lntlation Classic Yearbook, at 196wl97.
21
Rebuttal Testimony of Robert B. Hevert
A. No, it is not. The Sustainable Growth rate used in Mr. Gorman's DCF analysis is
2 premised upon the assumption that there is a positive relationship between the earnings retention
3 ratio and earnings growth. In that regard, Mr. Gorman states:
4 The internal growth methodology is tied to the percentage of earnings 5 retained in the company and not paid out as dividends. The earnings 6 retention ratio is I minus the dividend payout ratio. As the payout ratio 7 declines, the earnings retention ratio increases. An increased earnings 8 retention ratio will fuel stronger growth because the business funds 9 more investments with retained earnings".
10 White (as discussed above) I do not agree with Mr. Gorman's use of the Sustainable
11 Growth method, it is helpful to consider the current level ofthc S&P 500 earnings retention ratio
12 relative to its historical level. If the current market retention ratio is well above its long-term
13 average, it calls into question whether the market will maintain that level in perpetuity. As
14 shown in Cha1t 2 (below), data reported by Dr. Robert J. Shiller indicates the S&P 500 earnings
15 retention has trended upward over time and is currently well above its historical average.
16 Consequently, the Sustainable Growth estimate that Mr. Gorman relied upon suggests that future
17 market growth could outpace historical growth.
31 Direct Testimony and Schedules of Michael P. Gorman, at 11.
22

1
2
3
Rebuttal Testimony of Robert B. Hevcrt
Q.
Chart 2: S&P 500 Annual Eamings Retention Ratio, 1926 - 2013"
80.00%
70.00%
0 60.00% 'iii ~ 50.00% 0
'E ~
&i ~
g' 30.00% ·e ~ w 20.00%
10.00%
0.00% tnrtnfmrmTTTTTTTTTrnrrrnnnmTTITTTTTTnTmmrrnnm 1 1111 1 1111 1rnrro 1926 1936 1946 1956 1966 1976 1986 1996 2006
Did you also consider where Mr. Gorman's Market Risk Premium estimate
4 falls within the range of historical observations?
5 A. Yes, I did. Similar to my review of observed market returns, I gathered the
6 annual Market Risk Premia reported by Morningstar and produced a histogram of the
7 observations. The results of that analysis, which are presented in Chart 3, demonstrate that
8 MRPs of at least I 0.31 percent (the upper range of the MRP estimates described below; see
9 Schedule RBH-13) have occurred nearly half of the time.
32 Source: http://www.econ.yale.edu/-shiller/data.htm.
23
1
2
3
4
5
6
Rebuttal Testimony of Robert B. Hevert
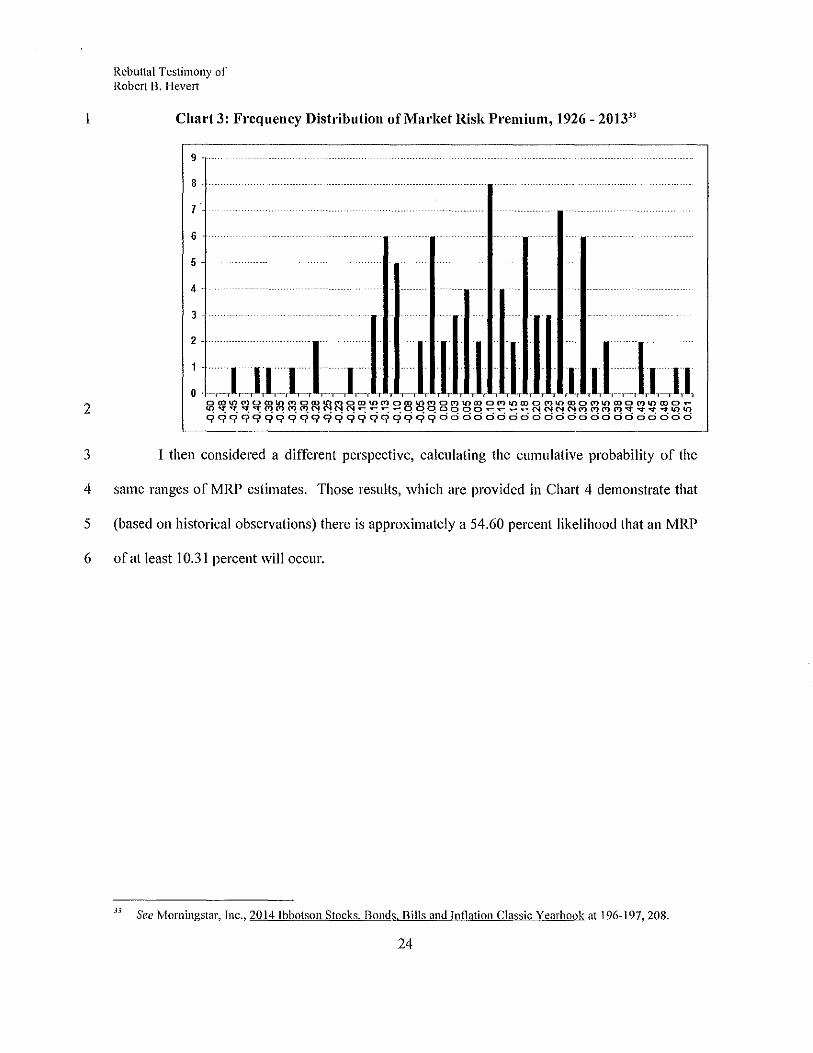
Chart 3: Frequency Distribution of Market Risk Premium, 1926- 2013"
9 ----
8 -
7.
6
5 -
4-
: :~~ ~IJUb.liliJUtllli,illj~u oro~~~ffl~~oro~~oro~~o~~~o~~rooM~mo~~mo~~roo~~roo~
~~qqqqq~~~qq~~~~~qq~dcidddddd~~~~d~d~dddci~~
I then considered a different perspective, calculating the cumulative probability of the
same ranges of MRP estimates. Those results, which are provided in Chart 4 demonstrate that
(based on historical observations) there is approximately a 54.60 percent likelihood that an MRP
of at least l 0.31 percent will occur.
J3 See Morningstar, Inc., 20l4lbbotson Stocks. Bonds. Bills and Inflation Classic Yearbook at 196-197,208.
24

2
Rebuttal Testimony of Robert B. llcvert
Chart 4: Cumulative Probability of Market Risk Premia, 1926- 2013"
100.00%
90.00%
80.00%
70.00%
60.00%
50.00%
40.00%
30.00%
20.00%
10.00%
o.oo% 1 , , , , : • : :r
3 It also is important to note that the annual average MRP of 6.70 percent is heavily
4 influenced by a small number of years in which the MRP fell because of significant market
5 losses. In 2008, for example, the market lost 37.00 percent, and as a result, MRP in that year
6 was negative 41.45 percent". Because of that large market loss, the long-term average MRP fell
7 from prior periods. In other words, in the year during which market risk and uncertainty were at
8 historically high levels (that is, 2008), the historical average MRP suggested that investors
9 required a significantly lower return on equity investments than they did on Treasury securities.
I 0 In fact, as shown on Table 2 (below), from 2007 to 2013, the historical average MRP decreased
II from 7.10 percent to 6.96 percent, while market volatility increased from 17.54 percent to a high
12 of32.69 percent in 2008, and eventually fell to 14.23 percent in 201336• That is, the effect of the
H Ibid. JS Ibid., at 196-197,208. 36 See Morningstar, Inc., 2013 Ibbotson Stocks. Bonds. Bills and Inflation Valuation Yearbook, at 142-143 and
Bloomberg Professional. Please note that the long-term average market volatility is approximately 20.13 percent.
25
Rebuttal Testimony of Robert B. Hevert
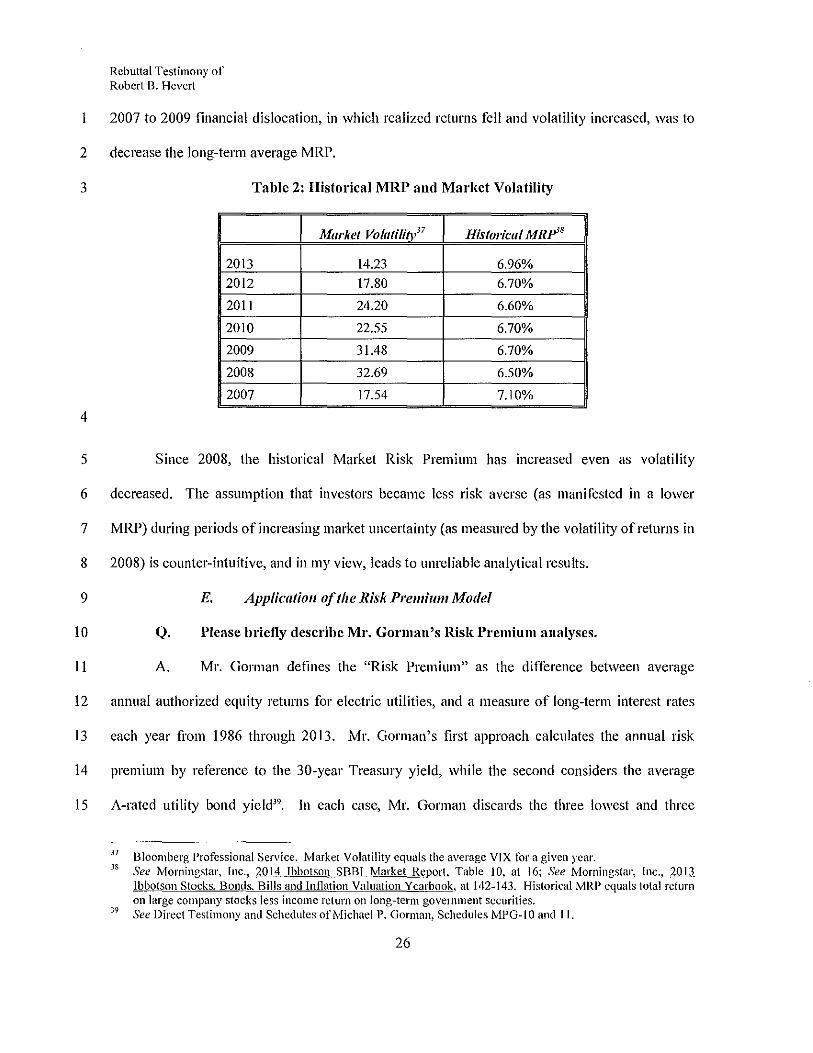
2007 to 2009 financial dislocation, in which realized returns fell and volatility increased, was to
2 decrease the long-term average MRP.
3 Table 2: Historical MRP and Market Volatility
Market Volatility" Historical MRP38
2013 14.23 6.96% 2012 17.80 6.70%
2011 24.20 6.60%
2010 22.55 6.70%
2009 31.48 6.70%
2008 32.69 6.50%
2007 17.54 7.10%
4
5 Since 2008, the historical Market Risk Premium has increased even as volatility
6 decreased. The assumption that investors became less risk averse (as manifested in a lower
7 MRP) during periods of increasing market uncertainty (as measured by the volatility of returns in
8 2008) is counter-intuitive, and in my view, leads to unreliable analytical results.
9 E. Application of the Risk Premium Model
10 Q. Please briefly describe Mr. Gorman's Risk Premium analyses.
11 A. Mr. Gorman defines the "Risk Premium" as the difference between average
12 annual authorized equity returns for electric utilities, and a measure of long-term interest rates
13 each year from 1986 through 2013. Mr. Gorman's first approach calculates the annual risk
14 premium by reference to the 30-year Treasury yield, while the second considers the average
15 A-rated utility bond yield". In each case, Mr. Gorman discards the three lowest and three
37 Bloomberg Professional Service. Market Volatility equals the average VIX fOr a given year. 38 See Morningstar, Inc., 2014 Ibbotson SBBI Market Report, Table 10, at 16; See Morningstar, Inc., 2013
Ibbotson Stocks. Bonds. Bills and Inflation Valuation Yearbook, at 142-143. Historical MRP equals total return on large company stocks less income return on long-term government securities.
39 See Direct Testimony and Schedules of Michael P. Gorman, Schedules MPG-10 and II.
26

Rebuttal Testimony of Robert B. Heve11
highest implied equity risk premia, and establishes the range of Risk Premium estimates based
2 on the next highest (or lowest) estimate. In other words, the lower bound of his Risk Premium
3 range is defined by the fourth-lowest risk premium, regardless of the year in which it occurred.
4 In a similar manner, the upper bound of Mr. Gorman's Risk Premium range is defined by the
5 fourth-highest estimate, regardless of the year in which that observation occurred. Mr. Gorman
6 then applies weights of 30.00 percent and 70.00 percent, respectively, to his lower and upper
7 bound estimates40•
8 As to the period over which he gathers and analyzes his data, Mr. Gorman suggests that
9 his 28-year horizon is a "generally accepted period to develop a risk premium study using
I 0 'expectational' data"." Mr. Gorman fmther notes that "it is reasonable to assume that averages
II of annual achieved returns over long time periods will generally converge on the investors'
12 expected returns," and concludes that his "risk premium study is based on expectational data, not
I3 actual returns, and, thus, need not encompass very long time periods42." Based on those
14 assumptions, Mr. Gorman calculates a range of estimates from 8.24 percent to I 0. 71 percent
15 which, Mr. Gorman suggests, produces a reasonable range of9.54 percent to IO.l4 percent with
16 a (rounded) midpoint of9.85 percent43•
17 Q. Does Mr. Gorman rely on his Risk Premium model in making his ROE
18 recommendation?
40
" 42
43
Ibid., at 23·24. I note that ·Mr. Gorman states "I propose to provide 75% weight to the high·end of my risk premium estimates and 25% to the low·cnd of my risk premium estimates." However, fOotnotes 15 and 16 indicate that Mr. Gorman provided 70 percent weight to the high·end of his risk premium estimates and 30 percent to the low·cnd of his risk premium estimates. Ibid, at 21. Ibid. Ibid., at 23-24. See also Schedule RBII-8.
27

Rebuttal Testimony of Robert 13. Hcvcrt
A. Yes, he does. As noted above, Mr. Gorman develops his ROE estimate (i.e., 9.85
2 percent) at least in part based on his Risk Premium results".
3 Q. What are your specific concems with Mr. Gonnan 's Risk Premium
4 analyses?
5 A. I have several concerns with Mr. Gorman's analysis: (I) his method of relying on
6 the fomth lowest and highest risk premium is arbitrary and establishes a range of ROE estimates
7 that are predicated on economic and financial conditions that are far removed fi·om the current
8 market; (2) Mr. Gorman's method and recommendation ignore an important relationship
9 revealed by his own data, i.e., that the Risk Premium has a strong negative correlation to the
10 level of interest rates (whether measured by Treasury or utility bond yields); and (3) the low end
II of Mr. Gorman's Risk Premium estimates is far lower than any ROE authorized since at least
12 1986 and as such, has no relevance in estimating the Company's Cost of Equity.
13 Q. Tuming first to the method by which Mr. Gorman selected the bounds of his
14 Risk Premium estimates, have you reviewed the range of data included in his analysis?
15 A. Yes, I have. Considering first the Treasury yield-based analysis, 1 plotted the
16 yields and Risk Premia over the 1986 to 2013 period included in Mr. Gorman's analysis. That
17 graph is presented in Chart 5 (below).
44 See Direct Testimony and Schedules of Michael P. Gorman, at 30.
28

1
2
Rebuttal Testimony of Robert B. Hevert
Chart 5: Mr. Gorman's Treasury Yield-Based Risk Premium Data"
10.CX>o/o
9.00%.
8.00%
7.00%
6.00%
5.00%
4.00%
3.00%
2.00%
1.00%
8.58% 8.14%
6.31%6.47%
·\··
\ .......................... . .......... ./\ .. \, II,. ' ---,., __ ... ' ,
..... ;,·(. ....... ~ .................... ,{ ............... ··········~
;;;;;;;,;~~::;/~::-~ .. -~~!
4.41% 4.41% Point of Inversion
3.33%
o.oo% L~~~~::::::-;::::::~.:;-:;;;;;;;--::~;;;;;~;-;;;s;;;;o-;1012' 1986 1988 1990 1992 1994 1996 1998 2000 2002 2004 2006 2008 2010 2012
-Treasury Yield --- • Risk Premium
3 There are several important points that may be taken fi·om that data. First, the low end of
4 Mr. Gorman's Risk Premium range, 4.41 percent, was observed in 1987 and 1991. It is apparent
5 that a discrete observation from an economic environment 26 years ago has little to do with
6 current market conditions. In fact, a very visible measure of such differences is the fact that in
7 1987, Treasury yields exceeded the Risk Premium. As Schedule RBH-8 demonstrates, however,
8 since the turn of the Millennium, the opposite has been true; the Risk Premium has consistently
9 exceeded Treasury yields. By that measure alone, it is clear that the low end of Mr. Gorman's
I 0 range has little, if any, relevance to the current market environment.
II As to the high end of his range, Mr. Gorman's convention of discarding the three highest
12 Treasury yield-based Risk Premium estimates has the effect of ignoring observations limn 2009,
13 2012 and 2013; the Utility bond-based estimates exclude 2011,2012 and 2013. Since 2008, the
14 Federal Reserve has proceeded on a steady path of initiatives designed to lower long-term
45 Source: Direct Testimony and Schedules of Michael P. Gorman, Schedule MPG-1 0. See also Schedule RBH-8.
29

Rebuttal Testimony of Robert 13. Hevet1
Treasury yields46• By not including the most recent data in his analysis, Mr. Gorman's selections
2 specifically exclude the market conditions that he finds important in other aspects of his
3 analyses". Moreover, the Risk Premium tends to move inversely with changes in interest rates:
4 As interest rates have fallen, the Risk Premium has increased. Mr. Gorman's approach,
5 therefore, removes very recent observations for which the Risk Premium would be relatively
6 high.
7 I also note that while 20 II and 1987 represented the fourth highest and lowest Treasury
8 yield-based Risk Premium observations, respectively, the second highest and lowest were
9 observed in 2013 and 1994. Certainly 2013 is more current than 2011, and there is no reason of
I 0 which I am aware to conclude that 1987 is more relevant to the analysis than 1994. Similarly,
11 the second highest and lowest Utility bond-based Risk Premium observations reflect data as of
12 2013 and 1990, rather than 2005 and 1994 (i.e., the fomth-highest and lowest observations).
13 Here again, 2013 is more current than 2005 and there is no reason to prefer 1994 to 1990.
14 Combining data from the second highest and lowest (rather than the fourth) return
15 produces an ROE estimate of 9.99 percent relative to the 9.85 percent result that Mr. Gorman
16 repotts; the highest and lowest observations produce an ROE estimate of I 0.26 percent. In fact,
17 moving from the fomth to the first highest and lowest return would increase the ROE estimate by
18 42 basis points while an equivalent move downward (i.e., moving from the fourth to the seventh)
19 would decrease the ROE by only 14 basis points. Given the rather subjective nature of the
20 analysis, and in light of the significant skew in results, it is my view that Mr. Gorman's Risk
21 Premium analysis tends to understate the Company's Cost of Equity.
46 See, also, Federal Reserve Press Release dated June 19,2013. 47 See, for example, Direct Testimony and Schedules of Michael P. Gorman, at 6-8.
30
Rebuttal Testimony of Robert B. Hever1
Q. Please now elaborate on your earlier observation that the Risk Premium has
2 increased as Tt·easury yields have decreased.
3 A. As Schedule RBH-8 demonstrates, over Mr. Gorman's study period the Risk
4 Premium has moved inversely to changes in Treasury yields and this relationship is supported by
5 the data contained in Mr. Gorman's Schedules MPG-10 and II; the correlation between the two
6 is negative 87.67 percent (see Schedule RBH-8). To put that degree of correlation in
7 perspective, if the two were to move in exactly opposite directions, the correlation would be
8 negative 100.00 percent, if they did not move together at all, the correlation would be zero.
9 Because correlation coefficients by definition are between zero and one (either positive or
I 0 negative), a correlation of negative 87.67 percent indicates a strong tendency for the Equity Risk
11 Premium to increase as interest rates decrease. These findings are suppmted in academic studies.
12 For example, Dr. Roger Morin notes that:
13 ... [p]ublished studies by Brigham, Shome, and Vinson (1985), Harris 14 (1986), Harris and Marston (1992, 1993), Carleton, Chambers, and 15 Lakonishok (1983), Morin (2005), and McShane (2005), and others 16 demonstrate that, beginning in 1980, risk premiums varied inversely 17 with the level of interest rates - rising when rates fell and declining 18 when interest rates rose48
•
19 Turning back to Mr. Gorman's data, a simple linear regression analysis reveals that for
20 every 100 basis point decrease in yields, the Risk Premium increases by approximately 44 basis
21 points (see Schedule RBH-849). That result is consistent with those found by Maddox, Pippert
22 and Sullivan, who determined that the Risk Premium would increase by 37 basis points for every
48 Roger A. Morin, New Regulatory Finance, Public Utilities Reports, Inc. (2006), at 128 [clari11cation added]. 49 Adjusting fOr serial correlation does not materially affCct the results; see Schedule RBI-1-8.
31

Rebuttal Testimony of Robert B. !Ievert
I 00 basis point change in the 30-year Treasury yield50• Citing Harris and Marston, the authors
2 note a similar estimate of 36 basis points".
3 Q. Have you made any adjustments to Mr. Gorman's analysis to reflect the
4 concerns discussed above?
5 A. Yes, I have. While I believe that the regression analysis described in Section V is
6 the appropriate method, I have adjusted Mr. Gorman's analysis to reflect the Risk Premium
7 associated with the prevailing level of interest rates. Based on Mr. Gorman's Schedule MPG-10,
8 the average 30-year Treasury yield in 2012 and 2013 was 3.13 percent; the average Risk
9 Premium during those years was 6.78 percent. Applying the projected 4.15 percent (30-year)
I 0 Treasury yield to that risk premium produces an ROE estimate of I 0.93 percent. Assuming the
II respective 2012 and 2013 Risk Premium estimates (combined with the projected 4.15 percent
12 Treasury yield) produces a range of 10.62 percent to 11.24 percent. Those estimates, which
13 reflect more recent and relevant data, are well above Mr. Gorman's 9.40 percent ROE estimate.
14 Q. Have you completed a similar analysis using Mr. Connan's Utility Bond
15 Yield data?
16 A. Yes, and those results are consistent with my analysis of Mr. Gorman's Treasury
17 yield-based Risk Premium. Here again, it is clear that the Risk Premium has increased as the
18 Utility Bond Yield has decreased. In fact, because the two have been moving steadily in
19 opposite directions, the Risk Premium now is higher than the Bond Yield. Mr. Gorman,
20 however, developed his Risk Premium (and, therefore, his ROE) estimates based on data points
21 that occurred more than 17 years prior to that point of inversion. Even the high end of
22 Mr. Gorman's Risk Premium estimate (which is based on calendar year 2005) is derived from
50
"
See Farris M. rvfaddox, Donna T. Pippert, and Rodney N. Sullivan, An Empirical Study of Ex Ante Risk Premiwnsfor the Electric Utility !ndustJ:V, Financial Management, Vol. 24, No.3, Autumn 1995, at 93. Ibid.
32
Rebuttal Testimony of Robert B. Heve11
data reflecting a period in which the Bond Yield exceeded the Risk Premium and as such,
2 produces an ROE estimate that is incompatible with the current market environment.
3 Q. Do you have any other observations regarding Mr. Gorman's Risk Premium
4 analysis?
5 A. Yes, I do. Aside from the shortcomings discussed above, Mr. Gorman's Risk
6 Premium recommendation gives considerable weight to ROE estimates that are well below the
7 lowest return that has ever been authorized. Of the 1,421 electric utility rate authorizations since
8 1980 for which authorized ROEs were disclosed, the lowest was 8.72 percent". Mr. Gorman,
9 however, gives specific weight to an ROE estimate that is approximately 50 basis points lower,
I 0 still (that is, the 8.24 percent ROE estimate to which Mr. Gorman gave 30.00 percent weight in
II his "A" rated utility bond version of the Risk Premium).
12 Lastly, although Mr. Gorman suggests that he applied weights of75.00 percent and 25.00
13 percent to his high and low observations, respectively, it appears that he actually applied weights
14 of70.00 percent and 30.00 percent. Had he applied the 75.00 percent/25.00 percent weights, his
15 estimates would have been 10.24 percent for the Treasury yield-based analysis53, and 9.64
16 percent for the Bond yield-based estimate". The midpoint of those two estimates is 9.94 percent,
17 nine basis points above the 9.85 percent estimate provided in Table 2 of Mr. Gorman's
18 testimony.
V. COST OF EQUITY ESTIMATION
19 Q. Have you developed your own estimate of Amercn Missouri's cost of equity?
20 A. Yes, using a proxy group and various analyses similar to those used by
21 Mr. Gorman.
52 Source: Regulatory Research Associates; see, also Schedule RBHR14. 53 (75%x 10.71%)+(25%x8.81%)~ 10.24% 5' (75% X 10.10%) + (25% X 8.24%) ~ 9.64%
33
1
2
3
Rebuttal Testimony of Robert B. Hever1
A. Proxy Group Selection
Q. Please provide a summary profile of Ameren Missouri.
A. Ameren Missouri, which is a wholly owned subsidiary of Ameren Corporation,
4 provides electric service to approximately 1.2 million retail customers, and natural gas
5 distribution service to approximately 127,000 retail customers in Missouri". Ameren
6 Corporation's current long-term issuer credit rating from S&P is BBB+ (outlook: Stable), Baa2
7 (outlook: Stable) fi·om Moody's, and BBB+ (outlook: Stable) from FitchRatings ("Fitch").
8 Ameren Missouri currently is rated BBB+ (outlook: Stable) by S&P, Baal (outlook: Stable) by
9 Moody's, and BBB+ (outlook: Stable) by Fitch56•
10 Q. How did you select the companies included in your proxy group?
11 A. As did Mr. Gorman, I began with the universe of companies that Value Line
12 classifies as Electric Utilities. However, my screening criteria narrow the proxy group to more
13 closely reflect the operations and risks of Ameren Missouri than Mr. Gorman's group (as noted
14 in Section IV, I do not believe that Mr. Gorman's screens render a group of companies that is
15 sufficiently comparable to Ameren Missouri). More specifically, I applied the following
16 screening criteria to the Value Line Electric Utility universe:
17
18
19
20
21
• I excluded companies that do not consistently pay quarterly cash dividends;
• All of the companies in my proxy group have been covered by at least two utility
industry equity analysts;
• All of the companies in my proxy group have investment grade senior unsecured
bond and/or corporate credit ratings from S&P;
55 See, Ameren Missouri, Facts About Ameren A!issouri. 56 Source: SNL Financial
34
1
2
3
4
5
6
7
8
9
10
Rebuttal 'l'estimony of Robert l3. Hevert
• 1 excluded any companies whose regulated operating income over the three most
recently reported fiscal years comprised less than 60.00 percent of the respective
totals for that company;
• I excluded any companies whose regulated electric operating income over the
three most recently reported fiscal years represented less than 90.00 percent of
total regulated operating income; and
• I eliminated companies that are currently known to be patty to a merger, or other
significant transaction.
Q. Did you include Ameren Corporation in your proxy group?
A. No. In order to avoid the circular logic that would otherwise occur, it has been
11 my consistent practice to exclude the subject company (or its parent) from the proxy group.
12 Q. What companies met those screening criteria?
13 A. The criteria discussed above resulted in a proxy group of the following sixteen
14 companies:
35

1
2
3
4
Rebuttal Testimony of Robert B. Hevert
Table 3: Proxy Group Screening Results
Company Ticker American Electric Power Company, Inc. AEP
Cleco Corporation CNL
Duke Energy Corporation DUK
Edison International EIX
Empire District Electric Company EDE
Great Plains Energy Inc. GXP
Hawaiian Electric Industries, Inc. HE
IDACORP, Inc. IDA
NextEra Energy, Inc. NEE
Northeast Utilities NU
Otter Tail Corporation OITR
Pinnacle West Capital Corporation PNW
PNM Resources, Inc. PNM
Portland General Electric Company POR
Southern Company so Westar Energy, Inc. WR
Q. Is this your final proxy group?
A. No. I examined the operating profile of each of the sixteen companies that met
5 my initial screens to be certain that none displayed characteristics that were inconsistent with my
6 intent to produce a proxy group that is fundamentally similar to the Company. As a result, I
7 excluded EIX based on recent financial information. As discussed in my response to
8 Mr. Gorman, as part of its Chapter 11 bankruptcy proceeding, EIX entered into a purchase
9 agreement on October 18, 2013 with NRG Energy for Edison Mission Energy's assets including
I 0 the assumption of certain related liabilities". Given the significant nature of that transaction, it is
II difficult to assess the degree to which regulated electric utility operations would be expected to
57 See, NRG Energy, Inc., SEC Form 8-K, October 18,2013, at 2.
36
Rebuttal Testimony of Robert B. Hevert
contribute to the company's consolidated financial performance in the future. Consequently, l
2 excluded EIX tl·om my final proxy group.
3 Q. Based on the criteria and issues discussed above, what is the composition of
4 your proxy group?
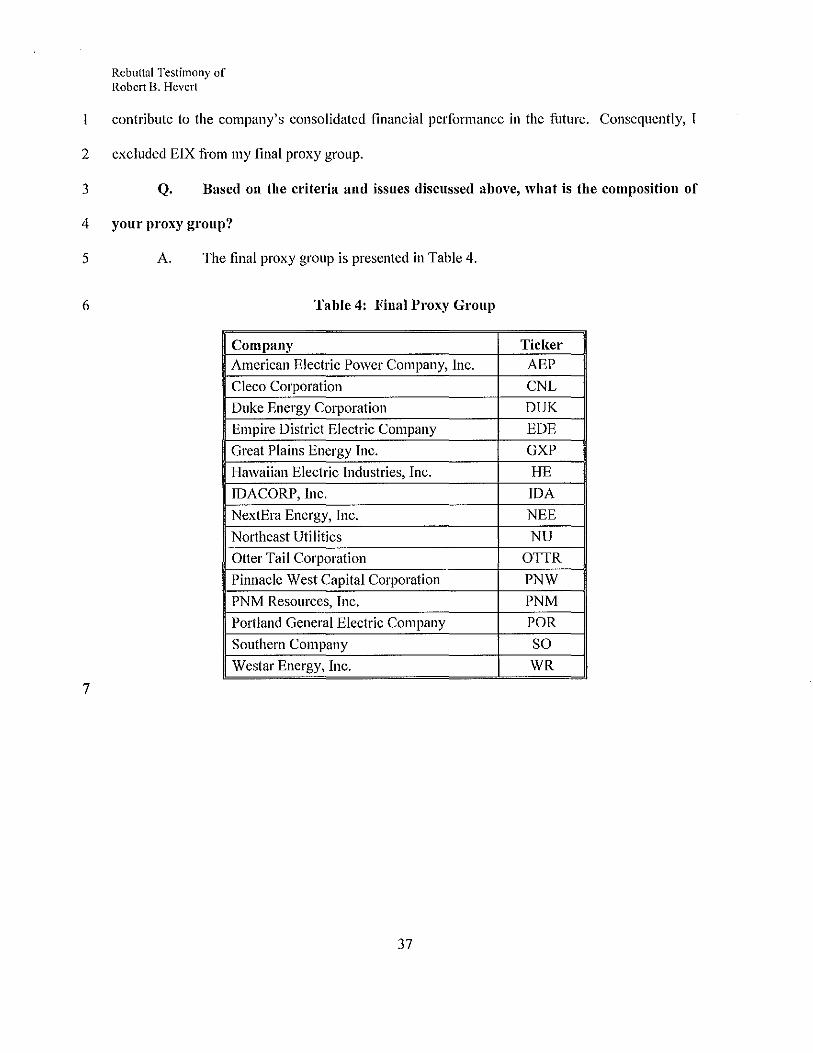
5 A. The final proxy group is presented in Table 4.
6 Table 4: Final Proxy Group
Company Ticker American Electric Power Company, Inc. AEP
Cleco Corporation CNL
Duke Energy Corporation DUK
Empire District Electric Company EDE
Great Plains Energy Inc. GXP
Hawaiian Electric Industries, Inc. HE
IDACORP, Inc. IDA
NextEra Energy, Inc. NEE
Northeast Utilities NU
Otter Tail Corporation OTIR
Pinnacle West Capital Corporation PNW
PNM Resources, Inc. PNM
Portland General Electric Company POR
Southern Company so Westar Energy, Inc. WR
7
37
2
3
Rebuttal Testimony of Robert B. Hevert
B. Constant Growth Discounted Cash Flow Model
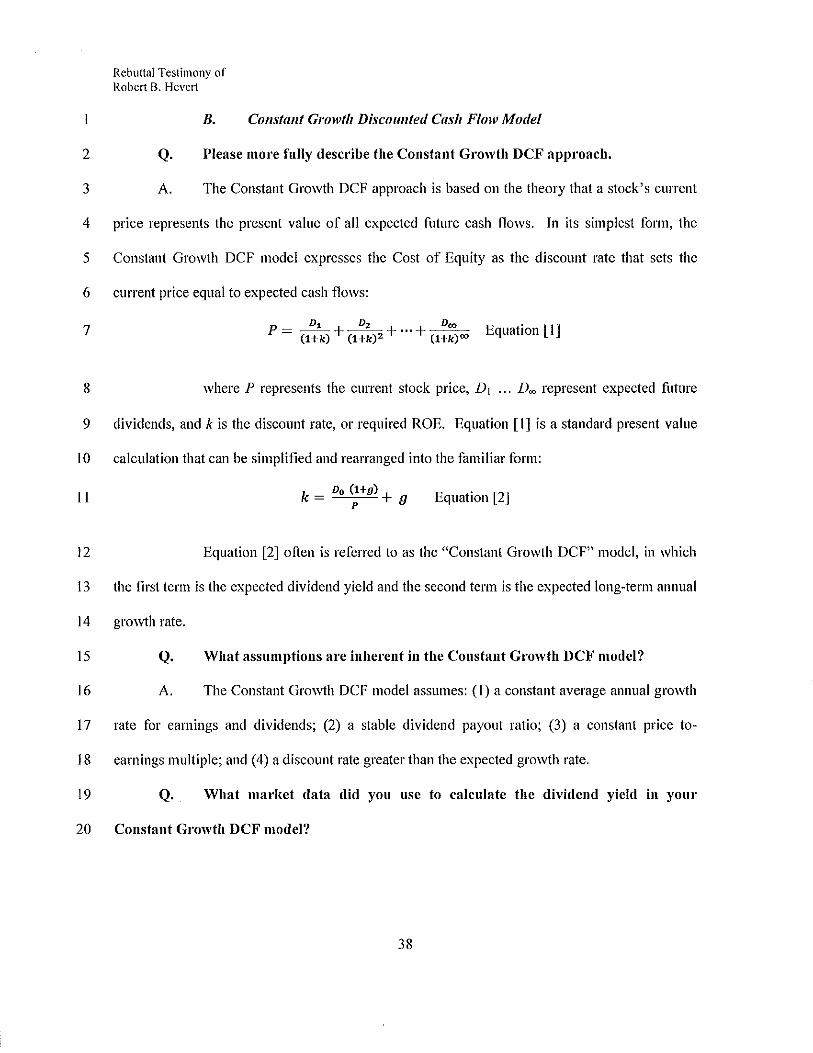
Q. Please more fully describe the Constant Growth DCF approach.
A. The Constant Growth DCF approach is based on the theory that a stock's current
4 price represents the present value of all expected future cash flows. In its simplest form, the
5 Constant Growth DCF model expresses the Cost of Equity as the discount rate that sets the
6 current price equal to expected cash flows:
7 p~~ ~ ... ~ - (l+k) + (1+k) 2 + + (l+k) 00 Equation [I)
8 where P represents the current stock price, D 1 ••• Doo represent expected future
9 dividends, and k is the discount rate, or required ROE. Equation [I) is a standard present value
10 calculation that can be simplified and rearranged into the familiar form:
II Do (l+g) + g k= p Equation [2)
12 Equation [2) often is referred to as the "Constant Growth DCF" model, in which
13 the first term is the expected dividend yield and the second term is the expected long-term annual
14 growth rate.
15 Q. What assumptions are inherent in the Constant Growth DCF model?
16 A. The Constant Growth DCF model assumes: ( l) a constant average annual growth
17 rate for earnings and dividends; (2) a stable dividend payout ratio; (3) a constant price to-
18 earnings multiple; and ( 4) a discount rate greater than the expected growth rate.
19 Q. What market data did you usc to calculate the dividend yield in your
20 Constant Growth DCF model?
38

Rebuttal Testimony of Robert B. Hevert
A. The dividend yield is based on the proxy companies' current annualized dividend,
2 and average closing stock prices over the 30, 90, and !SO-trading day periods as of April 15,
3 2014.
4 Q. Why did you use three averaging periods to calculate an average stock price?
5 A. I did so to ensure that the model's results are not skewed by anomalous events
6 that may affect stock prices on any given trading day. At the same time, the averaging period
7 should be reasonably representative of expected capital market conditions over the long term. In
8 my view, using 30-, 90-, and 180-day averaging periods reasonably balances those concerns.
9 Q. Did you make any adjustments to the dividend yield to account for periodic
10 growth in dividends?
I I A. Yes, I did. Since utility companies tend to increase their quarterly dividends at
12 different times throughout the year, it is reasonable to assume that dividend increases will be
13 evenly distributed over calendar quarters. Given that assumption, it is appropriate to calculate
14 the expected dividend yield by applying one-half of the long-term growth rate to the current
15 dividend yield. That adjustment ensures that the expected dividend yield is, on average,
16 representative of the coming twelve-month period, and does not overstate the dividends to be
17 paid during that time.
18 Q. Is it important to select appropriate measures of long-term growth in
19 applying the DCF model?
20 A. Yes. In its Constant Growth form, the DCF model (i.e., as presented in Equation
21 [2] above) assumes a single growth estimate in perpetuity. Accordingly, in order to reduce the
22 long-term growth rate to a single measure, one must assume a fixed payout ratio, and the same
23 constant growth rate for earnings per share ("EPS"), dividends per share, and book value per
39

Rebuttal Testimony of Robert B. Heve1t
share. Since dividend growth can only be sustained by earnings growth, the model should
2 incorporate a variety of measures of long-term earnings growth. That can be accomplished by
3 averaging those measures of long-term growth that tend to be least influenced by capital
4 allocation decisions that companies may make in response to near-term changes in the business
5 environment. Since such decisions may directly affect near-term dividend payout ratios,
6 estimates of earnings growth are more indicative of long-term investor expectations than are
7 dividend growth estimates. Therefore, for the purposes of the Constant Growth DCF model,
8 growth in EPS represents the appropriate measure of long-term growth.
9 Q. Please summarize the findings of academic research on the appropriate
I 0 measure for estimating equity retums using the DCF model.
II A. The relationship between various growth rates and stock valuation metrics has
12 been the subject of much academic research". As noted over 40 years ago by Charles Phillips in
13 The Economics of Regulation:
14 For many years, it was thought that investors bought utility stocks 15 largely on the basis of dividends. More recently, however, studies 16 indicate that the market is valuing utility stocks with reference to total 17 per share earnings, so that the earnings-price ratio has assumed 18 increased emphasis in rate cases".
19 Philips' conclusion continues to hold true. Subsequent academic research has clearly and
20 consistently indicated that measures of earnings and cash flow are strongly related to returns, and
21 that analysts' forecasts of growth arc superior to other measures of growth in predicting stock
ss See, for example, Harris, Robert, Using Analysis' Groll' III Forecasls to Eslimale Shareholder Required Rate of Return, Financial Management, Spring 1986.
59 Charles F. Phillips, Jr., The Economics of Regulation, Revised Edition, 1969, Richard D. [rwin, Inc., at 285.
40

Rebuttal Testimony of Robert B. Hevert
prices60• For example, Vander Weide and Carleton state that, "[our] results ... are consistent with
2 the hypothesis that investors use analysts' forecasts, rather than historically oriented growth
3 calculations, in making stock buy-and-sell decisions61 ." Other research specifically notes the
4 importance of analysts' growth estimates in determining the Cost of Equity, and in the valuation
5 of equity securities. Dr. Robe1t Harris noted that "a growing body of knowledge shows that
6 analysts' earnings forecast are indeed reflected in stock prices." Citing Cragg and Malkiel,
7 Dr. Harris notes that those authors "found that the evaluations of companies that analysts make
8 are the sorts of ones on which market valuation is based62." Similarly, Brigham, Shome and
9 Vinson noted that "evidence in the current literature indicates that (i) analysts' forecasts are
10 superior to forecasts based solely on time series data; and (ii) investors do rely on analysts'
I I forecasts63."
12 To that point, the research of Carleton and Vander Weide demonstrates that earnings
13 growth projections have a statistically significant relationship to stock valuation levels, while
14 dividend growth rates do not61• Those findings suggest that investors form their investment
15 decisions based on expectations of growth in earnings, not dividends. Consequently, earnings
16 growth not dividend growth is the appropriate estimate for the purpose of the Constant Growth
17 DCF model.
60
6\
62
63
"'
See, for example, Christoti, Christofi, Lori and Moliver, Evaluating Common Stocks U-;iug Value Line's Projected Cash Flows and Implied Growth Rate, Journal of Investing (Spring 1999); Harris and Marston, Estimating Shareholder Risk Premia Using Analysts' Growth Forecasts, Financial Management. 21 (Summer 1992); and Vander Weide and Carleton, Investor Growth Etpectations: Analysts vs. JlistOJy, The Journal of Portfolio Management, Spring 1988. Vander Weide and Carleton, Investor Growth Expectatiom: Analysts vs. Histmy, The Journal of Portfolio Management, Spring 1988. Robert S. Harris, Using Analysts' Growth Forecasts to Estimate Shareholder Required Rate of Retum, Financial IVlanagcment, Spring 1986. Eugene F. Brigham, Dilip K. Shomc, and Steve R. Vinson, 11ze Risk Premium Approach to 1\Ieasuring a Utility's Cost ojt.(ptily, Financial Management, Spring 1985. See Vander Weide and Carleton, Investor Growth Etpectations: Ana~vsts vs. lfistOJy, The Journal of Pot1folio Management, Spring 1988.
41

I
2
Rebuttal Testimony of Robert B. Heveti
Q. Please summarize your iuputs to the Constant Growth DCF model.
A. I applied the DCF model to the proxy group of integrated electric utility
3 companies using the following inputs for the price and dividend terms:
4 The average daily closing prices for the 30-trading days, 90-trading days, and 180-trading
5 days ended April 15, 2014, for the term P0; and
6 The annualized dividend per share as of April 15,2014, for the term DO.
7 I then calculated my DCF results using each ofthe following growth terms:
8 • The Zacks consensus long-term earnings growth estimates;
9 • The First Call consensus long-term earnings growth estimates; and
10 • The Value Line long-term earnings growth estimates.
I I Q. How did you calculate the mean high and mean low DCF results?
12 A. For each proxy company, I calculated the high DCF result by combining the
13 maximum EPS growth rate estimate as reported by Value Line, Zacks, and First Call with the
14 subject company's dividend yield. The mean high result simply is the average of those
15 estimates. I used the same approach to calculate the low DCF result, using instead the minimum
16 of the Value Line, Zacks, and First Call estimate for each proxy company, and calculating the
17 average result for those estimates.
18 Q. What arc the results of your Constant Growth DCF analysis?
19 A. My Constant Growth DCF results are summarized in Table 5, below (see also
20 Schedule RBH-9).
42

2
3
4
5
Rebuttal Testimony of Robert B. Heve11
Table 5: Constant Growth DCF Results
Mean Low Mean
30-Day Average 8.17% 9.48%
90-Day Average 8.28% 9.59%
180-Day Average 8.35% 9.67%
c. Multi-Stage DCF Model
Q. What other forms of the DCF model have you used?
Mean Higft
10.79%
10.90%
10.98%
A. In order to address certain limiting assumptions underlying the Constant Growth
6 form of the DCF model, I also considered the Multi-Stage (three-stage) DCF Model. The Multi-
7 Stage model, which is an extension of the Constant Growth form, enables the analyst to specify
8 growth rates over three distinct stages. As with the Constant Growth form of the DCF model,
9 the Multi-Stage form defines the Cost of Equity as the discount rate that sets the current price
I 0 equal to the discounted value of future cash flows. Unlike the Constant Growth form, however,
II the Multi-Stage model must be solved in an iterative fashion. As noted earlier, the Multi-Stage
12 model described below addresses several of the shortcomings contained in Mr. Gorman's
13 approach.
14 Q. Please generally describe the structure of your Multi-Stage model.
15 A. The model sets the subject company's stock price equal to the present value of
16 future cash flows received over three "stages". In the first two stages, "cash flows" are defined
17 as projected dividends. In the third stage, "cash flows" equal both dividends and the expected
18 price at which the stock will be sold at the end of the period (i.e., the "terminal price"). I
19 calculated the terminal price based on the Gordon model, which defines the price as the expected
20 dividend divided by the difference between the Cost of Equity (i.e., the discount rate) and the
2! long-term expected growth rate. In essence, the terminal price is defined by the present value of
43
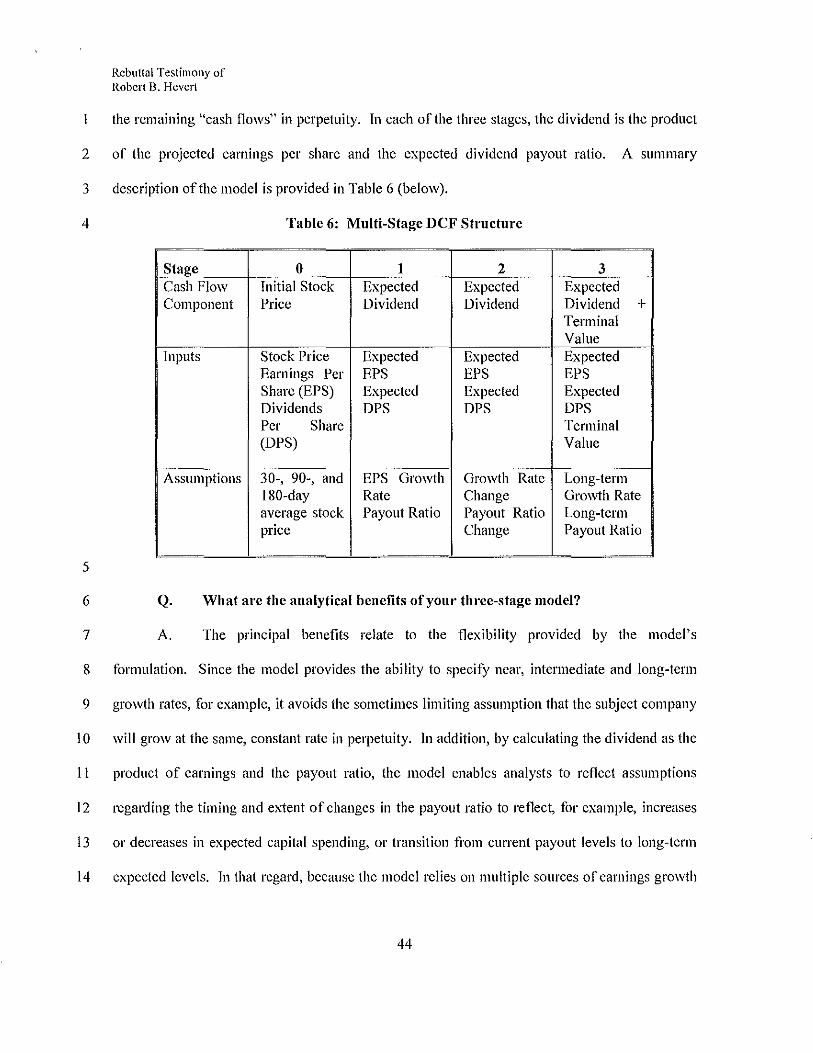
Rebuttal Testimony of Robert B. Heve1i
the remaining "cash flows" in perpetuity. In each of the three stages, the dividend is the product
2 of the projected earnings per share and the expected dividend payout ratio. A summary
3 description of the model is provided in Table 6 (below).
4 Table 6: Multi-Stage DCF Structure
' Stage 0 1 2 3 Cash Flow Initial Stock Expected Expected Expected Component Price Dividend Dividend Dividend +
Terminal Value
Inputs Stock Price Expected Expected Expected Earnings Per EPS EPS EPS Share (EPS) Expected Expected Expected Dividends DPS DPS DPS Per Share Terminal (DPS) Value
Assumptions 30-, 90-, and EPS Growth Growth Rate Long-term 180-day Rate Change Growth Rate average stock Payout Ratio Payout Ratio Long-term price Change Payout Ratio
5
6 Q. What are the analytical benefits of your three-stage model?
7 A. The principal benefits relate to the flexibility provided by the model's
8 formulation. Since the model provides the ability to specify near, intermediate and long-term
9 growth rates, for example, it avoids the sometimes limiting assumption that the subject company
I 0 will grow at the same, constant rate in perpetuity. In addition, by calculating the dividend as the
II product of earnings and the payout ratio, the model enables analysts to reflect assumptions
12 regarding the timing and extent of changes in the payout ratio to reflect, for example, increases
13 or decreases in expected capital spending, or transition from current payout levels to long-term
14 expected levels. In that regard, because the model relies on multiple sources of earnings growth
44

Rebuttal Testimony of Robert R. Hevert
rate assumptions, it is not limited to a single source, such as Value Line, for all inputs, and
2 mitigates the potential bias associated with relying on a single source of growth estimates65•
3 The model also enables the analyst to assess the reasonableness of the inputs and results
4 by reference to certain market-based metrics. For example, the stock price estimate can be
5 divided by the expected earnings per share in the final year to calculate an average Price to
6 Earnings ("P/E") ratio. Similarly, the terminal P/E ratio can be divided by the terminal growth
7 rate to develop a Price to Earnings Growth ("PEG") ratio. To the extent that either the projected
8 P/E or PEG ratios are inconsistent with either historical or expected levels, it may indicate
9 incorrect or inconsistent assumptions within the balance of the model.
10 Q. Please summarize your inputs to the Multi-Stage DCF model.
11 A. I applied the Multi-Stage model to the proxy group described earlier in my
12 Rebuttal Testimony. My assumptions with respect to the various model inputs are described in
13 Table 7 (below).
65 See, for example, Harris and Marston, Estimating Shareholder Risk Premia Using Analysts' Growth Forecasls, Financial Management, 21 (Summer I 992).
45
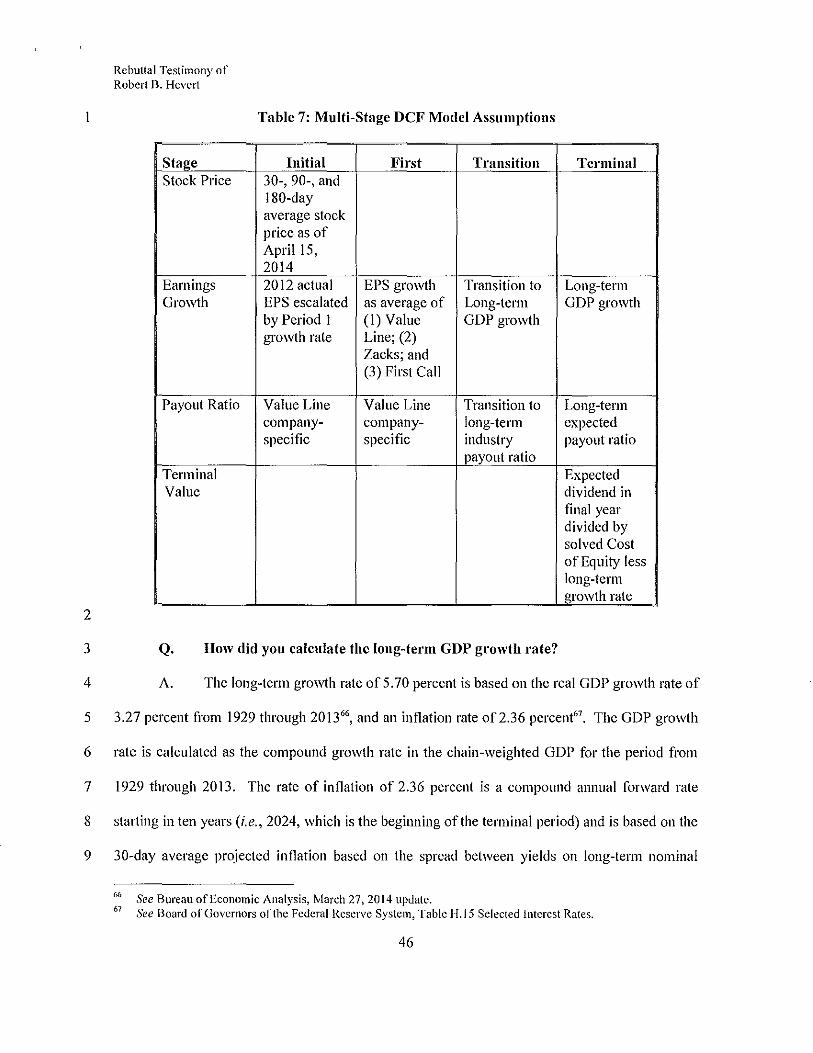
2
3
4
Rebuttal Testimony of Robert B. Hevert
Stae:e Stock Price
Earnings Growth
Payout Ratio
Terminal Value
Table 7: Multi-Stage DCF Model Assumptions
Initial First Transition 30-, 90-, and 180-day average stock price as of April15, 2014 2012 actual EPS growth Transition to EPS escalated as average of Long-term by Period I (I) Value GDP growth growth rate Line; (2)
Zacks; and (3) First Call
Value Line Value Line Transition to company- company- long-term specific specific industry
payout ratio
Q. How did you calculate the long-term GDP growth rate?
Terminal
Long-term GDP growth
Long-term expected payout ratio
Expected !
dividend in final year divided by solved Cost of Equity less long-term growth rate
A. The long-term growth rate of 5.70 percent is based on the real GDP growth rate of
5 3.27 percent from 1929 through 201366, and an inflation rate of2.36 percent". The GOP growth
6 rate is calculated as the compound growth rate in the chain-weighted GDP for the period from
7 1929 through 2013. The rate of inflation of 2.36 percent is a compound annual forward rate
8 starting in ten years (i.e., 2024, which is the beginning of the terminal period) and is based on the
9 30-day average projected inflation based on the spread between yields on long-term nominal
66 See Bureau of Economic Analysis, March 27, 2014 update. 67 See Board of Governors of the Federal Reserve System, Table l-f.l5 Selected Interest Rates.
46
Rebuttal Testimony of Robert B. Heveii
Treasury Securities and long-term Treasury Inflation Protected Securities, known as the "TIPS
2 spread".
3 In essence, my real GDP growth rate projection is based on the assumption that absent
4 specific knowledge to the contrary, it is reasonable to assume that over time, real GDP growth
5 will revert to its long-term mean. Moreover, since estimating the Cost of Equity is a market-
6 based exercise, it is important to reflect the sentiments and expectations of investors to the extent
7 possible. In that important respect, the TIPS spread represents the collective views of investors
8 regarding long-term inflation expectations. Equally imp01tant, by using forward yields we are
9 able to infer the level of long-term inflation expected by investors as of the terminal period of the
10 Multi-Stage model (that is, ten years in the fhture).
II Q. What were your specific assumptions with respect to the payout ratio?
12 A. As noted in Table 7, for the first two periods, I relied on the first year and long-
13 term projected payout ratios rep01ted by Value Line68 for each of the proxy companies. I then
14 assumed that by the end of the second period (i.e., the end of year 10), the payout ratio will
15 converge to the historical industry average ratio of67.05 percent".
16 Q. What are the results of your Multi-Stage DCF analysis?
17 A. Table 8 (below; see also Schedule RBH-10) presents the Multi-Stage DCF
18 analysis results. Using the Gordon model to calculate the terminal stock price, the Multi-Stage
19 DCF analysis produces a range of results fi·om 9.55 percent to I 0.59 percent.
68 As reported in the Value Line Investment Survey as ·'All Div'ds to Net Prot:" 69 Source: Bloomberg Professional
47

1
2
3
Rebuttal Testimony of Robert B. Hevert
Table 8: Multi-Stage DCF Model Results
Mean Low JI.Ieau
30-Day Average 9.55% 9.92%
90-Day Average 9.67% 10.05%
180-Day Average 9.75% 10.14%
Mean High
10.35%
10.49%
10.59%
Q. Did you undertake any additional analyses to snpport your
4 recommendation?
5 A. Yes. As noted earlier, I also applied the CAPM and Risk Premium approaches.
6 D. CAPM Analysis
7 Q. Please briefly describe the general form of the CAPM analysis.
8 A. The CAPM analysis is a risk premium method that estimates the Cost of Equity
9 for a given security as a function of a risk-free return plus a risk premium (to compensate
I 0 investors for the non-diversifiable or "systematic" risk of that security). As shown in Equation
11 [3], the CAPM is defined by four components, each of which theoretically must be a forward-
12 looking estimate:
13 k = r1 + P(r,,. - 1!) Equation [3]
14 where:
15 k =the required market ROE for a security;
16 ~=the Beta coefficient of that security;
17 rr= the risk-free rate of return; and
18 r, =the required return on the market as a whole.
48

Rebuttal Testimony of Robert B. Hevert
In Equation [4], the term (rm- J'j) represents the Market Risk Premium70• According to
2 the theory underlying the CAPM, since unsystematic risk can be diversified away by adding
3 securities to their investment portfolio, investors should be concerned only with systematic or
4 non-diversifiable risk. Non-diversifiable risk is measured by the Beta coefficient, which is
5 defined as:
6 u· p = _1 Xp·
) Um j.'tn Equation [ 4]
7 Where ~ is the standard deviation of returns for company ''j," a,. is the standard
8 deviation of returns for the broad market (as measured, for example, by the S&P 500 Index), and
9 pi ,m is the correlation of returns in between company j and the broad market. The Beta
10 coefficient therefore represents both relative volatility (i.e., the standard deviation) of returns,
II and the correlation in returns between the subject company and the overall market.
12 Intuitively, higher Beta coefficients indicate that the subject company's returns have been
13 relatively volatile, and have moved in tandem with the overall market. Consequently, if a
14 company has a Beta coefficient of 1.00, it is as risky as the market and does not provide any
I 5 diversification benefit.
16 Q. What assumptions did you include in your CAPM analysis?
17 A. Since utility assets represent long duration investments, I used two different
18 measures of the risk-free rate: (1) the current 30-day average yield on 30-year Treasury bonds
19 (i.e., 3.60 percent); and (2) the projected 30-ycar Treasury yield (i.e., 4.15 percent).
20 Q. Why have you relied upon the 30-year Treasury yield for your CAPM
21 analysis?
70 The Market Risk Premium is defined as the incremental return of the market over the risk-fi·ee rate.
49

Rebuttal Testimony of Robert B. Heveti
A. In determining the security most relevant to the application of the CAPM, it is
2 important to select the term (or maturity) that best matches the life of the underlying investment.
3 Electric utilities typically are long-duration investments and as such, the 30-year Treasury yield
4 is more suitable for the purpose of calculating the Cost of Equity.
5 Q. What Market Risk Premium did you use in your CAPM analysis?
6 A. For the reasons discussed in my response to Mr. Gorman, I did not use a historical
7 average; rather, I developed forward-looking (ex-ante) estimates of the Market Risk Premium.
8 Q. Please describe your ex-ante approach to estimating the Market Risk
9 Premium.
10 A. The approach is based on the market required return, less the current 30-year
II Treasury yield. To estimate the market required return, I calculated the market capitalization
12 weighted average ROE based on the Constant Growth DCF model. To do so, I relied on data
13 from two sources: (I) Bloomberg; and (2) Value Line. With respect to Bloomberg-derived
14 growth estimates, I calculated the expected dividend yield (using the same one-half growth rate
15 assumption described earlier), and combined that amount with the projected earnings growth rate
16 to arrive at the market capitalization weighted average DCF result. I performed that calculation
17 for each of the S&P 500 companies for which Bloomberg provided consensus growth rates. I
18 then subtracted the current 30-year Treasury yield fi·om that amount to arrive at the market DCF-
19 derived ex-ante market risk premium estimate. In the case of Value Line, I performed the same
20 calculation, again using all companies for which five-year earnings growth rates were available.
21 The results of those calculations are provided in Schedule RBH-11.
22 Q. How did you apply your expected Market Risk Premium and risk-free rate
23 estimates?
50

Rebuttal Testimony of Robert B. llcvert
A. I relied on the ex-ante Market Risk Premia discussed above, together with the
2 current and near-term projected 30-year Treasury yields as inputs to my CAPM analyses.
3 Q. What Beta coefficient did you use in your CAPM model?
4 A. As shown in Schedule RBH-12, I considered the Beta coefficients reported by
5 two sources: Bloomberg and Value Line. For each source, I employed the average of the
6 reported Beta coefficient for each proxy group company. While both of those services adjust
7 their calculated (or "raw") Beta coefficients to reflect the tendency of the Beta coefficient to
8 regress to the market mean of 1.00, Value Line calculates the Beta coefficient over a five-year
9 period, while Bloomberg's calculation is based on two years of data.
10 Q. What are the results of your CAPM analysis?
II A. As shown in Table 9 the CAPM analyses suggest an ROE range of 10.27 percent
12 to 12.08 percent (see also Schedule RBH-13).
13 Table 9: Summary ofCAPMResnlts
Bloomberg Value Line Derived Derived
Market Risk Market Risk Premium Premium
Average Bloomberg Bela Coefficient
Current 30-Year Treasury (3.60%) 11.50% 10.27%
Near Term Projected 30-Year Treasury ( 4.15%) 12.05% 10.82%
Average Value Line Beta Coefficient
Current 30-Year Treasury (3.60%) 11.53% 10.29%
Ncar Term Projected 30-Year Treasury (4.15%) 12.08% 10.84%
14
51
i
I

2
3
Rebuttal Testimony of Robert B. Hevert
E. Bond Yield Plus Risk Premium Approach
Q. Please generally describe the Bond Yield Plus Risk Premium approach.
A. This approach is based on the basic financial tenet that equity investors bear the
4 residual risk associated with ownership and therefore require a premium over the return they
5 would have earned as a bondholder. That is, since returns to equity holders are more risky than
6 returns to bondholders, equity investors must be compensated for bearing that risk. Risk
7 premium approaches, therefore, estimate the Cost of Equity as the smn of the equity risk
8 premium and the yield on a particular class of bonds. As noted in my discussion of the CAPM,
9 since the equity risk premium is not directly observable, it typically is estimated using a variety
I 0 of approaches, some of which incorporate ex-ante, or forward-looking estimates of the Cost of
II Equity, and others that consider historical, or ex-post, estimates. An alternative approach is to use
12 actual authorized returns for electric utilities to estimate the Equity Risk Premium.
13 Q. Please explain how yon performed your Bond Yield Plus Risk Premium
14 analysis.
15 A. As suggested above, I first defined the Risk Premium as the difference between
16 the authorized ROE and the then-prevailing level of long-term (i.e., 30-year) Treasury yield. I
17 then gathered data for over I ,421 electric utility rate proceedings between January, 1980 and
18 April IS, 2014. In addition to the authorized ROE, I also calculated the average period between
19 the filing of the case and the date of the tina! order (the "lag period"). In order to reflect the
20 prevailing level of interest rates during the pendency of the proceedings, I calculated the average
21 30-year Treasury yield over the average lag period (approximately 20 I days).
22 Because the data cover a number of economic cycles, the analysis also may be used to
23 assess the stability of the Equity Risk Premium. Prior research, for example, has shown that the
52
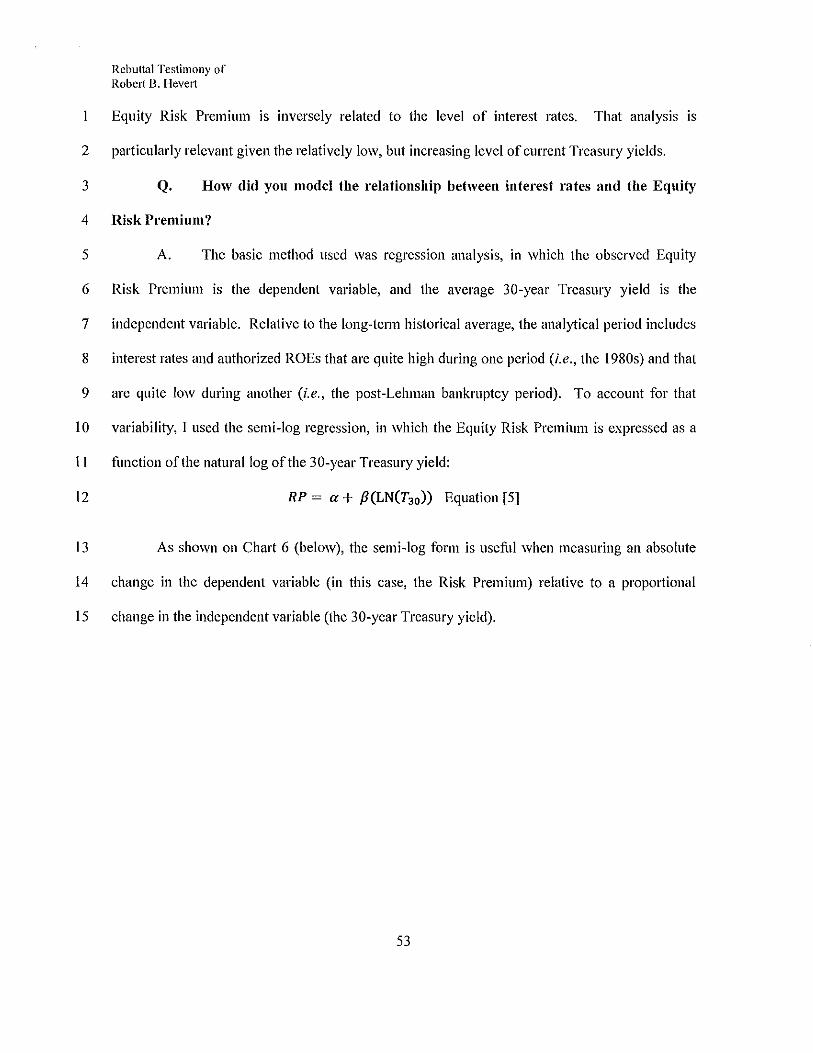
Rebuttal Testimony of Robert ll. Heve11
Equity Risk Premium is inversely related to the level of interest rates. That analysis is
2 particularly relevant given the relatively low, but increasing level of current Treasury yields.
3 Q. How did you model the relationship between interest rates and the Equity
4 Risk Premium?
5 A. The basic method used was regression analysis, in which the observed Equity
6 Risk Premium is the dependent variable, and the average 30-year Treasury yield is the
7 independent variable. Relative to the long-term historical average, the analytical period includes
8 interest rates and authorized ROEs that are quite high during one period (i.e., the 1980s) and that
9 are quite low during another (i.e., the post-Lehman bankruptcy period). To account for that
I 0 variability, I used the semi-log regression, in which the Equity Risk Premium is expressed as a
II function of the natural log of the 30-year Treasury yield:
12 RP = a+ P(LN(T30)) Equation [5]
13 As shown on Chart 6 (below), the semi-log form is useful when measuring an absolute
14 change in the dependent variable (in this case, the Risk Premium) relative to a proportional
15 change in the independent variable (the 30-year Treasury yield).
53
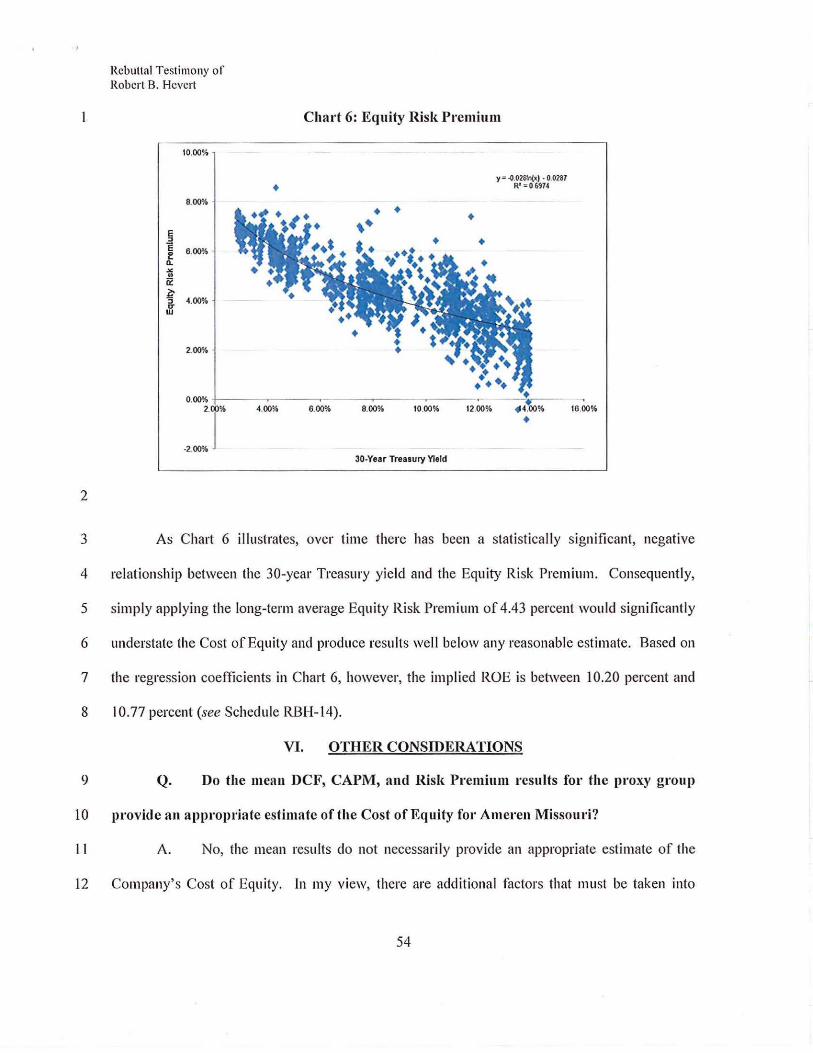
2
Rebuttal Testimony of Robert B. Hevert
10.00%
8.0014
E " E 6.00llo 0 .. 0.
"' .. ~ l;
4.00% " 0" w
2.D<ra
•
Char·t 6: Equity Risk Premium
y = ·0.020'r.(Jc) • 0.0281 R' =0 6974
~~ . •
-2.0014 30-Year Treasury Yield
16.00Si
3 As Chart 6 illustrates, over time there has been a statistically significant, negative
4 relationship between the 30-year Treasury yield and the Equity Risk Premium. Consequently,
5 simply applying the long-term average Equity Risk Premium of 4.43 percent would significantly
6 understate the Cost of Equity and produce results well below any reasonable estimate. Based on
7 the regression coefficients in Chart 6, however, the implied ROE is between 10.20 percent and
8 I 0. 77 percent (see Schedule RBH-14).
VI. OTHER CONSIDERATIONS
9 Q. Do the mean DCF, CAPM, and Risk Premium results for· the proxy group
10 provide an appropriate estimate of the Cost of Equity for Ameren Missouri?
II A. No, the mean results do not necessarily provide an appropriate estimate of the
12 Company's Cost of Equity. In my view, there are additional factors that must be taken into
54

Rebuttal Testimony of Robert B. Hevcrt
consideration when determining where the Company's cost of equity falls within the range of
2 results. Those factors include the regulatory environment in which the company operates. Those
3 risk factors, which are discussed below, should be considered with respect to their overall effect
4 on the Company's risk profile and therefore its cost of equity.
5 A. RegulatOIJ' Euvironment
6 Q. How does the regulatory environment in which a utility operates affect its
7 access to and cost of capital?
8 A. The regulatory environment can significantly affect both the access to, and cost of
9 capital in several ways. First, the proportion and cost of debt capital available to utility
10 companies are influenced by the rating agencies' assessment of the regulatory environment. As
II noted by Moody's, "Broadly speaking, the Regulatory Framework is the foundation for how all
12 the decisions that affect utilities are made (including the setting of rates), as well as the
13 predictability and consistency of decision-making provided by that foundation71." Investors
14 recognize that a reasonable allowed ROE that is subject to earnings attrition due to unfavorable
15 regulatory or economic factors does not provide any assurance that the utility will actually
16 recover its costs or earn a reasonable return.
17 Further, Moody's acknowledges that timely cost recovery is an important determinant of
18 credit quality, stating that "A utility operating in a regulatory framework that, by statute or
19 practice, allows the regulator to arbitrarily prevent the utility fi·om recovering its costs or earning
20 a reasonable return on prudently incurred investments ... will receive a much lower [rating]
21 score72."
71
72
rvfoody's Investors Service, Rating Alethodology, Regulated Electric and Gas UtUities, December 23, 2013, at 9. Ibid., at 10.
55
Rebuttal Testimony of Robert B. Hcvert
Q. Please explain how credit rating agencies consider regulatory risk in
2 establishing a company's credit rating.
3 A. While both S&P and Moody's consider regulatory risk in establishing credit
4 ratings, Moody's has published a report quantifying the importance of this metric. Moody's
5 establishes credit ratings based on four key factors; (I) regulatory framework; (2) the ability to
6 recover costs and earn returns; (3) diversification; and (4) financial strength, liquidity, and key
7 financial metrics. Of those criteria, regulatory framework and the ability to recover costs and
8 earn returns are each given a broad rating factor of 25.00 percent. Therefore, Moody's assigns
9 regulatory risk a 50.00 percent weighting in the overall assessment of business and financial risk
10 for regulated utilities73. The authorized ROE affects not only the cash flow-related metrics that
II measure financial strength but also provides an indication of the degree of regulatory support,
12 and risk, associated with a given utility and jurisdiction. It is, therefore, an important measure of
13 financial integrity from several perspectives.
14 Q. Are there specific issues relating to Missouri that are a consideration for
15 equity investors?
16 A. Yes, I believe so. As noted in an April 2013 report by Regulatory Research
17 Associates, Missouri is one of only five states that legally prohibit utilities fi·om including
18 Construction Work in Progress in the rate base74• As a consequence, the Company's ability to
19 maintain its cash flow is disadvantaged relative to others that either have the ability to include
20 CWIP in rate base during general rate cases (and therefore earn a cash return on that investment),
21 or are provided a more timely cash return through adjustment clauses. As discussed in my
22 response to Mr. Gorman, when the revenue per dollar of assets decreases, the earned return on
73
74 Ibid., at 6. Regulatory Research Associates, Construction Work in Progress; Getting acquainted with an old issue, April 22,2013, at 2
56

Rebuttal Testimony of Robert B. Hevet1
common equity also will decrease. Because net income is a principal element of cash flow, the
2 dilution in earnings resulting from not receiving a cash return on CWIP diminishes the
3 Company's financial profile and increases its relative risk.
4 In addition, Missouri utilities set rates based on an historical test year, with limited
5 "known and measurable" changes". In contrast, other utilities, including utilities in the proxy
6 group, have the ability to recover rate base additions through forecast test years or alternative
7 rate plans. As Regulatory Research Associates has noted, "[ s ]uch rate changes provide for
8 improved cash flow and possibly earnings through reduced regulatory lag76." As with the
9 inability to include CWIP in its rate base, because it is subject to the regulatory lag otherwise
10 mitigated by forecast test years or alternative rate plans, Ameren Missouri's ability to generate
II earnings and cash flow is disadvantaged relative to its peers.
12 The same holds true regarding the Company's inability to implement interim rates. As
13 RRA points out, the Commission "may authorize an interim increase, subject to refund, if a
14 company can demonstrate an emergency, or a near emergency situation." RRA concludes that as
15 a result, interim increases have rarely been sought or authorized" in Missouri77• Because interim
16 rates are unlikely, the Company's cash flow position is diluted as it invests in its rate base.
17 The inability to include CWIP in rate base, the use of an historical test year, and the
18 inability to implement interim rates are particularly relevant in light of the Company's plan to
19 invest over $3 billion in its regulated operations from 2014 to 2015. In 2014 alone, Ameren
75
76
77
Source: Regulatory Research Associates, lvlissouri Public Service Commission Pro tile. Regulatory Research Associates, Alternative Regulation/Incentive Plans, A State-by-Stale Review, November 2013, at I. Regulatory Research Associates, Missouri Public Service Commission Profile.
57

Rebuttal Testimony of Robert B. Hevcrt
Missouri expects to invest $756 million, which will contribute to the expected negative free cash
2 flow at the parent level".
3 Q. What are your conclusions regarding the regulatory and the Company's risk
4 profile?
5 A. The regulatory environment is one of the most important issues considered by
6 both debt and equity investors in assessing the risks and prospects of utility companies. From
7 the perspective of debt investors, the authorized return should enable the Company to generate
8 the cash flow needed to meet its near-term financial obligations, make the capital investments
9 needed to maintain and expand its system, and maintain sufficient levels of liquidity to fund
I 0 unexpected events. This financial liquidity must be derived not only from internally generated
II funds, but also by efficient access to capital markets. Moreover, because investors have many
12 investment alternatives, even within a given market sector, the Company's financial profile must
13 be adequate on a relative basis to ensure its ability to attract capital under a variety of economic
14 and financial market conditions.
15 From the perspective of Ameren Corporation, the parent holding company of Ameren
16 Missouri, the authorized return must be sufficient to provide an incentive to allocate equity
17 capital to Ameren Missouri in order to fund capital investments that will assure the Company's
18 ability to continue to provide safe and reliable service. From the perspective of equity investors,
19 the authorized return must be adequate to provide a risk-comparable return on the equity portion
20 of the Company's capital investments. Since equity investors are the residual claimants on the
21 Company's cash flows (which is to say that the equity return is subordinate to interest payments),
22 they are particularly concerned with regulatory uncertainty and its effect on future cash flows.
78 Ameren, Bm·clays Power and Utility Credit Conference, June 2014 at 20 - 21.
58
Rebuttal Testimony of Robert B. Hevert
1 Because of the regulatory lag created by the inability to include CW1P in the rate base,
2 the use of historical test periods, and the inability to implement interim rates, Ameren Missouri is
3 at a disadvantage in terms of its ability to earn its authorized return. Mr. Gorman's 9.40 percent
4 ROE recommendation would only diminish the Company's ability to earn a reasonable return.
5 In light of those risks, 1 believe that an ROE of 10.40 percent is reasonable and appropriate.
6 B. Generation Portfolio
7 Q. Please provide au overview of the Company's generation portfolio.
8 A. Ameren Missouri's operations are heavily dependent on coal-fired generation,
9 representing more than 75.00 percent of its 2013 net generation. The Company's remaining
10 generation pmtfolio is largely dependent on a single nuclear plant, which represented
11 approximately 20.00 percent of the Ameren Missouri's 2013 net generation".
12 Q. Please briefly describe the risl{S associated with the ownership of coal-fired
13 generating resources.
14 A. In general, capital-intensive generation assets such as coal-fired plants face risks
15 associated with capital recovery in the event of market structure changes or plant failure, or
16 replacement cost recovery in the event of extended or unplanned outages. Federal environmental
17 regulations creating emissions control requirements have been issued in recent years.
18 Compliance with new regulations can require substantial capital investment, or add operational
19 costs. In fact, a report by Staff of the Missouri Public Service Commission estimated that known
20 Environmental Protection Agency ("EPA") regulations, which primarily affect coal-fired
21 generating plants, would cost state electric utilities and their customers in the range of
79 Source: SNL Financial.
59

Rebuttal Testimony of Robert B. Heve1t
1 approximately $2.23 billion to $2.47 billion fi·om2012 to 202280• The report also highlighted the
2 level of uncertainty regarding emerging environmental regulations and the potential
3 consequences. The need to respond to environmental regulations makes it particularly important
4 that Ameren Missouri maintains reasonable access to the capital markets.
5 More recently, the risks and potential costs associated with coal-fired generating plants
6 have been highlighted in the EPA's proposed carbon dioxide reduction mle. Introduced on
7 June 2, 2014, the mle proposes to reduce carbon dioxide emissions in the year 2030 by 30
8 percent fi·om their 2005 levels. Under the EPA's "Clean Power Plan", carbon dioxide reduction
9 targets are proposed on a state-by-state basis, with four "pathways" to meet those goals. While
10 states can choose their own path to compliance, they must submit their plans to the EPA for
II approval by June 201681• Regardless of the path chosen, the uncertainty associated with the
12 potential costs, and the recovery of those costs, is a consideration for companies such as Ameren
13 Missouri, for which coal-fired generation represents a large share of its portfolio.
14 Q. Do you have any other observations regarding the Company's generation
15 portfolio?
16 A. Yes. As opposed to other owners of nuclear generating facilities, Ameren is the
17 owner of a single nuclear plant. As a single asset owner, the Company does not have the benefit
18 of diverse operations, or the scale economies that could result in lower marginal costs or higher
19 capacity factors. In that regard, Ameren may be exposed to somewhat higher risk than
20 companies that own and operate nuclear fleets, or those that operate no nuclear plants at all.
21
so See, fvlissouri Public Service Commission, Updated Sta..fl Report on 11ze Cost of Compliance wUh Federal Environmental Regulations, December 19, 20 I 3 at 23. The report includes cost estimates tbr Amcrcn Missouri, Great Plains and Kansas City Power & Light, and Empire District Electric Company.
81 Regulatory Research Associates) UPDATE: EPA proposes 30% reduction in greenhouse gas emissions from power sector, June 2, 2014.
60

Rebuttal Testimony of Robert B. Hevert
VII. CONCLUSIONS AND RECOMMENDATION
Q. What is your conclusion regarding the Company's Cost of Equity?
2 A. For the reasons discussed in Section IV, I strongly disagree with Mr. Gorman's
3 9.40 percent ROE recommendation. Not only is that estimate well below the prevailing
4 authorized return available to other vertically integrated electric utilities, it is the result of
5 analyses that are flawed in several fundamental respects. Correcting for those flaws significantly
6 raises Mr. Gorman's results, demonstrating that his 9.40 percent ROE recommendation is
7 unreasonable and fails to reflect Ameren Missouri's Cost of Equity.
8 As discussed earlier in Section V, I have performed several analyses in response to
9 Mr. Gorman's testimony. In light of those results, and taking into consideration other relevant
10 and observable market data, I believe that ROE in the range of I 0.20 percent to I 0.60 percent
II represents the range of returns required by equity investors under cmrent and expected market
12 conditions. Within that range, it is my view that an ROE of 10.40 percent is reasonable and
13 appropriate.
14 Table lOa: Summary of DCF Results
Constant Growth DCF Low Mean High
30-Day Average 8.17% 9.48% 10.79%
90-Day Average 8.28% 9.59% 10.90%
180-Day Average 8.35% 9.67% 10.98%
Multi-Stage DCF Low Me au High
30-Day Average 9.55% 9.92% 10.35%
90-Day Average 9.67% 10.05% 10.49%
180-Day Average 9.75% 10.14% 10.59%
15
61

2
3
4
Rebuttal Testimony of Robert B. Hcve11
Table lOb: Summary of Risk Premium and Other Analytical Results
Bloomberg Value Line Derived Derived
Markel Risk Markel Risk CAPM Results Premium Premium
Average Bloomberg Beta Co~[ficient 1
Current 30-Year Treasury (3.60%) 11.50% 10.27%
Near Term Projected 30-Year Treasury (4.15%) 12.05% 10.82%
Average Value Line Beta Co~f]icient
Current 30-Year Treasury (3.60%) 11.53% 10.29%
Near Term Projected 30-Year Treasury (4.15%) 12.08% 10.84%
Low Mid High
Bond Yield Plus Risk 10.20% 10.34% 10.77%
Premium - --
Q. Does this conclude your Rebuttal Testimony?
A. Yes, it does.
62
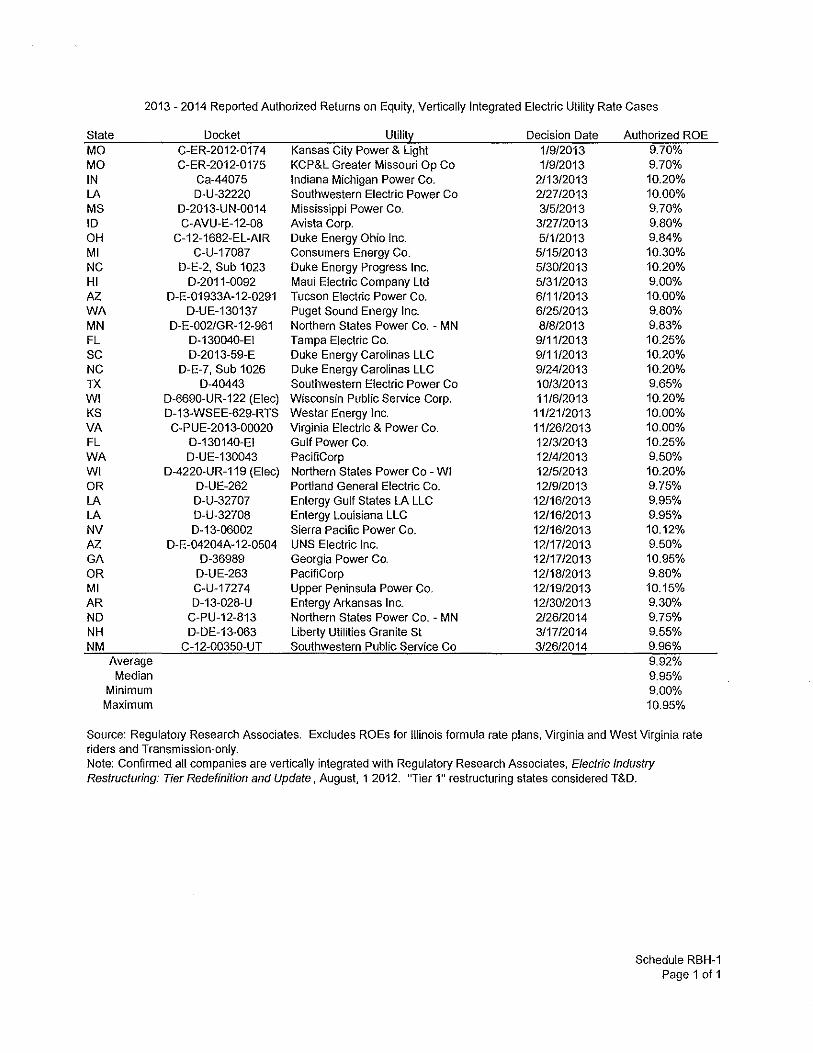
2013- 2014 Reported Authorized Returns on Equity, Vertically Integrated Electric Utility Rate Cases
State Docket uulitx Decision Date Authorized ROE MO C-ER-2012-0174 Kansas City Power & Light 11912013 9.70% MO C-ER-2012-0175 KCP&L Greater Missouri Op Co 11912013 9.70% IN Ca-44075 Indiana Michigan Power Co. 2/1312013 10.20% LA D-U-32220 Southwestern Electric Power Co 2/2712013 10.00% MS D-2013-UN-0014 Mississippi Power Co. 31512013 9.70% ID C-AVU-E-12-08 Avista Corp. 312712013 9.80% OH C-12-1682-EL-AIR Duke Energy Ohio Inc. 51112013 9.84% Ml C-U-17087 Consumers Energy Co. 511512013 10.30% NC D-E-2, Sub 1023 Duke Energy Progress Inc. 513012013 10.20% HI D-2011-0092 Maui Electric Company Ltd 513112013 9.00% AZ. D-E-01933A-12-0291 Tucson Electric Power Co. 611112013 10.00% WA D-UE-130137 Puget Sound Energy Inc. 612512013 9.80% MN D-E-002/GR-12-961 Northern States Power Co. - MN 81812013 9.83% FL D-130040-EI Tampa Electric Co. 911112013 10.25% sc D-2013-59-E Duke Energy Carolinas LLC 911112013 10.20% NC D-E-7, Sub 1026 Duke Energy Carolinas LLC 912412013 10.20% TX D-40443 Southwestern Electric Power Co 101312013 9.65% WI D-6690-UR-122 (Eiec) Wisconsin Public Service Corp. 111612013 10.20% KS D-13-WSEE-629-RTS Westar Energy Inc. 1112112013 10.00% VA C-PUE-2013-00020 Virginia Electric & Power Co. 1112612013 10.00% FL D-130140-EI Gulf Power Co. 121312013 10.25% WA D-UE-130043 PacifiCorp 121412013 9.50% WI D-4220-UR-119 (Eiec) Northern States Power Co -WI 12/512013 10.20% OR D-UE-262 Portland General Electric Co. 121912013 9.75% LA D-U-32707 Entergy Gulf States LA LLC 12/1612013 9.95% LA D-U-32708 Entergy Louisiana LLC 1211612013 9.95% NV D-13-06002 Sierra Pacific Power Co. 1211612013 10.12% AZ. D-E-04204A-12-0504 UNS Electric Inc. 1211712013 9.50% GA D-36989 Georgia Power Co. 1211712013 10.95% OR D-UE-263 PacifiCorp 1211812013 9.80% Ml C-U-17274 Upper Peninsula Power Co. 1211912013 10.15% AR D-13-028-U Entergy Arkansas Inc. 1213012013 9.30% ND C-PU-12-813 Northern States Power Co. - MN 2/2612014 9.75% NH D-DE-13-063 Liberty Utilities Granite St 311712014 9.55% NM C-12-00350-UT Southwestern Public Service Co 312612014 9.96%
Average 9.92% Median 9.95%
Minimum 9.00% Maximum 10.95%
Source: Regulatory Research Associates. Excludes ROEs for Illinois formula rate plans, Virginia and West Virginia rate riders and Transmission-only. Note: Confirmed all companies are vertically integrated with Regulatory Research Associates, Electric Industry Restructuring: Tier Redefinition and Update, August, 1 2012. "Tier 1" restructuring states considered T&D.
Schedule RBH-1 Page 1 of 1
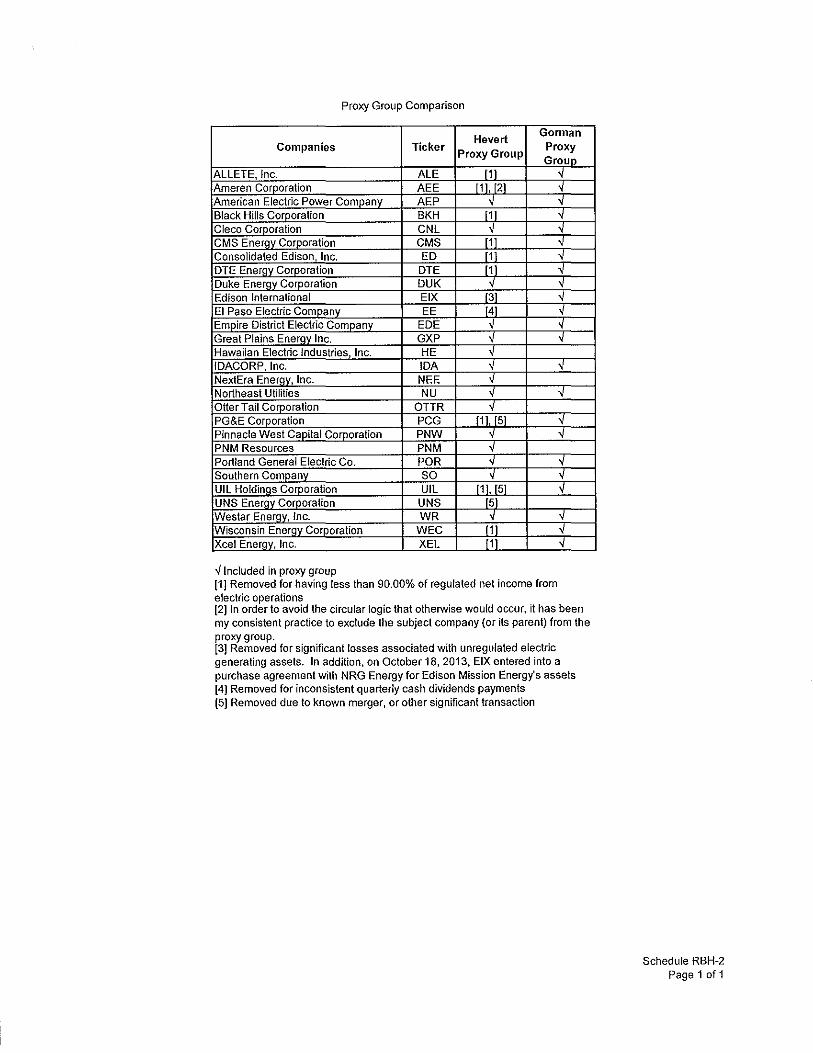
Proxy Group Comparison
Hevert Gonnan
Companies Ticker Proxy Group
Proxy Groun
ALLETE, Inc. ALE [1 Ameren Corporation AEE [1], 2] American Electric Power Company AEP ' Black Hills Corooration BKH [11 Cleco Corooration CNL " CMS Enerav Corooration CMS 1 Consolidated Edison, Inc. ED 1 DTE EnerQy Corporation DTE 1 Duke Enenw Corporation DUK Edison International EIX 131 El Paso Electric Comoanv EE 14 Emoire District Electric Comoanv EDE Great Plains Enerav Inc. GXP Hawaiian Electric Industries, Inc. HE IDACORP, Inc. IDA v NextEra EnerQV, Inc. NEE v Northeast Utilities NU v " OtterTail Cor oration OTTR " PG&E Corooration PCG 111, 51 " Pinnacle West Capital Corporation PNW v " PNM Resources PNM v Portland General Electric Co. POR v Southern Comoanv so v UIL Holdinos Corporation UIL [11, [51 UNS Enerav Corooration UNS 15 Westar Enerav, Inc. WR " Wisconsin Enerav Corooration WEC 11 Xcel EnerQy, Inc. XEL [1
..J Included in proxy group [1] Removed for having less than 90.00% of regulated net income from electric operations [2] In order to avoid the circular logic that otherwise would occur, it has been my consistent practice to exclude the subject company (or its parent) from the proxy group. [3] Removed for significant losses associated with unregulated electric generating assets. In addition, on October 18, 2013, EIX entered into a purchase agreement with NRG Energy for Edison Mission Energy's assets [4) Removed for inconsistent quarterly cash dividends payments [5) Removed due to known merger, or other significant transaction
Schedule RBH-2 Page 1 of 1

~~~~~"d £-Ha~ ~n:-<cpS
1\H'€.
"' 1\tSI
"' %£ ~~ \\QH
\\9~
~-"<:d 1<:1 u ... ,..n<.l
~
'i\19~)\
'i\9~ li'JI %91:£.)1
\\Q89J\ \\?31"'01 \\1:'131"'01 '1,93£0\ %SLI"\JI
%1"\JC•JI %&3W 'M?CQ\ 'i\ll&; 'f.noo~ 'i\\::8{•)\
¥.1:-3&3 '1\WM
'i\!OW \<))';F; %$700\ 'i\WW \\S9W '1'£g&> %\H•ll \\00(<)1
'E(<i:C•JI %a<ol 'i'iHC•J~
'i\ffi(()l 'htLC•ll 'i'\99001 w::..: 101 'i'\!9 101
%1~ 101 %1£001 .,.-,~.-;CoJI
'{,SH•ll %18101 %~tO\
o/iSQl'OI 'i\\LIO<ll
'i'~L'\01 %99 101 'i\00001 %~\t())
%1-S&'l %'?<:00\ 'f.C€001 \<WJ 10\
%10101 ~&5
'f.nw %91.101 'f.W&S Wl1&5 o/i1tC:6 'i'.£l(•)l
';',?;I;>) I 'M8M 'i\l~£-6 %!6(-6 \\MM 1':83&3 \\SQOO\ %16M
.,.-,s-;M %£?.001 %\6&; '{,lOC•Jl %1"£6-'l '1\LOOO\ %~0C>ll
'i\t-6&3
';\;o;E<;
'i\HW ¥.00(•)1 1\I"B&'l %£6&3 %10001 %60(•)1
MIC•ll
%\6&; 'fil~C•Jl
't';tOC>ll %&'i&'l '1\~M 'i\WC•JI 'i\ffi(•)l l':li!C•ll
%\~06 ..-.L6ffi %WOO\ %~1001
%95&5 l'il6('<l 'M8&3 '1\HC•J\
'i\00(•)1 >s&':C•JI \\61&3 'J\00001 ~w .,.-,r;<';&'l .,..,1606 '1<\Hl(()\
'{,j-Sffi
%\6&:; %1"£&> %£6&5 '{,9JC•ll '1\00001 'fi)Q(()I
%(>)(()\
%00f6 o;<;<Z((]\ 'i\00 101 %Z9 &'l %91&3 'i\00001 %91001 'i\WW 'i\£$00\ ';<;til&'l 'i\ta06 'i\WM 'i\Hio;;;; 'i\Z<3&6 %1-;l&'l %\000~
I<VX<Jll 'f.'K6<l %£l\OI %ZHOI %99C•ll '>S.<;:3\0\ 'i'.~'l>" \0\ %91101
\\S£&5 %<e3&3 1'.9166 'f.~ew
'i'iUOO\ 'i'.<:t&> %\9&3 'i\ffiW
'f.l0(()~
%ll 001 '1<\SQOO\ MQC•ll %000)\ .,_.VlOOI o/,L6W o/,16&>
'i'il£M •~w 'i\£6&5 'f.b)[•ll 'i\9]{•)1 \\00(0)1 'I\9)(<J\ 1'\WM
,~1?
l;_nb';[ c·c..,.·.c.-~
'tS6\~
¥.~HI 'fof.:'lSI '1".~} II %\SO~
'f.U ~~ 'M~U 'UCS £1
\<\£'>9 %0<:8 ¥.<98 %~~6
%l6a 'l'oH9 'ft-'!96 'f.WO~
1\WZ\ 'f.H€1 'f.!"OGI
'f.-69<\ ¥.~1<\
'M9S 1<\Hi:\ 'f.VH
o/&~01
'i\HOI 'i\180~ <;\\\H 'i'c~O\
'i'.€96
-~· 'f.~"3l
'f.006 -· %';76 'l'cl~Q\
%916 'f.WOI ~ .. 'i\Wl~
%o:t"6 %t6l 'i\~89
'f.Wl '1<\WS
-~' '>\£9\1 %1£6
'f.l-69 'f~l"l .,..,.,}\! %699 'i\Ul \\9'i9 .,,ws 'tJ.ll'\1
¥.n<:lt I';S'-;8':~;
\\WCX€ %1£81£ %\!<"liZ 1\W= o/:St&>l 'f.$9W<::
'f.S"O\l\: .,,\£ ~~ .,.-,g)££ 'f.£1~-i:
%WI); 'flt<.:fb 'fflHL 'iW£SL
%~£!29\ o/..ZIIi': ';\1\fl\ 1\Hii': 'i\Y.l'l91 U9& 'i'ill'"l\11 ¥£-lli': 'i\W6!1 ¥.~~<.: 'i'.Z'l!<ll %<;S t\': %Hi:91 'f..IJSW ¥.'?9&71 't\69tfl
¥.1"9i':>.ll ¥.9910"61 '1<\t'€.&51 %10!'<31 '\S\1\Hi\ %\OW\ 'f.£lto<: 'f.WS<'il
%6>;: ttl 'i'i9'!"S<.:<: 'i\OH<Z \lil\:6\i: 'f.OO'il~ %)<:6\i: o/,l£Sli: 'f.t!tU
'f.OClli': \\WI"S~ 'ii:~IW
1\\S l<i£ %!£0':-i: %!61!€ \\eo'li':l£ .,.-,<;;::0\t
%S9 ·~~ '\S!OS<'il M11:0<: 'f.ZS£1Y. '1<\<Z\1~
%!£ llY. '{,9;U,\
%00 lUI
'f.U"i:S~ 'f.ti<~U
\\£\:Ul 'I;<;SC(l
%\8U<: 'i\O':MI \<\-'.;l'"Vil %00!29\
-~~ \\~\"19 o/il\16 .. 'f211"9 %W93 'i\H"I-'3 'f.!{;9l %L9ll
'i\ZI' ~~ o/.s--3101" %tzS~ ';<-9:\'i 'i\tiW \\lOW 'iltOS9 '1o~993
'f.«\ I); 'f.<:.9(S %~!<;;
%91'19 '1\W£9 'i'.Wt'.l %UVL 'f .. €;9tl
<;\1;(10> %LS<i£ %<':0£€ o/,~SW
'i\~lt %C•JW '7;\ijl;
'ii\L69
'f8~W
%L9H _., 'i\19St woco;;o; '1:.91S".l 'i\HE~
%9~ w
';\9'_ll\
%€'911 'f .. ~·:>Ol \<.WZI '1<\L€~1 ..... H·\1 ¥.W6 %LSI\
'f.60SI %SHI %1<1>9~ o/X:\"H %?1<:1 'i\SHI %SH 'fill"!
¥.C'iG7i: o/2££€ %!901 %661;S<: w;,·l£ 'f.$00\ 'f.l'iY,.t o/,<;Se-;: o/o'?96
"'~\<:~ %6~0'>" 1\100\ 'i\SL"Is><: %tH>' %93 9 'f.£l\9<: %<U8!: 'f.Zl 01 .,.-,&fD>: '1\LLH \\l\:9 ..... 01'~ 'f..6ltt .,.-,!sa
'f.'i!Z"StZ 'i\'?l'HZ %SI<HZ
-~= 'i'OS9C9.: <;;&I<U %1"'3L€l %\O£<Z
¥.-(;7s;l\
'i\IL 161 %X:%\ ¥.~!~\ .,.-,.sn91 'i\<;StH %8ii19\ %S9HI
o/.OOW 'Y:.OOW 'i'.<:I'C:t %9> It 'fl91H .,_..UG? 'i'.<:i:ll' o/i!i'lO>
'i\IOf~
%€96~
-~~ %\ij~?
o/iU!b %?LSI> '>\ltl!S 'i'i\""1:9!
'1<\LZO\ 'i\Lii 'i\IO':la %Sill 'I\9L9 %099 'I\S9"l
"" 'ftWZI 'f~Z'O~
WJ\0\ %1101 %W9 'f.t\JS 'f.Ci:OI \\.ItO\
'i'.OO 1\ ¥4ii:l \<.OOSI %0001 o/,1;701
""" '«<'!<:\ 'f.rf.ln
'f.«<OI \if.h\1 %006 -· 'f.(76 'f.tr.le 'f:.(<';•l
'i\0!"1
\\1$9 'i'..CQS 'f.096
-~· ~~~
\\(79 %1$6 'f..l:.tOI
<:;,Qo;l(
m1n 'f.t-><1 ¥.<:i9GI 'i'.WZI 'i:.J).li ¥.>0!11
-~' 'ffAO\
~" I'>OGO~
'f..l)\"11
\'.,0001 'f.l$6 'i\096 'f::C•H
.,_hiS '>'.r..es o/i0\"1 '1\0i:£ '1'.(.09 'f.Co>S 'i\0!0 WAOI
~" ~· %'"$6 .,_fAOI 'i\IJ\6
"'"' W::£11 %t"ll
'f.006 'i\(<(11 Mill MH 'MU '>i099 'i'))JO\ 'i'..W II
'i\(•JH 'i'.('7.&7 M<:£7 'f.<Zl07 'f..C'I)tt
'i'>WS' 'ff.:lStjo
~ ..... C>lH
r:sw 'ff.:lS<' OS~i W::oJZS t"O~> 'W:olZ'i ~1'19 't\06t; 1-;lo; 'f.OL~
~67 'fi'l'"!S \S6l' ¥.'1-; 19 (71); ~ 'i'..0~69
'f,Cr;Cr; Wb<:; 'f.J).! ~9 <;i!it6t Wll67 '(..(•lh
%00£> t 'f.:OO>t
'f,C•)IS 'i>O.lZg mrr;; <;<,W<:g '#i7Ci'i \¥$09 o/,Q9Cr;
s WJ\(9
\<.WEt '>'.')~<:€
,....., \£ ,.....,,., W".riR %1:06~
'f.<Wl~
s %05~
'f_.Q;W 'f.OOt; <;\!itt;
'>.-.IJ'>IS <;<£>;<t 'f.m~~ o/,o.;Ot
s Wl!&;;
o/.OSH Wl71i7 o/.OS\f> ~A~ 'f,Q\€7 %OS IS \\Oll9
;; %ott9
Sl;(.jo o/,00(1'3
93Z~ 'f.«\ IS Lt ~£ <;\lit 6~ (€(£ %J:>;';6t ~e:t 'foOLS;.
Enz 'fflt~~ (.;:$! Wl1!it liS~ S V.·Dl'"lt
'f..C•Jts %C'l('; 1¥R6t '#.IL('; .,.,v;cr; %016t ¥.-Co:lti'i
$ \¥Jlo(';
'Hl'i~ <;\!its-; 'f.£!;';9;
'ffl1SS 'f.W~
~" V,G'&;
S WRI"9
hr:S3 ~·> w;1~r·o1 H•m.mJ. u_bJo;i J,rb3 u.~..-:. f~'f·'"O:,'Y"·O ~.P.jS O;¢!J u.-.;-><1 l:irD3 ,..,...,.
~ .... f1,,'<:J
~ %$!9 1<\~66 o/,li)L
%W\\ 'i'.ne 'f.SLH
f·':dl"ll u·~••r.•JL
ltc"'NV
l,·>ld IY.I ur~->ll <~."E'-./S r..d ""'<'II F;rh3 ~~-o·J~!:L ~OOij C'<•.!.''.l.<>:)
hr33~o
U.lr<'!:L
'i\SLH~
'f."ZO£tZ 'i\ZI'C:VZ l'oHHZ 'i\lt~£l %01'l<l 'f::O"E£?. %!6{.:;<:
'f.l"'g&£: %\Sf'> MH£ Ml<U 'f.SLH '1<\H"ll' 'f.sn·; %2<369
\\9'3 0~ %9\ 0) 'f.'llOI 'i\W6 '>'ilijij
%-'>I a 'i\<31'1 %~-3!
oooco;;·u C>l91S'I<: OllH'N OO<ll'ti': 00 ~S"::'<Z OOS91'1~ OOtKIZ oogrn1
(o)[('l'lt 009iH<t 00 £1lCS (•)91\'<:i: (Qgtl'H mwnz (oj(.%'91
s cow:-·H 1
OOO'il'91 00 ls->01 coz..uq·n CQOOHI 00&701
VJoo;n C•Hn·~ Olt69.\ OJ< II'\ C•l£SI'I
oon~n t·J~II'I (oJZ\I'H CQW.~'I
ronr~:1 s oo~~··•
61LII:·ll~
"~ "~ "~ "~ 6()Y,:
<(OJ<: s lCOJ<:
C<JC<..•H6 C•JC(;<H'1 C<JOOGOC C•JC•:q'£ £10<:·11~
Ul stn'L Ol o;nL C<J CG'Hl C•H•~H HlY. OOLOC.ll CoJ?>~-~"3 OO~l9'61 CoJ~€\0 nw OJ\Snt (()\9:'ftt C•J& .. 'tl C•J~'I IWt OOLWOl' c•Jttt'Gt 00?/GH C•JS9n 0\LII: r;.Jrrq'l£ OOC9l'L£ 00 \H£1 C•J IH'I E<..X e>Jesz·x: oo~o·x: ootre·n oo8tn KO<: OOLWCo> ~ C•lOH'I£ S OOIY.!O\ t CoJ<:<:n ~ l[•J:t.
OOOC9'1YCQ~I·9\
OOLN'I'~
CoJfio>l'H 00 119"£1 OOBif£1 OlW!·£~
OOt<:i£1 ~
(Q 00)'61 C<JC.."il'SI OO!i>Yt\ COS?HI CQlM~I
00 \l:tOL C•J l£<:'ll OOilC.jo'\1 $
00009'LZ 00 OC<'lt£ 009Lo·~~ C<Jtffi'£~ OO£t6' I~ CQ f.\':S'IM OOffiL·I~ CQOOJ'~
on;;.nz oo~u 00 C!i€.1Y. {oj t\ll'<i': oooors1 rotLs·ot C<Jll/"3.91 S C•H\6"61 $
(o)(o3l'.tl (•)0~ll
00 ·~~·II 00('(9'01 oo roJ'o~ C•HW'S ooc.;1's
0000101 c•Jiw·s oo1sn mt~s·a
OJL>S·s WHO'S 00Ut'8 00 19SS ~
C>)Oi<:'tl oooo;·~·
00.,3~0~
ooweo~ (>J!ii"T£1 oow:ru C>JtliiHI mo;:1·o ~
(•)0..'0'1 00~
00~ c.JtZ9 {1)0>::9 CO<<:'.l oosn CO£St
(<JOY.:. I OOSif\ C•l It\'\
c•n"n 00,~
CoJS:W {•JU:il
CoJS->:B
WC<X'L OORS 00~.>'·9 OJI<St (•)<:1€'9 (•)£\~ (o]f;ffi'9 (•) ~
C•JlW9 009'~ C<J9J'!:9 (o]lg (() IUI"9 (o)(•A:
oo oo;·o~ OOOCL'OI OJ \0\ 'OL [•)6Li:'6 C•Ha·s toJH6'a C•H6<3'9 C•H:\(9 s ooeue s OJ61s·e ~ mw~
OORO.£ OOC•:->0 Cr:>9'UO C-3 !?SLZ OOLIL"l c"~v<: 0! !9~ <: (ii(.:!L'\
(()(r·~~
DLlilLO 0'>""\H'Z OL02'Wi: OCW<:'<: OH•li"Z C'liSn Q<:tt<;'~
c<J oc•J"c.;. OOO.i9'1£ OO£Z8'C<i OOL~L'U OJI-'3L'U
[•] 0>9'~
Olf9<H r,;roY£ 00\:€90 otn.a C•Htn e>;sxn
S OORn
C•HLO'~
OCC~·n OLHL"Z C9WLO (<l'><it'Z 0100\.l ~U•l'l
s er;nn
(o)((!t•H C>Jl&>.!it oo£Sa-.: (()"Jlij'!f;;
Oltl9'<i£
(Q'i'.:V')
0!&<.0.1 0!£>0-5 C;;LLI'l OlfH'\ 00~ WOW'\
~ G9C<8J'I
ooosn C->SRI 0010!1"1 wun c.etoc·• 00~.0.01 t'l~·n
$ {)'lo;.,""')
ooc.;~g•
OOIS€'SI (o]Siil'tl 009\\''i~
ooan1
(>)9\i: OLWI
""' (1;\g~
Oi~H CO:!i'll 01"')1
s c.gH
Vl~SI
C>l'i\1 CoJW (707 00~ OHS
"" ~ 01001
C•)C..;-3'1 C•)(iiS'I C•lHn (<J£\g'L C•llft"tl
6\0<::·l\0<::
"~ ow~ .. ~ OilY.
·~ = i lC•Y,:
6\ot•!\0<::
"~ "~ 1\IY-
"~ = K•Y-$ LC<X
6\0<;•1\0<: £\(!.!
"~ "~ "~ ~~ K•X
S lC•X
610<::•11~
"~ "~ .. ~ "~ {0:(17.
~:ox s l(•Y-
6\IY-·l\ot
"~ "~ "~ OilY. fi:•Y. llC•Y-
s lC<X
6\0Z'l\<Y. £\0<:
"~ .. ~ OilY-
009->SB~ CQttt'X: 005S7'€1 C•lS%'~ roY-Vlffi<:'!V- OO'LH.~t OOC7t'tl CQW<:'I WJ<: OOtti:'t~ S OOOlS'e<: ~ OlO?Hl $ OJ"H\'1 $ LC<Y-
OJC•J\'Sl C>Jffi\'ZL 00\W.£1 oo~n1 oos>.JrSI CoJ\W.Sl ((It\!'€\ CQ~OI S
OOOXI'N OOC•:.-;·! oo 9J<:'91 oo ii':>:rs oo ooYsl C•l ug·g Vlll~'SL 00 \£~fL OOI.'iHI OJK':rt moWH oown 00 L9'i.91 Wf~'L
(•J68<l·~· ~ (()S?-5'1 ~
Co19.S'£ 099190 C•Ht'€."<: OI<:i:•H {o'}<;N')
QL<~9'1
OCL~'I
(()S!n (QOH !Jl'ij\0'~ Ol 1"\J\ cv.1w one ote<:6 C•H6 OOLOG C£9! 01 est C•l 19 CO IW 09<~
[•JCr?.:£ C>lS<t'l wx:~·z
ot He·~ t<9tvn C!iS<9'1 IRS WI Oi£9\.1 s Cr>l\ll"l s OLII-'3 s rota
wd''.,.;:olJR>(-;; €lot•\\~
6\ot·l\OZ E\o:t"
"~ \lot 0\IY-i'(•Y
= <=
6\ot·L\0<:: £\OZ
"~ \\0<:
"~ ·~ = «= S\O<:·HO<:
"~ "~ "~ 0\0Z 6•)J:t.
·~ S !CoY.:
sro
l~l)
3W

~pz<e•d ~-HS~"'f·"·~.f'S
'{,! !{:
"' %~8 'f.tOI 'fll 101 'llt-l ':\Z~<:
%S~ '1\'36 %SU Ml 'f.89 %001 'f)) I\
~ ~'*''."'"'1 ~
'>'-t9C•l! %9100! o/.Z65S %S<:C•ll '1\ffl 10! %1000\ %9> 001 'f.~) COli
'f.~tOOI
I':. It 101 '>\S<:C•ll 'i,illC•J\ 'f..il1&3 %t\(,jl %831:')1 ~6&3
%!8!5 M!8JI 'f.WC•ll o/:.J:l'iOll %WC>l\ o/,!6£.9 'f.-.C..»C•ll '1\~IC<J!
'ilt-'0~
'il!ne 'f.W€03 'f.UOO\ 'f.'n"Oll MSW 'f.!ZC•ll o/.WM
%1'6(•)1 ';1!5"bl\ 'i'.JX(O\ 'l\91:t01 %S<:t01 'f.£\lW\ 'l'::!H'O\ 'f.W~I
'j'£983 %t-iE.; 'f..S·;w %1):;((11 joi\~l;j
%S)&3 %9€((1\ %9:1011
'!'.6916 'f.WC<J\ 'f..GH-6 %0056 7\~£!;6
%91001 'f.L6e.; 'ii\9W
\'..&<iW %\€ \01
""""' 101 'fX!:'I 101 <jo;(li3 \01 %WC•l\ 'i\W\01 <;\t\l\01
'f.Wi!O\ 'i'\~9&3
'f..:Z\01 'f.<:\1 101 %~1'10~
'f.W \0~ %!\GO\ 'f.gL<:OJ\
%93\01 '{,9']65 'f.!>JCoJI %S1&6 %0000\
'f.W"" 'i\Ol'€<1 >-;~\ (()\
'i'\U<:O! %WC>JI \',IS 101 'f.OO \01 %'?7-C>ll '>\g\'101 '(,?.( ~01
o/,'?7(.:1\
%£1 &3 'f.Sl'W %~~.,..,
%9.00\ \\WOO! %\!&3 'f.ffi(•JI 1'..91:&6
~H
~'w '!\WC•ll %~~ (()\ %nC>J\ %;;.>&> 'f.zlW '>l.n:Ol\
%ffiC•JI l'oLL€\': '{,ti;&a
%1\00\ 'f.ffiC•JI
""''~"" ¥.~8&3 'f.ffl(<l\
'f.SI WI lo;liJC•l\ \\E<i€<3 'f.UW\ 'f,l6t8 ';<.1)100\ 'f.ffi((l\ ¥.9556
%l0C•l\ ';lSI Coli 'f.Z656 \o;\6(•)1 'f.NM \',1.)\(oJ\
-~~ 'f.95W
'f..IOtM \',!5&> ""oj(<JI 'i\NW! '1\B(<i 'f.OOC>JI 'f.C<S&; o/,\0(•)\
'f::!SOOI 'f.StC(I\ 'f."H(•JI %1-000\ 'l\roCoJI 'ilfflC•l! 'f.W5S %\6£.3
%1€&5 'f.9:1C•JI '{,9)1)]\
%9000\ 'llt-'056 'MOC•JI '1116&6 'f.N€-S
'f.&C•ll 'f.S.::C•ll ~<;NM
¥.HH-> 'f.9:100\ \'\S?€Q %1000\ 'i'.ffi((l\
'f.WOO %NC'll <;<.ge.s H6&3 %\1(•)1 '{,WC•J\ %1000\ o/::16&6
%(:9(•)\
'1116&> %SI e9 'i'\roool WJJC•JI Y--9&6 \<oOOOOI \\rocm
r,roC•ll %16&6 %!000\ 'f.WC(II <;',00((1\
-~~ 'fh>&> 'f.UW
o/.S\ 00~ %00((1\
%NC<J\ o/,l6t-6 'f.lil&6 %15<>&3 'f.tB&6
~·~ 'f.(->&6 %9100\ 'i\!0001 'f.~QOO
\<.({) (()~
l'bl &6 'f.~~M
'f.t~&>
%9900 'f.tBM %9)001 'f.OOC,jl 'f.9JC•JI 'f.');j&'; %ffi&6 %9JC•ll
;=-n h_1\b_3
~0'-'-<.J.J.O:J
\\9001 'f.U6 'f.-61 01 1'.£Q6 \<.((16 o/,\~6
<;\9<:6 ';',H6
'f.!SS\ 'MH\ 'f.g£\ \\Nll %!6 \I ¥.~901
'f..6!01 '1'.'-'>01
'>\S'€01 '{,9<:6 %~6
%\\'6 'f.S~9
%~76
%£\'01 'f.OOOI
1'.<:9<:\ 'f.Wl\ 1':.\H\ <;\\6<:1 'iSC9<:1 %~9Z\
\\190 I'.Wtl
%US 'H69 o/,!1-9 %t'a9 7\~9L
%L\ 9 <;;;::~-9
'i;IO II
%'1£9 'f.!!S %£l'l9 %~6
%196 'f. I€ \I 'f.gLa '(,<:Q II
-~· 'f,\t6 '1;196 'f.100\ \'i\€6 '{,(.,,. \\S~-L
%\99
M!-l %\"ZL %MS H9S %£>::-! 'f.~9t ¥.S9t %S\O\
%W6 'f.S\:6 ;<,10 II 'i'.ZHI 'liS I'll 'i'.N"6 J<.!.-!1 Mt\\ hrb3~~
~r.:•<J
~"'T<".~:J
'hlil('?<: %9\HZ '1\S>li?W 'f.9l£U \\USc>~
o/.~B£9.: r,9LE9. 'f.W~l
\',l3'>9LZ %9JS9: %~.;-",<:
'i'.V.S"«: \\.L£~.;.1;
\\0~~ %S7 <;>;~ \\tnn
'l\CQOCt \\0~
'hH£9.: 'i;\6HZ %S!~~
\\9. l~~ \\N£Sl 'f.9HS\i:
'f,~9Ul
%UUl 'f.~ en <;:;liHi:l 'f.{'ll9\~
'f.$900<: '{,t'QS'(Z
o/ollfll\
o/:,69~~
%9! It %1-iH %!91t 'fh3H %\1~9 'i'.(~£9
';<;1H9
%S£1't %HU '{,!10~
'!',9\H %llH ';;\SSt <;Sto<:S \'iH SS
')\I;: t-o:..: 'f.<Y-OC '{,£'\\(..: M\i~ %6g<:~
~" 'j\g'l£ %93-:;t
'i'.wv; o/.1S<:S %~€<;
Mr\9 'f.!9<:~
%9HL %!£E9 .,..,~! \\\
%\50ll \',!91~
\',U~l! %7_.6U 7\l9~ '1\.L\tz %SI~ 'i'\tn;; %9€6.;.1; \',;,;It 'f.Wt'?<: %£\Crt ¥;9\0LZ 'f.H'H \\Win<: %lOS~
'f.NO.C..<: 'f,L90l! 'i:.WY~ '11~!1<;{:
'f.C'>'-~S!
'hlt()?'f.19HZ 'i'.9LUZ
%\9\~ 1'.00 \Ll %<;91~
'f.~; em 'M~Cr:«: ¥i~I-6LZ
'llgLs-R %916<:~
'f.H!O<:..: l'dL'HZ 'f.c<lW~ 'f,W1a 'hl06l{: \SS96Ll %1;00?~
%\9&a
o;:;W161 'HSWI %91SH 'III€6U ¥.00\.;./; %t'a&1Z 1'.09 Ill ¥.OCon
%9J II~ %8>&3\ %9\'\0l 'fit-'OSO<: 'll~,.~
'1\W€10<: 'f.tL'\\~
'IW>9l~
\0\He\~
'f.M £~~ %91 \<:(: l'i01!2<'..<: %9L~l
%lin<! '1\<;l~l
%t'i61Z
H6E'l<: '1\W~l
'f.ro ><~ %919..<: %1'50\':l %N£tl
•u= <;\£~9\~
<;;')'is-;~
'f.OOE'E:l 'f.UY~ V,IZS">! %It CO.: %\QHZ %W&l \'iSH\<: ~.'i.<rti
1;d>_3
7\!..LL£ '1\(..:S'€ 'f.-Or\\> 'ilt~n
%tnt %9LSt '»~9<9
7\S"ilB'>
%~9& 'f.<So;C'i: 'f--9! It 'ilt'i'i!e %l0tz %\99€ 'f.9llt 'f.!! It
'f.91st %IS!€ \'i'l'JG~
<;\t~H
%\OH 'f.W57 Wl!Sc> 'i\SilSS
'f.c<31€ ~lit
'{,91l~
1'\~il<~ 'f.J){; \9 <;\(9 \9 <;\9901 'f.~[,
'i'\~SU 'f..C'\::c:t: 'i'\9'0('> %HOC 'iHH€ 'f.Wst ~~ %191:<::
%1tS£ 'f.'J'i \€ '1\IZ\~
'f.WZ€ 'i'.Zl"U '1\J'i€-<: 'i'.St-a %90t-a
7iO'>U
~·~ \\19£€ 'fMW 'f.€9<;~
'i'.Mte: W>Sii"i: %9i II'
%1$W 'i:.H6t '>\!SOl' %SI'H 'f.W1P 'MI'lt %\\ S9 '706)09
I'.H<:I 'f.C'l<:l 1'..€-Si:l 'f.H'\\ 'f.t'aOI %116 \',ZI 1'1 'hl6L
';;\~£1
1\li:"ZI 'f.9! e1 'f.H6 'i:.U6 %(91 %H'1 lo\9!6
1'.1;16 %\6L 'f.969 '1\S£:9
-~' %"')9 '1\109 'f.9B
%\HI %Ll tl
~" illi!i!l l'h9\l 'f.tl Z\ \',S•iOI %19 II
'f.S9 !\ 'fi!~ 1\ 'i\££11 %€\01 'i'..Z\01
-~· -~· 'f.S"l>'S
Ml£1 1':!1'101 'f.J);';I'I %W8 '11\Ll 'J\.l\9 %\IS %~0
'f.Utl %WH %WSI %<;.!9\ o/,H£1 'f:,S'il II %.;.1;01 'f.W6
'!\.91 0\ 'i\UO\ •w• %~H
'!\~6 ¥.(.;;9 %91'L <);Lg~
I'JJLOI '1\!90! l'.rf.lOI 'f.~6 %9LB 7\\lo:B %99L 'hLL9
%~1'01 ,~,
%930\ ~<.an
'f.&OI \'\9)9 'i:.ltL %~9
\'.(QOI 'f.W6 '/:.0:01
~· ""~" 1'1 'f.l)16 'f.N6 'f.O\ 6
'f.WSI '/:.W£1 %0<:0 'f.{o;;<:l ~<c{(ll\
'/:.090\ 'f.IJLO\ 'f.OOOI
1'_.000\ 'f.W6 ¥.!);;6
M" 'i'.W9 'f.J);';6 MIOI 'i:.!l\01
'1.:00<:1 m;-;:1 'ff.<9l\ %0-il\ II:OC<:\
~" M!£1 'f.C(IH
Whl! MLS Ml9
~· 'f.OL6 'i'JX 1\ 'f.WU MS\1
'f.J);';g 'Y.i'i6
~· \WIO! 'f.!);;6 'f.WB 'i'.OH %019
'f.J);';l %{'Ill 'f.{o;;S WAS 'f.Q:;;l 'f.Wt <;\1)9-y
1'.{)101
~-J))OI
M76 'f.':() I\ 'l)i9€\ I' . .()! I\ ¥.o;;6 %')!\\ %')!II J;_cb3 U><:J mu_r;:;•<J ~~<X!•!J
0091\ 'i-!01\ "LE<ll S<:E<ll liN\
'" \0\ «i(•)l tt(•)l
t~·»o.,>.r·O
••·"'S
YAH 'f-.l)lst 'f-.I)!St %WH ':lOCH 'f.-OLH 'f-.01-l~
$\'fil-E~
l'fiiW 'M<l (t 'f.(loJH 'f.C•)t;t 'i\((16t o/,01H %00H
t \(,1)(;6~
%000'i ¥.00 €t W_ilh 'i'blW ~~
l'fJ\st %0L6)
s \<\[<361
'f.:OOSt >K•lSt 'f./Jrlt %0..-!)' Y.f.llt ""')~ l<'J.,-Ht
> ;w;: 6t
J);'; IZ 7\00 i:t S7-\~ WASt Ml~ %Wl~ erre 'iWI-Lt 1~6\ 'iW!H S\1'11 'i'.WH WH 'iiWn ~l91 $ o/,OH~
'f.Jl'i IS %000~
'f.I:JO<:~ Wl~lh
'f..C•llt 'i'.'JLH ':«'9£~
$ 'i\01(1;
'>\C•lGg %0069 'f.:Crl-9> 'f.I:JOSS 'f:-<}Lt<J 'f.IJ9E\< 'f.{IG'g
$ 'i\{>)(':;
o/,00 \g %09<:S %Crl>'J);'; 'f.<Y-J);'; 'ff.bi:6t 'f.'ft-1t
WJS&~ t Wll St
'>\C•ltS ""'lt'i 'iiiJ7SS o/,O.:St o/.WH 7i0'>1t Mle>:
t 'f.<Y-~
~ .. 'i'FJS£S 'f.'hN 'i'.oG~ts
%0LO> 'f.Cl'16t 7\(;7<:~
S M\'\5
'f.<r>;;.; 'iiOl' 6~ 'f.i'ftK 'i'.IJ9 IS 'f.<JG'Et 'f.<Y-&7
"""'H $ %[<319
'!\OS IS 7\0C09 'f/AJ);'; 'i'JJIJ);'; '#Jllit 'i\Ol'lit 'i\IJ7&7
$ 'l'£<3Gt
C•lU 7\00~
tH~ 'f.OOin-lSOZ 'i'.<Y-St W61 'fJ:itS7 lil61 -rmi) ;~91 'i\OCH lt91 'f.<Y-St 9!1'1 $ M'lh
~ ...... , <·~~!J
"'j l!r·f',\ f;,-1;,3
~"'il ~""'.J.""'O
OOOOI'SI<: OOllt'Oi: 001!10'61 C>li~'H
oo<:s7·H Ollli:SI ())O:O;l'~l
OOI'tH\
WOOI'ti: OO<:ZI'e<; oown:~ (•] (:st<:l (o)£:W'I)Z
00 fF.n S\ 00(~3·!1
> 00!0'19-9! $
((IC\:·t'zl CQ1W'O\ OOUSOI 0) 001'01 J);'; \09'6 CrlOl0-6 CQHS-9
CQQo~:;H
cC>SI5'0\ m~ei'OI (>]9;9'01 00\1£01 Di:tt3'6 C•l£00':.11 OOti:D'O\ S
C'lC•hS ()J6\S't cwHn· 0~7'\>
09<:0?: t C->Lel't I)]\£~'"
(•]00\':'1 0.::&~6
JX\?)6 ("l>'-11-J
CQLU WS'S"il OL<;~
O:lSLS
0000< onLg o;tt-S [•] t(; rosst C-1'~!~
(<;6~~
6IO<:·HO<: E\0<: l\IJ<: \\[)!
"~ ~·< K•X
$ LCOX
61{1<:·1\ot noc eiO<: 1\0l
"~ 6(;•)!
K•X
C•JC•:o;;·a (() S~9 9 Di:619'l! ((1!<>)9'9 Olt\'L.L 01£H'L C•J<:I?'L 0\W€'9 $ CV.:IW'L $ C.Sltlt S O!Lt€ S lC•X 0~.!.1
oo=• Cr>StS'l O!S££:'L CotStL'g J);';&"$.:9 onLn 09(';:~··
(•]((<9'~
woLe·;: O'i\~ 00 Ill'<: ~WJ'i: ~..,;n
00~9'\
0001~
~'~ 01$LZ (() t!i: C<;(l)l
OC It\ (<;~;I
"""~"'O>dt(~
£10<: <ere ure 0\0<: a~ 9))<:
(•JC((j'g
Olt<i•J'9 01:1?1:6'5 oo ~~·5 [<0C'l1'5 [•3l>?'3~ 01 ((<'> .. ~
oc ~'<!'!> $ QHC'ift t we<:n S C'I'"WI $ 1Cot W.\
(•)(•)''!'>;
C(IIY.O:I'€ 009\!<:
000,.'9'€ CQ 0.0)'~ waa OtO!SO 09-a~<:
C>Y£SI'l o-~£!0'1
(•) 1);'3'\ (()( ..... '\ J);';!0-07'\ [70!S'I 1'11'16/i rows Ol &to
000!\ ())<;<:\
Ol(Q\ 0!&3 C>:OL (l.;ts 01 St
610<:·1\CV.: £1CV.:
"~ II !X Ol!X wx W.<Y.
OHY.I'z C->LWZ OL'l~Z'\
09UO'I OO'ffi $ otS!i t ()H83 S OLS7 $ wx 11(1
OJOCf.j'g OOOOI.L9 Wo;<:'l~ 00sz1·~ 6\0.::·110<: OOSH'OI' W CO:•ns 00 l"J'H C•l&:~·l (\0<: CQ1:'>"'9'W OOC€£'St OOLi;~'9\ OOSW~ ~10<:
WLOC'l£ C(IOIOS~ OOSHI 00&?<:<: \lot OOI?•Y~ CO<:C•JZt OO>Gt'll OOOtO(' 0\CV.: oo 1<-Cft£ OJ(l.:Z'€;: oot1<!'51 c•J0\6.1 a:.x OOtll'l€ OOS!H"€ Oll~I'LI 00!09'\ roJ<: W003'LZ $ OJU:€W t OOt9-:·9\ t OO<:iJL'l t !C•X
oo~n C•J~t'~ C•lt'.'!?:'~
00~€ 000:;€'€ 00001·~
C•li'IIS'<: ((1&9·~
CoJSI9'9 ((l(r.i>'9 C-o'IH'l c-o0t-i'9 O\&U9 09!2999 c.-·Ht·s ots·;,yg
c•J.;.t8·s C(IO€H oo-z,;,n oo~~·t
(•JU:I't C•JS·;n oo-~~·~
i C•Jl#l'£
())1);1'£\
OO~IGI\
OO""'YO\ W<:9~r6 (l99LS'6 091~'6
0!9169 s u~-(il:t'9
(()(\.'\{:{: ()J(o)t
OJS!.l'\ 009-\ l))g"J9'\ 00 \tl 0009'1 ((lit\ 00£9C\ (()'?-\
1))11;-l'l cow C•HtL'I [()!~
S OOfH.\ t C•lSl<l
OOOC•l" C<lSLt (•] Sit'€ 00 9:-€ oo1c<~:·e ert-tw WI~~·€ 0.::\Z€ 09(9<:£ [70€€ otte.<:£ cv.:eu 0\'LK£ C'Hl~
s ones·£ s oo~
6\ot·l\O<: (\!)":
liN: ure "re = ~~
$ lC•Y.
610<:·110<: £10<: llO.:: !lot "re ·~ OC<X
$ lC•Y..
OOOJ>W OOOO<s'<;>; OJOC•Y~ C(IOCS'I 6\Q<:•liO<:
"~ W\\£'LZ OO<:S'Oit 00\lOiS'S\ OJWJ 00993'SZ OHZ~'1€ 00 CKI'S\ C•l £69 <COC
ure "oc c~
0061\'VZ l)l9i9·ee oos;.;·~~ c•JU\'1 ootw<<: ms>ne oowt~1 coJel\'1 001:'31'1~ ooun;:: oo&o-e'£1 oown 00<9\'o:!: (,j-1'-':':'IZ 001Z9'tl C•JWI'I ~;<:OX
001?;9'91 $ CQS'>"'9'U $ OOl~<:'€1 t COJOlll'l $ !C•X
ooo-. .:nz (()Sl€.L\ WSl9.1'1\ C'l9i9'1'1 w \tl'll (1;&!9'9 01:9-':G'l 0\'\WL
C•JOOI't 0091''€ C-1'9.Z€ OZSN-€ (7131:1l'€ 0\.!W<:: C-><;.>;';'l O<:tw<:
((ll);l:'l 0167..0'£ W~H'9 0<:11-l'S
c.-1~?3'9 !h~l-'0·9
OH-7\'S WOOL<:
(()OW'\ (<;)('.;)'\
Cl>'6Crt'\ Ol9i'<'l 01!ht'l c..:ertn C-7071'\ on~D·I
C•l>'i:t'Z lbH-6'\ G-HW'! 0!9lS'I 0\099'1 ouzn C->tJ);';'\ 09 It>::' I
oo~n CQC•.f;;'LI 009J'l91 (() O'ft'OI 01'l93.6 coJw<r9 OOLO<:'a
> c-ow .. n
000\St (OSIL'€ [•)&""..;'£
W9'J'r'€ 01<-191'€ 00£16'< 01:fl.OL'l
$ 099\9'Z
00 C•:B·g Crl>'!RL'l 0\"i:O?r'L !);';(.;()'!
O'e'i!<"il9 onS99 CO::!W'9
s J);';flt'£
(•](')){;
00 IS~· I M'lW.\ OL€S-i'\ 0\619'1 ooe~n 0'1<:1i:'l
$ 001'1!\'\
cC>SI6C: lb1'i'<~ O>:i!•ll'"l: OI'H6.\ 09~?9'\
oo~•n 099;S'I
$ li9!ht'\
[<)0,'<;-1'1
o:!: \OC'L wea9 OLSSJT't CV.:i?c~'t ots:;p·g 01 oc-s·g
(()(•)€'\
0000<:'\ OlC,..,Y\ C"l\Zil'l !)]!?>))'\
090to'\ ~~
t (76!9
1))0<:1.\ O!IO<OL Oli:~S OCC<Jt (113lL€ 00~££
o.::w:::
OOSi\ [(I'>LI O'iml (<05'3\ 00<:\<\ Ol-l'U C7fiG
t c..:ts
0009)'€ ())01~
C~Sl')'z O<:!i?-05~:->(: [>';&61 OJHI£'~ C?\<1\ IJi'iS<:-~ on1~
C•J~'\ OOSH 0\Q!g'\ (1;611
t o~-LN"'£ t resg1
00(>5! C€1'59 Or! 'iS o:;~g
c.: I.-; Ol167 O.::S\9
t O.::C'l~
00>0 C<';-W
"'" 00, {7-!t oc \1' 0!1;.\;
t 0€1:<::
6\CV.:·Lil'e noc <COC uoc "oc 6C•X
·~ ~ lC•X
610.::·110<:
"re <ere uoc Oint f{:<)?:
!;')}(:
''= 610l-l!O~
"re "~ \10<: 0101: fl:•:l<: ~)}(:
S 1C<X.
6\ot·L\01: nre "~ "~ 010.::
·~ ~=-x
"= C•JC•ll'l {.,.009 OSZ~'il OJij\6 co;u~
OHZS C-31?1:0'\
009\\ 610<:•1!01: 09~'\1 noz (ol(o;; ~\0<:
09<'01 110<: C.£ 00 010<: o->&9 a-.:x CBli. K•J-t
$ C<lPL S li".<X.
o•
hOd

Roton~on Ratio ond Earnlngr. Growth
Compnny 1998 1999 2000 2001 2002 2003 2004 2005 200~ 2007 2008 2009 2010 2011 2012 2013 ALLETE, Inc, -~~-rn •• = = - - •• = = = = Dlvldond:;porSh~ro[2] 1.02 1.05 1.15 127 1,40 1.50 1,56 1,70 1,60 1,66
P~youtRofiop] 55.14% 47.51% 55.83% 47.21% 55.12% 79.37% 57.45% 51.82% 59.02% 57.14% .Eornlnga Growth [4] N/A 19.45% -6.79"A> 30.58% -5.58% -25,59% 45.50% 0,00% 10.91% 7,87% Avorn <> Enrnln n Growth 2.42% 7.tlJ% 8,1!8% 5.05% 7.74% N/A NIA N/A NIA NIA
Amoron CorporuUon Earning~ per Shore [1) 2.62 2.61 3.33 3.41 2.66 3.14 2.62 3.13 2,66 2,98 2.88 2.78 2.77 2.47 2.41 2.09 Dlvldond:;porShoro[2) 2.54 2.54 2.54 2.54 2.54 2.54 2.54 2,54 2,54 2.54 2.54 1.54 1.54 1.515 1.60 UO Payout Rofio [3) 90,07% 90.39% 7826% 74.49% 95.49% 80,80% 90,07% 81.15% 95.49% 85.23% 88.19% 55,40% 55,60% 63.16% 66.39% 76.56% Eornlng~ Growth [4) N/A -0.35% 18.51% 2.40% -21.99% 18.05% -10.19% 10.99% -15.02% 12.0J% -3.36% -3.47% -O.::W% -10.63% -2.43% -13.28% Avorogo Elltnl!lC!n Growth [5] 3,32% 1.35% ..0,15% -3,63% 3,17% -1.11% 0.24% -2.03% -1.20% -4.09% -6.07% N/A N/A NIA NIA N0.
Amorlcon Electric Power Company, Inc, Eornlno~ per Shore 111 2,81 2,69 1,04 3.27 2.86 2,53 2,61 2.64 2.86 2.86 2.99 2.97 2.50 3.13 2.98 3.18 Dtvidondr.por3horo[2J 2,40 2.40 2.40 2.40 2.40 1.G5 1,40 1.42 1,50 1,58 1,64 1,64 1.71 1.85 1.88 1.95 PnyoutRotlo PI 85.41% 89.22% 230.77% 73.39% 63,92"/0 6522% 53.64% 53,79% 52.45% 55.24% 54.55% 55.22% 65.77% 59.11% 63.0~% S1.J2% Enmlng~ Growth [4] NIA -4.27% ·61.34% 214.42% ·12.54% ·11.54% 3.16% 1.15% 8.33% 0.00% 4.55% -0.67% -12.46% 20.38% -4.79% 6.71% Av<>mgo Emnlt\Q~ Growth [5] 24.Q5% 2B.43% 38.93% -2.29% 0.22% 3.44% 2,57% -0.05% 2.39% 1.4ll% 1.84% NIA N/A NIA NIA NIA_
Block Hill!; Corpomtlon Eomlno~perSnaro{1J 1,50 1.70 2.37 3.42 2.3J 1,84 1,74 2.11 2.21 2.68 0.16 2.32 1.6G 1.01 1.97 2.75 Dlvldond~por3horo[2J 1.Cll 1.04 1.08 1.12 1.16 120 1.24 1.2a 1.32 1.37 1.40 1.42 1.44 1,46 1.45 1.52 Poyoul Rntlo PI ~2.50% 61.18% 45.57% 32.75% 4!l.7~% 6522% 71.26% 50.~6% 5S.73% 51.12% 7n.78% 31.21% 66.75% 144,55% 75.13% 55.27% Earning~ Growth !41 NIA 6.25% 39.41% 44.30% -31.87% -21,03% -5.43% 21.26% 4.74% 21.27% -93,28% 1188,89% -28,45% -39,15% 95,05% 39.59% Av<>rl>llO Earning~ Growth [5] 7.41% 5.08% 1.45% -6.47% 4.16% -10.2~% 228,58% 218.63% 209.85% 224.61% 251.19% NIA N/A N/A NIA NIA
Cloco Corpomllon Eornlng5 por Share {11 1.12 1.19 1.46 1.51 1,52 1,26 1.32 1.42 1.36 1.32 1.70 1.76 2.29 2.59 2.70 2.65 Dlv1dondnporSI!oro[2] 0.81 0.83 0.65 0.67 0.90 0.90 0.90 0.~0 o.so 0,90 0.90 0,90 0,98 1.12 1.30 1.43 PoyoutRotlo[3] 72.32"/0 6~.75% 55.22% 57.62% 59.21% 71.43% 68.18% 63,38% 66.18% 68.18% S2.g4% 51.14% 42.79% 4J.24% 48.15% 53.06% EornlngoGrowth[4) N/A 8.25% 22.69% 3.42"/o 0,65% ·17.11% 4,78% 7.58% -4.23% -2.94% 28.79% 3,53% 30,11% 13,10% 4,25% -1.65% AvemgeEnrnlnq~Gmwth[SJ 3.18% 2.89% .0.14% -1.67% -2.39% 6.79% 6.55% 11.05% 14.52% 15.96% 9.63% NIA NIA NIA NIA Nl_t
CMS Enorgy Corporollon Eornlno~porShoro{11 2.24 2.85 2.53 1,27 NIA NIA 0,74 1.10 0.64 0.64 1.23 0.93 1.33 1.45 1.53 1,66 Dlvldond5 por Shoro [2] 1.Z6 1.39 1.46 1.46 1,09 N/A N/A NIA NIA 0.20 0.36 0,50 0.66 0.64 0.96 1.02. Poyout Ro~o [31 56.25% 48,77% 57,71% 114,96% N/A NIA NIA NIA NIA 31,25% 29.27% 53,76% 49,62% 57,93% 62,75% 61.45% Eornlng~Growth[4] N/A 27.23% -11.23% -49.80% NIA N/A NIA 48,65% -41,82% 0,00% 92,19% -24.39% 43.01% 9.02% 5.52% 8.50% Avnr1111o Eornlnn~ Growth [SJ N!A NIA N/A NIA NIA N/A 14.93% 13.60% 23.97% 25.07% 8,33% NIA NIA NIA NIA NIA
Con5olldotod Ed1uon. Inc. EornmgapcrShcro{11 3.04 3.13 2.74 321 3.13 2.63 2.32 2,1/Q 2.~5 3.48 3.36 3.14 3.47 3.57 3.86 3,80 Dlvldond~ por Shuro [2) 2.12 2.14 2.18 220 2.22 2.24 2.26 2.28 2,30 2.32 2..34 2.36 2.38 2.40 2.42 2.46 Poyout Rn~o !31 6~.74% 66.37% 79,56% 68.54% 70.93% 7G.15% 97.41% 76.25% 77.97% 66.67% 69,64% 75,16% 68,5~% 67.23% 62.69% 64.74% Eurnlngt> Growth [4] NIA 2.9~% -12..46% 17.15% -2..49% -9.58% -18.02% 28,88% -1.34% 17.97% -3.45% -6,55% 10,51% 2.86% 6.12% -1.55% Avorogo Eornlng~ Growth !51 ..0.88% -5.08% 3.19% ..0.51% 3.SB% 4.81% 7.10% 3.43% 4,27% 2.30% 2.66% N/A NIA NIA NIA N/A Eurnlngc por Sh~ro [11 3,05 3,33 3.27 2,15 3,83 2.85 2.55 3.27 2.45 2,66 2.73 3.24 3,74 3,67 3,88 3,715 DTE Enor~y Company Dlvldonda p<~r Shmo [2] 2.06 2.06 2,06 2.06 2.06 2.06 2.06 2.05 2.08 2.12 2.12 2.12 2,16 2.32 2,42 2.59 Payout Rn~o PI 67.54% 61.86% 63.00% 95.81% 53.79% 72.28% 80.78% 63.00% 84.90% 79.70% 77.66% 65.43% 58.211% 63.22% 62.37% 68.88% Eornlng~ Growth [4] NIA ~.18% -1.80% -34.25% 78.14% -25,59% -10,53% 28.24% ·25.08% 8.57% 2.63% 18.68% 15.43% -1.87% 5.7:2% ·3.09% AVDfnri"E~rnlnn!!Growth!51 5.14% 1.19% 7.20% 9.04% -4.88% O.n% 6.61% 4.05% 8.6~% 8,12% 6.07% MIA NIA NIA N/A N/A
Duko Energy Corporollon EornlngtoporSh~ro[1] N/A NIA NIA NIA NIA NIA NIA NIA--:1:-:-te~O 3.0J 3.39 4.0Z 4.14 3,71 4,05 Dividend~ por Shore [2] N/A NIA NIA N/A NIA NIA NIA NIA NIA 2,58 2.70 2,82 2,91 2,97 3,03 3,09 PuyoutRo~o[31 NIA N/A NIA NIA NIA NIA NIA NIA NIA 71.67% 89.11% 83.19% 72.39% 71.74% 81.67% 75.30% Enrnlngn Growth [4) NIA N/A NIA NIA NIA NIA N/A NIA WA 30.43% -15.83% 11.88% 18.58% 2,99% -10,39% 9.16% Av<>mgo Eornlna~ Growth [S] NIA NIA NIA NIA NIA NIA NIA NIA fl,61% 1.45% 6.45% NIA NIA NIA NIA NIA
Edl~on lntornotlonol Enrnlngo por Shore [11 1.86 2.03 NIA 1,30 1,82 2,38 0~6~- 3.34--~-:-ia--3."32 3,68 3.24 3.35 3,23 4,55 3,65 Dwldond:!porShoro[2] 1,04 1.08 0.83 NIA NIA NIA 0.80 1.02 1.10 1.18 1.23 1.25 1,27 1.29 1.31 U7 PoyoutRotlopJ 55.91% 53.20% NIA NIA WA NIA 115.94% 30.54% 33.54% 35.54% 33,42% 38.56% 37.91% 39,94% 26.79% 37.53% EorningfiGrowth[4) N/A 9,14% NIA NIA 4D,OO% 30.77% -71.01% 384,06% -1.80% 1,22% 10,84% -11.96% 3,40% -3.58% 40.a7% -19.78% AvoroqnEnrnlnor.Growth[Sl NIA NIA NIA 76.4D% 68,65% 54,66% 76.47% 0,34% ..().02% 7.G1% 1.79% N/A NIA NIA NIA NIA
El Pll!lo Electric Com puny EornlngnporShore[1) 0,70 0,56 1.09 1.27 0.57 0.64 0.69 0.76 1.27 1,63 1.7J 1.50 2,07 2.46 2..25 - --2~:\Ci Dividends per Shoro [2) NIA NIA WA NIA NIA NIA N/A N/A WA NIA NIA NIA N!A 0.66 0,97 1.05 Puyou! Ratio p] NIA NIA NIA NIA NIA NIA NIA N/A WA NIA NIA N/A WA 26,61% 42,92% 45,65% Eorningo Growth [41 N/A 22,66% 26,74% 16,51% -55.12% 12.28% 7,81% 10,14% 67,11% 28,35% 6,13% -13,29% 36,00% 19.81% -6.87% 1.77% Avnmgo Eotnltl<!:< Growth [5) 4.66% 1.85% ·1.67% 8.45% 25,14% 23.91% 19.69% 25.26% 15.80% 8.36% 7.48% N/A N/A NIA NIA NIA
EmplroDiotnc!Eio~tn~ Eornlng~por3horo[11 1.SJ 1.1J 1.35 O.SS 1.19 1.29 0.66 O.Q2 1.41 1,09 1.17 1.18 1.17 1.31 1.32 1.48" Dtvodond~ porShoro [2] 1.25 1.28 128 1.28 128 1.28 1.28 1.28 1.28 1.28 1.25 1.28 128 0.64 1.00 1.01 Poyou!Ro!lo[3] 83.66% 113.27% 94.81% 216,95% 107.56% 9022% 146,84% 139.13% 90.7B% 117.43% 109.40% 108.47% 109.40% 46.BS% 75,76% 6624% Earning~ Growtl1 [4] NIA -26.14% 19.47% -56.30% 101,6~% 8.40% -33.33% 6.1'18% 53.26% -22..70% 7.34% 0.85% -0.85% 11,97% 0,76% 12.12% Av<>rngo Eamlnqn Growth [51 9.43% 7.99% 5.49% 27.40% 2.52",1. 2.31% 9.15% 7.58% ..(),38% 4.02% 4.97% NIA N/A NIA NIA NIA
GrootPioln~Enorgylnc. Enrnlngopor3huro{1] 1.89 1.26 2.05 1.59 2..04 2.27 2.46 2.18 1.62 1,66 1,16 1,03 1.53 1.25 1.JS 1.62 Dlvldond&por3h.oro[2] 1.64 1.66 1,66 1,66 1,66 1.66 1.65 1.66 1.66 1.eG 1,66 0,83 0,83 0,84 0.86 0,88 PayoutRotlo[3] 86,77% 131,75% 80,98% 104.40% 81,37% 73.13% 67.46% 76.15% 102,47% 89.25% 143,10% 60,58% 54,25% 67.20% 63.70% 54.32% Earnings Growtl1 [4) NIA -33.33% 62.70% ·22.44% 28.30% 11.27% 6.37% -11.::W% -2S,6Q% 14.61% -37.63% -11.21% 46.54% -18.JO% 8.00% 20.00% AVNnvn EnrnlngB Growth IS) 9 . .:10% 17.64% 2.83% 2.18% -0.52% -10.30% -1422% -2.23% ..0.76% -2.12% 9.41% NIA NIA NIA N/A NIA
IDACORP, Inc. Eurnlng~ por SMro !11 2.37 2.43 3.50 3.35 1,63 0,96 1.90 1.75 2.35 1.86 2.18 2.64 2,95 3,36 3,37 3.50 DlvldondsporShoro[2] 1.86 1M 1.86 1.86 1.86 1,70 1.20 1.20 1.20 1.20 1.20 1.20 1.20 1,20 1,37 1,57 Puyoul Ro~o [3] 78.46% 76.54% 53.14% 55.52% 114.11% 1n.06% 63.16% 66.57% 51.05% 134.52"A> 55,05% 45.45% 40.68% 35,71% 40.65% 44.66% EornlngnGrowth[4) N/A 2.53% 44.03% -4.29% -51.34% -41.10% 97,92% -7.89% 34.29% -20.85% 17.20% 21.10% 11.74% 13,90% 0,30% 3,66% Avnrnon Emnlno:m Growth [5] -10.03% 9.04% -1.34% 6.37% 12..47% 24.13% 8.77% 12JO% 8.62% 12,85% NIA NIA NIA NIA NIA NIA
Schedulo RSH-4 Pogo 1 of2
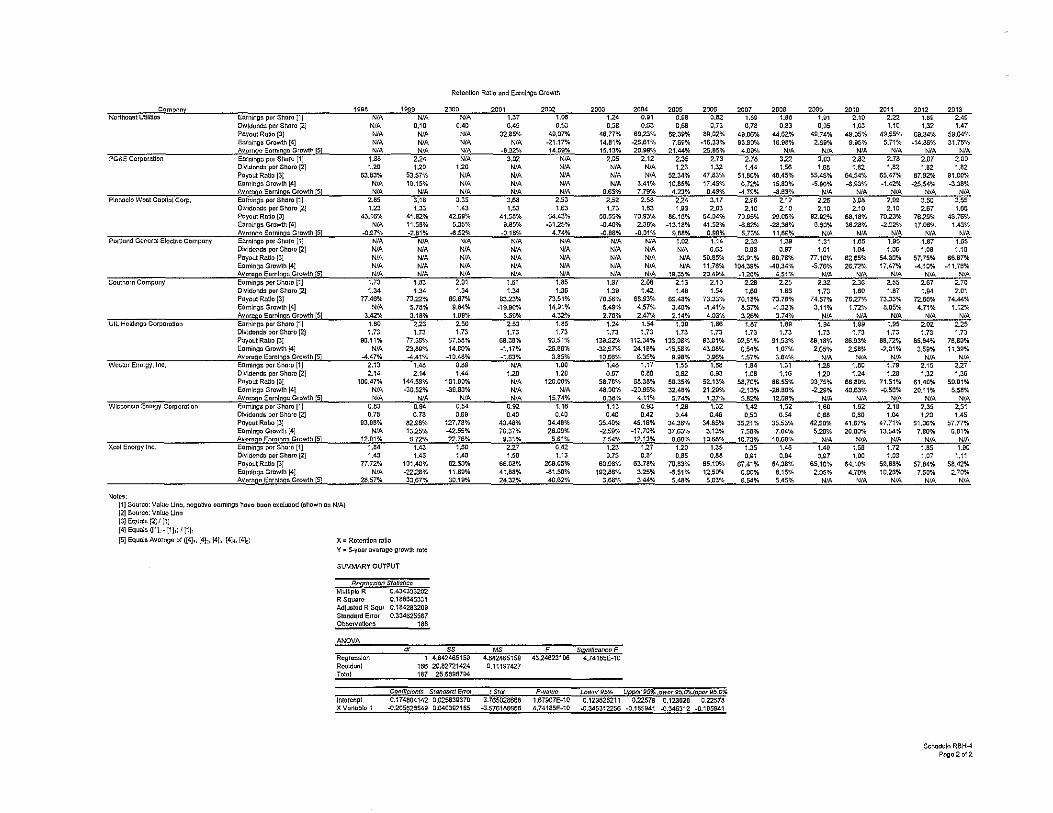
Roton~on Ratio ond Ellmlng& Growth
ComDonv 19116 1999 2000 2001 2002 2003 200<1 2005 2000 2007 2006 2001:1 2010 2011 2012 2013 Nort~oant umltlos Eornlngo por S~aro [11 NIA NIA NIA 1.:17 1.06 1.24 0.91 0.96 0.~2 1.SS 1-::ao 1,91 2.10 2.22 1.89 2A-9
DIVIdenMporShoro[2] NIA 0,10 0.40 0.45 0.53 0,58 0.63 0,58 0,73 0,78 0,83 0,95 1,03 1,10 1.:12 1.<17 Payout Ratio PI NIA NIA NIA 32.85% 49,07% 40.77% 69,2:1% 5S.39o/o 59.02% 49,06% 4<1,62% 49.74% 49,05% 49.55% 69,84% 59.0<1% Enrnlngu Growth [<I] NIA NIA NIA NIA ·21.17% 1<1.81% -26.61% 7,611% ·16.33% 93.90% 16.98% 2.69% 9.95% 5.71% -14,86% 31.75% Avornoc Eornlnqo Growth [5) NIA NIA NIA -8.32% 14.69% 15,13% 20.99% 21.44% 25.85% 4.09% NIA NIA NIA NIA NIA NIA
PG&E Corporation Eorningll por Shorn [1] 1.88 224 NIA 3.02 NIA 2.05 2,12 2.35 2.76 2.78 3.22 J--;-03___ 2.82 2.73 2.07 2.00 DMdond~porSharo[2] 1.20 1.20 1.20 NIA NIA NIA NIA 1.23 1.32 1.44 1.56 1.58 1.82 1.82 1,82 1.82 PayoutR:~Uo[3J 63.83% 53.57% NIA NIA NIA NIA NIA 52.34% 47.83% 51.80% 46.45% 55.45% 64.54% 65.47% 87.92% 91,00% Eorninao Growth [4] NIA 19.15'/o NIA NIA NIA NIA 3.41% 10.85% 17.45% 0.72% 15,83% -5.90% ---$,113% ·1.42% -25.54% -3,38% Avnroon Enrnlngn Growth [5] NIA NIA NIA NIA NIA 9.65% 7.79% 4.23% 0.46% -4.711% -8.63% NIA NIA NIA NIA N!8
Pinnoclo Wo~t Copitol Corp. EornJngn por Shnro [11 2.85 3,18 3.35 3,58 2.53 2,52 2.58 224 3.17 2.96 2.12 2.25 3,08 2,99 3,50 3.55 Olv•dondGpcrShoro[2] 1.23 1.33 1.43 1,53 1.63 1,73 1,63 1.Q3 2.03 2.10 2.10 2.10 2.10 2.10 2,67 1.66 Payout Rollo Pl 43.16% <11.62% 42.69% 41.~8% 64.43% 6!1.65% 70.113% 86.16% 54.04% 70.115% 119.0~% 92.92% 58,16% 70.23% 75.29% 46.76% Eoming~ Growth [4] NIA 11.56% 5.35% 9.85% ·31.25% -0.40% 2.36% -13.18% 41.S2"A. -8.62% -26,38% 6.60% 35.28% -2.92% 17.00% 1.43% AvnrnqnEnrnlnn~Growth!S! .0.~7% ·2.!11% -6.52% -0.16% 4.74% .0.66% .0.01% 9.88% 0.99% 5.73% 11.89% NIA NIA NIA NIA Nl~
Portland Gonorol Electric Com pony Earning~ por Shoro [1] NIA NIA NIA NIA NIA N/A NIA 1.02 1.14 2.33 1.39 1.31 1.em 1.95 1.67 1.65 DlvldondaporShoro[2) NIA NIA NIA NIA NIA NIA NIA NIA 0.68 0.113 0.97 1.01 1.04 1.05 1,08 1.10 PoyoutRo~o[3] NIA NIA NIA NIA NIA NIA NIA NIA 511.65% 39,91% 69,78% 77.10% 62.65% 54.30% 57.75% 58.67% EllrnlngoGrowth[4I NIA NIA NIA NIA N/A NIA NIA NIA 11.76% 104.39% -40.34% -5.76% 25.72% 17.47% -4,10% -11.76% Avnr~oo Eorning~ Growlh !5] NIA N/A NIA NIA NIA NIA NIA 19.35% 20.49% -1.20% 4.51% NIA NIA NIA NIA NIA
Southern Compony Eorning\1 por Shoro [1] 1.73 1.10 2.01 1.61 1.85 1.97 2.06 2.13 2.10 2.28 -2.25 2.32 2.36 2.55 2.67 -----2.70 DiVIdorldoporShoro[2] 1.34 1.34 1.34 1.34 1.35 1.39 1.42 1.48 1.54 1.60 1.66 1.73 1.60 1.87 1.S4 2.01 Poyout RoUo PI 77.46% 7322% 66.67% 83.23% 73.51% 70.5S% 66.93% 59.48% 73.:13% 70.16% 73.78% 74.57% 76.27% 73.33% 72.66% 74.44% EQrn1ng~Growth[4] NIA 5.78% 9.84% -19.90% 14.91% 6.49% 4,57% 3.40% -1.41% 8.57% -1.32% 3,11% 1.72% 8.05% 4.71% 1.12% Avnmqo Eomlnn~ Growth [5] 3.42% 3.18% 1,69% 5.59% 4,32% 2.76% 2.47% 2.14% 4.03% 3.25% 3.74% N/A NIA NIA NIA NIA
UIL Holding~ CorporoUon Eorningo por Shoro [1] 1.60 -2.23 2.56 2.53 1.65 1.24 1.54--1-.s"O____ 1.66 1.87 fail- 1.94 1.99 1.95~-- ---2.'25 DlvldondsporShoro[2] 1,73 1.73 1,73 1.73 1.73 1.73 1.73 1.73 1.73 1.73 1.73 1.73 1.73 1.73 1.73 1.7:1 P:~yout Ralio PI 96,11% 77.58% 67,58% 68.36% 93,51% 139,52% 112,34% 133.06% e3,01% 92.51% 91.53% 8S.18% 86.93% 88,72% 85,64% 76,89% E:~rning~ Growth [4] NIA 23,89% 14.60% -1.17% -26.88% -32.,97% 24,19% -15.58% 43,08% 0,54% 1.07"/0 2,65% 2.58% -2,01% 3,59% 11.39% Avoroqc Enrnlng~ Growth [S] -4.47% ---4.41% -10.46% -1.63% 3,85% 10.56% 6,35% 9.98% 0.~5% 1.57% 3.64% NIA NIA NIA NIA NIA
Wo~tor En orgy, Inc, E!lrning:o:porSharo[1] 2.13 -1.48 0.89 N/A 1.00 1.46 1.17~5--1.66 1.84 1.31 1.28 1.80 1.79 2.15 227 DMdond~porShmo[2) 2.14 2.14 1.4<1 1.20 1.20 0.87 0,80 0.112 0.96 1.06 1,16 1.20 1.24 1.28 1.32 1.36 Poyol!tRo~opj 100,47% 144.59% 161,80% NIA 120.00% 58.78% 66,38% 59.35% 52.13% 58,70% 88.55% @3.75% 86,89% 71.51% 61.40% 59,91% Eornlng~ Growth [41 NIA -30.52% -39.83% NIA NIA 48.00% -20.95% 32.46% 21.29% -2.13% -28.80% -2.29% 40.63% ..o.5~% 20.11% 5.Sa% Avnmgn Eornlng~ Growth [5] NIA NIA NIA NIA 15.74% 0.38% 4.11% 5,74% 1.37% 5.82% 12.69% NIA NIA NIA N!A N!£1
Wiecon~m Enmgy Corporation Earnings por Shnro [1] 0.83 0,94 0.54 0,92 1.16 1,13 0,93 1.28 1.32 1,42 1.52 1,50 1.92 2.18 2.35 2.51 Olvidondg porShQro [2] 0,78 0.78 0,69 0.40 0.40 0.40 0.42 0.4<1 0.45 0,50 0.54 0.68 0,80 1,04 1.20 1.45 Payout Rollo Pl 93.S8% 82.~8% 127.78% 43.48% 34.46% 35.40% 45.16% 34.38% 34.85% 35.21% 35.53% 42,50% 41,57% 47.71% 51.05% 57.77% Earnlngo Growth [4] NIA 13.25% ---42.55% 70.37% 25.09% -2.59% -17.70% 37.53'/o 3.13% 7.5!1% 7.04'/o 5.213% 20.00"/0 13.54% 7.80% 5.81% AvnroqnEnrnln~~Growlh[S] 12.~1% 6.72% 22.76% g,31% 5.81% 7.54% 12.13% 8.60"/0 10.68% 10.73% 10.58% NIA NIA NIA NIA NIA
Xcol Enorgy Inc. Earning~ porSfiilr-o [1] {84 1.43 1.50 2.27 0.42 1.23 1-::21 1.20 1.35 1.35 1.46 1.49 1.56 1.72 1.85___ 1.90 DlvldondoporShoro[2) 1.43 1.45 1.48 1.50 1.13 0.75 0.81 0,65 0,88 O.Q1 0,94 O.G7 1.00 1,03 1.07 1.11 PoyoutRaUopj 77.72% 101.40% 92.50% 56.08% 269.05% 60.98% 63.78% 70.83% 55.19% 67.41% 64.38% 55.10% 64.10% 59.88% 57,84% 56.42% Elltnlng:~ Growth [4] NIA -22.28% 11.89% 41.88% -81.50% 192.86% 3.25% -5.51% 12.50% 0.00% 8.15% 2.05% 4.70% 10.26% 7,56% 2.70"/0 Avcrno<> Enrninn~ Growth [S] 28.57"/o 33.57% 30.19% 24.32% 40.62% 3.68% 3.4<1% 5.48% 5.03% 6.54% 5.45% NIA NIA NIA NIA NIA
Nolo~:
111 Source: Value Uno, nogollvo oormngu ~ovo boon oxcludod (uhown ao NIA) [21 Source: Voluo Uno [3] Equolo [2]1 [1] [4] Equolo ([1],- !111) 1[111 [5] Equola Avorogo of ([4] 1, [4b [4], [4].,, [4],.) X .. Rotontlon rotlo
Y ~ S-yoor ovorago growth roto
SUMMARY OUTPUT
RnqrtMslon S/llT/$1/C$ M~IUplo R 0.434333202 R Squoro 0.188645331 Adju~tod R Squ1 0,18<1283209 Stondord Error 0.3348255137 Obnorvotlon~ 168
ANOVA
R"''JI<I"'...:I!On Ro~iduol Toto I
lntorcQpt X Vmioblo 1
,----,, 1 4.642465159
186 20.82721424 187 25.5698794
COt>III~S7iiffl:iiiid Error 0.17<1804142 0.0251:139379
-e.2tl5e2e549 o.0403Q2165
MS F S/qnm~an~~> F 4.842465159 43.:2462:1100 4.74185E-10
0,11197427
_!§.!E!.. 6.765028668
---6.5761866~(1
P-VIl/UO ~ 4,74185E-10
L!>Wt>t'P5% UpP"rPS%~5-;-6?iJpPMii5_-0%
0.123826211 0.22576 0.123626 0.22578 -0.345312256 -0.1659<11 -0.345312 .0.185941
Schedule RBH-4 PoQO 2 ol2

Adjustment of Mr. Gorman's Multi-Stage DCF Model Add Fourth Stage to Reflect Blue Chip Forecast Period- Mr. Hevert's Long-Term Growth Rate
[1] ]2] [3] [4] [5] [6] [7] [B] [9] [1 D]
Company Ticker S k P . Annualized First-Stage Second-stage Growth Third-Stage Fourth-Stage
toe nee Dividend Growth Year 6 Year 7 Year 8 Year 9 Year 10 Growth Gro\Nth
ALLETE, lnc. ALE % 5.00% 4,80% 5.70% Ameren Corporation AEE % 4.72% 4.80% 5.70% American Electric Power Company, Inc. AEP % 4.55% 4.80% 5.70% Black Hills Corporation BKH % 4.67% 4.80% 5.70% Cleco Corporation CNL % 4.89% 4.80% 5.70% CMS Energy Corporation CMS % 5.02% 4.80% 5.70% Consolidated Edison, Inc. ED % 4.32% 4.80% 5.70% DTE Energy Company DTE % 4.90% 4.80% 5.70% Duke Energy Corporation DUK % 4.59% 4.80% 5.70% Edison International EIX % 4.24% 4.80% 5.70% El Paso Electric Company EE % 4.53% 4.80% 5.70% Empire District Electric Company EDE % 4.50% 4.80% 5.70% Great Plains Energy Inc. GXP % 5.15% 4.80% 5.70% lDACORP, Inc. IDA % 4.67% 4.80% 5.70% Northeast Utilities NU % 5.24% 4.80% 5.70°/o PG&E Corporation PCG % 4,19% 4.80% 5.70% Pinnacle West Capital Corporation PNW % 4.70% 4.80% 5.70% Portland General Electric Company POR % 5.03% 4.80% 5.70% Southern Company SO :% 4.61% 4.80% 5.70% UIL Holdings Corporation UIL % 5.22% 4.80% 5.70% Westar Energy, Inc. WR % 4.57% 4.80% 5.70% Wisconsin Energy Corporation WEC % 4.92% 4.80% 5.70% Xcel Energy Inc. XEL % 4.82% 4.80% 5.70%
Mean 4.44% 4.50% 4.56% 4.62% 4.68% 4.74% 4.80% 5.70% Median 4.18% 4.28% 4.39% 4.49% 4.59% 4.70% 4.80% 5.70%
Notes: [1]13-week average stock price; Source: Schedule MPG-8 [2] Source: Schedule MPG-8 [3] Source: Schedule MPG-8 [4] Equals [3] + ([9] • [3])/6 [5] Equals [4] + ([9]- [3])/6 [6] Equals [5] + ([9] - [3])/6 [7] Equals [6] + ([9] - [3])/6 [8] Equals [7] + ([9] - [3])/6 [9] Source: Schedule MPG-8 [10] Source: Schedule RBH-10 (11] IRR based on stock price ([1]) and 200 years of projected dividends
111] Multi-Stage Growth DCF
9.73% 9.77% 9.64% 8.42% 8.87% 9.71% 9.27% 9.65% 9.73% 7.89% 8.33% 9.64% 9.99% 8.78% 9.74% 9.12% 9.62% 9.67% 10.20% 10.90% 9.52% 9.46% 9.60%
9.45% 9.64%
Schedule RBH-5 Page 1 of 1

Mr. Gorman's Multi·Stage DCF Growth Model Implied Growth Rate to Produce Average Authorized ROE as DCF Result
[1J [2J [3J [4J [5J 161 I:Q Company Ticker Stock Price
Annualized First-Stage Second~Stage Growth
ALLETE. Inc. ALE $49.64 Ameren Corporation AEE $46.52 American Electric Po\'Ver Company, Inc. AEP $36.01 Black Hills Corporation BKH $51.41 Cleco Corporation CNL $46.19 CMS Energy Corporation CMS $26.94 Consolidated Edison, Inc. ED $56.02 DTE Energy Company DTE $67.41 Duke Energy Corporation DUK $70.08 Edison International EIX $47,05 El Paso Electric Company EE $34.95 Empire District Electric Company EDE $22.58 Great Plains Energy Inc. GXP $23.89 IOACORP, Inc. IDA $51.56 Northeast Utilities NU $42.01 PG&E Corporation PCG $40.89 Pinnacle West Capital Corporation PNW $54.37 Portland General Electric Company POR $29.49 Southern Company so $41.23 UIL Holdings Corporation UIL $38.00 Westar Energy, Inc. WR $31.81 Wisconsin Energy Corporation WEC $41.54 Xcel Energy Inc. XEL $28.25
MEAN MEDIAN
Notes: [1]13~week ::iverage stock price; Source: Schedule MPG-8 [2] Source: Schedule MPG-8 [3J Source: Schedule MPG·8 [4] Equals [3] + ([91- [3])/6 [5] Equals [4] + ([9]- [3])/6 [6] Equals [5] + ([9]- [3])/6 [7] Equals [5] + ([9]- [3])/6 [8] Equals [7] + ([9]- [3])/6 [9] Implicit Growth Rate
Dividend
$1.90 $2.00 $1.60 $1.52 $1.45 $1.02 $2.46 $2.62 $3.12 $1.35 $1,06 $1.02 $0.92 $1.72 $1.47 $1.82 $2.27 $1.10 $2.03 $1.73 $1.36 $1.53 $1.12
[1 OJ IRR based on stock price ([1]) and 200 years of projected dividends
Growth YearS Year? Years Years
6.00% 6.03% 6.06% 6.10% 6.13% 4,30% 4.62% 4.93% 5.25% 5.56% 3,27% 3.76% 4.24% 4.73% 5.22% 4.00% 4.37% 4.73% 5.10% 5.46% 5.36% 5.50% 5.64% 5.78% 5.92% 6.09% 6.11% 6.12% 6.14% 6.16% 1.93% 2.64% 3.35% 4.06% 4.77% 5.41% 5.54% 5.67% 5.80% 5.93% 3.56% 4.00% 4.44% 4.88% 5.32% 1.45% 2.24% 3.03% 3.82% 4.61% 3.15% 3.66% 4.16% 4.67% 5.18% 3.00% 3.53% 4,06% 4.60% 5.13% 6.90% 6.78% 6.66% 6.55% 6.43% 4.00% 4.37% 4.73% 5.10% 5.46% 7,45% 7.24% 7.03% 6.82°/o 6.61% 1.11% 1.96% 2.80% 3.65% 4.50% 4.18% 4.52% 4.85% 5.19% 5.52% 6.17% 6.17% 6.18% 6.18% 6.19% 3.67% 4.09% 4,51% 4.93% 5.35% 7.32% 7.13% 6.94% 6.76% 6.57% 3.40% 3.87% 4.33% 4.80% 5.26% 5.51% 5.62% 5.74% 5.85% 5.97% 4.92% 5.13% 5.34% 5.56% 5.77%
4.44% 4.73% 5.03% 5.32% 5.61% 4.18% 4.52% 4.85% 5,19% 5.52%
[8J [9J Third·Stage
Year10 Growth
6.16% 6.19% 5.88% 6.19% 5.71% 6.19% 5.83% 6.19% 6.06% 6.19% 6,18% 6,19% 5.48% 6.19% 6.06% 6.19% 5.76% 6.19% 5.40% 6.19% 5.69% 6.19% 5.66% 6.19% 6.31% 6.19% 5.83% 6.19% 6.40% 6.19% 5.35% 6.19% 5.86% 6.19% 6.19% 6.19% 5,77% 6.19% 6.38% 6.19% 5.73% 6.19% 6.08% 6.19% 5.98% 6.19%
5.90% 6.19% 5.86% 6.19%
__.I!EJ Multl.stage
Growth DCF
10.21% 10.25% 10.12% 8.90% 9.35%
10.19% 9.74%
10.12% 10.20% 8.38% 8.81% 10.11% 10.47% 9.26% 10.21% 9.60% 10.10% 10.15% 10,67% 11.37% 10.00% 9.94% 10.08%
--9.92%
10.11%
Schedule RBH·6 Page 1 of 1

Step-By-step Adjustment of Mr. Gorman's Multi-Stage DCF Model
[1]
Company Ticker Stock Price
ALLETE, Inc. ALE $49.64 Ameren Corporation AEE $46,52 American Electric Power Company, Inc. AEP $36.01 Black Hills Corporation BKH $51.41 Cleco Corporation CNL $46.19 CMS Energy Corporation CMS $26.94 Consolidated Edison. Inc. ED $56.02 DTE Energy Company DTE $67.41 Duke Energy Corporation DUK $70.08 Edison International EIX $47.05 El Paso Electric Company EE $34.95 Empire District Electric Company EDE $22.58 Great Plains Energy Inc. GXP $23.89 IDACORP, Inc. IDA $51.56 Northeast Utilities NU $42.01 PG&E Corporation PCG $40.89 Pinnacle West Capital Corporation PNW $54.37 Portland General Electric Company POR $29.49 Southern Company so $41.23 UIL Holdings Corporation UIL $38.00 Westar Energy, Inc. WR $31.81 Wisconsin Energy Corporation WEC $41.54 Xcel Energy Inc. XEL $28.25
Mean Median
Notes: [1] 13-week average stock price; Source: Schedule MPG-8 [2] Source: Schedule MPG-8 [3] Source: Schedule MPG-8 [4] Equals [3] + ([9]- [3])/6 [5] Equals [4] + ([9]- [3])/6 [6] Equals [5] + ([9]- [3])/6 [7] Equals [6] + ([9] - [3])/6 [8] Equals [7] + ([9] - [3])/6 [9] Source: Schedule MPG-8
Re-Creation of Schedule MPG-8
[2] [3[ [4] Annualized First-Stage
Dividend Growth Years
$1.90 6.00% 5.80% $2.00 4.30% 4.38% $1.60 3.27% 3.53% $1.52 4.00% 4.13% $1.45 5.36% 5.27% $1.02 6.09% 5.88% $2.46 1.93% 2.41% $2.62 5.41% 5.31% $3.12 3.56% 3.77% $1.35 1.45% 2.01% $1.06 3.15% 3.43% $1,02 3.00% 3.30% $0.92 6.90% 6.55% $1.72 4.00% 4.13% $1.47 7.45% 7.01% $1.82 1.11% 1.73% $2.27 4.18% 4.28% $1.10 6.17% 5.94% $2.03 3.67% 3.86% $1.73 7.32% 6.90% $1.36 3.40% 3.63% $1.53 5.51% 5.39% $1.12 4.92% 4.90'-'/o
4.44% 4,50% 4.18% 4.28%
[10] IRR based on stock price ([1]) and 200 years of projected dividends
[51 161 Cl Second-Stage Growth
Year? Years Years
5.60% 5.40% 5.20% 4.47% 4.55% 4.63% 3,78% 4.04% 4.29% 4.27% 4.40% 4.53% 5.17% 5.08% 4.99% 5.66% 5.45% 5.23% 2.89% 3.37% 3.84% 5.21% 5.11% 5.00% 3.97% 4.18% 4.39% 2.57% 3.13% 3.68% 3.70% 3.98% 4.25% 3.60% 3.90% 4.20% 6.20% 5.85% 5,50% 4.27% 4.40% 4.53% 6.57% 6.13% 5.68% 2.34% 2.96% 3.57% 4.39% 4.49% 4.59% 5.71% 5.49% 5.26% 4.05% 4.24% 4.42% 6.48% 6.06% 5,64% 3.87% 4.10% 4.33% 5.27% 5.16%) 5.04% 4.88% 4.86% 4.84%
4.56% 4.62% 4.68% 4.39% 4.49% 4.59%
[8J [9] Third-Stage
Year 10 Growth
5.00% 4.80% 4.72% 4.80% 4.55% 4.80% 4.67% 4.80% 4.89% 4.80% 5.02% 4.80% 4.32% 4.80% 4.90% 4.80% 4.59% 4.80% 4.24% 4.80% 4.53% 4.80% 4,50% 4.80% 5.15% 4.80% 4.67% 4.80% 5.24% 4.80% 4.19% 4,80% 4.70% 4,80% 5.03% 4.80% 4.61% 4.80% 5.22% 4.80% 4,57% 4.80% 4.92% 4.80% 4.82% 4.80%
4.74% 4,80% 4.70% 4,80%
__11.21 Multi-Stage
Growth DCF
9.12% 9.17% 9.03% 7.73% 8.20% 9.10% 8.63% 9.03% 9.12% 7.18% 7.64% 9.02% 9.40% 8.11% 9.12% 8.48% 9.01% 9.06% 9.61%
10.35% 8.90% 8.83% 8.98%
8.82% 9.02%
Schedule RBH~7 Page 1 of 3
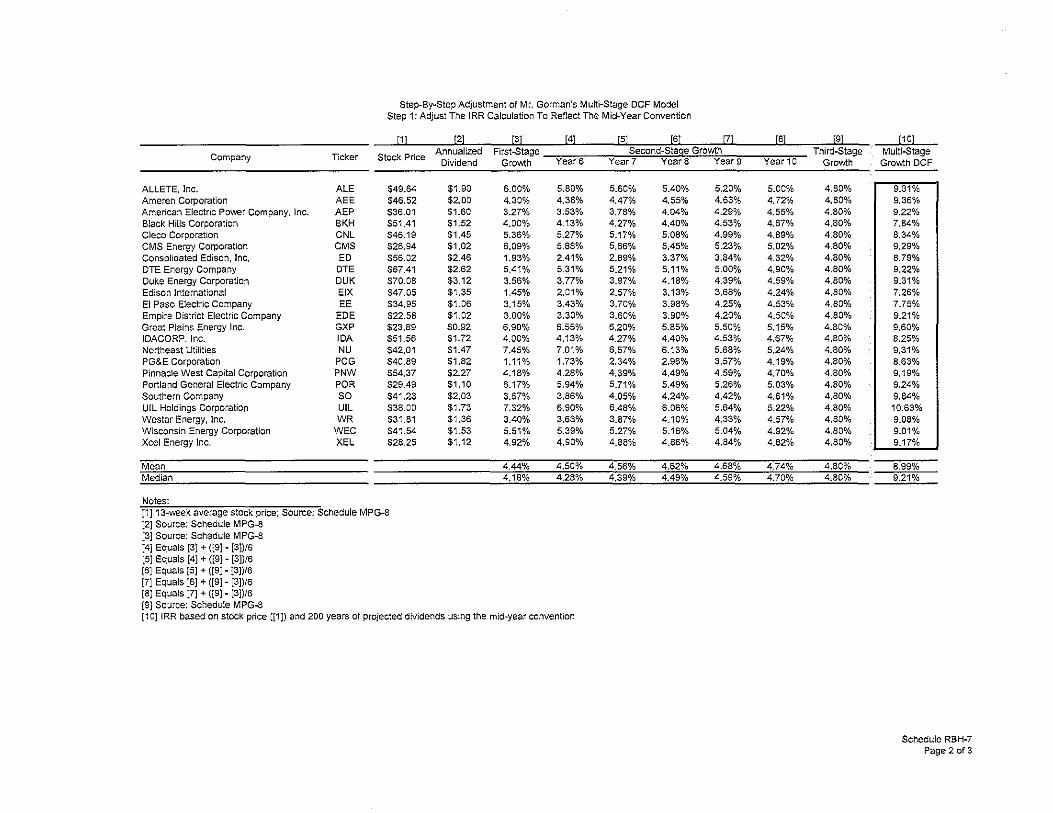
Step-By-Step Adjustment of Mr. Gorman's Multi-Stage DCF Model Step 1: Adjust The IRR Calculation To Reflect The Mid-Year Convention
[1] [2] [3] [4] [5] [6] [!]
Company Ticker Stock Price Annualized First-Stage Second-Stase Growth
ALLETE, Inc. ALE $49.64 Ameren Corporation AEE $46.52 American Electric Povver Company, Inc. AEP $36.01 Black Hills Corporation 8KH $51.41 Cleco Corporation CNL $46.19 CMS Energy Corporation CMS $26.94 Consolidated Edison, Inc. ED $56.02 DTE Energy Company DTE $67.41 Duke Energy Corporation DUK $70.08 Edison International EIX $47.05 El Paso Electric Company EE $34.95 Empire District Electric Company EDE $22.58 Great Plains Energy Inc. GXP $23.89 IDACORP, Inc. IDA $51.56 Northeast Utilities NU $42.01 PG&E Corporation PCG $40.89 Pinnacle West Capital Corporation PNW $54.37 Portland General Electric Company POR $29.49 Southern Company so $41.23 UIL Holdings Corporation UIL $38.00 Westar Energy, Inc. WR $31.81 Wisconsin Energy Corporation WEC $41.54 Xcel Energy Inc. XEL $28.25
Mean Median
Notes: [1]13-vveek average stock price; Source: Schedule MPG..S (2] Source: Schedule MPG-8 [3] Source: Schedule MPG-8 [4] Equals [3] + ([9]- [3])/6 [5] Equals [4] + ([9]- [3])/6 [6] Equals [5] + ([9]- [3])/6 [7] Equals [6] + ([9] - [3])/6 [8] Equals [7] + ([9] - [3])/6 (9] Source: Schedule MPG-8
Dividend Growth YearS
$1.90 6.00% 5.80% $2.00 4.30% 4.38% $1.60 3.27% 3.53% $1.52 4.00% 4.13% $1.45 5.36% 5.27% $1.02 6.09% 5.88% $2.46 1.93% 2.41% $2.62 5.41% 5.31% $3.12 3.56% 3.77% $1.35 1.45% 2.01% $1.06 3.15% 3.43% $1.02 3.00% 3,30% $0.92 6.90% 6.55% $1.72 4.00% 4.13% $1.47 7.45% 7.01% $1.82 1.11% 1.73% $2.27 4.18% 4.28% $1.10 6.17% 5.94% $2.03 3.67% 3.86% $1.73 7.32% 6.90% $1.36 3.40% 3.63% $1.53 5.51% 5.39% $1.12 4.92% 4.90%
4.44% 4.50% 4.18% 4.28%
(1 O]IRR based on stock price ([1]) and 200 years of projected dividends using the mid-year convention
Year7 YearS Years
5.60% 5.40% 5.20% 4.47% 4.55% 4.63% 3.78% 4.04% 4.29% 4.27% 4.40% 4.53% 5.17% 5.08% 4.99% 5.66% 5.45% 5.23% 2.89% 3,37% 3.84% 5.21% 5.11% 5.00% 3.97% 4.18% 4.39% 2.57% 3.13% 3.68% 3,70% 3.98% 4.25% 3.60% 3.90% 4.20% 6.20% 5.85% 5.50% 4.27% 4.40% 4.53% 6.57% 6.13% 5.68% 2.34% 2.96% 3.57% 4.39% 4.49% 4.59% 5.71% 5.49% 5.26% 4.05% 4.24% 4.42% 6.48% 6.06% 5.64% 3.87% 4.10% 4.33% 5.27% 5.16% 5.04% 4.88% 4.86% 4.84%
4.56% 4.62% 4.68% 4.39% 4.49% 4.59%
[8] [9] Third-Stage
Year 10 Growth
5.00% 4.80% 4.72% 4.80% 4.55% 4.80% 4.67% 4.80% 4.89% 4.80% 5.02% 4.80% 4.32% 4.80% 4.90% 4.80% 4.59% 4.80% 4.24% 4.80% 4.53% 4.80% 4.50% 4.80% 5.15% 4.80°/o 4.67% 4.80% 5.24% 4,80% 4.19% 4.80% 4.70% 4.80% 5.03% 4.80% 4.61% 4.80% 5.22% 4.80% 4.57% 4.80% 4.92% 4.80% 4.82% 4.80%
4.74% 4.80% 4.70% 4.80%
___j!.QI Multi-Stage Growth DCF
9.31% 9.36% 9.22% 7.84% 8.34% 9.29% 8.79% 9.22% 9.31% 7.26% 7.75% 9.21% 9.60% 8.25% 9.31% 8.63% 9.19% 9.24% 9,84% 10.63% 9.08% 9.01% 9.17%
8.99% 9.21%
Schedule RBH-7 Page 2 of 3

Step-By-Step Adjustment of Mr. Gorman's Multi-Stage DCF Model Step 2: Correct Long-Term Growth Estimate
[1] [2] [3] [4] 151 [6] I!]
Company Ticker Stock Price Annualized First-Stage Second-Stage Growth
ALLETE, Inc. ALE $49.64 Ameren Corporation AEE $46.52 American Electric Power Company, Inc. AEP $36.01 Black Hills Corporation BKH $51.41 Cleco Corporation CNL $46.19 CMS Energy Corporation CMS $26,94 Consolidated Edison, Inc. ED $56.02 DTE Energy Company DTE $67.41 Duke Energy Corporation DUK $70.08 Edison International EIX $47.05 El Paso Electric Company EE $34.95 Empire District Electric Company EDE $22.58 Great Plains Energy Inc. GXP $23.89 IOACORP, Inc. IDA $51.56 Northeast Utilities NU $42.01 PG&E Corporation PCG $40.89 Pinnacle West Capital Corporation PNW $54.37 Portland General Electric Company POR $29.49 Southern Company so $41.23 U!L Holdings Corporation UIL $38.00 Westar Energy, Inc. WR $31.81 Wisconsin Energy Corporation WEC $41.54 Xcel Energy Inc. XEL $28.25
Mean Median
Notes: [1] 13-week average stock price; Source: Schedule MPG-8 [2] Source: Schedule MPG-8 [3} Source: Schedule MPG-8 [4] Equals [3] + ([9] - [3])/6 [5] Equals [4] + ([9]- [3])/6 [6] Equals [5] + ([9] - [3])/6 [7] Equals [6] + ([9]- [3])/6 [8] Equals [7] + ([9] - [3])/6 [9] Source: Schedule RBH-10
Dividend Growth Years
$1.90 6.00% 5,95% $2.00 4.30% 4,53% $1.60 3.27% 3.68% $1.52 4.00% 4.28% $1.45 5.36% 5.42% $1.02 6.09% 6.03% $2.46 1.93% 2.56% $2.62 5.41% 5.46% $3.12 3.56% 3.92% $1.35 1.45% 2.16% $1.06 3.15% 3.58% $1.02 3.00% 3.45% $0.92 6.90% 6.70% $1.72 4.00% 4.28% $1.47 7.45% 7.16% $1.82 1.11% 1.88% $2.27 4.18% 4.43% $1.10 6.17% 6.09% $2.03 3.67% 4.01% $1.73 7.32% 7.05% $1.36 3.40% 3.78% $1.53 5.51% 5.54% $1.12 4.92% 5.05%
4.44% 4.65% 4.18% 4.43%
[1 OJ IRR based on stock price ([1]) and 200 years of projected dividends using the mid-year convention
Year7 Year 8 Year9
5.90% 5.85% 5.80% 4.77% 5.00% 5.24% 4.08% 4.49% 4.89% 4.57% 4.85% 5.14% 5.47% 5.53% 5.59% 5.96% 5.90% 5.83% 3.19% 3.82% 4.45% 5.51% 5.56% 5.61% 4.27% 4.63% 4.99% 2.87% 3.58% 4.29% 4.00% 4.43% 4.85% 3.90% 4.35% 4.80% 6.50% 6.30% 6.10% 4.57% 4.85% 5.14% 6.87% 6.58% 6.29% 2.64% 3.41% 4.17% 4.69% 4.94% 5.20% 6.01% 5.94% 5.86% 4,35% 4.69% 5,03% 6.78% 6.51% 6.24% 4.17% 4.55% 4.94% 5.57% 5.61% 5.64% 5.18% 5.31% 5.44%
4.86% 5.07% 5.28% 4,69% 4.94% 5,20%
(BJ [9] Third-Stage
Year10 Growth
5.75% 5.70% 5.47% 5.70% 5.30% 5,70% 5.42% 5.70% 5.65% 5.70% 5.77% 5.70% 5.08% 5.70% 5.66% 5.70% 5.35% 5.70% 5.00% 5.70% 5.28% 5.70% 5.25% 5.70% 5,90% 5.70% 5.42% 5.70% 6.00% 5.70% 4.94% 5.70% 5.45% 5.70% 5.78% 5.70% 5.37% 5,70% 5.97% 5.70% 5.32% 5.70% 5.67% 5.70% 5.57% 5.70%
5.49% 5.70% 5.45% 5.70%
_J1.QI Multi-Stage
Growth DCF
10.02% 10.07% 9.93% 8.60% 9.08%
10.00% 9.52% 9.93% 10.02% 8.05% 8.51% 9.92%
10.30% 8.99%
10.02% 9.36% 9.90% 9.95% 10.53% 11.29% 9.79% 9.73% 9.88%
--9.71%
9.82%
Schedule RBH-7 Page 3 of 3

1(1_00%
9.00'!.
8.00';/,
]_(')-'/,
6.00%
5.00%
4_00;~
J.CoO'h
2.00%
1.00';1,
Analysis Using Mr. Gorman's Equzy Risk Premium Data
Authorized 30-Year Indicated Ele<:tric Treasury Risk
y,. R.toms Yo" Premium 1980 13.93% 7.80% 6_13% 1987 12.99% 8_58% 4.41% 1988 12.79"1> 8.96% 3.83% 1989 12.97% 8.45% 4.52% 1990 12.7001.. 8.61% 4_09% 1991 12.55% 8.14% 4.41% 1992 12.09% 7.67% 4.42% 1993 11.41% 6.60% 4.81% 1994 11.34% 7.37% 3_97% 1995 11.55% 6.88-% 4.67% 1996 11.39'":/o 6.70% 4.69% 1997 11.40% 6.61% 4.79"'1.. 1998 11.66% 5_58% 6.08% 1999 10.77% 5.87% 4_90% 2000 11.43% 5.S4% 5.49";1, 2001 11.09% 5.49% 5.60% 2002 11.16% 5.43% 5.73% 2003 10.97% 4.96% 6.01% 2004 10.75% 5.05% 5.7D<h 2005 10.54% 4_65% 5.89'":/o 2000 10.36% 4.99% 5_37% 2007 10.36% 4.83% 5.53% 2008 10.-46% 4_28% 6.18% 2009 10.48"1.> 4.07% 6.41% 2010 10.34% 4_25% 6.09% 2011 10.22% 3.91% 6_31% 2012 10.01% 2.92% 7.09% 2013 9_80% 3.33% 6.47%
Average 11.34% 6.00% 5.34%
Source: Schedlle MPG~ 10
Correlation: -0.8767
8.5-SY, 8.14'!..
r-.... • • ' ' ,-.:.;..1 11.,,':"_ ..... _ .... ,,, 4.41% 4.41';1; Poi"toflrr,·~ion 391'h'
3.33;(,
0.00;(, +-----.--,----, --• -,- --r-~.~~.~
1!><.$ 1e-s.s 1WO 1992 19S4 1*6 1993 :2000 N02 2004 2006 2003 NIO 2012
--Trea;uryY""""d ----Rr>kPrem\lnl
Sut.•MARY OUTPUT
Regression Stab'stics flouitiple R 0.87672601 R Square 0.76$485 A~usted R Square 0_75975036 Standard Error 0.00428427 Observations 28
AN. OVA
Regression Residual Total
d( ss 1 0.00158556
26 0.00047723 27 0_00205279
MS 0_001585557 1.8354~-05
F Skm'ficarrceF 86.38310319 9.51474E-10
Schedv'e RBH--8 Page 1 of8

12.00%
10.00"/,
8.00%
6.00%
4.00>':.
2_00"}.,
Analysis Using Mr. Gorman's Equity Rlsk Premiun Data
Authorized Average Indicated Eloctric A Rated Utiity Risk y,., Re\Ufns Bood Yteld PremilHn
1986 13.93% 9_58% 4.35% 1987 12.99'% 10.10";1, 2.89% 1988 12.79"/o 10.49"/o 2.30% 1989 12.97% 9.77% 3.20% 1990 12.70% 9.86% 2.84% 1991 12_55% 9_36% 3.19% 1992 12.09% 869% 3.40"% 1993 11.41% 7.59',(, 3_82% 1994 11.34% 8.31% 3.03% 1995 11.55% 7.89'% 3.66% 1996 11.39"/., 7.75% 3.64% 1997 11.40";1, 7.80% 3.80% 1998 11.66% 7.04% 4.62% 1999 10.77% 7.62% 3.15% 2000 11.43% 824% 3.19'"-h 2001 11.09'";1, 7.76% 3.33% 2002 11.16% 7.37% 3.79% 2003 10.97% 6.58% 439"/., 2004 10.75% 6.16% 4.59'";1, 2005 10.54% 5.65% 4.89% 2006 10.36% 6.07% 4.29% 2007 10.36% 6_07% 4.29% 2008 10.46% 6.53% 3.93% 2009 10.48% 6.04% 4.44% 2010 10.34% 5.46% 4.88% 2011 1022% 5.04% 5.18% 2012 10.0W:. 4.13% 5_88% 2013 9.80% 4.38"h 5.42%
Average 11.34% 7.40% 3.94%
Source: SchedLie MPG-11
Correlation.: --0.8907
5_65%
' ' ...... ,, ........... ,.; ... -..-.r>·-...;~-...... '\ , .... ...~.... -., ___ ,, - -- ---_ ........... 3.031'.. 4 85'/, ...
o.oo'J..h~~~~
5.42% .-.. 4.3S%
1%5 19-M 1m 1932 1n4 1&96 199-3 woo 2002 2004 2.::00 :2'00<1 2010 2012
--Fts\Pr~rrium ---·A-BrodYidd
SUMMJ\.RY OUTPUT
Regression Statistics Multip:e R 0.89055729 R Square 0.79327041 Adjusted R Square 0.78531927 Standard Error 0.00399289 Observations 28
M.OVA
Regression Resklual Total
Intercept A Rated Uta Bord Yie!d
df ss 0.00159002
26 0.00041452 27 0.00200515
Coefficients Standerd Error 0.07207712 0.0033556 --0.4414648 0.04419775
MS 0.001590025 1.59432E-05
tStat 21.47962665 -9_988401155
F S.i_qniflcance F 99.76815764 2.17192E-10
P-va!ue 4.50559E-18 2.17192E-10
Lower 95% Upper 95% Loa€{95:0% Upper 95.0% 0.06517958 0.0789747 0.06517958 0.07897467 -0.5323146 --0.3506151 --0.5323146 --0.35061500
Schedule RBH-8 Page2of8

Analysis Using Mr_ Gorman's Eqli1y Risk Premii.ITI Data
Authorized Average 30--Year Indicated Electric A Rated Uti'# TreaslZ)' CreOrt Risk y,, Relums Bond Yield Yiekl seread Premium
1986 13.93% 9_58% 7.80% 1.78% 6.13% 1987 12.99% 10.10% 8.58% 1.52% 4.41% 1988 12.79% 10.49-"h 8.96% 1.53'/, 3.83% 1989 12.97% 9.77% 8.45% 1.32% 4.52% 1990 12.70% 9.86% 8.61% 1.25% 4.09% 1991 12.55% 9.36% 8.14% 1.22% 4.41% 1992 12.09% 8.69% 7.67% 1.02% 4.42% 1993 11.41% 7.59"/, 6_60",(, ()_99% 4.81% 1994 11.34% 8.31% 7.37% 0.94% 3.97% 1995 11.55% 7.89-"h 6.88% 1.01% 4.67% 1995 11.39"1o 7.75% 6_70% 1.05% 4.69% 1997 11.40% 7.60% 6.61% O.Wh 4.7S% 1998 11.66% 7.04% 5.58% 1.46% 6_08% 1999 10.77% 7.62% 5.87% 1.75% 4.91Yh 2000 11.43% 8.24% 5.94% 2.30"..6 5.49% 2001 11.09% 7.76% 5.49% 227% 5.00% 2002 11.16% 7.37% 5.43% 1.94% 5.73% 2003 10.97% 6.58% 4.96% 1.62% 6.01% 2004 10.75% 6.16% 5.05% 1.11% 5.70% 2005 10.54% 5.65% 4_65% 1.00"h 5_89% 2000 10.36% 6.07% 4.99";1, 1.08% 5.37% 2007 10.36% 6_07% 4.83% 1.24% 5.53% 2000 10.46% 6.53% 428% 2.25% 6.18% 2009 10.48'h 6.04% 4.07% 1.97'h 6.41% 2010 10.34% 5.45% 4.25% 1.21% 6.09% 2011 10.22% 5.04% 3.91% 1.13% 6.31% 2012 10.01% 4.13% 292% 1.21% 7.09% 2013 9.80% 4.38% 3.33% 1.05% 6.47%
Average 11.34% 7.4001, 6_00% 1.400..6 5.34%
Source: Schedules MPG-10 & MPG-11
SUt.'J,\ARY OUTPUT
R~ression Statistics Mv!tip:.aR 0_89761412 RSquare 0.80571111 A~usted R Square 0.790168 Stt'lf'ld3.rd Error 0_00400388
~lions 28
AN OVA df ss lAS F Si rificance F
Regression 2 0.00166201 0.000831005 51.83718471 1.27526E--09 Residual 25 0.00040078 1.60311E--05 Total 27 0.00206279
Coofficien/s Standard &r01 tStat P-value Lower 95% Upeer 95% Low Intercept 0.07397465 0.00393966 18.77691919 2.97929E-16 0.065860769 0.0820885 oc 30--Year Treasury Yield --0.4350801 0.0448-5244 -9.700254174 5_90466E-10 --0.5274554 -0.3427047 -0.5274554 -0.34270474 Creo.t S£!:.ead 0_39579554 0.18124116 2.183806071 0.038570978 0.022522389 0.7690687 0.02252239 0.76906869
Schedu:.a RBH--8 Page3of8

Analysis Using Mr. Gorman's Equity Risk Premium Data
tlof. Gorman's Projected Treasury YJ.ekl 4.40"% Mr. Gorman's Current Ul1ty Bood YJ.ekl 5.21%
RISK RISK PREM\U PREM!U
HIGH RANK
1 2 3 4 5 6 7 8 9 10
2 3 4 5 6 7 8 9 10
1 2 3 4 5 6 7 8 9 10
YEAR M
2012 7.09'"-,1, 2013 6.47% 2009 6.41% 2011 6.31% 2008 6.18% 1986 6.13% 2010 6.09% 1998 6.oa<h 2003 6.01% 2005 5.89'%
2012 5.88"% 2013 5.42% 2011 s.18V:. 2005 4.89't:. 2010 4.88% 1998 4.62% 2004 4.59% 2009 4.44% 2003 4.39% 1986 4.35%
ROE LOW RAN~ YEAR Treastry Ylfr'.d-Based Risk Premium
11.49% 28 19&! 10.87% 27 1994 10.81% 26 1990 10.7"1% 25 1987 10.58% 24 1991 10.53% 23 1992 10.49'% 22 1989 10.48% 21 1995 10.41% 20 1993 10.29% 19 1997
A-Utf~ty Bond-Based Risk Premium 11.W% 28 1988 10.63% 27 1990 10.39'% 26 1987 10.10'h 25 1994 10.Wh 24 1999 9.83% 23 2000 9.80'/.. 22 1991 9.65% 21 1989 9.60":h 20 2001 9.56% 19 1992
Estimated Return on Equity (tAJdpo(nt)
Source: Sched!ies MPG-10, MPG-11 arK! MPG-13 Nola: Differences due to rotrufng
M
3.83"h 3.97% 4.09% 4.41% 4.41% 4.42% 4.52% 4.67% 4.69% 4.79%
2.30% 2.84% 2.89% 3.03% 3.15% 3.19% 3.19% 3.20% 3.33% 3.40'/..
ROE
823% 8.37% 8.4S>t:. 8.81% 8.81% 8.82% 8.92% 9.07% 9.09% 9.19"%
7.51% 8.05% 8.10% 824% 8.36% 8.40% 8.40""/, 8.41% 8.54% 8.61%
'NE!GHTED ROE
10.51% 10.12<h 10.12% 10.14% 10.05% 10.02<1.. 10.02% 10.00% 10.02% 9.96%
10.02% 9.86% 9.70% 9.54% 9.57% 9.40% 9.38% 9.28% 9.28% 9.28%
10.26% 9.99% 9.91% 9.84% 9.81% 9.71% 9.70% 9.67% 9.65% 9.62%
Schedule RBH-8 Page 4 of8

Analysis Using Mr. Gorman's Eqlity Rlsk Premit.m Data
Autoregression
Output Created
Comments
'nput
•,t:ss;ng Va~;e HaMfng
Syntax
Resources
"" Pred'ct
nme Series Sett'rlgs (TSET}
ariab!t!s Created or J.\od,c')ed
'Jodel Name
Dep-endent Series 'ndependent Se6es Constant
No' NO<e:>
AcL'-Je Dataset
~er
Weight Spl'tf•',;, tl of Rows in WcQ;ng Data FOO
DefVlifon of Missifl9
Cases Used
Processor Til"!» ElapsedTifOO.
From To From
To Amount of Output
Saoing tle-HVariahles MaxOrum Nurnber of lags in Autocorre~foo or Partial A!Jiocorre!ation
""" Maxfflml Number of Lags in cross-C«re-\aOOn Plolts MaxffiJm Number of Ne.vVariab-:-es Generated Per Procedure MaxirrMn Number of Ne.v Cases Per ProtedoJre T real!rent of User-11issifl9 Va!ues Confidence lntef'lal Percenta~ Va~ue
Tolerance lor Entering Variatks in R€-9ression Equations ~1 axlm;m Iterative Parameter Change
J,'eth-od of Ca'cu!atlng Std. Errors f()f Au-tocorre-lafons length of Seasonal Period
Varia~ V.'hose Va'LJes Lab-el Observat~ns in P'.o-ls Equafons lncluda
FfT#I
ERR# I
LCL#1
UCL#1
SEP#I
Model Description
Af:>p!y'.J19 the m:xle! specif.:,;Lons from MOD_5
Iteration Termination Criteria
~laximum Pararreter Change
Nurrber oflterafons Equal ~l
.001
10
Ol-JUN-2014 15.04:48
Dataset! <nOfle> <nOlle> <n011e>
28 User-def.r;ed mssi:lg values are treated asnisslog_
Cases v.ith m"ssing values that sl>Ccessivett occur at the beg'1111fng or end of the series are s!<.ipped. A~ other cases may not contain any rrisslog va'ue.
ar€-9 varOOOOiv.ith var00002 .'me\h.od=<PW.
00.0000_00
00;00.00.02
Flfst observafon last obs€-f'latioo Fnt obsef'lafon fof.:ril1ng the use p<Md Last o-bserva!ioo PRINT,. DEFAULT
UEVNAR "'CURRENT
MXAUT0,.16
MXCROSS"'7
MXUEVNAR" 60
MXPRED!CT,. 1000
MISSING"' EXCLUDE
CHI= 95
TOLER= .0001
CINERGE" .001
ACFSE" IND
Unspecifed
Unspeciied
CONSTANT
FrtforVAROOOOI fromAREG, MOD_5
ErrorlorVAR00001 fromAREG, I.\OD_5 95% LCL fu.f VAROOOOI fromAREG, MOD_5 gs<;, UCL f()fVAROOOOI frcmAREG, I.IOD_5 SE of Fll forVAROOOOI from AREG, MOD 5
,.~OD_5
R<sl<.Prerri-um
iTreasury30Y Included
Schedule RBH--8 Page5of8
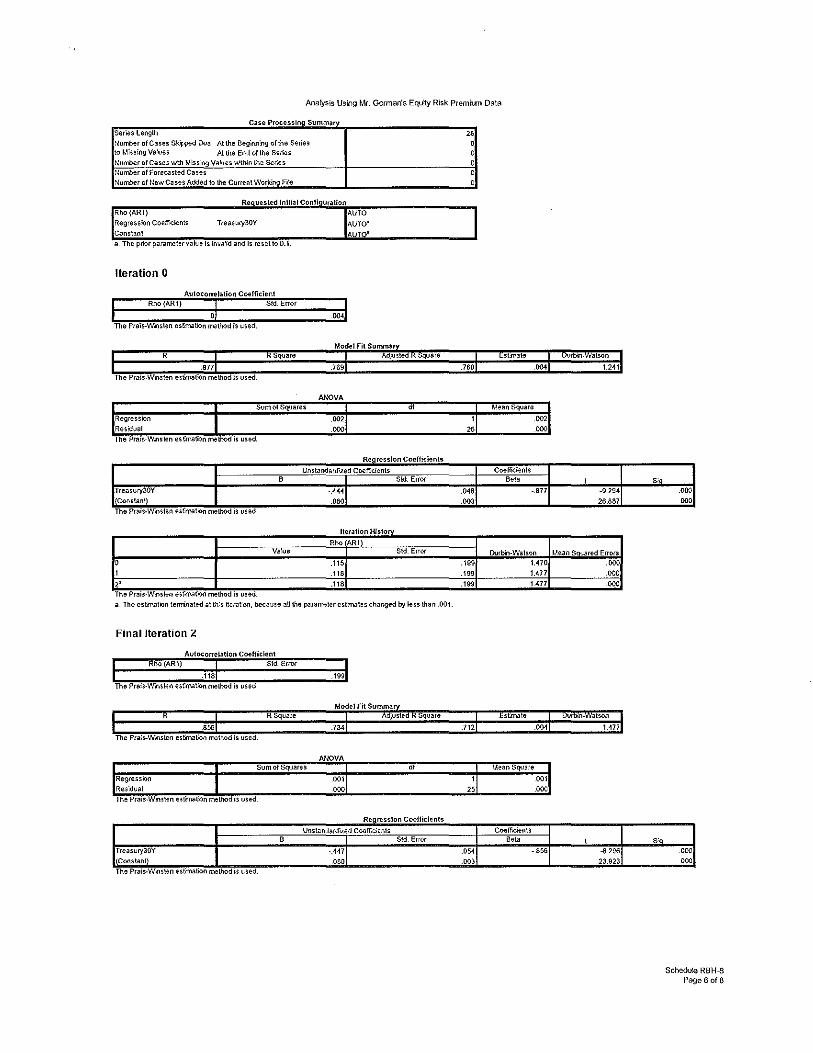
Analysis Uslng t.lf. Gonnan's Eqtity Risk Premilm Data
case Processm :>umma
series Length
~~u~r of Cases Sk1;.ped Due At the Beginn"ng of the Series to Missing Va...,es AI the End of \he Series NurrOer of Cases y,tth Missflg Va'ues y,;lhlnlhe ser;es Numt>er of Foree.; sled Cases
NurrOer or tlewCases Added 1\l the Current Working F~~
Requested Initial Configuration
Rtlo(ARI)
Regression Coeffro;ients
:eon stan!
TreaSU<)"30Y
a. The priOf" pararreter·va~Je ls irwa~d and ls reset 0·0.1.
Iteration 0
Autocorrelation Coefficient
3 The Prais-W.oslen estimation me"""""'"'~'"""'''-· ----
Rho (ARt) ol Sid. Error IJo. I
Regress 1om
Residual
Sum of Squares
n.-e·rrats~Wilsten es!imatloniTiiihod ls used.
ANOYA
002
000
AUTO
AUTO' AUTn•
Kegress10n o..;oemctems
Unslalfdard".zed Coefficients B Sid. ErrOl"
Treasury30Y -.44~1 {Constant) ·"' The Prals-W.nsten estimation method is used.
nerauon r-us1or
I Rho ARt Value S\<:1. ErrOl"
r: .115 .118
2' .118
The Prais-W.osten esfmation method is used.
a. The esfunatioo teminated at th"s ~erafoo, t>ecause a~ the parameter estfrotes changed bot less than .001.
final Iteration 2
Regression
Residual
Sum of SqJares
ThePI3iS~Winsten es!imation me.th-ii{fis used_
ANOYA
001
000
iif
KegreSS!On L"OOli!CH!ntS
UnstandarO.zed Co-afficients B Std. ErrOl"
Treasui)'30Y -A4~~ (Constant) ow The Prals-W.ns!en Htimalion rr-.;thod is used.
" 0 0
0 0
0
26
.048
.003
.199
.199
.199
"
.0>4
.003
Coefficients
"'" -.877
Durbin-WatS'Jn
1.470
1.477
1.477
Mean Square
Coefficients Beta
001
.000
-.856
t -9.294
26.S87
MeanS ared Errors
.000
.o-oo
.000
t --$2(16
23.923
s
s
.000 000
000
000
Schedule RBH--8 Page 6 of 8
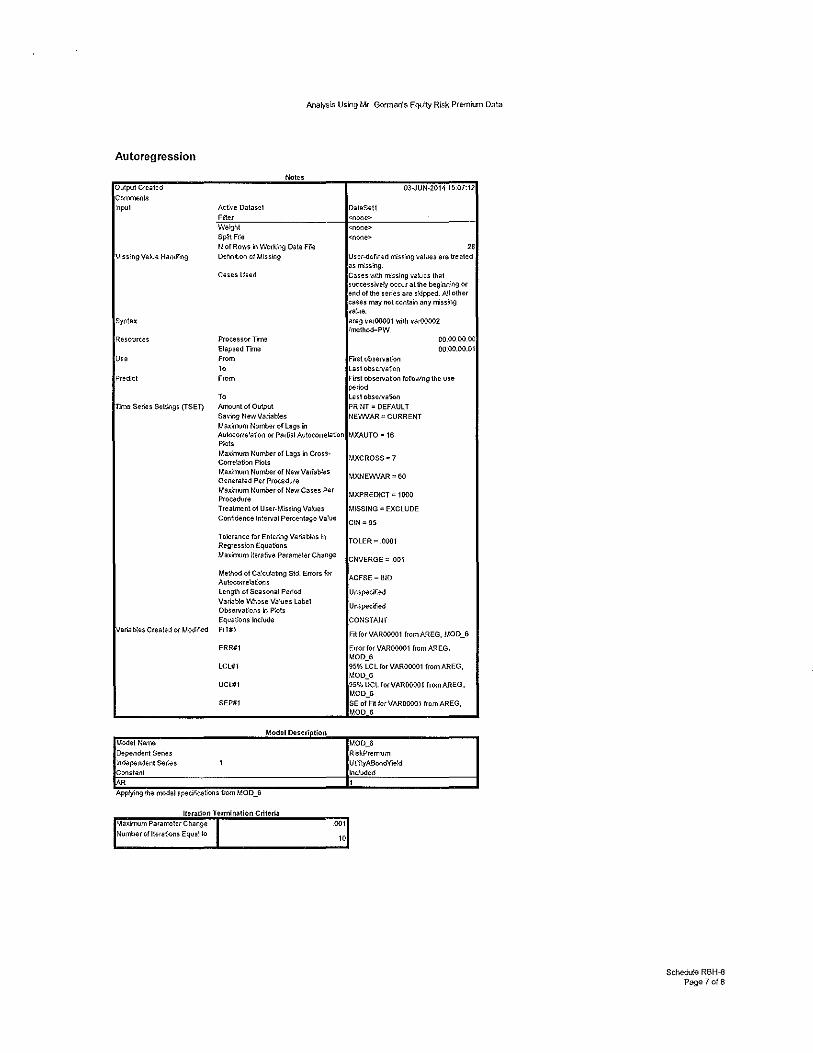
Analysis Uslng Mr. Gorman's Eqv:ty Risk Premitm Data
Autoregression
Output Creal~
ClXIl!lle.nts 'npul
•.~:Ssing Vak.ie Hand':ng
Syntax
Resources
u ..
Pred:ct
T!ll1a Sari-as Settings (TSED
~ariabl,es Created or MOOne-d
MOdetName Dependent Series lndepen-~nt series Constant
'"' NOleS
Actve Dataset Fb'ter Weight
S~tFt'.a
tl of Ro'h"S in WOOQ(I{J Data File Diffirlit:.on of Missing
Cases Used
Pro-cessor Tum Elapsed Trre ,,~
To From
To Amount of Output Sa~'ing tlewVariat>les Max:;mum Number or Lags in AukX:Qrre'afoo or Partial Autocorrelatioo Plots Maximum Number of Lags in Cross-CO-rreLaDon Plots l.'axirmm Number or NewVariab.!es Generated Per Prao>dure "ax:imum tlumberor New Cases Per Pro-cedure Treal!rent a-1 User-Missing Va'ues Confidence tn!ef'lal Perantage Va'ue
Toloorance for Enterin-g Variabl-es in Regrass~n Equations
'·'axim:Jm ltera&.-e Pararre:erChang-e
Method ofCa'culatin-g Std. Errors f<J.r Aulocorre\atOns leno;~lh of Seasonal Period Variab-1<~ V.'hose Va\ues Lat>el ObseNat;ons in P'oQ\s Equations Include
FIT#\
ERR#\
LCL#1
UCLfl
SEP#I
Model D<fscriptiQn
Applyingths. model spetif,~tioos from MOD_6
Iteration Termiflltion Criteria
'.la-.imum Parameter Change
Number or 1\erafons Equal kl
001
10
03-JUN-2014 15.07:12
DataSet! ~none>
~none>
.:none>
" User-defined nissing values are treated as mss:ng. Cases v.i:h m:~slng va~Jes that successively occur at the beg"nn:ng Of
end oflhe series are s!oipped. A'l other cases ma'J not contain any niss'ng value. areg var00001 v.ith var00002 lmelhod=PW.
00.00.00.00
00;00.00.01
F"!fSI obSef'laf-on last observation
F"1fst obsel'lafoo fo-I'N"h'ng the use
"""' Las\ ob-se-rvation PRINT= DEFAULT
NE\'NAR = CURREtH
MXAUTO = 16
MXCROS-S = 7
1.\XNEI.\VAR = 60
MXPREIY.CT = 1000
MISSING= EXCLUDE
CIN = 95
TOLER= .0001
CNVERGE = .001
CFSE=I/10
Unspec.if~
Unspedfied
CONSTNIT
FrtforVAROOOOI fromAREG, !WD_6
ErrorforVAR00001 from MEG, MOD_6 95'/, LCL for VAROOOOI from AREG, MOD_6 95'h UCL forVAROOOOI fromAREG, I.\OD_6 SE of Fit forVAROOOOl from AREG, MOD 6
MOD_6
Ris!-J>rem:um
UH\yABondYte-:0 lndl!ded
Schedu!e RBH--8 Page 7 of8
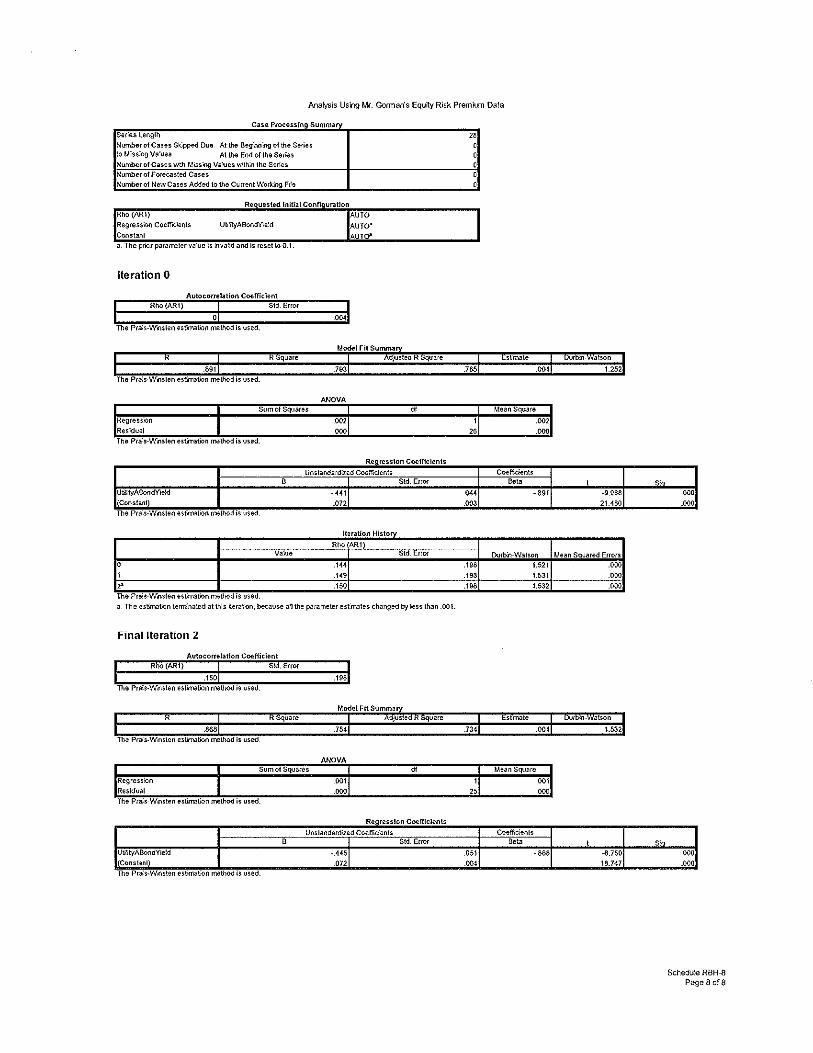
Analysis Using Ml. Gorman's Equity Risk Premiun Data
'-'d""" '""""'"""' "'""'"'~' Series Lenglh ~lumber of Cases Sk.:pped Due At !he Beg"nn"ng of the Series to Missing Va'uas At the End of \he Series ~lumber of Cases v.<·JJ !.~iss"og Values \\~lh:n the Series ~lumber of forecasted Cases il:umberof tle-.vCases Added to the Current Workng F~'-e
Reouested Initial Confiouration Rtto(ARI)
1
Regressi<m Coelf,.z:.Onts
Constant
Ut"ityABondYte~d
a. The prior pararmter value is inva~d and is reset \o 0.1.
Iteration 0
Rho {ARI) Sld. ErrN A"lo•o:rHoo C~ffl•lool
The Pra.s.wmten estKnation rmllw-d is used.
Regress:On Residual
Sum of SqJares
The Pra:s-Wmlen estimation rmllw-d is used.
AUTO
IAUTO'
AUTO"
o.41
MIOVA
002
000
ill
"'~ I~:>~IVII ... ""'111~1<'1111>
B
Ut?.tyA!loodYiekl
(Constant) Thl'! Pr:.;o.W.n<ll'!n ~.<lirmtinn m.thrn1 io to<...-!
VaNe
,. The Prais-W.nsten estimafun rmth<l-d is used.
Unstandard<z.ed Coefficients
-.4~~~ _072
lleration History
Rho{AR\
.144
.149
.ISO
Std. Error
Sid. Error
a. The est:maton terrrina!ed at this ~erafon, l.>et:ause a, 1M parameter esfirotes ch<mged by less than .001.
Final Iteration 2
Regression
Resklual
Sum of Squares
The Prais-Wonsten estimation method is used_
MIOVA
001
000
ilf
"'" "'""'"" """'"~'""'" Unstandard'zecl Co-el'fici;,n!s
B Std. Error
UtMyA!loodYield -A~~~ (Constoot) 072 Thl'! Pr;>"o.V..'.n<ll'n l'<f-<Mt;nn m>thrn1 io """'"'
" ' ' 0 0
'
Coefficients
"" I 044 -.891 -9.9B8 003 21.4SO
I DurDil-Watson I !.~ean Swared Errors .198 1.521 .000
.193
.193
051
o.4
1.531
1.532
Co-efficients
"~ ·.Wl
EE!'. .000
I -{1.750 18.747
s:q
s~
.000
.000
.000 000
Sched~-e RBH-8 Page8of8
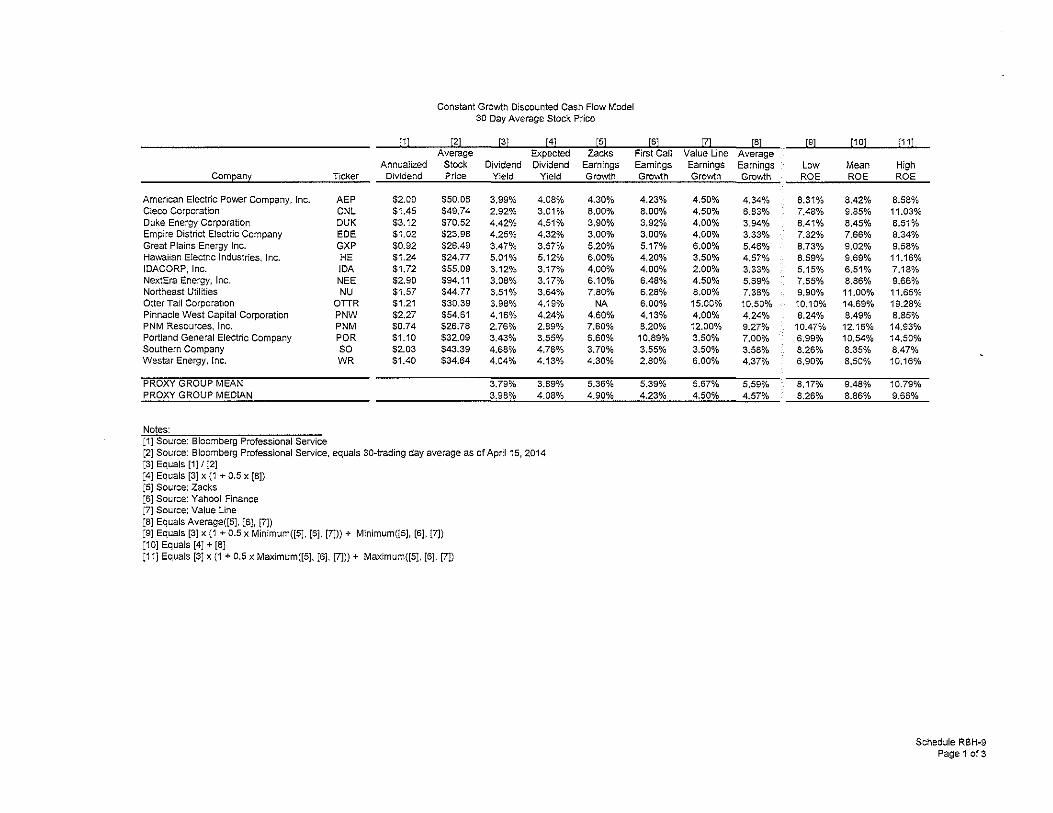
Constant Growth Discounted Cash Flow Model 30 Day Average Stock Price
[1] [2] [3J [4J Average Expected
Annualized Stock Dividend Dividend Com~anz:: Ticker Dividend Price Yield Yield
American Electric Povver Company, Inc. AEP $2.00 $50.06 3.99% 4.08% Cleco Corporation CNL $1.45 $49.74 2.92% 3.01% Duke Energy Corporation DUK $3.12 $70.52 4.42% 4.51% Empire District Electric Company EDE $1.02 $23.98 4.25% 4.32% Great Plains Energy Inc. GXP $0.92 $26.49 3.47% 3.57% Hawaiian Electric Industries, Inc. HE $1.24 $24.77 5.01% 5.12% IDACORP, Inc. IDA $1.72 $55.09 3.12% 3.17% NextEra Energy, Inc. NEE $2.90 $94.11 3.08% 3.17% Northeast Utilities NU $1.57 $44.77 3.51% 3.64% Otter Tail Corporation OTTR $1.21 $30.39 3.98% 4.19% Pinnacle West Capital Corporation PNW $2.27 $54.61 4.16% 4.24% PNM Resources, Inc. PNM $0.74 $26.78 2.76% 2.89% Portland General Electric Company POR $1.10 $32.09 3.43% 3.55% Southern Company so $2.03 $43.39 4.68% 4.76% Westar Energy, Inc. WR $1.40 $34.64 4.04% 4.13%
PROXY GROUP MEAN 3.79% 3.89% PROXY GROUP MEDIAN 3.98% 4.08%
Notes: [1] Source: Bloomberg Professional Service [2] Source: Bloomberg Professional Service, equals 3D-trading day average as of April15, 2014 [3] Equals [1]/ [2] [4] Equals [3] X (1 + 0.5 x [B]) [5] Source: Zacks [6] Source: Yahoo I Finance [7] Source: Value Line [B] Equals Average([5]. [6], [7]) [9] Equals [3] x (1 + 0.5 x Minimum([5], [6], [7])) + Minimum([S], [6], [7]) [1 OJ Equals [4] + [B] [11] Equals [3] x (1 + 0.5 x Maximum([5], [6], [7])) + Maximum([5], [6], [7])
[5J Zacks
Earnings Growth
4.30% 8,00% 3.90% 3.00% 5.20% 6.00% 4.00% 6.10% 7.80%
NA 4.60% 7.60% 6.60% 3.70% 4.30%
5.36% 4.90%
[6J IZI [8J First Call Value Line Average Earnings Earnings Earnings Growth Growth Growth
4.23% 4.50% 4.34% 8,00% 4,50% 6.83% 3.92% 4,00% 3.94% 3.00% 4.00% 3.33% 5.17% 6.00% 5.46% 4.20% 3.50% 4.57% 4.00% 2.00% 3.33% 6.48% 4.50% 5.69% 6.28% 8.00% 7.36% 6.00% 15.00% 10.50% 4.13% 4,00% 4.24% 8.20% 12.00% 9.27%
10.89% 3.50% 7.00% 3.55% 3.50% 3.58% 2.80% 6.00% 4.37%
5.39% 5.67% 5.59% 4.23% 4.50% 4.57%
[9] [10J
Low Mean ROE ROE
8.31% 8.42% 7.48% 9.85% 8.41% 8.45% 7.32% 7.66% 8.73% 9.02% 8.59% 9.69% 5.15% 6.51% 7.65% 8.86% 9.90% 11.00% 10.10% 14.69% 8.24% 8.49%
10.47% 12.16% 6.99% 10.54% 8.26% 8.35%) 6.90% 8.50%
8.17% 9.48'% 8.26% 8.86%
[11]
High ROE
8.58% 11.03% 8.51% 8.34% 9.58%
11.16% 7.18% 9.66%
11.65% 19.28% 8.85%
14.93% 14.50% 8.47%
10.16%
10.79% 9.66%
Schedule RBH-9 Page 1 of 3

Constant Growth Discounted Cash Flow Model so Day Average Stock Price
[1[ [2] [3] [4] Average Expected
Annualized Stock Dividend Dividend
ComEan:z:: Ticker Dividend Price Yield Yield
American Electric Power Company, Inc. AEP $2.00 $48.45 4.13% 4.22% Cleco Corporation CNL $1.45 $48.20 3.01% 3.11% Duke Energy Corporation DUK $3.12 $69.79 4.47% 4.56% Empire District Electric Company EDE $1.02 $23.23 4.39% 4.46% Great Plains Energy Inc. GXP $0.92 $25.25 3.64% 3.74% Hawaiian Electric Industries, Inc. HE $1.24 $25.45 4.87% 4.98% IDACORP, Inc. IDA $1.72 $53.48 3.22% 3.27% NextEra Energy, Inc. NEE $2.90 $89.87 3.23% 3.32% Northeast Utilities NU $1.57 $43.49 3.61% 3.74% Otter Tail Corporation OTTR $1.21 $29.45 4.11% 4.32% Pinnacle West Capital Corporation PNW $2.27 $53.65 4.23% 4.32% PNM Resources, Inc. PNM $0.74 $25.19 2.94% 3.07% Portland General Electric Company POR $1.10 $30.80 3.57% 3.70% Southern Company so $2.03 $41.96 4.84% 4.92% Westar Energy, Inc. WR $1.40 $33.44 4.19% 4.28%
PROXY GROUP MEAN 3.90% 4.00% PROXY GROUP MEDIAN 4.11% 4.22%
Notes: [1] Source: Bloomberg Professional Service [2] Source: Bloomberg Professional Service, equals 90~trading day average as of April 15, 2014 [3] Equals [1] I [2] [4] Equals [3] x (1 + 0,5 x [8]) [5] Source: Zacks [6] Source: Yahoo! Finance [7] Source: Value Llne [8] Equals Average([5]. [6]. [7]) [9] Equals [3] x (1 + 0.5 x Minimum([S], [6], [7])) + Minimum([5], [6], [7]) [10] Equals [4] + [8] [11] Equals [3] x (1 + 0.5 x Maximum([5], [6], [7])) + Maximum([5], [6], [7])
[5[ Zacks
Earnings Growth
4.30% 8.00% 3.90% 3.00% 5.20% 6.00% 4.00% 6.10% 7.80%
NA 4.60% 7.60% 6.60% 3.70% 4.30%
5.36% 4.90%
[6] [7] [BJ First Ca!! Value Line Average Earnings Earnings Earnings Growth Growth Growth
4.23% 4.50% 4.34% 8.00% 4.50% 6.83% 3.92% 4.00% 3.94% 3.00% 4.00% 3.33% 5.17% 6.00% 5.46% 4.20% 3.50% 4.57% 4.00% 2.00% 3.33% 6.48% 4.50% 5.69% 6.28% 8.00% 7.36% 6.00% 15.00% 10.50% 4.13% 4.00% 4.24% 8.20% 12.00% 9.27%
10.89% 3.50% 7.00'% 3.55% 3.50% 3.58% 2.80% 6.00% 4.37%)
5.39% 5.67% 5.59% 4.23% 4.50% 4.57%
[9] [10]
Low Mean ROE ROE
8.45% 8.56% 7.58% 9.94% 8.46% 8.50% 7.46% 7.80% 8.91% 9.20% 8.46% 9.55% 5.25% 6.60% 7.80% 9.01% 10.00% 11.10% 10.23% 14.82% 8.32% 8,56%
10.65% 12.34% 7.13% 10.69% 8.42% 8.51% 7.05% 8,64%
8.28% 9.59% 8.42% 9.01%
[11]
High ROE
8.72% 11.13% 8.56% 8.48% 9.75% 11.02% 7.28% 9.81% 11.75% 19.42% 8,93% 15.11% 14.66% 8.63%
10,31%
10.90% 9.81%
Schedule RBH-9 Page 2 of 3

Constant Growth Discounted Cash Flow Model 180 Day Average Stock Price
[1] [2] J3] J4] Average Expected
Annualized Stock Dividend Dividend ComE!an:z:: Ticker Dividend Price Yield Yield
American Electric Power Company, Inc. AEP $2.00 $46.69 4.28% 4.38% Cleco Corporation CNL $1.45 $47.08 3.08% 3.19% Duke Energy Corporation DUK $3.12 $69,39 4,50% 4.58% Empire District Electric Company EDE $1.02 $22.71 4.49% 4.57% Great Plains Energy Inc. GXP $0.92 $24.16 3.81% 3.91% Hawaiian Electric Industries. Inc. HE $1.24 $25.58 4.85% 4.96% IOACORP, Inc. IDA $1.72 $51,73 3.32% 3.38% Next Era Energy, Inc. NEE $2.90 $86.64 3,35% 3.44% Northeast Utilities NU $1.57 $42.73 3.67% 3.81% Otter Tail Corporation OTIR $1.21 $29.04 4.17% 4.39% Pinnacle West Capital Corporation PNW $2.27 $54,52 4,16% 4,25% PNM Resources, Inc. PNM $0.74 $24.08 3.07% 3.22% Portland General Electric Company POR $1.10 $29.98 3.67% 3.80% Southern Company so $2.03 $41.92 4.84% 4,93% Westar Energy, Inc, WR $1.40 $32.49 4.31% 4.40%
PROXY GROUP MEAN 3.97% 4.08% PROXY GROUP MEDIAN 4.16% 4.25%
Notes: [1] Source: Bloomberg Professional Service [2] Source: Bloomberg Professional Service, equals 180-trading day average as of April15, 2014 [3] Equals [1]1 [2] [4] Equals [3] x (1 + 0.5 x [B]) [5] Source: Zacks [6] Source: Yahoo I Finance [7] Source: Value Line [8] Equals Average([5]. [6], [7]) [9] Equals [3] x (1 + 0.5 x Minimum([5]. [6], [7])) + Minimum([5], [6], [7]) [1 OJ Equals [4] + [8] [11] Equals [3] x (1 + 0.5 x Maximum([5], [6], [7])) + Maximum([5], [6], [7])
J5] Zacks
Earnings Growth
4.30% 8.00% 3.90% 3.00% 5.20% 6.00% 4.00% 6.10% 7.80%
NA 4.60% 7.60% 6.60% 3.70% 4,30%
5.36% 4.90%
16] IZI JBJ First Ca!! Value Line Average Earnings Earnings Earnings Growth Growth Growth
4.23% 4.50% 4.34% 8.00% 4.50% 6.83% 3.92% 4.00% 3.94% 3.00% 4.00% 3.33% 5.17% 6.00% 5.46% 4.20% 3.50% 4.57% 4.00% 2.00% 3.33% 6.48% 4.50% 5,69% 6.28% 8.00% 7.36% 6.00% 15.00% 10.50% 4.13% 4.00% 4.24% 8.20% 12.00% 9.27%
10.89% 3.50% 7.00% 3.55% 3.50% 3.58% 2.80% 6.00% 4.37%
5.39% 5.67% 5.59% 4.23% 4.50% 4.57%
J9]
Low ROE
8.60% 7.65% 8.48% 7.56% 9.08% 8.43% 5.36% 7,92%
10.07% 10.29% 8,25% 10.79% 7.23% 8.43% 7.17%
8.35% 8.43%
J10J
Mean ROE
8.72% 10.02% 8.52% 7.90% 9.37% 9.52% 6.71% 9.14%
11.17% 14.89% 8.50% 12.48% 10.79% 8.51% 8.77%
9.67% 9.14%
[11]
High ROE
8.88% 11.20% 8.59% 8.58% 9,92%
10.99% 7,39% 9.94%
11.82% 19.48% 8.86%
15.26% 14.76% 8.63%
10,44%
10.98% 9.94%
Schedule RBH-9 Page 3 of 3

lt'6L$ 16l$ \9l$ '"" zs-zs '"' 6\l$ ""' l6 IS C•nS ons (19"1$ 0"' WI$ 060$ ColO$ (t9K~) }!',, -,'-'! 'liiR1J3 -"'"<'"M Si£6$ 9-HS ens 01'($ £60~ ""' sns 6'i""ZS om zns ~ns 6-!ZS tz-oS St""ZS Cis-IS ((10$ (StU$) 00 /.IX"du.»> URWl'JS
sna ""' "'" ~-zs tL'ZS ""' ow lt""ZS ffi'l$ ll'IS Z91S lt"l$ tt'IS o-ns 160$ ooos (e,.:msl "" ll.,d•.i!<>J~B l!i'»tA~ Pll>l!IY.'d ~s~s S'9lS t'i-zt ons a-zs lOZS o·ns 69'1$ Z!i'IS sos sns ~-IS "" "" "" ColDS (H'WS) I"•Nd -"'-, 's;;.>n,_..~l:ll'iNd tOtZIS ens "" 6ZH .,.. ISU 6HS "" IUS ""' sns 9L-zS "" om S9-IS ooos (t9ts$) t.'.'ld u-:·;~y~;i>>J r«.O.:ll"'M "f.>W\J!d 6SOlS '"' tllS II ZS OHS s-ns lOS 19 IS tns ens sns lD'I$ fiH$ t>HS 9lOS ooos (Gt"Oi$) l:IHO t>)_;.;o~~e_!_R.O
1Zlr1ll$ <:HS tiH 16""ZS t9""ZS 19ZS lt'l$ fZlS S<H$ "" zns ss·ts sns 1£'1$ "" Col OS {l1'HSl nn s..::-ml'"'a<v:11 IZHZS Z-'YLS "" "" WiS$ "" ti-H tns (t't$ zns ZS'H SStS ez-u "'" 16'1$ w·os Ot't5Sl 33.'1 :•JI 'II3RIJ3 1i'-'3J'"tl !i9SZIS eos "" '"' tstS '"' ll'£~ &ES "" l9ZS tstS Zl'lS sn:s 15"\S tns ooos (60-SSS) vru ·~'&KY.1\fCII 6StSS '"' ms n-zs C(I""ZS zo·ts ~-~s sns tl'IS '"" ""' "" tnS S7'tS c•ns C\10$ (lnzsl 3H ~U\ 'S"!--'i""f'.!J "!Jl.>"'3 ll!:J•-"£!--1 lOOSS "'" (6'1$ ZS'IS tl'IS t•ns K'IS st'IS lt'IS ons t.ZIS St'IS 00 IS "" lSOS (o)'O$ (GHeSl ""' '001 l.f\NI.f3 S'-!~Jdie<>~ 9rtss s~rts 6nS I); 'I$ zns KIS "" ens rns i•HS to' IS Co)' I$ MOS '"" l90S "'" (96 fZS) "" !=d•.li<>J ~~B t#j$0{} a~du-8
Z$'9-;IS '"" 69tS ens ""'' £6£'S ons ens ""' £1'($ l6ZS ""' 19ZS "'"' £t""ZS "'" <zs-otsl ""' IY.•.~e>:®:) ll!R'-'3 a~I'(J 9-I'HtS "" tns .,,
"" 1St$ ""' "'' ens ""' St""ZS ti'ZS M'IS N'IS SI'IS "'" (tL'6tSl "" '-Y.>J".>:>dlCI:)t=l:) ZizttS tns E'HS sns ~HS lZ:£S "" '"' t.HS tns SHS '"' £Z:ZS SI'ZS sns C'YOS (OO'friSl £/ ·~ 'f.l"iid.J.."'' P..""d "!-Ql78 L~W'j
"""' """' """"' """"" '""" """" """" '"""' """" 61.1()'£19 91.W'9 lt.~£19 91.%9 91.'000 tl/1£/ll ti/SIIt ""IHO a~:'!l m.uoo
""" lost leil [gil IW [gil [gil !til !HI lUI lW toil !sst li91 [Lg[ l9S'I is§! 101 !>I'D[:!'f'~L·l<"''.UI
q<'(] l"'nll'J.f~P<-f:>ld
ez:sa trrs l6ZS 19ZS "'' Z'i"ZS sns 6t'ZS "" zns os·ts Ol'l$ ""' "" tns zns tlt$ HM ~I Jh.s\8 Rl>"'J,\ £Z:06S "" SH$ ez:cs OI'£S t6ZS ons "" snS ""' ZHS sns 6-!Z$ tZZS QI""ZS £1<:~ lOG'S 00 h"lofun:) Ul>lJI'KIS o-t:ZLS "" OZ:t$ wu s-ns tLG'S oszs OHS Zl""l$ wns ll'IS zns l?'"IS ens o-ns 9t'IS zns ""' hW.uoo"'!--'i-»!3 [1!-»m~ptm,v:>d
""' '"' "" tsZ$ '""'' ltZ$ lO""lS es·ts 69'\S zns sns ens Kl'IS ""' w·os 6LOS u-os l'!lld ·::.., 'SaJ:r~H\'IIkl 11111\S lO'S$ e1 tS "" 6Zt$ ""' 19~$ 6S't$ 6HS IZ:£$ "'" ens 9l'ZS "" ons s-ns "" l.'.'ld ""'~~'~ M.da:l l"'M ~proo.l'd
'"'' OHS '"' "'' II""ZS "'"' 99'\S z.ns lS't$ tns '"' sns lol'IS ro·ts tO' IS to' I$ tO' IS HllO oo.:"'»d.o>:Jl"i"'ro Ol-OOIS IS£$ "" tl'($ 16""l$ IQ""l$ 19""ZS ZHS £ZZS "" ~9'1S U'i$ 9i'IS g·ns lt'IS ens om nn saumtwa~l llt'6C<:S zns "'" '"" "" "" c9·ss trss LnS ens Zl't$ "" S<aS '"' "'" 19-zS ""' 33.'1 ·~"-'1 'll!.mg e8}(<N ti'IZIS '"' "" "" "" "" "" 1rrs "" "'' l9""ZS "'' ZHS 6\'ZS 16'\$ 91'1$ lS'IS vo ·~ 'dl:IO::WGI enss om '"' tZlS ll""l$ "'" "" S'S IS sns tnS !;9'\S ons sns IS-IS 9-t't$ WIS lt'IS 3H 'Ot.lj 'S"'!.IiStlf<..IIC!Jl..""8 IRJ<>V.q.j lertss SJC:t "'" e6 IS -zns tns £9'\t KU sns l£'\S ons t.Z: IS sns sons "" LeoS SLT!S dXO 001 !ti.mg w.<"ld)ea~n KISS 11'1$ W'IS 69'\S 0..-t$ Zt'IS tnt '"' 61'1$ tns eons Kl'l$ cons wos "" ""' £60S '"' }~~--'i»8J.~l>J,dug ~z ISIS tzss "" '"' tns om £6£$ OHS 6HS ons H-es 160$ "'' lBZS oo-zs l6'Z$ ts-zs '"" '-"~}e>:o.fn:)}iia'-'3 a,na l9Z\IS titS "" '"' ~-tS ~tS 19£$ "'" "'" 61ZS sns St""ZS tl""l$ "" N-IS 69\S 9'i'IS "" oo,:;e.r.<ilo:) o~n 1t'SOIS St tS 1ns "" "" "'" a-u LOtS 6'HS ras Qil$ Hl$ '"' t.z-t$ 91(:$ 10""l$ 66'1$ ""' ~<.Jj'/!_-;d-.uoo P->""d0!4»8l.~laU/j
"'-'A '"' ""' "" ·= ""' tZDZ '"' ·= "'' '"' 810l ""' 910Z ""' ""' £10<: -"'V'.l i.I123J><>J Jru.UlH_l
h:§l lzsl US! lo?ll [sst [s-;l [Lsi [go;[ Iss! lKI 1~1 !zd [lsi los I lstl lerl tal S.V4tjl.j$g-;)
1""'-"-"iP~fo-'d
%9Y19 %S<rL9 'i'.S<H9 '/,S>:r£9 %9H9 %lr1l-W '1:((199 ';WH9 'hz.ns %10""l9 'f,to·ts %0(1'1)9 %91'1>9 '>\~·1s %'><:'9-; '/o!)JSS l:!M -~)bi>!J3-'<~,\ %9Y19 %9Yl9 %9Yl9 %9Yl9 %9H9 '!,<;l"l9 '1:9-?'W %11'69 '{,"?g'69 'i\S9'0! o/:~ll %00""ll Wil?l '{,O'>t.l %SZ:tl %Col'S! 00 /tredWJ-0 <UaWl'JS %W'l9 '{,S(I"l9 %W'19 %W'l9 %$1l'19 %l~-s9 o/Me9 %1£(:9 %tl'09 %9\'GS %S">'LS %Col'S'> %OS'S"> Y,((l-19 %0;-(9 '{,((1'99 """ lwedo.i!<>JO!-P>a I"=<> ptn'jl.l(ld
%9Y19 o/,Oi{fl9 %S<H9 %W'L9 %9H9 %sn.g %S7""l9 V:l\'09 o/S.HS %S9-SS 'l:-.6l'£S %DO' IS %Sl'09 '1\09'09 %'><:'09 %Ol'OS l'iNd ·~·JJ ·s~~~H l'ilkl o/,W.19 %W'19 %9Yl9 't.S0-19 %W'l9 %19'99' '1:91'!;9 %tl'S9 %1£'S9 'f:L8'1'9 '{,tt-1'9 %0Yt9 "'0..-£9 '{,((1£9 'I:I);Z9 %00(:9 UNd \Xi-~Nd.JCI:) rqd~:)t*M ~Prutl'd %W'l9 '{,S(I"l9 'N~Yl9 %S0'19 %9H9 %WS9 %Sl-t9 'f:-@(9 %SH9 o/cOC\9 %91'09 o/:((1'69 '1:-«rw wxrtt 'loOO'O'S '7.-J)J'18 HilO UC..;<!»d.oJ-0 ["_1.1>1'() %W-19 %S1H9 'I.W-l9 %W'19 %9H9 %Sl'S9 %9',.t9 %!\'(9 %s-ns .,;s--;;·os %el6S "'-DOGS %$-Z'SS <(:0$'1>9 %9!'SS %0Y6S nu H}ffli$!~'-V".-fl
%W'19 %W'19 %!/.fl9 %W-l9 %W'l9 't;06S9 %SL't9 %09'£9 %SH-9 V,l)t:'\9 o/:SI-09 'f.--((1'6S %~FlS 'f.\i;;9'; <j,~~ss 'I:O<l'ts 33N ~UI '/.6-""-'3 e-'31'<~1/ %W'l9 %9Yl9 ',<,9:1'19 ',<,9:r19 %S<I'19 '/,91-&9 o/,.li $9 %st't9 '1:69'£9 'I:H""l9 %..."'3"(9 '1:00-\9 'l:l)HS %0Y£S 'l:(loY6t 'I:Olst vo -~ 'cruooY(]
'!.W-19 %W-l9 ',<,W'l9 %9:1'19 '1-,9)'19 %t0"0'9 %t1)'69 %£0'0! "'lO'\l %\O""ll %\Ot.l o/c.OO'Jo-1 <f:OO'Sl %QY9l o/.-fYHL %DO 'ill '" '0'--'l'5~~'--\::>!-'P<'81P-!1i.V"'H <J,$(l'l9 %00"!9 %W-LS %W-lS %9:1'!9 %0099' %SL'W %09!;9 %st-w o/.-.(i£:'&9 %Sr99 '1.-{0W %SZ~9 o/:09'09 %SL'lS %0HS """ OOIIll-'~'-'3•'--!'EJdle~"CC %W'l9 %W"l9 %W-l9 %00'l9 o/,W"l9 %19&9 %-91'99 'Ml'S9 %1£-$9 %!fl't9 %tl't9 "'OO't9 o/cOH9 Wi0'99 %00'!9 %0H9 '"' J.tffil.1>>:) ~~--\C"Bl~ :>J,dug %W'l9 %W'l9 %9J'19 '1>00'19 %W-19 'l:lt-w 'I.--6~S9 o/,t£'99 %~'l't9 'l:-91't9 %S9'(9 '1.-<0-.9 %<;ZW %0'i'69 %<;L'ZL 'I:Ol'9L >no ""'l~>>dJ<>:)I.fi-""-'3 av10 %W-l9 '!,W-L9 %9'Yl9 %00'19 %9H9 %19"S9 'l.---91-t9 %tl""l9 %1£'19 'i'l'i/'6~ %tt'I<S %00"19 %$-Z'S'i 'i'£o'i'SS %SL'ts '!.on·s ~"' OO:<«.r.&.o ~p '!,W.l9 %W"l9 %W-l9 '1:9:rL9 o/,W"l9 '1:1t'W %~'S9 %1t'S9 %H-t9 %91't9 ¥.S9'(9 '1.-<0£9 %Sl~9 '!.OS't.9 %SL't9 %00't9 ""' .<..._, 'h"':i<.L'<'O~""d "!--'t»8 ve.:~UI;I
'"' ""' ""' "'' ·= '"'' ""' '"" """ '"' ""' ""' ""' ""' ""' ""' ,.,~J. h~
lstl lstl inl tal lztl [a! loti !W [S£[ [L£1 lsd lsd ltd lW IW lit! OJeMlfl<:,Z2dJ><F>P!I!(J [lll'l'J\Ij ~<>t»J'l'd
6HS tns '"' LG£$ sn£ "" lHS ons S.OH 15-zS &as 99ZS sszs "" KZS tZZS 91""ZS l:l.'.\ -"'-'l WmJ3 N"JS'!/,\
'"' li'SS "" "" LOS tns £6'£$ tns 1S£S tHS Qi:($ srct lOt$ l6G'S '"' ll""l$ 19ZS OS h"iidu>Y.) URlJI'KIS
"'" lltS IStS lZ'tS "'" zns "'" ont 6rts 00'£$ IQZ$ "" St--z$ '"' tl""lt "'" l'ilt$ "" ,(u.;j,.uoo 0!4»81<1.1>'-""£1 pu!!'.+JOd
"'' "" sns LHS '"' ""' IOU IS""lS "" ZHS £Z'""ZS "'" 1Q'IS tl'IS s-ns tns tns 1"/Nd ·e•q's;;o.lm-lt~l:li'md
sns Si'lS 91'S$ OJo-'9$ .,, ZLSS tt"SS 91'S$ t6tS &9H 6HS tns tns "'" ""' "" li'>U f.'.'ld 1.101~.10dJ.:>:) M,·"W:)~M"PWU>:I
"" ZS£S "" St'tS w-zs "" sns lt""l£ £Z'ZS Ol'lS 16'1$ £1'1$ tns lt"tt ''"' 91'1$ ""' HHO u~;e.IOd-iO:)~"_!_n;;o
tZSS sons "" vns "'" 16£$ SH$ "" Itt$ otn E'HS OLZS ISlS "'' St'lS (0-z$ 69'1$ nN ""'-~'M ~~<v:1Z lO'IIS lt'OIS 166S 1t'6S "" '"' '"' IS'1S Ol'l$ US$ "" "'" 69'S$ '"' "'" zs·t$ "" 33ll 'OI.l)'l.t'lmJ3~8l(<j'j
"" "" "'" Zl'SS wss ZI'S~ "'" "" tns "" ont lf.i£S '"' lL £$ ""' stn 1££$ '"' 'WI'dHO'.)IJQI Zl't$ lHS tH$ sre$ w-zs ZSZ$ 1Sl$ "" lt-zS "'" "'" OI'ZS tOG'S "" t'HS 9ns S9tS '" <>".JI 'S'!--'.-V-0-1 04-'fHa "<!"-"£!-! IZ'tS "'" "" ll""l$ "" »·n t£-zt SIC:$ lO""lS sons 9-9'\S ens 19'\$ snt O!HS zns St IS ""' ':><JIIiiR\89--\?'dl<"~.l£1
"'' (io;l$ 1t""l$ tz:z$ Zt""ZS """ 06'1$ 19'1$ tl'IS l9'1$ 19'1$ "" 1);;'1$ 9-7'1$ WIS s-ns lOS "" F.J.~Ww.oo "1--'f""B P!-'l~ a~dug ltrLS sns "" 199S "" "" "" '"' OI'SS ens "" Wt$ tns Lrtt tOtS '"' "" '"" UO}e.r.·:l»:}!l'i.l'NJ3a~no
Si'LS 6L'SS et-9$ .,, sns »"H ti'St tns &as I?.ZH to-ts 9HS "" '"' s•:as "'' OLG'S '"' ~'1<1-l?dJ.>:)~n 6t'9$ tl'9$ <oSSS 6t-SS 61-SS 16-H "" tns lz:tS w·u S'H$ sgn "" 6tt$ "" tl't$ £>5-a £/ -~ ·f....,d-.ooo ..,.,.,d 0!--Q»B ""-'~
"'" '"'' ""' ·= '"' ""' "" "'" """ ""' ""' liOZ' ""' ""' '"'' noz ""' F>):U ~
(0£1 lW lui tal [Sll ls~l bzl lW IW ltll lOll tell lstl Uti (gt) lsi! Itt! "-"''iS iM S&J.ur!'3 l"f'\J'JiM»fo-'d
tt'Z U'£1 'I.St-6 ..,., '" £t'61 %1SOI x~·•
'" IO'H %Z'-6'6 """'~ ""'"""' "' LZ91 o/.-$01 l:»c-t• o/,SJ:rL9 'I.C•Y09 ¥.00 ss 'hO!'S 'h1£'jo- W)0'9 %1J9-z o/£1\:'t "m ll.'.\ %1 JM\8 i€$¥A
"" ZS91 %66'6 (XIC1l %SO'l9 'I:OO'lL %OY9L o/.-.Ql-S o/,S"i'£ ""' o/:'iS£ %0L't. 6CH$ 00 hl'!'dW>:)WO!f.llOS
~.;t tnt %t9'01 "'"' %W'l9 'i'(i;Y9-i '!,oow %1)!'9 %00"! %n o/,63'01 wxrg "'M ""' i.I.~Co!--'l-»8~*'-"~~""'ll-""d
'" hi'tl %St'O\ ~:0 ('$.) %W-LS o/,oo·ts ¥-C(I-09 'foOl'S %1G6 %00ZI '1.--IKS o/M'l Sl9l$ l'iNd ·04 '$a>.,--,xaM t'llkl tl'l lS'SI '1\tZ:OI ~)J '"'' 'i'.W'LS o/oOO't9 '7.-«109 ~':_.O!'S %tZ't <r.«ft %Crt ~'\OO't 19tsS r.'.'ld <»!.-~'od.J<>:J ~~ ~M epetN'd
"" l£~1 %~6 ro• %9:rL9 %00'69 %00'l'il o/.-{ll-S %0-i'OI o/:00-SI %00'9 "' 6£'t'i$ llllO lJo)_;<!»d.o>:) !"i"'.O
'" "'" '1.6£'6 00" %W'19 'f,_(I(I'Qi <J,oo-eg %Cl-9 'i'\S£'1 """' %SZ9 o/,09'1 1L'tt$ "'' NJH;(li$!~'V'fl
'" 9?'91 %tfe 0Jci.l 't':W'19 'i.-Ql'6S 'loOO-K %0!'S 'I:WS o/.-{19-t %'it'9 wn·s 1rtos 3::1N 'OUI 'IJlmg e8}(:1fj trc t6'll %S9'6 roo %SO-l9 o/.-{0'19 o/.--.Q<YSt 'hOL'S ',\£('£ '>1-00'l %00't '1.4)') "'"'' vo 'OUI'&lOOVOI lt'Z ll't.l 'i'£8'01 000 %9:1'19 ~OO'tl 'f))J'S! %QL'S '/,Ls-t 71-0St '1.-.e>Gt '>\00'9 11'tZS '" ~"l'""'-"SI"'J>'-- ~a lle'! .. ".Fj-)
91'€ IO''i/1 'l:t9'6 000 %W'19 %00S9 o/,(oJSS 'l~l'S o/,9)"9 v.oo·s %LJ'S '1.--Q.ZS 61'9tS ""' 'OOIIilHtJ30u;>:Jdlg~~
IH £)-'61 %st'6 oo« %W-l9 ¥.00't9 'IM-109 'IJJ!'S o/,{t'f; <,{IXH o/&rt v.--oo-t i'6£ZS '"' ~ o~»8 I:W.::O aJ.du8
'" '"' %9'Z6 000 o/,$o)'19 '1.-<0-(9 o/.-OY9l o/:Ol'S '1\t6'£ """' %.Zti'C '!.-o6'£ l90lS llnO u.;.;n:<l.ro:J !il.~>\8 ~'I'(J
"' "" o/clz:OI OO« %9:1'19 ~~00'1S %C<I'K '1.-.oL-s ¥.£'S-S -· 'hOIJ'Q 'AOOS t1'6tS ~"' OO!J!i'JOOJo:) "''"10
'" £!'91 %t06 oo« %W'l9 %00£'S 'f,OO-t9 o/.-{ll'9 %tn 'h\l'.l't %t.l't ¥-on OOO<S ""' Wi 'lL-;.j•J.l<>:).F.l.W'd O!JI:»S L~Wif
01"'1:1 ~3d<\lgl:l 3'd "" J'XI-'d '"' "" ""' """"' £02.,...,.
"" t>?O 1>1_::\ "P~Z l>"J!ld ,.,;o!J. mCI:)
~eA i"'U.UlHl [llti,Uila_l '-»Y'r.>S ~·§<'~l v;eHifl').~~<l UH1--fil>>1 ~-l~U-§.'>3 i?I<"H ~ ....... i£1 Sd3 ){N)$
l£11 lW Ull loll [6] lsi Ill (9] lsi lrl tel [~] ttl s;ridu1
af<eJSJU_::\ '--! O~UJ:1"3 O;.;"H'-"'M"f>Sd3:M<.B"J <>:\--'cf1pC'l$:M<.B~7~<'(]ftt
P.PC>,'j ll<l~ l.fSe-::l P~:n:G 4'1'"·~ <6.-,s-;w>,'l
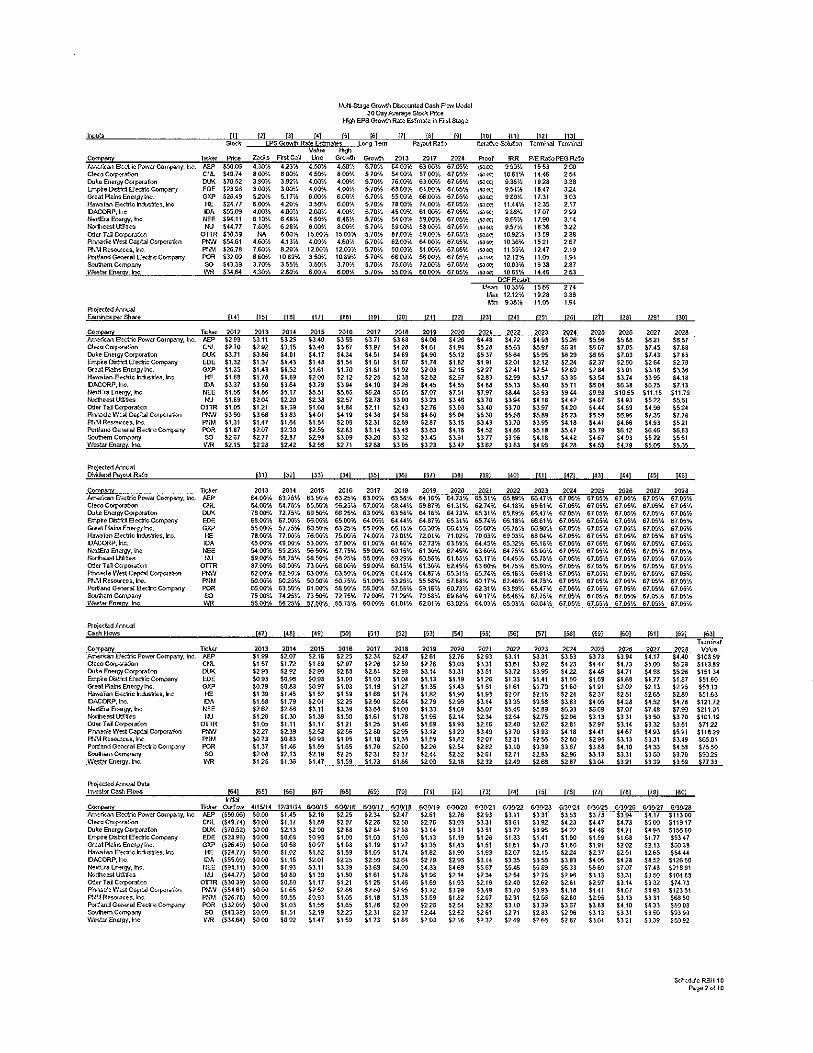
" $«.77 O;!u Tail Corpon;!·:<l OTTR S3Jn9 f'>rv~ade WN Capbl CNpo.-af.:<l PWI $54.61 PN'~ R<-5-0U(tU, h: FN'·1 $26.78 f'ort'anj Ge-<aal B«-11>: Coo" .pony <'OR $3203
Ptoj~WArwaJ Eamhq>wsttare 1141
Corr~ Td:...- 2012 ~ 8Ktric P""'a' Comp<t:-.y, h~ f-EP $2H Cl.-.::oCorp<.-a:'.:.n "'- $2.70 {)Ae EntrgJCorp«afun 00< $3.71 Empfe {);;!r\:1 Be.."tic Corr.p.my "" $1.3'2 Grea!PI<ills Energ1 b->c. G>P $1-~ 1-b'""ian 8.,;;trk: .-,M~, Inc HE $1.6-3 JDACORP,In¢. OA $.3.37 lk>iEla Enwu. tnc. '"' '"' l'kd!e<d ltl.f-es "" $1.&9 Oda Tail Cupora~':<1 OTTR $1 05 P'~e WHI C&p-bl Corporak<~ Pl." .'I "'' PIIM RewJ<ces. Jr.::. PIIM $1.31 Port!<md Gm..-al 8;;-.:lf'.::Cor;.;:<•:-.y """ $1.87 Sou1>en CornpMJ "' $267 W~Et«<g:tlnc. \',R $2.15
Pr.;.;-e<:ted k:noal or.n..oo P<>1~:·ut R>-fo
Corrfi!-J:i H:\<f hr>!;rkan 8~ID;: P""a Coo"·~"IJ'. r<:. JoB> Clro:t Corpvia!'Qil o• D.Ae &oa-g/Cofp-:orafon W< Empfe Distri:t El<Q-'~ C.:.mpar;y EOE Grea!Piaffi EnHIJ'/Irw. GXP 1-b-h-,.i'ID ~lric f1.:1us-'ri:s, lrlc "" IDACORP, ;-,c,_ VA lk>iE!a Enr<gf, ~ I•'EE 1}-~<d!J;M.,; '·" O:aTalCt;porco':i:<l OTTR ?.~e Wi'SICcp'b.l Cot-po<a~.:>"' PIN I Pill,! R~roJce"' iru_ PNI.t Port' a.-;;! Gm..-al 8ec:h:Corr1'->nY <'OR Sou'tl<fn Cc-mpa!T/ "' \'.~...- Ena-gz he. WR
Ptoi«t.=dk.-,u;l
'""""" Coo"~ To:.l<f hnffkall 8;;-.:tric Pow;;~ Compa<Yf, r.::. JoB> aero Corp-:;~a::'iln ""-O.A<> EM:rgJCorp-:ora!«J w.< &npre 00;.*-t Be-:'f~ Corrrpar;y EDE Grea\PI;oh;; Ene.-g1 b->c G>P i"!<rfl31an &ctic bMn<s, lf1c. "' IDACORP, IrK>. VA IO.>!&a Em<gf, ho /lEE N-:.ffuast W~.;s "" O;!u Tal Corpora!«1 onR P,rmocle Wcl Cap't>l <Mporaf..:<:~ PIW FNM R~sw:cu, h:. PIIM PodanrlGe-"l-efal~tr;:;~"'"r1' """ Swfl~m C<mpM/ "' w~ En<fgy Inc. "" Proj-ede<!ArrnvaJ 0.13 h'o'e&« Cash Rows ~l
h~
6_1Cfh 6_4/>Y.. HO'h 621>7:.
"" 6.00¥> 4_(;0% 4.t:>Y.. 7-Wh 820-'h 6_61)-'/, 10_S%
1151 1151
"" "" $3.11 "" ""' $3.15 $3&3 S4 01 $1.37 $1.43 $1.43 $1.52 $1.78 SI.S3
"'" '"' $480 $5.17
""' ""' $121 $1.39
'"' "" $1.47 $\.64 $2.07 $2.30 $2.77 $2.87 ~228 ~2.42
131! P2!
2013 2014
4.5(1'/, 8.00'h
1/!.Jti-S>.ag;> Gn:t.v.h D&<<nt~d Cash AWl ~lood.ol 30 Day A:.<orar- St;x~ Pri:~
ff.j1 EF'$ Gr0'1>1l fute Es.!'ml~e 11 Frststa.Je
451Y.f'h 61.00'h 6.41>% 5.7Cfh (i.4_(o)% 59.(10% 67.05% 8_cwn\ 5.7Cfh 59 (1)'/., 5$_00-'f, 67.0%
15.00¥. 1500% 5.70'!.. 87.1))'1, 59J)0'h 67.0% 4.00'h 4.60'/o 5.70)', 621))% 64.00¥. 67.0% 12.0C>-Y, 12.00\1, 5.70)', 50.00-;t, 51.00'h 67.0% 3_5(1'/., 10.89-'h 5.70% 61> ro~~ U>.OO'h 67.C6'h
5.7Cfh 75_00'/., 72.00'/., 67.05% 5.7fi'h 55 OO'h 6{1 OO'h 67.05';1,
1171 !181 !191 1201 1211 !2:21
2015 2016 20H 2018 '"' 2020 $3.40 '"' "'' '"' H-06 '"' $3.40 $367 $397 '"' '"' $494 $4.17 $4.34 $4.51 $469 $4.!?0 $5.12 $1.48 $1_54 $161 $1.67 $1.74 '"' $1.61 $1.70 $1.81 $1_W '"' $2.15 $200 $2.12 "'' "'' $252 $2.67 $379 '"' $4.10 $42'6 $4.45 '"' $551 $5_80 "" "" $7.07 $751
"" $257 $2.78 ""' "" "" $1.60 $1.84 $2.11 $2.43 $2.76 $3(<.3 $401 $4.19 $4.38 $4&3 $4-W ""' $1.84 $200 $231 '"' $2.87 $3.15 $2.$5 ,,., $3.14 $3.48 "" $4.18 $2_93 "" ""' "'' SHS $3.61 $256 $271 "'' §:Hf.i i)23 $.3.42
J33( Jl-4( (;.5[ p6[ [37] l~l
2015 "'" "'" "'" "'" 2020
(~OCJ 9.MY.. 11.00 3.14 liJ(<;j 9.57% "" 322 (~){t.'j 10.92"/., 1359 "' (~lOO) 1036'1. 1521 "' <iJOC) 11.39-'h 12.47 2.19 (~<I:') 12.12'-h 11.05 '-" \~)00) 10-03',1, '"' 287 ilJOO] 1061'1. ' DCFRs.it ~\,;«1 10.~% ' l.'la< 12.1:?0!.. ' l.'m 93SY.. ' In! !24! f2Sl 1261 (271 12a1 1291 13()1
"" "" "" ''" ms ""' "" "" $4.48 $4.72 '"' "" '"" "" '"' "" '"' $563 "" "" '"' $7.05 $7.45 $7.&3 $537 '"' "" "" "" $7.03 $7.43 SH-5 $1.91 $2.01 $2.12 $2.24 $2.37 $2.50 "" $2.79 $227 $2.41 ""'
,, "" $301 $3.18 $33? ,,., ,, $.3_17 "'' "" SH4 "" $4.18
'"' $5.13 $5.40 $571 ""' "" S-6.75 $7.13 $7.97 "" $8!'13 $9.4-4 $9.~ $1055 $11.15 $11.79 $370 "" sus $4.42 $467 $493 $$22 $551 $3.40 $370 $397 ""' $4_4-4 $459 "" $524
'"" $5$13 $$8.9 $623 $6&3 "" $7.35 $7.78 S-H3 $3.70 "" $4.18 $4.41 SH? $4.93 $521 $452 ""' $5.18 $5_47 $579 $6.12 "" "" $l77 $396 $4.18 $4.42 $467 S4 93 "" $551 i)62 "'' "" $428 S4.53 $4.79 "'" $53.5
(39[ (~OJ [41] [42] (H( [44] [45[ J46[
"" ""' 2023 '"'' ms 2026 2027 202. €-4.00% 63.75% 6llf.r-;t, 6325% 63.00)1, 63.53% €-4.16-'h &4.73'!.. 65_3\'-1.. 6<5.&'9-'h 60.47'-~ 67.06'-1.. 6Hf.i'-l.. 67.05% 67.05% 67.06'1. 5-HV'h 5-4.75% 55_50'/, 56.25% 57.00'1, 5$.H% 59.871'> 61.31% 62.74% 64.18% 65.61'-1.. 67.06'h 67.05'1. 67.05% 67.06% 67.05'-1.. 7600% 72.75% 69.50'h 6025% 63_0Cfh 635-S''!.. €-4.16'-1.. €-4_]3'/, 65.31'-1.. 6S.t9llo 66.47% 67.05% 67.05% 67.05'1. 67.05% 67.05% 68.00:.~ 67.00>', 66.00'!.. 65.00% €-4.W"h €-4.44% €-4.87% £531% 65.74% 66.1&% 6061% 67.05% 67_05'-/., 67.05% 67.1Y.>% 67.(!5% 55.00>~ 57.75% 60.50)!, 6325% 65.00% 66.15'1. 61>.3-0"h 60.45'-1.. 61>60'/, 66.75'-1.. 60_9lf,~ 67.05',~ 67.05% 67.1Y.>% 67.1Y.>% 67.05% 78_00'/., 7HO% 76.00;.~ 75.00'/, 74.<(1% 730\'h 720\'h 71.Q2l':> 7003% 69roV. 6804'-1.. 67.06¥.. 67.05% 67.06% 67.05% 67_05<;, 4500'!.. ~9_1):fh 53.C>Yh 57.00'h 61_00'/., 61.66'-1.. 6213\1, 63.59% e4.4S'h 65~\lo 66.16% 67.05% 67.05% 67.05% 67.05% 67.05',:', 5-4.00% 5525% 56_50'h 57.75% 5900'h 60.15% 61.:Wh 62.45'-1.. 63.Wh €-4_75% 65_ro;.~ 67.05'/.. 61-CIS'h 67.(!5% 67.(!5'1. 67.05% 59.0;1",~ 5$.75% 5$.50% 5$25'-1.. 5$..00)1, 5329% 6{1_55'!.. 61.M7> 63.1H', €-4.#% 65.75% 67.06% 67_05'-1.. 67.05% 67.05'1. 67.0?% 87_00'!.. SIJ_I):f,~ 73Wh 66_W!.. 59_o;r;, 60.15'/, 61.30'/, 62.4$% 6360-'h 64.75% 65.00¥.. 67.06% 67.05% 67.1)5'1. 67.05% 67_05'-1.. 62.00% 6250'h 630;1"/., 63_50'h €-4.C>:t'h €-4.44% €-4.87% 65.31'!.. 65.74% 66.16\6 €-6.61% 67.05% 67.1)5% 67.05% 67.05'h 67.05% 50.00'/o 5025% 5<1.51J'h 50.75% 51.00% 5329% 55.5a-'h 57.&3'!.. 60.17¥.. 62.#% €-4.75% 67.05'/., 67_05% 67.0?% 67.05% 67.0$% 66_00'/, 63_50'h 61.00'-~ 5$.5'-fh W.OO'h $7.$-S'h 53.16'/o 60.73'-1.. 62,31'h 63&'9'!. 65.47% 67.06'h 67.05¥.. 67.06% 67.05% 67.05'!. 7500% 7425'1. 73.50-'h 72.75'1. 72.00'!.. 7129''h 70_ss-;~ 69_1\-5"'/, 69.17'h 56.46% 67.75% 67.05% 67.05'1> 67.(15'1. 67.(15% 67.05% 55.00\1, $625% 57.50'-h 5$.75% 60CO'h 61.0\'h 6201% 63(12-'/., €-4.03'!.. 6503'1.. 60N'-I.. 67.05% 6Hf.i% 67.05% 67.Cr'i% 67.05'1>
J47J [48[ [49[ JSO[ J51J JS2[ [53) [54] [55] [56] [57] [5a-J [59] !.§.';!] [§;1] 1§;2!
"" 2014 2015 "" "" "'" "'" ""' "'' 2022 2022 "'' 202$ ""' m' =· $1.99 $2.07 $2.16 "" "'' $2.47 $261 $2.76 $293 $3.11 $331 "'' $373 "" $4.17 $4.40 $1.57 $1.72 SU9 $2.07 "'' mo $2.76 $3.0-3 $331 $361 SH2 "" $4.47 $4.73 $300 "" $2!'13 $2.n $200 "" '"' S2W $.3.14 $331 $351 $3_72 "'' '"" $4.# $4.71 S4% $526 $093 so.re $0_93 $1.(10 $1.03 ""' $1.13 $1.19 '"' $1.33 $1.41 '"" $1.$9 $1.60 $1.77 $1.87 $0.79 $0.&3 $097 $1.(•3 $1.19 $127 $1.~ $1.43 $1.51 $1.61 $1.70 "'' $1.91 ''"' $2.13 "" $1.39 $1.45 $1.52 $1.59 $1.60 $1.74 $1.151 $\.S•) $1.% $207 $2.15 $224 $237 $251 ''"
,., $1.$6 $1.79 $201 $225 .,,
'"' $2.79 "'' $3.14 '"' SHS $383 $4.05 S42a $4.52 $4.78
''" ''"' $3.11 $).39 , .. ""' "" $469 $5.07 ss_.v.; '"' "" "" $7.07 $7.48 $1-S•)
"'' $1.:!-0 $1.39 $1_50 $1.61 $1.78 $1.00 $2.14 ''" ""' $2.75 s2re $3.13 $331 ""' $370 $1.05 $1.11 $1.17 $121 '"' S1 . .v.; $1.69 $1.93 $2.16 $2.40 ,, $2.81 $2.97 Sl.14 '"' $351 $227 $2.39 $2.$2 '"" '"' $2&5 $3.12 "'' $-3.49 $3.70 $393 $4.18 $4.41 $467 $493 $521 $1)_73 "'" $0_93 SH<5 Sf.IS SI.M $1.59 $1.82 $207 $231 $2!>5 "" "" $3.13 $331 $3_H $1.37 $1.# $1_56 $165 $1.76 $2_(o) ,, ., .. ,, $3.10 $3.39 $367 sua $-4.10 "" "" ''" $2.13 $2.19 "'' $231 $237 $2.4-4 $252 $261 $271 ,,., $200 $3.13 $3.31 ""' $3.70
"'' $1.36 $1.47 $1.59 $1.73 Sl.t? ""' $2.16 $232 $2.49 "" $287 ""' $321 $339 $359
1:§;5] [6?] ~!] [§;§:] 1:§;9! [70[ [!1] [!2! [!3) (!4) [!5[ [!SJ [!!] [!8! [!91 [BDJ
~~ TffffiMI
Va.-'ue $10359 $113.89 $151 J-4 $SUO $$3.13 $51.63
$121.72 $211.01 $101.19 $7122 $11829 $65.01 $75_5(1 $9029 $77 33
Co.T~ n:hr OJtl!O'-II' 4!15114 12131114 5.%'15 6~16 5130i17 6.'30.'18 600119 6'30120 613-0121 6J3'Y22 6'3M3 613M.4 613M5 613MB 613!}'27 "'"" knerY.-a.1 Sectric P""'a' Corrop-;;_oy, .-;; JoB> ($50.06) $0.00 $!AS $2.16 "" ,,, $2.47
Clwo Corpu<KOO cw.. ($49.74) '"" $1.17 $1.M $207 "'' "'" Du~e En..-g,cup-.af«J DlJ,( ($70.52) $000 $2.13 $200 '"' '"' $26-a Empi-e Dstret B<-IT~ Cotropar.f EDE ($23.98) $000 $0.6S $0!f3 $!.Col S1.o3 s1.oa Gcea\Piah> Energ1 ~ G::-J> ($26.49) $0_00 "'" $097 "" $1.19 $127 1-b-A'll.ian 8-<-<:l!"k> h~.m--ios, Inc. HE ($24.77) $000 $1.02 $1.52 $1.59 $1.66 $1.74 IDACORP,In¢ VA ($55.0-9) "'"' $1.15 $2.01 $225 "'" '"' tl-ol1Ba Elwgy, Inc. t/EE ($94.11) $000 SL93 $3.11 $339 "" S-tOO lk<rthta;t \J""J;{-os '·" ($«.77] '"" $0&9 $1.39 $1.50 $1.61 $1.78 O::.•rTal C.:;-porOCi;on OTTR ($Y.I39) $0Qo) SO.t-0 $1.17 $121 '"' $1.# p;r"lr\lcle ;•,•e;tCsp~ CorJ-oraf,:<J PI,W (S5t.61) sooo $1.65 $2.52 S2.€Jl ''" '"' PllMR~w • ._es, h:. Pi'-.'M ($26.7a) "00 "" $0.93 "" $1.18 SD~ POO';m:l Gh-;aal 8;;-.:!ri.o Comp>ny POR (S32m) $0(o) $1.03 S1.~Jl $1.65 $1.76 $2Qo) So<Altm Cc-mpar-.f "' ($43.39) so_oJ $1.51 $2_19 "" $2.31 $2.37 Wt$'.=-r 8wg1. Inc \',R ($34.€-4) "00 $092 $1.47 $159 $1_73 $1M
$2.61 $2.76 $293 $3.11 $331 $353 $2.76 $303 $331 $361 "" $423 $3.14 $331 $351 $312 "'' '"" $1.13 $1.19 '"' $1.33 $1.41 "'' $1-3·5 $1.43 $1.51 $1_61 $1.70 suo
'"' $1_90 $1_93 $207 $2_15 $224 $279 $200 $3.14 '"' "'' $383 $03 $469 $507 $5 . .v.; $559 $633 $1 96 $2.14 $2.34 "" $2.75 $2.00 SU9 $1_93 $2.16 SHO $2.62 $2.81 $3.12 '"' $3.49 $3.70 $393 $4.18 $1 59 $1.~2 $2.07 $2.31 '"' $2.80
"'' ""' $2.8'2 $3.10 $3 39 $367 $2.-« $252 $261 $271 $283 $200
""' $2.16 $2.32 $2.49 '"' $287
$3.73 "" S4.17 $4.47 $4.73 $$00 ,,. $4.71 $4% $1.59 $1.63 $1.77 $Ul1 $202 $2.13 $2.37 $2.51 $265
"" "" $452
"" $7.07 $7.48 $3.13 $331 $350 $2.97 $314 $332 $4.41 $467 $493 $2.00 $3.13 $331 $3&3 S4.10 $433 $3.13 $331 $350
""' $321 $3.39
$11300 $119.17 $15?60 $53.47
""" $54.44 $12650 $21891 $10-HS $74.73 $12351 $6350 SMC.J $939·3 $-M92
S:ffi-ddeRBH--10 Pag-e2~110

OLI<>t .,.ol'd OL·HmJ:<~:.S
BI'BLS tSHS 9gus
"'"' tL'lZIS
""' 91'£01$ HtiZS trtc:IS £0£SS 166SS ZOtsS
H'9SIS S'i til$ 69ZIIS
"""" lc-sl
Z~"SH 9l""l$ 61"06$ ms l€ OLS sm
'""' S><S 9l'liiS 16 tS 9~'99$ sns taus "'" e-crms tl'9$
10-0ZIS OO>S 'iHriS ., IQ'lSS n-zs &<:"ISS tns
Sl'ISIS "" !S'OIIS "" 6£'12\11$ lt'tS
"''A '"' f<V.Uilll_
(t91 (t-91
%9:1'19 %9Y19 %9H9 %9Yl9 %9Yl9 %9Yl9 %9Yl9 w;o·19 %¥.1'19 '/,S0-19 %9l"l9 '/,9H9 %¥.1'19 %0"19 %9,)'19
'"' 1stl
Zl'tS Zt'SS e-ns ons IHS ISZS
'"' so·oiS
"'" IHS t~"($
1'iZS 6!'lt
"" H'9$
'"' [01:1
Z9Z$ tt<:S ms H-H ~ZfS f•lH IH~ e<:"ZS 91'ZS SHS '"" orzs ons tt'tS Olt$
'"" 1ns WIS
"'" ens tl'ZS
"" £09$ ILSS
"'' £9{$ £HS 91'ZS s-m t6'1S 6?'1$ 6'HS sns £9'1$ "'" 9-t'IS tns 19H zns 1!'($ 19£$ "" "'" S'HS S9£S
"""' """' """' lsil [gi] lUI
"" lt'ZS ms tHS sm (>)($
11>7$ ent 917$ sns "" OIGS ons »"tS "" W'l$ tns GnS
"'" 6nS HG$
"" "" It'S$ »« t9!:S tHS 91'ZS "" tii IS e-ns EnS ens tns K-IS 9t"IS
"" l9tS zns lHS l'i($ '"' £CI'tS 99£$ "" '"' "" '"' !191 tool {5<;]
%S0"19 %9:1'19 'j',9)"19 %9Yl9 %S>H9 %9H9 %9H9 %9H9 %9:1"19 %9:1'19 %9:1'19 %9:1'19 %9l"l9 %9H9 %9:1'19 %9l"l9 %9l"l9 %Sol"l9 %9:1-19 %9:rl9 %9:.-19 '1,9H9 '1.9H9 '1,<;0'19 '/,9l"l9 %9rt9 '/,9Yl9 %¥.1'19 %9Yl9 %9H9 %SO-l9 %¥.1'19 %9H9 %9:1-!9 '/,9Yl9 '/,9Yl9 '/,9H9 %0'19 ';',<;0-!9 %9H9 WiO'L9 '/,9H9 WXI'l9 ';',9Yl9 '/,'i(l"l9
'"" "'~ '"' lstl lnl !ttl
OHS "" stU £1''>$ '"' "" 6S'£S '"' "" "" lttS trtS IO'lS '"' "" 1H$ "" IZZS SS't$ '"' 10 tS 196$ "" I9SS u·s-s It"S$ zrss
"'" "" 6"3Z$ 16ZS 19'ZS "'" n·zs c-t-zs BIGS 1£'1$ l69$ "" "" '"' "'" "'" sgs "" "'" "" '"" l6tl !~zl llll
LZZS wzs f6'L$ "" I6'ZS BHS l9ZS l~ZS ,., ~-ns 9L'IS Z9 IS
"" "" ~9'1$ o-; IS U£S tHS '"' '"' O'r'l$ ons I<:" IS £1"1$
"" o-ns "'" "'" ans "" 19t$ £0$ sw (IHS S'HS 69ZS ttnS 91'1$ MIS Y-I'IS €<9 IS 6'i IS Vi IS zns W'i$ "" £Z IS 91'1$ sn-s '"' "" OHS
"" 95'ZS tns ~'i'ZS ~HS tZH '"" ta-zs
tU00'9 '"""' """' '""' [gil r~il [til !til
IZZS 00<$ £6'1$ zns ISZS an~ l9ZS 1'iZS
"'" W"IS sns Z9 IS e .. ns zns "" Q<;'l$ ~.ats tns Z'i£1 "" ons ons I<! IS tnS iS""lS OHS "" "'" Ot'SS "" 1HS "" 'iZH £0($ "'' 69'ZS £B-IS 9L"IS 6'9'1$ W'IS 69'\S 6nS "'" zns W'IS ons fZI~ 91'1$ ertS "" 6HS SHS
"'" 96ZS tt<S sns St'tS tns "'" lQl$
'"' '"" ""' ''" t~l its! (g._;) iss!
%9H9 '!.to99 %Hl'S9 %to t9 ';',9H9 %'il"l9 %9t"G'9 '1:11'69 %9H9 %lH9 %6H9 '1.1£29 '/,9J"l9 %SL-w '/,9t"Z9 %11'09 %9H9 '/,1999 %SI'99 %tLS9 %9H9 'I,OOS9 '/,Sl't9 'I,Q.H9 '1,9J'l9 %sgg '/,971>9 '1'dl"f9 %9J'l9 %0o>-S9 %51-w <;1;(>3'£9 %¥.1"19 >"-SI'W %lt-~9 %9~'t9 %SO-l9 %Kf~ %£0'69 'loto-01 %9.)"19 %1"il"W %'il-W '>'0099 %9.)"19 %W99 %91"99 'f,tl-S9 Wi-0"19 %lt'W 'loW'S9 %1t-S9 'iSS0-19 %19''i9 ';',91"1>9 %tLZ9 %S0'19 %l~"99 %6'H9 %1£-S9
"" ta~ '"' '"' lztl Htl lo~J le£1
"" Zl'£1 l6"ZS "" "" ll'tS 06£$ '"' '"" "" H'ZS "'" 16Z$ IS'Z$ sn~ 6HS £6'iS 19'i$ ""' £-HS M'ZS £<5 IS lll IS 1L'IS
"" "" tftS "'" "'" zns "'" "" SHt s-as '"' ijj't$
u-zt 6'S"ZS StGi "" "" "'' sm ti'Z$ &HS 'i<riS sns ll IS
"'' "" "'" "" u.s ISU 1Z'I"S 9HS 91''iS "'' ms 60$
"'' ""' '"-" '"" @'I tszl ltzl IW
'" lS tl 'Y...St'Q "" "' "" 'l:lt"OI "" "' tllll %'iS"S wa;4
""'"= li£ "" %99"6 l:>:>c-sl
'" ""' %106 "" >« l'illl "'' oo• '" 91'91 '/,t66 oo• '" {")91 %91'01 "" 9H wsz %~t"B oo• '" H-o.z %11"6 oo•
"' Ol'Cl ';',£1'6 looc~l
gH '"' %SZ"6 '-."'lC~l
"' llltl 'f,a·o~ IOO(tl
"' 01''81 %9S'6 "" 6t't £661 'i'\Sl'6 00" on lt'61 '!.St-6 "" "'' "" '>\:ZS-6 IC>:JC~l
!!' lll91 'i'..\6'6 "" ''1"l::l03d09E'~3.'d "" JO.~ld
1"-!.W.I>j_ f"'.l.'ll.l>j_ uoy-.ps "'\J"P.~ !til lW ill] loll
ll'IS f9'1S SS'LS BY' I$ II>' I$ InS i'S-OS ooos (tH~Sl liM ~UJ 'IJl.mg l<i""'M
"" Lt""lS "'' "" £ZZ$ BI"Z$ Cri'!S ooos (5£HS) 00 l.utdwo-o 11.17\lf•'"S IS'IS WI$ zns tZ'IS "" "" £60$ (jo)'O$ (50 TIS) ""' 1.'-"'d>l!O:J 0'.-4--'>8 i"'Rl.-'~£1 PW}Kid
~tiS IZ'I$ t·ns 96'0$ 5SOS "" Z'iOS ooos (91'9ZSl I'!Hd -OI.Il"""'.:r'''"l::ll'•rkl srts (oj£$ Si'Z~ £HS "'" SHS I"HS ooos (19-KS) !.'.'kl o.>:-;eiC-dJ·%) J"i.•:k:Jl*M <>P£<--"J'd to' IS 160$ ooos HlOS !9-0S 160$ I LOS ooos (6toal l::IUO "'"~-;~JoXI>%) ~"1 P.;:(>
"" 'iL'IS 19'1$ WI$ ot-IS ('€'IS 180$ O.YOS (ll'hSl n" ,._:;e,Ml<"~'-V'N
10 tS IHS lHS SHS ti'£S tOZS 18-IS Co)-OS (ll"tBSl 3~1 'OUJ '}JlP.<g "'3?~U
9-;l$ "" ~tz~ lZ'ZS "'" O•HS 11'1$ ooos (&:rsssl VO< "::<.JI 'dlKKH"Ol 6S IS K'IS l'i'IS s-t'IS sns zns "" coos U.L'tZSl 3H "'-'l'•~-sr'P'-'1~81l"'.l'l-"-"ll S£ 1$ lZ'IS iz-IS sns to' I$ ss·os '"' coos (WSZ$) "'" Ool.ljli5.v"3"'-l~ldl"~~
11"1$ £-ns z.ns reos "" "" 19'0$ ooos (£5Ui;) "" 1'--'<'dwo;:J ~~81:04\KI ()J_&.!J3 6<!£$ zrts 16ZS tnS w-zs 69ZS trzs ooos (l'i'Ol~l Ym uo-}l'~>dn:Jfi5m.g av"(]
LCZS "" "'" z.ns IQ'IS ll'IS 11'1$ ooos ftl'&Hl "' IIO<)E'}_;.:IJO:) C¢?1:.)
inS "" £HS l£'l$ "'" ti<:S sns ooos (901hSl ""' "OUj 'hr<.j.J.IO-O F.NI>d "!--'ll->8 lJeO!-HU"f
'"""' 61.«-'9 SI!V£19 11100'9 9110£19 """"' HII\YU tl.-:tl/1' NDY"(] -"'lf'ti }.llii'ih"%) ,,,,, kll Uil toil [691 (i§j l£91 1991 l§9j lt91 &.IOl:llf.i":l -"'1<"-"--'1
~t{) i"f>I.P.'tP<'P7!o'd
ll'IS £-9'1$ S'i'IS WI$ It' IS tns ens "" l:!M "001 }bR<g~'" wzs lt"ZS "'' "" "'" BI"ZS Zl-z$ 1o-zs "' '-'-"<<:1-.lY',O ORIVJOS 19'1$ InS Z£'1$ tZIS "'" "'" 1Z'IS "" ""' lc"d-"00~--'1>->8 f"P.U0£1 pu;c~ s·ns IZ'IS ~ns ooos '"' Z90$ 91-0S "" l'•lkl -~ 'S;n..-,;;;;al::ll'l~kl
~r£S "'" sns ras W<S ii'ZS 1£<:$ "'" !.'.'ld oo-.~~~ rqda:J 1-~M ap«.~~>:~ to'IS '"' 060$ "" LB-O$ 160$ "'" 160$ MilO lY.•,:)E!JOd__ol:l[aj_J>;)Q C10HS sns 19'1S WI$ o-t"IS tns "'" 61"1$ ON W"JlUll""';K,lY-11 lO't$ liltS lS'tS ~HS tns "'" 'il'Z$ lS""lS 3311 OUJ 'lilP.<J3 e'31'<tl
"" wzs SHS l<!l~ ""' e-ns zns SS'I$ vrn "OUI 'cruo:N'Cl
ens tns IS IS sns WIS zns 5ns s-ns 3H '""' ·~4>npu) ~.1',»::3 ""!1'.."-'1--1 ~ns lZIS IZ'IS sns to' IS "" wos 9l"OS &0 ,;:.uj !.ll.P.lg SU.<Jd INJ<) IriS 00'1$ uns "" 160S "" "" zoos 3<E h.JNw.%)~~a P.-YKJ a-'!1<113
'"" ZJ't$ l6ZS m< $(:$ 6~GS 16ZS £6ZS """ "'"J~•>tiJo.:J!l!RII3a,no l£-zS ons sm Z6'1S 19'1$ I !'IS 19'1$ ZS'IS l.'l:J ""'.~e~>:i>oo """'0 IE$ ms HGS I£'ZS ms ti"ZS OOZ$ 6·S'IS "" "O!.Jj 'l.ued!.'<>:) P."oiOd ~ lm!-'WJ'V
"'' "" "" "" '"' "" "" "" ~,::..l AUi?d\tJ<>:>
[KJ ltsl lzsl lis! (o<,;j loti tat! !ttl S.VIOtJlf.i~
1€0'-"-'f~l»,ll'd
""-Z0£9 o/,JQZ9 %10'19 '1:0009 'Nil-BS o;.;O'i'!'i %'><:9-i %00'99 ~M "O!.ll i.flR<gr.;~M v,£"i'69 %S">-Ol <;(-.6l'll 'f,OO'U %Sl"tl s--,09-fl %'Ktl o/.--OCIH 00 /"-"'dW'J trn<g.og
%1:1"09 %91'6; 7\S'HS 'f,((f9'; <;::-.(;o;S'i %00'19 <,~-IZl"£9 %00'99 """ "'-"'J..I.IO-O ::>.-P>B /".m~ P'R~"d ""W"1~ 'I:S">-SS %6Z't<; '1:-0cns %'il-OS v.os·os %'><:09 '1:00'0>; ~l.'kl ·::..q 'S~'"""'3l::ll'olM %1£'i9 %LB't9 %Wt9 '7\00'1>9 %09't'9 •f,OY£9 %09Z9 %COZ9 f.','Jd uqe»:Uo:;. !"'<d":JJ'».'.\ OP<t-<~'d %St-z9 '/,Q£'19 %91'09 <;::-CoY6'i %0099 '1:-0l'tl %C0'09 >"-Ol-19 l::IHO ~~-~;e>Vd>%) [aj_ "00 %-e-1'19 'I:S">'Cr9 %6Z'69 %!iol'B9 o/,s.z-ss 'fiQ<;'&'i %'i1"99 'I:W'6S nN HU'.()fW~l
v,st·zg %0£"19 %SI'09 S>00"69 %9l'l9 "h()oi'S'i %'>lS9 wxn-s 33N "0Ul'/.6P.<J3g8:-'~N
'1~9-£9 ';',fl-z9 %9'3'19 %CO'i9 '/COO'lS ';t-oo·ts %'))"6:0 %00St va• Ool.lj '&10:1'101 'I:ZD'Il %10'ZL %10£1 'f.--(•Hl '7.--C•:rH '1,00'9l %00"ll 'f,-oost 3H "OI.Ij'S~<;-;;np<.!j~lreJ<-V.qj
s--,st·w '/,OC99 %9<"99 %00'99 %££9 W);'Cr9 %'iL"lS 't,oo·ss 0<0 Ool.ljfilJW3 &.\~kl~3~ %1£S9 'ldS't9 %Wt9 'hOO't9 'f.C•YS9 •r..CJ•:r99 '1,00'19 '/COO'S9 '"' ~~~8l~"';:(]:<J,J.ll3
%tl't9 'Z-BI"t9 %S">£9 ¥.J:(I't9 %~99 '/M-69 %'ilGl '1,0091 )'no LN]~JVd»ol.5"113 a~r'(]
%1t"l9 %19"59 %t)'S"'i 'iSOHS %«COO %09S9 %sn-s %00'1'5 "' uo-;;..-mo-oo-l'>n %£l't9 %91'1>9 %SS"t9 '1:-oo·tg %'i.z-£9 'r.{r'i'£9 %'iL"£9 'lo00't9 ""' -""-,'/.lJW,ll<I:JSMd~8U?~
""' "" "" "" "" '"' "" "" R)"_j_ I>UM-"03
lit I Uti (~j lstl ltd lui izd U£1 "lel::l l'l0.1.ed p~·;a j>'Oll'-'iP~~!:J'd
ms "" K<S 1tZS ons tnS ll"l$ IZZS ~I'ZS liM .,.,,ni,.tl3tG~'·'
"" IYfS "" 11"£$ ro·ts .,, "" 9LGS 19<:$ as '"-"'do.!»o UH-<pl"S
6t"Z$ ens On! "" 'iiGS lOGS OO<S "" 19 IS ""' W!'d>l!Q:J ~--'l--"8 1\'.m<>o P'R.+JOd
"" Sl""lS tozs ens 9!'1$ £9'1$ Z'i-1$ It" IS InS I'IHd 'OI.Il 's-nEII:OH~ l'i~kl
"" zns £nS '"' 60't$ tti'tS 6HS "" "'" f.'.'ld 1.1-:1el0dlo:;. r<:~,•:!~o~M aparud 19'1$ sns 6t'IS It'~$ tns '"' SI"IS II'IS "'" l::ll!O 00<.:;<!.10-dt<%) lf"l P.;;(l
"" "" u-zs ""' lt""lS azs £1GS IO'Z$ 6'HS "'' S?-lJEfllS<>~N
"" "" "" "'" tt'SS O<<S e<i tS ll"tS "" 301N ""''/liP.'-'3"J3;<'tl
"" 6HS (IS'($ U'£$ "" "" 19'£$ tHS 1££$ vo '0\.lj '<ili<XJ'>'(Jl
tzzs 'ii'Z$ lO'ZS 00<1 £6'1S "'" ons tl'IS "" '" ~'-'I 's<¥,.,..,._. O!--fP-38 W!f:\1-"lj
"" z.ns t-S'IS tl'IS S9-IS 1~ IS 6t"IS Zt'IS snt 0<0 "UJI.B131J3';>..!eldiN~
69'1S £9'1$ 11i'IS £9'1$ s~·~s tns C'I''IS "" zns "" kNdwoo ~"'""8 P.J'i<'!Cl ~•.d>.!J3 €Q'SS $'t$ ls-tS sns "" 91"tS IOU ~itS IHS '"' u-':;e»dJool.5""3 avu
"" "'' (:<;£-$ £-'l":'tS "" "'" "" (9-z$ ons '" uo-_;e.JC-1/o:) e<»O Grts ""' "'' 19£$ G:~tS lttS "" liT$ MZS "" "Wj'I.I!Wwoor..Md0~8~.ll\f
""' '"' "" ""' "" '"'' tiOZ ""' ZIO~ ~'i:lO.l }JJ~
Lui Uzl (Oll [61[ lSH till l9Ji @Ji (~I[ "'·"'48 l'"l WU.we3 jllf>'--"-'i p<>p.(o'd
'/,9H9 'loC<Y09 'I:OO'SS %0!"9 o/.Oi-z '7.--(<1)'9 _,, %0'E:"t "~' tiM '5UJ l'liR<g-"'M'II %'iCI'l9 '"l::(;)'l1 1(--((l'i[ '1\.CJl"S %09£- o/.-{)ST '/,S'i'£ 'iSOH 6£HS as lmdu>%) um;.nos %9)'19 %00'9S 'f.--(1)'99 'iSOl"i "h()oi'£ 'lc-0'1£- %~'01 o/.-Q9'9 60 Zi:S ""' !;_,.d.J.IO-O ~-P"B 1"-"'~ P'R~ %90'19 'I,I)O'IS '!:CO'OS '1.01-'i %0'3'1 WXIZI ""'' %<!9"! at-9lS l'ltld '"'-l's<>),.-,,..,3l::II'4Nd
%9Yl9 '/,-oo·t9 'f.--QOG9 'ftiJl''i o/.--OCI't o/.-J)Iyt %£1"t o/,l)g"t 19'KS f,','ld tn!.•l>:>dl<%)rq<:l~~.'.'.a)X'UU>:I '1,';')"19 '/,00'6'i %00'19 Ml'S '7.--Q0"9 o/.--QO''il ';',C09 "'' 6t~S l::IUO OO<_~ndJo:.~<>_i.~>;;o
'(,SiJ-19 o;-,oo·gg %t•Y6'i 'iSOl"'i %€Z9 %00"S 'i'\9Z'9 'f.OH U»S "'' S.._;.'Nj}Se&ljl>'t.J
%<;:0'19 %W'6S '/J)J'K 'i'.Ol"i 'I:..Wt %1lS"t %St"9 %01'9 ll"tiiS 33.N -~1 'l/5f¥.13 "''31-''tl '/,9)'19 %00'19 %009t ML-s v.--oo·z o;::--oo·z ';'&Q't %.CJ(ft ""' vo 'OUl '<ili<XHa %9J'l9 <;::-{IHl %1:•HL %01'" 'I,.CJ<;"£ '%-on o/.-/Kt '1.--oo-9 ll"tZS 3H <•'JI 's<¥,-gipl! 0~ IR!_t.\1-"lj
'I,SJ)'l9 %-oo-99 %00-S'i 'iSOl''i 'l.ll''i o;;oo·g %li"S '/,l)l"''i 6t-9ZS 0<0 ::<.JjiJl,.'--'3&--!~ldl•~J<l 'I,SQ'l9 'k!iol't9 %0099 o/.Ol''i o;::--oo·£ o;::--oot %00"£ %1)(1"£- 86£ZS '"' hWwoo o!.r.»st:v;""!(( <>•:fuG %9:1'19 %00£9 '/,-oo-9L WJL'S ~~£ v.--oo·t 'f.ZH "'" Zi'01$ '"' U(>_~~IOdJ<>O lliRU3 3\1"1(]
%<;0"19 'i'\('J'£9 'f,O:rts 'iSOl"'i 'ld)>t '1.4H '1.-<Xrs %1)1Yll ~n~S '" uo-.::e-~::-1/o:) =n 'l,'iiJ"l9 'ACO't9 %00'1>9 'f.Ol"i %£Z't o;::~·t o/.tz-t o/.-o·n eo:ross '"" "OI.J! '!.t.f'<.j.J.IO-O R'oiOd "!--''-'"'8lJe'l-'~OJV
'"' "" "" """"' """"' "" 1'0:1~--" >P'Z ~ .... R~:U m.I.IO-O ~ "'"'" <\1-el::ll'l'"(e.:! U13J. -6ucq S"!<l.l!>~3 a'IQ!lf,VOJ<) Sd"3 ,~.
lsi [g) Lil [9'] [;) ltl l£1 w Ill qldllj
aBmtH'j t.ta;ew.~3. :>-;elJ!j;IN>>f>Sd3""'1
<n\'d l:"?V:S ~"'"""'"{) 0£-1-i'l""''l"al:llf.i~:IP"'i.._...,"'lCC'-ll'"'lJ<l<SIO,S-;.yt,'l

OIJ?tr;<IJ"d 01-Hm:I•_,.•NlPS
auus 9-H>SS i"3ZLS ttzss l60U$
'"'' ~noJS E>rlOZS LL'ULS s-osss tt'lSS ~-~ss
OHSJS ~':rtiiS 9Z&OIS -· !wl
£9{1$ trtS ortas '"' 1~'69$ ens
'"'' rns 99'911$ lOS$
'"'' "" 1916$ LStS \t-OOlS zns S~'lLL$ t~ tS lS ZSS om srsss 91'lS ~nH ll'IS
99'6tL$ tzss 9Z&OLS Ln·s l6't1JJS Stt$ "'-'A "" Jill.lliH_l
l£91 lzsl
o;>,~•H9
';',9Y19 Wi0'19 ';','ioY£9 '!,S0'19 <;',SQ"19 ';',S0-19 %9H9 %9Yl9 ';',S0"19 %SO-l9 %'i'Yl9 %SO"l9 <;',S0"19 %'i'Yl9
'"' {gtj
69'tS 9t'S$
"" ""' ~S'l$
"" tz-ss 10'11$ S1'9S ZH'S Ln-s
'"' 19'1$ 91'1$ 6t'9S
'"'' loti
l6:ZS 19lS ""' S'HS "" 01 £S OHS liltS "'' an:s E~lS o-ns sns (~ tS £tS wzs fZZS LL'lS lH$ trtS 16Z$ l•J'LS "" '"' nts o;o·ts EStS
'"' '"' LIZ$
'"' £6 IS "'' W'L$ 69'($ "" s-ns "'' (t't$ S'it$ LEt$ B<HS ll'tS e:ns '"' '"'"' """"' """" !sil (giJ Ull
16ZS L9:Zi '"" 9t'£$ '"' ons om "'" wn
"'' ts:z~ om sns "" '"" '"' tZlS n·zs l~ ($ tl [$ l6ZS ZO'l$ '"' '"' €Z'tS "'" '"' '"' '"'' II'ZS
"'" f?'IS zns
'"' "" Cri'l$ &;t$ 69t$ £t't$ SS'ir$ LEtS ""' IUS "" 0-"3£$
"" "" "" (191 (ogj l6sl
'1'.'io:r19 %9)'19 '1'.9)'19 'NZ1'19 'f..S¢'19 '1,9)'19 <;','io)'l9 %!;(1'19 'f,S¢'19 ';','i(l'19 %9)'19 '!,S¢'!9 %9H9 'hS0'19 %S0'19 '!,S0'£9 %S0'19 %9)'19 %S0'19 %9J19 %SO'l9 '/,W-l9 %S0'19 %S0'19 %'ZI'l9 %SO-l9 "{,S0'19 %SO'l9 %9H9 %9H9 %S0'19 %S0'19 %S0'19 %S0'19 %9)'19 %S0'19 %SO-lS %W-l9 o/,S0'£9 ';',S0'£9 'A9H9 %'ioYl9 'f,S0"19 %S0'19 ,..,<;.)'l9
'"' '"'' ""' lst! !ttl in!
rnS (ll'tS "" li'S$ e-ns "'' ll't$ LS'tS LnS
"" "" "" Sl'lt "" 0"' ZS£$ '"' SL'tS OOH "" tt't$
llr'OJS 166S lt6S
'"' "" "" "" '"' SL'H
"" ms UGS ons lt:ZS tZlS sns '"" "" SL-9$ u·ss '"' t\'9$ "'" s~·ss
'"' ""' ""' lui [gzj U<l
ZiZ$ St:z5 6J""li "'" E6ZS ons 59-l$ 59(;$ ll'l~ '"' ""' u·zs lGZS lO:ZS 0"3'1$ 69'1$ oo>S 19£$ 6HS 6H$
""' ens ll'LS lHS LSZ$ 19-ZS lt'l$ £ll$
""' "" trss tns
'"' 6{($ LL'H €-6ZS ()o)'t$ u·ls sns ans tL'LS {9'1$ t'HS St'JS zns "" "" 6L'LS om £6($ OHS 6H$ 9o-HS l'HS ""' "'" ll't't$ ll£$ lOH 6nt
>0%9 {Z,W9 """' '"""' (sil tsil !til tW
Z<;l$ ~tzS 6LGS "'" £6l$ ""' 69lS G~l$ Ill$ "'" om ll'l$ 1Zl$ lOZ$ g-ns 69'1$ ootS "" "" "" "'" s-ns U'IS 19'1$ L&lS LSZS Zlr'l$ (z-l$
'"' ESSS trss lH$ NH 6ttS lHS "" "'" Zii'L$ ~ns ens Ent £9 L$ ts'LS WI$ zns tt·Js en$ 6J'f$
'"' tHS ow 6H$
'"' g($ oe:·ts to'tS Ot'H llt$ 10£$ "" '"' ''" = "" tssl lt~l l9Sl l~sl
o/,S¢"l9 %to-w %to-S9 o;-,ro-w '1,<;¢'19 %SL'L9 '1:97'!19 'l:ll"69 %9Yl9 %lt'<;9 %69£9 <;',L£'Z9 %S0-19 %9Ct9 ';',97'l9 ';',lJ"(r9
%S0'19 %19'9'1 %snn ';',t1'99 %S0'19 %00'S9 'f,S£'t9 ';\Q9'£9 %9H9 %SfS9 <;',9t"t9 ';',11'£9 %S0'19 'l:«rsg %91-t-9 '1:{19'£9 %S0'19 %SL'99 %Zt'S9 %St"tg 'f,${1'19 %to99 %£0'69 %toOL %Y.I'19 o/.--otrgg '1,9£-99 %(19'9'1 %S0'19 %19'9'1 %91'99 %tl•S9 %S0'19 'Tdlr'9'3 '1.6S"S9 %1£"59 %S0'19 %19$9 %9L't9 %t1'1'9 %9:r19 '!:lt-w 'f.--6-9$9 %Jt-S9
'"' '"' "" "" lztl Uti loti !sd
stH SS'tS ltU onS tns tn-s tHS trns to't$ "" "'" OHS WtS "" JOtS IS'l$
"'" ll'~$ tlr'SS 91'S$ ;,;<$ "" "" llr'l$
"" l6£S "" "" '"' '"' H.i'LS LHS Lt'SS ~L'H Wt$ '"' '"' ms l9:zS ms SSGS •m lt:ZS Sl'l$ uzs ""' MIS InS
'"' '"' z>rss KS$ SHS tt-ss ti'SS t\H$ 6L'SS L6t$ "'" tns
"" '"' '"" '"" l9ll lsd bil lW
ll'l "'" %07'6 ~·· '" 91'61 %TO-Ol ,.,
'" OS9L %SIYOI W<)"/ )..<ls;l~oJXJ
'" IHI %ll'O~ •• "'' S-6'~1 %91'01 foototl
ZH ""' %v.I'OL "" lt'l OJ'tl '>\£1'01 •• '" '"' %£COL •• ~J'£ Z:S'll %S9'6 •• "' £9-SL %09'6 (0)(\ll
trt 11'91 'hZ96 ., "' IHI %ll.6 •• St'Z ZnL '1':-UOJ ''" '"' 91'11 ';-',Cil'6 (00(\ll
"" 1991 %1t'6 •• '" 91'61 o/.-Ot-6 (OJCS.l
'" '"' 'i:S'i:'OI m• "' 9\'91 %BYOL (C>JCS.l
<l>l~l::IB3dO~<'H3'd "" ·00~ IW_WH.li"J!U!H,l IJ?Y':OS a•!!"'"'~
ltLI [zLl (LL] (oL]
u·ts ons ons 09-'LS OS' IS WI$ o.;os CoJOS <tnul H'.\ -:<.J~'I.6ffi03r.W,_M
ons ltcS S£ZS "" tzzs SI'ZS ons Ol'OS (S.HirS) "' /mdtlKIJ UR'-1/K'S
'"' LHS ?9'1$ lt"IS H'IS ons 16'0$ ColO$ {e&CrLS) "" l.l.~Wo-'-""0 ".-'i»S I'"~ p<r.::J-l"d Z'i-IS sns sns to' IS '"" wos ESOS C'lOS {Gr~S) ~'l!hl ',;.l.lj -~~)...-,;,s~~~-.~,kj
JZES "" "'' 9E$ Z9l$ o;zs S9 LS (•)0$ (S9-£SS) f.'.'kJ oo~""->d;o;:~ w • ..:!~" ~,.,, ~'"'-'W'd Et'IS £LS sns ZiHS EO-IS ro·Js 9L-OS ColO$ (W6Z$) lo!HO "'~.:;!!J?d.'J r•.l-"PO
"'" o·ns zns s-::ns SHS lOS £"~-os Col OS (Gt"£\>1) ru• H;-1'.[1 )'SI1~w<'fl
tl'tS u·ts '"' "" 6ZtS "" 16'1$ "'" ua·s~sl 33:1 '"'-'! 'liimg 1113;«:4 zras 19-z$ "'' lt'l$ 6J'lS 16'1$ tL'LS 000$ (ll't'~$) vo '"'-'l'dOO:r-10 Ll'IS 9£1'1$ erns s-:ns LS'IS s·ns c•nS C•YOS (H·~~S) '" ·~ ·s~.r;srs:-cq ~!ll»s tre!t.H1-1 lt'IS ons tl'LS 91'1$ 00'1$ 900$ lSOS Col OS <sz~sl "'" '"'-'J!.IJm.g ~u_~k!le~JO £L'LS ~,-u "" "'" wos ooos 190$ ColO$ (£Zf(;$) 3<E h>edw~ "l--'P-'3 p,f,"«J a>,dug
'"' ()'£$ l6Z$ "" lS'l$ o-m n·zs Col-O$ (61'69-S) '"" \lo~.l~•odloo!.5H!J3 ~,na 6L'l$ "'" "'' tL'lS WIS t~-IS 9nS OYO$ {N"Il'tS) '" OJV.~e»d!OJ """IJ EL'lS w·zs H<:S '"' EZZS SL'lS St'JS "'" fsnvsl "" ':>UI '1~-d>l!<>:) S""d 0!-')'»a ~
O«W9 6100'3 &I!Ot/9 li!VU'9 9100'3 ~100'3 ti!LI:!<:I tLISLit MOJ1.<1(} "'Vll Atiiid-"OJ ~£'!:,"'--'.
(zll Uil loll 1691 ts91 (1§1 19?1 Is§! its! $V.Oljl(*:) .1010"-'.1.1( G~a~ruJU.Jp-,ol-~f:l-'d
"" W'IS ons 09'LS ~";;'LS LHS zns fz-IS H'•' '"'-'! }BF.<g~J.\ o<;ZS Zt'l$ '"' '"' '"' &L'lS o·zs lOl$ "' "·"'d-ul?J "-"W'OS
""' 11'1$ zns llr'LS (lr'L$ ons 9£'1$ zns """ f_uro..,'OJ~4»8 t<'RI-''>0 p<Rft.'Od ~ns sns sns XI' IS "" '"'' 6l'Ct$ U'O$ mM ·~"-4 'U:>$'10$"lJI"t~hl \Zt$ to'£$ ons 9L'lS ms "'"' '"' '"' ''"'~ UQ)gJo><iJ.Y.J l<l~"Jl'>'M ~p•tru'd Elr'LS 6ZI$ ~L'LS l(fl$ £•l'LS to' IS [0'1$ 10'1$ HHO l>~.;<!JodJ?:) l"l.R;x)
"" sns z.ns ens WI$ lt'l$ SZ'IS "" "" n-}~1$\'~j
tir'tS ~L'tS "'' sns "" '"' Lal$ ons 33N :.UJ'I.f5JW3E-'3>';>/j
'"' 19l$ "" Zt'l$ 6t'lS l6'1$ sns 1~'1$ vru 0<.-1 '.ruo::ttot 1ns 9'SHS (19'1$ ~-~s LHS 9t'LS Lir'IS lt'U 3H '~'-'!'S'l!!--',-"""1"--'!~8 Ul1!l;Y~
lt'l$ oe:·u "" SJ'JS eons 900$ "" SL'Ct$ "'" :.UJ }.8H!J3 S'--!<ld j~~JO tns ~ns to' IS 00'1$ i-!JOS 9<50$ ""' "" 3<E 1~0j4l->EJn.."KK"'::Iw:l
"'" £\'{$ 16l$ "" LS'l$ Od'l$ u;<S £6'lS '"" ~K>le}:od»-:)/ll.»!J3 a,na 6l:zS ""' sm tL'ZS M'L$ £2'1$ &9'1$ S<ns ~" OO_li1JO.:I;OJ OHKJ HZ$ sns St'ZS <«S tllS 9J'l$ lOl$ "" '"" ""-l'~JJOJ-"'""d ~a '-'?:1-~\L'o'
""' "" "" ""' ""' "" "" ""' Rl(.>l_j_ l.uro:il{ij
IKI ltsl lzsi Us! los! l6tl let I Uti $Wif='lj'$~
i"ruJU.JP"lHfo-'d
%ZOt9 %LOZ9 %10'19 '1:00'09 %9l"S!l V.O'i-lS '"'"' 'f.ColSS HM -o<J( lbR!J3JG$>M %2..-69 o;-,ss-ot %&'11 %00'll %91'll '1\,CJ<;'tl %Sl'tl %Col'S! 00 l.r .. ..adw-JJ wxv,os %Wl9 %91-M 'I:S'i'lS wxrss 'h')iil~ %00'19 ~~(r;-{9 'i'-00'99 lJQd 1~1!<>:) :.:-tHE! f"a\.~0 PLR)JOd <;',W"l9 <;',g.;-~g %6Z'£9 %00'LS o;-,st-v; '1\.J)';'i";; '"'" 'f.-{ol-OS 1\l:d ""-1"'""'~~l::ll'oHd %Jt-S9 'I:L9't9 %Wn '/,OO'W 'f..(i<;'£9 %C'H9 'I:OO'l9 'f,(oJ'l9 f.'Nd oo~eJodJCO IQ_W:}l>':M apruu:d %St'l9 %0£'19 %~1'09 'i':--OCI'6S %ColW '1\:00'H %00'0>1 '1:00'19 lo!UO lJO_;»Jo>dJ.:>:J ~"l P.;;Q
%-S'H9 ,..,.s-;·os '1',-6Z'M '1.00'99 %SZ"99 %0S'99 %H'9S %0oY6S '" ""l'l¥11$11<'-V"--N %St'l9 %0C'L9 %SI'09 '1'dXI'69 %9l"l9 <;.09'99 %SZ"SS 'i':--J)YK 331l 'OOI'I.6R<J3 "'.131'"1'1 %69-£9 %El'Z9 ';','39'19 %00'19 'Y...OO'LS '1.00'£~ '1:00'6t %00-Sir va "'-'J'doo:N'Ot 'hZll'Ll %10'll %10'(£ o;-,ont 'f,(ol-Sl %00'9l 'M.lYll %00'9l '" otll 's"(..;·snptl( ~a~!~"~ %St-w """ %SL'9'3 '>'>00-ss o;r,~£9 '/h:l'09 %9Cl~ o/.--O:r~ "'" '"'-'! l.6ffi!3 "'{{'Jd ~~~-'0 %L£S9 'fd9't9 %t~·n %00'}'g %oo-s9 'f,{!)'S9 'f.--(•Yl9 o/.--{•:rss "" .WW..W:J 0!-4>"81'!--'\-s:cJ aJ::fuG 'f.tl'l·9 o;-,gJ·t-9 'f,s-i'£9 %0Yt9 %Sl99 %09'69 %9l"ZL %0C1'9l ""' oo;~':4?:)1.flmsa~na ';',1£'19 %£8"69 %tt-99 %0H~ '"'"' '1\00-~ %Sl'K ,..,oo·K 1.'lJ '-""'.:;e.•:®oo~o %El'tg %9L't9 ..,,.s-;·~9 %00'£9 %Slt9 '1\00'[9 'f,Sl-£9 'I:OO't-9 d" ~'4 'h."d-JJ-o:) "'""d ".--'1»8 !Jro!H!Ibf
""' ""' ""' "" "" ""' tiOZ "" "''ti ;l:UW:~
(~j Utl !~I !sU !ttl !crl !Zil U£1 "iQI lfl<'12d 1''-"'W-!Cl ('ffiU'-';IP~lH:0-'d
"'" L6l§ I.IL~S ""' SSGS '"' ms tll~ 9L'lS H'A 'Wj XbffiEJ NMVO 19'£$ tHS "'" 91'{$ 10£$ 16l$ '"" ms 19:ZS OS li111dw-:>J URI.lfiOS 6L'C$ eons LS:Z$ ms St'lS ons t~·zs "'" l>n$ """ I.I.Rd>l!<>:)".--'1""8 r<!-"lRQp!II';Il{ld Z9:ZS llr'ZS t~ZS ><><! LS'IS Ll'IS s-ns [t'J$ LOS 1'11,\d ~'i~:>...-G-sa~\\1,\d
J6t$ 69tS 6t'tS LOS £L'tS 90tS "'" SHS "'" f.'o'ld oo;~Jo>dJ.:>:J IQ_d~ 1;;:,•,, a~"'UUJd
"'' Ol'l$ 16-U El'l$ lH$ zns "" 9~'LS 9HS HUO IY.>,;11J?d>~ ~".l-"::0 Itt$ 0\'t$ sns ons I~:ZS tnS Sl'lS tO'l$ 69'1$ "" H]1'{ll"";;qJqj
on~ "" "" "'" 69S$ g-tS$ &O'SS znt '"' '~' oJ-Ut'fflJW3 e'3'<"N £HS sns ortt 16t'S ~'{$ ZH$ '"' ~ns lt£$ vrn '::>Ul'dH<KHCLI LtzS ons ozzt Ol'lS IO'l$ "" '"' 9l'l$ W'LS "' 'O\Jj'~-srv<JIO!--'}H8tr.'!~''~
LOl$ W'LS !?1'1$ 9l'l$ 19-IS SS'IS O'i'LS lt'IS o;ns "'" :x.qi.IJR!J3Sll,;!kJ1UJO tns 19'1$ 191$ 9'i'IS "'" 9t'LS Jt'LS 90S zns 3<E ~~~"'13P.-¢>!d~J_dug OI'SS ~-ns "" "'" £OS 1\'t$ lOtS s-ns IHS ""' u:-.u~fllmgavl(]
"'" '"' lo-tS 9HS zns '"" "'" w-zs OlZ$ .,., l>~.:;e»iJO:) OHI:J LZH Z•HS "" "" "" '"' irH$ IL'tS £>5ZS '"" """·~~~ ....... ,d ~8 W""-+'*"\f
""' "" "" HO< ""' "" tLO~ ""' "" J?V<.J. ""''"" lui lLZi ll>li (GL( [gL( ULJ l91l (gJ! ltJ! ~R'-l$:P.O'JilJ~.L"3
!'<11'-"-'"fM»fo.ld
%S0'19 ';',00'09 ..,,oo·s~ %0LS o/:l~t WYHl "'"" '7Ji0 tnt$ HM OU(M-"l'-'3~",\
o/,<;{1'19 '1.-{oJ'll 'MICISL %01'$ %~£ ~on %99'£ v.-on 951tS 00 1"-"'diD~"-"'-Y'OS %<;{1'19 '1.-oo gg o;-,ocrw Ml'S o/,C(fl '1.-os·t %6S'OL %09'9 "'~' BOd lmd>.ll<lO "-~EI rem.~ P'J'O)I>Od ..,,S0'19 ¥.00"19 %00'09 '1.-{ILS %lZ"6 ~@'ll """' '1.-{19'1 6L'SZS 1'1/,kl -~ 's"J:ros~~ I'•Nd %S0'19 %00't9 '1:0079 Wln o;-,tz-t %1JoH %£L't %09't S9t<;$ NJ.Id ~e>od>:>J !"ldi>Jl'>'M ~P..W:d %S0'19 %Col'6S %00'19 %0l'S ..,,er;·o~ %00'91 o/.0(1'9 '"' st-us llHO lk.".-;<l~Vd.>Y.)!•.l.Ri'Q
%9:r19 v...oo-99 '1.--oo 6~ '1.--0l'S %9£'1 """' %SZ9 %09'1 6Ht$ "" RJUJIS'la'-VOI/ %S0'19 %00'69 'I:OO'irS v.-on '1.-.6-9'9 %On %st'9 %0L'9 1969$ "'" '"'-'J'/.6JW3eg;talf %S0'19 o/...00'19 '/,OO'St %Ql'9 %(£'£ o/.--oerz ""'' o/.-{IH SHS$ va• '"'-'! '.ruo::tt~ ';',S0-19 '1\(o)'tl 'f.-{oJSl 'f.-Ol"i %lS'Ir ';',1)7£ \-',OZt '1...00'9 SHZS 3H ·~ 'S~tr'i"--'1 "!-'i><>S UEJW21-l
'/o9H9 %0:1'99 >"00'$9 'f.-{11'9 '119t'S '11-0CI'9 '/,lL"~ %0<:'~ Si!'SZ'S '"'" '"'-'J!I>~\J3.5>.\11kj\NJO %S0'19 o/oOO't-9 o/oOO'S9 %0l'9 %tt't '1.--«l't '1\{;yt 't'&rt Ezt~S 303 l.w.dwoJ ~,_"'Ell~ aJ,d>.lJ3 ';',S0'19 o/...00'£9 o/.-{ol91 'f.Ol'S %t6'€ 1-'hH %<:6'£ o/;-{\5'£ 61'69$ '"" w_:;.~ni>:>JI.fl-"'-'3 a~na
%9H9 '/,Ol'l9 >"CoJ-K 'f.-{11'9 '/,{gg %0<a o;,oo·g o/.-{1{19 OZ'StS '" OJV_:;elVdJCO O:-.KJ o;r,SQ"19 '1:{'(1'(9 'f,Mt-9 'f.-{ll-9 'i'ltt't "h(l'i't %€Zt %00 St'StS "" ·~ 'lL'E'd•l!<>:) IWCdO!!):HEilJW!P.'-'-";1
'"' "" ""' li>'MJO <i!f..fJJ'>."/ '"' li"'Jl"~~ s:pez •w Hl(."ti hii&:'¢0 '"'A
<1-~l::ll'l"''.!'d 1.1»1_-liool S'l>tUl;S3 ~JQII,'l.'MJO Sd3 ,~.
{;] lsi Ill 191 lsi ltl h:l l?l (\I '"'" ~-elS IS-U ~ ~;o<Wt-"3 ~;<'~ "'".OJO Sd3 .t\""''V ?~~-,~~-eJc;,'-'JI€{11)<;
W"''l ~'"l:llf'~ ~i<Jno>>£;0 '-1"">-"21 .&-',s--"-.J"\'1

OlJ~Saied 0\-Ha<l"<"~
~eLS SS06S 6\'ll$ ">SS 6UZJS S9ZLS
SQZOIS I-9'6ClS S-5ZZIS 15'>SS 'i'rl'iS £9'L~S
goKIS 9L'SLIS tt'ISOJS
"""' (ogJ
s-n1S 69'{$ 91'18$ ons l9Zl$ "" St'LS$ WU
81'911$ LZSS tr5SS IHS St E>SS ons
£9-IOlS (•3'1$ tnms ans ll't'iS ons o~·ss-s "'" g.;-sH 18'1$ 11'6~\S "" St'Oil$ ~.z-sS tO-SOLS ot'tS
"''' "" IZL'.Ul.R_j_
lt91 lz§!
%<;(1'19 '/,<;(1'19 %<;(1'19 %<;(1'19 %<;(1-19 %S>H9 '/,<;(1'19 ';',<;Q-l9 '/,!;0'19 '1,<;(1"19 %<;(1'19 %'i'J'l9 %'i'Yl9 %ro·19 ')',9)'19
"" lstl
Sts'S 19'<;~
'"' "" sns tzss
"" snu £1'1$ 91't$
'"' 6l'ZS SS'lS ens
"'' '"" lot: I
'"' \(';(~ "" '"' It£$ u·u tt'tS OJ'tS "" Itt$ !:LH oo-zs HitS "" LHS ltts t1 tS 16ZS
"" Itt'S rrcs sns 10'1$ ""' l9 ~$ ~_z-g WtS
'"' IS"ZS l£l$ u-zs Zill$ InS lL'I$ "" 6~'1$
eB ~s lltS !WtS 00<$ rns LnS ll'tS hHS tHS
wow """' """' l6il (ail !til
"" "" XIU C&U IHS £1'tS
'"' 0\')$ "'' '"' £\'{$ 9o:its (.;;-)$ 19tS LHS ZHS 'rl't-!: l6ZS
'"' Itt$ tns ans lOlS "" Z'it$ "" w·.s
"" LSZ$ 1C(:$ tl-zS ""' 16'1$ ll'LS '"' 6nS eatS lltS s·ns OO<S tl'tS LH$ l\')$ "" £L'tS
"" SZDZ "" (J§! (6§1 i£sl
't.SoY19 %'i'H9 ')',9)"19 ')',<;(1"19 %9H9 '/,W-19 %'i'H9 )1,9)"19 %9H9 '/,<;>Y£9 %<;(1'19 %9)'19 '1,<;(1"19 '1,9)'19 %<;(1'19 %<;(1'19 %9)'19 %SoH9 %S<I'l9 %9)'19 %<;(1'19 %<;(1'19 %'i':rl9 %<;(1'19 %<;(1'19 %S<I'19 <t,!Xfl9 %S<I'l9 %'i'H9 %<;(1'19 %S<I'l9 '/,<;(l'l9 %S>Yl9 '/,<;{l'£9 %<;Q'l9 %<;(1'19 %'i'H9 %S<I'l9 %'i'H9 S'>'i'H9 %<;(1'19 '1,9)'19 %SCI'19 %'i'H9 %9)'19
"" ""' "" lstl lnl lui
ross 6ft$ £9 ti
""' t6t$ l9t$ ,..,. zrss 6L"iS
'"' "" IH$ 9·ns "" "'" '"" 69t$ Wt$
'"' (5ti t9tS 91'1\S SS'OLS '"' ~ns "" "" ""' tHS "" SL't$ IOU nzs
""' ons lt'ZS £HS to' IS ""' WlS SQ'lS "'' IZ9S S-39'!: wss
'"" "" '"' !al [gzj llll
l9ZS "" 6~-z~ '"' &o;?S UZ$ tl?S l9lS 19('!: 6HS on'S ens
"" 9';-t$ ICZ~ lO?S sns £6($ ons 6HS lli?S "" ot'ZS 9\'ZS oozs SLZS "" '"' ttSS "" 9-l'SS lO-SS
'"' '"' '"' t!H tzZS Sl'ZS lO'ZS W'LS C•H$ on<; L9'1S 1!.-JS ons It' IS (C'J$ "" "'' "" "" LStS £ZH "" 19($ LHS
"" It£$ II'£$ t5'ZS
'"""' «<W """"' I VOW
l9il lsil (til lril
lS'ZS WZ$ 6t'ZS "" "" "" Ill$ 19ZS 19{$ 6t($ 01-tS '"' "" 9-iZS Lt'ZS 10?$ sns (5£$ "" 6HS ISZS ""' om 9\G$
"" Sll$ tns "'' "" "" 97'S$ lOSS
'"' sns SHS trH tZZS Sl ZS lOGS M'IS o-ns ons L91S L'i'l$ OS' I$ It' IS rns "" "'' "" "" "" "" ZotS \9($ Itt$ t-;'tS ltH LHS ~HS
'"' "" "" '"" tssl !t~l 1~1 ls-;J
%<;(1'19 't.t'099 %to~9 <;',ro·w %<;(1'19 %9L'l9 '/,9}-"sg %ll"69 %<;Q'l9 %lH9 %6:9'(9 '/,Jt-z9 %9H9 %9L-t9 o/,9')-Gg )1,11'09 %<;(1'19 '1,\9'99 %'31'99 %t1"~9
%<;Q'l9 o/.--03S9 %9l't9 %o-n9 %'i'Yl9 %Sn9 %9¥'r9 '/,11'{9 %9(fl9 '/,J);$9 %'il't9 ~~£9 )l,o;>J'l9 '/,S\'99 'I:ZO:-S9 %St't'9 %9J'19 )l,t'089 '1;«1'69 'AtO'Ol %W'19 o/:00"99 <;',<;l-99 o/.-W99 %9)'19 %19'99 %91'99 %tl'S9 %9)'19 o/dt'99 %~-S9 %1£S9 %9H9 %19'i9 'f,SJ"t-9 %tl'l-9 %<;{)'19 %1t-99 '1',09 S9 %1£-S9
'"" '"' '"' "'' lltl Uti loti l6tl
"'' "'" UHS "" zns ens "" 11'£$ 1t'SS BI-H '"' ZH$ 8\'t$ "" OH$ tHS
"" 6HS S9'SS "" ons l6£S 01H ot'U zns SI-tS "" 01'{$ tt'GS '"' "" lHS llSS ot·ss u·ss s·ns Stt-!: 11'£-$ '"' "" 69'Zi "" IHS lZZ$ tzzs U'Z$ 10?$ 16'1$
"'" "" "" 1£~$
"" l5SS '"' "" "" £»H "" ~ns
'"" "'" ""' '"" !9:11 ls?l l~ll !W
gn £901 'I...Zt'6 ... , '" 1061 %l£'ll n;•j
"' ""' '1:?~"01 L"i"(j ~):!~:)(]
sfz '"" %8!'01 bJC1,)
"' ISS\ %61-01 "'"' '" ""' %1tGl b:lc'l.l
'"' 6!'11 %ll'l\ {)J('I,l
'" .... %st'O\ ()J(o\)
"' 6\'£1 ~~>;nl \)Jei,l
tr£ n·11 %S">6 "'"' 00'£ Ol'll %WO (Co)(>';)
"' !~91 %£66 0)Jei,l
"' \lZI '1:9z-JI !olt'l.l
"' 6t'91 '1:«101 (Ci.J()$1
trt 6HI '1'ol96 (CI.J()$)
"' 106\ 'Z..Zt-6 (CI.J(>tl
9t-z {{/'t\ %9L'Ol """ Q:l' '"' 'l.t\'01 (WI)$)
"1"'l:l£13dco;-?l:l3.'d "" '00" Jru.W~_j_ ('l1.l_WJ~_j_ UOlf'l'JS&'<'~'!.I'>~
[£1) LW Ill! loll
9\'Z$ NZS %\S fl'\S 69 IS 1ns uos C<JOS (~HH) ~lM "'-'''l.fiP.Il3~M
l9"l~ wzs ltZS ltZS SllS 61"ZS ls-tS »OS Cw-ttSl OS Md>.t.>:>Ournv.os
"'' '"' VHS 9nS sns sns HnS 000$ (OS"OtS) """ l.u<ld<.!:<>:) ~-';~8 f"~U~£1 p<.N,l.IO.d
ZS'JS 69\S "" ans 'i'HS t60S ~·:ros "'" (6\"SZS) WM ·~~1-'"~"'"'~l:ll'•rkl ens Zl'tS "" C•3?$ '"' Z9ZS S9'LS Qo)OS c~nsil r.'.'kl m~~JOd>:oo m_<l~~M ~P"-'-".d £61S 69'1$ WIS "" LtLS 11'1$ MOS (•)0$ (SHlS) 1:1110 UC>.~>:>dn-:)!<!_I_RR)
tl"ZS s;ns sns \9'1$ ~-IS 6t'IS e.sos 000$ (GHtS) "" 9~'Ml"'•'-V'tl
69tS ens O<HS "" 6HS II'{$ tB'LS C<l'OS ti.HsS) 33tl '::<..j'/J3P.<~;j "137~tl
oo-zs 6!-ZS WZ$ e&ZS "'" IO'ZS sns "'"' (l/HSS) vo 'o:>UL'doo-:l'/0! o.ns zns tns 99'1$ 6~'1$ zns lOIS ooos csnesl '" 'WI ·~~>np<.'l ~~-'paa ""!~"-"ll £t'IS <;t'JS lin$ 61'JS 8':rJS l60S t~OS oo·os (sz-~~~ oxo 'O<.it !3>-W;j "'-!~ldi'N-"!) 61'1S rns t-ens (0'1$ C•nS 8'50~ w·os 000$ {£GH$) 3<B 1-'-"'d>.wo 0~8 I~')S;(] aJ.du8 1£('!: trtS W?S "" "'' on:s ti'ZS CoJOS (6!'69$) >OO "'~l~'M»o!Bmg a\na (0'($ sas "" '"' 10'2$ e.ns Li'IS ooos (QGs-t$) ''" IY.>_;.,Jo>d.J.):)~IO
9LZ$ 19ZS 1~-zs "'' "" 9\'ZS ~-ns ooos <sl'-gtSJ '"" '""-'l '!.uclm-:;J R'Md C>;4HB <=~ _, 61/0V'S 91009 ll.~f./9 91iVU9 <;1.%'9 ti/1£/ZL tl.'Sllt ~""' HOj:O.J. h.WJJO-O L""''--'1
(zll (til (oil lssl [g) lt91 (§§! (~ill ltsl ~V.O!;llf'e:)Jo>M'.LIJ
El€Q ~ ............ ~1»/0.Id
91'ZS "" SOl' IS tns 6'i'IS lt'l$ 9'2'1$ sz LS HM ~1 NlP.tf;:l m;S-'>M lS'l$ '"' KlS LtZ$ "'" 61-zS o-zs i<HS OS 1'-ll"dm:>:J umv>OS
"" "" "'" 9l'IS S9'1S 9-i'LS 91-'JS lOS """ I.L«d>J.'O:) ::>:~8 f"R<HO P""J.IOcl
"" 6S'L$ ~-IS sns SQ'IS {60$ "" tl'OS 1'11~ -~..__. 's~J!Or.~l:l r.rkl
"'" ZITS "" ons "'' Z'i'ZS om lZZS f.'Nd u.;.l>~'odJ~ !'l"''~M ap-a>..~ £9'1$ 6:9')$ sns "" LZ IS ll'IS 11'\S s-ns 1:1110 00;<-~('!_j_.l>;JQ
tiGS 00'1$ 9L'I$ InS "" '"' ons "'" m1 s-.mn~~l
69'tS '"' "'" "" 6HS InS W"l$ "" 3~1 '"'-'1 'ltimg e-G;t~j OOZ$ ISL'ZS ms "" ~zzs LOGS sns sns va ~'dHOJ'OQI o-ns ZS'JS tns 99'1~ sns ZS'IS St'L$ 6t'IS 3H "'-'I 'S"1~ Ol4»8 U<'J<.Y-"H tns sns lZ IS 6\'IS .,ns 150~ i'i'OS 61'0$ 0<0 :-Lil !l!mg SUJI'IdJ?~lf) 6\'1$ t\'1$ 8'HS co-IS CoJ'LS wos "" ""' 303 AL.~Wct~o::~~a~~'.duG LHS tl'~$ om "'' "" oo-zs "'' £6?~ '"" "'~I«r..:io>ol.fl"ll3 a~na
tOt$ sns C&'l$ "" lO"l$ rns ZL'J$ 19'1$ '" oo;-e~<>»o
9L-z$ ISGS lt'ZS '"' "'" 91"ZS lOGS 66'1$ ""' 'ruJ'I.m-011<>:) -"'Md ~8'-"""~
""'' ""' "" ""' '"'' ~10<! tiOZ ""' .R~?!l -~ lKI ltsl lzs! (Lsi ]I)S] l5tl lsH Utl S.'fflli'J$<1::>
f<'fiU'~p~~~O-'d
'I:.UH9 %10'29 %10'19 %1))'09 %Sl'~ 'f.OS"l9 %'>Z'9'i S'.OO-SS HM -;)ljt w ... "3 ... W.\ 't;W'69 't;.SS'Ol 'OZil 'AOO'll JI,H"Zl W.r'itl %S,'rl %0Cf91 OS l.uWuJ.>o u_m;:I1<IS
%~T09 %91'6<; %ss·g 'AC<IS'> "AC&-SS o/.{")'19 ¥.0S'(9 ¥.00><9 """ 1.1-"'dom-::J 0!4~8 rea~~ P'R.v->d %?ir19 %SH'i %£(-; %00'\S %Sl'O'> '1.09'<:& <;<,-;z-oo; %(00<; l'll'kl ':-<JI ·->:t'IO'H):II'l~kl %1tS9 %19"t9 'f:Wtg 'i':-{I•HB %1);'{9 %00'(9 'I.C&'l-9 %00'29 !.'Nd uc-;eJOdJ~O rqW::J~M apruu'd %StG9 <;(-{1£'19 %~1'1)-3 %0oHS %1))'99 'f.-(oJt1 'I:OY09 %00"19 ):1110 l>l;<'}l<l»:) ('l!_j_ .19;;() %W-19 %-W09 ~69 'I:OOG"i %-;z-ss 'l.e&-s-; %SL'll'i <;(--(oJ'6S "'' S<-}J_M~~'!j
'f,<;t"Z9 %f.rt:"l9 %SJ-09 'h00'6S %'il'19 %<:&'99 %-;z-ss 'r.-J:O:rK 3311 -o-<.!J'Ill-"''.13 "'Bl'~ll <;(-,6<;{9 %tl'Z9 '/,sn9 %O<:rl9 ~Qo)'l<; '#:oJ'£9 %00'6t %0l'Sl' va """-'l'dHCI:HCH %-l•:rll )1,\0'Zl %10-CL %00'~l '1:00'9! or.o:r9l 'hOHL %1:oJ9l ,., -~'lJ 's~~~-~8'-""!e.Y-"lJ
%S'r"99 'f,w-w ';','il"99 ""'" 'f,'il£9 7'-~'01 'f,sn-; 'f,CoJ-S'i 0<0 -"'-1 !Jlmg st?ldlU;!f) %1t-s9 'iS1S-t9 S'.tt"t-9 'f.--(()'t9 'I:OOS9 ~~CO:r99 'I:O<H9 'i0:0Y89 "" ~"!~8t>!-lf'>!(]a•.dw:3 %H''r9 'I,.S\'t"9 'I:S!H9 '1.-«l£9 Wil'99 %0i'69 %$1?1 '1:009! '"" mJ1110dto:}IJlJatg a,na
%1C'I9 %19'69 'f,tt'SS '}_(oJ'lS %Sl'9'> %OS-~ 'l,'il'K %0YK wo uo-;:eJo>d.J.)o~o
%U't9 %9n-s '1\SS-£9 %("]{9 'f,•iG£9 <;.O-H9 %'il'£9 %00't9 '"" 'OVJ'I.U..dJ.'O:)B'Md~8~
""'' ""' 810(: ""' "" ""' ""' ""' a~·:tt IL~Wi.~><>o
(~! l!U l9d ls-d (td lW (zd ltd C>}l'J:IiiY.J-"d~'-10 f' ............ P""P->fo-'d
zns tG£5 "'" N'ZS LlZS "" Zt-zS ~-llS SI'Z$ l:IM -~Jf.bH<g~\\
19£'!: SHS '"' "'" "" "" lBZS "'' 19GS OS l.~.roduJo:) UJ9W10S sns '"' s-t-ts tns "" ~ns om lOGS lQ'LS """ "'-'"do.J.oo:) 0!4~8 ~HmOp<Je,lXId 9HS lS"l$ 6'i'ZS Lt?S rozs t-n<; W'IS lt'IS InS I'L'M «.~~ "'"''-"""S~l:l r.~kl
"'" ans s·ns s·ns sru LOtS '"' "" "" !UI.d ~eJOdlo:) l"l.W::I ~M apruu:.:~
"'" 9lGS tt'ZS ll'l$ tns 09'\S sns LZIS 9l'LS ):1110 uo-.~~[3_!.19~
91>-'t-!: tz-tS "'" 9LZS l~ZS ~zs "'" "'" 69'LS ~" srlMJ<~'~j
LS'l$ 1(1'1$ "" tzss "" !'iSS li'SS 9-Hi Wt$ 3~1 'OOJ 'llimg <!.13>'"'rl 'ia')$ sns '"' OL'tS "" 6HS t~rts ~tS lCtS vo ';>OJ 'dH<XNCB l9Z$ zs-zs "" "" Z\'Z$ OO<S 6'i'IS ens ens 3H '0'--'] 'S<!-f,:lt'IJ'l-'!~!-V"8 ""1:._''-"H SI'Zi tOGS ztdS 19 IS ons 19'1$ zns tns KIS 0<0 :-!Jli.Bmg 5'--\<'JdjU;!f) zns tnS 19-IS 19'1$ K'IS s-ns £t'IS l£\S z:ns 303 Alr.'duK>o 0!~8 P.-$'.0 a•::fw:3 li'H Cl5tS "" LS'tS tnt ll'tS LOtS W($ Ll'tS '"" oo_;-e~IJJmga~<XJ
hHS \9 tS "" 16{$ 19U OH-!: sr~s "" OLZ$ ·m "'~'1!'-»d.JGO~IO
'"' '""' "" "" "" "" "'" II'£$ "" "" ':;tl!'f.IJWJJ-v:) R.Wd C>;..IIRB ~
= "" ""' ""' 910l '"'' ""' ""' ""' "'"' IL~Wim-o
[u:! Hzl Loll [Gil [gJ[ [Li( (gJ[ tsJt L~Jt "'Rl.!S H<l st:lJ1.!re3 f'tnu>..'f~!JJd
%W'l9 'f,Qo)'09 S'oOOSS S'.OLS %00'9 'iHlo·g v.-m·z Wit-t WttS ~:l.',\ OI-1M11<.13~M %<;(1'19 %NU '1:00'9! o/.-{ll-S 'Z-{Il't ""' %~-;-( mn 9-5 ItS OS 1'-ll"dU»:) till<;II'IOS
'{,<;(1'19 o/.-{oJ$9 ')<_(()'~ '1.-{1£'9 '/BiOI 'f',IJS-£ '1.---6901 ',<.00'9 {/1'(j{'!; """ /mdJ.'O-:) ~-4»8 L"HIHD p<R,lJ<rd %SQ'l9 ~cons 'h00'09 %0L"i 'A(o:rll '/cN'ZI '>"0ir8 W/H 6\''il$ l'ilkl "t-1'S¥.1Jro-;~l:l)'"/,d
%9Yl9 o/.-{1(1'1''9 oz--oo-z9 'l,<ll''i 'li09't '/,IXrt %£1"t '""' S9£S$ f,,'.'kl l>=-?;~JNFlO [<~d~~M ap<tJU!d %W'l9 'f,Oo:r69 'Z--I)Y£8 ML"i <;'.OO'il 'f.OO'SI 'l&r9 VN SHZS MilO lro;:!!~!"l-"';;Q %<;(1'19 %00-~ 'l,oo·6s 'i(-{1!'9 %0(1'1/ wxrs W?-2'9 %-QS"l 6Ht$ "'' s-_l,r'.(j~<-lj!Jqj
'/,<;(1-!9 '1.-«l-G'i <;'o(oJ'K %ill'S WW9 'l.-09't %st"9 <;',{11'9 1969$ 33N -~1 '/.IIRtg e-G;taN %<;(1"19 '/,.I))'J9 'Z--(oJ-St %0B %{01Jt %(lo:rl '1:-«rt 'Z-{IH SHSS vo 'O'lJ '&100'/CB %<;(1'19 'I:OO't1 %00'Sl %On 'h00'9 %0S-t %0-Z't 'I.--'Xr9 St-;zS 3H -~ "!i"'!-4~ ~~~8 ""'! .. "-"H %<;(1"!9 ';'o(o]'99 <;(-«l'S~ 'l:<ll'9 %009 <;::-{OIY9 'ldl''i %0GS SZSlS 0><0 'O<Jt!limgst?ldl~alf) %W-19 <;',QYW <;(--(oJ'l/9 ~'oOB %0CI't %0o:rt ';',00'{ %00'{ tztZ$ 3<B ~:luw.l Of-!1,_.8 P.Jl~ a{du.J3 %<;(1'19 %00'€9 'f,J)Y9l 'loOl''i ',1,00') 'f,_OO't o/:ZG'£ 't.OoS't 6l-6SS Y.fla '-""A•Jo:od»::> 1.6_.,"3 3il1(] ')',<;(1"19 "'--Yl'i 'hOO''r!l %0!'9 'f.{;JS <;(-{lg't 'l&l'S 7:--o\I'S QGStS -m u.~.'l!'»<l:oo o~o %<;(1'19 '1.-«l £9 <;(-{oJ't-9 '1-JJB %W> V.-09-t '1\~z-t ""' ~t'StS ""' '"'-'' 'IJJ«!.m-:;J P.ll'.:>d 0!~8 Lv--~
"" lLOZ ""' "'""' ty.'.Ol£1 "" L'<:J\~~..:1 SP"'Z aw "~'il J.IJ@m-o lfi! ar•I"A
e<;e-)_-J r>:l~"d UHl--f-1>>1 Hi~'4.\S3Uie):lt.g,''£l'OSd3 :p~JS
lsi [g[ ill !91 [;] Lt! H:l (lj UJ s-li'JI.II
~«JSlU..:I '-! a;<>W!j<13 ~;<;'l:l lfH.Ol£1 Sd3l,6_H a)l,<dl{J-<:n..C-<'JMV!."{]QoS
j.;pq.'j .....,!;! 4$?0 ~tur'IO'".<S!a lj)\'1>)£1 ffiE"&-;I.If',1
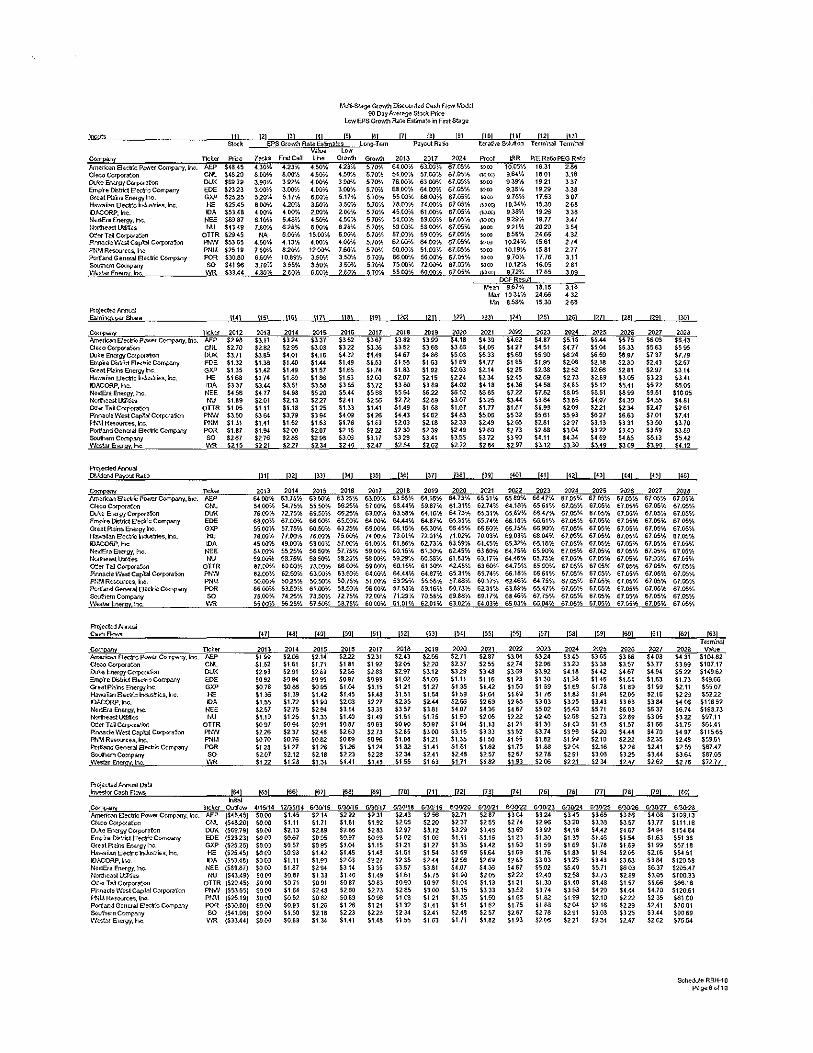
I.Vi--S'.D(}' GrC1'Mil D<s<:wr,\<dCaW FlCW>' l.bd-;1 00 D•yk.'<cf~ st.c~ Pric.~
Low EPS GrQ',\11 Ra~ Est:m~!.e in Font st.~
l!!2•f.s ]1] "' Pl !4] '" 1§1 IIl [8] [9] 1101 [Ill [12] [13] .«. EPS Gr<Mf'l R~E Esljpal<s Lmg-Tem Pa)outRo5-> torn.~s--Mon T«m"naJ T.,.-m"rul vme ·~ C<J..T•t2T( no~"' Plbe ""'' Frnca<~ ""
<);,,., Growth 2013 2017 "'' ~"" "" P;E Rafu PEG R~·>
Am~rka, 8~1!"'.;. P;;>h'<f C<-.T-p~, ho_ AEfi $48.45 4.:V.No 423¥, 4.50% 423% 570'1. 6-4.00Y.. 63.00% 67.05% •oo 10.05% 16.31 "' Cl«<~ Cc<tt>«..:C"«l c" H820 8.0W.. 8.00% 4.50)'; 4.50% 5.70% 54.01Yh 57.00% 67.1i5'h (WOCj 9.6-4% 1801 3 .. 16 DI.J~ef?lw;gJColp«•fvn Dl1l< U9.79 3.00% 3.92% 4.Wh 300'h 570'h 76.00'h 6300'h 67 .. 05'/, •oo 9.39% 1921 '" Erropi"e DStr\..; Senic COIT.pany CDC $2"323 3.00% 3.01Yh 4.007.. 3.00% 5.70'h 68.01Y/. 64.00% 67.05% •ro 9.38% "E '" GreatP'.Mrs Er>HgJ' IrK:. GXP $2525 ,,, 5.1Ti> 6.00'1.. 5.11% 5.70% 55 OIYh 60.007, 67.05% "ro 9.75% 17.53 '" Ha-""i"l Bed!'.:: hdus.'ri.;s.lno. "' $25.45 6(0)'1., 420'h 3.50Yo ''"" 5..7Cfh 7S Wh 74.00Y.. 67.Ct5% <~lOC) 10.34'/, 15.30 "' ID.O.CORP. In¢. VA $53.48 4.00% 'OO'h LOO'h <00% 57Cfh 45.(-JY, 61.00'h 67.05% <l-:100) 9.38% 1925 '" N-<>i&a Er\«gf. Ill¢. •~c $<.'387 6 .. 10% 9.4-S% 4.50¥.. 4.Wh 5.7Cfh 54_00'/, 59.00'h 67.05'» \l-JC<') 9Eh 19.77 3.47 N>:-rfleauoro:.os '"' $43.49 7JWh 628% BXIQ'h 628?.. 5.70'h 59 {o))t; 53 OO',S 67.05'h "" 921% "" "' O!'.<f Ui C«p«i>!Cn OTTR $29.45 "' 6.Wh 15.00% 6.1Xfh 5.7Cfh 87.00)', 59.00'1.. 67 .. 05% woo 858% 2Hf.i "' PiM<~cl"'-' W~C3pbl Corpora $on FN."I $.S365 4.&Wo 4.137;; 4.007;; 4.00'/o 5.7CI'h 62.00'/, 64.00'h 67.05'1.. "" 1024% 15.61 "' PI<'A R~re<;s, he. PN!.I $25.19 7.60"1> 820'h 12.00% 7.60'/o 5.70'h 50.00% 51.00'/o 67.05'1.. •ro 10.19'h 1581 2.71 Pc<rtl.andGenuaiS«tricCo-~1 POR $3080 '"" 10.W;<; 35(1'}., 3.%~ 5.70'/o 60.01Yh 56.00'/, 67.M'h "00 9..70'/o 17.76 3.11 So<J!hun CompMrf "' $4196 3.7o-;'; 3.55% 3.501'. '"'" 5.70'/o 75.00'h 72.00% 67 .. 05% "" 10.12% 11>.05 '" W.osBrEnag:1 !rN, "" sn.44 4.31J"Yo ''"" 6.Wh 2.&1% 57CI'h 55 00'/o 60.00i', 67.05'1.. <}lCCJ 9.72"% 17.65 '" DCFR~
.......... 9.67% 18.15 3.18 !.bl 10.34% 24.66 "' ....... 8.5S% 15.W '" PrOi~d•d>'«lu~
Ea:nhpwS>are !14] !151 !16] !171 !18] 1191 1201 !211 !221 ]23) !241 !251 ]261 ]2D 1281 129] !30]
Coo"~ M• 2012 20!3 "" "" "'" "" "" "'" "" '"" ""' "" "" '"' "'' "'' '"" fti"<wrka,, 8«tr'.: p""'~ C<,T.p.>o<TJ, fn.:;. 1-EP $2.1?3 $3.11 $l24 $337 "" "" $H2 '"' $4.18 $439 $4.62 $4.87 $5.15 $5.« $575 "'" $1>.43 Oe<o Cr...rpor.st-oo '" $2.70 '"' "" "'" '"' '"' $352 '"' '"' ""' $427 $4.51 $4.77 "" '"' "" "" DIJ~eF?Jw;gtCO!)X{afoo DC« $371 "" $4.01 $4.16 "" $4.49 $467 '"" ""' "" "" "" "" '"' '"' S737 $7.79 Emp·re DM>iot B"'~ Corr.pat<y CDC $1.32 $1.36 $lA-O $1.« $1.49 $1.53 $1.SS $163 $1.69 $1.77 $165 $1.95 ""' $2.18 "'' $2.43 $2.57 Gre~tP'.aOs Em<gJ' he G>O' $1.3-5 $H2 $1.49 $1 57 $1.65 $1.74 $1.83 $H12 $2.(13 $2.14 $225 "'' "'' ""' $2.81 $2.97 $3.14 Ha-.,.fen Bectic hl.o>'rl<,s,lnc HE '"' $1.74 $1.&1 $1.00 $193 '"" $2.07 $2.15 $224 $234 $245 $2.59 $273 $2.&9 $3.05 $)23 $3.41 IOACORP.Inc. OA $337 $3.44 $351 "" $365 $372 $3.&1 "" $4.02 $4.18 $4.36 '"' $4.65 $5.12 $5.41 "" '"" ~k>i&a EnO<gf.ln¢. NEE $456 $4.77 "'' "" $5.« '"' '"' ""' "" '"" ""' $7.62 ""' '"' "" $951 $1005 ~.k.~asill;l\1~ "" $1.89 $2.01 $2...13 $227 $2...41 '"'
,, $2.09 '"' "" "" $3.64 $35.5 $4.07 '"' $4.55 $481 o:t..-T.JCorpvr-~00 OTTR $1.05 SUI $1.18 "" SU3 $1.41 $1.49 "" $1.67 $1.77 $1.87 $1.9-3 '"" $221 "" $2.47 $2.61 Pinnacle W~ Capbl Cc<!pc.raXo PUN "'" '"' $3.79 '"' ""' '"' $4.43 '"' "" ""' $532 $561 $593 '"' S$.63 $7.01 $7.41 Pt.:t.l Rerourca, I= PNM $1.31 $1.41 $1.52 $1.&3 $1.76 $1.89 "" $2.18 "" $2...49 "" $2.81 $297 $3.13 $331 "'" $3.70 PwllanrlGen<ra.l B~ ~~ """ $1 87 $1.94 "00 $2.07 $2.15 "''
,,, $239 $2...49 '"' $273 '"' "" '"" $3.40 $359 "'' So<Aurn COfl"IPYII "' $267 $276 "'' $200 $300 $3.17 '"' SH\ $35.5 "" $300 $4.11 $4.34 $459 "" $5.13 $5.42 W<&afF?Jw;~ 1M '·" $215 5221 5227 ,,.. S2.4!J ~2.47 $254 '"'
,, '"' $297 $3.12 '"' S-3.49 !369 ~300 SU2
Pr~~~ Di.idtn<:l P~~ ~to [l1l p2] ]n] ]:14] ~~5] ]36] j37] ]!.8] 1391 [4D] [41] [42] [43] [H] [45] 1'6]
01-~'i"i M• "'" "" "'" "" "" "'" "" "" "'' "'" "'' "'' "'' "" "'' 2028 ~, Bectric Pm.-.;r C<-.T.p<>.'!'J. fn.::. M:.P 6-4.00% 53.75% 63Wh 6325% 53C>l"h 63.5-5:% 64.16% 6-4.73% 6531'h 65W'h 66.47'/, 67.C6'f.. 67.05'1.. 67.05'h 67.05% 67.05% ctt<:o C«p«a"...c11 c" 54.00'h 54.75% 5550% 5625% 57.toJ'h 58.4''1. 59.87% 61.31% 62.74% 64.18% 6561'h 67.05% 67.C6% 67.05% 67.05% 67.05% DIJ~e En..-gjCC!<J>Ofa!·:-n DUK 7600'h 72...75% 69.$Cr'/, 6625'1. 63.CV'h 63.55% 6-4.16% 6-4.73% 65.31% 65.t9'h 66.47'h 67.05% 6H<5'h 67_0$% 67.05'» 67.C<5'h Empi"e Distri;t Bt<:'>ic c:c.rr.p...,y rnc 68.00?. 67.00"'f.. 6001Yh 65.00'h 6400¥.. 64..44'/, 6-4.87% 65.3\'h 65.74% 60.18?.. 60.61% 67.05% 67.C<5'h 67.C<5'h 67.05% 67.05% Gre~t~OsEm<gtlr>: G>O' 5SOO'h 57.75'h 60.50'>1. 6325% 66.tol"h 66.15% 6630% W.45'h 66.601'. 60.75'1.. 60.90'/, 67.05% 67.05% 67.05'1.. 67.(<5'h 67 .. 05% Ha-""ian 8-ecVic ~'li<s. h:_ "' 78.0CM 77.00'1.. 76.C>:I7i 75.00'/o 74.00'h 73.01% 72.0\'h 71.02'1.. 70.03'/, 69.03% 68.04'h 67.C<5'h 67.05% 67.05% 67.05'/, 67.05% ION:ORP, In¢ DA 45C>l"'h 49.00'h 5300% 57.(W 6\.C>J'/, 61.&5% 62.73'h 6.3.59% 64.45% 65.l2'h 66.16% 67.05% 67.(<5'1.. 67.05% 67.05'h 67.C6'h ~krlEraEm<w,~nc NEE 54.00% 5525'» 5650% 57.75% 59.C>J'h 60.15'!. 61.30% 62.45'1.. 63.60'1.. 6-4.75'1.. 65 .. 90% 67.05'1.. 67.05% 67.(<5% 67.M'h 67JJ5'h r~:<t>ea;t lJ:l;!~ "" 59_oo;t, 58.75'h 5850i', 5825% 5800'h 5929'h 60.53% 61.83% 63 .. 17% e4.%'h 65.75% 67.05'1.. 67.05% 67.05% 67-0$% 67.05% O!'.erT.JCorp«a.."«l OTTR 87.C>l"'h 80.00% 73.Co)% 60.C>J'h 59.Co))', 60.15% 61.W'h 62.45'h 53.00'h 64 .. 75% 55.00'1.. 67 .. 05% 67.05'1.. 67.05% 67.05% 67.05% P.noacle I'.'~Capbl Co<poraXo PtNJ S2.00'h 62.5CI'h 6l.00i<S 63.5CI'h 6-4.00'.~ 64A4'h 64.87'h 65.31% 65.74% 66.18'/, E-6.61% 67.05'1.. 67.05% 67.05% 67.05% 67J)5% f1''A Rev.wC<Os, ln.:. PNI.I SO.Qo)'h 5025% 5050% 50.75'h 51.00'h 5329'h 55.58"'1.. 57.8S'h 60.17'/, 62.#5% 64.75% 67.05'1.. 67..1)5% 67.05'h 67.05% 67.C6'h Pert' and Genu <>I B«h:; CJ.~f POR W.OO'h 63.00>~ 61.00% 5!_50'/, 50.00% 57.55'» 59.16% 60.73'» 6231'h 63.0$% 65.47'h 67.0% 67.05'/, 67.05% 67.05% 67.05% So<J!um Compwrf "' 7500% 74.25~~ 73.$0'h 72.75'» 72CV% 7129·% 70.55% 69.83"% 69.17i', 68.46-'>S 67.75% 67.05% 67.05% 67.0$% 67.05'» 67.1:"<5% \'o'ffi!N Enaru lrl¢. WR. 55(>)'/o 5-525% 57.50% 58.75'h 60Co}'h 61.01% S2.01'h 63.02'1.. 64.03% 65.C<l'h 60.04% 67.05% 67.05% 67.C6'h 67.(<5% 67.05%
Pr~~Mh>r>Wi cash Fk¥.o; [41] [48] [49] [50] 151] (52] [53] [5-4] [55] j$5] [57] [55] [59] 12.21 1§:1] 1§:2] [63]
T<-<rr<rol C00'~'1"f "''" "" "" "" "" 2017 "" "'" "" "'' "" "'' "'' "'' "" "'' "" V"'-'" hnori-:a~ Bedtic PO...'<f 01-.Tpiillf. fn.:;. ~ S1.W '"'" $2.14 "" $231 $2.43 $2&3 $2.71 $287 "" $324 $3.45 $365 ,,.. $403 $431 $10.U2 CIKO C.,rpora&-"1 c" $1.52 $1.61 $1.71 $181 $1.92 ""' '"' $237 $255 $274 $200 "" "" $357 $3.77 "" $107.17 DI.J\e En<fgfCcq:-:<a~·m OO< $2.93 $2.91 $2.89 $2M "" $2.97 $3.12 "" $3.48 $369 '"' $4.18 $4.42 $467 '"' "" $14962 Empi"e Districts...,..;, Corr<pany CDC $-l92 '"" '"" $097 "" $1.02 $1.00 $1.11 $1.16 '"' $1.3{) sus $\.{6- $1.54 $1.63 $1.73 $49.60 Greal~,.·ns Em!gjlne. G>P $0.78 '"' "" $1.04 $1.15 $121 $127 $1.35 $1.42 $1.50 $1 59 $1.69 $1.78 $1.89 "" $2.11 $5507 H.l"""3oiorl B~lf.:: nM'l"ios, Inc HE $1 30 $1.39 $1.42 $1.45 $1.4-3 $1.51 $1.54 $1.59 $1.64 $1.6:9 $1.76 $1.8) $1.94 ""' $2.16 '"' $52.22 IDACOR.P, In¢. VA $1.55 $1.72 $1 Sol $2.0-3 $227 $235 $2.« '"" $269 '"' $3.03 $325 $3.43 $363 '"' SH6 $1\6.52 N<d&a En<fgy, lne. tlEE $2.57 $2.75 $294 $3.14 "" $357 $381 $4.07 '"' $467 ""' $5.4'l $571 $603 $6.37 $6.74 $1g3.73 tbf1easti.Mlles '"' $1.19 "" $1.33 $1.4!J $1.49 $1.61 $1.75 St.% '"' "" $2.40 "" $273 $2.t9 ""' "" $97.11 0:!« Tal C«p.:<atOO OTTR $097 "'" $091 $-l87 $083 $090 $097 $1.04 $1.13 $121 $1.30 $1.40 $1.43 $1.57 $1.60 $1.75 $&U1 P ...... de W'1St capbl Cor;:-oro'k"' PUN "'' $237 $2.48 ""' $273 $2105 $3.00 $3.15 "" $352 $3.74 $3?8 "" $4.« $4 70 $4 97 $11565 PN'.IR=urces,lnc. P,l\.1 "" $().76 "" "'" sow $1.0·3 $121 $1.35 '"" $165 $1.82 SI.W $2.10 ""
,, $2.48 $5!51 Port'andGw..-aJ B«tr;cewopar, """ '"' $127 '"' '"' $124 $1.32 $1.41 $1 51 $1.62 $1.75 $1.83 "" $2.16 '"' $2.41 $2.55 $67.47 Soufum Complrrj "' $2.07 $2..12 $2.18 $>2} $2Z8 "" $2...41 $2.48 $2.57 $267 $278 $291 ""' "" $3.44 '"' $87.05 ww.u Enus:t IrK:. "" '"' "" $1.34 $1.41 sus ~1.55 $163 51.71 "" $]93 ""' $221 "" $2.47 $2.62 $276 $7277
Prd,i-lli~~[h~ ln-..estor Ca>h Frum 16-4] t?ll ~ 1§:7] ~~ 1§:9] 110] 1111 112] 113] [!4] [!5] [!6] [!7] [!8] [!9] jUt]
'""" Cw~ Tlc~<f Ou'"JQ'N 4115/14 12/3\1\4 61301"15 6/:V.l/16 61301"17 6/Y.I/18 6<30."19 6!30120 6.'3001 6J3<Y22 6.130'23 ~4 6.'W25 S/3{l.t26 6!3il'27 6.%'2a Al"ooica., B«tric Powa" Corr<P3rrJ, In¢. 1-EP {$48.45) $000 $1.45 $2.14 "" $231 $2.43 "" $2...71 $287 "" ~324 $3.45 "" $3M '"' $109.13 Cl«o Cl:<p-ora5:-n Cl'."- (S4820) ""' $1.11 $1.71 $1.81 "" $LCO ""' $2.37 $255 $274 $2£06 "" $3.;\.S $357 $3.77 $111.16 DI.J\e Em!"!l"/Ce<p-or.f.on 00,{ {S69.79) $0.00 $2.13 $289 $2.&5 '"' $297 $3.12 sm $3.43 $369 "" $4.18 $4.42 $467 "" $154 e4 Efr,~,Te Di!;'fi:t Sec'iocCorr<PM'I' EDE {$2323) ""' $0.67 "" $097 $01?3 ""' $1.00 $1.11 $1.16 $123 $1.3{) sns $1.#5 $1.54 $1.63 $51 38 Gfea1P:&"' EM<gt b~. GXP {$2515) $000 so 57 "" $1.04 $1.15 $121 $127 $1.35 $1.42 '"' $1.59 $1 69 $1.78 $1.89 '"' $57.18 Ha-""i-"1 B~c W-'">lri<>s. Inc. "' {$25..45) "'"' son $1.42 $1.45 $1.49 $1.51 $1.54 $1 59 $1.64 $169 $1.76 $1.81 $1 !M ""' $2.16 $54.51 IO.O.CORP. Inc VA {$53.48) $000 $1.11 $1.~ $2.03 $227 '"' $2<4 $2!-5 $2.69 '"' SHI-3 '"' $3.43 '"' "" $12058 N~>ffi"a En«gt. tnc. tiEE {$8"9.87) SO(>) $1.87 "" $3.14 Sl35 $357 $381 $4.07 '"' $467 $502 ss.~o $5 71 "" S$37 S2oti.47 lk<ll"leas!IJ"".H-os tru {S4H9) ""' $0.87 $1 33 $lAO $1.49 $1.61 $1.75 $1.9(1 ""' ""
,,., $258 $273 $2.8~ "" $10033 o:_.,. Tal C«por~¢n OTTR {$Z9.45) $0 00 $0.71 $091 $087 '"' $090 $097 $1.04 $1.13 $1 21 suo $1.40 $1.48 $1.57 $1.66 $66.16 p;nmde W~~W Corp«al;:.o P,UJ ($5365) SOC(I '"'
,,., '"' $2.73 $21;5 $>00 $3.15 "" $352 $374 Sl% "" $M-4 $4.70 $120.61
Fti!.l Rew..-c~. /w... P.l!.l ($25.19) $000 "" "" $069 $000 s1.oa $1 21 $1.35 $1.~') $1 65 $1.82 $1.9"3 $2.10 12" "" $61.00 POO'&nd Genua! B«t"ic Corr.p'''"l POR ($30.80) $000 $093 "" "" $124 $1.32 $1.41 $1.51 $162 $1.75 SI.E-3 "" $2...16 $223 $2.41 $70 01 So1tium Comf.'-'•''J' "' ($41.6'5) $0Col $1.t>O $2.18 '"' $2.23 ""' $2.41 $2.4~ $257 $267 $278 $291 ""' $325 SH4 $9069 w~ur En.,-gf, 1ne ;•,'R (Sl3.44J ,., so e.~ "" $1.41 $14! $1.55 $1.63 $1.71 $1.82 $1 93 $2C>5 $221 $234 $2.47 $262 $75.54
&hWJ~ RBH-1 0 P~ge6c-f10

M.tf-SI-"g; G<oW.h D"sr.«n!N C"s!l AtwMod<l 1&0 D"fA>'i!ta'J'" S>xl< Prio:;"
A·,·~rag; EPS Grzyfl'tl RO:e Eslim..!e il n.:.St3-~
!i:.':e'.tS [1[ "' "' "' [S] !§:] Ill [6] [9] 1101 [11] 1121 [13] Ooc< EPS Grw.11 Rat~ Es~:.~s Lon.J-T~m Po,w~~., ta~.'e ScMor> Ttnriml THm:llil
V<f:.u: Cotr£Yo:Z: n:-'<<~' ""'• Zao;Jo.s F.-s1Ca.1 '"' Al:~f'"?- Grqff)l "" "" "" "00' "" P,ERafuPEGR;;fo hna"kan B<ttric POh<f Corr<p<>ny, In-~. PEP $~69 4.:)(1'/, 4.23% 4.!>0% 4.-34% 5.70'/o 6-4.00'h 63.Wh 67.Cf.i% (~00) 1025% 15.$8 2.73 ClecoC«pot-&.:00 «< $47.03 8.00% 8.Wh 4.50'h 6.$3% 5.70% 54.0o)Y, 57.00'h 67.05% iloJOO) 10.47% 1487 "' IJ.Ae 'EliMg(C<q:«a~·:<l DUrt $6939 ''"" 392% 4.00'h 3.94% 5.70% 76.00'h 63.00% 67.05% (~00) 9.43% "" '" Empi"e [)i';;l;'ctB<<'ri¢~1 EDE $22.71 3.00% 3.00'/0 4 00% 3.33\':, 5.70'/, 158Wh 64.Wh 67.0:.% "00 9.&6% 1837 , G<eat Plahs Enagfln¢ GXP $24.16 5.2CI'h 5.17% 6.00'/, 5.45"'1> 5.70% 55 OO'h &5 OO'h 67.0:.% f}lOO) 10.02'/, 16.42 "' i-h"h"lkn SH!rlc ~'ri=s.lr>:: "' ""' 6.00% '""h 3.50'h 4.57'1> 5-1CI'h 78.00'/, 74.00% 67.0:.% •oo 10.70% "" 2.49 IDACORP,!w.;. VA $51.73 4.00% 4.1)oJ';', 200'h 3.:m<. 5.70'/, 45C>Yh 61_00'/, 67.0:.% (1-J(<:') 9.31% "" "' tk~a En«gJ, \-,c tlEE $M64 6.10'/o 5.4S'h 4.&0% $69')1; 5.70% 54.00'h 59.Wh 67.0:.% (}lOO) 9.7S% 17.46 '"' tlvrfuas.t I.Bf~s "" $42.73 7.W¥.. 6.2ii'h 8.Wh 7.:W;4 5.70'/, 59.00% 58.00% 6H<5% (~00) 957% '"'
, 00« Tall <%'P¢fat:OO DTTR $2e.~ "" 61)o)'h 15.0W.. 10.50% 5.70% 87.Wh 59.00'/, 67.1:<5% 1~00) 9.74% 11.57 '·" P:r"!mde W<&Capbl C«ptora'k.n PtrN $54.52 HO% 4.n» 4.001'> 424¥.. 5.70% 62.00'1.. 64.C>Yh 6Hf.i'h "00 10.25% 1559 2.73 PW,1 RtSO!JfC~S. he. P:-1!.1 $24.c.3 1.&0¥.. 8.20% 12 00% 927% 5.70'/, 50.00'1.. 51.0CI'f.. 67.Cf.i'h \~00! IO.s-5% 1351 "' Port'~ G~al B«Vic Co-.T~I POR $29.93 6.&0'/, 10.59';<, 3.50% 7.00'h 5.70% 56.1J•)% &S.OO'h 67.05% '""' 10.%'1.. '"' "' ~~~ 00 $41.92 3_7()7, 3.55% 3.507.. 3.5SY, 5.70'h 75 00"'1> 72.00'1.. 67.05% •oo 10.15% 1593 2.79 w~t.rEn«!U !rY.; \',R sn.49 4.:3-0% ""'" 600}3 437% 5.70'1> 55.00% 60.00'1.. 67_05',1, !~£9 10.~'h ,,, "' OCF Reru't
/,'eM 10.14% 16.16 "' Mal 10.9S% 19.05 '" Mon 9.43~S 13.44 "' Proj..,."'te-dF<;r.ual Earrtn-nw S.a<e ]HI ]151 ]161 11!1 ]181 \191 \XII 121) 1?21 ]231 1241 ]25l 126) 1271 In\ 1291 !YJ]
== T>::l<a "" "" "" 2015 "" "" "" '"' '"' ""' = "'' ''" "'' "" '"' "'' Nn"'-;;a,., Bectrio PO'ha ~y. roc m> $200 $.3.11 S324 "" $353 $)69 $3&5 $4.02 $4.21 $4.43 '"' $491 $5.19 $5.49 SSW $6.14 $6.49 ae.::.olhf]:«at:.::.n Cl< $2.70 sua "" "" $.352 $3 76 $401 ,.,
""' $4.64 $5.14 $5.« $5.75 "" $6.43 $6.79 $7.18 Du\e Ene<gJ C«p-::nfun OUK S-171 "'' $401 $4.17 $03 $450 '"' $4.88 $5.10 "" '"' '"' '"' '"' '"' $1.3tl $7.81 Empie Distri:t B~ Cc-mpU<J' '"' $1.32 $1.36 $1.41 $1.413 "'' $156 $1.61 $1.67 $1.74 $1.81 $190 "00 $2.12 $2.24 $2_37 '"' "" Grea!Plahs Ene<gJirll:. GXP $L\5 $1.42 $1.50 $1.58 $167 $1.76 $1.00 $1.96 $2.07 $2.\8 $2.31 '"'" "" sm '"' "" S-1.21 Ha-""li.m e..ctic i;.~'!lio=s.lnc ,., $1.6-S $1.76 $1.84 $1.92 $201 $2.10 '"' $230 $2.41 ''" $2.67 '"' "" $.3.15 5333 "" $3.72 IDACORP,In-: OA $3 37 $3.4-3 '"" $3.72 '"' $397 $4.10 '"' $4.43 $4 63 '"' $5.12 $5.41 $5.72 "" '"' $6.75 1--kUEra ErsgJ, In-:. '~' "" '"' $5.09 5538 "" '"' "" $6.12 $7.10 $7.51 $7.93 '"' $887 $937 $991 $10.47 $11.07 l~astl)j;f-es NU $1.8:9 $203 $218 "" $2.51 $2.70 $2.89 $1.10 $331 $H3 $3.75 "" "" $4.« "" '"' $524 Ott..- Tal C«J:«<>~-on OTTR $1.05 $1.16 ,, $1.42 $1.57 S1.73 $1.91 $2.10 '"' $2.47 $2_65 ,., $2.&3 $3.15 "" $352 $.3.72 P'.rn.>tlil WQt Car>"t>! C«r];«ak., F't-.'W ""' $365 ""' $3W $4.13 $-01 su~ $4.69 $491 $5.16 $5.43 $5.72 "" S6.40 ~.76 $7.15 S7.5S PN\IR~W-'"Ce>. !no. PNM $1.31 S1.43 $1.56 $1.71 $1.87 '"" $2.23 52.42 "" $2.81 $3.01 "" "" $357 $378 '"' 5<22 l'«i!;;ndGO>-,;raiEl<-ciD::~y """ $1.87 $2.00 $2.14 "'' $2.45 "" $281 $300 $-3.19 $3.40 '"' $3.82 $4.04 $427 $451 H-71 ""' ~C«r'P)I]'j 00 52.67 $2.77 $2.~<5 52.97 $307 $3.18 "'' $3.43 $357 "" "" S4.14 '"' $4.6:2 $4.M $5.17 $5.4'3 W*'-"'En&iUir\o. WR S2.15 S224 "" ~2« ~255 "" $2.78 $2.91 ""' S3.20 $337 "" p.75 i397 ~4.20 $4.43 SH'.l
Pr~.odedl«\laf ct.~ P"'t"''JI fGf>l !311 !321 !331 !!41 !351 1>61 !371 !3-'ll rm !401 [411 !421 !431 !441 !45] [46]
eoo- n:~..- "" "" "" "" "" "" "" '"" "'' "" "" '"" "'' "'" "'' "" Amffi,:an Bfctr"ic PO'o\<r Corr~w. be. PEP &4.00% 63.75% 6350% 63.2ti'h 63.C>Yh 63.5&'1. 64.16% 64_7lY, 65.31% 65.89% 6'5.47% 67.05% 67.0:.% 67.Co5'h 67.05% 67.Co5'A a~o eorv_,-..::oo "~ 5-I.OO'h 5-U5'h 55.50% f-625'h 57.00% 58.44% 59.87'1. 61.31% 62.74% 64.18'h 65.61% 67.05% 67.05% 67.05% 57.05% 67.05% DAe EnagiCo<f-:.rafcfl '"" 76C>:W.. 72.75% 69_50% &525% 63.00'/, 63.5S% 64.16"-h &4.73% 65.31% 65.89% 66.47'1. 67.Co5'h 67.05% 67.05'h 67.05% 67.05% ~rernm::ts~T..;:C%~1 EDE 6$.00% 67.00% 5600i', 6500'1. 64.C>J"h 6-4.44% 64.87% 65.31% 65.74% 66.16% E?.61'h 67.05% 67.05% 67.05% 67.05% 67.1i5% Greatf'lahs Ene<gflnc. GXP 55.00'.S 57.75% 6050% 6325% 66C>:fh 66.15'1.. &5.30'/, 66.45% &5.&0;', 66.75% 56.00% 67.05% 67.C6'h 67.05'1.. 67.1)5% 67.1iS'h fh"m;ian Ekc'ric k-.dt.ts-'ri<s, frlc HE 78.00'/, 77.0)% 76.00Y. 7500% 74.C>Yi'.. 73.01% 72.01% 71.02'h 70.03% 69.03'/, 68.04'/o 67.05'h 67.05% 67.05% 67.05% 67.05% IDACORP, h>~ DA 45_(>)';1, 49.C>Yh 53_00% 57_00'/, 61.00% 61.60-h 62.7l'h 6353>'.. 6-4.45% 65.32:'1. 66.18'1. 67_0:.<;, 67.0',~ 67.0% 67.05% 61.C<5% lk>l&a Elagf.lr\-:. ,~, 54.C>:l'h 5525'h ~-6.50>'.. 57.75% 59.C>:fh 60.15'h 61.30% 62.45% 63.6CWo 64.75% 65.00% 67.0:.% 67.0% 67.05% 67.0'h 67.05% t~::<t-.i'<»t\JoR...,; ''" 59.00'/o 5a.75% 58.&0>'> 5a25% 5SWh 59.29% &O.SS% 6LS6;.<; 63.17'h 64.40-/, 65.75% 67.0:.% 67.05% 67.05% 67.0:.% 67.05% O';!a Ta"i C«v«#.c.n OTTR 87.C>Yh &1.00% 73J))'h &5.00'/, 59.WY. 60.15% 61.30% 62.45% 6360'h &US% 65.90'h 67.05% 67.1:6% 67.Co5% 67.()5% 67.05% ?.m..."C!a \','<-si,Caphl CVpc.raK<l PUN 62.0:l'h 62.50'h 630J% 63.50% 64.00'1.. 64.44% 64.87;t, 65.31'1> 65.74% 56.16% 6661% 67.0:.% 67.C6% 67.05% 67.05% 67.()5% PW.\Reso..-ces, fn<:_ PN!.1 50.00;<. 5025'h 50.50'% 50.75% 51.Wh 53.29-'h 55.5&% 57.86% 60.17% 62.4'3% 64.75% 67.0:.% 67.0% 67.0:.'h 67.0:.% 67.C,S'h Pwt:u.d G.,wra! BK!i"icC<>rr~'l)' COR 68.00% 63.50% 61.00>~ 5-$.50'% 5?.00'/, 57.5S'h 59.16% 60.73% 62.31% 63.69% 65.47% 67.()5% 67.(15% 67.0:.'h 67.0:.% 67.C6% Soifo'la'n Compa"'J' 00 75C>:l'h 74.25% 7350% 72.75% 72.00Yo 71.29'% 70.5$'/o 69.U'h 69.11% 158.4'3'h 67.75% 67_0:.'h 67.0:.% 67.1"JS% 67.()5% 67.0:.% W~EnNqrtnc. \',R 55.CoJ% ~25'h 57.50% 5875% 6000% 61.01% 62.0l'h 63.02% 64,0.)% 65.03% 56~% 67.0:.% 67.0% 67.05% 67.0:.% 67.0:.%
Pr~«te-dlnv.oJ CaffiFlO'h'S !47] !4~] [49] )50] [51) [52] ]53] ]5-I] ]55] 1~1 ]57] ];<S] ]59) 1§:2! ~11 ~2] [63]
Tarriml
~''''t n·..ka "" "" 2015 "" "" "" 2019 "" ""' ""' "'' "'' "'' ~"' '"" "" V«\Je hniD:an 8.-.::tric p""""' Comp!!,1y, );,_ />EP 51.&'3 $2.07 $2.15 $2.23 $232 $2.45 "" S2.73 "" $3.07 $3.27 $3.48 "" S3t9 $4.11 '"' 5101.05 a~(l C«pora"hn C<~ S1.56 $169 $1.83 $1.9-3 $2.14 "" ''"' $279 "" '"" "" '"' "" $4.31 $4.55 $481 $10077 DuleEn&g(C.o.-p-;.raf"n W< $293 '"' '"' $287 "" $297 $3.13 $3:1<, SH~ $3.70 $393 "" 54.43 "" '"' $524 $14a&O En-oprernm::tB...::-T.c~rr.parrf ED£ "" '"' $096 $09-3 $1.00 "" $1.00 $1.13 $1.19 '"' $1.34 S1.42 "" $1.59 $1.6~ $1.77 "'"' GreatP!.affiEn<><qfln<: GXP "'" $0.87 $000 $1.(05 $1.16 '"' $1.30 $1 37 S\.45 51.54 $1.6-3 $1.73 SU2 "" "" $2.16 S52.78 Ha-11-a."ian 8«<lic lr1<1v>!i-F.-s, In<: "' $1.37 51.41 $1.4'3 $1 51 $1.55 $1.60 $1.66 S1.71 $1.78 $1.85 '"' $200 $2.11 $2..23 "" ""' $52 8o5 IDACORP, Inc. OA $1.57 $1.76 S1.97 $2.19 $2.42 '"' $2.67 "" "" $3.17 $339 "" $38.3 "" $4.23 $453 $113.73 t .... >l&a Em<qf, 1M "' '"' $281 "" "" "" $38"2 $4.12 $4.43 $4.77 $5.14 $5-53 '"' $623 "" $7.02 $7.42 $193,2g t~:.f">ea.""t\J'Ji~-es '" ""
,, $1.37 $1.413 $156 $1.72 $1.&3 $205 $223 $2.42 $2.61 $2.81 $297 $3.14 "" $351 $M.19 CX:!MTal CorpPta:'on OTTR $1.01 $1.03 S1.03 S1.03 $1.02 $1.15 ,, $1.43 $1.57 $1.72 $1.00 $200 52.11 $223 "" $2.50 $65.42 P'o!Vlatfilllo'i:Sf.C..ptil Co:poraf.:;.n Ptr.'l "" $2~ $250 '"' $276 "'' "" S3.21 $339 U59 $381 ""' '"' "" $4.79 $5.07 $117.76 PN',IR~w.o-us,lr.c. PW.1 S0.72 $0.79 ""' '"' $IN $1.19 $1.35 S1.S2 $1.69 sus $207 $227 $2.40 "" '"' $283 $5702 l'«i!¥.d G<roMal B<t.ticCotrf"'lY <'OR $1.32 $136 suo $1.43 $1.47 "" $1.77 $1.94 $2.12 "'' ""' $2.71 $2.&3 ""' "'" $3<-~ $67.70 SotJfum Ch7>pl>."lj' ro $2.07 $2.13 $2.18 $224 $229 "" $2.42 "'' $2.59 "" $200 $293 $.3.10 "" S-3.413 $3.66 $87.01 Wi:'>~Eneo-~ he. WR $1.23 $1 32 $1.41 $1 50 ""' i1.70 ~1.80 $1 92 "" $2.19 $2.35 $2.52 S2€-? $281 $297 $3.14 57153
Proj...::t~di«<JaiD>Ia
lrr.~~-:or cash Flows ~~ ~5) !§§:! 1§7] fg] 1§:9] (!OJ [11] [12] [p] !Z4] [!5] JZ6] [!7] [!8] [1S] ]&OJ
""" Corr'£!!!t Trtke< OJtl'ow (115114 12131114 5130/15 6.%16 51311'17 5130i18 6J30i19 61»20 6fY.\121 ~ 6.%'23 6.00>24 5/30125 6'30'215 6lYY21 5/3M"a knW.an B<>::bic PVha C<>rr,ploTJ, I-.e. AEP ($~.69) SO.OO $1.45 $2.15 $223 $2.32 $2.45 "" $2.73 '"' $3.07 $3.27 $3.4~ "" $36"9 $4.11 $10539 ct~o Cor>"'"~"'" CUI. ($47.0-5) $0 OJ S1.15 S1.83 $1.93 $2.14 "" ""' S2.79 ""' $3~ $357 $3&5 SH-3 S4.31 $4 55 S\11.59 Dule Ene•wC«v.<af-:on 001'( ($-$9.39) $1.1.00 $2.13 S2W $287 '"' $2.97 $-3.13 $3.~ $3.49 $3.70 $393 $4 20 $4.43 $469 "" $1S4.fl3 Emp"re D<>'ri:t B<IT'.c Comperq EDE ($22.71) ,., $0.67 $096 $093 $1.00 $1.(14 $1.03 51.13 $1.19 "" SI.M $1.42 $1.~.0 $1.59 S1.&S $50'.37 GrHtf>rafn~gJiroc. GXP ($24.16) SO.OO $057 SOM '"' $1.16 .,, suo $1.37 $1.45 S1.5-l $1.63 $1.73 $1.$2 $193 $2.04 $5494 Ha-""'i-"1 8-<o::tric ~'rio;.ln<:. HE ($25.5-SJ so.ro $1.00 $1A6 S1.51 "" $1.60 $1.66 $1.71 $1.78 "" '"' $200 $2.11 $223 "" $5536 IOACORP, lr,~. IDA ($51.73) S'J CoO $1.13 $U7 $2.19 $242 "" S2.67 $202 '"' $3.17 $3.39 $36.3 "" '"' S428 5118.26 N~>tEra En<rgJ. In<: tlEE (SW.64) SO (o) $191 ""
,, $355 $382 $4.12 $4.43 SU7 $5.14 '"' $5.94 "" '"' S7.02 $200.71 t~;S\Jj;~-e-s '" ($42.73) $0_1)o) "" $1.37 $1.4'3 '"' $1.72 S1.M $205 $223 $242 $261 $2.81 $297 $3.14 $3.32 S'n.71 OTia hl Cc;p«o:'·:<~ OTTR (S29.04) ""' $').76 $1.{ol S1.Q3 $1.02 $1.15 '"' $1.43 $1 57 $1.72 $!.t6 ,., $2.11 $223 $22-6 S67 91 Pirm~cle \",'<$!: Caf;tll C:.rporof.:;.o ~UI ($54.52) $0 00 $1.65 $250 "" $2.76 '"' ""' $321 '"' '"' $381 sH.r; '"' $453 $4.79 $1228.3 PN~IR~W-'"C~>. fn.~. P:"lt.l tS24.05J so.ro "" $0.65 '"' "" $1.19 $1 35 $1.~ S1.63 sua $207 S2.27 '"' $2.53 $2.68 $5955 P<:orl'-and GB">Kal B•ch:: Corr<P""Y POR ($29.98) SO CoO $097 sua $1.43 $1.47 $1 62 51.77 "" $2.12 $230 $250 $2.71 $265 $302 $3.20 $71 07 Scot.m<m (%,-op~'l'( ro ($41.91) SOC.) $1.5Jl $2.18 $224 $229 $235 $2.42 ""' $2.59 $269 ,., $2.93 $3.10 S32a $3.4'3 $90.67 W~Enagf,lrK. WR. ($12.49) $0.00 $000 $1.41 "50 $1.1S\J $1.70 ""' $1.92 "" $219 "" S2.52 "'' $2.81 $297 $7467
&1-,;,:l>./ .. RBH-10 Page7a10

I,Vt-S~ GwAtll Dis<:wnt~d Ca>Jl F1owM~cicl 1w o..,.A'"'~g,l &..x~ Prk<o
1-f.jt EP$ GIO'h~ R~e 8.~mot.e J1 Frst~J'!
12f!LJts [1] [2[ "' "' '" !§] [l] [8[ [9[ f101 1!11 [12[ [131 s~• EPSG:0<11l Ra~ E~lim3!H L~T...-u Pa;V!A R.l~o te~at'",..,Solu'i""! Tarr.'n.al THmr..l
Va\>e "" C«r:£!"~-, "''" ""'' '~~ Frs:l (:a,l "" G<oMh G<~h 2013 "'" ''"' ew• <RR f>,'ERafuf'EGRato
krm-kan Bed!ic ?o.-= C<>.T~-rJ, h::. AEP $4669 '"" 42~% 4!-'J"h 4_5{1'/, 5.7lfh 64_1))~ 6-3.00'/o 67.0% (1.)00) 10_31% 15.40 "' Cl«:o (Mp«,.[-:11 CNl $4703 8.00% 8Wh 4..50% 8Wh 5.7Ct% 54.CQl-S 57 .. 00\oS 67.0% \s-JOO) 10 .. 87% 1371 2_40 DAeErl-«gfO:<p<>rafoo OVr< $69 39 3_S(/-;I, 3.B2% 4 .. 00-'h HO% 5.70% 76.00'1, 63W'l. 67.05% (1-JOO) 9.44% 18£-5 '" Elr.;·fe Dis'JktBWiicCom.pllly EDE 522.71 3_1))'1., 3 .. 00-'h 4.1))-'h 4_00'/, 5.70% 6-$_00'/, 64.00\', 67 .. 05% (~)00) 9.76% 1H7 "' G-oa.!Pia"n; Enag1 h~ GXP 524.16 5""' 5.11% 6.00% 6J)O'h 5 .. 7(1'/, 55 Wh 66 .. 00>$ 67.05% (~)00) 1020% 1578 2.77 H,o,..-..i~n B<-0'.:: Jn.iJS-~i;s,lrlc. HE "'" 6.00% 420'h 3.$0% 6.00-'h 5.70'h 78.00'1. 74.Wh 67.05% '"'" 11..2$% 1278 n< IDJ..CORP, Inc. OA $51.73 4 .. 00% Uo-ls 200'h 4 .. 00'/o 5.70'1. 45 .. (>0% 61.00'1. 67 .. 0S'h !Y.l0C1 10.13% 16.03 '" t.:.0>1Era Enaw, Inc_ NEE $~?64 6.10% 5.40% 4..50% 5 .. 40"% 5.70'/o 54_1)(1'/, 59 .. 00% 67.0S'h tlJOCj 1000% '"" '" l.k-rtleast IJ";n~ .. ~ $4273 7M% 62&\-!. 8..!10% 800',1; 5_7Cfh 59.00'1. 58_00'/, 67.05% •oo 9.75% 17.54 "' 0::..- Tal 0;.-p.:{at(!o OTTR $2904 '" 6.00'1.. 15007, 15.00)', 5_7(fh 87.(0% 59 OO'h 67.0% <s-:100) 11.15% 1302 '" P'.n.-ude W~Ca;>hl Corpo!aWo P'I~.'J $-54.52 4.6W.. 4 .. 13% 4.00% 4_w;, 5.70'1;; 62..00'1.. 64.00% 67.0% <1-JOOJ 10_37'1. 15.18 "' PW.I Rts-oo't~S.1no;. PN/.1 $24M ]_f/J'/, 8.20'h 12-CIO"h 12007, 5.70% 5{1_00',!. 51.00"- 67.05% '""' 11.97'1. 11.31 "' P<:ct!wd Gen«i'i se-.~Ct>mpa7J POR $299-3 661)-Y, 10.W:h 3.51J)-(, 1059"h 5 .. 70'-h 65 C>:fh 56.00'/, 67.05% '""' 12..55% '"'' 1.82 S.:..Al<mC<<ropYi'f so $41 92 3..7(1% 3.55% 3.50% 3.70\', 570'1.. 75.Co)¥. 72..00'/, 67.05% <l(l0Cj 10..197, 15 79 2.77 Wr<!~t Enagz lnc WR 532.49 ·- 2.Wl'. 6_(•)-'h 6_1)0'/, 5.70'/, 55 .. 00'.-$ 60_00'f.. 67 .. 05% ·~'!:!); 10~% 1357 '" DCfRes:.o't
l.'«on 10..59?, '"' '" M.u 12..55% 18.$15 '" ~~ 9.441'. '"'' 1.8"2 Prti«led ffiOU!-l Eam"<mP¥Sl3te [141 [151 1161 Jl71 11e1 [191 12(11 1211 )22) j23) 124) 125) 1261 1ZD r2a1 129[ [30]
c.;,..£!1:1' Tk~~ "'" "'" "" 2015 "'" "" "'" ""' ""' "'' "" "'" ''" "" "'" ""' ""' AmiD::ar1 Be<:~ P""'<f O;;."pa.rrf,li><:.. N;;p "" $-3.11 "" $-3..40 "" $371 $3M $<00 "" $4A-8 $4 72 $4£<3 "" $5_56 55 <a 5"' "" C!«:(l lh'P<'fiK"«l 0~ Sl-70 5202 $3.15 ""' $-367 $397 ma $4.61 "" 55" "" $597 "" "" $7.05 $7.45 S7.M !>.Ae Erl-«gJC«p<:<ak<~ ""' $-371 "'' $4.01 S4.17 "" $451 '"' '"" $5.12 "" "" '"' 5"' "" $7.03 $7.43 $7.65 Empie Di:!Mct Bertie Coo-opan)l WE $1.32 $1.37 $1.43 sua $1.54 $1.61 $1.67 $1.74 Sl.$.2 $1.91 $201 $2..12 $224 $237 $251) "" S279 Greal P\ahs EJ><,rgy lrv.: GXP sus $1.43 $1.52 $1.51 $1..70 $1.81 "'' 5aro $2..15 $227 $2..41 '"' $259 "" ""' $3.18 "" H:r~t-.ian El<!ct'~ b'>ru;.Vi.os,1nc. "" '"' $1.78 "" $2Co) $212 "" ms $2..52 $257 5W "'' Sl17 "" "" $3.74 "" $4.1$ IDACORP, In¢. OA $);17 ""' "" $379 "" $4.10 "" sus $4_65 "" $5.13 $5_40 $5.71 ""' "" $6.75 $7.13 11-<n&aEn-e<rn,lrK:. "" "'' su.:; $5.17 $-551 '"' "" 566$ $7.07 $7.51 $7.97 "" "" $9A4 $9_W $10.55 $11.15 $11.79 r.-~~lJolfu$ "" $1.&9 52<>4 "'' "" $2..57 $278 $-3(o) $323 ""' $3.70 "" sus $4.42 $4.67 "" "" $-551 O:':ei T eil CC<p<oratOO OTTR SH6 $121 $1..:>9 $1.60 $1.84 $211 $2..43 $2..75 ""' $3.40 $3.70 $397 ""' $4.44 "" ""' $524 P'.r""cle Wntcap:ta.~ COfJ""ra5on Ph".' I "'' SH-6 "" $401 $4.19 "'' 5H" ""' $5.04 ""' SSM "" "" '"' ""' $7_36 $7.78 PN1,1R~;rurc"';., he. PI'< !.I $1.31 $1.47 $1.54 "" sz.c.; $231 SZ.59 $2..87 $-3 .. 15 $3.43 $-3 .. 70 $3.9'5 $4.18 $4.41 '"" $493 $521 Fi:<tmd Gtrmal 8eo::lr(: (/__.,TpO.of POR $L87 $207 $2..:!-0 "''
,., $3.14 $3.48 $3.8-3 $4.18 5"' SH-6 $5 .. 18 $5.47 $5.79 $-6 .. 12 55<? ""' S.:..A'l<mCcrr.p-Yi'f 00 $267 5W $287 S2W ""' "'" $332 $345 $361 $377 ""' $4.18 $4.42 $467 "" "" $551 w.,.>.,.-Ent<ai1nc. !\'R $2.15 $228 $2.42 ""' S271 S2&3 53.0 $323 S3.42 "" }383 $4_(15 $4_28 "'' $4 79 5$00 55.35
Pre>;«led~
ct.~P,..pRat'l (311 !321 In! !l4! 1351 1:>61 1371 13-31 J391 140) 1411 1421 !431 1441 [451 {46)
c,.,..~,.( n:~a 20q 2014 2015 "'" "" 2018 "'" """ "" '"" ""' '"" 2<~5 "" "'" '"" Jlm<r>:a.~ Be-o:<r:C p,..,..a 0;;.TopMrf, In-:: N'P 64_00'1.. 63.751'. 63~h 6325\', 6300'/, 63 .. 5-S'/o 64.15¥. 64.73% 65.31% 6H9% 6<>.47Fo 67.05% 67.CI5% 57.0% 67.Ct5% 5Hh'h Cl«<l Cc-tp«O::<:<~ '" 54.00\(, 54 .. 75% 55,~(1'/, 5625% 57.00% 58.44\/, 59.87?, 61.3\% 52..74\/, 64.16'1. 65 .. 61% 67.05% 67 .. 05'/, 67.05% 67 .. 05% 67.0S% C<!te Ene~gJC«pw•~vn DV.< 76.00'h 7275% 69.5Ci% ~25% 63_00';, 63.58% 64.16% 64.73'/o 6531% 6-HS'h 66.47% 67.Cf.i% 67.05% 57 .. 05% 67.0S% 67.05% Empre~tBeo::';icCoo>~y ,,, 6800\S 67.CoJV, 66-CO% 65.00'/, 64 .. 00-'h 64 .. 44% 64.87% 65 .. 31% 65.74% ~.18'h ~.61% 67.05% 67.051'. 67.0S% 67.05% 67.Ct5\', GreatP\ah;;; EM.rgylrv.:. GXP 55JXh', 57.75% 6D50'h 6325% 66.C>J'h 66 .. 15% ~30% 66 .. 45% 66.60% 66.75¥. 66 .. 90% 67.05'h 67.05% 67.05% 67.Ct5'h 67.CrS'h t-bN:•ian Bect'cc b'>ru;.'Ji,;,;., !roc. HE 78(1(1¥, 77..CO'h 76.1))% 75_0)\-!, 74.1))'/, 7301% 72..01'/o 71.0Z'h 70.03'h 69.031'. 6-8 .. 0-4% 67.05% 67 .. 05'/, 67.0S% 67 .. 05% 67.05% IDJ..CORP,In¢. DA 4SOOV. 49.C>J'h 53_0)'/o 57.00'h 61.00'h 6L&'"% 62..73'h 6359% 64.45% 65 .. 32% 66.18'1. 57.C6% 67.0S'h 67.05% 67.05% 67.0% N~>l&a EncrgJ,In-c. .~, 5-H>:,V, 5525% 5650'1.. 57.75% 59DJ'h 60 .. 15% 61.30'h 62..45% 63.60% 64.75% 65.90l'. 67.0'h 67.05% 67-0S% 67.05% 57.CIS'h t~~astlJi<:"li.,. "' 59C>:Iti 5-8 .. 75% 5S50'h 5-825% 5$.00% 5929'h 60.5-S'h 61.U'h 6-1 .. 17% 64.%% 65 .. 75% 67.05% 57 .. 05% 67.05% 67.05'h 67 .. 05% O:':e~TalCorp;;.r<o::ion OTTR 87.N'h 8{1_00\S 73.00?, 66_00',1; 59 .. 00'/, «1.15% 61 .. M'h 62.4S'h 6-360'>S 64.75% 65Wh 67.05% 67.0% 67.05% 67.0S% 67.05% P'flfficleW~Cap.bl C~raSro Ptr.'l 6200% 62..50% 63.00'1. 63.50% 64C>Y/o 64.447, 64.87',1; 65 .. 31% 65.741'. 66_18% 6?61% 67 .. 0S% 67.05% 57 .. 05% 67.0S% 67.05% PI;'.IR~cos. ho .. PW.I so_OO"- W25% 5D_50";, ro_75% 5t.OO'i. 53297, 55.sa'h 5na-v, 60.1r>S 62.46% 64 .. 75% 67.05% 67 .. 05% 67.0% 67.05% 67 .. 0S'A ~ GWefal 8«1.->o 0;;.Ti'an"/ ""' 66-.C% 6-3.50'h 61.Co)% 58_50',$ M.(>);t, 57.537, 59 .. 16% 60.73% 62..31% 6l89% 55.47% 67.051'. 67.0% 67.0S% 67 .. 0S',$ 67.0S% S.:..Rl<m~;'I.'Tj 00 75.C>Cr% 7425% 735Ci% 72.75% 72..00'/, 7129'l. 7053\-!. 69.t-S?<o 69.17% 6-S_Wh 67.75% 67 .. 05% 67.C6% 67.05% 57.05% 67.0S% WW:uEn«g:tln-c. "" 55_00'h 5S25% 57.5Ci'h 58 .. 75% 6{1_1))-'/, 51..01% 62 .. 01% 53_oz:;, 64.ro'h 65031'. 66 .. 0-4'/o 67.0S% 67.05% 67.05'h 67.05% 67.051'.
PrCS«~d AmmJ Cas'!Ro-r."' IH! (48] (49] ]50] ]51] ]52] [53] ]54] ]55] ]sa] ]5lJ ]58] [59] ~OJ l.i!1] 1§;2] @:3]
TMTI"iru.l O"...rr~TI """ "'" 2014 "'" "'" "'" "'" "'" """ '"' "" '"" ""' "'" '"" "'' ""' v~:ue hro<tka.~ 8«:1.-'-o Pw,.,.- Co.TPMJ, Inc. AEP $1_&9 $2..07 $216 "" "'' $2..47 $261 $2.76 520> $3.11 $-331 $353 $3.73 "" $4.17 $4_40 $101.17 Cl~coCorp-oca~OO oa $1.57 $1.72 51 t9 $207 $220 $250 $2.76 $303 $331 $361 "" $423 $4.47 $4.73 5$00 "" $107M DJ~~ En«gJC«r>«afon ""' $293 $2..92 $29-:l "" "" $2W $3.14 $-331 $351 "" '"5 "" $4.% $4.71 '"' "" sus 8-5 Err'!'fe D'sm;t8~ C<:lmjo-IDY roo "" so.re "" $1.00 $1.03 SI.C•3 $1.13 51.19 "" $1.33 $1.41 ""' $1.59 $1.68 $1.77 $1.87 $4881 Glea.!PIZ:m En<!!gflrv.: G>P $0.79 SOM $097 $1.1)3 $1.19 $127 $1.35 $1.43 $1.51 $1.61 $1.70 $1.M $1.91 ""' $213 "" $52..99 H.omion 8-ect-'.:: ln&.<'>ffis, !no. HE $1.39 $1.45 $1.~ $1.59 "'' $1.74 "" $1.00 $1.~ $207 $215 5224 $237 $251 "" su.o $-S-3.40 IDACORP,Ine OA $1_5$ $1.79 $201 52" "" 525< $279 52% $3.14 $-335 $3.5-S $-3 83 $C.05 "" $452 $4.7S $114 .. 31 t.!;,>!Eta En«w, Inc IIEE $262 52&> $3.11 $339 "" $4.C>J $4.33 $469 $507 $5.~ $589 "" "'" $7.07 $7.48 $7_9(1 $11?450 t«m=m~J:U~ ((U $120 $1_:!-0 sqg $1.51) $1.61 $1.78 $193 $214 "" 525< $275 $2$15 $3.13 $331 "" $3.70 S%68 O:':a Tail C«po:(a:'o:-n OTTR $1 .. 05 $1.11 $1.17 $121 "" $1.46 $1.69 $1.93 $2..16 ""' $2..62 $2_81 $297 $3.14 "" $351 "'"' P.rmc!eW~Capolallhrp-,o~a'f-on ?tUI $227 $2..39 "" 52" $2M "" $3.12 "" $3.49 "" $-393 $4.18 54.41 $467 $493 $521 $1180-3 PN 1.1 RtS'Xli'C>e->, 1f>;. ?tiM $0.73 $063 $093 $1.05 sua $1.38 $1_59 $1.82 $207 $2..31 ""' "'" "" $3.13 "'' $3.49 $58 g4 P~r!Mld Gwaal Bedri-::.C:>-,-p"""f POR $1.37 $1.46 $1_!.6 $1.&5 $1.76 '"" "" 5254 $282 $3.10 $339 "" ""' $4.10 '"' $4 .. 5-S $70 .. 78 S.:....l'h<mC~rr·l'·•trf so 520> Sl.13 $219 $225 $231 $237 .... $2..52 $261 $271 $2S3 $2~ $3.13 "" 5350 $-3..70 $<17.07 WW.MEI>t<gtirK:. .... 'R 51~ "" $1.47 $1.59 $1.73 ~1.&3 5200 $2..16 '"' $2.~9 "" $287 "" Sl21 $339 P59 $7257
Prci.e-.;e;l k.-.uol Dati h-,.-.t.,., Ca<h Rew> (64] @:$) !§§] I:Fl ~~ [§9] (!OJ [!1]
\n;-:'al [!2] [!3] !J:4] [!5] [!6! [?:1! [!8] [!9J [UIJ
Coo"iJ:Yrl TK~" o.t:l011 4115/14 12131114 f)t:l0i15 6130!15 6.%17 6!UIIIS 6/30i19 a%'20 MIJI21 6-'Y.IIZZ 5/3!}23 §2QJ:4 5/3012-5 6.'»'26 6/30121 6/30o2B hr><&--"'18«Vi;P(l'h<fCo.T~f.hY.:. AEP ($~69) $0.00 $1.45 $2..16 "" ""' $2...47 $251 $2..76 "" $3.11 $331 $-353 $3.73 $394 $4.17 $10557 Clev:o C~;p<:~,.~~-., Ctll. ($47.03) SO C>LI $1.17 $1M S207 "" "" $2..76 $303 $331 $361 $3s-2 $423 $4.47 $4 73 5$00 $11325 Dul;e Erl-«Q'fCorp«afc<l 001( ($W 39) so I)LI SZ.13 $200 "" "" sz.n $3.14 $-331 $351 $372 SHS '"' $4.% $4 71 $-H3 $164.11 Em;:>ie Distrk18oct>' Ct>rr.pany EDE (S22.71) $0_00 "'"' S0&-3 $!_(>) $1.03 51 .. 0.3 $1.13 $1.19 "" $1.33 $1_41 $1.~ $1_59 $1..6-8 $1.77 $50 .. 68 Gi-M1PL..."sEnf<gflr1'0. GXP ($24.16) "'" $05-8 5097 $1.03 $1.19 $127 $1.:>5 $1.43 $1.51 Sl-61 $1.70 suo $1 91 $2..(12 $2..13 $$525 H:ru•ion B«tr'>e ln~s.1m HE ($25 SS) 5000 $1.(12 SL52 $1.59 5><, $1.74 $1.8"2 SH>O $1.&-3 $207 $215 $224 $237 $251 $265 $5621 OACORP, Inc lOA ($51.73) $000 $1.15 $201 "" $2..50 "" Sl79 $200 $3.14 "" $3M "" $40 "" $4.$2 S119W ll~.:&a EnetgJ, Inc. !<EE (SWE4) $0CoJ $1.93 $3.11 "'' $3£.3 5<00 S4 33 $459 $507 5$<? "" "" "" $7.07 $7_48 $202.40 tk<tlu--.t lkH-o-s NU ($42..73) $0(o) S0.69 $139 suo $1.61 $1.78 $100 $2..14 $234 "" $2..75 ""' $3.13 $-331 ""' $100.37 {);!Of Tal Cc<p<<dt::.n OTTR ($29_0--1) "'00 so~,) $1.17 $121 "" sus $1.69 $1.93 $216 ""' ''"' $281 $297 $314 $332 $71.73 P:f'h"l.."<!e WPI capbl Corp-ora1-;.n Ptr.'l (55-4 .. 52) $()(") $1 65 $2$2 "" sz.w "" $3.12 5"' $349 $3.70 $393 $4.18 $4.41 5W $4 93 $12329 PN'.1 R",;.:urce;., L<x. PNM ($240-3) 5000 $055 $093 $1.05 $1.18 $1.3-3 $1.59 $182 $207 $2..31 $2..56 5W $200 $313 $331 S-62.43 Pcrt"ood Genua! 8«V0o Cc-.T<I)JITj POR ($291"3) SO Co:l $1.03 ""' 51.65 $1.76 S2C>:l "" "" '"' $3.10 $339 $367 ""' $4.10 "" $7536 So•.t:h-o<n C«r.pmf so (S4H•2J 5000 $1.51 $219 "" $231 $237 $2..44 $2S2 $251 S2-71 520> $2£<6 $3_13 $331 "'" $90 .. 76 Wn'a EnHQ'f, In-c. WR ($32.49) $0(,) '"' $1.47 $1.59 $1.73 "'" $2C>J $2 .. 16 $232 $2..49 $26-3 $2..87 ""' $321 $339 $76.15
Sd<W.leRB-f-1.10 f'ag,l8 « 10

n·tts ""' 1t'l$ ttl$ IZZS OO<:S t•S'IS <:S'IS ll"IS £91$ SS IS 9'1'1$ lt'IS tc'IS "" 000$ (61>-Zt$) l::l.'o\ ':>4 'IJJF.1.g 1'4~}.\
09C<iS tHS 'iZH NH 16GS ens L9ZS gzs lWZS lt<:S "'' eas tZZS QI'ZS ""' OO<>S (M-It$) "' '~""':!~ IZWS lt<:S <'ZZS SIGS tozs W"l$ 'inS zns 19'1$ lt'IS 2£'1$ tz IS ellS "'" £60S CoJOS f~~Sl ""' ,O:U.,.d•llO:J 00:-4>'>8 1'""'-"'DP<l<;tJOd IS~'SS '"' zzzs OI'ZS "" "" S9'1S erns sns IZ IS t-o IS &;<>S 690$ "" z~os CWYOS Uotzsl ~'11kl -~ 'S~)Jr10-S~1'•1kl
ZS ZZIS ons t>HS om u-ts 1>1H Z~tS ttH sns C•HS 5'S'ZS tl<:S "" et>'ZS WIS OoYOS fzn-ssl M1kl oo:'.e!Od>CO ~-&:11"','•\~Pfi'll'.d ~Z59S 99'1$ lS IS sns ons ons ll'IS tnS "'" l60S oo·os NOI "" 160S ILOS C•JOS (WSZSl HllO lYJ~"~>ID>:J !'2.l R;\Q
~19'MS "'" e.ns HZ$ sm OHS ""' "'" 06'1$ ~ns 19\S 6t'IS ons tnS LS'OS c.oos (tL'ZfS) "" R}f'.()l>"t>•!J>:N t~S61S K~ £09S llSS OHS zo ss l9t$ 90S lOtS ISH LHS sns H'H tsZS LS'IS OO<>S fta wsl 3::!11 ·~ W!.mg eq;t<>/1
H911S "" £9£S ti'£S '"" tnS "" 69GS ""' "" StGS 1ZZS t-ozs 05'1S II"IS 0001 (tl"ISSl vrn "l.ll'd1:100VCI
'"'' 91'ZS ""' t€i'IS tS'IS 9l'IS 69'1S WIS £!/'IS K"IS l'i IS WIS sns zns ~?'OS 0001 {~S''iZ$) '" "-'I ·s~~flP\.1 0!-4»81Jq<N-4J snss uns 6S'IS sns 69'1S 6S'IS WIS zns '"' LZ'IS IllS SJ'IS t\!'IS 1'01 l'iOS CoJOS {91'tZSI "'" ~lllm_gt'--'.~JdJU-":1
tZihS t9'1S '"' Si''IS o·ns ot'IS fZ IS 91"1$ II'IS £•ens "'" M'OS l60$ "" l90S ooos (ll-zz$) 3m I!JW"">:J ~~--"""8 l'l--''SJO '".~"'-"3 SHSIS tUS l9'1>S zns 21't$ Z6tS 69£S SHS 6ttS zns l6ZS "" wzs 6"3<:S tn:s oo·os (6£'69-$) Yro w-J">:;.:W-oltin'-'3 "V"l Q96'01S lHS LSB '"' '"' '"' tl<:S sns li':Z$ ozzs ""' ZS'IS IS'IS InS II'~$ oo·os (N'Lt$) "' u-o::;"'Y~iPlO ~J:.l
a-s-o~s N'H "'" sns 5HS tnS KI'H LSU ILZS '"' tt'ZS lt-zS ""' tJGS St'IS 000$ (69'9-tS) "" -,._, 'kr-~ n~>£>d~a ~oe:,;nwv
swm ,<=, """' """" """" '""'' ""''" ·- =w 61/000 """' l\.~ti9 91.'00'9 '>ltDt/9 till till ti/SIIt NOW<> RY-'-1 """""' ""' lrnl l6il tell lLil [glJ [glJ [til !til !zll Ull loll [691 10'91 Its! (991 Is§! lt9l WDH4>~0Y.I~
qe(] tHIIP-'fP~IHiold
L90lS SLZS "" ltGS "'' IZGS $<)(!$ t6'1S ZS IS IL"IS t91S S'i!S s-ns It' IS K'IS ~Z IS ""' ~lM '::rl!l AB>W3 -""iS"!,\
""' "" tHS '"'' OO'tS 16ZS ens l9GS LSGS ens lt'Z~ "'' 2ZZS '"' SICS ZI"ZS LOGS OS IJJ'IIdw>:J llffiVlOS
'"" w-zs lt'Z$ 2-?:ZS 91GS "'" sns sns t9'1S IS'IS It' IS "" tliS """ 9ZIS ltl$ 2-ZIS ""' I.L'ilJ-~ ~4H8j<!R\P.D P\l?.+>Od
t09SS s-t--zs '"' '"' OI"ZS "" v.ns ;ns Cri'IS sus IZ'IS "'" "" 61'0$ zs·os 9LOS Ol-OS l'iNd '"'-'!'sn-"'loJS~l:ll'md
SS'HIS L6 tS on$ tnS ons HtS tHS Z'iH £HS sns '"" sns tL'ZS "'" lit'ZS 1t-zS "" f,'.'ld lY.>j;OJO<iloJ Jel•:ko ""'""" <-flruu'_d
""' sns 9'~ns LS'IS St'IS Ot'IS ons I z- ~ $ EI'IS to' IS 160$ "'"' £1lOS "" \60S t€i'OS "" HHO OO}<~~e_LR..O
H-sss ""' 9HS '"' tlZS "'' OtG$ "" "'" "'" 'iL'IS 19'1$ 6~'1S ons tns "" sns 011 S«JI-l'i'll<"~~~
19'1SIS tl'~ Lt'S$ "" ILSS ons zo·ss l9'tS '"' lOtS IHS LHS sns tl'tS "'" 'il'ZS L9'ZS 33,',1 "<>'-'l 'lli>W3 e~<"tl S9Z\IS OOH "" £9'\':S tHS '"" '"' sns 69GS WGS wzs "'' LZZS "" MIS zns S'>'IS vrn 'OlJI'dHOOVQ1 ISZSS ""' 9\'Z$ "'" t6'1S £1l'IS 9l'lt 69'1$ t9'1S 6'i-IS K'IS l'i-IS St'IS sns Zt'IS 6£'1$ ~-IS 3H ·ollj ·s~J;-71P'--10!-fP-?8 U<J"-"~
L9Z~S II'ZS "" 6S'IS sns 69'\S 6'i'IS Cri'IS zns snt tz-lt InS ~I'IS to" IS 1'01 '"' ~l'OS ""' :otqiJl-.g ..... ~ld ... ~~
IS~tS tl'IS £9 It ts'IS 97'1$ ons ~-~s enS 91'1$ I \'IS £-J'IS Z0-1$ "" 160S "" tiiOS u·os 303 lmdwoo ~:-.;,s P.--.">!CC ~~o:ku3 91'itiS "" t6 t$ LS'tS zns ens "" 6'HS St-ts '"'' zns 16Z$ "" w-zs 6HS 16GS ~6GS >ro <>>JeJOOJo:)IJlRI-'3"VIQ
69toiS '"' ll't$ LH$ '"' '"" 9-5GS tlG$ S<;ZS Ltz$ '"' "'" uns IS'IS ll'IS 19'1S zns "' l>)_;~»i:O:J C>HQ
9-S'OOIS Itt$ "'" '"' S<HS s~·~s tZtS "'" LQGS ll'ZS w-zs ttG$ ltZ$ '"' ti"Z$ ooGS &nS """ -~"-'~ 'h~("-ll<>:J-"-""d~B ~wv
""-"'A "'' '"" ""' "'' '"' ""' "" l<m ow~ '"' '"' ""' ""' ""' ""' £10Z m,:<_i !l!Wctw.)
tru.UJF->1 l£91 tz&l 1191 lWI lssl (~] Usl (g-_;j issl Its! ltsl lz~l H~l (GS] l5tl lstl Uti ~""1:14'>"0
~\.1'-'i~f:l-'d
'/,9YL9 %W-l9 '/,W-!9 '/,SQ'l9 <;>,;;:Q-19 '/,to-w '>\(0'59 <;',(Q-t9 '10H9 %10£:9 %10'19 '>'0009 'f..'i!'SS o/,oo;·g ')',!;?:9S %00'SS ,., =1AB-"'-8~M %W-l9 %00'!9 %9Yl9 %9Yl9 %W"l9 %'il"L9 %9t'S9 'ld1'69 %W-69 %'?> OL '7.--slll %00'Zl %9l"tl '/,(.lo;-Cl 'A'<Z'tl 'H.:OY'il "' "-"dw>:J UR'iflOS %9Yl9 %9)'19 'f..'i>H9 %W-l9 ';WJ'L9 $~11>'59 '1o&'i€9 '1\ltZ9 '1\H'09 %91-69 %S9'l9 %V0'9'> c;;u:;~ %00"19 ~(9 'i':-0)'99 ""' J;wJ>.c-o::>0!4">8 je<><r~ ptllljlK>d
%9Yl9 "{,<;0-19 o/,S>H9 %o;.)'L9 >'.W'l9 %'>n-s %9H9 '/,11-09 ,,-.·n~ v,ss·s~ o/:Bl:t'i '/,OO'IS "{,'it"\% 'HJ'i'09 %!.'?:OS v,vo·os l'•lld ·oq 'S<>~.-.:ts-~}1\'!lld
'i'.S>Yl9 %<;0'!9 %9H9 'A9:l'19 %S>J'l9 '7.19-99 %91'99 'ML'S9 %1£'59 'idQ't9 '7,H"t9 %0Yt9 %09'£9 %V0'€9 'lc09G9 <;\OO'Z9 f.'.'ld lN);eJo:>dw.) 1"'1'.-R::> !S?M"PWl'<i %9H9 %S>J'l9 %S>J"l9 'f,S>J'£9 '7,S>J.l9 %05'S9 <,~'il't9 '/,09'£9 %St"Z9 %01:'19 %91-09 %OJ'69 'A00'99 wxrtL 't,oo·os 'Y.--OO'l~ ~uo l>)_;o?.>:><lli:J[I!.lR~
%S>J"l9 ',-',<;0"19 'f..S>H9 %S>)'l9 %9:l'l9 %'il'S9 '/,97·t9 '>"11.£9 '>"9<n9 'I:S•Hr9 '1:&'6S r,:oo·~~ %'iZG'i '1-.Crii'S '/,9[-~ wxr69 011 ""l'Ml>"~!JJCt.t
'/,$0"19 %9H9 %SO'l9 <j,9J'l9 '/,S>J"l9 %013'59 ';',9L-t9 %09't9 'h'it--zg 'j,(i£'19 'i.SI"09 'H:oJ'6'i %9Cl'i o/.-J"A-99 %U'S9 %00't9 33N ':x.Ji 'l.tl.mg ~~<tl
"'.S<:rl9 %9:l'l9 %9:rl9 'f..S>J'l9 't.S>J-£9 '1:<11'99 %Zt'S9 %'>t't9 o/.--G'i£9 '/,HG9 'f,9n9 'iSOY\9 '/:((l'l'i '1:00'1':5 '/,00-6t o/.-{oJSI> vo '"'-'1 'd1:100VOI %W'l9 ',-',S>J"l9 %W"l9 'f,S>J-£9 %9:l'l9 'l::toS9 't,ro-69 %to'01 %lO-ll 'f,IO'Z! %10'£1 '/:OO'tl 'j,(WY'iL %«191 'f.#Hl '1'..--oo-~! 3H "<".11'$<'!-f.-""'Pl-!~~a~reJIN-<1-!
%S>J"19 %S>J'l9 %SJ:rl9 %9:)'19 %S>J'l9 %00'99 %'il'99 o/.--1'.19'99 %St'99 %0C'99 %'il'99 "f.--I)Q99 %!.'?:£9 %M-09 '/,<;l-19 %00'S~ """ :..Jjlll""'-'3 S<.FJdlea-":1 ';',S(rl9 ~';S>J'l9 %SO'l9 %9H9 %S>J'l9 %19'99 %SI'99 %t1-99 %1£'99 'l:le-?·9 %H't9 %00'1'9 'ioOYW '!.--I)Q'99 %00-19 '/:001<9 303 .(~ o~s P!-~ a1.du8 %SO-l9 %9H9 %9:l'l9 %S>J'l9 'f..'i>Yl9 %lt-99 %?S-S9 %1£'59 %tl't9 '>"91'¥.1 'j,~£9 '1.-00H %U'99 %09'69 %'>L'Zl %00'91 ""' uc.}et:.j»:Jillm.g av'(] ';',9)'19 '/,S>J"l9 'f,S>J'l9 ';',S>J-19 %'iO'l9 %19''i9 '/,91't9 %tl<:9 %11:'19 %lB-69 %H'S9 '/:OO'LS %'<Z'W 'it,{I<;S<; %'il"ts o;t,OO-ts '"" ._..~~e>;o.iloo <>H!:J ',-',$0"!9 '/,S>J-l9 %W'19 %9:l'l9 '{,SQ"l9 %l~'99 %&"3S9 %1£'99 '/:£!'1>9 '1'..Sl't9 '/,SS'£9 ""'" '/,!,'?:£9 '!.-O'H9 'I.'Ut9 %00'?9 £< ·::"--'l'.(u.;dul<>:J-"'""'d ~..IJ~B W"--'!-9Ullf
'"" '"" "" '"' "" '"" "" '"" 0~~ ""' ""' ""' ""' 910Z ""' ""' "'V'.! ~.llo-J
l9tl lstl !ttl lui lui Htl loti ted l>'tl ltd (>'tl ls£1 !ttl tHI lzd Uti OF}!Jiil)"'dp-lll'j.)'-!(1 )'I'I'IUl.'fP~Pid
Zl'tS 05fS 69€S 6HS Ott'S zns l6GS "" ZLZS zgz§ "'" tt-zS ot-zS "'' ltlS IZZS 'ii'ZS J,l,',\ ':ot!j A£1""3~.'.\ Zt'SS ti'SS "" 6'itS '"' ll'tS 00£$ "" SHS IHS "" li'H OO'£S wzs "" 9LGS l9GS OS IL'E'dill>:J W'lW"'S
G>HS "" ens "" "'" W'ZS £L'ZS '"' 6t--zS 6tG$ '"' "" 'ii'ZS lOGS 00'1 to' IS LS'\$ ""' .(ueO.u<>:J ".-'P-'8 I"RWO P'R.+X'd ons O'i-ts ICtS €1'£S l6Z$ \1lGS S9'Z$ 6t-z$ '"' SI'ZS "" 6S'\S 9l'IS t!HS GHS lt'l$ InS \'Old -"'-'1 "Sn.nos~H rmd
WLS IO'l$ "" "" t6SS I9'SS ~iSS £-YSS "" "" tns '"' 6<HS tf;tS 6H"S "" "'" t.·.·~ L>:o>arod>eo 1>'\d~ l"'.'.\ aparu~:~ 19Z$ n·zs "'' IZGS "'" 0!6'1$ tnS lL'I$ L9-IS sns 6t'IS It' IS tns "" SI"IS InS SO' I$ 11110 IY.I-,;o?~ !"'.l »PQ
\9tS sons '"' lO'tS "" "" tHS "'" lO'CS 69GS ZLGS "" lt'ZS llGS t\GS lOG$ W"IS nil *~'l?(l!S'l~l
wo~t 196$ "" l'iH ""' l9'l$ ""' "" Z'iSS "" "'" "" i't'SS "'" NtS ll't$ w-tS 3~1 -~ 'lli>W3 ~~<"fl
"'" zns lt'SS ZI-SS s·ns ss·ts S't't$ arts "'" 6HS "" ZL'H ~9'£$ '"' \~£$ tt-ts lEtS vo ""'-'1 'dl:IO:NCD IHS tZT$ "'" 6"3G$ tlZS "" st--zs ""' tzzs S\G$ 102$ "'" £6-IS W'IS o-ns tns t9"1S 3H ~Cij'SO(J;->np'~ "!JJ»:3 l.fe!W~ tl'tS l6ZS 19GS """ Z'iZ$ '"' '"" tiCS to-zt zns tnt tns S9'1S l9'1$ 6HS zns sns """ ""'llh•<-'3 ».f"1d 1a~-":: lSGS HGS ~-zs SI'ZS "" SEi'IS "" LL'IS 69'1$ t9"1S i'i-IS t'i'l$ 6HS tt'IS ot'IS 9US zns 303 lmdWY.)O!I;l-'>EIIl!-')l;(]aJ.d-.113
ens Kl$ l6S$ '"' "" 013'SS "" "" ross "'' l9tS 6ns zn-s 91'tS lOt$ "" IHS "'" '-':>]er..f!oolti"'ll3avu
"" t9'9$ t:tSS "'" LL'tS 1..-tS llt>S OOtS "'' '"' C:StS s-t-ts "" "'" "" "" ons "' <>:>.'I"Y'..dJo:)O~J:.) [t'S$ "'" Sl'SS tHS ~I'SS lS-tS zns ens Sl'tS "" "" l9'tS ZHS LHS tttS ll'tS £'6ZS £< .,.--'l'll.l<'d.JJ<l:) I<>I'Cd ~8 Ul!'~Ullf
'"" LZOZ ""' '"" "" ""' "''' '"' ""' ""' ""' ""' ""' ""' tl02: ""' ""' .. ,-:.-1 U'€3-""':J
[Iii:] lszl t~c-J tal [§i] l~ll ltzl ll:ll lul ltzl lo.zl [611 [gl] llll (giJ (<;I] ltll a-"'4S P.d 'SW.u.-e;~ f<OU>-'f P~P~/<>ld
'" £0 91 %ZI'OI 00" %9l'l9 'fo(o) Zl '1'..-l:ol''il '/.-{11'9 '1.-W'£ '1.-W"C %S'>'£ o/.--Ql't Ult$ "' '" ""' %0!1'6 W« '/,S>J"l9 '1.-J:•YW 'it,00'99 %0!'9 '!&;'£ '"' '1M-OI o;tH.r9 '"" lJOd
"' £1''il "1.~£01 000 'f..'i0-l9 '!.00'19 '!.I))'OS '7Wl''i %{19"1 'ioOO""ZI '1.--QZ'S 'l#.fl N'tlS 1'11<d
'" lS'il %11"01 roo 't.'i0-l9 ~oo·t9 'I:CoJG9 o/,(ll''i %ocrt '1.--oo-t %Crt o/,{IH znss f-Nid ,_,.,._,~lOdlco
"' \ttl o;t,Z9-S roo '/,9)'l9 ',-',(()'6S ',-',I)J'lQ %-Ol"i 'f.00'9 %/JoY<; I %00'9 '"' "''" l:IUO
'" SS61 %9~6 roo %9:l"l9 o/....00~ "f.--006S %0l'g %S~9 '1,-oo·g ';\929 o/.--OH u·ztS nil ~;1-Mf<"o-qK'/1
"' '"' %Zt'6 '"'" %'i0-l9 '1.-l:O!YM %00'ts %0L"i '1.-0H '1.--0'>'t '/,8t•9 '1.-01'9 ""' 3~1 'O<lj 'lli>W3 E13><"f'J
'" £9'91 ';';\9'6 (;o(oj_l '!.SO'l9 WXI'I9 'f,(l<)'St "MML"i %oa-z 'im--z ~~·t %-OO't cnss vrn ""-'''dl:IO:Nru OL'Z 6£'91 %1£'01 (YJ<)\) %W'l9 %00'tl %0091 'I.Ol-9 '1.--0'>'£ 'IH.i't '/,')l't %009 so;·o;zs 3H ~"l ·s~mpuj "!Jl.~ """!"-1'~
"'' ll'91 %£6'6 000 %Wl9 'lo00'99 %0HS o/,{ll'S %11''> 't,oo-9 <;HI.'i o/.--Oz-9 91'tZS "'" OI.JIIB>*-'3 su.eld)ea-":1
'" <;9'!11 ';\9t"6 roo %S>J-l9 %00't9 o/hl'S9 %0l'S %001': 'loOO't 'I.OCI't %00'£ ll'&S 303 l.iJt'du!co o~~B ll!-')1;(] a~.:!W3
'" 01'61 ..,,ws "" %W'l9 '/,00-£9 'io009L %0L"i '1.--06'£ wxrt %l6't %06'( 6HS$ Yro """l"niD>oltlm.g a~TXJ
'" 6911 %~f6 fi))('!.) %SO'l9 'lh:rl'i 'loOO'ts 'Y.--OLS %0'1t '>'.nn <;>,oo·s 'f.--{10'8 o-o·as "" uo-:<eJ-:·:iw.)~tJ
SL'Z ll'SI 't,ZZO\ "" 'f,S>J-19 'f.-{1<)'(9 'lhl'ta o/iOL"i %tZ~ %0'i~ 'f.£Zt 'i~ot'~ 699)-$ ""' ''"-~ 'lv<?do.il<O .P-.I'Od ~8ll<'~UJV
<>9!H03d~"ll3:"d ""' ""~ '"' 1102: "'' """"' """"' '"' (;11:)\SJ_j ·= '"" "'VU llkl-""'0
"" ~r-;'€A
t<'U.'-"».l f"'J'.Wl'ill l»)l'o(.'$:0.';."'<'>0~ C~'1j)O~Ie.:J llR.L-fulj >"~J~W~'>3 GeH ~Jfl Sd3 •~s
ltll lul (II] loll [6] [gj 111 !9'l (~] [~] ltl lzl Ill ''"" .GFJSl"-".J "! "'i"o.I.IJ'3 G"H 4-I'OJ£) Sd3.1'£l1
3'!1d ')O)S a€-.!R.\7'1.!!{] I)'; I f.f<'l'jA"OH IJSI;f:J p>~>S;O l{;'IO~ ~".s-w\'1

1/Uii--S>_"® OCF l~:<!es: [1] &<..-c~:~«<robHg,b:r:-«<M~.W..an-:1180-dl'Jhi'lh:ic.al awr"'.?[2] &urce: Z&:~-~ [3) S«xce: Y<hoo! Fnan.:>e [4[ Srurce: V<fue Lir>e [5] EqJOl<o ild'ca!-N >'alue ("'•""":¥', rr.hrnum, maimum] r1cm Co!urm~ [2].[3]. [4] 161 Soorce: Fe&IIJ R~~. B..o-oau O<!Eo:f'IL'!n'c """''~ [7J Srurce: VtJua LIM [8] So<...-c-e: V<fue LiM [SJ Source: Blvoo-Wg Pro~ssoo..J
(I OJ Eq.~als C%1UITII1 (1]+ Co-\Jrnn!Q4] [It] Eq.~als r~<ol &ccl S.C..\.-a b-xt~..n; go-lJ: Coo'ucr., [IOJ~'sSO 00 [12] Eq.~ols Ccfumn[63]1 Cc·~mn (J,Jl] [13] Eq.~a4 CcMtn [12]1 (Coo'umn (6jx100) [14) &....-~e:V~ue~ [15) Eq.~els C<:lumn [14]x (1 + Coo'urr.-. [5D [16] Eq;ols Cd«rnn[15]x(1 + C<-.\Jmn [SD [17[ Eq.Jols Cclurrn [16]x(1 + C<-.'umn [5D {18] Eq.~alsCo(urn11[17]x(1+ Cclt.tmn[SD {19) Eq.Jals Cclum1[18]x (1 + Cc>\Jmn(SD (2'0) E<;JJ>ls Cci!Jnn{19)x(t + Cc>'tunn!SD [21] Eq•J~I5 {1 + (Cctrnn [5] + (((Co~;:r.n [5] -Cc~C<nn[SJ) /(202-4 -2019 + 1)1 x(2019- 2D18))))xCc~·.rr.n (20] [22] Equals{! + (Cc~;r.-.n [5) + (((Cckr.n (6[- Cc-l=.n!STI 1(202-4- 2019 + 1)1 X(20l0- 2il18))))xCclu:r.n[21] [23] Equal< {1 + (Cd..-nn [5] + (((Ch~nn [5]-Cc~lJITin [STI 1(2024- 2019 + 1)1 x(2021- 2018)1)) xC<:olm',n[22] [24] Equal; (1 + (Cc-!>1r1n [5] + (((CoN•-~ [6] -Cdumn [5]) /(2TJl-4 -2019 + 1))1<(2022- 2018))))J<Cc.luonn[23] [25] Equ3ls (1 + (Cc~_.,.,n (SJ + (((CcloJ..-,, [6]-CdUiTon (5]) 1(202-4- 2019 + t)) x(2023- 2018)))) xcc-lcn-.n [24] [26] Eva,'<; Cdurro1 [25]x (1 + Colurr.n ~D [27] EValS Column [25] x (1 + Cc.'urr.n 16D [28] Eva-'s Colo.mn[27] x (1 + Ch'umn 16D (lll] Eva.'5 C<lurn"l [28] x{1 + Co-\>rr.n 16D {:l-0] E'P-Ja.-'s cor....., (29]x{1 + Co\>rr.n 16D (31] EvahColunn[1J [32.[ Equ~!s C<:br.n [31] + ((Co!Ll'J",f1 !35]- CrJ....-nn [31fl/4) (3-3] Equal; C:;~...--r.n [32] + ((Colll'J".n [35]- Cc.'1r1n [31]1/4) (~] Equ<>}s Cclo_...,..n [33] + ((Co!umn (35]- CrJ.n-,n {31]114) t~S] Eva!s Colunn [8] [30[ Eq,.Ja!s C<:.jo...--r.n [35) + ((Co/JIT,n [42]- Cc_lcrr,n [35]117) (37] Eq • .,~o; Colo...rr.n [36] + ((Coi•JIT,n {42]- Cd•.lT.n (35ll 17) (38] Eq~~t; Ccl>Jrr.n (37j + ((Co!...-r.n (42) -cvr'--'"'" [35fl 17) [39) Eq;~ls C<:+...-r.n [38) + ((Cobrr,n [42] -Cui'->Oof1 [35J117) [40) Eq-<>t; C0~-"'•11 (3Sj + ((CO>iuT;-.n (42)-Cd<.VT,n (35)1 /7) [41) Eq.•~!s C<:"'-""'" (4Dj + ((Cch.<M [42] -C"-'.mn [35!J 17) [42] E'P-Jalscm.m:-,(9] {43) Eq.~alsC«umr>[9]
{H) Eq.Ja!S C-dumn (9] [45] EQJals Ctlum1 {9] (46) E<;JJaiS C:;olum; (9) [47] E'P-Ja.'s Cdcm.1 [15] x CC<.\Jmn (31) !48] Erpa.'sCdo.mn[16[xC:O.'umn[32] [49] EQJa.'s Column [17!x Coo'umn (33) [50] E<;JJa.-'sCdumn[18[xCC<.\Jrr.n[~l
[51] Ev>JsCd~XM(19]xCc>\Jrr.n[3SJ [S2[ E'P-Ja.-'s Colum; [20] xed>.Jmn (36[ (53] E'PJ"'-s C«um [lt)x cc<urr.n [371 !54] E'lJals Cofl.om [22] x Cc>'umn [J.eJ [5-S[ EvalsCol....nn[23]xCdumn[39] !56] Eva.'<; Colunn [24] xCho.\Jrr.n[40j [57] EvatsCffi.lrnn[25]xCho.'umn[41] [SS] Evals Cc.'unm [26]xCdurrn[42J [59] Ev&sCciUITII1[27JxCdurrn[43J (60] EvatsCclutM[28]xCC<.'urr.n[H] [61] EVoh Cclurr.-. (2S]xColurr.11 [45j [62] Eq.~als Cdutnn [30jxCC<.'urr.-.[4&j (6J] Equols (Cc~Jrr.~ (62]::<(1 + C:;h-nn !6!1)/(Cob..-.~ [11]- CcJ·Jrr.n [6]l [6--1] EqJoh n~p¥.~ ,-,.,t ~~~ \"211~: d.~1 rale eq.la!s CoiU!lYl [11 j. c-ash tam eq;al Coiu...-.n (6.5] ti"o'oo>Jh Cdumn [W] (65] Eq.~&s $0.00 (66) Evats Cd...-rlflf47Jx(1 • (0 5xCC<.'tlrr.-. [5p)x{1W112014 ·4115'2014) I U-5 ('57) Ev&lsCcl<.n'dl[H] [58) EqJofi Ccl<.mn [50] (69] Evats Cclun-<11 [51] [70) Eq.~a4 Cdun.; [52] [71] Eq.~i!h Cc/um; [53) [72] Evals Cclwnrl [54) [73) Eq.~&lsCth.rm[55] [74} Eq.~i!h Cdum; (56] [151 Eq.~als coo..m~ (57J [76] Eq.~als C-ohm'"l(58} [77] Eq.~alsC<Iurm[59] [78] Eq.~als Ccll.m1 j<;OJ [79] E'P-Jai<Colum1~1J [WJ Eq.~.,'sCdum,/62]+(61]
&h~L~RBH--4 Page10of10

Ex-Ante Market Risk Premium Market DCF Method Based- Bloomberg
1 2 3 S&P 500 Current 30-Year
Est. Required Treasury (30-day Implied Market Market Return average} Risk Premium
13.91% 3.60% 10.31%
4 5 6 7 9 Market Estimated Long-Term Wefghted
Com~an;t Ticker Ca~ltalization We!ght in Index Dividend Yield Growth Est. DCF Result DCF Result
AGILENT TECHNOLOGIES INC A 17,707.96 0.10% 0.91% 8.85% 9.80% 0.0100% ALCOA INC AA 15,282.85 o.o~.r.. 0.92% 5.00% 5.94% 0.0053% APPLE INC AAPL 462,005.70 2.67% 2.44% 16.4~/~ 19.14% 0.5112% ABBVIE INC ABBV 76,386.96 0.44% 3.48% 2.50% 6.02% 0.0268% AMERISOURCEBERGEN CORP ABC 14,719.30 0.09% 1.47% 13.65% 15.22% 0.0129% ABBOTT lABORATORIES ABT 58,590.38 0.34% 2.32% 11.81% 14.27% 0.0483% ACE LTD ACE 33,834.64 0.20% 2.54% 7.83% 10.46% 0.0205% ACCENTURE PLC-CL A ACN 53,126.22 0.31% 2.36% 10.50% 12.98% 0.0399% ACTA VIS PLC ACT 33,841.49 0.20"h 0.00% 14.01% 14.01% 0.0274% ADOBE SYSTEMS INC ADBE 30,909.06 0.18% 0.00% 15.70% 15.70% 0.0281% ANALOG DEVICES INC ADI 16,620.23 0.10% 2.70% 10.88% 13.73% 0.0132% ARCHER-DANIELS-MIDLAND CO ADM 29,030.68 0.17% 1.98% 7.45% 9.50% 0.0159% AUTOMATIC DATA PROCESSING ADP 36,175.46 0.21% 2.39"/0 10.33% 12.85% 0.0269% ALLIANCE OAT A SYSTEMS CORP ADS 13,684.50 0.08% 0.00% 14.26% 14.26% 0.0113% AUTODESK INC ADSK 10,636.80 0.06% 0.00% 11.27% 11.27% 0.0069% ADT CORPffHE ADT 5,488.30 0.03% 1.86% 8.00% 9.94% 0.0032% AMEREN CORPORATION AEE 10,130.00 0.06% 3.91% 6.57% 10.60% 0.0062% AMERICAN ELECTRIC POWER AEP 25,522.77 0.15% 3.88% 5.23% 9.21% 0.0136% AESCORP AES 10,373.88 0.06% 1.40% 6.82% 8.26% 0.0050% AETNA INC AET 25,980.20 0.15% 1.26% 10.20"ho 11.53% 0.0173% AFLACINC AFL 28,028.27 0.16% 2.44% 10.11% 12.68% 0.0205% ALLERGAN INC AGN 38,226.13 0.22% 0.16% 14.64% 14.81% 0.0327% AMERICAN INTERNATIONAL GROUP AIG 72,220.37 0.42% 0.99"/o 12.40% 13.45% 0.0582% APARTMENT INVT & MGMT CO ·A AIV 4,270.48 0.02% 3.62% 7.28% 11.02% 0.0027% ASSURANT INC AIZ 4,577.99 0.03% 1.68% 3.40% 5.11% 0.0014% AKAMAI TECHNOLOGIES INC AKAM 9,570.84 0.06% 0.00% 14.50% 14.50% 0.0080% ALLSTATE CORP ALL 24,791.46 0.14% 1.94% 9.68% 11.72% 0.0168% ALLEG!ON PLC ALLE 4,820.57 N/A 30.34% NIA N/A N/A ALTERACORP ALTR 10,737.15 0.06% 1.73% 11.88% 13.72% 0.0085% ALEXION PHARMACEUTICALS INC ALXN 28,768.49 0.17% 0.00",{, 39.48% 39.48% 0.0657% APPLIED MA TERlALS INC A/',1AT 22,840.75 0.13% 2.08% 20.06% 22.35% 0.0295% AMETEK INC AME 12,447.72 0.07% 0.52% 15.00% 15.55% 0.0112% AMGENINC AMGN 86,996.04 0.50% 2.11% 8.01% 10.20% 0.0513% AMERIPRISE FINANCIAL INC AMP 19,699.85 0.11% 2.20% 13.00% 15.34% 0.0175% AMERICAN TOVVER CORP AMT 32,317.29 0.19% 1.61% 23.42% 25.21% 0.0471% At.1AZON.COM INC AMZN 145,442.03 0.84% O.OO"Jo 42.42% 42.42% 0.3567% AUTONATION INC AN 6,337.76 NIA NIA 13.44% NIA N/A AON PLC AON 24,464.41 0.14% 0.90% 13.18% 14.14% 0.0200% APACHE CORP APA 32,813.72 0.19% 1.11% 9.55% 10.71% 0.0203% ANADARKO PETROLEUM CORP APC 50,152.79 0.2!¥-'/.:. 0.67% 18.23% 18.97% 0.0550% AIR PRODUCTS & CHEMICALS INC APD 24,619.67 0.14% 2.51% 8.70% 11.32% 0.0161% AMPHENOL CORP-CL A APH 14,453.11 0.08% 0.87% 8.71% 9.61% O.OOSO% AIRGAS INC ARG 7,817.02 0.05% 1.78% 12.71% 14.61% 0.0066% ALLEGHENY TECHNOLOGIES INC AT! 4,414.03 0.03% 1.77% 20.65% 22.60% 0.0058% AVALONBAY COMMUNITIES INC AVB 17,433.63 0.10% 3.26% 8.58% 11.98% 0.0121% AVON PRODUCTS INC AVP 6,351.11 0.04% 1.68% 11.22% 12.99% 0.0048% AVERY DENNISON CORP AVY 4,755.54 0.03% 2.32% 10.45% 12.89% 0.0035% AMERICAN EXPRESS CO N<P 91,423.36 0.53% 1.15% 11.27% 12.48% 0.0660% AUTOZONE INC AZO 17,267.58 0.10% 0.00% 14.96% 14.96% 0.0149% BOEING COffHE BA 91,596.60 0.53% 2.35% 10.60% 13.08% 0.0692% BANK OF AMERICA CORP BAC 172,558.55 1.00% 1.06% 9.50% 10.61% 0.1059% BAXTER INTERNATIONAL INC BN< 39,683.06 0.23% 2.78% 9.59% 12.49% 0.0287% BED BATH & BEYOND INC BBBY 13,689.09 0.08% 0.00% 12.08% 12.08% 0.0096% BB&TCORP BBT 27,844.25 0.16% 2.46% 6.91% 9.45% 0.0152% BEST BUY CO INC BBY 8,676.09 0.05% 2.78% 11.04% 13.97% 0.0070% CR BARD INC BCR 10,793.70 0.06% 0.64% 10.44% 11.11% 0.0069% BECTON DICKINSON AND CO BOX 21,958.09 0.13% 1.90% 9.60% 11.60% 0.0147% BEAM INC BEAM 13,772.49 0.08% 1.16% 8.40% 9.61% 0.0077% FRANKLIN RESOURCES INC BEN 32,740.87 0.19"/o 0.92% 13.88% 14.87% 0.0282% BROWN-FORMAN CORP-ClASS 8 BF/8 18,467.55 0.11% 1.26% 9.40% 10.71% 0.0114% BAKER HUGHES INC BHI 28,491.26 0.16% 0.92% 17.73% 18.73% 0.0309% BIOGEN IDEC INC BIIB 67,488.10 0.39"/o 0.00% 19.76% 19.76% 0.0771% BANK OF NEW YORK MELLON CORP BK 37,740.43 0.22% 1.99% 12.83% 14.95% 0.0326% BLACKROCK INC BLK 51,379.26 0.30% 2.58% 13.45% 16.20% 0.0481% BALL CORP BLL 7,779.54 0.04% 0.97% 10.07% 11.08% 0.0050% BEMIS COMPANY BMS 4,037.03 0.02% 2.68% 6.93% 9.71% 0.0023%
Schedule RBH-11 Page 1 of 14

(6] 171 (8] [9] Estimated Long-Term Weighted
Com~an:i Ticker caeita!izatioo We!ght in Index Dividend Yield Growth Est. DCF Resu!l DCF Result
BRISTOL-MYERS SQUIBB CO BMY 79,491.70 0.46% 2.99% 13.92% 17.12% 0.0787% BROADCOM CORP-Cl A BRCM 16,801.44 0.10% 1.61% 10.13% 11.82% 0.0115% BERKSHIRE HATHAWAY INC.CL 8 BRKIB 305,193.22 NIA NIA NIA NIA NIA BOSTON SCIENTIFIC CORP BSX 17,668.34 0.10"h 0.00% 9.90% 9.9Q<',{, 0.0101% PEABODY ENERGY CORP BTU 4,574.56 0.03% 2.06% 12.00% 14.19% 0.0038% BORGWARNER INC BWA 13,913.83 0.08% 0.60% 13.83% 14.47% 0.0116% BOSTON PROPERTIES INC BXP 17,870.94 0.10",{, 3.09% 5.62% 8.79"',{, 0.0091% ClTIGROUP INC c 146,756.12 0.85% 0.11% 9.10% 9.22% 0.0782% CAINC CA 13,406.18 0.08% 3.35% 5.87% 9.32% 0.0072% CONAGRA FOODS INC CAG 13,000.98 0.08% 3.23% 9.87% 13.26% 0.0100% CARDINAL HEALTH INC CAH 23,045.54 0.13% 1.80% 11.00",{, 12.90% 0.0172% CAMERON INTERNATIONAL CORP CAM 13,226.46 0.08°/v 0.00% 16.00% 16.00% 0.0122% CATERPILLAR INC CAT 65,376.79 0.38% 2.40"/o 10.35% 12.87% 0.0487% CHUBB CORP CB 22,086.69 0.13% 2.11% 9.00% 11.20% 0.0143% CBRE GROUP INC· A CBG 8,861.90 N/A NIA 10.95% NIA NIA CBS CORP-CLASS B NON VOTING CBS 34,053.66 0.20'% 0.88% 15.83% 16.78% 0.0330% COCA·COLA ENTERPRISES CCE 11,293.83 0.07% 2.20% 9.97% 12.28% 0.0080% CROWN CASTLE INTL CORP CCI 24,534.00 0.14% 1.95% 18.00% 20.12% 0.0285% CARNIVAL CORP CCL 28,193.75 0.16% 2.75% 16.06% 19.03% 0.0310% CELGENE CORP CELG 56,777.85 0.33% 0.00% 25.56% 25.56% 0.0839% CERNERCORP CERN 18,530.08 0.11% 0.00% 18.14% 18.14% 0.0194% CF INDUSTRIES HOLDINGS INC CF 12,867.97 0.07% 1.66% 7.04% 8.76% 0.0065% CAREFUSION CORP CFN 8,054.04 0.05% 0.00% 11.24% 11.24% 0.0052% CHESAPEAKE ENERGY CORP CHK 18,100.99 0.10"/o 1.31% 5.00% 6.34% 0.0066% C. H. ROBINSON WORLDWIDE INC CHRW 8,191.56 0.05% 2.70% 13.18% 16.06% 0.0076% CIGNACORP Cl 20,989.97 0.12% 0.05% 10.27% 10.33% 0.0125% CINCINNATI FINANCIAL CORP CINF 7,875.25 NIA 3.58% NIA NIA NIA COLGATE-PALMOLIVE CO CL 60,838.68 0.35% 2.1{Y-'A, 9.27% 11.56% 0.0407% CLOROX COMPANY CLX 11,676.67 0.07% 3.16% 7.78% 11.06% 0.0075% COMERICA INC CMA 8,845.89 0.05% 1.60% 8.10% 9.76% 0.0050% COMCAST CORP-ClASS A CMCSA 125,375.35 0.72% 1.86% 11.98% 13.95% 0.1011% CME GROUP INC CME 22,756.79 0.13% 4.51% 14.49% 19.32% 0.0254% CHIPOTLE MEXICAN GRILL INC CMG 16,804.95 0.10% 0.00% 21.13C/o 21.13% 0.0205% CUMMINS INC CMI 26,066.71 0.15% 1.90% 13.91% 15.94% 0.0240% CMS ENERGY CORP CMS 8,046.15 0.05% 3.60% 6.30% 10.02% 0.0047% CENTERPOINT ENERGY INC CNP 10,490.47 0.06% 3.88% 4.97% 8.95% 0.0054% CONSOL ENERGY INC CNX 9,406.84 0.05% 0.70% 12.00% 12.75% 0.0069% CAPITAL ONE FINANCIAL CORP COF 42,681.86 0.25% 1.63% 7.75% 9.44% 0.0233% CABOT OIL & GAS CORP COG 13,757.99 0.08% 0.24% 35.00% 35.29% 0.0281% COACH INC COH 13,562.61 0.08% 2.77% 9.91% 12.82% 0.0101% ROCKWELL COLLINS INC COL 10,485.33 0.06% 1.62% 9.70% 11.40% 0.0069% CONOCOPHILLIPS COP 89,537.69 0.52% 3.84% 7.50% 11.48% 0.0594% COSTCO VVHOLESALE CORP COST 49,292.68 0.29"/v 1.14% 11.30"/v 12.50% 0.0356% COVlDIEN PLC cov 31,507.17 0.18% 1.78% 9.02% 10.88% 0.0198% CAMPBELL SOUP CO CPB 13,858.19 0.08% 2.81% 5.57% 8.46% 0.0068% SALESFORCE.COM INC CRM 33,695.82 0.19"/o 0.00% 28.80% 28.80% 0.0561% COMPUTER SCIENCES CORP esc 8,750.29 0.05% 1.33% 12.40% 13.81% 0.0070% CISCO SYSTEMS INC csco 117,912.82 0.68% 3.15% 10.14% 13.44% 0.0917% CSXCORP csx 28,442.40 0.16% 2.24% 12.70% 15.09% 0.0248% CINTASCORP CTAS 6,771.65 0.04% 1.37% 10.96% 12.41% 0.0049% CENTURYLJNK INC CTL 19,679.38 0.11% 6.34% 1.30% 7.68% 0.0087% COGNIZANT TECH SOLUTIONS-A CTSH 29,690.88 0.17% 0.00% 16.18% 16.18% 0.0278°/u CITR!X SYSTEMS !NC CTXS 10,173.68 0.06% 0.00":/~ 14.13% 14.13% 0.0083% CABLEVISION SYSTEMS-NY GRP·A eve 4,315.79 0.02% 3.75% -1.43% 2.30% 0.0006% CVS CAREMARK CORP cvs 87,284.83 0.50% 1.38% 14.13% 15.60% 0.0787% CHEVRON CORP cvx 229,010.71 1.32% 3.46% 4.60% 8.14% 0.1077% DOMINION RESOURCES INCNA 0 41,043.80 0.24% 3.40% 6.14% 9.64% 0.0229% DELTA AIR LINES INC DAL 27,103.68 0.16% 0.82% -0.64% 0.18% 0.0003% DU PONT (E.I.) DE NEMOURS DO 61,298.83 0.35% 2.83% 7.30% 10.23% 0.0363% DEERE&CO DE 34,138.25 0.20% 2.23% 6.58% 8.8{Y-'/o 0.0175% DISCOVER FINANCIAL SERVICES DFS 26,060.87 0.15% 1.67% 11.25% 13.01% 0.0196% DOLLAR GENERAL CORP DG 17,039.22 0.10% 0.00% 13.91% 13.91% 0.0137% QUEST DIAGNOSTICS INC DGX 8,667.32 0.05% 2.20% 9.16% 11.46% 0.0057% DR HORTON INC DHI 7,014.96 0.04% 0.65% 6.90% 7.58% 0.0031% DANAHER CORP DHR 51,049.68 0.30% 0.42% 11.28% 11.72% 0.0346% WALT DISNEY COffHE DIS 136,064.91 0.79% 1.10% 11.19% 12.35% 0.0972% DISCOVERY COMMUNICATIONS-A DISCA 26,200.46 0.15% 0.00% 20.02% 20.02% 0.0303% DELPHI AUTOMOTIVE PLC DLPH 20,091.96 0.12% 1.45% 13.73% 15.28% 0.0178% DOLLAR TREE INC DLTR 10,461.79 NIA NIA 16.04% NIA NIA DUN & BRADSTREET CORP DNB 3,783.48 0.02% 1.72% 8.95% 10.75% 0.0024% DENBURY RESOURCES INC DNR 5,832.74 0.03% 1.08% 10.80% 11.94% 0.0040% DIAMOND OFFSHORE DRILLING DO 6,558.10 0.04% 7.32% 20.00% 28.06% 0.0106% DOVER CORP DOV 13,934.64 0.08% 1.87% 13.08% 15.07% 0.0121% DOW CHEMICAL COffHE DOW 57,535.20 0.33% 2.90% 6.69% 9.68% 0.0322% DR PEPPER SNAPPLE GROUP INC DPS 10,259.98 0.06% 3.16% 6.79% 10.06% 0.0060% DARDEN RESTAURANTS INC DRI 6,385.40 0.04% 4.55% 7.46% 12.18% 0.0045% DTE ENERGY COMPANY DTE 13,602.15 0.08% 3.52% 5.42% 9.04% 0.0071%
Schedule RBH-11 Page 2 or 14
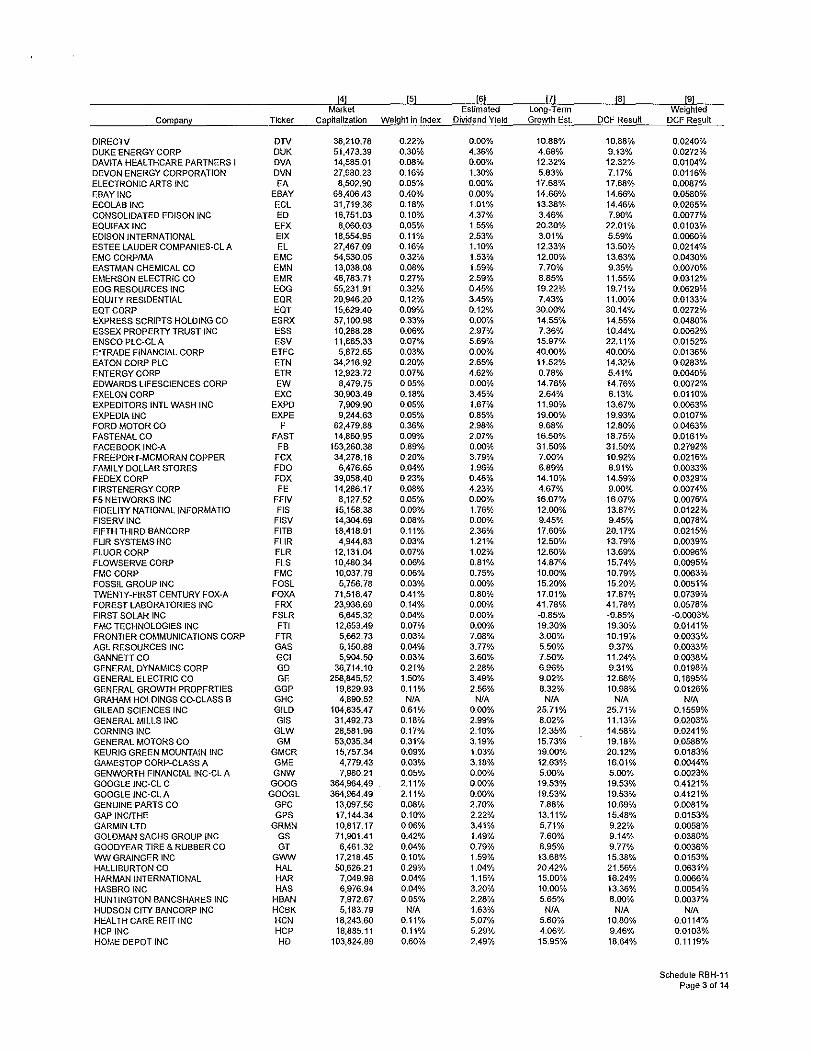
7 Estimated Long-Term
Com~anl Ticker cae:italization Wefght in Index Dividend Yield Gro;vth Est. OCF Result
DIRECTV DTV 38,210.78 0.22% 0.00% 10.88% 10.88% 0.0240% DUKE ENERGY CORP DUK 51,473.39 0.30% 4.36% 4.68% 9.13% 0.0272% DAVIT A HEALTHCARE PARTNERS I OVA 14,585.01 0.08% 0.00% 12.32% 12.32% 0.0104% DEVON ENERGY CORPORATION DVN 27,980.23 0.16% 1.30% 5.83% 7.17% 0.0116% ELECTRONIC ARTS INC EA 8,502.90 0.05% 0.00% 17.68% 17.68% 0.0087% EBAY INC EBAY 68,406.43 0.40% 0.00% 14.66% 14.66% 0.0580% ECOLAB INC ECL 31,719.36 0.18% 1.01% 13.38% 14.46% 0.0265% CONSOLIDATED EDISON INC ED 16,751.03 0.10% 4.37% 3.46% 7.90% 0.0077% EQUIFAXINC EFX 8,060.03 0.05% 1.55% 20.30"/o 22.01% 0.0103% EDISON INTERNATIONAL EIX 18,554.95 0.11% 2.53% 3.01% 5.59% 0.0060% ESTEE LAUDER COMPANIES-Cl A EL 27,467.09 0.16% 1.10% 12.33% 13.50% 0.0214% EMCCORPIMA EMC 54,530.05 0.32% 1.53% 12.00% 13.63% 0.0430% EASTMAN CHEMICAL CO EMN 13,038.08 0.08% 1.59% 7.70% 9.35% 0.0070% EMERSON ELECTRIC CO EMR 46,783.71 0.27% 2.59% 8.85% 11.55% 0.0312% EOG RESOURCES INC EOG 55,231.91 0.32% 0.45% 19.22% 19.71% 0.0629% EQUITY RESIDENTIAL EQR 20,946.20 0.12% 3.45% 7.43% 11.00% 0.0133% EQTCORP EQT 15,629.40 0.09% 0.12% 30.00% 30.14% 0.0272% EXPRESS SCRIPTS HOLDING CO ESRX 57,100.98 0.33% 0.00% 14.55% 14.55% 0.0480% ESSEX PROPERTY TRUST INC ESS 10,288.28 0.06% 2.97% 7.36% 10.44% 0.0062% ENSCO PLC-CLA ESV 11,865.33 0.07% 5.69% 15.97% 22.11% 0.0152% E*TRADE FINANCIAL CORP ETFC 5,872.65 0.03% 0.00% 40.00% 40.00% 0.0136% EATON CORP PLC ETN 34,216.92 0.20% 2.65% 11.52% 14.32% 0.0283% ENTERGY CORP ETR 12,923.72 0.07% 4.62% 0.78% 5.41% 0.0040% EDWARDS L!FESCIENCES CORP EW 8,479.75 0.05% 0.00% 14.76% 14.76% 0.0072% EXELON CORP EXC 30,903.49 0.18% 3.45% 2.64% 6.13% 0.0110% EXPEDITORS INTL WASH INC EXPO 7,909.90 0.05% 1.67% 11.90% 13.67% 0.0063% EXPEDIA INC EXPE 9,244.63 0.05% 0.85% 19.00% 19.93% 0.0107% FORD MOTOR CO F 62,479.88 0.36% 2.98% 9.68% 12.80'% 0.0463% FASTENAL CO FAST 14,860.95 0.09",{, 2.07% 16.50% 18.75% 0.0161% FACEBOOK INC-A FB 153,260.38 0.89% 0.00% 31.50% 31.50% 0.2792% FREEPORT-MCMORAN COPPER FCX 34,278.18 0.20% 3.79% 7.00% 10.92% 0.0216% FAMILY DOLLAR STORES FDO 6,476.65 0.04% 1.96% 6.89% 8.91% 0.0033% FEDEX CORP FOX 39,058.40 0.23% 0.46% 14.10% 14.59% 0.0329% FIRSTENERGY CORP FE 14,286.17 0.08% 4.23% 4.67% 9.00% 0.0074% F5 NETWORKS INC FFJV 8,127.52 0.05% 0.00% 16.07% 16.07% 0.0076% FIDELITY NATIONAL INFORMATIO FIS 15,158.38 0.09"/o 1.76% 12.00% 13.87% 0.0122% FISERV INC FISV 14,304.69 0.08% 0.00"10 9.45% 9.45% 0.0078% FIFTH THIRD BANCORP FITB 18,418.91 0.11% 2.36% 17.60% 20.17% 0.0215% FUR SYSTEMS INC FUR 4,944.83 0.03% 1.21% 12.50% 13.79% 0.0039% FLUOR CORP FlR 12,131.04 0.07% 1.02% 12.60% 13.69"-!o 0.0096% FLOWSERVE CORP FLS 10,480.34 0.06% 0.81% 14.87% 15.74% 0.0095% FMC CORP FMC 10,037.79 0.06% 0.75% 10.00% 10.79% 0.0063% FOSSIL GROUP INC FOSL 5,756.78 0.03% 0.00% 15.20% 15.20% 0.0051% TWENTY-FIRST CENTURY FOX-A FOXA 71,516.47 0.41% 0.80% 17.01% 17.87% 0.0739% FOREST LABORATORIES INC FRX 23,936.69 0.14% 0.00% 41.78% 41.78% 0.0578% FIRST SOLAR INC FSLR 6,645.32 0.04% 0.00% -0.85% -0.85% -0.0003% FMC TECHNOLOGIES INC FTI 12,653.49 0.07% 0.00% 19.30% 19.30% 0.0141% FRONTIER COMMUNICATIONS CORP FTR 5,662.73 0.03% 7.08% 3.00% 10.19% 0.0033% AGL RESOURCES INC GAS 6,150.88 0.04% 3.77% 5.50% 9.37% 0.0033% GANNETT CO GCI 5,904.50 0.03% 3.60% 7.50% 11.24% 0.0038% GENERAL DYNAMICS CORP GO 36,714.10 0.21% 2.28% 6.96% 9.31% 0.0198% GENERAL ELECTRIC CO GE 258,845.52 1.50% 3.49'% 9.02% 12.66% 0.1895% GENERAL GROWTH PROPERTIES GGP 19,829.93 0.11% 2.56% 8.32% 10.98% 0.0126% GRAHAM HOLDINGS CO-CLASS B GHC 4,890.52 NIA >l/A NIA >l/A >l!A GILEAD SCIENCES INC GILD 104,835.47 0.61% 0.00% 25.71% 25.71% 0.1559% GENERAL MILLS INC GIS 31,492.73 0.18% 2.99¢/., 8.02% 11.13% 0.0203% CORNING INC GLW 28,581.96 0.17% 2.10% 12.35% 14.58% 0.0241% GENERAL MOTORS CO GM 53,035.34 0.31% 3.19% 15.73% 19.18% 0.0588% KEURIG GREEN MOUNTAIN INC GMCR 15,757.34 0.09% 1.03% 19.00% 20.12% 0.0183% GAMESTOP CORP-CLASS A GME 4,779.43 0.03% 3.18% 12.63% 16.01% 0.0044% GENWORTH FINANCIAL INC-CL A GNW 7,980.21 0.05% 0.00% 5.00% 5.00% 0.0023% GOOGLE INC-CL C GOOG 364,964.49 2.11% 0.00% 19.53% 19.53% 0.4121% GOOGLE INC-CL A GOOGL 364,964.49 2.11% 0.00% 19.53% 19.53% 0.4121% GENUINE PARTS CO GPC 13,097.56 0.08% 2.70% 7.88% 10.69% 0.0081% GAP INC/THE GPS 17,144.34 0.10"/o 2.22% 13.11% 15.48% 0.0153% GARMINLTD GRMN 10,817.17 0.06% 3.41% 5.71% 9.22% 0.0058% GOLDMAN SACHS GROUP !NC GS 71,901.41 0.42% 1.49% 7.60% 9.14% 0.0380% GOODYEAR TIRE & RUBBER CO GT 6,461.32 0.04% 0.79% 8.95% 9.77% 0.0036% \NN GRAINGER INC GWN 17,218.45 0.10% 1.59% 13.68% 15.38% 0.0153% HALLIBURTON CO HAL 50,626.21 0.29% 1.04% 20.42% 21.56% 0.0631% HARMAN INTERNATIONAL HAR 7,049.98 0.04% 1.15% 15.00% 16.24% 0.0066% HASBROINC HAS 6,976.94 0.04% 3.20% 10.00% 13.36% 0.0054% HUNTINGTON BANCSHARES INC HBAN 7,972.67 0.05% 2.28% 5.65% 8.00% 0.0037% HUDSON CITY BANCORP INC HCBK 5,183.79 >l/A 1.63% NIA NIA >liA HEALTH CARE REIT INC HCN 18,243.60 0.11% 5.07% 5.60% 10.80% 0.0114% HCP INC HCP 18,885.11 0.11% 5.29% 4.06% 9.46% 0.0103% HOME DEPOT INC HD 103,824.89 0.60% 2.49% 15.95% 18.64% 0.1119%
Schedule RBH-11 Page 3 of 14
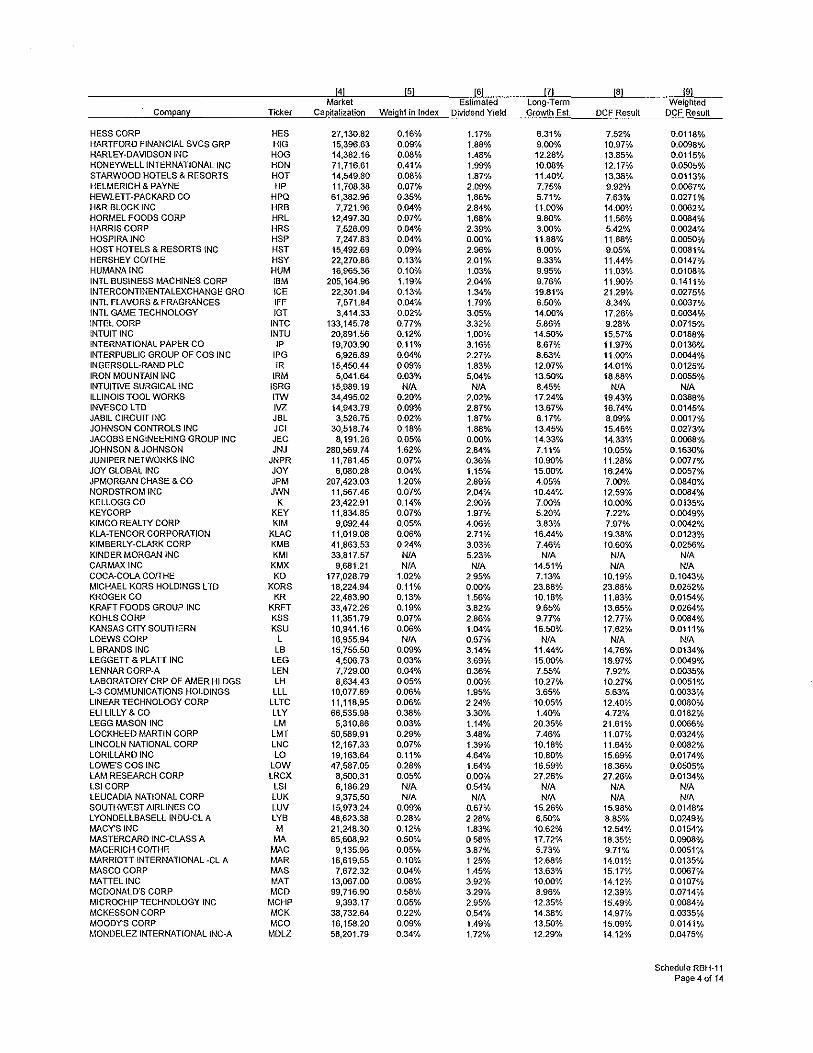
[41 [5J [6J 171 [8J 191 Market Estimated Long-Term Weighted
Company Ticker Capitalization Weight in Index Dividend Yield Growth Est DCF Result DCF Result
HESS CORP HES 27,130.82 0.16% 1.17% 6.31% 7.52% 0.0118% HARTFORD FINANCIAL SVCS GRP HIG 15,396.63 0.09% 1.88% 9.00% 10.97% 0.0098% HARLEY-DAVIDSON INC HOG 14,382.16 0.08% 1.48% 12.28% 13.85% 0.0115% HONEYWELL INTERNATIONAL INC HON 71,716.61 0.41% 1.99% 10.08% 12.17% 0.0505% STARWOOD HOTELS & RESORTS HOT 14,549.80 0.08% 1.87% 11.40% 13.38% 0.0113% HELM ERICH & PAYNE HP 11,708.38 0.07% 2.09% 7.75% 9.92% 0.0067% HEWLETT-PACKARD CO HPQ 61,382.00 0.35% 1.86% 5.71% 7.63% 0.0271% H&R BLOCK INC HRB 7,721.96 0.04% 2.84% 11.00% 14.00% 0.0062% HORMEL FOODS CORP HRL 12,497.30 0.07% 1.68% 9.80% 11.56% 0.0084% HARRIS CORP HRS 7,526.09 0.04% 2.39% 3.00% 5.42% 0.0024% HOSPlRAINC HSP 7,247.83 0.04% 0.00% 11.88% 11.88% 0.0050% HOST HOTELS & RESORTS INC HST 15,492.69 0.09% 2.96% 6.00% 9.05% 0.0081% HERSHEY COfTHE HSY 22,270.86 0.13% 2.01% 9.33% 11.44% 0.0147% HUMANAINC HUM 16,965.36 0.10% 1.03% 9.95% 11.03% 0.0108% INTL BUSINESS MACHINES CORP IBM 205,164.96 1.19% 2.04% 9.76% 11.90% 0.1411% INTERCONTINENTALEX.CHANGE GRO ICE 22,301.94 0.13% 1.34% 19.81% 21.29% 0.0275% INTL FlAVORS & FRAGRANCES IFF 7,571.84 0.04% 1.7~/o 6.50% 8.34% 0.0037% INTL GNI'IE TECHNOLOGY IGT 3,414.33 0.02% 3.05% 14.00% 17.26% 0.0034% INTEL CORP INTC 133,145.78 0.77% 3.32% 5.86% 9.28% 0.0715% INTUIT INC INTU 20,891.56 0.12% 1.00% 14.5Q?,.{, 15.57% 0.0188% INTERNATIONAL PAPER CO IP 19,703.90 0.11% 3.16% 8.67% 11.97% 0.0136% INTERPUBLIC GROUP OF COS INC lPG 6,926.89 0.04% 2.27% 8.63% 11.00% 0.0044% INGERSOLL-RAND PLC IR 15,450.44 0.09"Ao 1.83% 12.07% 14.01% 0.0125% IRON MOUNTAIN INC IRM 5,041.64 0.03% 5.04% 13.50% 18.88% 0.0055% INTUITIVE SURGICAL INC ISRG 15,989.19 NIA NIA 8.45% NIA NIA ILLINOIS TOOL WORKS ITW 34,495.02 0.20% 2.02% 17.24% 19.43% 0.0388% INVESCOLTD IVZ 14,943.79 O.W'.Ao 2.87% 13.67% 16.74% 0.0145% JABIL CIRCUIT INC JBL 3,526.75 0.02% 1.87% 6.17% 8.09% 0.0017% JOHNSON CONTROLS INC JCI 30,518.74 0.18% 1.88% 13.45% 15.46% 0.0273% JACOBS ENGINEERING GROUP INC JEC 8,191.26 0.05% 0.00% 14.33% 14.33% 0.0068% JOHNSON & JOHNSON JNJ 280,569.74 1.62% 2.84% 7.11% 10.05% 0.1630% JUNIPER NETWORKS INC JNPR 11,781.45 0.07% 0.36% 10.90% 11.28% 0.0077% JOY GLOBAL INC JOY 6,080.28 0.04% 1.15% 15.00% 16.24% 0.0057% JPMORGAN CHASE & CO JPM 207,423.03 1.20% 2.89% 4.05% 7.00% 0.0840% NORDSTROM INC JWN 11,567.46 0.07% 2.04% 10.44% 12.59% 0.0084% KELLOGG CO K 23,422.91 0.14% 2.90% 7.00% 10.00% 0.0135% KEYCORP KEY 11,834.85 0.07% 1.97% 5.20% 7.22% 0.0049% KIMCO REALTY CORP KIM 9,092.44 0.05% 4.06% 3.83% 7.97% 0.0042% KLA-TENCOR CORPORATION KLAC 11,019.08 0.06% 2.71% 16.44% 19.38% 0.0123% KIMBERLY-ClARK CORP KMB 41,863.53 0.24% 3.03% 7.46% 10.60% 0.0256% KINDER MORGAN INC KMI 33,817.57 NIA 5.23% NIA NIA NIA CARMAXINC KMX 9,681.21 NIA NIA 14.51% NIA NIA COCA-COLA CO!THE KO 177,028.79 1.02% 2.95% 7.13% 10.19% 0.1043% MICHAEL KORS HOLDINGS lTD KORS 18,224.94 0.11% 0.00% 23.88% 23.88% 0.0252% KROGER CO KR 22,483.90 0.13% 1.56% 10.18% 11.83% 0.0154% KRAFT FOODS GROUP INC KRFT 33,472.26 0.19% 3.82% 9.65% 13.65% 0.0264% KOHLS CORP KSS 11,351.79 0.07% 2.86% 9.77% 12.77% 0.0084% KANSAS CITY SOUTHERN KSU 10,941.16 0.08% 1.04% 16.50% 17.62% 0.0111% LOEWSCORP L 16,955.94 NIA 0.57% NIA NIA NIA L BRANDS INC LB 15,755.50 0.09% 3.14% 11.44% 14.76% 0.0134% LEGGETT & PLAIT INC LEG 4,506.73 0.03% 3.69% 15.00% 18.97% 0.0049% LENNAR CORP-A LEN 7,729.00 0.04% 0.36% 7.55% 7.92% 0.0035% lABORATORY CRP OF AMER HLDGS LH 8,634.43 0.05% 0.00% 10.27% 10.27% 0.0051% L-3 COMMUNICATIONS HOLDINGS LLL 10,077.89 0.06% 1.95% 3.65% 5.63% 0.0033% LINEAR TECHNOLOGY CORP LLTC 11,118.95 0.06% 2.24% 10.05% 12.40% 0.0080% Ell L!LL Y & CO LLY 66,535.98 0.38% 3.30% 1.40% 4.72% 0.0182% LEGG MASON INC LM 5,310.86 0.03% 1.14% 20.35% 21.61% 0.0066% LOCKHEED MARTIN CORP LMT 50,589.91 0.29% 3.48% 7.46% 11.07% 0.0324% LINCOLN NATIONAL CORP LNC 12,167.33 0.07% 1.39% 10.18% 11.64% 0.0082% LORILlARO INC LO 19,163.64 0.11% 4.64% 10.80% 15.69% 0.0174% LOWE'S COS INC LOW 47,587.05 0.28% 1.64% 16.59% 18.36% 0.0505% lAM RESEARCH CORP LRCX 8,500.31 0.05% 0.00% 27.26% 27.26% 0.0134% LSI CORP LSI 6,186.29 NIA 0.54% NIA NIA NIA LEUCADIA NATIONAL CORP LUK 9,375.50 NIA NIA NIA NIA NIA SOUTHWEST AIRLINES CO LUV 15,973.24 O.O~A. 0.67% 15.26% 15.98% 0.0148% l YONDELLBASELL INDU·CL A LYB 48,623.38 0.28% 2.28% 6.50% 8.85% 0.0249% MACY'S INC M 21,248.30 0.12% 1.83% 10.62% 12.54% 0.0154% MASTERCARD INC-CLASS A MA 85,608.92 0.50% 0.58% 17.72% 18.35% 0.0008% t.tACERICH COfTHE MAC 9,135.98 0.05% 3.87% 5.73% 9.71% 0.0051% t.tARRIOTT INTERNATIONAL-CL A MAR 16,619.55 0.10% 1.25% 12.68% 14.01% 0.0135% MASCOCORP MAS 7,672.32 0.04% 1.45% 13.63% 15.17% 0.0067% ~.tAITEL INC MAT 13,067.00 0.08% 3.92% 10.00% 14.12% 0.0107% MCDONALD'S CORP MCD 99,716.90 0.58% 3.29% 8.96% 12.39% 0.0714% MICROCHIP TECHNOLOGY INC MCHP 9,393.17 0.05% 2.95% 12.35% 15.49% 0.0084% MCKESSON CORP MCK 38,732.64 0.22% 0.54% 14.38% 14.97% 0.0335% MOODY'S CORP MCO 16,158.20 0.09% 1.49% 13.50% 15.09% 0.0141% MONDELEZ INTERNATIONAL INC-A MDLZ 58,201.79 0.34% 1.72% 12.2~,{, 14.12% 0.0475%
Schedule RBH-11 Page 4 of 14
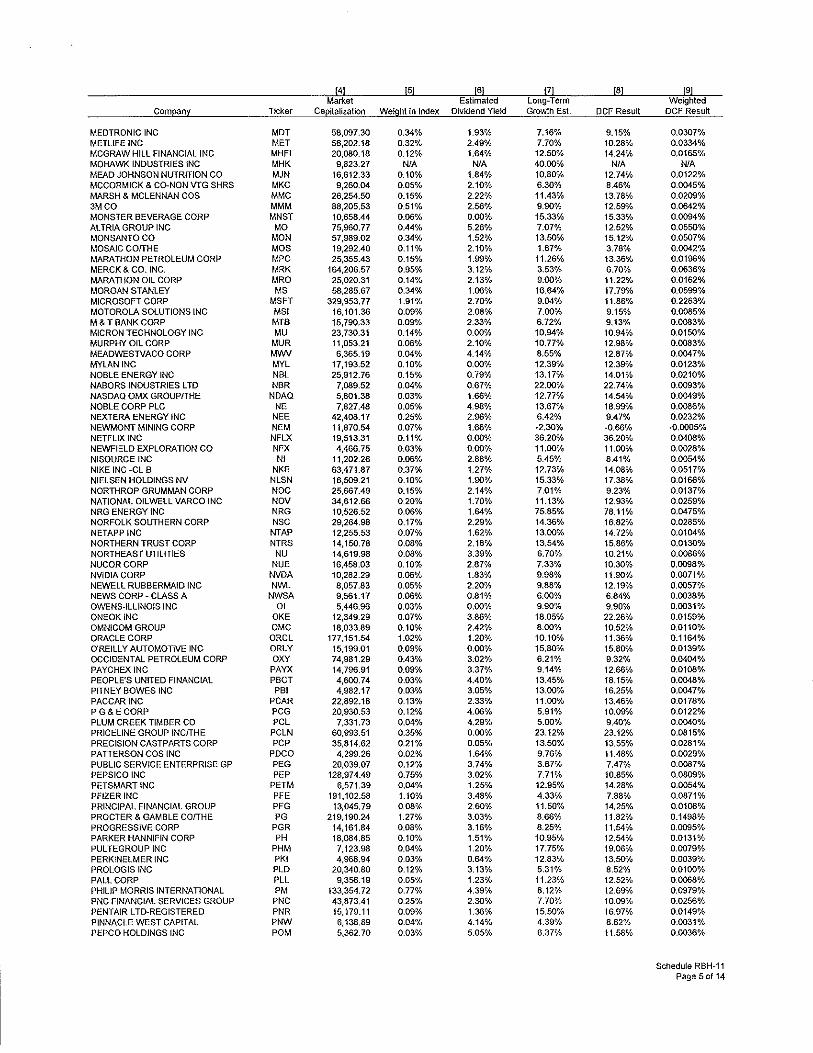
4 5 6 7 8 9 Market Estimated Long-Term Weighted
Com~nz: Ticker Ca~aliza!ion We!ghl in Index Dividend Yield Growth Est. DCF Result DCF Result
MEDTRONIC INC MDT 58,097.30 0.34% 1.93% 7.16% 9.15% 0.0307% METUFE INC MET 56,202.18 0.32% 2.49t',{, 7.70% 10.28% 0.0334% MCGRAW HILL FINANCIAL INC MHFI 20,080.18 0.12% 1.64% 12.50% 14.24% 0.0165% MOHAWK INDUSTRIES INC MHK 9,823.27 NIA NIA 40.00% NIA NIA MEAD JOHNSON NUTRITION CO MJN 16,612.33 0.10% 1.84% 10.80% 12.74% 0.0122% MCCORMICK & CO-NON VfG SHRS MKC 9,260.04 0.05% 2.10% 6.30% 8.46% 0.0045% MARSH & MCLENNAN COS MMC 26,254.50 0.15% 2.22% 11.43% 13.78% 0.0209% 3M CO MMM 88,205.53 0.51% 2.56% 9.90% 12.59% 0.0642% MONSTER BEVERAGE CORP MNST 10,658.44 0.06% 0.00% 15.33% 15.33% 0.0094% AURIA GROUP INC MO 75,960.77 0.44% 5.26% 7.07% 12.52% 0.0550°/.:. MONSANTO CO MON 57,989.02 0.34% 1.52% 13.50% 15.12% 0.0507% MOSAIC COfTHE MDS 19,292.40 0.11% 2.10% 1.67% 3.78% 0.0042% MARATHON PETROLEUM CORP MPC 25,355.43 0.15% 1.99% 11.26% 13.36% 0.0196% MERCK & CO. INC. MRK 164,206.57 0.95% 3.12% 3.53% 6.70% 0.0636% P.,\ARATHON OIL CORP MRO 25,020.31 0.14% 2.13% 9.00% 11.22% 0.0162% MORGAN STANLEY MS 58,285.67 0.34% 1.06% 16.64% 17.79% 0.0599% MICROSOFT CORP MSFT 329,953.77 1.91% 2.70% 9.04% 11.86% 0.2263% MOTOROlA SOLUTIONS INC MSI 16,101.36 0.09"/, 2.08% 7.00% 9.15% 0.0085% M & T BANK CORP MTB 15,790.33 0.09"k 2.33% 6.72% 9.13% 0.0083% MICRON TECHNOLOGY INC MU 23,730.31 0.14% 0.00% 10.94% 10.94% 0.0150% MURPHY OIL CORP MUR 11,053.21 0.06% 2.10% 10.77% 12.98% 0.0083% MEADWESTVACO CORP MVW 6,365.19 0.04% 4.14% 8.55% 12.87% 0.0047% MYLAN INC MYL 17,193.52 0.10% 0.00% 12.39% 12.39% 0.0123% NOBLE ENERGY INC NBL 25,912.76 0.15% 0.79% 13.17% 14.01% 0.0210% NABORS INDUSTRIES L TO NBR 7,089.52 0.04% 0.67% 22.00% 22.74% 0.0093% NASDAQ OMX GROUPfTHE NDAQ 5,801.38 0.03% 1.66% 12.77% 14.54% 0.0049% NOBLE CORP PLC NE 7,827.48 0.05% 4.98% 13.67% 18.99% 0.0086% NEXTERA ENERGY INC NEE 42,408.17 0.25% 2.96% 6.42% 9.47% 0.0232% NEWMONT MINING CORP NEM 11,870.54 0.07% 1.66% -2.30"/o ..0.66% ..0.0005% NETFLIX INC NFLX 19,513.31 0.11% 0.00% 36.20% 36.20% 0.0408% NEWFIELD EXPLORATION CO NFX 4,466.75 0.03% 0.00% 11.00% 11.00% 0.0028% NISOURCE INC Nl 11,202.26 0.06% 2.88% 5.45% 8.41% 0.0054% NIKE INC -CL B NKE 63,471.87 0.37% 1.27% 12.73% 14.08% 0.0517% NIELSEN HOLDINGS NV NLSN 16,509.21 0.10% 1.90% 15.33% 17.38% 0.0166% NORTHROP GRUMMAN CORP NDC 25,667.49 0.15% 2.14% 7.01% 9.23% 0.0137% NATIONAL OIL WELL VARGO INC NDV 34,612.66 0.2WA. 1.70% 11.13% 12.93% 0.0259% NRG ENERGY INC NRG 10,526.52 0.06% 1.64% 75.85% 78.11% 0.0475% NORFOLK SOUTHERN CORP NSC 29,264.98 0.17% 2.29% 14.36% 16.82% 0.0285% NETAPP INC NTAP 12,255.53 0.07% 1.62% 13.00% 14.72% 0.0104% NORTHERN TRUST CORP NTRS 14,150.78 0.08% 2.18% 13.54% 15.86% 0.0130% NORTHEAST UTILITIES NU 14,619.98 0.08% 3.39% 6.70% 10.21% 0.0086% NUCORCORP NUE 16,458.03 0.10% 2.87% 7.33% 10.30% 0.0098% NViDIACORP NVDA 10,282.29 0.06% 1.83% 9.98% 11.90% 0.0071% NEWELL RUBBERMAID INC NWL 8,057.83 0.05% 2.20% 9.88% 12.19% 0.0057% NEWS CORP • CLASS A NWSA 9,561.17 0.06% 0.81% 6.00% 6.84% 0.0038% OWENS-ILLINOIS INC 01 5,446.96 0.03% 0.00% 9.00% 9.90"-/o 0.0031% ONEOKINC OKE 12,349.29 0.07% 3.86% 18.05% 22.26% 0.0159% OMNICOM GROUP DMC 18,033.89 0.10% 2.42% 8.00% 10.52% 0.0110% ORACLE CORP ORCL 177,151.54 1.02% 1.20% 10.10% 11.36% 0.1164% O'REillY AUTOMOTIVE INC ORLY 15,199.01 0.09% 0.00% 15.80% 15.80"-A:. 0.0139% OCCIDENTAL PETROLEUM CORP OXY 74,981.29 0.43% 3.02% 6.21% 9.32% 0.0404% PAYCHEX!NC PAYX 14,796.91 0.09% 3.37% 9.14% 12.66% 0.0108% PEOPLE'S UNITED FINANCIAL PBCT 4,600.74 0.03% 4.40% 13.45% 18.15% 0.0048% PITNEY BOWES INC PBI 4,982.17 0.03% 3.05% 13.00",{, 16.25% 0.0047% PACCARINC PCAR 22,892.18 0.13% 2.33% 11.00% 13.46% 0.0178% PG&ECORP PCG 20,930.53 0.12% 4.06% 5.91% 10.09"% 0.0122% PLUM CREEK TIMBER CO PCL 7,331.73 0.04% 4.29% 5.00% 9.40% 0.0040% PRICELJNE GROUP INCfTHE PCLN 60,993.51 0.35% 0.00% 23.12% 23.12% 0.0815% PRECISION CASTPARTS CORP PCP 35,814.62 0.21% 0.05% 13.50% 13.55% 0.0281% PATIERSON COS INC PDCO 4,299.26 0.02% 1.64% 9.76% 11.48% 0.0029% PUBLIC SERVICE ENTERPRISE GP PEG 20,039.07 0.12% 3.74% 3.67% 7.47% 0.0087% PEPSICO INC PEP 128,974.49 0.75% 3.02% 7.71% 10.85% 0.0809% PETSMART INC PETM 6,571.39 0.04% 1.25% 12.95% 14.28% 0.0054% PFIZER INC PFE 191,102.58 1.10% 3.48% 4.33% 7.88% 0.0871% PRINCIPAL FINANCIAL GROUP PFG 13,045.79 0.08% 2.60% 11.50% 14.25% 0.0108% PROCTER & GAMBLE COfTHE PG 219,190.24 1.27% 3.03% 8.66% 11.82% 0.1498% PROGRESSIVE CORP PGR 14,161.84 0.08% 3.16% 8.25% 11.54% 0.0095% PARKER HANNIFIN CORP PH 18,084.85 0.10% 1.51% 10.95% 12.54% 0.0131% PULTEGROUP INC PHM 7,123.98 0.04% 1.20% 17.75% 19.06% 0.0079% PERKINELMER !NC PKI 4,968.94 0.03% 0.64% 12.83% 13.50% 0.0039% PROLOG IS INC PLD 20,340.80 0.12% 3.13% 5.31% 8.52% 0.0100% PALL CORP PLL 9,356.19 0.05% 1.23% 11.23% 12.52% 0.0068% PHILIP MORRIS INTERNA TlONAL PM 133,354.72 0.77% 4.39% 8.12% 12.69"/o 0.0979% PNC FINANCIAL SERVICES GROUP PNC 43,873.41 0.25% 2.30% 7.70% 10.09% 0.0256% PENT AIR L TO-REGISTERED PNR 15,179.11 0.09% 1.36% 15.50% 16.97% 0.0149% PINNACLE WEST CAPITAL PNW 6,138.89 0.04% 4.14% 4.39% 8.62% 0.0031% PEPCO HOLDINGS INC POM 5,362.70 0.03% 5.05% 6.37% 11.58% 0.0036%,
Schedule RBH-11 Page 5 of 14

4 5 8 9 Markel Long-Term Weighted
Com~an:t Ticker Ca~a!lzalion We!ght in Index Growth Est. DCF Result DCF Result
PPG INDUSTRIES INC PPG 26,144.47 0.15% 1.34% 7.68% 9.07% 0.0137% PPL CORPORATION PPL 20,952.56 0.12% 4.49% 3.56% 8.13% 0.0099% PERRIGO CO PLC PRGO 18,843.69 0.11% 0.27% 15.05% 15.34% 0.0167% PRUDENTIAL FINANCIAL INC PRU 36,390.43 0.21% 2.64% 10.67°/v 13.45% 0.0283% PUBLIC STORAGE PSA 29,415.43 0.17% 3.32% 4.94% 8.34% 0.0142% PHILLIPS 66 PSX 44,627.16 0.26% 2.05% 6.53% 8.65% 0.0223% PVHCORP PVH 10,024.81 0.08% 0.12% 12.71% 12.84% 0.0074% QUANT A SERVICES INC PWR 7,515.84 N/A N/A 11.30% N/A N/A PRAXAIR INC PX 37,910.19 0.22% 2.01% 9.59% 11.69% 0.0256% PIONEER NATURAL RESOURCES CO PXO 27,975.93 0.16% 0.03% 36.98% 37.02% 0.0599% QUALCOMM INC QCOM 134,423.94 0.78% 1.83% 13.57% 15.52% 0.1207% QEP RESOURCES INC QEP 5,634.61 0.03% 0.26% 15.00% 15.27% 0.0050% RYDER SYSTEM INC R 4,194.78 0.02% 1.71% 13.00% 14.82% 0.0036% REYNOLDS AMERICAN INC RAJ 29,221.89 0.17% 4.94% 6.58% 11.68% 0.0197% ROWAN COMPANIES PLC-A ROC 3,812.26 0.02% 0.79% 18.15% 19.01% 0.0042% REGENERON PHARMACEUTICALS REGN 28,640.52 0.17"/, 0.00% 28.83% 28.83% 0.0477% REGIONS FINANCIAL CORP RF 14,157.57 0.08% 1.76% 7.96% 9.80% 0.0080% ROBERT HAlF INTL INC RHI 5,527.92 0.03% 1.73% 17.11% 18.98% 0.0061% REO HAT INC RHT 9,495.87 0.05% 0.00% 16.48% 16.48% 0.0090% TRANSOCEAN LTD RIG 15,018.27 O.Wio 6.92% 15.50"-/o 22.95% 0.0199% RALPH LAUREN CORP RL 14,033.48 0.08% 1.10% 12.57% 13.73% 0.0111% ROCKWELL AUTOMATION INC ROK 16,990.99 0.10"',{, 1.84% 10.73% 12.67% 0.0124% ROPER INDUSTRIES INC ROP 12,840.68 0.07% 0.61% 15J)0% 15.65% 0.0116% ROSS STORES INC ROST 14,686.33 0.08% 1.10% 11.60% 12.76% 0.0108% RANGE RESOURCES CORP RRC 14,630.27 0.08% 0.18% 25.50"'1~ 25.70% 0.0217% REPUBLIC SERVICES INC RSG 12,328.77 0.07% 3.05% 4.30% 7.42% 0.0053% RAYTHEON COMPANY RTN 30,796.72 0.18% 2.43% 9.61% 12.16% 0.0217% STARBUCK$ CORP SBUX 52,073.95 0.30% 1.55% 17.95% 19.64% 0.0591% SCANACORP SCG 7,452.51 0.04% 3.95% 5.00% 9.05% 0.0039% SCHWAB (CHARLES) CORP SCHW 33,954.92 0.20% 0.92% 21.80% 22.82% 0.0448% SPECTRA ENERGY CORP SE 26,002.65 0.15% 3.48% 5.50% 9.07% 0.0136% SEALED AIR CORP SEE 6,827.62 0.04% 1.59% 12.47% 14.16% 0.0056% SHER\IVlN-\IVlLUAMS CO!THE SHW 19,177.95 0.11% 1.13% 13.50% 14.71% 0.0163% SIGMA-ALDRICH SIAL 11,036.48 0.06% 0.98% 7.13% 8.14% 0.0052% JM SMUCKER CO!THE SJM 9,858.74 0.06% 2.44% 7.03% 9.56% 0.0054% SCHLUMBERGER L TO SLB 130,787.74 0.76% 1.51% 14.86% 16.49% 0.1247% SLM CORP SLM 10,657.44 N/A 2.56% N/A NIA N/A SNAP-ON INC SNA 6,444.36 0.04% 1.53% 7.25% 8.84% 0.0033% SANDISK CORP SNDK 16,989.73 0.10% 1.19% 7.25% 8.49% 0.0083% SCRIPPS NETWORKS INTER-CL A SNI 10,678.02 0.06% 1.09% 12.05% 13.21% 0.0082% SOUTHERN CO!THE so 40,339.49 0.23% 4.61% 4.05% 8.75% 0.0204% SIMON PROPERTY GROUP INC SPG 53,409.04 0.31% 2.99% 6.80% 9.89% 0.0306% STAPLES INC SPLS 7,815.29 0.05% 4.06% 5.64% 9.81% 0.0044% STERICYCLE INC SRCL 9,353.19 N/A NIA 16.00% N/A N/A SEMPRA ENERGY SRE 23,742.93 0.14% 2.72% 6.86% 9.66% 0.0133% SUNTRUST BANKS INC STI 20,338.92 0.12% 1.71% 7.88% 9.65% 0.0114% ST JUDE MEDICAL INC STJ 17,948.36 0.10% 1.72% 10.86% 12.67% 0.0132% STATE STREET CORP SIT 27,752.30 0.16% 1.82% 12.2001,:, 14.13% 0.0227% SEAGATE TECHNOLOGY STX 18,042.08 0.10"'k 3.03% 7.80% 10.95% 0.0114% CONSTELLATION BRANDS INC-A STZ 14,811.62 0.09"/o 0.00% 18.51% 18.51% 0.0159% STANLEY BLACK & DECKER INC SWK 12,493.50 0.07% 2.54% 9.07% 11.73% 0.0085% SOUTHWESTERN ENERGY CO SWN 16,724.20 0.10"'~ 0.00% 18.30% 18.30% 0.0177% SAFEWAYINC swr 7,873.96 0.05% 2.38% 10.46% 12.97% 0.0059% STRYKER CORP SYK 30,093.37 0.17% 1.50% 9.10% 10.67% 0.0186% SYMANTEC CORP SYMC 14,356.67 0.08% 2.89% 7.68% 10.68% 0.0089% SYSCOCORP SYY 20,918.44 0.12% 3.26% 9.DO-% 12.40% 0.0150%:> AT&T INC T 185,780.39 1.07% 5.18% 4.75% 10.05% 0.1080% MOLSON COORS BREWING CO-B TAP 10,534.94 0.06% 2.55% 5.80% 8.42% 0.0051% TERADATACORP TOG 7,463.73 0.04% 0.00% 11.36% 11.36% 0.0049% TECO ENERGY INC TE 3,971.16 0.02% 4.88% 4.50% 9.49"1<. 0.0022% INTEGRYS ENERGY GROUP INC TEG 4,915.33 0.03% 4.42% 5.00% 9.54% 0.0027% TE CONNECTIVITY LTD TEL 24,498.40 0.14% 1.73% 9.40% 11.21% 0.0159% TARGET CORP TGT 37,661.23 0.22% 3.00% 10.60% 13.76% 0.0300% TENET HEAL THCARE CORP THC 3,848.26 0.02% 0.00% 12.87% 12.87% 0.0029% TIFFANY & CO TIF 11,084.54 0.06% 1.71% 14.24% 16.08% 0.0103% TJXCOMPANIES INC TJX 41,292.13 0.24% 1.13% 10.81% 12.()01.',{, 0.0286% TORCHMARK CORP TMK 6,822.25 0.04% 0.96% 8.50% 9.50% 0.0037% THERMO FISHER SCIENTIFIC INC TMO 46,935.09 0.27% 0.53% 13.71% 14.27% 0.0387% TRIPADVISOR INC TRIP 11,833.80 N/A N/A 24.50"'/o N/A N/A T ROWE PRICE GROUP INC TROW 20,810.16 0.12% 2.13% 12.75% 15.01% 0.0181% TRAVELERS COS INCfTHE TRV 29,843.43 0.17% 2.40% 8.33% 10.83% O.D187% TRACTOR SUPPLY COMPANY TSCO 9,255.37 0.05% 0.81% 16.98% 17.86% 0.0096% TYSON FOODS INC-CL A TSN 14,441.73 0.08% 0.67% 8.00% 8.70% 0.0073% TESORO CORP TSO 6,713.90 0.04% 2.05% 97.61% 100.67% 0.0391% TOTAL SYSTEM SERVICES INC TSS 5,442.25 0.03% 1.38% 11.14% 12.60% 0.0040% TIME WARNER CABLE TWC 37,214.53 0.22% 2.23% 12.05% 14.41% 0.0310% TIME WARNER INC TWX 56,487.60 0.33% 2.00% 12.56% 14.68% 0.0480%
Schedule RBH-11 Page 6 of 14
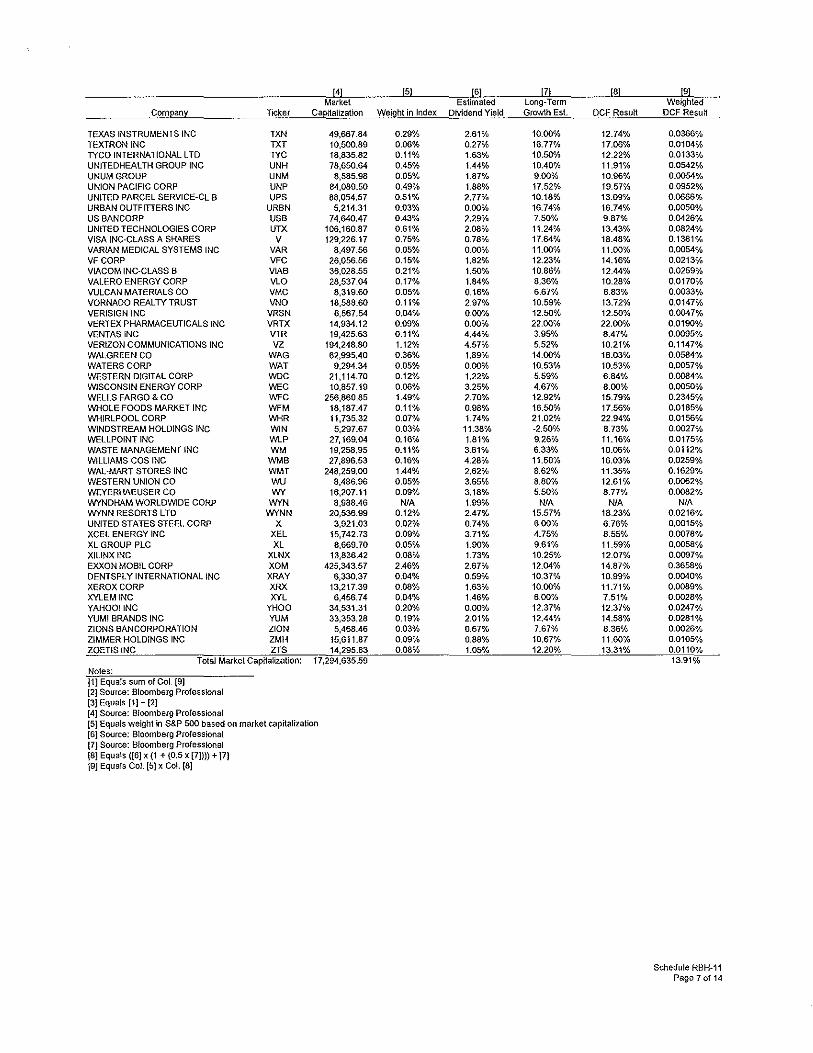
4 Market
Com~n~ Ticker Cae!!a!lzation
TEXAS INSTRUMENTS INC TXN 49,667.84 TEXTRON INC TXT 10,500.89 TYCO INTERNA TlONAL l TO TYC 18,835.82 UNJTEDHEALTH GROUP INC UNH 78,650.64 UNUM GROUP UNM 8,585.98 UNION PACIFIC CORP UNP 84,089.50 UNITED PARCEL SERVICE-CL B UPS 88,054.57 URBAN OUTFITIERS INC URBN 5,214.31 US BANCORP USB 74,640.47 UNITED TECHNOLOGIES CORP UTX 106,160.87 VISA INC-CLASS A SHARES v 129,226.17 VARIAN MEDICAL SYSTEMS INC VAR 8,497.56 VFCORP VFC 26,056.56 VIACOM INC-CLASS B VIAS 36,028.55 VALERO ENERGY CORP VLO 28,537.04 VULCAN MATERIALS CO VMC 8,319.60 VORNADO REALTY TRUST VNO 18,588.60 VERISIGN INC VRSN 6,567.54 VERTEX PHARMACEUTICALS INC VRTX 14,934.12 VENT AS INC VTR 19,425.63 VERIZON COMMUNICATIONS INC vz 194,248.80 WALGREEN CO WAG 62,995.40 WATERS CORP WAT 9,294.34 WESTERN DIGITAL CORP woe 21,114.70 WISCONSIN ENERGY CORP WEC 10,857.19 WELLS FARGO & CO WFC 256,860.85 WHOLE FOODS MARKET INC WFM 18,187.47 WHIRLPOOL CORP WHR 11,735.32 W!NDSTREAM HOLDINGS INC WlN 5,297.67 WELLPOINT INC WLP 27,169.04 WASTE MANAGEMENT INC WM 19,258.95 WILLIAMS COS INC WMB 27,896.53 WAL-MART STORES INC WMT 248,259.00 WESTERN UNION CO wu 8,486.96 WEYERHAEUSER CO W'( 16,207.11 WYNDHAM WORLDWIDE CORP WYN 8,988.46 WYNN RESORTS L TO WYNN 20,536.99 UNITED STATES STEEL CORP X 3,921.03 XCEL ENERGY INC XEL 15,742.73 XL GROUP PLC XL 8,669.70 XILINX INC XLNX 13,836.42 EXXON MOBIL CORP XOM 425,343.57 DENTSPL Y INTERNATIONAL INC XRAY 6,330.37 XEROX CORP XRX 13,217.39 XYLEM INC XYL 6,456.74 YAHOO! INC YHOO 34,531.31 YUM! BRANDS INC YUM 33,353.28 ZIONS BANCORPORA TION ZION 5,468.46 ZIMMER HOLDINGS INC ZMH 15,611.87 ZOETIS INC ZTS 14,295.83
Total Market Capitalization: 17,294,635.59 Notes: [1] Equals sum of CoL (9) (2] Source: Bloomberg Professional (3) Equals [1]-[2] [4] Source: Bloomberg Professional [5] Equals weight in S&P 500 based on market capitalization [6} Source: Bloomberg Professional [7) Source: Bloomberg Professional [8] Equals ([6] x (1 + (0.5 x (7]))) + [7) (9] Equals Col.(5) x Col. (8]
5 6 7 Estimated Long-Term
We!ght in Index Dividend Yield Growth Est.
0.29"/., 2.61% 10.00% 0.06% 0.27% 16.77% 0.11% 1.63% 10.50% 0.45%.> 1.44% 10.4~f.,
0.05% 1.87% 9.00% 0.49% 1.88% 17.52% 0.51% 2.77% 10.18% 0.03% 0.00% 16.74% 0.43% 2.29"/o 7.50"1~
0.61% 2.08% 11.24% 0.75% 0.78% 17.64% 0.05% 0.00% 11.00% 0.15% 1.82% 12.23% 0.21% 1.50% 10.86% 0.17% 1.84% 8.36% 0.05% 0.16% 6.67% 0.11% 2.97% 10.59% 0.04% 0.00% 12.50% 0.09"h 0.00% 22.00% 0.11% 4.44% 3.95% 1.12% 4.57% 5.52% 0.36% 1.89% 14.00% 0.05% 0.00% 10.53% 0.12% 1.22% 5.59% 0.06% 3.25% 4.67% 1.49% 2.70% 12.92% 0.11% 0.98% 16.50% 0.07% 1.74% 21.02% 0.03% 11.38% -2.50% 0.16% 1.81% 9.26% 0.11% 3.61% 6.33% 0.16% 4.28% 11.50"/v 1.44% 2.62% 8.62% 0.05% 3.65% 8.80% 0.09"h 3.18% 5.50%
NIA 1.99% NIA 0.12% 2.47% 15.57% 0.02% 0.74% 6.00% 0.09% 3.71% 4.75% 0.05% 1.90% 9.61% 0.08% 1.73% 10.25% 2.46% 2.67% 12.04% 0.04% 0.59"./0 10.37% 0.08% 1.63% 10.00% 0.04% 1.46% 6.00% 0.20% 0.00% 12.37% 0.19% 2.01% 12.44% 0.03% 0.67% 7.67% 0.09% 0.88% 10.67% 0.08% 1.05% 12.20%
8
DCF Result
12.74% 17.06% 12.22% 11.91% 10.96% 19.57% 13.0S% 16.74% 9.87% 13.43% 18.48% 11.00% 14.16% 12.44% 10.28% 6.83% 13.72% 12.50% 22.00% 8.47% 10.21% 16.03% 10.53% 6.84% 8.00% 15.79% 17.56% 22.94% 8.73% 1U6% 10.06% 16.03% 11.35% 12.61% 8.77%
NIA 18.23% 6.76% 8.55% 11.59% 12.07% 14.87% 10.99% 11.71% 7.51% 12.37% 14.58% 8.36% 11.60% 13.31%
9 Weighted
DCF Result
0.0366% 0.0104% 0.0133% 0.0542% 0.0054% 0.0952% 0.0686% 0.0050% 0.0426% 0.0824% 0.1381% 0.0054% 0.0213% 0.0259% 0.0170% 0.0033% 0.0147% 0.0047% 0.0190% 0.0095% 0.1147% 0.0584% 0.0057% 0.0084% 0.0050% 0.2345% 0.0185% 0.0156% 0.0027% 0.0175% 0.0112% 0.0259% 0.1629% 0.0062% 0.0082%
NIA 0.0216% 0.0015% 0.0078% 0.0058% 0.0097% 0.3658% 0.0040% 0.0089% 0.0028% 0.0247% 0.0281% 0.0026% 0.0105% O.D110% 13.91%
Schedule RBH-11 Page 7 of 14

Ex-Ante Market Risk Premium Market DCF Method Based- Value Une
3
Est. Requited Implied Market Market Return Risk Premium
12.31% 8.71%
4 6 Market Estimated
Com(?:an:i Ticker Caertalizatioo Weight in Index Dividend Yield DCF Result
AGILENT TECHNOLOGIES INC A 18,431.46 0.11% 0.96% 7.50% 8.50% 0.0091% ALCOA INC AA 15,903.52 0.09% 0.88% 17.00% 17.95% 0.0166% APPLE INC AAPL 506,704.70 2.94% 2.15% 12.50% 14.78% 0.4350% ABBVIE INC ABBV 78,288.59 0.45% 3.41% 0.00% 3.41% 0.0155% AMERISOURCEBERGEN CORP ABC 14,956.63 0.09'-'A:. 1.45% 13.50% 15.05% 0.0131% ABBOTT LA BORA TORIES ABT 59,419.89 0.35% 2.29"1<. -4.00% -1.76% -0.0061% ACE LTD ACE 34,727.84 0.20% 2.47% 9.00% 11.58% 0.0234% ACCENTURE PLC-CL A CAM 15,477.93 0.09'-'A:. 0.00% 16.00% 16.00% 0.0144% ACT AVIS PLC ACT 27,071.37 0.16% 0.00% 24.50% 24.50% 0.0385% ADOBE SYSTEMS INC ADBE 31,515.23 0.18% OJXYA:. 12.00% 12.00% 0.0220% ANALOG DEVICES INC ADI 16,782.70 0.10% 2.76% 11.00% 13.91% 0.0136% ARCHER-DANIELS-MIDlAND CO ADM 29,411.17 0.17% 2.15% 9.00% 11.25% 0.0192% AUTOMATIC DATA PROCESSING ADP 36,884.87 0.21% 2.58% 9.00% 11.70% 0.0251% ALLIANCE DATA SYSTEMS CORP ADS 11,743.11 0.07% 0.00% 15.00% 15.00% 0.0102% AUTODESK INC ADSK 10,765.63 0.06% O.O<r'A> 8.W/~ 8.00% 0.0050% ADT CORP/THE ADT 5,430.11 0.03% 2.70% 0.00% 2.70",{, 0.0009% M1EREN CORPORATION AEE 9,977.11 0.06% 3.92% 2.50% 6.47% 0.0037% AMERICAN ELECTRIC POWER AEP 25,525.37 0.15% 3.90% 4.50"/o 8.49"A:. 0.0126% AESCORP AES 10,445.33 0.06% 1.38% 10.5CY-'A:. 11.95% 0.0072% AETNA INC AET 26,426.11 0.15% 1.23% 10.50% 11.79% 0.0181% AFLAC INC AFL 28,557.11 0.17% 2.45% 7.50% 10.04% 0.0167% ALLERGAN INC AGN 49,584.13 0.29% 0.12% 13.50% 13.63% 0.0392% AMERICAN INTERNATIONAL GROUP AIG 77,283.28 0.45% 0.95% 0.00% 0.95% 0.0043% APARTMENT INVT & MGMT CO -A AIV 0.00'/<1 3.41% O.WJ~ 3.41% 0.0000% ASSURANT INC AIZ 4,924.84 0.03% 1.49% 7.50% 9.05% 0.0026% AKAMAI TECHNOLOGIES INC AKAM 9,527.24 0.06% O.O<r'J~ 13.50"-/o 13.50"./o 0.0075% ALLSTATE CORP ALL 25,323.60 0.15% 1.99% 16.00'A:. 18.15% 0.0267% AllEGION PLC ALLE 4,964.36 0.03% 0.62% 0.00% 0.62% 0.0002% ALTERACORP ALTR 10,962.53 0.06% 1.76% 0.00% 1.76% 0.0011% ALEXION PHARMACEUTICALS INC ALXN 30,727.11 0.18% 0.00% 31.50",{, 31.50% 0.0562% APPLIED MATERIALS INC AMAT 23,457.07 0.14% 2.07% 17.00% 19.25% 0.0262% AMETEKINC AME 12,707.58 0.07% 0.46% 10.50% 10.98% 0.0061% MtGEN INC AMGN 85,813.11 O.SCY-'h 2.18% 8.50'% 10.77% 0.0537% M1ER!PRISE FINANCIAL INC AMP 20,666.05 0.12% 1.97% 13.50% 15.60% 0.0187% AMERICAN TOWER CORP AMT 32,967.26 0.19"A:. 1.58% 16.50% 18.21% 0.0349% AMAZON.cm.-. INC AMZN 154,414.70 0.90% 0.00% 45.00'A:. 45.00% 0.4035% AUTONATION INC AN 6,364.02 0.04% O.O<r'l~ 12.5lY'k 12.50"/~ 0.0046% AON PLC AON 24,743.14 0.14% 0.85% 15.50"-A. 16.42% 0.0236% APACHE CORP APA 34,836.21 0.20"/<1 1.14% 8.00% 9.19% 0.0186% ANADARKO PETROLEUM CORP APC 50,468.21 0.29% 0.72% 74.50":/o 75.49% 0.2212% AIR PRODUCTS & CHEMICALS INC APD 25,072.55 0.15% 2.60% 9.0<r'/~ 11.72% 0.0171% AMPHENOL CORP-CL A APH 15,238.40 0.09% 0.83% 8.w1~ 8.86% 0.0078% AIRGAS INC ARG 7,963.20 0.05% 2.04% 13.50% 15.68% 0.0072% ALLEGHENY TECHNOLOGIES INC ATI 4,314.60 0.03% 1.77% 17.5CY-'/~ 19.42% 0.0049% AVALONBAY COMMUNITIES INC AVB 0.00% 3.54% 0.00% 3.54% 0.0000% AVON PRODUCTS INC AVP 6,486.81 0.04% 1.61% 36.50% 38.40% 0.0145% AVERY DENNISON CORP AVY 4,765.00 0.03% 2.49% 10.00% 12.61% 0.0035% AMERICAN EXPRESS CO AXP 93,004.24 0.54% 1.16% 10.00% 11.22% 0.0606% AUTOZONE INC AZO 17,540.73 0.10% 0.00% 12.00% 12.00% 0.0122% BOEING COfTHE BA 97,057.35 0.56% 2.30% 11.00% 13.43% 0.0757% BANK OF AMERICA CORP BAC 174,564.80 1.01% 0.73% 0.00% 0.73% 0.0074% BAXTER INTERNATIONAL INC BAX 39,262.45 0.23% 2.71% 8.00% 10.82% 0.0247% BED BATH & BEYOND INC BBBY 13,129.84 0.08% 0.00% 8.50% 8.51}'/o 0.0065% BB&T CORP BBT 26,717.30 0.16% 2.65% 11.50% 14.30% 0.0222% BEST BUY CO INC BBY 8,387.91 0.05% 2.98% 5.50% 8.56% 0.0042% CRBARD INC BCR 10,549.11 0.06% 0.62% 8.00% 8.64% 0.0053% BECTON DICK!NSON AND CO BOX 22,012.11 0.13% 1.91% 8.0<r'/o 9.99% 0.0128% BEAM INC BEAM 13,652.42 0.08% 1.08% 11.50% 12.64% 0.0100% FRANKUN RESOURCES INC BEN 33,981.14 0.20% 0.93% 9.50% 10.47% 0.0207% BR01NN-FORMAN CORP-CLASS 8 BFIB 18,895.63 0.11% 1.33% 10.00% 11.40% 0.0125% BAKER HUGHES 11\'C BHI 30,559.26 0.18% 0.86% 13.00% 13.92% 0.0247% BIOGEN IDEC INC BIIB 69,644.75 0.40",{, 0.00% 14.50% 14.50% 0.0586% BANK OF NEW YORK MELLON CORP BK 38,613.28 0.22% 2.02% 10.00% 12.12% 0.0272% BLACKROCK INC BLK 51,436.87 0.30% 2.54% 9.00% 11.65% 0.0348% BALL CORP BLL 7,873.34 0.05% 0.94% 12.00% 13.00% 0.0059% BEMIS COMPANY BMS 4,140.20 0.02% 2.68% 8.00% 10.79% 0.0026%
Schedule RBH-11 Page a of 14
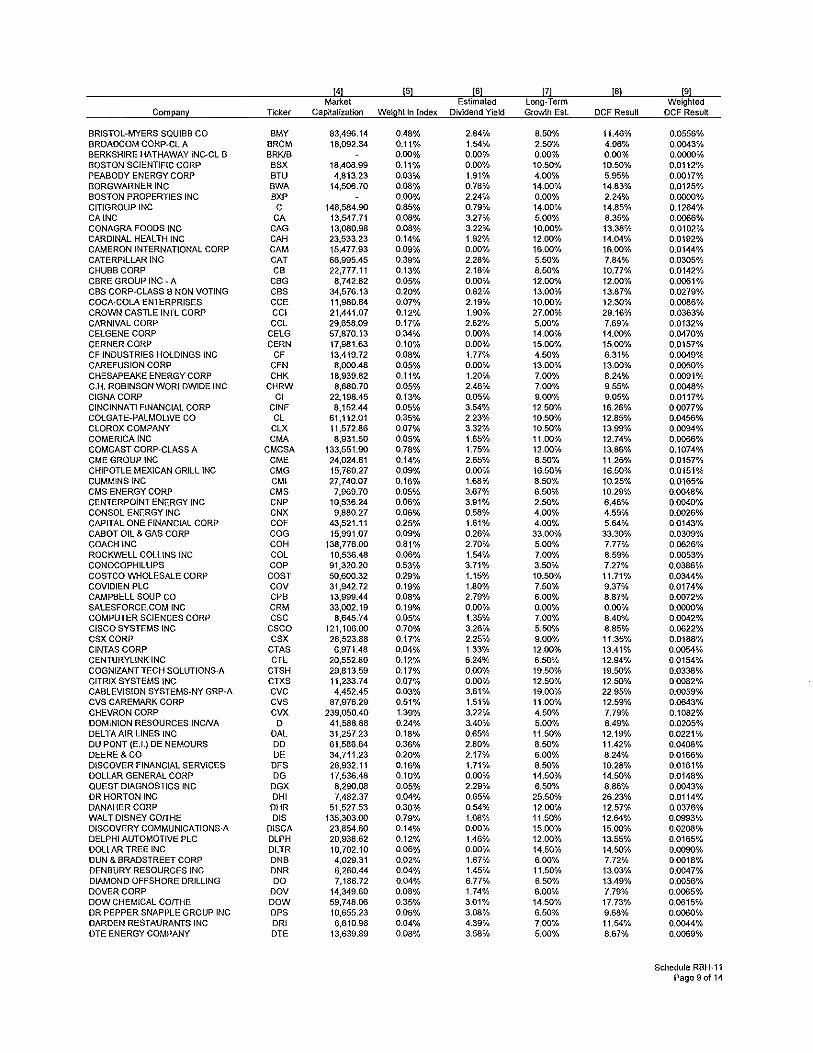
4 9 Market Long-Term Weighted
Corn~n'i Ticker caeitalization We!2ht in Index Dividend Yield Growth Est. DCF Result OCF Result
BRISTOL-MYERS SQUIBB CO BMY 83,496.14 0.48% 2.84% 8.50% 11.46% 0.0556% BROADCOM CORP-CL A BRCM 18,092.34 0.11% 1.54% 2.50% 4.06% 0.0043% BERKSHIRE HATHAWAY INC-CL B BRKIB 0.00% 0.00% 0.00% 0.00% 0.0000% BOSTON SCIENTIFIC CORP BSX 18,408.99 0.11% 0.00% 10.50% 10.50% 0.0112% PEABODY ENERGY CORP BTU 4,813.23 0.03% 1.91% 4.00% 5.95% 0.0017% BORGWARNER INC BWA 14,506.70 0.08% 0.78% 14.00% 14.83% 0.0125% BOSTON PROPERTIES INC BXP 0.00% 2.24% 0.00% 2.24% 0.0000% CITIGROUP INC c 146,584.90 0.85% 0.79% 14.00% 14.85% 0.1264% CAlNC CA 13,547.71 0.08% 3.27% 5.00% 8.35% 0.0066% CONAGRA FOODS INC GAG 13,080.98 0.08% 3.22% 10.00% 13.38% 0.0102% CARDINAL HEALTH INC CAH 23,533.23 0.14% 1.92% 12.00% 14.04% 0.0192% CAMERON INTERNATIONAL CORP CAM 15,477.93 0.09% 0.00% 16.00% 16.00% 0.0144% CATERPILlAR INC CAT 66,995.45 0.3gt'f.:, 2.28% 5.50% 7.84% 0.0305% CHUBB CORP CB 22,777.11 0.13% 2.18% 8.50% 10.77% 0.0142% CBRE GROUP 11\'C- A CBG 8,742.82 0.05% 0.00% 12.00% 12.00% 0.0061% CBS CORP-ClASS B NON VOTING CBS 34,576.13 0.20% 0.82% 13.00% 13.87% 0.0279% COCA-COLA ENTERPRISES CCE 11,980.84 0.07% 2.19% 10.00"/o 12.30% 0.0086% CROWN CASTLE INTL CORP CCI 21,441.07 0.12% 1.90% 27.00% 29.16% 0.0363% CARNIVAL CORP CCL 29,658.09 0.17% 2.62% 5.00% 7.69% 0.0132% CELGENE CORP CELG 57,870.13 0.34% 0.00% 14.00% 14.00% 0.0470% CERNERCORP CERN 17,981.63 0.10% 0.00% 15.00% 15.00% 0.0157% CF INDUSTRIES HOLDINGS INC CF 13,419.72 0.08% 1.77% 4.50% 6.31% 0.0049% CARE FUSION CORP CFN 8,000.48 0.05% 0.00% 13.00% 13.00% 0.0060% CHESAPEAKE ENERGY CORP CHK 18,939.82 0.11% 1.20% 7.00% 8.24% 0.0091% C.H. ROBINSON WORLDWIDE INC CHRW 8,680.70 0.05% 2.46% 7.00% 9.55% 0.0048% CIGNACORP Cl 22,198.45 0.13% 0.05% 9.00% 9.05% 0.0117% CINCINNATI FINANCIAL CORP CINF 8,152.44 0.05% 3.54% 12.50% 16.26% 0.0077% COLGATE-PALMOLIVE CO CL 61,112.01 0.35% 2.23% 10.50% 12.85% 0.0456% CLOROX COMPANY CLX 11,572.86 0.07% 3.32% 10.50% 13.99% O.OOO.A% COMERICA INC CMA 8,931.50 0.05% 1.65% 11.00% 12.74% 0.0066% COMCAST CORP-CLASS A CMCSA 133,551.90 0.78% 1.75% 12.00"/~ 13.86% 0.1074% CME GROUP INC CME 24,024.61 0.14% 2.65% 8.50% 11.26% 0.0157% CHIPOTLE MEXICAN GRILL INC CMG 15,780.27 0.09% 0.00% 16.50% 16.50% 0.0151% CUMMINS INC CMI 27,740.07 0.16% 1.68% 8.50% 10.25% 0.0165% CMS ENERGY CORP CMS 7,969.70 0.05% 3.67% 6.50% 10.29% 0.0048% CENTERPOINT ENERGY INC CNP 10,536.24 0.06% 3.91% 2.50% 6.46% 0.0040% CONSOL ENERGY INC CNX 9,880.27 0.06% 0.58% 4.00% 4.59¢/o 0.0026% CAPITAL ONE FINANCIAL CORP COF 43,521.11 0.25% 1.61% 4.00% 5.64% 0.0143% CABOT OIL & GAS CORP COG 15,991.07 0.09% 0.26% 33.00% 33.30% 0.0309% COACH INC COH 138,776.00 0.81% 2.70% 5.00% 7.77% 0.0626% ROCKWELL COLLINS INC COL 10,536.48 0.06% 1.54% 7.00% 8.59% 0.0053% CONOCOPHILLIPS COP 91,320.20 0.53% 3.71% 3.50% 7.27% 0.0386% COSTCO IJ\/HOLESALE CORP COST 50,600.32 0.29% 1.15% 10.50% 11.71% 0.0344% COVIDIEN PLC cov 31,942.72 0.19% 1.80% 7.50% 9.37% 0.0174% CAMPBELL SOUP CO CPB 13,999.44 0.08% 2.79% 6.00% 8.87% 0.0072% SALESFORCE.COM INC CRM 33,002.19 0.19% 0.00% 0.00% 0.00% 0.0000% COMPUTER SCIENCES CORP esc 8,645.74 0.05% 1.35% 7.00% 8.40% 0.0042% CISCO SYSTEMS INC csco 121,106.00 0.70% 3.26% 5.50% 8.85% 0.0622% CSXCORP csx 28,523.88 0.17% 2.25% 9.00% 11.35% 0.0188% CINTASCORP CTAS 6,971.48 0.04% 1.33% 12.00% 13.41% 0.0054% CENTURYL!NK INC CTL 20,552.80 0.12%> 6.24% 6.50% 12.94% 0.0154% COGNIZANT TECH SOLUTIONS-A CTSH 29,813.59 0.17% 0.00% 19.50% 19.50% 0.0338% CITRIX SYSTEMS INC CTXS 11,233.74 0.07% 0.00% 12.50% 12.50% 0.0082% CABLEV!S!ON SYSTEMS-NY GRP-A eve 4,452.45 0.03% 3.61% 19.00% 22.95% 0.0059% CVS CAREMARK CORP cvs 87,976.29 0.51% 1.51% 11.00"/o 12.59¢/o 0.0643% CHEVRON CORP cvx 239,050.40 1.39% 3.22% 4.50% 7.79¢/.:. 0.1082% DOMINION RESOURCES INCNA D 41,588.88 0.24% 3.40% 5.00% 8.49% 0.0205% DELTA AIR LINES INC DAL 31,257.23 0.18% 0.65% 11.50% 12.19% 0.0221% DUPONT (E. I.) DE NEMOURS DD 61,586.64 0.36% 2.80% 8.50% 11.42% 0.0408% DEERE&CO DE 34,711.23 0.20% 2.17% 6.00% 8.24% 0.0168% DISCOVER FINANCIAL SERVICES DFS 26,932.11 0.16% 1.71% 8.50% 10.28% 0.0161% DOLLAR GENERAL CORP DG 17,536.48 0.10% 0.00% 14.50% 14.50% 0.0148% QUEST DIAGNOSTICS INC DGX 8,290.08 0.05% 2.29% 6.50% 8.86% 0.0043% DR HORTON 11\'C DHI 7,482.37 0.04% 0.65% 25.50% 26.23% 0.0114% DANAHER CORP DHR 51,527.53 0.30% 0.54% 12.00% 12.57% 0.0376% WALT DISNEY COfTHE DIS 135,303.00 0.79% 1.08% 11.50% 12.64% 0.0993% DISCOVERY COMMUNICATIONS-A DISC A 23,854.60 0.14% 0.00% 15.00% 15.00% 0.0208% DELPHI AUTOMOTIVE PLC DLPH 20,938.62 0.12% 1.46% 12.00% 13.55% 0.0165% DOllAR TREE INC DLTR 10,702.10 0.06% 0.00% 14.50% 14.50"-lo 0.0090% DUN & BRADSTREET CORP DNB 4,029.31 0.02% 1.67% 6.00% 7.72% 0.0018% DEN BURY RESOURCES INC DNR 6,260.44 0.04% 1.45% 11.50% 13.03% 0.0047% DIAMOND OFFSHORE DRILLING DO 7,186.72 0.04% 6.77% 6.50% 13.49% 0.0056% DOVER CORP DOV 14,349.60 0.08% 1.74% 6.00% 7.79¢/o 0.0065% DOW CHEMICAL COfTHE DDW 59,748.00 0.35% 3.01% 14.50% 17.73% 0.0615% DR PEPPER SNAPPLE GROUP INC DPS 10,655.23 0.06% 3.08% 6.50% 9.68% 0.0060% DARDEN RESTAURANTS INC DRI 6,610.96 0.04% 4.39% 7.00% 11.54% 0.0044% DTE ENERGY COMPANY DTE 13,639.89 0.08% 3.58% 5.00% 8.67% 0.0069%
Schedule RBH-11 Page 9 of 14
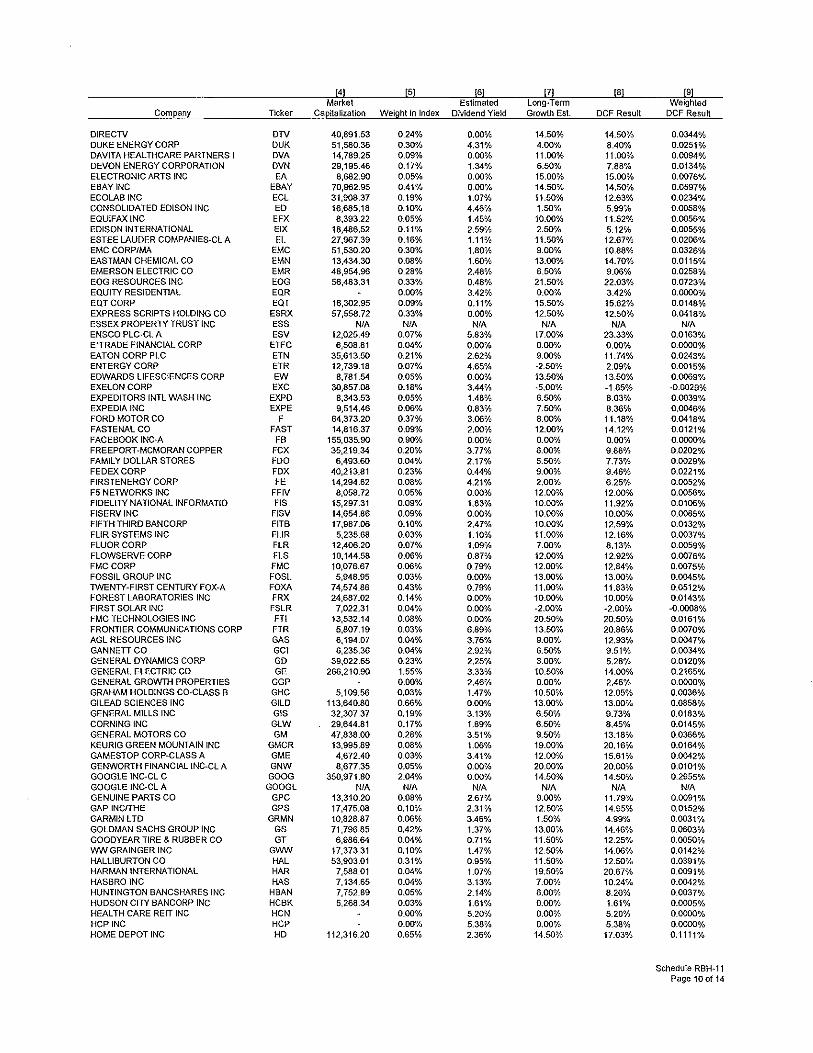
[4) [5] [6) 171 [8) [9] Market Estimated Long· Term Weighted
Comeanl Ticker Caeilalization Weight in Index Dividend Yield Gro;vth Est. DCF Resu!t DCF Result
D!RECTV OTV 40,891.53 0.24% 0.00% 14.50% 14.50% 0.0344% DUKE ENERGY CORP OUK 51,580.38 0.30% 4.31% 4.00% 8.40% 0.0251% DAVIT A HEALTHCARE PARTNERS I OVA 14,789.25 0.09"/v 0.00% 11.00% 11.00% 0.0094% DEVON ENERGY CORPORATION OVN 29,195.46 0.17% 1.34% 6.50% 7.88% 0.0134% ELECTRONIC ARTS INC EA 8,682.90 0.05% 0.00% 15.00% 15.00% 0.0076% EBAYINC EBAY 70,962.95 0.41% 0.00% 14.50% 14.50% 0.0597% ECOLAB INC ECL 31,908.37 0.19% 1.07% 11.50% 12.63% 0.0234% CONSOLIDATED EDISON INC ED 16,685.18 0.10% 4.46% 1.50% 5.99"-Jv 0.0058% EQUIFAXINC EFX 8,393.22 0.05% 1.45% 10.00% 11.52% 0.0056% EDISON INTERNATIONAL EIX 18,486.52 0.11% 2.5~,{, 2.50% 5.12% 0.0055% ESTEE LAUDER COMPANIES·CL A EL 27,967.39 0.16% 1.11% 11.50% 12.67% 0.0206% EMC CORP/MA EMC 51,530.20 0.30% 1.80% 9.00% 10.88% 0.0326% EASTMAN CHEMICAL CO EMN 13,434.30 0.08% 1.60% 13.Wh 14.70% 0.0115% EMERSON ELECTRIC CO EMR 48,954.96 0.28% 2.48% 6.50% 9.06% 0.0258% EOG RESOURCES INC EOG 56,483.31 0.33% 0.48% 21.50% 22.03% 0.0723% EQUITY RESIDENTIAL EQR 0.00% 3.42% 0.00% 3.42% 0.0000% EQTCORP EQT 16,302.95 0.09% 0.11% 15.50% 15.62% 0.0148% EXPRESS SCRIPTS HOLDING CO ESRX 57,558.72 0.33% 0.00% 12.50% 12.50% 0.0418% ESSEX PROPERTY TRUST INC ESS NIA NIA NIA NIA NIA NIA ENSCO PLC·CL A ESV 12,025.49 0.07% 5.83% 17.00% 23.33% 0.0163% E•TRADE FINANCIAL CORP ETFC 6,508.81 0.04% 0.00% 0.00% 0.00% 0.0000% EATON CORP PLC ETN 35,613.50 0.21% 2.62% 9.00% 11.74% 0.0243% ENTERGY CORP ETR 12,739.18 0.07% 4.65% ·2.50% 2.09% 0.0015% EDWARDS LIFESCIENCES CORP EW 8,781.54 0.05% 0.00% 13.50% 13.50% 0.0069% EXELONCORP EXC 30,857.08 0.18% 3.44% ·5.00% ·1.65% ·0.0029'-'A, EXPEDITORS INTL WASH INC EXPO 8,343.53 0.05% 1.48% 6.50% 8.03% 0.0039% EXPEDIA INC EXPE 9,514.46 0.06% 0.83% 7.50% 8.36% 0.0046% FORD MOTOR CO F 64,373.20 0.37% 3.06% 8.00% 11.18% 0.0418% FASTENAL CO FAST 14,816.37 0.09"k 2.00% 12.00% 14.12% 0.0121% FACEBOOK lt\IC·A FB 155,035.90 0.90% 0.00% 0.00% 0.00% 0.0000% FREEPORT·MCMORAN COPPER FCX 35,219.34 0.20% 3.77% 6.00% 9.88% 0.0202% FAMILY DOLLAR STORES FOO 6,493.60 0.04% 2.17% 5.50% 7.73% 0.0029% FEDEXCORP FOX 40,213.81 0.23% 0.44% 9.00% 9.46% 0.0221% FIRSTENERGY CORP FE 14,294.62 0.08% 4.21% 2.00% 6.25% 0.0052% F5 NETWORKS INC FFIV 8,058.72 0.05% 0.00% 12.00% 12.00% 0.0056% FIDELITY NATIONAL INFORMATIO FIS 15,297.31 0.09% 1.83% 10.00% 11.92% 0.0106% FISERV INC FISV 14,654.86 0.09% 0.00% 10.00% 10.00% 0.0085% FIFTH THIRD BANCORP FITB 17,987.06 0.10% 2.47% 10.00% 12.59% 0.0132% FUR SYSTEMS INC FUR 5,235.68 0.03% 1.10% 11.00% 12.16% 0.0037% FLUOR CORP FlR 12,406.20 0.07% 1.09% 7.00% 8.13% 0.0059% FLOWSERVE CORP FLS 10,144.58 0.06% 0.87% 12.00% 12.92% 0.0076% FMC CORP FMC 10,076.67 0.06% 0.79% 12.00% 12.84% 0.0075% FOSSIL GROUP INC FOSL 5,948.95 0.03% 0.00% 13.00% 13.00% 0.0045% TWENTY·FIRST CENTURY FOX·A FOXA 74,574.86 0.43% 0.79% 11.00% 11.83% 0.0512% FOREST lAB ORA TORIES INC FRX 24,687.02 0.14% 0.00% 10.00% 10.00% 0.0143% FIRST SOLAR INC FSLR 7,022.31 0.04% 0.00% ·2.00% ~2.00% ·0.0008% FMC TECHNOLOGIES INC FTI 13,532.14 0.08% 0.00% 20.50% 20.50% 0.0161% FRONTIER COMMUNICATIONS CORP FTR 5,807.19 0.03% 6.89% 13.50% 20.86% 0.0070% AGL RESOURCES INC GAS 6,194.07 0.04% 3.76% 9.00% 12.93% 0.0047% GANNEITCO GCJ 6,235.36 0.04% 2.92% 6.50% 9.51% 0.0034% GENERAL DYNAMICS CORP GO 39,022.65 0.23% 2.25% 3.00% 5.28% 0.0120% GENERAL ELECTRIC CO GE 266,210.90 1.55% 3.33% 10.50% 14.00% 0.2165% GENERAL GROWTH PROPERTIES GGP 0.00% 2.46% 0.00% 2.46% 0.0000% GRAHAM HOLDINGS CO·CLASS B GHC 5,109.56 0.03% 1.47% 10.50% 12.05% 0.0038% GILEAD SCIENCES INC GILD 113,640.80 0.66% 0.00% 13.00".,{; 13.00% 0.0858% GENERAL MILLS INC GIS 32,307.37 0.19% 3.13% 6.50% 9.73% 0.0183% CORNING INC GLW 29,644.81 0.17% 1.89% 6.5QI.'/o 8.45% 0.0145% GENERAL MOTORS CO GM 47,838.00 0.28% 3.51% 9.50% 13.18% 0.0366% KEURIG GREEN MOUNTAIN INC Q..ICR 13,995.89 0.08% 1.06% 19.00% 20.16% 0.0164% GAMESTOP CORP·CLASS A GME 4,672.40 0.03% 3.41% 12.Cl!Y',{, 15.61% 0.0042% GENWORTH FINANCIALINC.CL A GNW 8,677.35 0.05% 0.00% 20.00% 20.00% 0.0101% GOOGLE lNC·Cl C GOOG 350,971.80 2.04% 0.00% 14.5QI.'h 14.50% 0.2955% GOOGLE lNC·Cl A GOOGL NIA NIA NIA NIA NIA NIA GENUINE PARTS CO GPC 13,310.20 0.08% 2.67% 9.00% 11.79% 0.0091% GAP INCITHE GPS 17,475.08 0.10"/o 2.31% 12.50% 14.95% 0.0152% GARMIN LTD GRMN 10,828.87 0.08% 3.46% 1.50% 4.99"'/~ 0.0031% GOLDMAN SACHS GROUP INC GS 71,796.85 0.42% 1.37% 13.00% 14.46% 0.0603% GOODYEAR TIRE & RUBBER CO GT 6,986.64 0.04% 0.71% 11.50% 12.25% 0.0050% WN GRAINGER INC GWW 17,373.31 0.10"h 1.47% 12.50% 14.06% 0.0142% HALLIBURTON CO HAL 53,903.01 0.31% 0.95% 11.50% 12.50% 0.0391% HARMAN INTERNATIONAL HAR 7,588.01 0.04% 1.07% 19.50% 20.67% 0.0091% HASBROlNC HAS 7,134.65 0.04% 3.13% 7.00% 10.24% 0.0042% HUNTINGTON BANCSHARES INC HBAN 7,752.89 0.05% 2.14% 6.00% 8.20% 0.0037% HUDSON CITY BANCORP INC HCBK 5,268.34 0.03% 1.61% 0.00% 1.61% 0.0005% HEALTH CARE REIT INC HCN 0.000/~ 5.20% 0.00% 5.20% 0.0000% HCP INC HCP 0.00% 5.38% 0.00% 5.38% 0.0000% HOME DEPOT INC HO 112,316.20 0.65% 2.36% 14.50% 17.03% 0.1111%
Schedule RBH·11 Page 10 of 14

4 Market Estimated Long-Term
Com~anl Ticker Ca!:!ita!ization We~hl in Index Dividend Yield Grmvth Est. DCF Result
HESS CORP HES 29,937.09 0.17% 1.13% -1.00% 0.12% OJJ002% HARTFORD FINANCIAL SVCS GRP HIG 15,634.47 O.W'A:. 1.72% 11.00% 12.81% 0.0116% HARLEY-DAVIDSON INC HOG 15,755.66 0.09"/o 1.54% 16.00% 17.66% 0.0162% HONEYWELL INTERNATIONAL INC HON 73,323.53 0.43% 1.92% 9.50% 11.51% 0.0490% STARWOOD HOTELS & RESORTS HOT 14,618.71 0.08% 1.84% 14.00% 15.97% 0.0136% HELM ERICH & PAYNE HP 11,498.76 0.07% 2.34% 10J){y.'A, 12.46% 0.0083% HEWLETT-PACKARD CO HPQ 60,768.00 0.35% 2.00% 0.00% 2.00"A:. 0.0071% H&R BLOCK INC HRB 7,669.85 0.04% 3.40% 9.00% 12.55% 0.0056% HORMEL FOODS CORP HRL 12,562.92 0.07% 1.77% 11.00% 12.87% 0.0094% HARRIS CORP HRS 7,696.83 0.04% 2.45% 1.50% 3.97% 0.0018% HOSPIRA INC HSP 7,279.78 0.04% 0.00% 7.00% 7.00% 0.0030% HOST HOTELS & RESORTS INC HST 0.00% 2.94% 0.00% 2.94% 0.0000% HERSHEY COfTHE HSY 21,489.76 0.12% 2.08% 11.50"/o 13.70% 0.0171% HWMNAINC HUM 16,761.98 0.10% 0.99% 7.50% 8.53% 0.0083% lNTL BUSINESS MACHINES CORP IBM 200,566.10 1.16% 2.10% 7.50% 9.68% 0.1127% lNTERCONTINENTALEXCHANGE GRO ICE 23,663.55 0.14% 1.26% 18.50% 19.88% 0.0273% INTL FLAVORS & FRAGRANCES IFF 7,786.82 0.05% 1.69% 7.00% 8.75% 0.0040% lNTL GAME TECHNOLOGY IGT 3,158.76 0.02% 3.48% 13.00% 16.71% 0.0031% INTEL CORP lNTC 132,867.30 0.77% 3.36% 6.00% 9.46% 0.0730% INTUIT INC INTU 21,025.32 0.12% 1.03% 11.00% 12.000,{, 0.0148% INTERNATIONAL PAPER CO IP 20,071.27 0.12% 3.04% 12.00% 15.22% 0.0177% INTERPUBLIC GROUP OF COS INC lPG 7,200.97 0.04% 2.20% 13.50",{, 15.85% 0.0066% INGERSOLL-RAND PLC IR 16,570.89 0.10% 1.68% 12.50% 14.29% 0.0137% IRON MOUNTAIN INC IRM 5,371.15 0.03% 3.85% 5.50% 9.46% 0.0029% INTUITIVE SURGICAL INC lSRG 14,147.29 0.08% 0.00% 9.00% 9.00% 0.0074% ILLINOIS TOOL WORKS ITW 37,996.89 0.22% 1.96% 10.50% 12.56% 0.0277% lNVESCO LTD IVZ 15,680.42 O.Q9<'f.o 2.54% 17.00% 19.76% 0.0180% JABIL CIRCUIT INC JBL 3,660.37 0.02% 1.78% 3.00% 4.81% 0.0010% JOHNSON CONTROLS INC JCI 30,392.56 0.18% 1.92% 12.00% 14.04% 0.0248% JACOBS ENGINEERING GROUP INC JEC 8,354.78 0.05% 0.00% 12.00% 12.00% 0.0058% JOHNSON & JOHNSON JNJ 281,953.10 1.64% 2.64% 6.50% 9.23% 0.1510% JUNIPER NETWORKS INC JNPR 12,498.85 0.07% 1.1~/o 16.50"/ .. 17.79% 0.0129% JOY GLOBAL INC JOY 6,116.31 0.04% 1.15% 2.00% 3.16% 0.0011% JPMORGAN CHASE & CO JPM 211,202.00 1.23% 2.85% 8.00% 10.96% 0.1345% NORDSTROM INC JWN 11,984.20 0.07% 2.18% 8.50% 10.77% 0.0075% KELLOGG CO K 24,137.15 0.14% 2.80% 6.50% 9.39% 0.0132% KEYCORP KEY 12,131.66 0.07% 1.76% 8.W'A. 10.33% 0.0073% KIMCO REALTY CORP KIM 0.00% 4.06% 0.00% 4.06% 0.0000% KLA-TENCOR CORPORATION KLAC 11,283.93 0.07% 2.66% 6.00% 8.74°/v 0.0057% KIMBERLY-CLARK CORP KMB 41,126.12 0.24% 3.08% 8.50% 11.71% O.D280% KINDER MORGAN INC KMI 34,713.20 0.20% 4.99% 15.00% 20.36% 0.0410% CARMAXINC KMX 9,719.35 0.06% 0.00% 10.00% 10.00% 0.0056% COCA-COLA CO!THE KO 179,161.40 1.04% 3.07% 6.50% 9.67% 0.1006% MICHAEL KORS HOLDINGS LTD KORS 18,599.64 0.11% 0.00% 29.50% 29.50% 0.0319% KROGER CO KR 23,037.80 0.13% 1.57% 9.W'A. 11.14% 0.0149% KRAFT FOODS GROUP INC KRFT 33,883.98 0.20% 3.70% 0.00% 3.70% 0.0073% KOHLS CORP KSS 11,548.03 0.07% 2.92% 7.50% 10.53% 0.0071% KANSAS CITY SOUTHERN KSU 11,127.38 0.06% 1.11% 14.00% 15.19% 0.0098% LOEWS CORP L 17,205.26 0.10% 0.56% 13.00% 13.60% 0.0136% L BRANDS INC lB 15,786.75 0.09% 2.51% 8.50% 11.12% 0.0102% LEGGETT & PlATT INC lEG 4,703.36 0.03% 3.56% 12.50'% 16.28% 0.0044% LENNAR CORP-A lEN 8,076.52 0.05% 0.41% 27.00% 27.47% 0.0129% LABORATORY CRP OF AMER HLDGS lH 8,605.99 0.05% 0.00% 5.00% 5.00% 0.0025% L-3 COMMUNICATIONS HOLDINGS lll 9,997.74 0.06% 2.06% 4.00% 6.10% 0.0035% LINEAR TECHNOLOGY CORP LLTC 10,991.77 0.06% 2.31% S.W'/v 8.89% 0.0057% Ell LILLY &CO lLY 63,386.14 0.37% 3.34% -2.50% 0.80% 0.0029% LEGG MASON INC lM 5,553.75 0.03% 1.11% 14.50% 15.69% 0.0051% LOCKHEED MARTIN CORP lMT 51,237.78 0.30% 3.46% 7.W'Io 11.09% 0.0330% LINCOLN NATIONAL CORP lNC 12,768.86 0.07% 1.40% 8.00% 9.46% 0.0070% LORILLARD INC lO 19,948.14 0.12% 4.55% 11.00% 15.80% 0.0183% LOVVE'S COS INC lOW 49,518.00 0.2~/~ 1.53% 15.00% 16.64% 0.0479% LAM RESEARCH CORP LRCX 9,447.97 0.05% 0.00% 13.50% 13.50% 0.0074% LSI CORP lSI 6,050.52 0.04% 0.00% 26.50% 26.50% 0.0093% LEUCADIA NATIONAL CORP lUK NIA NIA NIA NIA NIA NIA SOUTHWEST AlRL!NES CO LUV 16,909.39 0.10% 0.66% 17.00% 17.72% 0.0174% LYONDELLBASELLINDU-CL A LYB 48,662.93 0.28% 2.75% 12.00% 14.92% 0.0421% fMCY'S INC M 21,390.32 0.12% 1.98% 14.00% 16.12% 0.0200% MASTERCARD INC-CLASS A MA 89,497.93 0.52% 0.59% 15.00% 15.63% 0.0813% MACERICH COfTHE MAC 0.00% 3.86% 0.00% 3.86% 0.0000% MARRIOTT INTERNATIONAL -CL A MAR 17,577.15 0.10% 1.18% 14.00% 15.26% 0.0156% t.'.ASCO CORP MAS 7,846.28 0.05% 1.34% 33.50% 35.06% 0.0160% MATIELINC MAT 12,822.50 0.07% 4.03% 9.W'/o 13.72% 0.0102% MCDONALD'S CORP MCO 98,881.53 0.57% 3.25% 7.00% 10.36% 0.0595% MICROCHIP TECHNOLOGY INC MCHP 9,635.27 0.06% 2.93% 9.00% 12.06% 0.0067% MCKESSON CORP MCK 39,227.28 0.23°/v 0.56% 14.00% 14.60% 0.0333% MOODY'S CORP MCO 17,132.71 0.10% 1.41% 12.50% 14.00% 0.0139% MONDELEZ INTERNATIONAL INC-A MDLZ 60,200.48 0.35% 1.59% 7.50% 9.15% 0.0320%
Schedule RBH-11 Page 11 of 14

4 5 6 7 6 9 Market Estimated Long-Term Wefghted
Comeany: Ticker Cafl:italizalion Weight in Index Dividend Yield GrO'.vlh Est. DCF Result DCF Result
MEDTRONIC INC MDT 58,240.82 0.34% 2.02% 6.50% 8.5~A. 0.0290% METUFE INC MET 58,289.45 0.34% 2.70% 7.50% 10.30% 0.0349% MCGRAW HILL FINANCIAL INC MHFI 20,578.09 0.12% 1.58% 0.00% 1.58% 0.0019% MOHAWK INDUSTRIES INC MHK 10,003.05 0.06% O.WA, 15.50% 15.50% OJJ090% MEAD JOHNSON NUTRITION CO MJN 18,243.90 0.11% 1.70% 11.00% 12.79% 0.0136% MCCORMICK & CO-NON VTG SHRS MKC 9,303.34 0.05% 2.16% 7.50% 9.74% 0.0053% MARSH & MCLENNAN COS MMC 26,529.50 0.15% 2.00% 13.00% 15.19% 0.0234% 3M CO MMM 90,639.39 0.53% 2.50% 9.00% 11.61% 0.0611% MONSTER BEVERAGE CORP MNST 11,135.37 0.06% 0.00% 14.50Yo 14.5QI.'/o 0.0094% AL TRIA GROUP INC MO 76,549.59 0.44% 5.00% 10.50"/o 15.76% 0.0701% MONSANTO CO MON 58,005.17 0.34% 1.56% 13.50% 15.17% 0.0511% MOSAIC COffHE MOS 20,782.88 0.12% 2..46% 6.00% 8.53% 0.0103% MARATHON PETROLEUM CORP MPC 26,949.78 0.16% 1.92% 0.00% 1.92% 0.0030% MERCK & CO. INC. MRK 168,368.00 0.98% 3.06% 2.00% 5.W/v 0.0498% MARATHON OIL CORP MRO 25,320.48 0.15% 2.Wio 0.00% 2.09% 0.0031% MORGAN STANLEY MS 60,174.21 0.35% 1.29% 30.00% 31.48% 0.1100% MICROSOFT CORP MSFT 330,838.00 1.92% 2.81% 8.50% 11.43% 0.2196% MOTOROLA SOLUTIONS INC MSI 16,033.50 0.09"/v 2.11% 8.00% 10.19% 0.0095% M & T BANK CORP MTB 16,007.92 0.09"-Ao 2.28% 7.00% 9.36% 0.0087% MICRON TECHNOLOGY INC MU 27,991.20 0.16% 0.00% 80.50% 80.50% 0.1308% MURPHY OIL CORP MUR 12,601.39 0.07% 1.93% 9.00% 11.02% 0.0081% MEADWESTVACO CORP MWV 6,696.87 0.04% 2.61% 11.00% 13.75% 0.0053% MYLAN INC MYL 19,270.30 0.11% 0.00% 14.00% 14.1XY'/o 0.0157% NOBLE ENERGY INC NBL 27,154.16 0.16% 0.96% 17.00% 18.04% 0.0284% NABORS INDUSTRIES LTD NBR 7,305.65 0.04% 0.65% 16.50% 17.20% 0.0073% NASDAQ OMX GROUPfTHE NDAQ 6,142.58 0.04% 1.65% 8.50% 10.22% 0.0036% NOBLE CORP PLC NE 8,055.21 0.05% 4.72% 19.50% 24.68% 0.0115% NEXTERA ENERGY INC NEE 42,060.15 0.24% 3.00% 4.50% 7.57% 0.0185% NEWMONT MINING CORP NEM 12,694.02 0.07% 0.39% -17.50% -17.14% ..0.0126% NETFLIX INC NFLX 20,508.98 0.12% 0.00% 20.50% 20.50% 0.0244% NEVVFIELD EXPLORATION CO NFX 4,387.24 0.03% 0.00% -1.00% -1.00% ..0.0003% NISOURCE INC Nl 11,251.52 0.07% 2.79% 10.50% 13.44% 0.0088% NIKE INC -CL B NKE 64,656.59 0.38% 1.31% 12.50% 13.89% 0.0522% NIELSEN HOLDINGS NV NLSN 17,396.12 0.10"-!v 1.74% O.IXY'I" 1.74% 0.0018% NORTHROP GRUMMAN CORP NOC 25,830.71 0.15% 2.05% 5.00% 7.11Y-'! .. 0.0107% NATIONAL OIL WELL VARGO INC NOV 35,449.35 0.21% 1.26% 11.50% 12.83% 0.0264% NRG ENERGY INC NRG 10,660.09 0.06% 1.70% 7.00% 8.76% 0.0054% NORFOLK SOUTHERN CORP NSC 29,377.39 0.17% 2.27% 8.50% 10.87% 0.0185% NETAPP INC NTAP 11,868.58 0.07% 1.68% 9.50% 11.26% 0.0078% NORTHERN TRUST CORP NTRS 14,396.33 0.08% 2.19% 9.50% 11.79% 0.0099% NORTHEAST UTILITIES NU 14,641.28 0.09"/v 3.38% 8.00% 11.52% 0.0098% NUCORCORP NUE 16,390.71 0.11Y-'Ao 2.87% 22.00% 25.19% 0.0240% NVIDIA CORP NVOA 10,949.98 0.06% 1.77% 6.50% 8.33% 0.0053% NEWELL RUBBERlMID INC NW\. 8,444.37 0.05% 1.98% 12.50% 14.60% 0.0072% NEWS CORP- CLASS A NWSA N/A NIA N/A NIA NIA N/A OWENS-ILLINOIS INC 01 5,338.38 0.03% 0.00":/o 8.50% 8.50"/o 0.0026% ONEOK!NC OKE 12,830.18 0.07% 3.76% 10.00"A. 13.95% 0.0104% OMNICOM GROUP OMC 18,064.95 0.11Y-'Ao 2.29% 11.50% 13.92% 0.0146% ORACLE CORP ORCL 178,199.30 1.03% 1.21% 9.00% 10.26% 0.1062% O'REILLY AUTOMOTNE INC ORLY 16,134.25 0.09% 0.00% 12.00"/o 12.00% 0.0112% OCCIDENTAL PETROLEUM CORP OXY 78,300.57 0.45% 3.00% 3.50% 6.55% 0.0298% PAYCHEXINC PAYX 14,884.20 0.09"-Ao 3.62% 8.00% 11.76% 0.0102% PEOPLE'S UNITED FINANCIAL PBCT 4,463.78 0.03% 4.54% 14.00% 18.86% 0.0049% PITNEY BOWES INC PBI 5,157.13 0.03% 2.94% 2.00% 4.97% 0.0015% PACCARINC PCAR 23,473.29 0.14% 2.56% 12.50% 15.22% 0.0207% PG&ECORP PCG 20,504.48 0.12% 4.05% 5.00% 9.15% 0.0109% PLUM CREEK TIMBER CO PCL 7,602.15 0.04% 4.10% 12.50"/v 16.86% 0.0074% PRICEUNE GROUP INCfTHE PCLN 62,141.55 0.36% 0.00% 25.50% 25.50% 0.0920% PRECISION CASTPARTS CORP PCP 37,204.25 0.22% 0.05% 13.00% 13.05% 0.0282% PATIERSON COS INC POCO 4,138.23 0.02% 1.96% 11.50% 13.57% 0.0033% PUBLIC SERVICE ENTERPRISE GP PEG 20,117.93 0.12% 3.72% -0.50% 3.21% 0.0038% PEPSICO INC PEP 130,760.10 0.76% 3.06% 8.50% 11.69% 0.0888% PETSMART INC PETM 6,806.49 0.04% 1.20% 11.50% 12.77% 0.0050% PFIZER INC PFE 199,033.70 1.16% 3.39% 10.50% 14.07% 0.1626% PR!NCIPAL FINANCIAL GROUP PFG 13,163.78 0.08% 2.50% 9.5QI.',6 12.12% 0.0093% PROCTER & GN.1BLE COTfHE PG 220,030.80 1.28% 3.17% 7.50% 10.79% 0.1378% PROGRESSIVE CORP PGR 14,263.45 0.08% 2.05% 14.00"/v 16.19% 0.0134% PARKER HANNI FIN CORP PH 18,560.47 0.11% 1.54% 6.50% 8.09"/o 0.0087% PUL TEGROUP INC PHM 7,240.87 0.04% 1.05% 31.50% 32.72% 0.0138% PERKINELMER INC PKI 4,990.46 0.03% 0.63% 8.50% 9.16% 0.0027% PROLOGIS INC PLD 0.00% 3.25% 0.00% 3.25% 0.0000% PALL CORP PLL 9,229.88 0.05% 1.31% 10.50% 11.88% 0.0064% PHILIP MORRIS INTERNATIONAL PM 132,665.80 0.77% 4.50% 7.50% 12.17% 0.0937% PNC FINANCIAL SERVICES GROUP PNC 44,826.32 0.26% 2.28% 7.00% 9.36% 0.0244% PENT AIR L TO-REGISTERED PNR 14,571.50 0.08% 1.34% 16.50% 17.95% 0.0152% PINNACLE WEST CAPITAL PNW 6,188.87 0.04% 4.13% 4.00% 8.21% 0.0030% PEPCO HOLDINGS INC POM 5,353.85 0.03% 5.04% 5.50% 10.68% 0.0033%
Schedule RBH-11 Page 12 of 14

41 [5} [6} jlj [8] (9] Market EsHmated Long· Term Weighted
Comean~ Ticker Ca~alization We!ght in Index Divklend Yield Growth Est DCF Result DCF Resu!\
PPG INDUSTRIES INC PPG 27,624.70 0.16% 1.38% 13.00% 14.47% 0.0232% PPL CORPORATION PPL 21,046.42 0.12% 4.46% 0.00% 4.46% 0.0055% PERRIGO CO PLC PRGO 19,747.49 0.11% 0.28% 13.50% 13.80% 0.0158% PRUDENTIAL FINANCIAL INC PRU 37,765.02 0.22% 2.63% 10.o<Y'A. 12.76% 0.0280% PUBLIC STORAGE PSA 0.00% 3.26% 0.00% 3.26% 0.0000% PHILLIPS 66 PSX 49,503.69 0.29% 1.93% 0.00% 1.93% 0.0055% PVHCORP PVH 9,937.98 0.08% 0.12% 10.50"k 10.63% 0.0061% QUANTA SERVICES INC PWR 7,630.16 0.04% 0.00% 19.50% 19.50% 0.0086% PRAXA!R INC PX 38,458.52 0.22% 2.05% 10.50% 12.66% 0.0283% PIONEER NATURAL RESOURCES CO PXD 28,143.16 0.16% 0.04% 23.00% 23.04% 0.0377% QUALCOMM INC QCOM 131,366.70 0.76% 2.16% 9.50% 11.76% 0.0897% QEP RESOURCES INC QEP 5,769.87 0.03% 0.34% 11.50% 11.86% 0.0040% RYDER SYSTEM INC R 4,371.53 0.03% 1.64% 14.50% 16.26% 0.0041% REYNOLDS AMERICAN INC RAI 29,017.20 0.17% 4.97% 9.50% 14.71% 0.0248% ROWAN COMPANIES PLC-A ROC 3,909.74 0.02% 0.00% 23.00"/~ 23.00% 0.0052% REGENERON PHARMACEUTICALS REGN 28,658.13 0.17% 0.00% 35.50% 35.50% 0.0591% REGIONS FINANCIAL CORP RF 14,204.29 0.08% 1.16% 72.50% 74.08% 0.0611% ROBERT HALF INTL INC RHI 6,060.88 0.04% 1.66% 12.00% 13.76% 0.0048% RED HAT INC RHT 9,406.13 0.05% O.OO"fo 14.50",.(, 14.50% 0.0079% TRANSOCEAN LTD RIG 15,550.91 0.09% 5.19% 13.50% 19.04% 0.0172% RALPH LAUREN CORP RL 13,853.05 0.08% 1.16% 9.00% 10.21% 0.0082% ROCKWELL AUTOfo.\ATION INC ROK 17,714.01 0.10% 1.82% 8.50% 10.40% 0.0107% ROPER INDUSTRIES INC ROP 13,111.33 0.08% 0.61% 11.00% 11.64% 0.0089% ROSS STORES INC ROST 14,604.33 0.08% 1.21% 9.00% 10.26% 0.0087% RANGE RESOURCES CORP RRC 15,291.54 0.09% 0.17% 38.00% 38.20% 0.0339% REPUBliC SERVICES INC RSG 12,510.00 0.07% 3.11% 8.50"./o 11.74% 0.0085% RAYTHEON COMPANY RTN 30,166.84 0.18% 2.52% 9.50% 12.14% 0.0213% STARBUCKS CORP SBUX 53,779.58 0.31% 1.58% 18.50% 20.23% 0.0632% SCANACORP SCG 7,410.96 0.04% 4.00% 5.00% 9.10% 0.0039% SCHWAB (CHARLES) CORP SCHW 35,132.64 0.20% 0.89% 10.50% 11.44% 0.0233% SPECTRA ENERGY CORP SE 26,190.30 0.15% 3.48% 3.00% 6.53% 0.0099% SEALED AIR CORP SEE 6,533.17 0.04% 1.57% 19.50% 21.22% 0.0081% SHERWIN-WILLIAMS COfTHE SHW 20,129.94 0.12% 1.14% 15.50% 16.73% 0.0196% SIGMA-ALDRICH SIAL 11,345.42 0.07% 0.97% 7.50% 8.51% 0.0056% JM SMUCKER COfTHE SJM 10,139.72 0.06% 2.45% 7.50% 10.04% 0.0059% SCHLUMBERGER LTD SLB 133,086.20 0.77% 1.57% 15.00% 16.69% 0.1290% SLM CORP SLM 11,614.92 0.07% 0.00% 8.50% 8.50"/~ 0.0057% SNAP-ON INC SNA 6,817.11 0.04% 1.50% 9.00% 10.57% 0.0042% SAND!SK CORP SNDK 19,210.94 0.11% 1.06% 11.50",.(, 12.62% 0.0141% SCRIPPS NET\rVORKS INTER-CL A SNI 10,979.07 0.06% 1.07% 9.00% 10.12% 0.0065% SOUTHERN COfTHE so 40,522.09 0.24% 4.60% 3.50% 8.18% 0.0192% SIMON PROPERTY GROUP INC SPG 0.00% 3.04% 0.00% 3.04% 0.0000% STAPLES INC SPLS 7,906.14 0.05% 3.96% -1.50% 2.43% 0.0011% STERICYCLE INC SRCL 9,692.62 0.06% 0.00% 11.50% 11.50% 0.0065% SEMPRA ENERGY SRE 23,759.16 0.14% 2.76% 6.00% 8.84% 0.0122% SUNTRUST BANKS INC STI 20,717.90 0.12% 2.06% 26.00% 28.33% 0.0341% ST JUDE MEDICAL INC STJ 18,063.39 0.10% 1.73% 8.50% 10.30% 0.0108% STATE STREET CORP STT 28,535.23 0.17% 1.70% 10.00% 11.79% 0.0195% SEAGATE TECHNOLOGY STX 17,717.89 0.10% 3.19% 6.50% 9.79% 0.0101% CONSTELLATION BRANDS INC-A STZ 15,102.25 0.09% 0.00% 16.50% 16.50% 0.0145% STANLEY BLACK & DECKER INC SWK 13,308.81 0.08% 2.34% 10.00% 12.46% 0.0096% SOUTH'NESTERN ENERGY CO SWN 17,071.61 0.10"-1.> 0.00% 11.00"-/~ 11.00% 0.0109% SAFEWAYINC swr 7,828.00 0.05% 2.65% 8.50% 11.26% 0.0051% STRYKER CORP SYK 29,471.20 0.17% 1.57% 7.50% 9.13% 0.0156% SYMANTEC CORP SYMC 14,225.27 0.08% 2.92% 15.00% 18.14% 0.0150% SYSCOCORP SYY 21,267.97 0.12% 3.19% 8.50% 11.83% 0.0146% AT&T INC T 180,307.90 1.05% 5.36% 7.00% 12.55% 0.1314% MOLSON COORS BREWiNG CO-B TAP 11,325.64 0.07% 2.51% 8.50% 11.12% 0.0073% TERADATACORP TOG 7,327.80 0.04% 0.00% 13.00% 13.00% 0.0055% TECO ENERGY INC TE 3,941.82 0.02% 4.85% 2.00% 6.90% 0.0016% INTEGRYS ENERGY GROUP INC TEG 4,808.81 0.03% 4.49% 3.50% 8.07% 0.0023% TE CONNECTIVITY L TO TEL 24,954.19 0.14% 1.65% 8.50% 10.22% 0.0148% TARGET CORP TGT 38,821.59 0.23% 3.06% 5.50% 8.64% 0.0195% TENET HEALTHCARE CORP THC 4,093.26 0.02% O.Wio 28.00% 28.W/~ 0.0067% TIFFANY &CO TIF 11,338.93 0.07% 1.63% 12.50"-,6 14.23% 0.0094% T JX COMPANIES INC TJX 41,427.29 0.24% 1.20% 12.50% 13.78% 0.0331% TORCHMARK CORP TMK 7,090.08 0.04% 0.96% 5.50% 6.49% 0.0027% THERMO FISHER SCIENTIFIC INC TMD 41,694.53 0.24% 0.52% 11.00% 11.55% 0.0280% TRIPADVISOR INC TRIP 11,861.59 0.07% 0.00% 0.00% O.Wk 0.0000% T ROWE PRICE GROUP INC TROW 21,344.55 0.12% 2.15% 12.50% 14.78% 0.0183% TRAVELERS COS INCfTHE TRV 31,316.56 0.18% 2.48% 9.50% 12.10% 0.0220% TRACTOR SUPPLY COMPANY TSCO 9,313.53 0.05% 0.96% 16.00% 17.04% 0.0092% TYSON FOODS lNC-CL A TSN 14,462.11 0.08% 0.71% 12.00% 12.75% 0.0107% TESORO CORP TSO 7,296.67 0.04% 1.85% 15.50% 17.49% 0.0074% TOTAL SYSTEM SERVICES INC TSS 5,591.92 0.03% 1.36% 9.50% 10.92% 0.0035% TIME WARNER CABLE TWC 39,719.16 0.23% 2.14% 10.00% 12.25% 0.0282% TIME WARNER INC TWX 58,747.80 0.34% 1.94% 12.50% 14.56% 0.0497%
Schedule RBH-11 Page 13 of 14

4 Market
Comearr~· Ticker Caeitalization
TEXAS INSTRUMENTS INC TXN 53,220.06 TEXTRON INC TXT 11,206.21 TYCO INTERNATIONAL LTD TYC 19,416.60 UNITEDHEAL TH GROUP INC UNH 75,670.91 UNUM GROUP UNM 8,699.26 UNION PACIFIC CORP UNP 86,333.88 UNITED PARCEL SERVJCE-CL B UPS 91,735.20 URBAN OUTFITIERS INC URBN 5,297.55 USBANCORP USB 74,176.01 UNITED TECHNOLOGIES CORP UTX 109,067.30 VISA 11\'C-ClASS A SHARES v 162,494.40 VARIAN MEDICAL SYSTEMS INC VAR 8,292.58 VF CORP VFC 26,467.03 VIACOM INC-CLASS B VIAS 37,287.18 VALERO ENERGY CORP VLO 30,628.89 VULCAN MATERIALS CO VMC 8,519.30 VORNADO REALlY TRUST VNO 18,895.59 VERISIGN INC VRSN 6,585.91 VERTEX PHARMACEUTICALS INC VRTX 15,472.09 VENT AS INC VTR VERIZON COMMUNICATIONS INC vz 132,441.80 WALGREEN CO WAG 64,340.99 WATERS CORP WAT 9,677.73 WESTERN DIGITAL CORP WDC 21,282.60 WISCONSIN ENERGY CORP WEC 10,791.95 WELLS FARGO & CO WFC 260,100.60 WHOLE FOODS MARKET INC WFM 18,974.34 WHIRLPOOL CORP WHR 12,218.14 WINDSTREAM HOLDINGS INC WlN 5,358.94 WELLPOINT lf\IC WLP 27,268.59 WASTE MANAGEMENT INC WM 20,100.53 WILLIAMS COS INC WMB 28,228.39 WAL-MART STORES INC WMT 253,881.00 WESTERN UNION CO wu 8,730.28 WEYERHAEUSER CO W'( 16,771.17 WYNDHAM WORLO'NlDE CORP WYN 9,590.60 WYNN RESORTS L TO WYNN 21,458.99 UNITED STATES STEEL CORP X 3,973.76 XCEL ENERGY INC XEL 15,686.09 XL GROUP PLC XL 9,423.42 XILINX INC XLNX 12,701.39 EXXON MOBIL CORP XOM 433,543.30 DENTSPL Y INTERNATIONAL INC XRAY 6,359.18 XEROX CORP XRX 14,247.96 XYLEM INC XYL 6,608.68 YAHOO! INC YHOO 35,700.20 YUM! BRANDS INC YUM 34,017.97 ZIONS BANCORPORA T!ON ZION 5,385.18 ZIMMER HOLDINGS INC ZMH 17,385.88 ZOETIS INC ZTS 14,945.18
Total Market Capitalization: 17,221,275.51 Notes: [1] Equals sum of Col. [9] (2] Source: Bloomberg Professional [3] Equals (1] -[2] !4] Source: Value Line (5] Equals weight in S&P 500 based on market capitalization (6] Source: Value Line [7] Source: Value Line [8] Equals ([6] x (1 + (0.5 x: [7]))) + [7] [9) Equals CoL [5] x Col.[8)
Estimated Long-Term We!ght in !rldex Dividend Yield Growth Est.
0.31% 2.48% 8JXl% 0.07% 0.28% 17.000.·(, 0.11% 1.71% 15.000,{, 0.44% 1.46% 10.00% 0.05% 1.73% 7.50% 0.50% 1.91% 11.00% 0.53% 2.72% 7.50% 0.03% 0.00% 14.50% 0.43% 2.31% 5.50% 0.63% 1.98% 9.5<Y'/o 0.94% 0.80% 18.50% 0.05% 0.00% 6.00% 0.15% 1.75% 11.50% 0.22% 1.41% 13.50% 0.18% 1.77% 15.00% 0.05% 0.31% 0.00"-ho 0.11% 2.91% 6.5QI.'A. 0.04% 0.00% 21.(}(Y'/o 0.09% 0.00% 0.00% 0.00% 4.51% 0.00% 0.77% 4.58% 10.50% 0.37% 1.87% 10.50% 0.06% 0.00% 7.00% 0.12% 1.34% 6.00% 0.06% 3.33% 6.00% 1.51% 2.43% 8.00% 0.11% 1.06% 15.5QI.'/o 0.07% 1.94% 10.50% 0.03% 11.12% 4.00% 0.16% 1.81% 6.50% 0.12% 3.50% 6.50% 0.16% 4.23% 8.00% 1.47% 2.45% 7.50% 0.05% 3.16% 5.00% 0.10% 3.06% 17.00% 0.06% 1.87% 13.50% 0.12% 2.35% 14.00% 0.02% 0.73% 0.00% 0.09"'/o 3.87% 5.50% 0.05% 2.03% 16.00% 0.07% 2.43% 8.50% 2.52% 2.64% 6.00% 0.04% 0.60% 8.50% 0.08% 2.09% 6.00% 0.04% 1.43% 10.50% 0.21% 0.00% to.omr,, 0.20% 2.05% 9.50% 0.03% 0.55% 0.000/o 0.10% 0.88% 9.50% 0.09% 0.97% 0.00%
DCF Result
10.58% 17.30% 16.84% 11.53% 9.29",(, 13.02% 10.32% 14.50% 7.87% 11.57% 19.37% 6.00% 13.35% 15.01% 16.90% 0.31% 9.50%
21.00"-/o OJJO% 4.51% 15.32% 12.47% 7.00% 7.38% 9.43% 10.53% 16.64% 12.54% 15.34% 8.37% 10.11% 12.40% 10.04% 8.24%
20.32% 15.50% 16.51% 0.73% 9.48% 18.19% 11.03% 8.72% 9.13% 8.15% 12.01% 10.00% 11.65% 0.55% 10.42% 0.97%
0.0327% 0.0113% 0.0190% 0.0507% 0.0047% 0.0652% 0.0550% 0.0045% 0.0339% 0.0733% 0.1828% 0.0029% 0.0205% 0.0325% 0.0301% 0.0002% 0.0104% 0.0080% 0.0000% 0.0000% 0.1178% 0.0466% 0.0039% 0.0091% 0.0059% 0.1590% 0.0183% 0.0089% 0.0048% 0.0133% 0.0118% 0.0203% 0.1480% 0.0042% 0.0198% 0.0086% 0.0206% 0.0002% 0.0086% 0.0100% 0.0081% 0.2195% 0.0034% 0.0067% 0.0046% 0.0207% 0.0230% 0.0002% 0.0105% 0.0008% 12.31%
Schedule RBH-11 Page 14 of 14

Bloomberg, Value Line, and Calculated Beta Coefficients
Company
American Electric Power Company, Inc. Cleco Corporation Duke Energy Corporation Empire District Electric Company Great Plains Energy Inc. Hawaiian Electric Industries, Inc. IDACORP, Inc. NextEra Energy, Inc. Northeast Utilities Otter Tail Corporation Pinnacle West Capital Corporation PNM Resources, Inc. Portland General Electric Company Southern Company UniSource Energy Corporation Westar Energy, Inc.
Mean
Notes: [1] Source: Bloomberg Professional Service [2] Source: Value Line
--- [1) Ticker Bloomberg
AEP 0.755 CNL 0.761 DUK 0.642 EDE 0.720 GXP 0.843 HE 0.782 IDA 0.880 NEE 0.717 NU 0.736
OTTR 0.898 PNW 0.815 PNM 0.826 POR 0.830 so 0.612
UNS 0.696 WR 0.749
0.766
[2) Value Line
0.70 0.70 0.70 0.75 0.90 0.80 0.75 0.75 0.75 0.95 0.75 0.95 0.75 0.60 0.70 0.80
0.77
Schedule RBH-12 Page 1 of 1

Capital Asset Pricing Model Results Bloomberg and Value Line Derived Market Risk Premium
Risk-Free Rate
PROXY GROUP BLOOMBERG BETA COEFFICIENT Current 30-Year Treasury (30-day average) [7] 3.60% Near-Term Projected 30-Year Treasury [8] · 4.15% Mean
Risk-Free Rate
PROXY GROUP VALUE UNE AVERAGE BETA COEFFICIENT Current 30-Year Treasury (30-clay average) [7] Near-Term Projected 30-Year Treasury [S] Mean
Notes: [1] See Notes [9] and [10] [2] Source: Schedule RBH-12 [3] Source: Schedule RBH-13 [4] Source: Schedule RBH-13 [5] Equals Col. [1] + (Col. [2] x Col. [3]) [6] Equals Col. [1] +(Col. [2] x Col. [4]) [7] Source: Bloomberg Professional
3.60% 4.15%
.
Average Beta Coefficient
0.766 0.766
Average Beta Coefficient
0.769 0.769
[8] Source: Blue Chip Financial Forecasts, Vol. 33, No. 4, April 1, 2014, at 2
" ~
Ex-Ante Market Risk Premium Bloomberg Value Line
Market DCF Market DCF Derived Derived
10.31% 8.71% 10.31% 8.71%
Ex-Ante Market Risk Premium Bloomberg Value Line
Market DCF Market DCF Derived Derived
10.31% 8.71% 10.31% 8.71%
" " CAPM Result
Bloomberg Value Line Market DCF Market DCF
Derived Derived
11.50% 10.27% 12.05% 10.82% 11.78% 10.55%
CAPM Result Bloomberg Value Line
Market DCF Market DCF Derived Derived
11.53% 10.29% 12.08% 10.84% 11.80% 10.57%
Schedule RBH-13 Page 1 of 1

Bond Yield Plus Risk Premio..m
(1) (2) (3) (4) (5) 30-Year TreasUt)' Risk Retllll on
Constant Slope -2.87% -2.85%
Current Near Term Pr<Y,ected L~ Term Pro;ected
10.00»
I • 8.00;',
-~ ~ s.oo'h .. ~ iX -~ ~
~ 4.00~
2ooa
0.00'.~ ~
-2.00»
Notes: (1) Constant of regression equation (2) Slope of regression equation
Yield Premio..m
I 3.60% 6.60% 4.15% 6.19% 525% 5.52%
30-Yur Treasury Yttld
(3) Source: Current = Bloomberg Professional,
Egui!}:
10.20'.4 10.34% 10.77%
y = -o.02U\W- 0.0237 R' =0.6974
•
Near Term Projected = Blue Chip Financial F()(ecasts, Vol. 33, No. 4, April 1, 2014, at 2, Long Term Projected= Blue Chip Financial F()(ecasts, Vol. 32, No. 12, December 1, 2013, at 14
(4) Equals (1) + ln((2)) x (3) (5) Equals (3) + (4) (6) Source: SNL Financial (7) Source: S NL Financial (excludes Virginia Generation Riders)
ts.oo;s
(8) Source: Bloomberg Professional, equals 201-trading day average (i.e. lag period) as of April 15th, 2014 (9) Equals (7) - (8)
(6) (7) (8) (9) Average
Date of 30-Year Electric Rale Return on TreaSUt)' Risk
Case EQuit~ Yield Premium 0110111980 14.50% 9.36% 5.14% 0110711980 14.39\!. 9.38% 5.01% 0110911980 15.00% 9.40% 5.60% 01114/1980 15. 17% 9.42% 5.75% 0111711980 13.93% 9.44% 4.49% 01123/1980 15.50'1. 9.47% 6 .03% 0113011980 13.86% 9.52% 4 .34% 0113111980 12.61% 9.53% 3 .08% 0210611980 13.71% 9.58% 4.13% 02113/1980 12.80% 9.63% 3.17'.4 02114/1980 13.00'1. 9 .65% 3.35'h 02119/1980 13.50% 9.68% 3.82% 0212711980 13.75'/• 9 .78% 3.97% 02129/1980 13.75% 9.81'h 3.94% 0212911980 14.00\', 9 .81% 4.19% 0212911980 14.77% 9.81% 4.96% 03/0711980 12.70% 9.89% 2.81% 03/14/1980 13.50% 9.97% 3.53% 03/26/1980 14.16% 10.10% 4.06'.4 03/2711980 14.24% 10.12% 4.12% 03/2811980 . 14.50% 10.13% 4.37% 0411111980 12.75'h 10.27% 2.48% 04/1411980 13.85% 10.29% 3.56'.4
Schedule RBH-14 Page 1 of 19
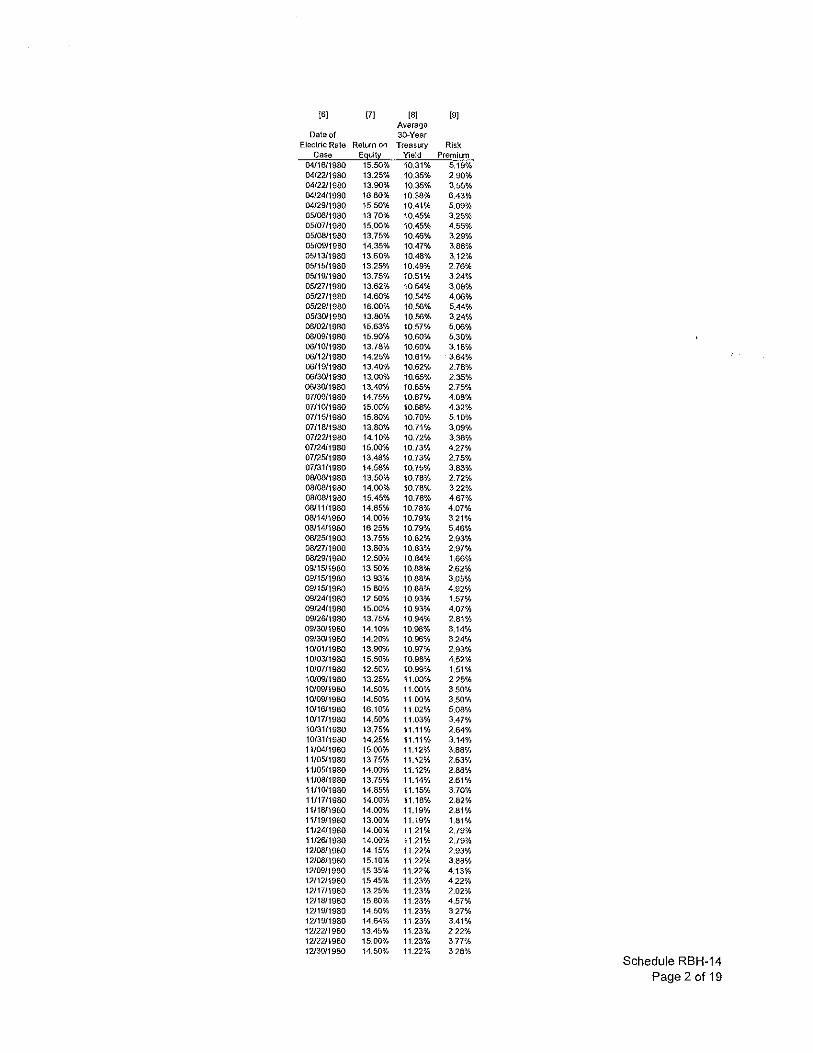
161 171 181 191 Average
Date of 30-.Year Electric Rate Return on Treasl.ll)' Risk
Case Eguit~ Yield Premium 04/16/1980 15.50% 10.31% 5.19% 04122/1980 13.25% 10.35% 2.90% 04122/1980 13.90% 10.35% 3.55% 04/24/1980 16.80% 10.38% 6.43% 04/29/1980 15.50% 10.41% 5.09% 05106/1980 13.70% 10.45% 3.25% 05/07/1980 15.00'h 10.45% 4.55% 05/0811980 13.75% 10.46% 3.2~h
05109/1980 14.35% 10.47% 3.88% 05/13/198{) 13.60% 10.48% 3.12% 05/15/1980 13.25% 10.49% 2.76% 05/19/1980 13.75% 10.51% 3.24% 05/27/1980 13.62% 10.54% 3.08% 05/27/1980 14.60":h 10.54% 4.06% 05/29/1980 16.0CYi.. 10.56% 5.44% 05/3011960 13.80% 10.56% 3.24% 06102/1980 15.63% 10.57% 5.06% 0010911980 15.90% 10.60% 5.30% 06/10/1980 13.78% 10.60% 3.18% 06/12/1980 14.25% 10.61% 3.64% 06/19/1980 13.40% 10.62% 2.78% 06/30/1980 13.00% 10.65% 2.35% 00130/1980 13.40'% 10.65% 2.75% 07/0911980 14.75% 10.67% 4.08% 07/1011980 15.00% 10.68"/;, 4.32% 07/15/1980 15.8o<h 10.70% 5.10% 07/18/1980 13.80% 10.71% 3.09% 07/2211980 14.10% 10.72% 3.3-8% 07/24/1980 15.00% 10.73% 4.27% 07125/1980 13.48% 10.73% 2.75% 07/3111980 14.58% 10.75% 3.83% 08/0811980 13.50% 10.78% 2.72% 08/08/1980 14.00% 10.78% 3.22% 08/08/1980 15.45% 10.78% 4.67% 08111/1980 14.85% 10.78% 4.07% 08/14/1980 14.00% 10.79% 3.21% 0811411980 16.25% 10.79% 5.46% 0812511980 13.75% 10.82% 2.93% 0812711980 13.8fr% 10.83% 2.97% 0812911980 12.50% 10.84% 1.66% 0911511980 13.50% 10.88% 2.62% 09/1511980 13.93% 10.88% 3.05% 09/1511980 15.80% 10.88% 4.92% 0912411980 12.50% 10.93% 1.57% 09!2411980 15.00% 10.93% 4.07% 09126/1980 13.75% 10.94% 2.81% 09/3011980 14.10'"1.> 10.96% 3.14% 09/3011980 14.20% 10.96% 3.24'h 10/0111980 13.90% 10.97% 2.93% 1010311980 15.50% 10.98% 4.52% 10107/1980 12.50-% 10.99% 1.51% 10/0911980 13.25% 11.00% 2.25% 10/09{1980 14.50% 11.00% 3.50'h 10/0911980 14.5lfh 11.00% 3.50% 10/16/1980 16.10% 11.02% 5.08% 10/17/1980 14.50% 11.03% 3.47% 10/3111980 13.75% 11.11% 2.64% 10/3111980 14.25% 11.11% 3.14% 11/04/1980 15.00'"i> 11.12% 3.88% 11J05/198Q 13.75% 11:12% 2.63% 1110.5/198{) 14.00% 11.12% 2.88% 11108/1980 13.75% 11.14% 2.61% 11/1011980 14.85% 11.15% 3.70% 11/1711980 14.00% 11.18% 2.82% 11/18/1980 14.00% 11.19% 2.81% 11119/1980 13.00% 11.19"h 1.81% 11124/198{) 14.00% 11.21% 2.79% 11126/1980 14.00% 11.21% 2.79% 12108/1980 14.15% 11.2"2% 2.93% 12108/1980 15.10% 11.22% 388% 1210911980 15.35% 11.22% 4.13% 1211211980 15.45% 11.23% 422% 12/1711980 13.25% 11.23% 2.02% 12/18/1980 15.80% 11.23% 4.57% 12/19/1980 14.50% 11.23% 327% 12/19/1980 14.64% 11.23% 3.41% 12/22/1980 13.45% 11.23% 222% 12/2211980 15.00',(, 11.23% 3.77% 12/3011980 14.50% 11.22% 328%
Schedule RBH-14 Page 2 of 19

[6] [7] [8] [91 Average
Date of 30~Year
Electric Rate Return oo Treasury Risk Case E9!:!lt:t Yield Premium
1213011980 14.95% 11.22% 3.73% 1213111980 13.39% 11.22% 2.17% 01/0211981 15.25% 11.22% 4.03% 01107/1981 14.30% 11.21% 3.09";1, 01119/1981 15.25% 11.20% 4.05% 01123/1981 13.10% 11.20% 1.90% 01/2311981 14.40% 11.20% 3.20% 01/2811981 15.25% 11.20% 4.05% 01127/1981 15.00% 11.21% 3.79"% 01/3111981 13.47% 11.22% 225% 02/0311981 15.25% 11.23% 4.02% 02/0511981 15.75% 11.25% 4.50% 02/1111981 15.60% 11.28% 4.32% 02120/1981 15.25% 11.33% 3.92% 03/1111981 15.40% 11.49% 3.91% 03/12/1981 14.51% 11.50% 3.01% 03/12/1981 16.00% 11.50% 4.50% 03/13/1981 13.02% 11.52% 1.50% 03/1811981 16.19% 11.55% 4.64% 03/19/1981 13.75% 11.56% 2.19% 03123/1981 14.30% 11.58% 2.72% 03/2511981 15.30% 11.60% 3.70"/.. 04!0111981 14.53% 11.68% 2.85% 04/0311981 19.10% 11.71% 7.39% 04/09/1981 15.00% 11.78% 3.22% 04/09/1981 15.30'";1, 11.78% 3.52% 04/0911981 16.50% 11.78% 4.72% 04/0911981 17.00% 11.78% 5.22% 04/1011981 13.75'1:. 11.80% 1.95% 04/1311981 13.57'1:. 11.82% 1.75% 04/15/1981 15.30'-h 11.85% 3.45% 04/1611981 13.50% 11_87% 1.63% 04/17/1981 14.10% 11.87% 223% 04/21/1981 14.00% 11.90% 2.10% 04/21/1981 16.80'"',(, 11.90% 4.90% 04/24/1981 16.00% 11.95% 4.05% 04/27/1981 12.50% 11.97% 0.53% 04/2711981 13.61% 11.97% 1.64% 0412911981 13.65% 12.00% 1.65% 04/30/1981 13.50% 12.02% 1.48% 0510411981 16.22% 12.05% 4.17% 0510511981 14.40"% 12.07% 2.33% 05/0711981 16.25% 12.11% 4.14% 05/0711981 16.27% 12.11% 4.16% 05/0&'1981 13.00% 12.13% 0.87% 0510&'1981 16.00"'/o 12.13% 3.87% 05/1211981 13.50% 12.16% 1.34% 05/1511981 15.75% 12.22% 3.53% 0511811981 14.88% 12.23% 2.65% 0512011981 16.00% 12.26% 3.74% 0512111981 14.()(}-Z, 12.27% 1.73% 05/26/1981 14.90% 12.30% 2.60% 0512711981 15.00% 12.31% 2.69% 05129/1981 15.50% 12.34% 3.16% 0610111981 16.50% 12.35% 4.15% 0610311981 14.67% 12.37% 2.30% 0610511981 13.00% 12.39% 0.61% 00110/1981 16.75% 12.42% 4.33% 00117/1981 14.40% 12.46% 1.94% 0011811981 16.33% 12.47% 3.86% 0612511981 14.75% 12.51% 2.24% 06/26/1981 16.00% 12.52% 3.48% 06/30/1981 15.25% 12.54% 2.71% 07/0111981 15.50% 12.56% 2.94% 07/0111981 17.50% 12.56% 4.94% 07/10/1981 16.00% 12.62% 3.38% 07/1411981 16.90% 12.64% 4.26% 07/15/1981 16.00% 12.65% 3.35% 07/1711981 15.00% 12.67% 2.33% 07120/1981 15.00% 12.68% 2.32% 07/21/1981 14.00% 12.69% 1.31% 07/2811981 13.48% 12.74% 0.74% 07/3111981 13.50% 12.78% 0.72% 07/3111981 15.00% 12.78% 222% 07/3111981 16.00% 12.78% 3.22% 0810511981 15.71% 12.83% 2.88% 08110/1981 14.50% 12.87% 1.63% 08/11/1981 15.00% 12.88% 2.12% 08120/1981 13.50% 12.95% 0.55%
Schedule RBH-14 Page 3 of 19

[6] [7] [8] [9] Ave raga
Date of 30-Year Electric Rate Return on Treasllfy Risk
" Eguil:[ YJeld Premiu 1/1981 16.50% 12.95% 3.5!
08/24/1981 15.00% 12.97% 2.03% 08/28/1981 15.00% 13.01% 1.99% 09/03/1981 14.50% 13.05% 1.45% 0911011981 14.50% 13.11% 1.39% 09111/1981 16.00% 13.12% 2.88% 09/1611981 16.00% 13.15% 2.85% 09/1711981 16.50% 13.16% 3.34% 09/2311981 15.85% 13.20% 2.65% 09/2811981 15.50',{, 13.23% 227% 10/0911981 15.75% 13.33% 2.42% 10/15/1981 16.25% 13.37% 2.88% 10/16/1981 15.50% 13.38% 2.12% 10/1611981 16.50% 13.38% 3.12% 10/19/1981 14.25% 13.39"1.. 0.86% 10120/1981 15.25% 13.41% 1.84% 10/20/1981 17.00% 13.41% 3.59% 10/2311981 16.00% 13.45% 2.55% 10/27/1981 10.00"-h 13.48% -3.48% 10/29/1981 14.75% 13.51% 1.24% 10/29/1981 16.50';1, 13.51% 2.99% 1110311981 15.17% 13.53% 1.64% 11105/1981 16.60% 13.55% 3.05% 11/0611981 15.17% 13.56% 1.61% 11124/1981 15.50% 13.61% 1.89"% 1112511981 15.25% 13.61% 1.64% 11125/1981 15.35% 13.61% 1.74% 11125/1981 16.10% 13.61% 2.49% 11125/1981 16.10% 13.61% 2.49% 12101/1981 15.70% 13.61% 2.09% 12101/1981 16.00% 13.61% 2.39% 12101/1981 16.49"'1.. 13.61% 2.88% 1210111981 16.50% 13.61% 2.89% 12104/1981 16.00% 13.61% 2.39% 12111/1981 16.25% 13.6-3% 2.62% 1211411981 14.00% 13.6-3% 0.37% 12115/1981 15.81% 13.6-3% 2.18% 12115/1981 16.00% 13.6-3% 2.37% 1211611981 15.25% 13.6-3% 1.62% 1211711981 16.50% 13.63% 2.87% 1211811981 15.45% 13.6-3% 1.82% 12130/1981 14.25% 13.67% 0.58% 1213011981 16.00% 13.67% 2.33% 12130/1981 16.25% 13.67% 2.58% 12131/1981 16.15% 13.67% 2.48% 01104/1982 15.50% 13.67% 1.83% 01/1111982 14.50% 13.72% 0.78% 01/11/1982 17.00% 13.72% 3.28% 01/1311982 14.75% 13.74% 1.01% 01114/1982 15.75% 13.75% 2.00";1, 01/15/1982 15.00% 13.76% 1.24% 0111511982 16.50% 13.76% 2.74% 01f2211982 16.25% 13.79% 2.46% 01127/1982 16.84% 13.81% 3.03% 01/2811982 13.00% 13.81% --0.81% 0112911982 15.50% 13.82% 1.68% 0210111982 15.85% 13.82% 2.03% 02/0311982 16.44% 13.84% 2.60% 0210811982 15.50% 13.86% 1.64% 02111/1982 16.00":;.(, 13.88% 2.12% 02111/1982 16.20% 13.88% 2.32% 02117/1982 15.00% 13.89"1.. 1.11% 02119/1982 15.17% 13.89"h 1.28% 0212611982 15.25% 13.89% 1.36% 03101/1982 15.03% 13.89% 1.14% 03101/1982 16.00% 13.89% 2.11% 0310311982 15.00% 13.88% 1.12% 0310311982 15.00% 13.88% 1.12% 03108/1982 17.10% 13.88% 3.22% 03/12/1982 16.25% 13.88% 2.37% 03/17/1982 !7.30% 13.88% 3.42% 03122/1982 15.10% 13.89% 1.21% 03/27/1982 15.40% 13.89% 1.51% 03/30/1982 15.50% 13.90% 1.60'1.. 03/3111982 17.00% 13.91% 3.09% 0410111982 14.70% 13.91% 0.79% 0410111982 16.50% 13.91% 2.59":-h 04/02/1982 15.50% 13.91% 1.59% 04/0-5/1982 15.50% 13.92% 1.58%
Schedule RBH-14 Page 4 of 19

[6] [7[ [8] ]9] Average
Date of 30-Year Electric Rate Return on Treasury Risk
Case E~ill Yield Premium 04108/1982 16.40% 13.93% 2.47% 04113/1982 14.50% 13.94% 0.55% 04123/1982 15.75% 13.94% 1.81% 04/27/1982 15.00% 13.94% 1.06% 04128/1962 15.75% 13.94% 1.81% 04/30/1982 14.70% 13.94% 0.76% 04/30/1982 15.50% 13.94% 1.56% 05/03/1982 16.60% 13.94% 2.65% 05/04/1982 16.00% 13.94% 2.05% 05(14/1982 15.50% 13.92% 1.58% 05{1811982 15.42% 13.92% 1.50% 05/1911982 14.69% 13.92% 0.77% 05/20/1982 15.00% 13.91% t.OS"h 05/2011982 15.10% 13.91% US% 05/20/1982 15.50% 13.91% 1.59'% 05/20/1982 16.30% 13.91% 2.39'% 05/2111982 17.75% 13.91% 3.84% 0512711982 15.00% 13.89% 1.11% 05/28/1982 15.50% 13.89% 1.61% 05/28/1982 17.00% 13.89% 3.11% 06/0111982 13.75% 13.89% -0.14% 0610111982 16.60% 13.89% 2.71% 06/09/1982 17.86% 13.88% 3.98% 0611411982 15_75% 13.88% 1.87% 0611511982 14.85% 13.88% 0.97% 0611811982 15.50-'h 13_87% 1.63% 06121!1982 14.90% 13.87% 1.03% 06/2311982 16.00-":h 13.86% 2.14% 06/2311982 16.17% 13.86% 2.31% 06/24!1982 14.85% 13.86% 0_99% 06/25/1982 14.70% 13.86% 0_84% 07101!1982 16.00% 13.84% 2.16% 07/0211982 15.62% 13.84% 1.78% 07/02/1982 i7.00% 13.84% 3.16% 07/1311982 14.00% 13.82% 0_18% 07/1311982 16.80% 13.82% 2.98% 07/14/1982 15.76% 13.82% 1.94% 07/14/1982 16.02% 13.82% 22G-% 07/19/1982 16.50% 13.80% 2.70% 07122/1982 14.5o-% 13.77% 0.73% 07/22/1982 17.00% 13.77% 3.23% 07/27/1982 16.75% 13.75% 3.00% 07/29/1982 16.50% 13.74% 2.76% 08111/1982 17.50% 13.68% 3.82% 0811811982 17.07% 13.6-3% 3.44% 08120/1982 15.73% 13.60% 2.13% 08/25/1982 16.00':h 13.57% 2.43% 08/26/1982 15.50":h 13.56% 1.94% 08/3011982 15.00% 13.55% 1.45% 09/0311982 16.20% 13.53% 2.67% 09/08/1982 15.00-":h 13.52% 1.48% 09/15/1982 13.08% 13.50% -0.42% 09/15/1982 16.25% 13.50"-1.. 2.75% 09/16/1982 16.00% 13.50% 2.50% 09117/1982 15.25% 13.50% 1.75% 09/2311982 17.17% 13.47% 3.70% 09/24/1982 14.50% 13.45% 1.04% 09/2711982 15.25% 13.45% 1.79% 10/01!1982 15.50% 13.42% 2.08% 1011511982 15.90% 13.32% 2.58% 10/2211982 15.75% 13.24% 2.51% 10/2211982 17.15% 13.24% 3.91% 10/29/1982 15.54% 13.16% 2.38% 11/01/1982 15.50% 13.15% 2.35% 11/0311982 17.20% 13.13% 4.07% 11/04/1982 16.25% 13.11% 3.14% 1110511982 16.20'h 13.09% 3.11% 11/09/1982 16_00% 13.05% 2.95% 11/23/1982 15.50% 12.89% 2.61% 11/23/1982 15.85% 12.89% 2.96% 11/30/1982 16.50% 12.81% 3.69% 12101/1982 17.04% 12.79% 425% 12106/1982 15.00% 12.73% 227% 12/0011982 16.35% 12.73% 3.62% 12/10/1982 15.50% 12.66% 2.84% 12113/1982 16.00% 12.65% 3.35% 12114/1982 15.30% 12.63% 2.67% 12114/1982 16.40% 12.63% 3.77% 12120/1982 16.00% 12.57% 3.43%
Schedule RBH-14 Page 5 of 19

[6) [7) [8) [9) Average
Date of 30-Year Electric Rate Return on Treasury Ris,l(
Case E~tz: Yield Premium 12/2111982 14.75% 12.56% 2.19% 12/21{1982 15.85% 12.56% 329% 1212211982 16.25% 12.54% 3.71% 12/2211982 16.58% 12.54% 4.04% 12/22/1982 16.75% 12.54% 4.21% 12/29{1982 14.00% 12.48% 2.42% 12/29/1982 16.25% 12.48% 3.77% 12/30/1982 16.00% 12.47% 3.53% 12130/1982 16.35% 12.47% 3.88% 12/30/1982 16.77% 12.47% 4.30% 01105/1983 17.33% 12.40% 4.93% 0111111983 15.90% 12.34% 3.56% 0111211983 14.63% 12.33% 2.30% 0111211983 15.50"'1.. 12.33% 3.17% 01/20/1983 17.75% 12.24% 5.51% 01/2111983 15.00% 12.22% 2.78% 01/24/1983 14.50% 12.21% 2.29% 01(24/1983 15.50% 12.21% 3.29% 01/25/1983 15.85% 12.19% 3.66% 01/27/1983 16.14% 12.17% 3.97% 02/01/1983 18.50% 12.13% 6.37% 02/0411983 14.00% 12.10% 1.00% 02/10/1983 15.00% 12.06% 2.94% 02121/1983 15.50% 11.98% 3.52% 02/22/1983 15.50% 11.97% 3.53% 02/23/1983 15.10% 11.96% 3.14% 02123/1983 16.00% 11.96% 4.04% 03/0211983 15.25% 11.89% 3.36% 03/09/1983 15.20'":h 11.62% 3.38% 03/1511983 13.00'"-i:. 11.77% 1.23% 03/Hl/1983 15.25% 11.73% 352% 03/23/1983 15.40% 11.69"/., 3.71% 03124/1983 15.00% 11.67% 3.33% 0312911983 15.50% 11.63% 3.67% 03/30/1983 16.71% 11.61% 5.10% 03/31(1983 15.00% 11.59% 3.41% 04(04(1983 15.20'h 11.58% 3.62% 04/0011983 15.50% 11.51% 3.99% 04/1111983 14.81% 11.49% 3.32% 04(19/1983 14.50% 11.38% 3.12% 04/20/1983 16.00% 11.36% 4.64% 04/29/1983 16.00% 11.24% 4.76% 05/0111983 14.50% 11.24% 3.26% 05/09/1983 15.50% 11.15% 4.35% 05/1111983 16.46% 11.12% 5.34% 05/1211983 14.14% 11.11% 3.03% 05/18/1983 15.00% 11.05% 3.95% 05123/1983 14.90% 11.01°1.. 3.89% 05/23/1983 15.50% 11.0t<h 4.49% 05/25/1983 15.50% 10.98% 4.52% 05/27/1963 15.00% 10.96% 4.04% 05/3111983 14.00% 10.95% 3.05% 05/31/1983 15.50% 10.95% 4.55% 0610211983 14.Wh 10.93% 3.57% 06117/1983 15.03% 10.!Wh 4.19% 07/0111983 14.80% 10.78% 4.02% 07/01/1983 14.90% 10.78% 4.12% 07/08/1983 16.25% 10.76% 5.49% 07/13/1983 13.20% 10.75% 2.45% 07119/1983 15.00% 10.74% 4.26% 07/19/1983 15.10% 10.74% 4.36% 07/25/1983 16.25% 10.73% 5.52% 07/28J1983 15.90% 10.74% 5.16% 08103/1983 16.34% 10.75% 5.59% 08103/1983 16.50% 10.75% 5.75% 08/19/1983 15.00% 10.80% 420"k 08/2211983 15.50% 10.80% 4.70% 0812211983 16.40% 10.80% 5.60% 0813111983 14.75% 10.84% 3.91% 09/07/1983 15.00% 1086% 4.14% 09/14/1983 15.78% 10.89% 4.89% 09/16/1963 15.00% 10.90% 4.10% 09/19/1983 14.50% 10.91% 3.59% 09/20/1963 16.50% 10.91% 5.59% 09!28/1983 14.50% 10.S4% 3.56% 09!29/1963 15.50% 10.95% 4.55% 09!3011983 15.25% 10.95% 4.30% 09/3011983 16.15% 10.95% 5.20% 10!04/1983 14.80% 10.96% 3.84%
Schedule RBH-14 Page 6 of 19
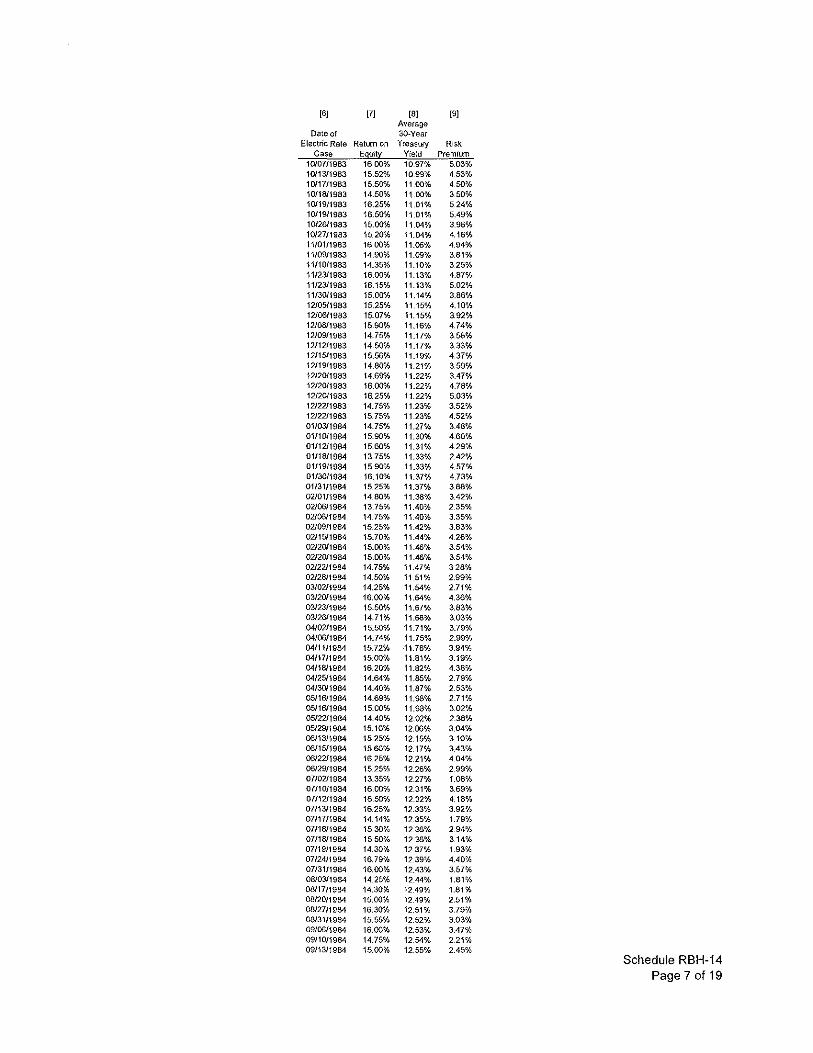
[6] [7] [8] [9] Average
Date of 30-Year Electric Rate Return on TreaslH)' Ris.ll.
Case E~!fl:t Yield Pre-mium 10/07/1983 16.00% 10.97% 5.03% 10/13/1983 15.52% 10.99"% 4.53% 10/17/1983 15.50% 11.00% 4.50% 10/18/1983 14.50% 11.00% 3.50% 10/19/1983 16.25% 11.01% 5.24% 10/19/1983 16.50% 11.01% 5.49% 10/26/1983 15.00% 11.04% 3.96% 10/27/1983 15.20% 11.04% 4.16% 11101/1983 16.00% 11.06% 4.94% 11109/1983 14.90% 1t.W% 3.81% 11110/1983 14.35% 11.10% 325% 11/23/1983 16.00% 11.13% 4.87% 11/2311983 16.15% 11.13% 5.02% 11/30/1983 15.00% 11.14% 3.86% 12/0511983 15.25% 11.15% 4.10% 12/06/1983 15.07% 11.15% 3.92% 12/08/1983 15.90% 11.16% 4.74% 12/09/1983 14.75% 11.17% 3.5$% 12/12/1983 14.50'1:, 11.17% 3.33% 12/1511983 15.56% 11.19% 4.37% 12/19/1983 14.80'"1.> 11.21% 3.59% 12120/1983 14.69"h 11.22% 3.47% 12120/1983 16.00% 11.22% 4.78% 12/20/1983 16.25% 11.22% 5.03% 12/2211983 14.75% 11.23% 3.52% 12122/1983 15.75% 11.23% 4.52% 0110311984 14.75% 11.27% 3.48% 01110/1984 15.90% 11.30"'/0 4.60% 01112/1984 15.60"h 11.31% 4.29",{, 01118/1984 13.75% 11.33% 2.42% 0111911984 15.90'"-J.. 11.33% 4.57% 01130/1984 16.10% 11.37% 4.73% 01131!1984 15.25% 11.37% 3.88% 02101!1984 14.80% 11.38% 3.42% 02/06/1984 13.75% 11AO% 2.35% 02/0611984 14.75% 11.40% 3.35% 02/09/1984 15.25% 11.42% 3.83% 02/15/1984 15.71}% 11.44% 426% 02/20/1984 15.00% 11.46% 3.54% 02/20/1984 15.00% 11.45% 3.54% 02/2211984 14.75% 11.47% 328% 02/28/1984 14.50% 11.51% 2.99% 03/0211984 14.25% 11.54% 2.71% 03/20/1984 16.00% 11.64% 4.36% 0312311984 15.50% 11.67% 3.83% 03/26/1984 14.71% 11.68% 3.03% 04/02/1984 15.50% 11.71% 3.79% 04/06/1984 14.74% 11.75% 2.99% 0411111984 15.72% 11.78% 3.94% 04/17/1984 15.00% 11.81% 3.19% 04/18/1984 16.20% 11.82% 4.38% 04125/1984 14.64% 11.85% 2.79% 04130/1984 14.40"-h 11.87% 2.53% 05/16/1984 14.69% 11.98% 2.71% 05/16/1984 15.00% 11.98% 3.02% 05122/1984 14.40% 12.02% 2.38% 05129!1984 15.1lfh 12.06% 3.04% 06/1311984 15.25% 12.15% 3.10% 06/1511984 15.60% 12.17% 3.43% 06/22/1984 16.25% 12.21% 4.04% 06/29/1984 15.25% 12.25% 2.99% 07/02/1984 13.35% 12.27% 1.08% 07/10/1984 16.0!Y':h 12.31% 3.69% 07/12/1984 16.50% 12.32% 4.18% 07/1311984 16.25% 12.33% 3.92% 07/17{1984 14.14% 12.35% 1.79% 07/18/1984 15.30% 12.36% 2.94% 07/18/1984 15.50% 12.36% 3.14% 07/19/1984 14.30% 1237% 1.93% 07/24/1984 16.79% 12.39% 4.40% 07/3111984 16.00% 12.43% 3.57% 0810311984 14.25% 12.44% 1.81% 08117/1984 14.30% 12.49":/., 1.81% 08/20/1984 15.00% 12.49% 2.51% 08127/1984 16.30% 12.51% 3.79% 08131{1984 15.55% 12.52% 3.03% 09/06/1984 16.00% 12.53% 3.47% 09/10!1984 14.75% 12.54% 221% 09/1311984 15.00% 12.55% 2.45%
Schedule RBH-14 Page 7 of 19

[61 [71 [81 [91 Average
Date of 30-Year Electric Rate Return on Treasury Risk
Case E~i!l Yield Premium 09/1711984 17.38% 12.56% 4.82% 09126/1984 14.50% 12.57% 1.93% 09/281\984 15.00% 12.57% 2.43% 0912811984 16.25% 12.57% 3.68% 10/0911984 14.75% 12.58% 2.17% 10/1211984 15.60% 12.59% 3.01% 10/221l984 15.00% 12.59% 2.41% 10126/1984 16.40% 12.58% 3.82% 10/3111984 16.25% 12.58% 367% 11/07/1984 15.60% 12.58% 3.02% 1110911984 16.00% 12.58% 3.42% 1111411984 15.75% 12.58% 3.17% 11120/1984 15.25% 12.58% 2.67% 11120/1984 15.92% 12.58% 3.34% 11/2311984 15.00% 12.58% 2.42% 11128/1984 16.15% 12.57% 3.58% 12/0311984 15.80"'h 12.56% 3.24% 12/04/1984 16.50% 12.56% 3.94% 12/1811984 16.40% 12.53% 3.87% 12/19/1984 14.75% 12.53% 2.22% 1211911984 15.00% 12.53% 2.47% 12/20/1984 16_00% 12.53'h 3.47% 12/28/1984 16.00% 12.50% 3.50% 0110311985 14.75% 12.49% 2.26% 01/10/1985 15.75% 12.47% 3_28% 01111/1985 16.30% 12.46% 3.84% 01/23/1985 15.80% 12.43% 3.37% 01/24/1985 15.82% 12.43% 3.39% 01/25/1985 16.75% 12.42% 4.33% 01130/1985 14.90% 12.40"1, 2.50% 0113111985 14.75% 12.39% 2.36% 02/08/1985 14.47% 12.35% 2.12% 03101/1985 13.84% 12.31% 1.53% 03108/1985 16.85% 1228% 4.57% 03/1411985 15.50% 12.25% 3.25% 03115/1985 15.62% 12.25% 3.37% 03129(1985 15.62% 12.17% 3.45% 04103/1985 14.60% 12.14% 2.46% 04/0911985 15.50% 12.11% 3.39% 0411611985 15.70% 12.06% 3.64% 04/22/1985 14.00% 12.02% 1.98% 04/2611985 15.50% 11.98% 3.52% 04/29/1985 15.00% 11.97% 3.03% 05/02/1985 14.68% 11.94% 2.74% 05/0811985 15.62"h 11.89% 3.73% 05/10/1985 16.50% 11.87% 4.63% 05/2911985 14.61% 11.73% 2.88% 05/3111985 16.00% 11.71% 4.29% 06/1411985 15.50% 11.61% 3_89% 07109/1985 15.00% 11.45<;, 3.55% 07/1611985 14.50% 11.39% 3.11% 07/2611985 14.50% 11.33% 3.17% 08102/1985 14.80% 11.29% 3_51% 08107/1985 15.00"/o 11.27% 3.73% 08/2811985 14.25% 11.15% 3.10% 0812811985 15.50% 11.15<;, 4.35% 08129/1985 14.50% 11.15% 3_35% 09/09/1985 14.60% 11.11% 3.49% 09/09/1985 14.90% 11.11% 3.79% 09/17f1985 14.90% 11.08% 3.82% 09123/1985 15.00% 11.06% 3.94% 0912711985 15.50"-i> 11.05% 4.45% 09127/1985 15.80% 11.05% 4.75% 10102/1985 14.00% 11.03% 2.97% 10/02/1985 14.75% 11.03% 3.72% 10/03/1985 15.25% 11.03% 422% 10124/1985 15.40% 10.96% 4.44% 10/24/1985 15.82% 10.96% 4.86% 10/24/198-5 15.85% 10.96',{, 4.89% 1012811985 16.00% 10.95% 5.05% 10/29/1985 16.65% 10.94% 5.71% 1013111985 15.06% 10.93% 4.13% 11/04/1985 14.50'/, 10.92% 3.58% 11/07/1985 15.50% 10.90% 4.60% 11108/1985 14.30% 10.89% 3.41% 12/1211985 14.75% 10.73% 4.02% 12/18/1985 15.CXW, 10.69% 4.31% 12/20!1985 14.50% 10.67% 3.83% 12/2011985 14.50% 10.67% 3_83%
Schedule RBH-14 Page 8 of 19

[6) [7) [8) [9) Average
Date of 30.-Year Electric Rate Return on Treasury Risk
Case E~ll Yield Premium 12/20/1985 15.00% 10.67% 4.33% 01124/1986 15.40% 10.41% 4_99% 01/3111966 15.00% 10.35% 4.65% 02/05/1986 15_00% 10.32% 4.68% 02/05/1986 15.75% 10.32% 5.43% 02/10/1986 13.30% 10.29% 3.01% 0211111986 12.50"h 10.28% 222% 02/1411986 14.40% 10.24% 4.16•,(, 0211811986 16.00% 10.23% 5.77% 02/2411986 14.50% 10.18% 4.32% 02/26/1986 14.00% 10.15% 3.85% 03/05/1986 14.90% 10.08% 4.82% 03/1111986 14.50% 10.02% 4.48% 03/12/1986 13.50% 10.00% 3.50% 03127/1986 14.10% 9.86% 4.24% 0313111986 13.50% 9.84% 3.66% 04!0111986 14.Wh 9.83% 4.17% 04!02/1966 15.5o<h 9.81% 5.69% 04/04/1986 15.00% 9.78% 5.22% 04114/1986 13.40% 9.69% 3.71% 04123/1986 15.00% 9.57% 5.43% 0511611986 14.50% 9.32% 5.18% 05/16/1986 14.50-"h 9.32% 5.18% 0512911986 13.90"1, 9.19% 4.71% 05130/1986 15.10"'1.. 9.18% 5.92% 06102/1986 12.81% 9.17% 3.64% 0611111986 14.00",(, 9.07% 4.93% 06124/1986 16.63% 8_94% 7.69% 06126/1986 12.00% 8.91% 3.09% 06126/1986 14.75% 8.91% 5.84% 06130/1986 13.00% 8.87% 4.13% 07/10/1986 14.34% 8.75% 5.59% 07/1111986 12.75% 8.73% 4.02% 07/14/1986 12.60% 8.71% 3.89"-h 07/1711986 12.40% 8.66% 3.74% 07125/1986 14.25% 8.57% 5.68% 08106/1986 13.50% 8.44% 5.06% 08/1411986 13.50% 8.35% 5.15% 09/16/1986 12.75% 8.06% 4.69"-h 09/19/1986 13.25% 8.03% 5.22% 1010111986 14.00% 7.95% 6.05% 10/03/1986 13.40% 7.93% 5.47% 10/31/1986 13.50% 7.77% 5.73% 11/0511986 13.00% 7.75% 5.25% 12/0311986 12.90% 7.58% 5.32'h 12104/1986 14.44% 7.58% 6.8-6% 12/16/1986 13.60% 7.52% 6.08% 12/2211986 13.80% 7.51% 6.29"-h 12130/1986 13.00% 7.49% 5.51% 0110211987 13.00% 7.49% 5.51% 01/1211987 12.40"1.. 7.47% 4.93% 0112711987 12.71% 7.46% 5.25% 03/0211987 12.47% 7.47% 5.00% 03(0311987 13.60% 7.47% 6.13% 03104/1987 12.38% 7.47% 4.91% 03{10/1987 13.50% 7.47% 6.03% 03/1311987 13.00% 7.47% 5.53% 0313111987 13.00% 7.46% 5.54% 04!0611987 13.00% 7.47% 5.53% 04/14/1987 12.50% 7.49% 5.01% 04/16/1987 14.50% 7.50% 7.0lfh 04127/1987 12.00% 7.54% 4.46% 0510511987 12.85% 7.58% 5.27% 05/1211987 12.65% 7.62% 5.03°h 0512811987 13.50% 7.70% 5.80% 06/15/1987 13.20% 7.78% 5.42% 06129/1987 15.00% 7.83% 7.17% 06130/1987 12.50% 7.84% 4.66% 07/08(1987 12.00% 7.86% 4.14% 07/1011987 12.90% 7.86% 5.04% 07/1511987 1350% 7.88% 5.62% 0711611987 13.50% 7.88% 5.62% 07/16/1987 15.00% 7.88% 7.12% 07127/1987 13.00",{, 7.92% 5.08% 0712711987 13.40% 7.92% 5.48% 07/27/1987 13.50% 7.92% 5.58% 07/3111987 12.98% 7.95% 5.03% 08/2011987 12.63% 8.06% 4.57% 08/26/1987 12.75% 8.00% 4.69%
Schedule RBH-14 Page 9 of 19

[6} [7} [8} [9) Average
Date of 30-Year Electrk: Rate Return on Treasury Risk
Case E9ui!l Y1eld Premium 00127/1987 13.25% 8.06% 5.19% 09/09/1S87 13.00% 8.14% 4.86% 09130/1987 12.75% 8.31% 4.44% 0913011987 13.00% 8.31% 4.69% 10/02/1987 11.50"/o 8.33% 3.17% 1011511987 13.00% 8.43% 4.57% 11102/1987 13.00% 8.55% 4.45% 11/19/1987 13.00'io 8.64% 4.36% 11130{1987 12.00% 8.68% 3.32% 1210311987 14.20% 8.70% 5.50% 12115/1987 13.25% 8.77% 4.48% 12/1611987 13.50% 8.78% 4.72% 12/1611987 13.72% 8.78% 4.94% 12/17/1987 11.75% 8.79% 2.00% 12/18/1987 13.50% 8.80% 4.70% 12/2111987 12.01% 8.81% 3.20% 12/22/1987 12.00% 8_81% 3.19% 1212211987 12.00% 8.81% 3.19% 12/22/1987 12.75% 8.81% 3.94% 12122/1987 13.00% 8_81% 4.19% 01/20/1988 13.80% 8.94% 4.86% 01/2£/1988 13.90% 8.95% 4.95% 01/29/1988 13.20";1; 8.96% 4.24% 02/04/1988 12.60"1.. 8.96% 3.64% 03101/1988 11.56% 8.94% 2.62% 0312311988 12.87% 8.92% 3.95% 0312411988 11.24% 8.92% 2.32% 0313011988 12.72% 8.92% 3.80% 04/0111988 12.50% 8.92% 3.58% 0410711988 13.25% 8.93% 4.32% 0412511988 10.96% 8.96% 2.00% 0510311988 12.91% 8.97% 3.94% 05/1111988 13.50% 8.99% 4.51% 05/1611988 13.00% 8.99% 4.01% 0613011988 12.75% 9.00% 3.75% 07/01/1988 12.75% 8.99% 3.76% 07/20/1988 13.40% 8.95% 4.44% 08105/1988 12.75% 8.92% 3.83% 0812311988 11.70% 8.93% 2.77% 08129/1988 12.75% 8.94% 3.81% 0813011988 13.50% 8.94% 4.56% 09/0811988 12.60"1. 8.95% 3.65% 10/1311988 13.10% 8.93% 4.17% 1211911988 13.00% 9.02"/, 3.98% 12120/1988 12.25% 9.02% 3.23% 12120/1988 13.00% 9.02% 3.98% 1212111988 12.90% 9.02% 3.88% 12127/1988 13.00% 9.03% 3.97% 12128/1988 13.10% 9.03% 4.07% 1213011988 13.40% 9.04% 4.36% 01/27/1989 13.00% 9.05% 3.95% 01/3111989 13.00% 9.05% 3.95% 0211711989 13.00% 9.05% 3.95% 02120/1989 12.40% 9.05% 3.35% 03/01/1989 12.76% 9.05% 3.71% 03108/1989 13.00% 9.05% 3.95% 0313011989 14.00'-h 9.05% 4.95% 04/0511989 14.20% 9.05% 5.15% 04118/1989 13.00% 9.05% 3.95% 05/05/1989 12.40% 9.05% 3.35% 0610211989 13.20% 9.00% 4.20% 0610811989 13.50% 8.98% 4.52% 06127/1989 13.25% 8.91% 4.34% 0613011989 13.00% 8.90% 4.10% 08114/1989 12.50% 8.77% 3.73% 0912811989 12.25% 8.63% 3.62% 10/24/1989 12.50% 8.54% 3.96% 11/09/1989 13.00% 8.49% 4.51% 12115/1989 13.00% 8.34% 4.66% 12120/1989 12.90% 8.32% 4.58% 12121/1989 12.90% 8.31% 4.59% 12127/1989 12.50% 8.29% 4.21% 1212711989 13.00% 829% 4.71% 0111011990 12.80% 8.24% 4.56% 0111111990 12.90% 824% 4.66% 0111711990 12.80% 8 22% 4.58% 0112611990 12.00% 8.20% 3.80% 02109/1990 12.10% 8.17% 3.93% 02124/1990 12.86% 8.15% 4.71%
Schedule RBH-14 Page 10 of 19
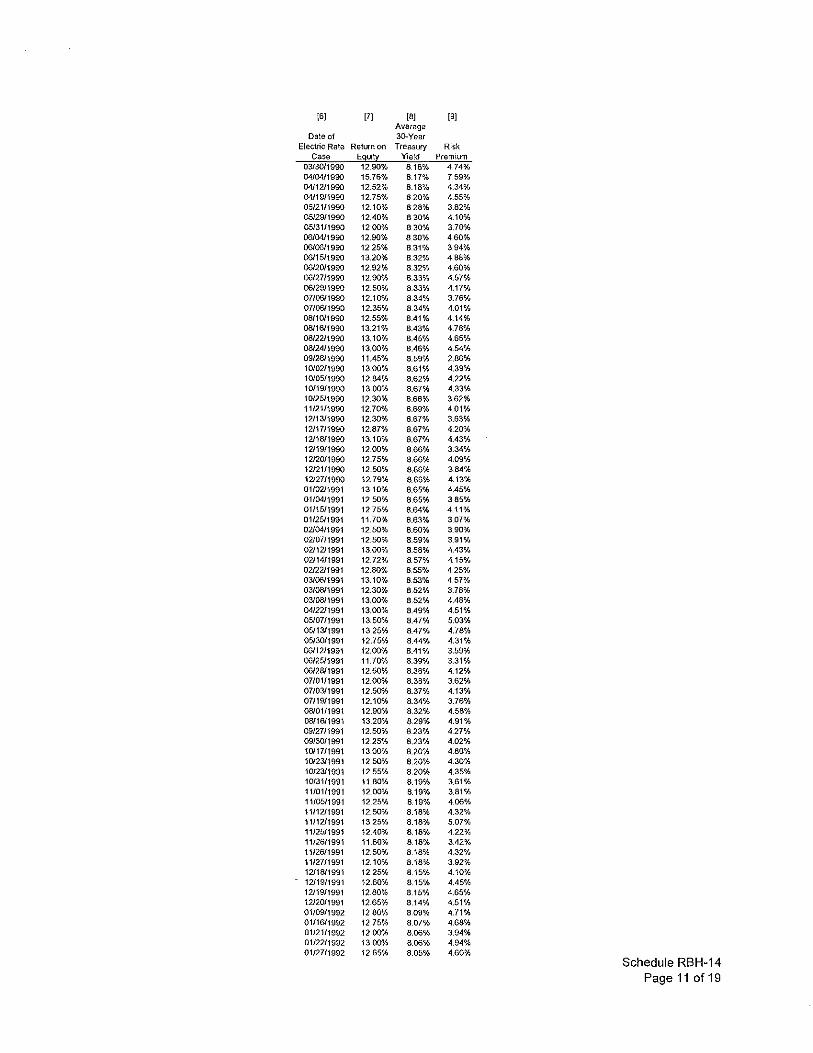
161 171 181 191 Average
Date of 30-Year Electric Rate Return on Treasury Risk
Case E~!l Yield Premium 03130/1990 12.90% 8.16% 4.74% 04/04/1990 15.76% 8.17% 7.59% 04/12/1990 12.52% 8.18% 4.34% 04/19{1990 12.75% 8.20% 4.55% 0512111990 12.10% 828% 3.82% 0512911990 12.40% 8.30% 4.10% 0513111990 12.00% 8.30% 3.70% 0610411990 12.90% 830% 4.60% 06106/1990 1225% 8.31% 3.94% 06/15/1990 13.20% 8.32% 4.88% 0512011990 12.92% 8.32% 4.60% 06127/1990 12.90% 8.33% 4.57% 06/29/1990 12.50% 8.33% 4.17% 07/06/1990 12.10% 8.34% 3.76% 07/06/1990 12.35% 8.34% 4.01% 08110/1990 12.55% 8.41% 4.14% 08116/1990 13.21% 8.43% 4.78% 08/2211990 13.10'h 8.45% 4.65% 08/24/1990 13.00% 8.46% 4.54% 09/26/1990 11.45% 8.59% 2.86% 10/0211990 13.00% 8.61% 4.39% 10/0511990 12.84% 8.62% 4.22% 10/1911990 13.00"1.. 8.67% 4.33% 10/25/1990 12.30% 8.68% 3.62% 1112111990 12.7o<'h 8.69",{, 4.01% 12/1311990 12.30% 8.67% 3.63% 12/17/19"90 12.87% 8.67% 4.20"'h 12118/19"90 13.10% 8.67% 4.43% 12/19119"90 12.00% 8.66% 3.34% 12/20/1990 12.75% 8.66% 4.09% 12/21119"90 12.50% 8.66% 3.84% 12/27/1990 12.79% 8.66% 4.13% 01/02/1991 13.10% 8.65% 4.45% 01104/1991 12.50% 8.65% 385% 01/15/1991 12.75% 8.64% 4.11% 01125/1991 11.70% 8.63% 3.07% 02104/1991 12.50% 8.60% 3.90% 02/0711991 12.50% 8.59% 3.91% 02/12/1991 13.00% 8.58% 4.43% 02114/1991 12.72% 8.57% 4.15% 02/22/1991 12.80% 8.55% 425% 0310611991 13.10% 8.53% 4.57% 0310811991 12.30% 8.52% 3.78% 03108./1991 13.00% 8.52% 4.48% 04/2211991 13.00% 8.49% 4.51% 0510711991 13.50% 8.47% 5.03% 0511311991 13.25% 8.47% 4.78% 05130/1991 12.75% 8.44% 4.31% 06112/1991 12.00% 8.41% 3.59% 0612511991 11.70% 8.39% 3.31% 0612811991 12.50% 8.38% 4.12% 07/0111991 12.00% 8.38% 3.62% 07/0311991 12.50% 8.37% 4.13% 07/19/1991 12.10% 8.34% 3.76% 0810111991 12.90% 8.32% 4.58% 0811611991 13.20% 8.29% 4.91% 09/27(1991 12.50% 8.23% 4.27% 0913011991 12.25% 8.23% 4.02% 10117/1991 13.00% 8.20"i> 4.80% 10/23/1991 12.50% 8.20% 4.30% 10123/1991 12.55% 8.20% 4.35% 1013111991 11.80% 8.19% 3.61% 1110111991 12.00% 8.19% 3.81% 11105/1991 12.25% 8.19% 4.06% 11112/1991 12.50% 8.18% 4.32% 1111211991 13.25% 8.18% 5.07% 11125/1991 12.40% 8.18% 422% 11/2611991 11.60% 8.18% 3.42% 1112611991 12.50% 8.18% 4.32% 11127/1991 12.10% 8.18% 3.92% 12/18/1991 12.25% 8.15% 4.10% 12/1911991 12.60% 8.15% 4.45% 12/19/1991 12.80% 8.15% 4.65% 12120/1991 12.65% 8.14% 4.51% 01/09/1992 12.80% 8.09% 4.71% 01116/1992 12.75% 8.07% 4.68% 0112111992 12.00% 8.06% 3.94% 01/2211992 13.00% 8.06% 4.94% 01/2711992 12.65% 8.05% 4.60%
Schedule RBH-14 Page 11 of19

[6] [7) [8) [9) Average
Date of 30-Year Electric Rate Return on Treasl..lfY Risk
Case Eguit~ Yield Premium 01/3111992 12.00% 8.04% 3_96% 02/11{1992 12.40% 8.03% 4.37% 02125/1992 12.50% 8.01% 4.49% 03/16/1992 11.43% 7.98% 3.45% 03/1811992 12.28% 7.98% 4.30% 04/02/1992 12.10',(, 7.95% 4.15% 04/09/1992 11.45% 7.94% 3.51% 04/10/1992 11.50% 7.93% 3.57% 04/14/1992 11.50% 7.93% 3.57% 05/0511992 11.50% 7.89% 3.61% 05/1211992 11.87% 7.88% 3.99% 05/12/1992 12.46% 7.88% 4.58% 06/01/1992 12.30% 7.87% 4.43% 06112/1992 10.90% 7.86% 3.04% 06128/1992 12.35% 7.S5% 4.50% 06129/1992 11.00% 7.85% 3.15% 06/30/1992 13.00% 7.85% 5.15% 0711311992 11.90% 7.84% 4.06% 07/1311992 13.50% 7.84% 5.66% 07/2211992 11.20% 7.83% 3.37% 08103/1992 12.00"1.. 7.81% 4.19% 08/06/1992 12.50% 7.80% 4.70% 09/22/1992 12.00%. 7.71% 4.29% 0912811992 11.40% 7.71% 3.69";1;. 09/3011992 11.75% 7.70% 4.05% 10/02/1992 13_00"h 7.70% 5.30% 10/12/1992 12.20% 7.70% 4.50"h 10/16/1992 13.16% 7.70% 5.46% 10130ft992 11.75% 7.71% 4.04% 11/03/1992 12.00% 7.71% 4.29% 12/03/1992 11.85% 7.68% 4.17% 12/15/1992 11.00% 7.66% 3.34% 12/16/1992 11.90% 7.66% 424% 12/1611992 12.40% 7.66% 4.74% 12/17/1992 12.00% 7.66% 4.34% 1212211992 12.30% 7.65% 4.65% 12122/1992 12.40% 7.65% 4.75% 12/29/1992 12.25% 7.63% 4.62% 12/30/1992 12.00% 7.63% 4.37% 12/31/1992 11.90% 7.63% 4.27% 0111211993 12.00% 7.61% 4.39% 01/21!1993 11.25% 7.59% 3.66% 02/02/1993 11.40% 7.56% 3.84% 02/15/1993 12.30% 7.52% 4.78% 02/24/1993 11.90"/o 7.49% 4.41% 02/26/1993 11.80% 7.48% 4.32% 02126/1993 12.20% 7.48% 4.72% 04/2311993 11.75% 7.29% 4.46% 0511111993 11.75% 7.25% 4.50% 05114/1993 11.50% 7.24% 426% 0512511993 11.50% 7.23% 4.27% 0512811993 11.00% 7.22% 3.78% 0010311993 12.00% 7.21% 4.79% 06/1611993 11.50% 7.19% 4.31% 06/1811993 12.10% 7.18% 4.92% 06/2511993 11.67% 7.17% 4.50% 0712111993 11.38% 7.10% 4.28% 07123/1993 10.46% 7.09% 3.37% 08/24!1993 11.50% 6.96% 4.54% 09!2111993 10.50% 6.81% 3.69% 09/29/1993 11.47% 6.77% 4.70'h 09/30/1993 11.60% 6.76% 4.84% 11102/1993 10.80% 6.60% 4.20% 11112/1993 12.00% 6.57% 5.43% 11/26/1993 11.00% 6.52% 4.48% 12/14/1993 10.55% 6.48% 4.07% 12116/1993 10_60% 6.48% 4.12% 1212111993 11.30% 6.47% 4.83% 01/0411994 10.07% 6.44% 3.63% 0111311994 11.00% 6.42% 4.58% 0112111994 11.00% 6.40% 4.60% 01128/1994 11 35% 6.39% 4.96% 02103/1994 11.40% 6.38% 5.02% 02117/1994 10.60% 6.36% 424% 02/2511994 11.25% 6.35% 4.90% 02/2511994 12.00% 6.35% 5.65% 03/0111994 11.00% 6_35% 4.65% 03104/1994 11.00% 6.35% 4.65% 04125/1994 11.00% 6.41% 4.59%
Schedule RBH-14 Page 12 of 19

[61 [71 [81 [91 Average
Date of 30~Year
Electric Rate Return on Treasury Risk Cow Eg!:!!t~ Yield Premium
05/10/1994 11.75% 6.45% 5_30% 05{1311994 10.51Yi> 6.46% 4.04% 06/0311994 11.00% 6.54% 4.45% 06/27!1994 11.40% 6.65% 4.75% 0810511994 12.75% 6.88% 5.67% 10/31!1994 10.00% 7.33% 2.67% 11109/1994 10.85% 7.39% 3.46% 11/09/1994 10.85% 7.39"% 3.46% 11118/1994 11.20% 7.45% 3.75% 11122/1994 11.60% 7.47% 4.13% 11/28/1994 11.06% 7.49% 3.57% 12/0811994 11.50% 7.54% 3.96% 12/0811994 11.70% 7.54% 4.16% 12/14/1994 10.95% 7.56% 3.39% 12/1511994 11.50% 7.57% 3.93% 12/19/190...4 11.50% 7.58% 3.92% 12/28/1994 12.15% 7.61% 4.54% 0110911995 12.28% 7.64% 4.64% 01/31/1995 11.00% 7.69<h 3.31% 02110/1995 12.60% 7.70% 4.90% 02/17!1995 11.90% 7.70% 4.20% 03109/1995 11.50% 7.71% 3.79% 03120/1995 12.00% 7.72% 4.28% 03/2311995 12.81% 7.72% 5.09% 03/29/1995 11.60"/, 7.72% 3.88% 04/0611995 11.10% 7.71% 3.39'"1. 04/0711995 11.00% 7.71% 3.29% 04/19/1995 11.00% 7.70'"-h 3.30% 0511211995 11.63% 7.68% 3.95% 05/25/1995 11.20% 7.65% 3.55% 06J09!1995 11.25% 7.60% 3.65% 06121/1995 12.25% 7.56% 4.69% 06130/1995 11.10% 7.52% 3.58% 09/11/1995 11.30% 7.20% 4.10% 09/2711995 11.30% 7.12% 4.18% 09/2711995 11.50% 7.12% 4.38% 09/2711995 11.75% 7.12% 4.63% 09/29/1995 11.00% 7.11% 3.89% 11/09/1995 11.38% 6.90% 4.48% 11/09/1995 12.38% 6.90% 5.46% 11/17/1995 11.00% 6.86% 4.14% 12104/1995 11.35% 6.78% 4.57% 12111!1995 11.40% 6.74% 4.66% 12120/1995 11.60% 6.70"h 4.90% 12127/1995 12.00% 6.66% 5.34% 02105/1996 12.25% 6.48% 5.77% 03/29/1996 10.67% 6.42% 4.25% 04108/1996 11.00% 6.42% 4.58% 04111/1996 12.59"',{, 6.43% 6.16% 0411111996 12.59% 6.43% 6.16% 04/2411996 11.25% 6.43% 4.82% 04/30/1996 11.00% 6.43% 4.57% 05/1311996 11.00% 6.44% 4.56% 05/2311996 11.25% 6.43% 4.82% 0612511996 11.25% 6.48% 4.77% 06127/1996 11.20% 6.48% 4.72% 08/1211996 10.40'% 6.57% 3.83% 09/27/1996 11.00% 6.71% 4.29% 10/16/1996 12.25% 6.76% 5.49% 11/05/1996 11.00% 6.81% 4.19% 11/2611996 11.30% 6.83% 4.47% 1211811996 11.75% 6.83% 4.92% 1213111996 11.50% 6.83% 4.67% 01103/1997 10.70% 6.83% 3.87% 02/13/1997 11.80% 6.82% 4.98% 02/20!1997 11.80% 6.82% 4.98% 0313111997 10.02% 6.80% 3.22% 04102/1997 11.65% 6.80% 4.85% 04/2811997 11.50'/o 6.81% 4.69% 0412911997 11.70% 6.81% 4.89% 07(1711997 12.00% 6.77% 5.23% 12/1211997 11.00% 6.60% 4.40% 12/2311997 11.12% 6.57% 4.55% 02102/1998 12.75% 6.39% 6.36% 03/0211998 11.25% 6.29% 4.96% 03/0611998 10.75% 6.27% 4.48% 03/20!1998 10.50% 6.22% 4.28% 04130/1998 12.20% 6.12% 6.08% 07/10!1998 11.40% 5.94% 5.46%
Schedule RBH-14 Page 13 of 19

{6] {7] {8] {9] Average
Date of 30-Year Electric Rate Return on Treasury Ris..l<
c,w E~!l Yield Premium 09/1511998 11.90% 5.78% 6.12% 11130/1998 12.60% 5.58% 7.02% 12/10/1998 12.21YA. 5.54% 6.66% 12117/1998 12.10% 5.52% 6.58% 02/05/1999 10.30% 5.38% 4.92% 03/0411999 10.50% 5.34% 5.16% 04106/1999 10.94% 5.32% 5.62% 07/29/1999 10.75% 5.52% 523% 09/2311999 10.75% 5.70-"~ 5.05% 1111711999 11.10% 5.90% 520% 0110712000 11.50% 6.05% 5.45% 01/0712000 11.50% 6.05% 5.45% 02/1712000 10.60% 6.17% 4.43% 03/2812000 11.25% 6.20% 5.05% 05/2412000 11.00"h 6.18% 4.82% 07/1812000 12.20'"-h 6.16% 6.04% 09/29/2000 11.16% 6.03% 5.13% 11/2812000 12.90% 5.89% 7.01% 11130/2000 12.10% 5.88% 6.22% 01123/2001 11.25% 5.79% 5.46% 0210812001 11.50% 5.77% 5.73% 05/0812001 10.75% 5.62% 5.13% 06/2612001 11.00% 5.62% 5.38% 07/2512001 11.02% 5.60"/; 5.42% 07/25/2001 11.02% 5.60% 5.42% 07/3112001 11.00"~ 5_59% 5.41% 08/31/2001 10.50% 5.56% 4_94% 09/07/2001 10.75% 5.55% 5.20% 09/1012001 11.00"~ 5.55% 5.45% 09/2012001 10.01Yh 5.55% 4.45% 10/24/2001 10.30% 5.54% 4.76% 11/2812001 10.60% 5.49% 5.11% 1210312001 12.88% 5.49% 7.39% 1212012001 12.50% 5.50% 7.00% 01/2212002 10.00% 5.50% 4.50% 0312712002 10.10% 5.45% 4.65% 04/2212002 11.80% 5.45% 6.35% 0512812002 10.17% 5.46% 4.71% 06/1012002 12.00% 5.47% 6.53% 06/1812002 11.16% 5.48% 5.68% 0612012002 11.00% 5.48% 5.52% 0612012002 12.30% 5.48% 6.82% 07/1512002 11.00% 5.48% 5.52% 09/1212002 12.30% 5.45% 6.85% 09/28f2002 10.45% 5.41% 5.04% 1210412002 11.55% 5.29% 6.26% 1211312002 11.75% 5.27% 6.48% 1212012002 11.40% 5.25% 6.15% 0110812003 11.10% 5.19"/., 5.91% 0113112003 12.45% 5.13% 7.32% 02128/2003 12.30% 5.05% 7.25% 03/06/2003 10.75% 5.03% 5.72% 0310712003 9.96% 5.02% 4.94% 03120f2003 12.00% 4.98% 7.02% 04/0312003 12.00% 4.96% 7.04% 04/1512003 11.15% 4.94% 6.21% 06/2512003 10.75% 4.79% 5_96% 06/2612003 10.75% 4.79% 5_96% 0710912003 9.75% 4.79"1.> 4.96% 07/16J2003 9.75% 4.79"/., 4_96% 07/2512003 9.50% 4.80% 4.70% 0812612003 10.50% 4.83% 5.67% 12/1712003 9_85% 4.94% 4.91% 12/1712003 10.70% 4.94% 5.76% 12/1812003 11.50% 4.94% 6.56% 12/19/2003 12.00% 4.94% 7.06% 12/1912003 12.00% 4.94% 7.06% 12/2312003 10_50% 4.94% 5.56% 01/1312004 12.00% 4.95% 7.05% 0310212004 10.75% 4.99% 5.76% 03/26J2004 10.25% 5.02% 523% 0410512004 11.25% 5_03% 622% 05/1812004 10.50% 5.07% 5.43% 05/2512004 10.25% 5_08% 5.17% 05/2712004 10.25% 5_08% 5.17% 06/0212004 11.22% 5_08% 6.14% 0013012004 10.50% 5.10% 5.40% 06/30f2004 10.50"1, 5.10% 5.40% 07/1612004 11.60% 5.11% 6.49%
Schedule RBH-14 Page 14 of 19

[61 [71 [81 [9J Average 30-Year
lectnc Rate Return on Treasllf}' Case E~itz: Yie:d
08/2512004 10.25% 5.10"; 09109/2004 10.40% 5.10% 5.30% 11109/2004 10.50% 5_07% 5.43% 11/2312004 11.00% 5_06% 5.94% 12/1412004 10.97% 5.07% 5.90% 1212112004 11.25% 5.07% 6.18% 12/2112004 11.50% 5.07% 6.43% 1212212004 10.70% 5.07% 5.63% 12/22/2004 11.50% 5.07% 6.43% 12/2912004 9.85% 5.07% 4.78% 01/0612005 10.70% 5.08% 5.62% 0211812005 10.30% 4.98% 5.32% 0212512005 10.50% 4.96% 5.54% 0311012005 11.00% 4.93% 6.07% 03!2412005 10.30% 4.9JYh 5.40% 0410412005 10.00% 4.88% 5.12% 0410712005 10.25% 4.87% 5.38% 0511812005 10.25% 4.78% 5.47% 0512512005 10.75% 4.76% 5.99% 0512612005 9.75% 4.76% 4.99% 06/01/2005 9.75% 4.75% 5.00% 07/1912005 11.50% 4.64% 6.86% 0810512005 11.75% 4.62% 7.13% 0811512005 10.13% 4.61% 5.52% 09/2812005 10.00% 4.54% 5.46% 10/0412005 10.75% 4.54% 6.21% 12/12/2005 11.00"h 4.55% 6.45% 12/13/2005 10.75% 4.55% 6.20% 1212112005 10.29% 4.54% 5.75% 1212112005 10.40% 4.54% 5.86% 1212212005 11.00% 4.54% 6.46% 1212212005 11.15% 4.54% 6.61% 1212812005 10.00% 4.54% 5.46% 1212812005 10.00"1.. 4.54% 5.46% 0110512006 11.00% 4.53% 6.47% 01127/2006 9.75% 4.52% 5.23% 0310312006 10.39% 4.53% 5.86% 04/1712006 10.20% 4.61% 5.59% 0412612006 10.60% 4.64% 5.96% 05(1712006 11.60% 4.69% 6.91% 0010612006 10.00% 4.74% 526% 0612712006 10.75% 4.80% 5.95% 07{06/2006 10.20",(, 4.83% 5.37% 0712412006 9.60% 4.86% 4.74% 0712612006 10.50% 4.86% 5.64% 07/2812006 10.05% 4.86% 5.19% 0812312006 9.55% 4.89% 4.66% 09/0112006 10.54% 4.90% 5.64% 09/1412006 10.00% 4.91% 5.09% 10/0612006 9.67% 4.92% 4.75% 11121/2006 10.08% 4.95% 5.13% 11/2112006 10.08% 4.95% 5.13% 11121/2006 10.12% 4.95% 5.17% 12101/2006 10.25% 4.95% 5.30% 12101/2006 10.50% 4.95% 5.55% 1210712006 10.75% 4.95% 5.80% 1212112006 10.90% 4.95% 5.95% 1212112006 11.25% 4.95% 6.30% 1212212006 10.25% 4.95% 5.30% 0110512007 10.00"1.. 4.95% 5.05% 0111112007 10.10"1.> 4.95% 5.15% 01/11/2007 10.10",(, 4.95% 5.15% 01/11/2007 10.90% 4.95% 5.95% 01/1212007 10.10"1.> 4.95% 5.15% 0111312007 10.40% 4.95% 5.45% 01/19/2007 10.80% 4.94% 5.86% 0312112.007 11.35% 487% 6.48% 0312212007 9.75% 4.86% 4.89"h 05/15/2007 10.00% 4.81% 5.19% 05/1712.007 10.25% 4.81% 5.44% 0511712.007 10.25% 4.81% 5.44% 0512212007 10.20% 4.80% 5.40% 0512212007 10.50% 480% 5.70% 05/2312007 10.70% 4.80% 5.90% 0512512007 9.67% 4.80% 4.87% 06/1512007 9.90% 4.82% 5.08% 06/21/2007 10.20% 483% 5.37% 0612212007 10.50% 4.83% 5.67% 06/28{2007 10.75% 4.84% 5.91%
Schedule RBH-14 Page 15 of 19

[6} [7} [8} [9} Average
Date of 30-Year Electric Rate Return on Treasury Risk
Case Eguit~ Yleid Premium 07112!2007 9.67% 4.86% 4.81% 07/19!2007 10.00% 4.87% 5.13% 0711912007 10.00% 4.87% 5.13% 0811512007 10.40% 4.88% 5.52% 10/09/2007 10.00% 4.91% 5.09% 10/17/2007 9.10% 4.91% 4.19% 10/31/2007 9.90% 4.90% 5.06% 11/2912007 10.90% 4.87% 6.03% 1210612007 10.75% 4.86% 5.89% 1211312007 9.96% 4.86% 5.10% 12/1412007 10.70% 4.86% 5.84% 12/14/2007 10.80% 4.86% 5.94% 12/19/2007 10.20% 4.86% 5.34% 1212012007 10.20% 4.85% 5.35% 12120/2007 11.00"-1.. 4.85% 6.15% 12/2812007 10.25% 4.85% 5.40% 12/3112007 11.25% 4.85% 6.40% 0110812008 10.75% 4.83% 5.92% 01117/2008 10.75% 4.81% 5.94% 01/2812008 9.40% 4.80% 4.60% 01 /3012000 10.00% 4.79% 5.21% 01131/2008 10.7'1% 4.79% 5.92% 02/2912008 10.25% 4.75% 5.50% 0311212008 10.25% 4.73% 5.52% 0312512008 9.10% 4.68% 4.42% 04/2212008 10.25% 4.60% 5.65% 04124!2008 10.10% 4.60% 5.50% 05/0112008 10.70"',(, 4.59% 6.11% 0511912008 11.00% 4.56% 6.44% 05/2712008 10.00'Yo 4.55% 5.45% 0611012008 10.70"% 4.54% 6.16% 06/2712008 10.50":h 4.54% 5.96% 0612712008 11.04% 4.54% 6.50% 0711012008 10.43% 4.52% 5.91% 07116/2008 9.40';1;. 4.52% 4.88% 07/30/2008 10.80% 4.51% 6.29% 07/31/2008 10.70% 4.51% 6.19% 08/11/2008 10.25% 4.51% 5.74% 0812612008 10.18% 4.50% 5.68% 09/10/2008 10.30% 4.50% 5.80% 09/2412008 10.65% 4.48% 6.17% 0912412008 10.65% 4.48% 6.17% 09!24/2008 10.65% 4.48% 6.17% 0913012008 10.20',(, 4.48% 5.72% 10!0812008 10.15% 4.46% 5.69""h 11{1312008 10.55% 4.45% 6.10":-h 11{17/2008 10.20% 4.44% 5.76% 1210112008 10.25% 4.40% 5.85% 12123/2008 11.00'"i:> 4.27% 6.73% 12129/2008 10.00% 4.24% 5.76% 1212912008 10.20% 4.24% 5.96% 12131/2008 10.75% 4.22% 6.53% Otf1412009 10.50"'1.. 4.15% 6.35% 01{2112009 10.50% 4.12% 6.38% 01/2112009 10.50"',(, 4.12% 6.38% 01{2112009 10.50% 4.12% 6.38% Otf27f2009 10.76% 4.09% 6.67% 0113012009 10.50"'h 4.08% 6.42% 0210412009 8.75% 4.06% 4.69% 0310412009 10.50% 3.96% 6.54% 0311212009 11.50% 3.93% 7.57% 04/0212009 11.10% 3.85% 7.25% 04/21{2009 10.61% 3.80% 6.81% 04/2412009 10.00% 3.79% 6.21% 04/30{2009 11.25% 3.78% 7.47% 0510412009 10.74% 3.77% 6.97% 0512012009 10.25% 3.74% 6.51% 05/2812009 10.50% 3.74% 6.76% 05/2912009 10.50% 3.74% 6.76% 06/22{2009 10.00% 3.76% 624% 0612412009 10.00% 3.77% 7.03% 07/0812009 10.63% 3.77% 6.86% 07{1712009 10.50% 3.78% 6.72% 08/31/2009 10.25% 3.82% 6.43% 10/1412009 10.70% 4.01% 6.69% 10/2312009 10.88% 4.06% 6.82% 11f02f2009 10.70% 4.09% 6.61% 11f0312009 10.70% 4.10% 6.60% 11124/2009 1025% 4.15% 6.10%
Schedule RBH-14 Page 16 of 19

[6] [7] [8] [9] Average
Date of 30-Year Electric Rate Return on Treasury Risk
Case Egui!,l Yield Premium 11/2512009 10.75% 4.16% 6_59%
11t3012009 10.35% 4.17% 6.18% 1210312009 10.50% 4.18% 6.32% 1210712009 10.70% 4.18% 6.52% 12/1612009 10.90",(, 4.21% 6.69% 12/1612009 11.00% 4.21% 6.79% 12/1812009 10.40% 4.22% 6.18% 1211812009 10.40% 4.22% 6.18% 12/22/2009 10.20% 4.23% 5.97% 12/2212009 10.40".{, 4.23% 6.17% 12/2212009 10.40% 4.23% 6.17% 12130!2009 10.00% 4.26% 5.74% 01/04/2010 10.80% 4.28% 6.52% 01111/2010 11.00% 4.30% 6.70% 0112612010 10.13% 4.35% 5.78% 0112712010 10.40% 4.35% 6.05% 0112712010 10.40% 4.35% 6.05% 0112712010 10.70% 4.35% 6.35% 02109/2010 9.80% 4.38% 5.42% 02/1812010 10.60% 4.40"'1.. 6.20% 02/24!2010 10.18% 4.41•1.. 5.77% 0310212010 9.63% 4.41% 5.22% 0310412010 10.50% 4.41% 6.09% 03/0512010 10.50% 4.41% 6_()9",-h
03/11/2010 11.90% 4.42% 7.48% 03/1712010 10.00% 4.41% 5.59% 03/2512010 10.15% 4.42% 5.73% 04/0212010 10.10% 4.43% 5.67% 04/2712010 10.00% 4.46% 5.54% 04/2912010 9.90",(, 4.46% 5.44% 04/2912010 10.05% 4.46% 5.60"h 04/2912010 10.26% 4.46% 5.80% 0511212010 10.30% 4.45% 5.85% 0511212010 10.30% 4.45% 5.85% 0512812010 10.10% 4.44% 5.66% 0512812010 10.20% 4.44% 5.76% 06/0712.010 10.30% 4.44% 5.66% 06/1612010 10.00% 4.44% 5.56% 06/2812010 9.67% 4.43% 5.24% 0612812010 10.50% 4.43% 6.07% 06/3012010 9.40":.(, 4.43% 4.97% 0710112.010 10.25% 4.43% 5.82% 07/1512010 10.53% 4.43% 6.10% 07/1512010 10.70% 4.43% 6.27% 07/3012010 10.70% 4.41% 629% 08/0412.010 10.50% 4.41% 6.09% 08/0612010 9.83% 4.41% 5.42% 0812512010 9.90% 4.37% 5.53% 09/0312010 10.60% 4.35% 6.25% 09/1412010 10.70% 4.33% 6.37% 09/1612010 10.00% 4.33% 5.67% 09/1612010 10.00% 4.33% 5.67% 09/3012010 9.75% 4.29% 5.46% 09/3012010 11.00% 4.29% 6.71% 10/1412010 10.35% 4.24% 6.11% 10/2812010 10.70% 4.21% 6.49% 11/02/2010 10.38% 4.20% 6.18% 1110412010 10.70% 4.20% 6.50% 1111912.010 10.20% 4.18% 6.02% 1112212010 10.00% 4.18% 5.82% 1210112.010 10.13% 4.16% 5.97% 1210612010 9.86% 4.15% 5.71% 1210912.010 10.25% 4.15% 6.10% 1211312010 10.70% 4.15% 6.55% 1211412.010 10.13% 4.15% 5.98% 1211512010 10.44% 4.15% 6.29°1.. 12117/2010 10.00% 4.15% 5.85% 1212012010 10.60% 4.15% 6.45% 1212112010 10.30",(, 4.14% 6.16% 1212712010 9.9!Y'h 4.14% 5.76% 12129/2010 11.15% 4.14% 7.01% 0110512011 10.15% 4.13% 6.02% 0111212011 10.30% 4.12% 6.18% 0111312011 10.30% 4.12% 6.18% 0111812011 10.00% 4.12% 5.88% 01120/2011 9.30% 4.12% 5.18% 01120/2011 10.13% 4.12% 6.01% 01131/2011 9.60% 4.12% 5.48% 0210312011 10.00% 4.12% 5.88%
Schedule RBH-14 Page 17 of 19

[6] [7] [8] [9] Average
Date of 30-Year Electric Rate Return on Treasury Risk
Case E~tz: Yield Premium 0212512011 10.00% 4.14% 5_86% 03/2512011 9.80% 4.18% 5.62% 03/30/2011 10.00% 4.18% 5.82% 04/1212011 10.00% 4.21% 5.79-"i> 0412512011 10.74% 4.23% 6.51% 04!2612{)11 9.67% 4.23% 5.44% 04!2712{)11 10.40% 4.24% 6.16% 05104/2011 10.00% 4.24% 5.75% 05104/2011 10.00% 4.24% 5.76% 0512412011 10.50% 4.27% 6.23% 1)5/0812011 10.75% 4.30% 6.45% 0611612011 9.20% 4.32% 4.88% 06/1712011 9.95% 4.32% 5.63% 0711312011 10.20% 4.36% 5.84% 08101/2011 9.20% 4.39% 4.81% 08/0812011 10.00% 4.38% 5.62% 08/1112011 10.00% 4.38% 5.62% 08/1212011 10.35% 4.37% 5.98% 0811912011 10.25% 4.36% 5.89% 0910212011 12.88% 4.32% 8_56% 0912212011 10.0!Yh 4.24% 5_76%
10/1212011 10.30"h 4.14% 6.16% 10/20(2011 10.50% 4.10% 6.40% 11130/2011 10.90% 3.87% 7.03% 11/3012011 10.90"/0 3.87% 7.03% 1211412011 10.00% 3.80% 6.20% 12114/2011 10.30% 3.80% 6.50% 1212012011 10.20% 3.76% 6.44% 1212112011 10.20% 3.76% 6.44% 1212212011 9.9001.. 3.75% 6.15% 1212212011 10.40% 3.75% 6.65% 1212312011 10.19% 3.74% 6.45% 01125!2012 10.50% 3.57% 6.93% 0112712012 10.50% 3.56% 6.94% 02115!2012 10.20% 3.47% 6.73% 02/2312012 9.90% 3.44% 6.46% 0212712012 10.25% 3.43% 6.82% 02129/2012 10.40% 3.41% 6.99% 03129/2012 10.37% 3.32% 7.05% 04/04/2012 1 O.OOOA. 3.30% 6.70'1.. 04/26/2012 10.0001.. 321% 6.79% 05/0212012 10.00% 3.18% 6.82% 05/0712012 9.80% 3.17% 6.63% 05/1512012 10.QO---",(, 3.14% 6.86% 05/29/2012 to.os•J.. 3.11% 6.94% 0010712012 10.30% 3.08% 722% 0011412012 9.40% 3.06% 6.34% 0011512012 10.40% 3.06% 7.34% 06/18/2{) 12 9.60% 3.06% 6.54% 06/19/2012 9.25% 3.05% 6.20% 06/2612012 10.10% 3.04% 7.06% 06/29/2012 10.00% 3.04% 6.96% 07/09/2012 10.20% 3.03% 7.17% 07/1612012 9.80% 3.02% 6.78% 07/20/2012 9.31% 3.01% 6.30% 07/20/2012 9.81% 3.01% 6.80% 09/13/2012 9.80% 2.94% 6.86% 09/19/2012 9.80% 2.94% 6.86% 09/19/2012 10.05% 2.94% 7.11% 09/2612012 9.50% 2.94% 6.56% 10/1212012 9.6-0% 2.93% 6-.67% 10123/2012 9.75% 2.93% 6.82% 10124/2012 10.3Q</., 2.93% 7.37°h 11109/2012 10.30% 2.92% 7.38% 1112812012 10.40% 2.90% 7.50% 11/29/2012 9.75% 2.90% 6.85% 11/29/2012 9.88% 2.90% 6.98% 12/05/2012 9.71% 2.89% 6.82% 12/0512012 10.40% 2.89% 7.51% 1211212012 9.80% 2.88% 6.92% 12/13/2012 9.50% 2.88% 6.62% 12113/2012 10.50% 2.88% 7.62% 12/1412012 10.40% 288% 7.52% 12/19/2012 9.71% 2.88% 6.83% 12/19/2012 10.25% 2.88% 7.37% 1212012012 9.50% 2.87% 6.63% 12/2012012 9.80% 2.87% 6.93% 1212012012 10.25% 2.87% 7.38% 12/20/2012 10.25% 2.87% 7.38%
Schedule RBH-14 Page 18 of 19
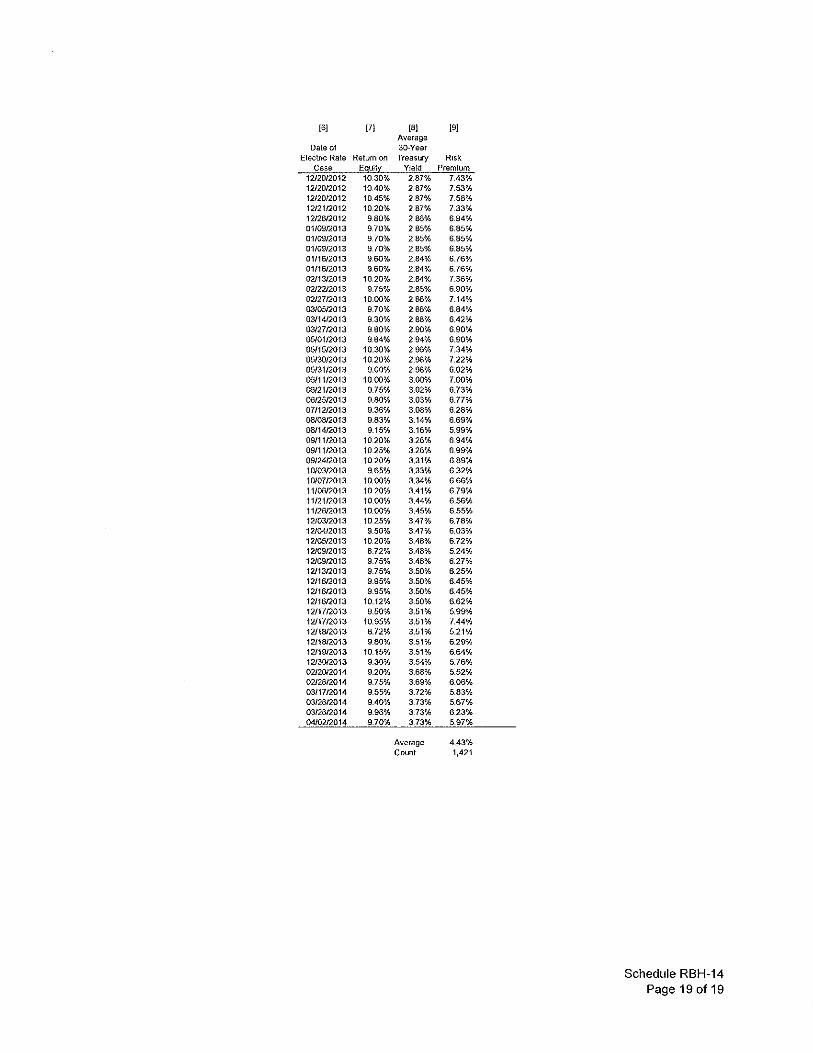
[6[ [7)
Date of Electric Rate Return on
Case E~ill': 12/2012012 10.30% 1212012012 10.40% 12/2012012 10.45% 1212112012 10.20% 12/2812012 9.80% 01/0912013 9.70% 01/09/2013 9.70% 01/09/2013 9.70% 0111612013 9.60% 0111612013 9.60% 0211312013 10.20% 0212ll2013 9.75% 02/2712013 10.00% 03/0512013 9.70% 03/1412013 9.30% 03/27/2013 9.80% 05101/2013 9.84% 0511512013 10.30% 05130/2013 10.20% 05131/2013 9.00% 06/11/2013 10.00% 06/2112013 9.75% 06/2512013 9.80% 07/1212013 9.35% 08/081:2013 9.83% 08/1412013 9.15% 09/11/2013 10 20% 0911112013 10 25% 09/24/2013 10.20% 10/0312013 9.65% 10/0712013 10.00% 11/0612013 10.20% 11/2112013 10.00% 11/2"ol2013 1o.oov. 1210312013 10.25% 12/04/2013 9.50% 12/0512013 10.20% 12/0912013 8.72% 12/09/2013 9.75% 12/1312013 9.75% 12/1612013 9.95% 12/16/2013 9.95% 12/16/2013 10.12% 12/1712013 9.50% 12/1712013 10.95% 12/1812013 8.72% 12/18/2013 9.80% 12/19/2013 10.15% 12/3012013 9.30% 0212012014 9.20% 0212:612014 9.75% 03/1712014 9.55% 03/2"ol2014 9.40% 03(26/2014 9.96% 0410212014 9.70%
[8) Average 30.-Year Treasury
Yield 2.87% 2.87% 2.87% 2.87% 2.86% 2.85% 2.85% 2.85% 2.84% 2.84% 2.84% 2_85%
2.86% 2.66% 2.88% 2.90% 2.94% 2.96% 2.98% 2.98% 3.000/o 3.02% 3.03% 3.08% 3.14% 3.16% 3.26% 3.26% 3.31% 3.33% 3.34% 3.41% 3.44% 3.45% 3.47% 3.47% 3.48% 3.48% 3.48% 3.50% 3.50% 3.50% 3.50% 3.51% 3.51% 3.51% 3.51% 3.51% 3.54% 3.68% 3.69% 3.72% 3.73% 3.73% 3.73%
Average c~t
)9)
Risk Premium
7.43% 7.53% 7.58% 7.33% 6.94% 6.85% 6.85% 6.85% 6.76% 6.76% 7.35% 6_90%
7.14% 6.84% 6.42% 6.90% 6.90% 7.34% 7.22% 6.02% 7.00% 6.73% 6.77% 628% 6.69% 5.99% 6.94% 6.99% 6.89% 6.32% 6.66% 6.79% 6.56% 6.55% 6.78% 6.03% 6.72% 5.24% 6.27% 6.25% 6.45% 6.45% 6.62% 5.99'% 7.44% 5.21% 6.2~h
6.64% 5.76% 5.52% 6.06% 5.83% 5.67% 6.23% 5.97%
4.43% 1,421
Schedule RBH-14 Page 19 of 19

1, >
BEFORE THE PUBLIC SERVICE COMMISSION OF THE STATE OF MISSOURI
Noranda Aluminum, Inc. et al.
Complainants, v.
Union Electric Company, d/b/a Ameren Missouri
Respondent.
) ) ) ) ) ) ) )
File No. EC-2014-0223
AFFIDAVIT OF ROBERT B. HEVERT
COMMONWEALTH OF MASSACHUSETTS ) ) ss
COUNTY OF MIDDLESEX )
Robert B. Revert, being first duly sworn on his oath, states:
1. My name is Robert B. Revert and my office is located in Framingham,
Massachusetts and I am Managing Partner of Sussex Economic Advisors, LLC.
2. Attached hereto and made a part hereof for all purposes is my Rebuttal
Testimony on behalf of Union Electric Company d/b/a Ameren Missouri consisting of
_g_ pages and Schedule(s) RBH-1 thru RBH-14, all of which have been prepared in
written fonn for introduction into evidence in the above-referenced docket.
3. I hereby swear and affinn that my answers contained in the attached
testin10ny to the questions therein propounded are true and correct.
k:t:lfff= Subscribed and swom to before me this s
My commission expires:
~ KIMBERLY H. DAO
® Notary Public
Comrnonwca!th of Massachu,etb My Commission Expires
April 16, 2015
Related Documents