Final Environment Impact Assessment Report (EIA) with Regional Environment Management Plan (REMP) for Minor Mineral (Sand / Morrum) Excavation from Riverbed of Betwa River Submitted to State Level Environment Impact Assessment Authority, U.P. Baseline Consultant Research Institute of Material Sciences, New Delhi Environment Consultant ENV Developmental Assistance Systems (India) Pvt. Ltd. Lucknow (QCI-NABET Accredited for Category ‘A’ Projects) D-2247, Indira Nagar, Lucknow-226016 Ph: +91 522 4007470, 4107624 TeleFax: 0522 4021236 Email: [email protected], Website: www.dasindia.org OCTOBER, 2018 located at Khand No. 23/12, Village – Bhedi Kharka, Tehsil - Sarila, District – Hamirpur Sanctioned Lease Area- 12.145 ha, Effective working Area- 9.995 ha Proposed Production of Sand / Morrum - 1,94,304 m 3 /year File No. – 4529 / 4429 Submitted by: M/s Yadav And Sons Proprietor – Shri Avadhesh Kumar S/o Shri Bahoram Singh Address - H.No. B-1/35, Sector –1, LDA Colony, Kanpur Road, Tehsil - Lucknow, District - Lucknow, Uttar Pradesh

Welcome message from author
This document is posted to help you gain knowledge. Please leave a comment to let me know what you think about it! Share it to your friends and learn new things together.
Transcript
Final Environment Impact Assessment Report (EIA)withRegional Environment Management Plan (REMP)for
Minor Mineral (Sand / Morrum) Excavation
from Riverbed of Betwa River
Submitted toState Level Environment Impact Assessment Authority, U.P.Baseline Consultant
Research Institute of Material Sciences, New DelhiEnvironment ConsultantENV Developmental Assistance Systems (India) Pvt. Ltd. Lucknow(QCI-NABET Accredited for Category ‘A’ Projects)D-2247, Indira Nagar, Lucknow-226016Ph: +91 522 4007470, 4107624 TeleFax: 0522 4021236 Email: [email protected], Website: www.dasindia.org
OCTOBER, 2018
located at Khand No. 23/12, Village – Bhedi Kharka,
Tehsil - Sarila, District – Hamirpur
Sanctioned Lease Area- 12.145 ha, Effective working Area- 9.995 ha
Proposed Production of Sand / Morrum - 1,94,304 m3/year
File No. – 4529 / 4429
Submitted by:M/s Yadav And Sons
Proprietor – Shri Avadhesh Kumar S/o Shri Bahoram SinghAddress - H.No. B-1/35, Sector –1, LDA Colony, Kanpur Road,Tehsil - Lucknow, District - Lucknow, Uttar Pradesh
1
To reduce the size, all the figures and
illustration are removed from soft copy only.
All annexures are already uploaded with the
Form-1 and PFR.
TABLE OF CONTENTS
S. NO. CONTENTSI TOR COMPLIANCEII PH COMPLIANCE
CHAPTER-11.1 GENERAL1.2 PURPOSE OF REGIONAL EIA1.3 LEGISLATION APPLICABLE TO MINING OF MINOR MINERALS1.4 EXTRACT OF EIA NOTIFICATION1.5 PROJECT / PROPONENT DETAILS1.6 PROJECT IMPORTANCE TO THE COUNTRY AND REGION1.7 SCOPE OF THE STUDY1.8 NATURE AND SIZE OF GROUP OF LEASES1.9 CARRYING CAPACITY OF AREA1.10 STRUCTURE OF EIA REPORTCHAPTER-22.1 DESCRIPTION OF THE PROJECT2.2 LEGISLATION APPLICABLE TO MINING OF MINOR MINERALS2.3 CONNECTIVITY2.4 TOPOGRAPHY & PHYSIOGRAPHY2.5 RIVER PROFILE2.6 DRAINAGE2.7 TYPE OF THE PROJECT2.8 LIMITATIONS AND RESTRICTIONS OF MINING2.9 CLOSURE OF MINES2.10 TECHNOLOGY AND PROCESS DESCRIPTION2.11 MINING TECHNOLOGY2.12 LAND USE PATTERN2.13 LIFE OF MINE2.14 INFRASTRUCTURE FACILITIES2.15 COST OF INDIVIDUAL MINE & WHOLE GROUP OF LEASES2.16 OTHERS2.17 FACILITIES TO LABOURS2.182.19 OTHER PROJECTS IN THE CLUSTERCHAPTER-33.0 STUDY AREA3.1 LAND ENVIRONMENT3.2 PHYSICAL ENVIRONMENT3.3 WATER ENVIRONMENT (GROUND & SURAFCE WATER)3.4 AIR ENVIRONMENT3.5 NOISE ENVIRONMENT

3.6 SOIL ENVIRONMENT3.7 BIOLOGICAL ENVIRONMENT3.9 SOCIO-ECONOMIC ENVIRONMENTCHAPTER-44.0 GENERAL4.1 IMPACTS OF MORRUM MININGCHAPTER-55.1 EXCAVATION METHODS AS PER SUSTAINABLE SAND MININGGUIDELINES 20165.2 OTHER POPULAR METHODS5.3 ACCEPTIBILITY OF VARIOUS MINING METHODS FORSUSTAINABLE MINING5.4 WHY BAR SKIMMING/SCALPING5.5 ANALYSIS OF ALTERNATIVE SITECHAPTER-66.1 INTRODUCTON6.2 MONITORING SCHEDULE & PARAMETERS6.3 MEASUREMENT METHODOLOGY6.4 IMPLEMENTATION OF ENVIRONMENT MONITORING PLAN6.5 ENVIRONMENTAL POLICY6.6 STANDARD OPERATING PROCEDURES FOR REPORTING OFNON-COMPLIANCE OF EIA CONDITIONS:6.7 CO-ORDINATION WITH DISTRICT MAGISTRATE & RO, UPPCBFOR MONITORING PLAN.CHAPTER-77.1 PUBLIC CONSULTATION7.2 RISK ASSESSMENT7.3 IDENTIFICATION OF HAZARDS7.4 MITIGATION OF HAZARDS7.5 SEDIMENT INFLUX RATE7.6 SOCIAL IMPCT ASSESSMENT7.7 RESSETLEMENT & REHABILITATION PLAN7.8 DISASTER MANAGEMENT7.9 TRANSPORTATIONAL ROUTE ANALYSIS7.10 GREEN BELT DEVELOPMENT7.11.1. Function of vegetation in river bank protectionCHAPTER-88.1 BENEFITS OF SUSTAINABLE/SCIENTIFIC MINING8.2 ROAD MAINTAINANCE8.3 EMPLOYMENT POTENTIAL- SKILLED, SEMISKILLED AND
UNSKILLED8.4 ECONOMICAL BENEFITS8.5 POSITIVE ASPECTS OF MINING8.6 SUMMARY
CHAPTER-99.1 INTRODUCTION9.2 ANALYSIS OF PROJECT COMPONENTS9.3 QUANTITATIVE ANALYSIS9.4 QUALITATIVE ANALYSIS9.5 INFERENCE9.6 COST BENEFIT ANALYSIS OF THE PROJECTS IN THE STUDYAREACHAPTER-1010.1 INTRODUCTION10.2 REGIONAL ENVIRONMENT MANAGEMENT PLAN (REMP)10.3 PRESENT ENVIRONMENTAL CONDITION10.4 FUTURE SCENARIO10.5 REGIONAL ENVIRONMENTAL MANANGEMENT PLAN10.6 ENVIRONMENTAL MANAGEMENT ACTIVITIES.10.7 ENVIRONMENTAL MANAGEMENT PLANCHAPTER-1111.1 SUMMARY OF REIA11.2 PROJECTS11.3 PROJECT DESCRIPTION11.4 OVERALL JUSTIFICATION FOR THE IMPLEMENTATION OF THEPROJECT11.5 RECOMMENDED MANAGEMENT PRACTICES11.6 EXPLANATION OF HOW ADVERSE EFFECTS HAVE BEENMITIGATEDCHAPTER-12
12.1 DISCLOSURE OF COSULTANTS
V REFERENCES
VI ANNEXURES
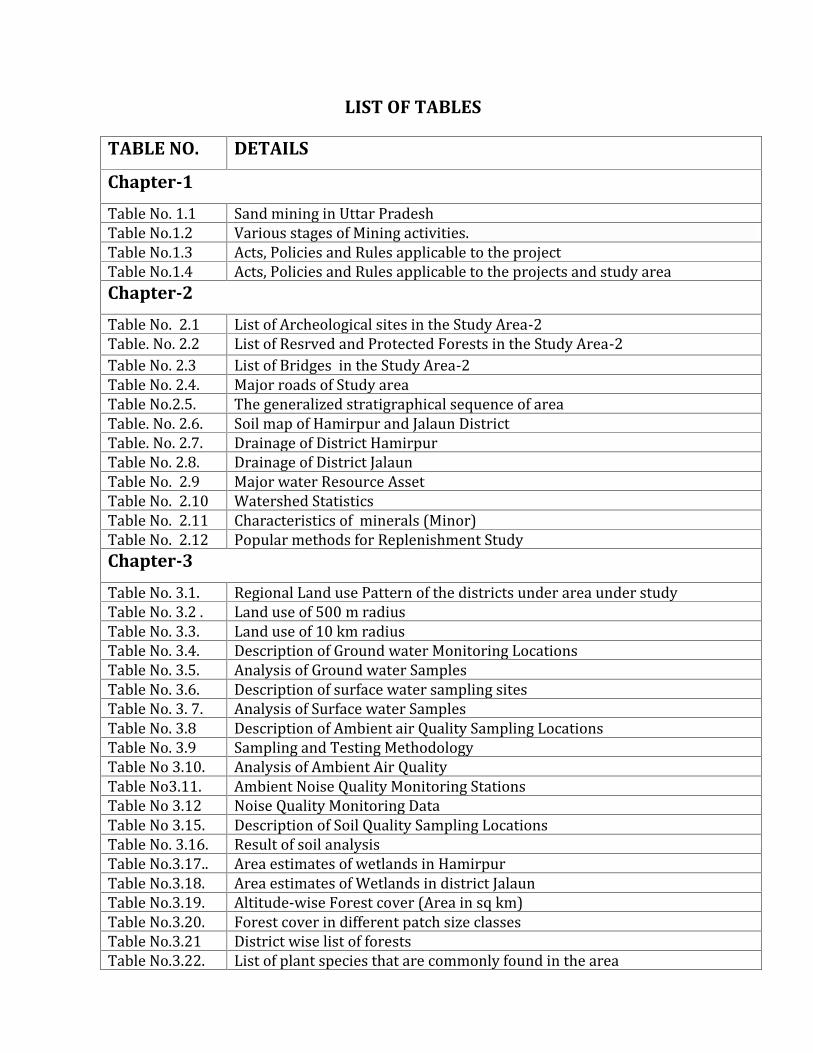
LIST OF TABLES
TABLE NO. DETAILS
Chapter-1Table No. 1.1 Sand mining in Uttar PradeshTable No.1.2 Various stages of Mining activities.Table No.1.3 Acts, Policies and Rules applicable to the projectTable No.1.4 Acts, Policies and Rules applicable to the projects and study areaChapter-2Table No. 2.1 List of Archeological sites in the Study Area-2Table. No. 2.2 List of Resrved and Protected Forests in the Study Area-2Table No. 2.3 List of Bridges in the Study Area-2Table No. 2.4. Major roads of Study areaTable No.2.5. The generalized stratigraphical sequence of areaTable. No. 2.6. Soil map of Hamirpur and Jalaun DistrictTable. No. 2.7. Drainage of District HamirpurTable No. 2.8. Drainage of District JalaunTable No. 2.9 Major water Resource AssetTable No. 2.10 Watershed StatisticsTable No. 2.11 Characteristics of minerals (Minor)Table No. 2.12 Popular methods for Replenishment StudyChapter-3Table No. 3.1. Regional Land use Pattern of the districts under area under studyTable No. 3.2 . Land use of 500 m radiusTable No. 3.3. Land use of 10 km radiusTable No. 3.4. Description of Ground water Monitoring LocationsTable No. 3.5. Analysis of Ground water SamplesTable No. 3.6. Description of surface water sampling sitesTable No. 3. 7. Analysis of Surface water SamplesTable No. 3.8 Description of Ambient air Quality Sampling LocationsTable No. 3.9 Sampling and Testing MethodologyTable No 3.10. Analysis of Ambient Air QualityTable No3.11. Ambient Noise Quality Monitoring StationsTable No 3.12 Noise Quality Monitoring DataTable No 3.15. Description of Soil Quality Sampling LocationsTable No. 3.16. Result of soil analysisTable No.3.17.. Area estimates of wetlands in HamirpurTable No.3.18. Area estimates of Wetlands in district JalaunTable No.3.19. Altitude-wise Forest cover (Area in sq km)Table No.3.20. Forest cover in different patch size classesTable No.3.21 District wise list of forestsTable No.3.22. List of plant species that are commonly found in the area
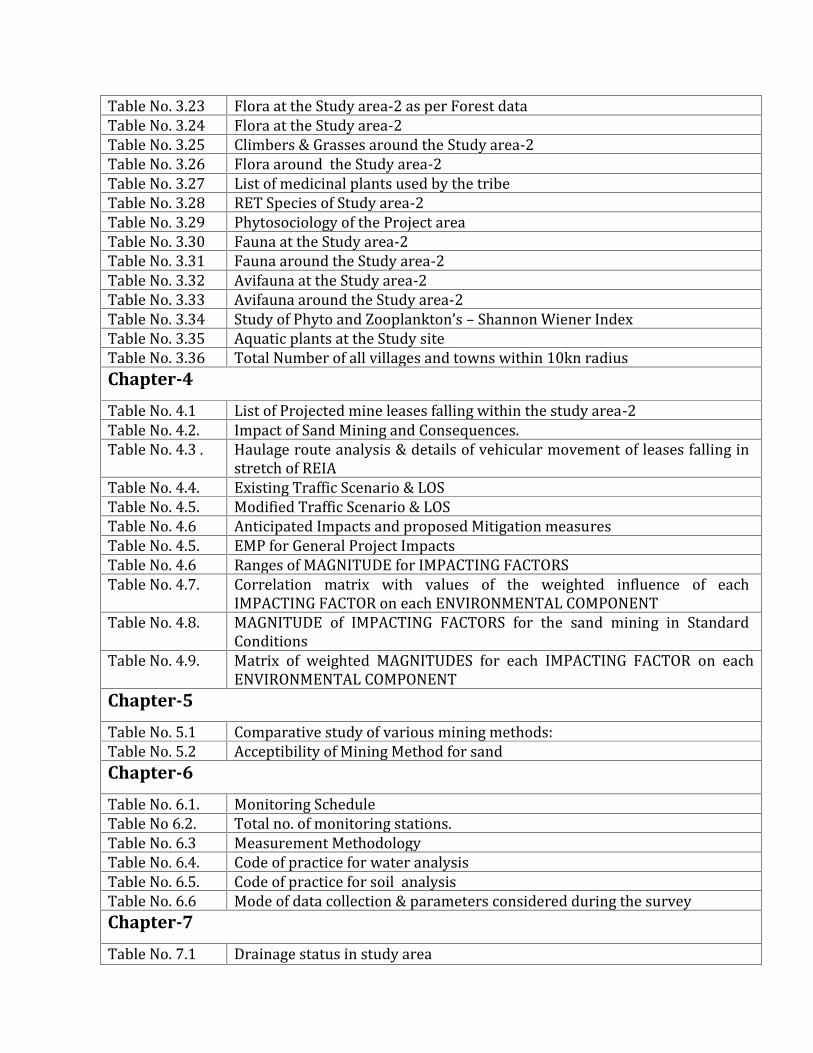
Table No. 3.23 Flora at the Study area-2 as per Forest dataTable No. 3.24 Flora at the Study area-2Table No. 3.25 Climbers & Grasses around the Study area-2Table No. 3.26 Flora around the Study area-2Table No. 3.27 List of medicinal plants used by the tribeTable No. 3.28 RET Species of Study area-2Table No. 3.29 Phytosociology of the Project areaTable No. 3.30 Fauna at the Study area-2Table No. 3.31 Fauna around the Study area-2Table No. 3.32 Avifauna at the Study area-2Table No. 3.33 Avifauna around the Study area-2Table No. 3.34 Study of Phyto and Zooplankton’s – Shannon Wiener IndexTable No. 3.35 Aquatic plants at the Study siteTable No. 3.36 Total Number of all villages and towns within 10kn radiusChapter-4Table No. 4.1 List of Projected mine leases falling within the study area-2Table No. 4.2. Impact of Sand Mining and Consequences.Table No. 4.3 . Haulage route analysis & details of vehicular movement of leases falling instretch of REIATable No. 4.4. Existing Traffic Scenario & LOSTable No. 4.5. Modified Traffic Scenario & LOSTable No. 4.6 Anticipated Impacts and proposed Mitigation measuresTable No. 4.5. EMP for General Project ImpactsTable No. 4.6 Ranges of MAGNITUDE for IMPACTING FACTORSTable No. 4.7. Correlation matrix with values of the weighted influence of eachIMPACTING FACTOR on each ENVIRONMENTAL COMPONENTTable No. 4.8. MAGNITUDE of IMPACTING FACTORS for the sand mining in StandardConditionsTable No. 4.9. Matrix of weighted MAGNITUDES for each IMPACTING FACTOR on eachENVIRONMENTAL COMPONENTChapter-5Table No. 5.1 Comparative study of various mining methods:Table No. 5.2 Acceptibility of Mining Method for sandChapter-6Table No. 6.1. Monitoring ScheduleTable No 6.2. Total no. of monitoring stations.Table No. 6.3 Measurement MethodologyTable No. 6.4. Code of practice for water analysisTable No. 6.5. Code of practice for soil analysisTable No. 6.6 Mode of data collection & parameters considered during the surveyChapter-7Table No. 7.1 Drainage status in study area
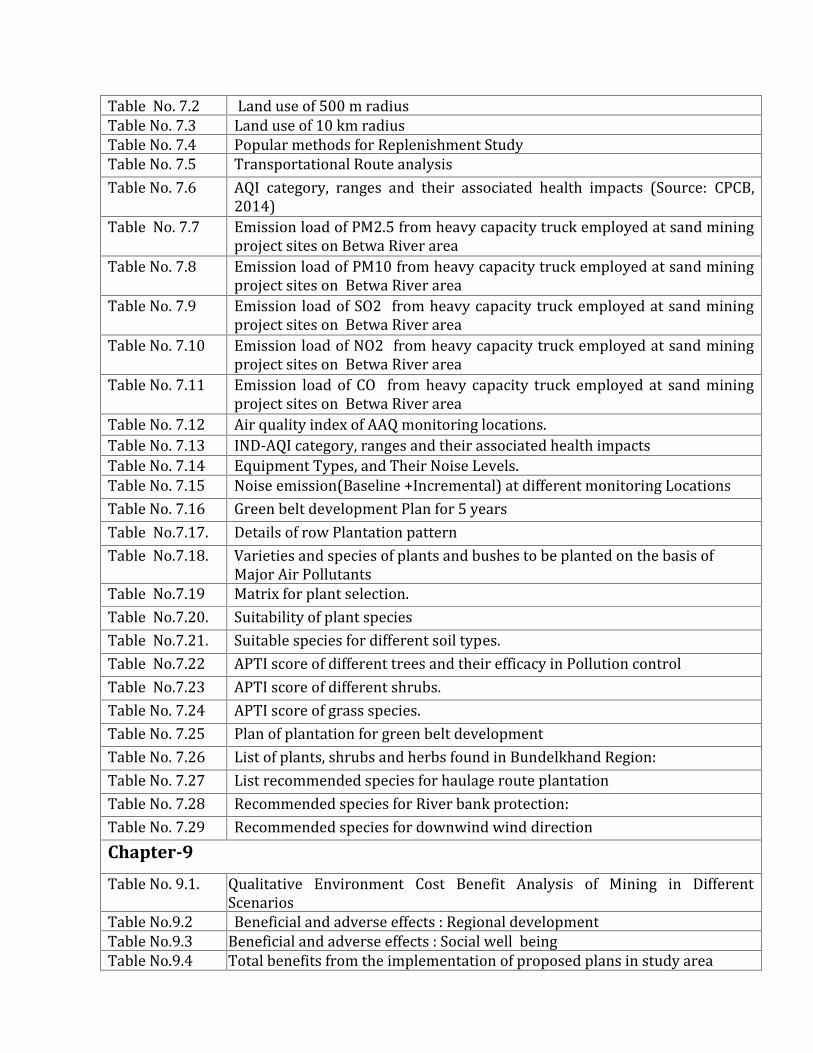
Table No. 7.2 Land use of 500 m radiusTable No. 7.3 Land use of 10 km radiusTable No. 7.4 Popular methods for Replenishment StudyTable No. 7.5 Transportational Route analysisTable No. 7.6 AQI category, ranges and their associated health impacts (Source: CPCB,2014)Table No. 7.7 Emission load of PM2.5 from heavy capacity truck employed at sand miningproject sites on Betwa River areaTable No. 7.8 Emission load of PM10 from heavy capacity truck employed at sand miningproject sites on Betwa River areaTable No. 7.9 Emission load of SO2 from heavy capacity truck employed at sand miningproject sites on Betwa River areaTable No. 7.10 Emission load of NO2 from heavy capacity truck employed at sand miningproject sites on Betwa River areaTable No. 7.11 Emission load of CO from heavy capacity truck employed at sand miningproject sites on Betwa River areaTable No. 7.12 Air quality index of AAQ monitoring locations.Table No. 7.13 IND-AQI category, ranges and their associated health impactsTable No. 7.14 Equipment Types, and Their Noise Levels.Table No. 7.15 Noise emission(Baseline +Incremental) at different monitoring LocationsTable No. 7.16 Green belt development Plan for 5 yearsTable No.7.17. Details of row Plantation patternTable No.7.18. Varieties and species of plants and bushes to be planted on the basis ofMajor Air PollutantsTable No.7.19 Matrix for plant selection.Table No.7.20. Suitability of plant speciesTable No.7.21. Suitable species for different soil types.Table No.7.22 APTI score of different trees and their efficacy in Pollution controlTable No.7.23 APTI score of different shrubs.Table No. 7.24 APTI score of grass species.Table No. 7.25 Plan of plantation for green belt developmentTable No. 7.26 List of plants, shrubs and herbs found in Bundelkhand Region:Table No. 7.27 List recommended species for haulage route plantationTable No. 7.28 Recommended species for River bank protection:Table No. 7.29 Recommended species for downwind wind directionChapter-9Table No. 9.1. Qualitative Environment Cost Benefit Analysis of Mining in DifferentScenariosTable No.9.2 Beneficial and adverse effects : Regional developmentTable No.9.3 Beneficial and adverse effects : Social well beingTable No.9.4 Total benefits from the implementation of proposed plans in study area
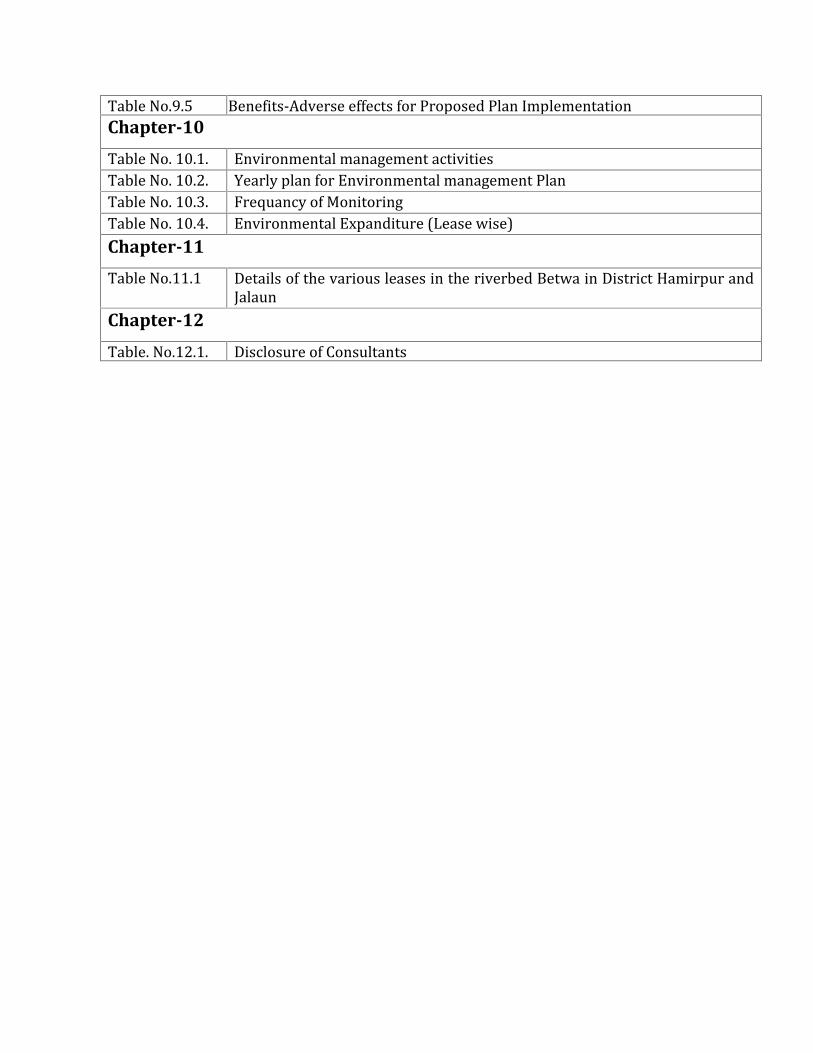
Table No.9.5 Benefits-Adverse effects for Proposed Plan ImplementationChapter-10Table No. 10.1. Environmental management activitiesTable No. 10.2. Yearly plan for Environmental management PlanTable No. 10.3. Frequancy of MonitoringTable No. 10.4. Environmental Expanditure (Lease wise)Chapter-11Table No.11.1 Details of the various leases in the riverbed Betwa in District Hamirpur andJalaunChapter-12Table. No.12.1. Disclosure of Consultants
CHAPTER-1
S. NO. CONTENTS1.1 GENERAL1.2 PURPOSE OF EIA1.3 LEGISLATIONS APPLICABLE TO MINING OF MINOR MINERALS1.4 EXTRACT OF EIA NOTIFICATION1.5 PROJECT / PROPONENT DETAILS1.6 PROJECT IMPORTANCE TO THE COUNTRY AND REGION1.7 SCOPE OF THE STUDY1.8 NATURE AND SIZE OF GROUP OF LEASES1.9 CARRYING CAPACITY OF AREA1.10 STRUCTURE OF EIA REPORT
A Environmental Impact Assessment (EIA) is an environmental framework thatevaluates environmental impacts and associated risks at a strategic level.The EIA assesses the potential cumulative impact of the project on the environment incombination with other known developments in the wider area and will considercumulative impacts. These may include carrying capacity of the area.An EIA can only address a limited range of alternatives and mitigation measures, whileEIA Considers a broad range of potential alternatives over a wider location.1.1 GENERAL
The spectacular growth of the construction industry has unforseen consequences for every riverin India through mining of sand — which is an essential part of construction.Modern cities arebuilt with sand. Most of it is used in the construction industry to make concrete and asphalt. Nosurprise, then, that Asia is the biggest consumer of sand. The UN forecasts that, by 2030, therewill be over 40 “megacities” home to more than 10million inhabitants (up from 31 in 2016),which means more housing and infrastructure will need to be built , this can explain the
thecountry's breakneck pace of construction. Sand also has industrial uses: it is used to makeglass, electronics, and to help extract oil in the fracking industry.1.1.1 Sand mining in IndiaSand is a good source of revenue for state governments. The huge gap between supplyand demand of natural sand has seen an increase in the illegal filter sand business(washing of sandy loam soil and selling it as sand) in the state. The farmers along theriverbeds, tank beds and streams are extracting sand and selling it for Rs 6,000 to Rs9,000 per truckload, depending on the quality.The increase in the construction ofapartments, townships, roads and bridges has pushed up the demand for sand. Sand is anexpensive commodity today, though the price varies in different markets. Soaringdemand for sand due to massive construction poses a threat not just to the environmentbut to society at large, and urgent measures are needed to tackle the problem.With realestate mushrooming and construction of highways and roads booming, there is hugedemand for sand. Apart from the big bucks, the livelihood of hundreds of thousands ofpeople, from truck drivers to construction labourers, are linked to the business. Anydisruption in supply is expected to push up the project costs, and slow down buildingactivity. Already builders are facing the heat. The real estate sector is one of the largestemployers. Officially blocks are earmarked and then auctioned by the state governmentafter environment clearance is granted.1.1.2 Present status of sand MiningThe mining of sand and gravel has emerged as a major regulatory concern in the lastdecade, especially because of the global construction boom and the spread ofurbanisation. The removal of sand, which was earlier only for low-scale, householdpurposes or as a managementexercise to prevent flooding, is now one of the mostunregulated mining sectors in India
1.1.3 Sand Mining in Uttar Pradesh
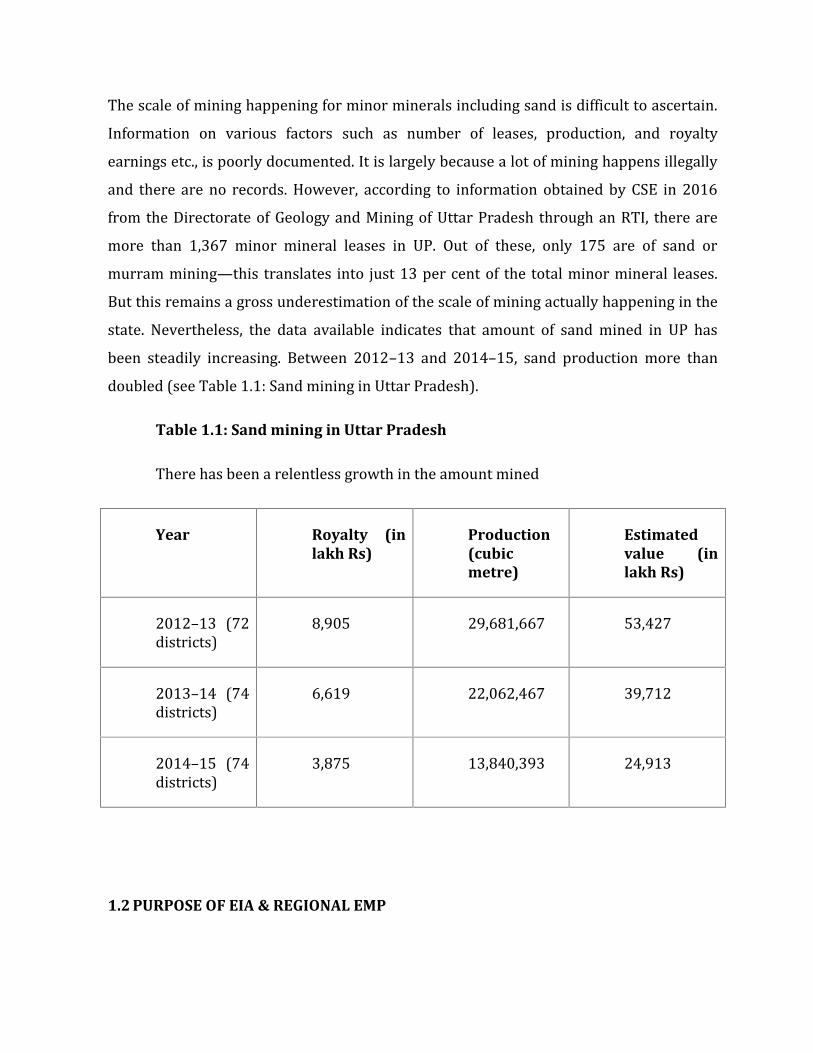
The scale of mining happening for minor minerals including sand is difficult to ascertain.Information on various factors such as number of leases, production, and royaltyearnings etc., is poorly documented. It is largely because a lot of mining happens illegallyand there are no records. However, according to information obtained by CSE in 2016from the Directorate of Geology and Mining of Uttar Pradesh through an RTI, there aremore than 1,367 minor mineral leases in UP. Out of these, only 175 are of sand ormurram mining—this translates into just 13 per cent of the total minor mineral leases.But this remains a gross underestimation of the scale of mining actually happening in thestate. Nevertheless, the data available indicates that amount of sand mined in UP hasbeen steadily increasing. Between 2012–13 and 2014–15, sand production more thandoubled (see Table 1.1: Sand mining in Uttar Pradesh).Table 1.1: Sand mining in Uttar PradeshThere has been a relentless growth in the amount minedYear Royalty (in
lakh Rs)Production(cubicmetre)
Estimatedvalue (inlakh Rs)
2012–13 (72districts) 8,905 29,681,667 53,4272013–14 (74districts) 6,619 22,062,467 39,7122014–15 (74districts) 3,875 13,840,393 24,913
1.2 PURPOSE OF EIA & REGIONAL EMP
The proposal for EIA has been put forth during various TOR presentations and detailoutline was explained and SEAC was agreed with the proposal. The standard TOR willform the basis of this EIA as no additional TORs were issued by the SEAC, UttarPradesh.The total mine lease area of M/s Yadav and Sons is 12.145 haand it is situated
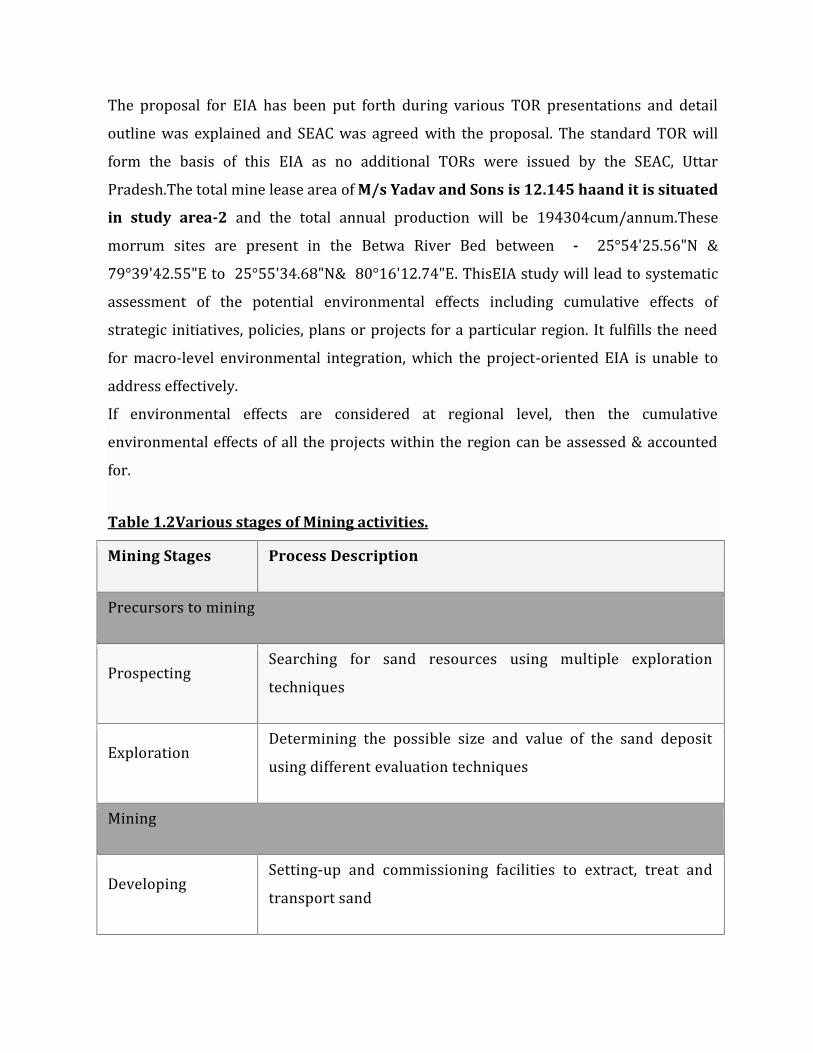
in study area-2 and the total annual production will be 194304cum/annum.Thesemorrum sites are present in the Betwa River Bed between - 25°54'25.56"N &79°39'42.55"E to 25°55'34.68"N& 80°16'12.74"E. ThisEIA study will lead to systematicassessment of the potential environmental effects including cumulative effects ofstrategic initiatives, policies, plans or projects for a particular region. It fulfills the needfor macro-level environmental integration, which the project-oriented EIA is unable toaddress effectively.If environmental effects are considered at regional level, then the cumulativeenvironmental effects of all the projects within the region can be assessed & accountedfor.Table 1.2Various stages of Mining activities.
Mining Stages Process Description
Precursors to miningProspecting Searching for sand resources using multiple explorationtechniquesExploration Determining the possible size and value of the sand depositusing different evaluation techniquesMiningDeveloping Setting-up and commissioning facilities to extract, treat andtransport sand
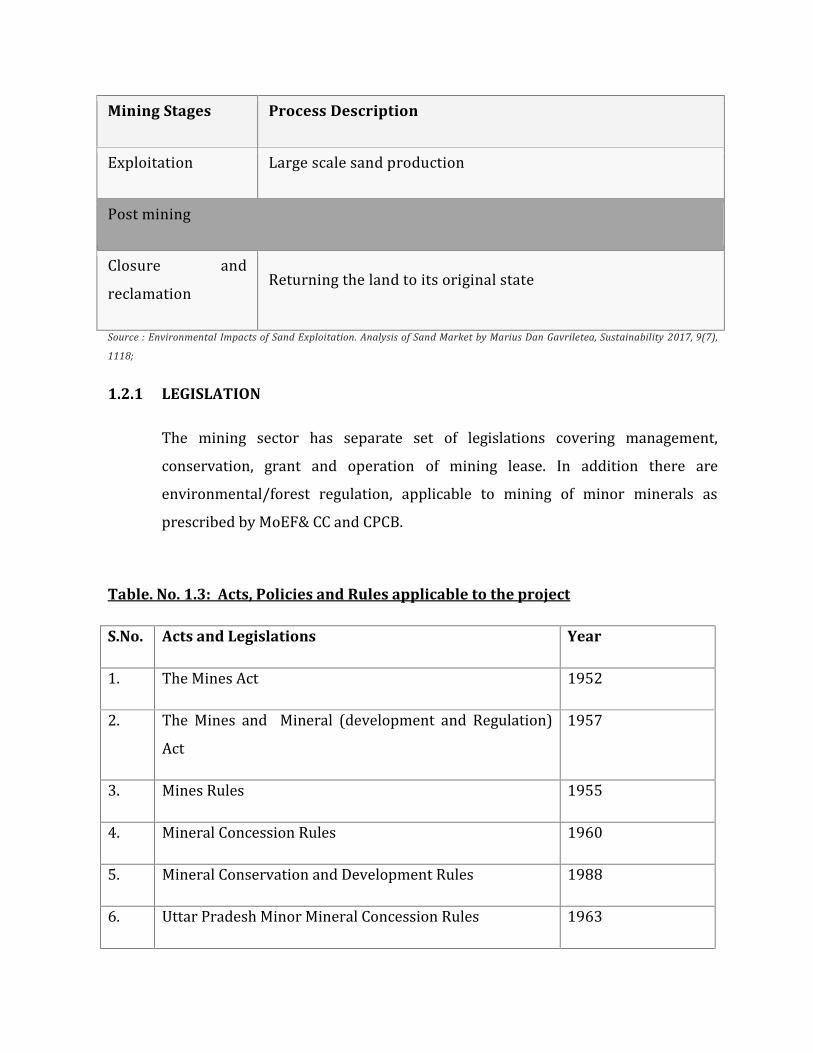
Mining Stages Process Description
Exploitation Large scale sand productionPost miningClosure andreclamation Returning the land to its original stateSource : Environmental Impacts of Sand Exploitation. Analysis of Sand Market by Marius Dan Gavriletea, Sustainability 2017, 9(7),
1118;
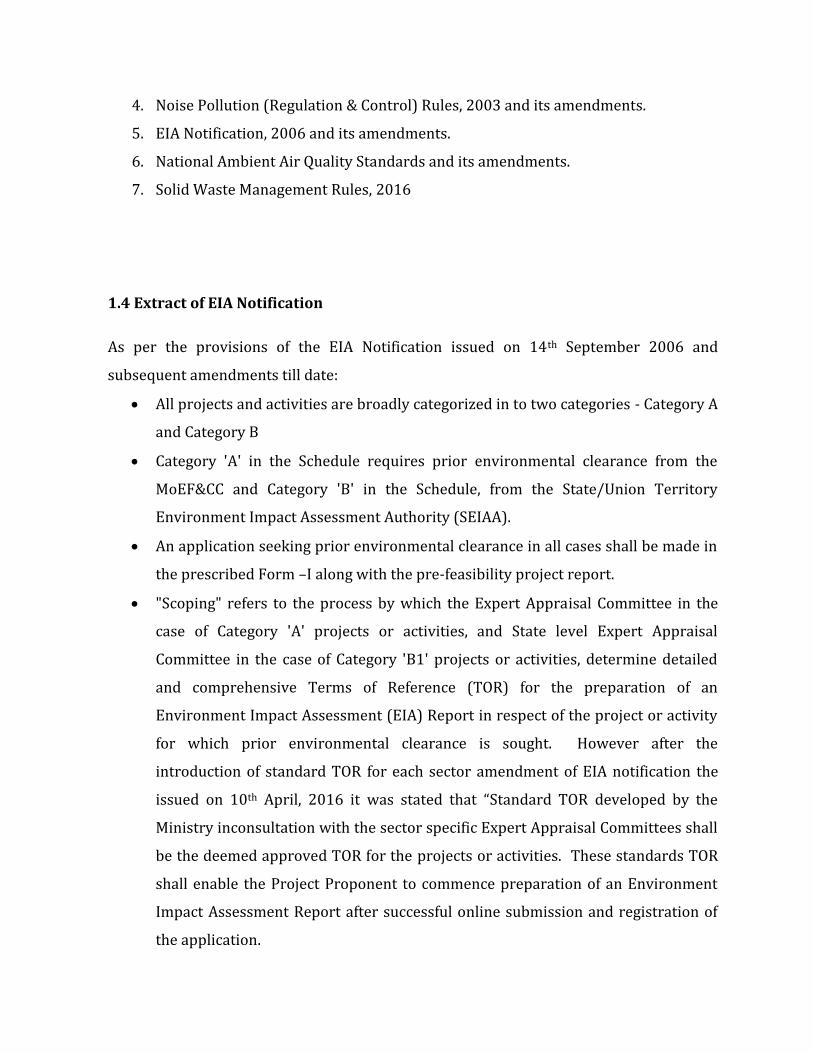
1.2.1 LEGISLATIONThe mining sector has separate set of legislations covering management,conservation, grant and operation of mining lease. In addition there areenvironmental/forest regulation, applicable to mining of minor minerals asprescribed by MoEF& CC and CPCB.Table. No. 1.3: Acts, Policies and Rules applicable to the project
S.No. Acts and Legislations Year1. The Mines Act 19522. The Mines and Mineral (development and Regulation)Act 19573. Mines Rules 19554. Mineral Concession Rules 19605. Mineral Conservation and Development Rules 19886. Uttar Pradesh Minor Mineral Concession Rules 1963

7. The Environment (Protection) Act, 19868. Notification on Environment Impact Assessment ofDevelopment projects (and amendments) (referred to asthe Notification on Environmental Clearance)2006, 2009, 2015,2018
9. Wildlife Protection Act, MoEF 197210. The Forest (Conservation) Act, 198011. Water (Prevention and Control of Pollution) Act (andsubsequent amendments) 197412. The Water (Prevention & Control of Pollution) Rules 197513. The Water (Prevention & Control of Pollution) Cess Act 197714. The Water (Prevention & Control of Pollution) CessRules 197815. Air (Prevention and Control of Pollution) Act (andsubsequent amendments) 1981In order to keep the local & regional environment intact and to achieve the goals ofsustainable development, all the mining activities under mining operations of theproposed project will be carried out within the framework of governmental policies, actsand rules of mining, forest conservation and environmental protection. The Environment(Protection) Act, 1986, is the most comprehensive law on the subject. The law grantspower to the Central and State Government to take all measures necessary to protect andimprove the quality of environment and to prevent pollution of the environment. Thefollowing rules, notifications and standards under the Environment (Protection) Act,1986 are particularly relevant in this case:1. Environment (Protection) Rules, 1986 and its amendments.2. The Water (Prevention and Control of Pollution) Rules, 19753. The Air (Prevention and Control of Pollution) Rules, 1982
4. Noise Pollution (Regulation & Control) Rules, 2003 and its amendments.5. EIA Notification, 2006 and its amendments.6. National Ambient Air Quality Standards and its amendments.7. Solid Waste Management Rules, 2016
1.4 Extract of EIA NotificationAs per the provisions of the EIA Notification issued on 14th September 2006 andsubsequent amendments till date: All projects and activities are broadly categorized in to two categories - Category Aand Category B Category 'A' in the Schedule requires prior environmental clearance from theMoEF&CC and Category 'B' in the Schedule, from the State/Union TerritoryEnvironment Impact Assessment Authority (SEIAA). An application seeking prior environmental clearance in all cases shall be made inthe prescribed Form –I along with the pre-feasibility project report. "Scoping" refers to the process by which the Expert Appraisal Committee in thecase of Category 'A' projects or activities, and State level Expert AppraisalCommittee in the case of Category 'B1' projects or activities, determine detailedand comprehensive Terms of Reference (TOR) for the preparation of anEnvironment Impact Assessment (EIA) Report in respect of the project or activityfor which prior environmental clearance is sought. However after theintroduction of standard TOR for each sector amendment of EIA notification theissued on 10th April, 2016 it was stated that “Standard TOR developed by theMinistry inconsultation with the sector specific Expert Appraisal Committees shallbe the deemed approved TOR for the projects or activities. These standards TORshall enable the Project Proponent to commence preparation of an EnvironmentImpact Assessment Report after successful online submission and registration ofthe application.
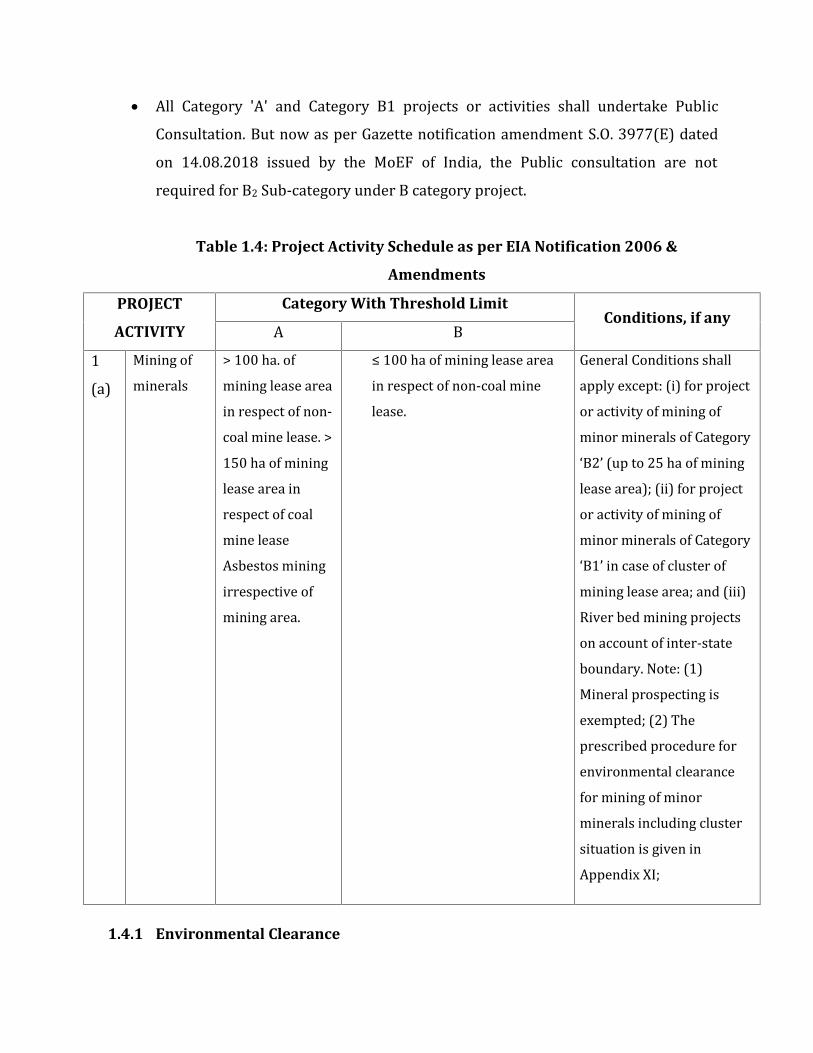
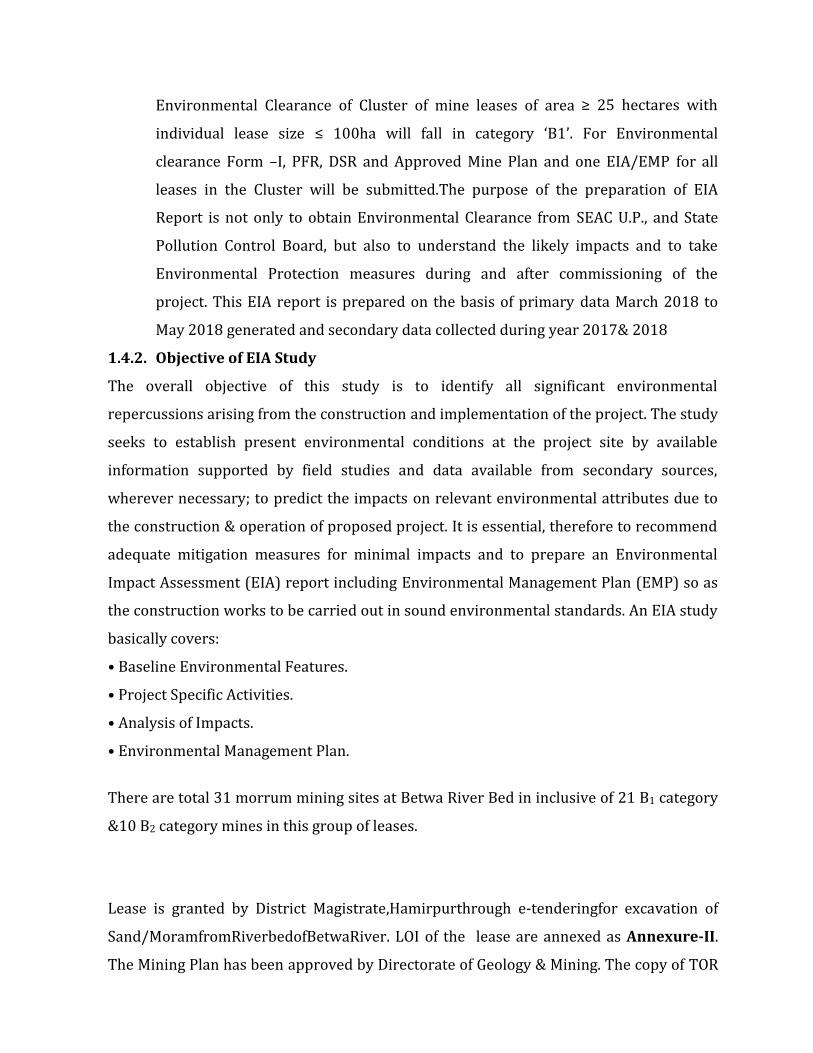
All Category 'A' and Category B1 projects or activities shall undertake PublicConsultation. But now as per Gazette notification amendment S.O. 3977(E) datedon 14.08.2018 issued by the MoEF of India, the Public consultation are notrequired for B2 Sub-category under B category project.Table 1.4: Project Activity Schedule as per EIA Notification 2006 &
Amendments
PROJECT
ACTIVITY
Category With Threshold LimitConditions, if anyA B1(a) Mining ofminerals > 100 ha. ofmining lease areain respect of non-coal mine lease. >150 ha of mininglease area inrespect of coalmine leaseAsbestos miningirrespective ofmining area.
≤ 100 ha of mining lease areain respect of non-coal minelease.General Conditions shallapply except: (i) for projector activity of mining ofminor minerals of Category‘B2’ (up to 25 ha of mininglease area); (ii) for projector activity of mining ofminor minerals of Category‘B1’ in case of cluster ofmining lease area; and (iii)River bed mining projectson account of inter-stateboundary. Note: (1)Mineral prospecting isexempted; (2) Theprescribed procedure forenvironmental clearancefor mining of minorminerals including clustersituation is given inAppendix XI;
1.4.1 Environmental Clearance
Environmental Clearance of Cluster of mine leases of area ≥ 25 hectares withindividual lease size ≤ 100ha will fall in category ‘B1’. For Environmentalclearance Form –I, PFR, DSR and Approved Mine Plan and one EIA/EMP for allleases in the Cluster will be submitted.The purpose of the preparation of EIAReport is not only to obtain Environmental Clearance from SEAC U.P., and StatePollution Control Board, but also to understand the likely impacts and to takeEnvironmental Protection measures during and after commissioning of theproject. This EIA report is prepared on the basis of primary data March 2018 toMay 2018 generated and secondary data collected during year 2017& 20181.4.2. Objective of EIA StudyThe overall objective of this study is to identify all significant environmentalrepercussions arising from the construction and implementation of the project. The studyseeks to establish present environmental conditions at the project site by availableinformation supported by field studies and data available from secondary sources,wherever necessary; to predict the impacts on relevant environmental attributes due tothe construction & operation of proposed project. It is essential, therefore to recommendadequate mitigation measures for minimal impacts and to prepare an EnvironmentalImpact Assessment (EIA) report including Environmental Management Plan (EMP) so asthe construction works to be carried out in sound environmental standards. An EIA studybasically covers:• Baseline Environmental Features.• Project Specific Activities.• Analysis of Impacts.• Environmental Management Plan.There are total 31 morrum mining sites at Betwa River Bed in inclusive of 21 B1 category&10 B2 category mines in this group of leases.Lease is granted by District Magistrate,Hamirpurthrough e-tenderingfor excavation ofSand/MoramfromRiverbedofBetwaRiver. LOI of the lease are annexed as Annexure-II.The Mining Plan has been approved by Directorate of Geology & Mining. The copy of TOR
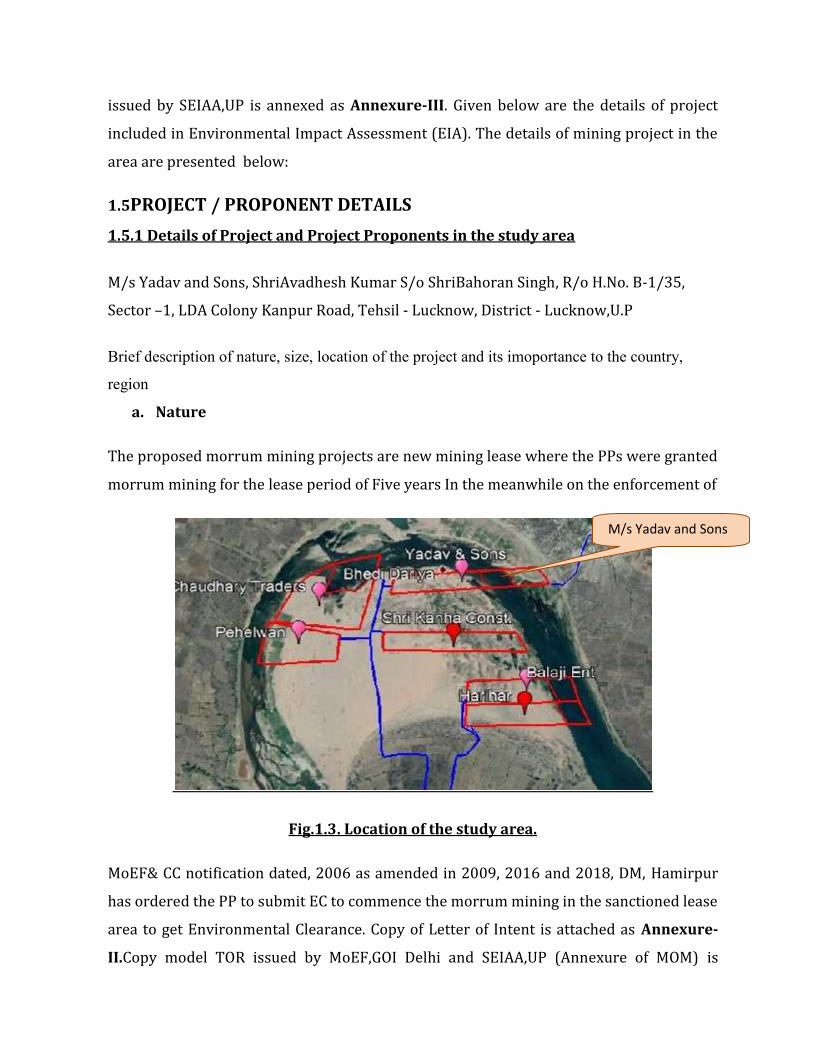
issued by SEIAA,UP is annexed as Annexure-III. Given below are the details of projectincluded in Environmental Impact Assessment (EIA). The details of mining project in thearea are presented below:1.5PROJECT / PROPONENT DETAILS
1.5.1 Details of Project and Project Proponents in the study area
M/s Yadav and Sons, ShriAvadhesh Kumar S/o ShriBahoran Singh, R/o H.No. B-1/35,Sector –1, LDA Colony Kanpur Road, Tehsil - Lucknow, District - Lucknow,U.PBrief description of nature, size, location of the project and its imoportance to the country,
region
a. NatureThe proposed morrum mining projects are new mining lease where the PPs were grantedmorrum mining for the lease period of Five years In the meanwhile on the enforcement of
Fig.1.3. Location of the study area.MoEF& CC notification dated, 2006 as amended in 2009, 2016 and 2018, DM, Hamirpurhas ordered the PP to submit EC to commence the morrum mining in the sanctioned leasearea to get Environmental Clearance. Copy of Letter of Intent is attached as Annexure-
II.Copy model TOR issued by MoEF,GOI Delhi and SEIAA,UP (Annexure of MOM) is
M/s Yadav and Sons
annexedas Annexure-III.The proposed projects are to mine morrum from dry river bedsustainably and scientifically. Mining will be done by semi mechanized/OTFM (OtherThan Fully Mechanized) method using light earth mover machines e.g. bar scrapers andloaders along the river bed keeping the banks unaffected. Google Map of 10 km radiusfrom proposed project site showing surrounding features is given below:b. Brief History of Projects in the study area
c. The lease is granted by District Magistrate,Hamirpurthrough e-tenderingforexcavation of S a n d / Moram from Riverbed of Betwa River. LOI ofthe leasesis annexed as Annexure-II. The Mining Plan has been approved byDirectorate of Geology & Mining. The copy of standard TOR is annexed asAnnexure-III.
d. SizeProposed mine leases has been sanctioned over for period of five years. Only morrum willbe excavated. It has been proposed that 1,94,304cum/ year of morrum will be excavated.e. Area and categorization of Projects in the study areaAlthough the area of the project is 12.145 ha and it is B1 category project.
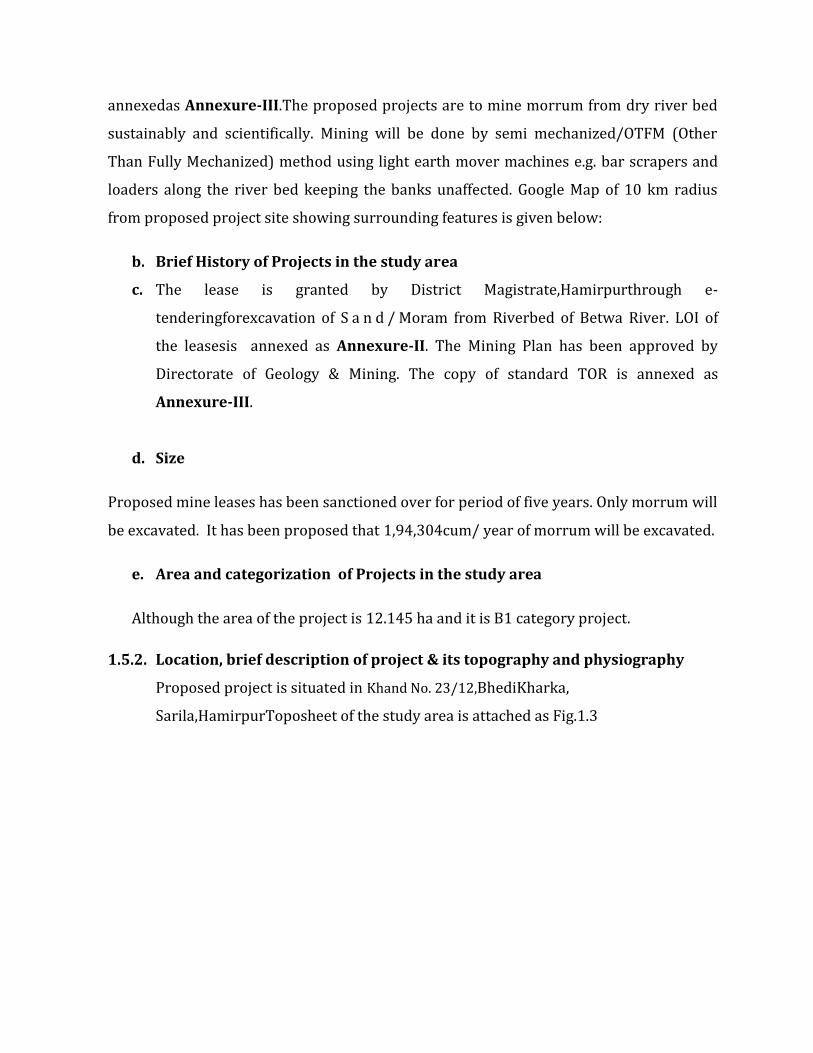
1.5.2. Location, brief description of project & its topography and physiographyProposed project is situated in Khand No. 23/12,BhediKharka,Sarila,HamirpurToposheet of the study area is attached as Fig.1.3

Fig 1.4Toposheet of the stretch of Betwa covered in EIA of study area-2
f. Location of Lease Area.Proposed project is situated in Khand No. 23/12,BhediKharka, Sarila, Hamirpur1.6PROJECT IMPORTANCE TO THE COUNTRY AND REGIONDue to the increased industrial and infrastructural growth of the rural and urban areasdemand of morrum is very high. Morrum has become a very important mineral for theexpansion of society. With the increase of urbanization thedemand for morrum isgrowing in infrastructure sector in our country. The mineral is used for making concrete,filling roads, building sites, brick making, making glass, morrum papers, reclamations etc.Individual and private companies are increasingly demanding morrum for constructionpurposes and this has immense pressure on morrum resources. This increasing demandmakes this an environmental issue. Similar initiates are also being taken up in road sectorby National Highway Authority of India and Ministry of Transport. Achieving such a hugeinfrastructure requires basic building materials and morrum, bajri and boulders is one ofprimary building material required for the purpose. The mining activities are the
M/s Rama Traders
backbone of all construction and infrastructure projects as raw material for constructionis available only from such mining. The mining being undertaken will support demand formorrum, stone and bajri in the area. Simultaneously, the morrum excavation helps inchannelizing the river, which minimizes the hazards of floods and water logging in theregion.1.7 SCOPE OF THE STUDYThe present EIA report of the study area is prepared as per requirement of the TORissued by SEAC, UP attached as Annexure II. The monitoring and analysis study for theproject was done during March 2018 – May 2018 around study area is also attached asAnnexure XII. Toposheet of the study area is attached as Annexure-XVIII.1.8 NATURE AND SIZE OF GROUP OF LEASEThe mining lease area is 12.145 ha. It has been proposed that 1,94,304 cum/ year ofmorrum will be excavated. The plan period of the entire lease is 05 years.a. Nature of MinesThe proposed project is sand/ morrum mining projects. Area wise the project is fallingunder category B2 having area of 12.145 ha but due to the cluster situation it become B1category project. The spirit of EIA notification is the cumulative impact assessment of twosmall mines which individually are believed to cause less impact. The buffer zones ofvarious mines on the stretch of river Betwa are overlapping each other, that is the needfor impact assessment on the large scale and EIA is undertaken.1.9CARRYING CAPACITY OF AREAPredicting future growth and assessing the extent of infrastructural development(industrial, commercial other such activities) the region can support based on theload based discharge and pollutant concentration which does not adversely affect thenatural resource base and existing ecosystem of the region. mining and removal ofsand from in-stream and upstream of several rivers, which may have seriousenvironmental impact on ephemeral, seasonal and perennial rivers and river bedsand sand extraction may have an adverse effect on bio-diversity as well. Further it
may also lead to bed degradation and sedimentation having a negative effect on theaquatic life. Carrying capacity refers to the number of individual projects which can besupported in a given area within natural resource limits, and without degrading thenatural social, cultural and economic environment for present and future generations.The carrying capacity for any given area is not fixed. It can be altered by improvedtechnology, but mostly it is changed for the worse by pressures which accompany apopulation increase. As the environment is degraded, carrying capacity actuallyshrinks, leaving the environment no longer able to support even the number of peoplewho could formerly have lived in the area on a sustainable basis. No population canlive beyond the environment's carrying capacity for very long. We must think in termsof "carrying capacity" not land area. The effects of unfettered population growthdrastically reduce the carrying capacity Extraction of alluvial material within or neara river bed has an impact on the rivers physical habitat characteristics, like riverstability, flood risk, environmental degradation, loss of habitat, decline in biodiversity,it is not an answer to say that the extraction is in blocks of less than 5 hectares,separated by 1 kilometre, because their collective impact may be significant, hencethe necessity of a proper environmental assessment plan. Damaging lakes, riverbedsand groundwater leading to drying up of water beds and causing water scarcity onaccount of quarry/mining leases and mineral concessions granted by the StateGovernments, even if the area was small, the collective impact on environment wassignificant. Mining of minerals, whether major or minor have a direct bearing on thehydrological regime of the area. Besides, affecting the availability of water as aresource, it also affects the quality of water through direct run of going into thesurface water bodies and infiltration / leaching into groundwater. Further,groundwater withdrawal, dewatering of water from mine pit and diversion of surfacewater may cause surface and sub surface hydrologic systems to dry up. An idealsituation would require that quarrying should be restricted to unsaturated zone onlyabove the phreatic water table and should not intersect the groundwater table at anypoint of time. Sand is vital for sustenance of rivers. It has now been establishedbeyond doubt that uncontrolled sand mining from the river bed leads to thedestruction of the entire system. If sand and gravel are extracted in quantities
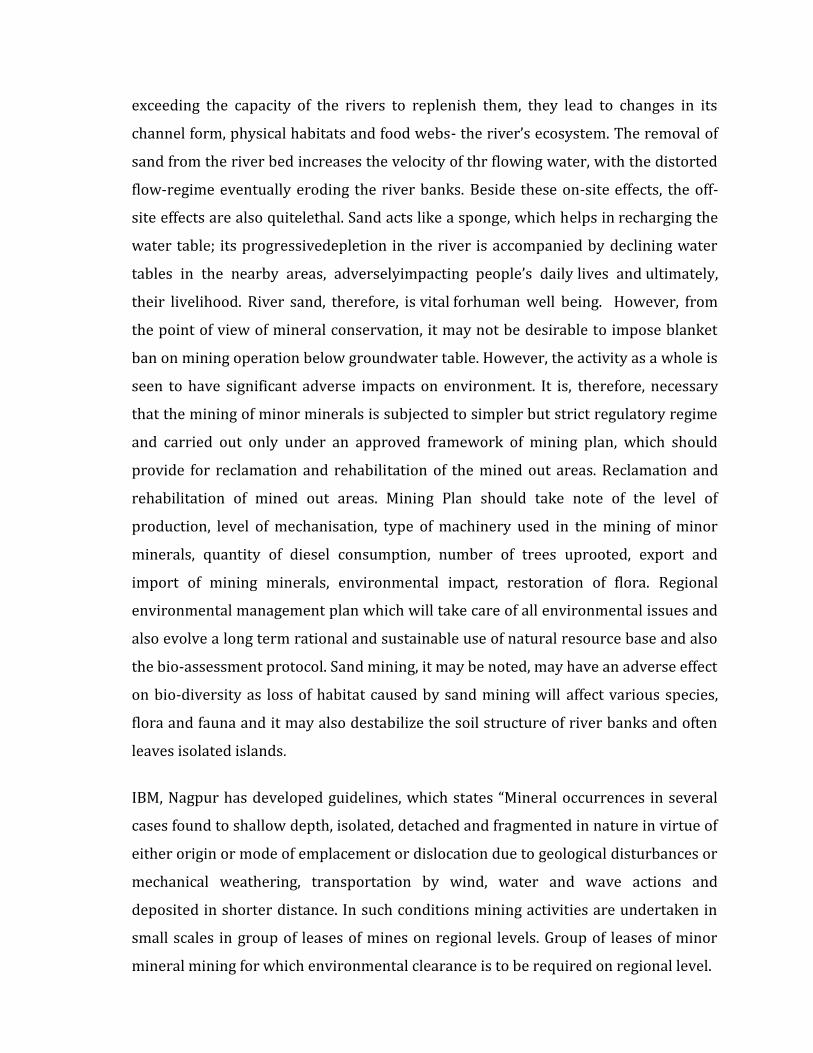
exceeding the capacity of the rivers to replenish them, they lead to changes in itschannel form, physical habitats and food webs- the river’s ecosystem. The removal ofsand from the river bed increases the velocity of thr flowing water, with the distortedflow-regime eventually eroding the river banks. Beside these on-site effects, the off-site effects are also quitelethal. Sand acts like a sponge, which helps in recharging thewater table; its progressivedepletion in the river is accompanied by declining watertables in the nearby areas, adverselyimpacting people’s daily lives and ultimately,their livelihood. River sand, therefore, is vital forhuman well being. However, fromthe point of view of mineral conservation, it may not be desirable to impose blanketban on mining operation below groundwater table. However, the activity as a whole isseen to have significant adverse impacts on environment. It is, therefore, necessarythat the mining of minor minerals is subjected to simpler but strict regulatory regimeand carried out only under an approved framework of mining plan, which shouldprovide for reclamation and rehabilitation of the mined out areas. Reclamation andrehabilitation of mined out areas. Mining Plan should take note of the level ofproduction, level of mechanisation, type of machinery used in the mining of minorminerals, quantity of diesel consumption, number of trees uprooted, export andimport of mining minerals, environmental impact, restoration of flora. Regionalenvironmental management plan which will take care of all environmental issues andalso evolve a long term rational and sustainable use of natural resource base and alsothe bio-assessment protocol. Sand mining, it may be noted, may have an adverse effecton bio-diversity as loss of habitat caused by sand mining will affect various species,flora and fauna and it may also destabilize the soil structure of river banks and oftenleaves isolated islands.IBM, Nagpur has developed guidelines, which states “Mineral occurrences in severalcases found to shallow depth, isolated, detached and fragmented in nature in virtue ofeither origin or mode of emplacement or dislocation due to geological disturbances ormechanical weathering, transportation by wind, water and wave actions anddeposited in shorter distance. In such conditions mining activities are undertaken insmall scales in group of leases of mines on regional levels. Group of leases of minormineral mining for which environmental clearance is to be required on regional level.
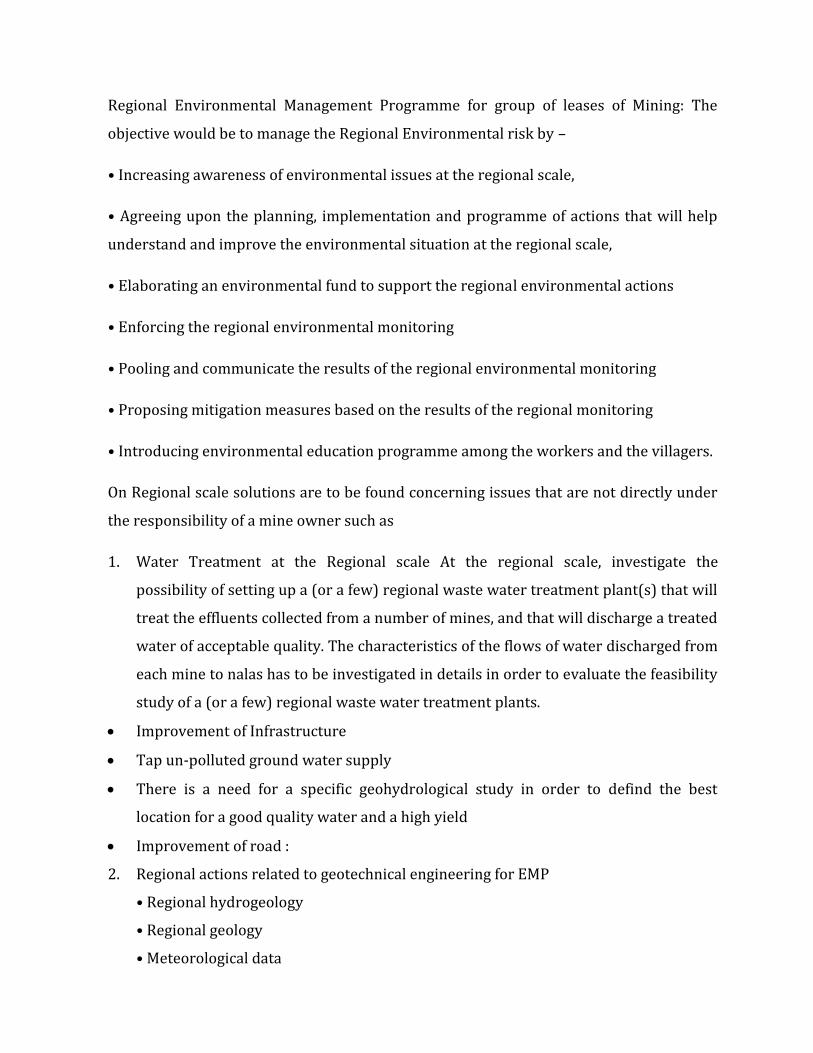
Regional Environmental Management Programme for group of leases of Mining: Theobjective would be to manage the Regional Environmental risk by –• Increasing awareness of environmental issues at the regional scale,• Agreeing upon the planning, implementation and programme of actions that will helpunderstand and improve the environmental situation at the regional scale,• Elaborating an environmental fund to support the regional environmental actions• Enforcing the regional environmental monitoring• Pooling and communicate the results of the regional environmental monitoring• Proposing mitigation measures based on the results of the regional monitoring• Introducing environmental education programme among the workers and the villagers.On Regional scale solutions are to be found concerning issues that are not directly underthe responsibility of a mine owner such as1. Water Treatment at the Regional scale At the regional scale, investigate thepossibility of setting up a (or a few) regional waste water treatment plant(s) that willtreat the effluents collected from a number of mines, and that will discharge a treatedwater of acceptable quality. The characteristics of the flows of water discharged fromeach mine to nalas has to be investigated in details in order to evaluate the feasibilitystudy of a (or a few) regional waste water treatment plants. Improvement of Infrastructure Tap un-polluted ground water supply There is a need for a specific geohydrological study in order to defind the bestlocation for a good quality water and a high yield Improvement of road :2. Regional actions related to geotechnical engineering for EMP• Regional hydrogeology• Regional geology• Meteorological data
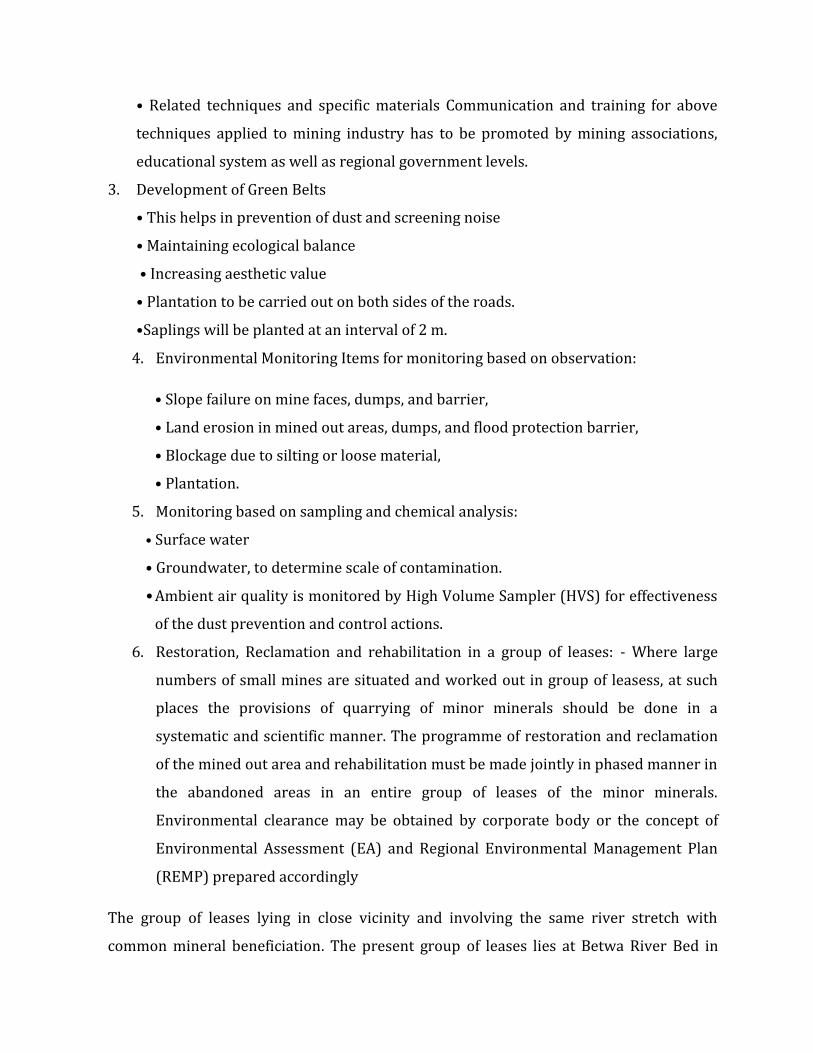
• Related techniques and specific materials Communication and training for abovetechniques applied to mining industry has to be promoted by mining associations,educational system as well as regional government levels.3. Development of Green Belts• This helps in prevention of dust and screening noise• Maintaining ecological balance• Increasing aesthetic value• Plantation to be carried out on both sides of the roads.•Saplings will be planted at an interval of 2 m.4. Environmental Monitoring Items for monitoring based on observation:• Slope failure on mine faces, dumps, and barrier,• Land erosion in mined out areas, dumps, and flood protection barrier,• Blockage due to silting or loose material,• Plantation.5. Monitoring based on sampling and chemical analysis:• Surface water• Groundwater, to determine scale of contamination.•Ambient air quality is monitored by High Volume Sampler (HVS) for effectivenessof the dust prevention and control actions.6. Restoration, Reclamation and rehabilitation in a group of leases: - Where largenumbers of small mines are situated and worked out in group of leasess, at suchplaces the provisions of quarrying of minor minerals should be done in asystematic and scientific manner. The programme of restoration and reclamationof the mined out area and rehabilitation must be made jointly in phased manner inthe abandoned areas in an entire group of leases of the minor minerals.Environmental clearance may be obtained by corporate body or the concept ofEnvironmental Assessment (EA) and Regional Environmental Management Plan(REMP) prepared accordinglyThe group of leases lying in close vicinity and involving the same river stretch withcommon mineral beneficiation. The present group of leases lies at Betwa River Bed in

Hamirpur and Jalaun District inclusive of 21B1 category mines and 10 B2 Category minesfor morrum excavation(inclusive of upcoming projects of B1-sub-category for whichPublic Hearing is awaited and B2- sub-category projects for which EC is awaited).1.9.1 Environmental rationale considered for group of leasesing of mines
Ambient Air Quality in group of Mines leasesThe group of mines is having common transport and dispatch network. This will ensurebetter assessment and prediction of air pollution load, thereby enabling common controland mitigation measures.Surface HydrologyWater regime of group of leases can be effectively assessed and mitigated throughcommon measures.Pre-dominant wind DirectionThe emission of air pollutants will remain confined to the group of leases area only hencemerely affecting the nearby areaEcological RestorationPlantation of native species of plants in consultation with DFO, Hamirpur and Jalaun.Socio economic EnvironmentEach mine has individual CSR plans which will be implemented in nearby areas. As aresult the nearby areas will be economically improved. Below given are the activities thatare proposed as a part of Corporate Social Resonsibility; however the execution of theseproposed activities will be done in consultation of local authorities.1.10 STRUCTURE OF EIA REPORT
This EIA report has been presented as per requirements of ToR of the EIANotification of Ministry of Environment and Forests (MoEF), Government of
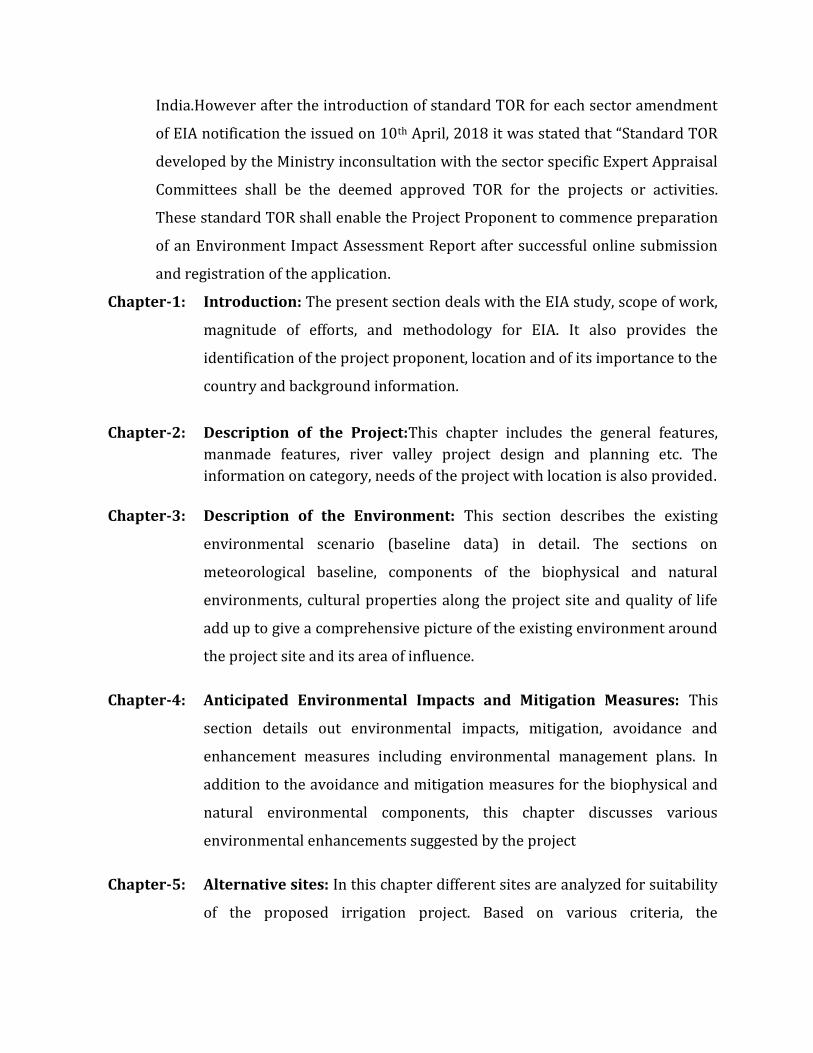
India.However after the introduction of standard TOR for each sector amendmentof EIA notification the issued on 10th April, 2018 it was stated that “Standard TORdeveloped by the Ministry inconsultation with the sector specific Expert AppraisalCommittees shall be the deemed approved TOR for the projects or activities.These standard TOR shall enable the Project Proponent to commence preparationof an Environment Impact Assessment Report after successful online submissionand registration of the application.Chapter-1: Introduction: The present section deals with the EIA study, scope of work,magnitude of efforts, and methodology for EIA. It also provides theidentification of the project proponent, location and of its importance to thecountry and background information.Chapter-2: Description of the Project:This chapter includes the general features,manmade features, river valley project design and planning etc. Theinformation on category, needs of the project with location is also provided.Chapter-3: Description of the Environment: This section describes the existingenvironmental scenario (baseline data) in detail. The sections onmeteorological baseline, components of the biophysical and naturalenvironments, cultural properties along the project site and quality of lifeadd up to give a comprehensive picture of the existing environment aroundthe project site and its area of influence.Chapter-4: Anticipated Environmental Impacts and Mitigation Measures: Thissection details out environmental impacts, mitigation, avoidance andenhancement measures including environmental management plans. Inaddition to the avoidance and mitigation measures for the biophysical andnatural environmental components, this chapter discusses variousenvironmental enhancements suggested by the projectChapter-5: Alternative sites: In this chapter different sites are analyzed for suitabilityof the proposed irrigation project. Based on various criteria, the
justification is given for selection of the most optimum site identified forsetting up of the projectChapter-6: Environmental Monitoring Program: This chapter covers the plannedEnvironmental Monitoring Program. It includes the technical aspects ofmonitoring the effectiveness of mitigation measures.Chapter-7: Disaster Management Plan: This chapter is intended to guide theconcerned officers in identifying, monitoring, responding to and mitigatingthe emergency situations. It is also useful to assist the officials to takeimmediate action in a critical situation. This chapter also details about thefamilies and persons who are going to be directly affected by the project. Itfurther discusses about the displacement, resettlement, rehabilitation andcompensation to the affected familiesChapter-8: Project Benefits:This chapter covers the benefits accruing to the locality,neighborhood, region and nation as a whole. It brings out the details ofbenefits by means of improvement in the physical infrastructure, socialinfrastructure, employment potential and other tangible benefitsChapter-9: Cost-Benefit Analysis: This chapter discusses about thetechnique used fortesting the financial viability of the project i.e. whether the investment to bemade is worth and whether the project is financially rewarding. Costs hereare described as the intended or unintended negative effects of projectinvestment, whereas, benefits is described as the intended or unintendedpositive effects of the projectChapter-10: Regional Environment Management Program:This chaptercomprehensively presents the Regional Environmental Management Plan(REMP), which includes the administrative and technical setup, summary
matrix of EMP, the cost involved to implement the EMP, both during theconstruction and operational phases.Chapter-11: Summary & Conclusion:This chapter forms the summary of the full EIAreport. It provides the overall justification for implementation of theproject and how the project is going to benefit the local people. It alsoexplains how the adverse effects are proposed to be mitigatedChapter-12: Disclosure of Consultant:This chapter includes the names of theconsultants engaged, along with a brief resume and nature of consultancyrenderedThis report is based on scientific principles and professional judgment with resultant
subjective interpretation. Professional judgments expressed herein are based on the
available data/comments/feedback/modifications and comments from Functional Area
Experts and finally compiled by EIA Coordinator.
CHAPTER- II
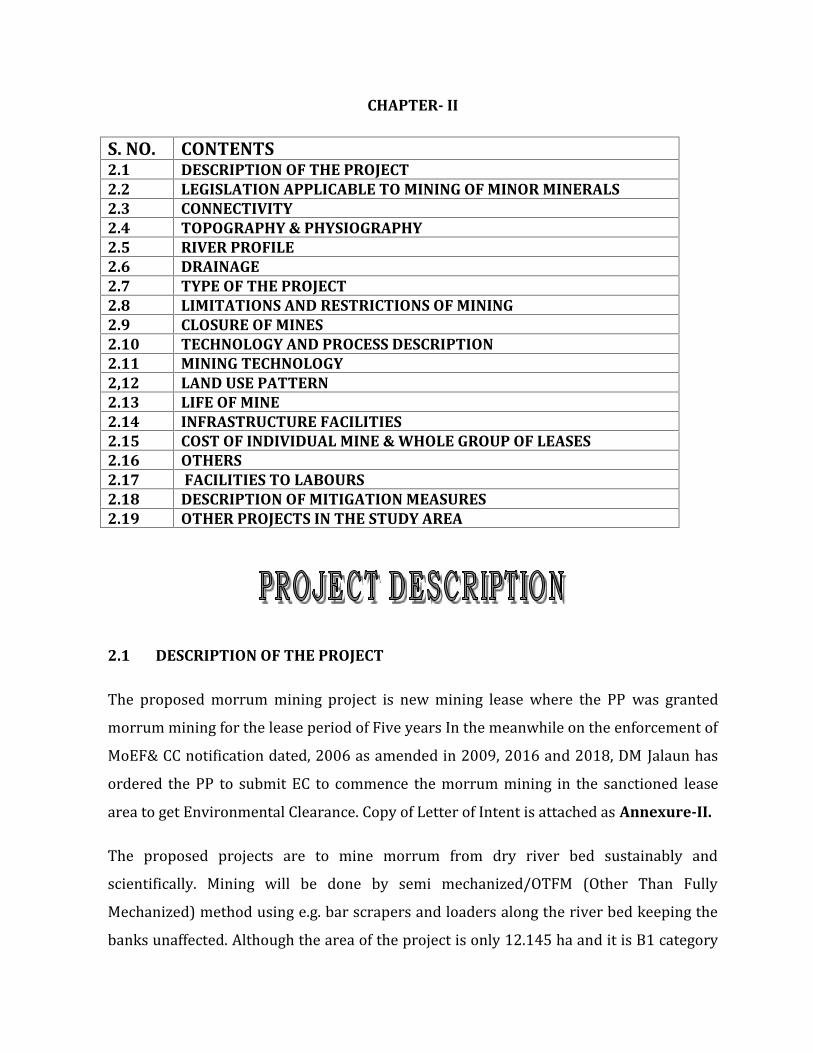
S. NO. CONTENTS2.1 DESCRIPTION OF THE PROJECT2.2 LEGISLATION APPLICABLE TO MINING OF MINOR MINERALS2.3 CONNECTIVITY2.4 TOPOGRAPHY & PHYSIOGRAPHY2.5 RIVER PROFILE2.6 DRAINAGE2.7 TYPE OF THE PROJECT2.8 LIMITATIONS AND RESTRICTIONS OF MINING2.9 CLOSURE OF MINES2.10 TECHNOLOGY AND PROCESS DESCRIPTION2.11 MINING TECHNOLOGY2,12 LAND USE PATTERN2.13 LIFE OF MINE2.14 INFRASTRUCTURE FACILITIES2.15 COST OF INDIVIDUAL MINE & WHOLE GROUP OF LEASES2.16 OTHERS2.17 FACILITIES TO LABOURS2.18 DESCRIPTION OF MITIGATION MEASURES2.19 OTHER PROJECTS IN THE STUDY AREA
2.1 DESCRIPTION OF THE PROJECTThe proposed morrum mining project is new mining lease where the PP was grantedmorrum mining for the lease period of Five years In the meanwhile on the enforcement ofMoEF& CC notification dated, 2006 as amended in 2009, 2016 and 2018, DM Jalaun hasordered the PP to submit EC to commence the morrum mining in the sanctioned leasearea to get Environmental Clearance. Copy of Letter of Intent is attached as Annexure-II.The proposed projects are to mine morrum from dry river bed sustainably andscientifically. Mining will be done by semi mechanized/OTFM (Other Than FullyMechanized) method using e.g. bar scrapers and loaders along the river bed keeping thebanks unaffected. Although the area of the project is only 12.145 ha and it is B1 category

projectProposed mine leases has been sanctioned over for period of five years. Onlymorrum will be excavated. It has been proposed that 1,94,304cum/ yearof morrum willbe excavated. The proposed project is situated in Khand No23/12, Bhedi Kharka, Sarila,Hamirpur.STUDY AREA DESCRIPTIONThe project is included in the study area-2 because there are 30 other leases (B1 and B2)are situated on the River Betwa between - 25°54'25.56"N& 79°39'42.55"E to25°55'34.68"N& 80°16'12.74"EThe study includes information on: Type of mining areas (B1 and B2) proposed currently. Constraints to mining in terms of infrastructure, skilled labour, etc.
Typical environmental impacts associated. Synergistic and cumulative impacts which can be identified Relative importance of each of these impacts
The study will allow the regulators to focus attention on priority environmental issuesand mining regions. The study can be used by stakeholders and roleplayers to determinethe level of small-scale mining on a regionalbasis. It can also be used by interested and affected parties to identify the type ofenvironmental impacts that could be expected from the various mining lease area on astretch.The process include following steps: Inventarization of the leases on the stretch Undertake Initial Screening Site Visits Undertake site surveys Collate survey findings Utilization of Environmental assessment tools
Sand mining have a widespread impact on a national level, if mining is done byunscientific methods. Extraction of alluvial material from within or near a streambed hasa direct impact on the stream’s physical habitat characteristics. These characteristicsinclude channel geometry, bed elevation, substrate composition and stability, instreamroughness elements (large woody debris, boulders, etc.) depth, velocity, turbidity,sediment transport, stream discharge and temperature (Hill & Kleynhans, 1999).Altering these habitat characteristics can have deleterious impacts on both instream biotaand the associated riparian habitat. The interconnectedness of channels and ripariansystems requires the simultaneous evaluation of potential disruptions of the riparianzone and channel activities. For example, aggregate mining involves the channel andboundary but requires land access and material storage that could adversely affectriparian zones, e.g. construction and access roads. Singly, many of the effects of mining onthe environment may well be non-significant. However, when they occur simultaneously,their significance may increase by orders of magnitude. The overriding principle is Thatthe greater the number of small-scale mines in an area, the greater the cumulativeimpacts are on the water environment. The major cumulative impacts include: Loss of riparian habitat due to large areas of riparian vegetation being removed. Riverbank destabilisation after vegetation removed. Soil erosion of arable land adjacent to mined areas. Increased surface areas of discard (sand, rock and other forms of waste) that canbe mobilised during rain and ultimately are deposited in the rivers. Increased mobilisation of sediments, which become available and clog the aquaticenvironment. Increased incidents of oils (from machinery) and chemical (if refinement takesplace) spills into rivers. Increased potential of mobilisation of metals, sulphates, Loss of arable land due to no rehabilitation. Large tracts of land becoming a safety hazard (for people and livestock).
The duration of these impacts is mainly long term. For example, many areas along the
Rivers and the environmental footprints will remain prevalent. Unless appropriaterehabilitation takes place in areas that are on the riverbanks, theland largely remainsunusable unless the area is naturally restored by for example, floods. Themining thattakes place within the riverbed or flood plain has more chance of being restoredback toits original status over time due to floods.The majority of the water-related impacts ofsmall-scale mining are localised to theimmediate vicinity of the mine. If, however, manymines occur within the same area then thecumulative impacts will be felt over a muchlarger area. Typically, the major impact wouldoccur during high rain events when themined areas will produce large volumes of silt, whichwill be washed downstream.Thesize, type, and locality of each mining operation was assessed in order to comparetherelative impact of each operation to the cumulative impacts.a. Specific features of study area
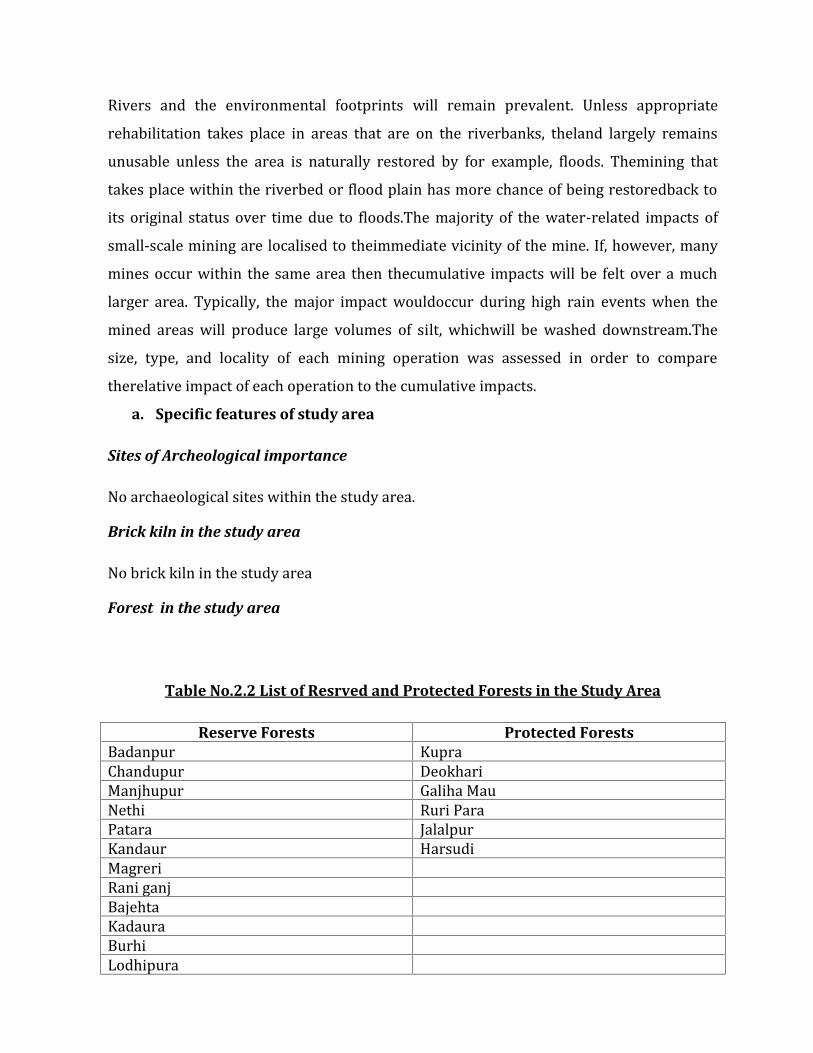
Sites of Archeological importanceNo archaeological sites within the study area.Brick kiln in the study areaNo brick kiln in the study areaForest in the study area
Table No.2.2 List of Resrved and Protected Forests in the Study Area
Reserve Forests Protected ForestsBadanpur KupraChandupur DeokhariManjhupur Galiha MauNethi Ruri ParaPatara JalalpurKandaur HarsudiMagreriRani ganjBajehtaKadauraBurhiLodhipura
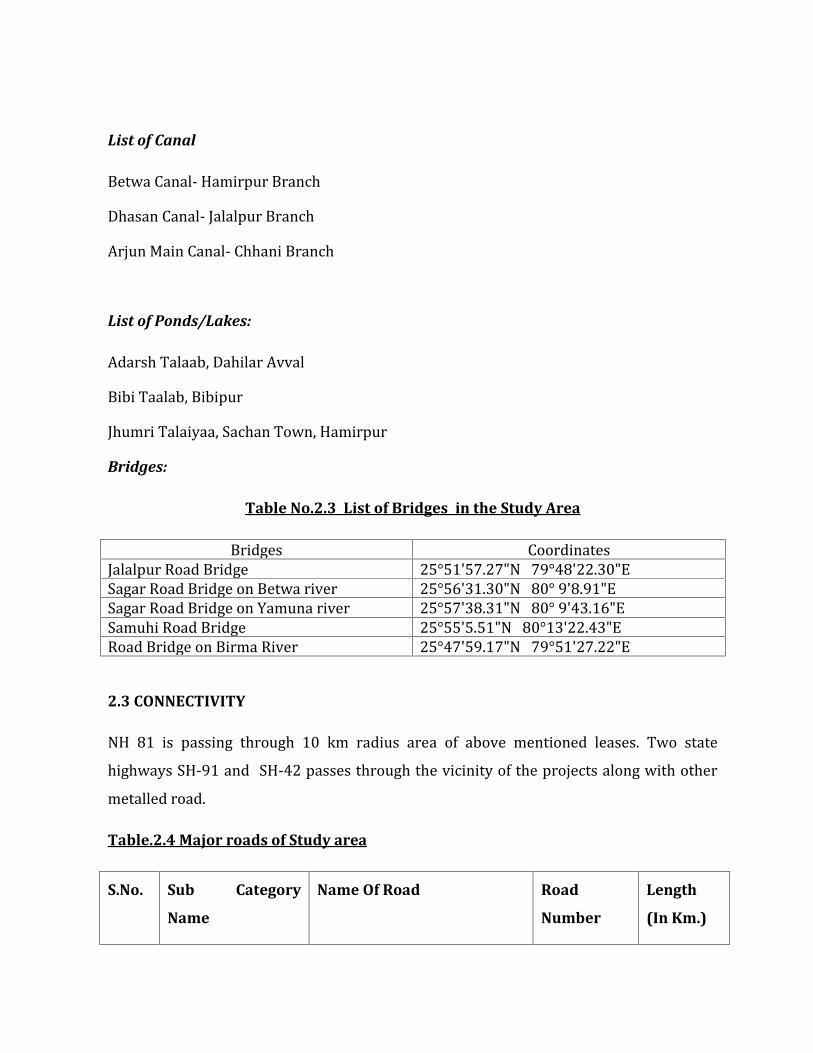
List of CanalBetwa Canal- Hamirpur BranchDhasan Canal- Jalalpur BranchArjun Main Canal- Chhani BranchList of Ponds/Lakes:Adarsh Talaab, Dahilar AvvalBibi Taalab, BibipurJhumri Talaiyaa, Sachan Town, HamirpurBridges:
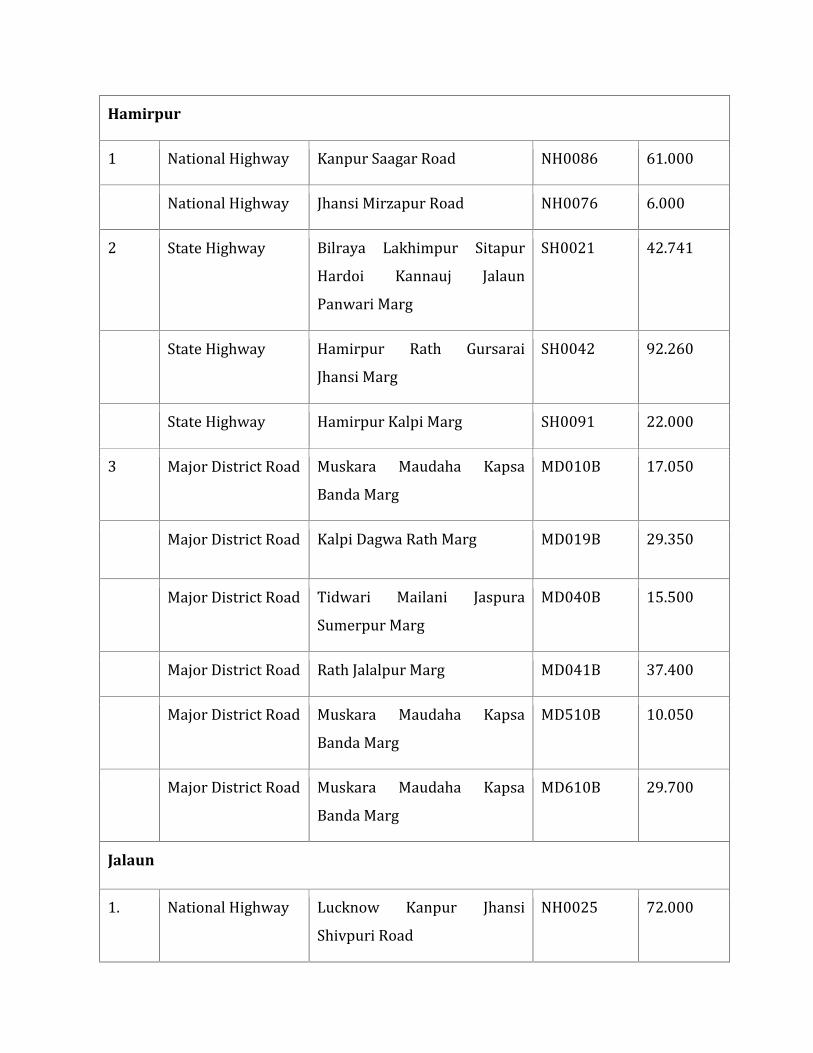
Table No.2.3 List of Bridges in the Study AreaBridges CoordinatesJalalpur Road Bridge 25°51'57.27"N 79°48'22.30"ESagar Road Bridge on Betwa river 25°56'31.30"N 80° 9'8.91"ESagar Road Bridge on Yamuna river 25°57'38.31"N 80° 9'43.16"ESamuhi Road Bridge 25°55'5.51"N 80°13'22.43"ERoad Bridge on Birma River 25°47'59.17"N 79°51'27.22"E2.3 CONNECTIVITYNH 81 is passing through 10 km radius area of above mentioned leases. Two statehighways SH-91 and SH-42 passes through the vicinity of the projects along with othermetalled road.Table.2.4 Major roads of Study area
S.No. Sub Category
Name
Name Of Road Road
Number
Length
(In Km.)
Hamirpur
1 National Highway Kanpur Saagar Road NH0086 61.000National Highway Jhansi Mirzapur Road NH0076 6.000
2 State Highway Bilraya Lakhimpur SitapurHardoi Kannauj JalaunPanwari MargSH0021 42.741
State Highway Hamirpur Rath GursaraiJhansi Marg SH0042 92.260State Highway Hamirpur Kalpi Marg SH0091 22.000
3 Major District Road Muskara Maudaha KapsaBanda Marg MD010B 17.050Major District Road Kalpi Dagwa Rath Marg MD019B 29.350Major District Road Tidwari Mailani JaspuraSumerpur Marg MD040B 15.500Major District Road Rath Jalalpur Marg MD041B 37.400Major District Road Muskara Maudaha KapsaBanda Marg MD510B 10.050Major District Road Muskara Maudaha KapsaBanda Marg MD610B 29.700
Jalaun
1. National Highway Lucknow Kanpur JhansiShivpuri Road NH0025 72.000

2. State Highway Jalaun Bhind Marg SH0070 30.680State Highway Bilraya Lakhimpur SitapurHardoi Kannauj JalaunPanwari Marg
SH0021 66.107State Highway Hamirpur Kalpi Marg SH0091 29.900
3. Major District Road Kalpi Madaripur Marg MD023B 40.049Major District Road Jalaun Konch Marg MD027B 23.066Major District Road Kalpi Rath Marg MD519B 22.00
The study area comprises of 04 districts namely, Hamirpur and Jalun along the stretch ofBetwa River, and part of Kanpur Nagar & Fatehpur. The road network of Hamirpur andJalaun given below:2.4 TOPOGRAPHY & PHYSIOGRAPHYHamirpur andJalaunDistrictissituatedonthesouthernpartoftheStateofUttarPradeshandsurroundedbythe district Allahabad in the east, Fatehpur in the west, Chitrakoot in the south anddistrict Pratapgarhinnorth.Thetotalgeographicalareaofthedistrictis1903.17Sq.Km.Itisanoldtown situatedonthenorthernbankofYamuna, about55kmwestofAllahabad.Totallandareaofdistrict liesinbetweentheholy riversGangainnorthandYamunainsouthandcomprises ofalluvialsoil grouphavingsandyandsandyloamsoil.Initsgeneralaspectthedistrictisalevelplainwithoutany hills.Theonlyvariationsinthesurfacearecausedbytheuneven landalongthestreams thatdrainit.Depressionsofvaryingdepthandextentarefoundhereandthere,inwhichthesurfacedrainageof the interiorcollects. No mineraldepositisavailablein Hamirpur and Jalaun exceptfor
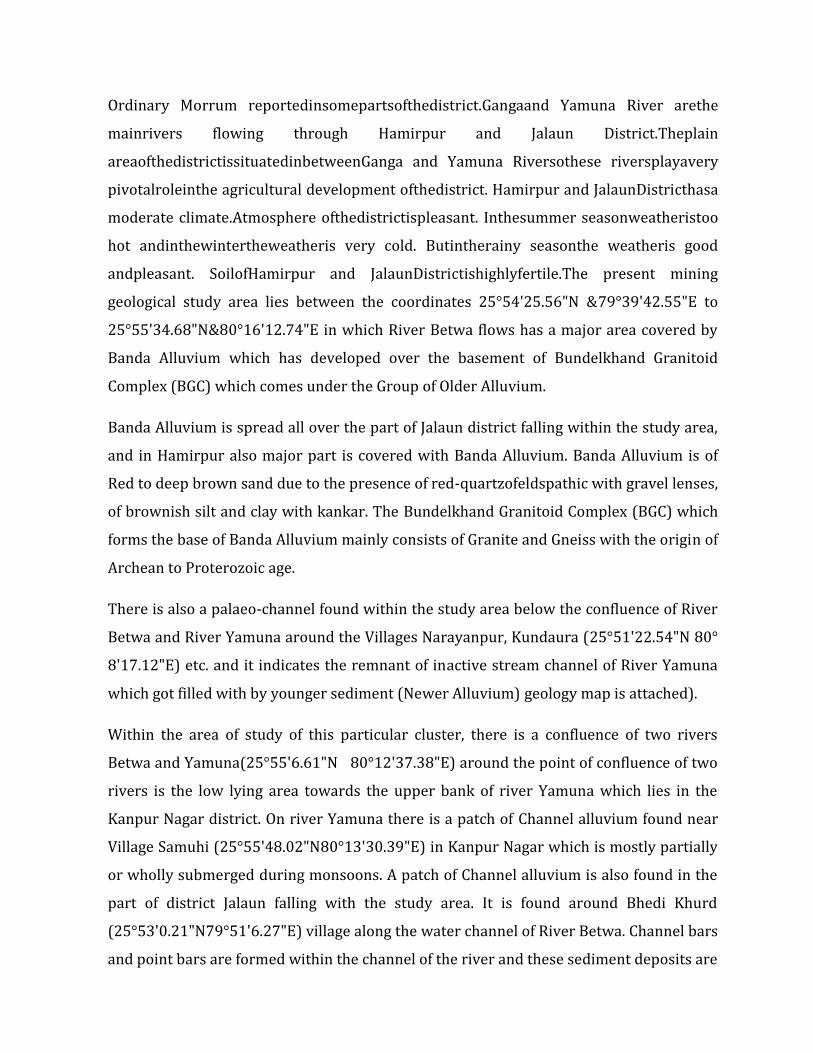
Ordinary Morrum reportedinsomepartsofthedistrict.Gangaand Yamuna River arethemainrivers flowing through Hamirpur and Jalaun District.TheplainareaofthedistrictissituatedinbetweenGanga and Yamuna Riversothese riversplayaverypivotalroleinthe agricultural development ofthedistrict. Hamirpur and JalaunDistricthasamoderate climate.Atmosphere ofthedistrictispleasant. Inthesummer seasonweatheristoohot andinthewintertheweatheris very cold. Butintherainy seasonthe weatheris goodandpleasant. SoilofHamirpur and JalaunDistrictishighlyfertile.The present mininggeological study area lies between the coordinates 25°54'25.56"N &79°39'42.55"E to25°55'34.68"N&80°16'12.74"E in which River Betwa flows has a major area covered byBanda Alluvium which has developed over the basement of Bundelkhand GranitoidComplex (BGC) which comes under the Group of Older Alluvium.Banda Alluvium is spread all over the part of Jalaun district falling within the study area,and in Hamirpur also major part is covered with Banda Alluvium. Banda Alluvium is ofRed to deep brown sand due to the presence of red-quartzofeldspathic with gravel lenses,of brownish silt and clay with kankar. The Bundelkhand Granitoid Complex (BGC) whichforms the base of Banda Alluvium mainly consists of Granite and Gneiss with the origin ofArchean to Proterozoic age.There is also a palaeo-channel found within the study area below the confluence of RiverBetwa and River Yamuna around the Villages Narayanpur, Kundaura (25°51'22.54"N 80°8'17.12"E) etc. and it indicates the remnant of inactive stream channel of River Yamunawhich got filled with by younger sediment (Newer Alluvium) geology map is attached).Within the area of study of this particular cluster, there is a confluence of two riversBetwa and Yamuna(25°55'6.61"N 80°12'37.38"E) around the point of confluence of tworivers is the low lying area towards the upper bank of river Yamuna which lies in theKanpur Nagar district. On river Yamuna there is a patch of Channel alluvium found nearVillage Samuhi (25°55'48.02"N80°13'30.39"E) in Kanpur Nagar which is mostly partiallyor wholly submerged during monsoons. A patch of Channel alluvium is also found in thepart of district Jalaun falling with the study area. It is found around Bhedi Khurd(25°53'0.21"N79°51'6.27"E) village along the water channel of River Betwa. Channel barsand point bars are formed within the channel of the river and these sediment deposits are
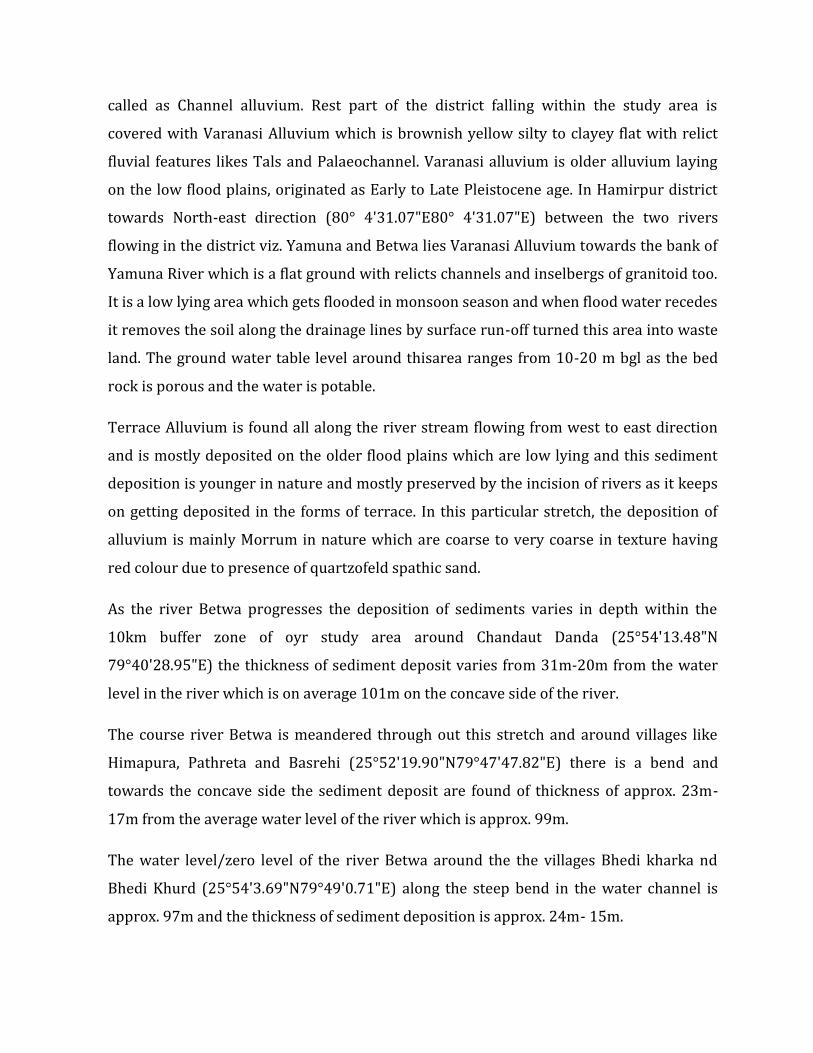
called as Channel alluvium. Rest part of the district falling within the study area iscovered with Varanasi Alluvium which is brownish yellow silty to clayey flat with relictfluvial features likes Tals and Palaeochannel. Varanasi alluvium is older alluvium layingon the low flood plains, originated as Early to Late Pleistocene age. In Hamirpur districttowards North-east direction (80° 4'31.07"E80° 4'31.07"E) between the two riversflowing in the district viz. Yamuna and Betwa lies Varanasi Alluvium towards the bank ofYamuna River which is a flat ground with relicts channels and inselbergs of granitoid too.It is a low lying area which gets flooded in monsoon season and when flood water recedesit removes the soil along the drainage lines by surface run-off turned this area into wasteland. The ground water table level around thisarea ranges from 10-20 m bgl as the bedrock is porous and the water is potable.Terrace Alluvium is found all along the river stream flowing from west to east directionand is mostly deposited on the older flood plains which are low lying and this sedimentdeposition is younger in nature and mostly preserved by the incision of rivers as it keepson getting deposited in the forms of terrace. In this particular stretch, the deposition ofalluvium is mainly Morrum in nature which are coarse to very coarse in texture havingred colour due to presence of quartzofeld spathic sand.As the river Betwa progresses the deposition of sediments varies in depth within the10km buffer zone of oyr study area around Chandaut Danda (25°54'13.48"N79°40'28.95"E) the thickness of sediment deposit varies from 31m-20m from the waterlevel in the river which is on average 101m on the concave side of the river.The course river Betwa is meandered through out this stretch and around villages likeHimapura, Pathreta and Basrehi (25°52'19.90"N79°47'47.82"E) there is a bend andtowards the concave side the sediment deposit are found of thickness of approx. 23m-17m from the average water level of the river which is approx. 99m.The water level/zero level of the river Betwa around the the villages Bhedi kharka ndBhedi Khurd (25°54'3.69"N79°49'0.71"E) along the steep bend in the water channel isapprox. 97m and the thickness of sediment deposition is approx. 24m- 15m.
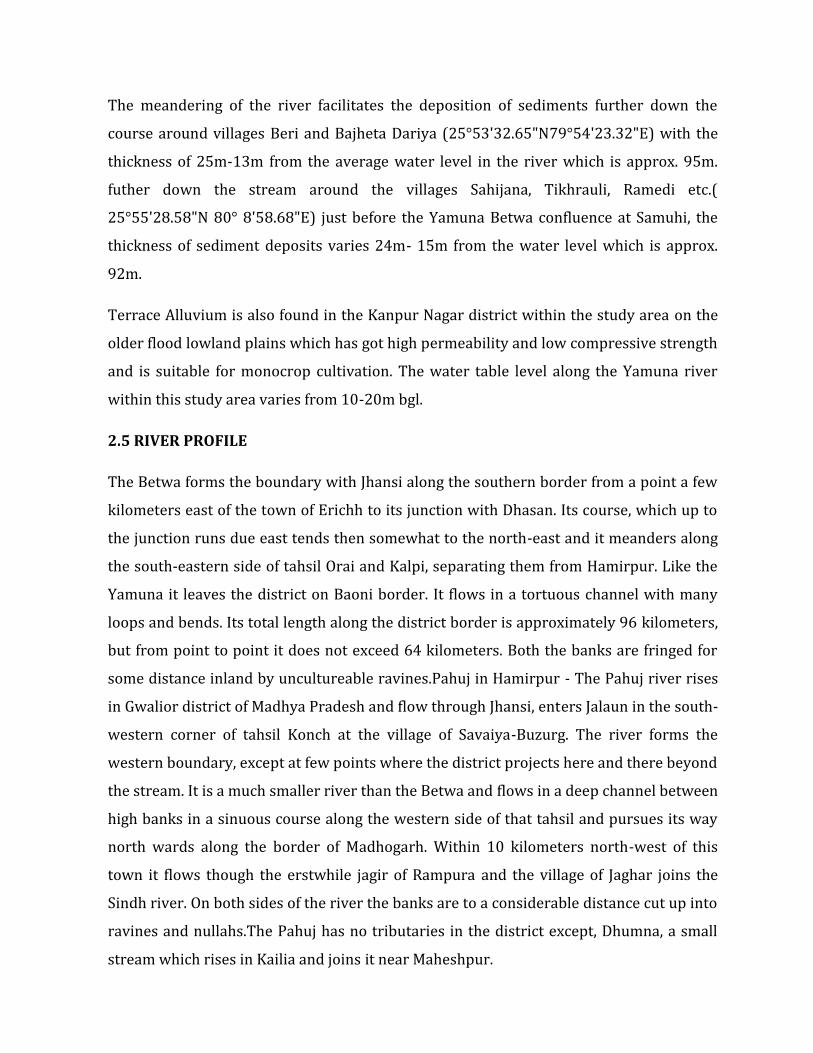
The meandering of the river facilitates the deposition of sediments further down thecourse around villages Beri and Bajheta Dariya (25°53'32.65"N79°54'23.32"E) with thethickness of 25m-13m from the average water level in the river which is approx. 95m.futher down the stream around the villages Sahijana, Tikhrauli, Ramedi etc.(25°55'28.58"N 80° 8'58.68"E) just before the Yamuna Betwa confluence at Samuhi, thethickness of sediment deposits varies 24m- 15m from the water level which is approx.92m.Terrace Alluvium is also found in the Kanpur Nagar district within the study area on theolder flood lowland plains which has got high permeability and low compressive strengthand is suitable for monocrop cultivation. The water table level along the Yamuna riverwithin this study area varies from 10-20m bgl.2.5 RIVER PROFILEThe Betwa forms the boundary with Jhansi along the southern border from a point a fewkilometers east of the town of Erichh to its junction with Dhasan. Its course, which up tothe junction runs due east tends then somewhat to the north-east and it meanders alongthe south-eastern side of tahsil Orai and Kalpi, separating them from Hamirpur. Like theYamuna it leaves the district on Baoni border. It flows in a tortuous channel with manyloops and bends. Its total length along the district border is approximately 96 kilometers,but from point to point it does not exceed 64 kilometers. Both the banks are fringed forsome distance inland by uncultureable ravines.Pahuj in Hamirpur - The Pahuj river risesin Gwalior district of Madhya Pradesh and flow through Jhansi, enters Jalaun in the south-western corner of tahsil Konch at the village of Savaiya-Buzurg. The river forms thewestern boundary, except at few points where the district projects here and there beyondthe stream. It is a much smaller river than the Betwa and flows in a deep channel betweenhigh banks in a sinuous course along the western side of that tahsil and pursues its waynorth wards along the border of Madhogarh. Within 10 kilometers north-west of thistown it flows though the erstwhile jagir of Rampura and the village of Jaghar joins theSindh river. On both sides of the river the banks are to a considerable distance cut up intoravines and nullahs.The Pahuj has no tributaries in the district except, Dhumna, a smallstream which rises in Kailia and joins it near Maheshpur.
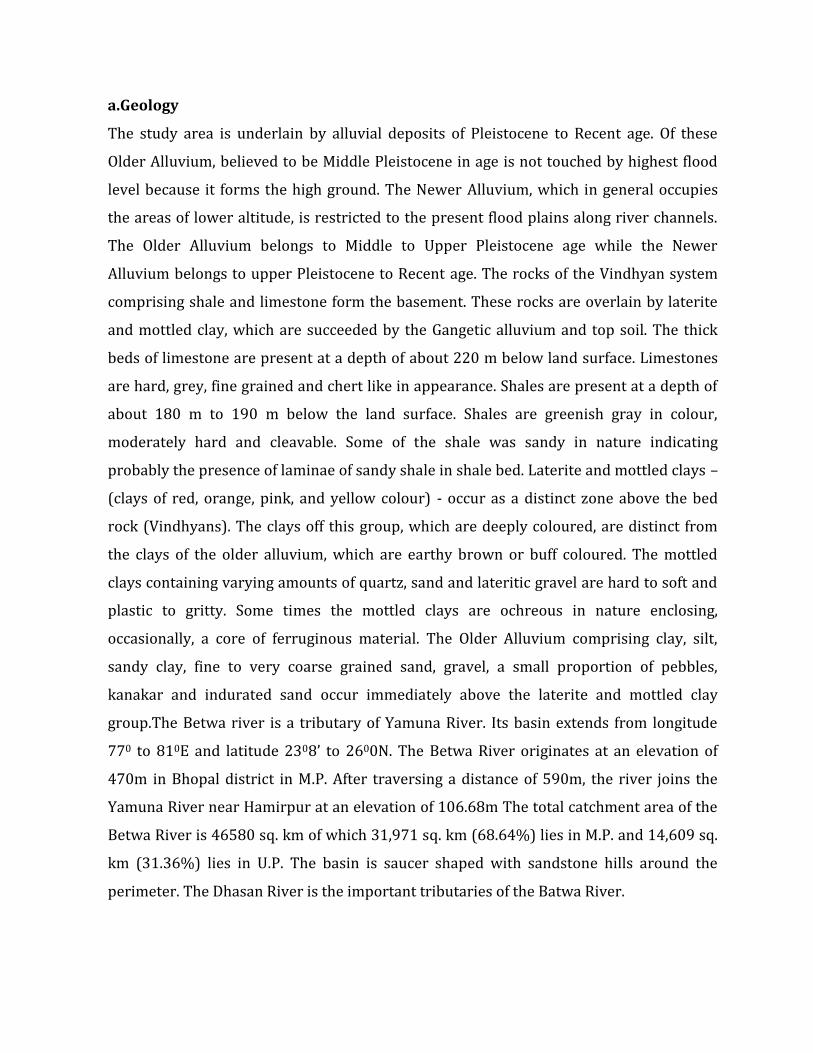
a.GeologyThe study area is underlain by alluvial deposits of Pleistocene to Recent age. Of theseOlder Alluvium, believed to be Middle Pleistocene in age is not touched by highest floodlevel because it forms the high ground. The Newer Alluvium, which in general occupiesthe areas of lower altitude, is restricted to the present flood plains along river channels.The Older Alluvium belongs to Middle to Upper Pleistocene age while the NewerAlluvium belongs to upper Pleistocene to Recent age. The rocks of the Vindhyan systemcomprising shale and limestone form the basement. These rocks are overlain by lateriteand mottled clay, which are succeeded by the Gangetic alluvium and top soil. The thickbeds of limestone are present at a depth of about 220 m below land surface. Limestonesare hard, grey, fine grained and chert like in appearance. Shales are present at a depth ofabout 180 m to 190 m below the land surface. Shales are greenish gray in colour,moderately hard and cleavable. Some of the shale was sandy in nature indicatingprobably the presence of laminae of sandy shale in shale bed. Laterite and mottled clays –(clays of red, orange, pink, and yellow colour) - occur as a distinct zone above the bedrock (Vindhyans). The clays off this group, which are deeply coloured, are distinct fromthe clays of the older alluvium, which are earthy brown or buff coloured. The mottledclays containing varying amounts of quartz, sand and lateritic gravel are hard to soft andplastic to gritty. Some times the mottled clays are ochreous in nature enclosing,occasionally, a core of ferruginous material. The Older Alluvium comprising clay, silt,sandy clay, fine to very coarse grained sand, gravel, a small proportion of pebbles,kanakar and indurated sand occur immediately above the laterite and mottled claygroup.The Betwa river is a tributary of Yamuna River. Its basin extends from longitude770 to 810E and latitude 2308’ to 2600N. The Betwa River originates at an elevation of470m in Bhopal district in M.P. After traversing a distance of 590m, the river joins theYamuna River near Hamirpur at an elevation of 106.68m The total catchment area of theBetwa River is 46580 sq. km of which 31,971 sq. km (68.64%) lies in M.P. and 14,609 sq.km (31.36%) lies in U.P. The basin is saucer shaped with sandstone hills around theperimeter. The Dhasan River is the important tributaries of the Batwa River.
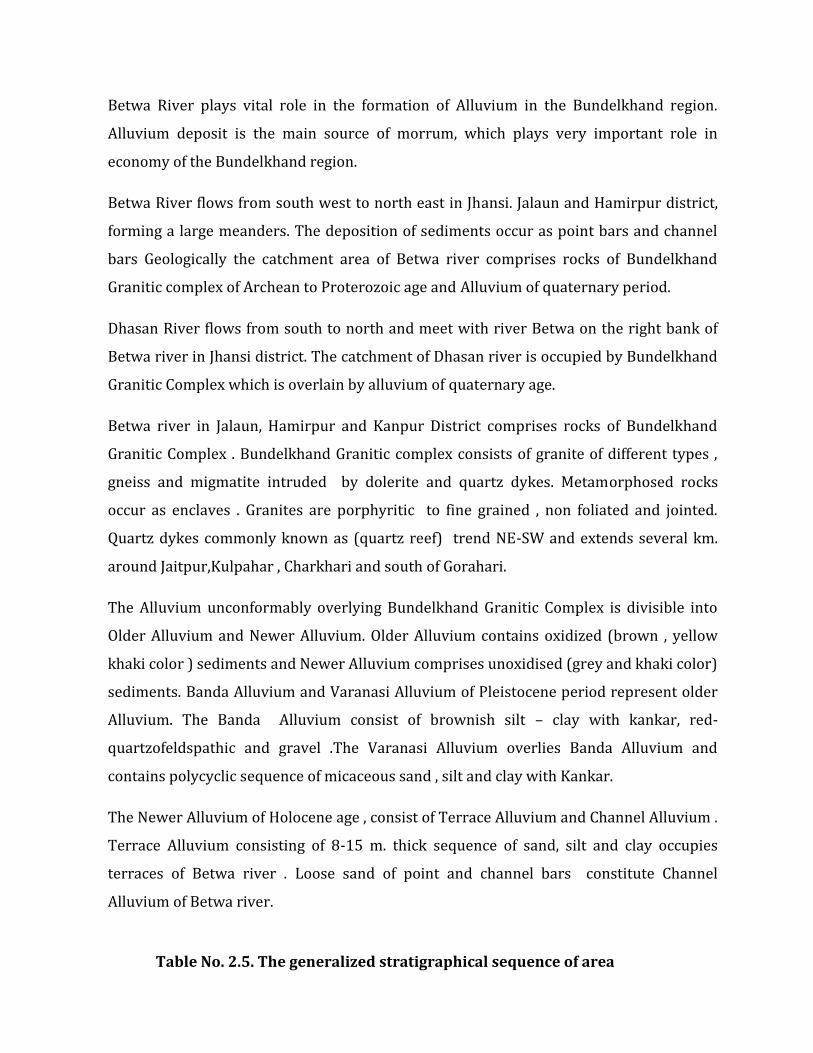
Betwa River plays vital role in the formation of Alluvium in the Bundelkhand region.Alluvium deposit is the main source of morrum, which plays very important role ineconomy of the Bundelkhand region.Betwa River flows from south west to north east in Jhansi. Jalaun and Hamirpur district,forming a large meanders. The deposition of sediments occur as point bars and channelbars Geologically the catchment area of Betwa river comprises rocks of BundelkhandGranitic complex of Archean to Proterozoic age and Alluvium of quaternary period.Dhasan River flows from south to north and meet with river Betwa on the right bank ofBetwa river in Jhansi district. The catchment of Dhasan river is occupied by BundelkhandGranitic Complex which is overlain by alluvium of quaternary age.Betwa river in Jalaun, Hamirpur and Kanpur District comprises rocks of BundelkhandGranitic Complex . Bundelkhand Granitic complex consists of granite of different types ,gneiss and migmatite intruded by dolerite and quartz dykes. Metamorphosed rocksoccur as enclaves . Granites are porphyritic to fine grained , non foliated and jointed.Quartz dykes commonly known as (quartz reef) trend NE-SW and extends several km.around Jaitpur,Kulpahar , Charkhari and south of Gorahari.The Alluvium unconformably overlying Bundelkhand Granitic Complex is divisible intoOlder Alluvium and Newer Alluvium. Older Alluvium contains oxidized (brown , yellowkhaki color ) sediments and Newer Alluvium comprises unoxidised (grey and khaki color)sediments. Banda Alluvium and Varanasi Alluvium of Pleistocene period represent olderAlluvium. The Banda Alluvium consist of brownish silt – clay with kankar, red-quartzofeldspathic and gravel .The Varanasi Alluvium overlies Banda Alluvium andcontains polycyclic sequence of micaceous sand , silt and clay with Kankar.The Newer Alluvium of Holocene age , consist of Terrace Alluvium and Channel Alluvium .Terrace Alluvium consisting of 8-15 m. thick sequence of sand, silt and clay occupiesterraces of Betwa river . Loose sand of point and channel bars constitute ChannelAlluvium of Betwa river.Table No. 2.5. The generalized stratigraphical sequence of area
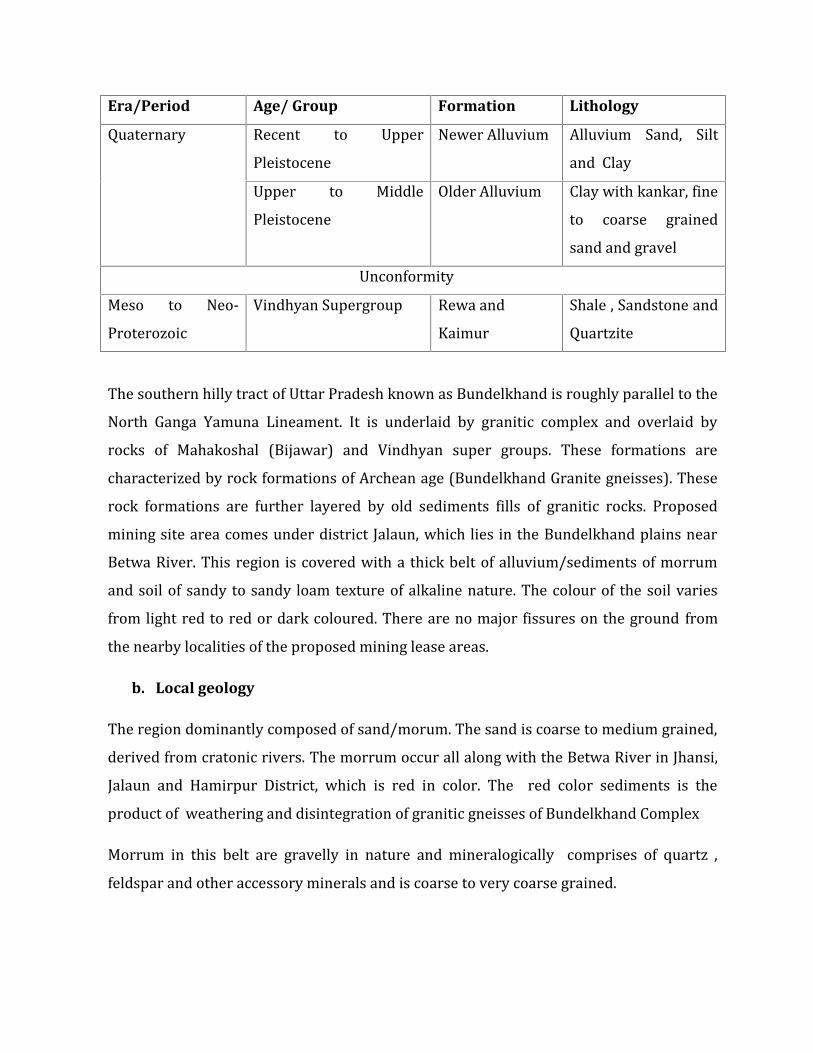
Era/Period Age/ Group Formation LithologyQuaternary Recent to UpperPleistocene Newer Alluvium Alluvium Sand, Siltand ClayUpper to MiddlePleistocene Older Alluvium Clay with kankar, fineto coarse grainedsand and gravelUnconformityMeso to Neo-Proterozoic Vindhyan Supergroup Rewa andKaimur Shale , Sandstone andQuartziteThe southern hilly tract of Uttar Pradesh known as Bundelkhand is roughly parallel to theNorth Ganga Yamuna Lineament. It is underlaid by granitic complex and overlaid byrocks of Mahakoshal (Bijawar) and Vindhyan super groups. These formations arecharacterized by rock formations of Archean age (Bundelkhand Granite gneisses). Theserock formations are further layered by old sediments fills of granitic rocks. Proposedmining site area comes under district Jalaun, which lies in the Bundelkhand plains nearBetwa River. This region is covered with a thick belt of alluvium/sediments of morrumand soil of sandy to sandy loam texture of alkaline nature. The colour of the soil variesfrom light red to red or dark coloured. There are no major fissures on the ground fromthe nearby localities of the proposed mining lease areas.
b. Local geologyThe region dominantly composed of sand/morum. The sand is coarse to medium grained,derived from cratonic rivers. The morrum occur all along with the Betwa River in Jhansi,Jalaun and Hamirpur District, which is red in color. The red color sediments is theproduct of weathering and disintegration of granitic gneisses of Bundelkhand ComplexMorrum in this belt are gravelly in nature and mineralogically comprises of quartz ,feldspar and other accessory minerals and is coarse to very coarse grained.
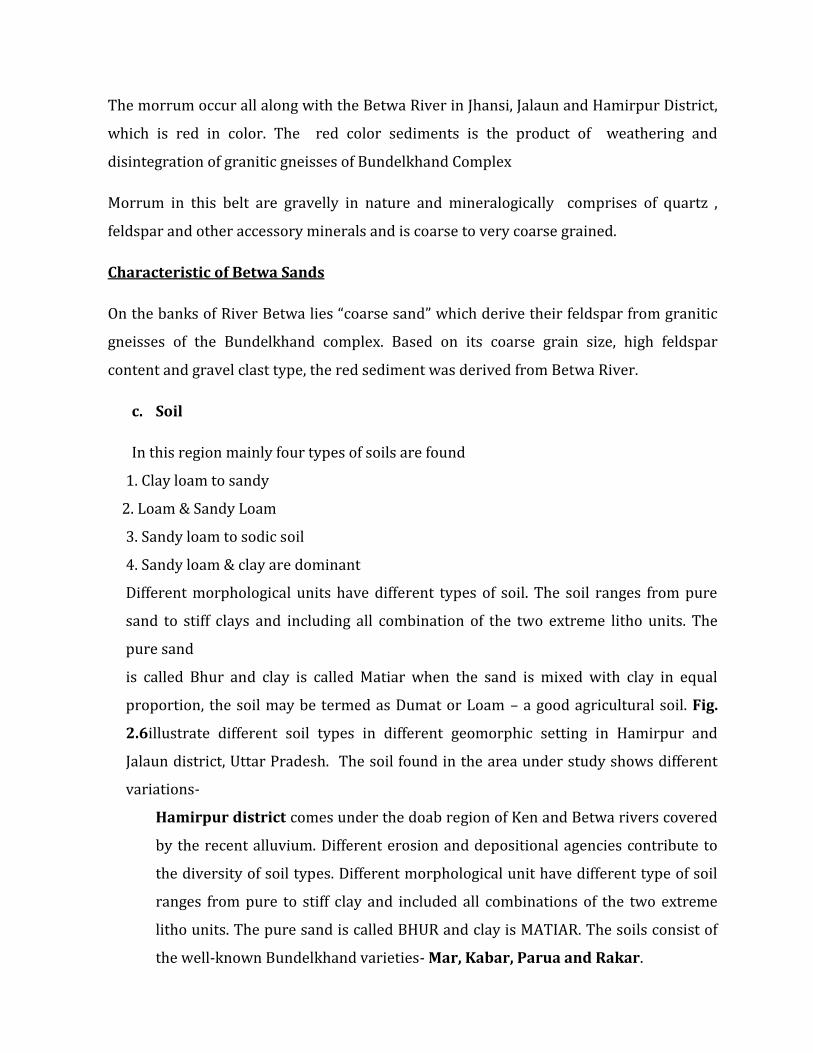
The morrum occur all along with the Betwa River in Jhansi, Jalaun and Hamirpur District,which is red in color. The red color sediments is the product of weathering anddisintegration of granitic gneisses of Bundelkhand ComplexMorrum in this belt are gravelly in nature and mineralogically comprises of quartz ,feldspar and other accessory minerals and is coarse to very coarse grained.Characteristic of Betwa SandsOn the banks of River Betwa lies “coarse sand” which derive their feldspar from graniticgneisses of the Bundelkhand complex. Based on its coarse grain size, high feldsparcontent and gravel clast type, the red sediment was derived from Betwa River.
c. SoilIn this region mainly four types of soils are found1. Clay loam to sandy2. Loam & Sandy Loam3. Sandy loam to sodic soil4. Sandy loam & clay are dominantDifferent morphological units have different types of soil. The soil ranges from puresand to stiff clays and including all combination of the two extreme litho units. Thepure sandis called Bhur and clay is called Matiar when the sand is mixed with clay in equalproportion, the soil may be termed as Dumat or Loam – a good agricultural soil. Fig.
2.6illustrate different soil types in different geomorphic setting in Hamirpur andJalaun district, Uttar Pradesh. The soil found in the area under study shows differentvariations-Hamirpur district comes under the doab region of Ken and Betwa rivers coveredby the recent alluvium. Different erosion and depositional agencies contribute tothe diversity of soil types. Different morphological unit have different type of soilranges from pure to stiff clay and included all combinations of the two extremelitho units. The pure sand is called BHUR and clay is MATIAR. The soils consist ofthe well-known Bundelkhand varieties- Mar, Kabar, Parua and Rakar.
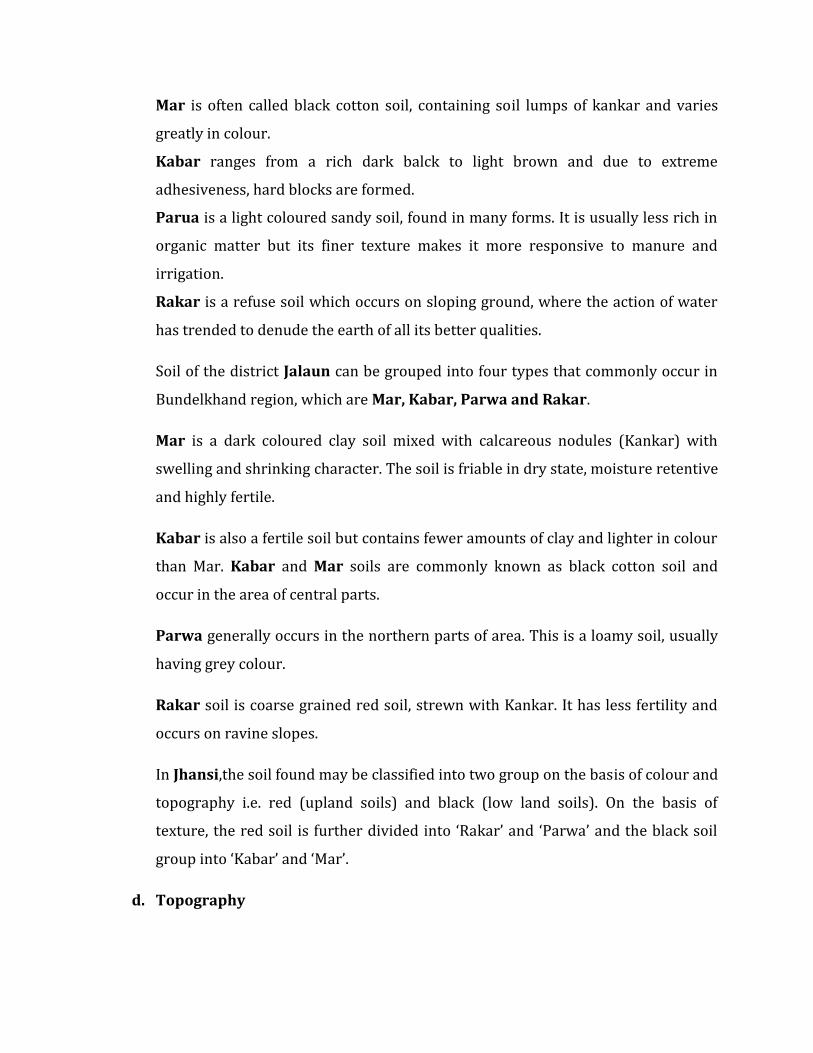
Mar is often called black cotton soil, containing soil lumps of kankar and variesgreatly in colour.Kabar ranges from a rich dark balck to light brown and due to extremeadhesiveness, hard blocks are formed.Parua is a light coloured sandy soil, found in many forms. It is usually less rich inorganic matter but its finer texture makes it more responsive to manure andirrigation.Rakar is a refuse soil which occurs on sloping ground, where the action of waterhas trended to denude the earth of all its better qualities.Soil of the district Jalaun can be grouped into four types that commonly occur inBundelkhand region, which are Mar, Kabar, Parwa and Rakar.Mar is a dark coloured clay soil mixed with calcareous nodules (Kankar) withswelling and shrinking character. The soil is friable in dry state, moisture retentiveand highly fertile.Kabar is also a fertile soil but contains fewer amounts of clay and lighter in colourthan Mar. Kabar and Mar soils are commonly known as black cotton soil andoccur in the area of central parts.Parwa generally occurs in the northern parts of area. This is a loamy soil, usuallyhaving grey colour.Rakar soil is coarse grained red soil, strewn with Kankar. It has less fertility andoccurs on ravine slopes.In Jhansi,the soil found may be classified into two group on the basis of colour andtopography i.e. red (upland soils) and black (low land soils). On the basis oftexture, the red soil is further divided into ‘Rakar’ and ‘Parwa’ and the black soilgroup into ‘Kabar’ and ‘Mar’.
d. Topography
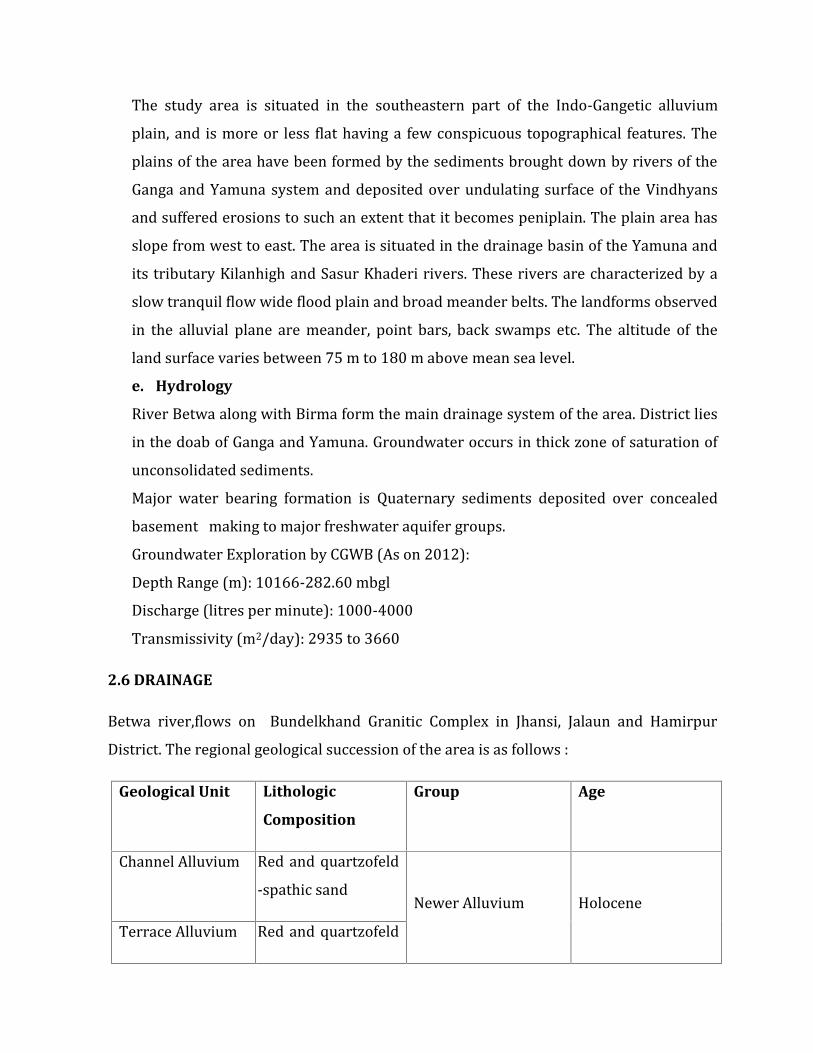
The study area is situated in the southeastern part of the Indo-Gangetic alluviumplain, and is more or less flat having a few conspicuous topographical features. Theplains of the area have been formed by the sediments brought down by rivers of theGanga and Yamuna system and deposited over undulating surface of the Vindhyansand suffered erosions to such an extent that it becomes peniplain. The plain area hasslope from west to east. The area is situated in the drainage basin of the Yamuna andits tributary Kilanhigh and Sasur Khaderi rivers. These rivers are characterized by aslow tranquil flow wide flood plain and broad meander belts. The landforms observedin the alluvial plane are meander, point bars, back swamps etc. The altitude of theland surface varies between 75 m to 180 m above mean sea level.e. HydrologyRiver Betwa along with Birma form the main drainage system of the area. District liesin the doab of Ganga and Yamuna. Groundwater occurs in thick zone of saturation ofunconsolidated sediments.Major water bearing formation is Quaternary sediments deposited over concealedbasement making to major freshwater aquifer groups.Groundwater Exploration by CGWB (As on 2012):Depth Range (m): 10166-282.60 mbglDischarge (litres per minute): 1000-4000Transmissivity (m2/day): 2935 to 3660
2.6 DRAINAGEBetwa river,flows on Bundelkhand Granitic Complex in Jhansi, Jalaun and HamirpurDistrict. The regional geological succession of the area is as follows :Geological Unit Lithologic
Composition
Group Age
Channel Alluvium Red and quartzofeld-spathic sand Newer Alluvium HoloceneTerrace Alluvium Red and quartzofeld

-spathic sandVaranasi Alluvium Brownish yellowsilt, clay with kankarOlder Alluvium Early to latePleistoceneBanda Alluvium Red to deep brownsand with gravellenses ,silt and claywith kankarBundelkhandGranitic Complex Granite and gneissesand outcrops ofgranitoid ,metasedimentariesand basites, doleriteand quartz reef
B.G.C. ArcheanToProterozoic
Betwa river in Jhansi, Hamirpur and Jalaun District comprises rocks of BundelkhandGranitic Complex . Bundelkhand Granitic complex consists of granite of different types ,gneiss and migmatite intruded by dolerite and quartz dykes. Metamorphosed rocksoccur as enclaves . Granites are porphyritic to fine grained , non foliated and jointed.Quartz dykes commonly known as (quartz reef) trend NE-SW and extends several km.around Jaitpur,Kulpahar , Charkhari and south of Gorahari.The Alluvium unconformably overlying Bundelkhand Granitic Complex is divisible intoOlder Alluvium and Newer Alluvium. Older Alluvium contains oxidized (brown , yellowkhaki color ) sediments and Newer Alluvium comprises unoxidised (grey and khaki color)sediments. Banda Alluvium and Varanasi Alluvium of Pleistocene period represent olderAlluvium. The Banda Alluvium consist of brownish silt – clay with kankar, red-quartzofeldspathic and gravel .The Varanasi Alluvium overlies Banda Alluvium andcontains polycyclic sequence of micaceous sand , silt and clay with Kankar.
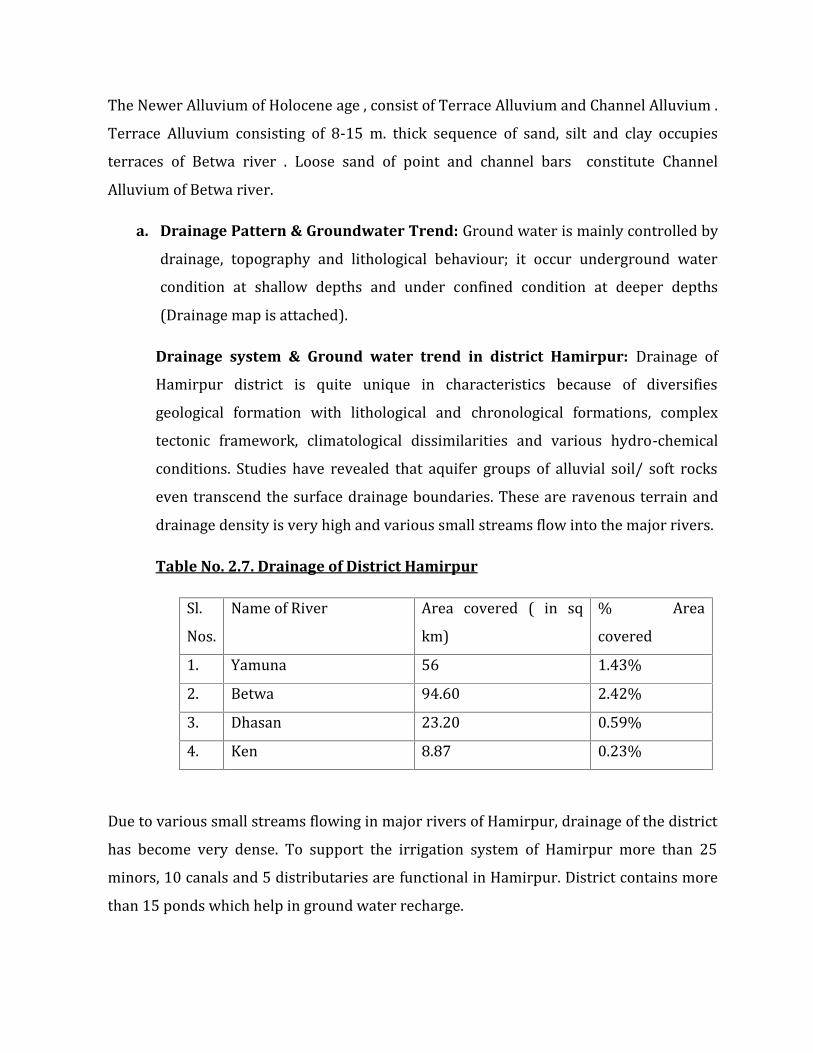
The Newer Alluvium of Holocene age , consist of Terrace Alluvium and Channel Alluvium .Terrace Alluvium consisting of 8-15 m. thick sequence of sand, silt and clay occupiesterraces of Betwa river . Loose sand of point and channel bars constitute ChannelAlluvium of Betwa river.a. Drainage Pattern & Groundwater Trend: Ground water is mainly controlled bydrainage, topography and lithological behaviour; it occur underground watercondition at shallow depths and under confined condition at deeper depths(Drainage map is attached).
Drainage system & Ground water trend in district Hamirpur: Drainage ofHamirpur district is quite unique in characteristics because of diversifiesgeological formation with lithological and chronological formations, complextectonic framework, climatological dissimilarities and various hydro-chemicalconditions. Studies have revealed that aquifer groups of alluvial soil/ soft rockseven transcend the surface drainage boundaries. These are ravenous terrain anddrainage density is very high and various small streams flow into the major rivers.Table No. 2.7. Drainage of District HamirpurSl.Nos. Name of River Area covered ( in sqkm) % Areacovered1. Yamuna 56 1.43%2. Betwa 94.60 2.42%3. Dhasan 23.20 0.59%4. Ken 8.87 0.23%
Due to various small streams flowing in major rivers of Hamirpur, drainage of the districthas become very dense. To support the irrigation system of Hamirpur more than 25minors, 10 canals and 5 distributaries are functional in Hamirpur. District contains morethan 15 ponds which help in ground water recharge.

Groundwater trend: Depth to water level in pre-monsoon ranges between 4.08 mbgl atKharela to 29.32 mbgl at Jalalpur with an average water level at almost places in districtvaries between 4.12 to 17.50 mbgl. Water level has become shallower and varies from2.22 to 28.82 mbgl during the post-monsoon season. Annual seasoned fluctuation ofwater level has been determined from the pre-monsoon and post-monsoon (2012) waterlevel data of ground water monitoring wells the fluctuation varies from minimum 0.02mbgl at Kunheta and maximum 4.75 mbgl at Lalpura.Ground water in shallow aquifers is colourless and slightly alkaline in nature, the specificconductance range from 550 to 1400 mhos/cm at 25˚C. It is suitable for drinking anddomestic uses. Groundwater withdrawl is mainly through dug well, hand pumps andtubewells. The gross ground water draft for irrigation in the irrigation in the district(2009) was 20612.16ha-m whereas the ground water draft for the domestic andindustrial was 2225.61ha-m. Hence, the existing gross groundwater draft for all uses indistrict was 22837.77 ha-m and net ground water availability for future and irrigationdevelopment in the district is 23393.51ha-m.Drainage system &Groundwater trend in district Jalaun: This district is principallydrained by the rivers Yamuna, Betwa and Pahuj. Yamuna and Betwa generally flow aneast to south-easterly course finally confluencing near Hamirpur. Pahuj arising from theBundelkhand rocky terrains of U.P. and M.P. flows in a northerly direction to meet Sind, atributary to Yamuna. The other major tributaries of Yamuna in the area are Kuchmalangaand Non. Which arise locally from southern highlands mainly along Konch and Orai. TheKunchmalanga-Non drainage basins occupy the major part of the area in the south andeast. These streams become perennial in their lower reaches and are mainly fed bygroundwater effluences. The overall drainage of the area forms dendritic pattern.Besides, there is good network of canal system draining from Betwa river throughKuthaund and Jalaun branches. The entire area of Jalaun district is underlain byquaternary alluvium, comprising mainly clay, Kankar, sand, and gravel over the basementof Bundelkhand granites. The thickness of alluvium increases towards north which hasgood potential. Ground water potential in granites is poor as they have little porosity. Theweathered zone in the granite rock usually hold good quantity of water. The ground
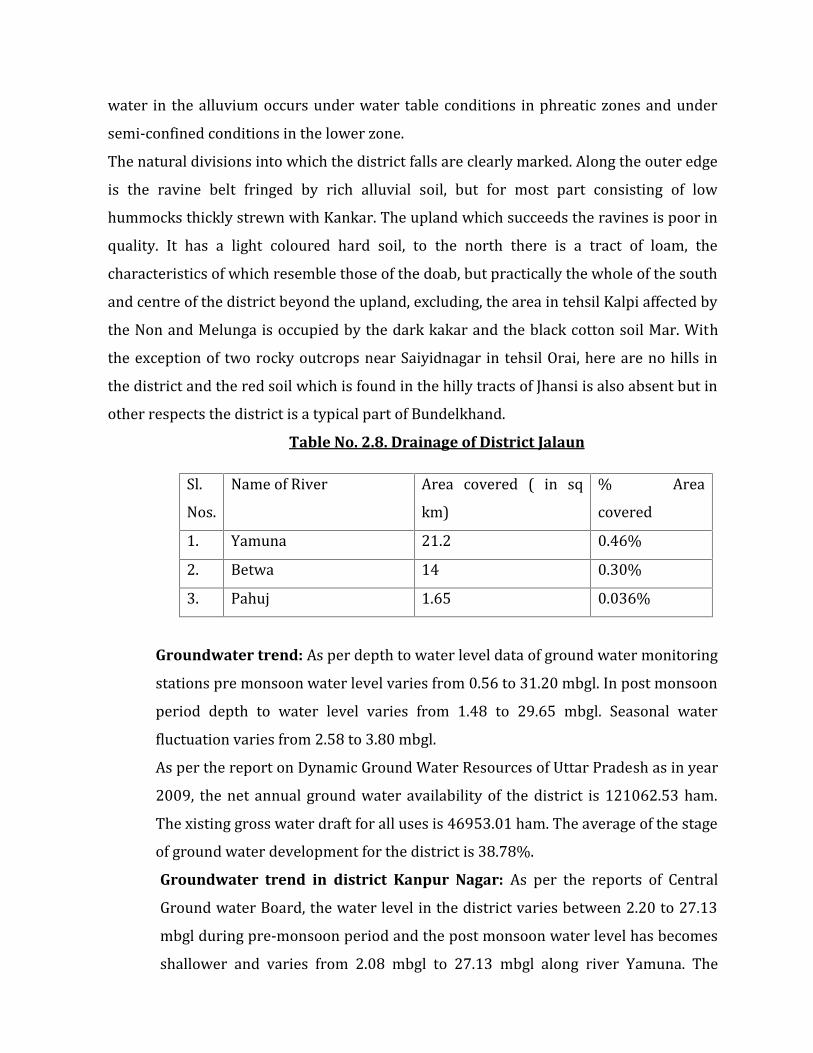
water in the alluvium occurs under water table conditions in phreatic zones and undersemi-confined conditions in the lower zone.The natural divisions into which the district falls are clearly marked. Along the outer edgeis the ravine belt fringed by rich alluvial soil, but for most part consisting of lowhummocks thickly strewn with Kankar. The upland which succeeds the ravines is poor inquality. It has a light coloured hard soil, to the north there is a tract of loam, thecharacteristics of which resemble those of the doab, but practically the whole of the southand centre of the district beyond the upland, excluding, the area in tehsil Kalpi affected bythe Non and Melunga is occupied by the dark kakar and the black cotton soil Mar. Withthe exception of two rocky outcrops near Saiyidnagar in tehsil Orai, here are no hills inthe district and the red soil which is found in the hilly tracts of Jhansi is also absent but inother respects the district is a typical part of Bundelkhand.Table No. 2.8. Drainage of District JalaunSl.Nos. Name of River Area covered ( in sqkm) % Areacovered1. Yamuna 21.2 0.46%2. Betwa 14 0.30%3. Pahuj 1.65 0.036%
Groundwater trend: As per depth to water level data of ground water monitoringstations pre monsoon water level varies from 0.56 to 31.20 mbgl. In post monsoonperiod depth to water level varies from 1.48 to 29.65 mbgl. Seasonal waterfluctuation varies from 2.58 to 3.80 mbgl.As per the report on Dynamic Ground Water Resources of Uttar Pradesh as in year2009, the net annual ground water availability of the district is 121062.53 ham.The xisting gross water draft for all uses is 46953.01 ham. The average of the stageof ground water development for the district is 38.78%.Groundwater trend in district Kanpur Nagar: As per the reports of CentralGround water Board, the water level in the district varies between 2.20 to 27.13mbgl during pre-monsoon period and the post monsoon water level has becomesshallower and varies from 2.08 mbgl to 27.13 mbgl along river Yamuna. The

seasonal annual water level fluctuation varies between 0.0 to 1.70 meters in thedistrict.Groundwater trend in district Fatehpur: As per the reports of Central Groundwater Board, the water level in the district varies between 8.60 to 20.90 mbglduring pre-monsoon period and the deepest water level occurs in the eastern partin the Mau Block. The post monsoon water level varies between 2.90 to 15.43mbgl and the shallowest water level which is less than 5 meters occur in thesouthern part of the district in Manikpur block. The seasonal annual fluctuationvaries between 1.15 to 10.38 meters in the district.
b. Water Course & Hydrology: The study of Environmental Impact Assessment(EIA) is being done along the river Betwa for the various sand mining projectssituated in the river bed of River Betwa in two districts Hamirpur and Jalaun. TheBetwa river is the Tributary of Yamuna River System which is the Sub-Basin ofGanga River System.Yamuna Lower Sub-basin:The geographical extent of the Yamuna Lower sub-basin liesbetween 77° 6' to 81° 55' east longitudes and 22° 51' to 28° 1' north latitudes of thecountry.The Sind, the Betwa, the Dhasan, the Ken rivers are the major tributaries in the Yamunalower sub-basin. The Yamuna Lower sub-basin is the largest sub-basin of the Ganga basinwith a total catchment area of 1,24,867 Sq.km. The sub-basin majorly covers the states ofUttar Pradesh and Madhya Pradesh.
Table No. 2.9 Major water Resource Asset
Sl.
No.
Name of
Sub-Basin
Area(
sq.km)
No. of
Dam
No. of
B/W/A
No. of
Reservoirs
No. of
Surface
water
bodies
No. of
HO
Stations
1. YamunaLower 124867.19 201 17 199 16022 23
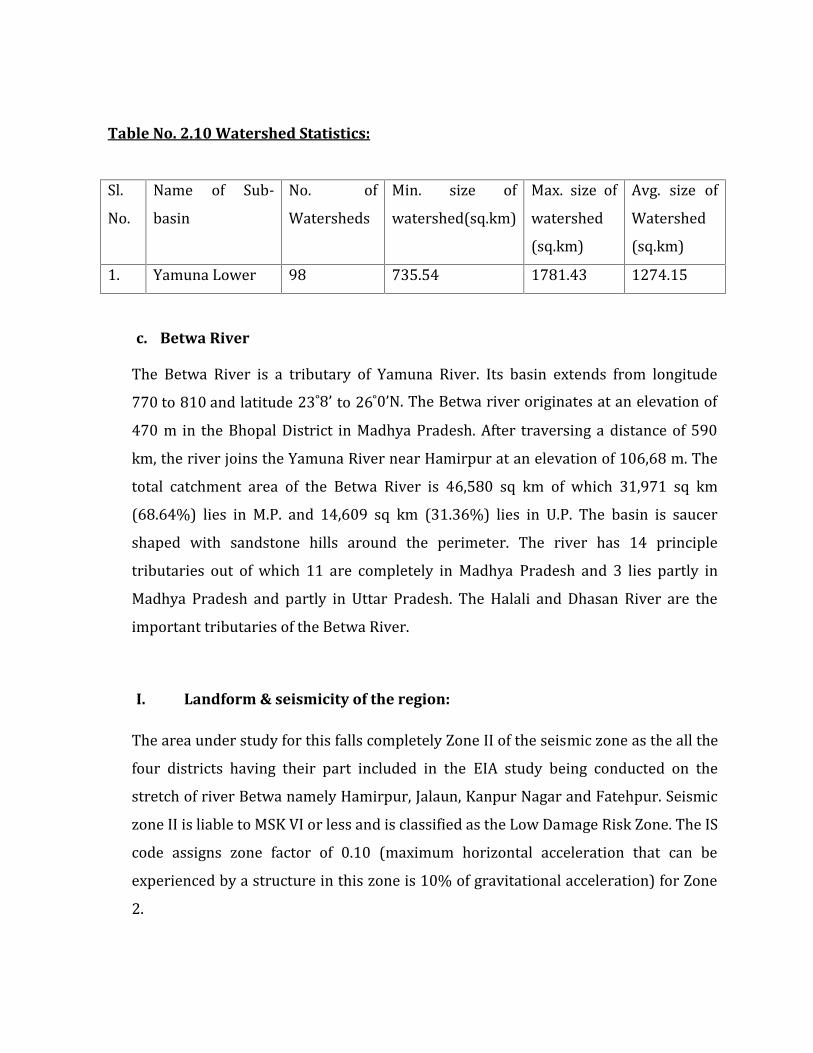
Table No. 2.10 Watershed Statistics:
Sl.No. Name of Sub-basin No. ofWatersheds Min. size ofwatershed(sq.km) Max. size ofwatershed(sq.km)Avg. size ofWatershed(sq.km)1. Yamuna Lower 98 735.54 1781.43 1274.15
c. Betwa RiverThe Betwa River is a tributary of Yamuna River. Its basin extends from longitude770 to 810 and latitude 23˚8’ to 26˚0’N. The Betwa river originates at an elevation of470 m in the Bhopal District in Madhya Pradesh. After traversing a distance of 590km, the river joins the Yamuna River near Hamirpur at an elevation of 106,68 m. Thetotal catchment area of the Betwa River is 46,580 sq km of which 31,971 sq km(68.64%) lies in M.P. and 14,609 sq km (31.36%) lies in U.P. The basin is saucershaped with sandstone hills around the perimeter. The river has 14 principletributaries out of which 11 are completely in Madhya Pradesh and 3 lies partly inMadhya Pradesh and partly in Uttar Pradesh. The Halali and Dhasan River are theimportant tributaries of the Betwa River.I. Landform & seismicity of the region:The area under study for this falls completely Zone II of the seismic zone as the all thefour districts having their part included in the EIA study being conducted on thestretch of river Betwa namely Hamirpur, Jalaun, Kanpur Nagar and Fatehpur. Seismiczone II is liable to MSK VI or less and is classified as the Low Damage Risk Zone. The IScode assigns zone factor of 0.10 (maximum horizontal acceleration that can beexperienced by a structure in this zone is 10% of gravitational acceleration) for Zone2.
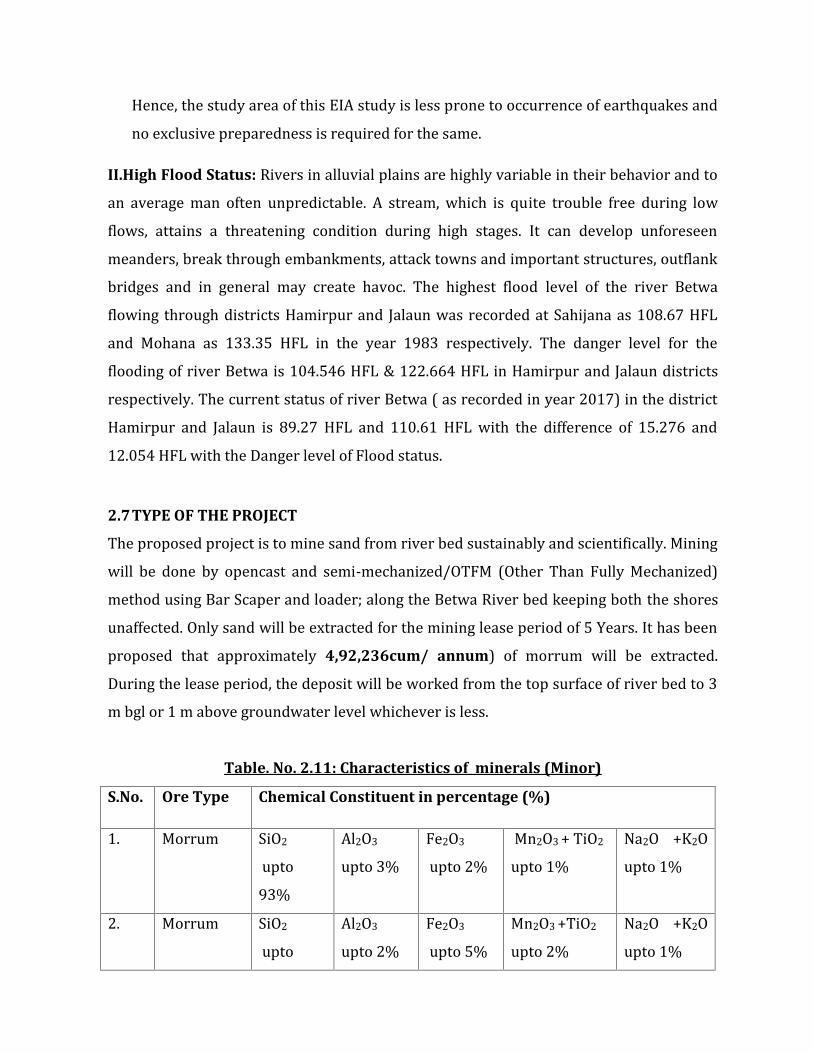
Hence, the study area of this EIA study is less prone to occurrence of earthquakes andno exclusive preparedness is required for the same.II.High Flood Status: Rivers in alluvial plains are highly variable in their behavior and toan average man often unpredictable. A stream, which is quite trouble free during lowflows, attains a threatening condition during high stages. It can develop unforeseenmeanders, break through embankments, attack towns and important structures, outflankbridges and in general may create havoc. The highest flood level of the river Betwaflowing through districts Hamirpur and Jalaun was recorded at Sahijana as 108.67 HFLand Mohana as 133.35 HFL in the year 1983 respectively. The danger level for theflooding of river Betwa is 104.546 HFL & 122.664 HFL in Hamirpur and Jalaun districtsrespectively. The current status of river Betwa ( as recorded in year 2017) in the districtHamirpur and Jalaun is 89.27 HFL and 110.61 HFL with the difference of 15.276 and12.054 HFL with the Danger level of Flood status.2.7TYPE OF THE PROJECTThe proposed project is to mine sand from river bed sustainably and scientifically. Miningwill be done by opencast and semi-mechanized/OTFM (Other Than Fully Mechanized)method using Bar Scaper and loader; along the Betwa River bed keeping both the shoresunaffected. Only sand will be extracted for the mining lease period of 5 Years. It has beenproposed that approximately 4,92,236cum/ annum) of morrum will be extracted.During the lease period, the deposit will be worked from the top surface of river bed to 3m bgl or 1 m above groundwater level whichever is less.
Table. No. 2.11: Characteristics of minerals (Minor)
S.No. Ore Type Chemical Constituent in percentage (%)1. Morrum SiO2upto93%Al2O3upto 3% Fe2O3upto 2% Mn2O3 + TiO2upto 1% Na2O +K2Oupto 1%
2. Morrum SiO2upto Al2O3upto 2% Fe2O3upto 5% Mn2O3 +TiO2upto 2% Na2O +K2Oupto 1%
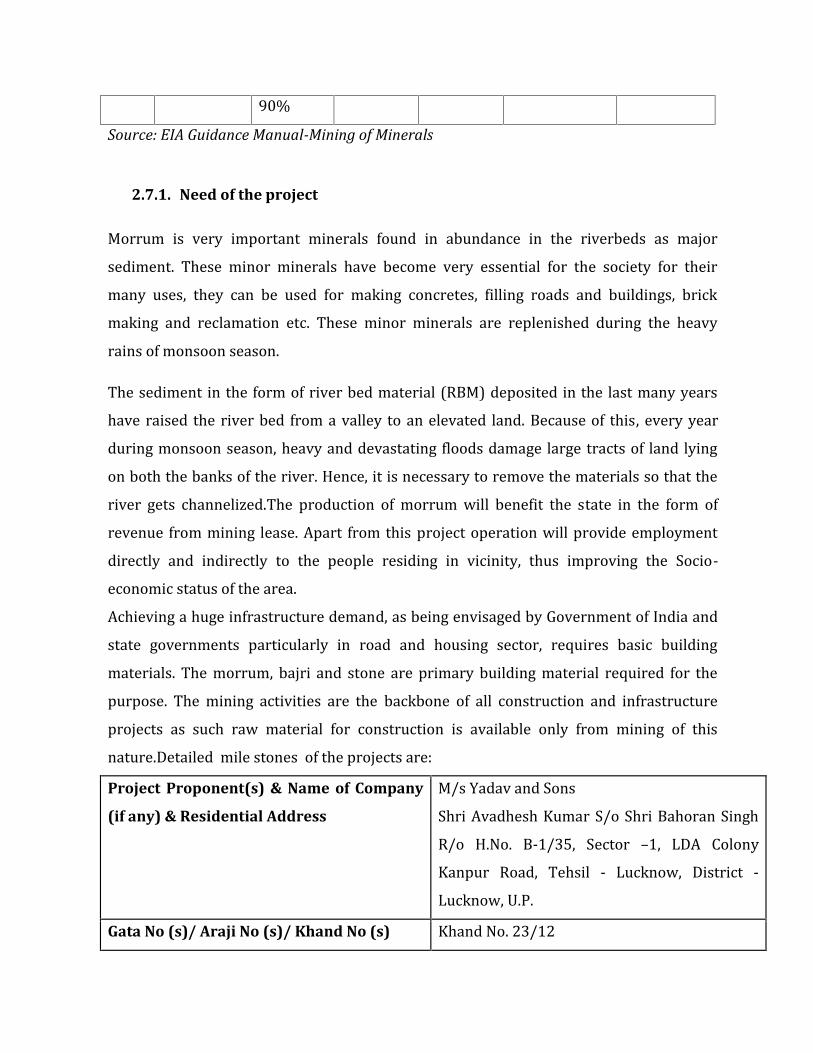
90%Source: EIA Guidance Manual-Mining of Minerals
2.7.1. Need of the projectMorrum is very important minerals found in abundance in the riverbeds as majorsediment. These minor minerals have become very essential for the society for theirmany uses, they can be used for making concretes, filling roads and buildings, brickmaking and reclamation etc. These minor minerals are replenished during the heavyrains of monsoon season.The sediment in the form of river bed material (RBM) deposited in the last many yearshave raised the river bed from a valley to an elevated land. Because of this, every yearduring monsoon season, heavy and devastating floods damage large tracts of land lyingon both the banks of the river. Hence, it is necessary to remove the materials so that theriver gets channelized.The production of morrum will benefit the state in the form ofrevenue from mining lease. Apart from this project operation will provide employmentdirectly and indirectly to the people residing in vicinity, thus improving the Socio-economic status of the area.Achieving a huge infrastructure demand, as being envisaged by Government of India andstate governments particularly in road and housing sector, requires basic buildingmaterials. The morrum, bajri and stone are primary building material required for thepurpose. The mining activities are the backbone of all construction and infrastructureprojects as such raw material for construction is available only from mining of thisnature.Detailed mile stones of the projects are:Project Proponent(s) & Name of Company
(if any) & Residential Address
M/s Yadav and SonsShri Avadhesh Kumar S/o Shri Bahoran SinghR/o H.No. B-1/35, Sector –1, LDA ColonyKanpur Road, Tehsil - Lucknow, District -Lucknow, U.P.Gata No (s)/ Araji No (s)/ Khand No (s) Khand No. 23/12
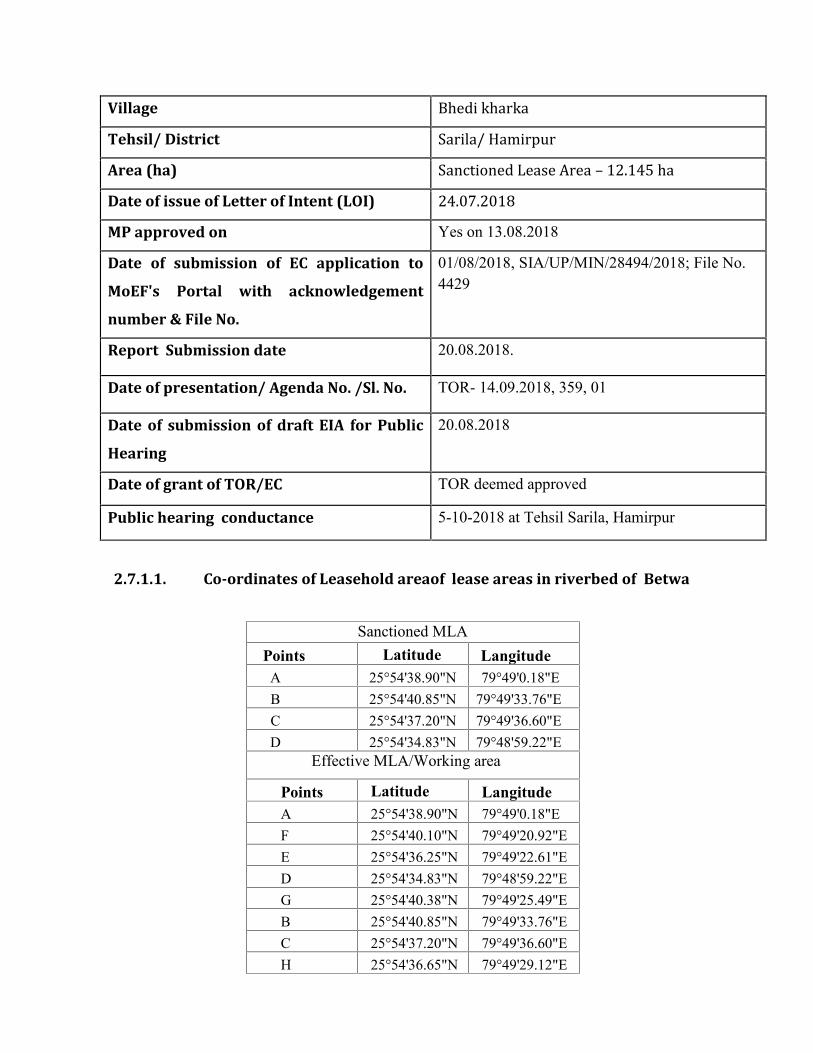
Village Bhedi kharkaTehsil/ District Sarila/ HamirpurArea (ha) Sanctioned Lease Area – 12.145 haDate of issue of Letter of Intent (LOI) 24.07.2018MP approved on Yes on 13.08.2018
Date of submission of EC application to
MoEF's Portal with acknowledgement
number & File No.
01/08/2018, SIA/UP/MIN/28494/2018; File No.4429
Report Submission date 20.08.2018.
Date of presentation/ Agenda No. /Sl. No. TOR- 14.09.2018, 359, 01
Date of submission of draft EIA for Public
Hearing
20.08.2018
Date of grant of TOR/EC TOR deemed approved
Public hearing conductance 5-10-2018 at Tehsil Sarila, Hamirpur
2.7.1.1. Co-ordinates of Leasehold areaof lease areas in riverbed of Betwa
Sanctioned MLAPoints Latitude Langitude
A 25°54'38.90"N 79°49'0.18"EB 25°54'40.85"N 79°49'33.76"EC 25°54'37.20"N 79°49'36.60"ED 25°54'34.83"N 79°48'59.22"E
Effective MLA/Working area
Points Latitude LangitudeA 25°54'38.90"N 79°49'0.18"EF 25°54'40.10"N 79°49'20.92"EE 25°54'36.25"N 79°49'22.61"ED 25°54'34.83"N 79°48'59.22"EG 25°54'40.38"N 79°49'25.49"EB 25°54'40.85"N 79°49'33.76"EC 25°54'37.20"N 79°49'36.60"EH 25°54'36.65"N 79°49'29.12"E
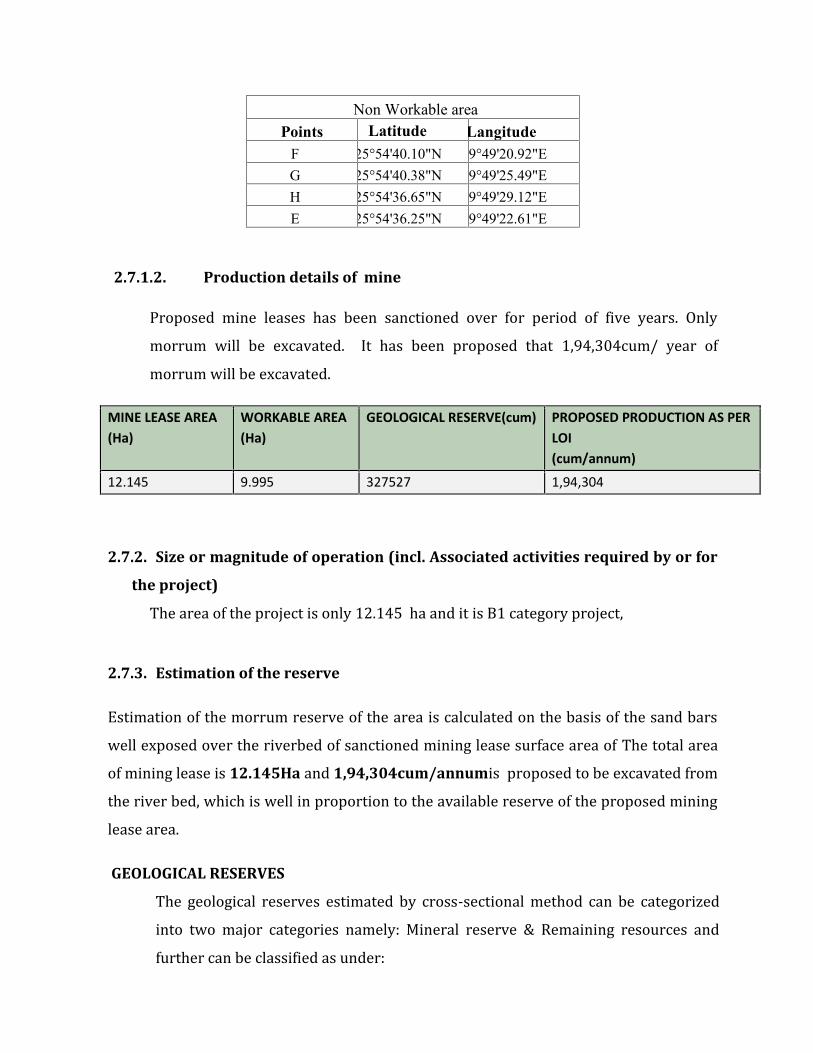
Non Workable areaPoints Latitude Langitude
F 25°54'40.10"N 79°49'20.92"EG 25°54'40.38"N 79°49'25.49"EH 25°54'36.65"N 79°49'29.12"EE 25°54'36.25"N 79°49'22.61"E
2.7.1.2. Production details of mineProposed mine leases has been sanctioned over for period of five years. Onlymorrum will be excavated. It has been proposed that 1,94,304cum/ year ofmorrum will be excavated.MINE LEASE AREA(Ha)
WORKABLE AREA(Ha)
GEOLOGICAL RESERVE(cum) PROPOSED PRODUCTION AS PERLOI(cum/annum)
12.145 9.995 327527 1,94,304
2.7.2. Size or magnitude of operation (incl. Associated activities required by or for
the project)The area of the project is only 12.145 ha and it is B1 category project,2.7.3. Estimation of the reserveEstimation of the morrum reserve of the area is calculated on the basis of the sand barswell exposed over the riverbed of sanctioned mining lease surface area of The total areaof mining lease is 12.145Ha and 1,94,304cum/annumis proposed to be excavated fromthe river bed, which is well in proportion to the available reserve of the proposed mininglease area.GEOLOGICAL RESERVESThe geological reserves estimated by cross-sectional method can be categorizedinto two major categories namely: Mineral reserve & Remaining resources andfurther can be classified as under:
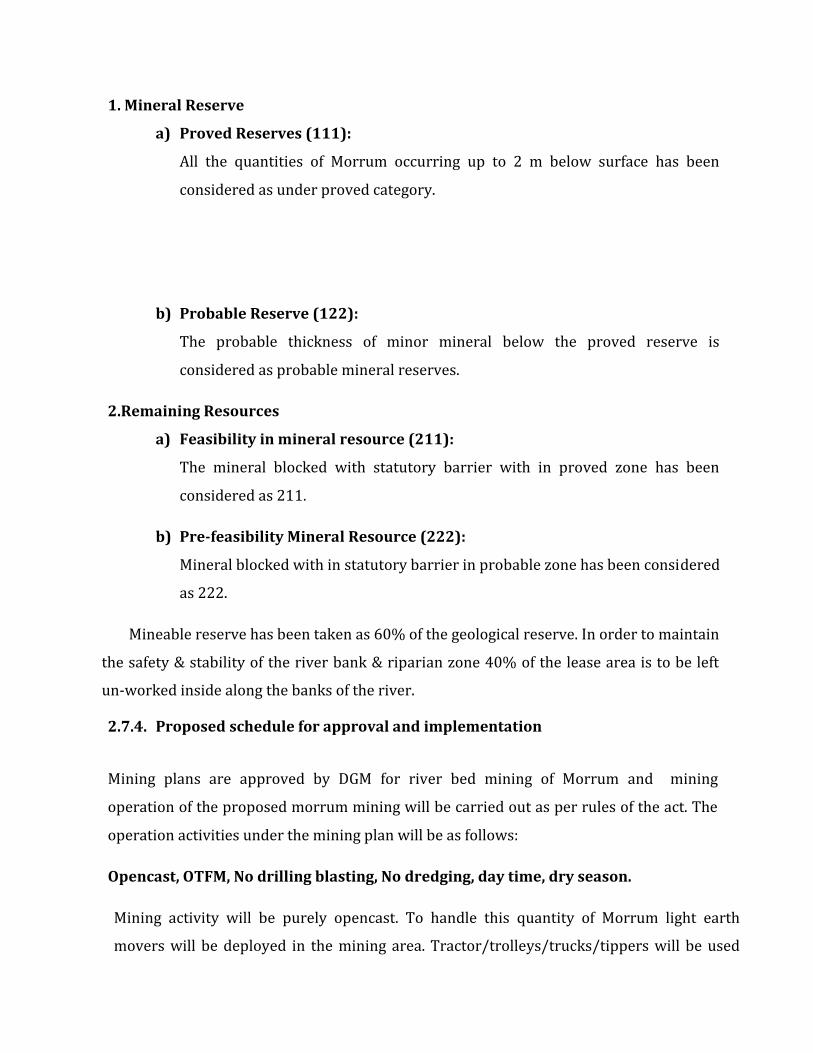
1. Mineral Reserve
a) Proved Reserves (111):All the quantities of Morrum occurring up to 2 m below surface has beenconsidered as under proved category.
b) Probable Reserve (122):The probable thickness of minor mineral below the proved reserve isconsidered as probable mineral reserves.2.Remaining Resources
a) Feasibility in mineral resource (211):The mineral blocked with statutory barrier with in proved zone has beenconsidered as 211.b) Pre-feasibility Mineral Resource (222):Mineral blocked with in statutory barrier in probable zone has been consideredas 222.Mineable reserve has been taken as 60% of the geological reserve. In order to maintainthe safety & stability of the river bank & riparian zone 40% of the lease area is to be leftun-worked inside along the banks of the river.
2.7.4. Proposed schedule for approval and implementation
Mining plans are approved by DGM for river bed mining of Morrum and miningoperation of the proposed morrum mining will be carried out as per rules of the act. Theoperation activities under the mining plan will be as follows:Opencast, OTFM, No drilling blasting, No dredging, day time, dry season.Mining activity will be purely opencast. To handle this quantity of Morrum light earthmovers will be deployed in the mining area. Tractor/trolleys/trucks/tippers will be used
for transportation of minor mineral to the local markets and manual/hand equipments willbe used as per the requirements. Apart from this water sprinkler will also be used for dustsuppression on haulage road during transportation.Postulates of Mining methodology
Morrum mining will be carried out strictly as per Mining Act/Rules. Dredging will not be done. Blasting and drilling not required. Main stream will not be disturbed. Mining from breaded, dune and accumulated areas. Mining in day time and in dry season only. No mining in rainy season. Required safe corridor will be maintained. Numbers of ramp will be less. Mining restricted to the depth of 3 m from the surface / 1 m above water levelwhichever is less. Only Morrum will be extracted. Mining will be carried out in slices/ladder form of 30 cm to 60 cm. Ground water will not be disturbed. Angle of repose for mining will not be more than 30 degree.
(ii) Haulage and Surface TransportMode of transportation of the mixed material is by trucks/ tractor trolleys. Trucks oflarger size may also be used where the material is to be carried to a long distance to beused for out bound transportation. Mining areas are connected with a ‘Kuccha’ road upto the nearest pucca road and thereafter it is metalled road up to destination. Theapproach roads are adequate to permit easy maneuverability of trucks and it alsoprovides cross-over and changing points. Waterwill be sprayed regularly by watersprinklers to suppress fugitive dust generation.
(iii) Brief layout of mine working, layout mine faces & sites for disposal of
overburden/waste.Bar scalping or skimming is extraction of Morrum and gravel from the surface of bars.Historical scalping commonly removed most of the bar above the low flow water level,leaving an irregular topography. Present method generally requires that surfaceirregularities be smoothed out and that the extracted material be limited to what couldbe taken above an imaginary line sloping upwards and away from the water from aspecified level above the river's water surface at the time of extraction (typically 0.3 -0.6 m (1-2 ft)) bar scalping or skimming. Bar scalping is commonly repeated year afteryear. To maintain the hydraulic control provided to upstream by the riffle head, thepreferred method of bar scalping is now generally to leave the top one-third(approximately) of the bar undisturbed, mining only from the downstream two-thirds.1. Can create efficient channel.2. Less disturbance on bar.3. Smaller impact on riparian vegetation.4. Can create pool habitat.5. Can remedy channel braiding.6. Useful for aggraded channels.Mining faces shall be opened from top to down word. It will be advanced towards alldirections. Approach & Haul roads of 6 m wide and 1:16 gradient shall be provided toeach mining faces for transportation of mineral. No top soil exist within the areatherefore, no proposal has been given for its management.2.7.5.1 Mining planThe proposed leases are simple open cast river bed morrum (minor mineral), and ,mining plans, describing the methodology of mining operations, limitations,restrictions and mine closing along with layout, surface plan is prepared anddiscussed herewith:i) Location & Basic Information of the Mining Lease Area:
Spreading over an area of 12.145 ha, the proposed project is to extract morrum from theriver bed of BetwaRiver.Demarcation of Mining Lease Area:First of all the total proposed mining lease area will be demarcated by pucca pillars at theThe area used for amenities include Site office, drinking facility, rest shelters for workersand the persons who will be staying on site during night as watchman/guards etc. ;portable toilets will also be using this space only.
a. First year
The proposed mine leases falling within the Study Area-2are confined to theextraction of morrum up to 9903658 m3/year from the riverbed of the effectiveworkable area along the river bed Proposed mining project is an open cast mining where no drilling or blasting isrequired. Mining sites & points will be selected in the riverbed where the concentration ofminor mineral is higher & preferably at places or points where the minor mineralis well exposed & present in dunes of higher elevation. The mining will be done by semi mechanized/OTFM (Other Than FullyMechanized) method using Bar scrapers and loaders. To reduce the further chances of erosion & landslides at the bank of the river,mining will not be done in the concave areas of the rivers. To safe guard the river banks as per mining rules, mining will be done at least 7.5m inside of the either banks inside the river bed in the lateral form. Mining will bedone as given in SSMMG, 2016 and the depth of excavation shall not exceed 3 m or1 m above water level, in proper bench form with suitable slope of gradient notmore than 30°. Mining at any case will not be carried out below the water table. Mining will be done in the dry season only at places where the replenishment ofsediments is high.
Mining will be completely stopped during the monsoon. Mining operation will be carried out in the day time only.b. Subsequent years
Mining will be carried out in the dry season only & will be stopped completelyduring monsoon. Thus the mining area leftover will get replenished with the sediments of minormineral in the monsoon itself. After the monsoon the filled excavated area will become re-mineable, and can bemined as per findings of the Replenishment study.
2.7.5.2. Replenishment Study: For calculation of actual replenishment, proposal ofreplenishment study on the basis of visit to extraction sites annually, reviews of cross-sectional survey data and estimation of the actual amount of replenishment during theflood season is proposed.Replenishment term means refilling up-to former or previous level. Sediment transportprocess that determines the sand replenishment rate, hence, the volume of sand that canbe extracted from the reach of the river channel.In the first year following Letter of Intent a volume could be extracted from the reach ofchannel. Replenishment study would need to occur before subsequent extraction takesplace.The concept of annual replenishment accounts for the episodic nature of sedimenttransport. For example, during wet periods with high stream flows, and a highcontribution of sediment from hill slopes and tributaries, monitoring data would showthat sand and gravel bars are replenished quickly. During drought periods with lowstream flow, and little sediment supply or transport, monitoring data would likely showthat bars were replenished at a slower rate.The use of monitoring data is essential in measuring when actual replenishment occurs.The use of the concept of annual replenishment protects long-term channel stability aswell as aquatic and riparian habitat by extracting a volume sustainable by watershedprocesses. It is important to develop a system to allocate the total estimated annualreplenishment between all of the operators.

• Sediment transport process determines the sand replenishment rate• Replenishment study will be done before the process of extraction commence• Concept of annual replenishment protects long-term channel stability as wellas aquatic and riparian habitat by extracting the mineral sustainably bywatershed processes.
Table No.2.12. Popular methods for Replenishment StudySediment TransportEquations • Yang Equation• Engelund-Hansen EquationRiver Modeling • River Modelling Using HEC-RAS
Sediment Rating CurveDetermination • Flow Discharge based on Surveyed Cross Section• Sediment Distribution Curve• Total Bed Material Load Computation• Historical Flood Hydrograph• Extraction Volume DeterminationSite Visits andEstimation of ActualAmount• Visits to extraction site annually, reviews crosssection survey data & estimates the actualamount of replenishment over the flood season.
The replenishment study by site visit and estimation of actual amount is given inChapter-7: Additional studies.
LIMITATIONS AND RESTRICTIONS OF MINING1. The mine owner will carry out mining work as per UPMMCR, 1963 and under all therules and regulations, term and condition laid down therein.2. Mining in any case will not be done below the water table. During the lease period,the deposit will be worked from the top surface of the river bed to 3m BGL or 1 mabove groundwater level whichever is less.
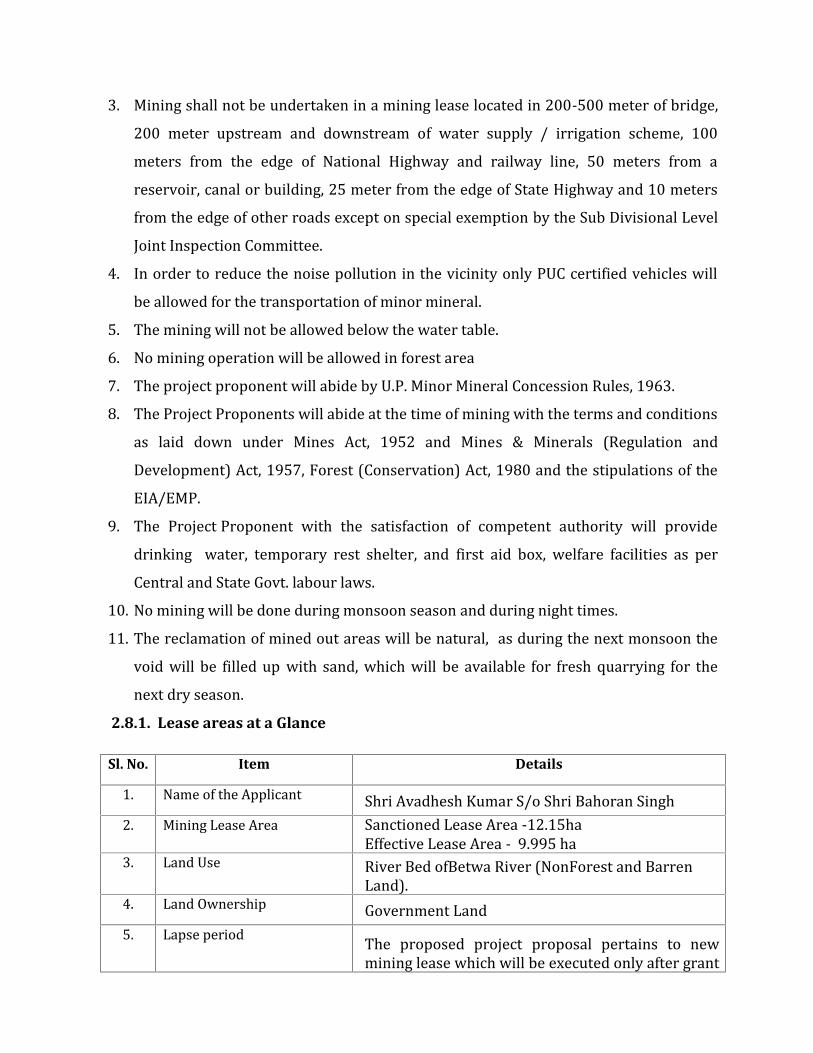
3. Mining shall not be undertaken in a mining lease located in 200-500 meter of bridge,200 meter upstream and downstream of water supply / irrigation scheme, 100meters from the edge of National Highway and railway line, 50 meters from areservoir, canal or building, 25 meter from the edge of State Highway and 10 metersfrom the edge of other roads except on special exemption by the Sub Divisional LevelJoint Inspection Committee.4. In order to reduce the noise pollution in the vicinity only PUC certified vehicles willbe allowed for the transportation of minor mineral.5. The mining will not be allowed below the water table.6. No mining operation will be allowed in forest area7. The project proponent will abide by U.P. Minor Mineral Concession Rules, 1963.8. The Project Proponents will abide at the time of mining with the terms and conditionsas laid down under Mines Act, 1952 and Mines & Minerals (Regulation andDevelopment) Act, 1957, Forest (Conservation) Act, 1980 and the stipulations of theEIA/EMP.9. The Project Proponent with the satisfaction of competent authority will providedrinking water, temporary rest shelter, and first aid box, welfare facilities as perCentral and State Govt. labour laws.10. No mining will be done during monsoon season and during night times.11. The reclamation of mined out areas will be natural, as during the next monsoon thevoid will be filled up with sand, which will be available for fresh quarrying for thenext dry season.2.8.1. Lease areas at a Glance
Sl. No. Item Details1. Name of the Applicant Shri Avadhesh Kumar S/o Shri Bahoran Singh2. Mining Lease Area Sanctioned Lease Area -12.15haEffective Lease Area - 9.995 ha3. Land Use River Bed ofBetwa River (NonForest and BarrenLand).4. Land Ownership Government Land5. Lapse period The proposed project proposal pertains to newmining lease which will be executed only after grant
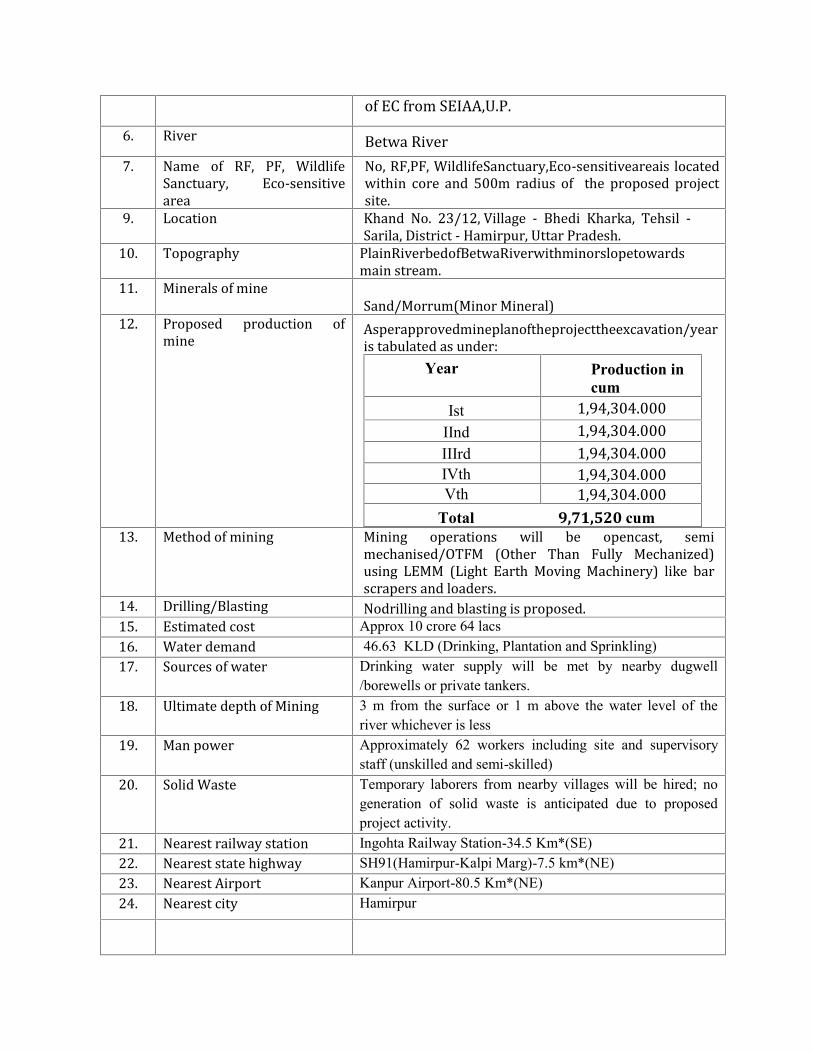
of EC from SEIAA,U.P.6. River Betwa River7. Name of RF, PF, WildlifeSanctuary, Eco-sensitivearea No, RF,PF, WildlifeSanctuary,Eco-sensitiveareais locatedwithin core and 500m radius of the proposed projectsite.9. Location Khand No. 23/12, Village - Bhedi Kharka, Tehsil -Sarila, District - Hamirpur, Uttar Pradesh.10. Topography PlainRiverbedofBetwaRiverwithminorslopetowardsmain stream.11. Minerals of mine Sand/Morrum(Minor Mineral)12. Proposed production ofmine Asperapprovedmineplanoftheprojecttheexcavation/yearis tabulated as under:Year Production in
cumIst 1,94,304.000
IInd 1,94,304.000IIIrd 1,94,304.000IVth 1,94,304.000Vth 1,94,304.000
Total 9,71,520 cum13. Method of mining Mining operations will be opencast, semimechanised/OTFM (Other Than Fully Mechanized)using LEMM (Light Earth Moving Machinery) like barscrapers and loaders.14. Drilling/Blasting Nodrilling and blasting is proposed.15. Estimated cost Approx 10 crore 64 lacs16. Water demand 46.63 KLD (Drinking, Plantation and Sprinkling)17. Sources of water Drinking water supply will be met by nearby dugwell/borewells or private tankers.18. Ultimate depth of Mining 3 m from the surface or 1 m above the water level of theriver whichever is less19. Man power Approximately 62 workers including site and supervisorystaff (unskilled and semi-skilled)20. Solid Waste Temporary laborers from nearby villages will be hired; nogeneration of solid waste is anticipated due to proposedproject activity.21. Nearest railway station Ingohta Railway Station-34.5 Km*(SE)22. Nearest state highway SH91(Hamirpur-Kalpi Marg)-7.5 km*(NE)23. Nearest Airport Kanpur Airport-80.5 Km*(NE)24. Nearest city Hamirpur
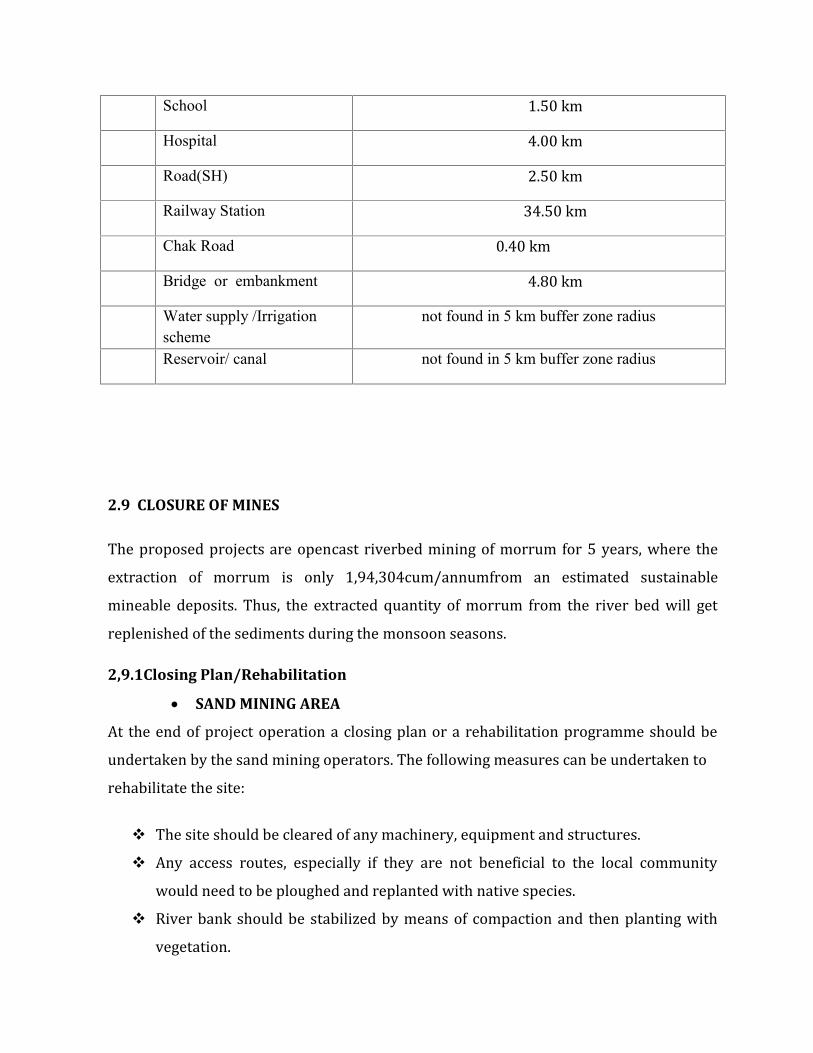
School 1.50 kmHospital 4.00 kmRoad(SH) 2.50 kmRailway Station 34.50 kmChak Road 0.40 kmBridge or embankment 4.80 kmWater supply /Irrigationscheme
not found in 5 km buffer zone radius
Reservoir/ canal not found in 5 km buffer zone radius
2.9 CLOSURE OF MINESThe proposed projects are opencast riverbed mining of morrum for 5 years, where theextraction of morrum is only 1,94,304cum/annumfrom an estimated sustainablemineable deposits. Thus, the extracted quantity of morrum from the river bed will getreplenished of the sediments during the monsoon seasons.2,9.1Closing Plan/Rehabilitation
SAND MINING AREAAt the end of project operation a closing plan or a rehabilitation programme should beundertaken by the sand mining operators. The following measures can be undertaken torehabilitate the site: The site should be cleared of any machinery, equipment and structures. Any access routes, especially if they are not beneficial to the local communitywould need to be ploughed and replanted with native species. River bank should be stabilized by means of compaction and then planting withvegetation.
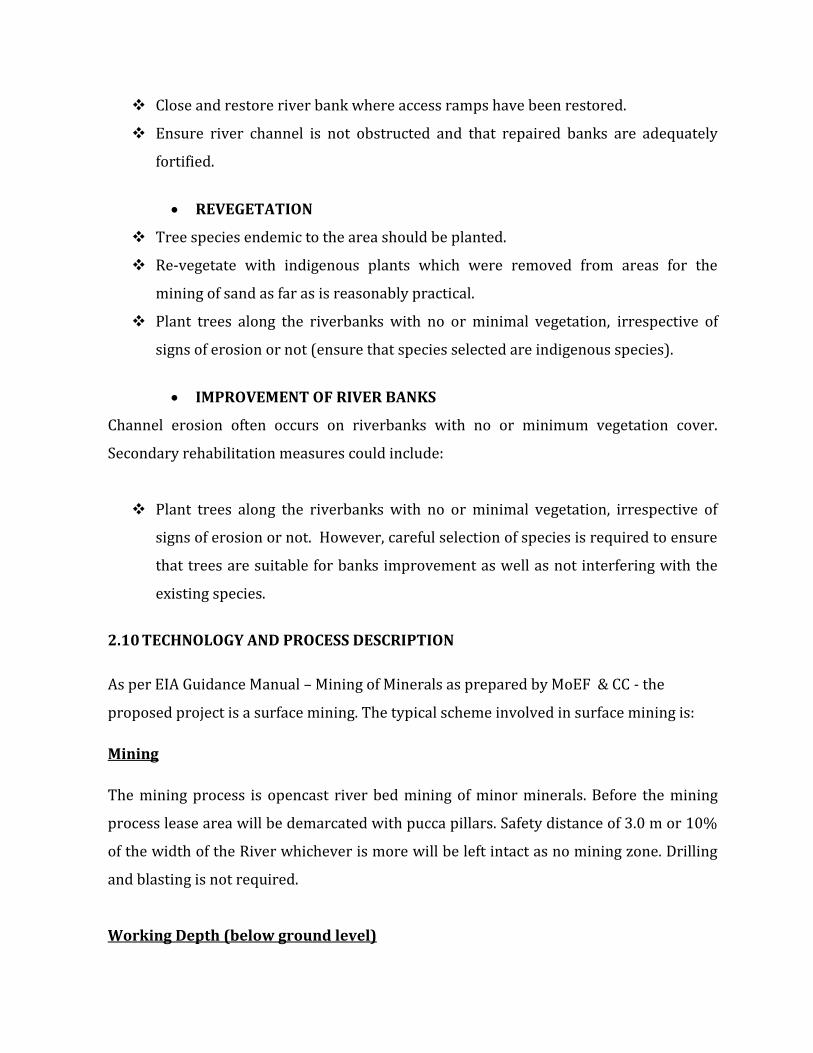
Close and restore river bank where access ramps have been restored. Ensure river channel is not obstructed and that repaired banks are adequatelyfortified.
REVEGETATION
Tree species endemic to the area should be planted. Re-vegetate with indigenous plants which were removed from areas for themining of sand as far as is reasonably practical. Plant trees along the riverbanks with no or minimal vegetation, irrespective ofsigns of erosion or not (ensure that species selected are indigenous species).
IMPROVEMENT OF RIVER BANKSChannel erosion often occurs on riverbanks with no or minimum vegetation cover.Secondary rehabilitation measures could include: Plant trees along the riverbanks with no or minimal vegetation, irrespective ofsigns of erosion or not. However, careful selection of species is required to ensurethat trees are suitable for banks improvement as well as not interfering with theexisting species.
2.10 TECHNOLOGY AND PROCESS DESCRIPTIONAs per EIA Guidance Manual – Mining of Minerals as prepared by MoEF & CC - theproposed project is a surface mining. The typical scheme involved in surface mining is:MiningThe mining process is opencast river bed mining of minor minerals. Before the miningprocess lease area will be demarcated with pucca pillars. Safety distance of 3.0 m or 10%of the width of the River whichever is more will be left intact as no mining zone. Drillingand blasting is not required.Working Depth (below ground level)
During the entire lease period, the deposit will be worked from the top surface to 3 m bglor above the ground water level whichever comes first.The mining process is also detailed below:Mining Process:
Mining will be started at the farthest downstream end, moving upstream from there. At the cross section of the flood plain at the downstream end, the mining will beinitiated from the middle of the cross section of the river bed. Mining will be continued in layers of 0.6 m depth to avoid ponding effect. Mining will be done in such a way that the process of mining remains confined to themiddle of the flood plain. For achieving this purpose, a width of about 6m, suitable forlocating the truck/trolley for simultaneous loading will be first excavated. To startwith it may be covered with wooden plank or metal sheet if required to prevent anysagging. Having excavated that, the process will be continued to the flanks, of a truckwidth, alternating from one side to the other every time. After the first layer is excavated, the process will be repeated for next layers. 1.Cancreateefficientchannel. 2. Lessdisturbanceonbar. Smallerimpactonriparianvegetation. 4.Canremedychannelbraiding. 5.Usefulforaggradedchannels.2.11 MINING TECHNOLOGY
Opencast,OTFM/SemiMechanized,Nodrillingblasting,Nodredging,daytime,dry
season.Mining activity inriverbedofBetwaRiverwillbeopencastandsemimechanized(OTFM).Theminingmethodwillbebarscalping/scraping(OTFM)usingbarscraperforMorrumscrapingformthe
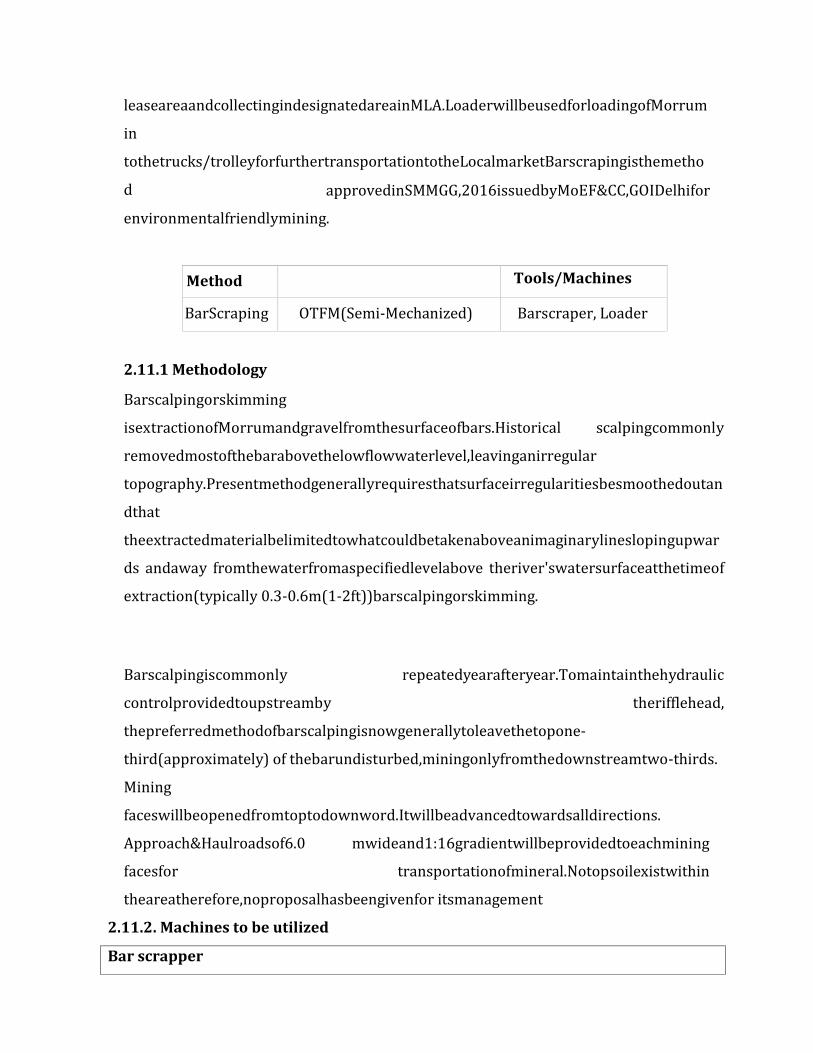
leaseareaandcollectingindesignatedareainMLA.LoaderwillbeusedforloadingofMorrumintothetrucks/trolleyforfurthertransportationtotheLocalmarketBarscrapingisthemethod approvedinSMMGG,2016issuedbyMoEF&CC,GOIDelhiforenvironmentalfriendlymining.Method
Technology
Tools/MachinesBarScraping OTFM(Semi-Mechanized) Barscraper, Loader2.11.1 MethodologyBarscalpingorskimmingisextractionofMorrumandgravelfromthesurfaceofbars.Historical scalpingcommonlyremovedmostofthebarabovethelowflowwaterlevel,leavinganirregulartopography.Presentmethodgenerallyrequiresthatsurfaceirregularitiesbesmoothedoutandthattheextractedmaterialbelimitedtowhatcouldbetakenaboveanimaginarylineslopingupwards andaway fromthewaterfromaspecifiedlevelabove theriver'swatersurfaceatthetimeofextraction(typically 0.3-0.6m(1-2ft))barscalpingorskimming.Barscalpingiscommonly repeatedyearafteryear.Tomaintainthehydrauliccontrolprovidedtoupstreamby therifflehead,thepreferredmethodofbarscalpingisnowgenerallytoleavethetopone-third(approximately) of thebarundisturbed,miningonlyfromthedownstreamtwo-thirds.Miningfaceswillbeopenedfromtoptodownword.Itwillbeadvancedtowardsalldirections.Approach&Haulroadsof6.0 mwideand1:16gradientwillbeprovidedtoeachminingfacesfor transportationofmineral.Notopsoilexistwithintheareatherefore,noproposalhasbeengivenfor itsmanagement
2.11.2. Machines to be utilized
Bar scrapper

The Bar scrapper is a PTO driven rearmounted attachment of tractor whichcollects sand from the surface throughthe scrapper blade and fills it in thetractor’s trailer through a conveyorarrangement..Sand is accumulated bythe scrapper blade from the ground andcollected by angles which are placed onthe belt of conveyor This sand isconveyed along the chain of conveyorwhich drops it from a height of eightfeet in the trailer of the tractor movingparallelly. The conveyor comprises a setof chains.Loader A loader is a type of tractor, usuallywheeled, sometimes on tracks, that has afront-mounted squarewide bucket connected to the end of twobooms (arms) to scoop up loose materialfrom the ground, such as dirt, sand orgravel, and move it from one place toanother without pushing the materialacross the ground. A loader is commonlyused to move a stockpiled material fromground level and deposit it into anawaiting dump truck or into an opentrench excavation.
Dumper A dumper is a vehicle designed forcarrying bulk material, often on
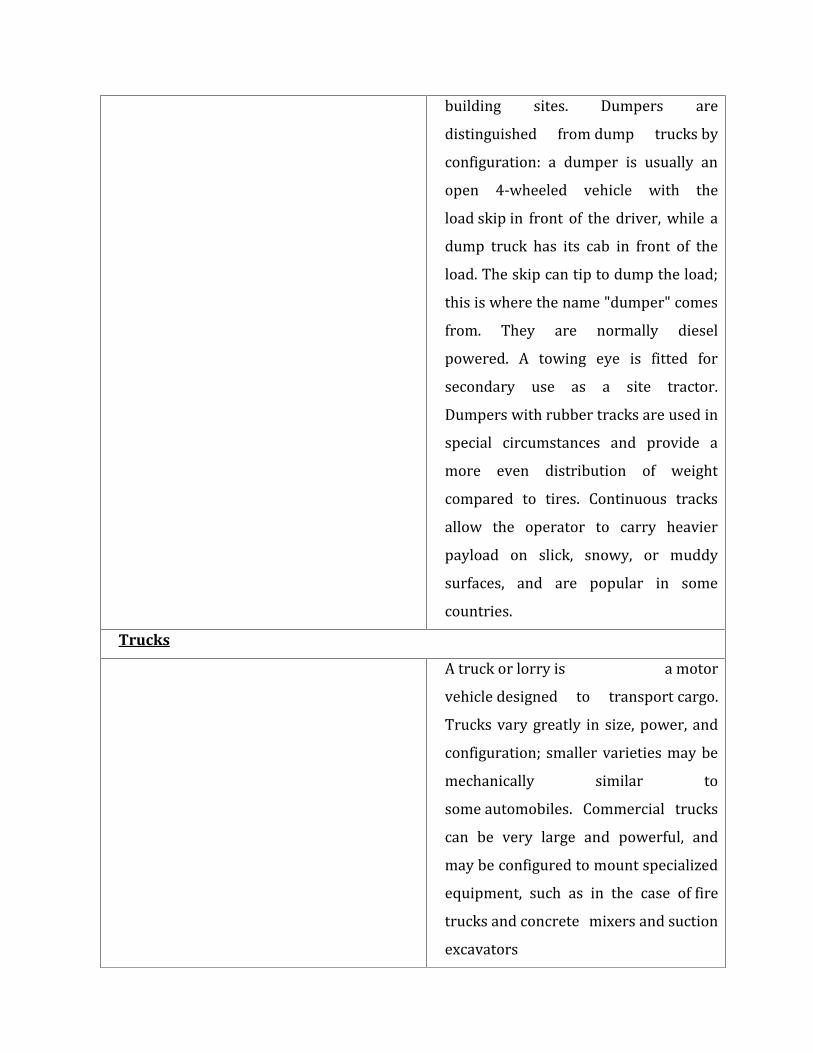
building sites. Dumpers aredistinguished from dump trucks byconfiguration: a dumper is usually anopen 4-wheeled vehicle with theload skip in front of the driver, while adump truck has its cab in front of theload. The skip can tip to dump the load;this is where the name "dumper" comesfrom. They are normally dieselpowered. A towing eye is fitted forsecondary use as a site tractor.Dumpers with rubber tracks are used inspecial circumstances and provide amore even distribution of weightcompared to tires. Continuous tracksallow the operator to carry heavierpayload on slick, snowy, or muddysurfaces, and are popular in somecountries.Trucks A truck or lorry is a motorvehicle designed to transport cargo.Trucks vary greatly in size, power, andconfiguration; smaller varieties may bemechanically similar tosome automobiles. Commercial truckscan be very large and powerful, andmay be configured to mount specializedequipment, such as in the case of firetrucks and concrete mixers and suctionexcavators
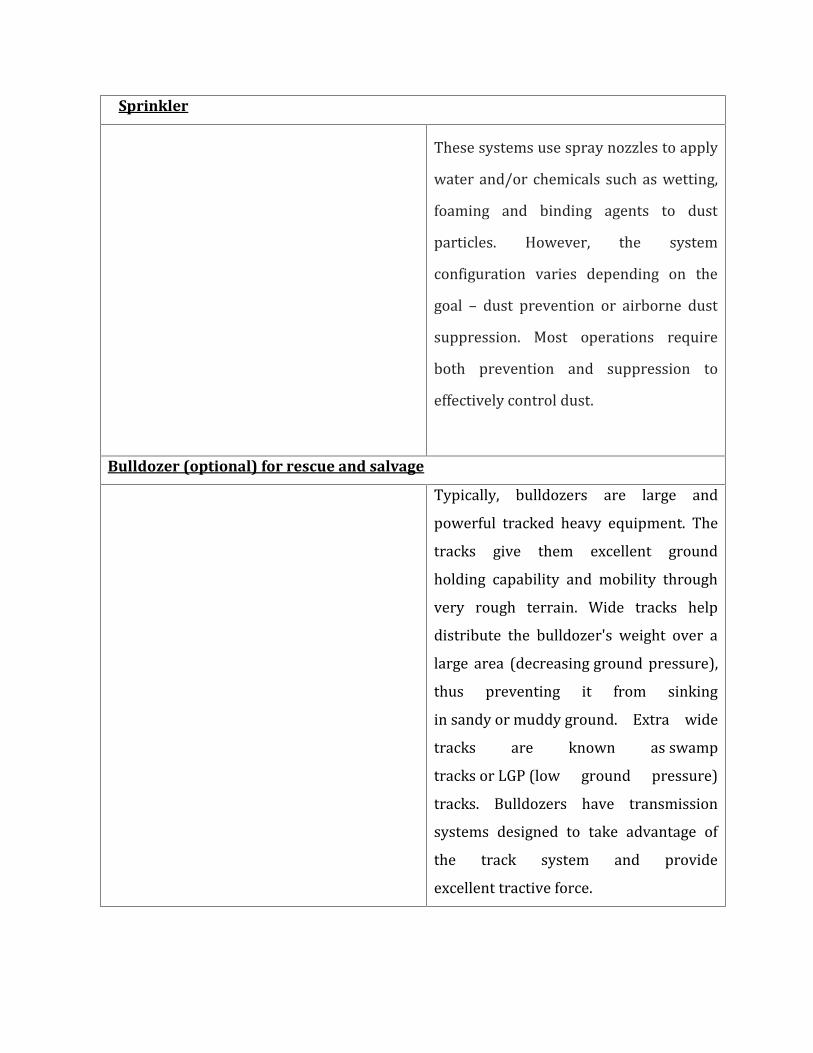
Sprinkler These systems use spray nozzles to applywater and/or chemicals such as wetting,foaming and binding agents to dustparticles. However, the systemconfiguration varies depending on thegoal – dust prevention or airborne dustsuppression. Most operations requireboth prevention and suppression toeffectively control dust.Bulldozer (optional) for rescue and salvage Typically, bulldozers are large andpowerful tracked heavy equipment. Thetracks give them excellent groundholding capability and mobility throughvery rough terrain. Wide tracks helpdistribute the bulldozer's weight over alarge area (decreasing ground pressure),thus preventing it from sinkingin sandy or muddy ground. Extra widetracks are known as swamptracks or LGP (low ground pressure)tracks. Bulldozers have transmissionsystems designed to take advantage ofthe track system and provideexcellent tractive force.

2.11.3. Hand tools for SandExcavation:These are generally used for smaller depths of excavations in small areas. Man power isrequired to operate these tools. The tools come under this category are explained belowSpadeSpade is a tool which consists metal platehaving sharp edges, the plate is attached tolong handle which is generally made up ofwood. Because of its sharp edges the sandcan be dig easily. The metal plate havingless curvature in the spade so, we cannotlift the sand by spade.ShovelShovel is tool which is used for the purposeof lifting of excavated sand. It is also similarto spade the difference between spade andshovel is the difference in leading edge. Thecurvature of metal plate of shovel isgenerally higher when compared to spadeso we can hold the soil easily and lifted it.Shovel can also be used for digging purposein case of soft soils, sand etc.HoeHoe is an excavating tool which consists ametal plate attached to a long handle withacute angle. The plate having sharp edge isused to excavate the soil. For small work ofexcavation it is widely preferred tool.Sometimes metal plate is replaced by forktype plate.
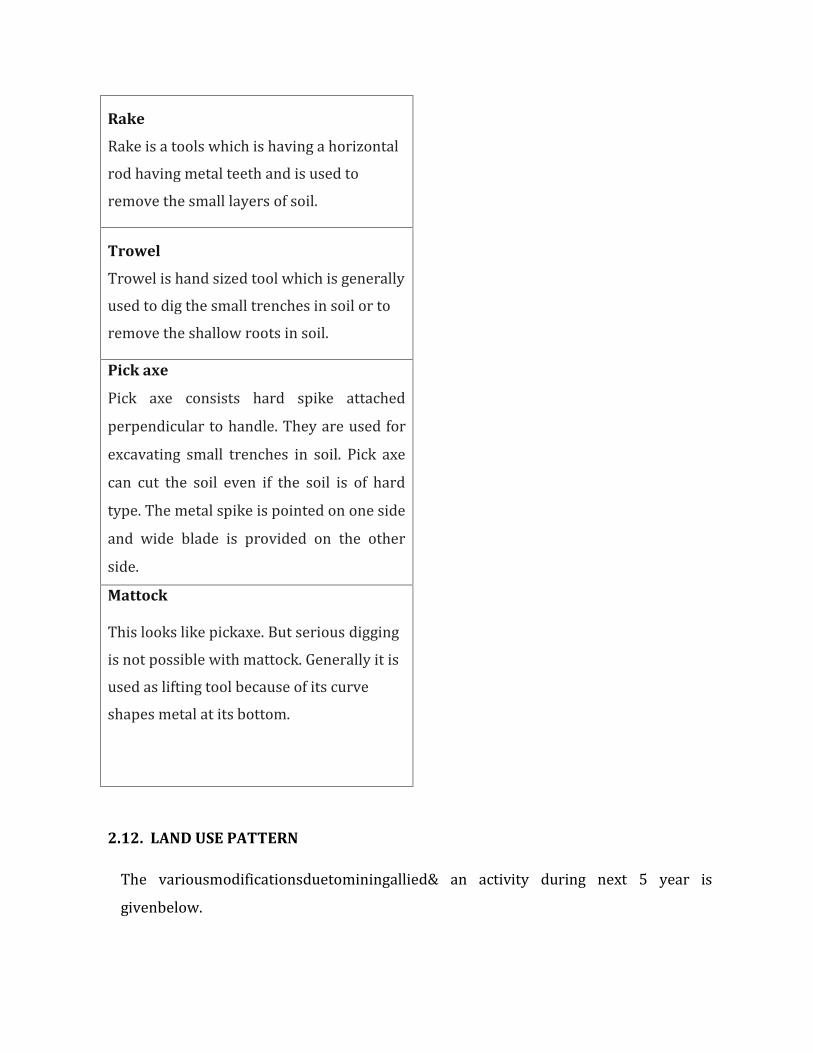
RakeRake is a tools which is having a horizontalrod having metal teeth and is used toremove the small layers of soil.TrowelTrowel is hand sized tool which is generallyused to dig the small trenches in soil or toremove the shallow roots in soil.Pick axePick axe consists hard spike attachedperpendicular to handle. They are used forexcavating small trenches in soil. Pick axecan cut the soil even if the soil is of hardtype. The metal spike is pointed on one sideand wide blade is provided on the otherside.MattockThis looks like pickaxe. But serious diggingis not possible with mattock. Generally it isused as lifting tool because of its curveshapes metal at its bottom.
2.12. LAND USE PATTERNThe variousmodificationsduetominingallied& an activity during next 5 year isgivenbelow.
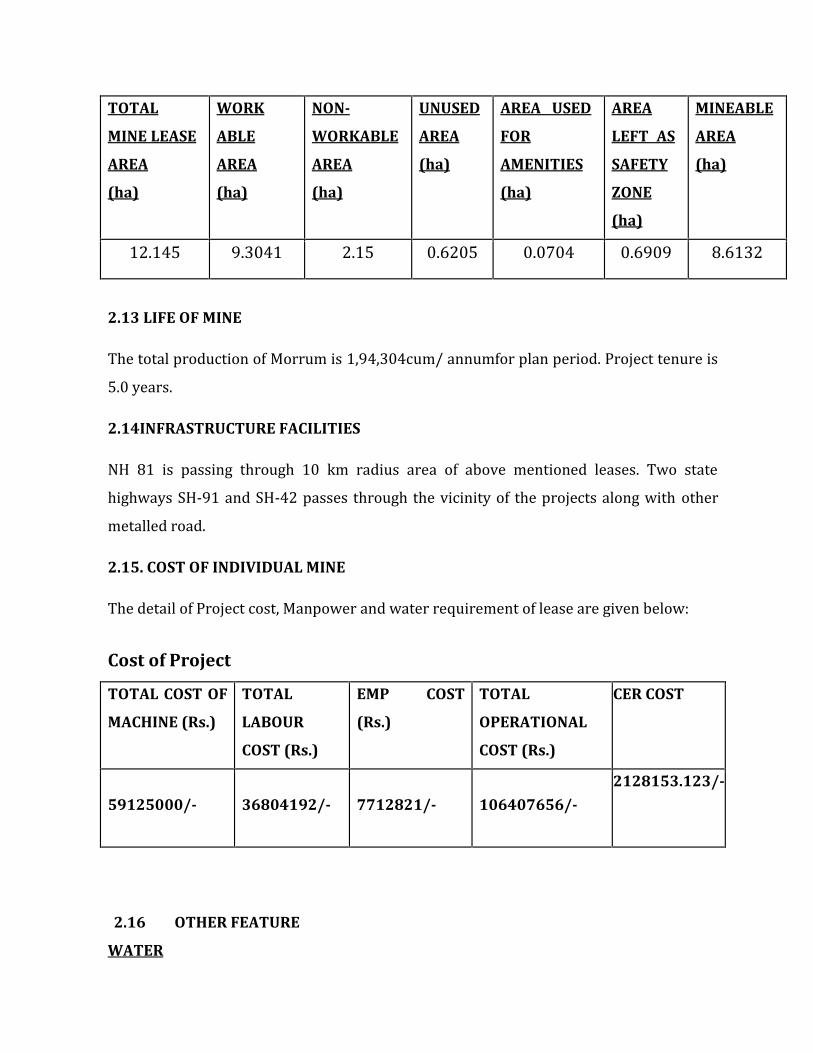
TOTAL
MINE LEASE
AREA
(ha)
WORK
ABLE
AREA
(ha)
NON-
WORKABLE
AREA
(ha)
UNUSED
AREA
(ha)
AREA USED
FOR
AMENITIES
(ha)
AREA
LEFT AS
SAFETY
ZONE
(ha)
MINEABLE
AREA
(ha)
12.145 9.3041 2.15 0.6205 0.0704 0.6909 8.61322.13 LIFE OF MINEThe total production of Morrum is 1,94,304cum/ annumfor plan period. Project tenure is5.0 years.2.14INFRASTRUCTURE FACILITIESNH 81 is passing through 10 km radius area of above mentioned leases. Two statehighways SH-91 and SH-42 passes through the vicinity of the projects along with othermetalled road.2.15. COST OF INDIVIDUAL MINEThe detail of Project cost, Manpower and water requirement of lease are given below:Cost of Project
TOTAL COST OF
MACHINE (Rs.)
TOTAL
LABOUR
COST (Rs.)
EMP COST
(Rs.)
TOTAL
OPERATIONAL
COST (Rs.)
CER COST
59125000/- 36804192/- 7712821/- 106407656/-
2128153.123/-
2.16 OTHER FEATURE
WATER
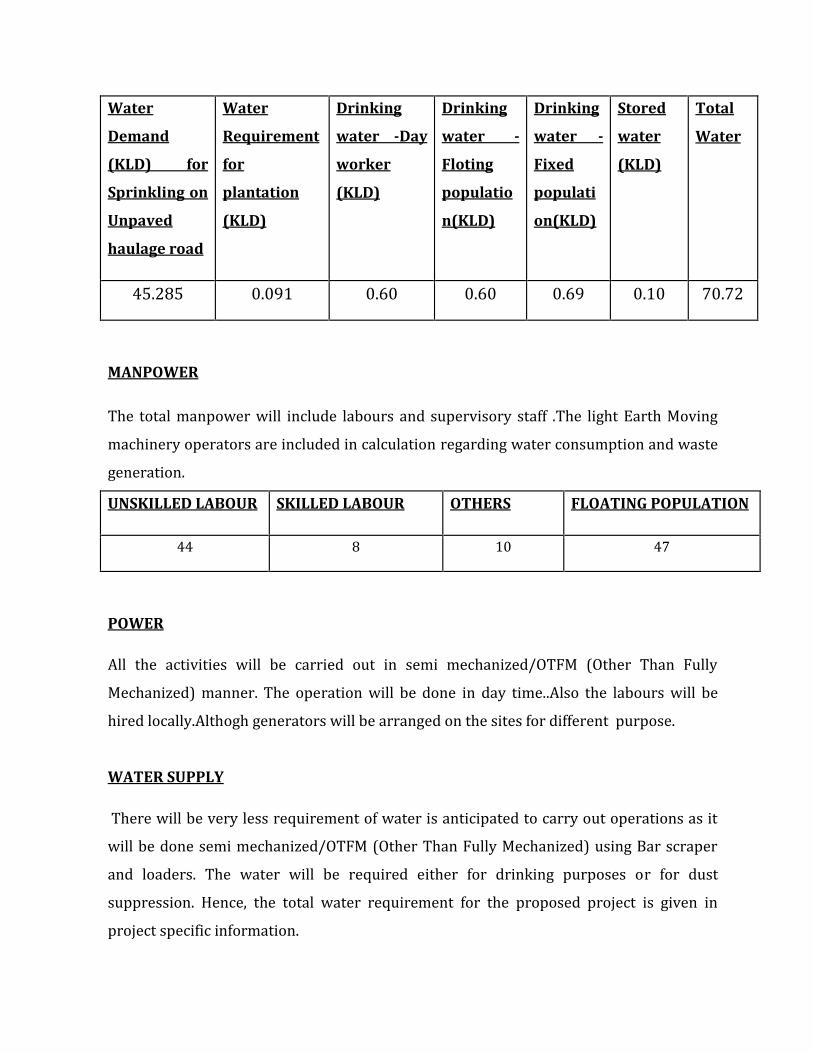
Water
Demand
(KLD) for
Sprinkling on
Unpaved
haulage road
Water
Requirement
for
plantation
(KLD)
Drinking
water -Day
worker
(KLD)
Drinking
water -
Floting
populatio
n(KLD)
Drinking
water -
Fixed
populati
on(KLD)
Stored
water
(KLD)
Total
Water
45.285 0.091 0.60 0.60 0.69 0.10 70.72MANPOWERThe total manpower will include labours and supervisory staff .The light Earth Movingmachinery operators are included in calculation regarding water consumption and wastegeneration.UNSKILLED LABOUR SKILLED LABOUR OTHERS FLOATING POPULATION
44 8 10 47POWERAll the activities will be carried out in semi mechanized/OTFM (Other Than FullyMechanized) manner. The operation will be done in day time..Also the labours will behired locally.Althogh generators will be arranged on the sites for different purpose.WATER SUPPLYThere will be very less requirement of water is anticipated to carry out operations as itwill be done semi mechanized/OTFM (Other Than Fully Mechanized) using Bar scraperand loaders. The water will be required either for drinking purposes or for dustsuppression. Hence, the total water requirement for the proposed project is given inproject specific information.
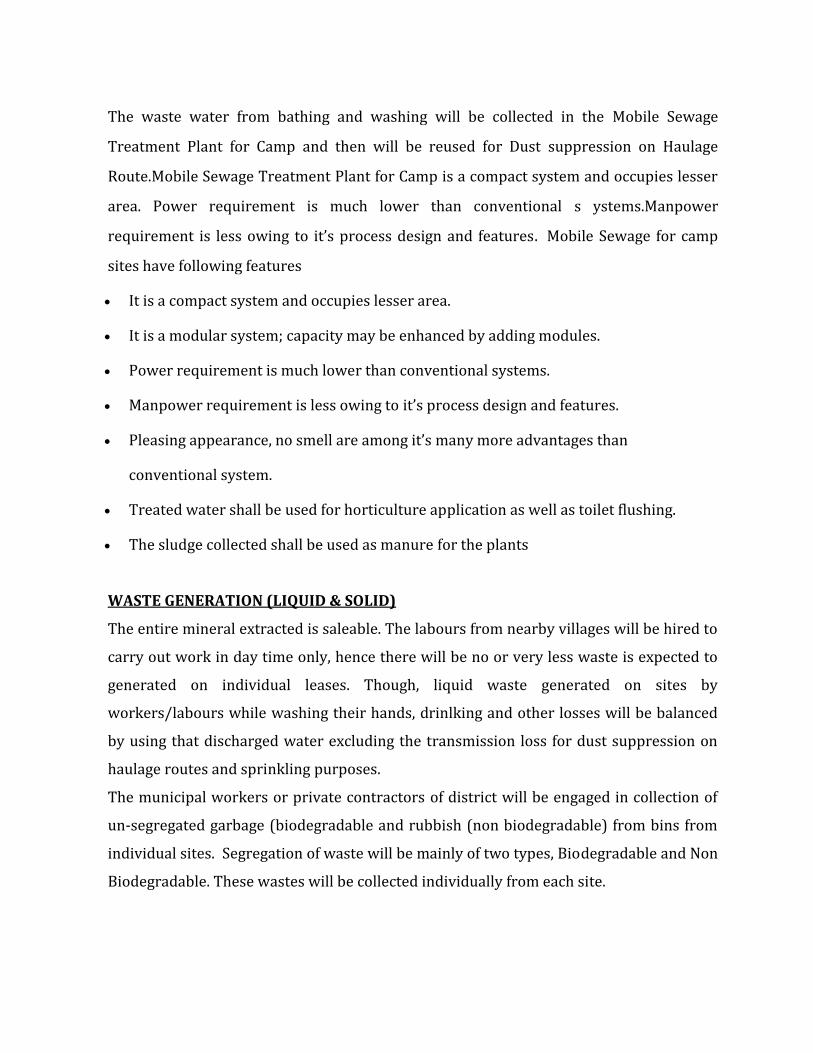
The waste water from bathing and washing will be collected in the Mobile SewageTreatment Plant for Camp and then will be reused for Dust suppression on HaulageRoute.Mobile Sewage Treatment Plant for Camp is a compact system and occupies lesserarea. Power requirement is much lower than conventional s ystems.Manpowerrequirement is less owing to it’s process design and features. Mobile Sewage for campsites have following features It is a compact system and occupies lesser area. It is a modular system; capacity may be enhanced by adding modules. Power requirement is much lower than conventional systems. Manpower requirement is less owing to it’s process design and features. Pleasing appearance, no smell are among it’s many more advantages thanconventional system. Treated water shall be used for horticulture application as well as toilet flushing. The sludge collected shall be used as manure for the plantsWASTE GENERATION (LIQUID & SOLID)The entire mineral extracted is saleable. The labours from nearby villages will be hired tocarry out work in day time only, hence there will be no or very less waste is expected togenerated on individual leases. Though, liquid waste generated on sites byworkers/labours while washing their hands, drinlking and other losses will be balancedby using that discharged water excluding the transmission loss for dust suppression onhaulage routes and sprinkling purposes.The municipal workers or private contractors of district will be engaged in collection ofun-segregated garbage (biodegradable and rubbish (non biodegradable) from bins fromindividual sites. Segregation of waste will be mainly of two types, Biodegradable and NonBiodegradable. These wastes will be collected individually from each site.
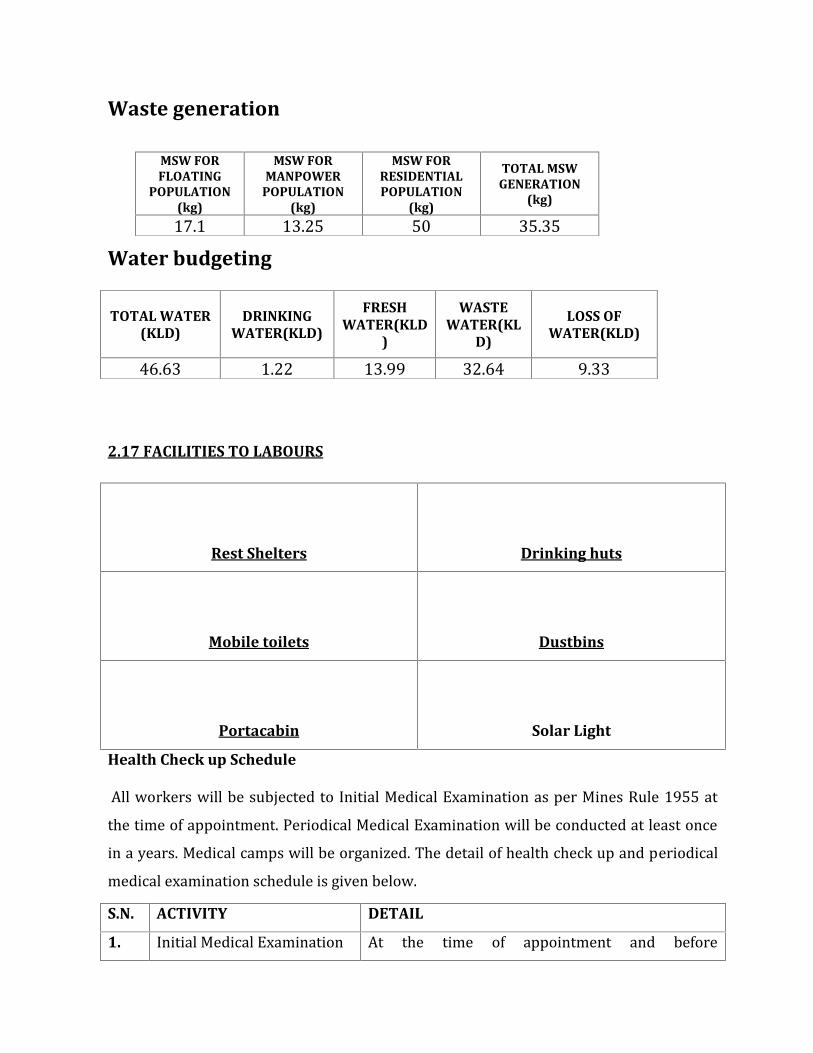
Waste generation
Water budgeting
2.17 FACILITIES TO LABOURS
Rest Shelters Drinking huts
Mobile toilets Dustbins
Portacabin Solar Light
Health Check up ScheduleAll workers will be subjected to Initial Medical Examination as per Mines Rule 1955 atthe time of appointment. Periodical Medical Examination will be conducted at least oncein a years. Medical camps will be organized. The detail of health check up and periodicalmedical examination schedule is given below.
MSW FORFLOATING
POPULATION(kg)
MSW FORMANPOWER
POPULATION(kg)
MSW FORRESIDENTIALPOPULATION
(kg)
TOTAL MSWGENERATION
(kg)17.1 13.25 50 35.35TOTAL WATER
(KLD)DRINKING
WATER(KLD)
FRESHWATER(KLD
)
WASTEWATER(KL
D)
LOSS OFWATER(KLD)46.63 1.22 13.99 32.64 9.33
S.N. ACTIVITY DETAIL
1. Initial Medical Examination At the time of appointment and before

(Mine Workers) commencement ofminework all the mine workerswill go through the initial Medical Examination likeB.P., Weight, Height and other primary healthparameters.2. Physical Check -up Health checkup camp will be organized for mineworkers as well as for Villagers in which physicalparameters like height, weight and B.P. will bemonitored and Psychological test & RespiratoryTests will be conducted.However the medicines will only be given orprescribed by Recognized Doctors at PHC ofconcerned Villages.
3. Psychological Test4. Respiratory Test
5. Eye Check -up Regular Eye checks up camps are being organizedby Government at Village levels. The proponentwill arrange for a Bus or Van to carry the mineworkers for specific location of Eye Check Upcamps. The Panchayat will let the proponent knowabout the dates of check up camp and proponentwill arrange for the transportation to & fro.6. Training (Mine Workers) The Mine workers will be trained by
Environment officer for –
Working conditions are hazardous details Site specification Emergency response Providing first aid Evacuation Plan Report of Incidence Emergency contact numbersThe Mine Manager will be responsible for Trainingof Mine Workers.
Basic medical facility (First aid box), PPE and drinking water will be provided by themining leasee/mine holder for workers during all the working hours of the lease periodon site.PPEs like dust mask, Hard Hat, Shoes etc will be provided wherever necessary tothe labors2.17 DESCRIPTION OF MITIGATION MEASURES
Although the river morrum is worlds most plentiful and has got the ability to replenishitself, even then morrum mining is a coastal activity referring to the process of actualremoval of the minor mineral from the riverbed, stream which causes hazards andpollutions to the surrounding environment. In order to overcome these environmentalproblems the lessee will follow the following mitigation measures for mining:1. The main stream will not be diverted to form inactive channels from mining.2. Mining below subterranean water will not be done.Detailed mitigation measures are discussed in chapter.4.
2.18.1. ASSESSMENT OF NEW & UNTESTED TECHNOLOGY FOR THE RISK OF
TECHNOLOGICAL FAILURENo new or untested technology is adopted for the proposed mining. The project does notinvolve any processes as overburden removal, drilling, blasting and beneficiation. Miningwill be done by Bar Scalping method which is approved in SSMMG, 2016. The sand willnot be scraped more than 3 meter as proposed in mining lease and shall be in the lateraldirection of the river. These pits get replenished during monsoon. The proposed mininglease project is a simple opencast mining where no drilling and blasting is required.
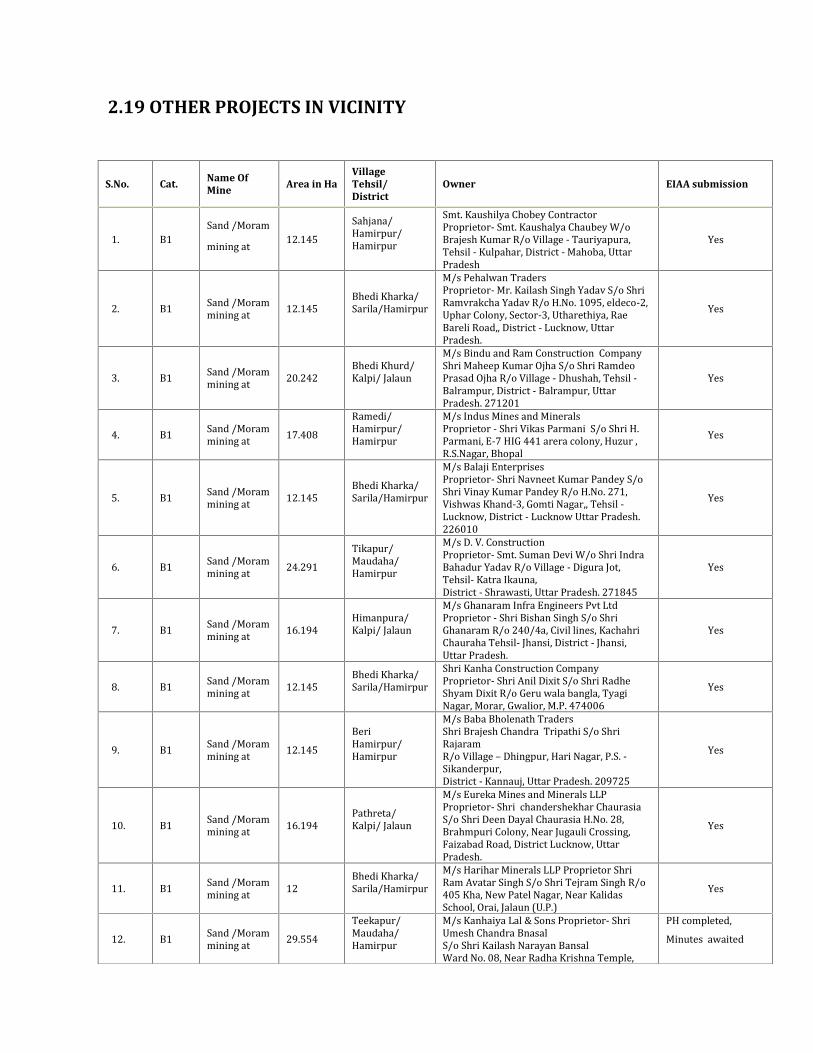
2.19 OTHER PROJECTS IN VICINITY
S.No. Cat. Name OfMine Area in Ha
VillageTehsil/District
Owner EIAA submission
1. B1 Sand /Morammining at 12.145 Sahjana/Hamirpur/HamirpurSmt. Kaushilya Chobey ContractorProprietor- Smt. Kaushalya Chaubey W/oBrajesh Kumar R/o Village - Tauriyapura,Tehsil - Kulpahar, District - Mahoba, UttarPradesh Yes
2. B1 Sand /Morammining at 12.145 Bhedi Kharka/Sarila/HamirpurM/s Pehalwan TradersProprietor- Mr. Kailash Singh Yadav S/o ShriRamvrakcha Yadav R/o H.No. 1095, eldeco-2,Uphar Colony, Sector-3, Utharethiya, RaeBareli Road,, District - Lucknow, UttarPradesh.
Yes3. B1 Sand /Morammining at 20.242 Bhedi Khurd/Kalpi/ Jalaun M/s Bindu and Ram Construction CompanyShri Maheep Kumar Ojha S/o Shri RamdeoPrasad Ojha R/o Village - Dhushah, Tehsil -Balrampur, District - Balrampur, UttarPradesh. 271201 Yes4. B1 Sand /Morammining at 17.408 Ramedi/Hamirpur/Hamirpur M/s Indus Mines and MineralsProprietor - Shri Vikas Parmani S/o Shri H.Parmani, E-7 HIG 441 arera colony, Huzur ,R.S.Nagar, Bhopal Yes5. B1 Sand /Morammining at 12.145 Bhedi Kharka/Sarila/Hamirpur
M/s Balaji EnterprisesProprietor- Shri Navneet Kumar Pandey S/oShri Vinay Kumar Pandey R/o H.No. 271,Vishwas Khand-3, Gomti Nagar,, Tehsil -Lucknow, District - Lucknow Uttar Pradesh.226010Yes
6. B1 Sand /Morammining at 24.291 Tikapur/Maudaha/HamirpurM/s D. V. ConstructionProprietor- Smt. Suman Devi W/o Shri IndraBahadur Yadav R/o Village - Digura Jot,Tehsil- Katra Ikauna,District - Shrawasti, Uttar Pradesh. 271845 Yes
7. B1 Sand /Morammining at 16.194 Himanpura/Kalpi/ Jalaun M/s Ghanaram Infra Engineers Pvt LtdProprietor - Shri Bishan Singh S/o ShriGhanaram R/o 240/4a, Civil lines, KachahriChauraha Tehsil- Jhansi, District - Jhansi,Uttar Pradesh. Yes8. B1 Sand /Morammining at 12.145 Bhedi Kharka/Sarila/Hamirpur Shri Kanha Construction CompanyProprietor- Shri Anil Dixit S/o Shri RadheShyam Dixit R/o Geru wala bangla, TyagiNagar, Morar, Gwalior, M.P. 474006 Yes9. B1 Sand /Morammining at 12.145 BeriHamirpur/Hamirpur
M/s Baba Bholenath TradersShri Brajesh Chandra Tripathi S/o ShriRajaramR/o Village – Dhingpur, Hari Nagar, P.S. -Sikanderpur,District - Kannauj, Uttar Pradesh. 209725Yes
10. B1 Sand /Morammining at 16.194 Pathreta/Kalpi/ JalaunM/s Eureka Mines and Minerals LLPProprietor- Shri chandershekhar ChaurasiaS/o Shri Deen Dayal Chaurasia H.No. 28,Brahmpuri Colony, Near Jugauli Crossing,Faizabad Road, District Lucknow, UttarPradesh.
Yes11. B1 Sand /Morammining at 12 Bhedi Kharka/Sarila/Hamirpur M/s Harihar Minerals LLP Proprietor ShriRam Avatar Singh S/o Shri Tejram Singh R/o405 Kha, New Patel Nagar, Near KalidasSchool, Orai, Jalaun (U.P.) Yes12. B1 Sand /Morammining at 29.554 Teekapur/Maudaha/Hamirpur M/s Kanhaiya Lal & Sons Proprietor- ShriUmesh Chandra BnasalS/o Shri Kailash Narayan BansalWard No. 08, Near Radha Krishna Temple,
PH completed,Minutes awaited
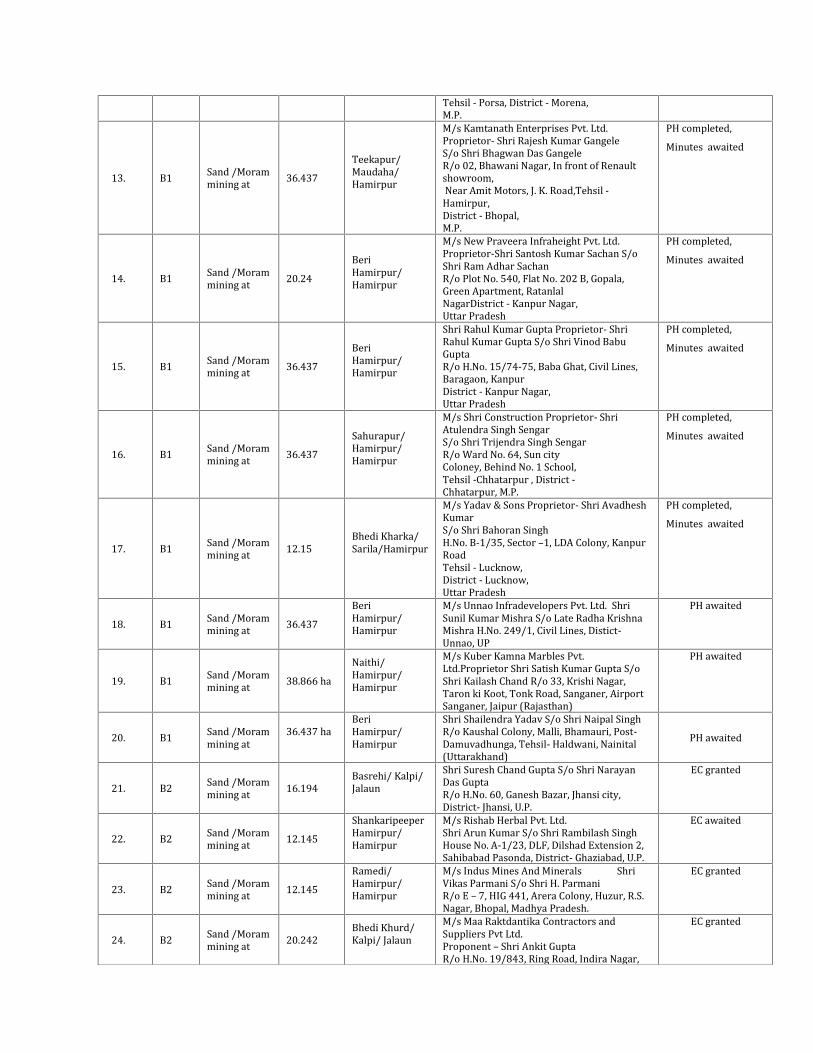
Tehsil - Porsa, District - Morena,M.P.13. B1 Sand /Morammining at 36.437 Teekapur/Maudaha/Hamirpur
M/s Kamtanath Enterprises Pvt. Ltd.Proprietor- Shri Rajesh Kumar GangeleS/o Shri Bhagwan Das GangeleR/o 02, Bhawani Nagar, In front of Renaultshowroom,Near Amit Motors, J. K. Road,Tehsil -Hamirpur,District - Bhopal,M.P.
PH completed,Minutes awaited
14. B1 Sand /Morammining at 20.24 BeriHamirpur/HamirpurM/s New Praveera Infraheight Pvt. Ltd.Proprietor-Shri Santosh Kumar Sachan S/oShri Ram Adhar SachanR/o Plot No. 540, Flat No. 202 B, Gopala,Green Apartment, RatanlalNagarDistrict - Kanpur Nagar,Uttar Pradesh
PH completed,Minutes awaited
15. B1 Sand /Morammining at 36.437 BeriHamirpur/HamirpurShri Rahul Kumar Gupta Proprietor- ShriRahul Kumar Gupta S/o Shri Vinod BabuGuptaR/o H.No. 15/74-75, Baba Ghat, Civil Lines,Baragaon, KanpurDistrict - Kanpur Nagar,Uttar Pradesh
PH completed,Minutes awaited
16. B1 Sand /Morammining at 36.437 Sahurapur/Hamirpur/HamirpurM/s Shri Construction Proprietor- ShriAtulendra Singh SengarS/o Shri Trijendra Singh SengarR/o Ward No. 64, Sun cityColoney, Behind No. 1 School,Tehsil -Chhatarpur , District -Chhatarpur, M.P.
PH completed,Minutes awaited
17. B1 Sand /Morammining at 12.15 Bhedi Kharka/Sarila/HamirpurM/s Yadav & Sons Proprietor- Shri AvadheshKumarS/o Shri Bahoran SinghH.No. B-1/35, Sector –1, LDA Colony, KanpurRoadTehsil - Lucknow,District - Lucknow,Uttar Pradesh
PH completed,Minutes awaited
18. B1 Sand /Morammining at 36.437 BeriHamirpur/Hamirpur M/s Unnao Infradevelopers Pvt. Ltd. ShriSunil Kumar Mishra S/o Late Radha KrishnaMishra H.No. 249/1, Civil Lines, Distict-Unnao, UPPH awaited
19. B1 Sand /Morammining at 38.866 ha Naithi/Hamirpur/HamirpurM/s Kuber Kamna Marbles Pvt.Ltd.Proprietor Shri Satish Kumar Gupta S/oShri Kailash Chand R/o 33, Krishi Nagar,Taron ki Koot, Tonk Road, Sanganer, AirportSanganer, Jaipur (Rajasthan)
PH awaited
20. B1 Sand /Morammining at 36.437 ha BeriHamirpur/Hamirpur Shri Shailendra Yadav S/o Shri Naipal SinghR/o Kaushal Colony, Malli, Bhamauri, Post-Damuvadhunga, Tehsil- Haldwani, Nainital(Uttarakhand) PH awaited21. B2 Sand /Morammining at 16.194 Basrehi/ Kalpi/Jalaun Shri Suresh Chand Gupta S/o Shri NarayanDas GuptaR/o H.No. 60, Ganesh Bazar, Jhansi city,District- Jhansi, U.P.
EC granted22. B2 Sand /Morammining at 12.145 ShankaripeeperHamirpur/Hamirpur M/s Rishab Herbal Pvt. Ltd.Shri Arun Kumar S/o Shri Rambilash SinghHouse No. A-1/23, DLF, Dilshad Extension 2,Sahibabad Pasonda, District- Ghaziabad, U.P.
EC awaited23. B2 Sand /Morammining at 12.145 Ramedi/Hamirpur/Hamirpur M/s Indus Mines And Minerals ShriVikas Parmani S/o Shri H. ParmaniR/o E – 7, HIG 441, Arera Colony, Huzur, R.S.Nagar, Bhopal, Madhya Pradesh.
EC granted24. B2 Sand /Morammining at 20.242 Bhedi Khurd/Kalpi/ Jalaun M/s Maa Raktdantika Contractors andSuppliers Pvt Ltd.Proponent – Shri Ankit GuptaR/o H.No. 19/843, Ring Road, Indira Nagar,
EC granted

Colony - Vasundhara Complex, Indira Nagar,District - Lucknow,Uttar Pradesh25. B2 Sand /Morammining at 12.145 BeriHamirpur/Hamirpur
M/s Silver Mist Retail Private LimitedShri Prashant Kumar Malviya S/o ShriSantosh MalviyaR/o H.No. Ward No - 10 ,Hamirpur Ward,Hoshangabad, Madhya Pradesh.EC granted
26. B2 Sand /Morammining at 12.145 BeriHamirpur/HamirpurM/s Silver Mist Retail Private LimitedShri Prashant Kumar Malviya S/o ShriSantosh MalviyaR/o H.No. Ward No - 10 ,Hamirpur Ward,Hoshangabad, Madhya Pradesh.
EC granted
27. B2 Sand /Morammining at 20.242 Himanpura/Kalpi/ JalaunM/s Sharad Enterprises Shri Sharad PratapSingh Yadav S/o Shri Shyam Sundar SinghYadavR/o H.No. 240, 4A, Civil Lines, KachhehriChauraha,District- Jhansi, U.P
EC granted
28. B2 Sand /Morammining at 24.291 Bhedi Kharka/Sarila/Hamirpur M/s Chaudhary Traders Shri Giriraj KumarSharmaS/o Shri Ramji Lal SharmaR/o Muraina Road, Badfara Ambah,Muraina, M.P.EC granted
29. B2 Sand /Morammining at 12.145 BeriHamirpur/Hamirpur APM Mining and Infra Pvt. Ltd. EC awaited30. B2 Sand /Morammining at 8.90 Pathrehta/Kalpi/ Jalaun M/s Associated Commerce, Proprietor- ShriVishwas Parmani S/o Shri H. Parmani R/oPipriya, Hoshangabad (M.P.) EC granted
CHAPTER-III
S. NO. CONTENTS3.0 STUDY AREA3.1 LAND ENVIRONMENT3.2 PHYSICAL ENVIRONMENT3.3 WATER ENVIRONMENT (GROUND & SURAFCE WATER)3.4 AIR ENVIRONMENT3.5 NOISE ENVIRONMENT
3.6 SOIL ENVIRONMENT
3.7 BIOLOGICAL ENVIRONMENT
3.9 SOCIO-ECONOMIC ENVIRONMENT
Environmental Impact Assessment should include a description of the present state of theenvironment in the location of the mining project. The compilation of the information onthe state of the environment is a vital aspect of the whole EIA process. This informationwill facilitate the identification of environmental impacts and alternatives. It will alsoprovide a basis for comparisons between the various project alternatives.Mining activities invariably affect the existing environmental status of the site. It has bothadverse and beneficial effects. Hence, the methods are required to be selected in such amanner so as to maintain environmental equilibrium ensuring sustainable development,and in order to maintain the environmental commensuration with the mining operation, itis essential to undertake studies on the existing environmental scenario and assess theimpact on different environmental components. This would help in formulating suitablemanagement plans for sustainable extraction.Data must be collected of the present state of the environment regarding environmentalparameters that can be expected to be significantly affected by the process of mining, suchas water (Surface and Ground) quality, ambient air quality, noise quality, soil quality andbiodiversity. It is also beneficial to investigate any existing polluting activities in the studyarea/region that may already affect the environment and to also determine the loadscaused by these factors.3.0 Study Area:The study area for this particular regional study on the stretch of River Betwa covers three
districts namely Hamirpur, Jalaun, and Jhansi. Total31Sand Mining projects (inclusive ofupcoming projects of B1-sub-category for which Public Hearing is awaited and B2- sub-category projects for which EC is awaited) comprising 21 of Sub-category B1 and 10 ofSub-category of B2 are situated on the river Betwa in two districts namely Hamirpur andJalaun between - 25°54'25.56"N &79°39'42.55"E to 25°55'34.68"N& 80°16'12.74"Ein the river bed of Betwa.Project DescriptionThe proposal for EIA has been put forth during various TOR presentations and detailoutline was explained and SEAC was agreed with the proposal. The TOR issued form thebasis of this EIA.The total mine lease area of M/s Yadav and Sons is 12.145 haand it is
situated in study area-2 having mineable area of631.51ha(inclusive of upcomingprojects for which Public Hearing/EC is awaited) and the total annual production will be9903658 (inclusive of upcoming projects for which Public Hearing/EC is awaited)cum/annum.These morrum sites are present in the Betwa River Bed between-25°54'25.56"N & 79°39'42.55"E to 25°55'34.68"N& 80°16'12.74"E. Proposed mineleases has been sanctioned over for period of five years. The proposed project is 12.145 haand fall in B1 category due to cluster formation. Only morrum will be excavated. It hasbeen proposed that 1,94,304cum/ year of morrum will be excavated. The proposedproject is situated in Khand No.23/12, bhedi kharka,Sarila, Hamirpura. Methodology:Baseline information is collected by field surveys, monitoring etc. for micro-meteorology, ambient air quality, ground and surface water quality, noise levels,present land use pattern, soil quality, biological environment, socio-economic status,health status etc. within the study area. Baseline environmental data was monitoredand collected by a NABL Certified Lab “The Research Institute of Material Sciences”,New Delhi, for one full season i.e. March- May, 2018. The baseline data monitoringprocedures conforms to the requirement of EIA Notification, 2006(amended in 2009 &2016). The study area comprises of four districts Hamirpur, Jalaun, and Jhansi.Additional information have been gathered from various secondary sources, toestablish a correlation between existing physical, natural, socio-economic and culturalenvironment condition of the area under study which is been collected in consultation
with the key persons. All relevant secondary data has been collected on regionalenvironmental and social features from various reports pertaining to GovernmentAgencies / Institutions and through literature reviews. Details regarding demographicand socio-economic features of the study area have been collected from the CensusData 2001 & 2011 (as available).b. Secondary Data CollectionFor getting the first hand information of study area we had collected and studiedthe secondary data regarding wind speed, annual rainfall,wind direction. Thesecondary data help us to set the course. Data collected indirectly from publishedrecords or documents suc h as project documents, village prof li e, maps, p hotos,internet sources etc. Secondary sources are mentioned in reference chapter.c. Assessments of the Present state of the Environment for the specified area
under study based on following factors:
Bedrock, soils and landforms Surface water bodies and groundwater bodies, e.g. lakes and watercourses, flowrates and directions in water courses, water levels, water quality, soil and bedrockhydrogeology, and particularly any important reserves of groundwater used for thelocal water supply Any protected areas Natural habitats and any plant and animal species of conservation interest Local climate and air quality Land use, e.g. regional and local land use patterns and structures Current regional land use plans, local detailed plans Landscapes and landforms Cultural heritage and the built environment (including any significant built culturalenvironments and archaeological sites) The usage of local natural resources Settlements, demographic structureProfile of the overall study area is presented in the following sections. The scope of thebaseline studies includes detailed characterization of various Environmental & Socialcomponents, which are most likely to be influenced by the mining activity.
1. Land Environment:
Land use/Land Cover Topography & Terrain Drainage Pattern & Ground water Trend Geology and Physical Features Soil
2. Physical Environment: Meteorological conditions Climate Rainfall & Relative Humdity Windspeed & Wind direction
3. Water Environment4. Air Environment5. Noise Environment6. Soil Environment7. Biological Environment8. Socio-Economic Environment9. Occupational Health Status10. Public Utilities (Traffic Analyses)11. Site-specific features
3.1 LAND ENVIRONMENTUnder this section, the study of natural features like Geology, physical features,topography, terrain, land use/land cover, drainage pattern, ground water trend andsoil is given.a. Regional Geology & physical features :The study area for this particularregional study includes part of four districts i.e Hamirpur, Jalaun, and Jhansialong the river Betwa. Hence, the regional geology given here is of four districts: District Hamirpur: The district Hamipur is located in southern part of the stateand is a part of Bundelkhand plateau. It lies between the latitude 25˚27’00” and25˚57’00” N and longitude 79˚11’00” and 80˚19’00” E. The district falls insurvey of India toposheet No. 54/0 and 63/0. The geographical area of districtis 4139.09 sq.km.
Geographically, the area comprises Bundelkhand granite gneiss complexand Recent alluvium. The thickness of alluvium varies from 120 to 150 m. themaster slope of the district is due north-east. The Quaterny alluvial materialoverlies the granite.The district could be broadly divided into twophysiographic regions.a) The southern part of district between latitude 25˚30’00” and 25˚42’00” N of ismainly plain area with average elevation of 250 mamsl. The region is underlainby thn alluvial cover.b) The northern part of district that is north latitude 25˚42’00” N represent the flattopography. The average elevation of the region 120 m above mean sea level.The general geological sequence of the formation present is as under:Age Formation LithologyQuaternary Recent tosub recent Alluvium Sand, Silt, Clay
--------------------------------Unconformity-----------------------------------------Precambrian Bundelkhand MassifIt forms the most portion of the Trans Yamuna tract of the country. Jalaundistrict is surrounded in all four directions by rivers Yamuna, Betwa, Pahuj andDhasan. It encompasses a geographical area of 4544 sq.km. The area is bounded inthe north by Yamuna river, in the south by Betwa river and its western boundaryfollows Pahuj river. The eastern border is shared with Hamirpur district. The arealies between latitude 26˚26’ to 25˚45’ N and longitude 79˚57’ to 78˚00’ E, falling inthe survey of India Toposheet No. 54N and O.The district forms a part of marginal Ganga, alluvial plains. Geomorphologybears tremendous control on the ground water regime. The relief, slope,depth of weathering, type material, nature of deposits and thickness andoverall assemblage of different land forms plays an important role in theground water regime in hard rock as well as in the unconsolidatedsediments. Various geomorphic units identified in the area are grouped intofour major categories, which are:1) Pediment zone
2) Alluvial zone3) Ravines land and4) Flood plains.The main physical features of the district are largely determined by thethree rivers- the Yamuna, the Betwa and the Pahuj, which nearly encircle it.They are surrounded by a deep network of ravines running 1-3 km from thestreams. These ravines are succeeded by a bank or belt of higher land, thesehigh lands border on the Khadir valleys of the Betwa and Pahuj, while lowlands occupy the central tract. The low lands have a wide flat basin encircledby a narrow rim of higher ground which breaks up into network of ravinesalong the river banks, stretching for some km inland from the streams.Thelevels are clearly indicated from the situation and direction of the branchesof the Betwa canal which follows the watersheds closely. The drainage of thecentral tract is supplied by two minor streams, the Non and the Melungawhich flowing north-eastwards unite some l2 kilometers from the Yamunabank and join that river at an equal distance to the north of the town ofKalpi, Like the larger rivers they too have carved deep ravines whichincrease in extent the nearer the Yamuna is approached and as aconsequence of their action, the Kalpi Tahsil is cut by a tracery of ravineswhich have scored the greater portion of soil and having more barren andsterile land than in any other part of the district.
District Kanpur Nagar: The Kanpur Nagar district lies in middle part of UttarPradesh,It lies between Latitude 25°26' to 26°58' North and Longitude 79°43' to 80°34'East in Survey of India Toposheet No. 54N and 63B. The total geographical area of thedistrict is 3155 sq.km. The major parts of the area are almost a flat plain with some minorundulations. The river Ganga and Yamuna with their tributaries form the drainage system(Dendritic type).Kanpur Nagar plain is situated in the central part of the district coveringparts of all six tahsils of the district with a little variation in relative relief. It is alsoformed of Alluvium and Dun-gravels of Recent age. A continuous belt of erodedsurface may be seen along the Surayana, Gond and Puras streams in their lowercourses. This region covers an area of 2,828.55 sq. km.

The Kanpur Nagar district is a part of Indo-Gangetic Plain. The clay, silt,gravel and sands of different grades are main sedimentary constituents. Thegeneralized geological succession is as follows:Period Age Land form(Geomorphology) Rock Type
QUATERNARY UpperPleistocene toRecentNewer Alluvium Fine Sand andClays
LowerPleistocene toUpperPleistoceneOlder Alluvium Sand of differentgrades and claymixed withKankar-----------------------------------Unconformity----------------------------------------------Bundelkhand Granite (Archean), Vindhyan Sandstone (Proterozoic)
The older alluvium, alluvial deposit mostly occurring in the central part wasdeposited during lower to Upper Pleistocene period. The newer alluvium wasdeposited during Upper Pleistocene to recent period mostly occurring along thecourse of rivers. District Fatehpur: The area is underlain by the unconsolidated sediments ofQuaternary to recent period which comprises of silt, clay, sand of variousgrades or gravel and Kankar in varying proportions. The unconsolidatedsediment deposited over the undulating surface of the basement graniteVindhyan sand stone rocks. It exhibits the existence of thick succession ofgranular and clastic formations. The depth of basement varies between 100 to200 mbgl along southern boundary of district along river Yamuna 200 to 350mbgl in the central part of district and 300 to 450 mbgl along Ganga riverboarding the northern part of district.
b. Topography & terrain: The proposed area under study is a riverbed which isslightly undulating due to the deposition of sand/morrum minerals. The studyarea of this particular regional study includes part of four districts i.e Hamirpur,Jalaun, Kanpur Nagar and Fatehpur along the river Betwa. Hence, thetopography and terrain given here is of four districts: District Hamirpur: The district can be divided into three topographical units:
1. Bundelkhand Gneiss.2. Recent Alluvial Plain: The area occupied by the recent alluvium can bedelineated all along Betwa and Ken river. These recent alluviums are semi-confined.3. Bundelkhand Granite Gneiss: the isolated hillocks and obstruction totopography of the regions.
District Jalaun: The are forms part of the Gangetic alluvial plains which isbounded on the south by Bundelkhand rocky terrain of Jhansi. It si roughlydemarcated by rivers Betwa, Pahuj and Yamuna in the South, west and Northand North-east respectively. A few outliners of Bundelkhand granite forminglow hillocks are met with in southern parts of the area protruding form the vastspread of alluvial plains. The area is otherwise characterised by monotonous agradational surfaces of the Gangetic alluvial plains. The master slope is in aNorth to North-easterly direction becoming mainly easterly in the northernparts of the area. The bank zones of major streams are deeply eroded andravenous forming bed lands which occur etensively along Pahuj and Yamunarivers. The upper central portion of the area is significantly devoid of inlanddrainage and consequent land features which is however, prevalent in thesouthern and eastern parts of the area. District Kanpur Nagar: The district of Kanpur Nagar occupies the north-western part of the Kanpur division and belongs to the tract known as the lowerDoab (which comprises the eastern extremity of the strip of country lyingbetween the Ganga and the Yamuna rivers). The district is a part of Indo-Gangetic plain. The silt, gravel and sands of different grades are main water
bearing formations. The ground water occurs under unconfined condition inphreatic zones and under confined condition in deeper zones. The sedimentconstitution of the subsurface granular zones shows remarkable variation inthe depth and the nature of occurrence in north and southern part of thedistrict. In southern part especially along the Yamuna, feldspar-quartz, Jasparsand and gravel (Morrum) are the main constituents of the granular zones thatoccurs comparatively at shallow levels i.e. 24 to 57 mbgl whereas in thenorthern parts along the Ganga river, these reworked sedimentary formationsare existing at deeper levels i.e. 265 to 310 mbgl. The provenance of thesesedimentary formations is mainly Bundelkhand Granite Complex of Archeanage and Vindhyan Sandstone of Puranas. In the northern part the silt and claysediments forming thin lensoid beds are frequently occurring in depth. District Fatehpur: The district form a part of central Ganga plain and exhibitsfluvial feature typical of the flood plain Fatehpur district can be categorized asthe composite flood plain and the meander flood plain. The meander flood plainoccurs in northern part of district along river Ganga covering in the northernpart of Malwar, Teliyam, Bhitura, hathgon and Airwan blocks and southern partof district along river Yamuna covering of south part of Amamli, Khayua,Asother, Bijaipur and Dhata block. These plains are low lying, the river meanderare found within the area and form Ox-bow Lake due to abandoning channel.The composite flood plain occupy, entire central part of district extending fromNE to SW. these flood plain bear feature of more than one phase of flood plainformation.
c. Land use/Land cover: Mining activities are subjected to the extensive land usechanges even in the short period of time and have the direct impact on the landenvironment due to opencast mining. The total mine lease area is 631.51 ha. Thecore zone of the study area is taken as 500m all along the stretch of river Betwa andsimilarly the buffer zone as 10.0 km km from the river bank all along the stretch ofriver Betwa of the area under study. Other river which flow in the buffer zone isDhasan river which flows for about 16.60 km towards South-west direction in thebuffer zone which joins Betwa river at Kamtha village after which our mine leasesstart to appear on the stretch of river Betwa.
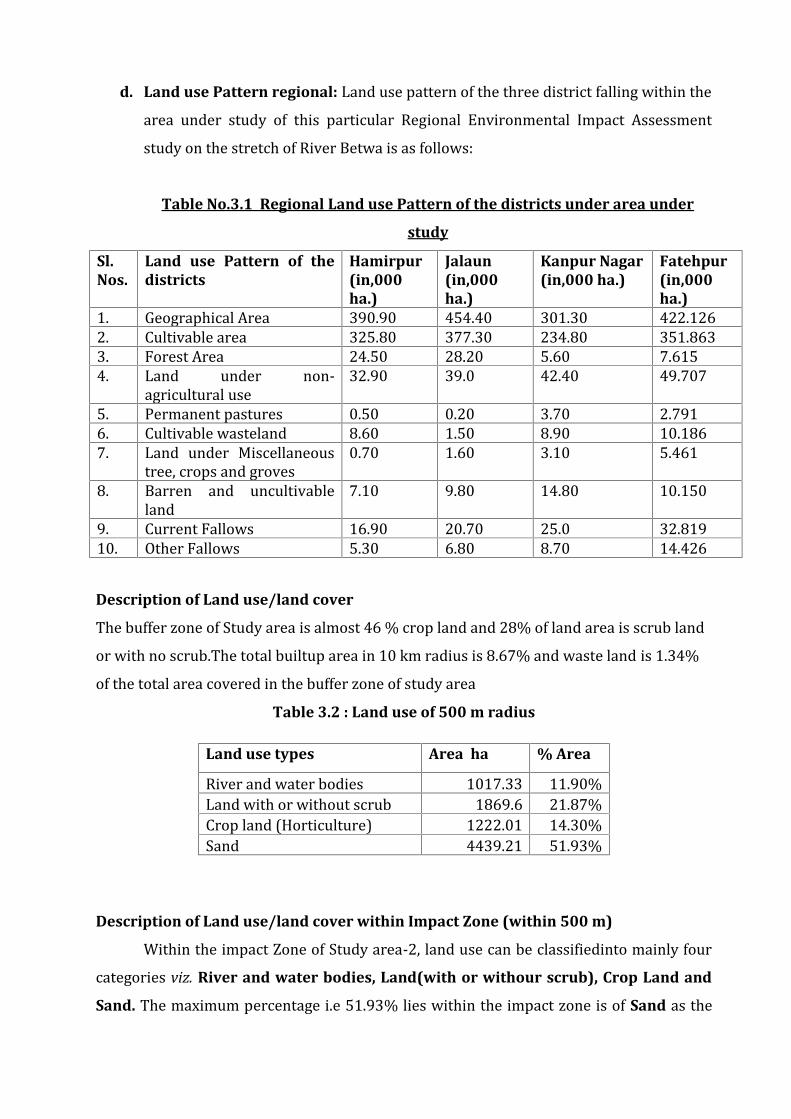
d. Land use Pattern regional: Land use pattern of the three district falling within thearea under study of this particular Regional Environmental Impact Assessmentstudy on the stretch of River Betwa is as follows:Table No.3.1 Regional Land use Pattern of the districts under area under
study
Sl.Nos.
Land use Pattern of thedistricts
Hamirpur(in,000ha.)
Jalaun(in,000ha.)
Kanpur Nagar(in,000 ha.)
Fatehpur(in,000ha.)1. Geographical Area 390.90 454.40 301.30 422.1262. Cultivable area 325.80 377.30 234.80 351.8633. Forest Area 24.50 28.20 5.60 7.6154. Land under non-agricultural use 32.90 39.0 42.40 49.7075. Permanent pastures 0.50 0.20 3.70 2.7916. Cultivable wasteland 8.60 1.50 8.90 10.1867. Land under Miscellaneoustree, crops and groves 0.70 1.60 3.10 5.4618. Barren and uncultivableland 7.10 9.80 14.80 10.1509. Current Fallows 16.90 20.70 25.0 32.81910. Other Fallows 5.30 6.80 8.70 14.426
Description of Land use/land coverThe buffer zone of Study area is almost 46 % crop land and 28% of land area is scrub landor with no scrub.The total builtup area in 10 km radius is 8.67% and waste land is 1.34%of the total area covered in the buffer zone of study areaTable 3.2 : Land use of 500 m radius
Land use types Area ha % AreaRiver and water bodies 1017.33 11.90%Land with or without scrub 1869.6 21.87%Crop land (Horticulture) 1222.01 14.30%Sand 4439.21 51.93%Description of Land use/land cover within Impact Zone (within 500 m)Within the impact Zone of Study area-2, land use can be classifiedinto mainly fourcategories viz. River and water bodies, Land(with or withour scrub), Crop Land and
Sand. The maximum percentage i.e 51.93% lies within the impact zone is of Sand as the
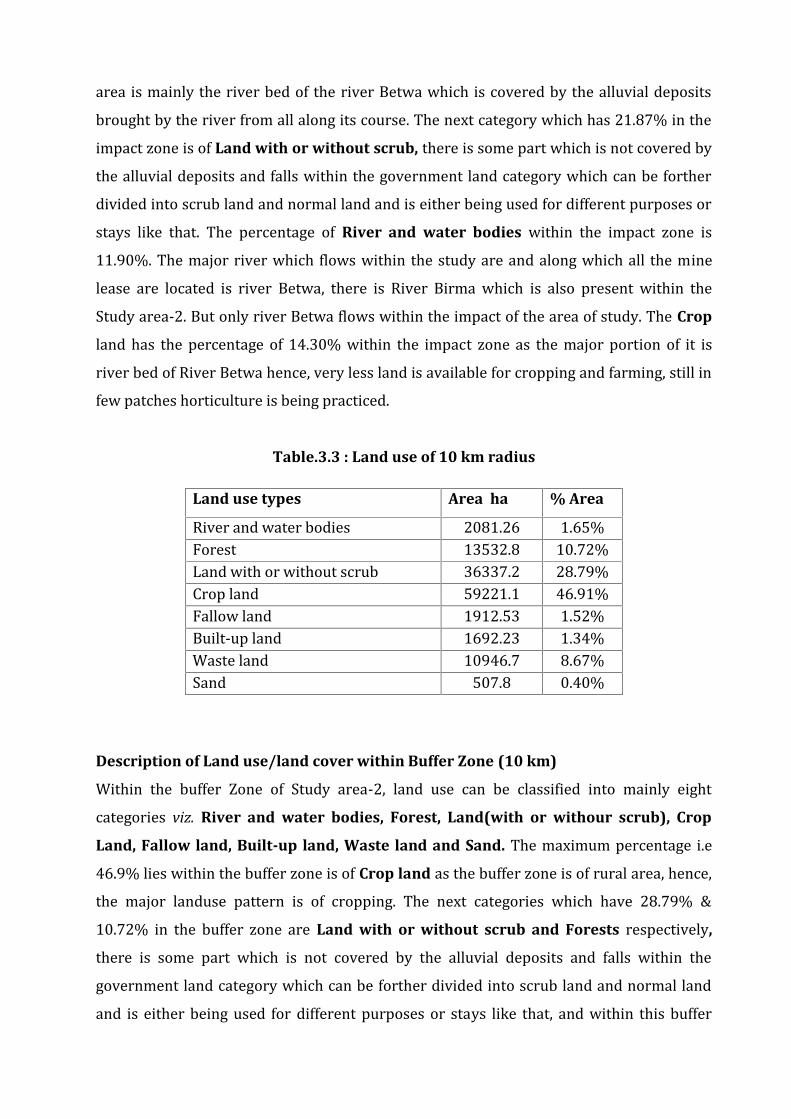
area is mainly the river bed of the river Betwa which is covered by the alluvial depositsbrought by the river from all along its course. The next category which has 21.87% in theimpact zone is of Land with or without scrub, there is some part which is not covered bythe alluvial deposits and falls within the government land category which can be fortherdivided into scrub land and normal land and is either being used for different purposes orstays like that. The percentage of River and water bodies within the impact zone is11.90%. The major river which flows within the study are and along which all the minelease are located is river Betwa, there is River Birma which is also present within theStudy area-2. But only river Betwa flows within the impact of the area of study. The Cropland has the percentage of 14.30% within the impact zone as the major portion of it isriver bed of River Betwa hence, very less land is available for cropping and farming, still infew patches horticulture is being practiced.Table.3.3 : Land use of 10 km radius
Land use types Area ha % AreaRiver and water bodies 2081.26 1.65%Forest 13532.8 10.72%Land with or without scrub 36337.2 28.79%Crop land 59221.1 46.91%Fallow land 1912.53 1.52%Built-up land 1692.23 1.34%Waste land 10946.7 8.67%Sand 507.8 0.40%Description of Land use/land cover within Buffer Zone (10 km)Within the buffer Zone of Study area-2, land use can be classified into mainly eightcategories viz. River and water bodies, Forest, Land(with or withour scrub), Crop
Land, Fallow land, Built-up land, Waste land and Sand. The maximum percentage i.e46.9% lies within the buffer zone is of Crop land as the buffer zone is of rural area, hence,the major landuse pattern is of cropping. The next categories which have 28.79% &10.72% in the buffer zone are Land with or without scrub and Forests respectively,there is some part which is not covered by the alluvial deposits and falls within thegovernment land category which can be forther divided into scrub land and normal landand is either being used for different purposes or stays like that, and within this buffer
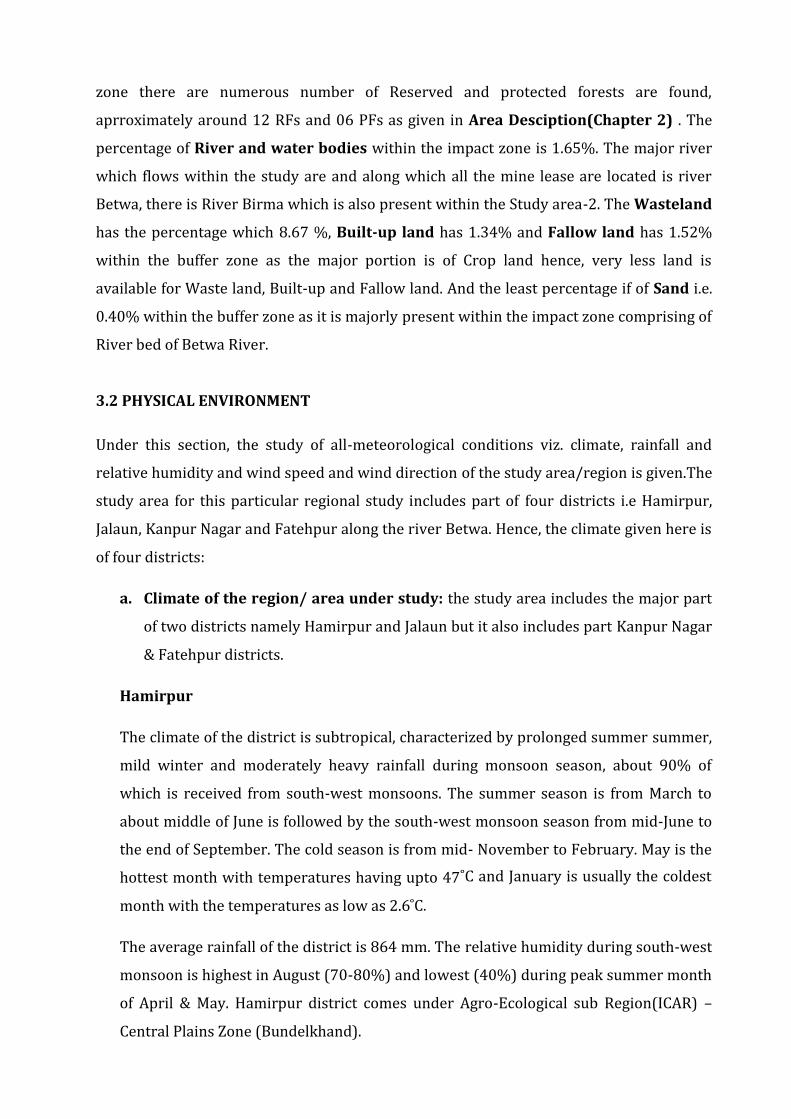
zone there are numerous number of Reserved and protected forests are found,aprroximately around 12 RFs and 06 PFs as given in Area Desciption(Chapter 2) . Thepercentage of River and water bodies within the impact zone is 1.65%. The major riverwhich flows within the study are and along which all the mine lease are located is riverBetwa, there is River Birma which is also present within the Study area-2. The Wastelandhas the percentage which 8.67 %, Built-up land has 1.34% and Fallow land has 1.52%within the buffer zone as the major portion is of Crop land hence, very less land isavailable for Waste land, Built-up and Fallow land. And the least percentage if of Sand i.e.0.40% within the buffer zone as it is majorly present within the impact zone comprising ofRiver bed of Betwa River.3.2 PHYSICAL ENVIRONMENTUnder this section, the study of all-meteorological conditions viz. climate, rainfall andrelative humidity and wind speed and wind direction of the study area/region is given.Thestudy area for this particular regional study includes part of four districts i.e Hamirpur,Jalaun, Kanpur Nagar and Fatehpur along the river Betwa. Hence, the climate given here isof four districts:
a. Climate of the region/ area under study: the study area includes the major partof two districts namely Hamirpur and Jalaun but it also includes part Kanpur Nagar& Fatehpur districts.HamirpurThe climate of the district is subtropical, characterized by prolonged summer summer,mild winter and moderately heavy rainfall during monsoon season, about 90% ofwhich is received from south-west monsoons. The summer season is from March toabout middle of June is followed by the south-west monsoon season from mid-June tothe end of September. The cold season is from mid- November to February. May is thehottest month with temperatures having upto 47˚C and January is usually the coldestmonth with the temperatures as low as 2.6˚C.The average rainfall of the district is 864 mm. The relative humidity during south-westmonsoon is highest in August (70-80%) and lowest (40%) during peak summer monthof April & May. Hamirpur district comes under Agro-Ecological sub Region(ICAR) –Central Plains Zone (Bundelkhand).
JalaunThe climate of the district is sub-humid and is characterized by hot summers, humidmonsoon and cold winters season. About 90% of the annual rainfall is received fromsouth-west monsoon during the months from June to September. May and early June isthe hottest part of the year with highest temperature recorded upto 47˚C and meandaily minimum temperature as 27.1˚C whereas mean daily maximum temperature as42.6˚C . With the advancement of monsoon by about mid-June, temperature dropsappreciably in nights, January is the coldest month with daily mean temperature as8.4˚C. The average rainfall of the district is 862 mm. The mean monthly morningrelative humidity is 57% and mean monthly evening relative humidity 42%. The meanwind velocity is 703 kmph. The potential evapotranspiration is 1603.3 mm.FatehpurThe climate is typically sub-humid punctuated by long and intense summer and mildwinters. The average rainfall in the district is 932 mm and about 90% of which isreceived from south-west monsoon. May is the hottest month with temperatureshooting up to 46.5˚C. January is generally the coldest month and temperature dropsgenerally 8˚C but occasionally even upto 4˚C. The highest relative humidity in themorning during the month of August is 86% and the lowest is 25% during the monthof May.Kanpur NagarClimate is sub humid and is characterized by hot summer and general dryness exceptin the south west monsoon. About 90% of rainfall takes place from third week of Juneto September. During monsoon surplus water is available for deep percolation toground water. May and early part of June constitute the hottest part of the year. Themean daily maximum temperature in May is 41.7˚C. The mean daily minimumtemperature is 27.2˚C and maximum temperature rises up to 45˚C or over. With theonset of the monsoon in June the day temperature drops down appreciably. TheJanuary is the coldest month with mean daily maximum temperature at 22.8˚C andmean daily minimum temperature at 8.6˚C. The mean monthly maximum temperature
is 32.2˚C and means monthly minimum temperature is 19.5˚ C. During monsoon seasonthe relative humidity is high and in summer season, humidity is less. The meanmonthly morning relative humidity is 69% and mean monthly relative humidity is50%. The winds are generally light with some strength in force during summer andearly monsoon season. The mean wind velocity is 9.6 kmph. The potentialevapotranspiration is 1660.9 mm.b. Study Area:
c. The climatic condition of the study area ranges from sub-tropical to sub-humid andthe average rainfall ranges from 862 mm to 932 mm. May is the hottest month andJanuary the coldest and more than 90% of the rainfall are received from the south-west monsoons. The average humidity of the region also varies from 60%-75%and August records the maximum monthly relative humidity approx. 80-85%while May records the lowest approx.. 20-25%. Winds of the region are generallyhigh with some increase in force during summer and south-west monsoon season.A) Temperature: The temperature during the months in which environmentalmonitoring has been done is shown below in Fig.3.10. The graph represents the meanmonthly variation in the months of March, April and May. The rainfall data has beengathered from the IMD monitoring stations in each district of the past 5 years.
B) Rainfall: The variation in rainfall during the duration of environmental monitoringis shown below in Fig.3.12. The graph represents the mean monthly variation in themonths of March, April and May. The rainfall data has been gathered from the IMDmonitoring stations in each district of the past 5 years.C) Wind Speed and Wind Direction: The winds are generally with an increase inforce in summers and the early part of the south-west monsoon season. During theperiod from November to April winds are mostly from the west or North-westdirection. With the advent of April strong and scorching winds locally called loocontinue to blow till it is replaced by the rain bearing winds in the south-westmonsoon season. By May easterlies and north- easterlies also appear. In the South-
west monsoon season winds are either from the south-west and west or from theNorth-East and East direction. By October easterlies and North-easterlies becomeless common.D) Ground water: Seasonal fluctuation in water levels in the Study Area indicatedminimal change in groundwater storage.Water table fluctuates in response is directfunction of the above. Recharge take place mainly during rainy season. The minimumdepth to water level in area is expected sometime at the close of monsoon or in themiddle of monsoon period depending upon the intensity and duration of rainfall aswell as soil characteristics and maximum depth to water level is expected to the rainfall. generally occur below the surface clay and weathered material whose thickness isThe Granitic base has got very uneven configuration. The fresh rock generally occurbelow the surface clay and weathered material whose thickness is variable. Themaximum thick 120.00 mts observed in Sulempur block and north of Betwa river isover 150.00 mts. : Aquifer system prevails I tier – Ground water level to phreatic II tier– 150 m to 200 mts at base.3.3 WATER ENVIRONMENT (GROUND & SURAFCE WATER)The working of the mine is unlikely to intersect with the groundwater as mining will berestricted well 1m above the ground water table. Water quality of surface and groundwater resources in core and buffer zone of the study area has been studied for assessingthe water environment. The two major aspects of the water environment related tomining activity is water availability and water quality. Water availability can beunderstood in reference of water consumption and its sources which will be required forthe process of mining and other related activities.Water Consumption and its sources: Total water requirement for all the mine lease sitesincluded in the Regional study along the stretch or river Betwa situated in the districtHamirpur & Jalaun of Uttar Pradesh is approx. 1030.38 KLD. The water required for thedrinking purpose will be procured from wells situated in nearby villages and for otherpurposes like plantation, dust suppression etc. will be taken care of by proponents ofindividual mine lease sites. The breakup of water requirement of mine lease site is given .Water Water Drinking Drinking Drinking Stored Total
Demand
(KLD) for
Sprinkling on
Unpaved
haulage road
Requirement
for
plantation
(KLD)
water -Day
worker
(KLD)
water -
Floting
populati
on(KLD)
water -Fixed
population(
KLD)
water
(KLD)
Water
45.285 0.091 0.60 0.60 0.69 0.10 70.72Water Quality: Understanding of the water quality is essential in preparation ofenvironmental impact assessment and to identify critical issues with a view to suggestappropriate mitigation measures for implementation. The purpose of this study is to: Assess the water characteristics for critical parameters; Evaluate the impacts on agricultural productivity, habitat conditions, recreationalresources and aesthetics in the vicinity; and Prediction of impact on water quality through this project related activities. Suggest appropriate mitigation measuresThe quality and quantity of ground water differ over area, as these depend on the physicaland chemical parameters and also on topographical and hydro-geological characteristicsof the area.To study the present water quality status of the area with respect to theirphysico-chemical, Biological & Bacteriological characteristics, 20 ground water &21surface water samples were collected and analyzed. Parameters for analysis of waterquality were selected based on the utility of the particular source of water as per MoEF &CC guidance. Hence, quality of ground water was compared with IS: 10500 for drinkingpurposes and surface water quality were compared with CPCB Water Quality Criteriaagainst A, B , C, D & E class of water.The analysis was done as per APHA and IS-3025 procedures. Ground water is the majorsource of potable water in the study area. The water quality standards are annexed andthe analysis of the groundwater samples collected from different monitoring stations aspart of this EIA study are summarized in Table No3.3.
Methodology:Monitoring locations were finalized based on following factors:
Drainage pattern Location of major water bodies Location of residential areas representing different activities/ likely impact areas Areas which can represent baseline conditionsA) Ground water:
20 groundwater sources consisting of bore wells from site were examined during thestudy period for physic-chemical, heavy metals and bacteriological parameters in order toassess the effect of mining activities on ground water quality. The samples were analyzedas per the procedures specified in ‘Standard Methods for the Examination of Water andWastewater’ published by American Public Health Association (APHA) as well as IS 3025.Samples for chemical analysis were collected in polyethylene carboys. Samples collectedfor metal content were acidified with 1 ml HNO3. Samples for bacteriological analysis werecollected in sterilized glass bottles. Selected physico-chemical and bacteriologicalparameters have been analyzed for projecting the existing water quality status in thestudy area. Parameters like temperature, Dissolved Oxygen (DO), and pH were analyzed atthe time of sample collection.Water Sampling Locations:Total 20 GW sampling locations 03 are dedicated to this projectThe ground watersampling locations are listed below in Table No3.4 and represented in Google Map in FigNo.3.19.
Table No.3.4 Description of Ground water Monitoring Locations
Sl. No. Station Code Location Study Area Coordinates
1. GW 1 Hajipur Saliya Buffer Zone 25°53'19.68"N79°47'49.90"E2. GW5 Bhedi Danda Buffer Zone 25°52'2.07"N79°50'23.13"E3. GW6 Baragawn Buffer Zone 25°54'58.45"N79°49'40.62"E

4. GW7 Bhedi Khurd Buffer Zone 25°54'38.33"N79°50'32.83"ETable No 3.5 Analysis of Ground water Samples
Sl.
No.PARAMETERS UNIT GW1 GW5 GW6 GW7
Accepta
ble
Limit
Permissible
Limit
1 Colour Hazen < 1 < 1 < 1 < 1 5 152 Odour - Agreeable Agreeable Agreeable Agreeable Agreeable Agreeable3 pH Value at25°C - 7.13 7.21 7.33 7.22 6.5 8.54 Taste - Agreeable Agreeable Agreeable Agreeable Agreeable Agreeable5 Turbidity NTU 0.5 0.2 0.4 0.5 1 56 Total DissolveSolids mg/L 442 451 473 443 500 20007 Chloride (asCl) mg/L 38.3 39.4 40.3 38.6 250 10008 Fluoride (as F) mg/L 0.12 0.08 0.09 0.1 1 1.59 Free ResidualChlorine mg/L BDL BDL BDL BDL 0.2 110 Iron (as Fe) mg/L 0.11 0.16 0.18 0.16 0.3 0.311 Total Hardness(as CaCO3) mg/L 132 146 92 112 200 60012 E.coli MPN/100ml <2 <2 <2 <2 IS: 1622 (1981)13 Total Coliform MPN/100ml <2 <2 <2 <2
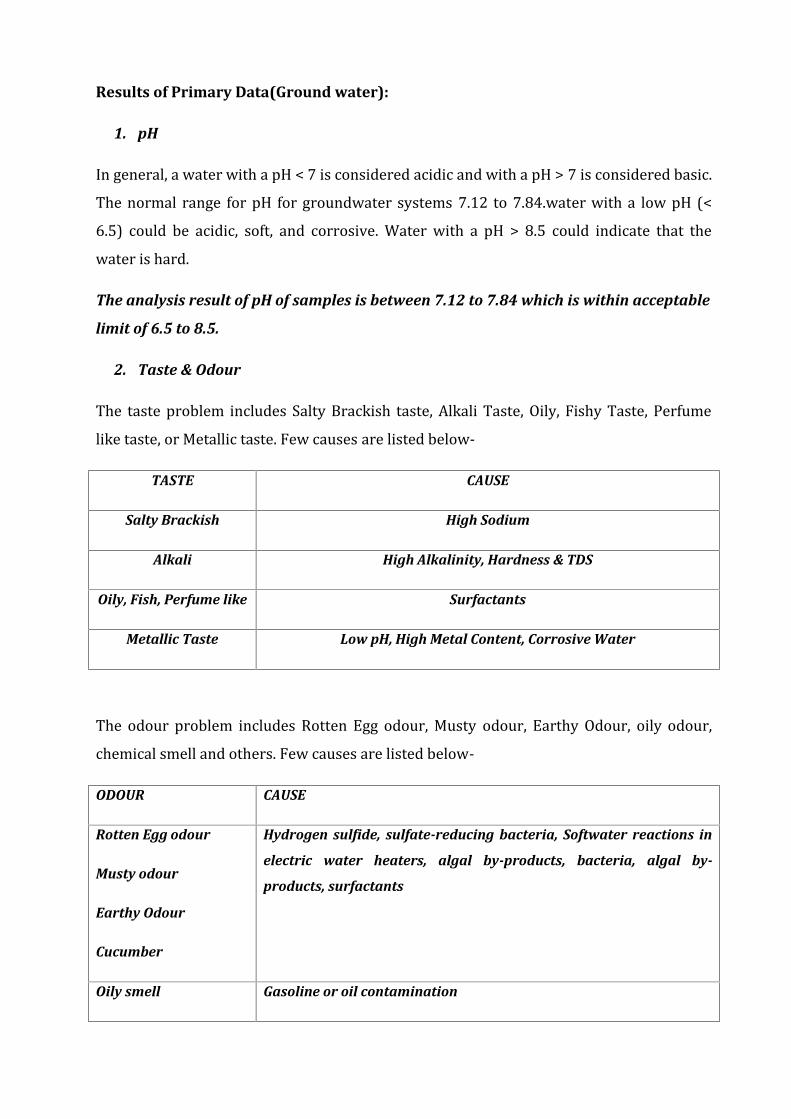
Results of Primary Data(Ground water):
1. pHIn general, a water with a pH < 7 is considered acidic and with a pH > 7 is considered basic.The normal range for pH for groundwater systems 7.12 to 7.84.water with a low pH (<6.5) could be acidic, soft, and corrosive. Water with a pH > 8.5 could indicate that thewater is hard.The analysis result of pH of samples is between 7.12 to 7.84 which is within acceptable
limit of 6.5 to 8.5.
2. Taste & OdourThe taste problem includes Salty Brackish taste, Alkali Taste, Oily, Fishy Taste, Perfumelike taste, or Metallic taste. Few causes are listed below-TASTE CAUSE
Salty Brackish High Sodium
Alkali High Alkalinity, Hardness & TDS
Oily, Fish, Perfume like Surfactants
Metallic Taste Low pH, High Metal Content, Corrosive Water
The odour problem includes Rotten Egg odour, Musty odour, Earthy Odour, oily odour,chemical smell and others. Few causes are listed below-ODOUR CAUSE
Rotten Egg odour
Musty odour
Earthy Odour
Cucumber
Hydrogen sulfide, sulfate-reducing bacteria, Softwater reactions in
electric water heaters, algal by-products, bacteria, algal by-
products, surfactants
Oily smell Gasoline or oil contamination
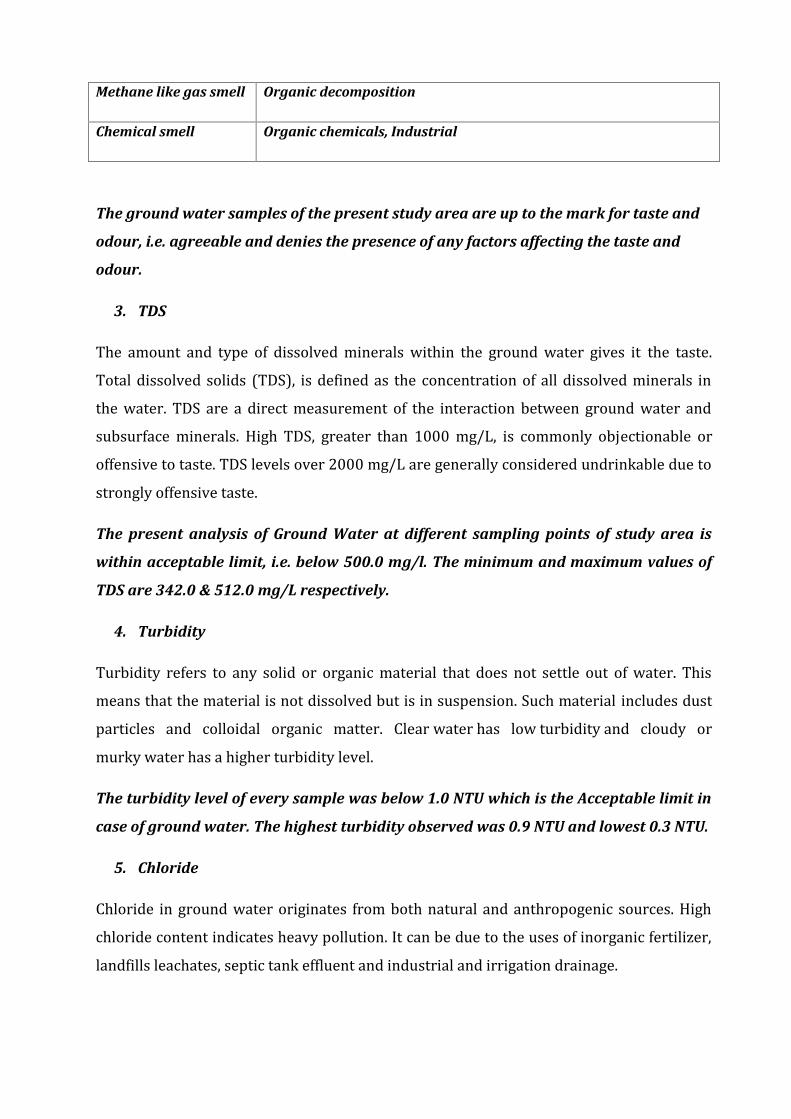
Methane like gas smell Organic decomposition
Chemical smell Organic chemicals, Industrial
The ground water samples of the present study area are up to the mark for taste and
odour, i.e. agreeable and denies the presence of any factors affecting the taste and
odour.
3. TDSThe amount and type of dissolved minerals within the ground water gives it the taste.Total dissolved solids (TDS), is defined as the concentration of all dissolved minerals inthe water. TDS are a direct measurement of the interaction between ground water andsubsurface minerals. High TDS, greater than 1000 mg/L, is commonly objectionable oroffensive to taste. TDS levels over 2000 mg/L are generally considered undrinkable due tostrongly offensive taste.The present analysis of Ground Water at different sampling points of study area is
within acceptable limit, i.e. below 500.0 mg/l. The minimum and maximum values of
TDS are 342.0 & 512.0 mg/L respectively.
4. TurbidityTurbidity refers to any solid or organic material that does not settle out of water. Thismeans that the material is not dissolved but is in suspension. Such material includes dustparticles and colloidal organic matter. Clear water has low turbidity and cloudy ormurky water has a higher turbidity level.The turbidity level of every sample was below 1.0 NTU which is the Acceptable limit in
case of ground water. The highest turbidity observed was 0.9 NTU and lowest 0.3 NTU.
5. ChlorideChloride in ground water originates from both natural and anthropogenic sources. Highchloride content indicates heavy pollution. It can be due to the uses of inorganic fertilizer,landfills leachates, septic tank effluent and industrial and irrigation drainage.
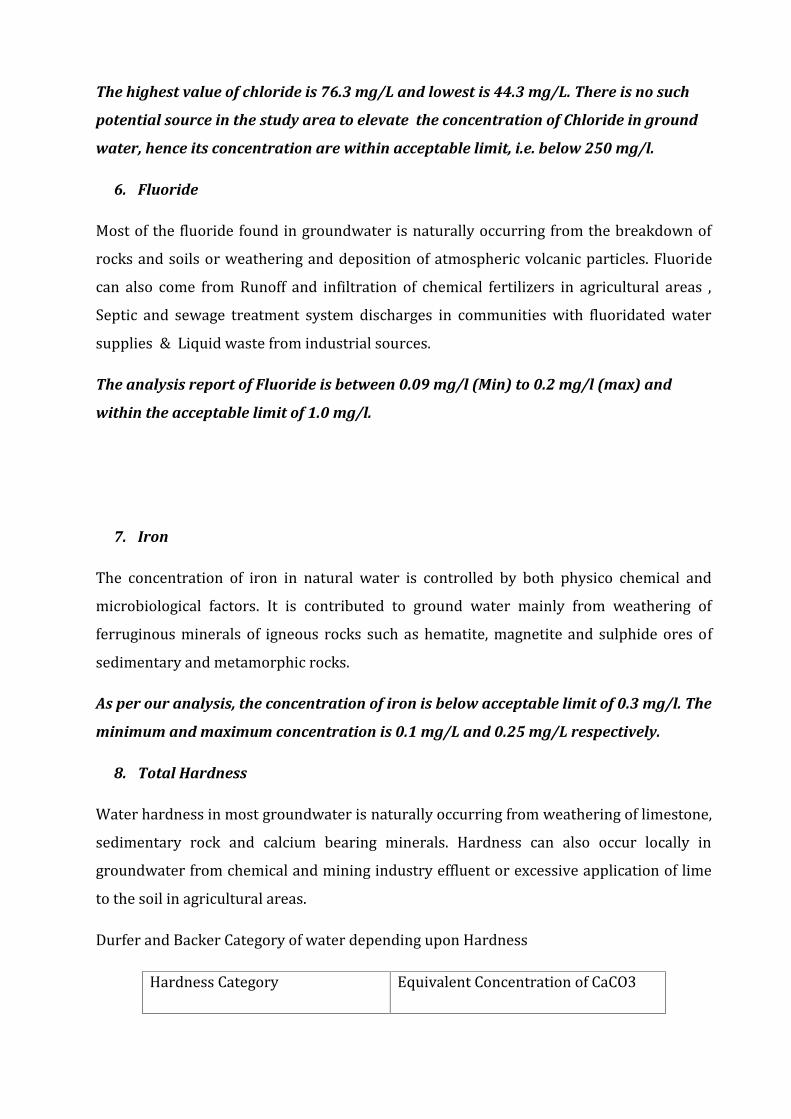
The highest value of chloride is 76.3 mg/L and lowest is 44.3 mg/L. There is no such
potential source in the study area to elevate the concentration of Chloride in ground
water, hence its concentration are within acceptable limit, i.e. below 250 mg/l.
6. FluorideMost of the fluoride found in groundwater is naturally occurring from the breakdown ofrocks and soils or weathering and deposition of atmospheric volcanic particles. Fluoridecan also come from Runoff and infiltration of chemical fertilizers in agricultural areas ,Septic and sewage treatment system discharges in communities with fluoridated watersupplies & Liquid waste from industrial sources.The analysis report of Fluoride is between 0.09 mg/l (Min) to 0.2 mg/l (max) and
within the acceptable limit of 1.0 mg/l.
7. IronThe concentration of iron in natural water is controlled by both physico chemical andmicrobiological factors. It is contributed to ground water mainly from weathering offerruginous minerals of igneous rocks such as hematite, magnetite and sulphide ores ofsedimentary and metamorphic rocks.As per our analysis, the concentration of iron is below acceptable limit of 0.3 mg/l. The
minimum and maximum concentration is 0.1 mg/L and 0.25 mg/L respectively.
8. Total HardnessWater hardness in most groundwater is naturally occurring from weathering of limestone,sedimentary rock and calcium bearing minerals. Hardness can also occur locally ingroundwater from chemical and mining industry effluent or excessive application of limeto the soil in agricultural areas.Durfer and Backer Category of water depending upon HardnessHardness Category Equivalent Concentration of CaCO3
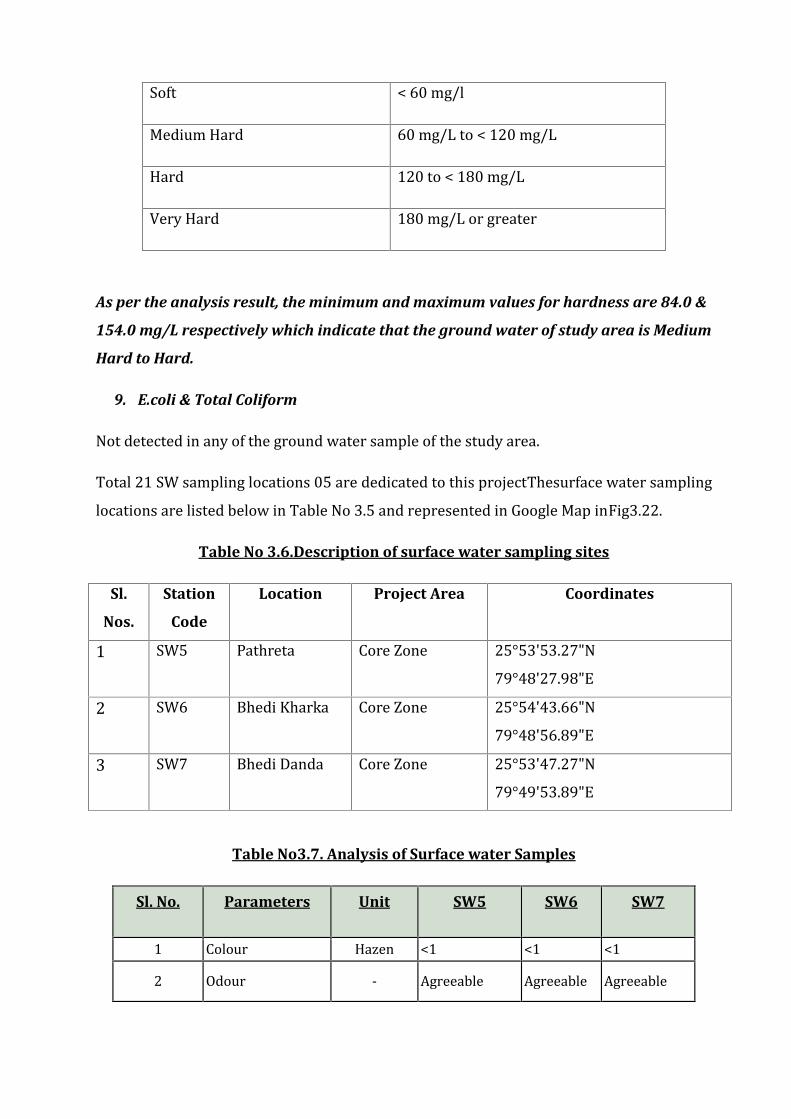
Soft < 60 mg/lMedium Hard 60 mg/L to < 120 mg/LHard 120 to < 180 mg/LVery Hard 180 mg/L or greaterAs per the analysis result, the minimum and maximum values for hardness are 84.0 &
154.0 mg/L respectively which indicate that the ground water of study area is Medium
Hard to Hard.
9. E.coli & Total ColiformNot detected in any of the ground water sample of the study area.Total 21 SW sampling locations 05 are dedicated to this projectThesurface water samplinglocations are listed below in Table No 3.5 and represented in Google Map inFig3.22.Table No 3.6.Description of surface water sampling sites
Sl.
Nos.
Station
Code
Location Project Area Coordinates
1 SW5 Pathreta Core Zone 25°53'53.27"N79°48'27.98"E2 SW6 Bhedi Kharka Core Zone 25°54'43.66"N79°48'56.89"E3 SW7 Bhedi Danda Core Zone 25°53'47.27"N79°49'53.89"ETable No3.7. Analysis of Surface water Samples
Sl. No. Parameters Unit SW5 SW6 SW7
1 Colour Hazen <1 <1 <12 Odour - Agreeable Agreeable Agreeable
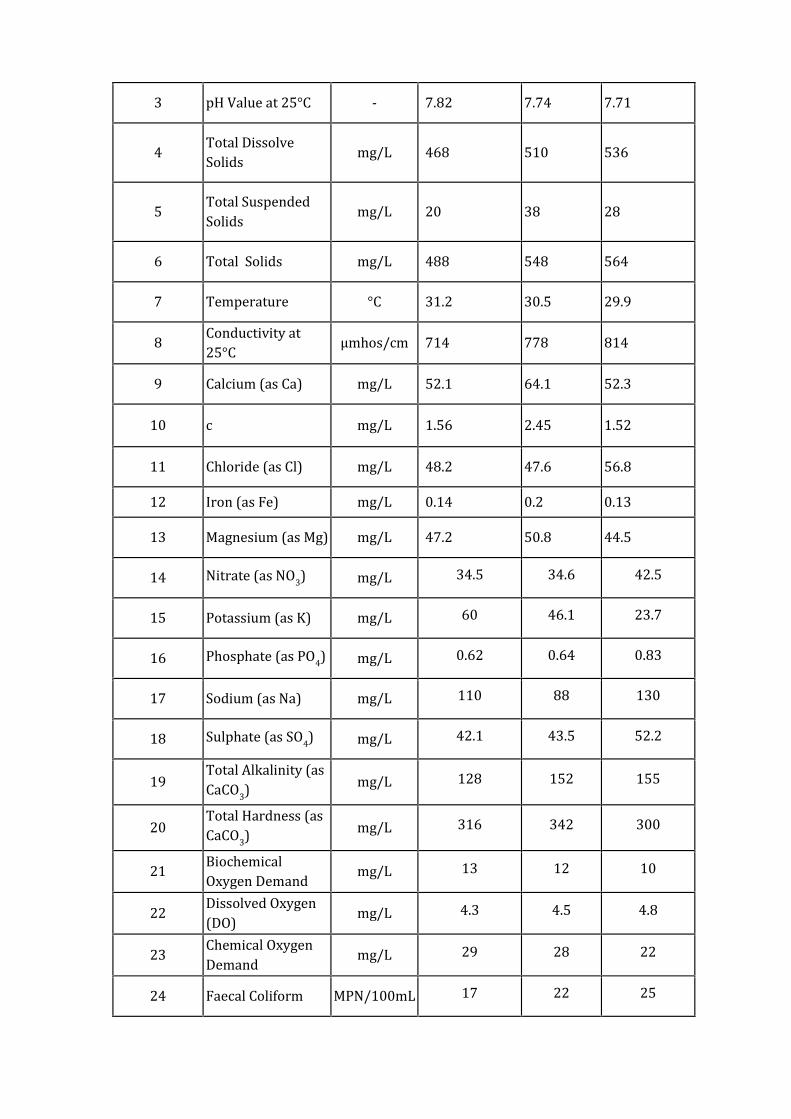
3 pH Value at 25°C - 7.82 7.74 7.714 Total DissolveSolids mg/L 468 510 5365 Total SuspendedSolids mg/L 20 38 286 Total Solids mg/L 488 548 5647 Temperature °C 31.2 30.5 29.98 Conductivity at25°C µmhos/cm 714 778 8149 Calcium (as Ca) mg/L 52.1 64.1 52.3
10 c mg/L 1.56 2.45 1.5211 Chloride (as Cl) mg/L 48.2 47.6 56.812 Iron (as Fe) mg/L 0.14 0.2 0.1313 Magnesium (as Mg) mg/L 47.2 50.8 44.514 Nitrate (as NO3) mg/L 34.5 34.6 42.515 Potassium (as K) mg/L 60 46.1 23.716 Phosphate (as PO4) mg/L 0.62 0.64 0.8317 Sodium (as Na) mg/L 110 88 13018 Sulphate (as SO4) mg/L 42.1 43.5 52.219 Total Alkalinity (asCaCO3) mg/L 128 152 15520 Total Hardness (asCaCO3) mg/L 316 342 30021 BiochemicalOxygen Demand mg/L 13 12 1022 Dissolved Oxygen(DO) mg/L 4.3 4.5 4.823 Chemical OxygenDemand mg/L 29 28 2224 Faecal Coliform MPN/100mL 17 22 25
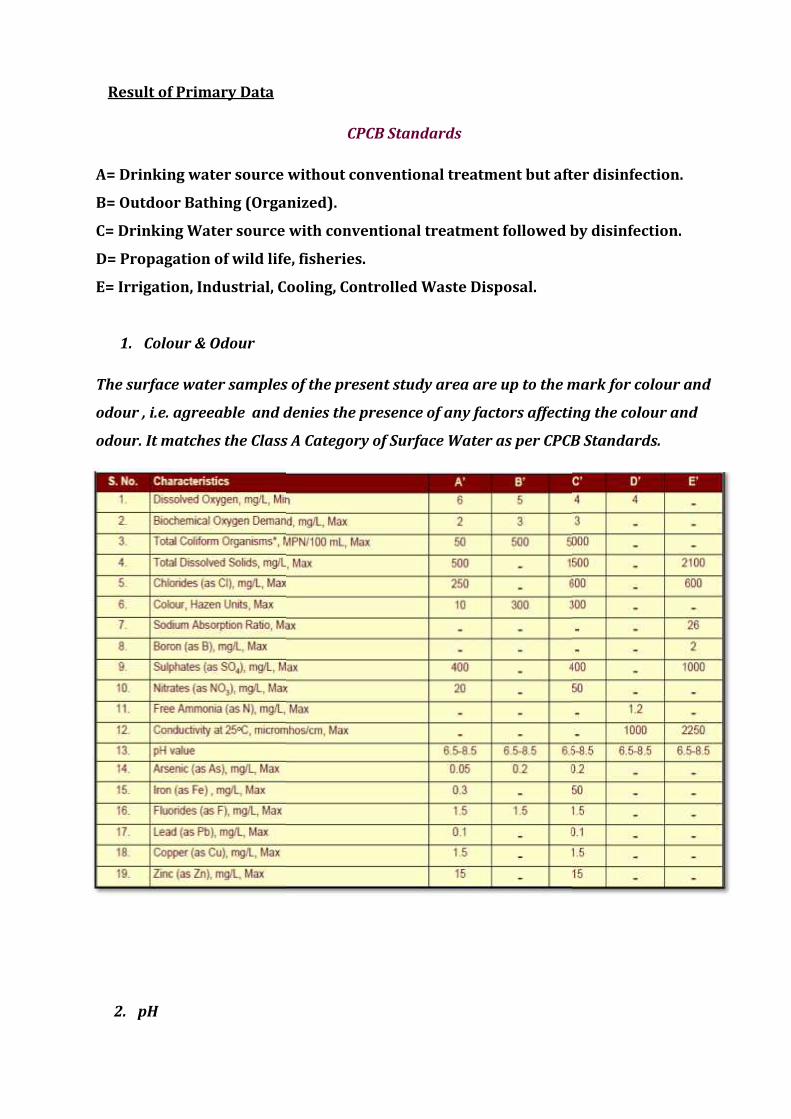
Result of Primary Data
CPCB Standards
A= Drinking water source without conventional treatment but after disinfection.
B= Outdoor Bathing (Organized).
C= Drinking Water source with conventional treatment followed by disinfection.
D= Propagation of wild life, fisheries.
E= Irrigation, Industrial, Cooling, Controlled Waste Disposal.
1. Colour & Odour
The surface water samples of the present study area are up to the mark for colour and
odour , i.e. agreeable and denies the presence of any factors affecting the colour and
odour. It matches the Class A Category of Surface Water as per CPCB Standards.
2. pH
In general, water with a pH < 7 is considered acidic and with a pH > 7 is considered basic.The normal range for pH for Surface water systems is 6.5 to 8.5. Water with a low pH(<6.5) could be acidic, soft, and corrosive. Water with a pH > 8.5 could indicate that thewater is hard.The analysis result of pH of samples are between 7.41 to 7.96 which are within acceptable
limit, i.e. between 6.5 to 8.5 of Class A Category of Surface Water as per CPCB Standards.
3. Total Dissolved SolidsThe TDS varied from a minimum of 434.0 mg/L to a maximum of 604 mg/L . The valuesare generally higher in the summer seasons due to reduction in water volume. When TDS> 1000 mg/L , the water is likely to have objectionable tastes; however, no water samplein the present work, had TDS ≥ 1000 mg/L. Total dissolved solids represent the amount ofsoluble inorganic substances in the water and originates from natural sources, sewage,urban runoff, industrial wastewater and chemicals used in the water treatment process.TDS results falls in Class A& B Category of Surface Water as per CPCB Standards.
4. Total Suspended SolidThe suspended or colloidal particles, commonly referred to as total suspended solids(TSS), are all the extremely small suspended solids in water which will not settle out bygravity. The minimum and maximum TSS are 18.0 mg/L &38.0 mg/L respectively. Thesevalues are well within the limit of 100.0 mg/L as per BIS 2296 : 1982.5. ConductivityConductivity is directly related to the concentration of ions in water. The more ions thatare present, the higher the conductivity of water. Likewise, the fewer ions that are in thewater, the less conductive it is.The minimum value of conductivity is 712.0 µmhos/cm and Maximum 920.0 µmhos/cm and fallsunder Class, A, B & C Category of Surface Water as per CPCB Standards
6. Calcium & MagnesiumCalcium and magnesium doesn’t have wide variations in values. The minimum and maximumvalues of Calcium are 45.6 mg/L & 64.1 mg/L and that of Magnesium are 37.9 mg/L & 50.8mg/L.None of the samples of Calcium crossed the limits of 64.10 mg/L as per the BIS Standards.The values for Magnesium are within the permissible limit of 100 mg/L as per BIS Standards.

7. ChlorideThe minimum and maximum values of Chloride in the study area are 47.6 & 56.8 mg/Lwhich are within permissible limits of Class A Category of Surface Water as per CPCBStandards.High concentration of chloride makes water unpalatable and unfit for drinking andlivestock watering. However, all the surface water sources show Cl values below thepermissible limit of 250 mg/L which can be attributed to-(i) The rate of percolation of agricultural and domestic wastes to the surface waterbodies (the area is not industrial) is low .(ii) The contributions from the geological formations of the area are not muchsignificant preventing the sources from excessive chloride accumulation.8. IronThe iron content of surface water in the study area ranges from 0.13 mg/L (min) to 0.21mg/L (max) in the months of March, April & May 2018.These analysis reports are within the permissible limit (0.3 mg/L) of Class A Category ofSurface Water as per CPCB Standards.9. NitrateThe surface water of the investigated area contains nitrate from 28.1 to 47.5 mg/L.The higher values of nitrate indicate runoff from agricultural lands where manure and/orchemical fertilizers have been applied.The values of Nitrate are far below than the permissible limit of 50 mg/L and falls in Class
B & C Category of Surface Water as per CPCB Standards.10. Dissolved OxygenThe average Dissolved Oxygen levels in water quality of River Betwa is meeting thedesired levels of Class ‘C’ (4.0 mg/l) and Class ‘B’ (5.0 mg/l) of Drinking water sourcewith conventional treatment followed by disinfection, and Outdoor bathing(Organized) respectively.
The minimum and maximum values of DO in the study area are 4.0 and 6.2 mg/L
respectively.
11. Total HardnessThe total hardness of the surface water is dependent on the presence of Ca and Mgcontents that enter the water bodies through residues of soaps, detergents and parentbed rock materials made up of Ca, Mg and other metal ions.The total hardness values of the surface water samples varied from 286 – 342mg/L.
UsingDurfer and Backer classification, the surface water bodies in the study area are
Very Hard.
12. Biological Oxygen DemandThe BOD levels in water quality of River Betwa vary from 8.0 mg/l to 16.0 mg/l. Thesevalues are slightly higher than the standards because of great amount of microorganisms,mainly aerobic bacteria due to faecal contamination of humans and animals into riverwater.13. Faecal ColiformThe presence of faecal coliform bacteria in aquatic environments indicates that the waterhas been contaminated with the faecal material of man or other animals.
However in the study area,the Faecal Coliform ranges from 12.0 – 56.0 MPN/100 ml.River water can be considered fit for bathing if the faecal coliform count is between thedesirable limit of 500 and maximum permissible limit of 2,500 mpn (most probablenumber) per 100 ml.14. Total AlkalinityThe minimum and maximum values of total Alkalinity in the study area are 120.0 – 191.0mg/L which are well within the limit of BIS standards.
As per BIS limit 1998, the desirable limit is 200 mg/L and permissible limit is 600
mg/L
3.4 AIR ENVIRONMENT
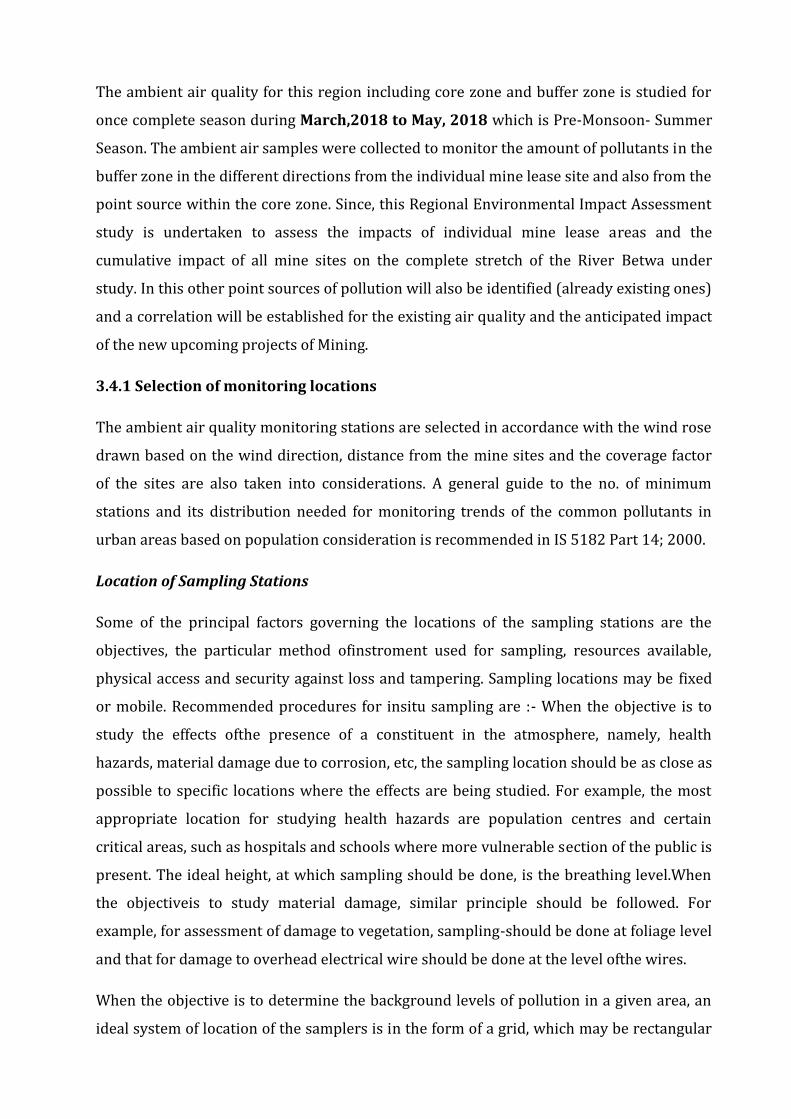
The ambient air quality for this region including core zone and buffer zone is studied foronce complete season during March,2018 to May, 2018 which is Pre-Monsoon- SummerSeason. The ambient air samples were collected to monitor the amount of pollutants in thebuffer zone in the different directions from the individual mine lease site and also from thepoint source within the core zone. Since, this Regional Environmental Impact Assessmentstudy is undertaken to assess the impacts of individual mine lease areas and thecumulative impact of all mine sites on the complete stretch of the River Betwa understudy. In this other point sources of pollution will also be identified (already existing ones)and a correlation will be established for the existing air quality and the anticipated impactof the new upcoming projects of Mining.3.4.1 Selection of monitoring locationsThe ambient air quality monitoring stations are selected in accordance with the wind rosedrawn based on the wind direction, distance from the mine sites and the coverage factorof the sites are also taken into considerations. A general guide to the no. of minimumstations and its distribution needed for monitoring trends of the common pollutants inurban areas based on population consideration is recommended in IS 5182 Part 14; 2000.Location of Sampling StationsSome of the principal factors governing the locations of the sampling stations are theobjectives, the particular method ofinstroment used for sampling, resources available,physical access and security against loss and tampering. Sampling locations may be fixedor mobile. Recommended procedures for insitu sampling are :- When the objective is tostudy the effects ofthe presence of a constituent in the atmosphere, namely, healthhazards, material damage due to corrosion, etc, the sampling location should be as close aspossible to specific locations where the effects are being studied. For example, the mostappropriate location for studying health hazards are population centres and certaincritical areas, such as hospitals and schools where more vulnerable section of the public ispresent. The ideal height, at which sampling should be done, is the breathing level.Whenthe objectiveis to study material damage, similar principle should be followed. Forexample, for assessment of damage to vegetation, sampling-should be done at foliage leveland that for damage to overhead electrical wire should be done at the level ofthe wires.When the objective is to determine the background levels of pollution in a given area, anideal system of location of the samplers is in the form of a grid, which may be rectangular

or radial depending uponwhether the sources of pollution may be treated as an areasource or an effectively single source respectively. The minimum number oflocationsrequired for such a system depend upon the variability ofpoJlutant concentration over thearea under survey. The spatial distribution of the samplers should be such that variationbetween adjacent sampling locations is sufficient to obtain the corroboration ofthedispersion model used or to detennine the modification to the model, ifnecessary, to suitlocal conditions. Physical Requirements,the site where the station is located should fulfillone or more of the following requirements depending on the types of instruments used:a) it should be available for a long period;b) it should preferably be accessible any time throughout the year;c) electrical power of sufficient rating should be availabled) it should be vandal-proof; ande) it may need to be protected from extreme of temperatures.The network density appears to have a seasonal vadation with fewer stations beingrequired in the su miller than in the winter. This is because concentrations of pollution insummer are uniformly low particularly at residential areas thus single station is a goodpredictor of air quality over a relatively large neighbourhood.. For generating background data on the ambient air quality around the proposed site of adevelopment project, ambient air quality monitoring is necessary. When proposal relatesto air quality trend analysis, the main criteria for network density is population. A citywith population of 0.5 to 1 million should have 5 to 10 monitoring stations distributed sothat one station represents 10 to 20 km2In cities with large number of population withcomplex topography or with an unusually large large number of pollution sources onestation per 5 to 10 km2 is suggested.
3.4.2. Recommended Minimum Number of Stations, Population-Wise (Clause
10.7.2.2)

Pollutant Population of Evaluation
Area
Minimum No. of AAQ Monitoring
StationSPM (Hi-Vol) < 100 000100 000 - 1 000 0001 000 000 - 5 000 000>5 000 00043+ 0.6 per 100-000 population7.5 + 0.25 per 100 000 population12 + 0.16 per 100 000 populationS02 < 100 000100 000 - 1 000 0001 000 000 - 10 000 000>10 000 00032.5+0.5 per 100 000 population6 + 0.15 per 1OO 000 population20N02 < 100 000100 000 - 5 000 000>5 000 00042 + 0.6 per 100 000 population3 10CO < 100 000100 000 - 10 000 000>10 000 00011 + 0.15. per 100 000 population6 + 0.05 per 100 000 populationOxidants - do- - do-
In cities with low traffic and a population of > 4 million, the no. of station can be reduced.Asite is representative if the data generated from the site reflects the concentrations ofpollutants and their variations, in the area. The stations are located at a place whereinterferences are not present or anticipated. Higher concentrations of pollutants arepossible in the vicinity of roads, highways. The gradients vary in both time and space onthe micro and on the neighbourhood scale. The recommended criteria for sitingmonitoring location and the values of base line data is based on compromise betweenavailable resources and site specific parameters such as nearby sources, concentrationgradients of pollutants etc. Most of the monitoring locations are TypeC – Type F.Type C Residential StationType D Mesoscale StationType E Non – urban stationType F Specialised source survey stationPM2.5& PM 10 have been estimated by Gravimetric method IS: 5182. Modified West andGaeke method (IS-5182 part-II, 1969) has been adopted for estimation of SO2 and Jacobs-Hochheiser method (IS-5182 part-VI, 1975) has been adopted for the estimation of NOx.
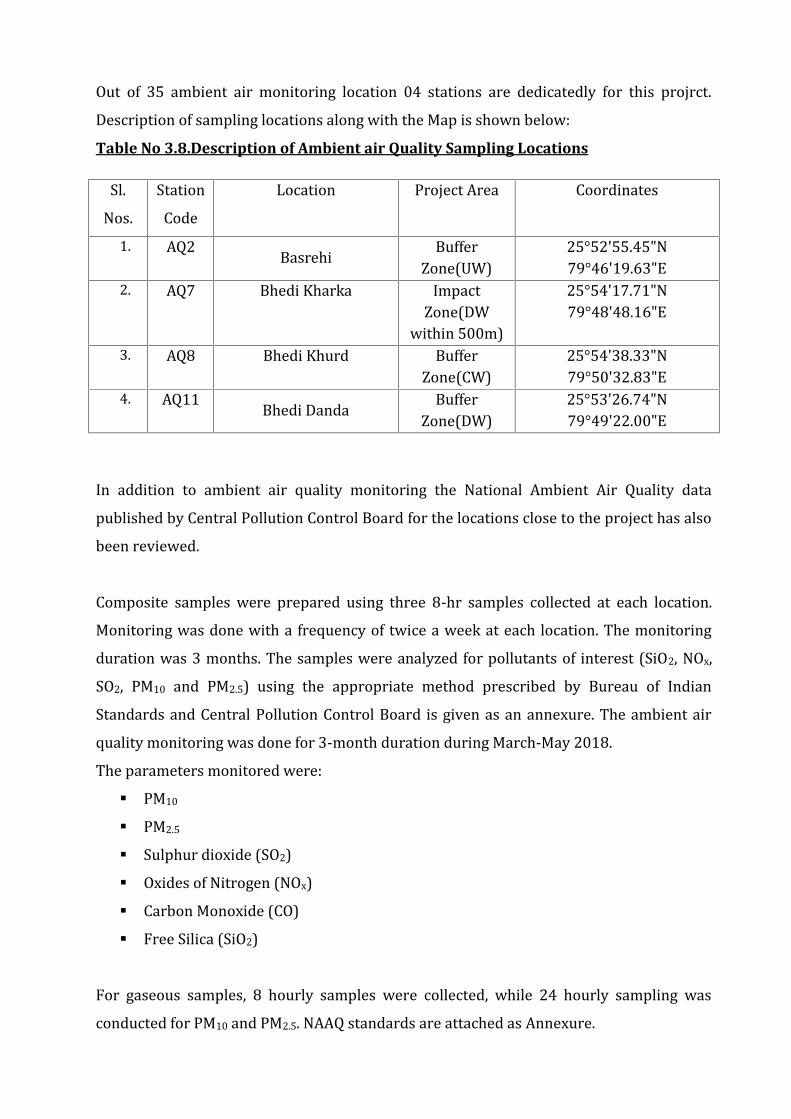
Out of 35 ambient air monitoring location 04 stations are dedicatedly for this projrct.Description of sampling locations along with the Map is shown below:Table No 3.8.Description of Ambient air Quality Sampling LocationsSl.Nos. StationCode Location Project Area Coordinates
1. AQ2 Basrehi BufferZone(UW) 25°52'55.45"N79°46'19.63"E2. AQ7 Bhedi Kharka ImpactZone(DWwithin 500m) 25°54'17.71"N79°48'48.16"E3. AQ8 Bhedi Khurd BufferZone(CW) 25°54'38.33"N79°50'32.83"E4. AQ11 Bhedi Danda BufferZone(DW) 25°53'26.74"N79°49'22.00"E
In addition to ambient air quality monitoring the National Ambient Air Quality datapublished by Central Pollution Control Board for the locations close to the project has alsobeen reviewed.Composite samples were prepared using three 8-hr samples collected at each location.Monitoring was done with a frequency of twice a week at each location. The monitoringduration was 3 months. The samples were analyzed for pollutants of interest (SiO2, NOx,SO2, PM10 and PM2.5) using the appropriate method prescribed by Bureau of IndianStandards and Central Pollution Control Board is given as an annexure. The ambient airquality monitoring was done for 3-month duration during March-May 2018.The parameters monitored were: PM10 PM2.5 Sulphur dioxide (SO2) Oxides of Nitrogen (NOx) Carbon Monoxide (CO) Free Silica (SiO2)
For gaseous samples, 8 hourly samples were collected, while 24 hourly sampling wasconducted for PM10 and PM2.5. NAAQ standards are attached as Annexure.
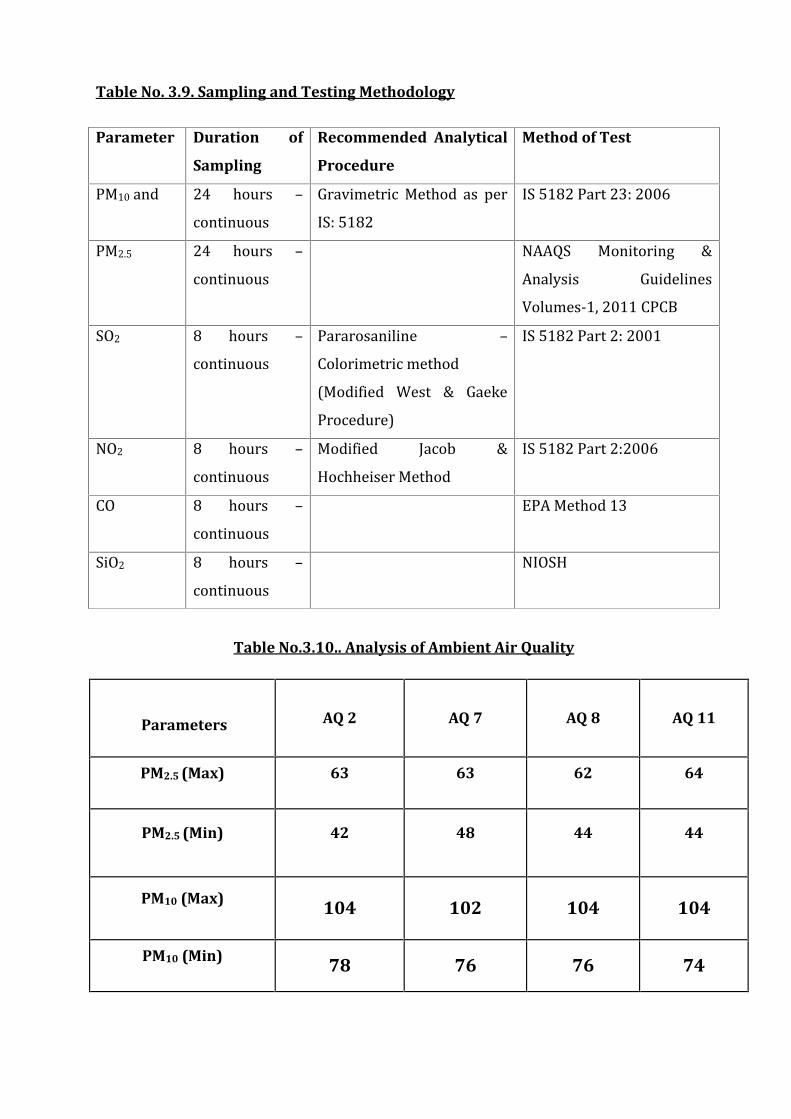
Table No. 3.9. Sampling and Testing Methodology
Table No.3.10.. Analysis of Ambient Air Quality
Parameters AQ 2 AQ 7 AQ 8 AQ 11
PM2.5 (Max) 63 63 62 64
PM2.5 (Min) 42 48 44 44
PM10 (Max) 104 102 104 104
PM10 (Min) 78 76 76 74
Parameter Duration of
Sampling
Recommended Analytical
Procedure
Method of Test
PM10 and 24 hours –continuous Gravimetric Method as perIS: 5182 IS 5182 Part 23: 2006PM2.5 24 hours –continuous NAAQS Monitoring &Analysis GuidelinesVolumes-1, 2011 CPCBSO2 8 hours –continuous Pararosaniline –Colorimetric method(Modified West & GaekeProcedure)
IS 5182 Part 2: 2001
NO2 8 hours –continuous Modified Jacob &Hochheiser Method IS 5182 Part 2:2006CO 8 hours –continuous EPA Method 13SiO2 8 hours –continuous NIOSH

SO2 (Max) 9.6 9.6 9.2 10.6
SO2 (Min) 6.4 6.4 6.7 6.5
NO2 (Max)12.2 12.8 13.5 12.8
NO2 (Min)8 8.262 8.2 8.5
Results of Ambient Air QualityFor Fugitive dust emission at any site, the most prevalent particulate sources, suchas unpaved roads, bare ground, and loading. The upwind and downwind concentrationsof TSP, PM10, and PM2.5 were measured. Emission of fugitive dust are influenced bymoisture content, silt content, wind speed, and vehicle activity on unpaved roads, whichincludes vehicle speed and vehicle counts. The value of PM2.5 is higher on all themonitoring locationsthan the NAAQS, 2009 (Attached as annexure-) standards withexception of AQ 30 and AQ32 i.e. Ramedi and Bhilawa dariya. Higher PM2.5 levels may becontributed due to traditional ways of cooking along with vehicular emission. PM10 in thearea may be formed by physical processes of abrasion of surfaces and agriculturalactivities. The anthropogenic source are coarse particles are produced by the mechanicalbreak-up of larger solid particles, wind blown dust such as road dust,soot, agriculturalprocesses, combustion of fossil fuel . It also causes visibility reduction Almost all themonitoring locations are having higher PM10. SO2 and NO2 are far below standards.3.4.3. Free SilicaThe NAAQ standards prescribed for Industrial, Residential, Rural and other areas do notdefine limits for standards of free silica in ambient air. Silica is a component of PM10,standards for which are prescribed under the NAAQ. Crystalline silica is composed of SiO2whereas SiO2 in the pure form (not combined with cations) is free silica.
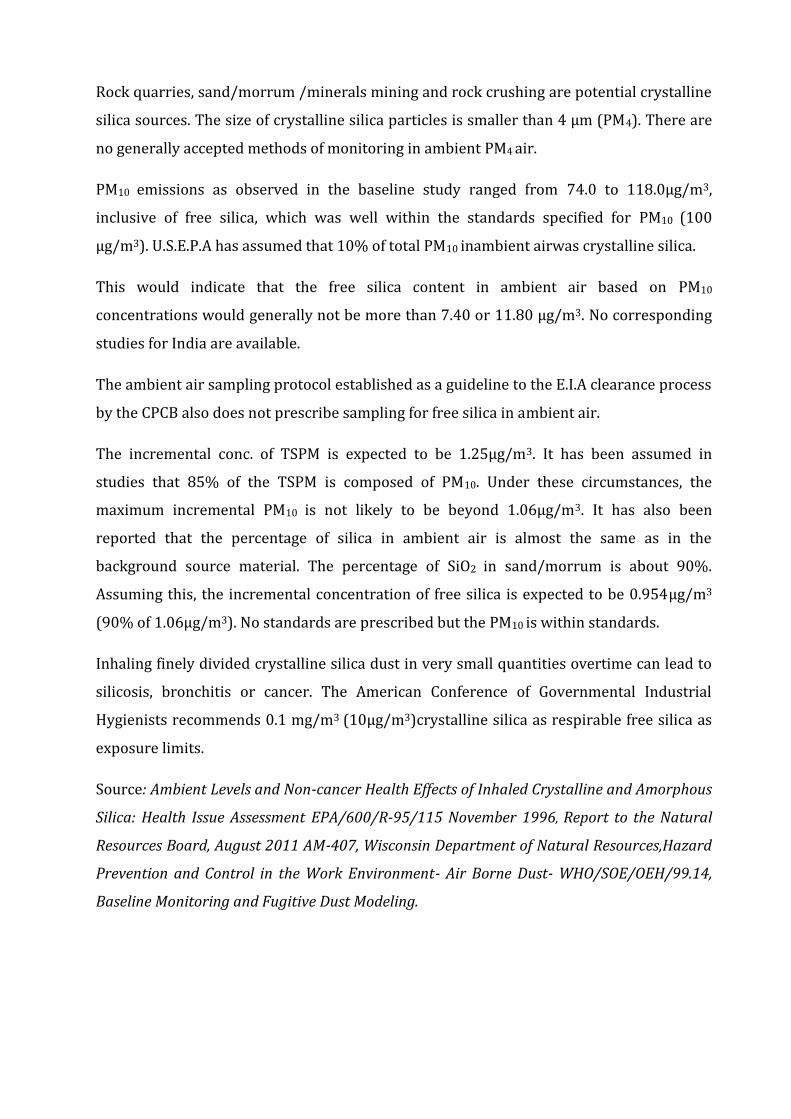
Rock quarries, sand/morrum /minerals mining and rock crushing are potential crystallinesilica sources. The size of crystalline silica particles is smaller than 4 µm (PM4). There areno generally accepted methods of monitoring in ambient PM4 air.PM10 emissions as observed in the baseline study ranged from 74.0 to 118.0µg/m3,inclusive of free silica, which was well within the standards specified for PM10 (100µg/m3). U.S.E.P.A has assumed that 10% of total PM10 inambient airwas crystalline silica.This would indicate that the free silica content in ambient air based on PM10concentrations would generally not be more than 7.40 or 11.80 µg/m3. No correspondingstudies for India are available.The ambient air sampling protocol established as a guideline to the E.I.A clearance processby the CPCB also does not prescribe sampling for free silica in ambient air.The incremental conc. of TSPM is expected to be 1.25µg/m3. It has been assumed instudies that 85% of the TSPM is composed of PM10. Under these circumstances, themaximum incremental PM10 is not likely to be beyond 1.06µg/m3. It has also beenreported that the percentage of silica in ambient air is almost the same as in thebackground source material. The percentage of SiO2 in sand/morrum is about 90%.Assuming this, the incremental concentration of free silica is expected to be 0.954µg/m3(90% of 1.06µg/m3). No standards are prescribed but the PM10 is within standards.Inhaling finely divided crystalline silica dust in very small quantities overtime can lead tosilicosis, bronchitis or cancer. The American Conference of Governmental IndustrialHygienists recommends 0.1 mg/m3 (10µg/m3)crystalline silica as respirable free silica asexposure limits.Source: Ambient Levels and Non-cancer Health Effects of Inhaled Crystalline and Amorphous
Silica: Health Issue Assessment EPA/600/R-95/115 November 1996, Report to the Natural
Resources Board, August 2011 AM-407, Wisconsin Department of Natural Resources,Hazard
Prevention and Control in the Work Environment- Air Borne Dust- WHO/SOE/OEH/99.14,
Baseline Monitoring and Fugitive Dust Modeling.

AQStn.Name
Remarks
AQ 17
Significant incremental value was observed in PM10 due to near and upwinddirection from the haulage rout whereas all pollutants concentrations were belowthe NAAQS permissible limit due to haulage route (300m) and sand/morrummines project more than 1000m. It was situated in core zone.AQ 20
Significant incremental value was observed in PM10 due to downwind direction.Whereas all pollutants concentrations were below the NAAQS permissible limitdue to distance from haulage (300m) and projects (about 500m). It was situated incore zone.AQ 23
All pollutants concentrations were below the NAAQS permissible limit due tomore distance from haulage and projects (about 2km).AQ 24
Significant incremental values were observed in PM10 and PM2.5 due todownwind direction. All pollutants concentrations were below the NAAQSpermissible limit due to distance from haulage and projects (about 300 m).3.5 NOISE ENVIRONMENTNoise attributed to roads depends on factors such as traffic intensity, the type andcondition of the vehicles plying on the road, acceleration/deceleration/gear changes bythe vehicles depending on the level of congestion and smoothness of road surface (IRC:104-1988). High noise levels are a concern for sensitive receptors, i.e., hospitals,educational institutions, etc.The Central Pollution Control Board has specified ambient noise levels for different landuses for day and night times. Importance was given to the timing of exposure and areasdesignated as sensitive. The noise standard specified by the Central Pollution ControlBoard is annexed in the end of report.Note: (1) Day-time: 6 AM to 10 PM, Night-time: 10 PM to 6 AM;The noise monitoring was conducted at 35 locations within the study area. Normally, forselection of noise monitoring stations, sensitivity of sites is also considered. As per theCPCB standards, sensitive locations are covered under Silence Zone, which includes anarea up to 100 m around premises as hospitals, educational institutions and courts.
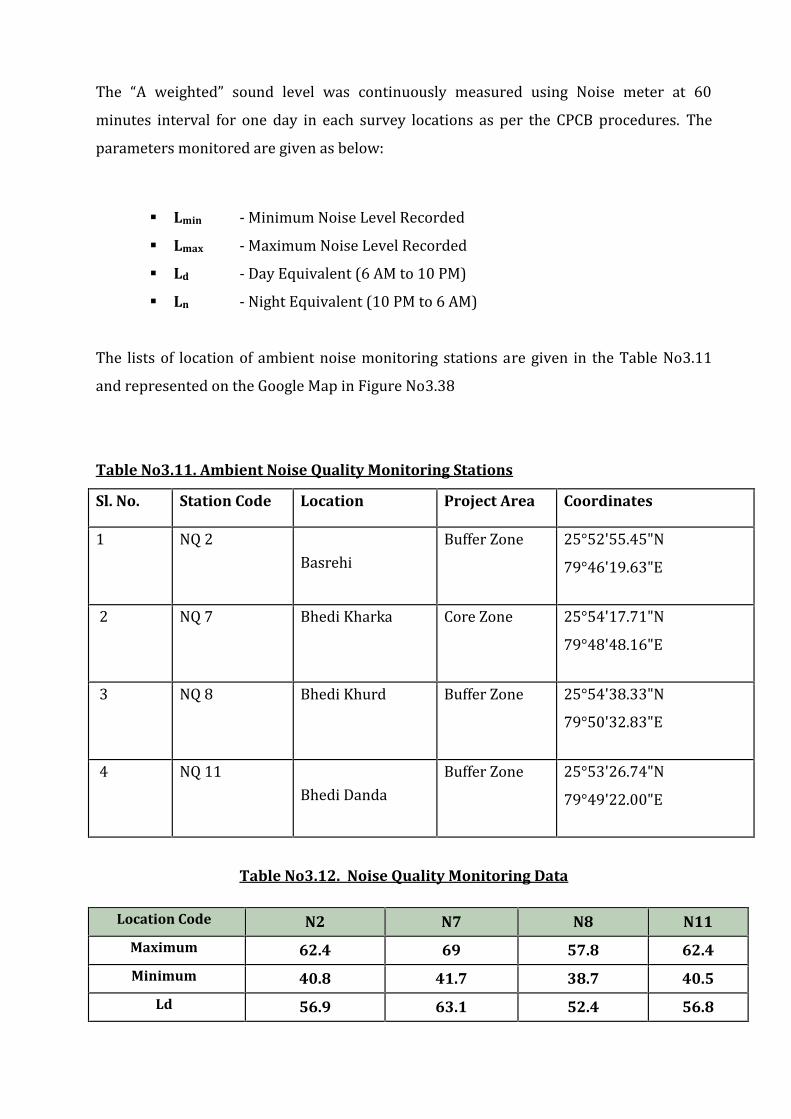
The “A weighted” sound level was continuously measured using Noise meter at 60minutes interval for one day in each survey locations as per the CPCB procedures. Theparameters monitored are given as below: Lmin - Minimum Noise Level Recorded Lmax - Maximum Noise Level Recorded Ld - Day Equivalent (6 AM to 10 PM) Ln - Night Equivalent (10 PM to 6 AM)
The lists of location of ambient noise monitoring stations are given in the Table No3.11and represented on the Google Map in Figure No3.38Table No3.11. Ambient Noise Quality Monitoring Stations
Sl. No. Station Code Location Project Area Coordinates1 NQ 2 Basrehi Buffer Zone 25°52'55.45"N79°46'19.63"E2 NQ 7 Bhedi Kharka Core Zone 25°54'17.71"N79°48'48.16"E3 NQ 8 Bhedi Khurd Buffer Zone 25°54'38.33"N79°50'32.83"E4 NQ 11 Bhedi Danda Buffer Zone 25°53'26.74"N79°49'22.00"E
Table No3.12. Noise Quality Monitoring Data
Location Code N2 N7 N8 N11
Maximum 62.4 69 57.8 62.4
Minimum 40.8 41.7 38.7 40.5
Ld 56.9 63.1 52.4 56.8
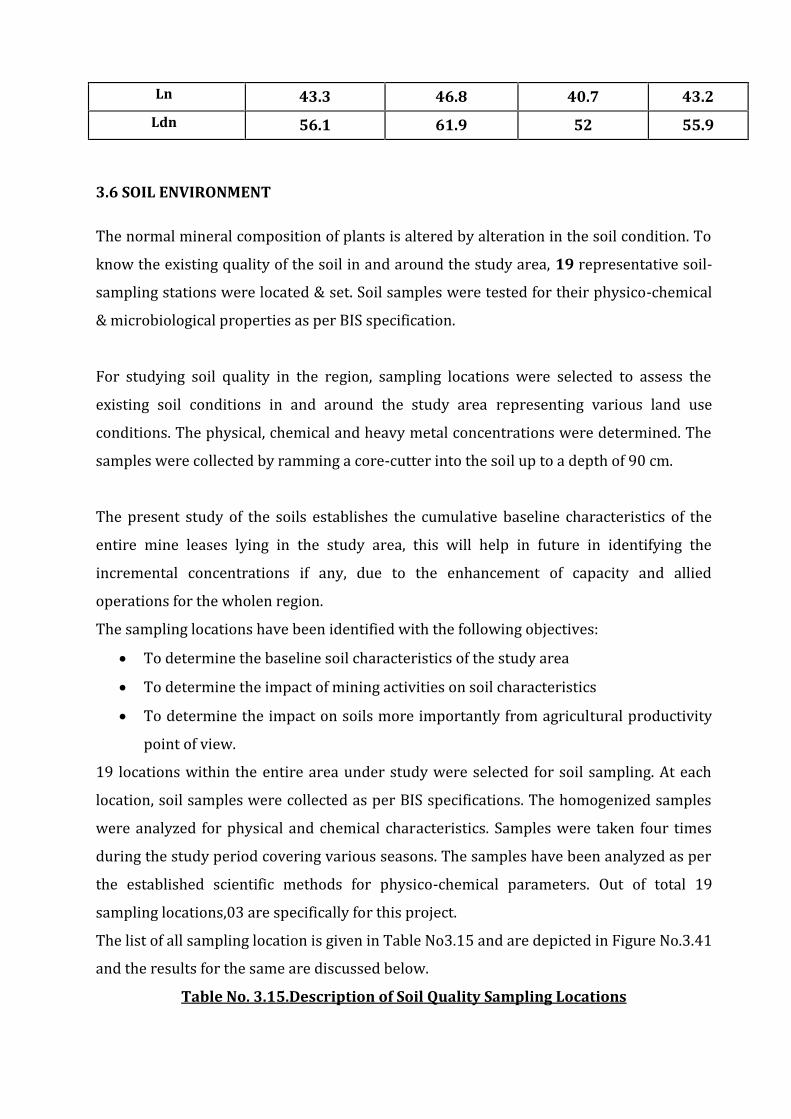
Ln 43.3 46.8 40.7 43.2
Ldn 56.1 61.9 52 55.9
3.6 SOIL ENVIRONMENTThe normal mineral composition of plants is altered by alteration in the soil condition. Toknow the existing quality of the soil in and around the study area, 19 representative soil-sampling stations were located & set. Soil samples were tested for their physico-chemical& microbiological properties as per BIS specification.For studying soil quality in the region, sampling locations were selected to assess theexisting soil conditions in and around the study area representing various land useconditions. The physical, chemical and heavy metal concentrations were determined. Thesamples were collected by ramming a core-cutter into the soil up to a depth of 90 cm.The present study of the soils establishes the cumulative baseline characteristics of theentire mine leases lying in the study area, this will help in future in identifying theincremental concentrations if any, due to the enhancement of capacity and alliedoperations for the wholen region.The sampling locations have been identified with the following objectives: To determine the baseline soil characteristics of the study area To determine the impact of mining activities on soil characteristics To determine the impact on soils more importantly from agricultural productivitypoint of view.19 locations within the entire area under study were selected for soil sampling. At eachlocation, soil samples were collected as per BIS specifications. The homogenized sampleswere analyzed for physical and chemical characteristics. Samples were taken four timesduring the study period covering various seasons. The samples have been analyzed as perthe established scientific methods for physico-chemical parameters. Out of total 19sampling locations,03 are specifically for this project.The list of all sampling location is given in Table No3.15 and are depicted in Figure No.3.41and the results for the same are discussed below.
Table No. 3.15.Description of Soil Quality Sampling Locations
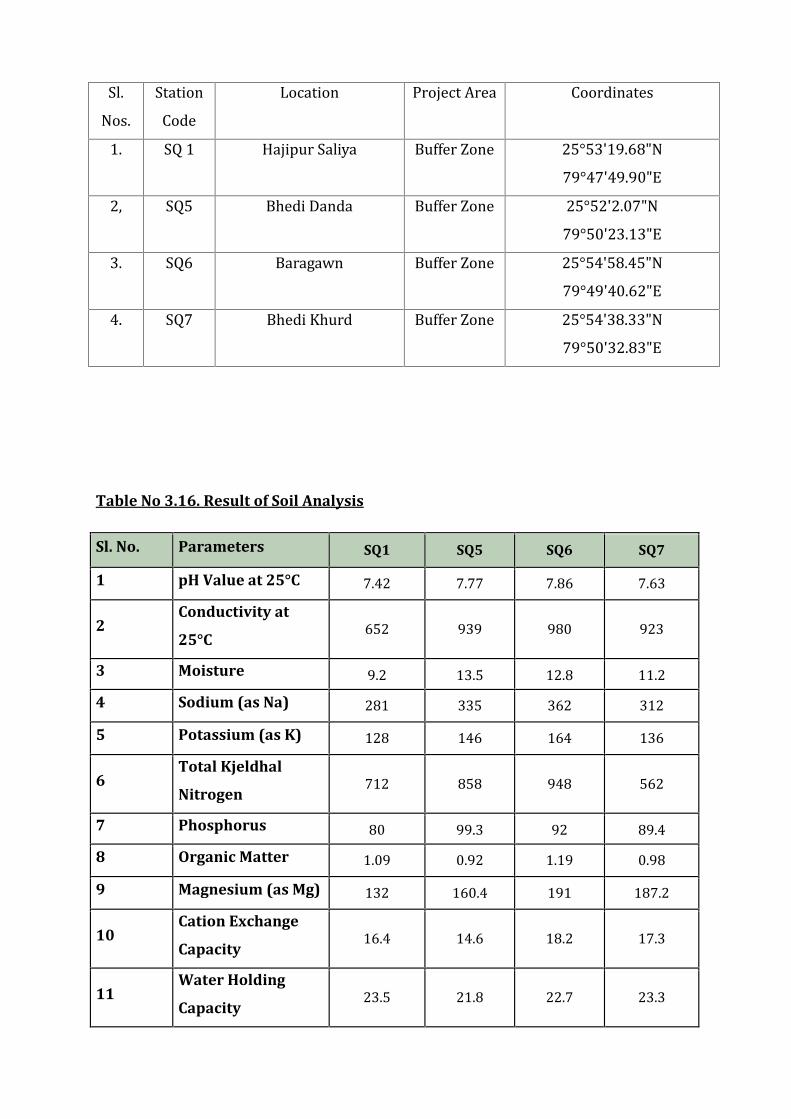
Sl.Nos. StationCode Location Project Area Coordinates1. SQ 1 Hajipur Saliya Buffer Zone 25°53'19.68"N79°47'49.90"E2, SQ5 Bhedi Danda Buffer Zone 25°52'2.07"N79°50'23.13"E3. SQ6 Baragawn Buffer Zone 25°54'58.45"N79°49'40.62"E4. SQ7 Bhedi Khurd Buffer Zone 25°54'38.33"N79°50'32.83"E
Table No 3.16. Result of Soil Analysis
Sl. No. Parameters SQ1 SQ5 SQ6 SQ7
1 pH Value at 25°C 7.42 7.77 7.86 7.632
Conductivity at
25°C652 939 980 923
3 Moisture 9.2 13.5 12.8 11.24 Sodium (as Na) 281 335 362 3125 Potassium (as K) 128 146 164 1366
Total Kjeldhal
Nitrogen712 858 948 562
7 Phosphorus 80 99.3 92 89.48 Organic Matter 1.09 0.92 1.19 0.989 Magnesium (as Mg) 132 160.4 191 187.210
Cation Exchange
Capacity16.4 14.6 18.2 17.3
11Water Holding
Capacity23.5 21.8 22.7 23.3
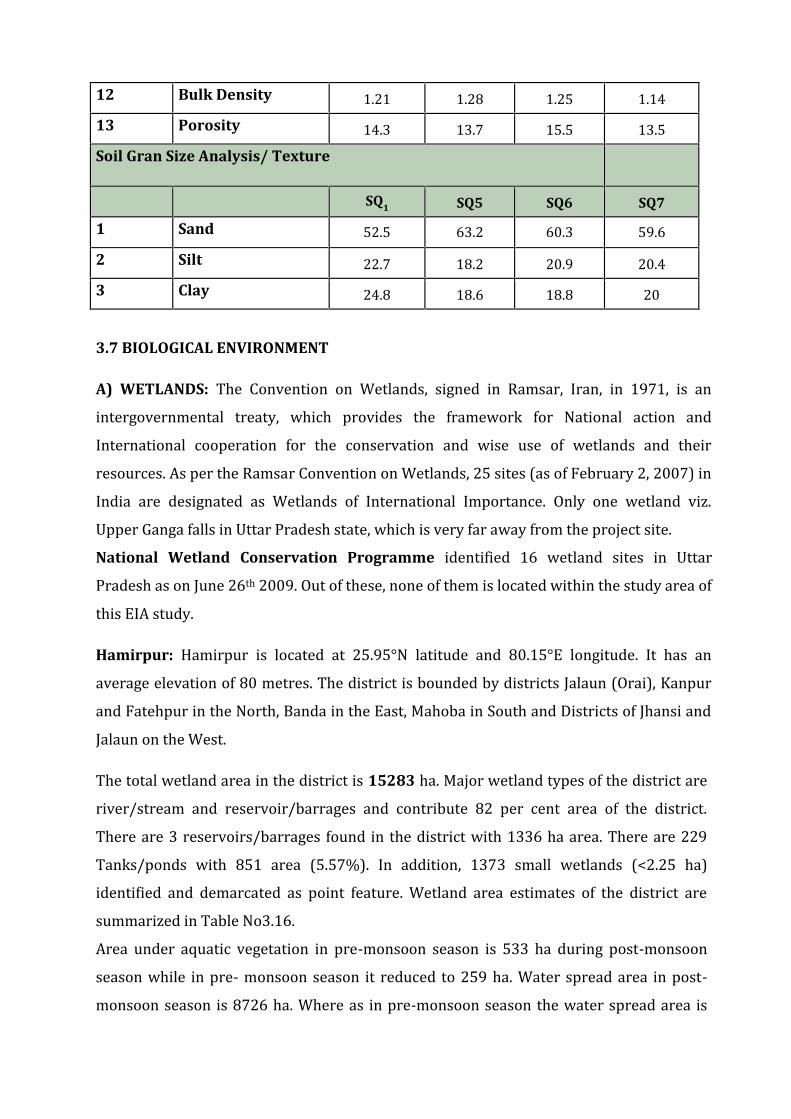
12 Bulk Density 1.21 1.28 1.25 1.1413 Porosity 14.3 13.7 15.5 13.5Soil Gran Size Analysis/ Texture
SQ1 SQ5 SQ6 SQ7
1 Sand 52.5 63.2 60.3 59.62 Silt 22.7 18.2 20.9 20.43 Clay 24.8 18.6 18.8 203.7 BIOLOGICAL ENVIRONMENT
A) WETLANDS: The Convention on Wetlands, signed in Ramsar, Iran, in 1971, is anintergovernmental treaty, which provides the framework for National action andInternational cooperation for the conservation and wise use of wetlands and theirresources. As per the Ramsar Convention on Wetlands, 25 sites (as of February 2, 2007) inIndia are designated as Wetlands of International Importance. Only one wetland viz.Upper Ganga falls in Uttar Pradesh state, which is very far away from the project site.National Wetland Conservation Programme identified 16 wetland sites in UttarPradesh as on June 26th 2009. Out of these, none of them is located within the study area ofthis EIA study.Hamirpur: Hamirpur is located at 25.95°N latitude and 80.15°E longitude. It has anaverage elevation of 80 metres. The district is bounded by districts Jalaun (Orai), Kanpurand Fatehpur in the North, Banda in the East, Mahoba in South and Districts of Jhansi andJalaun on the West.The total wetland area in the district is 15283 ha. Major wetland types of the district areriver/stream and reservoir/barrages and contribute 82 per cent area of the district.There are 3 reservoirs/barrages found in the district with 1336 ha area. There are 229Tanks/ponds with 851 area (5.57%). In addition, 1373 small wetlands (<2.25 ha)identified and demarcated as point feature. Wetland area estimates of the district aresummarized in Table No3.16.Area under aquatic vegetation in pre-monsoon season is 533 ha during post-monsoonseason while in pre- monsoon season it reduced to 259 ha. Water spread area in post-monsoon season is 8726 ha. Where as in pre-monsoon season the water spread area is
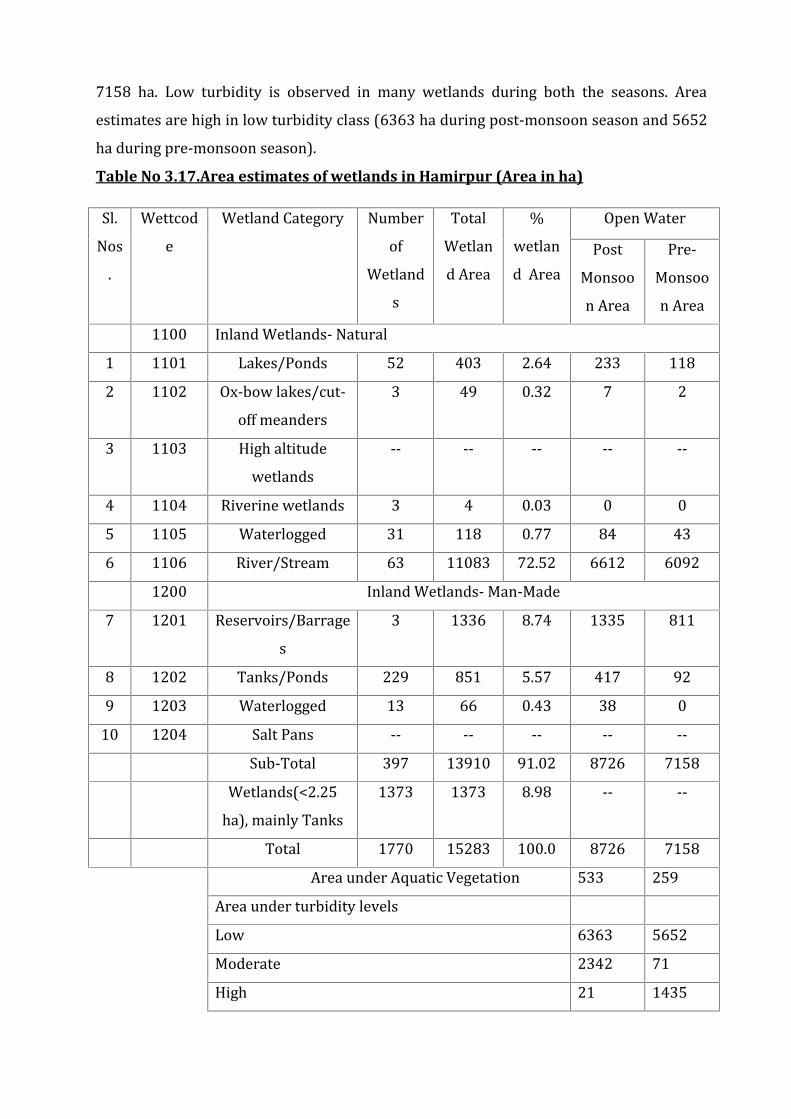
7158 ha. Low turbidity is observed in many wetlands during both the seasons. Areaestimates are high in low turbidity class (6363 ha during post-monsoon season and 5652ha during pre-monsoon season).Table No 3.17.Area estimates of wetlands in Hamirpur (Area in ha)Sl.Nos.
Wettcode Wetland Category NumberofWetlandsTotalWetland Area
%wetland AreaOpen WaterPostMonsoon Area
Pre-Monsoon Area1100 Inland Wetlands- Natural1 1101 Lakes/Ponds 52 403 2.64 233 1182 1102 Ox-bow lakes/cut-off meanders 3 49 0.32 7 23 1103 High altitudewetlands -- -- -- -- --4 1104 Riverine wetlands 3 4 0.03 0 05 1105 Waterlogged 31 118 0.77 84 436 1106 River/Stream 63 11083 72.52 6612 60921200 Inland Wetlands- Man-Made7 1201 Reservoirs/Barrages 3 1336 8.74 1335 8118 1202 Tanks/Ponds 229 851 5.57 417 929 1203 Waterlogged 13 66 0.43 38 010 1204 Salt Pans -- -- -- -- --Sub-Total 397 13910 91.02 8726 7158Wetlands(<2.25ha), mainly Tanks 1373 1373 8.98 -- --
Total 1770 15283 100.0 8726 7158Area under Aquatic Vegetation 533 259Area under turbidity levelsLow 6363 5652Moderate 2342 71High 21 1435
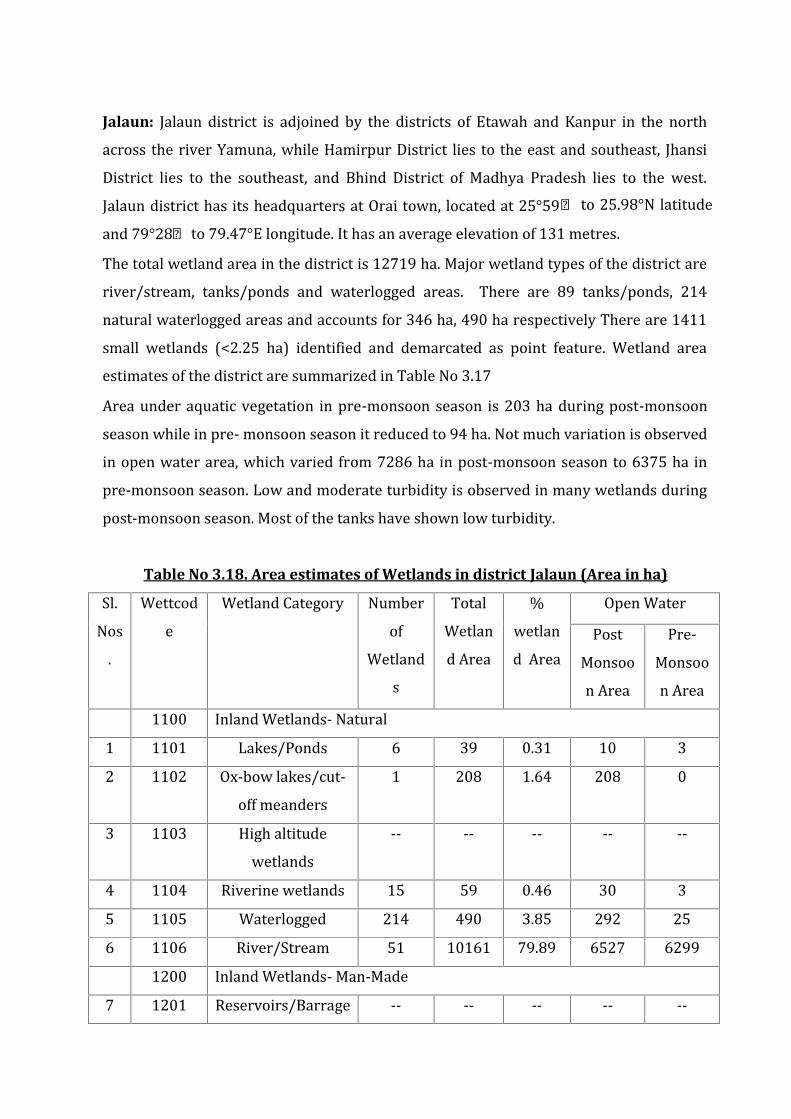
Jalaun: Jalaun district is adjoined by the districts of Etawah and Kanpur in the northacross the river Yamuna, while Hamirpur District lies to the east and southeast, JhansiDistrict lies to the southeast, and Bhind District of Madhya Pradesh lies to the west.Jalaun district has its headquarters at Orai town, located at 25°59′ to 25.98°N latitudeand 79°28′ to 79.47°E longitude. It has an average elevation of 131 metres.The total wetland area in the district is 12719 ha. Major wetland types of the district areriver/stream, tanks/ponds and waterlogged areas. There are 89 tanks/ponds, 214natural waterlogged areas and accounts for 346 ha, 490 ha respectively There are 1411small wetlands (<2.25 ha) identified and demarcated as point feature. Wetland areaestimates of the district are summarized in Table No 3.17Area under aquatic vegetation in pre-monsoon season is 203 ha during post-monsoonseason while in pre- monsoon season it reduced to 94 ha. Not much variation is observedin open water area, which varied from 7286 ha in post-monsoon season to 6375 ha inpre-monsoon season. Low and moderate turbidity is observed in many wetlands duringpost-monsoon season. Most of the tanks have shown low turbidity.Table No 3.18. Area estimates of Wetlands in district Jalaun (Area in ha)Sl.Nos.Wettcode Wetland Category NumberofWetlands
TotalWetland Area%wetland Area
Open WaterPostMonsoon AreaPre-Monsoon Area1100 Inland Wetlands- Natural1 1101 Lakes/Ponds 6 39 0.31 10 32 1102 Ox-bow lakes/cut-off meanders 1 208 1.64 208 0
3 1103 High altitudewetlands -- -- -- -- --4 1104 Riverine wetlands 15 59 0.46 30 35 1105 Waterlogged 214 490 3.85 292 256 1106 River/Stream 51 10161 79.89 6527 62991200 Inland Wetlands- Man-Made7 1201 Reservoirs/Barrage -- -- -- -- --
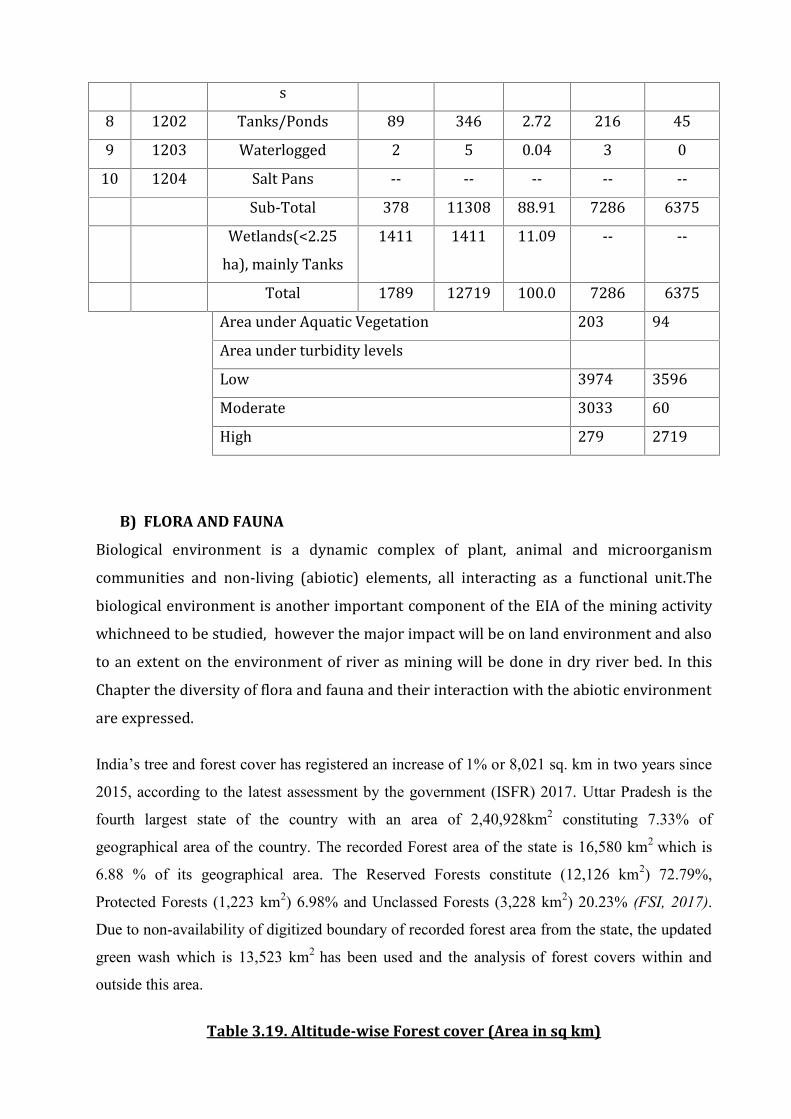
s8 1202 Tanks/Ponds 89 346 2.72 216 459 1203 Waterlogged 2 5 0.04 3 010 1204 Salt Pans -- -- -- -- --Sub-Total 378 11308 88.91 7286 6375Wetlands(<2.25ha), mainly Tanks 1411 1411 11.09 -- --Total 1789 12719 100.0 7286 6375Area under Aquatic Vegetation 203 94Area under turbidity levelsLow 3974 3596Moderate 3033 60High 279 2719
B) FLORA AND FAUNABiological environment is a dynamic complex of plant, animal and microorganismcommunities and non-living (abiotic) elements, all interacting as a functional unit.Thebiological environment is another important component of the EIA of the mining activitywhichneed to be studied, however the major impact will be on land environment and alsoto an extent on the environment of river as mining will be done in dry river bed. In thisChapter the diversity of flora and fauna and their interaction with the abiotic environmentare expressed.India’s tree and forest cover has registered an increase of 1% or 8,021 sq. km in two years since
2015, according to the latest assessment by the government (ISFR) 2017. Uttar Pradesh is the
fourth largest state of the country with an area of 2,40,928km2 constituting 7.33% of
geographical area of the country. The recorded Forest area of the state is 16,580 km2 which is
6.88 % of its geographical area. The Reserved Forests constitute (12,126 km2) 72.79%,
Protected Forests (1,223 km2) 6.98% and Unclassed Forests (3,228 km2) 20.23% (FSI, 2017).
Due to non-availability of digitized boundary of recorded forest area from the state, the updated
green wash which is 13,523 km2 has been used and the analysis of forest covers within and
outside this area.
Table 3.19. Altitude-wise Forest cover (Area in sq km)

Altitudezone (m)
Geo. Area Very DenseForest
ModerateDenseForest
Open forest Total
0-500 2,40,458 2,617 3,883 7,771 14,271500-1000 670 0 186 222 408Total 2,49,928 2,617 4069 7,993 14,679(Source :FSI,2017)
Table 3.20. Forest cover in different patch size classes
S.No. Patch size(Sq.Km)
No of patch Area (Sq.Km) %age1. 0.01-1.0 64,469 3,627 24.712. 1.0-10.0 728 1,934 13.173. 10-100 97 2,508 17.094. 100-500 20 4,086 27.845. 500-1000 4 2,524 17.19Total 65,318 14,679 100.00
(Source :FSI,2017)
Table No. 3.21.District wise list of forests
District Geographical
Area
Very
Dense
Forest
Mod.
Dense
Forest
Open
Forest
Total % of
GA
Change* Scrub
Hamirpur 4021 00 80 147 227 5.65 50 14
Jalaun 4565 00 61 188 249 5.45 4 36
Jhansi 5024 00 42 261 303 6.03 88 40
1.FLORA
QUALITATIVE STUDY OF TERRESTRIAL VEGETATIONIn order to carryout qualitative study of the terrestrial flora, buffer zone of 10 km fromriver bank of Betwa all along the stretch under study has been surveyed extensively bycriss-cross movement and records of field data were made. The plant species fallingunder dicots, monocots, pteridophytes, thalophytes, parasites, and epithytes wereenlisted in alphabetical sequence with botanical, common and family name. The list thusproduced is not absolute inventory but represents the maximum coverage.The forests of Hamirpur, Jalaun and Jhansi districts belong to the Northern Tropical Dry-
Deciduous type according to Champion & Seth Classification (group 4b). The forests of thedistrict can be considered under the following broad sub-types:- (i) Teak forests: (a) Teakforest on alluvium, (b) Teak forest on sandstone, (ii) Mixed forests, (iii) Khair forests etc.The Forest cover of the State Uttar Pradesh is given in Fig. 3.20.The area of study usually support a luxurious growth of teak saplings (Tectona grandis).Saj (Terminalia tomentosa) is the tree next in importance to teak, whose timber is largelyused for houses and furniture. Koha (Terminalia arjuna) is another tree growing on riverbanks. Tendu or Ebony (Diospyros tomentosa) is fairly common. The black heartwood ofthis tree is valuable and is used for furniture and the fruit is edible.The southern half isalmost bare without any sign of tree growth on black soil the hardy babul growsspontaneously and in the riverine tracts there is generally mixed jungle of small andstunted scrubtype. The Khair (Acacia catechu) is a common tree and the other treesinclude the hingol, karaunda (Carisa opaca) and karil (Caparia decidua). Other commonspecies besides the mahua (Mudhuca indica) are the semal (Salmalia malabarica) dudhi(Holarrhena antidyssentrica), dhawa (Anogeissus latifolia) gurja (Lannea coromandelica),dhak (Butea monospermal), rioni khair and kardhai. Saleh (Boswellia serrata) is acommon tree on the dry hillsides. It is considered of little value locally. The timber of thistree is of good quality when it grows to a large size but it is usually found as a small treewith little or no heartwood. The wood is sometimes used for planks and sports and is abad fuel. The bark is used for tanning and the leaves for fodder. Kullu (Sterculia urens) isanother tree characteristic of the hills and plateau and is conspicuous for its lightcoloured smooth bark. Sejo or Lendia (Lagerstroemia parviflora) is a common tree and isimportant as one of the best timbers of the mixed forests. Its wood is used for housepillars, rafters and agricultural implements.Ghout (Ziziphus xylopyrus) is a small tree with grey or reddish brown bark and thickoblong exfoliating scales. This tree is a very frequent one and lac is grown on it. 1t has alarge round fruit and three pointed leaves alike to that of the Bel tree (Aegle marmelos)but relatively small in size.Hadlu (Adina cordifolia) is a fairly common and a beautiful, imposing tree with whiterough bark and large round leaves. Chheola or Palas (Butea monosperma) is a tree ofmoderate size, common on both government and private forests. It has brilliant, scarletorange flowers which are locally called Tesu and give a good, red, yellow dye. It exudes aruby coloured gum when cut, which is used as medicine for dysentery. Ropes are madefrom the fibres of the roots and are said to withstand the rains better than ordinary hemp.
Aonla (Emblica officinalis) is a small but pretty tree found both in the forests and invillages. The bark and leaves are used for tanning and as a medicine and the fruit is edible.This tree is considered sacred by the local people.Dhavari (Woodfordia floribunda) is a large shrub conspicuous on dry hillsides and rockyground with red flowers from which a dye is obtained for colouring silk. Kumhi(Cochlospermum gossypium) is a small tree with thick spreading branches and ischaracteristic of the driest and stoniest slopes. It is always conspicuous and covered withlarge brilliant yellow flowers, or in full foliage with glossy green leaves.Achar(Buchanania lanzan) is a very common tree in the forestsand is only leafless for ashort time. Its characteristic bark, dark grey or nearly black in colour and thick, rough andtessellated with regular boss-like prominences makes this tree conspicuous. The kernel ofthe fruit is called Chironji which is edible. Karonda (Carissa carandas) is a large thornyshrub whose branches are used for fencing. Neem (Azadirachta indica) is a commonvillage tree and is also found in roadside avenues, for which it makes an excellent tree,giving shade in the hot season. Banyan, pipal and tamarind are other village trees. The beror wild plum (Ziziphus jujuba) is a common village tree, as is also the Bel (Aeglemarmelos), the tree sacred to Lord Siva, the fruit of which is used as medicine. The prettyMununga (Moringa pterygosperma) is largely cultivated in villages for its edible fruits.The best grazing grasses in the district are Musyal (Iseilema laxum) and Kel or Kuila(Andropogon annulatus). The leaves of kel are long and those of musyal are short thelatter is a small grass which keeps fresh for a long time. Parwariya (Heteropogon
contortus) is also a good grazing grass especially when young.Plantaions of trees such as mango, mahua, jamun (Syzygium cumini), sissoo (Dalbergia
sissoo), siris, amaltas (Cassia fistula), gulmohar (Delonix regia), pipal (Ficus religiosa),arjuna (Terminalia arjuna), kanji (Pongamia pinnata), bargad (Ficus bengalensis), andneem (Azadirachta indica) were raised along the PWD roads under the roadside avenuelsscheme. List of plant species found in the region, are given in the following tables.
TableNo. 3.22 List of plant species that are commonly found in the area
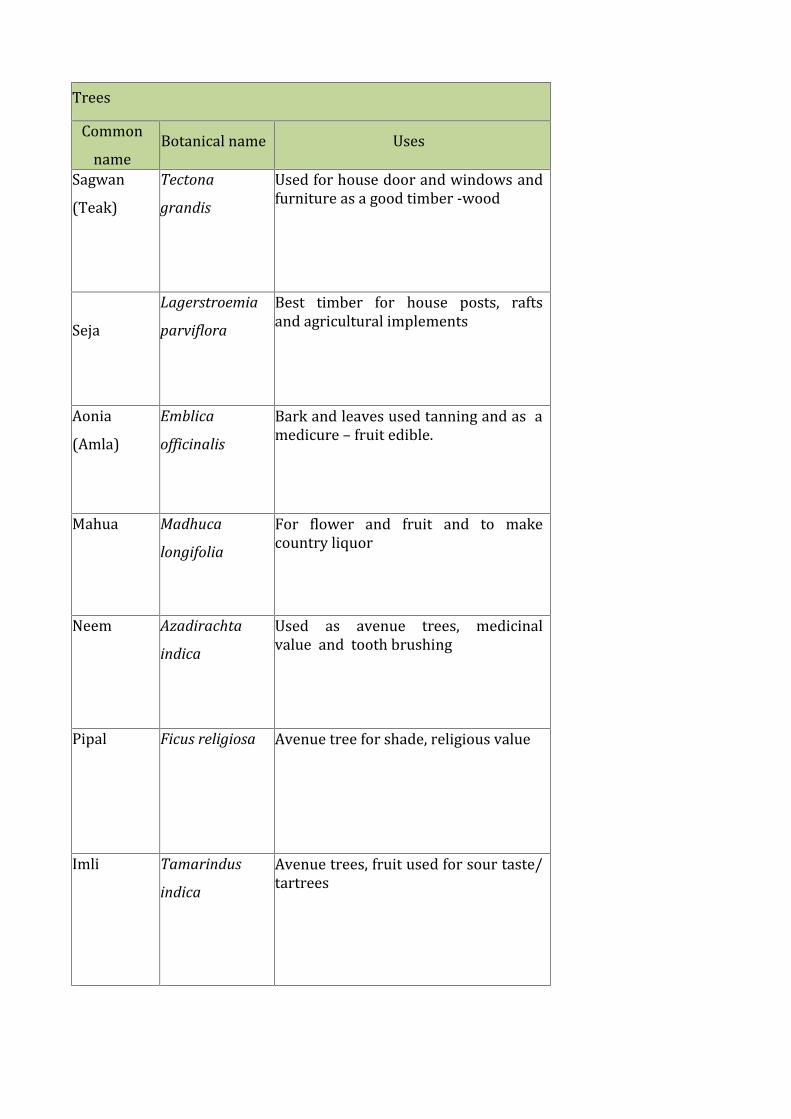
TreesCommonname Botanical name UsesSagwan(Teak) Tectona
grandis
Used for house door and windows andfurniture as a good timber -wood
Seja Lagerstroemia
parviflora
Best timber for house posts, raftsand agricultural implementsAonia(Amla) Emblica
officinalis
Bark and leaves used tanning and as amedicure – fruit edible.Mahua Madhuca
longifolia
For flower and fruit and to makecountry liquorNeem Azadirachta
indica
Used as avenue trees, medicinalvalue and tooth brushingPipal Ficus religiosa Avenue tree for shade, religious value
Imli Tamarindus
indica
Avenue trees, fruit used for sour taste/tartrees
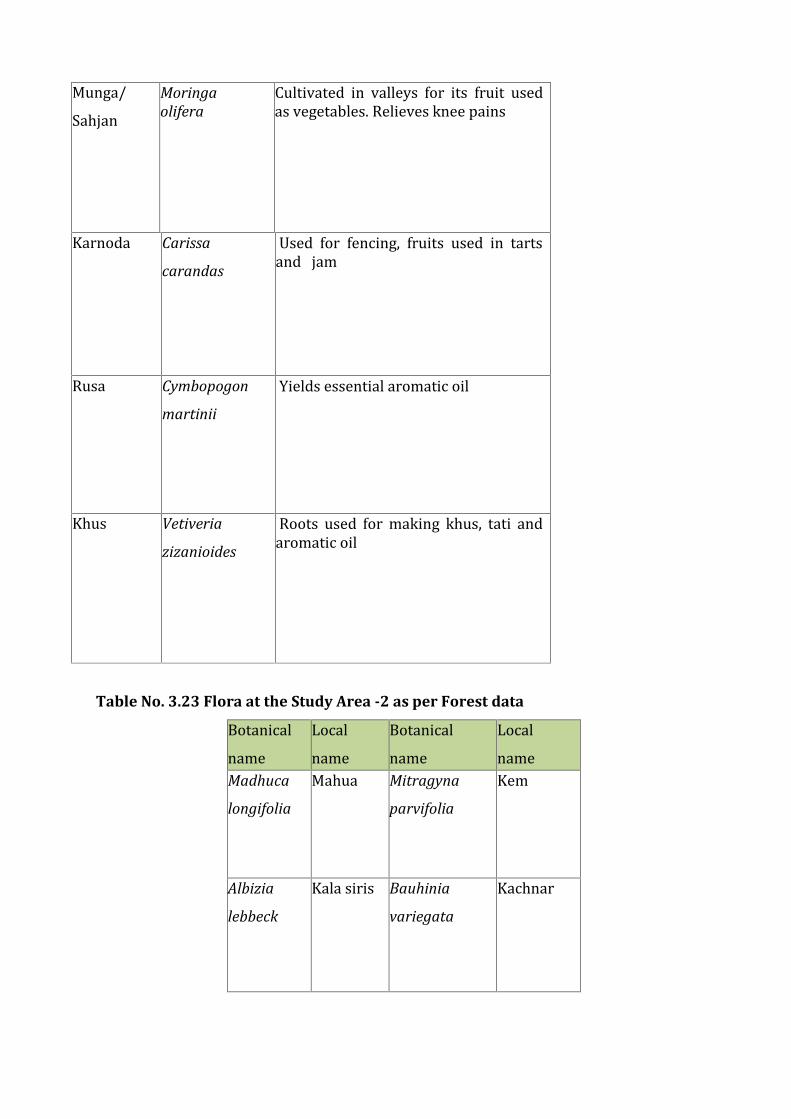
Munga/Sahjan Moringaolifera
Cultivated in valleys for its fruit usedas vegetables. Relieves knee pains
Karnoda Carissa
carandas
Used for fencing, fruits used in tartsand jam
Rusa Cymbopogon
martinii
Yields essential aromatic oil
Khus Vetiveria
zizanioides
Roots used for making khus, tati andaromatic oil
Table No. 3.23 Flora at the Study Area -2 as per Forest dataBotanicalname Localname Botanicalname LocalnameMadhuca
longifolia
Mahua Mitragyna
parvifolia
KemAlbizia
lebbeck
Kala siris Bauhinia
variegata
Kachnar
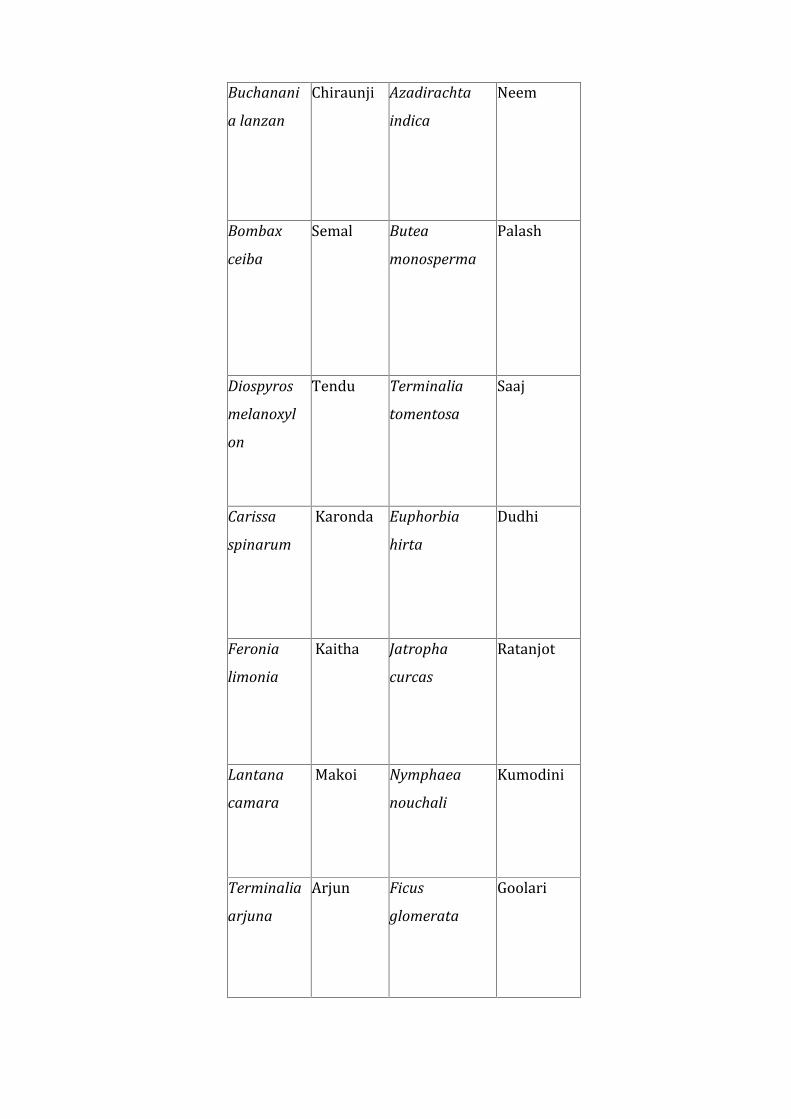
Buchanani
a lanzan
Chiraunji Azadirachta
indica
Neem
Bombax
ceiba
Semal Butea
monosperma
Palash
Diospyros
melanoxyl
on
Tendu Terminalia
tomentosa
Saaj
Carissa
spinarum
Karonda Euphorbia
hirta
Dudhi
Feronia
limonia
Kaitha Jatropha
curcas
Ratanjot
Lantana
camara
Makoi Nymphaea
nouchali
Kumodini
Terminalia
arjuna
Arjun Ficus
glomerata
Goolari

Syzygium
cumini
Jamun Ziziphus
mauritiana
Ber
Sterculia
urens
Kullu Emblica
officinalis
Amla
Terminalia
bellirica
Bahera
Among the flora given in the table above, some of the species are found at the Study Area-2 while others are found within the 10 km radius of the Study Area . Plant species foundat project region and its surroundings are enlisted in the following tables:Table No. 3.24 Flora at the Study Area -2
BotanicalName Family CommonName
Tectonagrandis Lamiaceae Sagoan
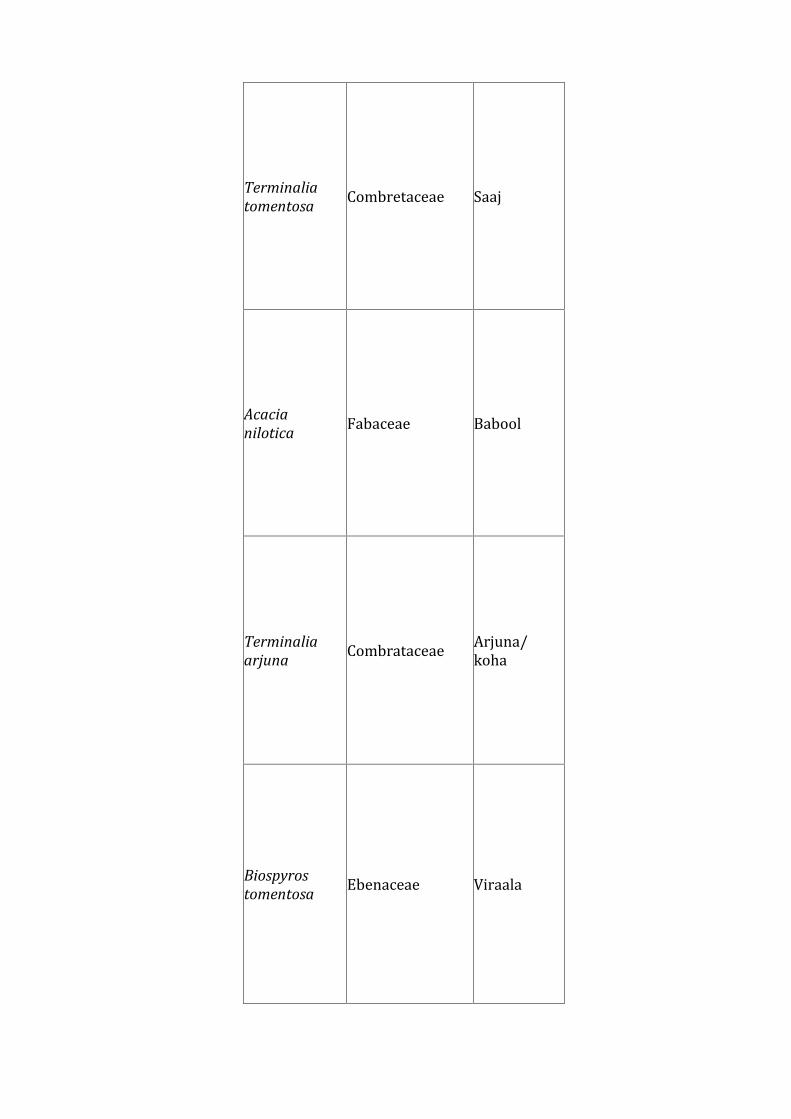
Terminaliatomentosa
Combretaceae Saaj
Acacianilotica Fabaceae Babool
Terminaliaarjuna
Combrataceae Arjuna/koha
Biospyrostomentosa
Ebenaceae Viraala
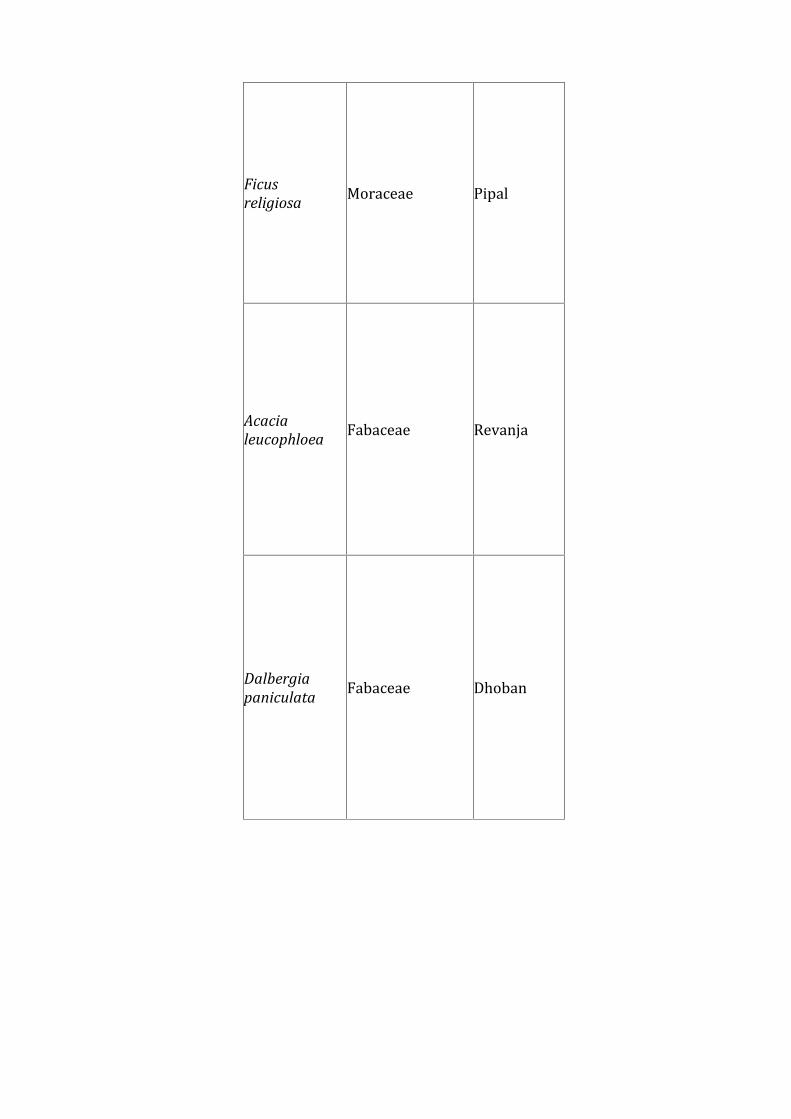
Ficusreligiosa Moraceae Pipal
Acacialeucophloea
Fabaceae Revanja
Dalbergiapaniculata
Fabaceae Dhoban
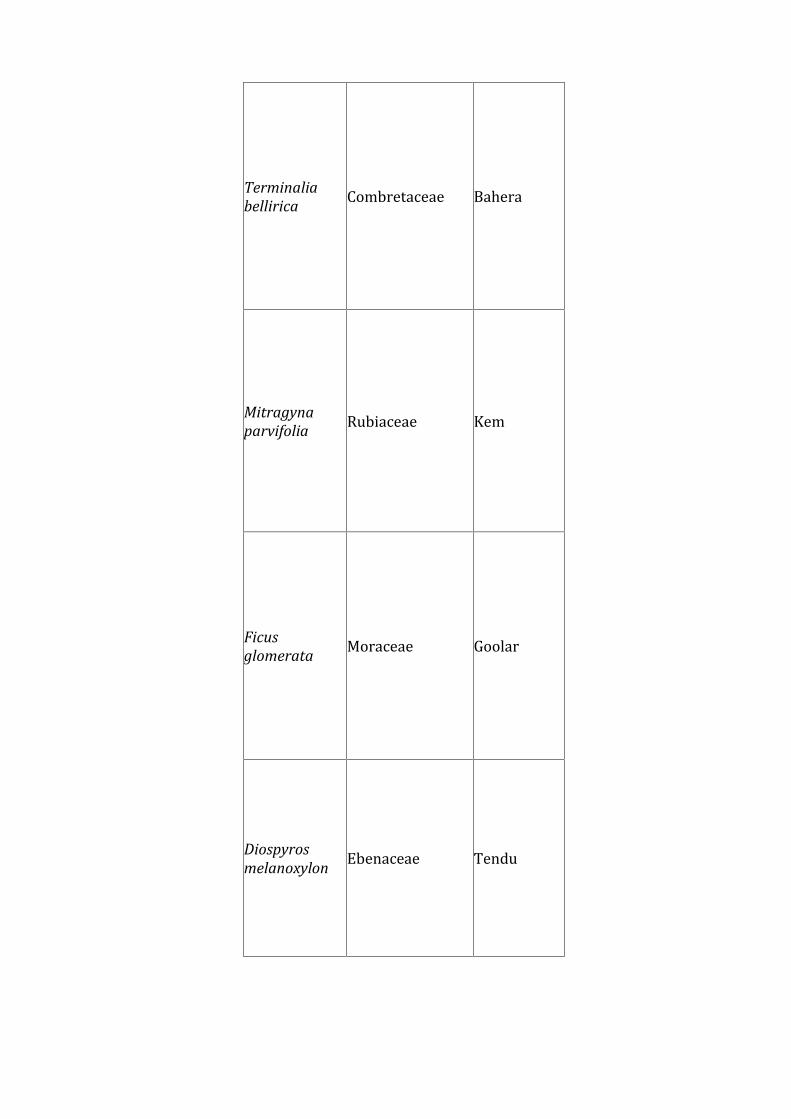
Terminaliabellirica
Combretaceae Bahera
Mitragynaparvifolia Rubiaceae Kem
Ficusglomerata
Moraceae Goolar
Diospyrosmelanoxylon
Ebenaceae Tendu

Dodonaeaviscosa
Dodonaeaviscosa Dodonaeaviscosa
Sapindaceae Sapindaceae Sapindaceae
Cassia fistula Caesalpiniaceae Amaltas
Bauhiniaracemosa
Caesalpiniaceae Aashto
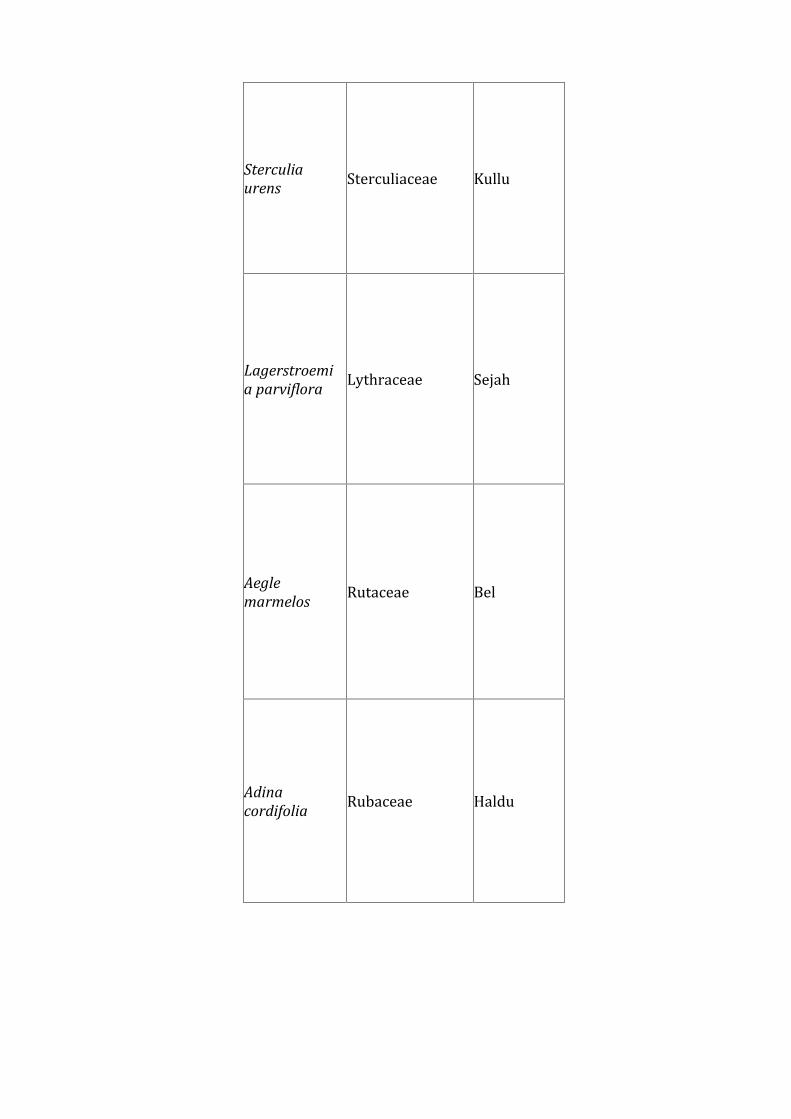
Sterculiaurens Sterculiaceae Kullu
Lagerstroemia parviflora
Lythraceae Sejah
Aeglemarmelos
Rutaceae Bel
Adinacordifolia
Rubaceae Haldu
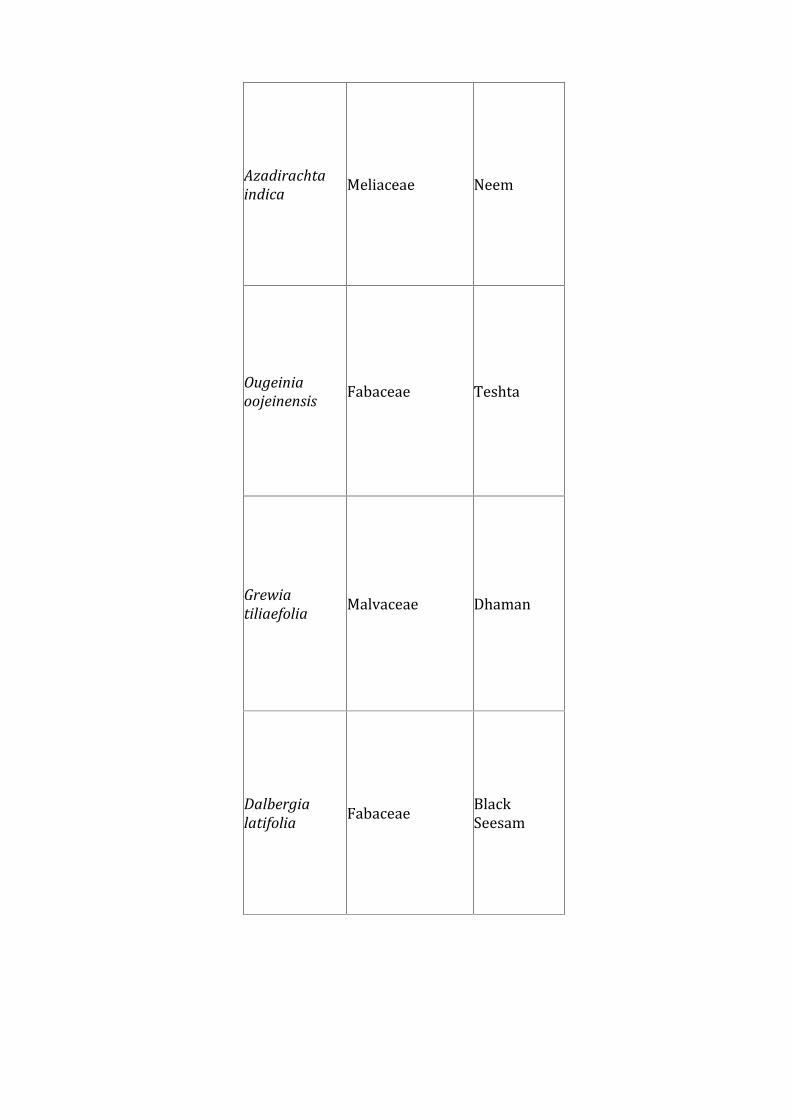
Azadirachtaindica
Meliaceae Neem
Ougeiniaoojeinensis
Fabaceae Teshta
Grewiatiliaefolia
Malvaceae Dhaman
Dalbergialatifolia
Fabaceae BlackSeesam
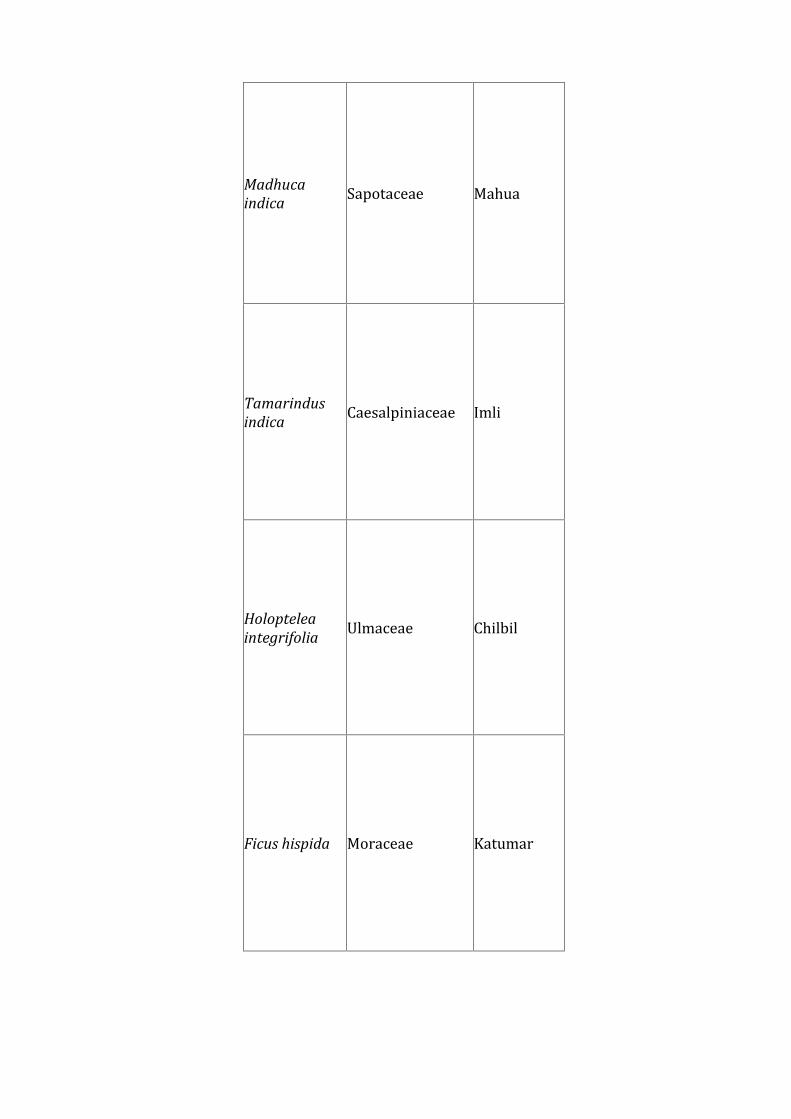
Madhucaindica
Sapotaceae Mahua
Tamarindusindica
Caesalpiniaceae Imli
Holopteleaintegrifolia
Ulmaceae Chilbil
Ficus hispida Moraceae Katumar

Ziziphusxylopyrus Rhaminaceae Kathber
Holarrhenaantidysenterica
Apocyanaceae Doogi
Gardenialatifolia
Rubiaceae Papada
Crataevareligiosa
Capparidaceae Barnov
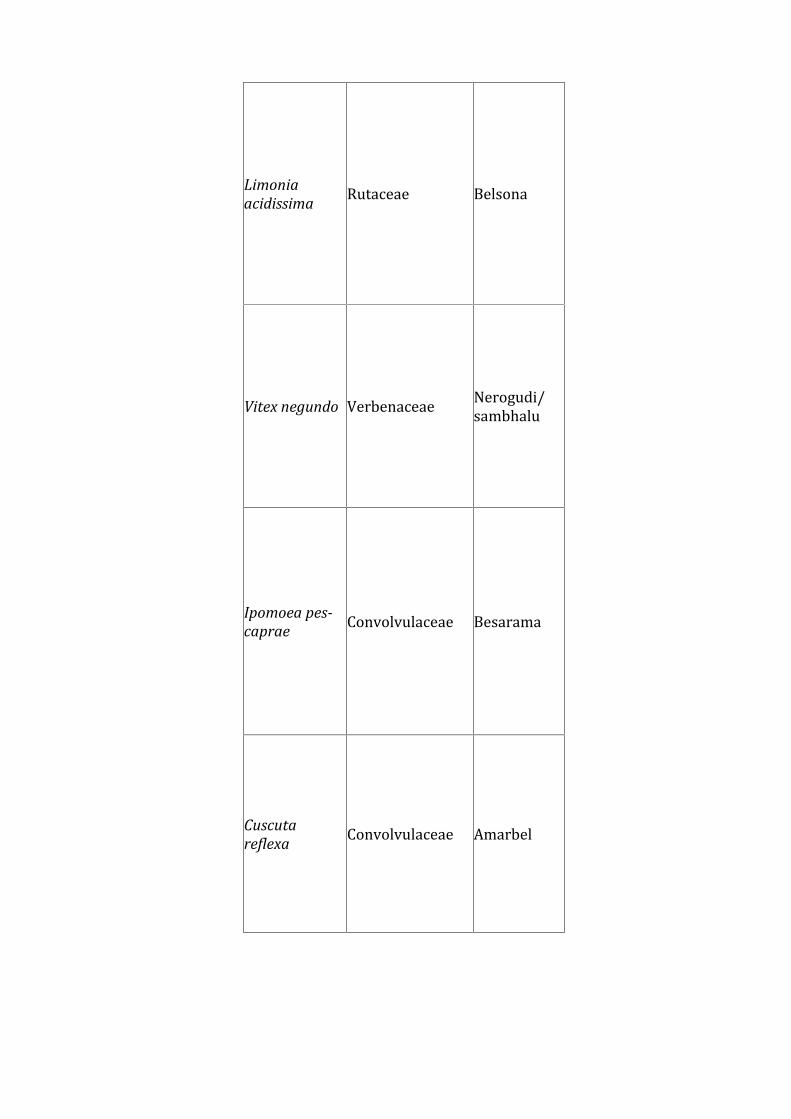
Limoniaacidissima
Rutaceae Belsona
Vitex negundo Verbenaceae Nerogudi/sambhalu
Ipomoea pes-caprae Convolvulaceae Besarama
Cuscutareflexa
Convolvulaceae Amarbel

Ricinuscommunis Euphorbiaceae Arandi
Lantanacamara
Verbenaceae Vedaysini
Annonasquamosa Annonaceae Sitaphal
Gardeniaturgida Rubiaceae Fatara
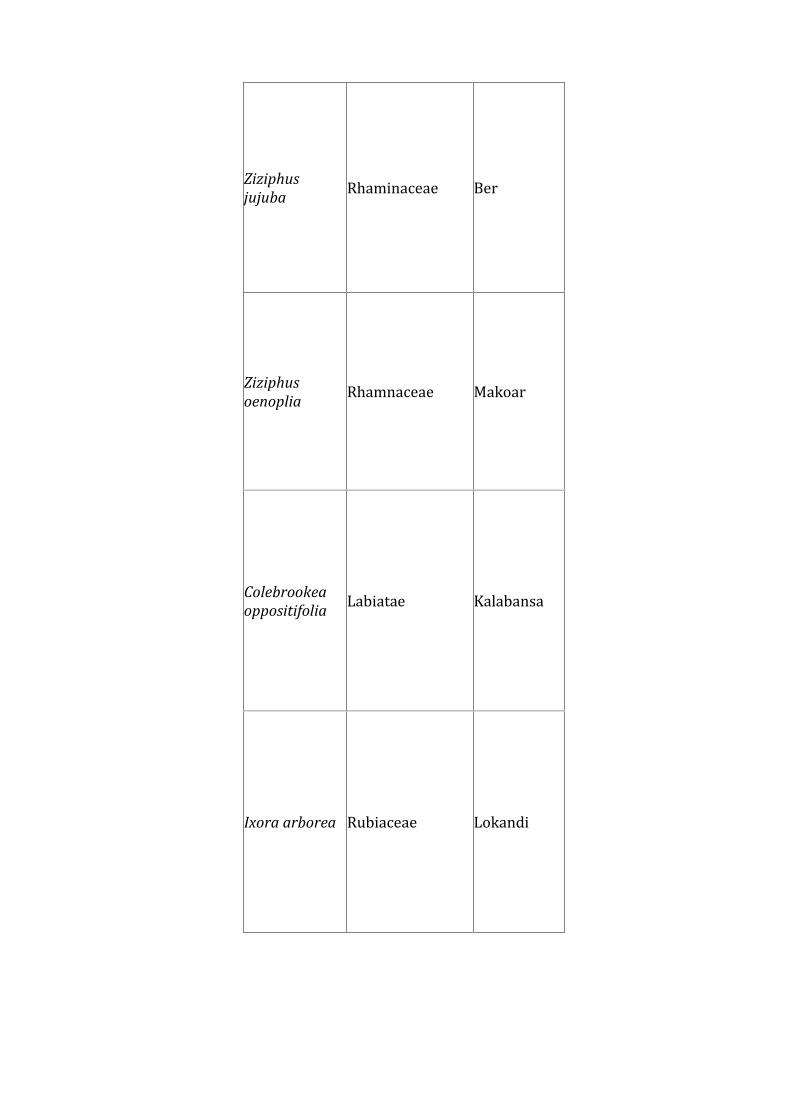
Ziziphusjujuba Rhaminaceae Ber
Ziziphusoenoplia
Rhamnaceae Makoar
Colebrookeaoppositifolia
Labiatae Kalabansa
Ixora arborea Rubiaceae Lokandi
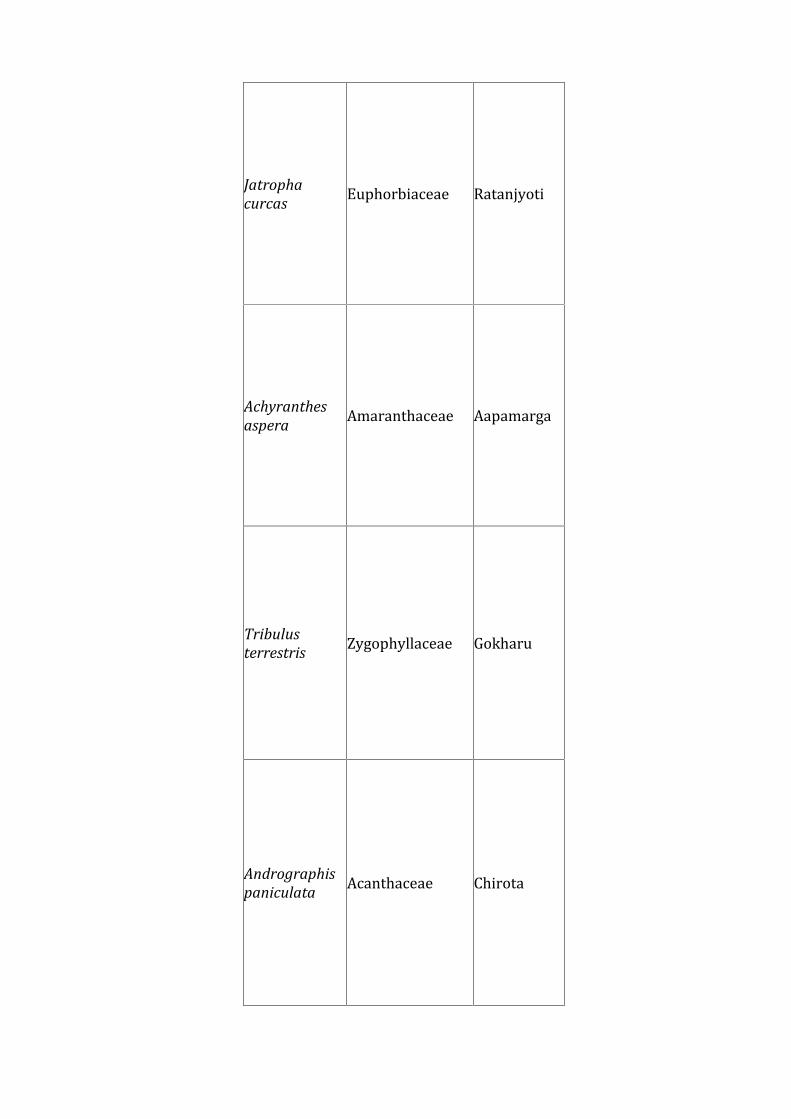
Jatrophacurcas
Euphorbiaceae Ratanjyoti
Achyranthesaspera
Amaranthaceae Aapamarga
Tribulusterrestris Zygophyllaceae Gokharu
Andrographispaniculata Acanthaceae Chirota
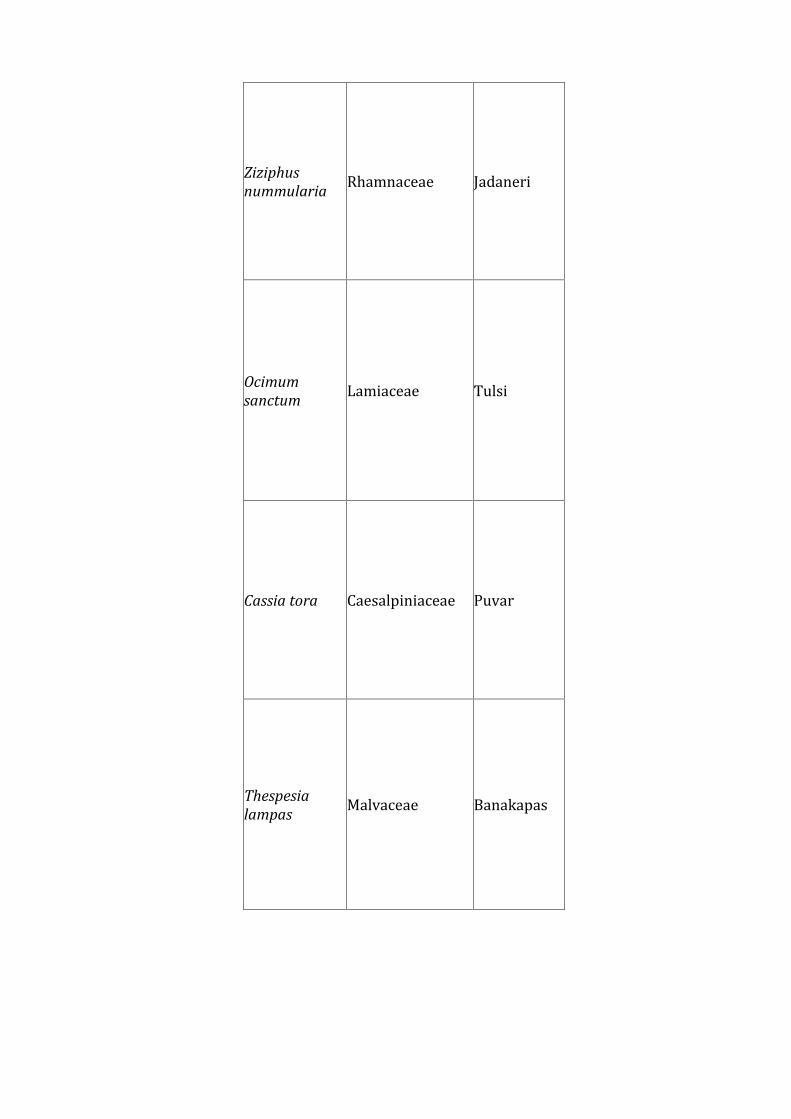
Ziziphusnummularia
Rhamnaceae Jadaneri
Ocimumsanctum
Lamiaceae Tulsi
Cassia tora Caesalpiniaceae Puvar
Thespesialampas
Malvaceae Banakapas
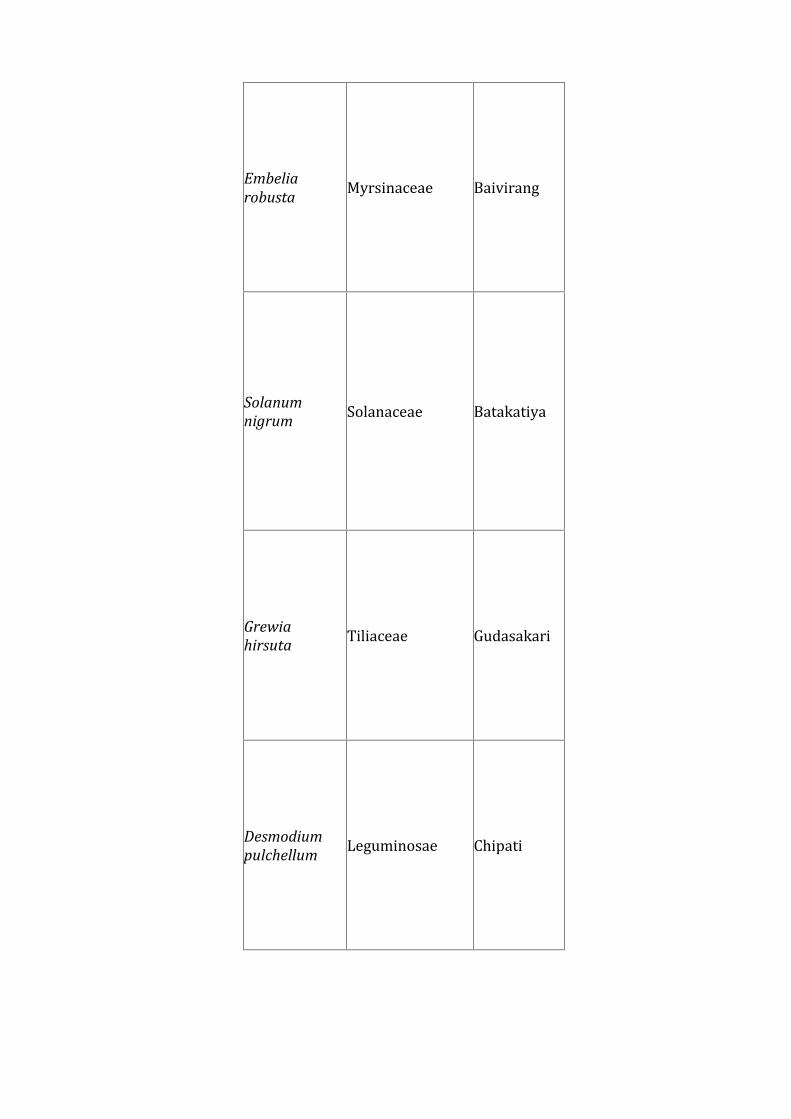
Embeliarobusta
Myrsinaceae Baivirang
Solanumnigrum Solanaceae Batakatiya
Grewiahirsuta Tiliaceae Gudasakari
Desmodiumpulchellum
Leguminosae Chipati
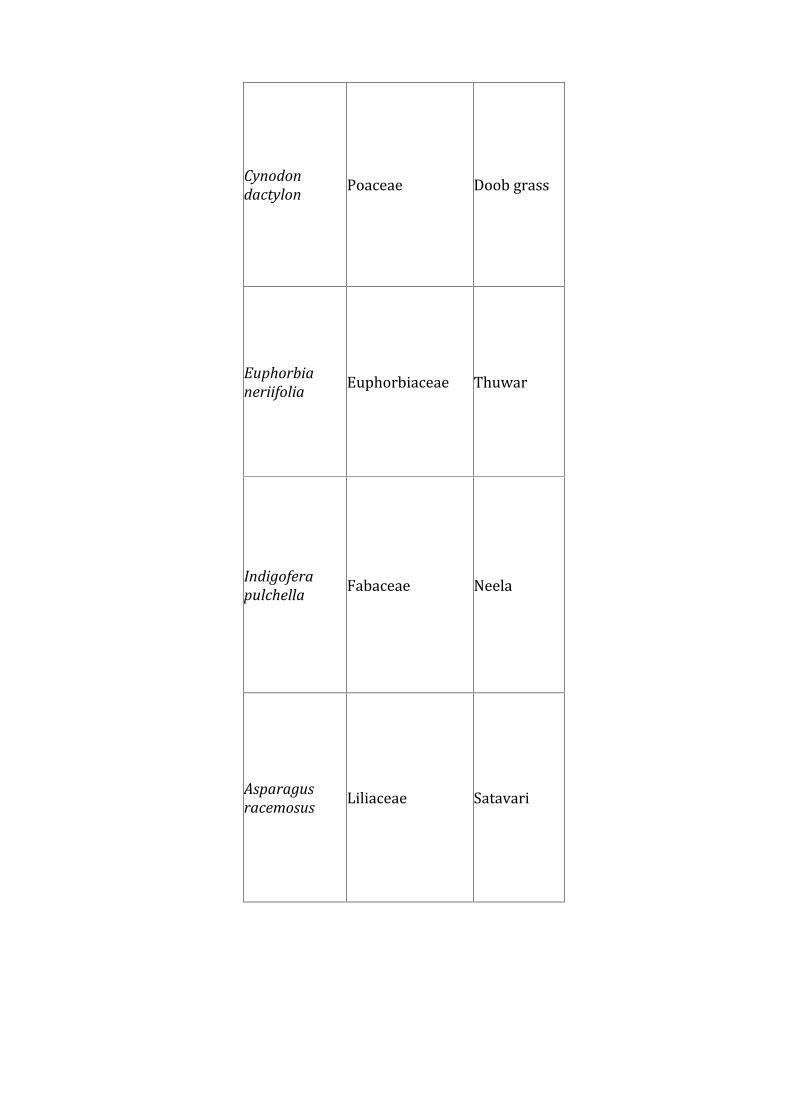
Cynodondactylon
Poaceae Doob grass
Euphorbianeriifolia
Euphorbiaceae Thuwar
Indigoferapulchella Fabaceae Neela
Asparagusracemosus
Liliaceae Satavari

Ecliptaprostrata
Asteraceae Bhrungraj
Vernoniaindica Asteraceae Mohati
Table No. 3.25 Climbers & Grasses at the Study Area
Botanical Name Family CommonNameName

Ventilago calyculata Rhamnaceae Kevto
Abrus precatorius Leguminosae Gunjha
Ichnocarpus frutescens Apocynaceae Demarbel
Acacia pennata Leguminosae Raini
Butea superba Leguminosae Palasbel

Bauhinia vahlii Leguminosae Mahul
Saccharum spontaneum Poaceae Kans
Dendrocalamus strictus Poaceae Baans
Iseilema laxum Poaceae Mushel

Desmostachyabipinnata
Poceae Khus
Vetiveria zizanioides Poaceae Khas
Aristida setacea Poaceae Jhani
Table No. 3.26 Flora around the Study Area
Botanical Name Family CommonName

Tectona grandis Lamiaceae Sagoan
Terminaliatomentosa
Combretaceae Saaj
Anogeissus latifolia Combretaceae Dhaora
Terminalia arjuna Combrataceae Arjuna/ koha
Syzygium cumini Myrtaceae jamun
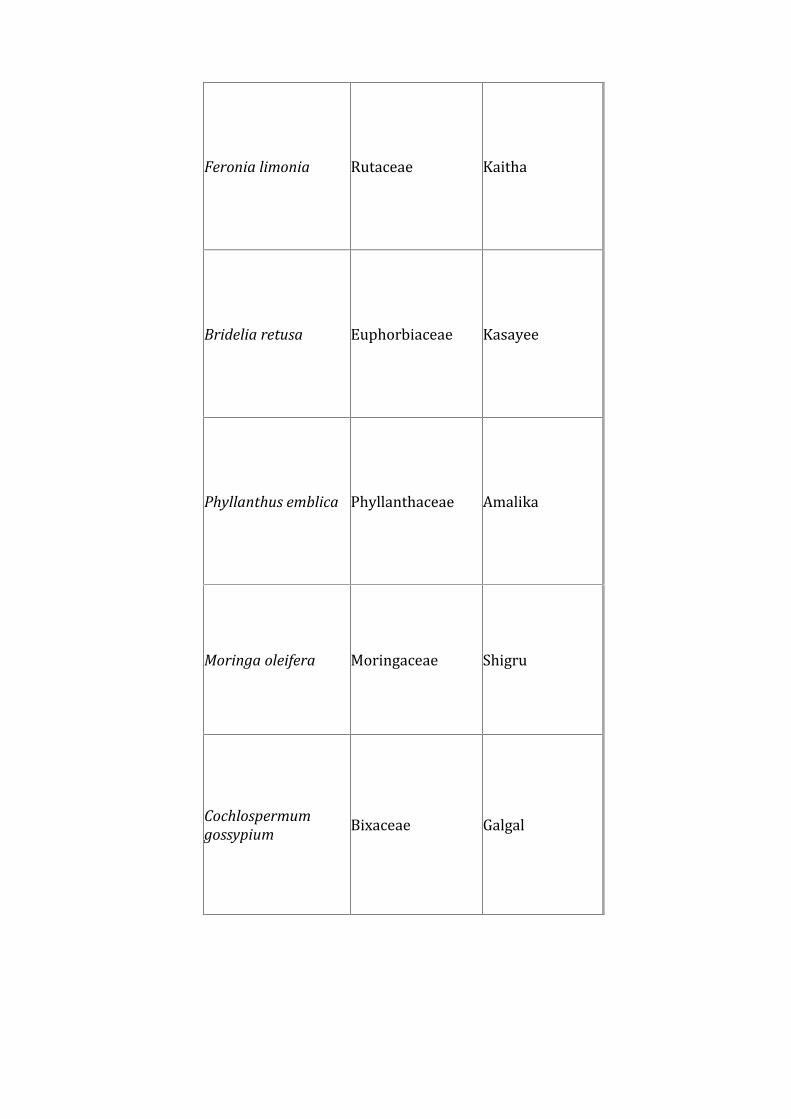
Feronia limonia Rutaceae Kaitha
Bridelia retusa Euphorbiaceae Kasayee
Phyllanthus emblica Phyllanthaceae Amalika
Moringa oleifera Moringaceae Shigru
Cochlospermumgossypium
Bixaceae Galgal

Lannea grandis Anacardiaceae Kimul
Emblica officinalis Euphorbiaceae Amla
Ficus religiosa Moraceae Pipal
Acacia leucophloea Fabaceae Revanja
Dalbergiapaniculata Fabaceae Dhoban
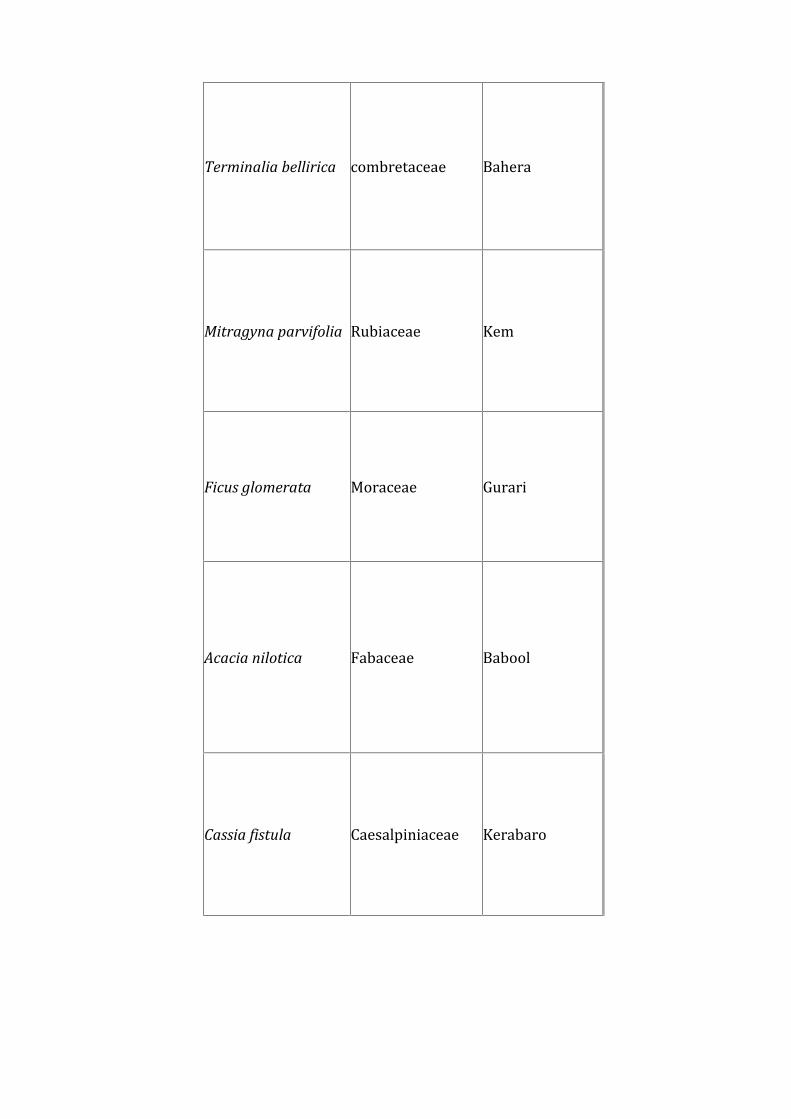
Terminalia bellirica combretaceae Bahera
Mitragyna parvifolia Rubiaceae Kem
Ficus glomerata Moraceae Gurari
Acacia nilotica Fabaceae Babool
Cassia fistula Caesalpiniaceae Kerabaro

Alangiumsalvifolium Cornaceae Akola
Achyranthes aspera Amaranthaceae Aapamarga
Garuga pinnata Burseraceae Khekda
Sterculia urens Sterculiaceae Kullu
Lagerstroemiaparviflora
Lythraceae Sejah
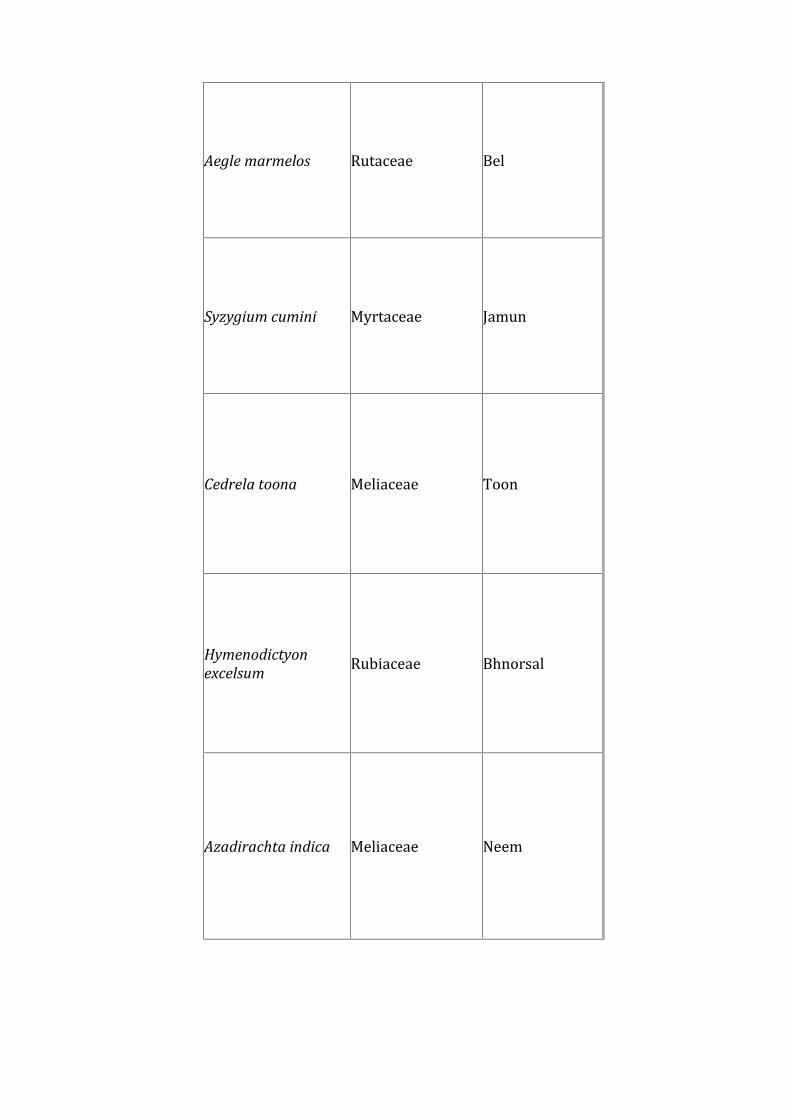
Aegle marmelos Rutaceae Bel
Syzygium cumini Myrtaceae Jamun
Cedrela toona Meliaceae Toon
Hymenodictyonexcelsum
Rubiaceae Bhnorsal
Azadirachta indica Meliaceae Neem

Acacia nilotica Fabaceae Babul
Bassia latifolia Sapotaceae Mahua
Diospyrosmelanoxylon Ebenaceae Tendu
Madhuca longifolia Sapotaceae Mahua
Tamarindus indica Caesalpiniaceae Imli
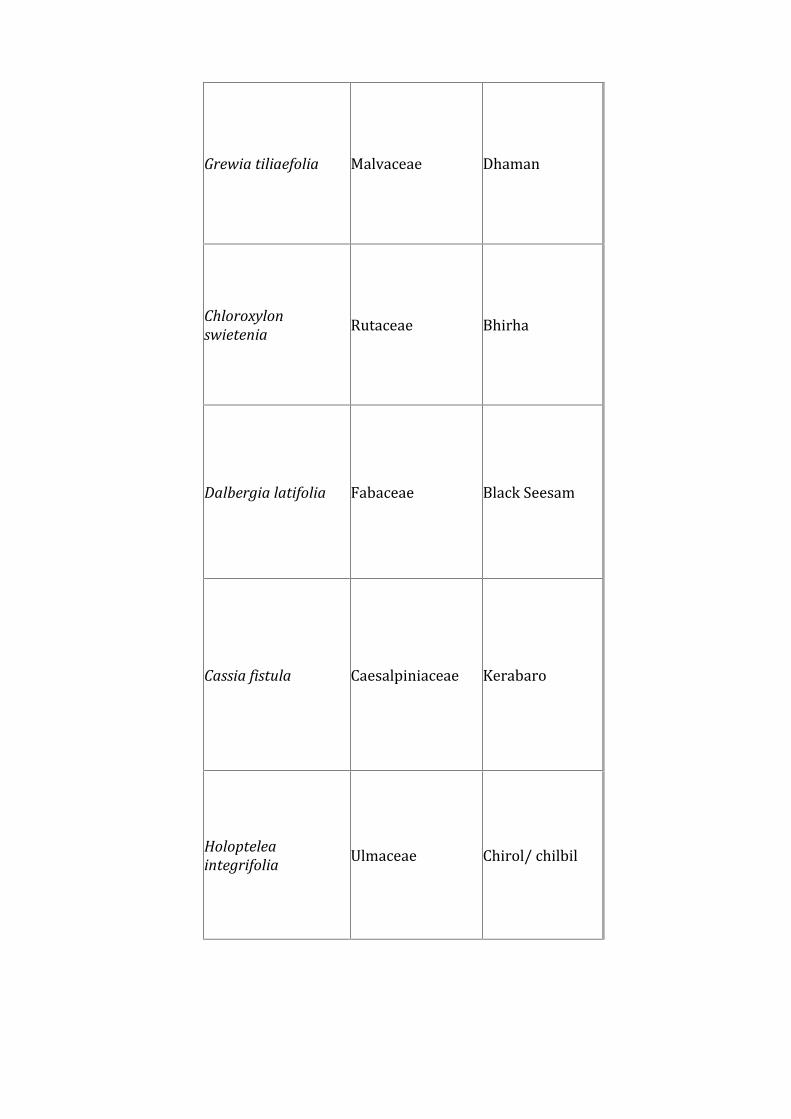
Grewia tiliaefolia Malvaceae Dhaman
Chloroxylonswietenia
Rutaceae Bhirha
Dalbergia latifolia Fabaceae Black Seesam
Cassia fistula Caesalpiniaceae Kerabaro
Holopteleaintegrifolia Ulmaceae Chirol/ chilbil

Ficus hispida Moraceae Katumar
Ziziphus xylopyrus Rhaminaceae Kathber
Adhatoda vasica Acanthaceae Adusa
Helicteres isora Sterculiaceae Marorphali
Bauhinia racemosa Caesalpiniaceae Aashto
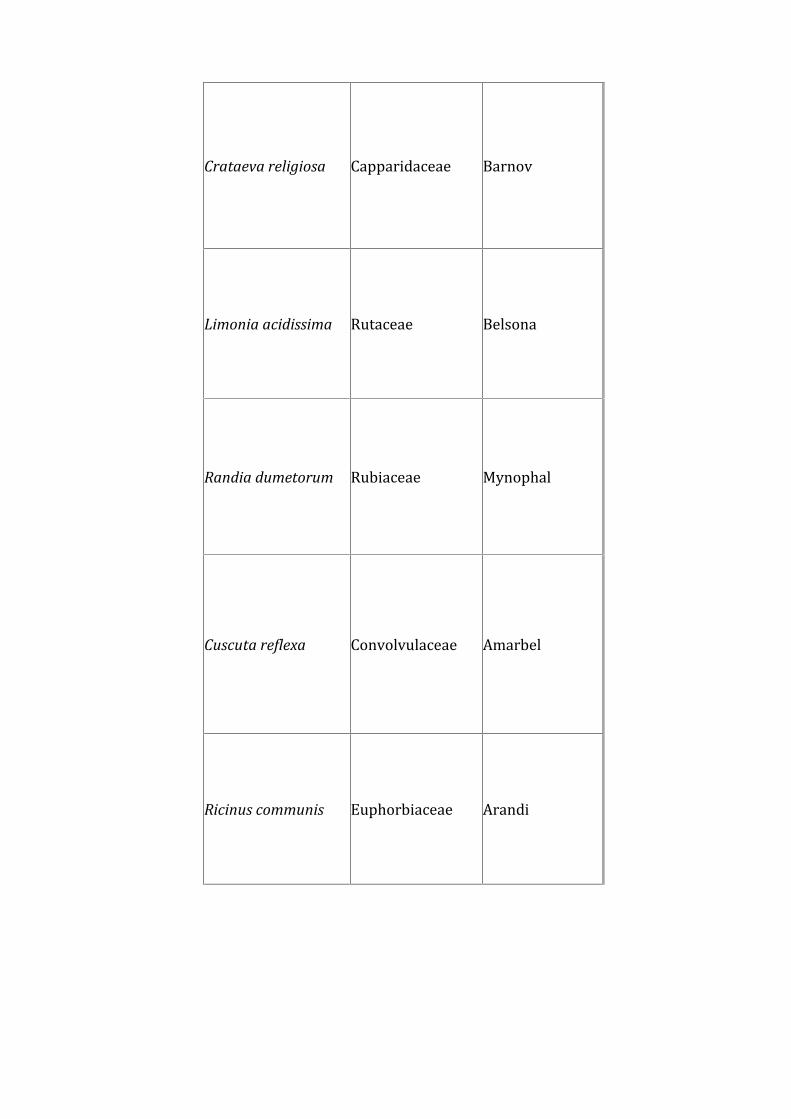
Crataeva religiosa Capparidaceae Barnov
Limonia acidissima Rutaceae Belsona
Randia dumetorum Rubiaceae Mynophal
Cuscuta reflexa Convolvulaceae Amarbel
Ricinus communis Euphorbiaceae Arandi

Lantana camara Verbenaceae Vedaysini
Annona squamosa Annonaceae Sitaphal
Vitex negundo Verbenaceae Nerogudi
Dodonaea viscosa Sapindaceae Kharetha
Holarrhenaantidysenterica
Apocyanaceae Doogi

Gardenia latifolia Rubiaceae Papada
Gardenia turgida Rubiaceae Fatara
Ziziphus jujuba Rhaminaceae Bera
Semecarpusanacardium
Anacardiaceae Belma
Ixora arborea Rubiaceae Lokandi
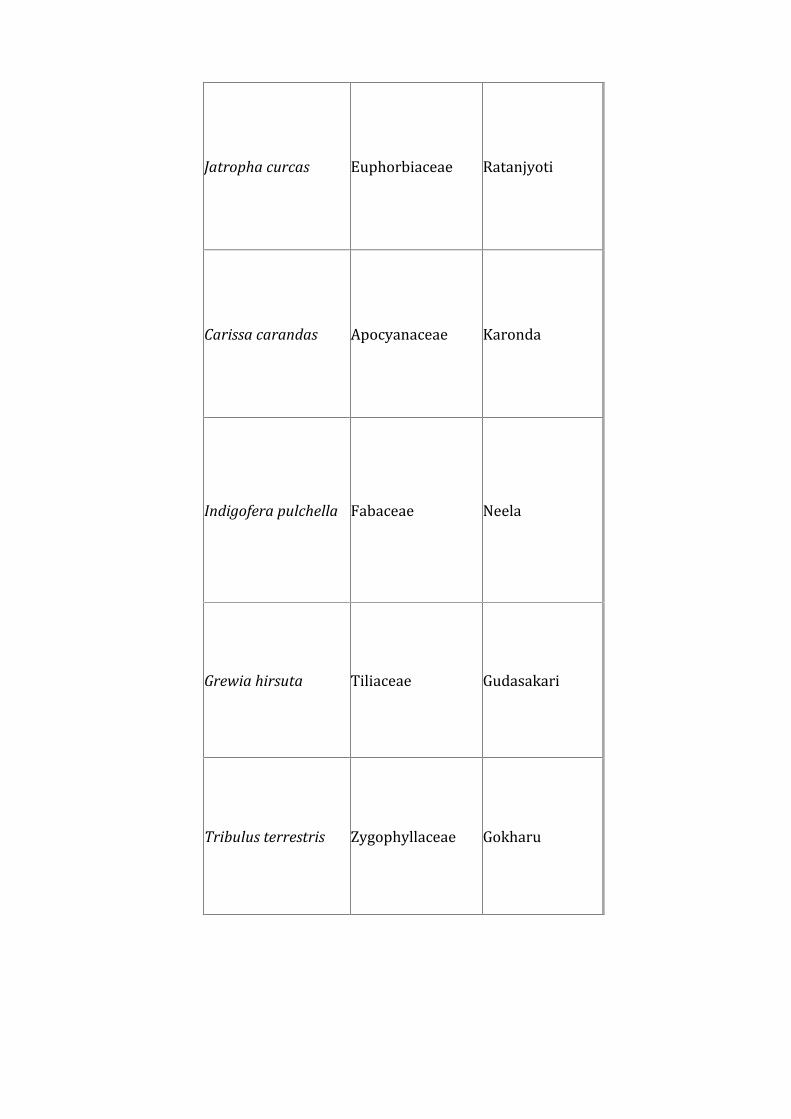
Jatropha curcas Euphorbiaceae Ratanjyoti
Carissa carandas Apocyanaceae Karonda
Indigofera pulchella Fabaceae Neela
Grewia hirsuta Tiliaceae Gudasakari
Tribulus terrestris Zygophyllaceae Gokharu

Andrographispaniculata Acanthaceae Chirota
Ziziphusnummularia
Rhamnaceae Jadaneri
Ocimum sanctum Lamiaceae Tulsi
Xanthiumstrumarium
Asteraceae Godhara
Desmodiumpulchellum Leguminosae Chipati
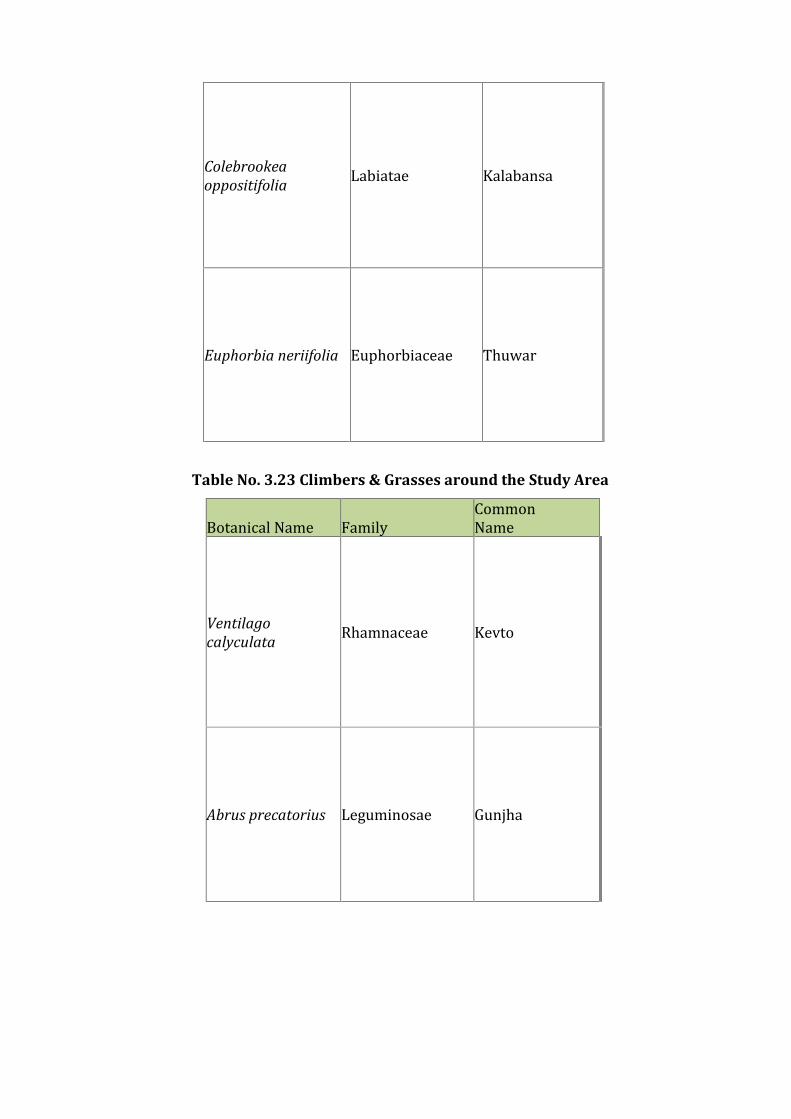
Colebrookeaoppositifolia
Labiatae Kalabansa
Euphorbia neriifolia Euphorbiaceae Thuwar
Table No. 3.23 Climbers & Grasses around the Study Area
Botanical Name Family CommonNameVentilagocalyculata
Rhamnaceae Kevto
Abrus precatorius Leguminosae Gunjha

Ichnocarpusfrutescens
Apocynaceae Demarbel
Butea superba Leguminosae Palasbel
Bauhinia vahlii Leguminosae Mahul
Saccharumspontaneum
Poaceae Kans
Dendrocalamusstrictus
Poaceae Bhans
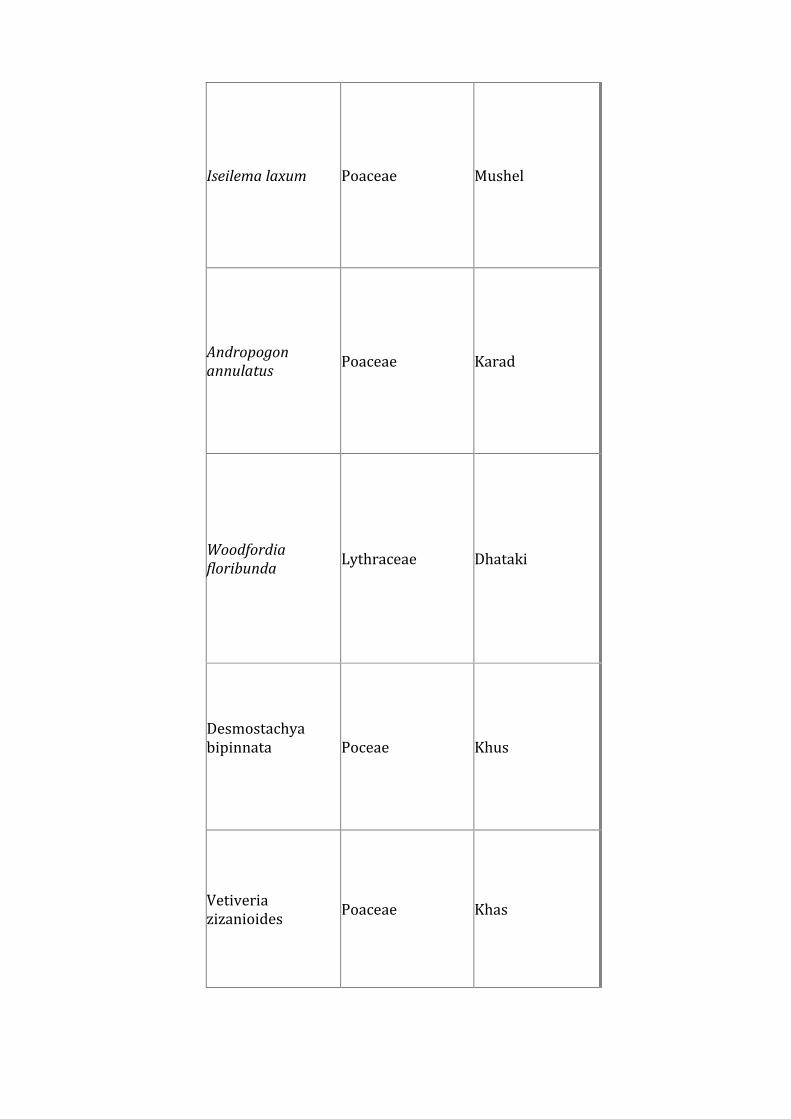
Iseilema laxum Poaceae Mushel
Andropogonannulatus Poaceae Karad
Woodfordiafloribunda Lythraceae Dhataki
Desmostachyabipinnata Poceae Khus
Vetiveriazizanioides Poaceae Khas

Aristida setacea Poaceae Jhani
Cynodon dactylon Poaceae Dhoob grass
Dichanthiumannulatum Poaceae Bhuravel
Eragrostisinterrupta Poaceae Bhurabhusi choti
Medicinal plantsLists of the medicinal plants found at Study Area and its surrounding regions.Table No.3.27: List of medicinal plants used by the tribe
No. Botanical Name ofthe plant Local name ofmedicinal plant Disorder Part of theplant used Mode of use
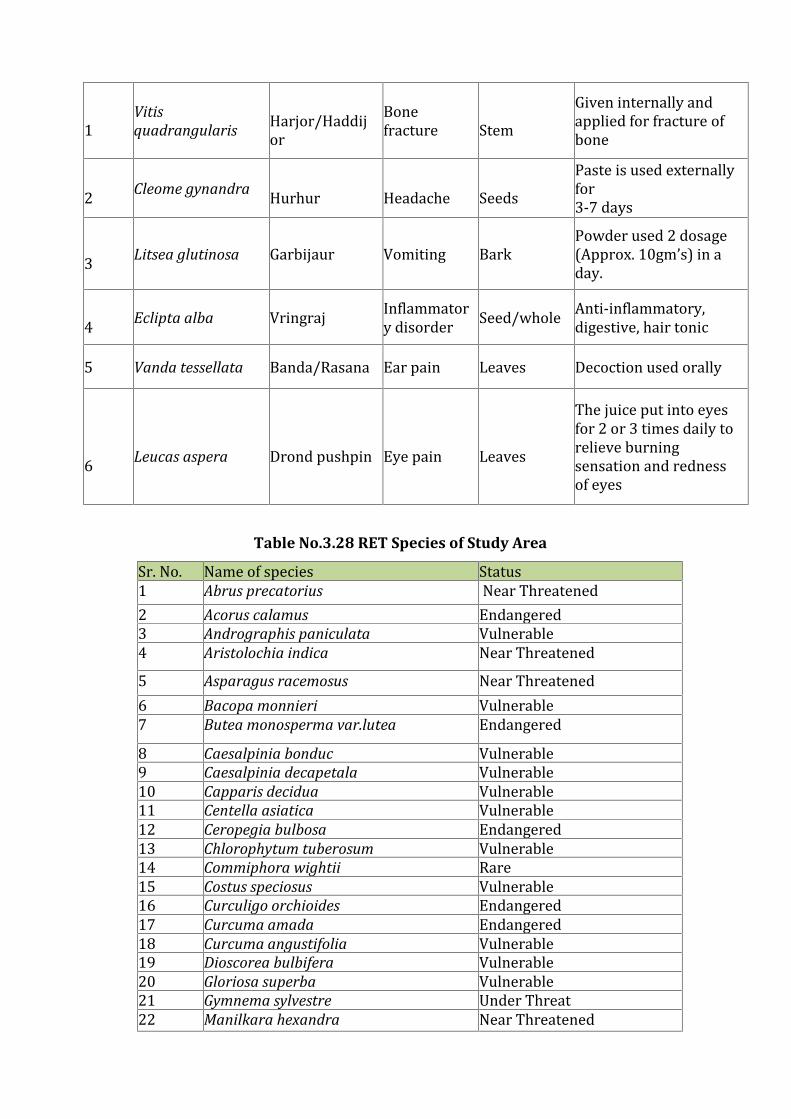
1 Vitisquadrangularis Harjor/Haddijor Bonefracture Stem Given internally andapplied for fracture ofbone
2 Cleome gynandra Hurhur Headache Seeds Paste is used externallyfor3-7 days3 Litsea glutinosa Garbijaur Vomiting Bark Powder used 2 dosage(Approx. 10gm’s) in aday.4 Eclipta alba Vringraj Inflammatory disorder Seed/whole Anti-inflammatory,digestive, hair tonic5 Vanda tessellata Banda/Rasana Ear pain Leaves Decoction used orally6 Leucas aspera Drond pushpin Eye pain Leaves
The juice put into eyesfor 2 or 3 times daily torelieve burningsensation and rednessof eyesTable No.3.28 RET Species of Study AreaSr. No. Name of species Status1 Abrus precatorius Near Threatened2 Acorus calamus Endangered3 Andrographis paniculata Vulnerable4 Aristolochia indica Near Threatened5 Asparagus racemosus Near Threatened6 Bacopa monnieri Vulnerable7 Butea monosperma var.lutea Endangered8 Caesalpinia bonduc Vulnerable9 Caesalpinia decapetala Vulnerable10 Capparis decidua Vulnerable11 Centella asiatica Vulnerable12 Ceropegia bulbosa Endangered13 Chlorophytum tuberosum Vulnerable14 Commiphora wightii Rare15 Costus speciosus Vulnerable16 Curculigo orchioides Endangered17 Curcuma amada Endangered18 Curcuma angustifolia Vulnerable19 Dioscorea bulbifera Vulnerable20 Gloriosa superba Vulnerable21 Gymnema sylvestre Under Threat22 Manilkara hexandra Near Threatened
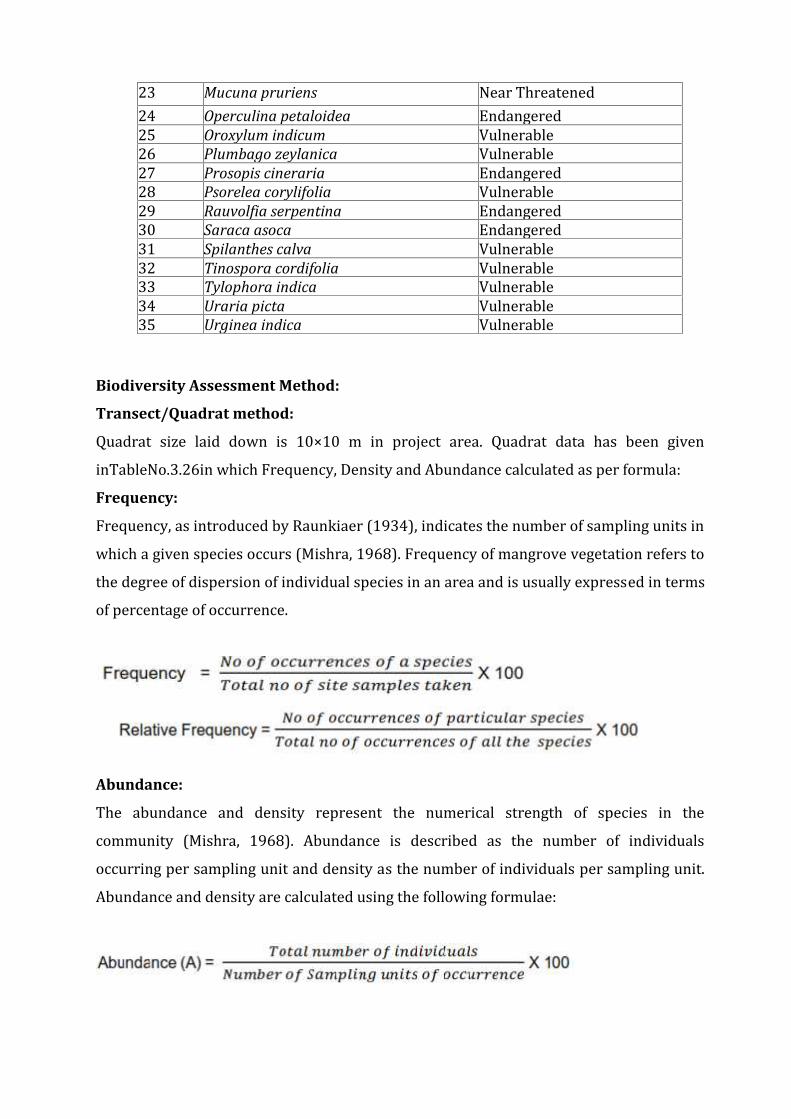
23 Mucuna pruriens Near Threatened24 Operculina petaloidea Endangered25 Oroxylum indicum Vulnerable26 Plumbago zeylanica Vulnerable27 Prosopis cineraria Endangered28 Psorelea corylifolia Vulnerable29 Rauvolfia serpentina Endangered30 Saraca asoca Endangered31 Spilanthes calva Vulnerable32 Tinospora cordifolia Vulnerable33 Tylophora indica Vulnerable34 Uraria picta Vulnerable35 Urginea indica VulnerableBiodiversity Assessment Method:
Transect/Quadrat method:Quadrat size laid down is 10×10 m in project area. Quadrat data has been giveninTableNo.3.26in which Frequency, Density and Abundance calculated as per formula:Frequency:Frequency, as introduced by Raunkiaer (1934), indicates the number of sampling units inwhich a given species occurs (Mishra, 1968). Frequency of mangrove vegetation refers tothe degree of dispersion of individual species in an area and is usually expressed in termsof percentage of occurrence.
Abundance:The abundance and density represent the numerical strength of species in thecommunity (Mishra, 1968). Abundance is described as the number of individualsoccurring per sampling unit and density as the number of individuals per sampling unit.Abundance and density are calculated using the following formulae:
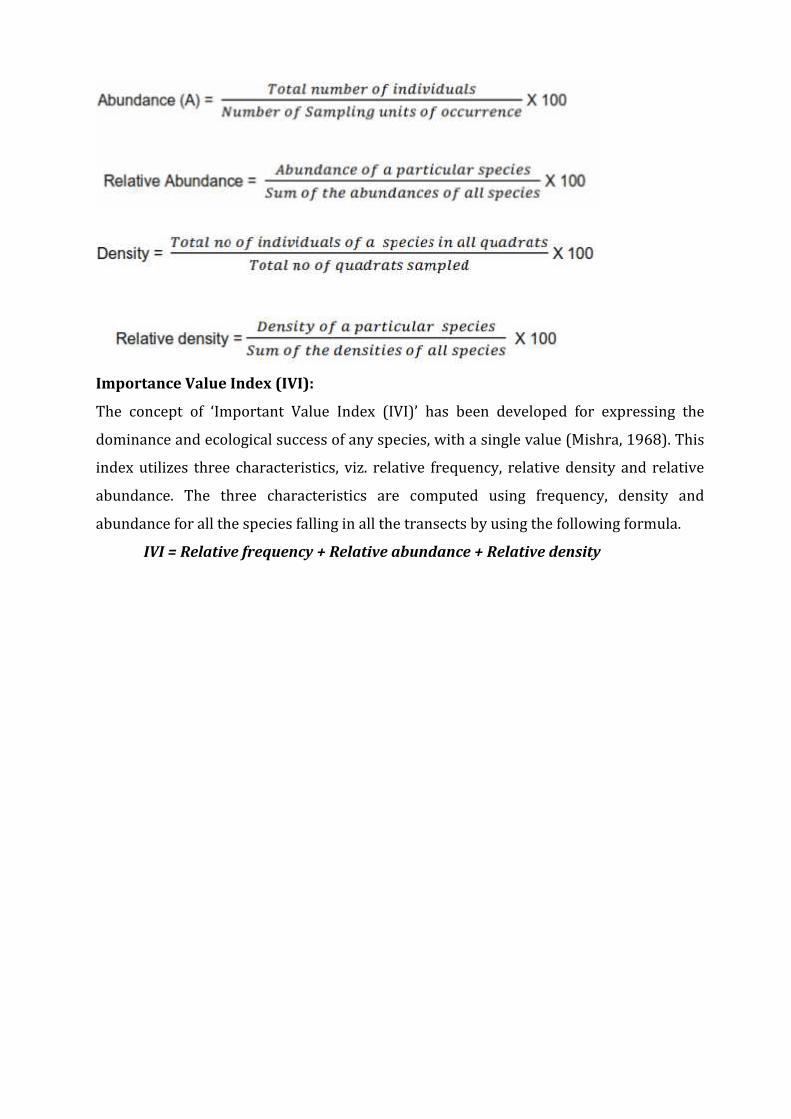
Importance Value Index (IVI):The concept of ‘Important Value Index (IVI)’ has been developed for expressing thedominance and ecological success of any species, with a single value (Mishra, 1968). Thisindex utilizes three characteristics, viz. relative frequency, relative density and relativeabundance. The three characteristics are computed using frequency, density andabundance for all the species falling in all the transects by using the following formula.IVI = Relative frequency + Relative abundance + Relative density

Table No. 3.29. Phytosociology of the Project area
(Quadrat size 10 x 10 m)
Sl.
No.
Name of the
speciesQuadrat Total
Quad.
Present
Total
Quad.Frequency Abundance Density IVI1 2 3 4 5 6 7 8 9 101. Sapindus
emarginata 1 0 3 0 0 1 0 1 1 0 7 5 10 0.5 1.4 0.7 3.022. Ailanthus excelsa
0 1 0 0 1 0 0 2 1 1 6 5 10 0.5 1.2 0.6 2.83. Terminalia
bellirica 1 0 0 3 2 1 0 3 2 1 13 7 10 0.7 1.85 1.3 4.24. Terminalia arjuna
1 3 0 0 1 0 2 0 0 0 7 4 10 0.4 1.75 0.7 3.25. Ficus hispida
0 0 1 0 0 1 3 3 1 0 9 5 10 0.5 1.8 0.9 3.956. Mitragyna 0 2 1 0 1 0 0 0 1 2 7 5 10 0.5 1.4 0.7 2.85
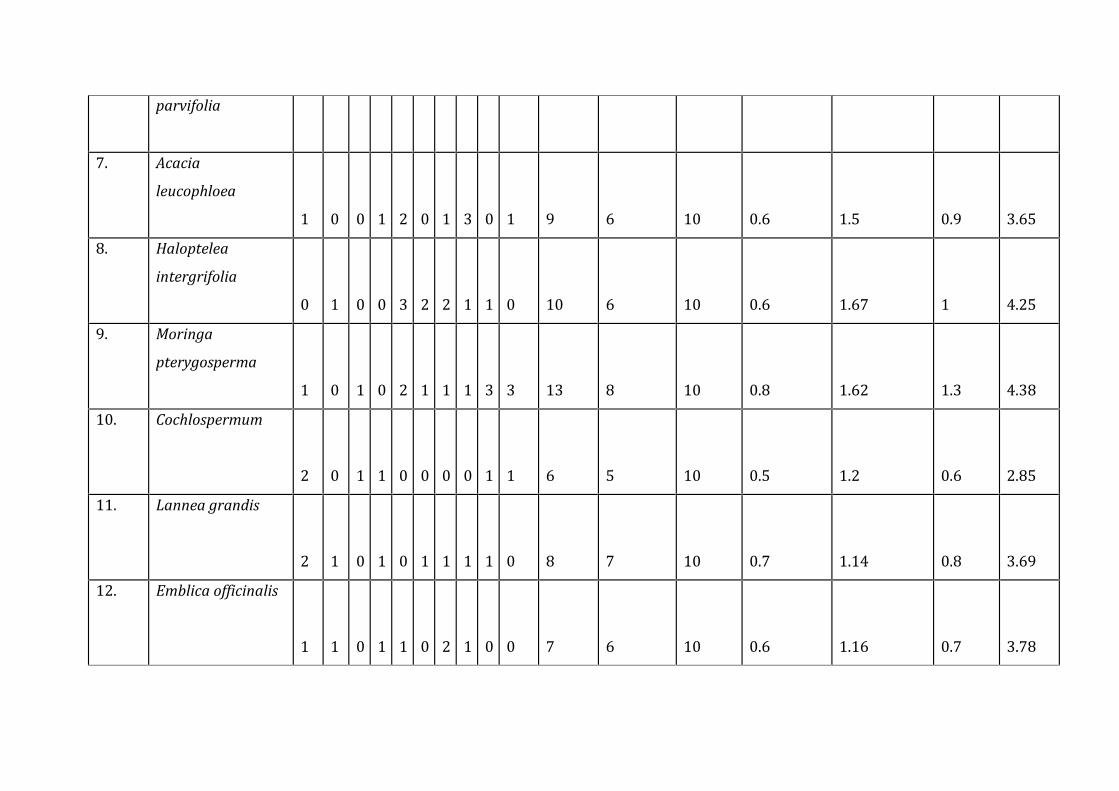
parvifolia
7. Acacia
leucophloea 1 0 0 1 2 0 1 3 0 1 9 6 10 0.6 1.5 0.9 3.658. Haloptelea
intergrifolia 0 1 0 0 3 2 2 1 1 0 10 6 10 0.6 1.67 1 4.259. Moringa
pterygosperma 1 0 1 0 2 1 1 1 3 3 13 8 10 0.8 1.62 1.3 4.3810. Cochlospermum
2 0 1 1 0 0 0 0 1 1 6 5 10 0.5 1.2 0.6 2.8511. Lannea grandis
2 1 0 1 0 1 1 1 1 0 8 7 10 0.7 1.14 0.8 3.6912. Emblica officinalis
1 1 0 1 1 0 2 1 0 0 7 6 10 0.6 1.16 0.7 3.78
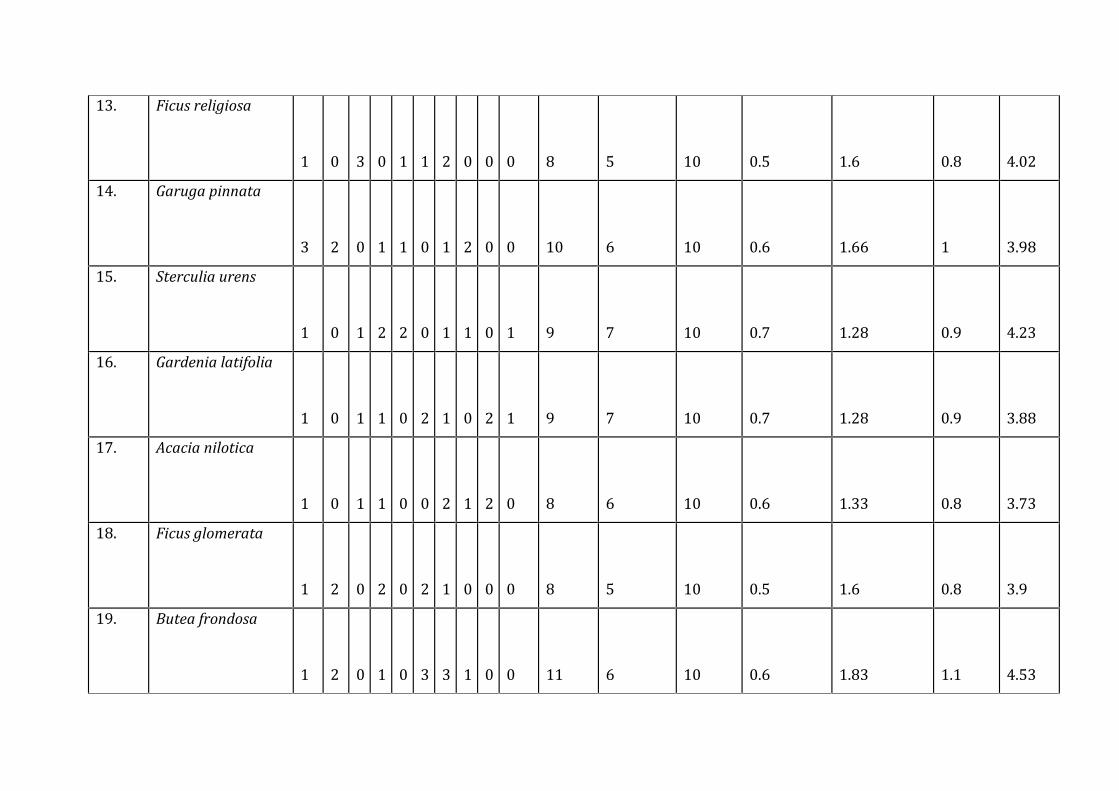
13. Ficus religiosa
1 0 3 0 1 1 2 0 0 0 8 5 10 0.5 1.6 0.8 4.0214. Garuga pinnata
3 2 0 1 1 0 1 2 0 0 10 6 10 0.6 1.66 1 3.9815. Sterculia urens
1 0 1 2 2 0 1 1 0 1 9 7 10 0.7 1.28 0.9 4.2316. Gardenia latifolia
1 0 1 1 0 2 1 0 2 1 9 7 10 0.7 1.28 0.9 3.8817. Acacia nilotica
1 0 1 1 0 0 2 1 2 0 8 6 10 0.6 1.33 0.8 3.7318. Ficus glomerata
1 2 0 2 0 2 1 0 0 0 8 5 10 0.5 1.6 0.8 3.919. Butea frondosa
1 2 0 1 0 3 3 1 0 0 11 6 10 0.6 1.83 1.1 4.53
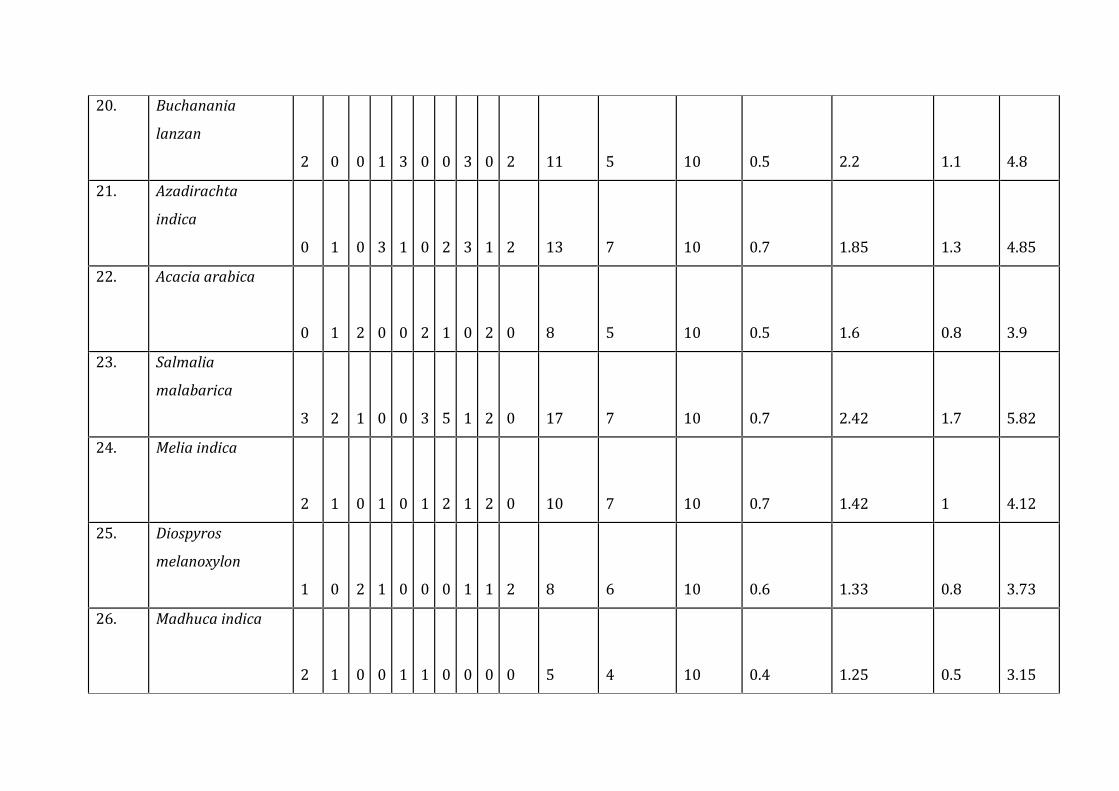
20. Buchanania
lanzan 2 0 0 1 3 0 0 3 0 2 11 5 10 0.5 2.2 1.1 4.821. Azadirachta
indica 0 1 0 3 1 0 2 3 1 2 13 7 10 0.7 1.85 1.3 4.8522. Acacia arabica
0 1 2 0 0 2 1 0 2 0 8 5 10 0.5 1.6 0.8 3.923. Salmalia
malabarica 3 2 1 0 0 3 5 1 2 0 17 7 10 0.7 2.42 1.7 5.8224. Melia indica
2 1 0 1 0 1 2 1 2 0 10 7 10 0.7 1.42 1 4.1225. Diospyros
melanoxylon 1 0 2 1 0 0 0 1 1 2 8 6 10 0.6 1.33 0.8 3.7326. Madhuca indica
2 1 0 0 1 1 0 0 0 0 5 4 10 0.4 1.25 0.5 3.15
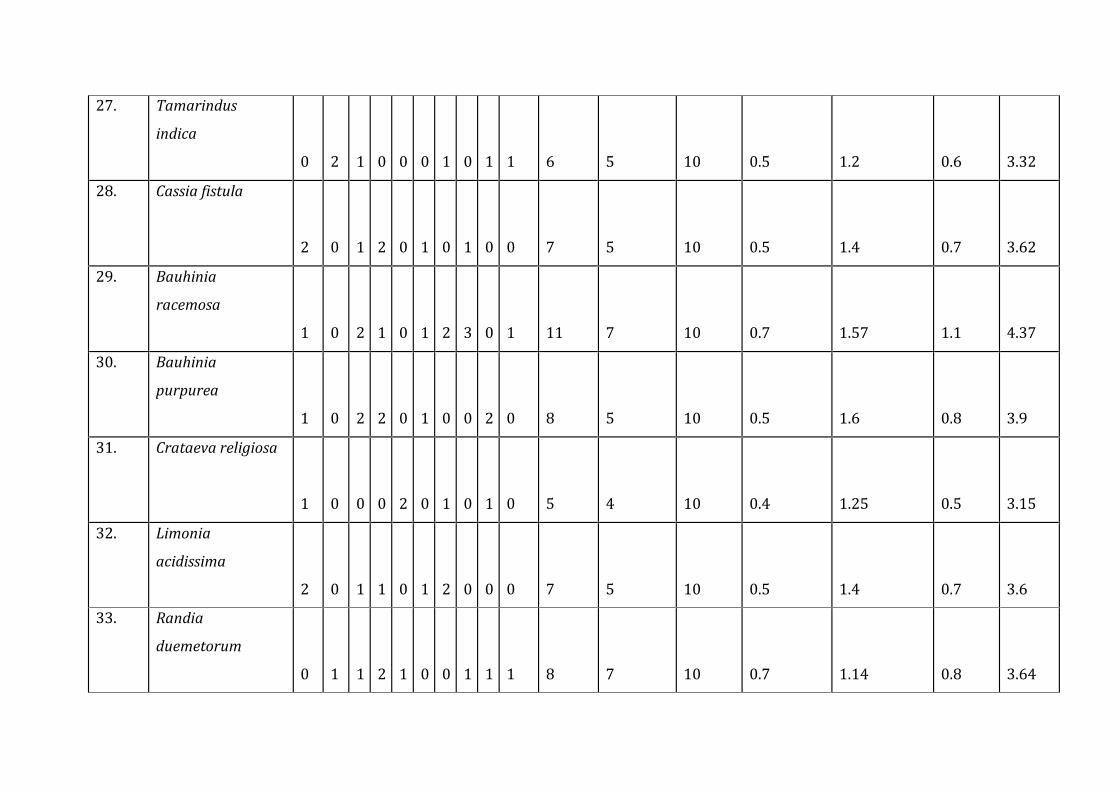
27. Tamarindus
indica 0 2 1 0 0 0 1 0 1 1 6 5 10 0.5 1.2 0.6 3.3228. Cassia fistula
2 0 1 2 0 1 0 1 0 0 7 5 10 0.5 1.4 0.7 3.6229. Bauhinia
racemosa 1 0 2 1 0 1 2 3 0 1 11 7 10 0.7 1.57 1.1 4.3730. Bauhinia
purpurea 1 0 2 2 0 1 0 0 2 0 8 5 10 0.5 1.6 0.8 3.931. Crataeva religiosa
1 0 0 0 2 0 1 0 1 0 5 4 10 0.4 1.25 0.5 3.1532. Limonia
acidissima 2 0 1 1 0 1 2 0 0 0 7 5 10 0.5 1.4 0.7 3.633. Randia
duemetorum 0 1 1 2 1 0 0 1 1 1 8 7 10 0.7 1.14 0.8 3.64
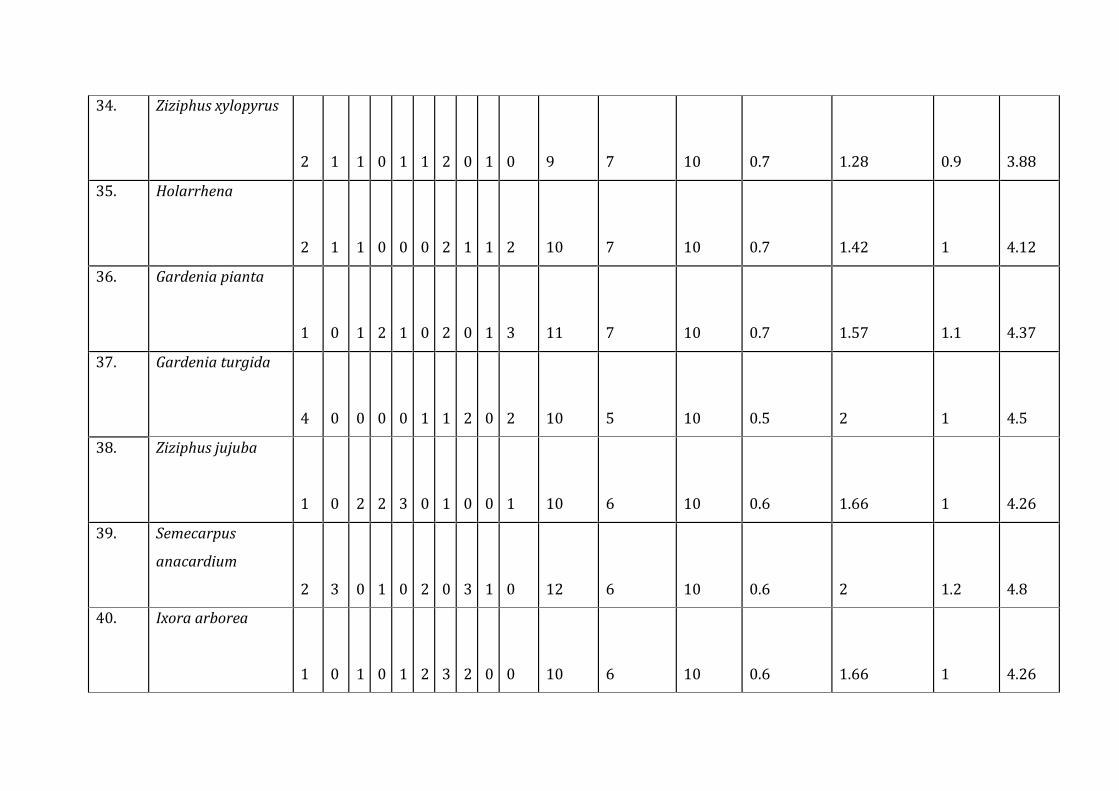
34. Ziziphus xylopyrus
2 1 1 0 1 1 2 0 1 0 9 7 10 0.7 1.28 0.9 3.8835. Holarrhena
2 1 1 0 0 0 2 1 1 2 10 7 10 0.7 1.42 1 4.1236. Gardenia pianta
1 0 1 2 1 0 2 0 1 3 11 7 10 0.7 1.57 1.1 4.3737. Gardenia turgida
4 0 0 0 0 1 1 2 0 2 10 5 10 0.5 2 1 4.538. Ziziphus jujuba
1 0 2 2 3 0 1 0 0 1 10 6 10 0.6 1.66 1 4.2639. Semecarpus
anacardium 2 3 0 1 0 2 0 3 1 0 12 6 10 0.6 2 1.2 4.840. Ixora arborea
1 0 1 0 1 2 3 2 0 0 10 6 10 0.6 1.66 1 4.26
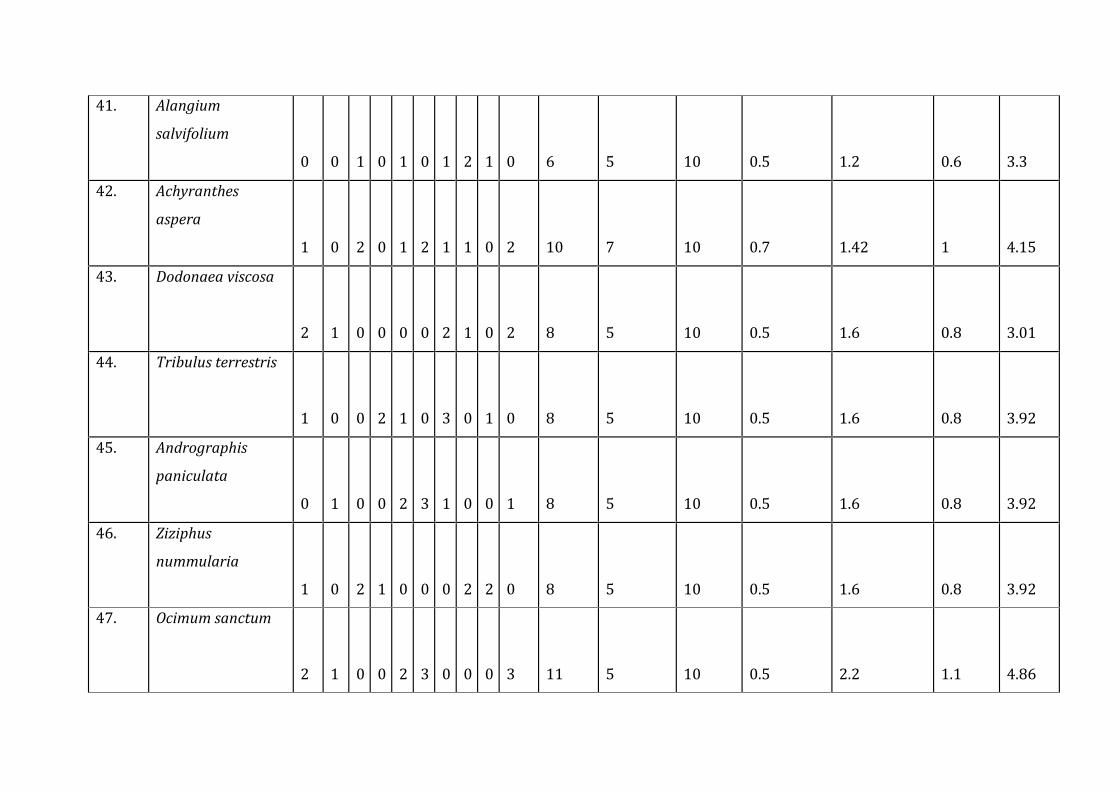
41. Alangium
salvifolium 0 0 1 0 1 0 1 2 1 0 6 5 10 0.5 1.2 0.6 3.342. Achyranthes
aspera 1 0 2 0 1 2 1 1 0 2 10 7 10 0.7 1.42 1 4.1543. Dodonaea viscosa
2 1 0 0 0 0 2 1 0 2 8 5 10 0.5 1.6 0.8 3.0144. Tribulus terrestris
1 0 0 2 1 0 3 0 1 0 8 5 10 0.5 1.6 0.8 3.9245. Andrographis
paniculata 0 1 0 0 2 3 1 0 0 1 8 5 10 0.5 1.6 0.8 3.9246. Ziziphus
nummularia 1 0 2 1 0 0 0 2 2 0 8 5 10 0.5 1.6 0.8 3.9247. Ocimum sanctum
2 1 0 0 2 3 0 0 0 3 11 5 10 0.5 2.2 1.1 4.86

48. Vitex negundo
1 0 2 3 1 0 2 1 1 0 11 7 10 0.7 1.57 1.1 4.449. Cassia tora
1 0 2 1 0 0 0 2 2 1 9 6 10 0.6 1.5 0.9 4.1250. Thespesia lampas
2 1 0 0 1 0 1 0 1 0 6 5 10 0.5 1.2 0.6 3.4251. Embelia robusta
2 0 1 0 0 2 2 0 1 2 10 7 10 0.7 1.42 1 4.2352. Solanum nigrum
3 0 1 0 2 1 1 0 0 1 9 6 10 0.6 1.5 0.9 4.1853. Eclipta prostrata
2 1 0 1 1 1 0 2 1 0 9 7 10 0.7 1.28 0.9 3.9254. Vernonia
divergens 1 2 2 0 1 0 1 1 0 1 9 7 10 0.7 1.28 0.9 3.92

55. Adhatoda vasica
0 1 0 2 1 2 0 1 0 0 7 5 10 0.5 1.4 0.7 3.856. Ricinus communis
0 1 0 2 1 0 0 0 1 0 5 4 10 0.4 1.25 0.5 3.1957. Grewia hirsuta
1 0 2 1 2 0 1 0 0 0 7 5 10 0.5 1.4 0.7 3.858. Xanthium
strumarium 0 0 1 2 0 1 0 1 2 2 9 6 10 0.6 1.5 0.9 3.7859. Desmodium
pulchellum 3 0 1 0 2 0 2 1 2 0 11 6 10 0.6 1.83 1.1 4.660. Tamarix dioica
1 0 1 2 1 0 1 0 1 1 8 7 10 0.7 1.14 0.8 3.6861. Euphorbia
nerifolia 2 1 0 3 1 0 2 0 2 0 11 6 10 0.6 1.83 1.1 4.59
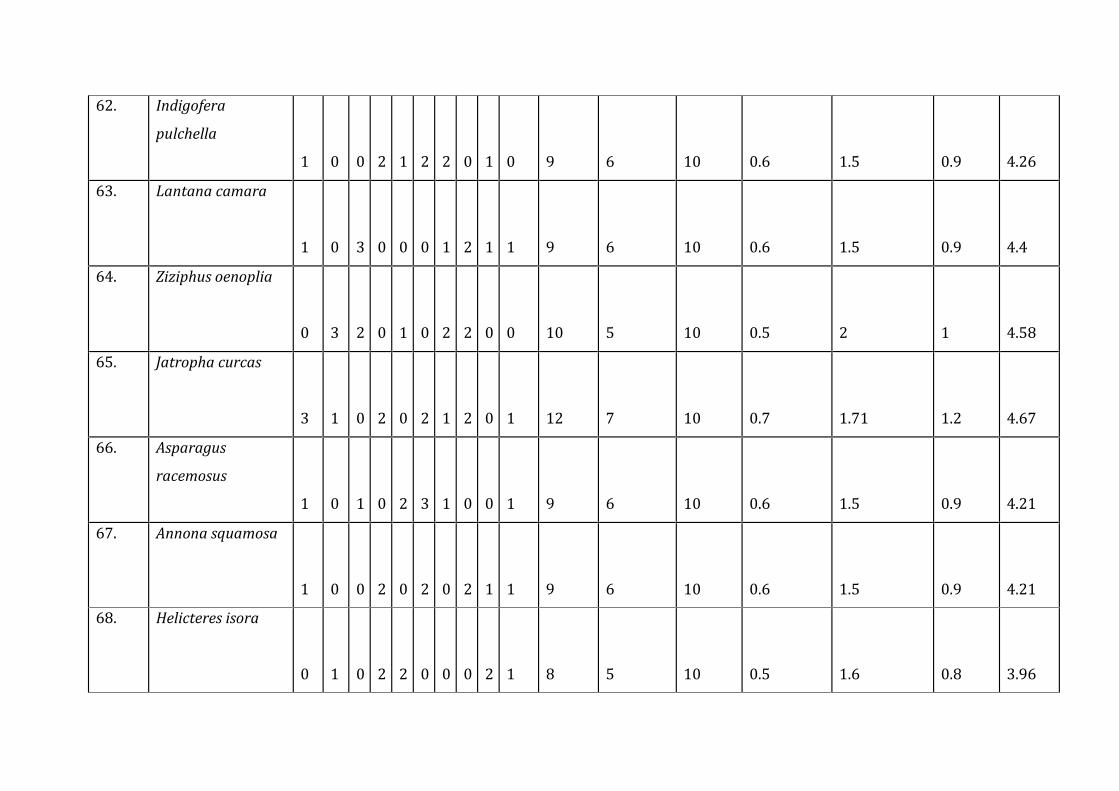
62. Indigofera
pulchella 1 0 0 2 1 2 2 0 1 0 9 6 10 0.6 1.5 0.9 4.2663. Lantana camara
1 0 3 0 0 0 1 2 1 1 9 6 10 0.6 1.5 0.9 4.464. Ziziphus oenoplia
0 3 2 0 1 0 2 2 0 0 10 5 10 0.5 2 1 4.5865. Jatropha curcas
3 1 0 2 0 2 1 2 0 1 12 7 10 0.7 1.71 1.2 4.6766. Asparagus
racemosus 1 0 1 0 2 3 1 0 0 1 9 6 10 0.6 1.5 0.9 4.2167. Annona squamosa
1 0 0 2 0 2 0 2 1 1 9 6 10 0.6 1.5 0.9 4.2168. Helicteres isora
0 1 0 2 2 0 0 0 2 1 8 5 10 0.5 1.6 0.8 3.96
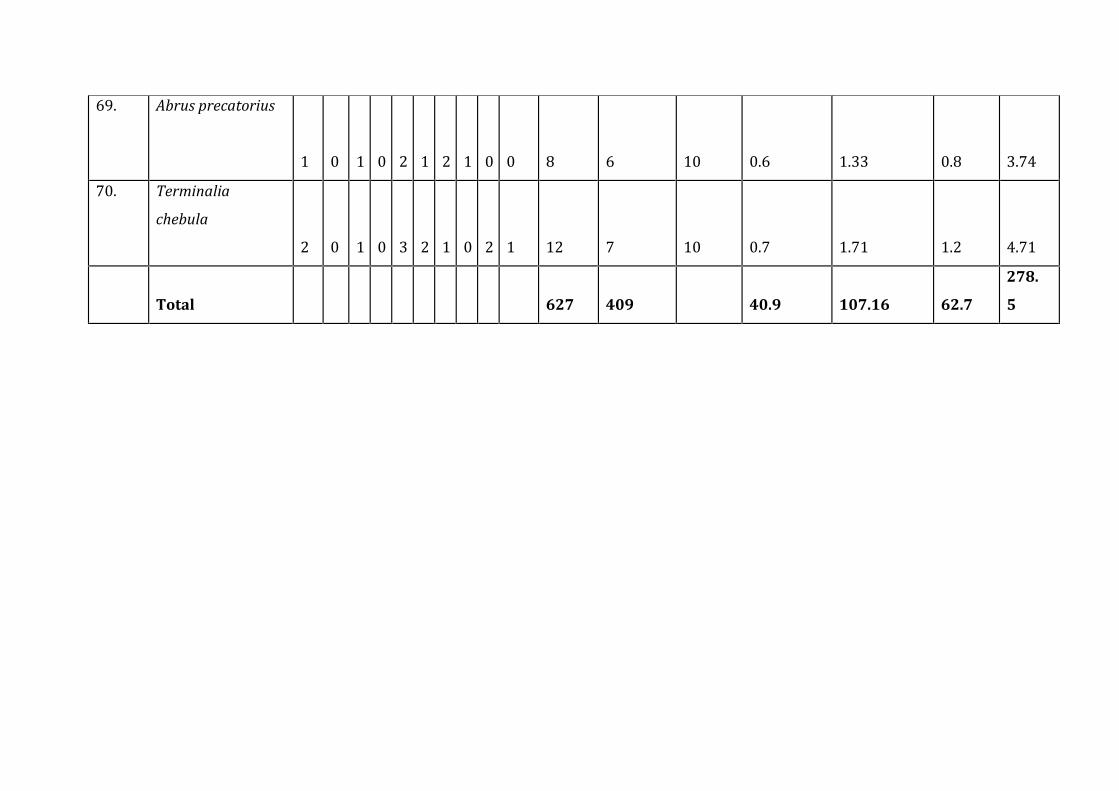
69. Abrus precatorius
1 0 1 0 2 1 2 1 0 0 8 6 10 0.6 1.33 0.8 3.7470. Terminalia
chebula 2 0 1 0 3 2 1 0 2 1 12 7 10 0.7 1.71 1.2 4.71Total 627 409 40.9 107.16 62.7
278.
5
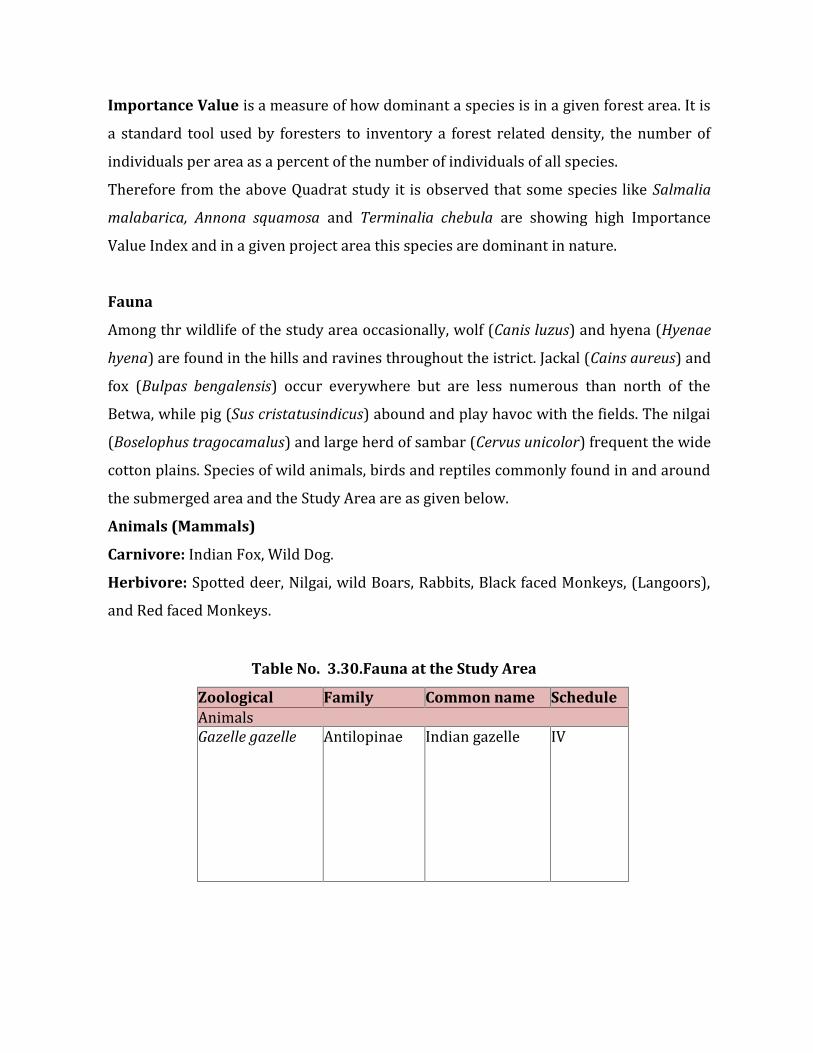
Importance Value is a measure of how dominant a species is in a given forest area. It isa standard tool used by foresters to inventory a forest related density, the number ofindividuals per area as a percent of the number of individuals of all species.Therefore from the above Quadrat study it is observed that some species like Salmalia
malabarica, Annona squamosa and Terminalia chebula are showing high ImportanceValue Index and in a given project area this species are dominant in nature.FaunaAmong thr wildlife of the study area occasionally, wolf (Canis luzus) and hyena (Hyenae
hyena) are found in the hills and ravines throughout the istrict. Jackal (Cains aureus) andfox (Bulpas bengalensis) occur everywhere but are less numerous than north of theBetwa, while pig (Sus cristatusindicus) abound and play havoc with the fields. The nilgai(Boselophus tragocamalus) and large herd of sambar (Cervus unicolor) frequent the widecotton plains. Species of wild animals, birds and reptiles commonly found in and aroundthe submerged area and the Study Area are as given below.Animals (Mammals)
Carnivore: Indian Fox, Wild Dog.Herbivore: Spotted deer, Nilgai, wild Boars, Rabbits, Black faced Monkeys, (Langoors),and Red faced Monkeys.
Table No. 3.30.Fauna at the Study Area
Zoological
name
Family Common name ScheduleAnimalsGazelle gazelle Antilopinae Indian gazelle IV

Macaca mulatta Cercopithecidae Bandar IV
Felis chaus Felidae Jungli billi II
Sus scrofa Suidae Suwar III
Bandicota
bengalensis
Muridae Field rat V
Golunda ellioti Muridae The Indian bushrat IV

Muntiacus
muntjak
Cervidae Indian muntjak IV
Cervus unicolor Cervidae Sambhar III
Axis axis Cervidae Cheetal III
Boselaphus
tragocamelus
Bovidae Nilgai IV
Lepus nigricollis Leporidae Kharghosh IV
Hyaena hyaena Hyaenidae Lakadbagga III

Rattus rattus Muridae Chuha V
Bos indicus Bovinae Cow V
ReptilesBungarus
caeruleus
Elapidae Krait IV
Naja naja Elapidae Naga II
Ptyas mucosus Colubridae Dhaman II
Varanus
bengalensis
Varanidae Godhi II
Fishes
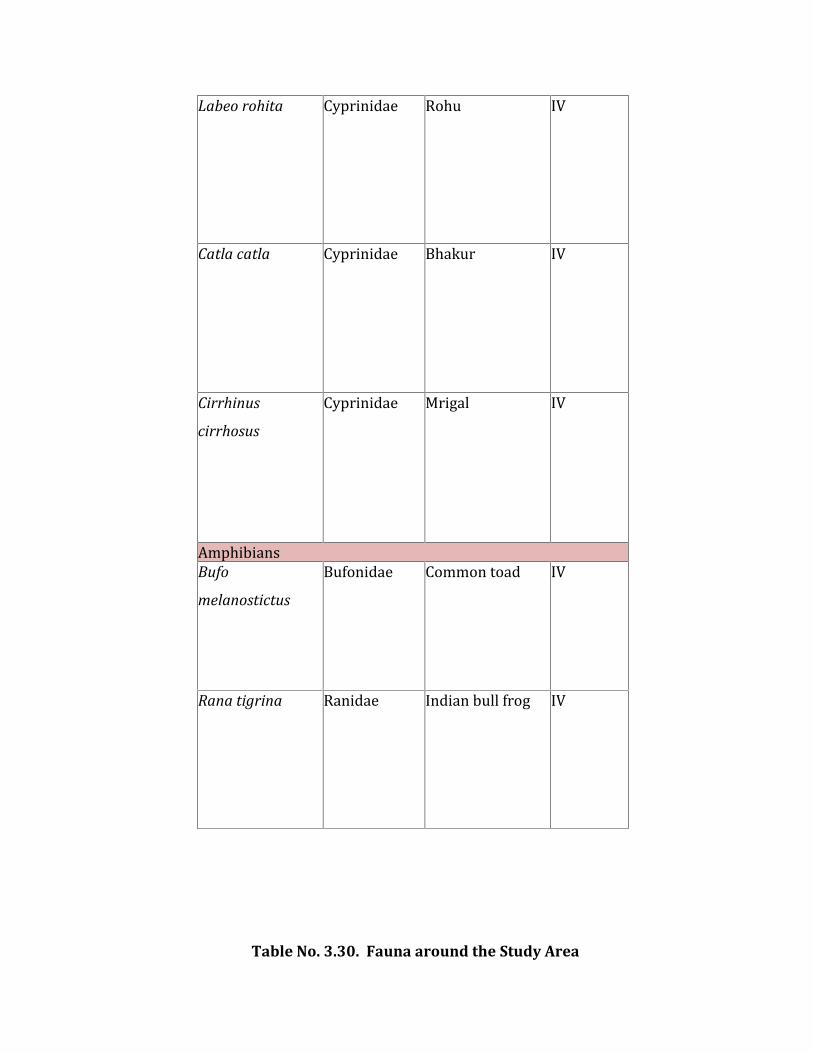
Labeo rohita Cyprinidae Rohu IV
Catla catla Cyprinidae Bhakur IV
Cirrhinus
cirrhosus
Cyprinidae Mrigal IV
AmphibiansBufo
melanostictus
Bufonidae Common toad IV
Rana tigrina Ranidae Indian bull frog IV
Table No. 3.30. Fauna around the Study Area
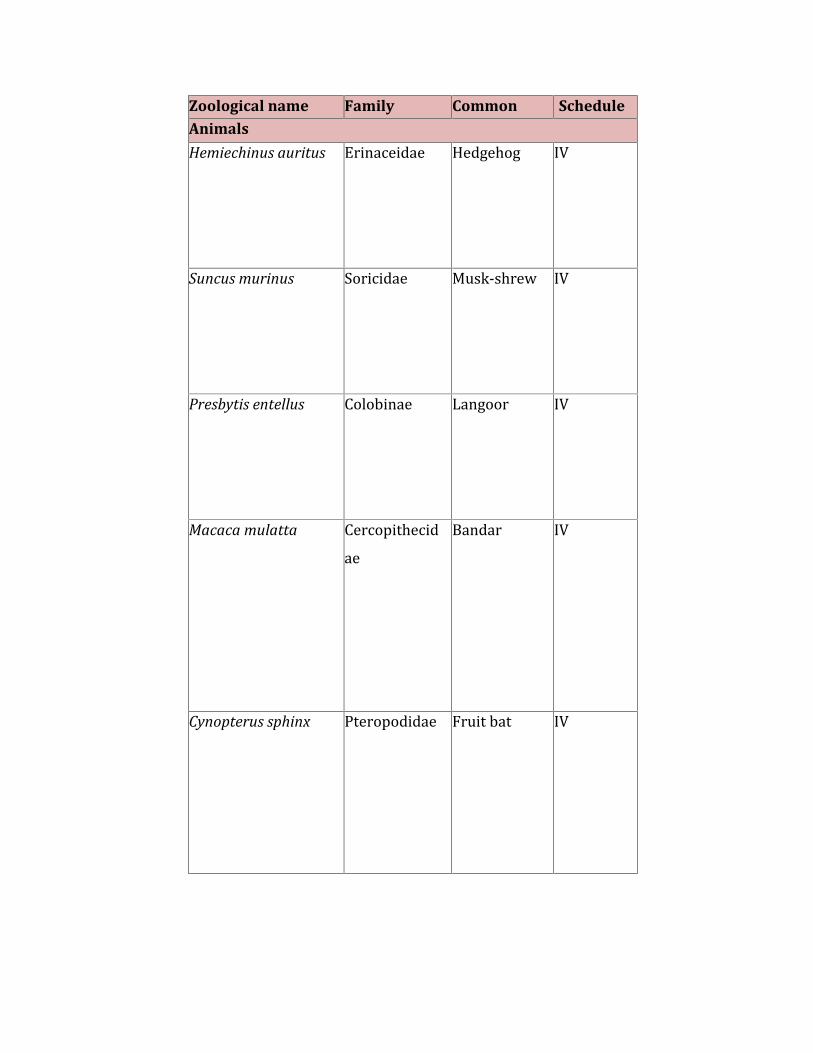
Zoological name Family Common
name
ScheduleAnimals
Hemiechinus auritus Erinaceidae Hedgehog IV
Suncus murinus Soricidae Musk-shrew IV
Presbytis entellus Colobinae Langoor IV
Macaca mulatta Cercopithecidae Bandar IV
Cynopterus sphinx Pteropodidae Fruit bat IV

Felis chaus Felidae Jungli billi II
Panthera pardus Felidae Panther III
Sus scrofa Suidae Suwar III
Cuon alpinus Canidae Wild dog II
Bandicota
bengalensis
Muridae Field rat V
Mellivora capensis Mustelidae Honeybadger IV

Golunda ellioti Muridae The Indianbush rat IV
Muntiacus muntjak Cervidae Indianmuntjak IV
Cervus unicolor Cervidae Sambhar III
Axis axis Cervidae Cheetal III
Herpestes hyaena Hyaenidae Spottedhyaena IV
Boselaphus
tragocamelus Bovidae Nilgai IV

Rattus rattus Muridae Chuha V
Bos indicus Bovinae Cow V
Funambulus pennanti Sciuridae Squirrel IV
Vulpes bengalensis Canidae Indian fox IV
Gazelle gazelle Antilopinae Indiangazelle IV
ReptilesBungarus caeruleus Elapidae Krait IV

Naja naja Elapidae Indian Cobra IIPtyas mucosus Colubridae Dhaman II
Varanus bengalensis Varanidae IndianBengalMonitorII
FishesLabeo rohita Cyprinidae Rohu IV
Catla catla Cyprinidae Bhakur IV
Cirrhinus cirrhosus Cyprinidae Mrigal IV
Amphibians
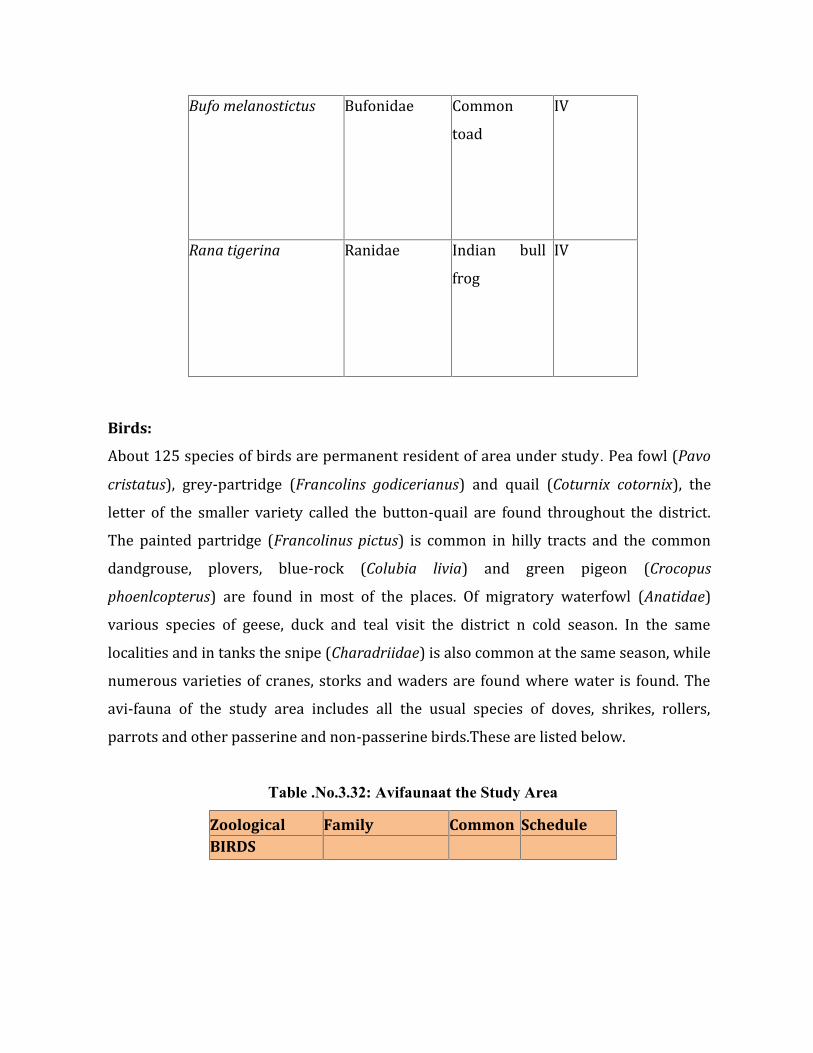
Bufo melanostictus Bufonidae Commontoad IV
Rana tigerina Ranidae Indian bullfrog IV
Birds:About 125 species of birds are permanent resident of area under study. Pea fowl (Pavo
cristatus), grey-partridge (Francolins godicerianus) and quail (Coturnix cotornix), theletter of the smaller variety called the button-quail are found throughout the district.The painted partridge (Francolinus pictus) is common in hilly tracts and the commondandgrouse, plovers, blue-rock (Colubia livia) and green pigeon (Crocopus
phoenlcopterus) are found in most of the places. Of migratory waterfowl (Anatidae)various species of geese, duck and teal visit the district n cold season. In the samelocalities and in tanks the snipe (Charadriidae) is also common at the same season, whilenumerous varieties of cranes, storks and waders are found where water is found. Theavi-fauna of the study area includes all the usual species of doves, shrikes, rollers,parrots and other passerine and non-passerine birds.These are listed below.Table .No.3.32: Avifaunaat the Study Area
Zoological
name
Family Common
name
ScheduleBIRDS
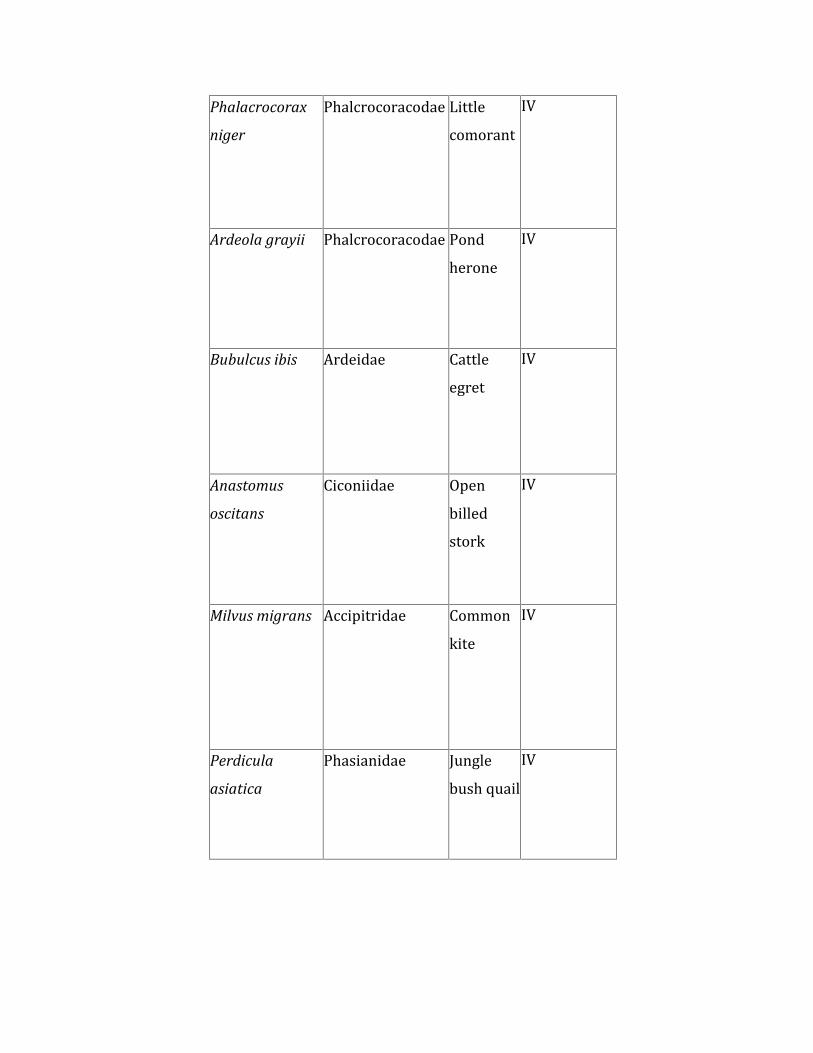
Phalacrocorax
niger
Phalcrocoracodae Littlecomorant IV
Ardeola grayii Phalcrocoracodae Pondherone IV
Bubulcus ibis Ardeidae Cattleegret IV
Anastomus
oscitans
Ciconiidae OpenbilledstorkIV
Milvus migrans Accipitridae Commonkite IV
Perdicula
asiatica
Phasianidae Junglebush quailIV

Grus grus Gruidae Commoncrane IV
Psittacula
krameri
Psittacidae Parrot IV
Eudynamys
scolopaceus
Cuculidae Cukoo IV
Halcyon
smyrnensis
Halcyonidae WhitebrestedkingfisherIV
Acridotheres
tristis
Sturnidae Commonmyna IV
Pycnonotus
cafer
Pycnonotidae Bulbul IV
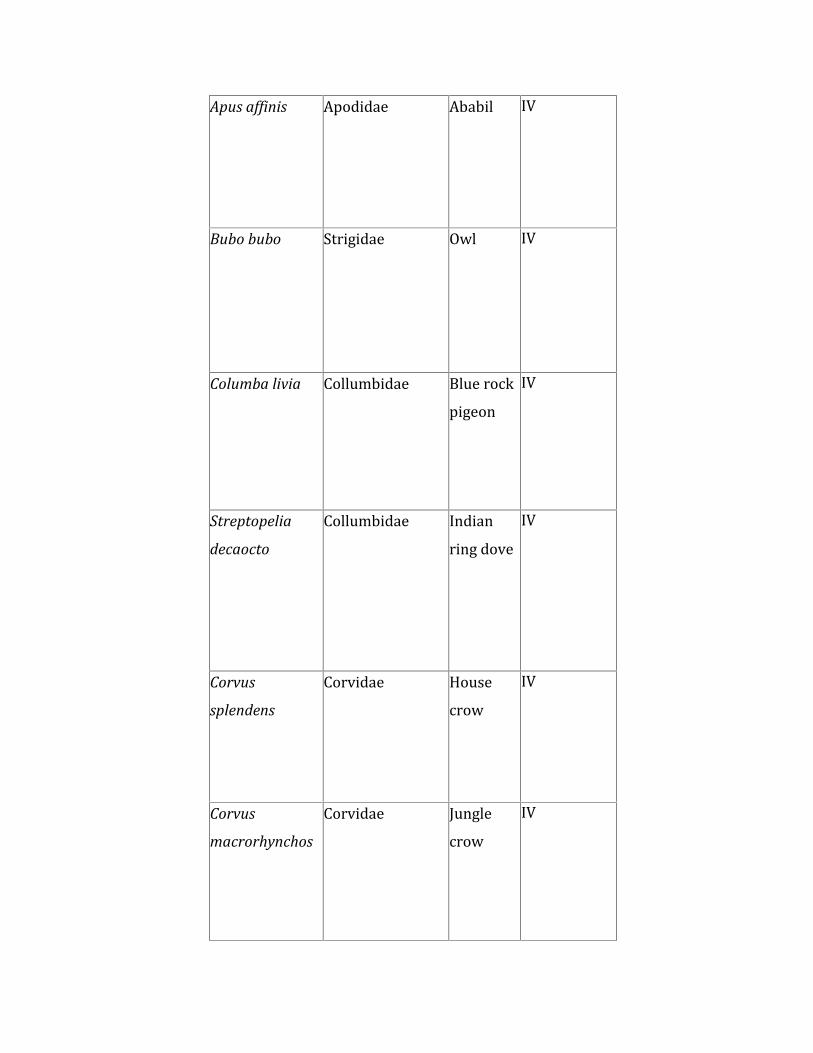
Apus affinis Apodidae Ababil IV
Bubo bubo Strigidae Owl IV
Columba livia Collumbidae Blue rockpigeon IV
Streptopelia
decaocto
Collumbidae Indianring dove IV
Corvus
splendens
Corvidae Housecrow IV
Corvus
macrorhynchos
Corvidae Junglecrow IV
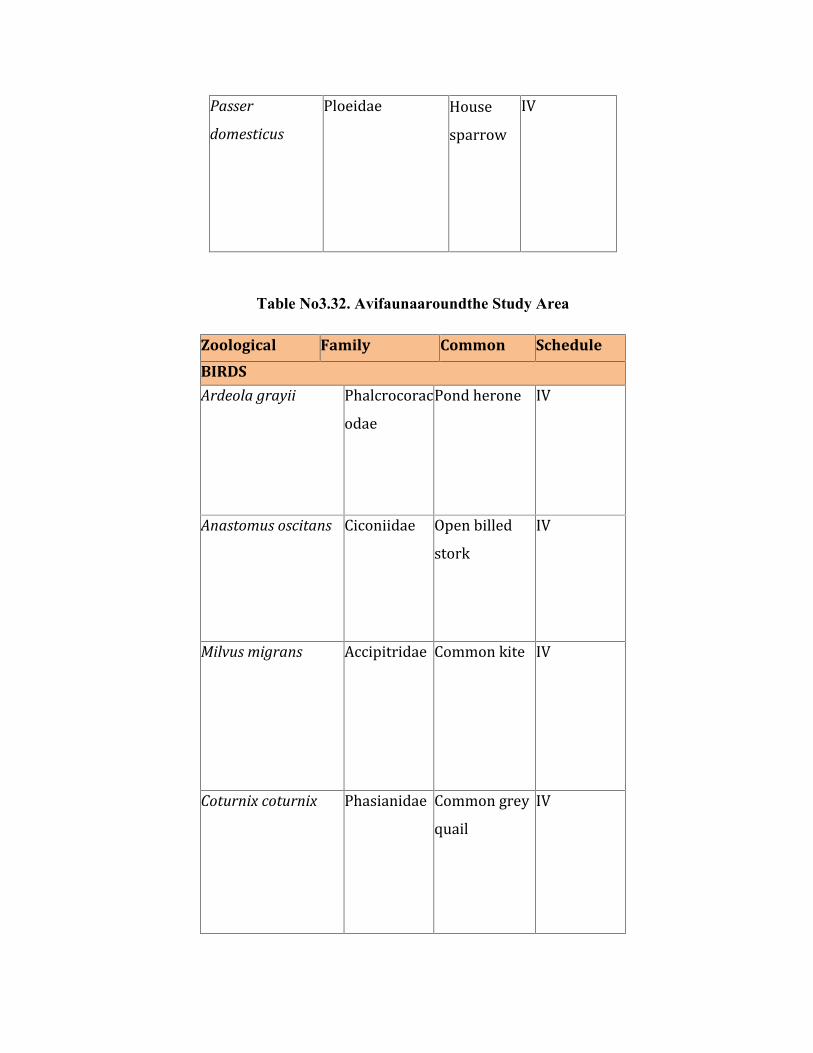
Passer
domesticus
Ploeidae Housesparrow IV
Table No3.32. Avifaunaaroundthe Study Area
Zoological
name
Family Common
name
Schedule
BIRDS
Ardeola grayii Phalcrocoracodae Pond herone IV
Anastomus oscitans Ciconiidae Open billedstork IV
Milvus migrans Accipitridae Common kite IV
Coturnix coturnix Phasianidae Common greyquail IV

Perdicula asiatica Phasianidae Jungle bushquail IV
Grus grus Gruidae Commoncrane IV
Eudynamys
scolopaceus
Cuculidae Cukoo IV
Alcedo atthis Alcedinidae Small blueking IV
Halcyon smyrnensis Halcyonidae White brestedkingfisher IV
Acridotheres tristis Sturnidae Commonmyna IV

Spilornis cheela Accipitridae Crestedserpent eagleAccipiter badius Accipitridae Crested hawkSpizaetus cirrhatus Accipitridae Cheel IV
Psittacula krameri Psittacidae Parrot IV
Pycnonotus cafer Pycnonotidae Bulbul IV
Centropus sinensis Cuculidae Mokha IV
Eudynamys
scolopaceus
Cuculidae Cukoo

Apus affinis Apodidae Ababil IV
Bubo bubo Strigidae Owl IV
Ploceus philippinus Ploceidae Baya IV
Phalacrocorax niger Phalcrocoracodae Littlecomorant IV
Columba livia Collumbidae Blue rockpigeon IV
Streptopelia
chinensis
Collumbidae Spotted dove IV
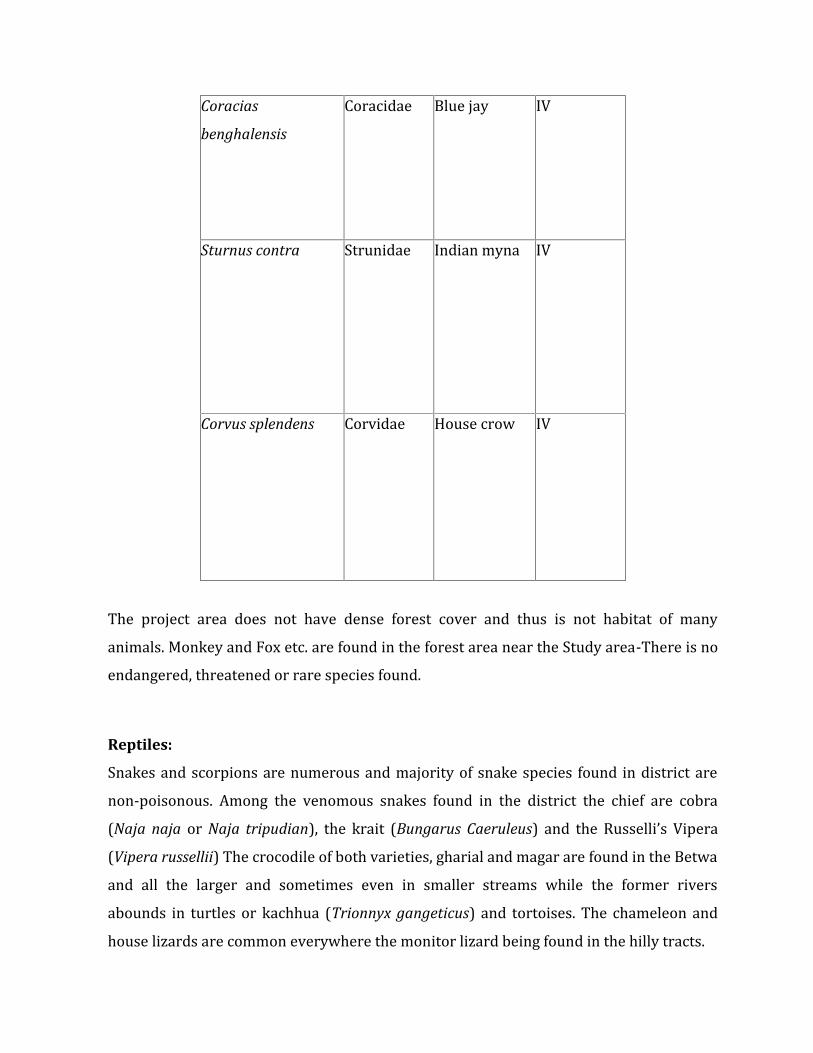
Coracias
benghalensis
Coracidae Blue jay IV
Sturnus contra Strunidae Indian myna IV
Corvus splendens Corvidae House crow IV
The project area does not have dense forest cover and thus is not habitat of manyanimals. Monkey and Fox etc. are found in the forest area near the Study area-There is noendangered, threatened or rare species found.Reptiles:Snakes and scorpions are numerous and majority of snake species found in district arenon-poisonous. Among the venomous snakes found in the district the chief are cobra(Naja naja or Naja tripudian), the krait (Bungarus Caeruleus) and the Russelli’s Vipera(Vipera russellii) The crocodile of both varieties, gharial and magar are found in the Betwaand all the larger and sometimes even in smaller streams while the former riversabounds in turtles or kachhua (Trionnyx gangeticus) and tortoises. The chameleon andhouse lizards are common everywhere the monitor lizard being found in the hilly tracts.
4. AQUATIC ECOLOGYRiver Betwa is the right bank tributary of Yamuna river. It originates from theNorthwards slope of the Vindhyan Mountains. The total length for which it flows is590km. the average depth of the whole Betwa river ranges between 2.7-9.4 m. the riverbed of Betwa River mostly aggregates stones, sand, riffle and pools; pebbles and cobble.The study area has a wide range of biotic communities - Phytoplankton dominated byChlorophyceae, Bacillariophyceae; and Myxophyceae, Zooplankton such as Copepods,Cladocerans Rotifers and Protozoans.The chief species found are mahseer, (Barbus Tor),rohu (Labeo rohita), Tengra or kantua (Mystus seenghala), parhin (Wallagonia attu), saul(Opheocopholus sp.) kalabanu (Labeo colbasa) and nain (Cirrhina mrigala). Other speciessuch as moi (Notopterus notopterus), Bhakur (catla catla) and bam or eel (Rhynchobdilla
aculata) are also found. Oil is extracted for medicinal purposes from the sus. Benthos isrepresented by insect larvae and nymphs, Oligochaeta, Nematods and Mollusca and a richgrowth of Periphyton on submerged objects. However, the physico – chemicalparameters will change after the construction is over and water is filled in the reservoir.This would result in high flushing in reservoir in the monsoon months.1) Sampling collection method-
Take plankton net with the mesh size of 0.32 mm aperture. Drop the net into the water from the bank and haul up vertically. Collectabout 25 litres of water with Phytoplankton in it and sieve by using mesh. A flow meter can be attached with the net to measure the water flow.
2) Preservation techniques-
Planktonic organisms are sensitive to temperature so should be collected inthermos flask. The samples should be examined within 24 hrs hours. Further preservation can be done by adding Lugol’s solution to the samples.
3) Sample analyses-
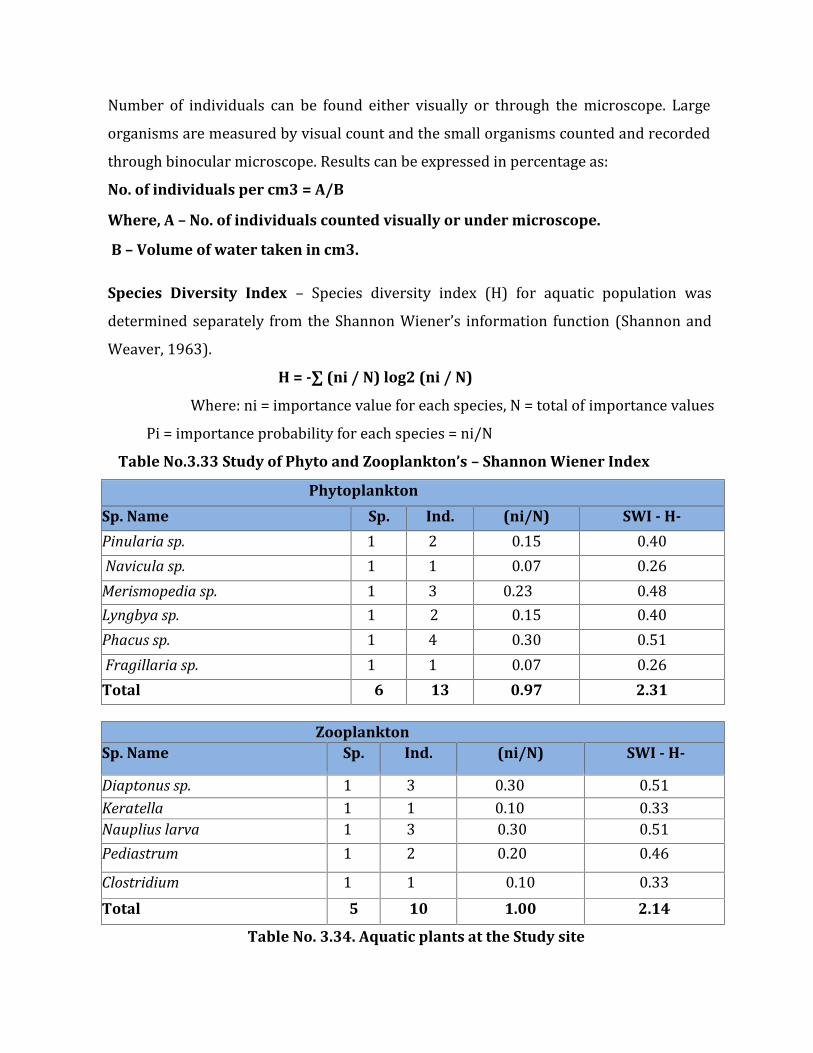
Number of individuals can be found either visually or through the microscope. Largeorganisms are measured by visual count and the small organisms counted and recordedthrough binocular microscope. Results can be expressed in percentage as:No. of individuals per cm3 = A/B
Where, A – No. of individuals counted visually or under microscope.
B – Volume of water taken in cm3.
Species Diversity Index – Species diversity index (H) for aquatic population wasdetermined separately from the Shannon Wiener’s information function (Shannon andWeaver, 1963).H = -∑ (ni / N) log2 (ni / N)Where: ni = importance value for each species, N = total of importance valuesPi = importance probability for each species = ni/N
Table No.3.33 Study of Phyto and Zooplankton’s – Shannon Wiener Index
Phytoplankton
Sp. Name Sp. Ind. (ni/N) SWI - H-
Pinularia sp. 1 2 0.15 0.40Navicula sp. 1 1 0.07 0.26
Merismopedia sp. 1 3 0.23 0.48Lyngbya sp. 1 2 0.15 0.40Phacus sp. 1 4 0.30 0.51Fragillaria sp. 1 1 0.07 0.26
Total 6 13 0.97 2.31
ZooplanktonSp. Name Sp. Ind. (ni/N) SWI - H-
Diaptonus sp. 1 3 0.30 0.51Keratella 1 1 0.10 0.33Nauplius larva 1 3 0.30 0.51Pediastrum 1 2 0.20 0.46Clostridium 1 1 0.10 0.33Total 5 10 1.00 2.14
Table No. 3.34. Aquatic plants at the Study site
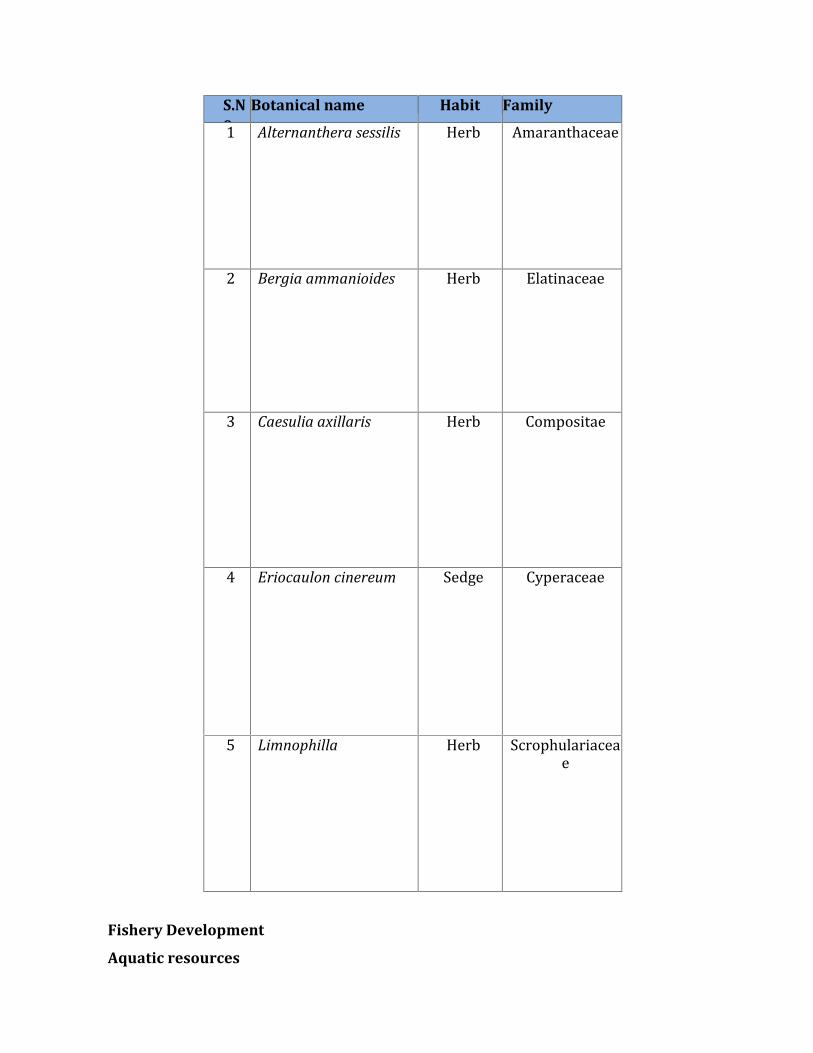
S.No.
Botanical name Habit Family1 Alternanthera sessilis Herb Amaranthaceae
2 Bergia ammanioides Herb Elatinaceae
3 Caesulia axillaris Herb Compositae
4 Eriocaulon cinereum Sedge Cyperaceae
5 Limnophilla Herb Scrophulariaceae
Fishery Development
Aquatic resources

Fish is of the most important species of the aquatic fauna as well as important source ofprotein in human food. Since, topographical and climatological condition of Betwa Rivervaries from tropical to moderate temperature region; there are significant variations inthe fish species observed at different elevations. Normally the varieties of fish Catla,Rohu, Bam, Padan are normally observed.Pisciculture: A wide range of indigenous fishes are found in the Betwa River. Theimportant commercial fish species in the river are Cirrhinus mrigala, Catla catla,labeo
rohita, Labeo calbasu among major carps; Tor tor among mahseer; Spereta seenghala.
Spereta aor, Wallago attu and Rita rita among catfishes; Chitala chitala amongfeatherbacks. A number of species of lesser size and importance are available in the riverare reported as miscellaneous fishes and comprise Aspidoparia morar, Salmophasia
bacaila, Oxygaster gora, Labeo boggut, Labeo bata, Cirrhinus reba, Gudusia chapra.The water bodies that would be created by dam provide ample opportunity to developfresh water fishery and should be developed for food and sport.3.9SOCIO-ECONOMIC ENVIRONMENTThe Uttar Pradesh state constitutes of 75 districts as per Census 2011. The study areacomprises of four districts i.e. Hamirpur, Jalaun, Kanpur Nagar and Fatehpur. In includesfour sub-districts of Hamirpur namely Hamirpur, Rath, Sarila and Maudaha, similarlythree sub-districts of Kanpur Nagar district Ghatampur, Kanpur and Bilhaur, and twosub-districts of Fatehpur namely Fatehpur and Bindki and one sub-districts of Jalaundistrict Kalpi. Total 194 villages fall under the area under study covering 4 districts. Thedetailed socio economic study is attached as Annexure XV
Table No.3.36. Total Number of all villages and towns within 10kn radius
District Tehsil No. of Villages No. of Towns
Hamipur Hamirpur 92 --Rath 01 --
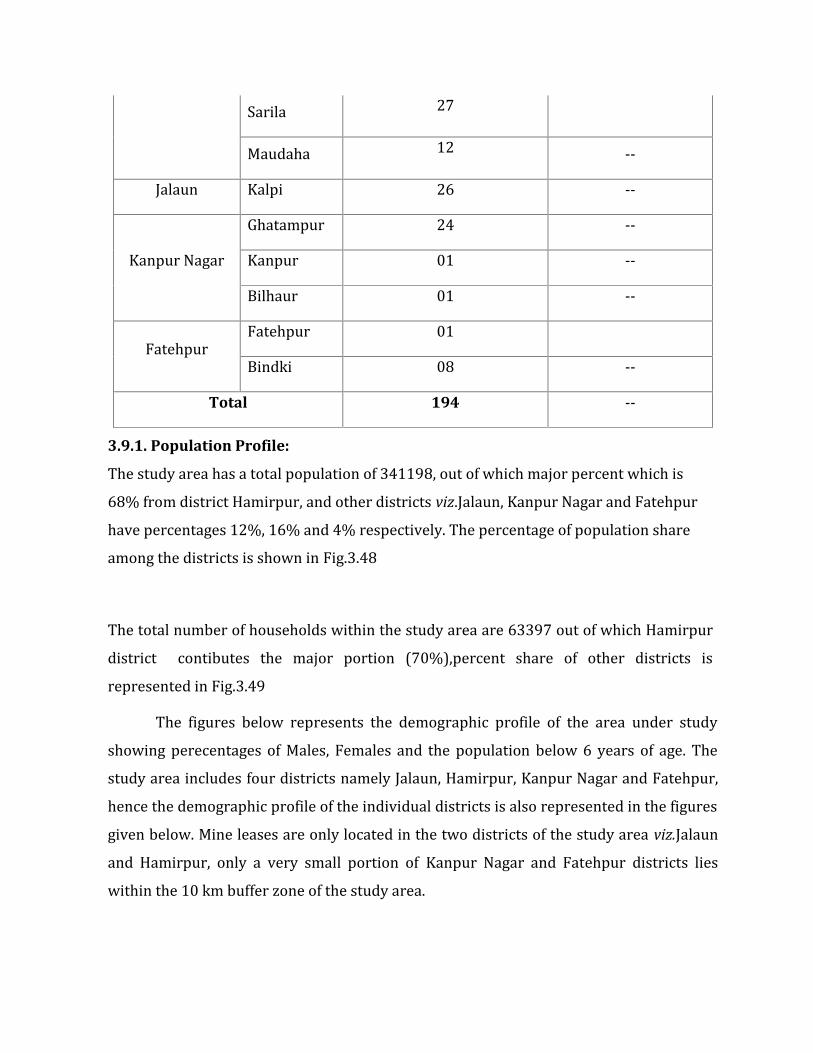
Sarila 27Maudaha 12 --Jalaun Kalpi 26 --
Kanpur Nagar Ghatampur 24 --Kanpur 01 --Bilhaur 01 --Fatehpur Fatehpur 01Bindki 08 --
Total 194 --3.9.1. Population Profile:The study area has a total population of 341198, out of which major percent which is68% from district Hamirpur, and other districts viz.Jalaun, Kanpur Nagar and Fatehpurhave percentages 12%, 16% and 4% respectively. The percentage of population shareamong the districts is shown in Fig.3.48The total number of households within the study area are 63397 out of which Hamirpurdistrict contibutes the major portion (70%),percent share of other districts isrepresented in Fig.3.49The figures below represents the demographic profile of the area under studyshowing perecentages of Males, Females and the population below 6 years of age. Thestudy area includes four districts namely Jalaun, Hamirpur, Kanpur Nagar and Fatehpur,hence the demographic profile of the individual districts is also represented in the figuresgiven below. Mine leases are only located in the two districts of the study area viz.Jalaunand Hamirpur, only a very small portion of Kanpur Nagar and Fatehpur districts lieswithin the 10 km buffer zone of the study area.
3.9.2. Literacy profile:There are parts of four districts which are falling under this EIA study namely Hamirpur,Jalaun, Kanpur Nagar and Fatehpur. Literacy profile of the study area is given below in3.9.3.Occupational profile:The percentage of Worker and Non-Worker population out of the total populationconstituting the study area is given in Fig 3.52. number and percentage of Main worker,which work as worker for major part of the duration of the year and Marginal Workers,which work as Workers for less than 6 Months in the duration of a year. Here, As perCensus Of India, 2011. Marginal Workers have been categorised into two Categories:a) Marginal Workers who work for 3-6 Monthsb) Marginal Workers who work for less than 3 MonthsCategory of workers as per their occupation for both Main and Marginal workers isdefined as Cultivators, Agricultural Laborers, Household Industry Workers and OtherWorkers. Category wise percentage of Main and Marginal workers is given in in Fig. 3.53.Details of Socio-economic status of villages in the study area is annexed as Annexure-XV
CHAPTER- IV
S. NO. CONTENTS
4.0 GENERAL
4.1 IMPACTS OF MORRUM MINING4.1.1 Physical4.1.2 Land Environment4.1.3. Waste Dumps4.1.4. Air Environment4.1.5. Water Environment4.1.6. Noise Environment4.1.7. Biological environment4.1.8. Socio-Economic Environment4.1.9. Increased risk of road traffic accidents4.1.10. Decreased Availability Of Water And Livelihood Impacts4.1.11 Cultural heritage4.1.12. Visual and landscape character4.1.13 Occupational health
4. GENERALThe mining projects along with other activities in vicinity may influence the existingphysical, biological and social components of environment. In case of mining projects,impacts on biodiversity, air pollution, water pollution, waste management and socialissues may be associated. These impacts could be minimized up to a significant levelwhen scientific mining procedures, guidelines and rules are taken into account. Thenature and characteristics of impacts are required to be taken into consideration whileevaluating the magnitude of impacts. Open cast mining activities have different types ofimpacts on nearby environment with respect to both magnitude and significance. During
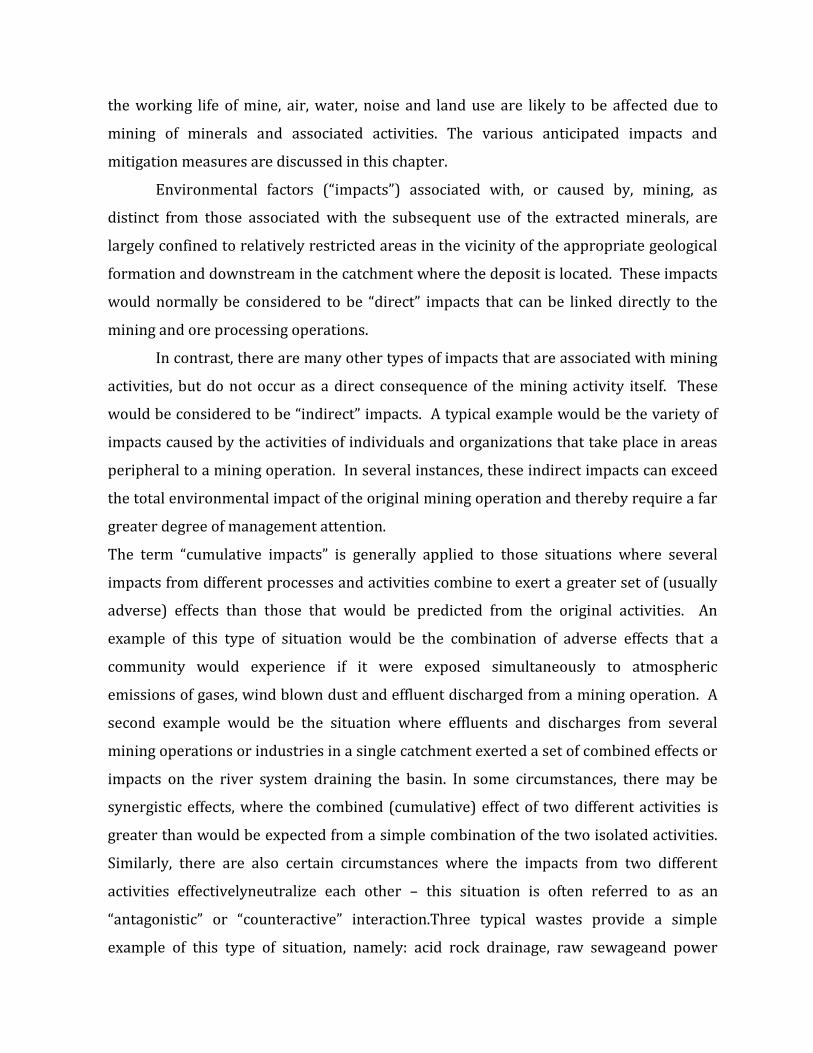
the working life of mine, air, water, noise and land use are likely to be affected due tomining of minerals and associated activities. The various anticipated impacts andmitigation measures are discussed in this chapter.Environmental factors (“impacts”) associated with, or caused by, mining, asdistinct from those associated with the subsequent use of the extracted minerals, arelargely confined to relatively restricted areas in the vicinity of the appropriate geologicalformation and downstream in the catchment where the deposit is located. These impactswould normally be considered to be “direct” impacts that can be linked directly to themining and ore processing operations.In contrast, there are many other types of impacts that are associated with miningactivities, but do not occur as a direct consequence of the mining activity itself. Thesewould be considered to be “indirect” impacts. A typical example would be the variety ofimpacts caused by the activities of individuals and organizations that take place in areasperipheral to a mining operation. In several instances, these indirect impacts can exceedthe total environmental impact of the original mining operation and thereby require a fargreater degree of management attention.The term “cumulative impacts” is generally applied to those situations where severalimpacts from different processes and activities combine to exert a greater set of (usuallyadverse) effects than those that would be predicted from the original activities. Anexample of this type of situation would be the combination of adverse effects that acommunity would experience if it were exposed simultaneously to atmosphericemissions of gases, wind blown dust and effluent discharged from a mining operation. Asecond example would be the situation where effluents and discharges from severalmining operations or industries in a single catchment exerted a set of combined effects orimpacts on the river system draining the basin. In some circumstances, there may besynergistic effects, where the combined (cumulative) effect of two different activities isgreater than would be expected from a simple combination of the two isolated activities.Similarly, there are also certain circumstances where the impacts from two differentactivities effectivelyneutralize each other – this situation is often referred to as an“antagonistic” or “counteractive” interaction.Three typical wastes provide a simpleexample of this type of situation, namely: acid rock drainage, raw sewageand power

station ash. Individually, these wastes exert serious adverse impacts on aquaticenvironments; in combination, however, they neutralize and offset each other so thattheir combined effect on the aquatic environment is often innocuous.4.0.1. Regional ImpactsRegional impacts are those impacts that act together with other impacts (including thosefrom concurrent or planned future third party activities) to affect the same resourcesand/or receptors in the proposed study area. Regional impacts are therefore generallyimpacts that act with others in such a way that the sum is greater than the parts. This is,however, not always the case – sometimes they will simply be the sum of the parts, butthat sum becomes significant. Regional impacts arise from the environmental effectswhich ranges from simple additive impacts to complex interaction of the stressesanticipated because of the proposed project. It occurs when; impacts on the natural and social environments take place so frequently in time orso densely in space that the effects of individual “impact” cannot be assimilated; the impacts of one activity combine with those of another in a synergistic manner.Causes of environmental change also include natural variability and anthropogenicclimate change. Four types of impact of mining are identified which compined to createregional impact.1. Space Crowding-occurs when a system is disturbed by several similar activities,or by different activities producing a similar effect, in an area small to assimilatethe combined impacts. (Rees 1995)2. Time Crowding-occurs when impacts are so close in time that the impact of oneaction are not dissipated before the next occurs.(CEARC 1986)3. Interactive effects- can be additive or compounding, reflecting the interactivenature of ecosystems. Additive is the simple linear addition of one impact onanother, whereas compounding is when two or more agents combine to cause animpact. Antagonistic effects can also occur, where the combined impact of morethan one agent is less than the sum of the individual impacts. (Canter and Kamanth1995)
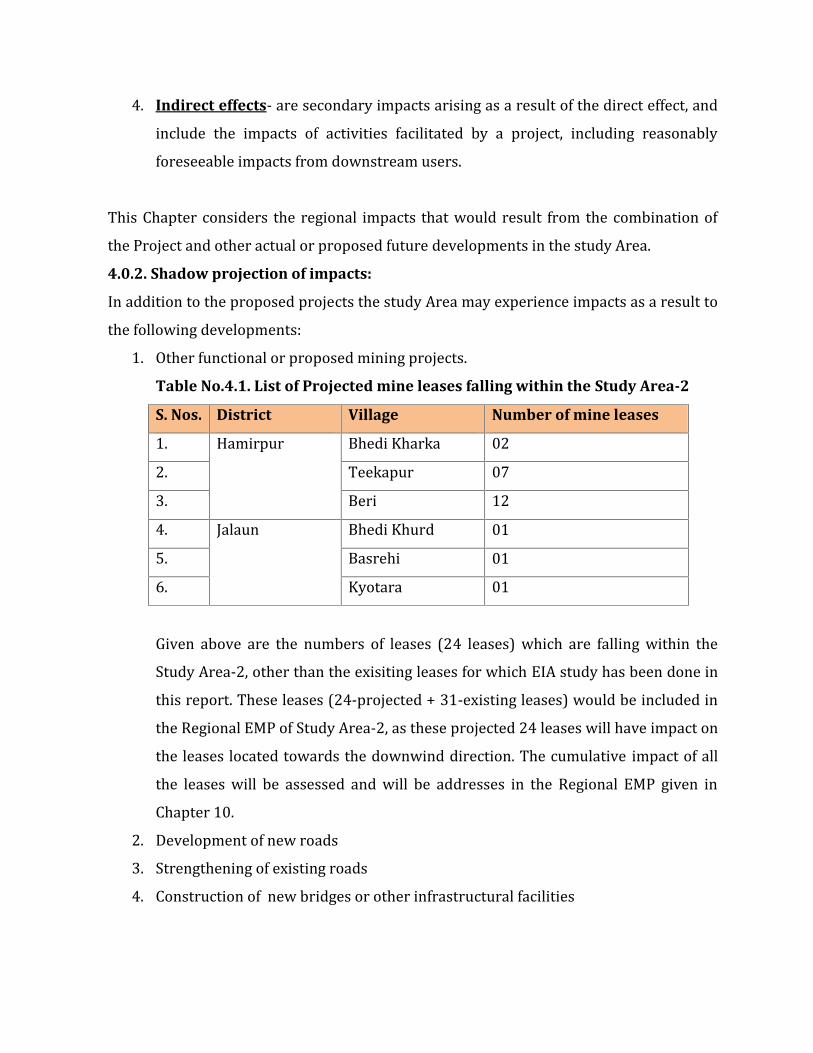
4. Indirect effects- are secondary impacts arising as a result of the direct effect, andinclude the impacts of activities facilitated by a project, including reasonablyforeseeable impacts from downstream users.This Chapter considers the regional impacts that would result from the combination ofthe Project and other actual or proposed future developments in the study Area.4.0.2. Shadow projection of impacts:In addition to the proposed projects the study Area may experience impacts as a result tothe following developments:1. Other functional or proposed mining projects.
Table No.4.1. List of Projected mine leases falling within the Study Area-2
S. Nos. District Village Number of mine leases1. Hamirpur Bhedi Kharka 022. Teekapur 073. Beri 124. Jalaun Bhedi Khurd 015. Basrehi 016. Kyotara 01Given above are the numbers of leases (24 leases) which are falling within theStudy Area-2, other than the exisiting leases for which EIA study has been done inthis report. These leases (24-projected + 31-existing leases) would be included inthe Regional EMP of Study Area-2, as these projected 24 leases will have impact onthe leases located towards the downwind direction. The cumulative impact of allthe leases will be assessed and will be addresses in the Regional EMP given inChapter 10.2. Development of new roads3. Strengthening of existing roads4. Construction of new bridges or other infrastructural facilities
These developments may worsen or enhance the impacts identified. Given the limitedinformation available regarding such future developments, the assessment that follows isnecessarily of a generic (qualitative) nature and focuses on key issues and sensitivities,and how these might be influenced by cumulative impacts with other planneddevelopments.4.0.3. Management and mitigation of regional impacts
Managing cumulative effects in a Regional Environmental Impact Assessment requires, asa start, the same type of mitigation and monitoring that would be recommended in anEnvironmental Impact Assessment for a stand alone mining project. Mitigating a localeffect as much as possible is the best way to reduce regional effects. Mitigating andmanaging an individual project’s impacts as far as possible, even when the project itselfdoes not result in significant impacts, is an appropriate way to reduce impacts across aregion. It is generally unreasonable to expect a single proponent however to bear theburden of mitigating effects attributable to other actions in the region. Such an approachcan significantly disadvantage later projects and be a disincentive to investment.Ultimately, when threshold level of regional impacts required a broader intervention andmitigation of impact, regional impact assessment and regional environmentalmanagement plan comes into the picture. This may result in increased regulation ofactivities contributing to these impacts and regional collaborative initiatives. Followingare specific management measures for mitigate and manage all impacts.4.0.4 Shared InfrastructureProposed project will discuss and decide between them where possible, to shareinfrastructure (viz. access roads and transportation routes inside their project areas) toreduce the potential disturbance caused by installing several similar infrastructure inclose proximity to each other.4.0.5.Undertaking a Strategic Regional Environmental and Social Impact
AssessmentIn the context of this study, these examples of cumulative impacts are highly relevant asthe river basins evaluated in this study contain very large numbers of mining operations

as well as other forms of land use. In combination, therefore, there is a large potential forthe impacts of mining operations to add to, or possibly even counteract, some of theimpacts from these other activities. Keeping in mind the Environment Impact Assessment(EIA) (due to numbers of leases (31) on Betwa river in district Jalaun and Hamirpur, theenvironmental baseline scenario as detailed in Chapter 3 and the proposed miningactivity described in Chapter 2) is attempted to assess the likely impact and its extent onvarious environmental parameters and likely mitigation measures to be adopted. Animpact matrix has also been made for the EIA considering all vital parameters of thephysical & biological parameters if nearby environment in relation to their significance.4.0.5. Assessment of regional impactsIt is very important to identify the contribution of individual mines in regional impact.Detailed scoping exercise has been undertaken to determine the relevant projects,environmental receptors and potential impacts to consider. An assessment of the regionalimpacts can be undertaken which include Individual environmental values, consideringthe impacts of all relevant projects (noting that these may not all be the same for eachreceptor). The following sections outline the steps in the recommended assessmentprocess:1. Determine the baseline2. Determine what constitutes a significant impact3. Set thresholds4. Estimate cumulative impacts, and5. Determine the significance of potential impacts.
Table No. 4.2 Impact of Sand Mining and Consequences.
Main Impact Consequences
Air Increase level of airpollutantsconcentration Human health risksFlora and Habitat loss Alteration on fish population
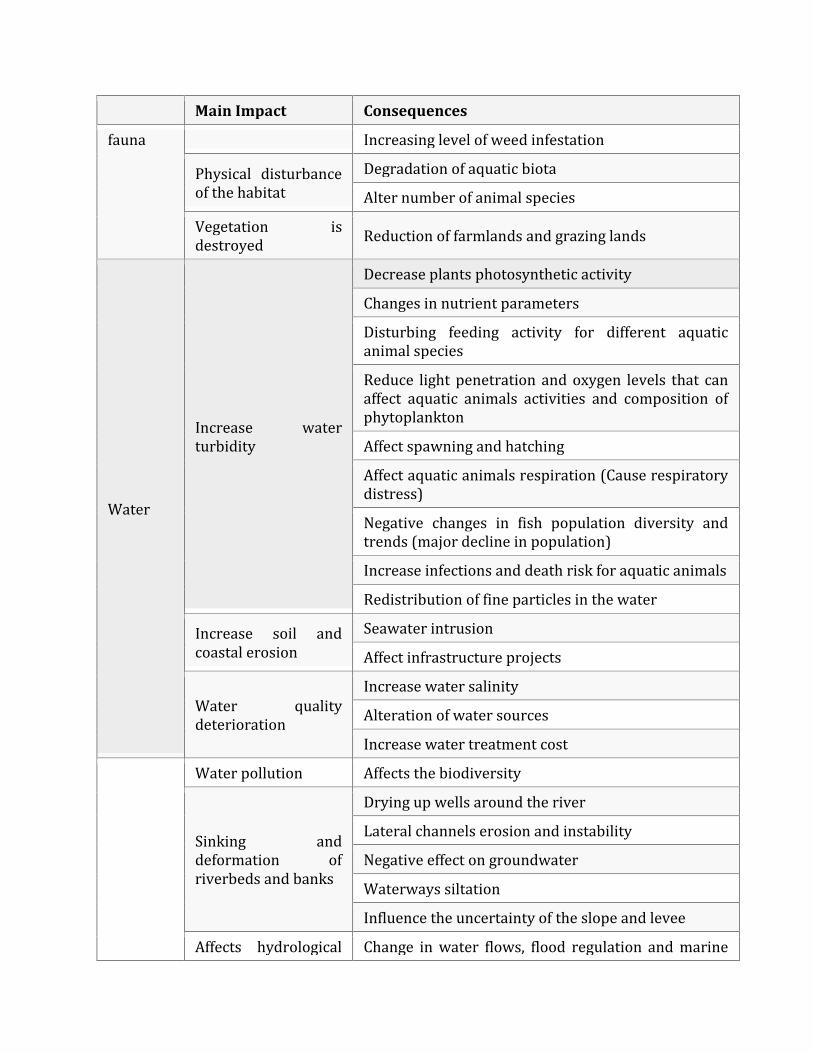
Main Impact Consequencesfauna Increasing level of weed infestationPhysical disturbanceof the habitat Degradation of aquatic biotaAlter number of animal speciesVegetation isdestroyed Reduction of farmlands and grazing lands
WaterIncrease waterturbidity
Decrease plants photosynthetic activityChanges in nutrient parametersDisturbing feeding activity for different aquaticanimal speciesReduce light penetration and oxygen levels that canaffect aquatic animals activities and composition ofphytoplanktonAffect spawning and hatchingAffect aquatic animals respiration (Cause respiratorydistress)Negative changes in fish population diversity andtrends (major decline in population)Increase infections and death risk for aquatic animalsRedistribution of fine particles in the waterIncrease soil andcoastal erosion Seawater intrusionAffect infrastructure projectsWater qualitydeterioration Increase water salinityAlteration of water sourcesIncrease water treatment costWater pollution Affects the biodiversitySinking anddeformation ofriverbeds and banks
Drying up wells around the riverLateral channels erosion and instabilityNegative effect on groundwaterWaterways siltationInfluence the uncertainty of the slope and leveeAffects hydrological Change in water flows, flood regulation and marine

Main Impact Consequencesfunction currentsSoil Decrease soil quality Increase dark areas (fertile land became unfertile dueto lowering groundwater levels)Changes in soil geochemistry (increase concentrationof lead, arsenic, mercury, etc.)Soil erosion Watercourses, wetlands and lakes pollution
LandLandscapedisturbance
Dramatically change of the landscapeDeforestationLoss of bathing beachesDecrease sand reserve for natural beach stormresponseMine-InducedSeismicityStructures stability Damage of the public and private property.4.0.6. Criteria of impact studyIt is a near impossibility to remove all subjectivity involved in making Present Statusassessments such as those presented here. Descriptions of each criterion are provided toassist with the assessment.
Criterion 1 : Water abstractionCriterion 2 : InundationCriterion 3 : Water qualityCriterion 4 : Flow modificationCriterion 5 : Bed modificationsCriterion 6 : Channel modificationsCriterion 7 : Presence of exotic aquatic fauna (e.g. fish)Criterion 8 : Presence of exotic macrophytesCriterion 9 : Solid waste disposalCriterion 10 : Indigenous vegetation removalCriterion 11 : Exotic vegetation encroachmentCriterion 12 : Bank erosionCriterion 13 : Ground water movementCriterion 14 : Change in particle sizeCriterion 15 : Lowering of ground water
4.1. IMPACTS OF MORRUM MININGOn a large scale, to carry out a EIA impacts of morrum mining can be broadly classified asgiven below:4.1.1. PhysicalThe large-scale extraction of streambed materials, mining below the existing stream bedand the alteration of channel-bed form and shape may lead to several impacts such aserosion of channel bed and banks, increase in channel slope, and change in channelmorphology.4.1.1.1. Regional ImpactThese impacts may cause:(1) the undercutting and collapse of river banks,(2) the loss of adjacent land and/or structures,(3) upstream erosion as a result of an increase in channel slope and changes in flowvelocity, and(4) downstream erosion due to increase carrying capacity of the stream, downstream,downstream changes in patterns of deposition, and changes in channel bed and habitattype.4.1.1.2.Mitigation Measures
Ultimate working depth shall be up to 3.0 m from Riverbed level and not less than onemeter from the water level of the River channel whichever is reached earlier. The River Bed Mining (RBM) will be done in unsaturated zone. Thus no loss to habitatis anticipated. Dredging will not be allowed. Mining activities will be done using bar scraper andloader.

The mining procedure will also be made to conform to the recommendations of MoEF& CC’s Standard Environmental Conditions for Sand Mining mentioned in SSMMG,2016. The e-tendering of the leases were done by DM, Jalaun and Hamirpur keeping in viewthe points like availability of minor mineral reserves, sites specific problem likeflooding, submergence crop lands/ fields, need of excavation rate of sedimentdeposition etc. RBM will be done in responsible manner. Head cutting will not be done. The RBM will be done in unsaturated zone. As per SSMMG, 2016, the required safety distances will be maintained when miningwill be carried out near important structure like bridges, dam and otherinfrastructures to prevent any damage & bar skimming.4.1.2. Land EnvironmentThe impact on the land form or physiography will be limited to the modification of theslope. The landscape and land use will undergo a radical change due to open castmining. The impact during next 5 year is limited as benches will be formed and will bereplenished during monsoon. Besides these benches, roads will also modify thePhysiography. Mining activity causes impact on flora and fauna due to land degradation,deforestation, etc. However, as the mining is restricted to very small area in the river bedin dry condition. There is no likelihood of any land degradation or deforestation beingcaused. The impact on land use will also be limited. The mining activity is restrictedalong the river bed only. Since the site is government owned waste land, no impact onexisting land use is anticipated; also the mined area would get replenished on arrival ofmonsoon every year itself. The impacts of mining on land environment arepredominantly governed by the area acquired and land use characteristics. The satelliteimagery on land use, discussed in Chapter 3 of baseline information should form the basisof impact prediction on land. Cost- Benefit analysis is also carried out to see the overallbenefits the project will bring and the economic benefits the land is providing to the area
are to be estimated. The potential impacts of mining on land and their significance arecompiled hereunder and summarized in table 4.4.4.1.2.1.Regional ImpactMining developments increased accessibility made possible influx of further peopleattracted to the study area by job opportunities, these ephemeral river systems maypossibly come (i.e. – if not mitigated) under increasing pressure, not only in terms ofwater abstraction, but also in terms of the potential contamination of these river systemsby diffusing sources of pollution, such as:The ad hoc maintenance of vehicles and machinery; The washing of equipment and vehicles; Dirty run-off water from different mining company components and staff camps, etc.; Improper management of sewage; and Potential spillages of fuels and chemicals.A number of the projects are proposed in the study area and some other projects arefunctional at the moment. This phase is unlikely to result in significant regional impactsto groundwater drawdown, as current water demand is relatively low; however, thecombined operational phase water requirements for these companies will be needed forconsideration.4.1.2.3. Anticipated impacts and evaluationThe proposed morrum mining operations will have both positive and negative changeson the pre mining environmental and ecological status of the area. All mining companiesproposed/ operating in the study area will require the good quality water for drinking.The water demand for sprinkling and plantation, when projected on the regional basiswill be greater.a. Impact on quantity and characteristics of top soilThe current EIA identifies the impact of 11 morrum mining projects (inclusive ofupcoming projects of B1-sub-category for which Public Hearing is awaited and B2- sub-category projects for which EC is awaited) in a stretch of River Betwa between
25°54'25.56"N & 79°39'42.55"E to 25°55'34.68"N & 80°16'12.74"E. The project willbe restricted to scraping and loading of morrum deposit. The lease areas proposed in EIAare deficient of top soil, so no loss of top soil is anticipated and non-plastic and havingmany vertical tubular pores. It appears that due to the mixing of different soil horizonsduring mining, the soil profile changed to a great extent (Ghosh, 1989). The particle sizeanalysis reveals that sand particles increased, and silt and clay decreased with respect tounmined soil. This trend may be due to increased erosion of aggregates and consequentlya high rate of infiltration. The soil dumps were found to be sandy loam in texture, andgradually changed to loamy sand after that period. The high bulk density of the soildumps may be attributed to the use of heavy machinery. This has the high bulk density ofthe soil dumps may be attributed to the use of heavy machinery. This has a seriousimplication for subsequent changes in soil properties, because gaseous diffusion is mademore difficult. Thus, restrictions on growth of deep-rooted plants may be one of thereasons for stagnation of plant succession at the shrub stage. However, if any layer of soilis found beneath the surface during mining it will be utilized for strengthening thehaulage route as it is not biologically active/ fertile.b. Impact on soil quality of the surrounding areaSince it is RBM project, absence of topsoil in mining lease areas is observed, so nomitigation measures required. However, the following mitigation measures will be takento prevent any impact on soil quality of the nearby areas due to operational aspects of theproject: It will be ensured that the scraper and front-end loader are properly maintained. Equipments will be regularly serviced and inspected to make sure there are no leaksof oil, diesel, fuel, detergents or hydraulic fluids. Servicing and maintenance of vehicles as far as possible will occur outside of theboundaries of mining lease area. If maintenance does occur on site due to breakdown,all steps will be undertaken to avoid hydrocarbon spills/leakages. Under no circumstances will oil or diesel to be stored and disposed of at the site. No night parking of vehicles in the mining lease area.

Vendors of UPPCB will be contracted for collection of hazardous waste (used oil) & oilspill kit will be provided with each vehicle.c. Impact On Existing Land UseThese impacts may cause: (1) the undercutting and collapse of river banks, (2) the loss ofadjacent land and/or structures, (3) upstream erosion as a result of an increase inchannel slope and changes in flow velocity, and (4) downstream erosion due to increasedcarrying capacity of the stream, downstream changes in patterns of deposition, andchanges in channel bed and habitat type. The mining activities will be restricted to theriver bed only. Since the site is government owned waste land, no impact on existing landuse is anticipated. Also, the mined area would get replenished on arrival of monsoonevery year.d. Impact of siltation in the morrum pitsSince it is RBM project, no over burden or waste will be generated during mining activity.Impact of siltation will be very low to Nil as there will be no pit formation due to use ofbar scraper.
e.Impact on natural course of river/diversion of water flow due to bank erosionThe mining activities will be confined to the river bed only, hence will help the river toremain channelized also avoiding natural hazards like erosion, flooding etc. thus theimpact is positive and significant.e. Impact on riverine ecologyIn the current EIA, dredging or instream mining is not proposed in any of the 31 leases(inclusive of upcoming projects of B1-sub-category for which Public Hearing is awaitedand B2- sub-category projects for which EC is awaited). Hence, the impact on riverineecology would be negligible. However, it has been found that during site visit some part ofthe few lease areas was submerged in the active water channel. In such condition, the
depth of the mining in contrast with LOI will be increased in the dry mining area to meetout the production from the respective leases. Ultimate mining depth will be kept at 03 mfrom surface limiting above 1 m above water level of the river.Riparian ecology includes the vegetative cover on and adjacent to the river banks. Themining activity will be confined to the river bed only. No vegetation is adversely affected.f. Erosion potential and terrain: stability of river banks (which may lead to
loss of chunks of land and make area flood prone)
Kondolf (1993) reported that in stream mining resulted in channel degradation anderosion, head cutting, increased turbidity, stream bank erosion and sedimentation ofriffle areas. All these changes adversely affect fish and other aquatic organisms eitherdirectly by damage to organisms or through habitat degradation or indirectly throughdisruption of food web. Further, effects on stream geomorphology (e.g., channel incision)can result in infrastructure damage such as undermining bridge piers and exposure ofburied pipeline crossings and water supply intake (Kondolf, 1997). The mining activitywill be confined to the river bed only; hence will help the river to remain channelized alsoavoiding natural hazards like erosion, flooding etc. Thus, the impact is positive andsignificant.4.1.3. Waste DumpsThis is RBM project, no drilling; blasting is proposed thus not involving any wastegeneration. The excavated material will be loaded and transported directly to thepotential markets, not leaving any waste dumps behind. There may be incidental wastedue to activities of mine workers which will be insignificant and provisions for dustbinswill be available on site to collect the incidental waste.4.1.3.1 .Mitigation Measures
The Mineable reserves will be limited by
a) Free space of 3 m or 10% of the channel width of the river from riparianzone.b) Bench height will be kept at max. of 0.6 m and width of minimum 10 m.c) Bench slope not more than of 30° from vertical axis.d) safety margins from civil structures for each site. The main stream will not be diverted to form inactive channels from mining. Mining below subterranean water will not be done. Riverbed mining will be carried out where maximum sedimentation occurs. Segments of breaded river will be used preferably for mining. Mining at the concave side of the river channel will not be done so that the bankerosion may not occur. Mining will be carried out at places where sediment aggregations are maximum. Mining will be restricted during the monsoon season and at the time of floods. Mining schedule will be synchronized with the river flow direction and thegradient of the land. Care will be taken to ensure that ponds are not formed in the river bed. Access roads from public roads and up to river bank will be selected in such a waythat it would cause least environmental damage. Productive land will not be utilized for storage and other purpose. Siltation on agriculture land will be prevented.
4.1.4 Air Environment
4.1.4.1. Anticipated Impacts and EvaluationAir pollution is likely to be caused at various stages of morrum mining operations such asexcavation, loading, transportation and screening of material. If we look at regional level,dust generated during loading, unloading and transportation of morrum is the mainpollutants of morrum mining operations of which cumulative impacts would be verysignificant. Most of the dust will be generated from loading, screening and transportationoperations. This dust becomes air borne and gets carried away to surrounding areas. The
impact on air is mainly localized in nature as the dust particles are not carried to longerdistances due to larger size and the effect is felt within the core zone of the all 06 miningleases. But combined impact of air borne dust from the mining lease areas will definitelygive a relatively larger picture of fugitive dust emission in the area. Also, loading,transportation and unloading operations may cause deterioration in air quality due tohandling dry materials.In the present case, only wet materials will be handled by suitable water sprinklingduring loading & on haulage routes, thus eliminating problems of fugitive dust. Also, thecollection and lifting of minerals will be done manually without any blasting. Thereforethe dust generated is insignificant as compared to mining process of other hard mineralslike the process of drilling, blasting, mechanized loading etc.4.1.4.2. Regional impact of air pollutionOther activities associated with the proposed mining projects in the study area have thepotential to create significant negative cumulative impacts associated with the generationof total dust, PM10 and PM2.5. The magnitude of these potential impacts may be minor,moderate or major, depending upon how the impacts from other mining projects willcombine with impacts arising from the proposed Mining Projects and the respectivetiming of each project. These impacts may be worsened by elevated wind speeds,increasing the potential for cumulative impacts during periods of adverse weather.4.1.4.3. Air ModelingIn general, mining operations may generate airborne respirable dust, which leads to thedevelopment of respirable diseases in mine workers. The increasing trend of miningleads to release of huge amount of dust. These air borne dust particles, generally below10 micron in size, are nuisance particulates and cause health hazards as an ill effect ofmining activities. Mining activities like drilling, blasting, material handling and transportare a potential source of air pollution. Therefore, a detailed study on emission sourcesand quantification of pollutant concentration by means of dispersion modeling isrequired to access the environmental impact of a mine. On the basis of the predicted

increments to air pollutant concentrations, an effective mitigation and environmentalplan can be devised for sensitive areas. In case of river bed morrum mining, as there areno blasting and drilling activities, the impacts are caused by material handling andtransportation activities of mostly wet morrum and are minimal.4.1.4.4. Fugitive dust- modelingConcentration of the fugitive dust was calculated using the empirical equations forunpaved roads published by USEPA- AP42. The Concentration of the fugitive Dust is givenbelow:C = (2/π) 1/2 (E / σz υ) Exp- [(h2) / (2 σz2)] x 106 ---------------------------- (2)WhereC = Concentration in microgram/ m3E = Emission Rate = 0.012 g/sec/mυ = Wind Speed =1 m/sh = 1mModelling was done for an infinite line source assuming unpaved road. For conservativecalculation wind was assumed to blow at a velocity of 1 m/s perpendicular to the road.For fugitive emission control, the uncontrolled emissions from various source rangesfrom 1,00,000 to 4,00,000 µg/m3 . As control efficiency of 95% could reduce this level to5,000 to 20,000 µg/m3, close to source, measured at maximum 1 M distance. By applyingGaussian Model for neutral atmospheric conditions, the effect of SPM at different distancewould be as mentioned belowFor an average achievable SPM concentration value at source (<1Meter) of 10,000microgram per cubic meter would have a projected SPM concentration in the range of150 microgram per cubic meter at 30 Meter distance.
4.1.4.5. Mitigation MeasuresDuring operational phase of mining, the only air pollution sources are fugitive dustemission due to movement, loading, unloading and transportation of minor minerals asdrilling, blasting, crushing, DG Set/furnace or storage is not proposed at site. Thefollowing mitigation measures are suggested: Dust suppression measures like spraying/sprinkling of water on haulage route tokeep the surface wet as well as during loading/ unloading of minor mineral. No overloading of the trucks/trolleys. Transportation of material in covered vehicles to prevent dust emission in case oflong haulage or if the road passes through in close proximity to habitation. Provision of water spray on the dumper and roads to arrest fine dust beforetransportation. Suitable dust barriers in the form of green nylon curtains near excavation site.4.1.5. Water Environment
4.1.5.1. Baseline StatusThe source of water in the area is generally the ground water and rainwater. The RiverBetwa is one of the major flowing rivers of the district. Betwa River during its coursefrom the source is joined by a number of sub-tributaries. As the proposed activity is aprocess involving scraping of morrum from the river bed & hence intersection of groundwater does not arise.4.1.5.2. Anticipated impacts and evaluationDuring the mining operations, there will be no wastewater discharges to water bodiesfrom the lease areas. The inflow of sewage or effluents from the surrounding locality isalso considered nil as no temporary or permanent housing is proposed at mine sites. Theonly water contaminant is rainwater run-off during the monsoon season. There will be noimpact due to the proposed mining on the water environment and the water flow patterndoes not disturb the turbidity and velocity, hence no mitigation measures are suggested.There is no noticeable effect on surrounding ground water resource due to mining as the
mining activity does not require ground water extraction. The collection of morrum isdone on the river bed where excessive sedimentation has been noticed up to the requireddepth only. Excessive mining will reduce the thickness of the natural filtermaterials (sediments) through which the groundwater is recharged. The pollutantsdue to mining, such as washing ofmining materials, wastes disposal, diesel and vehicularoil lubricants and other human activities may pollute the groundwater. Dumping of finematerial, compaction of filter zone due to movement heavy machinery and vehiclesformining purposes may reduce the permeability and porosity of the filter materialthrough which the groundwater is recharging, thus resulting in steady decrease of groundwater resources. Deposition of silt on river bed can smother diatoms, benthic algae,macro-invertebrates and fish eggs. Composition of benthic and fish communities affectedby changes in sediment texture and habitat loss arising from selective removal of fineaggregates from the river bed deposit. Many aquatic organisms, especially the benthos,are affected severely by sand mining. The organisms include different species of mayfly,dragonfly, chironomids, eaddisfly and other insects of the order Diptera. Sand mining canalso negatively affect the survival and dispersal of benthic organisms belonging to thegroups Polychaeta, Crustacea and Mollusca. Dispersal of eggs and larvae is an importantaspect of the biological processes of aquatic organisms. In the fisheries point of view, lossof food in the form of benthic invertebrates is a major negative impact which willultimately end up in the decline of inland fishery resource of the area.The impact on the aquatic flora & fauna due to the proposed opencast mining isinsignificant as mining involves only scraping of morrum from the river bed which willnot disturb the aquatic life present in the river. The detrimental effects to biota resultingfrom bed material mining are caused by three main processes:i. alteration of flow patterns resulting from modification of the river bedii. an excess of suspended sedimentiii. damage to riparian vegetation and in stream habitat4.1.5.3. Impact on water level:- When mining is done in the sand pits above the groundwater level, pit is not dewatered , no significant impact on ground water is observed.However when the mining is done from mining pit below the water table, mine altered
the ground water flow direction in the sand and gravel deposits affecting the nearbyground water source for the area. Sand and gravel operations are found in depositsformed during the advance and retreat of glaciers and in alluvial floodplain depositsformed by streams. Both types of deposits often are critical ground-water aquifers andrecharge areas in upland settings; they often are focused discharge zones in stream andriver valleys where wetlands and springs depend on continued groundwater flowsthrough the sand and gravel. Because sand and gravel deposits allow comparatively highinfiltration rates and relatively rapid rates of water transfer within an aquifer, activitiesand land uses within and above granular aggregate can have negative effects ongroundwater quantity and quality within aquifers. Excess esive dewatering in minesas shown in figure create the cone of depression surrounding the pit and the merging ofAquifer 1 and Aquifer 2 water surfaces due to dewatering. The red arrows represent theground-water flow under these conditions and approximate the hydraulic gradient, orwater surface slope, of Aquifer 1. Because the potentiometric surface of Aquifer 2 hasbeen reduced, the hydraulic gradient of Aquifer 1 is steeply sloping toward the pit.Groundwater flow paths, water table elevations, groundwater gradients and bothsurface- and ground-water basins can be altered by mining below the water table.Excavation of the pit below the water table can cause water levels to decline near themine and downgradient of the mine. The effect is due to redirection of ground-water flowto the pond and then to the ditch system and is due to evaporation from the pond surface.The greatest potential for alteration of water levels and flow patterns occurs where minesintersect a wateryielding zone. The magnitude and arial extent of changes in waterlevels and flow patterns are dependent on many variables including1. The arial extent of the flow system penetrated by the mine,2. The thickness of the saturated interval penetrated by the mine,3. The hydraulic head at the mine site,4. the hori zontal and vertical dtstnbution and magnitude of hydraulic conductivityand storage coefficient surroundmg the mine site,5. the distance to and types of hydrologic boundaries,6. the stze and shape of the mine cut,7. the length of time the mine is in operation
4.1.5.3. Increase in turbidity :- Turbidity is the cloudiness or murkiness of water, whichis an expression of the optical properties of water, which cause the light to bescattered and absorbed rather than transmitted in straight lines. It is thereforecommonly regarded as the opposite of clarity (Wass et al., 1997). Turbidity impairsthe suitability of the water for many purposes. High levels of mean turbidity in themining and downstream sites is due to increased riverbed and bank erosionassociated with sand mining which increases suspended solids in the water at themining and downstream sites. Mining operation also release fine sand and small siltparticles that are present in the stream. Silt particles (< 63 µm) can be transportedover large distances by the river because of their small settling velocity (Kondolf,1994). Although water turbidity does not pose a serious problem to ground watersince it is unable to migrate beyond the immediate infiltration site, the continualinfiltration of the turbid water does raise the potential for other sources ofcontaminant to migrate to the aquifer because it decreases the distance between theground water table and land surface. In some cases, the excavation actuallypenetrates the shallow aquifers, leading a direct access to ground water (Despreze,2000) mean depth of 3- 4 meters. Any chemical contaminants that are allowed toenter wash water or spills in the area would have quicker access to the aquifer. Oncein the ground water, a chemical substance would be free tomove with the water inthe aquifer. It should also be recognized that although it does not pose a threat tothe health of water users, the impact of turbidity are many and include, its being asprimary agent causing biological stresses; source of introduction ofabnormalvolumes of organic material and nutrients and reintroduction of toxic substancesuncovered by miningactivities thus increasing the biological oxygen demand (BOD),which in turn reduces oxygen levels. Also it hasbeen observed that sand miningoperations reduce the buffering capacity of subsurface materials by removing thesoillayer from an area. The reduction in buffering capacity makes the groundwatersensitive to pH change (Borges, etal, 2002) . Other impact of turbidity is discolorationof water which more than anything renders goodwater appear bad.4.1.5.5 .Regional Impact
Surface water course is present in the study area, and drainage channels flow duringrainy season. Mining companies active in the study area will establish infrastructure fortheir mining operations including offices, access roads. The establishment ofinfrastructure has the potential to interrupt run-off channels and result in cumulativenegative impacts to the sensitive ecology that depend on small drainage lines thattransport surface water during flash flood events.4.1.5.6. Mitigation MeasuresNo mitigation measures are required as the project activity is carried out in themeandering part of the river bed; none of the project activities will affect the waterenvironment or riparian habitats. In the projects, it is not proposed to divert or truncateany stream. No proposal is envisaged for pumping of water either from the river ortapping the ground water. Project Proponent will adhere to all guidelines and rules forproper and scientific method of mining during the period of extracting the morrum. Thus,the project activities shall not have any adverse effect on the physical components of theenvironment and therefore may not have any effect on the recharge of ground waters oraffect the water quality.4.1.6. Noise EnvironmentThe proposed RBM project is predominantly semi-mechanized/OTFM, thus will generatevery less noise, that too by the movement of vehicles as drilling blasting etc. are notproposed.4.1.6.1. Anticipated impacts and evaluationAs there will be no heavy earth moving machinery hence there will not be any majorimpact on noise level due to the mining and other associated activities. A detailed noisesurvey has been carried out and results are discussed in Chapter 3. Drilling & Blastingtechnique is not required for morrum lifting, hence no possibility of land vibration. It isfound that the mining activity will not have any significant impact on the noise

environment of the region. The only impact will be due to transportation of materials bytrucks/trolleys.4.1.6.2. Regional ImpactIn the event that present and proposed projects of mining leases falling within the StudyArea-2 to run in parallel with the other activities of the study area, it is possible that thecumulative noise impact of activities carried out in these phases may increase from thedirect impact predicted; however, this is dependent on how the impacts from otherdevelopments combine with the impacts from the proposed projects of mining leasesfalling within the Study Area-2, and the respective timing of these impacts. However, thissaid, proposed projects will vary in their locality and hence it is unlikely that there will bea cumulative increase in predicted noise.4.1.6.3. Traffic during operationsIt is likely that mining companies will use the same main haul road to transport productout of the study area and through road networks. Although this will result in an increasein the number of trucks utilising the road, the actual predicted noise level will notincrease; rather, the predicted road noise levels will become less intermittent.4.1.6.3. Mitigation MeasuresAs the only impact is due to transportation of morrum though village roads, emphasis willbe given on the following points: Haulage route for transportation of the excavated minor mineral will be opted &constructed away from the habitation, schools, hospitals & other social areas. Trucks which are newer or less than 15 years old having fitness certificate will bedeployed for transportation of minor minerals after obtaining pollution undercontrol certificate. Minimum use of horns in the village area will be promoted and silence zone (if any)will be marked as applicable. Care will be taken to produce minimum sound during loading.
Labourers will be provided with personal hearing protection device i.e. ear plugs orear muffs if required.4.1.6.4. Traffic analysis of regional impact of additional traffic because of
proposed projectsSignificant cumulative impacts can arise due to emissions from vehicle exhausts and fromdust dispersion lifted from unpaved road surfaces. Impacts at roadside sensitivereceptors caused by the vehicles associated with the proposed projects are howeverpredicted to be of negligible negative significance (post-mitigation). On this basis, whereair quality standards are to be approached or exceeded, these impacts would likely arisefrom vehicles other than trucks from the proposed mining projects. Where unpavedaccess roads are used however, major adverse impacts associated with dispersion of dustand PM 10/PM2.5 can potentially occur. These effects can be especially significant if thesame unpaved road is used by various mining company traffic.The vehicular movement within the site is inevitable. However, during operationphase, this activity would not cause any significant impact on the ambient airquality. To ensure this traffic analysis is carried out by: visiting each and every mine site & finalizing the opted haulage route awayfrom the habitation, schools, hospitals & other social areas. categorizing the paved & unpaved length & width of the haulage route foreach mine site in the region. identifying the common haulage route for two or more leases in the stretch. calculating the no. of trucks to be deployed for transportation of excavatedminor mineral. understanding the existing carrying capacity of the roads near to the projectsite and the connecting main roads in the area. Then depending on thecapacity of the mine, the number of trucks that will be added to the presentscenario will be compared to the carrying capacity.

The details regarding length of haulage route, daily production and no. of trucks to bedeployed per day is given in the Table 4.1 below:Table 4.2. Haulage route analysis & details of vehicular movement of leases
falling in stretch of EIA
Project Proponent (s)& Name of Company (if
any) & ResidentialAddress
Gata No(s)/
KhandNo (s)
,VillageTehsil/District
Details of Production Haulage Route Length (km)
DailyProduction(cum/day)
No. of Trucks to bedeployed for
transportation/dayDescription
Un
pav
edLe
ngt
h
Pav
ed L
engt
h
Tot
al L
engt
h
B1 Category ProjectsM/s Ghanaram InfraEngineers Pvt. Ltd. Gata No.240,KhandNo. 05883 59 >8m wide roadconnected toMDR(Jalalpur-Kadaura) which isfurther connected toSH 91 (Hamirpur-Kalpi Marg)
0.34 0.92 1.26
M/s Pehalwan Traders KhandNo.23/07 707 47 >6m wide roadconnected toMDR(Kadaura-Bewar) which isfurther connected toSH 42 (Hamirpur-Gursarai-JhansiMarg)
2.77 6.91* 9.68
Shri Kanha ConstructionCompany KhandNo.23/13 707 47 >6m wide roadconnected toMDR(Kadaura-Bewar) which isfurther connected toSH 42 (Hamirpur-Gursarai-JhansiMarg)
2.67 6.91* 9.58
M/s Balaji Enterprises KhandNo.23/20 707 47 >6m wide roadconnected toMDR(Kadaura-Bewar) which isfurther connected toSH-42 (Hamirpur-Gursarai-JhansiMarg)
1.46 6.91 8.37
M/s Bindu & RamConstruction Company Gata No.1396 Ga,KhandNo. 031,104 74 >10m wide roadconnected to SH 42(Hamirpur-Gursarai-Jhansi Road) which isfurther connected toSH 91 (Hamirpur-Kalpi Marg)
1.2 8.56+10.7=19.26 20.46
M/s D. V. Construction KhandNo.20/06 1,413 94 >8m wide roadconnected toMDR(Jalalpur- 0.92 2.71+6.39=9.1 10.02
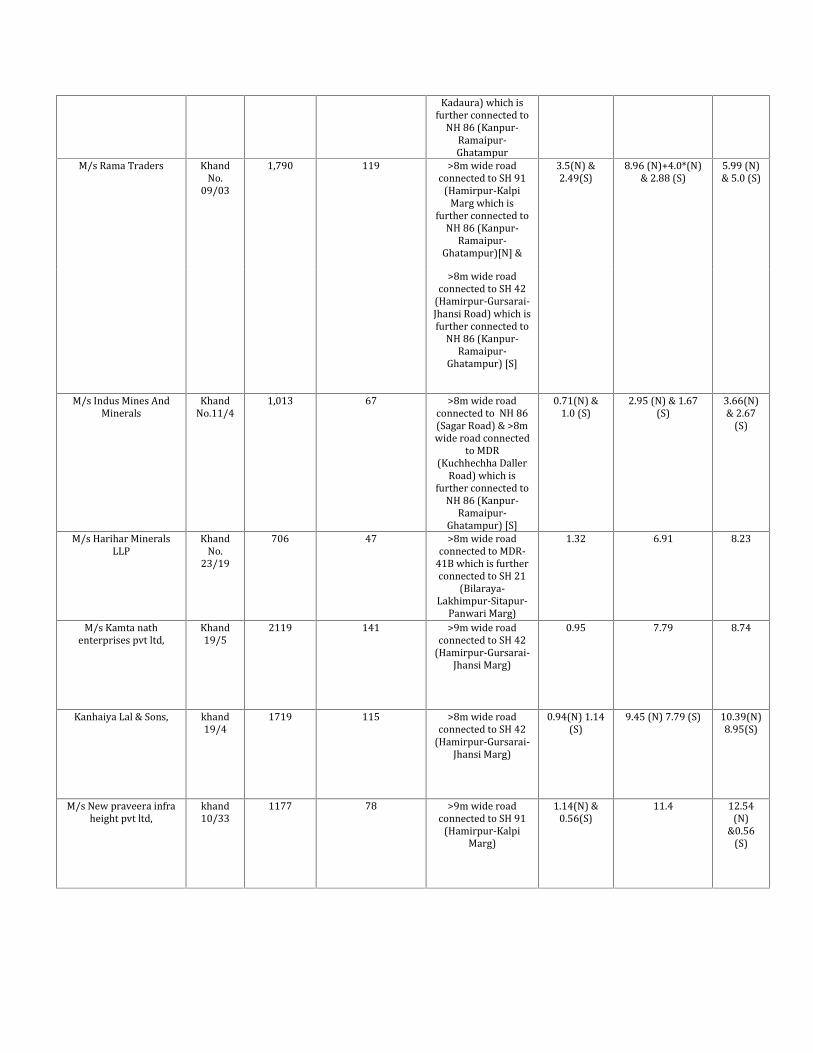
Kadaura) which isfurther connected toNH 86 (Kanpur-Ramaipur-GhatampurM/s Rama Traders KhandNo.09/03 1,790 119 >8m wide roadconnected to SH 91(Hamirpur-KalpiMarg which isfurther connected toNH 86 (Kanpur-Ramaipur-Ghatampur)[N] &
3.5(N) &2.49(S) 8.96 (N)+4.0*(N)& 2.88 (S) 5.99 (N)& 5.0 (S)
>8m wide roadconnected to SH 42(Hamirpur-Gursarai-Jhansi Road) which isfurther connected toNH 86 (Kanpur-Ramaipur-Ghatampur) [S]M/s Indus Mines AndMinerals KhandNo.11/4 1,013 67 >8m wide roadconnected to NH 86(Sagar Road) & >8mwide road connectedto MDR(Kuchhechha DallerRoad) which isfurther connected toNH 86 (Kanpur-Ramaipur-Ghatampur) [S]
0.71(N) &1.0 (S) 2.95 (N) & 1.67(S) 3.66(N)& 2.67(S)
M/s Harihar MineralsLLP KhandNo.23/19 706 47 >8m wide roadconnected to MDR-41B which is furtherconnected to SH 21(Bilaraya-Lakhimpur-Sitapur-Panwari Marg)
1.32 6.91 8.23
M/s Kamta nathenterprises pvt ltd, Khand19/5 2119 141 >9m wide roadconnected to SH 42(Hamirpur-Gursarai-Jhansi Marg)0.95 7.79 8.74
Kanhaiya Lal & Sons, khand19/4 1719 115 >8m wide roadconnected to SH 42(Hamirpur-Gursarai-Jhansi Marg)0.94(N) 1.14(S) 9.45 (N) 7.79 (S) 10.39(N)8.95(S)
M/s New praveera infraheight pvt ltd, khand10/33 1177 78 >9m wide roadconnected to SH 91(Hamirpur-KalpiMarg)1.14(N) &0.56(S) 11.4 12.54(N)&0.56(S)
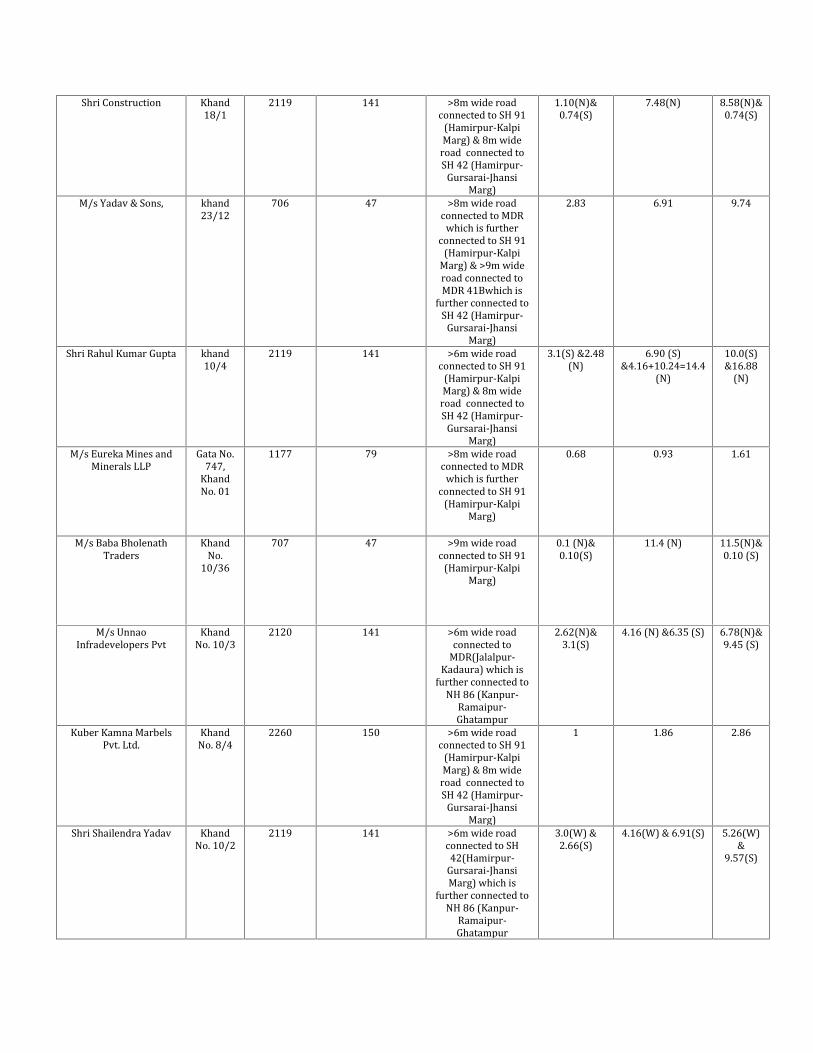
Shri Construction Khand18/1 2119 141 >8m wide roadconnected to SH 91(Hamirpur-KalpiMarg) & 8m wideroad connected toSH 42 (Hamirpur-Gursarai-JhansiMarg)
1.10(N)&0.74(S) 7.48(N) 8.58(N)&0.74(S)
M/s Yadav & Sons, khand23/12 706 47 >8m wide roadconnected to MDRwhich is furtherconnected to SH 91(Hamirpur-KalpiMarg) & >9m wideroad connected toMDR 41Bwhich isfurther connected toSH 42 (Hamirpur-Gursarai-JhansiMarg)
2.83 6.91 9.74
Shri Rahul Kumar Gupta khand10/4 2119 141 >6m wide roadconnected to SH 91(Hamirpur-KalpiMarg) & 8m wideroad connected toSH 42 (Hamirpur-Gursarai-JhansiMarg)
3.1(S) &2.48(N) 6.90 (S)&4.16+10.24=14.4(N) 10.0(S)&16.88(N)
M/s Eureka Mines andMinerals LLP Gata No.747,KhandNo. 011177 79 >8m wide roadconnected to MDRwhich is furtherconnected to SH 91(Hamirpur-KalpiMarg)
0.68 0.93 1.61
M/s Baba BholenathTraders KhandNo.10/36 707 47 >9m wide roadconnected to SH 91(Hamirpur-KalpiMarg)0.1 (N)&0.10(S) 11.4 (N) 11.5(N)&0.10 (S)
M/s UnnaoInfradevelopers Pvt KhandNo. 10/3 2120 141 >6m wide roadconnected toMDR(Jalalpur-Kadaura) which isfurther connected toNH 86 (Kanpur-Ramaipur-Ghatampur
2.62(N)&3.1(S) 4.16 (N) &6.35 (S) 6.78(N)&9.45 (S)
Kuber Kamna MarbelsPvt. Ltd. KhandNo. 8/4 2260 150 >6m wide roadconnected to SH 91(Hamirpur-KalpiMarg) & 8m wideroad connected toSH 42 (Hamirpur-Gursarai-JhansiMarg)
1 1.86 2.86
Shri Shailendra Yadav KhandNo. 10/2 2119 141 >6m wide roadconnected to SH42(Hamirpur-Gursarai-JhansiMarg) which isfurther connected toNH 86 (Kanpur-Ramaipur-Ghatampur
3.0(W) &2.66(S) 4.16(W) & 6.91(S) 5.26(W)&9.57(S)
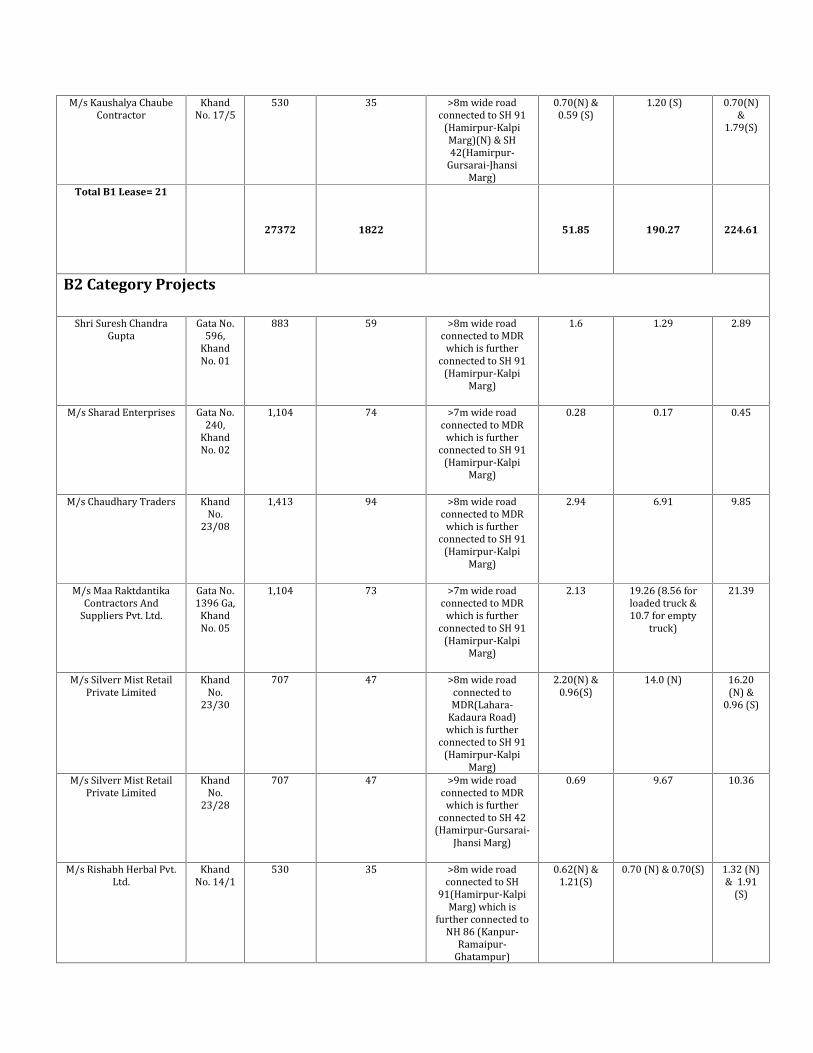
M/s Kaushalya ChaubeContractor KhandNo. 17/5 530 35 >8m wide roadconnected to SH 91(Hamirpur-KalpiMarg)(N) & SH42(Hamirpur-Gursarai-JhansiMarg)
0.70(N) &0.59 (S) 1.20 (S) 0.70(N)&1.79(S)Total B1 Lease= 21
27372 1822 51.85 190.27 224.61
B2 Category Projects
Shri Suresh ChandraGupta Gata No.596,KhandNo. 01883 59 >8m wide roadconnected to MDRwhich is furtherconnected to SH 91(Hamirpur-KalpiMarg)
1.6 1.29 2.89
M/s Sharad Enterprises Gata No.240,KhandNo. 021,104 74 >7m wide roadconnected to MDRwhich is furtherconnected to SH 91(Hamirpur-KalpiMarg)
0.28 0.17 0.45
M/s Chaudhary Traders KhandNo.23/08 1,413 94 >8m wide roadconnected to MDRwhich is furtherconnected to SH 91(Hamirpur-KalpiMarg)2.94 6.91 9.85
M/s Maa RaktdantikaContractors AndSuppliers Pvt. Ltd. Gata No.1396 Ga,KhandNo. 051,104 73 >7m wide roadconnected to MDRwhich is furtherconnected to SH 91(Hamirpur-KalpiMarg)
2.13 19.26 (8.56 forloaded truck &10.7 for emptytruck)21.39
M/s Silverr Mist RetailPrivate Limited KhandNo.23/30 707 47 >8m wide roadconnected toMDR(Lahara-Kadaura Road)which is furtherconnected to SH 91(Hamirpur-KalpiMarg)
2.20(N) &0.96(S) 14.0 (N) 16.20(N) &0.96 (S)
M/s Silverr Mist RetailPrivate Limited KhandNo.23/28 707 47 >9m wide roadconnected to MDRwhich is furtherconnected to SH 42(Hamirpur-Gursarai-Jhansi Marg)0.69 9.67 10.36
M/s Rishabh Herbal Pvt.Ltd. KhandNo. 14/1 530 35 >8m wide roadconnected to SH91(Hamirpur-KalpiMarg) which isfurther connected toNH 86 (Kanpur-Ramaipur-Ghatampur)
0.62(N) &1.21(S) 0.70 (N) & 0.70(S) 1.32 (N)& 1.91(S)

M/s Indus Mines AndMinerals KhandNo.11/5 707 47 >7m wide roadconnected to NH 86(Kanpur-Ramaipur-Ghatampur)0.14 2.95 3.09
M/s A.P.M. Mining AndInfra Pvt.Ltd. KhandNo.10/29 707 47 >6 m wide roadconnected to SH 91(Hamirpur-KalpiMarg)2.30(N) &0.75(S) 1.40(N) & 8.41 (S) 3.7(N) &9.16(S)
Associate Commerce Gata No.747/16 246 16 >8m wide roadconnected to MDRwhich is furtherconnected to SH 91(Hamirpur-KalpiMarg)0.65 0.93 1.58
Total 10Leases-B2
8638 575 17.76 67.59 85.35
GrandTotal
31Leases-(B1+B2)**
36010 2397 69.61 257.86 309.96
*Upcoming B1- sub-category Projects for which Public Hearing is awaited and EC from SEAC for B2-
sub-category projects is also awaited & granted.
** (inclusive of upcoming projects of B1-sub-category for which Public Hearing is awaited and B2-
sub-category projects for which EC is awaited)
Table 4.3 : Existing Traffic Scenario & LOS
Road V C Existing V/C Ratio LOSNear projectsites 82* 500 0.16 ASH 328* 1500 0.22 BNH 386* 2400 0.16 A* Source: local survey
V= Volume in PCU’s/hr C= Capacity in PCU’s/ hr LOS- level of serviceThe existing Level of Service for State Highway-21 is “B” i.e. Very Good and for NationalHighway-25 is “A” i.e Excellent.
V/C LOS Performance0.0 - 0.2 A Excellent
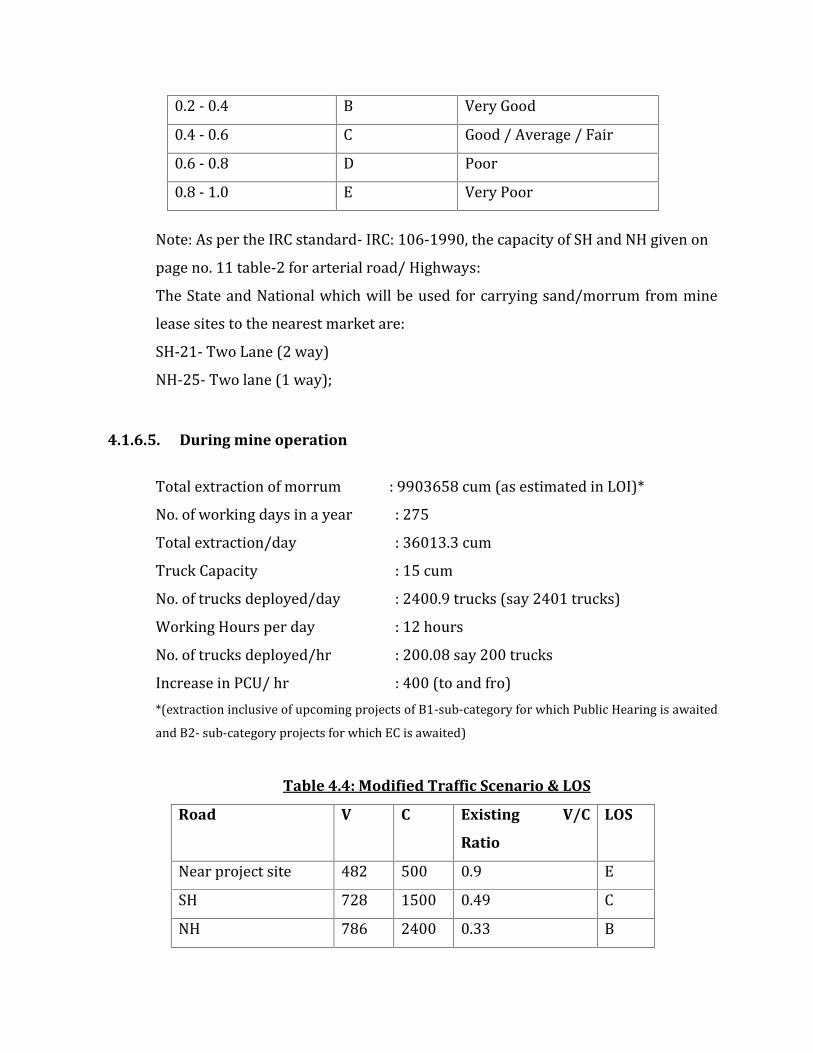
0.2 - 0.4 B Very Good0.4 - 0.6 C Good / Average / Fair0.6 - 0.8 D Poor0.8 - 1.0 E Very PoorNote: As per the IRC standard- IRC: 106-1990, the capacity of SH and NH given onpage no. 11 table-2 for arterial road/ Highways:The State and National which will be used for carrying sand/morrum from minelease sites to the nearest market are:SH-21- Two Lane (2 way)NH-25- Two lane (1 way);
4.1.6.5. During mine operation
Total extraction of morrum : 9903658 cum (as estimated in LOI)*No. of working days in a year : 275Total extraction/day : 36013.3 cumTruck Capacity : 15 cumNo. of trucks deployed/day : 2400.9 trucks (say 2401 trucks)Working Hours per day : 12 hoursNo. of trucks deployed/hr : 200.08 say 200 trucksIncrease in PCU/ hr : 400 (to and fro)*(extraction inclusive of upcoming projects of B1-sub-category for which Public Hearing is awaitedand B2- sub-category projects for which EC is awaited)Table 4.4: Modified Traffic Scenario & LOS
Road V C Existing V/C
Ratio
LOS
Near project site 482 500 0.9 ESH 728 1500 0.49 CNH 786 2400 0.33 B
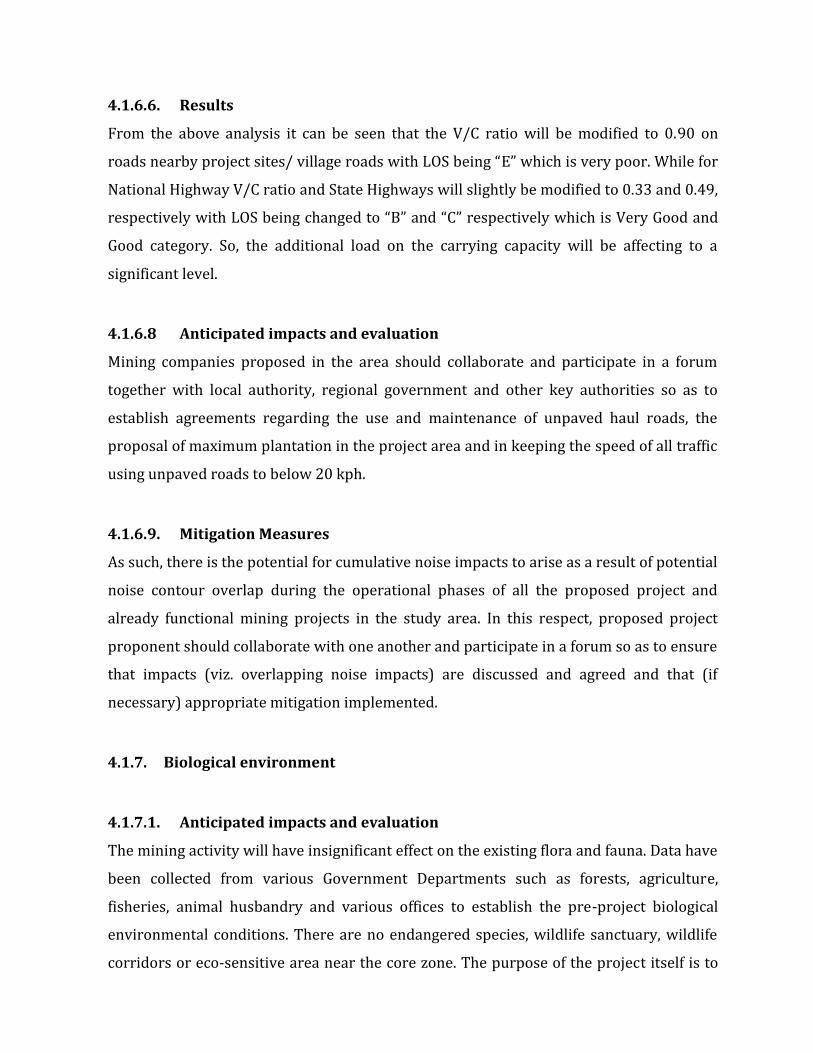
4.1.6.6. ResultsFrom the above analysis it can be seen that the V/C ratio will be modified to 0.90 onroads nearby project sites/ village roads with LOS being “E” which is very poor. While forNational Highway V/C ratio and State Highways will slightly be modified to 0.33 and 0.49,respectively with LOS being changed to “B” and “C” respectively which is Very Good andGood category. So, the additional load on the carrying capacity will be affecting to asignificant level.4.1.6.8 Anticipated impacts and evaluationMining companies proposed in the area should collaborate and participate in a forumtogether with local authority, regional government and other key authorities so as toestablish agreements regarding the use and maintenance of unpaved haul roads, theproposal of maximum plantation in the project area and in keeping the speed of all trafficusing unpaved roads to below 20 kph.4.1.6.9. Mitigation MeasuresAs such, there is the potential for cumulative noise impacts to arise as a result of potentialnoise contour overlap during the operational phases of all the proposed project andalready functional mining projects in the study area. In this respect, proposed projectproponent should collaborate with one another and participate in a forum so as to ensurethat impacts (viz. overlapping noise impacts) are discussed and agreed and that (ifnecessary) appropriate mitigation implemented.4.1.7. Biological environment
4.1.7.1. Anticipated impacts and evaluationThe mining activity will have insignificant effect on the existing flora and fauna. Data havebeen collected from various Government Departments such as forests, agriculture,fisheries, animal husbandry and various offices to establish the pre-project biologicalenvironmental conditions. There are no endangered species, wildlife sanctuary, wildlifecorridors or eco-sensitive area near the core zone. The purpose of the project itself is to
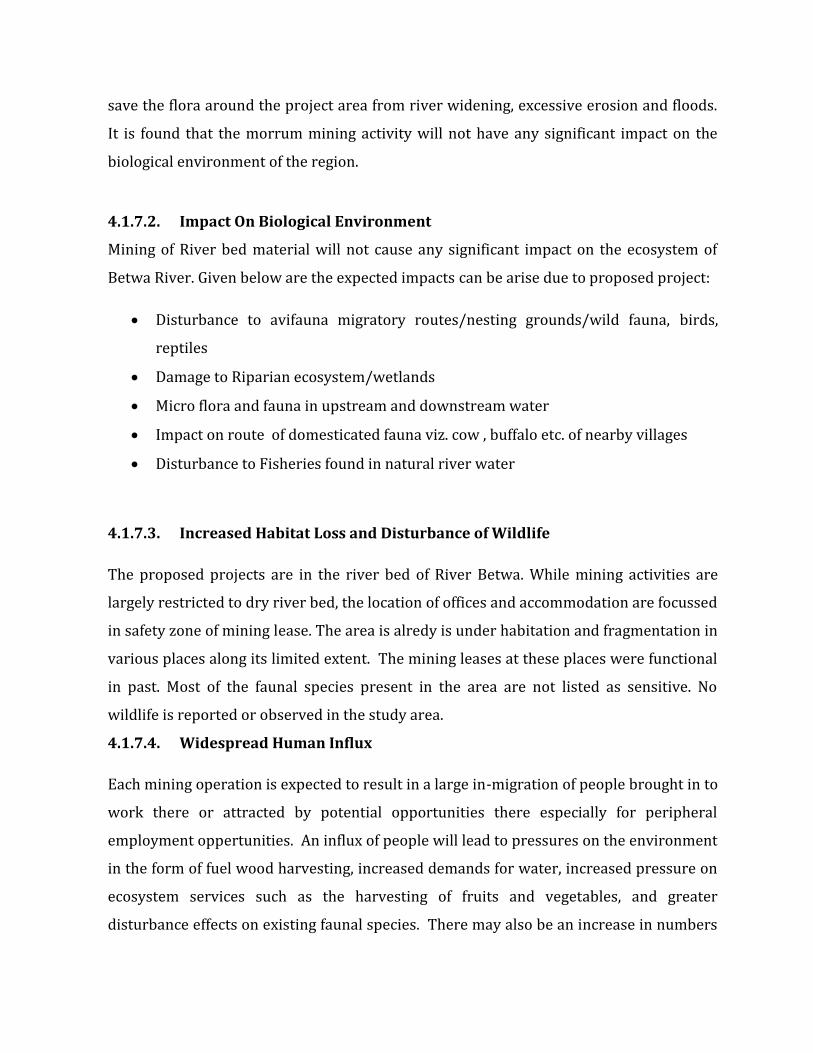
save the flora around the project area from river widening, excessive erosion and floods.It is found that the morrum mining activity will not have any significant impact on thebiological environment of the region.4.1.7.2. Impact On Biological EnvironmentMining of River bed material will not cause any significant impact on the ecosystem ofBetwa River. Given below are the expected impacts can be arise due to proposed project: Disturbance to avifauna migratory routes/nesting grounds/wild fauna, birds,reptiles Damage to Riparian ecosystem/wetlands Micro flora and fauna in upstream and downstream water Impact on route of domesticated fauna viz. cow , buffalo etc. of nearby villages Disturbance to Fisheries found in natural river water
4.1.7.3. Increased Habitat Loss and Disturbance of WildlifeThe proposed projects are in the river bed of River Betwa. While mining activities arelargely restricted to dry river bed, the location of offices and accommodation are focussedin safety zone of mining lease. The area is alredy is under habitation and fragmentation invarious places along its limited extent. The mining leases at these places were functionalin past. Most of the faunal species present in the area are not listed as sensitive. Nowildlife is reported or observed in the study area.4.1.7.4. Widespread Human InfluxEach mining operation is expected to result in a large in-migration of people brought in towork there or attracted by potential opportunities there especially for peripheralemployment oppertunities. An influx of people will lead to pressures on the environmentin the form of fuel wood harvesting, increased demands for water, increased pressure onecosystem services such as the harvesting of fruits and vegetables, and greaterdisturbance effects on existing faunal species. There may also be an increase in numbers
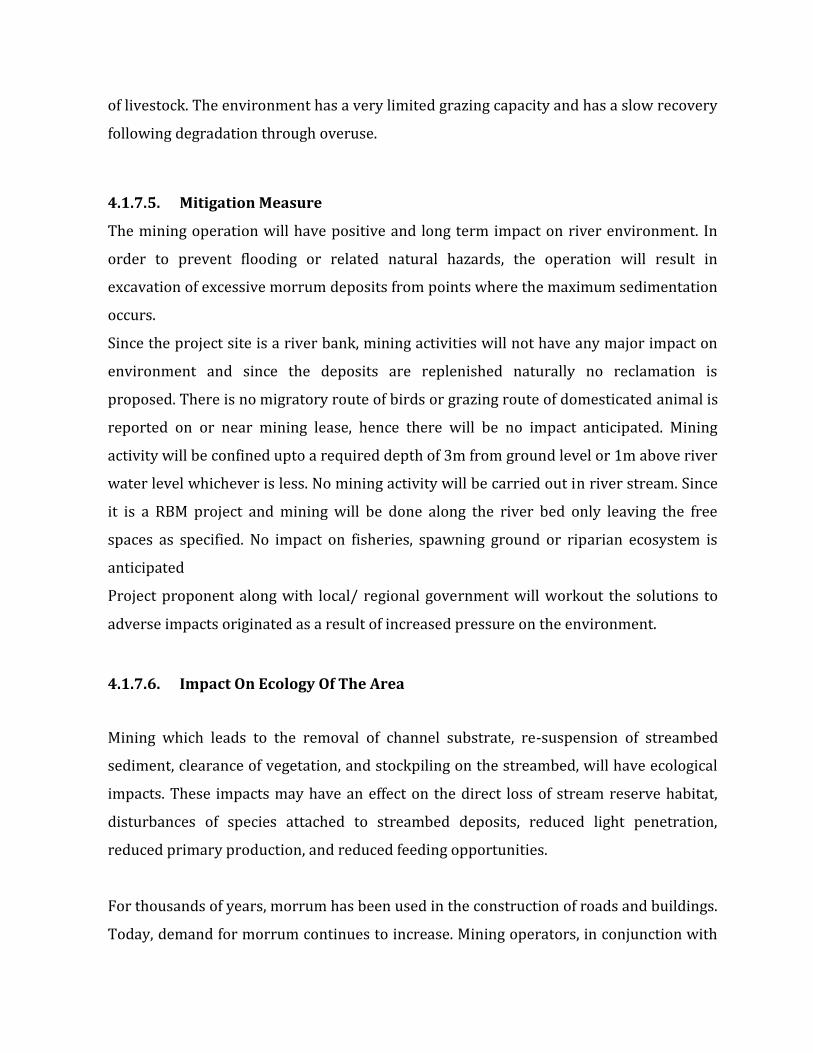
of livestock. The environment has a very limited grazing capacity and has a slow recoveryfollowing degradation through overuse.4.1.7.5. Mitigation MeasureThe mining operation will have positive and long term impact on river environment. Inorder to prevent flooding or related natural hazards, the operation will result inexcavation of excessive morrum deposits from points where the maximum sedimentationoccurs.Since the project site is a river bank, mining activities will not have any major impact onenvironment and since the deposits are replenished naturally no reclamation isproposed. There is no migratory route of birds or grazing route of domesticated animal isreported on or near mining lease, hence there will be no impact anticipated. Miningactivity will be confined upto a required depth of 3m from ground level or 1m above riverwater level whichever is less. No mining activity will be carried out in river stream. Sinceit is a RBM project and mining will be done along the river bed only leaving the freespaces as specified. No impact on fisheries, spawning ground or riparian ecosystem isanticipatedProject proponent along with local/ regional government will workout the solutions toadverse impacts originated as a result of increased pressure on the environment.4.1.7.6. Impact On Ecology Of The Area
Mining which leads to the removal of channel substrate, re-suspension of streambedsediment, clearance of vegetation, and stockpiling on the streambed, will have ecologicalimpacts. These impacts may have an effect on the direct loss of stream reserve habitat,disturbances of species attached to streambed deposits, reduced light penetration,reduced primary production, and reduced feeding opportunities.For thousands of years, morrum has been used in the construction of roads and buildings.Today, demand for morrum continues to increase. Mining operators, in conjunction with
cognizant resource agencies, must work to ensure that morrum mining is conducted in aresponsible manner.Excessive and unscientific Riverbed morrum mining causes the degradation of rivers.Riverbed mining lowers the stream bottom, which may lead to bank erosion. Depletion ofmorrum in the streambed causes the deepening of rivers, and the enlargement of rivermouths. Any volume of morrum exported from streambeds is a loss to a system.It may also be a threat to bridges, river banks and nearby structures. Morrum mining alsoaffects the adjoining groundwater system and the uses that local people make of the riverand sometimes result in destruction of aquatic and riparian habitat through largechanges in the channel morphology. Impacts include bed degradation, bed coarsening,lowered water tables near the streambed, and channel instability. These physical impactscause degradation of riparian and aquatic biota and may lead to the undermining ofbridges and other structures. Continued extraction may also cause the entire streambedto degrade to the depth of excavation.Morrum mining generates extra vehicular traffic, which negatively impairs theenvironment. Where access roads cross riparian areas, the local environment may beimpacted.4.1.7.7. Mitigation measuresAs the present mining will be done in a scientific manner as mentioned before, significantadverse impacts are not predicted; however the following mitigation measure will betaken to further minimize it. Re-suspension, turbulence, stream flow, channel substrate and associated specieswill be disturbed and could be lost due to mining. This loss of species is negligiblein case of river bed mining as mining will be restricted to river bed only leavingthe free space as per mining law.
No mining will be done near to important structure like bridges, dam and othersstructures as per mining law. Safety distance as per SSMMG, 2016 will bemaintained. No mining will be carried out during monsoons. This will minimize impact onaquatic life. Since it is a RBM project, it has no vegetation, therefore clearance of vegetation isnot required. The mining activity will employ many vehicles (tractors/ trollies) to transport themorrum outside the mine to desired destination. Safe site/routes having lessimpact will be selected for transportation, all the vehicles will be employed fortransportation purpose will be PUC certified.
4.1.7.8. Flora and fauna of riparian habitat
If morrum mining is done in an unscientific way, i.e. beyond the replenishment capacity,riverbed mining can have adverse effects at the mine sites. The fertile streamside landwill be lost gradually and the wildlife in the riparian areas may start vanishing. Degradedstream habitats will result in loss of fisheries productivity, biodiversity, and recreationalpotential. Thus the severely degraded channels may lower the aesthetic value too.All species require specific habitat conditions to ensure long-term survival. Nativespecies in streams are uniquely adapted to the habitat conditions that existed beforehuman began alterations. These have caused major habitat disruptions that favouredsome species over others and caused overall declines in biological diversity andproductivity. In most streams and rivers, habitat quality is strongly linked to the stabilityof channel bed and banks. Unstable stream channels are inhospitable to most aquaticspecies. No dredging is proposed and hence there will be no possibility of sedimentsaltering water quality.Factors that increase or decrease sediment supplies often destabilize bed andbanks and result in dramatic channel readjustment. For example, human activities thataccelerate stream bank erosion, such as riparian forest clearing/ Riverbed mining causestream banks to become net sources of sediment that often have severe consequences for
aquatic species. Anthropogenic activities that artificially lower stream bed elevationcause bed instabilities that result in a net release of sediment in the local vicinity.Unstable sediments simplify and, therefore, degrade stream habitats for many aquaticspecies.The most important effects of excessive and unscientific Riverbed morrum miningon aquatic habitats are bed degradation and sedimentation, which can have substantialnegative effects on aquatic life. The stability of morrum -bed and morrum-bed streamsdepends on a delicate balance between stream flow, sediment supplied from thewatershed, and channel form. Mining- induced changes in sediment supply and channelform disrupt channel and habitat development processes. Furthermore, movement ofunstable substrates results in downstream sedimentation of habitats. The affecteddistance depends on the intensity of mining, particle sizes, stream flows, and channelmorphology. Channel widening causes swallowing of the streambed, producing braidedflow or subsurface inter gravel flow in riffle areas, hindering movement of fishes betweenpools. All such impacts can be reduced by following scientific mining practices andmitigation measures. All such impacts can be reduced by following scientific miningpractices and mitigation measures.4.1.7.9. Environmental Management Plan (Biological Environment)Proper environmental management plan is proposed for “River Bed Material” miningproject to mitigate the impact during the mining operation: Mining operation will be suspended during monsoon season. Mining operation will be carried out during day time only. No labour camps will be allowed on river bed. Prior to mining, short awareness program will be conducted for labours to makethem aware about the finer nuances related to mining. If some casualty or injury to animal occurs, proper treatment should be given. No tree cutting, chopping, lumbering, uprooting of shrubs and herbs should beallowed.
Corridor movement of wild mammals (If exists) should be avoided Care should be taken that noise produced during vehicles movement for carryingRBM materials are within the permissible noise level. No piling of RBM material should be done in agricultural areas. Care should be taken that no hunting of animals or collections of medicinal plant arecarried out by labours. If wild animals are noticed crossing the river bed, it should not be disturbed orchased away, instead the labours should move away from their path.4.1.8. Socio-Economic EnvironmentThe proposed project will have direct and positive impact on socio-economicenvironment. The field survey conducted based on a social survey to understand theknowledge and the perception of the people living around the project area, gives a clearidea about the need for the project.The project activities shall not have any adverse impacts on any of the commonproperty resources of the village communities, as the morrum mine lease area is notbeing used for any purpose by any section of the society in this region. There is no R & Rinvolvement in this project. There is no land acquisition in this project.This activity will help raise the socio-economic status of the people who aredirectly and indirectly involved through primary direct employment of local workers tosecondary employment through transportation. It has also come to light that if thisactivity is not activated, then the affected groups will tend to participate in other illegalactivities. This project will provide employment to the people residing in vicinity peoplewill to be benefited directly or indirectly by the project. Only local labour will be used forthe proposed mining operation and no will be approximately 2107 for all the miningleases in the riverbed of Betwa river in District Jalaun and Hamirpur.4.1.8.1. Project induced in-migrationThe proposed Project is expected to cause some in-migration into the study area andsurrounds related to the arrival of opportunistic economic migrants and migrant labour.
Other potential mining operations in the vicinity of the proposed Project may increasethe scale and likelihood of this in-migration due to a perception that more benefits areavailable in the area. The presence of several mining Projects in the region is likely toincrease the perceived desirability of the area for visitors, increasing the scale of in-migration. This increased in-migration is likely to contribute to in-migration relatedimpacts.4.1.8.2. Mitigation Measure
Capacity Building: Local administration along with the Project proponent will discussand agree on a holistic approach to provide government with support and build thecapacity of its staff to plan effectively for future development. Administrative capacitybuilding could include training, provision of equipment and the provision of technicalsupport (e.g. information technology support). The potential benefits may includeimproved local governance and greater efficiency in capacity development initiatives.Increasing Human Capital among the Local Population: The residents of the study areawill have access many of the potential benefits from economic activity related to thestudy area and other proposed mining developments. Increasing the capacity of the localpopulation will allow for increased local benefits and increase the local resilience topotential in-migration related impacts. Early efforts to increase human resource capitalthrough training and capacity building would assist in putting local inhabitants in aposition to be employed or start business enterprises to service future developments.Recruitment Alignment: Mining companies should agree a holistic approach to aligningrecruitment strategies. This will help to ensure that there is a viable labour pool of localemployees for companies and help to build the skills and experience of local people.Combined efforts to align the approach to recruitment will help to reduce or avoidpotential inmigration.The factors related to in-migration will be enhanced by the presence of mining projects inthe area therefore collaboration in implementing measures to avoid and manage in-migration will boost the potential for successful implementation. This may include:
Collaboration with the regional and local Government and other operators in thedeveloping and implementation of a shared Environmental Management Plan Developing a shared approach to monitoring changes in specific baselineconditions related to in-migration. This would require the establishment of ashared monitoring capability to consider price inflation, demographics, changes inland cover and land use etc.
4.1.9. Increased risk of road traffic accidents
4.1.9.1. ImpactExisting vehicle traffic is not significant in the study area; local people tend to walkor use there personal vehicles to their destinations to transport their goods.Settlements tend to be located close to existing roads and children and livestock roamfreely and are unsupervised. The proposed Projects will increase light and heavyvehicles using the local roads throughout the duration of the project period andduring the life of mine. During operations, there will be 400 heavy vehicle movementsper day related to Yara Dallol BV leaving the processing site and travelling along thetransport corridor to the market place, as well as returning. The anticipated numberof light and heavy vehicles movements related to these other proposed mines is alsotaken into consideration; however, it can be assumed to be a significant number. Thecombined volumes of road traffic will place both human and livestock in danger ofbeing injured or killed throughout the life of mine.4.1.9.2. Mitigation MeasuresFollowing are the proposed mitigate measures for potential cumulative impacts fromother mining developers related to traffic accidents. A specialist and integrated RoadTraffic Risk Assessment is considered to understand the cumulative risks related toproposed projects using the transport corridor to the market place. This assessmentwill assist in planning and coordination of road traffic reducing risks related to trafficaccidents. Where possible all operators should consider the use of shared accessroads that join a shared transport corridor.
4.1.10. Decreased Availability Of Water And Livelihood Impacts
4.1.10.1. ImpactFresh water is a resource, which has a livelihood impact on resident of study area. If theground water is being withdrawl, decrease in available groundwater resources may beobserved. This could have adverse impacts on local communities. Without systematicmanagement the unplanned and uncoordinatedabstraction of groundwater resourcescould contribute to water shortages andlivelihood impacts. The unmanaged cumulativeeffect of these operators could exacerbate the impacts on natural resources assessed forthe proposed Projects.4.1.10.2. Mitigation MeasuresThe measures described in the assessment of cumulative groundwater impacts will helpto avoid or mitigate these impacts. Specifically establishing a regional water committeewill help to manage the abstraction of groundwater.4.1.11 Cultural heritage
4.1.11.1. ImpactIn terms of cumulative impacts, the main concern for cultural heritage is thepotential for a substantial increase in population within the larger region aspeople from neighbouring regions move into the study area in search of work.Increased population is usually accompanied by the expansion of existingsettlements or the establishment of new settlements. As settlements expand orare established, new areas are impacted by building activity and it is likely thatarchaeological resources will be impacted by this increased activity. Populationgrowth may also prompt the development of roads and other civil infrastructurewith ground disturbing components, which will also likely impact archaeologicalsites. Increased traffic resulting from higher population density or other miningprojects in the area could also generate additional vibration impacts.4.1.11.2. Mitigation Measure
It is proposed that the residents of the study area will be educated about theregion’s important local heritage and what areas should be avoided whenchoosing new places to build or expand communities.4.1.12 Visual and landscape character
4.1.12.1. ImpactProposed mining leases and the leaseswhich will be come up in future increase willcaused impacts on the surrounding landscape and visual receptors/amenity during theoperational phases, including: Landscape Impacts – the presence of additional development will increase theimpact on the open desolate character of the surrounding landscape. Visual Impacts – the presence of additional infrastructure along with othermining leases in the area will increase the visual impact from receptors in relativeproximity, and will also experience a greater visual impact although this isunlikely to result in significant cumulative effects.
4.1.12.2. Mitigation MeasureProject proponents of the study area will collaborate the potential to shareinfrastructure is discussed (viz. access roads and transportation routes).4.1.13. Occupational healthThere is no environmental pollution due to the proposed mining as it is proposedto be a mainly semi-mechanized/OTFM mining for extraction of morrum on the banks ofRiver Betwa. Hence there will be no major occupational health hazards. The villagersavail medical facilities from the nearest public health centre locally and for specifictreatments & health assistance they avail facilities from Govt. hospital located at districtlevel.
4.1.13.1. Anticipated Health ImpactIt is anticipated that the effect on public health will be primarily due to emanationof dust & smoke from the haulage of transport vehicles in the buffer zone. On continuousexposure to the proposed activities certain occupational health hazards are anticipated. Fungal infection of the hands and legs due to constant contact with the wetmorrum. Due to lack of personal hygiene water borne diseases are also envisaged to theworkers. Continuous exposure to morrum dust can lead to silicosis, Silica tuberculosis otherpulmonary diseases.Proposed mining activity may not pose any adverse health hazard to the people in& around the area as healthy mining practices are carried out during the course of miningand the activities are restricted to excavation of permitted volume in Environmentalclearance. Further no one is residing in the core zone and regulatory restriction for theinhabitation will be maintained.
4.1.13.2 Mitigation MeasuresAn inventory of the risks involved during the proposed project would bedelineated with the measures to mitigate the same and the same would be ensured to thepeople by conducting an awareness program in the surrounding areas. Other mitigationmeasures are given below: Mining activities will be carried out semi-mechanized/ OTFM using bar scraper andloader only. Laborers will have access to basic first aid (first aid box) facility on site. Awareness on safety and ensure using of personal protective equipments (PPE) byworkers like gloves, helmets, boots ear plugs and ear muff etc. to avoid injuries. The workers will be trained on using personal protective equipments as aprecautionary measure & thereby preventing any infectious diseases. Workers will be periodically made aware of health & safety and various other risks.
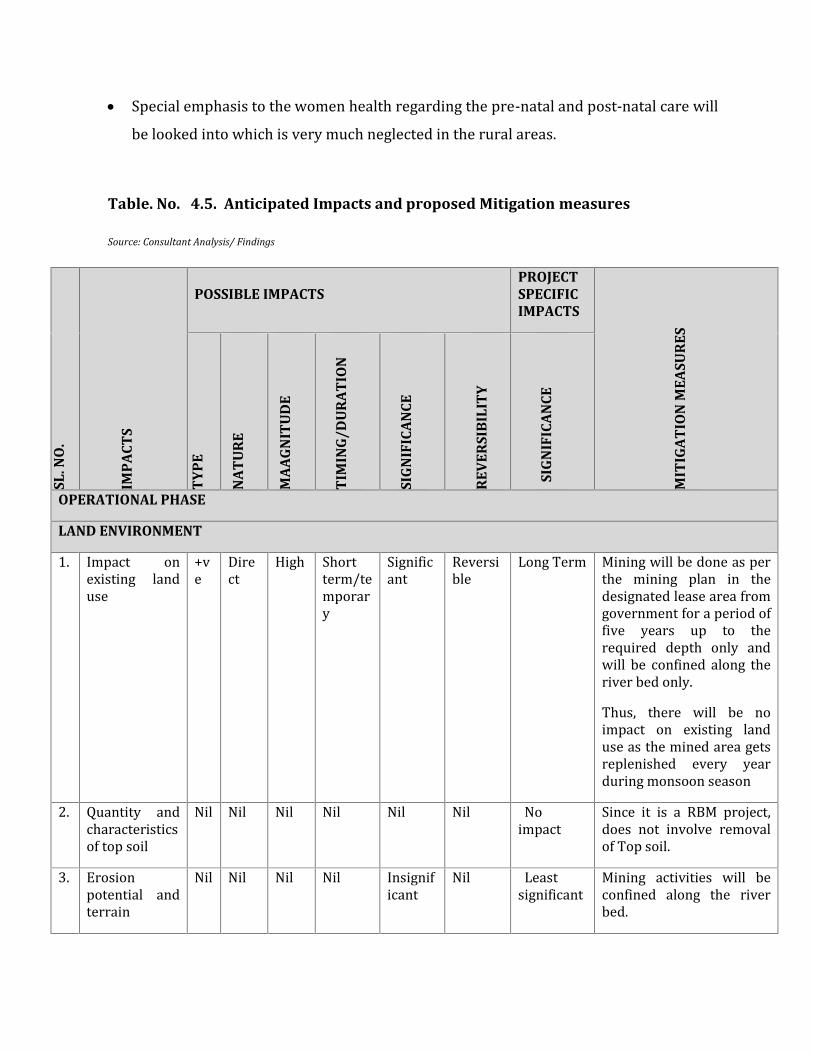
Special emphasis to the women health regarding the pre-natal and post-natal care willbe looked into which is very much neglected in the rural areas.Table. No. 4.5. Anticipated Impacts and proposed Mitigation measures
Source: Consultant Analysis/ Findings
SL. N
O.
IMP
ACT
S
POSSIBLE IMPACTSPROJECTSPECIFICIMPACTS
MIT
IGA
TIO
N M
EASU
RES
TY
PE
NA
TU
RE
MA
AG
NIT
UD
E
TIM
ING
/DU
RA
TIO
N
SIG
NIF
ICA
NCE
REV
ERSI
BIL
ITY
SIG
NIF
ICA
NCE
OPERATIONAL PHASE
LAND ENVIRONMENT1. Impact onexisting landuse +ve Direct High Shortterm/temporarySignificant Reversible Long Term Mining will be done as perthe mining plan in thedesignated lease area fromgovernment for a period offive years up to therequired depth only andwill be confined along theriver bed only.Thus, there will be noimpact on existing landuse as the mined area getsreplenished every yearduring monsoon season2. Quantity andcharacteristicsof top soil Nil Nil Nil Nil Nil Nil Noimpact Since it is a RBM project,does not involve removalof Top soil.3. Erosionpotential andterrain Nil Nil Nil Nil Insignificant Nil Leastsignificant Mining activities will beconfined along the riverbed.

4. Excavation ofPits in minelease area Nil Nil Nil Nil Nil Nil Leastsignificant There will be no pits.Sandwill be scrapped.The mine section will bebackfilled on arrival ofMonsoon every year itself.5. Waste dumps NA NA NA NA Insignificant NA Significant It is a morrum miningproject, no wastegeneration is anticipated.Workers will also be hiredlocally to avoid permanenthousing at site, thus theMSW waste generation isalso Nil.6. Agriculturalland andproductivity -ve Indirect NA NA NA NA Insignificant Productive land will not beutilized for storage andother proposes.Siltation on agricultureLand will be prevented.Garland drain system willbe provided to preventexcessive runoff frommine site.AIR ENVIRONMENT1. Fugitive dustemission dueto movement,loading ,unloading andtransportationof minorminerals
-ve direct moderate Shortterm/temporarySignificant Irreversible ShortTerm/Insignificant
Dust suppressionmeasures likespraying/sprinkling ofwater to keep the surfacewet and provision of thedust barriers.Overloading of thetrucks/trolleys will not bedone.Transportation of sand/morrum will be in coveredvehicles to preventfugitive dust emission. Theroad will be properlymaintained.2. Blasting andDrilling NA NA NA NA NA NA No Impact Not proposed3. Boiler/DGSet/furnace NA NA NA NA NA NA No Impact Not proposedWATER ENVIRONMENT
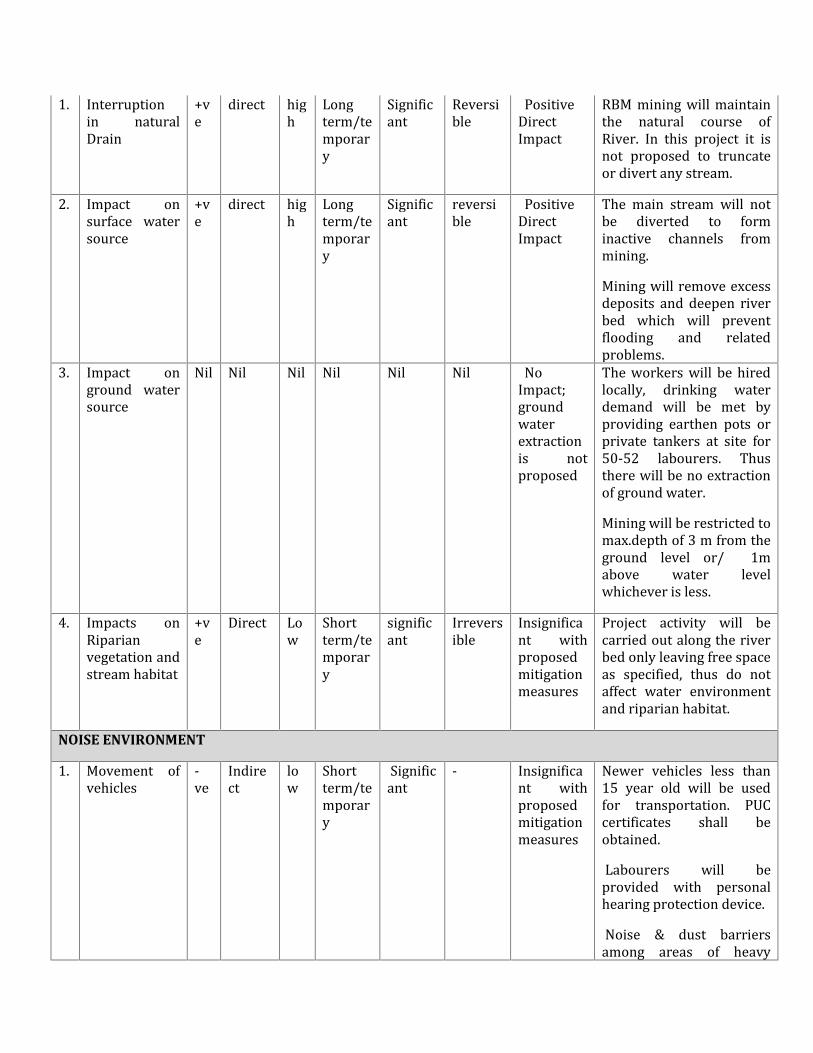
1. Interruptionin naturalDrain +ve direct high Longterm/temporarySignificant Reversible PositiveDirectImpact RBM mining will maintainthe natural course ofRiver. In this project it isnot proposed to truncateor divert any stream.2. Impact onsurface watersource +ve direct high Longterm/temporarySignificant reversible PositiveDirectImpact The main stream will notbe diverted to forminactive channels frommining.Mining will remove excessdeposits and deepen riverbed which will preventflooding and relatedproblems.3. Impact onground watersource Nil Nil Nil Nil Nil Nil NoImpact;groundwaterextractionis notproposed
The workers will be hiredlocally, drinking waterdemand will be met byproviding earthen pots orprivate tankers at site for50-52 labourers. Thusthere will be no extractionof ground water.Mining will be restricted tomax.depth of 3 m from theground level or/ 1mabove water levelwhichever is less.4. Impacts onRiparianvegetation andstream habitat+ve Direct Low Shortterm/temporary
significant Irreversible Insignificant withproposedmitigationmeasuresProject activity will becarried out along the riverbed only leaving free spaceas specified, thus do notaffect water environmentand riparian habitat.
NOISE ENVIRONMENT1. Movement ofvehicles -ve Indirect low Shortterm/temporarySignificant - Insignificant withproposedmitigationmeasures
Newer vehicles less than15 year old will be usedfor transportation. PUCcertificates shall beobtained.Labourers will beprovided with personalhearing protection device.Noise & dust barriersamong areas of heavy
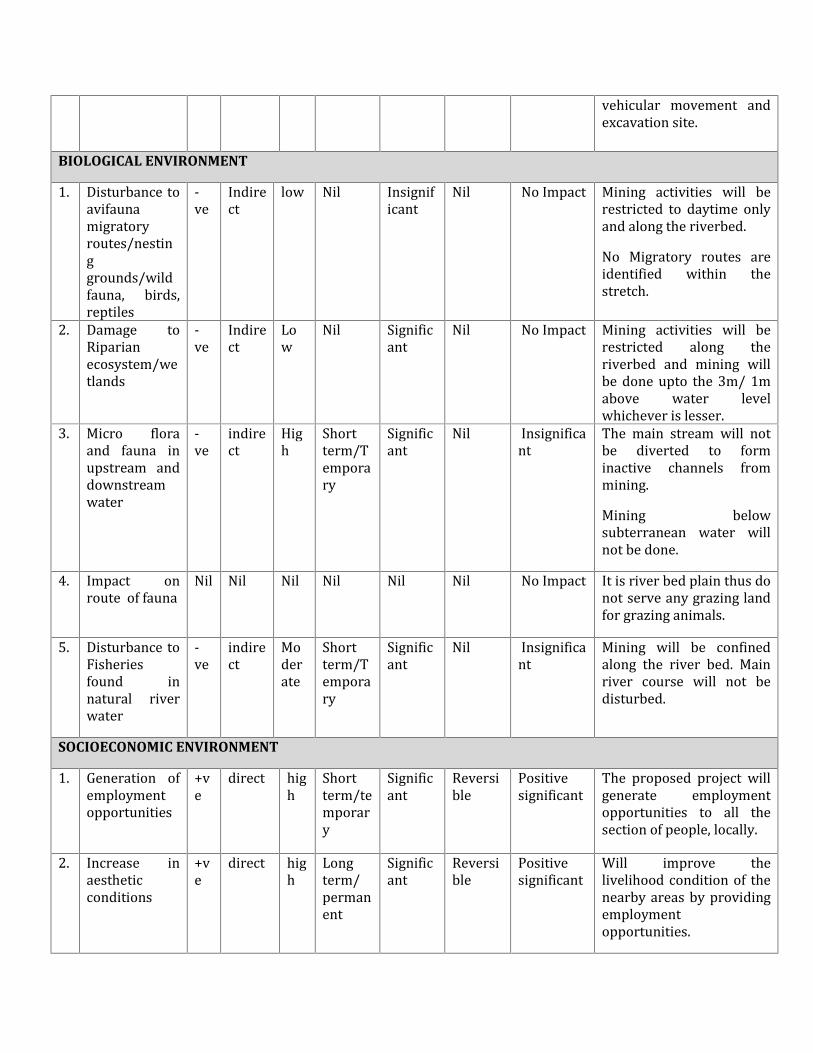
vehicular movement andexcavation site.BIOLOGICAL ENVIRONMENT1. Disturbance toavifaunamigratoryroutes/nestinggrounds/wildfauna, birds,reptiles
-ve Indirect low Nil Insignificant Nil No Impact Mining activities will berestricted to daytime onlyand along the riverbed.No Migratory routes areidentified within thestretch.2. Damage toRiparianecosystem/wetlands-ve Indirect Low Nil Significant Nil No Impact Mining activities will berestricted along theriverbed and mining willbe done upto the 3m/ 1mabove water levelwhichever is lesser.3. Micro floraand fauna inupstream anddownstreamwater-ve indirect High Shortterm/Temporary
Significant Nil Insignificant The main stream will notbe diverted to forminactive channels frommining.Mining belowsubterranean water willnot be done.4. Impact onroute of fauna Nil Nil Nil Nil Nil Nil No Impact It is river bed plain thus donot serve any grazing landfor grazing animals.5. Disturbance toFisheriesfound innatural riverwater-ve indirect Moderate Shortterm/Temporary
Significant Nil Insignificant Mining will be confinedalong the river bed. Mainriver course will not bedisturbed.SOCIOECONOMIC ENVIRONMENT1. Generation ofemploymentopportunities +ve direct high Shortterm/temporary
Significant Reversible Positivesignificant The proposed project willgenerate employmentopportunities to all thesection of people, locally.2. Increase inaestheticconditions +ve direct high Longterm/permanentSignificant Reversible Positivesignificant Will improve thelivelihood condition of thenearby areas by providingemploymentopportunities.
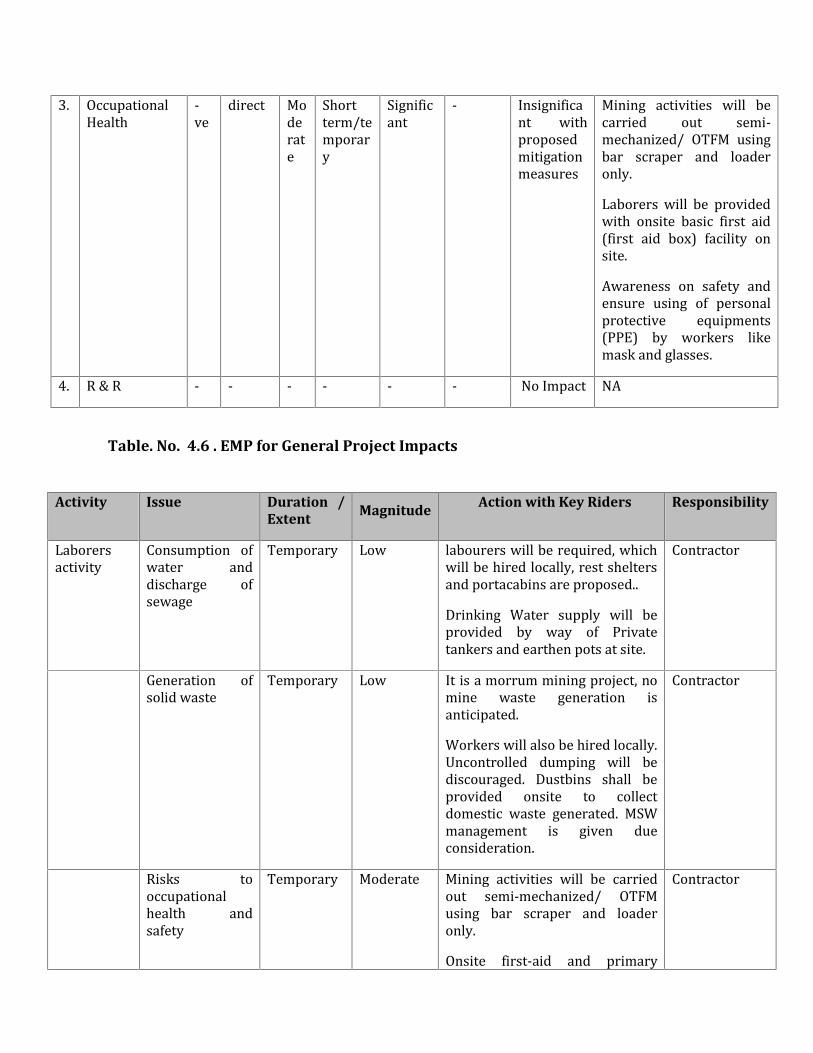
3. OccupationalHealth -ve direct ModerateShortterm/temporary
Significant - Insignificant withproposedmitigationmeasuresMining activities will becarried out semi-mechanized/ OTFM usingbar scraper and loaderonly.Laborers will be providedwith onsite basic first aid(first aid box) facility onsite.Awareness on safety andensure using of personalprotective equipments(PPE) by workers likemask and glasses.4. R & R - - - - - - No Impact NA
Table. No. 4.6 . EMP for General Project Impacts
Activity Issue Duration /Extent
Magnitude Action with Key Riders Responsibility
Laborersactivity Consumption ofwater anddischarge ofsewageTemporary Low labourers will be required, whichwill be hired locally, rest sheltersand portacabins are proposed..Drinking Water supply will beprovided by way of Privatetankers and earthen pots at site.
Contractor
Generation ofsolid waste Temporary Low It is a morrum mining project, nomine waste generation isanticipated.Workers will also be hired locally.Uncontrolled dumping will bediscouraged. Dustbins shall beprovided onsite to collectdomestic waste generated. MSWmanagement is given dueconsideration.
Contractor
Risks tooccupationalhealth andsafetyTemporary Moderate Mining activities will be carriedout semi-mechanized/ OTFMusing bar scraper and loaderonly.Onsite first-aid and primary
Contractor
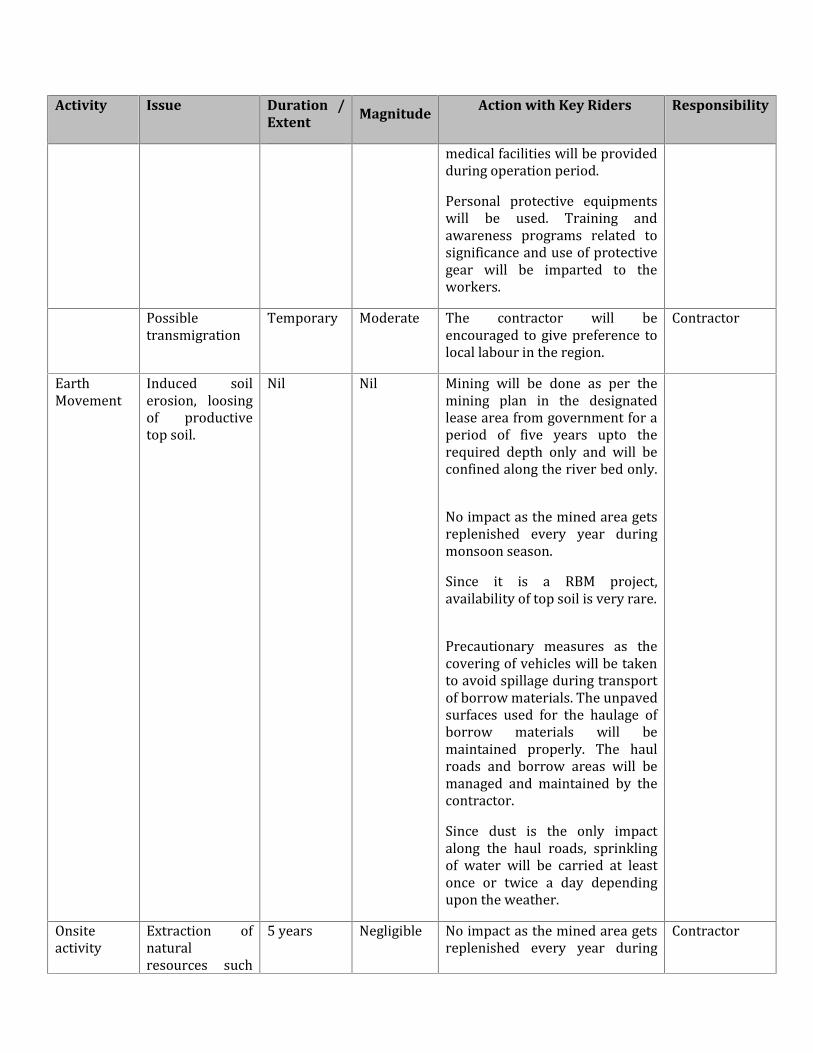
Activity Issue Duration /Extent
MagnitudeAction with Key Riders Responsibility
medical facilities will be providedduring operation period.Personal protective equipmentswill be used. Training andawareness programs related tosignificance and use of protectivegear will be imparted to theworkers.Possibletransmigration Temporary Moderate The contractor will beencouraged to give preference tolocal labour in the region. ContractorEarthMovement Induced soilerosion, loosingof productivetop soil.
Nil Nil Mining will be done as per themining plan in the designatedlease area from government for aperiod of five years upto therequired depth only and will beconfined along the river bed only.No impact as the mined area getsreplenished every year duringmonsoon season.Since it is a RBM project,availability of top soil is very rare.Precautionary measures as thecovering of vehicles will be takento avoid spillage during transportof borrow materials. The unpavedsurfaces used for the haulage ofborrow materials will bemaintained properly. The haulroads and borrow areas will bemanaged and maintained by thecontractor.Since dust is the only impactalong the haul roads, sprinklingof water will be carried at leastonce or twice a day dependingupon the weather.Onsiteactivity Extraction ofnaturalresources such 5 years Negligible No impact as the mined area getsreplenished every year during Contractor

Activity Issue Duration /Extent
MagnitudeAction with Key Riders Responsibility
as morrum monsoon season.Noise generationdue to themovement ofVehiclesTemporary Moderate No heavy machinery is proposedfor the extraction of morrum,mining activities will be carriedout semi-mechanized/ OTFMusing bar scraper and loaderonly.Noise generated due tomovement of vehicles will bemanaged by the use of vehicleswhich are less than 15 years oldand after obtaining the pollutionunder control certificate. Alsosilence zones will be demarcatedand noise barriers will be putaccordingly.Labourers should be providedwith personal hearing protectiondevice (if required).
Contractor
Air emissions Temporary/Short Term Moderate The dust emissions will beminimized by following the goodpractices, for example, watersprinkling, provision of noisebarriers, etc.Overloading of thetrucks/trolleys should not bedone.Suitable dust barriers shall beproposed.
Contractor
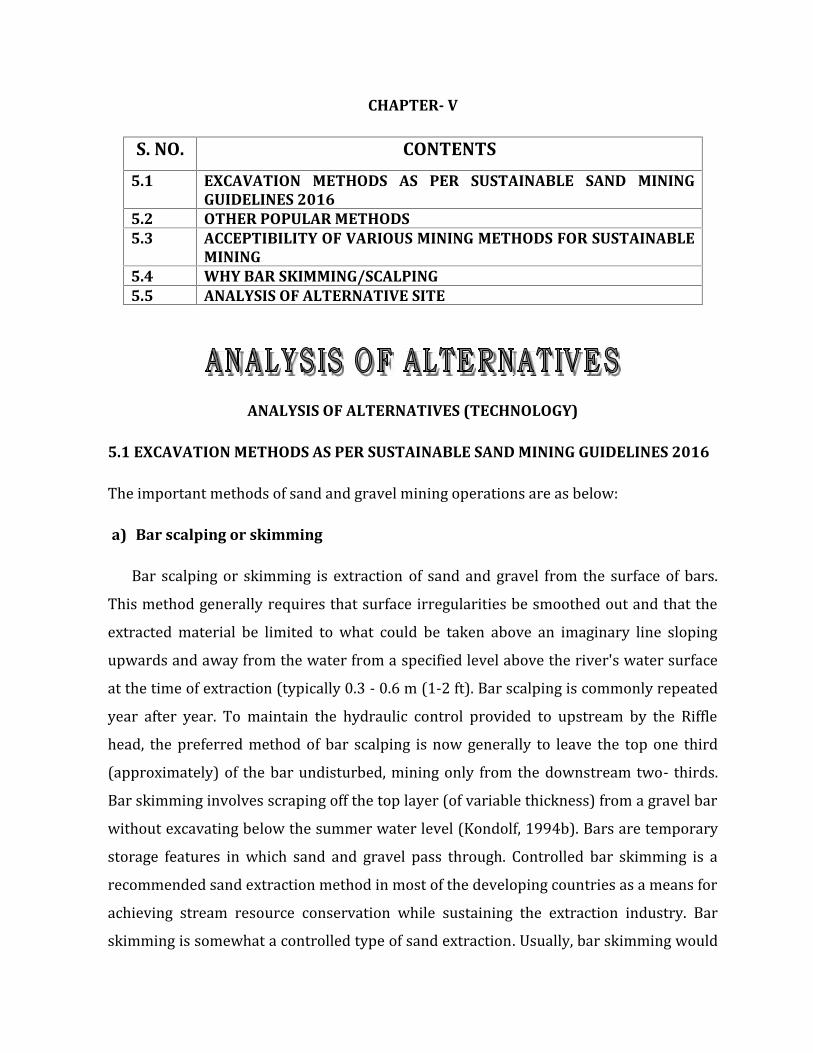
CHAPTER- V
S. NO. CONTENTS
5.1 EXCAVATION METHODS AS PER SUSTAINABLE SAND MININGGUIDELINES 2016
5.2 OTHER POPULAR METHODS5.3 ACCEPTIBILITY OF VARIOUS MINING METHODS FOR SUSTAINABLE
MINING5.4 WHY BAR SKIMMING/SCALPING5.5 ANALYSIS OF ALTERNATIVE SITE
ANALYSIS OF ALTERNATIVES (TECHNOLOGY)
5.1 EXCAVATION METHODS AS PER SUSTAINABLE SAND MINING GUIDELINES 2016The important methods of sand and gravel mining operations are as below:a) Bar scalping or skimmingBar scalping or skimming is extraction of sand and gravel from the surface of bars.This method generally requires that surface irregularities be smoothed out and that theextracted material be limited to what could be taken above an imaginary line slopingupwards and away from the water from a specified level above the river's water surfaceat the time of extraction (typically 0.3 - 0.6 m (1-2 ft). Bar scalping is commonly repeatedyear after year. To maintain the hydraulic control provided to upstream by the Rifflehead, the preferred method of bar scalping is now generally to leave the top one third(approximately) of the bar undisturbed, mining only from the downstream two- thirds.Bar skimming involves scraping off the top layer (of variable thickness) from a gravel barwithout excavating below the summer water level (Kondolf, 1994b). Bars are temporarystorage features in which sand and gravel pass through. Controlled bar skimming is arecommended sand extraction method in most of the developing countries as a means forachieving stream resource conservation while sustaining the extraction industry. Barskimming is somewhat a controlled type of sand extraction. Usually, bar skimming would
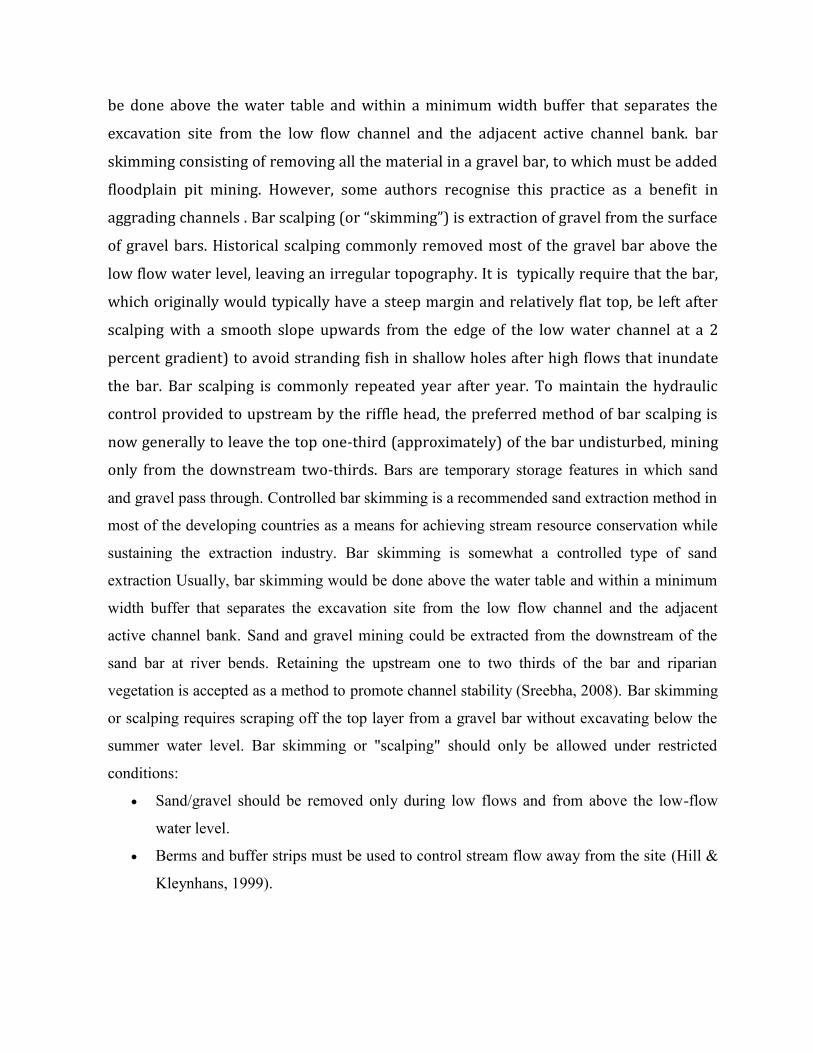
be done above the water table and within a minimum width buffer that separates theexcavation site from the low flow channel and the adjacent active channel bank. barskimming consisting of removing all the material in a gravel bar, to which must be addedfloodplain pit mining. However, some authors recognise this practice as a benefit inaggrading channels . Bar scalping (or “skimming”) is extraction of gravel from the surfaceof gravel bars. Historical scalping commonly removed most of the gravel bar above thelow flow water level, leaving an irregular topography. It is typically require that the bar,which originally would typically have a steep margin and relatively flat top, be left afterscalping with a smooth slope upwards from the edge of the low water channel at a 2percent gradient) to avoid stranding fish in shallow holes after high flows that inundatethe bar. Bar scalping is commonly repeated year after year. To maintain the hydrauliccontrol provided to upstream by the riffle head, the preferred method of bar scalping isnow generally to leave the top one-third (approximately) of the bar undisturbed, miningonly from the downstream two-thirds. Bars are temporary storage features in which sand
and gravel pass through. Controlled bar skimming is a recommended sand extraction method in
most of the developing countries as a means for achieving stream resource conservation while
sustaining the extraction industry. Bar skimming is somewhat a controlled type of sand
extraction Usually, bar skimming would be done above the water table and within a minimum
width buffer that separates the excavation site from the low flow channel and the adjacent
active channel bank. Sand and gravel mining could be extracted from the downstream of the
sand bar at river bends. Retaining the upstream one to two thirds of the bar and riparian
vegetation is accepted as a method to promote channel stability (Sreebha, 2008). Bar skimming
or scalping requires scraping off the top layer from a gravel bar without excavating below the
summer water level. Bar skimming or "scalping" should only be allowed under restricted
conditions:
Sand/gravel should be removed only during low flows and from above the low-flow
water level.
Berms and buffer strips must be used to control stream flow away from the site (Hill &
Kleynhans, 1999).
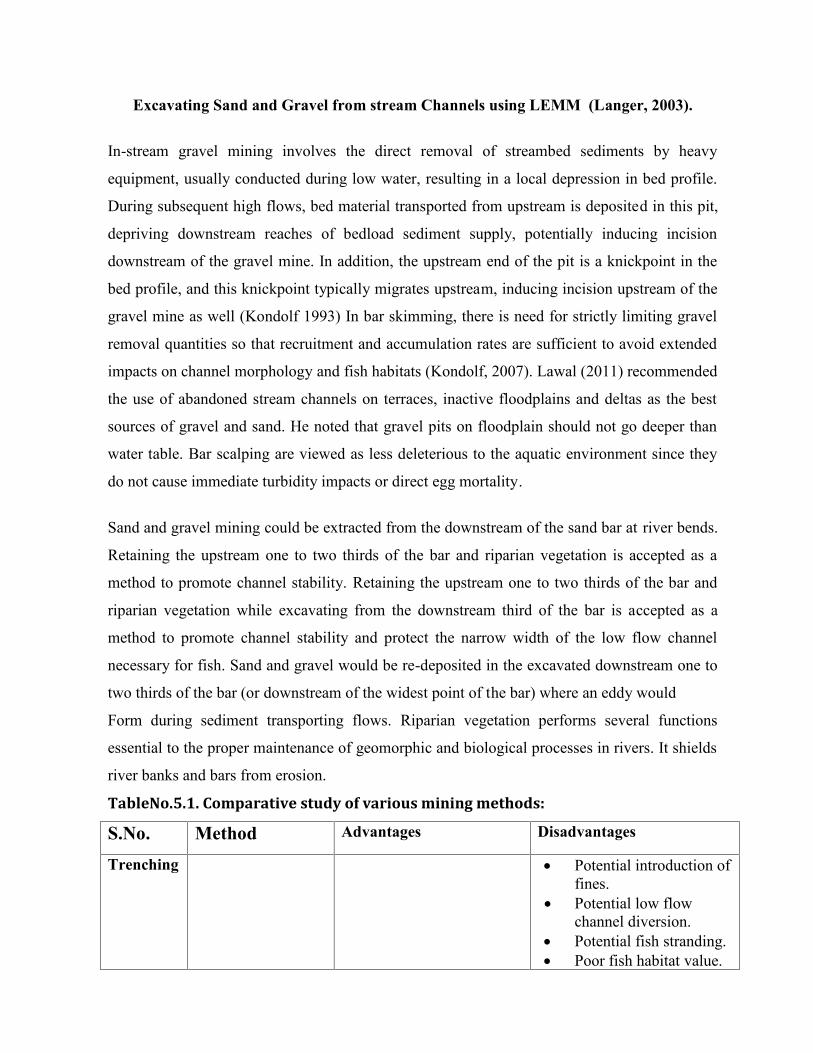
Excavating Sand and Gravel from stream Channels using LEMM (Langer, 2003).
In-stream gravel mining involves the direct removal of streambed sediments by heavy
equipment, usually conducted during low water, resulting in a local depression in bed profile.
During subsequent high flows, bed material transported from upstream is deposited in this pit,
depriving downstream reaches of bedload sediment supply, potentially inducing incision
downstream of the gravel mine. In addition, the upstream end of the pit is a knickpoint in the
bed profile, and this knickpoint typically migrates upstream, inducing incision upstream of the
gravel mine as well (Kondolf 1993) In bar skimming, there is need for strictly limiting gravel
removal quantities so that recruitment and accumulation rates are sufficient to avoid extended
impacts on channel morphology and fish habitats (Kondolf, 2007). Lawal (2011) recommended
the use of abandoned stream channels on terraces, inactive floodplains and deltas as the best
sources of gravel and sand. He noted that gravel pits on floodplain should not go deeper than
water table. Bar scalping are viewed as less deleterious to the aquatic environment since they
do not cause immediate turbidity impacts or direct egg mortality.
Sand and gravel mining could be extracted from the downstream of the sand bar at river bends.
Retaining the upstream one to two thirds of the bar and riparian vegetation is accepted as a
method to promote channel stability. Retaining the upstream one to two thirds of the bar and
riparian vegetation while excavating from the downstream third of the bar is accepted as a
method to promote channel stability and protect the narrow width of the low flow channel
necessary for fish. Sand and gravel would be re-deposited in the excavated downstream one to
two thirds of the bar (or downstream of the widest point of the bar) where an eddy would
Form during sediment transporting flows. Riparian vegetation performs several functions
essential to the proper maintenance of geomorphic and biological processes in rivers. It shields
river banks and bars from erosion.
TableNo.5.1. Comparative study of various mining methods:
S.No. Method Advantages Disadvantages
Trenching Potential introduction offines.
Potential low flowchannel diversion.
Potential fish stranding. Poor fish habitat value.
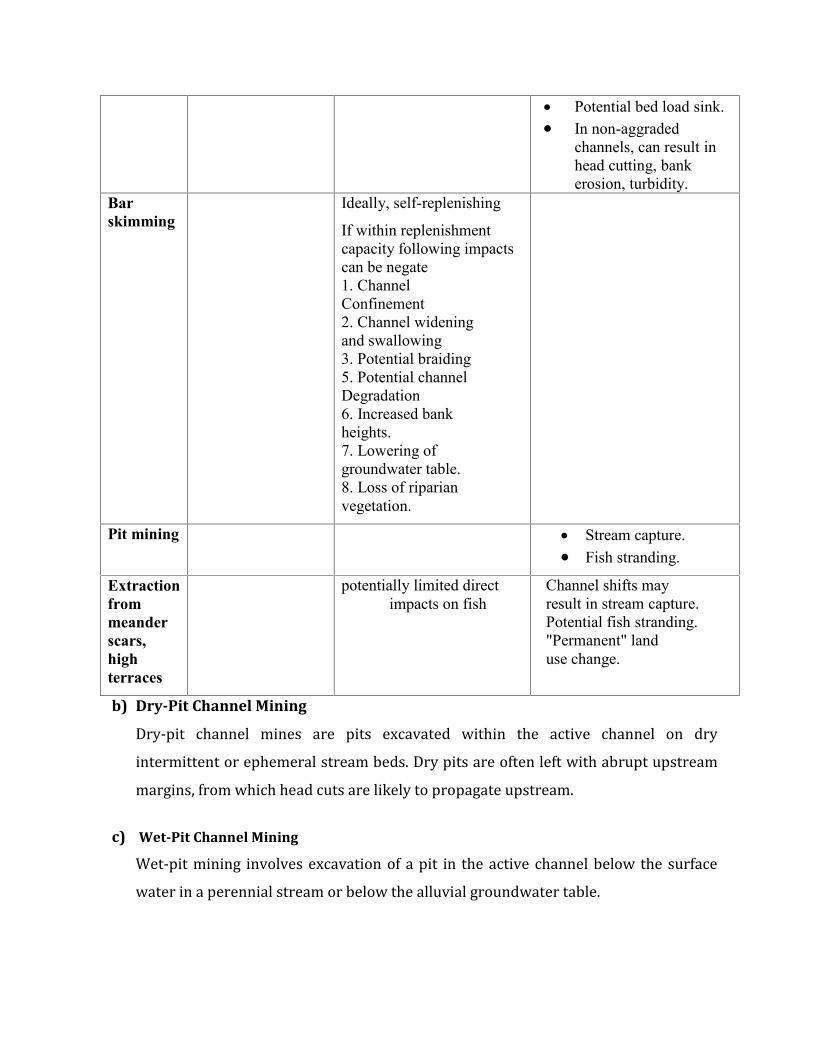
Potential bed load sink. In non-aggraded
channels, can result inhead cutting, bankerosion, turbidity.
Barskimming
Ideally, self-replenishing
If within replenishmentcapacity following impactscan be negate1. ChannelConfinement2. Channel wideningand swallowing3. Potential braiding5. Potential channelDegradation6. Increased bankheights.7. Lowering ofgroundwater table.8. Loss of riparianvegetation.
Pit mining Stream capture. Fish stranding.
Extractionfrommeanderscars,highterraces
potentially limited directimpacts on fish
Channel shifts mayresult in stream capture.Potential fish stranding."Permanent" landuse change.
b) Dry-Pit Channel MiningDry-pit channel mines are pits excavated within the active channel on dryintermittent or ephemeral stream beds. Dry pits are often left with abrupt upstreammargins, from which head cuts are likely to propagate upstream.c) Wet-Pit Channel MiningWet-pit mining involves excavation of a pit in the active channel below the surfacewater in a perennial stream or below the alluvial groundwater table.
Bar ExcavationA pit is excavated at the downstream end of the bar as a source of aggregate and as asite to trap sand and gravel. Upon completion, the pit may be connected to thechannel at its downstream end to provide side channel habitat.d) Channel-wide River bed MiningIn rivers with a highly variable flow regime, sand and gravel are commonly extractedacross the entire active channel during the dry season. The bed is evened out anduniformly (or nearly so) lowered.5.2 OTHER POPULAR METHODS
5.2.1 Bucket-Plow Method Of Sand MiningOne of the most popular methods of riverbed sand mining is extraction of the sand withhelp of hydraulic excavators which operates with an assembly of a steel bucket which isdriven by hydraulic pressure. This method of mining is sometimes also used to lifting upthe instream bottom sediments which is referred as dredging. In other words, dredging isan excavation activity usually carried out underwater, in shallow seas or freshwater areaswith the purpose of gathering up bottom sediments and widening with help of a bucket.This technique is often used to keep waterways navigable and creates an anti-sludgepathway for boats.A bucket (also called a scoop to qualify shallower designs of tools) is a specializedcontainer attached to a machine, as compared to a bucket adapted for manual use by ahuman being. It is a bulk material handling component.The bucket has an inner volume as compared to other types of machine attachments likeblades or shovels.The bucket could be attached to the lifting hook of a crane, at the end ofthe arm of an excavating machine, to the wires of a dragline excavator, to the arms ofa power shovel or atractor equipped with a backhoe loader or to a loader, or to a dredge.The name "bucket" may have been coined from buckets used in water wheels, or used inwater turbines or in similar-looking devices.
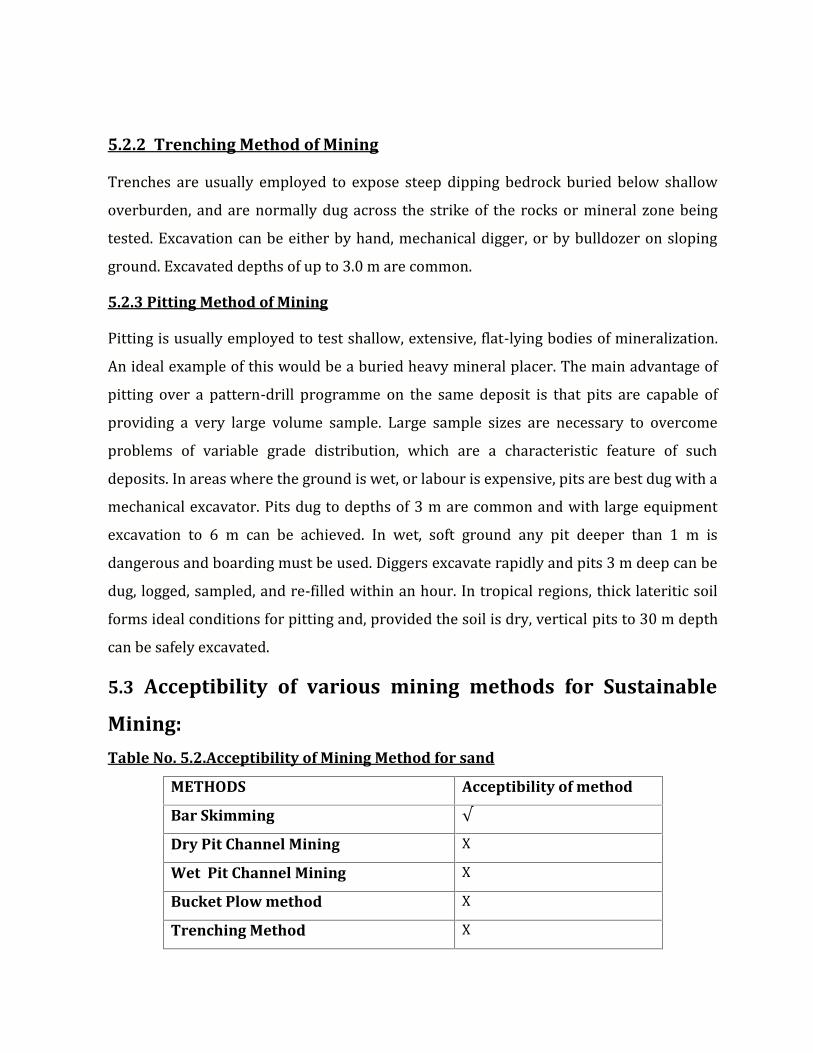
5.2.2 Trenching Method of MiningTrenches are usually employed to expose steep dipping bedrock buried below shallowoverburden, and are normally dug across the strike of the rocks or mineral zone beingtested. Excavation can be either by hand, mechanical digger, or by bulldozer on slopingground. Excavated depths of up to 3.0 m are common.5.2.3 Pitting Method of MiningPitting is usually employed to test shallow, extensive, flat-lying bodies of mineralization.An ideal example of this would be a buried heavy mineral placer. The main advantage ofpitting over a pattern-drill programme on the same deposit is that pits are capable ofproviding a very large volume sample. Large sample sizes are necessary to overcomeproblems of variable grade distribution, which are a characteristic feature of suchdeposits. In areas where the ground is wet, or labour is expensive, pits are best dug with amechanical excavator. Pits dug to depths of 3 m are common and with large equipmentexcavation to 6 m can be achieved. In wet, soft ground any pit deeper than 1 m isdangerous and boarding must be used. Diggers excavate rapidly and pits 3 m deep can bedug, logged, sampled, and re-filled within an hour. In tropical regions, thick lateritic soilforms ideal conditions for pitting and, provided the soil is dry, vertical pits to 30 m depthcan be safely excavated.5.3 Acceptibility of various mining methods for Sustainable
Mining:
Table No. 5.2.Acceptibility of Mining Method for sand
METHODS Acceptibility of method
Bar Skimming √Dry Pit Channel Mining XWet Pit Channel Mining XBucket Plow method XTrenching Method X

Pitting Method XBars are temporary storage features in which sand and gravel pass through. Controlledbar skimming is a recommended sand extraction method in most of the developingcountries as a means for achieving stream resource conservation while sustaining theextraction industry. Bar skimming is somewhat a controlled type of sand extractionUsually, bar skimming would be done above the water table and within a minimum widthbuffer that separates the excavation site from the low flow channel and the adjacentactive channel bank. Sand and gravel mining could be extracted from the downstream ofthe sand bar at river bends. Retaining the upstream one to two thirds of the bar andriparian vegetation is accepted as a method to promote channel stability .Bar skimmingor scalping requires scraping off the top layer from a gravel bar without excavating belowthe summer water level. Bar skimming or "scalping" should only be allowed underrestricted conditions.5.4 WHY BAR SKIMMING/SCALPING
Sand/gravel should be removed only during low flows and from above the low-flow water level. Berms and buffer strips must be used to control stream flow away from the site
Instream gravel mining involves the direct removal of streambed sediments by heavyequipment, usually conducted during low water, resulting in a local depression in bedprofile. During subsequent high flows, bed material transported from upstream isdeposited in this pit, depriving downstream reaches of bedload sediment supply,potentially inducing incision downstream of the gravel mine. In addition, the upstreamend of the pit is a knickpoint in the bed profile, and this knick point typically migratesupstream, inducing incision upstream of the gravel mine as well In bar skimming, there isneed for strictly limiting gravel removal quantities so that recruitment and accumulationrates are sufficient to avoid extended impacts on channel morphology and fish habitats. .Bar scalping are viewed as less deleterious to the aquatic environment since they do notcause immediate turbidity impacts or direct egg mortality.
Sand and gravel mining could be extracted from the downstream of the sand bar atriverbends. Retaining the upstream one to two thirds of the bar and riparian vegetation isaccepted as a method to promote channel stability. Retaining the upstream one to twothirds of the bar and riparian vegetation whileexcavating from the downstream third ofthe bar is accepted as a method to promotechannel stability and protect the narrowwidth of the low flow channel necessary forfish. Sand and gravel would be redeposited inthe excavated downstream one to twothirds of the bar (or downstream of the widestpoint of the bar) where an eddy wouldform during sediment transporting flows. Riparian vegetation performs several functionsessential to the proper maintenance of geomorphic and biological processes in rivers. Itshields river banks and bars from erosion.5.5 ANALYSIS OF ALTERNATIVE SITEThe site selection is based on the following points :Appropriate extraction sites are locations chosen based on knowledge of the local rate ofaggradation or scour, a site-specific determination of channel stability and bank erosionand evaluation of riparian resources.Site-specific evaluation is needed to evaluate each proposed operation to minimizedisturbance and maximise stability of channel.In-stream extraction sites should be located where the channel loses gradient orincreases in width, and deposition occurs unrelated to regular bar-pool spacing inchannel. Particular sites may include sites upstream of a bedrock constriction orbackwater, or at deltas created near confluences.It is not applicable because the lease area is e-auctioned and granted to lessee for sandexcavation by District Magistrate. So no alternative site is analysed for the project.Identification of sand mining blocks:-Identification of sand blocks is one of the important activities in sand mining. The departmentshould estimate the demand of the particular district and State and hence come out with therequirement of further allotment. Based on the requirement, the process of identification of sandreaches should be taken up by the relevant department responsible for sand mining in the State.The relevant department/ person needs to obtain the Khasra map of the area and conduct a spotinspection and confirm from other departments regarding availability of area to check if the area

is not reserved for some other purpose and can be allotted for sand mining. Further, if theinspector finds that the block is not lying in the restricted zone based on the above parametersand that the area is available for sand extraction, the area should be presented for e-auction. Thesand mining area is allotted only through e-auction process, so alternative site analysis is notopted and no other NOCs are required.
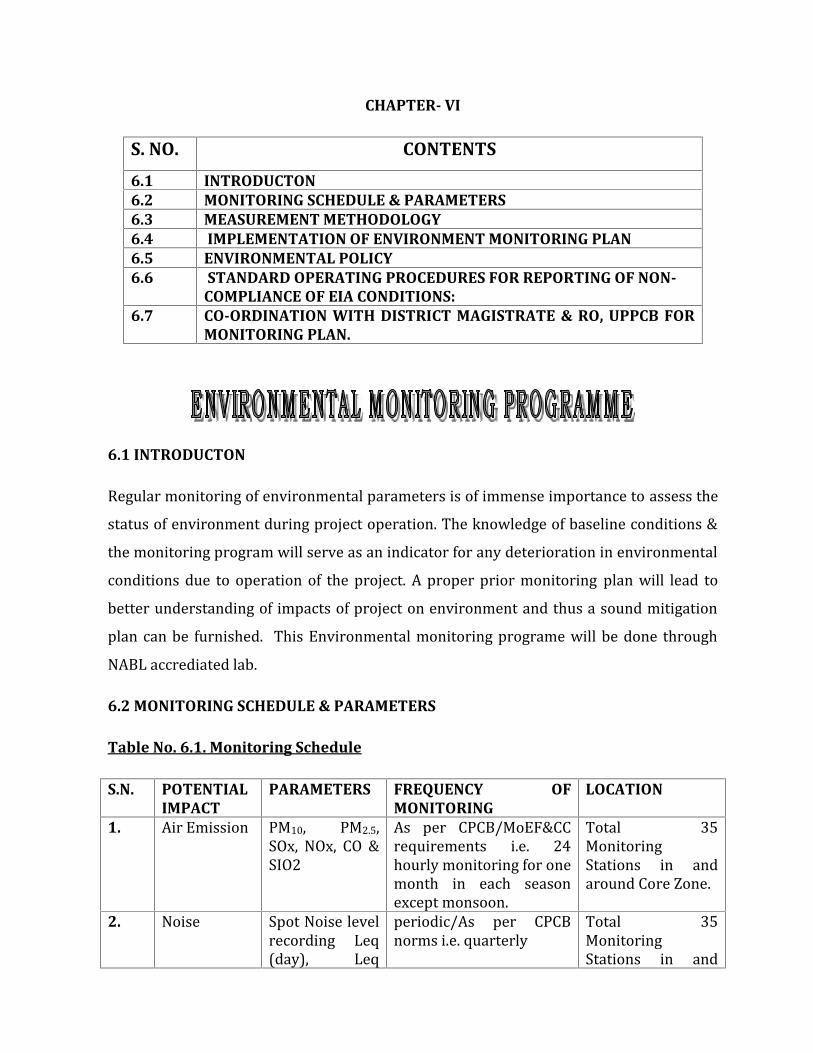
CHAPTER- VI
S. NO. CONTENTS
6.1 INTRODUCTON6.2 MONITORING SCHEDULE & PARAMETERS6.3 MEASUREMENT METHODOLOGY6.4 IMPLEMENTATION OF ENVIRONMENT MONITORING PLAN6.5 ENVIRONMENTAL POLICY6.6 STANDARD OPERATING PROCEDURES FOR REPORTING OF NON-
COMPLIANCE OF EIA CONDITIONS:6.7 CO-ORDINATION WITH DISTRICT MAGISTRATE & RO, UPPCB FOR
MONITORING PLAN.
6.1 INTRODUCTONRegular monitoring of environmental parameters is of immense importance to assess thestatus of environment during project operation. The knowledge of baseline conditions &the monitoring program will serve as an indicator for any deterioration in environmentalconditions due to operation of the project. A proper prior monitoring plan will lead tobetter understanding of impacts of project on environment and thus a sound mitigationplan can be furnished. This Environmental monitoring programe will be done throughNABL accrediated lab.6.2 MONITORING SCHEDULE & PARAMETERS
Table No. 6.1. Monitoring Schedule
S.N. POTENTIALIMPACT
PARAMETERS FREQUENCY OFMONITORING
LOCATION
1. Air Emission PM10, PM2.5,SOx, NOx, CO &SIO2 As per CPCB/MoEF&CCrequirements i.e. 24hourly monitoring for onemonth in each seasonexcept monsoon.Total 35MonitoringStations in andaround Core Zone.
2. Noise Spot Noise levelrecording Leq(day), Leq periodic/As per CPCBnorms i.e. quarterly Total 35MonitoringStations in and
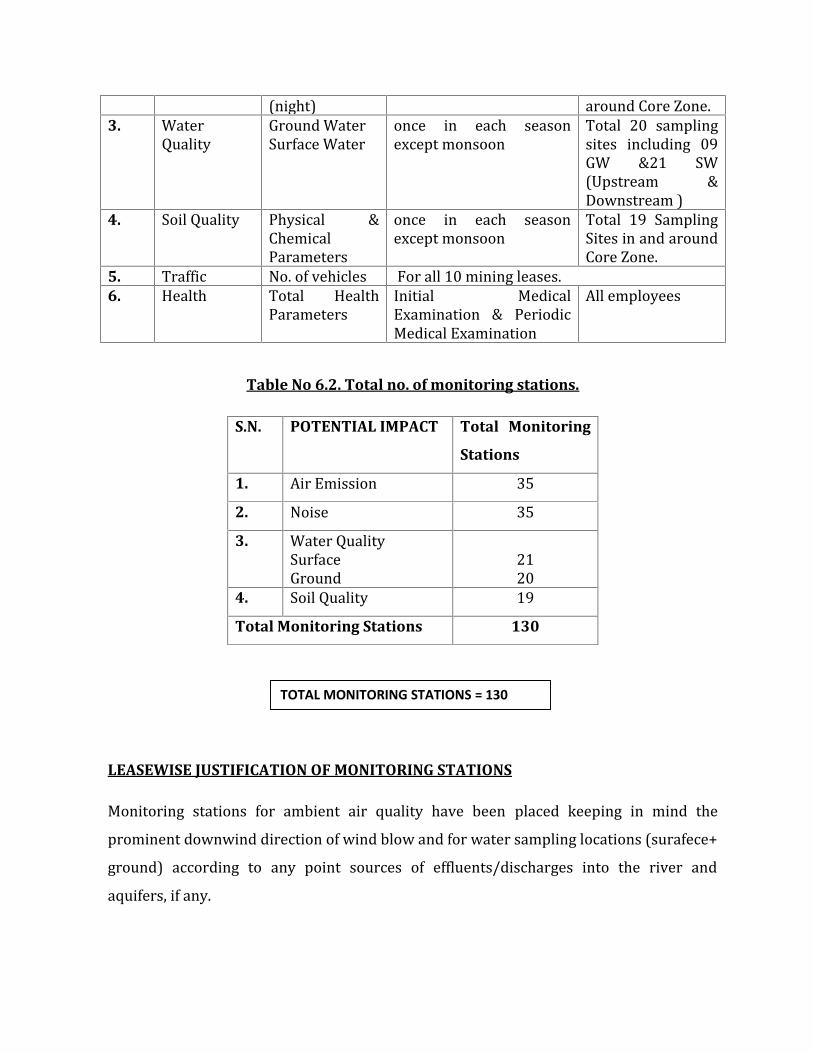
(night) around Core Zone.3. WaterQuality Ground WaterSurface Water once in each seasonexcept monsoon Total 20 samplingsites including 09GW &21 SW(Upstream &Downstream )4. Soil Quality Physical &ChemicalParameters once in each seasonexcept monsoon Total 19 SamplingSites in and aroundCore Zone.5. Traffic No. of vehicles For all 10 mining leases.6. Health Total HealthParameters Initial MedicalExamination & PeriodicMedical Examination All employees
Table No 6.2. Total no. of monitoring stations.
S.N. POTENTIAL IMPACT Total Monitoring
Stations
1. Air Emission 352. Noise 353. Water QualitySurfaceGround 21204. Soil Quality 19Total Monitoring Stations 130
LEASEWISE JUSTIFICATION OF MONITORING STATIONSMonitoring stations for ambient air quality have been placed keeping in mind theprominent downwind direction of wind blow and for water sampling locations (surafece+ground) according to any point sources of effluents/discharges into the river andaquifers, if any.
TOTAL MONITORING STATIONS = 130
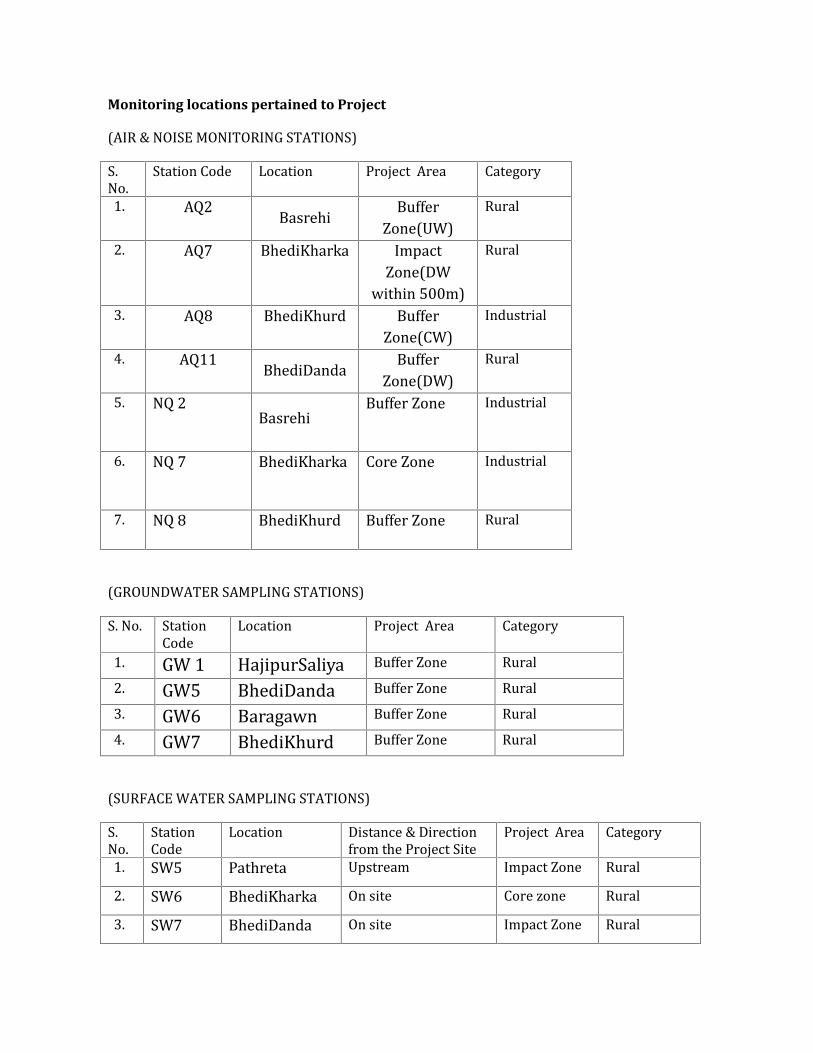
Monitoring locations pertained to Project(AIR & NOISE MONITORING STATIONS)S.No. Station Code Location Project Area Category1. AQ2 Basrehi BufferZone(UW) Rural2. AQ7 BhediKharka ImpactZone(DWwithin 500m) Rural3. AQ8 BhediKhurd BufferZone(CW) Industrial4. AQ11 BhediDanda BufferZone(DW) Rural5. NQ 2 Basrehi Buffer Zone Industrial6. NQ 7 BhediKharka Core Zone Industrial7. NQ 8 BhediKhurd Buffer Zone Rural
(GROUNDWATER SAMPLING STATIONS)S. No. StationCode Location Project Area Category1. GW 1 HajipurSaliya Buffer Zone Rural2. GW5 BhediDanda Buffer Zone Rural3. GW6 Baragawn Buffer Zone Rural4. GW7 BhediKhurd Buffer Zone Rural(SURFACE WATER SAMPLING STATIONS)S.No. StationCode Location Distance & Directionfrom the Project Site Project Area Category1. SW5 Pathreta Upstream Impact Zone Rural2. SW6 BhediKharka On site Core zone Rural3. SW7 BhediDanda On site Impact Zone Rural
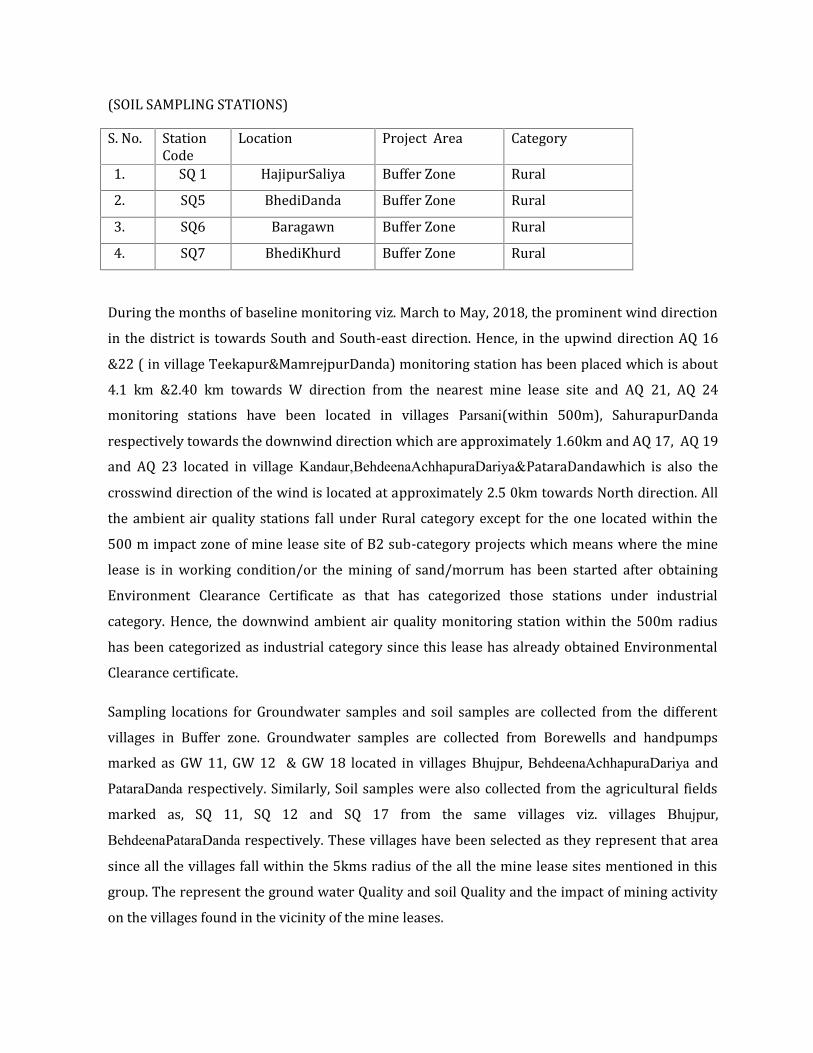
(SOIL SAMPLING STATIONS)S. No. StationCode Location Project Area Category1. SQ 1 HajipurSaliya Buffer Zone Rural2. SQ5 BhediDanda Buffer Zone Rural3. SQ6 Baragawn Buffer Zone Rural4. SQ7 BhediKhurd Buffer Zone RuralDuring the months of baseline monitoring viz. March to May, 2018, the prominent wind directionin the district is towards South and South-east direction. Hence, in the upwind direction AQ 16&22 ( in village Teekapur&MamrejpurDanda) monitoring station has been placed which is about4.1 km &2.40 km towards W direction from the nearest mine lease site and AQ 21, AQ 24monitoring stations have been located in villages Parsani(within 500m), SahurapurDandarespectively towards the downwind direction which are approximately 1.60km and AQ 17, AQ 19and AQ 23 located in village Kandaur,BehdeenaAchhapuraDariya&PataraDandawhich is also thecrosswind direction of the wind is located at approximately 2.5 0km towards North direction. Allthe ambient air quality stations fall under Rural category except for the one located within the500 m impact zone of mine lease site of B2 sub-category projects which means where the minelease is in working condition/or the mining of sand/morrum has been started after obtainingEnvironment Clearance Certificate as that has categorized those stations under industrialcategory. Hence, the downwind ambient air quality monitoring station within the 500m radiushas been categorized as industrial category since this lease has already obtained EnvironmentalClearance certificate.Sampling locations for Groundwater samples and soil samples are collected from the differentvillages in Buffer zone. Groundwater samples are collected from Borewells and handpumpsmarked as GW 11, GW 12 & GW 18 located in villages Bhujpur, BehdeenaAchhapuraDariya andPataraDanda respectively. Similarly, Soil samples were also collected from the agricultural fieldsmarked as, SQ 11, SQ 12 and SQ 17 from the same villages viz. villages Bhujpur,BehdeenaPataraDanda respectively. These villages have been selected as they represent that areasince all the villages fall within the 5kms radius of the all the mine lease sites mentioned in thisgroup. The represent the ground water Quality and soil Quality and the impact of mining activityon the villages found in the vicinity of the mine leases.
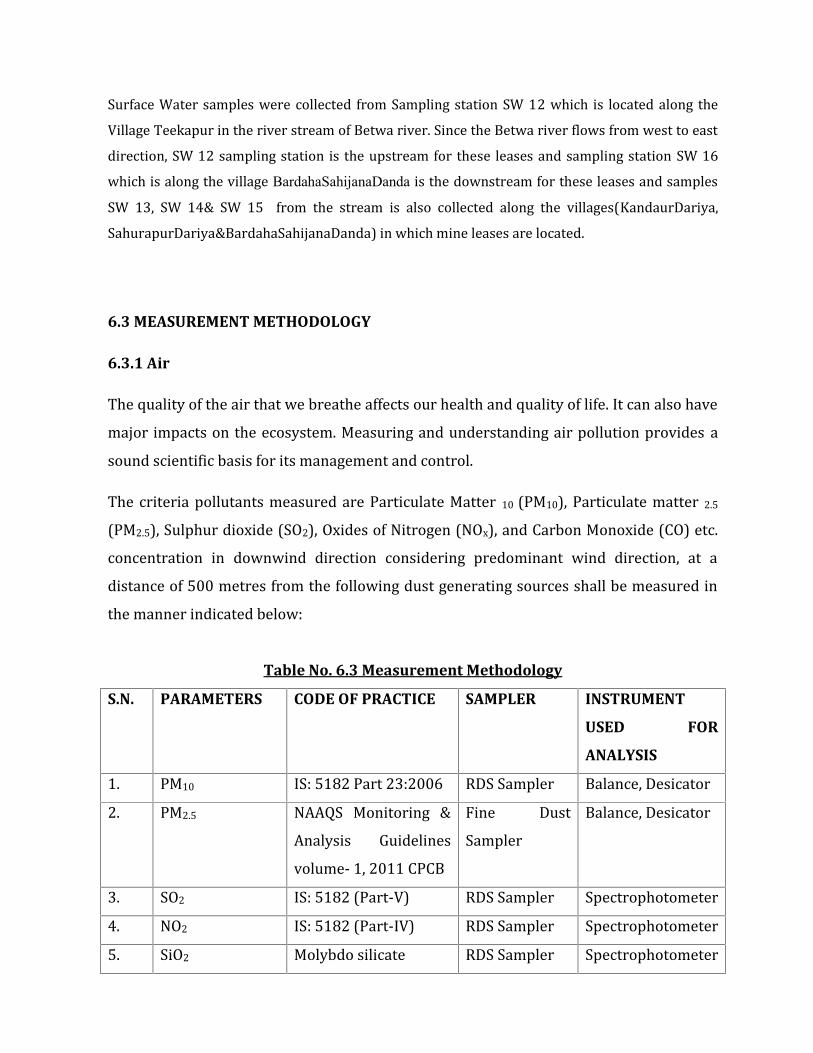
Surface Water samples were collected from Sampling station SW 12 which is located along theVillage Teekapur in the river stream of Betwa river. Since the Betwa river flows from west to eastdirection, SW 12 sampling station is the upstream for these leases and sampling station SW 16which is along the village BardahaSahijanaDanda is the downstream for these leases and samplesSW 13, SW 14& SW 15 from the stream is also collected along the villages(KandaurDariya,SahurapurDariya&BardahaSahijanaDanda) in which mine leases are located.6.3 MEASUREMENT METHODOLOGY
6.3.1 AirThe quality of the air that we breathe affects our health and quality of life. It can also havemajor impacts on the ecosystem. Measuring and understanding air pollution provides asound scientific basis for its management and control.The criteria pollutants measured are Particulate Matter 10 (PM10), Particulate matter 2.5(PM2.5), Sulphur dioxide (SO2), Oxides of Nitrogen (NOx), and Carbon Monoxide (CO) etc.concentration in downwind direction considering predominant wind direction, at adistance of 500 metres from the following dust generating sources shall be measured inthe manner indicated below:Table No. 6.3 Measurement Methodology
S.N. PARAMETERS CODE OF PRACTICE SAMPLER INSTRUMENT
USED FOR
ANALYSIS1. PM10 IS: 5182 Part 23:2006 RDS Sampler Balance, Desicator2. PM2.5 NAAQS Monitoring &Analysis Guidelinesvolume- 1, 2011 CPCBFine DustSampler Balance, Desicator
3. SO2 IS: 5182 (Part-V) RDS Sampler Spectrophotometer4. NO2 IS: 5182 (Part-IV) RDS Sampler Spectrophotometer5. SiO2 Molybdo silicate RDS Sampler Spectrophotometer
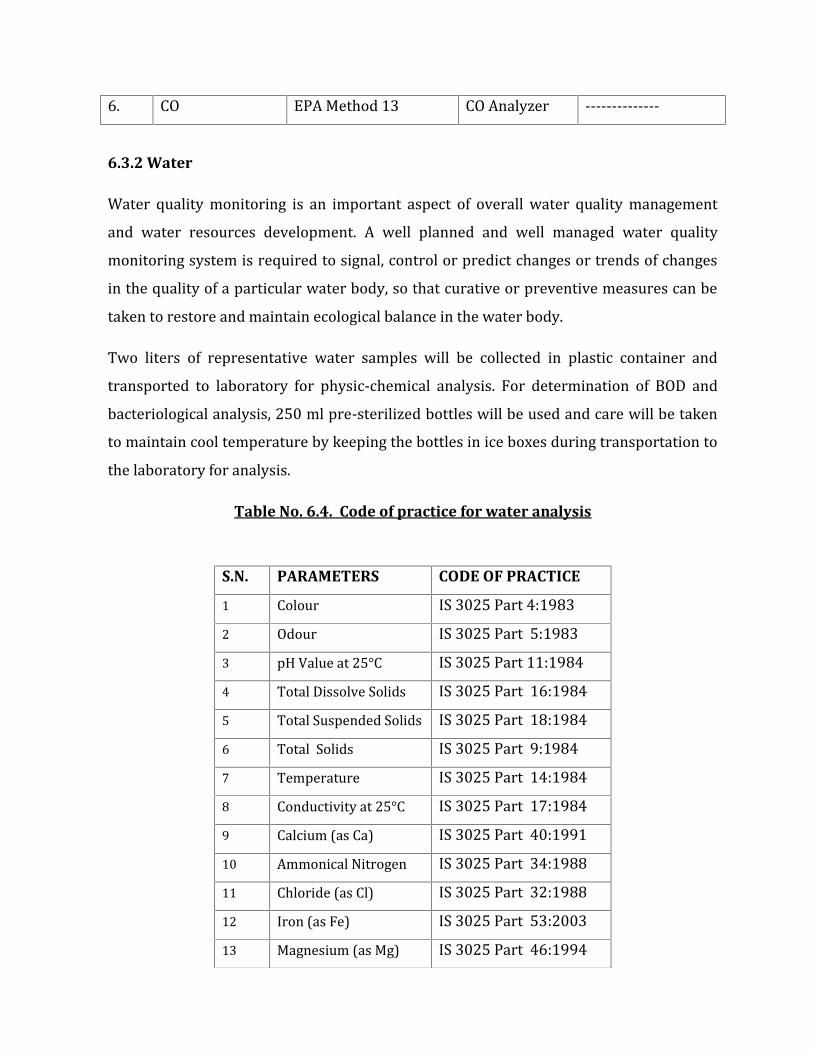
6. CO EPA Method 13 CO Analyzer --------------6.3.2 WaterWater quality monitoring is an important aspect of overall water quality managementand water resources development. A well planned and well managed water qualitymonitoring system is required to signal, control or predict changes or trends of changesin the quality of a particular water body, so that curative or preventive measures can betaken to restore and maintain ecological balance in the water body.Two liters of representative water samples will be collected in plastic container andtransported to laboratory for physic-chemical analysis. For determination of BOD andbacteriological analysis, 250 ml pre-sterilized bottles will be used and care will be takento maintain cool temperature by keeping the bottles in ice boxes during transportation tothe laboratory for analysis.
Table No. 6.4. Code of practice for water analysis
S.N. PARAMETERS CODE OF PRACTICE1 Colour IS 3025 Part 4:19832 Odour IS 3025 Part 5:19833 pH Value at 25°C IS 3025 Part 11:19844 Total Dissolve Solids IS 3025 Part 16:19845 Total Suspended Solids IS 3025 Part 18:19846 Total Solids IS 3025 Part 9:19847 Temperature IS 3025 Part 14:19848 Conductivity at 25°C IS 3025 Part 17:19849 Calcium (as Ca) IS 3025 Part 40:199110 Ammonical Nitrogen IS 3025 Part 34:198811 Chloride (as Cl) IS 3025 Part 32:198812 Iron (as Fe) IS 3025 Part 53:200313 Magnesium (as Mg) IS 3025 Part 46:1994
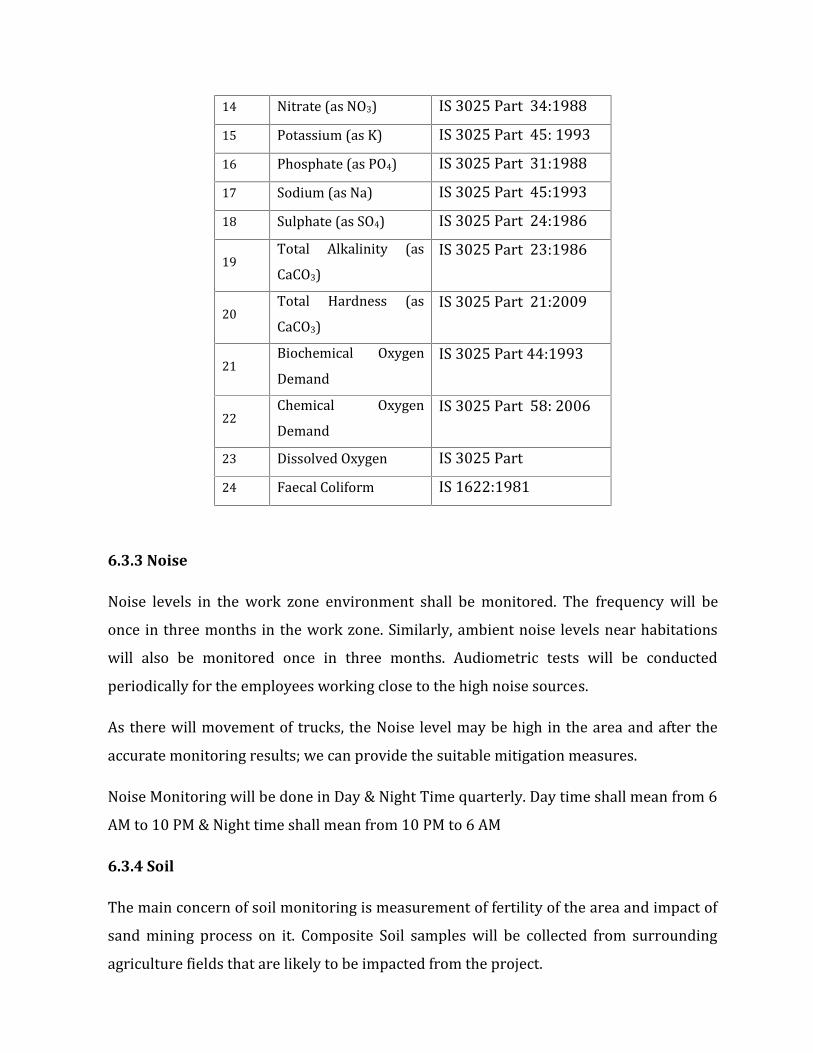
6.3.3 NoiseNoise levels in the work zone environment shall be monitored. The frequency will beonce in three months in the work zone. Similarly, ambient noise levels near habitationswill also be monitored once in three months. Audiometric tests will be conductedperiodically for the employees working close to the high noise sources.As there will movement of trucks, the Noise level may be high in the area and after theaccurate monitoring results; we can provide the suitable mitigation measures.Noise Monitoring will be done in Day & Night Time quarterly. Day time shall mean from 6AM to 10 PM & Night time shall mean from 10 PM to 6 AM6.3.4 SoilThe main concern of soil monitoring is measurement of fertility of the area and impact ofsand mining process on it. Composite Soil samples will be collected from surroundingagriculture fields that are likely to be impacted from the project.
14 Nitrate (as NO3) IS 3025 Part 34:198815 Potassium (as K) IS 3025 Part 45: 199316 Phosphate (as PO4) IS 3025 Part 31:198817 Sodium (as Na) IS 3025 Part 45:199318 Sulphate (as SO4) IS 3025 Part 24:198619 Total Alkalinity (asCaCO3) IS 3025 Part 23:198620 Total Hardness (asCaCO3) IS 3025 Part 21:200921 Biochemical OxygenDemand IS 3025 Part 44:199322 Chemical OxygenDemand IS 3025 Part 58: 200623 Dissolved Oxygen IS 3025 Part24 Faecal Coliform IS 1622:1981
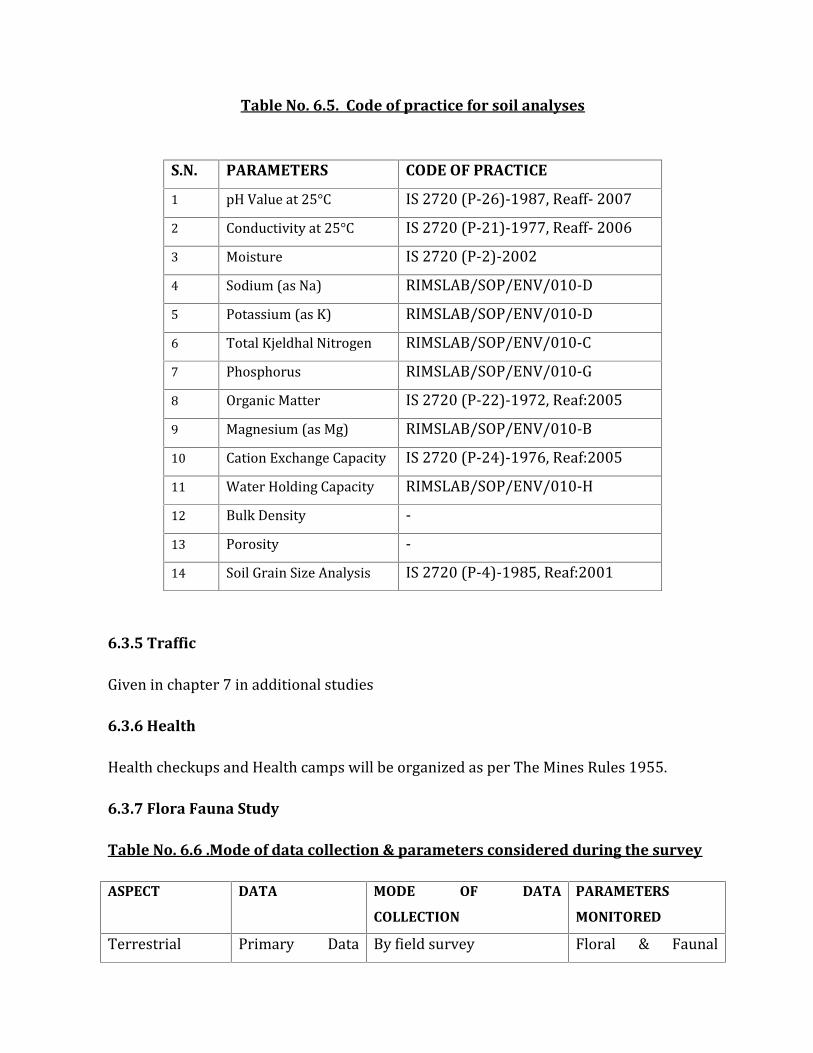
Table No. 6.5. Code of practice for soil analyses
6.3.5 TrafficGiven in chapter 7 in additional studies6.3.6 HealthHealth checkups and Health camps will be organized as per The Mines Rules 1955.6.3.7 Flora Fauna Study
Table No. 6.6 .Mode of data collection & parameters considered during the survey
ASPECT DATA MODE OF DATA
COLLECTION
PARAMETERS
MONITOREDTerrestrial Primary Data By field survey Floral & Faunal
S.N. PARAMETERS CODE OF PRACTICE1 pH Value at 25°C IS 2720 (P-26)-1987, Reaff- 20072 Conductivity at 25°C IS 2720 (P-21)-1977, Reaff- 20063 Moisture IS 2720 (P-2)-20024 Sodium (as Na) RIMSLAB/SOP/ENV/010-D5 Potassium (as K) RIMSLAB/SOP/ENV/010-D6 Total Kjeldhal Nitrogen RIMSLAB/SOP/ENV/010-C7 Phosphorus RIMSLAB/SOP/ENV/010-G8 Organic Matter IS 2720 (P-22)-1972, Reaf:20059 Magnesium (as Mg) RIMSLAB/SOP/ENV/010-B10 Cation Exchange Capacity IS 2720 (P-24)-1976, Reaf:200511 Water Holding Capacity RIMSLAB/SOP/ENV/010-H12 Bulk Density -13 Porosity -14 Soil Grain Size Analysis IS 2720 (P-4)-1985, Reaf:2001
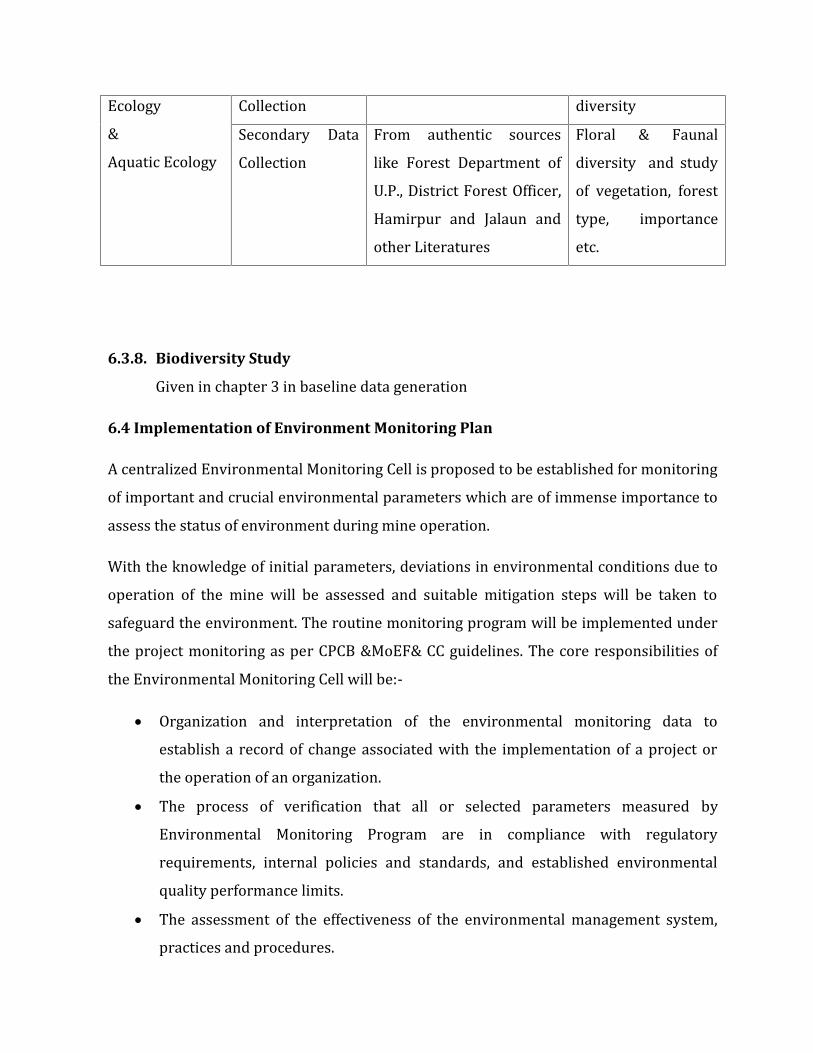
Ecology&Aquatic EcologyCollection diversitySecondary DataCollection From authentic sourceslike Forest Department ofU.P., District Forest Officer,Hamirpur and Jalaun andother Literatures
Floral & Faunaldiversity and studyof vegetation, foresttype, importanceetc.
6.3.8. Biodiversity StudyGiven in chapter 3 in baseline data generation6.4 Implementation of Environment Monitoring PlanA centralized Environmental Monitoring Cell is proposed to be established for monitoringof important and crucial environmental parameters which are of immense importance toassess the status of environment during mine operation.With the knowledge of initial parameters, deviations in environmental conditions due tooperation of the mine will be assessed and suitable mitigation steps will be taken tosafeguard the environment. The routine monitoring program will be implemented underthe project monitoring as per CPCB &MoEF& CC guidelines. The core responsibilities ofthe Environmental Monitoring Cell will be:- Organization and interpretation of the environmental monitoring data toestablish a record of change associated with the implementation of a project orthe operation of an organization. The process of verification that all or selected parameters measured byEnvironmental Monitoring Program are in compliance with regulatoryrequirements, internal policies and standards, and established environmentalquality performance limits. The assessment of the effectiveness of the environmental management system,practices and procedures.
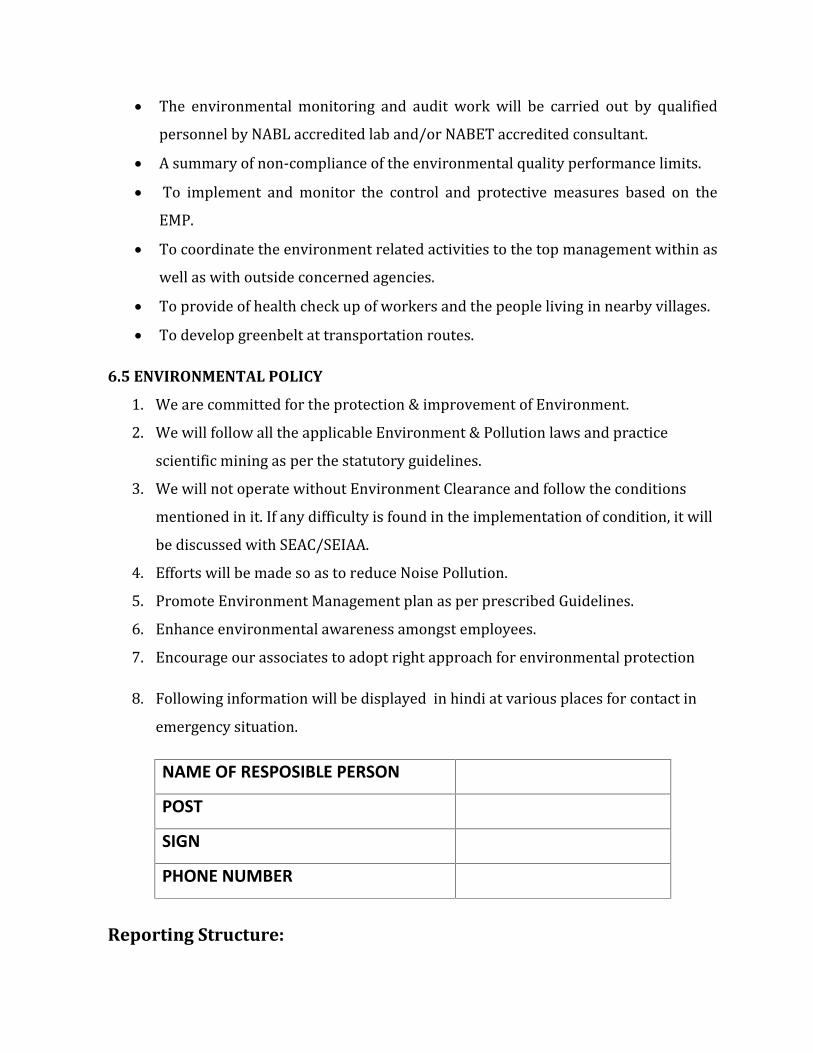
The environmental monitoring and audit work will be carried out by qualifiedpersonnel by NABL accredited lab and/or NABET accredited consultant. A summary of non-compliance of the environmental quality performance limits. To implement and monitor the control and protective measures based on theEMP. To coordinate the environment related activities to the top management within aswell as with outside concerned agencies. To provide of health check up of workers and the people living in nearby villages. To develop greenbelt at transportation routes.
6.5 ENVIRONMENTAL POLICY1. We are committed for the protection & improvement of Environment.2. We will follow all the applicable Environment & Pollution laws and practicescientific mining as per the statutory guidelines.3. We will not operate without Environment Clearance and follow the conditionsmentioned in it. If any difficulty is found in the implementation of condition, it willbe discussed with SEAC/SEIAA.4. Efforts will be made so as to reduce Noise Pollution.5. Promote Environment Management plan as per prescribed Guidelines.6. Enhance environmental awareness amongst employees.7. Encourage our associates to adopt right approach for environmental protection8. Following information will be displayed in hindi at various places for contact inemergency situation.
Reporting Structure:
NAME OF RESPOSIBLE PERSON
POST
SIGN
PHONE NUMBER
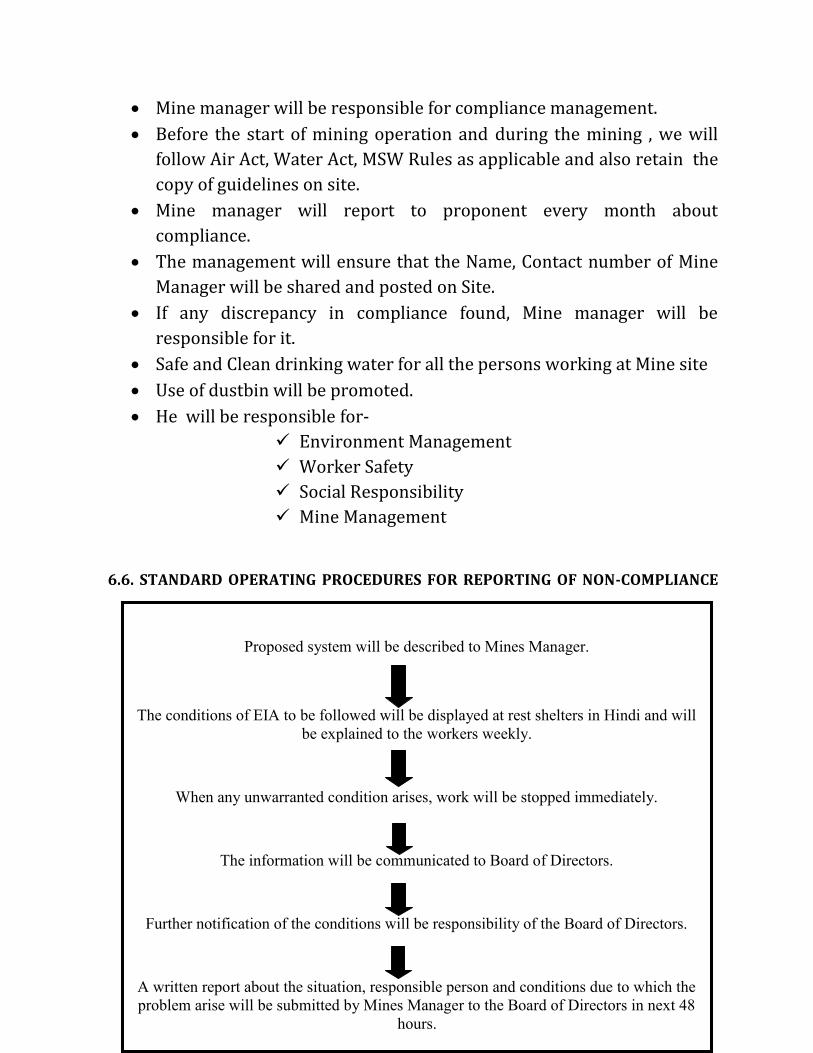
Proposed system will be described to Mines Manager.
The conditions of EIA to be followed will be displayed at rest shelters in Hindi and willbe explained to the workers weekly.
When any unwarranted condition arises, work will be stopped immediately.
The information will be communicated to Board of Directors.
Further notification of the conditions will be responsibility of the Board of Directors.
A written report about the situation, responsible person and conditions due to which theproblem arise will be submitted by Mines Manager to the Board of Directors in next 48
hours.
Mine manager will be responsible for compliance management. Before the start of mining operation and during the mining , we willfollow Air Act, Water Act, MSW Rules as applicable and also retain thecopy of guidelines on site. Mine manager will report to proponent every month aboutcompliance. The management will ensure that the Name, Contact number of MineManager will be shared and posted on Site. If any discrepancy in compliance found, Mine manager will beresponsible for it. Safe and Clean drinking water for all the persons working at Mine site Use of dustbin will be promoted. He will be responsible for-
Environment Management Worker Safety Social Responsibility Mine Management
6.6. STANDARD OPERATING PROCEDURES FOR REPORTING OF NON-COMPLIANCE

OF EIACONDITIONS:
6.7CO-ORDINATION WITH DISTRICT MAGISTRATE & RO, UPPCB FOR MONITORING
PLAN.The letters regarding pre monsoon monitoring plan has been sent to Regional Officers,UPPCB & District Magistrates of Hamirpur and Jalaun. Copy of letter is annexed asannexure separately.
CHAPTER VIIS. NO. CONTENTS
7.1 PUBLIC CONSULTATION7.2 RISK ASSESSMENT7.3 IDENTIFICATION OF HAZARDS7.4 MITIGATION OF HAZARDS7.5 SEDIMENT INFLUX RATE7.6 SOCIAL IMPCT ASSESSMENT7.7 RESSETLEMENT & REHABILITATION PLAN7.8 DISASTER MANAGEMENT7.9 TRANSPORTATIONAL ROUTE ANALYSIS7.10 INCREAMENTAL NOISE IN THE STUDY AREA7.11 GREEN BELT DEVELOPMENT
7.1PUBLIC CONSULTATIONThe public hearing process is an important part of the EC process. Public hearings mandate theEAC and MoEF to consider recorded public concerns. As a component of public consultation, apublic hearing provides a “decentralised democratic space” (Utkarsh Mandal v Union of India2009) in the clearance process where members of the public are given an opportunity toparticipate in the regulatory process. It is meant to give assurance to people by thegovernment, through face-to-face interactions, to raise their concerns and provide them withall the information regarding the project, while seeking their opinions and hearing theirgrievances. At the same time, the opinions of the project proponents are also consideredbefore a final decision is made. These face-to-face interactions fulfi l the government’scommitment towards “sustainable development,” “environmental justice” (Bowen 2001 andUS EPA), “empowered participatory governance” (Fung and Erik 2003) and “principles ofnatural justice” (S Nandkumar v State of Tamil Nadu 2010).The addressing of these issues byproponents ensures that authorities are aware of ground realities and the pros and cons of theproject, which would contribute to effective decision-making (M P Patil v Union of India 2012).7.1.1Procedural Guidelines
Online submission of project proposal. Preparation of draft report on the basis of TOR issued/standard TOR. The draft EIA is prepared by TOR issued by SEAC or on the basis of standard TOR issuedby MoEF as presecribed in EIA notification 2006 amended on 10th April 2015, issubmitted to SPCB. After submission of draft EIA State Pollution Control Board gave the advertisement forpublic hearing, which will be conducted between 30-45 days. At the day of the public heariong Regional office made all the arrangements for publichearing.
The presentation based on the draft EIA was presented in the presence of all the peopleassembled for the public hearing, item-wise. No person was be allowed to enter the pandal/hall where the public hearing is beingconducted holding party fl ags and they shall not be allowed to raise party slogans. No irrelevant issues were discussed and the public hearing was strictly confined to theissues that arise from the draft EIA report and ancillary there to, and nothing more. The persons who wanted to speak in the public hearing were asked to give their namesin a prescribed form indicating details such as name, father/husband’s name, name ofthe village, taluk/tehsil, and the subject on which he or she wants to speak, etc. Thosepeople were periodically given the mike Consultants were present with the proponent in the presence of the public and submitviews, on the subject. At the end, all the views, whether for or against the project, were addressed subject-wise/issue-wise and be responded to by the project proponent or consultants. The authority conducting the public hearing took an active part in following each andevery minute procedure required for conducting the public hearing. Regional Officeprepared minutes of the proceedings in accordance with the EIA notification, 2006 andshow it to the public. All the concerned issues are mentioned and incorporated in Regional EnvironemntalImpact Assessment.Point wise public hearing compliances were given in PH compliances.Minutes of public hearing, clippings of news paper were attached as annexure-VIII
7.2RISK ASSESSMENT
Mining and allied activities are associated with several potential hazards to both theemployees and the public at large. A worker in a mine should be able to work under conditions,which are adequately safe and healthy. At the same time the environmental conditions shouldbe such as not to be impair his working efficiency. This is possible only when there is adequatesafety in mines.7.3 IDENTIFICATION OF HAZARDSThere are various factors, which can create unsafe working conditions in mining of minorminerals from river bed. These hazards are as follows:a) Inundation / Flooding.b) Quick Morrum Condition.
c) Drowning.d) Accident due to vehicular movement.e) Accident during morrum loading, transporting and dumping.7.3.1. Mineral loadinga. The minerals are loaded in the trucks using loader. There is no possibility of injury duringloading with loaders.b. There is possibility that the workers standing on the other side while loading may get injurydue to over thrown morrum with pebbles.c. There is possibility of workers getting injured during opening of side covers to facilitateloading.d. There is possibility of riverbank collapse.e. There is a chance of falling of cattle/children into pits in river bed.7.3.2. TransportThe minerals loaded in trucks (almost 2401) are being sent to through public roads.a. Possibilities of road accidents.b. Accident may also occur during movement in the mine.c. There are possibilities that due to overloading, pebbles or boulders may injure thepassersby.7.3.3. Inundation/floodinga. The possibility of inundation/flooding of the mines are very high during monsoon orduring heavy rains as the mine area lies in the riverbed.b. There is danger to the trucks and other machineries due to flooding.c. There is danger to the workers working in the mines.Inundation or flooding is expected and beneficial for these mines as during this time only themineral reserve gets replenished.
7.3.4. Quick sand conditionQuickmorrum is a colloidhydrogel consisting of fine granular material (such as morrum orsilt), clay, and water.Quickmorrum forms in saturated loose morrum when the morrum is suddenly agitated. Whenwater in the morrum cannot escape, it creates liquefied soil that loses strength and cannotsupport weight.This condition occurs when the permeability of the strata is very high. Thiscondition occurs when the effective stress in the morrum becomes zero due to influx of wateri.e.i = icr = y’/yw-;where i = Hydraulic gradient,icr = Critical Hydraulic gradient,y’ = submerged unit weight,yw = unit weight of water.This creates danger condition to the trucks and other machineries plying over the morrumdunes on the river banks.7.3.5. DrowningThere are no possibilities of drowning in the river, since mining operations are carried outonly in the dry seasons. All mining activities will be stopped during the monsoon season.7.4. MITIGATION OF HAZARDS
7.4.1. Measures to prevent accidents during loading
Loading will be done by using fron end loader in general. In case of manual loading followingPrecautions will be taken1. The truck will be brought to a lower level so that the loading operation suits to theergonomic condition of the workers.2. The loading will be done from one side of the truck only.3. The workers will be provided with gloves and safety shoes during loading.4. Opening of the side covers (pattas) will be done carefully and with warning to preventinjury to the loaders.
5. Operations during daylight only.6. No foreign material will be allowed to remain/spill in river bed and catchment area, orno pits/pockets are allowed to be filled with such material.7. Stockpiling of harvested material on the river bank will be avoided.7.4.2. Measures to prevent accidents during transportation1. All transportation within the main working will be carried out directly under thesupervision and control of the management.2. The Vehicles will be maintained in good repairs and checked thoroughly at least once aweek by the competent person authorized for the purpose by the Management.3. To avoid danger while reversing the trackless vehicles especially at the embankment andtipping points, all areas for reversing of lorries will as far as possible be made man free,and.4. A statutory provision of the fences, constant education, training etc. will go a long way inreducing the incidents of such accidents.5. Generally, overloading will not be permitted.6. The truck will be covered and maintained to prevent any spillage.7. The maximum permissible speed limit will be ensured.8. The truck drivers will have proper driving license.7.4.3. MEASURES TO PREVENT DANGEROUS INCIDENTS DUE TO
INUNDATION/FLOODINGInundation of flooding is expected and beneficial for these mines as during this time only themineral reserve gets replenished.1. During monsoon months and heavy rains the mining operations are ceased.2. There will be mechanism/warning system of heavy rains and discharges from theupstream dams.7.4.4. Measures to prevent quick sand condition1. The only way to avoid quick morrum condition is by avoiding mineral lifting belowwater table.
2. The critical hydraulic gradient (icr) will be maintained at less than 1 to prevent highartesian pressure in a coarse morrum area.3. 1/3rd of sand will be left in Mine Lease Area as the provision of Bar scalping.7.4.5. Measures to prevent drowning1. The mining will be done under strict supervision and only during the dry season.2. Mining will be done in dry bed zone.3. No go zones will be clearly marked and made aware to the mine workers.7.4.6. Natural resource conservation
Marking of mining lease at the concave side of the river channel is avoided by Directerate ofGeology and mining to prevent bank erosion. Similarly meandering segment of a river are beselected for mining in such a way as to avoid natural eroding banks and to promote mining onnaturally building (aggrading) meander components. These precautions are taken at the timeof lease demarcation.7.5 SEDIMENT INFLUX RATESediment influx in Ephemeral streams is generally confined to the beginning of the rainyseason as velocity of the water washes down medium to fine sand and silt depending on thevelocity and gradient of land. Cobbles, pebbles and boulders will be transported buy only overshort distance. Boulders are normally 256 mm and above are normally transported either bydragging action.As waters flow from high elevation to sea level, their potential energy isconverted to other forms as they sculpt the landscape, developing complex channel networksand a variety of associated habitats. Rivers accomplish their geomorphic work using excessenergy above that required to simply move water from one point on the landscape to another.In natural channels, the excess energy of rivers is dissipated in many ways: in turbulence atsteps in the river profile, in the frictional resistance of cobbles and boulders, vegetation alongthe bank, in bends, in irregularities of the channel bed and banks, and in sediment transport.The transport of sand- and gravel-sized sediment is particularly important in determiningchannel form, and a reduction in the supply of these sediments may induce channel changes.
Supply of sand and gravel is influenced by many factors, including changes in land use,vegetation, climate, and tectonic activity. Sediment is transported mostly as suspended load.Whereas clay, silt, and sand held aloft in the water column by turbulence, in contrast tobedload, sand, gravel, cobbles, and boulders transported by rolling, sliding, and bouncing alongthe bed . The idealized watershed can be divided into three zones: that of erosion or sedimentproduction (steep, rapidly eroding headwaters), transport (through which sediment is movedmore or less without net gain or loss), and deposition .The size of sediment typically changesalong the length of the river system from gravel, cobbles, and boulders in steep upper reachesto sands and silts in low gradient downstream reaches, reflecting diminution in size byweathering and abrasion, as well as sorting of sizes by flowing water. Over time scales ofcenturies, the river channel in the transport reach can be likened to a “conveyor belt”, whichtransports the erosional products downstream to the ultimate depositional sites below sealevel. Transport of sediment is highly flow dependent, an “event-based” process that varieswidely from year to year. At time scales of years to decades, the transport of sediment tends tobe episodic, in contrast to the continuous transport implied by the conveyor belt analogy.Moreover, individual grains may not move very far per flood – often jumping just from one barto the next bar downstream, and material transport is heterogeneous spatially within thechannel Transport of sediment through the catchment and along the length of the river systemis continuous (on geologic time scales). Increased erosion in upper reaches of the catchmentcan affect the river environment many miles downstream (and for years or decades) as theincreased sediment loads propagate downstream through the river network. Rivers andstreams draining the western slope of the Cascade Mountains in Western Washington typicallytransition abruptly from steep, eroding uplands to relatively flat coastal plains. Gravel miningactivities are typically situated near urban areas in these transitions, where the coarse portionof the sediment delivered from steep uplands during floods is deposited. These are alsotypically zones of naturally pronounced channel activity. Along the river channel “conveyorbelt”, channel forms (such as gravel bars) may appear stable but the grains of which they arecomposed may be replaced annually or biannually by new sediment from upstream. Similarly,the sediments that make up the river floodplain (the valley flat adjacent to the channel) aretypically mobile on a time scale of decades or centuries. The floodplain acts as a storagereservoir for sediments transported in the channel, alternately storing sediments, by
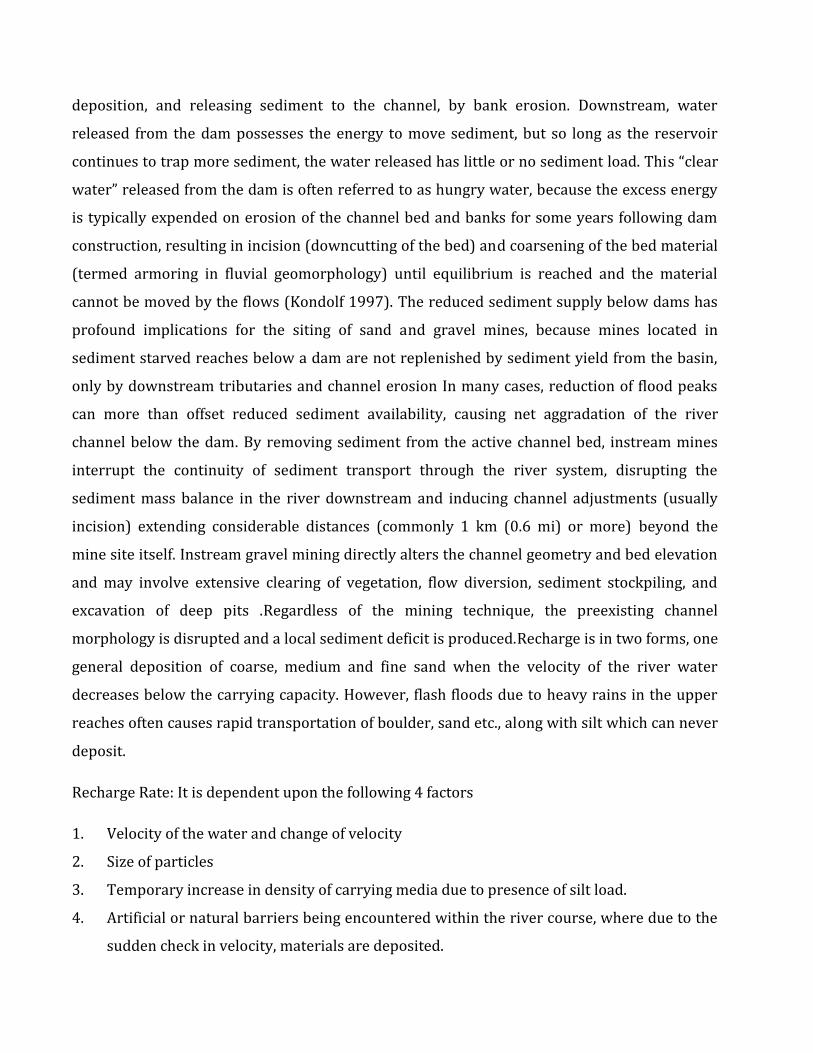
deposition, and releasing sediment to the channel, by bank erosion. Downstream, waterreleased from the dam possesses the energy to move sediment, but so long as the reservoircontinues to trap more sediment, the water released has little or no sediment load. This “clearwater” released from the dam is often referred to as hungry water, because the excess energyis typically expended on erosion of the channel bed and banks for some years following damconstruction, resulting in incision (downcutting of the bed) and coarsening of the bed material(termed armoring in fluvial geomorphology) until equilibrium is reached and the materialcannot be moved by the flows (Kondolf 1997). The reduced sediment supply below dams hasprofound implications for the siting of sand and gravel mines, because mines located insediment starved reaches below a dam are not replenished by sediment yield from the basin,only by downstream tributaries and channel erosion In many cases, reduction of flood peakscan more than offset reduced sediment availability, causing net aggradation of the riverchannel below the dam. By removing sediment from the active channel bed, instream minesinterrupt the continuity of sediment transport through the river system, disrupting thesediment mass balance in the river downstream and inducing channel adjustments (usuallyincision) extending considerable distances (commonly 1 km (0.6 mi) or more) beyond themine site itself. Instream gravel mining directly alters the channel geometry and bed elevationand may involve extensive clearing of vegetation, flow diversion, sediment stockpiling, andexcavation of deep pits .Regardless of the mining technique, the preexisting channelmorphology is disrupted and a local sediment deficit is produced.Recharge is in two forms, onegeneral deposition of coarse, medium and fine sand when the velocity of the river waterdecreases below the carrying capacity. However, flash floods due to heavy rains in the upperreaches often causes rapid transportation of boulder, sand etc., along with silt which can neverdeposit.Recharge Rate: It is dependent upon the following 4 factors1. Velocity of the water and change of velocity2. Size of particles3. Temporary increase in density of carrying media due to presence of silt load.4. Artificial or natural barriers being encountered within the river course, where due to thesudden check in velocity, materials are deposited.
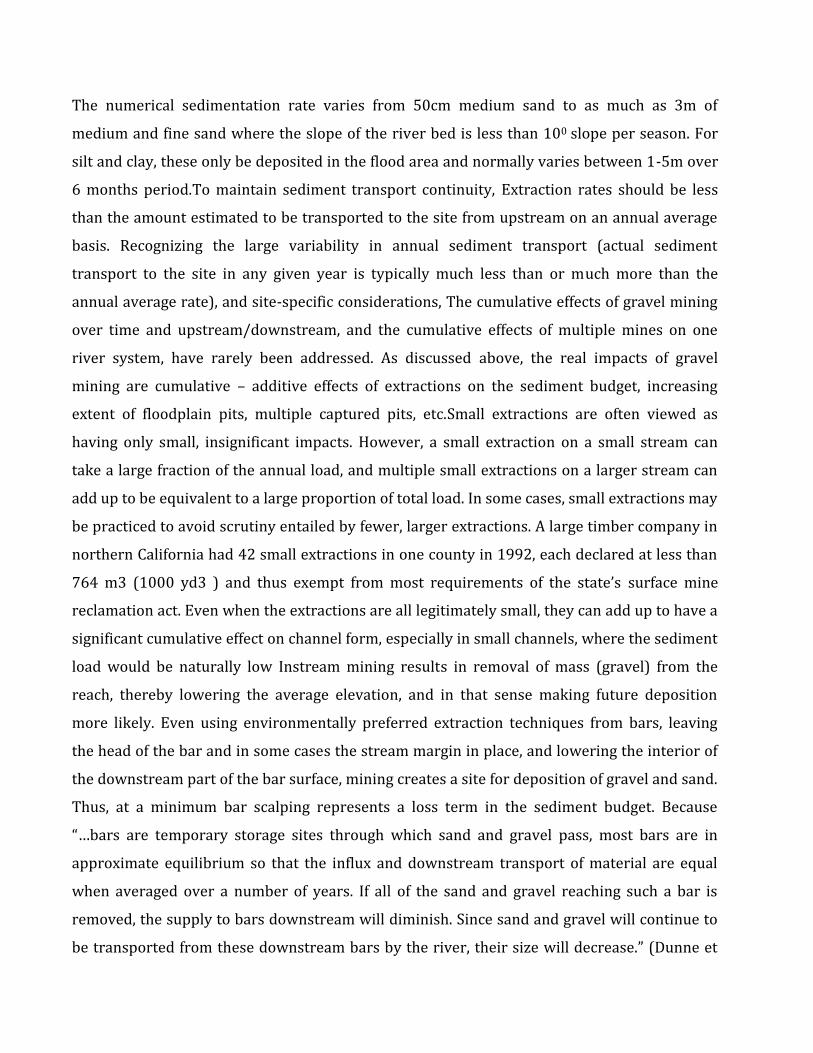
The numerical sedimentation rate varies from 50cm medium sand to as much as 3m ofmedium and fine sand where the slope of the river bed is less than 100 slope per season. Forsilt and clay, these only be deposited in the flood area and normally varies between 1-5m over6 months period.To maintain sediment transport continuity, Extraction rates should be lessthan the amount estimated to be transported to the site from upstream on an annual averagebasis. Recognizing the large variability in annual sediment transport (actual sedimenttransport to the site in any given year is typically much less than or much more than theannual average rate), and site-specific considerations, The cumulative effects of gravel miningover time and upstream/downstream, and the cumulative effects of multiple mines on oneriver system, have rarely been addressed. As discussed above, the real impacts of gravelmining are cumulative – additive effects of extractions on the sediment budget, increasingextent of floodplain pits, multiple captured pits, etc.Small extractions are often viewed ashaving only small, insignificant impacts. However, a small extraction on a small stream cantake a large fraction of the annual load, and multiple small extractions on a larger stream canadd up to be equivalent to a large proportion of total load. In some cases, small extractions maybe practiced to avoid scrutiny entailed by fewer, larger extractions. A large timber company innorthern California had 42 small extractions in one county in 1992, each declared at less than764 m3 (1000 yd3 ) and thus exempt from most requirements of the state’s surface minereclamation act. Even when the extractions are all legitimately small, they can add up to have asignificant cumulative effect on channel form, especially in small channels, where the sedimentload would be naturally low Instream mining results in removal of mass (gravel) from thereach, thereby lowering the average elevation, and in that sense making future depositionmore likely. Even using environmentally preferred extraction techniques from bars, leavingthe head of the bar and in some cases the stream margin in place, and lowering the interior ofthe downstream part of the bar surface, mining creates a site for deposition of gravel and sand.Thus, at a minimum bar scalping represents a loss term in the sediment budget. Because“…bars are temporary storage sites through which sand and gravel pass, most bars are inapproximate equilibrium so that the influx and downstream transport of material are equalwhen averaged over a number of years. If all of the sand and gravel reaching such a bar isremoved, the supply to bars downstream will diminish. Since sand and gravel will continue tobe transported from these downstream bars by the river, their size will decrease.” (Dunne et
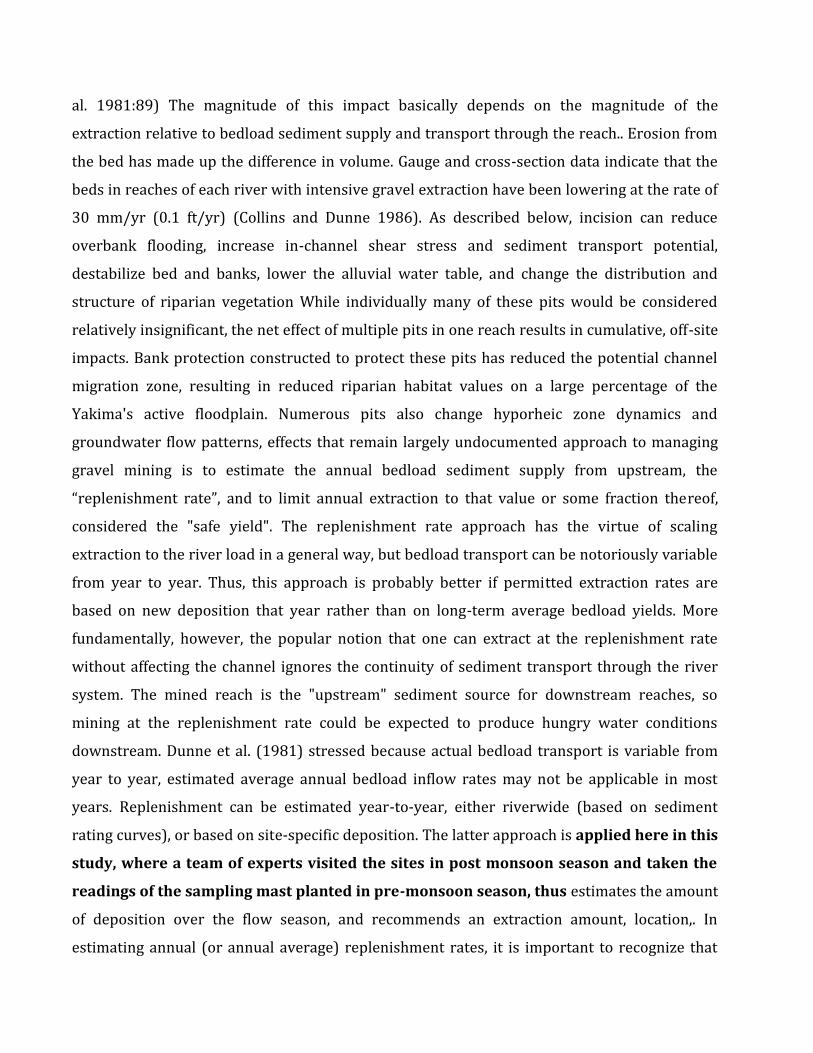
al. 1981:89) The magnitude of this impact basically depends on the magnitude of theextraction relative to bedload sediment supply and transport through the reach.. Erosion fromthe bed has made up the difference in volume. Gauge and cross-section data indicate that thebeds in reaches of each river with intensive gravel extraction have been lowering at the rate of30 mm/yr (0.1 ft/yr) (Collins and Dunne 1986). As described below, incision can reduceoverbank flooding, increase in-channel shear stress and sediment transport potential,destabilize bed and banks, lower the alluvial water table, and change the distribution andstructure of riparian vegetation While individually many of these pits would be consideredrelatively insignificant, the net effect of multiple pits in one reach results in cumulative, off-siteimpacts. Bank protection constructed to protect these pits has reduced the potential channelmigration zone, resulting in reduced riparian habitat values on a large percentage of theYakima's active floodplain. Numerous pits also change hyporheic zone dynamics andgroundwater flow patterns, effects that remain largely undocumented approach to managinggravel mining is to estimate the annual bedload sediment supply from upstream, the“replenishment rate”, and to limit annual extraction to that value or some fraction thereof,considered the "safe yield". The replenishment rate approach has the virtue of scalingextraction to the river load in a general way, but bedload transport can be notoriously variablefrom year to year. Thus, this approach is probably better if permitted extraction rates arebased on new deposition that year rather than on long-term average bedload yields. Morefundamentally, however, the popular notion that one can extract at the replenishment ratewithout affecting the channel ignores the continuity of sediment transport through the riversystem. The mined reach is the "upstream" sediment source for downstream reaches, somining at the replenishment rate could be expected to produce hungry water conditionsdownstream. Dunne et al. (1981) stressed because actual bedload transport is variable fromyear to year, estimated average annual bedload inflow rates may not be applicable in mostyears. Replenishment can be estimated year-to-year, either riverwide (based on sedimentrating curves), or based on site-specific deposition. The latter approach is applied here in this
study, where a team of experts visited the sites in post monsoon season and taken the
readings of the sampling mast planted in pre-monsoon season, thus estimates the amountof deposition over the flow season, and recommends an extraction amount, location,. Inestimating annual (or annual average) replenishment rates, it is important to recognize that
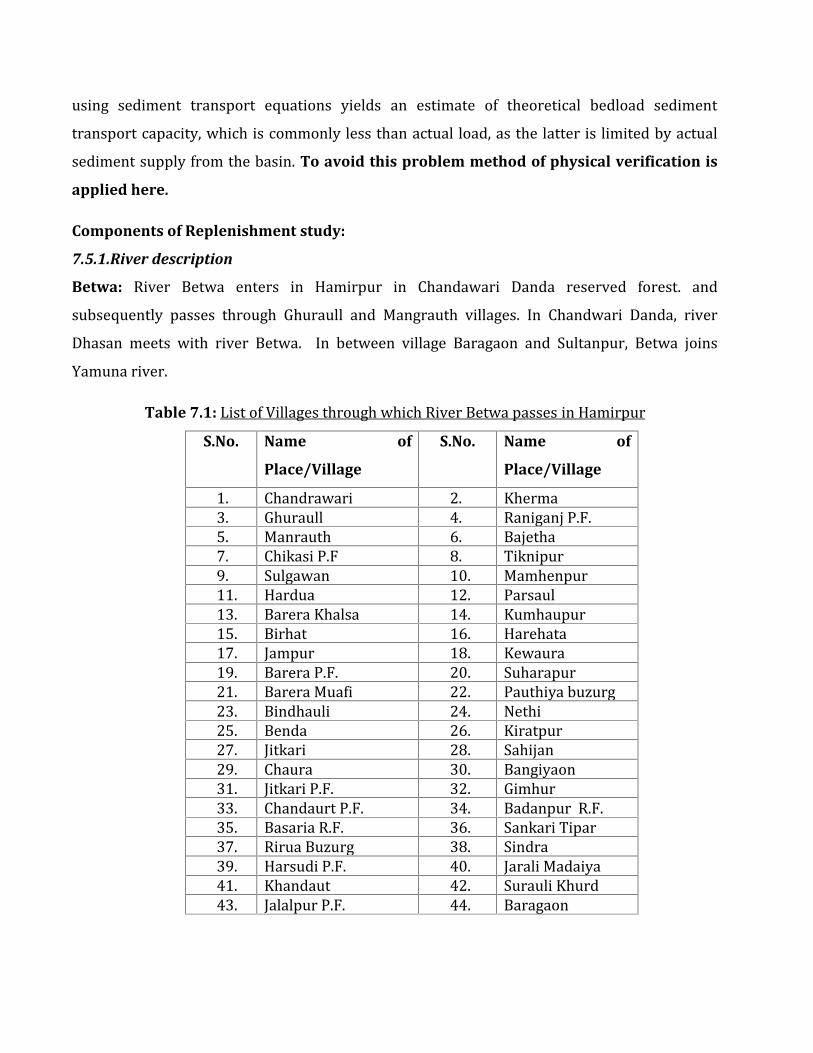
using sediment transport equations yields an estimate of theoretical bedload sedimenttransport capacity, which is commonly less than actual load, as the latter is limited by actualsediment supply from the basin. To avoid this problem method of physical verification is
applied here.
Components of Replenishment study:
7.5.1.River description
Betwa: River Betwa enters in Hamirpur in Chandawari Danda reserved forest. andsubsequently passes through Ghuraull and Mangrauth villages. In Chandwari Danda, riverDhasan meets with river Betwa. In between village Baragaon and Sultanpur, Betwa joinsYamuna river.Table 7.1: List of Villages through which River Betwa passes in Hamirpur
S.No. Name of
Place/Village
S.No. Name of
Place/Village1. Chandrawari 2. Kherma3. Ghuraull 4. Raniganj P.F.5. Manrauth 6. Bajetha7. Chikasi P.F 8. Tiknipur9. Sulgawan 10. Mamhenpur11. Hardua 12. Parsaul13. Barera Khalsa 14. Kumhaupur15. Birhat 16. Harehata17. Jampur 18. Kewaura19. Barera P.F. 20. Suharapur21. Barera Muafi 22. Pauthiya buzurg23. Bindhauli 24. Nethi25. Benda 26. Kiratpur27. Jitkari 28. Sahijan29. Chaura 30. Bangiyaon31. Jitkari P.F. 32. Gimhur33. Chandaurt P.F. 34. Badanpur R.F.35. Basaria R.F. 36. Sankari Tipar37. Rirua Buzurg 38. Sindra39. Harsudi P.F. 40. Jarali Madaiya41. Khandaut 42. Surauli Khurd43. Jalalpur P.F. 44. Baragaon
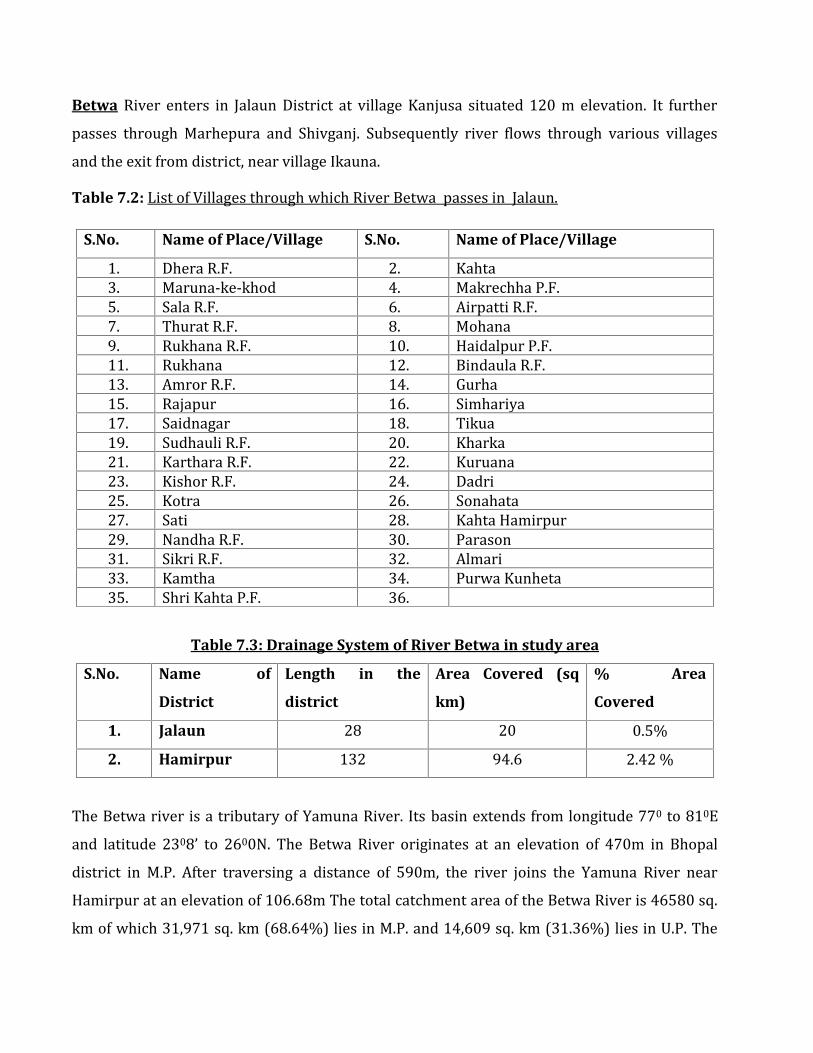
Betwa River enters in Jalaun District at village Kanjusa situated 120 m elevation. It furtherpasses through Marhepura and Shivganj. Subsequently river flows through various villagesand the exit from district, near village Ikauna.Table 7.2: List of Villages through which River Betwa passes in Jalaun.
S.No. Name of Place/Village S.No. Name of Place/Village1. Dhera R.F. 2. Kahta3. Maruna-ke-khod 4. Makrechha P.F.5. Sala R.F. 6. Airpatti R.F.7. Thurat R.F. 8. Mohana9. Rukhana R.F. 10. Haidalpur P.F.11. Rukhana 12. Bindaula R.F.13. Amror R.F. 14. Gurha15. Rajapur 16. Simhariya17. Saidnagar 18. Tikua19. Sudhauli R.F. 20. Kharka21. Karthara R.F. 22. Kuruana23. Kishor R.F. 24. Dadri25. Kotra 26. Sonahata27. Sati 28. Kahta Hamirpur29. Nandha R.F. 30. Parason31. Sikri R.F. 32. Almari33. Kamtha 34. Purwa Kunheta35. Shri Kahta P.F. 36.Table 7.3: Drainage System of River Betwa in study area
S.No. Name of
District
Length in the
district
Area Covered (sq
km)
% Area
Covered
1. Jalaun 28 20 0.5%2. Hamirpur 132 94.6 2.42 %
The Betwa river is a tributary of Yamuna River. Its basin extends from longitude 770 to 810Eand latitude 2308’ to 2600N. The Betwa River originates at an elevation of 470m in Bhopaldistrict in M.P. After traversing a distance of 590m, the river joins the Yamuna River nearHamirpur at an elevation of 106.68m The total catchment area of the Betwa River is 46580 sq.km of which 31,971 sq. km (68.64%) lies in M.P. and 14,609 sq. km (31.36%) lies in U.P. The
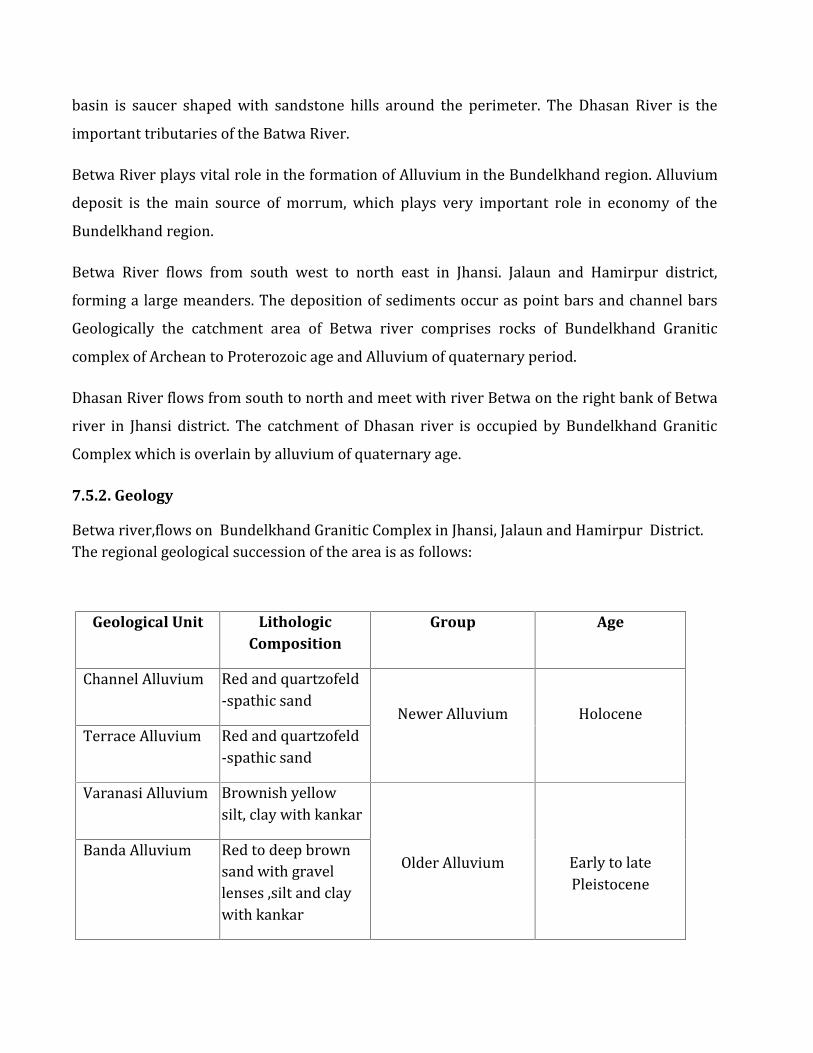
basin is saucer shaped with sandstone hills around the perimeter. The Dhasan River is theimportant tributaries of the Batwa River.Betwa River plays vital role in the formation of Alluvium in the Bundelkhand region. Alluviumdeposit is the main source of morrum, which plays very important role in economy of theBundelkhand region.Betwa River flows from south west to north east in Jhansi. Jalaun and Hamirpur district,forming a large meanders. The deposition of sediments occur as point bars and channel barsGeologically the catchment area of Betwa river comprises rocks of Bundelkhand Graniticcomplex of Archean to Proterozoic age and Alluvium of quaternary period.Dhasan River flows from south to north and meet with river Betwa on the right bank of Betwariver in Jhansi district. The catchment of Dhasan river is occupied by Bundelkhand GraniticComplex which is overlain by alluvium of quaternary age.7.5.2. GeologyBetwa river,flows on Bundelkhand Granitic Complex in Jhansi, Jalaun and Hamirpur District.The regional geological succession of the area is as follows:
Geological Unit LithologicComposition
Group Age
Channel Alluvium Red and quartzofeld-spathic sand Newer Alluvium HoloceneTerrace Alluvium Red and quartzofeld-spathic sandVaranasi Alluvium Brownish yellowsilt, clay with kankarOlder Alluvium Early to latePleistoceneBanda Alluvium Red to deep brownsand with gravellenses ,silt and claywith kankar
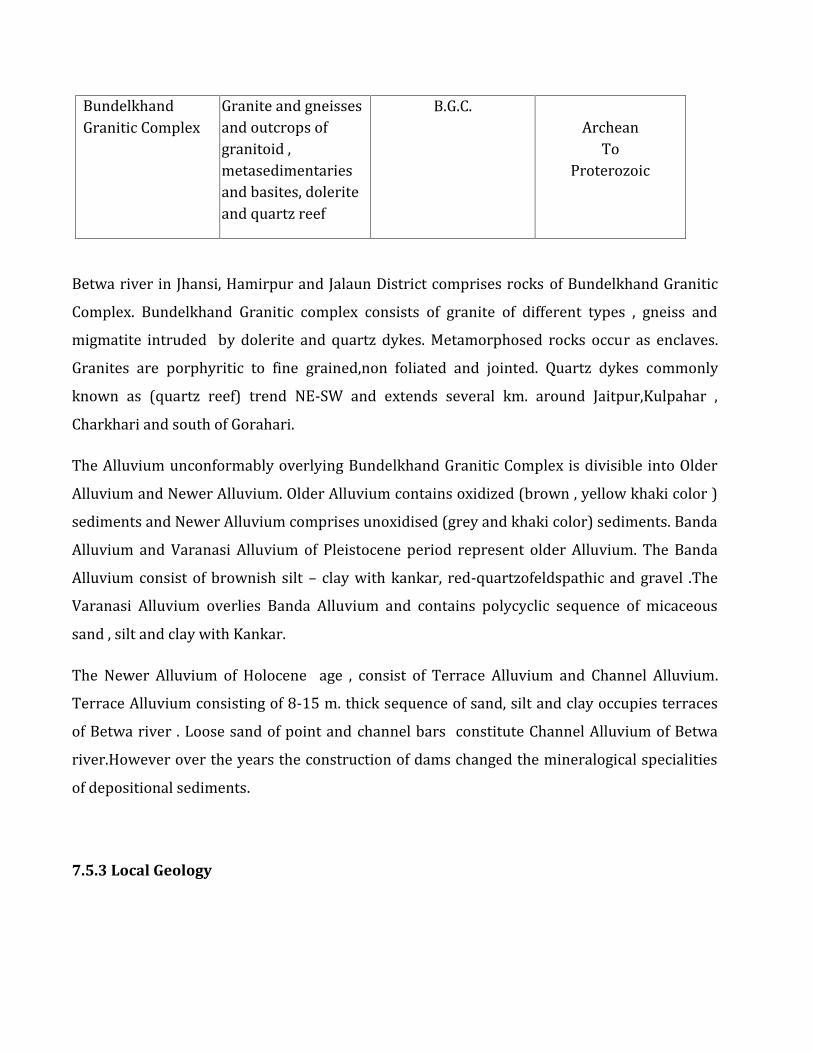
BundelkhandGranitic Complex Granite and gneissesand outcrops ofgranitoid ,metasedimentariesand basites, doleriteand quartz reefB.G.C. ArcheanToProterozoic
Betwa river in Jhansi, Hamirpur and Jalaun District comprises rocks of Bundelkhand GraniticComplex. Bundelkhand Granitic complex consists of granite of different types , gneiss andmigmatite intruded by dolerite and quartz dykes. Metamorphosed rocks occur as enclaves.Granites are porphyritic to fine grained,non foliated and jointed. Quartz dykes commonlyknown as (quartz reef) trend NE-SW and extends several km. around Jaitpur,Kulpahar ,Charkhari and south of Gorahari.The Alluvium unconformably overlying Bundelkhand Granitic Complex is divisible into OlderAlluvium and Newer Alluvium. Older Alluvium contains oxidized (brown , yellow khaki color )sediments and Newer Alluvium comprises unoxidised (grey and khaki color) sediments. BandaAlluvium and Varanasi Alluvium of Pleistocene period represent older Alluvium. The BandaAlluvium consist of brownish silt – clay with kankar, red-quartzofeldspathic and gravel .TheVaranasi Alluvium overlies Banda Alluvium and contains polycyclic sequence of micaceoussand , silt and clay with Kankar.The Newer Alluvium of Holocene age , consist of Terrace Alluvium and Channel Alluvium.Terrace Alluvium consisting of 8-15 m. thick sequence of sand, silt and clay occupies terracesof Betwa river . Loose sand of point and channel bars constitute Channel Alluvium of Betwariver.However over the years the construction of dams changed the mineralogical specialitiesof depositional sediments.7.5.3 Local Geology

The morrum occur all along with the Betwa River in Jhansi, Jalaun and Hamirpur District,which is red in color. The red color sediments is the product of weathering and disintegrationof granitic gneisses of Bundelkhand ComplexMorrum in this belt are gravelly in nature and mineralogically comprises of quartz, feldsparand other accessory minerals and is coarse to very coarse grained.7.5.4.Topography of the study areaThe present mining geological study area lies between the coordinates 25°54'25.56"N &79°39'42.55"E to 25°55'34.68"N & 80°16'12.74"E in which River Betwa flows has a major areacovered by Banda Alluvium which has developed over the basement of Bundelkhand GranitoidComplex (BGC) which comes under the Group of Older Alluvium.Banda Alluvium is spread all over the part of Jalaun district falling within the study area, and inHamirpur also major part is covered with Banda Alluvium. Banda Alluvium is of Red to deepbrown sand due to the presence of red-quartzofeldspathic with gravel lenses, of brownish siltand clay with kankar. The Bundelkhand Granitoid Complex (BGC) which forms the base ofBanda Alluvium mainly consists of Granite and Gneiss with the origin of Archean toProterozoic age.There is also a palaeo-channel found within the study area below the confluence of RiverBetwa and River Yamuna around the Villages Narayanpur, Kundaura (25°51'22.54"N 80°8'17.12"E) etc. and it indicates the remnant of inactive stream channel of River Yamuna whichgot filled with by younger sediment (Newer Alluvium).Within the area of study of this particular cluster, there is a confluence of two rivers Betwa andYamuna (25°55'6.61"N 80°12'37.38"E) around the point of confluence of two rivers is thelow lying area towards the upper bank of river Yamuna which lies in the Kanpur Nagar district.On river Yamuna there is a patch of Channel alluvium found near Village Samuhi(25°55'48.02"N 80°13'30.39"E) in Kanpur Nagar which is mostly partially or whollysubmerged during monsoons. A patch of Channel alluvium is also found in the part of districtJalaun falling with the study area. It is found around Bhedi Khurd (25°53'0.21"N79°51'6.27"E) village along the water channel of River Betwa. Channel bars and point bars are
formed within the channel of the river and these sediment deposits are called as Channelalluvium. Rest part of the district falling within the study area is covered with VaranasiAlluvium which is brownish yellow silty to clayey flat with relict fluvial features likes Tals andPalaeochannel. Varanasi alluvium is older alluvium laying on the low flood plains, originated asEarly to Late Pleistocene age. In Hamirpur district towards North-east direction (80° 4'31.07"E80° 4'31.07"E) between the two rivers flowing in the district viz. Yamuna and Betwa liesVaranasi Alluvium towards the bank of Yamuna River which is a flat ground with relictschannels and inselbergs of granitoid too. It is a low lying area which gets flooded in monsoonseason and when flood water recedes it removes the soil along the drainage lines by surfacerun-off turned this area into waste land. The ground water table level around this area rangesfrom 10-20 m bgl as the bed rock is porous and the water is potable.Terrace Alluvium is found all along the river stream flowing from west to east direction and ismostly deposited on the older flood plains which are low lying and this sediment deposition isyounger in nature and mostly preserved by the incision of rivers as it keeps on gettingdeposited in the forms of terrace. In this particular stretch, the deposition of alluvium is mainlyMorrum in nature which are coarse to very coarse in texture having red colour due to presenceof quartzofeld spathic sand.As the river Betwa progresses the deposition of sediments varies in depth within the 10kmbuffer zone of oyr study area around Chandaut Danda (25°54'13.48"N 79°40'28.95"E) thethickness of sediment deposit varies from 31m-20m from the water level in the river which ison average 101m on the concave side of the river.The course river Betwa is meandered through out this stretch and around villages likeHimapura, Pathreta and Basrehi (25°52'19.90"N 79°47'47.82"E) there is a bend and towardsthe concave side the sediment deposit are found of thickness of approx. 23m-17m from theaverage water level of the river which is approx. 99m.The water level/zero level of the river Betwa around the the villages Bhedi kharka nd BhediKhurd (25°54'3.69"N 79°49'0.71"E) along the steep bend in the water channel is approx. 97mand the thickness of sediment deposition is approx. 24m- 15m.
The meandering of the river facilitates the deposition of sediments further down the coursearound villages Beri and Bajheta Dariya (25°53'32.65"N 79°54'23.32"E) with the thickness of25m-13m from the average water level in the river which is approx. 95m. futher down thestream around the villages Sahijana, Tikhrauli, Ramedi etc.( 25°55'28.58"N 80° 8'58.68"E) justbefore the Yamuna Betwa confluence at Samuhi, the thickness of sediment deposits varies24m- 15m from the water level which is approx. 92m.Terrace Alluvium is also found in the Kanpur Nagar district within the study area on the olderflood lowland plains which has got high permeability and low compressive strength and issuitable for monocrop cultivation. The water table level along the Yamuna river within thisstudy area varies from 10-20m bgl.Betwa in Jalaun: The Betwa forms the boundary with Jhansi along the southern border from apoint a few kilometers east of the town of Erichh to its junction with Dhasan. Its course, whichup to the junction runs due east tends then somewhat to the north-east and it meanders alongthe south-eastern side of tahsil Orai and Kalpi, separating them from Hamirpur. Like theYamuna it leaves the district on Baoni border. It flows in a tortuous channel with many loopsand bends. Its total length along the district border is approximately 96 kilometers, but frompoint to point it does not exceed 64 kilometers. Both the banks are fringed for some distanceinland by uncultureable ravines.Betwa in Hamirpur: This river flows along the north-eastern border of the district form thepoint where Dhasan joins Betwa separating tehsil Rath from district Jalaun. It Joins Yamuna at10 km east of Hamirpur. The total distance of river is almost 65 km but it is almost doubleddue to numerous loops formed in tortuous course. After joining Yamuna its channel curvesgently from north to south. The banks except at the end of its course are precipitous and verylittle alluvial soil is formed between the ricer and cliff. In the upper reaches rocks and bouldersoccur in a few places in its bed , but for the most part the bed is sandy. The banks except in thelast few km are usually scoured with ravines. The river brings down large volume of water inthe rains and for the rest of the year, the river shrinks to a narrow stream.
Table No.7.4 Drainage status in study area
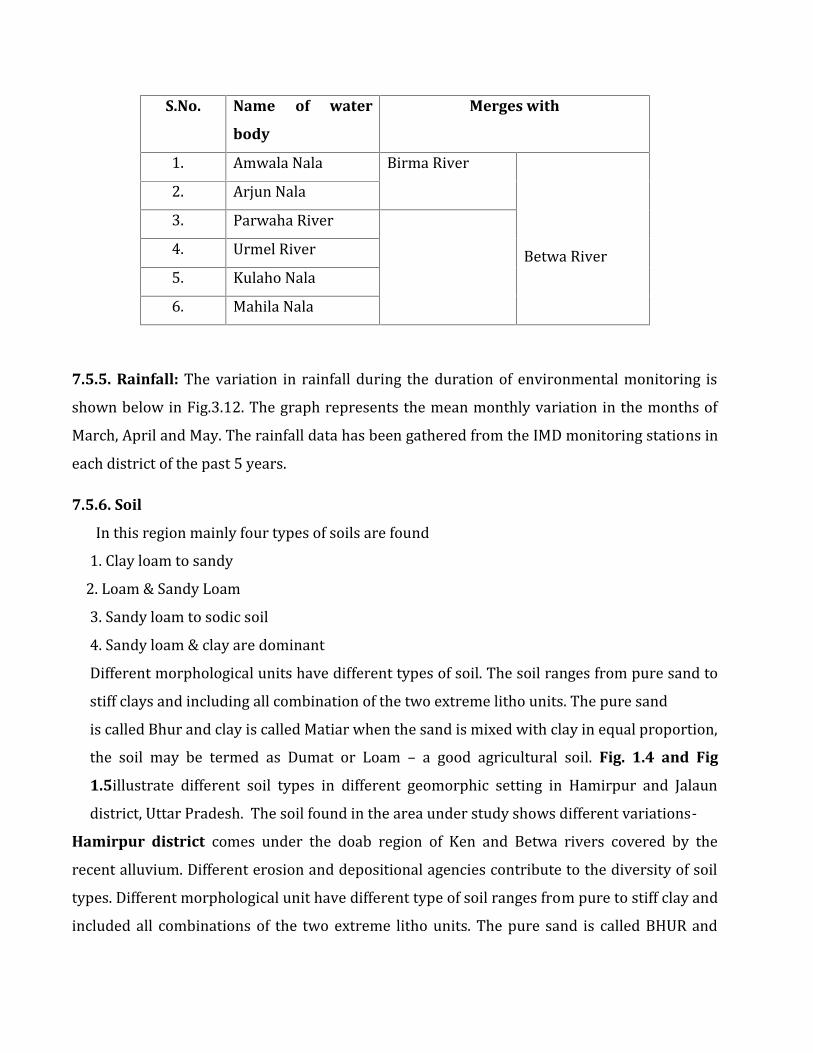
S.No. Name of water
body
Merges with
1. Amwala Nala Birma RiverBetwa River
2. Arjun Nala3. Parwaha River4. Urmel River5. Kulaho Nala6. Mahila Nala7.5.5. Rainfall: The variation in rainfall during the duration of environmental monitoring isshown below in Fig.3.12. The graph represents the mean monthly variation in the months ofMarch, April and May. The rainfall data has been gathered from the IMD monitoring stations ineach district of the past 5 years.7.5.6. SoilIn this region mainly four types of soils are found1. Clay loam to sandy2. Loam & Sandy Loam3. Sandy loam to sodic soil4. Sandy loam & clay are dominantDifferent morphological units have different types of soil. The soil ranges from pure sand tostiff clays and including all combination of the two extreme litho units. The pure sandis called Bhur and clay is called Matiar when the sand is mixed with clay in equal proportion,the soil may be termed as Dumat or Loam – a good agricultural soil. Fig. 1.4 and Fig
1.5illustrate different soil types in different geomorphic setting in Hamirpur and Jalaundistrict, Uttar Pradesh. The soil found in the area under study shows different variations-Hamirpur district comes under the doab region of Ken and Betwa rivers covered by therecent alluvium. Different erosion and depositional agencies contribute to the diversity of soiltypes. Different morphological unit have different type of soil ranges from pure to stiff clay andincluded all combinations of the two extreme litho units. The pure sand is called BHUR and
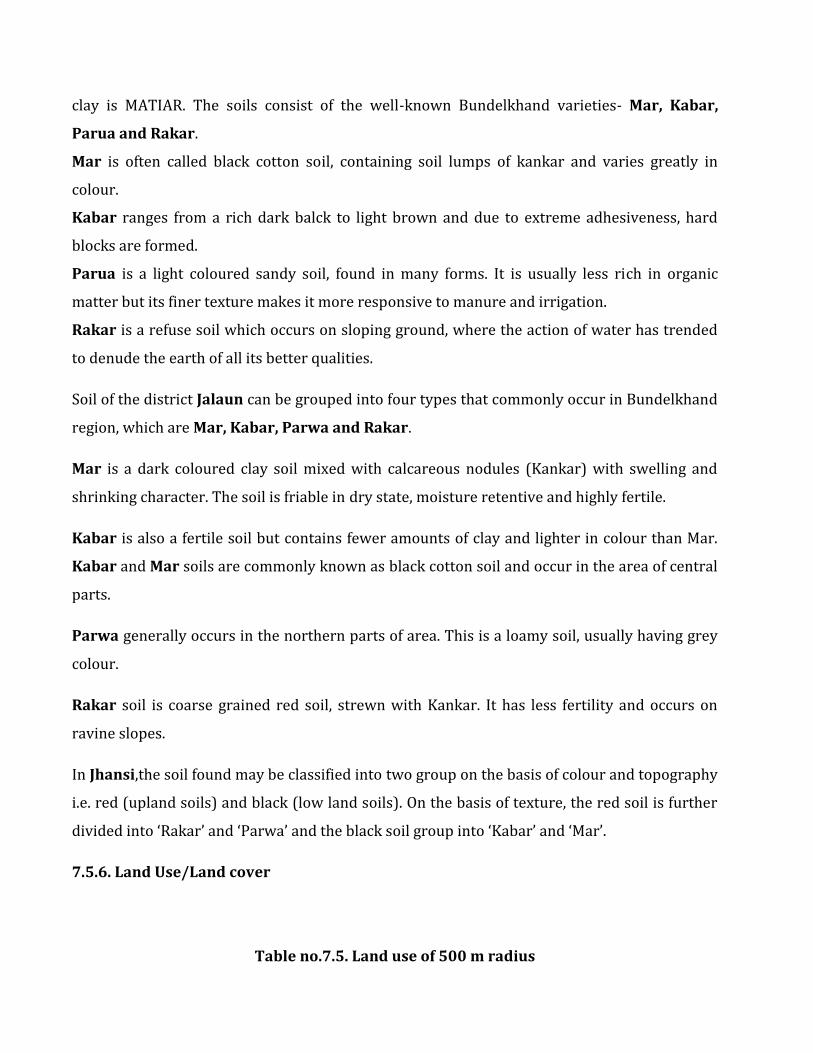
clay is MATIAR. The soils consist of the well-known Bundelkhand varieties- Mar, Kabar,
Parua and Rakar.Mar is often called black cotton soil, containing soil lumps of kankar and varies greatly incolour.Kabar ranges from a rich dark balck to light brown and due to extreme adhesiveness, hardblocks are formed.Parua is a light coloured sandy soil, found in many forms. It is usually less rich in organicmatter but its finer texture makes it more responsive to manure and irrigation.Rakar is a refuse soil which occurs on sloping ground, where the action of water has trendedto denude the earth of all its better qualities.Soil of the district Jalaun can be grouped into four types that commonly occur in Bundelkhandregion, which are Mar, Kabar, Parwa and Rakar.Mar is a dark coloured clay soil mixed with calcareous nodules (Kankar) with swelling andshrinking character. The soil is friable in dry state, moisture retentive and highly fertile.Kabar is also a fertile soil but contains fewer amounts of clay and lighter in colour than Mar.Kabar and Mar soils are commonly known as black cotton soil and occur in the area of centralparts.Parwa generally occurs in the northern parts of area. This is a loamy soil, usually having greycolour.Rakar soil is coarse grained red soil, strewn with Kankar. It has less fertility and occurs onravine slopes.In Jhansi,the soil found may be classified into two group on the basis of colour and topographyi.e. red (upland soils) and black (low land soils). On the basis of texture, the red soil is furtherdivided into ‘Rakar’ and ‘Parwa’ and the black soil group into ‘Kabar’ and ‘Mar’.7.5.6. Land Use/Land cover
Table no.7.5. Land use of 500 m radius
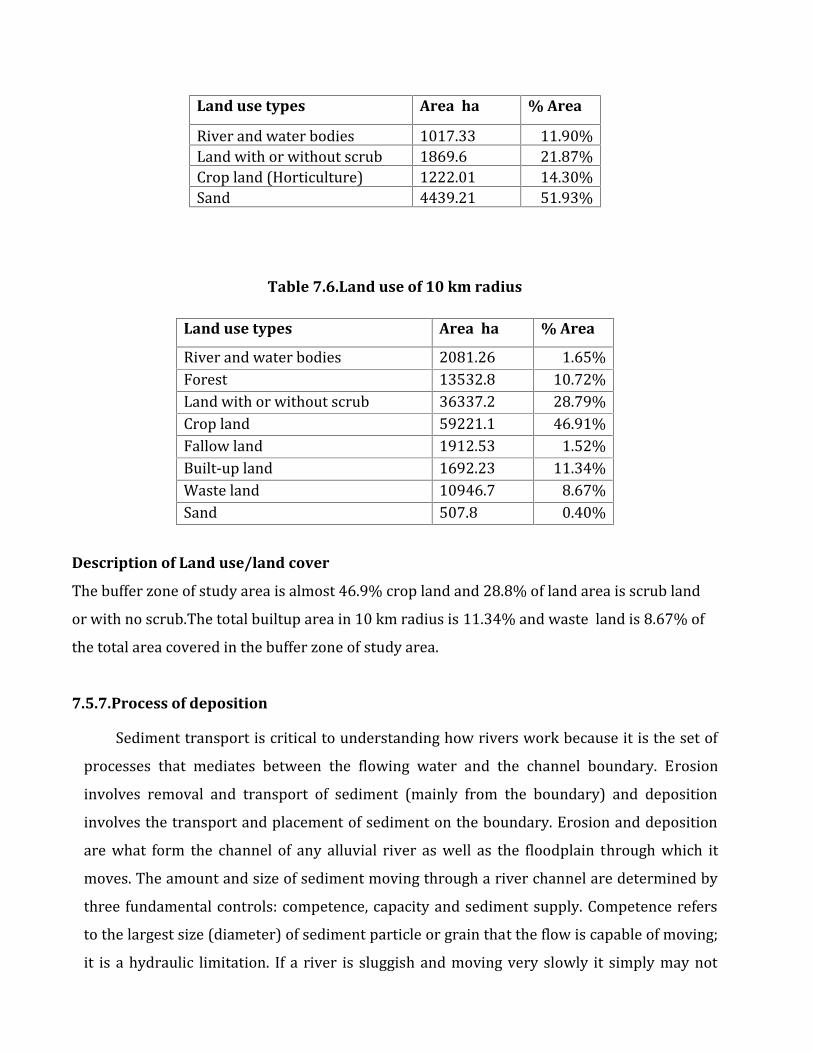
Land use types Area ha % AreaRiver and water bodies 1017.33 11.90%Land with or without scrub 1869.6 21.87%Crop land (Horticulture) 1222.01 14.30%Sand 4439.21 51.93%Table 7.6.Land use of 10 km radius
Land use types Area ha % AreaRiver and water bodies 2081.26 1.65%Forest 13532.8 10.72%Land with or without scrub 36337.2 28.79%Crop land 59221.1 46.91%Fallow land 1912.53 1.52%Built-up land 1692.23 11.34%Waste land 10946.7 8.67%Sand 507.8 0.40%Description of Land use/land coverThe buffer zone of study area is almost 46.9% crop land and 28.8% of land area is scrub landor with no scrub.The total builtup area in 10 km radius is 11.34% and waste land is 8.67% ofthe total area covered in the buffer zone of study area.7.5.7.Process of depositionSediment transport is critical to understanding how rivers work because it is the set ofprocesses that mediates between the flowing water and the channel boundary. Erosioninvolves removal and transport of sediment (mainly from the boundary) and depositioninvolves the transport and placement of sediment on the boundary. Erosion and depositionare what form the channel of any alluvial river as well as the floodplain through which itmoves. The amount and size of sediment moving through a river channel are determined bythree fundamental controls: competence, capacity and sediment supply. Competence refersto the largest size (diameter) of sediment particle or grain that the flow is capable of moving;it is a hydraulic limitation. If a river is sluggish and moving very slowly it simply may not
have the power to mobilize and transport sediment of a given size even though suchsediment is available to transport. So a river may be competent or incompetent with respectto a given grain size. If it is incompetent it will not transport sediment of the given size. If it iscompetent it may transport sediment of that size if such sediment is available (that is, theriver is not supply-limited). Capacity refers to the maximum amount of sediment of a givensize that a stream can transport in traction as bedload. Given a supply of sediment, capacitydepends on channel gradient, discharge and the calibre of the load (the presence of fines mayincrease fluid density and increase capacity; the presence of large particles may obstruct theflow and reduce capacity). Capacity transport is the competence-limited sediment transport(mass per unit time) predicted by all sediment-transport equations, examples of which wewill examine below. Capacity transport only occurs when sediment supply is abundant (non-limiting). Sediment supply refers to the amount and size of sediment available for sedimenttransport. Capacity transport for a given grain size is only achieved if the supply of thatcalibre of sediment is not limiting (that is, the maximum amount of sediment a stream iscapable of transporting is actually available). Because of these two different potentialconstraints (hydraulics and sediment supply) distinction is often made between supply-limited and capacity-limited transport.Most rivers probably function in a sediment-supply limited condition although we oftenassume that this is not the case. Much of the material supplied to a stream is so fine (silt andclay) that, provided it can be carried in suspension, almost any flow will transport it.Although there must be an upper limit to the capacity of the stream to transport such fines, itis probably never reached in natural channels and the amount moved is limited by supply. Incontrast, transport of coarser material (say, coarser than fine sand) is largely capacitylimited.7.5.9.Modes of Sediment Transport
The sediment load of a river is transported in various ways although these distinctionsare to some extent arbitrary and not always very practical in the sense that not all of thecomponents can be separated in practice:1. Dissolved load

2. Suspended load3. Intermittent suspension (saltation) load4. Wash load5. Bed load7.5.10.Sediment Transport in Rivers
The loose boundary (consisting of movable material) of an alluvial channel deforms under theaction of flowing water and the deformed bed with its changing roughness (bed forms)interacts with the flow. A dynamic equilibrium state of the boundary may be expected when asteady and uniform flow has developed (Nalluri & Featherstone, 2009). The resultingmovement of the bed material (sediment) in the direction of flow is called sediment transportand a critical bed shear stress (t) must be exceeded to start the particle movement. Such acritical shear stress is referred as incipient (threshold) motion condition, below which theparticles will be at rest and the flow is similar to that on a rigid boundary.Sediment Influx Rate
Sediment influx in Ephemeral streams is generally confined to the beginning of the rainyseason as velocity of the water washes down medium to fine sand and silt depending on thevelocity and gradient of land. Cobbles, pebbles and boulders will be transported buy only overshort distance. Boulders are normally 256 mm and above are normally transported either bydragging action or by saltation.Recharge Rate: It is dependent upon the following 4 factors Velocity of the water and change of velocity Size of particles Temporary increase in density of carrying media due to presence of silt load. Artificial or natural barriers being encountered within the river course, where due to thesudden check in velocity, materials are deposited.The numerical sedimentation rate varies from 50cm medium sand to as much as 3m ofmedium and fine sand where the slope of the river bed is less than 100 slope per season. For
silt and clay, these only be deposited in the flood area and normally varies between 1-5m over6 months period.7.5.11. Estimation of SedimentThe sedimentation rate in India is estimated using empirical formula, actual observeddata and reservoir sedimentation survey. In addition the sediment data is also collected by thestate governments on river systems in their respective territories. Thus there is enough data toestimate both the average annual sediment yield and also the distribution of annual sedimentyields. There are also situations where the gauging stations provide nested systems ofcatchments. In these situations data can be used to identify the contribution to the totalsediment yield from individual sub-catchments. Though this data is extremely useful and isrecommended to be fully used for estimation of sediment rate, the data need to be interpretedwith care. The sediment measurements are, in general, based on bottle sample taken from nearthe water surface. In general, the suspended sediment concentration varies with depth, withthe sediment concentration being greatest at the lower levels. This means that themeasurement may under estimate the suspended sediment concentrations. The sediment yielddepends on catchment area, the average catchment slope, the lithology of the catchment, theland use, the drainage density, the annual/seasonal precipitation and storm events etc. Thereare a number of empirical methods developed in USA and still used worldwide to assesssediment erosion, including the Universal Soil Loss Equation (USLE), MUSLE, and RevisedUniversal Soil Loss Equation (RUSLE). Some work has been done in India and certain empiricalrelations have been developed linking annual sediment yield with some of these parameters.Estimation of sediment yield from the catchment area above the reservoir is usually madeusing river sediment observation data or more commonly from the experience ofsedimentation cf existing reservoirs with similar characteristics. On adopting the firstprocedure, it is usually necessary ( though often not complied within practice ) to evolveproper sediment water discharge rating curve and combine it with flow duration ( or stageduration curve ) based on uniformly spaced daily or shorter time units in case of smaller riverbasins. Where observed stage/flow data is available for only shorter periods, these have to besuitably extended with the help of longer data on rainfall to eliminate, as far as possible, thesampling errors due to shortness of records. The sediment discharge rating curves may also be
prepared from hydraulic considerations using sediment load formulae, that is, modifiedEinstein’s procedure but this has not yet become popular. It is also necessary to account for thebed load which may not have been measured. While bed load measurement is preferable;when it is not possible, it is often estimated as a percentage generally ranging from 5 to 20percent of the suspended load. However, practical means of measuring bed load of sedimentneeds to be undertaken particularly in cases where high bed loads are anticipated. To assessthe volume of sediment that would deposit in the reservoir, it is further necessary to makeestimates of average trap efficiency for the reservoir in question and the likely unit weight ofsediment deposits, time averaged over the period selected. The trap efficiency would dependmainly on the capacity inflow ratio but would also vary with location of controlling outlets andreservoir operating procedures. The density of deposited sediment would vary with thecomposition of the deposits, the location of the deposit within the reservoir, the flocculationcharacteristics of clay and water, and the age of the deposit. For coarse material ( 0.0625 mmand above), variation of density with location and age may be unimportant. For silt and clay,this may be significant. Normally, a time and space average density of these fractions,applicable for the period under study is required for finding the overall volume of deposits. Forthis purpose, the trapped sediment for the period under study would have to be classified infractions by corrections in inflow estimates of the fractions by trap efficiency. Most of thesediment removed from the reservoir should be from the silt and clay fraction. In some specialcases, local estimates of densities at a point in the reservoir may be required instead of averagedensity over the reservoir. Estimates of annual sediment yield/sedimentation rate assessedfrom past data are further required to be suitably interpreted and where necessary, the unitrates which would apply to the future period are computed by analysing data for trends or bymaking subjective adjustments for the likely future changes. Where the contributing drainagearea is likely to be reduced by upstream future storages, only such of the projects as are underconstruction or which have the same priority of being taken up and completed as the project inquestion are considered for assessing the total sediment yield. Sediment observation data (isnecessary if the yield is being assessed from hydrometric data. If observational methods areinadequate, the possibility of large errors should be considered. For drawing conclusions fromreservoir re-surveys, it is important that reduction of at least 10 percent or more has beenobserved in the capacities of the two successive surveys; if this is not done, inaccuracies in the
successive surveys will distort the estimation of the capacity reduction between the surveys. Ifthe loss of capacity is small, useful conclusions may not be forthcoming, and in such cases,river sediment measurements with its large observational errors may still provide a betterestimate. It is essential to make a proper assessment of sediment yield for reservoir understudy taking relevant factors into account.A proper assessment of the effects of sediment transport and of the measures that maybe necessary for its control requires knowledge of the processes of sediment erosion,transportation, and deposition, and of their interaction with the hydrological processes in thecatchment.
Erosion of catchmentsThe most significant agent for eroding sediments from land isrunning water. Other agents of land erosion include wind, ice, and gravity. The processes bywhich water degrades the soil are complicated and depend upon the rainfall properties, soilproperties, land slope, vegetation, agricultural methods, and urbanization process. The last twofactors account for the most important effects of man’s activities on erosion. Empiricalequations have been developed for the determination of soil loss (sheet erosion) fromagricultural lands. One of them, developed by Musgrave for conditions prevailing in the UnitedStates , is given as an example: E = IRS1.35 l0.35 p1.75 (59.1) where E is the mean annual soilloss, in millimetres, I is the inherent erodibility of the soil, in millimetres, R is a land-coverfactor, S is the land slope, in per cent, l is the length of the slope, in metres, and p is the 30-minute, two-year rainfall depth, in millimetres. The values of the parameters I and R aredetermined empirically from regional studies.Channel erosion Channel erosion is caused by the forces of the concentrated flow ofwater. Its rate depends on the hydraulic characteristics of channel flow and on the inherenterodibility of channel materials. In non-cohesive materials, the resistance to erosion is affectedby the size, shape, and specific gravity of the particles and by the slope of the bed. In cohesivematerials it also depends on the bonding agents. The relationships between the hydraulicvariables and the parameters influencing the erodibility of channels are not fully understoodand are often expressed by empirical formulae. Stream- and river-control works may have aserious local influence on accelerating channel erosion if they cause an increase in channeldepth, flow velocity, change the direction of the flow, or reduce the natural sediment load. Thelatter effect occurs frequently below dams and may persist for many kilometres downstream.
Bare land and badlands may develop gullies with rates of advance that can be computed byempirical formulae containing such parameters as the drainage area of the gully, slope of theapproach channel, depth of rainfall, and clay content of the eroding soil .Transportation of sediments in channels Fine (suspended) sediments transported inrivers originate mainly from the topsoil of the catchment and from the banks of the channels.However, fine sediments also originate from sewage and other return flows, e.g., suchsediments comprise about onethird of the suspended-sediment load in the lower Rhine river. Alarge portion of the transported material comes to rest on flood plains especially upstreamfrom hydraulic structures. The settled material undergoes compaction and other physical andchemical changes that can sometimes prevent its re-erosion by flows that would have carriedit previously. A decrease is usually found in the mean annual sediment transported per unitarea of the catchment as the area of the catchment increases. The concentration of suspendedsediment in runoff is described by formulae such as log cs = C log Q + B (59.2) in which cs is theconcentration expressed in weight per unit volume of water, Q is the water discharge, C is adimensionless coefficient, and B is a function of the rainfall depth, of the antecedent discharge,or of other meteorological and hydrological variables. The concentration of suspendedsediment varies within the channel crosssection. It is relatively high in the lower portion andmay also be non-uniform laterally .so that its sampling at several points or along severalverticals of the cross-section is often necessary for obtaining its mean. The mean concentrationshould be evaluated to yield the total sediment weight per unit time when multiplied by thewater discharge. The graph of suspended sediment against time usually has a peak that doesnot occur simultaneously with the peak discharge. This lag is a result of the specific conditionsin a watershed, and no generalization has yet been formulated for the evaluation of thisdifference.Bed-load transportCoarse sediments (bed load) move by sliding, rolling, and bouncingalong channels and are concentrated at or near the channel bed. The variables that governtransport are the size and shape of the particles and the hydraulic properties of the flow. As aconsequence of the interaction between the hydraulic forces and the coarse sediment, thechannel bed assumes different configurations known as plane, ripples, dunes, flat, standingwaves, and antidunes. They exert resistance to the flow of water that varies within a widerange and assumes a maximum value for the dune configuration.
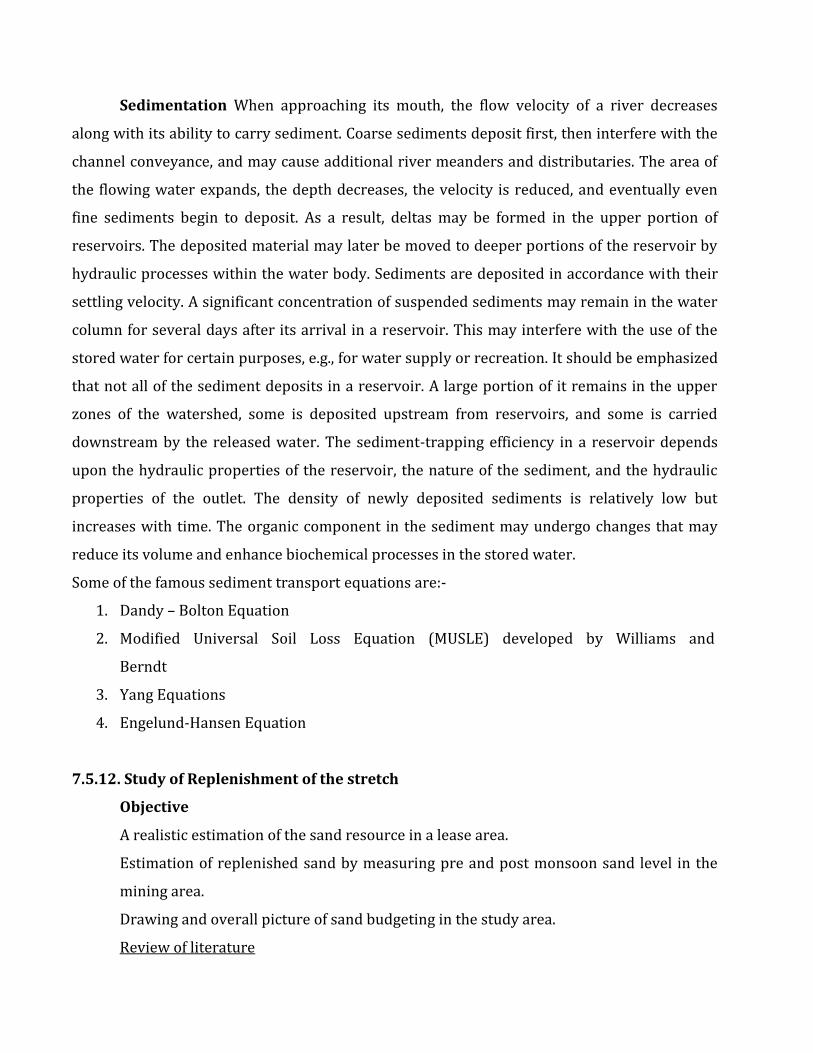
Sedimentation When approaching its mouth, the flow velocity of a river decreasesalong with its ability to carry sediment. Coarse sediments deposit first, then interfere with thechannel conveyance, and may cause additional river meanders and distributaries. The area ofthe flowing water expands, the depth decreases, the velocity is reduced, and eventually evenfine sediments begin to deposit. As a result, deltas may be formed in the upper portion ofreservoirs. The deposited material may later be moved to deeper portions of the reservoir byhydraulic processes within the water body. Sediments are deposited in accordance with theirsettling velocity. A significant concentration of suspended sediments may remain in the watercolumn for several days after its arrival in a reservoir. This may interfere with the use of thestored water for certain purposes, e.g., for water supply or recreation. It should be emphasizedthat not all of the sediment deposits in a reservoir. A large portion of it remains in the upperzones of the watershed, some is deposited upstream from reservoirs, and some is carrieddownstream by the released water. The sediment-trapping efficiency in a reservoir dependsupon the hydraulic properties of the reservoir, the nature of the sediment, and the hydraulicproperties of the outlet. The density of newly deposited sediments is relatively low butincreases with time. The organic component in the sediment may undergo changes that mayreduce its volume and enhance biochemical processes in the stored water.Some of the famous sediment transport equations are:-1. Dandy – Bolton Equation2. Modified Universal Soil Loss Equation (MUSLE) developed by Williams andBerndt3. Yang Equations4. Engelund-Hansen Equation7.5.12. Study of Replenishment of the stretch
ObjectiveA realistic estimation of the sand resource in a lease area.Estimation of replenished sand by measuring pre and post monsoon sand level in themining area.Drawing and overall picture of sand budgeting in the study area.Review of literature
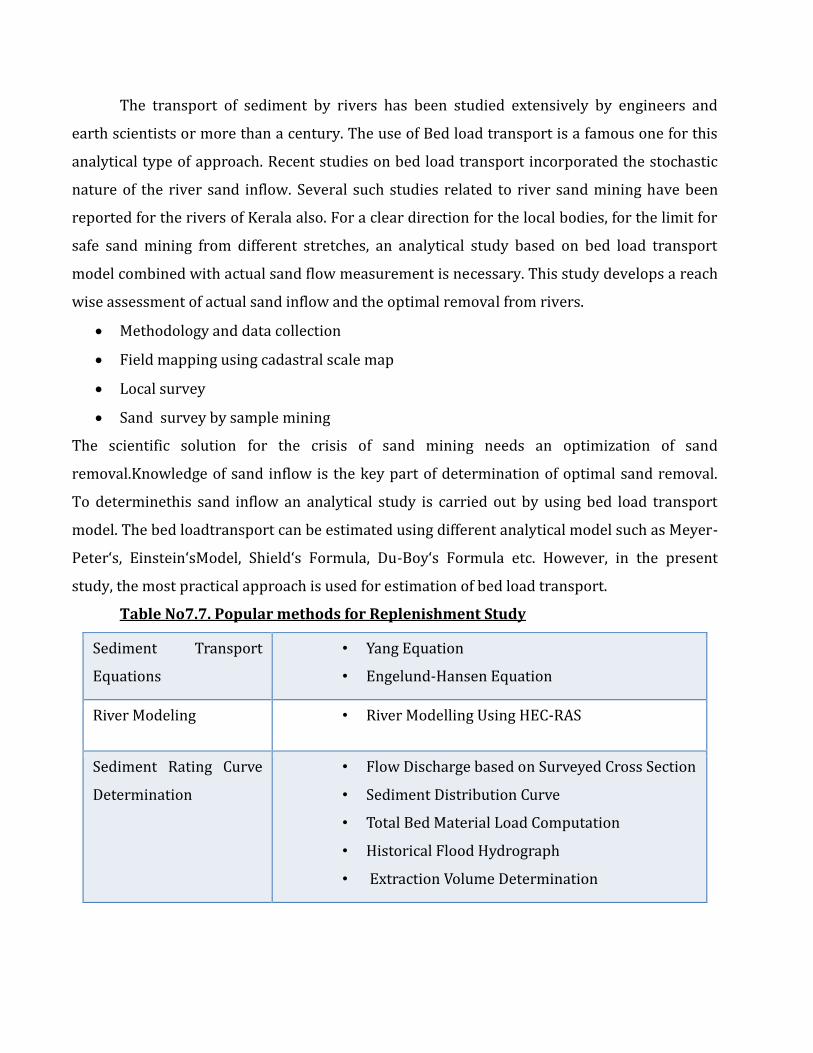
The transport of sediment by rivers has been studied extensively by engineers andearth scientists or more than a century. The use of Bed load transport is a famous one for thisanalytical type of approach. Recent studies on bed load transport incorporated the stochasticnature of the river sand inflow. Several such studies related to river sand mining have beenreported for the rivers of Kerala also. For a clear direction for the local bodies, for the limit forsafe sand mining from different stretches, an analytical study based on bed load transportmodel combined with actual sand flow measurement is necessary. This study develops a reachwise assessment of actual sand inflow and the optimal removal from rivers. Methodology and data collection Field mapping using cadastral scale map Local survey Sand survey by sample miningThe scientific solution for the crisis of sand mining needs an optimization of sandremoval.Knowledge of sand inflow is the key part of determination of optimal sand removal.To determinethis sand inflow an analytical study is carried out by using bed load transportmodel. The bed loadtransport can be estimated using different analytical model such as Meyer-Peter‘s, Einstein‘sModel, Shield‘s Formula, Du-Boy‘s Formula etc. However, in the presentstudy, the most practical approach is used for estimation of bed load transport.
Table No7.7. Popular methods for Replenishment StudySediment TransportEquations • Yang Equation• Engelund-Hansen EquationRiver Modeling • River Modelling Using HEC-RAS
Sediment Rating CurveDetermination • Flow Discharge based on Surveyed Cross Section• Sediment Distribution Curve• Total Bed Material Load Computation• Historical Flood Hydrograph• Extraction Volume Determination
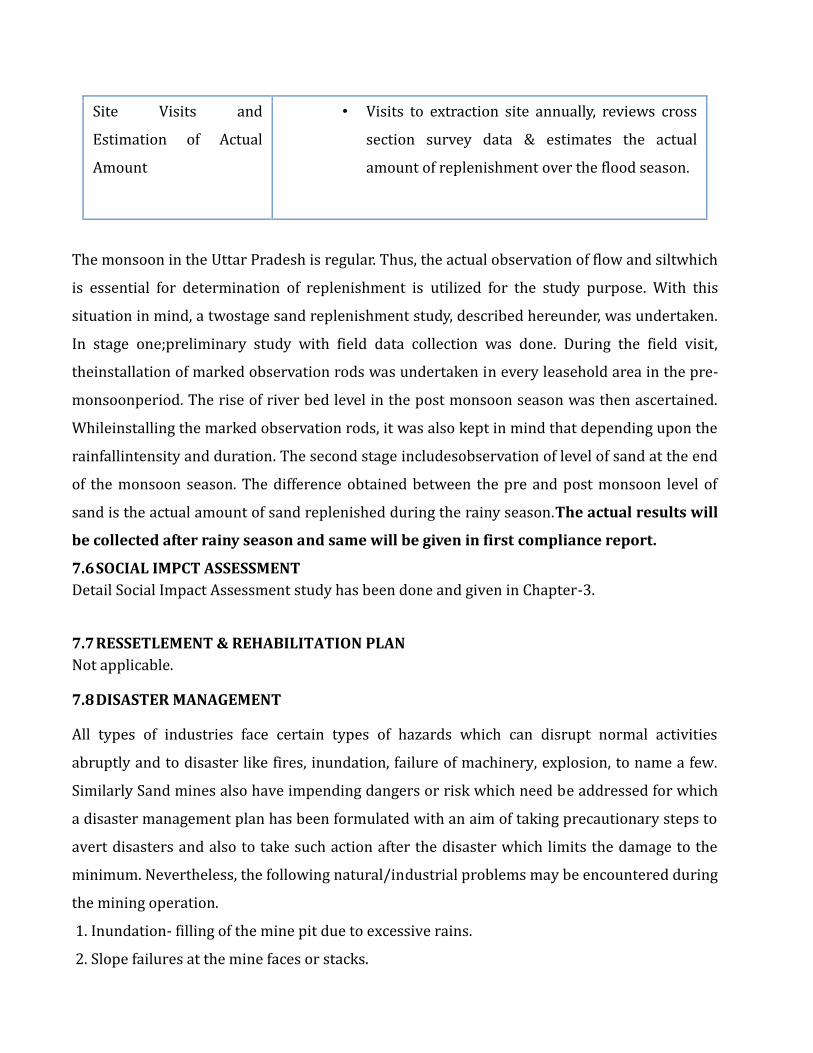
Site Visits andEstimation of ActualAmount• Visits to extraction site annually, reviews crosssection survey data & estimates the actualamount of replenishment over the flood season.
The monsoon in the Uttar Pradesh is regular. Thus, the actual observation of flow and siltwhichis essential for determination of replenishment is utilized for the study purpose. With thissituation in mind, a twostage sand replenishment study, described hereunder, was undertaken.In stage one;preliminary study with field data collection was done. During the field visit,theinstallation of marked observation rods was undertaken in every leasehold area in the pre-monsoonperiod. The rise of river bed level in the post monsoon season was then ascertained.Whileinstalling the marked observation rods, it was also kept in mind that depending upon therainfallintensity and duration. The second stage includesobservation of level of sand at the endof the monsoon season. The difference obtained between the pre and post monsoon level ofsand is the actual amount of sand replenished during the rainy season.The actual results will
be collected after rainy season and same will be given in first compliance report.
7.6SOCIAL IMPCT ASSESSMENTDetail Social Impact Assessment study has been done and given in Chapter-3.7.7RESSETLEMENT & REHABILITATION PLANNot applicable.7.8DISASTER MANAGEMENTAll types of industries face certain types of hazards which can disrupt normal activitiesabruptly and to disaster like fires, inundation, failure of machinery, explosion, to name a few.Similarly Sand mines also have impending dangers or risk which need be addressed for whicha disaster management plan has been formulated with an aim of taking precautionary steps toavert disasters and also to take such action after the disaster which limits the damage to theminimum. Nevertheless, the following natural/industrial problems may be encountered duringthe mining operation.1. Inundation- filling of the mine pit due to excessive rains.2. Slope failures at the mine faces or stacks.
3. Accident due to storage of explosive and blasting.4. Accident due to fire.As per proposal made under the mining plan, during proposed working the area will bedeveloped by means of opencast and OTFM mining method. Exploitation and transportation ofminerals are to be carried out by manual means. Water table will not be touched duringprocessed working. No high risk accidents like landslides, subsidence flood etc. have beenapprehended. But, possibility of accidental disaster is also not ruled out. Therefore, all thestatutory precautions should be taken for quick evacuation as per; the Mines Act 1952, theMines Rules 1955, MMR-1961 and MCDR-1988. There will be no storage of explosives orblasters and sae is not required in River bed Mining.7.8.1. Risk Assessment and Disaster Management PlanThe possible risks in the case of river bed mining project are bank erosion, floods, accidentsdue to transportation etc. Mining and allied activities are associated with several potentialhazards to both the employees and the public at large. A worker in a mine should be able towork under condition, which are adequately safe and healthy. At the same time, theenvironment should be such as not to impair his working efficiency. This is possible only whenthere is adequate safety in mines. Hence, safety at the mine of all the employees is taken care ofby the mining rules & regulations, which are well defined with laid down procedure for safety,which when scrupulously followed safety is ensured not only to manpower but also tomachines & working environment.Possible Risks Due To Inundation & Its ControlMining will be done during the non monsoon periods; therefore, problem of inundation isnot likely to happen.DewateringDepth of mine is limited to 3m/ water level whichever less is whereas the ground waterflows far below the bed level. Fig 3.17 in chapter 3 depicted pre and post monsoon water leveland depth of mining.Possible Risks Due To Failure Of Pit Slope & Its Control
Pit will be created of limited depth only i.e. 3 m water level whichever is less thus thechance of failure of pit slope does not exist.Possible Risks Due To Failure Of Waste Dump & Its ControlNo waste dump is created; therefore the question of failure of waste dump does not exist.Possible Risks Due To Fire & Its ControlThe operation does not anticipate any fire disaster.7.8.2 Measures to Prevent Accidents Due to Trucks and Dumpers
All transportation within mining lease working should be carried out directly under thesupervision and control of the management. The vehicles will be maintained in good condition and checked thoroughly at least once amonth by the competent person authorized for the purpose by the management. Road signs will be provided at each and every turning point up to the main road (whereverrequired). To avoid danger while reversing the equipments/ vehicles especially at the working place /loading points, stopper should be posted to properly guide reversing/ spotting operating,otherwise no person should be there within 10 m radius of machine. A statutory provision of the fences, constant education, and training etc.will go a long wayin reducing the incidents of such accidents.7.8.3. Other Possible Measures to Avoid Risks/ Disaster Due to River Bed Mining. Unwanted material including mineral or spillage (if any) should not be stacked on thebanks as it will hinder the flow of water in monsoon season. Mining of minerals / working shall be started from the centre from dip to rise and thenlaterally in 0.6 Meter slice so that the river course could not get affected. The minerals will be mined out in a uniform way so that the river flow/ course shall not getdisturbed. River banks will not be excavated to from access ramps. Only excavated river gravel shouldbe used to deposit against the river bank to form access ramps.
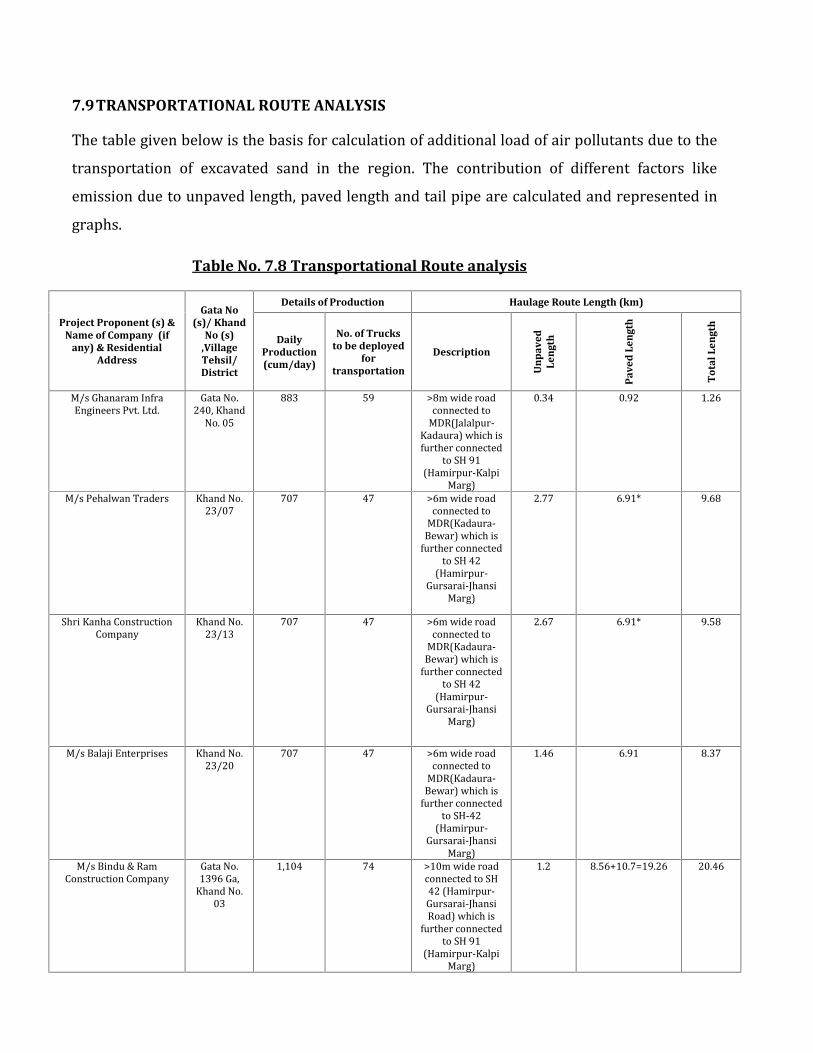
7.9TRANSPORTATIONAL ROUTE ANALYSISThe table given below is the basis for calculation of additional load of air pollutants due to thetransportation of excavated sand in the region. The contribution of different factors likeemission due to unpaved length, paved length and tail pipe are calculated and represented ingraphs.Table No. 7.8 Transportational Route analysis
Project Proponent (s) &Name of Company (if
any) & ResidentialAddress
Gata No(s)/ Khand
No (s),VillageTehsil/District
Details of Production Haulage Route Length (km)
DailyProduction(cum/day)
No. of Trucksto be deployed
fortransportation
Description
Un
pav
edLe
ngt
h
Pav
ed L
engt
h
Tot
al L
engt
h
M/s Ghanaram InfraEngineers Pvt. Ltd. Gata No.240, KhandNo. 05 883 59 >8m wide roadconnected toMDR(Jalalpur-Kadaura) which isfurther connectedto SH 91(Hamirpur-KalpiMarg)
0.34 0.92 1.26
M/s Pehalwan Traders Khand No.23/07 707 47 >6m wide roadconnected toMDR(Kadaura-Bewar) which isfurther connectedto SH 42(Hamirpur-Gursarai-JhansiMarg)
2.77 6.91* 9.68
Shri Kanha ConstructionCompany Khand No.23/13 707 47 >6m wide roadconnected toMDR(Kadaura-Bewar) which isfurther connectedto SH 42(Hamirpur-Gursarai-JhansiMarg)
2.67 6.91* 9.58
M/s Balaji Enterprises Khand No.23/20 707 47 >6m wide roadconnected toMDR(Kadaura-Bewar) which isfurther connectedto SH-42(Hamirpur-Gursarai-JhansiMarg)
1.46 6.91 8.37
M/s Bindu & RamConstruction Company Gata No.1396 Ga,Khand No.031,104 74 >10m wide roadconnected to SH42 (Hamirpur-Gursarai-JhansiRoad) which isfurther connectedto SH 91(Hamirpur-KalpiMarg)
1.2 8.56+10.7=19.26 20.46
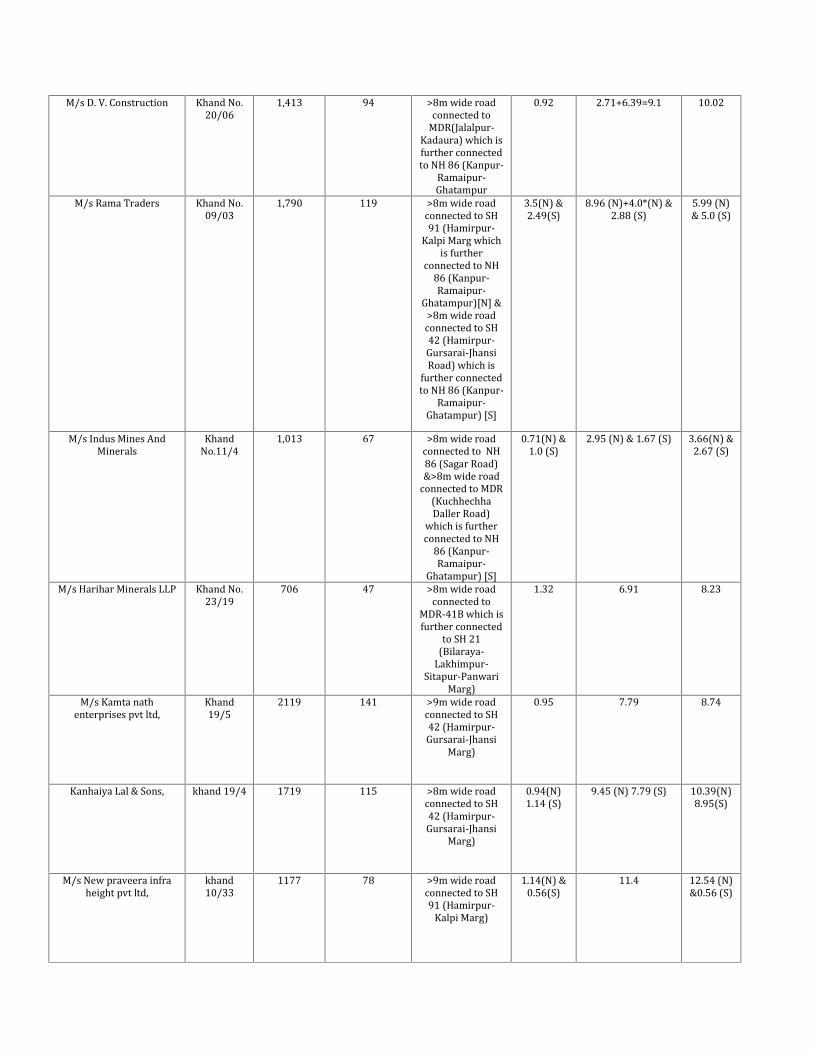
M/s D. V. Construction Khand No.20/06 1,413 94 >8m wide roadconnected toMDR(Jalalpur-Kadaura) which isfurther connectedto NH 86 (Kanpur-Ramaipur-Ghatampur
0.92 2.71+6.39=9.1 10.02
M/s Rama Traders Khand No.09/03 1,790 119 >8m wide roadconnected to SH91 (Hamirpur-Kalpi Marg whichis furtherconnected to NH86 (Kanpur-Ramaipur-Ghatampur)[N] &>8m wide roadconnected to SH42 (Hamirpur-Gursarai-JhansiRoad) which isfurther connectedto NH 86 (Kanpur-Ramaipur-Ghatampur) [S]
3.5(N) &2.49(S) 8.96 (N)+4.0*(N) &2.88 (S) 5.99 (N)& 5.0 (S)
M/s Indus Mines AndMinerals KhandNo.11/4 1,013 67 >8m wide roadconnected to NH86 (Sagar Road)&>8m wide roadconnected to MDR(KuchhechhaDaller Road)which is furtherconnected to NH86 (Kanpur-Ramaipur-Ghatampur) [S]
0.71(N) &1.0 (S) 2.95 (N) & 1.67 (S) 3.66(N) &2.67 (S)
M/s Harihar Minerals LLP Khand No.23/19 706 47 >8m wide roadconnected toMDR-41B which isfurther connectedto SH 21(Bilaraya-Lakhimpur-Sitapur-PanwariMarg)
1.32 6.91 8.23
M/s Kamta nathenterprises pvt ltd, Khand19/5 2119 141 >9m wide roadconnected to SH42 (Hamirpur-Gursarai-JhansiMarg)0.95 7.79 8.74
Kanhaiya Lal & Sons, khand 19/4 1719 115 >8m wide roadconnected to SH42 (Hamirpur-Gursarai-JhansiMarg)0.94(N)1.14 (S) 9.45 (N) 7.79 (S) 10.39(N)8.95(S)
M/s New praveera infraheight pvt ltd, khand10/33 1177 78 >9m wide roadconnected to SH91 (Hamirpur-Kalpi Marg)1.14(N) &0.56(S) 11.4 12.54 (N)&0.56 (S)
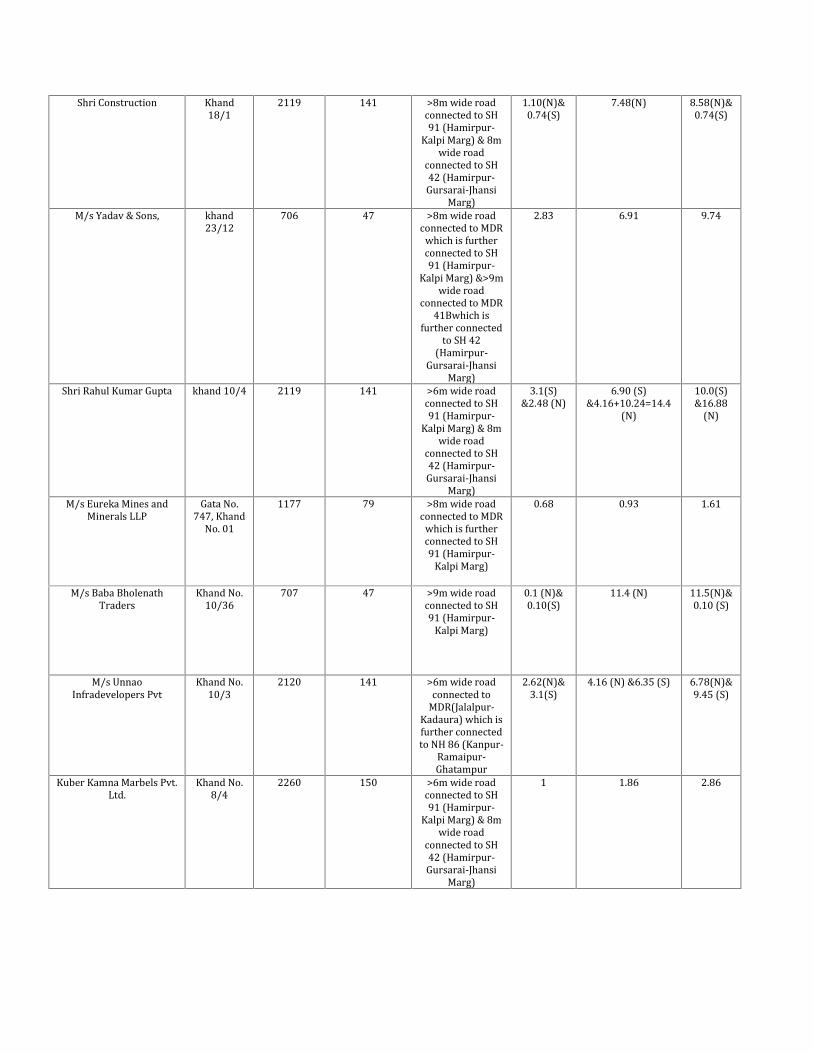
Shri Construction Khand18/1 2119 141 >8m wide roadconnected to SH91 (Hamirpur-Kalpi Marg) & 8mwide roadconnected to SH42 (Hamirpur-Gursarai-JhansiMarg)
1.10(N)&0.74(S) 7.48(N) 8.58(N)&0.74(S)
M/s Yadav & Sons, khand23/12 706 47 >8m wide roadconnected to MDRwhich is furtherconnected to SH91 (Hamirpur-Kalpi Marg) &>9mwide roadconnected to MDR41Bwhich isfurther connectedto SH 42(Hamirpur-Gursarai-JhansiMarg)
2.83 6.91 9.74
Shri Rahul Kumar Gupta khand 10/4 2119 141 >6m wide roadconnected to SH91 (Hamirpur-Kalpi Marg) & 8mwide roadconnected to SH42 (Hamirpur-Gursarai-JhansiMarg)
3.1(S)&2.48 (N) 6.90 (S)&4.16+10.24=14.4(N) 10.0(S)&16.88(N)
M/s Eureka Mines andMinerals LLP Gata No.747, KhandNo. 01 1177 79 >8m wide roadconnected to MDRwhich is furtherconnected to SH91 (Hamirpur-Kalpi Marg)0.68 0.93 1.61
M/s Baba BholenathTraders Khand No.10/36 707 47 >9m wide roadconnected to SH91 (Hamirpur-Kalpi Marg)0.1 (N)&0.10(S) 11.4 (N) 11.5(N)&0.10 (S)
M/s UnnaoInfradevelopers Pvt Khand No.10/3 2120 141 >6m wide roadconnected toMDR(Jalalpur-Kadaura) which isfurther connectedto NH 86 (Kanpur-Ramaipur-Ghatampur
2.62(N)&3.1(S) 4.16 (N) &6.35 (S) 6.78(N)&9.45 (S)
Kuber Kamna Marbels Pvt.Ltd. Khand No.8/4 2260 150 >6m wide roadconnected to SH91 (Hamirpur-Kalpi Marg) & 8mwide roadconnected to SH42 (Hamirpur-Gursarai-JhansiMarg)
1 1.86 2.86

Shri Shailendra Yadav Khand No.10/2 2119 141 >6m wide roadconnected to SH42(Hamirpur-Gursarai-JhansiMarg) which isfurther connectedto NH 86 (Kanpur-Ramaipur-Ghatampur
3.0(W) &2.66(S) 4.16(W) & 6.91(S) 5.26(W)& 9.57(S)
M/s Kaushalya ChaubeContractor Khand No.17/5 530 35 >8m wide roadconnected to SH91 (Hamirpur-Kalpi Marg)(N) &SH 42(Hamirpur-Gursarai-JhansiMarg)
0.70(N) &0.59 (S) 1.20 (S) 0.70(N) &1.79(S)
Total B1 Lease= 21
27372 1822 51.85 190.27 224.61
Shri Suresh ChandraGupta Gata No.596, KhandNo. 01 883 59 >8m wide roadconnected to MDRwhich is furtherconnected to SH91 (Hamirpur-Kalpi Marg)1.6 1.29 2.89
M/s Sharad Enterprises Gata No.240, KhandNo. 02 1,104 74 >7m wide roadconnected to MDRwhich is furtherconnected to SH91 (Hamirpur-Kalpi Marg)0.28 0.17 0.45
M/s Chaudhary Traders Khand No.23/08 1,413 94 >8m wide roadconnected to MDRwhich is furtherconnected to SH91 (Hamirpur-Kalpi Marg)2.94 6.91 9.85
M/s Maa RaktdantikaContractors And SuppliersPvt. Ltd. Gata No.1396 Ga,Khand No.051,104 73 >7m wide roadconnected to MDRwhich is furtherconnected to SH91 (Hamirpur-Kalpi Marg)
2.13 19.26 (8.56 forloaded truck & 10.7for empty truck) 21.39
M/s Silverr Mist RetailPrivate Limited Khand No.23/30 707 47 >8m wide roadconnected toMDR(Lahara-Kadaura Road)which is furtherconnected to SH91 (Hamirpur-Kalpi Marg)
2.20(N) &0.96(S) 14.0 (N) 16.20 (N)& 0.96(S)
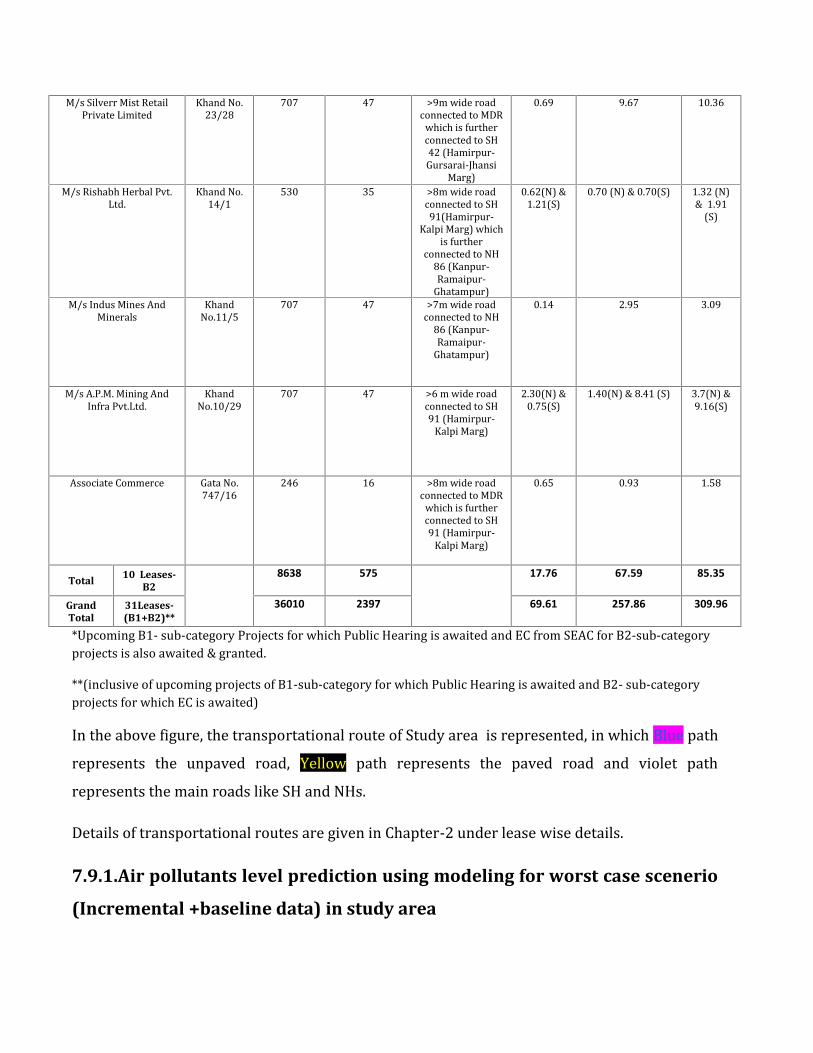
M/s Silverr Mist RetailPrivate Limited Khand No.23/28 707 47 >9m wide roadconnected to MDRwhich is furtherconnected to SH42 (Hamirpur-Gursarai-JhansiMarg)
0.69 9.67 10.36
M/s Rishabh Herbal Pvt.Ltd. Khand No.14/1 530 35 >8m wide roadconnected to SH91(Hamirpur-Kalpi Marg) whichis furtherconnected to NH86 (Kanpur-Ramaipur-Ghatampur)
0.62(N) &1.21(S) 0.70 (N) & 0.70(S) 1.32 (N)& 1.91(S)
M/s Indus Mines AndMinerals KhandNo.11/5 707 47 >7m wide roadconnected to NH86 (Kanpur-Ramaipur-Ghatampur)0.14 2.95 3.09
M/s A.P.M. Mining AndInfra Pvt.Ltd. KhandNo.10/29 707 47 >6 m wide roadconnected to SH91 (Hamirpur-Kalpi Marg)2.30(N) &0.75(S) 1.40(N) & 8.41 (S) 3.7(N) &9.16(S)
Associate Commerce Gata No.747/16 246 16 >8m wide roadconnected to MDRwhich is furtherconnected to SH91 (Hamirpur-Kalpi Marg)0.65 0.93 1.58
Total 10 Leases-B2
8638 575 17.76 67.59 85.35
GrandTotal
31Leases-(B1+B2)**
36010 2397 69.61 257.86 309.96*Upcoming B1- sub-category Projects for which Public Hearing is awaited and EC from SEAC for B2-sub-categoryprojects is also awaited & granted.**(inclusive of upcoming projects of B1-sub-category for which Public Hearing is awaited and B2- sub-categoryprojects for which EC is awaited)In the above figure, the transportational route of Study area is represented, in which Blue pathrepresents the unpaved road, Yellow path represents the paved road and violet pathrepresents the main roads like SH and NHs.Details of transportational routes are given in Chapter-2 under lease wise details.7.9.1.Air pollutants level prediction using modeling for worst case scenerio
(Incremental +baseline data) in study area
Additional emission load of air pollutant emission from heavy vehicles using
sand/morrum transportation in sand mining project surrounding, Betwa River District
Jalaun/ HamirpurSand/morrum mining minerals have been transported through roads using motor vehicles.Motor vehicles have been producing various air pollutants through exhaust such as PM, CO,NO2, and SO2. Dusts are also released from vehicle tires while play on unpaved (haulage road)and paved road. This dust is well known as suspended dust.The ambient air quality might get degraded of sand/morrum mining project site surroundingsfrom vehicular emissions through transportation of sand/morrum. Vehicular emissions andresuspension of road dust which may lead to respirable diseases of human beings at projectsites and surroundings. The emission load contribution at the receptor sites in atmospheredepends upon multitude of factors such as local meteorology, location, height of release andatmospheric removal processes.The incremental air pollutant level for worst case scenerio was predicted using modeling instudy area. The methods have been discussed in the next section.MethodologyAir Quality Modeling is a method used to predict air quality in study area for sand/morrum.The emission factor one of input parameter for modeling. The emission factor of vehicles hastaken from “The Automotive Research Association of India (ARAI)”, Pune (ARAI, 2016). Theheavy vehicle populations have been count daily movements up and down trip fortransportation of sand/morrum. Emission factor from paved and unpaved road has beencalculated using USEPA AP-42 method. Air quality modeling was done using line source modelas published by USEPA for transportation through roads and the empirical emission factorequations from article, “Emission Factor Equations for Haul roads: The Indian Perspective”(Singh et al., 2006). Concentration of the fugitive dust was calculated by using empiricalequations for unpaved roads. Gaussian plume a model has been predicted the downwind airpollutants (CO, SO2, NO2, and Particulates) concentrations from line source through exhaust(Goyal, P. 2007; Demirarslan et al. 2017).

Air Quality Index (AQI) is a tool for effective communication of air quality status to people interms, which are easy to understand. It transforms complex air quality data of variouspollutants into a single number (index value), nomenclature and colour. There are six AQIcategories, namely Good, Satisfactory, Moderately polluted, Poor, Very Poor, and Severe. Eachof these categories is decided based on ambient concentration values of air pollutants andtheir likely health impacts (known as health breakpoints) (CPCB 2014). AQI range is alsoassociated with possible health impacts and presented in Table 1 as prescribed by CPCB, 2014.Air pollutants concentration and air quality index (AQI) has been plotted using GIS tool. GISmapping was done in this study using spatial interpolation technique by inverse distanceweighted (IDW) (Jha et al., 2011; Wong et al. 2004). Contour map was also plotted usingArcGIS tool for distribution of air pollutants and AQI value in the study area.Table No. 7.9. AQI category, ranges and their associated health impacts (Source: CPCB,
2014)
AQI ColorCode Associated Health ImpactsGood (0-50) Minimal ImpactSatisfactory(51-100) May cause minor breathing discomfort to sensitive peopleModeratelypolluted(101-200)
May cause breathing discomfort to the people with lung disease suchas asthma and discomfort to people with heart disease, children andolder adultsPoor(201-300) May cause breathing discomfort to people on prolonged exposure anddiscomfort to people with heart diseaseVery poor(301-400) May cause respiratory illness to the people on prolonged exposure.The effect may be more pronounced in people with lung and heartdiseases
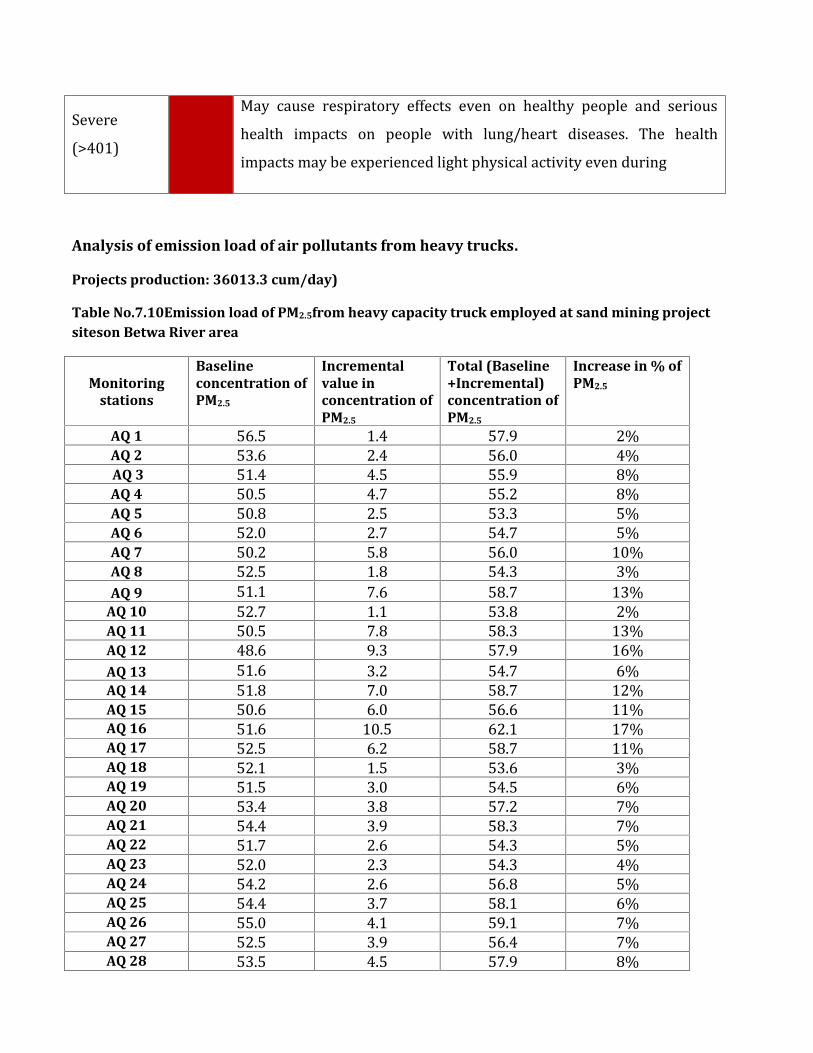
Severe(>401) May cause respiratory effects even on healthy people and serioushealth impacts on people with lung/heart diseases. The healthimpacts may be experienced light physical activity even duringAnalysis of emission load of air pollutants from heavy trucks.
Projects production: 36013.3 cum/day)
Table No.7.10Emission load of PM2.5from heavy capacity truck employed at sand mining projectsiteson Betwa River area
Monitoringstations
Baselineconcentration ofPM2.5
Incrementalvalue inconcentration ofPM2.5
Total (Baseline+Incremental)concentration ofPM2.5
Increase in % ofPM2.5
AQ 1 56.5 1.4 57.9 2%AQ 2 53.6 2.4 56.0 4%AQ 3 51.4 4.5 55.9 8%AQ 4 50.5 4.7 55.2 8%AQ 5 50.8 2.5 53.3 5%AQ 6 52.0 2.7 54.7 5%AQ 7 50.2 5.8 56.0 10%AQ 8 52.5 1.8 54.3 3%AQ 9 51.1 7.6 58.7 13%
AQ 10 52.7 1.1 53.8 2%AQ 11 50.5 7.8 58.3 13%AQ 12 48.6 9.3 57.9 16%AQ 13 51.6 3.2 54.7 6%AQ 14 51.8 7.0 58.7 12%AQ 15 50.6 6.0 56.6 11%AQ 16 51.6 10.5 62.1 17%AQ 17 52.5 6.2 58.7 11%AQ 18 52.1 1.5 53.6 3%AQ 19 51.5 3.0 54.5 6%AQ 20 53.4 3.8 57.2 7%AQ 21 54.4 3.9 58.3 7%AQ 22 51.7 2.6 54.3 5%AQ 23 52.0 2.3 54.3 4%AQ 24 54.2 2.6 56.8 5%AQ 25 54.4 3.7 58.1 6%AQ 26 55.0 4.1 59.1 7%AQ 27 52.5 3.9 56.4 7%AQ 28 53.5 4.5 57.9 8%
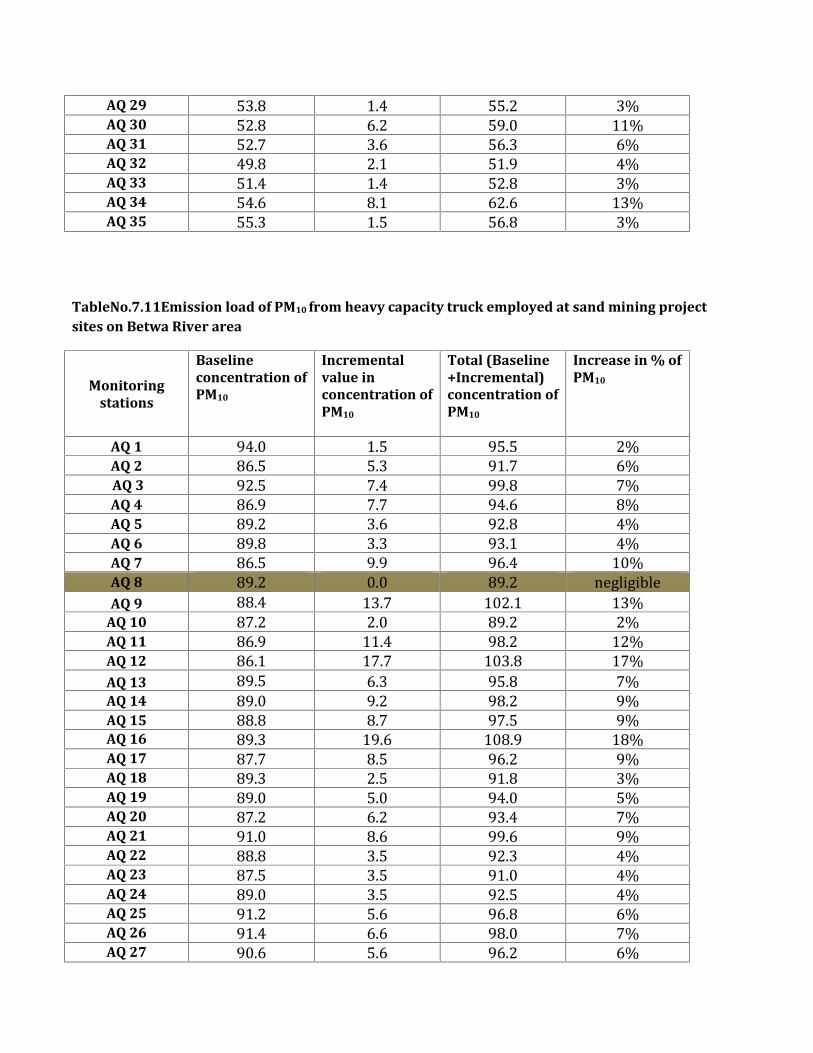
AQ 29 53.8 1.4 55.2 3%AQ 30 52.8 6.2 59.0 11%AQ 31 52.7 3.6 56.3 6%AQ 32 49.8 2.1 51.9 4%AQ 33 51.4 1.4 52.8 3%AQ 34 54.6 8.1 62.6 13%AQ 35 55.3 1.5 56.8 3%
TableNo.7.11Emission load of PM10 from heavy capacity truck employed at sand mining projectsites on Betwa River area
Monitoringstations
Baselineconcentration ofPM10
Incrementalvalue inconcentration ofPM10
Total (Baseline+Incremental)concentration ofPM10
Increase in % ofPM10
AQ 1 94.0 1.5 95.5 2%AQ 2 86.5 5.3 91.7 6%AQ 3 92.5 7.4 99.8 7%AQ 4 86.9 7.7 94.6 8%AQ 5 89.2 3.6 92.8 4%AQ 6 89.8 3.3 93.1 4%AQ 7 86.5 9.9 96.4 10%AQ 8 89.2 0.0 89.2 negligibleAQ 9 88.4 13.7 102.1 13%
AQ 10 87.2 2.0 89.2 2%AQ 11 86.9 11.4 98.2 12%AQ 12 86.1 17.7 103.8 17%AQ 13 89.5 6.3 95.8 7%AQ 14 89.0 9.2 98.2 9%AQ 15 88.8 8.7 97.5 9%AQ 16 89.3 19.6 108.9 18%AQ 17 87.7 8.5 96.2 9%AQ 18 89.3 2.5 91.8 3%AQ 19 89.0 5.0 94.0 5%AQ 20 87.2 6.2 93.4 7%AQ 21 91.0 8.6 99.6 9%AQ 22 88.8 3.5 92.3 4%AQ 23 87.5 3.5 91.0 4%AQ 24 89.0 3.5 92.5 4%AQ 25 91.2 5.6 96.8 6%AQ 26 91.4 6.6 98.0 7%AQ 27 90.6 5.6 96.2 6%
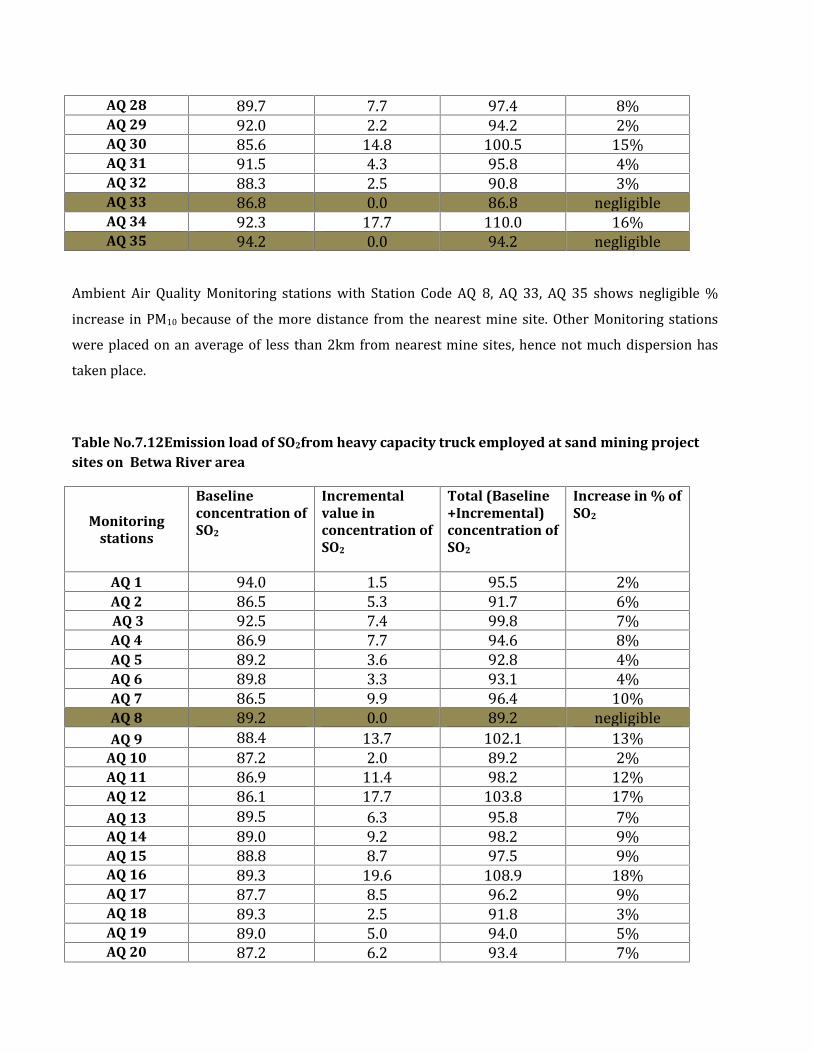
AQ 28 89.7 7.7 97.4 8%AQ 29 92.0 2.2 94.2 2%AQ 30 85.6 14.8 100.5 15%AQ 31 91.5 4.3 95.8 4%AQ 32 88.3 2.5 90.8 3%AQ 33 86.8 0.0 86.8 negligibleAQ 34 92.3 17.7 110.0 16%AQ 35 94.2 0.0 94.2 negligible
Ambient Air Quality Monitoring stations with Station Code AQ 8, AQ 33, AQ 35 shows negligible %increase in PM10 because of the more distance from the nearest mine site. Other Monitoring stationswere placed on an average of less than 2km from nearest mine sites, hence not much dispersion hastaken place.Table No.7.12Emission load of SO2from heavy capacity truck employed at sand mining projectsites on Betwa River area
Monitoringstations
Baselineconcentration ofSO2
Incrementalvalue inconcentration ofSO2
Total (Baseline+Incremental)concentration ofSO2
Increase in % ofSO2
AQ 1 94.0 1.5 95.5 2%AQ 2 86.5 5.3 91.7 6%AQ 3 92.5 7.4 99.8 7%AQ 4 86.9 7.7 94.6 8%AQ 5 89.2 3.6 92.8 4%AQ 6 89.8 3.3 93.1 4%AQ 7 86.5 9.9 96.4 10%AQ 8 89.2 0.0 89.2 negligibleAQ 9 88.4 13.7 102.1 13%
AQ 10 87.2 2.0 89.2 2%AQ 11 86.9 11.4 98.2 12%AQ 12 86.1 17.7 103.8 17%AQ 13 89.5 6.3 95.8 7%AQ 14 89.0 9.2 98.2 9%AQ 15 88.8 8.7 97.5 9%AQ 16 89.3 19.6 108.9 18%AQ 17 87.7 8.5 96.2 9%AQ 18 89.3 2.5 91.8 3%AQ 19 89.0 5.0 94.0 5%AQ 20 87.2 6.2 93.4 7%
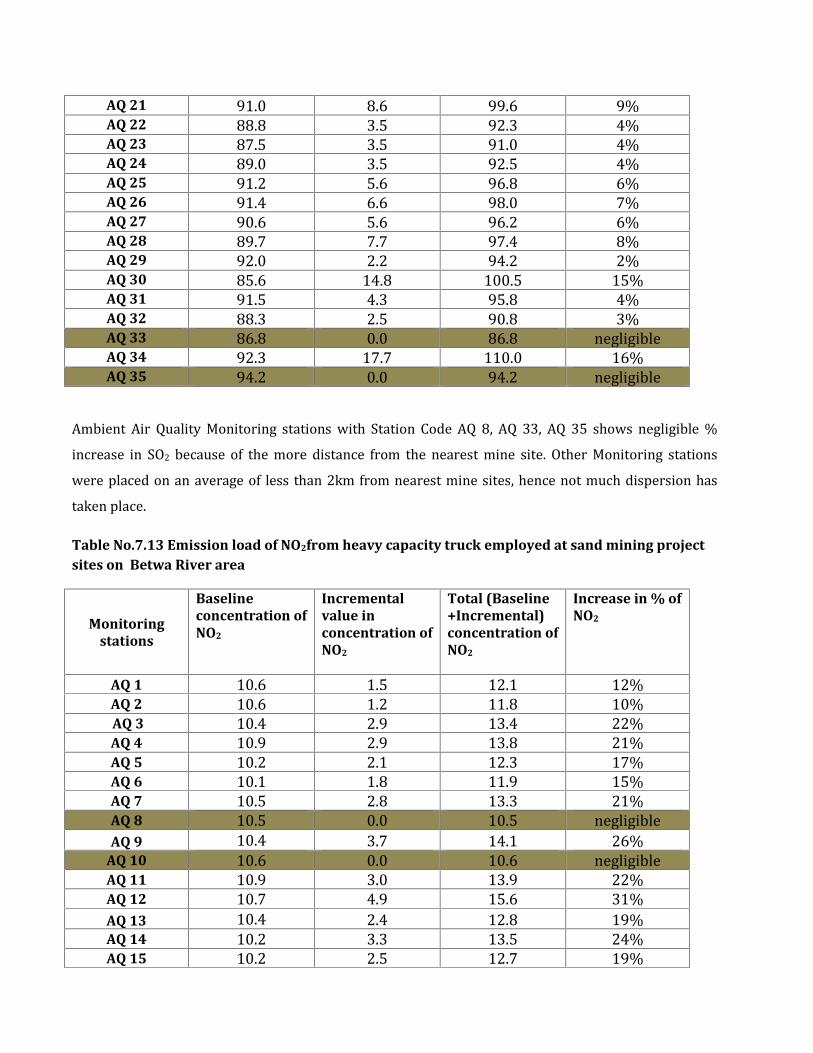
AQ 21 91.0 8.6 99.6 9%AQ 22 88.8 3.5 92.3 4%AQ 23 87.5 3.5 91.0 4%AQ 24 89.0 3.5 92.5 4%AQ 25 91.2 5.6 96.8 6%AQ 26 91.4 6.6 98.0 7%AQ 27 90.6 5.6 96.2 6%AQ 28 89.7 7.7 97.4 8%AQ 29 92.0 2.2 94.2 2%AQ 30 85.6 14.8 100.5 15%AQ 31 91.5 4.3 95.8 4%AQ 32 88.3 2.5 90.8 3%AQ 33 86.8 0.0 86.8 negligibleAQ 34 92.3 17.7 110.0 16%AQ 35 94.2 0.0 94.2 negligible
Ambient Air Quality Monitoring stations with Station Code AQ 8, AQ 33, AQ 35 shows negligible %increase in SO2 because of the more distance from the nearest mine site. Other Monitoring stationswere placed on an average of less than 2km from nearest mine sites, hence not much dispersion hastaken place.Table No.7.13 Emission load of NO2from heavy capacity truck employed at sand mining projectsites on Betwa River area
Monitoringstations
Baselineconcentration ofNO2
Incrementalvalue inconcentration ofNO2
Total (Baseline+Incremental)concentration ofNO2
Increase in % ofNO2
AQ 1 10.6 1.5 12.1 12%AQ 2 10.6 1.2 11.8 10%AQ 3 10.4 2.9 13.4 22%AQ 4 10.9 2.9 13.8 21%AQ 5 10.2 2.1 12.3 17%AQ 6 10.1 1.8 11.9 15%AQ 7 10.5 2.8 13.3 21%AQ 8 10.5 0.0 10.5 negligibleAQ 9 10.4 3.7 14.1 26%
AQ 10 10.6 0.0 10.6 negligibleAQ 11 10.9 3.0 13.9 22%AQ 12 10.7 4.9 15.6 31%AQ 13 10.4 2.4 12.8 19%AQ 14 10.2 3.3 13.5 24%AQ 15 10.2 2.5 12.7 19%

AQ 16 10.6 5.8 16.4 36%AQ 17 10.4 2.5 12.9 20%AQ 18 10.2 0.0 10.2 negligibleAQ 19 9.9 2.1 12.0 17%AQ 20 10.6 2.1 12.7 16%AQ 21 10.5 2.1 12.6 16%AQ 22 10.2 2.1 12.3 17%AQ 23 10.4 2.1 12.5 17%AQ 24 10.2 2.3 12.5 18%AQ 25 10.2 2.9 13.2 22%AQ 26 10.3 2.9 13.3 22%AQ 27 10.9 2.9 13.9 21%AQ 28 10.6 2.5 13.1 19%AQ 29 10.8 0.0 10.8 negligibleAQ 30 10.4 4.4 14.8 30%AQ 31 10.3 2.3 12.5 18%AQ 32 10.0 2.0 12.1 17%AQ 33 10.4 0.0 10.4 negligibleAQ 34 11.0 3.3 14.3 23%AQ 35 11.2 0.0 11.2 negligible
Ambient Air Quality Monitoring stations with Station Code AQ 8, AQ 10, AQ 18, AQ 29, AQ 33& AQ 35shows negligible % increase in NO2 because of the more distance from the nearest mine site. Othermonitoring stations showing varied incremental percentage depending upon the distance ofmonitoring stations from the pollution sources causing less dispersion of the pollutants.Table No. 7.14 Emission load of COfrom heavy capacity truck employed at sand mining projectsites on Betwa River area
Monitoringstations
Baseline Airpollutantsconcentration
Incrementalvalue of Airpollutantsconcentration
Total Airpollutantsconcentration
AQ 1 BDL 0.02 0.02AQ 2 BDL 0.08 0.08AQ 3 BDL 0.04 0.04AQ 4 BDL 0.08 0.08AQ 5 BDL 0.01 0.01AQ 6 BDL 0.00 negligibleAQ 7 BDL 0.08 0.08AQ 8 BDL 0.00 negligibleAQ 9 BDL 0.04 0.04
AQ 10 BDL 0.00 negligibleAQ 11 BDL 0.16 0.16
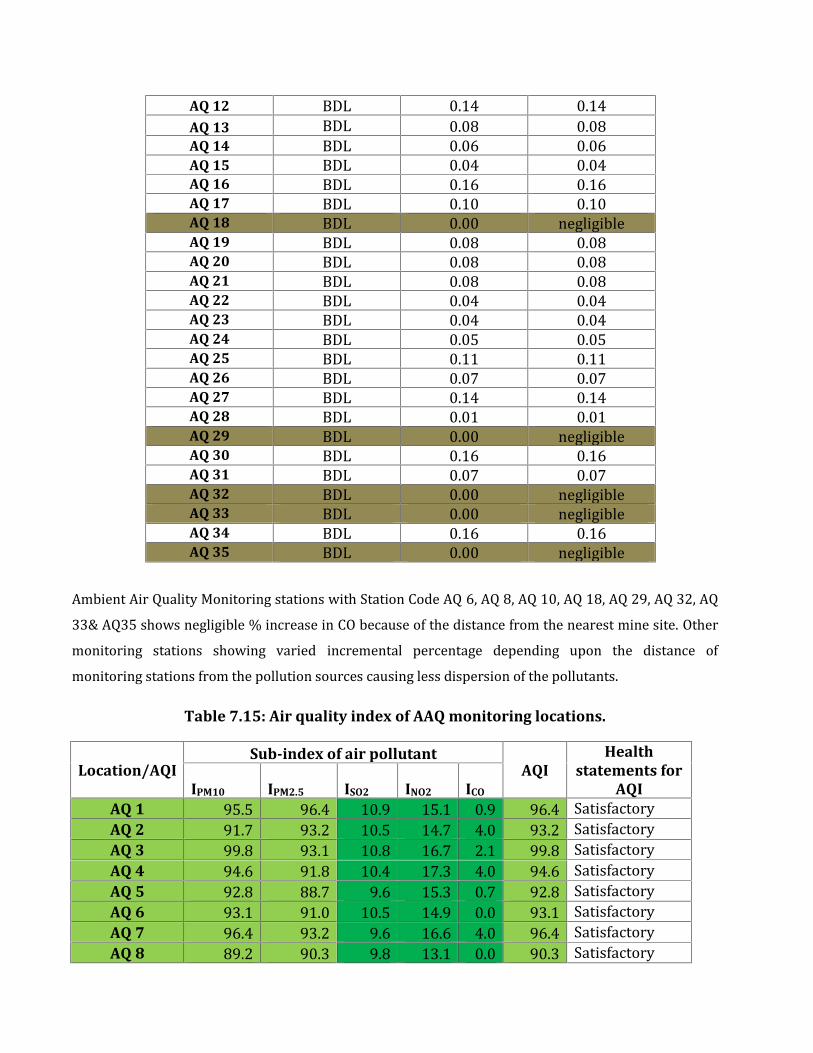
AQ 12 BDL 0.14 0.14AQ 13 BDL 0.08 0.08AQ 14 BDL 0.06 0.06AQ 15 BDL 0.04 0.04AQ 16 BDL 0.16 0.16AQ 17 BDL 0.10 0.10AQ 18 BDL 0.00 negligibleAQ 19 BDL 0.08 0.08AQ 20 BDL 0.08 0.08AQ 21 BDL 0.08 0.08AQ 22 BDL 0.04 0.04AQ 23 BDL 0.04 0.04AQ 24 BDL 0.05 0.05AQ 25 BDL 0.11 0.11AQ 26 BDL 0.07 0.07AQ 27 BDL 0.14 0.14AQ 28 BDL 0.01 0.01AQ 29 BDL 0.00 negligibleAQ 30 BDL 0.16 0.16AQ 31 BDL 0.07 0.07AQ 32 BDL 0.00 negligibleAQ 33 BDL 0.00 negligibleAQ 34 BDL 0.16 0.16AQ 35 BDL 0.00 negligible
Ambient Air Quality Monitoring stations with Station Code AQ 6, AQ 8, AQ 10, AQ 18, AQ 29, AQ 32, AQ33& AQ35 shows negligible % increase in CO because of the distance from the nearest mine site. Othermonitoring stations showing varied incremental percentage depending upon the distance ofmonitoring stations from the pollution sources causing less dispersion of the pollutants.Table 7.15: Air quality index of AAQ monitoring locations.
Location/AQISub-index of air pollutant
AQIHealth
statements forAQIIPM10 IPM2.5 ISO2 INO2 ICO
AQ 1 95.5 96.4 10.9 15.1 0.9 96.4 SatisfactoryAQ 2 91.7 93.2 10.5 14.7 4.0 93.2 SatisfactoryAQ 3 99.8 93.1 10.8 16.7 2.1 99.8 SatisfactoryAQ 4 94.6 91.8 10.4 17.3 4.0 94.6 SatisfactoryAQ 5 92.8 88.7 9.6 15.3 0.7 92.8 SatisfactoryAQ 6 93.1 91.0 10.5 14.9 0.0 93.1 SatisfactoryAQ 7 96.4 93.2 9.6 16.6 4.0 96.4 SatisfactoryAQ 8 89.2 90.3 9.8 13.1 0.0 90.3 Satisfactory
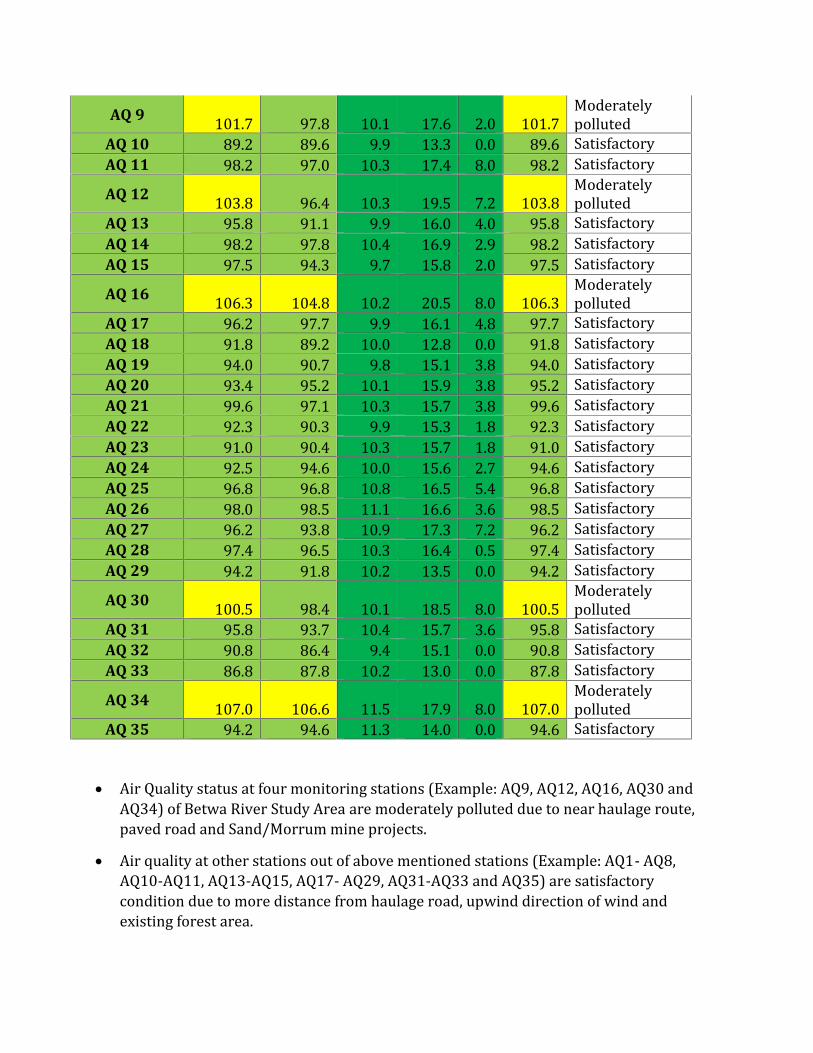
AQ 9 101.7 97.8 10.1 17.6 2.0 101.7 ModeratelypollutedAQ 10 89.2 89.6 9.9 13.3 0.0 89.6 SatisfactoryAQ 11 98.2 97.0 10.3 17.4 8.0 98.2 SatisfactoryAQ 12 103.8 96.4 10.3 19.5 7.2 103.8 ModeratelypollutedAQ 13 95.8 91.1 9.9 16.0 4.0 95.8 SatisfactoryAQ 14 98.2 97.8 10.4 16.9 2.9 98.2 SatisfactoryAQ 15 97.5 94.3 9.7 15.8 2.0 97.5 SatisfactoryAQ 16 106.3 104.8 10.2 20.5 8.0 106.3 ModeratelypollutedAQ 17 96.2 97.7 9.9 16.1 4.8 97.7 SatisfactoryAQ 18 91.8 89.2 10.0 12.8 0.0 91.8 SatisfactoryAQ 19 94.0 90.7 9.8 15.1 3.8 94.0 SatisfactoryAQ 20 93.4 95.2 10.1 15.9 3.8 95.2 SatisfactoryAQ 21 99.6 97.1 10.3 15.7 3.8 99.6 SatisfactoryAQ 22 92.3 90.3 9.9 15.3 1.8 92.3 SatisfactoryAQ 23 91.0 90.4 10.3 15.7 1.8 91.0 SatisfactoryAQ 24 92.5 94.6 10.0 15.6 2.7 94.6 SatisfactoryAQ 25 96.8 96.8 10.8 16.5 5.4 96.8 SatisfactoryAQ 26 98.0 98.5 11.1 16.6 3.6 98.5 SatisfactoryAQ 27 96.2 93.8 10.9 17.3 7.2 96.2 SatisfactoryAQ 28 97.4 96.5 10.3 16.4 0.5 97.4 SatisfactoryAQ 29 94.2 91.8 10.2 13.5 0.0 94.2 SatisfactoryAQ 30 100.5 98.4 10.1 18.5 8.0 100.5 ModeratelypollutedAQ 31 95.8 93.7 10.4 15.7 3.6 95.8 SatisfactoryAQ 32 90.8 86.4 9.4 15.1 0.0 90.8 SatisfactoryAQ 33 86.8 87.8 10.2 13.0 0.0 87.8 SatisfactoryAQ 34 107.0 106.6 11.5 17.9 8.0 107.0 ModeratelypollutedAQ 35 94.2 94.6 11.3 14.0 0.0 94.6 Satisfactory Air Quality status at four monitoring stations (Example: AQ9, AQ12, AQ16, AQ30 andAQ34) of Betwa River Study Area are moderately polluted due to near haulage route,paved road and Sand/Morrum mine projects. Air quality at other stations out of above mentioned stations (Example: AQ1- AQ8,AQ10-AQ11, AQ13-AQ15, AQ17- AQ29, AQ31-AQ33 and AQ35) are satisfactorycondition due to more distance from haulage road, upwind direction of wind andexisting forest area.
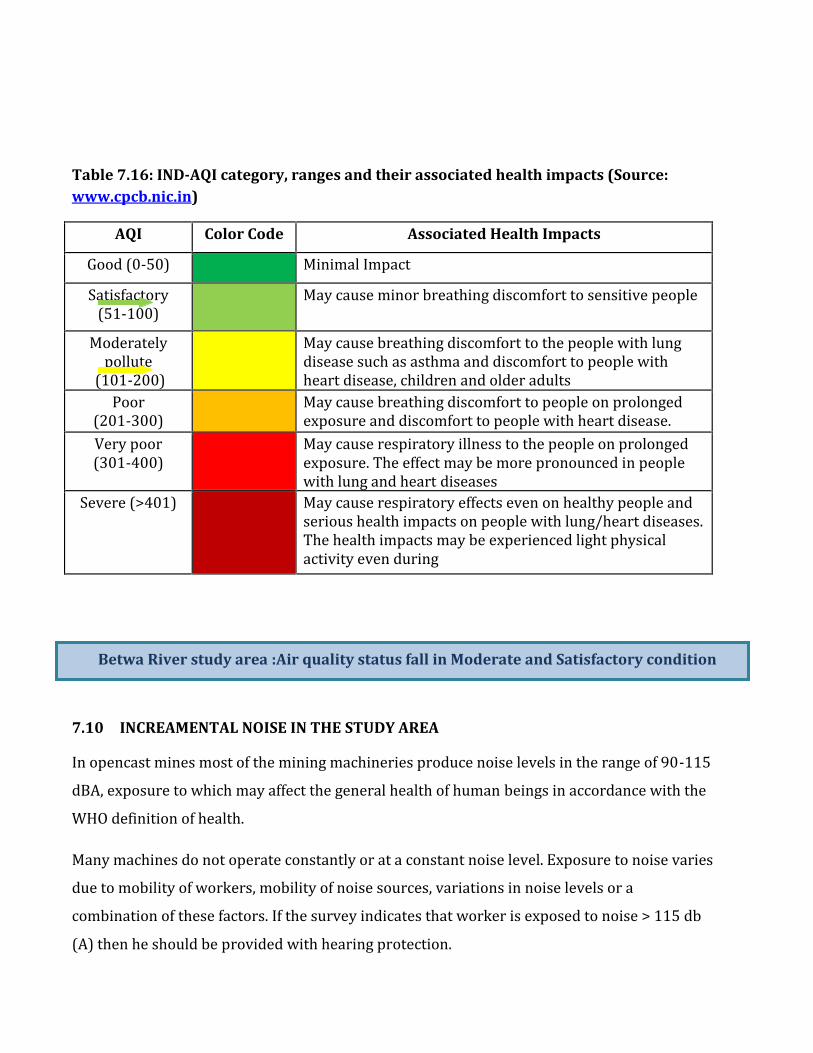
Table 7.16: IND-AQI category, ranges and their associated health impacts (Source:www.cpcb.nic.in)
AQI Color Code Associated Health ImpactsGood (0-50) Minimal ImpactSatisfactory(51-100) May cause minor breathing discomfort to sensitive peopleModeratelypollute(101-200) May cause breathing discomfort to the people with lungdisease such as asthma and discomfort to people withheart disease, children and older adultsPoor(201-300) May cause breathing discomfort to people on prolongedexposure and discomfort to people with heart disease.Very poor(301-400) May cause respiratory illness to the people on prolongedexposure. The effect may be more pronounced in peoplewith lung and heart diseasesSevere (>401) May cause respiratory effects even on healthy people andserious health impacts on people with lung/heart diseases.The health impacts may be experienced light physicalactivity even during
7.10 INCREAMENTAL NOISE IN THE STUDY AREAIn opencast mines most of the mining machineries produce noise levels in the range of 90-115dBA, exposure to which may affect the general health of human beings in accordance with theWHO definition of health.Many machines do not operate constantly or at a constant noise level. Exposure to noise variesdue to mobility of workers, mobility of noise sources, variations in noise levels or acombination of these factors. If the survey indicates that worker is exposed to noise > 115 db(A) then he should be provided with hearing protection.
Betwa River study area :Air quality status fall in Moderate and Satisfactory condition
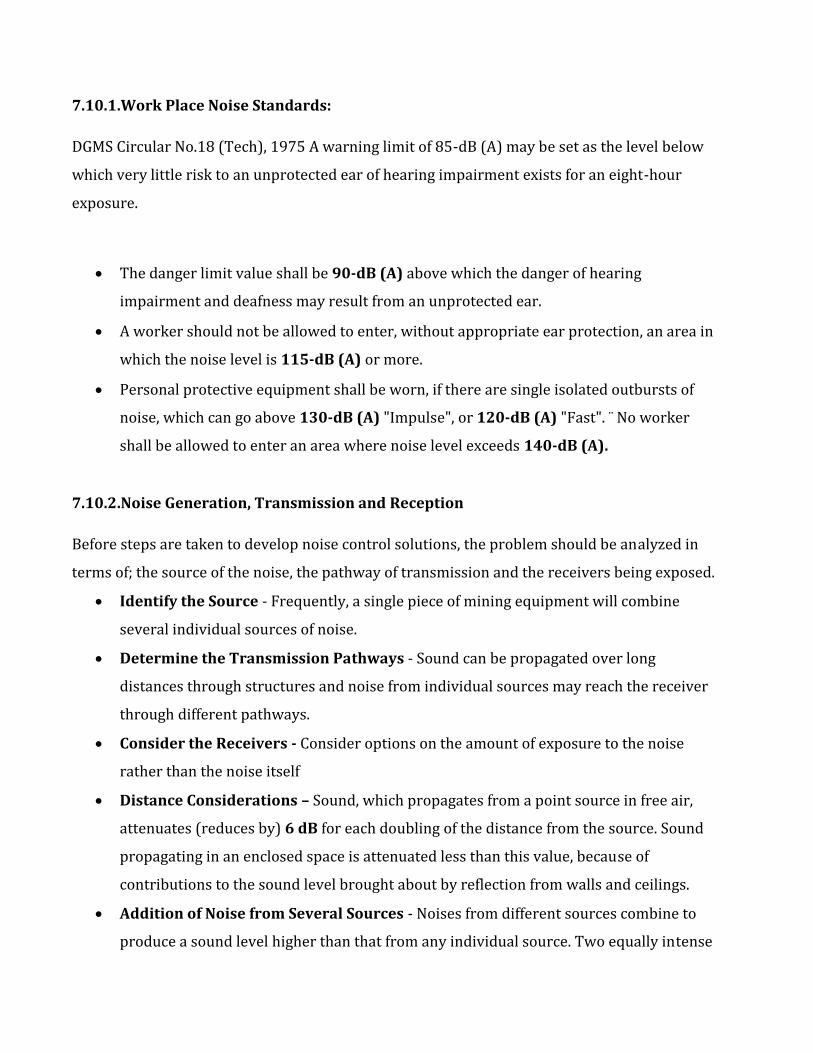
7.10.1.Work Place Noise Standards:DGMS Circular No.18 (Tech), 1975 A warning limit of 85-dB (A) may be set as the level belowwhich very little risk to an unprotected ear of hearing impairment exists for an eight-hourexposure. The danger limit value shall be 90-dB (A) above which the danger of hearingimpairment and deafness may result from an unprotected ear. A worker should not be allowed to enter, without appropriate ear protection, an area inwhich the noise level is 115-dB (A) or more. Personal protective equipment shall be worn, if there are single isolated outbursts ofnoise, which can go above 130-dB (A) "Impulse", or 120-dB (A) "Fast". ¨ No workershall be allowed to enter an area where noise level exceeds 140-dB (A).
7.10.2.Noise Generation, Transmission and ReceptionBefore steps are taken to develop noise control solutions, the problem should be analyzed interms of; the source of the noise, the pathway of transmission and the receivers being exposed. Identify the Source - Frequently, a single piece of mining equipment will combineseveral individual sources of noise. Determine the Transmission Pathways - Sound can be propagated over longdistances through structures and noise from individual sources may reach the receiverthrough different pathways. Consider the Receivers - Consider options on the amount of exposure to the noiserather than the noise itself Distance Considerations – Sound, which propagates from a point source in free air,attenuates (reduces by) 6 dB for each doubling of the distance from the source. Soundpropagating in an enclosed space is attenuated less than this value, because ofcontributions to the sound level brought about by reflection from walls and ceilings. Addition of Noise from Several Sources - Noises from different sources combine toproduce a sound level higher than that from any individual source. Two equally intense
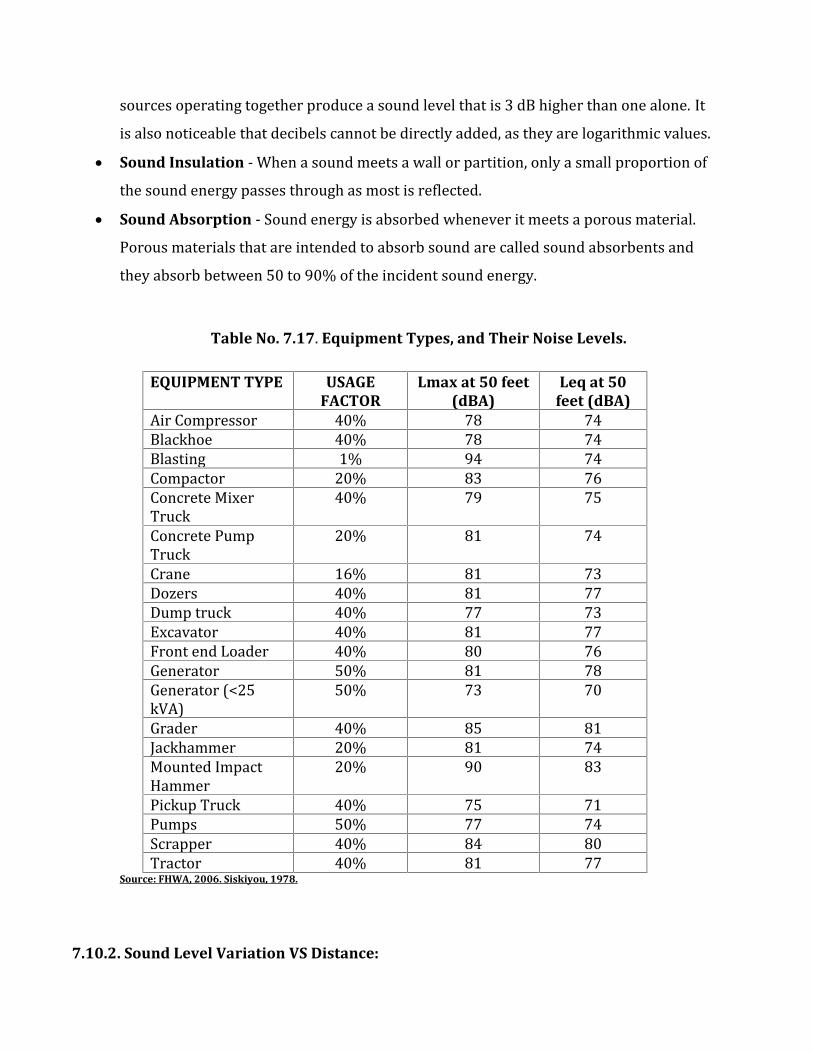
sources operating together produce a sound level that is 3 dB higher than one alone. Itis also noticeable that decibels cannot be directly added, as they are logarithmic values. Sound Insulation - When a sound meets a wall or partition, only a small proportion ofthe sound energy passes through as most is reflected. Sound Absorption - Sound energy is absorbed whenever it meets a porous material.Porous materials that are intended to absorb sound are called sound absorbents andthey absorb between 50 to 90% of the incident sound energy.
Table No. 7.17. Equipment Types, and Their Noise Levels.
EQUIPMENT TYPE USAGEFACTOR
Lmax at 50 feet(dBA)
Leq at 50feet (dBA)Air Compressor 40% 78 74Blackhoe 40% 78 74Blasting 1% 94 74Compactor 20% 83 76Concrete MixerTruck 40% 79 75Concrete PumpTruck 20% 81 74Crane 16% 81 73Dozers 40% 81 77Dump truck 40% 77 73Excavator 40% 81 77Front end Loader 40% 80 76Generator 50% 81 78Generator (<25kVA) 50% 73 70Grader 40% 85 81Jackhammer 20% 81 74Mounted ImpactHammer 20% 90 83Pickup Truck 40% 75 71Pumps 50% 77 74Scrapper 40% 84 80Tractor 40% 81 77
Source: FHWA, 2006. Siskiyou, 1978.
7.10.2. Sound Level Variation VS Distance:
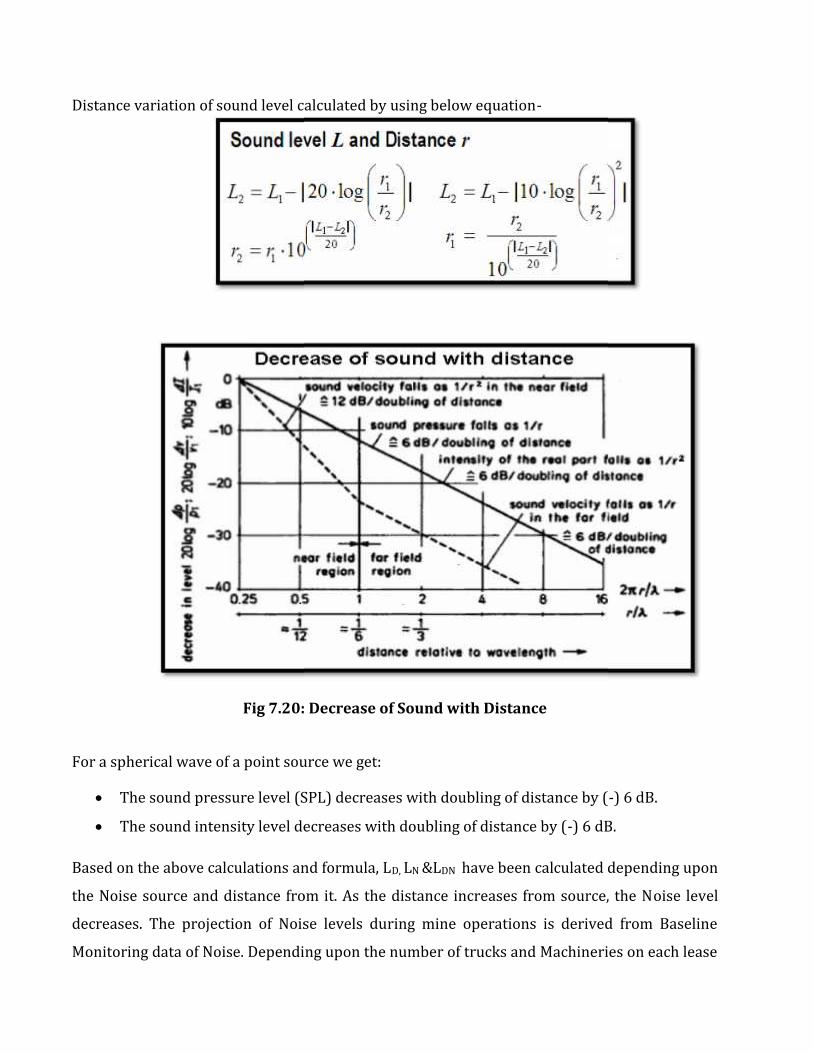
Distance variation of sound level calculated by using below equation-
Fig 7.20: Decrease of Sound with Distance
For a spherical wave of a point source we get: The sound pressure level (SPL) decreases with doubling of distance by (-) 6 dB. The sound intensity level decreases with doubling of distance by (-) 6 dB.Based on the above calculations and formula, LD, LN &LDN have been calculated depending uponthe Noise source and distance from it. As the distance increases from source, the Noise leveldecreases. The projection of Noise levels during mine operations is derived from BaselineMonitoring data of Noise. Depending upon the number of trucks and Machineries on each lease
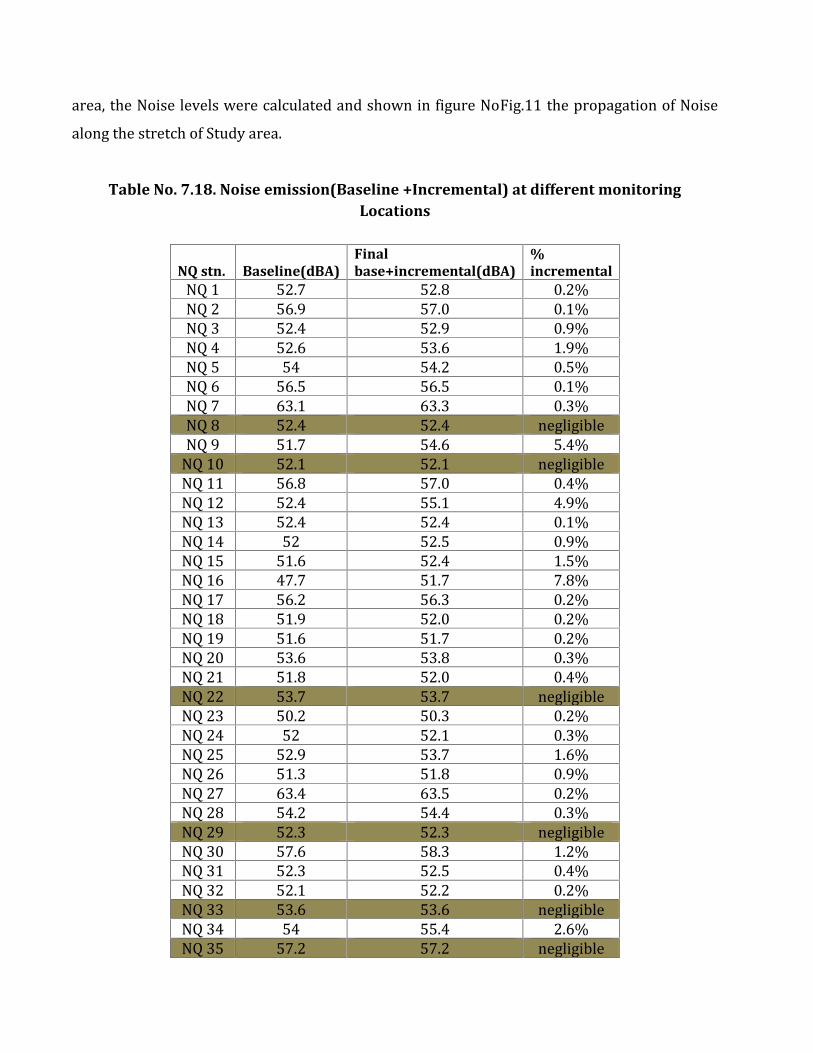
area, the Noise levels were calculated and shown in figure NoFig.11 the propagation of Noisealong the stretch of Study area.Table No. 7.18. Noise emission(Baseline +Incremental) at different monitoring
Locations
NQ stn. Baseline(dBA)Finalbase+incremental(dBA)
%incrementalNQ 1 52.7 52.8 0.2%NQ 2 56.9 57.0 0.1%NQ 3 52.4 52.9 0.9%NQ 4 52.6 53.6 1.9%NQ 5 54 54.2 0.5%NQ 6 56.5 56.5 0.1%NQ 7 63.1 63.3 0.3%NQ 8 52.4 52.4 negligibleNQ 9 51.7 54.6 5.4%NQ 10 52.1 52.1 negligibleNQ 11 56.8 57.0 0.4%NQ 12 52.4 55.1 4.9%NQ 13 52.4 52.4 0.1%NQ 14 52 52.5 0.9%NQ 15 51.6 52.4 1.5%NQ 16 47.7 51.7 7.8%NQ 17 56.2 56.3 0.2%NQ 18 51.9 52.0 0.2%NQ 19 51.6 51.7 0.2%NQ 20 53.6 53.8 0.3%NQ 21 51.8 52.0 0.4%NQ 22 53.7 53.7 negligibleNQ 23 50.2 50.3 0.2%NQ 24 52 52.1 0.3%NQ 25 52.9 53.7 1.6%NQ 26 51.3 51.8 0.9%NQ 27 63.4 63.5 0.2%NQ 28 54.2 54.4 0.3%NQ 29 52.3 52.3 negligibleNQ 30 57.6 58.3 1.2%NQ 31 52.3 52.5 0.4%NQ 32 52.1 52.2 0.2%NQ 33 53.6 53.6 negligibleNQ 34 54 55.4 2.6%NQ 35 57.2 57.2 negligible
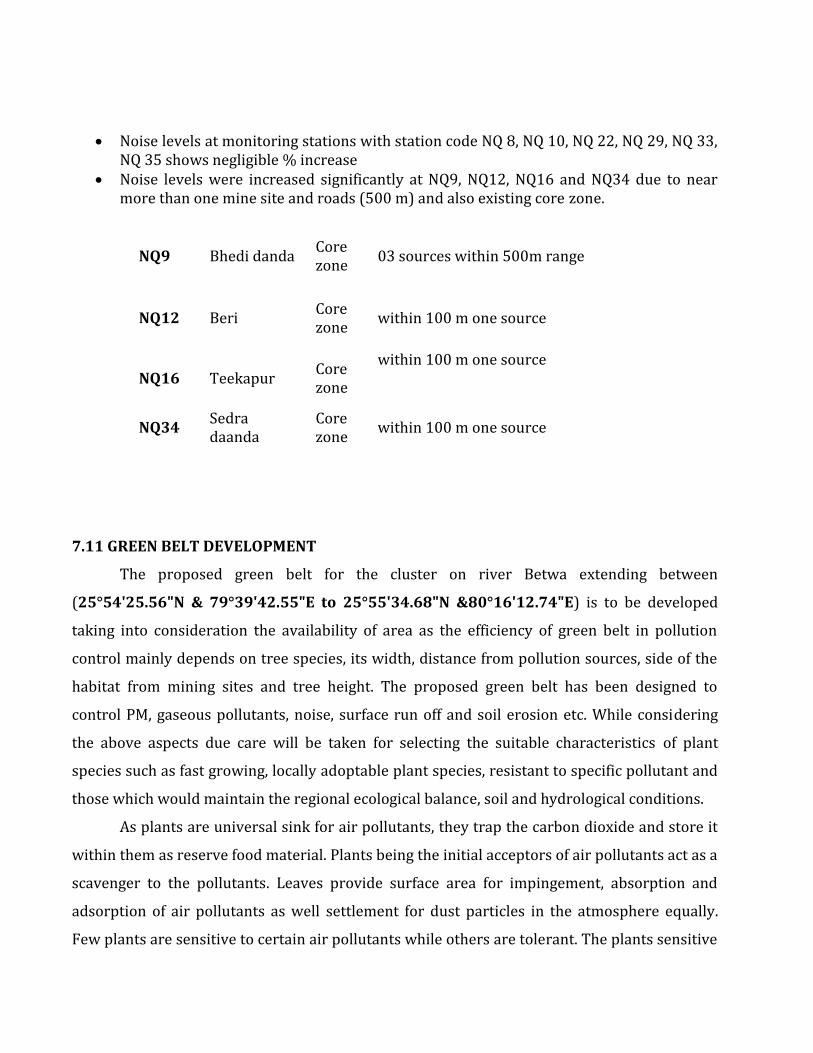
Noise levels at monitoring stations with station code NQ 8, NQ 10, NQ 22, NQ 29, NQ 33,NQ 35 shows negligible % increase Noise levels were increased significantly at NQ9, NQ12, NQ16 and NQ34 due to nearmore than one mine site and roads (500 m) and also existing core zone.
NQ9 Bhedi danda Corezone 03 sources within 500m rangeNQ12 Beri Corezone within 100 m one sourceNQ16 Teekapur Corezone within 100 m one sourceNQ34 Sedradaanda Corezone within 100 m one source
7.11 GREEN BELT DEVELOPMENTThe proposed green belt for the cluster on river Betwa extending between(25°54'25.56"N & 79°39'42.55"E to 25°55'34.68"N &80°16'12.74"E) is to be developedtaking into consideration the availability of area as the efficiency of green belt in pollutioncontrol mainly depends on tree species, its width, distance from pollution sources, side of thehabitat from mining sites and tree height. The proposed green belt has been designed tocontrol PM, gaseous pollutants, noise, surface run off and soil erosion etc. While consideringthe above aspects due care will be taken for selecting the suitable characteristics of plantspecies such as fast growing, locally adoptable plant species, resistant to specific pollutant andthose which would maintain the regional ecological balance, soil and hydrological conditions.As plants are universal sink for air pollutants, they trap the carbon dioxide and store itwithin them as reserve food material. Plants being the initial acceptors of air pollutants act as ascavenger to the pollutants. Leaves provide surface area for impingement, absorption andadsorption of air pollutants as well settlement for dust particles in the atmosphere equally.Few plants are sensitive to certain air pollutants while others are tolerant. The plants sensitive
to pollutants act as pollution indicators while the plants tolerant to pollutants act as sink.While selecting the species for pollution control the following are the important characteristicscould be considered. Plants should be evergreen, large leaved, rough bark, indigenous,ecologically compatible, low water requirement, minimum care, high absorption of pollutants,resistant pollutants, agro-climatic suitability, height and spread, canopy architecture, growthrate and habit (straight undivided trunk), aesthetic effect (foliage, conspicuous and attractiveflower colour), pollution tolerance and dust scavenging capacity. Hence, plantation needs to bedone on haul routes to curb air pollution in respect to dust emission.For sand mining projects, there is one more important function of plantation along theriver bank is river bank protection from water erosion. As the vegetation along river bankcontributes to bank stability by retarding water speeds and tractive forces near the soilsurface. Following are the various functions of river bank protection by plantation:7.11.1.Function of vegetation in river bank protectiona) Catching: Loose materials have a tendency to roll down a slope because of gravity anderosion, and this can be controlled by planting vegetation. The stems and fine roots can catchand hold loose material.b) Armoring: Some slopes are very water sensitive. They start moving and/or are easilyliquefied when water falls on them. Vegetation can protect the surface runoff and promoteswater infiltration and control erosion by rain splash.c) Reinforcing: The shear strength of the soil can be increased by planting vegetation. Theroots bind the particles of soil. The level of reinforcement depends on the nature of theroots.Species having more adventitious roots aremore suitable then the surface of top rootsformsd) Supporting: Lateral earth pressure causes a lateral and outward movement of slopematerials. Large and mature plants can provide support and prevent movement.e) Anchoring: Layers with a tendency to slip over each other can be pinned to each other andthe stable underlying layer by penetration of and ramification roots from the vegetationfunctions as anchors.

f) Draining: Water is the most common triggering factor for slope instability. Surface waterdrains away more easily in areas with sparse rooted vegetation. Thus, draining can bemanaged by planting small and dense rooted vegetation such as durva grass.Under the afforestation plan, plantation in nearby villages and connecting roads will bedone. The implementation for development of greenbelt will be of paramount importance as itwill not only add up as an aesthetic feature but will also act as a pollution sink. The species tobe grown in the areas will be dust tolerant and fast growing species so that a permanentgreenbelt is created. Plantation in the barrier zone and roads is necessary as these areas willcontain fine particulates resulting from mining operation and vehicle movement Plantationwill also be carried out as social forestry program in village, school and the areas allocated bythe Panchayat/State authorities. Native plants like Neem, Peepal, and other local species willbe planted. A suitable combination of trees that can grow fast and also have good leaf covershall be adopted to develop the greenbelt. It is proposed to plant almost 2200 Nos of nativespecies along with some fruit bearing and medicinal trees during the plan period. Thegreenbelt development program is given in Table below:Table No.7.19. Green belt development Plan for 5 years
Year Saplings to beplanted(Survival rate(@ 100 %))
Species Place of Plantation
I 3158 Local species foundin the region afterconsultation withDFO Jalaun andHamirpur
Along the Haul routes which will beused by empty and loaded vehicles(especially bushes) Plantation in nearby villages towardsProminent downwind direction fromthe mine lease sites Plantation along the river bank for itsprotection Plantation in the vacant places in theregion(transition region between theDariya and Danda regions)
II 395*III 395*IV 395*V 395*

7.11.2. Guidelines for plantation:The plant species identified for greenbelt development shall be planted using pittingtechnique. The pit size will be of 60 cm x 60 cm x 60 cm. bigger pit size will be considered atmarginal and poor quality soil. Soil used for filling the pit should be mixed with welldecomposed farm yard manure or sewage sludge at the rate of 2.5 kg (on dry weight basis) and3.6 kg (on dry weight basis) for 60 cm x 60 cm x 60 cm size pits respectively. The filling of soilshould be completed at least 5-10 days before the onset of monsoon. Healthy sapling ofidentified species should be planted in each pit with the commencement of monsoon. Provisionfor regular and liberal watering during the summer period during the commissioning stage ofthe plant will be arranged from the local available resources. The authorities responsible forplantation will also make adequate measures for the protection of the saplings. While makingchoices of plant species for plantation in green belt, weightage has been given to the nativespecies, bio climatic condition, plants which can be grown as per normal silvicultural practices.Plant species are identified for greenbelt development, considering the bioclimatic and soilcondition.7.11.3.Selection of Plants for Greenbelts:The main limitation for plants to function as scavenger of pollutants are, plant’s interaction toair pollutants, sensitivity to pollutants, climatic conditions and soil characteristics. Whilemaking choice of plants species for plantation in green belts, due consideration has to be givento the natural factor of bio-climate. Xerophyte plants are not necessarily good for greenbelts;they with their sunken stomata can withstand pollution by avoidance but are poor absorber ofpollutants. Character of plants mainly considered for affecting absorption of pollutant gasesand removal of dust particle are as follows.a.For absorption of gases:
Tolerance towards pollutants in question, at concentration, that are not too high to beinstantaneously lethal Longer duration of foliage Freely exposed foliage
Adequate height of crown Openness of foliage in canopy Big leaves (long and broad laminar surface) Large number of stomatal apertures
b.For Removal of Suspended Particular matter:
Height and spread of crown. Leaves supported on firm petiole Abundance of surface on bark and foliage Roughness of bark Abundance of axillaries hairs Hairs or scales on laminar surface Protected Stomata
c.Main objectives of plantation: The main purpose of developing green belt is to meet withspecific purposes by the completion of the lease period:1. For aesthetic enhancement of the project corridors and places of importance byplanting selective ornamental trees, landscaping and turfing with grasses andornamental shrubs.2. To reduce the impacts of air pollution and dust as trees and shrubs are known to benatural sink for air pollutants.3. To provide much needed shade on glaring hot roads during summer.4. To reduce the impact of ever increasing noise pollution caused due to increase innumber of vehicles.5. To arrest soil erosion and dust emission.6. Moderating the effect of wind and incoming radiation.
As envisaged in the Official issue vide letter No. H16405/220/2018/02 on subject- “Green
belt development for the carbon offsetting and Air Pollution control” by Uttar Pradesh
Pollution Control Board issued on 16.02.2018, protocol for Green Belt Development has been
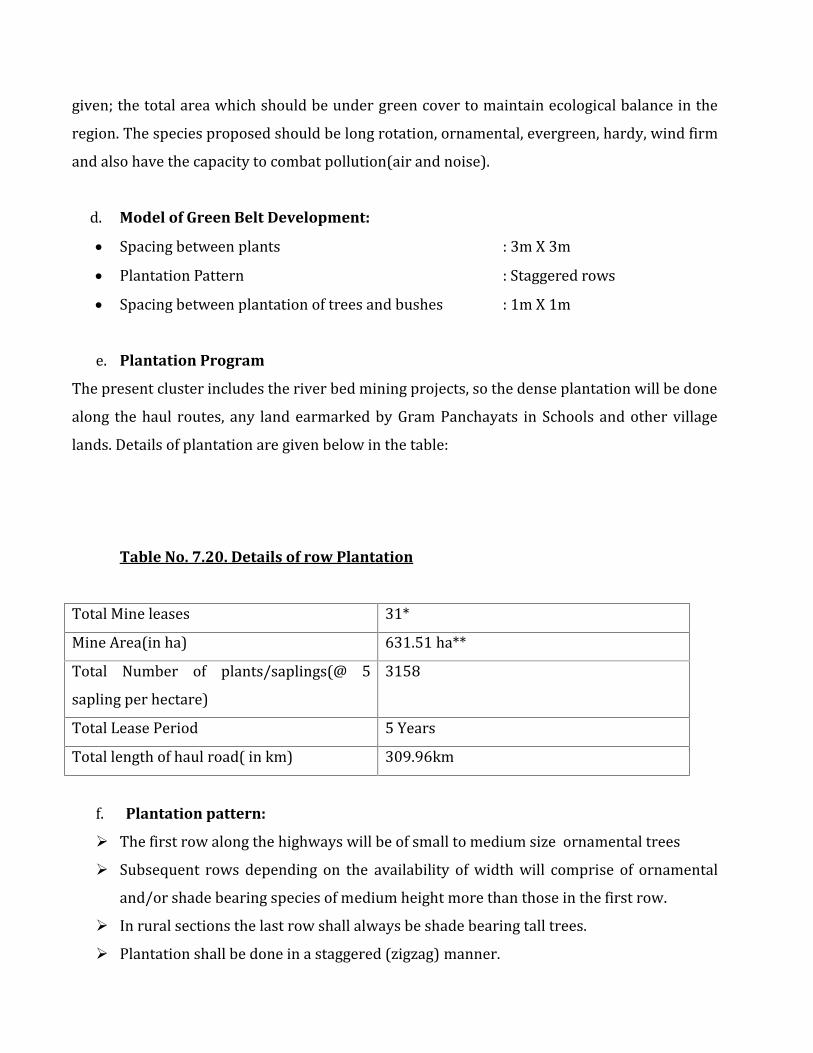
given; the total area which should be under green cover to maintain ecological balance in theregion. The species proposed should be long rotation, ornamental, evergreen, hardy, wind firmand also have the capacity to combat pollution(air and noise).d. Model of Green Belt Development:
Spacing between plants : 3m X 3m Plantation Pattern : Staggered rows Spacing between plantation of trees and bushes : 1m X 1me. Plantation ProgramThe present cluster includes the river bed mining projects, so the dense plantation will be donealong the haul routes, any land earmarked by Gram Panchayats in Schools and other villagelands. Details of plantation are given below in the table:
Table No. 7.20. Details of row Plantation
Total Mine leases 31*Mine Area(in ha) 631.51 ha**Total Number of plants/saplings(@ 5sapling per hectare) 3158Total Lease Period 5 YearsTotal length of haul road( in km) 309.96km
f. Plantation pattern:
The first row along the highways will be of small to medium size ornamental trees Subsequent rows depending on the availability of width will comprise of ornamentaland/or shade bearing species of medium height more than those in the first row. In rural sections the last row shall always be shade bearing tall trees. Plantation shall be done in a staggered (zigzag) manner.
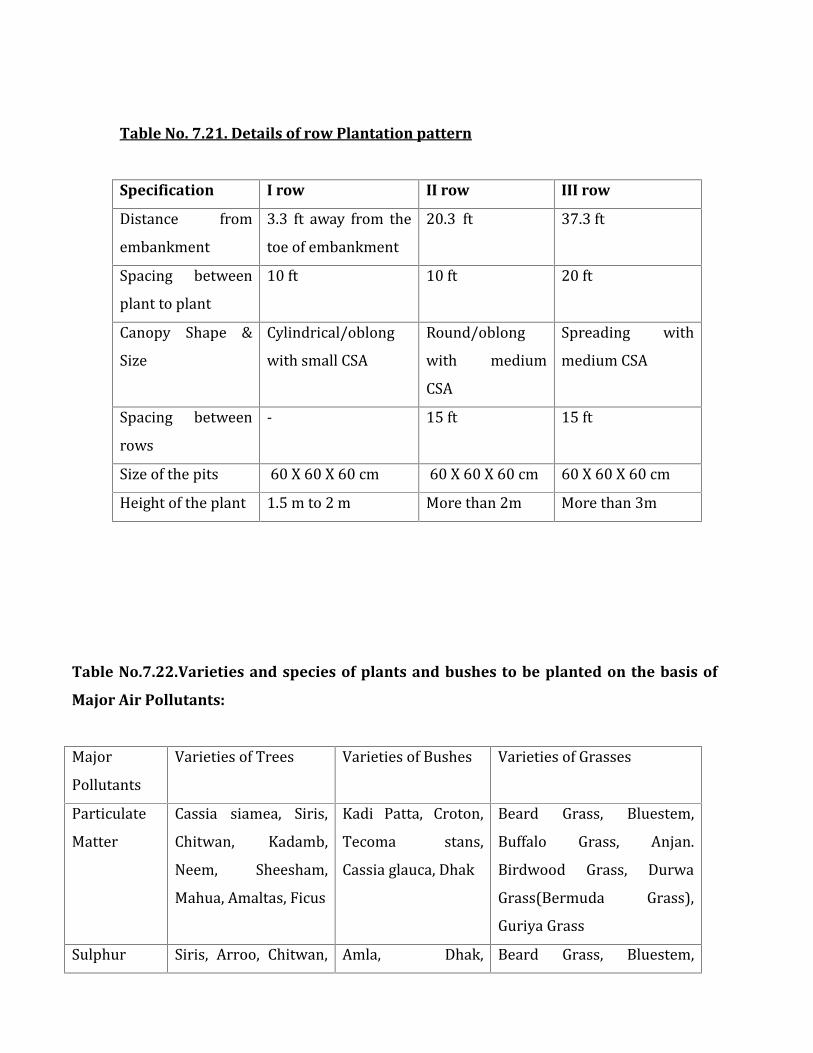
Table No. 7.21. Details of row Plantation pattern
Specification I row II row III rowDistance fromembankment 3.3 ft away from thetoe of embankment 20.3 ft 37.3 ftSpacing betweenplant to plant 10 ft 10 ft 20 ftCanopy Shape &Size Cylindrical/oblongwith small CSA Round/oblongwith mediumCSA
Spreading withmedium CSASpacing betweenrows - 15 ft 15 ftSize of the pits 60 X 60 X 60 cm 60 X 60 X 60 cm 60 X 60 X 60 cmHeight of the plant 1.5 m to 2 m More than 2m More than 3m
Table No.7.22.Varieties and species of plants and bushes to be planted on the basis of
Major Air Pollutants:
MajorPollutants Varieties of Trees Varieties of Bushes Varieties of GrassesParticulateMatter Cassia siamea, Siris,Chitwan, Kadamb,Neem, Sheesham,Mahua, Amaltas, Ficus
Kadi Patta, Croton,Tecoma stans,Cassia glauca, DhakBeard Grass, Bluestem,Buffalo Grass, Anjan.Birdwood Grass, DurwaGrass(Bermuda Grass),Guriya GrassSulphur Siris, Arroo, Chitwan, Amla, Dhak, Beard Grass, Bluestem,
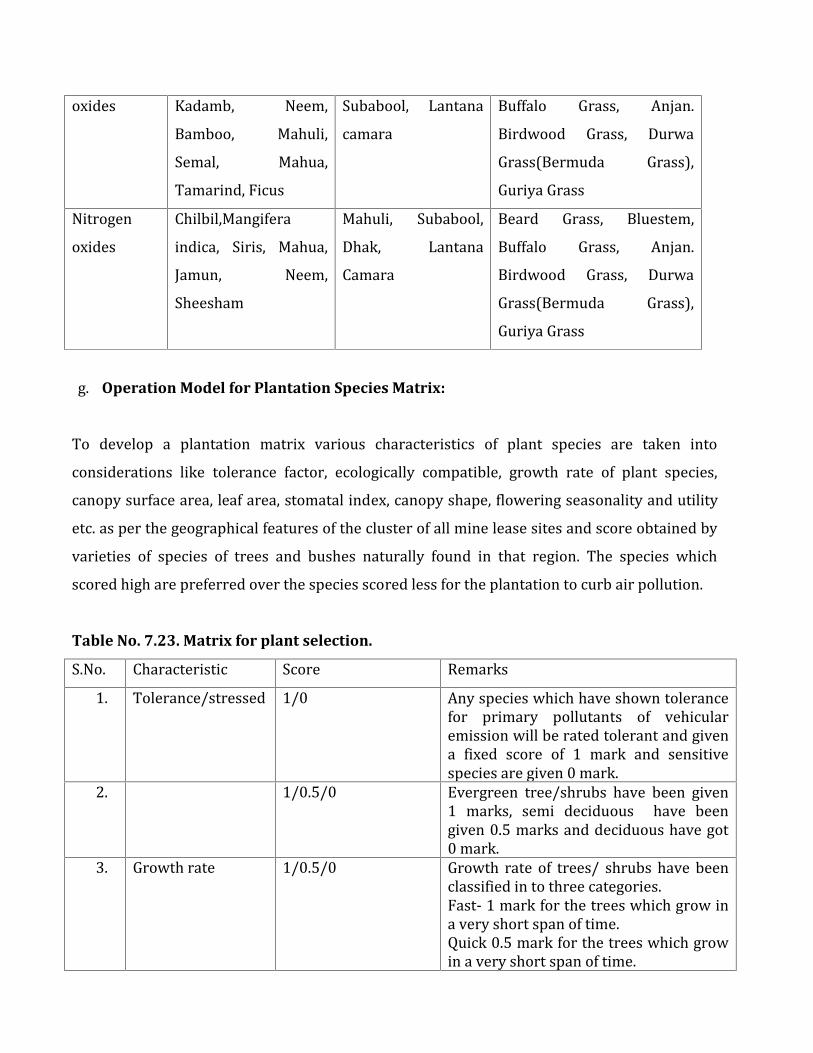
oxides Kadamb, Neem,Bamboo, Mahuli,Semal, Mahua,Tamarind, FicusSubabool, Lantanacamara Buffalo Grass, Anjan.Birdwood Grass, DurwaGrass(Bermuda Grass),Guriya GrassNitrogenoxides Chilbil,Mangiferaindica, Siris, Mahua,Jamun, Neem,SheeshamMahuli, Subabool,Dhak, LantanaCamara
Beard Grass, Bluestem,Buffalo Grass, Anjan.Birdwood Grass, DurwaGrass(Bermuda Grass),Guriya Grassg. Operation Model for Plantation Species Matrix:
To develop a plantation matrix various characteristics of plant species are taken intoconsiderations like tolerance factor, ecologically compatible, growth rate of plant species,canopy surface area, leaf area, stomatal index, canopy shape, flowering seasonality and utilityetc. as per the geographical features of the cluster of all mine lease sites and score obtained byvarieties of species of trees and bushes naturally found in that region. The species whichscored high are preferred over the species scored less for the plantation to curb air pollution.Table No. 7.23. Matrix for plant selection.S.No. Characteristic Score Remarks1. Tolerance/stressed 1/0 Any species which have shown tolerancefor primary pollutants of vehicularemission will be rated tolerant and givena fixed score of 1 mark and sensitivespecies are given 0 mark.2. 1/0.5/0 Evergreen tree/shrubs have been given1 marks, semi deciduous have beengiven 0.5 marks and deciduous have got0 mark.3. Growth rate 1/0.5/0 Growth rate of trees/ shrubs have beenclassified in to three categories.Fast- 1 mark for the trees which grow ina very short span of time.Quick 0.5 mark for the trees which growin a very short span of time.
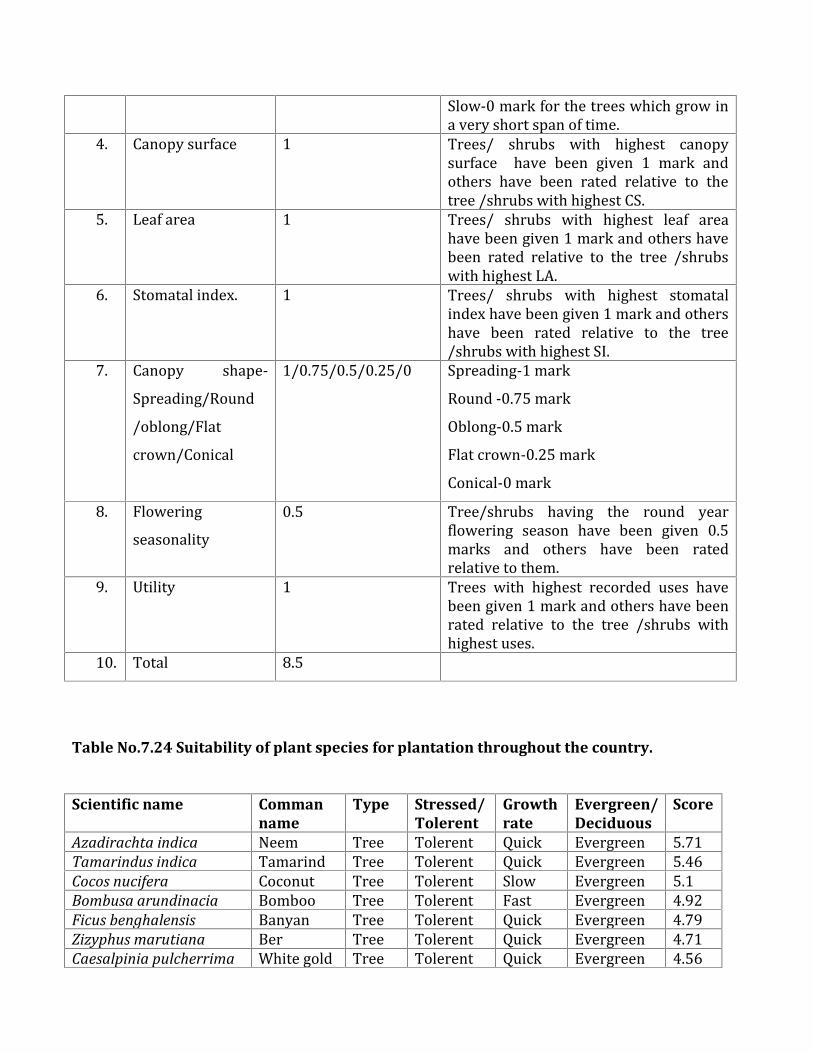
Slow-0 mark for the trees which grow ina very short span of time.4. Canopy surface 1 Trees/ shrubs with highest canopysurface have been given 1 mark andothers have been rated relative to thetree /shrubs with highest CS.5. Leaf area 1 Trees/ shrubs with highest leaf areahave been given 1 mark and others havebeen rated relative to the tree /shrubswith highest LA.6. Stomatal index. 1 Trees/ shrubs with highest stomatalindex have been given 1 mark and othershave been rated relative to the tree/shrubs with highest SI.7. Canopy shape-Spreading/Round/oblong/Flatcrown/Conical1/0.75/0.5/0.25/0 Spreading-1 markRound -0.75 markOblong-0.5 markFlat crown-0.25 markConical-0 mark8. Floweringseasonality 0.5 Tree/shrubs having the round yearflowering season have been given 0.5marks and others have been ratedrelative to them.9. Utility 1 Trees with highest recorded uses havebeen given 1 mark and others have beenrated relative to the tree /shrubs withhighest uses.10. Total 8.5
Table No.7.24 Suitability of plant species for plantation throughout the country.
Scientific name Commanname
Type Stressed/Tolerent
Growthrate
Evergreen/Deciduous
Score
Azadirachta indica Neem Tree Tolerent Quick Evergreen 5.71Tamarindus indica Tamarind Tree Tolerent Quick Evergreen 5.46Cocos nucifera Coconut Tree Tolerent Slow Evergreen 5.1Bombusa arundinacia Bomboo Tree Tolerent Fast Evergreen 4.92Ficus benghalensis Banyan Tree Tolerent Quick Evergreen 4.79Zizyphus marutiana Ber Tree Tolerent Quick Evergreen 4.71Caesalpinia pulcherrima White gold Tree Tolerent Quick Evergreen 4.56

mahurTrema orentalis Charcoal Tree Tolerent Quick Evergreen 4.53Alstonia scholaris Devil tree Tree Tolerent Quick Evergreen 4.51Peitophorumpterocarpum
Copper podtree Tree Tolerent Quick Evergreen 4.45Samanea saman Rain tree Tree Tolerent Quick Evergreen 4.45Duranta repens Duranta Tree Tolerent Quick Evergreen 4.4Anona squamosa CustardApple Tree Tolerent Fast Evergreen 4.4Dendrocalamus strictus Lathi bans Shrubs Tolerent Fast Evergreen 4.4Thespesia populnea Umbrelatree Tree Tolerent Quick Evergreen 4.39Cassia siamea Iron woodtree Tree Tolerent Fast Evergreen 4.37Anthocephalus chinensis Kadam Tree Tolerent Fast Deciduous 4.34Prosopis cineraris Khejari Tree Tolerent Quick Evergreen 4.32Acacia nilotica Babul Tree Tolerent Quick Evergreen 4.29
h. Recommended Species for Various Soil Types:
Uttar Pradesh is the fourth largest state of the country and is been drained by one of themajor river of India Ganga and its biggest tributary Yamuna and several other distributaries.Hence, across the state all along the rivers sediment gets deposited according the flow of theriver which somehow defines the soil of that region. Selection of suitable plant species for theplantation on haul routes, river bank protection and also in the transition region betweenKhadar and Bangar region is the key of successful plantation programme. Given below are thefew species suitable for plantation according the soil types found in that region.Table No.25 Suitable species for different soil types.
Soil Type Suitable SpeciesClay Soil Azadirachata indica, Pongamia pinnata, Swieteniamahagoni, Pterocarpus marsupium, Terminaliatomentosa, Melia dubia, Delbergia latifolia, DelbergiasissooRed soil with 10 ft minimum soildepth Swietenia mahagoni, Pterocarpus marsupium,Terminalia tomentosa, Melia dubia, Delbergia latifolia,Azadirachata indica, Pongamia pinnata, AilanthusexceisaRed soil with 5 ft minimum soildepth Tectona grandis, Swietenia mahagoni, Santalumalbum, Pterocarpus marsupium, Delbergia latifolia,Azadirachata indica, Melia dubia, Ailanthus exceisa

Alluvial soil Tectona grandis, Swietenia mahagoni,Pterocarpusmarsupium, , Melia dubia,Delbergia latifolia,Neolamarckia cadamba, Pongamia pinnataUncultivable soil Azadirachata indica, Albezia lebbeck, Delbergia sissoo,Ailanthus exceisa, Pterocarpus santanaliusTerminalia arjuna, Casurina junghuniana, PongamiapinnataPlants experience physiological changes before getting damaged when the leaves areexposed to air pollutants. The tolerant species are preferred over the sensitive species forplantation. To analyze the species, various variables are used like Air Pollution ToleranceIndex (APTI) which is based on biochemical parameters, Anticipated Performance Index (API)which is based on biological and socio-economic aspect of a plant. The carbon trapping anddust accumulating potential also varies from species to species.Table No. 7.26 APTI score of different trees and their efficacy in Pollution control.
S.Nos. Botanical Name Family Common Name APTIEffective in
Control1. Cassia siamea Caesalpiniodeae Kassod tree 10.41 Dust2. Albizia lebbeck Fabaceae Siris tree 15.9 Airpollution3. Alstonia scholaris Apocynaceae Chitwantree(Blackboardtree) 6.6 Dust4. Neolamarckia
cadambaRubiaceae Kadambtree(Burflowertree) 15.5 Dust
5. Azadirachta indica Meliaceae Neem tree 18.73 Dust, airpollutionand Noisepollution6. Dalbergia sissoo Papilionaceae Sheesham 16.59 Airpollution ,noisepollution7. Madhuca indica Sapotaceae Mahua 22.57 Airpollution8. Mangifera indica Anacardiaceae Mango 20.80 Airpollution
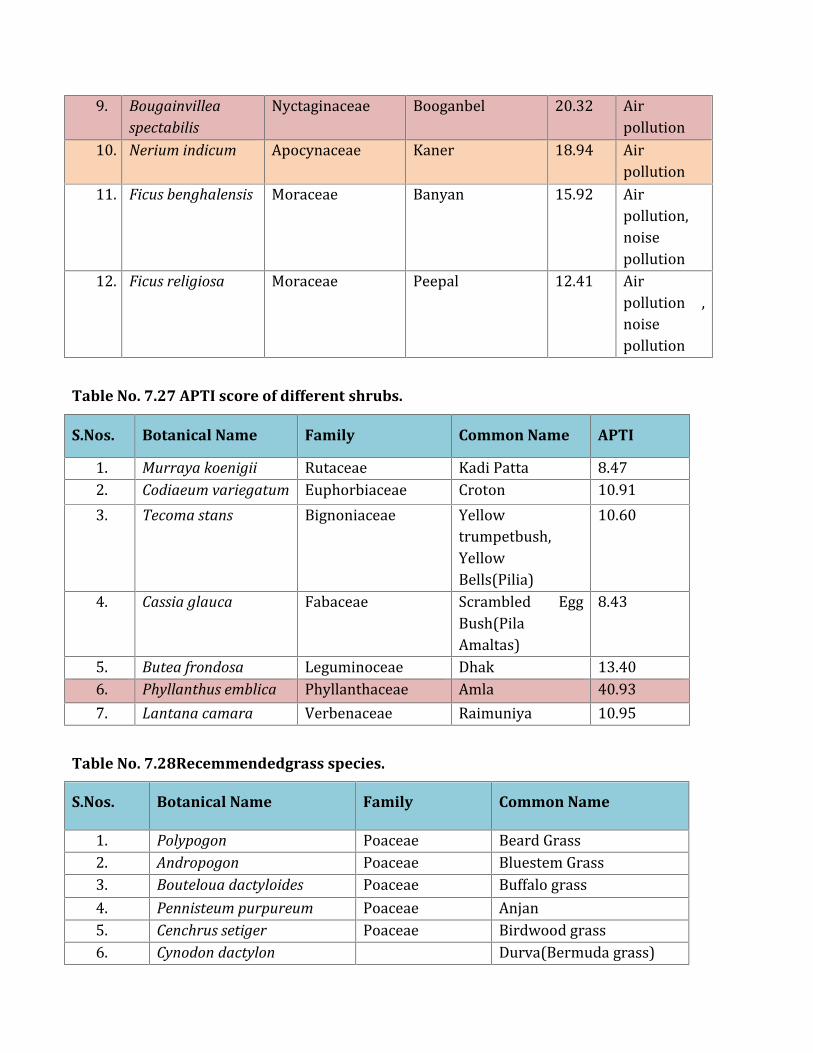
9. Bougainvilleaspectabilis
Nyctaginaceae Booganbel 20.32 Airpollution10. Nerium indicum Apocynaceae Kaner 18.94 Airpollution11. Ficus benghalensis Moraceae Banyan 15.92 Airpollution,noisepollution12. Ficus religiosa Moraceae Peepal 12.41 Airpollution ,noisepollutionTable No. 7.27 APTI score of different shrubs.
S.Nos. Botanical Name Family Common Name APTI1. Murraya koenigii Rutaceae Kadi Patta 8.472. Codiaeum variegatum Euphorbiaceae Croton 10.913. Tecoma stans Bignoniaceae Yellowtrumpetbush,YellowBells(Pilia)10.60
4. Cassia glauca Fabaceae Scrambled EggBush(PilaAmaltas) 8.435. Butea frondosa Leguminoceae Dhak 13.406. Phyllanthus emblica Phyllanthaceae Amla 40.937. Lantana camara Verbenaceae Raimuniya 10.95
Table No. 7.28Recemmendedgrass species.
S.Nos. Botanical Name Family Common Name1. Polypogon Poaceae Beard Grass2. Andropogon Poaceae Bluestem Grass3. Bouteloua dactyloides Poaceae Buffalo grass4. Pennisteum purpureum Poaceae Anjan5. Cenchrus setiger Poaceae Birdwood grass6. Cynodon dactylon Durva(Bermuda grass)
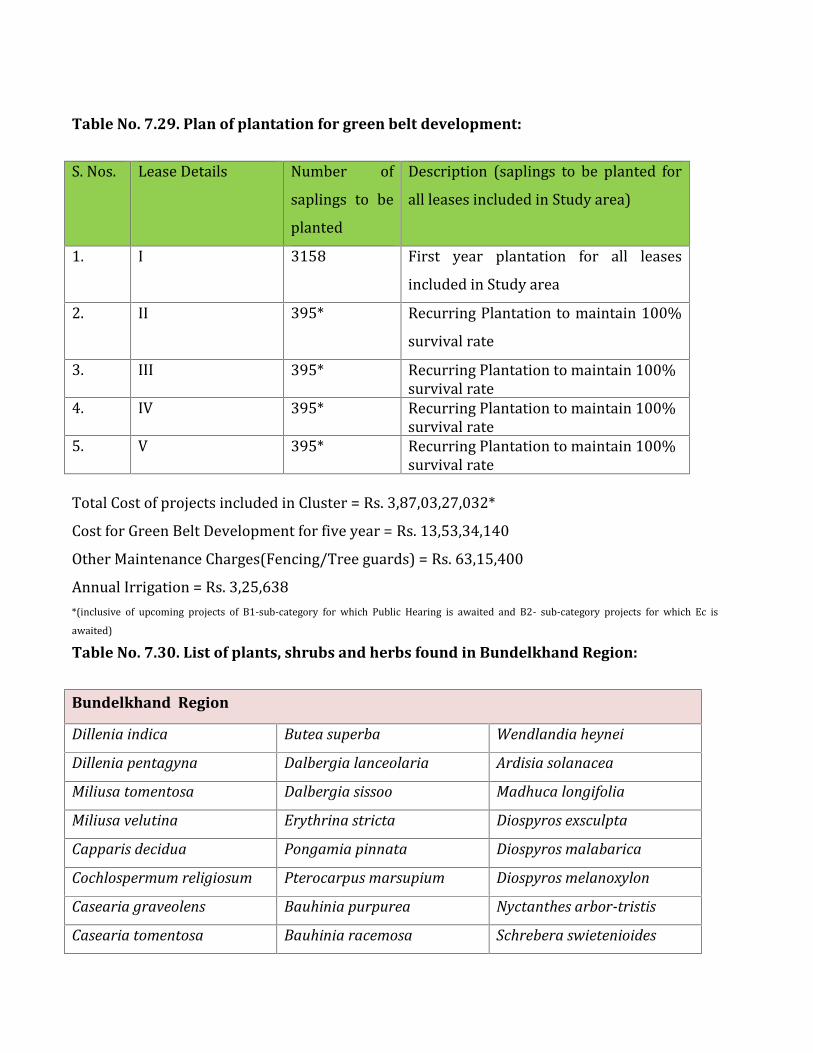
Table No. 7.29. Plan of plantation for green belt development:
S. Nos. Lease Details Number ofsaplings to beplantedDescription (saplings to be planted forall leases included in Study area)
1. I 3158 First year plantation for all leasesincluded in Study area2. II 395* Recurring Plantation to maintain 100%survival rate3. III 395* Recurring Plantation to maintain 100%survival rate4. IV 395* Recurring Plantation to maintain 100%survival rate5. V 395* Recurring Plantation to maintain 100%survival rateTotal Cost of projects included in Cluster = Rs. 3,87,03,27,032*Cost for Green Belt Development for five year = Rs. 13,53,34,140Other Maintenance Charges(Fencing/Tree guards) = Rs. 63,15,400Annual Irrigation = Rs. 3,25,638*(inclusive of upcoming projects of B1-sub-category for which Public Hearing is awaited and B2- sub-category projects for which Ec isawaited)Table No. 7.30. List of plants, shrubs and herbs found in Bundelkhand Region:
Bundelkhand Region
Dillenia indica Butea superba Wendlandia heynei
Dillenia pentagyna Dalbergia lanceolaria Ardisia solanacea
Miliusa tomentosa Dalbergia sissoo Madhuca longifolia
Miliusa velutina Erythrina stricta Diospyros exsculpta
Capparis decidua Pongamia pinnata Diospyros malabarica
Cochlospermum religiosum Pterocarpus marsupium Diospyros melanoxylon
Casearia graveolens Bauhinia purpurea Nyctanthes arbor-tristis
Casearia tomentosa Bauhinia racemosa Schrebera swietenioides

Flacourtia indica Bauhinia variegata Salvadora oleoides
Tamarix indica Bauhinia tomentosa Carissa spinarum
Shorea robusta Cassia fistula Holarrhena pubescens
Kydia calycina Acacia catechu Wrightia tinctoria
Bombax ceiba Acacia leucophloea Calotropis gigantean
Eriolaena hookeriana Acacia nilotica Cordia dichotoma
Helicteres isora Acacia tomentosa Cordia sinensis
Pterospermum acerifolium Albizia lebbeck Ehretia laevis
Sterculia urens Albizia odoratissima Solanum incanum
Sterculia villosa Albizia procera Dolichandrone falcate
Grewia abutilifolia Dichrostachys cinerea Millingtonia hortensis
Grewia asiatica Pithecellobium dulce Oroxylum indicum
Grewia flavescens Prosopis cineraria Pajanelia longifolia
Grewia helicterifolia Prosopis juliflora Stereospermum chelonoides
Grewia hirsuta Anogeissus latifolia Tecomella undulate
Grewia orbiculata Terminalia elliptica Tecoma stans
Grewia tiliifolia Terminalia arjuna Clerodendrum phlomidis
Balanites roxburghii Terminalia bellirica Gmelina arborea
Murraya koenigii Terminalia chebula Premna barbata
Murraya paniculata Syzygium cumini Tectona grandis
Ailanthus excelsa Syzygium heyneanum Litsea chinensis
Boswellia serrata Careya arborea Litsea glutinosa
Azadirachta indica Lagerstroemia parviflora Antidesma ghaesembilla
Melia azedarach Lawsonia inermis Bridelia retusa
Soymida febrifuga Alangium salviifolium Bridelia squamosal
Elaeodendron glaucum Catunaregam spinosa Mimusops elengi
Gymnosporia senegalensis Ceriscoides turgida Drypetes roxburghii
Ziziphus mauritiana Gardenia latifolia Flueggea virosa
Ziziphus rugosa Haldina cordifolia Mallotus philippensis
Ziziphus xylopyrus Hymenodictyon orixense Trewia nudiflora
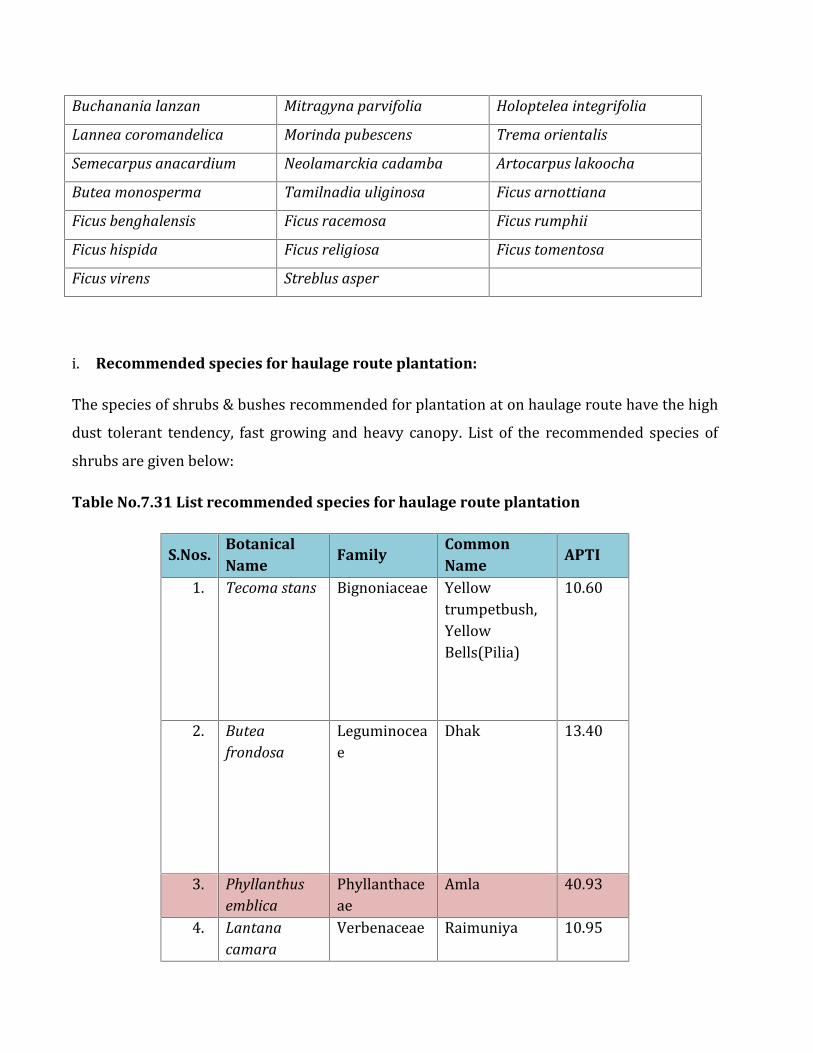
Buchanania lanzan Mitragyna parvifolia Holoptelea integrifolia
Lannea coromandelica Morinda pubescens Trema orientalis
Semecarpus anacardium Neolamarckia cadamba Artocarpus lakoocha
Butea monosperma Tamilnadia uliginosa Ficus arnottiana
Ficus benghalensis Ficus racemosa Ficus rumphii
Ficus hispida Ficus religiosa Ficus tomentosa
Ficus virens Streblus asper
i. Recommended species for haulage route plantation:The species of shrubs & bushes recommended for plantation at on haulage route have the highdust tolerant tendency, fast growing and heavy canopy. List of the recommended species ofshrubs are given below:Table No.7.31 List recommended species for haulage route plantation
S.Nos.BotanicalName
FamilyCommonName
APTI1. Tecoma stans Bignoniaceae Yellowtrumpetbush,YellowBells(Pilia)10.60
2. Buteafrondosa
Leguminoceae Dhak 13.40
3. Phyllanthusemblica
Phyllanthaceae Amla 40.934. Lantanacamara
Verbenaceae Raimuniya 10.95
Plantation onHaul Route
Plantation onHaul Route
Plantation towordsprominent winddirection
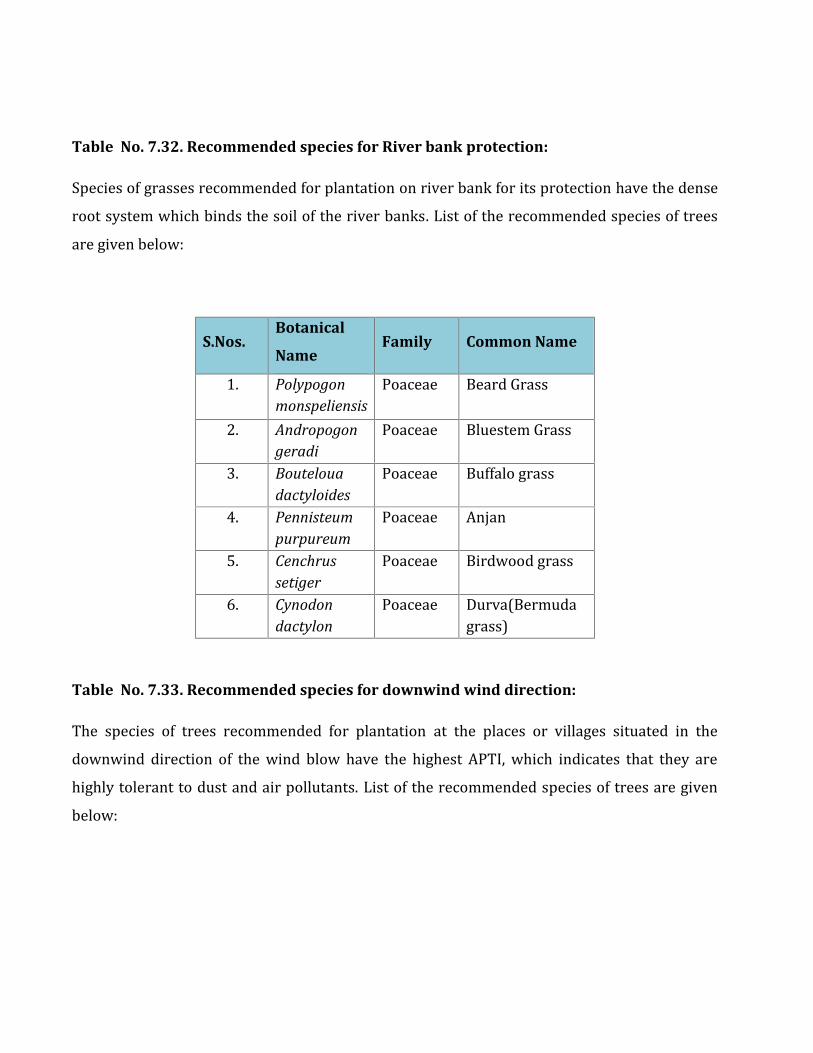
Table No. 7.32. Recommended species for River bank protection:Species of grasses recommended for plantation on river bank for its protection have the denseroot system which binds the soil of the river banks. List of the recommended species of treesare given below:S.Nos.
Botanical
NameFamily Common Name1. Polypogon
monspeliensisPoaceae Beard Grass
2. Andropogongeradi
Poaceae Bluestem Grass3. Boutelouadactyloides
Poaceae Buffalo grass4. Pennisteumpurpureum
Poaceae Anjan5. Cenchrussetiger
Poaceae Birdwood grass6. Cynodondactylon
Poaceae Durva(Bermudagrass)Table No. 7.33. Recommended species for downwind wind direction:The species of trees recommended for plantation at the places or villages situated in thedownwind direction of the wind blow have the highest APTI, which indicates that they arehighly tolerant to dust and air pollutants. List of the recommended species of trees are givenbelow:
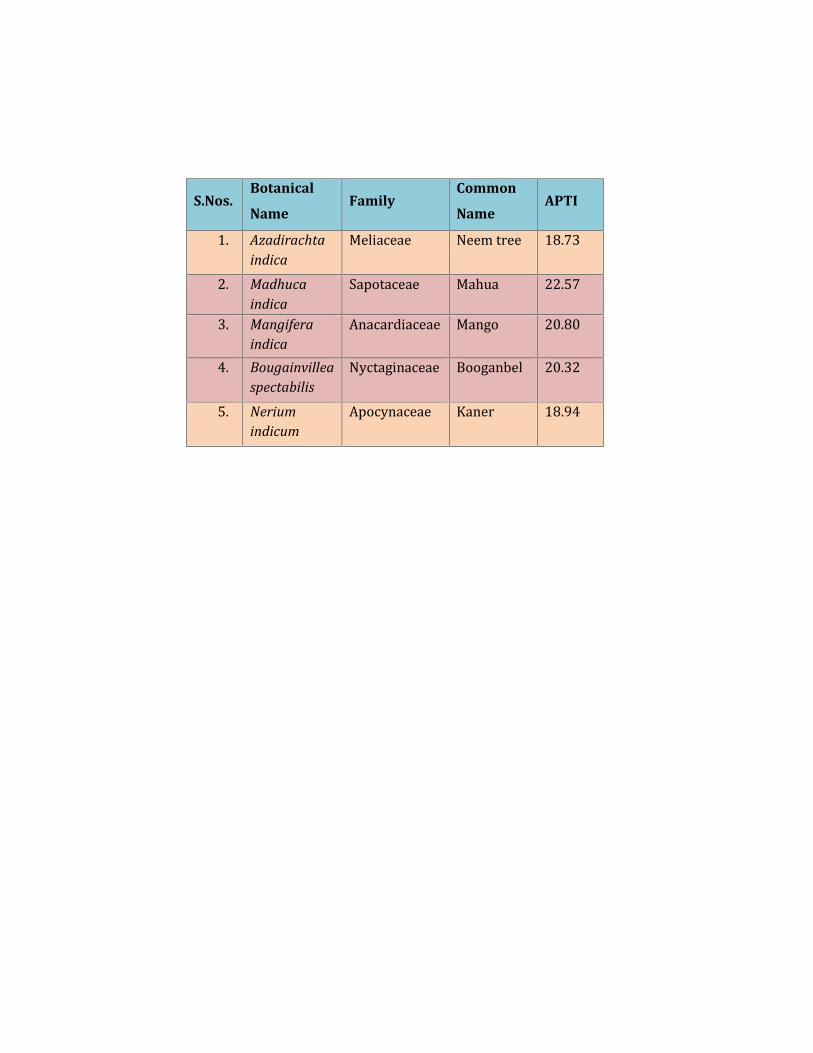
S.Nos.Botanical
NameFamily
Common
NameAPTI1. Azadirachta
indicaMeliaceae Neem tree 18.73
2. Madhucaindica
Sapotaceae Mahua 22.573. Mangiferaindica
Anacardiaceae Mango 20.804. Bougainvillea
spectabilisNyctaginaceae Booganbel 20.32
5. Neriumindicum
Apocynaceae Kaner 18.94
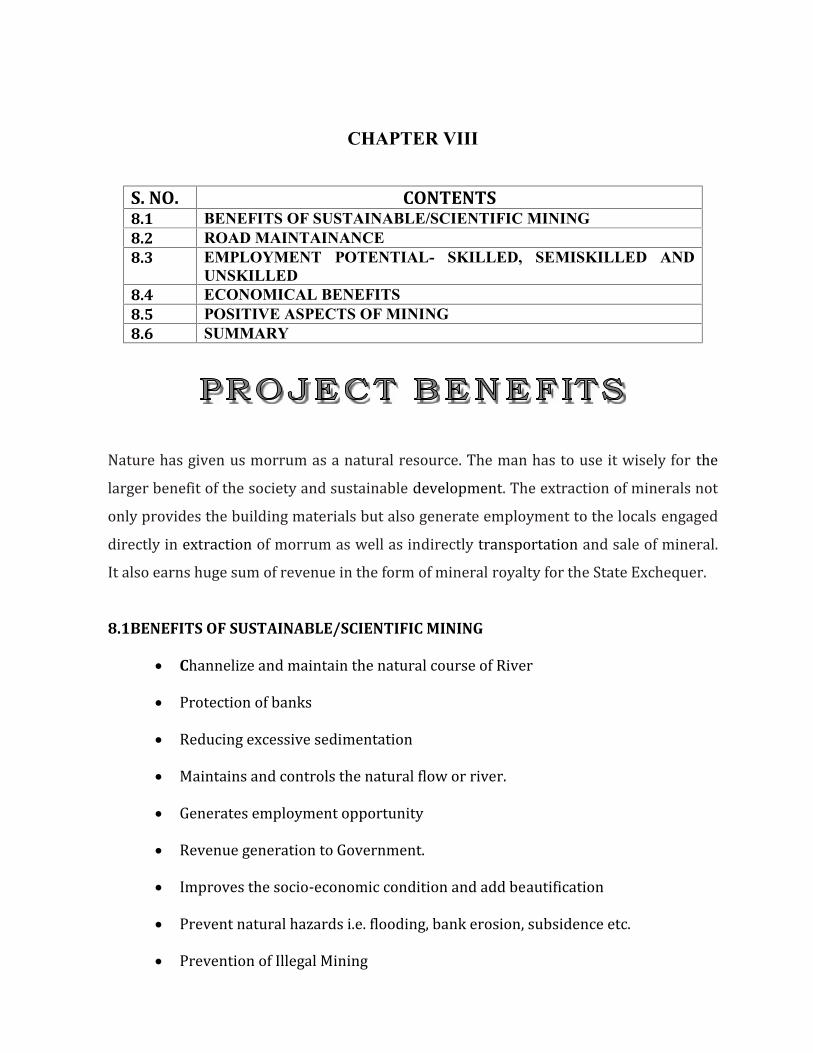
CHAPTER VIII
S. NO. CONTENTS8.1 BENEFITS OF SUSTAINABLE/SCIENTIFIC MINING8.2 ROAD MAINTAINANCE8.3 EMPLOYMENT POTENTIAL- SKILLED, SEMISKILLED AND
UNSKILLED8.4 ECONOMICAL BENEFITS8.5 POSITIVE ASPECTS OF MINING8.6 SUMMARY
Nature has given us morrum as a natural resource. The man has to use it wisely for thelarger benefit of the society and sustainable development. The extraction of minerals notonly provides the building materials but also generate employment to the locals engageddirectly in extraction of morrum as well as indirectly transportation and sale of mineral.It also earns huge sum of revenue in the form of mineral royalty for the State Exchequer.8.1BENEFITS OF SUSTAINABLE/SCIENTIFIC MINING
Channelize and maintain the natural course of River Protection of banks Reducing excessive sedimentation Maintains and controls the natural flow or river. Generates employment opportunity Revenue generation to Government. Improves the socio-economic condition and add beautification Prevent natural hazards i.e. flooding, bank erosion, subsidence etc. Prevention of Illegal Mining
8.1.1 Environmental Benefitsa It controls river bank erosion by deepening of river channel, thus prevents floodingand other natural hazards.b It helps in Regeneration & Establishment of Pioneer Species like Shisham & Khair onthe banks of rivers besides saving agricultural land & land cutting.c It regulates & maintains the existing course of the river, and improves the waterholding capacity of channels.8.1.2 Improvement in physical infrastructureMining and agriculture are the only industries from which the mankind receives directly.In the fast growing economics of vibrant India, both the sectors play important role, onein developing infrastructure and the other in maintaining food securities. Morrum is anintegral part of soil. When present in common in right proportions it imparts favourableproperties and improves soil productivity. Similarly, morrum is an important aggregateused in bulk in construction industry. Beginning 21st century, India is witnessing a spurtin infrastructure sector. Construction of high rise group housing and commercialcomplexes, growth of new private townships, lanes to highways, expressways, flyovers,and bridges, modernization of airports, metros, game villages, stadiums and constructionof abodes by ordinary people has given ample impetus for mining. Rivers are the majorsources of morrum as they replenish themselves every year during monsoons.8.1.3 Improvement in social infrastructureNearby villages shall be benefited in several ways like, protected water supply, basichealth camps, improved infrastructure facilities, employment opportunities etc., besidesenhancing the local economy through the benefits from the project activities andpersonnel.Now the royalty received from mining activites are now used in Pradhan Mantri KhanijKshetra Kalyan Yojana (PMKKKY) is a programme launched on 17 September 2015 toprovide for the welfare of areas and people affected by mining related operations.PMKKKY is implemented by the District Mineral Foundations (DMFs) of the respectivedistricts using the funds accruing to the DMF from miners. (Khanij means Mineral and

Kshetra means area or field in Hindi. Kalyan stands for welfare and Yojana stands for aPlan or project). District Mineral Foundation (DMF) is a trust set up under Mines andMinerals (Development & Regulation) Amendment Act, (MMDRA) 2015 as a non-profitbody in those districts affected by the mining works to work for the interest and benefitof persons and areas affected by mining related operations, in such manner as prescribedby the relevant State Government. At least 60% of the funds under the PMKKKY has to beused for high priority areas such as drinking water supply, environment preservation andpollution control measures, primary / secondary health care, education, welfare ofwomen, children, aged and disabled people, skill development & sanitation. Up to 40% ofthe funds can be used for infrastructure projects such as physical infrastructure,irrigation, energy and watershed development and any other measures for enhancingenvironmental quality in mining district. Not more than 5% of the funds can be used foradministrative expenses. Save for the base minimum contractual posts, creation of posts,purchase of vehicles etc. would require prior permission. The DMFs have also beendirected to take all major decision in a participatory mode, in consultation with the ‘gramsabhas’ of the respective villages. They are expected to maintain utmost transparency intheir functioning and provide periodic reports on the various projects and schemes takenup by them. Efforts are made to achieve convergence with the State and the District Plansso that the activities taken up by the DMF supplement/complement the development andwelfare activities already being carried out. However, activities meant to be taken upunder the ‘polluter pays principle’ cannot be taken up under the PMKKKY.Of the total funds that DMF would receive in a year, no less than 20 per cent should bedeposited in an account for future use (when mining operations are closed) as well as foremergency situations, such as natural calamities. Of the total funds that DMF would receive in a year, no more than 80 per. centshould be spent in the year. Of the total money that DMF has to spend in a year: No less than 65 per cent should be spent on directly affected areas. No less than 50 per cent should be used for the upliftment of directly affectedpersons.
No more than 20 per cent should be spent on indirectly affected areas. No more than 10 per cent should be spent for the development of the district,excluding directly and indirectly affected areas. No more than 5 per cent should be used as administrative expenses of the DMF.
a. Benefit-sharing
Every directly affected family should be entitled to equal monetary benefit, whichcould either be paid monthly or annually. The directly affected family couldinclude widows, single mothers and old people without family support. The amount of monetary benefit should be decided by the Governing Council ofthe DMF at the beginning of each financial year. However, such amount ofmonetary benefit shall not be less than the amount a family may be entitled tounder the provisions of the Mahatma Gandhi National Rural EmploymentGuarantee Act, 2005. In fact the need to provide at least the minimum wage has also been mentionedunder the Mineral Concession Rules, 1960 (Rule 27p and q). It specifies that suchmonetary benefit must be given to tribals and persons displaced due to mining ifthey are employed by mining-lease holders. It is important that a part of the DMF money be used to secure livelihoods ofdirectly affected persons. The second priority, therefore, should be given foreducation scholarships, health insurance, livelihood trainings, loans to establishsmall businesses, etc. Priority should be given to support businesses of women. The DMF funds can be used as an ‘add-on’ (to supplement the funds thatdistrict/blocks/ villages would receive normally) for developing localinfrastructure, including healthcare facilities, schools, water supply, sanitation andsewerage, electricity, roads, etc. For such developmental purposes, there should bemechanisms in place to transfer DMF funds to other concerned governmentdepartments that can implement and maintain these assets. However, the DMFmust have a system to verify and audit its contributions.
A part of the DMF money used for administrative expenses must be used forcapacity building of the affected communities to run the DMF, including fiscaltraining. Investing in the future A part of the money should be invested for the future. This money should be keptto revive the economy of the area when mining finishes to avoid the issue of ‘ghosttowns’ as is commonly observed in mining areas. DMF funds to be used for thesocio-economic upliftment of the community must not be compromised by itsadministrative expense requirements. Similarly, district entitlements from statecoffers must not be affected.However all the decisions regarding DMF are responsibility of district administration.Activities that may be shared in the study area by administration and project proponent: Road strengthening. Road widening Road creation School building renovation. Medical assistance to the beneficiaries Educational assistance Plantation Creation of new drinking water facilities Repairing of existing drinking water facilities Creation of public toilets for public use Support to existing facilities in the area
b. CER activities

Various Project proponents will implement various activities taking into accountthe local conditions after consultation with local administration. The indicativeactivities which can be undertaken by a company under CER. Various Project proponents will implement its CER activities through thefollowing methods:
1. Directly on its own2. Through its own non-profit foundation set- up so as to facilitate thisinitiative3. Through independently registered non-profit organisations that have arecord of at least three years in similar such related activities4. Collaborating or pooling their resources with other companies
Various activites which will be taken into the CER activities may include: Eradicating hunger and poverty; Promoting education; Promotion of gender equality and women empowerment; Reduction of child mortality and improving maternal health; Combating HIV/AIDS malaria and other diseases; Ensuring environmental sustainability; Vocational skills development for enhancing employment; Social business projects; Contributing to the PM's National Relief Fund, Development of funds for the welfare of the SCs/STs, OBCs, minorities andwomenAction both by public and private sector companies mainly spans a diverse set ofthematic areas- health, education, livelihood, poverty alleviation, environment, housing,water, women empowerment, child development, infrastructure etc.

The CER activities, which are mandatory for execution of mining activities, are not merelycompliance; it is a commitment to support initiatives that measurably improve the livesof underprivileged by one or more of the following focus areas as notified under Section135 of the Companies Act 2013 and Companies (Corporate Social Responsibility Policy)Rules 2014: Eradicating hunger, poverty & malnutrition, promoting preventive health care &sanitation & making available safe drinking water; Promoting education, including special education & employment enhancingvocation skills especially among children, women, elderly & the differently unable& livelihood enhancement projects; Promoting gender equality, empowering women, setting up homes & hostels forwomen & orphans, setting up old age homes, day care centers & such otherfacilities for senior citizens & measures for reducing inequalities faced by socially& economically backward groups; Reducing child mortality and improving maternal health by providing goodhospital facilities and low cost medicines; Providing with hospital and dispensary facilities with more focus on clean andgood sanitation so as to combat human immunodeficiency virus, acquired immunedeficiency syndrome, malaria and other diseases; Ensuring environmental sustainability, ecological balance, protection of flora &fauna, animal welfare, agro forestry, conservation of natural resources &maintaining quality of soil, air & water; Employment enhancing vocational skills Protection of national heritage, art & culture including restoration of buildings &sites of historical importance & works of art; setting up public libraries; promotion& development of traditional arts & handicrafts; Measures for the benefit of armed forces veterans, war widows & theirdependents;
Training to promote rural sports, nationally recognized sports, sports & Olympicsports; Contribution to the Prime Minister‘s National Relief Fund or any other fund set upby the Central Government for socio-economic development & relief & welfare ofthe Scheduled Castes, the Scheduled Tribes, other backward classes, minorities &women; xii. Contributions or funds provided to technology incubators locatedwithin academic institutions, which are approved by the Central Government; Rural development projects, etc Slum area development. Explanation for the purposes of this item, the term “slumarea” shall mean any area declared as such by the Central Government or any StateGovernment or any other competent authority under any law for the time being inforce.
c. Education.i) Support t o Technical /Vocational Institutions for their self -development.ii) Academic education by way of financial assistance to Primary, Middle andHigher Secondary Schools.iii) Adult literacy amongst those belonging to BPL.iv) Awareness Programmes on girl education.v) Counseling of parentsvi) Special attention on education, training and rehabilitation of mentally &physically challenged children/persons.vii) Spreading legal awareness amongst people and disadvantageous sections ofthe society about their rights & remedies available.viii) Promotion of Professional Education by setting up educational Institutionsoffering courses in Engg, Nursing, Management,ix) Medicine and in Technical subjects etc.

x) Provide fees for a period of one year or more to the poor and meritorious,preferably girl students of the school in the operational area of the Company toenable them to get uninterrupted education. B Water Supply includingDrinking Waterd. Water Supply including Drinking Water:i) Installation/Repair of Hand Pumps/Tube Wells.ii) Digging/Renovation of Wells.iii) Gainful utilization of waste water from Under -ground Mines for Cultivation orany other purpose.iv) Development/construction of Water Tank/Ponds.v) Rain water-harvesting scheme.vi) Formation of a Task Force of Volunteers to educate people regardingvii) Proper use of drinking water.viii) Empowerment to the villagers for maintenance of the above facilities foravailability of water.: Installation/Repair of Hand Pumps/Tube Wells. Digging/Renovation of Wells. Gainful utilization of waste water from Under -ground Mines for Cultivation orany other purpose Development/construction of Water Tank/Ponds. Rain water-harvesting scheme. Formation of a Task Force of Volunteers to educate people regarding Proper use of drinking water. Empowerment to the villagers for maintenance of the above facilities foravailability of water.Health Care organizing, health awareness Camps on
i) AIDS TB and Leprosyii) Social evils like alcohol, smoking, drug abuse etc.iii) Child and Mother careiv) Diet and Nutrition.v) Blood donation camps.vi) Diabetics detection & Hypertension Campsvii) Family Welfare.viii) Senior Citizen Health Care Wellness Clinics.ix) Fully equipped Mobile Medical Vans.x) Tele medicinexi) To supplement the different programme of Local/State Authorities.xii) Along with De addiction centerse. Environmenti) Organizing sensitizing programmes on Environment Management andii) Pollution Control.iii) Green belt Developmentiv) Afforestation, Social Forestry, Check Dams, Park.v) Restoration of mined out lands.vi) Development of jobs related to agro product i.e., Dairy/Poultry/farmingand others.vii) Plantation of saplings producing fruit.viii) Animal care.
f. Social Empowerment.i) Self /Gainful Employment Opportunities – Training of Rural Youth for SelfEmployment (TRYSEM) on Welding, Fabrication, and other Electronic appliances.
ii) To provide assistance to villagers having small patch of land to developmushroom farming, medicinal plants, farming & other cash crops to make themeconomically dependent on their available land resources.iii) Training may be provided by agricultural experts for above farming.iv) Organizing training programmes for women on tailoring Embroidery designs,v) Home Foods/Fast Foods, Pickles, Painting and Interior Decoration and othervi) Vocational Courses.vii) Care for senior citizens.viii) Adoption/construction of Hostels (specially those for SC/ST &girls)ix) Village Electricity/Solar Lightx) To develop infrastructural facilities for providing electricity through Solar Lightsor alternative renewal energy to the nearby villages. Recurring expenditureshould be borne by the beneficiaries.xi) Pawan Chakki as alternative for providing electricity in villages, etc.g. Sports and Culturei) Promotion of Sports and Cultural Activities for participation in State and National level.ii) Promotion/Development of sports activities in nearby villages by conductingTournaments like Football, Kabaddi and Khokho, Cricket etc.iii) Providing sports materials for Football, Volleyball, Hockey sticks etc. to the young andtalented villagers.iv) Promotion of State level teams.v) Sponsorship of State Sports events in Bihar.vi) Sponsorship of Cultural event to restore Indian Cultural Traditions and Values.vii) Possibility of providing facilities for physically handicapped persons may be explored.ix) Medias for preparing of documentary films.
x) Guide-lines to be followed to promote sports activities by way of grantingfinancial assistance/donation/sponsorship etc.xi) Registered Clubs/Institutions which promote Sports activities may be grantedfinancial assistance/donations/sponsorship based on the following norms:-1) Sports talent development programme by Clubs/Institutions may beencouraged provided the proposal is routed through the respective GovernmentAuthorities/Block Development Office/Sub-Divisional Office/District Office/StateAssociations/ local people representatives i.e. Panchayat ,Pradhan/Mukhiya/MLA/MP/ Minister etc., to ascertain bonafide objective, statusof activities and contribution to the society.2) Helping State Government in promotion of sports by providing them propertraining facilities, grounds, construction of fields,etc.3) While sanctioning financial assistance/donation/sponsorship for State/National/International events, Company could send its representatives to ensureproper utilization of fund for the specific purpose, as well as, to ensurepublicity/coverage for corporate image building.4) As per the Government policy for payment of financial assistance/donation/sponsorship Registered Clubs/Institution will furnish details as required byCompany. i.e. their Registration, PAN No. etc. to establish their authenticity.xi) Generate self-employment.xii) Infrastructure Support – construction, repair, extension etc. of:- Auditorium, Educational Institutions Rural Dispensaries initiated by reputed NGOs. Mobile Crèches. Bridges, Culverts & Roads, Check Dam
Shopping Complex to facilitate business/self employment for local people Community Centre, Sulabh Souchalaya, Yatri Shed in Bus Stand, Burning Ghat/Crematorium Development of Park Play ground/Sports complex/Good Coaches. Old Age Home
8.2. ROAD MAINTAINANCE
Access roads are maintained during the period of time they are required. The level of
maintenance on an access road varies depending on its use at any given time. For example,
during wood extraction operations, when numerous heavily loaded trucks are using a road,
it is maintained to keep the riding surface very smooth. Later, if the road is no longer used
for timber management, the road use may change. It can either be maintained at minimal
levels for light recreational and other traffic uses. The operations carried out for road
maintenance can be broken into two main groups: routine and non-routine. Routine
operations include those day-today activities necessary to maintain the road for the traffic
using it. These may include grading and the maintenance of drainage by cleaning out
blocked ditches and culverts. Non-routine maintenance includes major repairs and
restoration. Since roads gradually deteriorate with time, there is a periodic need to restore
the condition of roads serving a long-term need. These roads may require major
maintenance or re-construction to restore their original condition every ten to twenty years.
Example operations falling into this category include: brush control with mechanical and
chemical methods; replacement of gravel surfacing material; repair of major flood damage,
and, replacement of substandard bridges. Remove roadside vegetation that shades the road,
for safety (visibility) and for drying of the road. In erodible soils, do not expose the mineral
soil during the brushing operation. Special mitigative techniques such as sediment traps and
check dams should receive regular maintenance as long as they are needed.
8.2.1 Construction of motarable roads
The construction of access roads will cause significant disturbance to the natural
environment, if not properly maitained. Construction of access road activities will be
subdivided into a series of operations that take place in a chronological sequence. Using
this sequence, the good practices have been grouped into the following components:
• Road planning and location- This phase comprises finalization of route that will have the
minimal environmental and social effect. the preconstruction components of the route
study, road location and road design. The level of technical evaluation, layout and design
required on a particular road depends on the geometric standard, the terrain through which
the road will be built and the method of construction. At this stage, the final route is
selected. Decisions about the location of a particular road have an important influence on
the impact the road will have on the natural environment. For environmental as well as
practical considerations, road alignments will follow the contours of the land. Gentle
grades (1-4%) for proper drainage and economical construction will be taken into
consideration • Construction of a road to a higher standard than necessary increases costs
and has the potential for more environmental damage. Landings, loading areas and
turnarounds will be located when the road is being laid out
• A clearing- To avoid any vegetation clearing the existing haulage route.If the need arise
the normal practice will be to specify a minimum width of clearing. This will be done for
several reasons: to allow space for construction equipment to operate without knocking
down standing trees; to provide safe sight lines around curves; and, to allow drying of the
roadway in wet weather and spring break-up. Maximum widths should also be specified to
minimize the areal extent of disturbance caused by road construction.However in the study
area clearing is not required as path for haulage route is already decided.
• Grubbing- Grubbing, or stripping, consists of the removal and disposal of stumps, roots,
brush, small trees, embedded logs and organic material overlying the mineral soil.
Grubbing is done to expose the mineral soil for three reasons: • To prepare for earth
grading operations. • To improve roadway performance by eliminating weak organic
material in the zone carrying wheel loads; and • To minimize future sight distance
problems that roadside vegetation could cause.
• Earth Grading- Earth grading reshapes the original ground contours to the shape of the
road, in profile and cross-section. The operation includes the excavation of earth cuts and
the construction of earth fills. Lower standard roads tend to follow the original ground
contours more closely, because their geometric requirements are less critical; this means
that cut and fill depths will be less than those for a higher- standard road constructed along
the same route.
• Graveling- This operation refers to the placing of sand and gravel materials to form the
structural road sub-base and surface that supports the wheel loads. A sand cushion may be
used as a sub-base under the gravel surface if the underlying earth cut or fill materials are
poor and of low strength. The operation generally involves importing select material from a
gravel pit nearby. The equipment normally used includes front-end loaders, dump trucks,
bulldozers, graders and back- hoes. Occasionally, crushing units, compaction equipment
and water trucks are also used.
• Road Maintenance- Access roads are maintained during the period of time they are
required. The level of maintenance on an access road varies depending on its use at any
given time. For example, during wood extraction operations, when numerous heavily
loaded trucks are using a road, it is maintained to keep the riding surface very smooth.
• Road Abandonment- Physical Abandonment occurs when there is a deliberate act to
render a road unusable by vehicular traffic. Physical abandonment could include taking
steps which will minimize the environmental impacts of non-maintenance. Natural
Abandonment occurs when road maintenance has ceased, yet steps are not taken to prevent
the use of the road by vehicles. With natural abandonment, no physical changes are made
to the road.
8.3 EMPLOYMENT POTENTIAL- SKILLED, SEMISKILLED AND UNSKILLEDMorrum mining and agriculture is the basic sector of employment for the local people inthis area. This project will lead to indirect employment opportunity. Employment isexpected during morrum excavation, morrum transportation, in trade and other ancillaryservices. Employment in these sectors will be primarily temporary or contractual andinvolvement of unskilled labour will be more. A major part of this labour force will bemainly from local villagers who are expected to engage themselves both in agriculture
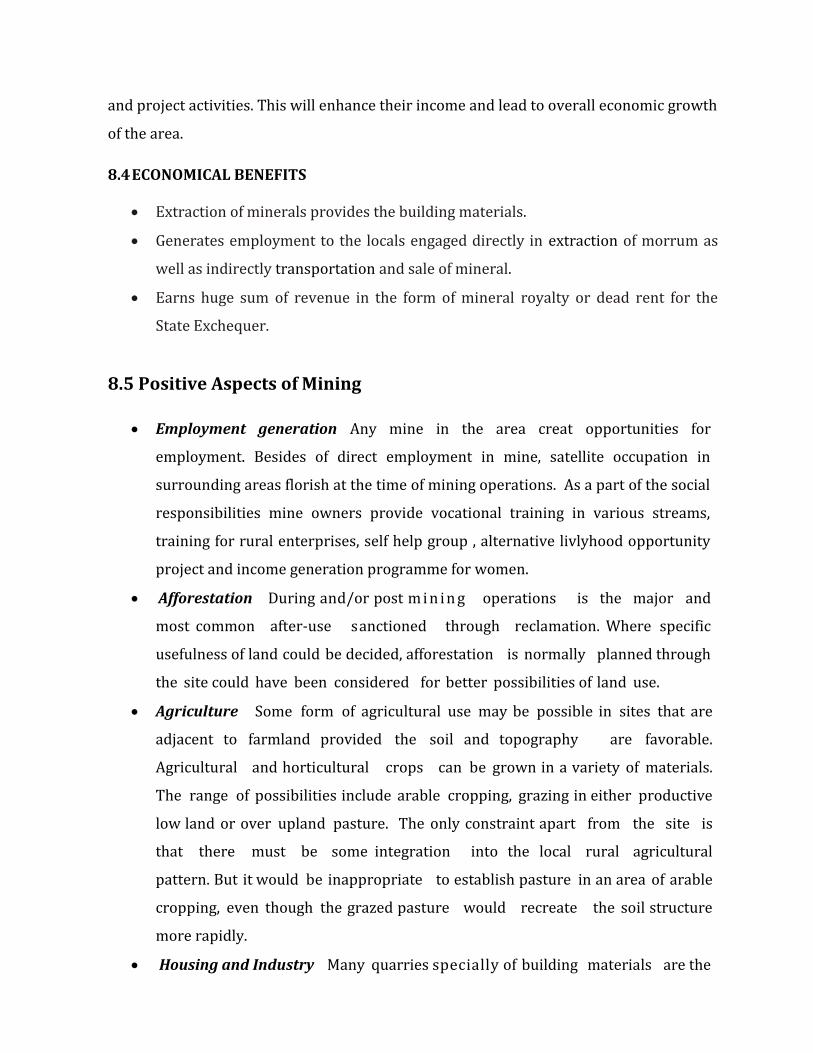
and project activities. This will enhance their income and lead to overall economic growthof the area.8.4ECONOMICAL BENEFITS
Extraction of minerals provides the building materials. Generates employment to the locals engaged directly in extraction of morrum aswell as indirectly transportation and sale of mineral. Earns huge sum of revenue in the form of mineral royalty or dead rent for theState Exchequer.
8.5 Positive Aspects of Mining
Employment generation Any mine in the area creat opportunities foremployment. Besides of direct employment in mine, satellite occupation insurrounding areas florish at the time of mining operations. As a part of the socialresponsibilities mine owners provide vocational training in various streams,training for rural enterprises, self help group , alternative livlyhood opportunityproject and income generation programme for women. Afforestation During and/or post m i n i n g operations is the major andmost common after-use sanctioned through reclamation. Where specificusefulness of land could be decided, afforestation is normally planned throughthe site could have been considered for better possibilities of land use. Agriculture Some form of agricultural use may be possible in sites that areadjacent to farmland provided the soil and topography are favorable.Agricultural and horticultural crops can be grown in a variety of materials.The range of possibilities include arable cropping, grazing in either productivelow land or over upland pasture. The only constraint apart from the site isthat there must be some integration into the local rural agriculturalpattern. But it would be inappropriate to establish pasture in an area of arablecropping, even though the grazed pasture would recreate the soil structuremore rapidly. Housing and Industry Many quarries specially of building materials are the
basis of development for residential accommodation, infrastructure andindustrial activities.Sl.No.
Project/ Owner Village/Tehsil/District
Total ProjectCost (Rs.)
CER Cost (Rs.)(2% of TotalProject Cost)11. M/s Yadav andSons Bhedi Kharka,Sarila,Hamirpur 10,64,40,656/- 21,28,153.123/-
8.6 SUMMARYThe in situ mining activity in any area is on one hand bring revenue and employment(Primary and secondary) and on other hand if not done properly potential pollution andecological imbalance increases. The ability of the ecosystem to fix nitrogen can also bereduced. Particulate matter transported by the wind as a result of excavations, blasting,transportation of materials, wind erosion (more frequent in open-pit mining), fugitivedust from tailings facilities, stockpiles, waste dumps, and haul roads. Exhaust emissionsfrom mobile sources (cars, trucks, heavy equipment) raise these particulate levels; andGas emissions from the combustion of fuels in stationary and mobile sources, explosions,and mineral processing. The direct impact of activities will be from mining andtransportation. The indirect impacts comprises adjacent areas affected through miningactivities and changes in the landscape that can propagate ecological changes for variousdistances; this includes such items as fragmentation, changes in forest type within thedirect effect, changes in wildlife migration and habitat use patterns, noise, light,windblown dust, dispersal of invasive species established on the mine site, andwatershed areas affected by water withdrawals and mine drainage. Mining will directlydisplace forests and potentially change the composition of any forest. Certain speciesrequire large tracts of unfragmented forest, Wildlife species living within the primarymining footprint would be directly displaced, due to loss of forest and other vegetation.Employment generation and social upliftment along strenghed infrastructure will be thebeneficial aspects. The mining activity along with precaution and mitigation measure willbe beneficial.
CHAPTER-IX
S. NO. CONTENTS
9.1 INTRODUCTION9.2 ANALYSIS OF PROJECT COMPONENTS9.3 QUANTITATIVE ANALYSIS9.4 QUALITATIVE ANALYSIS9.5 INFERENCE9.6 COST BENEFIT ANALYSIS OF THE PROJECTS IN THE STUDY AREA:
9.1 INTRODUCTIONSince sand/ morrum are the basic requirements in construction industry and due to therecent boom in the sector, indiscriminate river sand mining has created a number ofenvironmental and social problems. Within this context, this chapter attempts to identifyenvironmentally safe options for sustainable river sand mining that minimizeenvironmental degradation while meeting the requirements of the construction industryand local people. It is essential to have a cost benefit impact analysis of a project. It lies ina range of project and plan appraisal methods that seek to apply monetary value to costand benefits. It is more compressive in scope. It takes long view of the project (further aswell as nearer future) and a wide view (in the sense of allowing for side effect). It is thecomparison of any positive or negative changes in the value of mine environmentamenities with costs (or benefits) of implementing the proposed change. It is based inwelfare, economics and seeks to include all the relevant cost and benefits to evaluate thenet social benefits of a project. In proposal for de-reservation or diversion of forest use, itis essential that ecological and environmental losses and sufferance cause to the people,who are displaced are weighted against the economic and social gain. It contains simplythe work necessary to present a decision taken with the information, which require inorder to make a decision.9.1.1 General Application of Costs-Benefits Analysis

1. In calculation of environmental impact of a proposed mining activity2. In transportation3. In evaluating alternative planning policy,4. In optimum allocation of resource to activities,5. In water resource planning,
9.1.2 Types of Impact of Mining
Three distinctive process of mining can be isolated as causative agents of environmentaldeterioration. Possible impacts may be siltation, impact on aquiflora and aquifauna,siltation, change in flow and current pattern, alteration of the sand budget, change inerosion and deposition rates, change in ground water level. Loading process may createsclouds or plumes of sand. A bottom plume will be created at the point of excavation andasurface plume will be created from the loading itself.9.1.3 Benefits of Mining
MethodologyThere are various methodologies to calculate the CBA Project definition Identification Enumeration of cost and benefits Evaluation of cost and benefits Discounting and presentation of result
Cost - benefit analysis typically involves reducing an innumerable of com-plex physicaland social-economic variable to simple, quantifiable categories of costs and benefits.The mine environment can be structured in several ways- include components, scale,space and time. A narrow definition of mine environmental component would focus
primarily on all media susceptible to mine pollution, including air, water, soil; flora andfauna, and human being; landscape, urban and rural conservation and the built heritage.The net benefits of sand mining are analyzed from a social (cost-benefit analysis) and aprivate (financial analysis) perspective. Sand mining of the riverbeds has huge social andenvironment impacts on the rivers and communities depending on the rivers.One of the most important concepts in residual management is costs and benefitsinvolvement in term of mine environmental pollution and waste minimization. Properdecision making involves a comparison of total project cost and benefit in order to choosean alternative that returns the appropriate benefit for the least cost, thereby allocatingresources in the most efficient way. The ultimate goal of residual management is toprovide the level of protection necessary for the prevention of significant damage toecological and social system at a minimum cost.Pollution because development cannot took place free of cost. However, as sharplyminimize the losses of crops and forests, improve the life system etc. It reducesprotection cost of buildings attested by pollutant; minimize expenditure on imports ofenergy and raw materials. Mine environmental quality controls can offer more suitablebenefits. Mine Environmental controls reduce the need for defensive products, such asmedical care health and life insurance burglar alarms and soon by improving the healthand living condition of the general populate. The economic, health, physical, and socialbenefits of mine environmental quality controls clearly outweigh the costs. In trueeconomics sense, mine environmental controls provide a valuable service to citizens bypromoting health, safety, welfare, peace, and permanence.After the system’s capacity to assimilate mine pollution has been exceeded. The costbenefit analysis is a useful tool to predict the damage caused by the mining in term of itsimpact of cost which can help management to take precautionary measure to minimizethe damage and reduce the cost. It will heavily reduce the costs of health service,improved productivity, minimize the losses of crops and forests, improve the life systemetc. It reduce s protection cost of buildings attested by pollutant, minimize expenditureon imports of energy and raw materials. Mine environmental quality controls can offermore suitable benefits. Mine Environmental controls reduce the need for defensiveproducts, such as medical care health and life insurance burglar alarms and soon by
improving the health and living condition of the general populate. The economic, health,physical, and social benefits of mine environmental quality controls clearly outweigh thecosts. In true economics sense, mine environmental controls provide a valuable service tocitizens by promoting health, safety, welfare, peace, and permanence. The cost benefitanalysis is a useful tool to predict the damage caused by the mining in term of its impactof cost which can help management to take precautionary measure to minimize thedamage and reduce the cost. It will heavily reduce the costs of health service, improvedproductivity,9.1.4 Environmental cost-benefit analysis at regional levelThe specific purpose of the CBA is to express measures of impact from a plan onenvironmental quality. Beneficial effects from a plans implementation may be a result ofmanagement, preservation and restoration etc under regional development. It willprovide regional concerns resulting from environmental activities in a given area.Imqapctof regional nature are divided into two separate sub accounts, Regional development andsocial well being. Regional development in turn is partitioned into five categories ofeffects:
1. Regional income2. Regional employement3. Population distribution4. Regional economic base and stability5. Regional environmental9.2 ANALYSIS OF PROJECT COMPONENTS (ECONOMIC AND FINANCIAL ANALYSIS)An Economic analysis is conducted from the perspective of the community as a whole. Itfocuses on “real” resource costs and benefits, including any “external” environmentalcosts and benefits that affect the broader community.In Financial analysis, from a private perspective, similar concepts apply as in theeconomic analysis, but the benefits and costs are estimated in terms of the financialbenefits received and costs borne by private producers. Because the financial analysisfocused only on the project proponent’s private financial prospects and did not take into
account externalities or external environmental costs, it is inadequate in determining theefficiency of resource allocation.9.3 QUANTITATIVE ANALYSIS
9.3.1 Financial analysis: The total profit per year that a project proponent can receivefrom sand mining is calculated as follows:Total Profit = Unit Profit x Sand Extract VolumeUnit Profit = Market Value of 100 m3of Extracted Sand – Total Costs of Extraction of 100m3The market value of sand was calculated based on the market price of sand; the cost ofsand extraction includes cost of labour, fuels, equipment depreciation, and other costs.However some measure cost components are1. Cost of Labour
a Unskilledb Semi skilled
2. Cost of Equipments
a Scraping and Loading
i Bar scraper and Light Earth Moverii Fuel and Contigency Charges
iii Manual Hand equipments3. Environment Management Plan (EMP)
a
PlantationNo of plantsTree GuardWater Demand for plantationb Air Pollution ControlSprinkling on haulage route for dustsuppressionc Environmental Monitoring
4. Site Services
a Portable toilets

b PPE for Health and Safety of laboursc Drinking water for site workers
5. Miscellaneous
a
Site Development (Pole Marking, soil & debrisremoval etc.)b Training and Awareness Camps for laboursc River bank plantationd Channel flow conservation (Hume pipe)e Road maintainancef Installation of waste water treatment.
Above components will include for the Total Cost of project. Suppose this cost is ‘X’ forcurrent production ‘P’ per annum.Now equation is –Production P per annum = Rs. XSo, cost of production per cum = Rs. X/ PNow, Selling Cost per cum = Rs. S(which can be calculated on the basis of Cost per truck, say it 15 cum)We can clearly compare the values of S & X9.3.2 Economic analysis: The net benefit that a society receives from sand mining wascalculated as follows:NPV = ( )Where NPV is net social benefit from sand mining;Bi is the financial benefits of sand mining for society through the years;Ci is the cost of sand mining through the years, including the financial cost (cost of labour,fuel, and equipment that the dredgers have to pay), external costs of riverbank erosion,
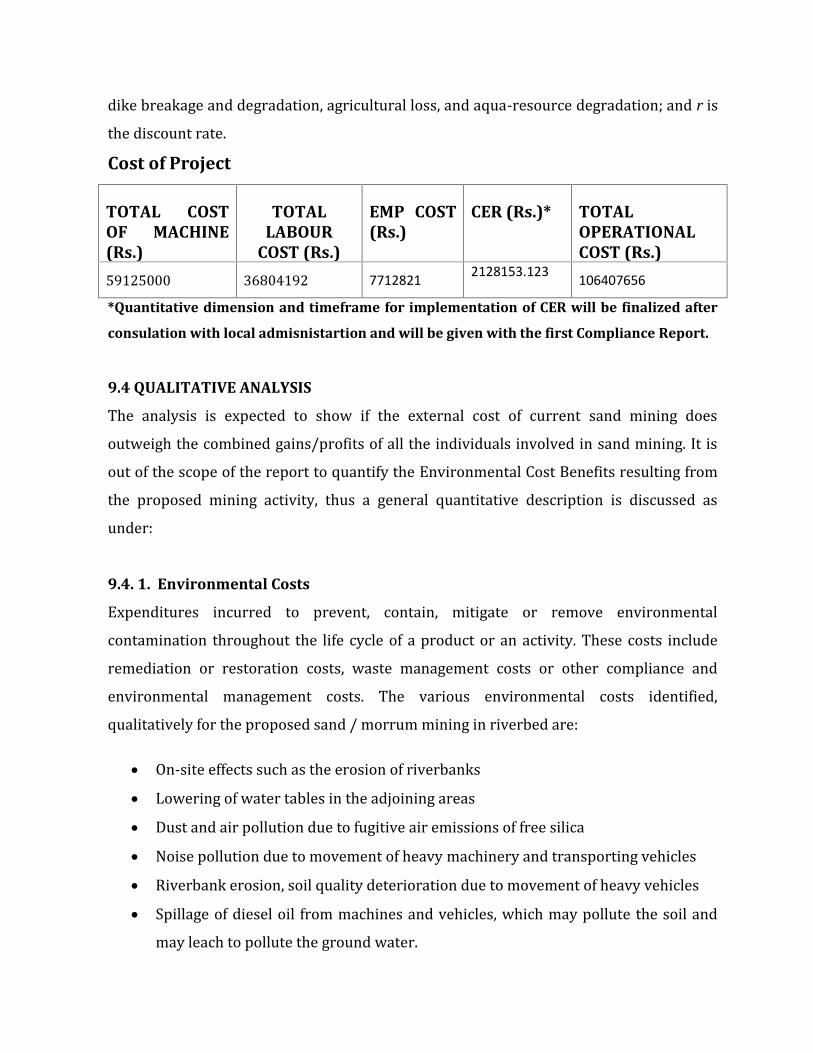
dike breakage and degradation, agricultural loss, and aqua-resource degradation; and r isthe discount rate.Cost of Project
TOTAL COSTOF MACHINE(Rs.)
TOTALLABOUR
COST (Rs.)
EMP COST(Rs.)
CER (Rs.)* TOTALOPERATIONALCOST (Rs.)59125000 36804192 7712821
2128153.123106407656
*Quantitative dimension and timeframe for implementation of CER will be finalized after
consulation with local admisnistartion and will be given with the first Compliance Report.
9.4 QUALITATIVE ANALYSISThe analysis is expected to show if the external cost of current sand mining doesoutweigh the combined gains/profits of all the individuals involved in sand mining. It isout of the scope of the report to quantify the Environmental Cost Benefits resulting fromthe proposed mining activity, thus a general quantitative description is discussed asunder:9.4. 1. Environmental CostsExpenditures incurred to prevent, contain, mitigate or remove environmentalcontamination throughout the life cycle of a product or an activity. These costs includeremediation or restoration costs, waste management costs or other compliance andenvironmental management costs. The various environmental costs identified,qualitatively for the proposed sand / morrum mining in riverbed are: On-site effects such as the erosion of riverbanks Lowering of water tables in the adjoining areas Dust and air pollution due to fugitive air emissions of free silica Noise pollution due to movement of heavy machinery and transporting vehicles Riverbank erosion, soil quality deterioration due to movement of heavy vehicles Spillage of diesel oil from machines and vehicles, which may pollute the soil andmay leach to pollute the ground water.

Damage to Riparian biodiversity Reduced vegetative bank cover. Loss of habitat of the aquatic population Alteration of flow patterns due to the modification of riverbeds, overloading ofsuspended sediment Damage to the channel beds due to the use of heavy equipment Disturbance of the natural hydrology of the riparian zone because of infrequentelevated flow levels Drying up of irrigation channels, thus reduced flooding of paddy fields withnutrient-laden water Presence of water puddles in lease vicinity and haulage road, thus increase inmosquito-related health problems Breakout of epidemics leading to loss of life. Expenditure on control of thesebreakouts, vaccines, medicines, scientific research and quarantining the area. Off-site effects include the impairment of rural roads, causing damage to the roadinfrastructure due to heavy loads carried on weak rural roads.Sand mining is a global activity in both developed and developing countries. Exploitingsand from different sources has both multiple benefits (poverty reduction, economicgrowth, new habitats for plants and animals, new water reservoirs are created, and aseries of negative impacts on the environment. Based on the studies, several factors mustbe taken into account when the environmental impact of sand mining is analyzed: location of sand mine; size of mining area; time of exploitation; secondary mineralogy; habitats and vegetation diversity across the mining area; and Technical conditions for exploitation.
Environment Mangement Plan (EMP)
a No of plants (@5 plants/ha and 50% 60saplings 9,109

mortality rate)b Tree Guard (@2000/- per unit) 60 saplings 1,21,450
cWater Demand for plantation (@ 0.5litre/plant) 0.030 KLD 6,262
dSprinkling on haulage route for dustsupression 45.28 KLD 62,26,000
e Monitoring cost 1350000Total 77,12,821
9.4.2 Environmental BenefitsExpenditures saved on safeguard, management or upkeep of environment, through director indirect practices, implemented during the course of life cycle of a product or anactivity. In the case of sand mining for the Proposed Sand / Morrum mining projects theenvironmental benefits are:The proposition is to mine morrum from the riverbeds to cater to the increasingdemands of the construction industry. This can help desilt the riverbeds that havebeen silted up over the years. This in turns has a number of benefits: Prevention of floods due to channelization of river. Restoring of banks and safety,if and when undertaken, will cost in crores to Govt. Prevention of losses due to flooding. Prevention of Loss of life Prevention of Loss of homes or other items of utility Prevention of Agricultural losses Prevention of loss of cattle and aquatic resources.
1. Prevention of Change of Course of riverAs the yearly deposition of morrum is excavated, the change in course of river, whichmight have occurred in absence of such extraction, is prevented. It thus has followingbenefits: Continual use of infrastructure along the course of the river such as bridges, dams,hydro-electric power plants, sewer lines, purification units or other industrialunits.
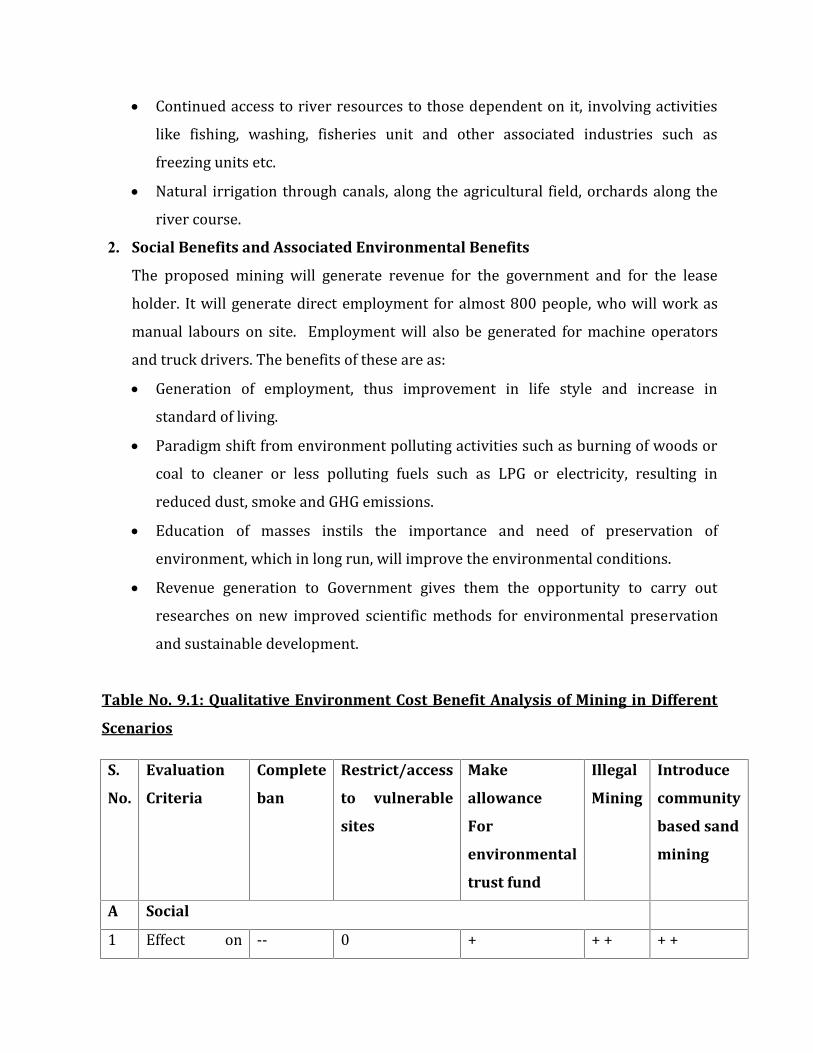
Continued access to river resources to those dependent on it, involving activitieslike fishing, washing, fisheries unit and other associated industries such asfreezing units etc. Natural irrigation through canals, along the agricultural field, orchards along theriver course.
2. Social Benefits and Associated Environmental BenefitsThe proposed mining will generate revenue for the government and for the leaseholder. It will generate direct employment for almost 800 people, who will work asmanual labours on site. Employment will also be generated for machine operatorsand truck drivers. The benefits of these are as: Generation of employment, thus improvement in life style and increase instandard of living. Paradigm shift from environment polluting activities such as burning of woods orcoal to cleaner or less polluting fuels such as LPG or electricity, resulting inreduced dust, smoke and GHG emissions. Education of masses instils the importance and need of preservation ofenvironment, which in long run, will improve the environmental conditions. Revenue generation to Government gives them the opportunity to carry outresearches on new improved scientific methods for environmental preservationand sustainable development.
Table No. 9.1: Qualitative Environment Cost Benefit Analysis of Mining in Different
Scenarios
S.
No.
Evaluation
Criteria
Complete
ban
Restrict/access
to vulnerable
sites
Make
allowance
For
environmental
trust fund
Illegal
Mining
Introduce
community
based sand
mining
A Social1 Effect on -- 0 + + + + +
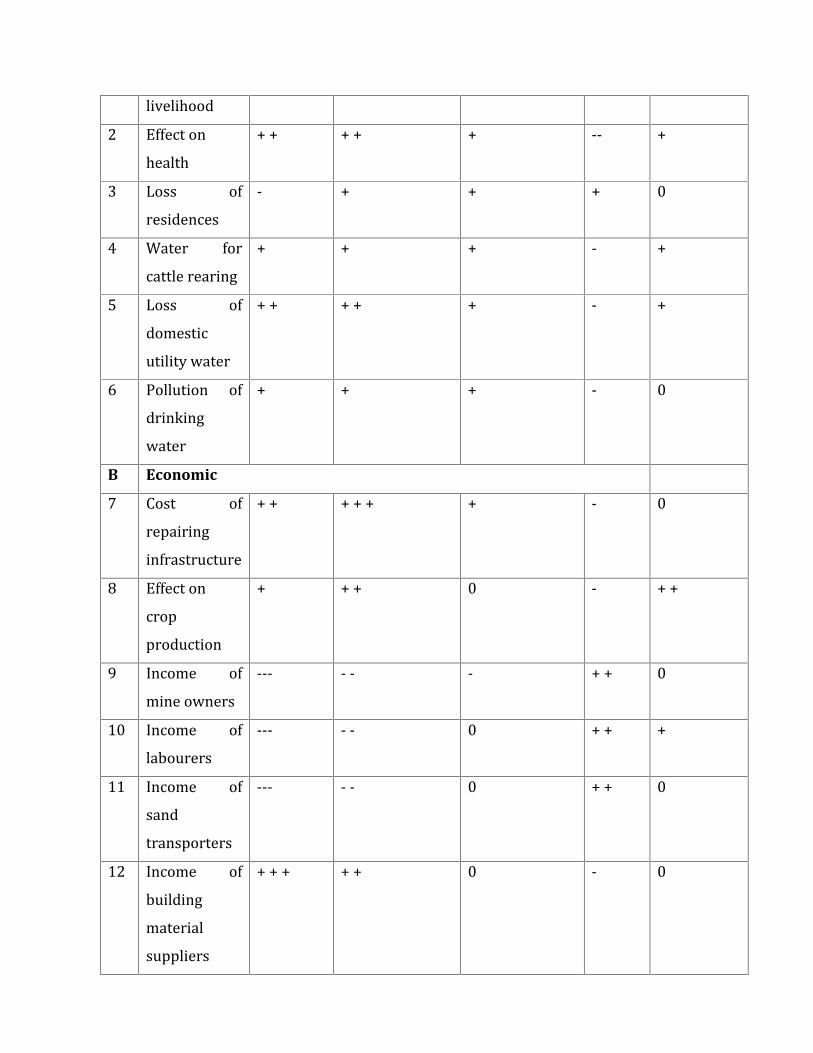
livelihood2 Effect onhealth + + + + + -- +3 Loss ofresidences - + + + 04 Water forcattle rearing + + + - +5 Loss ofdomesticutility water
+ + + + + - +6 Pollution ofdrinkingwater
+ + + - 0B Economic7 Cost ofrepairinginfrastructure
+ + + + + + - 08 Effect oncropproduction
+ + + 0 - + +9 Income ofmine owners --- - - - + + 010 Income oflabourers --- - - 0 + + +11 Income ofsandtransporters
--- - - 0 + + 012 Income ofbuildingmaterialsuppliers
+ + + + + 0 - 0
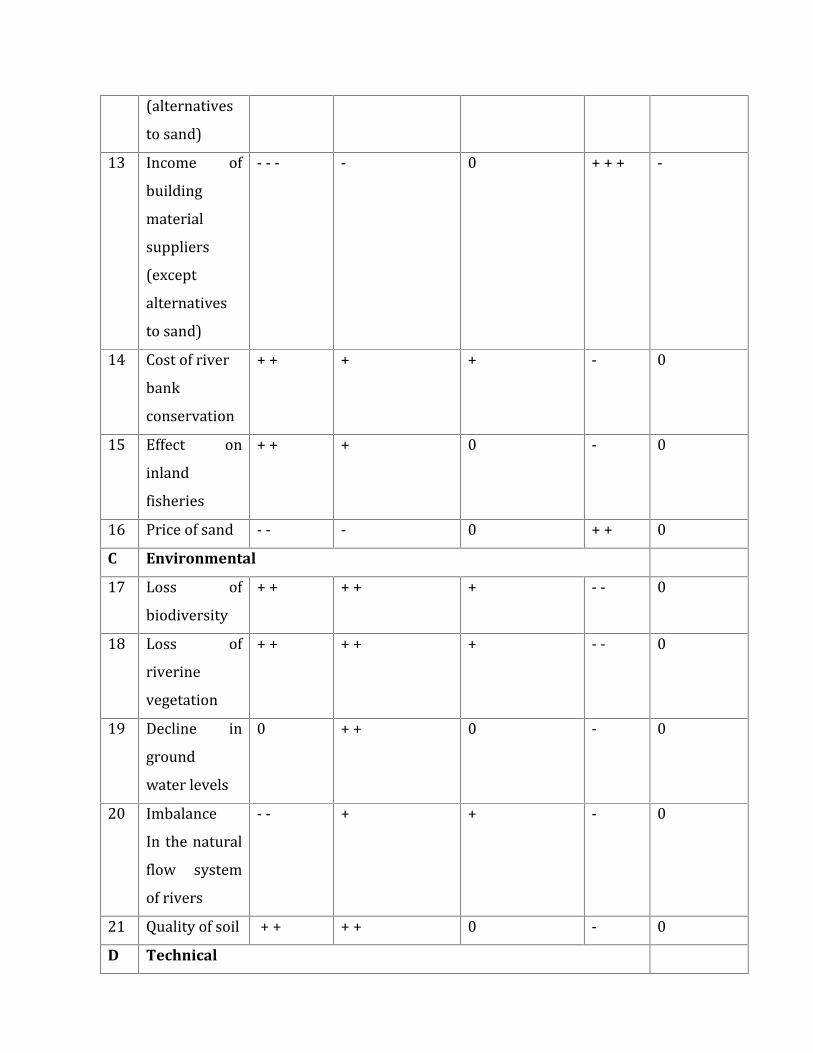
(alternativesto sand)13 Income ofbuildingmaterialsuppliers(exceptalternativesto sand)
- - - - 0 + + + -
14 Cost of riverbankconservation+ + + + - 0
15 Effect oninlandfisheries+ + + 0 - 0
16 Price of sand - - - 0 + + 0C Environmental17 Loss ofbiodiversity + + + + + - - 018 Loss ofriverinevegetation
+ + + + + - - 019 Decline ingroundwater levels
0 + + 0 - 020 ImbalanceIn the naturalflow systemof rivers
- - + + - 0
21 Quality of soil + + + + 0 - 0D Technical
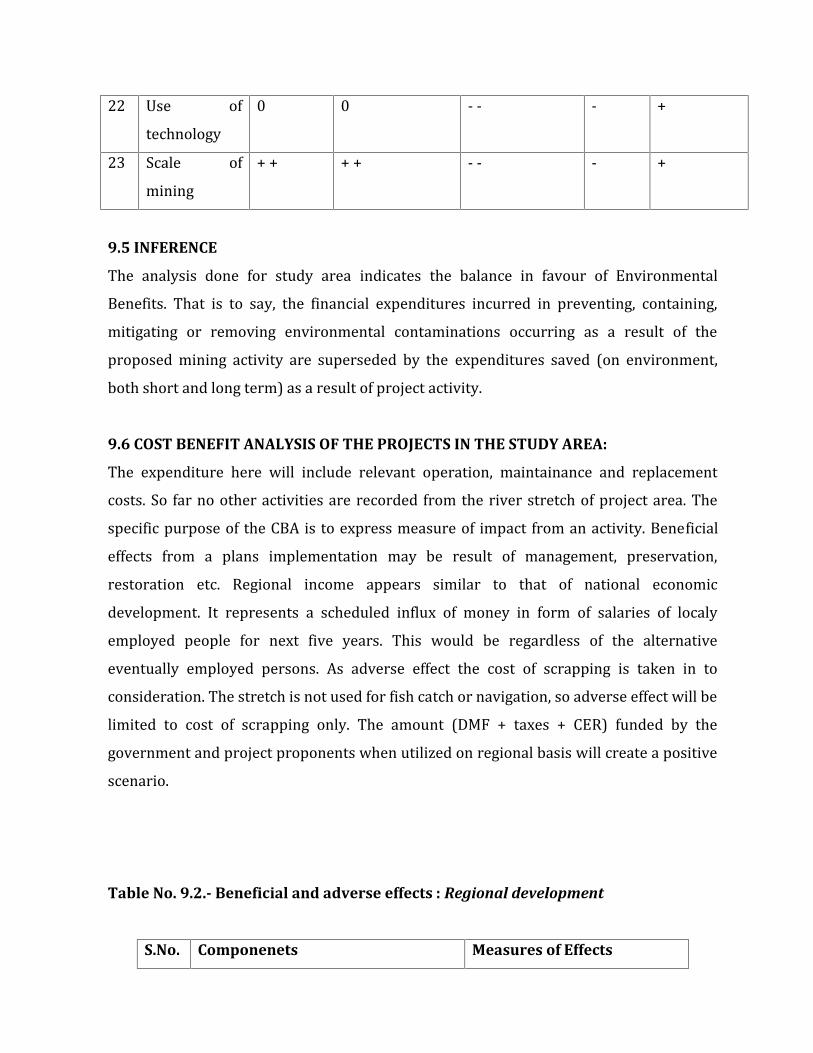
22 Use oftechnology 0 0 - - - +23 Scale ofmining + + + + - - - +9.5 INFERENCEThe analysis done for study area indicates the balance in favour of EnvironmentalBenefits. That is to say, the financial expenditures incurred in preventing, containing,mitigating or removing environmental contaminations occurring as a result of theproposed mining activity are superseded by the expenditures saved (on environment,both short and long term) as a result of project activity.9.6 COST BENEFIT ANALYSIS OF THE PROJECTS IN THE STUDY AREA:The expenditure here will include relevant operation, maintainance and replacementcosts. So far no other activities are recorded from the river stretch of project area. Thespecific purpose of the CBA is to express measure of impact from an activity. Beneficialeffects from a plans implementation may be result of management, preservation,restoration etc. Regional income appears similar to that of national economicdevelopment. It represents a scheduled influx of money in form of salaries of localyemployed people for next five years. This would be regardless of the alternativeeventually employed persons. As adverse effect the cost of scrapping is taken in toconsideration. The stretch is not used for fish catch or navigation, so adverse effect will belimited to cost of scrapping only. The amount (DMF + taxes + CER) funded by thegovernment and project proponents when utilized on regional basis will create a positivescenario.
Table No. 9.2.- Beneficial and adverse effects : Regional development
S.No. Componenets Measures of Effects

1. Regional IncomeBeneficial Effectsa. Value of Sand produced It may vary from place toplaceb. External components (Other riverbased activities like fishing) NilAdverse Effectsa. Cost of Excavation Cost of labour and machinesproject wise given in chapter2a.b. Additional costc. Lack of other activities NilTotal Net benefit2. Regional EmployementBeneficial Effectsa. Increase in number of employedperson (Direct and Indirect) Almost 8200
Adverse Effectsb. None -Total Net benefit3. Population Distributiona. Beneficial and adverse Effects Incoming of people forsatellite ioccupation candeplete the livelihoodresources.Total Net benefit None4. Reginal Economic Base and StabilityBeneficial Effects Yesa. Provide a source of Economic stabilityand economic diversification.b. Provide for regional mining capability YesTotal Net benefit5. Regional Environmental ConcernsAdverse Effects
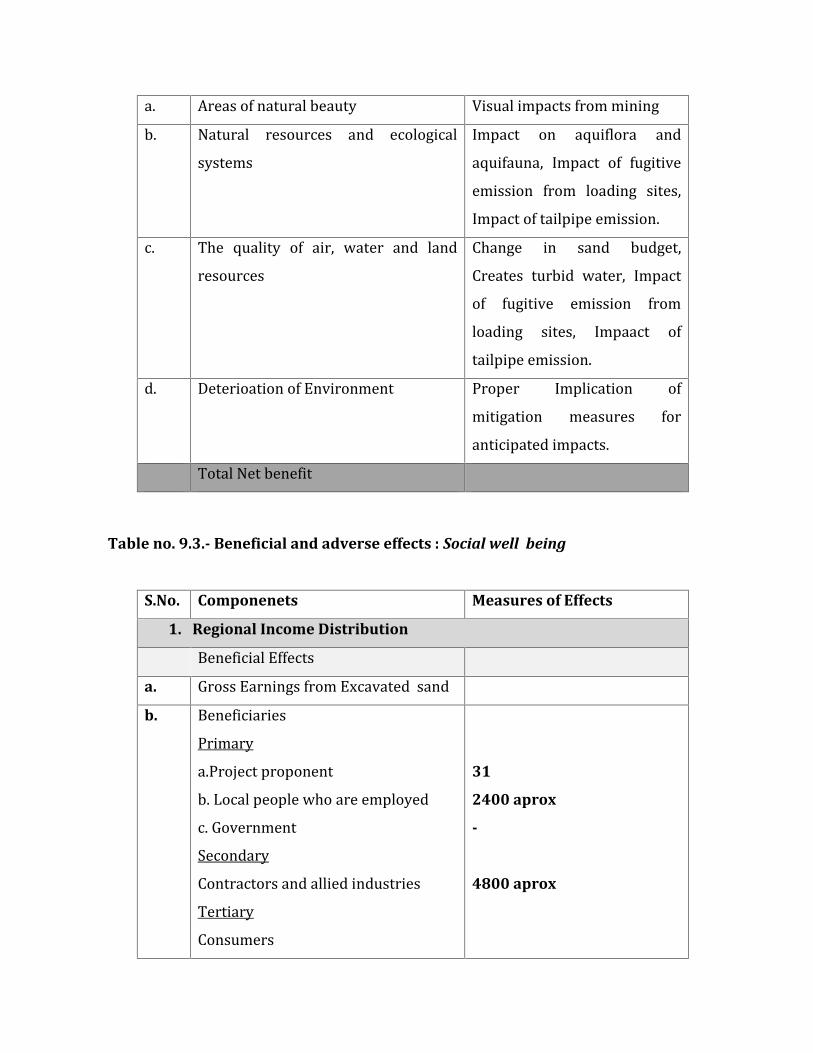
a. Areas of natural beauty Visual impacts from miningb. Natural resources and ecologicalsystems Impact on aquiflora andaquifauna, Impact of fugitiveemission from loading sites,Impact of tailpipe emission.c. The quality of air, water and landresources Change in sand budget,Creates turbid water, Impactof fugitive emission fromloading sites, Impaact oftailpipe emission.d. Deterioation of Environment Proper Implication ofmitigation measures foranticipated impacts.Total Net benefitTable no. 9.3.- Beneficial and adverse effects : Social well being
S.No. Componenets Measures of Effects
1. Regional Income DistributionBeneficial Effectsa. Gross Earnings from Excavated sandb. BeneficiariesPrimarya.Project proponentb. Local people who are employedc. GovernmentSecondaryContractors and allied industriesTertiaryConsumers
31
2400 aprox
-
4800 aprox
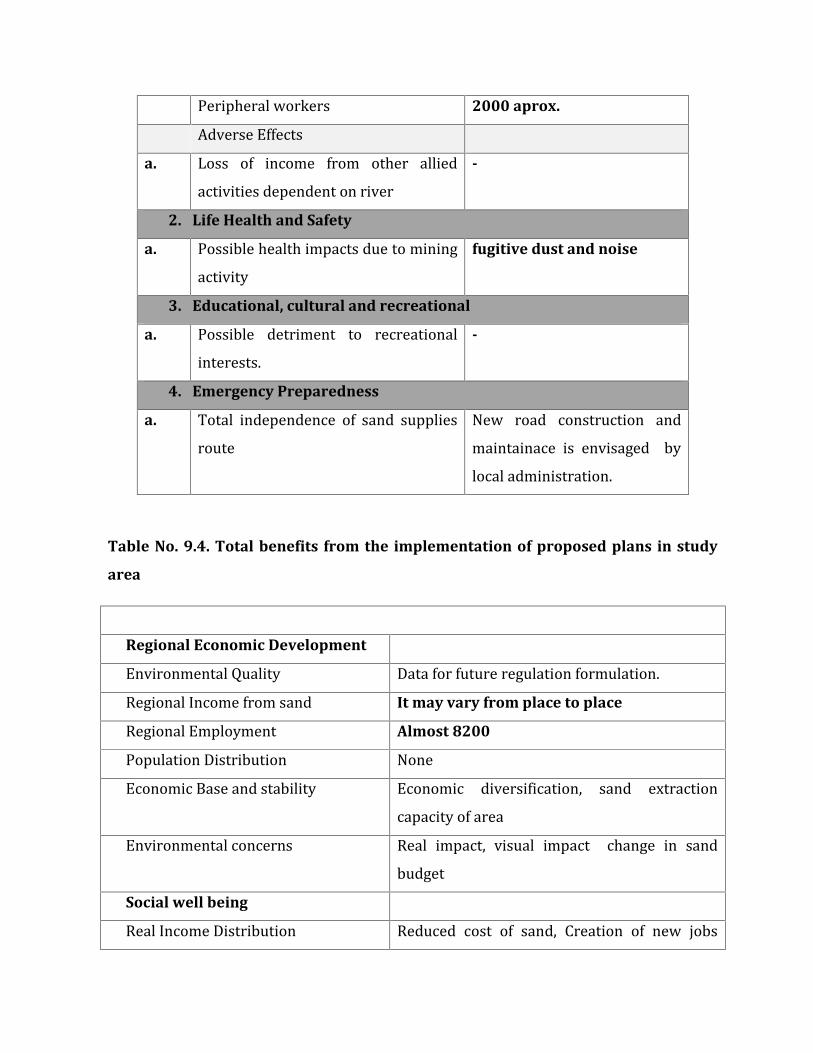
Peripheral workers 2000 aprox.Adverse Effectsa. Loss of income from other alliedactivities dependent on river -
2. Life Health and Safety
a. Possible health impacts due to miningactivity fugitive dust and noise
3. Educational, cultural and recreational
a. Possible detriment to recreationalinterests. -
4. Emergency Preparedness
a. Total independence of sand suppliesroute New road construction andmaintainace is envisaged bylocal administration.Table No. 9.4. Total benefits from the implementation of proposed plans in study
area
Regional Economic DevelopmentEnvironmental Quality Data for future regulation formulation.Regional Income from sand It may vary from place to placeRegional Employment Almost 8200Population Distribution NoneEconomic Base and stability Economic diversification, sand extractioncapacity of areaEnvironmental concerns Real impact, visual impact change in sandbudgetSocial well beingReal Income Distribution Reduced cost of sand, Creation of new jobs
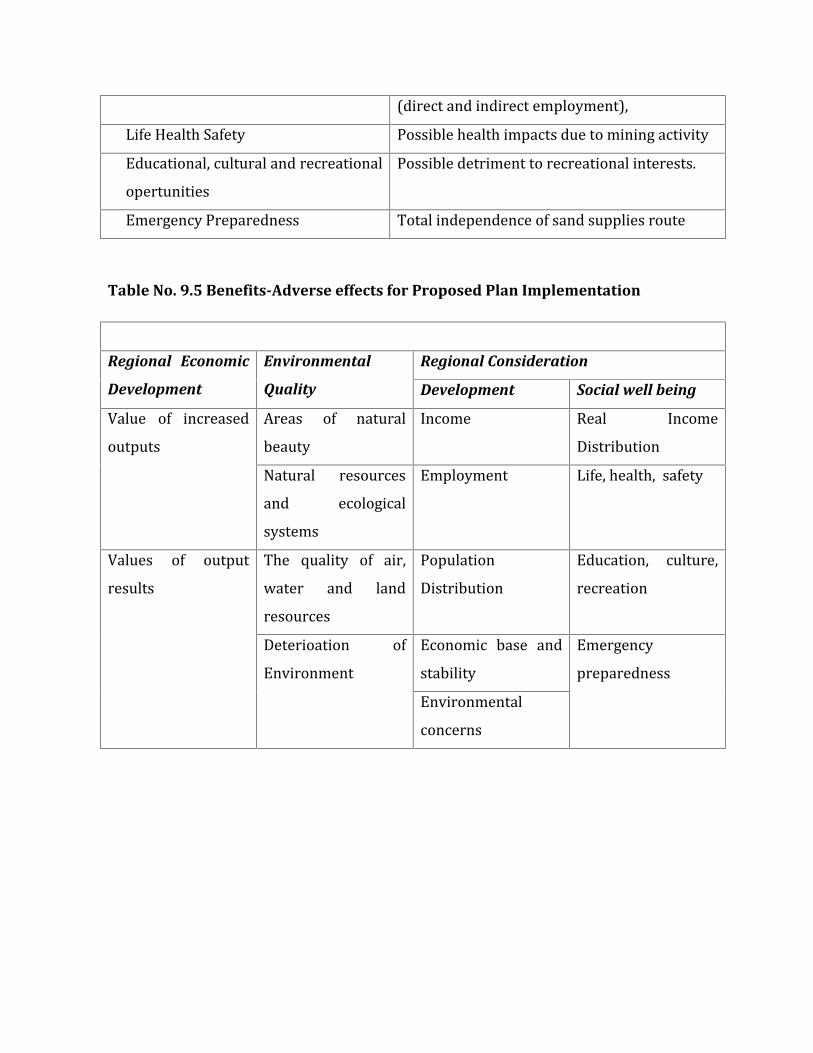
(direct and indirect employment),Life Health Safety Possible health impacts due to mining activityEducational, cultural and recreationalopertunities Possible detriment to recreational interests.Emergency Preparedness Total independence of sand supplies route
Table No. 9.5 Benefits-Adverse effects for Proposed Plan Implementation
Regional Economic
Development
Environmental
Quality
Regional Consideration
Development Social well beingValue of increasedoutputs Areas of naturalbeauty Income Real IncomeDistributionNatural resourcesand ecologicalsystemsEmployment Life, health, safety
Values of outputresults The quality of air,water and landresourcesPopulationDistribution Education, culture,recreation
Deterioation ofEnvironment Economic base andstability EmergencypreparednessEnvironmentalconcerns
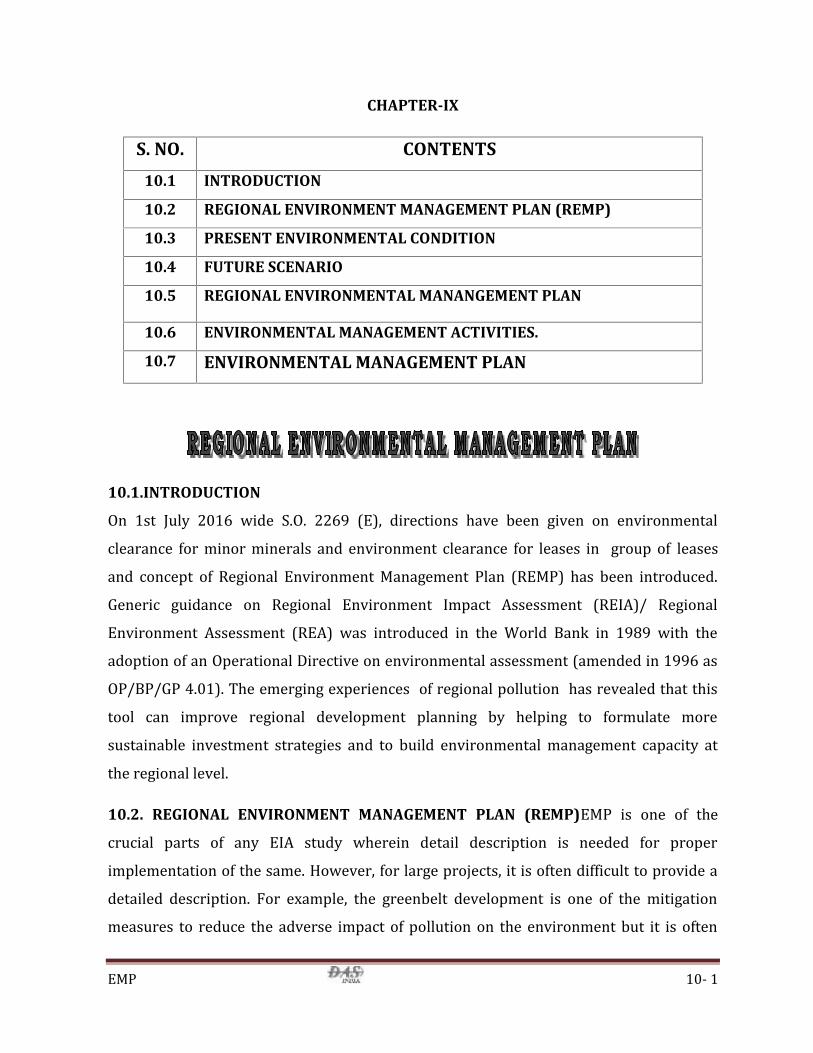
EMP 10- 1
CHAPTER-IX
S. NO. CONTENTS
10.1 INTRODUCTION
10.2 REGIONAL ENVIRONMENT MANAGEMENT PLAN (REMP)
10.3 PRESENT ENVIRONMENTAL CONDITION
10.4 FUTURE SCENARIO
10.5 REGIONAL ENVIRONMENTAL MANANGEMENT PLAN
10.6 ENVIRONMENTAL MANAGEMENT ACTIVITIES.
10.7 ENVIRONMENTAL MANAGEMENT PLAN
10.1.INTRODUCTIONOn 1st July 2016 wide S.O. 2269 (E), directions have been given on environmentalclearance for minor minerals and environment clearance for leases in group of leasesand concept of Regional Environment Management Plan (REMP) has been introduced.Generic guidance on Regional Environment Impact Assessment (REIA)/ RegionalEnvironment Assessment (REA) was introduced in the World Bank in 1989 with theadoption of an Operational Directive on environmental assessment (amended in 1996 asOP/BP/GP 4.01). The emerging experiences of regional pollution has revealed that thistool can improve regional development planning by helping to formulate moresustainable investment strategies and to build environmental management capacity atthe regional level.10.2. REGIONAL ENVIRONMENT MANAGEMENT PLAN (REMP)EMP is one of thecrucial parts of any EIA study wherein detail description is needed for properimplementation of the same. However, for large projects, it is often difficult to provide adetailed description. For example, the greenbelt development is one of the mitigationmeasures to reduce the adverse impact of pollution on the environment but it is often
EMP 10- 2
quite challenging to mention in the EIA report the type of plants to be plantedconsidering the type of soil, agro climatic region and the type of pollutant emitted by theindustry. Also, the total cost for implementing the mitigation plan is often hard to workout.Causes of environmental change also include natural variability and anthropogenicclimate change. Four types of impact of mining are identified which compined to createregional impact.1. Space Crowding-occurs when a system is disturbed by several similar activities,or by different activities producing a similar effect, in an area small to assimilatethe combined impacts. (Rees 1995)2. Time Crowding-occurs when impacts are so close in time that the impact of oneaction are not dissipated before the next occurs.(CEARC 1986)3. Interactive effects- can be additive or compounding, reflecting the interactivenature of ecosystems. Additive is the simple linear addition of one impact onanother, whereas compounding is when two or more agents combine to cause animpact. Antagonistic effects can also occur, where the combined impact of morethan one agent is less than the sum of the individual impacts. (Canter and Kamanth1995)4. Indirect effects- are secondary impacts arising as a result of the direct effect, andinclude the impacts of activities facilitated by a project, including reasonablyforeseeable impacts from downstream users.5. Regional issues When preparing theRegional Envieonmental management planthe first step is the identification of regional issues. Some of them are given below:Water abstractionDirect abstraction from within the specified river/river reach as well as upstream(including tributaries) must be considered. This excludes indirect abstraction, forexample by exotic vegetation. The presence of any of the following can be used asan indication of abstraction: cultivated lands, water pumps, canals, pipelines, cities,towns, settlements, mines, impoundments, weirs and industries. Water abstractionhas a direct impact on habitat type, abundance and size; is implicated in flow, bed,
EMP 10- 3
channel and water quality characteristics; and riparian vegetation may beinfluenced by a decrease in water quantity.InundationDestruction of instream habitat (e.g. riffle, rapid) and riparian zone habitatthrough submerging with water by, for example, construction of an on-channelimpoundment such as a dam or weir. This leads to a reduction in habitatavailable to aquatic fauna and may obstruct movement of aquatic fauna; inaddition it influences water quality and sediment transport.Water qualityThe following aspects should be considered: untreated sewage, urban andindustrial runoff, agricultural runoff, mining effluent and effects ofimpoundments. Ranking may be based on direct measurements or indirectlyvia observation of agricultural activities, human settlements and industrialactivities in the area. Water quality is aggravated by a decrease in the volumeof water during low or no flow conditions.Flow modificationThis relates to the consequence of abstraction or regulation by impoundments.Changes in temporal and spatial characteristics of flow such as an increase induration of low flow season can have an impact on habitat attributes. Thisresults in low availability of certain habitat types or water at the start of thebreeding, flowering or growing season. Effects of flow regulation of floods andlow flows are assessed separately.Bed modificationsThis is regarded as the result of increased input of sediment from thecatchment or a decrease in the ability of the river to transport sediment.Indirect indications of sedimentation are stream bank and catchment erosion.
EMP 10- 4
Purposeful alteration of the stream bed, e.g. the removal of rapids fornavigation is also included.Channel modificationsThis may be the result of a change in flow, which alters channel characteristicscausing achange in marginal instream and riparian habitat. Purposeful channelmodification to improve drainage is also included.Presence of exotic aquatic fauna (e.g. fish)The disturbance of the stream bottom during feeding may influence, forexample, the water quality and lead to an increase in turbidity. Predation onindigenous fish is also a factor. The extent of the effect is dependant upon thespecies involved and their abundance.Presence of exotic macrophytesExotic macrophytes may alter habitat by obstruction of flow and may influencewater quality. The extent of infestation over instream area by exoticmacrophytes, the species involved, and its invasive abilities should beconsidered.Solid waste disposalThe amount and type of waste present in and on the banks of a river,e.g. litterand building rubble is an obvious indicator of external influences on streamand a general indication of the misuse and mismanagement of the river.Bank erosionA decrease in bank stability will cause sedimentation and possible collapse ofthe river bank resulting in a loss or modification of both instream and riparian
EMP 10- 5
habitats. Increased erosion can be the result of natural vegetation removal,overgrazing or encroachment of exotic vegetation. Siltation is the processwhereby fine solid particles build up on the bed of a river or lake and is theresult of an excessive load of suspended solids in a river or rivers. Miningoperations produce large quantities of dust and finely powdered rock, withmuch rock having been ground to particle sizes below 0.2 mm. Though thematerials that are dumped after removal of the commodity being mined havefine particle size and reasonable physical characteristics that could permitplant growth and retain adequate amounts of water, these materials have beenformed from hard unweathered material and so may not contain much of thefinest clay material and lack organic or microbial activity. The result is thatmine dumps may be very unstable, easily blown by wind when they are dryand eroded by heavy rain when wet. The action of rain and wind thus removesfine particles into nearby water systems, leading to a build up of suspendedsolids and ultimately siltation.Ground water movementMany so‐called sandstone aquifers are actually multiple‐aquifer systems consisting ofdiscontinuous sand bodies distributed complexly in a matrix of lower‐permeability siltsand clays. The arrangement and Interconnectedness of these various lithofacies stronglyinfluence spatial patterns of hydraulic conductivity (K) and, in turn, groundwater flowand mass transport. The aquifer system, which is consists of multiple, elongate sandbodies and silts and clays deposited in a fluvial environment and is similar to many othersystems found in the sedimentary basins. The resulting deterministic‐conceptual flowmodel demonstrates the importance and methods of incorporating geologic informationin groundwater models. Flow in the aquifer is controlled not so much by hydraulicconductivity of the sands as by their continuity and Interconnectedness. Much of theaquifer system consists of large zones in which the fluvial channel‐fill sands are sparseand apparently disconnected, resulting in groundwater flow rates lower by a factor of101 to 103 than in adjacent, well‐interconnected belts of fluvial channel‐fill sand belts.Though sand body Interconnectedness is critically important, it is also very difficult to
EMP 10- 6
estimate. One or two well‐connected sands among a system of otherwise disconnectedsands can completely alter a velocity field. This is particularly true if the sands areconnected vertically and nonzero vertical hydraulic gradients exist, which yieldreasonably accurate hydraulic heads (Fogg, 1986).Change in particle size: It appears that due to the mixing of different soil horizonsduring mining, the soil profile changed to a great extent (Ghosh, 2002). The particle sizeanalysis reveals that sand particles increased, and silt and clay decreased with respect tounmined soil. This trend may be due to increased erosion of aggregates and consequentlya high rate of infiltration.Studies reveal that indiscriminate and continued mining of sandfrom the alluvial reaches of river systems could impose marked changes in the grain sizecharacteristics of river beds, in the long run (Scott, 1973; Sandecki, 1989; Stevens et al.,I990). It is now we understood that the physical composition and stability of substrateare changed significantly as a result of instream sand mining. And. most of these physicaleffects exacerbate sediment entrainment in the channel. The deep pits created in thechannel as a result of pit excavation method of sand mining act as sediment traps and thehungry water leaving the pits could selectively entrain sand particles in the finer entitiesand deposit further downstream. Continuation of this process, in the long run could resultin bed coarsening with high percent content of coarser particles in the upstream.Indiscriminate extraction of sand from the lower reaches could impose marked changesin the sediment distribution pattern in thi s fluvial environment. The sand mining activates the selective removal of medium to very fine sands from the upstream and theirdeposition in the subsequent downst ream stations. This processes of selective sortingbased on grain size aggravated many folds by indiscriminate sand mining, is responsiblefor bed coarsening in the upstream reaches of the rivers.Lowering of ground water: Due to the connectivity of aquifer with the river channel. Theaquifer lithology of alluvial sand and alluvial clay consists of thick ferruginous fine sand,underlain successively by fine sand, 2-3 m of unconsolidated clay and the weathered zonewith open fractures and boulders of basement. This unique lithological assemblage hassome advantages to areas with thick vermicular laterite upslope. When the river is in
EMP 10- 7
flood, the water level rises above the sand-clay interface. A major part of the sandthickness gets saturated. When the water saturated sand is in contact with vermicularlaterite upslope, the water potential of the latter increases. However, when thefloodwatcrs recede and reach its level of January to May virtually the entire sand isdrained of its water and escapes as baseflow to the river leaving the wells along the riverbank virtually dry. However, the water table in the vermicular laterite does not getlowered correspondingly. Continuous removal of sand from river bed increases velocityof flowing water which erodes beds and banks. Kondolf (2007) noted that as the velocityincreases, the river bed can propagate both upstream and downstream for manykilometres. This can lower alluvial water tables. Stebbins (2006) added that in streamsand mining causes destruction of aquatic and riparian habitat through large changes inchannel morphology, lowered water table, instability and sedimentation at mining sitesdue to stock piling and dumping of excess mining materials. There is environmentaldegradation on open land and rivers as well as high evaporation from exposed river bedsleading to dry rivers and shortage of water for domestic purposes and animals. Sand actas a reservoir to charge ground water wells, so when removed, wells have to be dugdeeper which increases water costs (Pereira, 2012). Generally, there is loss ofemployment to farm workers as agricultural land is destroyed to pave way for miningwhile there is human rights violation to farmers. When sand bed water is exposed bymining to dry atmosphere, there is a lot of evaporation. This leads to a micro disturbanceof ground water. Continuous movement of heavy machines on rivers weaken riverbeds,causing water table to be nearer the surface where water is forming a pool fromunderground. Raised water table and formation of pools on riverbeds increasesevaporation rate in summer such that exposed water is lost to atmosphere, and will notbe useful to livestock and crops. (MADYISE, 2013) The water table along the river bankplunges steeply to the riverbed.Channel incision due to sand mining, typically lowers thealluvial water table as the channel itself determines the level down to which the alluvialgroundwater drains (Galay, 1983; Creuz des Chatelliers and Reygrobellet, I990; Mas-Plaet al., 1999). This results in loss of groundwater storage and influences alluvialgroundwater-surface water exchanges along the river system.Typical mining impactmanagement and mitigation measures include the adherence to the Best Practice
EMP 10- 8
Guidelines that have been developed for a range of mining activities (for example, waterquality management), investigating alternative locations for infrastructure and wastedisposal sites, the adoption of different mining and beneficiation technologies, the use ofcleaner production technologies, recycling of water and specific materials, pollutioncontrol measures, rehabilitation and landscaping, and the acquisition of additionalproperty to compensate for habitat loss.10.2.1. The area was divided into three zonesas per the sensitivity of the area on the
basis of different environmental issues.1. Area of high sensitivityArea of high sensitivity is near the project site where impact is highest.2. Area of medium sensitivityArea of medium sensitivity is near the project site where impact is lesser.3. Area of Low sensitivityArea of low sensitivity is farthest from the project site where impact isleast.10.2.1.1.Future scenarioThe economic activitie which areexpected grow in the future are sand extraction.Becauseof these incoming population for permanent and satellite occupoation and increasedtransportation will enhance. The stretgy for for future scenario will include1. Identification of present scenario.2. Need for additional control measures for air quality deterioration becauseof the upcoming project.3. Need for planning for additional solid waste due to incoming population.10.2.1.2. Cost estimation for the different stretgies.Identification of the problems because of the upcoming projects include the fugitive dustcontrol measures will entail the cost of dust suppression by water spraying,improvement of PWD roads , paving of unpaved road. This will constitute bulk ofinvestment.10.2.1.3. Study areaOut of total 31 sand/moram mine leases, 07 leases are granted by DistrictMagistrate,Jalaun while 24 leases are granted by District Magistrate Hamirpur through e-

EMP 10- 9
tenderingforexcavation of S a n d / Moramfrom Riverbed of BetwaRiver.The total area ofmining lease is 619.41 ha and the annual production will be 1,00,56,018 cum/annum.These lease are situated on the river Betwa in two districts namely Hamirpur andJalaunbetween - 25°54'25.56"N &79°39'42.55"E to 25°55'34.68"N& 80°16'12.74"E in theriver bed of BetwaThe plan period of the entire lease is 05 years.Area wise only eightprojects “M/s Rama Traders, M/s KanhaiyaLal& Sons, M/s Kamtanath Enterprises Pvt.Ltd*., M/s Shri Rahul Kumar Gupta*, M/s UnnaoInfradevelopers*, M/s KuberKamnaMarbles Pvt. Ltd.* and M/s ShriShailendraYadav* (*for which PH is awaited)” are fallingunder category B1 having area of more then 25 ha. All other projects are below 25 ha butsome of them are being treated as B1category because of group of leases situation. Thespirit of EIA notification is the cumulative impact assessment of two small mines whichindividually are believed to cause less impact. The buffer zones of various mines on thestretch of river Betwa are overlapping each other, that is the need for impact assessmenton the large scale and REIA is undertaken.10.3. PRESENT ENVIRONMENTAL CONDITIONpH of the ground water samples ranges from 7.12 to 7.84. The ground water sample fromKudra village shows lowest pH i.e. 7.15 whereas from Sidradanda village shows thehighest pH 7.84, which is in permissible limit of standards given by CPCB (Fig3.14).Fluoride and Iron both are lowest in concentration in Beri Village but highestfluoride concentaration is in Baragaon but the Iron concentration is highest in SidraDanda (Fig 3.15).The concentration of iron and fluoride is far below the standardsspecified by CPCB for drinking water.Total hardness of ground water samples are wellwithin the limits. For Fugitive dust emission at any site, the most prevalent particulatesources, such as unpaved roads, bare ground, and loading. The upwind and downwindconcentrationsof TSP, PM10, and PM2.5 were measured. Emission of fugitive dust areinfluenced by moisture content, silt content, wind speed, and vehicle activity on unpavedroads, which includes vehicle speed and vehicle counts. The value of PM2.5 is higher on allthe monitoring locationsthan the NAAQS, 2009 (Attached as annexure-) standards withexception of AQ 30 and AQ 32 i.e. Ramedi and Bhilawadariya. Higher PM2.5 levels may becontributed due to traditional ways of cooking along with vehicular emission. PM10 in the
EMP 10- 10
area may be formed by physical processes of abrasion of surfaces and agriculturalactivities. The anthropogenic source are coarse particles are produced by the mechanicalbreak-up of larger solid particles, wind blown dust such as road dust,soot, agriculturalprocesses, combustion of fossil fuel . It also causes visibility reduction Almost all themonitoring locations are having higher PM10. SO2 and NO2 are far below standards.10.4. FUTURE SCENARIOIt is expected that the economic growth in the study area would continue to be dominatedby mining and associated activities. So environmental quality will be affected theenvironmental so there are number of strategies are in pipeline.10.4.1. Management StratgiesThis stretgy confirms the need for additional abatement. Improvement of roads Improvement of quality of life.
10.4.2. Combined PlanningA combined strategy incorporating elements from all the components will be used forintegrated environmental management plan. It will imply the integrated approach fromthe point of entry to closure of mines.10.4.3. Cost estimatesThe cost estimation of all the components of environmental protection will be account forall the projects proposed in the area.10.5 REGIONAL ENVIRONMENTAL MANANGEMENT PLAN
10.5.1. Aims and objectivesThe general aims and objectives of this plan are as follows:(a) to maintain and improve the water quality and river flows and its tributaries andensure that development is managed in a manner that is in keeping with the national,state, regional and local significance of the Catchment,
EMP 10- 11
(b) to protect and enhance the environmental quality of the Catchment for the benefit ofall users through the management and use of the resources in the Catchment in anecologically sustainable manner,(c) to ensure consistency with local environmental plans and also in the delivery of theprinciples of ecologically sustainable development in the assessment of developmentwithin the Catchment where there is potential to impact adversely on ground waterand on the water quality and river flows(d) to establish a consistent and coordinated approach to environmental planning andassessment for land along the river to promote integrated catchment managementpolicies and programs in the planning and management of the Catchment,(e) to encourage more effective consultation between local government and StateGovernment agencies in executing the responsibility for environmental planningwithin the Catchment,10.5.2. REMP applicationGeneral principles when this Plan applies the following must be taken into account:(a) the aims, objectives and planning principles of this plan,(b) the likely effect of the proposed plan, development or activity on adjacent ordownstream local government areas, (c) the cumulative impact of the proposed development or activity on the River or itstributaries,(d) any relevant plans of management including any River and Water Management Plansapproved by the Minister for Environment and the Minister for Land and WaterConservation and best practice guidelines approved by MoEF&CC(e) all relevant State Government policies, manuals and guidelines of which the council,consent authority, public authority or person has notice,(f) whether there are any feasible alternatives to the development or other proposalconcerned.
10.5.3. Specific issues
River quality and river flows On-site sewage management
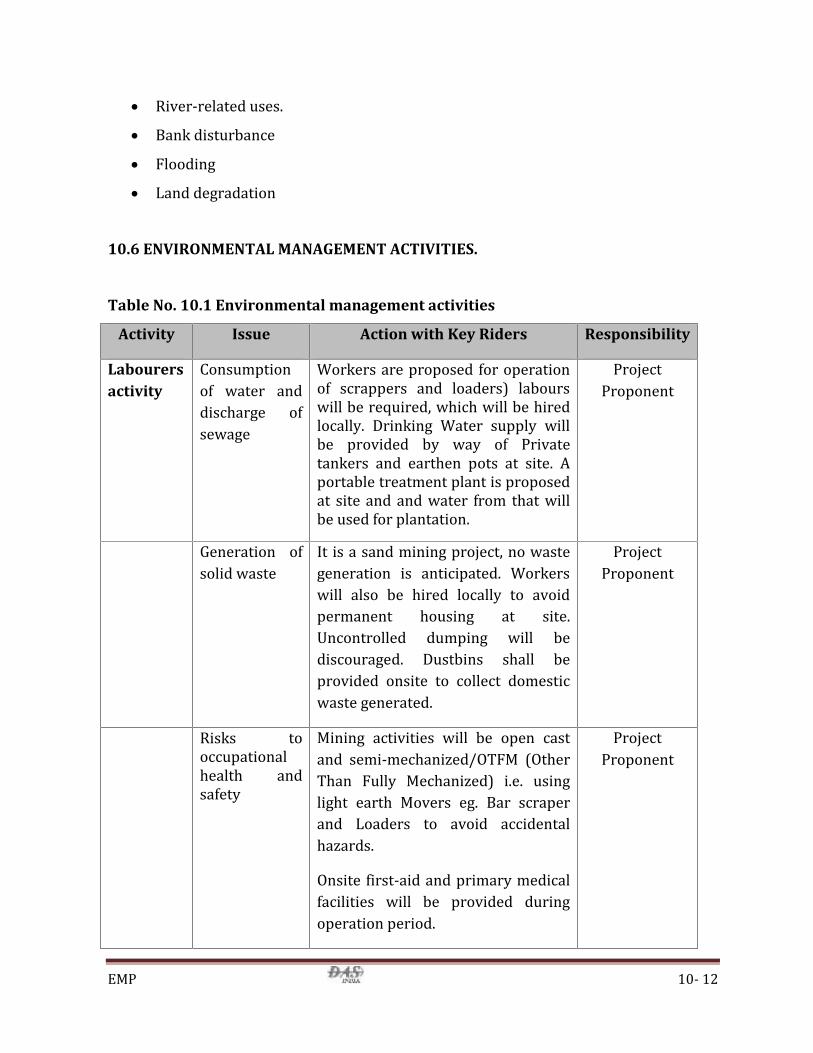
EMP 10- 12
River-related uses. Bank disturbance Flooding Land degradation
10.6 ENVIRONMENTAL MANAGEMENT ACTIVITIES.
Table No. 10.1 Environmental management activities
Activity Issue Action with Key Riders Responsibility
Labourersactivity
Consumptionof water anddischarge ofsewageWorkers are proposed for operationof scrappers and loaders) labourswill be required, which will be hiredlocally. Drinking Water supply willbe provided by way of Privatetankers and earthen pots at site. Aportable treatment plant is proposedat site and and water from that willbe used for plantation.
ProjectProponent
Generation ofsolid waste It is a sand mining project, no wastegeneration is anticipated. Workerswill also be hired locally to avoidpermanent housing at site.Uncontrolled dumping will bediscouraged. Dustbins shall beprovided onsite to collect domesticwaste generated.
ProjectProponent
Risks tooccupationalhealth andsafetyMining activities will be open castand semi-mechanized/OTFM (OtherThan Fully Mechanized) i.e. usinglight earth Movers eg. Bar scraperand Loaders to avoid accidentalhazards.Onsite first-aid and primary medicalfacilities will be provided duringoperation period.
ProjectProponent
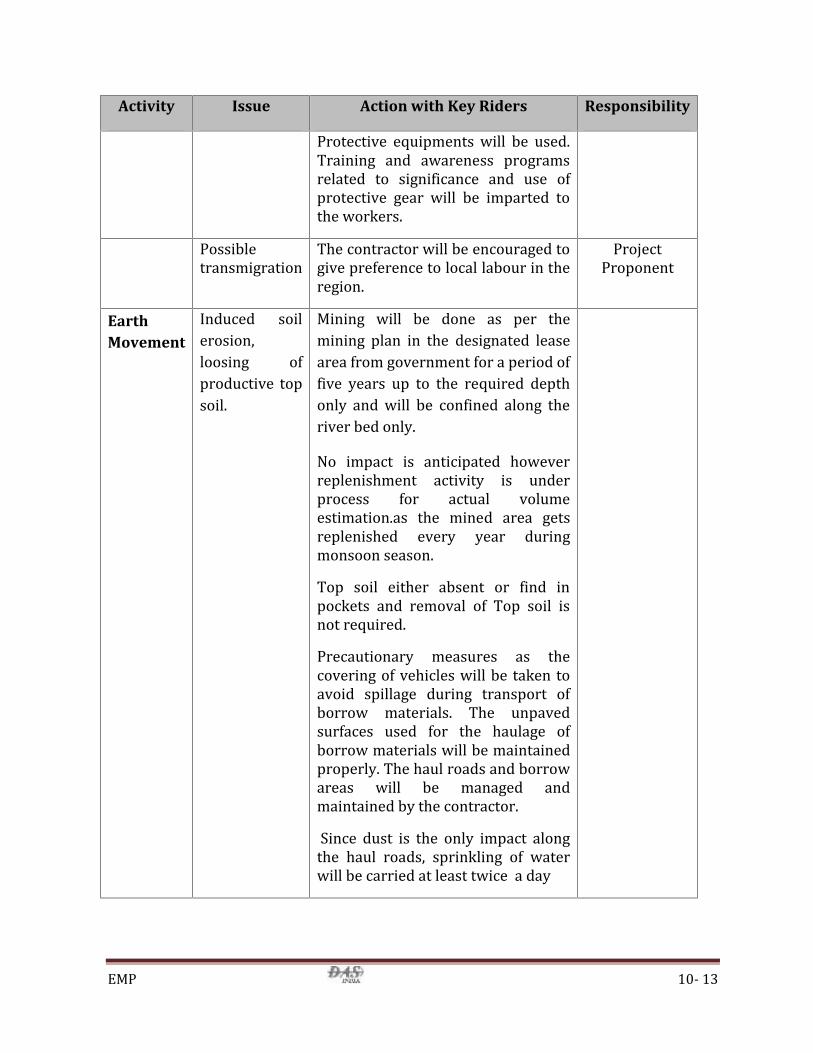
EMP 10- 13
Activity Issue Action with Key Riders ResponsibilityProtective equipments will be used.Training and awareness programsrelated to significance and use ofprotective gear will be imparted tothe workers.Possibletransmigration The contractor will be encouraged togive preference to local labour in theregion. ProjectProponentEarthMovement
Induced soilerosion,loosing ofproductive topsoil.Mining will be done as per themining plan in the designated leasearea from government for a period offive years up to the required depthonly and will be confined along theriver bed only.No impact is anticipated howeverreplenishment activity is underprocess for actual volumeestimation.as the mined area getsreplenished every year duringmonsoon season.Top soil either absent or find inpockets and removal of Top soil isnot required.Precautionary measures as thecovering of vehicles will be taken toavoid spillage during transport ofborrow materials. The unpavedsurfaces used for the haulage ofborrow materials will be maintainedproperly. The haul roads and borrowareas will be managed andmaintained by the contractor.Since dust is the only impact alongthe haul roads, sprinkling of waterwill be carried at least twice a day
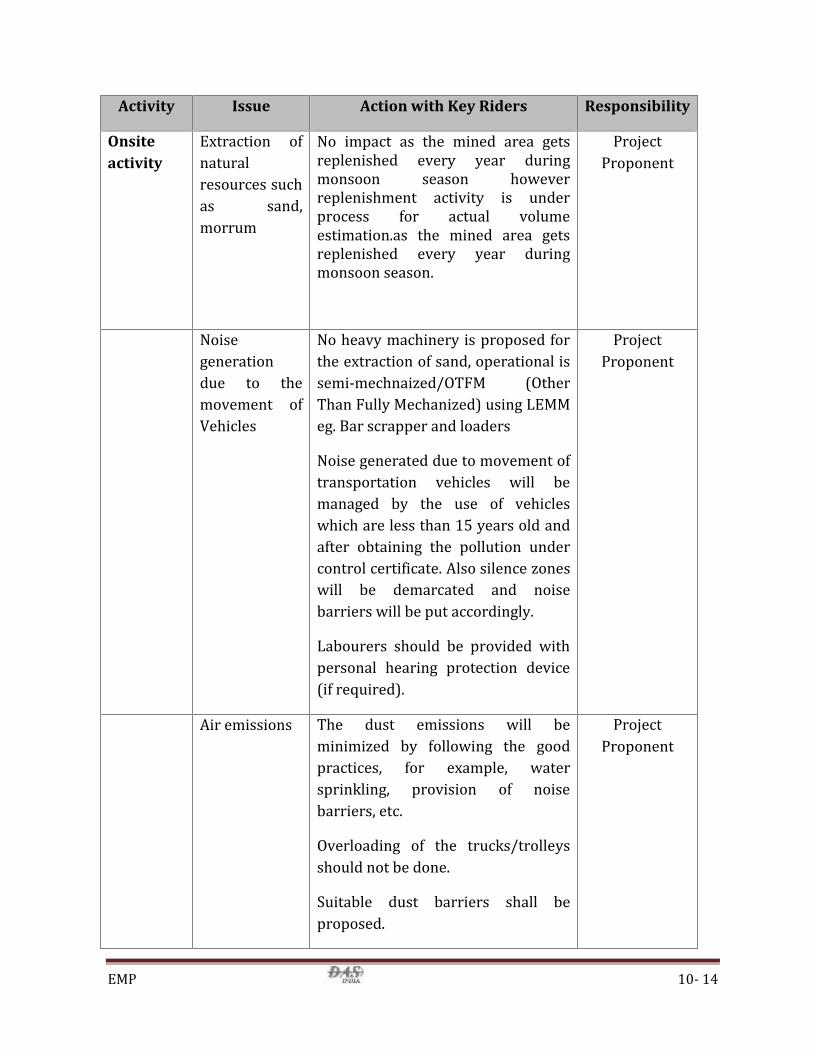
EMP 10- 14
Activity Issue Action with Key Riders Responsibility
Onsiteactivity
Extraction ofnaturalresources suchas sand,morrumNo impact as the mined area getsreplenished every year duringmonsoon season howeverreplenishment activity is underprocess for actual volumeestimation.as the mined area getsreplenished every year duringmonsoon season.
ProjectProponent
Noisegenerationdue to themovement ofVehiclesNo heavy machinery is proposed forthe extraction of sand, operational issemi-mechnaized/OTFM (OtherThan Fully Mechanized) using LEMMeg. Bar scrapper and loadersNoise generated due to movement oftransportation vehicles will bemanaged by the use of vehicleswhich are less than 15 years old andafter obtaining the pollution undercontrol certificate. Also silence zoneswill be demarcated and noisebarriers will be put accordingly.Labourers should be provided withpersonal hearing protection device(if required).
ProjectProponent
Air emissions The dust emissions will beminimized by following the goodpractices, for example, watersprinkling, provision of noisebarriers, etc.Overloading of the trucks/trolleysshould not be done.Suitable dust barriers shall beproposed.
ProjectProponent
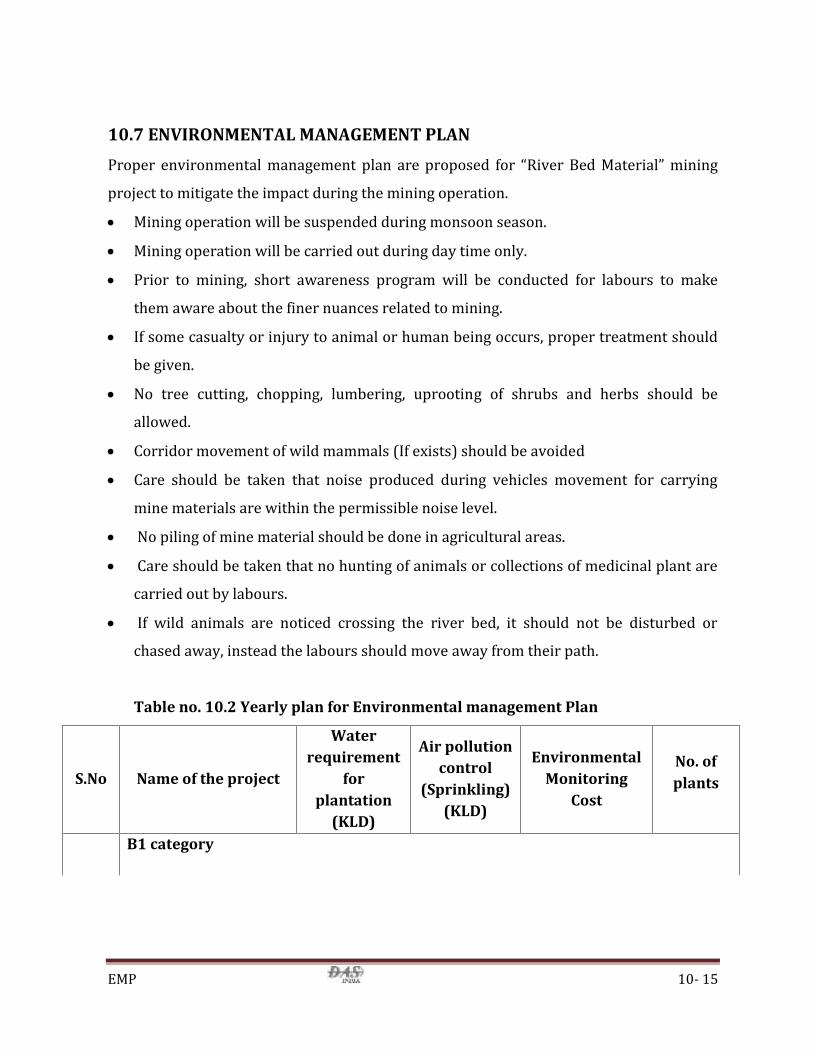
EMP 10- 15
10.7 ENVIRONMENTAL MANAGEMENT PLANProper environmental management plan are proposed for “River Bed Material” miningproject to mitigate the impact during the mining operation. Mining operation will be suspended during monsoon season. Mining operation will be carried out during day time only. Prior to mining, short awareness program will be conducted for labours to makethem aware about the finer nuances related to mining. If some casualty or injury to animal or human being occurs, proper treatment shouldbe given. No tree cutting, chopping, lumbering, uprooting of shrubs and herbs should beallowed. Corridor movement of wild mammals (If exists) should be avoided Care should be taken that noise produced during vehicles movement for carryingmine materials are within the permissible noise level. No piling of mine material should be done in agricultural areas. Care should be taken that no hunting of animals or collections of medicinal plant arecarried out by labours. If wild animals are noticed crossing the river bed, it should not be disturbed orchased away, instead the labours should move away from their path.
Table no. 10.2 Yearly plan for Environmental management Plan
S.No Name of the project
Waterrequirement
forplantation
(KLD)
Air pollutioncontrol
(Sprinkling)(KLD)
EnvironmentalMonitoring
Cost
No. ofplants
B1 category
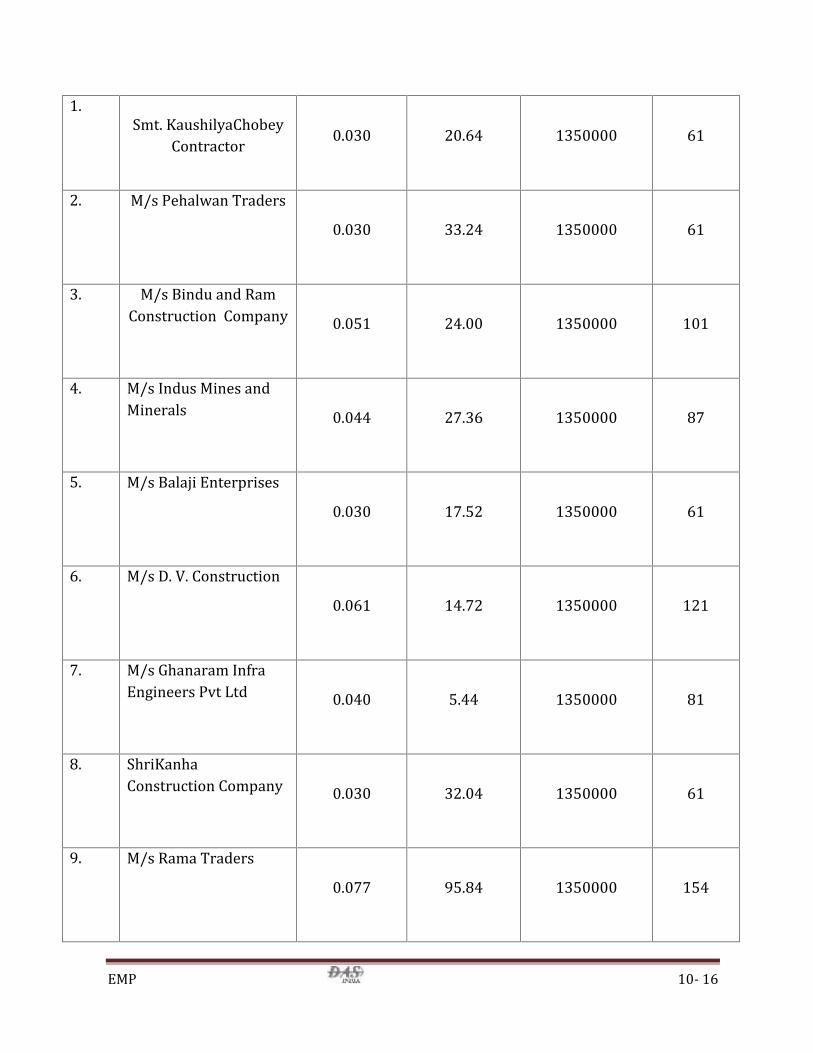
EMP 10- 16
1. Smt. KaushilyaChobeyContractor 0.030 20.64 1350000 612. M/s Pehalwan Traders 0.030 33.24 1350000 613. M/s Bindu and RamConstruction Company 0.051 24.00 1350000 1014. M/s Indus Mines andMinerals 0.044 27.36 1350000 875. M/s Balaji Enterprises 0.030 17.52 1350000 616. M/s D. V. Construction 0.061 14.72 1350000 1217. M/s Ghanaram InfraEngineers Pvt Ltd 0.040 5.44 1350000 818. ShriKanhaConstruction Company 0.030 32.04 1350000 619. M/s Rama Traders 0.077 95.84 1350000 154
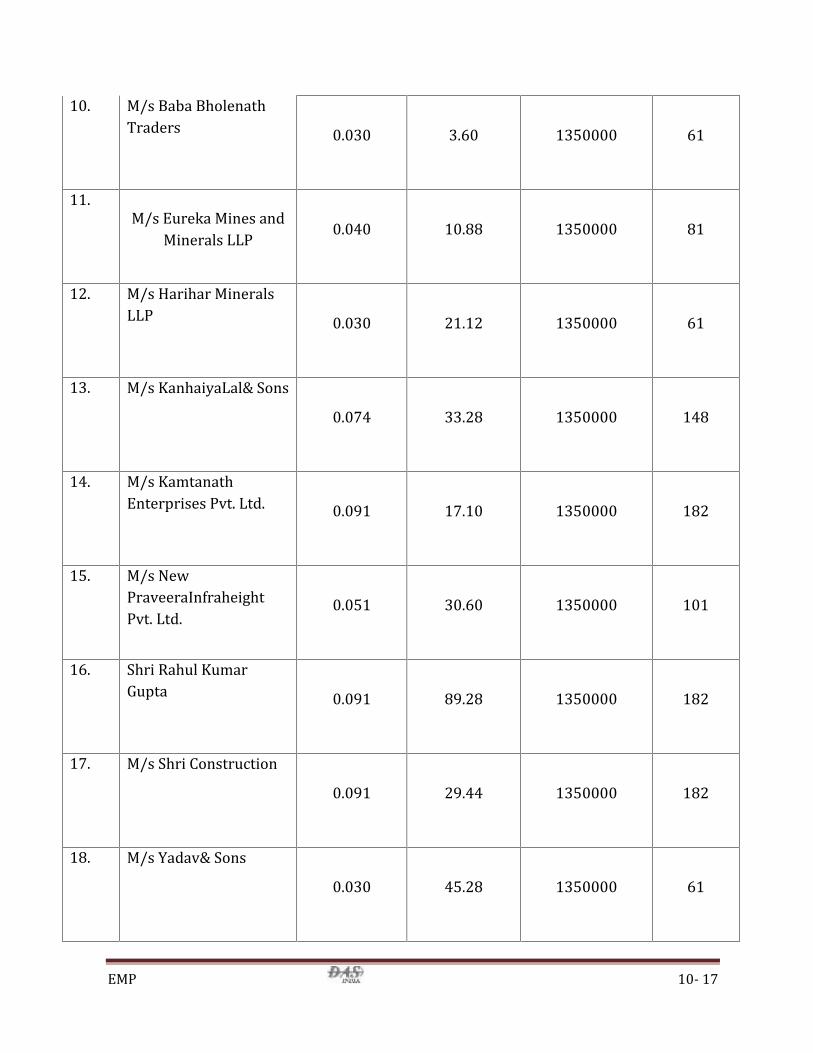
EMP 10- 17
10. M/s Baba BholenathTraders 0.030 3.60 1350000 6111. M/s Eureka Mines andMinerals LLP 0.040 10.88 1350000 8112. M/s Harihar MineralsLLP 0.030 21.12 1350000 6113. M/s KanhaiyaLal& Sons 0.074 33.28 1350000 14814. M/s KamtanathEnterprises Pvt. Ltd. 0.091 17.10 1350000 18215. M/s NewPraveeraInfraheightPvt. Ltd. 0.051 30.60 1350000 10116. Shri Rahul KumarGupta 0.091 89.28 1350000 18217. M/s Shri Construction 0.091 29.44 1350000 18218. M/s Yadav& Sons 0.030 45.28 1350000 61

EMP 10- 18
19. M/sUnnaoInfradevelopersPvt. Ltd. 135000020. M/s KuberKamnaMarbles Pvt. Ltd.
Projects Still under process21. ShriShailendraYadav22. M/s APM Mining &Infra Pvt. Ltd.
B2 category23. Shri Suresh ChandGupta. 0.040 25.60 1350000 8124. M/s Rishab Herbal Pvt.Ltd. 0.030 29.28 1350000 6125. M/s Indus Mines AndMinerals 0.030 1.96 1350000 6126. M/s MaaRaktdantikaContractors andSuppliers Pvt Ltd. 0.051 29.82 1350000 10127. M/s Silver Mist RetailPrivate Limited 0.030 56.88 1350000 61
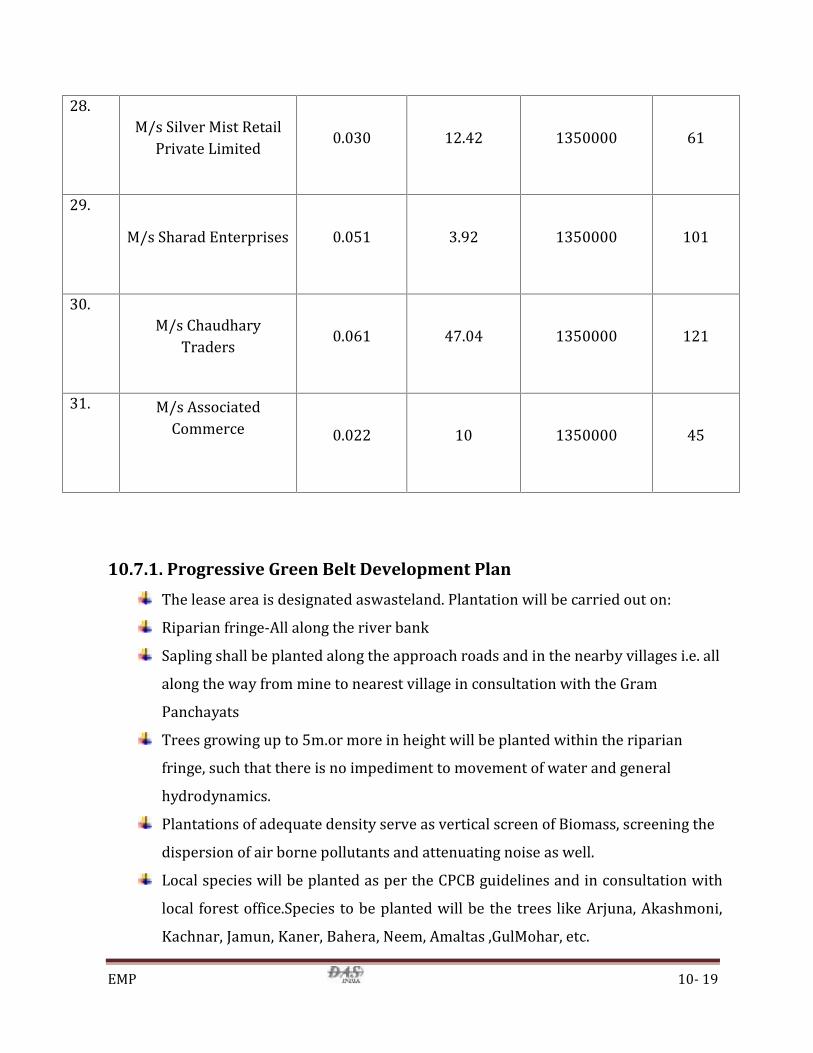
EMP 10- 19
28. M/s Silver Mist RetailPrivate Limited 0.030 12.42 1350000 6129. M/s Sharad Enterprises 0.051 3.92 1350000 10130. M/s ChaudharyTraders 0.061 47.04 1350000 12131. M/s AssociatedCommerce 0.022 10 1350000 45
10.7.1. Progressive Green Belt Development PlanThe lease area is designated aswasteland. Plantation will be carried out on:Riparian fringe-All along the river bankSapling shall be planted along the approach roads and in the nearby villages i.e. allalong the way from mine to nearest village in consultation with the GramPanchayatsTrees growing up to 5m.or more in height will be planted within the riparianfringe, such that there is no impediment to movement of water and generalhydrodynamics.Plantations of adequate density serve as vertical screen of Biomass, screening thedispersion of air borne pollutants and attenuating noise as well.Local species will be planted as per the CPCB guidelines and in consultation withlocal forest office.Species to be planted will be the trees like Arjuna, Akashmoni,Kachnar, Jamun, Kaner, Bahera, Neem, Amaltas ,GulMohar, etc.

EMP 10- 20
Fast growing trees with thick perennial foliage will be grown,as otherwise it maytake many years for trees to grow to their full height.Planting should be done in large sized 90cm x 90cm.due in advance and filledabout 50 days before planting. The plantation raised earlier should be carefullymaintained. Mortalities should be replaced by fresh planting.10.7.2. Green Belt Development in the study area.Same has been given in Chapter-07 under section 7.10.10.7.3.Environmental Monitoring PlanAn Environmental monitoring programme has been prepared for the proposed projectfor periodical assessment of effectiveness of implementation of EnvironmentManagement Plan and to take corrective measures in case of any degradation in thesurrounding environment.For assessing the prevailing quality of air, water, noise, landetc., regular monitoring of parameters are necessary. The data assessed will be helpful inpredicting the impact and planning suitable measures to improve / protect theenvironment. In the study area, the lessee will carry out monitoring studies for ambientair quality, fugitive dust, water quality, noise levels and soil quality as per the standardprocedures and schedules. The monitoring system will include:1. Monitoring stations in the buffer zone remain the same as selected in this study for Air,water, Soil, Noise etc.2. Implementation of the planned mitigating measures.3. Monitoring the programme of implementation.The Environmental parameters will be monitored & samples will be analyzed as per thestipulations of Indian Bureau of Mines & UP Pollution Control Board and as per MOEFGuidelines. The above monitoring proposals shall be adhered to and the results shall beintimated to the appropriate authorities for their perusal and records. A typicalenvironmental monitoring plan is given below in Chapter-06Table No. 10.3: Frequancy of Monitoring
S.No. Monitoring parameters Frequency ofMonitoring
1 Ambient Air QualityAmbient air monitoring at appropriate location for Half-yearly
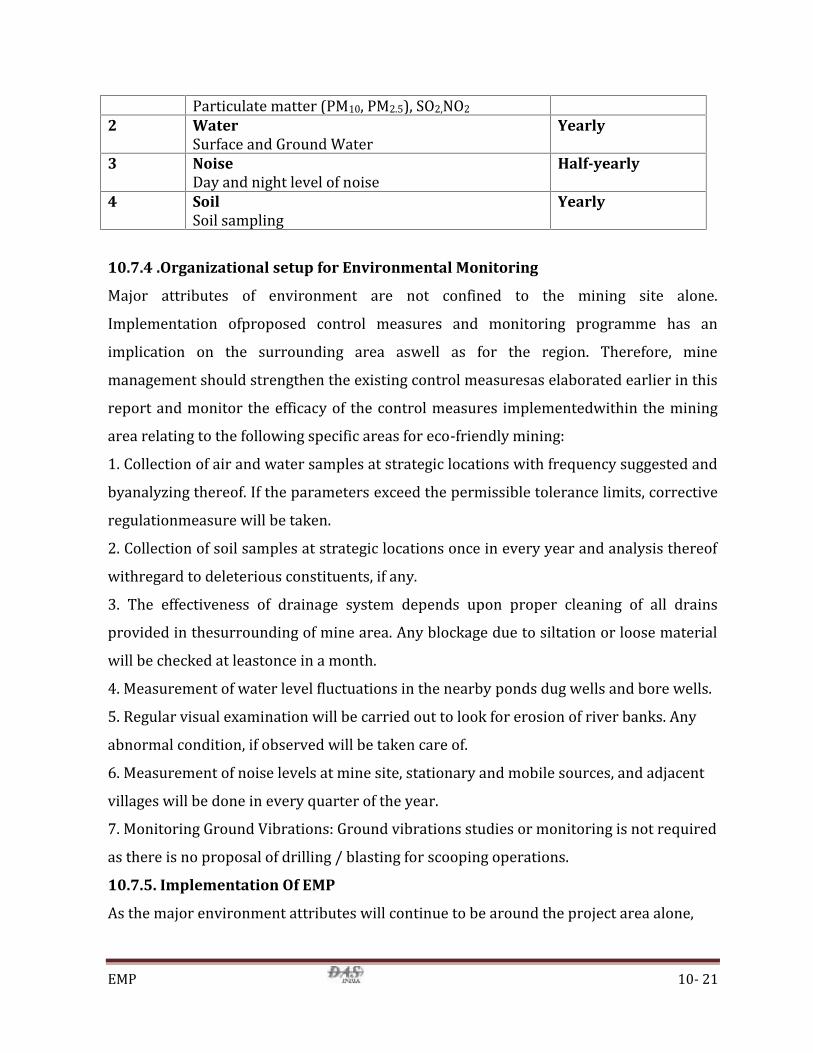
EMP 10- 21
Particulate matter (PM10, PM2.5), SO2,NO22 WaterSurface and Ground Water Yearly
3 NoiseDay and night level of noise Half-yearly
4 SoilSoil sampling Yearly
10.7.4 .Organizational setup for Environmental MonitoringMajor attributes of environment are not confined to the mining site alone.Implementation ofproposed control measures and monitoring programme has animplication on the surrounding area aswell as for the region. Therefore, minemanagement should strengthen the existing control measuresas elaborated earlier in thisreport and monitor the efficacy of the control measures implementedwithin the miningarea relating to the following specific areas for eco-friendly mining:1. Collection of air and water samples at strategic locations with frequency suggested andbyanalyzing thereof. If the parameters exceed the permissible tolerance limits, correctiveregulationmeasure will be taken.2. Collection of soil samples at strategic locations once in every year and analysis thereofwithregard to deleterious constituents, if any.3. The effectiveness of drainage system depends upon proper cleaning of all drainsprovided in thesurrounding of mine area. Any blockage due to siltation or loose materialwill be checked at leastonce in a month.4. Measurement of water level fluctuations in the nearby ponds dug wells and bore wells.5. Regular visual examination will be carried out to look for erosion of river banks. Anyabnormal condition, if observed will be taken care of.6. Measurement of noise levels at mine site, stationary and mobile sources, and adjacentvillages will be done in every quarter of the year.7. Monitoring Ground Vibrations: Ground vibrations studies or monitoring is not requiredas there is no proposal of drilling / blasting for scooping operations.10.7.5. Implementation Of EMPAs the major environment attributes will continue to be around the project area alone,
EMP 10- 22
Implementation of the proposed control measures and monitoring thereof will beundertaken on aregional basis. The project proponent will ensure the implementation ofthe measures within themine area and carryout efficient monitoring through outsourcingto competent certified consultantsand laboratories.In order to implement the measuressuggested for mitigating the adverse impacts on theenvironment, it is suggested tomonitor the environmental parameters regularly.10. 7.6. Environment Management MechanismNo cell is proposed to form; the plan will be implemented through outsourcing suitableandaccredited consultants and experts.Environmental Monitoring will be directlycoordinated by the Supervisor / Owner. Competentoutsourced certified organization/labpersonnel will conduct the monitoring operations. A full-fledged laboratory is notessential; part of the work will be given to competent consultants toundertake these jobs.Regular semi skilled manpower will be required for supervision, assistance inreclamation worksfollowed by trained unskilled labourers to carry out other necessaryoperations.10.7.7 . Functions of the EMP Implementation Team
1. Implementation of the mitigation measures.
2. Maintain Records of the operation.
3. Monitoring the programme of implementation.
4. To estimate the efficiency of measures taken.
5. To bring out any other unforeseen effect on environment not covered under the report.
6. Inspection and regular maintenance of mining equipments and transport vehicles.
10.7.8. Budget For Environmental ManagementAnnual budget for EMP is very essential for successful implementation of EMP. The fundallocated will not be diverted for any other purposes and the top management will beresponsible for this. The budget will take into consideration of capital and recurringexpenses:Table no. 10.4 Environmental Expanditure (Lease wise)
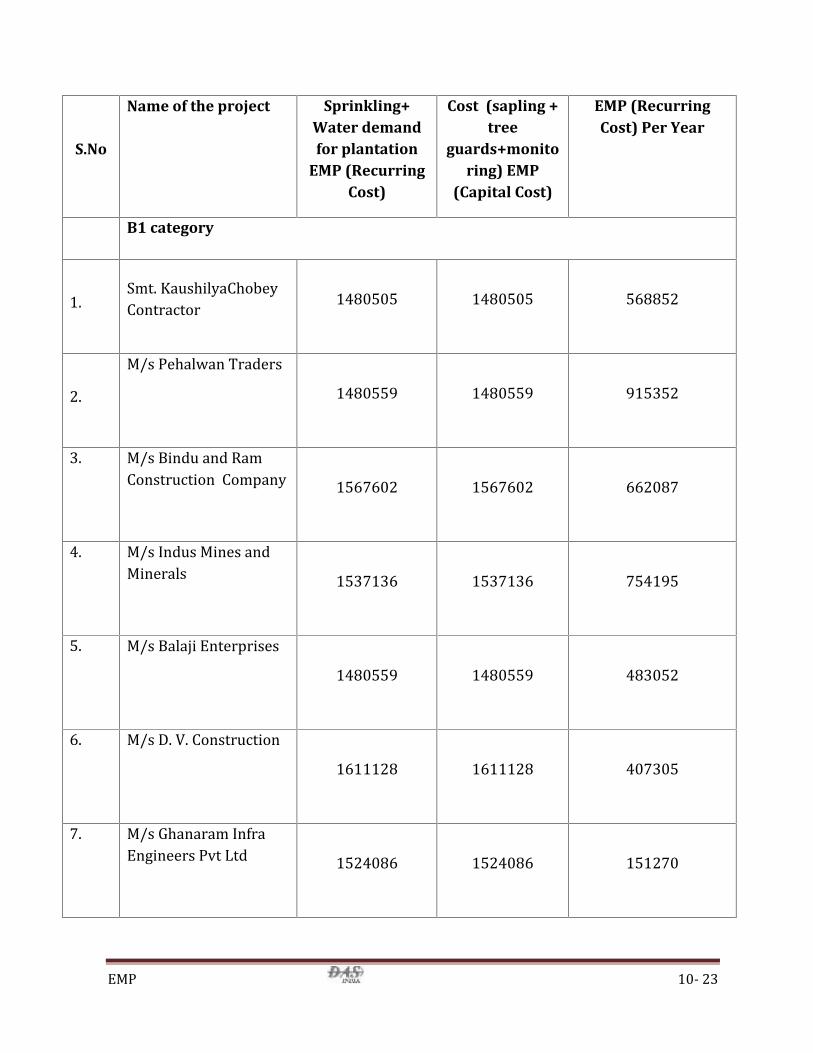
EMP 10- 23
S.No
Name of the project Sprinkling+Water demandfor plantation
EMP (RecurringCost)
Cost (sapling +tree
guards+monitoring) EMP
(Capital Cost)
EMP (RecurringCost) Per Year
B1 category
1. Smt. KaushilyaChobeyContractor 1480505 1480505 5688522. M/s Pehalwan Traders 1480559 1480559 9153523. M/s Bindu and RamConstruction Company 1567602 1567602 6620874. M/s Indus Mines andMinerals 1537136 1537136 7541955. M/s Balaji Enterprises 1480559 1480559 4830526. M/s D. V. Construction 1611128 1611128 4073057. M/s Ghanaram InfraEngineers Pvt Ltd 1524086 1524086 151270
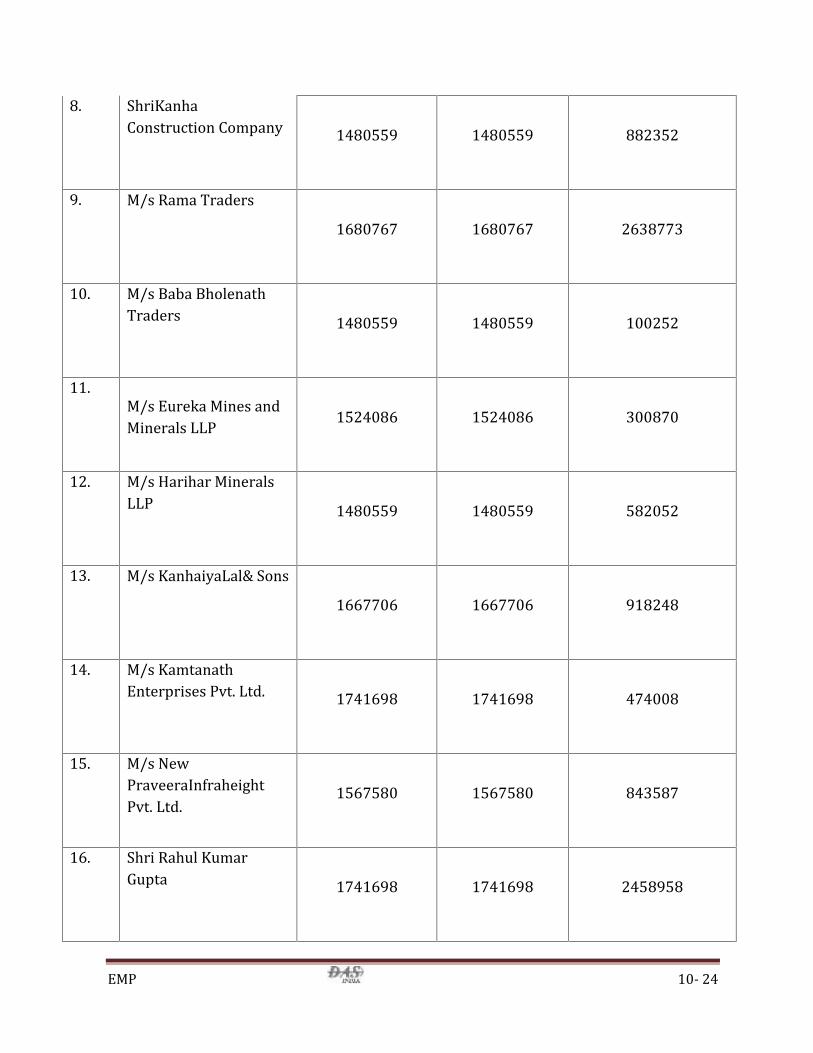
EMP 10- 24
8. ShriKanhaConstruction Company 1480559 1480559 8823529. M/s Rama Traders 1680767 1680767 263877310. M/s Baba BholenathTraders 1480559 1480559 10025211. M/s Eureka Mines andMinerals LLP 1524086 1524086 30087012. M/s Harihar MineralsLLP 1480559 1480559 58205213. M/s KanhaiyaLal& Sons 1667706 1667706 91824814. M/s KamtanathEnterprises Pvt. Ltd. 1741698 1741698 47400815. M/s NewPraveeraInfraheightPvt. Ltd. 1567580 1567580 84358716. Shri Rahul KumarGupta 1741698 1741698 2458958
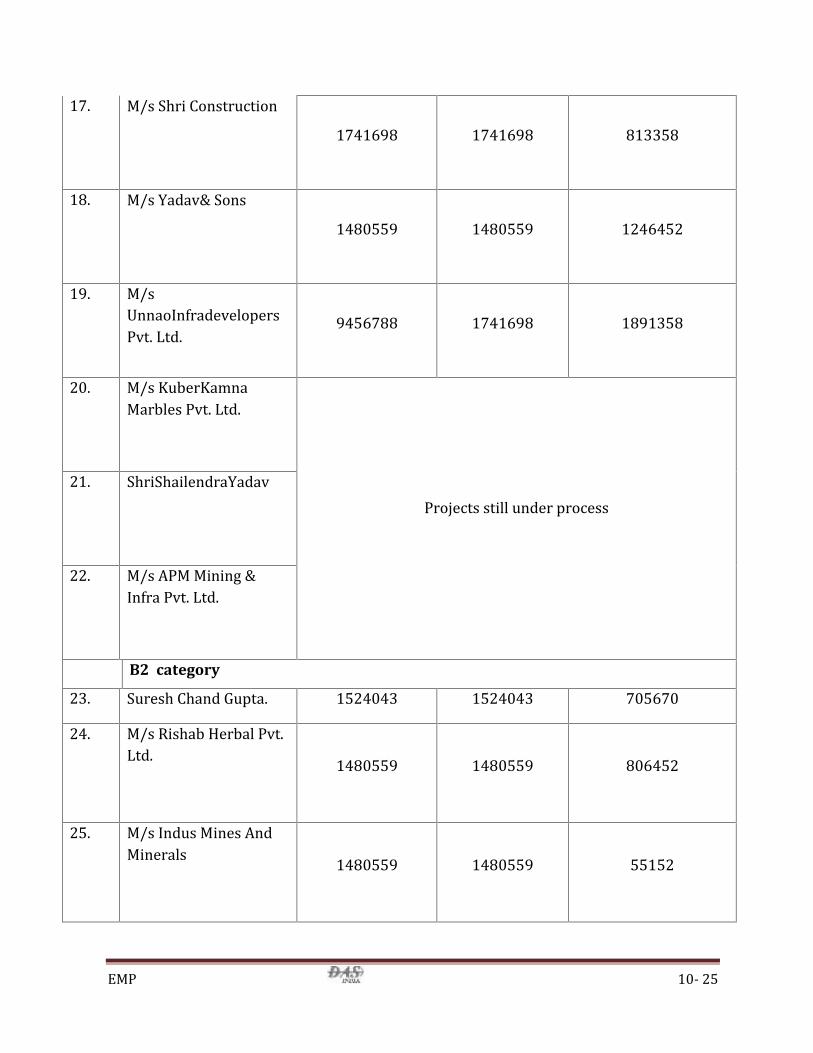
EMP 10- 25
17. M/s Shri Construction 1741698 1741698 81335818. M/s Yadav& Sons 1480559 1480559 124645219. M/sUnnaoInfradevelopersPvt. Ltd. 9456788 1741698 189135820. M/s KuberKamnaMarbles Pvt. Ltd.
Projects still under process21. ShriShailendraYadav22. M/s APM Mining &Infra Pvt. Ltd.
B2 category23. Suresh Chand Gupta. 1524043 1524043 70567024. M/s Rishab Herbal Pvt.Ltd. 1480559 1480559 80645225. M/s Indus Mines AndMinerals 1480559 1480559 55152
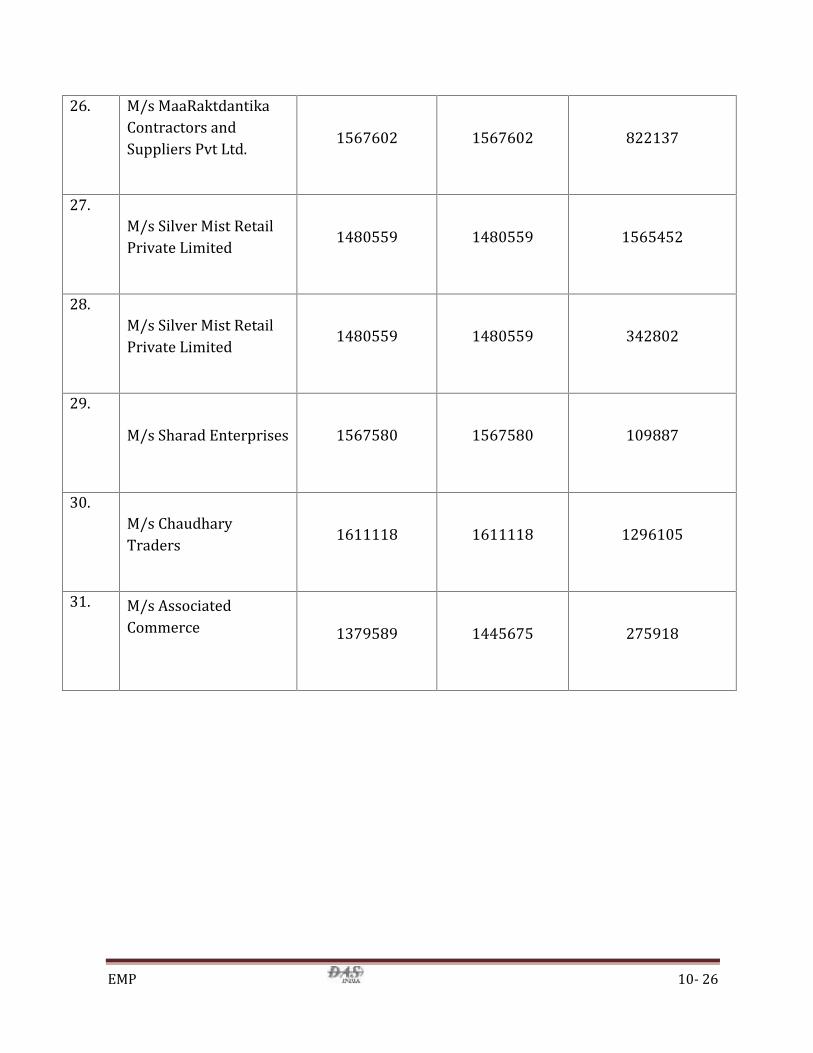
EMP 10- 26
26. M/s MaaRaktdantikaContractors andSuppliers Pvt Ltd. 1567602 1567602 82213727. M/s Silver Mist RetailPrivate Limited 1480559 1480559 156545228. M/s Silver Mist RetailPrivate Limited 1480559 1480559 34280229. M/s Sharad Enterprises 1567580 1567580 10988730. M/s ChaudharyTraders 1611118 1611118 129610531. M/s AssociatedCommerce 1379589 1445675 275918
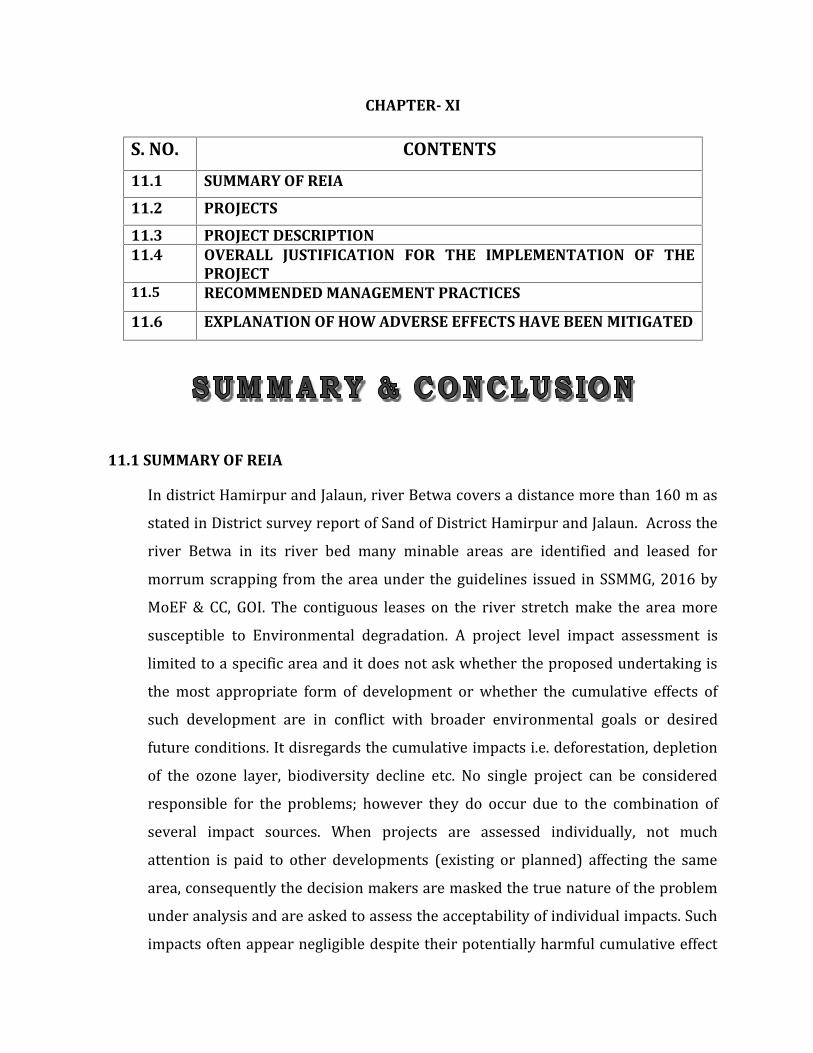
CHAPTER- XI
S. NO. CONTENTS
11.1 SUMMARY OF REIA
11.2 PROJECTS
11.3 PROJECT DESCRIPTION11.4 OVERALL JUSTIFICATION FOR THE IMPLEMENTATION OF THE
PROJECT11.5 RECOMMENDED MANAGEMENT PRACTICES
11.6 EXPLANATION OF HOW ADVERSE EFFECTS HAVE BEEN MITIGATED
11.1 SUMMARY OF REIAIn district Hamirpur and Jalaun, river Betwa covers a distance more than 160 m asstated in District survey report of Sand of District Hamirpur and Jalaun. Across theriver Betwa in its river bed many minable areas are identified and leased formorrum scrapping from the area under the guidelines issued in SSMMG, 2016 byMoEF & CC, GOI. The contiguous leases on the river stretch make the area moresusceptible to Environmental degradation. A project level impact assessment islimited to a specific area and it does not ask whether the proposed undertaking isthe most appropriate form of development or whether the cumulative effects ofsuch development are in conflict with broader environmental goals or desiredfuture conditions. It disregards the cumulative impacts i.e. deforestation, depletionof the ozone layer, biodiversity decline etc. No single project can be consideredresponsible for the problems; however they do occur due to the combination ofseveral impact sources. When projects are assessed individually, not muchattention is paid to other developments (existing or planned) affecting the samearea, consequently the decision makers are masked the true nature of the problemunder analysis and are asked to assess the acceptability of individual impacts. Suchimpacts often appear negligible despite their potentially harmful cumulative effect
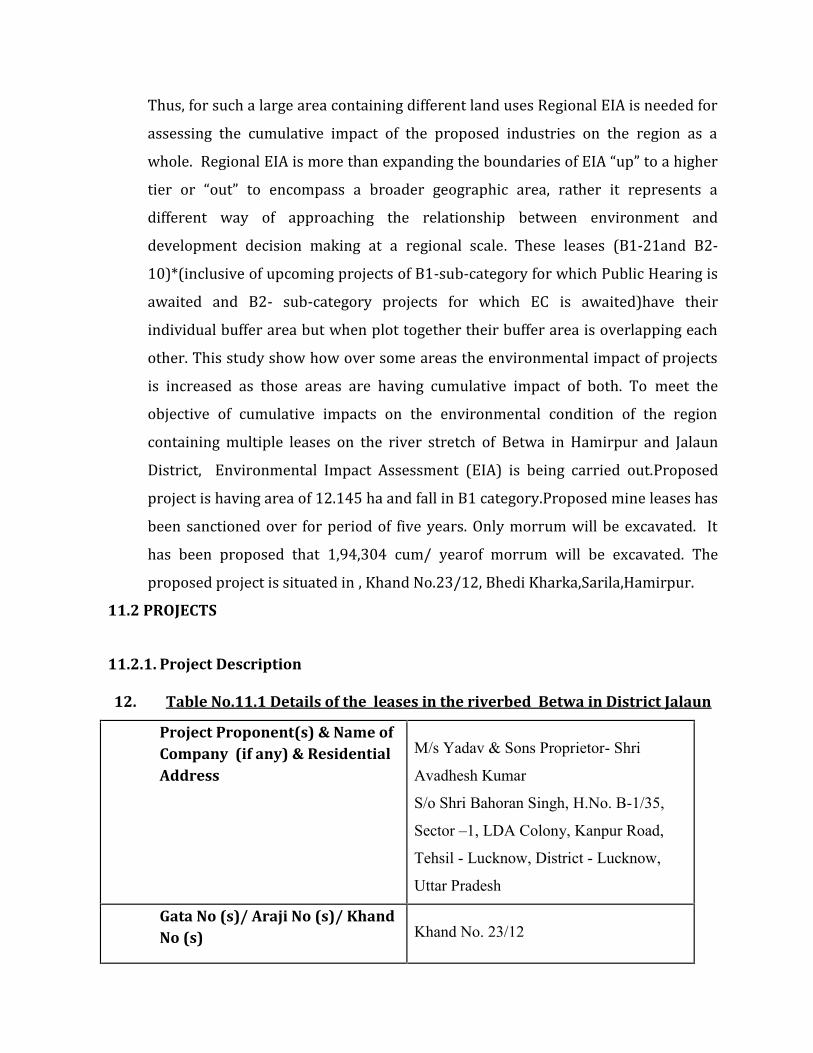
Thus, for such a large area containing different land uses Regional EIA is needed forassessing the cumulative impact of the proposed industries on the region as awhole. Regional EIA is more than expanding the boundaries of EIA “up” to a highertier or “out” to encompass a broader geographic area, rather it represents adifferent way of approaching the relationship between environment anddevelopment decision making at a regional scale. These leases (B1-21and B2-10)*(inclusive of upcoming projects of B1-sub-category for which Public Hearing isawaited and B2- sub-category projects for which EC is awaited)have theirindividual buffer area but when plot together their buffer area is overlapping eachother. This study show how over some areas the environmental impact of projectsis increased as those areas are having cumulative impact of both. To meet theobjective of cumulative impacts on the environmental condition of the regioncontaining multiple leases on the river stretch of Betwa in Hamirpur and JalaunDistrict, Environmental Impact Assessment (EIA) is being carried out.Proposedproject is having area of 12.145 ha and fall in B1 category.Proposed mine leases hasbeen sanctioned over for period of five years. Only morrum will be excavated. Ithas been proposed that 1,94,304 cum/ yearof morrum will be excavated. Theproposed project is situated in , Khand No.23/12, Bhedi Kharka,Sarila,Hamirpur.11.2 PROJECTS
11.2.1. Project Description
12. Table No.11.1 Details of the leases in the riverbed Betwa in District Jalaun
Project Proponent(s) & Name ofCompany (if any) & ResidentialAddress
M/s Yadav & Sons Proprietor- Shri
Avadhesh Kumar
S/o Shri Bahoran Singh, H.No. B-1/35,
Sector –1, LDA Colony, Kanpur Road,
Tehsil - Lucknow, District - Lucknow,
Uttar Pradesh
Gata No (s)/ Araji No (s)/ KhandNo (s) Khand No. 23/12
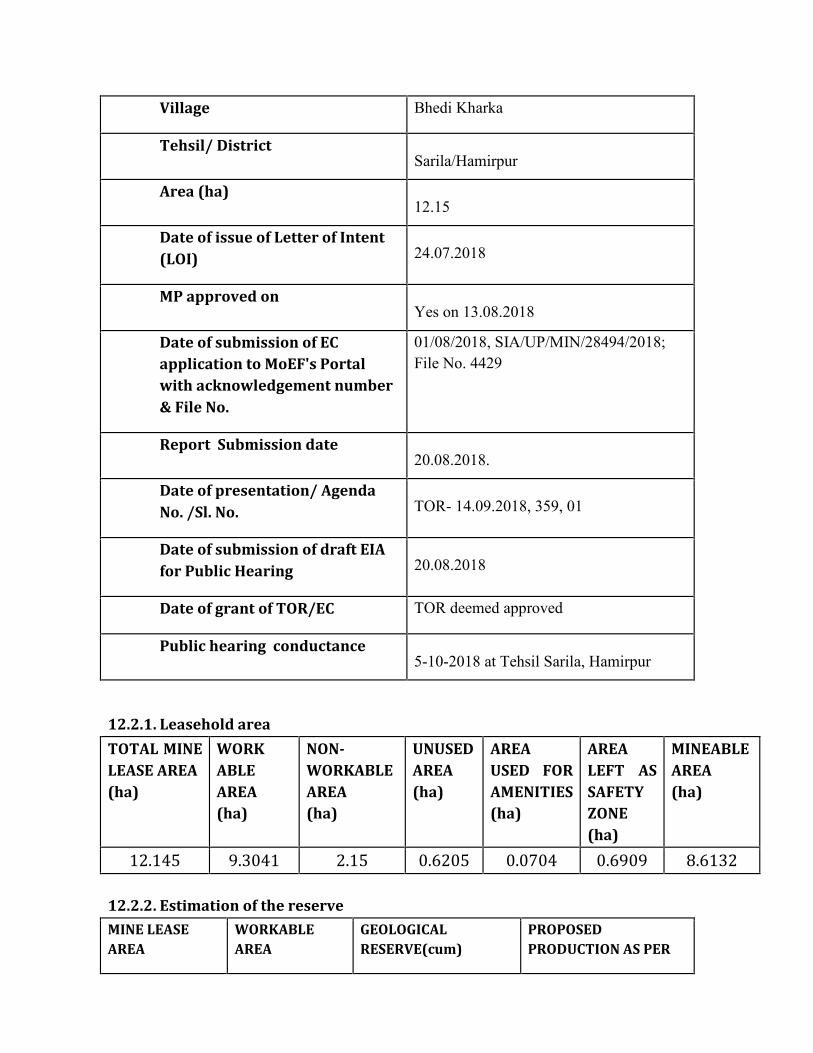
Village Bhedi Kharka
Tehsil/ DistrictSarila/Hamirpur
Area (ha)12.15
Date of issue of Letter of Intent(LOI) 24.07.2018
MP approved onYes on 13.08.2018
Date of submission of ECapplication to MoEF's Portalwith acknowledgement number& File No.
01/08/2018, SIA/UP/MIN/28494/2018;File No. 4429
Report Submission date20.08.2018.
Date of presentation/ AgendaNo. /Sl. No. TOR- 14.09.2018, 359, 01
Date of submission of draft EIAfor Public Hearing 20.08.2018
Date of grant of TOR/EC TOR deemed approved
Public hearing conductance5-10-2018 at Tehsil Sarila, Hamirpur
12.2.1. Leasehold area
TOTAL MINELEASE AREA(ha)
WORKABLEAREA(ha)
NON-WORKABLEAREA(ha)
UNUSEDAREA(ha)
AREAUSED FORAMENITIES(ha)
AREALEFT ASSAFETYZONE(ha)
MINEABLEAREA(ha)
12.145 9.3041 2.15 0.6205 0.0704 0.6909 8.613212.2.2. Estimation of the reserve
MINE LEASEAREA
WORKABLEAREA
GEOLOGICALRESERVE(cum)
PROPOSEDPRODUCTION AS PER
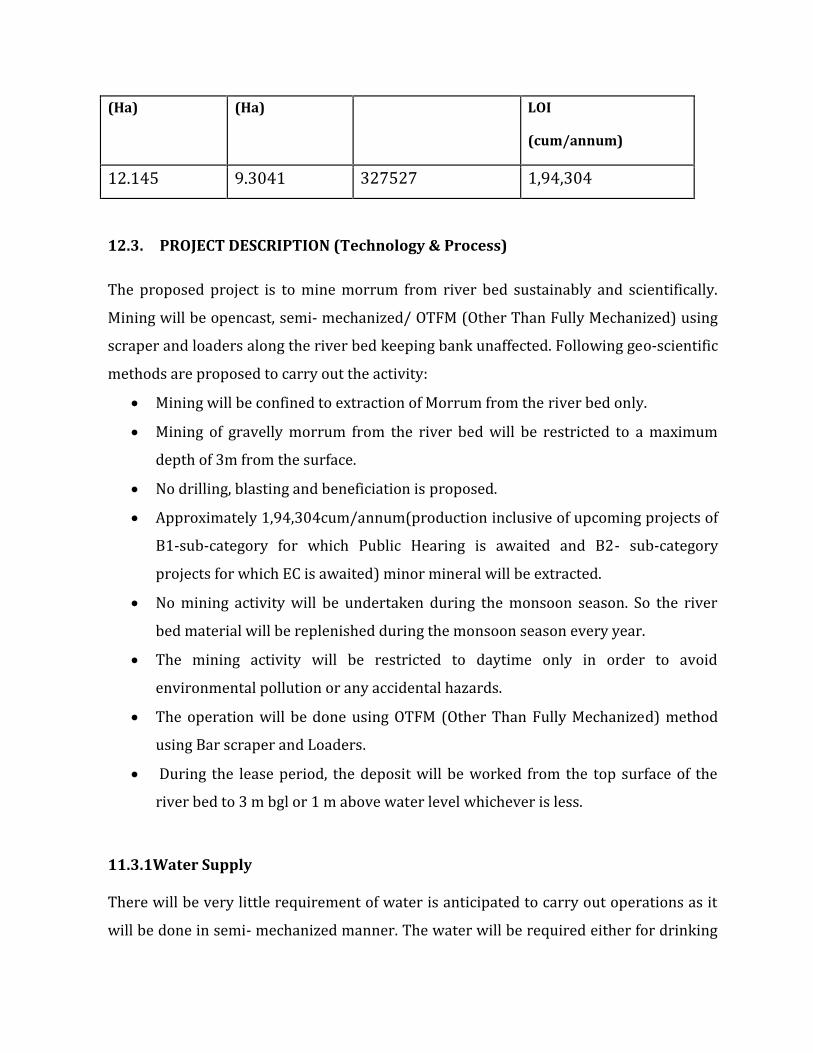
(Ha) (Ha) LOI
(cum/annum)12.145 9.3041 327527 1,94,30412.3. PROJECT DESCRIPTION (Technology & Process)The proposed project is to mine morrum from river bed sustainably and scientifically.Mining will be opencast, semi- mechanized/ OTFM (Other Than Fully Mechanized) usingscraper and loaders along the river bed keeping bank unaffected. Following geo-scientificmethods are proposed to carry out the activity: Mining will be confined to extraction of Morrum from the river bed only. Mining of gravelly morrum from the river bed will be restricted to a maximumdepth of 3m from the surface. No drilling, blasting and beneficiation is proposed. Approximately 1,94,304cum/annum(production inclusive of upcoming projects ofB1-sub-category for which Public Hearing is awaited and B2- sub-categoryprojects for which EC is awaited) minor mineral will be extracted. No mining activity will be undertaken during the monsoon season. So the riverbed material will be replenished during the monsoon season every year. The mining activity will be restricted to daytime only in order to avoidenvironmental pollution or any accidental hazards. The operation will be done using OTFM (Other Than Fully Mechanized) methodusing Bar scraper and Loaders. During the lease period, the deposit will be worked from the top surface of theriver bed to 3 m bgl or 1 m above water level whichever is less.
11.3.1Water SupplyThere will be very little requirement of water is anticipated to carry out operations as itwill be done in semi- mechanized manner. The water will be required either for drinking
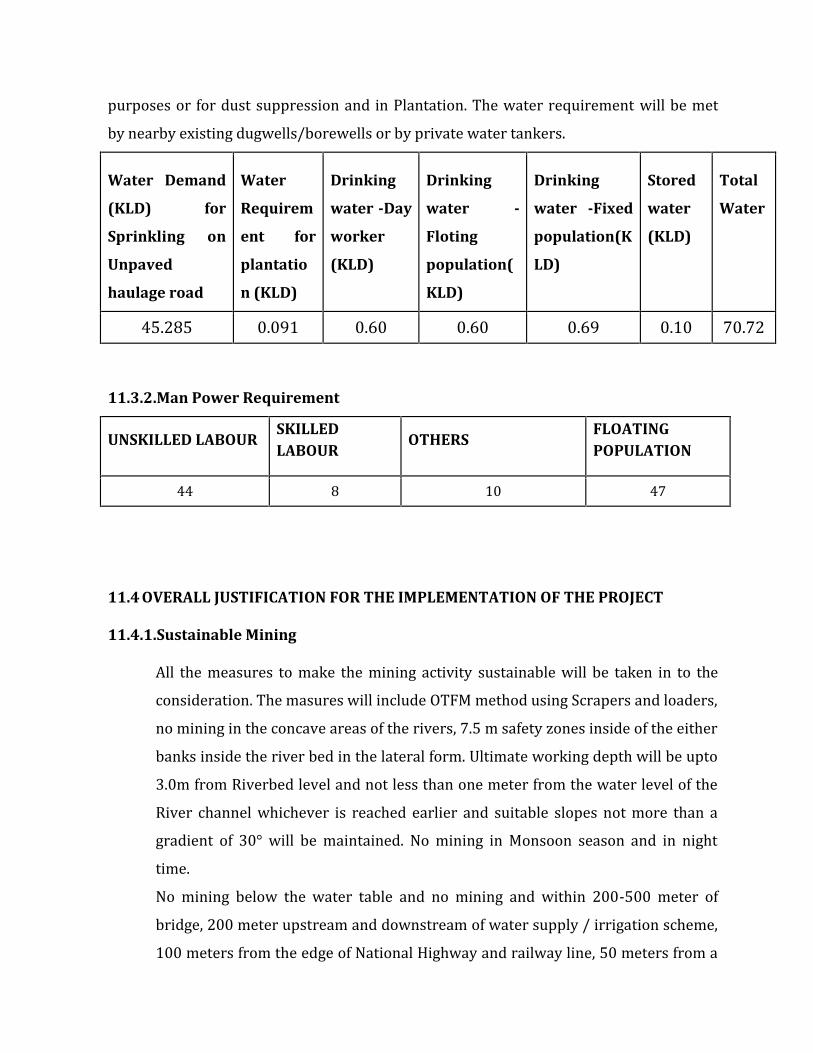
purposes or for dust suppression and in Plantation. The water requirement will be metby nearby existing dugwells/borewells or by private water tankers.Water Demand
(KLD) for
Sprinkling on
Unpaved
haulage road
Water
Requirem
ent for
plantatio
n (KLD)
Drinking
water -Day
worker
(KLD)
Drinking
water -
Floting
population(
KLD)
Drinking
water -Fixed
population(K
LD)
Stored
water
(KLD)
Total
Water
45.285 0.091 0.60 0.60 0.69 0.10 70.7211.3.2.Man Power Requirement
UNSKILLED LABOURSKILLEDLABOUR
OTHERSFLOATINGPOPULATION44 8 10 47
11.4 OVERALL JUSTIFICATION FOR THE IMPLEMENTATION OF THE PROJECT
11.4.1.Sustainable MiningAll the measures to make the mining activity sustainable will be taken in to theconsideration. The masures will include OTFM method using Scrapers and loaders,no mining in the concave areas of the rivers, 7.5 m safety zones inside of the eitherbanks inside the river bed in the lateral form. Ultimate working depth will be upto3.0m from Riverbed level and not less than one meter from the water level of theRiver channel whichever is reached earlier and suitable slopes not more than agradient of 30° will be maintained. No mining in Monsoon season and in nighttime.No mining below the water table and no mining and within 200-500 meter ofbridge, 200 meter upstream and downstream of water supply / irrigation scheme,100 meters from the edge of National Highway and railway line, 50 meters from a
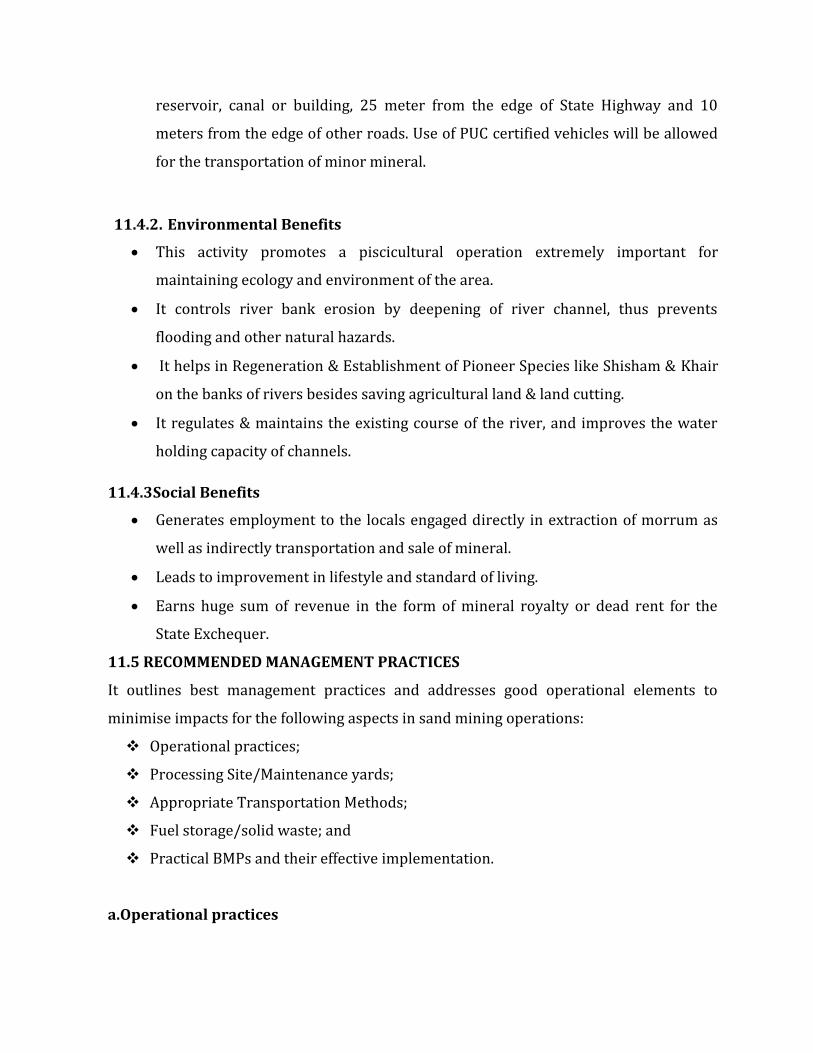
reservoir, canal or building, 25 meter from the edge of State Highway and 10meters from the edge of other roads. Use of PUC certified vehicles will be allowedfor the transportation of minor mineral.11.4.2. Environmental Benefits
This activity promotes a piscicultural operation extremely important formaintaining ecology and environment of the area. It controls river bank erosion by deepening of river channel, thus preventsflooding and other natural hazards. It helps in Regeneration & Establishment of Pioneer Species like Shisham & Khairon the banks of rivers besides saving agricultural land & land cutting. It regulates & maintains the existing course of the river, and improves the waterholding capacity of channels.
11.4.3Social Benefits
Generates employment to the locals engaged directly in extraction of morrum aswell as indirectly transportation and sale of mineral. Leads to improvement in lifestyle and standard of living. Earns huge sum of revenue in the form of mineral royalty or dead rent for theState Exchequer.
11.5 RECOMMENDED MANAGEMENT PRACTICESIt outlines best management practices and addresses good operational elements tominimise impacts for the following aspects in sand mining operations: Operational practices; Processing Site/Maintenance yards; Appropriate Transportation Methods; Fuel storage/solid waste; and Practical BMPs and their effective implementation.
a.Operational practices

The use of river reserve as dumping area will be prohibited; the river itself will not beused as dumping area; Machinery and transportation vehicles used in the operations must be maintainedwell and be free of any leakages; Mining activities will be avoided at night times; Vehicles transporting sand will maintain speed to not more than 20km/hr, be coveredto avoid spilling on public roads and should travel on non-peak hours; Site office and workers quarters will be equipped with proper sanitation facilities. Nodirect discharge of sewage or sullage will be allowed into the river course; Proper waste collection bins will be provided; and Working areas will be made good after operations.b.Processing site and maintenance yard
No discharge of oily wastewater directly into the river; Wherever skid tank is used for fuel storage, it should be surrounded by a bund andunderlain with concrete flooring to prevent any spillages reaching the river; Equipment, machinery and transportation leaving the site should always be clean andif applicable, provision made for a wheel washing facility to clean tyre prior toentering public roads; A maintenance yard should be concreted with perimeter drainage to collect oilywaste; and Overburden from mining activities is not allowed to be dumped on the riverbank orriverine reservec.Appropriate transportation methodsSand from the project site will be transported mainly via land and possibly by landtransportation. Land transportation involves dumpers. Impact of this type oftransportation will be fugitive dust from the sand itself and the gravel road on which thedumpers travel. Appropriate measures such as covering the dumpers with canvas orplastic sheets can prevent dust nuisance to road users and local residents.
d.Modifying operational practices working timeEnvironmental impacts can be minimized by improvement and improvisation in theworking time. By operating at certain particular times, impact on the environment can beminimized. The following can be used as guidelines for mining operations. There will notbe any mining activities during breeding periods of fish and other aquatic inhabitants(the operator should verify with the Fisheries Department).11.6 EXPLANATION OF HOW ADVERSE EFFECTS HAVE BEEN MITIGATEDA brief description of mitigation of adverse effects is discussed as under, however, adetailed discussion on the same is done in Chapter 4 of EIA. The mining activity is restricted to the dry river bed only. Since the site isgovernment owned waste land, no impact on existing land use is anticipated. Also themined area would get replenished on arrival of monsoon every year. Mining will be done as per the mining plan in the designated lease area fromgovernment for a period of five years up to the required depth only (3m below riverbed/ or 1 m above the water level/ water table whichever is less) and should beconfined to the dry river bed only. The only air pollution sources are fugitive dust emission due to movement, loading,unloading and transportation of minor minerals, as drilling, blasting, crushing, DGSet/furnace or storage is not proposed at site. There are no wastewater discharges to water bodies from the mining operations. Theonly water contaminant is rainwater run-off during the monsoon season. There willbe almost negligible impact due to the proposed mining on the water environmentand the water flow pattern does not disturb the turbidity and velocity, hence nomitigation measures are suggested. There is no noticeable effect on surrounding ground water resource due to mining asthe mining activity does not require ground water extraction. As there will be no heavy earth moving machinery involved in the mining operations,there will not be any major impact on noise level due to the mining and otherassociation activities. A detailed noise survey has been carried out and results arediscussed in Chapter 3.

Blasting technique is not used for morrum lifting, hence no possibility of landvibration. The mining operation will have positive and long term impact on river environmentas the operation will result in extraction of excessive morrum deposits from pointswhere the maximum sedimentation occurs, in order to prevent flooding or relatednatural hazards, which in turn will save the existing agricultural practices of nearbyareas. No mining will be carried out during monsoons. This will minimize impact on aquaticlife. It is a river bed mineral mining project which has no vegetation, therefore clearanceof vegetation is not required An inventory of the risks involved during the proposed project would be delineatedwith the measures to mitigate the same and the same would be ensured to the peopleby conducting an awareness program in the surrounding areas.
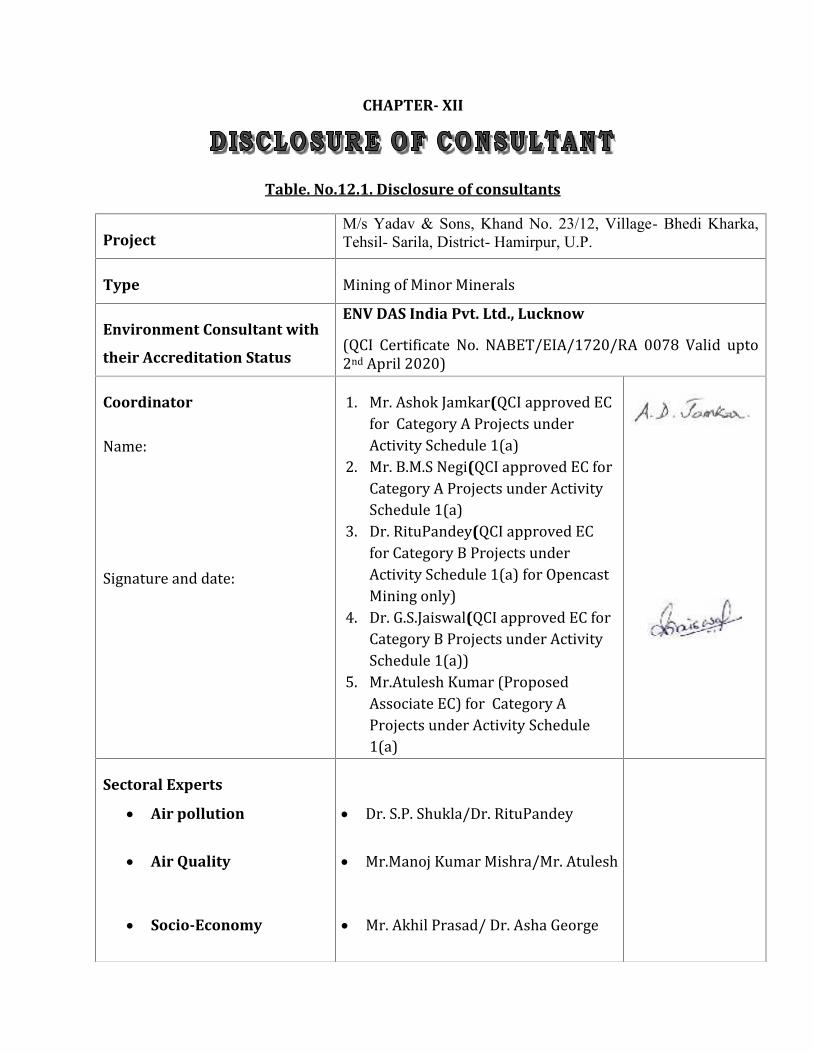
CHAPTER- XII
Table. No.12.1. Disclosure of consultants
ProjectM/s Yadav & Sons, Khand No. 23/12, Village- Bhedi Kharka,Tehsil- Sarila, District- Hamirpur, U.P.
Type Mining of Minor MineralsEnvironment Consultant with
their Accreditation Status
ENV DAS India Pvt. Ltd., Lucknow(QCI Certificate No. NABET/EIA/1720/RA 0078 Valid upto2nd April 2020)CoordinatorName:
Signature and date:
1. Mr. Ashok Jamkar(QCI approved ECfor Category A Projects underActivity Schedule 1(a)2. Mr. B.M.S Negi(QCI approved EC forCategory A Projects under ActivitySchedule 1(a)3. Dr. RituPandey(QCI approved ECfor Category B Projects underActivity Schedule 1(a) for OpencastMining only)4. Dr. G.S.Jaiswal(QCI approved EC forCategory B Projects under ActivitySchedule 1(a))5. Mr.Atulesh Kumar (ProposedAssociate EC) for Category AProjects under Activity Schedule1(a)Sectoral Experts
Air pollution
Air Quality
Socio-Economy
Dr. S.P. Shukla/Dr. RituPandey Mr.Manoj Kumar Mishra/Mr. Atulesh Mr. Akhil Prasad/ Dr. Asha George
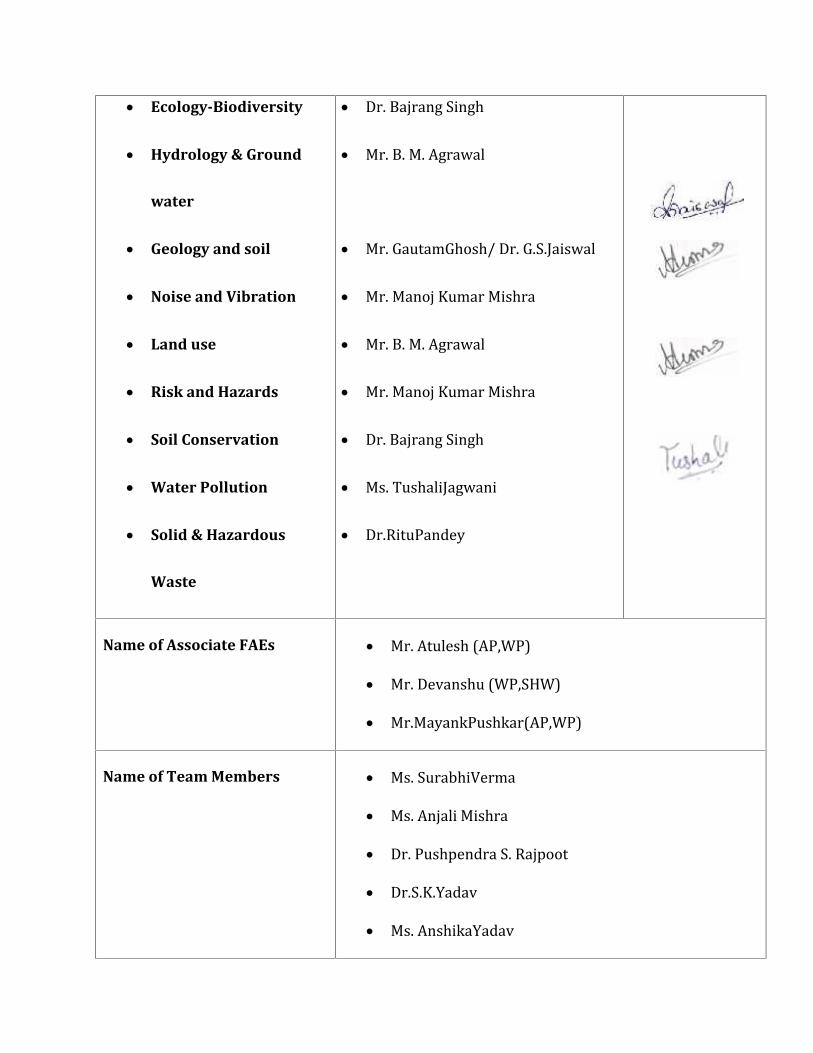
Ecology-Biodiversity
Hydrology & Ground
water
Geology and soil
Noise and Vibration
Land use
Risk and Hazards
Soil Conservation
Water Pollution
Solid & Hazardous
Waste
Dr. Bajrang Singh Mr. B. M. Agrawal Mr. GautamGhosh/ Dr. G.S.Jaiswal Mr. Manoj Kumar Mishra Mr. B. M. Agrawal Mr. Manoj Kumar Mishra Dr. Bajrang Singh Ms. TushaliJagwani Dr.RituPandey
Name of Associate FAEs Mr. Atulesh (AP,WP) Mr. Devanshu (WP,SHW) Mr.MayankPushkar(AP,WP)
Name of Team Members Ms. SurabhiVerma Ms. Anjali Mishra Dr. Pushpendra S. Rajpoot Dr.S.K.Yadav Ms. AnshikaYadav
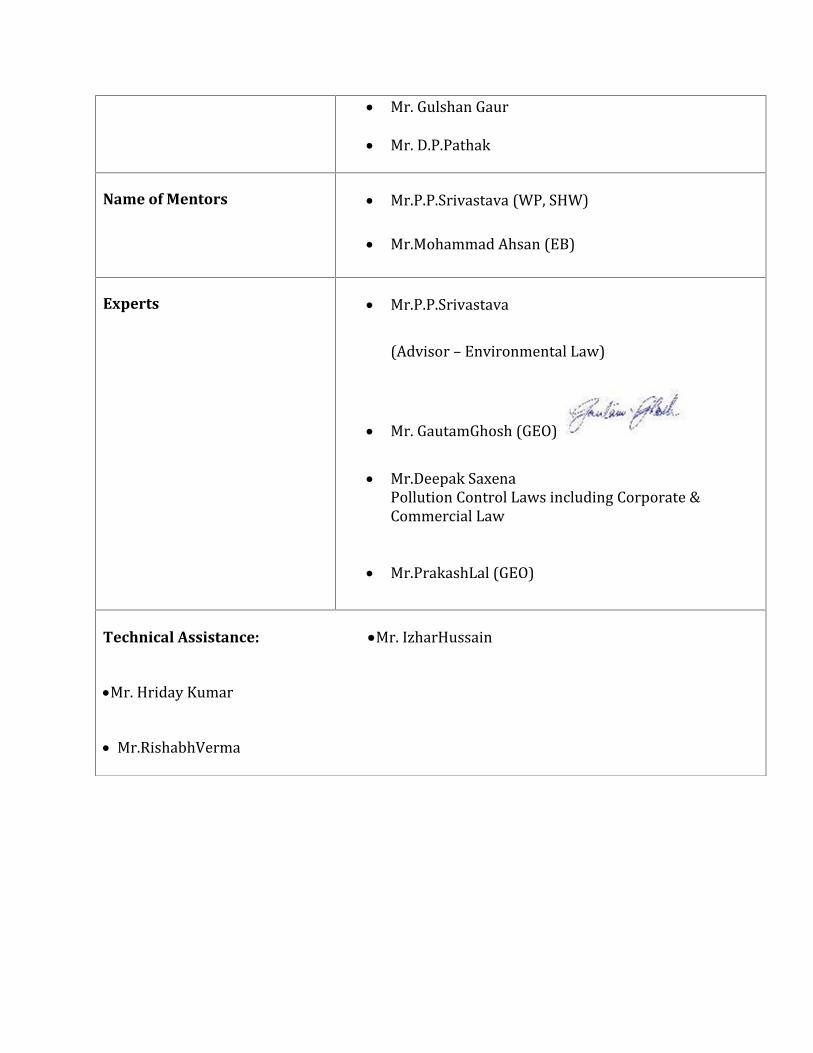
Mr. Gulshan Gaur Mr. D.P.Pathak
Name of Mentors Mr.P.P.Srivastava (WP, SHW) Mr.Mohammad Ahsan (EB)
Experts Mr.P.P.Srivastava(Advisor – Environmental Law)
Mr. GautamGhosh (GEO) Mr.Deepak SaxenaPollution Control Laws including Corporate &Commercial Law Mr.PrakashLal (GEO)
Technical Assistance: Mr. IzharHussainMr. Hriday Kumar Mr.RishabhVerma
Related Documents