C/ CIRCULATING COPY TO BE RETURNED TO REPORTS DESK FILE buri fLt%fLvl' tTi-1 rI flfl Ttrr'v * AI'.r.t Aj T 3 p4x t run. nflfllt%Tfl'flf TflhfTfl'T I tTn "Tht ,r'y %lnl~ SnkrL IJI.AuiV I OF I1NTERUNPATIO"NA L BANK FOR ui.flLUN wKlRUIN AjNDJ DJE,vELOPMri;vrnT INTERNATIONAL DEVELOPMENT ASSOCIATION Not For Public Use | \X h <t < '; W 2$' ;2'' ' 't U 'Report No. 38-BR l/ ' THE ECONOMIC AND SOCIAL DEVELOPMENT OF BRAZIL VOLUME VII INDUSTRY March 12, 19173 La-tin A mler4ca andu th'e CariLbubean D-epartrment This report was prepared for official use only by the Bank Group. It may not be published, quoted or cited without Bank Group authorization. The Bank Group does not accept responsibility for the accurac-y or conpleteness of the report, Public Disclosure Authorized Public Disclosure Authorized Public Disclosure Authorized Public Disclosure Authorized Public Disclosure Authorized Public Disclosure Authorized Public Disclosure Authorized Public Disclosure Authorized

Welcome message from author
This document is posted to help you gain knowledge. Please leave a comment to let me know what you think about it! Share it to your friends and learn new things together.
Transcript
C/CIRCULATING COPY
TO BE RETURNED TO REPORTS DESK
FILE burifLt%fLvl' tTi-1 rI flfl Ttrr'v * AI'.r.t Aj T 3 p4x t run. nflfllt%Tfl'flf TflhfTfl'T I tTn "Tht ,r'y %lnl~ SnkrL
IJI.AuiV I OF I1NTERUNPATIO"NA L BANK FOR ui.flLUN wKlRUIN AjNDJ DJE,vELOPMri;vrnT
INTERNATIONAL DEVELOPMENT ASSOCIATION
Not For Public Use
| \X h <t < '; W 2$' ;2'' ' 't U 'Report No. 38-BR
l/ '
THE ECONOMIC AND
SOCIAL DEVELOPMENT
OF
BRAZIL
VOLUME VII
INDUSTRY
March 12, 19173
La-tin A mler4ca andu th'e CariLbubean D-epartrment
This report was prepared for official use only by the Bank Group. It may not be published, quoted
or cited without Bank Group authorization. The Bank Group does not accept responsibility for theaccurac-y or conpleteness of the report,
Pub
lic D
iscl
osur
e A
utho
rized
Pub
lic D
iscl
osur
e A
utho
rized
Pub
lic D
iscl
osur
e A
utho
rized
Pub
lic D
iscl
osur
e A
utho
rized
Pub
lic D
iscl
osur
e A
utho
rized
Pub
lic D
iscl
osur
e A
utho
rized
Pub
lic D
iscl
osur
e A
utho
rized
Pub
lic D
iscl
osur
e A
utho
rized

CURRENCY EQUIVALENT
Currency Uvnet: Cruzeiro- (Prior to Mav 15j 1970; the eurrencyunit was called the "Cruzeiro Novo" or "NewCrUzeiro", the adjective was dropnPA in May, 1970;without any change involved.)
"Achange Rates Effecie L;L,LVW~ ^Ce -F be r 'I -7* 1972
Selling Hate:VS 'St.0L -VJ rtS
Buying Rate: US$1.00 = Cr$6,165
Average Exchange Rates
US$1.00 Cr$h.59 Cr$5.285US$1 million = Cr$4y594,000 Cr$5,285,000Cr$1 million US$217,675 US$189,215

This report is based on the findings of a mission inMay to June, 1972 to Brazil composed of:
Roger P. Hipskind (Chief of Mission);Lorne T. Sonley (Agricultural Economist);Donald Pickering (Consultant - Agricultural Economist);Bernard Decaux (Consultant - Industrial Econonist);Gerhard Thiebach (Industrial Economist)-Joaquin A. Martinez (Telecommunications 5 ;Sonia C. Hoehlein (Secretary)


TA nnD OF 0 WCi,vlyi EiS
Paure No.
I - THE TEXTILE INDUSTRY ................. 1
II - THE LEATHER INDUSTRY .*.... ...... *.... s..** .... ,.s..s. .o.. 73
III - THE SHOE MANUFACTURING INDUSrRY .. ........ ... 95
IV - THE FERTILIZER INDUSTRY ..... .*.*. 10O


I. THE TEXTILE INDUSTRY
1. DESCRIPTION OF TIE TEXTILE INDUSTRY
A. Significance of the Textile Industry in the Natioinal Econony
1. The textile industry is an important source of industrialemployment, providing work for about 3)40,000 operatives out of a totalof 2.3 j4lion persons employed in manufacturing (14.6 percent of thetota±, .0= Similarly, the wages paid by the textile industry, whichamounted to more than 1 billion cruzeiros in 1969, represented a signifi-cant proportion (about 11 percent) of the total wages paid by the manufac-turing industry. Gross value added in textile production was 3.5billion cruzeiros in 1969, i.e., 10 percent of total gross manufacturingproduct. As the latter contributes about 15 percent of GDP the textileindustry therefore supplies 1.5 percent of the GDP, apart from the In-direct contribution it makes by purchasing raw materials fram othersectors.
2, The recent evolution of the textile industry shows that it istending to develop at a much slower pace than the manufacturing industryas a whole, and is therefore contributing less than in the past. Forinstance, the number of persons employed in the textile industry, althoughrepresenting a substantial proportion of industrial employment (thelargest for any one branch of activity) is now less than in 1958, whennearly 20 percent of the operatives in the manufacturing industry wereworking in the textile sector. At the same time, the proportion of totalmanufacturing wages paid by the textile industry dropped from 17 percentin 1958 to 11 percent in 1969, and the value added declined from 13percent to 10 percent of the total for the whole manufacturing sector.The contribution made by the textile industry shrank as a result of therelatively slow growth of its production, which in the period in questionincreased by 73 percent, as against 120 percent for the manufacturingindustry as a whole.
3. The purchase of raw and related materials by the textileindustry is one of the prime spurs to several sectors of the eqonomy,especially agriculture, stock fanming and the chemical industry. In thelast decade, its average yearly purchases of cotton totalled 250,000 tonswhich was about 45 percent of domestic cotton production. In 1969, thesector as a whole consumer about 3.0 billion cruzeiros' worth of domesticraw materials, mainly cotton, wool, rayon, synthetics and jute. The
1/ Source: IBGE - Data are for 1969.

- 2 -
textile industry thus makes possible a large volume of employment inother sectors. estimated at about half a million workers in the agricul-tural sector alone.
B. Structure of the Textile Industryv
The Brazilian textile industry comnrises the following groupswithin the manufacturing sector: the processing and preparation of fibresfnr txYtiles purposes; the spinning; weAvina of yarn and fabricr nrocessingof cotton, wool, man-made fibres, jute and similar fibres, flax and ramie,and natural silk; the knitti.ng industry, and the mnanufacturaA of hnRivrvand knitted goods in general; the industry manufacturing trimmings, ribbons,t.ullp- feltjq lace and emhrnoiderv goodg. the industries nroducing rone;carpets and serving and emboidery thread; the hammock and fishing netindustry, arnr d som.e other arnninl tetile 1 rancrhes.
5. TIn all, the textile industry is c omosed of about 10QnOplantsV of every size excluding artisan units employing less than five persons.
6. The spinning and weaving sectors cover spinning, weaving,print+ing, +he dyeingr of nylar.n andd shbr4 n o+her Ae , procssving sec-
- .A.** tA.. SA~ ~ USS *J ~.A.- o - e-**- - - -†- - - .5
tions, including the finishing and packaging of sewing and embroiderycot-tons. nnlis is 4th-e p,t-ncipal sec4tor ir.-l -h 4-4ile indust-r;, - -rising
about 80 percent of the production in tons.
Ts.ble 1: STRUCTURE OF THE TEXTILE INDUSTRY
_~~~~~~~~~~~~~~~~~~ , . ~%%,UL1
(In.thousand tons) %
3pinning, weaving, and yarn and 298 77.6
AKJUtu.Lire ar-id hosiery 54 14.1
Trimming, ribbons, tulle, felts, etc. 18 4.7
Ropms, cords 14 3.6
TOTAL 384 100.0
Source: Engineering Vesdre (Belgium)
7. Next in importance is the knitting and hosiery industry, whichaccounts for 14 percent of the production. The industry is highly atom-ized. There are hundreds of manufacturers of knittear in the. country,and only a few have more than 10 machines. Traditional (flat) knittingmachinery is found in the areas around Porto Alegre, Blumenau and Petro-
17 lBGE Producao Industrial, 1969.

polis. The fully fashioned flat machines are concentrated wiLthin aroundt.en , 11X9 s -n Sao auo. rs-3ly, mlodern, c Irc-'ar 1-n-1 'In maL-l are_ _ -ItLI I.±LII i.i 0 r,.U.L r 2Ir&L.LY IIUU .Liuu.L" A&IWLL .LI16 hZiauLLLI1OS arelocated predominantly in Sao Paulo, except for the cotton knitting indus-t,ry of Santa Ca_aria. Hosiery i s also developed in the latter S-ate.
8. The other specialized branches of textile ma^nufacture play afairly minor part in the industry as a whole, except in the state of Riode Janeiro -where the manufactuwr Of t1Mmi ngs, lace, felts, anu otherspecialities is important.
Table 2: STRUCTURE OF THE TEXTILE INDUSTRY FOR THE DIFFEYENT STATES
Value Added C-L
(Cr million) Value Added
Sao Paulo 2,065.2 57.0Nordeste 354.9 9.8Guanabara 279.5 7.7Minas Gerais 243.5 6.7Rio de Janeiro 204.6 5.7Santa Catarina 200.6 5.5Rio Grande do Sul 114.6 3.2Parana 103.4 2.8Others 59.2 1.6
TOTAL 3,625.5 100e0
Source: Producao Industrial, 1969.
C. Distribution of Textile Production
The Textile Industry as a khole
9. In 1970, the output of the spinning industry was estimated at325,000 tons of yarn and 270,000 tons of fabrics. This compares with total,domestic output of 285,000 tons of yarn and 260,000 tons of fabric in 1960.Y/It is clear that in Brazilian textile production cotton predominates intenns of volume, followed by man-made fibres, wool and flax and ramie.
Cotton Sector
10. Total yarn production was estimated at 270 thousand tons in1970, i.e. 19 percent above the 1960 level. Production of fabrics was approxi-mately 1,200 million square meters against 1,171 million in 1960. Fabrics pro-duction has increased much less than yarn output due to the diversion of in-creased quantity of yarn to the knitting and hosiery industries which havegrown at a fast rate.
1/ ECLA survey.

-14.-
Table 3: STRuCTURE OF PROD-UCTION IN TIE TEXTILE INDUSTRY
Yarn Production Fabrics(Thousiard of tons) (Million square meters)
I1960-/ 1970_/ 1960 1970
Cotton 227.0 270.0 1,170.7 1,200.0
Wool 30.0 15.3 14.1 20.0
Artificial Fibres 13.0 14.6/ ( ((122.6 (300.0
Synthetic Fibres 1.2 15-02. (
Silk o.5 o.5 n.a. n.a.
Flax/ramie 9.0 9.0 22.8 i8.o
280.7 3214.8 1,359,2 1.558.OY
V/ ECLA survey7/ Engineering Vesdre
/ Excluding filaments, directly used in weaving, knitting, etc.z/ Mission estimates.
11. Cotton consumption represented 64 percent of total apparentconsumption of fibres in 1970 against 73 percent in 1960. Such a decreaseis due to inroads made by synthetics and artificial fibres. Data availablefor Sao Paulo State show that cotton consumption in spinning mills rose by6.3 percent from 1960 to 1971 while yarn production increased by 8.7 percent.
Wool Sector
12. Domestic consumntion of raw wool has decreased in the lastdecade from about 25,000 tons (including re-used wool) in 1960 to about15,000 tons in 1970. But while in 1960Q onlg 11 nercent of fibres usedin the wool spinning mills were artificials and synthetics, this propor-tion rose to L6 percent in 1970. Thus the total fibre consi ntion was
oUut the same in 1960 and in 1970, i.e. less than 30,000 tons. The useof woolen goods in annarel is very small in Brazil. noving to thle rclimates
Man-made Fibre setorl/
13. Cons'ampti on of man-made fibres has substantIally Increased in1/ n-made fibres refers to 11 fibre mater s c h-uman
.~~~ n alI,aha -- p r A..o d~ UU.I C -Uy' Ua
manipulation of natural resources. In other words, fibres which do nototi-hr natu.rall auch as cot+or., wTol "' ax 4 J et.. f'i .he u
synthetic fibres refers specifically to those fibrous materials producedfrom rolm-ers1 r The main -+'-.the,, YNks a-e the ,lon- polyester and acr) - lict, - 8 Ul j.v.. LV.LIJA, V1.LJ1i.L I1U vy ctypes, the other man-made fibres being the cellulosic type, namely rayonand acetate.

recent years. Sixty percent of fibres used in the textile indu3try arecontinuous filaments sLch as polyester, nylon; viscose and acetate. Themain end use is for knitting, hoseiry and cords.
Table 4: CONSIIMTION OF MAN-MADE FIBRES IN THE TEXTILE INDUSTRY
(In thousand tons)
1965 1970 % Increase
Artificial Fibres
Staple 11.0 16.8 52.7FIlMent 18.2 24.0 31.9r X lament,--
29.2 40.8 40.7
Synthetic Fr'bres
Duwl A.> 20.21.Filament 7.7 30.4 294..8
12.7 50.1 294.5
Total
Staple Ul.9 90.9 116.9Filament 16.0 37.5 134.4
25.9 54.4 110.0
11X. Production capacity of man-made fibres in Brazil in 1971 wasabout 41,000 ons for artificial fibres and 54,000 tons for synthetics usedin textiles.,/ Actual dcmestic production was 23,000 tons in 1970 forartificials and 43,000 tons for synthetics. Polyester, and yeny larothe main inported fibres.
D. Mill Size and Vertical Integration
15. In 1969, the average size mill in the textile industry as awhole was one with 150 persons employed. The average size mill in 1960
V/ There are also some industrial uses (acetate staple for cigarettefilters, nylon 6 and viscose for tires).

was 108 persons, thus revealing some increase in mi'l size in the lastdecade. In 1969 firms with 500 to 999 employees contributed 23.5 per-cent of value added and 27.5 percent of employment but represented only6.2 percent of the total number of mills. Also firms with more than1,000 employees contributed 26.8 percent of value added and 2415 percentof employment. These large mills represented only 2.4 percent of the totalnumber of mills.
16. The number of textile mills has also decreased from about2,900 in 1958 to 1,900 in 1969 (excluding units with less than 5 workers).This has been partly due to increasing integration of the mills. rnelargest proportion of man power is employed by the fully integrated mills(spinning, weaving and yarn and fabric processing, including printing anddyeing). In other words, the bigger establishments generally tend tocover the whole range of processing.
17. Admittedly, the lack of any tradition in the marketing of inter-mediate production has been a contributory factor. In this respect, thetextile economy of each state is practically a watertight compartment,trade among the different regions being in raw materials and end goodsonly. The vertical integration of the industry at the regional leveland the consequent limitation of the market for intermediate goods areleading to more and more integration at the mill level, and in some casesto production units that are not of economic size. It is reported thatin one state, mills with only 6,000 spindles have also finishing sections.:'This state of affairs is far from satisfactory, since it results in idlecapacity and a low level of specialization, factors which together withlow machine efficiency and labor productivity tend to raise costs.
18. It should be noted that in such countries as the United King-dom, the Federal Republic of Germany,and France, the textile industry ishighly specialized, and complete integration is found only in a fewexceptionally large mills. Consequently, except for such very large mills,the industrial integration of textile mills would not seemi justified oneconomic grounds. Specialization and standardization of production at themill would make for an overall improvement in industrial efficiency andproductivity.
19. There are still several large 4yig houses specializing intollwork, the most important ones being located in Americana (Sao PaulaState) and in Sao Paulo. In general these large houses have a strongposition in the Dolyester field on account of the high investment requiire-rents of dyeing. The smaller houses, however, have 50 to 60 percent ofthe knitted goods finishing market. which also hapnens to be the fastergrowing sector. Small houses are more flexible as to minimum quantities.Large operatorsr' mIinimmn requiremrents exclude most of the Tit-wear factoriesand warp knitters. The larger houses, on the other hand, are being threatened
1/ Also independent spinners are being increasingly squeezed by the integratedm.ills For instance, integrated mills already spirn 70 percent of poly-
ester blends against only around 30 percent by unintegrated spinners.

- 7 -
by the gradual switch of the large cotton mills to polyester/cotton blends.This points to a growth of in-house finishing at the exnense of the customfinishers. Even so, custom finishers may continue to handle peak-shavingwork ev.n for the large nolvester/cotton weavers, aside from the outnutof the smaller mills. This overall impression is confirmed by the opinionof the larger houses; who complahin that their position has bhen eroded bvthe smaller dyers. This process will probably continue because of thehigh grnwth rate of thp knitting industry.
20. As to printing, t-llwork is spread amonga ach larger rnimherof small operations and thus more difficult to evaluate. There are aroundten larg1 e cuno stoQm printers, oing boetween them soma 1 m41 1 nma t/ h
This is probably around 60 percent of the printing tollwork total, whichis- +.hia aa+Amm+.t a+. 1.5 milliof n mff%v'a/1,,A4h o ut Or +a t+,l Toaz4lin
production of 4 5 million meters/month of printed cloth.
21. As regards weaving on a toll basis, it is estixaated that itApru,rinaQ l0-000 nnn rym n rinf' na4v+ Rn Ann 1OM -nnam 4in 7a41 Tr^0+lw 4tvr^ Z--- - - __v_-_ __-w . S~~..-.,, ,,,.,&, * yA.L
Americana where there is a large concentration of weaving mills havingless thann l00 looms which nve go-ne oter alost entirely +o +his fo ofoperation in order to stay in business at all. This would represent some10 crcena of +-o+.I cot+on fl%4n- --apac, -1h. h 48 I rea sonable ag,ree-ment with the ECLA survey, according to which in 1960 around 11 percentofL co-t't on weav4 ig capsacity was in mJ '" 10 of, le8a8 L"CLU _LVW L 0-s.
2. THE MARKET FOR TEXTILES
A. Evolution of Apparent Consumption
22. Total apparent consumption of textilesa/ in Brazil rose from302,000 tonv ia 1955 to 45U,000 ton& in i970, representing an increase of49 percent.
23. As Table 5 shows, the only year-to-year reduction in totalapparent consumption during une period was in i964-65. Most other yearsshow some increase, particularly from 1967 to 1968 when apparent consump-tion grew by 6.9 percent. However, in some years such as 1963 and 1969consumption remained stagnant.
24. The per capita series shows that after declining from 1961 to1965 consumption started rising regularly up to 1970 (with the only excep-tion of 1969). However, per capita consumption was still lower in 1970Uanl it was in i955 witn 4.82 kg compared to 5.02 kg in 1955 and 5.14 Kg
in 1961. This level of consumption is to be compared with 6 kg per capitaiLn Colombia, 10 kg in Argentina, 14 kg in uermany, 15 kg in France and 20kg in the United States._
1i, in ,ierms Of natural ana man-made fibres.T/ Source: IPEA draft study on the Textile Industry in Brazil.

- 8 -
Table t: TOTAL APPARENT CONSUMPTIONI. OF TEXTILES 1955-70
Total 3/Consumntion Consumption Per Clanita
Population 2/ (Thousand of Index ConsumptionYear (-m.i I1 io)n) tons) Oqqq5loo) T( Io,rs
1955 60.2 30l2.3 100 < 021956 62.2 306.5 102 4.961957 6I.2 312.1 103 4-861958 66.3 326.1 1o8 4.92195° AR *. c '-I.9 16 5. o
1960 71.0 362.2 120 5.10I (z)i 71 0 17? n n0.Cn1.J./ V-L D t. J e V- _. 1 v- v V- .L-. * J e w
1962 75.0 372.7 123 4.971C62 -77 1 370.A 1V23 -.
1964 79.3 357.7 118 4.51I9 O1.5 A6. 121 4. 501966 83.8 383.2 127 4.57-I oA pA f, -oI' 7) -7 O En
xL;l ~a 7v uv- . -L _71.7J . f U4.V
1968 88.5 423.2 140 4.78I AAA0 AlA1.) , AVL1969 91.0 U 4f-L2 14V 4.64
1970 93.2 450.0 149 4.82
1/' Production L imports ls or of natur a,-.dt .
5/ Population data interpolated on the basis of 1950, 1960, and 1970 censuses.v/, Consumption of cotton, wool, artificial and syn.thetic ibres, silk, lilne
and ramie excluding jute and sisal. Includes industrial uses for wThichdetailed yearly data a-e not a-vailable. In 1970, industrial uses (tirecord, bagging, tarpaulins, rope, etc.) have been estimated at about64,0oo tons. L?cl-uding such ind-ustrial uses, cons-wuption of fibresclassed as for personal use would thus be 386,ooo tons in 4.14 kg percapita.
25. The composition of apparent consumptioD by fibre underwent nomarked changes from 1955 until the early sixties .1 Consumption of cottontextiles predominated throughout that period, representing always a littleless than 3/4 of the total. The remaining consumption was of manufacturesof artificial fibres, wool, synthetic fibres and linon and ramie. However,in recent years, the share of cotton has decreased to less than 65 percentsL the total while synthetic fibres increased drastically, accounting for12 percent of total fibres consumption in 1970 (against only 1.4 percentin 1960). The share of artificial fibres has also slightly increased whilewool, linen and ramie registered some decline.
1/ See Annex Table 13.

26. This general picture of the composition of consumption can beregardedl a s r,o maL -,; sir.ce couttorn is produck, edI inJL "1%ab,dance "I theU cow,1.ty,it can be expected to still predominate over all other fibres consumed,particularly as cottor products meet rmost of 'the requirements of a countrywith extensive tropical areas. Artificial fibres, which can be used eitheralone or blended with other fibres, are also qualifieu to obtain a substan-tial share of the total consumption of textiles. However, the growth ofartificial fibres has and will remain small as compared with the mughfaster growing sector of synthetic fibres. The consumption of syntheticfibres has increased four-fold from 1965 to 1970. Tne significant changein the structure of consumption of textiles in Brazil which occurred inrecent years is generally expected to be continued in favor of syntheticsand at the expense of cotton.
27. Total textiles consumption increased at the low average annualrate of 2.7 percent from 1955 to 1970, cotton textiles consumption grewby 1.7 percent only while wool, linen and ramie stagnated. Consequentlyonly artificial and synthetic fibres have shown significant increases.
B. Marketing of Textile Products
28. Until about ten years ago, the bulk of the sales for each plantwere made through wholesalers. In the virtual absence of a garment industry,wholesalers bought the bulk of the entire output from the mills and resoldit to the piece goods stores, often through one or two fu't;her links inthe chain known as "grossistas". There is no doubt that in those somewholesalers were of greater individual importance than any of the mills.This type of organization however, is facing extinction, as in the urbancenters the mills increasingly sell direct not only to the garment indus-try but also to the chains of piece goods stores and even to individualoutlets.
29. Nevertheless mission interviews with some of the major cottonmills show that 50 percent or more of their sales are still typically madevia wholesalers. In the urban centers, the wholesale trade has evolvedin two ways. On the one hand, there still exist the purely textile whole-sale houses that more often can manage to survive only by evading taxes,selling a part of their throughput without invoicing. Others have movedinto different but related fields. There are garment wholesalers who alsohandle standard items such as hosiery, men's slacks and undergarments; andindustry oriented wholesalers catering to military, government, hospitalor other institutional markets and who survive thanks to "special rela-tionships" with the appropriate purchasing agents. These latter tradinghouses may have a future although their links with the industry proper arebecoming more and more tenuous.
30. In the interior, however, the wholesaler still exists and thisis what accounts for the high percentage mentioned by the mills. Theseare usually wholesalers-retailers, who buy directly from the mill to gainaccess to the goods at mill prices, but then sell part of their purchasesthey cannot channel to the public themselves to other, smaller retail stores.

- 10 -
31. The typical price structure of the cotton goods distributionchain is as follows:
Level Price Index
Mill 100Wholesaler 130'lrossista" 170Retail 220
32. There is thus a 30 percent mark-up at each level. Thisillust.rn+ates qni+.t cwlperly the adcivan+tnag of thp nhninec . bh alimintAtna +twn
stages, they are able to buy at 100 and to sell at around 190, undercuttingother stores in the area while ennoying agross margin three times higherthan that of any single one of the traditional channels.
33. The piece goods stores are a very important outlet for thetexti;- oindust". A nf :1 l .1 A+.; nr ._ar Q D D+.i1 1__~~J X _M __- ,*-- - r - ~-' Y ---~a~~~-sold as yard goods, although a portion of this may be going to cottage
34. rPh. lroI li.e of __t a-ivieaa (ofiresged. 4 v me+ers) of +he pstores has in the last ten years declined by 40 percent, while the number_of -,,+-le+. w 11 al b;r AO per ent -- neverL-eless, --- A n(rVo
'.~ ~ .A.L tLl CA. .J .L- -MS -J d" t.-flU * W j -U t CJ. UL* Q .OO D%AMV %1¼, ~%OJ~
stores left in Brazil that deal in piece goods. The degree of specializa-4tior. dimirishes zsa e4tne rRW w cent-rs Jncreases;-h-aU.L.'Ji A t .LJU J.ILC 0. ULLC %A-A. U0"..LIV .L4.Ltu VI=I &A.L10LA LCL IJCl. "J%.-OL Z WuC.Lfd.zin cities like Sao Paulo stores will deal only in yard goods, in the out-sL.r+ 4O Itey - '1 also st0ock remady madeI I c.U.JVUMIJUJ..JLVu-LLg .L) onU e U V V LoU4w
interior, cloth tends to be one of numerous itess sold by small "generalstores.'11
35. The dominant factor- if thiL field is tne chain, which accountsfor a share of the business that is out of all proportion to its numbers.Th-us, one very- large chain, with 700 stores in the country, sells around120 million meters per year. Two other chains have 180 and 200 outlets,respectively, and seil between them another 60 miilion meters. rnus, withless than 2 percent of the outlets, these three chains of stores move over15 percent of the estimated volume of yard goods sold in Brazil. Theirbuying power also allows the chains in many cases to act as wholesalers,
IZ±ing to other stores in their geographic area and undercutting thewholesaler with his traditional structure of travelling commission sales-men.
36. A fairly prosperous sector of the piece goods business is insuitings, which are handled primarily by specialized chains. Around 75percent of all suits are stYULl tail or-made, although slacks are increasinglybeing bought off the rack._
1/ In Sao Paulo custom tailors make around 40 percent of the suits boughtor made in the city annually. But in the interior, the ready made suitdisappears almost entirely.
37. The only other channel of importance is the factory outlet.According to a study carried out on a sample of smaller mills, thisaccounts for around 8 percent of the total sales. If larger mills wereincluded, the overall percentage might be somewhat lower, but it is never-theless an important channel. Even among the middle classes, consumerstravel out to the various plants to buy textiles.
38. Lack of proper marketing organization is a problem for many tex-tile mills in Brazil. Only a small number of textile firms have a marketingsection, Among the mills visited by the mission, marketing was frequentlymentioned as an important problem.J-/ Areas where improvements were consideredas needed include increase in the number of salesmen, better training to beprovided for the latter, improved market research and quick collection ofinformation on consumers' taste and changing fashion. Also some manufacturerscomplained about the small size, poor management and lack of financial re-sources of garment manufacturers. The latter have substantially developedsince 1965 but largely remain at a semi-artisan level, often unable to cor-rectly process valuable material. Measures such as standardization and regionalmarket studies are needed to help garment manufacturers. In the meantime,chain stores would continue to be developed, in close association with the mills.
C. Evolution and Structure of Imoorts
Textile Products
39. Although small as compared to domestic production, importshave increased in the last decade from US$1.1 million in 1960 to US$12.2million in 1970._/ Imports of cotton fabrics rose from US$0,3 million in1960 to US$1.2 million in 1970. However. the largest increase has takenplace for artificial and synthetic fibres whose import value rose fror US$0.2million in 1960 to US$3.2 million in 1970. Tmnorts of fabrics consist mainlyof special process items for industrial uses, such as fabrics treated withrubber or other materials. The other manufactures consist either of itemsfor industrial use, such as rope and twine, or costly items such as linentowels, wool carpets, and even some knitted articles such as stockings.
ho. Wiile man-made fibres reoresented 15.5 percent of total imoortsin 1960 they rose to 36.4 percent in i968 but decreased to 26.3 percent in1970.3/
Textile Raw Materials
Lu. As in imnorts of finished oroducts. there was a shar_ increasein imports of textile raw materials (see Annex Table 22) and the value ofimports in 1970 was seven times hi8her than in 1960- rthith Thqkpl -819
17 In 18 mills questioned, marketing was mentioned 4 times as the secondmost important prohlTm a-d in most cases as one o tfhe fiv mostimportant problems of the company.
2/ 0. percen.t pt of total im porrt3/ About 0.8 percent of total imports,

- 12 -
million in the former vear 9 The relative imnortance of the variousfibres showed marked changes during the period, with decreased percentagesfor wool and flnr Tmrmnnrt.+ nf fflna practica1vy e-ased aq there was anoverall stagnation in the final consumption of flax products largely com-pensate hyr +'hp us of nr+ifii ml andi cnm+.hp+i fi'hrAq. ont.+.nn imnortq
were negligible and were attributable solely to occasional special importsof extra long stple fibre (38 or 39 millirneters) not prodMnno in the countr,vwhich are used for very fine yarns (100's and above) needed for the produc-I nn P' 4 mel nf h;~ Ar ov96 -nh; - Qw -- 1 - -6. 5 e> i ---
h2.* Artifi^cial an.d synthetic fibres imports rose from. about US$Tj0.3million in 1960 to US$20.3 million in 1970. In volume they grew from 136tons in 1965 to 11,4N0 tons in. 1970. Imports ere maInly for p(4,100 tons), acrylics (2,300 tons), nylon (1,100 tons) and polypropylene(1,000 + Xns. Schb. imports are foreca+st to decrease to about +.0 tr.sa
by 1975./ with growing domestic production capacity in particular forL. VfLwe iS i
D. Evolution and Composition of Exports
Textile Products
43. Textile exports rose from less than US$2 million in 1961 andU$7 MrLL.iLliun i-L 1J74 UU UOtPJ4 II"L.±-.UL irL. L7966.* jL.ej ±eaChULJ.U U04).LU o
million in 1970.Y Cotton textile products represented about 8 ercentof expor t va-lue, Jute a-na sisal products providnrg tle ba1arne.=' Of thecotton fabrics exported, the greater part is grey cloth (67 percent ofblLIt, V a.±U.- U. I ULAU LI[±aV idU.U±6 :Ap U1 -L UICU il 1 J rU ~flU a u U U -LI JJ I I T flUUMLLL.5 U
which is normal since grey cloth is heavier than other finer, higher qualityfabr-ic). There are no ex rs of syn-thetics or arici-'sal srince basic
raw materials are still importec'. and Brazil is now engaged in an importsubstitution process.
progress made by cotton textile exports in recent years hasbeen encouraging.
i5. In 1970, a trade agreement with the United Saates allowed Brazilan export quota of 75 million square meters for cotton textiles. The quotacovers yarn for 30 million square meters equivalent, cotton cloth for 39r-Lion and clothing for 6 million. The agreement provides for a 5 percentannual increase in the volume of authorized export, which would thus reach
1/ See Annex Table 22.2j See Annex Table 16.3/ About 0.7 percent of total exports.4/ 9See Annex Table 23.

1.968 1797 170 I 7 [. ±70 ±7 16 IX70
(In US$ million)
Cotton Yarn 1.75 2.82 5.77 6.81 1,806 2,960 5,781
Cotton Fabrics 1.83 4.14 9.04 11.04 808 3040 7,979
3.58 6.96 14.47 17.85 2,614 7,000 13,760
92 million square meters Dy 1974. As a result Brazilian exports to theUnited States increased in 1971 and should continue to grow in 1972 andsubsequent years.
46. Brazilian exports are also increasing to other countries.Already in the past some exports were made to Australia, South Africa,the United Kingdom and Switzerland. Efforts are now being made toexport to EEC countries. Part of wool yarn exports also go to the USSR.
47. So far, exports are made by a limited number of textile firms.Cacex (Carteira de Comercio Exterior of Banco do Brasil) has publisheda list of eight companies exporting cotton yarn while 19 other firms arelisted for cotton fabrics export and 11 to export clothing. About 25firms effectively export, of which 70 percent are in Sao Paulo. Exportsas a percentage of their sales range from less than 5 percent to 25percent. Most of the firms visited by the Mission had plans to substantiallyincrease their export sales in 1972 and 1973.
48. Government incentives provided to the industry play a decisiverole in enabling firms, who would not normally be in a position to exporta significant part of their production, to venture into foreign markets.Such incentives allow various tax exemptions and subsidies which permityarn and cloth to be sold f.o.b. Brazilian ports below domestic sellingprice.
49. It can be seen from the above table that cotton yarn may beexported c.i.f. at 97 percent of net domestic selling price (includingprofit) and cotton cloth at 86 percent of net domestic price if full ad-vantage is taken of existing incentives. When taking net domestic pricebefore profit, i.e., at cost, cotton cloth can still be exported belowcost after incentives are taken into account. This may explain whyexports of cloth have shown a faster rate of increase than exports ofyarn. In fact, a comparison between production costs and export pricesf.o.b. shows that in a number of cases mills do export cloth at pricesbelow cost.Y This clearly shows that without incentives the Brazilian

- 14 -
Table 7: INCENTIVES FOR TEXTILE EXPORT5i;'
Yarn Cloth
1. Gross domestic selling price (including10 percent profit margin, IPI, ICMand financial charges) 100.00 100.00
2. Net domestic selling price (excludingtaxes and financial charges) 71.24 66.78
3. Net domestic selline Drice(excluding profit) 64.12 60.10
4. Export incentives in percent of grossselling nrice 3.. 071/
5 f..o.b. Axnort pnrc.-k/ 63.22 .3l
6. c.i.f. export nrine&' 69.0o3 7.
1/ For detailed calculation see Annex Table 25.7/ Tnnl iiriPcz TPT irrpmnti.; n (),-70- Tr.M yomnsti nn tll <91a _ Tntrk +-Q-r-, __ _ _______ _-_ _ w _,;Z__ __r____,X__ ______
exemption (1,90), ICM credit (4,95), IPI credit (5106), financialinr-.Antves Resolutinn 71 (3TjY Tal tines -not inceA+. ie TPT credit
on insurance and freight (0,51).'A/ Tineiiidna TPT nmt....i nnc (10-71), Tr.M awpwmrni nw (IJi 49) T-n.em= +
exemption (1,54), ICM credit (7,04), IPI credit (7,70), financialiinon ivpr P.eouitioArn 71 (9 79). 'T'+n does not jinc1li TIT credi+
on insurance and freight (1,08).L/ +^c1 A-e by1 t. 1- r.g 6^Oas d-esfic se-"Ir. prc de-4-4tir eort-
incentives, and financial charges as export sales are made cash,~~ ~'~-- F6 k' r %,W. W ~ '.'J _
4IPJ.JJ W, .55.L . 6L U IJOAJ S CUJ.IJ- h=O11 IJIJ %;Uoko$Jau
and loading charges.,/fo. b. pri;c e pl us ocear freigh -. d 4 n-nem-8 a R tofreight and insurance.
textile industry would not be in a position to export its products dueto hi. p_4 r-odcto a" s.l
R,kaw ,atriL J
50. The main raw materials exported by Brazi are raw cotton, wooland sisal. For 1960-65, the annual average sales abroad are shown in Tableu. Theue a,-e 4ju tmpourts of uoer raw materials sucn as jute and ramie,but only in very small amounts.
1/ It must be recognized,however, that export prices have to be very compet-itive on the world market and that many countries other than Brazil alsoexport below cost. Brazil, now trying to open new markets, is alsoprobably obliged to sell at low prices in order to gain external markets.
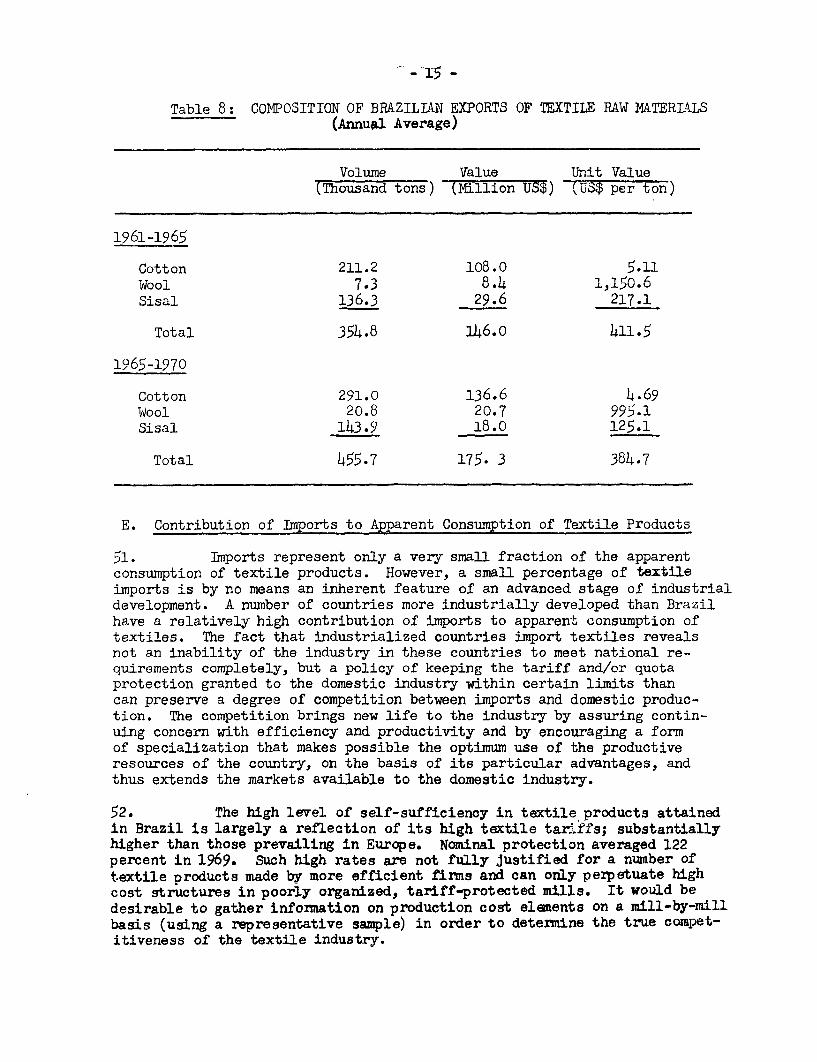
Table 8: CONPOSITION OF BRAZILIAN EXPORTS OF TEXTILE RAW MATERIALS
Volume Value Unit Valueu tionusO.LALLU1 ,.) (rJ ,'±L±Lio UYT) '4 UtJy YI UUe I)
1961-1965
Cotton 211.2 108.0 5.1117 11 D I. , -Iff *wool I v. 1 .6
Sisal 136.3 29.6 217.1
Total 354.8 146.0 411.5
1965-1970
Cotton 291.0 136.6 4.69n fl C~n AH -
Wool 2u.o 0u.7 yy>±Sisal 143.9 18.0 125.1
Total 455.7 175. 3 384.7
E. Contribution of Imports to Apparent Consumption of Textile Products
51. Imports represent only a very small fraction of the apparentconsumption of textile products. However, a small percentage of textileimports is by no means an inherent feature of an advanced stage of industrialdevelopment. A number of countries more industrially developed than Brazilhave a relatively high contribution of imports to apparent consumption oftextiles. The fact that industrialized countries import textiles revealsnot an inability of the industry in these countries to meet national re-quirements completely, but a policy of keeping the tariff and/or quotaprotection granted to the domestic industry within certain limits thancan preserve a degree of competition between imports and domestic produc-tion. The competition brings new life to the industry by assuring contin-uing concern with efficiency and productivity and by encouraging a formof specialization that makes possible the optimum use of the productiveresources of the country, on the basis of its particular advantages, andthus extends the markets available to the domestic industry.
52. The high level of self-sufficiency in textile products attainedin Brazil is largely a reflection of its high textile tariffs; substantiallyhigher than those prevailing in Europe. Nominal protection averaged 122percent in 1969. Such high rates are not fully Justified for a number oftextile Droducts made by more efficient firms and can only perpetuate highcost structures in poorly organized, tariff-protected mills. It would bedesirable to gather information on production cost elements on a mill-by-millbasis (using a representative sample) in order to determine the true compet-itiveness of the textile industry.

- 16 -
Table 9: BRAZILIAN TEXTILE EXPORTS AND IMpORTS OFTEXTILE MANUFACTIUES, 1968-70
Foreign / Domestic Ratio of inportsImPorts Exports Trade Balance Consumption to Domestic------------- (Thousands of tons)---------------- Consumption(%)
1968 2.5 24.8 + 22.3 423.2 o.61969 2.6 27.1 + 2h.5 Lll.9 0.61970 3.9 27.3 + 23.4 150.0 0.9
Table 10: FOREIGN TRADE AND APPARENT CONSUMTION OF TEXTILEFA_RRTC ITN Sn.RECTED CG0NTRTES (1970?
Foreign Ratio of ImportsTrade Annarent to Annarant
IrPorts Exports Balance Consumption Consumption--------------(ThAU9anl nf' tOns) --------------- (PerCentageA)
EEC 2.822 3i063 -+2J 11 8.h82 33n3UK 644 257 -387 1,991 32.3US 1/ 870 -426 i6AWorld= 10,650 9,652 -998 56,838 18.7
1/ ExcludIng i TSSR Easter.n. Eu rope, Ghi ,na.
So"lce:. The Tertjil Gour.nil, Mnr..hs+oer, Uv1.tew Kt,ndc,rn
3. PRODUCTION CAPACITY IN THE TEXTILE INDUSTRY
53. In 1970, the basic equipment in the Brazilian spinning andxa.ir4 n6, -4 ,iiery far' -ha prensnr4 ofn c- or,, -nfl 3 .,--..dA P4 ib-n -a
flax was estimated to consist of 3.2 million spindles.17 The number ofcotton v-.piAnles was 2 0/ r,llAion .na the e,number of cott-on Alon s about 76thousand. This inrentory puts Brazil in the first place in Latin America.r-j7 a.. pos4.ition of. isUSme J.hILpJrta n U 1J nt.LU na ti%aU LsAM.L.LjV *.Z .LI .. 7%JVj, JL.L4V 11urnLIMJ
of spindles was 4.2 million and the number of locms 127,000.
1/ See Annex Table 27.wc/ This large num,ber of spindles installed. includes, hev-evr, substa-ntial
obsolete equipment with the result that much lower production is achievedwdith a very large machine inventory.

- 17 -
Table 1l: SPINNING AND WEAV1NG MACHINERiKY (COTTON SYSIr.mJIN SELECTED COUNTRIES
Spindles Looms(In millions) (In thousands)
Italy 4.1 70Western Germany 4.0 52France 3.5 56United Kingdom 3.5 75Belgium 0.9 19Netherlands 0.5 10Brazil 2.9 76
Source: Cotton industries EEC Comm,ittee and Textile Council, Manchester,United Kingdom.
Table 12: COTTON SPINDLES AND LOOMS INSTALLED CAPACITY
Thousand Spindles Looms1960 1970- 1960 1970
Sao Paulo 1,412 1,40221 31,008 33,900Rio-Guanabara 830 44O 20.159 11,730Nordeste 642 4i1 22,476 11,500Minas Gerais 532 400 16,630 13,720Santa Catarina 102 170 2,1445 3,600Others/_ 19 25 771 2.000
Total 3764- 2.878 93,I89 76.L60
Percentar'e PAre!n ta519600 1970
Sao Paulo 39.9 48.7 33.2 44.3Rio-nuanabara 2 13 21.6 1Nordeste 18.2 15.3 24.0 15.0Minas rfrais 15 0 13-9 17.8 18.0Santa Catarina 2.9 5.9 2.6 4.7Others n- 09 n0. 2.6
Total 100.0 100.0 10(0. 100.0
1/ Mainly Rio Grande do Sul.2/ Including 49,000 inactive spindles.J/ Total number of cotton spindles estimated at 3,840 in 1970 by ECLA.
Above number of 3,357 relates to industries surveyed for which onlya geographical breakdown is available.
4/ Total number of cotton looms estimated at 102, 760 in 1970 by ECLA.Same remark as in note (3).
Source: ECLA and SUDENE surveYs for 1960; Engineering Ves&Le for 1970.

54. The uneven distribution of textile equipment inventory amongthe different regions of Brazil is a close reflection of the difference inthe levels of industrial development of the various states. Table 12 showsthat the cotton textile industry is centered in the state of Sao Paulo,which has 49 percent of installed cotton weaving capacity. The correspondingfigures for the states with the bulk of the remaining capacity are: Rio-Guanabara, 15 percent both for spinning and weaving; Northeast states l5percent; and Minas Gerais, 14 and 18 percent.
55. In cotton spinning, capacity decreased by 19 percent duringthe period (while the increase in cotton yarn production was also 19 percent).The 47 percent decrease in the number of spindles in Rio-Guanabara and the31 percent decrease in the Northeast region was due to the shutting downof several mills whose severe shortage of technical facilities and lack ofadministrative organization resulted in high production costs that made itimpossible to compete in the market with manufacturers of other regions.However, in several instances, existing mills have also replaced oldequipment by modern spindles with higher unit output. These factors explainhow Brazilian average yarn output per spindle grew from 6L kg in 1960 to9h kw in 1970. i.e.. by L7 percent. The sizaificant increase in capacityin Santa Catarina can be attributed to the specialization of productionthere (towels, coverlets, etc.) and to the proximity of the major textileconsumer centers and cotuon growers (Sao Paulo and Parana). The develop-ment of the industry in Sao Paulo is undoubtedly due to the proximity ofa large market, the existence of facilities for the purchase of raw materials,nnd suihsfantial external enonomies. The same remarks applv to the cottonweaving industry.
56. In every country weaving mills are converting more and more toautnmatic lonms, bhreause of thelr higher And more uniform output andthe smaller labor force required. In Brazil the share of automatic loomsin the total has neteased frnm ahouit 2P pereent in 1960 to h4 -nercent in1970. However, this increase has been achieved mainly as the result of thepr~oga..+ress; sispp>^.c of nnwpv l1nOmq znn th- i-adhntion in tntal numbArof looms. It is estimated that the absolute number of automatic loomshas riser. from 9A0n0 in 1io to +n 0,00 in lQ70. Iho rrhrnm of nntorRtil
looms range from 100 percent in the United States to 80 percent in Western
Eur j A 1, . 4-n- ,,, 'I ' 4- m"+. -4
r-m.v4 T 4 Ain4M ~ "v -pe, 70 perent -. Pa kitar ar. 18 I cr. in. 1
-_ J I
t' A sub+ 1ta opr -io ofP the ~ " Aqir ita e 4t=n
,.id, and another appreciable proportion is between 10 and 15 years old._/T>'e SU4A11S i4sited, 1- +16e )ssio had n vr^ o-4dOetettn
over 15 years old. However, certain modern mills, particularly those newly
-LTh J.11e ULLOssi.Lon ..S.LIVU. A^U.L.LJ wLJe a. suLv 5ual A.Lr kJ.L VkofOAL 01 loMws f re30 to 40 years old. However, these looms were operated although evidently
__ A. _4 - - _ _ _ 'I*| A 4.. Al 'I - - - - - - -_ , x, k . - - _- - - -Pr VALAV.1 Vel J L , Iv . aiL tUU'vurU LAvJvD IW.L 4 L-LAU Us 1jJVKO -IUOu .LV. UX%_- V
years, they became obsolete as compared with more modern machinery. In-. J.L. TV_4Le.2 S~.LL.. ' -- I..L .. 4-.. !' J.. f
E-rope andu u'-e VuILi St,aue loomOs are cui -udlU uobsoleteu afual 5 to 6
years.

- 19 -
established in the Northeast, have a high proportion of machinery less than
5 years old. In the Northeast the proportion of looms above 30 years hasdecreased fram 81 percent of tht total in 1959 to 35 percent in 1969,whereas the proportion of looms below 10 yearphas increased from about 10
percent to 35 percent during the same period.±' Detailed data are lackingas regards the various types and age of machinery existing in Brazil. An
inventory of textile equipment should be made in order to detenmine theexact degree of obsolescence of machinery.
58. Production capacity is determined partly by the number anxltypes of machines available and partly by the level of utilization,which depends both on technical conditions and on institutional factors(such as the number of hours worked per shift, number of days of leave perworker. relative importance of women in total staff, etc.) partly or wholly
outside the industry's control. Although most existing machinery is utilized,not all available hours and shifts are turned to account. The proportionof machinery utilized is satisfactory, but the number of hours and shifts
worked is rather less than it might be; not only because of legal andinstitutional factors, but also because the age of machinery results ina high proportion of stoppage time for repairs and upkeep.
59. The number of hours available with three shifts is theoreticallyeight hours per shift and 300 days a year, or 7,200 hours/year. But as the
third shift is usually shorter than the others because of the time neededto clean machines and the compulsory rest period halfway through the thirdShift which is required by social legislation, production estimates arebased on a third shift of only six hours, which reduces the daily workinghours to 22, and gives an annual total of 6,600 hours. In Brazil', theactual number of hours worked in cotton weaving has been estimated at 5,400hours/yea-r in. 1970n,/ i0e.- 82 nercent of theoretical work time. This
compares with 5,062 hours in 1960y, i.e., a 6.7 percent increase from 1960so 170.
6o. Lil+4izat-ion of Gapacitv is higher in spinning than in weaving.
Data for Sao Paulo State show that the number of hours worked in spinningwas ,739 in. 1970 against 5,235 in 1960. i.e., a 9.6 percent increase.Hours worked in 1970 represented 87 percent of theoretical work time. Thenmrber of pindlle hours is higher than that of weaving hours because the
spinning mills have to supply intermediate products to other textile groupsmakine kn4tted goods, carpets, rs-pe; sewing thread , etc. Furthermore, there
is a preponderance of small weaving establishments run on family lines,and there are institutional difficulties in having a three shift working
day in mills of this kind that are unconnected with the big manufacturingsectors. i'4naly,r lnck of mnarket for cotton cloth has been mentioned to
J./ toeU Ann I Ta9U 31.Source: Engineering Vesdre.
. s Sources ECLA.
- 20 -
the Mission as the most important problem faced by cotton -ills which alsoexplains this relatively low utilization of capacity.
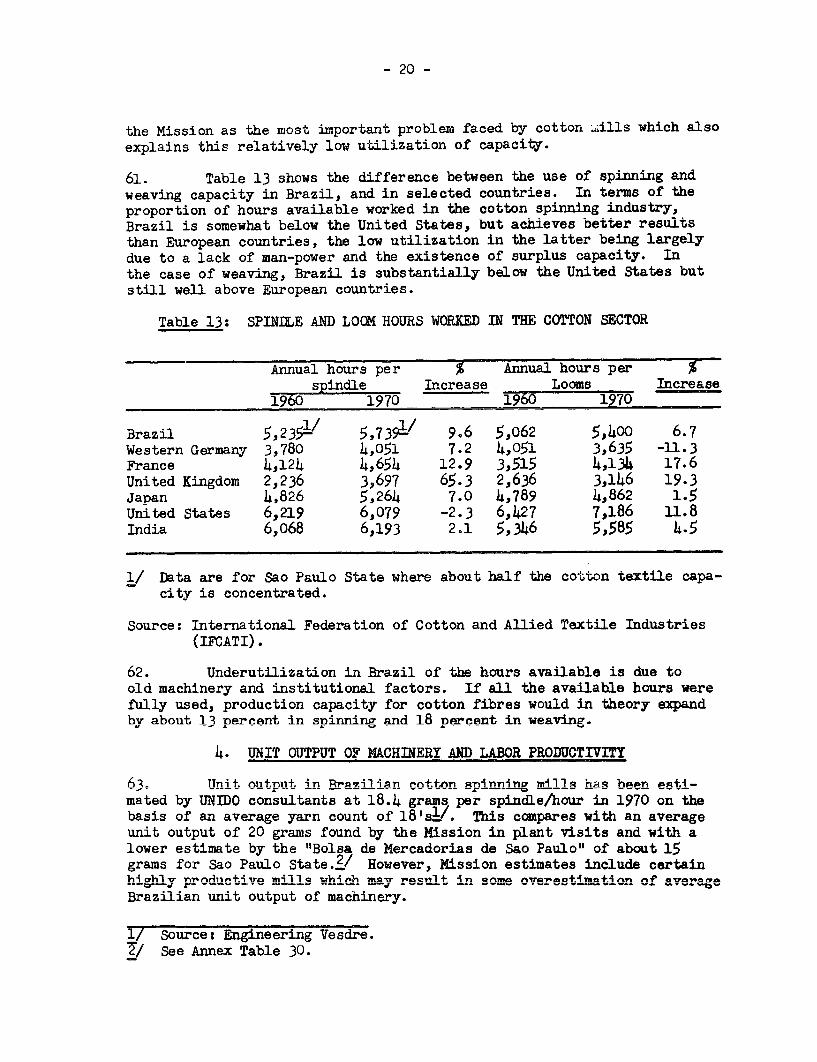
61. Table 13 shows the difference between the use of spinning andweaving capacity in Brazil, and in selected countries. In terms of theproportion of hours available worked in the cotton spinning industry,Brazil is somewhat below the United States, but achieves better resultsthan European countries, the low utilization in the latter being largelydue to a lack of man-power and the existence of surplus capacity. Inthe case of weaving, Brazil is substantially below the United States butstill well above European countries.
Table 13: SPINDE AND LOOK HOURS WORKED IN THE COTTON SECTOR
Annual hours per Annual hours per %spindle Increase Looms Increase
1960 1970 1960 _ __ _ 1970
Brazil 5,235 -/ 5,73#/ 9.6 5,062 5s40o 6.7Western Germany 3,780 4,051 7.2 4,051 3,635 -11.3France 4,124 4,654 12.9 3,515 4,134 17.6United Kingdom 2,236 3,697 65.3 2,636 3,146 19.3Japan 4,826 5,264 7.0 4,789 4,862 1.5United States 6,219 6,079 -2.3 6,427 7,186 11.8India 6,068 6,193 2.1 5,346 5,585 4.5
1/ Data are for Sao Paulo State where about half the cotton textile capa-city is concentrated.
Source: International Federation of Cotton and Allied Textile Industries(IFCATI).
62. Underutilization in Brazil of the hours available is due toold machinerv and institutional factors. If all the available hours werefully used, production capacity for cotton fibres would in theory expandby about 13 nereAnt in spinning and 18 narcent in weaving.
4. NTTT nfTPPT OW MA(RTtNJRY ANn T.AROR PROMDTITVTY
63. Unit outpnt, in 3rail ian cottnn Rninning milTh has bhpn esti-
mated by UNDO consultants at 18.4 grams per spindle/hour in 1970 on theh1-qii of an average yvrn eo-nnt of 1RI l/- This C-mYuiar-A viti an Rverage
unit output of 20 grams found by the Mission in plant visits and with a1ower esmicte~ hi the I'n1ors An eis nrlador nA e Sa P lo eof abnhnt I
grams for Sao Paulo State.& However, Mission estimates include certainbJ lar npnAllrtitr -millct wh;-h mn-r wowmlt in Qnmn nvrdavgct
Brazilian unit output of machinery.
1/ Source: Engineering Vesdre.2/ See Annex Table 30.

- 21 -
64. A unit output of 18.4 grams per spindle/hour is to becomr%ny.aA wi +h nn naloaga eri i+v..+. ofv I Is ierl 4ne 19hn, Oi.A 'I an ss+ov.i
increase of about 30 percent. Such output remains, however, below the
This shows that unit output is still low in the Brazilian cotton spinninga-C*' yV U. °o.w'e V Wr 3 U,U L%.. U %OL= LO soWe exceed thAe 0 adUope ILVU UVU UY
ECLA testify to the feasibility of a reorganization program designed topromotJ e eUA0 wiLe U.LL-e J.LiVftisLUL Vo. FCU%;VUW 5U s MVU 'w.ALCS Vof W'rL Watare already in full use in some mills.
65. Labor productivity is not known with precision for the whole ofDr-azil. nowever, a study by SUDEN shnows AT output in grama per mian
hours was 3,435 gr in the Northeast in 1970..~/ Estimates for Santa CatarinaState coverj.u-g 5u percent of the installed spindles capacity snow anaverage output of 2,956 gr per man/hour. Assuming conservatively thataverage Brazilian la-bor productivity was 3,uuu gr per man/nour in 1970,this would represent a 50 percent increase over the 1960 average of 1,996grams per man/hnurs anc a reauction in te number or workers ror 1,0U0spindles from 7 to 6.3/ Despite such progress, Brazil remains below theLatin America standard set by EGLA of 4,300 grams per man/hour and of5 workers for 1,000 spindles.
66. As regards cotton weavin7 the average output was estimated at5.40 meters per loom/hour in 1970,YV against 2.93 meters per locm/hours in1960. This represents an 84 percent increase in unit output, largely dueto the increase in the proportion of automatic looms in total installedcapacity (from 25 to 45 percent). The number of hours/year where spindlesand looms are in operation has evolved as follows from 1960 to 1970:
Latin Amerip1960 1970' % Increasie StandardZ/
Hours/spindle/year 5,235 5,739 9.6Hours/loom/year 5,062 5,400 6.6 6,600
1/ The Latin American standard was based on a unit output of 22 gr perspindle/hour for carded yarn of count 18. The standard workload adoptedwas five workers (of all ages) to 1,000 spindles, which represented 200spindles to each spinning operative. Output for 1,000 spindles wastaken as 22 kg per hour and output per man/hour as 4,400 gr (22 k2/5workers). In Brazil, as in othei Latin American countries, about 80percent of the yarn produced is carded and about 20 percent combed.Combing involves the use of more machinery and hence a greater numberof operatives, estimated at about 10 percent more than those needed forcarding. To allow for this difference, the standard output adoptedfor carded cotton yarn was reduced by 2 percent, giving an output of4,300 gr per man/hour as the average standard output for Zarn of count18 (both carded and combed).
2/ On the basis of an average yarn count of 18's._/ Unit output per spindle loom divided by output in grams per man/hour.i~/ Engineering Vesdre.5/ As set bv ECLA: RAP naraf anph 59 4, 4for ,-.4l. A4e..-av.

- 22 -
67. Above figures represent only approximate averages and do notgive a full picture of the extremely large variations existing amongmills. Some mills may have obsolete equipment and be of small size, butthere is also a nunber of relatively small mills (i.e., about 200 looms)which have attained a good level of productivity and which have a fairlyhigh portion of old machinery, Similarly large cotton mills show vastdifferences in productivity with about the same equipment. Consequently,after studying the limited data available, it must be concluded that theexplanation of that part of the variation in productivity not attributableto physical factors involved must be looked for in the human factors inthe production process. The most important is mill management, includingthe whole concept of the entrepreneur's or manager's responsibility asregards use of satisfactory raw material, careful machinery maintenance,manpower training, etc. The question arises whether manpower training isthe direct responsibility of the entrepreneur or whether he siould make useof the services of existing training institutions. The plain fact is thatlabor productivity in some mills is many times that in others, and theexplanation of such very different results in the same country would appearto be the concern of the entrepreneur. Differences in productivity, giventhe same conditions of obsolescence, mill size and type of product, callfor a more searching analysis, which is beyond the scope of the presentreport. Nevertheless, a more thorough knowledge of the reasons for thissituation and of the role played therein by the entrepreneur will contributeto the more efficient operation of Brazil' s textile industry.
68. The existence in one country of mills working efficientlyside-by-side with others where conditions are sadly deficient proves thatefficiency can be attained even under existing conditions* For theinefficient mills, attaining these standards might require some time, andprobably pravision of appropriate incentives and financin-g but there donot appear to be any insuperable difficulties since the moreprogressivemills have been able to reach their present standard with the resourcesnow available. The foregoing implies also that Brazil possesses sufficientknow-how to attain pr-oductivitv levels comnarable with those of Europe,and that this kind of knowledge,whether administrative or technical couldwell be channelled into an effort to reorganize the 1ndu try on a rationalrbasis to meet future requirements.
5 PRODlUCTTON COSTS
A. Labor Costs
69. Labor in terms of wages paid is relatively cheap in Brazil,even with the payroll taxes, paid holidays, 13S h month bonus and otherbenefits which represent about three-fourths pereent of the hourly wagelevel, O. the other hard, l1w "roduc it&V1y means that labor accounts fora relatively high share of production costs.

- 23 -
70. The average monthly wage in the textile industry in Sao PauloState was about Cr$260 in May 1972, i.e., about Cr$1.08 per hour (US$0.18).2!In the weaving mills with automatic loms, one operative can handle a greaternunber than where the looms are mechanical. The wage paid in such cases ishither bv about 20 nercent.
71. The different social securitv-related navroll taxes should beadded to the wage as should the cost of the 13th month bonus, weekly timeoff; legal naid holidavy and the annual naid vacations -- ueuallv 20 davB --all of which are required by law.
72. The incidence of all of these changes in the case of Sao Paulote,lt.ile millq i9q skwn in Annr,r 'Pnh.- 32. Vno thes A ,A 11q non-waue laborcosts represent 77 percent of basic wage costs, i.e., in the case of anhoil-lg A" wair ofvA MI,83 +he varieus socriol c.>12&A Mes ar.d be-Nits Z1Tnn1"tPd
to Cr$O,838, giving a total cost of Cr$1,921 per hour.
73. The labor cost per kilogram of yarn resulting from the pro-ducttiity leegl e1ti.ted abe at I,+ 0 r0 pert --- -- a--
64) is Cr9 . Cr$0,640 i.e., US¢10.9 per kg of yarn produced.
countries.2/
Table 14: LABOR COSTS IN SELECTED COUNTRIES
A.ZV . V D / 4 Z 1 4 I
Hour US$/Kg Yarn Hour Hours/Years- ( ~~~~~~~TUIOW
Bai .7 10.9A 30 ^eAll
West Germany 132.0 12.5 10,530 1,906France 98.0 10.3 9,490 2,0United States 242.0 13.6 17,775 2,400Japan 42.9 7.2 5,920 2,232Hong Kong 32.3 7.2 4,500 2,464
Inuia 19.0 ~~9.5 2,000 2,304
75. The above estimates clearly show that the level of laborproductivity wnich is still rather low in Brazil is an essential factorin determining the cost of labor per unit of output. Although Brazilianwages remain low, they are to a large extent offset by lower labor pro-ductivity, thus resulting in a relatively high labor cost per unit of output.
1/ See Annex Table 32.6/ Sourcet Werner Associates, Inc. New York.

B. Cost of Raw Materials
76. Two main ty es of cotton are used: Paulistal/ and NordestinomTedAim, ale otton+._/ Bot+bi are of fan4 l r t% nnlinl i +%, wit +h a,iea a
fibre strength, but their classification leaves a good dpal to be desiredrhie'nh mnsvia +.In+ +.3h m4ill ewr,nir' hnzra afna+A.mrna +.n Tc.r'1naaif'ir le-&.- my47,4v
at their warehouses. The lots are mixed, consisting of fibres of different1 --nths; ofter. they are not cleanr enr.o ng1, -.n ^"MIMl s"artards, ardthis leads to a relatively high proDortion of wastage. This is particularlythe cas-.e for NoTdtir.o+A . .st..n stpl cottor..l M,ng of' various fibre-length cottons is one of the causes of inefficiency and low productivity insp mi n rinn a.d results in production l,oses. rt I n a to al^ +naetheamount of wastage, and to lower the quality of the yarn, a defect thatultim.a4
el r affects weae.g o1+put+ *T i9 h,wsr, -^+rtd- 0 A 4h1na+&5 _ p _ LW ~~~~~~~~~~~~~~~~~~~~ .&Y"WW-A, ._JJ_- _ W-W~~~~~~~~~~~~~~~~~~~~~~~~, *..~,~* *u ~ v
progress has been made in recent years in reducing wastage.
77. The cost of Paulista cotton no. 5 (1-Y6 inches), which is themost4 c oam,,or nZS US30J Ie o,--^ 9073.re 4cvnoLiA~J~ U t~ VMS 1fi!AA, UsJf 1)' -)J I - -A~L1J -1 . IC '-q7 / f .- * .4, J~UU UJ
similar quality produced by other countries w,ere generally more expensiveas Shown in Table L5. Thus, BraZil i8 ,n a f.arly good position as regardsits supply of raw cotton, subject to reservations as to cleaning and classi-ficationL, Which cause wastage and er-lntal the expense Of'I 'eLaSsif'CatiOnIn addition, the marketing system entails the tying up of large aum9 ofmoney, Since th;e whole yearly -"uP'4Y O' et,uux,-UO ly hs to be boughbduring the months of the crop season, and the indumtrialtsts who have tobuy 1n advanUce are forced to pa-y the Undt4.-y aig prices aaked on the currentmarket for some of the scarcer types of cotton.
Table 15: PRICES OF COTTON IN SELECTED COUNTRIES .
1970/ ?71(Average)
Brazil SP Tip o 5 30, 31Mexico aI, l, -/l6. '; J,12United States ,M, 1-1/16" (Memphia) 31,77Turkey - Izmir 3a, 1-1/16"1 30,67Syria SM, 1-1/16 " 31,11z.caragua 94, 1-1/16" 30.,98Soviet Union SM, 1-1/16", 33,30
Source: Bolsa de Mercadorias do Sao Paulo.
1/ 1-1/6 inches or 30/32 mm.7/ 30/32 and 32/34 mm.3/ 12 month average.

- 25 -
78. Brazil is in a much less favorable position as regards syntheticfibre supplies part of which are imported and part of which are producedlocally by two of Brazil's existing synthetics producers (of which one hasabout 90 percent of the domestic production capacity). For example, theBrazilian price of polyester staple is US$1.98/kg while it is only US$0.80/kgin the United States (but was US$2.00 in 1964).1'
C. Machinery Costs
79. Most of the machinery in use is old and is generally not properlymaintained. The units are of almost every type, make and origin. and arealready fully amortized, with the exception of a certain number of machinesimported in recent years. To this last group must be added the machinesproduced domestically (see text Table 16). No estimate of amortization canbe made, as neither the value of the machinery as a whole nor that of theas yet unamortized machinery is known.
80. Domestic production covers only a portion of the machinery requiredfor the spinning and weaving of cotton and artificial fibres. for prepara-tion and conditioning of yarns and for dyeing and processing in general.Thus, in the existing- circumstances it is necessary to imnort many tvnes ofmachinery that are not produced or produced only on an insufficient scale,by domestic manufacturers. Tn brief; the conditionks governing imnnrts c.fmachinery are:
(i) where no similar machinery is produced domestically,eAuipnment is generally ijnortAd wit.hoult c-i+o.mnduty;
(ii) where similar machinery is produced domesvically,iforfts +te bJay-= CI r+o iMn^ortAIMD Auies of1- An t
percent. The mission did not hear substantialcomplaints reqa"eijv%" +the applij+jto.w" ^ +o,tprinciple of "similarity' by administrativeauthor±ties.
81. The yst--em governing import-s of pa-ts a" accessories is thesame as for machinery, but most of the items needed are already beingrodAucedlA 4 t- +he c^',,+w * " A , e -1 n-O+. -4 . 1 I - 41- I -- - - ---- -*v-v^-g * ^ v- --J * -- - EVW La ' WO
have their own factories and workshop and produce many of the parts andaccessories needed th.emssel-vues, &-d &-e of+er. abl to -recor.ditior.4- or ever.manufacture certain machines. Thus, lack of spares is not considered aproblem of 4y r tn 4n B r 4n
1/ Polyester staple prices have continuously declined in the lastter. v as

- 26 -
Table 1% O1 TTIN OT ^V TT I r-rMIWI'r%Ti? N MV1VTI' T?w1J
(.In p.eLcenitage Of val-ue of m.u.LplWuInU)
-17 n -1 %V 17 1 79 17.L >VU L7V f L7V J7V 7 U7t
1. Brazilian Finns
T _ _ s _ I ~~r ]_ _ _1M I 0-t r ^ 0 1oI inporteu Equipment 95.4 8u.7 69.2 84.9 807.Local Equipment 4o6 18.3 30.8 15.1 12.1
Total 100.0 100.0 100.0 100.0 100.0
2. Foreign Firms
Imported Equipment 96.0 63.5 89.8 54.3 66.7Local Equipment 4.0 f0. lO 45.7 34.3
Total 100.0 100.0 100.0 100.0 100.0
3. Total (1 + 2)
Imported Equipment 95.5 79.8 70.5 75.8 82.9Local Equipment 4.5 20.2 29.5 24.2 17.1
Total 100.0 100.0 100.0 100.0 100.0
Source: IPEA - Study covering 156 firms.
D. Cavital Co.ts
82. In recent years, textile industrialists have financed abouthalf of their investments through their own resources and half throughloans, the latter about equally divided between domestiG and foreign credits.
83. The profitability of the textile industry is not particularlyhigh. An analysis of balance sheets of 33 textile companies shows an averagenet profit on capital and reserves of 12.6 percent (see Annex Table 34).Hoiwen-3r, 10 out of 33 companies show net profits of less than 8 percentand 15 less than 10 percent. Some highly efficient fires show very highprofits, i.e. around 25 percent. This reflects the wide dispersion betweenfirms of different productivity already noted above.
84. The number of firms which have engaged in modernization, ex-pansion or opened new plants is relatively small. One hundred and twenty tex-tile firms were given investment incentives by the government's IndustrialDevelopment Council (CDI) in 1971 (see Annex Table 35). This number probablyrepresents most of the firms having effected substantial investment during

- 27 -
Table 17: SOURCES OF FINANCING - TEXTILE INDUSTRY
(Average 1966-70, in percentage)
1. Company's Own Resources
Capital and Reserves 9.8Retained E.arnings 3u .Fiscal Incentives 3.4Others 0.1
Total 47.7
2. Other Resources 52.3
i. Domestic
Regional Development Banks 9.0Commercial Banks 3.4BNDE/FIPEME 5.3Domestic Suppliers 2.5Bank of Brazil 0.8BNDE/FRE 0.5BNDE/FINAME 0.3Others 2.1
Sub-Total 25.1
ii. External
Suppliers'Credits 18.9Financial Credits 8.3Direct Investment 0.0
Sub-Total 27.2
TOTAL (1+2i+2ii) 100.0
Source: IPEA - Study covering 156 enterprises.

- 28 -
1971. However, enterprises procuring small amounts of equipment onlyprob-ably did r.o+ soii G,.I 4e.ivs-
AC Tle Ie e a.of N - -1 - m t t4-^ 4 | A- 4---*41_ .V>.).L A-, W. _ - W. J .1 J- ^' - -�� . IL W.JW UA. W .W 4LULLU u41 UtL a OD en
relatively high in recent years, i.e., around US$100 million per annum inI969/71. Thi4s com,-ares with only abot- US$50 o-41"ior in 1967 and In 1968 2/It must be noted, however, that in the total of US$100 million are includedsome exceptionall.y large nvesQtmLents. For example, in 1971, about 20 per-cent of the total was for two new plants to produce synthetic fibres andfor.L a vet large LC.L-,.ode.. .izatior.L-6 Crog&..
86. ,The national and regional development banks are the most impor-tant source of domestic long-term loan capital. The Bank of the NortheastkDnv) proviUeUj Ub LLoLVd16- 4rU± sorW k -Uxlu ZL.LUt:1 lor LMextle inaustries inthe Northeast. Several modern plants have come to that region in recentyears. Entrepreneurs have had access to subsidized resources in tne formof 34/18 funds. These resources, while normally not available to financethe cost of imported equipment, release their own resources for that pur-pose. In several instances, SUDENE has permitted project sponsors to con-vert 34/i8 funds into foreign exonange.
87. BDE an- its specilized subsidiaries such as F1NAME and FIPEMEis also a significant source of finance. FINAME finances purchases ofdomestic equipment. It covers '0 percent of the cost of equipment; privatefinancial intermediaries are expected to finance 30 percent and the sup-pliers, 20 percent. FThAME !enas on terms up to 15 years and at 3 to 8percent interest plus monetary correction. The objective is to assistdomestic equipment producers, who are not in a position to compete withforeign suppliers in providing credit to their customers. However, asnoted above, this objective is limited by the need to import most of therequired textile machinery. FIPEME is a special fund designed to assistmedium-size industries, and seems to be the second most important source ofdomestic borrowings for the textile industry. These funds utilize pri-marily tax resources and external credit as well as repayment of earlierloans.
88. The Fund for Modernization and Reorganization of Industry (FMRI)is another specialized agency of BNDE for the financing of investment and/orworking capital to firms facing financial reorganization problems or wantingto merge. Terms are up to 4 to 5 years. For mergers, interest rate of 6percent and for other cases, 8 percent (both plus monetary correction. ThroughMay 21, 1972 FMRI lending totalled Cr$229 million (about US$38 million). Loans
1/ CDI data do not cover fixed investment in the Northeast.
2/ The above-mentioned IPEA survey covering 156 textile firms gives anaverage annual fixed investment during the period 1966-70 of US$40.8million. (1966 = US$4.1 million; 1967 = US$16.1 million; 1968 = US$38-4million; 1969 = US$65.4 million; 1970 US$79.8 million.)

- 29 -
were made to 25 finns out of which 7 were for textiles. FMRI's source offunds is the BNDE. External credits play as important a role in textileindustry investment finance as domestic borrowings. The largest amountis represented by suppliers' credits, the balance by financial credits.The cost of financial credits is somewhat less than of most official domes-tic financing and much lower than that of private domestic financing.
Table 18: TERMS OF EXTERNAL FINANCIAL CREDITS
Borrower's InterestRate
Nominal Real _Mat urity _
Commercial and InvestmeitBanks (Resolution 63)i/ 24% 8% 6 months to 10 years
Other External Financial Credits(Instruction 289)2/ 22% 6% 6 months to 1 year
Law 4131-2/ 22% 6% 6 months to 10 years
1/ Borrowing abroad on behalf of Brazilian clients.2/ Firms allowed to contract directly with external lenders for working
capital finance. Usually the lenders are parent companies of theBrazilian borrower.
3/ Law 4131 covers a variety of transactions including some import financingbut like both Resolution 63 and Instruction 289 categories, it is usedprimarily as a source of cruzeiro denominated investment and workingcapital finance.
89. Reasons which have motivated recourse to this tvne of credit bythe textile industry include: (a) limits on and -- in some cases -- thehizh cost of domestic credit; and, (b) the fact that foreign nrincinalq canmaximize capital income extracted from Brazil if they make capital availableas loans rather than equity participation.
90. The 2h and 22 percent borrowers' cruzeiro interest rates on thesefinancial credits quoted above assume: (i) a 7 to 8 percent dollar interestrate plus withheld income tax at 33 nircent of the interest nnvmant;. s(iJ A2 percent Brazilian intermediary's charge in the case of Resolution 63 fin-ancine: and (iii) 10 percent annual xychange rate devAluAztIon ao pranyingan internal inflation rate of 15 percent. Were the authorities to devaluethe cruzeiro at annual rates eaunl to the rate of inteArnnl i nfl Ati on ratherthan to that rate measuring internal inflation, the borrowers' cost of thiscross currency financino would mAke it much leAas cnmtnaiti1?lJ
1/ "Current Economic PoatI+oAns nd PD"mr of %P M uml4e if paragr>ah161, IBRD, September 30, 1971.

-3r-
9i. Thu5-9s, despite rapidd expansiion uI du1moestic sources oI inwestmenzfinance (at least as compared with the situation prevailing in the earlysixties) the hign cost Of dome stic borrowing makes investment finance neavilydependent on retained earnings and external credit. Regional developmentbanks and B-uEJ make medium-term loans but their contribution to total invest-ment remains limited (about 15 percent).
92. W.i'h respect to working capital to meet the need for ii-int inventories,conditions in the raw materials markets oblige the industrialist to buy farin advance; during the four months of the crop season he generally buysenough to meet all his needs for a whole production year. Thus, the 60 to120 credit available from commercial banks to finance working capital re-quirements is inadequate. Tne industrialist must finance his productionfrom the point of maturity of such credit up to the time when he invoiceshis own customers.
93. Considering that the industrialist must bear a large part of thefinancial burden involved in carrying large stocks of raw materials and thatthe nominal rate of interest on working capital finance now averages about34 percent, it can be concluded that the textile industry faces seriousproblems as regards working capital. This problem was mentioned to themission (together with lack of demand) as the most important problem metby textile mills. The situation is made even more difficult when weakerfirms, lacking access to long-teim finance, resort to short-term borrowingto finance purchase of machinery.
94. These financial problems tend to perpetuate the relatively poorstate of the present machinery inventory, with considerable adverse effectson production costs.
E. International Comparison
95. A comparison of labor and raw material costs per unit ofoutput between various countries shows that raw materials costs are relativelylow and labor costs relatively high in Brazil' s cotton spinning and weavingindustry. The result of these two contrary factors is a joint input oflabor and raw materials per unit of output (fabric of a given tgne) some-what higher in value term than that found in the United States and lower thanthat found in Western Germany.
96. As regards labor costs, differences are due to low productivitvin spinning and weaving, particularly the latter. The number of man-hoursrequired to produce cotton fabrics is much higher in Brazil than in theUnited States and therefore productivity in weaving in Brazil is much lowerthan that for spinning. This fact calls attention to the need for thorouahsteps to improve operating conditions in weaving.
97. As noted above, the cost of raw material (Brazilian cotton) isabout equivalent to that of the United States; takina into annnurlht t.hna. inBrazil the low price of raw cotton is offset by higher wastage.

Table 19: COMPARISON OF COSTS OF COTTON AND LABOR FOR THEDDAfnlTrT90TTA?T AP A UZPLID Al;l fArv-l%YT WAODD(r.LL%L 0UV-.Lu%1 V; £r L- raU vL w-L . * vj* .Ls1 rjXE ± v..
IN SEICTED COUNTRIESY
(US¢/meter)
ui twd -Brazil States Japan Germany Hong Kong Iran
Raw Materials 7.18 7.18 7.42 7.63 7.25 7.19
Labor 6.50 4.80 3.75 7.43 3.75 6.36
TOTAL 13.68 11.78 10.17 15.06 11.00 13.55
_/ Cotton print cloth - 100 cm wide. Cotton counts 20's.
Source: Brazil - Mission estimates. Other countries: IBRD Report PI---,June 10, 1971.
98. This brief comparison leads to the conclusion that if Brazilused a better quality cotton, leading to a lower percentage of wastage, andif the number of man-hours to produce cotton fabrics were substantiallyreduced, Brazil could compete successfully in the world market. In fact,this is already the case for certain Brazilian firms whose productivity levelsare appreciably higher than the national average.
99. Nevertheless, it must be borne in mind that this comparison relatesonly to the cost of two inputs. If the others are taken into account, Brazil'srelative position wodild probably be less favorable since the prices of relatedmaterials (such as dyes) and machinery are higher than those in the UnitedStates, Japan and Germany. However, the incidence of the other components inthe cost of production should not represent more than a tLird of the totalcost, and if this is so, the price differences referred to would not have anappreciable effect.
100. It should be borne in mind, however, that the amortization of asubstantial modernization of the machinery would constitute an importantcomponent of the cost of the product. Consequently it would be necessary toreduce to the minimum the portion represented by other costs (mainly generaland administrative costs).
6. REORGANIZATION AND REEQUIPMENT OF THE TEXTILE INDUSTRY
101. The conclusions drawn in the previous sections give a pictureof imnrovned hbut. sQ+ti1ll un.san+t.ifac+.nrtr ynnn+.lnA opeattin.cnditlnn is +.hnt Pr:a7.i1inn
textile industry. Not only is the machinery old (despite the coming up of

- 32 -
some new plants and some modernization in recent years) but the low levelsof unit output, comiparedt-u WJL± WLMU %-;UL"IA wa coUGL."AW%L .'d.LW WAAV J.A .epst.L'JLL0,
show that even the existing machinery is not being fully utilized. Laborproductivityu is equally- low, reflecting inefficien,t tainn4g (lack of pr-oper-skil ls was mentioned by industrialists to the Mission as one key problem),inadequate internal orgaLizationL ad poor di.strb-utioU of workloads.
102 racr other tba- machinery- obsolesenc ___3 iu2-- at ls-1 1.LU.C. Fac'oors oi,ijev IaUli U DCLJ.±IiLy ULJU.U±C e4IUI .l.lu ..U 4LLcquaC .LaWUL
force training and utilization contributing to the inefficiency of theBrazilian textile industry include the poor quality of the raw material,lack of balanced output and good plant layout, and human factors such aspoor management and the lack oI qualified technicians and supervisors.
103. This indicates the complexity of the problem and the impossibilityof solving it on a piecemeal basis by remedying only one of the factors in-volved. Modernization of the equipment alone, which according to theabove analysis is the most marked single factor in keeping efficiency andproductivity low, Ls not likely to produce good results unless it is carriedout in conjunction with other improvements. For example, even the mostmodern machinery cannot produce the output of which it is capable if thepoor quality of the raw material continues to cause a large number of yarnbreaks and a high percentage of wastage. Moreover, withou-, proper training,the labor force would not be able to operate such machines. These areonly two examples which show the importance of a coordinated program con-templating both equipment and administrative reorganization.
104. Nevertheless, the main element in such a program would be modern-ization of the machinery and the improvement of its operating conditions,aimed at remedying the part of the overall operational efficiency of themachinery due to obsolescence. In practice, it would be difficult to under-take action in other respects (internal organization, planning of production,manpower training, quality of the raw material, etc.) without reequipmentsince internal reorganization involving a basic change in methods could noteasily be introduced without a parallel basic change in the characteristicsand composition of the machinery. In other words, reequipment is by itsvery nature a dynamic element, which is closely linked with action in theother fields and would provide an impetus that would undoubtedly be lackingif action were confined to the administrative aspects or just providingworking capital in isolation. Reequipment must therefore be the nucleus ofan overall program of modernization, but it cannot be fully effective inachieving higher levels of productivity in the Brazilian textile industryun' r o it goes hand in hand with a series of measures to improve wide organ-ization and manpower training. Only an integrated program combining thetwo elements, reequipment and overall reorganization, can provide an effectivesolution to the industry's problems.
105. There are six main factors that are in principle independent ofreequipment; all have been referred to previously. There follow somesuggestions as to what action in respect of these factors is most neededto complement reequipment, and thus ensure the most effective use of thefunds spent on reconditioning and purchasing of machinery.

- 33 -
A. Ounlitv of thA RAw MAtPrnid
1__ o6. nnprted acti on to iTznrnvA n cotton ginning and grcIina grOn1 dbe expected to have a marked effect in improving the raw material.
B_ MArnowr Trnitiner
1077 Visits to mclls conf rnid that badly traine lahnr i aobstacle to proper utilization even of the old machinery still in use.Th.e productivity of workero o=a fall +till lo"er if they were trarsferredfrom the machines that they understand, at least to some extent, to moremodern a,A fs,as+er rhire g . ii - 4 .i+ ca.-.o+ - , b -4e +)s4+ a wovker
w,-, C * a fa,J U.... **l.~&*¼5* .6 C 5 machi ese ..- Q..'U w V -l*f.J%. tlI C. u C l.W- -~'
accustomed to tending only a few hundred spindles will be able, without4-,S_4-_4_-- 4-- tak 00_ -- i lfes, ___5ll-e MO4.I CO .:_ C1 -- A
., U U. i . 5 . j6j. VW I V UCIf. VVU. CLVV ,5.J'JU CP..L_Gi LA 0J U VI C UV"Si ,CL_ . .LjL5JG
perhaps the most practical method, according to experience in manr countries< also iLn ULL INorUvast.L Dof Baz'l, Ls UV 'L-a'.L,U a gL-Up V.f assisLa,t o.rU-
men or intermediate level supervisors who can subsequently pass on what they;velear.-ed to peol-ple workir43 un-der `hemr. SDich ulrHirur4g -V"od taeLm p.lace
in a large mill, in classes held near a rniumber of mills or at a SENAI,.L _ %. LXT_ A. , _ - -. A. _- ' . |_ - .__ __ _ .. ], _ ~ . L _ 1_ , _~ _
U14e 1'IdL.LoXnaL L4.UU (rJrLeIL AppL-trIJ.LUt::3LLp OurYv.Lu SCUQQ.L 9 WI"InU"1X.IU -LS UL±u
near a group of mills. SENAI is reported to be equipped in some states toprovide proper training for assistant foremen but most tra-ne -se-m to c--emostly from large and very modern mills. The Mission found that industrialistsare sometimes not interested in impruving the level oI their wur-kers, despitethe fact that by doing so they could effect a sharp increase in productivityeven with the same machinery.
C. Organization and Management of the Mills
108. Controls are needed on machine stoppages, yarn breaks, theproduction of each sub-section and each machine, on quality, machine main-tenance, stocks of raw materials and volume of goods being processed or thathave been processed, and on wastage, product costs and operating nours.Such controls should be so designed and applied as to be more than purelyacademic or statistical. They should lead to studies to remedy the short-comings brought to light by comparison with established standards or withresults previously attained.
109. In addition to those controls, there should be systems forplanning production and for systematic research; the latter designed tosimplly tne operational and administrative work; to provide incentivesto increase production and improve quality, and to improve the marketingand distribution of the products. One great weakness of the Brazilian tex-tile industry is its passivity in the face of changing fashions and tastes,following such changes without coherent strategy,

- 34 -
110 In order to assist overburdened management, technicaladvisors may be hired by mills (as is already the case for a number of firms)and made responsible for proposing to the management solutions to the variousproblems encountered.
D. Machinery Maintenance
lllo The high cost of reequipping the textile industry makes itessential that replacement of old machinery go hand in hand with an intensivecampaign to publicize proper maintenance rules. Mills must have operatorsthoroughly trained to carry out a systematic monthly program providing forone stoppage a month for overhaul and a daily stoppage for cleaning, inorder to avoid excessive wear and stopDages for mechnical breakdown, withconsequent losses of output.
E. 9pecialization and Standardization
112. The cost of excessive integration of certain textile mills shouldbe studied and the specializat-ion and standardization of production at themill level stimulated, Both factors would make for an overall im=rovementin industrial efficiency and productivity.
F. Marketina
113. Measures must be taken to ensure that imnrovements in the nrs-duction side are followed by a modernization of the distribution system.Lack of paper marketinr is a nroblan for manv textile mills in Brazil.Areas where improvements were considered as needed by interviewed firmsinclude increase in the number of salesmen. better training. imnroved markotresearch and quick collection of information on conaumers'taste and changingfashion. Also measeures such as standardization anri regionAl mnrk&t, stiudiPsare needed to help ganment manufacturers.
The Reequipment Problem
114. The most economic solution would seem to involve partial re-- n;,r wi --- h w-- .-A a .-- othi the %..Ma... JJ lik ho used
in -(he average mill in most Western European countries, plus the recondition-4 one, r%f =%-4 .s+A y c 4ne v%w¶v yv.vaw. -hi 4 - r eco . 1 , .-. d-A 4 .,-ica1
sound proposition. This would involve for instance the use of high-draft4 ~ i S ~' *~&.U44 .a.. E .'JJLA%A.6~0, ~&& CSU'LLV% UC&UAA .LS6 1L NA.LPIJL J'JIUJ.LL %1AA'=.kh~'S 0
and a speed of about 180 to 200 picks per minute. Reconditioning of thecard s,-6-- A -t-he4-U -r-i. s a., ir, -Ie cae ;e l, wo -d J. U thisULi %A.~ 1J0JJL.J t,dLLLA .LIL QVIJLL La.0UD o"0 W LV UMLJ.IO NUIU.L%A LJ±.LLJ.6 LWLLJ
equipment into line with the new machinery.
115. Preference should be given to machinery made in Brazil, becausereequipment on this basis woulId ncoU--rage the doWestLc Manulacture oI machine-ry. This, in turn, would give rise to further capital investment, make

machinery and its regular maintenance, and also create conditions that woulden.able Braz'I to conside A eco.-4 a euplie of exvil c -ng to. ,.+hL.e
Latin American counltries.
116. The type of reequipment suggested in paragraph 113 would enablereasonable levels of productivity to be reached w-ithout the drastc reduc-tion in employment that would result from the introduction of highly auto-matic modern machinery, which is justifiable only in coun ries where wagesare much higher than in Brazil.
117. There is no doubt, however, that any program for the replacementof old equipment by modern machinery with a higher unit output willt endto reduce manpower absorption. Fewer modern high output machines will beneeded to maintain the same output (modern machines have a higher degree ofautomation) and one qperator can therefore handle- a large number of units.Moreover, rationalization and improved working methods will make possiblea better utilization of manpower.
118. A quantitative evaluation of the manpower displacement that willresult from a reequipment program is very difficult, because displacementwould result from innumerable individual situations. The degree of obsoles-cence varies considerably from mill to mill and moreover, the extent to whichequipment is replaced will depend upon decisions in each mill. Thus, theobservations that follow do no more than indicate the possible magnitude ofthe problem. It can, however, be assumed that at the end of the reequipmentprogram, the cotton textiles industry will be in a position to have achievedthe productivity standards set by ECLA (see paragraph 64 above). The esti-mated differences between present and future workloads would be as follows:
Present Future PercentageWork Force Work Force Difference
Cotton Spinning(Operatives for 1,000 6.o 5G0 16.7spindles)
Cotton Weaving(Operatives for 20looms) 6.o 4.0 33.4
4.-e -0. -edctor of m&po"e -u' b 4aou 1-7 pret4- 841g,-411sII LL LL . a1.ULA IJ.UU UJ. 1ICL~AALkPJNV WVUUA..IA Utj I.UU.I .A OLOJLL..4 EL.L
and 33 percent in weaving mills for each workshift. It should be noted thatthe total figu,-e .- ill onlIy br h at the end of t…t p r 4her. - heeffect of all the measures to improve the internal operation of the millswiA.ll be flt.Lu
19. There should also be a reduction in the number of machines neededto produce the same volume of output since the reequipment program will

include purchase of more productive machines.V' Thus 4the future inventorywould represent about 60 percent of the present --llwile- Uo machInes. At theend of the reorganization program the manpower needed to produce thepresent level of output would De:
9pinning 83 percent oI the present manpower (per machine)x 60 percent of the present machinery = 50 percentof the present manpower.
Weain rg = 67 percent of the present manpower (per machine)x 60 percent of the present machinery = 40 percentof the present manpower.
120. However, during the execution of a reequipment program internalconsumption is likely to expand so as to require use of additional machinery,Assuming that up to 1975, cotton textiles consumption increases at its 1955-70 pace, i.e. )17 percent per annum, and that man-made fibres continue togrow as rapidly as during the sixties, total consumption of cotton and man-made fibres would increase by about 28 percent from 1970 to 1975.! Conse-quently, the estimated labor force required for the proposed future textilemachinery inventoa would be, as a percentage of present labor force:
Spinning = 50 + 28 = 78 percent;
Weaving - 40 + 28 = 68 percent.
Total (spinning and weaving together) = 73 percent.3/
121. As previously stated, this calculation is no more than anapproximation because its aggregate nature does not take account of thevariations from mill to mill which may affect the final results. Moreover,it is assumed that the position as regards the other fibres will be muchthe same as for cotton and wool.
122. Hnmmer, the measures of internal reorganization and improvedworking methods 7-hich are intended to go hand in hand with the replacementof obsolete machinery may not in practice be fully synchronized with themachinery replacement in some years (at least as regards achieving fullresults). There will thus be a tendency for the figures for manpowerreduction given above to be substantially modified through the effect ofthe increase in apparent consumption. Moreover. the expansion of thedomestic market may take place more rapidly than expected if the high gross
1/ It is assumed that to produce the same quantity of yarn and cloth the numberof -i4)J41.U gnA d^Mh ,mo -he TPAIO e t hO 4 dxy-t.
Source: Engineering Vesdre) (Belgium).2 To 'P~.4....1 cor.s"--to of fibre' LrnolA t,-ri fr".r. 3959 0C tons
4in 19070 tro 5 70
4] !.'..UO.J- ¼'.J4O% JSL P aA ~ .. .kJ~ n - - - - -/ . I - ,- I w
tons in 1975 (cotton and man-made fibres). For latter fibres 1975 forecast(see A-e rS- Tales 19 .,A 20).3/ Abo MLu LfCJ.' t -h lo -i 0
31 About half the labor force is employed in spinning mills.
- 3? -
product growth rates recorded in past years are accompanied in the nextfe-w years hy a more bslanced regional ditastribution of groawth.,ReA +iio.in textile costs may also have a favorable effect in stimulating consumptionby the low ir.ncome grou. Anjother point is that there is a steady sta"f tur,-over in the textile mills, representing annually an average of 10 percentof the labor force emloyed 4r. the B,0z-J 41ia r spi ng an eavin industryIf during the period when the operators are adapting themselves to the newmachinery no additional labor i9 recuitAe to -.lace those 108 .
turn-over, the manpower displaced by modernization might be completelyreabsorbed hy the indus+v itself.

ANNEX ITable 1
I.AVjUE OF OUPUT AND VALU]E ADDED IN THE TEXTILE INDUSTRY
Gross value Gross valueValue of Gross value added per Value of Gross value added perOutptlt added enployee output added employee!
I. Cr,$ miiLliona 19&9-- (,n CR$ 1969) (index 199 in100)
1949 31,914s 1,835 5,414 100 100 100
1958 5,12() 2,270 6,737 131 124 124
1964 6,646 n.a. n.,. 170 n.a. n.a.
1966 7,126 3,574 10,482 182 195 194
1967 6,374 3,067 9,322 163 167 172
1968 8,245 3,908 11,166 211 213 206
1969 83,164 3,919 11,526 209 214 213
1970 13,156 n,a. n.a. 208 n.a. n,a.
Source: IBGE : Producao industrial

STRUCTURE OF' THE: TEXTILE INDUSTRY FOR THE DTFFEtRENT STATES :IN 1L969
Total ProductiveEstablishments e ployment personnel Value of output Gross value adided_…nts ___unoltsa _ __ _ Thousands Cr$ miLlions) (Cla mllions), %
SAO PAULO 1,032 149.5 133,6 '41'294.4 2,065.2 57,0
NORDESTE STATES 409 41.2 37,2 799,1 .353,9!- 9.8CGUANABARA 70 19.3 17.9 447,9 279 5 7,7MINAS GEAI S 144 29.4 27,5 436.9 243.5 6,7RLIO DE JANEIRO 78 23,5 21.5 369.3 204,6 5.7
SANTA CATARINA 73 18.7 17,3 328,0 :200.6 5.5
RIO GRANDE DO SUIJ 63 8,2 7.3 198,3 IL14.6 3,2
PARAINA 72 3.1 2.5 3600.3 103.4 2.8
OTHER STATES 38. 5.9 5.6 114.0 59,2 1,6,
TOTAL lj,979 298.8 270.4 7,348.2 3,625..5 10(),0
cof whiich 113 for Pernambuco State, 78 for Ceara and 53 for Paraiba States,
Source: Produrao industrial,

ANNEX I'Table 3
- 40 -
PERSONNEL EMPLOYED IN THE TEXTILE INDUSTRY
1958 337,000
1960 328,297
1961 n.a.
1962 365,753
1963 342,360
1964 342,364
1965 311,699
1966 341,000
1967 329,000
1968 350,000
1969 340.000
Source: IBGE.

ANNEX ITable 4
WtAGES AND SALARIES AND GRLOSS VALIJE ADDED PER EMP]LOYEEIN THE TEXMLE' IN)USTRY
Wages & Salaries % Wages & Salaries Wages & Salarites ser eWpaoy'(:r$2million. 1969) in g;ross value added 1-9tri 692 ) (Inde
1949 654 35.6 IL ,928 100
1958 875 38.5i 2:,595 1:35
1966 910 25.4 2,66,7 1'38
11967 878 28.6, 2;,669 138
1968 1,009 25.8 2,883 1150
1969 1 ,029 26 .3 3,026 1157
Source: tBGE ProdufaD Industrial.

TEXTILE 'INDUSTZRY , NUNBER CIF PLANTS AND PERSONS EMPLOYED BY NUMBER OF I'ERSONS FNPLOYED
P ersons employed Number of plants P'ersons anployed (Dec. 31) (,s Va added
1966 1967 1968 1969 196 1967 1968 1969 (Cr$ million
A . In number
Withiout employees 42 30 31 27 - - - 4.2
1 - 4 48 51 59 66 138 134 175 190 8.3
5 - 9 167 203 182 160 1,171 1, 462 1, 276 1, 165 41. 6
10 - 19 353 3115 316 314 4,886 4, 391 4,421 4. 3'98 115- 2
20 - 49 522 509 484 498 16; 254 16, 250 15, 523 15,988 268.4
50 - 99 315 3010 308 306 22,,730 21, 558 21,873 21,237 289.8
100 - 249 251 269 286 276 39, 932 42, ",99 45, 363 43,858 485.4
250 - 499 169 175 170 161 60.522 62, 647 59,667 56, 513 586.9
500 - 999 112 104 126 123 75,860 71,018 836,3510 82,297 855.0
1000 and more 46 44 46 48 7837 69,858 75 73, 177 970.8 N
Total 2,025 2,001 2,008 1,979 299)871 290,170 308,345 :298,8 23 3 625.5
13 . If ercntage
Without employees 2.1 1.5 1,5 1.4 ^ - 0.1
I - 4 2.4 2.5 2.9 3.3 0.1 0.1 0O.1 0.1 0.,2
5 - 9 8.2 10.1 9.1 8.0 0.4 0.5 0.4 C0.4 1,1
10 - 19 17.4 15.8 15,.7 15.9 1.6 1.5 1.4 1,4 3.2
20 - 49 25.8 25.5 24.1 25.2 5.4 5.6 5.0 5.4 7.4
50 - 99 15.6 15.0 15,,3 15.5 7.6 7*4 7.1 7.1 8.0
100 - 249 12.4 13.5 14.3 13.9 13.3 14.7 14.7 14, 7 13.5
250 - 499 8 .0 8.7 8. 5 8.3 20.2 21.6 19.4 18 .9 16,2
500 - 999 5.5 5.2 6.3 6,2 25. 3 24.5 28. 0 27.5 23.5 0 @
1000 and more 2. 3 2.2 2.3 2. 4 26.1 24.1 23.9 24. 5 26.8 m >
Tota.l 100.0 100.0 100.0 100.0 100.0 100.0 100.0 100.0 100.0
Sour e: Produ9 ao industrial - IBGE.

TEXTILE INDUSTRY. REAL WAGES AND SALARIES("' ALL EMPLOYEES AND PRODUC1TDN WORKERS
BY SIZE OF PLANT
Without 1000 &Employees 1-4 5-9 10-19 20-49 50-99 100-249 250-499 500-999 more Tohal
Salaries (in '000 Cr$ of 1969)1967 957 764 4,887 13,525 42,334 63,478 121,356 170,260 187.567 209.61)8 814.8226
196S 1,4e,9 1,561 6,295. 15,586 44,741 68,066 139,975 170,500) 260,514 242,612 951,32319649 6537 913 4,654 18.445 49,717 75,325 140,543 174 686 249 809 247.80at 962.258
Wrages and Salaries of Production
workers (in '000 of 1969 (Cr$)
1967 571 502 2,224 7,e28 30.533 44,940 90, 716 133.279 154,984 165X029 631.225
1968 1,:118 921 3,800 9,179 30,782 47 767 102,786 134.846 210,743 198.260 740,20219619 461 z37 2,781 11,630 33,123 50,934 103,258 134,235 200,197 200,905 738,070
S,alaries per employee
('000 Cr$ of 1969)
1967 - 5.7 3.3 3.1 2.6 .2.9 2.8 2.7 2.6 3.0 2, 1081968B - 8.9 4.9 3.5 2.9 3.1 3.1 2.9 3.0 3.3 3,0851969 - 4.8 4.0 4.2 2.1 3.5 3.2 3.1 3.0 3.4 3.:220
Wages and Salaries per prodluction
workers ('000 Cr$ of ]L969)
1967 - 8.0 2.2 2.4 2.2 2.4 2.4 2.3 2.4 2,7 2,423
1968 - 10.7' 4.4 2.8 2.3 2.5 2.5 2.,4 2.6 2.9 2,634
1969 - 4.8 3.5 3.6 2.45 2,7 2.6 2.6 2.64 2,0 2,730
(1) Ad justed by Guanabara Cost of Living Index 1
Source Produwao Indu5tsrial c

ANNEX I_r TZ_ Tnb1 A 7
APPA--iNT CONST'flON OF NATLURAL FIBERS (S0F']i)
(Thousand metric tons)
Linen and Sl oaYears Cotton Wool ieSilk Total
, . . . . . . .~~~~~~~~~am,
1955 223.1 13.7 32,1 1.1 270.0
1956 925 A 14;5 33,6 0=8 274.2
1957 225.7 15M0 33.7 1.0 275.4
1958 236.8 17,8 33.2 1.1 288.9
1959 252.6 18.4 32.6 1.1 304.7
1960 262.8 1 I AA I 1 I6.8
1961 275.6 18.4 31.4 1.6 327.0
1962 275.6 14.2 31.8 1.4 323.0
1963 271.0 14.1 32.0 1,6 318.0
19o6 255.7 13 .A2,4 1, 303,21
1965 260.6 13.9 33.0 1,6 309.1
1966 266.0 14.4 33.4 1.5 315.3
1967 270.0 14.9 33.8 1,4 320,1
1968 283.5 14.5 34.2 1.5 336.7
1969 281.4 15.0 34.5 1.6 332.5
1970 287.8 19.0 35.0 1.6 343,4
Annual -Growth1970/1955 % 1.7 2.2 0.6 2.5 1,6
Source: Organizacao das Nacoes Unidas - ONUServico de Estatistica da Producao - SEPCentro de Informacoes Economico-Fiscais - CIEFFundacao Getulio Vargas - FGVEngineering Vesdre Co.

ANNEX I- u. - Table 8
APPARENT CONSUMPTION OF NATURAL FIBERS (HARD)
(Thousand tons)
Guazima TucumYears Jute Sisal and Malva aud Total
1955 24.4 3.5 19.5 3.7 51,1
19o 31,7 5,2 1 4.2 610
1957 32.9 7.5 19.2 3.7 63,3
1958 30.9 7,7 17.3 3.9 59,8
1959 32.3 15,3 14.5 3.9 66,0
1960 38.7 25.0 11.6 3.3 78.6
1961 42A0 32.5 13.1 4A. 91,6
1962 47.4 37,2 13,2 4.4 102.2
1963 43,6 40.0 13.1 3.5 100.2
1964 50,7 43.0 12,3 3.6 109,6
1965 61.1 66.0 15,7 2.6 145,4
1966 42.9 70.0 17.2 2,6 132,7196-7 3. 70 .0 13.9 2.61 32,7
1968 47.3 65.0 14.0 2.1 128,4
1969 43,3 70.0 14.3 2.1 129,7
197C 45.0 75.0 14.5 2.2 136.7
An^.umal g1rowth.(1970/1975) % 4.2 22.5 (1.5) (2.3) 6.8
Source: Organizacao das Nacoes Unidas - ONUServico de Estatistica da Producao - SEPCentro de Informacoes Economico-Fiscal - CIEFBanco Nacional de Desenvolvimento Economico - BNDE
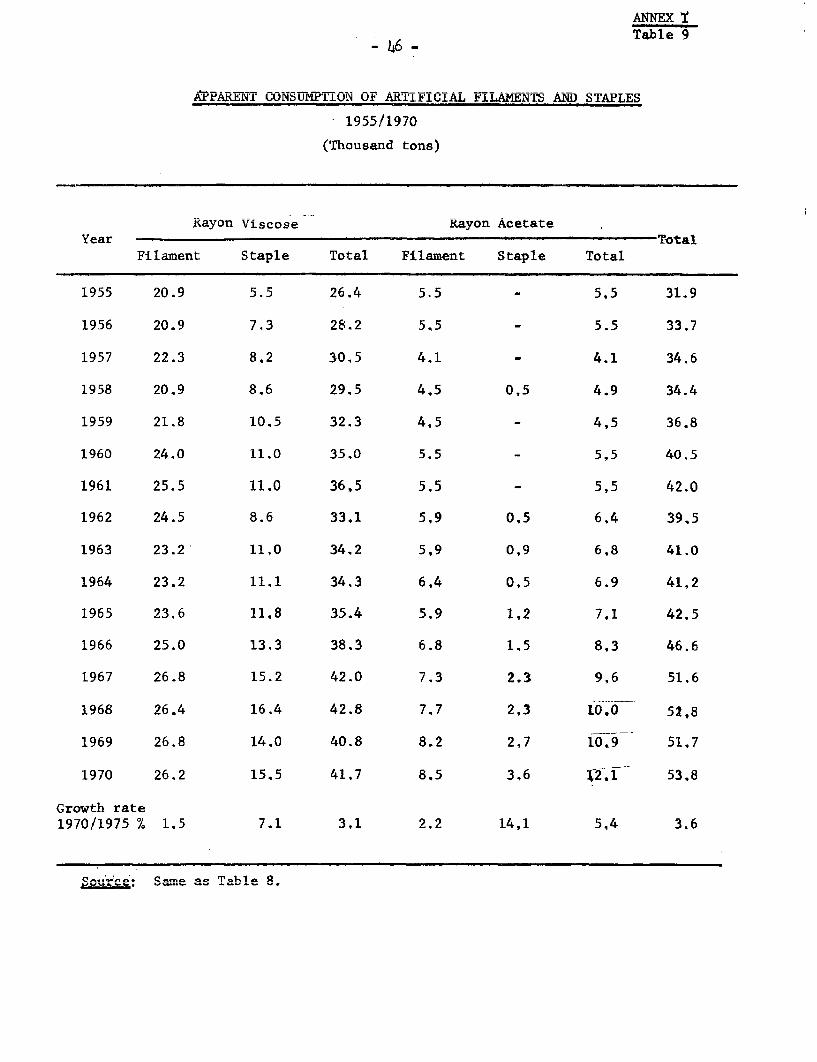
ANNEX ~tTable 9
Ak;PARENT CONSUMPTION OF ARTIFICIAL FILAMNTS AND STApLES
- 1qS9/1970
(Thousand tons)
T.ayon Viscose Rayon AcetateYear Total
Filament Staple Total Filament Staple Total
1955 20.9 5.5 26.4 5.5 - 5.5 31.9
1956 20.9 7,3 28.2 5.5 - 5.5 33.7
1957 22.3 8.2 30.5 4.1 - 4.1 34,6
1958 20.9 8.6 29.5 4.5 0,5 4.9 34.4
1959 21.8 10.5 32.3 4,5 - 4,5 36.8
1960 24.0 11.0 35,0 5.5 - 5,5 40.5
1961 25.5 11.0 36,5 5,5 - 5,5 42.0
1962 24.5 8.6 33,1 5,9 0,5 6,4 39,5
1963 23.2 11,0 34.2 5,9 0,9 6,8 41,0
1964 23.2 11.1 34.3 6,4 0,5 6.9 41,2
1965 23.6 11,8 35.4 5.9 1,2 7,1 42,5
1966 25.0 13.3 38.3 6.8 1.5 8,3 46.6
1967 26.8 15.2 42.0 7.3 2.3 9,6 51.6
1968 26.4 16.4 42.8 7,7 2,3 10,0 52,8
1969 26.8 14.0 40.8 8.2 2.7 10,9 51,7
1970 26.2 15.5 41,7 8.5 3.6 12,i 53.8
Growth rate1970/1975 % 1.5 7.1 3.1 2.2 14,1 5.4 3.6

APPARENT CONSUMDTION OF SYNTHErEC FIBERS
19,'55/1970
(Thousand tonS)
Pb Iyami d Polyester Polyacrylic PolylefinsYear -al I- f__ - __ __ To tal
Vijanent Staple TI-otal Fi Lament Staple TOtal . SaptI . Filament Staple TOtal
1955 0.4 - 0.4 - _ 0.41956 0,6 _ 0.6 - . _ 0.61957 1.9 0.2 2.1 - - - 2.11958 2,1 0.5 2.6 - -* 0,2 - 2.81959 2.9 0.2 31.1 - - 0.3 - 3,41960 4.2 0.5 4.7 - - 0.2 4.91961 5.2 0,6 5;.8 - * - 0,2 - - 6.0 1962 6.9 0,7 8.6 - 14 1.4 0.2 - - 10.2 ,
1963 8.0 0.8 8.8 0,1 2.6 2.7 0.3 - . 11.81964 9.2 0.8 10.0 0.1. 3.0 3.1 0,2 - - - 13,31965 9.5 1.0 10.5 0.1. 4.0 4.1 0,2 - - 14.81966 12.0 1.4 13.4 0.2 6.7 6,9 1,0 - - 21.31967 12.3 1,4 131.7 0,;' 5.6 6,3 4.0 - - - 24.0
1968 17.0 1,7 18.7 2,3 9.1 11,4 3,5 0.1 - 0.1 33.71969 17.8 1,5 19.3 3,1 10.9 14.0 3.8 0.4 0.2 0,6 37.719710 24.5 1.9 26.4 7,! 13,4 20,6 5.2 1.4 0.2 1.6 52.8
Siource: Same as Table 8. PD
_I _-48
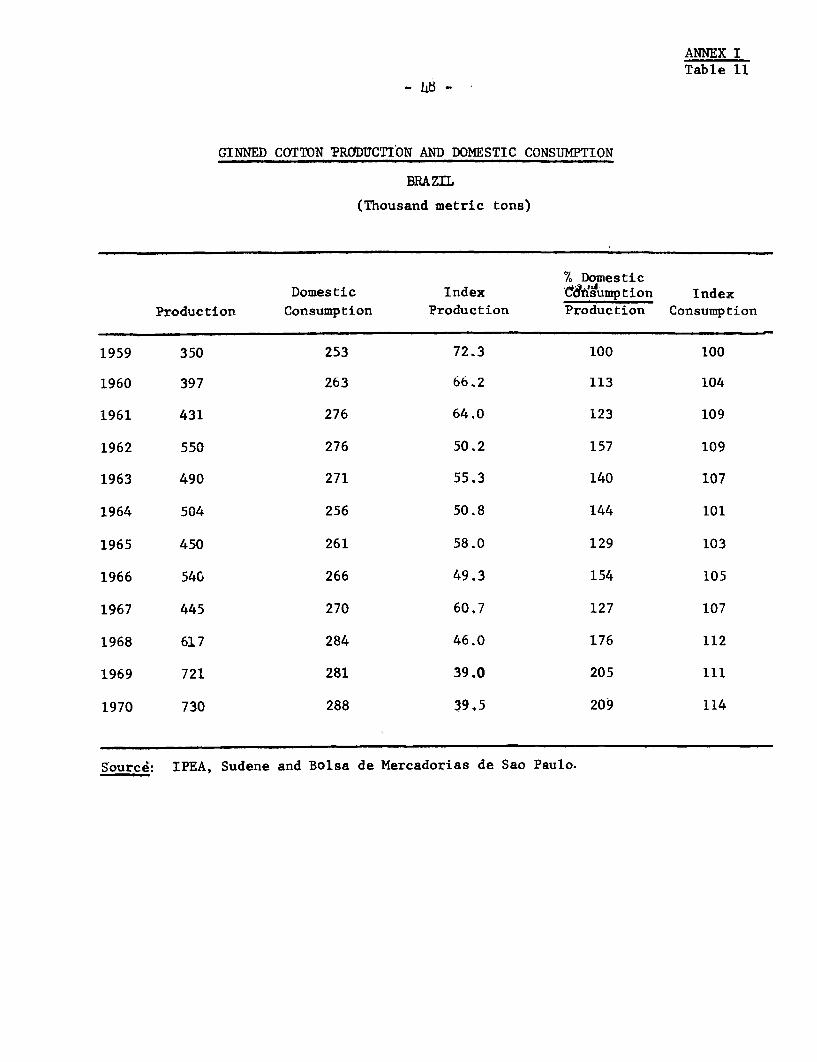
ANNEX ITable 11
r(TNNIET) rOTTON PRMYD1TTON AND DOMESTTC CONSIMPTTON
BRAZIL
(Thousand metric tons)
% DomesticDomestic Index dt&suumption Index
Pt-dilwtHinn ConRumntion Production Production Cnnsumption
1959 350 253 72.3 100 100
1960 397 263 66.2 113 104
1961 431 276 64.0 123 109
1962 550 276 50.2 157 109
1963 490 271 55.3 140 107
1964 504 256 50.8 144 101
1965 450 261 58.0 129 103
1966 54G 266 49.3 154 105
1967 445 270 60.7 127 107
1968 617 284 46.0 176 112
1969 721 281 39.0 205 111
1970 730 288 39.5 209 114
Source: IPEA, Sudene and Bolsa de Mercadorias de Sao Paulo.

ANNEX ITable 12
RAW WUwL PRODUCTLUON ANDI DJMES'l1lC CONSUMPTION
(Thousand metrie ton8)
% Consumption IndexProduction Consumption Production Production Consumption
1960 22.7 1R4 81R. 100 100
1961 24.6 1Ri4 74.8 108 100
1962 92 . 1A 5. 111 77
1963 26,5 14.1 532 1 17 77
1964 28,1 13.6 48.4 124 71
1Q65 29,1 13,9I45.4 29 7
].966 2714,4/. 4. .2 7a
-t v ~~LtJ /Oh1967 A8.3 It, 49. 12 8-1
.JJ.I LI.J 9/.L~~~~~~~~P - L&J 0
1968 30A.7 1 7.5 47. 135 95I
L 28v J3.6 123 82
1970 31.0 19.0 61.3 137 103
Source: IPEA, Sudene nad Boisa de Mercadorias de Sao Paulo.

COMPOSITION OF' APPALENT CONSUFM)TION OF TE)XIILES, BY FIBRE. 1955-1970
1955 1956 1957 1958 1959 1960 1961 1962 1963 1.964 1965 1966 1967 1968 L969 1970
… ~ ~ ~ ~ ~ ~ ~Fibre
Cotton 74.1 73.2 72.5 72.5 73.5 72 8 73.8 74.2 73.4 '71.8 71,4 69,6 68.5 67.'3 67.0 64.2
Wool 4.5 4.7 4.9 5.5 5.4 5.1 4.9 3.8 3.8E 3,8 3.8 3,8 3.8 4.'L 3.6 4.2
Artificial fibres 10.65 11.0 11,1 10.6 10.6 11.2 11.2 10,6 11.1 11.6 11 7 12.2 13.1 12.5 12,2 12 0
Synthetic fibres 0.1 0.2 0.7 0.8 1.0 1.4 1.6 2.7 3 2 3,7 4.1 5 6 6.0 8,0 9 0 11.8
Flax and ramie 10.7 10.9 10,8 10.2 9.5 9.5 8.5 8.7 8,5 9.1 9.0 8,8 8.6 8.1 8,2 7.8
Total 100.0 100.0 100.0 100.0 100.0 100.0 100.0 100 0 100.0 100.0 100.0 100.0 100.0 100.0 100.0 100.0
Total consumption(in thonsand tons) 302.3 308.5 312.1 326.1 344.9 362.2 375.0 372.7 370.8 357.7 366.4 383.2 395.7 423.2 411.9 450.0
Index (1960 = 100) 83.5 85.2 86.2 90.0 95.2 100 103,5 99.4 102.4 98.8 101,2 105.8 109,2 116.8 1l3.7 124.2
Source: IPEA

ANNEX ITable 14
- 51 -
COTTON CONSUMTION IN SPINNING NILLS - SAO PAULO STATE
IndexTons -l(n125 - 1inn)
1950 850650 100
1955 108,472 127
1960 127,865 149
1961 132,215 154
1962 135,424 158
1963 131,465 153
1964 128, 730 150
1965 117, 266 137
1966 128,380 149
1967 114,641 134
1968 129, 280 151
1969 136,463 159
1970 138, 576 162
1971 135,888 158
Source: Bolsa de Mercadorias de Sao Paulo.

52 ~~~~~~ANNEX I-- 52- Taef
COTTON YARN PRODUCTION IN SAD PAULO STATE
(in tons)
Index % cardedrartded Combed Total (1950=100) in total
1950 58,898 13,009 71,807 100 81.9
1955 73,113 17,720 90,833 126 80.5
1960 86,621 19,808 106,429 148 81.4
1961 91,125 20,661 111,786 155 81.5
1962 93,393 20,538 113,931 158 82.0
1963 91,588 18,522 111,110 155 82.4
1964 90,659 19,467 110,126 153 82.3
1965 83,145 16,953 100,098 139 83.1
1966 91,089 18,048 109,137 152 83.5
1967 81,969 i, l71i 97,675 136 83.9
1968 92,521 18,208 110,729 154 83,6
1969 99,401 18,714 118,115 164 84.2
1970 101,558 16,431 117,989 164 86.1
1971 102,707 13,005 115,711 161 88.8
Source: Bolsa de Mercadorias de Sao Paulo Relaoao da Diretoria,Contas, Doculmentos P Parpeer da Cammissao Fiscal 1972

PRODUCTION CAPAICITY - ARTIFICIAL A!ND SYNTHEIIC FIBRES
(metric tons)
A Artificial fibres Present capacity Projected capacity % Increase 1975/1976_ 1975)
Viscose Filament Staple Total Filament Staple Total Filament Staple Total
- textiles 21.260 2C,040 41,300 22,460 20,040 42,500 5.6 - 2.9
- industrial ' - 12, 00 12 600 - 12, 1600 -
33. 860 20,040 53, 900 35,060 20, 040 55,100 3, 5 - 2. 2Acetate 7, 500 4 800(1) 12,300 9 900 4 8_0M 14 700 32.0 - 13.5
41, 360 24,840 66, 200 44, 960 24,840 69,,800 8.7 - 5.4
B antheticd fibres
NylonJ
- textiles 22. 780 3,360 26, 140 37,940 3,360 41, 300 66.5 - 57.9
- industrial (1, 280 8,280 10, 810 - 10, 310 30.15 - 30.5
31 060 3,360 34, 420 48, 750 3, 360' 52, 110 57.0 - 51.3
Polyester
- textiles 6, 100 15,600 21,700 37, 630 31, 800 69,430 516.9 103.8E 2210.0
- industrial 480 480 1, 200I - 1, 200 66 7 - 6S 7
6, 580 15,600 22,180 38,830 31,800 70,630 490.L 103.8E 218.4
Acrylic's (textiles) - 4,200 4,200 - 23, 200 23, 200 - 452.21 452.3
Polpopylene (textiles) 1, 940 960 2, 5(0 2 460 960 3 420 59.E - 36.8
Total synthetics 39, 180 24,120 63, 300 90, 04C0 59, 320 149, 360 129.8 145.9 136.0
C . Total Artificial andC .thetics 80d 540 48, 960 129, 500 135, 000 84, 160 219, 160 67.t6 71.SI 69 .2
(1) Industrial use. 4 xSource: IPEA a W

ANNEX I'Table 17
AR[TIICIAL FIBItES
(Metric Tons)
I 1965 :1966 1967- 1968- 1969- 1970- 19715,- -____ n -- (Forecast),
][. Stapfe
Ak. 'llext'f I eis
'Viscose P l1,011 14,489 11,868 16,439 13,535 15 90c0 1E,5OCi
I W -- 19 564 473 90Cl -
C 1IL,01L 1T4,4819 11,887 174003 16,80Ci 5
Acetate P - - - - - m.a.
I :2 " a 30 1415 22' m.8
C :2 - 30 11522na-
B L p 1,158 1,1494 2,276 24157 2,635, 3l700 4 I 00o() \'
I _ _ _ a _ _- ;
C IL,1583 1,494 2,276 2,157 20635 31,70C1 4,n000
C. TcYtal artificialStaple P 12,169 1.5,983 14J144 18,596 16,1170C 1,LS600 22,500
I '2 - 49 115 495 900 -
C 1:2,171 F., 98 14,193 18,711 16, 665 2C1,500 20,500
(1) In addition. 500 tons would be exported.
Source: Brazilian assoc:iati.on of artif:Lcial and synthetic fibres producers for 1975, forecast is by IE'EA
.P = Production*1 = Import'C = Consumption

ANNEX -
Tatble 18
ARTIFICIAL FIBRES
GMetric Tons)
1965 1966 1967' 1968 1969 1974) 197.5_ _ . __ ^ __ (l2t~~~~~~~~~~~~~~~~6r-ecTs t)
1I. lS^mn
A Textiles
Viscose P 12,258 12,843 14,204 16,8993 17,3615 1'4,600 19,000
_ _ -L _ __ - 900 _
C 12,258 12,843 14,204 16,899 17,36.5 15,500 19,000
Acetate P 5,942 60908 7,566 7,61:1 8,1147 81300 9,500
I - 500 532 'Lf238 255 200 -
C 5,942 7,008 8,09 13,849) 8,402 84500 9,5010
Sub-total P 18,200 19,751 21,770 24,510i 25,512 22,900 28, 500
I - ltO 532 :L2315 255 1,100 -
C 1.8,200 20,751 223002 25,748 25,767 24,000 28,500
B . I_dustriLal
VIscose P 9, 096 11,643 1:11525 12,439 9,375 9,700 12,000
I a - -_ -
C 90906 JLI,64t3 1:L,5215 12,439 9,375 9',700 1.2,000
C. Total aLrtificialEil'6cts 27 2?296 31,3394 3:3,295 36,949 34,887 32,6C0 40,500
I _ 100 532 1,238 255 1l,10o -
C 27,296 31,494 33,827 38,187 35,142 33,700 40,500
LIt . LEilament P :39 465 47 377 47,439 55,555 51,057 53,300 63,000
1 2 lCb100 58: ', 353 750
C 39,467 47,477 483,020) 56,908 51,807 55,300 63,000

AMKEX ITable 19
SYNTHETIC FIBRES
(Metric Tons)1965 1966 1967 1968 1969 1970 1975
Staple fibres
A. Textiles P 1,022 1,314 1,195 1,706 1,435 1,800 2,000
I 4.5 1.59 14CI 49 100 -C 1,(22 1,359 1,354 1,846 1,484 1,900 2x0D0
Polyester P 3,813 5,688 4,705 8105 10,017 12,400 28J500
I 135 1,j5 877 1 019 927 1
C 3,948(2) 6,733(2) 5,5i82 9,124 10,944 13,400 36,0O00
(4)Acrylics P - -.
1 _ . - 4,2,27 .4 205 3,775 2,30-
1'' - - 4,227 44,205, 3,775 2,300 -
Pclyacrylics :e - - 662 1,048 2,900 15, 500
Cn ,, _ -E 662 1,048 2,900 15, 500
Polypropylele P - - - - 240 200 1, 000I . [ - - O ._ _ -oN .. _ - 240 200 1,0400
Sub-total staple P 4,835 7,002 5,900 10,473 12,740 17, 300 47, N00][ 1.35 1 ,09o 5,263 5,364 4 751 3 400 7, 500C 4, 970 8,092 11, 163 15J 837 17. 491 20, 700 54, 500
(1) No recorded industrial use of synthetic stiaple fibres.(2) Including Acrylics
(4) ';00 tiDns will gilso be availab1le for eap?ortI:ncluded in polyacrylicea there will ELlo t1 e a production for export of 3.000 tons
P = Production
1= InportC - Conswmptien

ANNEX ITable 20
SlaMETIC FIB]RES
(Metric Tons)'965 19156 196'7 1968 1969 1970 1975
(Forecast)
: Filaments
A Textiles
Nylon P 7,674 9,444 8,366 11,862 11,799 20,800 44,500
I 1 1 879 2,885 902 1,000
C 7065 91445 q9,245 14,747 12,701 21,800 449500
Polyester P 60 213 545 1Yl23 1,958 4,100 19,000(2)
I : L8 165 1,137 1.530 3,100 -
C- 60 2:31 710 24260 31488 7,200 197000
Acrylics P - - - - - - -
I - - 2 42 61 n.a. -
C - 2 42 61 n.a. -
Polypropylene P * - - - 180 4010 2,1000
I - - _ _ _ 1,00 OCI 1,500
C - - - 1e0 1,4CO 31500
Sub-total TextiLles P 7, 734 9 6.57 8,911 12,985 13,937 25,300 65,500
I 1 19 1,046 4,064 2,4913 5,1C0O 1,500
C 7,735 9,676 9,957 17^049 16,430 30,400 67 000
(2) A procluctiLon surplus of 12.500 tons would be available for export.A production surpLus of 115.000 tons would be available for export.

ANNEX ITTag- be
SYNTHETIC FIBRZES
(Metric Tons)1965 1966 1967 1968 196&9 1970 1975
B. Indstr-ial
Nylon P 1if855 2,561 :3,228 3690( 4,510D 5OOiD J,000
I .- _ _ _ _
C 1I855 2,56i1 3,228 :3,690 4,511) 5000 7,1000
Polyester P - - - - 8.5 90
I: -[ - - - _ _ .
C - - 8.5 90
Sub-total Industrial P 1,855 2,561 3,228 3,690 459.5 5,090 7,000
I -, - _ _ _- .
C s1855 2,561 3,228 :3,690( 4t595 5?090 7,000
C. Total synthetic P 9t589 1.2,218 12,139 166715 181532 30 f390 72F500F:Llaments
I 1 1.9 1.,046i 4,064 :2,49'3 6,000D 1,500
C 9,590 1.2,237 13,185 20,739 21,025 36 390D 74,000
III. Total staple and P 14,424 1.9,220 18,039 27,148 31,f 27'2 47,690 119 500Filaments I 136 2 C009 6,309 9,428 7,244 9,400D 9,00D
C 14,5,60 2!1,2.29 24 ,348B 36,I576i 38,516 57,090) 128,500

ANNEXI ITab l
VALUE OF IMPORTS OF TEXTILE RAW MATERIALS AND PRODICTS
1960 6L968 - 1969 1970 _ 1971
(Thousand % (Thousand 7, (Thousand (Thousand (ThousandUS 3) us ) us$) % US $) % US $)
I . Imports of textile raw materials
btpe of fibre
Wool (including tops) 590 21,2 1,819 9,,2 709 4.5 717 .3.3 1.642
Cotton 3 - 45- 0.,2 37 0.2 582 it.7 4,820
Flax 1,884 67,3 706 3,6 278 1.8 1:21 0.6 206
Synthetics 284 10.2 14,877 75,.2 13,250 83.5 18,258 83,9 42,561
Other 37 1.3 2,326 11.8 1,589 10.0 2,086 9.5
(natural and artificial fibres) -- -- -- -- -- -- _'
2,7981 100.0 19,773 100.0 15,863 100.0 21,764 10(.0
T: . Imports of main textile products
Wool fatbrics 10 0.9 520 5,9 92 1.1 2017 1.7
Cotton fabrics 290 26.4 545 6.1 598 7.5 1,227 10.1
Synthetic anLd artificial fibres 170 15,5 3,235 36.4 1,147 14,3 3,214 26.3
Other 600 57.2 4,588 51.6 6,168 77.1 71550 61.9
1,10( 100.0 8,888 100.0 8,005 100.0 12,198 100.0
Source: IBGE

3RAZILIN' '-YP'0RT' OF MALN TEXTILE PRODUCT';, 15Lg60
196o0 1961 1962 1963 1964 :L965 1966 1967 1968 15169 1970
1. Value (Million US$)Cotton Textiles 4.0 1.6 1.' 1.7 3.3 8.2 10).3 4.5 4.1 6.3 14.11Jute Products - - 0.1 C).3 3.0 4.2 2.1 3.3 7.2 5.3 1.4Sisal Products - 0.2 0.6 1.2 o.6 1.0 1.7 1.8 1.6 2.2 2.7
Total 4.0 1.8 1.8 3.2 6.9 14.0 14.1 9.6 12.9 13.El 18.2
2. Volume (Thousand to'ns)Cotton Textiles 2.2 0.7 0.5 1.5 3.3 8.2 9.2 3.9 2.9 7.7 15. 4'lute Products 0 0.3 0.5 5.3 7.1 3.1 6.7 15.2 lO.S 2.6Sisal Products o.6 2.1 3.-9 1.5 3.3 U. . 7. 11.8 i1
TotAl 2.2 1.3 2.9 !5.9 10.1 18.6 113.7 18.1 25.9 30.0 32.1
3. Unit Value USS/toniCotton Textiles 1,826.9 2,279.6 2,015.3 1,136 .5 984.6 1,000.2 1,124.2 1,1l5.8 1,437.6 19217.1L 1,087.9Jute Products - 503.8 60o.4 554.3 594.9 668 .3 1233-0 i74h.1 507.8 539.5S;isal Products 333.3 277.5 313.7 421.9 293.8 256 .4 2142.4 202.5 187.1 187.4
/ Excluding exports of cotton yari whiich amounted to US$1.7 million in 1968, U'S$2.8 million in 1969 and US$5.4 million in 15970.
S6urce- IMGE.
O. &0

,I - ANNEX I-olI - 2Table 21
EYpOp,'rs 01F COTTrON AND OTHER NATURAL FI13RES. 1960-70
(Ch--lu'e in -nil1ion US$, Volume ir thousand metric tonls, UJnit Value in US$/metric tons)
96o0 1961 1962 1963 1964 15'65 1966 1967 11968 1969 1970
Cotton (excludi linters:V slue 4,5.6 109.,7 112.2 114.2 108.3 95.7 111.0 90.8 150.8 196.0 154.4Viro1uLme 95.1z4 205,7 215.9 221.8 2:17.0 195.7 235.9 189.4 247.6 439.4 342.8Ufnit Value 477.8 533.2 519.5 515.0 498.8 4¢88.8 470.6 479.5 528.4 446.1 450.4
SisalValue 22.3 24,.8 24.8 36.4 37.5 24.6 23.2 '16.3 17.0 16.9 16.5Volumie 10'7.9 1284,7 137.1 130.0 135.6 150.2 152.6 127.8 146.1 144.4 148.8Unit Value 207.1 192,7 180.8 280.3 276.5 163.8E 151.8 127.3 116.5 117.0 110.8
Wool (ncludingA_ops)Value! '1.1 0.3 0.1 2.9 23.5 15.0 25.5 19.8 15.5 22.0 20.8Volume 1.1 0.,4 0.1 3.3 18.5 14. 3 21.8 20.9 19.4 22.6 19.5tInit Value 1,005.7 673,.2 474.1 B73.2 1,271.5 1,0o48.8 1,168.4 947.4 798.6 970.6 1,065.9
RavrneVTalue - 0.3 0.41 0.2 0.3 0.5 1.0 1.2 L. 4 1.,6 1.8Vfolunme - 0.8 0.95 0.6 0.9 1.7 3.1 3.6 4.6 h.,6 5.4UJnit Value - 443,.9 425.1 4C03.3 337.2 280."7 319.6 332.1 315.0 342.3 332.6
JuteValue 0.1 0.1 0.5 1.0 2.5 0.9 0.9 o.8 1.3 0.8Volumre 0.2 0.3 0.1 2.6 4.3 10.5 3.4 3.5 3.9 5.5 3.0UJnit Value 209.6 281.6 200.0 207.8 235.3 250.9 257.8 252.7 199.6 234,3 260.9
Source: IE3GE.

AMVV T W
Table 25
INCENTIVES ON TEXTILES EXPORTS
Yarn Cloth
I Domestic selling price (90 days credit, 10%profit margin, indirect tax (IPI) included) 100,00 100,00
2 Deduct indirect tax (IPI) 5% on yarn, 12% cloth (4,76) (10.71)
3 Domestic selling price (tax excluded) 95.24 89.29
49 $hFi nanci.a' chlarges, 1 , 8I/ mo,thly x 4 ontI s (6.86) (6 .43)
5 ICM 16% on (3) (15,24) (14.29)
6 Sales commission 2% (1,90) (1.79)
7 Net domestic selling price 71,24 66.78
8 Packaging for export iki,o,. ror yarn, L2 ror
Cloth ( ) 2.28 1.03
9 Sales commission 2%(l) 1.26 1.03
10 Freight S. Paulo-Santos, customs and loading(l) 3.79 1.54(6% yarn, 3% cloth) 7,33 3.60
11 Income tax excmption 3%(2) (1.90) (1,54)
12 Financial incentives (Resolution 71)(2) (3.44) (2.79)-(9)
13 ICM credit (8% yarn, 14% cloth)('- (4,95) (7,04)
i f. T171 _ _ _ W O/_1__ 1 _\_.X( 2 ) e r A r\ s14F LrPL crediu't (o%o yarnL , 5cJ/o h (;LUL2L) '6 (7 j^
(15,35) (19,07)
15 FOB price (EFport) (
16 Freight and insurance (10% yarn, 14% cioth) 6,32 7,i8
17 IPT credit on freight and insurance (8% yarn,15% cloth) (2) (0,51) (1.08)
18 CIF price (export) 69.03 57.41
19 r -erence domestic selling price( and FOBexport price 36.78 48.69
20 Difference domestic selling price(') and CIFeInnrI nr r.i 30.97 42-59
Calculated on FOB Santos value - whereas domestic sales commission iscalcul-ntated on. domnestic seplling, pri-_e (95.24)
(2) Calculated on FOB Santos value
Source: Textile industry association - Sao Paulo State, March 1972

ANNEX I Table 26
- 63 -
rOMPETTTI VENESS OF BRAZILIAN TEXTILE INDUSTRIES
Export Price % Export Price
Cost (FOB) Cost
Yarn (CR/Kg)
Cotton - 20 Ne 6.6 7.5 114.0
Wool - 19 Ne 18.9 16.0 84.7
Cloth (Cr/meter)
a) cotton shirtinR (grev)
modern mill 90cm - 40' x 40' 1.36 1.06 77.9
older mill 90cm - 40' x 40' 1.96 1.06 54.1
h) rnt-tnn ch'nP-t-in a (arpv)
c) Cottonx shee.t-ng (grey)R- - In' I~ 'ao 10 Lf6 102.9
137,5cm = 48' XA48 2.22 1.5I 78.7
d) blue denim a.35 2,00 59*7~~~~~~~~~~~~~~~~~~1)R
e)% c ot t on sh&e e t'.IrL g(grey)"
I K.n 1C t x. I Ll 3,11 1 C.0,29
f) cotton sheet-ing (gr-y)
95ccm = 24' x 24' 0,94 097 103.2
g) cotton print
nnfl.f.. I ant -- 2 IsaIt'f 02 A7'JLJ.L - LU -A LU .I,L L,I U
90cm - 50' x 50' 355 2,90 81,0
Source: Selected Brazilian textile mills.

A?^TNTV I
6 64 _ Table 27
E T,ArnTcIT'mTInTTAM OF UIDA7TTT AWT 'VVLEV'wrr Vr%TrTTrvk,rIrn
Thousand spindles Looms
1960 1970 1960 1970
Cotton 3,840.0 2,878,o 102,760 76,460( )
Wool 301.9 180.0 5,500 3,000
Man made fibres 60.0 140.0 17,500 n.a,
Flax and ramie 33.0 20.0 1,600 n.a.
4,234.9 3,218.0 127,360 n.a.
Source: ECLA and SUDENE survey for 1960 and Engineering Vesdre for 1970.
(1) The percentage of automatic loom has increased from about 25% in1960 to 45% in 1970. Such an increase has been achieved mainlyas the result of the progressive disappearance of power looms andhence the reduction in total number of looms.

ANNEX I:Table 28
-65 -
NUMBER OF SPINDLES AND HOURS WORKED PER YEAR - SAO PAULO STATE
Active Inactive Total Hours/Year( )
1950 1,262,987 n. a. n. a. 4,848
1955 1,471,922 n. a. n. a. 5,109
1956 1,477,193 n. a, no a. 5,154
1957 1,417,266 n. a. n. a, 4,872
1958 1,469,084 n. a. no a. 5,220
1959 1,450,493 n. a. n, a. 4,962
1960 1,485,529 n. a. n. a, 5,235
1961 1,495,878 n. a. n. a. 5,409
1962 1,566)015 n. a. n. a. 5,436
1963 1,549,378 n. a. n. a. 5,259
1964 1,480,455 n. a. n. a. 5,136
1965 1,442,652 n. a. n. a. 4,866
1966 1,373,822 n. a. n. a. 5,109
1967 1,286,227 116,351 1,402,578 5,220
1968 1,365,159 70,123 1,435,282 5,721
1969 1,362,317 71,293 1,433,610 5,775
1970 1,380,301 59,191 1,439,492 5,739
1971 1,409,252 56,919 1,466,171 5,754
Source: Bolsa de Mercadorias de Sao Paulo.
( )On the basis of 300 working days per year.

ANNEX IITable 2)
-66-
AVE RAGE COUNT OF COTTON YARN IN SAO PAULO STATE
(English count)
Carded Yarn Combed Yarn
1955 18.04 42,68
1960 18.13 40,30
1961 18,32 40,05
1962 18.02 40,12
1963 16,85 37.40
1964 16.94 38.12
1965 17,93 38,62
1966 17.40 37,19
1967 18.33 37,87
1968 17,79 37.71
1969 17.42 35,38
1970 17.17 36.37
1971 18.32 35.52
Son'rce: Bolsa de Mercadorias de Sao Pauln

ANNEX ItTable 30
OUTPUT PER SPINDLE - SAO PAULO STATE
…~~~~~~~~~~~~~~~~~~~~~~~~~~~~~~~~~~~~~~~~~~~~~~~~~~~~~~~~~~~~~~~~~~~~~~~~~~~~~~~Output per spindle
.CDOttofn Number Hours Average
Your production of Active per Yarn counat Per year Per hour
Spindles Spindle (carded)('in Kilograms) (Kg) (Grams)
1950 71,907,000 1,262,987 4,8l348 n.a. 56.93 11,74
1955 90,833,000 1,471,922 5,,109 18,04 61.71 12.07'
1960 106,429j000 1,485,529 5,235 18.13 71.64 13.6E8
1965 10,009,800 1,442,1652 4,8366 17.93 69.30 14,20
1966 l,0913,970 1,373,1822 5,:109 17.40 79.43 15.54
1967 97,675,000 1,286, 227 5,220 18.33 75.93 14.55
1968 110,729,000 1,365,L59 5,725 17.79 81.10 14.18
1969 118, 115,000 1,362, 317 5,775 17.42 86.70 15,01
1970 117, 989,000 1, 380 301 5, 739 17.17 85.48 14.89
19,71 115,711,000 1,409V252 5,754 18.32 82.10 14,27
Source: Bolsa de Mercadorias de Sao Paulo.

ANNEX I.
- 6B6- Table 31
AGE OF TEXTILE MACHINERY IN THE NORTH EAST
Spindles in Looms inoperation % operation %(Thousands) (Thousands)
A . Age of m1chine-- in 1959
Years
Liess -,han 1524 3,3 3 1 4
15 -3 48 75 1 5.4
Above 30 348 54.2 18 81.2
Total 642 10. 2 100.0
B Age of machinery in 1969
Years
Less than 10 168 38.8 4 35.4
10 - 19 107 24,7 3 26.5
20 - 30 75 17.4 0.3 2.7
Above 30 83 19,1 4 35.4
Total1 I An A 4 11 100.0
Source: S-uDuz

ANNVT Tr
- 69 - Table 32
BASIC WAGE (UNSKILLED AND SOCIAL CHARGES
IN THE TEXTILE INDUSTRY (SAO PAULO)(First half 1972)
?inimum wage = Cr$260 per month or Cr$1.083 per hour
Period = 12 months
I Annual basic wage for 12 months Ct$ 3,120
2 13th month 260
Total 3,380 3,380.00
3 . Social charges on 12 months
i nstituto de revi.den.cia (ITNDC 8Z ~tnAmn
- Servico National da Industria (SENAI) 1% CrS 31-20
- Servico Social da Industria (SESI) 1.5% Cr$ 46,80
- Instituto National Des.Agrario (INCRA) 2.6% Cr$ 81.12
- Family allowance 4.3% Cr$134.16
- Education Allowance 1.4% Cr$ 43.68
- Industrial accident insurance 3.0% Cr$ 93.60
Sub total Cr$680.16 680.16
4 . Guaranty fund (FGTSj 8% on 13 months Cr$270.40 270.40 969.2t
5 . Contribution to 1NPS o 3th month 7.2% cr$ 18.72 18.72
6 . Minimum cost per worker (1 + 2 + 3 + 4 + 5) 4;349.28
7 . Days worked per year
- Total days/year 365
- Sundays and holidays 82
- Days worker 283
8 Hours/Year = 283 x 8 = 2264
9 . Labour cost/Hour - 4 349-27 = Cr$1.921 Cr$i.e. US$0.326 -2264
10 . Labour cost/Hour = basic wage(l) 1,083 or 56.4%
(2)Social charges = 0,838 or 44.6%
Total 1,921
11 * 7. Social charges in Basic wage = 77.4%
tr) Excluding 13th month - Cr$260 months = 1.083 Cr$/HourOh) x 30 days
(2) Including 13th month

ANNEX ItTable 33
INDUSTRIAL FINANCE - TEXTILE INDUSTRY
1966 11967 1968 1969 1970
Investment
1 . Total p 1 ' 2(CR$ million, 1969 prices) 20,3 82,5 188,8 315,9 384,7
2 . Fixed % 87,7 7M.2 83.9 84.0 76,3
3 . Working; capital % 12.3 21,8 16.1 16.0 23.7
4 . Total 100,0 100,0 100,0 100.0 100.0
Sources of funds in %')
1 . Internal resources (of which 49,1 58.3 47,2 49.9 45.3
retained earnirigs) (18.9) (36.1) (11.7) (42.5) (36,6)
2 . Domestic borrowing 50.9 32.3 31.0 18,7 26.1
3 . External borrowing (of which 9,4 21.8 31.4 28.6
suppliers credits) (8.9) (12.0) (31.4) (14.5)
4 . Total 100,0 100,0 100,0 100.0 100.0
Source: IPEA
(1) Using the general price index.

ANNEX I*Table 34
- 71 -
PROFITABILITY OF SELECTED TEXTILE INDUSTRIES IN 1971
Capital -t Net ProftReserves Profit (net) Capital & Reserves
Artex 136.9 9,5 6.93
Santista.Tatuape 118.3 27.7 23.41
Santista Nordeste 5 2,9 -J.
Garcia 35.8 1.6 4.46
Kuehnrich 18k5 3,3 17.83
Hering 33.3 7,0 21.00
Cremer 29.0 2.6 8.97
Cotonifico L Barbosa - 47.8 1.5 3.13
Yolanda 9.2 1.3 14.13
Bangu 114.9 9.9 8.61
Nbova America 107.2 1R8, 17-53
Dona Isabel 74.0 7.8 10.54
Itatiaia 2.4 (2.2) (91,66)
Pernambucana 29.0 7.4 25.52
Soutex o 38A 7 * 7 * 1 A 6n
Fiacao Santa Adelia 5.1 0.3 5.88
Bucarebky 3.0 0,8 26.67
Guararapes 30.0 14,4 48,00
Gnrvalhn RniinAr 4.7 0,2 4.25
Carvalhal Tecidos 2.2 0,02 0.09
Tecelagem Seliba 11.1 6.0 54.00
Roupas A.B. 4.3 1.0 23.20
Lanificio Leslie 5.0 0.6 12.00
Textil Guimaraes 12.3 2 3 18.69
Mineira 12.5 1.4 11.20
Gavea 66.6 1.1 16.50
Gabrial Calfat 28.7 2.7 9.40
Artefina 9.0 0.4 4.44
Barbero 14.4 0.6 4.16
Carambei 10,0 1.3 13,00
9,4 1 19.14
Santa Constancia 5,4 0,5 9,25
Brasilana 8.1 0,7 8.64
Total 1,091.3 137.4 12.59
Source: Annual reports of textile companies.

Il"XEI INV`STMENTS IN TEXTILE PROJECTS APPROVED) BY !l'DfI.
1965 L966 1967 19,68 1969 1970 1971.
A. Value of fixed investments (US$ million) - - 43, 9 46.9 105.2 96.5 94.8
B. Geographic distribution in 1971 (1) Kinas Santa Rio de Rio Grande
Sao Paulo Gerais Guanabara Catarina Janeiro Do Sul Parana Other Total
-of investments (in 7. of total.) 5. 65 1. .. 1.8 2.3 0.7 ro- 10.0
- of incentives (in %7 of total) 54.0 15.1 15.9 4.9 5,1 1,5 2.8 0.7 1000C)
C. tumber of certificates (1) 70 21 6 11 4 3 2 3 120
D. Distribution by tvpe of investment (IL)14tdernizcatitan
Nev Expansion Mtdernization and Expansion Total
Fixed invesitment (US$ million) 20.65 6.11 28.30 6.22 61.28
]?ixed investment/certificates (US$ milliola) 1.88 0.28 0.38 0.48 0.51
Numiber of certificates 1i 22 74 13 120
E. Distribution by size of investment (1) Invelstment Number of
Value % Certificate Purpos,e of Investment
over IIS$ 10 millions 11,8 19.'3 1 synthetics (new plant)
over 13S$ 4 millions 4.8 7.8 1 cotton, synthetics (modernization)
over IJS$ 3 millions 3,7 6.1 1 synthetics (new plant)
Over IJS$ 1.5 million 10.4 17.0 3 spinning, weaving, finishing(erpansion, todernization)
over 13S$ 1L mll]Lion 8.3 (2) 13.5 6 cotton, synthetics (new, expansion,
modernization)
'below US$ 1 million 22.3 36.3 108 modernization, expansion
Tota'l 61.3 11007O 120
(1) Based on imonthly re;ports from C.D I. These reports give a total fixed investment of US$ 61,3 million only. probably due to a different
classification*
(2) Includes US$ 3 million for two new synthetic fibers plants.
Source: C.D.T.

- 73- -
II. THE LEATHER INDUSTRY
123. The leather and leather products industry.Y has grown at aslow pace in the last twenty years. Gross value added after rising at arate of 6.2 percent per annum from 1949 to 1958 only grew by 1.4 percentper annum from 1958 to 1969. In the latter period the share of the indus-try in total manufacturing value added decreased by half -- i.e., from 1.2percent to 0.6 percent. Employment has been reduced from 27,000 to 25,000during the same period but despite this decline, gross value added peremployee increased only by 2.1 percent per annum. Labor cost has increasedsomewhat in percentage of total cost but nevertheless, wages remain lowerthan in most other Brazilian industries.
124. Production is divided among a large number of plants.However, their number has decreased from 706 in 1966 to 657 in 1969. Thereare on average 34 employees per finm. Two-thirds of the firms employ franone to 19 persons. There is only 1 comparn employing more than 1,000 per-sons and eight from 250 to 499 employees.
125. Production and employment are concentrated in Rio Grande do Sul,Sao Paulo and Guanabara state. Fifty-two percent of establishments, 71 per-cent of employees and 77 of gross value added come from these three states.
126. Fixed investments seem to have stagnated in the sixties. Hereagain 71 percent of investments have been made in the three states mentionedabove during the neriod 1962-69 (see Annex Table 7).
127. Thp most imnortant branch of the leather and leather productsindustry (excluding shoes) is the tanning industry. The main problems en-countered by tanneries are lack of raw materials resulting in low utilizationof capacity, nmall size of plants, high production costs and generally lownrndu'Gti v-tvt.
Rmw Mn.PYter!1 SaP ronhl arm s
128. The industrv nuffered until recently from a lack of raw hides.Brazil's very large livestock industry suffers from low, on-farm productivity.The wide varietv of ecolomical tones nrovide onportunities for greatlydeveloping most types of annual production. The national cattle populationsmount.td tn 76 million hAata in 197IM aneordina to the AriteulturAl cen.xusof that year.
129. The most striking feature of Brazilian cattle production is thelow nroductivitv! calviig nercentafes generallv ranre from 30 to 70 percent
1/ ITn1 ie, q9 nllhtei-ng, ta.nni.ng of I PnthAr and leather products excentshoes.

- 71, -
with a national average of less than 50 percent, S)7aughter cattle usuallyrequire four to five years to reach market weight..- BraziL has one ofthe world's lowest slaughter rates disposing of only 12 percent of the nation-al herd annually. Tne United States and France slaughter 45 percent per annumand Argentina 20 percent per annum. High cattle fatality, especially inRio Grande do Sul, affects the efficiency of the industry. Half a millioncattle per annum usually are lost through the effects of drought, diseaseand sharp climatic variations. Some unscrupuous butchers consider theycan afford to lose a certain number of hides in order to avoid taxation.The hide count is used as a means of reckoning the number of animalsslaughtered and applying taxes. The government issues licenses for slaugh-tering. Therefore, it can be understood that in a vast country like Brazil,there is much unofficial killing carried out.
130. Because of high domestic demand, any hide exportation tends toraise prices. The 1970 figures show a production of 9.5 nillion bovinehides of which 7.3 million renained in Brazil./ About 80 percent of theexported hides are wet salted hides, the rest being dried hides. It isestimated that raw hide exports will be reduced to a minimum and there aredemands for government action to ensure this. There are strong indicationsthat the hide export in 1971 was very low, the frigorificos only exportingrejects so that hides converted into leather domestically reached the 8million mark.
131. Hide quality is generally poor due to the usual exigencies,which include the extensive nature of cattle breeding (little use ofstables), the use of marine salt and primitive killing methods. Zebu hideshave thin spines and hump which give poor return on splits; however theyare usually free of tick and warble. The European type hides from thesouth are ticky except those from the Uruguayan frontier region of RioGrande do Sul, which are free of ticks and warble because of the salinity ofthe soil and atmosphere in that area.
132. Brazil augments its hide input to a minor degree from contrabandcattle coming across from Uruguay and from Paraguay. South Paraguayan hidesare better than those from the north, which have bad cactus scratches andpoor flay. The best hides in Brazil are undoubtedly the highly prized Uruguayanfrontier hides. Brazil's official imports of hAdes amounted to 1,289 tons in1970 while exports were 35,577 tons (see Annex Table 10).
133. Current annual levels of production are 9.5 million bovinehir, , 2.5 million goatskins, 2.5 million pigskins, 1.5 million sheepskins,1.j, million gameskins and 2 million reptiles. Production in tons for
1/ Argentine cattle are slaughtered in two years.7/ However, in 1969, out of 9.5 million hides produced, 3.5 million were
exported and only 6 million remained available for the domestic market,i.e,, 6 3 percent only against 77 percent in 1970. (See Annex Table 9.)

75 -
bovine hides is about 200,000 tons while other hides and skins productionamount to 13,000 tons per annum. 36vine hides production has increasedover the years very slowly. It rose from 161,000 tons in 1956 to 188,000tons in 1965, and to 196,000 tons in 1970.
13h. Sheep are reared in Rio Grande do Sul and the Northeast.Very little mutton is eaten in the South, but much is eaten in the North.Frigorificos will only kill sheep if they can contract for the sale of themeat. Fortaleza (Ceara State) is a center for the pickling and export ofsheep and goat pelts. A new tannery opened in this area in 1971. Invest-ment cost was Cr$6 million and sales may reach Cr$7 million in 1972 (pickledand finished goat skins). The whole production is exported0
135. Pigskin production is declining in Brazil as a result of theexpansion of bacon production. However, Frigorifico Argentinos have a hogskinning plant in Rio Grande do Sul. and there are several nieskin tannersin the region.
136. The crocodile skin sector is undergoing a radical change. Therehas been a lack of control in this trAdde with a subseauant overkillinr.Production dropped from 758,000 in 1967 to 382,000 in 1969 and there hasbean the threat of exterminAt{on. The five rentilp 1 tAnnaer-eq in ManAuq havahad to consider diversification into other lines of production. Control ofthe reptile trAde should ensure that more value redounds to Brra4il a9 theexport of raw skins is gradually curtailed.
137. Bovine hides being the chief raw material of the leather indus-t.,'w it is im4npor.+-nt to obse+.-e thaft Bra.74 l lhas ani,,4+4^iu proerv.Wa forw e-
.g , a~. ~….4.- ,a~., J.ja- CM _ _Q M. _-sa O.-a.
panding its national herd. New farms are being established in the MatoP.?rfesO Dn7.n av.A 1aft"hnr^nQn + tf', M e. , a 1 ,.g,,A.w 4aA +w f"-. + 41 14 ,.. hs.A Av_O . I - . o -- o .- W0 Theze 0e' 0.,e , v.-.mn. *sLo *.
the two latter states. The breeders come mainly from the rich eastern states,ar. haefodthsre nmarem-as s114table f_or au5-,enr.&ir W-Seiralraytiv
operations in the more developed regions.
138. There are several Brazilian cattle ranchers expanding theirherds A n +.he Amzon raeg4ion". The 4i the p--s4b4±44- + k. + a i fco '-,1
be built in Belem at the mouth of the Amazon, with a view to the shortershippirg route to the United States an.d E _ We, 4heae is the posshi+.tof semi-processed leather exports to, Europe fram this port. Cattle rearingiS a!-- proa4 gb. 4 w Afor.4. R, +- .-.orth of the4 A--n, A de'.. d-I.-,1 A M-4
expand its cattle production as now planned and at the same time take necessarymea--res Vt" 4. I . UAJ .-- A' q-ity a I.d;o.tinue t AW..o UM£-- reduce raw tthe minimum, the 'leather industry would be in a position to use its capacitymore f'Ll ar .d +aus h aJl,Ala' 4- .ca -cAi-4.
Saughtelling
la 3 ,.- 0 A 4rI -4 -a-ttle 4 r.e,- jver %AA UJ.ta.feOZ ~ ~ ~ VLG&A Su:' .Lli &ASUJ~.LVIJL~ IU~IaII VL .UL U.jaVei1I;V
making transportation a key consideration. Many of the breeding areas arestill A4i1h^,, .Ads -a,, cttle r.ust be-ve to -8h-a lo-4Zpo.nsusantial progAre4s hJ44U'0, CLA beuen.V LLOL UV ade.LVnLL rcV years L n i LUmpro .Lv 6 PVrodIU O
Substantial progress has been made in recent years in improving roads and

- 76 -
construction for n75w areas. This is resulting in increased trucking oflivestock and changes in marketing patterns.
1h10. There appears to be a trend to develop slaughter plants closerto the production areas. For example, inland slaughter plants have beenestablished at Camso Grande and Goianaia. The big meatworks have moved intothe cattle rearing areas of Rio Grande do Sul, Sao Paulo and Minas GeraisStates with glaughter facilities. There is a new abattoir in Mato Grosso,another indication of the inland movement of agricultural and industrialaRtiv-ityV
Bordon is the largest slaughterer in Brazil. As home demand formeat has increased, this Brazilian company has siuperseded the former "bigfoul-r", Rwif' , Armour. Anglo and Wilson, who were principally meat exporters.Bordon slaughters about half a million cattle per year. Large slaughterhousesa_pronvin to bA uneconomical; newer ones are being built to handle 400 to500 animals per day. In Rio Grande do Sul slaughtering is only done in thesimr, February to .Tuly. because in the winter there are no fat cattleavailable. This has an impact on tanneries which are forced to stock hidesfor the rest of the year and must invest large amounts of working canitalfor this purpose.
142. The present division of slaughtering is 45 percent from the largemeat, packers (ffr_g ofcs), -5 per. ent. from emanller municinal abattoirsand 10 percent fron small butchers and faxms.
143. There is little or no long-term collaboration between frigori-ficos and t.=ner-s mor are there anv uioutnns. Hide slpnlies are secured bvprivate treaty with the abattoir. Carioca, the biggest tannery in LatinAmerica w4th a dal 4iput of 4,000 hides, have barracas (collecting wnre-houses) near major abattoirs throughout Brazil, where hides are salted and
X--,-dprior to -trar.3portation to th.e tannr"y , at Rio. Va-cchil of PortoAlegre (the second largest tannery in Brazil) has a barraca in Sao Paulo
4- Uv e,
Pri-c es for"nides
14X. 'M13at p-ices ar-e con"kro`ll0^' in- J.azi';u bu nt b.y-ru3pie
including hides. This exemption is in part a safety valve against thecontrolled meat p lces,, eablirig the meat works to obtain returs fr4rr by-products when cattle prices are rising. Tanners have been protestingagainst the government policy -which control leather prices but not hide. Onthe other hand, tanners have been able to evade leather price controls byconstantly reclassifying their products.
145. There was a 35 percent rise in hide prices (at 1970 prices)between May 1964 and May 1970. By October 1971 prices had risen by about50 percent as compared with 1970. Hide prices tend to reach a seasonalpeak in October-November prior to the commencement of the seasonal kill.Nevertheless, the sharp price increase registered in 1971 severely affectedtanneries and resulted in higher leather prices, thus making export moredifficult.

'7,,- 77 -
146. Export prices of hides have also increased. The average unitvalue per ton of raw hides exported from Brazil rose from U1L96 7U LL"U4 toUS$243 in 1970, i.e., by 24 percent in dollar terms. Hide prices throughoutthe world sharply increased early in 1972. It would appear that the cou-bination of shortage of Argentine hides, unavailability of European hides and,to some extent, low availability in Australia and New Zeaiand, have causedthe current price firmness, which is expected to prevail in the years ahead.
147. In Brazil, domestic tanners now take a large percentage of thekill, due not only to limited slaughter, but also to government measureslimiting the quantity of hides available for export. However, the tanners,in fact, are often paying higher prices than if the hides would be allowedfor export. Tanners have expanded further than cattle population over thelast ten years, thus contributing to higher hide prices and lower exportof hides.
Tanning Industry Conditions
148. Out of a total of 545 tanners in Brazil there are nine tannersin the North, 47 in the Northeast, 155 in the East and 334 in the South.Despite the large number of tanners, a relatively small number of themcontribute more than 50 percent of the installed capacity.
Table 20: PRODUCTIVE CAPACITY, PRODUCTION AND UTILIZATION OFCAPACITY IN THE LEATHER INDUSTRY (TANNERIES) IN 1970
Installed PercentCapacity V/ Production Utilization------------(Number of hides/year)-------------
Sao Paulo 1,560,000 1,146,093 73.5
South 1,840,000 1,336,572 72.6
Guanabara l,000,00O0/ 1,000,000 100.0
North/West and East 483,000 275,730 57.1
TOTAL 4,883,000 3,758,395 76.9
1/ On the basis of a samnle survev covering 21 enterprises. Total Brazilianestimated capacity is 9 million hides/year of which 4.6 million are in SaoPaulo, 2.4 million in the South and 1 million each in Guanabara Stateand the Northeast.
2/ One single tannerv, the largest in Brazil. i9 renorted to exist in thatstate.
Source: Leather Industries Center (CICB) Rio de Janeiro.

- 78
149. As shown in the above table, not only have 21 tanneries morethan 50 percent of the instaled tanning c_acity (which 4 2p''s tht thereis a very large number of small, ar-tlsan type units since the total numberof ta-nnek es is ah5) but evern +Jhc I !n'r+. 1ir,cts o n un+.lize their pro-ductive capacity filly. The survey mentioned in the footncte tolTable 1shows t+-at utilirt-ion of capacity w.ras about 77 percent in 1970.=
15n. O~ne ma4rj eao for u-Aei _-4zton of caigi akoraw hides. Another is lack of working capital as tanneries do not alwayshave ffile'
4.4av%+ *sources -om,orml mA^vnths of stocks i.Adr.e,a hides
being available during only part of the year. Other reasons include equip-r.n 1be.dv1-Aa.-,ii. due *o
1old gm~ncner vyw.'1, 'ack of.r4 1 il ar-Ad4 ir.ef'4'4 .4aw ,,.a,-,...
ment.
151. Tanneries complain about the high cost of chemicals. Dutiesar- 1 -4A Ao nm -xS4- -1 TX& -A cSl s. T1 4;'- -U4- 4sA 4- o^-
C JA.V Ail U Jr'v .L ,ja U 'A4MLJ CJ. Q .j.J. * % O %1,LAvV 0CA.J. E J'J.L VA 4.LJ U' LJi
re-exported in the resultant leather, duty drawback is available. However,if the latherI is Lfor Ioca usage,, 30 to 80 '.t dutJ r.ust bepad
Some chemicals are, however, made in Brazil. Wattle is grown extensivelyin fLi Grande do SaL. Chestnut (Barbadcliao) is also produced. There areseveral domestic producers of binders, pigments and solvents but the
_,.6tt - 4-4 _. @ s 4- A .U.aLIv ly JS ;1 J &By U 4 UV VPVV1J 0
.1Q~~. J.~~ ~~ tLZJ LtV U VJLI J.LVJL.-UL I LtU L1t;i dl.Ya E£*l.j .L-LIULLLZJg
up to 80 percent, Tanners prefer European machines to their nationalUr-ands. Brazilian machinery manufacturers make acceptabtle snavers, spray units,dryers and vacwiu dryers, but imported machinery for the main machine processesis rep-uted to h'ave 'etter productivity and reliabilitye
153. Many tanners are prepared to pay high d-4ties on imported machin-ery0 Therefore, imported machines are depreciated over ten years and Brazil-ian machines over three years even though tax legislation does not providefor such accelerated depreciation of the local equipment. The more advancedtype of machine manufactured in Europe aoes not yet nave its match in Brazii.Therefore, it can enter free of duty.
154. There are in Brazil about 30 tanning machinery producers. Theseare small to medium size enterprises. rne largest finms produce tannery equip-meDt t . side line. They have a small tannery equipment division and arenc Dpecialized. The specialized firms are too small due to the limitedmarket. Only 60 percent of their capacity is used but they have not enoughtechnology to make better machines and to rationalize. They produce toolarge a range of machines and are, in fact, a piecemeal operation. Tech-nical assistance thus seems required for tannery equipment manufacturers.Mergers should also be encouraged to set up larger firms specialized inleather equipmenV production and financial assistance would facilitate suchmergerse
1/ However, on the basis of estimates of raw hides availability (see AnnexTable 9), the ratio of utilization was 81 percent.

- 79-
lqq_ Production costs are high and exnorts of leather have increasedin recent years only due to special government incentives. Labor productivityis lo w And lznhnr nr+nt per unit of output. is renorted to be as high avq inEuropean tanneries. Raw hides are also expensive (see paragraph 24)e
156. To help improve productivity of workers and technicians, theGovernment haoa f4 ,irow. a +nnnJn ohn,n feor the fiver pans+ tvanr_ at Eqtancia
Velha in the Rio dos Sinos valley, Rio Grande do Sul. In addition to theUSinl I aoeha-e rnfga+w ua ndA sucienr.ce sus+ a +e e+iubecta a, -tand'h.t
-~~ a - . 1- o. U- _ - … , .~ t .Jn stdet ar t--h
maintenance engineering. The latter is a vital subject where remotenessfro-m foreis.a4 -vares s -lP+p oe 2-.ans tha+ tar nersa -1st ha-ve %"rexhrkao
.m ~ ~ ~ -~~ 5IC1 -_ tS .. Ce- ab s.cnz I mIs.k I. ,~ n f
to make spares. Most tanneries fabricate their own drying machines anddmS.9 Th.e school r.s a fourye&- co1ase 1.a.er +vlr. spe n tL4e. ewars
at the school and one in industry. There are 110 students ard 20 staff.A .esearch d,pa,t t, -1,.1nt --1 4 r -Z 1 .AAdA 4to the school, at,4 e.
AL .L ~ ..S L.L9
J VLI1L%;1AU W.L.L.L T7V WL&I 6J.A.L.L IJ, CL&&% V%O VUSL~ CJLJ OU S.
juncture it is hoped that the school will graduate to being a national4 r.st4tute ..&.L IJJ. U U IdT3
.L1 As a reWU.Lu V.t Or1 ,.LIr £e L- , te p,-.ce ofL LeatiLLVer has
risen considerably causing concern to domestic users which buy about 70percen.t of lea'wher produced, the rest bein.g epoed. t;e export- p.r-ce ofleather has also increased. The average unit value of leather made ofLVVJA.LLI £JJ.UR= LAc- L~LJ 7LOV 11L.UUI UOiPJ.,4V4 PV,L tIUUI L5.I A.LYVU LU WUpj..L44V -LH1 .54U7
and US$2,546 in 1970 (see Annex Table 12). Fortunately, such an increasecoincided with a general upsurge in wurld leather prAue and srazil s tOtalexports of leather went up from 6,188 tons in 1968 to 15,546 tons in 1970.
158. The market for national leather production is dynamic becauseoi tihe big demand fro-m shoe manufacturers in Brazii (who are rapidly increasingtheir exports) and also because of the export demand for Brazilian leather.Exports of leather, valued at uV 5.55 million in 1970, nave again increasedin 1971/72 and are expected to grow much further. There are pressures frominside and outside Brazil to improve production and quality standards so thatBrazilian leather can become established in reliability in the world market.
159. For the time being, however, tanners need a battery of govern-ment incentives in order to export profitably. Also present conditions inthe industry are such that only a handf%l of finms can be considered ascompetitive on the export market at present production costs. nTherefore,efforts are clearly needed to encourage the growth of larger manufacturingunits with increased productivity'in order to combat the existing numerouseconomic problems. Such policy, in conjunction with active steps taken toincrease the supply or hides to the leather industry, should enable Brazilto become established in the world leather market and to provide low costand regular supply of leather to the expanding shoe manufacturing industry.

oLTTPU'T, VALUE ADDED, WAGES AND EMPILYMENT IN THE LEATHER rNUSTRY
%'TAnnusl T AnnualGrowth Growth
_- _19169 1953 195 196h 3926 1967 1968 1569 1970 1258 1626-B
1. Value of! Output(In Cr$ milLion 1969) 3L9 360 1i81 489 576 558 601 546 574 4.7 1.2
2. % Value of Output in TotalManufacturing Output 1.5 1.3 1.2 0.8 0.9 0.9 0.9 0.8 0.7
3. Gross Value Added,(In Cr$ million 1969) 122 n.a. 209 n.a. 273 263 279 214k n.a. 6.2 L.It
4. % Value Added in TotaLManufacturing Value Added 1.3 n.a. 1.2 n.a. 0.8 0.8 0.8 0.6 n.a.
co
5. Grcoss Vlue Added. for Employee(In Cr$ 1969) 5,806 n.a. 7,735 n.a. 11,870 l0,520 10,333 9,760 n.a. 3.2 2.1
6. % Wages and Salaries in GrossV'alue Added 28.8 n.a. 33.0 n.a. 22.6 27.4 :28.3 31.1 n.a.
7. Employnment (thousand) ,21 n.a. 27 n.a. 23 25 27 25 n.a. 2.3 -0.7
/ n.a. - not available.
Source2 IBE
)o1,..

tEATfEaR rUSTRY .. RMER OF PLANTS IAND PERSONS EMWLION1Y NtC1BRR OF FERSON'S EM'IOTE0D
PersonEi Em:Loyed - Nwmber of' Plajts P43rsons Em_ial _i1966 1967 1968 19,69 1966 1967 1968 1969 1966 1967 1968 19,69
'Without, EmpLoyees 22 24 16 :15 - - - -1Lw -. 1586 160 160 150 286 372 370 35o 260 251 272 2Ls5 -. 9 131 124 108 102 9(9 81s3 750 706 702 64 579 5IJ310 - 19 139 138 139 14L0 1,929 1,926 1,894 ;i,i475 1,588 1,590 14,557 1,65120 L9 161 16h 159 lb2 5,099 1b891 4, 783 4,3h5 It,322 4,189 14,132 3,76050 99 48 61 67 63 3, 111 4s,319 4,639 4o234 3,040 3,808 kL,15o 3,776.100 - 2149 36 314 38 :36 5,566 14,917 5,80oi 5,492 14,586 14,305 5,176 14,961:250 - 499 4 9 10 8 1,117 2,771 3,087 2,536 1,000 2,483 2,754 2,223500 - 999 - - - - - - - - - - -1,000 and Above _1 _ . 1l 2 2,4 .O6 .a 2 J13 _2LU a J. 22
_ _ ~ ~ ~ ~ ~ ~ ~~~~~~~~ _ _ _i3 _I
TOTAL s0 6 _uU 1 ,78
Soire Prckdueao Industrial, :M3E.

ANNEX II-82- Table 3
NUMBER OF ESTABLISHIMENTS AND EMPLOYMENT BY STATES - LEATHER INDUSTRY
RioGrande Sao Minas Santa North-do Sul Paulo Gerais Guanabara Catarina east Other Total
Establishments
1966 141 199 87 17 17 133 90 6841967 138 205 86 21 22 103 116 6911968 136 205 84 19 23 125 106 6981969 133 195 75 16 23 117 98 657
Emplovment
1966 5,642 5,636 1,847 2,469 454 2,177 2,261 20,4861967 6,066 6,276 2,149 2,950 562 1,674 2,678 22,3551968 6,550 6,901 2,261 3,015 611 2,195 2,247 23,7801969 6,423 6,232 1,993 2,908 552 2,005 1,928 32,051
Source: Producao Industrial - IBGE.

ANNEX II
0 n ~ ~ ~ L
- 83 -
q-,Armn.rnwnflnv nflITA T ~TI. A nn,r tt 'k M,rnDISTRIBEulVION OF Vjtunj A l JA4 LN Tz
LEATHER INDUSTRY BY STATES
1966 1967 1968 1969
Rio Grande do Sul 27.3 29.1 29.7 32.0Sao Pa-" 31.0 29.4 30.3 30.2Guanabara 15.3 16.0 16.6 15.0Minas nbrais 8.1 8.4 6.t& 6.6Santa Catarina 2.1 2.h 2.2 2.6Nor+heI nas+ 5, 2 7 -3 6w8 A6.o
Other 11.0 _7. 8.3 7.6
TOTAL 100.0 100.0 100.0 100.0
Source: Producao Industrial, IBGE.

IEATHER INDUSTRY: REAL WAGES AND SALARIRS, ALL EPDYEES AND PROD1rCTION WORKERS BY SIZE OF PULNT
Witholxt_ olovees S1 5--> l 9_ 20-142 () 10L-2I2 25 CL- 02=2 bove Total
Salaries (In OOCI Cr$ of
1.967 174I S14. 1,895 4,500 12, 763 11,i09 1c15,47 59,470 - 1J,719 67,161;968 172 641 2,086 4,n2.9 121839 12,394 18,4313 11,011 - 12,54h2 748171969 149S 656 1, 187 5,080 :11,937 12,77e6 17,988 8,598 - 12,051 71,022
Wages and Salaries andProduction Workers
21967 158 556 1,277 2,9518 8,75'1 7,726 1,111 6,575 - 8,173 417,3251.968 116 433 1,409 3,348 9,109 8,754 12, 736 7,792 - 9,650 53,3471969 102 432 1,1087 3,584 8,430 8,8o3 12, 792 6,648 - 9,281 51,159
Salaries per EmnployreULn 'O00o Cr$ oL 196L
31967 - 2.2 2.2 2.3 2.6 2.6 3.1 3.4 - 4.6 3.01968 - 1.7 2.8 2.5 2.7 2.7 3,2 3.6 - 4.9 3.11 909 - 1.9 2.5 2.6 2.7 3.0 3.3 3.4 - 5.0 3.2
Wages anid Salaries per Producti-on
k 967 - 2.2 2.0 1.,9 2.1 2.0 2.6, 2.6 - 3.8 2.L1,968 1.6 2.4 2,,2 2.2 2.1. 2.5 2.8 - 4.2 2.61.969 - 2.5 ;2.0 2.,2 2.2 2. 3 2.6 3.0 - 4..1 2.6
Source: Producao Indastrial, IBGE.
H1

ANNEX II
LAT ER NUSTRY - PECENTAGE DISTRIBUIONr'F ,1naI1 TV TFA T TTP A0f DZlbiTTVqIOT^ITwJx 'j%OLi.4I. 4.11 YVJLI.JU %JX £ 1U..UU!.J.LVJ1I
Salaried Raw 1'Wages Materials Others. Total
1966 12.2 h9.3 38.' 100.01967 13.4 49.7 36.9 100.01968 13.7 50.0 36.3 100.01969 14.5 51.6 33.9 100.0
1/ Including taxes, social charges, advertising, etc.
Source: Producao Industrial, IBGE.

VALUE OF N VESTMEITS IN THE LEUTHER INDUSTRY BY STATES
(In thouesands Crr$ at 1969 pr:Lces)!/
Nwaber of RicoReporting 0rande Sao Minas Santa North-
Firms do Sul Paulo Gerais Gluanalbara Catarina east Others TotaL
:L962 189 9,95'8 9,278 696 2,073 362 4,549 1,184 28,140:L963 205 4,024 6,888 939 1,k!g28 371 2,998 1,081 17,729:1964 238 10,25,0 5.,624 2,,255 1,9?84 424 3s578 2,067 26,182:1965 260 12,365 3,808 1,966 978 4B0 2,767 1,81.0 24,174:L966 324 6,0C)2 4,716 2,333 405 697 2,83b. 1,471 18,358:1967 289 5,169 6,7o40 1,109 1,l019 240 1,530C 1,170 16,977:1968 698 6s563 7,2142 926 569 741 2,335 1,727 20,103:l969 657 8.11a 6C 2 2987 894 a _ Z0 - 766 l9,;zI
Total 1962-69 62,502 50,'598 11,211 9,350 4,235 22,298 11,2 76 171,.k70
PercentageDistribution 36.5 2'3.5 6.5 5.4 2.5 13.0 6.6 1().0
:11 Pricies adjusted by the Ceneral Price Index.
Source I Producao Industrial, IBGE.
CDn

- 87 -
AN?EX IITable 8
PROJECTS APPROVED BY CDI - LEATHER AND SHOE INDUSTRIES
Number of Projects Fixed Investment Fiked InvestmentApproved in Cr$ in US$
1965 4 1,839,000 1,533,0001966 11 2,4OO00 091,000 SOOO1967 13 2,6l4,000 963,OOO1968 20 6,990,000 2,065,0001969 20 14,802,000 3s617,0001970 52 17J8§2.000 3.824.000
TOTAL 120 46,487,000 13,093,000
Sources: Leather Industries Center (CICB).

ESTIMATED SUP:PLY OF RAW CATTLE HID2lS TO TIE LEATHER INDIISTRY
~~~ _ ~~~~ Cattle erd _x = lute- ,Woto aw Hi-des Do,-ti AviaiL 7f R)aar Hide7s9~~~~~~~pr of R- % of %o
Thousand IndOex Thousand Index Cattle Thiousand Index Slaugh- Thousand Index SIEugh-Year Heads (196(lO0L (1d65=100) Herd Hides (1965=1C00) in { Hides; 165=100) terirg>
:L965 90,505 loo 7,5142 icio 8.6 1,780 100 22.7 6,062 100 77.31966 90,153 99 7,6h1 97 8.4 1,1L8 64 15.0 6,hL93 107 85.01967 89,896 91 7,8143 100 8.7 901 51 11.5 6,942 115 88 .5L968 92,739 102 8,732 111 9.h 864 h9 9.9 7,868 130 9(.1
:1969 95,150 105 9,480 121 10.0 3,503 197 37.0 5,977 99 63.01970 96,652 107 9,h78 121 9.8 2,162 121 22.8 7,316 121 77.2
Source: T'rade Association o:1 Leather and Hades - Sao PauiLo state, Leather Center, Rio de Jane:iro and IBGE.
DO
C:D
91-

- 89-ANNEX IITable 10
PRODUCTION, EXPORTS, IMPORTS AND APPARENT CONSUMPTIONOF RAW CATTLE HIDES
Production iEbmorts Anvarenit uonsuBItjofIndex Index
Tons (1965=100) Tons Tons (1965=100) Tons
1956 161,529 100 - 13,074 100 14 8,L4351957 167,570 104 - 1h,072 108 153,h981958 165,749 103 - 18,911 145 146,8381959 184.094 114 - 38,795 297 1h5,2991960 170;228 105 - 20,522 157 Th9,7061961 170.566 106 - 8,102 62 162,h641962 168,5k5 lb - 4b,242 32 16h,3031963 169,116 105 - 4,371 33 16h,7451964 180,605 112 - 13,755 105 166,8501965 188.72h 117 - 33,332 255 155,3921966 180;166 112 - 1li,163 108 166,0031967 185,h88 115 - 14,200 109 171,325
1968 190,488 118 45 1b,302 109 176,4081969 192.565 119 2 57,979 hh3 134b,5881970 195,720 121 1,289 35,577 272 161,432
Source: Ieather Industry Center.

- 90 -
EXPORTS OF HIDES AM SKINS
19 1961 1962 1963 1964 1965 l9&; 1967 1968 969 1'970
Gattle Hides, Driedor Salted 1Value (US~/'5t 6,003 3,000 i,hoo .1,300 2,700 4,hO I±,700 2,609 11,685 8,653Volure (tons) 20,522 8,102 t42h2 It,371 13,755 33,332 14,163 16,200 1,302 57,979 35,577Unit Vplue (UV$/ton) 292,3 370.2 3300 297.4 196.3 162.0 331.9 252.9 182.6 201.5 243.2
Goat Skzins, DriledValue 3,00) 3,500 2,500 2,500 2,200 2,700 5,80o 3,900 3,766 5,299 3,513volume 1,60D0 1,900( :1,600 2!,000 1,500 2,10O 2,600 2,100 2,065 2,306 1,821Unit Value 1,781.2 1,832.3 1L,592.5 1,292.6 2,598.0 1,733.7 2,265.6 1,867.6 1,823.7 2,299.9? 1,929.2
Sheee) Skins.D,iedValue 1,600 2,200 2, 500 1,900 2,600 4,000 5,200 4,200 3, 775 4,772 4,o66Volume 1,703) l,8o0 1,900 1,800 2,10C0 3,200 3, 700 2,900 2,598 3,074 2,678Unit Value 970.5 1,228.4 1,333.2 1,085.5 1,287.6 1,2 40.8 1,388.5 1,465.5 1,453.0 1,552.l6 1,518.3
Hides and Skins Other /Than UnfinishIed CattleValue 1,800 2,200 2,000 1,goo 2,700 4,60D 4,300 5,000 6,2450 9,952 8,685Volume 1,100 1,600 :1,200 1,300 11,200 1,30) 1,Loo 1,5o 2,L33 1,669 1,526Unit Value 1,724.O 1,592.3 1,591.2 1,389.h 2,210.3 3,581s.2 3,166.4 3,b2>.0 2450.l 596.3 556.0
lj Excluding heifers and. calf.2/ Reptiles and gameskins.
Source: IE5GE. :9
I tR
o :$

EXPORTS OF HIDES AND LEATHER, 1968-70
Volume Value Unit Value(In tons (US$ thousarnd) ___
_-_…__zi168i.HI YE97CI is o68 15 -I17t 1' 6 _ 1961970
1. Raw HidesCattle Hides 14,302 57,980C 35,577 2,609 L,685 8,65:3 182.4 201.5 2h3.2Other _J9225 11.276 _8.811 8.01C5 1,.84 Xk0L -L1.013.9 l1 050 2 ID,
Total 22,207 69,256 4,388 l0,624 22,869 17, 05h 78.4 :330.2 384.2
2. LeatherCattle Leather 2,0h45 5,58 ,2b2 2,621 7,213 10,800 1,281.7 1,h26.1 2,545.9Other _.22 2.9 2.624 j§ 4j46 I 746 1d O6 L87221 ; L.
Total 4,167 7,650 6,866 6,188 11,677 1i,556 I, 48! .0 l,',26.J4 2,264.2
So-nrce: IBDE.

III. Tflfl SHOE iaTUunjii'4IJUSTRI
1. PRODUCTION
160. Total Brazilian production of shoes and sandals rose from 52.5million pairs in 1959 to 64.9 million in 1965 and to 90 million in 1970.Most of the production comes from two states; Sao Paulo (50 percent)and Rio Grande do Sul (30 percent). Guanabara State, which until thelate fifties was the shoe producing capital of Brazil now only proauces5 percent of the total. While in 1972 there were remaining only 6 shoefactories in Rio, there are now 455 shoe factories in Rio Grande do Suland 648 in Sao Paulo State.
161. Production in Rio Grande do Sul is concentrated in the Valedos Sinos, the major producing center being Novo Hamburgo with 285 estab-lishments out of a total of 455.1/ Other centers include Campo Bom,Sapiranga and San Leopoldo. Shoe industry empLoyment in Vale dos Sinoshas increased from 19,466 in 1968 to 25,518 in 1971. The average number ofemployees by firm rose from 36 in 1968 to 61 in 1971. Many factoriesremain of very small size and produce less than 50,000 pairs of shoesper annum. Only a small number of firms have an annual production of asmuch as 500,000 pairs. Production, however, after remaining almost stag-nant from 1968 to 1971 suddenly rose by 50 percent in 1971, part of thisincrease being due to a tripling of shoe exports. Production is expectedto rise by more than 20 percent in 1972, and exports will be twice thelevel reached in 1972. Exports would represent 25 percent of total pro-duction.
162. Despite recent developments in Rio Grande do Sul, the stateof Sao Paulo remains the most important production source in Brazil withhalf of total shoes output. The biggest concentration of shoe productionin Sao Paulo State in terms of number of establishments is at Francawhere about 400 factories are located employing 4,000 workers. This showsthe small average size of establishments, ten workers per factory. Aboutone-fifth of shoes produced in Sao Paulo State are made in Franca whilethe remaining come from the city of Sao Paulo itself and its vicinity,
-e are located some large, industrialized types of establishments.
1/ The number of establishments was 536 in 1968.

- 93 -
A. I rdust-y ColRdi4t-ionsA t..L. f ~ ~ iLa ', JJJ.VAZA
163. T71tse Brazilianl shoe lnd-usLE sLuulf-a Irsr aJ. -4 o-eoproduction and from a lack of industrial norms. Productivity per worker is10 to 30 percent below European or Amexican standards for hLigh qualityshoes, 20 to 30 percent for medium quality shoes and 30 to 50 percent forinexpensive shoes. hne number of snoes produced in Brazil is not more than2,000 pairs per worker per annum, against 4.,000 in the United States and3,000 in France.
164. Production costs are relatively high due to the small size ofthe firms, and the lack of industrial o+anization. Many factories areusing out of date production processes,,' there is little production21control, no cost accounting, lack of maintenance and lack of skillse_Workers are usually paid monthly or on a straight hourly basis withoutnecessary incentivss, with a resulting slow rate of production.
165. The bad quality of leather is also a general handicap. Largestocks have to be maintained as the availability of leather is limited tocertain periods of the year. This, of course, is a serious burden on thefinancial resources of enterprises and lack of working capital is a wide-spread problem. Industrialists complain about increasing exports of leatherwhile they would like to use more leather for domestic production. For along time the highest quality leather was exported, mainly to Italy and9pain, Brazil's main competitors in the shoe export market.
166. Most factories work only one shift. This is partly due tolack of working capital to purchase enough raw materials and also becauseof lack of demand. Competition in the shoe business is very strong. Theindustry sells below Government fixed price limits because of keen competi-tion0 The domestic market is now restricted by the low level of consump-tion per capita. The latter is about 1 pair of shoes per anmum, which com-pares with 2.7 in Italy, 2.9 in the USSR, 3.1 in Wbst Germany and 4.1 inthe United States.A' Brazilian enterorises have difficulties in trying tomake too many models of shoes and in adjpyting to frequent changes in fashionwhich disturb their production programs.,
167. A survey made by the Ministry of Industry in December 1968 showedthat most installed machinery was made in Brazil. In the Vale dos Sinos70.4 percent of machines were of national orizin. The average age of machinerywas 7.)4 years. There is no shortage of spares.
1/ Injection moulded soled shoes are still an exception.7/ There is no trainine school for supervisors and technicians.7/ Trade Association of Novo Hamburgo.i/ In most cases. no svstematic market research is made. In general.
trade agents tell shoe manufacturers what models to produce and producersdo little analvyis of the market needg either by thammelves or throughspecialized consulting firms.

-94 -
168. In general, the Brazilian shoe industry is going through adifficult adaptation phase shifting fran an artisan to an industrialtype of production. The industry par6icularly suffers from (i) a generallack of inf'ormation, (ii) a low level of capacity utiLization, (iii) thepoor quality of finished products resu Kion- Y _-1W iw eriaiYand (iv) a gener7' _! J_ J.I.-Zaflo aue to the lack of training at alllevels.
169. However, the shoe industrZr has a number of assets which ifproperly used could lead to a rapid development. The potential domesticmarket is enormous. Labor is cheap and abundant. Leather, despite recentprice increases, is less expensive than in many idustrialized countries.t/There are some modern establis'iments which could be expanded and serve asan examole for other producers. Domestic machinery is available. TheBrazilian taste is very good, which is inmportant in such a fashion consciousindustry. Finally, a number of the industry's managers are determined todevelop their business along efficient modern lines.
B. Exports
170. The most impressive development in recent years in the shoeindustry has been the rise of exports, mostly to the United States. ExD ortshave increased from 0.3 million pairs in 1968 to 3.8 million in 197Q0/ andto about 10 million in 1971.
171. The state of Rio Grande do Sul has taken the lead in exports,overtaking Sao Paulo State in 1970. Rio Grande do Sul shoe industry exported2.8 million pairs of shoes in 1971 and plans to export 12 million in 1972.
172. The increase in shoS exports has been achieved despite some risein unit nrices. Rubber shoe-1 prices increased from US9.860 per Dair in1969 to US$1.147 in 1970. However, leather shoe prices rose much less(see Annex Table 7!) with the result that leather shoe exports (whieh havea much higher unit value than rubber shoes) went up much faster than rubbershoeps.
1 73 Thcnort nrices are nornally' below averaze domestic prices. Dataavailable for Rio Grande do ,u.1 show that export prices were 77 percent ofdomestic p -ries in 1969, 75 np-rcent ln 19'(3 and 82 npercent in 1971=
-1 71. 'Pin -nYot- aynnT iNv,.Arn-rA w(=q n-rmt-i r;~R b' anry 3rmori+. (c3-ramivl.-nvnI7L. The *nleoz Yoti5enie rs 0e ygue;mett(Ytpir
of IOI, IPI and income tax on profit made out of export sales) have sub-
1/ With cheap labor ar.d relatively less expensive leather, production costscan be kept somewhat bulow industrialized countrie8l costs despite lowerproductivity.
2/ lne F.O.B. export value iffs U$8Q.j millior in 1970 against u 1.85 -mllionin 1969.
3/ RubDoer shoes and sandals represented h percene oC export volume in 197u.

stantially contri:buted tuo the 4crease in shoe ports. SWh incentives
enable manufacturers to make higher profits than by selling in the domesticmarket, even when shoes are exported at prices (before t-x) sig4ificantlybelow inland prices (see Annex Table 9).
175. Exports have been facilitated when factories in Vale dos Sinos
region formed a joint export venture called COPES (Cororation for Production
and Export of Shoes). Manufacturers that have complementary lines of pro-
duction are joining together in export partnerships to promote their goods.
COPES has succeeded in exporting shoes to Canada which has increased her
intake of footwear by 50w percent since 1^95. COPES also hlopes to sell foot-wear to the USSR and Australia. In Franca, a big order received from USSR
for one million pairs of shoes, may induce shoe producers to formia a trading
company. However, resistance is strong due to the pronounced individualismof manufacturers, encouraged by foreign buyers of shoes who prefer negot-ating
with individual firms.
176. Such trading companies have a useful role to play; for instance,
by providing information to their members on the export market, and by en-
abling producers to become true exporters rather than to depend on sometimes
unscrupulous foreign buyers. The import duty on shoes in the United States
is 9 to L4 percent ad valorem, but the importers' margin is often 100 percent.
Trading companies could also organize joint transportation to the export
markets,J etc.
177. In order to further develop exports and also increase the present
low shoe consumption in Brazil, the following are needed:
(i) modernization of existing facilities ir order toproduce shoes on more industrialized lines. Standard-ization of main parts of shoes could be studied. Suchparts would be produced by a smnall number of factoriesfor resale to shoe manufacturers;
(ii) regular supplies of good quality leather;
(iii) training of workers and supervisors and provision ofmodern management methods;
(iv) systematic analysis of the types of shoes (such asluxury shoes) for which Brazil has a competitive ad-vantage on the export market and planning of massproduction for the export and domestic markets;
1/ Present high Conference freight rates impede exports to Europe. Also
shipnin-g is not done with containers, while European exporters are using
them more and more. As an example of foreign importers' mark up, it may
be noted that leather boots exported by one Sao Paulo firm to the U.S.
at an F.O.B. price of U$11 per pair sell in New York for about US$35 per
pair.
- 96 -
(v) joint efforts through trading companies to reducemarketing and transportation costs, in particularto Europe;
(vi) establishment of permanent relations with foreianbuyers able to adequately promote Brazilian shoeexports and to provide guidance on the tvnes of shopsmost in demand abroad; and
(vii) encourage mergers between small shoe manufacturingunits to nermit industrial tvne of nroduction andincrease the number of shoes produced by worker.
178. Brazil has numerous assets to make further gains in the exportmarket -- relatively low-priced shoes (taking into aecount mrnort inc-entivesand cheap labor) and production capacity for high fashion quality shoes,partly handmade, which are in demand in the United States and Europe. wosuch factors, although essential to explain the present upsurge in exports,have to be sunnlpmented by a coherPnt integrated rationalization program inorder to make exports a permanent success and to encourage a higher consump-tion of footwear within Brail

- 97 -
ANNhX IIITable 1
EXPORT OF SHOES BY TYPES
1966 1967 1968 1969 1970
I. 'I.L.lWl (pair-s)
Rubber Shoes 69 124 78,327 294,911 569,788 1,605,087(f A-w-3J1 - r eh1 Oan-ls N10 (1,81 (7,81 1) (1013 I (1s144I- s454) - it Iri%.UL WII.L OfI lUttI±Dj LVjA/ %iU.LqUJL -L I .L.LJ I J~,.L -±)L jiL &4. W.)4
Leather Shoes 35,560 65,091 21,224 434,178 2,034,123fn - .1 -'W~~ C~- - I rI9%r4 91 19 -19 000 n r' r%' Z Ie-Textile Fibre Snoes 4 595 4,V05 11,888 1) s,6u [U.0Plastic Shoes 288 40,122 9,693 5, 714 22,436vOhers - - - 3,120 LO.1L,I
m ~~~~ ~~ ,a .n., ^ r'n, Z, ^wt , ,O -.r't "n fl r .ro810To9a56 197 fq.P5> A) [L 337oC;6 ;s08 .>0 f f 78s21>
IIA.. FOB value ( :w uS)pj
Rubber Shoes 51.5 62.2 220.3 490.1 1,841.1(of wnich sandals) (0.2) (1.o) (lO.i) (i49.i) (1,472.3)Leather Shoes 128.2 220.1 223.2 1,345.6 6,342.5Textile rFlre onoes 1.5 4.1 5. 5.8 208.7Plastic Shoes 0.8 11.2 1.9 4.8 8.8Others - -52.3
Total 182.0 297.6 45-0.4 1,850.3 8,273.4
III. Unit Value (USj/pair)Rubber Shoes 0.745 0.794 0.747 0.860 1.107(of which sandals) (2.000) (0.851) (0.567) (0.993) (1.286)Leather Shoes 3.605 3.381 10.516 22099 3.118
4Total 1.661 1.506 1.334 1.799 2.190
Sources Ministry of Finance and Caoex.

- 98 -
ANNEX IIITable 2
EXPORT OF SHOES BY MAIN PRODUCTION CENTRES
1966 1967 1968 1969 1970
I. Volume (pairs)Rio Grande do Sul 3,250 5,733 24,206 207,238 2,212,)437Sao Paulo 34.052 107,931 28,664 387,534 994,766Guan&ra 72,052 79,068 284,846 423,189 539,814Other - 4.859- _ _ 1-.795 - 31,198
Total 109,567 197,591 337.716 1,028,756) 3.778.215
II. FOB Value (US$)Rio Grande do Sul 9,969 25,817 62,647 383,045 4,557$612Sao Paulo 64.930 15)4036 4i.818 840.095 2.798.2h1Guanabara 107;090 11h70h 345,928 607,681 8,849,051Others - 3.0h9 - 19.262 68.1 82
Total 181,989 297,606 450.393 1,850,083 8,273.386
III. Unit Valu-e ($/pair)Rio Grande do Sul 3.067 4.503 2.580 1.848 2.060Sao Pailnh 1.907 1.L27 1i.h59 21682Guanabara 1.482 1.451 1.216 1.436 1.573Ot.hers o 0.62?- I -78)__
Tota 16e ____ 1.33)4 1799 2.190
2olc-Gcx

_ 99 ANNEX IIITable 3
DOMESTIC AND EXPORT PRICES OF SHOESII
(Cr$ per pair)
1969 1970 1971
At Current Prices
Average Domestic Price 11.56 12.75 18.18Average Export Price 8.94 9.56 14.91Export Price as a Percentage
of Domestic Price 77.3 75.O 82.0
At 1970 Prices ?/
Average Domestic Price 13.87 12.75 14.54Average Export Price 10.73 9.56 11.93
1/ Data are for the shoe industry in the Vale dos Sinos (RioGrande do Sul).
2/ PriGes deflated by the General Price Index-Increase in currentprices assumed to have been 20 percent 1971.
Source: Trade Association of Novo Hamburgo.

A lIThTIV T
- 100 - Table 4
CaMPARISO1 BETWEEN I)CMESTIC A7D EXPORT SALES - FOOTWEAR
Domestic Sales Export Sales
1. Volume of Sales 20,000/month 20,000/month
2. Sellin: Price per pair (Cr$) 25.2 20.2
3. Value of Sales (Cr$) 504,000 404,000
4. ICM (16'4) 96,000 --
5. IPI (12v) 72,000 --
6. Total Sales Value 672,000 404,000
7. Raw lMaterials Cost 180,000 180,000
8. Other Production Costs 169,8oo 169,800
9. Total Production Cost 349,8oo 349,800
10. ICMT (16? on Sales) 96,000 --
11. IPI (12, on Sales) 72,000 --
12. Total ICM and IPI 178,000 --
13. ICII Credit on Raw Materials 28,800 --
1h. IPI Credit on Raw Mlaterials 9,000 __
15. IPI Credit (18,) and ICM Credit (16%) on Export Sales -- 1i3,120
16. Total ICM and IPI Credit 37,800 113,120
17. lTet ICM and IPI (12-16) 130,200 (113,120)
18. Total (9+17) 480,ooo 236,680
19. rross Profit (6-18) 192,000 141,320
20. Income Tax (30%) 57,600 --
21. 'let Profit 134,400 141,320
22. 'a Profit per Sales 20% 35%
Source: Beanco Re7ional de Desenvolvimento de Extremo Sul (B!rDE).

-101 -
IV. THE FERTILIZER INDUSTRY
A. Consumption
179. Farmers in Brazil used increasing quantities of fertilizersbeginning in 1964, after usage remained static over the preceding six toeight years (Annex Table 1). Improvements in prices, credit, soil testingservices, and knowledge of the conditions under which use of fertilizer isprofitable contributed to the rising trend.
180. The use of fertilizer has increased from 281,000 tons of nutrientsin 1966 to 1,150,000 tons in 1971 at an average annual rate of 33 percent.
181. ConsumDtion of fertilizers is mainly for coffee and wheat. Sugar cane,cotton, corn and rice also take significant amounts of total fertilizer use.About two-thirds of total fertilizer consumption takes place in the Center-South and most of the rest in the far South. The Northeast with 21 percentof total GAP in 1970 took only 9 nereent of total fertilizer.V
Table 21: PERCENT CONSUMPTTON OF FERTTLTZERS BY REGTONl/
1961 1966 1970
Nor+hanst 8 10 9South 16 13 26
76, 77 65
l00 100 100
1/ For definition of these regions, see footnote Annex Table 3.
182. While fertilizer use has increased rapidly in all regions inrecent years,i it 1in the rAnte.A7-_-Outh that. mTn+. reni d pn.o.arma has hbeen
made. In 1970 the actual level of consumption had reached 262,000 tons ofnutrieA.n+. q _ rnszmnption lin the Northenst rePnaiins low with about 90700 t.AflA2/
l83 ~ Si o4I466, nitrogen. consumption has been ?rflrPsing fnastn +.hf,ni
phosphorous, as has that of potassium. The increase in nitrogen was 5.9 times,phosphorous l4.7 times and potassIua. n.0 tO es.
i AJ,_ T+.TnIt muat hb ae Ihnacrzed that a c +bst-an"+Aa1 mna-rn r?Mnairs forfurther increase in fertilizer use as the fertilized area represents less
g/ The Northeast, which oontains 30 percent of Brazil's cropland, consumes lessJU&PA4 .Lkj uj7LU=AU VJ. LDYJUa.L .L%;.&L J.J.J.L&DU Ouppj.Li~.10 rAwo.Ja*, 1.1± .JIS P-11- 0-..J'. A'JL
sugar and cocoa estates. Small fanmers growing maize, cotton and beans usenegligible amounts of fert>i'zers. They pay high service marginrs, resultingin a price for ammonium sulphate from 3 to 6 times above the "world market" price.
2/ See Annex Table 3.

_ 102 -
than 40 percent of the cultivated area.±i
185. Government credit for fertilizer purchases has been availableto fa nnrq in rscent yrears at 7 percent nominal interest. To the extentapplied this scheme amounts to a significant subsidy when the 20 percentwnMinl rate of general nrice inflation which has prevailed during recentyears is taken into account and this greatly encourages fertilizer purchases.
i86. The exemption of fertilizers from the ICM tax of 16 to 17 percenthas al90 elim-inated a significant cost-raising element.
187. TImnrirEs now make un 73 percent of Brazil's fertilizer consumption.However, in order to protect local producers a quota system has been established.The prinnncpiA sq that every vear. on the basis of conawuption and local Dro-duction forecast, a ratio of imports (free of duty) is calculated in relationto locnal productioneJ of findiQhed produntsq. For one ton of fertilizer manufac-tured locally, the following tonnages are allowed for duty free import
(aee 6ae9)
Tale 22: FERTT7IZR Qr)Tfl RqM 1972
Ni4 trogsen 20 e9°
Nortoh 2 5 free i ^-ortsCenter 2 o.6 free importsC-n4h Cne 4nw 7.5 fe -s-rn
188. Table 2 shos that there is no quota system for potash; potashiA no -.L -(M- f.n 1 041-.. Pa.. 4 ha Oa-4h a.. ra.nais no'vu prOduced rtn a'J.&.Lz L& AC -DL Wfl Uar0 JoJU C% J LU '.hoeA"fer=
tilizers are imported duty free because such fertilizer is not produced in.LL.- rt_...LL. A.- - ... ia. 4' 4bA -na- -.w -4 , - .d--.41 C . ,nln a4a-A -n 4kha h..4 aLIIW OVUtLhL AD a 9ViV f IJ.L.L.LOL p wce9 L" aL¶& c oa.1L,U&1aUW J U&A 10=0aa
of the ratio between imports and local production are substantially difgqr-_L Z. %. L1 t - -4 4 4-, _ 1a_ _Ar A _ _ .-_4 -4- 4A 4a a,- 1-41r /
tLi V ._V eatlLi IdA. LLLVA ULLCO5.LV5LOJ fl.LUL a c.w sV.Av auuo Uao LJ.utau._W
Once the quota has been filled, fertilizer inports are no more tax free and… a. -.a...o -- A ,t rnLare subject to a 1_ perseenLitar.L WILL .dLJ pCSX,LLU tC
I'y Fe"-'Z"LL Lif use UbrL.L fjitte LL-UL. o'y f..L-UUL gSverVY 0e1 LLOLLo i.LLL,L..&VUU,
credit and improvement of farming technology, but also from a decline inimport prLcea. Tue trend for seveml rua.sor pWod'nL.C. is as fro¶u.ws (fee Table
23):
1/' i %o data. Sourv e: unL±u.V/ There may be a relationship between the faster increase of fertilizer consump-
tion in the South tnan in the other regions and the fact Tnat cheaper importsare free for N or benefit from the largest quota for P 205, in the South. How-ever, one must also note that k20 consumption also rose faster in the Souththan elsewhere, despite the fact that imports are free for afl regions.

- 104 -
Table 23: CIF PRICE OF SELCTED FERTILIZERS
(US$/ton)
First Half196L 1965 1966 1967 1968 1969 1970 1971 1972
(Estimed)
Amnoniun Sulphate 48.0 54.1 48.7 44.5 36.1 32.8 22.6 17.1 30.8
S4,ng1e Super-Phosphate 35.2 35.2 34.5 34t5 34.5 34.3 20.7 33,0 36.0Triple Super-Phosphate 67.6 67.1 68.1 56e6 52.4 50.6 5006 49.0 70.0YT-^ n 9lR. 1-08.9 0102 92,3 79.2 6765 54.0 51.7 49.0
Potassiia Chloride 50.3 50o3 36,8 36,8 36.8 32,8 1,.,5 36.0 38.0
IOA. Tt ca. thus b+ observed that until 1971 nrices shawed a clear
declining trend. However, early in 1972 some increase took place in par-.4cu"'ar 4^o Am,m-,i Sulphate and Triple S-iner-Pho.rhate. The recent increase
in Ammonium Sulphate prices is partly due to the fact that this product isa by-product of the Snthetc fb MreS indust.y. As the world qvnthetiC fibres
industry is facing structural-technological changes resulting in the elimina-tlon o t.he p,j,sork Sulphate rouct, the lat;tertQ qv isc beuvmin_
more difficult, with direct impact on prices. As a result urea norw tends tobec1,Xe 'he or',> i-I-o-ant source of nitrogenous fertilizers, TTrea nrices,.
however, are not showing the same increasing trend as world capacity is ampleand the lon-g-term West European or Perstan C-f FO pc is s n ected
to be substantially higher over the medium-term than the level achieved inl97.2 1 IuIdern pr-es- circum.stances, Tr4ls Super-Phosphate and DAP pricesare not considered as likely to decline much further, As a ie-ult, the generalfall in fertillizer iMort prices in Braztl may now be coming +to a halt. Thequestion is thus raised as to what extent the Brazilian fertilizer industry-will be abule to co-eetC in tlhe 4uture 4products given the fore-
seeable world market prices,
B. Production
191, Brazil produces nitrogenous and phosphatic fertilizers but hasno domestic s-upply of potassim- ws chloride,
1Nitrogen
192. 'urtil 1770, n-1trogen was produced in very al-o' t a in t-heform of ammoni:mi sulphate by a few steel mills using coal coking gas as raw
if Source: OECD Developmel t DeLLer. 'Urea FOB'l. worldA p- declines fro-
US$100/ton in 1960 to US$42 in 1970. They may reach US$44/49 in the mid-seventies.

I

- 105 -
material. In that year, Petrobras completed an ammonium nitrate plant atCubatao (near the Port of Santos) with an installed capacity of 28,000TPY of N equivalent. The Petrobras plant uses refinery gas and lime asraw materials.
193. Also in 1970, Ultrafertil S.A. started to operate a nitrogen-phosphate fertilizer complex at Cubatao. The complex comprises sevenprocessing units, with related storage and dock facilities and a network of14 distribution centers in the state of Sao Paulo. At full capacity, theplant was planned to produce and sell annually about 108,000 tons of N and82,000 tons of P205 in the form of ammonium nitrate and of diammonium phosphate(DAP). The plant itself and the other fixed assets were built substantiallyas planned, although more domestic equipment had to be incorporated in thenlant than had originally been Dlanned. The cost overrun on fixed assetswas between 10 percent and 15 percent. However, the total overrun was 50percent on total project cost (including net working capital and cash oper-ating losses).!/ There were considerable delays in completion of the pro-duction units. which started up between February 1970 and January 1971,when the ammonium plant came on stream. Start-up of all the units was originallyplanned to have been comnleted by mid-1969.
1 94. The principal reasons for the overrun were the delays in start-up, the expensive marketing organization, the marketing expenditures under-taken before the plant started up and the excessive administrative overhead.After start-up, repeated individual plant shutdown and operating deficienciescontribut+ +edto nprw% ingj lose-jQa
195. rfert,il'sI m.sin prhoblem lies in. the nrperatio-r of the nlant.
While some progress was made during 1971 in correcting plant failures andi4mroving operating deficiencies, progress has bee-n slow and much remains tobe done before the plant can be considered to be operating satisfactorily.T.4 4 r-%4 A pa a" operation, CtSo+g e-nould be tiire.durc by several millionVW-L fC J4LJ -F - - eJ.&Lfl _ -rS.'_4U- …_
dollars per year. Production in the first-quarter of 1972 was very low,miainl; -.. ca use of siccessive fallures int he wmmora- p-lant. However pro-duction has not been limited by any difficulty in selling and Ultrafertilhas been ipor"ting fe-ti'izers i.n order to raise sas vol well as toblend with its own production. World fertilizer prices plus the high levelof protection are such that given reasonably effic r Mrs the C.nravcould make profits and rapidly reduce its debt load.
196. Even assuming that by 1973 profits can begin tc be made withAuproved o-perations, ultrafertil' s producAion capaci ' rem2.nir s ml and
uneconomic.
1/ Total project cost at December 31, 1971 was US$104.9 million against Us$69.8J..L.LAon Lorecast- on JInJe30 .

-10 _'±LJU -
Table 24: ULTRAFERTIL DESIGN PRODUCTION RATES
(Tons/day)
Produc 1tyn Production Annuai Production RateRates. 1971 (First quarter 1972)
Ammonia 450 318 206Ammionimu Nitrate Prills 62 27 15DAP 485 330 348
1/ Revised rates based on 330 days. Original rates were based on 365 days.
197. At this level of production, costs inevitably are high. AlsoUltrafertil is usiilg naphtha as a raw material; naphtha prices have increasedfrom US$25 per ton in 1971 to US$30 in 1972.
198. DAP is sold by Ultrafertilat US$118 per ton. This canpares toa CIF price for imports of US$86 per ton in May 1972. The need for protectionwas even greater at the lower CIF DAP import prices prevailing earlier: US$66.6iton in 1971 and US$78.4 in the first months of 1972. Taking into accountvarious port charges, unloading, financial charges, etc., DAP landed cost 1/now is around US$100 per ton (on the basis of a CIF price of US$86 per ton)-,still well below Ultrafertil s selling price.
199. Another important new producer of nitrogen is the COPEB (100percent Petrobras subsidiary) plant located at Camacari, 25 kilometers fromSalvador (Bahia). The company is operated by Petroquisa, also a Petrobrassubsidiary. It is designed to produce ammonia to be transformed into urea,only a small tonnage of ammonia being directly sold for petrochemical use.The plant has a capacity even smaller than that of Ultrafertil, i.e., 200tons/day of ammonia and 250 tons/day of urea (i.e., 37,000 tons/year of N,taking urea at 45 percent of N).
200. The company has run into technical troubles with the ammoniaunit from the start, In May 1972, the ammonia plant was working at 57.5percent of its capacity and the urea unit at 75 percent, The whole ammoniaproduction is absorbed by the urea plant, leaving no surplus for petrochemicaluse. Tecbnical difficulties are expected to be solved by the end of 1972when large compressor in the ammonia plant will have been repaired.
1J The long-term price forecast for DAP is US$75/ton (FOB United States)or US$85/ton CIF Santos. Source: OECD.

- 107 -
201. InvestmAnt t-n+t was UMP25 million- wlth a quhbzantial overrunas compared with original estimates. This cost includes access road, watersupply, a gas-pp ndohr on-ting2encies as the plant wvas intatlled in anewly developed area.
202. Operating costs are high due to the small size of the planta-- u..ae fact +he+ lii idA n d gas U i. dl as a raw mtn%l a i rea+-,-vel
expensive.
Table 25: OPERATIN) COSTS OF CAMACARI PLANT
(09$/ton)
Ammonia (200 tons/day) Urea (250 tons/day)lOO7 Capacity U5O Capacity 100% Capacity
r.LAUU jUaT _.u 4.u cu 7
Variable Costs 25.0 39.2 42.0
Total Cost 58.0 73.2 62.9
Selling Pricel/ 92.0 92.0 68.5
1/ Cash sales in bulk FOB plant.
203. A large ammonia plant (800 tons/day) with favorable natural gasprice would be expected to produce ammonia at a cost (before return,qninvestment) of US$29/ton at 80 percent capacity utilization factor.±'Similarly a urea plant (1,000 tons/day) could produce urea at about US$37/ton (before return on investment).
204. World prices of ammonia and urea remain low. Armonia priceCIF Santos is now US$41/45 per ton. Ammonia may be imported from Venezj5elaat U$32 FOB + US$9 freight i.e., US$41/ton, under a long-term contract.",'Anmonia prices are not expected to increase significantly in the yearsahead. Consequently the FOB Camacari or Ultrafertills Cabatao plant prices2/are very high ind6ed. Damnetic MAP producers now have to buy 50 percent oftheir ammonia requirements frcm Ultrafertil at US$ 85/ton while the cost forimported ammonia is US$43 thus bringing the average ammonia price at Us$6/ton.
205. As regards urea, of which Petroquisa is the only producer, theselling price FOB Camacari at US$68.5/ton (oash sales) is also much higherthan the present US$50/ton CIF import price. Even assuming that urea prices
1/ OECD Development Centers Data are for Persian Gulf plants.%/ Contract by Fertisul (RGS) for import of Venezuelan ammonia.31 Ultrafertil ammonia price is around US$85/ton for sales on large volume.

- 1c8 -
mav increase somewhat in the years ahead i/ local prices are likely to remainsubstantially above arnticipated CTF prices. Also the fact that urea has tobe transDorted from Camacari to the main market in the Center at a transportcost of Us$15/ton further increases the difference with regard to CIF pricesSantos.
. Phosphatic Fertilizers
206. Brazil does not possess deposits of rock phosphate of the size
of those of Florida and Morocco. Phosphate is in general of the apatitekind; a natural calcium phosphate containing fluorine, magnesium, manganeseor iron.
207. The only deposit of apatite now exploited is located at Jacupiranga(sno Paulo) which reauires the use of special techniques due to its low P2Ou
concentration (about 5 percent). Reserves are relatively moderate, aroundL2C Milli on tons of ore, and exploitation will soon be made on the basis of
200,000 tons of concentrates per annum containing 36 percent of P2 0 Pro-ductiiotn qcft is about US15/ton and the selling price (after transport fromthe mine to Sao Paulo and profit) is U3$23/ton. This compares with a CIFprice Santos of Us$16/ton for imported rock phosphate (FOB Florida, US$10+ freight US$6).
208.- The largest Brazilian deposit of rock phosphate with estimated
reserves of 100 m-illon tons of ore, averaging 22 percent of P>O,.islocated in Araxa (Minas Gerais), 600 km from the main markets. _'/Althoughdiscovered Tnre than twenty vears ago, this deposit was not exploited due
to its high iron content (more than 20 percent average of F20-) and ofbarium aT cde. o.weaver, more reaentlv research was carried oui in orderto develop a process to obtain a P2 0c concentration within the standards
- ,I I-., -h 4v" ,av~ re qu -imd 4-k th idut
209. A private co Sa 7 (Serran/Quimbrazil, part of the Samira
Group) has now decided to install a pilot concentration unit at Araxa before-J 4 4 ,4 , 1~f+An TnV n fi- rca a4-s3ap (li-v I Q7(tY -00 -rCY)r +j-e%la
of apatite a year could be produced yielding 200,000 tons of P20 . Theconcenstrat-ion4 plant would cos+ US$19 million whilea slfiic and phosphoriecacid plant_/ would cost US$25 million. Production cost of rock phosphatt isexpecbeU uo be around U$8/ton. and selling r-ce -n Sao -a-no TTO18/+o
In evaluating the justification for the Araxa mine prc4ect consideration shouldbe given to the iL'gh transportatiU n c f p..oh c o ic a^id frm Ar axa toSao Paulo area (600 kilometers) and also to the fact that imported rock phosphate
1/ OECD Development Center forecasts an FOB/North West Europe price ofUS$h4/1 /ton to w-ieh must be added about U$1"0/on freight.
2/ Only 20 percent of the market is in Bras Gerais, and the rest mainly inSao Paulo State0
3/ To be located in Araxa, in order to save transport cost for phosphate.LV Transportationfrra Araxa wouild oe around US$3o/ton. This is theoreticai,
as rock phosphate would be processed at Araxa rnine sites.

_ 109 =
prices may decline further in the next few years (see Annex Table 11).rnus, rather than to make a direct coaparison between prsent CIF p-i ces
and assumed production costs at Araxa, a longer term view of future worldmarket phosphate prlces shlouLd be taken.
210. Local production oE rocK phospba-e was about 56,000 tons ofP205 (from Serrana phosphate mine) in 1970. Rock phosphate imports amountedto about 113,000 tons P20 . since total P2 05 production in Drazil was169,000 tons, this shows that two-thirds of phosphatic fertilizers producedin the country are based on imported rock phosphate.
211. There are seventeen companies making phosphatic fertilizers.Apart from four companies (Quimbrazil, Capebras, Fasfanil and Profertil)phosphatic fertilizers production is in the hands of i4 smaller producers(see Annex Table 7). Ultrafertil became a new producer in 1970 with itsDAP unit. However, the bulk of the production of P205 is still in theform of single super-phosphate (56 percent of output of P20? in 1971.1/Most units are in Sao Paulo State, largely based on importea rock phosphate.Production of P205 has increased from 84,ooO tons in 1966 to 242,000 tonsin 1971.
212. Locally made single super-phosphate (20 percent P2 0g) is soldat the same price as imported fertilizers or somewhat below. Hfowever, triplesuper-phosphate (TSP) is sold at US$102/ton against US$85/ton for importedTSP (CIF Sao Paulo). The reason for higher local price is the high costof imported phosphoric acid. Phosphoric acid is now imported from Mexicoat US$132/ton CIF Santos or US$165 Sao Paulo. It is in short supply world-wide and imports have been made from Spain at US$173/ton. It is expectedthat phosphoric acid will be produced at Araxa at lower prices, i.e., at acost of US$90 to 95/ton or US$118/ton CIF selling price Sao Paulo. Onemust note, however, that new large phosphoric acid plants are being developedthroughout the world. A long-term price FOB Morocco or Florida of Us$85/105/ton is highly competitive with the future Araxa production.
Potassium Fertilizer213. Potash is supplied by the importation of potassium chloridewhich is added to the mixtures of fertilizers prepared by the firms in thisline of business. Up to 1965 there was no real likelihood of domestic pro-duction of potassium chloride or of potassium sulphate, as investigationsshowed the use of marine rock salt as a source of potash to be uneconomical.
214 TIn 1965, however, a discovery of potassium chloride, firstcarnallite and later silvinite, was made in Sergipe. The Goverment decidedto carry out a detailed survey with the object of measuring the reserves ofpotassium salt and in so doing declared an area of 452 square kilometers in
1/ See Annex Table L.

Sergipe a "national reserve". About 25 drillings were made in that area.P.enov en r ab le nr s ea r. e 4s Wo f s Ie 20 0 lm ,6 1 l4 4.tonso s4 1v4 r4te 4 - n4.1 averag
content of about 22 percent of K20 have been established. Potash islocated at dep,ths of,- ab4ou 6040...k 4'. 1A pts is 'y
about 50 kilometers from the sea.
215. The Brazilian consumption of K2 0 was 465,oo0 tons in 1971 and.LS L6 L AA%L0 UVJ .L Va,11 7..JJj'JVU ULi'J LL A 1 .L7 I'). JIWM 4Lt LL._Lt;U&lULJ~ WLDUJ.U u55jI
to justify the setting up of an industry to exploit known silvinite de-posits. All possible effort s shouid be made to brirng about domestic pro-duction of potash, provided it can be available at reasonable cost, In thatcorntext, the r U -f increase in world prices of potash may hnave a favorableimpact on the Sergipe project.
C.* Imports anu Future rroduaivOn riaUs
216. fLimports novw make up most of the Brazilian fertiiizer suppiy.They rose from 191,000 tons of nutrient in 1966 to about 840.,000 tons in
9 (.L./ rowevtr, Ln 1Y97 impor1Ts were only slignhly above the 1yrv levelbecause of a sizeable increase in the former year in the domestic productionof nitrogen and P205. As noted above there is no iocai production of potasn.
2i7. Th'±e ratio oI 1ocaL production to consump,ion has evolved asfollows:
Table 26: SHARE OF LOCAL PRODUCTION INCONSUW TION
(In %)
1966 1967 12°68 1969 1970 1971
Nitrogen 9.0 8.o 6.4 3.9 7.4 21.1
p205 72.0 53.0 45.0 48.o 40.0 53.0
Potassium - - - - - -
Total 32.0 26.0 22.0 21.0 19.0 27.0
218. Facing prospects of rapid increase in fertilizer use in the yearsahead, plans have been made by several local producers to increase domesticproduction. According to data available for a number of projects already
1/ See Annex Table 2.

- lJl-
under implementation, fertilizer production would increase as follows:
Table 27: ESTIMATED FUTURE PRODUCTION OF FERTILIZER&
(Thousand tons of nutrients)
1971 "I972 93977 1974 -1975 - 1976(Actual)
Nitrogenous 69.2 136.4 189.9 224.6 290.6 555.0
Phosphatic 242.7 259.1 392.8 502.1 607.1 607.1
Total 301.9 395.5 582.7 726.7 897.7 1,162.1
1/ See Annex Table 9 and 10.
219. The bulk of the increase in nitrogen and phosphate fertilizerswould come from 2 NPK projects, both located in Rio Grande do Sul (Fertisuland Adubos Trevo). These projects would originally use phosphoric acidfrom Mexico and ammonia from Venezuela. Later on, phosphoric acid wouldbe bought from a new plant in Santa Catarina to make first sulfuric andthen phosDhoric acid based on local pyrites (which thireatens to be uneconam-ical). Ammonia would be eventually purchased from a 1,000 tons/day plannedfor camacari (see below).
220. Other increases in production will result from the coming onstream of a new DAP plant and from two new MAP! plants all located in SaoPaulo state. BY 1976. other MAP/DAP nlants may-be erected-using7 phosphoric acidavailable at the Araxa mine site.
221. The above mentioned 1,000 TPD ammonia/urea plant, COPETRAN (acon9ortium formed by Paskin. FerUisul- Quimbrasil and Petrn4uisaa) mav comeinto production by 1976. The plant would use natural gas as raw material.This plant should be a source of low cost nitroeenous fertilizers.l/However, the availability of natural gas may create a problem in developingnatural gas-based nlants in the Northeaast. Rernervec of natural oas are nresentlvlimited (87 billion cubic meters) and most of the gas now available is gasassociated with oil produetionn also a lnrge pAtrochamtIal etmpole iA fqbeing erected near Bahia which may require extensive use of natural gas.Thus the questlon can he raised as to what woiuld be the moct netnneitcal usA
1/ Low cost ammonia could nArt.lv comAensate for relativelv high cost of phosphatethus making local MAP (40 percent P and 60 percent N) competitive with imports

- 112 -
of limited gas reserves; for fertilizer or for petrochemical industry.Another factor to consider is the relative cost of producing nitrogen frumlocal naphtha (which is expensive) in the absence of enough natural gasresources. It may prove more economical tw import liquified natural gas(LNG) at low cost to be used as a raw material for fertilizer productioninstead of naphtha. Finally should ammonia availability remain limited ortoo expensive in future years, consideration may be given to substantialimports of ammonia.|-/
222. Pture consumption of fertilizers in Brazil has been forecastas follows: 2
Table 28: FERTILIZER CONSUNPTION, 1972-76
(In thousand tons of nutrients)
Average Annual Average Annual1972 1973 1974 1975 1976 Growth Rate Growth Rate
(1976-72) (1971-67)
N U16 511 614 729 854 19.7 33.5
P205 550 651 762 883 1DO55 16.5 22.2
K20 465 570 686 815 954 19.7 28.0K2 _ __ --
Total 1,431 1,732 2,062 2,427 2,823 18.5 26.5
223. On the basis of the above forecast, the share of domesticproduction in consumption would evolve as follows:
Table 29: PERCENTAGE OF DOMESTIC PRODUCTION IN TOTAL CONSUWTION
1972 1973 1974--- 1975 1976
N 33 37 37 40 65
P 47 60 66 69 63
K2 0 -
Total 28 34 35 37 42
1/ The future Fertisul NPK plant will initially use imported ammonia startingin 1973.
2/ Source: Ultrafertil, S.A.

224. Domestic production of nitrogen based on naphtha, refinery gasand natural gas should amount to about 00,000 tons by 1976 out of a totalproduction of nitrogen fertilizer of 550,000 tons. Thus, production of Nfrom domestic raw materials as a percentage of total consumption woulddecrease from 100 percent in 1972 to 47 percent in 1976. As for-phosphaticferti,1izer;. nroduetion of P205 based on local rock nhosnhate would increasefrcm 10 percent of domestic consumption in 1972 (56,000 tons) to about 25nPrT.n+. in 197A (2q6A000 t±.nq inlnuiing 2C00-OnO tnns for the new Araxa mine!.
225. The above table cl pnrly Qhnwq that domestic productJon willincrease only slowly as a percentage of total fertilizer consumption.It consequently sem.s necessary to plnn ahead for fu-rther develoPmmPent ofBrazilian production capacity.
226. In planning ahead, a number of problems will have to be con-sldered. -- Ii-; -4 poli cis-- 4 read- fr z r i a+ state ' fI iv-
C3L* ±flOlL.U.ai j. .J.L Jt.O A UB6
,A %4.U AA6
.LO~ AVJ.J A` -A LA- 14- - _
In the past, import substitution policy succeeded in building a number ofDU.t.L,..11J .L4.¼-,.L4f_4 t.._4 VO .,atau ^^. o.AIfj~J _ tfl .&ih *J. ti tSfl.J Icha.flS o h4A 0 . ,;sma" XX X 1 -9 i' + *4 --4 + - Ca - . ^i - U @ -4 - ^ -4 +w 1h A - -- - ^I r kpn A 'v- 6Mwall of protection. Now, ambitious agricultural development plans call for.fCL-Iers.L toW beU prLYJ%V-dA i uh fertiU.lizers, at theA& WM0 l30es p lv bl cos4 h
the domestic industry mainly will have to be made to rely on its naturalgeographaiic advar.tage r-athe, toh C,Ian upo t& L U-LL. protection ._/II - AO noW clea CV
Government position regarding this dilemma has yet been defined, potentialALivestors may be reluctant to go aheadU.
227. In this context, the follawing points should be st-udied verycarefully:
(i) justification of existing price differentials betweenregions resulting from the pre3ent import quuta system;
(ii). validity of the comparison between spot CIF and localproduction costs, or need to adopt a long-term indica-tive price of imported fertilizers for comparison withdomestic prices (see Annex Table 11);
(iii) measures to improve efficiency in existing ammoniaproducing plants;
(iv) thorough analysis of the raw materials problem for nitrogenfertilizers. In particular, determine the amount of naturalgas reserves available at economic conditions for the pro-duction of ammoni 2 and analyze the economics of ammoniaproduction based either on refinery gas or naphtha near tne
l/ Ocean freight cost from Europe or the United States varies from US$6 to US$1O/ton.
2/ Such reserves are said to be limited and conflicts may arise between petro-chemical and fertilizer producers for its use.

- I1), -
main consumer market, or based on natural gas in theNort-h. Ane+.hr nlt l,wnn+e +.n ,'ne-v_rigcA Am i be th' nimport of ammonia and/or the imnport of natural gas (LNG);
(v) study possible sources of financing for additional
*- - -- u .g r.. -- - k
phosphate at Araxa taking into account its distance framthe market, t-he a,.1waA + a,chyricn1 qilstions an7 hfact that phosphate and phosphoric acid may be available atlow prices in he world market;
(,ri 4 \ s-4'I4+,r e%-P producir ,, 4ir. 4t1h Cgip4e- . 4a
a reasonable cost.
228. Brazilian consumption of fertilizers is foreseen to icmrease-a4,4' Jr ir: -e -seventies. Tvner- as .-,tdav ra; ma-te.Ii-a'Ssna.-
production problems remain quite serious and a number of technical andeo.4c que stions am st4i-l. L"I.sOWlv=%d J"eO UV the- heLav;l' i.uvrZo-uewLIU
inrvolved, the number of possible alternatives to meet future demand andALh LJ JV4A A V I-L...Lj. I eedI to pr I L a AULL-.ILUUIU cWU .oflaosu aI aUUMrUU7E
fertilizer policy should be developed as soon as possible in order to reducehe'k ga UWt4een -'Jpl-' .J -4 rA . m..ost econcall.

A14NEX IV- 115 - -'^Table i
APPARE-NI CONSuWP1YOUN OF FETELLhZERk, 1950-72
Nitrooen Phosphate Potash Tntal %
N P205 K20 Increase
---------- Thousand tons ----------------
1950 13.6 38.7 22.1 74.41951 17.9 5 9.2 27. 104.5 1952 10.3 38.5 14.5 63.3 -39.519Q532 91 n)I 30 .7 18R 9 70 .
1954 18.7 67.1 27.9 113.7 5.11 CC ~ 91 7. 1 I A -I LA A 0 C
1956 27.1 94.1 41.6 162.9 11.119057 26.R A 60,2 1
S.j G. -~L.. 1 4.
1958 hS.3 137.8 65.1 248.2 22.8iot Anf A f O R7 1. N.
1960 89.6 126.9 106.2 322.7 34 4ioA4i 'fi II 7rn '7 n.H. £ ', --/W9L 1,1 ff.5 118.LU . Ir C744.6 LLJ.L
1962 50.3 119.8 68.2 238.2 -2.61963 62.-1 15.4 a183722.
1964 50.8 135.1 69.6 255.4 -16.915.6 120.1 99y.7 20.4i7
1966 71.1 116.6 93.3 281.1 -3.2197U I 10Lu3).4 0u-4.U 15.9. 44f7.9 59.31968 144.3 273.1 184.3 601.7 34.3
6164.4 265.7 200.3 60.4 4.01970 275.9 415.9 306.7 998.6 58.41971 328.0 455.O 367.0 1,150.0 15.21972 416.o 55o.o 465.o 1,431.0 24.(forecast)
Sources: IBGE and Sindicato da Industria de Adubos e Colas do Estado deSao Paulo. For 1971 and 1972, data has been provided byUltrafertil, S.A.

- 116 - ANNEX IV
Table 2
CONSUMPTION OF FERTILIZERS BY TYPE AND SOURCE, 1966-71
1966 1967 1968 1969 1970 197 1
-__________________------ tons-- -----------------
NitrogenNational Production 6,400 7,885 9,292 6,460 20,361 69,168Importation 64,734 95,497 135,028 1572970 255,575 258,832
Total 71,134 103,382 1W4,320 164,430 Ž(5,936 328,000% National 9% 8% 6.4% 3.9% 7.4% 21.1%
P2 05 Soluble
National Production 64,089 92,283 109,397 118,350 160,404 231,507Tmnprt.ati;on 27- Ut 731671 10);i-7q 118-29< 21)i-89Q n a.
Total 1Ag q16j9 211,,072 9736,645 375,302 n.a
% National 69% 56% 51% 50% 43%
P205 Tricalcium
National Production 20,000 16,669 13,086 9,448 8,994 11,209Importation 5,059 21,983 45,936 19,574 31,642 n.a.
Total 25,o59 38,652 59,022 29,022 40,636 n.a.% National 79% 43% 22.5% 33% 28%
Total P205National Production 84,o89 108,952 122,483 127,798 169,398 242,716Importation 322559 95,654 150,611 137,869 246,540 212,284
Total 116,648 204,606 273,094 265,667 415,938 455,000% National 72% 53% 45% 48% 50% 53%
PotassiumNational Production - - - - -
Importation 93,337 136,937 184,295 200,290 306,692 367,000
Total 93,337 136,937 184,295 200,290 306,692 367,000
Total NPKNational Production 90,489 116,837 131,775 134,258 189,759 311,884Importation 190,630 328,088 469,934 496,129 808.807 838.116
Total 281,119 444,925 605,709 630,387 998,566 1,150,o00% National 32% 26% 22% 21% 19% 27%
Source: Sindicato da Industria de Adubos e Colas do Estado de Sao Paulo. For 1971,data on consumption are based on Ultrafertil, S.A. information.

-117- ANNEX IV
Table 3
APPARENT CONSUMPTION OF FERTILIZERS BY REGION
(Thousand tons of nutrients)
1961 1962 1963 1964 1965 1966 1967 1968 1969 1970
Nitrogen
North]/ 3.0 4.2 5.9 5.2 3.8 7.6 10.7 12.4 16.5 28.1SouthJ. I-93g . A '7 '7 6 6.3 7. '.7 2. 27r. r-'
Center2/ 47.4 40.7 51.6 39.6 60.5 56.3 82.5 110.9 180.8 202.4
Sub-Total 56.8 50.9 65.2 50.8 70.6 71.2 106.4 144.3 164.5 276.0
P205
North 11.1 11.2 10.3 10.9 9.7 11.3 12.8 13.7 17.4 31.6South 23.1 19.6 35.9 28.1 25.4 19.2 54.6 69.0 80.8 144.1Center 84.2 86.7 110.6 96.0 25.0 86.1 137.2 190.3 167.4 240.2
Sub-Total 118.4 117.5 156.8 135.0 60.1 116.6 204.6 273.0 265.6 415.9
Potassic
North 5.5 5.9 8.3 6.5 7.6 9.2 17.0 12.3 18.6 29.4South 9.6 8.5 12.3 8.7 11.3 11.1 17.6 33.3 43.1 72.7Center 56.8 54.1 71.4 54.4 80.8 73.0 102.3 138.7 138.5 204.6
Sub-Total 71.9 68.5 92.0 69.6 99.7 93.3 136.9 184.3 200.2 306.7
Total (1+2+3)
North 19.6 21.3 24.5 22.6 21.1 28.1 40.5 38.4 52.5 89.1South 39.1 34.1 55.9 42.8 43.0 37.6 85.4 123.3 151.1 262.3Center 188.4 181.5 233.6 190.0 166.3 215.4 322.0 439.9 426.7 647.2
Sub-Total 247.1 236.9 314.0 255.4 230.4 281.1 447.9 601.6 630.3 998.6
Consumption concentrated in Recife region and covering all states served by maritimeports from Belem to Vitoria. Includes the state of Amazon and states bordering thesea, up to Piaui, and in the Northeast Zone. the state of Ceara and other seabordering states up to Espirito Santo, included.
2/ Concentrated in Rio Grande and Porto Alegre, covers all the state of Rio Grande doSul, going further in areas near Santa Catarina.
3/ Located in Sao Paulo and covering all states served by maritime ports from Rio deJaneiro up to Santa Catarina. The states of Minas Gerais, Goias and Mato Grossoare also included in this region.
Source: Sindicato da Industria de Adubos. San Paiu1o.

-118 - &Dll'UINA IVTable 4
PRODUCTION OF FERTILIZERS BY TYPEI, 1966-71
(In tons of nutrient)
16OA 1967 16AR 19A 1070 1071
Nitrogenous
Ammoniuam Sulphate (20.5%' N) 2,542 2,558 2,131 1,520 1,397 1,73671 . L 4 j"- 7C~ ,NT rf 'or, A r77 -I iAi I. o).rn rc -) i.) A 1.1.7
.,aLc J arWC IUILUIMIi-WI 1NiLuVdU \ a ef 1(27% I 5,200 6,977 , I61 4,9i7LW ), JL3. _L'6,L44 I
Amnmoniujn Nitrate (33.5% N) 4,723 29,514-T e I T-d ,i\COUra 45),dJ+) zzz7
Sub-Total 7,742 9,535 9,292 I.Ar0 _LA LRA u, A
Phosprhatic
Single Superphosphate (20% P2 05) 63,297 90,626 91,555 97,374 117,332 134,843Concentrated Superhposphate
(30% P205) 793 - 14,700 15,00 15,600 2I4,747Superphosphate (46% P205) - - 12,228Dicalcium Pnosphate (30% P 2 0s) 793 n.a. 793 793 771 (04
Thermophosphate (18% P20) - 501 2,541 5,377 3,960 6,587Ground Phosphate rock ko/30 1_ 9
P205- Tricalciumr phosphate) 19,333 16 12,650 ,133 8 11,209
Sub-Total 84,216 107,240 122,239 127,677 1)46,657 190,398
Complex Fertilizers
Di -Ammonium Phosphate(]8-46-o) N - - - - 8,-- -20,472(DAP) P205 _ - _- _ 22,740 52,318
Sub-Total - - 31,639 72,790
Total (1+2+3) 91,958 116,775 131,531 134,137 189,758 311,884
Source: Sindicato da Industria de Adubo e Colas do Estado de Sao Paulo.Differences with global production figures given in Table 2 are due to slightvariations in conversion coefficients from tons of products to tons ofnutrient.

AlNEX I V- 119 - Table 5
IMPORTS OF FERTILIZERS, BY TYPE, 1966-70
(In tons of products)
1966 1968 1970
Nitrogenous Fertilizers
Sodium Saltpetre 28,083 17,710 2,021IPotassi-LUM.lW 0:.t'tL--e. L V870 971 7,662)I UrAmmonium Sulphonitrate 9,762 13,308 10,43511 - .1 - 1%~~~~~~~~ 'I 0 '~ e 71-i, 0 0 r'0 Lrn', ^~JtlUIILU LLUJTI 0)1±I1dbRA I -')OU., VU L4.iLU,O,.U UYI,C644
Calcium Ammonium Nitrate 234Ua.L LwfI NiUrdUe 3'9u 436u 4L4Urea 105 48,765 132,281Ammonium Anhydrid - , 250lCalcium Cyanamide 13,499 200 225Sodium NiTrate - __49_4 -
Sub-Total 308,629 509,720 875,843
Pnosphatic Fertilizers
Single Superphosphate 6,462 14,730 25,307Triple Superphosphate 52,338 101,490 198,049Ground Phosphate - 3,810 93,065Phosphate Rock 112,199 325,998 428,158Dicalcium Phosphate 1,440 6,021 5,259Thomas Slag 6,153 12,189 7,998Thermophosphate 2,017 100 -
Sub-Total 180,794 573,596 1,oo6,342
Potassic Fertilizers
Potassium Chloride 144,091 296,435 491,699Potassium Nitrate 100 - 2,631Potassium Sulphate 8,370 10,173 16,280Magnesium Potassium 130 790 625Sulphate Compounds 199 1.274 6.162
Sub-Total 152,890 308,672 517,397
Total (1+2+3) 642,313 1,391,988 2,399,582
Source: Sindicato de Industria de AduboB e Colas do Estado de Sao Paulo.

- 120 - ANNEX IVTable 6
APPARENT CONSIurPLrrION OF F-ERTIU ZERS 1970
(tons of nutrients)
ProductionImports Production Consumption Consumption
1. NitrogenousArmmonium Sulphate 142,931 1,397 144,328 1.0Urea 59,526 - 59,526Di-Ammonium Phosphate 44,726 89899 53,625 16.6Ammonium Nitrate - 4,723 4,j723 100.0Calcium Ammonium Nitrate 8,392 - 8,392 -
Sub-Total 255,575 20,361 275,936 7.4
2. PhosphaticSingle Superphosphate 5,061 117,332 122,393 95.9Triple Superphosphate (42% P205) 91,102 - 919102 -Superphosphate (concentrated 30%P205) - 15,600 15,600 100.0
Diammonium Phosphate (DAP) 114,221 22,740 136,961 16.6Ground Phosphate Rock 31,642 8,994 140,636 22.1Dicalcium Phosphate 2,104 771 2,875 26.8Others 2,411 3,960 6,071 65.2
Sub-Total 246,541 169,397 415,938 40.7
3. PotassicPotassium Chloride 295.019 - 295.01-Others 11.673 _ 11.673
Sub-Total 306,692 - 306,692 -
5. Total (1+2+3) 808.238 189.758 998.566 19.0
Source: IBGE.

- 1 - ANNFhYX TV
Table 7
PRODUCTION OF PHOSPHATIC FERTILIZERS BY COMPANIES
(Thousand tons)
1964 1965 1966 1967 1968 1969 1970 1971
1. Single Superpnospphates(18% P205)
ICISA (RS) 15.8 15.2 14.0 20.6 20.9 30.9 30.0 35.0CRA (RS) 10.0 7.5 11.4 20.8 30.7 35.0 31.0 35.0COPEBRAS (SF) - - 30.0 80.0 45.o 65.0 59.8 82.5FOSFANIL (SP) 69.2 55.0 48.o 65.o 81.9 77.9 82.5 103.2FEPTICAP (SF) 11.0 23.2 20.0 20.9 27.1 28.6 28.0 25 4QUIMBRASIL (SP) 199.6 169.3 141.o 190.0 188.6 166.2 187.1 195.01/INDAG (SP) - - - - - 12.6 50.0 81.0ELEKEIROZ (SP) 31.0 22.0 30.0 36.8 46.1 53.8 58.0 72.8POLICARBONO (MG) - - 1.6 5.8 3.4 1.7 8.0 n.a.PROFERTIL (PE) 13.5 12.3 15.o 13.o 13*9 1•52 22.0 110.0
Sub-Total 349.9 304.5 211.0 452.9 457.6 486.9 556.4 739.9
2. Concentrated SuperphosDhate(30% 2o5)COPEBRAS (SP) - - - - 419.0 30.0 52.0 77.3
3. Bicalcium PhosDhateIGARASSU (PE) - - - - 2.0 2.0 2.0 2.0
4. Therniosphate (18T)BRAGANTINA (SP) - - - - - 8.1 9,0 n.a.MITSUI (MG) - - - - 7.3 20.0 22.0 34.6FERTIMETAL (MG) _ - ~ 1.8 1A 1,5 n,a.
Sub-Total - - - - 9.1 P99 32. 36.6
5. Grorund PhnsnhatA Rntk (29Q)FOSFORITA (PE) 67.3 44.2 36.7 33.8 - _ _ _CAMIG (MG) 23.0 19.5 15.7 I5¢1 2J, 7 1 5 25.0 n.a.
FOSFERSA (PE) - - - - 3.4 2.3 3.0 n.a.SOCAL (SP) 6..9 9 1 11 t 6 7 1 9 7 20 n na-
SUib-Trtfl 102 2 72".8 66.7 55.6 ).t '1.5 148.0 n a.
6- Tnt.l r1+9-A+, +) 152.1 377.3 377.7 508.5 561.3 600,3 690.9 8914.5
7 - Pons Em,im,18D+. 1 _ .4- , ____-,__--------- .LU (. ,d. .U _ i .I2.L.5 12(.0 14(.' .L LO.
I<Tnhichuding'eade 22.7 tn o S ath 45%d P20oTn lhineh mu 0 be added 22.7 tSousand ton of DAP (P2 05) oonstant in 1970 and 52.3 in 1971.
Source: Ministry of Finance and ANDA.

- 122 - AlNNX IVTable 8
PRODUCTION OF NITROGEN FERTILIZERS BY COMPANIES
(Tons)
1966 1967 1968 1969 1970 1971
1. Anmmonium Sulphate (20.1% N)Steel Mills i/ 2,,542 2,558 2,131 1,520 1,397 1,736
2. Calcium Ammonium Nitrate (27% N)Petrobras (Cubatao) (SF) 5,2oo 6,977 7,161 4,940 5,242 16,447
3. Ammonium Nitrate (33.5 N)Ultrafertil (CubataoTTsp) - - - 4,723 29,514
4. Di-Ammonium Phosphate (18%).Ultrafertil (Cubatao) (SP) - - - - 8,899 20,472
5. UreaPetroquisa-COPEB (Salvador) --- 999
6. Total (1+2+3+h+5) 7,742 9,535 9,292 6,1460 20.,541 69,168
j Volta Redonda (RJ), Piacaguera (SP), Ipatinga (MG).
Source: Sindicato da Industria de Adubo e Colas de Sao Paulo.

- 123 - ANNEX IVTable 9
ESTIM™ATED FUTLTRE PRODUCTION 'OF NITRGTN FERTILIZERS BY COMPANIES
(In tons of N)
1972 1973 1974 1975
1. Ammonium Nitrate (33.5%)iuitrafertil vSP) ', 6A,32h 65,ThA 69,200 69>20o
2. D -A ̂unorwi Pho zWa b (DAP) (1% I688 2st 889 2,2Fertisul (FGS) - 25,000 30,000 309000Adubos Trevo ( ) 2,' = 2)E¶ 9C, 0I
Copebras (SP) - 35,000
3. Mono-Ammonium Phosphate (11%)j-~~- -. '- -. , C, ivn'~A'uimbrasil kGubatao- Q) - - = nn0
Quimbrasil (Jacupiranga-SP) _ 1h,000 14,000 lh,000
4. Urea (h4%)Petroquisa (Bania) 27,000 33,h-3 33,hO4 33,h00
5. AmiumSulhat (20%)Fibisa (Bah{ia 1,000 11,000 1,000 1,00Paskin "Bahiaa 3,e0l 5--- 5so 5'.
0. Sub-Total (1+2+3+4+5) ii8,2i2 i7i692 206.4 29
7. Others i/1 8,183 18,183 18,183 18,183
8. TOTAL (6+7) i36,325 189,875 224.6i2 220o`1-
9. Percentage of Estimated Consumption 33 37 37 4 )/
j/ Company forecast for ammonium nitrate prills. Does not include ammonium nitratein solution for 6,450 tons of N. However, since plant has been experiencingdifficulties in operating at capacity, it may be assumed that above figure isreasonable even including sales of ammonium nitrate in solution.
g/ Including N-content in NPK formulations.3/ Includes 1971 production level of Ammonium Sulphate (steel mills by-product) and
Calcium Ammonium Nitrate (Petrobras Plant in Cubatao)._W This total does not include a possible MAP project by Profertil in the Northeast
(15,000 tons) nor an Ammonium/Urea project near Salvador (Petroquisa/Petrobras)for 264,ooo tons of N. These projects would be ready by the end of 1975 only,
2/ Percentage on consumption in 1976 would be 67 with the two Northeast Plants (seenote 4).
Source: Ultrafertil, Quimbrasil, Petroquisa, Ministry of Finance, ANDA,

- L1L4 -
Table 10
1"cM -r&IrA M"r 1,yTMTl-T, 'n"^IrVriTMr~mr%rT ^ I nT~T^nT MMrr Y.T 'rnM-rT 'r7T'T" ZOI.uuiED ri uTi' rOLUCTJUIO.LI4 OR ProrlIftr ± rrT.LI
( ons)
1972 1973 197L 1975
1. Fertisul - TSP, DAP, NPK - 70,000 81,000 81,0002. Ariihhnq Trevn - Single SSipnrhosphates,
TSP, DAP, NPK - - 85,000 100,0003= -TtrI f4rtAI - nAP 6P 7o0 70-)'4n 73,700 73,7004. Quimbrasil Cubatao) - TSP, MAP _ 62,000 62,000 62,0005- Qimbrasil (Jacupiranga) - SSP- M4AP
DAP - - - 100.000
6. Sub-Total (1+2+3+4+5) 68,700 202,h00 301,700 416,700
7. Others 2/ 190,400 120h200 120,OO 190e 400
8. Total (6+7) / 5100 3912800 022100 607,100
2/ Includes other producers taken at their 1971 level of production.2 Does not include a possible MAP project in the Northeast to eventually
produce 25,000 tons of P205, which has been assumed to come into productionafter 1975 only.
>/ Sulfuric acid and Phosphatic acid will also be produced by Serrana Quimbrasilonce the ARAXA phosphate mine comes into production by 1976. Phosphatic acidproduction would be up to 200,000 tons P205 and used as an input in MAP/DAPplants. Another project in Santa Catarina (Paskin group) will also produceby 1975 sulfuric acid based on pyrites and phosphatic acid for sale tofertilizer producers.
Source: See Table 9.

- 1$7 - ANNEX IVTable 11
PF.RTTT.TZERqS nTI PRTlES AND PROnDTfTTON GOST
(TVqV.tn )
Present CIF Long-Term CIF LocalPric-e Eqniilibriiim Price Production
(Snntos) (Santos) Cost
Ammonia 41/45 44/45-V 39/h43
Rock Phosphate 16 13 1 A
1/ Assuming US$36 FOB North Africa plus US$9 frieght = US$45/ton orTTC2dt I . V'tID TT.... 4-.-3 c!4.-4.--... -.1.. _ rTOt 4-- 1U.-= TTCd!).1,/. Li-VUS$31)L FOBJ rUnitLd SJUtUtes p.lus U6J%P-0 fI-reight = 'J4W Wuon.
2/ For an Ammonia gas based plant of 1,000 tons per day. Includescostlu anCI 101 percentu ret-uMi on tuotalL investi-Mnt. Hof-wvron
should add transportation cost to main market in the South whenp.Lant is ±l oca± te in the1 J 1'4u-. U1alds t.L Suc JCLL ost U niow UC'u'.p/ UoXI
for ammonia transformed into Urea.2 if Araxa rine - U5%.P/uoni prod-uc ion cost u anu U532/1 Un return on
total investment. However, one whould add transport cost of_~~~~~~~~~ I L 1 _ _ __ - _ - I I1 e -1 I I phosphoric acid to b e maude at tne mine and then shipped to
Sao Paulo area. Much transport cost is estimated at US$8/ton.
Related Documents