Figure 1. Share of Developing Country Nationals by Department Type and Grade Grouping 1/ 0 10 20 30 40 50 60 70 80 90 100 Area Departments Functional Departments Support Departments Percent A1-A8 A9-A15 B1-B5 1/ Total in each grade group is all developing country and industrial country staff.

Welcome message from author
This document is posted to help you gain knowledge. Please leave a comment to let me know what you think about it! Share it to your friends and learn new things together.
Transcript
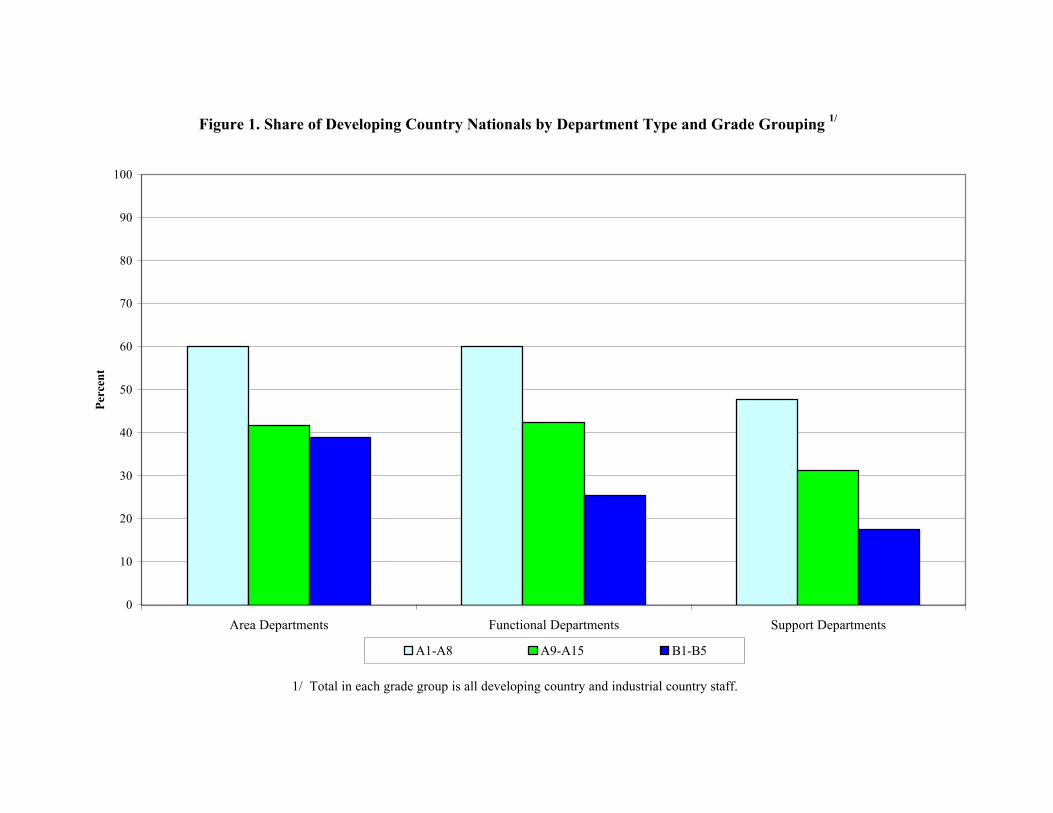
Figure 1. Share of Developing Country Nationals by Department Type and Grade Grouping 1/
0
10
20
30
40
50
60
70
80
90
100
Area Departments Functional Departments Support Departments
Per
cent
A1-A8 A9-A15 B1-B5
1/ Total in each grade group is all developing country and industrial country staff.

Figure 2a. Share of A9-A15 Developing Country Nationals by Department
0
10
20
30
40
50
60
70
80
90
100
WHD MED APD AFR EU2 EU1 INS STA ICM PDR MAE TRE LEG RES FAD HRD SEC TGS OMD EXR
Per
cent
Area Departments Functional Departments Support Departments
Fund Average(40.0)

Figure 2b. Share of B1-B5 Developing Country Nationals by Department
0
10
20
30
40
50
60
70
80
90
100
WHD MED AFR APD EU1 EU2 INS FAD MAE STA RES LEG PDR ICM TRE SEC EXR HRD TGS OMD
Per
cent
Area Departments Functional Departments Support Departments
Fund Average(26.8)

0
10
20
30
40
50
60
70
80
90
100
All A1-A8 A9-A15 B1-B5 All A1-A8 A9-A15 B1-B5 All A1-A8 A9-A15 B1-B5 All A1-A8 A9-A15 B1-B5
Per
cent
English Speaking Industrial Countries All Other English Speaking Countries Other Countries
Area Functional Support Total Fund
1/ 100% is all staff in the respective grade group.
Figure 3. Staff by Language and Developing/Industrial Country, by Department Type and Grade Grouping1/
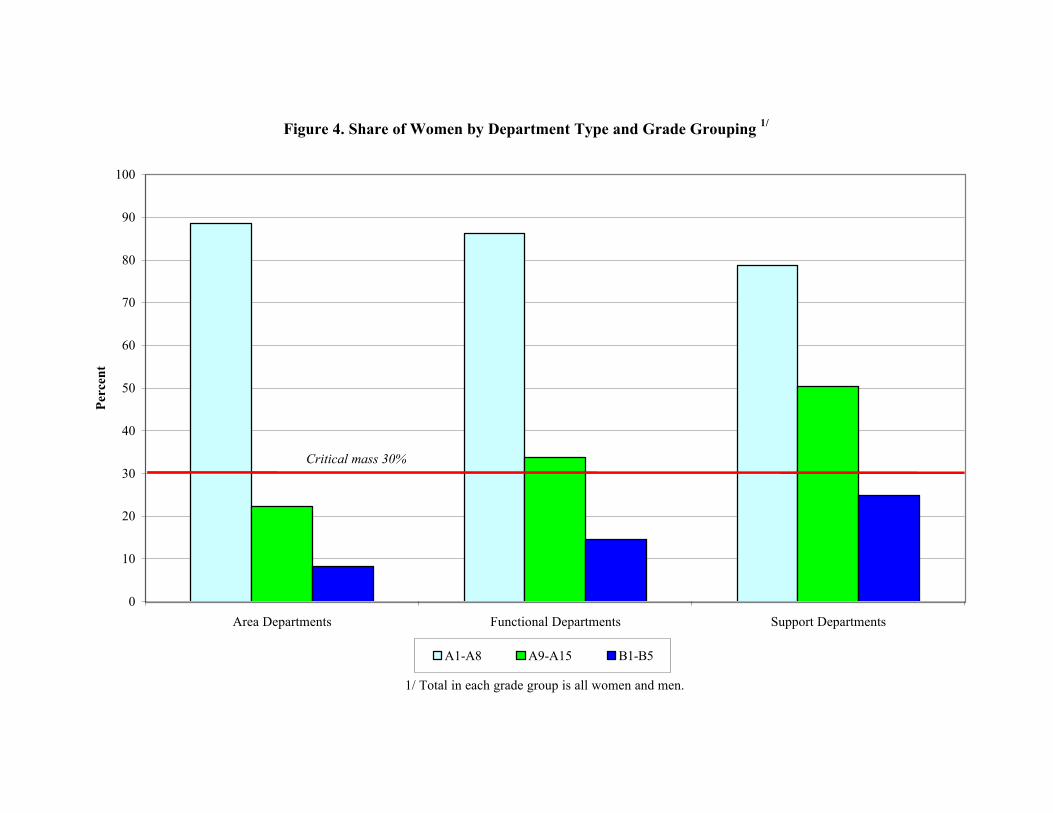
Figure 4. Share of Women by Department Type and Grade Grouping 1/
0
10
20
30
40
50
60
70
80
90
100
Area Departments Functional Departments Support Departments
Per
cent
A1-A8 A9-A15 B1-B5
1/ Total in each grade group is all women and men.
Critical mass 30%

Figure 5a. Share of A9-A15 Women by Department
0
10
20
30
40
50
60
70
80
MED WHD EU2 EU1 APD AFR TRE INS LEG MAE STA FAD ICM PDR RES HRD EXR OMD SEC TGS
Per
cent
Area Departments Functional Departments Support Departments
Critical mass 30%

Figure 5b. Share of B1-B5 Women by Department
0
10
20
30
40
50
60
70
80
APD MED EU1 AFR EU2 WHD PDR STA RES TRE INS LEG FAD MAE ICM HRD TGS SEC EXR OMD
Per
cent
Area Departments Functional Departments Support Departments
Critical mass 30%

Figure 6. Staff by Developing/Industrial Country, Career Stream, and Grade Grouping
0
10
20
30
40
50
60
70
80
90
100
A9-A15 Economists B1-B5 Economists Country Quota A9-A15 Specialized B1-B5 Specialized
Per
cent
Developing Countries Industrial Countries

Figure 7. Share of Developing Country Nationals by Career Stream and Grade Grouping, 1997-2001
0
10
20
30
40
50
60
70
80
90
100
1997 1998 1999 2000 2001
Per
cent
A9-A15 Economists B1-B5 Economists A1-A8 A9-A15 Specialized B1-B5 Specialized
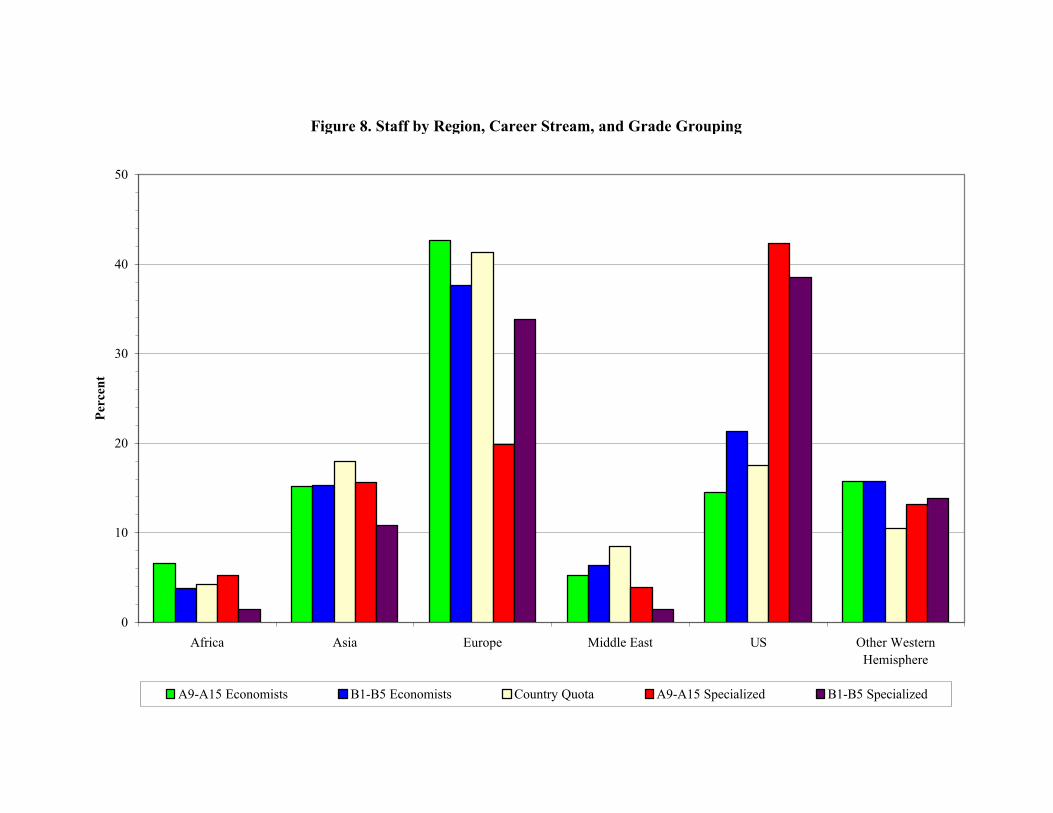
Figure 8. Staff by Region, Career Stream, and Grade Grouping
0
10
20
30
40
50
Africa Asia Europe Middle East US Other WesternHemisphere
Per
cent
A9-A15 Economists B1-B5 Economists Country Quota A9-A15 Specialized B1-B5 Specialized

Figure 9. Staff by Gender, Career Stream, and Grade Grouping
0
10
20
30
40
50
60
70
80
90
100
A9-A15 Economists B1-B5 Economists A1-A8 A9-A15 Specialized B1-B5 Specialized
Per
cent
Women Men
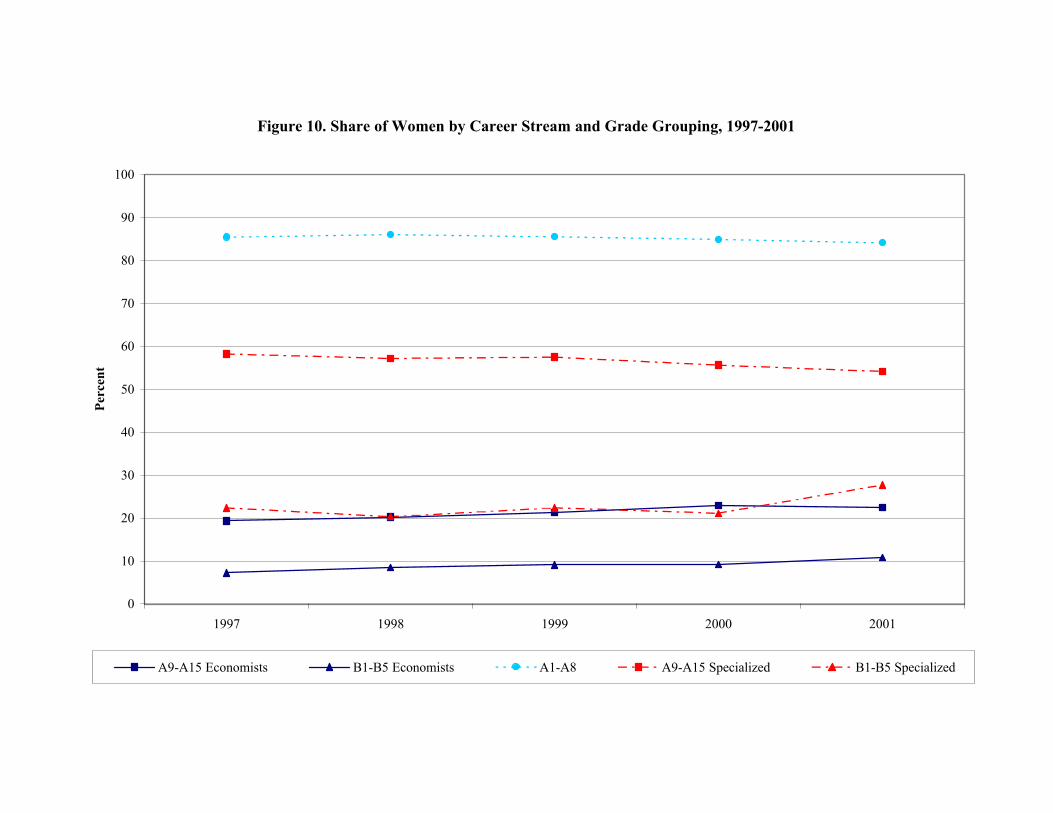
Figure 10. Share of Women by Career Stream and Grade Grouping, 1997-2001
0
10
20
30
40
50
60
70
80
90
100
1997 1998 1999 2000 2001
Per
cent
A9-A15 Economists B1-B5 Economists A1-A8 A9-A15 Specialized B1-B5 Specialized
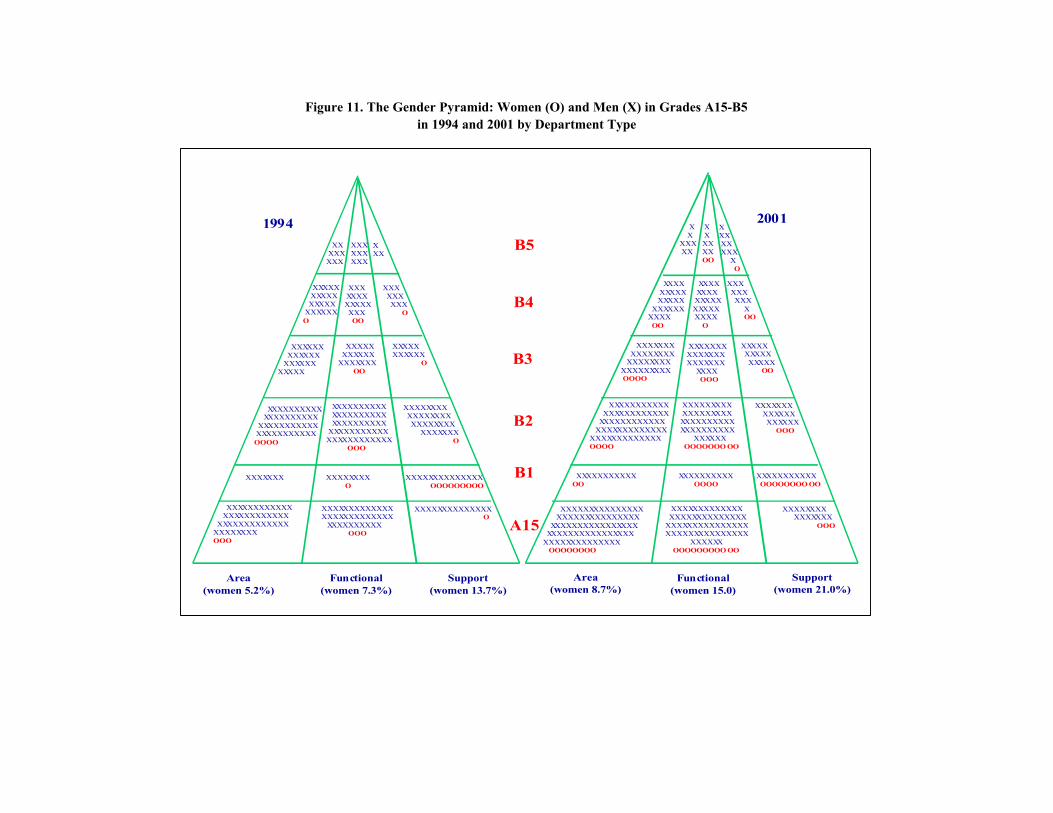
Figure 11. The Gender Pyramid: Women (O) and Men (X) in Grades A15-B5 in 1994 and 2001 by Department Type
B2
B1
2001XX
XXXXX
XXXXXXOO
XXX XXXXX
XO
XXXXXXXXXXXXXX
XXXXXXXXXX OO
XXXXXXXXXXXXXXXXXXXXXX
O
XXXXXXXXX
XOO
XXXXXXXXXXXXXXX
XXXXXXXXXXXXXXXXXOOOO
XXXXXXX XXXXXXXXXXXXXX
XXXX OOO
XXXXXXXXXXXXXXX
OO
XXXXXXXXXXXXXXXXXXXXXXX
XXXXXXXXXXXX XXXXXXXXXXXXX
XXXXXXXXXXXXXOOOO
XXXXXXXXXXXXXXXXXXXXXXXXXXXXXXXXXXXXXX
XXXXXXOOOOOOO OO
XXXXXXXXXXXXXXXXXXX
OOO
XXXXXXXXXXXOO
XXXXXXXXXXOOOO
XXXXXXXXXXXOOOOOOOO OO
Area(women 8.7%)
Functional (women 15.0)
Support (women 21.0%)
1994
XXXXXXXXXXXXXXX
XXXXXXO
XXXXXXXXXXXXXXXOO
XXXXXXXXX
O
XXXXXXXXXXXX
XXXXXXXXXXX
XXXXX XXXXXX
XXXXXXX OO
XXXXXXXXXXX
O
XXXXXXXXXXXXXXXXXXXX
XXXXXXXXXXXXXXXXXXXXXXOOOO
XXXXXXXXXXXXXXXXXXXXXXXXXXXXXX
XXXXXXXXXXXXXXXXXXXXXXX
OOO
XXXXXXXXXXXXXXXXXXXXXXXX
XXXXXXXO
XXXXXXX XXXXXXXXO
XXXXXXXXXXXXXXOOOOOOOOO
Area (women 5.2%)
Functional (women 7.3%)
XX XXXXXX
XXXXXXXXX
XXX
Support (women 13.7%)
B3
B4
B5
A15XXXXXXXXXXXX
XXXXXXXXXXXXXXXXXXXXXXXXX
XXXXXXXXOOO
XXXXXXXXXXXXXXXXXXXXXXXXXX
XXXXXXXXXXOOO
XXXXXXXXXXXXXXO
XXXXXXXXXXXXXXXXXXXXXXXXXXXXXX
XXXXXXXXXXXXXXXXXXXXXXXXXXXXXXXX
XXXXXXXXXXXXXX OOOOOOOO
XXXXXXXXXXXXXXXXXXXXXXXXXXX
XXXXXXXXXXXXXXX XXXXXXXXXXXXXXX
XXXXXX OOOOOOOOO OO
XXXXXXXXXXXXXXX
OOO
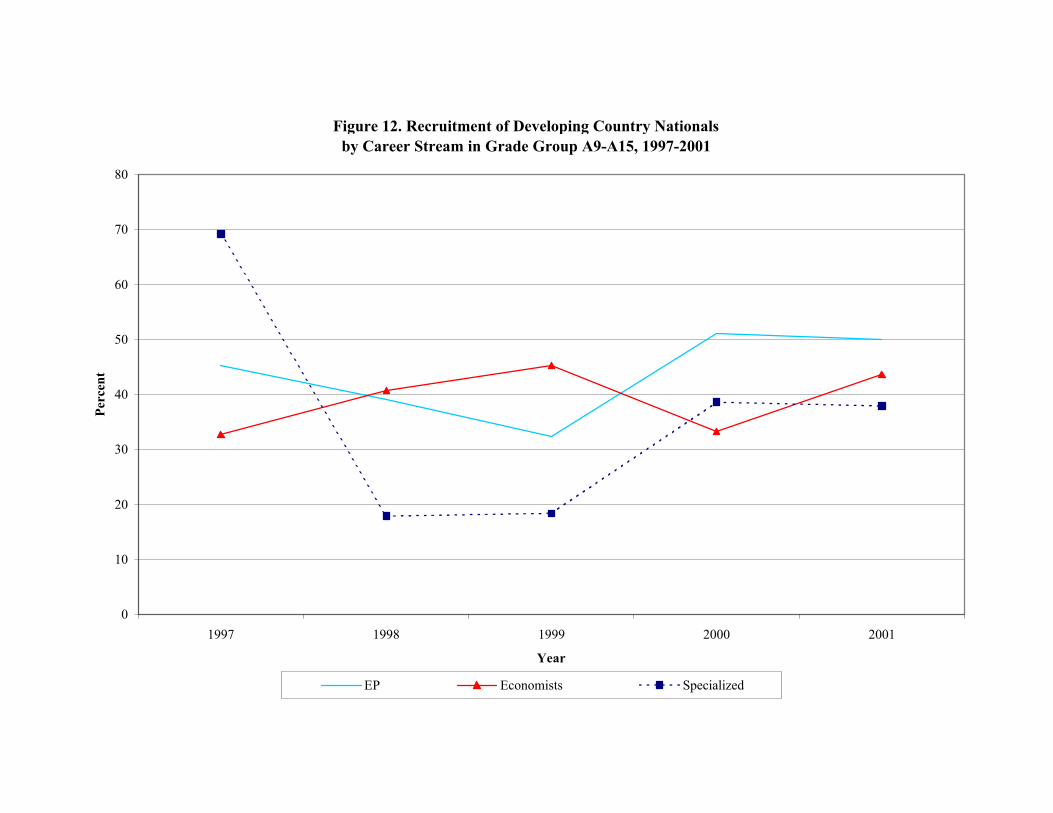
Figure 12. Recruitment of Developing Country Nationals by Career Stream in Grade Group A9-A15, 1997-2001
0
10
20
30
40
50
60
70
80
1997 1998 1999 2000 2001
Year
Per
cent
EP Economists Specialized
0
10
20
30
40
50
60
70
80
1997 1998 1999 2000 2001Year
Per
cent
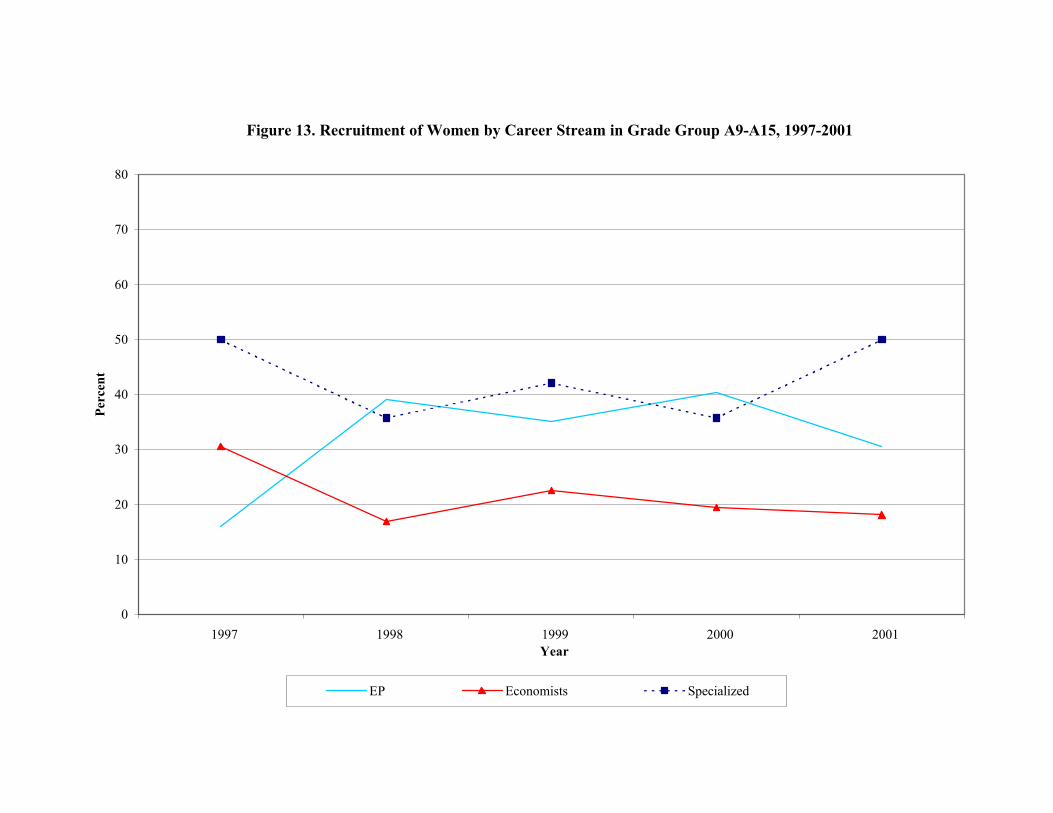
EP Economists Specialized
Figure 13. Recruitment of Women by Career Stream in Grade Group A9-A15, 1997-2001
0
5
10
15
20
25
30
1997 1998 1999 2000 2001
Year
Per
cent
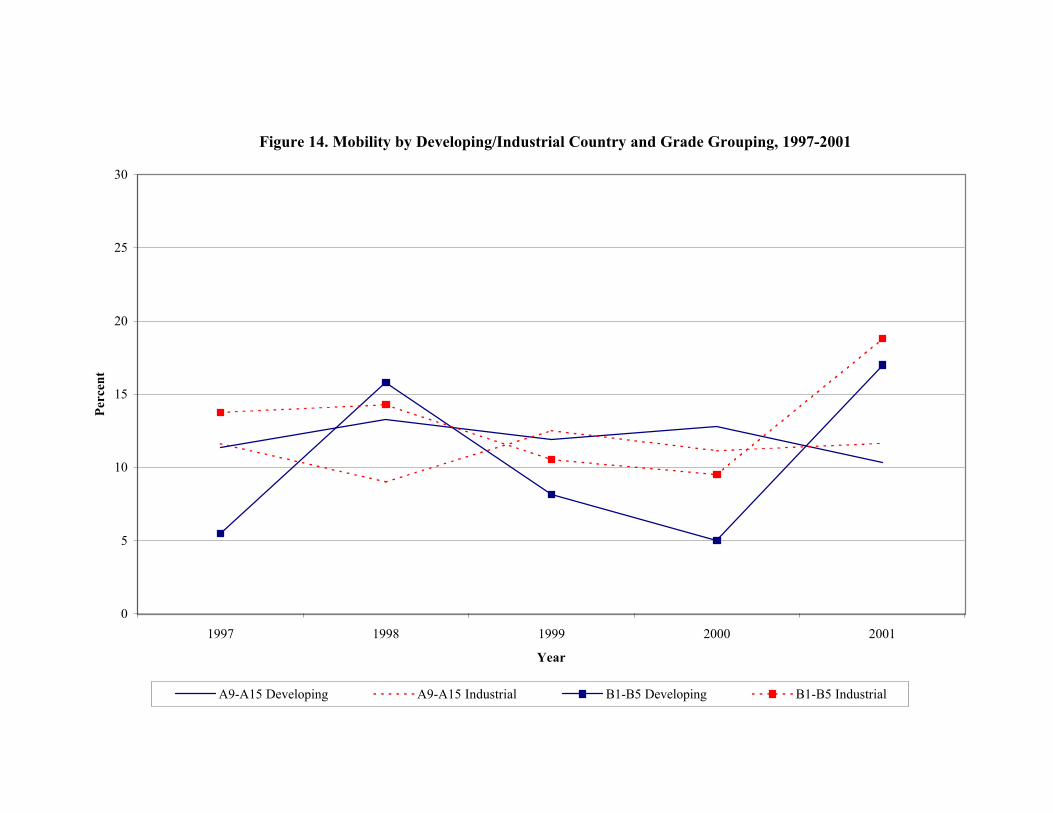
A9-A15 Developing A9-A15 Industrial B1-B5 Developing B1-B5 Industrial
Figure 14. Mobility by Developing/Industrial Country and Grade Grouping, 1997-2001

Figure 15. Mobility by Gender and Grade Grouping, 1997-2001
0
5
10
15
20
25
30
1997 1998 1999 2000 2001
Year
Per
cent
A9-A15 Women A9-A15 Men B1-B5 Women B1-B5 Men
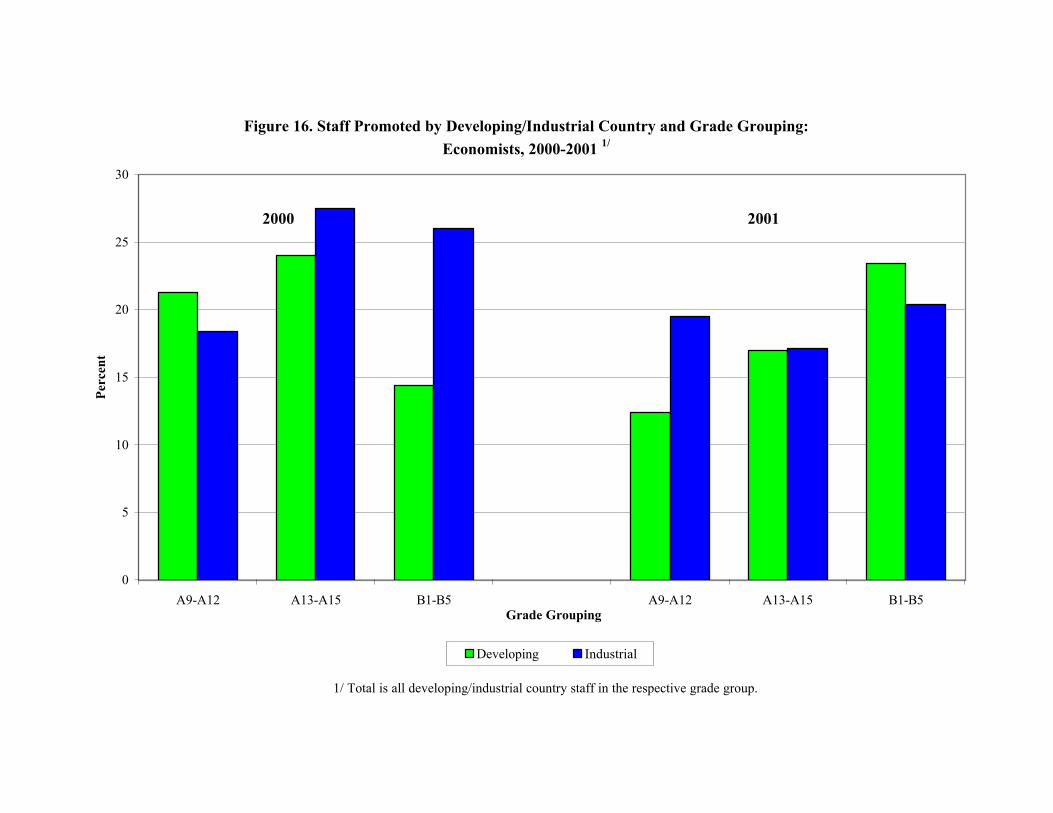
Figure 16. Staff Promoted by Developing/Industrial Country and Grade Grouping:
Economists, 2000-2001 1/
0
5
10
15
20
25
30
A9-A12 A13-A15 B1-B5 A9-A12 A13-A15 B1-B5Grade Grouping
Per
cent
Developing Industrial
2000 2001
1/ Total is all developing/industrial country staff in the respective grade group.

Figure 17. Staff promoted by Developing/Industrial Country and Grade Grouping: Specialized Career Streams, 2000-2001
0
5
10
15
20
25
30
A1-A8 A9-A12 A13-A15 B1-B5 A1-A8 A9-A12 A13-A15 B1-B5
Grade Grouping
Per
cent
Developing Industrial
2000 2001
1/ Total is all developing/industrial country staff in the respective grade group.
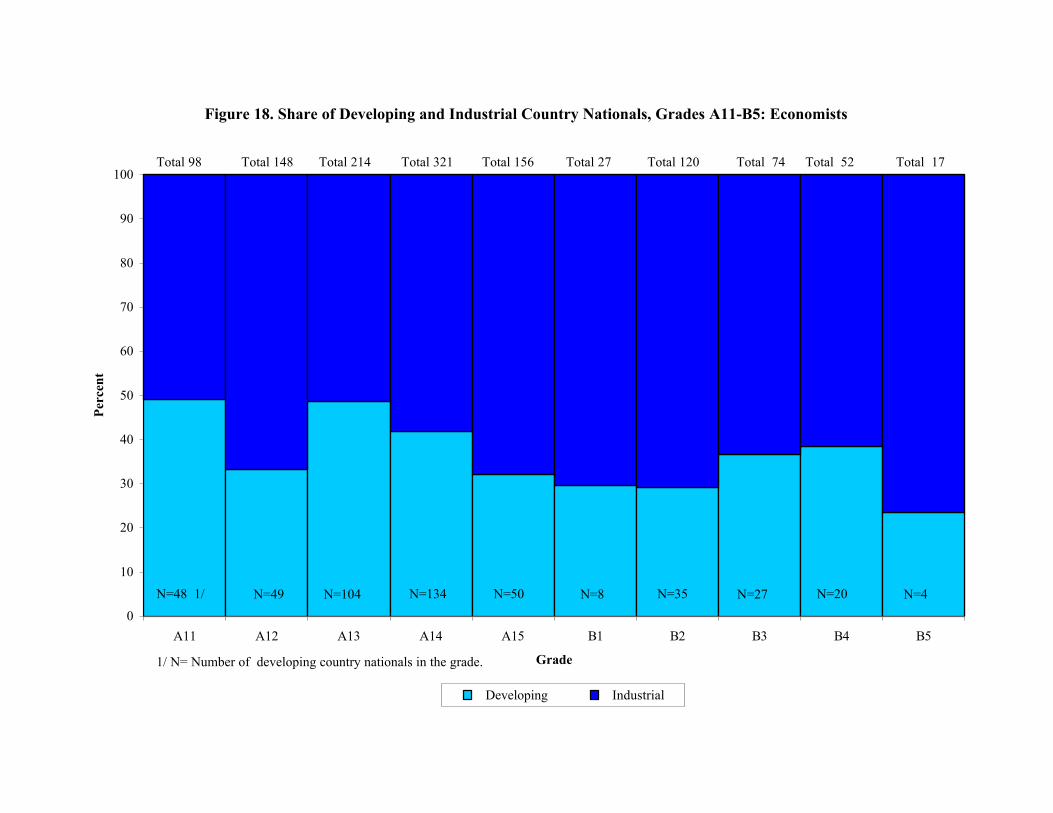
Figure 18. Share of Developing and Industrial Country Nationals, Grades A11-B5: Economists
0
10
20
30
40
50
60
70
80
90
100
A11 A12 A13 A14 A15 B1 B2 B3 B4 B5
Grade
Per
cent
Developing Industrial
N=48 1/ N=49 N=104 N=134 N=50 N=8 N=35 N=27 N=20 N=4
1/ N= Number of developing country nationals in the grade.
Total 98 Total 148 Total 214 Total 321 Total 156 Total 27 Total 120 Total 74 Total 52 Total 17

Figure 19. Share of Developing and Industrial Country Nationals, Grades A11-B5: Specialized Career Streams
0
10
20
30
40
50
60
70
80
90
100
A11 A12 A13 A14 A15 B1 B2 B3 B4 B5
Grade
Per
cent
Developing Industrial
N=44 1/ N=20 N=39 N=21 N=6 N=6 N=5 N=0 N=0 N=1
1/ N= Number of developing country nationals in the grade.
Total 107 Total 78 Total 107 Total 72 Total 19 Total 22 Total 19 Total 7 Total 9 Total 8

Figure 20. The Region Pyramid: African (O) and Middle Eastern (+) Staff in Grades A15-B5 in 1994 and 2001 by Department Type
B2
B1
2001X
XX XXXO
XXXXXXX
+
XXXXXXXXX
X
XXXXXXXXXXX
XXXXXXXXXXXX
O + +
XXXXXXXXXXXXXXXXXXX
O + + +
XXXXXXXXXXXX
XXXXXXXXXXXXXXX
XXXXXXXXXXXXXXX
OO + + + +
XXXXXX XXXXXXXXXXXXXX
XXXXXXX+
XXXXXXXXXXXX
XXXXX
XXXXXXXXXXXXXXXXXXXX
XXXXXXXXXXXXXXXXXXXX
XXXXXXXXXXXXXXXXX
OOOOO + + +
XXXXXXXXXXXXXXXXX
XXXXXXXXXXXXXXXXXXXXXXXXXXXXXXXX
O + + +
XXXXXXXXXXXXXXXXXXXXX
+
XXXXXXXXXXXX+
XXXXXXXXXXXXX
O
XXXXXXXXXXXXXXXXXXXXX
AreaAFR 7.4 MED 6.9
F unctionalAFR 3.0 MED 6.5
SupportAFR 2.0 MED 2.0
1994
XXXXXXXX
XXXXXXXXXXOOO
+
XXXXXXXXXXXXXXX
O+
XXXXXXXXX
XXXXXXXXXXXXXX
XXXXXX+ + +
XXXXXX XXXXXXXXXXXXXX
XXXXXXXXXX
O +
XXXXXXXXXXXXXXXX
XXXXXXXXXXXXXXXXXX
XXXXXXXOO
+ + +
XXXXXXXXXXXXXXXX
XXXXXXXXXXXXXXXXXXXXXXXXXXX
XXXXXXXO
+ + + + +
XXXXXXXXXXXXXXXXXXXXXX
XXXXXXXXO +
XXXXXXX XXXXXXX+ +
XXXXXXXXXXXXXXXXXXXXXX
O
AreaAFR 8.4 MED 5.8
F unctionalAFR 2.7 MED 6.0
XX XXX
XXX
XXXXXXXXO
XXX
SupportAFR 3.2 MED 5.3
B3
B4
B5
A15XXXXXXXXXXXX
XXXXXXXXXXXXXXXXXXXXXXXXXXOOOOOO OO
+ +
XXXXXXXXXXXXXXXXXXXXXXXX
XXXXXXXXXXXXXO+
XXXXXXXXXXXX+ + +
XXXXXXXXXXXXXXXXXXXXXXXXXXXXXXXXXXX
XXXXXXXXXXXXXXXXXXXXXXXXXXXXXXXXXXX
OOOOOOOO + + + + + +
XXX XXXXXXXXXXXXXXXXXXXXXXXXXXXXX
XXXXXXXXXXXXXXXXXXXX XXXXXXXXXXXXXX
O OO+ + + + +
XXXXXXXXXXXXXXX
OO+

Figure 21. Share of Women and Men, Grades A11-B5: Economists
0
10
20
30
40
50
60
70
80
90
100
A11 A12 A13 A14 A15 B1 B2 B3 B4 B5Grade
Per
cent
Women Men
N=36 1/ N=43 N=59 N=57 N=17 N=5 N=12 N=9 N=3 N=2
Total 98 Total 148 Total 214 Total 321 Total 156 Total 27 Total 120 Total 74 Total 52 Total 17
1/ N= Number of women in the grade.

Figure 22. Share of Women and Men, Grades A11-B5: Specialized Career Streams
0
10
20
30
40
50
60
70
80
90
100
A11 A12 A13 A14 A15 B1 B2 B3 B4 B5Grade
Per
cent
Women Men
1/ N= Number of women in the grade.
N=69 1/ N=40 N=47 N=30 N=5 N=11 N=4 N=2 N=1
Total 103 Total 73 Total 101 Total 63 Total 11 Total 22 Total 21 Total 9 Total 10 Total 9
N=0
0
20
40
60
80
100
1996 1997 1998 1999 2000 2001
A9-A15 B1-B5
AFR
0
20
40
60
80
100
1996 1997 1998 1999 2000 2001
APD
0
20
40
60
80
100
1996 1997 1998 1999 2000 2001
EU1
0
20
40
60
80
100
1996 1997 1998 1999 2000 2001
EU2
0
20
40
60
80
100
1996 1997 1998 1999 2000 2001
MED
0
20
40
60
80
100
1996 1997 1998 1999 2000 2001
WHD
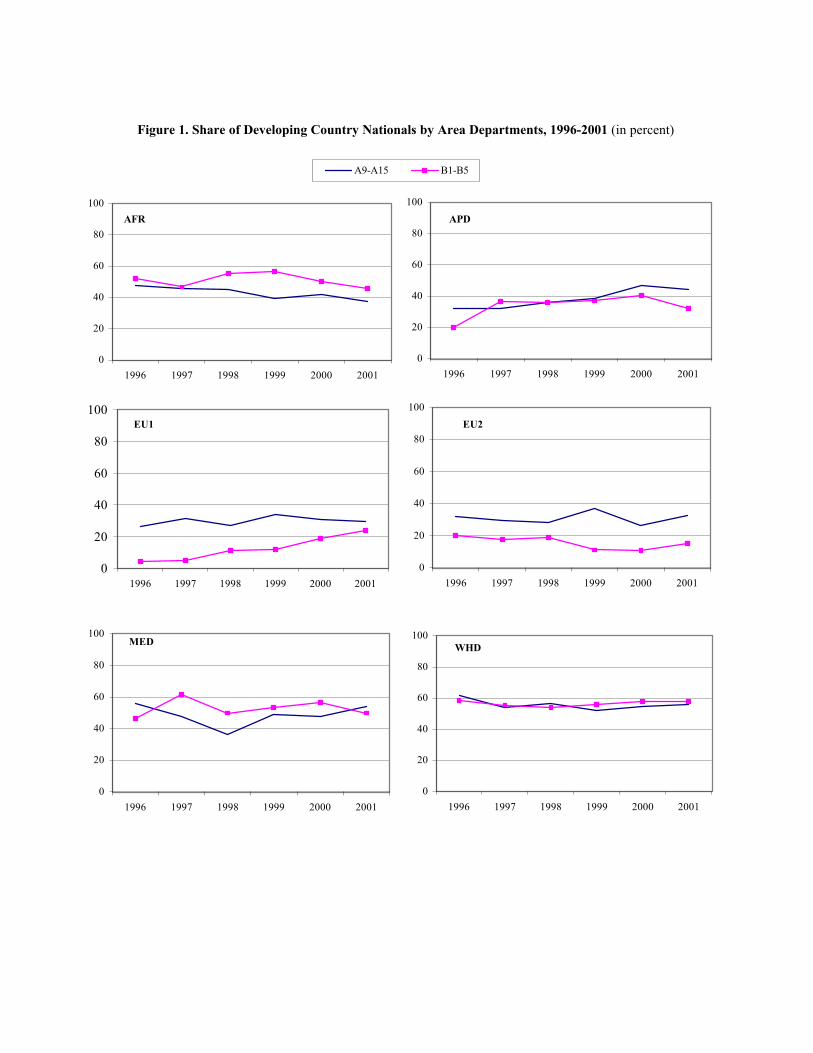
Figure 1. Share of Developing Country Nationals by Area Departments, 1996-2001 (in percent)

0
20
40
60
80
100
1996 1997 1998 1999 2000 2001
A9-A15 B1-B5
FAD
0
20
40
60
80
100
1996 1997 1998 1999 2000 2001
INS
LEG
0
20
40
60
80
100
1996 1997 1998 1999 2000 2001
MAE
0
20
40
60
80
100
1996 1997 1998 1999 2000 2001
PDR
0
20
40
60
80
100
1996 1997 1998 1999 2000 2001
RES
0
20
40
60
80
100
1996 1997 1998 1999 2000 2001
STA
0
20
40
60
80
100
1996 1997 1998 1999 2000 2001
TRE
1/ ICM was established in 2001. Developing country nationals in 2001 made up 45.5% in grade group A9-A15 and 12.5% in B1-B5.
0
20
40
60
80
100
1996 1997 1998 1999 2000 2001
INS
Figure 1 (contd). Share of Developing Country Nationals by Functional Departments, 1996-2001 (in percent)

0
20
40
60
80
100
1996 1997 1998 1999 2000 2001
A9-A15 B1-B5
EXR
0
20
40
60
80
100
1996 1997 1998 1999 2000 2001
HRD
0
20
40
60
80
100
1996 1997 1998 1999 2000 2001
OMD
0
20
40
60
80
100
1996 1997 1998 1999 2000 2001
SEC
0
20
40
60
80
100
1996 1997 1998 1999 2000 2001
TGS
Figure 1 (contd). Share of Developing Country Nationals by Support Departments, 1996-2001 (in percent)
0
20
40
60
80
100
1996 1997 1998 1999 2000 2001
A9-A15 B1-B5
AFR
0
20
40
60
80
100
1996 1997 1998 1999 2000 2001
APD
0
20
40
60
80
100
1996 1997 1998 1999 2000 2001
EU1
0
20
40
60
80
100
1996 1997 1998 1999 2000 2001
EU2
0
20
40
60
80
100
1996 1997 1998 1999 2000 2001
MED
0
20
40
60
80
100
1996 1997 1998 1999 2000 2001
WHD
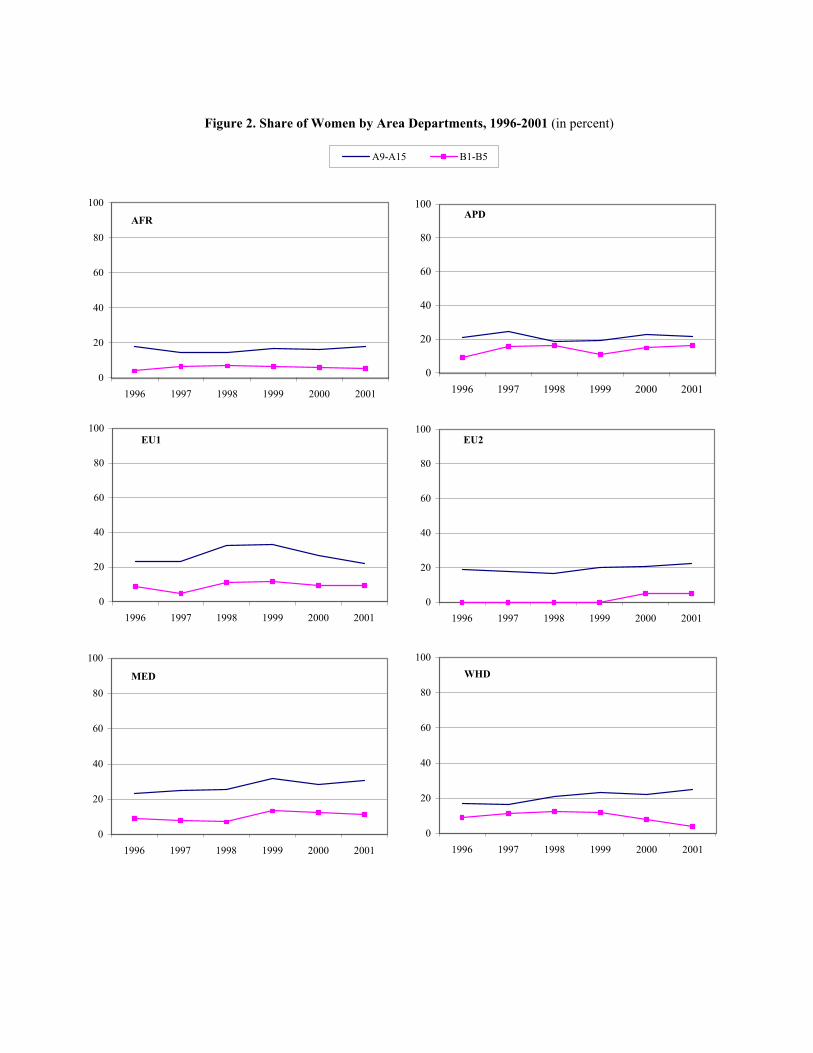
Figure 2. Share of Women by Area Departments, 1996-2001 (in percent)
0
20
40
60
80
100
1996 1997 1998 1999 2000 2001
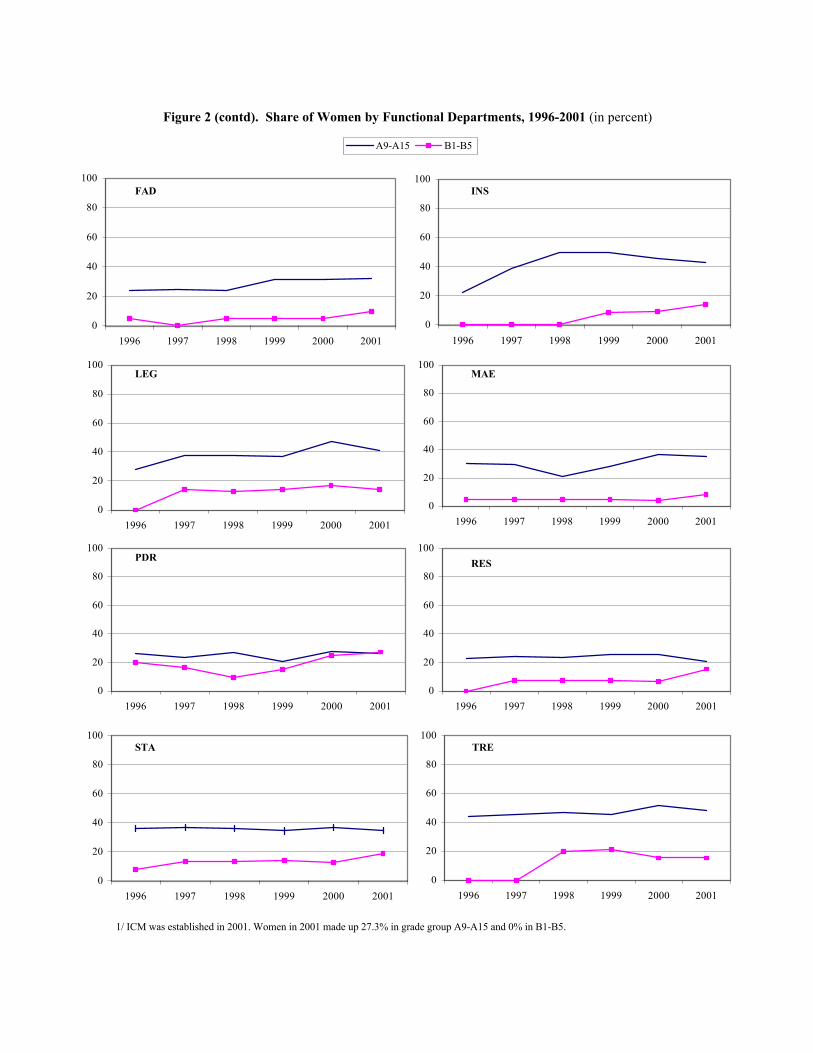
A9-A15 B1-B5
FAD
0
20
40
60
80
100
1996 1997 1998 1999 2000 2001
INS
0
20
40
60
80
100
1996 1997 1998 1999 2000 2001
LEG
0
20
40
60
80
100
1996 1997 1998 1999 2000 2001
MAE
0
20
40
60
80
100
1996 1997 1998 1999 2000 2001
PDR
0
20
40
60
80
100
1996 1997 1998 1999 2000 2001
RES
0
20
40
60
80
100
1996 1997 1998 1999 2000 2001
STA
0
20
40
60
80
100
1996 1997 1998 1999 2000 2001
TRE
1/ ICM was established in 2001. Women in 2001 made up 27.3% in grade group A9-A15 and 0% in B1-B5.
Figure 2 (contd). Share of Women by Functional Departments, 1996-2001 (in percent)

0
20
40
60
80
100
1996 1997 1998 1999 2000 2001
A9-A15 B1-B5
EXR
0
20
40
60
80
100
1996 1997 1998 1999 2000 2001
HRD
0
20
40
60
80
100
1996 1997 1998 1999 2000 2001
OMD
0
20
40
60
80
100
1996 1997 1998 1999 2000 2001
SEC
0
20
40
60
80
100
1996 1997 1998 1999 2000 2001
TGS
Figure 2. Share of Women by Support Departments, 1996-2001 (in percent)
Related Documents