High Penetration Solar Forum March 2011 Field Verification of High-Penetration Levels of PV into the Distribution Grid with Advanced Power Conditioning Systems Dr. Jason Lai Virginia Tech Future Energy Electronics Center 106 Plantation Road Blacksburg, VA 24061-0356

Welcome message from author
This document is posted to help you gain knowledge. Please leave a comment to let me know what you think about it! Share it to your friends and learn new things together.
Transcript

High Penetration Solar ForumMarch 2011
Field Verification of High-Penetration Levels of PV into the Distribution Grid with
Advanced Power Conditioning Systems
Dr. Jason LaiVirginia Tech
Future Energy Electronics Center106 Plantation Road
Blacksburg, VA 24061-0356
Outlines• Introduction
– Project Sponsors and Partners
– Focus Areas
– Key Deliverables
• Technical Areas 1. Solar Energy Production with Different PCS
Configurations
2. PCS Design Issues
3. OpenDSS Modeling
4. Power Quality Compliance Testing
• Q&AMarch 1-2, 2011 DOE/CPUC High Penetration Solar Forum 2
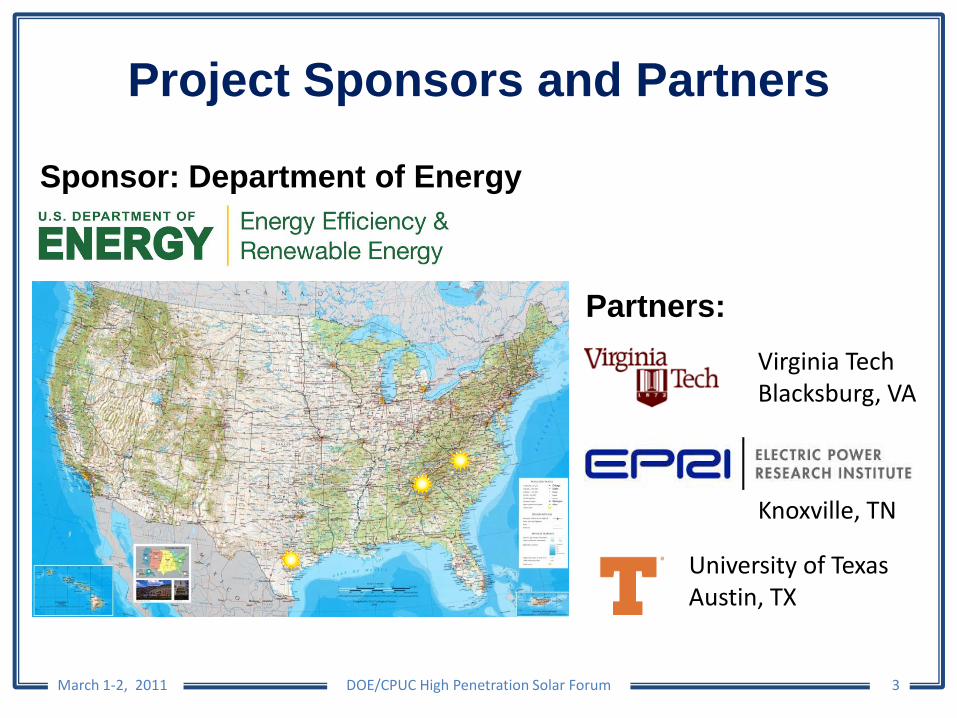
Project Sponsors and Partners
March 1-2, 2011 DOE/CPUC High Penetration Solar Forum 3
Virginia TechBlacksburg, VA
Knoxville, TN
University of TexasAustin, TX
Sponsor: Department of Energy
Partners:

Focus Areas
March 1-2, 2011 DOE/CPUC High Penetration Solar Forum 4
• BOS cost & installation efficiency (MYPP08-12, p. 26)
• Grid stability, voltage regulation, and power quality with high PV penetration (MYPP08-12, pp. 38-39)
• Protection and coordination with PV inverters (MYPP08-12, pp. 38-39)
MYPP: DOE Multi-Year Program Plan

Key Deliverables• Demonstration of PV power conditioners
from different manufactures and of different capacities (micro, centralized and hybrid).
• VT in-house developed power conditioning system prototype DC-DC-AC (DDA) operating in islanding and grid-tied conditions.
• PV resource and PCS (Power Conditioning System) modeling with EPRI OpenDSS.
March 1-2, 2011 DOE/CPUC High Penetration Solar Forum 5

Technical Area 1: Solar Energy Production with Different PCS Configurations
March 1-2, 2011 DOE/CPUC High Penetration Solar Forum 6
• Different PCS Configurations• VT-FEEC Solar House Energy Production Study with
Three PCS Configurations• FEEC Solar Energy Production with Three PCS
Configurations• PCS Power Outputs and Irradiance Level• PCS Startup in the Morning• PCS Output Under Frequent Cloud Movement
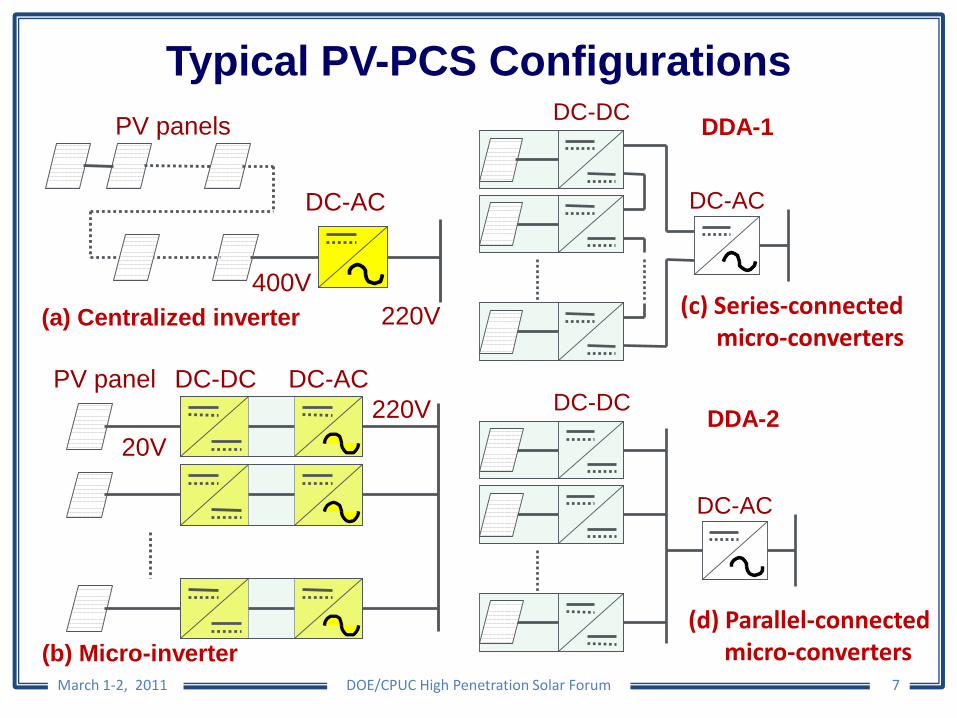
Typical PV-PCS Configurations
March 1-2, 2011 DOE/CPUC High Penetration Solar Forum 7
DC-DC
DC-AC
DC-DC
DC-AC
(c) Series-connected micro-converters
(d) Parallel-connected micro-converters
PV panels
DC-AC
400V220V
DC-DC DC-ACPV panel220V
20V
(a) Centralized inverter
(b) Micro-inverter
DDA-1
DDA-2
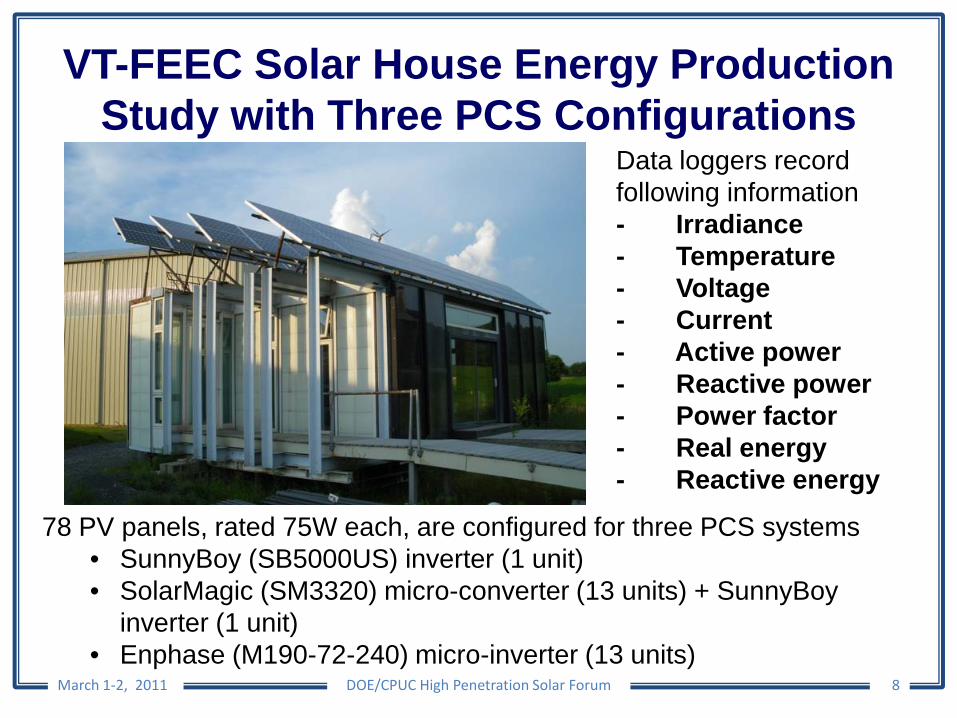
VT-FEEC Solar House Energy Production Study with Three PCS Configurations
March 1-2, 2011 DOE/CPUC High Penetration Solar Forum 8
Data loggers record following information - Irradiance - Temperature- Voltage- Current- Active power - Reactive power - Power factor - Real energy - Reactive energy
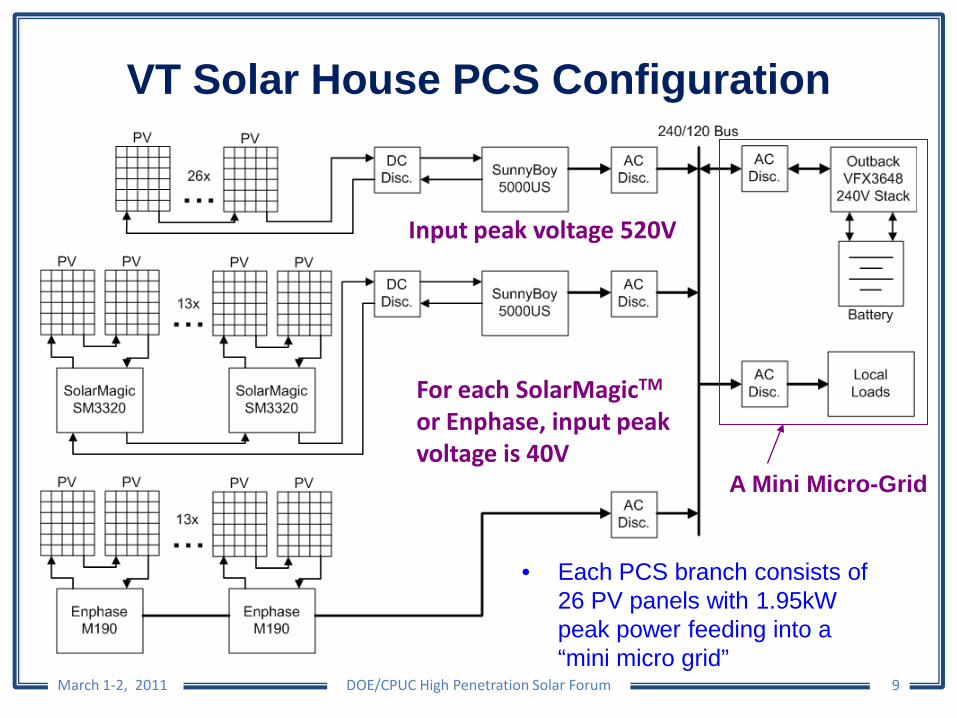
78 PV panels, rated 75W each, are configured for three PCS systems• SunnyBoy (SB5000US) inverter (1 unit) • SolarMagic (SM3320) micro-converter (13 units) + SunnyBoy
inverter (1 unit)• Enphase (M190-72-240) micro-inverter (13 units)
VT Solar House PCS Configuration
March 1-2, 2011 DOE/CPUC High Penetration Solar Forum 9
• Each PCS branch consists of 26 PV panels with 1.95kW peak power feeding into a “mini micro grid”
For each SolarMagicTM
or Enphase, input peak voltage is 40V
Input peak voltage 520V
A Mini Micro-Grid

FEEC Solar Energy Production with Three PCS Configurations Shown on Google PowerMeterTM
March 1-2, 2011 DOE/CPUC High Penetration Solar Forum 10
10
9.0 11.0
9.1 10.0
9.08.7
9.6
9.39.7
9.2
8.8 8.5
Enphase
Sunnyboy
SolarMagic+ Sunnyboy
12a 6a 12p 6p 12a 6a 12p 6p 12a
1.5
1.0
0.5
0.0
1.5
1.0
0.5
0.0
12a 6a 12p 6p 12a 6a 12p 6p 12a
1.5
1.0
0.5
0.0
1.5
1.0
0.5
0.0
1.5
1.0
0.5
0.0
1.5
1.0
0.5
0.0
kW kW
1-29-11 1-30-11 2-10-11 2-11-11
PCS design can impact energy production with following factors: (1) Morning startup (reconnection) (2) PCS efficiency
11 11
11
22

PCS Power Output and Energy Production (01/30/2011, Mostly Sunny, 63 F Peak)
March 1-2, 2011 DOE/CPUC High Penetration Solar Forum 11
0200400600800
1000120014001600
6 8 10 12 14 16 18
0123456789
6 8 10 12 14 16 18
Enphase
9.058.938.34
Power output collected with 1s interval data logger
Time (Hour)
Ene
rgy
(kW
hr)
Pow
er (W
)
Late start, problem with SunnyBoy reconnecting algorithm

PCS Power Outputs and Irradiance Level (7:00–11:50am, 02/08/2011, Total about 5 hours)
March 1-2, 2011 DOE/CPUC High Penetration Solar Forum 12
• Power Integration from 8:28 AM to 11:48 AM • Micro Inverter = 1.928 kWh (100%)• Centralized Inverter = 1.835 kWh (95%)• Series DC-DC & Centralized Inverter = 1.743 kWh (90%)
Each PCS power output > total peak PV power capacity?
0
500
1000
1500
2000
25007:
007:
107:
207:
307:
407:
508:
008:
108:
208:
308:
408:
509:
009:
109:
209:
309:
409:
5010
:00
10:1
010
:20
10:3
010
:40
10:5
011
:00
11:1
011
:20
11:3
011
:40
Pow
er O
utpu
t (W
)
Time
SolarMagic &SunnyBoyEnphase
SunnyBoy
Irradiance
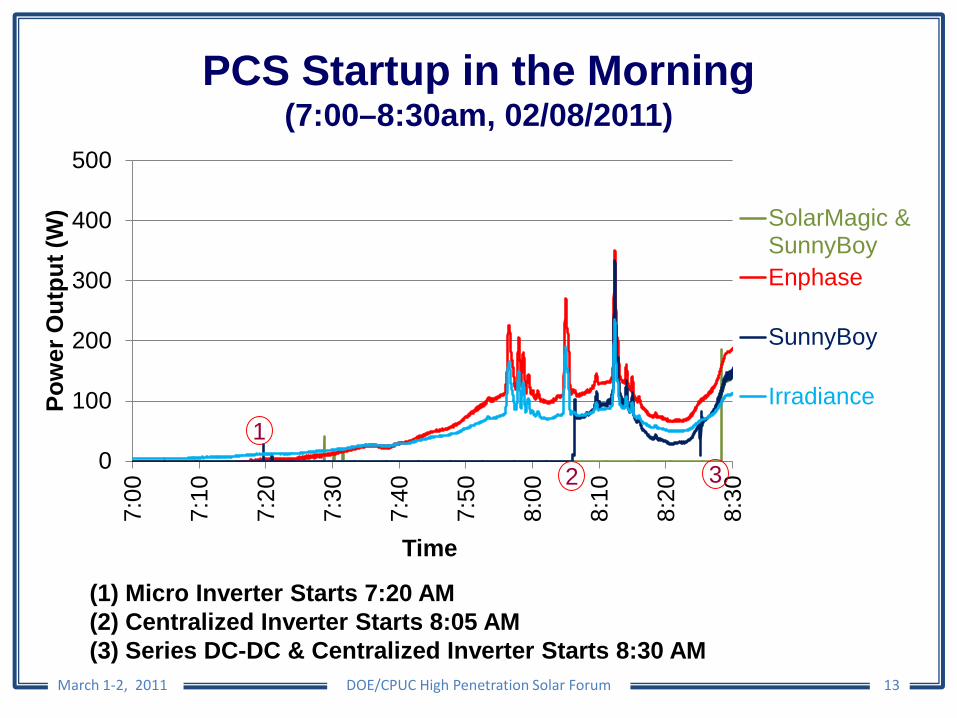
PCS Startup in the Morning (7:00–8:30am, 02/08/2011)
March 1-2, 2011 DOE/CPUC High Penetration Solar Forum 13
(1) Micro Inverter Starts 7:20 AM(2) Centralized Inverter Starts 8:05 AM(3) Series DC-DC & Centralized Inverter Starts 8:30 AM
0
100
200
300
400
5007:
00
7:10
7:20
7:30
7:40
7:50
8:00
8:10
8:20
8:30
Pow
er O
utpu
t (W
)
Time
SolarMagic &SunnyBoyEnphase
SunnyBoy
Irradiance
2
1
3

PCS Output Under Frequent Cloud Movement (11:45–11:47am, 02/08/2011, Total 2 minutes)
March 1-2, 2011 DOE/CPUC High Penetration Solar Forum 14
• PCS outputs from (1) 35% to (2) 113% of rated PV power in 3 seconds • 1-second data logging is insufficient to determine true ramp rate• PCS configuration has almost no effect on power ramp-rate • PCS peak power needs to be sized higher than PV peak power against traditional thinking (Note: manufacturer recommends 190W PCS for 230W PV)
2
10
500
1000
1500
2000
2500
11:4
5:00
11:4
5:10
11:4
5:20
11:4
5:30
11:4
5:40
11:4
5:50
11:4
6:00
11:4
6:10
11:4
6:20
11:4
6:30
11:4
6:40
11:4
6:50
11:4
7:00
Wat
ts
Time
SolarMagic &SunnyBoyEnphase
SunnyBoy
Irradiance
Statistic Energy Production over 3-Week Period
March 1-2, 2011 DOE/CPUC High Penetration Solar Forum 15
0
2
4
6
8
10
12
1 2 3 4 5 6 7 8 9 10 11 12 13 14 15 16 17 18 19 20 21
020406080
100120140
0 1 2 3 4 5 6 7 8 9 10 11 12 13 14 15 16 17 18 19 20 21Day
Cum
ulat
ed k
Wh
Dai
ly k
Wh
Enphase SunnyBoy
SolarMagic + SunnyBoy
Enphase
SunnyBoySolarMagic+SunnyBoy exceptions
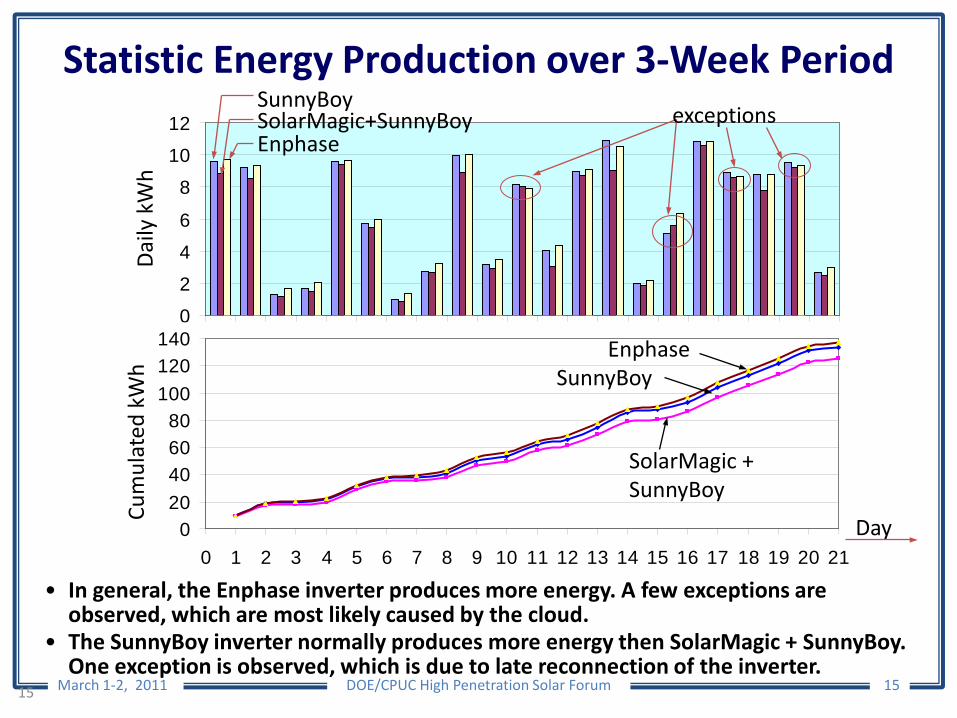
• In general, the Enphase inverter produces more energy. A few exceptions are observed, which are most likely caused by the cloud.
• The SunnyBoy inverter normally produces more energy then SolarMagic + SunnyBoy. One exception is observed, which is due to late reconnection of the inverter.
15
Summary of Technical Area 1 on PCS Configurations
March 1-2, 2011 DOE/CPUC High Penetration Solar Forum 16
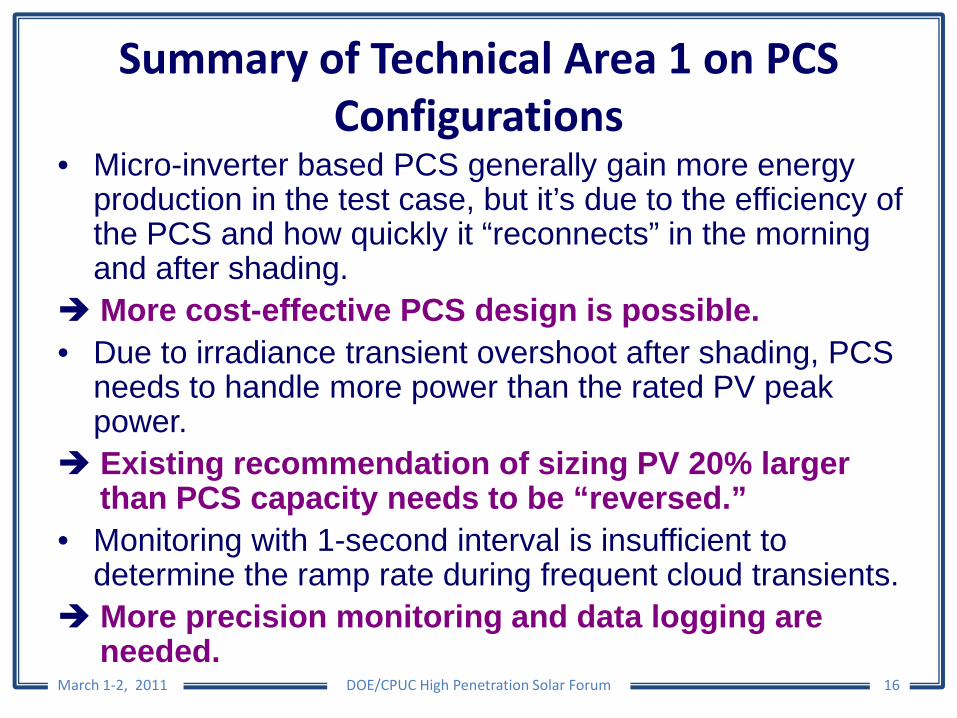
• Micro-inverter based PCS generally gain more energy production in the test case, but it’s due to the efficiency of the PCS and how quickly it “reconnects” in the morning and after shading.
More cost-effective PCS design is possible.• Due to irradiance transient overshoot after shading, PCS
needs to handle more power than the rated PV peak power.
Existing recommendation of sizing PV 20% larger than PCS capacity needs to be “reversed.”
• Monitoring with 1-second interval is insufficient to determine the ramp rate during frequent cloud transients.
More precision monitoring and data logging are needed.

Technical Area 2: PCS Design Issues
March 1-2, 2011 DOE/CPUC High Penetration Solar Forum 17
• Single-stage versus two-stage PWM designs
• Evaluation of different PV PCS designs and their features on – efficiency,
– waveform quality,
– hot spot temperature.

Block Diagram of Typical PV-PCS Designs
March 1-2, 2011 DOE/CPUC High Penetration Solar Forum 18
(a) Single PWM stage type, no high voltage energy storage, e.g. Enphase
(b) Two-PWM stage type, with high voltage DC bus and energy storage, e.g. ExcelTECH
AC/DCRectifier
HFSPWMDC/AC
Vac
Vdc
Vin
+
–
HFPWMDC/AC
HighFreq.
Xformer
AC/DCRectifier
Vin
+
–
HFPWMDC/AC
HighFreq.
Xformer LFunfolding
DC/AC
Vac
• Single PWM stage is generally more efficient, but requires large storage capacitor at the input to stabilize MPPT
• Two PWM stages mean more costly components and higher switching loss, but the system allows high voltage DC bus to absorb 120Hz ripple and thus eliminating electrolytic capacitor

Evaluation of Commercial PCS – SunnyBoy SB5000US Centralized Inverter
March 1-2, 2011 DOE/CPUC High Penetration Solar Forum 19
84
86
88
90
92
94
96
98
0 1000 2000 3000 4000 5000Power Output (W)
Effic
ienc
y % 250V Input
300V Input350V Input400V Input450V Input500V Input550V Input
ac output
Low freq.transformer
a
b
• Circuit topology: Full-bridge inverter + transformer• A large capacitor bank, more than 30 electrolytic capacitors, is connected across PV
array • Two switches are switched at 16kHz PWM frequency • Two switches are switched at 60Hz line frequency to reduce switching loss
Features: • Continuous operation under light load (<10W), no burst mode• Grid relay only trips on DC bus under-voltage condition, not power level• Approx. 2% efficiency drop from low-line to high-line input; reduced efficiency at
higher voltages due to the increased switching and magnetic losses.
Lm: 154mHLlk: 1.15mH

PCS Efficiency and Hot Spot Temperature
March 1-2, 2011 DOE/CPUC High Penetration Solar Forum 20
dc/ac inverter
PV input
AC output
DC-DC converter
filter
• Circuit topology: Push-pull DC-DC converter + Full-bridge DC-AC inverter
• DC-DC converter in 26 kHz hard-switching PWM
• DC-AC inverter in 30 kHz hard-switching sinusoidal PWM
70%
75%
80%
85%
90%
95%
10% 20% 30% 50% 75% 100%
Con
vers
ion
Effic
ienc
y
Efficiency vs. output power
CEC efficiency: 89.5%
Key Design Features:• Compact footprint • Good waveform fidelity, low THD, good power factor • Two-stage power conversion, poor overall efficiency • High heat sink temperature rise (96°C)• Concern on the life span of electrolytic capacitors
Hot spot temperature: 121 C
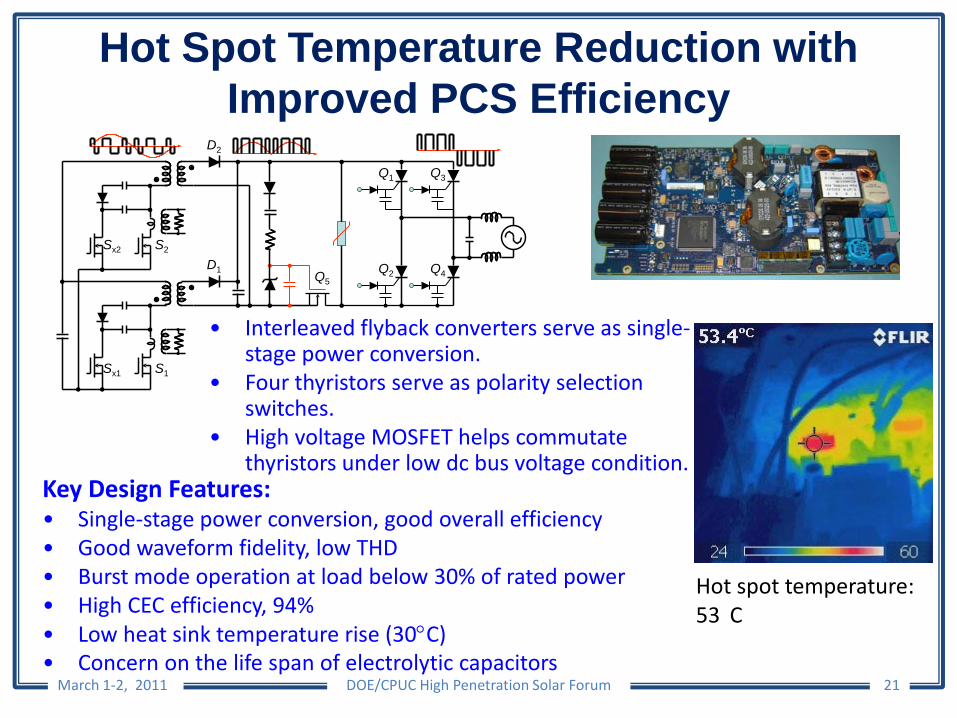
Hot Spot Temperature Reduction with Improved PCS Efficiency
March 1-2, 2011 DOE/CPUC High Penetration Solar Forum 21
• Interleaved flyback converters serve as single-stage power conversion.
• Four thyristors serve as polarity selection switches.
• High voltage MOSFET helps commutate thyristors under low dc bus voltage condition.
Q3
D2
D1
Sx2 S2
S1Sx1
Q1
Q2 Q4Q5
Key Design Features: • Single-stage power conversion, good overall efficiency • Good waveform fidelity, low THD• Burst mode operation at load below 30% of rated power • High CEC efficiency, 94% • Low heat sink temperature rise (30°C)• Concern on the life span of electrolytic capacitors
Hot spot temperature: 53 C

Virginia Tech Micro-converter and Micro-inverter
March 1-2, 2011 DOE/CPUC High Penetration Solar Forum 22
• Novel high boost ratio DC-DC converter• H6 inverter for high efficiency and elimination of ground loop current
+−
VinCdcQ1
D1
g
+D2
C2 −
D3
C1L1 L2
Vdc S3
S6S5
S4
S2S1
vab
vc
vb
va
vd
DC+LgLo1
Lo2
DC-
Vo1
Vo2
voVdc
Key Design Features: • Wide input voltage range, 15 to 70V• No “electrolytic capacitor”• High efficiency, >96% CEC efficiency at
40V • Fast control loop is designed to reject 120-
Hz ripple back to PV Maximum power point tracking (MPPT) does not fluctuate.
• The MPPT responds quickly under transient condition with shading effect. Hot spot temperature: 52 C
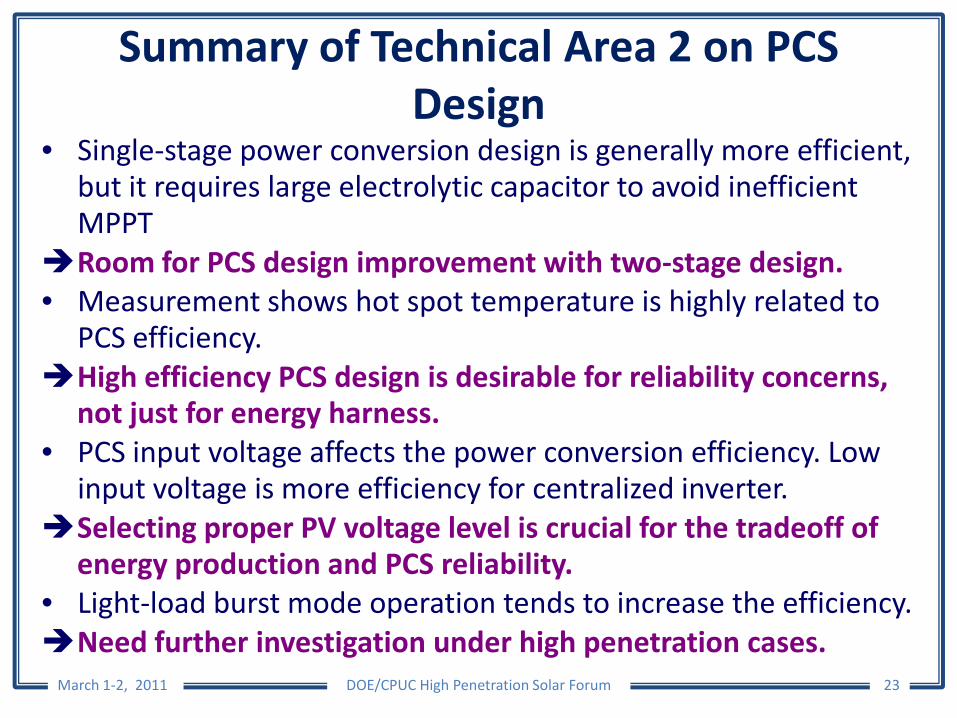
Summary of Technical Area 2 on PCS Design
March 1-2, 2011 DOE/CPUC High Penetration Solar Forum 23
• Single-stage power conversion design is generally more efficient, but it requires large electrolytic capacitor to avoid inefficient MPPT
Room for PCS design improvement with two-stage design.• Measurement shows hot spot temperature is highly related to
PCS efficiency. High efficiency PCS design is desirable for reliability concerns,
not just for energy harness.• PCS input voltage affects the power conversion efficiency. Low
input voltage is more efficiency for centralized inverter. Selecting proper PV voltage level is crucial for the tradeoff of
energy production and PCS reliability. • Light-load burst mode operation tends to increase the efficiency. Need further investigation under high penetration cases.

Technical Area 3: OpenDSS Modeling
March 1-2, 2011 DOE/CPUC High Penetration Solar Forum 24
• Brief Introduction of OpenDSS• Complete Solar PV System Modeling under
OpenDSS Simulation Platform • PV-PCS Model Validation with Actual Measurement
Data • Use of Developed Model for High Penetration PV
System Volt-Var Control Simulation Study • EPRI Distributed PV (DPV) Program

Simulation Platform -- OpenDSS
March 1-2, 2011 DOE/CPUC High Penetration Solar Forum 25
• Open source of EPRI’s Distribution System Simulator– developed in 1997– open sourced in 2008 to
collaborate with other research projects
• Used in 100’s of distribution studies
• OpenDSS designed from thebeginning to capture – Time-specific benefits and– Location-specific benefits
• Differentiating features– full multiphase model– numerous solution modes– “dynamic” power flow – system controls – flexible load models
• Needed for analysis of– DG/renewables– energy efficiency– PHEV/EV– non-typical loadshapes

Complete Solar PV System Modeling under OpenDSS Environment
March 1-2, 2011 DOE/CPUC High Penetration Solar Forum 26

Model Data and Usage
March 1-2, 2011 DOE/CPUC High Penetration Solar Forum 27
• Allows for simulation of vendor-specific inverter characteristics– Efficiency
– Cut-in/cut-out
– Fault response
– Var control
– Harmonics
– Single-phase and three-phase
• Output variability can be modeled using measured– Irradiance
– DC power
– AC power
• Model fidelity allows for simulation of grid impacts– Voltage regulation
– Voltage fluctuations
– Voltage unbalance
– Fault current contribution
– harmonics
• Model allows for– Daily/weekly/yearly
simulations
– High penetration scenarios
– Small-scale and large-scale PV

Measured Data for Model Validation
March 1-2, 2011 DOE/CPUC High Penetration Solar Forum 28
• EPRI Office• 187 kW PV panels• SATCON PVS 100
kW inverters

Measured PV Inverter Output vs OpenDSS Model Simulation Results
March 1-2, 2011 DOE/CPUC High Penetration Solar Forum 29
Measured vs Simulated PV OutputFeb 16, 2011
0
20
40
60
80
100
120
140
160
180
200
6:00
8:00
10:0
0
12:0
0
14:0
0
16:0
0
18:0
0
Time
kW
Measured kWSimulated kW
V(1)V(2)V(3)
V1
V2 V3
DOE/CPUC High Penetration Solar Forum
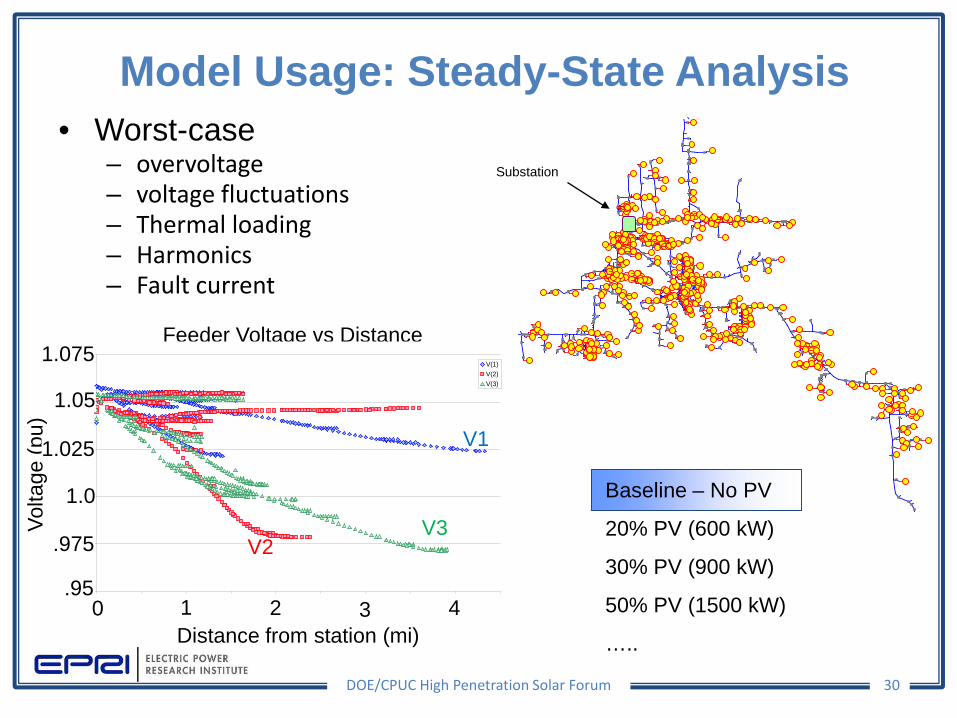
• Worst-case– overvoltage– voltage fluctuations– Thermal loading– Harmonics– Fault current
Baseline – No PV
20% PV (600 kW)
30% PV (900 kW)
50% PV (1500 kW)
…..
Substation
Feeder Voltage vs Distance
Model Usage: Steady-State Analysis
30
5
5
1
5
5
5
V(1)V(2)V(3)
V1
V2 V3
5
5
1
5
5
5
V(1)V(2)V(3)
V1
V2 V3
0 0 5 1 1 5 2 2 5 3 3 5 4 4 5
V(1)V(2)V(3)
V1
V3V2
1 2 3 4Distance from station (mi)
0
Volta
ge (p
u)
.95
.975
1.0
1.025
1.05
1.075

Model Usage: Time Series Analysis - How Does PV Interact with Grid Over Time
March 1-2, 2011 DOE/CPUC High Penetration Solar Forum 31
• Use high-resolution time-coincident data of feeder load and local PV measurements to develop unique solar profiles for each PV generator in the model
• Daily/weekly/yearly simulations at seconds-minutes-hours timeframe– how fast voltage really changes
due to PV– Increased duty on
• feeder regulators• LTCs• cap bank switching
• Advanced voltage control capability– Volt/var control
0
1
2
3
4
5
6
7
0 2 4 6 8 10 12 14 16 18 20 22Hour
kW
Customer LoadCustomer PV (-)
Customer Load
Volta
ge (p
u)
Baseline – No PV
20% PV20% PV withvolt/var control
5
5
5
5
5
0 4 8 12 16 20
1.050
1.025
1.000
0.975
0.950
0.925
0.900
Hour
0 4 8 12 16 20 24
0 4 8 12 16 20 24
PV Output
76543210
Pow
er (k
W)

EPRI Distributed PV (DPV) Program
March 1-2, 2011 DOE/CPUC High Penetration Solar Forum 32
• Install 200+ monitoring systems for utility-connected PV across North America• Monitor each PV system output and sunlight input at 1-s intervals for 18 months• Generate datasets to help define expected PV output and to supply data for
circuit analysis in OpenDSS• Report results and findings from site analyses and aggregate for broader
understandings
Committed site locations10 Feb 2011
©2011 Google – Map data ©2011 Europa Technologies, Google, INEGI

DPV sites clustered Georgia and Alabama Locations of single-panel sites installed (red) and planned (yellow)
March 1-2, 2011 DOE/CPUC High Penetration Solar Forum 33©2011 Google – Map data ©2011 Europa Technologies, Google, INEGI
8
7
77
7
7
7
99
92
9
8
9
1
Georgia: 51Alabama: 55

Satellite Cloud Info and Measured IrradianceMeasured in Knoxville on Aug. 4, 2010
March 1-2, 2011 DOE/CPUC High Penetration Solar Forum 34
0
200
400
600
800
1000
1200
6am 8am 10am 12pm 2pm 4pm 6pm 8pm
Glo
bal H
oriz
. Irr
adia
nce
(W/m
2 )
1-Minute Average Irradiance942 Corridor Park BlvdKnoxville, TN 37932
Visible satellite above Tennessee, 4:30pm EDT
1-s data logger
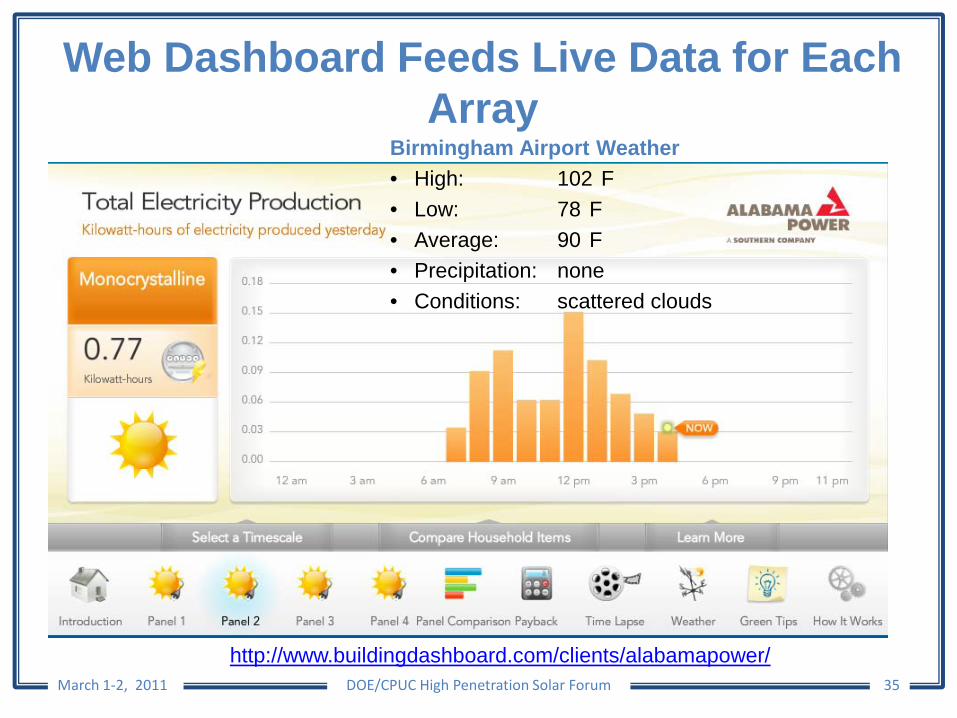
Web Dashboard Feeds Live Data for Each Array
March 1-2, 2011 DOE/CPUC High Penetration Solar Forum 35
http://www.buildingdashboard.com/clients/alabamapower/
Birmingham Airport Weather• High: 102 F• Low: 78 F• Average: 90 F• Precipitation: none• Conditions: scattered clouds

Normalized PV Array Performance with Different PV Materials
March 1-2, 2011 DOE/CPUC High Penetration Solar Forum 36
0%
20%
40%
60%
80%
100%
120%
12:00pm 12:30pm 1:00pm 1:30pm 2:00pm 2:30pmAugust 12, 2010
Nor
mal
ized
Pow
er, I
rrad
ianc
e
Surface Irradiance Thin Film Power Monocrystalline PowerPolycrystalline Power Heterojunction Power
monocrystalline shows weakness…why?
cloud reflections boost irradiance >100%

March 1-2, 2011 DOE/CPUC High Penetration Solar Forum 37
Partial List of Circuits Modeled
• 5-kV class: 3• 15-kV class: 33• 25-kV class: 3• 35-kV class: 3

Summary of Technical Area 3 on OpenDSS Modeling
March 1-2, 2011 DOE/CPUC High Penetration Solar Forum 38
• Solar PV-PCS system model used in OpenDSS has been verified with field measurement data.
• Model has been used in high penetration PV system study to show the impact with and without PV installation and with and without volt-var control.
• Utilization of EPRI DPV Program for OpenDSS is a tremendous asset to HiPen PV study.
Technical Area 4: Power Quality Compliance Testing
March 1-2, 2011 DOE/CPUC High Penetration Solar Forum 39
• Grid Interconnect Test Setup at EPRI • Abnormal Grid Voltage and Frequency Tests• Voltage Sag and Swell Ride Tests • Harmonic Spectra Tests • Power Factor and Waveforms under Dark and Dusk
Conditions
Grid Interconnect Test at EPRI
March 1-2, 2011 DOE/CPUC High Penetration Solar Forum 40
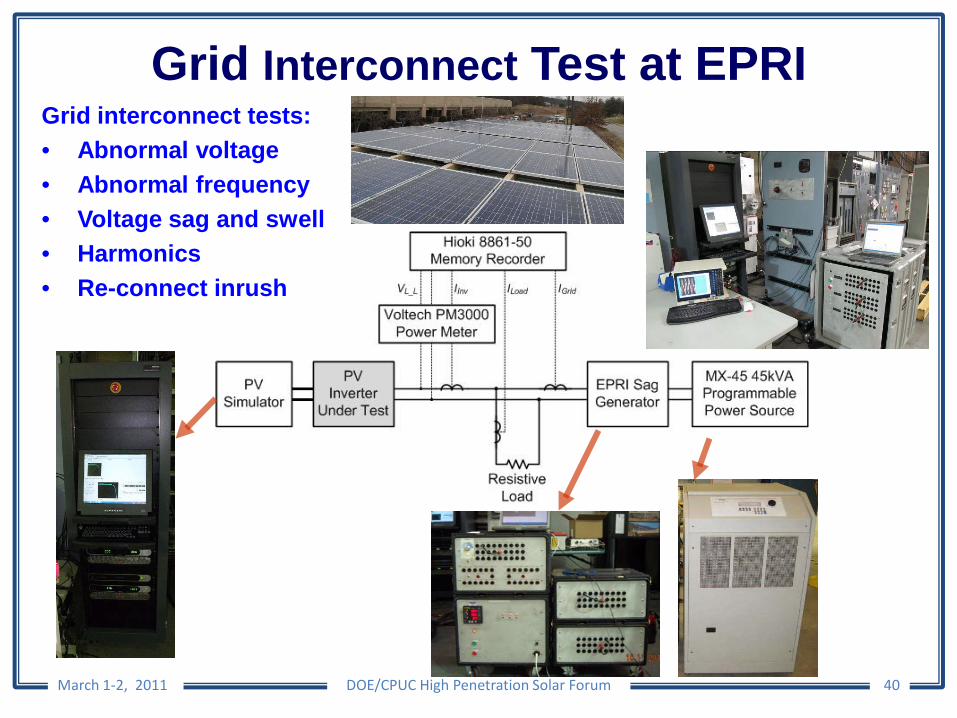
Grid interconnect tests:• Abnormal voltage• Abnormal frequency• Voltage sag and swell• Harmonics• Re-connect inrush
Abnormal Grid Voltage and Frequency Tests
March 1-2, 2011 DOE/CPUC High Penetration Solar Forum 41
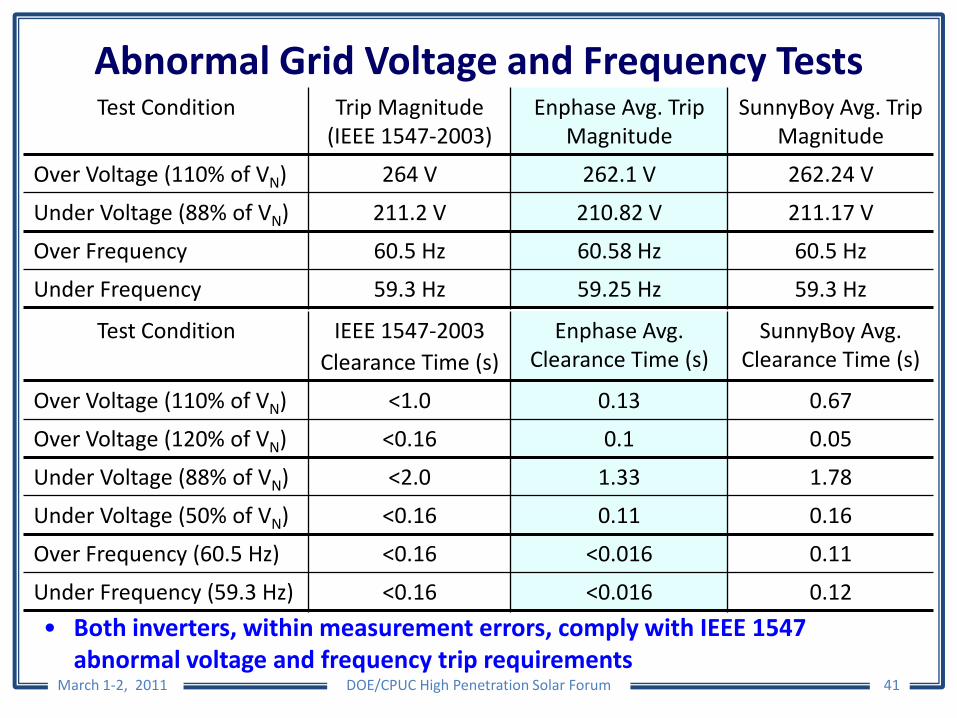
Test Condition Trip Magnitude (IEEE 1547-2003)
Enphase Avg. Trip Magnitude
SunnyBoy Avg. Trip Magnitude
Over Voltage (110% of VN) 264 V 262.1 V 262.24 V
Under Voltage (88% of VN) 211.2 V 210.82 V 211.17 V
Over Frequency 60.5 Hz 60.58 Hz 60.5 Hz
Under Frequency 59.3 Hz 59.25 Hz 59.3 Hz
Test Condition IEEE 1547-2003Clearance Time (s)
Enphase Avg. Clearance Time (s)
SunnyBoy Avg. Clearance Time (s)
Over Voltage (110% of VN) <1.0 0.13 0.67
Over Voltage (120% of VN) <0.16 0.1 0.05
Under Voltage (88% of VN) <2.0 1.33 1.78
Under Voltage (50% of VN) <0.16 0.11 0.16
Over Frequency (60.5 Hz) <0.16 <0.016 0.11
Under Frequency (59.3 Hz) <0.16 <0.016 0.12
• Both inverters, within measurement errors, comply with IEEE 1547 abnormal voltage and frequency trip requirements
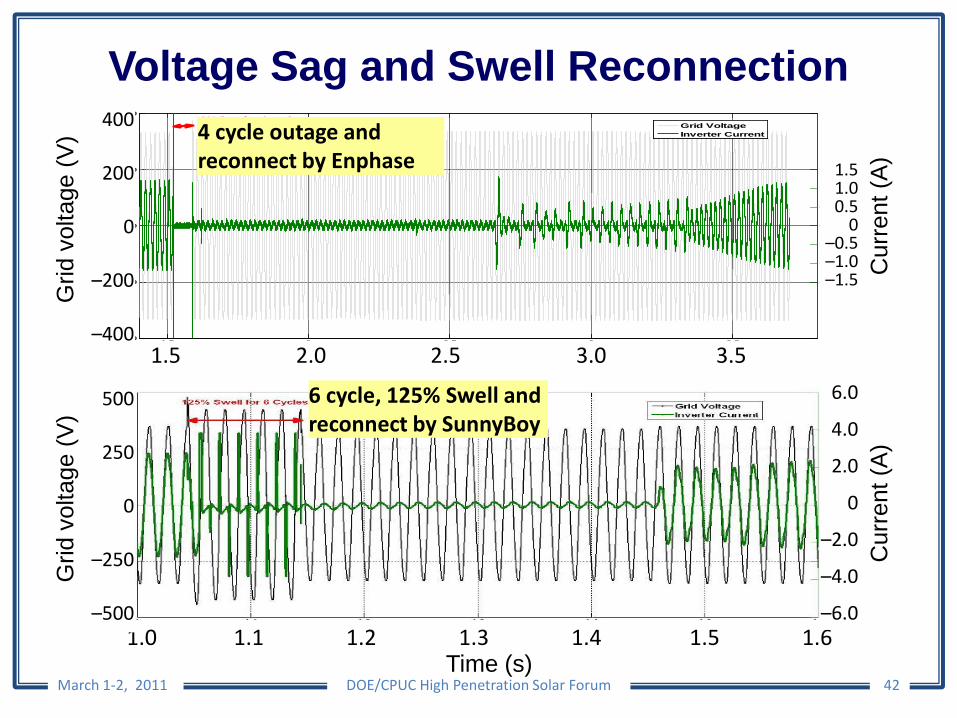
Voltage Sag and Swell Reconnection
March 1-2, 2011 DOE/CPUC High Penetration Solar Forum 42
6 cycle, 125% Swell and reconnect by SunnyBoy
1.5 2 2.5 3 3.5-400
-200
0
200
400Vo
ltage(V
)
Time (sec)
1.5 2 2.5 3 3.5
-1.5
-1
-0.5
0
0.5
1
1.5
Curre
nt(A)
Grid VoltageInverter Current
0% Sag for 4 cycles
1.0 1.1 1.2 1.3 1.4 1.5 1.6Time (s)
400
200
0
–200
–400
4 cycle outage and reconnect by Enphase
1.5 2.0 2.5 3.0 3.5
500
250
0
–250
–500
Grid
vol
tage
(V)
Grid
vol
tage
(V)
Cur
rent
(A)1.5
1.00.5
0–0.5–1.0–1.5
Cur
rent
(A)
6.0
4.0
2.0
0
–2.0
–4.0
–6.0

Voltage Swell and Sag Ride-Through Test Results
March 1-2, 2011 DOE/CPUC High Penetration Solar Forum 43
• Enphase inverter stays on within 110% over voltage • SunnyBoy inverter stays on within 106% over voltage • At 85% under-voltage, both Enphase and SunnyBoy inverters stay on • At 50% voltage sag, both inverters ride through more than 6 cycles
Perc
ent o
f Vn(
%)
Perc
ent o
f Vn(
%)
SunnyBoy
Enphase
Sag
125
120
115
110
105
100100
80
60
40
20
0
SunnyBoy
0 20 40 60 80 100 120 140 160 180Duration (cycles)
Swell Test
Enphase
Sag Test
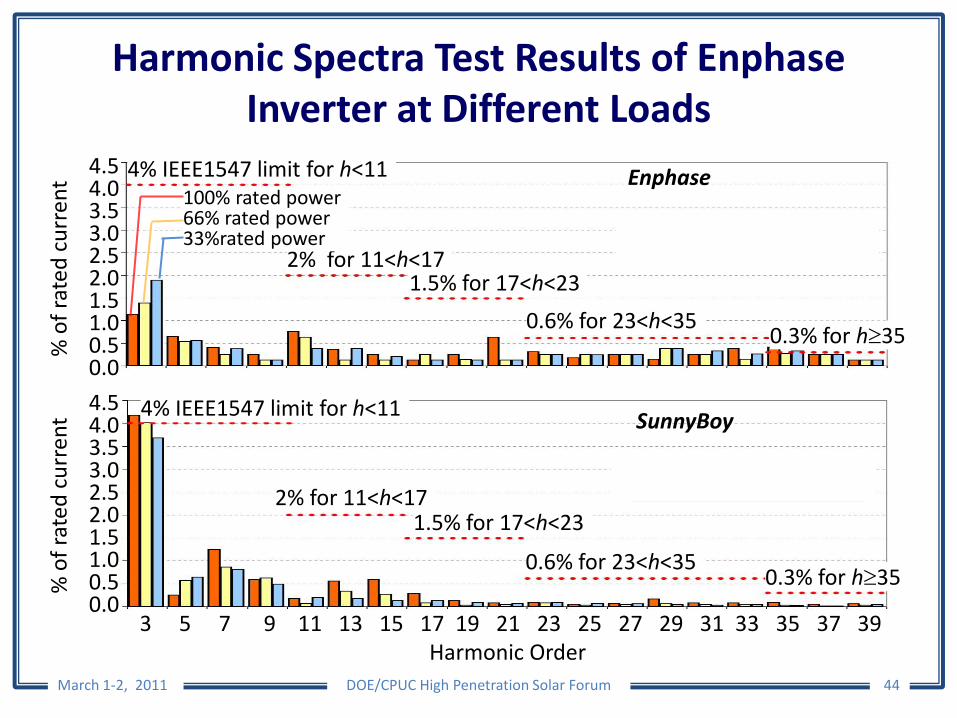
Harmonic Spectra Test Results of Enphase Inverter at Different Loads
March 1-2, 2011 DOE/CPUC High Penetration Solar Forum 44
Enphase4% IEEE1547 limit for h<11
2% for 11<h<17
2% for 11<h<17
4% IEEE1547 limit for h<11
1.5% for 17<h<23
1.5% for 17<h<23
0.6% for 23<h<35
0.6% for 23<h<35
0.3% for h≥35
0.3% for h≥35
4.54.03.53.02.52.01.51.00.50.0
% o
f rat
ed c
urre
nt
SunnyBoy
100% rated power66% rated power33%rated power
3 5 7 9 11 13 15 17 19 21 23 25 27 29 31 33 35 37 39Harmonic Order
4.54.03.53.02.52.01.51.00.50.0
% o
f rat
ed c
urre
nt
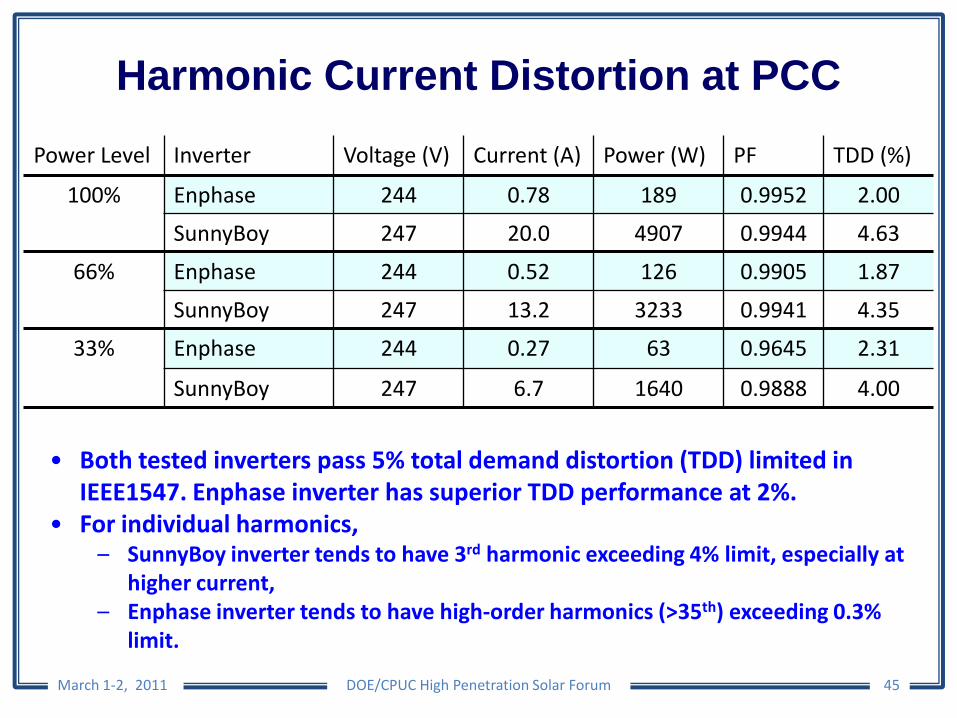
Harmonic Current Distortion at PCC
March 1-2, 2011 DOE/CPUC High Penetration Solar Forum 45
Power Level Inverter Voltage (V) Current (A) Power (W) PF TDD (%)
100% Enphase 244 0.78 189 0.9952 2.00
SunnyBoy 247 20.0 4907 0.9944 4.63
66% Enphase 244 0.52 126 0.9905 1.87
SunnyBoy 247 13.2 3233 0.9941 4.35
33% Enphase 244 0.27 63 0.9645 2.31
SunnyBoy 247 6.7 1640 0.9888 4.00
• Both tested inverters pass 5% total demand distortion (TDD) limited in IEEE1547. Enphase inverter has superior TDD performance at 2%.
• For individual harmonics, – SunnyBoy inverter tends to have 3rd harmonic exceeding 4% limit, especially at
higher current, – Enphase inverter tends to have high-order harmonics (>35th) exceeding 0.3%
limit.
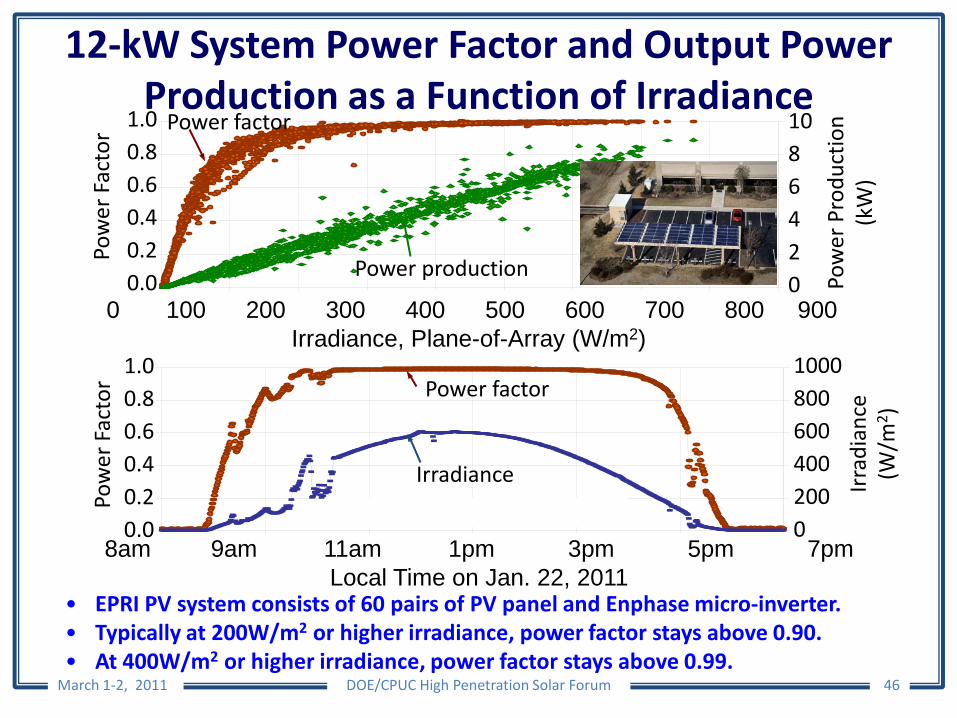
12-kW System Power Factor and Output Power Production as a Function of Irradiance
March 1-2, 2011 DOE/CPUC High Penetration Solar Forum 46
0.0
0.2
0.4
0.6
0.8
1.0
0 100 200 300 400 500 600 700 800 900
Irradiance, Plane-of-Array (W/m2)
Power F
actor
0
2
4
6
8
10
Power P
roduct
ion (kW
)
Power FactorPV Power (kW)Power production
Power factor
• EPRI PV system consists of 60 pairs of PV panel and Enphase micro-inverter.• Typically at 200W/m2 or higher irradiance, power factor stays above 0.90. • At 400W/m2 or higher irradiance, power factor stays above 0.99.
1.00.80.60.40.20.0
Pow
er F
acto
r 1086420 Po
wer
Pro
duct
ion
(kW
)
0 100 200 300 400 500 600 700 800 900Irradiance, Plane-of-Array (W/m2)
0.0
0.2
0.4
0.6
0.8
1.0
7 am 9 am 11 am 1 pm 3 pm 5 pm 7 pm
Local Time on Jan 22, 2011
Power F
actor
0
200
400
600
800
1000
Irradian
ce (W/m
2 )
Power FactorIrradiance, Plane-of-Array
1.00.80.60.40.20.0
Pow
er F
acto
r
10008006004002000
Irra
dian
ce(W
/m2 )
8am 9am 11am 1pm 3pm 5pm 7pmLocal Time on Jan. 22, 2011
Power factor
Irradiance

Burst Mode Operation with Enphase Inverter
March 1-2, 2011 DOE/CPUC High Penetration Solar Forum 47
22% of rated power 10% of rated power
7.5% of rated power 5.3% of rated power
Io Vo
The Enphase micro-inverter runs into burst mode when the power is below 30% of rated power to increase its light load efficiency.

Large Installation Burst Mode Operations under Dark and Dusk Conditions
March 1-2, 2011 DOE/CPUC High Penetration Solar Forum 48
• At dark, all Enphase inverters draw a constant leading current due to the output filter capacitor.
• At dusk, the aggregated current indicate that multiple burst-mode currents do not synchronize each other.
19 5 19 52 19 54 19 56 19 58 19 6 19 62 19 64 19 66 19 68 19 7-400
-200
0
200
400
Voltag
e(V)
19 5 19 52 19 54 19 56 19 58 19 6 19 62 19 64 19 66 19 68 19 7
-10
-5
0
5
10
Curren
t(A)
Feb 16, 2011; 7:18AM (0 W/m2 Irradiance)
400
200
0
–200
–400
Gri
d vo
ltage
(V)
Curr
ent (
A)
10
5
0
–5
–10
Grid voltage Aggregate Current of 60 microinverters
Aggregate Current of 15 microinverters
2563 48 2563 5 2563 52 2563 54 2563 56 2563 58 2563 6 2563 62 2563 64 2563 66-400
-200
0
200
400
Voltag
e(V)
2563 48 2563 5 2563 52 2563 54 2563 56 2563 58 2563 6 2563 62 2563 64 2563 66
-10
-5
0
5
10
Curre
nt(A)
400
200
0
–200
–400
10
5
0
–5
–10
Gri
d vo
ltage
(V)
Feb 16, 2011; 8AM (37 W/m2, Total 408 W, 3.5% of rated output)
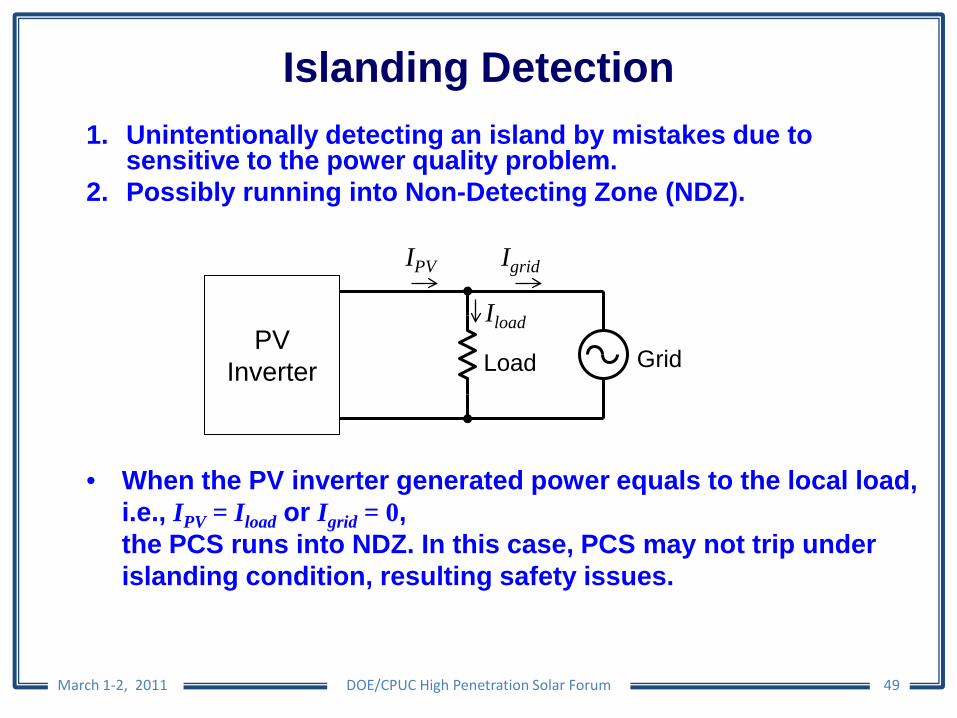
Islanding Detection
March 1-2, 2011 DOE/CPUC High Penetration Solar Forum 49
1. Unintentionally detecting an island by mistakes due to sensitive to the power quality problem.
2. Possibly running into Non-Detecting Zone (NDZ).
Grid
Igrid
IloadPV
Inverter
IPV
• When the PV inverter generated power equals to the local load, i.e., IPV = Iload or Igrid = 0, the PCS runs into NDZ. In this case, PCS may not trip under islanding condition, resulting safety issues.
Load
Anti-islanding with Frequency Shift
March 1-2, 2011 DOE/CPUC High Penetration Solar Forum 50
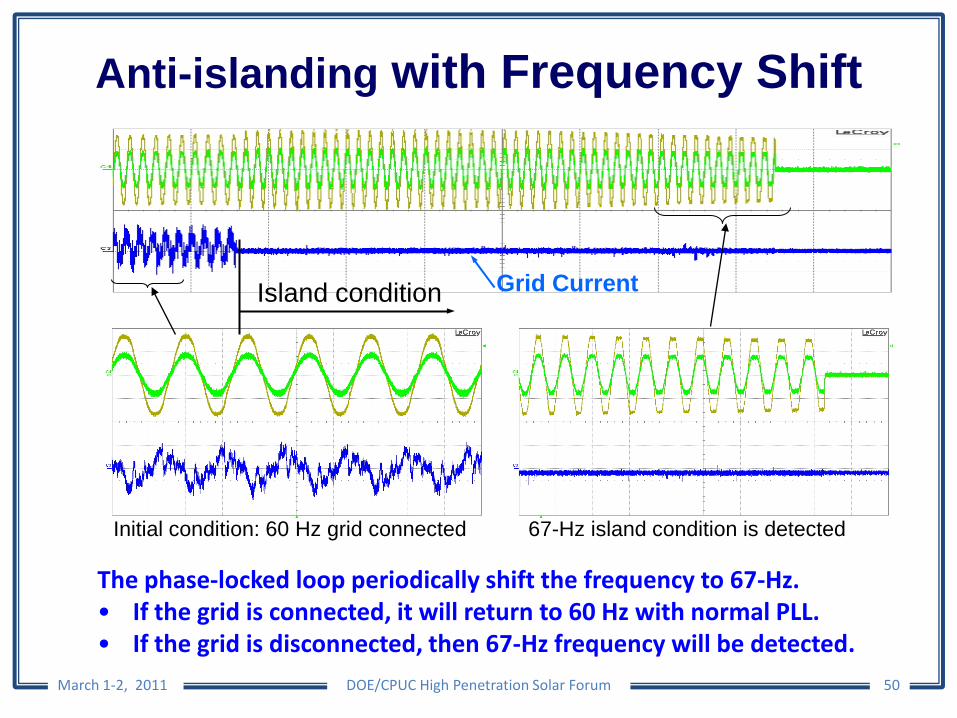
Initial condition: 60 Hz grid connected 67-Hz island condition is detected
Island condition Grid Current
The phase-locked loop periodically shift the frequency to 67-Hz. • If the grid is connected, it will return to 60 Hz with normal PLL. • If the grid is disconnected, then 67-Hz frequency will be detected.

Anti-islanding with Phase Shift
March 1-2, 2011 DOE/CPUC High Penetration Solar Forum 51
Inverter Output Current
Grid Current 0.5A/div
Grid Voltage 220 V
1A
DC input voltage 35V
Time: 20 ms/div
Island condition• A random phase shift to detect islanding – SunnyBoy approach. • A 50 µs phase shift is injected every 0.5 s – Enphase approach. • When island condition is detected, the inverter disconnects from
grid immediately.
Summary of Technical Area 4 on Power Quality Testing
March 1-2, 2011 DOE/CPUC High Penetration Solar Forum 52
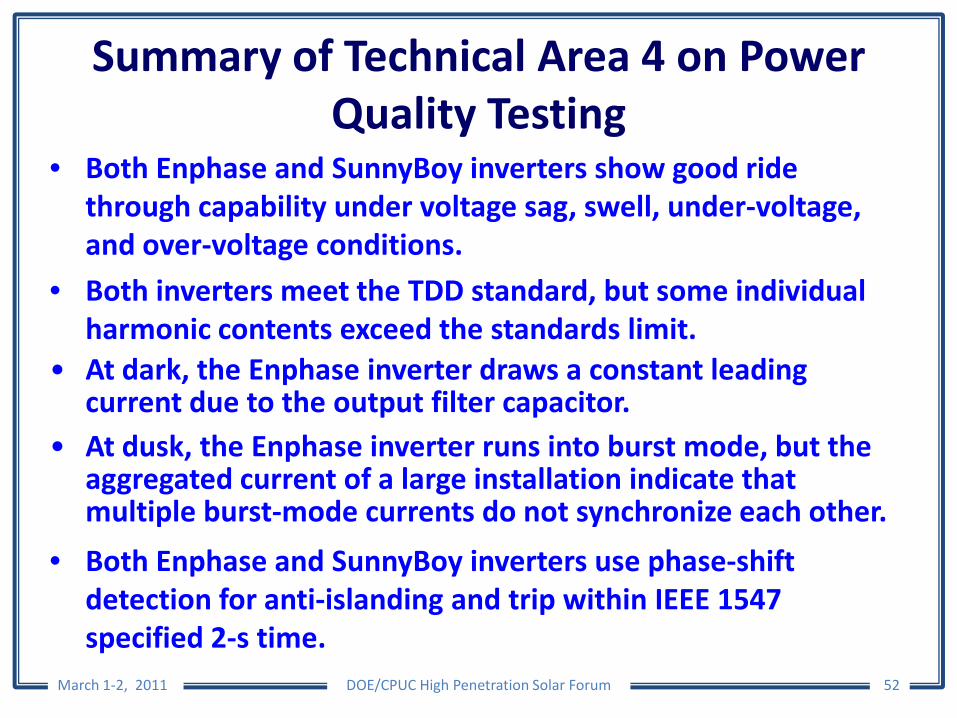
• Both Enphase and SunnyBoy inverters show good ride through capability under voltage sag, swell, under-voltage, and over-voltage conditions.
• Both inverters meet the TDD standard, but some individual harmonic contents exceed the standards limit.
• At dark, the Enphase inverter draws a constant leading current due to the output filter capacitor.
• At dusk, the Enphase inverter runs into burst mode, but the aggregated current of a large installation indicate that multiple burst-mode currents do not synchronize each other.
• Both Enphase and SunnyBoy inverters use phase-shift detection for anti-islanding and trip within IEEE 1547 specified 2-s time.

Real-Time Monitoring of VT-FEEC Solar House Energy and Power Production
March 1-2, 2011 DOE/CPUC High Penetration Solar Forum 53
Google Power Meter
Pachube online database service
Q &A
March 1-2, 2011 DOE/CPUC High Penetration Solar Forum 54
Contact Info: Jason Lai, Virginia Tech 540-231-4741 [email protected]
Tom Key, [email protected]
TOGETHER…SHAPING THE FUTURE OF ELECTRICITY
Related Documents


![Modeling High-Penetration PV for Distribution ......penetration PV at the distribution level (e.g, hosting capacity determinations) [1,2,3]. Likewise, EPRI has also, over the past](https://static.cupdf.com/doc/110x72/5ebb8c6543b978030f22c9e2/modeling-high-penetration-pv-for-distribution-penetration-pv-at-the-distribution.jpg)

