VSA Field Guides V I S U A L S O I L A S S E S S M E N T

Welcome message from author
This document is posted to help you gain knowledge. Please leave a comment to let me know what you think about it! Share it to your friends and learn new things together.
Transcript

VSAField Guides
V I S U A L S O I L A S S E S S M E N T
VIS
UA
L S
OIL
AS
SE
SS
ME
NT
— F
IEL
D G
UID
ES

VISUAL SOIL ASSESSMENT
AnnualCrops
FI
EL
D
GU
ID
E
9 7 8 9 2 5 1 0 5 9 4 1 8
TC/D/I0007E/1/02.08/1000
ISBN 978-92-5-105941-8
The present publication on Visual Soil Assessment is a practicalguide to carry out a quantitative soil analysis with reproduceable resultsusing only very simple tools. Besides soil parameters, also crop parametersfor assessing soil conditions are presented for some selected crops. TheVisual Soil Assessment manuals consist of a series of separate booklets forspecific crop groups, collected in a binder. The publication addressesscientists as well as field technicians and even farmers who want to analysetheir soil condition and observe changes over time.

VISUAL SOIL ASSESSMENT
AnnualCrops
FI
EL
D
GU
ID
E
Food and Agriculture Organization of the United NationsRome, 2008
Graham Shepherd, soil scientist,BioAgriNomics.com, New Zealand
Fabio Stagnari, assistant researcher,University of Teramo, Italy
Michele Pisante, professor,University of Teramo, Italy
José Benites, technical officer,Land and Water Development Division, FAO

Contents
The designations employed and the presentation of material in this informationproduct do not imply the expression of any opinion whatsoever on the partof the Food and Agriculture Organization of the United Nations (FAO) concerning thelegal or development status of any country, territory, city or area or of its authorities,or concerning the delimitation of its frontiers or boundaries. The mention of speciccompanies or products of manufacturers, whether or not these have been patented, doesnot imply that these have been endorsed or recommended by FAO in preference toothers of a similar nature that are not mentioned.
ISBN 978-92-5-105937-1
All rights reserved. Reproduction and dissemination of material in this informationproduct for educational or other non-commercial purposes are authorized withoutany prior written permission from the copyright holders provided the source is fullyacknowledged. Reproduction of material in this information product for resale or othercommercial purposes is prohibited without written permission of the copyright holders.Applications for such permission should be addressed to:ChiefElectronic Publishing Policy and Support BranchCommunication DivisionFAOViale delle Terme di Caracalla, 00153 Rome, Italyor by e-mail to:[email protected]
© FAO 2008

VINEYARDS | OLIVE ORCHARDS | ORCHARDS | WHEAT | MAIZE | ANNUAL CROPS | PASTURE
iii
Acknowledgements v
List of acronyms v
Visual Soil Assessment vi
SOIL TEXTURE 2
SOIL STRUCTURE 4
SOIL POROSITY 6
SOIL COLOUR 8
NUMBER AND COLOUR OF SOIL MOTTLES 10
EARTHWORMS 12
POTENTIAL ROOTING DEPTH 14Identifying the presence of a hardpan 16
SURFACE PONDING 18
SURFACE CRUSTING AND SURFACE COVER 20
SOIL EROSION 22
SOIL MANAGEMENT OF ANNUAL CROPS 24
Contents

iv
VISUAL SOIL ASSESSMENT
1. How to score soil texture 32. Visual scores for earthworms 133. Visual scores for potential rooting depth 154. Visual scores for surface ponding 19
Acknowledgements
List of acronyms
List of tables
List of figures
1. Soil scorecard – visual indicators for assessing soil quality in annual crops 12. Soil texture classes and groups 3
1. The VSA tool kit vii2. How to score soil structure 53. How to score soil porosity 74. How to score soil colour 95. How to score soil mottles 116. (a): earthworms casts under crop residue; (b): yellow-tail earthworm 137. Sample for assessing earthworms 138. Hole dug to assess the potential rooting depth 159. Using a knife to determine the presence or absence of a hardpan 1610. Identifying the presence of a hardpan 1711. Surface ponding in a field 1912. How to score surface crusting and surface cover 2113. How to score soil erosion 2314. No-till drilling an annual crop into an erosion-prone field protected by good residue cover 2515. Strip-tillage planting of an annual crop protected by good residue cover 2516. Harvesting an annual grain crop, followed immediately by no-till seeding the next crop into stubble 25
List of plates

VINEYARDS | OLIVE ORCHARDS | ORCHARDS | WHEAT | MAIZE | ANNUAL CROPS | PASTURE
v
This publication is adapted from the methodology developed in: Shepherd, T.G. 2008. Visual Soil Assessment. Volume 1. Field guide for pastoral grazing and cropping on flat to rolling country. 2nd edition. Palmerston North, New Zealand, Horizons Regional Council. 106 pp.
This publication is funded by FAO in collaboration with the Agronomy and Crop Science Research and Education Center of the University of Teramo.
Acknowledgements
List of acronyms
AEC Adenylate energy charge
Al Aluminium
ATP Adenosine triphosphate
B Boron
Ca Calcium
CO2 Carbon dioxide
Cu Copper
Fe Iron
K Potassium
Mg Magnesium
Mn Manganese
Mo Molybdenum
N Nitrogen
P Phosphorus
RSG Restricted spring growth
S Sulphur
VS Visual score
VSA Visual Soil Assessment
Zn Zinc

vi
VISUAL SOIL ASSESSMENT
IntroductionThe maintenance of good soil quality is vital for the environmental and economic sustainability of annual cropping. A decline in soil quality has a marked impact on plant growth and yield, grain quality, production costs and the increased risk of soil erosion. Therefore, it can have significant consequences on society and the environment. A decline in soil physical properties in particular takes considerable time and cost to correct. Safeguarding soil resources for future generations and minimizing the ecological footprint of annual cropping are important tasks for land managers.
Often, not enough attention is given to:< the basic role of soil quality in efficient and sustained production;< the effect of the condition of the soil on the gross profit margin;< the long-term planning needed to sustain good soil quality;< the effect of land management decisions on soil quality.
Soil type and the effect of management on the condition of the soil are important determinants of the character and quality of annual cropping and have profound effects on long-term profits. Land managers need tools that are reliable, quick and easy to use in order to help them assess the condition of their soils and their suitability for growing crops, and to make informed decisions that will lead to sustainable land and environmental management. To this end, Visual Soil Assessment (VSA) provides a quick and simple method to assess soil condition and plant performance. It can also be used to assess the suitability and limitations of a soil for annual crops. Soils with good VSA scores will usually give the best production with the lowest establishment and operational costs.
The VSA methodVisual Soil Assessment is based on the visual assessment of key soil ‘state’ and plant performance indicators of soil quality, presented on a scorecard. With the exception of soil texture, the soil indicators are dynamic indicators, i.e. capable of changing under different management regimes and land-use pressures. Being sensitive to change, they are useful early warning indicators of changes in soil condition and as such provide an effective monitoring tool.
Visual scoringEach indicator is given a visual score (VS) of 0 (poor), 1 (moderate), or 2 (good), based on the soil quality observed when comparing the soil sample with three photographs in the field guide manual. The scoring is flexible, so if the sample you are assessing does not align clearly with any one of the photographs but sits between two, an in-between score can be given, i.e. 0.5 or 1.5. Because some soil indicators are relatively more important in the assessment of soil quality than others, VSA provides a weighting factor of 1, 2 and 3. The total of the VS rankings gives the overall Soil Quality Index score for the sample you are evaluating. Compare this with the rating scale at the bottom of the scorecard to determine whether your soil is in good, moderate or poor condition.
Visual Soil Assessment

VINEYARDS | OLIVE ORCHARDS | ORCHARDS | WHEAT | MAIZE | ANNUAL CROPS | PASTURE
vii
The VSA tool kitThe VSA tool kit (Plate 1) comprises:< a spade – to dig a soil pit and to take a
200-mm cube of soil for the drop shatter soil structure test;
< a plastic basin (about 450 mm long x 350 mm wide x 250 mm deep) – to contain the soil during the drop shatter test;
< a hard square board (about 260x260x20 mm) – to fit in the bottom of the plastic basin on to which the soil cube is dropped for the shatter test;
< a heavy-duty plastic bag (about 750x 500 mm) – on which to spread the soil, after the drop shatter test has been carried out;
< a knife (preferably 200 mm long) to investigate the soil pit and potential rooting depth;
< a water bottle – to assess the field soil textural class;< a tape measure – to measure the potential rooting depth;< a VSA field guide – to make the photographic comparisons;< a pad of scorecards – to record the VS for each indicator.
The procedureWhen it should be carried outThe test should be carried out when the soils are moist and suitable for cultivation. If you are not sure, apply the ‘worm test’. Roll a worm of soil on the palm of one hand with the fingers of the other until it is 50 mm long and 4 mm thick. If the soil cracks before the worm is made, or if you cannot form a worm (for example, if the soil is sandy), the soil is suitable for testing. If you can make the worm, the soil is too wet to test.
Setting up
TimeAllow 25 minutes per site. For a representative assessment of soil quality, sample 4 sites over a 5-ha area.
Reference sampleTake a small sample of soil (about 100x50x150 mm deep) from under a nearby fence or a similar protected area. This provides an undisturbed sample required in order to assign the correct score for the soil colour indicator. The sample also provides a reference point for comparing soil structure and porosity.
PLATE 1 The VSA tool kit

viii
VISUAL SOIL ASSESSMENT
SitesSelect sites that are representative of the field. The condition of the soil in fields is site specific. Avoid areas that may have had heavier traffic than the rest of the field and sample between wheel traffic lanes. However, VSA can also be used to assess the effects of high traffic on soil quality by selecting to sample along wheel traffic lanes. Always record the position of the sites for future monitoring if required.
Site information
Complete the site information section at the top of the scorecard. Then record any special aspects you think relevant in the notes section at the bottom of the plant indicator scorecard.
Carrying out the test
Initial observationDig a small hole about 200x200 mm square by 300 mm deep with a spade and observe the topsoil (and upper subsoil if present) in terms of its uniformity, including whether it is soft and friable or hard and firm. A knife is useful to help you assess this.
Take the test sampleIf the topsoil appears uniform, dig out a 200-mm cube with the spade.You can sample whatever depth of soil you wish, but ensure that you sample the equivalent of a 200-mm cube of soil. If for example, the top 100 mm of the soil is compacted and you wish to assess its condition, dig out two samples of 200x200x100 mm with a spade. If the 100–200-mm depth is dominated by a tillage pan and you wish to assess its condition, remove the top 100 mm of soil and dig out two samples of 200x200x100 mm. Note that taking a 200-mm cube sample below the topsoil can also give valuable information about the condition of the subsoil and its implications for plant growth and farm management practices.
The drop shatter testDrop the test sample a maximum of three times from a height of 1 m onto the wooden square in the plastic basin. The number of times the sample is dropped and the height it is dropped from, is dependent on the texture of the soil and the degree to which the soil breaks up, as described in the section on soil structure.
Systematically work through the scorecard, assigning a VS to each indicator by comparing it with the photographs (or table) and description reported in the field guide.
Format of the bookletThe soil scorecard is given in Figure 1 and lists the ten key soil ‘state’ indicators required in order to assess soil quality. Each indicator is described on the following pages, with a section on how to assess each indicator and an explanation of its importance and what it reveals about the condition of the soil.

VINEYARDS | OLIVE ORCHARDS | ORCHARDS | WHEAT | MAIZE | ANNUAL CROPS | PASTURE
1
��������������������������������
���������������������������������������������������������������������������
��������� ����������
������������ ���
�������������� ���
������������� ���
����������� ���
��������������������������������� ���
�������������������� � �� ����������� � � ���
������������������������� � �� ���
��������������� ���
���������������������������������� ���
������������������������� ���
���������������������������������������
����������������������� ������������������
���� ����
�������� �����
���� ����
���������������������������������������������������������������������������������������
����������� ���������
��������������� ��������
�������������� �����
����������
���������������
���������������������
��������������������������� ������ ������ ������ ������� �����
�������������������� ���� ��������������� ������ ����������� ���
����������������������������� ���� ���� ����� ����� �������
�����
�����
�����
�����
������
������
������
������
������
������

VISUAL SOIL ASSESSMENT
2
soil
text
ure
Assessment
å Take a small sample of soil (half the size of your thumb) from the topsoil and a sample (or samples) that is (or are) representative of the subsoil.
ç Wet the soil with water, kneading and working it thoroughly on the palm of your hand with your thumb and forefinger to the point of maximum stickiness.
é Assess the texture of the soil according to the criteria given in Table 1 by attempting to mould the soil into a ball.
With experience, a person can assess the texture directly by estimating the percentages of sand, silt and clay by feel, and the textural class obtained by reference to the textural diagram (Figure 2).
There are occasions when the assignment of a textural score will need to be modified because of the nature of a textural qualifier. For example, if the soil has a reasonably high content of organic matter, i.e. is humic with 15–30 percent organic matter, raise the textural score by one (e.g. from 0 to 1 or from 1 to 2). If the soil has a significant gravelly or stony component, reduce the textural score by 0.5.
There are also occasions when the assignment of a textural score will need to be modified because of the specific preference of a crop for a particular textural class. For example, asparagus prefers a soil with a sandy loam texture and so the textural score is raised by 0.5 from a score of 1 to 1.5 based on the specific textural preference of the plant.
C
ImportanceISOIL TEXTURE defines the size of the mineral particles. Specifically, it refers to the relative proportion of the various size-groups in the soil, i.e. sand, silt and clay. Sand is that fraction that has a particle size >0.06 mm; silt varies between 0.06 and 0.002 mm; and the particle size of clay is <0.002 mm. Texture influences soil behaviour in several ways, notably through its effect on: water retention and availability; soil structure; aeration; drainage; soil workability and trafficability; soil life; and the supply and retention of nutrients.
A knowledge of both the textural class and potential rooting depth enables an approximate assessment of the total water-holding capacity of the soil, one of the major drivers of crop production.

VINEYARDS | OLIVE ORCHARDS | ORCHARDS | WHEAT | MAIZE | ANNUAL CROPS | PASTURE
3
FIGURE 2 Soil texture classes and groups
Textural classes.
Textural groups.
TABLE 1 How to score soil texture
Visual score(VS)
Textural class Description
2[Good]
Silt loamSmooth soapy feel, slightly sticky, no grittiness. Moulds into a cohesive ball that fissures when pressed flat.
1.5[Moderately good]
Clay loamVery smooth, sticky and plastic. Moulds into a cohesive ball that deforms without fissuring.
1[Moderate]
Sandy loam Slightly gritty, faint rasping sound. Moulds into a cohesive ball that fissures when pressed flat.
0.5[Moderately poor]
Loamy sandSilty clay
Clay
Loamy sand: Gritty and rasping sound. Will almost mould into a ball but disintegrates when pressed flat.Silty clay, clay: Very smooth, very sticky, very plastic. Moulds into a cohesive ball that deforms without fissuring.
0[Poor]
SandGritty and rasping sound. Cannot be moulded into a ball.

VISUAL SOIL ASSESSMENT
4
soil
stru
ctur
e
AssessmentC
ImportanceI
å Remove a 200-mm cube of topsoil with a spade (between or along wheel tracks).ç Drop the soil sample a maximum of three times from a height of 1 m onto the firm base
in the plastic basin. If large clods break away after the first or second drop, drop them individually again once or twice. If a clod shatters into small (primary structural) units after the first or second drop, it does not need dropping again. Do not drop any piece of soil more than three times. For soils with a sandy loam texture (Table 1), drop the cube of soil just once only from a height of 0.5 m.
é Transfer the soil onto the large plastic bag.è For soils with a loamy sand or sand texture, drop the cube of soil still sitting on the spade (once)
from a height of just 50 mm, and then roll the spade over, spilling the soil onto the plastic bag.ê Applying only very gently pressure, attempt to part each clod by hand along any exposed
cracks or fissures. If the clod does not part easily, do not apply further pressure (because the cracks and fissures are probably not continuous and, therefore, are unable to readily conduct oxygen, air and water).
ë Move the coarsest fractions to one end and the finest to the other end. Arrange the distribution of aggregates on the plastic bag so that the height of the soil is roughly the same over the whole surface area of the bag. This provides a measure of the aggregate-size distribution. Compare the resulting distribution of aggregates with the three photographs in Plate 2 and the criteria given.The method is valid for a wide range of moisture conditions but is best carried out when the soil is moist to slightly moist; avoid dry and wet conditions.
SOIL STRUCTURE is extremely important for arable cropping. It regulates:< soil aeration and gaseous exchange rates;< soil temperature;< soil infiltration and erosion;< the movement and storage of water;< nutrient supply;< root penetration and development;< soil workability;< soil trafficability;< the resistance of soils to structural degradation.
Good soil structure reduces the susceptibility to compaction under wheel traffic and increases the window of opportunity for vehicle access and for carrying out no-till, minimum-till or conventional cultivation between rows under optimal soil conditions.
Soil structure is ranked on the size, shape, firmness, porosity and relative abundance of soil aggregates and clods. Soils with good structure have friable, fine, porous, subangular and subrounded (nutty) aggregates. Those with poor structure have large, dense, very firm, angular or subangular blocky clods that fit and pack closely together and have a high tensile strength.

VINEYARDS | OLIVE ORCHARDS | ORCHARDS | WHEAT | MAIZE | ANNUAL CROPS | PASTURE
5
PLATE 2 How to score soil structure
GOOD CONDITION VS = 2Soil dominated by friable, fineaggregates with no significant clodding.Aggregates are generally subrounded(nutty) and often quite porous.
MODERATE CONDITION VS = 1Soil contains significant proportions(50%) of both coarse clods and friablefine aggregates. The coarse clods arefirm, subangular or angular in shape andhave few or no pores.
POOR CONDITION VS = 0Soil dominated by coarse clodswith very few finer aggregates. Thecoarse clods are very firm, angular orsubangular in shape and have very fewor no pores.

VISUAL SOIL ASSESSMENT
6
soil
poro
sity
AssessmentC
ImportanceI
å Remove a spade slice of soil (about 100 mm wide, 150 mm long and 200 mm deep) from the side of the hole and break it in half.
ç Examine the exposed fresh face of the sample for soil porosity by comparing against the three photographs in Plate 3. Look for the spaces, gaps, holes, cracks and fissures between and within soil aggregates and clods.
é Examine also the porosity of a number of the large clods from the soil structure test. This provides important additional information as to the porosity of the individual clods (the intra-aggregate porosity).
It is important to assess SOIL POROSITY along with the structure of the soil. Soil porosity, and particularly macroporosity (or large pores), influences the movement of air and water in the soil. Soils with good structure have a high porosity between and within aggregates, but soils with poor structure may not have macropores and coarse micropores within the large clods, restricting their drainage and aeration.
Poor aeration leads to the build up of carbon dioxide, methane and sulphide gases, and reduces the ability of plants to take up water and nutrients, particularly nitrogen (N), phosphorus (P), potassium (K) and sulphur (S). Plants can only utilize S and N in the oxygenated sulphate (SO
42-), nitrate (NO
3-) and ammonium (NH
4+) forms. Therefore,
plants require aerated soils for the efficient uptake and utilization of S and N. The number, activity and biodiversity of micro-organisms and earthworms are also greatest in well-aerated soils and they are able to decompose and cycle organic matter and nutrients more efficiently.
The presence of soil pores enables the development and proliferation of the superficial (or feeder) roots throughout the soil. Roots are unable to penetrate and grow through firm, tight, compacted soils, severely restricting the ability of the plant to utilize the available water and nutrients in the soil. A high penetration resistance not only limits plant uptake of water and nutrients, it also reduces fertilizer efficiency considerably and increases the susceptibility of the plant to root diseases.
Soils with good porosity will also tend to produce lower amounts of greenhouse gases. The greater the porosity, the better the drainage, and, therefore, the less likely it is that the soil pores will be water-filled to the critical levels required to accelerate the production of greenhouse gases. Aim to keep the soil porosity score above 1.

VINEYARDS | OLIVE ORCHARDS | ORCHARDS | WHEAT | MAIZE | ANNUAL CROPS | PASTURE
7
PLATE 3 How to score soil porosity
GOOD CONDITION VS = 2Soils have many macropores and coarsemicropores between and within aggregatesassociated with good soil structure.
MODERATE CONDITION VS = 1Soil macropores and coarse microporesbetween and within aggregates have declinedsignificantly but are present on closeexamination in parts of the soil. The soil showsa moderate amount of consolidation.
POOR CONDITION VS = 0No soil macropores and coarse microporesare visually apparent within compact,massive structureless clods. The clodsurface is smooth with few or no cracks orholes, and can have sharp angles.

VISUAL SOIL ASSESSMENT
8
soil
colo
ur AssessmentC
ImportanceI
å Compare the colour of a handful of soil from the field site with soil taken from under the nearest fenceline or a similar protected area.
ç Using the three photographs and criteria given (Plate 4), compare the relative change in soil colour that has occurred.
As topsoil colour can vary markedly between soil types, the photographs illustrate the degree of change in colour rather than the absolute colour of the soil.
SOIL COLOUR is a very useful indicator of soil quality because it can provide an indirect measure of other more useful properties of the soil that are not assessed so easily and accurately. In general, the darker the colour is, the greater is the amount of organic matter in the soil. A change in colour can give a general indication of a change in organic matter under a particular land use or management. Soil organic matter plays an important role in regulating most biological, chemical and physical processes in soil, which collectively determine soil health. It promotes infiltration and retention of water, helps to develop and stabilize soil structure, cushions the impact of wheel traffic and cultivators, reduces the potential for wind and water erosion, and indicates whether the soil is functioning as a carbon ‘sink’ or as a source of greenhouse gases. Organic matter also provides an important food resource for soil organisms and is an important source of, and major reservoir of, plant nutrients. Its decline reduces the fertility and nutrient-supplying potential of the soil; N, P, K and S requirements of crops increase markedly, and other major and minor elements are leached more readily. The result is an increased dependency on fertilizer input to maintain nutrient status.
Soil colour can also be a useful indicator of soil drainage and the degree of soil aeration. In addition to organic matter, soil colour is influenced markedly by the chemical form (or oxidation state) of iron (Fe) and manganese (Mn). Brown, yellow-brown, reddish-brown and red soils without mottles indicate well-aerated, well-drained conditions where Fe and Mn occur in the oxidized form of ferric (Fe3+) and manganic (Mn3+) oxides. Grey-blue colours can indicate that the soil is poorly drained or waterlogged and poorly aerated for long periods, conditions that reduce Fe and Mn to ferrous (Fe2+) and manganous (Mn2+) oxides. Poor aeration and prolonged waterlogging give rise to a further series of chemical and biochemical reduction reactions that produce toxins, such as hydrogen sulphide, carbon dioxide, methane, ethanol, acetaldehyde and ethylene, that damage the root system. This reduces the ability of plants to take up water and nutrients, causing poor vigour and ill-thrift. Decay and dieback of roots can also occur as a result of pests and diseases, including Rhizoctonia, Pythium and Fusarium root rot in soils prone to waterlogging.

VINEYARDS | OLIVE ORCHARDS | ORCHARDS | WHEAT | MAIZE | ANNUAL CROPS | PASTURE
9
PLATE 4 How to score soil colour
GOOD CONDITION VS = 2Dark coloured topsoil that is not toodissimilar to that under the fenceline.
MODERATE CONDITION VS = 1The colour of the topsoil is somewhatpaler than that under the fenceline, butnot markedly so.
POOR CONDITION VS = 0Soil colour has become significantly palercompared with that under the fenceline.

VISUAL SOIL ASSESSMENT
10
num
ber
and
colo
ur o
f soi
l mot
tles AssessmentC
ImportanceI
å Take a sample of soil (about 100 mm wide × 150 mm long × 200 mm deep) from the side of the hole and compare with the three photographs (Plate 5) and the percentage chart to determine the percentage of the soil occupied by mottles.
Mottles are spots or blotches of different colour interspersed with the dominant soil colour.
The NUMBER AND COLOUR OF SOIL MOTTLES provide a good indication of how well the soil is drained and how well it is aerated. They are also an early warning of a decline in soil structure caused by compaction under wheel traffic and overcultivation. The loss of soil structure reduces the number of channels and pores that conduct water and air and, as a consequence, can result in waterlogging and a deficiency of oxygen for a prolonged period. The development of anaerobic (deoxygenated) conditions reduces Fe and Mn from their brown/orange oxidized ferric (Fe3+) and manganic (Mn3+) form to grey ferrous (Fe2+) and manganous (Mn2+) oxides. Mottles develop as various shades of orange and grey owing to varying degrees of oxidation and reduction of Fe and Mn. As oxygen depletion increases, orange, and ultimately grey, mottles predominate. An abundance of grey mottles indicates the soil is poorly drained and poorly aerated for a significant part of the year. The presence of only common orange and grey mottles (10–25 percent) indicates the soil is imperfectly drained with only periodic waterlogging. Soil with only few to common orange mottles indicates the soil is moderately well drained, and the absence of mottles indicates good drainage.
Poor aeration reduces the uptake of water by plants and can induce wilting. It can also reduce the uptake of plant nutrients, particularly N, P, K, S and Cu. Moreover, poor aeration retards the breakdown of organic residues, and can cause chemical and biochemical reduction reactions that produce sulphide gases, methane, ethanol, acetaldehyde and ethylene, which are toxic to plant roots. In addition, decay and dieback of roots can occur as a result of fungal diseases such as Rhizoctonia, Pythium and Fusarium root rot, foot rot and crown rot in soils that are strongly mottled and poorly aerated. Fungal diseases and reduced nutrient and water uptake give rise to poor plant vigour and ill-thrift. If your visual score for mottles is ≤1, you need to aerate the soil.

VINEYARDS | OLIVE ORCHARDS | ORCHARDS | WHEAT | MAIZE | ANNUAL CROPS | PASTURE
11
PLATE 5 How to score soil mottles
GOOD CONDITION VS = 2Mottles are generally absent.
MODERATE CONDITION VS = 1Soil has common (10–25%) fine andmedium orange and grey mottles.
POOR CONDITION VS = 0Soil has abundant to profuse (>50%)medium and coarse orange and particularlygrey mottles.

VISUAL SOIL ASSESSMENT
12
eart
hwor
ms
AssessmentC
ImportanceI
å Count the earthworms by hand, sorting through the soil sample used to assess soil structure (Plate 7) and compare with the class limits in Table 2. Earthworms vary in size and number depending on the species and the season. Therefore, for year-to-year comparisons, earthworm counts must be made at the same time of year when soil moisture and temperature levels are good. Earthworm numbers are reported as the number per 200-mm cube of soil. Earthworm numbers are commonly reported on a square-metre basis. A 200-mm cube sample is equivalent to 1/25 m2, and so the number of earthworms needs to be multiplied by 25 to convert to numbers per square metre.
EARTHWORMS provide a good indicator of the biological health and condition of the soil because their population density and species are affected by soil properties and management practices. Through their burrowing, feeding, digestion and casting, earthworms have a major effect on the chemical, physical and biological properties of the soil. They shred and decompose plant residues, converting them to organic matter, and so releasing mineral nutrients. Compared with uningested soil, earthworm casts can contain 5 times as much plant available N, 3–7 times as much P, 11 times as much K, and 3 times as much Mg. They can also contain more Ca and plant-available Mo, and have a higher pH, organic matter and water content. Moreover, earthworms act as biological aerators and physical conditioners of the soil, improving:< soil porosity;< aeration;< soil structure and the stability of soil aggregates;< water retention;< water infiltration;< drainage.
They also reduce surface runoff and erosion. They further promote plant growth by secreting plant-growth hormones and increasing root density and root development by the rapid growth of roots down nutrient-enriched worm channels. While earthworms can deposit about 25–30 tonnes of casts/ha/year on the surface, 70 percent of their casts are deposited below the surface of the soil. Therefore, earthworms play an important role in cropping soils and can increase growth rates, crop yield and protein levels significantly.
Earthworms also increase the population, activity and diversity of soil microbes. Actinomycetes increase 6–7 times during the passage of soil through the digestive tract of the worm and, along with other microbes, play an important role in the decomposition of organic matter to humus. Soil microbes such as mycorrhizal fungi play a further role in the supply of nutrients, digesting soil and fertilizer and unlocking nutrients, such as P, that are fixed by the soil. Microbes also retain significant amounts of nutrients in their

VINEYARDS | OLIVE ORCHARDS | ORCHARDS | WHEAT | MAIZE | ANNUAL CROPS | PASTURE
13
biomass, releasing them when they die. Moreover, soil microbes produce plant-growth hormones and compounds that stimulate root growth and promote the structure, aeration, infiltration and water-holding capacity of the soil. Micro-organisms further encourage a lower incidence of pests and diseases. The collective benefits of microbes can increase crop production markedly while at the same time reducing fertilizer requirements.
Earthworm numbers (and biomass) are governed by the amount of food available as organic matter and soil microbes, as determined by the crops grown, the amount and quality of surface residues (Plate 6a), the use of cover crops and the method of tillage. Earthworm populations can be up to three times higher under no-tillage than conventional cultivation. Earthworm numbers are also governed by: soil moisture, temperature, texture, soil aeration, pH, soil nutrients (including levels of Ca), and the type and amount of fertilizer and N used. The overuse of acidifying salt-based fertilizers, anhydrous ammonia and ammonia-based products, and some insecticides and fungicides can further reduce earthworm numbers.
Soils should have a good diversity of earthworm species with a combination of: (i) surface feeders that live at or near the surface to breakdown plant residues and dung; (ii) topsoil-dwelling species that burrow, ingest and mix the top 200–300 mm of soil; and (iii) deep-burrowing species that pull down and mix plant litter and organic matter at depth.
Earthworms species can further indicate the overall condition of the soil. For example, significant numbers of yellow-tail earthworms (Octolasion cyaneum – Plate 6b) can indicate adverse soil conditions.
TABLE 2 Visual scores for earthworms
Visual score(VS)
Earthworm numbers(per 200-mm cube of soil)
2[Good]
> 30 (with preferably 3 or more species)
1[Moderate]
15–30 (with preferably 2 or more species)
0[Poor]
< 15 (with predominantly 1 species)
PLATE 7 Sample for assessing earthworms
PLATE 6 (a): earthworm casts under crop residue; (b): yellow-tail earthworm (Octolasion cyaneum)

VISUAL SOIL ASSESSMENT
14
pote
ntia
l roo
ting
dep
th
AssessmentC
ImportanceI
å Dig a hole to identify the depth to a limiting (restricting) layer where present (Plate 8), and compare with the class limits in Table 3. As the hole is being dug, note the presence of roots and old root channels, worm channels, cracks and fissures down which roots can extend. Note also whether there is an over-thickening of roots (a result of a high penetration resistance), and whether the roots are being forced to grow horizontally, otherwise known as right-angle syndrome. Moreover, note the firmness and tightness of the soil, whether the soil is grey and strongly gleyed owing to prolonged waterlogging, and whether there is a hardpan present such as a human-induced tillage or plough pan, or a natural pan such as an iron, siliceous or calcitic pan (pp 16–17). An abrupt transition from a fine (heavy) material to a coarse (sandy/gravelly) layer will also limit root development. A rough estimate of the potential rooting depth may be made by noting the above properties in a nearby road cutting or an open drain.
The POTENTIAL ROOTING DEPTH is the depth of soil that plant roots can potentially exploit before reaching a barrier to root growth, and it indicates the ability of the soil to provide a suitable rooting medium for plants. The greater is the rooting depth, the greater is the available-water-holding capacity of the soil. In drought periods, deep roots can access larger water reserves, thereby alleviating water stress and promoting the survival of non-irrigated crops. The exploration of a large volume of soil by deep roots means that they can also access more macronutrients and micronutrients, thereby accelerating the growth and enhancing the yield and quality of the crop. Conversely, soils with a restricted rooting depth caused by, for example, a layer with a high penetration resistance such as a compacted layer or a hardpan, restrict vertical root growth and development, causing roots to grow sideways. This limits plant uptake of water and nutrients, reduces fertilizer efficiency, increases leaching, and decreases yield. A high resistance to root penetration can also increase plant stress and the susceptibility of the plant to root diseases. Moreover, hardpans impede the movement of air, oxygen and water through the soil profile, the last increasing the susceptibility to waterlogging and erosion by rilling and sheet wash.
The potential rooting depth can be restricted further by:< an abrupt textural change;< pH;< aluminium (Al) toxicity;< nutrient deficiencies;< salinity;< sodicity;< a high or fluctuating water table;< low oxygen levels.

VINEYARDS | OLIVE ORCHARDS | ORCHARDS | WHEAT | MAIZE | ANNUAL CROPS | PASTURE
15
Anaerobic (anoxic) conditions caused by deoxygenation and prolonged waterlogging restrict the rooting depth as a result of the accumulation of toxic levels of hydrogen sulphide, ferrous sulphide, carbon dioxide, methane,
ethanol, acetaldehyde and ethylene, by-products of
chemical and biochemical reduction reactions.
Crops with a deep, vigorous root system help to raise soil organic matter levels and soil life at depth. The physical action of the roots and soil fauna and the glues they produce, promote soil structure, porosity, water storage, soil aeration and drainage at depth. A deep, dense root system provides huge scope for raising production while at the same time having significant environmental benefits. Crops are less reliant on frequent and high application rates of fertilizer and N to generate growth, and available nutrients are more likely to be taken up, so reducing losses by leaching into the environment.
PLATE 8 Hole dug to assess the potential rooting depth
The potential rooting depth extends tothe bottom of the arrow, below which thesoil is extremely firm and very tight withno roots or old root channels, no wormchannels and no cracks and fissures downwhich roots can extend.
TABLE 3 Visual scores for potential rooting depth
VSA score(VS)
Potential rooting depth(m)
2.0[Good]
> 0.8
1.5[Moderately good]
0.6–0.8
1.0[Moderate]
0.4–0.6
0.5[Moderately poor]
0.2–0.4
0[Poor]
< 0.2

16
VISUAL SOIL ASSESSMENT
Assessmentå Examine for the presence of a hardpan by rapidly jabbing the side of the soil profile
(that was dug to assess the potential rooting depth) with a knife, starting at the top and progressing systematically and quickly down to the bottom of the hole (Plate 9). Note how easy or difficult it is to jab the knife into the soil as you move rapidly down the profile. A strongly developed hardpan is very tight and extremely firm, and it has a high penetration resistance to the knife. Pay particular attention to the lower topsoil and upper subsoil where tillage pans and plough pans commonly occur if present (Plate 10).
ç Having identified the possible presence of a hardpan by a significant increase in penetration resistance to the point of a knife, gauge how strongly developed the hardpan is. Remove a large hand-sized sample and assess its structure, porosity and the number and colour of soil mottles (Plates 2, 3 and 5), and also look for the presence of roots. Compare with the photographs and criteria given in Plate 10.
PLATE 9 Using a knife to determine the presence or absence of a hardpan
Identifying the presence of a hardpan

VINEYARDS | OLIVE ORCHARDS | ORCHARDS | WHEAT | MAIZE | ANNUAL CROPS | PASTURE
17
PLATE 9 Using a knife to determine the presence or absence of a hardpan
PLATE 10 Identifying the presence of a hardpan
NO HARDPANThe soil has a low penetration resistanceto the knife. Roots, old root channels,worm channels, cracks and fissures may becommon. Topsoils are friable with a readilyapparent structure and have a soil porosityscore of ≥1.5.
MODERATELY DEVELOPED HARDPANThe soil has a moderate penetrationresistance to the knife. It is firm (hard)with a weakly apparent soil structure andhas a soil porosity score of 0.5–1. Thereare few roots and old root channels,few worm channels, and few cracksand fissures. The pan may have few tocommon orange and grey mottles. Notethe moderately developed tillage pan inthe lower half of the topsoil (arrowed).
STRONGLY DEVELOPED HARDPANThe soil has a high penetration resistanceto the knife. It is very tight, extremelyfirm (very hard) and massive (i.e. with noapparent soil structure) and has a soilporosity score of 0. There are no roots orold root channels, no worm channels orcracks or fissures. The pan may have manyorange and grey mottles. Note the stronglydeveloped tillage pan in the lower half ofthe topsoil (arrowed).

VISUAL SOIL ASSESSMENT
18
surf
ace
pond
ing
AssessmentC
ImportanceI
å Assess the degree of surface ponding (Plate 11) based on your observation or general recollection of the time ponded water took to disappear after a wet period during the spring, and compare with the class limits in Table 4.
SURFACE PONDING and the length of time water remains on the surface can indicate the rate of infiltration into and through the soil, a high water table, and the time the soil remains saturated. Prolonged waterlogging depletes oxygen in the soil causing anaerobic (anoxic) conditions that induce root stress, and restrict root respiration and the growth of roots. Roots need oxygen for respiration. They are most vulnerable to surface ponding and saturated soil conditions in the spring when plant roots and shoots are actively growing at a time when respiration and transpiration rates rise markedly and oxygen demands are high. They are also susceptible to ponding in the summer when transpiration rates are highest. Moreover, waterlogging causes the death of fine roots responsible for nutrient and water uptake. Reduced water uptake while the crop is transpiring actively causes leaf desiccation and the plant to wilt. Prolonged waterlogging also increases the likelihood of pests and diseases, including Rhizoctonia, Pythium and Fusarium root rot, and reduces the ability of roots to overcome the harmful effects of topsoil-resident pathogens. Plant stress induced by poor aeration and prolonged soil saturation can render crops less resistant to insect pest attack such as aphids, armyworm, cutworm and wireworm. Crops decline in vigour, have restricted spring growth (RSG) as evidenced by poor shoot and stunted growth, become discoloured and die.
Waterlogging and deoxygenation also results in a series of undesirable chemical and biochemical reduction reactions, the by-products of which are toxic to roots. Plant-available nitrate-nitrogen (NO
3-) is reduced by denitrification to nitrite (NO
2-) and nitrous
oxide (N2O), a potent greenhouse gas, and plant-available sulphate-sulphur (SO
42-) is
reduced to sulphide, including hydrogen sulphide (H2S), ferrous sulphide (FeS) and zinc
sulphide (ZnS). Iron is reduced to soluble ferrous (Fe2+) ions, and Mn to manganous (Mn2+) ions. Apart from the toxic products produced, the result is a reduction in the amount of plant-available N and S. Anaerobic respiration of micro-organisms also produces carbon dioxide and methane (also greenhouse gases), hydrogen gas, ethanol, acetaldehyde and ethylene, all of which inhibit root growth when accumulated in the soil. Unlike aerobic respiration, anaerobic respiration releases insufficient energy in the form of adenosine triphosphate (ATP) and adenylate energy charge (AEC) for microbial and root/shoot growth.

VINEYARDS | OLIVE ORCHARDS | ORCHARDS | WHEAT | MAIZE | ANNUAL CROPS | PASTURE
19
The tolerance of the root system to surface ponding and waterlogging is dependent on a number of factors, including the time of year and the type of crop. Tolerance of waterlogging is also dependent on: soil and air temperatures; soil type; the condition of the soil; fluctuating water tables; and the rate of onset and severity of anaerobiosis (or anoxia), a factor governed by the initial soil oxygen content and oxygen consumption rate.
Prolonged surface ponding makes the soil more susceptible to damage under wheel traffic, so reducing vehicle access. As a consequence, waterlogging can delay ground preparation and sowing dates significantly. Sowing can further be delayed because the seed bed is below the crop-specific critical temperature. Increases in the temperature of saturated soils can be delayed as long as water is evaporating.
PLATE 11 Surface ponding in a field
TABLE 4 Visual scores for surface ponding
VSA score(VS)
Surface ponding due to soil saturation
Number of daysof ponding *
Description
2[Good]
≤1No surface ponding of water evident after 1 day following heavy rainfall on soils that were at or near saturation.
1[Moderate]
2–4Moderate surface ponding occurs for 2–4 days after heavy rainfall on soils that were at or near saturation.
0[Poor]
>5Significant surface ponding occurs for longer than 5 days after heavy rainfall on soils that were at or near saturation.
* Assuming little or no air is trapped in the soil at the time of ponding.

VISUAL SOIL ASSESSMENT
20
surf
ace
crus
ting
and
sur
face
cov
er
AssessmentC
ImportanceI
å Observe the degree of surface crusting and surface cover and compare Plate 12 and the criteria given. Surface crusting is best assessed after wet spells followed by a period of drying, and before cultivation.
SURFACE CRUSTING reduces infiltration of water and water storage in the soil and increases runoff. Surface crusting also reduces aeration, causing anaerobic conditions, and prolongs water retention near the surface, which can hamper access by machinery for months. Crusting is most pronounced in fine-textured, poorly structured soils with a low aggregate stability and a dispersive clay mineralogy.
SURFACE COVER after harvesting and prior to canopy closure of the next crop helps to prevent crusting by minimizing the dispersion of the soil surface by rain or irrigation. It also helps to reduce crusting by intercepting the large rain droplets before they can strike and compact the soil surface. Vegetative cover and its root system return organic matter to the soil and promote soil life, including earthworm numbers and activity. The physical action of the roots and soil fauna and the glues they produce promote the development of soil structure, soil aeration and drainage and help to break up surface crusting. As a result, infiltration rates and the movement of water through the soil increase, decreasing runoff, soil erosion and the risk of flash flooding. Surface cover also reduces soil erosion by intercepting high impact raindrops, minimizing rain-splash and saltation. It further serves to act as a sponge, retaining rainwater long enough for it to infiltrate into the soil. Moreover, the root system reduces soil erosion by stabilizing the soil surface, holding the soil in place during heavy rainfall events. As a result, water quality downstream is improved with a lower sediment loading, nutrient and coliform content. The adoption of conservation tillage can reduce soil erosion by up to 90 percent and water runoff by up to 40 percent. The surface needs to have at least 70 percent cover in order to give good protection, while ≤30 percent cover provides poor protection. Surface cover also reduces the risk of wind erosion markedly.

VINEYARDS | OLIVE ORCHARDS | ORCHARDS | WHEAT | MAIZE | ANNUAL CROPS | PASTURE
21
PLATE 12 How to score surface crusting and surface cover
GOOD CONDITION VS = 2Little or no surface crusting is present; orsurface cover is ≥70%.
MODERATE CONDITION VS = 1Surface crusting is 2–3 mm thick and isbroken by signifi cant cracking; or surfacecover is >30% and <70%.
POOR CONDITION VS = 0Surface crusting is >5 mm thick and isvirtually continuous with little cracking;or surface cover is ≤30%.
Surface cover photos: courtesy of A. Leys

VISUAL SOIL ASSESSMENT
22
soil
eros
ion
AssessmentC
ImportanceI
å Assess the degree of soil erosion based on current visual evidence and on your knowledge of what the site looked like in the past relative to Plate 13.
SOIL EROSION reduces the productive potential of soils through nutrient losses, loss of organic matter, reduced potential rooting depth, and lower available-water-holding capacity. Soil erosion can also have significant off-site effects, including reduced water quality through increased sediment, nutrient and coliform loading in streams and rivers.
Overcultivation can cause considerable soil degradation associated with the loss of soil organic matter and soil structure. It can also develop surface crusting, tillage pans, and decrease infiltration and permeability of water through the soil profile (causing increased surface runoff ). If the soil surface is left unprotected on sloping ground, large quantities of soil can be water eroded by gullying, rilling and sheet wash. The cost of restoration, often requiring heavy machinery, can be prohibitively expensive.
The water erodibility of soil on sloping ground is governed by a number of factors including:< the percentage of vegetative cover on the soil surface;< the amount and intensity of rainfall;< the soil infiltration rate and permeability of water through the soil;< the slope and the nature of the underlying subsoil strata and bedrock.
The loss of organic matter and soil structure as a result of overcultivation can also give rise to significant soil loss by wind erosion of exposed ground.

VINEYARDS | OLIVE ORCHARDS | ORCHARDS | WHEAT | MAIZE | ANNUAL CROPS | PASTURE
23
PLATE 13 How to score soil erosion
GOOD CONDITION VS = 2Little or no water erosion. Topsoil depths inthe footslope areas are <150 mm deeperthan on the crest.Wind erosion is not a concern; only smalldust plumes emanate from the cultivatoron a windy day. Most wind-eroded material iscontained in the fi eld.
MODERATE CONDITION VS = 1Water erosion is a moderate concern witha signifi cant amount of rilling and sheeterosion. Topsoil depths in the footslopeareas are 150–300 mm greater than oncrests, and sediment input into drains/streams may be signifi cant.Wind erosion is of moderate concernwhere signifi cant dust plumes canemanate from the cultivator on windydays. A considerable amount of materialis blown off the fi eld but is containedwithin the farm.
POOR CONDITION VS = 0Water erosion is a major concern withsevere gullying, rilling and sheet erosionoccurring. Topsoils in footslope areas aremore than 300 mm deeper than on thecrests, and sediment input into drains/streams may be high.Wind erosion is a major concern. Largedust clouds can occur when cultivatingon windy days. A substantial amountof topsoil can be lost from the fi eld anddeposited elsewhere in the district.
Water erosion photos: courtesy of J. Quinton and A. Leys

24
VISUAL SOIL ASSESSMENT
Soil management of annual crops
Good soil management practices are needed in order to maintain optimal growth conditions for producing high crop yields, especially during the crucial periods of plant development. To achieve this, management practices need to maintain soil conditions that are good for plant growth, particularly aeration, temperature, nutrient and water supply. The soil needs to have a soil structure that promotes an effective root system that can maximize water and nutrient utilization. Good soil structure also promotes infiltration and movement of water into and through the soil, minimizing surface ponding, runoff and soil erosion.
Conservation tillage practices, including no-tillage and minimum tillage that incorporate the establishment of temporary cover crops and crop residues on the surface (Plates 14–16), provide soil management systems that conserve the environment, minimize the risk of soil degradation, enhance the resilience and quality of the soil, and reduce production costs. Conservation tillage protects the soil surface, reducing water runoff and soil erosion. It reduces wheel traffic, which lessens wheel traffic compaction and does not create tillage pans or plough pans. It improves soil trafficability and provides opportunities to optimize sowing time, being less dependent on climate conditions in spring and autumn. It improves soil physical characteristics, encourages soil life and biological activity (including earthworm numbers), and increases micro-organism biodiversity. Unlike conventional tillage, conservation tillage also enables the soil to retain a greater proportion of soil carbon sequestered from atmospheric carbon dioxide (CO
2), enabling the soil to act as a sink for CO
2. Consequently, soil
organic matter levels build up and, therefore, the potential to gain carbon credits. Moreover, conservation tillage uses smaller mounts of fossils fuels, generates lower greenhouse gas emissions and has a smaller ecological footprint on a region, thereby raising marketplace acceptance of produce.
On the other hand, conventional tillage can have a negative impact on the environment, with a greater food eco-footprint on a region and a country. It reduces the organic matter content of the soil by microbial oxidation, increases greenhouse gas emissions (including the release of 5–times more CO
2), and uses more fossil fuels (i.e., 6–times more consumption of fuel). It
degrades soil structure, increases soil erosion, and alters microflora and microfauna adversely by reducing both the number of species and their biomass. The fundamental difference between conventional tillage and conservation tillage is their relative environmental and economic sustainability. The long-term affects of conventional tillage are cumulatively negative whereas the long-term affects of conservation tillage are cumulatively positive.

VINEYARDS | OLIVE ORCHARDS | ORCHARDS | WHEAT | MAIZE | ANNUAL CROPS | PASTURE
25
PLATE 14 No-till drilling an annual crop into an erosion-prone field protected by herbicided pasture [BAKER NO-TILLAGE LTD]
PLATE 15 Strip-tillage planting of an annual crop protected by good residue cover
PLATE 16 Harvesting an annual grain crop followed immediately by no-till seeding the next crop into stubble [BAKER NO-TILLAGE LTD]

26
VISUAL SOIL ASSESSMENT
References
Shepherd, T. G., Stagnari, F., Pisante, M. and Benites, J. 2008. Visual Soil Assessment – Field guide for annual crops. FAO, Rome, Italy.

VISUAL SOIL ASSESSMENT
AnnualCrops
FI
EL
D
GU
ID
E9 7 8 9 2 5 1 0 5 9 4 1 8
TC/D/I0007E/1/02.08/1000
ISBN 978-92-5-105941-8
The present publication on Visual Soil Assessment is a practicalguide to carry out a quantitative soil analysis with reproduceable resultsusing only very simple tools. Besides soil parameters, also crop parametersfor assessing soil conditions are presented for some selected crops. TheVisual Soil Assessment manuals consist of a series of separate booklets forspecific crop groups, collected in a binder. The publication addressesscientists as well as field technicians and even farmers who want to analysetheir soil condition and observe changes over time.

VISUAL SOIL ASSESSMENT
OliveOrchards
FI
EL
D
GU
ID
E
9 7 8 9 2 5 1 0 5 9 4 1 8
TC/D/I0007E/1/02.08/1000
ISBN 978-92-5-105941-8
The present publication on Visual Soil Assessment is a practicalguide to carry out a quantitative soil analysis with reproduceable resultsusing only very simple tools. Besides soil parameters, also crop parametersfor assessing soil conditions are presented for some selected crops. TheVisual Soil Assessment manuals consist of a series of separate booklets forspecific crop groups, collected in a binder. The publication addressesscientists as well as field technicians and even farmers who want to analysetheir soil condition and observe changes over time.

VISUAL SOIL ASSESSMENT
OliveOrchards
FI
EL
D
GU
ID
E
Food and Agriculture Organization of the United NationsRome, 2008
Graham Shepherd, soil scientist,BioAgriNomics.com, New Zealand
Fabio Stagnari, assistant researcher,University of Teramo, Italy
Michele Pisante, professor,University of Teramo, Italy
José Benites, technical officer,Land and Water Development Division, FAO

Contents
The designations employed and the presentation of material in this informationproduct do not imply the expression of any opinion whatsoever on the partof the Food and Agriculture Organization of the United Nations (FAO) concerning thelegal or development status of any country, territory, city or area or of its authorities,or concerning the delimitation of its frontiers or boundaries. The mention of speciccompanies or products of manufacturers, whether or not these have been patented, doesnot imply that these have been endorsed or recommended by FAO in preference toothers of a similar nature that are not mentioned.
ISBN 978-92-5-105938-8
All rights reserved. Reproduction and dissemination of material in this informationproduct for educational or other non-commercial purposes are authorized withoutany prior written permission from the copyright holders provided the source is fullyacknowledged. Reproduction of material in this information product for resale or othercommercial purposes is prohibited without written permission of the copyright holders.Applications for such permission should be addressed to:ChiefElectronic Publishing Policy and Support BranchCommunication DivisionFAOViale delle Terme di Caracalla, 00153 Rome, Italyor by e-mail to:[email protected]
© FAO 2008

iii
VINEYARDS | OLIVE ORCHARDS | ORCHARDS | WHEAT | MAIZE | ANNUAL CROPS | PASTURE
Acknowledgements v
List of acronyms v
Visual Soil Assessment vi
SOIL TEXTURE 2
SOIL STRUCTURE 4
SOIL POROSITY 6
SOIL COLOUR 8
NUMBER AND COLOUR OF SOIL MOTTLES 10
EARTHWORMS 12
POTENTIAL ROOTING DEPTH 14Identifying the presence of a hardpan 16
SURFACE PONDING 18
SURFACE CRUSTING AND SURFACE COVER 20
SOIL EROSION 22
CANOPY VOLUME 26
CANOPY DENSITY 28
SHOOT LENGTH 30
FLOWERING 32
LEAF COLOUR 34
YIELD 36
VARIABILITY OF TREE PERFORMANCE ALONG THE ROW 38
SOIL MANAGEMENT IN OLIVE ORCHARDS 40
Contents

iv
VISUAL SOIL ASSESSMENT
1. How to score soil texture 32. Visual scores for earthworms 133. Visual scores for potential rooting depth 154. Visual scores for surface ponding 195. Visual scores for variability of tree performance along the row 38
Acknowledgements
List of acronyms
List of tables
List of figures
1. Soil scorecard – visual indicators for assessing soil quality in olive orchards 12. Soil texture classes and groups 33. Plant scorecard – visual indicators for assessing plant performance in olive orchards 25
1. The VSA tool kit vii2. How to score soil structure 53. How to score soil porosity 74. How to score soil colour 95. How to score soil mottles 116. Sample for assessing earthworms 137. Root system of an olive tree 158. Generic drawing of an olive tree 159. Using a knife to determine the presence or absence of a hardpan 1610. Identifying the presence of a hardpan 1711. Surface ponding in an olive orchard 1912. How to score surface crusting and surface cover 2113. How to score soil erosion 2314. How to score canopy volume 2715. How to score canopy density 2916. How to score shoot length 3117. How to score flowering 3318. How to score leaf colour 3519. How to score yield 3720. Effect of soil texture and available water on tree performance along the row 3921. Effect of soil aeration and drainage on tree performance along the row 39
List of plates

v
VINEYARDS | OLIVE ORCHARDS | ORCHARDS | WHEAT | MAIZE | ANNUAL CROPS | PASTURE
This publication is adapted from the methodology developed in: Shepherd, T.G. 2008. Visual Soil Assessment. Volume 1. Field guide for pastoral grazing and cropping on flat to rolling country. 2nd edition. Palmerston North, New Zealand, Horizons Regional Council. 106 pp.
The review of the manuscript and input provided by Professor P. Fiorino and Dr A. Lang are also gratefully acknowledged.
This publication is funded by FAO in collaboration with the Agronomy and Crop Science Research and Education Center of the University of Teramo.
Cover photograph: M. Pastor, CiFA-IFAPA.
Acknowledgements
List of acronyms
AEC Adenylate energy charge
Al Aluminium
ATP Adenosine triphosphate
B Boron
Ca Calcium
CO2 Carbon dioxide
Cu Copper
Fe Iron
K Potassium
Mg Magnesium
Mn Manganese
Mo Molybdenum
N Nitrogen
P Phosphorus
RSG Restricted spring growth
S Sulphur
VS Visual score
VSA Visual Soil Assessment
Zn Zinc

vi
VISUAL SOIL ASSESSMENT
IntroductionThe maintenance of good soil quality is vital for the environmental and economic sustainability of orchards. A decline in soil quality has a marked impact on tree growth, olive production and the character and quality of olive oil, production costs and the risk of soil erosion. Therefore, it can have significant consequences on society and the environment. A decline in soil physical properties in particular takes considerable time and cost to correct. Safeguarding soil resources for future generations and minimizing the ecological footprint of olive orchards are important tasks for land managers.
Often, not enough attention is given to:< the basic role of soil quality in efficient and sustained production;< the effect of the condition of the soil on the gross profit margin;< the long-term planning needed to sustain good soil quality;< the effect of land management decisions on soil quality.
Soil type and the effect of management on the condition of the soil are important determinants of the productive performance of olive orchards, and have profound effects on long-term profits. Land managers need tools that are reliable, quick and easy to use in order to help them assess the condition of their soils and their suitability for growing olives, and to make informed decisions that lead to sustainable land and environmental management. To this end, Visual Soil Assessment (VSA) provides a quick and simple method to assess soil condition and plant performance. It can also be used to assess the suitability and limitations of a soil for olives. Soils with good VSA scores will usually give the best production with the lowest establishment and operational costs.
The VSA methodVisual Soil Assessment is based on the visual assessment of key soil ‘state’ and plant performance indicators of soil quality, presented on a scorecard. Soil quality is ranked by assessment of the soil indicators alone. Plant indicators require knowledge of the growing history of the crop. This knowledge will facilitate the satisfactory and rapid completion of the plant scorecard. With the exception of soil texture, the soil and plant indicators are dynamic indicators, i.e. capable of changing under different management regimes and land-use pressures. Being sensitive to change, they are useful early warning indicators of changes in soil condition and plant performance and as such provide an effective monitoring tool.
Plant indicators allow you to make cause-and-effect links between management practices and soil characteristics. By looking at both the soil and plant indicators, VSA links the natural resource (soil) with plant performance and farm enterprise profitability. Because of this, the soil quality
Visual Soil Assessment

vii
VINEYARDS | OLIVE ORCHARDS | ORCHARDS | WHEAT | MAIZE | ANNUAL CROPS | PASTURE
assessment is not a combination of the ‘soil’ and ‘plant’ scores. Rather, the scores should be looked at separately, and compared.
Visual scoringEach indicator is given a visual score (VS) of 0 (poor), 1 (moderate), or 2 (good), based on the soil quality and plant performance observed when comparing the soil and plant with three photographs in the field guide manual. The scoring is flexible, so if the sample you are assessing does not align clearly with any one of the photographs but sits between two, an in-between score can be given, i.e. 0.5 or 1.5. Because some soil and plant indicators are relatively more important in the assessment of soil quality and plant performance than others, VSA provides a weighting factor of 1, 2 and 3. The total of the VS rankings gives the overall Soil Quality Index and Plant Performance Index for the site. Compare these with the rating scale at the bottom of the scorecard to determine whether your soil and plants are in good, moderate or poor condition.
Placing the soil and plant assessments side by side at the bottom of the plant indicator scorecard should prompt you to look for reasons if there is a significant discrepancy between the soil and plant indicators.
The VSA tool kitThe VSA tool kit (Plate 1) comprises:< a spade – to dig a soil pit and to take a
200-mm cube of soil for the drop shatter soil structure test;
< a plastic basin (about 450 mm long x 350 mm wide x 250 mm deep) – to contain the soil during the drop shatter test;
< a hard square board (about 260x260x20 mm) – to fit in the bottom of the plastic basin on to which the soil cube is dropped for the shatter test;
< a heavy-duty plastic bag (about 750x 500 mm) – on which to spread the soil, after the drop shatter test has been carried out;
< a knife (preferably 200 mm long) to investigate the soil pit and potential rooting depth;
< a water bottle – to assess the field soil textural class;< a tape measure – to measure the potential rooting depth;< a VSA field guide – to make the photographic comparisons;< a pad of scorecards – to record the VS for each indicator.
PLATE 1 The VSA tool kit

viii
VISUAL SOIL ASSESSMENT
The procedureWhen it should be carried outThe test should be carried out when the soils are moist and suitable for cultivation. If you are not sure, apply the ‘worm test’. Roll a worm of soil on the palm of one hand with the fingers of the other until it is 50 mm long and 4 mm thick. If the soil cracks before the worm is made, or if you cannot form a worm (for example, if the soil is sandy), the soil is suitable for testing. If you can make the worm, the soil is too wet to test.
Setting up
TimeAllow 25 minutes per site. For a representative assessment of soil quality, sample 4 sites over a 5-ha area.
Reference sampleTake a small sample of soil (about 100x50x150 mm deep) from under a nearby fence or a similar protected area. This provides an undisturbed sample required in order to assign the correct score for the soil colour indicator. The sample also provides a reference point for comparing soil structure and porosity.
SitesSelect sites that are representative of the orchard. The condition of the soil in olive orchards is site specific. Sample sites that have had little or no wheel traffic (e.g. near the olive tree). The VSA method can also be used to assess compacted areas by selecting to sample along wheel traffic lanes. Always record the position of the sites for future monitoring if required.
Site information
Complete the site information section at the top of the scorecard. Then record any special aspects you think relevant in the notes section at the bottom of the plant indicator scorecard.
Carrying out the test
Initial observationDig a small hole about 200x200 mm square by 300 mm deep with a spade and observe the topsoil (and upper subsoil if present) in terms of its uniformity, including whether it is soft and friable or hard and firm. A knife is useful to help you assess this.
Take the test sampleIf the topsoil appears uniform, dig out a 200-mm cube with the spade.You can sample whatever depth of soil you wish, but ensure that you sample the equivalent of a 200-mm cube of soil. If for example, the top 100 mm of the soil is compacted and you wish to assess its condition, dig out two samples of 200x200x100 mm with a spade. If the 100–200-mm depth is dominated by a tillage pan and you wish to assess its condition, remove the top 100 mm of soil and dig out two samples of 200x200x100 mm. Note that taking a 200-mm cube sample below the topsoil can also give valuable information about the condition of the subsoil and its implications for plant growth and farm management practices.

ix
VINEYARDS | OLIVE ORCHARDS | ORCHARDS | WHEAT | MAIZE | ANNUAL CROPS | PASTURE
The drop shatter testDrop the test sample a maximum of three times from a height of 1 m onto the wooden square in the plastic basin. The number of times the sample is dropped and the height it is dropped from, is dependent on the texture of the soil and the degree to which the soil breaks up, as described in the section on soil structure.
Systematically work through the scorecard, assigning a VS to each indicator by comparing it with the photographs (or table) and description reported in the field guide.
The plant indicatorsMany plant indicators cannot be assessed at the same time as the soil indicators. Ideally, the plant performance indicators should be observed at the appropriate time during the season. The plant indicators are scored and ranked in the same way as soil indicators: a weighting factor is used to indicate the relative importance of each indicator, with each contributing to the final determination of plant performance. The Plant Performance Index is the total of the individual VS rankings in the right-hand column.
Format of the bookletThe soil and plant scorecards are given in Figures 1 and 3, respectively, and list the key indicators required in order to assess soil quality and plant performance. Each indicator is described on the following pages, with a section on how to assess the indicator and an explanation of its importance and what it reveals about the condition of the soil and about plant performance.


1
VINEYARDS | OLIVE ORCHARDS | ORCHARDS | WHEAT | MAIZE | ANNUAL CROPS | PASTURE
��������������������������������
���������������������������������������������������������������������������
��������� ����������
������������ ���
�������������� ���
������������� ���
����������� ���
��������������������������������� ���
���
���
��������������� ���
���������������������������������� ���
������������������������� ���
���������������������������������������
����������������������� ������������������
���� ����
�������� �����
���� ����
�����������������������������������������������������������������������������������������
����������� ���������
��������������� ��������
�������������� �����
����������
���������������
���������������������
��������������������������� ������ ������ ������ ������� �����
�������������������� ���� ��������������� ������ ����������� ���
����������������������������� ���� ���� ����� ����� �������
�������������������� � �� ����������� � �
������������������������� � ��
�����
�����
�����
�����
������
������
������
������
������
������

2
VISUAL SOIL ASSESSMENTso
il te
xtur
e
Assessment
å Take a small sample of soil (half the size of your thumb) from the topsoil and a sample (or samples) that is (or are) representative of the subsoil.
ç Wet the soil with water, kneading and working it thoroughly on the palm of your hand with your thumb and forefinger to the point of maximum stickiness.
é Assess the texture of the soil according to the criteria given in Table 1 by attempting to mould the soil into a ball.
With experience, a person can assess the texture directly by estimating the percentages of sand, silt and clay by feel, and the textural class obtained by reference to the textural diagram (Figure 2).
There are occasions when the assignment of a textural score will need to be modified because of the nature of a textural qualifier. For example, if the soil has a reasonably high content of organic matter, i.e. is humic with 15–30 percent organic matter, raise the textural score by one (e.g. from 0 to 1 or from 1 to 2). If the soil has a significant gravelly or stony component, reduce the textural score by 0.5.
There are also occasions when the assignment of a textural score will need to be modified because of the specific preference of a crop for a particular textural class. For example, asparagus prefers a soil with a sandy loam texture and so the textural score is raised by 0.5 from a score of 1 to 1.5 based on the specific textural preference of the plant.
C
ImportanceISOIL TEXTURE defines the size of the mineral particles. Specifically, it refers to the relative proportion of the various size-groups in the soil, i.e. sand, silt and clay. Sand is that fraction that has a particle size >0.06 mm; silt varies between 0.06 and 0.002 mm; and the particle size of clay is <0.002 mm. Texture influences soil behaviour in several ways, notably through its effect on: water retention and availability; soil structure; aeration; drainage; soil trafficability; soil life; and the supply and retention of nutrients.
A knowledge of both the textural class and potential rooting depth enables an approximate assessment of the total water-holding capacity of the soil, one of the major drivers of crop production.

3
VINEYARDS | OLIVE ORCHARDS | ORCHARDS | WHEAT | MAIZE | ANNUAL CROPS | PASTURE
FIGURE 2 Soil texture classes and groups
Textural classes.
Textural groups.
TABLE 1 How to score soil texture
Visual score(VS)
Textural class Description
2[Good]
Silt loamSmooth soapy feel, slightly sticky, no grittiness. Moulds into a cohesive ball that fissures when pressed flat.
1.5[Moderately good]
Clay loamVery smooth, sticky and plastic. Moulds into a cohesive ball that deforms without fissuring.
1[Moderate]
Sandy loam Slightly gritty, faint rasping sound. Moulds into a cohesive ball that fissures when pressed flat.
0.5[Moderately poor]
Loamy sandSilty clay
Clay
Loamy sand: Gritty and rasping sound. Will almost mould into a ball but disintegrates when pressed flat.Silty clay, clay: Very smooth, very sticky, very plastic. Moulds into a cohesive ball that deforms without fissuring.
0[Poor]
SandGritty and rasping sound. Cannot be moulded into a ball.

4
VISUAL SOIL ASSESSMENTso
il st
ruct
ure
AssessmentC
ImportanceI
å Remove a 200-mm cube of topsoil with a spade (between or along wheel tracks).ç Drop the soil sample a maximum of three times from a height of 1 m onto the firm base
in the plastic basin. If large clods break away after the first or second drop, drop them individually again once or twice. If a clod shatters into small (primary structural) units after the first or second drop, it does not need dropping again. Do not drop any piece of soil more than three times. For soils with a sandy loam texture (Table 1), drop the cube of soil just once only from a height of 0.5 m.
é Transfer the soil onto the large plastic bag.è For soils with a loamy sand or sand texture, drop the cube of soil still sitting on the spade (once)
from a height of just 50 mm, and then roll the spade over, spilling the soil onto the plastic bag.ê Applying only very gently pressure, attempt to part each clod by hand along any exposed
cracks or fissures. If the clod does not part easily, do not apply further pressure (because the cracks and fissures are probably not continuous and, therefore, are unable to readily conduct oxygen, air and water).
ë Move the coarsest fractions to one end and the finest to the other end. Arrange the distribution of aggregates on the plastic bag so that the height of the soil is roughly the same over the whole surface area of the bag. This provides a measure of the aggregate-size distribution. Compare the resulting distribution of aggregates with the three photographs in Plate 2 and the criteria given.The method is valid for a wide range of moisture conditions but is best carried out when the soil is moist to slightly moist; avoid dry and wet conditions.
SOIL STRUCTURE is extremely important for olive orchards. It regulates:< soil aeration and gaseous exchange rates;< soil temperature;< soil infiltration and erosion;< the movement and storage of water;< nutrient supply;< root penetration and development;< soil workability;< soil trafficability;< the resistance of soils to structural degradation.
Good soil structure reduces the susceptibility to compaction under wheel traffic and increases the window of opportunity for vehicle access and for carrying out no-till, minimum-till or conventional cultivation between rows under optimal soil conditions.
Soil structure is ranked on the size, shape, firmness, porosity and relative abundance of soil aggregates and clods. Soils with good structure have friable, fine, porous, subangular and subrounded (nutty) aggregates. Those with poor structure have large, dense, very firm, angular or subangular blocky clods that fit and pack closely together and have a high tensile strength.

5
VINEYARDS | OLIVE ORCHARDS | ORCHARDS | WHEAT | MAIZE | ANNUAL CROPS | PASTURE
PLATE 2 How to score soil structure
GOOD CONDITION VS = 2Soil dominated by friable, fineaggregates with no significant clodding.Aggregates are generally subrounded(nutty) and often quite porous.
MODERATE CONDITION VS = 1Soil contains significant proportions(50%) of both coarse clods and friablefine aggregates. The coarse clods arefirm, subangular or angular in shape andhave few or no pores.
POOR CONDITION VS = 0Soil dominated by coarse clodswith very few finer aggregates. Thecoarse clods are very firm, angular orsubangular in shape and have very fewor no pores.

6
VISUAL SOIL ASSESSMENTso
il po
rosi
ty
AssessmentC
ImportanceI
å Remove a spade slice of soil (about 100 mm wide, 150 mm long and 200 mm deep) from the side of the hole and break it in half.
ç Examine the exposed fresh face of the sample for soil porosity by comparing against the three photographs in Plate 3. Look for the spaces, gaps, holes, cracks and fissures between and within soil aggregates and clods.
é Examine also the porosity of a number of the large clods from the soil structure test. This provides important additional information as to the porosity of the individual clods (the intra-aggregate porosity).
It is important to assess SOIL POROSITY along with the structure of the soil. Soil porosity, and particularly macroporosity (or large pores), influences the movement of air and water in the soil. Soils with good structure have a high porosity between and within aggregates, but soils with poor structure may not have macropores and coarse micropores within the large clods, restricting their drainage and aeration.
Poor aeration leads to the build up of carbon dioxide, methane and sulphide gases, and reduces the ability of plants to take up water and nutrients, particularly nitrogen (N), phosphorus (P), potassium (K) and sulphur (S). Plants can only utilize S and N in the oxygenated sulphate (SO
42-), nitrate (NO
3-) and ammonium (NH
4+) forms. Therefore,
plants require aerated soils for the efficient uptake and utilization of S and N. The number, activity and biodiversity of micro-organisms and earthworms are also greatest in well-aerated soils and they are able to decompose and cycle organic matter and nutrients more efficiently.
The presence of soil pores enables the development and proliferation of the superficial (or feeder) roots throughout the soil. Roots are unable to penetrate and grow through firm, tight, compacted soils, severely restricting the ability of the plant to utilize the available water and nutrients in the soil. A high penetration resistance not only limits plant uptake of water and nutrients, it also reduces fertilizer efficiency considerably and increases the susceptibility of the plant to root diseases.
Soils with good porosity will also tend to produce lower amounts of greenhouse gases. The greater the porosity, the better the drainage, and, therefore, the less likely it is that the soil pores will be water-filled to the critical levels required to accelerate the production of greenhouse gases. Aim to keep the soil porosity score above 1.

7
VINEYARDS | OLIVE ORCHARDS | ORCHARDS | WHEAT | MAIZE | ANNUAL CROPS | PASTURE
PLATE 3 How to score soil porosity
GOOD CONDITION VS = 2Soils have many macropores and coarsemicropores between and within aggregatesassociated with good soil structure.
MODERATE CONDITION VS = 1Soil macropores and coarse microporesbetween and within aggregates have declinedsignificantly but are present on closeexamination in parts of the soil. The soil showsa moderate amount of consolidation.
POOR CONDITION VS = 0No soil macropores and coarse microporesare visually apparent within compact,massive structureless clods. The clodsurface is smooth with few or no cracks orholes, and can have sharp angles.

8
VISUAL SOIL ASSESSMENTso
il co
lour AssessmentC
ImportanceI
å Compare the colour of a handful of soil from the field site with soil taken from under the nearest fenceline or a similar protected area.
ç Using the three photographs and criteria given (Plate 4), compare the relative change in soil colour that has occurred.
As topsoil colour can vary markedly between soil types, the photographs illustrate the degree of change in colour rather than the absolute colour of the soil.
SOIL COLOUR is a very useful indicator of soil quality because it can provide an indirect measure of other more useful properties of the soil that are not assessed so easily and accurately. In general, the darker the colour is, the greater is the amount of organic matter in the soil. A change in colour can give a general indication of a change in organic matter under a particular land use or management. Soil organic matter plays an important role in regulating most biological, chemical and physical processes in soil, which collectively determine soil health. It promotes infiltration and retention of water, helps to develop and stabilize soil structure, cushions the impact of wheel traffic and cultivators, reduces the potential for wind and water erosion, and maintains the soil carbon ‘sink’. Organic matter also provides an important food resource for soil organisms and is an important source of, and major reservoir of, plant nutrients. Its decline reduces the fertility and nutrient-supplying potential of the soil; N, P, K and S requirements of trees increase markedly, and other major and minor elements are leached more readily. The result is an increased dependency on fertilizer input to maintain nutrient status.
Soil colour can also be a useful indicator of soil drainage and the degree of soil aeration. In addition to organic matter, soil colour is influenced markedly by the chemical form (or oxidation state) of iron (Fe) and manganese (Mn). Brown, yellow-brown, reddish-brown and red soils without mottles indicate well-aerated, well-drained conditions where Fe and Mn occur in the oxidized form of ferric (Fe3+) and manganic (Mn3+) oxides. Grey-blue colours can indicate that the soil is poorly drained or waterlogged and poorly aerated for long periods, conditions that reduce Fe and Mn to ferrous (Fe2+) and manganous (Mn2+) oxides. Poor aeration and prolonged waterlogging give rise to a further series of chemical and biochemical reduction reactions that produce toxins, such as hydrogen sulphide, methane, ethanol, acetaldehyde and ethylene, that damage the root system. This reduces the ability of plants to take up water and nutrients, causing poor vigour and ill-thrift. Decay and dieback of roots can also occur as a result of fungal diseases such as Phytophthora root and crown rot in soils prone to waterlogging. Trees exhibit reduced growth, have thin canopies, and eventually die.

9
VINEYARDS | OLIVE ORCHARDS | ORCHARDS | WHEAT | MAIZE | ANNUAL CROPS | PASTURE
PLATE 4 How to score soil colour
GOOD CONDITION VS = 2Dark coloured topsoil that is not toodissimilar to that under the fenceline.
MODERATE CONDITION VS = 1The colour of the topsoil is somewhatpaler than that under the fenceline, butnot markedly so.
POOR CONDITION VS = 0Soil colour has become significantly palercompared with that under the fenceline.

10
VISUAL SOIL ASSESSMENTnu
mbe
r an
d co
lour
of s
oil m
ottl
es AssessmentC
ImportanceI
å Take a sample of soil (about 100 mm wide × 150 mm long × 200 mm deep) from the side of the hole and compare with the three photographs (Plate 5) and the percentage chart to determine the percentage of the soil occupied by mottles.
Mottles are spots or blotches of different colour interspersed with the dominant soil colour.
The NUMBER AND COLOUR OF SOIL MOTTLES provide a good indication of how well the soil is drained and how well it is aerated. They are also an early warning of a decline in soil structure caused by compaction under wheel traffic and overcultivation. The loss of soil structure decreases and blocks the number of channels and pores that conduct water and air and, as a consequence, can result in waterlogging and a deficiency of oxygen for a prolonged period. The development of anaerobic (deoxygenated) conditions reduces Fe and Mn from their brown/orange oxidized ferric (Fe3+) and manganic (Mn3+) form to grey ferrous (Fe2+) and manganous (Mn2+) oxides. Mottles develop as various shades of orange and grey owing to varying degrees of oxidation and reduction of Fe and Mn. As oxygen depletion increases, orange, and ultimately grey, mottles predominate. An abundance of grey mottles indicates the soil is poorly drained and poorly aerated for a significant part of the year. The presence of only common orange and grey mottles (10–25 percent) indicates the soil is imperfectly drained with only periodic waterlogging. Soil with only few to common orange mottles indicates the soil is moderately well drained, and the absence of mottles indicates good drainage.
Poor aeration reduces the uptake of water by plants and can induce wilting. It can also reduce the uptake of plant nutrients, particularly N, P, K and S. Moreover, poor aeration retards the breakdown of organic residues, and can cause chemical and biochemical reduction reactions that produce sulphide gases, methane, ethanol, acetaldehyde and ethylene, which are toxic to plant roots. Decay and dieback of roots can also occur as a result of fungal diseases such as Phytophthora root and crown rot in strongly mottled, poorly aerated soils. Root rot and reduced nutrient and water uptake give rise to poor plant vigour and ill-thrift. Trees exhibit reduced growth, have thin canopies, and eventually die. If your visual score for mottles is ≤1, you need to aerate the soil.

11
VINEYARDS | OLIVE ORCHARDS | ORCHARDS | WHEAT | MAIZE | ANNUAL CROPS | PASTURE
PLATE 5 How to score soil mottles
GOOD CONDITION VS = 2Mottles are generally absent.
MODERATE CONDITION VS = 1Soil has common (10–25%) fine andmedium orange and grey mottles.
POOR CONDITION VS = 0Soil has abundant to profuse (>50%)medium and coarse orange and particularlygrey mottles.

12
VISUAL SOIL ASSESSMENTea
rthw
orm
s
AssessmentC
ImportanceI
å Count the earthworms by hand, sorting through the soil sample used to assess soil structure (Plate 6) and compare with the class limits in Table 2. Earthworms vary in size and number depending on the species and the season. Therefore, for year-to-year comparisons, earthworm counts must be made at the same time of year when soil moisture and temperature levels are good. Earthworm numbers are reported as the number per 200-mm cube of soil. Earthworm numbers are commonly reported on a square-metre basis. A 200-mm cube sample is equivalent to 1/25 m2, and so the number of earthworms needs to be multiplied by 25 to convert to numbers per square metre.
EARTHWORMS provide a good indicator of the biological health and condition of the soil because their population density and species are affected by soil properties and management practices. Through their burrowing, feeding, digestion and casting, earthworms have a major effect on the chemical, physical and biological properties of the soil. They shred and decompose plant residues, converting them to organic matter, and so releasing mineral nutrients. Compared with uningested soil, earthworm casts can contain 5 times as much plant available N, 3–7 times as much P, 11 times as much K, and 3 times as much Mg. They can also contain more Ca and plant-available Mo, and have a higher pH, organic matter and water content. Moreover, earthworms act as biological aerators and physical conditioners of the soil, improving:< soil porosity;< aeration;< soil structure and the stability of soil aggregates;< water retention;< water infiltration;< drainage.
They also reduce surface runoff and erosion. They further promote plant growth by secreting plant-growth hormones and increasing root density and root development by the rapid growth of roots down nutrient-enriched worm channels. While earthworms can deposit about 25–30 tonnes of casts/ha/year on the surface, 70 percent of their casts are deposited below the surface of the soil. Therefore, earthworms play an important role in olive orchards and can increase growth rates and production significantly.
Earthworms also increase the population, activity and diversity of soil microbes. Actinomycetes increase 6–7 times during the passage of soil through the digestive tract of the worm and, along with other microbes, play an important role in the decomposition of organic matter to humus. Soil microbes such as mycorrhizal fungi play a further role in

13
VINEYARDS | OLIVE ORCHARDS | ORCHARDS | WHEAT | MAIZE | ANNUAL CROPS | PASTURE
the supply of nutrients, digesting soil and fertilizer and unlocking nutrients, such as P, that are fixed by the soil. Microbes also retain significant amounts of nutrients in their biomass, releasing them when they die. Moreover, soil microbes produce plant-growth hormones and compounds that stimulate root growth and promote the structure, aeration, infiltration and water-holding capacity of the soil. Micro-organisms further encourage a lower incidence of pests and diseases. The collective benefits of microbes reduce fertilizer requirements and improve trees and olive production.
Earthworm numbers (and biomass) are governed by the amount of food available as organic matter and soil microbes, as determined by the amount and quality of surface residue, the use of cover crops including legumes, and the cultivation of interrows. Earthworm populations can be up to three times higher in undisturbed soils compared with cultivated soils. Earthworm numbers are also governed by: soil moisture, temperature, texture, soil aeration, pH, soil nutrients (including levels of Ca), and the type and amount of fertilizer and N used. The overuse of acidifying salt-based fertilizers, anhydrous ammonia and ammonia-based products, and some insecticides and fungicides can further reduce earthworm numbers.
Soils should have a good diversity of earthworm species with a combination of: (i) surface feeders that live at or near the surface to breakdown plant residues and dung; (ii) topsoil-dwelling species that burrow, ingest and mix the top 200–300 mm of soil; and (iii) deep-burrowing species that pull down and mix plant litter and organic matter at depth.
PLATE 6 Sample for assessing earthworms
TABLE 2 Visual scores for earthworms
Visual score(VS)
Earthworm numbers(per 200-mm cube of soil)
2[Good]
> 30 (with preferably 3 or more species)
1[Moderate]
15–30 (with preferably 2 or more species)
0[Poor]
< 15 (with predominantly 1 species)

14
VISUAL SOIL ASSESSMENTpo
tent
ial r
ooti
ng d
epth
AssessmentC
ImportanceI
å Dig a hole to identify the depth to a limiting (restricting) layer where present, and compare with the class limits in Table 3. As the hole is being dug, note the presence of roots (Plates 7 and 8) and old root channels, worm channels, cracks and fissures down which roots can extend. Note also the firmness and tightness of the soil, whether the soil is grey and strongly gleyed owing to prolonged waterlogging, and whether there is a hardpan present such as a human-induced tillage or plough pan, or a natural pan such as an iron, siliceous or calcitic pan. An abrupt transition from a fine (heavy) material to a coarse (sandy/gravelly) layer will also limit root development. A rough estimate of the potential rooting depth may be made by noting the above properties in a nearby road cutting, gully, slip, earth slump or an open drain.
The POTENTIAL ROOTING DEPTH is the depth of soil that plant roots can potentially exploit before reaching a barrier to root growth, and it indicates the ability of the soil to provide a suitable rooting medium for plants. The greater is the rooting depth, the greater is the available-water-holding capacity of the soil. In drought periods, deep roots can access larger water reserves, thereby alleviating water stress and promoting the survival of non-irrigated olive orchards. The exploration of a large volume of soil by deep roots means that they can also access more macronutrients and micronutrients, thereby accelerating the growth and enhancing the yield and quality of the olives. Conversely, soils with a restricted rooting depth caused by, for example, a layer with a high penetration resistance such as a compacted layer or a hardpan, restrict vertical root growth and development, causing roots to grow sideways. This limits plant uptake of water and nutrients, reduces fertilizer efficiency, increases leaching, and decreases crop yield. A high resistance to root penetration can also increase plant stress and the susceptibility of the plant to root diseases. Moreover, hardpans impede the movement of air, oxygen and water through the soil profile, the last increasing the susceptibility to waterlogging and erosion by rilling and sheet wash.
The potential rooting depth can be restricted further by:< an abrupt textural change;< pH;< aluminium (Al) toxicity;< nutrient deficiencies;< salinity;< sodicity;< a high or fluctuating water table;< low oxygen levels.

15
VINEYARDS | OLIVE ORCHARDS | ORCHARDS | WHEAT | MAIZE | ANNUAL CROPS | PASTURE
Anaerobic (anoxic) conditions caused by deoxygenation and prolonged waterlogging restrict the rooting depth as a result of the accumulation of toxic levels of hydrogen sulphide, ferrous sulphide, carbon dioxide, methane,
ethanol, acetaldehyde and ethylene, by-products of
chemical and biochemical reduction reactions.
Olive trees with a deep, dense, vigorous root system raise soil organic matter levels and soil life at depth. The physical action of the roots and soil fauna and the glues they produce promote soil structure, porosity, water storage, soil aeration and drainage at depth. The soil depth should preferably not be less than 600 mm. Heavy clay soils are not recommended. Stony soils are acceptable under artificial irrigation. Furthermore, olive trees need a sufficient rooting depth to provide adequate anchorage for the trees at maturity.
PLATE 7 Root system of an olive tree
TABLE 3 Visual scores for potential rooting depth
VSA score(VS)
Potential rooting depth(m)
2.0[Good]
> 0.8
1.5[Moderately good]
0.6–0.8
1.0[Moderate]
0.4–0.6
0.5[Moderately poor]
0.2–0.4
0[Poor]
< 0.2
PLATE 8 Generic drawing of an olive tree [L. DRAZETA and A. LANG]

16
VISUAL SOIL ASSESSMENT
Assessmentå Examine for the presence of a hardpan by rapidly jabbing the side of the soil profile
(that was dug to assess the potential rooting depth) with a knife, starting at the top and progressing systematically and quickly down to the bottom of the hole (Plate 9). Note how easy or difficult it is to jab the knife into the soil as you move rapidly down the profile. A strongly developed hardpan is very tight and extremely firm, and it has a high penetration resistance to the knife. Pay particular attention to the lower topsoil and upper subsoil where tillage pans and plough pans commonly occur if present (Plate 10).
ç Having identified the possible presence of a hardpan by a significant increase in penetration resistance to the point of a knife, gauge how strongly developed the hardpan is. Remove a large hand-sized sample and assess its structure, porosity and the number and colour of soil mottles (Plates 2, 3 and 5), and also look for the presence of roots. Compare with the photographs and criteria given Plate 10.
PLATE 9 Using a knife to determine the presence or absence of a hardpan
Identifying the presence of a hardpan

17
VINEYARDS | OLIVE ORCHARDS | ORCHARDS | WHEAT | MAIZE | ANNUAL CROPS | PASTURE
PLATE 9 Using a knife to determine the presence or absence of a hardpan
PLATE 10 Identifying the presence of a hardpan
NO HARDPANThe soil has a low penetration resistanceto the knife. Roots, old root channels,worm channels, cracks and fissures may becommon. Topsoils are friable with a readilyapparent structure and have a soil porosityscore of ≥1.5.
MODERATELY DEVELOPED HARDPANThe soil has a moderate penetrationresistance to the knife. It is firm (hard)with a weakly apparent soil structure andhas a soil porosity score of 0.5–1. Thereare few roots and old root channels,few worm channels, and few cracksand fissures. The pan may have few tocommon orange and grey mottles. Notethe moderately developed tillage pan inthe lower half of the topsoil (arrowed).
STRONGLY DEVELOPED HARDPANThe soil has a high penetration resistanceto the knife. It is very tight, extremelyfirm (very hard) and massive (i.e. with noapparent soil structure) and has a soilporosity score of 0. There are no roots orold root channels, no worm channels orcracks or fissures. The pan may have manyorange and grey mottles. Note the stronglydeveloped tillage pan in the lower half ofthe topsoil (arrowed).

18
VISUAL SOIL ASSESSMENTsu
rfac
e po
ndin
g
AssessmentC
ImportanceI
å Assess the degree of surface ponding (Plate 11) based on your observation or general recollection of the time ponded water took to disappear after a wet period during the spring, and compare with the class limits in Table 4.
SURFACE PONDING and the length of time water remains on the surface can indicate the rate of infiltration into and through the soil, a high water table, and the time the soil remains saturated. Olive trees generally require free-draining soils. Prolonged waterlogging depletes oxygen in the soil causing anaerobic (anoxic) conditions that induce root stress, and restrict root respiration and the growth and development of roots. Roots need oxygen for respiration. While olive trees transpire all year round and do not have a dormant period, they are most vulnerable to surface ponding and saturated soil conditions in the spring when plant roots and shoots are growing actively at a time when respiration and transpiration rates rise markedly and oxygen demands are high. They are also susceptible to ponding in the summer when transpiration rates are highest. Moreover, waterlogging cause the death of fine roots responsible for nutrient and water uptake. Reduced water uptake while the tree is transpiring actively causes leaf desiccation and tip-burn. Prolonged waterlogging also increases the likelihood of infections and fungal diseases such as Phytophthora root rot and crown rot, and reduces the ability of roots to overcome the harmful effects of topsoil-resident pathogens. Trees decline in vigour, have restricted spring growth (RSG) as evidenced by poor shoot and stunted growth, have thin canopies, and eventually die.
Waterlogging and deoxygenation also results in a series of undesirable chemical and biochemical reduction reactions, the by-products of which are toxic to roots. Plant-available nitrate-nitrogen (NO
3-) is reduced by denitrification to nitrite (NO
2-) and nitrous
oxide (N2O), a potent greenhouse gas, and plant-available sulphate-sulphur (SO
42-) is
reduced to sulphide, including hydrogen sulphide (H2S), ferrous sulphide (FeS) and zinc
sulphide (ZnS). Iron is reduced to soluble ferrous (Fe2+) ions, and Mn to manganous (Mn2+) ions. Apart from the toxic products produced, the result is a reduction in the amount of plant-available N and S. Anaerobic respiration of micro-organisms also produces carbon dioxide and methane (also greenhouse gases), hydrogen gas, ethanol, acetaldehyde and ethylene, all of which inhibit root growth when accumulated in the soil. Unlike aerobic respiration, anaerobic respiration releases insufficient energy in the form of adenosine triphosphate (ATP) and adenylate energy charge (AEC) for microbial and root/shoot growth.

19
VINEYARDS | OLIVE ORCHARDS | ORCHARDS | WHEAT | MAIZE | ANNUAL CROPS | PASTURE
The tolerance of olive trees to waterlogging is dependent on a number of factors, including the time of year, the rootstock, soil and air temperatures, soil type, the condition of the soil, fluctuating water tables and the rate of onset and severity of anaerobiosis (or anoxia), a factor governed by the amount of entrapped air and the oxygen consumption rate by plant roots.
Prolonged surface ponding increases the susceptibility of soils to damage under wheel traffic, so reducing vehicle access.
PLATE 11 Surface ponding in an olive orchard [J. GOMEZ]
TABLE 4 Visual scores for surface ponding
VSA score(VS)
Surface ponding due to soil saturation
Number of daysof ponding *
Description
2[Good]
≤ 1No evidence of surface ponding after 1 day following heavy rainfall on soils that were already at or near saturation.
1[Moderate]
2–4Moderate surface ponding occurs for 1–3 days after heavy rainfall on soils that were already at or near saturation.
0[Poor]
> 5Significant surface ponding occurs for longer than 3 days after heavy rainfall on soils that were already at or near saturation.
* Assuming little or no air is trapped in the soil at the time of ponding.

20
VISUAL SOIL ASSESSMENTsu
rfac
e cr
usti
ng a
nd s
urfa
ce c
over
AssessmentC
ImportanceI
å Observe the degree of surface crusting and surface cover and compare with Plate 12 and the criteria given. Surface crusting is best assessed after wet spells followed by a period of drying, and before cultivation.
SURFACE CRUSTING reduces infiltration of water and water storage in the soil and increases runoff. Surface crusting also reduces aeration, causing anaerobic conditions, and prolongs water retention near the surface, which can hamper access by machinery for months. Crusting is most pronounced in fine-textured, poorly structured soils with a low aggregate stability and a dispersive clay mineralogy.
SURFACE COVER helps to prevent crusting by minimizing the dispersion of the soil surface by rain or irrigation. It also helps to reduce crusting by intercepting the large rain droplets before they can strike and compact the soil surface. Vegetative cover and its root system return organic matter to the soil and promote soil life, including earthworm numbers and activity. The physical action of the roots and soil fauna and the glues they produce promote the development of soil structure, soil aeration and drainage and help to break up surface crusting. As a result, infiltration rates and the movement of water through the soil increase, decreasing runoff, soil erosion and the risk of flash flooding. Surface cover also reduces soil erosion by intercepting high impact raindrops, minimizing rain-splash and saltation. It further serves to act as a sponge, retaining rainwater long enough for it to infiltrate into the soil. Moreover, the root system reduces soil erosion by stabilizing the soil surface, holding the soil in place during heavy rainfall events. As a result, water quality downstream is improved with a lower sediment loading, nutrient and coliform content. The adoption of managed cover crops has in some cases reduced sediment erosion rates from 70 tonnes/ha to 1.5 tonnes/ha during single large rainfall events. The surface needs to have at least 70 percent cover in order to give good protection, while ≤30 percent cover provides poor protection. Surface cover also reduces the risk of wind erosion markedly.

21
VINEYARDS | OLIVE ORCHARDS | ORCHARDS | WHEAT | MAIZE | ANNUAL CROPS | PASTURE
PLATE 12 How to score surface crusting and surface cover
GOOD CONDITION VS = 2Little or no surface crusting is present; orsurface cover is ≥70%.
MODERATE CONDITION VS = 1Surface crusting is 2–3 mm thick and isbroken by signifi cant cracking; or surfacecover is >30% and <70%.
POOR CONDITION VS = 0Surface crusting is >5 mm thick and isvirtually continuous with little cracking;or surface cover is ≤30%.
Photos of surface cover: courtesy of A. Leys

22
VISUAL SOIL ASSESSMENTso
il er
osio
n
AssessmentC
ImportanceI
å Assess the degree of soil erosion based on current visual evidence and, more importantly, on your knowledge of what the site looked like in the past relative to Plate 13.
SOIL EROSION reduces the productive potential of an olive orchard through nutrient losses, loss of organic matter, reduced potential rooting depth, and lower available-water-holding capacity. Soil erosion can also have significant off-site effects, including reduced water quality through increased sediment, nutrient and coliform loading in streams and rivers.
Overcultivation of interrows can cause considerable soil degradation associated with the loss of soil organic matter and soil structure. It can also develop surface crusting, tillage pans, and decrease infiltration and permeability of water through the soil profile (causing increased surface runoff ). If the soil surface is left unprotected on sloping ground, large quantities of soil can be removed by slips, flows, gullying and rilling, or it can be relocated semi-intact by slumping. The cost of restoration, often requiring heavy machinery, can be prohibitively expensive.
The water erodibility of soil on sloping ground is governed by a number of factors including:< the percentage of vegetative cover on the soil surface;< the amount and intensity of rainfall;< the soil infiltration rate and permeability;< the slope and the nature of the underlying subsoil strata and bedrock.
The loss of organic matter and soil structure as a result of overcultivation between rows can also give rise to significant soil loss by wind erosion of exposed ground where the tree spacing is quite large.

23
VINEYARDS | OLIVE ORCHARDS | ORCHARDS | WHEAT | MAIZE | ANNUAL CROPS | PASTURE
PLATE 13 How to score soil erosion
GOOD CONDITION VS = 2Little or no evidence of soil erosion. Little difference in height between the mounded row and interrow. The root system is completely covered.
MODERATE CONDITION VS = 1Moderate soil erosion with a significant difference in height between the interrow and the soil around the base of the tree trunk. Part of the upper root system is occasionally exposed.
POOR CONDITION VS = 0Severe soil erosion with deeply incised gullies or other mass movement features between rows. There is a large difference in height between the interrow and the soil around the base of the tree trunk. The root system is often well exposed and sometimes undermined.
Photos: courtesy of J. Gomez (Proterra Project supported by Syngenta) and M. Pastor


25
VINEYARDS | OLIVE ORCHARDS | ORCHARDS | WHEAT | MAIZE | ANNUAL CROPS | PASTURE
�������������������������������������
���������������������������������������������������������������������������
��������� ����������
������������� ���
�������������� ���
������������ ���
��������� ���
����������� ���
����� ���
� �
�����������������������
�������
� ��������������������
�����������������������������������������������������������������������������������������������
�������������������������������������������� ���
������
������
������
������
������
������
������
����������������������������
������
���������������������������������������
�����������������������
���� ����
�������� �����
���� ����
�������������������������������������� �����������������������������������������������������
��������������� ����������������

26
VISUAL SOIL ASSESSMENTca
nopy
vol
ume
AssessmentC
ImportanceICANOPY VOLUME at the flowering stage is dependent on: the age of the tree, cultivar, pruning, orchard management, disease, and climate factors (including frost damage). However, it can be a useful visual indicator of production and soil quality. Indeed, poor soil structure and soil aeration, limited movement and storage of water, and soil erosion as a result of structural degradation can reduce plant growth and vigour. Canopy volume is a particularly useful assessment of soil quality where climate factors have not limited crop development.
å Assess canopy volume in the late spring to early summer at flowering by comparing the olive tree with Plate 14 and the criteria given. In making the observation, consideration must be given to choosing a representative olive tree it terms of variety, pruning and age. In some cases, orchards are composed of trees of different age and cultivars. Corrections can be made on the basis of previously known annual growth rates as a function of age and cultivars, assigning a hypothetical common age for all trees and subtracting that part of the growth in the canopy volume. Canopy volume can be calculated approximately by applying the simple formula: canopy volume = w × b × h, where w is the width, b is the breadth and h is the height of the canopy.

27
VINEYARDS | OLIVE ORCHARDS | ORCHARDS | WHEAT | MAIZE | ANNUAL CROPS | PASTURE
PLATE 14 How to score canopy volume
GOOD CONDITION VS = 2Canopy volume is greater than 100 m3 (varying from 4–5 m high by 5–6 m wide or more) for mature trees planted at spacings of 5x5 or 6x6 m. Trees have a good distribution of leaves.
MODERATE CONDITION VS = 1Canopy volume is about 50 m3 (varying from 3–4 m high by 4 m wide) for mature trees planted at spacings of 5x5 or 6x6 m. Trees have a moderate distribution of leaves.
POOR CONDITION VS = 0Canopy volume is less than 23 m3 (i.e. ≤2–2.5 m high by 3 m wide) for mature trees planted at spacings of 5x5 or 6x6 m. Trees have a poor distribution of leaves.

28
VISUAL SOIL ASSESSMENTca
nopy
den
sity
AssessmentC
ImportanceICANOPY DENSITY is a good indicator of the health and vigour of the tree as reflected by the number of shoots, the number of leaves per shoot and the age of the leaves. In addition to the weather, tree vigour is related strongly to the availability of water and nutrients, and the texture of the soil (e.g. whether clayey, silty, loamy, sandy or gravelly). Moreover, soils in good condition with good structure and porosity, and having a deep, well-aerated root zone, enable the unrestricted movement of air and water into and through the soil and the development and proliferation of superficial (feeder) roots. Furthermore, soils with good organic matter levels and soil life show an active biological and chemical process, favouring the release and uptake of water and nutrients and, consequently, the growth and vigour of the tree. The amount of photosynthate produced by the tree is proportional to the number of leaves and, therefore, influences strongly the growth of the tree and the production and quality of olives.
å Assess the canopy density by comparing with Plate 15 and the criteria given.ç The assessment can be made at any stage after the new growth in the spring and before
harvest. In making the assessment, consideration must be given to the pruning and variety of the tree, the presence of pests and diseases, and the weather conditions at bud break (i.e. whether warm and dry, or cold and wet). Poor weather during bud break will promote a high number of leaf buds rather than flowering buds and give rise to many shoots and leaves.

29
VINEYARDS | OLIVE ORCHARDS | ORCHARDS | WHEAT | MAIZE | ANNUAL CROPS | PASTURE
PLATE 15 How to score canopy density
GOOD CONDITION VS = 2Good canopy density with abundant shoots and leaves per shoot. Many of the leaves are more than two years old.
MODERATE CONDITION VS = 1Moderate canopy density with a moderate number of shoots and leaves per shoot. Most leaves are less than two years old.
POOR CONDITION VS = 0Poor canopy density with few shoots and few leaves per shoot. The canopy appears sparse and spindly. The tree sheds its older leaves prematurely, with only one-year-old leavesbeing present.
Photos: courtesy of M. Greven

30
VISUAL SOIL ASSESSMENTsh
oot l
engt
h
AssessmentC
ImportanceISHOOT LENGTH determines the number of buds, some of which will bear flowers. It is also strongly related to the physical properties and chemical fertility of the soil, which in turn is influenced by soil management. Shoot length is an expression of plant vigour and general plant growth, which are regulated by the availability of water, nutrients and the aeration status of the soil. Soils in good condition with a deep vigorous root system, good structure, porosity, organic matter levels and soil life show an active chemical and biological process, favouring the release and uptake of nutrients and water, and consequently shoot growth.
å Measure or visually assess shoot length (each month if possible starting from mid-spring to the end of summer) on the mature part of the aerial part of the plant and compare it with Plate 16 and the criteria given. In making the assessment, consideration must be given to the pruning and variety of the tree, and to the weather conditions at bud break and during the spring.

31
VINEYARDS | OLIVE ORCHARDS | ORCHARDS | WHEAT | MAIZE | ANNUAL CROPS | PASTURE
PLATE 16 How to score shoot length
GOOD CONDITION VS = 2Shoots are at least 200 mm (depending on variety) on the external part of the plant.
MODERATE CONDITION VS = 1Shoot length is moderately below maximum (depending on variety) on the external part of the plant.
POOR CONDITION VS = 0Shoot length is significantly below maximum (depending on variety) on the external part of the plant.

32
VISUAL SOIL ASSESSMENTfl
ower
ing
AssessmentC
ImportanceIThe number and distribution of FLOWERS affects fruiting behaviour. The presence of a large number of flowers is also a good indicator of high yields. Flower induction starts in the preceding year of the olive production cycle. Its intensity depends on: weather conditions at the time (e.g. whether wet and cold, or dry and hot); the production of carbohydrate; and the presence of specific hormones necessary to drive the bud apex toward inflorescence production. Carbohydrate production depends on climate conditions, including: the amount of energy from the sun, the number of leaves on the tree, the cultivar, diseases, the availability of water and nutrients, and the physical status of the soil. Once again, soil fertility (physical, chemical and microbiological conditions) is crucial in determining high plant productivity.
å Assess by visual estimation the number and distribution of flowers at full flowering by comparing with Plate 17 and the criteria given. In making the assessment, consideration must be given to the pruning management of the tree and the weather conditions at bud break and in spring (i.e. whether warm and dry, or cold and wet). Poor weather will promote a high number of leaf buds rather than flowering buds and give rise to lots of shoots and leaves rather than flowers.

33
VINEYARDS | OLIVE ORCHARDS | ORCHARDS | WHEAT | MAIZE | ANNUAL CROPS | PASTURE
PLATE 17 How to score flowering
GOOD CONDITION VS = 2High number of flowers per shoot and well distributed over the tree.
MODERATE CONDITION VS = 1Moderate number of flowers occur.
POOR CONDITION VS = 0Low number of flowers and poorly distributed over the tree.
Photos: courtesy of P. Fiorino

34
VISUAL SOIL ASSESSMENTle
af c
olou
r
AssessmentC
ImportanceILEAF COLOUR can provide a good indication of the nutrient status and condition of the soil. The higher the soil fertility, the greener the leaf colour. Leaf colour is related primarily to water and nutrient availability and especially N. Leaf colour can also be related to a deficiency or excess in phosphorus (P), potassium (K), sulphur (S), calcium (Ca), magnesium (Mg), iron (Fe), manganese (Mn), zinc (Zn), copper (Cu) and boron (B). Chlorosis can further occur as a result of low N, K, S, Fe, Mg and Cu levels in the soil, low soil and air temperatures, and poor soil aeration caused by compaction and waterlogging.
Sulphur is an important element for plant growth and leaf colour and can only be utilized by plants in the sulphate (SO
42-) form. Under poorly-aerated conditions caused by
compaction or waterlogging, S will reduce to sulphur dioxide (SO2) and sulphides (e.g.
H2S, FeS). Sulphides and SO
2 cannot be taken up by the plant, are toxic to plant roots
and micro-organisms, and suppress the uptake of N. Plants can only utilize N where S is present in the oxygenated (sulphate) form. Nitrogen can also only be utilized by the plant in the nitrate (NO3-) and ammonium (NH4+) forms under aerobic conditions. Under poorly-aerated conditions, N will reduce to nitrite (NO
2 -) and nitrous oxide (N
2O), a potent
greenhouse gas, and become plant-unavailable.
å Assess the colour of the leaves by comparing with Plate 18 and the criteria given. The assessment must be made after the first flush of new growth at the end of the first annual growing period and on leaves exposed to the sunlight. Olive trees have leaves of different ages, varying from one to three years old. Assess only the young leaves, avoiding the deteriorating and immature leaves at the extremities of branches. Consideration must also be given to: the cultivar, the stage of growth, pests and diseases, and recent weather conditions. Prolonged cold and cloudy days with little sunlight can give rise to chlorosis (or yellowing of the leaf) owing to the inadequate formation or loss of chlorophyll.

35
VINEYARDS | OLIVE ORCHARDS | ORCHARDS | WHEAT | MAIZE | ANNUAL CROPS | PASTURE
PLATE 18 How to score leaf colour
GOOD CONDITION VS = 2Canopy has an intense green colour.
MODERATE CONDITION VS = 1Leaves are a medium-green or yellowish-green colour.
POOR CONDITION VS = 0Leaves are a distinct yellowish colour or turn opaque green.

36
VISUAL SOIL ASSESSMENTyi
eld
AssessmentC
ImportanceIYIELD can be a good visual indicator of the properties and condition of the soil. Olive trees can come under stress from drought (especially during the crucial flowering stage) and from a decline in soil quality caused by reduced water storage and plant-available water, nutrient deficiencies, poor aeration, and restricted root development as a result of soil compaction, a hardpan, a fluctuating water table, etc. This results in disease attack, shorter bud length, a lower number of flowers and poor yield production. Plant stress induced by soil structure degradation during harvesting time also affects the quality of the fruit by changing the amount and type of organic acids and polyphenols.
Appropriate soil management, including the adoption of a managed cover crop between rows and avoiding wheel traffic when the soil is wet, helps to promote the physical condition and overall fertility of the soil, minimize soil erosion, and promote sustainable long-term production.
å Assess relative crop yield by visually estimating the yield per tree and by comparing fruit number and size with Plate 19 and the criteria given. Compare also the percentage of olive oil extracted with that from an ideal crop.
ç In making your assessment, consideration must be given to the amount and type of fertilizer used, disease, and the cultivar, pruning and age of the olive tree. While olive trees can be rejuvenated by good pruning, the greatest yield potential of trees occurs from tree maturity to about 40 years of age on average. Olive trees generally mature in 10 years in humid temperate climates and 15 years in drier Mediterranean climates.
é Consideration must also be given to the weather conditions (e.g. whether warm and dry, or cold and wet) at pollination, fertilization, flowering and fruit-set. Pollination and fertilization are best when the weather is dry and warm. Cold and wet weather during flowering can give rise to poor fruit-set. Warm weather at fruit-set will give good yields while cold wet weather will give poorer yields. Yield is also influenced by the amount of photosynthate produced by the tree, which is proportional to the number of leaves. Because olive trees are generally biennial bearing, consider the average yield over a 3-year or 4-year period.

37
VINEYARDS | OLIVE ORCHARDS | ORCHARDS | WHEAT | MAIZE | ANNUAL CROPS | PASTURE
PLATE 19 How to score yield
GOOD CONDITION VS = 2Average yield is >0.5 kg of olives/m3 of mature trees (10–15 years old).
MODERATE CONDITION VS = 1Average yield is 0.3–0.5 kg of olives/m3 of mature trees (10–15 years old).
POOR CONDITION VS = 0Average yield is <0.3 kg of olives/m3 of mature trees (10–15 years old).

38
VISUAL SOIL ASSESSMENTva
riab
ility
of t
ree
perf
orm
ance
alo
ng th
e ro
w
AssessmentC
ImportanceIVARIABILITY OF TREE PERFORMANCE ALONG THE ROW is a good visual indicator of the properties and condition of the soil (Plates 20 and 21). In particular, the linear variability in tree performance is often related to the availability of water and nutrients, and the texture of the soil (e.g. whether clayey, silty, loamy, sandy or gravelly). Moreover, soils in good condition with good structure and porosity, and with a deep, well-aerated root zone, enable the unrestricted movement of air and water into and through the soil, the development and proliferation of superficial (feeder) roots, and unrestricted respiration and transpiration. Furthermore, soils with good organic-matter levels and soil life (including mycorrhiza) show an active biological and chemical process, favouring the release and uptake of water and nutrients and, consequently, the growth and vigour of the tree.
The spatial variability of tree performance along the row is also a useful indicator because it highlights those trees that are underperforming compared with the majority, enabling a specific investigation as to why those are struggling and what remedial action may be taken.
å Cast your eye along the rows and observe any variability in tree performance (in terms of tree height, trunk thickness, canopy volume, canopy density, leaf colour, etc.) and compare with the class limits in Table 5. In making the assessment, consideration must be given to the variety, pruning and age of the olive tree.
TABLE 5 Visual scores for variability of tree performance along the row
Visual score(VS)
Variability in tree performance along the row
2[Good]
Tree performance is good and even along the row
1[Moderate]
Tree performance is moderately variable along the row
0[Poor]
Tree performance is extremely variable along the row

39
VINEYARDS | OLIVE ORCHARDS | ORCHARDS | WHEAT | MAIZE | ANNUAL CROPS | PASTURE
PLATE 20 Effect of soil texture and available water on tree performance along the row [M. GREVEN]
Variable tree performance along the row owing to differences in soil texture and water-holding capacity. Poor-performing trees occur on gravelly (droughty) soils, while well-performing trees are situated on deeper siltier soils (in the background).
PLATE 21 Effect of soil aeration and drainage on tree performance along the row
Variable tree performance along the row in a four-year-old orchard owing to differences in the aeration and wetness status of the root zone. Poor-performing trees occur in the hollows with a shallow water table, while healthier trees are situated on the humps with a deeper, better-aerated root zone owing to a deeper water table.

40
VISUAL SOIL ASSESSMENT
Soil management in olive orchards
Olive trees with satisfactory production develop shoot of optimal length, promote flower-bud induction, give good percentage fruiting, and stimulate fruit development. Therefore, it is essential to maintain the availability of water, nutrients and carbohydrate during the crop cycle, avoiding any shortages.
Good soil management practices are needed in order to maintain good growth conditions and productivity to safeguard olive tree functionality especially during the crucial periods of plant development and fructification. To achieve this, management practices need to maintain and promote the condition and, therefore, functionality of the soil, particularly in regard to its aeration status and the supply of nutrients and water to the plant. To this end, the soil needs to have a good rooting environment, including an adequate soil structure to allow an effective root system to develop in order to maximize the utilization of water and nutrients, and to provide sufficient anchorage for the plant. Good soil structure also promotes infiltration and movement of water into and through the soil, so minimizing surface ponding, runoff and soil erosion. The maintenance of good soil health through the implementation of sound management practices further safeguards the environment and minimizes the ecological footprint of olive orchards on a region. A decline in soil quality through soil tillage, compaction, increased fertilizer and chemical inputs, and the loss of soil through erosion contribute to the food eco-footprint of a region and the country.
Where rainfall is not a limiting factor for plant growth, the establishment of cover crops is the most suitable soil management practice to protect the soil surface from erosion, to preserve the environment, to reduce production costs and to enhance the quality of the olive oil. Cover cropping not only helps in reducing water runoff and soil erosion, but it also improves the soil physical characteristics, enriches soil organic matter content, and suppresses soil-borne diseases by increasing micro-organism biodiversity. On the other hand, cover crops compete with olive trees for minerals, water and fertilizer where they are not well managed. In the absence of irrigation in the hottest months in those regions characterized by dry summers, competition for water could occur during flowering, fruit formation and development, so limiting the final yield. To avoid this competition, a temporary cover crop or natural vegetation can be grown during the wetter months and can be controlled during the hottest period by herbicide application or mowing 2–3 times during the period of major nutrient demand.
Different mixes of cover crops, including leguminous species that supply N, should be evaluated in different areas. In addition to legumes, the mix could comprise annual or perennial species, grasses and other broadleaf plants. Winter annuals can be grown to protect the soil from erosion in winter and to improve the ability of the soil to resist compaction when wet. Grasses, with their fibrous root system, are also more effective at improving soil structure, and generally add more organic matter to the soil than do legumes. If allowed to seed in early summer, a seed bank for subsequent regeneration is built up. Where possible, the grass in the interrows and within rows could be kept short by grazing sheep, provided the tree trunks

41
VINEYARDS | OLIVE ORCHARDS | ORCHARDS | WHEAT | MAIZE | ANNUAL CROPS | PASTURE
have protective plastic screens to shield them from strip and ring barking. The advantages of managing a grass cover crop using sheep compared with mowing and herbicide strips include: reduced use of synthetic (herbicide) chemicals, reduced fossil fuel usage, lower CO
2
emissions and, therefore, greater market acceptance. Other advantages include: lower labour and material costs; less compaction along wheel traffic lanes; and improved soil nutrient status and greater soil life (including earthworm numbers) as a result of the dung and urine applied. Stock tend to rest, urinate and defecate most within the tree row, translocating and concentrating nutrients to where the tree roots are greatest. Sheep can also graze grass very short, thereby reducing not only the competition for water and nutrients but also reducing insect and bird numbers and the possibility of fungal diseases.
The traditional management of the interrow is based on one or two cultivations with discs and tine harrows during the hot period following natural weed cover and could be satisfactory in limiting, principally, competition for water. The cultivation should be shallower than 100 mm in order to de-vigorate the cover crop but not to modify the canopy/root ratio of the trees by damaging the root system. The cultivation operations can also be useful for incorporating organic and mineral fertilizers as well as controlling diseases caused by fungi and bacteria in the soil.

42
VISUAL SOIL ASSESSMENT
References
Shepherd, T. G., Stagnari, F., Pisante, M. and Benites, J. 2008. Visual Soil Assessment – Field guide for olive orchards. FAO, Rome, Italy.

VISUAL SOIL ASSESSMENT
OliveOrchards
FI
EL
D
GU
ID
E9 7 8 9 2 5 1 0 5 9 4 1 8
TC/D/I0007E/1/02.08/1000
ISBN 978-92-5-105941-8
The present publication on Visual Soil Assessment is a practicalguide to carry out a quantitative soil analysis with reproduceable resultsusing only very simple tools. Besides soil parameters, also crop parametersfor assessing soil conditions are presented for some selected crops. TheVisual Soil Assessment manuals consist of a series of separate booklets forspecific crop groups, collected in a binder. The publication addressesscientists as well as field technicians and even farmers who want to analysetheir soil condition and observe changes over time.

VISUAL SOIL ASSESSMENT
Orchards
FI
EL
D
GU
ID
E
9 7 8 9 2 5 1 0 5 9 4 1 8
TC/D/I0007E/1/02.08/1000
ISBN 978-92-5-105941-8
The present publication on Visual Soil Assessment is a practicalguide to carry out a quantitative soil analysis with reproduceable resultsusing only very simple tools. Besides soil parameters, also crop parametersfor assessing soil conditions are presented for some selected crops. TheVisual Soil Assessment manuals consist of a series of separate booklets forspecific crop groups, collected in a binder. The publication addressesscientists as well as field technicians and even farmers who want to analysetheir soil condition and observe changes over time.

VISUAL SOIL ASSESSMENT
Orchards
FI
EL
D
GU
ID
E
Food and Agriculture Organization of the United NationsRome, 2008
Graham Shepherd, soil scientist,BioAgriNomics.com, New Zealand
Fabio Stagnari, assistant researcher,University of Teramo, Italy
Michele Pisante, professor,University of Teramo, Italy
José Benites, technical officer,Land and Water Development Division, FAO

Contents
The designations employed and the presentation of material in this informationproduct do not imply the expression of any opinion whatsoever on the partof the Food and Agriculture Organization of the United Nations (FAO) concerning thelegal or development status of any country, territory, city or area or of its authorities,or concerning the delimitation of its frontiers or boundaries. The mention of speciccompanies or products of manufacturers, whether or not these have been patented, doesnot imply that these have been endorsed or recommended by FAO in preference toothers of a similar nature that are not mentioned.
ISBN 978-92-5-105939-5
All rights reserved. Reproduction and dissemination of material in this informationproduct for educational or other non-commercial purposes are authorized withoutany prior written permission from the copyright holders provided the source is fullyacknowledged. Reproduction of material in this information product for resale or othercommercial purposes is prohibited without written permission of the copyright holders.Applications for such permission should be addressed to:ChiefElectronic Publishing Policy and Support BranchCommunication DivisionFAOViale delle Terme di Caracalla, 00153 Rome, Italyor by e-mail to:[email protected]
© FAO 2008

iii
VINEYARDS | OLIVE ORCHARDS | ORCHARDS | WHEAT | MAIZE | ANNUAL CROPS | PASTURE
Acknowledgements v
List of acronyms v
Visual Soil Assessment vi
SOIL TEXTURE 2
SOIL STRUCTURE 4
SOIL POROSITY 6
SOIL COLOUR 8
NUMBER AND COLOUR OF SOIL MOTTLES 10
EARTHWORMS 12
POTENTIAL ROOTING DEPTH 14Identifying the presence of a hardpan 16
SURFACE PONDING 18
SURFACE CRUSTING AND SURFACE COVER 20
SOIL EROSION 22
SOIL MANAGEMENT IN ORCHARDS 24
Contents

iv
VISUAL SOIL ASSESSMENT
1. How to score soil texture 32. Visual scores for earthworms 133. Visual scores for potential rooting depth 154. Visual scores for surface ponding 19
Acknowledgements
List of acronyms
List of tables
List of figures
1. Soil scorecard – visual indicators for assessing soil quality in orchards 12. Soil texture classes and groups 3
1. The VSA tool kit vii2. How to score soil structure 53. How to score soil porosity 74. How to score soil colour 95. How to score soil mottles 116. Sample for assessing earthworms 137. Generic drawing of the root system of a tree 158. Using a knife to determine the presence or absence of a hardpan 169. Identifying the presence of a hardpan 1710. Surface ponding in an orchard 1911. How to score surface crusting and sufrace cover 2112. How to score soil erosion 23
List of plates

v
VINEYARDS | OLIVE ORCHARDS | ORCHARDS | WHEAT | MAIZE | ANNUAL CROPS | PASTURE
This publication is adapted from the methodology developed in: Shepherd, T.G. 2008. Visual Soil Assessment. Volume 1. Field guide for pastoral grazing and cropping on flat to rolling country. 2nd edition. Palmerston North, New Zealand, Horizons Regional Council. 106 pp.
This publication is funded by FAO in collaboration with the Agronomy and Crop Science Research and Education Center of the University of Teramo.
Acknowledgements
List of acronyms
AEC Adenylate energy charge
Al Aluminium
ATP Adenosine triphosphate
B Boron
Ca Calcium
Cu Copper
Fe Iron
K Potassium
Mg Magnesium
Mn Manganese
Mo Molybdenum
N Nitrogen
P Phosphorus
RSG Restricted spring growth
S Sulphur
VS Visual score
VSA Visual Soil Assessment
Zn Zinc

vi
VISUAL SOIL ASSESSMENT
IntroductionThe maintenance of good soil quality is vital for the environmental and economic sustainability of orchards. A decline in soil quality can have a marked impact on tree growth, yield, fruit quality and the operation and running of the orchard. A decline in soil physical properties in particular can take considerable time and cost to correct. Safeguarding soil resources for future generations is an important task for land managers.
Often, not enough attention is given to:< the basic role of soil quality in efficient and sustained production;< the effect of the condition of the soil on the gross profit margin;< the long-term planning needed to sustain good soil quality;< the effect of land management decisions on soil quality.
Soil type and the effect of management on the condition of the soil are important determinants of the production performance of orchards and have profound effects on long-term profits. Land managers need tools that are reliable, quick and easy to use in order to help them assess the condition of their soils and their suitability for growing orchard crops, and to make informed decisions that will lead to sustainable land and environmental management. To this end, Visual Soil Assessment (VSA) provides a quick and simple method to assess soil condition and plant performance. The VSA method can also be used to assess the suitability and limitations of a soil for pipfruit, stonefruit and vine crops. Soils with good VSA scores will usually give the best production with the lowest establishment and operational costs.
The VSA methodVisual Soil Assessment is based on the visual assessment of key soil ‘state’ indicators of soil quality, presented on a scorecard. With the exception of soil texture, the soil indicators are dynamic indicators, i.e. capable of changing under different management regimes and land-use pressures. Being sensitive to change, they are useful early warning indicators of changes in soil condition and as such provide an effective monitoring tool.
Visual scoringEach indicator is given a visual score (VS) of 0 (poor), 1 (moderate), or 2 (good), based on the soil quality observed when comparing the soil sample with three photographs in the field guide manual. The scoring is flexible, so if the sample you are assessing does not align clearly with any one of the photographs but sits between two, an in-between score can be given, i.e. 0.5 or 1.5. Because some soil indicators are relatively more important for soil quality than others, VSA provides a weighting factor of 1, 2, and 3. The total of the VS rankings gives the overall Soil Quality Index score for the sample you are evaluating. Compare this with the rating scale at the bottom of the scorecard to determine whether your soil is in good, moderate or poor condition.
Visual Soil Assessment

vii
VINEYARDS | OLIVE ORCHARDS | ORCHARDS | WHEAT | MAIZE | ANNUAL CROPS | PASTURE
The VSA tool kitThe VSA tool kit (Plate 1) comprises:< a spade – to dig a soil pit and to take a
200-mm cube of soil for the drop shatter soil structure test;
< a plastic basin (about 450 mm long x 350 mm wide x 250 mm deep) – to contain the soil during the drop shatter test;
< a hard square board (about 260x260x20 mm) – to fit in the bottom of the plastic basin on to which the soil cube is dropped for the shatter test;
< a heavy-duty plastic bag (about 750x 500 mm) – on which to spread the soil, after the drop shatter test has been carried out;
< a knife (preferably 200 mm long) to investigate the soil pit and potential rooting depth;
< a water bottle – to assess the field soil textural class;< a tape measure – to measure the potential rooting depth;< a VSA field guide – to make the photographic comparisons;< a pad of scorecards – to record the VS for each indicator.
The procedureWhen it should be carried outThe test should be carried out when the soils are moist and suitable for cultivation. If you are not sure, apply the ‘worm test’. Roll a worm of soil on the palm of one hand with the fingers of the other until it is 50 mm long and 4 mm thick. If the soil cracks before the worm is made, or if you cannot form a worm (for example, if the soil is sandy), the soil is suitable for testing. If you can make the worm, the soil is too wet to test.
Setting up
TimeAllow 25 minutes per site. For a representative assessment of soil quality, sample 4 sites over a 5-ha area.
Reference sampleTake a small sample of soil (about 100x50x150 mm deep) from under a nearby fence or a similar protected area. This provides an undisturbed sample required in order to assign the correct score for the soil colour indicator. The sample also provides a reference point for comparing soil structure and porosity.
PLATE 1 The VSA tool kit

viii
VISUAL SOIL ASSESSMENT
SitesSelect sites that are representative of the field. The condition of the soil in orchards is site specific. Sample sites that have had little or no wheel traffic (e.g. near the tree). The VSA method can also be used to assess compacted areas by selecting to sample along wheel traffic lanes. Always record the position of the sites for future monitoring if required. Note that the VSA can be used to assess the suitability of a soil for growing pipfruit and stonefruit trees and vine crops before the orchard is established.
Site information
Complete the site information section at the top of the scorecard. Then record any special aspects you think relevant in the notes section at the bottom of the plant indicator scorecard.
Carrying out the test
Initial observationDig a small hole about 200x200 mm square by 300 mm deep with a spade and observe the topsoil (and upper subsoil if present) in terms of its uniformity, including whether it is soft and friable or hard and firm. A knife is useful to help you assess this.
Take the test sampleIf the topsoil appears uniform, dig out a 200-mm cube with the spade.You can sample whatever depth of soil you wish, but ensure that you sample the equivalent of a 200-mm cube of soil. If for example, the top 100 mm of the soil is compacted and you wish to assess its condition, dig out two samples of 200x200x100 mm with a spade. If the 100–200-mm depth is dominated by a tillage pan and you wish to assess its condition, remove the top 100 mm of soil and dig out two samples of 200x200x100 mm. Note that taking a 200-mm cube sample below the topsoil can also give valuable information about the condition of the subsoil and its implications for plant growth and farm management practices.
The drop shatter testDrop the test sample a maximum of three times from a height of 1 m onto the wooden square in the plastic basin. The number of times the sample is dropped and the height it is dropped from, is dependent on the texture of the soil and the degree to which the soil breaks up, as described in the section on soil structure.
Systematically work through the scorecard, assigning a VS to each indicator by comparing it with the photographs (or table) and description reported in the field guide.
Format of the bookletThe soil scorecard is given on Figure 1 and lists the ten key soil ‘state’ indicators required in order to assess soil quality. Each indicator is described on the following pages, with a section on how to assess the indicator and an explanation of its importance and what it reveals about the condition of the soil.

1
VINEYARDS | OLIVE ORCHARDS | ORCHARDS | WHEAT | MAIZE | ANNUAL CROPS | PASTURE
��������������������������������
���������������������������������������������������������������������������
��������� ����������
������������ ���
�������������� ���
������������� ���
����������� ���
��������������������������������� ���
���
���
��������������� ���
���������������������������������� ���
������������������������� ���
���������������������������������������
����������������������� ������������������
���� ����
�������� �����
���� ����
�����������������������������������������������������������������������������������
����������� ���������
��������������� ��������
�������������� �����
����������
���������������
���������������������
��������������������������� ������ ������ ������ ������� �����
�������������������� ���� ��������������� ������ ����������� ���
����������������������������� ���� ���� ����� ����� �������
�������������������� � �� ����������� � �
������������������������� � ��
�����
�����
�����
�����
������
������
������
������
������
������

2
VISUAL SOIL ASSESSMENTso
il te
xtur
e
Assessment
å Take a small sample of soil (half the size of your thumb) from the topsoil and a sample (or samples) that is (or are) representative of the subsoil.
ç Wet the soil with water, kneading and working it thoroughly on the palm of your hand with your thumb and forefinger to the point of maximum stickiness.
é Assess the texture of the soil according to the criteria given in Table 1 by attempting to mould the soil into a ball.
With experience, a person can assess the texture directly by estimating the percentages of sand, silt and clay by feel, and the textural class obtained by reference to the textural diagram (Figure 2).
There are occasions when the assignment of a textural score will need to be modified because of the nature of a textural qualifier. For example, if the soil has a reasonably high content of organic matter, i.e. is humic with 15–30 percent organic matter, raise the textural score by one (e.g. from 0 to 1 or from 1 to 2). If the soil has a significant gravelly or stony component, reduce the textural score by 0.5.
There are also occasions when the assignment of a textural score will need to be modified because of the specific preference of a crop for a particular textural class. For example, asparagus prefers a soil with a sandy loam texture and so the textural score is raised by 0.5 from a score of 1 to 1.5 based on the specific textural preference of the plant.
C
ImportanceISOIL TEXTURE defines the size of the mineral particles. Specifically, it refers to the relative proportion of the various size-groups in the soil, i.e. sand, silt and clay. Sand is that fraction that has a particle size >0.06 mm; silt varies between 0.06 and 0.002 mm; and the particle size of clay is <0.002 mm. Texture influences soil behaviour in several ways, notably through its effect on: water retention and availability; soil structure; aeration; drainage; soil trafficability; soil life; and the supply and retention of nutrients.
A knowledge of both the textural class and potential rooting depth enables an approximate assessment of the total water-holding capacity of the soil, one of the major drivers of crop production.

3
VINEYARDS | OLIVE ORCHARDS | ORCHARDS | WHEAT | MAIZE | ANNUAL CROPS | PASTURE
FIGURE 2 Soil texture classes and groups
Textural classes.
Textural groups.
TABLE 1 How to score soil texture
Visual score(VS)
Textural class Description
2[Good]
Silt loamSmooth soapy feel, slightly sticky, no grittiness. Moulds into a cohesive ball that fissures when pressed flat.
1.5[Moderately good]
Clay loamVery smooth, sticky and plastic. Moulds into a cohesive ball that deforms without fissuring.
1[Moderate]
Sandy loam Slightly gritty, faint rasping sound. Moulds into a cohesive ball that fissures when pressed flat.
0.5[Moderately poor]
Loamy sandSilty clay
Clay
Loamy sand: Gritty and rasping sound. Will almost mould into a ball but disintegrates when pressed flat.Silty clay, clay: Very smooth, very sticky, very plastic. Moulds into a cohesive ball that deforms without fissuring.
0[Poor]
SandGritty and rasping sound. Cannot be moulded into a ball.

4
VISUAL SOIL ASSESSMENTso
il st
ruct
ure
AssessmentC
ImportanceI
å Remove a 200-mm cube of topsoil with a spade (between or along wheel tracks).ç Drop the soil sample a maximum of three times from a height of 1 m onto the firm base
in the plastic basin. If large clods break away after the first or second drop, drop them individually again once or twice. If a clod shatters into small (primary structural) units after the first or second drop, it does not need dropping again. Do not drop any piece of soil more than three times. For soils with a sandy loam texture (Table 1), drop the cube of soil just once only from a height of 0.5 m.
é Transfer the soil onto the large plastic bag.è For soils with a loamy sand or sand texture, drop the cube of soil still sitting on the spade (once)
from a height of just 50 mm, and then roll the spade over, spilling the soil onto the plastic bag.ê Applying only very gently pressure, attempt to part each clod by hand along any exposed
cracks or fissures. If the clod does not part easily, do not apply further pressure (because the cracks and fissures are probably not continuous and, therefore, are unable to readily conduct oxygen, air and water).
ë Move the coarsest fractions to one end and the finest to the other end. Arrange the distribution of aggregates on the plastic bag so that the height of the soil is roughly the same over the whole surface area of the bag. This provides a measure of the aggregate-size distribution. Compare the resulting distribution of aggregates with the three photographs in Plate 2 and the criteria given.The method is valid for a wide range of moisture conditions but is best carried out when the soil is moist to slightly moist; avoid dry and wet conditions.
SOIL STRUCTURE is extremely important for orchards. It regulates:< soil aeration and gaseous exchange rates;< soil temperature;< soil infiltration and erosion;< the movement and storage of water;< nutrient supply;< root penetration and development;< soil workability;< soil trafficability;< the resistance of soils to structural degradation.
Good soil structure reduces the susceptibility to compaction under wheel traffic and increases the window of opportunity for vehicle access and for carrying out no-till, minimum-till or conventional cultivation between rows under optimal soil conditions.
Soil structure is ranked on the size, shape, firmness, porosity and relative abundance of soil aggregates and clods. Soils with good structure have friable, fine, porous, subangular and subrounded (nutty) aggregates. Those with poor structure have large, dense, very firm, angular or subangular blocky clods that fit and pack closely together and have a high tensile strength.

5
VINEYARDS | OLIVE ORCHARDS | ORCHARDS | WHEAT | MAIZE | ANNUAL CROPS | PASTURE
PLATE 2 How to score soil structure
GOOD CONDITION VS = 2Soil dominated by friable, fineaggregates with no significant clodding.Aggregates are generally subrounded(nutty) and often quite porous.
MODERATE CONDITION VS = 1Soil contains significant proportions(50%) of both coarse clods and friablefine aggregates. The coarse clods arefirm, subangular or angular in shape andhave few or no pores.
POOR CONDITION VS = 0Soil dominated by coarse clodswith very few finer aggregates. Thecoarse clods are very firm, angular orsubangular in shape and have very fewor no pores.

6
VISUAL SOIL ASSESSMENTso
il po
rosi
ty
AssessmentC
ImportanceI
å Remove a spade slice of soil (about 100 mm wide, 150 mm long and 200 mm deep) from the side of the hole and break it in half.
ç Examine the exposed fresh face of the sample for soil porosity by comparing against the three photographs in Plate 3. Look for the spaces, gaps, holes, cracks and fissures between and within soil aggregates and clods.
é Examine also the porosity of a number of the large clods from the soil structure test. This provides important additional information as to the porosity of the individual clods (the intra-aggregate porosity).
It is important to assess SOIL POROSITY along with the structure of the soil. Soil porosity, and particularly macroporosity (or large pores), influences the movement of air and water in the soil. Soils with good structure have a high porosity between and within aggregates, but soils with poor structure may not have macropores and coarse micropores within the large clods, restricting their drainage and aeration.
Poor aeration leads to the build up of carbon dioxide, methane and sulphide gases, and reduces the ability of plants to take up water and nutrients, particularly nitrogen (N), phosphorus (P), potassium (K) and sulphur (S). Plants can only utilize S and N in the oxygenated sulphate (SO
42-), nitrate (NO
3-) and ammonium (NH
4+) forms. Therefore,
plants require aerated soils for the efficient uptake and utilization of S and N. The number, activity and biodiversity of micro-organisms and earthworms are also greatest in well-aerated soils and they are able to decompose and cycle organic matter and nutrients more efficiently.
The presence of soil pores enables the development and proliferation of the superficial (or feeder) roots throughout the soil. Roots are unable to penetrate and grow through firm, tight, compacted soils, severely restricting the ability of the plant to utilize the available water and nutrients in the soil. A high penetration resistance not only limits plant uptake of water and nutrients, it also reduces fertilizer efficiency considerably and increases the susceptibility of the plant to root diseases.
Soils with good porosity will also tend to produce lower amounts of greenhouse gases. The greater the porosity, the better the drainage, and, therefore, the less likely it is that the soil pores will be water-filled to the critical levels required to accelerate the production of greenhouse gases. Aim to keep the soil porosity score above 1.

7
VINEYARDS | OLIVE ORCHARDS | ORCHARDS | WHEAT | MAIZE | ANNUAL CROPS | PASTURE
PLATE 3 How to score soil porosity
GOOD CONDITION VS = 2Soils have many macropores and coarsemicropores between and within aggregatesassociated with good soil structure.
MODERATE CONDITION VS = 1Soil macropores and coarse microporesbetween and within aggregates have declinedsignificantly but are present on closeexamination in parts of the soil. The soil showsa moderate amount of consolidation.
POOR CONDITION VS = 0No soil macropores and coarse microporesare visually apparent within compact,massive structureless clods. The clodsurface is smooth with few or no cracks orholes, and can have sharp angles.

8
VISUAL SOIL ASSESSMENTso
il co
lour AssessmentC
ImportanceI
å Compare the colour of a handful of soil from the field site with soil taken from under the nearest fenceline or a similar protected area.
ç Using the three photographs given (Plate 4), compare the relative change in soil colour that has occurred.
As topsoil colour can vary markedly between soil types, the photographs illustrate the degree of change in colour rather than the absolute colour of the soil.
SOIL COLOUR is a very useful indicator of soil quality because it can provide an indirect measure of other more useful properties of the soil that are not assessed so easily and accurately. In general, the darker the colour is, the greater is the amount of organic matter in the soil. A change in colour can give a general indication of a change in organic matter under a particular land use or management. Soil organic matter plays an important role in regulating most biological, chemical and physical processes in soil, which collectively determine soil health. It promotes infiltration and retention of water, helps to develop and stabilize soil structure, cushions the impact of wheel traffic and cultivators, reduces the potential for wind and water erosion, and maintains the soil carbon ‘sink’. Organic matter also provides an important food resource for soil organisms and is an important source of, and major reservoir of, plant nutrients. Its decline reduces the fertility and nutrient-supplying potential of the soil; N, P, K and S requirements of trees increase markedly, and other major and minor elements are leached more readily. The result is an increased dependency on fertilizer input to maintain nutrient status.
Soil colour can also be a useful indicator of soil drainage and the degree of soil aeration. In addition to organic matter, soil colour is influenced markedly by the chemical form (or oxidation state) of iron (Fe) and manganese (Mn). Brown, yellow-brown, reddish-brown and red soils without mottles indicate well-aerated, well-drained conditions where Fe and Mn occur in the oxidized form of ferric (Fe3+) and manganic (Mn3+) oxides. Grey-blue colours can indicate that the soil is poorly drained or waterlogged and poorly aerated for long periods, conditions that reduce Fe and Mn to ferrous (Fe2+) and manganous (Mn2+) oxides. Poor aeration and prolonged waterlogging give rise to a further series of chemical and biochemical reduction reactions that produce toxins, such as hydrogen sulphide, methane and ethanol that damage the root system. This reduces the ability of plants to take up water and nutrients, causing poor vigour and ill-thrift. Decay and dieback of roots can also occur as a result of fungal diseases such as Phytophthora root and crown rot in soils prone to waterlogging. Trees exhibit reduced growth, have thin canopies, and eventually die.

9
VINEYARDS | OLIVE ORCHARDS | ORCHARDS | WHEAT | MAIZE | ANNUAL CROPS | PASTURE
PLATE 4 How to score soil colour
GOOD CONDITION VS = 2Dark coloured topsoil that is not toodissimilar to that under the fenceline.
MODERATE CONDITION VS = 1The colour of the topsoil is somewhatpaler than that under the fenceline, butnot markedly so.
POOR CONDITION VS = 0Soil colour has become significantly palercompared with that under the fenceline.

10
VISUAL SOIL ASSESSMENTnu
mbe
r an
d co
lour
of s
oil m
ottl
es AssessmentC
ImportanceI
å Take a sample of soil (about 100 mm wide × 150 mm long × 200 mm deep) from the side of the hole and compare with the three photographs (Plate 5) and the percentage chart to determine the percentage of the soil occupied by mottles.
Mottles are spots or blotches of different colour interspersed with the dominant soil colour.
The NUMBER AND COLOUR OF SOIL MOTTLES provide a good indication of how well the soil is drained and how well it is aerated. They are also an early warning of a decline in soil structure caused by compaction under wheel traffic and overcultivation. The loss of soil structure decreases and blocks the number of channels and pores that conduct water and air and, as a consequence, can result in waterlogging and a deficiency of oxygen for a prolonged period. The development of anaerobic (deoxygenated) conditions reduces Fe and Mn from their brown/orange oxidized ferric (Fe3+) and manganic (Mn3+) form to grey ferrous (Fe2+) and manganous (Mn2+) oxides. Mottles develop as various shades of orange and grey owing to varying degrees of oxidation and reduction of Fe and Mn. As oxygen depletion increases, orange, and ultimately grey, mottles predominate. An abundance of grey mottles indicates the soil is poorly drained and poorly aerated for a significant part of the year. The presence of only common orange and grey mottles (10–25 percent) indicates the soil is imperfectly drained with only periodic waterlogging. Soil with only few to common orange mottles indicates the soil is moderately well drained, and the absence of mottles indicates good drainage.
Poor aeration reduces the uptake of water by plants and can induce wilting. It can also reduce the uptake of plant nutrients, particularly N, P, K and S. Moreover, poor aeration retards the breakdown of organic residues, and can cause chemical and biochemical reduction reactions that produce sulphide gases, methane, ethanol, acetaldehyde and ethylene, which are toxic to plant roots. In addition, decay and dieback of roots can occur as a result of fungal diseases such as Phytophthora root and crown rot in soils that are strongly mottled and poorly aerated. Fungal diseases and reduced nutrient and water uptake give rise to poor plant vigour and ill-thrift. Trees exhibit reduced growth, have thin canopies, and can eventually die. If your visual score for mottles is ≤1, you need to aerate the soil.

11
VINEYARDS | OLIVE ORCHARDS | ORCHARDS | WHEAT | MAIZE | ANNUAL CROPS | PASTURE
PLATE 5 How to score soil mottles
GOOD CONDITION VS = 2Mottles are generally absent.
MODERATE CONDITION VS = 1Soil has common (10–25%) fine andmedium orange and grey mottles.
POOR CONDITION VS = 0Soil has abundant to profuse (> 50%)medium and coarse orange and particularlygrey mottles.

12
VISUAL SOIL ASSESSMENTea
rthw
orm
s
AssessmentC
ImportanceI
å Count the earthworms by hand, sorting through the soil sample used to assess soil structure (Plate 6) and compare with the class limits in Table 2. Earthworms vary in size and number depending on the species and the season. Therefore, for year-to-year comparisons, earthworm counts must be made at the same time of year when soil moisture and temperature levels are good. Earthworm numbers are reported as the number per 200-mm cube of soil. Earthworm numbers are commonly reported on a square-metre basis. A 200-mm cube sample is equivalent to 1/25 m2, and so the number of earthworms needs to be multiplied by 25 to convert to numbers per square metre.
EARTHWORMS provide a good indicator of the biological health and condition of the soil because their population density and species are affected by soil properties and management practices. Through their burrowing, feeding, digestion and casting, earthworms have a major effect on the chemical, physical and biological properties of the soil. They shred and decompose plant residues, converting them to organic matter, and so releasing mineral nutrients. Compared with uningested soil, earthworm casts can contain 5 times as much plant available N, 3–7 times as much P, 11 times as much K, and 3 times as much Mg. They can also contain more Ca and plant-available Mo, and have a higher pH, organic matter and water content. Moreover, earthworms act as biological aerators and physical conditioners of the soil, improving:< soil porosity;< aeration;< soil structure and the stability of soil aggregates;< water retention;< water infiltration;< drainage.
They also reduce surface runoff and erosion. They further promote plant growth by secreting plant-growth hormones and increasing root density and root development by the rapid growth of roots down nutrient-enriched worm channels. While earthworms can deposit about 25–30 tonnes of casts/ha/year on the surface, 70 percent of their casts are deposited below the surface of the soil. Therefore, earthworms play an important role in orchards and can increase growth rates and production significantly.
Earthworms also increase the population, activity and diversity of soil microbes. Actinomycetes increase 6–7 times during the passage of soil through the digestive tract of the worm and, along with other microbes, play an important role in the decomposition of organic matter to humus. Soil microbes such as mycorrhizal fungi play a further role in

13
VINEYARDS | OLIVE ORCHARDS | ORCHARDS | WHEAT | MAIZE | ANNUAL CROPS | PASTURE
the supply of nutrients, digesting soil and fertilizer and unlocking nutrients, such as P, that are fixed by the soil. Microbes also retain significant amounts of nutrients in their biomass, releasing them when they die. Moreover, soil microbes produce plant-growth hormones and compounds that stimulate root growth and promote the structure, aeration, infiltration and water-holding capacity of the soil. Micro-organisms further encourage a lower incidence of pests and diseases. The collective benefits of microbes reduce fertilizer requirements and improve the health of the trees and fruit production.
Earthworm numbers (and biomass) are governed by the amount of food available as organic matter and soil microbes, as determined by the amount and quality of surface residue, the use of cover crops including legumes, and the cultivation of interrows. Earthworm populations can be up to three times higher in undisturbed soils compared with cultivated soils. Earthworm numbers are also governed by: soil moisture, temperature, texture, soil aeration, pH, soil nutrients (including levels of Ca), and the type and amount of fertilizer and N used. The overuse of acidifying salt-based fertilizers, anhydrous ammonia and ammonia-based products, and some insecticides and fungicides can further reduce earthworm numbers.
Soils should have a good diversity of earthworm species with a combination of:(i) surface feeders that live at or near the surface to breakdown plant residues and dung;(ii) topsoil-dwelling species that burrow, ingest and mix the top 200–300 mm of soil; and(iii) deep-burrowing species that pull down and mix plant litter and organic matter at depth.
PLATE 6 Sample for assessing earthworms
TABLE 2 Visual scores for earthworms
Visual score(VS)
Earthworm numbers(per 200-mm cube of soil)
2[Good]
> 30 (with preferably 3 or more species)
1[Moderate]
15–30 (with preferably 2 or more species)
0[Poor]
< 15 (with predominantly 1 species)

14
VISUAL SOIL ASSESSMENTpo
tent
ial r
ooti
ng d
epth
AssessmentC
ImportanceI
å Dig a hole to identify the depth to a limiting (restricting) layer where present (Plate 7), and compare with the class limits in Table 3. As the hole is being dug, note the presence of roots and old root channels, worm channels, cracks and fissures down which roots can extend. Note also the firmness and tightness of the soil, whether the soil is grey and strongly gleyed owing to prolonged waterlogging, and whether there is a hardpan present such as a human-induced tillage or plough pan, or a natural pan such as an iron, siliceous or calcitic pan (pp 16–17). An abrupt transition from a fine (heavy) material to a coarse (sandy/gravelly) layer will also limit root development. A rough estimate of the potential rooting depth may be made by noting the above properties in a nearby road cutting, gully, slip, earth slump or an open drain.
The POTENTIAL ROOTING DEPTH is the depth of soil that plant roots can potentially exploit before reaching a barrier to root growth, and it indicates the ability of the soil to provide a suitable rooting medium for plants. The greater is the rooting depth, the greater is the available-water-holding capacity of the soil. In drought periods, deep roots can access larger water reserves, thereby alleviating water stress and promoting the survival of non-irrigated orchards. The exploration of a large volume of soil by deep roots means that they can also access more macronutrients and micronutrients, thereby accelerating the growth and enhancing the yield and quality of the fruit. Conversely, soils with a restricted rooting depth caused by, for example, a layer with a high penetration resistance such as a compacted layer or a hardpan, restrict vertical root growth and development, causing roots to grow sideways. This limits plant uptake of water and nutrients, reduces fertilizer efficiency, increases leaching, and decreases yield. A high resistance to root penetration can also increase plant stress and the susceptibility of the plant to root diseases. Moreover, hardpans impede the movement of air, oxygen and water through the soil profile, the last increasing the susceptibility to waterlogging and erosion by rilling and sheet wash.
The potential rooting depth can be restricted further by:< an abrupt textural change;< pH;< aluminium (Al) toxicity;< nutrient deficiencies;< salinity;< sodicity;< a high or fluctuating water table;< low oxygen levels.

15
VINEYARDS | OLIVE ORCHARDS | ORCHARDS | WHEAT | MAIZE | ANNUAL CROPS | PASTURE
Anaerobic (anoxic) conditions caused by deoxygenation and prolonged waterlogging restrict the rooting depth as a result of the accumulation of toxic levels of hydrogen sulphide, ferrous sulphide, carbon dioxide, methane,
ethanol, acetaldehyde and ethylene, by-products of
chemical and biochemical reduction reactions.
Trees with a deep, dense vigorous root system raise soil organic matter levels and soil life at depth. The physical action of the roots and soil fauna and the glues they produce promote soil structure, porosity, water storage, soil aeration and drainage at depth. Soil depth should preferably not be less than 600 mm. Heavy clay soils are not recommended. Stony soils are acceptable under irrigation systems, particularly if the depth of the soil is less than 1 m. An adequate rooting depth is also needed to provide adequate anchorage of the tree at maturity.
TABLE 3 Visual scores for potential rooting depth
VSA score(VS)
Potential rooting depth(m)
2.0[Good]
> 0.8
1.5[Moderately good]
0.6–0.8
1.0[Moderate]
0.4–0.6
0.5[Moderately poor]
0.2–0.4
0[Poor]
< 0.2
PLATE 7 Generic drawing of the root system of a tree [L. DRAZETA and A. LANG]

16
VISUAL SOIL ASSESSMENT
Assessmentå Examine for the presence of a hardpan by rapidly jabbing the side of the soil profile
(that was dug to assess the potential rooting depth) with a knife, starting at the top and progressing systematically and quickly down to the bottom of the hole (Plate 8). Note how easy or difficult it is to jab the knife into the soil as you move rapidly down the profile. A strongly developed hardpan is very tight and extremely firm, and it has a high penetration resistance to the knife. Pay particular attention to the lower topsoil and upper subsoil where tillage pans and plough pans commonly occur if present (Plate 9).
ç Having identified the possible presence of a hardpan by a significant increase in penetration resistance to the point of a knife, gauge how strongly developed the hardpan is. Remove a large hand-sized sample and assess its structure, porosity and the number and colour of soil mottles (Plates 2, 3 and 5), and also look for the presence of roots. Compare with the photographs and criteria given Plate 9.
PLATE 8 Using a knife to determine the presence or absence of a hardpan
Identifying the presence of a hardpan

17
VINEYARDS | OLIVE ORCHARDS | ORCHARDS | WHEAT | MAIZE | ANNUAL CROPS | PASTURE
PLATE 8 Using a knife to determine the presence or absence of a hardpan
PLATE 9 Identifying the presence of a hardpan
NO HARDPANThe soil has a low penetration resistanceto the knife. Roots, old root channels,worm channels, cracks and fissures may becommon. Topsoils are friable with a readilyapparent structure and have a soil porosityscore of ≥1.5.
MODERATELY DEVELOPED HARDPANThe soil has a moderate penetrationresistance to the knife. It is firm (hard)with a weakly apparent soil structure andhas a soil porosity score of 0.5–1. Thereare few roots and old root channels,few worm channels, and few cracksand fissures. The pan may have few tocommon orange and grey mottles. Notethe moderately developed tillage pan inthe lower half of the topsoil (arrowed).
STRONGLY DEVELOPED HARDPANThe soil has a high penetration resistanceto the knife. It is very tight, extremelyfirm (very hard) and massive (i.e. with noapparent soil structure) and has a soilporosity score of 0. There are no roots orold root channels, no worm channels orcracks or fissures. The pan may have manyorange and grey mottles. Note the stronglydeveloped tillage pan in the lower half ofthe topsoil (arrowed).

18
VISUAL SOIL ASSESSMENTsu
rfac
e po
ndin
g
AssessmentC
ImportanceI
å Assess the degree of surface ponding (Plate 10) based on your observation or general recollection of the time ponded water took to disappear after a wet period during the spring, and compare with the class limits in Table 4.
SURFACE PONDING and the length of time water remains on the surface can indicate the rate of infiltration into and through the soil, a high water table, and the time the soil remains saturated. Orchard crops generally require free-draining soils. Prolonged waterlogging depletes oxygen in the soil causing anaerobic (anoxic) conditions that induce root stress, and restrict root respiration and the growth and development of roots. Roots need oxygen for respiration and are most vulnerable to surface ponding and saturated soil conditions in the spring when plant roots and shoots are actively growing at a time when respiration and transpiration rates rise markedly and oxygen demands are high. They are also susceptible to ponding in the summer when transpiration rates are highest. Moreover, waterlogging causes the death of fine roots responsible for nutrient and water uptake. Reduced water uptake while the tree is transpiring actively causes leaf desiccation and tip-burn, particularly in the outer canopy. Prolonged waterlogging also increases the likelihood of infections and fungal disease such as Phytophthora root rot and foot rot, and reduces the ability of roots to overcome the harmful effects of topsoil-resident pathogens. Trees decline in vigour, have restricted spring growth (RSG) as evidenced by poor shoot and stunted growth, have thin canopies, and can eventually die.
Waterlogging and deoxygenation also results in a series of undesirable chemical and biochemical reduction reactions, the by-products of which are toxic to roots. Plant-available nitrate-nitrogen (NO
3-) is reduced by denitrification to nitrite (NO
2-) and nitrous
oxide (N2O). a potent greenhouse gas, and plant-available sulphate-sulphur (SO
42-) is
reduced to sulphide, including hydrogen sulphide (H2S), ferrous sulphide (FeS) and
zinc sulphide (ZnS). Iron is reduced to soluble ferrous (Fe2+) ions, and manganese to manganous (Mn2+) ions. Apart from the toxic products produced, the result is a reduction in the amount of plant-available N, S and Zn. Anaerobic respiration of micro-organisms also produces carbon dioxide and methane (also greenhouse gases), hydrogen gas,
ethanol, acetaldehyde and ethylene, all of which inhibit root growth when accumulated in the soil. Unlike aerobic respiration, anaerobic respiration releases insufficient energy in the form of adenosine triphosphate (ATP) and adenylate energy charge (AEC) for microbial and root/shoot growth.
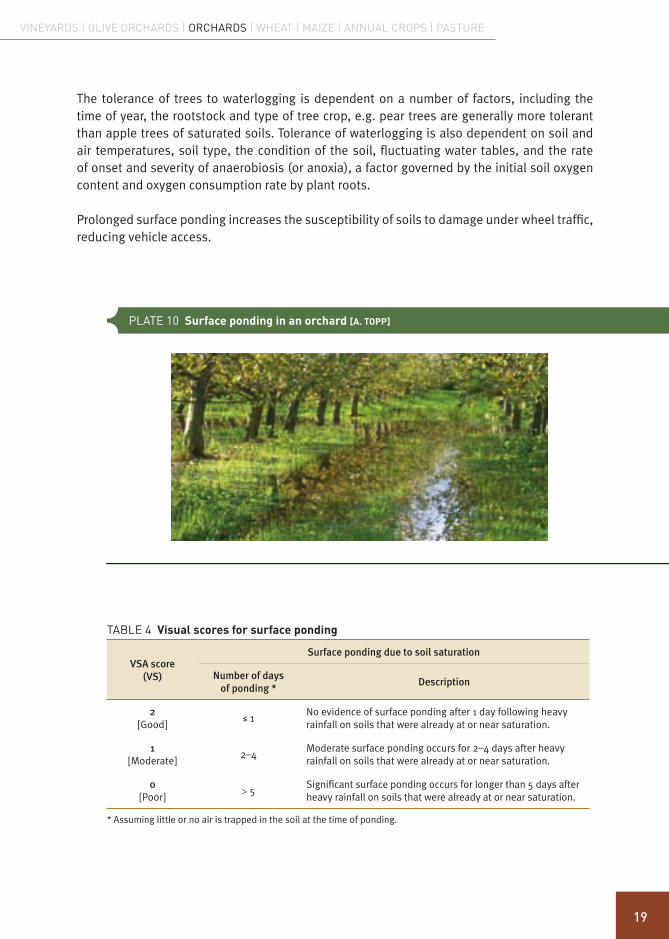
19
VINEYARDS | OLIVE ORCHARDS | ORCHARDS | WHEAT | MAIZE | ANNUAL CROPS | PASTURE
The tolerance of trees to waterlogging is dependent on a number of factors, including the time of year, the rootstock and type of tree crop, e.g. pear trees are generally more tolerant than apple trees of saturated soils. Tolerance of waterlogging is also dependent on soil and air temperatures, soil type, the condition of the soil, fluctuating water tables, and the rate of onset and severity of anaerobiosis (or anoxia), a factor governed by the initial soil oxygen content and oxygen consumption rate by plant roots.
Prolonged surface ponding increases the susceptibility of soils to damage under wheel traffic, reducing vehicle access.
PLATE 10 Surface ponding in an orchard [A. TOPP]
TABLE 4 Visual scores for surface ponding
VSA score(VS)
Surface ponding due to soil saturation
Number of daysof ponding *
Description
2[Good]
≤ 1No evidence of surface ponding after 1 day following heavy rainfall on soils that were already at or near saturation.
1[Moderate]
2–4Moderate surface ponding occurs for 2–4 days after heavy rainfall on soils that were already at or near saturation.
0[Poor]
> 5Significant surface ponding occurs for longer than 5 days after heavy rainfall on soils that were already at or near saturation.
* Assuming little or no air is trapped in the soil at the time of ponding.

20
VISUAL SOIL ASSESSMENTsu
rfac
e cr
usti
ng a
nd s
urfa
ce c
over
AssessmentC
ImportanceI
å Observe the degree of surface crusting and surface cover and compare with Plate 11 and the criteria given. Surface crusting is best assessed after wet spells followed by a period of drying, and before cultivation.
SURFACE CRUSTING reduces infiltration of water and water storage in the soil and increases runoff. Surface crusting also reduces aeration, causing anaerobic conditions, and prolongs water retention near the surface, which can hamper access by machinery for months. Crusting is most pronounced in fine-textured, poorly structured soils with a low aggregate stability and a dispersive clay mineralogy.
SURFACE COVER helps to prevent crusting by minimizing the dispersion of the soil surface by rain or irrigation. It also helps to reduce crusting by intercepting the large rain droplets before they can strike and compact the soil surface. Vegetative cover and its root system return organic matter to the soil and promote soil life, including earthworm numbers and activity. The physical action of the roots and soil fauna and the glues they produce promote the development of soil structure, soil aeration and drainage and help to break up surface crusting. As a result, infiltration rates and the movement of water through the soil increase, decreasing runoff, soil erosion and the risk of flash flooding. Surface cover also reduces soil erosion by intercepting high impact raindrops, minimizing rain-splash and saltation. It further serves to act as a sponge, retaining rainwater long enough for it to infiltrate into the soil. Moreover, the root system reduces soil erosion by stabilizing the soil surface, holding the soil in place during heavy rainfall events. As a result, water quality downstream is improved with a lower sediment loading, nutrient and coliform content. The adoption of managed cover crops has in some cases reduced sediment erosion rates from 70 tonnes/ha to 1.5 tonnes/ha during single large rainfall events. The surface needs to have at least 70 percent cover in order to give good protection, while ≤30 percent cover provides poor protection. Surface cover also reduces the risk of wind erosion markedly.

21
VINEYARDS | OLIVE ORCHARDS | ORCHARDS | WHEAT | MAIZE | ANNUAL CROPS | PASTURE
PLATE 11 How to score surface crusting and surface cover
GOOD CONDITION VS = 2Little or no surface crusting is present; orsurface cover is ≥70%.
MODERATE CONDITION VS = 1Surface crusting is 2–3 mm thick and isbroken by signifi cant cracking; or surfacecover is >30% and <70%.
POOR CONDITION VS = 0Surface crusting is >5 mm thick and isvirtually continuous with little cracking;or surface cover is ≤30%.
Surface cover photos: courtesy of A. Leys

22
VISUAL SOIL ASSESSMENTso
il er
osio
n
AssessmentC
ImportanceI
å Assess the degree of soil erosion based on current visual evidence and, more importantly, on your knowledge of what the site looked like in the past relative to Plate 12.
SOIL EROSION reduces the productive potential of an orchard through nutrient losses, loss of organic matter, reduced potential rooting depth, and lower available-water-holding capacity. Soil erosion can also have significant off-site effects, including reduced water quality through increased sediment, nutrient and coliform loading in streams and rivers.
Overcultivation of interrows can cause considerable soil degradation associated with the loss of soil organic matter and soil structure. It can also develop surface crusting, tillage pans, and decrease infiltration and permeability of water through the soil profile (causing increased surface runoff ). If the soil surface is left unprotected on sloping ground, large quantities of soil can be removed by slips, flows, gullying and rilling, or it can be relocated semi-intact by slumping. The cost of restoration, often requiring heavy machinery, can be prohibitively expensive.
The water erodibility of soil on sloping ground is governed by a number of factors including:< the percentage of vegetative cover on the soil surface;< the amount and intensity of rainfall;< the soil infiltration rate and permeability;< the slope and the nature of the underlying subsoil strata and bedrock.
The loss of organic matter and soil structure as a result of overcultivation between rows can also give rise to significant soil loss by wind erosion of exposed ground where the tree spacing is quite large.

23
VINEYARDS | OLIVE ORCHARDS | ORCHARDS | WHEAT | MAIZE | ANNUAL CROPS | PASTURE
PLATE 12 How to score soil erosion
GOOD CONDITION VS = 2Little or no evidence of soil erosion. Little difference in height between the mounded row and interrow. The root system is completely covered.
MODERATE CONDITION VS = 1Moderate soil erosion with a significant difference in height between the interrow and the soil around the base of the tree trunk. Part of the upper root system is occasionally exposed.
POOR CONDITION VS = 0Severe soil erosion with deeply incised gullies or other mass movement features between rows. There is a large difference in height between the interrow and the soil around the base of the tree trunk. The root system is often well exposed and sometimes undermined.
Photos: courtesy of J. Gomez (Proterra Project supported by Syngenta) and M. Pastor

24
VISUAL SOIL ASSESSMENT
Soil management in orchards
Trees with satisfactory production develop buds of optimal length, promote flower-bud induction, give good percentage fruiting, and stimulate fruit development. Therefore, it is essential to maintain the availability of water, nutrients and carbohydrates during the crop cycle, avoiding any shortages.
Good soil management practices are needed in order to maintain good growth conditions and productivity to safeguard the functionality of the tree, especially during the crucial periods of plant development and fructification. To achieve this, management practices need to maintain and promote the condition and, therefore, functionality of the soil, particularly in regard to its aeration status and the supply of nutrients and water to the plant. To this end, the soil needs to have a good rooting environment, including an adequate soil structure, to allow an effective root system to develop and so maximize the utilization of water and nutrients, and also provide sufficient anchorage for the plant. Good soil structure also promotes infiltration and movement of water through the soil, minimizing surface ponding, runoff and soil erosion.
Where rainfall is not a limiting factor for plant growth, the establishment of cover crops is the most suitable soil management practice to protect the soil surface from erosion, to preserve the environment, to reduce production costs, and to enhance the quality of the fruit. Cover cropping not only helps in reducing water runoff and soil erosion but also improves soil physical characteristics, enriches soil organic matter content and soil life (including earthworm numbers), and suppresses soil-borne diseases by increasing micro-organism biodiversity. However, cover crops compete for minerals, water and fertilizer where they are not well managed. In the absence of irrigation during the hottest months, competition for water could occur during flowering, fruit formation and development, thereby limiting the final yield. To avoid this competition, a temporary cover crop or natural vegetation can be grown from early autumn to mid-spring (often the wettest period), and it can be controlled during the hottest period by herbicide application or mowing 2–3 times during the period of major nutrient demand.
Different mixes of cover crops, including leguminous species that supply N, should be evaluated in different areas. In addition to legumes, the mix could include annual or perennial species, grasses and other broadleaf plants. Winter annuals can be grown to protect the soil from erosion during the winter and to improve the ability of the soil to resist compaction when wet. With their fibrous root system, grasses are also more effective at improving soil structure, and generally add more organic matter to the soil than do legumes. Where allowed to seed in early summer, a seed bank for subsequent regeneration is built up. Where possible, the grass in the interrows and within rows could be kept short by grazing sheep, provided the tree trunks have protective plastic screens to shield them from strip and ring barking. The advantages of managing a grass cover crop using sheep compared with mowing and herbicide strips include: lower use of synthetic (herbicide) chemicals; reduced fossil fuel use; and lower carbon dioxide emissions and, therefore, greater market acceptance. Other advantages include: lower labour and material costs; less compaction along wheel traffic lanes; improved soil nutrient

25
VINEYARDS | OLIVE ORCHARDS | ORCHARDS | WHEAT | MAIZE | ANNUAL CROPS | PASTURE
status; and greater soil life (including earthworm numbers), as a result of the dung and urine applied. Stock tend to rest, urinate and defecate most within the tree row, translocating and concentrating nutrients to where the tree roots are greatest. Sheep can also graze grass very short, reducing not only the competition for water and nutrients but also reducing insect and bird numbers and the possibility of fungal diseases.
The traditional management of the interrow is based on one or two cultivations with discs and tine harrows during the hot period following natural weed cover and it could be satisfactory in limiting, principally, competition for water. The cultivation should be shallower than 100 mm so as to de-vigorate the cover crop but not to modify the canopy/root ratio of the trees by damaging the root system. The cultivation operations can also be useful for incorporating organic and mineral fertilizers as well as controlling diseases caused by fungi and bacteria in the soil.
The application of mulches along the row in the form of compost, bark chips, cereal straw and grass clippings (spread during mowing) shades the soil, so reducing temperature and soil evaporation in summer. Mulches also encourage biological activity, especially earthworms. They suppress weeds and prevent the breakdown of the soil structure under the impact of rain, thereby enhancing water infiltration.

26
VISUAL SOIL ASSESSMENT
References
Shepherd, T. G., Stagnari, F., Pisante, M. and Benites, J. 2008. Visual Soil Assessment – Field guide for orchards. FAO, Rome, Italy.

VISUAL SOIL ASSESSMENT
Orchards
FI
EL
D
GU
ID
E
9 7 8 9 2 5 1 0 5 9 4 1 8
TC/D/I0007E/1/02.08/1000
ISBN 978-92-5-105941-8
The present publication on Visual Soil Assessment is a practicalguide to carry out a quantitative soil analysis with reproduceable resultsusing only very simple tools. Besides soil parameters, also crop parametersfor assessing soil conditions are presented for some selected crops. TheVisual Soil Assessment manuals consist of a series of separate booklets forspecific crop groups, collected in a binder. The publication addressesscientists as well as field technicians and even farmers who want to analysetheir soil condition and observe changes over time.

VISUAL SOIL ASSESSMENT
Vineyards
FI
EL
D
GU
ID
E
Food and Agriculture Organization of the United NationsRome, 2008
Graham Shepherd, soil scientist,BioAgriNomics.com, New Zealand
Fabio Stagnari, assistant researcher,University of Teramo, Italy
Michele Pisante, professor,University of Teramo, Italy
José Benites, technical officer,Land and Water Development Division, FAO

Contents
The designations employed and the presentation of material in this informationproduct do not imply the expression of any opinion whatsoever on the partof the Food and Agriculture Organization of the United Nations (FAO) concerning thelegal or development status of any country, territory, city or area or of its authorities,or concerning the delimitation of its frontiers or boundaries. The mention of speciccompanies or products of manufacturers, whether or not these have been patented, doesnot imply that these have been endorsed or recommended by FAO in preference toothers of a similar nature that are not mentioned.
ISBN 978-92-5-105940-1
All rights reserved. Reproduction and dissemination of material in this informationproduct for educational or other non-commercial purposes are authorized withoutany prior written permission from the copyright holders provided the source is fullyacknowledged. Reproduction of material in this information product for resale or othercommercial purposes is prohibited without written permission of the copyright holders.Applications for such permission should be addressed to:ChiefElectronic Publishing Policy and Support BranchCommunication DivisionFAOViale delle Terme di Caracalla, 00153 Rome, Italyor by e-mail to:[email protected]
© FAO 2008

iii
VINEYARDS | OLIVE ORCHARDS | ORCHARDS | WHEAT | MAIZE | ANNUAL CROPS | PASTURE
Acknowledgements v
List of acronyms v
Visual Soil Assessment vi
SOIL TEXTURE 2
SOIL STRUCTURE 4
SOIL POROSITY 6
SOIL COLOUR 8
NUMBER AND COLOUR OF SOIL MOTTLES 10
EARTHWORMS 12
POTENTIAL ROOTING DEPTH 14Identifying the presence of a hardpan 16
SURFACE PONDING 18
SURFACE CRUSTING AND SURFACE COVER 20
SOIL EROSION 22
WOOD PRODUCTION 26
SHOOT LENGTH 28
LEAF COLOUR 30
YIELD 34
VARIABILITY IN VINE PERFORMANCE ALONG THE ROW 36
PRODUCTION COSTS 38
SOIL MANAGEMENT IN VINEYARDS 40
Contents

iv
VISUAL SOIL ASSESSMENT
1. How to score soil texture 32. Visual scores for earthworms 133. Visual scores for potential rooting depth 154. Visual scores for surface ponding 195. Visual scores for variability in vine performance along the row 376. Visual scores for production costs 38
Acknowledgements
List of acronyms
List of tables
List of figures
1. Soil scorecard – visual indicators for assessing soil quality in vineyards 12. Soil texture classes and groups 33. Plant scorecard – visual indicators for assessing plant performance in vineyards 254. Assessment of production costs 39
1. The VSA tool kit vii2. How to score soil structure 53. How to score soil porosity 74. How to score soil colour 95. How to score soil mottles 116. Sample for assessing earthworms 137. Potential rooting depth 158. Restricted root penetration through plough pan at 25 cm 159. Using a knife to determine the presence or absence of a hardpan 1610. Identifying the presence of a hardpan 1711. Surface ponding in a vineyard 1912. How to score surface crusting and surface cover 2113. How to score soil erosion 2314. How to score wood production 2715. How to score shoot length 2916. How to score leaf colour 3117. Visual symptoms of nutrient deficiency in vines 3218. How to score yield 3519. Effect of soil texture, organic matter and mycorrhizae on vine performance 3620. Effect of soil aeration and drainage on vine performance 3721. Effect of soil-borne pathogens on vine performance 3722. Variable crop vigour and leaf colour along the row 37
List of plates

v
VINEYARDS | OLIVE ORCHARDS | ORCHARDS | WHEAT | MAIZE | ANNUAL CROPS | PASTURE
This publication is adapted from the methodology developed in: Shepherd, T.G. 2008. Visual Soil Assessment. Volume 1. Field guide for pastoral grazing and cropping on flat to rolling country. 2nd edition. Palmerston North, New Zealand, Horizons Regional Council. 106 pp.
The valuable assistance and input provided by C. Llewellyn and the review of the manuscript by Professor C. Intrieri (University of Bologna) and Dr A. Lang are also gratefully acknowledged.
This publication is funded by FAO in collaboration with the Agronomy and Crop Science Research and Education Center of the University of Teramo.
Acknowledgements
List of acronyms
AEC Adenylate energy charge
Al Aluminium
ATP Adenosine triphosphate
B Boron
Ca Calcium
Cu Copper
Fe Iron
K Potassium
Mg Magnesium
Mn Manganese
Mo Molybdenum
N Nitrogen
P Phosphorus
RSG Restricted spring growth
S Sulphur
VS Visual score
VSA Visual Soil Assessment
Zn Zinc

vi
VISUAL SOIL ASSESSMENT
IntroductionThe maintenance of good soil quality is vital for the environmental and economic sustainability of vineyards. A decline in soil quality has a marked impact on vine growth, grape quality, production costs and the risk of soil erosion. Therefore, it can have significant consequences on society and the environment. A decline in soil physical properties in particular takes considerable time and cost to correct. Safeguarding soil resources for future generations and minimizing the ecological footprint of viticulture are important tasks for land managers.
Often, not enough attention is given to:< the basic role of soil quality in efficient and sustained production;< the effect of the condition of the soil on the gross profit margin;< the long-term planning needed to sustain good soil quality;< the effect of land management decisions on soil quality.
Soil type and the effect of management on the condition of the soil are important determinants of the character and quality of wine, and have profound effects on long-term profits. Land managers need tools that are reliable, quick and easy to use in order to help them assess the condition of their soils and their suitability for growing grapes, and to make informed decisions that lead to sustainable land and environmental management. To this end, the Visual Soil Assessment (VSA) provides a quick and simple method to assess soil condition and plant performance. It can also be used to assess the suitability and limitations of a soil for viticulture. Soils with good VSA scores will usually give the best production with the lowest establishment and operational costs.
The VSA methodVisual Soil Assessment is based on the visual assessment of key soil ‘state’ and plant performance indicators of soil quality, presented on a scorecard. Soil quality is ranked by assessment of the soil indicators alone. Plant indicators require knowledge of the growing history of the crop. This knowledge will facilitate the satisfactory and rapid completion of the plant scorecard. With the exception of soil texture, the soil and plant indicators are dynamic indicators, i.e. capable of changing under different management regimes and land-use pressures. Being sensitive to change, they are useful early warning indicators of changes in soil condition and plant performance and as such provide an effective monitoring tool.
Plant indicators allow you to make cause-and-effect links between management practices and soil characteristics. By looking at both the soil and plant indicators, VSA links the natural resource (soil) with plant performance and farm enterprise profitability. Because of this, the soil quality assessment is not a combination of the ‘soil’ and ‘plant’ scores. Rather, the scores should be looked at separately, and compared.
Visual Soil Assessment

vii
VINEYARDS | OLIVE ORCHARDS | ORCHARDS | WHEAT | MAIZE | ANNUAL CROPS | PASTURE
Visual scoringEach indicator is given a visual score (VS) of 0 (poor), 1 (moderate), or 2 (good), based on the soil quality and plant performance observed when comparing the soil and plant with three photographs in the field guide manual. The scoring is flexible, so if the sample you are assessing does not align clearly with any one of the photographs but sits between two, an in-between score can be given, i.e. 0.5 or 1.5. Because some soil and plant indicators are relatively more important in the assessment of soil quality and plant performance than others, VSA provides a weighting factor of 1, 2 and 3. The total of the VS rankings gives the overall Soil Quality Index and Plant Performance Index for the site. Compare these with the rating scale at the bottom of the scorecard to determine whether your soil and plants are in good, moderate or poor condition.
Placing the soil and plant assessments side by side at the bottom of the plant indicator scorecard should prompt you to look for reasons if there is a significant discrepancy between the soil and plant indicators.
The VSA tool kitThe VSA tool kit (Plate 1) comprises:< a spade – to dig a soil pit and to take a
200-mm cube of soil for the drop shatter soil structure test;
< a plastic basin (about 450 mm long x 350 mm wide x 250 mm deep) – to contain the soil during the drop shatter test;
< a hard square board (about 260x260x20 mm) – to fit in the bottom of the plastic basin on to which the soil cube is dropped for the shatter test;
< a heavy-duty plastic bag (about 750x 500 mm) – on which to spread the soil, after the drop shatter test has been carried out;
< a knife (preferably 200 mm long) to investigate the soil pit and potential rooting depth;
< a water bottle – to assess the field soil textural class;< a tape measure – to measure the potential rooting depth;< a VSA field guide – to make the photographic comparisons;< a pad of scorecards – to record the VS for each indicator.
PLATE 1 The VSA tool kit

viii
VISUAL SOIL ASSESSMENT
The procedureWhen it should be carried outThe test should be carried out when the soils are moist and suitable for cultivation. If you are not sure, apply the ‘worm test’. Roll a worm of soil on the palm of one hand with the fingers of the other until it is 50 mm long and 4 mm thick. If the soil cracks before the worm is made, or if you cannot form a worm (for example, if the soil is sandy), the soil is suitable for testing. If you can make the worm, the soil is too wet to test.
Setting up
TimeAllow 25 minutes per site. For a representative assessment of soil quality, sample 4 sites over a 5-ha area.
Reference sampleTake a small sample of soil (about 100x50x150 mm deep) from under a nearby fence or a similar protected area. This provides an undisturbed sample required in order to assign the correct score for the soil colour indicator. The sample also provides a reference point for comparing soil structure and porosity.
SitesSelect sites that are representative of the vineyard. The condition of the soil in vineyards is site specific. Sample sites that have had little or no wheel traffic (e.g. near the vine). The VSA method can also be used to assess compacted areas by selecting to sample along wheel traffic lanes. Always record the position of the sites for future monitoring if required.
Site information
Complete the site information section at the top of the scorecard. Then record any special aspects you think relevant in the notes section at the bottom of the plant indicator scorecard.
Carrying out the test
Initial observationDig a small hole about 200x200 mm square by 300 mm deep with a spade and observe the topsoil (and upper subsoil if present) in terms of its uniformity, including whether it is soft and friable or hard and firm. A knife is useful to help you assess this.
Take the test sampleIf the topsoil appears uniform, dig out a 200-mm cube with the spade.You can sample whatever depth of soil you wish, but ensure that you sample the equivalent of a 200-mm cube of soil. If for example, the top 100 mm of the soil is compacted and you wish to assess its condition, dig out two samples of 200x200x100 mm with a spade. If the 100–200-mm depth is dominated by a tillage pan and you wish to assess its condition, remove the top 100 mm of soil and dig out two samples of 200x200x100 mm. Note that taking a 200-mm cube sample below the topsoil can also give valuable information about the condition of the subsoil and its implications for plant growth and farm management practices.

ix
VINEYARDS | OLIVE ORCHARDS | ORCHARDS | WHEAT | MAIZE | ANNUAL CROPS | PASTURE
The drop shatter testDrop the test sample a maximum of three times from a height of 1 m onto the wooden square in the plastic basin. The number of times the sample is dropped and the height it is dropped from, is dependent on the texture of the soil and the degree to which the soil breaks up, as described in the section on soil structure.
Systematically work through the scorecard, assigning a VS to each indicator by comparing it with the photographs (or table) and description reported in the field guide.
The plant indicatorsMany plant indicators cannot be assessed at the same time as the soil indicators. Ideally, the plant performance indicators should be observed at the appropriate time during the season. The plant indicators are scored and ranked in the same way as soil indicators: a weighting factor is used to indicate the relative importance of each indicator, with each contributing to the final determination of plant performance. The Plant Performance Index is the total of the individual VS rankings in the right-hand column.
Format of the bookletThe soil and plant scorecards are given in Figures 1 and 3, respectively, and list the key indicators required in order to assess soil quality and plant performance. Each indicator is described on the following pages, with a section on how to assess the indicator and an explanation of its importance and what it reveals about the condition of the soil and about plant performance.


1
VINEYARDS | OLIVE ORCHARDS | ORCHARDS | WHEAT | MAIZE | ANNUAL CROPS | PASTURE
��������������������������������
���������������������������������������������������������������������������
��������� ����������
������������ ���
�������������� ���
������������� ���
����������� ���
��������������������������������� ���
���
���
��������������� ���
���������������������������������� ���
������������������������� ���
���������������������������������������
����������������������� ������������������
���� ����
�������� �����
���� ����
������������������������������������������������������������������������������������
����������� ���������
��������������� ��������
�������������� �����
����������
���������������
���������������������
��������������������������� ������ ������ ������ ������� �����
�������������������� ���� ��������������� ������ ����������� ���
����������������������������� ���� ���� ����� ����� �������
�������������������� � �� ����������� � �
������������������������� � ��
�����
�����
�����
�����
������
������
������
������
������
������

2
VISUAL SOIL ASSESSMENTso
il te
xtur
e
Assessment
å Take a small sample of soil (half the size of your thumb) from the topsoil and a sample (or samples) that is (or are) representative of the subsoil.
ç Wet the soil with water, kneading and working it thoroughly on the palm of your hand with your thumb and forefinger to the point of maximum stickiness.
é Assess the texture of the soil according to the criteria given in Table 1 by attempting to mould the soil into a ball.
With experience, a person can assess the texture directly by estimating the percentages of sand, silt and clay by feel, and the textural class obtained by reference to the textural diagram (Figure 2).
There are occasions when the assignment of a textural score will need to be modified because of the nature of a textural qualifier. For example, if the soil has a reasonably high content of organic matter, i.e. is humic with 15–30 percent organic matter, raise the textural score by one (e.g. from 0 to 1 or from 1 to 2). If the soil has a significant gravelly or stony component, reduce the textural score by 0.5.
There are also occasions when the assignment of a textural score will need to be modified because of the specific preference of a crop for a particular textural class. For example, asparagus prefers a soil with a sandy loam texture and so the textural score is raised by 0.5 from a score of 1 to 1.5 based on the specific textural preference of the plant.
C
ImportanceISOIL TEXTURE defines the size of the mineral particles. Specifically, it refers to the relative proportion of the various size-groups in the soil, i.e. sand, silt and clay. Sand is that fraction that has a particle size > 0.06 mm; silt varies between 0.06 and 0.002 mm; and the particle size of clay is < 0.002 mm. Texture influences soil behaviour in several ways, notably through its effect on: water retention and availability; soil structure; aeration; drainage; soil trafficability; soil life; and the supply and retention of nutrients.
A knowledge of both the textural class and the potential rooting depth enables an approximate assessment of the total water-holding capacity of the soil, one of the major drivers of crop production.

3
VINEYARDS | OLIVE ORCHARDS | ORCHARDS | WHEAT | MAIZE | ANNUAL CROPS | PASTURE
FIGURE 2 Soil texture classes and groups
Textural classes.
Textural groups.
TABLE 1 How to score soil texture
Visual score(VS)
Textural class Description
2[Good]
Silt loamSmooth soapy feel, slightly sticky, no grittiness. Moulds into a cohesive ball that fissures when pressed flat.
1.5[Moderately good]
Clay loamVery smooth, sticky and plastic. Moulds into a cohesive ball that deforms without fissuring.
1[Moderate]
Sandy loam Slightly gritty, faint rasping sound. Moulds into a cohesive ball that fissures when pressed flat.
0.5[Moderately poor]
Loamy sandSilty clay
Clay
Loamy sand: Gritty and rasping sound. Will almost mould into a ball but disintegrates when pressed flat.Silty clay, clay: Very smooth, very sticky, very plastic. Moulds into a cohesive ball that deforms without fissuring.
0[Poor]
SandGritty and rasping sound. Cannot be moulded into a ball.

4
VISUAL SOIL ASSESSMENTso
il st
ruct
ure
AssessmentC
ImportanceI
å Remove a 200-mm cube of topsoil with a spade (between or along wheel tracks).ç Drop the soil sample a maximum of three times from a height of 1 m onto the firm base
in the plastic basin. If large clods break away after the first or second drop, drop them individually again once or twice. If a clod shatters into small (primary structural) units after the first or second drop, it does not need dropping again. Do not drop any piece of soil more than three times. For soils with a sandy loam texture (Table 1), drop the cube of soil just once only from a height of 0.5 m.
é Transfer the soil onto the large plastic bag.è For soils with a loamy sand or sand texture, drop the cube of soil still sitting on the spade (once)
from a height of just 50 mm, and then roll the spade over, spilling the soil onto the plastic bag.ê Applying only very gently pressure, attempt to part each clod by hand along any exposed
cracks or fissures. If the clod does not part easily, do not apply further pressure (because the cracks and fissures are probably not continuous and, therefore, are unable to readily conduct oxygen, air and water).
ë Move the coarsest fractions to one end and the finest to the other end. Arrange the distribution of aggregates on the plastic bag so that the height of the soil is roughly the same over the whole surface area of the bag. This provides a measure of the aggregate-size distribution. Compare the resulting distribution of aggregates with the three photographs in Plate 2 and the criteria given.The method is valid for a wide range of moisture conditions but is best carried out when the soil is moist to slightly moist; avoid dry and wet conditions.
SOIL STRUCTURE is extremely important for vineyards. It regulates:< soil aeration and gaseous exchange rates;< soil temperature;< soil infiltration and erosion;< the movement and storage of water;< nutrient supply;< root penetration and development;< soil workability;< soil trafficability;< the resistance of soils to structural degradation.
Good soil structure reduces the susceptibility to compaction under wheel traffic and increases the window of opportunity for vehicle access and for carrying out no-till, minimum-till or conventional cultivation between rows under optimal soil conditions.
Soil structure is ranked on the size, shape, firmness, porosity and relative abundance of soil aggregates and clods. Soils with good structure have friable, fine, porous, subangular and subrounded (nutty) aggregates. Those with poor structure have large, dense, very firm, angular or subangular blocky clods that fit and pack closely together and have a high tensile strength.

5
VINEYARDS | OLIVE ORCHARDS | ORCHARDS | WHEAT | MAIZE | ANNUAL CROPS | PASTURE
PLATE 2 How to score soil structure
GOOD CONDITION VS = 2Soil dominated by friable, fineaggregates with no significant clodding.Aggregates are generally subrounded(nutty) and often quite porous.
MODERATE CONDITION VS = 1Soil contains significant proportions(50%) of both coarse clods and friablefine aggregates. The coarse clods arefirm, subangular or angular in shape andhave few or no pores.
POOR CONDITION VS = 0Soil dominated by coarse clodswith very few finer aggregates. Thecoarse clods are very firm, angular orsubangular in shape and have very fewor no pores.

6
VISUAL SOIL ASSESSMENTso
il po
rosi
ty
AssessmentC
ImportanceI
å Remove a spade slice of soil (about 100 mm wide, 150 mm long and 200 mm deep) from the side of the hole and break it in half.
ç Examine the exposed fresh face of the sample for soil porosity by comparing against the three photographs in Plate 3. Look for the spaces, gaps, holes, cracks and fissures between and within soil aggregates and clods.
é Examine also the porosity of a number of the large clods from the soil structure test. This provides important additional information as to the porosity of the individual clods (the intra-aggregate porosity).
It is important to assess SOIL POROSITY along with the structure of the soil. Soil porosity, and particularly macroporosity (or large pores), influences the movement of air and water in the soil. Soils with good structure have a high porosity between and within aggregates, but soils with poor structure may not have macropores and coarse micropores within the large clods, restricting their drainage and aeration.
Poor aeration leads to the build up of carbon dioxide, methane and sulphide gases, and reduces the ability of plants to take up water and nutrients, particularly nitrogen (N), phosphorus (P), potassium (K) and sulphur (S). Plants can only utilize S and N in the oxygenated sulphate (SO
42-), nitrate (NO
3-) and ammonium (NH
4+) forms. Therefore,
plants require aerated soils for the efficient uptake and utilization of S and N. The number, activity and biodiversity of micro-organisms and earthworms are also greatest in well-aerated soils and they are able to decompose and cycle organic matter and nutrients more efficiently.
The presence of soil pores enables the development and proliferation of the superficial (or feeder) roots throughout the soil. Vine roots are unable to penetrate and grow through firm, tight, compacted soils, severely restricting the ability of the plant to utilize the available water and nutrients in the soil. A high penetration resistance not only limits plant uptake of water and nutrients, it also reduces fertilizer efficiency considerably and increases the susceptibility of the plant to root diseases.
Soils with good porosity will also tend to produce lower amounts of greenhouse gases. The greater the porosity, the better the drainage, and, therefore, the less likely it is that the soil pores will be water-filled to the critical levels required to accelerate the production of greenhouse gases. Aim to keep the soil porosity score above 1.

7
VINEYARDS | OLIVE ORCHARDS | ORCHARDS | WHEAT | MAIZE | ANNUAL CROPS | PASTURE
PLATE 3 How to score soil porosity
GOOD CONDITION VS = 2Soils have many macropores and coarsemicropores between and within aggregatesassociated with good soil structure.
MODERATE CONDITION VS = 1Soil macropores and coarse microporesbetween and within aggregates have declinedsignificantly but are present on closeexamination in parts of the soil. The soil showsa moderate amount of consolidation.
POOR CONDITION VS = 0No soil macropores and coarse microporesare visually apparent within compact,massive structureless clods. The clodsurface is smooth with few or no cracks orholes, and can have sharp angles.

8
VISUAL SOIL ASSESSMENTso
il co
lour AssessmentC
ImportanceI
å Compare the colour of a handful of soil from the field site with soil taken from under the nearest fenceline or a similar protected area.
ç Using the three photographs and criteria given (Plate 4), compare the relative change in soil colour that has occurred.
As topsoil colour can vary markedly between soil types, the photographs illustrate the degree of change in colour rather than the absolute colour of the soil.
SOIL COLOUR is a very useful indicator of soil quality because it can provide an indirect measure of other more useful properties of the soil that are not assessed so easily and accurately. In general, the darker the colour is, the greater is the amount of organic matter in the soil. A change in colour can give a general indication of a change in organic matter under a particular land use or management. Soil organic matter plays an important role in regulating most biological, chemical and physical processes in soil, which collectively determine soil health. It promotes infiltration and retention of water, helps to develop and stabilize soil structure, cushions the impact of wheel traffic and cultivators, reduces the potential for wind and water erosion, and maintains the soil carbon ‘sink’. Organic matter also provides an important food resource for soil organisms and is an important source of, and major reservoir of, plant nutrients. Its decline reduces the fertility and nutrient-supplying potential of the soil; N, P, K and S requirements of vines increase markedly, and other major and minor elements are leached more readily. The result is an increased dependency on fertilizer input to maintain nutrient status.
Soil colour can also be a useful indicator of soil drainage and the degree of soil aeration. In addition to organic matter, soil colour is influenced markedly by the chemical form (or oxidation state) of iron (Fe) and manganese (Mn). Brown, yellow-brown, reddish-brown and red soils without mottles indicate well-aerated, well-drained conditions where Fe and Mn occur in the oxidized form of ferric (Fe3+) and manganic (Mn3+) oxides. Grey-blue colours can indicate that the soil is poorly drained or waterlogged and poorly aerated for long periods, conditions that reduce Fe and Mn to ferrous (Fe2+) and manganous (Mn2+) oxides. Poor aeration and prolonged waterlogging give rise to a further series of chemical and biochemical reduction reactions that produce toxins, such as hydrogen sulphide, carbon dioxide, methane, ethanol, acetaldehyde and ethylene, that damage the root system. This reduces the ability of plants to take up water and nutrients, causing poor vigour and ill-thrift. Decay and dieback of roots can also occur as a result of the Phylloxera aphid and fungal diseases such as Phytophthora root rot and black foot rot in soils prone to waterlogging.
In general, dark-coloured soils are more favourable for red wine quality (owing to an increase in polyphenol and terpens).

9
VINEYARDS | OLIVE ORCHARDS | ORCHARDS | WHEAT | MAIZE | ANNUAL CROPS | PASTURE
PLATE 4 How to score soil colour
GOOD CONDITION VS = 2Dark coloured topsoil that is not toodissimilar to that under the fenceline.
MODERATE CONDITION VS = 1The colour of the topsoil is somewhatpaler than that under the fenceline, butnot markedly so.
POOR CONDITION VS = 0Soil colour has become significantly palercompared with that under the fenceline.

10
VISUAL SOIL ASSESSMENTnu
mbe
r an
d co
lour
of s
oil m
ottl
es AssessmentC
ImportanceI
å Take a sample of soil (about 100 mm wide × 150 mm long × 200 mm deep) from the side of the hole and compare with the three photographs (Plate 5) and the percentage chart to determine the percentage of the soil occupied by mottles.
Mottles are spots or blotches of different colour interspersed with the dominant soil colour.
The NUMBER AND COLOUR OF SOIL MOTTLES provide a good indication of how well the soil is drained and how well it is aerated. They are also an early warning of a decline in soil structure caused by compaction under wheel traffic and overcultivation. The loss of soil structure decreases and blocks the number of channels and pores that conduct water and air and, as a consequence, can result in waterlogging and a deficiency of oxygen for a prolonged period. The development of anaerobic (deoxygenated) conditions reduces Fe and Mn from their brown/orange oxidized ferric (Fe3+) and manganic (Mn3+) form to grey ferrous (Fe2+) and manganous (Mn2+) oxides. Mottles develop as various shades of orange and grey owing to varying degrees of oxidation and reduction of Fe and Mn. As oxygen depletion increases, orange, and ultimately grey, mottles predominate. An abundance of grey mottles indicates the soil is poorly drained and poorly aerated for a significant part of the year. The presence of only common orange and grey mottles (10–25 percent) indicates the soil is imperfectly drained with only periodic waterlogging. Soil with only few to common orange mottles indicates the soil is moderately well drained, and the absence of mottles indicates good drainage.
Poor aeration reduces the uptake of water by plants and can induce wilting. It can also reduce the uptake of plant nutrients, particularly N, P, K and S. Moreover, poor aeration retards the breakdown of organic residues, and can cause chemical and biochemical reduction reactions that produce sulphide gases, methane, ethanol, acetaldehyde and ethylene, which are toxic to plant roots. Decay and dieback of roots can also occur as a result of the Phylloxera aphid and fungal diseases such as Phytophthora root rot and black foot rot in strongly mottled, poorly aerated soils. Root rot and reduced nutrient and water uptake give rise to poor plant vigour and ill-thrift. If your visual score for mottles is ≤1, you need to aerate the soil.

11
VINEYARDS | OLIVE ORCHARDS | ORCHARDS | WHEAT | MAIZE | ANNUAL CROPS | PASTURE
PLATE 5 How to score soil mottles
GOOD CONDITION VS = 2Mottles are generally absent.
MODERATE CONDITION VS = 1Soil has common (10–25%) fine andmedium orange and grey mottles.
POOR CONDITION VS = 0Soil has abundant to profuse (> 50%)medium and coarse orange and particularlygrey mottles.

12
VISUAL SOIL ASSESSMENTea
rthw
orm
s
AssessmentC
ImportanceI
å Count the earthworms by hand, sorting through the soil sample used to assess soil structure (Plate 6) and compare with the class limits in Table 2. Pay particular attention to the turf mat. Earthworms vary in size and number depending on the species and the season. Therefore, for year-to-year comparisons, earthworm counts must be made at the same time of year when soil moisture and temperature levels are good. Earthworm numbers are reported as the number per 200-mm cube of soil. Earthworm numbers are commonly reported on a square-metre basis. A 200-mm cube sample is equivalent to 1/25 m2, and so the number of earthworms needs to be multiplied by 25 to convert to numbers per square metre.
EARTHWORMS provide a good indicator of the biological health and condition of the soil because their population density and species are affected by soil properties and management practices. Through their burrowing, feeding, digestion and casting, earthworms have a major effect on the chemical, physical and biological properties of the soil. They shred and decompose plant residues, converting them to organic matter, and so releasing mineral nutrients. Compared with uningested soil, earthworm casts can contain 5 times as much plant available N, 3–7 times as much P, 11 times as much K, and 3 times as much Mg. They can also contain more Ca and plant-available Mo, and have a higher pH, organic matter and water content. Moreover, earthworms act as biological aerators and physical conditioners of the soil, improving:< soil porosity;< aeration;< soil structure and the stability of soil aggregates;< water retention;< water infiltration;< drainage.
They also reduce surface runoff and erosion. They further promote plant growth by secreting plant-growth hormones and increasing root density and root development by the rapid growth of roots down nutrient-enriched worm channels. While earthworms can deposit about 25–30 tonnes of casts/ha/year on the surface, 70 percent of their casts are deposited below the surface of the soil. Therefore, earthworms play an important role in vineyards and can increase growth rates and production significantly.
Earthworms also increase the population, activity and diversity of soil microbes. Actinomycetes increase 6–7 times during the passage of soil through the digestive tract of the worm and, along with other microbes, play an important role in the decomposition of organic matter to humus. Soil microbes such as mycorrhizal fungi play a further role in

13
VINEYARDS | OLIVE ORCHARDS | ORCHARDS | WHEAT | MAIZE | ANNUAL CROPS | PASTURE
the supply of nutrients, digesting soil and fertilizer and unlocking nutrients, such as P, that are fixed by the soil. Microbes also retain significant amounts of nutrients in their biomass, releasing them when they die. Moreover, soil microbes produce plant-growth hormones and compounds that stimulate root growth and promote the structure, aeration, infiltration and water-holding capacity of the soil. Micro-organisms further encourage a lower incidence of pests and diseases. The collective benefits of microbes reduce fertilizer requirements and improve vine and grape quality.
Earthworm numbers (and biomass) are governed by the amount of food available as organic matter and soil microbes, as determined by the amount and quality of surface residue, the use of cover crops including legumes, and the cultivation of interrows. Earthworm populations can be up to three times higher in undisturbed soils compared with cultivated soils. Earthworm numbers are also governed by: soil moisture, temperature, texture, soil aeration, pH, soil nutrients (including levels of Ca), and the type and amount of fertilizer and N used. The overuse of acidifying salt-based fertilizers, anhydrous ammonia and ammonia-based products, and some insecticides and fungicides can further reduce earthworm numbers.
Soils should have a good diversity of earthworm species with a combination of: (i) surface feeders that live at or near the surface to breakdown plant residues and dung; (ii) topsoil-dwelling species that burrow, ingest and mix the top 200–300 mm of soil; and (iii) deep-burrowing species that pull down and mix plant litter and organic matter at depth.
PLATE 6 Sample for assessing earthworms
TABLE 2 Visual scores for earthworms
Visual score(VS)
Earthworm numbers(per 200-mm cube of soil)
2[Good]
> 30 (with preferably 3 or more species)
1[Moderate]
15–30 (with preferably 2 or more species)
0[Poor]
< 15 (with predominantly 1 species)

14
VISUAL SOIL ASSESSMENTpo
tent
ial r
ooti
ng d
epth
AssessmentC
ImportanceI
å Dig a hole to identify the depth to a limiting (restricting) layer where present (Plates 7 and 8), and compare with the class limits in Table 3. As the hole is being dug, note the presence of roots and old root channels, worm channels, cracks and fissures down which roots can extend. Note also whether there is an over-thickening of roots (a result of a high penetration resistance), and whether the roots are being forced to grow horizontally, otherwise know as right-angle syndrome. Moreover, note the firmness and tightness of the soil, whether the soil is grey and strongly gleyed owing to prolonged waterlogging, and whether there is a hardpan present such as a human-induced tillage or plough pan (Plate 8), or a natural pan such as an iron, siliceous or calcitic pan. An abrupt transition from a fine (heavy) material to a coarse (sandy/gravelly) layer will also limit root development. A rough estimate of the potential rooting depth may be made by noting the above properties in a nearby road cutting, gully, slip, earth slump or an open drain.
The POTENTIAL ROOTING DEPTH is the depth of soil that plant roots can potentially exploit before reaching a barrier to root growth, and it indicates the ability of the soil to provide a suitable rooting medium for plants. The greater is the rooting depth, the greater is the available-water-holding capacity of the soil. In drought periods, deep roots can access larger water reserves, thereby alleviating water stress and promoting the survival of non-irrigated vineyards. Under irrigation, the majority of roots are in the top 1 m of soil. The exploration of a large volume of soil by deep roots means that they can also access more macronutrients and micronutrients, thereby accelerating the growth and enhancing the yield and quality of the grapes. Conversely, soils with a restricted rooting depth caused by, for example, a layer with a high penetration resistance such as a compacted layer or a hardpan, restrict vertical root growth and development, causing roots to grow sideways. This limits plant uptake of water and nutrients, reduces fertilizer efficiency, increases leaching, and decreases yield. A high resistance to root penetration can also increase plant stress and the susceptibility of the plant to root diseases. Moreover, hardpans impede the movement of air, oxygen and water through the soil profile, the last increasing the susceptibility to waterlogging and erosion by rilling and sheet wash.
The potential rooting depth can be restricted further by:< an abrupt textural change;< pH;< aluminium (Al) toxicity;< nutrient deficiencies;< salinity;< sodicity;< a high or fluctuating water table;< low oxygen levels.

15
VINEYARDS | OLIVE ORCHARDS | ORCHARDS | WHEAT | MAIZE | ANNUAL CROPS | PASTURE
Anaerobic (anoxic) conditions caused by deoxygenation and prolonged waterlogging restrict the rooting depth as a result of the accumulation of toxic levels of hydrogen sulphide, ferrous sulphide, carbon dioxide, methane,
ethanol, acetaldehyde and
ethylene, by-products of chemical and biochemical reduction reactions.
Grapevines with a deep, dense, vigorous root system raise soil organic matter levels and soil life at depth. The physical action of the roots and soil fauna and the glues they produce promote soil structure, porosity, water storage, soil aeration and drainage at depth. For rainfed vineyards, the depth of a restricting layer should ideally be deeper than 2.5 m, with a soil depth of preferably not less than 600 mm. Stony soils are acceptable under irrigation systems, particularly where the depth of the soil is less than 1 m. Furthermore, grapevines need a sufficient rooting depth to provide adequate anchorage for the vines at maturity.
PLATE 7 Potential rooting depth [L. VAN HUYSSTEEN in VAN ZYL 1988]
TABLE 3 Visual scores for potential rooting depth
VSA score(VS)
Potential rooting depth(m)
2.0[Good]
> 0.8
1.5[Moderately good]
0.6–0.8
1.0[Moderate]
0.4–0.6
0.5[Moderately poor]
0.2–0.4
0[Poor]
< 0.2
PLATE 8 Restricted root penetration through plough pan at 25 cm [L. VAN HUYSSTEEN]

16
VISUAL SOIL ASSESSMENT
Assessmentå Examine for the presence of a hardpan by rapidly jabbing the side of the soil profile (that
was dug to assess the potential rooting depth) rapidly with a knife, starting at the top and progressing systematically and quickly down to the bottom of the hole (Plate 9). Note how easy or difficult it is to jab the knife into the soil as you move rapidly down the profile. A strongly developed hardpan is very tight and extremely firm, and it has a high penetration resistance to the knife. Pay particular attention to the lower topsoil and upper subsoil where tillage pans and plough pans commonly occur if present (Plate 10).
ç Having identified the possible presence of a hardpan by a significant increase in penetration resistance to the point of a knife, gauge how strongly developed the hardpan is. Remove a large hand-sized sample and assess its structure, porosity and the number and colour of soil mottles (Plates 2, 3 and 5), and also look for the presence of roots. Compare with the photographs and criteria given in Plate 10.
PLATE 9 Using a knife to determine the presence or absence of a hardpan
Identifying the presence of a hardpan

17
VINEYARDS | OLIVE ORCHARDS | ORCHARDS | WHEAT | MAIZE | ANNUAL CROPS | PASTURE
PLATE 9 Using a knife to determine the presence or absence of a hardpan
PLATE 10 Identifying the presence of a hardpan
NO HARDPANThe soil has a low penetration resistanceto the knife. Roots, old root channels,worm channels, cracks and fissures may becommon. Topsoils are friable with a readilyapparent structure and have a soil porosityscore of ≥1.5.
MODERATELY DEVELOPED HARDPANThe soil has a moderate penetrationresistance to the knife. It is firm (hard)with a weakly apparent soil structure andhas a soil porosity score of 0.5–1. Thereare few roots and old root channels,few worm channels, and few cracksand fissures. The pan may have few tocommon orange and grey mottles. Notethe moderately developed tillage pan inthe lower half of the topsoil (arrowed).
STRONGLY DEVELOPED HARDPANThe soil has a high penetration resistanceto the knife. It is very tight, extremelyfirm (very hard) and massive (i.e. with noapparent soil structure) and has a soilporosity score of 0. There are no roots orold root channels, no worm channels orcracks or fissures. The pan may have manyorange and grey mottles. Note the stronglydeveloped tillage pan in the lower half ofthe topsoil (arrowed).

18
VISUAL SOIL ASSESSMENTsu
rfac
e po
ndin
g
AssessmentC
ImportanceI
å Assess the degree of surface ponding (Plate 11) based on your observation or general recollection of the time ponded water took to disappear after a wet period during the spring, and compare with the class limits in Table 4.
SURFACE PONDING and the length of time water remains on the surface can indicate the rate of infiltration into and through the soil, a high water table, and the time the soil remains saturated. Grapevines generally require free-draining soils. Prolonged waterlogging depletes oxygen in the soil causing anaerobic (anoxic) conditions that induce root stress, and restrict root respiration and the growth and development of roots. Roots need oxygen for respiration. They are most vulnerable to surface ponding and saturated soil conditions in the spring when plant roots and shoots are growing actively at a time when respiration and transpiration rates rise markedly and oxygen demands are high. They are also susceptible to ponding in the summer when transpiration rates are highest. Moreover, waterlogging causes the death of fine roots responsible for nutrient and water uptake. Reduced water uptake while the vine is transpiring actively causes leaf desiccation and tip-burn. Prolonged waterlogging also increases the likelihood of pests and diseases, including the Phylloxera aphid and Phytophthora fungal root rot, and reduces the ability of roots to overcome the harmful effects of topsoil-resident pathogens. Vines decline in vigour, have restricted spring growth (RSG) as evidenced by poor shoot and stunted growth, and eventually die.
Waterlogging and deoxygenation also result in a series of undesirable chemical and biochemical reduction reactions, the by-products of which are toxic to roots. Plant-available nitrate-nitrogen (NO
3-) is reduced by denitrification to nitrite (NO
2-) and nitrous oxide
(N2O), a potent greenhouse gas, and plant-available sulphate-sulphur (SO
42-) is reduced
to sulphide, including hydrogen sulphide (H2S), ferrous sulphide (FeS) and zinc sulphide
(ZnS). Iron is reduced to soluble ferrous (Fe2+) ions, and Mn to manganous (Mn2+) ions. Apart from the toxic products produced, the result is a reduction in the amount of plant-available N and S. Anaerobic respiration of micro-organisms also produces carbon dioxide and methane (also greenhouse gases), hydrogen gas, ethanol, acetaldehyde and ethylene, all of which inhibit root growth when accumulated in the soil. Unlike aerobic respiration, anaerobic respiration releases insufficient energy in the form of adenosine triphosphate (ATP) and adenylate energy charge (AEC) for microbial and root/shoot growth.

19
VINEYARDS | OLIVE ORCHARDS | ORCHARDS | WHEAT | MAIZE | ANNUAL CROPS | PASTURE
The tolerance of vine roots to waterlogging is dependent on a number of factors, including the time of year, the rootstock, soil and air temperatures, soil type, the condition of the soil, fluctuating water tables and the rate of onset and severity of anaerobiosis (or anoxia), a factor governed by the amount of entrapped air and the oxygen consumption rate by plant roots. Prolonged surface ponding increases the susceptibility of soils to damage under wheel traffic, so reducing vehicle access.
PLATE 11 Surface ponding in a vineyard [CWi Technical Ltd]
TABLE 4 Visual scores for surface ponding
VSA score(VS)
Surface ponding due to soil saturation
Number of daysof ponding *
Description
2[Good]
≤ 1No evidence of surface ponding after 1 day following heavy rainfall on soils that were already at or near saturation.
1[Moderate]
2–3Moderate surface ponding occurs for 2–3 days after heavy rainfall on soils that were already at or near saturation.
0[Poor]
> 4Significant surface ponding occurs for longer than 4 days after heavy rainfall on soils that were already at or near saturation.
* Assuming little or no air is trapped in the soil at the time of ponding.

20
VISUAL SOIL ASSESSMENTsu
rfac
e cr
usti
ng a
nd s
urfa
ce c
over
AssessmentC
ImportanceI
å Observe the degree of surface crusting and surface cover and compare with Plate 12 and the criteria given. Surface crusting is best assessed after wet spells followed by a period of drying, and before cultivation.
SURFACE CRUSTING reduces infiltration of water and water storage in the soil and increases runoff. Surface crusting also reduces aeration, causing anaerobic conditions, and prolongs water retention near the surface, which can hamper access by machinery for months. Crusting is most pronounced in fine-textured, poorly structured soils with a low aggregate stability and a dispersive clay mineralogy.
SURFACE COVER helps to prevent crusting by minimizing the dispersion of the soil surface by rain or irrigation. It also helps to reduce crusting by intercepting the large rain droplets before they can strike and compact the soil surface. Vegetative cover and its root system return organic matter to the soil and promote soil life, including earthworm numbers and activity. The physical action of the roots and soil fauna and the glues they produce promote the development of soil structure, soil aeration and drainage and help to break up surface crusting. As a result, infiltration rates and the movement of water through the soil increase, decreasing runoff, soil erosion and the risk of flash flooding. Surface cover also reduces soil erosion by intercepting high impact raindrops, minimizing rain-splash and saltation. It further serves to act as a sponge, retaining rainwater long enough for it to infiltrate into the soil. Moreover, the root system reduces soil erosion by stabilizing the soil surface, holding the soil in place during heavy rainfall events. As a result, water quality downstream is improved with a lower sediment loading, nutrient and coliform content. The adoption of managed cover crops has in some cases reduced sediment erosion rates from 70 tonnes/ha to 1.5 tonnes/ha during single large rainfall events. The surface needs to have at least 70 percent cover in order to give good protection, while ≤30 percent cover provides poor protection. Surface cover also reduces the risk of wind erosion markedly.

21
VINEYARDS | OLIVE ORCHARDS | ORCHARDS | WHEAT | MAIZE | ANNUAL CROPS | PASTURE
PLATE 12 How to score surface crusting and surface cover
GOOD CONDITION VS = 2Little or no surface crusting is present; orsurface cover is ≥70%.
MODERATE CONDITION VS = 1Surface crusting is 2–3 mm thick and isbroken by signifi cant cracking; or surfacecover is >30% and <70%.
POOR CONDITION VS = 0Surface crusting is >5 mm thick and isvirtually continuous with little cracking;or surface cover is ≤30%.
Photos of surface cover: courtesy of A. Leys; Photo of severe crusting: courtesy of M. Speyer

22
VISUAL SOIL ASSESSMENTso
il er
osio
n
AssessmentC
ImportanceI
å Assess the degree of soil erosion based on current visual evidence and, more importantly, on your knowledge of what the site looked like in the past relative to Plate 13.
SOIL EROSION reduces the productive potential of a vineyard through nutrient losses, loss of organic matter, reduced potential rooting depth, and lower available-water-holding capacity. Soil erosion can also have significant off-site effects, including reduced water quality through increased sediment, nutrient and coliform loading in streams and rivers.
Overcultivation of interrows can cause considerable soil degradation associated with the loss of soil organic matter and soil structure. It can also develop surface crusting, tillage pans, and decrease infiltration and permeability of water through the soil profile (causing increased surface runoff ). If the soil surface is left unprotected on sloping ground, large quantities of soil can be removed by slips, flows, gullying and rilling, or it can be relocated semi-intact by slumping. The cost of restoration, often requiring heavy machinery, can be prohibitively expensive.
The water erodibility of soil on sloping ground is governed by a number of factors including:< the percentage of vegetative cover on the soil surface;< the amount and intensity of rainfall;< the soil infiltration rate and permeability;< the slope and the nature of the underlying subsoil strata and bedrock.

23
VINEYARDS | OLIVE ORCHARDS | ORCHARDS | WHEAT | MAIZE | ANNUAL CROPS | PASTURE
PLATE 13 How to score soil erosion
GOOD CONDITION VS = 2Little or no evidence of soil erosion. Little difference in height between the mounded row and interrow. The root system is completely covered.
MODERATE CONDITION VS = 1Moderate soil erosion with a significant difference in height between the mounded row and interrow. Part of the upper root system is occasionally exposed.
POOR CONDITION VS = 0Severe soil erosion with deeply incised gullies or other mass movement features between rows. The root system is often well exposed and the vine trunk totally undermined in places.
Photos: courtesy of C. Llewellyn and M. Greener


25
VINEYARDS | OLIVE ORCHARDS | ORCHARDS | WHEAT | MAIZE | ANNUAL CROPS | PASTURE
�������������������������������������
���������������������������������������������������������������������������
��������� ����������
��������������� ���
������������ ���
����������� ���
����� ���
���������������� ���
� ������������������������
�������
��������������������
����������������������������
������
���������������������������������������
�����������������������
���� ����
�������� �����
���� ����
�������������������������������������� �����������������������������������������������������
��������������� ����������������
������������������������������������������������������������������������������������������
�������������������������������������������� ���
������
������
������
������
������
������

26
VISUAL SOIL ASSESSMENTw
ood
prod
ucti
on AssessmentC
ImportanceIWhile climate factors, cultivar and agricultural practices all influence WOOD PRODUCTION, wood production at flowering is a good indicator of plant vigour and the fertility and physical condition of the soil (including its nutrient and water status). Therefore, it is a useful indicator of soil quality.
Soil degradation resulting from the loss of organic matter, soil compaction, poor aeration or soil erosion restricts root growth and limits the movement and storage of water, the cycling of nutrients and the efficient uptake of fertilizers. Plant roots either cannot reach the fertilizer, or the applied nutrients remain unavailable in the compacted soil because of impaired water movement or preferential flow through the soil, by-passing much of the soil volume. As a result, plant growth and vigour are poor.
å Estimate wood production per metre cord by assessing fresh wood weight at pruning (Plate 14). In making the observation, consideration must be given to the cultivar, pruning and age of the vine.

27
VINEYARDS | OLIVE ORCHARDS | ORCHARDS | WHEAT | MAIZE | ANNUAL CROPS | PASTURE
PLATE 14 How to score wood production
GOOD CONDITION VS = 2Depending on the cultivar, vineyards of seven years of age have 0.8 kg of vine-shoots per metre cord at pruning.
MODERATE CONDITION VS = 1Depending on the cultivar, vineyards of seven years of age have 0.6–0.8 kg of vine-shoots per metre cord at pruning.
POOR CONDITION VS = 0Depending on the cultivar, vineyards of seven years of age have <0.6 kg of vine-shoots per metre cord at pruning.

28
VISUAL SOIL ASSESSMENTsh
oot l
engt
h
AssessmentC
ImportanceISHOOT LENGTH is also influenced by the bud position on the trunk and cordon, and by bud orientation with respect to the vertical direction. It is related strongly to the physical and chemical fertility of the soil, which in turn is influenced by soil management. Shoot length is an expression of plant vigour and general plant growth, which are also regulated by the availability of water and nutrients and by the aeration status of the soil. Waterlogging and poor drainage can restrict spring growth and give rise to poor shoot growth and dieback. Soils in good condition with good structure and porosity, and with a deep, well-aerated rootzone, enable the unrestricted movement of air and water into and through the soil and the development and proliferation of superficial (feeder) roots. Furthermore, soils with good organic-matter levels and soil life show an active biological and chemical process, favouring the release and uptake of water and nutrients and, consequently, shoot growth.
å Measure or visually assess shoot length and compare with the criteria given (Plate 15) at veraison. In making your assessment, consideration must be given to the cultivar, pruning and age of the vine, and the weather conditions at bud break. Poor weather will promote a high number of leaf buds rather than flowering buds and give rise to many shoots and leaves rather than flowers.

29
VINEYARDS | OLIVE ORCHARDS | ORCHARDS | WHEAT | MAIZE | ANNUAL CROPS | PASTURE
PLATE 15 How to score shoot length
GOOD CONDITION VS = 2Vine-shoots are at or near the maximum length, with a little variability depending on the position of the shoot on the branch.
MODERATE CONDITION VS = 1Vine-shoot length is moderately below maximum and shows moderate variability depending on the position of the shoot on the plant.
POOR CONDITION VS = 0Vine-shoot length is significantly below the maximum length.

30
VISUAL SOIL ASSESSMENTle
af c
olou
r
AssessmentC
ImportanceILEAF COLOUR can provide a good indication of the nutrient status and condition of the soil. The higher is the soil fertility, the greener is the leaf colour. Leaf colour is related primarily to water and nutrient availability, especially N. Leaf colour can also indicate a deficiency or excess of P, K, S, Ca, Mg, Fe, Mn, zinc (Zn), copper (Cu) and boron (B). Chlorosis can further occur as a result of low N, K, S, Fe, Mg and Cu levels in the soil, low soil and air temperatures, and poor soil aeration caused by compaction and waterlogging. A deficiency or excess of one or more essential elements in a plant can also produce visual symptoms of necrosis of leaf margins, stunted growth of shoots, irregular fruit-set and small berries. Premature leaf senescence can further indicate plant stress.
Nutrient deficiencies or excesses can suppress the availability of other nutrients. For example, high P levels can suppress the uptake of Zn and Cu. Excess N can suppress B and Cu and cause the plant to luxury feed on K, which in turn can suppress the utilization of Ca and Mg. Sulphur can also only be utilized by plants in the sulphate (SO
42-) form.
Under poorly aerated conditions, S will reduce to sulphur dioxide (SO2) and sulphides (e.g.
hydrogen sulphide [H2S], and ferrous sulphide [FeS]). Sulphides and SO
2 cannot be taken
up by the plant, are toxic to plant roots and micro-organisms, and suppress N uptake. Plants can only utilize N where S is present in the oxygenated (sulphate) form. Like S, N can also only be utilized by the plant under aerobic conditions in the nitrate (NO
3-) or
ammonium form (NH4
+).
Plate 17 shows some of the most common symptoms of nutrient deficiencies.
å Assess the colour of the mature leaves at the base of the vine-shoots by comparing with Plate 16 and the criteria given. In making the observation, consideration must be given to the cultivar, the stage of growth, pests and diseases, and recent weather conditions. Prolonged cold and cloudy days with little sunlight can give rise to chlorosis (or yellowing of the leaf) owing to the inadequate formation or loss of chlorophyll.

31
VINEYARDS | OLIVE ORCHARDS | ORCHARDS | WHEAT | MAIZE | ANNUAL CROPS | PASTURE
PLATE 16 How to score leaf colour
GOOD CONDITION VS = 2Leaves have an intense dark green colour.
MODERATE CONDITION VS = 1Leaves have a yellowish-green or medium green colour.
POOR CONDITION VS = 0Leaves have a distinct yellowish colour or turn opaque green.

32
VISUAL SOIL ASSESSMENT
PLATE 17 Visual symptoms of nutrient deficiency in vines
Phosphorus
Potassium

33
VINEYARDS | OLIVE ORCHARDS | ORCHARDS | WHEAT | MAIZE | ANNUAL CROPS | PASTURE
PLATE 17 Visual symptoms of nutrient deficiency in vines PLATE 17 Visual symptoms of nutrient deficiency in vines (continued)
Boron
Zinc
Iron

34
VISUAL SOIL ASSESSMENTyi
eld
AssessmentC
ImportanceIYIELD can be a good visual indicator of the properties and condition of the soil. The physical condition of the soil (in terms of its texture, structure, porosity, aeration and drainage) has a significant effect on the root system, aeration status and water and nutrient availability at critical times of the year. It also plays an important role in vine growth and vigour, grape quality and yield.
Appropriate soil management, including the adoption of a managed cover crop between rows, and avoiding wheel traffic when the soil is wet, helps to promote the physical condition and overall fertility of the soil and sustainable long-term production.
å Assess relative crop yield by visual estimation of fruit number and size and by comparing with Plate 18 and the criteria given, or alternatively estimate or measure the weight of grapes per metre cord. In making your assessment, consideration must be given to the cultivar, pruning and age of the vine. Consideration must also be given to the weather conditions (e.g. whether warm and dry, or cold and wet) at pollination, fertilization, flowering and fruit-set. Pollination is best when the weather is dry, while fertilization is most successful when temperatures are warm. Poor weather during flowering can give rise to poor fruit-set. Warm weather at fruit-set will give good yields while cold wet weather will give poorer yields. Compare your assessment or measurement against the mean of the last 3 or 4 years.

35
VINEYARDS | OLIVE ORCHARDS | ORCHARDS | WHEAT | MAIZE | ANNUAL CROPS | PASTURE
PLATE 18 How to score yield
GOOD CONDITION VS = 2Depending on the cultivar, pruning and age of the vine, yields are good.
MODERATE CONDITION VS = 1Depending on the cultivar, pruning and age of the vine, yields are moderate.
POOR CONDITION VS = 0Depending on the cultivar, pruning and age of the vine, yields are poor.

36
VISUAL SOIL ASSESSMENTva
riab
ility
of v
ine
perf
orm
ance
alo
ng th
e ro
w
AssessmentC
ImportanceIVARIABILITY OF VINE PERFORMANCE ALONG THE ROW can be a very good visual indicator of the properties and condition of the soil. In particular, the linear variability of vine performance is often related to the availability of water and nutrients, and the texture of the soil (e.g. whether clayey, silty, loamy, sandy or gravelly). Moreover, soils in good condition with good structure and porosity, and with a deep, well-aerated rootzone, enable the unrestricted movement of air and water into and through the soil, the development and proliferation of superficial (feeder) roots, and unrestricted respiration and transpiration. Furthermore, soils with good organic-matter levels and soil life (including mycorrhizae) show an active biological and chemical process, favouring the release and uptake of water and nutrients and, consequently, the growth and vigour of the vine.
The spatial variability of vine performance along the row is also a useful indicator because it highlights those vines that are underperforming compared with the majority, enabling a specific investigation as to why those are struggling and what remedial action may be taken.
å Cast your eye along the rows and observe any variability in vine performance (in terms of vine height, stem thickness, canopy volume and density, leaf colour, early senescence of leaves, etc.) and compare with the class limits in Table 5. In making the assessment, consideration must be given to pruning and to diseases that are not soil-related (Plates 19–22).
PLATE 19 Effect of soil texture, organic matter and mycorrhizae on vine performance [D. MUNDY]
Poor-performing vines on the left are on coarse-textured soils with low organic matter and a low mycorrhizal colonization of 40%. Well-performing vines on the right are the result of better utilization of water and nutrients on a siltier soil with more organic matter and a 90% colonization of mycorrhizae.

37
VINEYARDS | OLIVE ORCHARDS | ORCHARDS | WHEAT | MAIZE | ANNUAL CROPS | PASTURE
TABLE 5 Visual scores for variability of vine performance along the row
Visual score (VS) Variability of vine performance along the row
2 [Good] Vine performance is good and even along the row
1 [Moderate] Vine performance is moderately variable along the row
0 [Poor] Vine performance is extremely variable along the row
PLATE 20 Effect of soil aeration and drainage on vine performance [D. MUNDY]
Poor-performing vines in the hollows are due to root (black foot) rot associated with poor drainage, while the better-performing vines on higher ground further along the row are on freer-draining, better-aerated soil.
PLATE 19 Effect of soil texture, organic matter and mycorrhizae on vine performance [D. MUNDY]
PLATE 21 Effect of soil-borne pathogens on vine performance [D. MUNDY]
Poor-performing vines in the centre row owing to a soil-borne pathogen.
PLATE 22 Variable crop vigour and leaf colour [S. GREEN]
Variable crop vigour and leaf colour along the row owing to differences in water and nutrient availability associated with differences in soil texture and soil depth.

38
VISUAL SOIL ASSESSMENTpr
oduc
tion
cos
ts
AssessmentC
ImportanceIContinuous tillage between rows using conventional cultivation techniques can give rise to a marked decline in soil structure, porosity and organic matter. The result is a reduction in root growth owing to a decline in soil aeration, an increase in penetration resistance to root development, a reduction in water storage and plant-available water, and a reduction in soil fertility and the ability of the soil to supply nutrients. Higher amounts of fertilizer are required in order to compensate for the loss of these nutrients and the decline in soil quality. Higher and more frequent applications of chemical sprays are also needed because of increased disease and pest attack in vineyards with degraded soils. The quantity and quality of the final product can often be reduced, with a lower income as a consequence.
Soil compaction under wheel traffic between rows increases the size, density and strength of soil clods, and increases the penetration resistance to lateral root development. Apart from decreasing infiltration and increasing runoff, the increased tillage resistance of compacted lanes often requires a greater number of passes and careful timing with the cultivator in order to break down the large clods. Subsoiling may also be necessary to ameliorate compaction in the subsoil in order to improve aeration and root development.
å Assess whether production costs have increased because of increased tillage/subsoiling, fertilizer requirements and pesticide application over the years (Figure 4 and Table 6). This assessment can be based on perceptions, but reference to annual balance sheets will give a more precise answer.

39
VINEYARDS | OLIVE ORCHARDS | ORCHARDS | WHEAT | MAIZE | ANNUAL CROPS | PASTURE
����������������������������������������
������������������
������������������
��������������������������������������
������������������������
��������������������������
���
�
���������������������������������������������������������������������
��������������������������
�������������
����������������������������������������������������������������������������
������������������������������������������������������������������������������������������������
TABLE 6 Visual scores for production costs
Visual score (VS) Production costs
2[Good]
Spraying, fertilizer and tillage/subsoiling requirementshave not increased significantly
1[Moderate]
Spraying, fertilizer and tillage/subsoiling requirementshave increased moderately
0[Poor]
Spraying, fertilizer and tillage/subsoiling requirementshave increased greatly

40
VISUAL SOIL ASSESSMENT
Soil management in vineyards
Soil management plays a key role in achieving good high-quality vineyard production while at the same time safeguarding the environment and minimizing the ecological footprint of viticulture on a region and the country.
One of the aims of the farmer should be soil conservation. This does not only mean having healthy plants and high grape quality, but achieving this with less fertilizer, chemical input and soil tillage. In general, conventional soil management in vineyards can have a negative impact on the environment. It enhances chemical residues, alters microflora and microfauna by reducing both the number of species and their biomass, reduces soil organic matter content and exposes the soil to accelerated soil erosion. Thus, the loss of soil and soil quality in vineyards contributes to the food eco-footprint.
Cover crops play an important role in protecting the soil surface and enhancing soil quality, so preserving the environment, reducing production costs and enhancing the quality of wine. Recent experiments have shown that the nutritional status of vineyards can have a strong influence on the chemical and organoleptic characteristics of wine.
Cover cropping not only helps in reducing water runoff and soil erosion but also improves soil physical characteristics, enriches soil organic matter content, reduces inorganic fertilization and root mortality, and suppresses soil-borne disease by increasing micro-organism activity and biodiversity.
One of the limiting factors of cover crops in vineyards is the competition for nutrients and plant-available water where the management is inadequate. This can affect the amount of available N to the plant and the N content and alcoholic fermentation of the wine. In order to solve this problem, a different mix of cover crops including leguminous species such as clover and lucerne that supply N (fixed from the atmosphere) should be evaluated in different areas, reducing the problem of N deficiency. The input of biologically fixed N is also an important component of the N cycle.
In addition to legumes, the mix of cover crops in the interrows could include annual and perennial species, grasses and other broadleaf plants. Winter annuals can be grown in order to protect the soil from erosion during winter and to improve the ability of the soil to resist compaction when wet. Grasses, with their fibrous root system, are also more effective at improving soil structure, and generally add more organic matter to the soil than do legumes. Where allowed to seed in early summer, a seed bank for subsequent regeneration is built up. In order to reduce competition, cover crops or natural weeds can be controlled by herbicide application or by mowing 2–3 times during the period of major water and nutrient demand. Grass should also be kept short in order to reduce insect and bird numbers. Where the grass cover crop extends along and under the vine row, ensure that the length of grass is kept short in order to reduce not only the competition for water and nutrients but also the possibility of fungal diseases.

41
VINEYARDS | OLIVE ORCHARDS | ORCHARDS | WHEAT | MAIZE | ANNUAL CROPS | PASTURE
In addition to the adoption of managed cover crops, the physical condition and overall fertility of the soil can be promoted by avoiding wheel traffic between rows when the soils are wet.
The application of mulches along the vine rows in the form of grass mowings, compost, bark chips and cereal straw shade the soil, so reducing temperature and soil evaporation during the summer. Mulches also encourage biological activity, especially earthworms. They suppress weeds and prevent the breakdown of the soil structure under the impact of rain, so enhancing water infiltration. The application of crushed glass as a ‘mulch’ enhances the availability of understorey light, so providing more energy from the rays of the sun to the ripening fruit, lifting the flavour, and ripening the fruit earlier. However, glass mulch does nothing to enhance the biological life of the soil.

42
VISUAL SOIL ASSESSMENT
References
Shepherd, T. G., Stagnari, F., Pisante, M. and Benites, J. 2008. Visual Soil Assessment – Field guide for vineyards. FAO, Rome, Italy.

VISUAL SOIL ASSESSMENT
Vineyards
FI
EL
D
GU
ID
E9 7 8 9 2 5 1 0 5 9 4 1 8
TC/D/I0007E/1/02.08/1000
ISBN 978-92-5-105941-8
The present publication on Visual Soil Assessment is a practicalguide to carry out a quantitative soil analysis with reproduceable resultsusing only very simple tools. Besides soil parameters, also crop parametersfor assessing soil conditions are presented for some selected crops. TheVisual Soil Assessment manuals consist of a series of separate booklets forspecific crop groups, collected in a binder. The publication addressesscientists as well as field technicians and even farmers who want to analysetheir soil condition and observe changes over time.

VISUAL SOIL ASSESSMENT
Wheat
FI
EL
D
GU
ID
E
9 7 8 9 2 5 1 0 5 9 4 1 8
TC/D/I0007E/1/02.08/1000
ISBN 978-92-5-105941-8
The present publication on Visual Soil Assessment is a practicalguide to carry out a quantitative soil analysis with reproduceable resultsusing only very simple tools. Besides soil parameters, also crop parametersfor assessing soil conditions are presented for some selected crops. TheVisual Soil Assessment manuals consist of a series of separate booklets forspecific crop groups, collected in a binder. The publication addressesscientists as well as field technicians and even farmers who want to analysetheir soil condition and observe changes over time.

VISUAL SOIL ASSESSMENT
Wheat
FI
EL
D
GU
ID
E
Food and Agriculture Organization of the United NationsRome, 2008
Graham Shepherd, soil scientist,BioAgriNomics.com, New Zealand
Fabio Stagnari, assistant researcher,University of Teramo, Italy
Michele Pisante, professor,University of Teramo, Italy
José Benites, technical officer,Land and Water Development Division, FAO

Contents
The designations employed and the presentation of material in this informationproduct do not imply the expression of any opinion whatsoever on the partof the Food and Agriculture Organization of the United Nations (FAO) concerning thelegal or development status of any country, territory, city or area or of its authorities,or concerning the delimitation of its frontiers or boundaries. The mention of speciccompanies or products of manufacturers, whether or not these have been patented, doesnot imply that these have been endorsed or recommended by FAO in preference toothers of a similar nature that are not mentioned.
ISBN 978-92-5-105941-8
All rights reserved. Reproduction and dissemination of material in this informationproduct for educational or other non-commercial purposes are authorized withoutany prior written permission from the copyright holders provided the source is fullyacknowledged. Reproduction of material in this information product for resale or othercommercial purposes is prohibited without written permission of the copyright holders.Applications for such permission should be addressed to:ChiefElectronic Publishing Policy and Support BranchCommunication DivisionFAOViale delle Terme di Caracalla, 00153 Rome, Italyor by e-mail to:[email protected]
© FAO 2008

iii
VINEYARDS | OLIVE ORCHARDS | ORCHARDS | WHEAT | MAIZE | ANNUAL CROPS | PASTURE
Acknowledgements vi
List of acronyms vi
Visual Soil Assessment vii
SOIL TEXTURE 2
SOIL STRUCTURE 4
SOIL POROSITY 6
SOIL COLOUR 8
NUMBER AND COLOUR OF SOIL MOTTLES 10
EARTHWORMS 12
POTENTIAL ROOTING DEPTH 14Identifying the presence of a hardpan 16
SURFACE PONDING 18
SURFACE CRUSTING AND SURFACE COVER 20
SOIL EROSION 22
CROP ESTABLISHMENT 26
TILLERING 28
LEAF COLOUR 30
VARIABILITY OF CROP PERFORMANCE ALONG THE ROW 34
ROOT DEVELOPMENT 36
ROOT DISEASE 38
CROP GROWTH AND HEIGHT AT MATURITY 40
KERNEL SIZE 42
CROP YIELD 44
PRODUCTION COSTS 46
SOIL MANAGEMENT OF WHEAT CROP 48
Contents

iv
VISUAL SOIL ASSESSMENT
1. How to score soil texture 32. Visual scores for earthworms 133. Visual scores for potential rooting depth 154. Visual scores for surface ponding 195. Visual scores for variability of crop performance along the row 356. Visual scores for root development 377. Visual scores for root disease 398. Visual scores for crop growth and height at maturity 419. Visual scores for crop yield 4510. Visual scores for production costs 46
List of tables
List of figures
1. Soil scorecard – visual indicators for assessing soil quality in wheat 12. Soil texture classes and groups 33. Plant scorecard – visual indicators for assessing plant performance in wheat 254. Assessment of production costs 47
1. The VSA tool kit viii2. How to score soil structure 53. How to score soil porosity 74. How to score soil colour 95. How to score soil mottles 116. (a): earthworms casts under crop residue; (b): yellow-tail earthworm 137. Sample for assessing earthworms 138. Hole dug to assess the potential rooting depth 159. Using a knife to determine the presence or absence of a hardpan 1610. Identifying the presence of a hardpan 1711. Surface ponding in a wheat field 1912. How to score surface crusting and surface cover 2113. How to score soil erosion 2314. How to score crop establishment 2715. How to score tillering 2916. How to score leaf colour 3117. Common symptoms of leaf discolouration due to nutrient deficiencies in wheat 3218. Variable crop performance due to soil aeration and soil wetness 34
List of plates

v
VINEYARDS | OLIVE ORCHARDS | ORCHARDS | WHEAT | MAIZE | ANNUAL CROPS | PASTURE
19. Variable crop performance due to soil compaction 3520. Variable crop performance due to an iron pan 3521. Variable crop performance due to water-repellency 3522. Root development 3723. Pythium root disease 3824. Take-all root disease 3925. Fusarium root disease 3926. Root rot 3927. Crop height at maturity 4128. How to score kernel size 4329. Crop yield 4430. Effect of boron deficiency on crop yield 4531. Effect of copper deficiency on crop yield 4532. No-till drilling a wheat crop into an erosion-prone field protected by good residue cover 4933. Strip-tillage planting of an annual crop protected by good residue cover 4934. Harvesting a wheat crop, followed immediately by no-till seeding the next crop into stubble 49

vi
VISUAL SOIL ASSESSMENT
This publication is adapted from the methodology developed in: Shepherd, T.G. 2008. Visual Soil Assessment. Volume 1. Field guide for pastoral grazing and cropping on flat to rolling country. 2nd edition. Palmerston North, New Zealand, Horizons Regional Council. 106 pp.
The authors gratefully acknowledge the contribution of a number of the photographs kindly provided by Annemie Leys (Katholieke Universiteit Leuven) and John Quinton, and the useful discussions held with Kevin Sinclair and Peter Jamieson, Crop & Food Research.
This publication is funded by FAO in collaboration with the Agronomy and Crop Science Research and Education Center of the University of Teramo.
Visual Soil AssessmentAcknowledgements
AEC Adenylate energy chargeAl AluminiumATP Adenosine triphosphateB BoronCa CalciumCO2 Carbon dioxideCu CopperFe IronK PotassiumMg MagnesiumMn ManganeseMo MolybdenumN NitrogenP PhosphorusRSG Restricted spring growthS SulphurVS Visual scoreVSA Visual Soil AssessmentZn Zinc
List of acronyms

vii
VINEYARDS | OLIVE ORCHARDS | ORCHARDS | WHEAT | MAIZE | ANNUAL CROPS | PASTURE
IntroductionThe maintenance of good soil quality is vital for the environmental and economic sustainability of wheat cropping. A decline in soil quality has a marked impact on yield and grain quality, production costs and the risk of soil erosion, and can therefore have significant consequences for society and the environment. A decline in soil physical properties in particular takes considerable time and cost to correct. Safeguarding soil resources for future generations and minimizing the ecological footprint of cropping wheat is an important task for land managers.
Often, not enough attention is given to:< the basic role of soil quality in efficient and sustained production;< the effect of the condition of the soil on the gross profit margin;< the long-term planning needed to sustain good soil quality;< the effect of land management decisions on soil quality.
Soil type and the effect of management on the condition of the soil are important determinants of the productive performance of wheat cropping and have profound effects on long term profits. Land managers need reliable, quick and easy to use tools to help them assess the condition of their soils and their suitability for growing crops, and make informed decisions that will lead to sustainable land and environmental management. To this end, the Visual Soil Assessment (VSA) provides a quick and simple method to assess soil condition and plant performance. It can also be used to assess the suitability and limitations of a soil for wheat. Soils with good VSA scores will, by and large, give the best production with the lowest establishment and operational costs.
The VSA methodVisual Soil Assessment is based on the visual assessment of key soil ‘state’ and plant performance indicators of soil quality, presented on a scorecard. Soil quality is ranked by assessment of the soil indicators alone. Plant indicators require knowledge of the growing history of the crop. This knowledge will facilitate the satisfactory and rapid completion of the plant scorecard. With the exception of soil texture, the soil and plant indicators are dynamic indicators, i.e. capable of changing under different management regimes and land-use pressures. Being sensitive to change, they are useful early warning indicators of changes in soil condition and plant performance and as such provide an effective monitoring tool.
Plant indicators allow you to make cause-and-effect links between management practices and soil characteristics. By looking at both the soil and plant indicators, VSA links the natural resource (soil) with plant performance and farm enterprise profitability. Because of this, soil quality assessment is not a combination of the ‘soil’ and ‘plant’ scores; rather, the scores should be looked at separately, and compared.
Visual Soil Assessment

viii
VISUAL SOIL ASSESSMENT
Visual scoringEach indicator is given a visual score (VS) of 0 (poor), 1 (moderate), or 2 (good), based on the soil quality and plant performance observed when comparing the soil and plant with three photographs in the field guide manual. The scoring is flexible, so if the sample you are assessing does not align clearly with any one of the photographs but sits between two, an in-between score can be given, i.e. 0.5 or 1.5. Because some soil and plant indicators are relatively more important in the assessment of soil quality and plant performance than others, VSA provides a weighting factor of 1, 2 and 3. The total of the VS rankings gives the overall Soil Quality Index and Plant Performance Index for the site. Compare these with the rating scale at the bottom of the scorecard to determine whether your soil and plants are in good, moderate or poor condition.
Placing the soil and plant assessments side by side at the bottom of the plant indicator scorecard should prompt you to look for reasons if there is a significant discrepancy between the soil and plant indicators.
The VSA tool kitThe VSA tool kit (Plate 1) comprises:< a spade – to dig a soil pit and to take a
200-mm cube of soil for the drop shatter soil structure test;
< a plastic basin (about 450 mm long x 350 mm wide x 250 mm deep) – to contain the soil during the drop shatter test;
< a hard square board (about 260x260x20 mm) – to fit in the bottom of the plastic basin on to which the soil cube is dropped for the shatter test;
< a heavy-duty plastic bag (about 750x500 mm) – on which to spread the soil, after the drop shatter test has been carried out;
< a knife (preferably 200 mm long) to investigate the soil pit and potential rooting depth;
< a water bottle – to assess the field soil textural class;< a tape measure – to measure the potential rooting depth;< a VSA field guide – to make the photographic comparisons;< a pad of scorecards – to record the VS for each indicator.
PLATE 1 The VSA tool kit

ix
VINEYARDS | OLIVE ORCHARDS | ORCHARDS | WHEAT | MAIZE | ANNUAL CROPS | PASTURE
The procedureWhen it should be carried outThe test should be carried out when the soils are moist and suitable for cultivation. If you are not sure, apply the ‘worm test’. Roll a worm of soil on the palm of one hand with the fingers of the other until it is 50 mm long and 4 mm thick. If the soil cracks before the worm is made, or if you cannot form a worm (for example, if the soil is sandy), the soil is suitable for testing. If you can make the worm, the soil is too wet to test.
Setting up
TimeAllow 25 minutes per site. For a representative assessment of soil quality, sample 4 sites over a 5-ha area.
Reference sampleTake a small sample of soil (about 100x50x150 mm deep) from under a nearby fence or a similar protected area. This provides an undisturbed sample required in order to assign the correct score for the soil colour indicator. The sample also provides a reference point for comparing soil structure and porosity.
SitesSelect sites that are representative of the field. The condition of the soil in wheat fields is site specific. Avoid areas that may have had heavier traffic than the rest of the field and sample between wheel traffic lanes. VSA can also be used however, to assess the effects of high traffic on soil quality by selecting to sample along wheel traffic lanes. Always record the position of the sites for future monitoring if required.
Site information
Complete the site information section at the top of the scorecard. Then record any special aspects you think relevant in the notes section at the bottom of the plant indicator scorecard.
Carrying out the test
Initial observationDig a small hole about 200x200 mm square by 300 mm deep with a spade and observe the topsoil (and upper subsoil if present) in terms of its uniformity, including whether it is soft and friable or hard and firm. A knife is useful to help you assess this.
Take the test sampleIf the topsoil appears uniform, dig out a 200-mm cube with the spade.You can sample whatever depth of soil you wish, but ensure that you sample the equivalent of a 200-mm cube of soil. If for example, the top 100 mm of the soil is compacted and you wish to assess its condition, dig out two samples of 200x200x100 mm with a spade. If the 100–200-mm depth is dominated by a tillage pan and you wish to assess its condition, remove the top 100 mm of soil and dig out two samples of 200x200x100 mm. Note that taking a 200-mm cube sample below the topsoil can also give valuable information about the condition of the subsoil and its implications for plant growth and farm management practices.
PLATE 1 The VSA tool kit

x
VISUAL SOIL ASSESSMENT
The drop shatter testDrop the test sample a maximum of three times from a height of 1 m onto the wooden square in the plastic basin. The number of times the sample is dropped and the height it is dropped from, is dependent on the texture of the soil and the degree to which the soil breaks up, as described in the section on soil structure.
Systematically work through the scorecard, assigning a VS to each indicator by comparing it with the photographs (or table) and description reported in the field guide.
The plant indicatorsMany plant indicators cannot be assessed at the same time as the soil indicators. Ideally, the plant performance indicators should be observed at the appropriate time during the season. The plant indicators are scored and ranked in the same way as soil indicators: a weighting factor is used to indicate the relative importance of each indicator, with each contributing to the final determination of plant performance. The Plant Performance Index is the total of the individual VS rankings in the right-hand column.
Format of the bookletThe soil and plant scorecards are given in Figures 1 and 3, respectively, and list the key indicators required in order to assess soil quality and plant performance. Each indicator is described on the following pages, with a section on how to assess the indicator and an explanation of its importance and what it reveals about the condition of the soil and about plant performance.

1
VINEYARDS | OLIVE ORCHARDS | ORCHARDS | WHEAT | MAIZE | ANNUAL CROPS | PASTURE
��������������������������������
���������������������������������������������������������������������������
��������� ����������
������������ ���
�������������� ���
������������� ���
����������� ���
��������������������������������� ���
���
���
��������������� ���
���������������������������������� ���
������������������������� ���
���������������������������������������
����������������������� ������������������
���� ����
�������� �����
���� ����
��������������������������������������������������������������������������������
����������� ���������
��������������� ��������
�������������� �����
����������
���������������
���������������������
��������������������������� ������ ������ ������ ������� �����
�������������������� ���� ��������������� ������ ����������� ���
����������������������������� ���� ���� ����� ����� �������
�������������������� � �� ����������� � �
������������������������� � ��
�����
�����
�����
�����
������
������
������
������
������
������

2
VISUAL SOIL ASSESSMENTso
il te
xtur
e
Assessment
å Take a small sample of soil (half the size of your thumb) from the topsoil and a sample (or samples) that is (or are) representative of the subsoil.
ç Wet the soil with water, kneading and working it thoroughly on the palm of your hand with your thumb and forefinger to the point of maximum stickiness.
é Assess the texture of the soil according to the criteria given in Table 1 by attempting to mould the soil into a ball.
With experience, a person can assess the texture directly by estimating the percentages of sand, silt and clay by feel, and the textural class obtained by reference to the textural diagram (Figure 2).
There are occasions when the assignment of a textural score will need to be modified because of the nature of a textural qualifier. For example, if the soil has a reasonably high content of organic matter, i.e. is humic with 15–30 percent organic matter, raise the textural score by one (e.g. from 0 to 1 or from 1 to 2). If the soil has a significant gravelly or stony component, reduce the textural score by 0.5.
There are also occasions when the assignment of a textural score will need to be modified because of the specific preference of a crop for a particular textural class. For example, asparagus prefers a soil with a sandy loam texture and so the textural score is raised by 0.5 from a score of 1 to 1.5 based on the specific textural preference of the plant.
C
ImportanceISOIL TEXTURE defines the size of the mineral particles. Specifically, it refers to the relative proportion of the various size-groups in the soil, i.e. sand, silt and clay. Sand is that fraction that has a particle size >0.06 mm; silt varies between 0.06 and 0.002 mm; and the particle size of clay is <0.002 mm. Texture influences soil behaviour in several ways, notably through its effect on: water retention and availability; soil structure; aeration; drainage; soil workability and trafficability; soil life; and the supply and retention of nutrients.
A knowledge of both the textural class and the potential rooting depth enables an approximate assessment of the total water-holding capacity of the soil, one of the major drivers of crop production.

3
VINEYARDS | OLIVE ORCHARDS | ORCHARDS | WHEAT | MAIZE | ANNUAL CROPS | PASTURE
FIGURE 2 Soil texture classes and groups
Textural classes.
Textural groups.
TABLE 1 How to score soil texture
Visual score(VS)
Textural class Description
2[Good]
Silt loamSmooth soapy feel, slightly sticky, no grittiness. Moulds into a cohesive ball that fissures when pressed flat.
1.5[Moderately good]
Clay loamVery smooth, sticky and plastic. Moulds into a cohesive ball that deforms without fissuring.
1[Moderate]
Sandy loam Slightly gritty, faint rasping sound. Moulds into a cohesive ball that fissures when pressed flat.
0.5[Moderately poor]
Loamy sandSilty clay
Clay
Loamy sand: Gritty and rasping sound. Will almost mould into a ball but disintegrates when pressed flat.Silty clay, clay: Very smooth, very sticky, very plastic. Moulds into a cohesive ball that deforms without fissuring.
0[Poor]
SandGritty and rasping sound. Cannot be moulded into a ball.

4
VISUAL SOIL ASSESSMENTso
il st
ruct
ure
AssessmentC
ImportanceI
å Remove a 200-mm cube of topsoil with a spade (between or along wheel tracks).ç Drop the soil sample a maximum of three times from a height of 1 m onto the firm base
in the plastic basin. If large clods break away after the first or second drop, drop them individually again once or twice. If a clod shatters into small (primary structural) units after the first or second drop, it does not need dropping again. Do not drop any piece of soil more than three times. For soils with a sandy loam texture (Table 1), drop the cube of soil just once only from a height of 0.5 m.
é Transfer the soil onto the large plastic bag.è For soils with a loamy sand or sand texture, drop the cube of soil still sitting on the spade (once)
from a height of just 50 mm, and then roll the spade over, spilling the soil onto the plastic bag.ê Applying only very gently pressure, attempt to part each clod by hand along any exposed
cracks or fissures. If the clod does not part easily, do not apply further pressure (because the cracks and fissures are probably not continuous and, therefore, are unable to readily conduct oxygen, air and water).
ë Move the coarsest fractions to one end and the finest to the other end. Arrange the distribution of aggregates on the plastic bag so that the height of the soil is roughly the same over the whole surface area of the bag. This provides a measure of the aggregate-size distribution. Compare the resulting distribution of aggregates with the three photographs in Plate 2 and the criteria given.The method is valid for a wide range of moisture conditions but is best carried out when the soil is moist to slightly moist; avoid dry and wet conditions.
SOIL STRUCTURE is extremely important for grain crops. It regulates:< soil aeration and gaseous exchange rates;< soil temperature;< soil infiltration and erosion;< the movement and storage of water;< nutrient supply;< root penetration and development;< soil workability;< soil trafficability;< the resistance of soils to structural degradation.
Good soil structure reduces the susceptibility to compaction under wheel traffic and increases the window of opportunity for vehicle access and for carrying out no-till, minimum-till, controlled traffic or conventional cultivation under optimal soil conditions.
Soil structure is ranked on the size, shape, firmness, porosity and relative abundance of soil aggregates and clods. Soils with good structure have friable, fine, porous, subangular and subrounded (nutty) aggregates. Those with poor structure have large, dense, very firm, angular or subangular blocky clods that fit and pack closely together and have a high tensile strength.

5
VINEYARDS | OLIVE ORCHARDS | ORCHARDS | WHEAT | MAIZE | ANNUAL CROPS | PASTURE
PLATE 2 How to score soil structure
GOOD CONDITION VS = 2Soil dominated by friable, fineaggregates with no significant clodding.Aggregates are generally subrounded(nutty) and often quite porous.
MODERATE CONDITION VS = 1Soil contains significant proportions(50%) of both coarse clods and friablefine aggregates. The coarse clods arefirm, subangular or angular in shape andhave few or no pores.
POOR CONDITION VS = 0Soil dominated by coarse clodswith very few finer aggregates. Thecoarse clods are very firm, angular orsubangular in shape and have very fewor no pores.

6
VISUAL SOIL ASSESSMENTso
il po
rosi
ty
AssessmentC
ImportanceI
å Remove a spade slice of soil (about 100 mm wide, 150 mm long and 200 mm deep) from the side of the hole and break it in half.
ç Examine the exposed fresh face of the sample for soil porosity by comparing against the three photographs in Plate 3. Look for the spaces, gaps, holes, cracks and fissures between and within soil aggregates and clods.
é Examine also the porosity of a number of the large clods from the soil structure test. This provides important additional information as to the porosity of the individual clods (the intra-aggregate porosity).
It is important to assess SOIL POROSITY along with the structure of the soil. Soil porosity, and particularly macroporosity (or large pores), influences the movement of air and water in the soil. Soils with good structure have a high porosity between and within aggregates, but soils with poor structure may not have macropores and coarse micropores within the large clods, restricting their drainage and aeration.
Poor aeration leads to the build up of carbon dioxide, methane and sulphide gases, and reduces the ability of plants to take up water and nutrients, particularly nitrogen (N), phosphorus (P), potassium (K) and sulphur (S). Plants can only utilize S and N in the oxygenated sulphate (SO
42-), nitrate (NO
3-) and ammonium (NH
4+) forms. Therefore,
plants require aerated soils for the efficient uptake and utilization of S and N. The number, activity and biodiversity of micro-organisms and earthworms are also greatest in well-aerated soils and they are able to decompose and cycle organic matter and nutrients more efficiently.
The presence of soil pores enables the development and proliferation of the superficial (or feeder) roots throughout the soil. Roots are unable to penetrate and grow through firm, tight, compacted soils, severely restricting the ability of the plant to utilize the available water and nutrients in the soil. A high penetration resistance not only limits plant uptake of water and nutrients, it also reduces fertilizer efficiency considerably and increases the susceptibility of the plant to root diseases.
Soils with good porosity will also tend to produce lower amounts of greenhouse gases. The greater the porosity, the better the drainage, and, therefore, the less likely it is that the soil pores will be water-filled to the critical levels required to accelerate the production of greenhouse gases. Aim to keep the soil porosity score above 1.

7
VINEYARDS | OLIVE ORCHARDS | ORCHARDS | WHEAT | MAIZE | ANNUAL CROPS | PASTURE
PLATE 3 How to score soil porosity
GOOD CONDITION VS = 2Soils have many macropores and coarsemicropores between and within aggregatesassociated with good soil structure.
MODERATE CONDITION VS = 1Soil macropores and coarse microporesbetween and within aggregates have declinedsignificantly but are present on closeexamination in parts of the soil. The soil showsa moderate amount of consolidation.
POOR CONDITION VS = 0No soil macropores and coarse microporesare visually apparent within compact,massive structureless clods. The clodsurface is smooth with few or no cracks orholes, and can have sharp angles.

8
VISUAL SOIL ASSESSMENTso
il co
lour AssessmentC
ImportanceI
å Compare the colour of a handful of soil from the field site with soil taken from under the nearest fenceline or a similar protected area.
ç Using the three photographs and criteria given (Plate 4), compare the relative change in soil colour that has occurred.
As topsoil colour can vary markedly between soil types, the photographs illustrate the degree of change in colour rather than the absolute colour of the soil.
SOIL COLOUR is a very useful indicator of soil quality because it can provide an indirect measure of other more useful properties of the soil that are not assessed so easily and accurately. In general, the darker the colour is, the greater is the amount of organic matter in the soil. A change in colour can give a general indication of a change in organic matter under a particular land use or management. Soil organic matter plays an important role in regulating most biological, chemical and physical processes in soil, which collectively determine soil health. It promotes infiltration and retention of water, helps to develop and stabilize soil structure, cushions the impact of wheel traffic and cultivators, reduces the potential for wind and water erosion, and indicates whether the soil is functioning as a carbon ‘sink’ or as a source of greenhouse gases. Organic matter also provides an important food resource for soil organisms and is an important source of, and major reservoir of, plant nutrients. Its decline reduces the fertility and nutrient-supplying potential of the soil; N, P, K and S requirements of crops increase markedly, and other major and minor elements are leached more readily. The result is an increased dependency on fertilizer input to maintain nutrient status.
Soil colour can also be a useful indicator of soil drainage and the degree of soil aeration. In addition to organic matter, soil colour is influenced markedly by the chemical form (or oxidation state) of iron (Fe) and manganese (Mn). Brown, yellow-brown, reddish-brown and red soils without mottles indicate well-aerated, well-drained conditions where Fe and Mn occur in the oxidized form of ferric (Fe3+) and manganic (Mn3+) oxides. Grey-blue colours can indicate that the soil is poorly drained or waterlogged and poorly aerated for long periods, conditions that reduce Fe and Mn to ferrous (Fe2+) and manganous (Mn2+) oxides. Poor aeration and prolonged waterlogging give rise to a further series of chemical and biochemical reduction reactions that produce toxins, such as hydrogen sulphide, carbon dioxide, methane, ethanol, acetaldehyde and ethylene, that damage the root system. This reduces the ability of plants to take up water and nutrients, causing poor vigour and ill-thrift. Decay and dieback of roots can also occur as a result of pests and diseases, including Rhizoctonia, Pythium and Fusarium root rot in soils prone to waterlogging.

9
VINEYARDS | OLIVE ORCHARDS | ORCHARDS | WHEAT | MAIZE | ANNUAL CROPS | PASTURE
PLATE 4 How to score soil colour
GOOD CONDITION VS = 2Dark coloured topsoil that is not toodissimilar to that under the fenceline.
MODERATE CONDITION VS = 1The colour of the topsoil is somewhatpaler than that under the fenceline, butnot markedly so.
POOR CONDITION VS = 0Soil colour has become significantly palercompared with that under the fenceline.
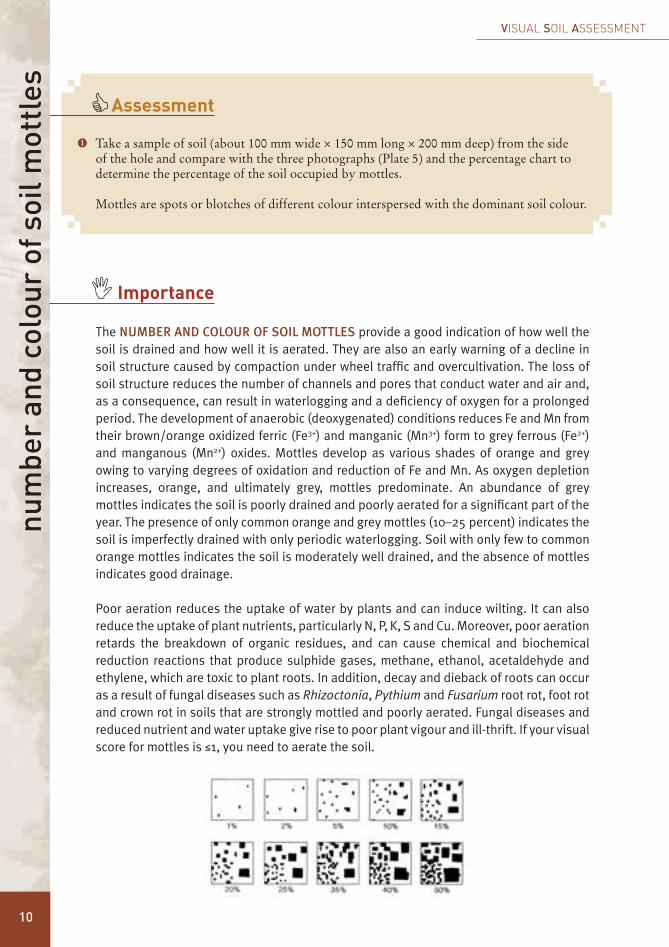
10
VISUAL SOIL ASSESSMENTnu
mbe
r an
d co
lour
of s
oil m
ottl
es AssessmentC
ImportanceI
å Take a sample of soil (about 100 mm wide × 150 mm long × 200 mm deep) from the side of the hole and compare with the three photographs (Plate 5) and the percentage chart to determine the percentage of the soil occupied by mottles.
Mottles are spots or blotches of different colour interspersed with the dominant soil colour.
The NUMBER AND COLOUR OF SOIL MOTTLES provide a good indication of how well the soil is drained and how well it is aerated. They are also an early warning of a decline in soil structure caused by compaction under wheel traffic and overcultivation. The loss of soil structure reduces the number of channels and pores that conduct water and air and, as a consequence, can result in waterlogging and a deficiency of oxygen for a prolonged period. The development of anaerobic (deoxygenated) conditions reduces Fe and Mn from their brown/orange oxidized ferric (Fe3+) and manganic (Mn3+) form to grey ferrous (Fe2+) and manganous (Mn2+) oxides. Mottles develop as various shades of orange and grey owing to varying degrees of oxidation and reduction of Fe and Mn. As oxygen depletion increases, orange, and ultimately grey, mottles predominate. An abundance of grey mottles indicates the soil is poorly drained and poorly aerated for a significant part of the year. The presence of only common orange and grey mottles (10–25 percent) indicates the soil is imperfectly drained with only periodic waterlogging. Soil with only few to common orange mottles indicates the soil is moderately well drained, and the absence of mottles indicates good drainage.
Poor aeration reduces the uptake of water by plants and can induce wilting. It can also reduce the uptake of plant nutrients, particularly N, P, K, S and Cu. Moreover, poor aeration retards the breakdown of organic residues, and can cause chemical and biochemical reduction reactions that produce sulphide gases, methane, ethanol, acetaldehyde and ethylene, which are toxic to plant roots. In addition, decay and dieback of roots can occur as a result of fungal diseases such as Rhizoctonia, Pythium and Fusarium root rot, foot rot and crown rot in soils that are strongly mottled and poorly aerated. Fungal diseases and reduced nutrient and water uptake give rise to poor plant vigour and ill-thrift. If your visual score for mottles is ≤1, you need to aerate the soil.

11
VINEYARDS | OLIVE ORCHARDS | ORCHARDS | WHEAT | MAIZE | ANNUAL CROPS | PASTURE
PLATE 5 How to score soil mottles
GOOD CONDITION VS = 2Mottles are generally absent.
MODERATE CONDITION VS = 1Soil has common (10–25%) fine andmedium orange and grey mottles.
POOR CONDITION VS = 0Soil has abundant to profuse (> 50%)medium and coarse orange and particularlygrey mottles.

12
VISUAL SOIL ASSESSMENTea
rthw
orm
s
AssessmentC
ImportanceI
å Count the earthworms by hand, sorting through the soil sample used to assess soil structure (Plate 7) and compare with the class limits in Table 2. Pay particular attention to the turf mat. Earthworms vary in size and number depending on the species and the season. Therefore, for year-to-year comparisons, earthworm counts must be made at the same time of year when soil moisture and temperature levels are good. Earthworm numbers are reported as the number per 200-mm cube of soil. Earthworm numbers are commonly reported on a square-metre basis. A 200-mm cube sample is equivalent to 1/25 m2, and so the number of earthworms needs to be multiplied by 25 to convert to numbers per square metre.
EARTHWORMS provide a good indicator of the biological health and condition of the soil because their population density and species are affected by soil properties and management practices. Through their burrowing, feeding, digestion and casting, earthworms have a major effect on the chemical, physical and biological properties of the soil. They shred and decompose plant residues, converting them to organic matter, and so releasing mineral nutrients. Compared with uningested soil, earthworm casts can contain 5 times as much plant available N, 3–7 times as much P, 11 times as much K, and 3 times as much Mg. They can also contain more Ca and plant-available Mo, and have a higher pH, organic matter and water content. Moreover, earthworms act as biological aerators and physical conditioners of the soil, improving:< soil porosity;< aeration;< soil structure and the stability of soil aggregates;< water retention;< water infiltration;< drainage.
They also reduce surface runoff and erosion. They further promote plant growth by secreting plant-growth hormones and increasing root density and root development by the rapid growth of roots down nutrient-enriched worm channels. While earthworms can deposit about 25–30 tonnes of casts/ha/year on the surface, 70 percent of their casts are deposited below the surface of the soil. Therefore, earthworms play an important role in arable cropping and can increase growth rates and production significantly.
Earthworms also increase the population, activity and diversity of soil microbes. Actinomycetes increase 6–7 times during the passage of soil through the digestive tract of the worm and, along with other microbes, play an important role in the decomposition of organic matter to humus. Soil microbes such as mycorrhizal fungi play a further role in the supply of nutrients, digesting soil and fertilizer and unlocking nutrients, such as P, that are fixed by the soil. Microbes also retain significant amounts of nutrients in their biomass, releasing them when they die. Moreover, soil microbes produce plant-growth hormones and compounds that

13
VINEYARDS | OLIVE ORCHARDS | ORCHARDS | WHEAT | MAIZE | ANNUAL CROPS | PASTURE
stimulate root growth and promote the structure, aeration, infiltration and water-holding capacity of the soil. Micro-organisms further encourage a lower incidence of pests and diseases, and promote a more rapid breakdown of organic herbicides. The collective benefits of microbes can increase crop production markedly while at the same time reducing fertilizer requirements.
Earthworm numbers (and biomass) are governed by the amount of food available as organic matter and soil microbes, as determined by the amount and quality of surface residue (Plate 6a), the use of cover crops including legumes, and the cultivation of interrows. Earthworm populations can be up to three times higher in undisturbed soils compared with cultivated soils. Earthworm numbers are also governed by: soil moisture, temperature, texture, soil aeration, pH, soil nutrients (including levels of Ca), and the type and amount of fertilizer and N used. The overuse of acidifying salt-based fertilizers, anhydrous ammonia and ammonia-based products, and some insecticides and fungicides can further reduce earthworm numbers.
Soils should have a good diversity of earthworm species with a combination of: (i) surface feeders that live at or near the surface to breakdown plant residues and dung; (ii) topsoil-dwelling species that burrow, ingest and mix the top 200–300 mm of soil; and (iii) deep-burrowing species that pull down and mix plant litter and organic matter at depth.
Earthworms species can further indicate the overall condition of the soil. For example, significant numbers of yellow-tail earthworms (Octolasion cyaneum – Plate 6b) can indicate adverse soil conditions.
PLATE 6 (a): earthworm casts under crop residue; (b): yellow-tail earthworm (Octolasion cyaneum)
PLATE 7 Sample for assessing earthworms
TABLE 2 Visual scores for earthworms
Visual score(VS)
Earthworm numbers(per 200-mm cube of soil)
2[Good]
> 30 (with preferably 3 or more species)
1[Moderate]
15–30 (with preferably 2 or more species)
0[Poor]
< 15 (with predominantly 1 species)

14
VISUAL SOIL ASSESSMENTpo
tent
ial r
ooti
ng d
epth
AssessmentC
ImportanceI
å Dig a hole to identify the depth to a limiting (restricting) layer where present (Plate 8), and compare with the class limits in Table 3. As the hole is being dug, note the presence of roots and old root channels, worm channels, cracks and fissures down which roots can extend. Note also whether there is an over-thickening of roots (a result of a high penetration resistance), and whether the roots are being forced to grow horizontally, otherwise known as right-angle syndrome. Moreover, note the firmness and tightness of the soil, whether the soil is grey and strongly gleyed owing to prolonged waterlogging, and whether there is a hardpan present such as a human-induced tillage or plough pan, or a natural pan such as an iron, siliceous or calcitic pan (pp 16–17). An abrupt transition from a fine (heavy) material to a coarse (sandy/gravelly) layer will also limit root development. A rough estimate of the potential rooting depth may be made by noting the above properties in a nearby road cutting or an open drain.
The POTENTIAL ROOTING DEPTH is the depth of soil that plant roots can potentially exploit before reaching a barrier to root growth, and it indicates the ability of the soil to provide a suitable rooting medium for plants. The greater is the rooting depth, the greater is the available-water-holding capacity of the soil. In drought periods, deep roots can access larger water reserves, thereby alleviating water stress and promoting the survival of non-irrigated crops. The exploration of a large volume of soil by deep roots means that they can also access more macronutrients and micronutrients, thereby accelerating the growth and enhancing the yield and quality of the crop. Conversely, soils with a restricted rooting depth caused by, for example, a layer with a high penetration resistance such as a compacted layer or a hardpan, restrict vertical root growth and development, causing roots to grow sideways. This limits plant uptake of water and nutrients, reduces fertilizer efficiency, increases leaching, and decreases yield. A high resistance to root penetration can also increase plant stress and the susceptibility of the plant to root diseases. Moreover, hardpans impede the movement of air, oxygen and water through the soil profile, the last increasing the susceptibility to waterlogging and erosion by rilling and sheet wash.
The potential rooting depth can be restricted further by:< an abrupt textural change;< pH;< aluminium (Al) toxicity;< nutrient deficiencies;< salinity;< sodicity;< a high or fluctuating water table;< low oxygen levels.

15
VINEYARDS | OLIVE ORCHARDS | ORCHARDS | WHEAT | MAIZE | ANNUAL CROPS | PASTURE
Anaerobic (anoxic) conditions caused by deoxygenation and prolonged waterlogging restrict the rooting depth as a result of the accumulation of toxic levels of hydrogen sulphide, ferrous sulphide, carbon dioxide, methane,
ethanol, acetaldehyde and ethylene, by-products of
chemical and biochemical reduction reactions.
Crops with a deep, vigorous root system help to raise soil organic matter levels and soil life at depth. The physical action of the roots and soil fauna and the glues they produce, promote soil structure, porosity, water storage, soil aeration and drainage at depth. A deep, dense root system provides huge scope for raising production while at the same time having significant environmental benefits. Crops are less reliant on frequent and high application rates of fertilizer and N to generate growth, and available nutrients are more likely to be taken up, so reducing losses by leaching into the environment.
TABLE 3 Visual scores for potential rooting depth
VSA score(VS)
Potential rooting depth(m)
2.0[Good]
> 0.8
1.5[Moderately good]
0.6–0.8
1.0[Moderate]
0.4–0.6
0.5[Moderately poor]
0.2–0.4
0[Poor]
< 0.2
PLATE 8 Hole dug to assess the potential rooting depth
The potential rooting depth extends tothe bottom of the arrow, below which thesoil is extremely firm and very tight withno roots or old root channels, no wormchannels and no cracks and fissures downwhich roots can extend.

16
VISUAL SOIL ASSESSMENT
Assessmentå Examine for the presence of a hardpan by rapidly jabbing the side of the soil profile
(that was dug to assess the potential rooting depth) with a knife, starting at the top and progressing systematically and quickly down to the bottom of the hole (Plate 9). Note how easy or difficult it is to jab the knife into the soil as you move rapidly down the profile. A strongly developed hardpan is very tight and extremely firm, and it has a high penetration resistance to the knife. Pay particular attention to the lower topsoil and upper subsoil where tillage pans and plough pans commonly occur if present (Plate 10).
ç Having identified the possible presence of a hardpan by a significant increase in penetration resistance to the point of a knife, gauge how strongly developed the hardpan is. Remove a large hand-sized sample and assess its structure, porosity and the number and colour of soil mottles (Plates 2, 3 and 5), and also look for the presence of roots. Compare with the photographs and criteria given in Plate 10.
PLATE 9 Using a knife to determine the presence or absence of a hardpan
Identifying the presence of a hardpan

17
VINEYARDS | OLIVE ORCHARDS | ORCHARDS | WHEAT | MAIZE | ANNUAL CROPS | PASTURE
PLATE 9 Using a knife to determine the presence or absence of a hardpan
PLATE 10 Identifying the presence of a hardpan
NO HARDPANThe soil has a low penetration resistanceto the knife. Roots, old root channels,worm channels, cracks and fissures may becommon. Topsoils are friable with a readilyapparent structure and have a soil porosityscore of ≥1.5.
MODERATELY DEVELOPED HARDPANThe soil has a moderate penetrationresistance to the knife. It is firm (hard)with a weakly apparent soil structure andhas a soil porosity score of 0.5–1. Thereare few roots and old root channels,few worm channels, and few cracksand fissures. The pan may have few tocommon orange and grey mottles. Notethe moderately developed tillage pan inthe lower half of the topsoil (arrowed).
STRONGLY DEVELOPED HARDPANThe soil has a high penetration resistanceto the knife. It is very tight, extremelyfirm (very hard) and massive (i.e. with noapparent soil structure) and has a soilporosity score of 0. There are no roots orold root channels, no worm channels orcracks or fissures. The pan may have manyorange and grey mottles. Note the stronglydeveloped tillage pan in the lower half ofthe topsoil (arrowed).

18
VISUAL SOIL ASSESSMENTsu
rfac
e po
ndin
g
AssessmentC
ImportanceI
å Assess the degree of surface ponding (Plate 11) based on your observation or general recollection of the time ponded water took to disappear after a wet period during the spring, and compare with the class limits in Table 4.
SURFACE PONDING and the length of time water remains on the surface can indicate the rate of infiltration into and through the soil, a high water table, and the time the soil remains saturated. Prolonged waterlogging depletes oxygen in the soil causing anaerobic (anoxic) conditions that induce root stress, and restrict root respiration and the growth of roots. Roots need oxygen for respiration. They are most vulnerable to surface ponding and saturated soil conditions in the spring when plant roots and shoots are actively growing at a time when respiration and transpiration rates rise markedly and oxygen demands are high. They are also susceptible to ponding in the summer when transpiration rates are highest. Moreover, waterlogging causes the death of fine roots responsible for nutrient and water uptake. Reduced water uptake while the crop is transpiring actively causes leaf desiccation and the plant to wilt. Prolonged waterlogging also increases the likelihood of pests and diseases, including Rhizoctonia, Pythium and Fusarium root rot, and reduces the ability of roots to overcome the harmful effects of topsoil-resident pathogens. Plant stress induced by poor aeration and prolonged soil saturation can render crops less resistant to insect pest attack such as aphids, armyworm, cutworm and wireworm. Crops decline in vigour, have restricted spring growth (RSG) as evidenced by poor shoot and stunted growth, become discoloured and die.
Waterlogging and deoxygenation also results in a series of undesirable chemical and biochemical reduction reactions, the by-products of which are toxic to roots. Plant-available nitrate-nitrogen (NO
3-) is reduced by denitrification to nitrite (NO
2-) and nitrous
oxide (N2O), a potent greenhouse gas, and plant-available sulphate-sulphur (SO
42-) is
reduced to sulphide, including hydrogen sulphide (H2S), ferrous sulphide (FeS) and zinc
sulphide (ZnS). Iron is reduced to soluble ferrous (Fe2+) ions, and Mn to manganous (Mn2+) ions. Apart from the toxic products produced, the result is a reduction in the amount of plant-available N and S. Anaerobic respiration of micro-organisms also produces carbon dioxide and methane (also greenhouse gases), hydrogen gas, ethanol, acetaldehyde and ethylene, all of which inhibit root growth when accumulated in the soil. Unlike aerobic respiration, anaerobic respiration releases insufficient energy in the form of adenosine triphosphate (ATP) and adenylate energy charge (AEC) for microbial and root/shoot growth.

19
VINEYARDS | OLIVE ORCHARDS | ORCHARDS | WHEAT | MAIZE | ANNUAL CROPS | PASTURE
The tolerance of the root system to surface ponding and waterlogging is dependent on a number of factors, including the time of year and the type of crop. Tolerance of waterlogging is also dependent on: soil and air temperatures; soil type; the condition of the soil; fluctuating water tables; and the rate of onset and severity of anaerobiosis (or anoxia), a factor governed by the initial soil oxygen content and oxygen consumption rate.
Prolonged surface ponding makes the soil more susceptible to damage under wheel traffic, so reducing vehicle access. As a consequence, waterlogging can delay ground preparation and sowing dates significantly. Sowing can further be delayed because the seed bed is below the crop-specific critical temperature. Increases in the temperature of saturated soils can be delayed as long as water is evaporating.
TABLE 4 Visual scores for surface ponding
VSA score(VS)
Surface ponding due to soil saturation
Number of daysof ponding *
Description
2[Good]
≤1No evidence of surface ponding after 1 day following heavy rainfall on soils that were already at or near saturation.
1[Moderate]
2–3Moderate surface ponding occurs for 2–3 days after heavy rainfall on soils that were already at or near saturation.
0[Poor]
>5Significant surface ponding occurs for longer than 5 days after heavy rainfall on soils that were already at or near saturation.
* Assuming little or no air is trapped in the soil at the time of ponding.
PLATE 11 Surface ponding in a wheat field

20
VISUAL SOIL ASSESSMENTsu
rfac
e cr
usti
ng a
nd s
urfa
ce c
over
AssessmentC
ImportanceI
å Observe the degree of surface crusting and surface cover and compare Plate 12 and the criteria given. Surface crusting is best assessed after wet spells followed by a period of drying, and before cultivation.
SURFACE CRUSTING reduces infiltration of water and water storage in the soil and increases runoff. Surface crusting also reduces aeration, causing anaerobic conditions, and prolongs water retention near the surface, which can hamper access by machinery for months. Crusting is most pronounced in fine-textured, poorly structured soils with a low aggregate stability and a dispersive clay mineralogy.
SURFACE COVER after harvesting and prior to canopy closure of the next crop helps to prevent crusting by minimizing the dispersion of the soil surface by rain or irrigation. It also helps to reduce crusting by intercepting the large rain droplets before they can strike and compact the soil surface. Vegetative cover and its root system return organic matter to the soil and promote soil life, including earthworm numbers and activity. The physical action of the roots and soil fauna and the glues they produce promote the development of soil structure, soil aeration and drainage and help to break up surface crusting. As a result, infiltration rates and the movement of water through the soil increase, decreasing runoff, soil erosion and the risk of flash flooding. Surface cover also reduces soil erosion by intercepting high impact raindrops, minimizing rain-splash and saltation. It further serves to act as a sponge, retaining rainwater long enough for it to infiltrate into the soil. Moreover, the root system reduces soil erosion by stabilizing the soil surface, holding the soil in place during heavy rainfall events. As a result, water quality downstream is improved with a lower sediment loading, nutrient and coliform content. The adoption of conservation tillage can reduce soil erosion by up to 90 percent and water runoff by up to 40 percent. The surface needs to have at least 70 percent cover in order to give good protection, while ≤30 percent cover provides poor protection. Surface cover also reduces the risk of wind erosion markedly.

21
VINEYARDS | OLIVE ORCHARDS | ORCHARDS | WHEAT | MAIZE | ANNUAL CROPS | PASTURE
PLATE 12 How to score surface crusting and surface cover
GOOD CONDITION VS = 2Little or no surface crusting is present; orsurface cover is ≥70%.
MODERATE CONDITION VS = 1Surface crusting is 2–3 mm thick and isbroken by signifi cant cracking; or surfacecover is >30% and <70%.
POOR CONDITION VS = 0Surface crusting is >5 mm thick and isvirtually continuous with little cracking;or surface cover is ≤30%.
Surface cover photos: courtesy of A. Leys

22
VISUAL SOIL ASSESSMENTso
il er
osio
n
AssessmentC
ImportanceI
å Assess the degree of soil erosion based on current visual evidence and on your knowledge of what the site looked like in the past relative to Plate 13.
SOIL EROSION reduces the productive potential of soils through nutrient losses, loss of organic matter, reduced potential rooting depth, and lower available-water-holding capacity. Soil erosion can also have significant off-site effects, including reduced water quality through increased sediment, nutrient and coliform loading in streams and rivers.
Overcultivation can cause considerable soil degradation associated with the loss of soil organic matter and soil structure. It can also develop surface crusting, tillage pans, and decrease infiltration and permeability of water through the soil profile (causing increased surface runoff ). If the soil surface is left unprotected on sloping ground, large quantities of soil can be water eroded by gullying, rilling and sheet wash. The cost of restoration, often requiring heavy machinery, can be prohibitively expensive.
The water erodibility of soil on sloping ground is governed by a number of factors including:< the percentage of vegetative cover on the soil surface;< the amount and intensity of rainfall;< the soil infiltration rate and permeability of water through the soil;< the slope and the nature of the underlying subsoil strata and bedrock.
The loss of organic matter and soil structure as a result of overcultivation can also give rise to significant soil loss by wind erosion of exposed ground.

23
VINEYARDS | OLIVE ORCHARDS | ORCHARDS | WHEAT | MAIZE | ANNUAL CROPS | PASTURE
PLATE 13 How to score soil erosion
GOOD CONDITION VS = 2Little or no water erosion. Topsoil depths inthe footslope areas are <150 mm deeperthan on the crest.Wind erosion is not a concern; only smalldust plumes emanate from the cultivatoron a windy day. Most wind-eroded material iscontained in the fi eld.
MODERATE CONDITION VS = 1Water erosion is a moderate concern witha signifi cant amount of rilling and sheeterosion. Topsoil depths in the footslopeareas are 150–300 mm greater than oncrests, and sediment input into drains/streams may be signifi cant.Wind erosion is of moderate concernwhere signifi cant dust plumes canemanate from the cultivator on windydays. A considerable amount of materialis blown off the fi eld but is containedwithin the farm.
POOR CONDITION VS = 0Water erosion is a major concern withsevere gullying, rilling and sheet erosionoccurring. Topsoils in footslope areas aremore than 300 mm deeper than on thecrests, and sediment input into drains/streams may be high.Wind erosion is a major concern. Largedust clouds can occur when cultivatingon windy days. A substantial amountof topsoil can be lost from the fi eld anddeposited elsewhere in the district.
Water erosion photos: courtesy of J. Quinton and A. Leys


25
VINEYARDS | OLIVE ORCHARDS | ORCHARDS | WHEAT | MAIZE | ANNUAL CROPS | PASTURE
�������������������������������������
���������������������������������������������������������������������������
��������� ����������
������������������ ���
��������� ���
����������� ���
���������������� ���
�����������������������������������������
�������
������������������������
������
���������������������������������������
������������������������������
�������������������
���� ����
�������� �����
���� ����
��������������������������������� ������������������������������������������������
��������������� ����������������
��������������������������������������������������������������������������������������
�������������������������������������������� ���
������
������
������
������
������
������������� ���������
�������������������������������� ���������
����������� ���������
���������� ���������
���������������� ���������

26
VISUAL SOIL ASSESSMENTcr
op e
stab
lishm
ent
AssessmentC
ImportanceIGOOD SEED GERMINATION, PLANT EMERGENCE AND CROP ESTABLISHMENT depend on factors that include the quality of soil tilth at the time of sowing and during the weeks immediately following. Soils that have poor structure through compaction and over-cultivation can resettle and consolidate rapidly after the seed bed has been prepared. Impeded water and air movement through the soil can give rise to increased soil-borne pathogens and areas low in oxygen (anaerobic zones). Anaerobic zones produce chemical and biochemical reduction reactions, the by-products of which are toxic to plants. Poor soil aeration and soil-borne pathogens can give rise to poor germination, poor pre- and post emergence, poor plant vigour and even death. While emergence may be slow, recovery can also be limited and plants often appear sickly. Poor plant emergence, bare patches and poor and uneven early leaf and tiller growth are commonly observed throughout paddocks and result in crop thinning and low plant populations. Young plants can also show discolouration of leaves, leaf blemishes and moisture stress.
The loss of soil condition can reduce crop establishment from 300 to 130 plants/m2 and grain yields from 8 to 5 tonnes per hectare. Seedling mortality can be high if the soil is waterlogged for more than 3 to 4 days between germination and emergence.
å Assess the degree and uniformity of crop establishment within a month of sowing by comparing the number and height of established plants with the three photographs provided (Plate 14).

27
VINEYARDS | OLIVE ORCHARDS | ORCHARDS | WHEAT | MAIZE | ANNUAL CROPS | PASTURE
PLATE 14 How to score crop establishment
GOOD CONDITION VS = 2Good emergence and crop establishment, with few gaps along the row and crop showing a good even height.
MODERATE CONDITION VS = 1Moderate emergence and crop establishment, with a significant number of gaps along the row and a significant variation in seedlingheight. Emergence may also be moderately slow but recovers somewhat.
POOR CONDITION VS = 0Poor emergence and crop establishment, with a large number of gaps along the row and a large variation in seedling height. Emergence may also be slow with limited recovery and plants often appear sickly.

28
VISUAL SOIL ASSESSMENTti
lleri
ng AssessmentC
ImportanceITHE NUMBER OF TILLERS play a fundamental role in determining the number of ears (spikes) per square metre and consequently the final yield. The potential number of tillers varies with the genotype, particularly among winter genotypes which have the greatest number. The new semi-dwarf wheat varieties normally have 2–3 tillers per plant to permit the development and grouping of tillers and ears that are contemporary, i.e. are equal in all vegetative, reproductive and ripening stages in order to maximise yields. Although this character is genetically determined and strongly influenced by planting density, it is also an expression of plant vigour and general plant growth which are firstly regulated by nutrient and water availability and the condition of the soil.
Soils in good health with good structure, porosity, organic matter levels, soil life, soil fertility and rooting depth favour the release and uptake of water and nutrients and subsequently the development of a greater number of tillers and there contemporary development.
å Measure the number of tillers at the end of the tillering stage and compare with the photographs (Plate 15) and class limits below.

29
VINEYARDS | OLIVE ORCHARDS | ORCHARDS | WHEAT | MAIZE | ANNUAL CROPS | PASTURE
PLATE 15 How to score tillering
GOOD CONDITION VS = 2Depending on the cultivar the plant has 3 well developed tillers with little variability compared to the main stem (i.e., main culm).
MODERATE CONDITION VS = 1Depending on the cultivar the plant has 2–3 tillers with moderate variability compared to the main stem (or culm).
POOR CONDITION VS = 0The plant has 1 or no tillers at all with significant differences in terms of development to the main stem (or culm).

30
VISUAL SOIL ASSESSMENTle
af c
olou
r
AssessmentC
ImportanceILEAF COLOUR prior to completion of grain filling can provide a good indication of the water and nutrient status and condition of the soil. Under normal environmental conditions the higher the soil fertility, the greener the crop. Plant vigour and colour is strongly related to soil water and nutrient availability, especially nitrogen (N). Discolouration of the foliar and blemishes on the leaf can also result from a deficiency or excess of phosphorus (P), potassium (K), sulphur (S), magnesium (Mg), manganese (Mn), zinc (Zn), copper (Cu) and boron (B) – Plate 17. Chlorosis (or yellowing of crops) due to the inadequate formation of chlorophyll, commonly occurs as a result of low N, K, S, Fe, Mg and Cu levels in the soil, low soil and air temperatures, prolonged cloudy days and poor soil aeration due to compaction and waterlogging.
Nutrient deficiencies or excesses can suppress the availability of other nutrients. For example, high P levels can suppress the uptake of Zn and Cu. Excess N can suppress B and Cu and cause the plant to luxury feed on K. Sulphur can also only be utilised by the plant in the sulphate (SO
42-) form. Under poorly aerated conditions sulphate-S will
reduce to sulphur dioxide (SO2) and sulphides (eg. hydrogen sulphide [H
2S], and ferrous
sulphide [FeS]). Sulphides and SO2 cannot be taken up by the plant, are toxic to plant roots
and micro organisms, and suppress the uptake of N. Plants can also only utilise N if S is present in the oxygenated (sulphate) form. Like S, N can only be utilised by the plant in the oxygenated nitrate (NO
3-) and ammonium (NH
4+) form under aerobic conditions.
The aeration status of the soil can further affect the uptake of nutrients. Phosphorus, copper and cobalt for example cannot be efficiently utilised by the plant under anaerobic conditions.
å Assess the leaf colour of the crop when all other factors favour rapid growth, and compare with the three photographs (Plate 16). In making the assessment, consideration must be given to the cultivar, the stage of growth, the soil moisture and temperature conditions, and the presence of pests and diseases (e.g. nematodes). The assessment can be done at any time prior to leaf senescence but ideally from four to six weeks after plant emergence to grain filling, avoiding very cold and wet weather.

31
VINEYARDS | OLIVE ORCHARDS | ORCHARDS | WHEAT | MAIZE | ANNUAL CROPS | PASTURE
PLATE 16 How to score leaf colour
GOOD CONDITION VS = 2Leaf colour is uniformly deep green. The odd colour blemish on leaves may be apparent within a broad area.
MODERATE CONDITION VS = 1Leaf colour is yellowish green; i.e. has a distinct yellowish tinge. Few colour blemishes on leaves may occur within a wide area.
POOR CONDITION VS = 0Leaf colour is quite yellow over a wide area. Colour blemishes on leaves may commonly occur.

32
VISUAL SOIL ASSESSMENT
PLATE 17 Common symptoms of leaf discolouration due to nutrient deficiencies in wheat
Nitrogen deficiency on the left
Phosphorus deficiency
Potassium deficiency
Sulphur deficiency on the right

33
VINEYARDS | OLIVE ORCHARDS | ORCHARDS | WHEAT | MAIZE | ANNUAL CROPS | PASTURE
PLATE 17 Common symptoms of leaf discolouration due to nutrient deficiencies in wheat PLATE 17 Common symptoms of leaf discolouration due to nutrient deficiencies in wheat (cont’d)
Magnesium deficiency on the left
Manganese deficiency
Copper deficiency
Zinc deficiency

34
VISUAL SOIL ASSESSMENTva
riab
ility
of c
rop
perf
orm
ance
alo
ng th
e ro
w
AssessmentC
ImportanceIVARIABILITY OF CROP PERFORMANCE ALONG THE ROW can be a good visual indicator of the condition of the soil (Plates 18–21). In particular, the linear variability in crop performance can be strongly related to the availability of water and nutrients, and the texture of the soil (e.g. whether clayey, silty, loamy or sandy). Also, soils in good condition with good structure and porosity, and have a deep, well aerated root zone enable the unrestricted movement of air and water into and through the soil, the development and proliferation of superficial (feeder) roots, and unrestricted respiration and transpiration. Furthermore, soils with good organic matter levels and soil life show an active biological and chemical process, favouring the release and uptake of water and nutrients and consequently the growth and vigour of the crop.
The spatial variability of crop performance along the row is also a useful indicator because it highlights those areas of the field that are under-performing enabling a site specific investigation as to why and what remedial action may be taken. This may include variable rate application of fertiliser by GPS guided ground spreaders.
å Cast your eye along the row and observe any variability in crop performance (in terms of crop height, plant and leaf density, stem thickness, leaf colour) and compare with the class limits in the Table 5. In making the assessment, consideration must also be given to other factors that may affect the performance of a crop such as pest and disease attack that are not related to the condition of the soil.
PLATE 18 Variable crop performance due to soil aeration and wetness
Variable crop performance due to differences in soil aeration and soil wetness.

35
VINEYARDS | OLIVE ORCHARDS | ORCHARDS | WHEAT | MAIZE | ANNUAL CROPS | PASTURE
TABLE 5 Visual scores for variability of crop performance along the row
Visual score (VS) Variability of crop performance along the row
2 [Good] Crop performance is good and even along the row
1 [Moderate] Crop performance is moderately variable along the row
0 [Poor] Crop performance is extremely variable along the row
PLATE 19 Variable crop performance due to soil compaction
Variable crop performance due to differences in soil compaction.
PLATE 18 Variable crop performance due to soil aeration and wetness
PLATE 20 Variable crop performance due to an iron pan
Variable crop performance due to differences in rooting depth to an iron pan.
PLATE 21 Variable crop performance due to water repellency
Concentric rings of poor wheat growth due to severely water repellent (hydrophobic) soils. Areas of stronger wheat growth occur on non-water repellent soils.

36
VISUAL SOIL ASSESSMENTro
ot d
evel
opm
ent
Assessment
ImportanceITHE ROOT LENGTH AND ROOT DENSITY provides a good indication of the condition of the plant root system. Crops with deep roots and a high root density are able to explore and utilise a greater proportion of the soil for water and nutrients compared to crops with a shallow, thin root system. Tillering, ear development and grain filling is therefore likely to be greater, crops are less likely to suffer wind throw, and they will be less susceptible to drought stress. Crops with a dense, deep, vigorous root system are also more likely to raise soil organic matter levels and soil life at depth. The physical action of the roots and soil fauna, and the glues they produce promote the development of soil structure, soil aeration and drainage.
A deep, dense root system provides huge scope for raising production while at the same time having significant environmental benefits. Crops are less reliant on high application rates of fertiliser and nitrogen to generate growth, and available nutrients are more likely to be sapped up reducing losses by leaching into the groundwater and waterways.
Root length and density can be restricted by the mechanical impedance of roots and the lack of soil pores due to soil compaction or a hardpan. Restrictions can also occur due to low soil moisture, soil temperature and pH, aluminium toxicity, salinity, sodicity, nutrient deficiencies, low mycorrhizal fungi levels, soil-borne pathogens, a high or fluctuating water table and low oxygen levels. Anaerobic (anoxic) conditions due to prolonged water-logging and deoxygenation restrict root length and density as a result of the accumulation of toxic levels of sulphides, carbon dioxide, methane,
ethanol, acetaldehyde and ethylene,
by-products of chemical and biochemical reduction reactions (see pg 18).
å Examine the upper part of the hole dug to assess the potential rooting depth of the soil. With the help of a knife, carefully loosen the soil around the roots to expose the root system in-situ (Plate 22). Alternatively, dig out a 250–300 mm deep slice of soil around a group of plants and gently tap the sample against the edge of the hole to expose the root system. Use a knife to help loosen the soil if required. Assess both the length and the density of the roots and compare with the class limits in the Table 6. Root length and root density is best assessed at or just prior to crop maturity.
C

37
VINEYARDS | OLIVE ORCHARDS | ORCHARDS | WHEAT | MAIZE | ANNUAL CROPS | PASTURE
PLATE 22 Root development
Photo showing good root development in the upper 150 mm of soil only. The root distribution and root density in the 150–300 mm zone is poor.
TABLE 6 Visual scores for root development
Visual score (VS) Root development
2[Good]
Good root length and root density in the upper 250–300 mm of soil
1[Moderate]
Moderate root length & density in the upper 250–300 mm of soil
0[Poor]
Poor root length & density in the upper 250–300 mm of soil with the root system being restricted to limited areas

38
VISUAL SOIL ASSESSMENTro
ot d
isea
se Assessment
ImportanceIROOT DISEASES encouraged by the degradation of soil quality include take-all (G. graminis var. tritici), dryland root rot (Fusarium graminearum and many others), Rhizoctonia root rot (Rhizoctonia solani) and Pythium root rot (Pythium spp.) (Plates 23–26). Their presence can cause severe yield loss and reduction in grain quality. Symptoms of root diseases include pre- and post emergence plant death in seedlings resulting in crop thinning, stunting and reduced tillering, discolouration of and blemishes (lesions) on stems, tillers and leaves, bleached heads and premature death. Infected plants have sparse root development and characteristically a brown-black rot can be seen at the crown and extending to the base.
Poor soil aeration, soil saturation and high penetration resistance to root development due to soil structural degradation can increase root rot and soil-borne pathogens. They can also reduce the ability of the root system to overcome the harmful effects of pathogens resident in the topsoil.
The conservation of soil moisture, amelioration of soil compaction, the build up of organic matter and the promotion of good soil life (in terms of microbial biomass, diversity and activity) are factors that contribute to the development of healthy plants and the suppression of soil-borne diseases. They also help enable the plant to better resist the pressure of disease and insect attack. Soil biota and especially those micro-organisms that enhance cellulytic breakdown and decomposition of straw residues further limit pathogen survival.
å Assess the presence of root diseases by pulling a number of stems out of the soil and carefully examining the root system for visual evidence of root diseases at or any time before crop maturity. Make your assessment based on the class limits in Table 7.
ç Consider also how commonly root diseases occur in a particular field from season to season.
C
PLATE 23 Pythium root disease [from Compendium of Wheat Diseases by M.V. WIESE]
Wheat seedlings damaged by Pythium species in wet soil.

39
VINEYARDS | OLIVE ORCHARDS | ORCHARDS | WHEAT | MAIZE | ANNUAL CROPS | PASTURE
TABLE 7 Visual scores for root disease
Visual score (VS) Occurrence of root diseases due to soil conditions
2 [Good] Root disease are rare
1 [Moderate] Root disease are common
0 [Poor] Root disease are very common
PLATE 24 Take-all root disease [from Compendium of Wheat Diseases by M.V. WIESE]
Root rot and darkened stem bases due to take-all (G. graminis var. tritici).
PLATE 23 Pythium root disease [from Compendium of Wheat Diseases by M.V. WIESE]
PLATE 25 Fusarium root disease [from Compendium of Wheat Diseases by M.V. WIESE]
Secondary root emerging from crown and invaded by Fusarium culmorum.
PLATE 26 Root rot [from Compendium of Wheat Diseases by M.V. WIESE]
Wheat crown on the left damaged by common root rot; healthy crown (right).

40
VISUAL SOIL ASSESSMENTcr
op g
row
th a
nd h
eigh
t at m
atur
ity
Assessment
ImportanceICROP GROWTH AND CROP HEIGHT AT MATURITY can be useful visual indicators of soil quality. They are also dependent on a number of other factors including climate, cultivar, nitrogen application and soil fertility, time of sowing, fungicide applications and the use of plant growth regulators to reduce straw length. Crop growth and crop height are however particularly helpful indicators of soil quality if agronomic factors have not limited crop emergence and development during the growing season. The growth and vigour of grain crops depend in part on the ability of the seedbed to maintain an adequate tilth throughout the growing season. Poor soil aeration and resistance to root penetration as a result of structural degradation reduce plant growth and vigour, and delay maturity.
å Assess crop growth and crop height when the crop has reached maturity and preferably two weeks after ear emergence (Plate 27). Compare with the class limits in Table 8. Your observations of crop growth and vigour during the growing season may also provide a useful indication of seedbed conditions. In a good season under non-limiting conditions, a particular cultivar should grow to a certain height with about a 10–15% variation. Allowances should be made for exceptionally good seasons and for poor seasons.
C

41
VINEYARDS | OLIVE ORCHARDS | ORCHARDS | WHEAT | MAIZE | ANNUAL CROPS | PASTURE
PLATE 27 Crop height at maturity
TABLE 8 Visual scores for crop growth and height at maturity
Visual score (VS) Crop growth and crop height at maturity
2[Good]
Crop growth is good and crops are at or near maximum height, with little variability in height at maturity. Semi-dwarf varieties commonly
have a crop height at maturity of >1000 mm
1[Moderate]
Crop growth is moderate. Crops show moderate variability in height at maturity and are signifi cantly below maximum (700–900 mm)
0[Poor]
Crop growth is poor and plants can appear sickly. Crop height is uneven and patchy and well below maximum at maturity (400–600 mm)
MODERATE HEIGHT MODERATELYPOOR HEIGHT
POOR HEIGHT

42
VISUAL SOIL ASSESSMENTke
rnel
siz
e
Assessment
ImportanceIKERNEL development starts immediately after floret fertilization with cellular division during which the endosperm cell and amyloplasts are formed. This period is known as the lag phase and lasts for about 20 to 30 percent of the grain filling period. This is followed by a phase of cell growth, differentiation and starch deposition in the endosperm which takes 50 to 70 percent of the grain filling period. Good availability of carbohydrate is essential to be maintained during the crop cycle avoiding any shortage especially during the grain filling period. Soils in good condition with good structure, porosity, organic matter levels, soil life, soil fertility and rooting depth help ensure the supply and availability of water and nutrients. The grain filling period is prolonged as a result and an increase in kernel size is achieved. Good crop management practices including the adoption of widely spaced rows and good residue cover between rows to conserve water in dry zones also help to maximise the size of the kernel.
KERNEL SIZE is a useful determinant of grain quality by measuring the weight of unscreened grain, the screening loss and the weight of 1000 grains of clean seed.
å Measure the size of the kernels just before harvesting and compare them with the photographs and criteria given (Plate 28).
While there is a strong association between kernel number and yield, kernel size and dry weight are also strong determinants of the final yield. In making the assessment, consideration must be given to the plant population, tiller density and weather conditions and in particular the rainfall and sunlight hours. High plant populations and tiller densities will reduce the size of the kernel, and dry conditions and prolonged cloudy weather will reduce photosynthesis and subsequently the formation of carbohydrates and starch.
C

43
VINEYARDS | OLIVE ORCHARDS | ORCHARDS | WHEAT | MAIZE | ANNUAL CROPS | PASTURE
PLATE 28 How to score kernel size
GOOD CONDITION VS = 2Depending on the variety, kernels are large, completely filled and well shaped with few or no moisture stress features apparent.
MODERATE CONDITION VS = 1Kernels are of moderate size, may show occasional incomplete grain filling and stress features are often apparent.
POOR CONDITION VS = 0Kernels are generally very small with an irregular shape and stress features are very common.

44
VISUAL SOIL ASSESSMENTcr
op y
ield
Assessment
ImportanceIWITH A DECLINE IN SOIL QUALITY, crops can come under stress as a result of poor soil aeration, water-logging, moisture stress (due to either soil saturation or a reduced available water-holding capacity), a lack of available nutrients (Plates 30–31), and adverse temperatures. Toxic chemicals can also build up and root growth be impeded owing to chemical reduction reactions and a high penetration resistance to root development. This results in poor germination and emergence, poor plant growth and vigour, the need for redrilling, delays in drilling, root diseases, pest attack, and consequently lower crop yields. Plant stress induced by structural degradation can further affect the quality of grain by changing the amount and type of protein and starch formed, and the enzymic potential. These affect the amount of fermentable carbohydrate, the baking quality of wheat and the malting potential of barley. Under good soil conditions with adequate water and nutrients, the ripening period is prolonged and the starch accumulation inside the kernel is delayed and more gradual. This increases yield with a higher starch and protein percentage and quality.
å Assess relative crop yield based on the class limits in Table 9. Assessments can be made for all varieties of crops by counting or estimating the number and size of ears (spikes) per square metre, the number of kernels (grains) per ear, and the degree of grain filling. Harvested yield monitors could also be employed. Compare these with an ‘ideal’ crop (Plates 29). In making the assessment, consideration must be given to the variety of wheat, the number of plants per square metre, the soil moisture, air temperature and sunshine hours during the growing season, and pests and diseases not associated with the condition of the soil.
C
PLATE 29 Crop yield
Good crop yield with large ear development and complete grain filling.

45
VINEYARDS | OLIVE ORCHARDS | ORCHARDS | WHEAT | MAIZE | ANNUAL CROPS | PASTURE
PLATE 29 Crop yield
TABLE 9 Visual scores for crop yield
Visual score (VS) Crop yield
2[Good]
Crops have >500 ears per square metre. The ears are large with a spike length >90% of maximum for the variety. Ears have >50 kernels (grains) per ear and show complete grain filling with few signs of stress, pests or diseases. Harvested yield is greater than 8 tonnes
per hectare
1[Moderate]
Crops have 300–400 ears per square metre. The ears are of medium size with the spike length varying from 60–80% of maximum for the variety. Ears have 30–40 kernels (grains) per ear and show moderate and occasional uneven grain filling. Stress, pest and disease
evidence is moderately common. Harvested yield is 6–7 tonnes per hectare
0[Poor]
Crops have <200 ears per square metre. The ears are generally small and vary in length. Spike length is commonly <50% of maximum for the variety. Ears have <20 kernels (grains) per ear and grain filling is poor and often uneven. Stress, pest and disease features are very
common. Harvested yield is less than 5 tonnes per hectare
PLATE 30 Effect of boron deficiency on crop yield
Small ear development on the left due to boron deficiency.
PLATE 31 Effect of copper deficiency on crop yield
White tipping and incomplete ear development due to copper deficiency.

46
VISUAL SOIL ASSESSMENTpr
oduc
tion
cos
ts
AssessmentC
ImportanceIGround preparation, fertiliser, herbicide and pesticide inputs account for some of the highest costs in any cropping operation, and can increase significantly with increasing soil degradation. As degradation increases, the density and strength of the soil increases and, as a result, the soil becomes more resistant to tillage forces. Plough resistance increases so that larger tractors are required to avoid excessive wheel slip and the need to operate at lower ground speeds in a lower gear. The size, density and strength of soil clods also increase with increasing loss of soil structure, and careful timing and additional energy is needed to break them down to a seedbed. This energy is generally applied by using more intensive methods of cultivation and by making a greater number of passes. As a result, conventional tillage costs can increase by over 300 percent.
Continuous cropping using conventional cultivation techniques can also give rise to a significant loss of organic matter and, as a result, can substantially reduce soil fertility and the ability of the soil to supply nutrients. Higher amount of fertilizer are needed to compensate for the loss of these nutrients. The loss of organic carbon under continuous conventional cultivation could further incur a possible carbon tax in the future.
Reductions in crop yield are often not recognised as the result of the degradation of soil structure. Growers often assume that soil fertility is at fault and increase their production costs by applying extra amounts of fertilisers.
å Assess whether production costs have increased because of increased tillage/fertilizer requirements and herbicide/fungicide application over the years (Figure 4 and Table 10). This assessment can be based on perceptions, but reference to annual balance sheets will give a more precise answer.

47
VINEYARDS | OLIVE ORCHARDS | ORCHARDS | WHEAT | MAIZE | ANNUAL CROPS | PASTURE
����������������������������������������
������������������
������������������
��������������������������������������
����������������
��������������������������������������������������������������������������������������������������������������������������������
��������������������������
���
�
������������������������������������������������������������������������������
���������������������������������������������������������������������������������
TABLE 10 Visual scores for production costs
Visual score (VS) Production costs
2[Good]
Production costs including ground preparation, fertiliser, herbicide & pesticide requirements have not increased
1[Moderate]
Production costs including ground preparation, fertiliser, herbicide & pesticide requirements have increased moderately
0[Poor]
Production costs including ground preparation, fertiliser, herbicide & pesticide requirements have increased greatly

48
VISUAL SOIL ASSESSMENT
Soil management of wheat crops
Good soil management practices are needed to maintain optimal growth conditions for producing high crop yields, especially during the crucial periods of plant development. To achieve this, management practices need to maintain soil conditions that are good for plant growth, particularly aeration, temperature, nutrient and water supply. The soil needs to have a soil structure that promotes an effective root system that can maximise water and nutrient utilisation. Good soil structure also promotes infiltration and movement of water into and through the soil, minimising surface ponding, runoff and soil erosion.
Conservation tillage practices, including no-tillage and minimum tillage that incorporate the establishment of temporary cover crops and crop residues on the surface (Plates 32–34), provide soil management systems that conserve the environment, minimise the risk of soil degradation, enhance the resilience and quality of the soil, and reduce production costs. Conservation tillage protects the soil surface reducing water runoff and soil erosion. It improves soil physical characteristics, reduces wheel traffic which lessens wheel traffic compaction, and does not create tillage pans or plough pans. It improves soil trafficability and provides opportunities to optimise sowing time, being less dependent on climatic conditions in spring and autumn. Conservation tillage also encourages soil life and biological activity (including earthworm numbers) and increases micro-organism biodiversity. It retains a greater proportion of soil carbon sequestered from atmospheric carbon dioxide (CO
2) and enables the
soil to operate as a sink for CO2. Soil organic matter levels build up as a result and create the
potential to gain ‘Carbon Credits’. Conservation tillage also uses smaller amounts of fossil fuels, generates lower greenhouse gas emissions and has a smaller ecological footprint on a region, thereby raising marketplace acceptance of produce.
On the other hand, conventional tillage can impact negatively on the environment, with a greater food eco-footprint on a region and a country. It reduces the organic matter content of the soil by microbial oxidation, increases green house gas emissions (including the release of 5-times more CO
2), uses more fossil fuels (i.e., 6-times more consumption of fuel), degrades
soil structure, increases soil erosion, and adversely alters microflora and microfauna by reducing both the number of species and their biomass. The fundamental difference between conventional tillage and conservation tillage is their relative environmental and economic sustainability. The long-term affects of conventional tillage are cumulatively negative whereas the long-term affects of conservation tillage are cumulatively positive.

49
VINEYARDS | OLIVE ORCHARDS | ORCHARDS | WHEAT | MAIZE | ANNUAL CROPS | PASTURE
PLATE 32 No-till drilling a wheat crop into an erosion-prone field protected by herbicided pasture [BAKER NO-TILLAGE LTD]
PLATE 33 Strip-tillage planting of an annual crop protected by good residue cover
PLATE 34 Harvesting a wheat crop followed immediately by no-till seeding the next crop into stubble [BAKER NO-TILLAGE LTD]

50
VISUAL SOIL ASSESSMENT
References
Shepherd, T. G., Stagnari, F., Pisante, M. and Benites, J. 2008. Visual Soil Assessment – Field guide for wheat. FAO, Rome, Italy.

VISUAL SOIL ASSESSMENT
Wheat
FI
EL
D
GU
ID
E9 7 8 9 2 5 1 0 5 9 4 1 8
TC/D/I0007E/1/02.08/1000
ISBN 978-92-5-105941-8
The present publication on Visual Soil Assessment is a practicalguide to carry out a quantitative soil analysis with reproduceable resultsusing only very simple tools. Besides soil parameters, also crop parametersfor assessing soil conditions are presented for some selected crops. TheVisual Soil Assessment manuals consist of a series of separate booklets forspecific crop groups, collected in a binder. The publication addressesscientists as well as field technicians and even farmers who want to analysetheir soil condition and observe changes over time.

VSAField Guides
V I S U A L S O I L A S S E S S M E N T
VIS
UA
L S
OIL
AS
SE
SS
ME
NT
— F
IEL
D G
UID
ES


<
<
<
<

<
<
<
<

<
<
<
<
<
<
<


å
ç
é
C
I


C
I
å
ç
é
è
ê


C
I
å
ç
é


C
I
å


C
I
å
ç


C
I
å


Cå
I


C
I
å
<
<
<
<
<
<
<
<


å
ç


C
I
å
<
<
<


<
<
<


C
I
å


C
I
å


I
‡
å
ç
é
è
C


å
C
I


å
C
I


å
C
I


C
I
å


I
å
C


I
å
C


I
‡
å
C


C
I
å


C
I
å


Cå
I


Cå
I


<
<
<
<

<
<
<
<

<
<
<
<
<


å
ç
é
C
I


C
I
å
ç
é
è
ê
<
<
<
<
<
<
<
<
<


C
I
å
ç
é


C
I
å


C
I
å
ç


C
I
å

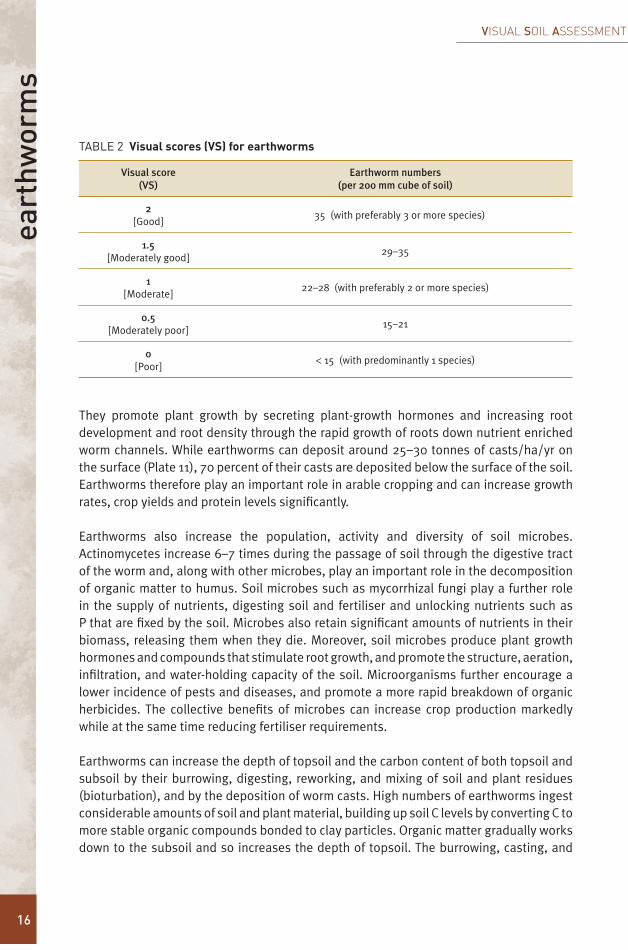


Cå
I


C
I
å
<
<
<
<
<
<
<
<


å
ç


C
I
å
<
<
<


C
I
å


C
I
å
<
<
<
<


C
I
å


I
å
C


C
I
å


T. Wallace 1961

C
I
å


I
å
C

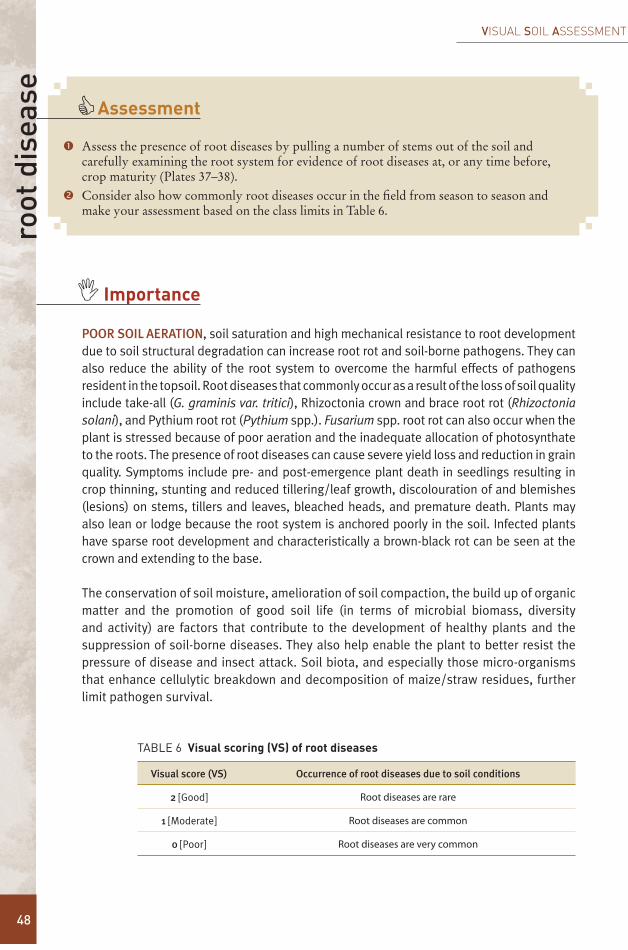
I
å
ç
C


I
å
C


I
å
C


I
<
<
<
<
<
<
<
<
<
å
C


C
I
å


C
I
å


Cå
I


Cå
I


C
I
å


Cå
I


Cå
I


VISUAL SOIL ASSESSMENT
AnnualCrops
FI
EL
D
GU
ID
E
9 7 8 9 2 5 1 0 5 9 4 1 8
TC/D/I0007E/1/02.08/1000
ISBN 978-92-5-105941-8
The present publication on Visual Soil Assessment is a practicalguide to carry out a quantitative soil analysis with reproduceable resultsusing only very simple tools. Besides soil parameters, also crop parametersfor assessing soil conditions are presented for some selected crops. TheVisual Soil Assessment manuals consist of a series of separate booklets forspecific crop groups, collected in a binder. The publication addressesscientists as well as field technicians and even farmers who want to analysetheir soil condition and observe changes over time.

VISUAL SOIL ASSESSMENT
AnnualCrops
FI
EL
D
GU
ID
E
Food and Agriculture Organization of the United NationsRome, 2008
Graham Shepherd, soil scientist,BioAgriNomics.com, New Zealand
Fabio Stagnari, assistant researcher,University of Teramo, Italy
Michele Pisante, professor,University of Teramo, Italy
José Benites, technical officer,Land and Water Development Division, FAO

Contents
The designations employed and the presentation of material in this informationproduct do not imply the expression of any opinion whatsoever on the partof the Food and Agriculture Organization of the United Nations (FAO) concerning thelegal or development status of any country, territory, city or area or of its authorities,or concerning the delimitation of its frontiers or boundaries. The mention of speciccompanies or products of manufacturers, whether or not these have been patented, doesnot imply that these have been endorsed or recommended by FAO in preference toothers of a similar nature that are not mentioned.
ISBN 978-92-5-105937-1
All rights reserved. Reproduction and dissemination of material in this informationproduct for educational or other non-commercial purposes are authorized withoutany prior written permission from the copyright holders provided the source is fullyacknowledged. Reproduction of material in this information product for resale or othercommercial purposes is prohibited without written permission of the copyright holders.Applications for such permission should be addressed to:ChiefElectronic Publishing Policy and Support BranchCommunication DivisionFAOViale delle Terme di Caracalla, 00153 Rome, Italyor by e-mail to:[email protected]
© FAO 2008

VINEYARDS | OLIVE ORCHARDS | ORCHARDS | WHEAT | MAIZE | ANNUAL CROPS | PASTURE
iii
Acknowledgements v
List of acronyms v
Visual Soil Assessment vi
SOIL TEXTURE 2
SOIL STRUCTURE 4
SOIL POROSITY 6
SOIL COLOUR 8
NUMBER AND COLOUR OF SOIL MOTTLES 10
EARTHWORMS 12
POTENTIAL ROOTING DEPTH 14Identifying the presence of a hardpan 16
SURFACE PONDING 18
SURFACE CRUSTING AND SURFACE COVER 20
SOIL EROSION 22
SOIL MANAGEMENT OF ANNUAL CROPS 24
Contents

iv
VISUAL SOIL ASSESSMENT
1. How to score soil texture 32. Visual scores for earthworms 133. Visual scores for potential rooting depth 154. Visual scores for surface ponding 19
Acknowledgements
List of acronyms
List of tables
List of figures
1. Soil scorecard – visual indicators for assessing soil quality in annual crops 12. Soil texture classes and groups 3
1. The VSA tool kit vii2. How to score soil structure 53. How to score soil porosity 74. How to score soil colour 95. How to score soil mottles 116. (a): earthworms casts under crop residue; (b): yellow-tail earthworm 137. Sample for assessing earthworms 138. Hole dug to assess the potential rooting depth 159. Using a knife to determine the presence or absence of a hardpan 1610. Identifying the presence of a hardpan 1711. Surface ponding in a field 1912. How to score surface crusting and surface cover 2113. How to score soil erosion 2314. No-till drilling an annual crop into an erosion-prone field protected by good residue cover 2515. Strip-tillage planting of an annual crop protected by good residue cover 2516. Harvesting an annual grain crop, followed immediately by no-till seeding the next crop into stubble 25
List of plates

VINEYARDS | OLIVE ORCHARDS | ORCHARDS | WHEAT | MAIZE | ANNUAL CROPS | PASTURE
v
This publication is adapted from the methodology developed in: Shepherd, T.G. 2008. Visual Soil Assessment. Volume 1. Field guide for pastoral grazing and cropping on flat to rolling country. 2nd edition. Palmerston North, New Zealand, Horizons Regional Council. 106 pp.
This publication is funded by FAO in collaboration with the Agronomy and Crop Science Research and Education Center of the University of Teramo.
Acknowledgements
List of acronyms
AEC Adenylate energy charge
Al Aluminium
ATP Adenosine triphosphate
B Boron
Ca Calcium
CO2 Carbon dioxide
Cu Copper
Fe Iron
K Potassium
Mg Magnesium
Mn Manganese
Mo Molybdenum
N Nitrogen
P Phosphorus
RSG Restricted spring growth
S Sulphur
VS Visual score
VSA Visual Soil Assessment
Zn Zinc

vi
VISUAL SOIL ASSESSMENT
IntroductionThe maintenance of good soil quality is vital for the environmental and economic sustainability of annual cropping. A decline in soil quality has a marked impact on plant growth and yield, grain quality, production costs and the increased risk of soil erosion. Therefore, it can have significant consequences on society and the environment. A decline in soil physical properties in particular takes considerable time and cost to correct. Safeguarding soil resources for future generations and minimizing the ecological footprint of annual cropping are important tasks for land managers.
Often, not enough attention is given to:< the basic role of soil quality in efficient and sustained production;< the effect of the condition of the soil on the gross profit margin;< the long-term planning needed to sustain good soil quality;< the effect of land management decisions on soil quality.
Soil type and the effect of management on the condition of the soil are important determinants of the character and quality of annual cropping and have profound effects on long-term profits. Land managers need tools that are reliable, quick and easy to use in order to help them assess the condition of their soils and their suitability for growing crops, and to make informed decisions that will lead to sustainable land and environmental management. To this end, Visual Soil Assessment (VSA) provides a quick and simple method to assess soil condition and plant performance. It can also be used to assess the suitability and limitations of a soil for annual crops. Soils with good VSA scores will usually give the best production with the lowest establishment and operational costs.
The VSA methodVisual Soil Assessment is based on the visual assessment of key soil ‘state’ and plant performance indicators of soil quality, presented on a scorecard. With the exception of soil texture, the soil indicators are dynamic indicators, i.e. capable of changing under different management regimes and land-use pressures. Being sensitive to change, they are useful early warning indicators of changes in soil condition and as such provide an effective monitoring tool.
Visual scoringEach indicator is given a visual score (VS) of 0 (poor), 1 (moderate), or 2 (good), based on the soil quality observed when comparing the soil sample with three photographs in the field guide manual. The scoring is flexible, so if the sample you are assessing does not align clearly with any one of the photographs but sits between two, an in-between score can be given, i.e. 0.5 or 1.5. Because some soil indicators are relatively more important in the assessment of soil quality than others, VSA provides a weighting factor of 1, 2 and 3. The total of the VS rankings gives the overall Soil Quality Index score for the sample you are evaluating. Compare this with the rating scale at the bottom of the scorecard to determine whether your soil is in good, moderate or poor condition.
Visual Soil Assessment

VINEYARDS | OLIVE ORCHARDS | ORCHARDS | WHEAT | MAIZE | ANNUAL CROPS | PASTURE
vii
The VSA tool kitThe VSA tool kit (Plate 1) comprises:< a spade – to dig a soil pit and to take a
200-mm cube of soil for the drop shatter soil structure test;
< a plastic basin (about 450 mm long x 350 mm wide x 250 mm deep) – to contain the soil during the drop shatter test;
< a hard square board (about 260x260x20 mm) – to fit in the bottom of the plastic basin on to which the soil cube is dropped for the shatter test;
< a heavy-duty plastic bag (about 750x 500 mm) – on which to spread the soil, after the drop shatter test has been carried out;
< a knife (preferably 200 mm long) to investigate the soil pit and potential rooting depth;
< a water bottle – to assess the field soil textural class;< a tape measure – to measure the potential rooting depth;< a VSA field guide – to make the photographic comparisons;< a pad of scorecards – to record the VS for each indicator.
The procedureWhen it should be carried outThe test should be carried out when the soils are moist and suitable for cultivation. If you are not sure, apply the ‘worm test’. Roll a worm of soil on the palm of one hand with the fingers of the other until it is 50 mm long and 4 mm thick. If the soil cracks before the worm is made, or if you cannot form a worm (for example, if the soil is sandy), the soil is suitable for testing. If you can make the worm, the soil is too wet to test.
Setting up
TimeAllow 25 minutes per site. For a representative assessment of soil quality, sample 4 sites over a 5-ha area.
Reference sampleTake a small sample of soil (about 100x50x150 mm deep) from under a nearby fence or a similar protected area. This provides an undisturbed sample required in order to assign the correct score for the soil colour indicator. The sample also provides a reference point for comparing soil structure and porosity.
PLATE 1 The VSA tool kit

viii
VISUAL SOIL ASSESSMENT
SitesSelect sites that are representative of the field. The condition of the soil in fields is site specific. Avoid areas that may have had heavier traffic than the rest of the field and sample between wheel traffic lanes. However, VSA can also be used to assess the effects of high traffic on soil quality by selecting to sample along wheel traffic lanes. Always record the position of the sites for future monitoring if required.
Site information
Complete the site information section at the top of the scorecard. Then record any special aspects you think relevant in the notes section at the bottom of the plant indicator scorecard.
Carrying out the test
Initial observationDig a small hole about 200x200 mm square by 300 mm deep with a spade and observe the topsoil (and upper subsoil if present) in terms of its uniformity, including whether it is soft and friable or hard and firm. A knife is useful to help you assess this.
Take the test sampleIf the topsoil appears uniform, dig out a 200-mm cube with the spade.You can sample whatever depth of soil you wish, but ensure that you sample the equivalent of a 200-mm cube of soil. If for example, the top 100 mm of the soil is compacted and you wish to assess its condition, dig out two samples of 200x200x100 mm with a spade. If the 100–200-mm depth is dominated by a tillage pan and you wish to assess its condition, remove the top 100 mm of soil and dig out two samples of 200x200x100 mm. Note that taking a 200-mm cube sample below the topsoil can also give valuable information about the condition of the subsoil and its implications for plant growth and farm management practices.
The drop shatter testDrop the test sample a maximum of three times from a height of 1 m onto the wooden square in the plastic basin. The number of times the sample is dropped and the height it is dropped from, is dependent on the texture of the soil and the degree to which the soil breaks up, as described in the section on soil structure.
Systematically work through the scorecard, assigning a VS to each indicator by comparing it with the photographs (or table) and description reported in the field guide.
Format of the bookletThe soil scorecard is given in Figure 1 and lists the ten key soil ‘state’ indicators required in order to assess soil quality. Each indicator is described on the following pages, with a section on how to assess each indicator and an explanation of its importance and what it reveals about the condition of the soil.

VINEYARDS | OLIVE ORCHARDS | ORCHARDS | WHEAT | MAIZE | ANNUAL CROPS | PASTURE
1
��������������������������������
���������������������������������������������������������������������������
��������� ����������
������������ ���
�������������� ���
������������� ���
����������� ���
��������������������������������� ���
�������������������� � �� ����������� � � ���
������������������������� � �� ���
��������������� ���
���������������������������������� ���
������������������������� ���
���������������������������������������
����������������������� ������������������
���� ����
�������� �����
���� ����
���������������������������������������������������������������������������������������
����������� ���������
��������������� ��������
�������������� �����
����������
���������������
���������������������
��������������������������� ������ ������ ������ ������� �����
�������������������� ���� ��������������� ������ ����������� ���
����������������������������� ���� ���� ����� ����� �������
�����
�����
�����
�����
������
������
������
������
������
������

VISUAL SOIL ASSESSMENT
2
soil
text
ure
Assessment
å Take a small sample of soil (half the size of your thumb) from the topsoil and a sample (or samples) that is (or are) representative of the subsoil.
ç Wet the soil with water, kneading and working it thoroughly on the palm of your hand with your thumb and forefinger to the point of maximum stickiness.
é Assess the texture of the soil according to the criteria given in Table 1 by attempting to mould the soil into a ball.
With experience, a person can assess the texture directly by estimating the percentages of sand, silt and clay by feel, and the textural class obtained by reference to the textural diagram (Figure 2).
There are occasions when the assignment of a textural score will need to be modified because of the nature of a textural qualifier. For example, if the soil has a reasonably high content of organic matter, i.e. is humic with 15–30 percent organic matter, raise the textural score by one (e.g. from 0 to 1 or from 1 to 2). If the soil has a significant gravelly or stony component, reduce the textural score by 0.5.
There are also occasions when the assignment of a textural score will need to be modified because of the specific preference of a crop for a particular textural class. For example, asparagus prefers a soil with a sandy loam texture and so the textural score is raised by 0.5 from a score of 1 to 1.5 based on the specific textural preference of the plant.
C
ImportanceISOIL TEXTURE defines the size of the mineral particles. Specifically, it refers to the relative proportion of the various size-groups in the soil, i.e. sand, silt and clay. Sand is that fraction that has a particle size >0.06 mm; silt varies between 0.06 and 0.002 mm; and the particle size of clay is <0.002 mm. Texture influences soil behaviour in several ways, notably through its effect on: water retention and availability; soil structure; aeration; drainage; soil workability and trafficability; soil life; and the supply and retention of nutrients.
A knowledge of both the textural class and potential rooting depth enables an approximate assessment of the total water-holding capacity of the soil, one of the major drivers of crop production.

VINEYARDS | OLIVE ORCHARDS | ORCHARDS | WHEAT | MAIZE | ANNUAL CROPS | PASTURE
3
FIGURE 2 Soil texture classes and groups
Textural classes.
Textural groups.
TABLE 1 How to score soil texture
Visual score(VS)
Textural class Description
2[Good]
Silt loamSmooth soapy feel, slightly sticky, no grittiness. Moulds into a cohesive ball that fissures when pressed flat.
1.5[Moderately good]
Clay loamVery smooth, sticky and plastic. Moulds into a cohesive ball that deforms without fissuring.
1[Moderate]
Sandy loam Slightly gritty, faint rasping sound. Moulds into a cohesive ball that fissures when pressed flat.
0.5[Moderately poor]
Loamy sandSilty clay
Clay
Loamy sand: Gritty and rasping sound. Will almost mould into a ball but disintegrates when pressed flat.Silty clay, clay: Very smooth, very sticky, very plastic. Moulds into a cohesive ball that deforms without fissuring.
0[Poor]
SandGritty and rasping sound. Cannot be moulded into a ball.

VISUAL SOIL ASSESSMENT
4
soil
stru
ctur
e
AssessmentC
ImportanceI
å Remove a 200-mm cube of topsoil with a spade (between or along wheel tracks).ç Drop the soil sample a maximum of three times from a height of 1 m onto the firm base
in the plastic basin. If large clods break away after the first or second drop, drop them individually again once or twice. If a clod shatters into small (primary structural) units after the first or second drop, it does not need dropping again. Do not drop any piece of soil more than three times. For soils with a sandy loam texture (Table 1), drop the cube of soil just once only from a height of 0.5 m.
é Transfer the soil onto the large plastic bag.è For soils with a loamy sand or sand texture, drop the cube of soil still sitting on the spade (once)
from a height of just 50 mm, and then roll the spade over, spilling the soil onto the plastic bag.ê Applying only very gently pressure, attempt to part each clod by hand along any exposed
cracks or fissures. If the clod does not part easily, do not apply further pressure (because the cracks and fissures are probably not continuous and, therefore, are unable to readily conduct oxygen, air and water).
ë Move the coarsest fractions to one end and the finest to the other end. Arrange the distribution of aggregates on the plastic bag so that the height of the soil is roughly the same over the whole surface area of the bag. This provides a measure of the aggregate-size distribution. Compare the resulting distribution of aggregates with the three photographs in Plate 2 and the criteria given.The method is valid for a wide range of moisture conditions but is best carried out when the soil is moist to slightly moist; avoid dry and wet conditions.
SOIL STRUCTURE is extremely important for arable cropping. It regulates:< soil aeration and gaseous exchange rates;< soil temperature;< soil infiltration and erosion;< the movement and storage of water;< nutrient supply;< root penetration and development;< soil workability;< soil trafficability;< the resistance of soils to structural degradation.
Good soil structure reduces the susceptibility to compaction under wheel traffic and increases the window of opportunity for vehicle access and for carrying out no-till, minimum-till or conventional cultivation between rows under optimal soil conditions.
Soil structure is ranked on the size, shape, firmness, porosity and relative abundance of soil aggregates and clods. Soils with good structure have friable, fine, porous, subangular and subrounded (nutty) aggregates. Those with poor structure have large, dense, very firm, angular or subangular blocky clods that fit and pack closely together and have a high tensile strength.

VINEYARDS | OLIVE ORCHARDS | ORCHARDS | WHEAT | MAIZE | ANNUAL CROPS | PASTURE
5
PLATE 2 How to score soil structure
GOOD CONDITION VS = 2Soil dominated by friable, fineaggregates with no significant clodding.Aggregates are generally subrounded(nutty) and often quite porous.
MODERATE CONDITION VS = 1Soil contains significant proportions(50%) of both coarse clods and friablefine aggregates. The coarse clods arefirm, subangular or angular in shape andhave few or no pores.
POOR CONDITION VS = 0Soil dominated by coarse clodswith very few finer aggregates. Thecoarse clods are very firm, angular orsubangular in shape and have very fewor no pores.

VISUAL SOIL ASSESSMENT
6
soil
poro
sity
AssessmentC
ImportanceI
å Remove a spade slice of soil (about 100 mm wide, 150 mm long and 200 mm deep) from the side of the hole and break it in half.
ç Examine the exposed fresh face of the sample for soil porosity by comparing against the three photographs in Plate 3. Look for the spaces, gaps, holes, cracks and fissures between and within soil aggregates and clods.
é Examine also the porosity of a number of the large clods from the soil structure test. This provides important additional information as to the porosity of the individual clods (the intra-aggregate porosity).
It is important to assess SOIL POROSITY along with the structure of the soil. Soil porosity, and particularly macroporosity (or large pores), influences the movement of air and water in the soil. Soils with good structure have a high porosity between and within aggregates, but soils with poor structure may not have macropores and coarse micropores within the large clods, restricting their drainage and aeration.
Poor aeration leads to the build up of carbon dioxide, methane and sulphide gases, and reduces the ability of plants to take up water and nutrients, particularly nitrogen (N), phosphorus (P), potassium (K) and sulphur (S). Plants can only utilize S and N in the oxygenated sulphate (SO
42-), nitrate (NO
3-) and ammonium (NH
4+) forms. Therefore,
plants require aerated soils for the efficient uptake and utilization of S and N. The number, activity and biodiversity of micro-organisms and earthworms are also greatest in well-aerated soils and they are able to decompose and cycle organic matter and nutrients more efficiently.
The presence of soil pores enables the development and proliferation of the superficial (or feeder) roots throughout the soil. Roots are unable to penetrate and grow through firm, tight, compacted soils, severely restricting the ability of the plant to utilize the available water and nutrients in the soil. A high penetration resistance not only limits plant uptake of water and nutrients, it also reduces fertilizer efficiency considerably and increases the susceptibility of the plant to root diseases.
Soils with good porosity will also tend to produce lower amounts of greenhouse gases. The greater the porosity, the better the drainage, and, therefore, the less likely it is that the soil pores will be water-filled to the critical levels required to accelerate the production of greenhouse gases. Aim to keep the soil porosity score above 1.

VINEYARDS | OLIVE ORCHARDS | ORCHARDS | WHEAT | MAIZE | ANNUAL CROPS | PASTURE
7
PLATE 3 How to score soil porosity
GOOD CONDITION VS = 2Soils have many macropores and coarsemicropores between and within aggregatesassociated with good soil structure.
MODERATE CONDITION VS = 1Soil macropores and coarse microporesbetween and within aggregates have declinedsignificantly but are present on closeexamination in parts of the soil. The soil showsa moderate amount of consolidation.
POOR CONDITION VS = 0No soil macropores and coarse microporesare visually apparent within compact,massive structureless clods. The clodsurface is smooth with few or no cracks orholes, and can have sharp angles.

VISUAL SOIL ASSESSMENT
8
soil
colo
ur AssessmentC
ImportanceI
å Compare the colour of a handful of soil from the field site with soil taken from under the nearest fenceline or a similar protected area.
ç Using the three photographs and criteria given (Plate 4), compare the relative change in soil colour that has occurred.
As topsoil colour can vary markedly between soil types, the photographs illustrate the degree of change in colour rather than the absolute colour of the soil.
SOIL COLOUR is a very useful indicator of soil quality because it can provide an indirect measure of other more useful properties of the soil that are not assessed so easily and accurately. In general, the darker the colour is, the greater is the amount of organic matter in the soil. A change in colour can give a general indication of a change in organic matter under a particular land use or management. Soil organic matter plays an important role in regulating most biological, chemical and physical processes in soil, which collectively determine soil health. It promotes infiltration and retention of water, helps to develop and stabilize soil structure, cushions the impact of wheel traffic and cultivators, reduces the potential for wind and water erosion, and indicates whether the soil is functioning as a carbon ‘sink’ or as a source of greenhouse gases. Organic matter also provides an important food resource for soil organisms and is an important source of, and major reservoir of, plant nutrients. Its decline reduces the fertility and nutrient-supplying potential of the soil; N, P, K and S requirements of crops increase markedly, and other major and minor elements are leached more readily. The result is an increased dependency on fertilizer input to maintain nutrient status.
Soil colour can also be a useful indicator of soil drainage and the degree of soil aeration. In addition to organic matter, soil colour is influenced markedly by the chemical form (or oxidation state) of iron (Fe) and manganese (Mn). Brown, yellow-brown, reddish-brown and red soils without mottles indicate well-aerated, well-drained conditions where Fe and Mn occur in the oxidized form of ferric (Fe3+) and manganic (Mn3+) oxides. Grey-blue colours can indicate that the soil is poorly drained or waterlogged and poorly aerated for long periods, conditions that reduce Fe and Mn to ferrous (Fe2+) and manganous (Mn2+) oxides. Poor aeration and prolonged waterlogging give rise to a further series of chemical and biochemical reduction reactions that produce toxins, such as hydrogen sulphide, carbon dioxide, methane, ethanol, acetaldehyde and ethylene, that damage the root system. This reduces the ability of plants to take up water and nutrients, causing poor vigour and ill-thrift. Decay and dieback of roots can also occur as a result of pests and diseases, including Rhizoctonia, Pythium and Fusarium root rot in soils prone to waterlogging.

VINEYARDS | OLIVE ORCHARDS | ORCHARDS | WHEAT | MAIZE | ANNUAL CROPS | PASTURE
9
PLATE 4 How to score soil colour
GOOD CONDITION VS = 2Dark coloured topsoil that is not toodissimilar to that under the fenceline.
MODERATE CONDITION VS = 1The colour of the topsoil is somewhatpaler than that under the fenceline, butnot markedly so.
POOR CONDITION VS = 0Soil colour has become significantly palercompared with that under the fenceline.

VISUAL SOIL ASSESSMENT
10
num
ber
and
colo
ur o
f soi
l mot
tles AssessmentC
ImportanceI
å Take a sample of soil (about 100 mm wide × 150 mm long × 200 mm deep) from the side of the hole and compare with the three photographs (Plate 5) and the percentage chart to determine the percentage of the soil occupied by mottles.
Mottles are spots or blotches of different colour interspersed with the dominant soil colour.
The NUMBER AND COLOUR OF SOIL MOTTLES provide a good indication of how well the soil is drained and how well it is aerated. They are also an early warning of a decline in soil structure caused by compaction under wheel traffic and overcultivation. The loss of soil structure reduces the number of channels and pores that conduct water and air and, as a consequence, can result in waterlogging and a deficiency of oxygen for a prolonged period. The development of anaerobic (deoxygenated) conditions reduces Fe and Mn from their brown/orange oxidized ferric (Fe3+) and manganic (Mn3+) form to grey ferrous (Fe2+) and manganous (Mn2+) oxides. Mottles develop as various shades of orange and grey owing to varying degrees of oxidation and reduction of Fe and Mn. As oxygen depletion increases, orange, and ultimately grey, mottles predominate. An abundance of grey mottles indicates the soil is poorly drained and poorly aerated for a significant part of the year. The presence of only common orange and grey mottles (10–25 percent) indicates the soil is imperfectly drained with only periodic waterlogging. Soil with only few to common orange mottles indicates the soil is moderately well drained, and the absence of mottles indicates good drainage.
Poor aeration reduces the uptake of water by plants and can induce wilting. It can also reduce the uptake of plant nutrients, particularly N, P, K, S and Cu. Moreover, poor aeration retards the breakdown of organic residues, and can cause chemical and biochemical reduction reactions that produce sulphide gases, methane, ethanol, acetaldehyde and ethylene, which are toxic to plant roots. In addition, decay and dieback of roots can occur as a result of fungal diseases such as Rhizoctonia, Pythium and Fusarium root rot, foot rot and crown rot in soils that are strongly mottled and poorly aerated. Fungal diseases and reduced nutrient and water uptake give rise to poor plant vigour and ill-thrift. If your visual score for mottles is ≤1, you need to aerate the soil.

VINEYARDS | OLIVE ORCHARDS | ORCHARDS | WHEAT | MAIZE | ANNUAL CROPS | PASTURE
11
PLATE 5 How to score soil mottles
GOOD CONDITION VS = 2Mottles are generally absent.
MODERATE CONDITION VS = 1Soil has common (10–25%) fine andmedium orange and grey mottles.
POOR CONDITION VS = 0Soil has abundant to profuse (>50%)medium and coarse orange and particularlygrey mottles.

VISUAL SOIL ASSESSMENT
12
eart
hwor
ms
AssessmentC
ImportanceI
å Count the earthworms by hand, sorting through the soil sample used to assess soil structure (Plate 7) and compare with the class limits in Table 2. Earthworms vary in size and number depending on the species and the season. Therefore, for year-to-year comparisons, earthworm counts must be made at the same time of year when soil moisture and temperature levels are good. Earthworm numbers are reported as the number per 200-mm cube of soil. Earthworm numbers are commonly reported on a square-metre basis. A 200-mm cube sample is equivalent to 1/25 m2, and so the number of earthworms needs to be multiplied by 25 to convert to numbers per square metre.
EARTHWORMS provide a good indicator of the biological health and condition of the soil because their population density and species are affected by soil properties and management practices. Through their burrowing, feeding, digestion and casting, earthworms have a major effect on the chemical, physical and biological properties of the soil. They shred and decompose plant residues, converting them to organic matter, and so releasing mineral nutrients. Compared with uningested soil, earthworm casts can contain 5 times as much plant available N, 3–7 times as much P, 11 times as much K, and 3 times as much Mg. They can also contain more Ca and plant-available Mo, and have a higher pH, organic matter and water content. Moreover, earthworms act as biological aerators and physical conditioners of the soil, improving:< soil porosity;< aeration;< soil structure and the stability of soil aggregates;< water retention;< water infiltration;< drainage.
They also reduce surface runoff and erosion. They further promote plant growth by secreting plant-growth hormones and increasing root density and root development by the rapid growth of roots down nutrient-enriched worm channels. While earthworms can deposit about 25–30 tonnes of casts/ha/year on the surface, 70 percent of their casts are deposited below the surface of the soil. Therefore, earthworms play an important role in cropping soils and can increase growth rates, crop yield and protein levels significantly.
Earthworms also increase the population, activity and diversity of soil microbes. Actinomycetes increase 6–7 times during the passage of soil through the digestive tract of the worm and, along with other microbes, play an important role in the decomposition of organic matter to humus. Soil microbes such as mycorrhizal fungi play a further role in the supply of nutrients, digesting soil and fertilizer and unlocking nutrients, such as P, that are fixed by the soil. Microbes also retain significant amounts of nutrients in their

VINEYARDS | OLIVE ORCHARDS | ORCHARDS | WHEAT | MAIZE | ANNUAL CROPS | PASTURE
13
biomass, releasing them when they die. Moreover, soil microbes produce plant-growth hormones and compounds that stimulate root growth and promote the structure, aeration, infiltration and water-holding capacity of the soil. Micro-organisms further encourage a lower incidence of pests and diseases. The collective benefits of microbes can increase crop production markedly while at the same time reducing fertilizer requirements.
Earthworm numbers (and biomass) are governed by the amount of food available as organic matter and soil microbes, as determined by the crops grown, the amount and quality of surface residues (Plate 6a), the use of cover crops and the method of tillage. Earthworm populations can be up to three times higher under no-tillage than conventional cultivation. Earthworm numbers are also governed by: soil moisture, temperature, texture, soil aeration, pH, soil nutrients (including levels of Ca), and the type and amount of fertilizer and N used. The overuse of acidifying salt-based fertilizers, anhydrous ammonia and ammonia-based products, and some insecticides and fungicides can further reduce earthworm numbers.
Soils should have a good diversity of earthworm species with a combination of: (i) surface feeders that live at or near the surface to breakdown plant residues and dung; (ii) topsoil-dwelling species that burrow, ingest and mix the top 200–300 mm of soil; and (iii) deep-burrowing species that pull down and mix plant litter and organic matter at depth.
Earthworms species can further indicate the overall condition of the soil. For example, significant numbers of yellow-tail earthworms (Octolasion cyaneum – Plate 6b) can indicate adverse soil conditions.
TABLE 2 Visual scores for earthworms
Visual score(VS)
Earthworm numbers(per 200-mm cube of soil)
2[Good]
> 30 (with preferably 3 or more species)
1[Moderate]
15–30 (with preferably 2 or more species)
0[Poor]
< 15 (with predominantly 1 species)
PLATE 7 Sample for assessing earthworms
PLATE 6 (a): earthworm casts under crop residue; (b): yellow-tail earthworm (Octolasion cyaneum)

VISUAL SOIL ASSESSMENT
14
pote
ntia
l roo
ting
dep
th
AssessmentC
ImportanceI
å Dig a hole to identify the depth to a limiting (restricting) layer where present (Plate 8), and compare with the class limits in Table 3. As the hole is being dug, note the presence of roots and old root channels, worm channels, cracks and fissures down which roots can extend. Note also whether there is an over-thickening of roots (a result of a high penetration resistance), and whether the roots are being forced to grow horizontally, otherwise known as right-angle syndrome. Moreover, note the firmness and tightness of the soil, whether the soil is grey and strongly gleyed owing to prolonged waterlogging, and whether there is a hardpan present such as a human-induced tillage or plough pan, or a natural pan such as an iron, siliceous or calcitic pan (pp 16–17). An abrupt transition from a fine (heavy) material to a coarse (sandy/gravelly) layer will also limit root development. A rough estimate of the potential rooting depth may be made by noting the above properties in a nearby road cutting or an open drain.
The POTENTIAL ROOTING DEPTH is the depth of soil that plant roots can potentially exploit before reaching a barrier to root growth, and it indicates the ability of the soil to provide a suitable rooting medium for plants. The greater is the rooting depth, the greater is the available-water-holding capacity of the soil. In drought periods, deep roots can access larger water reserves, thereby alleviating water stress and promoting the survival of non-irrigated crops. The exploration of a large volume of soil by deep roots means that they can also access more macronutrients and micronutrients, thereby accelerating the growth and enhancing the yield and quality of the crop. Conversely, soils with a restricted rooting depth caused by, for example, a layer with a high penetration resistance such as a compacted layer or a hardpan, restrict vertical root growth and development, causing roots to grow sideways. This limits plant uptake of water and nutrients, reduces fertilizer efficiency, increases leaching, and decreases yield. A high resistance to root penetration can also increase plant stress and the susceptibility of the plant to root diseases. Moreover, hardpans impede the movement of air, oxygen and water through the soil profile, the last increasing the susceptibility to waterlogging and erosion by rilling and sheet wash.
The potential rooting depth can be restricted further by:< an abrupt textural change;< pH;< aluminium (Al) toxicity;< nutrient deficiencies;< salinity;< sodicity;< a high or fluctuating water table;< low oxygen levels.

VINEYARDS | OLIVE ORCHARDS | ORCHARDS | WHEAT | MAIZE | ANNUAL CROPS | PASTURE
15
Anaerobic (anoxic) conditions caused by deoxygenation and prolonged waterlogging restrict the rooting depth as a result of the accumulation of toxic levels of hydrogen sulphide, ferrous sulphide, carbon dioxide, methane,
ethanol, acetaldehyde and ethylene, by-products of
chemical and biochemical reduction reactions.
Crops with a deep, vigorous root system help to raise soil organic matter levels and soil life at depth. The physical action of the roots and soil fauna and the glues they produce, promote soil structure, porosity, water storage, soil aeration and drainage at depth. A deep, dense root system provides huge scope for raising production while at the same time having significant environmental benefits. Crops are less reliant on frequent and high application rates of fertilizer and N to generate growth, and available nutrients are more likely to be taken up, so reducing losses by leaching into the environment.
PLATE 8 Hole dug to assess the potential rooting depth
The potential rooting depth extends tothe bottom of the arrow, below which thesoil is extremely firm and very tight withno roots or old root channels, no wormchannels and no cracks and fissures downwhich roots can extend.
TABLE 3 Visual scores for potential rooting depth
VSA score(VS)
Potential rooting depth(m)
2.0[Good]
> 0.8
1.5[Moderately good]
0.6–0.8
1.0[Moderate]
0.4–0.6
0.5[Moderately poor]
0.2–0.4
0[Poor]
< 0.2

16
VISUAL SOIL ASSESSMENT
Assessmentå Examine for the presence of a hardpan by rapidly jabbing the side of the soil profile
(that was dug to assess the potential rooting depth) with a knife, starting at the top and progressing systematically and quickly down to the bottom of the hole (Plate 9). Note how easy or difficult it is to jab the knife into the soil as you move rapidly down the profile. A strongly developed hardpan is very tight and extremely firm, and it has a high penetration resistance to the knife. Pay particular attention to the lower topsoil and upper subsoil where tillage pans and plough pans commonly occur if present (Plate 10).
ç Having identified the possible presence of a hardpan by a significant increase in penetration resistance to the point of a knife, gauge how strongly developed the hardpan is. Remove a large hand-sized sample and assess its structure, porosity and the number and colour of soil mottles (Plates 2, 3 and 5), and also look for the presence of roots. Compare with the photographs and criteria given in Plate 10.
PLATE 9 Using a knife to determine the presence or absence of a hardpan
Identifying the presence of a hardpan

VINEYARDS | OLIVE ORCHARDS | ORCHARDS | WHEAT | MAIZE | ANNUAL CROPS | PASTURE
17
PLATE 9 Using a knife to determine the presence or absence of a hardpan
PLATE 10 Identifying the presence of a hardpan
NO HARDPANThe soil has a low penetration resistanceto the knife. Roots, old root channels,worm channels, cracks and fissures may becommon. Topsoils are friable with a readilyapparent structure and have a soil porosityscore of ≥1.5.
MODERATELY DEVELOPED HARDPANThe soil has a moderate penetrationresistance to the knife. It is firm (hard)with a weakly apparent soil structure andhas a soil porosity score of 0.5–1. Thereare few roots and old root channels,few worm channels, and few cracksand fissures. The pan may have few tocommon orange and grey mottles. Notethe moderately developed tillage pan inthe lower half of the topsoil (arrowed).
STRONGLY DEVELOPED HARDPANThe soil has a high penetration resistanceto the knife. It is very tight, extremelyfirm (very hard) and massive (i.e. with noapparent soil structure) and has a soilporosity score of 0. There are no roots orold root channels, no worm channels orcracks or fissures. The pan may have manyorange and grey mottles. Note the stronglydeveloped tillage pan in the lower half ofthe topsoil (arrowed).

VISUAL SOIL ASSESSMENT
18
surf
ace
pond
ing
AssessmentC
ImportanceI
å Assess the degree of surface ponding (Plate 11) based on your observation or general recollection of the time ponded water took to disappear after a wet period during the spring, and compare with the class limits in Table 4.
SURFACE PONDING and the length of time water remains on the surface can indicate the rate of infiltration into and through the soil, a high water table, and the time the soil remains saturated. Prolonged waterlogging depletes oxygen in the soil causing anaerobic (anoxic) conditions that induce root stress, and restrict root respiration and the growth of roots. Roots need oxygen for respiration. They are most vulnerable to surface ponding and saturated soil conditions in the spring when plant roots and shoots are actively growing at a time when respiration and transpiration rates rise markedly and oxygen demands are high. They are also susceptible to ponding in the summer when transpiration rates are highest. Moreover, waterlogging causes the death of fine roots responsible for nutrient and water uptake. Reduced water uptake while the crop is transpiring actively causes leaf desiccation and the plant to wilt. Prolonged waterlogging also increases the likelihood of pests and diseases, including Rhizoctonia, Pythium and Fusarium root rot, and reduces the ability of roots to overcome the harmful effects of topsoil-resident pathogens. Plant stress induced by poor aeration and prolonged soil saturation can render crops less resistant to insect pest attack such as aphids, armyworm, cutworm and wireworm. Crops decline in vigour, have restricted spring growth (RSG) as evidenced by poor shoot and stunted growth, become discoloured and die.
Waterlogging and deoxygenation also results in a series of undesirable chemical and biochemical reduction reactions, the by-products of which are toxic to roots. Plant-available nitrate-nitrogen (NO
3-) is reduced by denitrification to nitrite (NO
2-) and nitrous
oxide (N2O), a potent greenhouse gas, and plant-available sulphate-sulphur (SO
42-) is
reduced to sulphide, including hydrogen sulphide (H2S), ferrous sulphide (FeS) and zinc
sulphide (ZnS). Iron is reduced to soluble ferrous (Fe2+) ions, and Mn to manganous (Mn2+) ions. Apart from the toxic products produced, the result is a reduction in the amount of plant-available N and S. Anaerobic respiration of micro-organisms also produces carbon dioxide and methane (also greenhouse gases), hydrogen gas, ethanol, acetaldehyde and ethylene, all of which inhibit root growth when accumulated in the soil. Unlike aerobic respiration, anaerobic respiration releases insufficient energy in the form of adenosine triphosphate (ATP) and adenylate energy charge (AEC) for microbial and root/shoot growth.

VINEYARDS | OLIVE ORCHARDS | ORCHARDS | WHEAT | MAIZE | ANNUAL CROPS | PASTURE
19
The tolerance of the root system to surface ponding and waterlogging is dependent on a number of factors, including the time of year and the type of crop. Tolerance of waterlogging is also dependent on: soil and air temperatures; soil type; the condition of the soil; fluctuating water tables; and the rate of onset and severity of anaerobiosis (or anoxia), a factor governed by the initial soil oxygen content and oxygen consumption rate.
Prolonged surface ponding makes the soil more susceptible to damage under wheel traffic, so reducing vehicle access. As a consequence, waterlogging can delay ground preparation and sowing dates significantly. Sowing can further be delayed because the seed bed is below the crop-specific critical temperature. Increases in the temperature of saturated soils can be delayed as long as water is evaporating.
PLATE 11 Surface ponding in a field
TABLE 4 Visual scores for surface ponding
VSA score(VS)
Surface ponding due to soil saturation
Number of daysof ponding *
Description
2[Good]
≤1No surface ponding of water evident after 1 day following heavy rainfall on soils that were at or near saturation.
1[Moderate]
2–4Moderate surface ponding occurs for 2–4 days after heavy rainfall on soils that were at or near saturation.
0[Poor]
>5Significant surface ponding occurs for longer than 5 days after heavy rainfall on soils that were at or near saturation.
* Assuming little or no air is trapped in the soil at the time of ponding.

VISUAL SOIL ASSESSMENT
20
surf
ace
crus
ting
and
sur
face
cov
er
AssessmentC
ImportanceI
å Observe the degree of surface crusting and surface cover and compare Plate 12 and the criteria given. Surface crusting is best assessed after wet spells followed by a period of drying, and before cultivation.
SURFACE CRUSTING reduces infiltration of water and water storage in the soil and increases runoff. Surface crusting also reduces aeration, causing anaerobic conditions, and prolongs water retention near the surface, which can hamper access by machinery for months. Crusting is most pronounced in fine-textured, poorly structured soils with a low aggregate stability and a dispersive clay mineralogy.
SURFACE COVER after harvesting and prior to canopy closure of the next crop helps to prevent crusting by minimizing the dispersion of the soil surface by rain or irrigation. It also helps to reduce crusting by intercepting the large rain droplets before they can strike and compact the soil surface. Vegetative cover and its root system return organic matter to the soil and promote soil life, including earthworm numbers and activity. The physical action of the roots and soil fauna and the glues they produce promote the development of soil structure, soil aeration and drainage and help to break up surface crusting. As a result, infiltration rates and the movement of water through the soil increase, decreasing runoff, soil erosion and the risk of flash flooding. Surface cover also reduces soil erosion by intercepting high impact raindrops, minimizing rain-splash and saltation. It further serves to act as a sponge, retaining rainwater long enough for it to infiltrate into the soil. Moreover, the root system reduces soil erosion by stabilizing the soil surface, holding the soil in place during heavy rainfall events. As a result, water quality downstream is improved with a lower sediment loading, nutrient and coliform content. The adoption of conservation tillage can reduce soil erosion by up to 90 percent and water runoff by up to 40 percent. The surface needs to have at least 70 percent cover in order to give good protection, while ≤30 percent cover provides poor protection. Surface cover also reduces the risk of wind erosion markedly.

VINEYARDS | OLIVE ORCHARDS | ORCHARDS | WHEAT | MAIZE | ANNUAL CROPS | PASTURE
21
PLATE 12 How to score surface crusting and surface cover
GOOD CONDITION VS = 2Little or no surface crusting is present; orsurface cover is ≥70%.
MODERATE CONDITION VS = 1Surface crusting is 2–3 mm thick and isbroken by signifi cant cracking; or surfacecover is >30% and <70%.
POOR CONDITION VS = 0Surface crusting is >5 mm thick and isvirtually continuous with little cracking;or surface cover is ≤30%.
Surface cover photos: courtesy of A. Leys

VISUAL SOIL ASSESSMENT
22
soil
eros
ion
AssessmentC
ImportanceI
å Assess the degree of soil erosion based on current visual evidence and on your knowledge of what the site looked like in the past relative to Plate 13.
SOIL EROSION reduces the productive potential of soils through nutrient losses, loss of organic matter, reduced potential rooting depth, and lower available-water-holding capacity. Soil erosion can also have significant off-site effects, including reduced water quality through increased sediment, nutrient and coliform loading in streams and rivers.
Overcultivation can cause considerable soil degradation associated with the loss of soil organic matter and soil structure. It can also develop surface crusting, tillage pans, and decrease infiltration and permeability of water through the soil profile (causing increased surface runoff ). If the soil surface is left unprotected on sloping ground, large quantities of soil can be water eroded by gullying, rilling and sheet wash. The cost of restoration, often requiring heavy machinery, can be prohibitively expensive.
The water erodibility of soil on sloping ground is governed by a number of factors including:< the percentage of vegetative cover on the soil surface;< the amount and intensity of rainfall;< the soil infiltration rate and permeability of water through the soil;< the slope and the nature of the underlying subsoil strata and bedrock.
The loss of organic matter and soil structure as a result of overcultivation can also give rise to significant soil loss by wind erosion of exposed ground.

VINEYARDS | OLIVE ORCHARDS | ORCHARDS | WHEAT | MAIZE | ANNUAL CROPS | PASTURE
23
PLATE 13 How to score soil erosion
GOOD CONDITION VS = 2Little or no water erosion. Topsoil depths inthe footslope areas are <150 mm deeperthan on the crest.Wind erosion is not a concern; only smalldust plumes emanate from the cultivatoron a windy day. Most wind-eroded material iscontained in the fi eld.
MODERATE CONDITION VS = 1Water erosion is a moderate concern witha signifi cant amount of rilling and sheeterosion. Topsoil depths in the footslopeareas are 150–300 mm greater than oncrests, and sediment input into drains/streams may be signifi cant.Wind erosion is of moderate concernwhere signifi cant dust plumes canemanate from the cultivator on windydays. A considerable amount of materialis blown off the fi eld but is containedwithin the farm.
POOR CONDITION VS = 0Water erosion is a major concern withsevere gullying, rilling and sheet erosionoccurring. Topsoils in footslope areas aremore than 300 mm deeper than on thecrests, and sediment input into drains/streams may be high.Wind erosion is a major concern. Largedust clouds can occur when cultivatingon windy days. A substantial amountof topsoil can be lost from the fi eld anddeposited elsewhere in the district.
Water erosion photos: courtesy of J. Quinton and A. Leys

24
VISUAL SOIL ASSESSMENT
Soil management of annual crops
Good soil management practices are needed in order to maintain optimal growth conditions for producing high crop yields, especially during the crucial periods of plant development. To achieve this, management practices need to maintain soil conditions that are good for plant growth, particularly aeration, temperature, nutrient and water supply. The soil needs to have a soil structure that promotes an effective root system that can maximize water and nutrient utilization. Good soil structure also promotes infiltration and movement of water into and through the soil, minimizing surface ponding, runoff and soil erosion.
Conservation tillage practices, including no-tillage and minimum tillage that incorporate the establishment of temporary cover crops and crop residues on the surface (Plates 14–16), provide soil management systems that conserve the environment, minimize the risk of soil degradation, enhance the resilience and quality of the soil, and reduce production costs. Conservation tillage protects the soil surface, reducing water runoff and soil erosion. It reduces wheel traffic, which lessens wheel traffic compaction and does not create tillage pans or plough pans. It improves soil trafficability and provides opportunities to optimize sowing time, being less dependent on climate conditions in spring and autumn. It improves soil physical characteristics, encourages soil life and biological activity (including earthworm numbers), and increases micro-organism biodiversity. Unlike conventional tillage, conservation tillage also enables the soil to retain a greater proportion of soil carbon sequestered from atmospheric carbon dioxide (CO
2), enabling the soil to act as a sink for CO
2. Consequently, soil
organic matter levels build up and, therefore, the potential to gain carbon credits. Moreover, conservation tillage uses smaller mounts of fossils fuels, generates lower greenhouse gas emissions and has a smaller ecological footprint on a region, thereby raising marketplace acceptance of produce.
On the other hand, conventional tillage can have a negative impact on the environment, with a greater food eco-footprint on a region and a country. It reduces the organic matter content of the soil by microbial oxidation, increases greenhouse gas emissions (including the release of 5–times more CO
2), and uses more fossil fuels (i.e., 6–times more consumption of fuel). It
degrades soil structure, increases soil erosion, and alters microflora and microfauna adversely by reducing both the number of species and their biomass. The fundamental difference between conventional tillage and conservation tillage is their relative environmental and economic sustainability. The long-term affects of conventional tillage are cumulatively negative whereas the long-term affects of conservation tillage are cumulatively positive.

VINEYARDS | OLIVE ORCHARDS | ORCHARDS | WHEAT | MAIZE | ANNUAL CROPS | PASTURE
25
PLATE 14 No-till drilling an annual crop into an erosion-prone field protected by herbicided pasture [BAKER NO-TILLAGE LTD]
PLATE 15 Strip-tillage planting of an annual crop protected by good residue cover
PLATE 16 Harvesting an annual grain crop followed immediately by no-till seeding the next crop into stubble [BAKER NO-TILLAGE LTD]

26
VISUAL SOIL ASSESSMENT
References
Shepherd, T. G., Stagnari, F., Pisante, M. and Benites, J. 2008. Visual Soil Assessment – Field guide for annual crops. FAO, Rome, Italy.

VISUAL SOIL ASSESSMENT
AnnualCrops
FI
EL
D
GU
ID
E9 7 8 9 2 5 1 0 5 9 4 1 8
TC/D/I0007E/1/02.08/1000
ISBN 978-92-5-105941-8
The present publication on Visual Soil Assessment is a practicalguide to carry out a quantitative soil analysis with reproduceable resultsusing only very simple tools. Besides soil parameters, also crop parametersfor assessing soil conditions are presented for some selected crops. TheVisual Soil Assessment manuals consist of a series of separate booklets forspecific crop groups, collected in a binder. The publication addressesscientists as well as field technicians and even farmers who want to analysetheir soil condition and observe changes over time.

VISUAL SOIL ASSESSMENT
OliveOrchards
FI
EL
D
GU
ID
E
9 7 8 9 2 5 1 0 5 9 4 1 8
TC/D/I0007E/1/02.08/1000
ISBN 978-92-5-105941-8
The present publication on Visual Soil Assessment is a practicalguide to carry out a quantitative soil analysis with reproduceable resultsusing only very simple tools. Besides soil parameters, also crop parametersfor assessing soil conditions are presented for some selected crops. TheVisual Soil Assessment manuals consist of a series of separate booklets forspecific crop groups, collected in a binder. The publication addressesscientists as well as field technicians and even farmers who want to analysetheir soil condition and observe changes over time.
VISUAL SOIL ASSESSMENT
OliveOrchards
FI
EL
D
GU
ID
E
Food and Agriculture Organization of the United NationsRome, 2008
Graham Shepherd, soil scientist,BioAgriNomics.com, New Zealand
Fabio Stagnari, assistant researcher,University of Teramo, Italy
Michele Pisante, professor,University of Teramo, Italy
José Benites, technical officer,Land and Water Development Division, FAO

Contents
The designations employed and the presentation of material in this informationproduct do not imply the expression of any opinion whatsoever on the partof the Food and Agriculture Organization of the United Nations (FAO) concerning thelegal or development status of any country, territory, city or area or of its authorities,or concerning the delimitation of its frontiers or boundaries. The mention of speciccompanies or products of manufacturers, whether or not these have been patented, doesnot imply that these have been endorsed or recommended by FAO in preference toothers of a similar nature that are not mentioned.
ISBN 978-92-5-105938-8
All rights reserved. Reproduction and dissemination of material in this informationproduct for educational or other non-commercial purposes are authorized withoutany prior written permission from the copyright holders provided the source is fullyacknowledged. Reproduction of material in this information product for resale or othercommercial purposes is prohibited without written permission of the copyright holders.Applications for such permission should be addressed to:ChiefElectronic Publishing Policy and Support BranchCommunication DivisionFAOViale delle Terme di Caracalla, 00153 Rome, Italyor by e-mail to:[email protected]
© FAO 2008

iii
VINEYARDS | OLIVE ORCHARDS | ORCHARDS | WHEAT | MAIZE | ANNUAL CROPS | PASTURE
Acknowledgements v
List of acronyms v
Visual Soil Assessment vi
SOIL TEXTURE 2
SOIL STRUCTURE 4
SOIL POROSITY 6
SOIL COLOUR 8
NUMBER AND COLOUR OF SOIL MOTTLES 10
EARTHWORMS 12
POTENTIAL ROOTING DEPTH 14Identifying the presence of a hardpan 16
SURFACE PONDING 18
SURFACE CRUSTING AND SURFACE COVER 20
SOIL EROSION 22
CANOPY VOLUME 26
CANOPY DENSITY 28
SHOOT LENGTH 30
FLOWERING 32
LEAF COLOUR 34
YIELD 36
VARIABILITY OF TREE PERFORMANCE ALONG THE ROW 38
SOIL MANAGEMENT IN OLIVE ORCHARDS 40
Contents

iv
VISUAL SOIL ASSESSMENT
1. How to score soil texture 32. Visual scores for earthworms 133. Visual scores for potential rooting depth 154. Visual scores for surface ponding 195. Visual scores for variability of tree performance along the row 38
Acknowledgements
List of acronyms
List of tables
List of figures
1. Soil scorecard – visual indicators for assessing soil quality in olive orchards 12. Soil texture classes and groups 33. Plant scorecard – visual indicators for assessing plant performance in olive orchards 25
1. The VSA tool kit vii2. How to score soil structure 53. How to score soil porosity 74. How to score soil colour 95. How to score soil mottles 116. Sample for assessing earthworms 137. Root system of an olive tree 158. Generic drawing of an olive tree 159. Using a knife to determine the presence or absence of a hardpan 1610. Identifying the presence of a hardpan 1711. Surface ponding in an olive orchard 1912. How to score surface crusting and surface cover 2113. How to score soil erosion 2314. How to score canopy volume 2715. How to score canopy density 2916. How to score shoot length 3117. How to score flowering 3318. How to score leaf colour 3519. How to score yield 3720. Effect of soil texture and available water on tree performance along the row 3921. Effect of soil aeration and drainage on tree performance along the row 39
List of plates

v
VINEYARDS | OLIVE ORCHARDS | ORCHARDS | WHEAT | MAIZE | ANNUAL CROPS | PASTURE
This publication is adapted from the methodology developed in: Shepherd, T.G. 2008. Visual Soil Assessment. Volume 1. Field guide for pastoral grazing and cropping on flat to rolling country. 2nd edition. Palmerston North, New Zealand, Horizons Regional Council. 106 pp.
The review of the manuscript and input provided by Professor P. Fiorino and Dr A. Lang are also gratefully acknowledged.
This publication is funded by FAO in collaboration with the Agronomy and Crop Science Research and Education Center of the University of Teramo.
Cover photograph: M. Pastor, CiFA-IFAPA.
Acknowledgements
List of acronyms
AEC Adenylate energy charge
Al Aluminium
ATP Adenosine triphosphate
B Boron
Ca Calcium
CO2 Carbon dioxide
Cu Copper
Fe Iron
K Potassium
Mg Magnesium
Mn Manganese
Mo Molybdenum
N Nitrogen
P Phosphorus
RSG Restricted spring growth
S Sulphur
VS Visual score
VSA Visual Soil Assessment
Zn Zinc

vi
VISUAL SOIL ASSESSMENT
IntroductionThe maintenance of good soil quality is vital for the environmental and economic sustainability of orchards. A decline in soil quality has a marked impact on tree growth, olive production and the character and quality of olive oil, production costs and the risk of soil erosion. Therefore, it can have significant consequences on society and the environment. A decline in soil physical properties in particular takes considerable time and cost to correct. Safeguarding soil resources for future generations and minimizing the ecological footprint of olive orchards are important tasks for land managers.
Often, not enough attention is given to:< the basic role of soil quality in efficient and sustained production;< the effect of the condition of the soil on the gross profit margin;< the long-term planning needed to sustain good soil quality;< the effect of land management decisions on soil quality.
Soil type and the effect of management on the condition of the soil are important determinants of the productive performance of olive orchards, and have profound effects on long-term profits. Land managers need tools that are reliable, quick and easy to use in order to help them assess the condition of their soils and their suitability for growing olives, and to make informed decisions that lead to sustainable land and environmental management. To this end, Visual Soil Assessment (VSA) provides a quick and simple method to assess soil condition and plant performance. It can also be used to assess the suitability and limitations of a soil for olives. Soils with good VSA scores will usually give the best production with the lowest establishment and operational costs.
The VSA methodVisual Soil Assessment is based on the visual assessment of key soil ‘state’ and plant performance indicators of soil quality, presented on a scorecard. Soil quality is ranked by assessment of the soil indicators alone. Plant indicators require knowledge of the growing history of the crop. This knowledge will facilitate the satisfactory and rapid completion of the plant scorecard. With the exception of soil texture, the soil and plant indicators are dynamic indicators, i.e. capable of changing under different management regimes and land-use pressures. Being sensitive to change, they are useful early warning indicators of changes in soil condition and plant performance and as such provide an effective monitoring tool.
Plant indicators allow you to make cause-and-effect links between management practices and soil characteristics. By looking at both the soil and plant indicators, VSA links the natural resource (soil) with plant performance and farm enterprise profitability. Because of this, the soil quality
Visual Soil Assessment

vii
VINEYARDS | OLIVE ORCHARDS | ORCHARDS | WHEAT | MAIZE | ANNUAL CROPS | PASTURE
assessment is not a combination of the ‘soil’ and ‘plant’ scores. Rather, the scores should be looked at separately, and compared.
Visual scoringEach indicator is given a visual score (VS) of 0 (poor), 1 (moderate), or 2 (good), based on the soil quality and plant performance observed when comparing the soil and plant with three photographs in the field guide manual. The scoring is flexible, so if the sample you are assessing does not align clearly with any one of the photographs but sits between two, an in-between score can be given, i.e. 0.5 or 1.5. Because some soil and plant indicators are relatively more important in the assessment of soil quality and plant performance than others, VSA provides a weighting factor of 1, 2 and 3. The total of the VS rankings gives the overall Soil Quality Index and Plant Performance Index for the site. Compare these with the rating scale at the bottom of the scorecard to determine whether your soil and plants are in good, moderate or poor condition.
Placing the soil and plant assessments side by side at the bottom of the plant indicator scorecard should prompt you to look for reasons if there is a significant discrepancy between the soil and plant indicators.
The VSA tool kitThe VSA tool kit (Plate 1) comprises:< a spade – to dig a soil pit and to take a
200-mm cube of soil for the drop shatter soil structure test;
< a plastic basin (about 450 mm long x 350 mm wide x 250 mm deep) – to contain the soil during the drop shatter test;
< a hard square board (about 260x260x20 mm) – to fit in the bottom of the plastic basin on to which the soil cube is dropped for the shatter test;
< a heavy-duty plastic bag (about 750x 500 mm) – on which to spread the soil, after the drop shatter test has been carried out;
< a knife (preferably 200 mm long) to investigate the soil pit and potential rooting depth;
< a water bottle – to assess the field soil textural class;< a tape measure – to measure the potential rooting depth;< a VSA field guide – to make the photographic comparisons;< a pad of scorecards – to record the VS for each indicator.
PLATE 1 The VSA tool kit

viii
VISUAL SOIL ASSESSMENT
The procedureWhen it should be carried outThe test should be carried out when the soils are moist and suitable for cultivation. If you are not sure, apply the ‘worm test’. Roll a worm of soil on the palm of one hand with the fingers of the other until it is 50 mm long and 4 mm thick. If the soil cracks before the worm is made, or if you cannot form a worm (for example, if the soil is sandy), the soil is suitable for testing. If you can make the worm, the soil is too wet to test.
Setting up
TimeAllow 25 minutes per site. For a representative assessment of soil quality, sample 4 sites over a 5-ha area.
Reference sampleTake a small sample of soil (about 100x50x150 mm deep) from under a nearby fence or a similar protected area. This provides an undisturbed sample required in order to assign the correct score for the soil colour indicator. The sample also provides a reference point for comparing soil structure and porosity.
SitesSelect sites that are representative of the orchard. The condition of the soil in olive orchards is site specific. Sample sites that have had little or no wheel traffic (e.g. near the olive tree). The VSA method can also be used to assess compacted areas by selecting to sample along wheel traffic lanes. Always record the position of the sites for future monitoring if required.
Site information
Complete the site information section at the top of the scorecard. Then record any special aspects you think relevant in the notes section at the bottom of the plant indicator scorecard.
Carrying out the test
Initial observationDig a small hole about 200x200 mm square by 300 mm deep with a spade and observe the topsoil (and upper subsoil if present) in terms of its uniformity, including whether it is soft and friable or hard and firm. A knife is useful to help you assess this.
Take the test sampleIf the topsoil appears uniform, dig out a 200-mm cube with the spade.You can sample whatever depth of soil you wish, but ensure that you sample the equivalent of a 200-mm cube of soil. If for example, the top 100 mm of the soil is compacted and you wish to assess its condition, dig out two samples of 200x200x100 mm with a spade. If the 100–200-mm depth is dominated by a tillage pan and you wish to assess its condition, remove the top 100 mm of soil and dig out two samples of 200x200x100 mm. Note that taking a 200-mm cube sample below the topsoil can also give valuable information about the condition of the subsoil and its implications for plant growth and farm management practices.

ix
VINEYARDS | OLIVE ORCHARDS | ORCHARDS | WHEAT | MAIZE | ANNUAL CROPS | PASTURE
The drop shatter testDrop the test sample a maximum of three times from a height of 1 m onto the wooden square in the plastic basin. The number of times the sample is dropped and the height it is dropped from, is dependent on the texture of the soil and the degree to which the soil breaks up, as described in the section on soil structure.
Systematically work through the scorecard, assigning a VS to each indicator by comparing it with the photographs (or table) and description reported in the field guide.
The plant indicatorsMany plant indicators cannot be assessed at the same time as the soil indicators. Ideally, the plant performance indicators should be observed at the appropriate time during the season. The plant indicators are scored and ranked in the same way as soil indicators: a weighting factor is used to indicate the relative importance of each indicator, with each contributing to the final determination of plant performance. The Plant Performance Index is the total of the individual VS rankings in the right-hand column.
Format of the bookletThe soil and plant scorecards are given in Figures 1 and 3, respectively, and list the key indicators required in order to assess soil quality and plant performance. Each indicator is described on the following pages, with a section on how to assess the indicator and an explanation of its importance and what it reveals about the condition of the soil and about plant performance.


1
VINEYARDS | OLIVE ORCHARDS | ORCHARDS | WHEAT | MAIZE | ANNUAL CROPS | PASTURE
��������������������������������
���������������������������������������������������������������������������
��������� ����������
������������ ���
�������������� ���
������������� ���
����������� ���
��������������������������������� ���
���
���
��������������� ���
���������������������������������� ���
������������������������� ���
���������������������������������������
����������������������� ������������������
���� ����
�������� �����
���� ����
�����������������������������������������������������������������������������������������
����������� ���������
��������������� ��������
�������������� �����
����������
���������������
���������������������
��������������������������� ������ ������ ������ ������� �����
�������������������� ���� ��������������� ������ ����������� ���
����������������������������� ���� ���� ����� ����� �������
�������������������� � �� ����������� � �
������������������������� � ��
�����
�����
�����
�����
������
������
������
������
������
������

2
VISUAL SOIL ASSESSMENTso
il te
xtur
e
Assessment
å Take a small sample of soil (half the size of your thumb) from the topsoil and a sample (or samples) that is (or are) representative of the subsoil.
ç Wet the soil with water, kneading and working it thoroughly on the palm of your hand with your thumb and forefinger to the point of maximum stickiness.
é Assess the texture of the soil according to the criteria given in Table 1 by attempting to mould the soil into a ball.
With experience, a person can assess the texture directly by estimating the percentages of sand, silt and clay by feel, and the textural class obtained by reference to the textural diagram (Figure 2).
There are occasions when the assignment of a textural score will need to be modified because of the nature of a textural qualifier. For example, if the soil has a reasonably high content of organic matter, i.e. is humic with 15–30 percent organic matter, raise the textural score by one (e.g. from 0 to 1 or from 1 to 2). If the soil has a significant gravelly or stony component, reduce the textural score by 0.5.
There are also occasions when the assignment of a textural score will need to be modified because of the specific preference of a crop for a particular textural class. For example, asparagus prefers a soil with a sandy loam texture and so the textural score is raised by 0.5 from a score of 1 to 1.5 based on the specific textural preference of the plant.
C
ImportanceISOIL TEXTURE defines the size of the mineral particles. Specifically, it refers to the relative proportion of the various size-groups in the soil, i.e. sand, silt and clay. Sand is that fraction that has a particle size >0.06 mm; silt varies between 0.06 and 0.002 mm; and the particle size of clay is <0.002 mm. Texture influences soil behaviour in several ways, notably through its effect on: water retention and availability; soil structure; aeration; drainage; soil trafficability; soil life; and the supply and retention of nutrients.
A knowledge of both the textural class and potential rooting depth enables an approximate assessment of the total water-holding capacity of the soil, one of the major drivers of crop production.

3
VINEYARDS | OLIVE ORCHARDS | ORCHARDS | WHEAT | MAIZE | ANNUAL CROPS | PASTURE
FIGURE 2 Soil texture classes and groups
Textural classes.
Textural groups.
TABLE 1 How to score soil texture
Visual score(VS)
Textural class Description
2[Good]
Silt loamSmooth soapy feel, slightly sticky, no grittiness. Moulds into a cohesive ball that fissures when pressed flat.
1.5[Moderately good]
Clay loamVery smooth, sticky and plastic. Moulds into a cohesive ball that deforms without fissuring.
1[Moderate]
Sandy loam Slightly gritty, faint rasping sound. Moulds into a cohesive ball that fissures when pressed flat.
0.5[Moderately poor]
Loamy sandSilty clay
Clay
Loamy sand: Gritty and rasping sound. Will almost mould into a ball but disintegrates when pressed flat.Silty clay, clay: Very smooth, very sticky, very plastic. Moulds into a cohesive ball that deforms without fissuring.
0[Poor]
SandGritty and rasping sound. Cannot be moulded into a ball.

4
VISUAL SOIL ASSESSMENTso
il st
ruct
ure
AssessmentC
ImportanceI
å Remove a 200-mm cube of topsoil with a spade (between or along wheel tracks).ç Drop the soil sample a maximum of three times from a height of 1 m onto the firm base
in the plastic basin. If large clods break away after the first or second drop, drop them individually again once or twice. If a clod shatters into small (primary structural) units after the first or second drop, it does not need dropping again. Do not drop any piece of soil more than three times. For soils with a sandy loam texture (Table 1), drop the cube of soil just once only from a height of 0.5 m.
é Transfer the soil onto the large plastic bag.è For soils with a loamy sand or sand texture, drop the cube of soil still sitting on the spade (once)
from a height of just 50 mm, and then roll the spade over, spilling the soil onto the plastic bag.ê Applying only very gently pressure, attempt to part each clod by hand along any exposed
cracks or fissures. If the clod does not part easily, do not apply further pressure (because the cracks and fissures are probably not continuous and, therefore, are unable to readily conduct oxygen, air and water).
ë Move the coarsest fractions to one end and the finest to the other end. Arrange the distribution of aggregates on the plastic bag so that the height of the soil is roughly the same over the whole surface area of the bag. This provides a measure of the aggregate-size distribution. Compare the resulting distribution of aggregates with the three photographs in Plate 2 and the criteria given.The method is valid for a wide range of moisture conditions but is best carried out when the soil is moist to slightly moist; avoid dry and wet conditions.
SOIL STRUCTURE is extremely important for olive orchards. It regulates:< soil aeration and gaseous exchange rates;< soil temperature;< soil infiltration and erosion;< the movement and storage of water;< nutrient supply;< root penetration and development;< soil workability;< soil trafficability;< the resistance of soils to structural degradation.
Good soil structure reduces the susceptibility to compaction under wheel traffic and increases the window of opportunity for vehicle access and for carrying out no-till, minimum-till or conventional cultivation between rows under optimal soil conditions.
Soil structure is ranked on the size, shape, firmness, porosity and relative abundance of soil aggregates and clods. Soils with good structure have friable, fine, porous, subangular and subrounded (nutty) aggregates. Those with poor structure have large, dense, very firm, angular or subangular blocky clods that fit and pack closely together and have a high tensile strength.

5
VINEYARDS | OLIVE ORCHARDS | ORCHARDS | WHEAT | MAIZE | ANNUAL CROPS | PASTURE
PLATE 2 How to score soil structure
GOOD CONDITION VS = 2Soil dominated by friable, fineaggregates with no significant clodding.Aggregates are generally subrounded(nutty) and often quite porous.
MODERATE CONDITION VS = 1Soil contains significant proportions(50%) of both coarse clods and friablefine aggregates. The coarse clods arefirm, subangular or angular in shape andhave few or no pores.
POOR CONDITION VS = 0Soil dominated by coarse clodswith very few finer aggregates. Thecoarse clods are very firm, angular orsubangular in shape and have very fewor no pores.

6
VISUAL SOIL ASSESSMENTso
il po
rosi
ty
AssessmentC
ImportanceI
å Remove a spade slice of soil (about 100 mm wide, 150 mm long and 200 mm deep) from the side of the hole and break it in half.
ç Examine the exposed fresh face of the sample for soil porosity by comparing against the three photographs in Plate 3. Look for the spaces, gaps, holes, cracks and fissures between and within soil aggregates and clods.
é Examine also the porosity of a number of the large clods from the soil structure test. This provides important additional information as to the porosity of the individual clods (the intra-aggregate porosity).
It is important to assess SOIL POROSITY along with the structure of the soil. Soil porosity, and particularly macroporosity (or large pores), influences the movement of air and water in the soil. Soils with good structure have a high porosity between and within aggregates, but soils with poor structure may not have macropores and coarse micropores within the large clods, restricting their drainage and aeration.
Poor aeration leads to the build up of carbon dioxide, methane and sulphide gases, and reduces the ability of plants to take up water and nutrients, particularly nitrogen (N), phosphorus (P), potassium (K) and sulphur (S). Plants can only utilize S and N in the oxygenated sulphate (SO
42-), nitrate (NO
3-) and ammonium (NH
4+) forms. Therefore,
plants require aerated soils for the efficient uptake and utilization of S and N. The number, activity and biodiversity of micro-organisms and earthworms are also greatest in well-aerated soils and they are able to decompose and cycle organic matter and nutrients more efficiently.
The presence of soil pores enables the development and proliferation of the superficial (or feeder) roots throughout the soil. Roots are unable to penetrate and grow through firm, tight, compacted soils, severely restricting the ability of the plant to utilize the available water and nutrients in the soil. A high penetration resistance not only limits plant uptake of water and nutrients, it also reduces fertilizer efficiency considerably and increases the susceptibility of the plant to root diseases.
Soils with good porosity will also tend to produce lower amounts of greenhouse gases. The greater the porosity, the better the drainage, and, therefore, the less likely it is that the soil pores will be water-filled to the critical levels required to accelerate the production of greenhouse gases. Aim to keep the soil porosity score above 1.

7
VINEYARDS | OLIVE ORCHARDS | ORCHARDS | WHEAT | MAIZE | ANNUAL CROPS | PASTURE
PLATE 3 How to score soil porosity
GOOD CONDITION VS = 2Soils have many macropores and coarsemicropores between and within aggregatesassociated with good soil structure.
MODERATE CONDITION VS = 1Soil macropores and coarse microporesbetween and within aggregates have declinedsignificantly but are present on closeexamination in parts of the soil. The soil showsa moderate amount of consolidation.
POOR CONDITION VS = 0No soil macropores and coarse microporesare visually apparent within compact,massive structureless clods. The clodsurface is smooth with few or no cracks orholes, and can have sharp angles.

8
VISUAL SOIL ASSESSMENTso
il co
lour AssessmentC
ImportanceI
å Compare the colour of a handful of soil from the field site with soil taken from under the nearest fenceline or a similar protected area.
ç Using the three photographs and criteria given (Plate 4), compare the relative change in soil colour that has occurred.
As topsoil colour can vary markedly between soil types, the photographs illustrate the degree of change in colour rather than the absolute colour of the soil.
SOIL COLOUR is a very useful indicator of soil quality because it can provide an indirect measure of other more useful properties of the soil that are not assessed so easily and accurately. In general, the darker the colour is, the greater is the amount of organic matter in the soil. A change in colour can give a general indication of a change in organic matter under a particular land use or management. Soil organic matter plays an important role in regulating most biological, chemical and physical processes in soil, which collectively determine soil health. It promotes infiltration and retention of water, helps to develop and stabilize soil structure, cushions the impact of wheel traffic and cultivators, reduces the potential for wind and water erosion, and maintains the soil carbon ‘sink’. Organic matter also provides an important food resource for soil organisms and is an important source of, and major reservoir of, plant nutrients. Its decline reduces the fertility and nutrient-supplying potential of the soil; N, P, K and S requirements of trees increase markedly, and other major and minor elements are leached more readily. The result is an increased dependency on fertilizer input to maintain nutrient status.
Soil colour can also be a useful indicator of soil drainage and the degree of soil aeration. In addition to organic matter, soil colour is influenced markedly by the chemical form (or oxidation state) of iron (Fe) and manganese (Mn). Brown, yellow-brown, reddish-brown and red soils without mottles indicate well-aerated, well-drained conditions where Fe and Mn occur in the oxidized form of ferric (Fe3+) and manganic (Mn3+) oxides. Grey-blue colours can indicate that the soil is poorly drained or waterlogged and poorly aerated for long periods, conditions that reduce Fe and Mn to ferrous (Fe2+) and manganous (Mn2+) oxides. Poor aeration and prolonged waterlogging give rise to a further series of chemical and biochemical reduction reactions that produce toxins, such as hydrogen sulphide, methane, ethanol, acetaldehyde and ethylene, that damage the root system. This reduces the ability of plants to take up water and nutrients, causing poor vigour and ill-thrift. Decay and dieback of roots can also occur as a result of fungal diseases such as Phytophthora root and crown rot in soils prone to waterlogging. Trees exhibit reduced growth, have thin canopies, and eventually die.

9
VINEYARDS | OLIVE ORCHARDS | ORCHARDS | WHEAT | MAIZE | ANNUAL CROPS | PASTURE
PLATE 4 How to score soil colour
GOOD CONDITION VS = 2Dark coloured topsoil that is not toodissimilar to that under the fenceline.
MODERATE CONDITION VS = 1The colour of the topsoil is somewhatpaler than that under the fenceline, butnot markedly so.
POOR CONDITION VS = 0Soil colour has become significantly palercompared with that under the fenceline.

10
VISUAL SOIL ASSESSMENTnu
mbe
r an
d co
lour
of s
oil m
ottl
es AssessmentC
ImportanceI
å Take a sample of soil (about 100 mm wide × 150 mm long × 200 mm deep) from the side of the hole and compare with the three photographs (Plate 5) and the percentage chart to determine the percentage of the soil occupied by mottles.
Mottles are spots or blotches of different colour interspersed with the dominant soil colour.
The NUMBER AND COLOUR OF SOIL MOTTLES provide a good indication of how well the soil is drained and how well it is aerated. They are also an early warning of a decline in soil structure caused by compaction under wheel traffic and overcultivation. The loss of soil structure decreases and blocks the number of channels and pores that conduct water and air and, as a consequence, can result in waterlogging and a deficiency of oxygen for a prolonged period. The development of anaerobic (deoxygenated) conditions reduces Fe and Mn from their brown/orange oxidized ferric (Fe3+) and manganic (Mn3+) form to grey ferrous (Fe2+) and manganous (Mn2+) oxides. Mottles develop as various shades of orange and grey owing to varying degrees of oxidation and reduction of Fe and Mn. As oxygen depletion increases, orange, and ultimately grey, mottles predominate. An abundance of grey mottles indicates the soil is poorly drained and poorly aerated for a significant part of the year. The presence of only common orange and grey mottles (10–25 percent) indicates the soil is imperfectly drained with only periodic waterlogging. Soil with only few to common orange mottles indicates the soil is moderately well drained, and the absence of mottles indicates good drainage.
Poor aeration reduces the uptake of water by plants and can induce wilting. It can also reduce the uptake of plant nutrients, particularly N, P, K and S. Moreover, poor aeration retards the breakdown of organic residues, and can cause chemical and biochemical reduction reactions that produce sulphide gases, methane, ethanol, acetaldehyde and ethylene, which are toxic to plant roots. Decay and dieback of roots can also occur as a result of fungal diseases such as Phytophthora root and crown rot in strongly mottled, poorly aerated soils. Root rot and reduced nutrient and water uptake give rise to poor plant vigour and ill-thrift. Trees exhibit reduced growth, have thin canopies, and eventually die. If your visual score for mottles is ≤1, you need to aerate the soil.

11
VINEYARDS | OLIVE ORCHARDS | ORCHARDS | WHEAT | MAIZE | ANNUAL CROPS | PASTURE
PLATE 5 How to score soil mottles
GOOD CONDITION VS = 2Mottles are generally absent.
MODERATE CONDITION VS = 1Soil has common (10–25%) fine andmedium orange and grey mottles.
POOR CONDITION VS = 0Soil has abundant to profuse (>50%)medium and coarse orange and particularlygrey mottles.

12
VISUAL SOIL ASSESSMENTea
rthw
orm
s
AssessmentC
ImportanceI
å Count the earthworms by hand, sorting through the soil sample used to assess soil structure (Plate 6) and compare with the class limits in Table 2. Earthworms vary in size and number depending on the species and the season. Therefore, for year-to-year comparisons, earthworm counts must be made at the same time of year when soil moisture and temperature levels are good. Earthworm numbers are reported as the number per 200-mm cube of soil. Earthworm numbers are commonly reported on a square-metre basis. A 200-mm cube sample is equivalent to 1/25 m2, and so the number of earthworms needs to be multiplied by 25 to convert to numbers per square metre.
EARTHWORMS provide a good indicator of the biological health and condition of the soil because their population density and species are affected by soil properties and management practices. Through their burrowing, feeding, digestion and casting, earthworms have a major effect on the chemical, physical and biological properties of the soil. They shred and decompose plant residues, converting them to organic matter, and so releasing mineral nutrients. Compared with uningested soil, earthworm casts can contain 5 times as much plant available N, 3–7 times as much P, 11 times as much K, and 3 times as much Mg. They can also contain more Ca and plant-available Mo, and have a higher pH, organic matter and water content. Moreover, earthworms act as biological aerators and physical conditioners of the soil, improving:< soil porosity;< aeration;< soil structure and the stability of soil aggregates;< water retention;< water infiltration;< drainage.
They also reduce surface runoff and erosion. They further promote plant growth by secreting plant-growth hormones and increasing root density and root development by the rapid growth of roots down nutrient-enriched worm channels. While earthworms can deposit about 25–30 tonnes of casts/ha/year on the surface, 70 percent of their casts are deposited below the surface of the soil. Therefore, earthworms play an important role in olive orchards and can increase growth rates and production significantly.
Earthworms also increase the population, activity and diversity of soil microbes. Actinomycetes increase 6–7 times during the passage of soil through the digestive tract of the worm and, along with other microbes, play an important role in the decomposition of organic matter to humus. Soil microbes such as mycorrhizal fungi play a further role in

13
VINEYARDS | OLIVE ORCHARDS | ORCHARDS | WHEAT | MAIZE | ANNUAL CROPS | PASTURE
the supply of nutrients, digesting soil and fertilizer and unlocking nutrients, such as P, that are fixed by the soil. Microbes also retain significant amounts of nutrients in their biomass, releasing them when they die. Moreover, soil microbes produce plant-growth hormones and compounds that stimulate root growth and promote the structure, aeration, infiltration and water-holding capacity of the soil. Micro-organisms further encourage a lower incidence of pests and diseases. The collective benefits of microbes reduce fertilizer requirements and improve trees and olive production.
Earthworm numbers (and biomass) are governed by the amount of food available as organic matter and soil microbes, as determined by the amount and quality of surface residue, the use of cover crops including legumes, and the cultivation of interrows. Earthworm populations can be up to three times higher in undisturbed soils compared with cultivated soils. Earthworm numbers are also governed by: soil moisture, temperature, texture, soil aeration, pH, soil nutrients (including levels of Ca), and the type and amount of fertilizer and N used. The overuse of acidifying salt-based fertilizers, anhydrous ammonia and ammonia-based products, and some insecticides and fungicides can further reduce earthworm numbers.
Soils should have a good diversity of earthworm species with a combination of: (i) surface feeders that live at or near the surface to breakdown plant residues and dung; (ii) topsoil-dwelling species that burrow, ingest and mix the top 200–300 mm of soil; and (iii) deep-burrowing species that pull down and mix plant litter and organic matter at depth.
PLATE 6 Sample for assessing earthworms
TABLE 2 Visual scores for earthworms
Visual score(VS)
Earthworm numbers(per 200-mm cube of soil)
2[Good]
> 30 (with preferably 3 or more species)
1[Moderate]
15–30 (with preferably 2 or more species)
0[Poor]
< 15 (with predominantly 1 species)

14
VISUAL SOIL ASSESSMENTpo
tent
ial r
ooti
ng d
epth
AssessmentC
ImportanceI
å Dig a hole to identify the depth to a limiting (restricting) layer where present, and compare with the class limits in Table 3. As the hole is being dug, note the presence of roots (Plates 7 and 8) and old root channels, worm channels, cracks and fissures down which roots can extend. Note also the firmness and tightness of the soil, whether the soil is grey and strongly gleyed owing to prolonged waterlogging, and whether there is a hardpan present such as a human-induced tillage or plough pan, or a natural pan such as an iron, siliceous or calcitic pan. An abrupt transition from a fine (heavy) material to a coarse (sandy/gravelly) layer will also limit root development. A rough estimate of the potential rooting depth may be made by noting the above properties in a nearby road cutting, gully, slip, earth slump or an open drain.
The POTENTIAL ROOTING DEPTH is the depth of soil that plant roots can potentially exploit before reaching a barrier to root growth, and it indicates the ability of the soil to provide a suitable rooting medium for plants. The greater is the rooting depth, the greater is the available-water-holding capacity of the soil. In drought periods, deep roots can access larger water reserves, thereby alleviating water stress and promoting the survival of non-irrigated olive orchards. The exploration of a large volume of soil by deep roots means that they can also access more macronutrients and micronutrients, thereby accelerating the growth and enhancing the yield and quality of the olives. Conversely, soils with a restricted rooting depth caused by, for example, a layer with a high penetration resistance such as a compacted layer or a hardpan, restrict vertical root growth and development, causing roots to grow sideways. This limits plant uptake of water and nutrients, reduces fertilizer efficiency, increases leaching, and decreases crop yield. A high resistance to root penetration can also increase plant stress and the susceptibility of the plant to root diseases. Moreover, hardpans impede the movement of air, oxygen and water through the soil profile, the last increasing the susceptibility to waterlogging and erosion by rilling and sheet wash.
The potential rooting depth can be restricted further by:< an abrupt textural change;< pH;< aluminium (Al) toxicity;< nutrient deficiencies;< salinity;< sodicity;< a high or fluctuating water table;< low oxygen levels.

15
VINEYARDS | OLIVE ORCHARDS | ORCHARDS | WHEAT | MAIZE | ANNUAL CROPS | PASTURE
Anaerobic (anoxic) conditions caused by deoxygenation and prolonged waterlogging restrict the rooting depth as a result of the accumulation of toxic levels of hydrogen sulphide, ferrous sulphide, carbon dioxide, methane,
ethanol, acetaldehyde and ethylene, by-products of
chemical and biochemical reduction reactions.
Olive trees with a deep, dense, vigorous root system raise soil organic matter levels and soil life at depth. The physical action of the roots and soil fauna and the glues they produce promote soil structure, porosity, water storage, soil aeration and drainage at depth. The soil depth should preferably not be less than 600 mm. Heavy clay soils are not recommended. Stony soils are acceptable under artificial irrigation. Furthermore, olive trees need a sufficient rooting depth to provide adequate anchorage for the trees at maturity.
PLATE 7 Root system of an olive tree
TABLE 3 Visual scores for potential rooting depth
VSA score(VS)
Potential rooting depth(m)
2.0[Good]
> 0.8
1.5[Moderately good]
0.6–0.8
1.0[Moderate]
0.4–0.6
0.5[Moderately poor]
0.2–0.4
0[Poor]
< 0.2
PLATE 8 Generic drawing of an olive tree [L. DRAZETA and A. LANG]

16
VISUAL SOIL ASSESSMENT
Assessmentå Examine for the presence of a hardpan by rapidly jabbing the side of the soil profile
(that was dug to assess the potential rooting depth) with a knife, starting at the top and progressing systematically and quickly down to the bottom of the hole (Plate 9). Note how easy or difficult it is to jab the knife into the soil as you move rapidly down the profile. A strongly developed hardpan is very tight and extremely firm, and it has a high penetration resistance to the knife. Pay particular attention to the lower topsoil and upper subsoil where tillage pans and plough pans commonly occur if present (Plate 10).
ç Having identified the possible presence of a hardpan by a significant increase in penetration resistance to the point of a knife, gauge how strongly developed the hardpan is. Remove a large hand-sized sample and assess its structure, porosity and the number and colour of soil mottles (Plates 2, 3 and 5), and also look for the presence of roots. Compare with the photographs and criteria given Plate 10.
PLATE 9 Using a knife to determine the presence or absence of a hardpan
Identifying the presence of a hardpan

17
VINEYARDS | OLIVE ORCHARDS | ORCHARDS | WHEAT | MAIZE | ANNUAL CROPS | PASTURE
PLATE 9 Using a knife to determine the presence or absence of a hardpan
PLATE 10 Identifying the presence of a hardpan
NO HARDPANThe soil has a low penetration resistanceto the knife. Roots, old root channels,worm channels, cracks and fissures may becommon. Topsoils are friable with a readilyapparent structure and have a soil porosityscore of ≥1.5.
MODERATELY DEVELOPED HARDPANThe soil has a moderate penetrationresistance to the knife. It is firm (hard)with a weakly apparent soil structure andhas a soil porosity score of 0.5–1. Thereare few roots and old root channels,few worm channels, and few cracksand fissures. The pan may have few tocommon orange and grey mottles. Notethe moderately developed tillage pan inthe lower half of the topsoil (arrowed).
STRONGLY DEVELOPED HARDPANThe soil has a high penetration resistanceto the knife. It is very tight, extremelyfirm (very hard) and massive (i.e. with noapparent soil structure) and has a soilporosity score of 0. There are no roots orold root channels, no worm channels orcracks or fissures. The pan may have manyorange and grey mottles. Note the stronglydeveloped tillage pan in the lower half ofthe topsoil (arrowed).

18
VISUAL SOIL ASSESSMENTsu
rfac
e po
ndin
g
AssessmentC
ImportanceI
å Assess the degree of surface ponding (Plate 11) based on your observation or general recollection of the time ponded water took to disappear after a wet period during the spring, and compare with the class limits in Table 4.
SURFACE PONDING and the length of time water remains on the surface can indicate the rate of infiltration into and through the soil, a high water table, and the time the soil remains saturated. Olive trees generally require free-draining soils. Prolonged waterlogging depletes oxygen in the soil causing anaerobic (anoxic) conditions that induce root stress, and restrict root respiration and the growth and development of roots. Roots need oxygen for respiration. While olive trees transpire all year round and do not have a dormant period, they are most vulnerable to surface ponding and saturated soil conditions in the spring when plant roots and shoots are growing actively at a time when respiration and transpiration rates rise markedly and oxygen demands are high. They are also susceptible to ponding in the summer when transpiration rates are highest. Moreover, waterlogging cause the death of fine roots responsible for nutrient and water uptake. Reduced water uptake while the tree is transpiring actively causes leaf desiccation and tip-burn. Prolonged waterlogging also increases the likelihood of infections and fungal diseases such as Phytophthora root rot and crown rot, and reduces the ability of roots to overcome the harmful effects of topsoil-resident pathogens. Trees decline in vigour, have restricted spring growth (RSG) as evidenced by poor shoot and stunted growth, have thin canopies, and eventually die.
Waterlogging and deoxygenation also results in a series of undesirable chemical and biochemical reduction reactions, the by-products of which are toxic to roots. Plant-available nitrate-nitrogen (NO
3-) is reduced by denitrification to nitrite (NO
2-) and nitrous
oxide (N2O), a potent greenhouse gas, and plant-available sulphate-sulphur (SO
42-) is
reduced to sulphide, including hydrogen sulphide (H2S), ferrous sulphide (FeS) and zinc
sulphide (ZnS). Iron is reduced to soluble ferrous (Fe2+) ions, and Mn to manganous (Mn2+) ions. Apart from the toxic products produced, the result is a reduction in the amount of plant-available N and S. Anaerobic respiration of micro-organisms also produces carbon dioxide and methane (also greenhouse gases), hydrogen gas, ethanol, acetaldehyde and ethylene, all of which inhibit root growth when accumulated in the soil. Unlike aerobic respiration, anaerobic respiration releases insufficient energy in the form of adenosine triphosphate (ATP) and adenylate energy charge (AEC) for microbial and root/shoot growth.

19
VINEYARDS | OLIVE ORCHARDS | ORCHARDS | WHEAT | MAIZE | ANNUAL CROPS | PASTURE
The tolerance of olive trees to waterlogging is dependent on a number of factors, including the time of year, the rootstock, soil and air temperatures, soil type, the condition of the soil, fluctuating water tables and the rate of onset and severity of anaerobiosis (or anoxia), a factor governed by the amount of entrapped air and the oxygen consumption rate by plant roots.
Prolonged surface ponding increases the susceptibility of soils to damage under wheel traffic, so reducing vehicle access.
PLATE 11 Surface ponding in an olive orchard [J. GOMEZ]
TABLE 4 Visual scores for surface ponding
VSA score(VS)
Surface ponding due to soil saturation
Number of daysof ponding *
Description
2[Good]
≤ 1No evidence of surface ponding after 1 day following heavy rainfall on soils that were already at or near saturation.
1[Moderate]
2–4Moderate surface ponding occurs for 1–3 days after heavy rainfall on soils that were already at or near saturation.
0[Poor]
> 5Significant surface ponding occurs for longer than 3 days after heavy rainfall on soils that were already at or near saturation.
* Assuming little or no air is trapped in the soil at the time of ponding.

20
VISUAL SOIL ASSESSMENTsu
rfac
e cr
usti
ng a
nd s
urfa
ce c
over
AssessmentC
ImportanceI
å Observe the degree of surface crusting and surface cover and compare with Plate 12 and the criteria given. Surface crusting is best assessed after wet spells followed by a period of drying, and before cultivation.
SURFACE CRUSTING reduces infiltration of water and water storage in the soil and increases runoff. Surface crusting also reduces aeration, causing anaerobic conditions, and prolongs water retention near the surface, which can hamper access by machinery for months. Crusting is most pronounced in fine-textured, poorly structured soils with a low aggregate stability and a dispersive clay mineralogy.
SURFACE COVER helps to prevent crusting by minimizing the dispersion of the soil surface by rain or irrigation. It also helps to reduce crusting by intercepting the large rain droplets before they can strike and compact the soil surface. Vegetative cover and its root system return organic matter to the soil and promote soil life, including earthworm numbers and activity. The physical action of the roots and soil fauna and the glues they produce promote the development of soil structure, soil aeration and drainage and help to break up surface crusting. As a result, infiltration rates and the movement of water through the soil increase, decreasing runoff, soil erosion and the risk of flash flooding. Surface cover also reduces soil erosion by intercepting high impact raindrops, minimizing rain-splash and saltation. It further serves to act as a sponge, retaining rainwater long enough for it to infiltrate into the soil. Moreover, the root system reduces soil erosion by stabilizing the soil surface, holding the soil in place during heavy rainfall events. As a result, water quality downstream is improved with a lower sediment loading, nutrient and coliform content. The adoption of managed cover crops has in some cases reduced sediment erosion rates from 70 tonnes/ha to 1.5 tonnes/ha during single large rainfall events. The surface needs to have at least 70 percent cover in order to give good protection, while ≤30 percent cover provides poor protection. Surface cover also reduces the risk of wind erosion markedly.

21
VINEYARDS | OLIVE ORCHARDS | ORCHARDS | WHEAT | MAIZE | ANNUAL CROPS | PASTURE
PLATE 12 How to score surface crusting and surface cover
GOOD CONDITION VS = 2Little or no surface crusting is present; orsurface cover is ≥70%.
MODERATE CONDITION VS = 1Surface crusting is 2–3 mm thick and isbroken by signifi cant cracking; or surfacecover is >30% and <70%.
POOR CONDITION VS = 0Surface crusting is >5 mm thick and isvirtually continuous with little cracking;or surface cover is ≤30%.
Photos of surface cover: courtesy of A. Leys

22
VISUAL SOIL ASSESSMENTso
il er
osio
n
AssessmentC
ImportanceI
å Assess the degree of soil erosion based on current visual evidence and, more importantly, on your knowledge of what the site looked like in the past relative to Plate 13.
SOIL EROSION reduces the productive potential of an olive orchard through nutrient losses, loss of organic matter, reduced potential rooting depth, and lower available-water-holding capacity. Soil erosion can also have significant off-site effects, including reduced water quality through increased sediment, nutrient and coliform loading in streams and rivers.
Overcultivation of interrows can cause considerable soil degradation associated with the loss of soil organic matter and soil structure. It can also develop surface crusting, tillage pans, and decrease infiltration and permeability of water through the soil profile (causing increased surface runoff ). If the soil surface is left unprotected on sloping ground, large quantities of soil can be removed by slips, flows, gullying and rilling, or it can be relocated semi-intact by slumping. The cost of restoration, often requiring heavy machinery, can be prohibitively expensive.
The water erodibility of soil on sloping ground is governed by a number of factors including:< the percentage of vegetative cover on the soil surface;< the amount and intensity of rainfall;< the soil infiltration rate and permeability;< the slope and the nature of the underlying subsoil strata and bedrock.
The loss of organic matter and soil structure as a result of overcultivation between rows can also give rise to significant soil loss by wind erosion of exposed ground where the tree spacing is quite large.

23
VINEYARDS | OLIVE ORCHARDS | ORCHARDS | WHEAT | MAIZE | ANNUAL CROPS | PASTURE
PLATE 13 How to score soil erosion
GOOD CONDITION VS = 2Little or no evidence of soil erosion. Little difference in height between the mounded row and interrow. The root system is completely covered.
MODERATE CONDITION VS = 1Moderate soil erosion with a significant difference in height between the interrow and the soil around the base of the tree trunk. Part of the upper root system is occasionally exposed.
POOR CONDITION VS = 0Severe soil erosion with deeply incised gullies or other mass movement features between rows. There is a large difference in height between the interrow and the soil around the base of the tree trunk. The root system is often well exposed and sometimes undermined.
Photos: courtesy of J. Gomez (Proterra Project supported by Syngenta) and M. Pastor


25
VINEYARDS | OLIVE ORCHARDS | ORCHARDS | WHEAT | MAIZE | ANNUAL CROPS | PASTURE
�������������������������������������
���������������������������������������������������������������������������
��������� ����������
������������� ���
�������������� ���
������������ ���
��������� ���
����������� ���
����� ���
� �
�����������������������
�������
� ��������������������
�����������������������������������������������������������������������������������������������
�������������������������������������������� ���
������
������
������
������
������
������
������
����������������������������
������
���������������������������������������
�����������������������
���� ����
�������� �����
���� ����
�������������������������������������� �����������������������������������������������������
��������������� ����������������

26
VISUAL SOIL ASSESSMENTca
nopy
vol
ume
AssessmentC
ImportanceICANOPY VOLUME at the flowering stage is dependent on: the age of the tree, cultivar, pruning, orchard management, disease, and climate factors (including frost damage). However, it can be a useful visual indicator of production and soil quality. Indeed, poor soil structure and soil aeration, limited movement and storage of water, and soil erosion as a result of structural degradation can reduce plant growth and vigour. Canopy volume is a particularly useful assessment of soil quality where climate factors have not limited crop development.
å Assess canopy volume in the late spring to early summer at flowering by comparing the olive tree with Plate 14 and the criteria given. In making the observation, consideration must be given to choosing a representative olive tree it terms of variety, pruning and age. In some cases, orchards are composed of trees of different age and cultivars. Corrections can be made on the basis of previously known annual growth rates as a function of age and cultivars, assigning a hypothetical common age for all trees and subtracting that part of the growth in the canopy volume. Canopy volume can be calculated approximately by applying the simple formula: canopy volume = w × b × h, where w is the width, b is the breadth and h is the height of the canopy.

27
VINEYARDS | OLIVE ORCHARDS | ORCHARDS | WHEAT | MAIZE | ANNUAL CROPS | PASTURE
PLATE 14 How to score canopy volume
GOOD CONDITION VS = 2Canopy volume is greater than 100 m3 (varying from 4–5 m high by 5–6 m wide or more) for mature trees planted at spacings of 5x5 or 6x6 m. Trees have a good distribution of leaves.
MODERATE CONDITION VS = 1Canopy volume is about 50 m3 (varying from 3–4 m high by 4 m wide) for mature trees planted at spacings of 5x5 or 6x6 m. Trees have a moderate distribution of leaves.
POOR CONDITION VS = 0Canopy volume is less than 23 m3 (i.e. ≤2–2.5 m high by 3 m wide) for mature trees planted at spacings of 5x5 or 6x6 m. Trees have a poor distribution of leaves.

28
VISUAL SOIL ASSESSMENTca
nopy
den
sity
AssessmentC
ImportanceICANOPY DENSITY is a good indicator of the health and vigour of the tree as reflected by the number of shoots, the number of leaves per shoot and the age of the leaves. In addition to the weather, tree vigour is related strongly to the availability of water and nutrients, and the texture of the soil (e.g. whether clayey, silty, loamy, sandy or gravelly). Moreover, soils in good condition with good structure and porosity, and having a deep, well-aerated root zone, enable the unrestricted movement of air and water into and through the soil and the development and proliferation of superficial (feeder) roots. Furthermore, soils with good organic matter levels and soil life show an active biological and chemical process, favouring the release and uptake of water and nutrients and, consequently, the growth and vigour of the tree. The amount of photosynthate produced by the tree is proportional to the number of leaves and, therefore, influences strongly the growth of the tree and the production and quality of olives.
å Assess the canopy density by comparing with Plate 15 and the criteria given.ç The assessment can be made at any stage after the new growth in the spring and before
harvest. In making the assessment, consideration must be given to the pruning and variety of the tree, the presence of pests and diseases, and the weather conditions at bud break (i.e. whether warm and dry, or cold and wet). Poor weather during bud break will promote a high number of leaf buds rather than flowering buds and give rise to many shoots and leaves.

29
VINEYARDS | OLIVE ORCHARDS | ORCHARDS | WHEAT | MAIZE | ANNUAL CROPS | PASTURE
PLATE 15 How to score canopy density
GOOD CONDITION VS = 2Good canopy density with abundant shoots and leaves per shoot. Many of the leaves are more than two years old.
MODERATE CONDITION VS = 1Moderate canopy density with a moderate number of shoots and leaves per shoot. Most leaves are less than two years old.
POOR CONDITION VS = 0Poor canopy density with few shoots and few leaves per shoot. The canopy appears sparse and spindly. The tree sheds its older leaves prematurely, with only one-year-old leavesbeing present.
Photos: courtesy of M. Greven

30
VISUAL SOIL ASSESSMENTsh
oot l
engt
h
AssessmentC
ImportanceISHOOT LENGTH determines the number of buds, some of which will bear flowers. It is also strongly related to the physical properties and chemical fertility of the soil, which in turn is influenced by soil management. Shoot length is an expression of plant vigour and general plant growth, which are regulated by the availability of water, nutrients and the aeration status of the soil. Soils in good condition with a deep vigorous root system, good structure, porosity, organic matter levels and soil life show an active chemical and biological process, favouring the release and uptake of nutrients and water, and consequently shoot growth.
å Measure or visually assess shoot length (each month if possible starting from mid-spring to the end of summer) on the mature part of the aerial part of the plant and compare it with Plate 16 and the criteria given. In making the assessment, consideration must be given to the pruning and variety of the tree, and to the weather conditions at bud break and during the spring.

31
VINEYARDS | OLIVE ORCHARDS | ORCHARDS | WHEAT | MAIZE | ANNUAL CROPS | PASTURE
PLATE 16 How to score shoot length
GOOD CONDITION VS = 2Shoots are at least 200 mm (depending on variety) on the external part of the plant.
MODERATE CONDITION VS = 1Shoot length is moderately below maximum (depending on variety) on the external part of the plant.
POOR CONDITION VS = 0Shoot length is significantly below maximum (depending on variety) on the external part of the plant.

32
VISUAL SOIL ASSESSMENTfl
ower
ing
AssessmentC
ImportanceIThe number and distribution of FLOWERS affects fruiting behaviour. The presence of a large number of flowers is also a good indicator of high yields. Flower induction starts in the preceding year of the olive production cycle. Its intensity depends on: weather conditions at the time (e.g. whether wet and cold, or dry and hot); the production of carbohydrate; and the presence of specific hormones necessary to drive the bud apex toward inflorescence production. Carbohydrate production depends on climate conditions, including: the amount of energy from the sun, the number of leaves on the tree, the cultivar, diseases, the availability of water and nutrients, and the physical status of the soil. Once again, soil fertility (physical, chemical and microbiological conditions) is crucial in determining high plant productivity.
å Assess by visual estimation the number and distribution of flowers at full flowering by comparing with Plate 17 and the criteria given. In making the assessment, consideration must be given to the pruning management of the tree and the weather conditions at bud break and in spring (i.e. whether warm and dry, or cold and wet). Poor weather will promote a high number of leaf buds rather than flowering buds and give rise to lots of shoots and leaves rather than flowers.

33
VINEYARDS | OLIVE ORCHARDS | ORCHARDS | WHEAT | MAIZE | ANNUAL CROPS | PASTURE
PLATE 17 How to score flowering
GOOD CONDITION VS = 2High number of flowers per shoot and well distributed over the tree.
MODERATE CONDITION VS = 1Moderate number of flowers occur.
POOR CONDITION VS = 0Low number of flowers and poorly distributed over the tree.
Photos: courtesy of P. Fiorino

34
VISUAL SOIL ASSESSMENTle
af c
olou
r
AssessmentC
ImportanceILEAF COLOUR can provide a good indication of the nutrient status and condition of the soil. The higher the soil fertility, the greener the leaf colour. Leaf colour is related primarily to water and nutrient availability and especially N. Leaf colour can also be related to a deficiency or excess in phosphorus (P), potassium (K), sulphur (S), calcium (Ca), magnesium (Mg), iron (Fe), manganese (Mn), zinc (Zn), copper (Cu) and boron (B). Chlorosis can further occur as a result of low N, K, S, Fe, Mg and Cu levels in the soil, low soil and air temperatures, and poor soil aeration caused by compaction and waterlogging.
Sulphur is an important element for plant growth and leaf colour and can only be utilized by plants in the sulphate (SO
42-) form. Under poorly-aerated conditions caused by
compaction or waterlogging, S will reduce to sulphur dioxide (SO2) and sulphides (e.g.
H2S, FeS). Sulphides and SO
2 cannot be taken up by the plant, are toxic to plant roots
and micro-organisms, and suppress the uptake of N. Plants can only utilize N where S is present in the oxygenated (sulphate) form. Nitrogen can also only be utilized by the plant in the nitrate (NO3-) and ammonium (NH4+) forms under aerobic conditions. Under poorly-aerated conditions, N will reduce to nitrite (NO
2 -) and nitrous oxide (N
2O), a potent
greenhouse gas, and become plant-unavailable.
å Assess the colour of the leaves by comparing with Plate 18 and the criteria given. The assessment must be made after the first flush of new growth at the end of the first annual growing period and on leaves exposed to the sunlight. Olive trees have leaves of different ages, varying from one to three years old. Assess only the young leaves, avoiding the deteriorating and immature leaves at the extremities of branches. Consideration must also be given to: the cultivar, the stage of growth, pests and diseases, and recent weather conditions. Prolonged cold and cloudy days with little sunlight can give rise to chlorosis (or yellowing of the leaf) owing to the inadequate formation or loss of chlorophyll.

35
VINEYARDS | OLIVE ORCHARDS | ORCHARDS | WHEAT | MAIZE | ANNUAL CROPS | PASTURE
PLATE 18 How to score leaf colour
GOOD CONDITION VS = 2Canopy has an intense green colour.
MODERATE CONDITION VS = 1Leaves are a medium-green or yellowish-green colour.
POOR CONDITION VS = 0Leaves are a distinct yellowish colour or turn opaque green.

36
VISUAL SOIL ASSESSMENTyi
eld
AssessmentC
ImportanceIYIELD can be a good visual indicator of the properties and condition of the soil. Olive trees can come under stress from drought (especially during the crucial flowering stage) and from a decline in soil quality caused by reduced water storage and plant-available water, nutrient deficiencies, poor aeration, and restricted root development as a result of soil compaction, a hardpan, a fluctuating water table, etc. This results in disease attack, shorter bud length, a lower number of flowers and poor yield production. Plant stress induced by soil structure degradation during harvesting time also affects the quality of the fruit by changing the amount and type of organic acids and polyphenols.
Appropriate soil management, including the adoption of a managed cover crop between rows and avoiding wheel traffic when the soil is wet, helps to promote the physical condition and overall fertility of the soil, minimize soil erosion, and promote sustainable long-term production.
å Assess relative crop yield by visually estimating the yield per tree and by comparing fruit number and size with Plate 19 and the criteria given. Compare also the percentage of olive oil extracted with that from an ideal crop.
ç In making your assessment, consideration must be given to the amount and type of fertilizer used, disease, and the cultivar, pruning and age of the olive tree. While olive trees can be rejuvenated by good pruning, the greatest yield potential of trees occurs from tree maturity to about 40 years of age on average. Olive trees generally mature in 10 years in humid temperate climates and 15 years in drier Mediterranean climates.
é Consideration must also be given to the weather conditions (e.g. whether warm and dry, or cold and wet) at pollination, fertilization, flowering and fruit-set. Pollination and fertilization are best when the weather is dry and warm. Cold and wet weather during flowering can give rise to poor fruit-set. Warm weather at fruit-set will give good yields while cold wet weather will give poorer yields. Yield is also influenced by the amount of photosynthate produced by the tree, which is proportional to the number of leaves. Because olive trees are generally biennial bearing, consider the average yield over a 3-year or 4-year period.

37
VINEYARDS | OLIVE ORCHARDS | ORCHARDS | WHEAT | MAIZE | ANNUAL CROPS | PASTURE
PLATE 19 How to score yield
GOOD CONDITION VS = 2Average yield is >0.5 kg of olives/m3 of mature trees (10–15 years old).
MODERATE CONDITION VS = 1Average yield is 0.3–0.5 kg of olives/m3 of mature trees (10–15 years old).
POOR CONDITION VS = 0Average yield is <0.3 kg of olives/m3 of mature trees (10–15 years old).

38
VISUAL SOIL ASSESSMENTva
riab
ility
of t
ree
perf
orm
ance
alo
ng th
e ro
w
AssessmentC
ImportanceIVARIABILITY OF TREE PERFORMANCE ALONG THE ROW is a good visual indicator of the properties and condition of the soil (Plates 20 and 21). In particular, the linear variability in tree performance is often related to the availability of water and nutrients, and the texture of the soil (e.g. whether clayey, silty, loamy, sandy or gravelly). Moreover, soils in good condition with good structure and porosity, and with a deep, well-aerated root zone, enable the unrestricted movement of air and water into and through the soil, the development and proliferation of superficial (feeder) roots, and unrestricted respiration and transpiration. Furthermore, soils with good organic-matter levels and soil life (including mycorrhiza) show an active biological and chemical process, favouring the release and uptake of water and nutrients and, consequently, the growth and vigour of the tree.
The spatial variability of tree performance along the row is also a useful indicator because it highlights those trees that are underperforming compared with the majority, enabling a specific investigation as to why those are struggling and what remedial action may be taken.
å Cast your eye along the rows and observe any variability in tree performance (in terms of tree height, trunk thickness, canopy volume, canopy density, leaf colour, etc.) and compare with the class limits in Table 5. In making the assessment, consideration must be given to the variety, pruning and age of the olive tree.
TABLE 5 Visual scores for variability of tree performance along the row
Visual score(VS)
Variability in tree performance along the row
2[Good]
Tree performance is good and even along the row
1[Moderate]
Tree performance is moderately variable along the row
0[Poor]
Tree performance is extremely variable along the row

39
VINEYARDS | OLIVE ORCHARDS | ORCHARDS | WHEAT | MAIZE | ANNUAL CROPS | PASTURE
PLATE 20 Effect of soil texture and available water on tree performance along the row [M. GREVEN]
Variable tree performance along the row owing to differences in soil texture and water-holding capacity. Poor-performing trees occur on gravelly (droughty) soils, while well-performing trees are situated on deeper siltier soils (in the background).
PLATE 21 Effect of soil aeration and drainage on tree performance along the row
Variable tree performance along the row in a four-year-old orchard owing to differences in the aeration and wetness status of the root zone. Poor-performing trees occur in the hollows with a shallow water table, while healthier trees are situated on the humps with a deeper, better-aerated root zone owing to a deeper water table.

40
VISUAL SOIL ASSESSMENT
Soil management in olive orchards
Olive trees with satisfactory production develop shoot of optimal length, promote flower-bud induction, give good percentage fruiting, and stimulate fruit development. Therefore, it is essential to maintain the availability of water, nutrients and carbohydrate during the crop cycle, avoiding any shortages.
Good soil management practices are needed in order to maintain good growth conditions and productivity to safeguard olive tree functionality especially during the crucial periods of plant development and fructification. To achieve this, management practices need to maintain and promote the condition and, therefore, functionality of the soil, particularly in regard to its aeration status and the supply of nutrients and water to the plant. To this end, the soil needs to have a good rooting environment, including an adequate soil structure to allow an effective root system to develop in order to maximize the utilization of water and nutrients, and to provide sufficient anchorage for the plant. Good soil structure also promotes infiltration and movement of water into and through the soil, so minimizing surface ponding, runoff and soil erosion. The maintenance of good soil health through the implementation of sound management practices further safeguards the environment and minimizes the ecological footprint of olive orchards on a region. A decline in soil quality through soil tillage, compaction, increased fertilizer and chemical inputs, and the loss of soil through erosion contribute to the food eco-footprint of a region and the country.
Where rainfall is not a limiting factor for plant growth, the establishment of cover crops is the most suitable soil management practice to protect the soil surface from erosion, to preserve the environment, to reduce production costs and to enhance the quality of the olive oil. Cover cropping not only helps in reducing water runoff and soil erosion, but it also improves the soil physical characteristics, enriches soil organic matter content, and suppresses soil-borne diseases by increasing micro-organism biodiversity. On the other hand, cover crops compete with olive trees for minerals, water and fertilizer where they are not well managed. In the absence of irrigation in the hottest months in those regions characterized by dry summers, competition for water could occur during flowering, fruit formation and development, so limiting the final yield. To avoid this competition, a temporary cover crop or natural vegetation can be grown during the wetter months and can be controlled during the hottest period by herbicide application or mowing 2–3 times during the period of major nutrient demand.
Different mixes of cover crops, including leguminous species that supply N, should be evaluated in different areas. In addition to legumes, the mix could comprise annual or perennial species, grasses and other broadleaf plants. Winter annuals can be grown to protect the soil from erosion in winter and to improve the ability of the soil to resist compaction when wet. Grasses, with their fibrous root system, are also more effective at improving soil structure, and generally add more organic matter to the soil than do legumes. If allowed to seed in early summer, a seed bank for subsequent regeneration is built up. Where possible, the grass in the interrows and within rows could be kept short by grazing sheep, provided the tree trunks

41
VINEYARDS | OLIVE ORCHARDS | ORCHARDS | WHEAT | MAIZE | ANNUAL CROPS | PASTURE
have protective plastic screens to shield them from strip and ring barking. The advantages of managing a grass cover crop using sheep compared with mowing and herbicide strips include: reduced use of synthetic (herbicide) chemicals, reduced fossil fuel usage, lower CO
2
emissions and, therefore, greater market acceptance. Other advantages include: lower labour and material costs; less compaction along wheel traffic lanes; and improved soil nutrient status and greater soil life (including earthworm numbers) as a result of the dung and urine applied. Stock tend to rest, urinate and defecate most within the tree row, translocating and concentrating nutrients to where the tree roots are greatest. Sheep can also graze grass very short, thereby reducing not only the competition for water and nutrients but also reducing insect and bird numbers and the possibility of fungal diseases.
The traditional management of the interrow is based on one or two cultivations with discs and tine harrows during the hot period following natural weed cover and could be satisfactory in limiting, principally, competition for water. The cultivation should be shallower than 100 mm in order to de-vigorate the cover crop but not to modify the canopy/root ratio of the trees by damaging the root system. The cultivation operations can also be useful for incorporating organic and mineral fertilizers as well as controlling diseases caused by fungi and bacteria in the soil.

42
VISUAL SOIL ASSESSMENT
References
Shepherd, T. G., Stagnari, F., Pisante, M. and Benites, J. 2008. Visual Soil Assessment – Field guide for olive orchards. FAO, Rome, Italy.

VISUAL SOIL ASSESSMENT
OliveOrchards
FI
EL
D
GU
ID
E9 7 8 9 2 5 1 0 5 9 4 1 8
TC/D/I0007E/1/02.08/1000
ISBN 978-92-5-105941-8
The present publication on Visual Soil Assessment is a practicalguide to carry out a quantitative soil analysis with reproduceable resultsusing only very simple tools. Besides soil parameters, also crop parametersfor assessing soil conditions are presented for some selected crops. TheVisual Soil Assessment manuals consist of a series of separate booklets forspecific crop groups, collected in a binder. The publication addressesscientists as well as field technicians and even farmers who want to analysetheir soil condition and observe changes over time.

VISUAL SOIL ASSESSMENT
Orchards
FI
EL
D
GU
ID
E
9 7 8 9 2 5 1 0 5 9 4 1 8
TC/D/I0007E/1/02.08/1000
ISBN 978-92-5-105941-8
The present publication on Visual Soil Assessment is a practicalguide to carry out a quantitative soil analysis with reproduceable resultsusing only very simple tools. Besides soil parameters, also crop parametersfor assessing soil conditions are presented for some selected crops. TheVisual Soil Assessment manuals consist of a series of separate booklets forspecific crop groups, collected in a binder. The publication addressesscientists as well as field technicians and even farmers who want to analysetheir soil condition and observe changes over time.

VISUAL SOIL ASSESSMENT
Orchards
FI
EL
D
GU
ID
E
Food and Agriculture Organization of the United NationsRome, 2008
Graham Shepherd, soil scientist,BioAgriNomics.com, New Zealand
Fabio Stagnari, assistant researcher,University of Teramo, Italy
Michele Pisante, professor,University of Teramo, Italy
José Benites, technical officer,Land and Water Development Division, FAO

Contents
The designations employed and the presentation of material in this informationproduct do not imply the expression of any opinion whatsoever on the partof the Food and Agriculture Organization of the United Nations (FAO) concerning thelegal or development status of any country, territory, city or area or of its authorities,or concerning the delimitation of its frontiers or boundaries. The mention of speciccompanies or products of manufacturers, whether or not these have been patented, doesnot imply that these have been endorsed or recommended by FAO in preference toothers of a similar nature that are not mentioned.
ISBN 978-92-5-105939-5
All rights reserved. Reproduction and dissemination of material in this informationproduct for educational or other non-commercial purposes are authorized withoutany prior written permission from the copyright holders provided the source is fullyacknowledged. Reproduction of material in this information product for resale or othercommercial purposes is prohibited without written permission of the copyright holders.Applications for such permission should be addressed to:ChiefElectronic Publishing Policy and Support BranchCommunication DivisionFAOViale delle Terme di Caracalla, 00153 Rome, Italyor by e-mail to:[email protected]
© FAO 2008

iii
VINEYARDS | OLIVE ORCHARDS | ORCHARDS | WHEAT | MAIZE | ANNUAL CROPS | PASTURE
Acknowledgements v
List of acronyms v
Visual Soil Assessment vi
SOIL TEXTURE 2
SOIL STRUCTURE 4
SOIL POROSITY 6
SOIL COLOUR 8
NUMBER AND COLOUR OF SOIL MOTTLES 10
EARTHWORMS 12
POTENTIAL ROOTING DEPTH 14Identifying the presence of a hardpan 16
SURFACE PONDING 18
SURFACE CRUSTING AND SURFACE COVER 20
SOIL EROSION 22
SOIL MANAGEMENT IN ORCHARDS 24
Contents

iv
VISUAL SOIL ASSESSMENT
1. How to score soil texture 32. Visual scores for earthworms 133. Visual scores for potential rooting depth 154. Visual scores for surface ponding 19
Acknowledgements
List of acronyms
List of tables
List of figures
1. Soil scorecard – visual indicators for assessing soil quality in orchards 12. Soil texture classes and groups 3
1. The VSA tool kit vii2. How to score soil structure 53. How to score soil porosity 74. How to score soil colour 95. How to score soil mottles 116. Sample for assessing earthworms 137. Generic drawing of the root system of a tree 158. Using a knife to determine the presence or absence of a hardpan 169. Identifying the presence of a hardpan 1710. Surface ponding in an orchard 1911. How to score surface crusting and sufrace cover 2112. How to score soil erosion 23
List of plates

v
VINEYARDS | OLIVE ORCHARDS | ORCHARDS | WHEAT | MAIZE | ANNUAL CROPS | PASTURE
This publication is adapted from the methodology developed in: Shepherd, T.G. 2008. Visual Soil Assessment. Volume 1. Field guide for pastoral grazing and cropping on flat to rolling country. 2nd edition. Palmerston North, New Zealand, Horizons Regional Council. 106 pp.
This publication is funded by FAO in collaboration with the Agronomy and Crop Science Research and Education Center of the University of Teramo.
Acknowledgements
List of acronyms
AEC Adenylate energy charge
Al Aluminium
ATP Adenosine triphosphate
B Boron
Ca Calcium
Cu Copper
Fe Iron
K Potassium
Mg Magnesium
Mn Manganese
Mo Molybdenum
N Nitrogen
P Phosphorus
RSG Restricted spring growth
S Sulphur
VS Visual score
VSA Visual Soil Assessment
Zn Zinc

vi
VISUAL SOIL ASSESSMENT
IntroductionThe maintenance of good soil quality is vital for the environmental and economic sustainability of orchards. A decline in soil quality can have a marked impact on tree growth, yield, fruit quality and the operation and running of the orchard. A decline in soil physical properties in particular can take considerable time and cost to correct. Safeguarding soil resources for future generations is an important task for land managers.
Often, not enough attention is given to:< the basic role of soil quality in efficient and sustained production;< the effect of the condition of the soil on the gross profit margin;< the long-term planning needed to sustain good soil quality;< the effect of land management decisions on soil quality.
Soil type and the effect of management on the condition of the soil are important determinants of the production performance of orchards and have profound effects on long-term profits. Land managers need tools that are reliable, quick and easy to use in order to help them assess the condition of their soils and their suitability for growing orchard crops, and to make informed decisions that will lead to sustainable land and environmental management. To this end, Visual Soil Assessment (VSA) provides a quick and simple method to assess soil condition and plant performance. The VSA method can also be used to assess the suitability and limitations of a soil for pipfruit, stonefruit and vine crops. Soils with good VSA scores will usually give the best production with the lowest establishment and operational costs.
The VSA methodVisual Soil Assessment is based on the visual assessment of key soil ‘state’ indicators of soil quality, presented on a scorecard. With the exception of soil texture, the soil indicators are dynamic indicators, i.e. capable of changing under different management regimes and land-use pressures. Being sensitive to change, they are useful early warning indicators of changes in soil condition and as such provide an effective monitoring tool.
Visual scoringEach indicator is given a visual score (VS) of 0 (poor), 1 (moderate), or 2 (good), based on the soil quality observed when comparing the soil sample with three photographs in the field guide manual. The scoring is flexible, so if the sample you are assessing does not align clearly with any one of the photographs but sits between two, an in-between score can be given, i.e. 0.5 or 1.5. Because some soil indicators are relatively more important for soil quality than others, VSA provides a weighting factor of 1, 2, and 3. The total of the VS rankings gives the overall Soil Quality Index score for the sample you are evaluating. Compare this with the rating scale at the bottom of the scorecard to determine whether your soil is in good, moderate or poor condition.
Visual Soil Assessment

vii
VINEYARDS | OLIVE ORCHARDS | ORCHARDS | WHEAT | MAIZE | ANNUAL CROPS | PASTURE
The VSA tool kitThe VSA tool kit (Plate 1) comprises:< a spade – to dig a soil pit and to take a
200-mm cube of soil for the drop shatter soil structure test;
< a plastic basin (about 450 mm long x 350 mm wide x 250 mm deep) – to contain the soil during the drop shatter test;
< a hard square board (about 260x260x20 mm) – to fit in the bottom of the plastic basin on to which the soil cube is dropped for the shatter test;
< a heavy-duty plastic bag (about 750x 500 mm) – on which to spread the soil, after the drop shatter test has been carried out;
< a knife (preferably 200 mm long) to investigate the soil pit and potential rooting depth;
< a water bottle – to assess the field soil textural class;< a tape measure – to measure the potential rooting depth;< a VSA field guide – to make the photographic comparisons;< a pad of scorecards – to record the VS for each indicator.
The procedureWhen it should be carried outThe test should be carried out when the soils are moist and suitable for cultivation. If you are not sure, apply the ‘worm test’. Roll a worm of soil on the palm of one hand with the fingers of the other until it is 50 mm long and 4 mm thick. If the soil cracks before the worm is made, or if you cannot form a worm (for example, if the soil is sandy), the soil is suitable for testing. If you can make the worm, the soil is too wet to test.
Setting up
TimeAllow 25 minutes per site. For a representative assessment of soil quality, sample 4 sites over a 5-ha area.
Reference sampleTake a small sample of soil (about 100x50x150 mm deep) from under a nearby fence or a similar protected area. This provides an undisturbed sample required in order to assign the correct score for the soil colour indicator. The sample also provides a reference point for comparing soil structure and porosity.
PLATE 1 The VSA tool kit

viii
VISUAL SOIL ASSESSMENT
SitesSelect sites that are representative of the field. The condition of the soil in orchards is site specific. Sample sites that have had little or no wheel traffic (e.g. near the tree). The VSA method can also be used to assess compacted areas by selecting to sample along wheel traffic lanes. Always record the position of the sites for future monitoring if required. Note that the VSA can be used to assess the suitability of a soil for growing pipfruit and stonefruit trees and vine crops before the orchard is established.
Site information
Complete the site information section at the top of the scorecard. Then record any special aspects you think relevant in the notes section at the bottom of the plant indicator scorecard.
Carrying out the test
Initial observationDig a small hole about 200x200 mm square by 300 mm deep with a spade and observe the topsoil (and upper subsoil if present) in terms of its uniformity, including whether it is soft and friable or hard and firm. A knife is useful to help you assess this.
Take the test sampleIf the topsoil appears uniform, dig out a 200-mm cube with the spade.You can sample whatever depth of soil you wish, but ensure that you sample the equivalent of a 200-mm cube of soil. If for example, the top 100 mm of the soil is compacted and you wish to assess its condition, dig out two samples of 200x200x100 mm with a spade. If the 100–200-mm depth is dominated by a tillage pan and you wish to assess its condition, remove the top 100 mm of soil and dig out two samples of 200x200x100 mm. Note that taking a 200-mm cube sample below the topsoil can also give valuable information about the condition of the subsoil and its implications for plant growth and farm management practices.
The drop shatter testDrop the test sample a maximum of three times from a height of 1 m onto the wooden square in the plastic basin. The number of times the sample is dropped and the height it is dropped from, is dependent on the texture of the soil and the degree to which the soil breaks up, as described in the section on soil structure.
Systematically work through the scorecard, assigning a VS to each indicator by comparing it with the photographs (or table) and description reported in the field guide.
Format of the bookletThe soil scorecard is given on Figure 1 and lists the ten key soil ‘state’ indicators required in order to assess soil quality. Each indicator is described on the following pages, with a section on how to assess the indicator and an explanation of its importance and what it reveals about the condition of the soil.

1
VINEYARDS | OLIVE ORCHARDS | ORCHARDS | WHEAT | MAIZE | ANNUAL CROPS | PASTURE
��������������������������������
���������������������������������������������������������������������������
��������� ����������
������������ ���
�������������� ���
������������� ���
����������� ���
��������������������������������� ���
���
���
��������������� ���
���������������������������������� ���
������������������������� ���
���������������������������������������
����������������������� ������������������
���� ����
�������� �����
���� ����
�����������������������������������������������������������������������������������
����������� ���������
��������������� ��������
�������������� �����
����������
���������������
���������������������
��������������������������� ������ ������ ������ ������� �����
�������������������� ���� ��������������� ������ ����������� ���
����������������������������� ���� ���� ����� ����� �������
�������������������� � �� ����������� � �
������������������������� � ��
�����
�����
�����
�����
������
������
������
������
������
������

2
VISUAL SOIL ASSESSMENTso
il te
xtur
e
Assessment
å Take a small sample of soil (half the size of your thumb) from the topsoil and a sample (or samples) that is (or are) representative of the subsoil.
ç Wet the soil with water, kneading and working it thoroughly on the palm of your hand with your thumb and forefinger to the point of maximum stickiness.
é Assess the texture of the soil according to the criteria given in Table 1 by attempting to mould the soil into a ball.
With experience, a person can assess the texture directly by estimating the percentages of sand, silt and clay by feel, and the textural class obtained by reference to the textural diagram (Figure 2).
There are occasions when the assignment of a textural score will need to be modified because of the nature of a textural qualifier. For example, if the soil has a reasonably high content of organic matter, i.e. is humic with 15–30 percent organic matter, raise the textural score by one (e.g. from 0 to 1 or from 1 to 2). If the soil has a significant gravelly or stony component, reduce the textural score by 0.5.
There are also occasions when the assignment of a textural score will need to be modified because of the specific preference of a crop for a particular textural class. For example, asparagus prefers a soil with a sandy loam texture and so the textural score is raised by 0.5 from a score of 1 to 1.5 based on the specific textural preference of the plant.
C
ImportanceISOIL TEXTURE defines the size of the mineral particles. Specifically, it refers to the relative proportion of the various size-groups in the soil, i.e. sand, silt and clay. Sand is that fraction that has a particle size >0.06 mm; silt varies between 0.06 and 0.002 mm; and the particle size of clay is <0.002 mm. Texture influences soil behaviour in several ways, notably through its effect on: water retention and availability; soil structure; aeration; drainage; soil trafficability; soil life; and the supply and retention of nutrients.
A knowledge of both the textural class and potential rooting depth enables an approximate assessment of the total water-holding capacity of the soil, one of the major drivers of crop production.

3
VINEYARDS | OLIVE ORCHARDS | ORCHARDS | WHEAT | MAIZE | ANNUAL CROPS | PASTURE
FIGURE 2 Soil texture classes and groups
Textural classes.
Textural groups.
TABLE 1 How to score soil texture
Visual score(VS)
Textural class Description
2[Good]
Silt loamSmooth soapy feel, slightly sticky, no grittiness. Moulds into a cohesive ball that fissures when pressed flat.
1.5[Moderately good]
Clay loamVery smooth, sticky and plastic. Moulds into a cohesive ball that deforms without fissuring.
1[Moderate]
Sandy loam Slightly gritty, faint rasping sound. Moulds into a cohesive ball that fissures when pressed flat.
0.5[Moderately poor]
Loamy sandSilty clay
Clay
Loamy sand: Gritty and rasping sound. Will almost mould into a ball but disintegrates when pressed flat.Silty clay, clay: Very smooth, very sticky, very plastic. Moulds into a cohesive ball that deforms without fissuring.
0[Poor]
SandGritty and rasping sound. Cannot be moulded into a ball.

4
VISUAL SOIL ASSESSMENTso
il st
ruct
ure
AssessmentC
ImportanceI
å Remove a 200-mm cube of topsoil with a spade (between or along wheel tracks).ç Drop the soil sample a maximum of three times from a height of 1 m onto the firm base
in the plastic basin. If large clods break away after the first or second drop, drop them individually again once or twice. If a clod shatters into small (primary structural) units after the first or second drop, it does not need dropping again. Do not drop any piece of soil more than three times. For soils with a sandy loam texture (Table 1), drop the cube of soil just once only from a height of 0.5 m.
é Transfer the soil onto the large plastic bag.è For soils with a loamy sand or sand texture, drop the cube of soil still sitting on the spade (once)
from a height of just 50 mm, and then roll the spade over, spilling the soil onto the plastic bag.ê Applying only very gently pressure, attempt to part each clod by hand along any exposed
cracks or fissures. If the clod does not part easily, do not apply further pressure (because the cracks and fissures are probably not continuous and, therefore, are unable to readily conduct oxygen, air and water).
ë Move the coarsest fractions to one end and the finest to the other end. Arrange the distribution of aggregates on the plastic bag so that the height of the soil is roughly the same over the whole surface area of the bag. This provides a measure of the aggregate-size distribution. Compare the resulting distribution of aggregates with the three photographs in Plate 2 and the criteria given.The method is valid for a wide range of moisture conditions but is best carried out when the soil is moist to slightly moist; avoid dry and wet conditions.
SOIL STRUCTURE is extremely important for orchards. It regulates:< soil aeration and gaseous exchange rates;< soil temperature;< soil infiltration and erosion;< the movement and storage of water;< nutrient supply;< root penetration and development;< soil workability;< soil trafficability;< the resistance of soils to structural degradation.
Good soil structure reduces the susceptibility to compaction under wheel traffic and increases the window of opportunity for vehicle access and for carrying out no-till, minimum-till or conventional cultivation between rows under optimal soil conditions.
Soil structure is ranked on the size, shape, firmness, porosity and relative abundance of soil aggregates and clods. Soils with good structure have friable, fine, porous, subangular and subrounded (nutty) aggregates. Those with poor structure have large, dense, very firm, angular or subangular blocky clods that fit and pack closely together and have a high tensile strength.

5
VINEYARDS | OLIVE ORCHARDS | ORCHARDS | WHEAT | MAIZE | ANNUAL CROPS | PASTURE
PLATE 2 How to score soil structure
GOOD CONDITION VS = 2Soil dominated by friable, fineaggregates with no significant clodding.Aggregates are generally subrounded(nutty) and often quite porous.
MODERATE CONDITION VS = 1Soil contains significant proportions(50%) of both coarse clods and friablefine aggregates. The coarse clods arefirm, subangular or angular in shape andhave few or no pores.
POOR CONDITION VS = 0Soil dominated by coarse clodswith very few finer aggregates. Thecoarse clods are very firm, angular orsubangular in shape and have very fewor no pores.

6
VISUAL SOIL ASSESSMENTso
il po
rosi
ty
AssessmentC
ImportanceI
å Remove a spade slice of soil (about 100 mm wide, 150 mm long and 200 mm deep) from the side of the hole and break it in half.
ç Examine the exposed fresh face of the sample for soil porosity by comparing against the three photographs in Plate 3. Look for the spaces, gaps, holes, cracks and fissures between and within soil aggregates and clods.
é Examine also the porosity of a number of the large clods from the soil structure test. This provides important additional information as to the porosity of the individual clods (the intra-aggregate porosity).
It is important to assess SOIL POROSITY along with the structure of the soil. Soil porosity, and particularly macroporosity (or large pores), influences the movement of air and water in the soil. Soils with good structure have a high porosity between and within aggregates, but soils with poor structure may not have macropores and coarse micropores within the large clods, restricting their drainage and aeration.
Poor aeration leads to the build up of carbon dioxide, methane and sulphide gases, and reduces the ability of plants to take up water and nutrients, particularly nitrogen (N), phosphorus (P), potassium (K) and sulphur (S). Plants can only utilize S and N in the oxygenated sulphate (SO
42-), nitrate (NO
3-) and ammonium (NH
4+) forms. Therefore,
plants require aerated soils for the efficient uptake and utilization of S and N. The number, activity and biodiversity of micro-organisms and earthworms are also greatest in well-aerated soils and they are able to decompose and cycle organic matter and nutrients more efficiently.
The presence of soil pores enables the development and proliferation of the superficial (or feeder) roots throughout the soil. Roots are unable to penetrate and grow through firm, tight, compacted soils, severely restricting the ability of the plant to utilize the available water and nutrients in the soil. A high penetration resistance not only limits plant uptake of water and nutrients, it also reduces fertilizer efficiency considerably and increases the susceptibility of the plant to root diseases.
Soils with good porosity will also tend to produce lower amounts of greenhouse gases. The greater the porosity, the better the drainage, and, therefore, the less likely it is that the soil pores will be water-filled to the critical levels required to accelerate the production of greenhouse gases. Aim to keep the soil porosity score above 1.

7
VINEYARDS | OLIVE ORCHARDS | ORCHARDS | WHEAT | MAIZE | ANNUAL CROPS | PASTURE
PLATE 3 How to score soil porosity
GOOD CONDITION VS = 2Soils have many macropores and coarsemicropores between and within aggregatesassociated with good soil structure.
MODERATE CONDITION VS = 1Soil macropores and coarse microporesbetween and within aggregates have declinedsignificantly but are present on closeexamination in parts of the soil. The soil showsa moderate amount of consolidation.
POOR CONDITION VS = 0No soil macropores and coarse microporesare visually apparent within compact,massive structureless clods. The clodsurface is smooth with few or no cracks orholes, and can have sharp angles.

8
VISUAL SOIL ASSESSMENTso
il co
lour AssessmentC
ImportanceI
å Compare the colour of a handful of soil from the field site with soil taken from under the nearest fenceline or a similar protected area.
ç Using the three photographs given (Plate 4), compare the relative change in soil colour that has occurred.
As topsoil colour can vary markedly between soil types, the photographs illustrate the degree of change in colour rather than the absolute colour of the soil.
SOIL COLOUR is a very useful indicator of soil quality because it can provide an indirect measure of other more useful properties of the soil that are not assessed so easily and accurately. In general, the darker the colour is, the greater is the amount of organic matter in the soil. A change in colour can give a general indication of a change in organic matter under a particular land use or management. Soil organic matter plays an important role in regulating most biological, chemical and physical processes in soil, which collectively determine soil health. It promotes infiltration and retention of water, helps to develop and stabilize soil structure, cushions the impact of wheel traffic and cultivators, reduces the potential for wind and water erosion, and maintains the soil carbon ‘sink’. Organic matter also provides an important food resource for soil organisms and is an important source of, and major reservoir of, plant nutrients. Its decline reduces the fertility and nutrient-supplying potential of the soil; N, P, K and S requirements of trees increase markedly, and other major and minor elements are leached more readily. The result is an increased dependency on fertilizer input to maintain nutrient status.
Soil colour can also be a useful indicator of soil drainage and the degree of soil aeration. In addition to organic matter, soil colour is influenced markedly by the chemical form (or oxidation state) of iron (Fe) and manganese (Mn). Brown, yellow-brown, reddish-brown and red soils without mottles indicate well-aerated, well-drained conditions where Fe and Mn occur in the oxidized form of ferric (Fe3+) and manganic (Mn3+) oxides. Grey-blue colours can indicate that the soil is poorly drained or waterlogged and poorly aerated for long periods, conditions that reduce Fe and Mn to ferrous (Fe2+) and manganous (Mn2+) oxides. Poor aeration and prolonged waterlogging give rise to a further series of chemical and biochemical reduction reactions that produce toxins, such as hydrogen sulphide, methane and ethanol that damage the root system. This reduces the ability of plants to take up water and nutrients, causing poor vigour and ill-thrift. Decay and dieback of roots can also occur as a result of fungal diseases such as Phytophthora root and crown rot in soils prone to waterlogging. Trees exhibit reduced growth, have thin canopies, and eventually die.

9
VINEYARDS | OLIVE ORCHARDS | ORCHARDS | WHEAT | MAIZE | ANNUAL CROPS | PASTURE
PLATE 4 How to score soil colour
GOOD CONDITION VS = 2Dark coloured topsoil that is not toodissimilar to that under the fenceline.
MODERATE CONDITION VS = 1The colour of the topsoil is somewhatpaler than that under the fenceline, butnot markedly so.
POOR CONDITION VS = 0Soil colour has become significantly palercompared with that under the fenceline.

10
VISUAL SOIL ASSESSMENTnu
mbe
r an
d co
lour
of s
oil m
ottl
es AssessmentC
ImportanceI
å Take a sample of soil (about 100 mm wide × 150 mm long × 200 mm deep) from the side of the hole and compare with the three photographs (Plate 5) and the percentage chart to determine the percentage of the soil occupied by mottles.
Mottles are spots or blotches of different colour interspersed with the dominant soil colour.
The NUMBER AND COLOUR OF SOIL MOTTLES provide a good indication of how well the soil is drained and how well it is aerated. They are also an early warning of a decline in soil structure caused by compaction under wheel traffic and overcultivation. The loss of soil structure decreases and blocks the number of channels and pores that conduct water and air and, as a consequence, can result in waterlogging and a deficiency of oxygen for a prolonged period. The development of anaerobic (deoxygenated) conditions reduces Fe and Mn from their brown/orange oxidized ferric (Fe3+) and manganic (Mn3+) form to grey ferrous (Fe2+) and manganous (Mn2+) oxides. Mottles develop as various shades of orange and grey owing to varying degrees of oxidation and reduction of Fe and Mn. As oxygen depletion increases, orange, and ultimately grey, mottles predominate. An abundance of grey mottles indicates the soil is poorly drained and poorly aerated for a significant part of the year. The presence of only common orange and grey mottles (10–25 percent) indicates the soil is imperfectly drained with only periodic waterlogging. Soil with only few to common orange mottles indicates the soil is moderately well drained, and the absence of mottles indicates good drainage.
Poor aeration reduces the uptake of water by plants and can induce wilting. It can also reduce the uptake of plant nutrients, particularly N, P, K and S. Moreover, poor aeration retards the breakdown of organic residues, and can cause chemical and biochemical reduction reactions that produce sulphide gases, methane, ethanol, acetaldehyde and ethylene, which are toxic to plant roots. In addition, decay and dieback of roots can occur as a result of fungal diseases such as Phytophthora root and crown rot in soils that are strongly mottled and poorly aerated. Fungal diseases and reduced nutrient and water uptake give rise to poor plant vigour and ill-thrift. Trees exhibit reduced growth, have thin canopies, and can eventually die. If your visual score for mottles is ≤1, you need to aerate the soil.

11
VINEYARDS | OLIVE ORCHARDS | ORCHARDS | WHEAT | MAIZE | ANNUAL CROPS | PASTURE
PLATE 5 How to score soil mottles
GOOD CONDITION VS = 2Mottles are generally absent.
MODERATE CONDITION VS = 1Soil has common (10–25%) fine andmedium orange and grey mottles.
POOR CONDITION VS = 0Soil has abundant to profuse (> 50%)medium and coarse orange and particularlygrey mottles.

12
VISUAL SOIL ASSESSMENTea
rthw
orm
s
AssessmentC
ImportanceI
å Count the earthworms by hand, sorting through the soil sample used to assess soil structure (Plate 6) and compare with the class limits in Table 2. Earthworms vary in size and number depending on the species and the season. Therefore, for year-to-year comparisons, earthworm counts must be made at the same time of year when soil moisture and temperature levels are good. Earthworm numbers are reported as the number per 200-mm cube of soil. Earthworm numbers are commonly reported on a square-metre basis. A 200-mm cube sample is equivalent to 1/25 m2, and so the number of earthworms needs to be multiplied by 25 to convert to numbers per square metre.
EARTHWORMS provide a good indicator of the biological health and condition of the soil because their population density and species are affected by soil properties and management practices. Through their burrowing, feeding, digestion and casting, earthworms have a major effect on the chemical, physical and biological properties of the soil. They shred and decompose plant residues, converting them to organic matter, and so releasing mineral nutrients. Compared with uningested soil, earthworm casts can contain 5 times as much plant available N, 3–7 times as much P, 11 times as much K, and 3 times as much Mg. They can also contain more Ca and plant-available Mo, and have a higher pH, organic matter and water content. Moreover, earthworms act as biological aerators and physical conditioners of the soil, improving:< soil porosity;< aeration;< soil structure and the stability of soil aggregates;< water retention;< water infiltration;< drainage.
They also reduce surface runoff and erosion. They further promote plant growth by secreting plant-growth hormones and increasing root density and root development by the rapid growth of roots down nutrient-enriched worm channels. While earthworms can deposit about 25–30 tonnes of casts/ha/year on the surface, 70 percent of their casts are deposited below the surface of the soil. Therefore, earthworms play an important role in orchards and can increase growth rates and production significantly.
Earthworms also increase the population, activity and diversity of soil microbes. Actinomycetes increase 6–7 times during the passage of soil through the digestive tract of the worm and, along with other microbes, play an important role in the decomposition of organic matter to humus. Soil microbes such as mycorrhizal fungi play a further role in

13
VINEYARDS | OLIVE ORCHARDS | ORCHARDS | WHEAT | MAIZE | ANNUAL CROPS | PASTURE
the supply of nutrients, digesting soil and fertilizer and unlocking nutrients, such as P, that are fixed by the soil. Microbes also retain significant amounts of nutrients in their biomass, releasing them when they die. Moreover, soil microbes produce plant-growth hormones and compounds that stimulate root growth and promote the structure, aeration, infiltration and water-holding capacity of the soil. Micro-organisms further encourage a lower incidence of pests and diseases. The collective benefits of microbes reduce fertilizer requirements and improve the health of the trees and fruit production.
Earthworm numbers (and biomass) are governed by the amount of food available as organic matter and soil microbes, as determined by the amount and quality of surface residue, the use of cover crops including legumes, and the cultivation of interrows. Earthworm populations can be up to three times higher in undisturbed soils compared with cultivated soils. Earthworm numbers are also governed by: soil moisture, temperature, texture, soil aeration, pH, soil nutrients (including levels of Ca), and the type and amount of fertilizer and N used. The overuse of acidifying salt-based fertilizers, anhydrous ammonia and ammonia-based products, and some insecticides and fungicides can further reduce earthworm numbers.
Soils should have a good diversity of earthworm species with a combination of:(i) surface feeders that live at or near the surface to breakdown plant residues and dung;(ii) topsoil-dwelling species that burrow, ingest and mix the top 200–300 mm of soil; and(iii) deep-burrowing species that pull down and mix plant litter and organic matter at depth.
PLATE 6 Sample for assessing earthworms
TABLE 2 Visual scores for earthworms
Visual score(VS)
Earthworm numbers(per 200-mm cube of soil)
2[Good]
> 30 (with preferably 3 or more species)
1[Moderate]
15–30 (with preferably 2 or more species)
0[Poor]
< 15 (with predominantly 1 species)

14
VISUAL SOIL ASSESSMENTpo
tent
ial r
ooti
ng d
epth
AssessmentC
ImportanceI
å Dig a hole to identify the depth to a limiting (restricting) layer where present (Plate 7), and compare with the class limits in Table 3. As the hole is being dug, note the presence of roots and old root channels, worm channels, cracks and fissures down which roots can extend. Note also the firmness and tightness of the soil, whether the soil is grey and strongly gleyed owing to prolonged waterlogging, and whether there is a hardpan present such as a human-induced tillage or plough pan, or a natural pan such as an iron, siliceous or calcitic pan (pp 16–17). An abrupt transition from a fine (heavy) material to a coarse (sandy/gravelly) layer will also limit root development. A rough estimate of the potential rooting depth may be made by noting the above properties in a nearby road cutting, gully, slip, earth slump or an open drain.
The POTENTIAL ROOTING DEPTH is the depth of soil that plant roots can potentially exploit before reaching a barrier to root growth, and it indicates the ability of the soil to provide a suitable rooting medium for plants. The greater is the rooting depth, the greater is the available-water-holding capacity of the soil. In drought periods, deep roots can access larger water reserves, thereby alleviating water stress and promoting the survival of non-irrigated orchards. The exploration of a large volume of soil by deep roots means that they can also access more macronutrients and micronutrients, thereby accelerating the growth and enhancing the yield and quality of the fruit. Conversely, soils with a restricted rooting depth caused by, for example, a layer with a high penetration resistance such as a compacted layer or a hardpan, restrict vertical root growth and development, causing roots to grow sideways. This limits plant uptake of water and nutrients, reduces fertilizer efficiency, increases leaching, and decreases yield. A high resistance to root penetration can also increase plant stress and the susceptibility of the plant to root diseases. Moreover, hardpans impede the movement of air, oxygen and water through the soil profile, the last increasing the susceptibility to waterlogging and erosion by rilling and sheet wash.
The potential rooting depth can be restricted further by:< an abrupt textural change;< pH;< aluminium (Al) toxicity;< nutrient deficiencies;< salinity;< sodicity;< a high or fluctuating water table;< low oxygen levels.

15
VINEYARDS | OLIVE ORCHARDS | ORCHARDS | WHEAT | MAIZE | ANNUAL CROPS | PASTURE
Anaerobic (anoxic) conditions caused by deoxygenation and prolonged waterlogging restrict the rooting depth as a result of the accumulation of toxic levels of hydrogen sulphide, ferrous sulphide, carbon dioxide, methane,
ethanol, acetaldehyde and ethylene, by-products of
chemical and biochemical reduction reactions.
Trees with a deep, dense vigorous root system raise soil organic matter levels and soil life at depth. The physical action of the roots and soil fauna and the glues they produce promote soil structure, porosity, water storage, soil aeration and drainage at depth. Soil depth should preferably not be less than 600 mm. Heavy clay soils are not recommended. Stony soils are acceptable under irrigation systems, particularly if the depth of the soil is less than 1 m. An adequate rooting depth is also needed to provide adequate anchorage of the tree at maturity.
TABLE 3 Visual scores for potential rooting depth
VSA score(VS)
Potential rooting depth(m)
2.0[Good]
> 0.8
1.5[Moderately good]
0.6–0.8
1.0[Moderate]
0.4–0.6
0.5[Moderately poor]
0.2–0.4
0[Poor]
< 0.2
PLATE 7 Generic drawing of the root system of a tree [L. DRAZETA and A. LANG]

16
VISUAL SOIL ASSESSMENT
Assessmentå Examine for the presence of a hardpan by rapidly jabbing the side of the soil profile
(that was dug to assess the potential rooting depth) with a knife, starting at the top and progressing systematically and quickly down to the bottom of the hole (Plate 8). Note how easy or difficult it is to jab the knife into the soil as you move rapidly down the profile. A strongly developed hardpan is very tight and extremely firm, and it has a high penetration resistance to the knife. Pay particular attention to the lower topsoil and upper subsoil where tillage pans and plough pans commonly occur if present (Plate 9).
ç Having identified the possible presence of a hardpan by a significant increase in penetration resistance to the point of a knife, gauge how strongly developed the hardpan is. Remove a large hand-sized sample and assess its structure, porosity and the number and colour of soil mottles (Plates 2, 3 and 5), and also look for the presence of roots. Compare with the photographs and criteria given Plate 9.
PLATE 8 Using a knife to determine the presence or absence of a hardpan
Identifying the presence of a hardpan

17
VINEYARDS | OLIVE ORCHARDS | ORCHARDS | WHEAT | MAIZE | ANNUAL CROPS | PASTURE
PLATE 8 Using a knife to determine the presence or absence of a hardpan
PLATE 9 Identifying the presence of a hardpan
NO HARDPANThe soil has a low penetration resistanceto the knife. Roots, old root channels,worm channels, cracks and fissures may becommon. Topsoils are friable with a readilyapparent structure and have a soil porosityscore of ≥1.5.
MODERATELY DEVELOPED HARDPANThe soil has a moderate penetrationresistance to the knife. It is firm (hard)with a weakly apparent soil structure andhas a soil porosity score of 0.5–1. Thereare few roots and old root channels,few worm channels, and few cracksand fissures. The pan may have few tocommon orange and grey mottles. Notethe moderately developed tillage pan inthe lower half of the topsoil (arrowed).
STRONGLY DEVELOPED HARDPANThe soil has a high penetration resistanceto the knife. It is very tight, extremelyfirm (very hard) and massive (i.e. with noapparent soil structure) and has a soilporosity score of 0. There are no roots orold root channels, no worm channels orcracks or fissures. The pan may have manyorange and grey mottles. Note the stronglydeveloped tillage pan in the lower half ofthe topsoil (arrowed).

18
VISUAL SOIL ASSESSMENTsu
rfac
e po
ndin
g
AssessmentC
ImportanceI
å Assess the degree of surface ponding (Plate 10) based on your observation or general recollection of the time ponded water took to disappear after a wet period during the spring, and compare with the class limits in Table 4.
SURFACE PONDING and the length of time water remains on the surface can indicate the rate of infiltration into and through the soil, a high water table, and the time the soil remains saturated. Orchard crops generally require free-draining soils. Prolonged waterlogging depletes oxygen in the soil causing anaerobic (anoxic) conditions that induce root stress, and restrict root respiration and the growth and development of roots. Roots need oxygen for respiration and are most vulnerable to surface ponding and saturated soil conditions in the spring when plant roots and shoots are actively growing at a time when respiration and transpiration rates rise markedly and oxygen demands are high. They are also susceptible to ponding in the summer when transpiration rates are highest. Moreover, waterlogging causes the death of fine roots responsible for nutrient and water uptake. Reduced water uptake while the tree is transpiring actively causes leaf desiccation and tip-burn, particularly in the outer canopy. Prolonged waterlogging also increases the likelihood of infections and fungal disease such as Phytophthora root rot and foot rot, and reduces the ability of roots to overcome the harmful effects of topsoil-resident pathogens. Trees decline in vigour, have restricted spring growth (RSG) as evidenced by poor shoot and stunted growth, have thin canopies, and can eventually die.
Waterlogging and deoxygenation also results in a series of undesirable chemical and biochemical reduction reactions, the by-products of which are toxic to roots. Plant-available nitrate-nitrogen (NO
3-) is reduced by denitrification to nitrite (NO
2-) and nitrous
oxide (N2O). a potent greenhouse gas, and plant-available sulphate-sulphur (SO
42-) is
reduced to sulphide, including hydrogen sulphide (H2S), ferrous sulphide (FeS) and
zinc sulphide (ZnS). Iron is reduced to soluble ferrous (Fe2+) ions, and manganese to manganous (Mn2+) ions. Apart from the toxic products produced, the result is a reduction in the amount of plant-available N, S and Zn. Anaerobic respiration of micro-organisms also produces carbon dioxide and methane (also greenhouse gases), hydrogen gas,
ethanol, acetaldehyde and ethylene, all of which inhibit root growth when accumulated in the soil. Unlike aerobic respiration, anaerobic respiration releases insufficient energy in the form of adenosine triphosphate (ATP) and adenylate energy charge (AEC) for microbial and root/shoot growth.

19
VINEYARDS | OLIVE ORCHARDS | ORCHARDS | WHEAT | MAIZE | ANNUAL CROPS | PASTURE
The tolerance of trees to waterlogging is dependent on a number of factors, including the time of year, the rootstock and type of tree crop, e.g. pear trees are generally more tolerant than apple trees of saturated soils. Tolerance of waterlogging is also dependent on soil and air temperatures, soil type, the condition of the soil, fluctuating water tables, and the rate of onset and severity of anaerobiosis (or anoxia), a factor governed by the initial soil oxygen content and oxygen consumption rate by plant roots.
Prolonged surface ponding increases the susceptibility of soils to damage under wheel traffic, reducing vehicle access.
PLATE 10 Surface ponding in an orchard [A. TOPP]
TABLE 4 Visual scores for surface ponding
VSA score(VS)
Surface ponding due to soil saturation
Number of daysof ponding *
Description
2[Good]
≤ 1No evidence of surface ponding after 1 day following heavy rainfall on soils that were already at or near saturation.
1[Moderate]
2–4Moderate surface ponding occurs for 2–4 days after heavy rainfall on soils that were already at or near saturation.
0[Poor]
> 5Significant surface ponding occurs for longer than 5 days after heavy rainfall on soils that were already at or near saturation.
* Assuming little or no air is trapped in the soil at the time of ponding.

20
VISUAL SOIL ASSESSMENTsu
rfac
e cr
usti
ng a
nd s
urfa
ce c
over
AssessmentC
ImportanceI
å Observe the degree of surface crusting and surface cover and compare with Plate 11 and the criteria given. Surface crusting is best assessed after wet spells followed by a period of drying, and before cultivation.
SURFACE CRUSTING reduces infiltration of water and water storage in the soil and increases runoff. Surface crusting also reduces aeration, causing anaerobic conditions, and prolongs water retention near the surface, which can hamper access by machinery for months. Crusting is most pronounced in fine-textured, poorly structured soils with a low aggregate stability and a dispersive clay mineralogy.
SURFACE COVER helps to prevent crusting by minimizing the dispersion of the soil surface by rain or irrigation. It also helps to reduce crusting by intercepting the large rain droplets before they can strike and compact the soil surface. Vegetative cover and its root system return organic matter to the soil and promote soil life, including earthworm numbers and activity. The physical action of the roots and soil fauna and the glues they produce promote the development of soil structure, soil aeration and drainage and help to break up surface crusting. As a result, infiltration rates and the movement of water through the soil increase, decreasing runoff, soil erosion and the risk of flash flooding. Surface cover also reduces soil erosion by intercepting high impact raindrops, minimizing rain-splash and saltation. It further serves to act as a sponge, retaining rainwater long enough for it to infiltrate into the soil. Moreover, the root system reduces soil erosion by stabilizing the soil surface, holding the soil in place during heavy rainfall events. As a result, water quality downstream is improved with a lower sediment loading, nutrient and coliform content. The adoption of managed cover crops has in some cases reduced sediment erosion rates from 70 tonnes/ha to 1.5 tonnes/ha during single large rainfall events. The surface needs to have at least 70 percent cover in order to give good protection, while ≤30 percent cover provides poor protection. Surface cover also reduces the risk of wind erosion markedly.

21
VINEYARDS | OLIVE ORCHARDS | ORCHARDS | WHEAT | MAIZE | ANNUAL CROPS | PASTURE
PLATE 11 How to score surface crusting and surface cover
GOOD CONDITION VS = 2Little or no surface crusting is present; orsurface cover is ≥70%.
MODERATE CONDITION VS = 1Surface crusting is 2–3 mm thick and isbroken by signifi cant cracking; or surfacecover is >30% and <70%.
POOR CONDITION VS = 0Surface crusting is >5 mm thick and isvirtually continuous with little cracking;or surface cover is ≤30%.
Surface cover photos: courtesy of A. Leys

22
VISUAL SOIL ASSESSMENTso
il er
osio
n
AssessmentC
ImportanceI
å Assess the degree of soil erosion based on current visual evidence and, more importantly, on your knowledge of what the site looked like in the past relative to Plate 12.
SOIL EROSION reduces the productive potential of an orchard through nutrient losses, loss of organic matter, reduced potential rooting depth, and lower available-water-holding capacity. Soil erosion can also have significant off-site effects, including reduced water quality through increased sediment, nutrient and coliform loading in streams and rivers.
Overcultivation of interrows can cause considerable soil degradation associated with the loss of soil organic matter and soil structure. It can also develop surface crusting, tillage pans, and decrease infiltration and permeability of water through the soil profile (causing increased surface runoff ). If the soil surface is left unprotected on sloping ground, large quantities of soil can be removed by slips, flows, gullying and rilling, or it can be relocated semi-intact by slumping. The cost of restoration, often requiring heavy machinery, can be prohibitively expensive.
The water erodibility of soil on sloping ground is governed by a number of factors including:< the percentage of vegetative cover on the soil surface;< the amount and intensity of rainfall;< the soil infiltration rate and permeability;< the slope and the nature of the underlying subsoil strata and bedrock.
The loss of organic matter and soil structure as a result of overcultivation between rows can also give rise to significant soil loss by wind erosion of exposed ground where the tree spacing is quite large.

23
VINEYARDS | OLIVE ORCHARDS | ORCHARDS | WHEAT | MAIZE | ANNUAL CROPS | PASTURE
PLATE 12 How to score soil erosion
GOOD CONDITION VS = 2Little or no evidence of soil erosion. Little difference in height between the mounded row and interrow. The root system is completely covered.
MODERATE CONDITION VS = 1Moderate soil erosion with a significant difference in height between the interrow and the soil around the base of the tree trunk. Part of the upper root system is occasionally exposed.
POOR CONDITION VS = 0Severe soil erosion with deeply incised gullies or other mass movement features between rows. There is a large difference in height between the interrow and the soil around the base of the tree trunk. The root system is often well exposed and sometimes undermined.
Photos: courtesy of J. Gomez (Proterra Project supported by Syngenta) and M. Pastor

24
VISUAL SOIL ASSESSMENT
Soil management in orchards
Trees with satisfactory production develop buds of optimal length, promote flower-bud induction, give good percentage fruiting, and stimulate fruit development. Therefore, it is essential to maintain the availability of water, nutrients and carbohydrates during the crop cycle, avoiding any shortages.
Good soil management practices are needed in order to maintain good growth conditions and productivity to safeguard the functionality of the tree, especially during the crucial periods of plant development and fructification. To achieve this, management practices need to maintain and promote the condition and, therefore, functionality of the soil, particularly in regard to its aeration status and the supply of nutrients and water to the plant. To this end, the soil needs to have a good rooting environment, including an adequate soil structure, to allow an effective root system to develop and so maximize the utilization of water and nutrients, and also provide sufficient anchorage for the plant. Good soil structure also promotes infiltration and movement of water through the soil, minimizing surface ponding, runoff and soil erosion.
Where rainfall is not a limiting factor for plant growth, the establishment of cover crops is the most suitable soil management practice to protect the soil surface from erosion, to preserve the environment, to reduce production costs, and to enhance the quality of the fruit. Cover cropping not only helps in reducing water runoff and soil erosion but also improves soil physical characteristics, enriches soil organic matter content and soil life (including earthworm numbers), and suppresses soil-borne diseases by increasing micro-organism biodiversity. However, cover crops compete for minerals, water and fertilizer where they are not well managed. In the absence of irrigation during the hottest months, competition for water could occur during flowering, fruit formation and development, thereby limiting the final yield. To avoid this competition, a temporary cover crop or natural vegetation can be grown from early autumn to mid-spring (often the wettest period), and it can be controlled during the hottest period by herbicide application or mowing 2–3 times during the period of major nutrient demand.
Different mixes of cover crops, including leguminous species that supply N, should be evaluated in different areas. In addition to legumes, the mix could include annual or perennial species, grasses and other broadleaf plants. Winter annuals can be grown to protect the soil from erosion during the winter and to improve the ability of the soil to resist compaction when wet. With their fibrous root system, grasses are also more effective at improving soil structure, and generally add more organic matter to the soil than do legumes. Where allowed to seed in early summer, a seed bank for subsequent regeneration is built up. Where possible, the grass in the interrows and within rows could be kept short by grazing sheep, provided the tree trunks have protective plastic screens to shield them from strip and ring barking. The advantages of managing a grass cover crop using sheep compared with mowing and herbicide strips include: lower use of synthetic (herbicide) chemicals; reduced fossil fuel use; and lower carbon dioxide emissions and, therefore, greater market acceptance. Other advantages include: lower labour and material costs; less compaction along wheel traffic lanes; improved soil nutrient

25
VINEYARDS | OLIVE ORCHARDS | ORCHARDS | WHEAT | MAIZE | ANNUAL CROPS | PASTURE
status; and greater soil life (including earthworm numbers), as a result of the dung and urine applied. Stock tend to rest, urinate and defecate most within the tree row, translocating and concentrating nutrients to where the tree roots are greatest. Sheep can also graze grass very short, reducing not only the competition for water and nutrients but also reducing insect and bird numbers and the possibility of fungal diseases.
The traditional management of the interrow is based on one or two cultivations with discs and tine harrows during the hot period following natural weed cover and it could be satisfactory in limiting, principally, competition for water. The cultivation should be shallower than 100 mm so as to de-vigorate the cover crop but not to modify the canopy/root ratio of the trees by damaging the root system. The cultivation operations can also be useful for incorporating organic and mineral fertilizers as well as controlling diseases caused by fungi and bacteria in the soil.
The application of mulches along the row in the form of compost, bark chips, cereal straw and grass clippings (spread during mowing) shades the soil, so reducing temperature and soil evaporation in summer. Mulches also encourage biological activity, especially earthworms. They suppress weeds and prevent the breakdown of the soil structure under the impact of rain, thereby enhancing water infiltration.

26
VISUAL SOIL ASSESSMENT
References
Shepherd, T. G., Stagnari, F., Pisante, M. and Benites, J. 2008. Visual Soil Assessment – Field guide for orchards. FAO, Rome, Italy.

VISUAL SOIL ASSESSMENT
Orchards
FI
EL
D
GU
ID
E
9 7 8 9 2 5 1 0 5 9 4 1 8
TC/D/I0007E/1/02.08/1000
ISBN 978-92-5-105941-8
The present publication on Visual Soil Assessment is a practicalguide to carry out a quantitative soil analysis with reproduceable resultsusing only very simple tools. Besides soil parameters, also crop parametersfor assessing soil conditions are presented for some selected crops. TheVisual Soil Assessment manuals consist of a series of separate booklets forspecific crop groups, collected in a binder. The publication addressesscientists as well as field technicians and even farmers who want to analysetheir soil condition and observe changes over time.

VISUAL SOIL ASSESSMENT
Vineyards
FI
EL
D
GU
ID
E
9 7 8 9 2 5 1 0 5 9 4 1 8
TC/D/I0007E/1/02.08/1000
ISBN 978-92-5-105941-8
The present publication on Visual Soil Assessment is a practicalguide to carry out a quantitative soil analysis with reproduceable resultsusing only very simple tools. Besides soil parameters, also crop parametersfor assessing soil conditions are presented for some selected crops. TheVisual Soil Assessment manuals consist of a series of separate booklets forspecific crop groups, collected in a binder. The publication addressesscientists as well as field technicians and even farmers who want to analysetheir soil condition and observe changes over time.

VISUAL SOIL ASSESSMENT
Vineyards
FI
EL
D
GU
ID
E
Food and Agriculture Organization of the United NationsRome, 2008
Graham Shepherd, soil scientist,BioAgriNomics.com, New Zealand
Fabio Stagnari, assistant researcher,University of Teramo, Italy
Michele Pisante, professor,University of Teramo, Italy
José Benites, technical officer,Land and Water Development Division, FAO

Contents
The designations employed and the presentation of material in this informationproduct do not imply the expression of any opinion whatsoever on the partof the Food and Agriculture Organization of the United Nations (FAO) concerning thelegal or development status of any country, territory, city or area or of its authorities,or concerning the delimitation of its frontiers or boundaries. The mention of speciccompanies or products of manufacturers, whether or not these have been patented, doesnot imply that these have been endorsed or recommended by FAO in preference toothers of a similar nature that are not mentioned.
ISBN 978-92-5-105940-1
All rights reserved. Reproduction and dissemination of material in this informationproduct for educational or other non-commercial purposes are authorized withoutany prior written permission from the copyright holders provided the source is fullyacknowledged. Reproduction of material in this information product for resale or othercommercial purposes is prohibited without written permission of the copyright holders.Applications for such permission should be addressed to:ChiefElectronic Publishing Policy and Support BranchCommunication DivisionFAOViale delle Terme di Caracalla, 00153 Rome, Italyor by e-mail to:[email protected]
© FAO 2008

iii
VINEYARDS | OLIVE ORCHARDS | ORCHARDS | WHEAT | MAIZE | ANNUAL CROPS | PASTURE
Acknowledgements v
List of acronyms v
Visual Soil Assessment vi
SOIL TEXTURE 2
SOIL STRUCTURE 4
SOIL POROSITY 6
SOIL COLOUR 8
NUMBER AND COLOUR OF SOIL MOTTLES 10
EARTHWORMS 12
POTENTIAL ROOTING DEPTH 14Identifying the presence of a hardpan 16
SURFACE PONDING 18
SURFACE CRUSTING AND SURFACE COVER 20
SOIL EROSION 22
WOOD PRODUCTION 26
SHOOT LENGTH 28
LEAF COLOUR 30
YIELD 34
VARIABILITY IN VINE PERFORMANCE ALONG THE ROW 36
PRODUCTION COSTS 38
SOIL MANAGEMENT IN VINEYARDS 40
Contents

iv
VISUAL SOIL ASSESSMENT
1. How to score soil texture 32. Visual scores for earthworms 133. Visual scores for potential rooting depth 154. Visual scores for surface ponding 195. Visual scores for variability in vine performance along the row 376. Visual scores for production costs 38
Acknowledgements
List of acronyms
List of tables
List of figures
1. Soil scorecard – visual indicators for assessing soil quality in vineyards 12. Soil texture classes and groups 33. Plant scorecard – visual indicators for assessing plant performance in vineyards 254. Assessment of production costs 39
1. The VSA tool kit vii2. How to score soil structure 53. How to score soil porosity 74. How to score soil colour 95. How to score soil mottles 116. Sample for assessing earthworms 137. Potential rooting depth 158. Restricted root penetration through plough pan at 25 cm 159. Using a knife to determine the presence or absence of a hardpan 1610. Identifying the presence of a hardpan 1711. Surface ponding in a vineyard 1912. How to score surface crusting and surface cover 2113. How to score soil erosion 2314. How to score wood production 2715. How to score shoot length 2916. How to score leaf colour 3117. Visual symptoms of nutrient deficiency in vines 3218. How to score yield 3519. Effect of soil texture, organic matter and mycorrhizae on vine performance 3620. Effect of soil aeration and drainage on vine performance 3721. Effect of soil-borne pathogens on vine performance 3722. Variable crop vigour and leaf colour along the row 37
List of plates

v
VINEYARDS | OLIVE ORCHARDS | ORCHARDS | WHEAT | MAIZE | ANNUAL CROPS | PASTURE
This publication is adapted from the methodology developed in: Shepherd, T.G. 2008. Visual Soil Assessment. Volume 1. Field guide for pastoral grazing and cropping on flat to rolling country. 2nd edition. Palmerston North, New Zealand, Horizons Regional Council. 106 pp.
The valuable assistance and input provided by C. Llewellyn and the review of the manuscript by Professor C. Intrieri (University of Bologna) and Dr A. Lang are also gratefully acknowledged.
This publication is funded by FAO in collaboration with the Agronomy and Crop Science Research and Education Center of the University of Teramo.
Acknowledgements
List of acronyms
AEC Adenylate energy charge
Al Aluminium
ATP Adenosine triphosphate
B Boron
Ca Calcium
Cu Copper
Fe Iron
K Potassium
Mg Magnesium
Mn Manganese
Mo Molybdenum
N Nitrogen
P Phosphorus
RSG Restricted spring growth
S Sulphur
VS Visual score
VSA Visual Soil Assessment
Zn Zinc

vi
VISUAL SOIL ASSESSMENT
IntroductionThe maintenance of good soil quality is vital for the environmental and economic sustainability of vineyards. A decline in soil quality has a marked impact on vine growth, grape quality, production costs and the risk of soil erosion. Therefore, it can have significant consequences on society and the environment. A decline in soil physical properties in particular takes considerable time and cost to correct. Safeguarding soil resources for future generations and minimizing the ecological footprint of viticulture are important tasks for land managers.
Often, not enough attention is given to:< the basic role of soil quality in efficient and sustained production;< the effect of the condition of the soil on the gross profit margin;< the long-term planning needed to sustain good soil quality;< the effect of land management decisions on soil quality.
Soil type and the effect of management on the condition of the soil are important determinants of the character and quality of wine, and have profound effects on long-term profits. Land managers need tools that are reliable, quick and easy to use in order to help them assess the condition of their soils and their suitability for growing grapes, and to make informed decisions that lead to sustainable land and environmental management. To this end, the Visual Soil Assessment (VSA) provides a quick and simple method to assess soil condition and plant performance. It can also be used to assess the suitability and limitations of a soil for viticulture. Soils with good VSA scores will usually give the best production with the lowest establishment and operational costs.
The VSA methodVisual Soil Assessment is based on the visual assessment of key soil ‘state’ and plant performance indicators of soil quality, presented on a scorecard. Soil quality is ranked by assessment of the soil indicators alone. Plant indicators require knowledge of the growing history of the crop. This knowledge will facilitate the satisfactory and rapid completion of the plant scorecard. With the exception of soil texture, the soil and plant indicators are dynamic indicators, i.e. capable of changing under different management regimes and land-use pressures. Being sensitive to change, they are useful early warning indicators of changes in soil condition and plant performance and as such provide an effective monitoring tool.
Plant indicators allow you to make cause-and-effect links between management practices and soil characteristics. By looking at both the soil and plant indicators, VSA links the natural resource (soil) with plant performance and farm enterprise profitability. Because of this, the soil quality assessment is not a combination of the ‘soil’ and ‘plant’ scores. Rather, the scores should be looked at separately, and compared.
Visual Soil Assessment

vii
VINEYARDS | OLIVE ORCHARDS | ORCHARDS | WHEAT | MAIZE | ANNUAL CROPS | PASTURE
Visual scoringEach indicator is given a visual score (VS) of 0 (poor), 1 (moderate), or 2 (good), based on the soil quality and plant performance observed when comparing the soil and plant with three photographs in the field guide manual. The scoring is flexible, so if the sample you are assessing does not align clearly with any one of the photographs but sits between two, an in-between score can be given, i.e. 0.5 or 1.5. Because some soil and plant indicators are relatively more important in the assessment of soil quality and plant performance than others, VSA provides a weighting factor of 1, 2 and 3. The total of the VS rankings gives the overall Soil Quality Index and Plant Performance Index for the site. Compare these with the rating scale at the bottom of the scorecard to determine whether your soil and plants are in good, moderate or poor condition.
Placing the soil and plant assessments side by side at the bottom of the plant indicator scorecard should prompt you to look for reasons if there is a significant discrepancy between the soil and plant indicators.
The VSA tool kitThe VSA tool kit (Plate 1) comprises:< a spade – to dig a soil pit and to take a
200-mm cube of soil for the drop shatter soil structure test;
< a plastic basin (about 450 mm long x 350 mm wide x 250 mm deep) – to contain the soil during the drop shatter test;
< a hard square board (about 260x260x20 mm) – to fit in the bottom of the plastic basin on to which the soil cube is dropped for the shatter test;
< a heavy-duty plastic bag (about 750x 500 mm) – on which to spread the soil, after the drop shatter test has been carried out;
< a knife (preferably 200 mm long) to investigate the soil pit and potential rooting depth;
< a water bottle – to assess the field soil textural class;< a tape measure – to measure the potential rooting depth;< a VSA field guide – to make the photographic comparisons;< a pad of scorecards – to record the VS for each indicator.
PLATE 1 The VSA tool kit

viii
VISUAL SOIL ASSESSMENT
The procedureWhen it should be carried outThe test should be carried out when the soils are moist and suitable for cultivation. If you are not sure, apply the ‘worm test’. Roll a worm of soil on the palm of one hand with the fingers of the other until it is 50 mm long and 4 mm thick. If the soil cracks before the worm is made, or if you cannot form a worm (for example, if the soil is sandy), the soil is suitable for testing. If you can make the worm, the soil is too wet to test.
Setting up
TimeAllow 25 minutes per site. For a representative assessment of soil quality, sample 4 sites over a 5-ha area.
Reference sampleTake a small sample of soil (about 100x50x150 mm deep) from under a nearby fence or a similar protected area. This provides an undisturbed sample required in order to assign the correct score for the soil colour indicator. The sample also provides a reference point for comparing soil structure and porosity.
SitesSelect sites that are representative of the vineyard. The condition of the soil in vineyards is site specific. Sample sites that have had little or no wheel traffic (e.g. near the vine). The VSA method can also be used to assess compacted areas by selecting to sample along wheel traffic lanes. Always record the position of the sites for future monitoring if required.
Site information
Complete the site information section at the top of the scorecard. Then record any special aspects you think relevant in the notes section at the bottom of the plant indicator scorecard.
Carrying out the test
Initial observationDig a small hole about 200x200 mm square by 300 mm deep with a spade and observe the topsoil (and upper subsoil if present) in terms of its uniformity, including whether it is soft and friable or hard and firm. A knife is useful to help you assess this.
Take the test sampleIf the topsoil appears uniform, dig out a 200-mm cube with the spade.You can sample whatever depth of soil you wish, but ensure that you sample the equivalent of a 200-mm cube of soil. If for example, the top 100 mm of the soil is compacted and you wish to assess its condition, dig out two samples of 200x200x100 mm with a spade. If the 100–200-mm depth is dominated by a tillage pan and you wish to assess its condition, remove the top 100 mm of soil and dig out two samples of 200x200x100 mm. Note that taking a 200-mm cube sample below the topsoil can also give valuable information about the condition of the subsoil and its implications for plant growth and farm management practices.

ix
VINEYARDS | OLIVE ORCHARDS | ORCHARDS | WHEAT | MAIZE | ANNUAL CROPS | PASTURE
The drop shatter testDrop the test sample a maximum of three times from a height of 1 m onto the wooden square in the plastic basin. The number of times the sample is dropped and the height it is dropped from, is dependent on the texture of the soil and the degree to which the soil breaks up, as described in the section on soil structure.
Systematically work through the scorecard, assigning a VS to each indicator by comparing it with the photographs (or table) and description reported in the field guide.
The plant indicatorsMany plant indicators cannot be assessed at the same time as the soil indicators. Ideally, the plant performance indicators should be observed at the appropriate time during the season. The plant indicators are scored and ranked in the same way as soil indicators: a weighting factor is used to indicate the relative importance of each indicator, with each contributing to the final determination of plant performance. The Plant Performance Index is the total of the individual VS rankings in the right-hand column.
Format of the bookletThe soil and plant scorecards are given in Figures 1 and 3, respectively, and list the key indicators required in order to assess soil quality and plant performance. Each indicator is described on the following pages, with a section on how to assess the indicator and an explanation of its importance and what it reveals about the condition of the soil and about plant performance.


1
VINEYARDS | OLIVE ORCHARDS | ORCHARDS | WHEAT | MAIZE | ANNUAL CROPS | PASTURE
��������������������������������
���������������������������������������������������������������������������
��������� ����������
������������ ���
�������������� ���
������������� ���
����������� ���
��������������������������������� ���
���
���
��������������� ���
���������������������������������� ���
������������������������� ���
���������������������������������������
����������������������� ������������������
���� ����
�������� �����
���� ����
������������������������������������������������������������������������������������
����������� ���������
��������������� ��������
�������������� �����
����������
���������������
���������������������
��������������������������� ������ ������ ������ ������� �����
�������������������� ���� ��������������� ������ ����������� ���
����������������������������� ���� ���� ����� ����� �������
�������������������� � �� ����������� � �
������������������������� � ��
�����
�����
�����
�����
������
������
������
������
������
������

2
VISUAL SOIL ASSESSMENTso
il te
xtur
e
Assessment
å Take a small sample of soil (half the size of your thumb) from the topsoil and a sample (or samples) that is (or are) representative of the subsoil.
ç Wet the soil with water, kneading and working it thoroughly on the palm of your hand with your thumb and forefinger to the point of maximum stickiness.
é Assess the texture of the soil according to the criteria given in Table 1 by attempting to mould the soil into a ball.
With experience, a person can assess the texture directly by estimating the percentages of sand, silt and clay by feel, and the textural class obtained by reference to the textural diagram (Figure 2).
There are occasions when the assignment of a textural score will need to be modified because of the nature of a textural qualifier. For example, if the soil has a reasonably high content of organic matter, i.e. is humic with 15–30 percent organic matter, raise the textural score by one (e.g. from 0 to 1 or from 1 to 2). If the soil has a significant gravelly or stony component, reduce the textural score by 0.5.
There are also occasions when the assignment of a textural score will need to be modified because of the specific preference of a crop for a particular textural class. For example, asparagus prefers a soil with a sandy loam texture and so the textural score is raised by 0.5 from a score of 1 to 1.5 based on the specific textural preference of the plant.
C
ImportanceISOIL TEXTURE defines the size of the mineral particles. Specifically, it refers to the relative proportion of the various size-groups in the soil, i.e. sand, silt and clay. Sand is that fraction that has a particle size > 0.06 mm; silt varies between 0.06 and 0.002 mm; and the particle size of clay is < 0.002 mm. Texture influences soil behaviour in several ways, notably through its effect on: water retention and availability; soil structure; aeration; drainage; soil trafficability; soil life; and the supply and retention of nutrients.
A knowledge of both the textural class and the potential rooting depth enables an approximate assessment of the total water-holding capacity of the soil, one of the major drivers of crop production.

3
VINEYARDS | OLIVE ORCHARDS | ORCHARDS | WHEAT | MAIZE | ANNUAL CROPS | PASTURE
FIGURE 2 Soil texture classes and groups
Textural classes.
Textural groups.
TABLE 1 How to score soil texture
Visual score(VS)
Textural class Description
2[Good]
Silt loamSmooth soapy feel, slightly sticky, no grittiness. Moulds into a cohesive ball that fissures when pressed flat.
1.5[Moderately good]
Clay loamVery smooth, sticky and plastic. Moulds into a cohesive ball that deforms without fissuring.
1[Moderate]
Sandy loam Slightly gritty, faint rasping sound. Moulds into a cohesive ball that fissures when pressed flat.
0.5[Moderately poor]
Loamy sandSilty clay
Clay
Loamy sand: Gritty and rasping sound. Will almost mould into a ball but disintegrates when pressed flat.Silty clay, clay: Very smooth, very sticky, very plastic. Moulds into a cohesive ball that deforms without fissuring.
0[Poor]
SandGritty and rasping sound. Cannot be moulded into a ball.

4
VISUAL SOIL ASSESSMENTso
il st
ruct
ure
AssessmentC
ImportanceI
å Remove a 200-mm cube of topsoil with a spade (between or along wheel tracks).ç Drop the soil sample a maximum of three times from a height of 1 m onto the firm base
in the plastic basin. If large clods break away after the first or second drop, drop them individually again once or twice. If a clod shatters into small (primary structural) units after the first or second drop, it does not need dropping again. Do not drop any piece of soil more than three times. For soils with a sandy loam texture (Table 1), drop the cube of soil just once only from a height of 0.5 m.
é Transfer the soil onto the large plastic bag.è For soils with a loamy sand or sand texture, drop the cube of soil still sitting on the spade (once)
from a height of just 50 mm, and then roll the spade over, spilling the soil onto the plastic bag.ê Applying only very gently pressure, attempt to part each clod by hand along any exposed
cracks or fissures. If the clod does not part easily, do not apply further pressure (because the cracks and fissures are probably not continuous and, therefore, are unable to readily conduct oxygen, air and water).
ë Move the coarsest fractions to one end and the finest to the other end. Arrange the distribution of aggregates on the plastic bag so that the height of the soil is roughly the same over the whole surface area of the bag. This provides a measure of the aggregate-size distribution. Compare the resulting distribution of aggregates with the three photographs in Plate 2 and the criteria given.The method is valid for a wide range of moisture conditions but is best carried out when the soil is moist to slightly moist; avoid dry and wet conditions.
SOIL STRUCTURE is extremely important for vineyards. It regulates:< soil aeration and gaseous exchange rates;< soil temperature;< soil infiltration and erosion;< the movement and storage of water;< nutrient supply;< root penetration and development;< soil workability;< soil trafficability;< the resistance of soils to structural degradation.
Good soil structure reduces the susceptibility to compaction under wheel traffic and increases the window of opportunity for vehicle access and for carrying out no-till, minimum-till or conventional cultivation between rows under optimal soil conditions.
Soil structure is ranked on the size, shape, firmness, porosity and relative abundance of soil aggregates and clods. Soils with good structure have friable, fine, porous, subangular and subrounded (nutty) aggregates. Those with poor structure have large, dense, very firm, angular or subangular blocky clods that fit and pack closely together and have a high tensile strength.

5
VINEYARDS | OLIVE ORCHARDS | ORCHARDS | WHEAT | MAIZE | ANNUAL CROPS | PASTURE
PLATE 2 How to score soil structure
GOOD CONDITION VS = 2Soil dominated by friable, fineaggregates with no significant clodding.Aggregates are generally subrounded(nutty) and often quite porous.
MODERATE CONDITION VS = 1Soil contains significant proportions(50%) of both coarse clods and friablefine aggregates. The coarse clods arefirm, subangular or angular in shape andhave few or no pores.
POOR CONDITION VS = 0Soil dominated by coarse clodswith very few finer aggregates. Thecoarse clods are very firm, angular orsubangular in shape and have very fewor no pores.

6
VISUAL SOIL ASSESSMENTso
il po
rosi
ty
AssessmentC
ImportanceI
å Remove a spade slice of soil (about 100 mm wide, 150 mm long and 200 mm deep) from the side of the hole and break it in half.
ç Examine the exposed fresh face of the sample for soil porosity by comparing against the three photographs in Plate 3. Look for the spaces, gaps, holes, cracks and fissures between and within soil aggregates and clods.
é Examine also the porosity of a number of the large clods from the soil structure test. This provides important additional information as to the porosity of the individual clods (the intra-aggregate porosity).
It is important to assess SOIL POROSITY along with the structure of the soil. Soil porosity, and particularly macroporosity (or large pores), influences the movement of air and water in the soil. Soils with good structure have a high porosity between and within aggregates, but soils with poor structure may not have macropores and coarse micropores within the large clods, restricting their drainage and aeration.
Poor aeration leads to the build up of carbon dioxide, methane and sulphide gases, and reduces the ability of plants to take up water and nutrients, particularly nitrogen (N), phosphorus (P), potassium (K) and sulphur (S). Plants can only utilize S and N in the oxygenated sulphate (SO
42-), nitrate (NO
3-) and ammonium (NH
4+) forms. Therefore,
plants require aerated soils for the efficient uptake and utilization of S and N. The number, activity and biodiversity of micro-organisms and earthworms are also greatest in well-aerated soils and they are able to decompose and cycle organic matter and nutrients more efficiently.
The presence of soil pores enables the development and proliferation of the superficial (or feeder) roots throughout the soil. Vine roots are unable to penetrate and grow through firm, tight, compacted soils, severely restricting the ability of the plant to utilize the available water and nutrients in the soil. A high penetration resistance not only limits plant uptake of water and nutrients, it also reduces fertilizer efficiency considerably and increases the susceptibility of the plant to root diseases.
Soils with good porosity will also tend to produce lower amounts of greenhouse gases. The greater the porosity, the better the drainage, and, therefore, the less likely it is that the soil pores will be water-filled to the critical levels required to accelerate the production of greenhouse gases. Aim to keep the soil porosity score above 1.

7
VINEYARDS | OLIVE ORCHARDS | ORCHARDS | WHEAT | MAIZE | ANNUAL CROPS | PASTURE
PLATE 3 How to score soil porosity
GOOD CONDITION VS = 2Soils have many macropores and coarsemicropores between and within aggregatesassociated with good soil structure.
MODERATE CONDITION VS = 1Soil macropores and coarse microporesbetween and within aggregates have declinedsignificantly but are present on closeexamination in parts of the soil. The soil showsa moderate amount of consolidation.
POOR CONDITION VS = 0No soil macropores and coarse microporesare visually apparent within compact,massive structureless clods. The clodsurface is smooth with few or no cracks orholes, and can have sharp angles.

8
VISUAL SOIL ASSESSMENTso
il co
lour AssessmentC
ImportanceI
å Compare the colour of a handful of soil from the field site with soil taken from under the nearest fenceline or a similar protected area.
ç Using the three photographs and criteria given (Plate 4), compare the relative change in soil colour that has occurred.
As topsoil colour can vary markedly between soil types, the photographs illustrate the degree of change in colour rather than the absolute colour of the soil.
SOIL COLOUR is a very useful indicator of soil quality because it can provide an indirect measure of other more useful properties of the soil that are not assessed so easily and accurately. In general, the darker the colour is, the greater is the amount of organic matter in the soil. A change in colour can give a general indication of a change in organic matter under a particular land use or management. Soil organic matter plays an important role in regulating most biological, chemical and physical processes in soil, which collectively determine soil health. It promotes infiltration and retention of water, helps to develop and stabilize soil structure, cushions the impact of wheel traffic and cultivators, reduces the potential for wind and water erosion, and maintains the soil carbon ‘sink’. Organic matter also provides an important food resource for soil organisms and is an important source of, and major reservoir of, plant nutrients. Its decline reduces the fertility and nutrient-supplying potential of the soil; N, P, K and S requirements of vines increase markedly, and other major and minor elements are leached more readily. The result is an increased dependency on fertilizer input to maintain nutrient status.
Soil colour can also be a useful indicator of soil drainage and the degree of soil aeration. In addition to organic matter, soil colour is influenced markedly by the chemical form (or oxidation state) of iron (Fe) and manganese (Mn). Brown, yellow-brown, reddish-brown and red soils without mottles indicate well-aerated, well-drained conditions where Fe and Mn occur in the oxidized form of ferric (Fe3+) and manganic (Mn3+) oxides. Grey-blue colours can indicate that the soil is poorly drained or waterlogged and poorly aerated for long periods, conditions that reduce Fe and Mn to ferrous (Fe2+) and manganous (Mn2+) oxides. Poor aeration and prolonged waterlogging give rise to a further series of chemical and biochemical reduction reactions that produce toxins, such as hydrogen sulphide, carbon dioxide, methane, ethanol, acetaldehyde and ethylene, that damage the root system. This reduces the ability of plants to take up water and nutrients, causing poor vigour and ill-thrift. Decay and dieback of roots can also occur as a result of the Phylloxera aphid and fungal diseases such as Phytophthora root rot and black foot rot in soils prone to waterlogging.
In general, dark-coloured soils are more favourable for red wine quality (owing to an increase in polyphenol and terpens).

9
VINEYARDS | OLIVE ORCHARDS | ORCHARDS | WHEAT | MAIZE | ANNUAL CROPS | PASTURE
PLATE 4 How to score soil colour
GOOD CONDITION VS = 2Dark coloured topsoil that is not toodissimilar to that under the fenceline.
MODERATE CONDITION VS = 1The colour of the topsoil is somewhatpaler than that under the fenceline, butnot markedly so.
POOR CONDITION VS = 0Soil colour has become significantly palercompared with that under the fenceline.

10
VISUAL SOIL ASSESSMENTnu
mbe
r an
d co
lour
of s
oil m
ottl
es AssessmentC
ImportanceI
å Take a sample of soil (about 100 mm wide × 150 mm long × 200 mm deep) from the side of the hole and compare with the three photographs (Plate 5) and the percentage chart to determine the percentage of the soil occupied by mottles.
Mottles are spots or blotches of different colour interspersed with the dominant soil colour.
The NUMBER AND COLOUR OF SOIL MOTTLES provide a good indication of how well the soil is drained and how well it is aerated. They are also an early warning of a decline in soil structure caused by compaction under wheel traffic and overcultivation. The loss of soil structure decreases and blocks the number of channels and pores that conduct water and air and, as a consequence, can result in waterlogging and a deficiency of oxygen for a prolonged period. The development of anaerobic (deoxygenated) conditions reduces Fe and Mn from their brown/orange oxidized ferric (Fe3+) and manganic (Mn3+) form to grey ferrous (Fe2+) and manganous (Mn2+) oxides. Mottles develop as various shades of orange and grey owing to varying degrees of oxidation and reduction of Fe and Mn. As oxygen depletion increases, orange, and ultimately grey, mottles predominate. An abundance of grey mottles indicates the soil is poorly drained and poorly aerated for a significant part of the year. The presence of only common orange and grey mottles (10–25 percent) indicates the soil is imperfectly drained with only periodic waterlogging. Soil with only few to common orange mottles indicates the soil is moderately well drained, and the absence of mottles indicates good drainage.
Poor aeration reduces the uptake of water by plants and can induce wilting. It can also reduce the uptake of plant nutrients, particularly N, P, K and S. Moreover, poor aeration retards the breakdown of organic residues, and can cause chemical and biochemical reduction reactions that produce sulphide gases, methane, ethanol, acetaldehyde and ethylene, which are toxic to plant roots. Decay and dieback of roots can also occur as a result of the Phylloxera aphid and fungal diseases such as Phytophthora root rot and black foot rot in strongly mottled, poorly aerated soils. Root rot and reduced nutrient and water uptake give rise to poor plant vigour and ill-thrift. If your visual score for mottles is ≤1, you need to aerate the soil.

11
VINEYARDS | OLIVE ORCHARDS | ORCHARDS | WHEAT | MAIZE | ANNUAL CROPS | PASTURE
PLATE 5 How to score soil mottles
GOOD CONDITION VS = 2Mottles are generally absent.
MODERATE CONDITION VS = 1Soil has common (10–25%) fine andmedium orange and grey mottles.
POOR CONDITION VS = 0Soil has abundant to profuse (> 50%)medium and coarse orange and particularlygrey mottles.

12
VISUAL SOIL ASSESSMENTea
rthw
orm
s
AssessmentC
ImportanceI
å Count the earthworms by hand, sorting through the soil sample used to assess soil structure (Plate 6) and compare with the class limits in Table 2. Pay particular attention to the turf mat. Earthworms vary in size and number depending on the species and the season. Therefore, for year-to-year comparisons, earthworm counts must be made at the same time of year when soil moisture and temperature levels are good. Earthworm numbers are reported as the number per 200-mm cube of soil. Earthworm numbers are commonly reported on a square-metre basis. A 200-mm cube sample is equivalent to 1/25 m2, and so the number of earthworms needs to be multiplied by 25 to convert to numbers per square metre.
EARTHWORMS provide a good indicator of the biological health and condition of the soil because their population density and species are affected by soil properties and management practices. Through their burrowing, feeding, digestion and casting, earthworms have a major effect on the chemical, physical and biological properties of the soil. They shred and decompose plant residues, converting them to organic matter, and so releasing mineral nutrients. Compared with uningested soil, earthworm casts can contain 5 times as much plant available N, 3–7 times as much P, 11 times as much K, and 3 times as much Mg. They can also contain more Ca and plant-available Mo, and have a higher pH, organic matter and water content. Moreover, earthworms act as biological aerators and physical conditioners of the soil, improving:< soil porosity;< aeration;< soil structure and the stability of soil aggregates;< water retention;< water infiltration;< drainage.
They also reduce surface runoff and erosion. They further promote plant growth by secreting plant-growth hormones and increasing root density and root development by the rapid growth of roots down nutrient-enriched worm channels. While earthworms can deposit about 25–30 tonnes of casts/ha/year on the surface, 70 percent of their casts are deposited below the surface of the soil. Therefore, earthworms play an important role in vineyards and can increase growth rates and production significantly.
Earthworms also increase the population, activity and diversity of soil microbes. Actinomycetes increase 6–7 times during the passage of soil through the digestive tract of the worm and, along with other microbes, play an important role in the decomposition of organic matter to humus. Soil microbes such as mycorrhizal fungi play a further role in

13
VINEYARDS | OLIVE ORCHARDS | ORCHARDS | WHEAT | MAIZE | ANNUAL CROPS | PASTURE
the supply of nutrients, digesting soil and fertilizer and unlocking nutrients, such as P, that are fixed by the soil. Microbes also retain significant amounts of nutrients in their biomass, releasing them when they die. Moreover, soil microbes produce plant-growth hormones and compounds that stimulate root growth and promote the structure, aeration, infiltration and water-holding capacity of the soil. Micro-organisms further encourage a lower incidence of pests and diseases. The collective benefits of microbes reduce fertilizer requirements and improve vine and grape quality.
Earthworm numbers (and biomass) are governed by the amount of food available as organic matter and soil microbes, as determined by the amount and quality of surface residue, the use of cover crops including legumes, and the cultivation of interrows. Earthworm populations can be up to three times higher in undisturbed soils compared with cultivated soils. Earthworm numbers are also governed by: soil moisture, temperature, texture, soil aeration, pH, soil nutrients (including levels of Ca), and the type and amount of fertilizer and N used. The overuse of acidifying salt-based fertilizers, anhydrous ammonia and ammonia-based products, and some insecticides and fungicides can further reduce earthworm numbers.
Soils should have a good diversity of earthworm species with a combination of: (i) surface feeders that live at or near the surface to breakdown plant residues and dung; (ii) topsoil-dwelling species that burrow, ingest and mix the top 200–300 mm of soil; and (iii) deep-burrowing species that pull down and mix plant litter and organic matter at depth.
PLATE 6 Sample for assessing earthworms
TABLE 2 Visual scores for earthworms
Visual score(VS)
Earthworm numbers(per 200-mm cube of soil)
2[Good]
> 30 (with preferably 3 or more species)
1[Moderate]
15–30 (with preferably 2 or more species)
0[Poor]
< 15 (with predominantly 1 species)

14
VISUAL SOIL ASSESSMENTpo
tent
ial r
ooti
ng d
epth
AssessmentC
ImportanceI
å Dig a hole to identify the depth to a limiting (restricting) layer where present (Plates 7 and 8), and compare with the class limits in Table 3. As the hole is being dug, note the presence of roots and old root channels, worm channels, cracks and fissures down which roots can extend. Note also whether there is an over-thickening of roots (a result of a high penetration resistance), and whether the roots are being forced to grow horizontally, otherwise know as right-angle syndrome. Moreover, note the firmness and tightness of the soil, whether the soil is grey and strongly gleyed owing to prolonged waterlogging, and whether there is a hardpan present such as a human-induced tillage or plough pan (Plate 8), or a natural pan such as an iron, siliceous or calcitic pan. An abrupt transition from a fine (heavy) material to a coarse (sandy/gravelly) layer will also limit root development. A rough estimate of the potential rooting depth may be made by noting the above properties in a nearby road cutting, gully, slip, earth slump or an open drain.
The POTENTIAL ROOTING DEPTH is the depth of soil that plant roots can potentially exploit before reaching a barrier to root growth, and it indicates the ability of the soil to provide a suitable rooting medium for plants. The greater is the rooting depth, the greater is the available-water-holding capacity of the soil. In drought periods, deep roots can access larger water reserves, thereby alleviating water stress and promoting the survival of non-irrigated vineyards. Under irrigation, the majority of roots are in the top 1 m of soil. The exploration of a large volume of soil by deep roots means that they can also access more macronutrients and micronutrients, thereby accelerating the growth and enhancing the yield and quality of the grapes. Conversely, soils with a restricted rooting depth caused by, for example, a layer with a high penetration resistance such as a compacted layer or a hardpan, restrict vertical root growth and development, causing roots to grow sideways. This limits plant uptake of water and nutrients, reduces fertilizer efficiency, increases leaching, and decreases yield. A high resistance to root penetration can also increase plant stress and the susceptibility of the plant to root diseases. Moreover, hardpans impede the movement of air, oxygen and water through the soil profile, the last increasing the susceptibility to waterlogging and erosion by rilling and sheet wash.
The potential rooting depth can be restricted further by:< an abrupt textural change;< pH;< aluminium (Al) toxicity;< nutrient deficiencies;< salinity;< sodicity;< a high or fluctuating water table;< low oxygen levels.

15
VINEYARDS | OLIVE ORCHARDS | ORCHARDS | WHEAT | MAIZE | ANNUAL CROPS | PASTURE
Anaerobic (anoxic) conditions caused by deoxygenation and prolonged waterlogging restrict the rooting depth as a result of the accumulation of toxic levels of hydrogen sulphide, ferrous sulphide, carbon dioxide, methane,
ethanol, acetaldehyde and
ethylene, by-products of chemical and biochemical reduction reactions.
Grapevines with a deep, dense, vigorous root system raise soil organic matter levels and soil life at depth. The physical action of the roots and soil fauna and the glues they produce promote soil structure, porosity, water storage, soil aeration and drainage at depth. For rainfed vineyards, the depth of a restricting layer should ideally be deeper than 2.5 m, with a soil depth of preferably not less than 600 mm. Stony soils are acceptable under irrigation systems, particularly where the depth of the soil is less than 1 m. Furthermore, grapevines need a sufficient rooting depth to provide adequate anchorage for the vines at maturity.
PLATE 7 Potential rooting depth [L. VAN HUYSSTEEN in VAN ZYL 1988]
TABLE 3 Visual scores for potential rooting depth
VSA score(VS)
Potential rooting depth(m)
2.0[Good]
> 0.8
1.5[Moderately good]
0.6–0.8
1.0[Moderate]
0.4–0.6
0.5[Moderately poor]
0.2–0.4
0[Poor]
< 0.2
PLATE 8 Restricted root penetration through plough pan at 25 cm [L. VAN HUYSSTEEN]

16
VISUAL SOIL ASSESSMENT
Assessmentå Examine for the presence of a hardpan by rapidly jabbing the side of the soil profile (that
was dug to assess the potential rooting depth) rapidly with a knife, starting at the top and progressing systematically and quickly down to the bottom of the hole (Plate 9). Note how easy or difficult it is to jab the knife into the soil as you move rapidly down the profile. A strongly developed hardpan is very tight and extremely firm, and it has a high penetration resistance to the knife. Pay particular attention to the lower topsoil and upper subsoil where tillage pans and plough pans commonly occur if present (Plate 10).
ç Having identified the possible presence of a hardpan by a significant increase in penetration resistance to the point of a knife, gauge how strongly developed the hardpan is. Remove a large hand-sized sample and assess its structure, porosity and the number and colour of soil mottles (Plates 2, 3 and 5), and also look for the presence of roots. Compare with the photographs and criteria given in Plate 10.
PLATE 9 Using a knife to determine the presence or absence of a hardpan
Identifying the presence of a hardpan

17
VINEYARDS | OLIVE ORCHARDS | ORCHARDS | WHEAT | MAIZE | ANNUAL CROPS | PASTURE
PLATE 9 Using a knife to determine the presence or absence of a hardpan
PLATE 10 Identifying the presence of a hardpan
NO HARDPANThe soil has a low penetration resistanceto the knife. Roots, old root channels,worm channels, cracks and fissures may becommon. Topsoils are friable with a readilyapparent structure and have a soil porosityscore of ≥1.5.
MODERATELY DEVELOPED HARDPANThe soil has a moderate penetrationresistance to the knife. It is firm (hard)with a weakly apparent soil structure andhas a soil porosity score of 0.5–1. Thereare few roots and old root channels,few worm channels, and few cracksand fissures. The pan may have few tocommon orange and grey mottles. Notethe moderately developed tillage pan inthe lower half of the topsoil (arrowed).
STRONGLY DEVELOPED HARDPANThe soil has a high penetration resistanceto the knife. It is very tight, extremelyfirm (very hard) and massive (i.e. with noapparent soil structure) and has a soilporosity score of 0. There are no roots orold root channels, no worm channels orcracks or fissures. The pan may have manyorange and grey mottles. Note the stronglydeveloped tillage pan in the lower half ofthe topsoil (arrowed).

18
VISUAL SOIL ASSESSMENTsu
rfac
e po
ndin
g
AssessmentC
ImportanceI
å Assess the degree of surface ponding (Plate 11) based on your observation or general recollection of the time ponded water took to disappear after a wet period during the spring, and compare with the class limits in Table 4.
SURFACE PONDING and the length of time water remains on the surface can indicate the rate of infiltration into and through the soil, a high water table, and the time the soil remains saturated. Grapevines generally require free-draining soils. Prolonged waterlogging depletes oxygen in the soil causing anaerobic (anoxic) conditions that induce root stress, and restrict root respiration and the growth and development of roots. Roots need oxygen for respiration. They are most vulnerable to surface ponding and saturated soil conditions in the spring when plant roots and shoots are growing actively at a time when respiration and transpiration rates rise markedly and oxygen demands are high. They are also susceptible to ponding in the summer when transpiration rates are highest. Moreover, waterlogging causes the death of fine roots responsible for nutrient and water uptake. Reduced water uptake while the vine is transpiring actively causes leaf desiccation and tip-burn. Prolonged waterlogging also increases the likelihood of pests and diseases, including the Phylloxera aphid and Phytophthora fungal root rot, and reduces the ability of roots to overcome the harmful effects of topsoil-resident pathogens. Vines decline in vigour, have restricted spring growth (RSG) as evidenced by poor shoot and stunted growth, and eventually die.
Waterlogging and deoxygenation also result in a series of undesirable chemical and biochemical reduction reactions, the by-products of which are toxic to roots. Plant-available nitrate-nitrogen (NO
3-) is reduced by denitrification to nitrite (NO
2-) and nitrous oxide
(N2O), a potent greenhouse gas, and plant-available sulphate-sulphur (SO
42-) is reduced
to sulphide, including hydrogen sulphide (H2S), ferrous sulphide (FeS) and zinc sulphide
(ZnS). Iron is reduced to soluble ferrous (Fe2+) ions, and Mn to manganous (Mn2+) ions. Apart from the toxic products produced, the result is a reduction in the amount of plant-available N and S. Anaerobic respiration of micro-organisms also produces carbon dioxide and methane (also greenhouse gases), hydrogen gas, ethanol, acetaldehyde and ethylene, all of which inhibit root growth when accumulated in the soil. Unlike aerobic respiration, anaerobic respiration releases insufficient energy in the form of adenosine triphosphate (ATP) and adenylate energy charge (AEC) for microbial and root/shoot growth.

19
VINEYARDS | OLIVE ORCHARDS | ORCHARDS | WHEAT | MAIZE | ANNUAL CROPS | PASTURE
The tolerance of vine roots to waterlogging is dependent on a number of factors, including the time of year, the rootstock, soil and air temperatures, soil type, the condition of the soil, fluctuating water tables and the rate of onset and severity of anaerobiosis (or anoxia), a factor governed by the amount of entrapped air and the oxygen consumption rate by plant roots. Prolonged surface ponding increases the susceptibility of soils to damage under wheel traffic, so reducing vehicle access.
PLATE 11 Surface ponding in a vineyard [CWi Technical Ltd]
TABLE 4 Visual scores for surface ponding
VSA score(VS)
Surface ponding due to soil saturation
Number of daysof ponding *
Description
2[Good]
≤ 1No evidence of surface ponding after 1 day following heavy rainfall on soils that were already at or near saturation.
1[Moderate]
2–3Moderate surface ponding occurs for 2–3 days after heavy rainfall on soils that were already at or near saturation.
0[Poor]
> 4Significant surface ponding occurs for longer than 4 days after heavy rainfall on soils that were already at or near saturation.
* Assuming little or no air is trapped in the soil at the time of ponding.

20
VISUAL SOIL ASSESSMENTsu
rfac
e cr
usti
ng a
nd s
urfa
ce c
over
AssessmentC
ImportanceI
å Observe the degree of surface crusting and surface cover and compare with Plate 12 and the criteria given. Surface crusting is best assessed after wet spells followed by a period of drying, and before cultivation.
SURFACE CRUSTING reduces infiltration of water and water storage in the soil and increases runoff. Surface crusting also reduces aeration, causing anaerobic conditions, and prolongs water retention near the surface, which can hamper access by machinery for months. Crusting is most pronounced in fine-textured, poorly structured soils with a low aggregate stability and a dispersive clay mineralogy.
SURFACE COVER helps to prevent crusting by minimizing the dispersion of the soil surface by rain or irrigation. It also helps to reduce crusting by intercepting the large rain droplets before they can strike and compact the soil surface. Vegetative cover and its root system return organic matter to the soil and promote soil life, including earthworm numbers and activity. The physical action of the roots and soil fauna and the glues they produce promote the development of soil structure, soil aeration and drainage and help to break up surface crusting. As a result, infiltration rates and the movement of water through the soil increase, decreasing runoff, soil erosion and the risk of flash flooding. Surface cover also reduces soil erosion by intercepting high impact raindrops, minimizing rain-splash and saltation. It further serves to act as a sponge, retaining rainwater long enough for it to infiltrate into the soil. Moreover, the root system reduces soil erosion by stabilizing the soil surface, holding the soil in place during heavy rainfall events. As a result, water quality downstream is improved with a lower sediment loading, nutrient and coliform content. The adoption of managed cover crops has in some cases reduced sediment erosion rates from 70 tonnes/ha to 1.5 tonnes/ha during single large rainfall events. The surface needs to have at least 70 percent cover in order to give good protection, while ≤30 percent cover provides poor protection. Surface cover also reduces the risk of wind erosion markedly.

21
VINEYARDS | OLIVE ORCHARDS | ORCHARDS | WHEAT | MAIZE | ANNUAL CROPS | PASTURE
PLATE 12 How to score surface crusting and surface cover
GOOD CONDITION VS = 2Little or no surface crusting is present; orsurface cover is ≥70%.
MODERATE CONDITION VS = 1Surface crusting is 2–3 mm thick and isbroken by signifi cant cracking; or surfacecover is >30% and <70%.
POOR CONDITION VS = 0Surface crusting is >5 mm thick and isvirtually continuous with little cracking;or surface cover is ≤30%.
Photos of surface cover: courtesy of A. Leys; Photo of severe crusting: courtesy of M. Speyer

22
VISUAL SOIL ASSESSMENTso
il er
osio
n
AssessmentC
ImportanceI
å Assess the degree of soil erosion based on current visual evidence and, more importantly, on your knowledge of what the site looked like in the past relative to Plate 13.
SOIL EROSION reduces the productive potential of a vineyard through nutrient losses, loss of organic matter, reduced potential rooting depth, and lower available-water-holding capacity. Soil erosion can also have significant off-site effects, including reduced water quality through increased sediment, nutrient and coliform loading in streams and rivers.
Overcultivation of interrows can cause considerable soil degradation associated with the loss of soil organic matter and soil structure. It can also develop surface crusting, tillage pans, and decrease infiltration and permeability of water through the soil profile (causing increased surface runoff ). If the soil surface is left unprotected on sloping ground, large quantities of soil can be removed by slips, flows, gullying and rilling, or it can be relocated semi-intact by slumping. The cost of restoration, often requiring heavy machinery, can be prohibitively expensive.
The water erodibility of soil on sloping ground is governed by a number of factors including:< the percentage of vegetative cover on the soil surface;< the amount and intensity of rainfall;< the soil infiltration rate and permeability;< the slope and the nature of the underlying subsoil strata and bedrock.

23
VINEYARDS | OLIVE ORCHARDS | ORCHARDS | WHEAT | MAIZE | ANNUAL CROPS | PASTURE
PLATE 13 How to score soil erosion
GOOD CONDITION VS = 2Little or no evidence of soil erosion. Little difference in height between the mounded row and interrow. The root system is completely covered.
MODERATE CONDITION VS = 1Moderate soil erosion with a significant difference in height between the mounded row and interrow. Part of the upper root system is occasionally exposed.
POOR CONDITION VS = 0Severe soil erosion with deeply incised gullies or other mass movement features between rows. The root system is often well exposed and the vine trunk totally undermined in places.
Photos: courtesy of C. Llewellyn and M. Greener


25
VINEYARDS | OLIVE ORCHARDS | ORCHARDS | WHEAT | MAIZE | ANNUAL CROPS | PASTURE
�������������������������������������
���������������������������������������������������������������������������
��������� ����������
��������������� ���
������������ ���
����������� ���
����� ���
���������������� ���
� ������������������������
�������
��������������������
����������������������������
������
���������������������������������������
�����������������������
���� ����
�������� �����
���� ����
�������������������������������������� �����������������������������������������������������
��������������� ����������������
������������������������������������������������������������������������������������������
�������������������������������������������� ���
������
������
������
������
������
������

26
VISUAL SOIL ASSESSMENTw
ood
prod
ucti
on AssessmentC
ImportanceIWhile climate factors, cultivar and agricultural practices all influence WOOD PRODUCTION, wood production at flowering is a good indicator of plant vigour and the fertility and physical condition of the soil (including its nutrient and water status). Therefore, it is a useful indicator of soil quality.
Soil degradation resulting from the loss of organic matter, soil compaction, poor aeration or soil erosion restricts root growth and limits the movement and storage of water, the cycling of nutrients and the efficient uptake of fertilizers. Plant roots either cannot reach the fertilizer, or the applied nutrients remain unavailable in the compacted soil because of impaired water movement or preferential flow through the soil, by-passing much of the soil volume. As a result, plant growth and vigour are poor.
å Estimate wood production per metre cord by assessing fresh wood weight at pruning (Plate 14). In making the observation, consideration must be given to the cultivar, pruning and age of the vine.

27
VINEYARDS | OLIVE ORCHARDS | ORCHARDS | WHEAT | MAIZE | ANNUAL CROPS | PASTURE
PLATE 14 How to score wood production
GOOD CONDITION VS = 2Depending on the cultivar, vineyards of seven years of age have 0.8 kg of vine-shoots per metre cord at pruning.
MODERATE CONDITION VS = 1Depending on the cultivar, vineyards of seven years of age have 0.6–0.8 kg of vine-shoots per metre cord at pruning.
POOR CONDITION VS = 0Depending on the cultivar, vineyards of seven years of age have <0.6 kg of vine-shoots per metre cord at pruning.

28
VISUAL SOIL ASSESSMENTsh
oot l
engt
h
AssessmentC
ImportanceISHOOT LENGTH is also influenced by the bud position on the trunk and cordon, and by bud orientation with respect to the vertical direction. It is related strongly to the physical and chemical fertility of the soil, which in turn is influenced by soil management. Shoot length is an expression of plant vigour and general plant growth, which are also regulated by the availability of water and nutrients and by the aeration status of the soil. Waterlogging and poor drainage can restrict spring growth and give rise to poor shoot growth and dieback. Soils in good condition with good structure and porosity, and with a deep, well-aerated rootzone, enable the unrestricted movement of air and water into and through the soil and the development and proliferation of superficial (feeder) roots. Furthermore, soils with good organic-matter levels and soil life show an active biological and chemical process, favouring the release and uptake of water and nutrients and, consequently, shoot growth.
å Measure or visually assess shoot length and compare with the criteria given (Plate 15) at veraison. In making your assessment, consideration must be given to the cultivar, pruning and age of the vine, and the weather conditions at bud break. Poor weather will promote a high number of leaf buds rather than flowering buds and give rise to many shoots and leaves rather than flowers.

29
VINEYARDS | OLIVE ORCHARDS | ORCHARDS | WHEAT | MAIZE | ANNUAL CROPS | PASTURE
PLATE 15 How to score shoot length
GOOD CONDITION VS = 2Vine-shoots are at or near the maximum length, with a little variability depending on the position of the shoot on the branch.
MODERATE CONDITION VS = 1Vine-shoot length is moderately below maximum and shows moderate variability depending on the position of the shoot on the plant.
POOR CONDITION VS = 0Vine-shoot length is significantly below the maximum length.

30
VISUAL SOIL ASSESSMENTle
af c
olou
r
AssessmentC
ImportanceILEAF COLOUR can provide a good indication of the nutrient status and condition of the soil. The higher is the soil fertility, the greener is the leaf colour. Leaf colour is related primarily to water and nutrient availability, especially N. Leaf colour can also indicate a deficiency or excess of P, K, S, Ca, Mg, Fe, Mn, zinc (Zn), copper (Cu) and boron (B). Chlorosis can further occur as a result of low N, K, S, Fe, Mg and Cu levels in the soil, low soil and air temperatures, and poor soil aeration caused by compaction and waterlogging. A deficiency or excess of one or more essential elements in a plant can also produce visual symptoms of necrosis of leaf margins, stunted growth of shoots, irregular fruit-set and small berries. Premature leaf senescence can further indicate plant stress.
Nutrient deficiencies or excesses can suppress the availability of other nutrients. For example, high P levels can suppress the uptake of Zn and Cu. Excess N can suppress B and Cu and cause the plant to luxury feed on K, which in turn can suppress the utilization of Ca and Mg. Sulphur can also only be utilized by plants in the sulphate (SO
42-) form.
Under poorly aerated conditions, S will reduce to sulphur dioxide (SO2) and sulphides (e.g.
hydrogen sulphide [H2S], and ferrous sulphide [FeS]). Sulphides and SO
2 cannot be taken
up by the plant, are toxic to plant roots and micro-organisms, and suppress N uptake. Plants can only utilize N where S is present in the oxygenated (sulphate) form. Like S, N can also only be utilized by the plant under aerobic conditions in the nitrate (NO
3-) or
ammonium form (NH4
+).
Plate 17 shows some of the most common symptoms of nutrient deficiencies.
å Assess the colour of the mature leaves at the base of the vine-shoots by comparing with Plate 16 and the criteria given. In making the observation, consideration must be given to the cultivar, the stage of growth, pests and diseases, and recent weather conditions. Prolonged cold and cloudy days with little sunlight can give rise to chlorosis (or yellowing of the leaf) owing to the inadequate formation or loss of chlorophyll.

31
VINEYARDS | OLIVE ORCHARDS | ORCHARDS | WHEAT | MAIZE | ANNUAL CROPS | PASTURE
PLATE 16 How to score leaf colour
GOOD CONDITION VS = 2Leaves have an intense dark green colour.
MODERATE CONDITION VS = 1Leaves have a yellowish-green or medium green colour.
POOR CONDITION VS = 0Leaves have a distinct yellowish colour or turn opaque green.

32
VISUAL SOIL ASSESSMENT
PLATE 17 Visual symptoms of nutrient deficiency in vines
Phosphorus
Potassium

33
VINEYARDS | OLIVE ORCHARDS | ORCHARDS | WHEAT | MAIZE | ANNUAL CROPS | PASTURE
PLATE 17 Visual symptoms of nutrient deficiency in vines PLATE 17 Visual symptoms of nutrient deficiency in vines (continued)
Boron
Zinc
Iron

34
VISUAL SOIL ASSESSMENTyi
eld
AssessmentC
ImportanceIYIELD can be a good visual indicator of the properties and condition of the soil. The physical condition of the soil (in terms of its texture, structure, porosity, aeration and drainage) has a significant effect on the root system, aeration status and water and nutrient availability at critical times of the year. It also plays an important role in vine growth and vigour, grape quality and yield.
Appropriate soil management, including the adoption of a managed cover crop between rows, and avoiding wheel traffic when the soil is wet, helps to promote the physical condition and overall fertility of the soil and sustainable long-term production.
å Assess relative crop yield by visual estimation of fruit number and size and by comparing with Plate 18 and the criteria given, or alternatively estimate or measure the weight of grapes per metre cord. In making your assessment, consideration must be given to the cultivar, pruning and age of the vine. Consideration must also be given to the weather conditions (e.g. whether warm and dry, or cold and wet) at pollination, fertilization, flowering and fruit-set. Pollination is best when the weather is dry, while fertilization is most successful when temperatures are warm. Poor weather during flowering can give rise to poor fruit-set. Warm weather at fruit-set will give good yields while cold wet weather will give poorer yields. Compare your assessment or measurement against the mean of the last 3 or 4 years.

35
VINEYARDS | OLIVE ORCHARDS | ORCHARDS | WHEAT | MAIZE | ANNUAL CROPS | PASTURE
PLATE 18 How to score yield
GOOD CONDITION VS = 2Depending on the cultivar, pruning and age of the vine, yields are good.
MODERATE CONDITION VS = 1Depending on the cultivar, pruning and age of the vine, yields are moderate.
POOR CONDITION VS = 0Depending on the cultivar, pruning and age of the vine, yields are poor.

36
VISUAL SOIL ASSESSMENTva
riab
ility
of v
ine
perf
orm
ance
alo
ng th
e ro
w
AssessmentC
ImportanceIVARIABILITY OF VINE PERFORMANCE ALONG THE ROW can be a very good visual indicator of the properties and condition of the soil. In particular, the linear variability of vine performance is often related to the availability of water and nutrients, and the texture of the soil (e.g. whether clayey, silty, loamy, sandy or gravelly). Moreover, soils in good condition with good structure and porosity, and with a deep, well-aerated rootzone, enable the unrestricted movement of air and water into and through the soil, the development and proliferation of superficial (feeder) roots, and unrestricted respiration and transpiration. Furthermore, soils with good organic-matter levels and soil life (including mycorrhizae) show an active biological and chemical process, favouring the release and uptake of water and nutrients and, consequently, the growth and vigour of the vine.
The spatial variability of vine performance along the row is also a useful indicator because it highlights those vines that are underperforming compared with the majority, enabling a specific investigation as to why those are struggling and what remedial action may be taken.
å Cast your eye along the rows and observe any variability in vine performance (in terms of vine height, stem thickness, canopy volume and density, leaf colour, early senescence of leaves, etc.) and compare with the class limits in Table 5. In making the assessment, consideration must be given to pruning and to diseases that are not soil-related (Plates 19–22).
PLATE 19 Effect of soil texture, organic matter and mycorrhizae on vine performance [D. MUNDY]
Poor-performing vines on the left are on coarse-textured soils with low organic matter and a low mycorrhizal colonization of 40%. Well-performing vines on the right are the result of better utilization of water and nutrients on a siltier soil with more organic matter and a 90% colonization of mycorrhizae.

37
VINEYARDS | OLIVE ORCHARDS | ORCHARDS | WHEAT | MAIZE | ANNUAL CROPS | PASTURE
TABLE 5 Visual scores for variability of vine performance along the row
Visual score (VS) Variability of vine performance along the row
2 [Good] Vine performance is good and even along the row
1 [Moderate] Vine performance is moderately variable along the row
0 [Poor] Vine performance is extremely variable along the row
PLATE 20 Effect of soil aeration and drainage on vine performance [D. MUNDY]
Poor-performing vines in the hollows are due to root (black foot) rot associated with poor drainage, while the better-performing vines on higher ground further along the row are on freer-draining, better-aerated soil.
PLATE 19 Effect of soil texture, organic matter and mycorrhizae on vine performance [D. MUNDY]
PLATE 21 Effect of soil-borne pathogens on vine performance [D. MUNDY]
Poor-performing vines in the centre row owing to a soil-borne pathogen.
PLATE 22 Variable crop vigour and leaf colour [S. GREEN]
Variable crop vigour and leaf colour along the row owing to differences in water and nutrient availability associated with differences in soil texture and soil depth.

38
VISUAL SOIL ASSESSMENTpr
oduc
tion
cos
ts
AssessmentC
ImportanceIContinuous tillage between rows using conventional cultivation techniques can give rise to a marked decline in soil structure, porosity and organic matter. The result is a reduction in root growth owing to a decline in soil aeration, an increase in penetration resistance to root development, a reduction in water storage and plant-available water, and a reduction in soil fertility and the ability of the soil to supply nutrients. Higher amounts of fertilizer are required in order to compensate for the loss of these nutrients and the decline in soil quality. Higher and more frequent applications of chemical sprays are also needed because of increased disease and pest attack in vineyards with degraded soils. The quantity and quality of the final product can often be reduced, with a lower income as a consequence.
Soil compaction under wheel traffic between rows increases the size, density and strength of soil clods, and increases the penetration resistance to lateral root development. Apart from decreasing infiltration and increasing runoff, the increased tillage resistance of compacted lanes often requires a greater number of passes and careful timing with the cultivator in order to break down the large clods. Subsoiling may also be necessary to ameliorate compaction in the subsoil in order to improve aeration and root development.
å Assess whether production costs have increased because of increased tillage/subsoiling, fertilizer requirements and pesticide application over the years (Figure 4 and Table 6). This assessment can be based on perceptions, but reference to annual balance sheets will give a more precise answer.

39
VINEYARDS | OLIVE ORCHARDS | ORCHARDS | WHEAT | MAIZE | ANNUAL CROPS | PASTURE
����������������������������������������
������������������
������������������
��������������������������������������
������������������������
��������������������������
���
�
���������������������������������������������������������������������
��������������������������
�������������
����������������������������������������������������������������������������
������������������������������������������������������������������������������������������������
TABLE 6 Visual scores for production costs
Visual score (VS) Production costs
2[Good]
Spraying, fertilizer and tillage/subsoiling requirementshave not increased significantly
1[Moderate]
Spraying, fertilizer and tillage/subsoiling requirementshave increased moderately
0[Poor]
Spraying, fertilizer and tillage/subsoiling requirementshave increased greatly

40
VISUAL SOIL ASSESSMENT
Soil management in vineyards
Soil management plays a key role in achieving good high-quality vineyard production while at the same time safeguarding the environment and minimizing the ecological footprint of viticulture on a region and the country.
One of the aims of the farmer should be soil conservation. This does not only mean having healthy plants and high grape quality, but achieving this with less fertilizer, chemical input and soil tillage. In general, conventional soil management in vineyards can have a negative impact on the environment. It enhances chemical residues, alters microflora and microfauna by reducing both the number of species and their biomass, reduces soil organic matter content and exposes the soil to accelerated soil erosion. Thus, the loss of soil and soil quality in vineyards contributes to the food eco-footprint.
Cover crops play an important role in protecting the soil surface and enhancing soil quality, so preserving the environment, reducing production costs and enhancing the quality of wine. Recent experiments have shown that the nutritional status of vineyards can have a strong influence on the chemical and organoleptic characteristics of wine.
Cover cropping not only helps in reducing water runoff and soil erosion but also improves soil physical characteristics, enriches soil organic matter content, reduces inorganic fertilization and root mortality, and suppresses soil-borne disease by increasing micro-organism activity and biodiversity.
One of the limiting factors of cover crops in vineyards is the competition for nutrients and plant-available water where the management is inadequate. This can affect the amount of available N to the plant and the N content and alcoholic fermentation of the wine. In order to solve this problem, a different mix of cover crops including leguminous species such as clover and lucerne that supply N (fixed from the atmosphere) should be evaluated in different areas, reducing the problem of N deficiency. The input of biologically fixed N is also an important component of the N cycle.
In addition to legumes, the mix of cover crops in the interrows could include annual and perennial species, grasses and other broadleaf plants. Winter annuals can be grown in order to protect the soil from erosion during winter and to improve the ability of the soil to resist compaction when wet. Grasses, with their fibrous root system, are also more effective at improving soil structure, and generally add more organic matter to the soil than do legumes. Where allowed to seed in early summer, a seed bank for subsequent regeneration is built up. In order to reduce competition, cover crops or natural weeds can be controlled by herbicide application or by mowing 2–3 times during the period of major water and nutrient demand. Grass should also be kept short in order to reduce insect and bird numbers. Where the grass cover crop extends along and under the vine row, ensure that the length of grass is kept short in order to reduce not only the competition for water and nutrients but also the possibility of fungal diseases.

41
VINEYARDS | OLIVE ORCHARDS | ORCHARDS | WHEAT | MAIZE | ANNUAL CROPS | PASTURE
In addition to the adoption of managed cover crops, the physical condition and overall fertility of the soil can be promoted by avoiding wheel traffic between rows when the soils are wet.
The application of mulches along the vine rows in the form of grass mowings, compost, bark chips and cereal straw shade the soil, so reducing temperature and soil evaporation during the summer. Mulches also encourage biological activity, especially earthworms. They suppress weeds and prevent the breakdown of the soil structure under the impact of rain, so enhancing water infiltration. The application of crushed glass as a ‘mulch’ enhances the availability of understorey light, so providing more energy from the rays of the sun to the ripening fruit, lifting the flavour, and ripening the fruit earlier. However, glass mulch does nothing to enhance the biological life of the soil.

42
VISUAL SOIL ASSESSMENT
References
Shepherd, T. G., Stagnari, F., Pisante, M. and Benites, J. 2008. Visual Soil Assessment – Field guide for vineyards. FAO, Rome, Italy.

VISUAL SOIL ASSESSMENT
Vineyards
FI
EL
D
GU
ID
E9 7 8 9 2 5 1 0 5 9 4 1 8
TC/D/I0007E/1/02.08/1000
ISBN 978-92-5-105941-8
The present publication on Visual Soil Assessment is a practicalguide to carry out a quantitative soil analysis with reproduceable resultsusing only very simple tools. Besides soil parameters, also crop parametersfor assessing soil conditions are presented for some selected crops. TheVisual Soil Assessment manuals consist of a series of separate booklets forspecific crop groups, collected in a binder. The publication addressesscientists as well as field technicians and even farmers who want to analysetheir soil condition and observe changes over time.

VISUAL SOIL ASSESSMENT
Wheat
FI
EL
D
GU
ID
E
9 7 8 9 2 5 1 0 5 9 4 1 8
TC/D/I0007E/1/02.08/1000
ISBN 978-92-5-105941-8
The present publication on Visual Soil Assessment is a practicalguide to carry out a quantitative soil analysis with reproduceable resultsusing only very simple tools. Besides soil parameters, also crop parametersfor assessing soil conditions are presented for some selected crops. TheVisual Soil Assessment manuals consist of a series of separate booklets forspecific crop groups, collected in a binder. The publication addressesscientists as well as field technicians and even farmers who want to analysetheir soil condition and observe changes over time.

VISUAL SOIL ASSESSMENT
Wheat
FI
EL
D
GU
ID
E
Food and Agriculture Organization of the United NationsRome, 2008
Graham Shepherd, soil scientist,BioAgriNomics.com, New Zealand
Fabio Stagnari, assistant researcher,University of Teramo, Italy
Michele Pisante, professor,University of Teramo, Italy
José Benites, technical officer,Land and Water Development Division, FAO

Contents
The designations employed and the presentation of material in this informationproduct do not imply the expression of any opinion whatsoever on the partof the Food and Agriculture Organization of the United Nations (FAO) concerning thelegal or development status of any country, territory, city or area or of its authorities,or concerning the delimitation of its frontiers or boundaries. The mention of speciccompanies or products of manufacturers, whether or not these have been patented, doesnot imply that these have been endorsed or recommended by FAO in preference toothers of a similar nature that are not mentioned.
ISBN 978-92-5-105941-8
All rights reserved. Reproduction and dissemination of material in this informationproduct for educational or other non-commercial purposes are authorized withoutany prior written permission from the copyright holders provided the source is fullyacknowledged. Reproduction of material in this information product for resale or othercommercial purposes is prohibited without written permission of the copyright holders.Applications for such permission should be addressed to:ChiefElectronic Publishing Policy and Support BranchCommunication DivisionFAOViale delle Terme di Caracalla, 00153 Rome, Italyor by e-mail to:[email protected]
© FAO 2008

iii
VINEYARDS | OLIVE ORCHARDS | ORCHARDS | WHEAT | MAIZE | ANNUAL CROPS | PASTURE
Acknowledgements vi
List of acronyms vi
Visual Soil Assessment vii
SOIL TEXTURE 2
SOIL STRUCTURE 4
SOIL POROSITY 6
SOIL COLOUR 8
NUMBER AND COLOUR OF SOIL MOTTLES 10
EARTHWORMS 12
POTENTIAL ROOTING DEPTH 14Identifying the presence of a hardpan 16
SURFACE PONDING 18
SURFACE CRUSTING AND SURFACE COVER 20
SOIL EROSION 22
CROP ESTABLISHMENT 26
TILLERING 28
LEAF COLOUR 30
VARIABILITY OF CROP PERFORMANCE ALONG THE ROW 34
ROOT DEVELOPMENT 36
ROOT DISEASE 38
CROP GROWTH AND HEIGHT AT MATURITY 40
KERNEL SIZE 42
CROP YIELD 44
PRODUCTION COSTS 46
SOIL MANAGEMENT OF WHEAT CROP 48
Contents

iv
VISUAL SOIL ASSESSMENT
1. How to score soil texture 32. Visual scores for earthworms 133. Visual scores for potential rooting depth 154. Visual scores for surface ponding 195. Visual scores for variability of crop performance along the row 356. Visual scores for root development 377. Visual scores for root disease 398. Visual scores for crop growth and height at maturity 419. Visual scores for crop yield 4510. Visual scores for production costs 46
List of tables
List of figures
1. Soil scorecard – visual indicators for assessing soil quality in wheat 12. Soil texture classes and groups 33. Plant scorecard – visual indicators for assessing plant performance in wheat 254. Assessment of production costs 47
1. The VSA tool kit viii2. How to score soil structure 53. How to score soil porosity 74. How to score soil colour 95. How to score soil mottles 116. (a): earthworms casts under crop residue; (b): yellow-tail earthworm 137. Sample for assessing earthworms 138. Hole dug to assess the potential rooting depth 159. Using a knife to determine the presence or absence of a hardpan 1610. Identifying the presence of a hardpan 1711. Surface ponding in a wheat field 1912. How to score surface crusting and surface cover 2113. How to score soil erosion 2314. How to score crop establishment 2715. How to score tillering 2916. How to score leaf colour 3117. Common symptoms of leaf discolouration due to nutrient deficiencies in wheat 3218. Variable crop performance due to soil aeration and soil wetness 34
List of plates

v
VINEYARDS | OLIVE ORCHARDS | ORCHARDS | WHEAT | MAIZE | ANNUAL CROPS | PASTURE
19. Variable crop performance due to soil compaction 3520. Variable crop performance due to an iron pan 3521. Variable crop performance due to water-repellency 3522. Root development 3723. Pythium root disease 3824. Take-all root disease 3925. Fusarium root disease 3926. Root rot 3927. Crop height at maturity 4128. How to score kernel size 4329. Crop yield 4430. Effect of boron deficiency on crop yield 4531. Effect of copper deficiency on crop yield 4532. No-till drilling a wheat crop into an erosion-prone field protected by good residue cover 4933. Strip-tillage planting of an annual crop protected by good residue cover 4934. Harvesting a wheat crop, followed immediately by no-till seeding the next crop into stubble 49

vi
VISUAL SOIL ASSESSMENT
This publication is adapted from the methodology developed in: Shepherd, T.G. 2008. Visual Soil Assessment. Volume 1. Field guide for pastoral grazing and cropping on flat to rolling country. 2nd edition. Palmerston North, New Zealand, Horizons Regional Council. 106 pp.
The authors gratefully acknowledge the contribution of a number of the photographs kindly provided by Annemie Leys (Katholieke Universiteit Leuven) and John Quinton, and the useful discussions held with Kevin Sinclair and Peter Jamieson, Crop & Food Research.
This publication is funded by FAO in collaboration with the Agronomy and Crop Science Research and Education Center of the University of Teramo.
Visual Soil AssessmentAcknowledgements
AEC Adenylate energy chargeAl AluminiumATP Adenosine triphosphateB BoronCa CalciumCO2 Carbon dioxideCu CopperFe IronK PotassiumMg MagnesiumMn ManganeseMo MolybdenumN NitrogenP PhosphorusRSG Restricted spring growthS SulphurVS Visual scoreVSA Visual Soil AssessmentZn Zinc
List of acronyms

vii
VINEYARDS | OLIVE ORCHARDS | ORCHARDS | WHEAT | MAIZE | ANNUAL CROPS | PASTURE
IntroductionThe maintenance of good soil quality is vital for the environmental and economic sustainability of wheat cropping. A decline in soil quality has a marked impact on yield and grain quality, production costs and the risk of soil erosion, and can therefore have significant consequences for society and the environment. A decline in soil physical properties in particular takes considerable time and cost to correct. Safeguarding soil resources for future generations and minimizing the ecological footprint of cropping wheat is an important task for land managers.
Often, not enough attention is given to:< the basic role of soil quality in efficient and sustained production;< the effect of the condition of the soil on the gross profit margin;< the long-term planning needed to sustain good soil quality;< the effect of land management decisions on soil quality.
Soil type and the effect of management on the condition of the soil are important determinants of the productive performance of wheat cropping and have profound effects on long term profits. Land managers need reliable, quick and easy to use tools to help them assess the condition of their soils and their suitability for growing crops, and make informed decisions that will lead to sustainable land and environmental management. To this end, the Visual Soil Assessment (VSA) provides a quick and simple method to assess soil condition and plant performance. It can also be used to assess the suitability and limitations of a soil for wheat. Soils with good VSA scores will, by and large, give the best production with the lowest establishment and operational costs.
The VSA methodVisual Soil Assessment is based on the visual assessment of key soil ‘state’ and plant performance indicators of soil quality, presented on a scorecard. Soil quality is ranked by assessment of the soil indicators alone. Plant indicators require knowledge of the growing history of the crop. This knowledge will facilitate the satisfactory and rapid completion of the plant scorecard. With the exception of soil texture, the soil and plant indicators are dynamic indicators, i.e. capable of changing under different management regimes and land-use pressures. Being sensitive to change, they are useful early warning indicators of changes in soil condition and plant performance and as such provide an effective monitoring tool.
Plant indicators allow you to make cause-and-effect links between management practices and soil characteristics. By looking at both the soil and plant indicators, VSA links the natural resource (soil) with plant performance and farm enterprise profitability. Because of this, soil quality assessment is not a combination of the ‘soil’ and ‘plant’ scores; rather, the scores should be looked at separately, and compared.
Visual Soil Assessment

viii
VISUAL SOIL ASSESSMENT
Visual scoringEach indicator is given a visual score (VS) of 0 (poor), 1 (moderate), or 2 (good), based on the soil quality and plant performance observed when comparing the soil and plant with three photographs in the field guide manual. The scoring is flexible, so if the sample you are assessing does not align clearly with any one of the photographs but sits between two, an in-between score can be given, i.e. 0.5 or 1.5. Because some soil and plant indicators are relatively more important in the assessment of soil quality and plant performance than others, VSA provides a weighting factor of 1, 2 and 3. The total of the VS rankings gives the overall Soil Quality Index and Plant Performance Index for the site. Compare these with the rating scale at the bottom of the scorecard to determine whether your soil and plants are in good, moderate or poor condition.
Placing the soil and plant assessments side by side at the bottom of the plant indicator scorecard should prompt you to look for reasons if there is a significant discrepancy between the soil and plant indicators.
The VSA tool kitThe VSA tool kit (Plate 1) comprises:< a spade – to dig a soil pit and to take a
200-mm cube of soil for the drop shatter soil structure test;
< a plastic basin (about 450 mm long x 350 mm wide x 250 mm deep) – to contain the soil during the drop shatter test;
< a hard square board (about 260x260x20 mm) – to fit in the bottom of the plastic basin on to which the soil cube is dropped for the shatter test;
< a heavy-duty plastic bag (about 750x500 mm) – on which to spread the soil, after the drop shatter test has been carried out;
< a knife (preferably 200 mm long) to investigate the soil pit and potential rooting depth;
< a water bottle – to assess the field soil textural class;< a tape measure – to measure the potential rooting depth;< a VSA field guide – to make the photographic comparisons;< a pad of scorecards – to record the VS for each indicator.
PLATE 1 The VSA tool kit

ix
VINEYARDS | OLIVE ORCHARDS | ORCHARDS | WHEAT | MAIZE | ANNUAL CROPS | PASTURE
The procedureWhen it should be carried outThe test should be carried out when the soils are moist and suitable for cultivation. If you are not sure, apply the ‘worm test’. Roll a worm of soil on the palm of one hand with the fingers of the other until it is 50 mm long and 4 mm thick. If the soil cracks before the worm is made, or if you cannot form a worm (for example, if the soil is sandy), the soil is suitable for testing. If you can make the worm, the soil is too wet to test.
Setting up
TimeAllow 25 minutes per site. For a representative assessment of soil quality, sample 4 sites over a 5-ha area.
Reference sampleTake a small sample of soil (about 100x50x150 mm deep) from under a nearby fence or a similar protected area. This provides an undisturbed sample required in order to assign the correct score for the soil colour indicator. The sample also provides a reference point for comparing soil structure and porosity.
SitesSelect sites that are representative of the field. The condition of the soil in wheat fields is site specific. Avoid areas that may have had heavier traffic than the rest of the field and sample between wheel traffic lanes. VSA can also be used however, to assess the effects of high traffic on soil quality by selecting to sample along wheel traffic lanes. Always record the position of the sites for future monitoring if required.
Site information
Complete the site information section at the top of the scorecard. Then record any special aspects you think relevant in the notes section at the bottom of the plant indicator scorecard.
Carrying out the test
Initial observationDig a small hole about 200x200 mm square by 300 mm deep with a spade and observe the topsoil (and upper subsoil if present) in terms of its uniformity, including whether it is soft and friable or hard and firm. A knife is useful to help you assess this.
Take the test sampleIf the topsoil appears uniform, dig out a 200-mm cube with the spade.You can sample whatever depth of soil you wish, but ensure that you sample the equivalent of a 200-mm cube of soil. If for example, the top 100 mm of the soil is compacted and you wish to assess its condition, dig out two samples of 200x200x100 mm with a spade. If the 100–200-mm depth is dominated by a tillage pan and you wish to assess its condition, remove the top 100 mm of soil and dig out two samples of 200x200x100 mm. Note that taking a 200-mm cube sample below the topsoil can also give valuable information about the condition of the subsoil and its implications for plant growth and farm management practices.
PLATE 1 The VSA tool kit

x
VISUAL SOIL ASSESSMENT
The drop shatter testDrop the test sample a maximum of three times from a height of 1 m onto the wooden square in the plastic basin. The number of times the sample is dropped and the height it is dropped from, is dependent on the texture of the soil and the degree to which the soil breaks up, as described in the section on soil structure.
Systematically work through the scorecard, assigning a VS to each indicator by comparing it with the photographs (or table) and description reported in the field guide.
The plant indicatorsMany plant indicators cannot be assessed at the same time as the soil indicators. Ideally, the plant performance indicators should be observed at the appropriate time during the season. The plant indicators are scored and ranked in the same way as soil indicators: a weighting factor is used to indicate the relative importance of each indicator, with each contributing to the final determination of plant performance. The Plant Performance Index is the total of the individual VS rankings in the right-hand column.
Format of the bookletThe soil and plant scorecards are given in Figures 1 and 3, respectively, and list the key indicators required in order to assess soil quality and plant performance. Each indicator is described on the following pages, with a section on how to assess the indicator and an explanation of its importance and what it reveals about the condition of the soil and about plant performance.

1
VINEYARDS | OLIVE ORCHARDS | ORCHARDS | WHEAT | MAIZE | ANNUAL CROPS | PASTURE
��������������������������������
���������������������������������������������������������������������������
��������� ����������
������������ ���
�������������� ���
������������� ���
����������� ���
��������������������������������� ���
���
���
��������������� ���
���������������������������������� ���
������������������������� ���
���������������������������������������
����������������������� ������������������
���� ����
�������� �����
���� ����
��������������������������������������������������������������������������������
����������� ���������
��������������� ��������
�������������� �����
����������
���������������
���������������������
��������������������������� ������ ������ ������ ������� �����
�������������������� ���� ��������������� ������ ����������� ���
����������������������������� ���� ���� ����� ����� �������
�������������������� � �� ����������� � �
������������������������� � ��
�����
�����
�����
�����
������
������
������
������
������
������

2
VISUAL SOIL ASSESSMENTso
il te
xtur
e
Assessment
å Take a small sample of soil (half the size of your thumb) from the topsoil and a sample (or samples) that is (or are) representative of the subsoil.
ç Wet the soil with water, kneading and working it thoroughly on the palm of your hand with your thumb and forefinger to the point of maximum stickiness.
é Assess the texture of the soil according to the criteria given in Table 1 by attempting to mould the soil into a ball.
With experience, a person can assess the texture directly by estimating the percentages of sand, silt and clay by feel, and the textural class obtained by reference to the textural diagram (Figure 2).
There are occasions when the assignment of a textural score will need to be modified because of the nature of a textural qualifier. For example, if the soil has a reasonably high content of organic matter, i.e. is humic with 15–30 percent organic matter, raise the textural score by one (e.g. from 0 to 1 or from 1 to 2). If the soil has a significant gravelly or stony component, reduce the textural score by 0.5.
There are also occasions when the assignment of a textural score will need to be modified because of the specific preference of a crop for a particular textural class. For example, asparagus prefers a soil with a sandy loam texture and so the textural score is raised by 0.5 from a score of 1 to 1.5 based on the specific textural preference of the plant.
C
ImportanceISOIL TEXTURE defines the size of the mineral particles. Specifically, it refers to the relative proportion of the various size-groups in the soil, i.e. sand, silt and clay. Sand is that fraction that has a particle size >0.06 mm; silt varies between 0.06 and 0.002 mm; and the particle size of clay is <0.002 mm. Texture influences soil behaviour in several ways, notably through its effect on: water retention and availability; soil structure; aeration; drainage; soil workability and trafficability; soil life; and the supply and retention of nutrients.
A knowledge of both the textural class and the potential rooting depth enables an approximate assessment of the total water-holding capacity of the soil, one of the major drivers of crop production.

3
VINEYARDS | OLIVE ORCHARDS | ORCHARDS | WHEAT | MAIZE | ANNUAL CROPS | PASTURE
FIGURE 2 Soil texture classes and groups
Textural classes.
Textural groups.
TABLE 1 How to score soil texture
Visual score(VS)
Textural class Description
2[Good]
Silt loamSmooth soapy feel, slightly sticky, no grittiness. Moulds into a cohesive ball that fissures when pressed flat.
1.5[Moderately good]
Clay loamVery smooth, sticky and plastic. Moulds into a cohesive ball that deforms without fissuring.
1[Moderate]
Sandy loam Slightly gritty, faint rasping sound. Moulds into a cohesive ball that fissures when pressed flat.
0.5[Moderately poor]
Loamy sandSilty clay
Clay
Loamy sand: Gritty and rasping sound. Will almost mould into a ball but disintegrates when pressed flat.Silty clay, clay: Very smooth, very sticky, very plastic. Moulds into a cohesive ball that deforms without fissuring.
0[Poor]
SandGritty and rasping sound. Cannot be moulded into a ball.

4
VISUAL SOIL ASSESSMENTso
il st
ruct
ure
AssessmentC
ImportanceI
å Remove a 200-mm cube of topsoil with a spade (between or along wheel tracks).ç Drop the soil sample a maximum of three times from a height of 1 m onto the firm base
in the plastic basin. If large clods break away after the first or second drop, drop them individually again once or twice. If a clod shatters into small (primary structural) units after the first or second drop, it does not need dropping again. Do not drop any piece of soil more than three times. For soils with a sandy loam texture (Table 1), drop the cube of soil just once only from a height of 0.5 m.
é Transfer the soil onto the large plastic bag.è For soils with a loamy sand or sand texture, drop the cube of soil still sitting on the spade (once)
from a height of just 50 mm, and then roll the spade over, spilling the soil onto the plastic bag.ê Applying only very gently pressure, attempt to part each clod by hand along any exposed
cracks or fissures. If the clod does not part easily, do not apply further pressure (because the cracks and fissures are probably not continuous and, therefore, are unable to readily conduct oxygen, air and water).
ë Move the coarsest fractions to one end and the finest to the other end. Arrange the distribution of aggregates on the plastic bag so that the height of the soil is roughly the same over the whole surface area of the bag. This provides a measure of the aggregate-size distribution. Compare the resulting distribution of aggregates with the three photographs in Plate 2 and the criteria given.The method is valid for a wide range of moisture conditions but is best carried out when the soil is moist to slightly moist; avoid dry and wet conditions.
SOIL STRUCTURE is extremely important for grain crops. It regulates:< soil aeration and gaseous exchange rates;< soil temperature;< soil infiltration and erosion;< the movement and storage of water;< nutrient supply;< root penetration and development;< soil workability;< soil trafficability;< the resistance of soils to structural degradation.
Good soil structure reduces the susceptibility to compaction under wheel traffic and increases the window of opportunity for vehicle access and for carrying out no-till, minimum-till, controlled traffic or conventional cultivation under optimal soil conditions.
Soil structure is ranked on the size, shape, firmness, porosity and relative abundance of soil aggregates and clods. Soils with good structure have friable, fine, porous, subangular and subrounded (nutty) aggregates. Those with poor structure have large, dense, very firm, angular or subangular blocky clods that fit and pack closely together and have a high tensile strength.

5
VINEYARDS | OLIVE ORCHARDS | ORCHARDS | WHEAT | MAIZE | ANNUAL CROPS | PASTURE
PLATE 2 How to score soil structure
GOOD CONDITION VS = 2Soil dominated by friable, fineaggregates with no significant clodding.Aggregates are generally subrounded(nutty) and often quite porous.
MODERATE CONDITION VS = 1Soil contains significant proportions(50%) of both coarse clods and friablefine aggregates. The coarse clods arefirm, subangular or angular in shape andhave few or no pores.
POOR CONDITION VS = 0Soil dominated by coarse clodswith very few finer aggregates. Thecoarse clods are very firm, angular orsubangular in shape and have very fewor no pores.

6
VISUAL SOIL ASSESSMENTso
il po
rosi
ty
AssessmentC
ImportanceI
å Remove a spade slice of soil (about 100 mm wide, 150 mm long and 200 mm deep) from the side of the hole and break it in half.
ç Examine the exposed fresh face of the sample for soil porosity by comparing against the three photographs in Plate 3. Look for the spaces, gaps, holes, cracks and fissures between and within soil aggregates and clods.
é Examine also the porosity of a number of the large clods from the soil structure test. This provides important additional information as to the porosity of the individual clods (the intra-aggregate porosity).
It is important to assess SOIL POROSITY along with the structure of the soil. Soil porosity, and particularly macroporosity (or large pores), influences the movement of air and water in the soil. Soils with good structure have a high porosity between and within aggregates, but soils with poor structure may not have macropores and coarse micropores within the large clods, restricting their drainage and aeration.
Poor aeration leads to the build up of carbon dioxide, methane and sulphide gases, and reduces the ability of plants to take up water and nutrients, particularly nitrogen (N), phosphorus (P), potassium (K) and sulphur (S). Plants can only utilize S and N in the oxygenated sulphate (SO
42-), nitrate (NO
3-) and ammonium (NH
4+) forms. Therefore,
plants require aerated soils for the efficient uptake and utilization of S and N. The number, activity and biodiversity of micro-organisms and earthworms are also greatest in well-aerated soils and they are able to decompose and cycle organic matter and nutrients more efficiently.
The presence of soil pores enables the development and proliferation of the superficial (or feeder) roots throughout the soil. Roots are unable to penetrate and grow through firm, tight, compacted soils, severely restricting the ability of the plant to utilize the available water and nutrients in the soil. A high penetration resistance not only limits plant uptake of water and nutrients, it also reduces fertilizer efficiency considerably and increases the susceptibility of the plant to root diseases.
Soils with good porosity will also tend to produce lower amounts of greenhouse gases. The greater the porosity, the better the drainage, and, therefore, the less likely it is that the soil pores will be water-filled to the critical levels required to accelerate the production of greenhouse gases. Aim to keep the soil porosity score above 1.

7
VINEYARDS | OLIVE ORCHARDS | ORCHARDS | WHEAT | MAIZE | ANNUAL CROPS | PASTURE
PLATE 3 How to score soil porosity
GOOD CONDITION VS = 2Soils have many macropores and coarsemicropores between and within aggregatesassociated with good soil structure.
MODERATE CONDITION VS = 1Soil macropores and coarse microporesbetween and within aggregates have declinedsignificantly but are present on closeexamination in parts of the soil. The soil showsa moderate amount of consolidation.
POOR CONDITION VS = 0No soil macropores and coarse microporesare visually apparent within compact,massive structureless clods. The clodsurface is smooth with few or no cracks orholes, and can have sharp angles.

8
VISUAL SOIL ASSESSMENTso
il co
lour AssessmentC
ImportanceI
å Compare the colour of a handful of soil from the field site with soil taken from under the nearest fenceline or a similar protected area.
ç Using the three photographs and criteria given (Plate 4), compare the relative change in soil colour that has occurred.
As topsoil colour can vary markedly between soil types, the photographs illustrate the degree of change in colour rather than the absolute colour of the soil.
SOIL COLOUR is a very useful indicator of soil quality because it can provide an indirect measure of other more useful properties of the soil that are not assessed so easily and accurately. In general, the darker the colour is, the greater is the amount of organic matter in the soil. A change in colour can give a general indication of a change in organic matter under a particular land use or management. Soil organic matter plays an important role in regulating most biological, chemical and physical processes in soil, which collectively determine soil health. It promotes infiltration and retention of water, helps to develop and stabilize soil structure, cushions the impact of wheel traffic and cultivators, reduces the potential for wind and water erosion, and indicates whether the soil is functioning as a carbon ‘sink’ or as a source of greenhouse gases. Organic matter also provides an important food resource for soil organisms and is an important source of, and major reservoir of, plant nutrients. Its decline reduces the fertility and nutrient-supplying potential of the soil; N, P, K and S requirements of crops increase markedly, and other major and minor elements are leached more readily. The result is an increased dependency on fertilizer input to maintain nutrient status.
Soil colour can also be a useful indicator of soil drainage and the degree of soil aeration. In addition to organic matter, soil colour is influenced markedly by the chemical form (or oxidation state) of iron (Fe) and manganese (Mn). Brown, yellow-brown, reddish-brown and red soils without mottles indicate well-aerated, well-drained conditions where Fe and Mn occur in the oxidized form of ferric (Fe3+) and manganic (Mn3+) oxides. Grey-blue colours can indicate that the soil is poorly drained or waterlogged and poorly aerated for long periods, conditions that reduce Fe and Mn to ferrous (Fe2+) and manganous (Mn2+) oxides. Poor aeration and prolonged waterlogging give rise to a further series of chemical and biochemical reduction reactions that produce toxins, such as hydrogen sulphide, carbon dioxide, methane, ethanol, acetaldehyde and ethylene, that damage the root system. This reduces the ability of plants to take up water and nutrients, causing poor vigour and ill-thrift. Decay and dieback of roots can also occur as a result of pests and diseases, including Rhizoctonia, Pythium and Fusarium root rot in soils prone to waterlogging.

9
VINEYARDS | OLIVE ORCHARDS | ORCHARDS | WHEAT | MAIZE | ANNUAL CROPS | PASTURE
PLATE 4 How to score soil colour
GOOD CONDITION VS = 2Dark coloured topsoil that is not toodissimilar to that under the fenceline.
MODERATE CONDITION VS = 1The colour of the topsoil is somewhatpaler than that under the fenceline, butnot markedly so.
POOR CONDITION VS = 0Soil colour has become significantly palercompared with that under the fenceline.

10
VISUAL SOIL ASSESSMENTnu
mbe
r an
d co
lour
of s
oil m
ottl
es AssessmentC
ImportanceI
å Take a sample of soil (about 100 mm wide × 150 mm long × 200 mm deep) from the side of the hole and compare with the three photographs (Plate 5) and the percentage chart to determine the percentage of the soil occupied by mottles.
Mottles are spots or blotches of different colour interspersed with the dominant soil colour.
The NUMBER AND COLOUR OF SOIL MOTTLES provide a good indication of how well the soil is drained and how well it is aerated. They are also an early warning of a decline in soil structure caused by compaction under wheel traffic and overcultivation. The loss of soil structure reduces the number of channels and pores that conduct water and air and, as a consequence, can result in waterlogging and a deficiency of oxygen for a prolonged period. The development of anaerobic (deoxygenated) conditions reduces Fe and Mn from their brown/orange oxidized ferric (Fe3+) and manganic (Mn3+) form to grey ferrous (Fe2+) and manganous (Mn2+) oxides. Mottles develop as various shades of orange and grey owing to varying degrees of oxidation and reduction of Fe and Mn. As oxygen depletion increases, orange, and ultimately grey, mottles predominate. An abundance of grey mottles indicates the soil is poorly drained and poorly aerated for a significant part of the year. The presence of only common orange and grey mottles (10–25 percent) indicates the soil is imperfectly drained with only periodic waterlogging. Soil with only few to common orange mottles indicates the soil is moderately well drained, and the absence of mottles indicates good drainage.
Poor aeration reduces the uptake of water by plants and can induce wilting. It can also reduce the uptake of plant nutrients, particularly N, P, K, S and Cu. Moreover, poor aeration retards the breakdown of organic residues, and can cause chemical and biochemical reduction reactions that produce sulphide gases, methane, ethanol, acetaldehyde and ethylene, which are toxic to plant roots. In addition, decay and dieback of roots can occur as a result of fungal diseases such as Rhizoctonia, Pythium and Fusarium root rot, foot rot and crown rot in soils that are strongly mottled and poorly aerated. Fungal diseases and reduced nutrient and water uptake give rise to poor plant vigour and ill-thrift. If your visual score for mottles is ≤1, you need to aerate the soil.

11
VINEYARDS | OLIVE ORCHARDS | ORCHARDS | WHEAT | MAIZE | ANNUAL CROPS | PASTURE
PLATE 5 How to score soil mottles
GOOD CONDITION VS = 2Mottles are generally absent.
MODERATE CONDITION VS = 1Soil has common (10–25%) fine andmedium orange and grey mottles.
POOR CONDITION VS = 0Soil has abundant to profuse (> 50%)medium and coarse orange and particularlygrey mottles.

12
VISUAL SOIL ASSESSMENTea
rthw
orm
s
AssessmentC
ImportanceI
å Count the earthworms by hand, sorting through the soil sample used to assess soil structure (Plate 7) and compare with the class limits in Table 2. Pay particular attention to the turf mat. Earthworms vary in size and number depending on the species and the season. Therefore, for year-to-year comparisons, earthworm counts must be made at the same time of year when soil moisture and temperature levels are good. Earthworm numbers are reported as the number per 200-mm cube of soil. Earthworm numbers are commonly reported on a square-metre basis. A 200-mm cube sample is equivalent to 1/25 m2, and so the number of earthworms needs to be multiplied by 25 to convert to numbers per square metre.
EARTHWORMS provide a good indicator of the biological health and condition of the soil because their population density and species are affected by soil properties and management practices. Through their burrowing, feeding, digestion and casting, earthworms have a major effect on the chemical, physical and biological properties of the soil. They shred and decompose plant residues, converting them to organic matter, and so releasing mineral nutrients. Compared with uningested soil, earthworm casts can contain 5 times as much plant available N, 3–7 times as much P, 11 times as much K, and 3 times as much Mg. They can also contain more Ca and plant-available Mo, and have a higher pH, organic matter and water content. Moreover, earthworms act as biological aerators and physical conditioners of the soil, improving:< soil porosity;< aeration;< soil structure and the stability of soil aggregates;< water retention;< water infiltration;< drainage.
They also reduce surface runoff and erosion. They further promote plant growth by secreting plant-growth hormones and increasing root density and root development by the rapid growth of roots down nutrient-enriched worm channels. While earthworms can deposit about 25–30 tonnes of casts/ha/year on the surface, 70 percent of their casts are deposited below the surface of the soil. Therefore, earthworms play an important role in arable cropping and can increase growth rates and production significantly.
Earthworms also increase the population, activity and diversity of soil microbes. Actinomycetes increase 6–7 times during the passage of soil through the digestive tract of the worm and, along with other microbes, play an important role in the decomposition of organic matter to humus. Soil microbes such as mycorrhizal fungi play a further role in the supply of nutrients, digesting soil and fertilizer and unlocking nutrients, such as P, that are fixed by the soil. Microbes also retain significant amounts of nutrients in their biomass, releasing them when they die. Moreover, soil microbes produce plant-growth hormones and compounds that

13
VINEYARDS | OLIVE ORCHARDS | ORCHARDS | WHEAT | MAIZE | ANNUAL CROPS | PASTURE
stimulate root growth and promote the structure, aeration, infiltration and water-holding capacity of the soil. Micro-organisms further encourage a lower incidence of pests and diseases, and promote a more rapid breakdown of organic herbicides. The collective benefits of microbes can increase crop production markedly while at the same time reducing fertilizer requirements.
Earthworm numbers (and biomass) are governed by the amount of food available as organic matter and soil microbes, as determined by the amount and quality of surface residue (Plate 6a), the use of cover crops including legumes, and the cultivation of interrows. Earthworm populations can be up to three times higher in undisturbed soils compared with cultivated soils. Earthworm numbers are also governed by: soil moisture, temperature, texture, soil aeration, pH, soil nutrients (including levels of Ca), and the type and amount of fertilizer and N used. The overuse of acidifying salt-based fertilizers, anhydrous ammonia and ammonia-based products, and some insecticides and fungicides can further reduce earthworm numbers.
Soils should have a good diversity of earthworm species with a combination of: (i) surface feeders that live at or near the surface to breakdown plant residues and dung; (ii) topsoil-dwelling species that burrow, ingest and mix the top 200–300 mm of soil; and (iii) deep-burrowing species that pull down and mix plant litter and organic matter at depth.
Earthworms species can further indicate the overall condition of the soil. For example, significant numbers of yellow-tail earthworms (Octolasion cyaneum – Plate 6b) can indicate adverse soil conditions.
PLATE 6 (a): earthworm casts under crop residue; (b): yellow-tail earthworm (Octolasion cyaneum)
PLATE 7 Sample for assessing earthworms
TABLE 2 Visual scores for earthworms
Visual score(VS)
Earthworm numbers(per 200-mm cube of soil)
2[Good]
> 30 (with preferably 3 or more species)
1[Moderate]
15–30 (with preferably 2 or more species)
0[Poor]
< 15 (with predominantly 1 species)

14
VISUAL SOIL ASSESSMENTpo
tent
ial r
ooti
ng d
epth
AssessmentC
ImportanceI
å Dig a hole to identify the depth to a limiting (restricting) layer where present (Plate 8), and compare with the class limits in Table 3. As the hole is being dug, note the presence of roots and old root channels, worm channels, cracks and fissures down which roots can extend. Note also whether there is an over-thickening of roots (a result of a high penetration resistance), and whether the roots are being forced to grow horizontally, otherwise known as right-angle syndrome. Moreover, note the firmness and tightness of the soil, whether the soil is grey and strongly gleyed owing to prolonged waterlogging, and whether there is a hardpan present such as a human-induced tillage or plough pan, or a natural pan such as an iron, siliceous or calcitic pan (pp 16–17). An abrupt transition from a fine (heavy) material to a coarse (sandy/gravelly) layer will also limit root development. A rough estimate of the potential rooting depth may be made by noting the above properties in a nearby road cutting or an open drain.
The POTENTIAL ROOTING DEPTH is the depth of soil that plant roots can potentially exploit before reaching a barrier to root growth, and it indicates the ability of the soil to provide a suitable rooting medium for plants. The greater is the rooting depth, the greater is the available-water-holding capacity of the soil. In drought periods, deep roots can access larger water reserves, thereby alleviating water stress and promoting the survival of non-irrigated crops. The exploration of a large volume of soil by deep roots means that they can also access more macronutrients and micronutrients, thereby accelerating the growth and enhancing the yield and quality of the crop. Conversely, soils with a restricted rooting depth caused by, for example, a layer with a high penetration resistance such as a compacted layer or a hardpan, restrict vertical root growth and development, causing roots to grow sideways. This limits plant uptake of water and nutrients, reduces fertilizer efficiency, increases leaching, and decreases yield. A high resistance to root penetration can also increase plant stress and the susceptibility of the plant to root diseases. Moreover, hardpans impede the movement of air, oxygen and water through the soil profile, the last increasing the susceptibility to waterlogging and erosion by rilling and sheet wash.
The potential rooting depth can be restricted further by:< an abrupt textural change;< pH;< aluminium (Al) toxicity;< nutrient deficiencies;< salinity;< sodicity;< a high or fluctuating water table;< low oxygen levels.

15
VINEYARDS | OLIVE ORCHARDS | ORCHARDS | WHEAT | MAIZE | ANNUAL CROPS | PASTURE
Anaerobic (anoxic) conditions caused by deoxygenation and prolonged waterlogging restrict the rooting depth as a result of the accumulation of toxic levels of hydrogen sulphide, ferrous sulphide, carbon dioxide, methane,
ethanol, acetaldehyde and ethylene, by-products of
chemical and biochemical reduction reactions.
Crops with a deep, vigorous root system help to raise soil organic matter levels and soil life at depth. The physical action of the roots and soil fauna and the glues they produce, promote soil structure, porosity, water storage, soil aeration and drainage at depth. A deep, dense root system provides huge scope for raising production while at the same time having significant environmental benefits. Crops are less reliant on frequent and high application rates of fertilizer and N to generate growth, and available nutrients are more likely to be taken up, so reducing losses by leaching into the environment.
TABLE 3 Visual scores for potential rooting depth
VSA score(VS)
Potential rooting depth(m)
2.0[Good]
> 0.8
1.5[Moderately good]
0.6–0.8
1.0[Moderate]
0.4–0.6
0.5[Moderately poor]
0.2–0.4
0[Poor]
< 0.2
PLATE 8 Hole dug to assess the potential rooting depth
The potential rooting depth extends tothe bottom of the arrow, below which thesoil is extremely firm and very tight withno roots or old root channels, no wormchannels and no cracks and fissures downwhich roots can extend.

16
VISUAL SOIL ASSESSMENT
Assessmentå Examine for the presence of a hardpan by rapidly jabbing the side of the soil profile
(that was dug to assess the potential rooting depth) with a knife, starting at the top and progressing systematically and quickly down to the bottom of the hole (Plate 9). Note how easy or difficult it is to jab the knife into the soil as you move rapidly down the profile. A strongly developed hardpan is very tight and extremely firm, and it has a high penetration resistance to the knife. Pay particular attention to the lower topsoil and upper subsoil where tillage pans and plough pans commonly occur if present (Plate 10).
ç Having identified the possible presence of a hardpan by a significant increase in penetration resistance to the point of a knife, gauge how strongly developed the hardpan is. Remove a large hand-sized sample and assess its structure, porosity and the number and colour of soil mottles (Plates 2, 3 and 5), and also look for the presence of roots. Compare with the photographs and criteria given in Plate 10.
PLATE 9 Using a knife to determine the presence or absence of a hardpan
Identifying the presence of a hardpan

17
VINEYARDS | OLIVE ORCHARDS | ORCHARDS | WHEAT | MAIZE | ANNUAL CROPS | PASTURE
PLATE 9 Using a knife to determine the presence or absence of a hardpan
PLATE 10 Identifying the presence of a hardpan
NO HARDPANThe soil has a low penetration resistanceto the knife. Roots, old root channels,worm channels, cracks and fissures may becommon. Topsoils are friable with a readilyapparent structure and have a soil porosityscore of ≥1.5.
MODERATELY DEVELOPED HARDPANThe soil has a moderate penetrationresistance to the knife. It is firm (hard)with a weakly apparent soil structure andhas a soil porosity score of 0.5–1. Thereare few roots and old root channels,few worm channels, and few cracksand fissures. The pan may have few tocommon orange and grey mottles. Notethe moderately developed tillage pan inthe lower half of the topsoil (arrowed).
STRONGLY DEVELOPED HARDPANThe soil has a high penetration resistanceto the knife. It is very tight, extremelyfirm (very hard) and massive (i.e. with noapparent soil structure) and has a soilporosity score of 0. There are no roots orold root channels, no worm channels orcracks or fissures. The pan may have manyorange and grey mottles. Note the stronglydeveloped tillage pan in the lower half ofthe topsoil (arrowed).

18
VISUAL SOIL ASSESSMENTsu
rfac
e po
ndin
g
AssessmentC
ImportanceI
å Assess the degree of surface ponding (Plate 11) based on your observation or general recollection of the time ponded water took to disappear after a wet period during the spring, and compare with the class limits in Table 4.
SURFACE PONDING and the length of time water remains on the surface can indicate the rate of infiltration into and through the soil, a high water table, and the time the soil remains saturated. Prolonged waterlogging depletes oxygen in the soil causing anaerobic (anoxic) conditions that induce root stress, and restrict root respiration and the growth of roots. Roots need oxygen for respiration. They are most vulnerable to surface ponding and saturated soil conditions in the spring when plant roots and shoots are actively growing at a time when respiration and transpiration rates rise markedly and oxygen demands are high. They are also susceptible to ponding in the summer when transpiration rates are highest. Moreover, waterlogging causes the death of fine roots responsible for nutrient and water uptake. Reduced water uptake while the crop is transpiring actively causes leaf desiccation and the plant to wilt. Prolonged waterlogging also increases the likelihood of pests and diseases, including Rhizoctonia, Pythium and Fusarium root rot, and reduces the ability of roots to overcome the harmful effects of topsoil-resident pathogens. Plant stress induced by poor aeration and prolonged soil saturation can render crops less resistant to insect pest attack such as aphids, armyworm, cutworm and wireworm. Crops decline in vigour, have restricted spring growth (RSG) as evidenced by poor shoot and stunted growth, become discoloured and die.
Waterlogging and deoxygenation also results in a series of undesirable chemical and biochemical reduction reactions, the by-products of which are toxic to roots. Plant-available nitrate-nitrogen (NO
3-) is reduced by denitrification to nitrite (NO
2-) and nitrous
oxide (N2O), a potent greenhouse gas, and plant-available sulphate-sulphur (SO
42-) is
reduced to sulphide, including hydrogen sulphide (H2S), ferrous sulphide (FeS) and zinc
sulphide (ZnS). Iron is reduced to soluble ferrous (Fe2+) ions, and Mn to manganous (Mn2+) ions. Apart from the toxic products produced, the result is a reduction in the amount of plant-available N and S. Anaerobic respiration of micro-organisms also produces carbon dioxide and methane (also greenhouse gases), hydrogen gas, ethanol, acetaldehyde and ethylene, all of which inhibit root growth when accumulated in the soil. Unlike aerobic respiration, anaerobic respiration releases insufficient energy in the form of adenosine triphosphate (ATP) and adenylate energy charge (AEC) for microbial and root/shoot growth.

19
VINEYARDS | OLIVE ORCHARDS | ORCHARDS | WHEAT | MAIZE | ANNUAL CROPS | PASTURE
The tolerance of the root system to surface ponding and waterlogging is dependent on a number of factors, including the time of year and the type of crop. Tolerance of waterlogging is also dependent on: soil and air temperatures; soil type; the condition of the soil; fluctuating water tables; and the rate of onset and severity of anaerobiosis (or anoxia), a factor governed by the initial soil oxygen content and oxygen consumption rate.
Prolonged surface ponding makes the soil more susceptible to damage under wheel traffic, so reducing vehicle access. As a consequence, waterlogging can delay ground preparation and sowing dates significantly. Sowing can further be delayed because the seed bed is below the crop-specific critical temperature. Increases in the temperature of saturated soils can be delayed as long as water is evaporating.
TABLE 4 Visual scores for surface ponding
VSA score(VS)
Surface ponding due to soil saturation
Number of daysof ponding *
Description
2[Good]
≤1No evidence of surface ponding after 1 day following heavy rainfall on soils that were already at or near saturation.
1[Moderate]
2–3Moderate surface ponding occurs for 2–3 days after heavy rainfall on soils that were already at or near saturation.
0[Poor]
>5Significant surface ponding occurs for longer than 5 days after heavy rainfall on soils that were already at or near saturation.
* Assuming little or no air is trapped in the soil at the time of ponding.
PLATE 11 Surface ponding in a wheat field

20
VISUAL SOIL ASSESSMENTsu
rfac
e cr
usti
ng a
nd s
urfa
ce c
over
AssessmentC
ImportanceI
å Observe the degree of surface crusting and surface cover and compare Plate 12 and the criteria given. Surface crusting is best assessed after wet spells followed by a period of drying, and before cultivation.
SURFACE CRUSTING reduces infiltration of water and water storage in the soil and increases runoff. Surface crusting also reduces aeration, causing anaerobic conditions, and prolongs water retention near the surface, which can hamper access by machinery for months. Crusting is most pronounced in fine-textured, poorly structured soils with a low aggregate stability and a dispersive clay mineralogy.
SURFACE COVER after harvesting and prior to canopy closure of the next crop helps to prevent crusting by minimizing the dispersion of the soil surface by rain or irrigation. It also helps to reduce crusting by intercepting the large rain droplets before they can strike and compact the soil surface. Vegetative cover and its root system return organic matter to the soil and promote soil life, including earthworm numbers and activity. The physical action of the roots and soil fauna and the glues they produce promote the development of soil structure, soil aeration and drainage and help to break up surface crusting. As a result, infiltration rates and the movement of water through the soil increase, decreasing runoff, soil erosion and the risk of flash flooding. Surface cover also reduces soil erosion by intercepting high impact raindrops, minimizing rain-splash and saltation. It further serves to act as a sponge, retaining rainwater long enough for it to infiltrate into the soil. Moreover, the root system reduces soil erosion by stabilizing the soil surface, holding the soil in place during heavy rainfall events. As a result, water quality downstream is improved with a lower sediment loading, nutrient and coliform content. The adoption of conservation tillage can reduce soil erosion by up to 90 percent and water runoff by up to 40 percent. The surface needs to have at least 70 percent cover in order to give good protection, while ≤30 percent cover provides poor protection. Surface cover also reduces the risk of wind erosion markedly.

21
VINEYARDS | OLIVE ORCHARDS | ORCHARDS | WHEAT | MAIZE | ANNUAL CROPS | PASTURE
PLATE 12 How to score surface crusting and surface cover
GOOD CONDITION VS = 2Little or no surface crusting is present; orsurface cover is ≥70%.
MODERATE CONDITION VS = 1Surface crusting is 2–3 mm thick and isbroken by signifi cant cracking; or surfacecover is >30% and <70%.
POOR CONDITION VS = 0Surface crusting is >5 mm thick and isvirtually continuous with little cracking;or surface cover is ≤30%.
Surface cover photos: courtesy of A. Leys

22
VISUAL SOIL ASSESSMENTso
il er
osio
n
AssessmentC
ImportanceI
å Assess the degree of soil erosion based on current visual evidence and on your knowledge of what the site looked like in the past relative to Plate 13.
SOIL EROSION reduces the productive potential of soils through nutrient losses, loss of organic matter, reduced potential rooting depth, and lower available-water-holding capacity. Soil erosion can also have significant off-site effects, including reduced water quality through increased sediment, nutrient and coliform loading in streams and rivers.
Overcultivation can cause considerable soil degradation associated with the loss of soil organic matter and soil structure. It can also develop surface crusting, tillage pans, and decrease infiltration and permeability of water through the soil profile (causing increased surface runoff ). If the soil surface is left unprotected on sloping ground, large quantities of soil can be water eroded by gullying, rilling and sheet wash. The cost of restoration, often requiring heavy machinery, can be prohibitively expensive.
The water erodibility of soil on sloping ground is governed by a number of factors including:< the percentage of vegetative cover on the soil surface;< the amount and intensity of rainfall;< the soil infiltration rate and permeability of water through the soil;< the slope and the nature of the underlying subsoil strata and bedrock.
The loss of organic matter and soil structure as a result of overcultivation can also give rise to significant soil loss by wind erosion of exposed ground.

23
VINEYARDS | OLIVE ORCHARDS | ORCHARDS | WHEAT | MAIZE | ANNUAL CROPS | PASTURE
PLATE 13 How to score soil erosion
GOOD CONDITION VS = 2Little or no water erosion. Topsoil depths inthe footslope areas are <150 mm deeperthan on the crest.Wind erosion is not a concern; only smalldust plumes emanate from the cultivatoron a windy day. Most wind-eroded material iscontained in the fi eld.
MODERATE CONDITION VS = 1Water erosion is a moderate concern witha signifi cant amount of rilling and sheeterosion. Topsoil depths in the footslopeareas are 150–300 mm greater than oncrests, and sediment input into drains/streams may be signifi cant.Wind erosion is of moderate concernwhere signifi cant dust plumes canemanate from the cultivator on windydays. A considerable amount of materialis blown off the fi eld but is containedwithin the farm.
POOR CONDITION VS = 0Water erosion is a major concern withsevere gullying, rilling and sheet erosionoccurring. Topsoils in footslope areas aremore than 300 mm deeper than on thecrests, and sediment input into drains/streams may be high.Wind erosion is a major concern. Largedust clouds can occur when cultivatingon windy days. A substantial amountof topsoil can be lost from the fi eld anddeposited elsewhere in the district.
Water erosion photos: courtesy of J. Quinton and A. Leys


25
VINEYARDS | OLIVE ORCHARDS | ORCHARDS | WHEAT | MAIZE | ANNUAL CROPS | PASTURE
�������������������������������������
���������������������������������������������������������������������������
��������� ����������
������������������ ���
��������� ���
����������� ���
���������������� ���
�����������������������������������������
�������
������������������������
������
���������������������������������������
������������������������������
�������������������
���� ����
�������� �����
���� ����
��������������������������������� ������������������������������������������������
��������������� ����������������
��������������������������������������������������������������������������������������
�������������������������������������������� ���
������
������
������
������
������
������������� ���������
�������������������������������� ���������
����������� ���������
���������� ���������
���������������� ���������

26
VISUAL SOIL ASSESSMENTcr
op e
stab
lishm
ent
AssessmentC
ImportanceIGOOD SEED GERMINATION, PLANT EMERGENCE AND CROP ESTABLISHMENT depend on factors that include the quality of soil tilth at the time of sowing and during the weeks immediately following. Soils that have poor structure through compaction and over-cultivation can resettle and consolidate rapidly after the seed bed has been prepared. Impeded water and air movement through the soil can give rise to increased soil-borne pathogens and areas low in oxygen (anaerobic zones). Anaerobic zones produce chemical and biochemical reduction reactions, the by-products of which are toxic to plants. Poor soil aeration and soil-borne pathogens can give rise to poor germination, poor pre- and post emergence, poor plant vigour and even death. While emergence may be slow, recovery can also be limited and plants often appear sickly. Poor plant emergence, bare patches and poor and uneven early leaf and tiller growth are commonly observed throughout paddocks and result in crop thinning and low plant populations. Young plants can also show discolouration of leaves, leaf blemishes and moisture stress.
The loss of soil condition can reduce crop establishment from 300 to 130 plants/m2 and grain yields from 8 to 5 tonnes per hectare. Seedling mortality can be high if the soil is waterlogged for more than 3 to 4 days between germination and emergence.
å Assess the degree and uniformity of crop establishment within a month of sowing by comparing the number and height of established plants with the three photographs provided (Plate 14).

27
VINEYARDS | OLIVE ORCHARDS | ORCHARDS | WHEAT | MAIZE | ANNUAL CROPS | PASTURE
PLATE 14 How to score crop establishment
GOOD CONDITION VS = 2Good emergence and crop establishment, with few gaps along the row and crop showing a good even height.
MODERATE CONDITION VS = 1Moderate emergence and crop establishment, with a significant number of gaps along the row and a significant variation in seedlingheight. Emergence may also be moderately slow but recovers somewhat.
POOR CONDITION VS = 0Poor emergence and crop establishment, with a large number of gaps along the row and a large variation in seedling height. Emergence may also be slow with limited recovery and plants often appear sickly.

28
VISUAL SOIL ASSESSMENTti
lleri
ng AssessmentC
ImportanceITHE NUMBER OF TILLERS play a fundamental role in determining the number of ears (spikes) per square metre and consequently the final yield. The potential number of tillers varies with the genotype, particularly among winter genotypes which have the greatest number. The new semi-dwarf wheat varieties normally have 2–3 tillers per plant to permit the development and grouping of tillers and ears that are contemporary, i.e. are equal in all vegetative, reproductive and ripening stages in order to maximise yields. Although this character is genetically determined and strongly influenced by planting density, it is also an expression of plant vigour and general plant growth which are firstly regulated by nutrient and water availability and the condition of the soil.
Soils in good health with good structure, porosity, organic matter levels, soil life, soil fertility and rooting depth favour the release and uptake of water and nutrients and subsequently the development of a greater number of tillers and there contemporary development.
å Measure the number of tillers at the end of the tillering stage and compare with the photographs (Plate 15) and class limits below.

29
VINEYARDS | OLIVE ORCHARDS | ORCHARDS | WHEAT | MAIZE | ANNUAL CROPS | PASTURE
PLATE 15 How to score tillering
GOOD CONDITION VS = 2Depending on the cultivar the plant has 3 well developed tillers with little variability compared to the main stem (i.e., main culm).
MODERATE CONDITION VS = 1Depending on the cultivar the plant has 2–3 tillers with moderate variability compared to the main stem (or culm).
POOR CONDITION VS = 0The plant has 1 or no tillers at all with significant differences in terms of development to the main stem (or culm).

30
VISUAL SOIL ASSESSMENTle
af c
olou
r
AssessmentC
ImportanceILEAF COLOUR prior to completion of grain filling can provide a good indication of the water and nutrient status and condition of the soil. Under normal environmental conditions the higher the soil fertility, the greener the crop. Plant vigour and colour is strongly related to soil water and nutrient availability, especially nitrogen (N). Discolouration of the foliar and blemishes on the leaf can also result from a deficiency or excess of phosphorus (P), potassium (K), sulphur (S), magnesium (Mg), manganese (Mn), zinc (Zn), copper (Cu) and boron (B) – Plate 17. Chlorosis (or yellowing of crops) due to the inadequate formation of chlorophyll, commonly occurs as a result of low N, K, S, Fe, Mg and Cu levels in the soil, low soil and air temperatures, prolonged cloudy days and poor soil aeration due to compaction and waterlogging.
Nutrient deficiencies or excesses can suppress the availability of other nutrients. For example, high P levels can suppress the uptake of Zn and Cu. Excess N can suppress B and Cu and cause the plant to luxury feed on K. Sulphur can also only be utilised by the plant in the sulphate (SO
42-) form. Under poorly aerated conditions sulphate-S will
reduce to sulphur dioxide (SO2) and sulphides (eg. hydrogen sulphide [H
2S], and ferrous
sulphide [FeS]). Sulphides and SO2 cannot be taken up by the plant, are toxic to plant roots
and micro organisms, and suppress the uptake of N. Plants can also only utilise N if S is present in the oxygenated (sulphate) form. Like S, N can only be utilised by the plant in the oxygenated nitrate (NO
3-) and ammonium (NH
4+) form under aerobic conditions.
The aeration status of the soil can further affect the uptake of nutrients. Phosphorus, copper and cobalt for example cannot be efficiently utilised by the plant under anaerobic conditions.
å Assess the leaf colour of the crop when all other factors favour rapid growth, and compare with the three photographs (Plate 16). In making the assessment, consideration must be given to the cultivar, the stage of growth, the soil moisture and temperature conditions, and the presence of pests and diseases (e.g. nematodes). The assessment can be done at any time prior to leaf senescence but ideally from four to six weeks after plant emergence to grain filling, avoiding very cold and wet weather.

31
VINEYARDS | OLIVE ORCHARDS | ORCHARDS | WHEAT | MAIZE | ANNUAL CROPS | PASTURE
PLATE 16 How to score leaf colour
GOOD CONDITION VS = 2Leaf colour is uniformly deep green. The odd colour blemish on leaves may be apparent within a broad area.
MODERATE CONDITION VS = 1Leaf colour is yellowish green; i.e. has a distinct yellowish tinge. Few colour blemishes on leaves may occur within a wide area.
POOR CONDITION VS = 0Leaf colour is quite yellow over a wide area. Colour blemishes on leaves may commonly occur.

32
VISUAL SOIL ASSESSMENT
PLATE 17 Common symptoms of leaf discolouration due to nutrient deficiencies in wheat
Nitrogen deficiency on the left
Phosphorus deficiency
Potassium deficiency
Sulphur deficiency on the right

33
VINEYARDS | OLIVE ORCHARDS | ORCHARDS | WHEAT | MAIZE | ANNUAL CROPS | PASTURE
PLATE 17 Common symptoms of leaf discolouration due to nutrient deficiencies in wheat PLATE 17 Common symptoms of leaf discolouration due to nutrient deficiencies in wheat (cont’d)
Magnesium deficiency on the left
Manganese deficiency
Copper deficiency
Zinc deficiency

34
VISUAL SOIL ASSESSMENTva
riab
ility
of c
rop
perf
orm
ance
alo
ng th
e ro
w
AssessmentC
ImportanceIVARIABILITY OF CROP PERFORMANCE ALONG THE ROW can be a good visual indicator of the condition of the soil (Plates 18–21). In particular, the linear variability in crop performance can be strongly related to the availability of water and nutrients, and the texture of the soil (e.g. whether clayey, silty, loamy or sandy). Also, soils in good condition with good structure and porosity, and have a deep, well aerated root zone enable the unrestricted movement of air and water into and through the soil, the development and proliferation of superficial (feeder) roots, and unrestricted respiration and transpiration. Furthermore, soils with good organic matter levels and soil life show an active biological and chemical process, favouring the release and uptake of water and nutrients and consequently the growth and vigour of the crop.
The spatial variability of crop performance along the row is also a useful indicator because it highlights those areas of the field that are under-performing enabling a site specific investigation as to why and what remedial action may be taken. This may include variable rate application of fertiliser by GPS guided ground spreaders.
å Cast your eye along the row and observe any variability in crop performance (in terms of crop height, plant and leaf density, stem thickness, leaf colour) and compare with the class limits in the Table 5. In making the assessment, consideration must also be given to other factors that may affect the performance of a crop such as pest and disease attack that are not related to the condition of the soil.
PLATE 18 Variable crop performance due to soil aeration and wetness
Variable crop performance due to differences in soil aeration and soil wetness.

35
VINEYARDS | OLIVE ORCHARDS | ORCHARDS | WHEAT | MAIZE | ANNUAL CROPS | PASTURE
TABLE 5 Visual scores for variability of crop performance along the row
Visual score (VS) Variability of crop performance along the row
2 [Good] Crop performance is good and even along the row
1 [Moderate] Crop performance is moderately variable along the row
0 [Poor] Crop performance is extremely variable along the row
PLATE 19 Variable crop performance due to soil compaction
Variable crop performance due to differences in soil compaction.
PLATE 18 Variable crop performance due to soil aeration and wetness
PLATE 20 Variable crop performance due to an iron pan
Variable crop performance due to differences in rooting depth to an iron pan.
PLATE 21 Variable crop performance due to water repellency
Concentric rings of poor wheat growth due to severely water repellent (hydrophobic) soils. Areas of stronger wheat growth occur on non-water repellent soils.

36
VISUAL SOIL ASSESSMENTro
ot d
evel
opm
ent
Assessment
ImportanceITHE ROOT LENGTH AND ROOT DENSITY provides a good indication of the condition of the plant root system. Crops with deep roots and a high root density are able to explore and utilise a greater proportion of the soil for water and nutrients compared to crops with a shallow, thin root system. Tillering, ear development and grain filling is therefore likely to be greater, crops are less likely to suffer wind throw, and they will be less susceptible to drought stress. Crops with a dense, deep, vigorous root system are also more likely to raise soil organic matter levels and soil life at depth. The physical action of the roots and soil fauna, and the glues they produce promote the development of soil structure, soil aeration and drainage.
A deep, dense root system provides huge scope for raising production while at the same time having significant environmental benefits. Crops are less reliant on high application rates of fertiliser and nitrogen to generate growth, and available nutrients are more likely to be sapped up reducing losses by leaching into the groundwater and waterways.
Root length and density can be restricted by the mechanical impedance of roots and the lack of soil pores due to soil compaction or a hardpan. Restrictions can also occur due to low soil moisture, soil temperature and pH, aluminium toxicity, salinity, sodicity, nutrient deficiencies, low mycorrhizal fungi levels, soil-borne pathogens, a high or fluctuating water table and low oxygen levels. Anaerobic (anoxic) conditions due to prolonged water-logging and deoxygenation restrict root length and density as a result of the accumulation of toxic levels of sulphides, carbon dioxide, methane,
ethanol, acetaldehyde and ethylene,
by-products of chemical and biochemical reduction reactions (see pg 18).
å Examine the upper part of the hole dug to assess the potential rooting depth of the soil. With the help of a knife, carefully loosen the soil around the roots to expose the root system in-situ (Plate 22). Alternatively, dig out a 250–300 mm deep slice of soil around a group of plants and gently tap the sample against the edge of the hole to expose the root system. Use a knife to help loosen the soil if required. Assess both the length and the density of the roots and compare with the class limits in the Table 6. Root length and root density is best assessed at or just prior to crop maturity.
C

37
VINEYARDS | OLIVE ORCHARDS | ORCHARDS | WHEAT | MAIZE | ANNUAL CROPS | PASTURE
PLATE 22 Root development
Photo showing good root development in the upper 150 mm of soil only. The root distribution and root density in the 150–300 mm zone is poor.
TABLE 6 Visual scores for root development
Visual score (VS) Root development
2[Good]
Good root length and root density in the upper 250–300 mm of soil
1[Moderate]
Moderate root length & density in the upper 250–300 mm of soil
0[Poor]
Poor root length & density in the upper 250–300 mm of soil with the root system being restricted to limited areas

38
VISUAL SOIL ASSESSMENTro
ot d
isea
se Assessment
ImportanceIROOT DISEASES encouraged by the degradation of soil quality include take-all (G. graminis var. tritici), dryland root rot (Fusarium graminearum and many others), Rhizoctonia root rot (Rhizoctonia solani) and Pythium root rot (Pythium spp.) (Plates 23–26). Their presence can cause severe yield loss and reduction in grain quality. Symptoms of root diseases include pre- and post emergence plant death in seedlings resulting in crop thinning, stunting and reduced tillering, discolouration of and blemishes (lesions) on stems, tillers and leaves, bleached heads and premature death. Infected plants have sparse root development and characteristically a brown-black rot can be seen at the crown and extending to the base.
Poor soil aeration, soil saturation and high penetration resistance to root development due to soil structural degradation can increase root rot and soil-borne pathogens. They can also reduce the ability of the root system to overcome the harmful effects of pathogens resident in the topsoil.
The conservation of soil moisture, amelioration of soil compaction, the build up of organic matter and the promotion of good soil life (in terms of microbial biomass, diversity and activity) are factors that contribute to the development of healthy plants and the suppression of soil-borne diseases. They also help enable the plant to better resist the pressure of disease and insect attack. Soil biota and especially those micro-organisms that enhance cellulytic breakdown and decomposition of straw residues further limit pathogen survival.
å Assess the presence of root diseases by pulling a number of stems out of the soil and carefully examining the root system for visual evidence of root diseases at or any time before crop maturity. Make your assessment based on the class limits in Table 7.
ç Consider also how commonly root diseases occur in a particular field from season to season.
C
PLATE 23 Pythium root disease [from Compendium of Wheat Diseases by M.V. WIESE]
Wheat seedlings damaged by Pythium species in wet soil.

39
VINEYARDS | OLIVE ORCHARDS | ORCHARDS | WHEAT | MAIZE | ANNUAL CROPS | PASTURE
TABLE 7 Visual scores for root disease
Visual score (VS) Occurrence of root diseases due to soil conditions
2 [Good] Root disease are rare
1 [Moderate] Root disease are common
0 [Poor] Root disease are very common
PLATE 24 Take-all root disease [from Compendium of Wheat Diseases by M.V. WIESE]
Root rot and darkened stem bases due to take-all (G. graminis var. tritici).
PLATE 23 Pythium root disease [from Compendium of Wheat Diseases by M.V. WIESE]
PLATE 25 Fusarium root disease [from Compendium of Wheat Diseases by M.V. WIESE]
Secondary root emerging from crown and invaded by Fusarium culmorum.
PLATE 26 Root rot [from Compendium of Wheat Diseases by M.V. WIESE]
Wheat crown on the left damaged by common root rot; healthy crown (right).

40
VISUAL SOIL ASSESSMENTcr
op g
row
th a
nd h
eigh
t at m
atur
ity
Assessment
ImportanceICROP GROWTH AND CROP HEIGHT AT MATURITY can be useful visual indicators of soil quality. They are also dependent on a number of other factors including climate, cultivar, nitrogen application and soil fertility, time of sowing, fungicide applications and the use of plant growth regulators to reduce straw length. Crop growth and crop height are however particularly helpful indicators of soil quality if agronomic factors have not limited crop emergence and development during the growing season. The growth and vigour of grain crops depend in part on the ability of the seedbed to maintain an adequate tilth throughout the growing season. Poor soil aeration and resistance to root penetration as a result of structural degradation reduce plant growth and vigour, and delay maturity.
å Assess crop growth and crop height when the crop has reached maturity and preferably two weeks after ear emergence (Plate 27). Compare with the class limits in Table 8. Your observations of crop growth and vigour during the growing season may also provide a useful indication of seedbed conditions. In a good season under non-limiting conditions, a particular cultivar should grow to a certain height with about a 10–15% variation. Allowances should be made for exceptionally good seasons and for poor seasons.
C

41
VINEYARDS | OLIVE ORCHARDS | ORCHARDS | WHEAT | MAIZE | ANNUAL CROPS | PASTURE
PLATE 27 Crop height at maturity
TABLE 8 Visual scores for crop growth and height at maturity
Visual score (VS) Crop growth and crop height at maturity
2[Good]
Crop growth is good and crops are at or near maximum height, with little variability in height at maturity. Semi-dwarf varieties commonly
have a crop height at maturity of >1000 mm
1[Moderate]
Crop growth is moderate. Crops show moderate variability in height at maturity and are signifi cantly below maximum (700–900 mm)
0[Poor]
Crop growth is poor and plants can appear sickly. Crop height is uneven and patchy and well below maximum at maturity (400–600 mm)
MODERATE HEIGHT MODERATELYPOOR HEIGHT
POOR HEIGHT

42
VISUAL SOIL ASSESSMENTke
rnel
siz
e
Assessment
ImportanceIKERNEL development starts immediately after floret fertilization with cellular division during which the endosperm cell and amyloplasts are formed. This period is known as the lag phase and lasts for about 20 to 30 percent of the grain filling period. This is followed by a phase of cell growth, differentiation and starch deposition in the endosperm which takes 50 to 70 percent of the grain filling period. Good availability of carbohydrate is essential to be maintained during the crop cycle avoiding any shortage especially during the grain filling period. Soils in good condition with good structure, porosity, organic matter levels, soil life, soil fertility and rooting depth help ensure the supply and availability of water and nutrients. The grain filling period is prolonged as a result and an increase in kernel size is achieved. Good crop management practices including the adoption of widely spaced rows and good residue cover between rows to conserve water in dry zones also help to maximise the size of the kernel.
KERNEL SIZE is a useful determinant of grain quality by measuring the weight of unscreened grain, the screening loss and the weight of 1000 grains of clean seed.
å Measure the size of the kernels just before harvesting and compare them with the photographs and criteria given (Plate 28).
While there is a strong association between kernel number and yield, kernel size and dry weight are also strong determinants of the final yield. In making the assessment, consideration must be given to the plant population, tiller density and weather conditions and in particular the rainfall and sunlight hours. High plant populations and tiller densities will reduce the size of the kernel, and dry conditions and prolonged cloudy weather will reduce photosynthesis and subsequently the formation of carbohydrates and starch.
C

43
VINEYARDS | OLIVE ORCHARDS | ORCHARDS | WHEAT | MAIZE | ANNUAL CROPS | PASTURE
PLATE 28 How to score kernel size
GOOD CONDITION VS = 2Depending on the variety, kernels are large, completely filled and well shaped with few or no moisture stress features apparent.
MODERATE CONDITION VS = 1Kernels are of moderate size, may show occasional incomplete grain filling and stress features are often apparent.
POOR CONDITION VS = 0Kernels are generally very small with an irregular shape and stress features are very common.

44
VISUAL SOIL ASSESSMENTcr
op y
ield
Assessment
ImportanceIWITH A DECLINE IN SOIL QUALITY, crops can come under stress as a result of poor soil aeration, water-logging, moisture stress (due to either soil saturation or a reduced available water-holding capacity), a lack of available nutrients (Plates 30–31), and adverse temperatures. Toxic chemicals can also build up and root growth be impeded owing to chemical reduction reactions and a high penetration resistance to root development. This results in poor germination and emergence, poor plant growth and vigour, the need for redrilling, delays in drilling, root diseases, pest attack, and consequently lower crop yields. Plant stress induced by structural degradation can further affect the quality of grain by changing the amount and type of protein and starch formed, and the enzymic potential. These affect the amount of fermentable carbohydrate, the baking quality of wheat and the malting potential of barley. Under good soil conditions with adequate water and nutrients, the ripening period is prolonged and the starch accumulation inside the kernel is delayed and more gradual. This increases yield with a higher starch and protein percentage and quality.
å Assess relative crop yield based on the class limits in Table 9. Assessments can be made for all varieties of crops by counting or estimating the number and size of ears (spikes) per square metre, the number of kernels (grains) per ear, and the degree of grain filling. Harvested yield monitors could also be employed. Compare these with an ‘ideal’ crop (Plates 29). In making the assessment, consideration must be given to the variety of wheat, the number of plants per square metre, the soil moisture, air temperature and sunshine hours during the growing season, and pests and diseases not associated with the condition of the soil.
C
PLATE 29 Crop yield
Good crop yield with large ear development and complete grain filling.

45
VINEYARDS | OLIVE ORCHARDS | ORCHARDS | WHEAT | MAIZE | ANNUAL CROPS | PASTURE
PLATE 29 Crop yield
TABLE 9 Visual scores for crop yield
Visual score (VS) Crop yield
2[Good]
Crops have >500 ears per square metre. The ears are large with a spike length >90% of maximum for the variety. Ears have >50 kernels (grains) per ear and show complete grain filling with few signs of stress, pests or diseases. Harvested yield is greater than 8 tonnes
per hectare
1[Moderate]
Crops have 300–400 ears per square metre. The ears are of medium size with the spike length varying from 60–80% of maximum for the variety. Ears have 30–40 kernels (grains) per ear and show moderate and occasional uneven grain filling. Stress, pest and disease
evidence is moderately common. Harvested yield is 6–7 tonnes per hectare
0[Poor]
Crops have <200 ears per square metre. The ears are generally small and vary in length. Spike length is commonly <50% of maximum for the variety. Ears have <20 kernels (grains) per ear and grain filling is poor and often uneven. Stress, pest and disease features are very
common. Harvested yield is less than 5 tonnes per hectare
PLATE 30 Effect of boron deficiency on crop yield
Small ear development on the left due to boron deficiency.
PLATE 31 Effect of copper deficiency on crop yield
White tipping and incomplete ear development due to copper deficiency.

46
VISUAL SOIL ASSESSMENTpr
oduc
tion
cos
ts
AssessmentC
ImportanceIGround preparation, fertiliser, herbicide and pesticide inputs account for some of the highest costs in any cropping operation, and can increase significantly with increasing soil degradation. As degradation increases, the density and strength of the soil increases and, as a result, the soil becomes more resistant to tillage forces. Plough resistance increases so that larger tractors are required to avoid excessive wheel slip and the need to operate at lower ground speeds in a lower gear. The size, density and strength of soil clods also increase with increasing loss of soil structure, and careful timing and additional energy is needed to break them down to a seedbed. This energy is generally applied by using more intensive methods of cultivation and by making a greater number of passes. As a result, conventional tillage costs can increase by over 300 percent.
Continuous cropping using conventional cultivation techniques can also give rise to a significant loss of organic matter and, as a result, can substantially reduce soil fertility and the ability of the soil to supply nutrients. Higher amount of fertilizer are needed to compensate for the loss of these nutrients. The loss of organic carbon under continuous conventional cultivation could further incur a possible carbon tax in the future.
Reductions in crop yield are often not recognised as the result of the degradation of soil structure. Growers often assume that soil fertility is at fault and increase their production costs by applying extra amounts of fertilisers.
å Assess whether production costs have increased because of increased tillage/fertilizer requirements and herbicide/fungicide application over the years (Figure 4 and Table 10). This assessment can be based on perceptions, but reference to annual balance sheets will give a more precise answer.

47
VINEYARDS | OLIVE ORCHARDS | ORCHARDS | WHEAT | MAIZE | ANNUAL CROPS | PASTURE
����������������������������������������
������������������
������������������
��������������������������������������
����������������
��������������������������������������������������������������������������������������������������������������������������������
��������������������������
���
�
������������������������������������������������������������������������������
���������������������������������������������������������������������������������
TABLE 10 Visual scores for production costs
Visual score (VS) Production costs
2[Good]
Production costs including ground preparation, fertiliser, herbicide & pesticide requirements have not increased
1[Moderate]
Production costs including ground preparation, fertiliser, herbicide & pesticide requirements have increased moderately
0[Poor]
Production costs including ground preparation, fertiliser, herbicide & pesticide requirements have increased greatly

48
VISUAL SOIL ASSESSMENT
Soil management of wheat crops
Good soil management practices are needed to maintain optimal growth conditions for producing high crop yields, especially during the crucial periods of plant development. To achieve this, management practices need to maintain soil conditions that are good for plant growth, particularly aeration, temperature, nutrient and water supply. The soil needs to have a soil structure that promotes an effective root system that can maximise water and nutrient utilisation. Good soil structure also promotes infiltration and movement of water into and through the soil, minimising surface ponding, runoff and soil erosion.
Conservation tillage practices, including no-tillage and minimum tillage that incorporate the establishment of temporary cover crops and crop residues on the surface (Plates 32–34), provide soil management systems that conserve the environment, minimise the risk of soil degradation, enhance the resilience and quality of the soil, and reduce production costs. Conservation tillage protects the soil surface reducing water runoff and soil erosion. It improves soil physical characteristics, reduces wheel traffic which lessens wheel traffic compaction, and does not create tillage pans or plough pans. It improves soil trafficability and provides opportunities to optimise sowing time, being less dependent on climatic conditions in spring and autumn. Conservation tillage also encourages soil life and biological activity (including earthworm numbers) and increases micro-organism biodiversity. It retains a greater proportion of soil carbon sequestered from atmospheric carbon dioxide (CO
2) and enables the
soil to operate as a sink for CO2. Soil organic matter levels build up as a result and create the
potential to gain ‘Carbon Credits’. Conservation tillage also uses smaller amounts of fossil fuels, generates lower greenhouse gas emissions and has a smaller ecological footprint on a region, thereby raising marketplace acceptance of produce.
On the other hand, conventional tillage can impact negatively on the environment, with a greater food eco-footprint on a region and a country. It reduces the organic matter content of the soil by microbial oxidation, increases green house gas emissions (including the release of 5-times more CO
2), uses more fossil fuels (i.e., 6-times more consumption of fuel), degrades
soil structure, increases soil erosion, and adversely alters microflora and microfauna by reducing both the number of species and their biomass. The fundamental difference between conventional tillage and conservation tillage is their relative environmental and economic sustainability. The long-term affects of conventional tillage are cumulatively negative whereas the long-term affects of conservation tillage are cumulatively positive.

49
VINEYARDS | OLIVE ORCHARDS | ORCHARDS | WHEAT | MAIZE | ANNUAL CROPS | PASTURE
PLATE 32 No-till drilling a wheat crop into an erosion-prone field protected by herbicided pasture [BAKER NO-TILLAGE LTD]
PLATE 33 Strip-tillage planting of an annual crop protected by good residue cover
PLATE 34 Harvesting a wheat crop followed immediately by no-till seeding the next crop into stubble [BAKER NO-TILLAGE LTD]

50
VISUAL SOIL ASSESSMENT
References
Shepherd, T. G., Stagnari, F., Pisante, M. and Benites, J. 2008. Visual Soil Assessment – Field guide for wheat. FAO, Rome, Italy.

VISUAL SOIL ASSESSMENT
Wheat
FI
EL
D
GU
ID
E9 7 8 9 2 5 1 0 5 9 4 1 8
TC/D/I0007E/1/02.08/1000
ISBN 978-92-5-105941-8
The present publication on Visual Soil Assessment is a practicalguide to carry out a quantitative soil analysis with reproduceable resultsusing only very simple tools. Besides soil parameters, also crop parametersfor assessing soil conditions are presented for some selected crops. TheVisual Soil Assessment manuals consist of a series of separate booklets forspecific crop groups, collected in a binder. The publication addressesscientists as well as field technicians and even farmers who want to analysetheir soil condition and observe changes over time.


<
<
<
<

<
<
<
<

<
<
<
<
<
<
<


å
ç
é
C
I


C
I
å
ç
é
è
ê


C
I
å
ç
é


C
I
å


C
I
å
ç


C
I
å


Cå
I


C
I
å
<
<
<
<
<
<
<
<


å
ç


C
I
å
<
<
<


<
<
<


C
I
å


C
I
å


I
‡
å
ç
é
è
C


å
C
I


å
C
I


å
C
I


C
I
å


I
å
C


I
å
C


I
‡
å
C


C
I
å


C
I
å


Cå
I


Cå
I


<
<
<
<

<
<
<
<

<
<
<
<
<


å
ç
é
C
I


C
I
å
ç
é
è
ê
<
<
<
<
<
<
<
<
<


C
I
å
ç
é


C
I
å


C
I
å
ç


C
I
å


Cå
I


C
I
å
<
<
<
<
<
<
<
<


å
ç


C
I
å
<
<
<

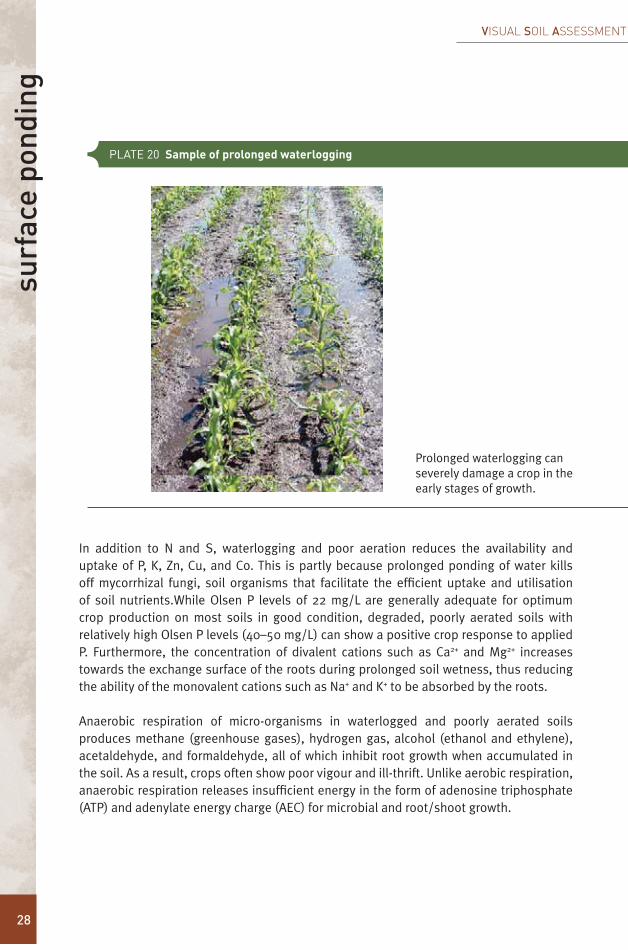

C
I
å


C
I
å
<
<
<
<


C
I
å


I
å
C


C
I
å


T. Wallace 1961

C
I
å


I
å
C


I
å
ç
C


I
å
C


I
å
C


I
<
<
<
<
<
<
<
<
<
å
C


C
I
å


C
I
å


Cå
I


Cå
I


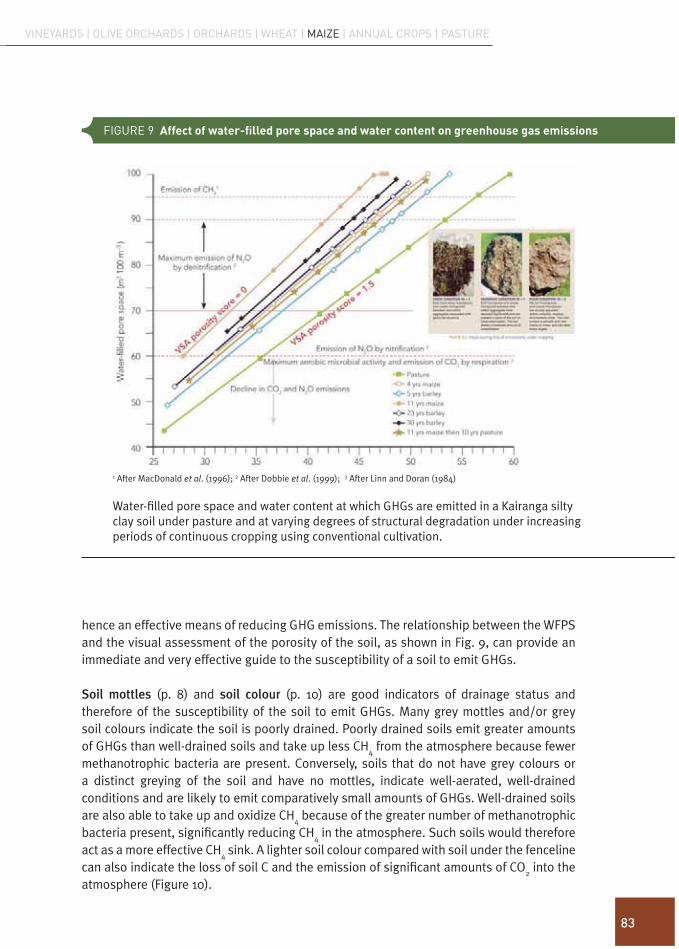


C
I
å


Cå
I


Cå
I


Related Documents