FIELD EVALUATION OF SAFETY IMPACTS OF ADAPTIVE CRUISE CONTROL By: Hesham Rakha 1 ., Jonathan Hankey, Angela Patterson, and Michel Van Aerde ABSTRACT This paper provides an attempt at evaluating the safety impacts of an Adaptive Cruise Control (ACC) system relative to Conventional Cruise Control (CCC) utilizing data that were gathered as part of a Field Operational Test (FOT) in Ann Arbor, Michigan. The safety of the ACC system is quantified considering three surrogate safety measures. The first safety measure considers the car-following behavior of an ACC system relative to manual driving in order to identify potential differences in driver/vehicle aggressiveness. The second safety measure considers changes in demands on driver resources associated with ACC technology. The third, and final safety measure, considers differences in number of braking maneuvers and near encounters associated with ACC and CCC driving. These three surrogate safety measures are utilized to identify any potential hazards that could be associated with an ACC system. The three surrogate safety measures demonstrate consistency between ACC and manual car-following behavior, an increased usage of cruise control with adaptive features, reductions in driver manual resources and potential reductions in visual resources, and no differences in braking interventions and “near encounters.” These findings collectively suggest that the use of ACC does not appear to impose a safety hazard on the transportation system. Keywords: Adaptive Cruise Control, Intelligent Transportation Systems, Intelligent Vehicle Initiatives, and Traffic Safety 1. INTRODUCTION Prior to describing the specifics of the study approach this section provides a brief background of the similarities and differences between conventional and adaptive cruise control systems. Finally, the objectives of the paper are identified together with the layout of the paper. 1.1 Conventional Cruise Control Operation Conventional cruise control takes over the accelerator operation at speeds over 40 km/h (25 mph) when it is engaged. Activation requires that the ON button is pressed and setting a desired speed requires pressing the SET button, as illustrated in Figure 1. The user has to press the ON button to activate the system every time the engine is started. In order to deactivate the system while maintaining the set speed in memory, the driver has the choice of either making a soft tap on the brake pedal or pressing the CANCEL button. Pressing the OFF button or turning off the ignition turns the speed control system off and erases the memory. In order to resume to a previously set speed, the driver needs only to press the RESUME button as long as the speed exceeds 40 km/h (25 mph). The driver can also vary the speed setting by either pressing and holding the ACCEL button and releasing the button when the new set speed is established, or by tapping the ACCEL button. Each tapping of the ACCEL button results in a 3.2 km/h (2 mph) increase in the vehicle speed. In order to decrease the speed while the speed control is ON, the driver needs to hold the COAST button and release it when the desired speed is reached. 1 Corresponding Author: Assistant Professor at the Charles Via Department of Civil and Environmental Engineering, Virginia Tech. Virginia Tech Transportation Institute, 3500 Transportation Research Plaza (0536), Blacksburg, VA 24061. E-mail: [email protected]. Telephone: (540) 231-1505.

Welcome message from author
This document is posted to help you gain knowledge. Please leave a comment to let me know what you think about it! Share it to your friends and learn new things together.
Transcript
FIELD EVALUATION OF SAFETY IMPACTS OF ADAPTIVE CRUISE CONTROL By: Hesham Rakha1., Jonathan Hankey, Angela Patterson, and Michel Van Aerde
ABSTRACT This paper provides an attempt at evaluating the safety impacts of an Adaptive Cruise Control (ACC) system relative to Conventional Cruise Control (CCC) utilizing data that were gathered as part of a Field Operational Test (FOT) in Ann Arbor, Michigan. The safety of the ACC system is quantified considering three surrogate safety measures. The first safety measure considers the car-following behavior of an ACC system relative to manual driving in order to identify potential differences in driver/vehicle aggressiveness. The second safety measure considers changes in demands on driver resources associated with ACC technology. The third, and final safety measure, considers differences in number of braking maneuvers and near encounters associated with ACC and CCC driving. These three surrogate safety measures are utilized to identify any potential hazards that could be associated with an ACC system. The three surrogate safety measures demonstrate consistency between ACC and manual car-following behavior, an increased usage of cruise control with adaptive features, reductions in driver manual resources and potential reductions in visual resources, and no differences in braking interventions and “near encounters.” These findings collectively suggest that the use of ACC does not appear to impose a safety hazard on the transportation system. Keywords: Adaptive Cruise Control, Intelligent Transportation Systems, Intelligent Vehicle Initiatives, and Traffic Safety
1. INTRODUCTION Prior to describing the specifics of the study approach this section provides a brief background of the similarities and differences between conventional and adaptive cruise control systems. Finally, the objectives of the paper are identified together with the layout of the paper.
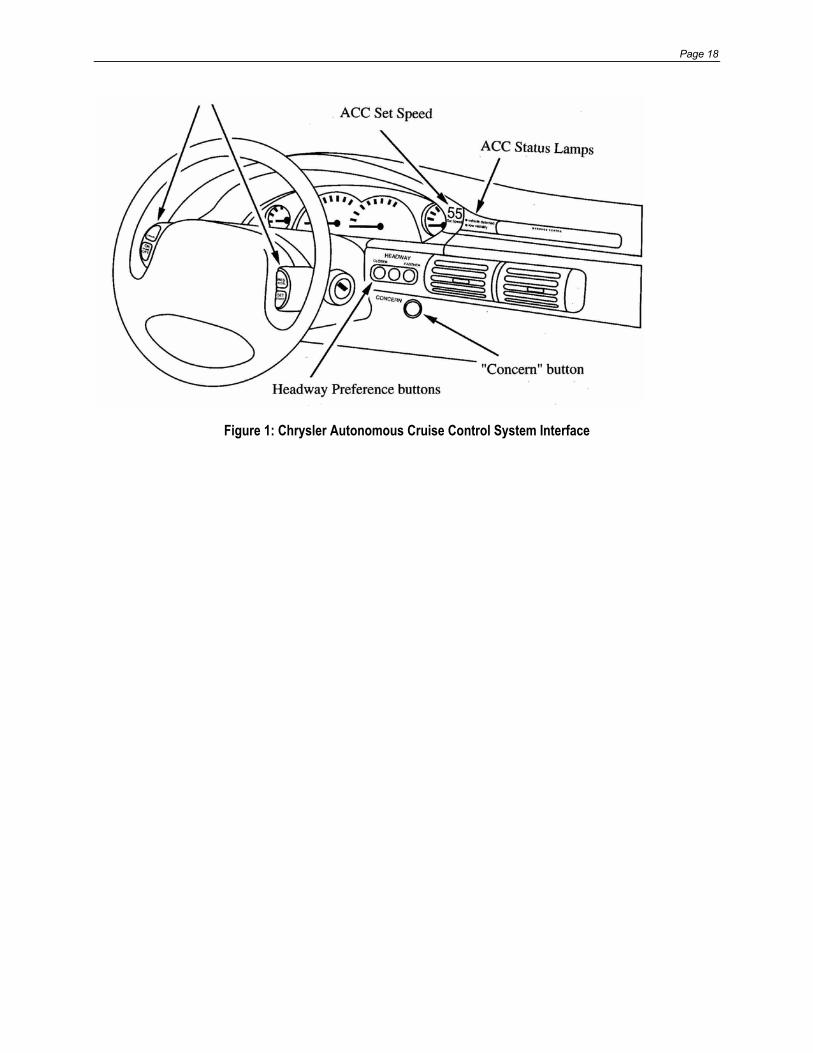
1.1 Conventional Cruise Control Operation Conventional cruise control takes over the accelerator operation at speeds over 40 km/h (25 mph) when it is engaged. Activation requires that the ON button is pressed and setting a desired speed requires pressing the SET button, as illustrated in Figure 1. The user has to press the ON button to activate the system every time the engine is started. In order to deactivate the system while maintaining the set speed in memory, the driver has the choice of either making a soft tap on the brake pedal or pressing the CANCEL button. Pressing the OFF button or turning off the ignition turns the speed control system off and erases the memory. In order to resume to a previously set speed, the driver needs only to press the RESUME button as long as the speed exceeds 40 km/h (25 mph). The driver can also vary the speed setting by either pressing and holding the ACCEL button and releasing the button when the new set speed is established, or by tapping the ACCEL button. Each tapping of the ACCEL button results in a 3.2 km/h (2 mph) increase in the vehicle speed. In order to decrease the speed while the speed control is ON, the driver needs to hold the COAST button and release it when the desired speed is reached.
1 Corresponding Author: Assistant Professor at the Charles Via Department of Civil and Environmental Engineering, Virginia Tech. Virginia Tech Transportation Institute, 3500 Transportation Research Plaza (0536), Blacksburg, VA 24061. E-mail: [email protected]. Telephone: (540) 231-1505.
Page 2
It must be noted that pressing the accelerator does not alter the set speed. Consequently, when the accelerator pedal is released, the vehicle returns to the previously set speed. In addition, the conventional cruise control can downshift to third gear if it is necessary to maintain the vehicles set speed.
1.2 Adaptive Cruise Control Operation Adaptive Cruise Control (ACC) has been introduced into the automobile market as a convenience option with potential safety and throughput impacts. ACC is an enhanced version of Conventional Cruise Control (CCC) where the driver has the option of selecting a desired time headway in addition to the desired speed that is available in conventional systems. The ACC system can downshift in order to maintain a selected headway or to maintain a set speed as is the case of conventional cruise control. The ACC system that is evaluated in this paper integrates a forward-looking sensor with a CCC system to automatically maintain a pre-specified user-defined time headway between the ACC-equipped vehicle and its preceding vehicle. The user-defined time headway includes three headway settings, namely a 1.0, 1.4, and 2.0-second headway. While in traffic, ACC-equipped drivers are relieved from engaging, disengaging, or manually resetting speed, as might more often be necessary with a CCC system. While not in traffic, drivers equipped with ACC achieve the same benefits of CCC where the system maintains a desired speed.
1.3 Paper Objectives and Layout The engagement of ACC can potentially alter the car-following behavior of the individual vehicles that constitute a traffic stream and thus may affect the throughput and safety of a transportation system. Two potential outcomes are possible. On the one hand, if the ACC system results in a more aggressive car-following behavior the system throughput may increase with an increase in the system rear-end crash rate. On the other hand, if the ACC system provides a less aggressive car-following behavior the system throughput would decrease with questionable impacts on the transportation system’s safety. It could be argued that a less aggressive car-following behavior can reduce the rear-end collision rate. Alternatively, it could be argued that a less aggressive car-following behavior could provide opportunities for other non-ACC vehicles to cut-in ahead of the ACC vehicle thus increasing the safety hazard. The ability of an ACC system to free the driver from the longitudinal control of the vehicle could, by reducing the driver workload, potentially reduce his/her crash risk. Alternatively, it could be argued that when the driver becomes dependent on an ACC system the driver may become complacent therefore increasing his/her reaction time and potentially increasing their crash risk. The objective of this paper is to analyze the potential safety impacts of an ACC system compared to CCC by looking at a number of surrogate safety measures of effectiveness. The first of these measures of effectiveness is the car-following behavior associated with alternative longitudinal control systems (ACC and manual driving). The second measure of effectiveness is the driver workload measured by the number of cruise control button presses. The workload can then be introduced into crash risk models to evaluate the safety impacts of such a system, however, this is beyond the scope of this paper. The third measure of effectiveness that is considered in this study is the number of brake interventions that are associated with the use ACC versus CCC. In addressing the identified objective, the paper first provides a description of state-of-the-art ACC evaluation studies in order to demonstrate the unique contributions of the research that is presented in this paper. Subsequently, the paper describes the research approach in terms of why and how like trips were extracted from the field database. Next, the paper describes how ACC was compared to CCC and presents the findings of the study. The final section summarizes the conclusions of the analysis.
2. BACKGROUND This section provides a brief background of the driver resource demands that are required for the task of driving a vehicle. This background is important to demonstrate the merit of comparing driver workloads that are associated with
Page 3
ACC versus CCC systems. In addition, this section summarizes the results of other studies that have evaluated ACC technologies with the objective of demonstrating the uniqueness of this study.
2.1 Demands on Driver Resources Wierwille (1993) describes the task of driving an automobile or heavy vehicle as being complex. Specifically, Wierwille mentions “drivers must perform lateral-directional loop closure, longitudinal loop closure, information gathering, and hazard detection. (For lateral directional loop closure, drivers use the steering wheel to control lane position and heading. For longitudinal loop closure, drivers use the accelerator and brake pedal, as well as the gear shift lever and clutch in manual transmission vehicles, to control longitudinal position and speed.) At the same time they must attend to additional in-vehicle tasks associated with the instrument panel and related comfort/convenience items.” Wierwille also mentions that research has been underway to develop technologies that automate the driving task, particularly the lateral and longitudinal loop closure operations. These research efforts started in the 1950s and continue to this day, with the objective of relieving the driver from the burden of the active control aspects of driving. One of these promising emerging technologies is adaptive cruise control, which “should make car following on major roads much easier for the driver by maintaining a minimum separation with any lead vehicle. Such a system, however, is likely to require close visual monitoring by the driver” (Wierwille, 1993). Wierwille enumerates the various resources that a driver requires for the task of driving as visual, manual, cognitive, auditory, and other resources. It has been estimated that approximately 90 percent of all information that drivers use for the primary task of driving is obtained visually (Rockwell, 1972). Wierwille indicates “there are in fact two forms of visual resources (i.e. two visual subsystems): foveal and peripheral. Foveal vision allows the driver to gather detailed information because of its high resolution capabilities. Peripheral is important because it provides motion impressions (flow cues) and can also be used to detect potential hazards, particularly those that are in motion relative to the driver.” The manual resources include the use of both hands. Specifically, Wierwille indicates “for in-vehicle tasks, most of which are performed on straight or only slightly curved sections of road, the driver can ordinarily make a hand available. It is probable that while the hand is attending to the in-vehicle task, the driver has somewhat less capability in maneuvering the vehicle in the lateral-directional mode. However, assuming detection of a hazard has occurred, it does not take long to bring the hand back to the wheel to perform an emergency maneuver. Thus, manual demand of in-vehicle tasks has a cost in terms of driver capability, but it is relatively small. It must be recognized, however, that the manual demand of an in-vehicle task cannot be treated in isolation. Eye-hand coordination is necessary for most manual inputs to the IP (instrument panel), thus creating additional visual load. This is an important consideration in the design of in-vehicle controls, since control usage usually includes a visual cost.” Wierwille indicates that the visual resource is the most important of the demand resources and should receive the most careful consideration in design of in-vehicle technologies. The manual resource has some importance because of its need in steering. The other resources are categorized as less important because they are not as essential as visual and manual resources in the task of driving. Consequently, one of the objectives of this study is to quantify differences in demands for driver resources using adaptive and conventional cruise control.
2.2 State-of-the-Art Adaptive Cruise Control Evaluations A number of ACC evaluations were conducted worldwide, including the Mitsubishi study, the University of Michigan Transportation Research Institute study, and the Swedish Road and Transport Research Institute simulator study.
2.2.1 Mitsubishi Study The Mitsubishi Motor Corporation conducted vehicle tests considering the effects of ACC on headway distance distribution and driving load (Watanabe et al., 1995). Unfortunately, Watanabe et al. presented summary results instead of providing a detailed description of the test methods or specific numerical results. The study considered the distance headway distribution at speeds of 80 to 100 km/h and concluded that the use of ACC reduced the headway variability
Page 4
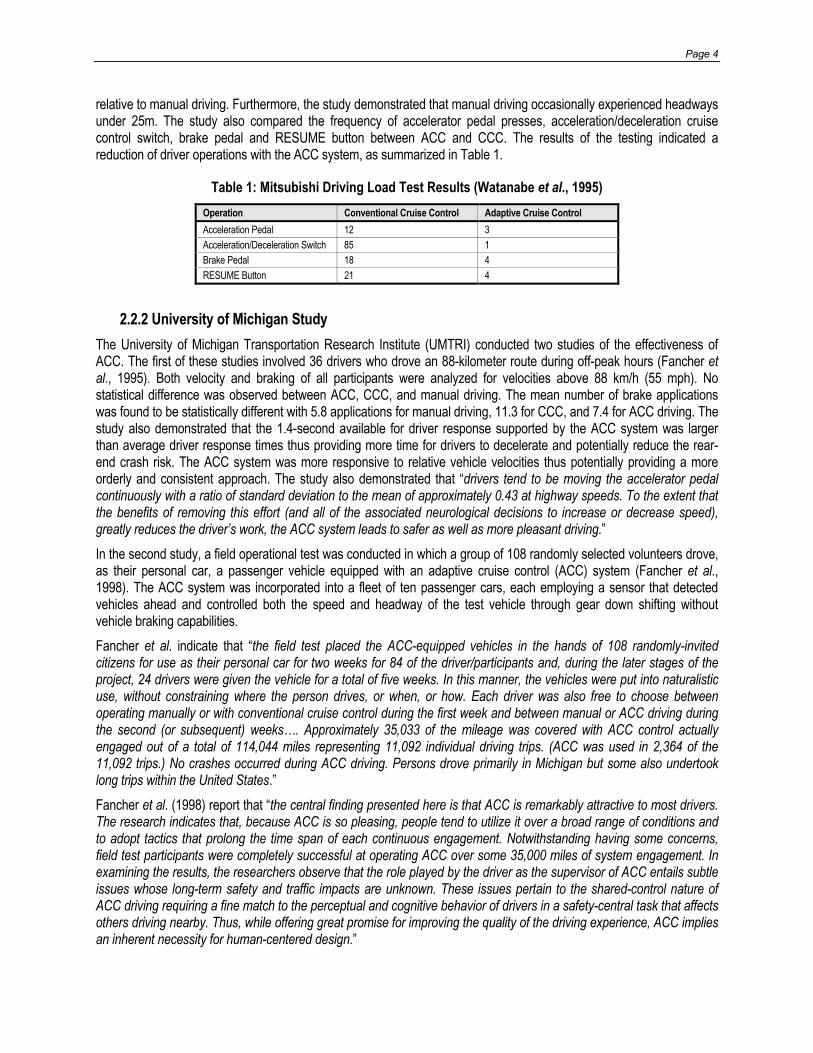
relative to manual driving. Furthermore, the study demonstrated that manual driving occasionally experienced headways under 25m. The study also compared the frequency of accelerator pedal presses, acceleration/deceleration cruise control switch, brake pedal and RESUME button between ACC and CCC. The results of the testing indicated a reduction of driver operations with the ACC system, as summarized in Table 1.
Table 1: Mitsubishi Driving Load Test Results (Watanabe et al., 1995) Operation Conventional Cruise Control Adaptive Cruise Control Acceleration Pedal 12 3 Acceleration/Deceleration Switch 85 1 Brake Pedal 18 4 RESUME Button 21 4
2.2.2 University of Michigan Study The University of Michigan Transportation Research Institute (UMTRI) conducted two studies of the effectiveness of ACC. The first of these studies involved 36 drivers who drove an 88-kilometer route during off-peak hours (Fancher et al., 1995). Both velocity and braking of all participants were analyzed for velocities above 88 km/h (55 mph). No statistical difference was observed between ACC, CCC, and manual driving. The mean number of brake applications was found to be statistically different with 5.8 applications for manual driving, 11.3 for CCC, and 7.4 for ACC driving. The study also demonstrated that the 1.4-second available for driver response supported by the ACC system was larger than average driver response times thus providing more time for drivers to decelerate and potentially reduce the rear-end crash risk. The ACC system was more responsive to relative vehicle velocities thus potentially providing a more orderly and consistent approach. The study also demonstrated that “drivers tend to be moving the accelerator pedal continuously with a ratio of standard deviation to the mean of approximately 0.43 at highway speeds. To the extent that the benefits of removing this effort (and all of the associated neurological decisions to increase or decrease speed), greatly reduces the driver’s work, the ACC system leads to safer as well as more pleasant driving.” In the second study, a field operational test was conducted in which a group of 108 randomly selected volunteers drove, as their personal car, a passenger vehicle equipped with an adaptive cruise control (ACC) system (Fancher et al., 1998). The ACC system was incorporated into a fleet of ten passenger cars, each employing a sensor that detected vehicles ahead and controlled both the speed and headway of the test vehicle through gear down shifting without vehicle braking capabilities. Fancher et al. indicate that “the field test placed the ACC-equipped vehicles in the hands of 108 randomly-invited citizens for use as their personal car for two weeks for 84 of the driver/participants and, during the later stages of the project, 24 drivers were given the vehicle for a total of five weeks. In this manner, the vehicles were put into naturalistic use, without constraining where the person drives, or when, or how. Each driver was also free to choose between operating manually or with conventional cruise control during the first week and between manual or ACC driving during the second (or subsequent) weeks…. Approximately 35,033 of the mileage was covered with ACC control actually engaged out of a total of 114,044 miles representing 11,092 individual driving trips. (ACC was used in 2,364 of the 11,092 trips.) No crashes occurred during ACC driving. Persons drove primarily in Michigan but some also undertook long trips within the United States.” Fancher et al. (1998) report that “the central finding presented here is that ACC is remarkably attractive to most drivers. The research indicates that, because ACC is so pleasing, people tend to utilize it over a broad range of conditions and to adopt tactics that prolong the time span of each continuous engagement. Notwithstanding having some concerns, field test participants were completely successful at operating ACC over some 35,000 miles of system engagement. In examining the results, the researchers observe that the role played by the driver as the supervisor of ACC entails subtle issues whose long-term safety and traffic impacts are unknown. These issues pertain to the shared-control nature of ACC driving requiring a fine match to the perceptual and cognitive behavior of drivers in a safety-central task that affects others driving nearby. Thus, while offering great promise for improving the quality of the driving experience, ACC implies an inherent necessity for human-centered design.”
Page 5
2.2.3 Swedish Road and Transport Research Institute Study The Swedish Road and Transport Research Institute (SRTRI) conducted a study of an ACC system using a simulator. The study involved 10 male and 10 female drivers between the ages of 26 and 46. One half of the group (equal female and male participants) performed the test with the ACC system activated while the other half performed the test based on manual driving. The ACC system prototype that was tested used controlled speed and distance headways with the use of throttle and brake control. The maximum braking capabilities of the ACC system were 20 to 30 percent the force of gravity. The ACC system could be active in the speed range of 30 to 130 km/h. At higher speeds the system operated as a CCC system while at lower speeds the system shut off. The ACC system that was tested could not detect stationary vehicles (Nilsson, 1995). A number of simulated scenarios were tested on a 2-lane roadway that had a designated speed limit of 110 km/h and a length of 100 kilometers (Nilsson, 1995). The first scenario involved following a hard braking lead vehicle (braking at a rate of 8 m/s2). In this scenario, an acoustic tone was activated to nine out of the ten ACC drivers to indicate to the driver that he/she was required to take control over the system or else a collision was inevitable. The comparisons indicated that there was no statistical difference in the reaction times between manual and ACC driving at a 95 percent level of confidence (driver reaction time of 1.33 seconds for manual driving and 1.49 seconds for ACC driving). The second scenario involved the subject vehicle passing a vehicle and having a car pull out in front of the subject vehicle. Once again the maximum ACC system deceleration capability was insufficient to avoid a collision, however, in this case no acoustic warning was activated. The time between the left direction indicator activation and the braking action was on average 1.11 seconds for the ACC drivers and 1.17 seconds for manual drivers. This difference in reaction times was not found to be statistically different at a 95 percent level of significance. The third and final scenario that was tested had the subject vehicle approach a stationary queue. The queue covered both lanes of the road and since the ACC system did not detect stationary vehicles as lead vehicles all response to the queue was manual. A total of 5 collisions were observed in this test situation. Four resulted from ACC supported drivers and one from the group of drivers without ACC support. In summary, the study indicated that the different driving scenarios produced varied driver behavior depending on the type of vehicle control. The study did draw some doubts on the safety impacts of the ACC system especially when approaching a stationary queue. However, it should be emphasized that the study was conducted on a vehicle simulator and these findings could be a result of the lack of realism of the simulator.
2.3 Uniqueness of Proposed Evaluation The literature indicates a number of evaluations of ACC technologies. Apart from the UMTRI evaluation, these evaluations have been limited in scope or confined to a simulator thus lacking naturalistic driving conditions. The presented evaluation, as was the case with the UMTRI evaluation, utilizes data collected over an entire year with a total of 108 participants as will be discussed in the subsequent section. The evaluation that is presented in this paper is unique in a number of aspects. First, it ensures that the evaluation is conducted over similar trips during similar traffic conditions by extracting like-trips from the entire trip database. Second, the evaluation considers a number of safety surrogates in conducting the evaluation. Third, the study considers differences in car-following behavior that are associated with ACC. The use of safety surrogate measures is required because vehicle crashes are rare events; therefore it is extremely difficult to evaluate the safety impacts of new technologies using crash frequencies. Consequently, two approaches are feasible. The first approach looks at comparing safety surrogate measures and potentially relating these surrogate measures to crash rates. It should be noted that relating surrogate measures to crash rates is extremely difficult and is an area of research. The second approach is to attempt to estimate crash rates using time-to-collision models. In this regard Van Aerde and Rakha (1999) developed a framework for evaluating the system-wide safety impacts of an ACC system.
Page 6
This paper presents an attempt at investigating the safety impacts of an ACC system using field data that were collected as part of a field operational test in Ann Arbor, Michigan using safety surrogate measures. It is anticipated that this study, while building on previous studies, extends the envelop of understanding ACC technology. It should be noted that this study represents a first step in a sequence of future endeavors targeted at evaluating the safety impacts of an ACC system.
3. FIELD OPERATIONAL TEST AND EXTRACTION OF LIKE TRIPS This section describes the field operational test that was conducted for the evaluation of the ACC system in Ann Arbor, Michigan. In order to compare ACC and CCC systems for comparable traffic and roadway conditions similar trips were extracted from the field operational data. This section describes how these similar trips were extracted from the database for the evaluation of the ACC system.
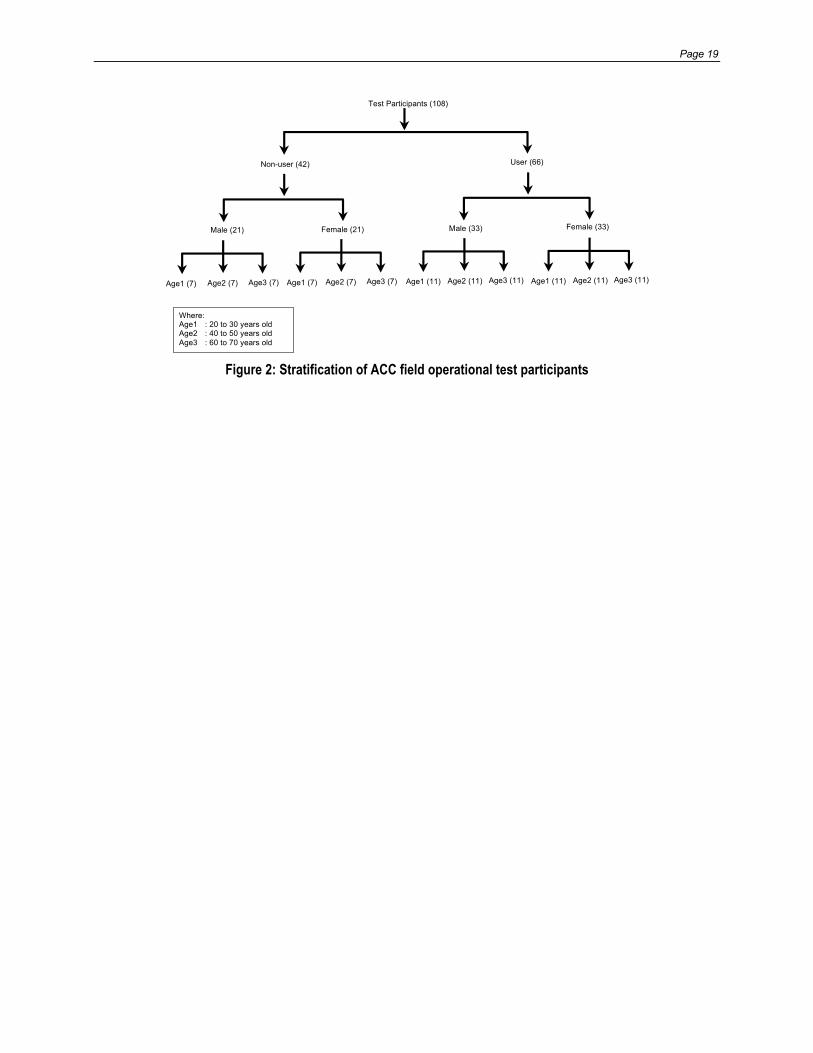
3.1 ACC Field Operational Test The ACC Field Operational Test (FOT) was the result of a cooperative agreement between the National Highway Traffic Safety Administration (NHTSA) and the University of Michigan Transportation Research Institute (UMTRI). Other parties contributing to the field operational test were Leica AG, the Michigan Department of Transportation, and Haugen Associates. For the FOT, ten 1996 Chrysler Concordes were equipped with an ACC system. The ACC system consisted of the standard Chrysler cruise control; Leica sensors and adaptive (intelligent) cruise control logic and hardware; and a data acquisition system that collected data to support the evaluation. The data collection system collected video data and a variety of vehicle performance measures. The vehicle performance measures that were sampled 10 times per second (10 Hz) included the range to the preceding vehicle, rate of change in range to preceding vehicle, the vehicle velocity, the headway time selected by the driver, the curve radius, and the throttle setting. One hundred and eight volunteers were recruited to drive ACC-equipped Chrysler Concordes for 2 or 5 weeks. Both groups of drivers experienced one week of driving the Concorde in a standard configuration (no ACC) before ACC functions were made available. The one-week without ACC was intended to provide baseline data for driving performance without ACC. One and four week exposures to ACC were included in the research design to enable assessment of longer term changes in behavior as a function of experience with ACC. Other subject variables in the research design were driver age, previous cruise control usage, and driver type. The 108 drivers were selected to include 66 drivers who had used cruise control before and 42 drivers who had not used cruise control before, as illustrated in Figure 2. These were further equally stratified by gender and by age group. Three age groups were considered, namely: 20 to 30 years old, 40 to 50 years old, and 60 to 70 years old. Figure 2 illustrates that the test participants were equally stratified by gender and age group in order to reduce the potential for systematic biases. The 108 drivers, who were encouraged to drive as much as possible, drove a total of approximately 11,000 trips. During these trips the speed, acceleration and other measures (GPS coordinate, range, range rate, brake status, usage of the cruise control, etc.) of the ACC-equipped vehicle were recorded every deci-second. A Trip summary file was generated from these raw data, which included the trip length and duration, the number of times various cruise control buttons were pressed during a trip, the number of brake presses during a trip, and the number of brake interventions and close encounters during the trip. Using the trip summary file, this paper describes how ACC usage was compared to Conventional Cruise Control (CCC) usage, for purposes of establishing the safety risk associated with an ACC system.
3.2 Extraction of Like Trips In order to compare the usage of two systems, it is paramount that the before and after conditions be consistent and similar except for the factor that is under consideration. In the case of the evaluation of system usage and brake interventions an effort was made to ensure that the trips without ACC were as similar as possible to the trips with the
Page 7
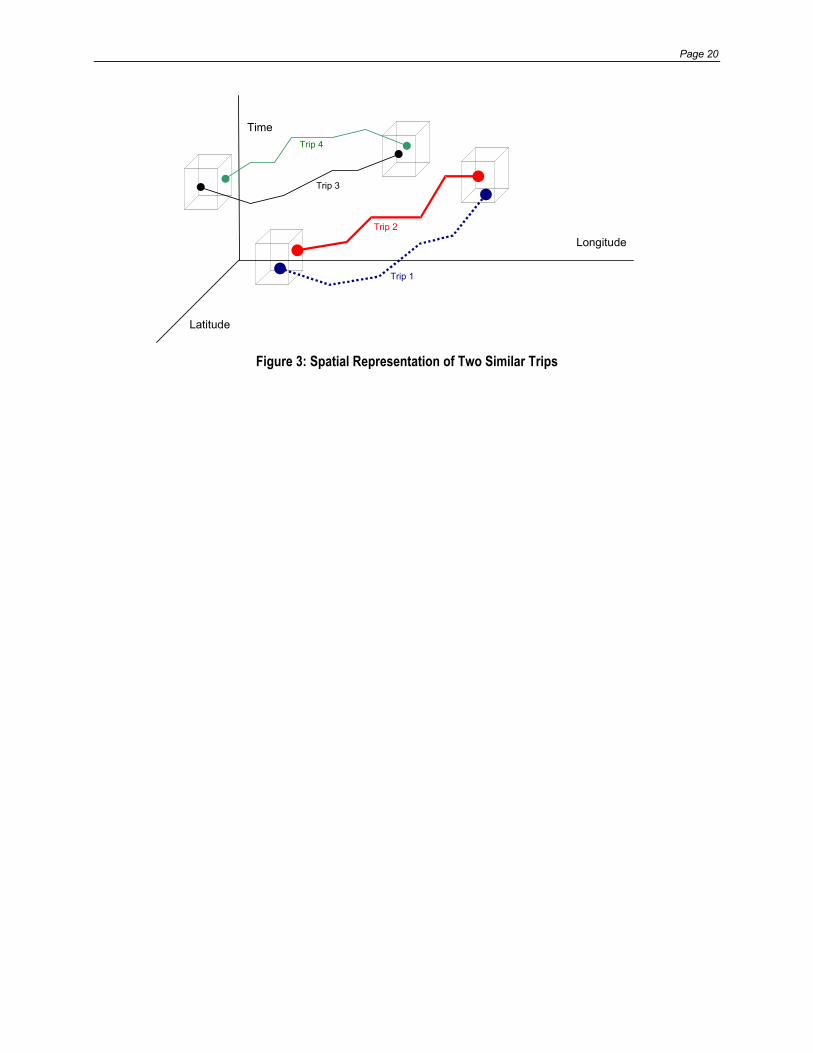
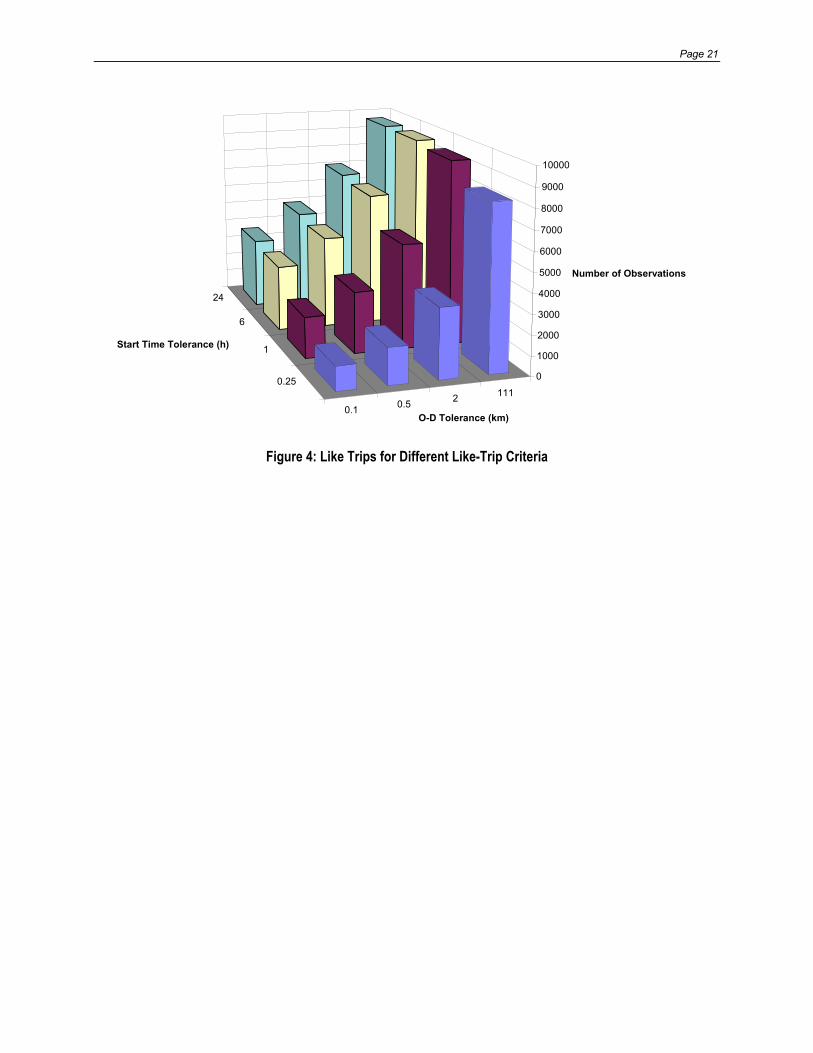
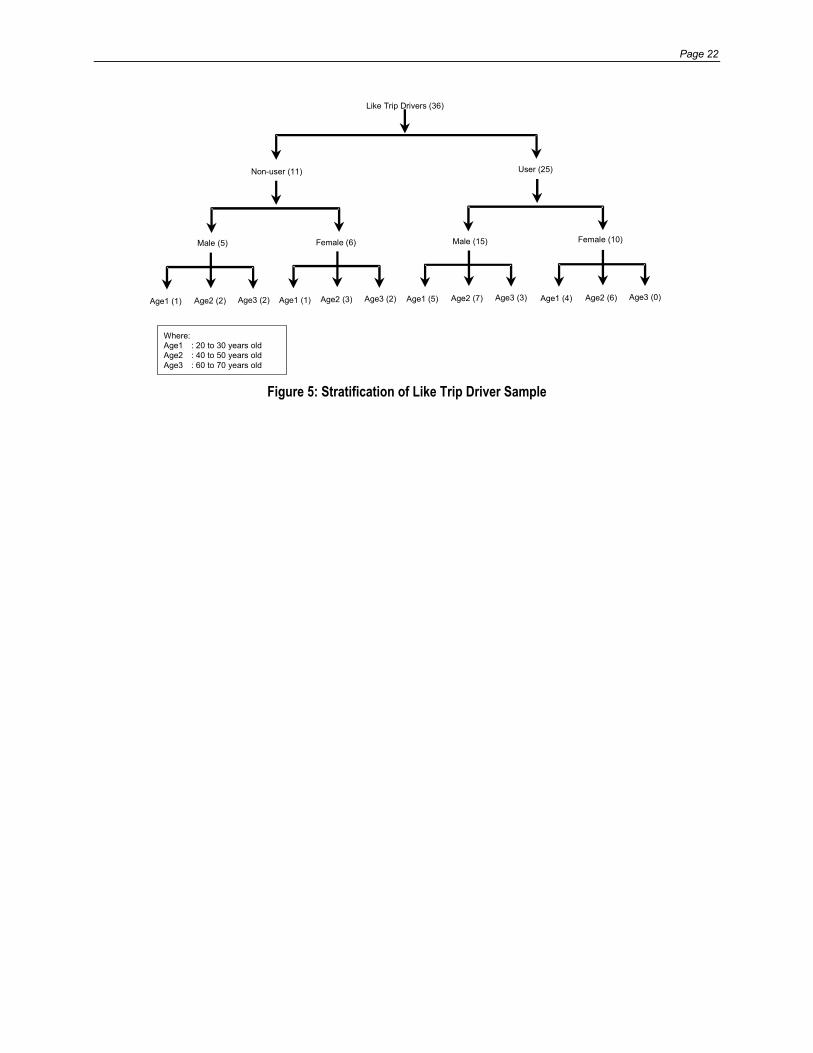
ACC system in order to isolate the effect of the ACC capabilities on the surrogate measures. This section describes how these similar trips were defined and extracted. The classification of like trips was based on three parameters, including the driver, the spatial location of the origin/destination, and the trip start time. Using these criteria, two similar trips were viewed as trips that started and ended within a similar spatial and temporal window, as illustrated in Figure 3. In this example, trips 1 and 2 are similar and trips 3 and 4 are similar. However, trips 1 and 2 are not similar to trips 3 and 4 because they do not originate or terminate within a similar spatial/temporal window. A group of trips that are similar are referred to as a similar trip set in this paper. So trips 1 and 2 of Figure 3 constitute a similar trip set and trips 3 and 4 constitute another similar trip set. Tools were developed in order to extract from the ACC trip summary file all the trips that were similar as defined by the similar-trip criteria. Depending on the magnitude of the similar trip criteria, the number of similar trips could differ. At the one extreme, usage of very restrictive criteria would ensure that any similar trips were identical (in terms of the criteria), however, it could result in a very small number of similar trips. Alternatively, relaxed criteria could result in a large number of trips that are not necessarily very similar (as defined by the similar trip criteria). In the former case, the statistical analysis could be impacted because of the small sample size, while in the latter case the analysis could be impacted because the trips have little in common. Consequently, the first step in the similar trip extraction exercise was to investigate the sensitivity of the number of similar trips to the similar trip criteria. Figure 4 illustrates the output obtained as part of the sensitivity analysis. As expected, as the tolerances were relaxed, the number of like trip observations increased. The figure illustrates that the number of similar trips ranged from approximately 1300 trips (temporal tolerance of 15 minutes and spatial tolerance of 100 meters) to approximately 9000 trips (temporal tolerance of 24 hours and spatial tolerance of 111 km). A decision was made to keep the trip length tolerance at its maximum value of 1000 kilometers in order to capture any potential re-routing that could have resulted from the use of ACC. Furthermore, a decision was made to use the most rigorous like-trip criteria (departure times within 15 minutes and O-D’s within 100 meters) because a significant number of like trips were available (1309 trips). The resulting 1309 like trips included a total of 37 drivers (statistics available on 36 drivers only), as illustrated in Figure 5. The stratification of these like trips involved a very small sample of drivers within the 60-70 age group, with the majority of drivers in the 40 to 50 year age group.
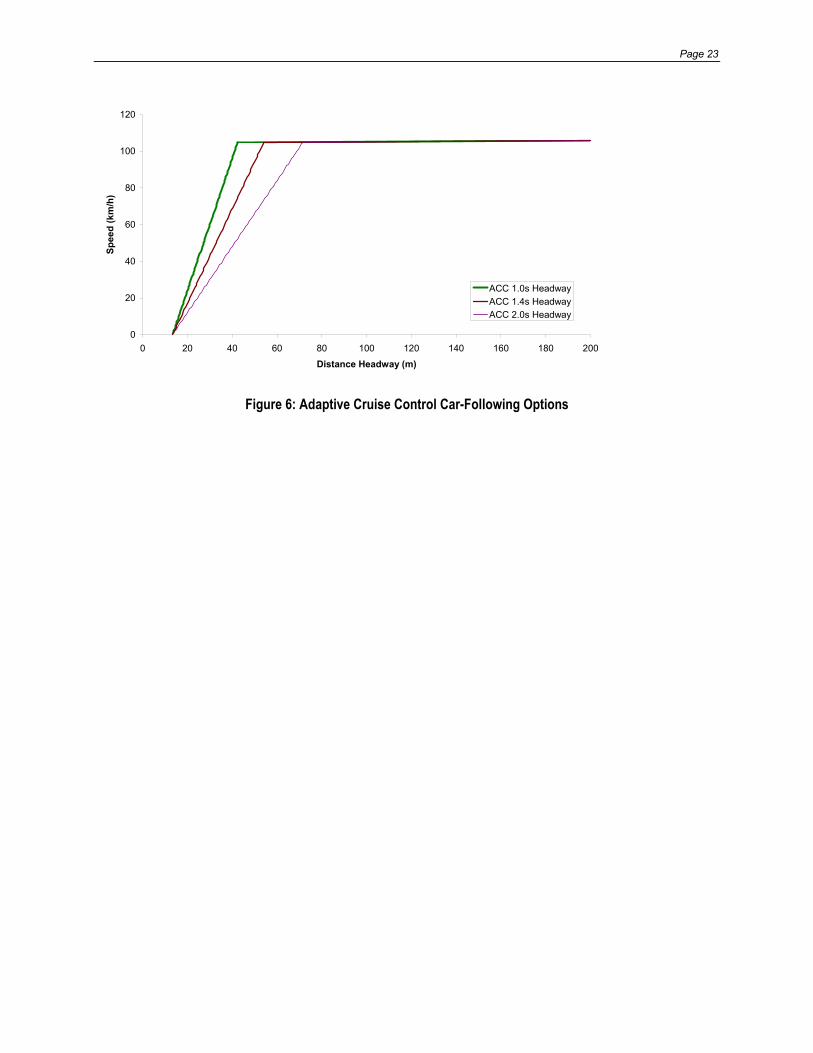
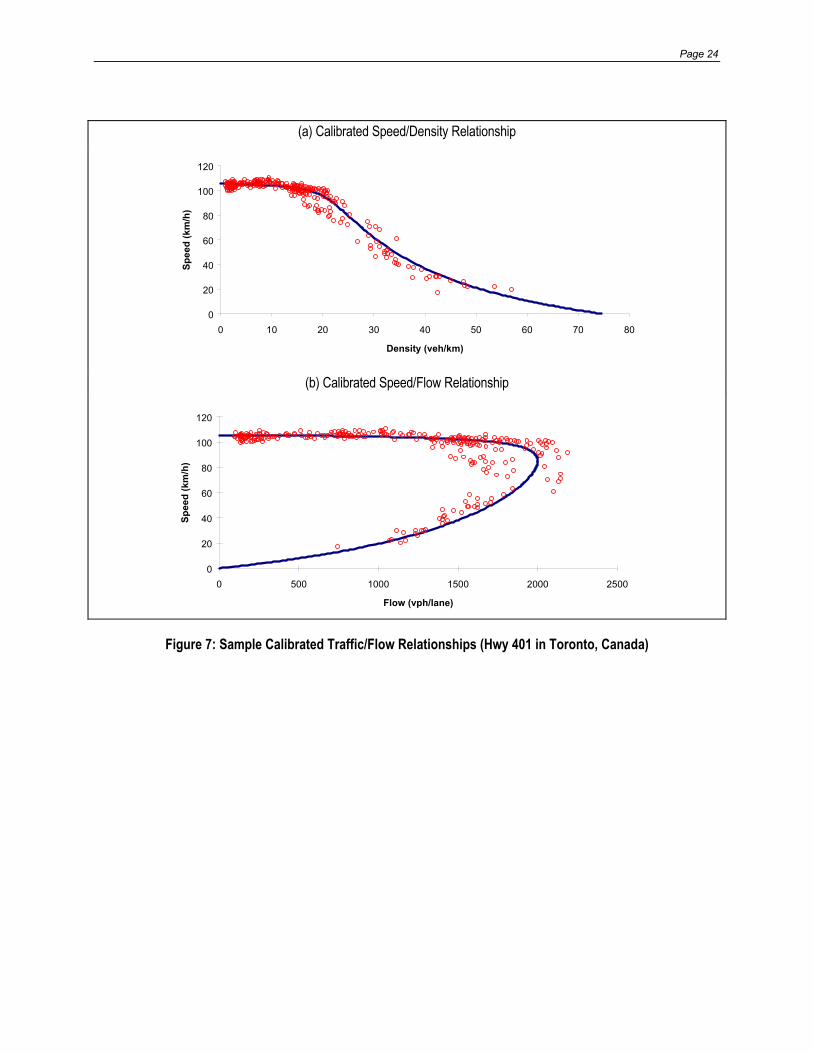
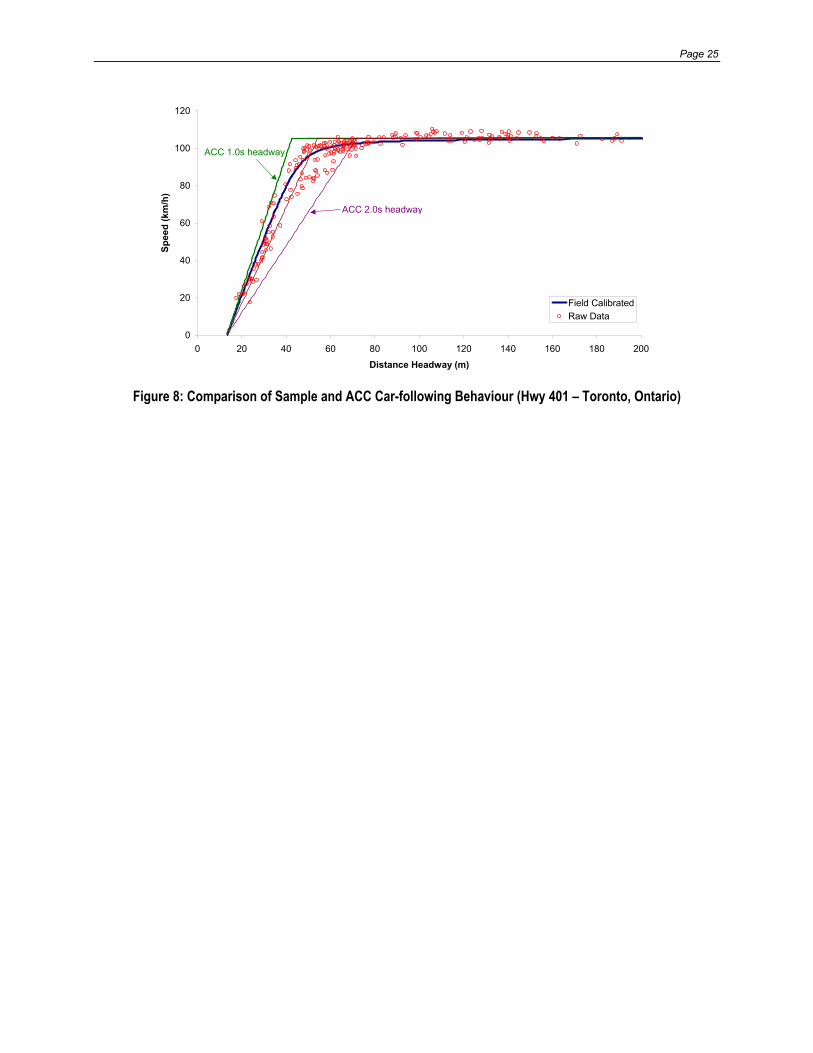
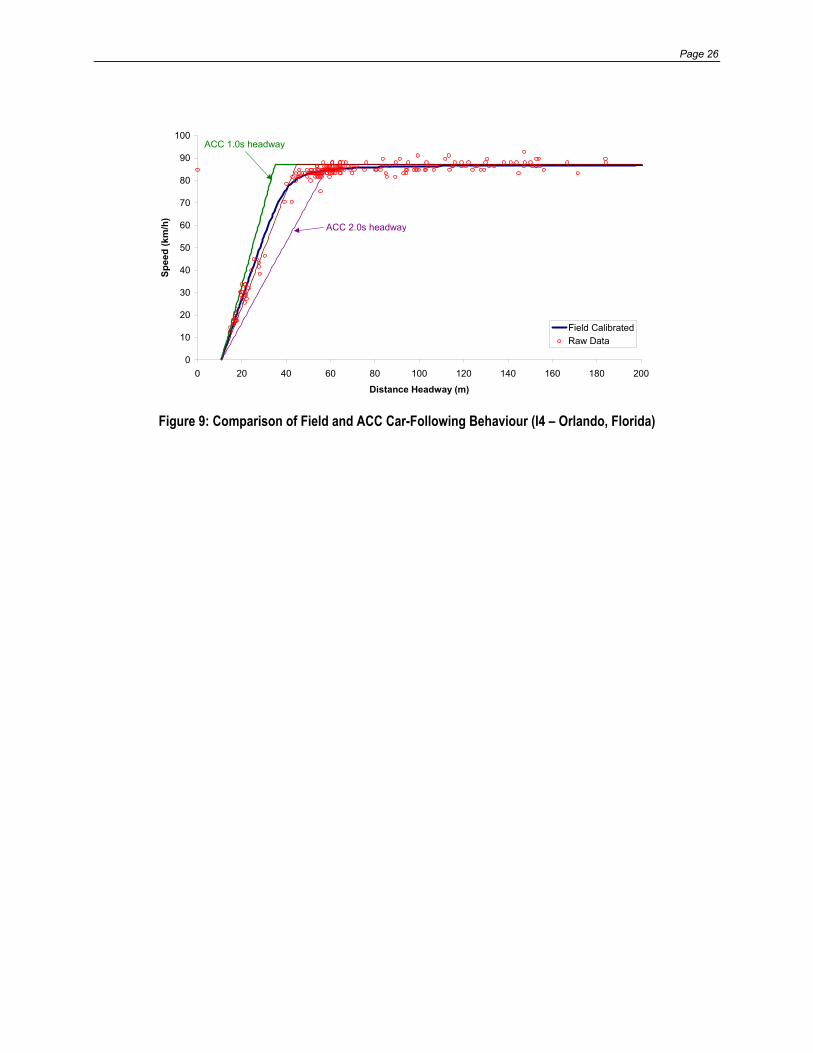
4. EVALUATION OF ADAPTIVE CRUISE CONTROL CAR-FOLLOWING BEHAVIOR As was mentioned earlier, the ACC system that was tested allowed drivers to select a desired speed and desired time headway to be maintained between the subject vehicle and the vehicle preceding it. The driver had the choice of three headway settings that included a 1.0, 1.4, and 2.0-second headway, as illustrated in Figure 6. Specifically, the figure illustrates the car-following relationships that result by setting a desired speed of 105 km/h (65 mph) for each of the three headway settings. In an attempt to compare ACC car-following behavior to typical manual driving behavior, macroscopic speed/flow relationships were calibrated using loop detector data that were gathered along a typical urban freeway, as illustrated in Figure 7. The calibration of the speed/flow and speed/density relationships was conducted using a tool developed by Van Aerde and Rakha (1995). The corresponding microscopic car-following behavior was derived from the calibrated speed/density relationship and compared to ACC car-following behavior, as illustrated in Figure 8. The figure illustrates that typical driving involves following at a headway that is somewhere between 1.0 and 1.4 seconds. Similarly, Figure 9 illustrates a good correspondence between manual and ACC car-following behavior for headway settings of 1.0 and 1.4 seconds. While a direct comparison of ACC and manual car-following behavior is beyond the scope of this paper, it can be concluded from Figure 8 and Figure 9 that the use of ACC with a headway setting of 1.0 or 1.4 seconds appears to be consistent with typical car-following behavior.
Page 8
5. EVALUATION OF DRIVER WORKLOAD AND BRAKE INTERVENTIONS Section 3.2 described how similar trips were extracted from the trip summary logs that were gathered as part of the ACC field operational test. These similar trip sets were utilized in order to verify statistically whether the use of adaptive cruise control resulted in different driving behavior relative to the use of conventional cruise control. This section describes how the data were compiled in order to apply the statistical techniques to the data, the various types of data manipulations that were required in order to conduct the statistical analysis of the data, and the results of the comparisons that were conducted.
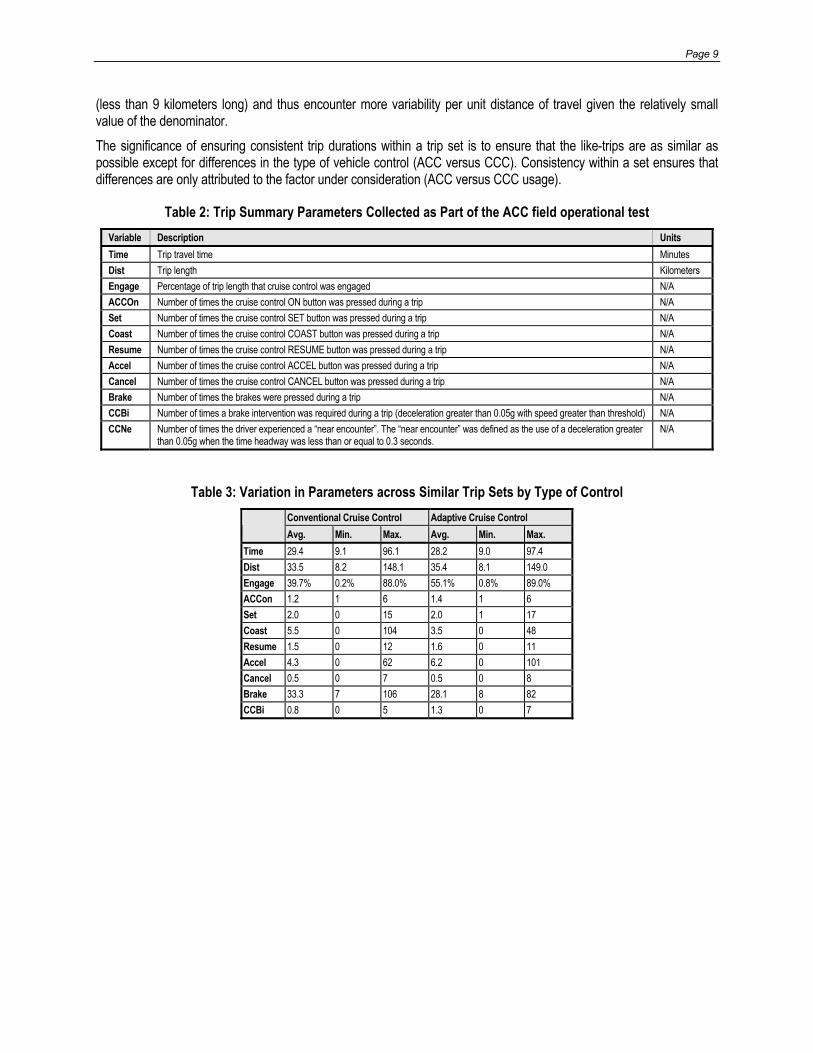
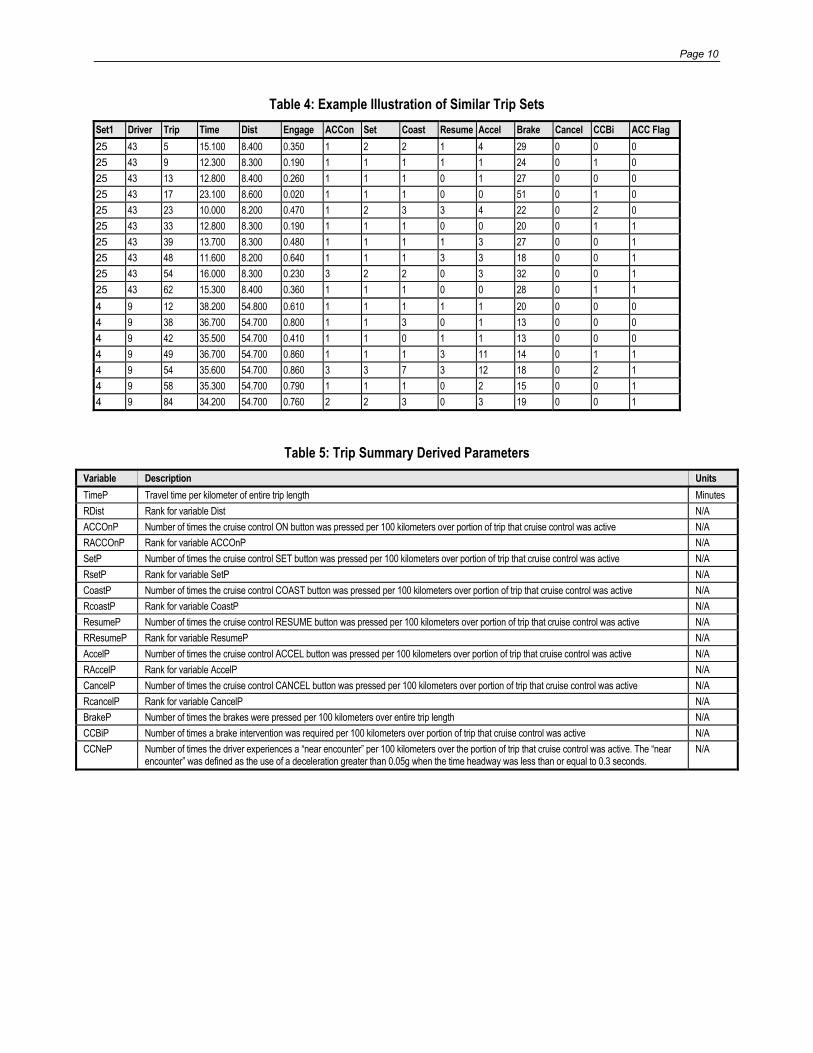
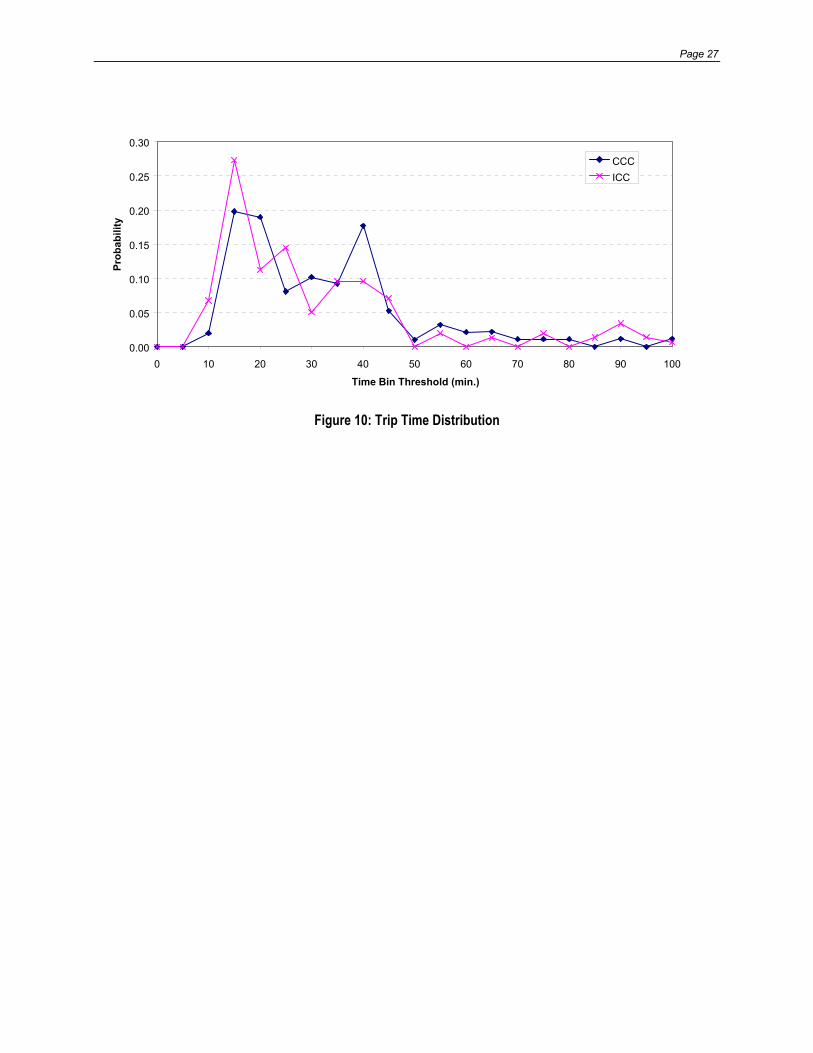
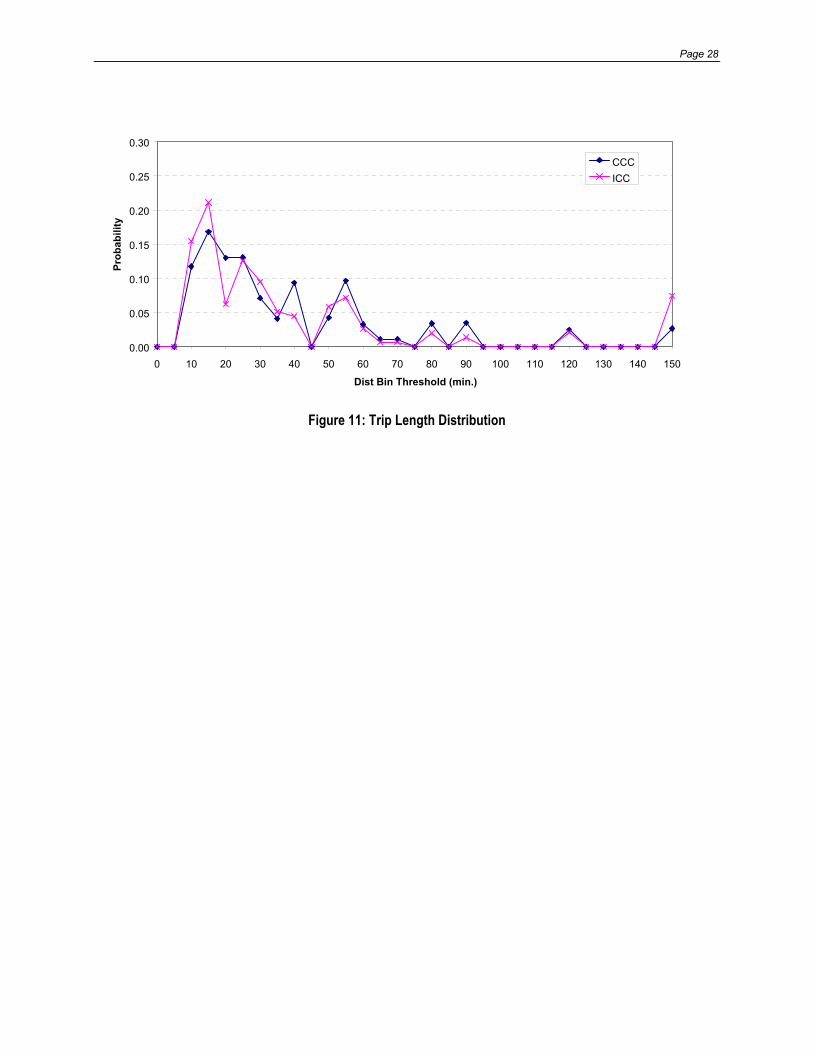
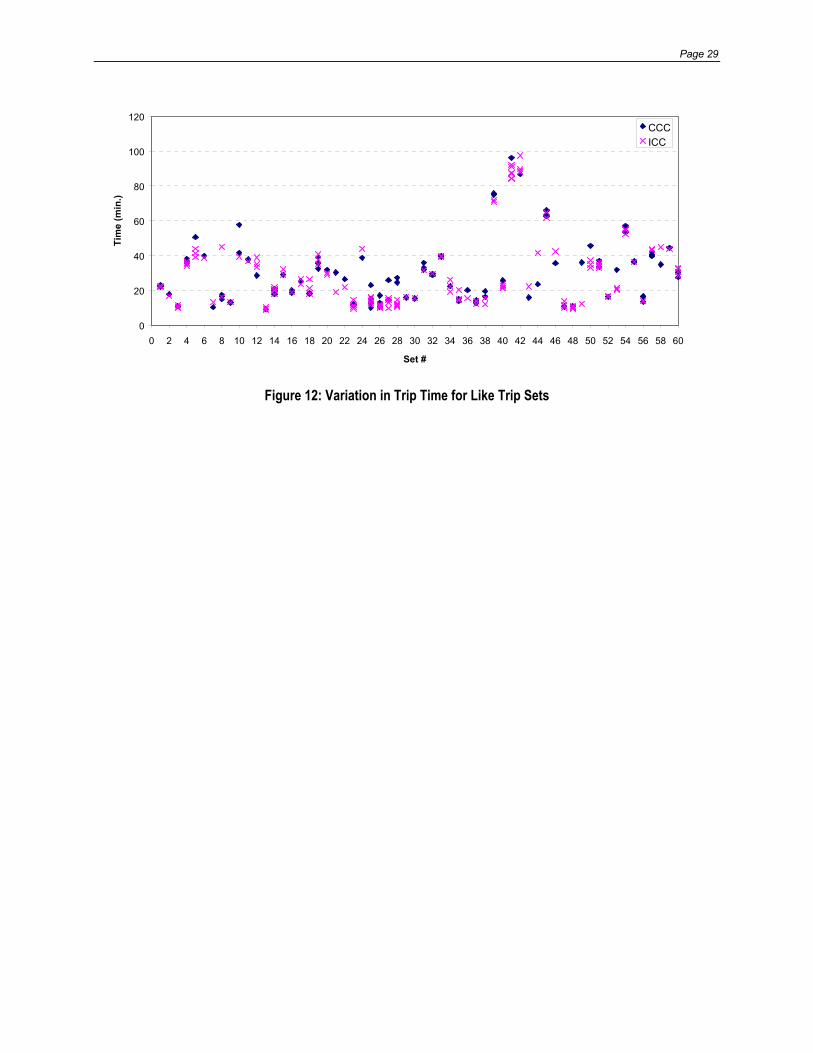
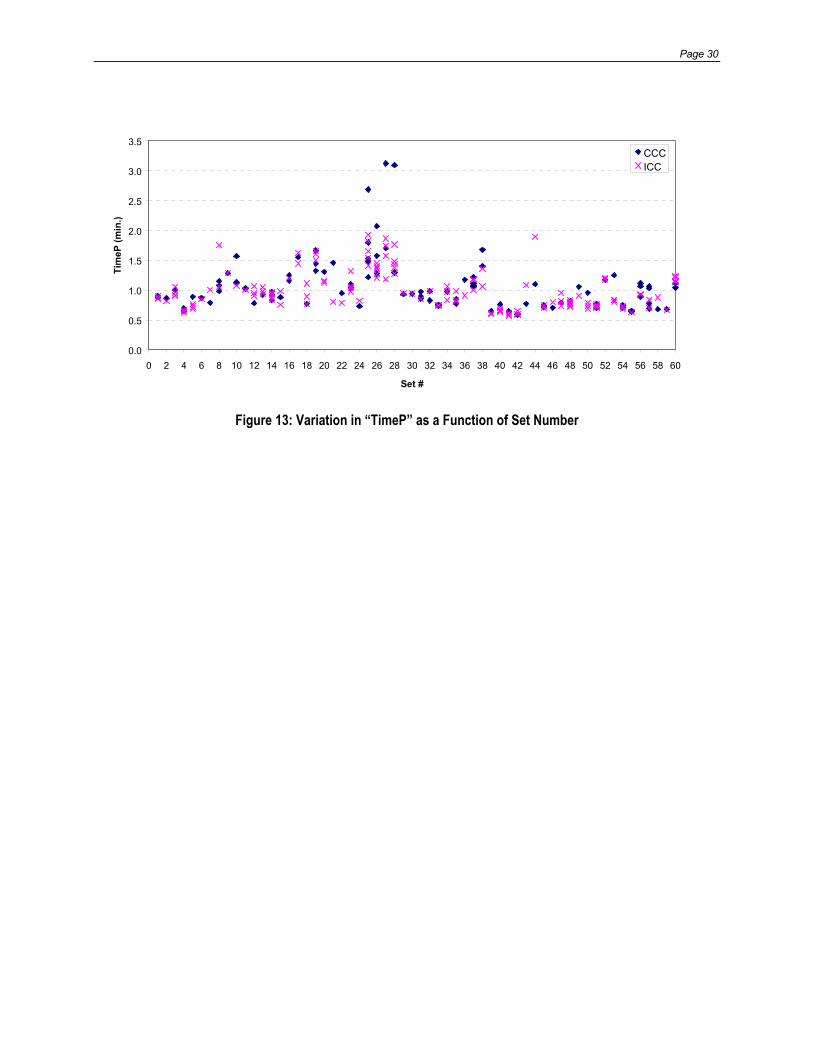
5.1 Screening of Data A number of summary parameters were gathered at the trip level. These parameters included the trip length, trip duration, percentage of trip length that cruise control was active, statistics regarding the usage of the cruise control system, and some safety measures, as described in Table 2. The similar trips that were described in Section 3.2 were screened in order to ensure that each similar trip set was composed of at least one Conventional Cruise Control (CCC) trip and one Adaptive Cruise Control (ACC) trip. Furthermore, trips that did not involve the use of either CCC or ACC were removed from the data set (distance of cruise control engaged = 0.0). The reason for ensuring that only CCC and ACC trips were included in the analysis stems from the fact that the majority of parameters that were analyzed could only be associated with the use of cruise control (e.g. number of times the ON button was pressed). It was felt that the use of trips that did not involve any type of cruise control usage would only bias the results because they would involve zeros for most measures. The screening of the data resulted in a total of 60 similar trip sets that constituted a total of 266 similar trips. Of the 266 trips 103 were CCC and 163 were ACC trips. The similar trip sets ranged from 2 similar trips to 10 similar trips per set with an average of 4.4 trips per set. Table 3 demonstrates how the average, minimum and maximum parameter values varied for trips that involved CCC and ACC type of control across all sets. Although there were a larger number of ACC versus CCC trips (163 versus 103), the mix of trip sets resulted in comparable trip characteristics (in terms of trip duration and trip length) for both the ACC and CCC configurations. Specifically, the average trip duration and length were within 2 percent for the CCC and ACC configurations. In addition, Figure 10 and Figure 11 demonstrate a close match between the CCC and ACC trip duration and trip length distributions. Consequently, the mix of CCC and ACC trips across the various similar trip sets allowed for an unbiased comparison of the CCC and ACC configurations. As described earlier, each similar trip set was comprised of a group of trips that involved a common driver, a common origin, a common destination, and a common time window. Table 4 demonstrates a sample of two similar trip sets. The first set involves five trips without ACC (ACC flag equals zero) and five trips with ACC available (ACC flag equals one) for driver 43. The second set involves three non-ACC trips and four ACC trips for driver 9. It is important to note that the trip lengths for the first set were in the range of 8 kilometers while they were in the range of 55 kilometers for the second set. In order to overcome any biases that would result from the trip length (e.g. longer trips could typically involve a larger number of counts of RESUME button presses) the various parameters were normalized by dividing by the trip length or the portion of trip length that the cruise control was enabled depending on the measure being considered. This normalization of parameters attempted to remove any biases that could have resulted from different trip lengths, however, it did not address biases that could result from differences in driving habits across drivers or differences in traffic conditions by origin/destination or time-of-day. A summary of the various parameters that were computed is presented in Table 5. Figure 12 illustrates, that the trip duration varied considerably across the various sets, with some sets involving travel times in the range of 80 to 100 minutes and other sets involving travel times in the range of 10 to 15 minutes. Alternatively, Figure 13 illustrates less variability in the distance normalized travel time “TimeP.” Specifically, most of the sets were centered on a value of 1 minute/kilometer. Figure 13 still demonstrates some variability in trip durations across trip sets that resulted because of varying levels of congestion along the route of travel and/or differences in route of travel. It should be noted that the trips with significant variability in Figure 13 are trips that are relatively short in length
Page 9
(less than 9 kilometers long) and thus encounter more variability per unit distance of travel given the relatively small value of the denominator. The significance of ensuring consistent trip durations within a trip set is to ensure that the like-trips are as similar as possible except for differences in the type of vehicle control (ACC versus CCC). Consistency within a set ensures that differences are only attributed to the factor under consideration (ACC versus CCC usage).
Table 2: Trip Summary Parameters Collected as Part of the ACC field operational test Variable Description Units Time Trip travel time Minutes Dist Trip length Kilometers Engage Percentage of trip length that cruise control was engaged N/A ACCOn Number of times the cruise control ON button was pressed during a trip N/A Set Number of times the cruise control SET button was pressed during a trip N/A Coast Number of times the cruise control COAST button was pressed during a trip N/A Resume Number of times the cruise control RESUME button was pressed during a trip N/A Accel Number of times the cruise control ACCEL button was pressed during a trip N/A Cancel Number of times the cruise control CANCEL button was pressed during a trip N/A Brake Number of times the brakes were pressed during a trip N/A CCBi Number of times a brake intervention was required during a trip (deceleration greater than 0.05g with speed greater than threshold) N/A CCNe Number of times the driver experienced a “near encounter”. The “near encounter” was defined as the use of a deceleration greater
than 0.05g when the time headway was less than or equal to 0.3 seconds. N/A
Table 3: Variation in Parameters across Similar Trip Sets by Type of Control Conventional Cruise Control Adaptive Cruise Control Avg. Min. Max. Avg. Min. Max.
Time 29.4 9.1 96.1 28.2 9.0 97.4 Dist 33.5 8.2 148.1 35.4 8.1 149.0 Engage 39.7% 0.2% 88.0% 55.1% 0.8% 89.0% ACCon 1.2 1 6 1.4 1 6 Set 2.0 0 15 2.0 1 17 Coast 5.5 0 104 3.5 0 48 Resume 1.5 0 12 1.6 0 11 Accel 4.3 0 62 6.2 0 101 Cancel 0.5 0 7 0.5 0 8 Brake 33.3 7 106 28.1 8 82 CCBi 0.8 0 5 1.3 0 7
Page 10
Table 4: Example Illustration of Similar Trip Sets Set1 Driver Trip Time Dist Engage ACCon Set Coast Resume Accel Brake Cancel CCBi ACC Flag 25 43 5 15.100 8.400 0.350 1 2 2 1 4 29 0 0 0 25 43 9 12.300 8.300 0.190 1 1 1 1 1 24 0 1 0 25 43 13 12.800 8.400 0.260 1 1 1 0 1 27 0 0 0 25 43 17 23.100 8.600 0.020 1 1 1 0 0 51 0 1 0 25 43 23 10.000 8.200 0.470 1 2 3 3 4 22 0 2 0 25 43 33 12.800 8.300 0.190 1 1 1 0 0 20 0 1 1 25 43 39 13.700 8.300 0.480 1 1 1 1 3 27 0 0 1 25 43 48 11.600 8.200 0.640 1 1 1 3 3 18 0 0 1 25 43 54 16.000 8.300 0.230 3 2 2 0 3 32 0 0 1 25 43 62 15.300 8.400 0.360 1 1 1 0 0 28 0 1 1 4 9 12 38.200 54.800 0.610 1 1 1 1 1 20 0 0 0 4 9 38 36.700 54.700 0.800 1 1 3 0 1 13 0 0 0 4 9 42 35.500 54.700 0.410 1 1 0 1 1 13 0 0 0 4 9 49 36.700 54.700 0.860 1 1 1 3 11 14 0 1 1 4 9 54 35.600 54.700 0.860 3 3 7 3 12 18 0 2 1 4 9 58 35.300 54.700 0.790 1 1 1 0 2 15 0 0 1 4 9 84 34.200 54.700 0.760 2 2 3 0 3 19 0 0 1
Table 5: Trip Summary Derived Parameters Variable Description Units TimeP Travel time per kilometer of entire trip length Minutes RDist Rank for variable Dist N/A ACCOnP Number of times the cruise control ON button was pressed per 100 kilometers over portion of trip that cruise control was active N/A RACCOnP Rank for variable ACCOnP N/A SetP Number of times the cruise control SET button was pressed per 100 kilometers over portion of trip that cruise control was active N/A RsetP Rank for variable SetP N/A CoastP Number of times the cruise control COAST button was pressed per 100 kilometers over portion of trip that cruise control was active N/A RcoastP Rank for variable CoastP N/A ResumeP Number of times the cruise control RESUME button was pressed per 100 kilometers over portion of trip that cruise control was active N/A RResumeP Rank for variable ResumeP N/A AccelP Number of times the cruise control ACCEL button was pressed per 100 kilometers over portion of trip that cruise control was active N/A RAccelP Rank for variable AccelP N/A CancelP Number of times the cruise control CANCEL button was pressed per 100 kilometers over portion of trip that cruise control was active N/A RcancelP Rank for variable CancelP N/A BrakeP Number of times the brakes were pressed per 100 kilometers over entire trip length N/A CCBiP Number of times a brake intervention was required per 100 kilometers over portion of trip that cruise control was active N/A CCNeP Number of times the driver experiences a “near encounter” per 100 kilometers over the portion of trip that cruise control was active. The “near
encounter” was defined as the use of a deceleration greater than 0.05g when the time headway was less than or equal to 0.3 seconds. N/A
Page 11
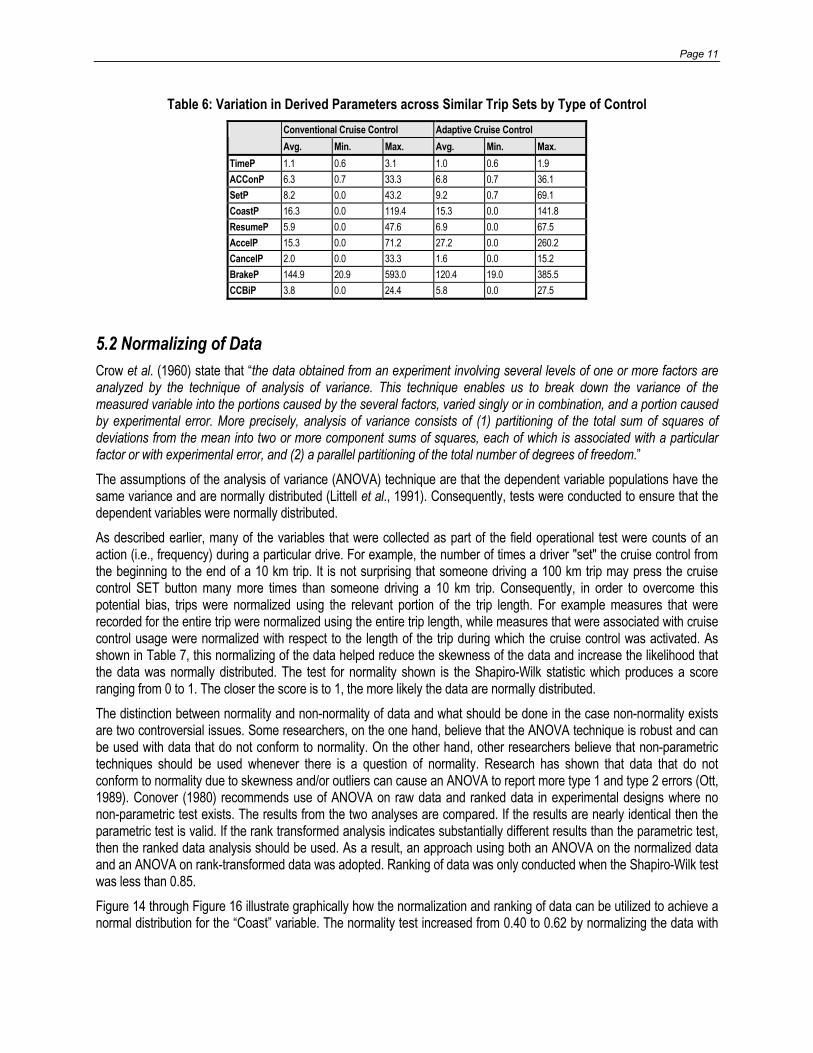
Table 6: Variation in Derived Parameters across Similar Trip Sets by Type of Control Conventional Cruise Control Adaptive Cruise Control Avg. Min. Max. Avg. Min. Max.
TimeP 1.1 0.6 3.1 1.0 0.6 1.9 ACConP 6.3 0.7 33.3 6.8 0.7 36.1 SetP 8.2 0.0 43.2 9.2 0.7 69.1 CoastP 16.3 0.0 119.4 15.3 0.0 141.8 ResumeP 5.9 0.0 47.6 6.9 0.0 67.5 AccelP 15.3 0.0 71.2 27.2 0.0 260.2 CancelP 2.0 0.0 33.3 1.6 0.0 15.2 BrakeP 144.9 20.9 593.0 120.4 19.0 385.5 CCBiP 3.8 0.0 24.4 5.8 0.0 27.5
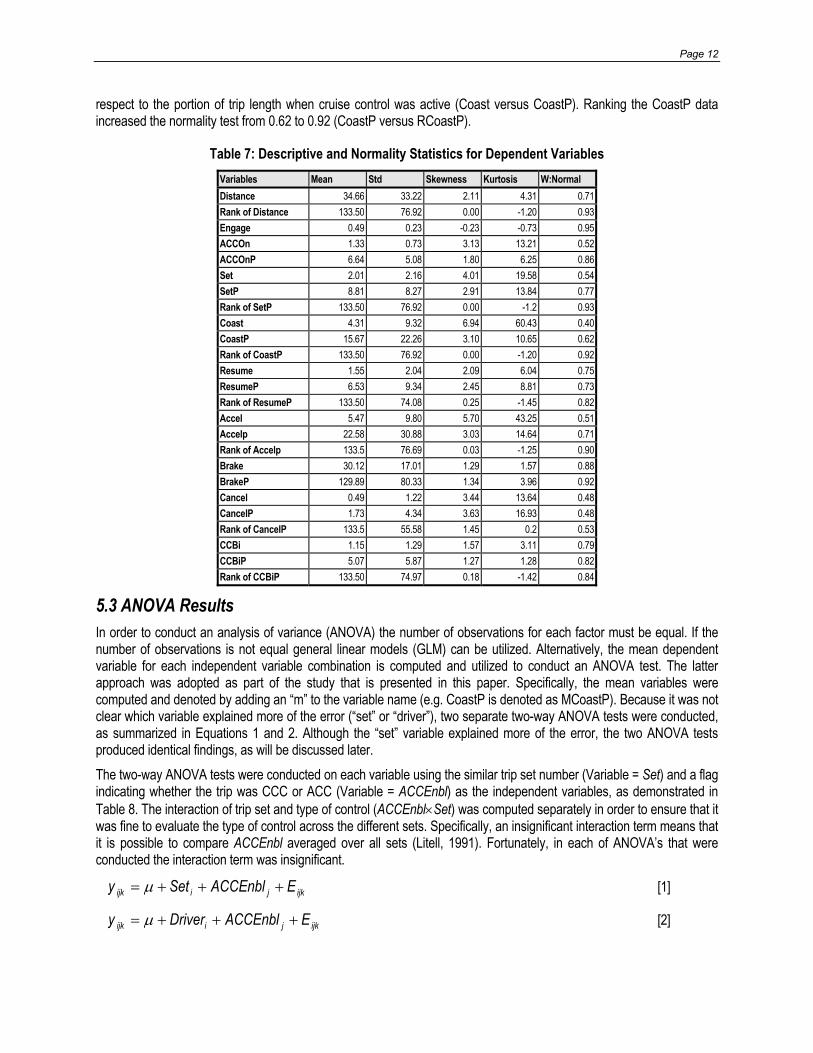
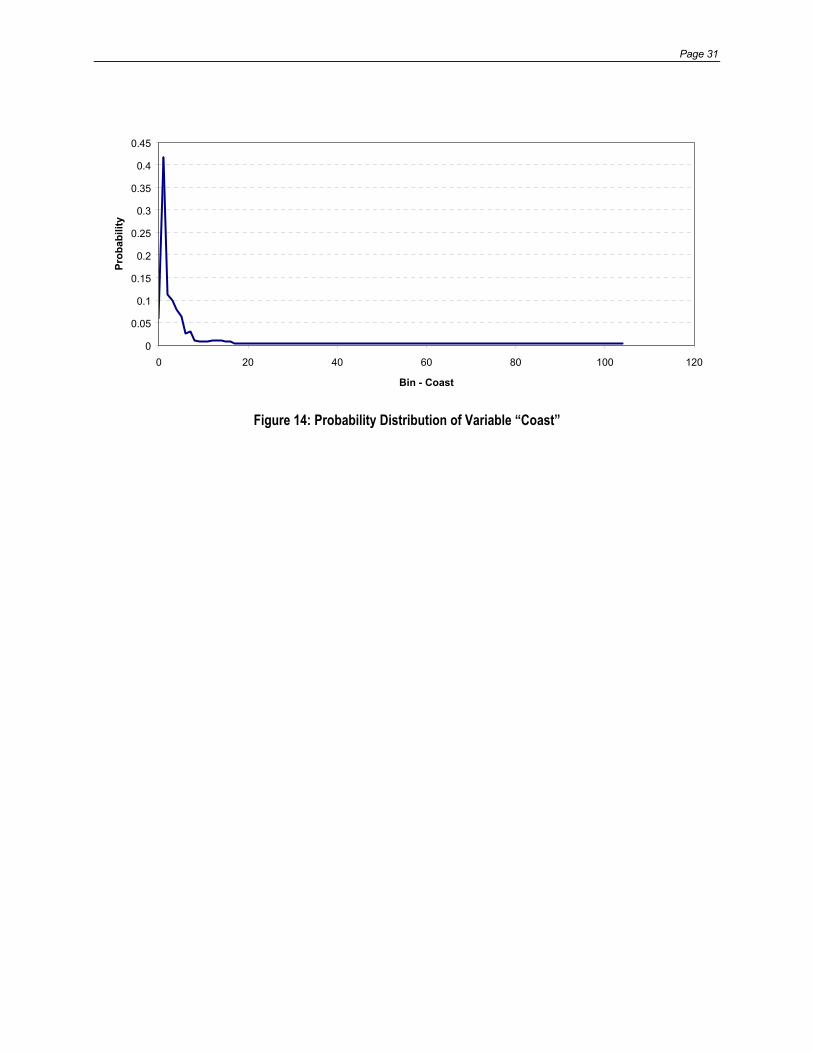
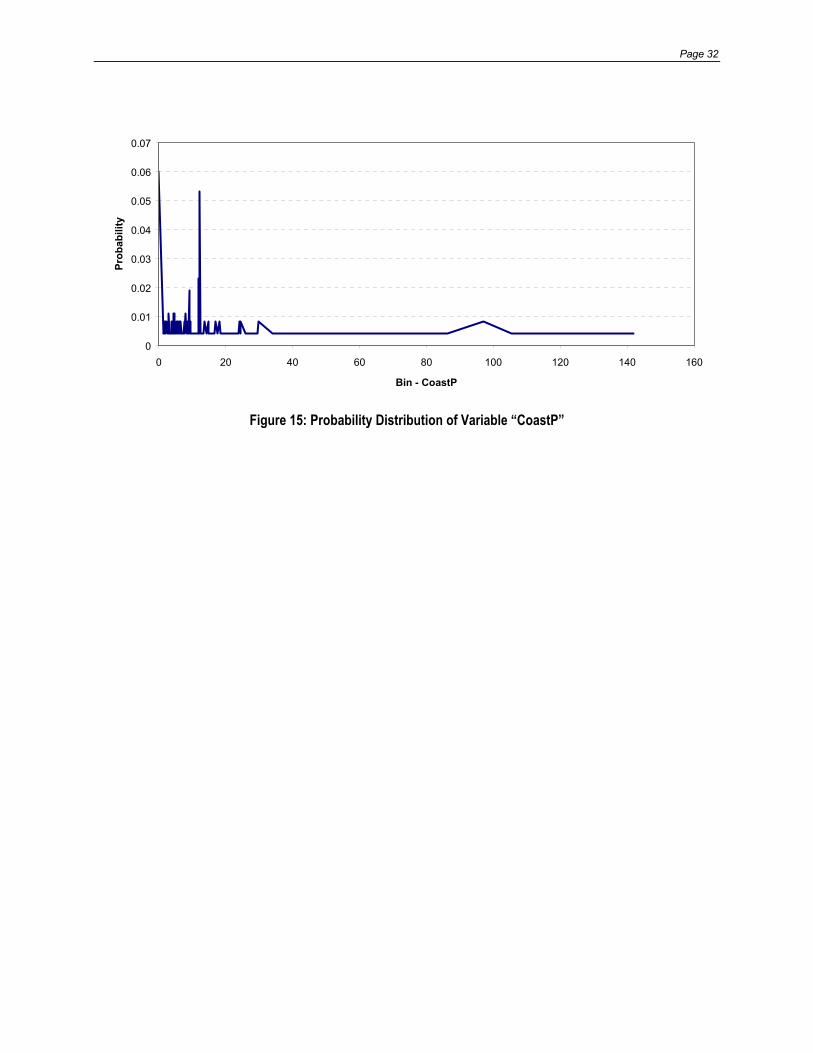
5.2 Normalizing of Data Crow et al. (1960) state that “the data obtained from an experiment involving several levels of one or more factors are analyzed by the technique of analysis of variance. This technique enables us to break down the variance of the measured variable into the portions caused by the several factors, varied singly or in combination, and a portion caused by experimental error. More precisely, analysis of variance consists of (1) partitioning of the total sum of squares of deviations from the mean into two or more component sums of squares, each of which is associated with a particular factor or with experimental error, and (2) a parallel partitioning of the total number of degrees of freedom.” The assumptions of the analysis of variance (ANOVA) technique are that the dependent variable populations have the same variance and are normally distributed (Littell et al., 1991). Consequently, tests were conducted to ensure that the dependent variables were normally distributed. As described earlier, many of the variables that were collected as part of the field operational test were counts of an action (i.e., frequency) during a particular drive. For example, the number of times a driver "set" the cruise control from the beginning to the end of a 10 km trip. It is not surprising that someone driving a 100 km trip may press the cruise control SET button many more times than someone driving a 10 km trip. Consequently, in order to overcome this potential bias, trips were normalized using the relevant portion of the trip length. For example measures that were recorded for the entire trip were normalized using the entire trip length, while measures that were associated with cruise control usage were normalized with respect to the length of the trip during which the cruise control was activated. As shown in Table 7, this normalizing of the data helped reduce the skewness of the data and increase the likelihood that the data was normally distributed. The test for normality shown is the Shapiro-Wilk statistic which produces a score ranging from 0 to 1. The closer the score is to 1, the more likely the data are normally distributed. The distinction between normality and non-normality of data and what should be done in the case non-normality exists are two controversial issues. Some researchers, on the one hand, believe that the ANOVA technique is robust and can be used with data that do not conform to normality. On the other hand, other researchers believe that non-parametric techniques should be used whenever there is a question of normality. Research has shown that data that do not conform to normality due to skewness and/or outliers can cause an ANOVA to report more type 1 and type 2 errors (Ott, 1989). Conover (1980) recommends use of ANOVA on raw data and ranked data in experimental designs where no non-parametric test exists. The results from the two analyses are compared. If the results are nearly identical then the parametric test is valid. If the rank transformed analysis indicates substantially different results than the parametric test, then the ranked data analysis should be used. As a result, an approach using both an ANOVA on the normalized data and an ANOVA on rank-transformed data was adopted. Ranking of data was only conducted when the Shapiro-Wilk test was less than 0.85. Figure 14 through Figure 16 illustrate graphically how the normalization and ranking of data can be utilized to achieve a normal distribution for the “Coast” variable. The normality test increased from 0.40 to 0.62 by normalizing the data with
Page 12
respect to the portion of trip length when cruise control was active (Coast versus CoastP). Ranking the CoastP data increased the normality test from 0.62 to 0.92 (CoastP versus RCoastP).
Table 7: Descriptive and Normality Statistics for Dependent Variables Variables Mean Std Skewness Kurtosis W:Normal Distance 34.66 33.22 2.11 4.31 0.71 Rank of Distance 133.50 76.92 0.00 -1.20 0.93 Engage 0.49 0.23 -0.23 -0.73 0.95 ACCOn 1.33 0.73 3.13 13.21 0.52 ACCOnP 6.64 5.08 1.80 6.25 0.86 Set 2.01 2.16 4.01 19.58 0.54 SetP 8.81 8.27 2.91 13.84 0.77 Rank of SetP 133.50 76.92 0.00 -1.2 0.93 Coast 4.31 9.32 6.94 60.43 0.40 CoastP 15.67 22.26 3.10 10.65 0.62 Rank of CoastP 133.50 76.92 0.00 -1.20 0.92 Resume 1.55 2.04 2.09 6.04 0.75 ResumeP 6.53 9.34 2.45 8.81 0.73 Rank of ResumeP 133.50 74.08 0.25 -1.45 0.82 Accel 5.47 9.80 5.70 43.25 0.51 Accelp 22.58 30.88 3.03 14.64 0.71 Rank of Accelp 133.5 76.69 0.03 -1.25 0.90 Brake 30.12 17.01 1.29 1.57 0.88 BrakeP 129.89 80.33 1.34 3.96 0.92 Cancel 0.49 1.22 3.44 13.64 0.48 CancelP 1.73 4.34 3.63 16.93 0.48 Rank of CancelP 133.5 55.58 1.45 0.2 0.53 CCBi 1.15 1.29 1.57 3.11 0.79 CCBiP 5.07 5.87 1.27 1.28 0.82 Rank of CCBiP 133.50 74.97 0.18 -1.42 0.84
5.3 ANOVA Results In order to conduct an analysis of variance (ANOVA) the number of observations for each factor must be equal. If the number of observations is not equal general linear models (GLM) can be utilized. Alternatively, the mean dependent variable for each independent variable combination is computed and utilized to conduct an ANOVA test. The latter approach was adopted as part of the study that is presented in this paper. Specifically, the mean variables were computed and denoted by adding an “m” to the variable name (e.g. CoastP is denoted as MCoastP). Because it was not clear which variable explained more of the error (“set” or “driver”), two separate two-way ANOVA tests were conducted, as summarized in Equations 1 and 2. Although the “set” variable explained more of the error, the two ANOVA tests produced identical findings, as will be discussed later. The two-way ANOVA tests were conducted on each variable using the similar trip set number (Variable = Set) and a flag indicating whether the trip was CCC or ACC (Variable = ACCEnbl) as the independent variables, as demonstrated in Table 8. The interaction of trip set and type of control (ACCEnbl×Set) was computed separately in order to ensure that it was fine to evaluate the type of control across the different sets. Specifically, an insignificant interaction term means that it is possible to compare ACCEnbl averaged over all sets (Litell, 1991). Fortunately, in each of ANOVA’s that were conducted the interaction term was insignificant.
ijkjiijk EACCEnblSety +++= µ [1]
ijkjiijk EACCEnblDrivery +++= µ [2]
Page 13
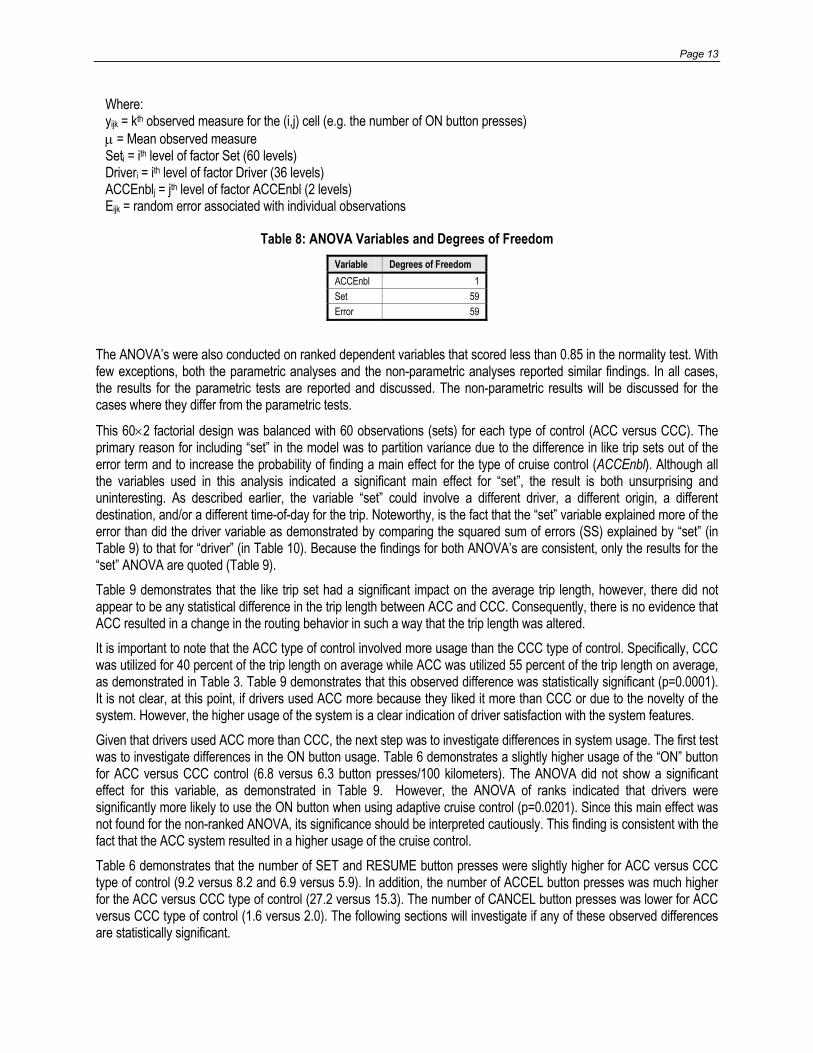
Where: yijk = kth observed measure for the (i,j) cell (e.g. the number of ON button presses) µ = Mean observed measure Seti = ith level of factor Set (60 levels) Driveri = ith level of factor Driver (36 levels) ACCEnblj = jth level of factor ACCEnbl (2 levels) Eijk = random error associated with individual observations
Table 8: ANOVA Variables and Degrees of Freedom Variable Degrees of Freedom ACCEnbl 1 Set 59 Error 59
The ANOVA’s were also conducted on ranked dependent variables that scored less than 0.85 in the normality test. With few exceptions, both the parametric analyses and the non-parametric analyses reported similar findings. In all cases, the results for the parametric tests are reported and discussed. The non-parametric results will be discussed for the cases where they differ from the parametric tests.
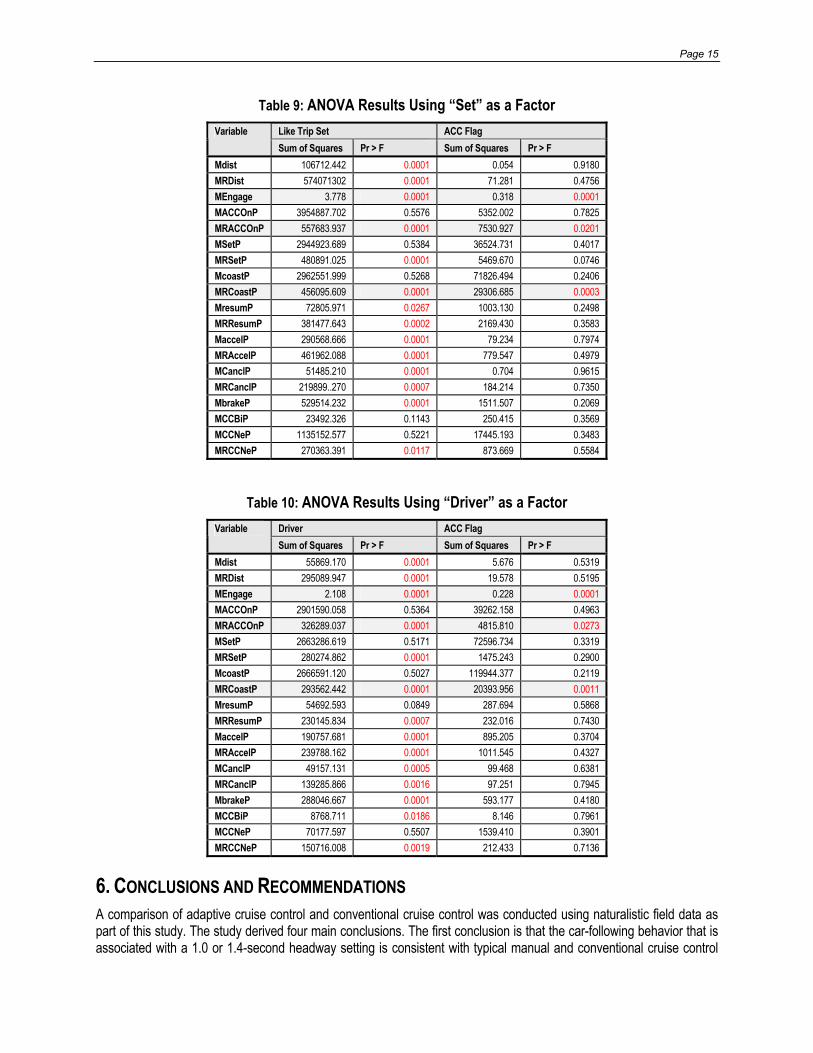
This 60×2 factorial design was balanced with 60 observations (sets) for each type of control (ACC versus CCC). The primary reason for including “set” in the model was to partition variance due to the difference in like trip sets out of the error term and to increase the probability of finding a main effect for the type of cruise control (ACCEnbl). Although all the variables used in this analysis indicated a significant main effect for “set”, the result is both unsurprising and uninteresting. As described earlier, the variable “set” could involve a different driver, a different origin, a different destination, and/or a different time-of-day for the trip. Noteworthy, is the fact that the “set” variable explained more of the error than did the driver variable as demonstrated by comparing the squared sum of errors (SS) explained by “set” (in Table 9) to that for “driver” (in Table 10). Because the findings for both ANOVA’s are consistent, only the results for the “set” ANOVA are quoted (Table 9). Table 9 demonstrates that the like trip set had a significant impact on the average trip length, however, there did not appear to be any statistical difference in the trip length between ACC and CCC. Consequently, there is no evidence that ACC resulted in a change in the routing behavior in such a way that the trip length was altered. It is important to note that the ACC type of control involved more usage than the CCC type of control. Specifically, CCC was utilized for 40 percent of the trip length on average while ACC was utilized 55 percent of the trip length on average, as demonstrated in Table 3. Table 9 demonstrates that this observed difference was statistically significant (p=0.0001). It is not clear, at this point, if drivers used ACC more because they liked it more than CCC or due to the novelty of the system. However, the higher usage of the system is a clear indication of driver satisfaction with the system features. Given that drivers used ACC more than CCC, the next step was to investigate differences in system usage. The first test was to investigate differences in the ON button usage. Table 6 demonstrates a slightly higher usage of the “ON” button for ACC versus CCC control (6.8 versus 6.3 button presses/100 kilometers). The ANOVA did not show a significant effect for this variable, as demonstrated in Table 9. However, the ANOVA of ranks indicated that drivers were significantly more likely to use the ON button when using adaptive cruise control (p=0.0201). Since this main effect was not found for the non-ranked ANOVA, its significance should be interpreted cautiously. This finding is consistent with the fact that the ACC system resulted in a higher usage of the cruise control. Table 6 demonstrates that the number of SET and RESUME button presses were slightly higher for ACC versus CCC type of control (9.2 versus 8.2 and 6.9 versus 5.9). In addition, the number of ACCEL button presses was much higher for the ACC versus CCC type of control (27.2 versus 15.3). The number of CANCEL button presses was lower for ACC versus CCC type of control (1.6 versus 2.0). The following sections will investigate if any of these observed differences are statistically significant.
Page 14
As was the case with the ON button, the SET button was used more for ACC versus CCC (9.2 versus 8.2 times per 100 km), however, this difference was not statistically significant (p=0.4017), as demonstrated in Table 9. As was mentioned earlier the driver may increase the vehicle speed after it has been initially set by pressing the ACCEL button and releasing it at the desired speed, tapping the ACCEL button to increase incrementally, or pressing the accelerator until obtaining the desired speed and repressing the SET button. An analysis of the data indicates that there was no statistically significant difference in the use of the ACCEL button between ACC and CCC, as demonstrated in Table 9 (p=0.7974). In order to decrease the originally set speed on the cruise control, drivers can either press the COAST button and release it when the desired speed has been obtained or deactivate the system and press the SET button when the desired speed has been obtained. The ANOVA did not show a significant effect for this variable, as demonstrated in Table 9. However, the ANOVA of ranks indicated that drivers were significantly more likely to use the COAST button when using conventional cruise control (p=0.0003). Since this main effect was not found for the non-ranked ANOVA, its significance should be interpreted cautiously. This finding is consistent with the function of the ACC system. Given that the ACC system reduces the vehicle speed when it closes in on an object this finding indicates that the system appeared to work as intended. In order to deactivate the cruise control while keeping the set speed in memory, the driver has the choice to either tap the brake pedal or press the CANCEL button. The results indicate that although the CCC involved more usage of the CANCEL button compared to ACC (2.0 versus 1.6 presses per 100 km), this difference was not statistically significant (p=0.4979), as demonstrated in Table 9. When drivers want to reactivate the cruise control after hitting the CANCEL button or touching the brake, all they need to do is to press the RESUME button. Given that the use of the CANCEL button was not statistically different between CCC and ACC, it is not surprising that there was no significant difference in re-activating the cruise control (ACC = 6.9 and CCC = 5.9, p=0.2498). The next step in the analysis was to investigate differences in braking between ACC and CCC drivers. Table 6 illustrates how the use of brakes varied within and across similar trip sets for CCC and ACC types of control. Noteworthy, is the fact that drivers used their brakes more (BrakeP=144.9 versus 120.4 times per 100 km) for trips that involved CCC while they used their brakes less while the cruise control was activated (CCBiP=3.8 versus 5.8 brake interventions per 100 km) relative to ACC. However, both measures are statistically insignificant. Finally, there was some concern that drivers with ACC would be more likely to be in an accident or a near miss type of situation than drivers using CCC. This analysis showed no significant difference (p=0.3483) in the number of “near encounters” when using ACC (mean 2.6) compared to CCC (mean 2.5). A “near encounter” was defined as the use of a deceleration rate greater than 0.05g when the time headway was less than 0.3 seconds.
Page 15
Table 9: ANOVA Results Using “Set” as a Factor Like Trip Set ACC Flag Variable Sum of Squares Pr > F Sum of Squares Pr > F
Mdist 106712.442 0.0001 0.054 0.9180 MRDist 574071302 0.0001 71.281 0.4756 MEngage 3.778 0.0001 0.318 0.0001 MACCOnP 3954887.702 0.5576 5352.002 0.7825 MRACCOnP 557683.937 0.0001 7530.927 0.0201 MSetP 2944923.689 0.5384 36524.731 0.4017 MRSetP 480891.025 0.0001 5469.670 0.0746 McoastP 2962551.999 0.5268 71826.494 0.2406 MRCoastP 456095.609 0.0001 29306.685 0.0003 MresumP 72805.971 0.0267 1003.130 0.2498 MRResumP 381477.643 0.0002 2169.430 0.3583 MaccelP 290568.666 0.0001 79.234 0.7974 MRAccelP 461962.088 0.0001 779.547 0.4979 MCanclP 51485.210 0.0001 0.704 0.9615 MRCanclP 219899..270 0.0007 184.214 0.7350 MbrakeP 529514.232 0.0001 1511.507 0.2069 MCCBiP 23492.326 0.1143 250.415 0.3569 MCCNeP 1135152.577 0.5221 17445.193 0.3483 MRCCNeP 270363.391 0.0117 873.669 0.5584
Table 10: ANOVA Results Using “Driver” as a Factor Driver ACC Flag Variable Sum of Squares Pr > F Sum of Squares Pr > F
Mdist 55869.170 0.0001 5.676 0.5319 MRDist 295089.947 0.0001 19.578 0.5195 MEngage 2.108 0.0001 0.228 0.0001 MACCOnP 2901590.058 0.5364 39262.158 0.4963 MRACCOnP 326289.037 0.0001 4815.810 0.0273 MSetP 2663286.619 0.5171 72596.734 0.3319 MRSetP 280274.862 0.0001 1475.243 0.2900 McoastP 2666591.120 0.5027 119944.377 0.2119 MRCoastP 293562.442 0.0001 20393.956 0.0011 MresumP 54692.593 0.0849 287.694 0.5868 MRResumP 230145.834 0.0007 232.016 0.7430 MaccelP 190757.681 0.0001 895.205 0.3704 MRAccelP 239788.162 0.0001 1011.545 0.4327 MCanclP 49157.131 0.0005 99.468 0.6381 MRCanclP 139285.866 0.0016 97.251 0.7945 MbrakeP 288046.667 0.0001 593.177 0.4180 MCCBiP 8768.711 0.0186 8.146 0.7961 MCCNeP 70177.597 0.5507 1539.410 0.3901 MRCCNeP 150716.008 0.0019 212.433 0.7136
6. CONCLUSIONS AND RECOMMENDATIONS A comparison of adaptive cruise control and conventional cruise control was conducted using naturalistic field data as part of this study. The study derived four main conclusions. The first conclusion is that the car-following behavior that is associated with a 1.0 or 1.4-second headway setting is consistent with typical manual and conventional cruise control
Page 16
car-following behavior. Second, the study demonstrated that ACC was utilized more than conventional cruise control (55 versus 40 percent of trip length) demonstrating driver satisfaction with the system. Third, the study demonstrated that there was no statistical difference in usage of the SET, RESUME, ACCEL, and CANCEL buttons between ACC and CCC. In addition, ACC resulted in a larger usage of the ON button (6.8 versus 6.3 times per 100 km) and a lower usage of the COAST button compared to CCC (COAST button used 15.3 versus 16.3 times per 100 km). Given that the ON button is only used at the beginning of a trip while the COAST button is utilized during a trip, this finding demonstrates that an ACC system could reduce the driver visual and manual demands while driving with potential reductions in driver workloads. Forth, the study demonstrated that there was no statistical difference in the usage of the vehicle brakes, the number of brake interventions, and number of “near encounters” between ACC and CCC usage. In conclusion, these four findings collectively suggest that ACC technology does not pose a safety hazard to drivers and appears to be a technology that is worthy of further testing and evaluation. Consequently, it is recommended that further analysis be initiated in order to conduct in-depth studies to quantify differences in lane-changing and car-following behavior between ACC and CCC usage. In addition, further investigation is required into differences in vehicle cut-ins ahead of cruise control vehicles for ACC and CCC type of control.
REFERENCES Conover, W. J. (1980), Practical Nonparametric Statistics, Second Edition by John Wiley and Sons Inc.
Crow E.L., Davis F.A. and Maxfield M.W. (1960) Statistics Manual, Dover 0-486-60599-X.
Fancher P., Baraket Z., Johnson G., and Sayer J. (1995), “Evaluation of Human Factors and Safety Performance in the Longitudinal Control of Headway”, Proceedings of the World Congress on Intelligent Transport Systems, pp. 1732-1738.
Fancher P., Irvin R., Sayer J., Hagan M., Bogard S., Baraket Z., Mefford M., and Haugen J. (1998), Intelligent Cruise Control Field Operational Test (Final Report), DOT HS 808 849, May.
Littell R.C., Freund R.J., Spector P.C. SAS System for Linear Models, Third Edition, SAS Institute Inc.
Nilsson, L. (1995), “Safety Effects of Adaptive Cruise Controls in Critical Traffic Situations,” Proceedings of the World Congress on Intelligent Transport Systems, pp. 1254-1259.
Ott, Lyman. (1988), An Introduction to Statistical Methods and Data Analysis, Third Edition. PWS-Kent.
Rockwell T. H. (1972), “Skills, Judgment, and Information Acquisition in Driving,” In T.W. Forbes (Ed.), Human Factors in Highway Traffic Safety Research, Wiley Interscience, New York.
Van Aerde M. and Rakha H. (1995) “Multivariate Calibration of Single Regime Speed-Flow-Density Relationships,” Vehicle Navigation and Information Systems (VNIS) conference, Seattle, Washington, August.
Van Aerde M. and Rakha H. (1999), A Framework for the Evaluation of System Safety Benefits of Intelligent Cruise Control Systems, ITS Journal, Vol. 5, pp. 163-189.
Watanabe T., Kishimoto N., Hayafune K., and Yamada K. (1995), “Development of an Intelligent Cruise Control System,” Proceedings of the World Congress on Intelligent Transport Systems, pp. 1229-1235.
Wierwille W. (1993), Demands on Driver Resources Associated with Introducing Advanced Technology into the Vehicle, Transportation Research-C, Vol. 1, No. 2, pp. 133-142.
Page 17
ACKNOWLEDGEMENTS The authors would like to acknowledge the technical feedback that was provided by the following individuals: Mark Baker at Delcan, Mark Carter at Science Applications International Corporation (SAIC), Vaughan Inman at SAIC, and Joseph Koziol at the Volpe Center.
LIST OF FIGURES Figure 1: Chrysler Autonomous Cruise Control System Interface Figure 2: Stratification of ACC field operational test participants Figure 3: Spatial Representation of Two Similar Trips Figure 4: Like Trips for Different Like-Trip Criteria Figure 5: Stratification of Like Trip Driver Sample Figure 6: Adaptive Cruise Control Car-Following Options Figure 7: Sample Calibrated Traffic/Flow Relationships (Hwy 401 in Toronto, Canada) Figure 8: Comparison of Sample and ACC Car-following Behaviour (Hwy 401 – Toronto, Ontario) Figure 9: Comparison of Field and ACC Car-Following Behaviour (I4 – Orlando, Florida) Figure 10: Trip Time Distribution Figure 11: Trip Length Distribution Figure 12: Variation in Trip Time for Like Trip Sets Figure 13: Variation in “TimeP” as a Function of Set Number Figure 14: Probability Distribution of Variable “Coast” Figure 15: Probability Distribution of Variable “CoastP” Figure 16: Probability Distribution of Variable “RCoastP”
LIST OF TABLES Table 1: Mitsubishi Driving Load Test Results (Watanabe et al., 1995) Table 2: Trip Summary Parameters Collected as Part of the ACC field operational test Table 3: Variation in Parameters across Similar Trip Sets by Type of Control Table 4: Example Illustration of Similar Trip Sets Table 5: Trip Summary Derived Parameters Table 6: Variation in Derived Parameters across Similar Trip Sets by Type of Control Table 7: Descriptive and Normality Statistics for Dependent Variables Table 8: ANOVA Variables and Degrees of Freedom Table 9: ANOVA Results Using “Set” as a Factor Table 10: ANOVA Results Using “Driver” as a Factor
Page 18
Figure 1: Chrysler Autonomous Cruise Control System Interface
Page 19
Test Participants (108)
Female (21)Male (21)
User (66)Non-user (42)
Male (33) Female (33)
Age1 (7) Age2 (7) Age3 (7) Age1 (7) Age2 (7) Age3 (7) Age1 (11) Age2 (11) Age3 (11) Age1 (11) Age2 (11) Age3 (11)
Where:Age1 : 20 to 30 years oldAge2 : 40 to 50 years oldAge3 : 60 to 70 years old
Figure 2: Stratification of ACC field operational test participants
Page 20
Latitude
Longitude
TimeTrip 4
Trip 3
Trip 2
Trip 1
Figure 3: Spatial Representation of Two Similar Trips
Page 21
0.1 0.5 2 1110.25
1
6
24
0
1000
2000
3000
4000
5000
6000
7000
8000
9000
10000
Number of Observations
O-D Tolerance (km)
Start Time Tolerance (h)
Figure 4: Like Trips for Different Like-Trip Criteria
Page 22
Like Trip Drivers (36)
Female (6)Male (5)
User (25)Non-user (11)
Male (15) Female (10)
Age1 (1) Age2 (2) Age3 (2) Age1 (1) Age2 (3) Age3 (2) Age1 (5) Age2 (7) Age3 (3) Age1 (4) Age2 (6) Age3 (0)
Where:Age1 : 20 to 30 years oldAge2 : 40 to 50 years oldAge3 : 60 to 70 years old
Figure 5: Stratification of Like Trip Driver Sample
Page 23
0
20
40
60
80
100
120
0 20 40 60 80 100 120 140 160 180 200
Distance Headway (m)
Spee
d (k
m/h
)
ACC 1.0s HeadwayACC 1.4s HeadwayACC 2.0s Headway
Figure 6: Adaptive Cruise Control Car-Following Options
Page 24
(a) Calibrated Speed/Density Relationship
0
20
40
60
80
100
120
0 10 20 30 40 50 60 70 80
Density (veh/km)
Spee
d (k
m/h
)
(b) Calibrated Speed/Flow Relationship
0
20
40
60
80
100
120
0 500 1000 1500 2000 2500
Flow (vph/lane)
Spee
d (k
m/h
)
Figure 7: Sample Calibrated Traffic/Flow Relationships (Hwy 401 in Toronto, Canada)
Page 25
0
20
40
60
80
100
120
0 20 40 60 80 100 120 140 160 180 200
Distance Headway (m)
Spee
d (k
m/h
)
Field CalibratedRaw Data
ACC 1.0s headway
ACC 2.0s headway
Figure 8: Comparison of Sample and ACC Car-following Behaviour (Hwy 401 – Toronto, Ontario)
Page 26
0
10
20
30
40
50
60
70
80
90
100
0 20 40 60 80 100 120 140 160 180 200
Distance Headway (m)
Spee
d (k
m/h
)
Field CalibratedRaw Data
ACC 1.0s headway
ACC 2.0s headway
Figure 9: Comparison of Field and ACC Car-Following Behaviour (I4 – Orlando, Florida)
Page 27
0.00
0.05
0.10
0.15
0.20
0.25
0.30
0 10 20 30 40 50 60 70 80 90 100
Time Bin Threshold (min.)
Prob
abili
ty
CCCICC
Figure 10: Trip Time Distribution
Page 28
0.00
0.05
0.10
0.15
0.20
0.25
0.30
0 10 20 30 40 50 60 70 80 90 100 110 120 130 140 150
Dist Bin Threshold (min.)
Prob
abili
ty
CCCICC
Figure 11: Trip Length Distribution
Page 29
0
20
40
60
80
100
120
0 2 4 6 8 10 12 14 16 18 20 22 24 26 28 30 32 34 36 38 40 42 44 46 48 50 52 54 56 58 60
Set #
Tim
e (m
in.)
CCCICC
Figure 12: Variation in Trip Time for Like Trip Sets
Page 30
0.0
0.5
1.0
1.5
2.0
2.5
3.0
3.5
0 2 4 6 8 10 12 14 16 18 20 22 24 26 28 30 32 34 36 38 40 42 44 46 48 50 52 54 56 58 60
Set #
Tim
eP (m
in.)
CCCICC
Figure 13: Variation in “TimeP” as a Function of Set Number
Page 31
0
0.05
0.1
0.15
0.2
0.25
0.3
0.35
0.4
0.45
0 20 40 60 80 100 120
Bin - Coast
Prob
abili
ty
Figure 14: Probability Distribution of Variable “Coast”
Page 32
0
0.01
0.02
0.03
0.04
0.05
0.06
0.07
0 20 40 60 80 100 120 140 160
Bin - CoastP
Prob
abili
ty
Figure 15: Probability Distribution of Variable “CoastP”
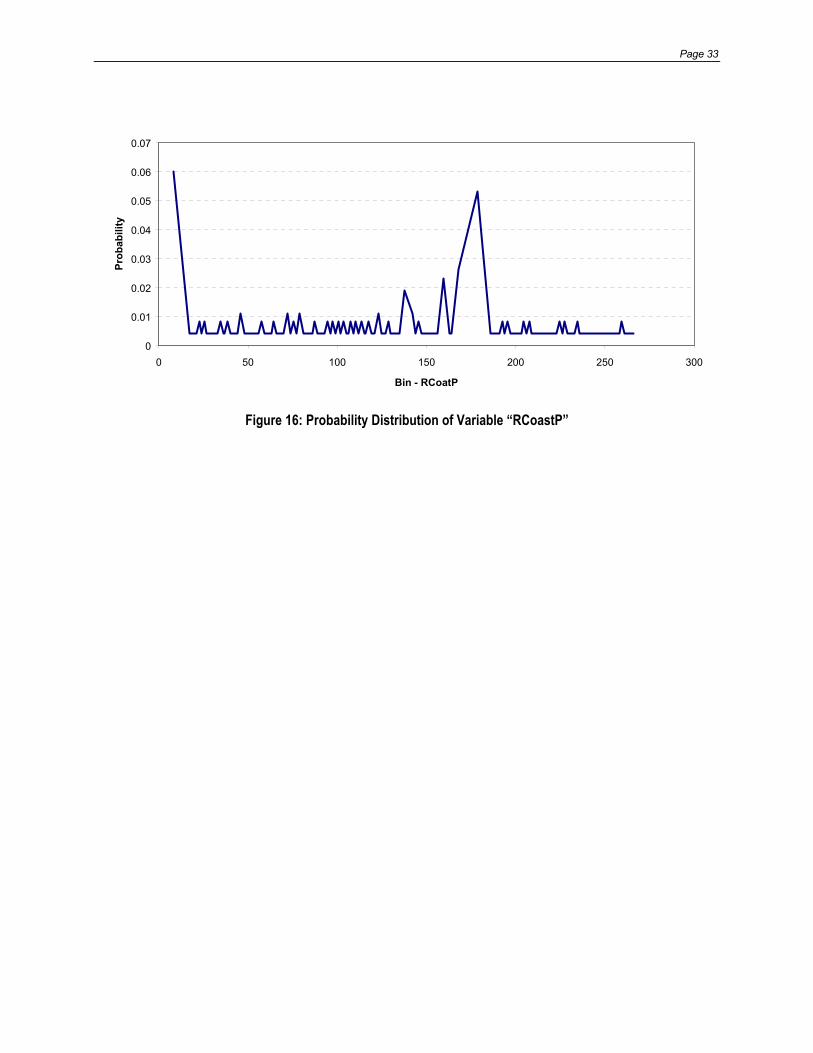
Page 33
0
0.01
0.02
0.03
0.04
0.05
0.06
0.07
0 50 100 150 200 250 300
Bin - RCoatP
Prob
abili
ty
Figure 16: Probability Distribution of Variable “RCoastP”
Related Documents