FIELD-BASED USABILITY STUDY OF PHYSICAL ACTIVITY MONITORING AND SHARING SYSTEM FOR MANUAL WHEELCHAIR USERS WITH SPINAL CORD INJURY by Natthasit Wongsirikul BS in Biomedical Engineering, University of Rochester, 2012 Submitted to the Graduate Faculty of The School of Health and Rehabilitation Sciences in partial fulfillment of the requirements for the degree of Masters of Science University of Pittsburgh 2014

Welcome message from author
This document is posted to help you gain knowledge. Please leave a comment to let me know what you think about it! Share it to your friends and learn new things together.
Transcript

FIELD-BASED USABILITY STUDY OF PHYSICAL ACTIVITY MONITORING AND SHARING SYSTEM FOR MANUAL WHEELCHAIR
USERS WITH SPINAL CORD INJURY
by
Natthasit Wongsirikul
BS in Biomedical Engineering, University of Rochester, 2012
Submitted to the Graduate Faculty of
The School of Health and Rehabilitation Sciences in partial fulfillment
of the requirements for the degree of
Masters of Science
University of Pittsburgh
2014
UNIVERSITY OF PITTSBURGH SCHOOL OF HEALTH AND REHABILITATION SCIENCES
This thesis was presented
by
Natthasit Wongsirikul
It was defended on
July 25, 2014
and approved by
Rory Cooper, PhD, FISA/PVA, Distinguished Professor and Chair, Department of
Rehabilitation Science and Technology
Annmarie Kelleher, MS, OTR/L, ATP, CCRC, Clinical Instructor, Department of
Rehabilitation Science and Technology
Shivayogi Hiremath, PhD, Postdoctoral Associate, Department of Physical Medicine and
Rehabilitation
Thesis Director: Dan Ding, PhD, Associate Professor, Department of Rehabilitation Science
and Technology
ii

Copyright © by Natthasit Wongsirikul 2014
iii
Manual wheelchair users (MWUs) with spinal cord injury (SCI) have significantly lower levels of
physical activity (PA) due to physical limitations, mobility limitations, environmental barriers, and
social barriers. Physical inactivity has been shown to lead to obesity and other secondary
complications. The use of personal health monitoring technology to increase PA level has become
popular among the ambulatory population; however, none of these technologies pertain to the SCI
population. In order to fill this gap, the investigators at the Human Engineering Research
Laboratories developed a Physical Activity Monitoring and Sharing System (PAMS) that could
track PA parameters among MWUs. PAMS consists of a tri-axial accelerometer worn on the arm,
a gyroscopic-based wheel rotation monitor (GWRM) mounted on the wheel, and a smartphone
application that communicates with the two sensors. The objective of this thesis is to evaluate the
feasibility of PAMS in the home environment. The thesis is broken into two parts. The first part
describes the preparation work for the field study, and the second part describes the field-based
usability testing. Preparation work included the development of PA parameter estimation
algorithms and the PAMS app. The estimated PA parameters were distance, energy expenditure
(EE), time being active, push count, and push efficiency. The absolute errors for the estimation
were 1.7%±1.3% for distance, 15.4%±9.4% for EE, 37.5%±22.1% for time being active, and
11.7%±10.0% for push count. The push efficiency was calculated by dividing the distance by push
FIELD-BASED USABILITY STUDY OF PHYSICAL ACTIVITY MONITORING
AND SHARING SYSTEM FOR MANUAL WHEELCHAIR USERS WITH SPINAL
CORD INJURY
Natthasit Wongsirikul, MS
University of Pittsburgh, 2014
iv
count. The PAMS app presented the PA parameters to users and incorporated several features for
promoting PA such as goal-setting, summary, and social interaction. The field-based usability
study evaluated PAMS in the home setting for 7 days to identify problems encountered by users
and then assessed user experience and satisfaction. Ten MWUs with SCI were recruited, and
PAMS scored an 85.56 out of 100 points on the System Usability Scale. The study concluded that
MWUs with SCI could use PAMS to track their PA on a daily basis and that they find it useful.
PAMS also has the potential to promote an active lifestyle among this population.
v
TABLE OF CONTENTS
PREFACE .................................................................................................................................. XII
1.0 INTRODUCTION ........................................................................................................ 1
1.1 WEARABLE TECHNOLOGIES AS PHYSICAL ACTIVITY MONITORS ..... 2
1.2 LIMITATIONS OF COMMERCIAL ACTIVITY MONITORS FOR
WHEELCHAIR USERS ...................................................................................................... 4
1.3 CURRENT WORK ON ACTIVITY MONITORS FOR MANUAL
WHEELCHAIR USERS ...................................................................................................... 6
1.4 OBJECTIVE ............................................................................................................... 8
2.0 PREVIOUS WORK ..................................................................................................... 9
2.1 WHAT IS PAMS? ...................................................................................................... 9
2.2 PAMS DEVELOPMENT PROCESS ..................................................................... 11
2.3 CONTRIBUTION OF THIS THESIS .................................................................... 14
3.0 PREPARATION WORK FOR THE FIELD-BASED USABILITY TESTING .. 16
3.1 BENCHTOP TESTING OF PAMS COMPONENT ............................................. 16
3.1.1 Method ............................................................................................................ 16
3.1.2 Results ............................................................................................................. 17
3.2 GWRM CASE DESIGN .......................................................................................... 19
3.2.1 Concept Generation ....................................................................................... 19
3.2.2 Concept Selection ........................................................................................... 20
3.3 PAMS LOGISTICS .................................................................................................. 22
3.3.1 Recharge Setup .............................................................................................. 22
vi

3.3.2 Instruction Tutorial ....................................................................................... 23
3.3.3 Packaging of PAMS ....................................................................................... 23
3.4 EVALUATION AND REFINEMENT OF METHODS FOR ESTIMATING
PHYSICAL ACTIVITY PARAMETERS ....................................................................... 24
3.4.1 Distance........................................................................................................... 25
3.4.1.1 GWRM Validation Protocol ................................................................. 25
3.4.1.2 Results .................................................................................................. 26
3.4.2 Energy Expenditure ...................................................................................... 27
3.4.2.1 Experimental Protocol .......................................................................... 28
3.4.2.2 Algorithm Development ....................................................................... 30
3.4.2.3 Results .................................................................................................. 32
3.4.3 Time Being Active .......................................................................................... 34
3.4.4 Push Count & Push Efficiency ..................................................................... 34
3.4.4.1 Algorithm Development ....................................................................... 35
3.4.4.2 Results .................................................................................................. 36
3.5 DEVELOPMENT OF PAMS APP VERSION 2.0 ................................................ 36
3.6 DISCUSSION ............................................................................................................ 41
4.0 FIELD-BASED USABILITY TESTING ................................................................. 44
4.1 METHODS ................................................................................................................ 45
4.1.1 Protocol ........................................................................................................... 45
4.1.2 Data Collection ............................................................................................... 46
4.1.3 Data Analysis.................................................................................................. 48
4.2 RESULTS .................................................................................................................. 49
4.2.1 Demographics................................................................................................. 49
4.2.2 In-Lab Evaluation.......................................................................................... 52
4.2.2.1 First Impression .................................................................................... 52
vii

4.2.2.2 Learnability ........................................................................................... 56
4.2.2.3 Errors .................................................................................................... 58
4.2.2.4 User Confidence ................................................................................... 59
4.2.3 Post Home Evaluation ................................................................................... 60
4.2.3.1 Physical activity parameter performed by participants ........................ 60
4.2.3.2 General Usability .................................................................................. 61
4.2.3.3 Usefulness ............................................................................................. 63
4.2.3.4 App Usage ............................................................................................ 64
4.2.3.5 Perceived Accuracy .............................................................................. 66
4.2.3.6 System Usability Scale (SUS) .............................................................. 66
4.2.3.7 Qualitative Analysis ............................................................................. 68
4.2.3.8 Possible Future Features ....................................................................... 81
4.3 DISCUSSION ............................................................................................................ 83
4.3.1 In-Lab Evaluation.......................................................................................... 83
4.3.2 Post-Home Evaluation ................................................................................... 85
4.4 CONCLUSION ......................................................................................................... 89
5.0 RECOMMENDATIONS FOR FUTURE WORK .................................................. 90
APPENDIX A. CONCEPT SKETCHES .................................................................................. 93
APPENDIX B. PAMS INSTRUCTION MANUAL ................................................................. 98
BIBLIOGRAPHY ..................................................................................................................... 127
viii

LIST OF TABLES
Table 1: Wocket summary ............................................................................................................ 18
Table 2: GWRM summary............................................................................................................ 18
Table 3: Smartphone summary ..................................................................................................... 18
Table 4: Design criteria for GWRM casing .................................................................................. 19
Table 5: Concept-scoring matrix .................................................................................................. 20
Table 6: Items for PAMS field study ............................................................................................ 23
Table 7: Estimation error of angular velocity ............................................................................... 27
Table 8: Estimation error of distance ............................................................................................ 27
Table 9: Variables used in the “simplified calories model” algorithm development ................... 30
Table 10: Classification of all activities into four types ............................................................... 31
Table 11: Stepwise regression for resting EE equation ................................................................ 33
Table 12: Confusion matrix of activity classification model for testing data set ......................... 33
Table 13: Accuracy of the activity classification model by activity type ..................................... 33
Table 14: Accuracy of MET multiplier equations evaluated on testing data set .......................... 33
Table 15: Accuracy of the simplified EE estimation model ......................................................... 33
Table 16: Participant demographics.............................................................................................. 50
Table 17: Initial interest level in tracking PA parameters before seeing PAMS .......................... 51
Table 18: Smartphone use information ......................................................................................... 51
Table 19: Responses regarding fluency, importance, and satisfaction with smartphone ............. 52
Table 20: Responses to first impression of PAMS prior to use ................................................... 53
ix
Table 21: Qualitative analysis of first impression ........................................................................ 54
Table 22: Time to perform each task for the first time ................................................................. 56
Table 23: In-lab responses to the ease-of-use of the Wocket ....................................................... 56
Table 24: In-lab responses to the ease-of-use of the GWRM ...................................................... 57
Table 25: In-lab responses to the ease-of-use of PAMS app version 2.0 ..................................... 57
Table 26: Identified errors in performing PAMS tasks ................................................................ 58
Table 27: Self-rated confidence level in using PAMS on a daily basis ........................................ 59
Table 28: Physical activity parameter log for each participant over 6 days ................................. 60
Table 29: Post-home responses to the ease-of-use of the Wocket ................................................ 61
Table 30: Post-home responses to the ease-of-use of the GWRM ............................................... 61
Table 31: Post-home responses to the ease-of-use of PAMS app version 2.0 .............................. 62
Table 32: Post-home responses to usefulness of the features & PA parameters .......................... 63
Table 33: Post-home ranking of PA parameters ........................................................................... 64
Table 34: Summary of system use time ........................................................................................ 65
Table 35: Viewing time of the summary feature & the social feature page on the app................ 65
Table 36: Rating of perceived accuracy for PA parameters ......................................................... 66
Table 37: System usability scale of PAMS................................................................................... 67
Table 38: Qualitative summary for Wocket.................................................................................. 69
Table 39: Qualitative summary for GWRM ................................................................................. 71
Table 40: Qualitative summary for PAMS app version 2.0.......................................................... 74
Table 41: Qualitative summary for PAMS overall ....................................................................... 79
Table 42: Responses to questionnaire regarding possible features ............................................... 82
Table 43: Recommendations for future work ............................................................................... 90
x
LIST OF FIGURES
Figure 1: System architecture ......................................................................................................... 9
Figure 2: Wocket, GWRM, and smartphone app ......................................................................... 11
Figure 3: 3D model of single buckle concept ............................................................................... 21
Figure 4: SLS single buckle concept ............................................................................................ 21
Figure 5: PAMS recharge setup .................................................................................................... 22
Figure 6: PAMS field study kit ..................................................................................................... 24
Figure 7: Plot of digital output in response to calibration protocol .............................................. 26
Figure 8: Main page of the app ..................................................................................................... 38
Figure 9: Weekly and daily summary feature of PAMS app ........................................................ 39
Figure 10: Weekly and daily social feature of PAMS app ........................................................... 40
Figure 11: Sketch A1 single buckle .............................................................................................. 93
Figure 12: Sketch A2 side-release buckle ..................................................................................... 94
Figure 13: Sketch A3 fit-rotate lock ............................................................................................. 95
Figure 14: Sketch A4 jig-slide fit.................................................................................................. 96
Figure 15: Sketch A5 helical grove shaft ...................................................................................... 97
xi

PREFACE
I would like to thank the University of Pittsburgh and the School of Health and Rehabilitation
Sciences for providing me with a higher education. I would also like to thank the faculty, the staff,
and the students at the Department of Rehabilitation Science and Technology and the Human
Engineering Research Laboratories (HERL) for all their support during this research. I would
especially like to acknowledge my advisor, Dr. Dan Ding, for her guidance and support during my
years of study. I would also like to thank Dr. Shivayogi Hiremath for all his hard work in providing
the groundwork for my study and Dr. Rory Cooper for providing me with the opportunity to work
in this department. My thanks to Annmarie Kelleher for helping me with my IRB protocol, and all
of the shop staff, including Mark McCartney, Josh Brown, Garrett Grindle, Ben Gebrosky, and
Dalton Relich, for helping me create the PAMS prototype. Also, thank you to all the participants
in this study for taking the time to help evaluate PAMS. Finally, thank you to all my friends in
Pittsburgh for all their support and special thanks to my parents for giving me the opportunity to
pursue a higher education.
xii
1.0 INTRODUCTION
Lack of regular physical activity (PA) in the general population is a top public health
concern [1]. It has been shown that regular PA among adults, regardless of chronic disease
or disability, can improve quality of life and prolong life expectancy by reducing rates of
obesity, coronary heart disease, stroke, high blood pressure, type 2 diabetes, some types of
cancer, and depression [2, 3]. However, performing and maintaining regular PA can be a
challenge for both people with and without disabilities. Sedentary lifestyles have become
more common over the past sixty years due to the rise of automobile use, urbanization, and
the shift from blue-collar to white-collar jobs [4-6]. In fact, the lifestyle of a modern person
seems to be dominated by activities that are sedentary. Watching television and surfing the
Internet have become the preferred leisure activities, resulting in long periods of inactivity
daily [7, 8]. This has led to exercising and vigorous activity becoming side tasks that need
to be fitted into the daily routine [6]. In fact, it seems that such activity is not common as,
according to the Centers for Disease Control and Prevention, less than half (48%) of all
adults meet the 2008 Physical Activity Guidelines set by the American Heart Association
[9].
Lack of physical activity is even more prevalent among people with disabilities
who use manual wheelchairs due to their physical limitations, mobility limitations,
1
environmental barriers, and social barriers [10-13]. Specifically, according to the U.S.
Department of Health and Human Services (2013), 54% of individuals with disabilities
were inactive and performed fewer activities than the general population [14]. Moreover,
a public study of PA among persons with disabilities revealed that only 10 – 20% of the
adult population with mobility disabilities exercise at a level high enough to convey some
cardiorespiratory benefits [15]. A study by Warms et al. objectively assessed the PA level
of fifty adult manual wheelchair users over a period of seven days using a wrist-worn
accelerometer and two self-reported measures. The study found thirty-eight percent of the
participants did not report any strenuous activity, and fifty-six percent reported less than
the 150 minutes weekly of moderate or strenuous activity required to meet public health
guidelines [16]. People with disabilities who live a sedentary lifestyle experience such
negative outcomes as being prone to weight gain, deconditioning, and encountering other
secondary complications [11]. Performing and maintaining regular PA offers this
population a way to maintain health.
1.1 WEARABLE TECHNOLOGIES AS PHYSICAL ACTIVITY MONITORS
To combat the issue of inactivity, many approaches, such as education and intervention
programs to change sedentary behavior, have been implemented and tested on the general
population and shown promising results [17-21]. However, a meta-analysis of 127 studies
that examined the efficacy of interventions for increasing PA among the ambulatory
population in community, worksite, school, home, and health care settings found that
2

interventions using behavior modification have an overall larger effect on increasing
activity level [22]. One such intervention utilizes self-management techniques to change
PA behavior by providing users with information about their activity level.
Recent advancements in miniature wearable technology have made its use as a self-
management tool to modify PA behavior popular commercially. Examples of wearable
activity monitors include Up (Jawbone, Inc. San Francisco, CA), Nike+ FuelBand (Nike,
Inc. Beaverton, OR), the Samsung Gear Fit (Samsung, Ltd. Suwon, South Korean), Fitbit
Flex (FitBit, Inc. San Francisco, CA), and SenseWearTM armband (BodyMedia, Inc.
Pittsburgh, PA). All of these products work in conjunction with a smartphone, which
expands their functions and capabilities. Fitbit can store data in its private server and allows
users to share their PA achievements with their friends. Nike+ FuelBand can use a built-in
GPS in the smartphone to track distance and route travelled. Some activity monitor can
accurately predict the energy expenditure of the wearer. SenseWearTM armband
(BodyMedia, Inc. Pittsburgh, PA) is a commercially successful and effective PA
monitoring system on the market that was proven accurate in comparison to the doubly-
labeled water method for measuring daily energy expenditure. The mean absolute percent
difference between SenseWearTM and the doubly labeled water in kilocalories per-person
per-day was less than 10% [23]. Research has also shown that the SenseWearTM armband
can enhance lifestyle changes and promote weight loss in sedentary overweight adults [24,
25]. For example, a 9-month study conducted by Shuger, S.L., et al. recruited 197 sedentary
overweight or obese adults and randomly assigned them into 1 of 4 groups: a self-directed
weight loss program via an evidence-based weight loss manual, a group-based behavioral
3

weight loss program (GWL), the SenseWearTM armband alone (SWA), or the GWL plus
the SenseWearTM armband (GWL+SWA). The primary outcome was change in body
weight and waist circumference. There was significant weight loss in all 3 intervention
groups (GWL, P = 0.05; SWA-alone, P = 0.0002; GWL+SWA, P < 0.0001) but not in the
self-directed weight loss program group (P = 0.39) [24]. The popularity of wearable
technology as an intervention tool will initiate more research and advance the field.
1.2 LIMITATIONS OF COMMERCIAL ACTIVITY MONITORS
FOR WHEELCHAIR USERS
Unfortunately, most activity monitoring systems currently available commercially cannot
measure the activity of manual wheelchair users (MWUs). A major issue is the majority of
wearable sensors measure steps taken as an indicator of PA level, which does not apply to
MWUs. Moreover, devices that predict energy expenditure (EE) do not accurately predict
EE for MWUs because the energy expenditure models in these devices are based primarily
upon lower extremity movements, while people who use wheelchairs for mobility rely on
their upper extremities for almost all activities of daily living.
In response to this lack, Chacon et al. evaluated the use of an RT3 tri-axial
accelerometer (StayHealth, Inc; Monrovia, California) worn on the arm and the waist to
measure the PA of individuals with spinal cord injury (SCI) in terms of EE. They compared
estimated EE from the RT3 with the criterion EE from the Cosmed K4b2 portable
metabolic cart (COSMED srl, Rome, Italy) and found that the predictions of these
technologies were not accurate. An RT3 worn on the arm overestimated EE by 111% while
4

an RT3 worn on the waist underestimated EE by 22% [26]. Another study evaluated the
SenseWearTM armband in predicting EE for MWUs with SCI while performing wheelchair
propulsion, arm ergometer exercise, and deskwork. Criterion EE was measured using the
Cosmed K4b2 portable metabolic cart. The study found that the SenseWearTM armband
overestimated EE for resting (+5.78%), wheelchair propulsion (+88.20%, +46.20%, and
+138.21% for the three trials at different intensities, respectively), arm-ergometer exercise
(+55.05%, +26.91%, and +39.17% for the three trials at different intensities, respectively)
and deskwork (+13.11%) [27].
Another issue with accurately measuring the PA of wheelchair users with SCI is
that they have significantly lower overall lean tissue mass in the legs and the trunk when
compared to non-SCI individuals [28]. The lower fat-free-mass in this population, as well
as reductions in peripheral sympathetic nervous system activity, are believed to cause a
reduction in resting metabolic rate (RMR) [29-31], which accounts for 65%-75% of total
EE [32]. A study done by Monroe et al. matched 10 male SCI participants with participants
who were able-bodied as a control. They measured the RMR for each participant in the
morning without any food or drink and found that the RMRs of SCI participants were 27%
lower than their able-bodied counterparts [29].
In summary, the activity monitors on the market today cannot provide accurate and
relevant information for wheelchair users, and thus they cannot be directly used by these
individuals to track their daily PA participation [29].
5

1.3 CURRENT WORK ON ACTIVITY MONITORS FOR MANUAL
WHEELCHAIR USERS
An activity monitor that can accurately keep track of PA parameters for MWUs is lacking
in the market. Fortunately, the need for such technology is being realized. Many studies
have investigated the use of accelerometer-based sensors worn on the body for quantifying
wheelchair-specific activities. For example, Warms et al. assessed the suitability and
validity of an accelerometer-based monitor worn on the wrist as a measure of free-living
PA for wheelchair users with SCI. Twenty-two participants wore the sensors at home for
four days and completed a self-report activity intensity questionnaire over this period.
Pearson correlation coefficients of the activity counts with self-reported activity intensity
varied from .30 to .77 (p < .01) for individual participants, which shows that a wrist
accelerometer can detect various PA performed by wheelchair users with SCI [33]. Another
study by Postma et al. showed that accelerometer-based activity monitors placed on each
thigh, each wrist and the sacrum could detect wheelchair propulsion at a sensitivity and
specificity of 87 (76–99)% and 92 (85–98)%, respectively [34]. Another study suggested
that a tri-axial accelerometer worn on the arm could be used to accurately monitor the
temporal parameters of wheelchair propulsion, including the number of strokes and
cadences in the natural environment [35].
Another type of activity monitor that has been investigated is a wheel-mounted
sensor to characterize mobility behavior. Coulter et al. developed and validated a tri-axial
accelerometer on the wheelchair wheel and found that it can accurately measure a
wheelchair’s wheel revolution, absolute angle and duration of movement (ICC
6

(2,1)>0.999, 0.999, 0.981, respectively) [36]. Tolerico et al. developed a wheel rotation
monitor to investigate the mobility characteristics and activity levels of MWUs in the
residential setting and at the National Veterans Wheelchair Games (NVWG) [37]. They
found that MWUs travelled 6.7±1.9 km per day at a speed of 0.96±0.17 m/s and 2.5±1.2
km per day at a speed of 0.79±0.19 m/s in the NVWG and community, respectively.
Information regarding wheelchair mobility can provide much insight about PA behavior of
MWUs.
Research results have shown that body sensors and wheel sensors are often limited
when used alone. A single body sensor can only track upper body activities. It cannot
differentiate between wheel movement activities and non-wheel movement activities
unless several sensors are placed on multiple parts of the body. At the same time, use of
multiple wearable sensors adds complexity to the system and is inconvenient for users.
Wheel sensors, on the other hand, can only provide information about mobility. Wheel
sensors cannot detect vigorous activities that require no wheel movement, such as arm
ergometry. They also cannot differentiate between self-propelling and being pushed by a
caregiver [38]. A system where a body sensor and a wheel sensor could work together
would be ideal for providing a comprehensive picture of MWUs activity.
Activity monitors for MWUs that can provide real-time information is also missing.
Most of the activity monitors for MWUs were developed for logging activity information
for research purposes instead of for enabling MWUs to track their PA and motivating
people to be physically active. With the increase in the availability of smartphones and
wireless capabilities, activity monitors that work in conjunction with a smartphone to
7
provide real-time data for the wearer are becoming common [39]. The technology usually
consists of a monitoring unit and a smartphone application. Some examples are
SenseWearTM armband + the BodyMedia Fit App (BodyMedia, Inc. Pittsburgh, PA), Up
wrist-band + Up App (Jawbone, Inc. San Francisco, CA), Nike FuelBand + App (Nike,
Inc. Beaverton), and Fitbit Flex + “Lose It!” App (FitBit, Inc. San Francisco, CA).
1.4 OBJECTIVE
The objective of this thesis is to evaluate the feasibility of a physical activity monitoring
and sharing system (PAMS) especially suited for capturing PAs that are part of the lifestyle
of wheelchair users by conducting a field-based usability study. PAMS was indeed shown
to be capable of monitoring the PA of wheelchair users using an arm sensor and a wheel
sensor and of providing real-time feedback to the users through a smartphone app.
8

2.0 PREVIOUS WORK
This chapter describes the previous work on developing and evaluating PAMS version 1.0
and how this thesis is built upon the previous work and contributes to the overall project.
2.1 WHAT IS PAMS?
The physical activity monitoring and sharing system (PAMS) is a tool designed to track
the physical activity of MWUs and potentially to motivate them to be physically active.
The system architecture is shown in Figure 1. PAMS consists of a monitoring unit that
includes an arm sensor called Wocket and a gyroscopic wheel rotation monitor (GWRM),
a smartphone app, and a secure server.
Figure 1: System architecture
9
• The Wocket (Figure 2) is a miniature tri-axial accelerometer that can send raw
accelerations to a smartphone at a rate of 40 Hz via its embedded Bluetooth module. It
weighs 0.03 lbs. and is about 1.69” x 1.75” x 0.438” in dimension. It is rechargeable
with a charging dock. The Wocket can be inserted into an armband made of soft cloth
and strapped to a user’s upper arm with Velcro. The Wocket was developed by
researchers at Northeastern University as part of an open source effort to create low-
cost motion measurement devices [40].
• The GWRM (Figure 2) is a self-contained two-axial gyroscope-based monitor that
can send the raw rotational speeds of the wheelchair wheel to a smartphone at a rate of
1Hz via its embedded Bluetooth module. It weighs about 0.19 lbs. and is about 2.69” x
1.87” x 1.25” in dimension. Charging is done via a USB connection to either a computer
or a wall outlet.
• The smartphone app (Figure 2) works on the Android system. It contains the
algorithms that convert the data from the Wocket and GWRM into PA parameters
relevant to MWUs. It allows users to view their physical activity levels in terms of
distance travelled, energy expenditure in kilocalories, time being active in minutes,
number of pushes for wheelchair propulsion, and push efficiency in terms of distance
travelled per push. The app also allows users to set up goals and track their daily and
weekly progress. In addition, the app has a social feature which enables users to share
and compare their activity levels with family members or friends. The app currently
runs on a Samsung Galaxy Nexus S with a 3.7V 3800mAh rechargeable Lithium-ion
battery.
10
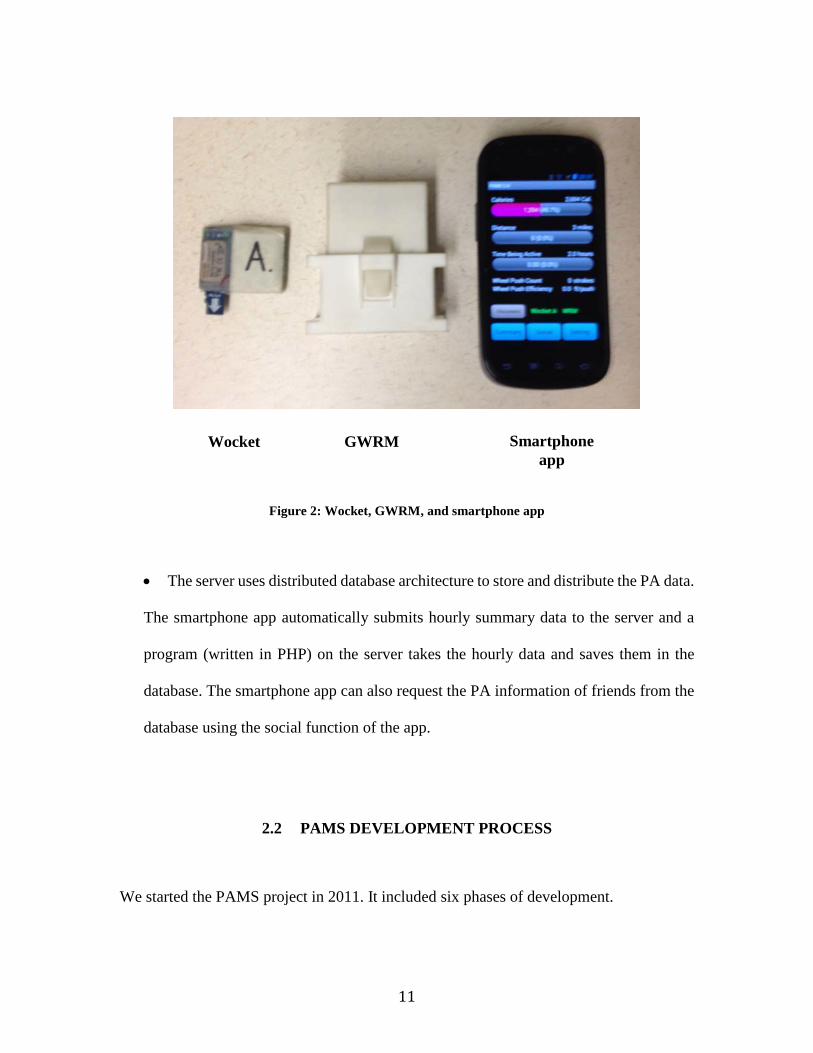
Figure 2: Wocket, GWRM, and smartphone app
• The server uses distributed database architecture to store and distribute the PA data.
The smartphone app automatically submits hourly summary data to the server and a
program (written in PHP) on the server takes the hourly data and saves them in the
database. The smartphone app can also request the PA information of friends from the
database using the social function of the app.
2.2 PAMS DEVELOPMENT PROCESS
We started the PAMS project in 2011. It included six phases of development.
Wocket GWRM Smartphone app
11

Phase I: Development of the Monitoring Unit
This phase focused on the development of the monitoring unit especially the GWRM. The
GWRM was designed, developed, and bench-top tested at the Human Engineering
Research Laboratories (HERL) in Pittsburgh. The details of the study can be found in
Hiremath et al. [41].
Phase II: Development of the EE Prediction Algorithms
This phase focused on the development of the EE prediction algorithms for MWUs based
on the data from the monitoring unit. Forty-five MWUs with SCI were recruited to perform
a variety of physical activities in laboratories and home/community settings while wearing
the Wocket, the GWRM, and a portable metabolic cart (as a criterion measure for EE).
Data from 80% of the subjects was used to develop the EE prediction algorithm. The
algorithm was then validated on the remaining 20% of subjects. The mean absolute error
between the estimated EE and criterion EE was 29.04%. The details of the study can be
found in Hiremath et al. [41].
Phase III: In-Lab Usability Testing of the Monitoring Unit
This phase included the usability testing of the monitoring unit in a laboratory setting. Six
MWUs with SCI were asked to perform a list of tasks that included putting on the Wocket
and GWRM, performing various activities while wearing the devices, and taking them off.
Participants then filled out a usability questionnaire and were interviewed about their
experience. They also rated the ease-of-use of the monitoring unit and the usefulness of the
PA parameters presented (distance travelled, averaged speed, EE, and duration of
12
performing moderate to high intensity activities). More details can be found in Hiremath’s
dissertation chapter 4.0 [42].
Phase IV: Development of the Smartphone App & Server
This phase focused on the development of the smartphone app as well as the server
application. The first version of the PAMS app and server was developed by Soleh et al. at
the University of Pittsburgh. At this time, the researchers’ focus was on user interface
design and the social features. More details about the first PAMS app can be found in [43].
The 2nd version of the PAMS app was built on the first version and added the algorithms
for obtaining physical activity parameters relevant to MWUs.
Phase V: In-Lab Usability Testing of the Smartphone App
This phase included usability testing of the first PAMS app in a laboratory setting. Five
MWUs with SCI were recruited to perform a list of tasks using the PAMS app. Participants
then filled out a usability questionnaire and were interviewed about their experience. They
also rated the ease-of-use of the app and its usefulness. More details about this evaluation
can be found in Ayubi’s dissertation chapter 7.0 [42].
Phase VI: Field-Based Feasibility Testing of the PAMS
This phase marked the final stage of the PAMS development process, with a focus on
evaluating the feasibility of the PAMS system when used by MWUs in their
13
home/community setting on a daily basis. This thesis describes the preparation work prior
to the field study and the actual field-based usability testing of PAMS with 10 MWUs with
SCI.
2.3 CONTRIBUTION OF THIS THESIS
Usability testing determines whether a product performs as intended when interacting with
real users. While the usability tests done in Phase III and Phase V of the development
process returned valuable feedback, they took place in a controlled laboratory setting.
Therefore, we were still not clear how users would interact with the system on their own
outside of the research site. In addition, the separate testing of the monitoring unit and
PAMS app did not allow for feedback on the PAMS system as a whole. It is important to
verify if PAMS can indeed be used on a daily basis by a diverse group of MWUs before
investigating its effectiveness in supporting self-management and increasing physical
activity levels among this population. Thus a field-based feasibility testing for PAMS was
warranted.
Field-based usability testing combines techniques from traditional lab testing and
field-research to test a product in the actual context in which it will be used [44]. The
benefits of performing a field usability testing on PAMS are it allows the investigators to
analyze the performance of PAMS in the real environment, to identify any problems from
the user’s point of view, to assess users’ experience, and to gain a better understanding of
users’ perceptions and satisfaction levels. Moreoever, data collected can serve as guidelines
for improvement and eventual refinement of PAMS as a real product. This thesis focuses
14

on the work related to the preparation of PAMS for the field test and the execution of the
field-based usability testing.
• Preparation work involved benchtop testing of all the devices (Wocket, GWRM,
and smartphone), the redesign of the GWRM casing, the repackaging of the system,
the development of new PA parameters, and the development of PAMS app version
2.0.
• The field-based usability testing was performed in two distinct contexts. The first
was a laboratory setting, where participants came in and learned how to use PAMS
through a video tutorial. They then performed tasks in the lab related to using the
monitoring unit and the app (version 2.0). Afterward, participants rated the ease-
of-use and provided their first impression of PAMS. The second context was the
home. Participants took PAMS home for up to seven days. The smartphone had a
logging feature that recorded usage activity. After the seventh day, the investigator
travelled to the participants’ home or workplace to pick up PAMS then
administered a usability questionnaire and conducted an interview.
15
3.0 PREPARATION WORK FOR THE FIELD-BASED USABILITY TESTING
This chapter details the work done to prepare for testing the feasibility of PAMS in the
home/community of the wheelchair users. The main goal was to ensure that all PAMS
components were properly packaged and integrated so that the system would be reliable
and easy to use without any assistance from the investigators. Major efforts discussed in
this chapter include the redesign of the casing for the GWRM to make it suitable for field
use, the evaluation and refinement of methods for estimating PA parameters for MWUs,
and the development of PAMS app version 2.0.
3.1 BENCHTOP TESTING OF PAMS COMPONENT
Bench-top testing was done to provide users with basic information about the battery life
and duration of recharge for each device as well as the reliability of the Bluetooth
connection between the PAMS monitoring unit and the smartphone.
3.1.1 Method
Wockets
All Wockets were fully charged and wirelessly connected to the smartphone. Since
Wockets were designed to stream data to a Smartphone, they were left alone until all the
batteries were depleted. The duration of connectivity, which represented the battery life of
16
the Wockets, was recorded. Wocket recharging time was measured with a timer. The range
of the Bluetooth was tested by incrementally increasing the range between the Wocket and
the smartphone until connection was lost; then the distance between them was measured.
Gyroscopic Wheel Rotation Monitor (GWRM)
The testing procedures for the GWRM were identical to those of the Wocket.
Smartphone
Testing the phone’s battery life was more complicated because the battery duration was
dependent on how the phone was used, not just on its use for collecting incoming data and
running the PAMS app. The testing condition for the phone was constant connection to
both the Wocket and the GWRM while the tester used the app for 5 min every hour until
the battery was depleted. This condition was a simulation of an exaggerated use of PAMS
app and did not take into account regular phone use for calls, texting, media consumption,
and Internet browsing. The recharge rate was measured when the phone was connected to
the wall outlet with no activity taking place. The duration of battery use and time to
recharge was recorded by the phone’s internal log.
3.1.2 Results
The results of the test for the Wockets (Table 1), the GWRM (Table 2), and the smartphone
(Table 3) are summarized below. These results show that PAMS can last up to around 8
hours. To make sure that PAMS could be used throughout the whole day in the field study,
17
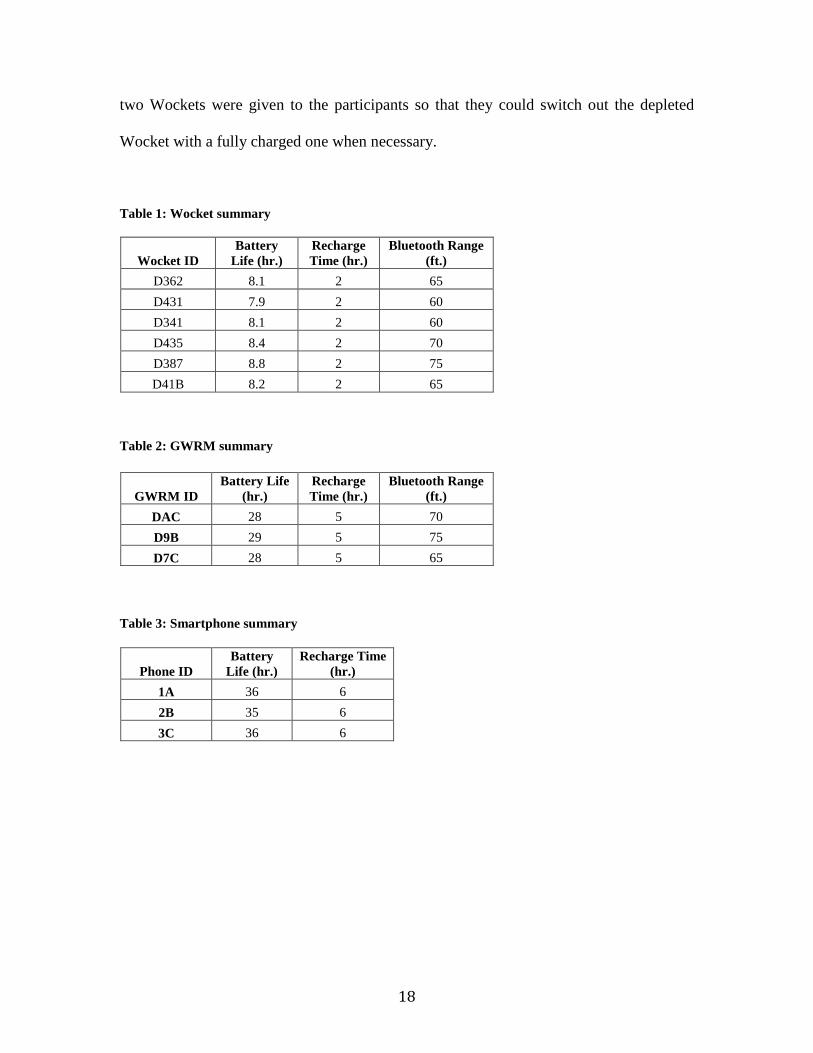
two Wockets were given to the participants so that they could switch out the depleted
Wocket with a fully charged one when necessary.
Table 1: Wocket summary
Table 2: GWRM summary
Table 3: Smartphone summary
Wocket ID Battery
Life (hr.) Recharge Time (hr.)
Bluetooth Range (ft.)
D362 8.1 2 65 D431 7.9 2 60 D341 8.1 2 60 D435 8.4 2 70 D387 8.8 2 75 D41B 8.2 2 65
GWRM ID Battery Life
(hr.) Recharge Time (hr.)
Bluetooth Range (ft.)
DAC 28 5 70 D9B 29 5 75 D7C 28 5 65
Phone ID Battery
Life (hr.) Recharge Time
(hr.) 1A 36 6 2B 35 6 3C 36 6
18
3.2 GWRM CASE DESIGN
The GWRM casing required a new design that was suitable for the field study. The old
design was inconvenient to use outside of the research site. The design process moved
forward based on product design and development literature [45]. First, the design criteria
were determined, then concepts were generated through sketches. Concepts were compared
and the best design for 3D modeling and 3D printing was selected.
3.2.1 Concept Generation
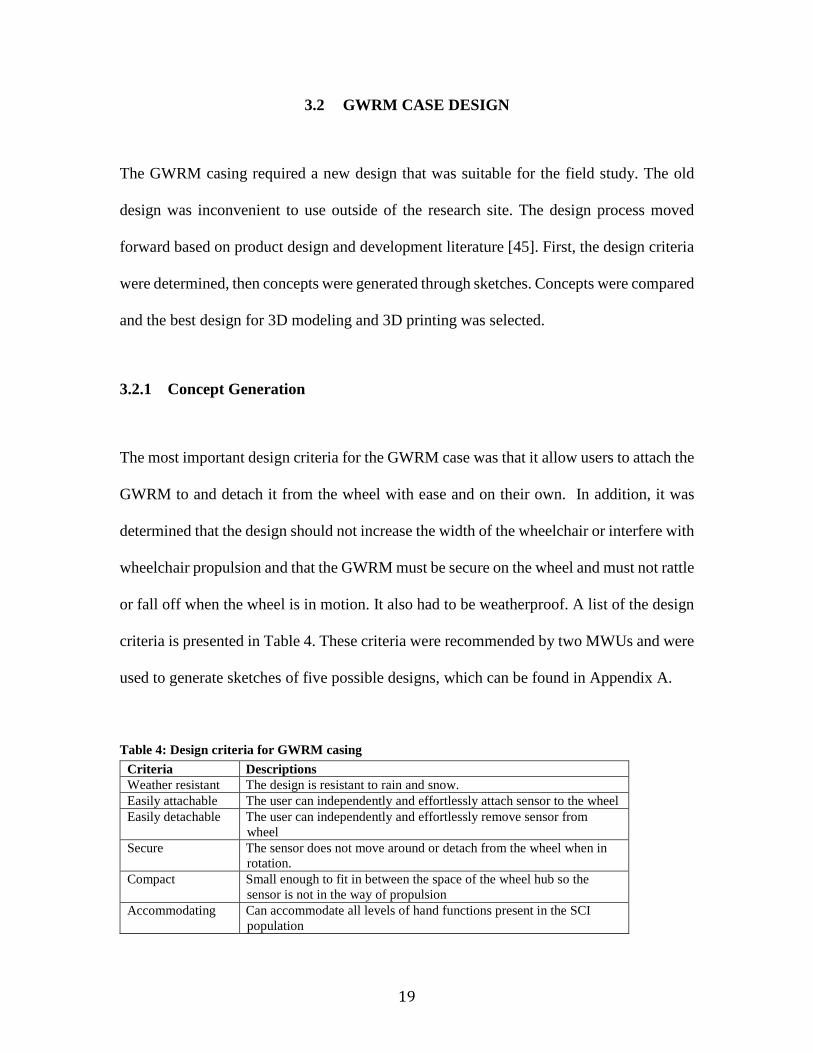
The most important design criteria for the GWRM case was that it allow users to attach the
GWRM to and detach it from the wheel with ease and on their own. In addition, it was
determined that the design should not increase the width of the wheelchair or interfere with
wheelchair propulsion and that the GWRM must be secure on the wheel and must not rattle
or fall off when the wheel is in motion. It also had to be weatherproof. A list of the design
criteria is presented in Table 4. These criteria were recommended by two MWUs and were
used to generate sketches of five possible designs, which can be found in Appendix A.
Table 4: Design criteria for GWRM casing
Criteria Descriptions Weather resistant The design is resistant to rain and snow. Easily attachable The user can independently and effortlessly attach sensor to the wheel Easily detachable The user can independently and effortlessly remove sensor from
wheel Secure The sensor does not move around or detach from the wheel when in
rotation. Compact Small enough to fit in between the space of the wheel hub so the
sensor is not in the way of propulsion Accommodating Can accommodate all levels of hand functions present in the SCI
population
19
3.2.2 Concept Selection
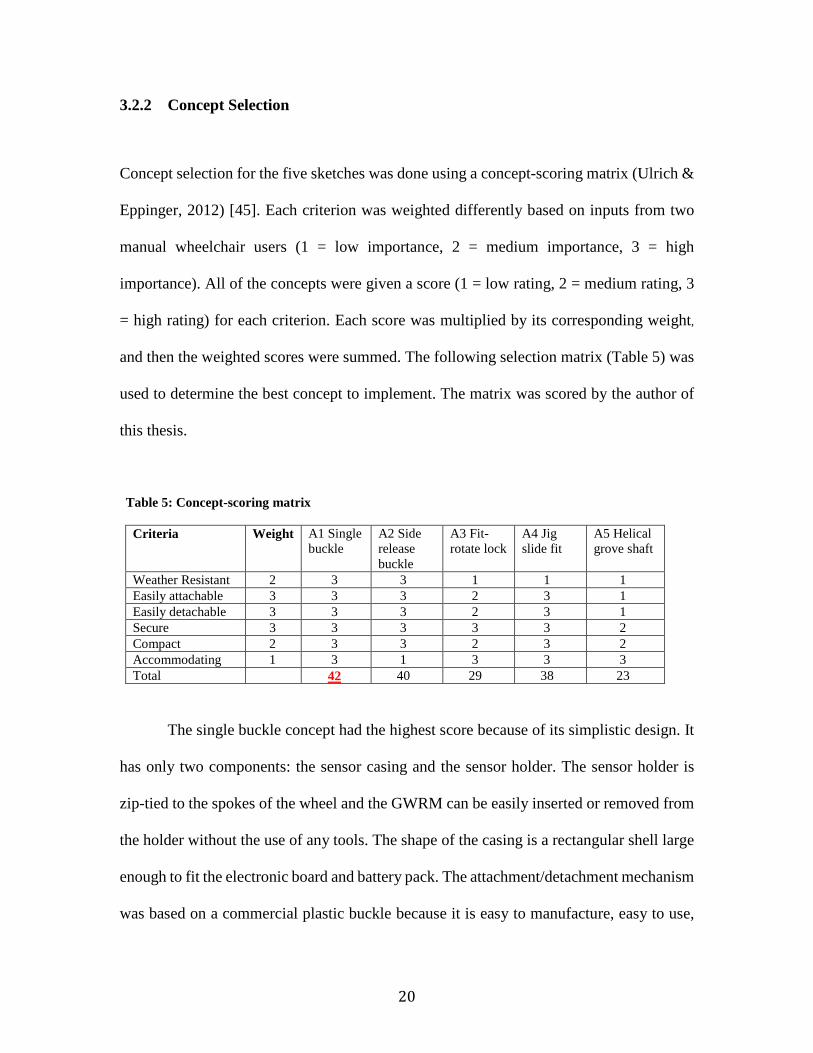
Concept selection for the five sketches was done using a concept-scoring matrix (Ulrich &
Eppinger, 2012) [45]. Each criterion was weighted differently based on inputs from two
manual wheelchair users (1 = low importance, 2 = medium importance, 3 = high
importance). All of the concepts were given a score (1 = low rating, 2 = medium rating, 3
= high rating) for each criterion. Each score was multiplied by its corresponding weight,
and then the weighted scores were summed. The following selection matrix (Table 5) was
used to determine the best concept to implement. The matrix was scored by the author of
this thesis.
Table 5: Concept-scoring matrix
Criteria Weight A1 Single buckle
A2 Side release buckle
A3 Fit-rotate lock
A4 Jig slide fit
A5 Helical grove shaft
Weather Resistant 2 3 3 1 1 1 Easily attachable 3 3 3 2 3 1 Easily detachable 3 3 3 2 3 1 Secure 3 3 3 3 3 2 Compact 2 3 3 2 3 2 Accommodating 1 3 1 3 3 3 Total 42 40 29 38 23
The single buckle concept had the highest score because of its simplistic design. It
has only two components: the sensor casing and the sensor holder. The sensor holder is
zip-tied to the spokes of the wheel and the GWRM can be easily inserted or removed from
the holder without the use of any tools. The shape of the casing is a rectangular shell large
enough to fit the electronic board and battery pack. The attachment/detachment mechanism
was based on a commercial plastic buckle because it is easy to manufacture, easy to use,
20
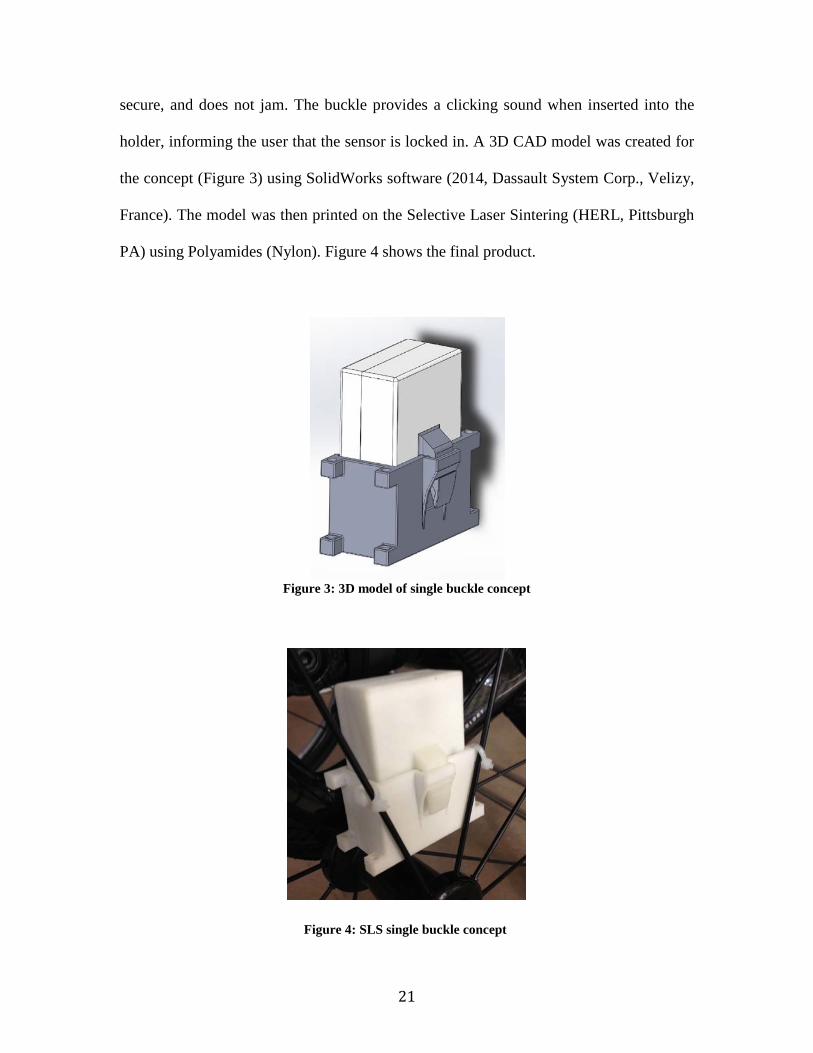
secure, and does not jam. The buckle provides a clicking sound when inserted into the
holder, informing the user that the sensor is locked in. A 3D CAD model was created for
the concept (Figure 3) using SolidWorks software (2014, Dassault System Corp., Velizy,
France). The model was then printed on the Selective Laser Sintering (HERL, Pittsburgh
PA) using Polyamides (Nylon). Figure 4 shows the final product.
Figure 3: 3D model of single buckle concept
Figure 4: SLS single buckle concept
21

3.3 PAMS LOGISTICS
3.3.1 Recharge Setup
The recharge setup for PAMS used a Belkin USB 2.0 4-Port Mobile-Powered Hub to
distribute charges from the wall outlet to three devices: the Wocket charging dock, the
GWRM, and the smartphone. The smartphone and the GWRM were connected to the
power hub via a 6-inch microUSB cord. The Wocket charging dock was connected to the
power hub via a 6-inch miniUSB cord. Each Wocket had a charging electrode that was
inserted into the charging dock. To make the charging setup look cleaner and to prevent
the cables from getting tangled, 6-inch USB cords were used. Figure 5 shows the PAMS
recharge setup.
Figure 5: PAMS recharge setup
22

3.3.2 Instruction Tutorial
An instruction manual and three instructional videos were created. The instruction manual
is a 29-page color print A4-sized booklet that explains how to use PAMS. The instruction
manual is in Appendix B. The first video (1:38 min) explains what PAMS is. The second
video (4:43 min) explains how to use the Wocket and GWRM. The third video (4:40 min)
explains how to use PAMS app version 2.0. The videos were edited using iMovie software
(Apple, Cupertino CA). These videos were stored in the HERL network drive.
3.3.3 Packaging of PAMS
The items given with PAMS for the field test are listed in Table 6. Everything was put
together in a light medium plastic duty case. Foam cutouts with slots were made to hold
each component of PAMS so they did not move around. Figure 6 shows the PAMS
package.
Table 6: Items for PAMS field study
Items include with PAMS
1. Wall outlet adapter
2. Belkin USB 2.0 4-Port Mobile Powered Hub
3. 2X 6inch micro USB
4. 6inch mini USB
5. Wocket Armband
6. 2X Wocket
7. Wocket charging dock
8. Smartphone
9. GWRM + holder
10. Instruction manual
23
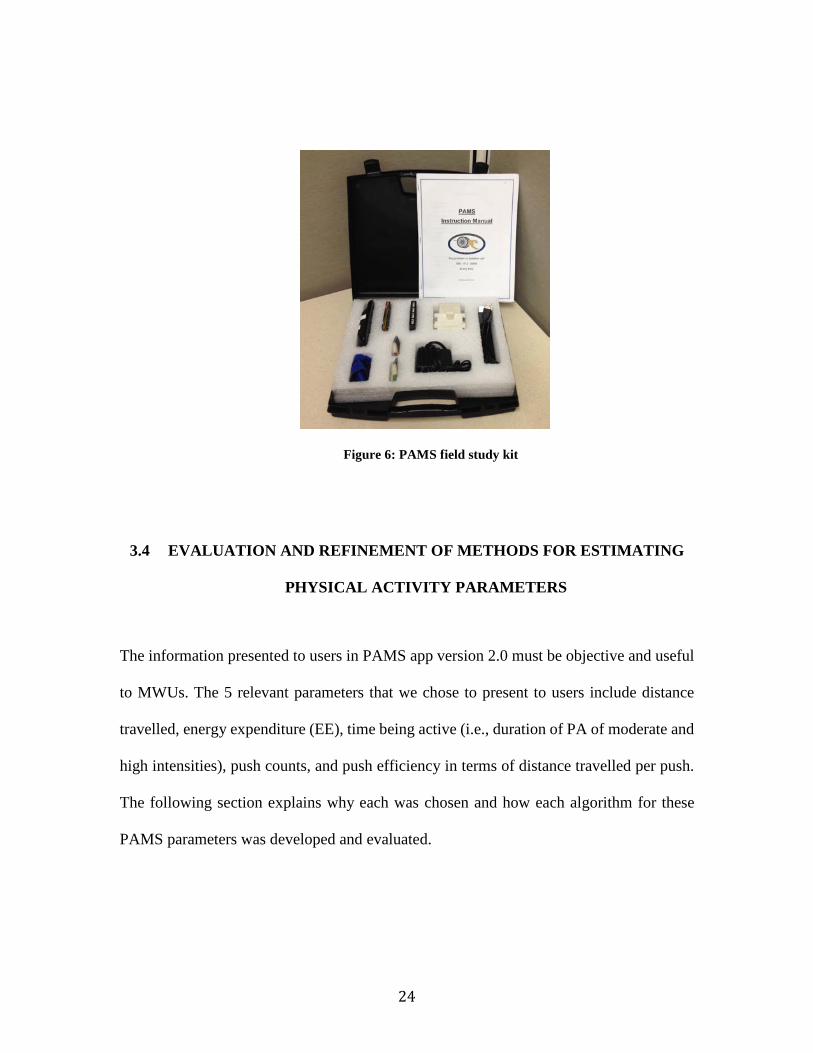
Figure 6: PAMS field study kit
3.4 EVALUATION AND REFINEMENT OF METHODS FOR ESTIMATING
PHYSICAL ACTIVITY PARAMETERS
The information presented to users in PAMS app version 2.0 must be objective and useful
to MWUs. The 5 relevant parameters that we chose to present to users include distance
travelled, energy expenditure (EE), time being active (i.e., duration of PA of moderate and
high intensities), push counts, and push efficiency in terms of distance travelled per push.
The following section explains why each was chosen and how each algorithm for these
PAMS parameters was developed and evaluated.
24

3.4.1 Distance
Distance was the first parameter chosen to measure because it is one of the most commonly
used indicators to gauge PA levels. First, a calibration protocol was developed to identify
the relationship between the GWRM output voltage and angular velocity. The GWRM was
attached to a ST20 Computer Numerical Controlled (CNC) lathe (HAAS Automation, Inc.,
Oxnard, CA, USA) that was programmed to rotate at speeds of 40, 60, and 80 rotations per
minute (rpm) in both the clockwise and counterclockwise direction. Six trials were
performed, with a 30-sec stop between each trial. The measured digital output (mV) was
used to develop offset values to maximize sensitivity of the GWRM to detecting various
angular velocities. A linear regression was completed between the outputs (°/sec) and the
known speeds (°/sec). The regressions for the forward and backward direction were done
separately. Angular velocities were then converted to translational velocity (m/s) and
distance based on the sampling frequency.
3.4.1.1 GWRM Validation Protocol
Angular velocity test
The GWRM was attached to the CNC lathe and spun at angular velocities of 40, 60, and
80 rpm for two minutes. Estimated angular velocities over 2 minutes were compared to
actual angular velocities.
Distance test
The GWRM was attached to the spokes of a wheelchair that was pushed 22.2 feet, the
length of tile in the laboratory, in both the forward and backward direction for 8 trials.
25
Estimated distance was compared to the actual distance, where the error for each trial
(combining forward and backward) was calculated.
Drift test
Another distance test was done 4 months after the initial calibration to assess if there were
drifts in the output of the GWRM.
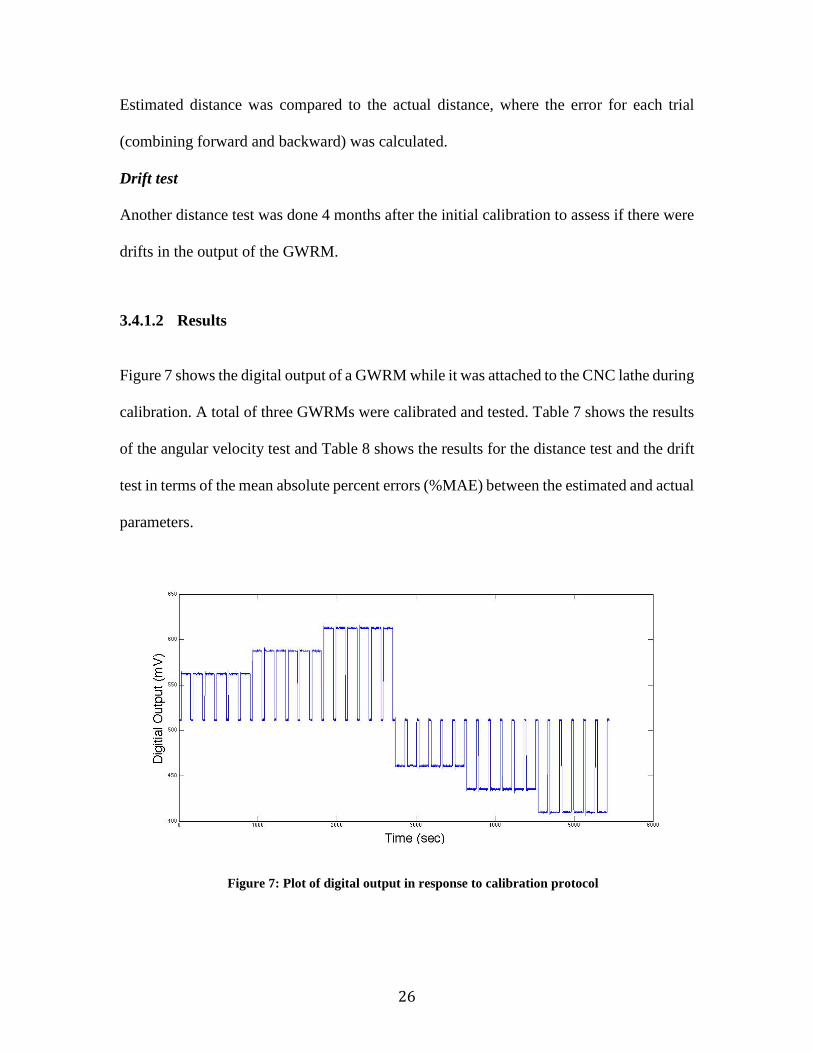
3.4.1.2 Results
Figure 7 shows the digital output of a GWRM while it was attached to the CNC lathe during
calibration. A total of three GWRMs were calibrated and tested. Table 7 shows the results
of the angular velocity test and Table 8 shows the results for the distance test and the drift
test in terms of the mean absolute percent errors (%MAE) between the estimated and actual
parameters.
Figure 7: Plot of digital output in response to calibration protocol
26

Table 7: Estimation error of angular velocity
Table 8: Estimation error of distance
3.4.2 Energy Expenditure
EE is another parameter commonly used to gauge PA level, and it is also commonly used
to monitor energy balance for maintaining appropriate body weight or losing weight.
Information about EE can help users plan their dietary intake based on how many calories
they expend, or it can incentivize users to increase their EE to match what they have taken
in. The energy expenditure estimation algorithms developed previous to this study were
computationally expensive and would take some effort to implement on the smartphone.
Thus a simplified EE estimation model was developed for use in this thesis, where EE for
a certain activity was calculated by multiplying resting EE by a MET (Metabolic
%MAE (SD) %MSE (SD) GWRM1 GWRM2 GWRM3 GWRM1 GWRM2 GWRM3
40 rpm 0.92% (1.21%)
1.02% (0.87%)
1.31% (1.43%)
-0.04% (1.1%)
-0.41% (0.04%)
0.05% (1.54%)
60 rpm 0.52% (1.04%)
0.52% (1.12%)
0.8% (1.23%)
-0.12% (0.76%)
-0.02% (0.79%)
0.04% (1.03%)
80 rpm 0.39% (0.95%)
0.47% (0.77%)
0.62% (1.34%)
-0.09% (0.57%)
-0.05% (0.62%)
0.00% (0.78%)
%MAE (SD) %MSE (SD) GWRM1 GWRM2 GWRM3 GWRM1 GWRM2 GWRM3
Distance Test
2.13% (1.7%)
1.00% (0.91%)
2.09% (1.16%)
0.01% (2.8%)
-0.0% (1.4%)
0.61% (2.43%)
Drift Test 2.15% (1.7%)
1.77% (0.71%)
1.98% (1.24%)
2.1% (1.62%)
-1.5% (1.07%)
0.04% (1.51%)
27
Equivalent Task) multiplier for the activity. The MET multiplier is defined as the ratio of
the metabolic rate during a specific PA to a reference metabolic rate at resting. The
simplified model uses data from both the Wocket and the GWRM to estimate EE. The
simplified EE estimation model was developed utilizing data collected from a study done
by Hiremath 2013 [42]. Full details on the method can be found in [42].
3.4.2.1 Experimental Protocol
The study recruited 45 MWUs with SCI. The inclusion criteria were the following: 18-65
years of age, uses a manual wheelchair as a primary means of mobility (> 80% of their
ambulation), and has a diagnosis of SCI. Subjects were excluded if they were unable to
tolerate sitting for three hours, had active pelvic or thigh wounds (pressure ulcers), had a
history of cardiovascular disease, or were pregnant. Thirty-nine participants were male and
six were female, with a mean age of 41.0±12.6 years, weight of 78.1±18.1 kg, height of
1.8±0.1 m, and body fat percentage of 20.58%±6.3%. The injury level of the participants
varied from C5 to L5, with 14 participants having injuries at or above T3 and 31
participants having injuries at or below T4.
Subjects were asked to perform at least ten PAs from the following list: 1) resting,
2) propelling wheelchair on a tile surface at a self-selected medium pace, 3) propelling
wheelchair on a tile surface at a self-selected fast pace, 4) propelling wheelchair on a
medium pile carpet at a medium or slow pace, 5) propelling wheelchair up and down a
ramp at a self-selected pace, 6) being pushed in a wheelchair on a tile surface, 7) being
pushed in a wheelchair on a medium pile carpet, 8) being pushed in a wheelchair up and
down a ramp, 9) playing wheelchair basketball, 10) folding laundry, 11) performing
28

deskwork involving reading and using a computer, 12) playing darts, 13) using a resistance
band (Thera-band), and 14) exercising on an arm ergometer at a self-selected pace and
resistance. Participants were also invited to do a follow-up session if they were within 60
miles of the research site and were willing to perform 10 activities at their home such as
watching TV, laundry, dishwashing, cleaning, and wheelchair propulsion in the home.
The subjects wore a Cosmed K4b2 portable metabolic cart (COSMED srl, Rome,
Italy). It collected the criterion EE for all the activities they chose to perform. They were
also fitted with a GWRM mounted on the wheel and a Wocket. All subjects used their own
manual wheelchairs and performed each activity for a minimum of 6 minutes, with at least
a 3-minute break between activity trials.
3.4.2.1.1 Data Preparation Data preparation and manipulation was done through MATLAB (The Mathworks, Inc.,
Natick, MA, USA). First, data from the GWRM, the Wocket, and the K4b2 were aligned
based on their time stamps. The resultant acceleration of the Wocket was calculated based
on its component accelerations (x, y, and z). Then raw data from the GWRM and the
Wocket were averaged over 1-minute intervals to match the EE data from the K4b2. In
addition, the standard deviations of the raw data from the GWRM and the Wocket were
computed over 1-minute intervals. The resting EE for each participant was obtained by
averaging the resting EE measured by the K4b2 over six minutes. To compute the MET
multipliers, we divided EE during each activity trial by the resting EE for each participant.
Table 9 summarizes all the resulting variables from the data preparation needed to develop
29

the simplified EE estimation model. Finally, the data were randomly split into a training
set (29 participants) and a testing set (7 participants).
Table 9: Variables used in the “simplified calories model” algorithm development
Variable Description EE Energy expended from performing activities expressed in kCal/min MET multiplier
The ratio of energy expended relative to resting
mean_xyz The mean resultant acceleration from the Wocket expressed in g/min std_xyz The standard deviation of resultant acceleration from the Wocket over
1-minute intervals mean_v The mean velocity from the GWRM expressed in degree/min std_v The standard deviation of velocity from the GWRM over 1-minute
window size data
3.4.2.2 Algorithm Development
The simplified EE estimation model includes three parts: 1) estimating the resting EE; 2)
classifying activities into four categories; 3) estimating four the MET multipliers for the
four categories of activities.
Resting EE Equation
A stepwise regression with an alpha-to-enter and an alpha-to-remove at a significance level
of 0.05 was performed using MATLAB software (R2013a, Mathworks Inc., Natick, MA,
USA). The dependent variable was the resting EE and the predictor variables included age,
height, weight, and BMI. The training data set was used to develop the regression equation,
while the testing data set was used to estimate the errors.
30
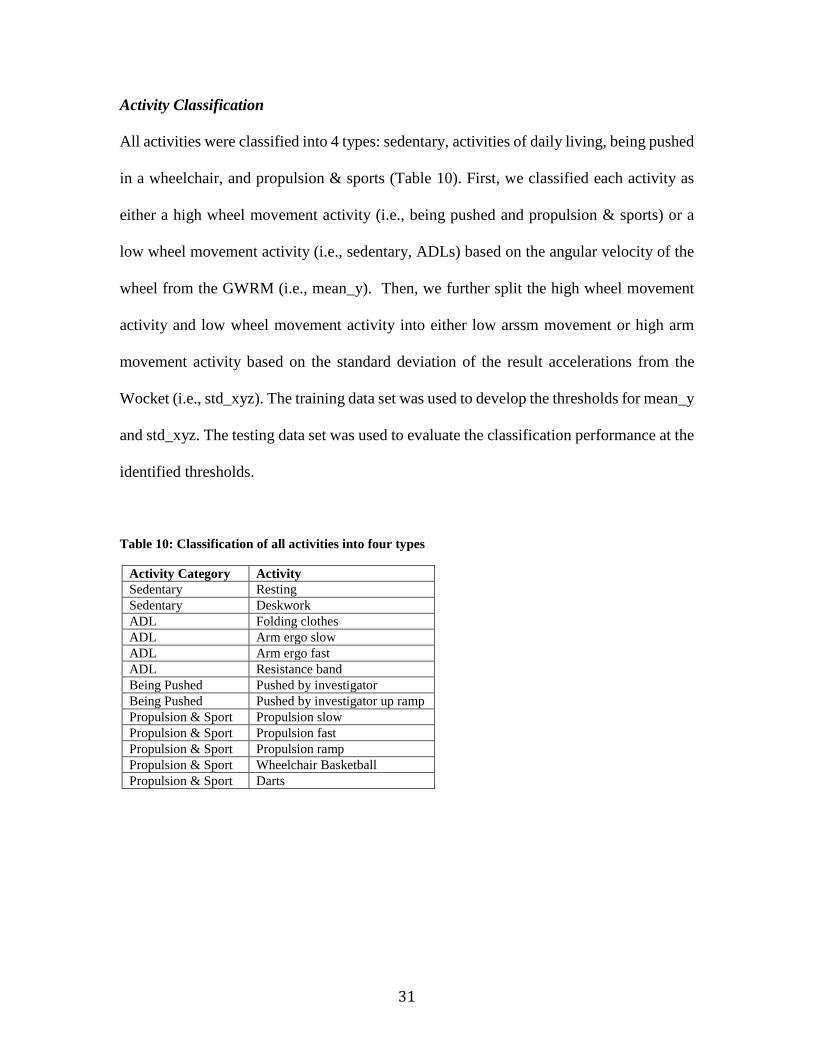
Activity Classification
All activities were classified into 4 types: sedentary, activities of daily living, being pushed
in a wheelchair, and propulsion & sports (Table 10). First, we classified each activity as
either a high wheel movement activity (i.e., being pushed and propulsion & sports) or a
low wheel movement activity (i.e., sedentary, ADLs) based on the angular velocity of the
wheel from the GWRM (i.e., mean_y). Then, we further split the high wheel movement
activity and low wheel movement activity into either low arssm movement or high arm
movement activity based on the standard deviation of the result accelerations from the
Wocket (i.e., std_xyz). The training data set was used to develop the thresholds for mean_y
and std_xyz. The testing data set was used to evaluate the classification performance at the
identified thresholds.
Table 10: Classification of all activities into four types
Activity Category Activity Sedentary Resting Sedentary Deskwork ADL Folding clothes ADL Arm ergo slow ADL Arm ergo fast ADL Resistance band Being Pushed Pushed by investigator Being Pushed Pushed by investigator up ramp Propulsion & Sport Propulsion slow Propulsion & Sport Propulsion fast Propulsion & Sport Propulsion ramp Propulsion & Sport Wheelchair Basketball Propulsion & Sport Darts
31
MET Multipliers
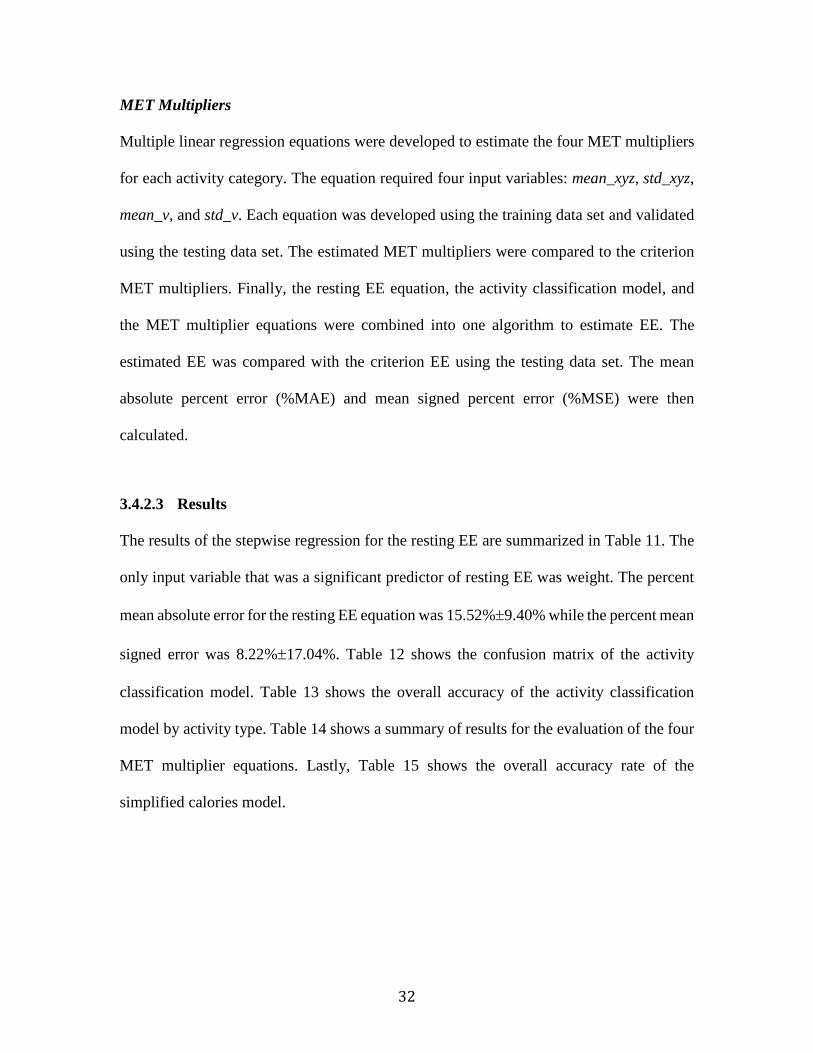
Multiple linear regression equations were developed to estimate the four MET multipliers
for each activity category. The equation required four input variables: mean_xyz, std_xyz,
mean_v, and std_v. Each equation was developed using the training data set and validated
using the testing data set. The estimated MET multipliers were compared to the criterion
MET multipliers. Finally, the resting EE equation, the activity classification model, and
the MET multiplier equations were combined into one algorithm to estimate EE. The
estimated EE was compared with the criterion EE using the testing data set. The mean
absolute percent error (%MAE) and mean signed percent error (%MSE) were then
calculated.
3.4.2.3 Results
The results of the stepwise regression for the resting EE are summarized in Table 11. The
only input variable that was a significant predictor of resting EE was weight. The percent
mean absolute error for the resting EE equation was 15.52%±9.40% while the percent mean
signed error was 8.22%±17.04%. Table 12 shows the confusion matrix of the activity
classification model. Table 13 shows the overall accuracy of the activity classification
model by activity type. Table 14 shows a summary of results for the evaluation of the four
MET multiplier equations. Lastly, Table 15 shows the overall accuracy rate of the
simplified calories model.
32
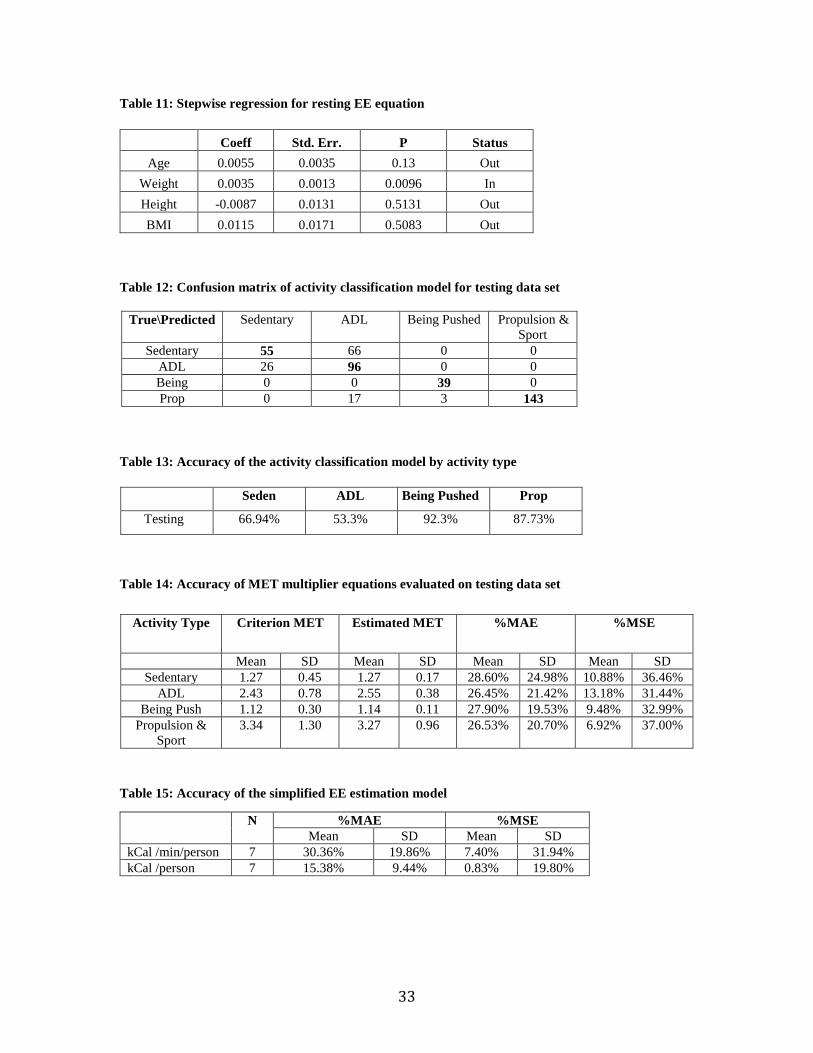
Table 11: Stepwise regression for resting EE equation
Table 12: Confusion matrix of activity classification model for testing data set
Table 13: Accuracy of the activity classification model by activity type
Table 14: Accuracy of MET multiplier equations evaluated on testing data set
Table 15: Accuracy of the simplified EE estimation model
Coeff Std. Err. P Status Age 0.0055 0.0035 0.13 Out
Weight 0.0035 0.0013 0.0096 In Height -0.0087 0.0131 0.5131 Out BMI 0.0115 0.0171 0.5083 Out
True\Predicted Sedentary ADL Being Pushed Propulsion & Sport
Sedentary 55 66 0 0 ADL 26 96 0 0 Being 0 0 39 0 Prop 0 17 3 143
Seden ADL Being Pushed Prop
Testing 66.94% 53.3% 92.3% 87.73%
Activity Type Criterion MET Estimated MET %MAE %MSE
Mean SD Mean SD Mean SD Mean SD Sedentary 1.27 0.45 1.27 0.17 28.60% 24.98% 10.88% 36.46%
ADL 2.43 0.78 2.55 0.38 26.45% 21.42% 13.18% 31.44% Being Push 1.12 0.30 1.14 0.11 27.90% 19.53% 9.48% 32.99%
Propulsion & Sport
3.34 1.30 3.27 0.96 26.53% 20.70% 6.92% 37.00%
N %MAE %MSE Mean SD Mean SD
kCal /min/person 7 30.36% 19.86% 7.40% 31.94% kCal /person 7 15.38% 9.44% 0.83% 19.80%
33

3.4.3 Time Being Active
The parameter “time being active” keeps track of the duration of activities performed that
are considered moderate to high intensity. This parameter was included based on the
recommendation of the American Heart Association (AHA) that individuals achieve a
minimum PA per week. Specifically, the AHA promotes that to maintain health, all adults
aged 18 to 65 years old need moderate-intensity (3.0 MET) aerobic PA for a minimum of
30 minutes five days each week [46]. The algorithm used for this study takes in the
estimated MET multipliers from the simplified EE estimation model and decides if the
users were active or not, then accumulates the time when they were determined as “being
active”. The estimated MET was compared to the criterion MET derived from the criterion
EE for the subjects in the testing data set. The percent mean signed error was -
37.5%±22.1% while the percent mean absolute error was 37.5%±22.1%.
3.4.4 Push Count & Push Efficiency
The rationale for including the parameter wheel push count and push efficiency is based
on the publication Preservation of Upper Limb Function Following Spinal Cord Injury,
which indicates that repetitive use of the upper arms in wheelchair users during propulsion
increases their risk of upper extremity pain and injury [47]. Thus manual wheelchair users
should pay close attention to their propulsion technique and make sure they perform it
correctly and efficiently. An efficient push technique will yield a greater distance per push.
The push count algorithm takes in data from the Wocket and GWRM, and then calculates
34
the number of pushes performed. Push efficiency is determined by dividing the total
distance travelled by total number of wheel pushes.
The push count algorithm was developed and tested using the data from the same
experimental protocol mentioned in the EE section. A full description of the protocol can
be found in Hiremath’s dissertation 2013 chapter 5.0 [42].
3.4.4.1 Algorithm Development
The algorithm was developed using MATLAB software (R2013a, Mathworks Inc., Natick,
MA, USA). The algorithm took 2 inputs: the translational velocity from the GWRM and
resultant acceleration of the Wocket. First, a threshold was set for the GWRM to determine
if the wheel was moving or not. If the wheel was not moving, the algorithm determined
that no propulsion activities were detected. If the wheel was moving, the algorithms found
the maximum peaks and the minimum troughs in the Wocket data and determined if they
were true peaks/troughs. Each true peak was considered one push.
To locate the peaks and troughs, we divided the Wocket data into 4-second
intervals. The rational for breaking the data up into 4-sec segments was to allow the
algorithm to adjust for changes in propulsion speed. For every interval, two thresholds
(upper and lower) were found by calculating the average and standard deviation of the
acceleration. The upper threshold was equal to the interval’s average plus half of the
interval’s standard deviation. The lower threshold was equal to the interval’s average minus
half of the interval’s standard deviation. Based on the two thresholds, the local maximum
and the local minimum within each interval were identified. Unfortunately, by breaking
the data up into intervals, systematic error in peak detection at the edge of each interval
35

arose. A correction algorithm was then implemented to correct any false peaks or add
missing peaks.
The condition for a true peak was that it must be in between two minimum troughs.
To identify the true peaks, the algorithm found a new upper threshold and a new lower
threshold for each interval. The new upper threshold was calculated by averaging all the
maximum peaks in the interval then subtracting it by half of the maximum peaks standard
deviation. The new lower threshold was calculated by averaging all the minimum troughs
in the interval then adding it by half of the minimum troughs standard deviation.
3.4.4.2 Results
Thirty wheelchair propulsion trials from the previous study [42] were randomly selected
for video analysis, where the numbers of wheel pushes was tallied and served as criterion
(true pushes). The estimated push counts derived from the algorithm were compared to the
criterion from the video analysis. The mean absolute error of the algorithm was 11.72% ±
10.03%. The mean sign error of the algorithm was -4.54% ± 15.01%. The combined push
count for all trials was 6926 while the combined estimated push count for all trials was
6858, which yielded a percent error of 0.98%.
3.5 DEVELOPMENT OF PAMS APP VERSION 2.0
This section explains the features of PAMS app version 2.0.The smartphone app is a critical
component of PAMS because users interact with PAMS through the app to track their daily
PA. PAMS app version 2.0 was written in Java using Eclipse software (Eclipse Foundation)
36
developed by Monsak Socharoentum (University of Pittsburgh’s School of Information
Science, Pittsburgh PA). The PA parameter algorithms developed in the previous section
were implemented in the app. The app could then display the real time feedback of all the
PA parameters to the users.
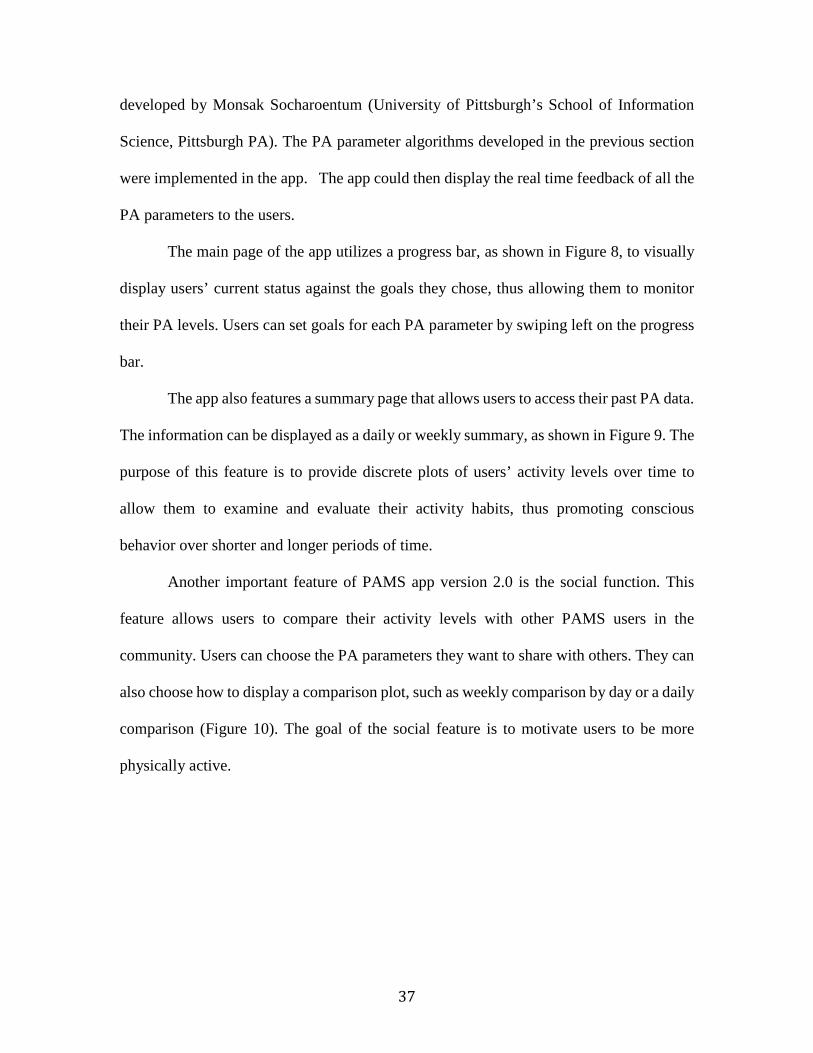
The main page of the app utilizes a progress bar, as shown in Figure 8, to visually
display users’ current status against the goals they chose, thus allowing them to monitor
their PA levels. Users can set goals for each PA parameter by swiping left on the progress
bar.
The app also features a summary page that allows users to access their past PA data.
The information can be displayed as a daily or weekly summary, as shown in Figure 9. The
purpose of this feature is to provide discrete plots of users’ activity levels over time to
allow them to examine and evaluate their activity habits, thus promoting conscious
behavior over shorter and longer periods of time.
Another important feature of PAMS app version 2.0 is the social function. This
feature allows users to compare their activity levels with other PAMS users in the
community. Users can choose the PA parameters they want to share with others. They can
also choose how to display a comparison plot, such as weekly comparison by day or a daily
comparison (Figure 10). The goal of the social feature is to motivate users to be more
physically active.
37
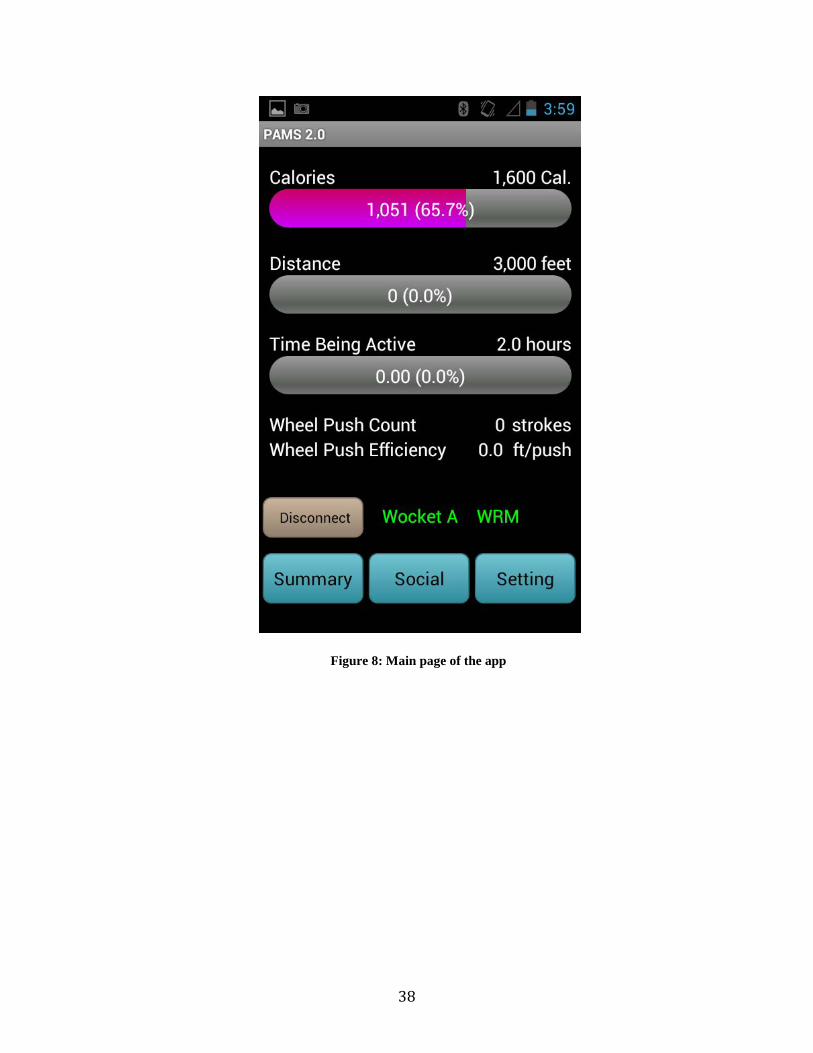
Figure 8: Main page of the app
38
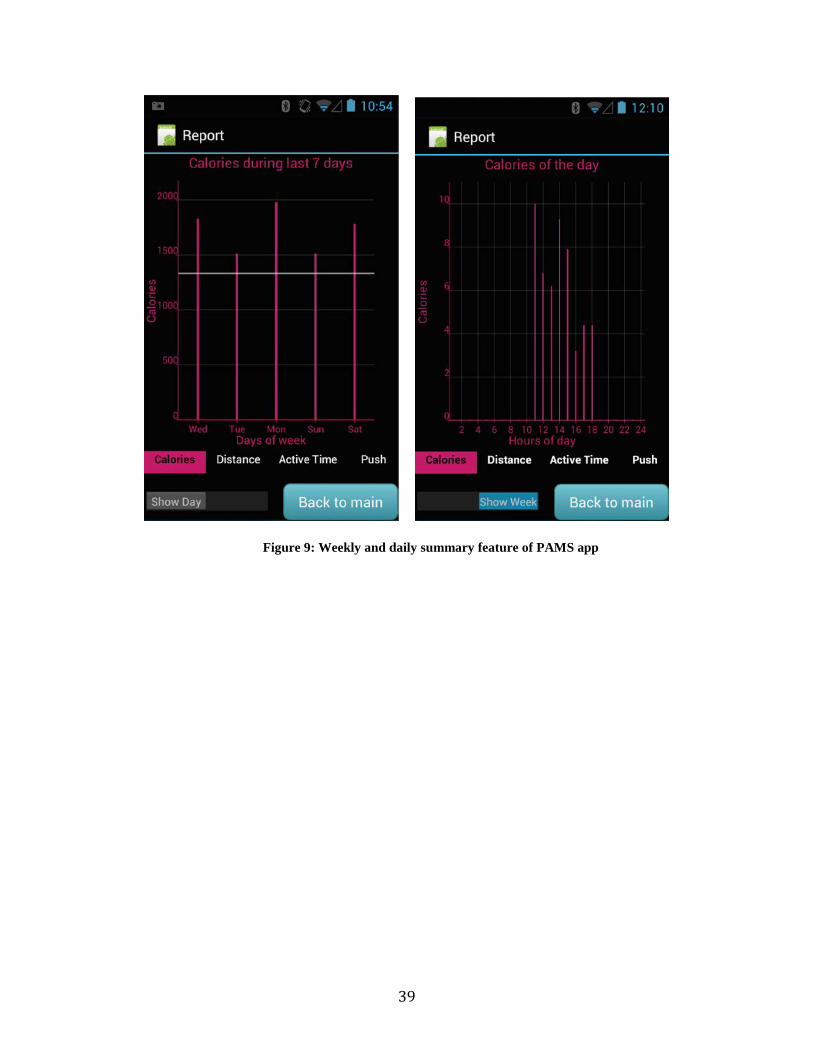
Figure 9: Weekly and daily summary feature of PAMS app
39
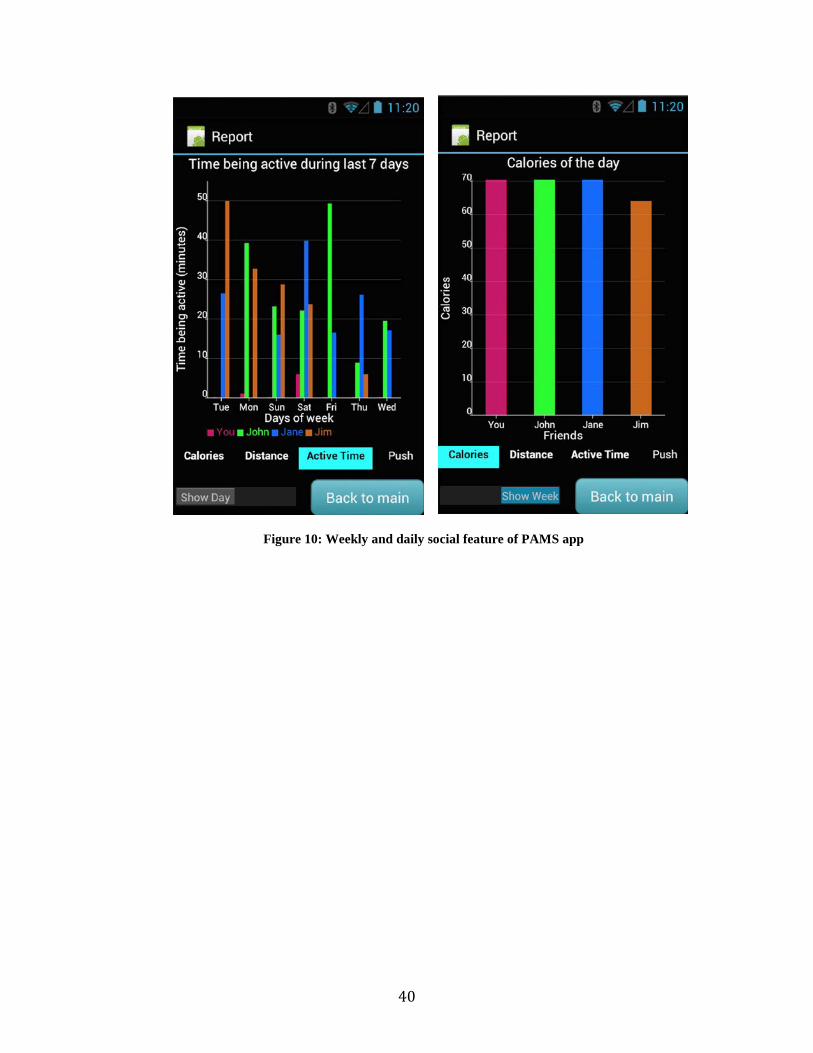
Figure 10: Weekly and daily social feature of PAMS app
40

3.6 DISCUSSION
To facilitate a successful trial, PAMS needed to be converted from a lab-based system to a
field-ready system. In addition to repackaging the system and creating instruction tutorials,
a significant amount of effort was directed towards developing and refining the methods
for estimating PA parameters for the field deployment as well as towards development of
PAMS app version 2.0.
The simplified calories model showed a high mean absolute prediction error. The
sources of this error are the compounding errors within the model. For example, resting EE
was not accurate because there was no control over what participants consumed or did
before the study [48]. Also, the activity classification model could not differentiate between
ADL and sedentary types activity with high accuracy. The four-MET multiplier equations
showed fairly high mean absolute error. The mean absolute EE error of 30.4% per minute
per person, is slightly higher than that of the EE prediction model developed by Hiremath
(29.0%) [42]. However, the simplified calories model developed in this thesis is
computationally more efficient and can be easily implemented on a smartphone. Also when
considering the overall absolute EE estimation error for the whole testing session per
person, we obtained smaller errors (15.4%±9.4%) because the over- and under-estimation
for different activities canceled each other out. This seems to indicate that PAMS may yield
smaller errors when tracking the EE over a period of mixed activities instead of tracking
the EE for a specific type of activity. The parameter “time being active” also showed high
error, which is due to the error in the simplified calories model. However, we wanted to
examine if the parameter could be perceived as useful in the field. The algorithm for
predicting the wheel push count is relatively accurate (11.7%±10.0%). Previous work on
41
push count estimation using arm accelerometer was done by Aguilar, where the mean
absolute percent error was 8.0%±7.1% [35]. Even though, the push count algorithm
implemented in PAMS app version 2.0 has higher error, it can measure push count in a
free-living environment whereas the Aguilar algorithm only works under controlled speeds
in a laboratory setting.
PAMS app version 2.0 was developed based on other mainstream PA monitor apps.
The progress bar with a goal setting feature was implemented because it reflects goal-
setting theory, which states that much of human action is purposeful, in that it is directed
by conscious goals [50]. In support of this theory, one study showed that self-directed PA
goal setting generates immediate and profound improvement in PA behavior among
individuals with type II diabetes by increasing the number of steps taken daily [51]. The
summary feature was implemented because it represented the self-regulation theory, which
states that people cannot influence their own motivation and action very well if they do not
pay adequate attention to their own performance [53]. A randomized controlled trial on
wearable technology and weight loss concluded that continuous self-monitoring from
wearable technology with real-time and past feedback can be useful in enhancing lifestyle
changes that promote weight loss in sedentary overweight or obese adults [54]. The social
feature was implemented because it played an important role in self-assessment and self-
improvement. A study by Williams and French found interventions that included
‘facilitated social comparison’ (i.e., drawing an individual’s attention to others’
performance to elicit comparisons) produced a significantly larger effect size on change in
physical activity [55]. In fact, many physical activity monitors utilize some social
interaction element. For example, Curmi et al. designed HeartLink, a system that
42

broadcasts personal-data to social networks [56]. The study found that athletes were more
motivated when their friends were aware of their performance.
There are several limitations to PAMS. On the hardware side, the Wocket’s battery
life did not last long enough for the whole day, so we had to give two Wockets to the
participants for the field test. Also, the Wocket and the GWRM do not have an on/off
switch; thus, users have less control over the device. On the algorithm side, the simplified
calories model does not include important demographic variables such as gender and injury
level. Also as PAMS is a movement-based activity monitor, it cannot capture resistance-
based activities such as weight lifting or resistant training. For example, PAMS is not able
to differentiate between high and low resistant arm ergometry. Regarding the wheel push
algorithm, it works best when propulsion is done with two arms uniformly. If the users are
being pushed in a wheelchair and move their arms extensively, the algorithm may
misclassify the activity as self-propulsion. On the software side, the app needs to be
connected to both the Wocket and the GWRM in order to function properly even though
not every PA parameter requires both sensors.
Nonetheless, significant changes were made to PAMS to transform it into a product
prototype that can be used outside of the developer site. As far as we know, PAMS is the
only tool existing designed to capture PA in wheelchair users and present relevant
information to this population.
43
4.0 FIELD-BASED USABILITY TESTING
Personal health monitoring applications for smartphones are receiving increasing attention
from both consumers and researchers. The use of wearable sensors to capture and present
physical activity (PA) parameters to the users has been shown to increase PA levels among
users [17, 24, 57]. The concept that self-awareness and self-management provide
incentives for behavior change has been the central theme in most personal health
monitoring systems, such as the Fitbit Flex (FitBit, Inc. San Francisco, CA) and
SenseWearTM armband (BodyMedia, Inc. Pittsburgh, PA). However, none of the
commercially available activity monitors are appropriate for manual wheelchair users
(MWUs). All of them were designed to track activity of the lower extremities and so do
not capture activities typically performed by MWUs. This study is the first to have
developed a complete prototype of an activity monitor (i.e., PAMS) for MWUs.
Up until this study, PAMS had never been evaluated outside of the lab setting, nor
had the system as a whole undergone a usability testing. It is important to perform an
extensive usability testing on any technology, including PAMS, in both the laboratory
setting and out in the field before translating the technology into an actual product [58].
For PAMS, this testing was done to provide us with information about how users perceive
and interact with PAMS. It also allowed us to identify any problems from the user’s point
of view, assess user experience, and survey users’ satisfaction. The objective of this field-
based usability study was to see if it is feasible for the PAMS to be used by MWUs to
monitor their PA parameters on a daily basis.
44

4.1 METHODS
The study was approved by the Institutional Review Board of the University of Pittsburgh.
It was also approved by the US Army Medical Research and Material Command’s
(USAMRMC) Human Research Protections Office (HRPO). The study was conducted at
the Human Engineering Research Laboratories (HERL), University of Pittsburgh.
4.1.1 Protocol
Ten people with spinal cord injury (SCI) were recruited with the following inclusion
criteria: 18-65 years of age, uses a manual wheelchair as a primary means of mobility (>
80% of ambulation), has a diagnosis of SCI, and has experience using a smartphone.
Participants were excluded if they could not tolerate sitting for more than 2.5 hours or had
an active pelvic or thigh wound.
Participants were asked to pay one visit to a quiet room in the Rehabilitation
Science and Technology department’s testing room, where the study took place. After
signing the consent form, participants filled out two questionnaires. The first questionnaire
included questions on demographics while the second questionnaire inquired about
participants’ physical activity habits and smartphone usage. The participants were then
shown three videos.
• Video #1: explained what PAMS is, how it works, and what it is used for. After the
participants viewed this video, they were given a questionnaire and interviewed
about their first impression of PAMS.
45
• Video #2: explained how to use the Wocket and the GWRM. After the participants
viewed this video, they were asked to perform a serious of tasks related to using the
two devices. Participants were then given a questionnaire and interviewed about
their experience using the devices.
• Video #3: explained how to use the PAMS app. After the participants viewed this
video, they were asked to perform a serious of tasks related to using the app.
Participants were then given a questionnaire and interviewed about their experience
using the app.
Participants also had the option to complete an in-home trial where they would take
PAMS home for up to 7 days. They were instructed to use the Wocket and GWRM,
carry the PAMS smartphone everyday, and use the app at least 3 times a day.
Participants did not have to wear the Wocket at night while they were sleeping. At
the end of the home trial, participants were given a questionnaire and interviewed
about their experience using PAMS on a daily basis over these several days.
4.1.2 Data Collection
During the in-lab trial, demographics data such as sex, age, height, weight, injury level,
date of injury, brand and model of wheelchair used were collected. Information regarding
physical activity (PA) such as their interest in tracking PA and their current PA level,
fitness level, and physical activity stage of change were collected [59]. There are five
physical activity stages. The first stage is pre-contemplation (stage 1), during which the
person has not yet acknowledged that there is a problem with their PA behavior that needs
46
to be changed. The second stage is contemplation (stage 2), during which the person
acknowledges the existence of a problem but is not yet ready to make a change. The third
stage is preparation (stage 3), during which the person is getting ready to change their PA
behavior. The fourth stage is decision/action (stage 4), during which the person is
undergoing a change in behavior. The final stage is maintenance (stage 5), in which the
person maintains an earlier implemented behavior change.
Information regarding their previous smartphone usage such as how much time
participants spend on phone, how long they had been using a smartphone, how they carry
their phone, how fluent they are at using a smartphone, and how important the smartphone
is to them was collected as well.
Following Video #1, questions regarding their first impression of PAMS,
desirability of PAMS as a product, and perceived usefulness of the system were asked
using 5-item Likert Scales. Participants were also asked to rate their confidence level from
0 to 100 regarding their understanding of PAMS and their ability to use it. Then two
interview questions were asked about how PAMS might help participants attain or maintain
an active lifestyle and how they saw themselves using it.
Following completion of the tasks introduced in Video #2, participants were asked
to rate the effort it took to perform each task in the task list using 5-item Likert Scales.
They were then asked to rate their confidence level from 0 to 100 with respect to their
ability to perform those tasks on a daily basis. A semi-structured interview followed to
obtain their feedback on the task completion experience.
Following their experience using the app after watching Video #3, participants were
asked to rate the effort of using the app in terms of ease-of-use and usefulness on 5-item
47
Likert Scales. They were then asked to rate their confidence level from 0 to 100 in their
ability to use the app independently to its full potential on a daily basis. A semi-structured
interview followed to obtain feedback on how they might use the app and what parameters
and features they found to be of interest and to elicit their comments and suggestions.
For the in-home trial, the build-in logging function of the smartphones recorded the
overall usage time of PAMS app version 2.0 and time spent on each page and feature (e.g.,
goal setting and social interaction). Following the in-home trial, participants filled out
comprehensive questionnaires about their experience using the PAMS using 5-item Likert
Scales in terms of the ease of wearing, taking off, and recharging the devices and ease of
using the app to track their PA on a daily basis. Participants were also asked to rate the
usefulness of each PA parameter and app feature and their satisfaction level with the app’s
responsiveness, connection speeds, and interface layouts. A System Usability Scale (SUS)
was used to assess the ease-of-use and usefulness of PAMS [60]. We also asked the
participants to rate their interest in some possible features that were not included in PAMS
app version 2.0. A semi-structured interview followed to obtain their feedback on the
experience and elicit suggestions. All interviews during the lab trial and in-home trial were
audio recorded and transcribed for data analysis.
4.1.3 Data Analysis
All of the quantitative data from the questionnaires and the smartphone logs were analyzed
using descriptive statistics. The video footage of participants performing tasks provided
descriptive statistics that were used to summarize the amount of time spent performing
each task; content analysis was used to categorize the problems encountered by
48
participants. In addition, content analysis was used to extract themes that appeared in the
interviews after both the lab and the in-home trials.
4.2 RESULTS
4.2.1 Demographics
Table 16 summarizes the demographics of the participants. Table 17 shows the responses
related to participants’ interest level in tracking some PA parameter before seeing PAMS.
Table 18 shows information regarding smartphone usage and Table 19 shows self-rated
information regarding fluency, importance, and satisfaction with current smartphone
49

Table 16: Participant demographics
Demographics variables Mean±SD Sex Female 1 Male 9 Age (years) 34.8±9.7 Weight (kg.) 85.1±22.2 Height (m) 1.8±0.1 Age (years) 34.8±9.7 Injury Level Range Paraplegia (T4 and below) 8 Tetraplegia (T3 and above) 2 Injury Type Complete 7 Incomplete 3 Ethnicity Caucasian 8 African American 2 Smoker 2 Nutrition Habit (Self Rated) Excellent 1 Very Good 1 Good 6 Fair 2 Poor 0 Fitness Level (Self Rated) Excellent 0 Very Good 4 Good 4 Fair 2 Poor 0 Physical Activity Stage of Change Pre-contemplation 0 Contemplation 1 Preparation 3 Action 1 Maintenance 5
50

Table 17: Initial interest level in tracking PA parameters before seeing PAMS
Table 18: Smartphone use information
Not Interested
Less Interested
Neutral Very Interested
Interested
Tracking Distance 0 0 3 4 3 Tracking EE 1 1 2 2 4
Tracking time being active
0 1 1 5 2
Tracking wheel pushes
0 0 1 6 3
Smartphone Use Mean±SD Currently own a smartphone
Yes 8 No 2
Type of smartphone iPhone 5 HTC 2 Galaxy 1
Duration of smartphone use Less than a month 1 1-6 month 1 1-2 year 4 2-3 years 1 More than 3 years 3
Average number of hours spent on smartphone daily Less than 1 hour 1 2-4 hours 4 More than 6 hours 3
Location where phone is carried On the lap 4 Pant pocket 4 Pouch 2
51

Table 19: Responses regarding fluency, importance, and satisfaction with smartphone
4.2.2 In-Lab Evaluation
The lab evaluation focused on assessing participants’ first encounter and interaction with
the PAMS. Data regarding users’ first impression, the learnability of the system, errors
made during the tasks, and confidence in using PAMS are summarized below.
4.2.2.1 First Impression
Table 20 below shows the response from the lab questionnaire. The questionnaire was
filled out after participants had viewed the first video but before they had used PAMS.
Smartphone Information 1. Please rate your fluency in smartphone usage.
Not Fluent 0
Less Fluent 2
Competent 0
Fluent 8
Very Fluent 0
2. Please rate the importance of a smartphone to you.
Not Important 1
Less Important 1
Neutral 1
Important 3
Very Important 4
3. Please rate how satisfied you are with your smartphone. Very Unsatisfied
0 Unsatisfied
0 Neutral
2 Satisfied
4 Very Satisfied
4
52

Table 20: Responses to first impression of PAMS prior to use
We asked each user two questions. When asked “Do you think PAMS will be effective at
helping you attain or maintain an active lifestyle?” all participants answered yes. When
asked “How do you see yourself using it?” participants responded in various ways, listed
in Table 21 below.
Impression Questions 1. Please rate your overall impression of PAMS.
Not Impressed 0
Slightly Impressed
0
Somewhat Impressed
2
Impressed 6
Very Impressed 2
2. Please rate how desirable PAMS is as a product for you. Not Desirable
0
Slightly Desirable 0
Somewhat Desirable
1
Desirable 5
Very Desirable 4
3. Please rate how useful PAMS will be for you. Not Useful
0
Slightly Useful 0
Somewhat Useful
2
Useful 5
Very Useful 3
4. On first impression, how useful will the goal bar feature be for you? Not Useful
0 Slightly Useful
0 Somewhat
Useful 0
Useful 4
Very Useful 6
5. On first impression, how useful will the summary feature be for you? Not Useful
0 Slightly Useful
0 Somewhat
Useful 0
Useful 5
Very Useful 5
6. On first impression, how useful will the social feature be for you? Not Useful
0 Slightly Useful
1 Somewhat
Useful 2
Useful 3
Very Useful 4
53
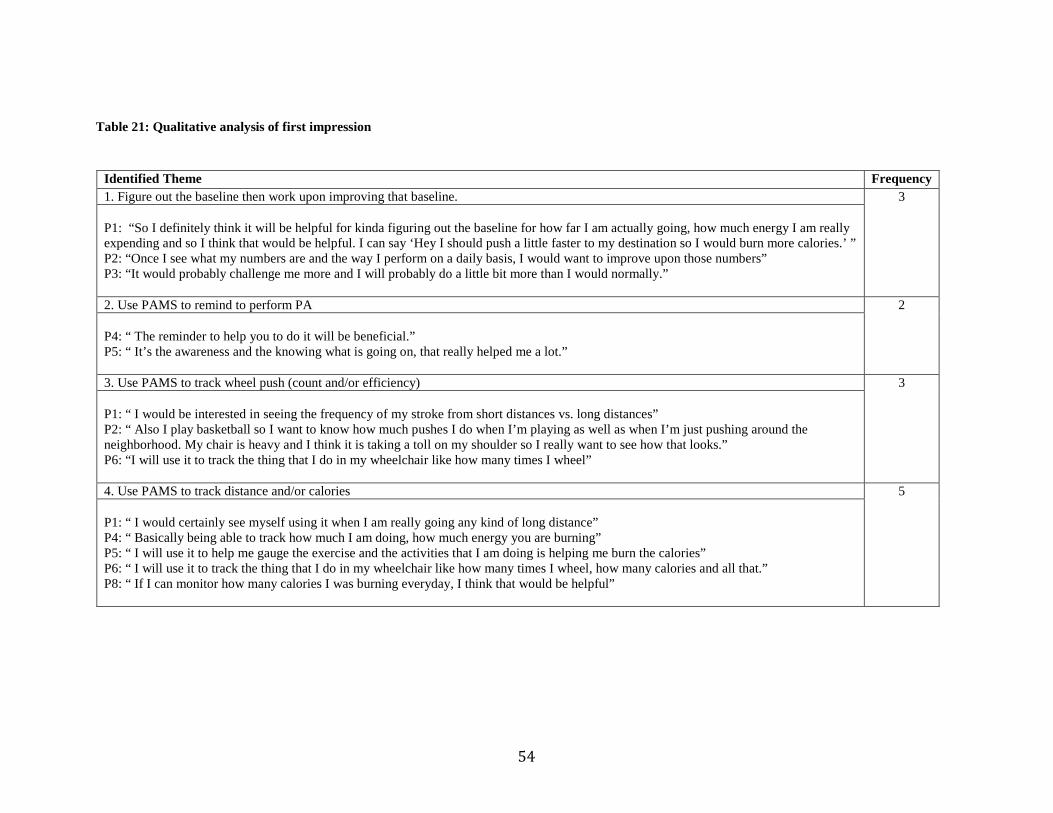
Table 21: Qualitative analysis of first impression
Identified Theme Frequency 1. Figure out the baseline then work upon improving that baseline. 3 P1: “So I definitely think it will be helpful for kinda figuring out the baseline for how far I am actually going, how much energy I am really expending and so I think that would be helpful. I can say ‘Hey I should push a little faster to my destination so I would burn more calories.’ ” P2: “Once I see what my numbers are and the way I perform on a daily basis, I would want to improve upon those numbers” P3: “It would probably challenge me more and I will probably do a little bit more than I would normally.” 2. Use PAMS to remind to perform PA 2 P4: “ The reminder to help you to do it will be beneficial.” P5: “ It’s the awareness and the knowing what is going on, that really helped me a lot.” 3. Use PAMS to track wheel push (count and/or efficiency) 3
P1: “ I would be interested in seeing the frequency of my stroke from short distances vs. long distances” P2: “ Also I play basketball so I want to know how much pushes I do when I’m playing as well as when I’m just pushing around the neighborhood. My chair is heavy and I think it is taking a toll on my shoulder so I really want to see how that looks.” P6: “I will use it to track the thing that I do in my wheelchair like how many times I wheel” 4. Use PAMS to track distance and/or calories 5 P1: “ I would certainly see myself using it when I am really going any kind of long distance” P4: “ Basically being able to track how much I am doing, how much energy you are burning” P5: “ I will use it to help me gauge the exercise and the activities that I am doing is helping me burn the calories” P6: “ I will use it to track the thing that I do in my wheelchair like how many times I wheel, how many calories and all that.” P8: “ If I can monitor how many calories I was burning everyday, I think that would be helpful”
54
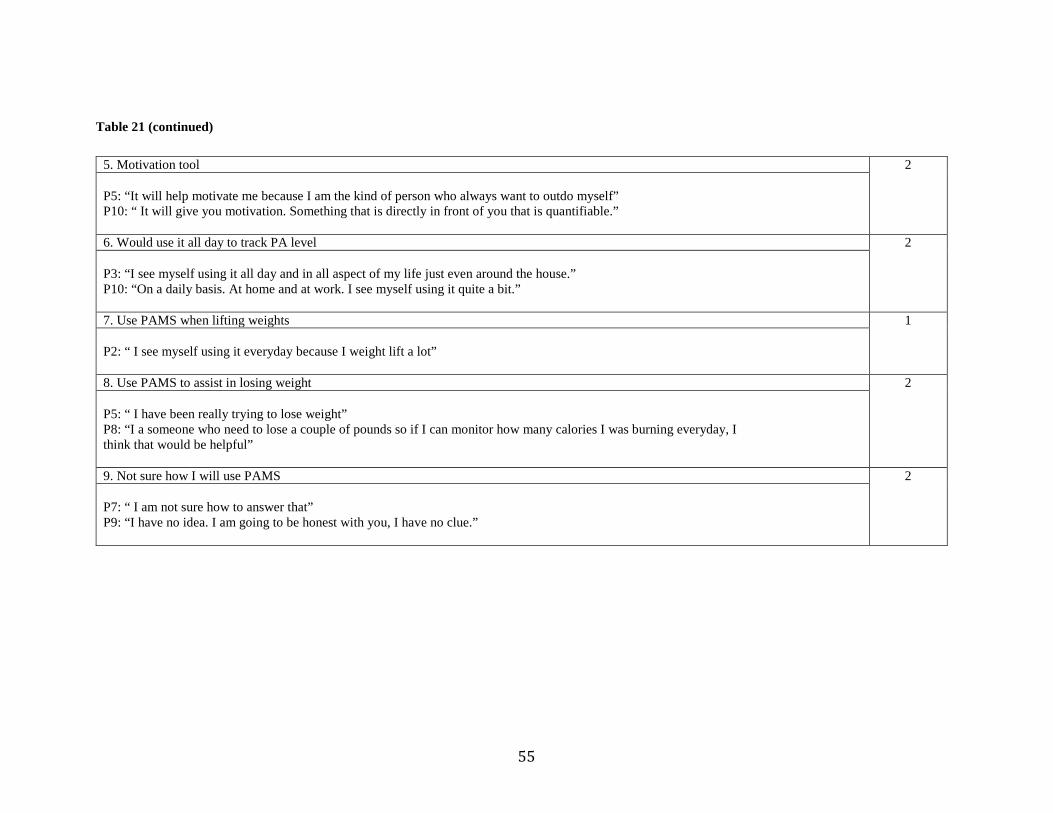
Table 21 (continued)
5. Motivation tool 2 P5: “It will help motivate me because I am the kind of person who always want to outdo myself” P10: “ It will give you motivation. Something that is directly in front of you that is quantifiable.” 6. Would use it all day to track PA level 2 P3: “I see myself using it all day and in all aspect of my life just even around the house.” P10: “On a daily basis. At home and at work. I see myself using it quite a bit.” 7. Use PAMS when lifting weights 1 P2: “ I see myself using it everyday because I weight lift a lot” 8. Use PAMS to assist in losing weight 2 P5: “ I have been really trying to lose weight” P8: “I a someone who need to lose a couple of pounds so if I can monitor how many calories I was burning everyday, I think that would be helpful” 9. Not sure how I will use PAMS 2 P7: “ I am not sure how to answer that” P9: “I have no idea. I am going to be honest with you, I have no clue.”
55
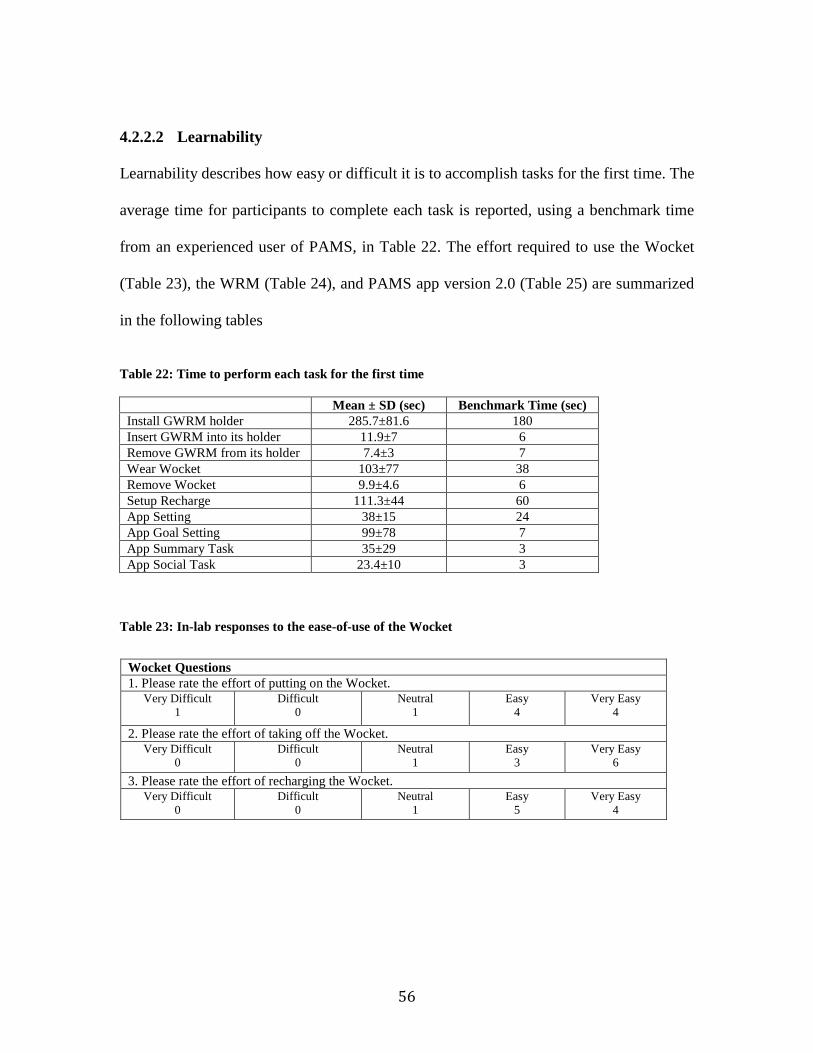
4.2.2.2 Learnability
Learnability describes how easy or difficult it is to accomplish tasks for the first time. The
average time for participants to complete each task is reported, using a benchmark time
from an experienced user of PAMS, in Table 22. The effort required to use the Wocket
(Table 23), the WRM (Table 24), and PAMS app version 2.0 (Table 25) are summarized
in the following tables
Table 22: Time to perform each task for the first time
Mean ± SD (sec) Benchmark Time (sec) Install GWRM holder 285.7±81.6 180 Insert GWRM into its holder 11.9±7 6 Remove GWRM from its holder 7.4±3 7 Wear Wocket 103±77 38 Remove Wocket 9.9±4.6 6 Setup Recharge 111.3±44 60 App Setting 38±15 24 App Goal Setting 99±78 7 App Summary Task 35±29 3 App Social Task 23.4±10 3
Table 23: In-lab responses to the ease-of-use of the Wocket
Wocket Questions 1. Please rate the effort of putting on the Wocket.
Very Difficult 1
Difficult 0
Neutral 1
Easy 4
Very Easy 4
2. Please rate the effort of taking off the Wocket. Very Difficult
0 Difficult
0 Neutral
1 Easy
3 Very Easy
6 3. Please rate the effort of recharging the Wocket.
Very Difficult 0
Difficult 0
Neutral 1
Easy 5
Very Easy 4
56

Table 24: In-lab responses to the ease-of-use of the GWRM
Table 25: In-lab responses to the ease-of-use of PAMS app version 2.0
GWRM Questions 1. Please rate the effort of attaching the GWRM holder onto the wheel.
Very Difficult 1
Difficult 2
Neutral 3
Easy 1
Very Easy 3
2. Please rate the effort of inserting the GWRM into its holder on the wheel. Very Difficult
0 Difficult
1 Neutral
1 Easy
5 Very Easy
3 3. Please rate the effort of removing the GWRM from its holder on the wheel.
Very Difficult 0
Difficult 0
Neutral 1
Easy 5
Very Easy 4
4. Please rate the effort of recharging the GWRM. Very Difficult
0 Difficult
0 Neutral
0 Easy
4 Very Easy
6
PAMS App Version 2.0 Questions 1. Please rate how easy or difficult the app is to use.
Very Difficult 0
Difficult 0
Neutral 2
Easy 4
Very Easy 4
2. Please rate the cognitive effort to navigate through the app to get information or change setting. Very Difficult
0 Difficult
0 Neutral
3 Easy
5 Very Easy
2
3. Please rate how easy or difficult the content in the app is to understand. Very Difficult
0 Difficult
0 Neutral
2 Easy
4 Very Easy
4
57
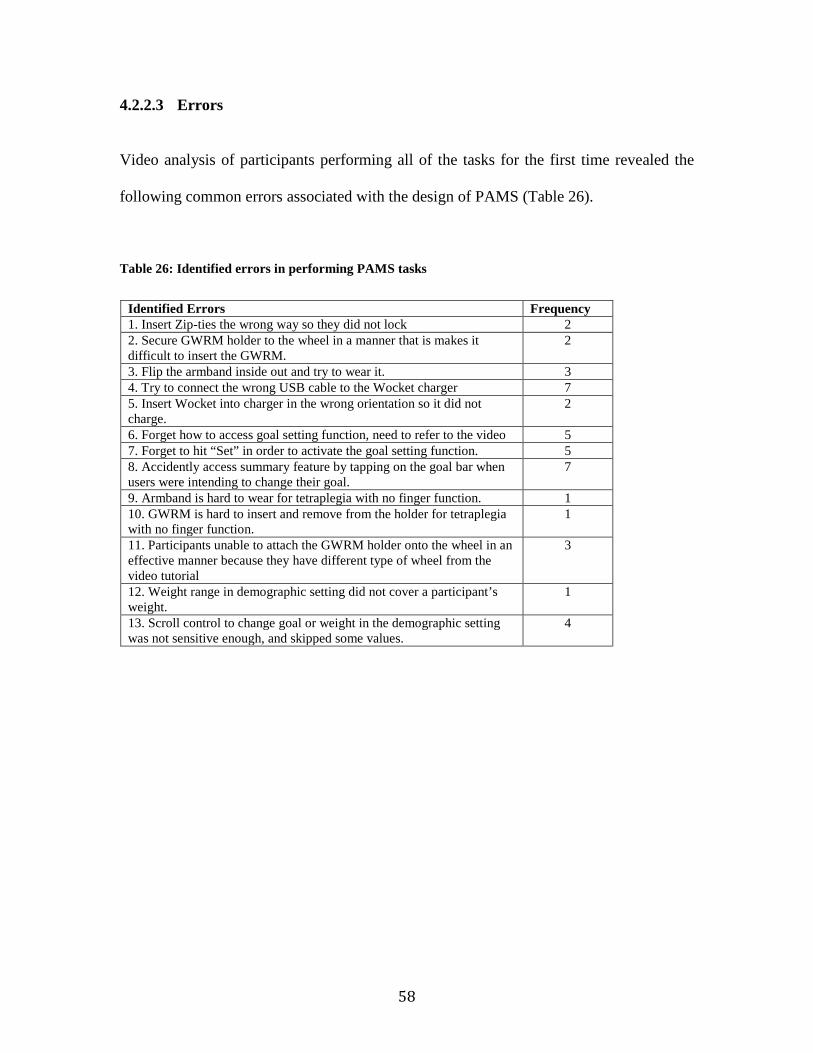
4.2.2.3 Errors
Video analysis of participants performing all of the tasks for the first time revealed the
following common errors associated with the design of PAMS (Table 26).
Table 26: Identified errors in performing PAMS tasks
Identified Errors Frequency 1. Insert Zip-ties the wrong way so they did not lock 2 2. Secure GWRM holder to the wheel in a manner that is makes it difficult to insert the GWRM.
2
3. Flip the armband inside out and try to wear it. 3 4. Try to connect the wrong USB cable to the Wocket charger 7 5. Insert Wocket into charger in the wrong orientation so it did not charge.
2
6. Forget how to access goal setting function, need to refer to the video 5 7. Forget to hit “Set” in order to activate the goal setting function. 5 8. Accidently access summary feature by tapping on the goal bar when users were intending to change their goal.
7
9. Armband is hard to wear for tetraplegia with no finger function. 1 10. GWRM is hard to insert and remove from the holder for tetraplegia with no finger function.
1
11. Participants unable to attach the GWRM holder onto the wheel in an effective manner because they have different type of wheel from the video tutorial
3
12. Weight range in demographic setting did not cover a participant’s weight.
1
13. Scroll control to change goal or weight in the demographic setting was not sensitive enough, and skipped some values.
4
58

4.2.2.4 User Confidence
Participants rated their confidence level in performing different tasks on a daily basis. The
results are summarized in Table 27. Overall, participants were confident that they could
use PAMS on a daily basis.
Table 27: Self-rated confidence level in using PAMS on a daily basis
User Confidence Level Mean ± SD 0 10 20 30 40 50 60 70 80 90 100
Cannot Moderately Certain do at all sure can do can do 1. I understand how PAMS works 85±15.7 2. I can use PAMS 92±9.3 3. I can wear the Wocket on a daily basis 90±14.8 4. I can recharge the Wocket on a daily basis 89±19.7 5. I can use the Wheel Rotation Monitor on a daily basis 93±15.5 6. I can recharge the Wheel Rotation Monitor on a daily basis 94±15 7. I can attach the Wheel Rotation Monitor holder by myself or I can find someone to attach it for me
95±10.2
8. I can use the app independently 94±9.2 9. I can use the app to its full potential 89±13 10. I can use the app on a daily basis 97±9
59

4.2.3 Post Home Evaluation
The post home evaluation focused on assessing participants experience using PAMS after
a week of use. Quantitative data regarding the general usability, perceived usefulness, and
perceived accuracy were summarized. Qualitative data regarding how PAMS was used and
what the experience using it was like were compiled and themes were identified.
4.2.3.1 Physical activity parameter performed by participants
Table 28 summarized the PA parameters for each participant over the course of six days.
Table 28: Physical activity parameter log for each participant over 6 days
Rate of physical activity per day
EE (kCal)
over 6 days
Distance (miles) over
6 days
Push count over 6 days
Time being active (min) over 6 days
Push efficiency
(feet/push) P1 4370.99 5.18 3993 56 6.85 P2 3524.02 3.53 4276 88 4.36 P3 8229 9.09 7243 185 6.63 P4 5377.69 1.90 3174 150 3.16 P5 4021.44 3.52 5388 612 3.45 P6 829.33 0.76 731 91 5.50 P7 6138.5 5.40 10224 22 2.79 P8 6837.37 4.04 3425 912 6.23 P9 1977.18 0.98 2195 10 2.36
P10 9665.78 3.81 3990 101 5.04
60
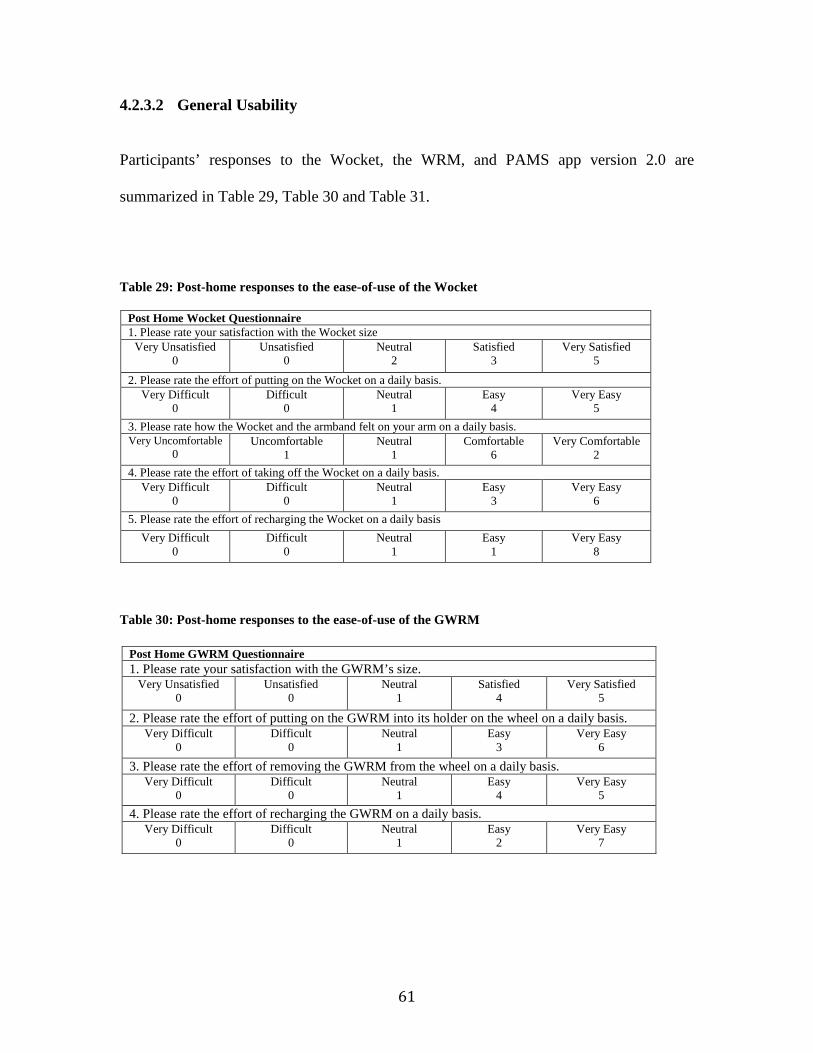
4.2.3.2 General Usability
Participants’ responses to the Wocket, the WRM, and PAMS app version 2.0 are
summarized in Table 29, Table 30 and Table 31.
Table 29: Post-home responses to the ease-of-use of the Wocket
Table 30: Post-home responses to the ease-of-use of the GWRM
Post Home Wocket Questionnaire 1. Please rate your satisfaction with the Wocket size
Very Unsatisfied 0
Unsatisfied 0
Neutral 2
Satisfied 3
Very Satisfied 5
2. Please rate the effort of putting on the Wocket on a daily basis. Very Difficult
0 Difficult
0 Neutral
1 Easy
4 Very Easy
5 3. Please rate how the Wocket and the armband felt on your arm on a daily basis. Very Uncomfortable
0 Uncomfortable
1 Neutral
1 Comfortable
6 Very Comfortable
2 4. Please rate the effort of taking off the Wocket on a daily basis.
Very Difficult 0
Difficult 0
Neutral 1
Easy 3
Very Easy 6
5. Please rate the effort of recharging the Wocket on a daily basis Very Difficult
0 Difficult
0 Neutral
1 Easy
1 Very Easy
8
Post Home GWRM Questionnaire 1. Please rate your satisfaction with the GWRM’s size.
Very Unsatisfied 0
Unsatisfied 0
Neutral 1
Satisfied 4
Very Satisfied 5
2. Please rate the effort of putting on the GWRM into its holder on the wheel on a daily basis. Very Difficult
0 Difficult
0 Neutral
1 Easy
3 Very Easy
6 3. Please rate the effort of removing the GWRM from the wheel on a daily basis.
Very Difficult 0
Difficult 0
Neutral 1
Easy 4
Very Easy 5
4. Please rate the effort of recharging the GWRM on a daily basis. Very Difficult
0 Difficult
0 Neutral
1 Easy
2 Very Easy
7
61
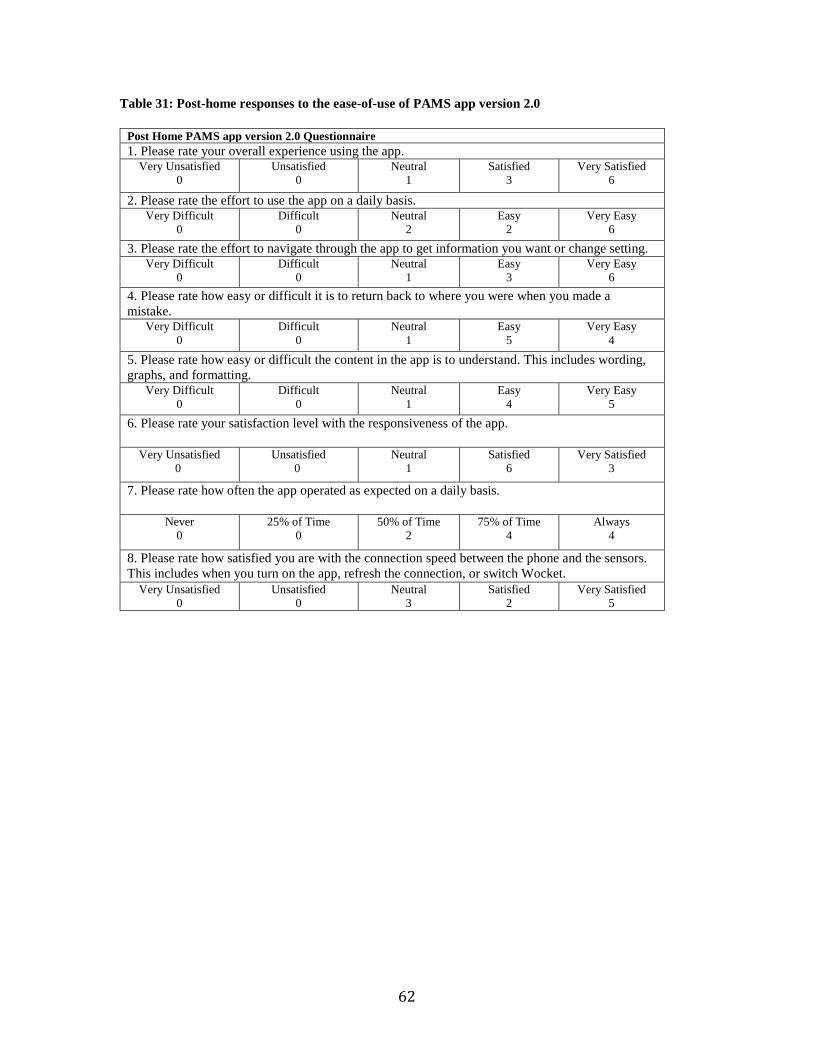
Table 31: Post-home responses to the ease-of-use of PAMS app version 2.0
Post Home PAMS app version 2.0 Questionnaire 1. Please rate your overall experience using the app.
Very Unsatisfied 0
Unsatisfied 0
Neutral 1
Satisfied 3
Very Satisfied 6
2. Please rate the effort to use the app on a daily basis. Very Difficult
0 Difficult
0 Neutral
2 Easy
2 Very Easy
6 3. Please rate the effort to navigate through the app to get information you want or change setting.
Very Difficult 0
Difficult 0
Neutral 1
Easy 3
Very Easy 6
4. Please rate how easy or difficult it is to return back to where you were when you made a mistake.
Very Difficult 0
Difficult 0
Neutral 1
Easy 5
Very Easy 4
5. Please rate how easy or difficult the content in the app is to understand. This includes wording, graphs, and formatting.
Very Difficult 0
Difficult 0
Neutral 1
Easy 4
Very Easy 5
6. Please rate your satisfaction level with the responsiveness of the app.
Very Unsatisfied 0
Unsatisfied 0
Neutral 1
Satisfied 6
Very Satisfied 3
7. Please rate how often the app operated as expected on a daily basis.
Never 0
25% of Time 0
50% of Time 2
75% of Time 4
Always 4
8. Please rate how satisfied you are with the connection speed between the phone and the sensors. This includes when you turn on the app, refresh the connection, or switch Wocket.
Very Unsatisfied 0
Unsatisfied 0
Neutral 3
Satisfied 2
Very Satisfied 5
62

4.2.3.3 Usefulness
Participants rated the usefulness of each feature and parameter on PAMS app version 2.0.
The results are summarized in Table 32. Table 33 shows the participants’ rankings for the
parameters (1 being favorite and 5 being least favorite).
Table 32: Post-home responses to usefulness of the features & PA parameters
Please rate how useful the features & parameters were to you. 1. Goal setting feature
Not Useful 0
Slightly Useful 0
Somewhat Useful 0
Useful 5
Very Useful 5
2. Summary feature Not Useful
0 Slightly Useful
0 Somewhat Useful
2 Useful
3
Very Useful 5
3. Social feature Not Useful
3 Slightly Useful
0 Somewhat Useful
2 Useful
2 Very Useful
3 4. Distance
Not Useful 0
Slightly Useful 0
Somewhat Useful 0
Useful 3
Very Useful 7
5. EE Not Useful
0 Slightly Useful
0 Somewhat Useful
1 Useful
5 Very Useful
4 6. Time Being Active
Not Useful 0
Slightly Useful 2
Somewhat Useful 0
Useful 6
Very Useful 2
7. Push Count Not Useful
0 Slightly Useful
0 Somewhat Useful
0 Useful
4 Very Useful
6
8. Push Efficiency Not Useful
0 Slightly Useful
0 Somewhat Useful
0 Useful
4 Very Useful
6
63
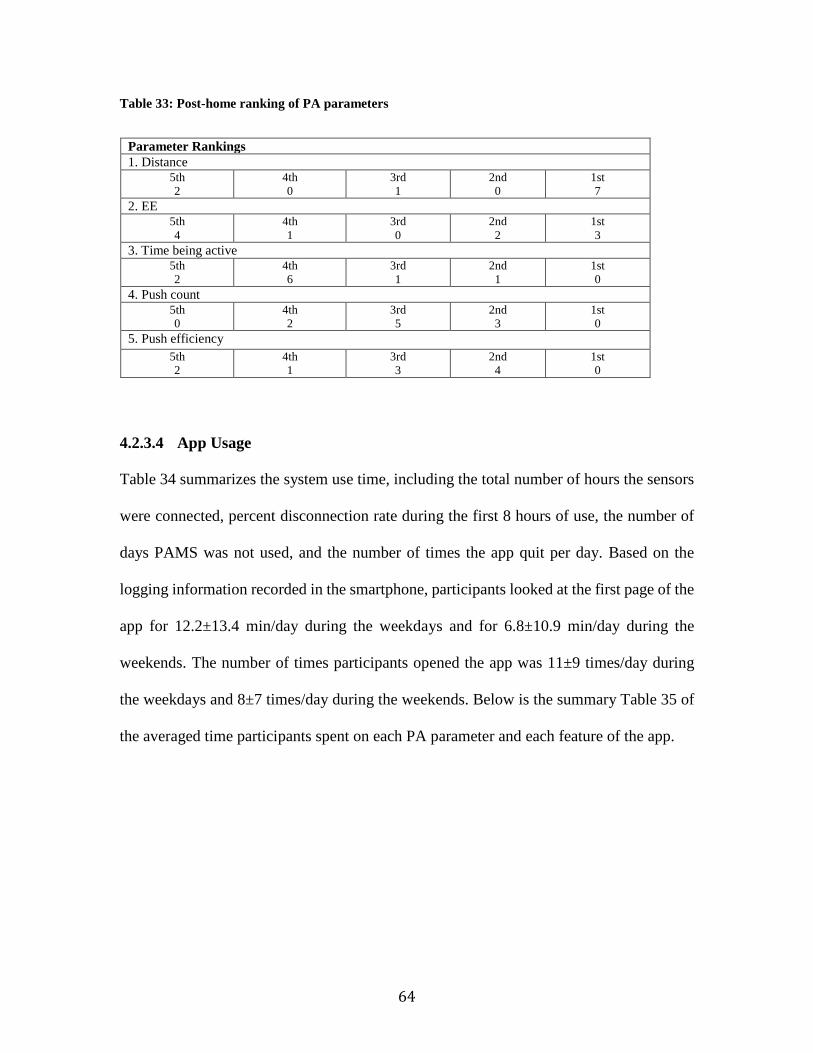
Table 33: Post-home ranking of PA parameters
4.2.3.4 App Usage
Table 34 summarizes the system use time, including the total number of hours the sensors
were connected, percent disconnection rate during the first 8 hours of use, the number of
days PAMS was not used, and the number of times the app quit per day. Based on the
logging information recorded in the smartphone, participants looked at the first page of the
app for 12.2±13.4 min/day during the weekdays and for 6.8±10.9 min/day during the
weekends. The number of times participants opened the app was 11±9 times/day during
the weekdays and 8±7 times/day during the weekends. Below is the summary Table 35 of
the averaged time participants spent on each PA parameter and each feature of the app.
Parameter Rankings 1. Distance
5th 2
4th 0
3rd 1
2nd 0
1st 7
2. EE 5th 4
4th 1
3rd 0
2nd 2
1st 3
3. Time being active 5th 2
4th 6
3rd 1
2nd 1
1st 0
4. Push count 5th 0
4th 2
3rd 5
2nd 3
1st 0
5. Push efficiency 5th 2
4th 1
3rd 3
2nd 4
1st 0
64

Table 34: Summary of system use time
Table 35: Viewing time of the summary feature & the social feature page on the app
Summary Table of Usage Time (sec/day) Mean ± SD Mean ± SD
Summary Weekly EE 25.2±64 Social Weekly EE 14.2±41 Summary Weekly Distance 28.5±120 Social Weekly Distance 9±33 Summary Weekly Time Being Active
8±18 Social Weekly Time Being Active
1.5±4
Summary Weekly Push Count 3.8±8 Social Weekly Push Count 4.3±15 Summary Daily EE 4.8±14 Social Daily EE 3.2±11 Summary Daily Distance 9±39 Social Daily Distance 2±10 Summary Daily Time Being Active
4±23 Social Daily Time Being Active
0.5±2
Summary Daily Push Count 2.3±1.6 Social Daily Push Count 1.3±6
The most-looked-at parameter for both the summary and social features was EE (16.2±78.8
sec/day), followed by Distance (12.1±65.8 sec/day), then Time Being Active (3.5±15
sec/day), and lastly Push Count (2.9±10.1 sec/day). The averaged time participants spent
on the first page of the app was 10.3±12.7 min/day. Four out of ten participants changed
their goal during their in-home trial. Only goals for the parameters Distance, EE, and “Time
Being Active” were changed. Distance was changed most often (5 times), followed by
“Time Being Active” (3 times), and lastly EE (2 times). The average number of times that
Sensor Connected (hr.)
over 6 days
% Disconnected the first 8 hours
of use
# of days PAMS was
not used
# of times app quits per
day P1 30 29.8%±29.7% 0 1.3±0.5 P2 31.5 34.4%±18.5% 0 1.2±1.2 P3 56.3 6.25%±9.5% 0 3.3±2.4 P4 39.9 34.0%±38.8% 0 2.2±0.8 P5 29.7 10.6%±6.3% 2 1.0±0.8 P6 9.9 46.9%±29.2% 3 1.7±1.0 P7 50.6 9.5%±8.4% 1 3.6±0.9 P8 36.5 29.0%±22.0% 1 4.4±1.5 P9 20.5 35%±28.8% 3 0.3±0.5
P10 46.1 18.5%±22.5% 0 1.7±1.4 Mean±SD 35.1±14.0 25.4%±13.4% NA 2±1
65

the phone was disconnected from the sensors, either intentionally or non-intentionally, was
2±1.7 times per day
4.2.3.5 Perceived Accuracy
Participants were asked to rate how accurate each parameter was based on their perception.
Their responses are tabulated in Table 36.
Table 36: Rating of perceived accuracy for PA parameters
4.2.3.6 System Usability Scale (SUS)
Participants filled out a 10-item System Usability Scale (SUS) and the statistic for each
item is tabulated in Table 37. To calculate the SUS score, each item’s score contribution
ranged from 0 to 4. For all the odd items, its score was subtracted by 1. For all the even
items, its score was subtracted by 5. All the scores were summed then multiplied by 2.5 to
get the final SUS score. PAMS scored an 86.5±12.9 on the SUS, indicating that it has a
very high usability and learnability [61].
Please rate how accurate the app was at predicting the parameters. 1. Distance
Very Inaccurate 0
Inaccurate 0
Neutral 1
Accurate 3
Very Accurate 6
2. EE Very Inaccurate
0 Inaccurate
0 Neutral
2 Accurate
3 Very Accurate
4 3. Time being active
Very Inaccurate 0
Inaccurate 0
Neutral 3
Accurate 3
Very Accurate 4
4. Push count Very Inaccurate
0 Inaccurate
0 Neutral
1 Accurate
4 Very Accurate
5
5. Push efficiency Very Inaccurate
0 Inaccurate
0 Neutral
0 Accurate
4 Very Accurate
6
66

Table 37: System usability scale of PAMS
PAMS System Usability Scale 1. I think that I would like to use this system frequently. Strongly Disagree
0 Disagree
0 Neutral
1 Agree
3 Strongly Agree
6
2. I found the system unnecessarily complex. Strongly Disagree
6 Disagree
3 Neutral
1 Agree
0 Strongly Agree
0 3. I thought the system was easy to use. Strongly Disagree
0 Disagree
0 Neutral
0 Agree
5 Strongly Agree
5 4. I think that I would need the support of another person to be able to use this system. Strongly Disagree
5 Disagree
4 Neutral
1 Agree
0 Strongly Agree
0
5. I found the various functions in this system were well integrated. Strongly Disagree
0 Disagree
0 Neutral
1 Agree
4 Strongly Agree
4 6. I thought there was too much inconsistency in this system. Strongly Disagree
3 Disagree
5 Neutral
2 Agree
0 Strongly Agree
0 7. I would imagine that most people would learn to use this system very quickly. Strongly Disagree
0 Disagree
0 Neutral
1 Agree
2 Strongly Agree
7 8. I found the system very cumbersome or burdensome to use. Strongly Disagree
7 Disagree
2 Neutral
1 Agree
0 Strongly Agree
0 9. I felt very confident using the system.
Strongly Disagree 0
Disagree 0
Neutral 0
Agree 5
Strongly Agree 5
10. I needed to learn a lot of things before I could get going with this system. Strongly Disagree
6 Disagree
3 Neutral
1 Agree
0 Strongly Agree
0
67
4.2.3.7 Qualitative Analysis
We classified the findings from the interviews after the in-home trial into three groups:
positive findings, negative findings, and suggestions. Table 38, Table 39, Table 40, and
Table 41 show a summary of the Wocket, the GWRM, PAMS app version 2.0, and the
overall system, respectively. All participants reported that they could envision themselves
using PAMS in the future and would recommend PAMS to other MWU
68
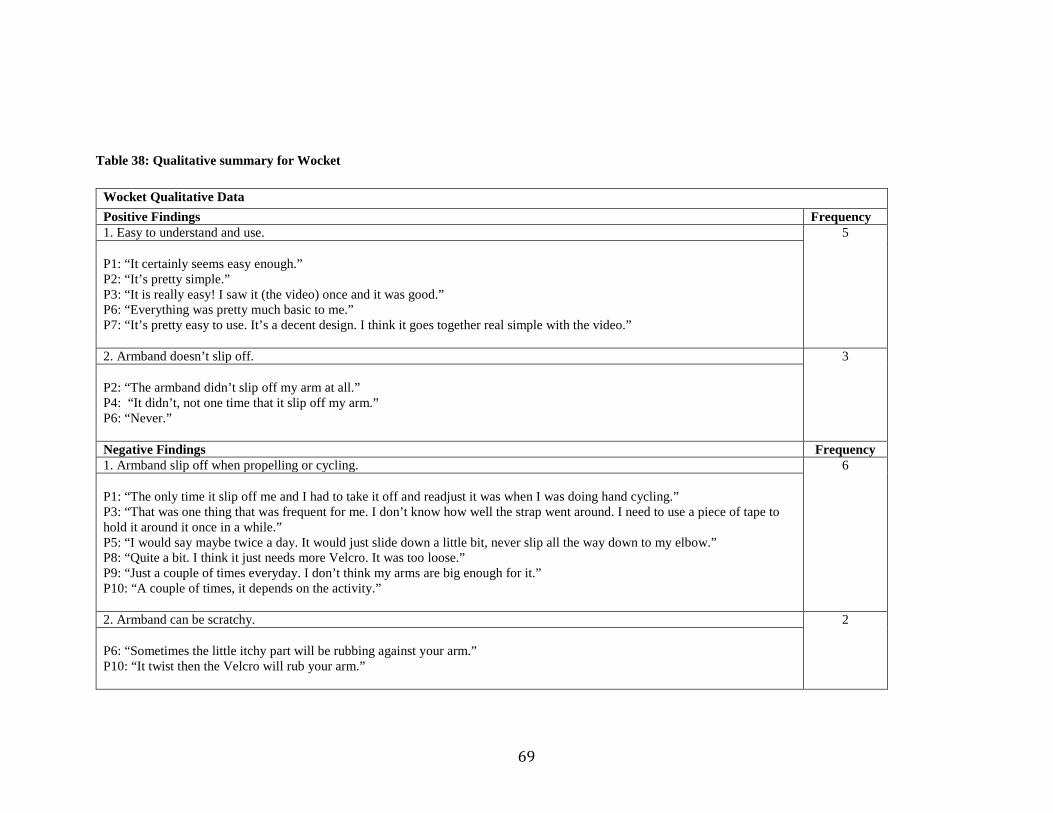
Table 38: Qualitative summary for Wocket
Wocket Qualitative Data Positive Findings Frequency 1. Easy to understand and use. 5 P1: “It certainly seems easy enough.” P2: “It’s pretty simple.” P3: “It is really easy! I saw it (the video) once and it was good.” P6: “Everything was pretty much basic to me.” P7: “It’s pretty easy to use. It’s a decent design. I think it goes together real simple with the video.” 2. Armband doesn’t slip off. 3 P2: “The armband didn’t slip off my arm at all.” P4: “It didn’t, not one time that it slip off my arm.” P6: “Never.” Negative Findings Frequency 1. Armband slip off when propelling or cycling. 6 P1: “The only time it slip off me and I had to take it off and readjust it was when I was doing hand cycling.” P3: “That was one thing that was frequent for me. I don’t know how well the strap went around. I need to use a piece of tape to hold it around it once in a while.” P5: “I would say maybe twice a day. It would just slide down a little bit, never slip all the way down to my elbow.” P8: “Quite a bit. I think it just needs more Velcro. It was too loose.” P9: “Just a couple of times everyday. I don’t think my arms are big enough for it.” P10: “A couple of times, it depends on the activity.” 2. Armband can be scratchy. 2 P6: “Sometimes the little itchy part will be rubbing against your arm.” P10: “It twist then the Velcro will rub your arm.”
69
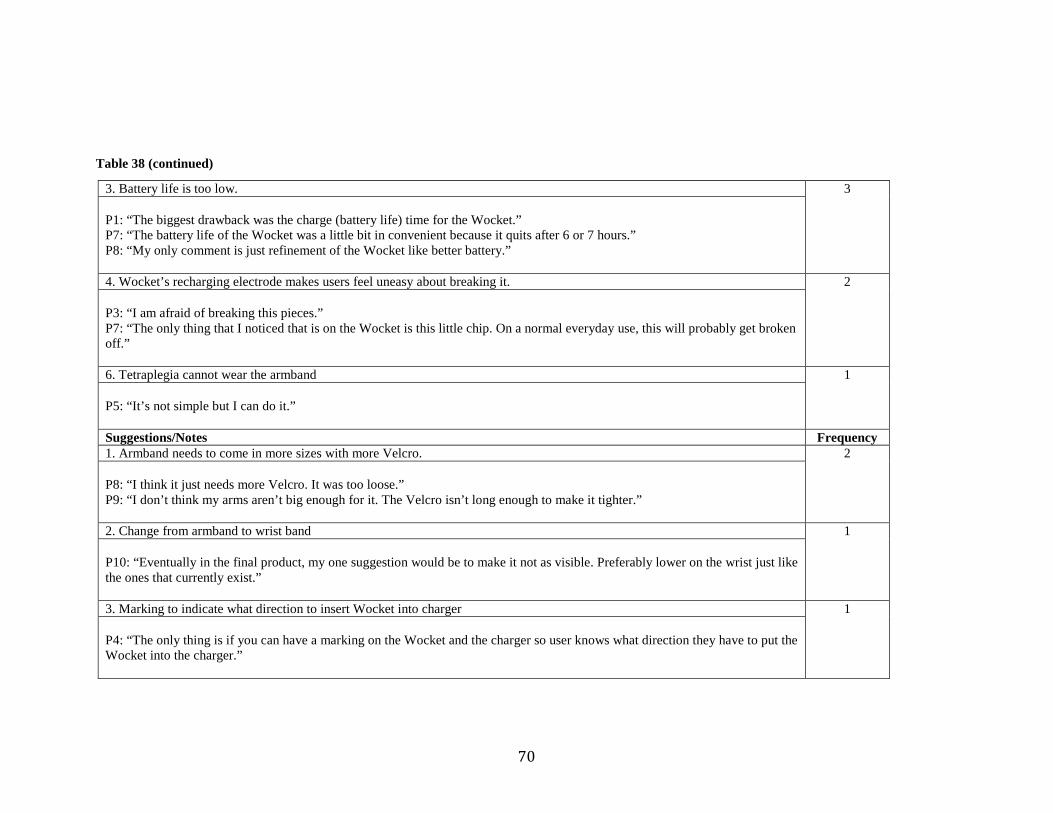
Table 38 (continued)
3. Battery life is too low. 3 P1: “The biggest drawback was the charge (battery life) time for the Wocket.” P7: “The battery life of the Wocket was a little bit in convenient because it quits after 6 or 7 hours.” P8: “My only comment is just refinement of the Wocket like better battery.” 4. Wocket’s recharging electrode makes users feel uneasy about breaking it. 2 P3: “I am afraid of breaking this pieces.” P7: “The only thing that I noticed that is on the Wocket is this little chip. On a normal everyday use, this will probably get broken off.” 6. Tetraplegia cannot wear the armband 1 P5: “It’s not simple but I can do it.” Suggestions/Notes Frequency 1. Armband needs to come in more sizes with more Velcro. 2 P8: “I think it just needs more Velcro. It was too loose.” P9: “I don’t think my arms aren’t big enough for it. The Velcro isn’t long enough to make it tighter.” 2. Change from armband to wrist band 1 P10: “Eventually in the final product, my one suggestion would be to make it not as visible. Preferably lower on the wrist just like the ones that currently exist.” 3. Marking to indicate what direction to insert Wocket into charger 1 P4: “The only thing is if you can have a marking on the Wocket and the charger so user knows what direction they have to put the Wocket into the charger.”
70
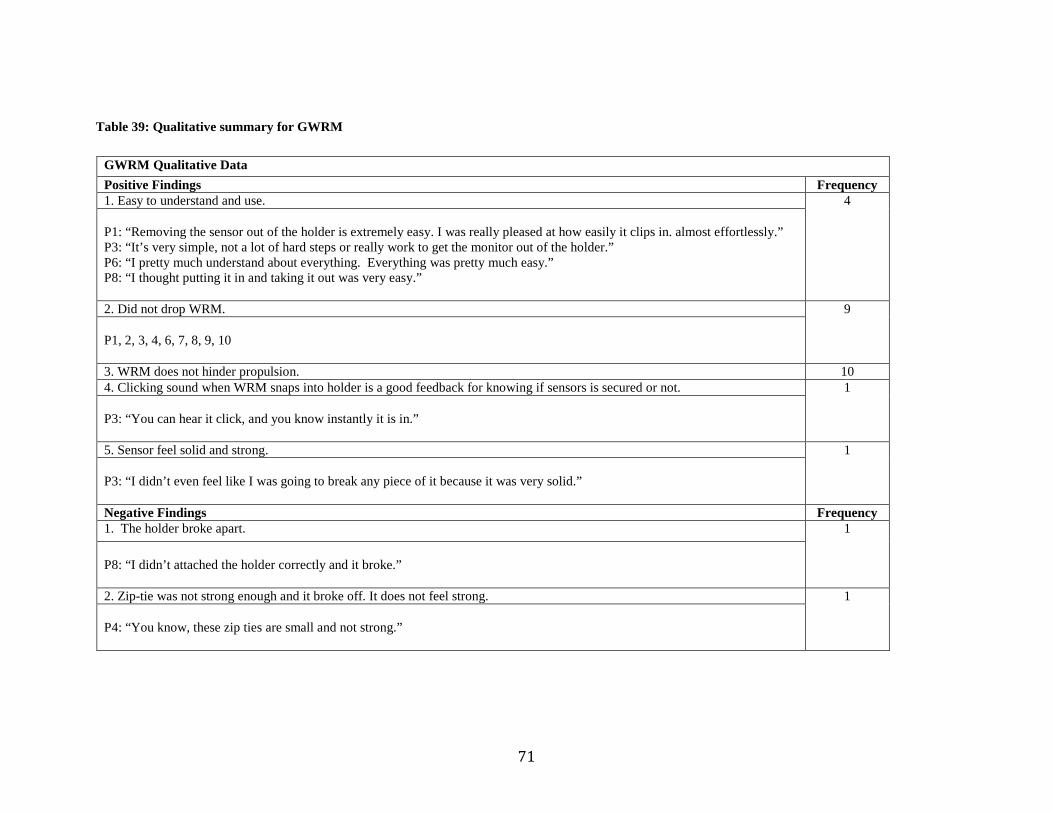
Table 39: Qualitative summary for GWRM
GWRM Qualitative Data Positive Findings Frequency 1. Easy to understand and use. 4 P1: “Removing the sensor out of the holder is extremely easy. I was really pleased at how easily it clips in. almost effortlessly.” P3: “It’s very simple, not a lot of hard steps or really work to get the monitor out of the holder.” P6: “I pretty much understand about everything. Everything was pretty much easy.” P8: “I thought putting it in and taking it out was very easy.” 2. Did not drop WRM. 9 P1, 2, 3, 4, 6, 7, 8, 9, 10 3. WRM does not hinder propulsion. 10 4. Clicking sound when WRM snaps into holder is a good feedback for knowing if sensors is secured or not. 1 P3: “You can hear it click, and you know instantly it is in.” 5. Sensor feel solid and strong. 1 P3: “I didn’t even feel like I was going to break any piece of it because it was very solid.” Negative Findings Frequency 1. The holder broke apart. 1 P8: “I didn’t attached the holder correctly and it broke.” 2. Zip-tie was not strong enough and it broke off. It does not feel strong. 1 P4: “You know, these zip ties are small and not strong.”
71
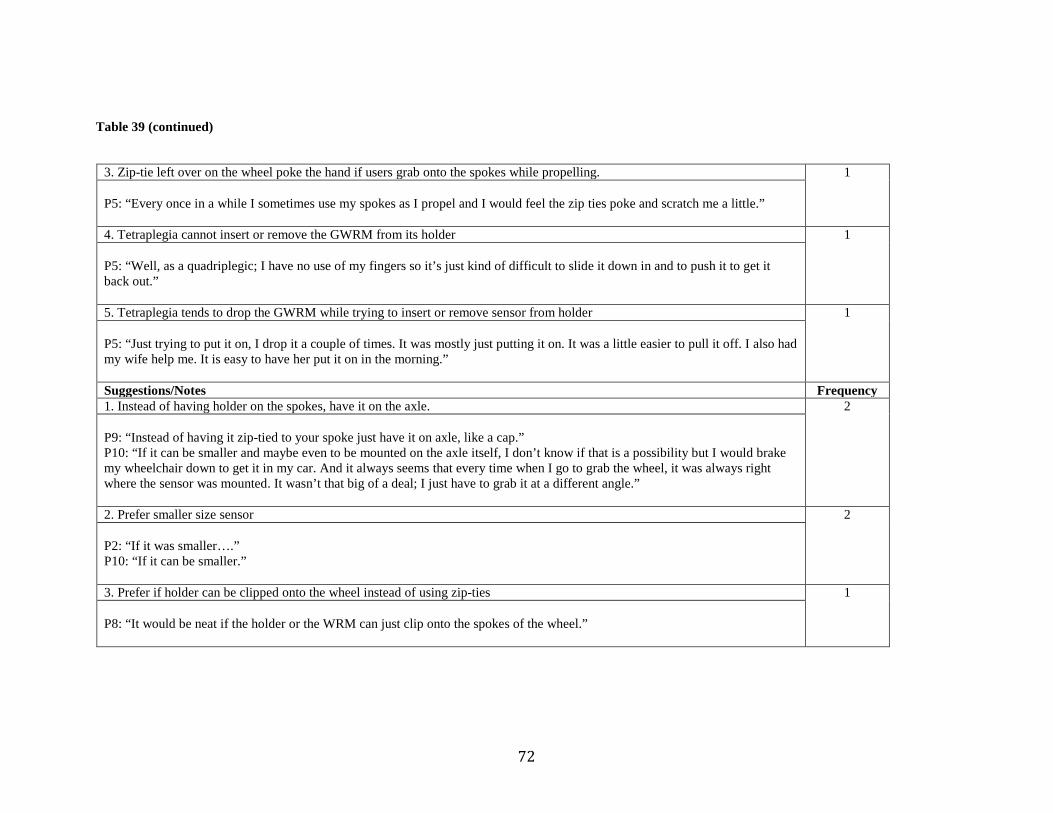
Table 39 (continued)
3. Zip-tie left over on the wheel poke the hand if users grab onto the spokes while propelling. 1 P5: “Every once in a while I sometimes use my spokes as I propel and I would feel the zip ties poke and scratch me a little.” 4. Tetraplegia cannot insert or remove the GWRM from its holder 1 P5: “Well, as a quadriplegic; I have no use of my fingers so it’s just kind of difficult to slide it down in and to push it to get it back out.” 5. Tetraplegia tends to drop the GWRM while trying to insert or remove sensor from holder 1 P5: “Just trying to put it on, I drop it a couple of times. It was mostly just putting it on. It was a little easier to pull it off. I also had my wife help me. It is easy to have her put it on in the morning.” Suggestions/Notes Frequency 1. Instead of having holder on the spokes, have it on the axle. 2 P9: “Instead of having it zip-tied to your spoke just have it on axle, like a cap.” P10: “If it can be smaller and maybe even to be mounted on the axle itself, I don’t know if that is a possibility but I would brake my wheelchair down to get it in my car. And it always seems that every time when I go to grab the wheel, it was always right where the sensor was mounted. It wasn’t that big of a deal; I just have to grab it at a different angle.” 2. Prefer smaller size sensor 2 P2: “If it was smaller….” P10: “If it can be smaller.” 3. Prefer if holder can be clipped onto the wheel instead of using zip-ties 1 P8: “It would be neat if the holder or the WRM can just clip onto the spokes of the wheel.”
72
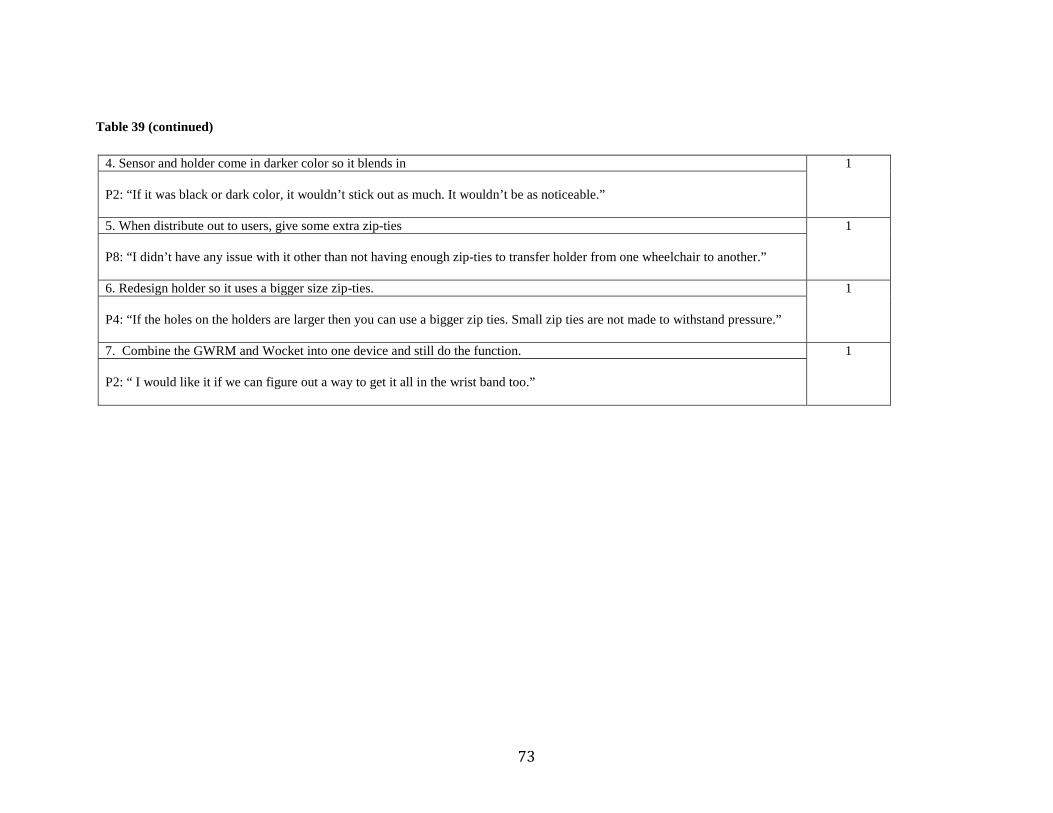
Table 39 (continued)
4. Sensor and holder come in darker color so it blends in 1 P2: “If it was black or dark color, it wouldn’t stick out as much. It wouldn’t be as noticeable.” 5. When distribute out to users, give some extra zip-ties 1 P8: “I didn’t have any issue with it other than not having enough zip-ties to transfer holder from one wheelchair to another.” 6. Redesign holder so it uses a bigger size zip-ties. 1 P4: “If the holes on the holders are larger then you can use a bigger zip ties. Small zip ties are not made to withstand pressure.” 7. Combine the GWRM and Wocket into one device and still do the function. 1 P2: “ I would like it if we can figure out a way to get it all in the wrist band too.”
73

Table 40: Qualitative summary for PAMS app version 2.0.
PAMS App Version 2.0 Qualitative Data Positive Findings Frequency 1. Strong interest in the social feature if it was implemented. 6 P1: “I will say that the social feature may be very effective if it is really your friend, and I think I would really enjoy it.” P2: “I like the social feature the most. Sometimes I would look at it like in the morning and everybody would already started. I used it the most.” P3: “I see how the social would be awesome.” P4: “After a couple of days using it I knew that the social feature was not real. If it were real, I would probably use it.” P8: “I think it would be fun to have some friends to use the PAMS with.” P10: “the social feature in the app is kind of nice because you can compare the activity of your friends. That is kind of how the FitBit works as well.” 2. Very simple and easy to use. 3 P1: “So... I think overall, it is designed very well. It is very easy to navigate and I think anyone that is familiar with using the smartphone should be able to use it.” P3: “I like the way it is set up. It is very simple. I think it will be very easy to use.” P10: “I think it is very easy to use as long as you remember to set everything but yeah it was relatively simple to use.” 3. Push count and push efficiency are interesting. 5 P1: “The other one that is really interesting and something that I need to work with a little more is my push efficiency because I certainly know that I try to monitor my push rate because if I push too fast or too quickly I would be at risk for repetitive stress and injury. I have already been aware of this, trying to push more efficiently and the fact that I can actually monitor and see it in number is great!” P3: “I love the wheel push efficiency. That is just excellent. It’s just something that makes me think about my pushing on a daily basis and how many times am I doing all these wheel stroke or need to be doing all these wheel stroke. Kind of using what you were taught a while ago, how to push, sometimes let it glide a little instead of always going and going and over use your shoulder.” P8: “I like the fact that it tells you how far you go. The distance of each push.” P9: “The push efficiency may be helpful.” P10: “I would like to see if my push was as efficient as it use to be.”
74
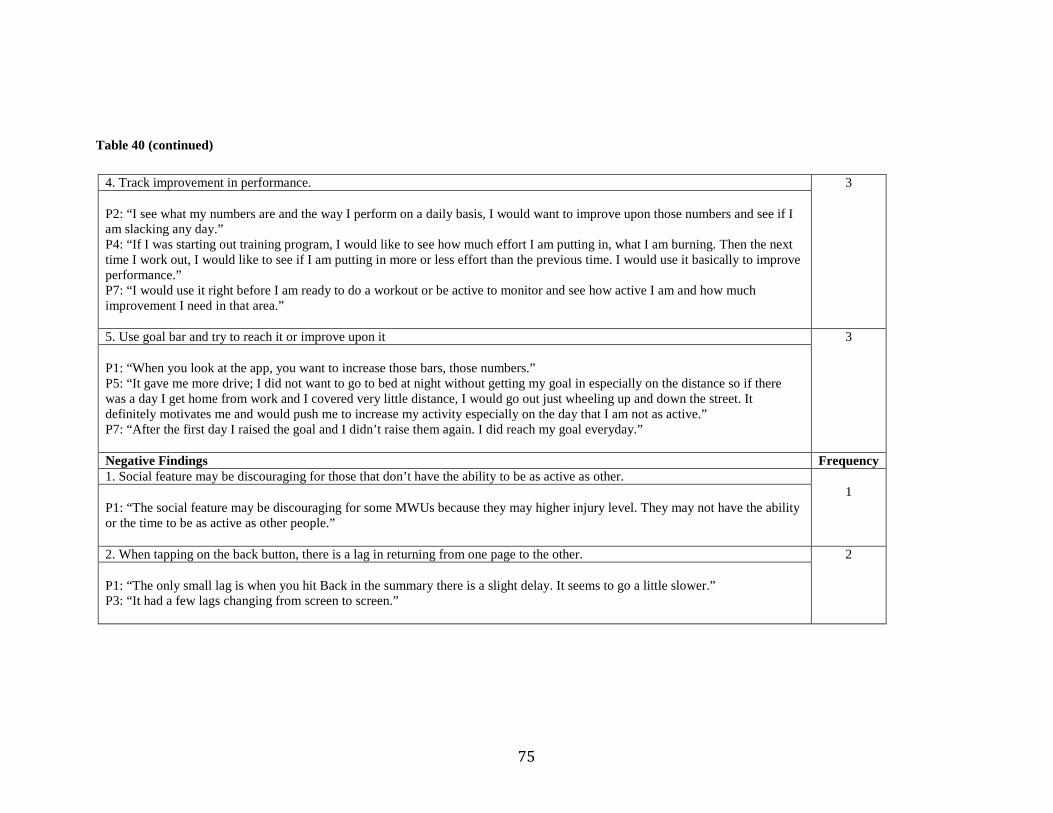
Table 40 (continued)
4. Track improvement in performance. 3 P2: “I see what my numbers are and the way I perform on a daily basis, I would want to improve upon those numbers and see if I am slacking any day.” P4: “If I was starting out training program, I would like to see how much effort I am putting in, what I am burning. Then the next time I work out, I would like to see if I am putting in more or less effort than the previous time. I would use it basically to improve performance.” P7: “I would use it right before I am ready to do a workout or be active to monitor and see how active I am and how much improvement I need in that area.” 5. Use goal bar and try to reach it or improve upon it 3 P1: “When you look at the app, you want to increase those bars, those numbers.” P5: “It gave me more drive; I did not want to go to bed at night without getting my goal in especially on the distance so if there was a day I get home from work and I covered very little distance, I would go out just wheeling up and down the street. It definitely motivates me and would push me to increase my activity especially on the day that I am not as active.” P7: “After the first day I raised the goal and I didn’t raise them again. I did reach my goal everyday.” Negative Findings Frequency 1. Social feature may be discouraging for those that don’t have the ability to be as active as other.
1 P1: “The social feature may be discouraging for some MWUs because they may higher injury level. They may not have the ability or the time to be as active as other people.” 2. When tapping on the back button, there is a lag in returning from one page to the other. 2 P1: “The only small lag is when you hit Back in the summary there is a slight delay. It seems to go a little slower.” P3: “It had a few lags changing from screen to screen.”
75

Table 40 (continued)
3. App crashes out. 1 P4: “Mine did shut off a couple of times, I don’t know why. The app would just shut off.” 4. Sensors would be disconnected from the app when it shouldn’t. 2 P5: “Just the one-day that somewhere it disconnected.” P7: “The other thing was with the Wocket B; it doesn’t like to stay connected. The Wocket A was good but with the Wocket B; it would be disconnected every few hour when I checked it. At least half the time it would be disconnected and I would have to reconnect it.” 5. Sensors connection speed to phone is too slow. 2 P6: “It takes pretty long actually.” P7: “It (connection speed) varies a little bit because there are a couple mornings where I was in a hurry and when I turn it on, one light would turn green and the other wouldn’t. So the connection speed was a little too long.” 6. On one night, the phone didn’t reset the parameters. 1 P7: “On one day, it didn’t reset for me, like the next day my distance and my calories carried over.” 7. Switching Wocket is hard to do. 2 P5: “I did, one day, have to switch the wocket and I forgot to change the wocket A to wocket B.” P10: “I seem to have a problem reconnecting the wocket; switching from wocket A to wocket B.”
76
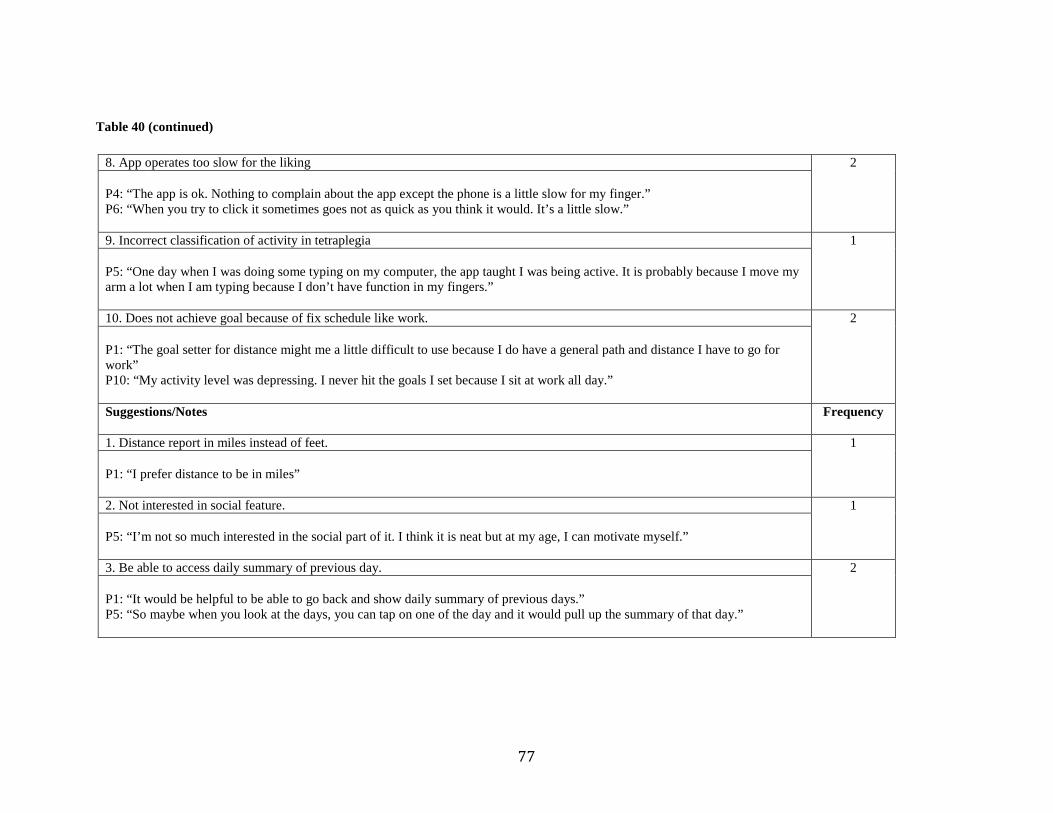
Table 40 (continued)
8. App operates too slow for the liking 2 P4: “The app is ok. Nothing to complain about the app except the phone is a little slow for my finger.” P6: “When you try to click it sometimes goes not as quick as you think it would. It’s a little slow.” 9. Incorrect classification of activity in tetraplegia 1 P5: “One day when I was doing some typing on my computer, the app taught I was being active. It is probably because I move my arm a lot when I am typing because I don’t have function in my fingers.” 10. Does not achieve goal because of fix schedule like work. 2 P1: “The goal setter for distance might me a little difficult to use because I do have a general path and distance I have to go for work” P10: “My activity level was depressing. I never hit the goals I set because I sit at work all day.” Suggestions/Notes Frequency
1. Distance report in miles instead of feet. 1 P1: “I prefer distance to be in miles” 2. Not interested in social feature. 1 P5: “I’m not so much interested in the social part of it. I think it is neat but at my age, I can motivate myself.” 3. Be able to access daily summary of previous day. 2 P1: “It would be helpful to be able to go back and show daily summary of previous days.” P5: “So maybe when you look at the days, you can tap on one of the day and it would pull up the summary of that day.”
77
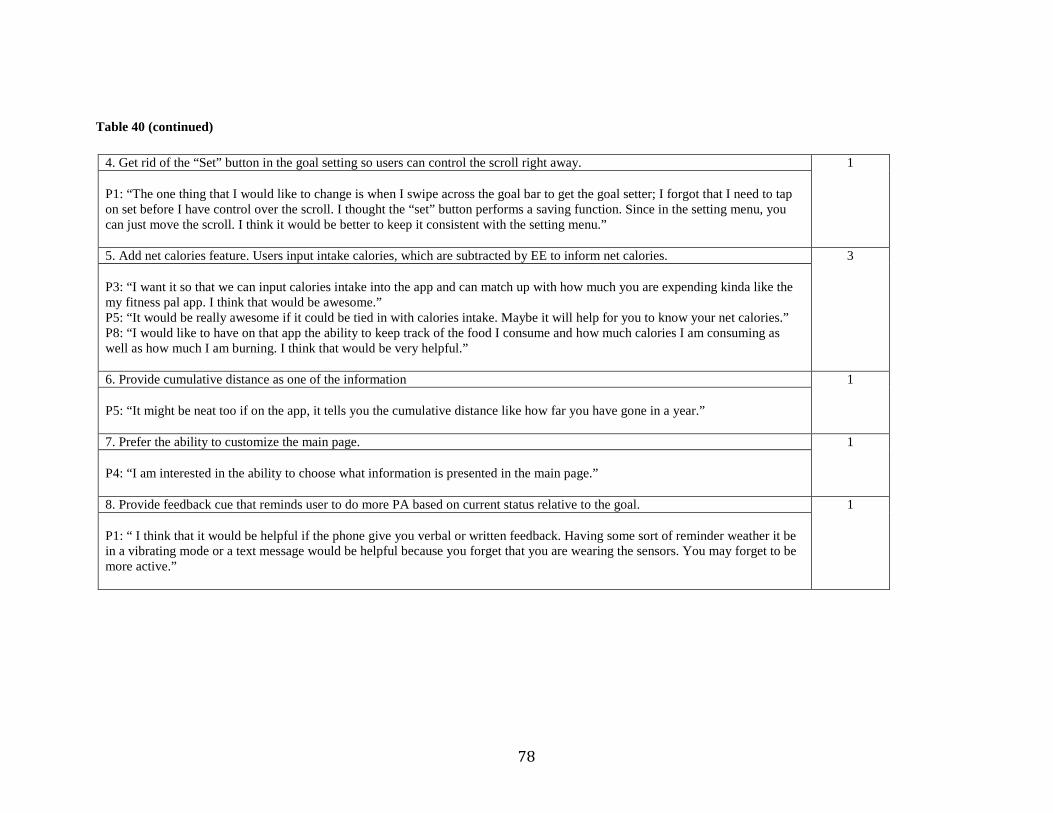
Table 40 (continued)
4. Get rid of the “Set” button in the goal setting so users can control the scroll right away. 1 P1: “The one thing that I would like to change is when I swipe across the goal bar to get the goal setter; I forgot that I need to tap on set before I have control over the scroll. I thought the “set” button performs a saving function. Since in the setting menu, you can just move the scroll. I think it would be better to keep it consistent with the setting menu.” 5. Add net calories feature. Users input intake calories, which are subtracted by EE to inform net calories. 3 P3: “I want it so that we can input calories intake into the app and can match up with how much you are expending kinda like the my fitness pal app. I think that would be awesome.” P5: “It would be really awesome if it could be tied in with calories intake. Maybe it will help for you to know your net calories.” P8: “I would like to have on that app the ability to keep track of the food I consume and how much calories I am consuming as well as how much I am burning. I think that would be very helpful.” 6. Provide cumulative distance as one of the information 1 P5: “It might be neat too if on the app, it tells you the cumulative distance like how far you have gone in a year.” 7. Prefer the ability to customize the main page. 1 P4: “I am interested in the ability to choose what information is presented in the main page.” 8. Provide feedback cue that reminds user to do more PA based on current status relative to the goal. 1 P1: “ I think that it would be helpful if the phone give you verbal or written feedback. Having some sort of reminder weather it be in a vibrating mode or a text message would be helpful because you forget that you are wearing the sensors. You may forget to be more active.”
78

Table 41: Qualitative summary for PAMS overall
PAMS Overall Qualitative Data Suggestions/Notes Frequency 1. Did not use the instruction manual. 10 2. Start using PAMS in the morning and stop using at night. 10 3. Use PAMS more on the day that will be active. See PAMS as a performance-measuring tool. 5 P4: “ I wouldn’t put it on in the house but if I were to get out and do something, then that would be worth while putting on.” P5: “I don’t know if it would be something that I would use all-day or only use it when I am going out to exercise or going to the mall. Just to use it as needed type thing rather than using it all the time.” P6: “When I am at home watching TV I don’t wear it because it does keep track of nothing when you just sit there.” P7: “ The days I work where I stay in front of the computer all day, it didn’t make too much sense to wear it. If you were sitting and watching TV all day, I wouldn’t wear it. But if me and my buddies are going around the track then the PAMS would be perfect for that occasion.” P9: “I would just take it off. If I am not going to be active, what is the sense of using it if I am not going to be active.”
4. Would use PAMS throughout the day. See PAMS as an activity-monitoring tool. 3 P3: “I use it in the house just to see how much distance in the house, using it to and from work. I also use it at work all day long. I kinda use it to track, during the day, how much I am doing all the way to the afternoon into the evening.” P7: “I think I am going to use it all day. Just use it throughout the day. I a someone who need to lose a couple of pounds so if I can monitor how many calories I was burning everyday, I think that would be helpful.” P10: “If you are anybody wanting to monitor your PA, then I think you would wear it all the time. There wouldn’t be any reason not to.” 5. Stop using PAMS when Wocket runs out of battery. 1 P1: “I usually stop using PAMS when the Wocket run out of battery.”
79

Table 41 (continued)
6. Recharge all devices together at night. 10 7. For recharge, use one type of USB cable and not two. 1 P9: “There should be a one-size fit all USB. Instead of having two different USB”
1
8. Having to carry two phones is inconvenient. P8: “It was an inconvenient to have to carry another phone. It would be nice if I can just download it on my own phone.” P10: “Having to carry two phones is troublesome. I sometimes forget the second phone.”
2
80
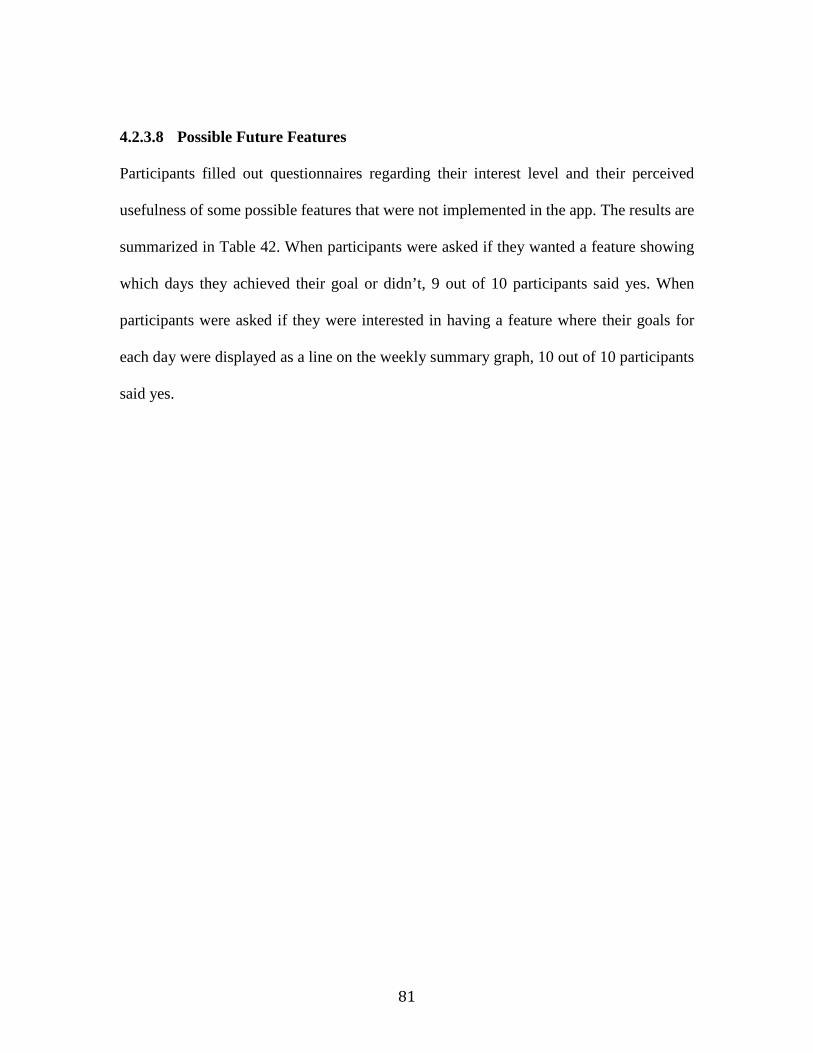
4.2.3.8 Possible Future Features
Participants filled out questionnaires regarding their interest level and their perceived
usefulness of some possible features that were not implemented in the app. The results are
summarized in Table 42. When participants were asked if they wanted a feature showing
which days they achieved their goal or didn’t, 9 out of 10 participants said yes. When
participants were asked if they were interested in having a feature where their goals for
each day were displayed as a line on the weekly summary graph, 10 out of 10 participants
said yes.
81
Table 42: Responses to questionnaire regarding possible features
Possible Features 1. Please rate the usefulness of the feature that show the distribution of your travelled distance over different location
Not Useful 0
Slightly Useful 1
Somewhat Useful 0
Useful 5
Very Useful 4
2. Please rate the usefulness of the feature that plots your speed over the day. Not Useful
0 Slightly Useful
1 Somewhat Useful
2 Useful
4 Very Useful
3 3. Please rate the usefulness of the feature that shows history of your average speed.
Not Useful 0
Slightly Useful 1
Somewhat Useful 3
Useful 4
Very Useful 2
4. Please rate the usefulness the feature that shows the distribution of the calories you burnt over different location.
Not Useful 0
Slightly Useful 1
Somewhat Useful 1
Useful 3
Very Useful 5
5. Please rate the usefulness the feature that shows the distribution of the time you were active over different location.
Not Useful 0
Slightly Useful 0
Somewhat Useful 2
Useful 7
Very Useful 1
6. Please rate the usefulness the feature that shows you the distribution of your wheel push count over different location.
Not Useful 0
Slightly Useful 0
Somewhat Useful 0
Useful 4
Very Useful 6
7. Please rate the usefulness of the social feature where you work with other PAMS users to achieve a common goal such as reach a certain distance or burn a certain amount of calories together.
Not Useful 0
Slightly Useful 0
Somewhat Useful 0
Useful 5
Very Useful 5
8. Please rate your interest level in sharing your results with your friends, who are not necessarily a manual wheelchair user, via social network sites i.e. Facebook
Not Interested 0
Less Interested 1
Somewhat Interested
1
Interested 6
Very Interested 2
9. Please rate you interest level in adding a feature that keep track your weight change. Not Interested
0 Less Interested
0 Somewhat Interested
1
Interested 4
Very Interested 5
10. Please rate your interest level in adding a feature that keeps track of your caloric intake into the app. You will input your calories intake into the app.
Not Interested 0
Less Interested 1
Somewhat Interested
1
Interested 4
Very Interested 4
82

4.3 DISCUSSION
The lab usability test was important in that it allowed us to analyze how participants
interacted with the product for the first time in a distraction-free environment. It allowed
us to assess the learnability of the system and to assess users’ perception of the technology
before using it. The field-based usability testing was useful for evaluating the system’s
performance out in the field. Over the course of the home trial users may have changed
their perception of the system, which information is important for the developer to gather
in order to evaluate the system more effectively.
4.3.1 In-Lab Evaluation
The results of the lab evaluation showed that if PAMS were a real product, it would catch
users’ attention. It gave a very good first impression. Participants were able to envision
how they could use PAMS right after viewing a brief video explaining what PAMS was.
They all speculated that PAMS could help them attain a more active lifestyle.
Participants were able to learn how to use PAMS sensors (Wocket & GWRM)
independently through a video tutorial. They were able to complete all sensors-related tasks
with little to no assistance. The most difficult task was to install the holder onto the wheel.
Six participants were able to do it independently. Two participants did not use the same
type of wheel as in the video tutorial so they couldn’t refer to the tutorial for help and were
unable to perform the task. One participant with tetraplegia was physically unable to
perform the tasks due to-the impaired hand functions. Another participant was not able to
install the holder correctly the first time. After the tasks, participants were confident that
83
they could use the sensors by themselves at home on a daily basis. The most significant
finding from the in-lab trial was that PAMS sensors were not designed well enough for a
person with tetraplegia. One participant who had tetraplegia had trouble wearing the
Wocket, mounting the GWRM onto the wheel, and setting up for recharging. Another
major finding was that the tutorial did not inform users that the Wockets must be inserted
into the recharging dock in a particular orientation in order to be charged. One participant
did not setup the recharge of the Wocket properly and was not aware that the Wocket was
not charging. To fix this problem, this information must be included in the video tutorial.
The rest of the errors found were minor because they did not interfere with or hinder the
function of the sensors and they were all corrected eventually by the users through trial and
error.
PAMS app version 2.0 was shown to be easy to learn and use. Every participant
successfully completed all the app tasks without any major problem. Participants were
confident in their ability to use PAMS app version 2.0 independently at home on a daily
basis. This may be partly due to the fact that all participants had experience using a
smartphone. All the problems found in the app were user interface (UI) issues and can be
fixed by changing the UI design. The most common problem for the participants was the
goal setting. Most participants forgot how to access the goal setting feature and forgot to
hit “Set” in order to set goal. Another common problem with the app was that the virtual
scroll wheel for inputting the values for the goals was hard to control. A digital input should
replace these scroll wheels when implementing the next version.
84
4.3.2 Post-Home Evaluation
The results from the post-home evaluation suggest that the Wocket, the GWRM, and
PAMS app version 2.0 were easy to use at home on a daily basis. When comparing the
rating of the in-lab trial and the post-home trial, the score for ease-of-use either stayed the
same or improved, which indicates that user experience with PAMS improved after a week
of use.
In examining the qualitative data, several issues were found regarding the Wocket.
Participants thought its battery life was too short, and they had to stop using PAMS after
the Wocket battery depleted. This limitation compromises PAMS ability to be an everyday
tool for MWUs. Another negative finding was that participants felt uneasy about the
protruding electrode on the Wocket because they were afraid of breaking it. One possible
solution is to encapsulate the electrode to make it feel more robust, however this means
redesigning the charging dock as well. An effort should be made to modify the Wocket to
extend its battery life or find an alternative wearable tri-axial accelerometer.
Regarding the GWRM, participants thought it was easy to use. One of the
participants broke the zip-ties that were used to attach the GWRM holder onto the wheel,
indicating that stronger zip-ties should be used in the future. One participant suggested that
the holder and the GWRM casing come in black in order to blend in with the wheelchair
more. This was a good suggestion because the white GWRM always returned looking dirty.
The participant with tetraplegia rated neutral for inserting and removing the GWRM in and
out of the holder. It was the lowest rating out of all the participants. It is clear that a redesign
for the GWRM casing and how it is attached to the wheel is needed for users with
tetraplegia. One possible solution would be to add a string with a hand loop onto the case
85
so the participant could lower the sensor into the holder or pull the sensor out without
having to use their fingers.
PAMS app version 2.0 received positive ratings from all participants. On average,
the app was running for 14.5±3.6 hours per day. This included both active use and non-
active use, which means participants left the app on for the whole day. Over the 6 days, the
averaged total number of hours the sensors were connected to the phone was 35.1±14.0
hours. We looked at the first 8 hours of use each day to see how often the sensors were
connected. We chose 8 hours because that was the battery life of the Wocket. In an ideal
situation, the app and the sensors should be connected for 8 hours at first use until the
Wocket runs out of battery. However, in reality the disconnection rate was 25.4%±13.4%
over the first 8 hours of use. There were three scenarios responsible for the disconnection.
First, the app may have crashed in the background and participants were not aware of this
event and so did not reestablish the connection. Second, the participants may have
manually disconnected the sensors and the app because they did not think it was
appropriate to use PAMS. Third, the sensors and the phone may have become separated as
a result of surpassing the Bluetooth connection radius. The app was shown to quit on
average 2±1 times a day; this includes both manual quitting and the app crashing out.
According to the app logs, participants spent the majority of their time on the main
page of the app. This is because the first page of the app informs the users of their most
current status, which updates every minute. Most participants reported using the main page
of the app to quantify their PA parameters throughout the day. Participants would use the
summary feature at the end of the day to compare their current performances with their
past performances. The app logs also indicated that the participants spent a lot of time on
86
the Weekly Distance Summary and the Weekly EE Summary and very little time looking
at the rest of the summary pages. It seems possible that majority of the participants only
looked at these two graphs because they were the first two pages users would see when
accessing the summary page. Also it is possible that some of the graphs looked similar. For
example, the plot of the distance and the wheel push count were similar, and the plot of EE
and time being active also showed similar trends. It might be worth considering that not
every PA parameter deserves a daily/weekly summary plot. Interestingly, the ratings for
all features’ usefulness were lower in the post home trial compared to the lab trial. This
indicates that participants’ experience using the app did not fully match their expectations.
Participants did not use the social feature because they didn’t know whom they were
comparing their PA with, though more than half of the participants indicated strong interest
in the social feature if they could compare their PA levels with those of their friends.
Overall, PAMS as a product received a very high SUS rating of 86.5±12.9. A SUS
score of 68 is considered to be above average [62]. The participants thought that the video
tutorial was thorough enough that they did not need to use the instruction manual. The
field-based usability study showed us that the subjects had differing views on this tool.
Some subjects viewed PAMS as a tool to measure their performance when being active
and found PAMS unnecessary to use when they were not being active. For example, if they
were in the house and watching TV, they would not wear the sensors. Other users, on the
other hand, viewed PAMS as an activity monitor and would wear it throughout the day
even if they were not being active. These two perspectives on PAMS will result in two very
different ways of using the system.
87
Every participant was happy with PAMS. They found that the system was easy to
learn and easy to use. Participants thought that PAMS app version 2.0 provided useful
information that helped motivate them to be more active. Information regarding wheel push
efficiency, which does not exist in any commercial activity monitor, made participants
feels that PAMS was a product designed just for them. They were all excited about the
possibility of PAMS becoming a real product and provided suggestions regarding how the
system can be improved.
There were some limitations to this field-based usability study. None of the
participants were at stage 1 (pre-contemplation) in the PA Stages of Change model, which
is characterized as not acknowledging that there is a problem with PA behavior that needs
to be changed. The lack of participants in stage 1 (pre-contemplation) means that we are
missing the perspective of users who are not considering being active. All participants
expressed interest in using PAMS because they all acknowledged that they want to be more
active and PAMS could possibly help them achieve that goal. Future studies should include
participants from all stages evenly. Various levels of injury were well represented in the
MWUs spectrum; however there was more of a concentration in the area of lower thoracic
injury (T6-T12) as seven out of ten participants were in this group. The second limitation
was that the home trial had guidelines that participants had to follow. These guidelines
were provided to prevent the sensors from being damaged and prevent participants from
neglecting to use PAMS throughout the home trial. Thus, certain assumptions cannot be
made about the behavior of actual users.
88
4.4 CONCLUSION
Participants had a positive impression of the PAMS from their first encounter and gave the
PAMS a high satisfaction rating after one week of use. The sensors were easy to handle for
most of the MWUs. PAMS app version 2.0 showed itself to be easy to use and provided
useful and relevant PA information to MWUs. Results also showed that the goal setting,
summary, and social features may help motivate those in this population to a more
physically active lifestyle. Problems identified by the users did not affect the overall
performance of PAMS nor did it negate their desire for PAMS to be an actual product. The
results of this study indicate that after further refinement based on user feedback, PAMS
could become a feasible tool for MWUs to track their PA levels on a daily basis.
89
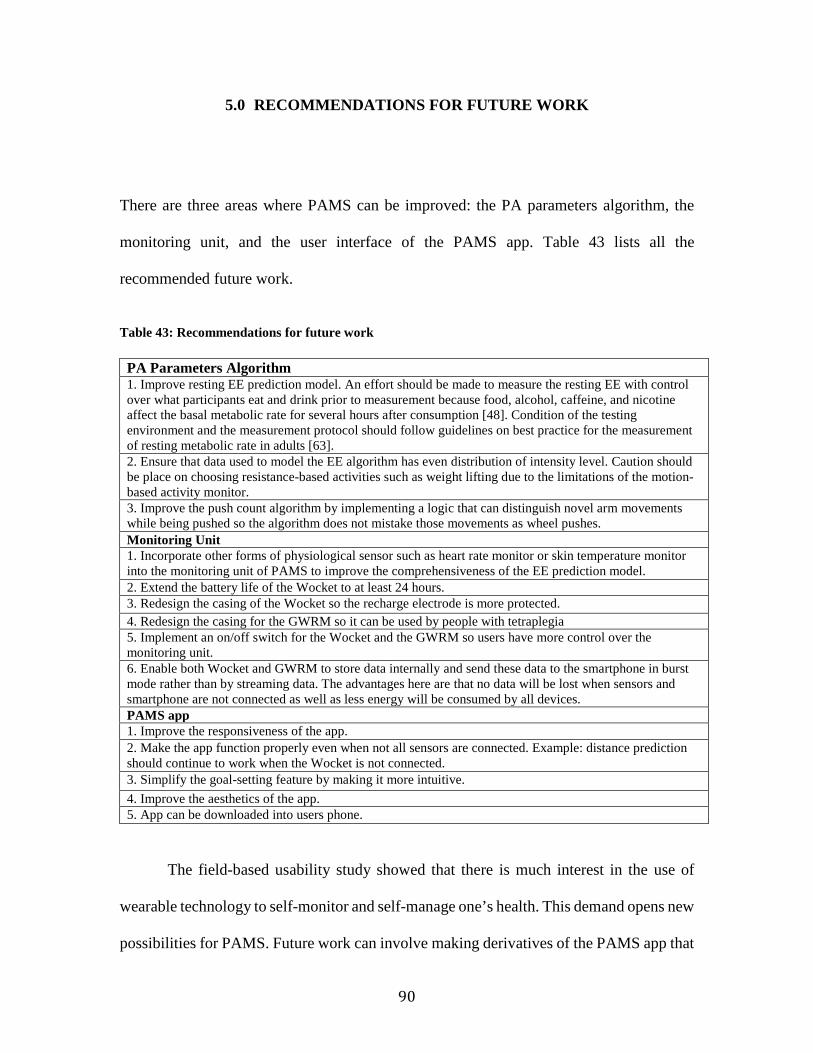
5.0 RECOMMENDATIONS FOR FUTURE WORK
There are three areas where PAMS can be improved: the PA parameters algorithm, the
monitoring unit, and the user interface of the PAMS app. Table 43 lists all the
recommended future work.
Table 43: Recommendations for future work PA Parameters Algorithm 1. Improve resting EE prediction model. An effort should be made to measure the resting EE with control over what participants eat and drink prior to measurement because food, alcohol, caffeine, and nicotine affect the basal metabolic rate for several hours after consumption [48]. Condition of the testing environment and the measurement protocol should follow guidelines on best practice for the measurement of resting metabolic rate in adults [63]. 2. Ensure that data used to model the EE algorithm has even distribution of intensity level. Caution should be place on choosing resistance-based activities such as weight lifting due to the limitations of the motion-based activity monitor. 3. Improve the push count algorithm by implementing a logic that can distinguish novel arm movements while being pushed so the algorithm does not mistake those movements as wheel pushes. Monitoring Unit 1. Incorporate other forms of physiological sensor such as heart rate monitor or skin temperature monitor into the monitoring unit of PAMS to improve the comprehensiveness of the EE prediction model. 2. Extend the battery life of the Wocket to at least 24 hours. 3. Redesign the casing of the Wocket so the recharge electrode is more protected. 4. Redesign the casing for the GWRM so it can be used by people with tetraplegia 5. Implement an on/off switch for the Wocket and the GWRM so users have more control over the monitoring unit. 6. Enable both Wocket and GWRM to store data internally and send these data to the smartphone in burst mode rather than by streaming data. The advantages here are that no data will be lost when sensors and smartphone are not connected as well as less energy will be consumed by all devices. PAMS app 1. Improve the responsiveness of the app. 2. Make the app function properly even when not all sensors are connected. Example: distance prediction should continue to work when the Wocket is not connected. 3. Simplify the goal-setting feature by making it more intuitive. 4. Improve the aesthetics of the app. 5. App can be downloaded into users phone.
The field-based usability study showed that there is much interest in the use of
wearable technology to self-monitor and self-manage one’s health. This demand opens new
possibilities for PAMS. Future work can involve making derivatives of the PAMS app that
90
have specialized or customizable functions. For example, as discovered in the field-based
usability study, there were people who wanted to focus on using PAMS as a performance
measurement tool. In such cases, a PAMS athlete app that reports parameters related to
sport such as distance, speed, acceleration, push count, and push efficiency could be
implemented. The app should also include features such as a timer, a GPS tracker, a
summary of propulsion profiles, and a plot of speed. All these parameters and features
could be helpful to MWUs looking to improve their physical performance. Another
example of a specialized PAMS app is one that focuses on diet balance and weight control.
A major feature for this app would be the calculation of net calories, where energy
expenditure is subtracted by calorie intake from food and drinks. The purpose of this app
would be to assist MWUs in keeping track of their diet and their activity levels. It is
recommended that individual specialized apps be made rather than combining all the
special features into one app. This would reduce the app’s complexity and improve users’
experience, which is very important to the success of an app. The possibility of creating a
specialized app that utilizes wearable technology to enhance different aspects of a MWUs
life is limitless and should be pursued.
In addition to incorporating all of the participants’ suggestions and fixing all of the
issues found in the field test, it is highly recommended that another field-based usability
study be done. In this case, several recommended protocol changes could be made that
would improve the outcome of the study. The first is recruiting participants in pairs,
meaning two MWUs friends would enroll for the study. This would allow all participants
to have at least one friend in the social feature. This would result in a more genuine use of
the feature. Second, there should be no guidelines instructing participants on how to use
91
PAMS. Participants should have the freedom to use PAMS according to their own wishes.
The third recommendation is to extend the length of the home trial to a month. This would
enable a more accurate depiction of how participants would really use PAMS in the home.
This would also enable a preliminary investigation on the effectiveness of PAMS at
increasing users physical activity level. Weight measurement could be done pre- home trial
and post- home trial to see if there are any significant changes. Also, the activity
information stored could be analyzed for physical activity trends given the longer use
period. The last recommendation would be to install PAMS app on the participants’ phone
if possible as participants indicated that carrying two phones was a burden.
92
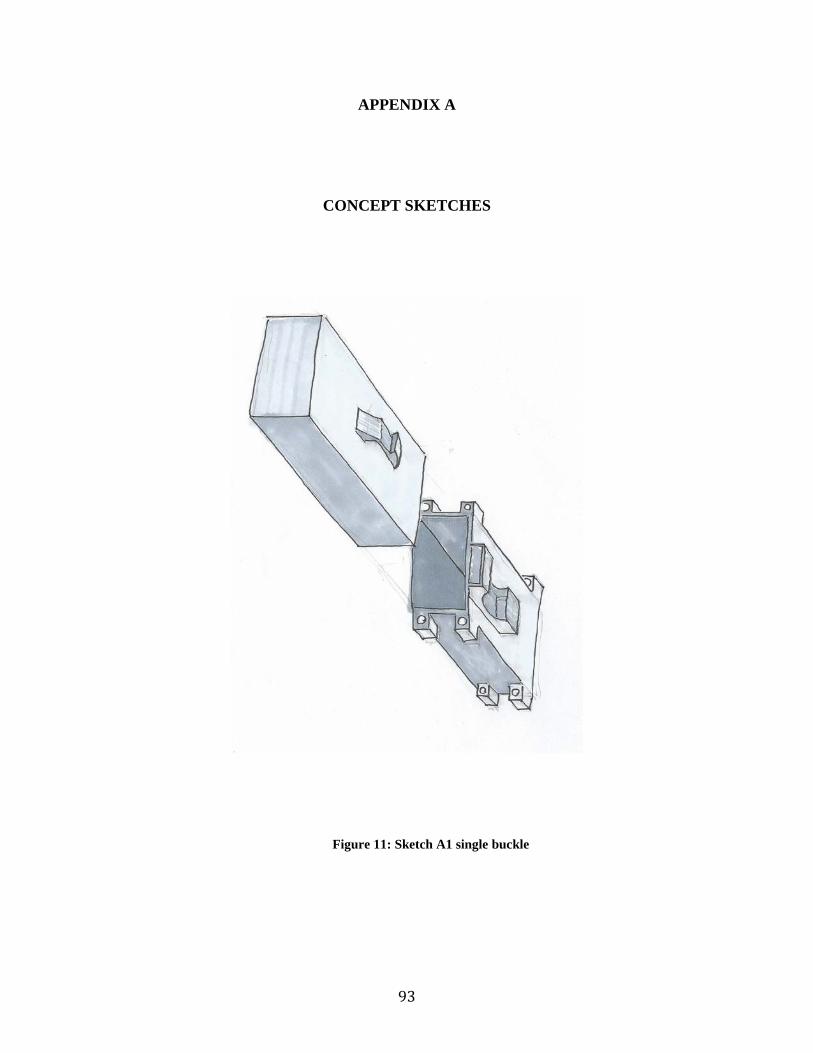
APPENDIX A
CONCEPT SKETCHES
Figure 11: Sketch A1 single buckle
93

Figure 12: Sketch A2 side-release buckle
94
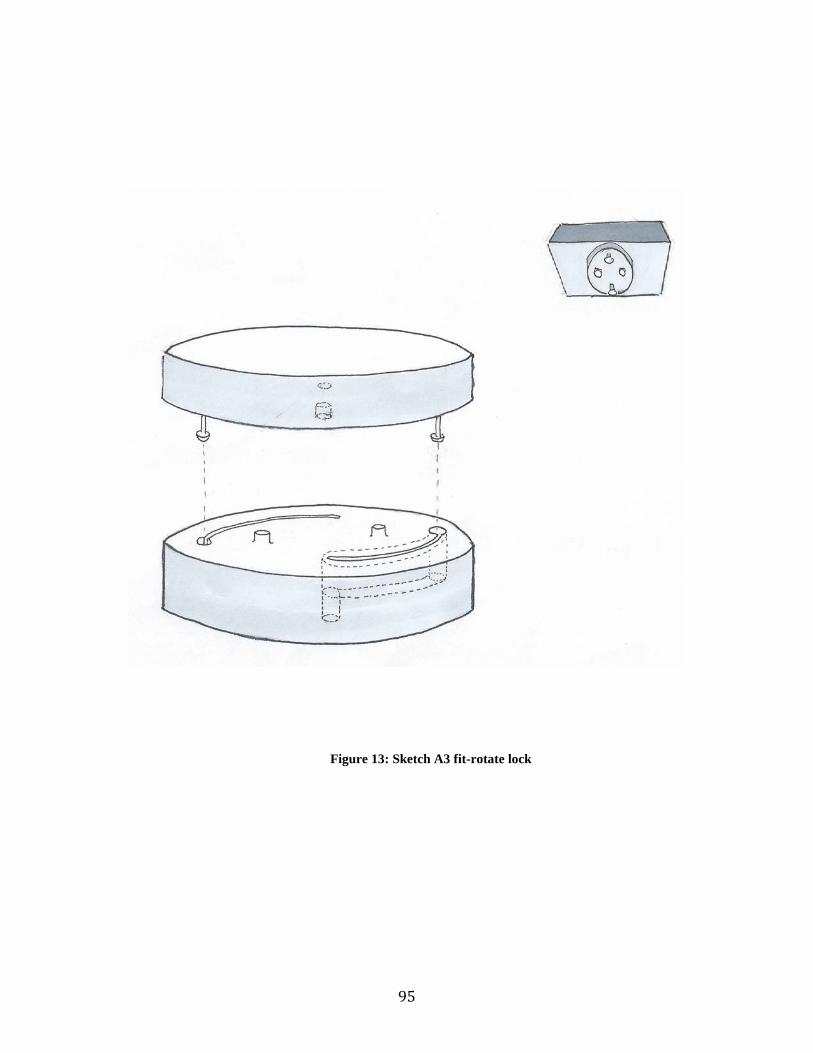
Figure 13: Sketch A3 fit-rotate lock
95

Figure 14: Sketch A4 jig-slide fit
96
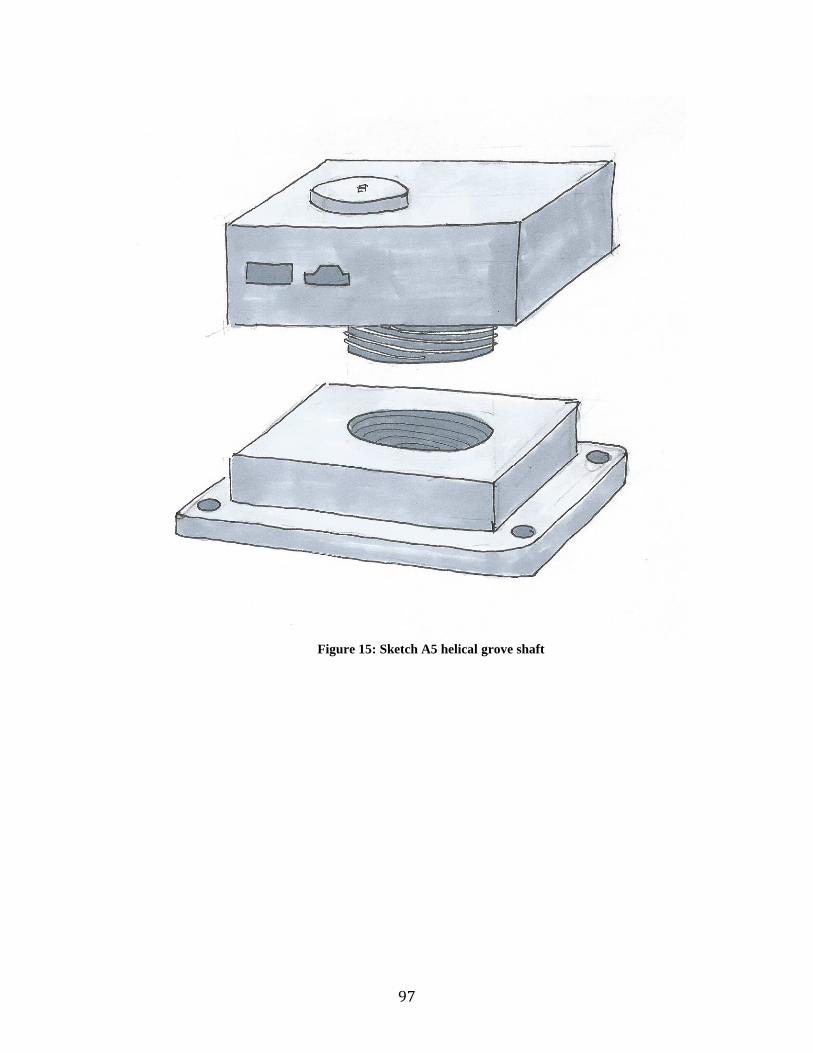
Figure 15: Sketch A5 helical grove shaft
97

APPENDIX B
PAMS INSTRUCTION MANUAL
PAMS Instruction Manual
Last Revised 3/6/2014
98
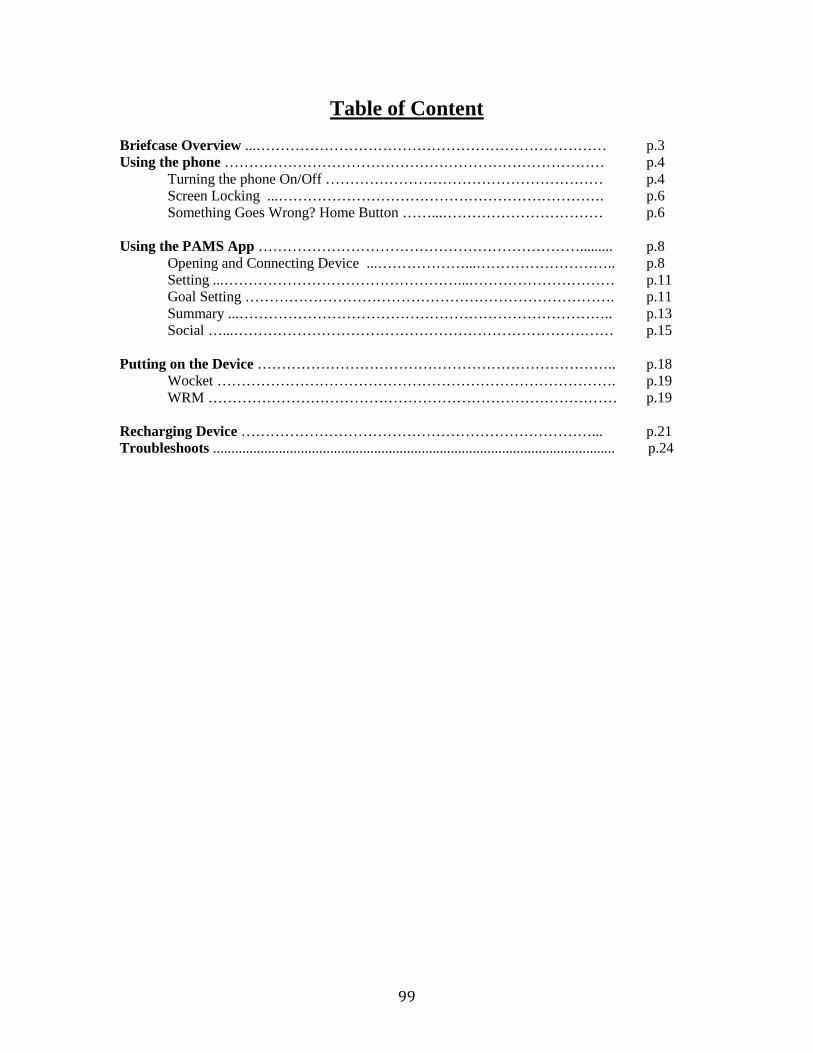
Table of Content
Briefcase Overview ...……………………………………………………………… p.3 Using the phone …………………………………………………………………… p.4 Turning the phone On/Off ………………………………………………… p.4
Screen Locking ...…………………………………………………………. p.6 Something Goes Wrong? Home Button ……...…………………………… p.6
Using the PAMS App …………………………………………………………......... p.8 Opening and Connecting Device ...………………...……………………….. p.8 Setting ...…………………………………………...………………………… p.11 Goal Setting …………………………………………………………………. p.11 Summary ...………………………………………………………………….. p.13 Social …...…………………………………………………………………… p.15 Putting on the Device ……………………………………………………………….. p.18 Wocket ………………………………………………………………………. p.19 WRM ………………………………………………………………………… p.19 Recharging Device ………………………………………………………………... p.21 Troubleshoots .............................................................................................................. p.24
99
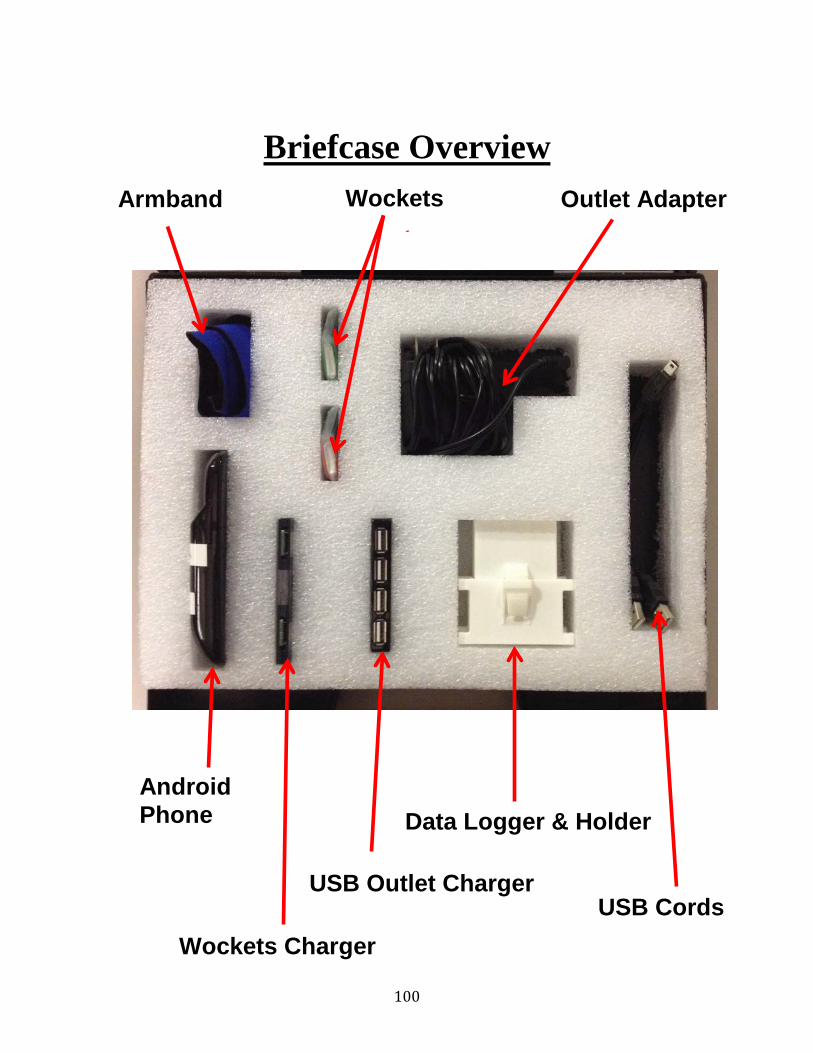
Briefcase Overview
Data Logger & Holder Android Phone
Wockets Charger
Outlet Adapter Armband Wockets
USB Cords USB Outlet Charger
100
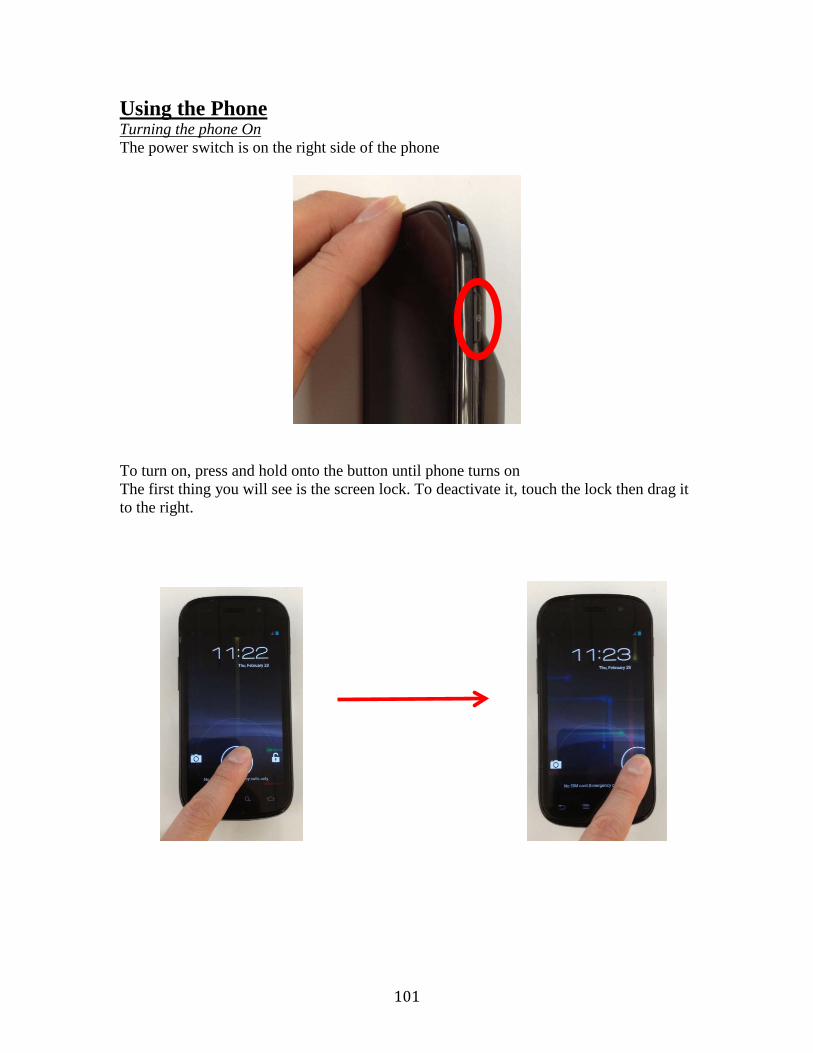
Using the Phone Turning the phone On The power switch is on the right side of the phone
To turn on, press and hold onto the button until phone turns on The first thing you will see is the screen lock. To deactivate it, touch the lock then drag it to the right.
101

Turning the phone Off To turn the phone off, press and hold onto the power button until the phone option menu pops up. Select the Power off button. Tap on Yes to confirm.
102
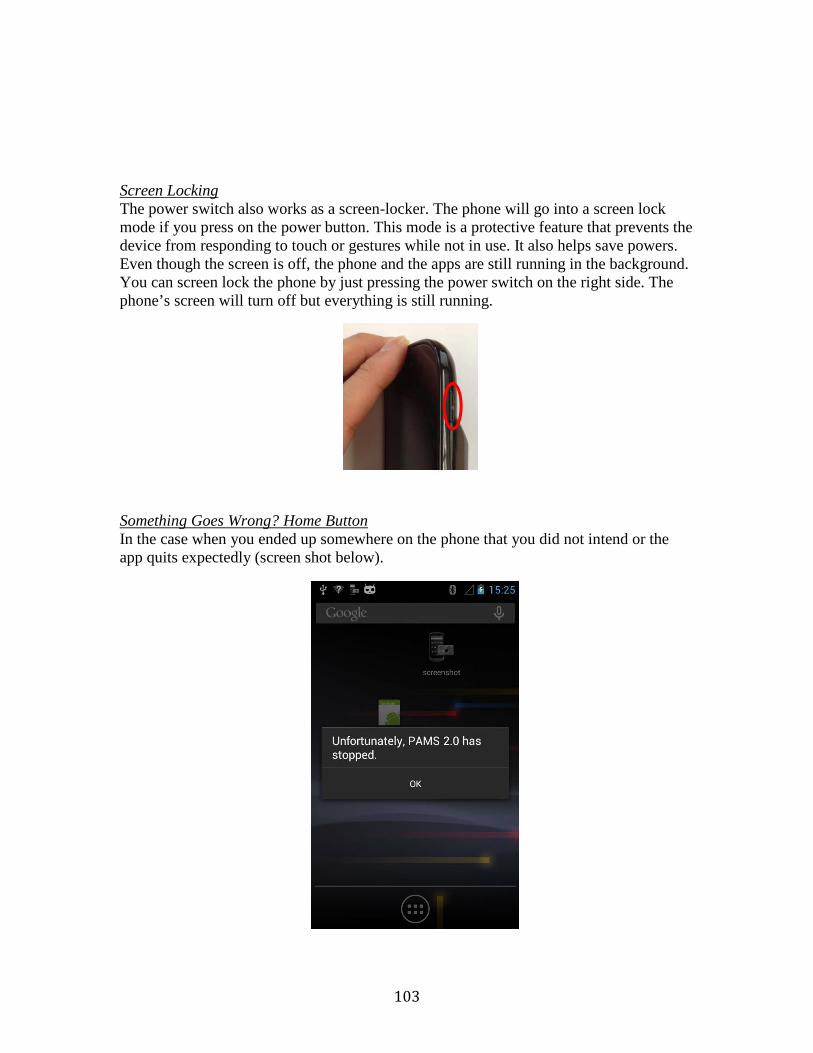
Screen Locking The power switch also works as a screen-locker. The phone will go into a screen lock mode if you press on the power button. This mode is a protective feature that prevents the device from responding to touch or gestures while not in use. It also helps save powers. Even though the screen is off, the phone and the apps are still running in the background. You can screen lock the phone by just pressing the power switch on the right side. The phone’s screen will turn off but everything is still running. Something Goes Wrong? Home Button In the case when you ended up somewhere on the phone that you did not intend or the app quits expectedly (screen shot below).
103

You can navigate your way back to the app by tapping the home button . No matter where you are on the phone, if you tap the Home button you will always go to the main screen. Tap on the PAMS 2.0 icon and it will take you back to the app
104
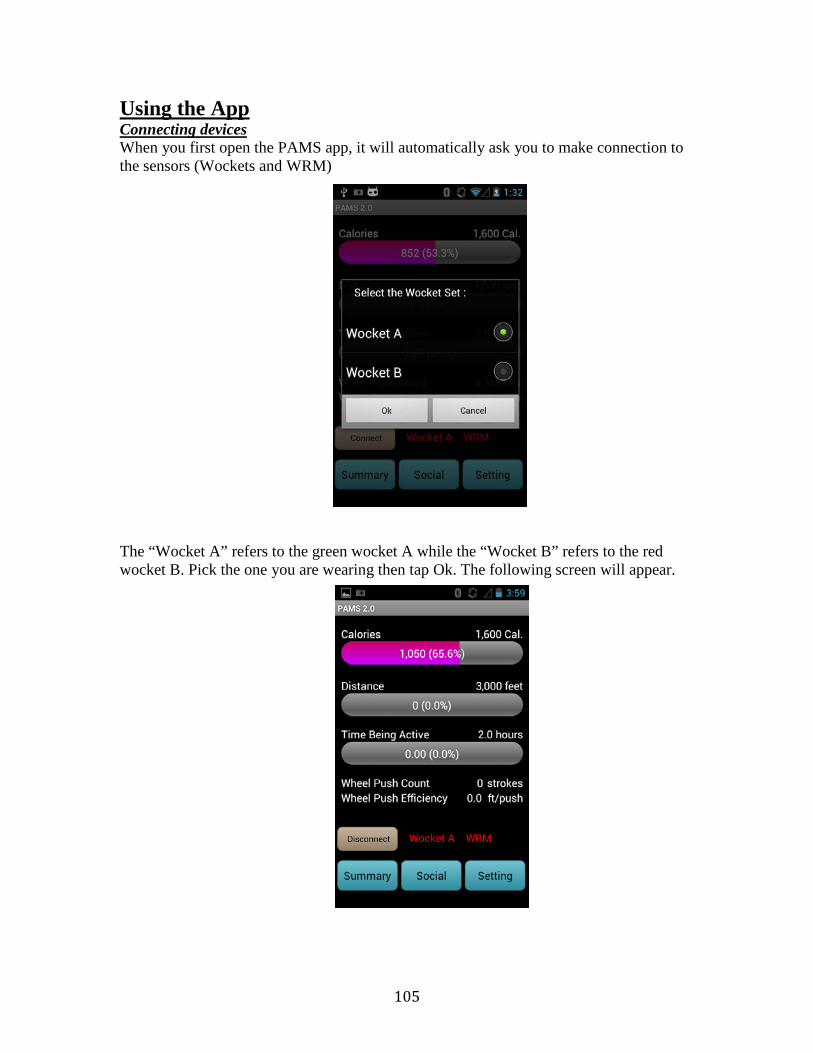
Using the App Connecting devices When you first open the PAMS app, it will automatically ask you to make connection to the sensors (Wockets and WRM) The “Wocket A” refers to the green wocket A while the “Wocket B” refers to the red wocket B. Pick the one you are wearing then tap Ok. The following screen will appear.
105

Wait until the connection has been established. Green is connected and Red is not connected. Not Connected Connected In a situation where one of the sensors got disconnected or you want to change wocket set, you can reconnect the sensor by tapping the “Disconnect” button. Confirm that you will disconnect. Now tap on the “Connect” button, the app will take you back to the “Select Wocket Set” box. Pick the set then hit Ok to reconnect.
106
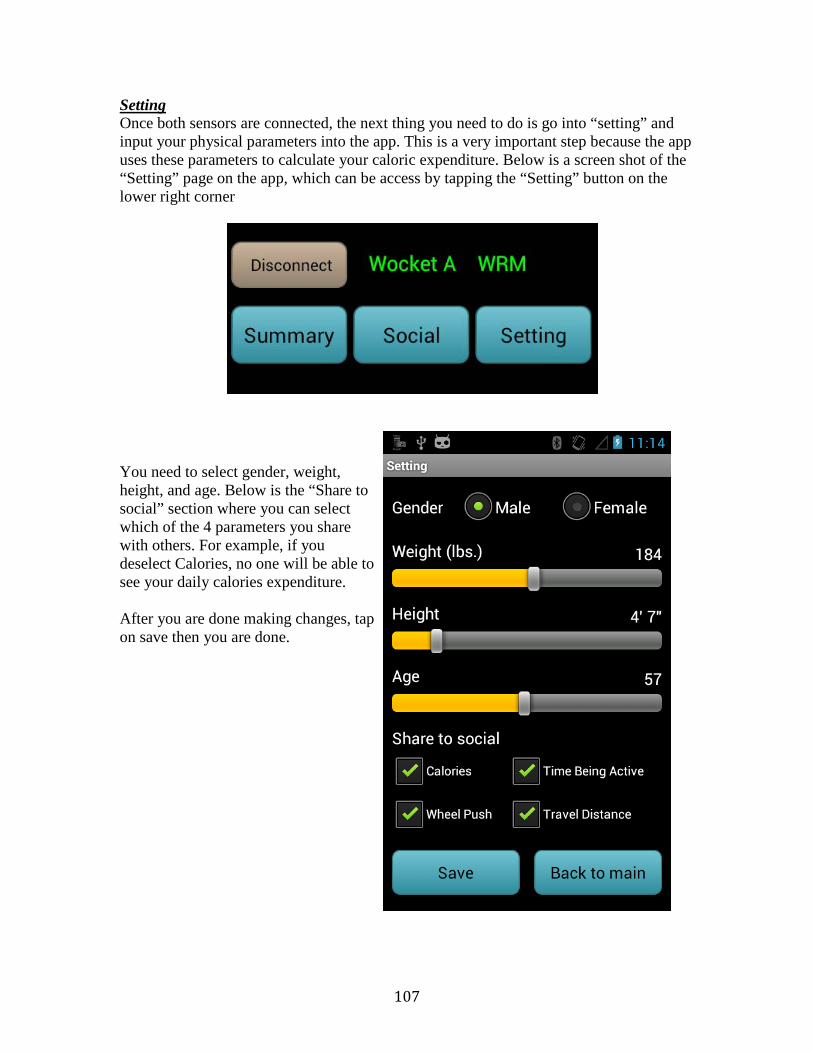
Setting Once both sensors are connected, the next thing you need to do is go into “setting” and input your physical parameters into the app. This is a very important step because the app uses these parameters to calculate your caloric expenditure. Below is a screen shot of the “Setting” page on the app, which can be access by tapping the “Setting” button on the lower right corner You need to select gender, weight, height, and age. Below is the “Share to social” section where you can select which of the 4 parameters you share with others. For example, if you deselect Calories, no one will be able to see your daily calories expenditure. After you are done making changes, tap on save then you are done.
107
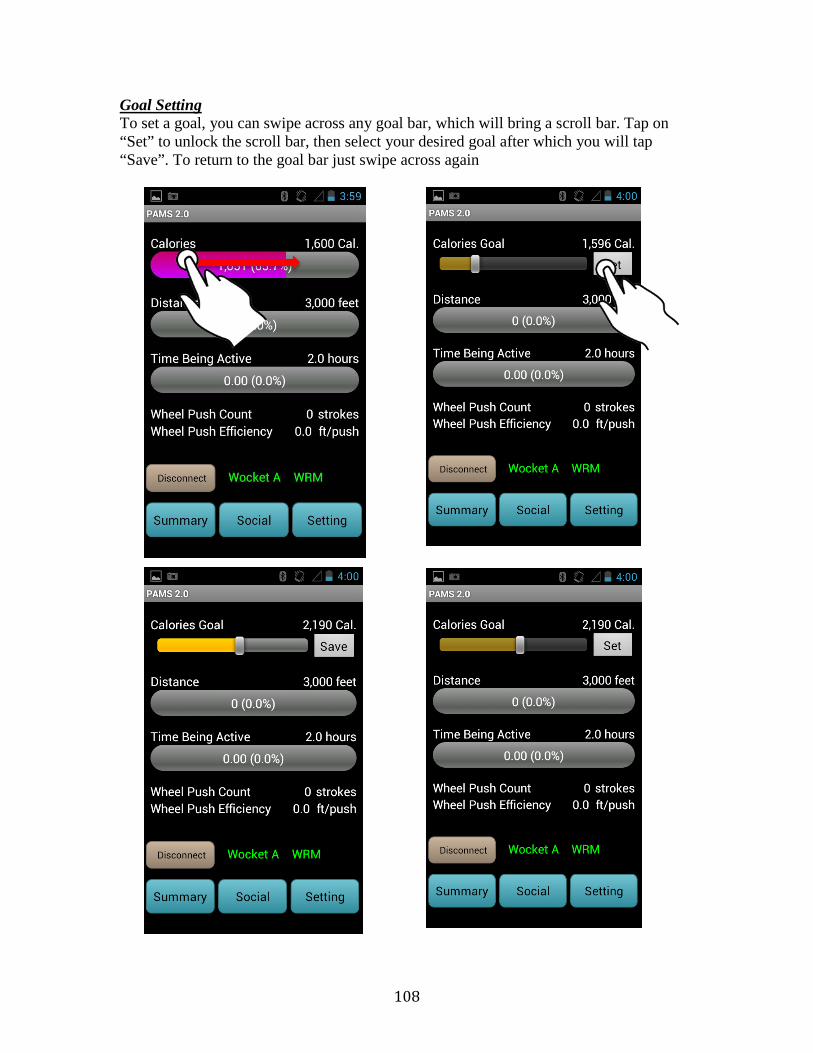
Goal Setting To set a goal, you can swipe across any goal bar, which will bring a scroll bar. Tap on “Set” to unlock the scroll bar, then select your desired goal after which you will tap “Save”. To return to the goal bar just swipe across again
108
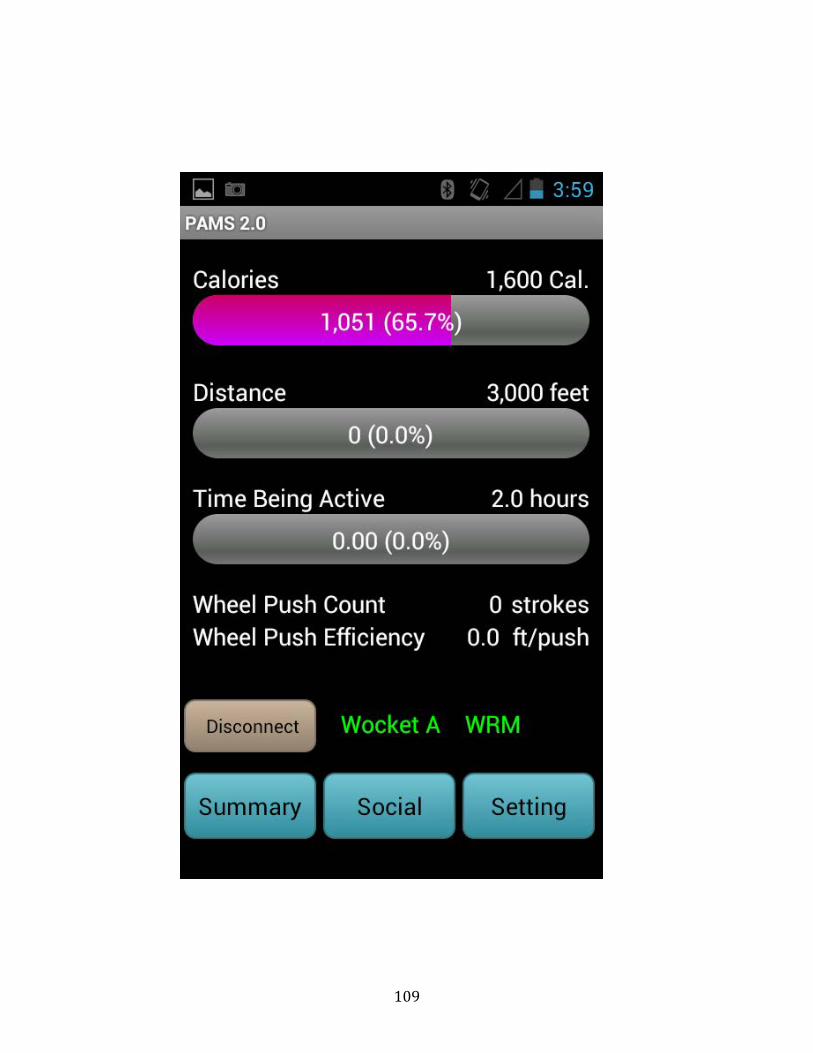
109
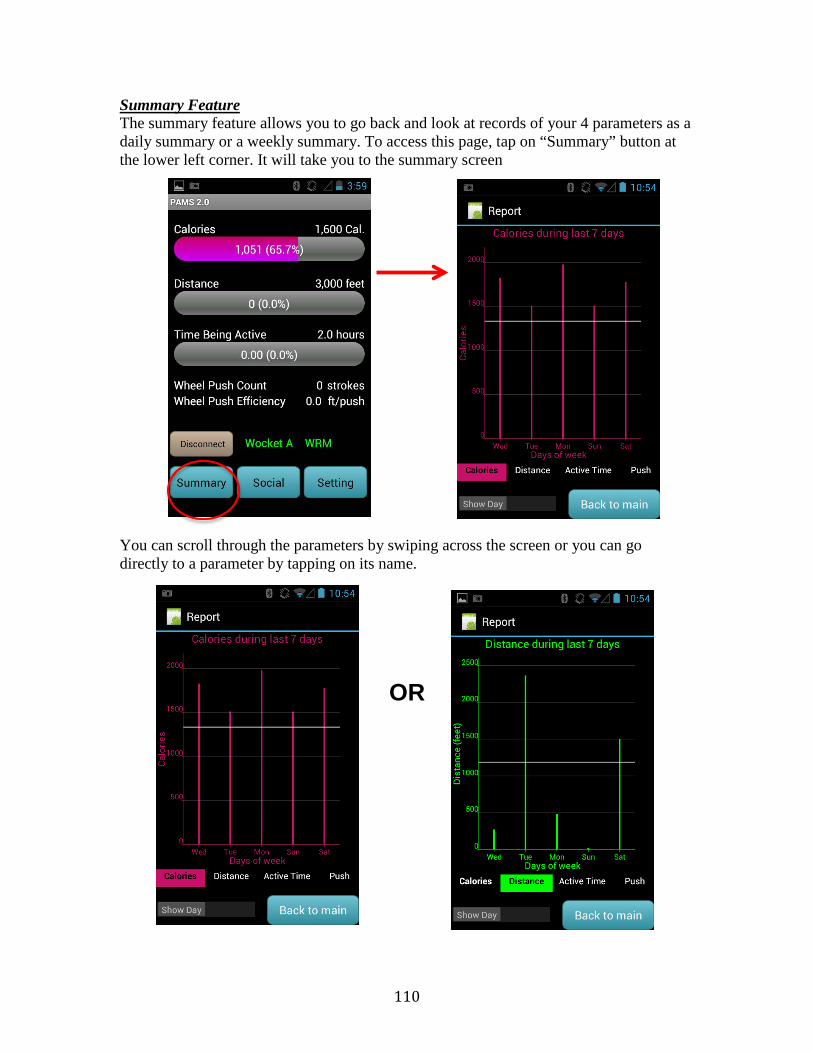
Summary Feature The summary feature allows you to go back and look at records of your 4 parameters as a daily summary or a weekly summary. To access this page, tap on “Summary” button at the lower left corner. It will take you to the summary screen You can scroll through the parameters by swiping across the screen or you can go directly to a parameter by tapping on its name.
OR
110
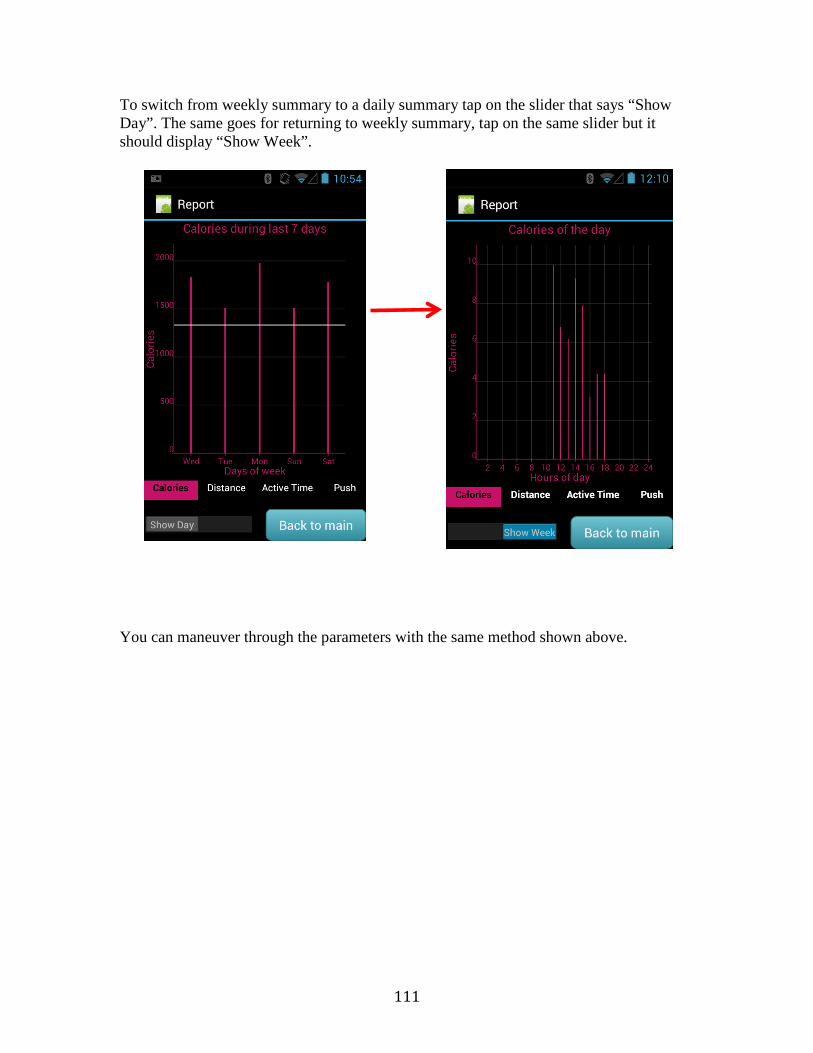
To switch from weekly summary to a daily summary tap on the slider that says “Show Day”. The same goes for returning to weekly summary, tap on the same slider but it should display “Show Week”. You can maneuver through the parameters with the same method shown above.
111
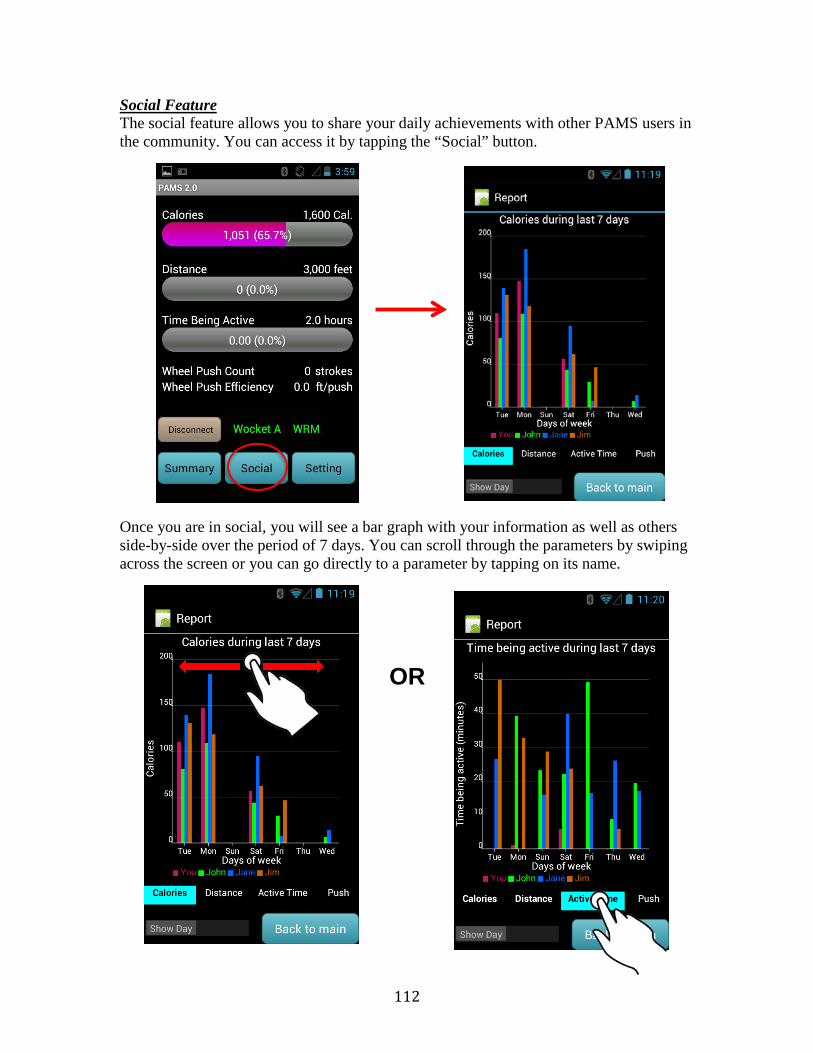
Social Feature The social feature allows you to share your daily achievements with other PAMS users in the community. You can access it by tapping the “Social” button. Once you are in social, you will see a bar graph with your information as well as others side-by-side over the period of 7 days. You can scroll through the parameters by swiping across the screen or you can go directly to a parameter by tapping on its name.
OR
112

If you would like to see only the today’s comparison, you can tap on the slider that says “Show Day”. Again you can maneuver through each parameter the same way as show above. To go back to 7 days display, just tap on the slider, it should now say “Show Week”. You can choose which of the 4 parameters (distance, calories, time being active, push count) you want to share in the “Setting” menu under “Share to social”.
113

If you chose not to share a parameter then you will not be able to see that parameter from others. Example: if you do not want to share distance travel, you can deselect it in the Setting menu Then you will not be able to see the parameter Distance in the “Social” feature.
114

Putting on the Devices
Wocket @ Arm
WRM @ Wheel
Android Phone
115
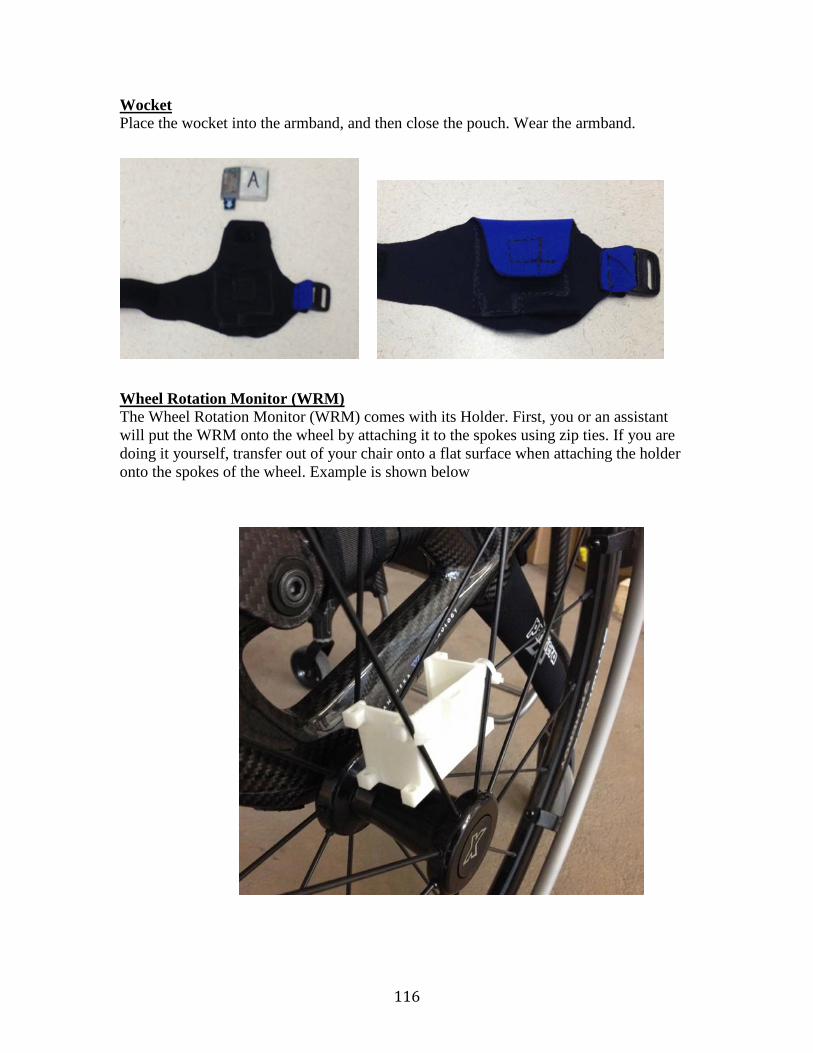
Wocket Place the wocket into the armband, and then close the pouch. Wear the armband. Wheel Rotation Monitor (WRM) The Wheel Rotation Monitor (WRM) comes with its Holder. First, you or an assistant will put the WRM onto the wheel by attaching it to the spokes using zip ties. If you are doing it yourself, transfer out of your chair onto a flat surface when attaching the holder onto the spokes of the wheel. Example is shown below
116

Once the WRM Holder is secured to the wheel, you can put the WRM into its holder by just inserting it in. You will hear a click when the buckle is locked in
To release the WRM from its Holder, push the buckle inward to release the lock. Then pull the Data Logger out.
117
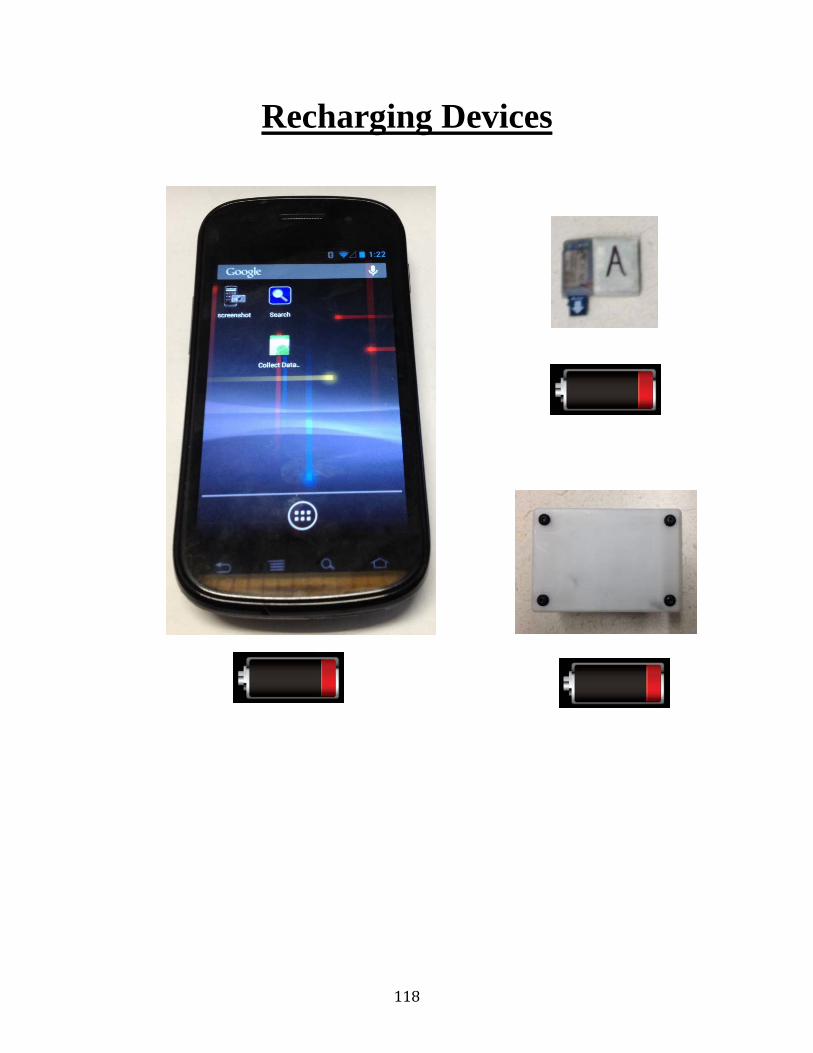
Recharging Devices
118

Recharging Devices
Wocket Charger Outlet
Adapter
USB Hub
119
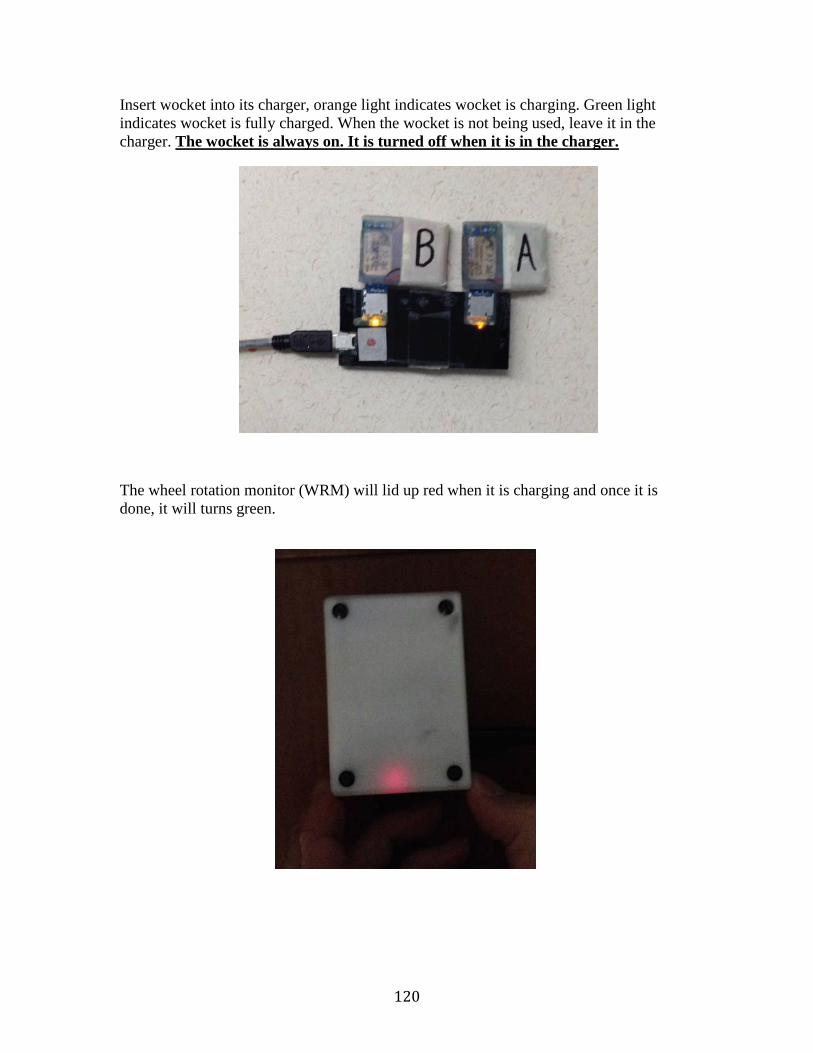
Insert wocket into its charger, orange light indicates wocket is charging. Green light indicates wocket is fully charged. When the wocket is not being used, leave it in the charger. The wocket is always on. It is turned off when it is in the charger. The wheel rotation monitor (WRM) will lid up red when it is charging and once it is done, it will turns green.
120

Troubleshoots
1. Disconnect and reconnect the sensors. Tap on the disconnect button.
A pop up box will appear, tap Yes Then tap on the connect button
121

The app will take you back to “Select Wocket Set” box. Select the appropriate wocket set then tap Ok.
122

2. Quit and reopen app.
To quit the app, tap on the menu while you are still in the app. The following menu will appear. Select Quit. The following pop up box will appear. Tap on Yes.
123

Tap on the PAMS 2.0 icon and it will take you back to the app. If the app wont start, count to 10 then try again.
124
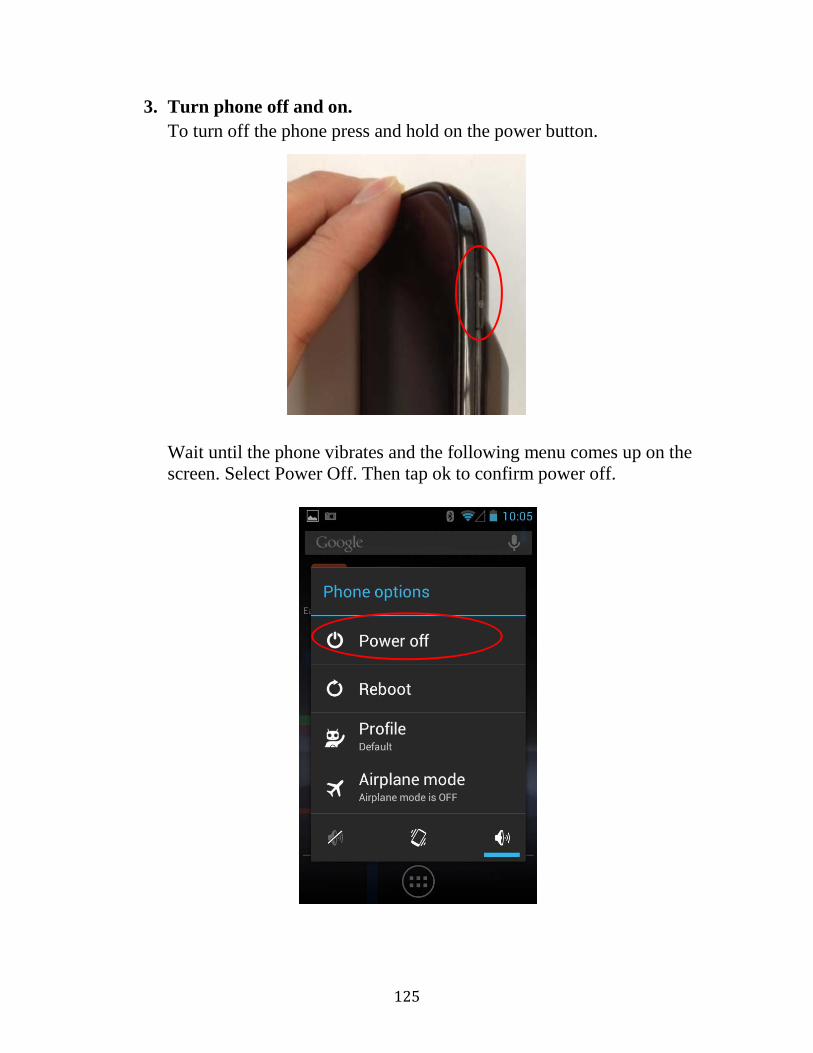
3. Turn phone off and on. To turn off the phone press and hold on the power button. Wait until the phone vibrates and the following menu comes up on the screen. Select Power Off. Then tap ok to confirm power off.
125
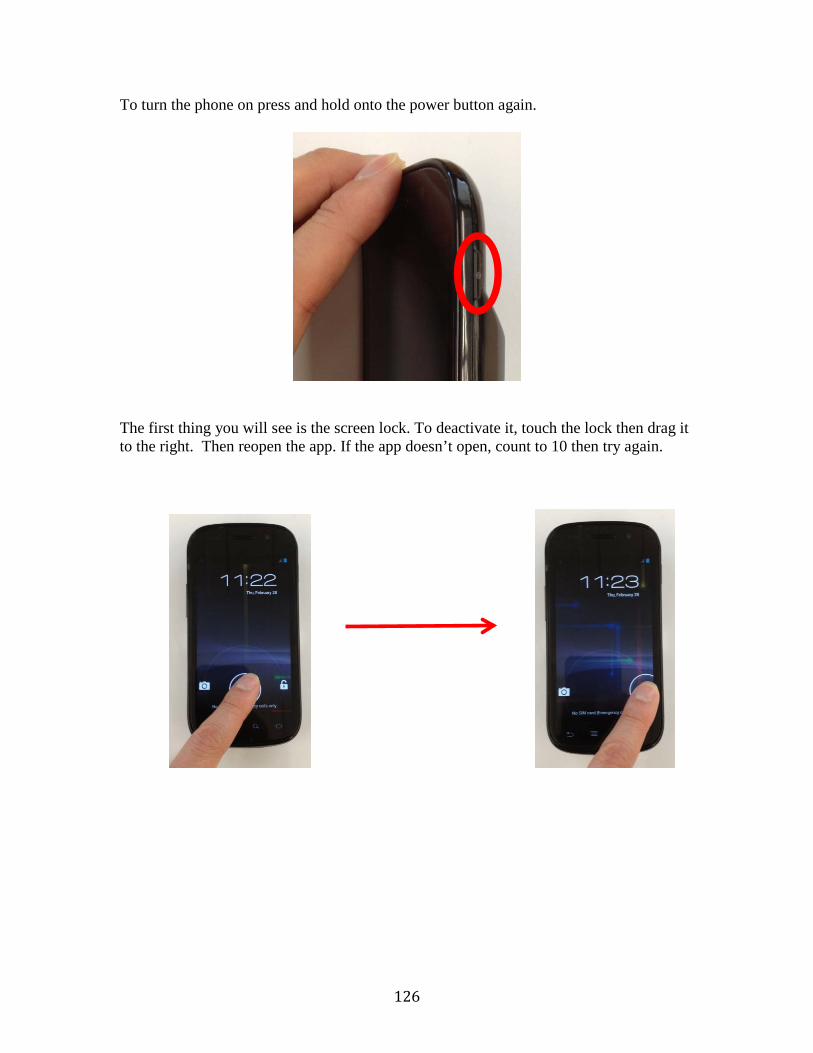
To turn the phone on press and hold onto the power button again.
The first thing you will see is the screen lock. To deactivate it, touch the lock then drag it to the right. Then reopen the app. If the app doesn’t open, count to 10 then try again.
126
BIBLIOGRAPHY
1. Martin, S.B., et al., Variables related to meeting the CDC/ACSM physical activity guidelines. Med Sci Sports Exerc, 2000. 32(12): p. 2087-92.
2. Barwais, F.A., T.F. Cuddihy, and L.M. Tomson, Physical activity, sedentary
behavior and total wellness changes among sedentary adults: a 4-week randomized controlled trial. Health Qual Life Outcomes, 2013. 11: p. 183.
3. (HHS), U.S.D.o.H.a.H.S., 2008 Physical Ativity Guidlines for Americans,
U.S.D.o.H.a.H.S. (HHS), Editor. 2013: Washington D.C. 4. Frumkin, H., Urban sprawl and public health. Public Health Rep, 2002. 117(3): p.
201-17. 5. Matthews, C.E., et al., Amount of time spent in sedentary behaviors in the United
States, 2003-2004. Am J Epidemiol, 2008. 167(7): p. 875-81. 6. Pate, R.R., J.R. O'Neill, and F. Lobelo, The evolving definition of "sedentary".
Exerc Sport Sci Rev, 2008. 36(4): p. 173-8. 7. Fung, T.T., et al., Leisure-time physical activity, television watching, and plasma
biomarkers of obesity and cardiovascular disease risk. Am J Epidemiol, 2000. 152(12): p. 1171-8.
8. Clark, B.K., et al., Validity and reliability of measures of television viewing time
and other non-occupational sedentary behaviour of adults: a review. Obes Rev, 2009. 10(1): p. 7-16.
9. Control, C.f.D. Facts about Physical Activity. 2014 5/1/2014]; Available from:
http://www.cdc.gov/physicalactivity/data/facts.html 10. Cooper, R.A., et al., Research on physical activity and health among people with
disabilities: A consensus statement. Journal of Rehabilitation Research and Development, 1999. 36(2): p. 142-154.
11. Hoenig, H., et al., Activity restriction among wheelchair users. Journal of the
American Geriatrics Society, 2003. 51(9): p. 1244-1251. 12. LaPlante, M.P. and H.S. Kaye, Demographics and Trends in Wheeled Mobility
Equipment Use and Accessibility in the Community. Assistive Technology, 2010. 22(1): p. 3-17.
127

13. Buchholz, A.C., C.F. McGillivray, and P.B. Pencharz, Physical activity levels are low in free-living adults with chronic paraplegia. Obes Res, 2003. 11(4): p. 563-70.
14. Services, U.S.D.o.H.a.H. Disability and Health. 2013 11/13/2013 [cited 2014
5/1/2014]. 15. Heath, G.W. and P.H. Fentem, Physical activity among persons with disabilities--
a public health perspective. Exerc Sport Sci Rev, 1997. 25: p. 195-234. 16. Warms, C.A., J.D. Whitney, and B. Belza, Measurement and description of
physical activity in adult manual wheelchair users. Disabil Health J, 2008. 1(4): p. 236-44.
17. Duncan, M.J., C. Vandelanotte, and W.K. Mummery, Using Smartphone
Technology to Monitor Physical Activity in the 10,000 Steps Program: A Matched Case-Control Trial. Journal of Medical Internet Research, 2012. 14(2): p. 20-20.
18. Leijon, M., et al., Improvement of Physical Activity by a Kiosk-based Electronic
Screening and Brief Intervention in Routine Primary Health Care: Patient-Initiated Versus Staff-Referred. J Med Internet Res, 2011. 13(4): p. e99.
19. Antypas, K. and S.C. Wangberg, An Internet- and mobile-based tailored
intervention to enhance maintenance of physical activity after cardiac rehabilitation: short-term results of a randomized controlled trial. J Med Internet Res, 2014. 16(3): p. e77.
20. Kooijmans, H., et al., Randomized controlled trial of a self-management
intervention in persons with spinal cord injury: design of the HABITS (Healthy Active Behavioural Intervention in SCI) study. Disabil Rehabil, 2013. 35(13): p. 1111-8.
21. Godin, G., et al., The effect of mere-measurement of cognitions on physical activity
behavior: a randomized controlled trial among overweight and obese individuals. Int J Behav Nutr Phys Act, 2011. 8: p. 2.
22. Dishman, R.K. and J. Buckworth, Increasing physical activity: a quantitative
synthesis. Med Sci Sports Exerc, 1996. 28(6): p. 706-19. 23. Johannsen, D.L., et al., Accuracy of armband monitors for measuring daily energy
expenditure in healthy adults. Med Sci Sports Exerc, 2010. 42(11): p. 2134-40. 24. Shuger, S.L., et al., Electronic feedback in a diet- and physical activity-based
lifestyle intervention for weight loss: a randomized controlled trial. Int J Behav Nutr Phys Act, 2011. 8: p. 41.
128
25. Polzien, K.M., et al., The efficacy of a technology-based system in a short-term behavioral weight loss intervention. Obesity (Silver Spring), 2007. 15(4): p. 825-30.
26. Adriana Chacon, S.H.M., Dan Ding, PhD, Evaluation of the RT3 Tri-axial
Accelerometer to Measure Physical Activity in Manual Wheelchair Users with Spinal Cord Injury, in RESNA Annual Conference. 2010: Las Vegas, Nevada.
27. Hiremath, S.V. and D. Ding, Evaluation of activity monitors to estimate energy
expenditure in manual wheelchair users. Conf Proc IEEE Eng Med Biol Soc, 2009. 2009: p. 835-8.
28. Spungen, A.M., et al., Factors influencing body composition in persons with spinal
cord injury: a cross-sectional study. Journal of Applied Physiology, 2003. 95(6): p. 2398-2407.
29. Monroe, M.B., et al., Lower daily energy expenditure as measured by a respiratory
chamber in subjects with spinal cord injury compared with control subjects. The American journal of clinical nutrition, 1998. 68(6): p. 1223-1227.
30. Mollinger, L.A., et al., Daily energy expenditure and basal metabolic rates of
patients with spinal cord injury. Arch Phys Med Rehabil, 1985. 66(7): p. 420-6. 31. Buchholz, A.C., C.F. McGillivray, and P.B. Pencharz, Differences in resting
metabolic rate between paraplegic and able-bodied subjects are explained by differences in body composition. Am J Clin Nutr, 2003. 77(2): p. 371-8.
32. Frankenfield, D.C., E.R. Muth, and W.A. Rowe, The Harris-Benedict studies of
human basal metabolism: history and limitations. J Am Diet Assoc, 1998. 98(4): p. 439-45.
33. Warms, C.A. and B.L. Belza, Actigraphy as a measure of physical activity for
wheelchair users with spinal cord injury. Nursing Research, 2004. 53(2): p. 136-143.
34. Postma, K., et al., Validity of the detection of wheelchair propulsion as measured
with an Activity Monitor in patients with spinal cord injury. Spinal Cord, 2005. 43(9): p. 550-557.
35. Aguilar, A.M.O., TOWARDS MONITORING WHEELCHAIR PROPULSION IN NATURAL ENVIRONMENT USING WEARABLE SENSORS. 2013, University of Pittsburgh.
36. Coulter, E.H., et al., Development and validation of a physical activity monitor for
use on a wheelchair. Spinal Cord, 2011. 49(3): p. 445-450.
129
37. Tolerico, M.L., et al., Assessing mobility characteristics and activity levels of manual wheelchair users. Journal of Rehabilitation Research and Development, 2007. 44(4): p. 561-571.
38. Sonenblum, S.E., et al., Validation of an accelerometer-based method to measure
the use of manual wheelchairs. Med Eng Phys, 2012. 34(6): p. 781-6. 39. Dobkin, B.H., Wearable motion sensors to continuously measure real-world
physical activities. Curr Opin Neurol, 2013. 26(6): p. 602-8. 40. Intille, S.S., et al., Design of a wearable physical activity monitoring system using
mobile phones and accelerometers. Conf Proc IEEE Eng Med Biol Soc, 2011. 2011: p. 3636-9.
41. Hiremath, S.V., D. Ding, and R.A. Cooper, Development and evaluation of a
gyroscope-based wheel rotation monitor for manual wheelchair users. J Spinal Cord Med, 2013. 36(4): p. 347-56.
42. Hiremath, S.V., Physical Activity Monitoring System for Manual Wheelchair
Users, in The School of Health and Rehabilitation Sciences 2013, University of Pittsburgh: Pittsburgh.
43. Ayubi, S.U.A., Model, Framework, and Platform of Health Persuasive Social
Network, in School of Health and Rehabilitation Sciences. 2012, University of Pittsburgh: Pittsburgh.
44. TECED User Experience Research and Design. Field Usability Testing 2014 [cited
2014 6/24/14]. 45. Eppinger, K.T.U.S.D., Product Design and Development. 5th ed. 2012: McGraw
Hill. 46. Haskell, W.L., et al., Physical activity and public health: updated recommendation
for adults from the American College of Sports Medicine and the American Heart Association. Med Sci Sports Exerc, 2007. 39(8): p. 1423-34.
47. Paralyzed Veterans of America Consortium for Spinal Cord, M., Preservation of
upper limb function following spinal cord injury: a clinical practice guideline for health-care professionals. J Spinal Cord Med, 2005. 28(5): p. 434-70.
48. Compher, C., et al., Best practice methods to apply to measurement of resting metabolic rate in adults: a systematic review. J Am Diet Assoc, 2006. 106(6): p. 881-903.
49. Haskell, W.L., S.N. Blair, and J.O. Hill, Physical activity: health outcomes and
importance for public health policy. Prev Med, 2009. 49(4): p. 280-2.
130
50. Locke, E.A. and G.P. Latham, Goal setting theory. Motivation: Theory and research, 1994: p. 13-29.
51. Tudor-Locke, C., et al., Controlled outcome evaluation of the First Step Program:
a daily physical activity intervention for individuals with type II diabetes. International journal of obesity, 2004. 28(1): p. 113-119.
52. Locke, E.A. and G.P. Latham, Building a practically useful theory of goal setting
and task motivation. A 35-year odyssey. Am Psychol, 2002. 57(9): p. 705-17. 53. Bandura, A., Social cognitive theory of self-regulation. Organizational behavior
and human decision processes, 1991. 50(2): p. 248-287. 54. Shuger, S.L., et al., Electronic feedback in a diet-and physical activity-based
lifestyle intervention for weight loss: a randomized controlled trial. Int J Behav Nutr Phys Act, 2011. 8(41): p. 1-8.
55. Williams, S.L. and D.P. French, What are the most effective intervention techniques
for changing physical activity self-efficacy and physical activity behaviour-and are they the same? Health Education Research, 2011. 26(2): p. 308-322.
56. Curmi, F., et al., HeartLink: Open Broadcast of Live Biometric Data to Social
Networks, in CHI 2013: Changing Perspectives, S.C.o.H.F.i.C. Systems, Editor. 2013: Paris, France. p. 1749-1758.
57. Benedetti, M.G., et al., Physical activity monitoring in obese people in the real life
environment. J Neuroeng Rehabil, 2009. 6: p. 47. 58. Han, S.H., et al., Usability of consumer electronic products. International Journal
of Industrial Ergonomics, 2001. 28(3-4): p. 143-151. 59. Marcus, B.H., et al., Using the stages of change model to increase the adoption of
physical activity among community participants. American journal of health promotion, 1992. 6(6): p. 424-429.
60. Bangor, A., P.T. Kortum, and J.T. Miller, An empirical evaluation of the system
usability scale. Intl. Journal of Human–Computer Interaction, 2008. 24(6): p. 574-594.
61. Brooke, J., SUS-A quick and dirty usability scale. Usability evaluation in industry,
1996. 189: p. 194. 62. Sauro, J. Measuring Usability With The System Usability Scale (SUS). Measuring
Usability; Quabtitative Usability, Statistics & Six Sigma 2011 2/2/2011 [cited 2014 6/16/2014]; Available from: http://www.measuringusability.com/sus.php.
131
63. Compher, C., et al., Best practice methods to apply to measurement of resting metabolic rate in adults: A systematic review. Journal of the American Dietetic Association, 2006. 106(6): p. 881-903.
132
Related Documents