RESEARCH ARTICLE Fiber-tract localized diffusion coefficients highlight patterns of white matter disruption induced by proximity to glioma Shawn D’Souza 1,2 , D. Ryan Ormond 2 , Jamie Costabile 2 , John A. Thompson ID 2,3 * 1 Department of Molecular Biology, University of Colorado, Boulder, CO, United States of America, 2 Department of Neurosurgery, University of Colorado Anschutz Medical Campus, Aurora, CO, United States of America, 3 Department of Neurology, University of Colorado Anschutz Medical Campus, Aurora, CO, United States of America * [email protected] Abstract Gliomas account for 26.5% of all primary central nervous system tumors. Recent studies have used diffusion tensor imaging (DTI) to extract white matter fibers and the diffusion coefficients derived from MR processing to provide useful, non-invasive insights into the extent of tumor invasion, axonal integrity, and gross differentiation of glioma from metasta- sis. Here, we extend this work by examining whether a tract-based analysis can improve non-invasive localization of tumor impact on white matter integrity. This study retrospectively analyzed preoperative magnetic resonance sequences highlighting contrast enhancement and DTI scans of 13 subjects that were biopsy-confirmed to have either high or low-grade glioma. We reconstructed the corticospinal tract and superior longitudinal fasciculus by applying atlas-based regions of interest to fibers derived from whole-brain deterministic streamline tractography. Within-subject comparison of hemispheric diffusion coefficients (e.g., fractional anisotropy and mean diffusivity) indicated higher levels of white matter deg- radation in the ipsilesional hemisphere. Novel application of along-tract analyses revealed that tracts traversing the tumor region showed significant white matter degradation com- pared to the contralesional hemisphere and ipsilesional tracts displaced by the tumor. Introduction Gliomas are the most prevalent form of intrinsic brain tumor [1] originating from neural tis- sue composed primarily of astrocytes, oligodendrocytes, and ependymal cells [2] with varying symptoms depending on the extent of invasion and location in the brain [3,4]. Surgical resec- tion of the tumor area remains a mainstay of conventional therapy, and extent of resection is a well-established predictor of patient survival [5–7]. Despite recent advances in surgical oncol- ogy, predictive biomarkers of tumor progression, and recurrence based on in vivo measures of microstructural change are still lacking, which could impact surgical decision-making. Over the last 15 years, white matter fiber tracking, using diffusion tensor imaging (DTI) has been investigated in different aspects of the surgical management of gliomas [8]. DTI is an in PLOS ONE | https://doi.org/10.1371/journal.pone.0225323 November 21, 2019 1 / 16 a1111111111 a1111111111 a1111111111 a1111111111 a1111111111 OPEN ACCESS Citation: D’Souza S, Ormond DR, Costabile J, Thompson JA (2019) Fiber-tract localized diffusion coefficients highlight patterns of white matter disruption induced by proximity to glioma. PLoS ONE 14(11): e0225323. https://doi.org/10.1371/ journal.pone.0225323 Editor: Jonathan H. Sherman, George Washington University, UNITED STATES Received: August 5, 2019 Accepted: November 1, 2019 Published: November 21, 2019 Copyright: © 2019 D’Souza et al. This is an open access article distributed under the terms of the Creative Commons Attribution License, which permits unrestricted use, distribution, and reproduction in any medium, provided the original author and source are credited. Data Availability Statement: All processed DTI parameters will be made available in the Dryad data repository site http://www.datadryad.org/ with https://doi.org/10.5061/dryad.wh70rxwj0. Funding: This work was supported by Cancer League of Colorado (http://cancerleague.org/), DRO and JAT; American Cancer Society (https:// www.cancer.org/), DRO and JAT. Competing interests: SD: The author declares that he has no relevant or material financial or non- financial interests that relate to the research

Welcome message from author
This document is posted to help you gain knowledge. Please leave a comment to let me know what you think about it! Share it to your friends and learn new things together.
Transcript
RESEARCH ARTICLE
Fiber-tract localized diffusion coefficients
highlight patterns of white matter disruption
induced by proximity to glioma
Shawn D’Souza1,2, D. Ryan Ormond2, Jamie Costabile2, John A. ThompsonID2,3*
1 Department of Molecular Biology, University of Colorado, Boulder, CO, United States of America,
2 Department of Neurosurgery, University of Colorado Anschutz Medical Campus, Aurora, CO, United States
of America, 3 Department of Neurology, University of Colorado Anschutz Medical Campus, Aurora, CO,
United States of America
Abstract
Gliomas account for 26.5% of all primary central nervous system tumors. Recent studies
have used diffusion tensor imaging (DTI) to extract white matter fibers and the diffusion
coefficients derived from MR processing to provide useful, non-invasive insights into the
extent of tumor invasion, axonal integrity, and gross differentiation of glioma from metasta-
sis. Here, we extend this work by examining whether a tract-based analysis can improve
non-invasive localization of tumor impact on white matter integrity. This study retrospectively
analyzed preoperative magnetic resonance sequences highlighting contrast enhancement
and DTI scans of 13 subjects that were biopsy-confirmed to have either high or low-grade
glioma. We reconstructed the corticospinal tract and superior longitudinal fasciculus by
applying atlas-based regions of interest to fibers derived from whole-brain deterministic
streamline tractography. Within-subject comparison of hemispheric diffusion coefficients
(e.g., fractional anisotropy and mean diffusivity) indicated higher levels of white matter deg-
radation in the ipsilesional hemisphere. Novel application of along-tract analyses revealed
that tracts traversing the tumor region showed significant white matter degradation com-
pared to the contralesional hemisphere and ipsilesional tracts displaced by the tumor.
Introduction
Gliomas are the most prevalent form of intrinsic brain tumor [1] originating from neural tis-
sue composed primarily of astrocytes, oligodendrocytes, and ependymal cells [2] with varying
symptoms depending on the extent of invasion and location in the brain [3,4]. Surgical resec-
tion of the tumor area remains a mainstay of conventional therapy, and extent of resection is a
well-established predictor of patient survival [5–7]. Despite recent advances in surgical oncol-
ogy, predictive biomarkers of tumor progression, and recurrence based on in vivo measures of
microstructural change are still lacking, which could impact surgical decision-making.
Over the last 15 years, white matter fiber tracking, using diffusion tensor imaging (DTI) has
been investigated in different aspects of the surgical management of gliomas [8]. DTI is an in
PLOS ONE | https://doi.org/10.1371/journal.pone.0225323 November 21, 2019 1 / 16
a1111111111
a1111111111
a1111111111
a1111111111
a1111111111
OPEN ACCESS
Citation: D’Souza S, Ormond DR, Costabile J,
Thompson JA (2019) Fiber-tract localized diffusion
coefficients highlight patterns of white matter
disruption induced by proximity to glioma. PLoS
ONE 14(11): e0225323. https://doi.org/10.1371/
journal.pone.0225323
Editor: Jonathan H. Sherman, George Washington
University, UNITED STATES
Received: August 5, 2019
Accepted: November 1, 2019
Published: November 21, 2019
Copyright: © 2019 D’Souza et al. This is an open
access article distributed under the terms of the
Creative Commons Attribution License, which
permits unrestricted use, distribution, and
reproduction in any medium, provided the original
author and source are credited.
Data Availability Statement: All processed DTI
parameters will be made available in the Dryad data
repository site http://www.datadryad.org/ with
https://doi.org/10.5061/dryad.wh70rxwj0.
Funding: This work was supported by Cancer
League of Colorado (http://cancerleague.org/),
DRO and JAT; American Cancer Society (https://
www.cancer.org/), DRO and JAT.
Competing interests: SD: The author declares that
he has no relevant or material financial or non-
financial interests that relate to the research
vivo neuroimaging technique that measures anisotropic water diffusion to extract white matter
tractography [9]. Thus far, DTI has been utilized as a structural tool to improve pre- and
intraoperative resection technique and preserve postoperative functionality. Preoperative
imaging locates eloquent tracts at risk of damage during resection and confirms tumor regions
of excision and avoidance [10]. Preoperative imaging has also been used as a predictive tool to
assess postresection morbidity and mortality [11,12]. Intraoperative use allows for correction
of brain shift and increases the spatial resolution of functional brain mapping techniques, such
as direct electrical stimulation [13,14].
In addition to the use of DTI as a structural tool, it has also been applied to indirectly and
quantitatively measure the microstructural integrity of white matter. Four diffusion coeffi-
cients are produced from DTI analysis: axial diffusivity (AD), radial diffusivity (RD), mean dif-
fusivity (MD), and fractional anisotropy (FA). FA and MD have traditionally been used to
evaluate overall white matter health [15]. Though FA has shown high sensitivity to changes in
white matter water diffusion in the context of neuropathologies, such as multiple sclerosis,
schizophrenia, and Alzheimer’s disease, it cannot differentiate between specific types of neural
injury (e.g., demyelination, axonal injury, inflammation) [15–20]. Similarly, elevated MD has
consistently been observed in pathologies causing edema, inflammation, and necrosis [15]. To
specify neural injury and white matter microstructural integrity, recent studies have begun
incorporating AD and RD analyses. Early studies utilizing mice models found these measure-
ments can differentiate between pathological demyelination or axonal injury, with an inverse
relation between RD and myelination status and an inverse relation between AD and axonal
degradation [21,22]. This study aims to further support the use of DTI as a pathophysiological
tool by analyzing how glioma proximity affects the microstructural integrity of major white
matter pathways.
In the present study, we used a novel application of along-tract-analysis (ATA), which
allowed us to address how tumor impact varies with distance from tumor. ATA normalizes
tract length across subjects, accounting for patient-specific neural anatomy [23,24]. We
applied ATA to two major white matter pathways: Corticospinal Tract (CST), critical for con-
duction of voluntary movement from upper to lower motor neurons [25,26], and Superior
Longitudinal Fasciculus (SLF), critical for motor coordination and speech function [27,28].
The CST and SLF were chosen based on anatomy and significance in glioma resection cases
[27,29,30].
A within-in subject analysis was conducted on tumor-present and tumor-free hemispheres.
Gross tractographic analysis at the level of the whole hemisphere indicated higher white matter
degradation in the ipsilesional hemisphere compared to the contralesional hemisphere, con-
firming our previous findings [24]. Application of ATA to the CST and SLF highlighted
regions of localized white matter degradation, across subjects, adjacent to or traversing the
tumor area.
Methods
Subject demographics
All procedures and protocols for this study were reviewed and approved by the Colorado
Multi-Institutional Review Board (COMIRB 17–1136) and followed in accordance with the
relevant guidelines and regulations. Subjects included in this study were patients undergoing
resective surgery, from January to December 2016 at the University of Colorado Hospital, to
remove an intracranial tumor classified by histopathology as glioma requiring functional
imaging due to localization in or near language or motor cortex. Eight patients were male
(62%) and the average age was 40 years (range: 20–73). Data were collected retrospectively
Along tract analyses indicate focal impact of glioma
PLOS ONE | https://doi.org/10.1371/journal.pone.0225323 November 21, 2019 2 / 16
described in this paper. DRO: The author declares
that he has no relevant or material financial or non-
financial interests that relate to the research
described in this paper. JC: Received a fellowship
sponsored by Synaptive Medical. JAT: The author
declares that he has no relevant or material
financial or non-financial interests that relate to the
research described in this paper.
from patient chart review through the application of a consent exempt IRB protocol wherein
only clinical data were reviewed after deidentification by a member of the study team. Initial
patient population (n = 16) was screened before analysis. Two cases were removed due to
tumor infiltration of the contralateral hemisphere. One case was removed due to the tumor
being located within the ventricle, which prevented any tracts from running through the
tumor region of interest. After screening, the glioma cases (n = 13) included in this study were
a heterogeneous group of both high and low-grade tumors. Data represent a subset of patient
data previously analyzed in Ormond et al., 2017.
Imaging sequence parameters
All images were obtained using a 3.0-T whole-body MR imager (Signa HDx; GE Medical Sys-
tems, Milwaukee, Wisconsin, USA) using single-shot echo-planar imaging. Acquisition times
were approximately 3.5 minutes for T2-weighted images (T2w) and 9 minutes for DT images.
For T2w, TE = 102.96ms, TR = 5781ms, and flip angle = 90˚. Data were recorded with a 512 x
512 spatial resolution in a 24 x 24cm field of view, a slice thickness of 2mm, and zero slice gap.
For DT images, TE = 84.4ms and TR = 16,000ms with the diffusion gradient encoding in 32
directions at b = 1,000 s/mm2 and an additional measurement without the diffusion gradient
(b = 0 s/mm2). Data were recorded with a 128 x 128 spatial resolution in a 24 x 24cm field of
view. A total of 50 sections were obtained with a slice thickness of 2.6mm and zero slice gap.
T2w segmentations using ITK-SNAP
Preoperative T2w images were linearly registered to its respective DT images using DSI Studio
(http://dsi-studio.labsolver.org) [31]. For all cases, the diseased tissue region (“lesion”) was
manually segmented using ITK-SNAP [32] and registered, preoperative T2w scans acquired at
most two weeks prior to surgery. T2w hyperintensities were used to define the lesion volume
as the T2w hyperintensity identifies edema. The peritumoral edema volumes are expected to
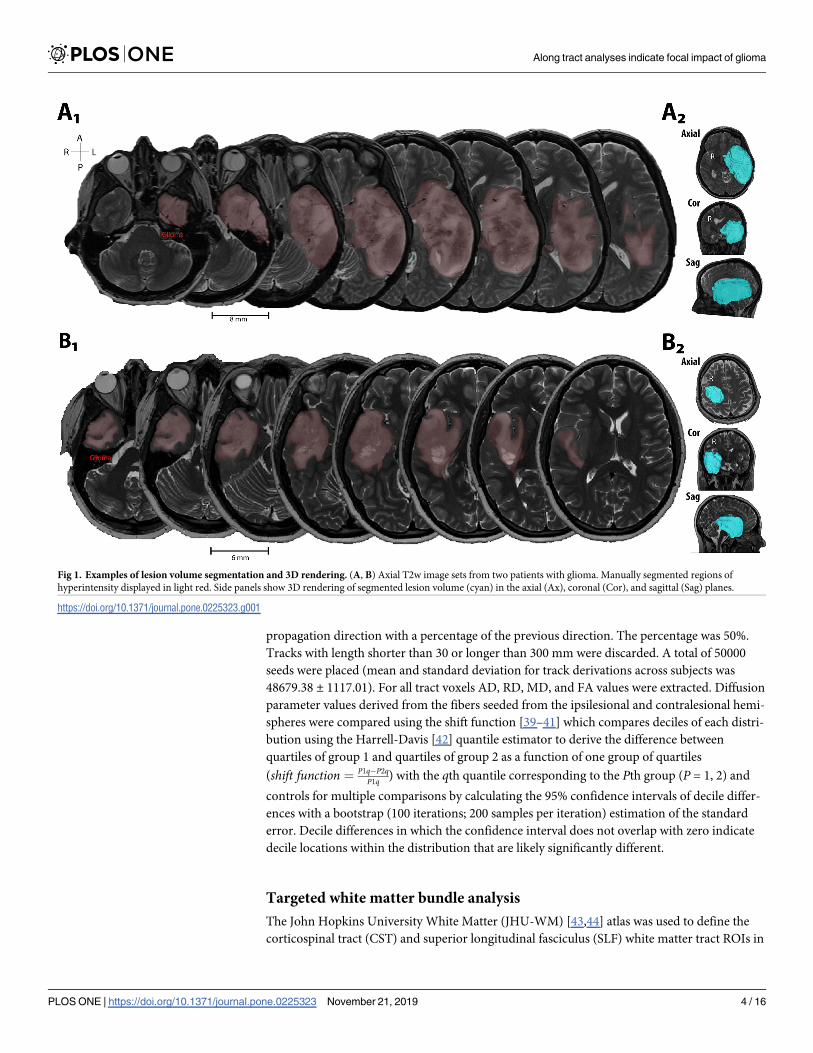
include the tumor volume as well [33]; see Fig 1 for example segmentations. Final segmenta-
tions were verified by a neurosurgeon (DRO).
White matter tract processing
All processing steps were conducted using DSI Studio. The diffusion data were reconstructed
using q-space diffeomorphic reconstruction [31] to obtain the spin distribution function [34].
A diffusion sampling length ratio of 1.25 was used. Restricted diffusion was quantified using
restricted diffusion imaging [35]. The b-table was checked by an automatic quality control
routine to ensure its accuracy [36]. Diffusion coefficient (AD, RD, MD, FA) maps were
extracted for each case and used in the along-tract-analysis detailed below.
Hemispheric Analysis
The Automated Anatomical Labeling Atlas (AAL) was used to autosegment left (L) and right
(R) hemisphere regions of interest (ROI)[37]. Fiber tracking for the tumor hemisphere was
determined by defining the hemisphere ipsilateral to the tumor as an ROI, and the contralat-
eral hemisphere as a region of avoidance (ROA). For fiber tracking in the non-tumor hemi-
sphere, the ROI and ROA are swapped: defining the hemisphere contralateral to the tumor as
an ROI and the hemisphere ipsilateral to the tumor as a ROA. A deterministic fiber tracking
algorithm [38] was applied using a whole-brain seeding region. The FA threshold was auto-
matically set at 0.15. The angular threshold was 55 degrees. The step size was randomly
selected from 1 voxel (i.e., 1 mm). The fiber trajectories were smoothed by averaging the
Along tract analyses indicate focal impact of glioma
PLOS ONE | https://doi.org/10.1371/journal.pone.0225323 November 21, 2019 3 / 16
propagation direction with a percentage of the previous direction. The percentage was 50%.
Tracks with length shorter than 30 or longer than 300 mm were discarded. A total of 50000
seeds were placed (mean and standard deviation for track derivations across subjects was
48679.38 ± 1117.01). For all tract voxels AD, RD, MD, and FA values were extracted. Diffusion
parameter values derived from the fibers seeded from the ipsilesional and contralesional hemi-
spheres were compared using the shift function [39–41] which compares deciles of each distri-
bution using the Harrell-Davis [42] quantile estimator to derive the difference between
quartiles of group 1 and quartiles of group 2 as a function of one group of quartiles
(shift function ¼ P1q� P2qP1q ) with the qth quantile corresponding to the Pth group (P = 1, 2) and
controls for multiple comparisons by calculating the 95% confidence intervals of decile differ-
ences with a bootstrap (100 iterations; 200 samples per iteration) estimation of the standard
error. Decile differences in which the confidence interval does not overlap with zero indicate
decile locations within the distribution that are likely significantly different.
Targeted white matter bundle analysis
The John Hopkins University White Matter (JHU-WM) [43,44] atlas was used to define the
corticospinal tract (CST) and superior longitudinal fasciculus (SLF) white matter tract ROIs in
Fig 1. Examples of lesion volume segmentation and 3D rendering. (A, B) Axial T2w image sets from two patients with glioma. Manually segmented regions of
hyperintensity displayed in light red. Side panels show 3D rendering of segmented lesion volume (cyan) in the axial (Ax), coronal (Cor), and sagittal (Sag) planes.
https://doi.org/10.1371/journal.pone.0225323.g001
Along tract analyses indicate focal impact of glioma
PLOS ONE | https://doi.org/10.1371/journal.pone.0225323 November 21, 2019 4 / 16
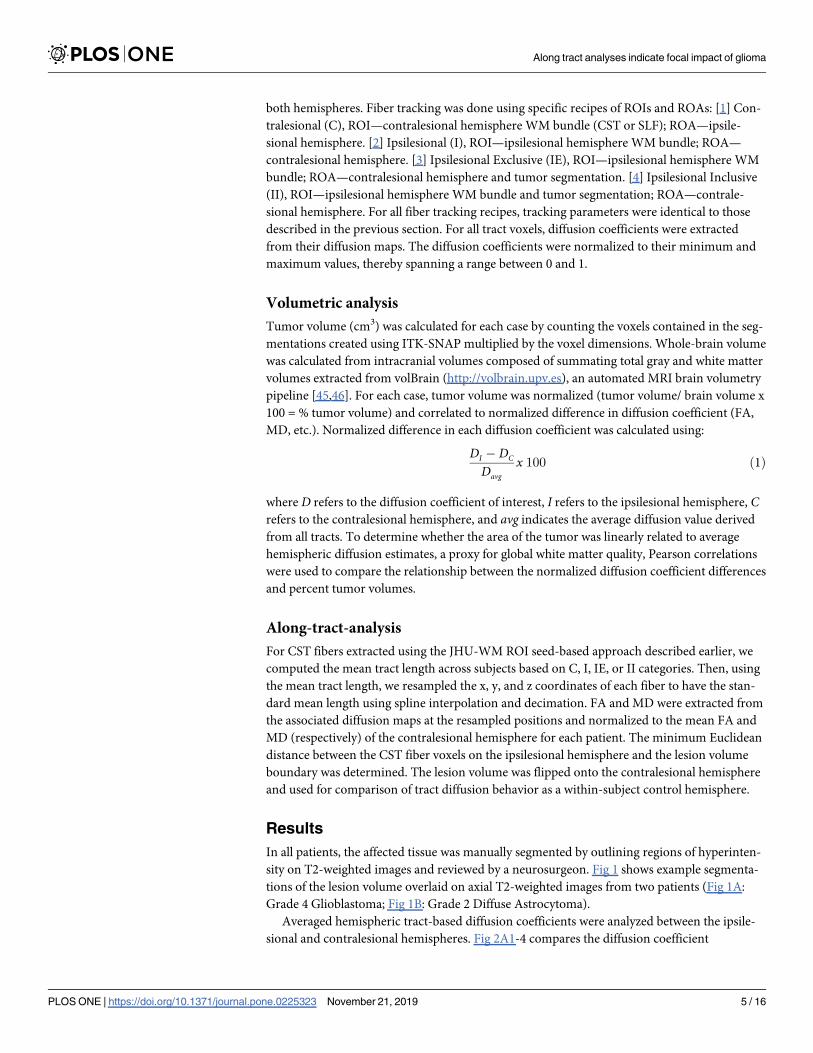
both hemispheres. Fiber tracking was done using specific recipes of ROIs and ROAs: [1] Con-
tralesional (C), ROI—contralesional hemisphere WM bundle (CST or SLF); ROA—ipsile-
sional hemisphere. [2] Ipsilesional (I), ROI—ipsilesional hemisphere WM bundle; ROA—
contralesional hemisphere. [3] Ipsilesional Exclusive (IE), ROI—ipsilesional hemisphere WM
bundle; ROA—contralesional hemisphere and tumor segmentation. [4] Ipsilesional Inclusive
(II), ROI—ipsilesional hemisphere WM bundle and tumor segmentation; ROA—contrale-
sional hemisphere. For all fiber tracking recipes, tracking parameters were identical to those
described in the previous section. For all tract voxels, diffusion coefficients were extracted
from their diffusion maps. The diffusion coefficients were normalized to their minimum and
maximum values, thereby spanning a range between 0 and 1.
Volumetric analysis
Tumor volume (cm3) was calculated for each case by counting the voxels contained in the seg-
mentations created using ITK-SNAP multiplied by the voxel dimensions. Whole-brain volume
was calculated from intracranial volumes composed of summating total gray and white matter
volumes extracted from volBrain (http://volbrain.upv.es), an automated MRI brain volumetry
pipeline [45,46]. For each case, tumor volume was normalized (tumor volume/ brain volume x
100 = % tumor volume) and correlated to normalized difference in diffusion coefficient (FA,
MD, etc.). Normalized difference in each diffusion coefficient was calculated using:
DI � DC
Davgx 100 ð1Þ
where D refers to the diffusion coefficient of interest, I refers to the ipsilesional hemisphere, Crefers to the contralesional hemisphere, and avg indicates the average diffusion value derived
from all tracts. To determine whether the area of the tumor was linearly related to average
hemispheric diffusion estimates, a proxy for global white matter quality, Pearson correlations
were used to compare the relationship between the normalized diffusion coefficient differences
and percent tumor volumes.
Along-tract-analysis
For CST fibers extracted using the JHU-WM ROI seed-based approach described earlier, we
computed the mean tract length across subjects based on C, I, IE, or II categories. Then, using
the mean tract length, we resampled the x, y, and z coordinates of each fiber to have the stan-
dard mean length using spline interpolation and decimation. FA and MD were extracted from
the associated diffusion maps at the resampled positions and normalized to the mean FA and
MD (respectively) of the contralesional hemisphere for each patient. The minimum Euclidean
distance between the CST fiber voxels on the ipsilesional hemisphere and the lesion volume
boundary was determined. The lesion volume was flipped onto the contralesional hemisphere
and used for comparison of tract diffusion behavior as a within-subject control hemisphere.
Results
In all patients, the affected tissue was manually segmented by outlining regions of hyperinten-
sity on T2-weighted images and reviewed by a neurosurgeon. Fig 1 shows example segmenta-
tions of the lesion volume overlaid on axial T2-weighted images from two patients (Fig 1A:
Grade 4 Glioblastoma; Fig 1B: Grade 2 Diffuse Astrocytoma).
Averaged hemispheric tract-based diffusion coefficients were analyzed between the ipsile-
sional and contralesional hemispheres. Fig 2A1-4 compares the diffusion coefficient
Along tract analyses indicate focal impact of glioma
PLOS ONE | https://doi.org/10.1371/journal.pone.0225323 November 21, 2019 5 / 16
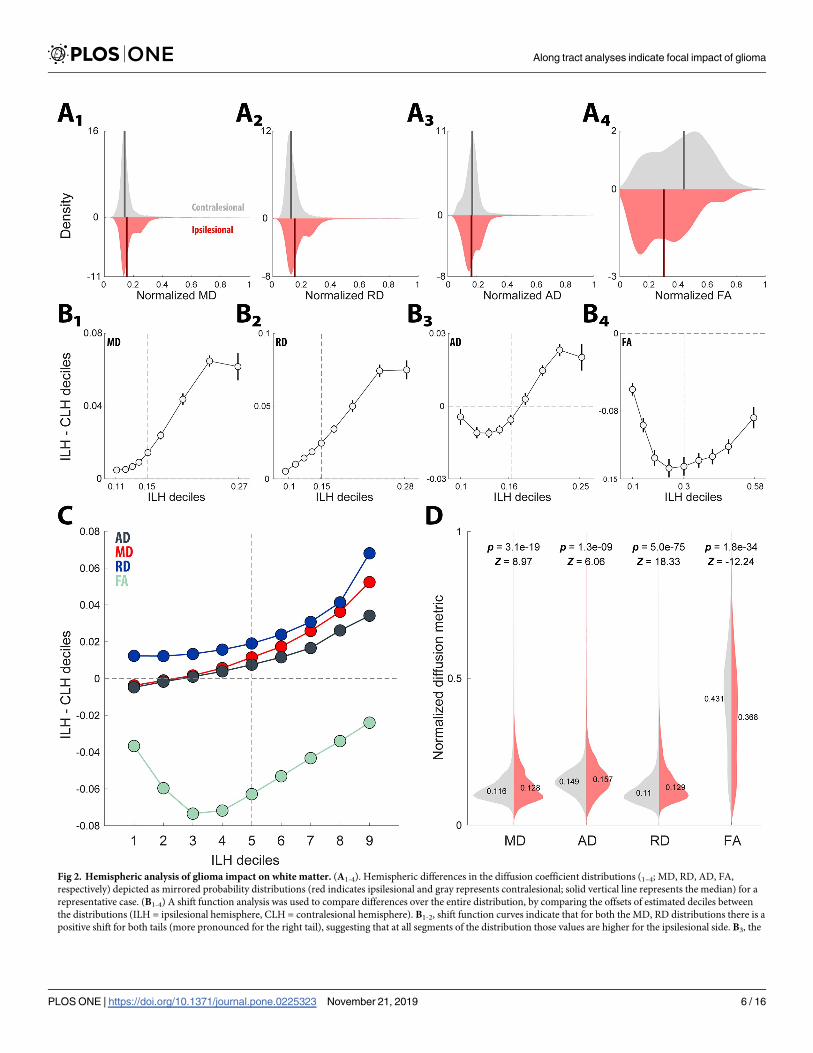
Fig 2. Hemispheric analysis of glioma impact on white matter. (A1-4). Hemispheric differences in the diffusion coefficient distributions (1–4; MD, RD, AD, FA,
respectively) depicted as mirrored probability distributions (red indicates ipsilesional and gray represents contralesional; solid vertical line represents the median) for a
representative case. (B1-4) A shift function analysis was used to compare differences over the entire distribution, by comparing the offsets of estimated deciles between
the distributions (ILH = ipsilesional hemisphere, CLH = contralesional hemisphere). B1-2, shift function curves indicate that for both the MD, RD distributions there is a
positive shift for both tails (more pronounced for the right tail), suggesting that at all segments of the distribution those values are higher for the ipsilesional side. B3, the
Along tract analyses indicate focal impact of glioma
PLOS ONE | https://doi.org/10.1371/journal.pone.0225323 November 21, 2019 6 / 16
distributions (AD, RD, MD, and FA) between the ipsilesional and contralesional hemispheres
for a representative case (red identifies ipsilesional and gray indicates contralesional; the solid
line demarcates the median). A shift function, which computes 95% confidence intervals for
the difference in decile offsets to compare overall shape differences between the distributions,
was utilized. Negative and positive offsets from 0, with confidence interval boundaries that do
not intersect 0, indicate decile locations between the distributions that are statistically signifi-
cantly different. Fig 2B1-4 shows that boot-strapped derivations of confidence interval bound-
aries for each subtracted distribution decile in Fig 2A1-4, show that all four diffusion
coefficients differ between the hemispheres. Furthermore, the shift function results obtained
from a single case (Fig 2A&2B), were representative of the population under study (Fig 2C).
Finally, in Fig 2D, statistical analysis (Wilcoxon rank-sum test) of downsampled (by a factor of
50) tract-based diffusion coefficient distributions replicated the shift function analysis: the ipsi-
lesional hemisphere exhibited higher MD (Z = 8.97, p = 3.1e-19), higher AD (Z = 6.06,
p = 1.3e-9), higher RD (Z = 18.33, z = 5.03–75) and lower FA (Z = -12.24, p = 1.8e-34) com-
pared to the contralesional hemisphere.
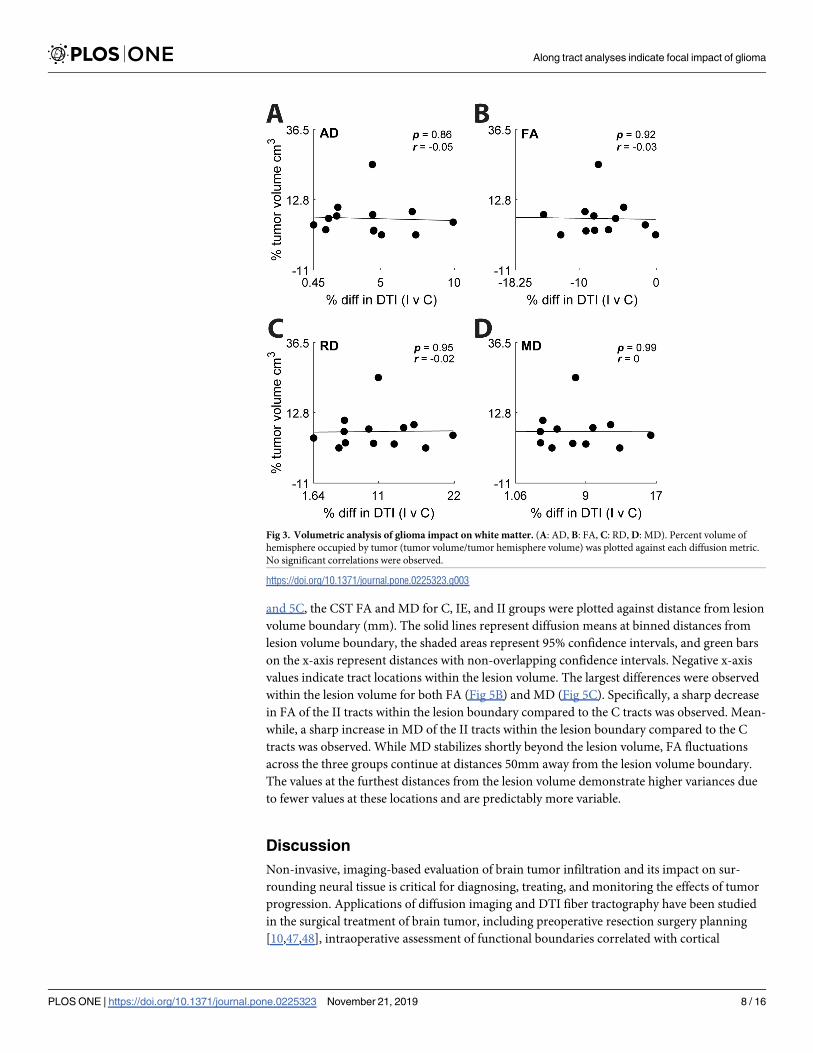
To determine whether the size of lesion contributed to the hemispheric difference in diffu-
sion coefficient representation we assessed the relationship between the relative size of the
lesion volume and the difference in hemispheric diffusion (Fig 3). AD, FA, and RD exhibited
non-significant, linear correlations; with Pearson’s correlation coefficient equal to -0.05, -0.03,
and 0.02, respectively. MD exhibited no linear correlation with Pearson’s correlation coeffi-
cient equal to 0.
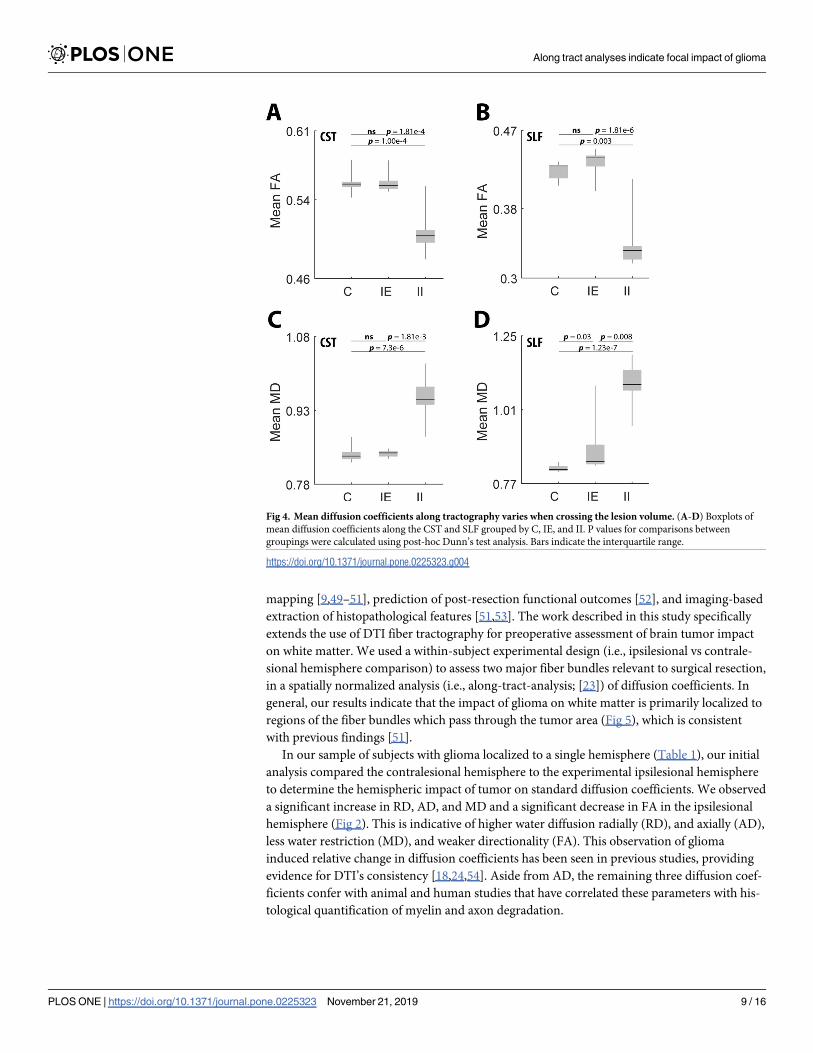
Boxplots were generated to illustrate the distribution of FA and MD between the three
experimental groups (C, IE, and II) for the CSTs and SLFs of all patients (Fig 4). Comparisons
between the experimental group and diffusion coefficient for the isolated tracts were con-
ducted using a Kruskal-Wallis H-test (a non-parametric ANOVA). Post-hoc Dunn’s test anal-
ysis was conducted for comparisons between experimental groups if H-test reached
significance (p<0.05). For the CST, the Kruskal-Wallis H-test showed significant difference in
distribution for FA and MD (FACST, H(2) = 8.46, p = 0.0145; MDCST, H(3) = 9.557, 0.0084).
The post-hoc analysis for the CST showed that II tracts had a significant decrease in FA and
significant increase in MD compared to the C and IE tracts (FACST: C v II p = 1.005 e-4; IE v II
p = 1.81 e-4; MDCST: C v II p = 7.3 e-6; IE v II p = 1.81 e-3). No significant differences were
seen in FA or MD of the CST between C v IE (FACST: C v IE p = 0.708; MDCST: C v IE
p = 0.68). For the SLF, the Kruskal-Wallis H-test showed significant differences in distribu-
tions of FA and MD (FASLF, H(2) = 6.233, p = 0.044; MDSLF, H(2) = 19.004, p = 7.46E-5). The
post-hoc analysis for the SLF showed that II tracts had a significant decrease in FA and signifi-
cant increase in MD compared to the C and IE tracts (FASLF: C v II p = 0.003; IE v II p = 1.81
e-6; MDSLF: C v II p = 1.23 e-7; IE v II p = 0.008). A significant increase was also observed in
SLF IE MD compared to C (MDSLF: C v IE p = 0.03). No significant differences were seen in
SLF FA between C v IE (FASLF: C v IE p = 0.702).
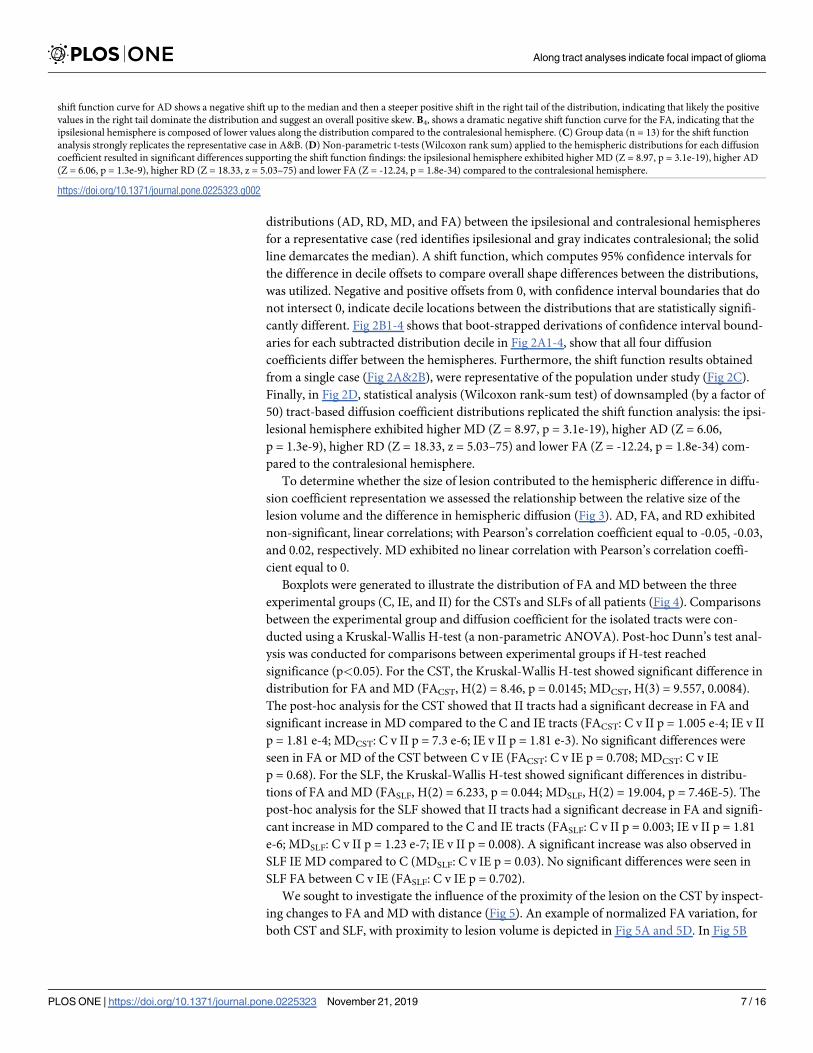
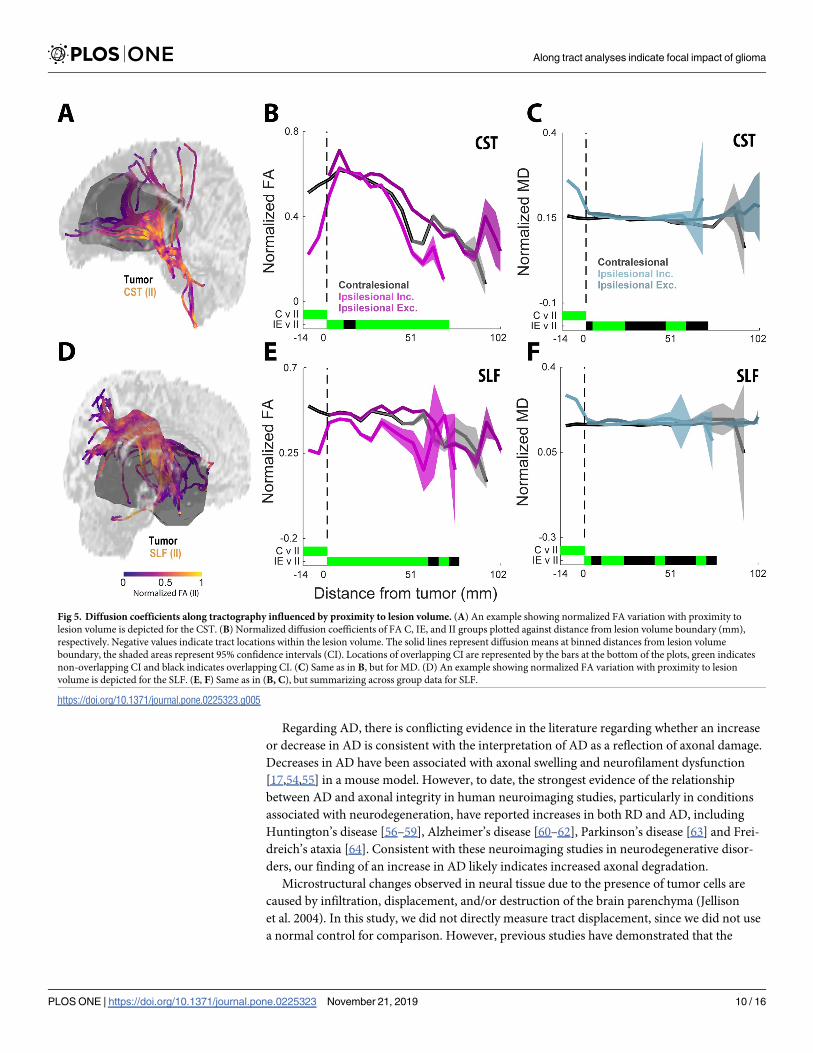
We sought to investigate the influence of the proximity of the lesion on the CST by inspect-
ing changes to FA and MD with distance (Fig 5). An example of normalized FA variation, for
both CST and SLF, with proximity to lesion volume is depicted in Fig 5A and 5D. In Fig 5B
shift function curve for AD shows a negative shift up to the median and then a steeper positive shift in the right tail of the distribution, indicating that likely the positive
values in the right tail dominate the distribution and suggest an overall positive skew. B4, shows a dramatic negative shift function curve for the FA, indicating that the
ipsilesional hemisphere is composed of lower values along the distribution compared to the contralesional hemisphere. (C) Group data (n = 13) for the shift function
analysis strongly replicates the representative case in A&B. (D) Non-parametric t-tests (Wilcoxon rank sum) applied to the hemispheric distributions for each diffusion
coefficient resulted in significant differences supporting the shift function findings: the ipsilesional hemisphere exhibited higher MD (Z = 8.97, p = 3.1e-19), higher AD
(Z = 6.06, p = 1.3e-9), higher RD (Z = 18.33, z = 5.03–75) and lower FA (Z = -12.24, p = 1.8e-34) compared to the contralesional hemisphere.
https://doi.org/10.1371/journal.pone.0225323.g002
Along tract analyses indicate focal impact of glioma
PLOS ONE | https://doi.org/10.1371/journal.pone.0225323 November 21, 2019 7 / 16
and 5C, the CST FA and MD for C, IE, and II groups were plotted against distance from lesion
volume boundary (mm). The solid lines represent diffusion means at binned distances from
lesion volume boundary, the shaded areas represent 95% confidence intervals, and green bars
on the x-axis represent distances with non-overlapping confidence intervals. Negative x-axis
values indicate tract locations within the lesion volume. The largest differences were observed
within the lesion volume for both FA (Fig 5B) and MD (Fig 5C). Specifically, a sharp decrease
in FA of the II tracts within the lesion boundary compared to the C tracts was observed. Mean-
while, a sharp increase in MD of the II tracts within the lesion boundary compared to the C
tracts was observed. While MD stabilizes shortly beyond the lesion volume, FA fluctuations
across the three groups continue at distances 50mm away from the lesion volume boundary.
The values at the furthest distances from the lesion volume demonstrate higher variances due
to fewer values at these locations and are predictably more variable.
Discussion
Non-invasive, imaging-based evaluation of brain tumor infiltration and its impact on sur-
rounding neural tissue is critical for diagnosing, treating, and monitoring the effects of tumor
progression. Applications of diffusion imaging and DTI fiber tractography have been studied
in the surgical treatment of brain tumor, including preoperative resection surgery planning
[10,47,48], intraoperative assessment of functional boundaries correlated with cortical
Fig 3. Volumetric analysis of glioma impact on white matter. (A: AD, B: FA, C: RD, D: MD). Percent volume of
hemisphere occupied by tumor (tumor volume/tumor hemisphere volume) was plotted against each diffusion metric.
No significant correlations were observed.
https://doi.org/10.1371/journal.pone.0225323.g003
Along tract analyses indicate focal impact of glioma
PLOS ONE | https://doi.org/10.1371/journal.pone.0225323 November 21, 2019 8 / 16
mapping [9,49–51], prediction of post-resection functional outcomes [52], and imaging-based
extraction of histopathological features [51,53]. The work described in this study specifically
extends the use of DTI fiber tractography for preoperative assessment of brain tumor impact
on white matter. We used a within-subject experimental design (i.e., ipsilesional vs contrale-
sional hemisphere comparison) to assess two major fiber bundles relevant to surgical resection,
in a spatially normalized analysis (i.e., along-tract-analysis; [23]) of diffusion coefficients. In
general, our results indicate that the impact of glioma on white matter is primarily localized to
regions of the fiber bundles which pass through the tumor area (Fig 5), which is consistent
with previous findings [51].
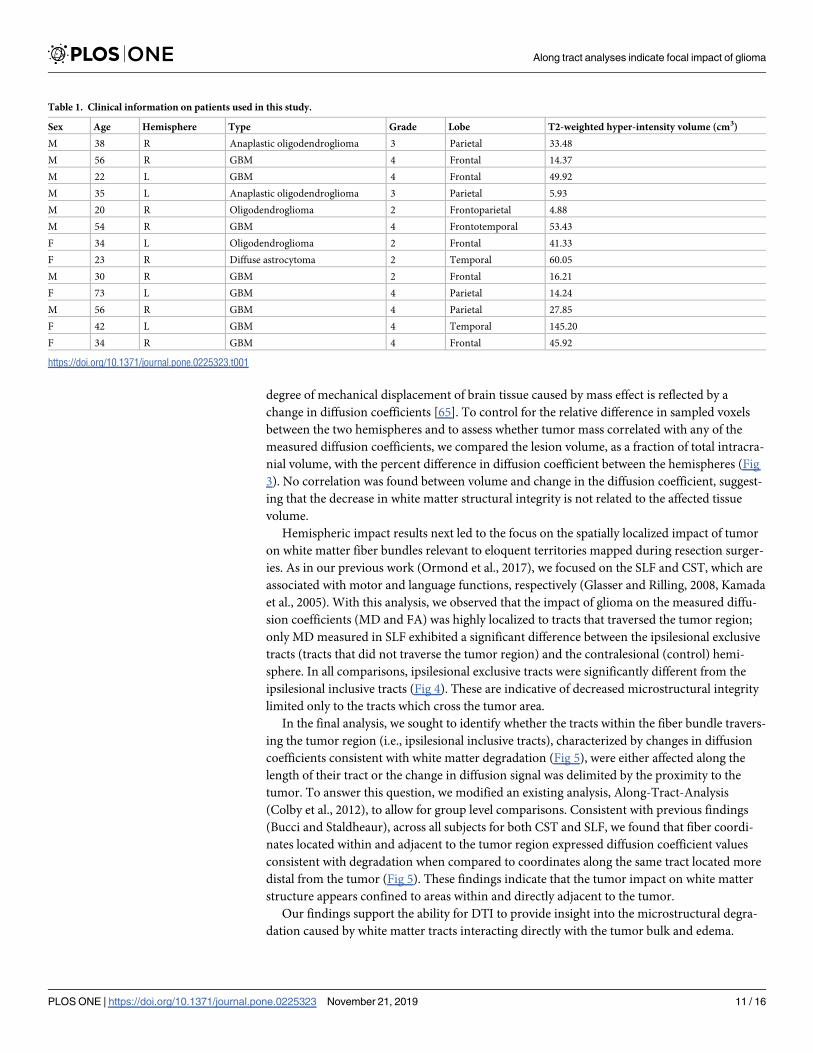
In our sample of subjects with glioma localized to a single hemisphere (Table 1), our initial
analysis compared the contralesional hemisphere to the experimental ipsilesional hemisphere
to determine the hemispheric impact of tumor on standard diffusion coefficients. We observed
a significant increase in RD, AD, and MD and a significant decrease in FA in the ipsilesional
hemisphere (Fig 2). This is indicative of higher water diffusion radially (RD), and axially (AD),
less water restriction (MD), and weaker directionality (FA). This observation of glioma
induced relative change in diffusion coefficients has been seen in previous studies, providing
evidence for DTI’s consistency [18,24,54]. Aside from AD, the remaining three diffusion coef-
ficients confer with animal and human studies that have correlated these parameters with his-
tological quantification of myelin and axon degradation.
Fig 4. Mean diffusion coefficients along tractography varies when crossing the lesion volume. (A-D) Boxplots of
mean diffusion coefficients along the CST and SLF grouped by C, IE, and II. P values for comparisons between
groupings were calculated using post-hoc Dunn’s test analysis. Bars indicate the interquartile range.
https://doi.org/10.1371/journal.pone.0225323.g004
Along tract analyses indicate focal impact of glioma
PLOS ONE | https://doi.org/10.1371/journal.pone.0225323 November 21, 2019 9 / 16
Regarding AD, there is conflicting evidence in the literature regarding whether an increase
or decrease in AD is consistent with the interpretation of AD as a reflection of axonal damage.
Decreases in AD have been associated with axonal swelling and neurofilament dysfunction
[17,54,55] in a mouse model. However, to date, the strongest evidence of the relationship
between AD and axonal integrity in human neuroimaging studies, particularly in conditions
associated with neurodegeneration, have reported increases in both RD and AD, including
Huntington’s disease [56–59], Alzheimer’s disease [60–62], Parkinson’s disease [63] and Frei-
dreich’s ataxia [64]. Consistent with these neuroimaging studies in neurodegenerative disor-
ders, our finding of an increase in AD likely indicates increased axonal degradation.
Microstructural changes observed in neural tissue due to the presence of tumor cells are
caused by infiltration, displacement, and/or destruction of the brain parenchyma (Jellison
et al. 2004). In this study, we did not directly measure tract displacement, since we did not use
a normal control for comparison. However, previous studies have demonstrated that the
Fig 5. Diffusion coefficients along tractography influenced by proximity to lesion volume. (A) An example showing normalized FA variation with proximity to
lesion volume is depicted for the CST. (B) Normalized diffusion coefficients of FA C, IE, and II groups plotted against distance from lesion volume boundary (mm),
respectively. Negative values indicate tract locations within the lesion volume. The solid lines represent diffusion means at binned distances from lesion volume
boundary, the shaded areas represent 95% confidence intervals (CI). Locations of overlapping CI are represented by the bars at the bottom of the plots, green indicates
non-overlapping CI and black indicates overlapping CI. (C) Same as in B, but for MD. (D) An example showing normalized FA variation with proximity to lesion
volume is depicted for the SLF. (E, F) Same as in (B, C), but summarizing across group data for SLF.
https://doi.org/10.1371/journal.pone.0225323.g005
Along tract analyses indicate focal impact of glioma
PLOS ONE | https://doi.org/10.1371/journal.pone.0225323 November 21, 2019 10 / 16
degree of mechanical displacement of brain tissue caused by mass effect is reflected by a
change in diffusion coefficients [65]. To control for the relative difference in sampled voxels
between the two hemispheres and to assess whether tumor mass correlated with any of the
measured diffusion coefficients, we compared the lesion volume, as a fraction of total intracra-
nial volume, with the percent difference in diffusion coefficient between the hemispheres (Fig
3). No correlation was found between volume and change in the diffusion coefficient, suggest-
ing that the decrease in white matter structural integrity is not related to the affected tissue
volume.
Hemispheric impact results next led to the focus on the spatially localized impact of tumor
on white matter fiber bundles relevant to eloquent territories mapped during resection surger-
ies. As in our previous work (Ormond et al., 2017), we focused on the SLF and CST, which are
associated with motor and language functions, respectively (Glasser and Rilling, 2008, Kamada
et al., 2005). With this analysis, we observed that the impact of glioma on the measured diffu-
sion coefficients (MD and FA) was highly localized to tracts that traversed the tumor region;
only MD measured in SLF exhibited a significant difference between the ipsilesional exclusive
tracts (tracts that did not traverse the tumor region) and the contralesional (control) hemi-
sphere. In all comparisons, ipsilesional exclusive tracts were significantly different from the
ipsilesional inclusive tracts (Fig 4). These are indicative of decreased microstructural integrity
limited only to the tracts which cross the tumor area.
In the final analysis, we sought to identify whether the tracts within the fiber bundle travers-
ing the tumor region (i.e., ipsilesional inclusive tracts), characterized by changes in diffusion
coefficients consistent with white matter degradation (Fig 5), were either affected along the
length of their tract or the change in diffusion signal was delimited by the proximity to the
tumor. To answer this question, we modified an existing analysis, Along-Tract-Analysis
(Colby et al., 2012), to allow for group level comparisons. Consistent with previous findings
(Bucci and Staldheaur), across all subjects for both CST and SLF, we found that fiber coordi-
nates located within and adjacent to the tumor region expressed diffusion coefficient values
consistent with degradation when compared to coordinates along the same tract located more
distal from the tumor (Fig 5). These findings indicate that the tumor impact on white matter
structure appears confined to areas within and directly adjacent to the tumor.
Our findings support the ability for DTI to provide insight into the microstructural degra-
dation caused by white matter tracts interacting directly with the tumor bulk and edema.
Table 1. Clinical information on patients used in this study.
Sex Age Hemisphere Type Grade Lobe T2-weighted hyper-intensity volume (cm3)
M 38 R Anaplastic oligodendroglioma 3 Parietal 33.48
M 56 R GBM 4 Frontal 14.37
M 22 L GBM 4 Frontal 49.92
M 35 L Anaplastic oligodendroglioma 3 Parietal 5.93
M 20 R Oligodendroglioma 2 Frontoparietal 4.88
M 54 R GBM 4 Frontotemporal 53.43
F 34 L Oligodendroglioma 2 Frontal 41.33
F 23 R Diffuse astrocytoma 2 Temporal 60.05
M 30 R GBM 2 Frontal 16.21
F 73 L GBM 4 Parietal 14.24
M 56 R GBM 4 Parietal 27.85
F 42 L GBM 4 Temporal 145.20
F 34 R GBM 4 Frontal 45.92
https://doi.org/10.1371/journal.pone.0225323.t001
Along tract analyses indicate focal impact of glioma
PLOS ONE | https://doi.org/10.1371/journal.pone.0225323 November 21, 2019 11 / 16
Hemispheric AD, RD, MD, and FA coefficients demonstrated sensitivity to the presence of a
lesion. Moreover, no relationship between these diffusion coefficients and the size of the lesion
volume could be detected. Upon further investigation, the impact of the lesion volume on the
primary diffusion coefficients FA and MD was primarily contained within the tracts that
crossed the lesion volume. Finally, the influence of the lesion on the tracts passing through it
appeared to be contained at the distance within or near the volume itself. Altogether, our study
demonstrates the impact of glioma on tractography proximal to the site of the lesion.
Limitations
This study comes with several limitations which should be improved upon in future experi-
ments. To use a within-subject experimental design to compare diffusion imaging data, we
included only those subjects with unilaterally localized glioma, which limits the generalizability
of the results. This design was selected for two reasons: 1) development of an individualized
approach to applying DTI analyses for preoperative surgical planning, and 2) avoid compari-
son to normal brain which could increase the likelihood of uninformative differences. Further,
the along-tract-analysis employed in this study comparing inclusive and exclusive tracts from
the ipsilesional hemisphere could be applied to whole-brain tractography in the context of
midline crossing gliomas. Similar to previous studies, we derived tumor boundaries from T2w
images, which has the inherent issue of confounding tumor, edema, and peritumoral regions
(Stadlhear, Provenzale, Lu et al, 2014). However, as indicated in Fig 5, diffusion coefficient val-
ues (FA and MD) within and near the border of the tumor appear relatively stable, so whether
the rim of the tumor region was composed of a combination of edema or tumor did not appear
to affect the coefficient. For future studies, since both edematous and neoplastic tissue regions
are believed to influence diffusion coefficients, one way to alleviate this issue would be to use
higher resolution tensor estimations such as HARDI or Q-Ball, which help to resolve known
issues concerning regions with complex diffusion patterns. Additionally, our method for iden-
tifying white matter bundles was intended to increase consistency and objectivity across sub-
jects. However, as with any atlas-based ROI approach, the computed bundle for some cases
may be significantly displaced due to the presence of the tumor. Finally, although our findings
on the ipsilesional hemisphere regarding diffusion coefficients are consistent with compro-
mised white matter, we must acknowledge that open questions remain regarding whether
these parameters truly reflect aspects of axon or myelin degeneration.
Acknowledgments
We thank the subjects that participated in this study.
Author Contributions
Conceptualization: D. Ryan Ormond, John A. Thompson.
Data curation: Shawn D’Souza, Jamie Costabile, John A. Thompson.
Formal analysis: Shawn D’Souza, Jamie Costabile, John A. Thompson.
Funding acquisition: D. Ryan Ormond, John A. Thompson.
Investigation: D. Ryan Ormond, John A. Thompson.
Project administration: John A. Thompson.
Supervision: John A. Thompson.
Along tract analyses indicate focal impact of glioma
PLOS ONE | https://doi.org/10.1371/journal.pone.0225323 November 21, 2019 12 / 16
Writing – review & editing: Shawn D’Souza, D. Ryan Ormond, Jamie Costabile, John A.
Thompson.
References1. Ostrom QT, Gittleman H, Liao P, Vecchione-Koval T, Wolinsky Y, Kruchko C, et al. CBTRUS Statistical
Report: Primary brain and other central nervous system tumors diagnosed in the United States in
2010–2014. Neuro Oncol. Oxford University Press; 2017; 19: v1–v88. https://doi.org/10.1093/neuonc/
nox158 PMID: 29117289
2. Louis DN, Perry A, Reifenberger G, von Deimling A, Figarella-Branger D, Cavenee WK, et al. The 2016
World Health Organization Classification of Tumors of the Central Nervous System: a summary. Acta
Neuropathol. Springer Berlin Heidelberg; 2016; 131: 803–820. https://doi.org/10.1007/s00401-016-
1545-1 PMID: 27157931
3. Raza SM, Lang FF, Aggarwal BB, Fuller GN, Wildrick DM, Sawaya R. Necrosis and Glioblastoma: A
Friend or a Foe? A Review and a Hypothesis. Neurosurgery. Oxford University Press; 2002; 51: 2–13.
https://doi.org/10.1097/00006123-200207000-00002 PMID: 12182418
4. Goldbrunner R, Ruge M, Kocher M, Lucas CW, Galldiks N, Grau S. The treatment of gliomas in adult-
hood. Dtsch Aerzteblatt Online. 2018; https://doi.org/10.3238/arztebl.2018.0356 PMID: 29914619
5. Li YM, Suki D, Hess K, Sawaya R. The influence of maximum safe resection of glioblastoma on survival
in 1229 patients: Can we do better than gross-total resection? J Neurosurg. 2016; 124: 977–988.
https://doi.org/10.3171/2015.5.JNS142087 PMID: 26495941
6. Kreth FW, Berlis A, Spiropoulou V, Faist M, Scheremet R, Rossner R, et al. The role of tumor resection
in the treatment of glioblastoma multiforme in adults. Cancer. 1999; 86: 2117–23. Available: http://www.
ncbi.nlm.nih.gov/pubmed/10570440 PMID: 10570440
7. Stummer W, Reulen H-J, Meinel T, Pichlmeier U, Schumacher W, Tonn J-C, et al. Extent of Resection
and Survival in Glioblastoma Multiforme. Neurosurgery. 2008; 62: 564–576. https://doi.org/10.1227/01.
neu.0000317304.31579.17 PMID: 18425006
8. Costabile JD, Alaswad E, D’Souza S, Thompson JA, Ormond DR. Current Applications of Diffusion
Tensor Imaging and Tractography in Intracranial Tumor Resection. Front Oncol. Frontiers Media SA;
2019; 9: 426. https://doi.org/10.3389/fonc.2019.00426 PMID: 31192130
9. Bucci M, Mandelli ML, Berman JI, Amirbekian B, Nguyen C, Berger MS, et al. Quantifying diffusion MRI
tractography of the corticospinal tract in brain tumors with deterministic and probabilistic methods. Neu-
roImage Clin. Elsevier; 2013; 3: 361–368. https://doi.org/10.1016/J.NICL.2013.08.008 PMID:
24273719
10. Essayed WI, Zhang F, Unadkat P, Cosgrove GR, Golby AJ, O’Donnell LJ. White matter tractography
for neurosurgical planning: A topography-based review of the current state of the art. NeuroImage Clin.
2017; 15: 659–672. https://doi.org/10.1016/j.nicl.2017.06.011 PMID: 28664037
11. Caverzasi E, Hervey-Jumper SL, Jordan KM, Lobach I V., Li J, Panara V, et al. Identifying preoperative
language tracts and predicting postoperative functional recovery using HARDI q-ball fiber tractography
in patients with gliomas. J Neurosurg. 2016; 125: 33–45. https://doi.org/10.3171/2015.6.JNS142203
PMID: 26654181
12. Meyer EJ, Gaggl W, Gilloon B, Swan B, Greenstein M, Voss J, et al. The Impact of Intracranial Tumor
Proximity to White Matter Tracts on Morbidity and Mortality: A Retrospective Diffusion Tensor Imaging
Study. Neurosurgery. 2017; 80: 193–200. https://doi.org/10.1093/neuros/nyw040 PMID: 28173590
13. D’Andrea G, Familiari P, Di Lauro A, Angelini A, Sessa G. Safe Resection of Gliomas of the Dominant
Angular Gyrus Availing of Preoperative FMRI and Intraoperative DTI: Preliminary Series and Surgical
Technique. World Neurosurg. 2016; 87: 627–639. https://doi.org/10.1016/j.wneu.2015.10.076 PMID:
26548825
14. Vassal F, Schneider F, Nuti C. Intraoperative use of diffusion tensor imaging-based tractography for
resection of gliomas located near the pyramidal tract: comparison with subcortical stimulation mapping
and contribution to surgical outcomes. Br J Neurosurg. 2013; 27: 668–675. https://doi.org/10.3109/
02688697.2013.771730 PMID: 23458557
15. Alexander AL, Lee JE, Lazar M, Field AS. Diffusion tensor imaging of the brain. Neurotherapeutics. NIH
Public Access; 2007; 4: 316–29. https://doi.org/10.1016/j.nurt.2007.05.011 PMID: 17599699
16. Racine AM, Adluru N, Alexander AL, Christian BT, Okonkwo OC, Oh J, et al. Associations between
white matter microstructure and amyloid burden in preclinical Alzheimer’s disease: A multimodal imag-
ing investigation. NeuroImage Clin. Elsevier; 2014; 4: 604–14. https://doi.org/10.1016/j.nicl.2014.02.
001 PMID: 24936411
Along tract analyses indicate focal impact of glioma
PLOS ONE | https://doi.org/10.1371/journal.pone.0225323 November 21, 2019 13 / 16
17. Winklewski PJ, Sabisz A, Naumczyk P, Jodzio K, Szurowska E, Szarmach A. Understanding the Phys-
iopathology Behind Axial and Radial Diffusivity Changes-What Do We Know? Front Neurol. Frontiers
Media SA; 2018; 9: 92. https://doi.org/10.3389/fneur.2018.00092 PMID: 29535676
18. Clark KA, Nuechterlein KH, Asarnow RF, Hamilton LS, Phillips OR, Hageman NS, et al. Mean diffusivity
and fractional anisotropy as indicators of disease and genetic liability to schizophrenia. J Psychiatr Res.
NIH Public Access; 2011; 45: 980–8. https://doi.org/10.1016/j.jpsychires.2011.01.006 PMID: 21306734
19. Naggara O, Oppenheim C, Rieu D, Raoux N, Rodrigo S, Dalla Barba G, et al. Diffusion tensor imaging
in early Alzheimer’s disease. Psychiatry Res Neuroimaging. Elsevier; 2006; 146: 243–249. https://doi.
org/10.1016/J.PSCYCHRESNS.2006.01.005 PMID: 16520023
20. Laule C, Vavasour IM, Moore GRW, Oger J, Li DKB, Paty DW, et al. Water content and myelin water
fraction in multiple sclerosis. J Neurol. 2004; 251: 284–293. https://doi.org/10.1007/s00415-004-0306-6
PMID: 15015007
21. Aung WY, Mar S, Benzinger TL. Diffusion tensor MRI as a biomarker in axonal and myelin damage.
Imaging Med. NIH Public Access; 2013; 5: 427–440. https://doi.org/10.2217/iim.13.49 PMID: 24795779
22. Sun S-W, Liang H-F, Trinkaus K, Cross AH, Armstrong RC, Song S-K. Noninvasive detection of cupri-
zone induced axonal damage and demyelination in the mouse corpus callosum. Magn Reson Med.
2006; 55: 302–308. https://doi.org/10.1002/mrm.20774 PMID: 16408263
23. Colby JB, Soderberg L, Lebel C, Dinov ID, Thompson PM, Sowell ER. Along-tract statistics allow for
enhanced tractography analysis. Neuroimage. 2012; 59: 3227–3242. https://doi.org/10.1016/j.
neuroimage.2011.11.004 PMID: 22094644
24. Ormond DR, D’Souza S, Thompson JA. Global and Targeted Pathway Impact of Gliomas on White Mat-
ter Integrity Based on Lobar Localization. Cureus. 2017; https://doi.org/10.7759/cureus.1660 PMID:
29147635
25. Puig J, Blasco G, Schlaug G, Stinear CM, Daunis-i-Estadella P, Biarnes C, et al. Diffusion tensor imag-
ing as a prognostic biomarker for motor recovery and rehabilitation after stroke. Neuroradiology. 2017;
59: 343–351. https://doi.org/10.1007/s00234-017-1816-0 PMID: 28293701
26. Rong D, Zhang M, Ma Q, Lu J, Li K. Corticospinal Tract Change during Motor Recovery in Patients with
Medulla Infarct: A Diffusion Tensor Imaging Study. Biomed Res Int. 2014; 2014: 1–5. https://doi.org/10.
1155/2014/524096 PMID: 24967374
27. Kamali A, Flanders AE, Brody J, Hunter J V, Hasan KM. Tracing superior longitudinal fasciculus con-
nectivity in the human brain using high resolution diffusion tensor tractography. Brain Struct Funct. NIH
Public Access; 2014; 219: 269–81. https://doi.org/10.1007/s00429-012-0498-y PMID: 23288254
28. Madhavan KM, McQueeny T, Howe SR, Shear P, Szaflarski J. Superior longitudinal fasciculus and lan-
guage functioning in healthy aging. Brain Res. NIH Public Access; 2014; 1562: 11–22. https://doi.org/
10.1016/j.brainres.2014.03.012 PMID: 24680744
29. Sollmann N, Fratini A, Zhang H, Zimmer C, Meyer B, Krieg SM. Associations between clinical outcome
and tractography based on navigated transcranial magnetic stimulation in patients with language-elo-
quent brain lesions. J Neurosurg. 2019; 1–10. https://doi.org/10.3171/2018.12.JNS182988 PMID:
30875686
30. Li Z, Wang M, Zhang L, Fan X, Tao X, Qi L, et al. Neuronavigation-Guided Corticospinal Tract Mapping
in Brainstem Tumor Surgery: Better Preservation of Motor Function. World Neurosurg. 2018; 116:
e291–e297. https://doi.org/10.1016/j.wneu.2018.04.189 PMID: 29733992
31. Yeh F-C, Tseng W-YI. NTU-90: A high angular resolution brain atlas constructed by q-space diffeo-
morphic reconstruction. Neuroimage. Academic Press; 2011; 58: 91–99. https://doi.org/10.1016/j.
neuroimage.2011.06.021 PMID: 21704171
32. Yushkevich PA, Piven J, Hazlett HC, Smith RG, Ho S, Gee JC, et al. User-guided 3D active contour
segmentation of anatomical structures: Significantly improved efficiency and reliability. Neuroimage.
Academic Press; 2006; 31: 1116–1128. https://doi.org/10.1016/j.neuroimage.2006.01.015 PMID:
16545965
33. Strugar JG, Criscuolo GR, Rothbart D, Harrington WN. Vascular endothelial growth/permeability factor
expression in human glioma specimens: correlation with vasogenic brain edema and tumor-associated
cysts. J Neurosurg. Journal of Neurosurgery Publishing Group; 1995; 83: 682–689. https://doi.org/10.
3171/jns.1995.83.4.0682 PMID: 7674019
34. Yeh F-C, Wedeen VJ, Tseng W-YI. Generalized $ {q}$-Sampling Imaging. IEEE Trans Med Imaging.
2010; 29: 1626–1635. https://doi.org/10.1109/TMI.2010.2045126 PMID: 20304721
35. Yeh F-C, Liu L, Hitchens TK, Wu YL. Mapping immune cell infiltration using restricted diffusion MRI.
Magn Reson Med. John Wiley & Sons, Ltd; 2017; 77: 603–612. https://doi.org/10.1002/mrm.26143
PMID: 26843524
Along tract analyses indicate focal impact of glioma
PLOS ONE | https://doi.org/10.1371/journal.pone.0225323 November 21, 2019 14 / 16
36. Schilling KG, Gao Y, Li M, Wu T, Blaber J, Landman BA, et al. Functional tractography of white matter
by high angular resolution functional-correlation imaging (HARFI). Magn Reson Med. 2019; 81: 2011–
2024. https://doi.org/10.1002/mrm.27512 PMID: 30277272
37. Tzourio-Mazoyer N, Landeau B, Papathanassiou D, Crivello F, Etard O, Delcroix N, et al. Automated
Anatomical Labeling of Activations in SPM Using a Macroscopic Anatomical Parcellation of the MNI
MRI Single-Subject Brain. Neuroimage. Academic Press; 2002; 15: 273–289. https://doi.org/10.1006/
nimg.2001.0978 PMID: 11771995
38. Yeh F-C, Verstynen TD, Wang Y, Fernandez-Miranda JC, Tseng W-YI. Deterministic Diffusion Fiber
Tracking Improved by Quantitative Anisotropy. Zhan W, editor. PLoS One. Public Library of Science;
2013; 8: e80713. https://doi.org/10.1371/journal.pone.0080713 PMID: 24348913
39. Rousselet GA, Pernet CR, Wilcox RR. Beyond differences in means: robust graphical methods to com-
pare two groups in neuroscience. Eur J Neurosci. 2017; 46: 1738–1748. https://doi.org/10.1111/ejn.
13610 PMID: 28544058
40. Doksum K. Empirical Probability Plots and Statistical Inference for Nonlinear Models in the Two-Sample
Case. Ann Stat. Institute of Mathematical Statistics; 1974; 2: 267–277. https://doi.org/10.1214/aos/
1176342662
41. Wilcox RR. Comparing Two Independent Groups Via Multiple Quantiles. Stat. John Wiley & Sons, Ltd
(10.1111); 1995; 44: 91. https://doi.org/10.2307/2348620
42. Harrell FE, Davis CE. A New Distribution-Free Quantile Estimator. Biometrika. Oxford University Press-
Biometrika Trust; 1982; 69: 635. https://doi.org/10.2307/2335999
43. Mori S, Wakana S, Van Zijl PCM, Nagae-Poetscher LM. MRI atlas of human white matter. Elsevier;
2005.
44. Wakana S, Caprihan A, Panzenboeck MM, Fallon JH, Perry M, Gollub RL, et al. Reproducibility of quan-
titative tractography methods applied to cerebral white matter. Neuroimage. Academic Press; 2007; 36:
630–644. https://doi.org/10.1016/j.neuroimage.2007.02.049 PMID: 17481925
45. Manjon J V., Coupe P. volBrain: An Online MRI Brain Volumetry System. Front Neuroinform. Frontiers;
2016; 10: 30. https://doi.org/10.3389/fninf.2016.00030 PMID: 27512372
46. Manjon J V., Tohka J, Robles M. Improved estimates of partial volume coefficients from noisy brain MRI
using spatial context. Neuroimage. Academic Press; 2010; 53: 480–490. https://doi.org/10.1016/j.
neuroimage.2010.06.046 PMID: 20600978
47. Jellison BJ, Field AS, Medow J, Lazar M, Salamat MS, Alexander AL. American Journal of Neuroradiol-
ogy. Am J Neuroradiol. American Journal of Neuroradiology; 2004; 23: 67–75. Available: http://www.
ajnr.org/content/25/3/356.short
48. Provenzale JM, Mukundan S, Barboriak DP. Diffusion-weighted and Perfusion MR Imaging for Brain
Tumor Characterization and Assessment of Treatment Response. Radiology. 2006; 239: 632–649.
https://doi.org/10.1148/radiol.2393042031 PMID: 16714455
49. Henry RG, Berman JI, Nagarajan SS, Mukherjee P, Berger MS. Subcortical pathways serving cortical
language sites: initial experience with diffusion tensor imaging fiber tracking combined with intraopera-
tive language mapping. Neuroimage. Academic Press; 2004; 21: 616–622. https://doi.org/10.1016/j.
neuroimage.2003.09.047 PMID: 14980564
50. Holodny AI, Schwartz TH, Ollenschleger M, Liu W-C, Schulder M. Tumor involvement of the corticosp-
inal tract: diffusion magnetic resonance tractography with intraoperative correlation. J Neurosurg. 2001;
95: 1082. https://doi.org/10.3171/jns.2001.95.6.1082 PMID: 11765829
51. Stadlbauer A, Nimsky C, Buslei R, Salomonowitz E, Hammen T, Buchfelder M, et al. Diffusion tensor
imaging and optimized fiber tracking in glioma patients: Histopathologic evaluation of tumor-invaded
white matter structures. Neuroimage. Academic Press; 2007; 34: 949–956. https://doi.org/10.1016/j.
neuroimage.2006.08.051 PMID: 17166744
52. Castellano A, Bello L, Michelozzi C, Gallucci M, Fava E, Iadanza A, et al. Role of diffusion tensor mag-
netic resonance tractography in predicting the extent of resection in glioma surgery. Neuro Oncol.
Oxford University Press; 2012; 14: 192–202. https://doi.org/10.1093/neuonc/nor188 PMID: 22015596
53. Nilsson M, Englund E, Szczepankiewicz F, van Westen D, Sundgren PC. Imaging brain tumour micro-
structure. Neuroimage. Academic Press; 2018; 182: 232–250. https://doi.org/10.1016/j.neuroimage.
2018.04.075 PMID: 29751058
54. Song S-K, Sun S-W, Ju W-K, Lin S-J, Cross AH, Neufeld AH. Diffusion tensor imaging detects and dif-
ferentiates axon and myelin degeneration in mouse optic nerve after retinal ischemia. Neuroimage.
Academic Press; 2003; 20: 1714–1722. https://doi.org/10.1016/j.neuroimage.2003.07.005 PMID:
14642481
Along tract analyses indicate focal impact of glioma
PLOS ONE | https://doi.org/10.1371/journal.pone.0225323 November 21, 2019 15 / 16
55. Song S-K, Yoshino J, Le TQ, Lin S-J, Sun S-W, Cross AH, et al. Demyelination increases radial diffusiv-
ity in corpus callosum of mouse brain. Neuroimage. 2005; 26: 132–140. https://doi.org/10.1016/j.
neuroimage.2005.01.028 PMID: 15862213
56. Rosas HD, Lee SY, Bender AC, Zaleta AK, Vangel M, Yu P, et al. Altered white matter microstructure in
the corpus callosum in Huntington’s disease: Implications for cortical “disconnection.” Neuroimage.
2010; 49: 2995–3004. https://doi.org/10.1016/j.neuroimage.2009.10.015 PMID: 19850138
57. Della Nave R, Ginestroni A, Tessa C, Giannelli M, Piacentini S, Filippi M, et al. Regional Distribution
and Clinical Correlates of White Matter Structural Damage in Huntington Disease: A Tract-Based Spa-
tial Statistics Study. Am J Neuroradiol. 2010; 31: 1675–1681. https://doi.org/10.3174/ajnr.A2128 PMID:
20488902
58. Odish OFF, Reijntjes RHAM, van den Bogaard SJA, Roos RAC, Leemans A. Progressive microstruc-
tural changes of the occipital cortex in Huntington’s disease. Brain Imaging Behav. Springer US; 2018;
12: 1786–1794. https://doi.org/10.1007/s11682-018-9849-5 PMID: 29492750
59. Bourbon-Teles J, Bells S, Jones DK, Coulthard E, Rosser A, Metzler-Baddeley C. Myelin Breakdown in
Human Huntington’s Disease: Multi-Modal Evidence from Diffusion MRI and Quantitative Magnetization
Transfer. Neuroscience. Pergamon; 2019; 403: 79–92. https://doi.org/10.1016/j.neuroscience.2017.05.
042 PMID: 28579146
60. Acosta-Cabronero J, Williams GB, Pengas G, Nestor PJ. Absolute diffusivities define the landscape of
white matter degeneration in Alzheimer’s disease. Brain. 2010; 133: 529–539. https://doi.org/10.1093/
brain/awp257 PMID: 19914928
61. Salat DH, Tuch DS, van der Kouwe AJW, Greve DN, Pappu V, Lee SY, et al. White matter pathology
isolates the hippocampal formation in Alzheimer’s disease. Neurobiol Aging. 2010; 31: 244–256.
https://doi.org/10.1016/j.neurobiolaging.2008.03.013 PMID: 18455835
62. Cavedo E, Lista S, Rojkova K, Chiesa PA, Houot M, Brueggen K, et al. Disrupted white matter structural
networks in healthy older adult APOE ε4 carriers–An international multicenter DTI study. Neuroscience.
Pergamon; 2017; 357: 119–133. https://doi.org/10.1016/j.neuroscience.2017.05.048 PMID: 28596117
63. Pozorski V, Oh JM, Adluru N, Merluzzi AP, Theisen F, Okonkwo O, et al. Longitudinal white matter
microstructural change in Parkinson’s disease. Hum Brain Mapp. John Wiley & Sons, Ltd; 2018; 39:
4150–4161. https://doi.org/10.1002/hbm.24239 PMID: 29952102
64. Della Nave R, Ginestroni A, Diciotti S, Salvatore E, Soricelli A, Mascalchi M. Axial diffusivity is increased
in the degenerating superior cerebellar peduncles of Friedreich’s ataxia. Neuroradiology. 2011; 53:
367–372. https://doi.org/10.1007/s00234-010-0807-1 PMID: 21128070
65. Angeli S, Emblem KE, Due-Tonnessen P, Stylianopoulos T. Towards patient-specific modeling of brain
tumor growth and formation of secondary nodes guided by DTI-MRI. NeuroImage Clin. Elsevier; 2018;
20: 664–673. https://doi.org/10.1016/j.nicl.2018.08.032 PMID: 30211003
Along tract analyses indicate focal impact of glioma
PLOS ONE | https://doi.org/10.1371/journal.pone.0225323 November 21, 2019 16 / 16
Related Documents