sensors Article Fiber Bragg Grating Sensors for Pile Jacking Monitoring in Clay Soil Yonghong Wang 1,2 , Xueying Liu 1 , Mingyi Zhang 1,2 , Xiaoyu Bai 1,2 and Ben Mou 1,2, * 1 School of Civil Engineering, Qingdao University of Technology, Qingdao 266033, China; [email protected] (Y.W.); [email protected] (X.L.); [email protected] (M.Z.); [email protected] (X.B.) 2 Shandong Province Higher Education School Blue Economic Zone Engineering Construction and Safety Collaborative Innovation Center, Qingdao University of Technology, Qingdao 266033, China * Correspondence: [email protected] Received: 8 July 2020; Accepted: 11 September 2020; Published: 14 September 2020 Abstract: The small deformation of the model pile in a pile jacking test makes its accurate measurement very difficult. Based on the installation method of clamping at both ends, a sensitized miniature fiber Bragg grating (FBG) strain sensor was developed to measure the pile strain of small-size model piles. This study investigated the working principle of the sensitized miniature FBG sensor and analyzed the strain transfer characteristics of the sensor by calibration test. The lateral resistance and the earth plug resistance of the model pile were measured accurately by the grooves embedded in the outer tube of the double-wall opening model pile and the sensors directly pasted on the surface of the inner tube. The results of this study show that the sensitized miniature FBG strain sensor has the advantages of high sensitivity, strong interference resistance, and high test accuracy. The FBG strain sensor was completely fixed on the pile by clamping supports at both ends, and the strain measured using the FBG strain sensor was found to be consistent with the pile deformation. Keywords: fiber Bragg grating; pile jacking; model pipe piles; laboratory test; numerical analysis 1. Introduction In the process of pile jacking, the pile body is subjected to complex forces, in which the pile end breaking the soil faces the resistance of the pile end, and the outer wall of the pile body produces sliding friction with the soil, i.e., the lateral resistance of the pile and the wall of the open-pipe pile body exert resistance to the soil plug because of the earth plug effect, i.e., the resistance of the pile inside [1]. An indoor model test is the most direct method to study the mechanical properties of penetration of the piles. The problem of pile jacking has been investigated in detail through indoor model tests, in which most model piles are made of steel or aluminum pipes [2–6]. In order to avoid the boundary effect of the model test and satisfy the geometric similarity ratio of the model pile and the engineering pile, the diameter and length of the model pile are both kept small. The model piles in the centrifuge designed by Nicola et al. [7] and Klotz et al. [8] are all 16 mm in diameter, and the pile lengths are 350 and 375 mm, respectively. White et al. [9] designed a centrifugal model pile with a side length of 9 mm and a pile length of 185 mm. Zhang et al. [10] designed instrumented model piles with the inner and outer diameters of 12.7 and 16.0 mm, respectively, and a pile length of 600 mm. In the model test, the stress environment of the model pile during the pile jacking process is complicated, making the strain measurement of the model pile very difficult. In the indoor model test, the strain of the model pile is measured using a traditional electric measuring strain gauge. Since the inside, outside, and end of the pile are in contact with the soil in the pile jacking process, the stress state of the soil around the pile end and pile body dynamically changes Sensors 2020, 20, 5239; doi:10.3390/s20185239 www.mdpi.com/journal/sensors

Welcome message from author
This document is posted to help you gain knowledge. Please leave a comment to let me know what you think about it! Share it to your friends and learn new things together.
Transcript
sensors
Article
Fiber Bragg Grating Sensors for Pile JackingMonitoring in Clay Soil
Yonghong Wang 1,2, Xueying Liu 1, Mingyi Zhang 1,2, Xiaoyu Bai 1,2 and Ben Mou 1,2,*1 School of Civil Engineering, Qingdao University of Technology, Qingdao 266033, China;
[email protected] (Y.W.); [email protected] (X.L.); [email protected] (M.Z.);[email protected] (X.B.)
2 Shandong Province Higher Education School Blue Economic Zone Engineering Construction and SafetyCollaborative Innovation Center, Qingdao University of Technology, Qingdao 266033, China
* Correspondence: [email protected]
Received: 8 July 2020; Accepted: 11 September 2020; Published: 14 September 2020�����������������
Abstract: The small deformation of the model pile in a pile jacking test makes its accurate measurementvery difficult. Based on the installation method of clamping at both ends, a sensitized miniature fiberBragg grating (FBG) strain sensor was developed to measure the pile strain of small-size model piles.This study investigated the working principle of the sensitized miniature FBG sensor and analyzedthe strain transfer characteristics of the sensor by calibration test. The lateral resistance and the earthplug resistance of the model pile were measured accurately by the grooves embedded in the outertube of the double-wall opening model pile and the sensors directly pasted on the surface of theinner tube. The results of this study show that the sensitized miniature FBG strain sensor has theadvantages of high sensitivity, strong interference resistance, and high test accuracy. The FBG strainsensor was completely fixed on the pile by clamping supports at both ends, and the strain measuredusing the FBG strain sensor was found to be consistent with the pile deformation.
Keywords: fiber Bragg grating; pile jacking; model pipe piles; laboratory test; numerical analysis
1. Introduction
In the process of pile jacking, the pile body is subjected to complex forces, in which the pile endbreaking the soil faces the resistance of the pile end, and the outer wall of the pile body producessliding friction with the soil, i.e., the lateral resistance of the pile and the wall of the open-pipe pile bodyexert resistance to the soil plug because of the earth plug effect, i.e., the resistance of the pile inside [1].An indoor model test is the most direct method to study the mechanical properties of penetrationof the piles. The problem of pile jacking has been investigated in detail through indoor model tests,in which most model piles are made of steel or aluminum pipes [2–6]. In order to avoid the boundaryeffect of the model test and satisfy the geometric similarity ratio of the model pile and the engineeringpile, the diameter and length of the model pile are both kept small. The model piles in the centrifugedesigned by Nicola et al. [7] and Klotz et al. [8] are all 16 mm in diameter, and the pile lengths are350 and 375 mm, respectively. White et al. [9] designed a centrifugal model pile with a side length of9 mm and a pile length of 185 mm. Zhang et al. [10] designed instrumented model piles with the innerand outer diameters of 12.7 and 16.0 mm, respectively, and a pile length of 600 mm. In the model test,the stress environment of the model pile during the pile jacking process is complicated, making thestrain measurement of the model pile very difficult.
In the indoor model test, the strain of the model pile is measured using a traditional electricmeasuring strain gauge. Since the inside, outside, and end of the pile are in contact with the soil in thepile jacking process, the stress state of the soil around the pile end and pile body dynamically changes
Sensors 2020, 20, 5239; doi:10.3390/s20185239 www.mdpi.com/journal/sensors
Sensors 2020, 20, 5239 2 of 14
in the pile jacking process, and soil particle movement during the test will disturb the pile end and pilebody; therefore, it is not suitable to attach the strain gauge on the outside surface of the model pile.In addition, the traditional test sensor exhibits poor anti-electromagnetic interference ability and isgreatly affected by environmental changes such as external temperature, causing a large error; thus,the measured value is significantly different from the actual value, affecting measurement accuracy.At the same time, the small size of the model pile in the model test results in a small strain and thus,has stringent requirements on the size and sensitivity of sensors. Traditional electric sensors cannotmeet these special test requirements [11,12]. In the geotechnical centrifugal model test, fiber Bragggrating (FBG) sensing technology was used to monitor the strain of the pile body caused by the collapseof collapsible loess around piles in loess areas [13]. However, the pile strain caused by the collapseof the soil around the pile cannot reflect the pile stress in the pile jacking process. Especially for theinner and outer pipes of the open pipe pile, the main goal of strain sensor application in the indoormodel test is to accurately measure the strain change of the model pile and reasonably install the sensorwithout affecting the pile jacking process.
A fiber Bragg grating (FBG) sensor has strong anti-electromagnetic interference ability and canrealize temperature self-compensation; therefore, it is less affected by external temperature and otherenvironmental changes. At the same time, this type of sensor is small in size and light in mass,and multiple gratings can be written in one fiber. In recent years, FBG sensors have been widely usedin various practical applications [14–16]. FBG sensing technology can monitor pile deformation in theprocess of pile foundation static load and drawing tests. FBG sensors have been embedded in the pileto reveal the stress mechanism of the pile [17–19]. For the strain test of the pile body in the pile jackingprocess, it is very important to overcome the serious disturbance caused by soil particle movement tothe pile end and pile body and to protect the sensor from damage during the test. Many researchersproposed the measures of embedding and encapsulating FBG sensors in the grooving of the pilebody [20–22]. The test results show that the FBG sensor exhibited reliable data in monitoring pilejacking and is suitable for axial strain measurement of a pile. These research results are mainly basedon prestressed high-strengh concrete (PHC) pipe pile diameter more than 300 mm and pile concreteelastic modulus of 36 GPa in a field test. However, in the laboratory test with small model pile size,the elastic modulus of steel or aluminum used to make the model pile is 70 and 206 GPa, respectively,resulting in a small deformation in the pile jacking process, which reduces the test accuracy of theFBG sensor.
In this study, a sensitized micro-FBG strain sensor was proposed and applied to the pile jackingtest of indoor model piles. In view of the small size of the indoor model pile and the limited strainrange of the pile, the FBG strain sensor was installed by the clamping method. In order to explorethe applicability of the sensitized miniature FBG strain sensor in the pile jacking model test, the pilejacking test was carried out by changing the pile diameter, pile length, and pile end form. The resultsshow that the strain sensor can effectively monitor the strain of the indoor model piles.
2. Operational Principles
2.1. Working Principle of the FBG Sensor
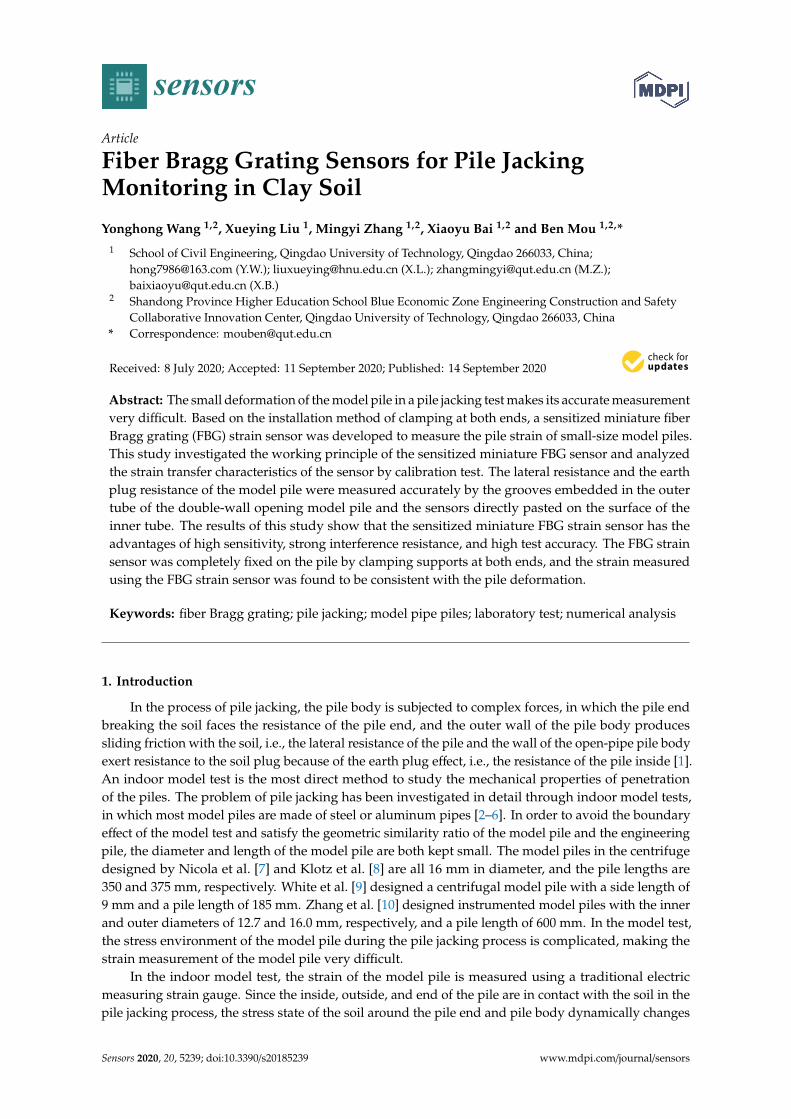
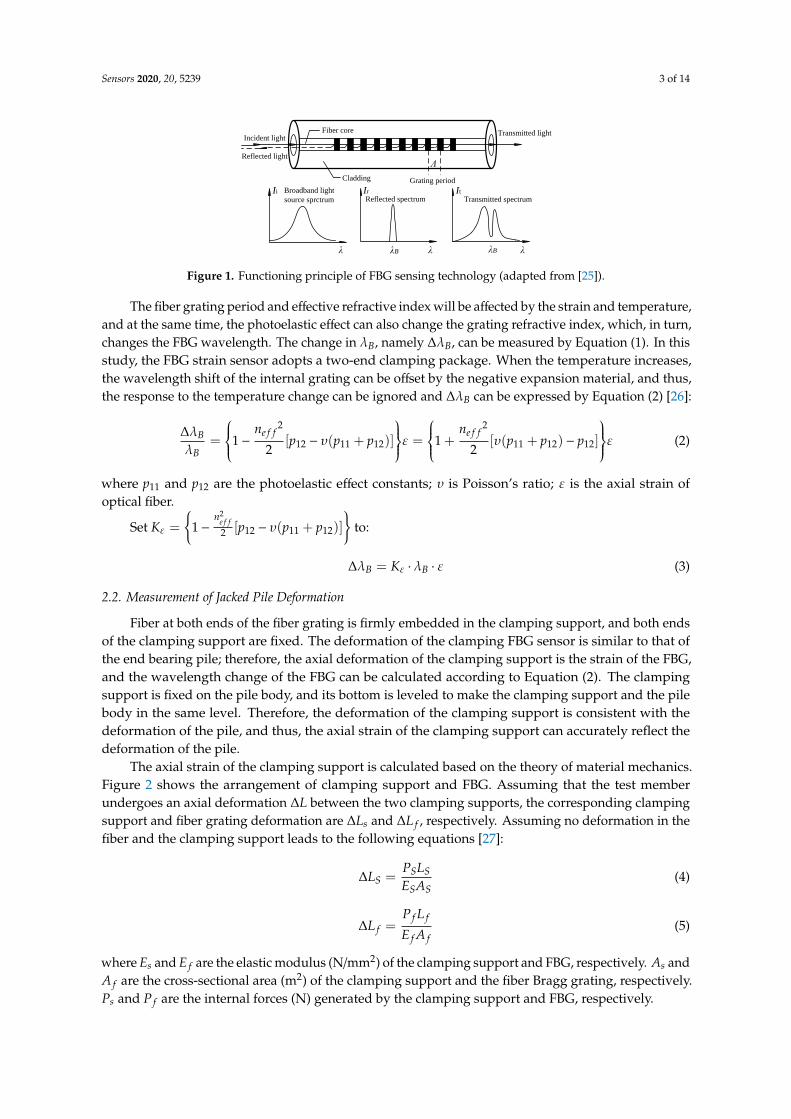
FBG is a type of fiber core refractive index that changes periodically and forms a Bragg gratingwith spatial phase in the fiber core by ultraviolet holographic exposure with germanium, phosphorus,and other fiber materials’ nonlinear absorption effect. As shown in Figure 1, light with a specific centerwavelength is reflected at the grating and is represented by the Bragg wavelength λB (nm). The spectralwidth of the grating period Λ is in the range 0.05–0.3 nm, and all other ordinary light passes throughthe optical fiber grating [23]. The Bragg wavelength λB satisfies Bragg conditions [24]:
λB = 2ne f f Λ (1)
where ne f f is the effective refractive index of the optical fiber core.
Sensors 2020, 20, 5239 3 of 14Sensors 2020, 20, x 3 of 15
where effn is the effective refractive index of the optical fiber core.
Fiber core
Cladding
Λ
Ii
λ
Ir It
λ λ
Broadband light
source sprctrum Reflected spectrum Transmitted spectrum
λB λB
Incident light
Grating period
Transmitted light
Reflected light
Figure 1. Functioning principle of FBG sensing technology (adapted from [25]).
The fiber grating period and effective refractive index will be affected by the strain and
temperature, and at the same time, the photoelastic effect can also change the grating refractive index,
which, in turn, changes the FBG wavelength. The change in λB, namely ΔλB, can be measured by
Equation (1). In this study, the FBG strain sensor adopts a two-end clamping package. When the
temperature increases, the wavelength shift of the internal grating can be offset by the negative
expansion material, and thus, the response to the temperature change can be ignored and ΔλB can be
expressed by Equation (2) [26]:
2 2
12 11 12 11 12 121 ( ) 1 ( )2 2
eff effB
B
n np p p p p p
= − − + = + + −
(2)
where 11p and 12p
are the photoelastic effect constants; is Poisson’s ratio; is the axial strain
of optical fiber.
Set ( )
+−−= 121112
2
21 ppp
nK
eff to:
B BK =
(3)
2.2. Measurement of Jacked Pile Deformation
Fiber at both ends of the fiber grating is firmly embedded in the clamping support, and both
ends of the clamping support are fixed. The deformation of the clamping FBG sensor is similar to that
of the end bearing pile; therefore, the axial deformation of the clamping support is the strain of the
FBG, and the wavelength change of the FBG can be calculated according to Equation (2). The
clamping support is fixed on the pile body, and its bottom is leveled to make the clamping support
and the pile body in the same level. Therefore, the deformation of the clamping support is consistent
with the deformation of the pile, and thus, the axial strain of the clamping support can accurately
reflect the deformation of the pile.
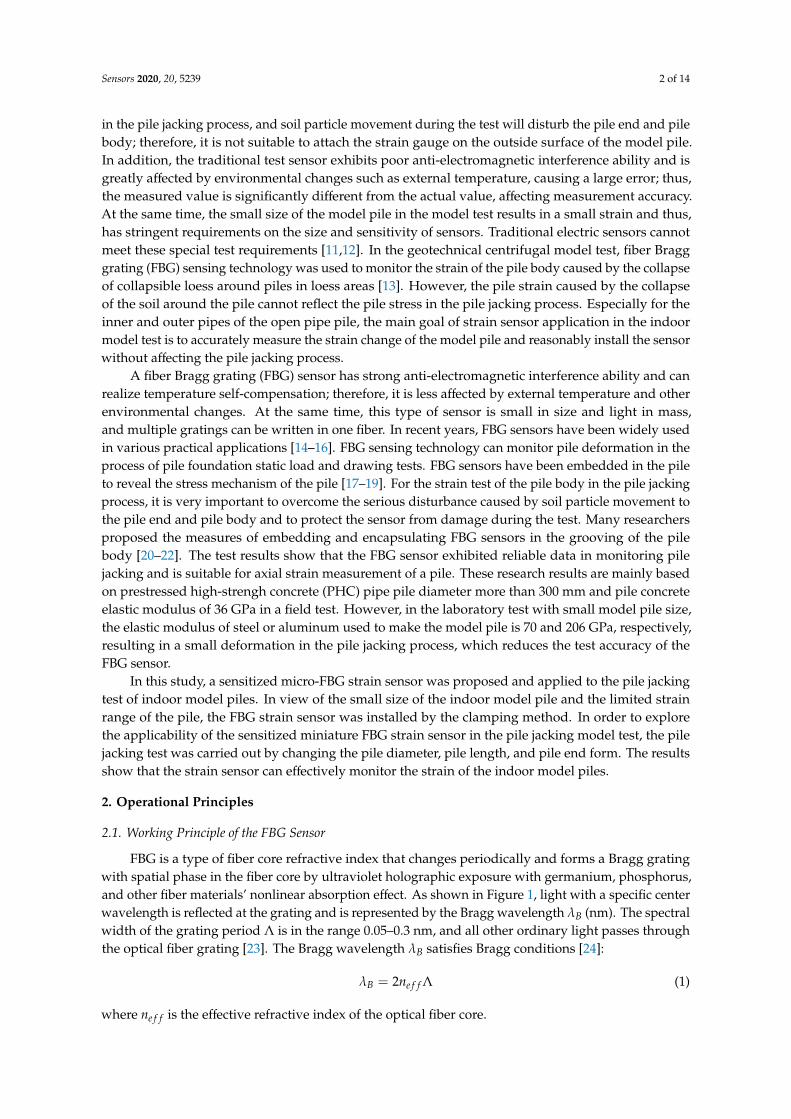
The axial strain of the clamping support is calculated based on the theory of material mechanics.
Figure 2 shows the arrangement of clamping support and FBG. Assuming that the test member
undergoes an axial deformation L between the two clamping supports, the corresponding
clamping support and fiber grating deformation are sL and fL , respectively. Assuming no
deformation in the fiber and the clamping support leads to the following equations [27]:
Figure 1. Functioning principle of FBG sensing technology (adapted from [25]).
The fiber grating period and effective refractive index will be affected by the strain and temperature,and at the same time, the photoelastic effect can also change the grating refractive index, which, in turn,changes the FBG wavelength. The change in λB, namely ∆λB, can be measured by Equation (1). In thisstudy, the FBG strain sensor adopts a two-end clamping package. When the temperature increases,the wavelength shift of the internal grating can be offset by the negative expansion material, and thus,the response to the temperature change can be ignored and ∆λB can be expressed by Equation (2) [26]:
∆λB
λB=
1−ne f f
2
2[p12 − υ(p11 + p12)]
ε =1 +
ne f f2
2[υ(p11 + p12) − p12]
ε (2)
where p11 and p12 are the photoelastic effect constants; υ is Poisson’s ratio; ε is the axial strain ofoptical fiber.
Set Kε ={
1−n2
e f f2 [p12 − υ(p11 + p12)]
}to:
∆λB = Kε · λB · ε (3)
2.2. Measurement of Jacked Pile Deformation
Fiber at both ends of the fiber grating is firmly embedded in the clamping support, and both endsof the clamping support are fixed. The deformation of the clamping FBG sensor is similar to that ofthe end bearing pile; therefore, the axial deformation of the clamping support is the strain of the FBG,and the wavelength change of the FBG can be calculated according to Equation (2). The clampingsupport is fixed on the pile body, and its bottom is leveled to make the clamping support and the pilebody in the same level. Therefore, the deformation of the clamping support is consistent with thedeformation of the pile, and thus, the axial strain of the clamping support can accurately reflect thedeformation of the pile.
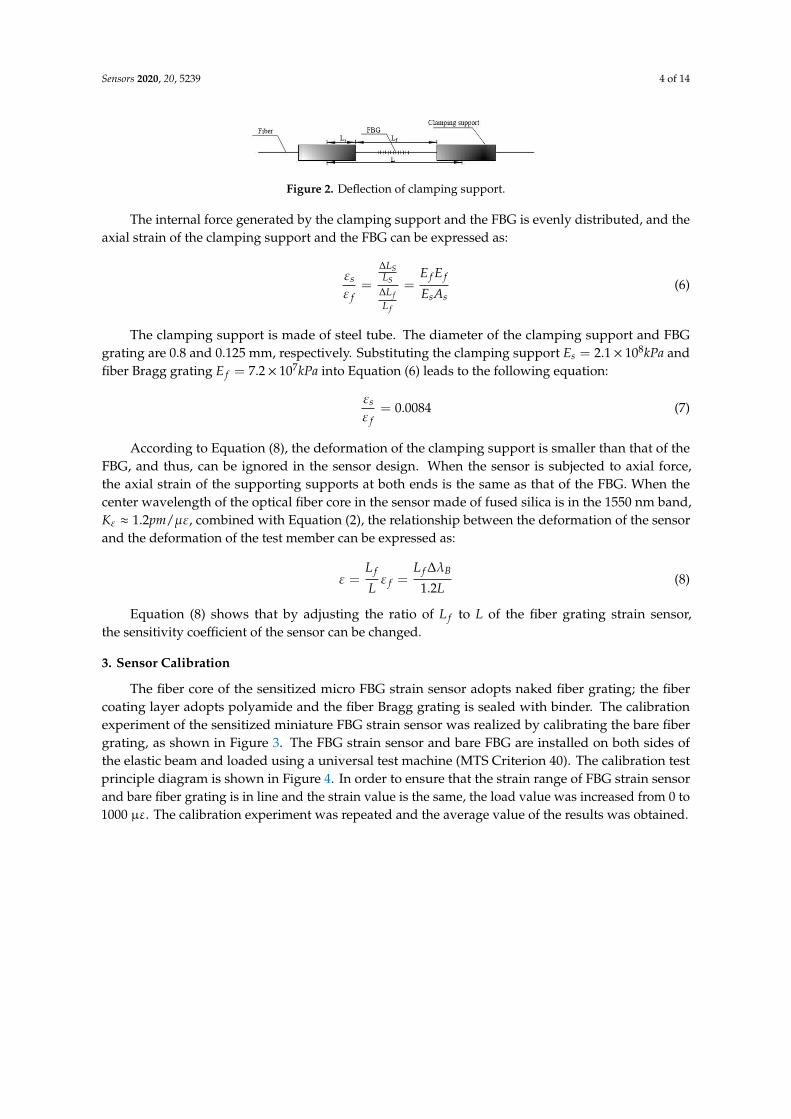
The axial strain of the clamping support is calculated based on the theory of material mechanics.Figure 2 shows the arrangement of clamping support and FBG. Assuming that the test memberundergoes an axial deformation ∆L between the two clamping supports, the corresponding clampingsupport and fiber grating deformation are ∆Ls and ∆L f , respectively. Assuming no deformation in thefiber and the clamping support leads to the following equations [27]:
∆LS =PSLSESAS
(4)
∆L f =P f L f
E f A f(5)
where Es and E f are the elastic modulus (N/mm2) of the clamping support and FBG, respectively. As andA f are the cross-sectional area (m2) of the clamping support and the fiber Bragg grating, respectively.Ps and P f are the internal forces (N) generated by the clamping support and FBG, respectively.
Sensors 2020, 20, 5239 4 of 14
Sensors 2020, 20, x 4 of 15
S SS
S S
P LL
E A = (4)
f f
f
f f
P LL
E A = (5)
where sE and fE are the elastic modulus (N/mm2) of the clamping support and FBG,
respectively. sA and fA are the cross-sectional area (m2) of the clamping support and the fiber
Bragg grating, respectively. sP and fP are the internal forces (N) generated by the clamping
support and FBG, respectively.
Figure 2. Deflection of clamping support.
The internal force generated by the clamping support and the FBG is evenly distributed, and the
axial strain of the clamping support and the FBG can be expressed as:
S
f fs S
ff s s
f
L
E EL
L E A
L
= =
(6)
The clamping support is made of steel tube. The diameter of the clamping support and FBG
grating are 0.8 and 0.125 mm, respectively. Substituting the clamping support 82.1 10sE kPa=
and fiber Bragg grating 77.2 10fE kPa= into Equation (6) leads to the following equation:
0.0084s
f
= (7)
According to Equation (8), the deformation of the clamping support is smaller than that of the
FBG, and thus, can be ignored in the sensor design. When the sensor is subjected to axial force, the
axial strain of the supporting supports at both ends is the same as that of the FBG. When the center
wavelength of the optical fiber core in the sensor made of fused silica is in the 1550 nm band,
1.2 /K pm , combined with Equation (2), the relationship between the deformation of the
sensor and the deformation of the test member can be expressed as:
1.2
f f B
f
L L
L L
= = (8)
Equation (8) shows that by adjusting the ratio of fL to L of the fiber grating strain sensor,
the sensitivity coefficient of the sensor can be changed.
3. Sensor Calibration
The fiber core of the sensitized micro FBG strain sensor adopts naked fiber grating; the fiber
coating layer adopts polyamide and the fiber Bragg grating is sealed with binder. The calibration
experiment of the sensitized miniature FBG strain sensor was realized by calibrating the bare fiber
Figure 2. Deflection of clamping support.
The internal force generated by the clamping support and the FBG is evenly distributed, and theaxial strain of the clamping support and the FBG can be expressed as:
εs
ε f=
∆LSLS
∆L fL f
=E f E f
EsAs(6)
The clamping support is made of steel tube. The diameter of the clamping support and FBGgrating are 0.8 and 0.125 mm, respectively. Substituting the clamping support Es = 2.1× 10⁸kPa andfiber Bragg grating E f = 7.2× 10⁷kPa into Equation (6) leads to the following equation:
εs
ε f= 0.0084 (7)
According to Equation (8), the deformation of the clamping support is smaller than that of theFBG, and thus, can be ignored in the sensor design. When the sensor is subjected to axial force,the axial strain of the supporting supports at both ends is the same as that of the FBG. When thecenter wavelength of the optical fiber core in the sensor made of fused silica is in the 1550 nm band,Kε ≈ 1.2pm/µε, combined with Equation (2), the relationship between the deformation of the sensorand the deformation of the test member can be expressed as:
ε =L f
Lε f =
L f ∆λB
1.2L(8)
Equation (8) shows that by adjusting the ratio of L f to L of the fiber grating strain sensor,the sensitivity coefficient of the sensor can be changed.
3. Sensor Calibration
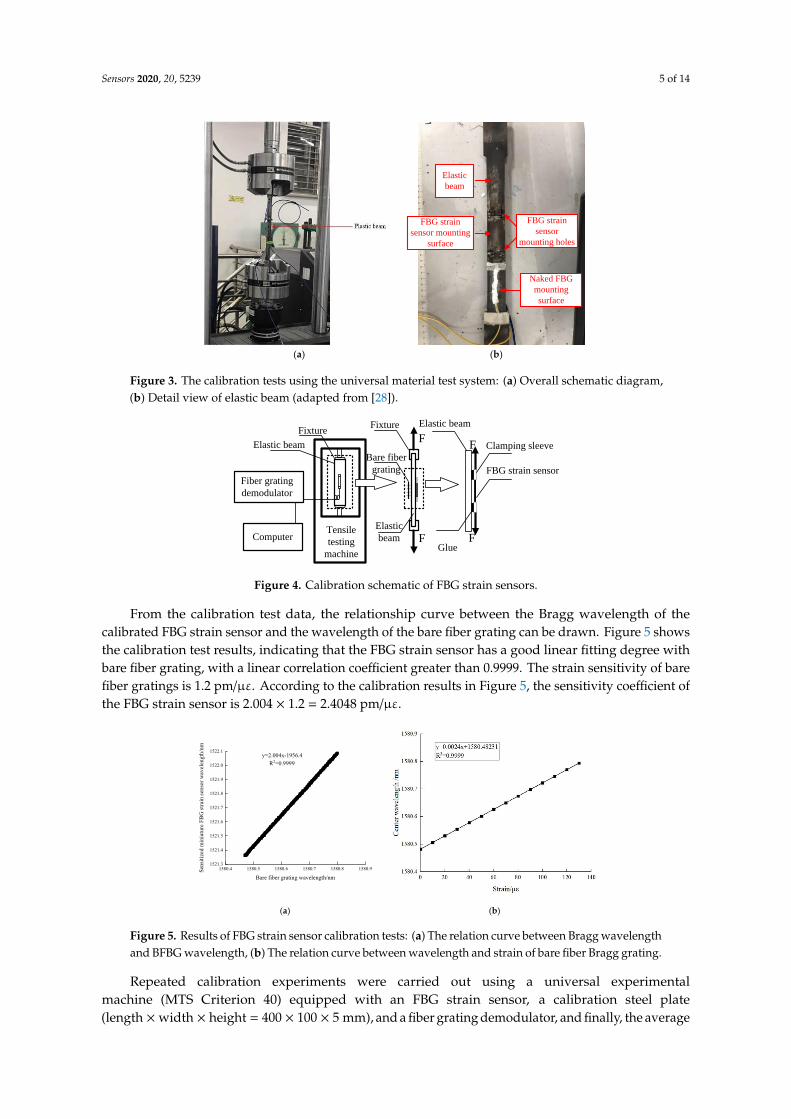
The fiber core of the sensitized micro FBG strain sensor adopts naked fiber grating; the fibercoating layer adopts polyamide and the fiber Bragg grating is sealed with binder. The calibrationexperiment of the sensitized miniature FBG strain sensor was realized by calibrating the bare fibergrating, as shown in Figure 3. The FBG strain sensor and bare FBG are installed on both sides ofthe elastic beam and loaded using a universal test machine (MTS Criterion 40). The calibration testprinciple diagram is shown in Figure 4. In order to ensure that the strain range of FBG strain sensorand bare fiber grating is in line and the strain value is the same, the load value was increased from 0 to1000 µε. The calibration experiment was repeated and the average value of the results was obtained.
Sensors 2020, 20, 5239 5 of 14
Sensors 2020, 20, x 5 of 15
grating, as shown in Figure 3. The FBG strain sensor and bare FBG are installed on both sides of the
elastic beam and loaded using a universal test machine (MTS Criterion 40). The calibration test
principle diagram is shown in Figure 4. In order to ensure that the strain range of FBG strain sensor
and bare fiber grating is in line and the strain value is the same, the load value was increased from 0
to 1000 με. The calibration experiment was repeated and the average value of the results was
obtained.
From the calibration test data, the relationship curve between the Bragg wavelength of the
calibrated FBG strain sensor and the wavelength of the bare fiber grating can be drawn. Figure 5
shows the calibration test results, indicating that the FBG strain sensor has a good linear fitting degree
with bare fiber grating, with a linear correlation coefficient greater than 0.9999. The strain sensitivity
of bare fiber gratings is 1.2 pm/με. According to the calibration results in Figure 5, the sensitivity
coefficient of the FBG strain sensor is 2.004 × 1.2 = 2.4048 pm/με.
FBG strain
sensor
mounting holes
FBG strain
sensor mounting
surface
Elastic
beam
Naked FBG
mounting
surface
(a) (b)
Figure 3. The calibration tests using the universal material test system: (a) Overall schematic diagram,
(b) Detail view of elastic beam (adapted from [28]).
F
F
F
FTensile
testing
machine
Fiber grating
demodulator
Computer
FixtureElastic beam
Glue
Clamping sleeve
FBG strain sensor
Fixture
Elastic beam
Elastic
beam
Bare fiber
grating
Figure 4. Calibration schematic of FBG strain sensors.
Figure 3. The calibration tests using the universal material test system: (a) Overall schematic diagram,(b) Detail view of elastic beam (adapted from [28]).
Sensors 2020, 20, x 5 of 15
grating, as shown in Figure 3. The FBG strain sensor and bare FBG are installed on both sides of the
elastic beam and loaded using a universal test machine (MTS Criterion 40). The calibration test
principle diagram is shown in Figure 4. In order to ensure that the strain range of FBG strain sensor
and bare fiber grating is in line and the strain value is the same, the load value was increased from 0
to 1000 με. The calibration experiment was repeated and the average value of the results was
obtained.
From the calibration test data, the relationship curve between the Bragg wavelength of the
calibrated FBG strain sensor and the wavelength of the bare fiber grating can be drawn. Figure 5
shows the calibration test results, indicating that the FBG strain sensor has a good linear fitting degree
with bare fiber grating, with a linear correlation coefficient greater than 0.9999. The strain sensitivity
of bare fiber gratings is 1.2 pm/με. According to the calibration results in Figure 5, the sensitivity
coefficient of the FBG strain sensor is 2.004 × 1.2 = 2.4048 pm/με.
FBG strain
sensor
mounting holes
FBG strain
sensor mounting
surface
Elastic
beam
Naked FBG
mounting
surface
(a) (b)
Figure 3. The calibration tests using the universal material test system: (a) Overall schematic diagram,
(b) Detail view of elastic beam (adapted from [28]).
F
F
F
FTensile
testing
machine
Fiber grating
demodulator
Computer
FixtureElastic beam
Glue
Clamping sleeve
FBG strain sensor
Fixture
Elastic beam
Elastic
beam
Bare fiber
grating
Figure 4. Calibration schematic of FBG strain sensors. Figure 4. Calibration schematic of FBG strain sensors.
From the calibration test data, the relationship curve between the Bragg wavelength of thecalibrated FBG strain sensor and the wavelength of the bare fiber grating can be drawn. Figure 5 showsthe calibration test results, indicating that the FBG strain sensor has a good linear fitting degree withbare fiber grating, with a linear correlation coefficient greater than 0.9999. The strain sensitivity of barefiber gratings is 1.2 pm/µε. According to the calibration results in Figure 5, the sensitivity coefficient ofthe FBG strain sensor is 2.004 × 1.2 = 2.4048 pm/µε.
Sensors 2020, 20, x 6 of 16
1580.4 1580.5 1580.6 1580.7 1580.8 1580.91521.3
1521.4
1521.5
1521.6
1521.7
1521.8
1521.9
1522.0
1522.1
Sens
itize
d m
inia
ture
FB
G st
rain
sens
or w
avel
engt
h/nm
Bare fiber grating wavelength/nm
y=2.004x-1956.4 R2=0.9999
(a) (b)
Figure 5. Results of FBG strain sensor calibration tests: (a) The relation curve between Bragg wavelength and BFBG wavelength, (b) The relation curve between wavelength and strain of bare fiber Bragg grating.
Repeated calibration experiments were carried out using a universal experimental machine (MTS Criterion 40) equipped with an FBG strain sensor, a calibration steel plate (length × width × height = 400 × 100 × 5 mm), and a fiber grating demodulator, and finally, the average value was taken, as shown in Figure 3. The FBG strain sensor and bare fiber grating are installed on both sides of the calibrated steel plate, and the load value of the calibrated steel plate was increased from 0 to 1000 με, to ensure that the strain online elastic range of the FBG strain sensor and bare fiber grating is within the same strain value.
4. Model Pile, Sensor Installment, and Instrumentation Setup
4.1. Model Pile
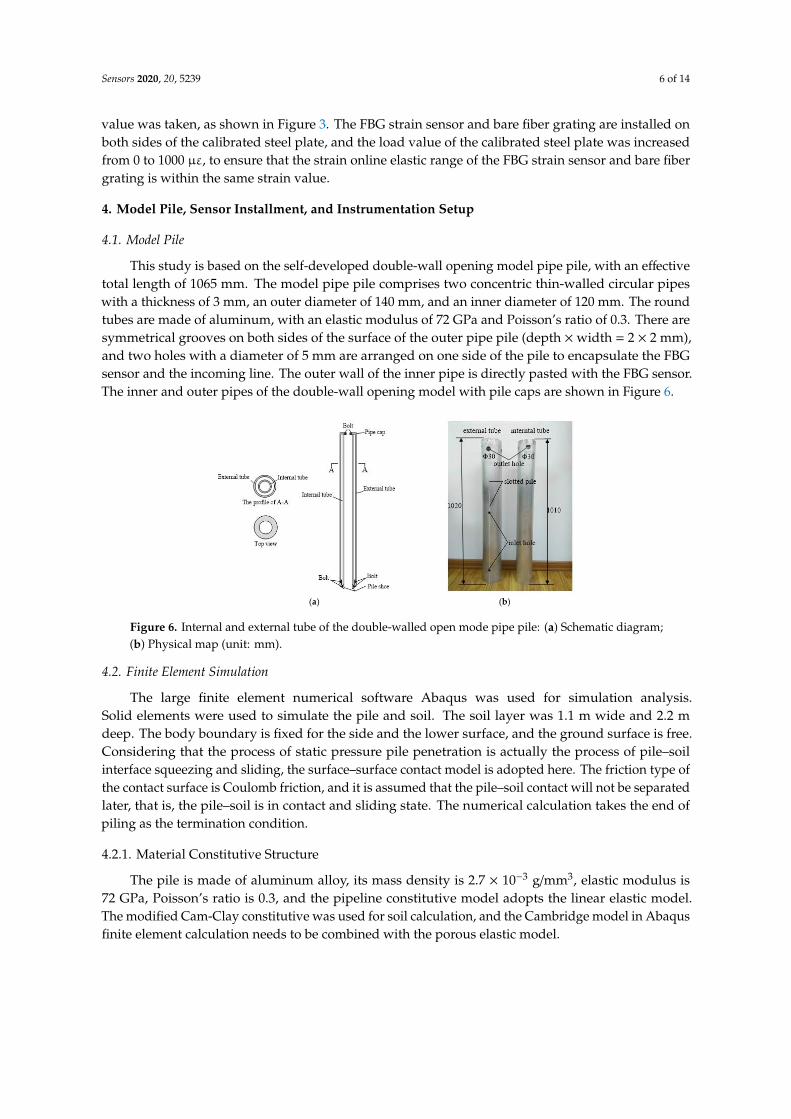
This study is based on the self-developed double-wall opening model pipe pile, with an effective total length of 1065 mm. The model pipe pile comprises two concentric thin-walled circular pipes with a thickness of 3 mm, an outer diameter of 140 mm, and an inner diameter of 120 mm. The round tubes are made of aluminum, with an elastic modulus of 72 GPa and Poisson’s ratio of 0.3. There are symmetrical grooves on both sides of the surface of the outer pipe pile (depth × width = 2 × 2 mm), and two holes with a diameter of 5 mm are arranged on one side of the pile to encapsulate the FBG sensor and the incoming line. The outer wall of the inner pipe is directly pasted with the FBG sensor. The inner and outer pipes of the double-wall opening model with pile caps are shown in Figure 6.
Figure 5. Results of FBG strain sensor calibration tests: (a) The relation curve between Bragg wavelengthand BFBG wavelength, (b) The relation curve between wavelength and strain of bare fiber Bragg grating.
Repeated calibration experiments were carried out using a universal experimentalmachine (MTS Criterion 40) equipped with an FBG strain sensor, a calibration steel plate(length ×width × height = 400 × 100 × 5 mm), and a fiber grating demodulator, and finally, the average
Sensors 2020, 20, 5239 6 of 14
value was taken, as shown in Figure 3. The FBG strain sensor and bare fiber grating are installed onboth sides of the calibrated steel plate, and the load value of the calibrated steel plate was increasedfrom 0 to 1000 µε, to ensure that the strain online elastic range of the FBG strain sensor and bare fibergrating is within the same strain value.
4. Model Pile, Sensor Installment, and Instrumentation Setup
4.1. Model Pile
This study is based on the self-developed double-wall opening model pipe pile, with an effectivetotal length of 1065 mm. The model pipe pile comprises two concentric thin-walled circular pipeswith a thickness of 3 mm, an outer diameter of 140 mm, and an inner diameter of 120 mm. The roundtubes are made of aluminum, with an elastic modulus of 72 GPa and Poisson’s ratio of 0.3. There aresymmetrical grooves on both sides of the surface of the outer pipe pile (depth ×width = 2 × 2 mm),and two holes with a diameter of 5 mm are arranged on one side of the pile to encapsulate the FBGsensor and the incoming line. The outer wall of the inner pipe is directly pasted with the FBG sensor.The inner and outer pipes of the double-wall opening model with pile caps are shown in Figure 6.
Sensors 2020, 20, x 7 of 15
(a) (b)
Figure 6. Internal and external tube of the double-walled open mode pipe pile: (a) Schematic diagram;
(b) Physical map (unit: mm).
4.2. Finite Element Simulation
The large finite element numerical software Abaqus was used for simulation analysis. Solid
elements were used to simulate the pile and soil. The soil layer was 1.1 m wide and 2.2 m deep. The
body boundary is fixed for the side and the lower surface, and the ground surface is free. Considering
that the process of static pressure pile penetration is actually the process of pile–soil interface
squeezing and sliding, the surface–surface contact model is adopted here. The friction type of the
contact surface is Coulomb friction, and it is assumed that the pile–soil contact will not be separated
later, that is, the pile–soil is in contact and sliding state. The numerical calculation takes the end of
piling as the termination condition.
4.2.1. Material Constitutive Structure
The pile is made of aluminum alloy, its mass density is 2.7 × 10⁻³ g/mm3, elastic modulus is 72
GPa, Poisson’s ratio is 0.3, and the pipeline constitutive model adopts the linear elastic model. The
modified Cam-Clay constitutive was used for soil calculation, and the Cambridge model in Abaqus
finite element calculation needs to be combined with the porous elastic model.
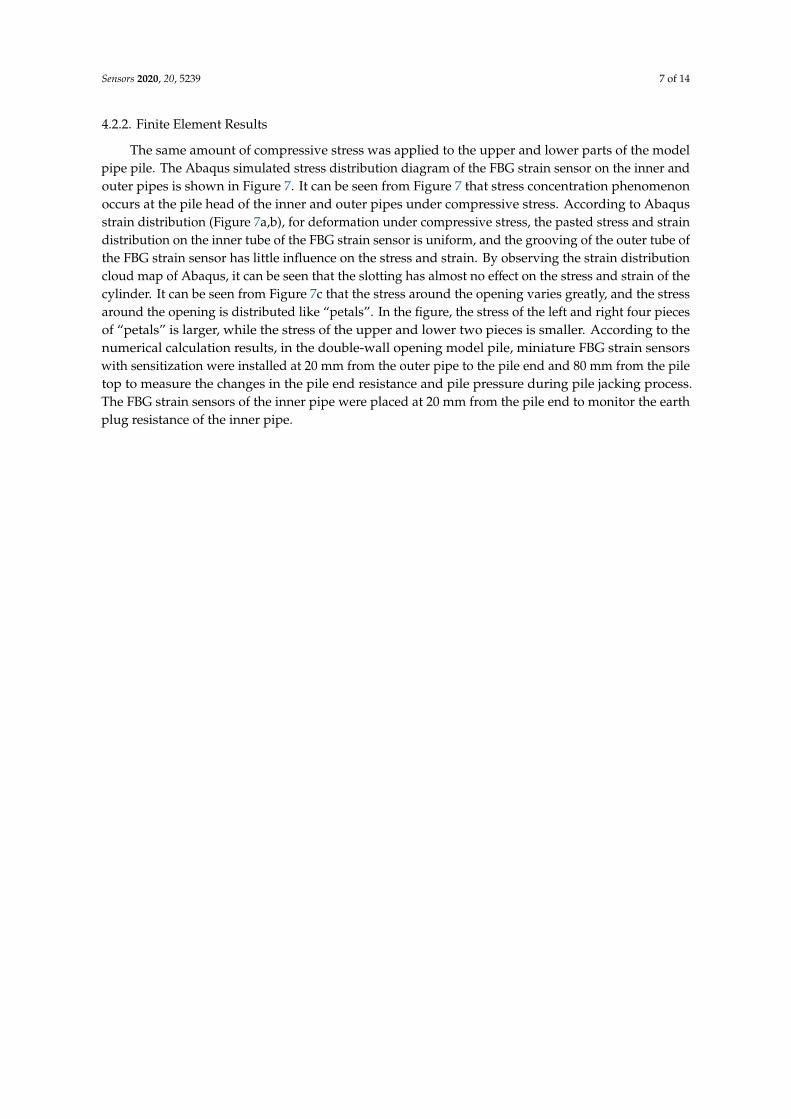
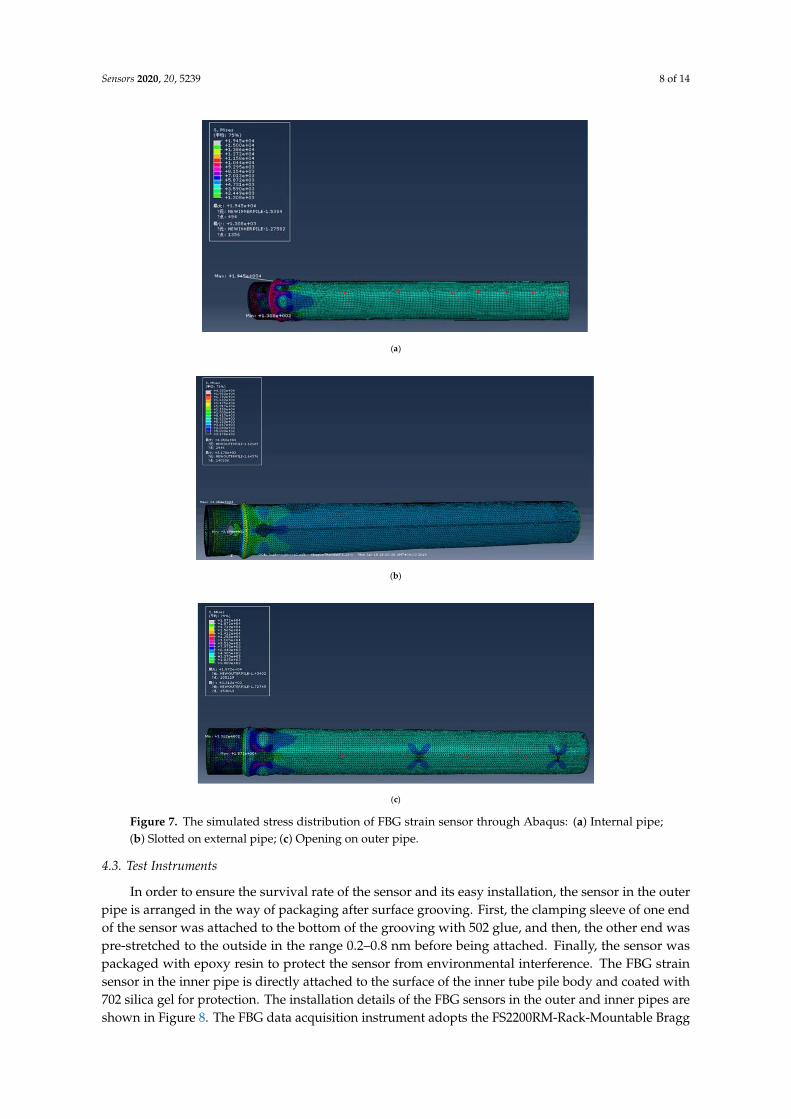
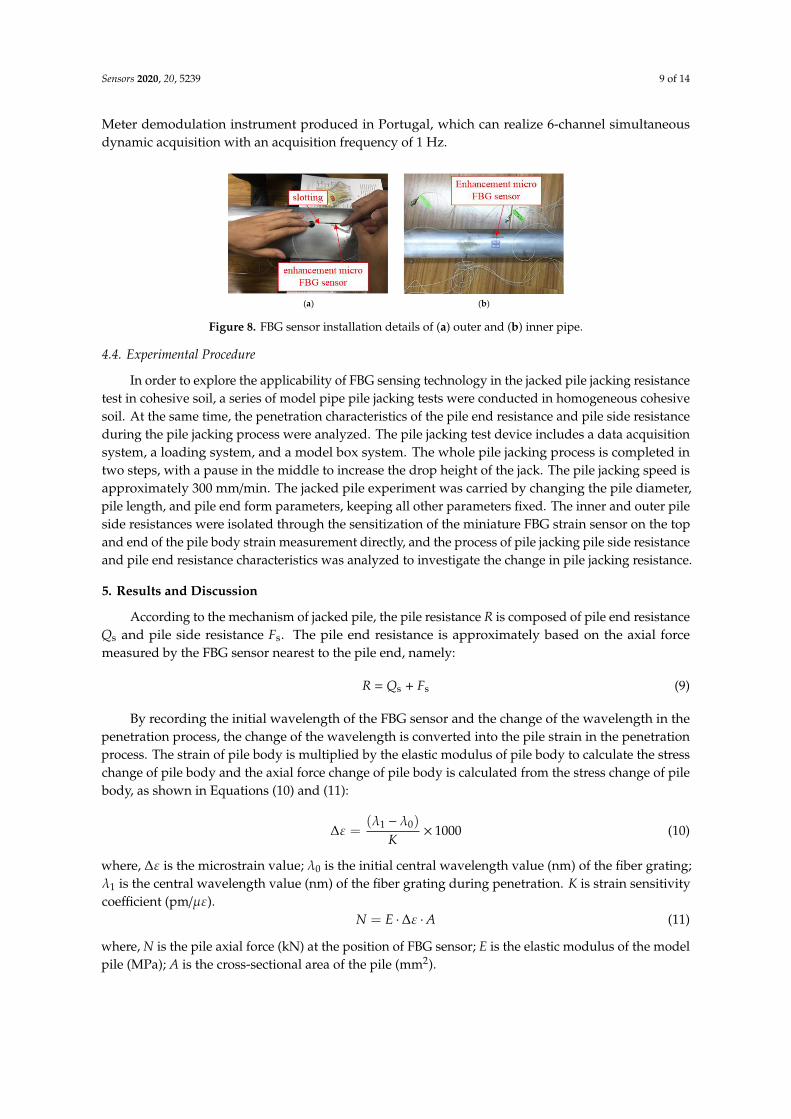
4.2.2. Finite Element Results
The same amount of compressive stress was applied to the upper and lower parts of the model
pipe pile. The Abaqus simulated stress distribution diagram of the FBG strain sensor on the inner
and outer pipes is shown in Figure 7. It can be seen from Figure 7 that stress concentration
phenomenon occurs at the pile head of the inner and outer pipes under compressive stress. According
to Abaqus strain distribution (Figure 7a,b), for deformation under compressive stress, the pasted
stress and strain distribution on the inner tube of the FBG strain sensor is uniform, and the grooving
of the outer tube of the FBG strain sensor has little influence on the stress and strain. By observing
the strain distribution cloud map of Abaqus, it can be seen that the slotting has almost no effect on
the stress and strain of the cylinder. It can be seen from Figure 7c that the stress around the opening
varies greatly, and the stress around the opening is distributed like “petals”. In the figure, the stress
of the left and right four pieces of “petals” is larger, while the stress of the upper and lower two pieces
is smaller. According to the numerical calculation results, in the double-wall opening model pile,
miniature FBG strain sensors with sensitization were installed at 20 mm from the outer pipe to the
pile end and 80 mm from the pile top to measure the changes in the pile end resistance and pile
pressure during pile jacking process. The FBG strain sensors of the inner pipe were placed at 20 mm
from the pile end to monitor the earth plug resistance of the inner pipe.
Figure 6. Internal and external tube of the double-walled open mode pipe pile: (a) Schematic diagram;(b) Physical map (unit: mm).
4.2. Finite Element Simulation
The large finite element numerical software Abaqus was used for simulation analysis.Solid elements were used to simulate the pile and soil. The soil layer was 1.1 m wide and 2.2 mdeep. The body boundary is fixed for the side and the lower surface, and the ground surface is free.Considering that the process of static pressure pile penetration is actually the process of pile–soilinterface squeezing and sliding, the surface–surface contact model is adopted here. The friction type ofthe contact surface is Coulomb friction, and it is assumed that the pile–soil contact will not be separatedlater, that is, the pile–soil is in contact and sliding state. The numerical calculation takes the end ofpiling as the termination condition.
4.2.1. Material Constitutive Structure
The pile is made of aluminum alloy, its mass density is 2.7 × 10⁻³ g/mm3, elastic modulus is72 GPa, Poisson’s ratio is 0.3, and the pipeline constitutive model adopts the linear elastic model.The modified Cam-Clay constitutive was used for soil calculation, and the Cambridge model in Abaqusfinite element calculation needs to be combined with the porous elastic model.
Sensors 2020, 20, 5239 7 of 14
4.2.2. Finite Element Results
The same amount of compressive stress was applied to the upper and lower parts of the modelpipe pile. The Abaqus simulated stress distribution diagram of the FBG strain sensor on the inner andouter pipes is shown in Figure 7. It can be seen from Figure 7 that stress concentration phenomenonoccurs at the pile head of the inner and outer pipes under compressive stress. According to Abaqusstrain distribution (Figure 7a,b), for deformation under compressive stress, the pasted stress and straindistribution on the inner tube of the FBG strain sensor is uniform, and the grooving of the outer tube ofthe FBG strain sensor has little influence on the stress and strain. By observing the strain distributioncloud map of Abaqus, it can be seen that the slotting has almost no effect on the stress and strain of thecylinder. It can be seen from Figure 7c that the stress around the opening varies greatly, and the stressaround the opening is distributed like “petals”. In the figure, the stress of the left and right four piecesof “petals” is larger, while the stress of the upper and lower two pieces is smaller. According to thenumerical calculation results, in the double-wall opening model pile, miniature FBG strain sensorswith sensitization were installed at 20 mm from the outer pipe to the pile end and 80 mm from the piletop to measure the changes in the pile end resistance and pile pressure during pile jacking process.The FBG strain sensors of the inner pipe were placed at 20 mm from the pile end to monitor the earthplug resistance of the inner pipe.
Sensors 2020, 20, 5239 8 of 14
Sensors 2020, 20, x 8 of 16
(a)
(b)
(c)
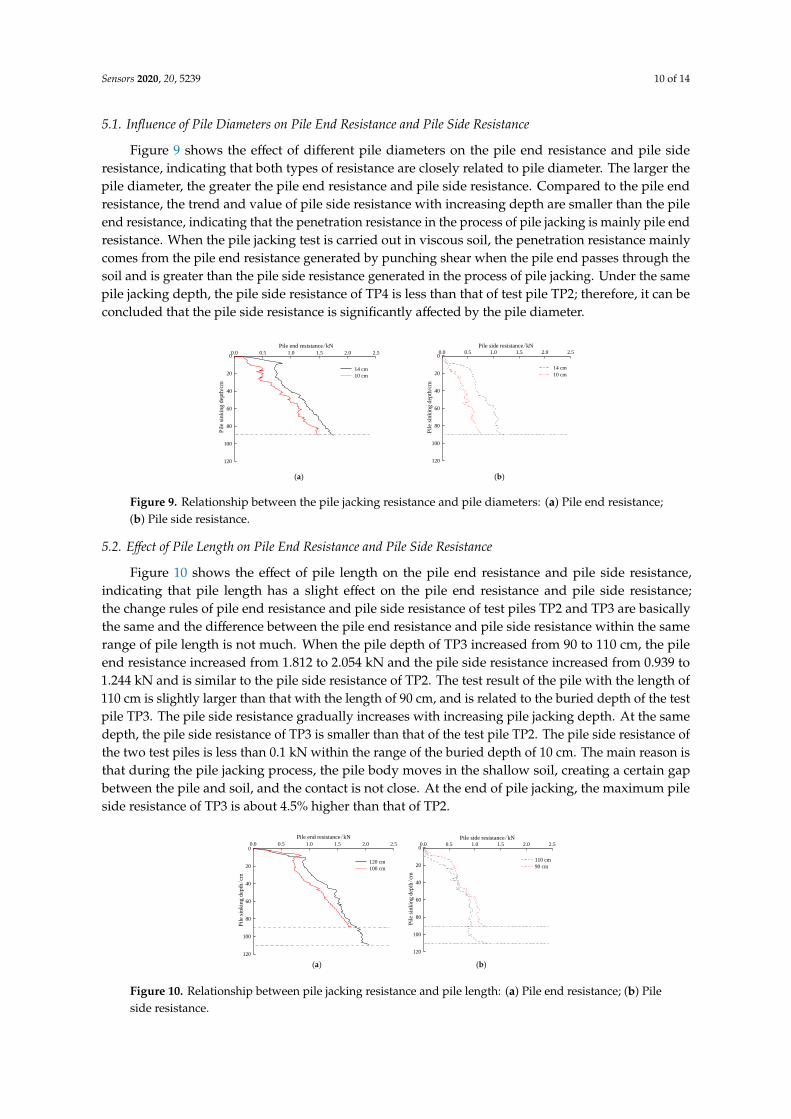
Figure 7. The simulated stress distribution of FBG strain sensor through Abaqus: (a) Internal pipe;(b) Slotted on external pipe; (c) Opening on outer pipe.
4.3. Test Instruments
In order to ensure the survival rate of the sensor and its easy installation, the sensor in the outerpipe is arranged in the way of packaging after surface grooving. First, the clamping sleeve of one endof the sensor was attached to the bottom of the grooving with 502 glue, and then, the other end waspre-stretched to the outside in the range 0.2–0.8 nm before being attached. Finally, the sensor waspackaged with epoxy resin to protect the sensor from environmental interference. The FBG strainsensor in the inner pipe is directly attached to the surface of the inner tube pile body and coated with702 silica gel for protection. The installation details of the FBG sensors in the outer and inner pipes areshown in Figure 8. The FBG data acquisition instrument adopts the FS2200RM-Rack-Mountable Bragg
Sensors 2020, 20, 5239 9 of 14
Meter demodulation instrument produced in Portugal, which can realize 6-channel simultaneousdynamic acquisition with an acquisition frequency of 1 Hz.
Sensors 2020, 20, x 9 of 15
(a) (b)
Figure 8. FBG sensor installation details of (a) outer and (b) inner pipe.
4.4. Experimental Procedure
In order to explore the applicability of FBG sensing technology in the jacked pile jacking
resistance test in cohesive soil, a series of model pipe pile jacking tests were conducted in
homogeneous cohesive soil. At the same time, the penetration characteristics of the pile end resistance
and pile side resistance during the pile jacking process were analyzed. The pile jacking test device
includes a data acquisition system, a loading system, and a model box system. The whole pile jacking
process is completed in two steps, with a pause in the middle to increase the drop height of the jack.
The pile jacking speed is approximately 300 mm/min. The jacked pile experiment was carried by
changing the pile diameter, pile length, and pile end form parameters, keeping all other parameters
fixed. The inner and outer pile side resistances were isolated through the sensitization of the
miniature FBG strain sensor on the top and end of the pile body strain measurement directly, and the
process of pile jacking pile side resistance and pile end resistance characteristics was analyzed to
investigate the change in pile jacking resistance.
5. Results and Discussion
According to the mechanism of jacked pile, the pile resistance R is composed of pile end
resistance Qs and pile side resistance Fs. The pile end resistance is approximately based on the axial
force measured by the FBG sensor nearest to the pile end, namely:
R = Qs + Fs (9)
By recording the initial wavelength of the FBG sensor and the change of the wavelength in the
penetration process, the change of the wavelength is converted into the pile strain in the penetration
process. The strain of pile body is multiplied by the elastic modulus of pile body to calculate the stress
change of pile body and the axial force change of pile body is calculated from the stress change of
pile body, as shown in Equations (10) and (11):
1 0 1000K
− =
( ) (10)
where, is the microstrain value; 0 is the initial central wavelength value (nm) of the fiber
grating; 1 is the central wavelength value (nm) of the fiber grating during penetration. K is
strain sensitivity coefficient (pm/ ).
N E A= (11)
where, N is the pile axial force (kN) at the position of FBG sensor; E is the elastic modulus of the
model pile (MPa); A is the cross-sectional area of the pile (mm2).
5.1. Influence of Pile Diameters on Pile End Resistance and Pile Side Resistance
Figure 8. FBG sensor installation details of (a) outer and (b) inner pipe.
4.4. Experimental Procedure
In order to explore the applicability of FBG sensing technology in the jacked pile jacking resistancetest in cohesive soil, a series of model pipe pile jacking tests were conducted in homogeneous cohesivesoil. At the same time, the penetration characteristics of the pile end resistance and pile side resistanceduring the pile jacking process were analyzed. The pile jacking test device includes a data acquisitionsystem, a loading system, and a model box system. The whole pile jacking process is completed intwo steps, with a pause in the middle to increase the drop height of the jack. The pile jacking speed isapproximately 300 mm/min. The jacked pile experiment was carried by changing the pile diameter,pile length, and pile end form parameters, keeping all other parameters fixed. The inner and outer pileside resistances were isolated through the sensitization of the miniature FBG strain sensor on the topand end of the pile body strain measurement directly, and the process of pile jacking pile side resistanceand pile end resistance characteristics was analyzed to investigate the change in pile jacking resistance.
5. Results and Discussion
According to the mechanism of jacked pile, the pile resistance R is composed of pile end resistanceQs and pile side resistance Fs. The pile end resistance is approximately based on the axial forcemeasured by the FBG sensor nearest to the pile end, namely:
R = Qs + Fs (9)
By recording the initial wavelength of the FBG sensor and the change of the wavelength in thepenetration process, the change of the wavelength is converted into the pile strain in the penetrationprocess. The strain of pile body is multiplied by the elastic modulus of pile body to calculate the stresschange of pile body and the axial force change of pile body is calculated from the stress change of pilebody, as shown in Equations (10) and (11):
∆ε =(λ1 − λ0)
K× 1000 (10)
where, ∆ε is the microstrain value; λ0 is the initial central wavelength value (nm) of the fiber grating;λ1 is the central wavelength value (nm) of the fiber grating during penetration. K is strain sensitivitycoefficient (pm/µε).
N = E · ∆ε ·A (11)
where, N is the pile axial force (kN) at the position of FBG sensor; E is the elastic modulus of the modelpile (MPa); A is the cross-sectional area of the pile (mm2).
Sensors 2020, 20, 5239 10 of 14
5.1. Influence of Pile Diameters on Pile End Resistance and Pile Side Resistance
Figure 9 shows the effect of different pile diameters on the pile end resistance and pile sideresistance, indicating that both types of resistance are closely related to pile diameter. The larger thepile diameter, the greater the pile end resistance and pile side resistance. Compared to the pile endresistance, the trend and value of pile side resistance with increasing depth are smaller than the pileend resistance, indicating that the penetration resistance in the process of pile jacking is mainly pile endresistance. When the pile jacking test is carried out in viscous soil, the penetration resistance mainlycomes from the pile end resistance generated by punching shear when the pile end passes through thesoil and is greater than the pile side resistance generated in the process of pile jacking. Under the samepile jacking depth, the pile side resistance of TP4 is less than that of test pile TP2; therefore, it can beconcluded that the pile side resistance is significantly affected by the pile diameter.
Sensors 2020, 20, x 10 of 15
Figure 9 shows the effect of different pile diameters on the pile end resistance and pile side
resistance, indicating that both types of resistance are closely related to pile diameter. The larger the
pile diameter, the greater the pile end resistance and pile side resistance. Compared to the pile end
resistance, the trend and value of pile side resistance with increasing depth are smaller than the pile
end resistance, indicating that the penetration resistance in the process of pile jacking is mainly pile
end resistance. When the pile jacking test is carried out in viscous soil, the penetration resistance
mainly comes from the pile end resistance generated by punching shear when the pile end passes
through the soil and is greater than the pile side resistance generated in the process of pile jacking.
Under the same pile jacking depth, the pile side resistance of TP4 is less than that of test pile TP2;
therefore, it can be concluded that the pile side resistance is significantly affected by the pile diameter.
0.0 0.5 1.0 1.5 2.0 2.5
120
100
80
60
40
20
0
14 cm
10 cm
Pil
e si
nk
ing
dep
th/c
m
Pile end resistance/kN
0.0 0.5 1.0 1.5 2.0 2.5
120
100
80
60
40
20
0
Pil
e si
nk
ing
dep
th/c
m
Pile side resistance/kN
14 cm
10 cm
(a) (b)
Figure 9. Relationship between the pile jacking resistance and pile diameters: (a) Pile end resistance;
(b) Pile side resistance.
5.2. Effect of Pile Length on Pile End Resistance and Pile Side Resistance
Figure 10 shows the effect of pile length on the pile end resistance and pile side resistance,
indicating that pile length has a slight effect on the pile end resistance and pile side resistance; the
change rules of pile end resistance and pile side resistance of test piles TP2 and TP3 are basically the
same and the difference between the pile end resistance and pile side resistance within the same
range of pile length is not much. When the pile depth of TP3 increased from 90 to 110 cm, the pile
end resistance increased from 1.812 to 2.054 kN and the pile side resistance increased from 0.939 to
1.244 kN and is similar to the pile side resistance of TP2. The test result of the pile with the length of
110 cm is slightly larger than that with the length of 90 cm, and is related to the buried depth of the
test pile TP3. The pile side resistance gradually increases with increasing pile jacking depth. At the
same depth, the pile side resistance of TP3 is smaller than that of the test pile TP2. The pile side
resistance of the two test piles is less than 0.1 kN within the range of the buried depth of 10 cm. The
main reason is that during the pile jacking process, the pile body moves in the shallow soil, creating
a certain gap between the pile and soil, and the contact is not close. At the end of pile jacking, the
maximum pile side resistance of TP3 is about 4.5% higher than that of TP2.
Figure 9. Relationship between the pile jacking resistance and pile diameters: (a) Pile end resistance;(b) Pile side resistance.
5.2. Effect of Pile Length on Pile End Resistance and Pile Side Resistance
Figure 10 shows the effect of pile length on the pile end resistance and pile side resistance,indicating that pile length has a slight effect on the pile end resistance and pile side resistance;the change rules of pile end resistance and pile side resistance of test piles TP2 and TP3 are basicallythe same and the difference between the pile end resistance and pile side resistance within the samerange of pile length is not much. When the pile depth of TP3 increased from 90 to 110 cm, the pileend resistance increased from 1.812 to 2.054 kN and the pile side resistance increased from 0.939 to1.244 kN and is similar to the pile side resistance of TP2. The test result of the pile with the length of110 cm is slightly larger than that with the length of 90 cm, and is related to the buried depth of the testpile TP3. The pile side resistance gradually increases with increasing pile jacking depth. At the samedepth, the pile side resistance of TP3 is smaller than that of the test pile TP2. The pile side resistance ofthe two test piles is less than 0.1 kN within the range of the buried depth of 10 cm. The main reason isthat during the pile jacking process, the pile body moves in the shallow soil, creating a certain gapbetween the pile and soil, and the contact is not close. At the end of pile jacking, the maximum pileside resistance of TP3 is about 4.5% higher than that of TP2.
Sensors 2020, 20, x 11 of 15
0.0 0.5 1.0 1.5 2.0 2.5
120
100
80
60
40
20
0
Pil
e si
nkin
g d
epth/cm
Pile end resistance/kN
120 cm
100 cm
0.0 0.5 1.0 1.5 2.0 2.5
120
100
80
60
40
20
0
Pil
e si
nkin
g d
epth/
cm
Pile side resistance/kN
110 cm
90 cm
(a) (b)
Figure 10. Relationship between pile jacking resistance and pile length: (a) Pile end resistance; (b) Pile
side resistance.
5.3. Effect of Pile End Form on Pile End Resistance and Pile Side Resistance
Figure 11 shows the effect of pile end form on the pile end resistance and pile side resistance,
indicating that both of them are related to the pile end form, and the side resistance of the closed-end
pile is obviously greater than that of the open-end pile. At the beginning of the pile jacking stage, the
pile end resistance of TP1 is less than that of TP2. With increasing pile jacking depth, the pile end
resistance of TP1 and TP2 gradually approaches, i.e., the soil plug of TP1 is formed, and the soil plug
resistance gradually develops until the height of the soil plug no longer changes. The pile side
resistance is affected by the pile end form. At the same burial depth, the pile side resistance of the
open-end test pile TP1 is less than that of the closed-end test pile TP2.
0.0 0.5 1.0 1.5 2.0 2.5
120
100
80
60
40
20
0
Pil
e si
nkin
g d
epth/c
m
Pile end resistance/kN
Close-ended
Open-ended
0.0 0.5 1.0 1.5 2.0 2.5
120
100
80
60
40
20
0
Pil
e si
nkin
g d
epth/c
m
Pile side resistance/kN
Closed-ended
Open-ended
(a) (b)
Figure 11. Relationship between pile jacking resistance and pile end form: (a) Pile end resistance; (b)
Pile side resistance.
5.4. Percentage of Pile End Resistance and Pile Side Resistance in Pile Jacking Resistance
The above analysis indicates that the pile jacking resistance in the homogeneous viscous soil
layer is mainly the pile end resistance and the pile side resistance is relatively small, as shown in
Table 1. At the same time, the pile diameter and pile end form significantly affect the pile jacking
resistance in the homogeneous viscous soil layer, but the pile length has no effect on the pile jacking
resistance.
Figure 10. Relationship between pile jacking resistance and pile length: (a) Pile end resistance; (b) Pileside resistance.
Sensors 2020, 20, 5239 11 of 14
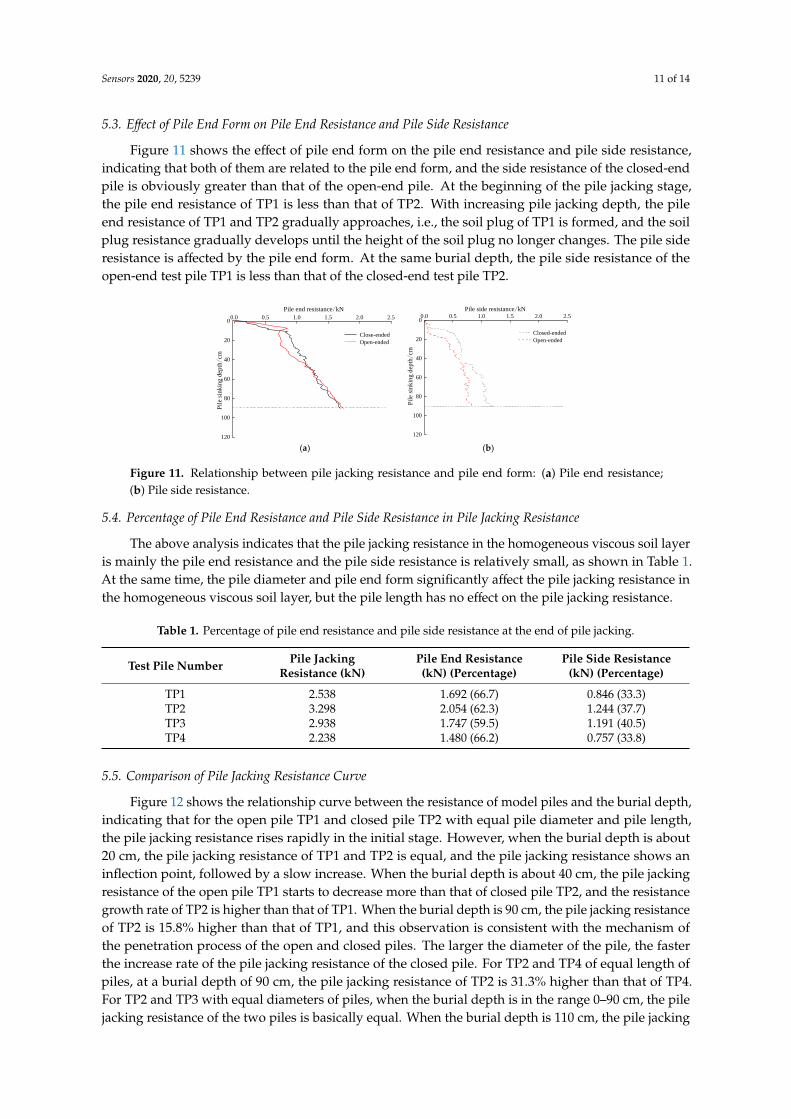
5.3. Effect of Pile End Form on Pile End Resistance and Pile Side Resistance
Figure 11 shows the effect of pile end form on the pile end resistance and pile side resistance,indicating that both of them are related to the pile end form, and the side resistance of the closed-endpile is obviously greater than that of the open-end pile. At the beginning of the pile jacking stage,the pile end resistance of TP1 is less than that of TP2. With increasing pile jacking depth, the pileend resistance of TP1 and TP2 gradually approaches, i.e., the soil plug of TP1 is formed, and the soilplug resistance gradually develops until the height of the soil plug no longer changes. The pile sideresistance is affected by the pile end form. At the same burial depth, the pile side resistance of theopen-end test pile TP1 is less than that of the closed-end test pile TP2.
Sensors 2020, 20, x 11 of 15
0.0 0.5 1.0 1.5 2.0 2.5
120
100
80
60
40
20
0
Pil
e si
nk
ing
dep
th/
cm
Pile end resistance/kN
120 cm
100 cm
0.0 0.5 1.0 1.5 2.0 2.5
120
100
80
60
40
20
0
Pil
e si
nk
ing
dep
th/
cm
Pile side resistance/kN
110 cm
90 cm
(a) (b)
Figure 10. Relationship between pile jacking resistance and pile length: (a) Pile end resistance; (b) Pile
side resistance.
5.3. Effect of Pile End Form on Pile End Resistance and Pile Side Resistance
Figure 11 shows the effect of pile end form on the pile end resistance and pile side resistance,
indicating that both of them are related to the pile end form, and the side resistance of the closed-end
pile is obviously greater than that of the open-end pile. At the beginning of the pile jacking stage, the
pile end resistance of TP1 is less than that of TP2. With increasing pile jacking depth, the pile end
resistance of TP1 and TP2 gradually approaches, i.e., the soil plug of TP1 is formed, and the soil plug
resistance gradually develops until the height of the soil plug no longer changes. The pile side
resistance is affected by the pile end form. At the same burial depth, the pile side resistance of the
open-end test pile TP1 is less than that of the closed-end test pile TP2.
0.0 0.5 1.0 1.5 2.0 2.5
120
100
80
60
40
20
0
Pil
e si
nk
ing
dep
th/c
m
Pile end resistance/kN
Close-ended
Open-ended
0.0 0.5 1.0 1.5 2.0 2.5
120
100
80
60
40
20
0
Pil
e si
nkin
g d
epth/c
m
Pile side resistance/kN
Closed-ended
Open-ended
(a) (b)
Figure 11. Relationship between pile jacking resistance and pile end form: (a) Pile end resistance; (b)
Pile side resistance.
5.4. Percentage of Pile End Resistance and Pile Side Resistance in Pile Jacking Resistance
The above analysis indicates that the pile jacking resistance in the homogeneous viscous soil
layer is mainly the pile end resistance and the pile side resistance is relatively small, as shown in
Table 1. At the same time, the pile diameter and pile end form significantly affect the pile jacking
resistance in the homogeneous viscous soil layer, but the pile length has no effect on the pile jacking
resistance.
Figure 11. Relationship between pile jacking resistance and pile end form: (a) Pile end resistance;(b) Pile side resistance.
5.4. Percentage of Pile End Resistance and Pile Side Resistance in Pile Jacking Resistance
The above analysis indicates that the pile jacking resistance in the homogeneous viscous soil layeris mainly the pile end resistance and the pile side resistance is relatively small, as shown in Table 1.At the same time, the pile diameter and pile end form significantly affect the pile jacking resistance inthe homogeneous viscous soil layer, but the pile length has no effect on the pile jacking resistance.
Table 1. Percentage of pile end resistance and pile side resistance at the end of pile jacking.
Test Pile Number Pile JackingResistance (kN)
Pile End Resistance(kN) (Percentage)
Pile Side Resistance(kN) (Percentage)
TP1 2.538 1.692 (66.7) 0.846 (33.3)TP2 3.298 2.054 (62.3) 1.244 (37.7)TP3 2.938 1.747 (59.5) 1.191 (40.5)TP4 2.238 1.480 (66.2) 0.757 (33.8)
5.5. Comparison of Pile Jacking Resistance Curve
Figure 12 shows the relationship curve between the resistance of model piles and the burial depth,indicating that for the open pile TP1 and closed pile TP2 with equal pile diameter and pile length,the pile jacking resistance rises rapidly in the initial stage. However, when the burial depth is about20 cm, the pile jacking resistance of TP1 and TP2 is equal, and the pile jacking resistance shows aninflection point, followed by a slow increase. When the burial depth is about 40 cm, the pile jackingresistance of the open pile TP1 starts to decrease more than that of closed pile TP2, and the resistancegrowth rate of TP2 is higher than that of TP1. When the burial depth is 90 cm, the pile jacking resistanceof TP2 is 15.8% higher than that of TP1, and this observation is consistent with the mechanism ofthe penetration process of the open and closed piles. The larger the diameter of the pile, the fasterthe increase rate of the pile jacking resistance of the closed pile. For TP2 and TP4 of equal length ofpiles, at a burial depth of 90 cm, the pile jacking resistance of TP2 is 31.3% higher than that of TP4.For TP2 and TP3 with equal diameters of piles, when the burial depth is in the range 0–90 cm, the pilejacking resistance of the two piles is basically equal. When the burial depth is 110 cm, the pile jacking
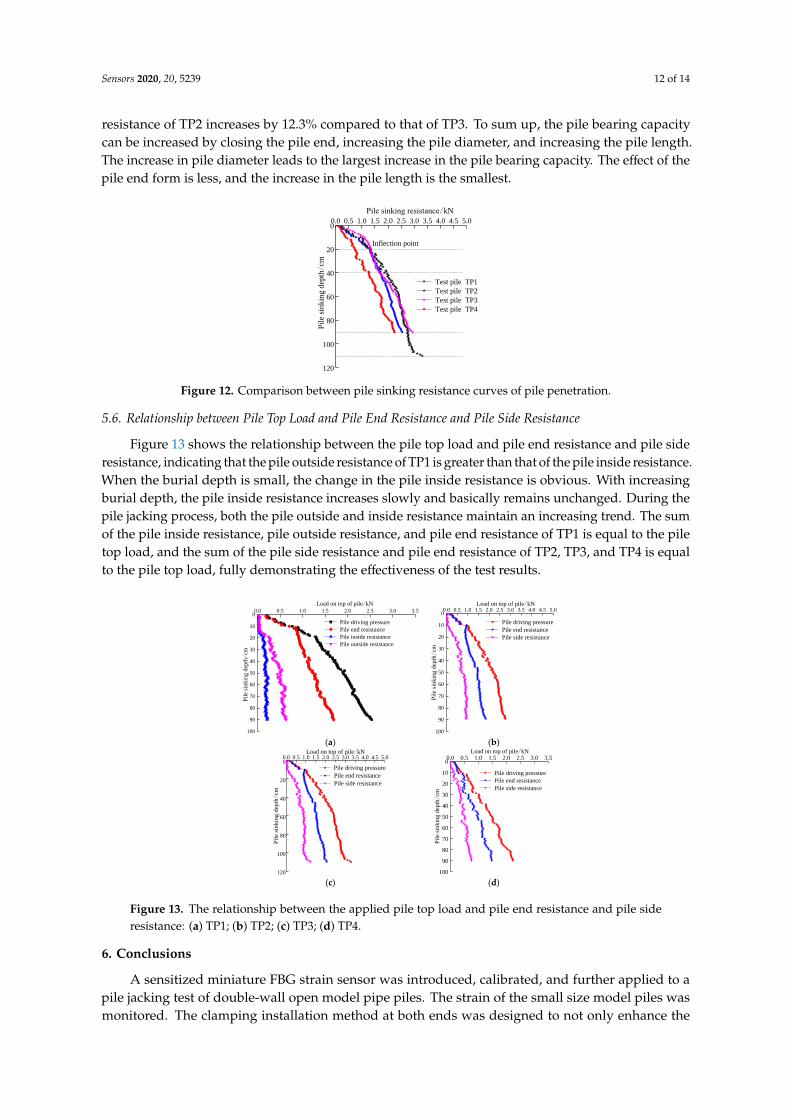
Sensors 2020, 20, 5239 12 of 14
resistance of TP2 increases by 12.3% compared to that of TP3. To sum up, the pile bearing capacitycan be increased by closing the pile end, increasing the pile diameter, and increasing the pile length.The increase in pile diameter leads to the largest increase in the pile bearing capacity. The effect of thepile end form is less, and the increase in the pile length is the smallest.
Sensors 2020, 20, x 12 of 15
Table 1. Percentage of pile end resistance and pile side resistance at the end of pile jacking.
Test Pile
Number
Pile Jacking
Resistance
(kN)
Pile End Resistance
(kN) (Percentage)
Pile Side Resistance
(kN) (Percentage)
TP1 2.538 1.692 (66.7) 0.846 (33.3)
TP2 3.298 2.054 (62.3) 1.244 (37.7)
TP3 2.938 1.747 (59.5) 1.191 (40.5)
TP4 2.238 1.480 (66.2) 0.757 (33.8)
5.5. Comparison of Pile Jacking Resistance Curve
Figure 12 shows the relationship curve between the resistance of model piles and the burial
depth, indicating that for the open pile TP1 and closed pile TP2 with equal pile diameter and pile
length, the pile jacking resistance rises rapidly in the initial stage. However, when the burial depth is
about 20 cm, the pile jacking resistance of TP1 and TP2 is equal, and the pile jacking resistance shows
an inflection point, followed by a slow increase. When the burial depth is about 40 cm, the pile jacking
resistance of the open pile TP1 starts to decrease more than that of closed pile TP2, and the resistance
growth rate of TP2 is higher than that of TP1. When the burial depth is 90 cm, the pile jacking
resistance of TP2 is 15.8% higher than that of TP1, and this observation is consistent with the
mechanism of the penetration process of the open and closed piles. The larger the diameter of the
pile, the faster the increase rate of the pile jacking resistance of the closed pile. For TP2 and TP4 of
equal length of piles, at a burial depth of 90 cm, the pile jacking resistance of TP2 is 31.3% higher than
that of TP4. For TP2 and TP3 with equal diameters of piles, when the burial depth is in the range 0–
90 cm, the pile jacking resistance of the two piles is basically equal. When the burial depth is 110 cm,
the pile jacking resistance of TP2 increases by 12.3% compared to that of TP3. To sum up, the pile
bearing capacity can be increased by closing the pile end, increasing the pile diameter, and increasing
the pile length. The increase in pile diameter leads to the largest increase in the pile bearing capacity.
The effect of the pile end form is less, and the increase in the pile length is the smallest.
0.0 0.5 1.0 1.5 2.0 2.5 3.0 3.5 4.0 4.5 5.0
120
100
80
60
40
20
0
Test pile TP1
Test pile TP2
Test pile TP3
Test pile TP4
Pil
e si
nk
ing
dep
th/c
m
Pile sinking resistance/kN
Inflection point
Figure 12. Comparison between pile sinking resistance curves of pile penetration.
5.6. Relationship between Pile Top Load and Pile End Resistance and Pile Side Resistance
Figure 13 shows the relationship between the pile top load and pile end resistance and pile side
resistance, indicating that the pile outside resistance of TP1 is greater than that of the pile inside
resistance. When the burial depth is small, the change in the pile inside resistance is obvious. With
increasing burial depth, the pile inside resistance increases slowly and basically remains unchanged.
During the pile jacking process, both the pile outside and inside resistance maintain an increasing
trend. The sum of the pile inside resistance, pile outside resistance, and pile end resistance of TP1 is
Figure 12. Comparison between pile sinking resistance curves of pile penetration.
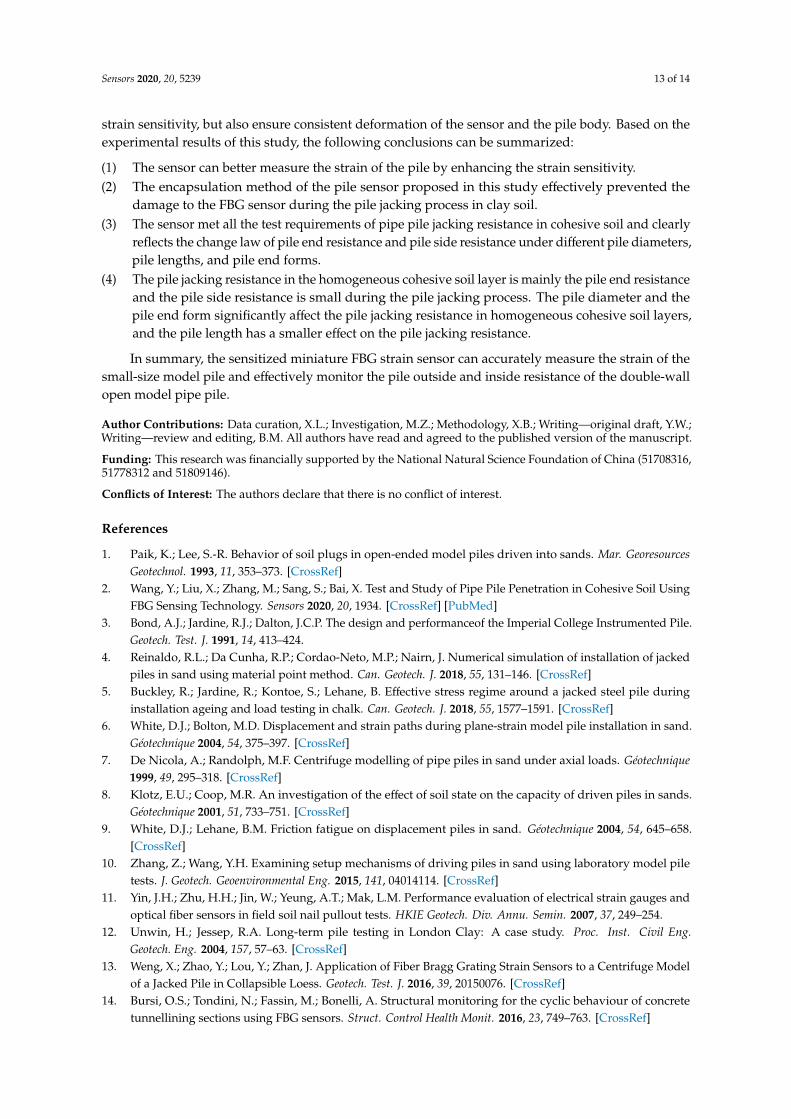
5.6. Relationship between Pile Top Load and Pile End Resistance and Pile Side Resistance
Figure 13 shows the relationship between the pile top load and pile end resistance and pile sideresistance, indicating that the pile outside resistance of TP1 is greater than that of the pile inside resistance.When the burial depth is small, the change in the pile inside resistance is obvious. With increasingburial depth, the pile inside resistance increases slowly and basically remains unchanged. During thepile jacking process, both the pile outside and inside resistance maintain an increasing trend. The sumof the pile inside resistance, pile outside resistance, and pile end resistance of TP1 is equal to the piletop load, and the sum of the pile side resistance and pile end resistance of TP2, TP3, and TP4 is equalto the pile top load, fully demonstrating the effectiveness of the test results.
Sensors 2020, 20, x 13 of 15
equal to the pile top load, and the sum of the pile side resistance and pile end resistance of TP2, TP3,
and TP4 is equal to the pile top load, fully demonstrating the effectiveness of the test results.
0.0 0.5 1.0 1.5 2.0 2.5 3.0 3.5
100
90
80
70
60
50
40
30
20
10
0
Load on top of pile/kN
Pil
e si
nk
ing
dep
th/c
m
Pile driving pressure
Pile end resistance
Pile inside resistance
Pile outside resistance
0.0 0.5 1.0 1.5 2.0 2.5 3.0 3.5 4.0 4.5 5.0
100
90
80
70
60
50
40
30
20
10
0
Pil
e si
nkin
g d
epth/c
m
Load on top of pile/kN
Pile driving pressure
Pile end resistance
Pile side resistance
(a) (b)
0.0 0.5 1.0 1.5 2.0 2.5 3.0 3.5 4.0 4.5 5.0
120
100
80
60
40
20
0
Pil
e si
nkin
g d
epth/
cm
Load on top of pile/kN
Pile driving pressure
Pile end resistance
Pile side resistance
0.0 0.5 1.0 1.5 2.0 2.5 3.0 3.5
100
90
80
70
60
50
40
30
20
10
0
Pil
e si
nkin
g d
epth/c
m
Load on top of pile/kN
Pile driving pressure
Pile end resistance
Pile side resistance
(c) (d)
Figure 13. The relationship between the applied pile top load and pile end resistance and pile side
resistance: (a) TP1; (b) TP2; (c) TP3; (d) TP4.
6. Conclusions
A sensitized miniature FBG strain sensor was introduced, calibrated, and further applied to a
pile jacking test of double-wall open model pipe piles. The strain of the small size model piles was
monitored. The clamping installation method at both ends was designed to not only enhance the
strain sensitivity, but also ensure consistent deformation of the sensor and the pile body. Based on
the experimental results of this study, the following conclusions can be summarized:
(1) The sensor can better measure the strain of the pile by enhancing the strain sensitivity.
(2) The encapsulation method of the pile sensor proposed in this study effectively prevented the
damage to the FBG sensor during the pile jacking process in clay soil.
(3) The sensor met all the test requirements of pipe pile jacking resistance in cohesive soil and clearly
reflects the change law of pile end resistance and pile side resistance under different pile
diameters, pile lengths, and pile end forms.
(4) The pile jacking resistance in the homogeneous cohesive soil layer is mainly the pile end
resistance and the pile side resistance is small during the pile jacking process. The pile diameter
and the pile end form significantly affect the pile jacking resistance in homogeneous cohesive
soil layers, and the pile length has a smaller effect on the pile jacking resistance.
In summary, the sensitized miniature FBG strain sensor can accurately measure the strain of the
small-size model pile and effectively monitor the pile outside and inside resistance of the double-
wall open model pipe pile.
Authors Contributions: Data curation, X.L.; Investigation, M.Z.; Methodology, X.B.; Writing—original draft,
Y.W.; Writing—review and editing, B.M. All authors have read and agreed to the published version of the
manuscript.
Figure 13. The relationship between the applied pile top load and pile end resistance and pile sideresistance: (a) TP1; (b) TP2; (c) TP3; (d) TP4.
6. Conclusions
A sensitized miniature FBG strain sensor was introduced, calibrated, and further applied to apile jacking test of double-wall open model pipe piles. The strain of the small size model piles wasmonitored. The clamping installation method at both ends was designed to not only enhance the
Sensors 2020, 20, 5239 13 of 14
strain sensitivity, but also ensure consistent deformation of the sensor and the pile body. Based on theexperimental results of this study, the following conclusions can be summarized:
(1) The sensor can better measure the strain of the pile by enhancing the strain sensitivity.(2) The encapsulation method of the pile sensor proposed in this study effectively prevented the
damage to the FBG sensor during the pile jacking process in clay soil.(3) The sensor met all the test requirements of pipe pile jacking resistance in cohesive soil and clearly
reflects the change law of pile end resistance and pile side resistance under different pile diameters,pile lengths, and pile end forms.
(4) The pile jacking resistance in the homogeneous cohesive soil layer is mainly the pile end resistanceand the pile side resistance is small during the pile jacking process. The pile diameter and thepile end form significantly affect the pile jacking resistance in homogeneous cohesive soil layers,and the pile length has a smaller effect on the pile jacking resistance.
In summary, the sensitized miniature FBG strain sensor can accurately measure the strain of thesmall-size model pile and effectively monitor the pile outside and inside resistance of the double-wallopen model pipe pile.
Author Contributions: Data curation, X.L.; Investigation, M.Z.; Methodology, X.B.; Writing—original draft, Y.W.;Writing—review and editing, B.M. All authors have read and agreed to the published version of the manuscript.
Funding: This research was financially supported by the National Natural Science Foundation of China (51708316,51778312 and 51809146).
Conflicts of Interest: The authors declare that there is no conflict of interest.
References
1. Paik, K.; Lee, S.-R. Behavior of soil plugs in open-ended model piles driven into sands. Mar. GeoresourcesGeotechnol. 1993, 11, 353–373. [CrossRef]
2. Wang, Y.; Liu, X.; Zhang, M.; Sang, S.; Bai, X. Test and Study of Pipe Pile Penetration in Cohesive Soil UsingFBG Sensing Technology. Sensors 2020, 20, 1934. [CrossRef] [PubMed]
3. Bond, A.J.; Jardine, R.J.; Dalton, J.C.P. The design and performanceof the Imperial College Instrumented Pile.Geotech. Test. J. 1991, 14, 413–424.
4. Reinaldo, R.L.; Da Cunha, R.P.; Cordao-Neto, M.P.; Nairn, J. Numerical simulation of installation of jackedpiles in sand using material point method. Can. Geotech. J. 2018, 55, 131–146. [CrossRef]
5. Buckley, R.; Jardine, R.; Kontoe, S.; Lehane, B. Effective stress regime around a jacked steel pile duringinstallation ageing and load testing in chalk. Can. Geotech. J. 2018, 55, 1577–1591. [CrossRef]
6. White, D.J.; Bolton, M.D. Displacement and strain paths during plane-strain model pile installation in sand.Géotechnique 2004, 54, 375–397. [CrossRef]
7. De Nicola, A.; Randolph, M.F. Centrifuge modelling of pipe piles in sand under axial loads. Géotechnique1999, 49, 295–318. [CrossRef]
8. Klotz, E.U.; Coop, M.R. An investigation of the effect of soil state on the capacity of driven piles in sands.Géotechnique 2001, 51, 733–751. [CrossRef]
9. White, D.J.; Lehane, B.M. Friction fatigue on displacement piles in sand. Géotechnique 2004, 54, 645–658.[CrossRef]
10. Zhang, Z.; Wang, Y.H. Examining setup mechanisms of driving piles in sand using laboratory model piletests. J. Geotech. Geoenvironmental Eng. 2015, 141, 04014114. [CrossRef]
11. Yin, J.H.; Zhu, H.H.; Jin, W.; Yeung, A.T.; Mak, L.M. Performance evaluation of electrical strain gauges andoptical fiber sensors in field soil nail pullout tests. HKIE Geotech. Div. Annu. Semin. 2007, 37, 249–254.
12. Unwin, H.; Jessep, R.A. Long-term pile testing in London Clay: A case study. Proc. Inst. Civil Eng.Geotech. Eng. 2004, 157, 57–63. [CrossRef]
13. Weng, X.; Zhao, Y.; Lou, Y.; Zhan, J. Application of Fiber Bragg Grating Strain Sensors to a Centrifuge Modelof a Jacked Pile in Collapsible Loess. Geotech. Test. J. 2016, 39, 20150076. [CrossRef]
14. Bursi, O.S.; Tondini, N.; Fassin, M.; Bonelli, A. Structural monitoring for the cyclic behaviour of concretetunnellining sections using FBG sensors. Struct. Control Health Monit. 2016, 23, 749–763. [CrossRef]
Sensors 2020, 20, 5239 14 of 14
15. Wang, H.; Jiang, L.; Xiang, P. Improving the durability of the optical fiber sensor based on strain transferanalysis. Opt. Fiber Technol. 2018, 42, 97–104. [CrossRef]
16. Zhang, Z.; Huang, Y.; Palek, L.; Strommen, R. Glass fiber–reinforced polymer–packaged fiber Bragg gratingsensors for ultra-thin unbonded concrete overlay monitoring. Struct. Health Monit. 2014, 14, 110–123.[CrossRef]
17. Borana, L.; Yin, J.-H.; Singh, D.N.; Shukla, S.K.; Pei, H.F. Influences of Initial Water Content and Roughnesson Skin Friction of Piles Using FBG Technique. Int. J. Géoméch. 2017, 17, 04016097. [CrossRef]
18. Gao, L.; Yang, K.; Chen, X.; Yu, X. Study on the Deformation Measurement of the Cast-In-Place Large-DiameterPile Using Fiber Bragg Grating Sensors. Sensors 2017, 17, 505. [CrossRef]
19. Wang, Y.; Liu, X.; Sang, S.; Zhang, M.; Wang, P. A Model Test for the Influence of Lateral Pressure on VerticalBearing Characteristics in Pile Jacking Process Based on Optical Sensors. Sensors 2020, 20, 1733. [CrossRef]
20. Bersan, S.; Bergamo, O.; Palmieri, L.; Schenato, L.; Simonini, P. Distributed strain measurements in a CFApile using high spatial resolution fibre optic sensors. Eng. Struct. 2018, 160, 554–565. [CrossRef]
21. Lu, X.-C.; Li, G.-W.; Pei, H.-F.; Su, G.-Y.; Wu, J.-T.; Amenuvor, A.C. Experimental Investigations on LoadTransfer of PHC Piles in Highway Foundation Using FBG Sensing Technology. Int. J. Géoméch. 2017, 17,04016123. [CrossRef]
22. Kou, H.-L.; Yu, F.; Liu, T. Strain Monitoring on PHC Pipe Piles Based on Fiber Bragg Grating Sensors.J. Perform. Constr. Facil. 2019, 33, 04019003. [CrossRef]
23. Berruti, G.; Consales, M.; Giordano, M.; Sansone, L.; Petagna, P.; Buontempo, S.; Breglio, G.; Cusano, A.Radiation hard humidity sensors for high energy physics applications using polyimide-coated fiber Bragggratings sensors. Sensors Actuators B Chem. 2013, 177, 94–102. [CrossRef]
24. Meng, S.; Sun, Y.; Wang, M. Fiber Bragg grating sensors for subgrade deformation monitoring in seasonallyfrozen regions. Struct. Control. Health Monit. 2019, 27. [CrossRef]
25. Oromiehie, E.; Prusty, B.G.; Compston, P.; Rajan, G. In situ process monitoring for automated fibre placementusing fibre Bragg grating sensors. Struct. Health Monit. 2016, 15. [CrossRef]
26. Chuang, K.-C.; Ma, C.-C.; Wang, C.-Y. Free-edge sensor placement for identifying vibration modes ofstructures subjected to impact loadings using fiber Bragg gratings. Struct. Control. Health Monit. 2016, 23,1350–1365. [CrossRef]
27. Fan, S.; Ren, L.; Chen, J. Investigation of fiber Bragg grating strain sensor in dynamic tests of small-scale dammodel. Struct. Control. Health Monit. 2015, 22, 1282–1293. [CrossRef]
28. Ren, L.; Jiang, T.; Jia, Z.-G.; Li, D.-S.; Yuan, C.-L.; Li, H.-N. Pipeline corrosion and leakage monitoring basedon the distributed optical fiber sensing technology. Measurement 2018, 122, 57–65. [CrossRef]
© 2020 by the authors. Licensee MDPI, Basel, Switzerland. This article is an open accessarticle distributed under the terms and conditions of the Creative Commons Attribution(CC BY) license (http://creativecommons.org/licenses/by/4.0/).
Related Documents