Welcome message from author
This document is posted to help you gain knowledge. Please leave a comment to let me know what you think about it! Share it to your friends and learn new things together.
Transcript
i
Table of Contents Table of Contents....................................................................................................................................i ACKNOWLEDGEMENTS .................................................................................................................. 1 Executive Summary .............................................................................................................................. 3
BELIZE FAMILY HEALTH SURVEY (MALES)............................................................ 3 Introduction................................................................................................................................ 3
CHAPTER 1 ......................................................................................................................................... 7 INTRODUCTION, BACKGROUND AND METHODOLOGY ................................... 7
1.1 Historical, Geographical, Demographic, and Social Background ................... 7 1.2 Population Policies and Programmes ...................................................................... 9 1.3 Objectives of the 1999 Family Health Survey of Belize.................................... 9 1.4 Coverage of the 1999 Survey .................................................................................... 9 1.5 Administration of the Survey .................................................................................. 10 1.6 The Sample Design .................................................................................................... 10 1.7 The Questionnaire Design........................................................................................ 11 1.8 Recruitment and Training ........................................................................................ 11 1.9 Fieldwork ..................................................................................................................... 12
CHAPTER 2 ....................................................................................................................................... 13 CHARACTERISTICS OF THE SURVEY POPULATION .......................................... 13
2.1 Introduction.................................................................................................................. 13 2.2 Housing and Household Characteristics............................................................... 13 2.3 General Characteristics............................................................................................. 15 2.4 Summary ...................................................................................................................... 17
CHAPTER 3 ....................................................................................................................................... 18 SEXUAL ACTIVITY............................................................................................................... 18
3.1 Introduction.................................................................................................................. 18 3.2 Age at first sexual intercourse................................................................................. 18 3.3 Level of education at first sexual intercourse ..................................................... 18 3.4 Relationship to first female...................................................................................... 18 3.5 Contraceptive use at first sexual intercourse....................................................... 19 3.6 Sexual intercourse in the last 30 days and last 3 months ................................. 19 3.7 Summary ...................................................................................................................... 20
CHAPTER 4 ....................................................................................................................................... 21 FERTILITY, RELATIONSHIP AND REPRODUCTIVE HISTORY........................ 21
4.1 Introduction.................................................................................................................. 21 4.2 Mean number of children ......................................................................................... 21 4.3 Level of education at the time first child was born ........................................... 22 4.4 Planning status of first and last children .............................................................. 22 4.5 Fathered children with more than one woman.................................................... 23 4.6 Spouse/Partner currently pregnant ......................................................................... 23 4.7 Summary ...................................................................................................................... 23
CHAPTER 5 ....................................................................................................................................... 25 GENERAL ATTITUDES AND ATTITUDES TOWARDS CHILDBEARING AND CONTRACEPTION ...................................................................................................... 25
ii
5.1 Introduction.................................................................................................................. 25 5.2 Family Planning Messages ...................................................................................... 25 5.3 Ideal Family Size........................................................................................................ 26 5.4 Opinions About Childbearing ................................................................................. 27 5.5 Attitudes Towards Contraception .......................................................................... 28 5.6 Ideal Age for a Man to have his First Sexual Relationship ............................. 29 5.7 Ideal Age for a Woman to have her First Sexual Relationship ...................... 29 5.8 General Attitudes and Opinions ............................................................................. 31 5.9 Beliefs of how a girl can avoid getting pregnant ............................................... 32 5.10 Beliefs about boys and sexuality........................................................................ 32 5.11 Beliefs about the importance of female virginity........................................... 33 5.12 Opinion about Pregnancy and School Admittance for boys and girls ...... 33 5.13 Opinion on Extramarital Affairs......................................................................... 33 5.14 Beliefs about Vasectomy...................................................................................... 34 5.15 The issue of family violence and sexual harassment .................................... 34 5.16 Summary .................................................................................................................. 34
CHAPTER 6 ....................................................................................................................................... 36 KNOWLEDGE, USE AND SOURCE OF CONTRACEPTION.................................. 36
6.1 Introduction.................................................................................................................. 36 6.2 Knowledge of Contraceptive Methods................................................................. 36 6.3 Knowledge of the Fertile Period ............................................................................ 37 6.4 Current Contraceptive Use....................................................................................... 37 6.5 Reasons for Currently Using Contraceptives ...................................................... 39 6.6 Characteristics at First Contraceptive Use........................................................... 40 6.7 Reasons for Non-Use of Contraceptives .............................................................. 41 6.8 Reasons for Discontinued Use of Contraceptives .............................................. 42 6.9 Desire to Use Contraceptives in the Future ......................................................... 42 6.10 Summary .................................................................................................................. 43
CHAPTER 7 ....................................................................................................................................... 44 FAMILY LIFE EDUCATION ............................................................................................... 44
7.1 Introduction.................................................................................................................. 44 7.2 Findings ........................................................................................................................ 44 7.3 Summary ...................................................................................................................... 46
CHAPTER 8 ....................................................................................................................................... 47 THE USE AND POTENTIAL DEMAND FOR SURGICAL CONTRACEPTION47
8.1 Introduction.................................................................................................................. 47 8.2 Demand for Vasectomy............................................................................................ 47 8.3 Summary ...................................................................................................................... 49
CHAPTER 9 ....................................................................................................................................... 51 9.1 Introduction.................................................................................................................. 51 9.2 Men who have heard of AIDS ................................................................................ 51 9.3 Sources of information on HIV/AIDS .................................................................. 52 9.4 Correct Knowledge of How AIDS May be Transmitted.................................. 52 9.5 Incorrect Knowledge of How AIDS May be Transmitted ............................... 53
iii
9.6 Perceived Risk of Getting AIDS Among Men ................................................... 54 9.7 Perceived Risk and Condom Use........................................................................... 55 9.8 Summary ...................................................................................................................... 56
CHAPTER 10 ..................................................................................................................................... 57 CONDOM USE.......................................................................................................................... 57
10.1 Introduction.............................................................................................................. 57 10.2 Knowledge and Use of Condoms....................................................................... 57 10.3 Frequency of Use with Steady and Non-Steady Partners ............................ 58 10.4 Other Matters Relating to Condom Use........................................................... 59 10.5 Summary .................................................................................................................. 61
CHAPTER 11 ..................................................................................................................................... 63 DRUG USE AND DOMESTIC VIOLENCE..................................................................... 63
11.1 Introduction.............................................................................................................. 63 11.2 Alcoholic Beverages.............................................................................................. 63 11.3 Cigarette Smoking ................................................................................................. 64 11.4 Marijuana Consumption....................................................................................... 65 11.5 Domestic Violence................................................................................................. 66 11.6 Summary .................................................................................................................. 68
Appendix I........................................................................................................................................... 70 Appendix II ......................................................................................................................................... 71 BIBLIOGRAPHY............................................................................................................................... 72
1
ACKNOWLEDGEMENTS
Both surveys of Males and Females’ Family Health were conducted in December, 1999.
Even though there were some unforeseen setbacks, I am now happy to report that the final reports
have been prepared by the following personnel, two of whom were intimately involved with the
project from its inception. Mrs. Jewell Quallo Rosberg, Director of the Belize Family Life
Association (BFLA) prepared chapters 6, 7, 8 and 9 of the female survey, and chapters 6 and 7 of
the male survey. Mr. Jose Orlando Puga, private consultant assisted in preparing chapters 14 and 9
of the female and male survey respectively. Mrs. Elizabeth Talbert, Deputy Chief Statistician was
responsible for chapters 3, 4, 5 and 15 of the female survey and chapters 3 and 4 of the male survey.
Mrs. Leticia Vega prepared chapters 10, 11 and 12 of the female survey and chapters 5,8 and 11 of
the male survey. I prepared chapters 1, 2 and 13 and chapters 1,2 and 10 of the female and male
surveys respectively.
Formal acknowledgements must also be made of the funding and technical assistance agencies
whose inputs were essential in realizing the final products. The Caribbean Development Bank
(CDB) funded most of the cost related to the female Family Health Survey. UNICEF and the
government of Belize also assisted with funding for this study, and together met all costs related to
the male survey. The Centers For Disease Control (CDC) provided very essential and timely
technical assistance in helping to train four (4) key members of the staff of the Central Statistical
Office (CSO), and also in the review of the final databases.
Most importantly, this is to formally acknowledge the co-operation of the many households who
were in the sample for both surveys, who so generously gave of their time and patience in answering
the questions. No matter how much funding or expertise were available, if the respondents had not
co-operated with the field-staff, these final reports would not have been possible. Let it be reiterated
here that the CSO greatly appreciates this co-operation and will always do all that is possible to
ensure the confidentiality of all information provided, and the usefulness of it in improving the
quality of life of the entire population.
CHIEF STATISTICIAN

2
3
Executive Summary
BELIZE FAMILY HEALTH SURVEY (MALES)
Introduction
This report on the Belize Family Health Survey of Males 1999 represents another milestone
for the Central Statistical Office, mainly because it is the first time it has been done in Belize, but
also because Belize is only the second country from among the CARICOM countries to carry out
such a survey. Besides providing bench mark data, the survey results present information on the
knowledge and attitudes of Belizean men on contraceptive use, child bearing, HIV/AIDS, condoms
and domestic violence to mention a few areas of concern.
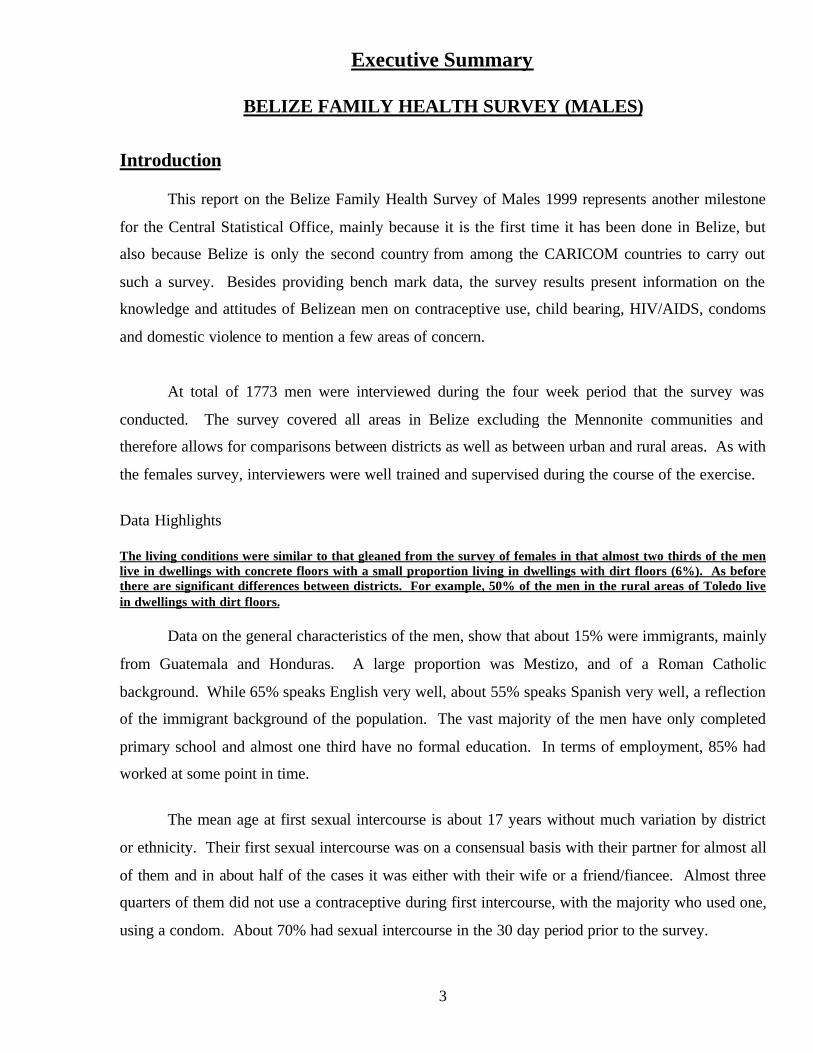
At total of 1773 men were interviewed during the four week period that the survey was
conducted. The survey covered all areas in Belize excluding the Mennonite communities and
therefore allows for comparisons between districts as well as between urban and rural areas. As with
the females survey, interviewers were well trained and supervised during the course of the exercise.
Data Highlights
The living conditions were similar to that gleaned from the survey of females in that almost two thirds of the men live in dwellings with concrete floors with a small proportion living in dwellings with dirt floors (6%). As before there are significant differences between districts. For example, 50% of the men in the rural areas of Toledo live in dwellings with dirt floors.
Data on the general characteristics of the men, show that about 15% were immigrants, mainly
from Guatemala and Honduras. A large proportion was Mestizo, and of a Roman Catholic
background. While 65% speaks English very well, about 55% speaks Spanish very well, a reflection
of the immigrant background of the population. The vast majority of the men have only completed
primary school and almost one third have no formal education. In terms of employment, 85% had
worked at some point in time.
The mean age at first sexual intercourse is about 17 years without much variation by district
or ethnicity. Their first sexual intercourse was on a consensual basis with their partner for almost all
of them and in about half of the cases it was either with their wife or a friend/fiancee. Almost three
quarters of them did not use a contraceptive during first intercourse, with the majority who used one,
using a condom. About 70% had sexual intercourse in the 30 day period prior to the survey.
4
In terms of fertility about half of the men fathered at least one child, but only 3% of the under
20 years report doing so and 14% of this group not having sexual intercourse at all. What is note
worthy though is the fact that most of these men (78%) have children with only one woman and 10%
with 2 women. Eight percent did not respond, so that the rate is even higher, which means only
about 4% of the men in Belize have children with 3 or more women. This latter rate is highest
among Creole men, about 9%. Of course in some of these cases the man could have been married
on more than one occasion.
The men interviewed are of the view that the ideal number of children a man should have is
just under 4 (3.9); these men on average have over 4 children (4.3). In their opinion a man should
have his first child at about 20 years although they think he should have his first sexual intercourse at
about 17 years. On the other hand they think women should have their first sexual intercourse at
about 18 years.
Over 60% of the men did not hear a family planning message in the six months prior to the
survey. However, most are knowledgeable about contraceptives, especially orals (86%), condoms
(74%) and to a lesser extent, females sterilization (65%) and injectables (62%). Well under half of
them know about other methods. However, 39% of these men are currently using a contraceptive,
with the largest group, men in a union, only half using a contraceptive. Maya/Ketchi men know the
least about contraceptives. Men with no children or 6 or more children were least likely to be using
a contraceptive at the time of the survey (35%). Maya/Ketchi men are the least likely to be currently
using a contraceptive (30%). As might be expected, the use of contraceptive increases with
education. While about 60% of the men say they do not want any more children or about half of
these are using any contraceptive and for about half of these, it is female sterilization.
Condoms are the most popular contraceptive among men, with just under half of the current users choosing this method, especially the younger men. While half always use this method, it is used more to prevent pregnancy (88%) than to prevent HIV/AIDS (37%) or STIs (29%). This low use to prevent STI’s including HIV/AIDS is due in part to the fact that well over two thirds of these men do not perceive themselves at risk of getting HIV/AIDS with another 16% do not think they are at much risk. However, more men use condoms to prevent getting HIV/AIDS (75%) than to avoid pregnancy (70%) when having sex with a non-steady partner.
With regards to their risk of getting HIV/AIDS, among those who perceive themselves to be
at great risk of contracting the virus are Maya/Ketchi men (13%), Garifuna men (7%), men in a
visiting relationship (6%), and men 20 to 24 years of age (7%). Overall, only 4% of the men
consider themselves to be at great risk, with another 9% considering themselves to be at some risk.
Among the sub-populations who consider themselves to be at some risk of getting HIV/AIDS, are
men 20 – 24 years (11%), men 25 to 29 years (14%), men 45 to 49 years (12%), men with 9 or more
5
years of education (11%), men in a visiting relationship (24%), Creole men (11%) and Garifuna men
(16%). What is worth noting is the fact that more men know where to get information on HIV/AIDS
and STI’s than information on sex and contraceptives. Almost all know about HIV/AIDS and most
know it is transmitted by heterosexual intercourse. However, only half know about transmission by
blood transfusion, sharing of needles or male sexual intercourse.
Almost all men think the topics of Human Reproduction, Contraception and STI’s and
HIV/AIDS should be taught in school, particularly between the ages of 10 and 15 years. Much less
than half of these men themselves had received any such education at all.
On the topics of drug use and domestic violence, just over half of the men interviewed are
using alcohol (58%), with a much smaller proportion using cigarettes (22%) or marijuana (6%). In
all cases a larger proportion had used these drugs. While alcohol is used by all groups, generally
older men use cigarettes and more young men use marijuana.
With regards to domestic violence, half of the men say they discuss problems that arise in the
home. Only 1% say they react violently. About one tenth of the men say they were abused as a
child. The abuse was mainly physical (83%) and was carried out by their father, about half of the
time. Of those men who were abused, 36% feel it is okay to beat a \woman if she had an affair while
28% of those who were never abused feel so. Again there is a difference in perception when it
comes to beating of children. Among abused men, 74% feel it is okay to beat a child who has been
disobedient as opposed to 62% for the never abused. However, about the same proportion in each
case (47%) feel it is okay to beat a child when they are upset. These instances were the most
significant responses of abuse of women and children. Opinions on other forms of abuse to women
were in small proportions, less than 7% when “she’s getting on your nerves.” While agreement on
abuse to children ranged from 29% “when they get home late” to 11%, “when they are too noisy.”

6
7
CHAPTER 1
INTRODUCTION, BACKGROUND AND METHODOLOGY
1.1 Historical, Geographical, Demographic, and Social Background
Belize is an independent country geographically located on the isthmus of Central
America. It is bordered on the north by Mexico, on the west and south by Guatemala and on
the east by the Caribbean Sea. Originally, Belize was a British colony but obtained political
independence on September 21, 1981. Regionally, Belize is a member of CARICOM, the
Caribbean Community of Nations, as well as of ECLAC, the Economic Commission for
Latin America and the Caribbean.
The country is approximately 8,866 square miles (22,700 square kilometres) and is
divided into six (6) administrative districts, namely, Corozal and Orange Walk in the north,
Belize in the east, Cayo in the west and Stann Creek and Toledo in the south. Each of these
districts is further sub-divided into a recognized urban and rural area, and the significance of
these divisions lies in the fact that there are sharp socio-economic differences between them.
Preliminary results from the National Population and Housing Census 2000 show that
at mid-year 2000, the population of the country was 249,800 with an annual population
growth rate of 2.7%. The estimated crude birth rate and crude death rate in 1999 were 25.1
per thousand population and 5.7 per thousand population respectively, resulting in a rate of
natural increase of 19.4. This compares with rates of natural increase of 33.8 at the beginning
of the decade, which clearly shows a decline during the period.
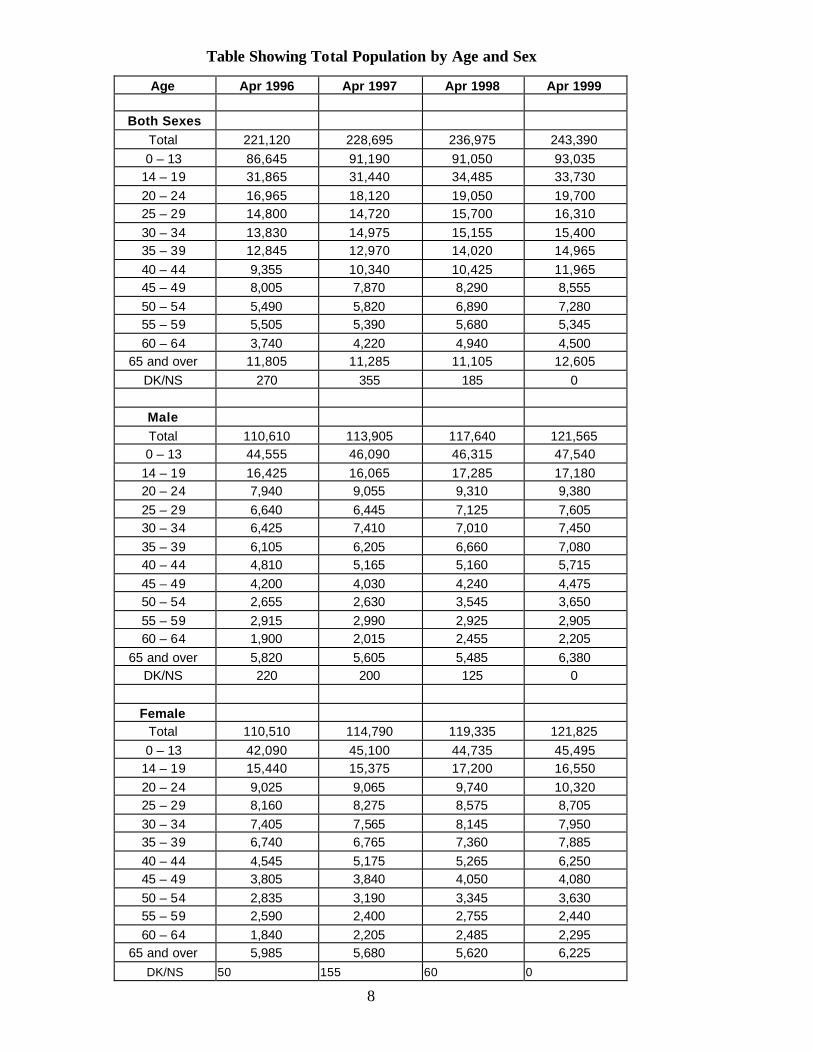
In any study of Reproductive Health, the age distribution of the population is very
important. Of particular significance, for example, is the proportion of women of
childbearing age, since this will assist greatly in projecting future population size. The age
distribution also provides important sub-groups for analysis, such as Young Adults and the
Child and Infant sub-groups. The table below shows the age distribution of Belize’s
population in 1999.
8
Table Showing Total Population by Age and Sex
Age Apr 1996 Apr 1997 Apr 1998 Apr 1999
Both Sexes Total 221,120 228,695 236,975 243,390 0 – 13 86,645 91,190 91,050 93,035
14 – 19 31,865 31,440 34,485 33,730 20 – 24 16,965 18,120 19,050 19,700 25 – 29 14,800 14,720 15,700 16,310 30 – 34 13,830 14,975 15,155 15,400 35 – 39 12,845 12,970 14,020 14,965 40 – 44 9,355 10,340 10,425 11,965 45 – 49 8,005 7,870 8,290 8,555 50 – 54 5,490 5,820 6,890 7,280 55 – 59 5,505 5,390 5,680 5,345 60 – 64 3,740 4,220 4,940 4,500
65 and over 11,805 11,285 11,105 12,605 DK/NS 270 355 185 0
Male Total 110,610 113,905 117,640 121,565 0 – 13 44,555 46,090 46,315 47,540
14 – 19 16,425 16,065 17,285 17,180 20 – 24 7,940 9,055 9,310 9,380 25 – 29 6,640 6,445 7,125 7,605 30 – 34 6,425 7,410 7,010 7,450 35 – 39 6,105 6,205 6,660 7,080 40 – 44 4,810 5,165 5,160 5,715 45 – 49 4,200 4,030 4,240 4,475 50 – 54 2,655 2,630 3,545 3,650 55 – 59 2,915 2,990 2,925 2,905 60 – 64 1,900 2,015 2,455 2,205
65 and over 5,820 5,605 5,485 6,380 DK/NS 220 200 125 0
Female
Total 110,510 114,790 119,335 121,825 0 – 13 42,090 45,100 44,735 45,495
14 – 19 15,440 15,375 17,200 16,550 20 – 24 9,025 9,065 9,740 10,320 25 – 29 8,160 8,275 8,575 8,705 30 – 34 7,405 7,565 8,145 7,950 35 – 39 6,740 6,765 7,360 7,885 40 – 44 4,545 5,175 5,265 6,250 45 – 49 3,805 3,840 4,050 4,080 50 – 54 2,835 3,190 3,345 3,630 55 – 59 2,590 2,400 2,755 2,440 60 – 64 1,840 2,205 2,485 2,295
65 and over 5,985 5,680 5,620 6,225 DK/NS 50 155 60 0
9
1.2 Population Policies and Programmes
Experience has shown that the adoption and promotion of positive population policies
can have significant socio-economic effects on people, and can improve their quality of life.
To date, however, Belize has not adopted a Population Policy, even though such a policy has
been drafted. Despite the lack of an articulated population policy, the Ministry of Health of
Belize does encourage and promote reproductive health to a great extent. Also, among the
Non Governmental Community, a very vibrant Belize Family Life Association (BFLA) has
been successfully promoting family planning and family life education among the interested
population.
1.3 Objectives of the 1999 Family Health Survey of Belize
The main objectives of the 1999 Family Health Survey of Belizean males are to have
an updated database for urgent use in decisions related to male family health. More
specifically, the survey will provide urgently needed information on fertility of males, family
practices, male attitudes towards various related health issues such as HIV/AIDS and other
STIs and other reproductive health issues. There presently exists a dire need for data on male
Reproductive Health, among others, and an FHS at this time would meet many of these
urgent needs. The major users of the results of this survey will include the Ministry of
Health, the BFLA and the Ministries of Human and Economic Development. Of course, the
survey will provide a rich database for use by socio-economic and demographic researchers,
as was the case with the database for the 1991 female survey. It is also hoped that local
research units, like that of the recently established University of Belize, will take full
advantage of the primary data collected in this survey.
1.4 Coverage of the 1999 Survey
The survey carried out in 1999 was of males aged 15 to 64 years, and is the first such
survey to be carried out in the country. Hence, very little comparison can be made. A
scientific sample of men between the above ages was used. This sample was representative
of all six (6) districts of the country. An interview was done with each selected male in the
survey and this provided information on a broad cross section of topics. Some of these topics
included the birth history of the man, contraceptive knowledge and use, knowledge of STIs
10
including HIV/AIDS, and behavioural risks. In order to enrich the analysis, basic social and
economic characteristics like educational level and employment status were also collected.
1.5 Administration of the Survey
The Central Statistical Office (CSO) of Belize was the major implementing agency
for the survey. However, there were other local collaborating agencies, including the BFLA
and the Ministry of Health, whose contributions were significant especially at the preparatory
stages of the project. Foreign collaborating agencies included the Caribbean Development
Bank (CDB), which provided some of the funding, including the provision of a regional
consultant to assist the CSO at the preparatory stages and in the preparation of reports;
UNICEF, which provided most of the funding for this survey; and the Centers for Disease
Control, which assisted with the training of CSO field staff and the analysis of the data.
1.6 The Sample Design
The sample finally used was a scientific sample, and was selected as follows. The
survey sought to interview 2,000 men between the ages of 13 and 64 years. It was expected
to interview only one eligible male per household even if there was more than one eligible
respondent. Preliminary investigations revealed that to achieve an objective of 2,000
interviews, it would be necessary to target some 2,670 households. It was also necessary
to analyze the data at the district and urban/rural levels. Allowing for a non-response rate of
10% meant that about 2,940 households would have to be selected. The estimated number of
households in the country at the time was 45,455, excluding the Mennonite settlements of
Little Belize in the Corozal District, Blue Creek and Shipyard in Orange Walk and Spanish
Lookout in the Cayo District. Hence, a sampling fraction of 1/15 was estimated to be
necessary to obtain this number of households.
To achieve the above, the total number of households in the country was broken up
into clusters of approximately 30 households and distributed proportionately among the
districts. This resulted in 1,524 clusters being formed for the country. Of this, 1/15 or 98
clusters were selected to be interviewed. This yielded approximately 2,940 households which
is the minimum needed to obtain 2,000 successful interviews. It turned out that only 1,773
successful interviews were completed, taking into account non-contacts and refusals.
11
1.7 The Questionnaire Design
A preparatory committee comprising representation from the Ministry of Health, the
BFLA, UNICEF and the CSO was established and one of its first tasks was to put together a
suitable questionnaire to collect the required information. Contacts with the CDC through the
person of Dr. Paul Stupp and with Mr. Stan Terrel of the regional programme on HIV/AIDS
were extremely beneficial in guiding the discussions on the final questionnaire. These two
gentlemen provided samples of both male and female questionnaires, which enriched the
committee’s deliberations, and resulted in a hybrid questionnaire in the end, tailored to meet
the needs of Belize. The final questionnaire was then translated into Spanish, the second
language of Belize. Spanish-speaking interviewers administered the questionnaire in Spanish
among the respondents who preferred to be interviewed in this language. A copy of the
questionnaire is appended at the back of this report.
1.8 Recruitment and Training
From the beginning, it was decided that only female interviewers would be used for
the Family Health Survey of females and males for the male survey. These interviewers were
centrally trained over a period of three days, i.e. 12-14 November, 1999, on the male
questionnaire. The staff of the CSO was responsible for the training, and this team comprised
a senior Statistician and one other Statistician. These lead trainers were assisted in
administrative and logistical matters by a Statistician (Ag.), two Statistical Officers and two
Statistical Assistants. Their task included matters such as venue preparations, hotel
arrangements for interviewers, payments to trainees and eventually to the fieldstaff,
distribution of training materials as well as other administrative and logistical matters.
Personnel trained included the six District Supervisors, who form part of the
permanent staff of the CSO and each of whom is based in one of Belize’s six administrative
areas. These officers are also charged with the responsibility for the recruitment of field
supervisors, interviewers and editors in their particular district. In addition, other officers
trained included one Assistant District Supervisor who was hired specifically for the survey,
seven (7) Field Supervisors, sixty one (61) Interviewers and seven (7) Editors. The first
morning of the training session was dedicated to administrative matters dealing with
payments and roles of different survey personnel, as well as to general survey topics such as
interviewing techniques and procedures, and concepts and definitions. Following this, the
12
various sections of the questionnaire were timetabled over the remaining days, leaving
adequate time at the end for paired interviews, mock interviews, as well as some live
interviews in the field.
1.9 Fieldwork
The fieldwork for the male Family Health Survey started as scheduled on November
15, 1999, and was to last for four (4) weeks. A pilot survey had been done prior to the main
fieldwork, and from this pilot, some changes to the questionnaire were incorporated, and
some logistics were corrected. The administration of the fieldwork was similar to the
administration of all of the CSO’s household surveys with staff from the headquarter liasing
directly with the District Supervisors. This District Supervisor, in turn, has at least one Field
Supervisor assisting him with the implementation of the fieldwork at the district level. In the
case of the Belize District however, because of population size, a staff member from
headquarters was assigned on a full time basis to assist the District Supervisor, who also had
assistance from at least three (3) Field Supervisors. A very important task of the Field
Supervisor, in addition to his task of correcting, guiding and training of his interviewers to
carry out the work, was to do sample re- interviews of households already interviewed by the
interviewers. This helps greatly in enhancing a higher quality of information collected. The
District Supervisor was also required to do sample re-interviews, and was the manager of all
the operations at the district level.
13
CHAPTER 2
CHARACTERISTICS OF THE SURVEY POPULATION
2.1 Introduction
This chapter can be compared to Chapter two in the report on the survey of females.
It presents some quick facts about the housing conditions and other characteristics of the
males in the survey. This background information is very useful in understanding the
circumstances surrounding the major subjects of the study. It will serve to enrich and
appreciate the analyses much more. It is hoped that these facts will assist the user to
appreciate the circumstances much more, and in making more meaningful intervention for
the betterment of males in Belize.
2.2 Housing and Household Characteristics
Tables 2.1 to 2.7 present various statistics on the general housing situation of the
sampled respondents who provided information in the survey. Table 2.1 shows that 62% of
the men live in dwelling units whose main construction material for flooring is ‘Cement’. In
addition, another 30% live in dwelling units with wooden floors. Almost 6%, however, still
live in dwelling units with ‘Dirt’ floors. As should be expected, these characteristics are
similar to those of the women in the report on the survey of women. Further, there are also
strong regional differences with respect to the type of flooring characteris tic. For example,
even though the table is not presented, the data show that whereas in most of the districts
‘Cement’ is the most commonly used material for floor construction, in the rural areas of
Toledo district in particular, 50% (the largest share) of the men live in houses with a dirt
floor. This is more than 10% higher than it is for females (see report on females). Only 30%
live in units with cement floors and 20% in units with wooden floors. Differences between
urban and rural areas within the district can also be illustrated by contrasting the above with
the example of Punta Gorda Town, with 65% of its dwelling units having ‘Cement’ floor and
no household having ‘Dirt’ floors.
Other housing characteristics also give useful information about the background
situation of the men in the survey. The type of ‘Lighting’ which the household uses, as well
as fuel used for ‘Cooking’ are two such variables. Table 2.2 shows that the main source
(83%) of ‘Lighting’ for households is the Belize Electricity Limited (BEL). In the case of
14
fuel used for ‘Cooking’, over 80% use mainly ‘Butane’ gas. Again, though, these figures at
the country level tend to disguise differences at the urban versus rural and at the district level.
For example, in the Stann Creek District, whereas in Dangriga, which is the main urban area,
more than 94% of households use electricity from the BEL for their lighting, in Stann Creek
rural only 58% are so privileged. In the Toledo District, the difference between the urban and
the rural areas is even more acute. In the town of Punta Gorda, 96% of households use
electricity from BEL, but in the rural parts of the Toledo district only 23% have this luxury.
This leaves 73% using ‘Kerosene Lamps’ and another 2% using ‘Gas Lamps’.
With respect to fuel used for cooking, Table 2.3 shows that ‘Butane Gas’ is the most
popular fuel used (80%). However, the table also shows that a sizeable (15%) proportion of
the households continue to use ‘Wood’ as their fuel for cooking. Again, there are distinct
regional differences. In the Toledo District, for example, whereas in the urban area 83%
(figure not shown) use mainly ‘Butane Gas’, in the rural areas 70% of the men use ‘Wood’ as
their main fuel for cooking. The data (not shown) also reveal that 22% of men in the rural
parts of the Cayo District are in households which continue to rely on ‘Wood’ as their main
source of fuel.
The main source of drinking water is also a good indicator of the prevailing socio-
economic circumstances. Table 2.4 presents this information for the men in the survey. From
the data in this table, whereas 33% of the men get their water from a VAT/DRUM or WELL
(not piped), only 19% get their drinking water from a public pipe in the dwelling and another
19% from a public pipe in the yard. It is good to note, however, that 10% use ‘Purified
Water’. From these data, it can be concluded that, whereas almost 50% are certain to be
using treated water for drinking, another 43% may be at risk since their source is private
piped into dwelling, vat, drum or well. The remaining 7% are most certainly at risk since
their source of drinking water is the river, stream, pond or public well i.e. water which will
be contaminated.
Information about the type of toilet facility available to men in their households was
also gathered in the survey. Together with the other housing characteristics, information here
can paint a very good picture of the socio-economic conditions prevailing. Table 2.5 presents
results relating to type of toilet facilities available. The table shows that even though 50% of
men have access to a toilet either linked to the sewer system or linked to a septic tank, over
15
44% continue to use a ‘Pit Latrine’. More than 18% of the latter use non ventilated pit
latrines, which is known to be the less sanitary of the two types of latrines. It is good to note,
though, that less than 5% of men reported that they have no type of toilet facility at all.
The number of bedrooms per dwelling unit is a further good indicator of living
conditions since it can reveal the level of ‘overcrowdedness’ within the household. Table 2.6
shows that over 40% of men live in dwelling units with 3 or more bedrooms. This finding
shows a marked improvement in the living conditions of men, as compared with other data
for years gone by. However, it should be noted that a worrying 22% are still living in houses
with one or no bedrooms. This latter situation certainly warrants much attention, with the aim
of improving these conditions.
Finally, respondents were asked to state whether certain household durables were
available in their households. Table 2.7 presents these results. Over 90% of the men own at
least one radio. Of concern, however, is the 10% who do not have even one radio in their
household. In addition, it is comforting to note that over 75% of men have access to at least
one television set in their homes. The potentially rich effect of the television set as a source
of education and useful information cannot be overemphasized. However, the data also show
that more than 22% do not have any television set. With respect to ownership of a video
recorder, it is perhaps not surprising that 73% do not own one. The video recorder may
perhaps continue to be a luxury item, which most people can either ill afford, or which may
be of much lower priority than other household durables. It is noted that ownership of a
refrigerator, which may be a necessity nowadays, is much higher with approximately 62% of
the respondents reporting that they owned at least one refrigerator. Over half of the men live
in households which own a washing machine, which may also be becoming a necessity in
Belizean households. It should be noted with some concern, however, that these data also
show that 93% of men in Belize do not have access to a personal computer. If the ‘Digital
Divide’ is to be narrowed, accelerated access to and use of personal computers within the
households will be necessary.
2.3 General Characteristics
Tables 2.8 to 2.11 present some of the major general characteristics of the survey
population. The first table presents a simple frequency relating to the country of birth of the
respondents. As expected, most men (83%) were born in Belize. These data also show 7%
16
recording their country of birth as Guatemala, and another 3%, as El Salvador. A further 2%
were born in Honduras. These data show that the largest percentage of immigrant men are
from the neighbouring Central American countries, in particular from Guatemala. These men
are therefore mainly of Mestizo or Hispanic origin.The general ethnic composition of the
male population is presented in table 2.9. From the table it is clear that the largest ethnic
group is the Mestizo (40%). This is followed by Creoles (27%), Spanish (11%), Mayas
(10%) and Garifuna (5%). Although not identical, this ethnic distribution is reflective of the
male population at large, as given in other surveys (see Labour Force Survey 1999).
Respondents were also asked to report their religion or religious denomination, as
well as how often they attend religious services. Tables 2.10 and 2.11 present these results. It
is clear from Table 2.10 that the most popular religious denomination continues to be Roman
Catholicism (54%), followed by Pentecostal (6%). Only 6% and 4% reported their religion as
Anglican or Methodist respectively. A surprising 11% stated that they are not affiliated to
any religion. As in the female survey, it is clear that the more recent religious denominations,
like the Pentecostals, which have more recently come to Belize, have surpassed the
traditional ones, like the Anglicans or Methodists, and may even be attracting a sizable share
of the Roman Catholics. When asked how often they attend religious services, however,
only 33% reported that they do so at least once per week. Another 37% reported that they
only attend services on special occasions like weddings, whereas 14% do so at least once per
month. It is interesting to note that when frequency of attendance is cross classified by
religious affiliations (table not shown), it is seen that the most dedicated, in terms of
frequency of attendance, are the Bahai’s.
Table 2.12 shows that just over 66% of the men speak ENGLISH 'Very Well',
whereas another 25% do so 'Not So Well'. However, 9% of the males can barely speak the
country's official language. When the respondents were asked how well they speak
SPANISH, 55% reported that they do so 'Very Well'. This is a clear reflection of the ethnic
distribution referred to earlier, where it was noted that over 50% reported their ethnic origin
as either Mestizo or Spanish. Not surprisingly, almost 26% of the men can barely speak the
Spanish language, which has become the second language of Belize.
Finally, respondents were asked for the highest level of education completed, and
about their economic activity. Table 2.13 shows that just under 50% of the men completed
17
only a Primary level of education. Another 12% reported that they have completed High
School, and a further 9% have completed the tertiary level. Of the latter, 4% went to
University. However, the statistic that stands out most here is that 26% of our men have no
formal education. With respect to the men's work status, the data show (table not included)
that 71% worked for pay, profit or family gain in the week prior to the interview. When those
who did not work in the past week were further questioned about whether they have ever
worked, 50% reported that they had ever done so.
2.4 Summary
In this chapter, an attempt has been made to 'paint' a reasonable picture of the socio-
economic situation of the men in the survey. In summary, these men are largely of Mestizo
ethnic origin, with approximately 15% being of immigrant background. Most have a Roman
Catholic religious background, but less than half reported attending religious services
weekly. Approximately 65% speak ENGLISH very well and just over 55% speak SPANISH
very well. Almost 30% have no formal education at all, and most of the other 70% have
completed Primary school only. Just over 85% of the men have ever worked before.
18
CHAPTER 3
SEXUAL ACTIVITY
3.1 Introduction
This chapter addresses the issues of men's sexual activity, in particular their age and
the age of their partner at first sexual intercourse, if they were in school or not and whether
their first intercourse was on a consensual basis. It also examines sexual activity over 30
days and 3 months prior to the survey. These issues are further examined by selected
characteristics.
3.2 Age at first sexual intercourse
The mean age at first intercourse for men is 17 years. Table 3.1 presents the rates by
selected characteristics. Rural men report an older age (17years) at first sexual intercourse
than urban men (16 years). There is a general tendency for mean age at first sexual
intercourse to increase with age with teenagers having a mean age of 15 years rising to 18
years for men 55 years and over. The mean age is highest among Maya (19 years) and lowest
among Garifuna men (16 years). The mean age is highest in Toledo (18 years) and lowest in
Belize (16 years) and Stann Creek Districts.
3.3 Level of education at first sexual intercourse
Among those that have had sexual intercourse, the majority (65%) report that they
were not in school at the time when they had their first sexual intercourse. This rate is higher
for rural men and highest among Maya men (see Table 3.2). Table 3.3 shows that the
majority (89%) of men had their first sexual intercourse before they had completed high
school.
3.4 Relationship to first female
When asked if the first sexual intercourse was on a consensual basis, the majority
(97%) said "Yes". Table 3.4 presents the rates by residence and ethnic group. Most of the
men (37%) had their first sexual intercourse with a friend or a fiancée/girlfriend (34%), while
15% had their first sexual intercourse with their wife. It is interesting to note that the
majority of Maya men (58%) reported that they had their first sexual intercourse with their
19
wife. Most of the men in the Toledo district also had their first sexual intercourse with their
wife. However, this figure was only 7% for either Garifuna or Creole men. For both of these
groups of men, the majority had their first experience with a friend or fiancée/girlfriend
(Table 3.5).
Thirty-two percent of the men stated that their female partners had not
completed high school at the time when the men had their first sexual intercourse with them.
This rate is higher among urban men and among Garifuna and Creole men (see Table 3.6).
The majority of the men (73%) stated that their female partners had not completed high
school at the time the men had their first sexual intercourse with them. Table 3.7 presents the
rates by residence and ethnic group.
3.5 Contraceptive use at first sexual intercourse
The majority (76%) of the men said that they did not use a contraceptive method
when they first had sexual intercourse. Contraceptive use is highest at first sexual
intercourse among men in the 15-19 age group. The majority of them (53%) had used a form
of contraception at first sexual intercourse. Contraceptive use was highest among Creole
(30%) men and men in the Corozal District (31%). Among those that use a form of
contraception, condom was the main method used at first sexual intercourse. Approximately
89% used a condom and approximately 6% stated that their female partner had used the pills
(see Table 3.9).
The majority of men (57%) stated that, of the two partners, they were the ones who
made the decision to use contraceptive at first sexual intercourse. Twelve percent stated that
it was their partner’s decision and 31% stated that both partners together, made the decision.
Table 3.10 presents the rates by residence and ethnic group.
3.6 Sexual intercourse in the last 30 days and last 3 months
Sixty-nine percent (69%) of the men stated that they had sex with a female in the 30
days prior to the survey. Slightly more urban men (70%) compared to rural men (69%)
stated that they had sex in the last 30 days. Also, the 40-44-age group had the largest percent
(82%) of men reporting having had sex in the last 30 days. In the 15-19 age group, only 36%
had sex in the reference period.
20
Those that did not have sex in the 30 days prior to the survey were asked, "Have you
had sexual intercourse with a female in the last 3 months?" Only 42% of them had sex in the
last 3 months. Table 3.14 presents the rates by residence, age and ethnic group.
Almost all the men stated that their last sexual intercourse was on a consensual basis
and with their wife (62%). Fifteen percent (15%) stated that it was with a fiancée/girlfriend
and 12% with a friend (see Table 3.14).
3.7 Summary
This chapter focused on sexual activity among males. Even though the mean age at
first sexual intercourse for all men is 17 years, it is as high as 19 years for Maya men and as
low as 15 years for Garifuna men. The majority (89%) of men had their first sexual
intercourse before completing high school. Only 15% of the men reported having their first
sexual intercourse with their wife. Most Maya men reported that they had their first sexual
intercourse with their wife. Further, most men did not use any form of contraception at their
first sexual intercourse. Four the minority who did use, the condom was the most popular
method. Sixty nine percent of the men state that they had had sexual intercourse within the
last 30 days. Of those who did not have sex in the last 30 days, only 42% had intercourse
within the last three months.
21
CHAPTER 4
FERTILITY, RELATIONSHIP AND REPRODUCTIVE HISTORY
4.1 Introduction
It is rare when fertility and reproductive issues are discussed about males. This
Chapter, therefore, focuses on male fertility and reproductive issues. More specifically, it
looks at the number of children the males have fathered, their age at which their first child
was born and whether they wanted and had planned to have their first and last children.
It should be noted that there are instances where the males reported that they are not
sure if they have fathered any children, or of the number of children they have fathered.
Even though the number of those who are not sure is small, it indicates the doubts that males
sometimes have about their own fertility and reproductive history. These doubts may be due
to their own perception of their ability or inability to reproduce, or more so, their mistrust in
the females who claim that these males have fathered their children.
4.2 Mean number of children
The men were asked, "Have you ever fathered any children, even if the child or
children died shortly after birth?" The majority, almost 53%, have fathered a child/children,
44% have not fathered a child and 4% have 'never had sexual intercourse.' Only 3% of the
younger men (15-19 years) have fathered a child/children and 14% of them have not had
sexual intercourse before. These teenagers and 2% of those in the 20-24 age groups are the
only males who reported that they have never had sexual intercourse.
The Maya males have the highest percentage (60%) that has fathered a child/children
compared to the other major ethnic groups (see Table 4.1). However, the majority of Mestizo
(55%), Garifuna (53%) and Creole (57%) have fathered a child/children. The Maya males
also have the highest percentage (8%) of males that have never had sexual intercourse. The
corresponding rates for the Creole and Mestizo are 4% and 3% respectively. No Garifuna
males reported that they have 'never had sexual intercourse.' It should be noted that the
respondents were not asked directly if they have ever had sexual intercourse. The choice
'never had sexual intercourse' was included among the choices for the question on whether
the respondent has fathered any children.
22
Table 4.2 presents the mean number of children the men have fathered by selected
characteristics. The mean number of children the men have fathered is 4. This number is
higher for rural men(3.6), and highest among Maya men (5.3) and men in the Toledo District
(5.3). A closer look at the mean number of children by other characteristics shows that the
mean number of children increases with age and decreases as education level increases, 5.5
for men with no education and 2.7 for men with secondary education. The mean number of
children is the same for working and non-working males (4). This figure indicates that the
male's work status does not affect his fertility as much as it does the female's fertility. This
raises the issue of the financial and emotional support one expects a male to give when he
fathers a child, if he is likely to have the same number of children with or without a job
The mean age at which the men had their first child is 24 years. There is little
difference between urban and rural men. However, Garifuna men reported the highest mean
age at 26 years, and Maya men the lowest at 22 years (see Table 4.4).
4.3 Level of education at the time first child was born
Only 4% of the men were in school at the time their first child was born. This rate is
higher for urban (5%) and Creole (6%) men. No Garifuna or Maya men were in school when
they had their first child (see Table 4.5). Twenty-nine percent (29%) had completed
secondary or higher education. Table 4.6 presents the rates by residence and ethnic group.
4.4 Planning status of first and last children
Eighty-seven percent (87%) of the males wanted to have their first child and 5% said
that they did not (see Table 4.7). Among those who wanted to, 75% had planned to have the
first child. Table 4.8 shows that more Garifuna men had planned to have their first child
compared to men in the other ethnic groups. Even though a higher percentage (93%) wanted
to have the last child (Table 4.9), the percentage of those who planned to have that last child
is similar (72%) to those that planned the first child (Table 4.10). The Maya men were more
likely to have planned their last child compared to the other ethnic groups. One would
expect that since a higher percentage of males wanted to have the last child there would have
been more planning for that last child compared to the first. The last child comes when the
male is at an older age and usually is more financially stable than when he had the first child.
Even if he did not plan to have the last child, he may see himself as more capable of caring
for that child and therefore is more willing to have wanted to have the last child. Creole
23
males were the least likely to have planned to have their first child (67%) and their last child.
Working males (74%) are more likely than non-working males (96%) to have planned to
have their first child.
However, there is not much difference between males who work and do not work
when it came to planning their last child, 73% and 72% respectively. It should be noted that
the working status was based on the current situation at the time of the survey and does not
reflect the work status at the time the males had their first or last child.
4.5 Fathered children with more than one woman
The men were asked, "How many women have had children for you?" The majority
(78%) had children with only one woman, 10% have children with 2 women, and 3% have
children with 3 women. Approximately 21% of Garifuna men have children with 2 women,
the highest rate compared to the other ethnic groups. They are followed by Creole males with
15%. However, only 7% of Mestizo and 5% of Maya men have fathered children with 2
women. A higher proportion of non-working men (12%) have fathered children with 2
women compared to 9% of men who work (see Table 4.11).
4.6 Spouse/Partner currently pregnant
Only 3% of the men had a woman that was pregnant for them at the time of the
survey. The rate was higher for rural (4%) and Maya (5%) men (see Table 4.12). None of
them had more than one woman pregnant. Of those for whom a woman was pregnant, the
majority of the men (78%) wanted the pregnancy (Table 4.13). When asked, "What type of
support do you give the first prospective baby mother?" 73% said that they give 'both
emotional and financial support', 13% give 'financial support' only and 4% give 'no support
at this time'. These figures indicate that more than one quarter of the men do not give
financial support to the prospective mother.
4.7 Summary
Men’s fertility, relationships and reproductive history are the main focus of this
chapter. The mean number of children that men have fathered is 4. The number is higher for
rural men and highest among the Maya men. It is also highest among men of the Toledo
district. The mean age at which men have their first child is 24 years. Maya men have their
first child the earliest, on average 22 years, whereas Garifuna men have their first child at an
average age of 26 years. Four percent of men had their first child when in school. Eighty

24
seven percent (87%) of the men wanted to have their first child, but only 75% had planned
for it. Seventy eight percent (78%) had fathered children with only one woman, while
another 10% had children with more than one woman.
25
CHAPTER 5
GENERAL ATTITUDES AND ATTITUDES TOWARDS CHILDBEARING
AND CONTRACEPTION
5.1 Introduction
Men aged 15 to 64 years were asked a series of questions on their attitudes towards
childbearing and contraception and their beliefs and opinions on topics related to sexuality.
They expressed their opinions on the ideal family size, the ideal interval between children,
abortion, contraception, the ideal age for a man and a woman to have his/her first sexual
relationship and the ideal age for a man and a woman to be responsible enough to have
his/her own child. Questions were also asked on general attitudes and opinions on topics
related to man and the way he views sexuality. These findings are presented by selected
characteristics. It is expected that this information will be useful to better understand the
attitudes and beliefs of men in Belize so as to develop programmes of intervention to
improve the lives of all Belizeans.
5.2 Family Planning Messages
Men were asked whether they have seen or heard messages on family planning on
radio, television and local newspaper over the past six months. Only 39% have heard such
messages on radio, 37% on television and 19% in a local newspaper (Table 5.1). As
expected, most of these messages were heard or seen in the urban areas. The education level
of the man was directly related to the likelihood of hearing or seeing a message. It is
alarming to note that more than 90% of men without any level of education have not seen
any message on family planning on television or newspaper, and that 88% of these men have
also not heard any message on the radio. Organizations working in the area of reproductive
health need to reach out to the male population, especially those in the rural areas. In
general, the coverage of family planning messages by radio, television and local newspaper
is poor.
When men who have seen or heard a family planning message were asked if they
have heard a message from the Belize Family Life Association (BFLA), more than half
responded yes (Table 5.2). Men who have seen or heard messages on family planning from
the BFLA were primarily among those in the urban areas (61%) and with a higher level of
26
education. However, it is worth noting that 21% of men stated that they did not know if the
message they heard was from the BFLA. In general, the BFLA is a major source of
information and services on family planning throughout the country.
5.3 Ideal Family Size
All men were asked their opinion on the ideal number of children a man should have.
Most men prefer to have four children (21%) (Table 5.3). A slightly lower percentage
indicated three (20%) and two children (18%). In general, men who indicated that they want
a lower number of children were men who have completed primary or a higher level of
education. It is interesting to note that 10% indicated it is fate or up to God. These persons
were mostly among men in the rural areas and with lower level of education.
The mean ideal family size is 3.9 children for men who have living children (Table
5.4) and 3.6 for men who do not have living children (Table 5.5). Rural men and older men
prefer larger families than urban and younger men. For men with children, ideal family size
decreases as years of schooling increase; for men without children, there is a marginal
difference in preferred family size by education level. Ideal family size does not vary
between Roman Catholics and Protestants and is about the same for the country as a whole.
Mestizos and Creoles have the smallest ideal family size, while the Maya/Ketchi have the
largest. It is worth noting that the Maya/Ketchi men think that their ideal family size is one
child more than the number of living children they already have (Table 5.4).
The majority of men who have children stated that the number of living children that
they have is greater than their ideal family size. In general, men with children have exceeded
their preferred family size. Major contributors to this excess are men 45 to 54 years of age
and men who did not complete primary school. It is worth noting that men 30 years or older
have already exceeded their ideal family size.
Moderately sized families are much desired in Belize. The comparison of the mean
ideal family size for men who do not have children with that of men who have children
suggests that if men who currently do not have any children have only the number they
desire, fertility will continue to decline in Belize.
27
5.4 Opinions About Childbearing
All men were asked their opinion on the main reason a man might wish to limit the
number of children that he has. It is interesting to note that 80% of them stated that the main
reason is financial reasons (Table 5.6). Men strongly agree that their economic situation is
an important factor that determines whether or not to have a child. Among other reasons
given were: child care problem (6%), work related reasons (4%) and health of mother (3%).
When asked who should decide on the number of children the couple wants to have,
87% stated both partners (Table 5.7). This percentage is similar among men in the urban and
rural areas. More men among those in urban areas, however, are likely to have the wife as
the person to decide (5%) while more men among those in the rural stated the husband (6%).
The proportion of men who stated that the husband should be the decision-maker is slightly
higher than those who stated the wife. This is perhaps partially due to the machismo
behaviour still present in some men. Men in union and men who were visiting partners were
those who strongly stated that both partners should decide (Table 5.8).
As the level of education increases, so does the likelihood of stating that both
partners should decide on the number of children the couple should have. In particular, the
difference is more noticeable among men who have completed primary education from those
who have incomplete primary or no education (Table 5.9). All men were asked their opinion
on the appropriate time spacing between two children. Seven out of every ten men stated two
years or more (Table 5.10). Men in urban areas as well as men with higher levels of
education preferred a higher interval between children. Almost 26% of men with no
education preferred an interval less than 2 years. In general, however, men think that both
partners should decide on the number of children a couple should have and that the time
spacing between the children should be two years or more.
The opinion that a woman always has the right to decide about her pregnancy,
including whether or not to have an abortion, was rejected by 47% of men (Table 5.11). An
almost equal percentage (46%) stated the contrary. The opinion among men in urban areas
differed substantially from among those in the rural areas. Most men in the urban areas
stated that the woman has the right, while men in the rural disagreed. The opinion of married
men also varied greatly from those who are visiting partners or not in union. In general, men
who are living in the rural areas, married, and with less than secondary level education are
more likely to strongly oppose that the woman always has the right to decide about her
28
pregnancy, including whether or not to have an abortion. Therefore, even if men strongly
agree that both partners should decide on the number of children they should have, they
disagree that the woman always has the right to decide about her pregnancy, including
whether or not to have an abortion.
Men were also asked under what circumstances they think that it should be
acceptable to terminate a pregnancy, that is, have an abortion. More than half of the men
stated it is acceptable only under one circumstance, for health reasons of the mother. This
percentage, however, was only acceptable for 55% of men (Table 5.12). Although accepted
by a minority, other circumstances stated were: health reasons of the child (43%), pregnancy
resulting from rape (36%) and economic reasons (22%). Although 80% of the men might
wish to limit the number of children because of financial reasons, only 22% stated it is an
acceptable reason for a woman to have an abortion. Men, in general, are against abortion
under any circumstance. Circumstances that were considered highly unacceptable were: if a
woman is not married (92%) and if both or either of the parents does not want the child
(more than 80% of men).
5.5 Attitudes Towards Contraception
The vast majority of men (86%) agreed that the decision for the couple to use
methods of family planning is a decision of both partners (Table 5.13). The low percentage
that stated the wife (6%) was almost equivalent to the percentage that stated the husband
(5%). As expected, men from the urban areas are more likely to state that both partners
should make the decision. The opinion that both partners should make the decision does not
vary by marital status (Table 5.14). However, it differs by educational level (Table 5.15).
Men with lower level of education tend to disagree that the couple should make the decision
and agree that the husband or wife should decide.
When asked who should decide on the type of contraceptive a couple should use, 75%
stated both partners (Table 5.16). The husband’s likelihood to decide the type of
contraceptive is higher than deciding whether or not to use a contraceptive. As expected,
men from the urban areas and with higher level of education tend to favour the couple
making the decision while men from the rural areas and with lower education prefer having
the husband make the decision. It is interesting to note that a higher proportion of men
believe that the nurse/doctor/mid-wife should decide the type of contraceptive to use (7%)
than the proportion who believe it should be the wife/partner (5%).
29
5.6 Ideal Age for a Man to have his First Sexual Relationship
It was found, in general, that 78% of men think that the ideal age to start having
sexual intercourse is before completing 20 years (Table 5.17). Two peaks are observed for
ideal ages less than 20 years: 16 years (11%) and 18 years (40%). After completing 18 years,
men in Belize are no longer considered children and can marry without the parents’ consent.
It is interesting to note that 51% of men believe that the earliest age that the woman can
legally consent to having sexual intercourse is 18 years (Table not shown). Thirty five
percent of men, however, believe that it is acceptable for men to have their first sexual
relationship before completing 18 years. There are no great differences in the ideal age by
place of residence.
Table 5.18 shows the mean age that men think they can have start having sexual
intercourse. In general, the mean age is 17.4 years and, with one exception, there is no big
difference based on the characteristics of men. The exception is that there exists a difference
of 1.2 years among men who have had a sexual relationship (17 years) and men who have not
had any sexual relationship (18%). It is interesting to note that in this survey the estimated
mean age for men 15 to 24 years to have their first sexual relationship is 14.8 years (see
Chapter 3).
5.7 Ideal Age for a Woman to have her First Sexual Relationship
While 35% of men aged 15 to 64 think that the ideal age for a man to have his first
sexual intercourse is before completing 18 years, a lower percentage (27%) believe this to be
the ideal age for a young woman (Table 5.19). This finding shows that men believe that
young women should wait more time than the men before starting to be sexually active. Men
also believe that there are two ideal ages for a woman under 20 years to start having sexual
intercourse: 16 years (14%) and 18 years (47%), the same as for men.
Table 5.20 shows the mean age that it is expected for a woman to have her first sexual
relationship. The mean age is 17.7 years, 3.6 months older than the mean age expected for
men to have their first sexual relationship. Men who have had sexual experience stated that
the age for a woman to have her first sexual relationship is 17.6 years. Men with no sexual
experience state that the woman should be 18.3 years. It is interesting to note that the 1999
Family Health Survey found that the mean age for women 15-24 years to have their first
sexual relationship is 16.5 years.
30
5.8 Ideal Age for a man and a woman to be responsible enough to have his/her own child
Even if men desire to begin their sexual life at an early age, they are not in much of a
hurry to have their first child. The ideal average age that the men stated being responsible
enough to have children is 20.9 years, three and a half years after having their first sexual
intercourse (Table 5.21). The ideal average age for men to have their first child did not vary
considerably by selected characteristics.
According to men, the ideal average age for a woman to have her first child is 20.3
years, 7.2 months earlier than men (Table 5.22), and the woman is expected to have her first
child two and a half years after her first sexual relationship. Therefore, men expect the
women to start having sexual intercourse later but to have their first child at a younger age
than themselves.
All men were asked when they think is the time in life when a man is responsible
enough to have his first child. The popular responses were when mature enough (35%) and
when economically stable (28%) (Table 5.23). It is important to note that men also think that
their financial condition is a very important reason for them to limit the number of children
they can have (Table 5.6). In addition, being in a stable union is considered a more
important reason to be responsible enough to have a child than after completing his
education.
Men were also asked when they think a woman is responsible enough to have her first
child. In their opinion, it is important for a woman to be mature enough (38%) and also to be
in a stable union (27%). Men believe that women who are economically stable are as
equally prepared to have their first child as those who have completed their education. It is
interesting to note that men think it is more important for a man, than it is for a woman, to be
economically stable to be responsible enough to have his first child. This is especially
significant, considering the expectation that society has of men, i.e., that of being the
breadwinner of the home. At the same time, they believe that it is more important for a
woman than it is for a man to be in a stable union for her to have her first child.
31
5.8 General Attitudes and Opinions
Being knowledgeable of the attitudes and opinions of men is important to be able to
understand their behaviour. This section researches the opinions and attitudes of men.
Eighteen statements were read out to the men and they stated whether they think it is true or
untrue. Table 5.24 provides the list of statements along with the percentage distribution of
the men's opinion.
More than 75% of men agreed that:
Ø Boys should not go to prostitutes to become men (86%)
Ø It is not okay for married men to have extramarital affairs (80%)
Ø You cannot get rid of STIs/HIV/AIDS by having sex with a virgin (79%)
Ø A girl cannot avoid getting pregnant by bathing in the sea after sexual
intercourse (78%), or by drinking pepsi or coke after sexual intercourse
(78%), or by having sex standing up (76%)
Ø Family Violence is a significant issue in our society (77%)
Ø Sexual Harassment of Women is a significant issue in our society (77%) and
Ø There is nothing wrong with a boy who has not had sex by the time he is 16
years (77%).
When asked their opinion on school admittance for teenage parents, it was equally
agreed by more than sixty percent of men that a school boy who gets a girl pregnant should
not be expelled from school and that a school girl who gets pregnant should be allowed to
return to school after she has had her baby.
At the same time, more than fifty percent of men believe that it is important for a
woman to be a virgin when she marries and that a girl can get pregnant only after she has
her period for the first time. The men's lack of knowledge of the menstrual cycle is also
expressed when 32% of them stated that the woman can more likely become pregnant right
after her period and 30% stated not knowing when it is more likely for a woman to become
pregnant during her menstrual cycle (Table not shown). Only 19% stated that the woman
could more likely get pregnant in the middle of the cycle.
A small but significant percentage of men stated that if a boy has an erection, he will
get sick unless he discharges (14%), there is something wrong with a boy who has not had
sex by the time he is 16 years (14%) and if a boy masturbates he will get sick (12%).
32
There were two statements that the majority of men did not know whether it was true
or false. When asked if men who had a vasectomy do not perform well sexually, 60% of men
did not know what to answer. Similarly, when asked if female sterilization is less
complicated than male sterilization, 49% answered that they did not know. As seen in
chapter 8, there is a need for educational programs for men on the topic of vasectomy.
5.9 Beliefs of how a girl can avoid getting pregnant
Five statements were closely related to beliefs of how a girl can avoid getting
pregnant:
Ø If a woman does not have sex, she will get sick (Table 5.25)
Ø A girl can get pregnant only after she has seen her period for the first time
(Table 5.26)
Ø A girl can avoid getting pregnant by having sex standing up (Table 5.27).
Ø A girl can avoid getting pregnant by drinking Pepsi or Coke after sexual
intercourse (Table 5.28) and
Ø A girl can avoid getting pregnant by bathing in the sea after sexual
intercourse (Table 5.29).
Men generally disagreed with these statements. The level of disagreement was
greater among men in the urban areas and among men with higher level of education. The
difference in opinion varied especially between men who have completed higher than
primary school education and those who have not completed primary school. It is important
to note that men in general are not knowledgeable of the women's reproductive system,
specifically the menstrual cycle (Table 5.26).
5.10 Beliefs about boys and sexuality
Men also gave their opinion on the following four statements that are related to the
way they view their sexuality:
Ø There is something wrong with a boy who has not had sex by the time he is 16
(Table 5.30)
Ø If a boy masturbates, he will get sick (Table 5.31)
Ø If a boy has an erection, he will get sick unless he discharges (Table 5.32) and
Ø Boys should go to prostitutes to become men (Table 5.33)
33
They disagreed strongly with the above statements, especially the fourth statement.
The disagreement increased with their level of education. Men in the urban areas tend to
disagree more than those in the rural. It is interesting to note that fifteen percent of men in
the rural areas believe that if a boy masturbates he will get sick and that if a boy has an
erection, he will get sick unless he discharges.
5.11 Beliefs about the importance of female virginity
More than half of men believe that it is important for a woman to be a virgin when
she marries, while 9% of men believe that you can get rid of STIs/HIV/AIDS by having sex
with a virgin. More than ten percent of men in the rural areas and men with less than primary
school education believe that you can get rid of STIs/HIV/AIDS by having sex with a virgin
(Table 5.35). Men not in union also expressed a high affirmation to this belief. In addition,
more men in the rural areas (58%) and more men with incomplete primary school (61%)
believe it is important for a woman to be a virgin when she marries (Table 5.34).
Although men expect a woman to have her first sexual relationship when she is 17.7
years (Table 5.20), 55% of them think it is important for a woman to be a virgin when she
marries. The mean age for a woman to marry in Belize was 25.6 years in 1998 (1). It
therefore seems that men want the women to have sexual intercourse at an age earlier than
the women’s average age of marriage and be a virgin at the time of marriage.
5.12 Opinion about Pregnancy and School Admittance for boys and girls
Men's acceptance of boys in school after they get a girl pregnant and girls in school
after having their baby was prevalent especially among men in the urban areas and men with
higher than primary school level completed (Tables 5.36 and 5.37). Men not in union and
men living in the rural areas and with no level of schooling were most likely to disagree that
these boys and girls should be accepted in school.
5.13 Opinion on Extramarital Affairs
It seems that it is not acceptable to have extramarital affairs in Belize. Eighty percent
of men regardless of place of residence, marital status and educational level said that it is not
acceptable for married men to have extramarital affairs (Table 5.38). Perhaps these
responses are socially conditioned responses. Nonetheless, ten percent of men in the urban
34
areas and men with complete primary level of education believe that it is acceptable for
married men to have extramarital affairs.
5.14 Beliefs about Vasectomy
Almost fifty percent of men do not know if female sterilization is less complicated
than male sterilization. A lower percentage of men (22%) said that female sterilization is
less complicated than those who said the contrary (29%) (Table 5.39). Moreover, when
asked if men who have had a vasectomy do not perform well sexually, 61% of men stated not
knowing (Table 5.40). However, a higher percentage of men said that men who had a
vasectomy do perform well sexually (29%) than those who said the contrary (10%). Thus,
from the men who stated that they knew, the majority had positive responses: female
sterilization is not less complicated than male sterilization and men who have had a
vasectomy do perform well sexually. Men not in union, men in the rural areas, and men with
less than primary level of education are most likely to give either an erroneous response or
state that they do not know. It is interesting to note that the difference between the responses
of men in the urban and the rural areas is marginal. This indicates that there exists a group of
men that can be taught to value vasectomy in a positive form.
5.15 The issue of family violence and sexual harassment
The majority of men (77%) believe that family violence and sexual harassment are
significant issues in our society. This belief was strongly expressed by men in the urban
areas, by men who were visiting partners and by men who had higher than a primary school
level of education (Table 5.41 and Table 5.42). Men who are married or men who have not
completed primary school education were less likely to believe that neither family violence
nor sexual harassment is a significant issue in our society.
5.16 Summary More than 90% of men agree that courses on human reproduction, contraception and
STIs/HIV/AIDS should be taught in school (see chapter 7). Men are thus interested in
reproductive health more than is usually believed. This chapter shows evidence that men
indeed are in need of programmes on reproductive health for them to decrease their
misconceptions and doubts and for them to develop a positive attitude on human
reproduction, family planning and other areas in reproductive health. Only in this way can
we have men increase their participation in decisions pertaining to reproductive health. Their
35
participation can most likely increase the impact of programs aimed at addressing social
problems such as family violence, sexual harassment and the spread of STIs/HIV/AIDS. The
information presented in this chapter is important because it gives ways to improve
reproductive health in Belize. It shows where there are weak areas of knowledge and
communication. This is useful to develop ideas and programmes to contribute to the goal of
a healthy and happy Belizean population.
36
CHAPTER 6
KNOWLEDGE, USE AND SOURCE OF CONTRACEPTION
6.1 Introduction
This chapter examines knowledge, use and source of contraception among males. It
explores reasons for use and non-use at present, as well as a desire to use in the future. The
chapter includes topics concerning contraceptive methods, knowledge of the fertile period,
current contraceptive use, and source of contraceptives.
6.2 Knowledge of Contraceptive Methods
Table 6.1 shows that knowledge of all the major contraceptive methods increases
with the number of years of education of the men. Knowledge of all contraceptive methods,
including Condoms, is less for men than for women1 . For the men in the survey, the most
known method is Oral contraceptives (86%) followed by Condoms (74%), and female
sterilization (65%). Only 38% report that they know about the Rhythm method and 8%
about the Billings method.
For those with no education, the most known method of contraception (59%) is Oral
contraceptives followed by female sterilization. In view of the fact that the proper use of
Orals necessitates a high level of education, the former result is surprising. However,
‘common sense’ more so that formal education may in fact be the major requirement here.
According to Table 6.2, the most known contraceptive, Orals, is known most by the
Garifuna men followed by Creole men. The Maya/Ketchi ethnic group report the least
knowledge of Orals. The Rhythm and the Billings methods are known the most by Garifuna
men and the least by Maya/Ketchi and Creole men respectively. Female Sterilization, the
second most known method, is known most again by the Garifuna ethnic group and least by
the Maya/Ketchi ethnic group.
Table 6.3 indicates that knowledge of contraceptive methods is generally higher
among English-speaking and Bilingual men than among Spanish-speaking men. (e.g. Orals:
90%, English-speaking; Bilingual, 89%; and, Spanish-speaking, 82%). For Condoms, the
1 See the Family Health Survey report (1999) on females.
37
pattern is quite similar: 81%, Bilingual, 80%, English-speaking; and, 70%, Spanish-speaking.
The pattern is again repeated for the method of female sterilization as follows: 73%, English-
speaking; 70%, Bilingual; and, 54%, Spanish-speaking. For Billings, the least known
method, knowledge is as follows: 8%, English-speaking; 11%, Bilingual; and 6%, Spanish-
speaking.
6.3 Knowledge of the Fertile Period
Men need to know their partners’ fertile period whenever they make use of any of
these methods (Rhythm, Billings, or Withdrawal). They also need to know specifically when,
during the woman’s menstrual cycle, she is most likely to conceive. Table 6.4 shows that
knowledge of the fertile period is higher among men aged 55-59 than among all the survey
respondents put together (i.e. 27% vs. 20% respectively). The rate is 20% among all urban
respondents compared to 35% among urban ever users. For rural survey respondents, the
rate 19% among all rural respondents compared with 33% of rural ever users. The table
further shows that teenage men and those aged 20-24 years are the least likely to correctly
know when during the menstrual cycle a woman is most likely to get pregnant.
Among all ever married respondents, the rate of knowledge is 22%, compared to 34%
of ever married men who have ever used the methods. Knowledge of these methods
increases with education from 14% for all respondents with 0-7 years of education to 29%
for all respondents with 9 or more years of education. As one would expect, the rates are
higher for ever users, rising from 19% for those with 0-7 years of education to 45% for those
with over 9 years of education.
Among Belize’s various ethnic groups, knowledge of these methods is highest among
Garifuna men (28%), and lowest for Maya/Kekchi men (9%). Higher rates are recorded for
ever users, following the same pattern: 52% for Creole men; 28% for Mestizos. There are
fewer than 25 cases recorded on this table for other ethnic groups. Among those not
currently using a method, knowledge is 16%, but is 30% among those who have ever used a
method.
6.4 Current Contraceptive Use
Tables 6.5 and 6.show that 39% of all men, and 49% of all married men, are using a
contraceptive method. Female sterilization is the method preferred by married men (14%),
38
followed by Orals (13%), and Condoms (10%). Seventy-six percent of visiting partners
among all men, are currently using contraceptives, and 58% are using Condoms. Twenty-
four percent of visiting partners are not currently using contraceptives. Seventeen percent of
men not in union use a method: 16% are using Condoms. Eighty-three percent of men not in
a union are not using a method.
The highest percent of married male contraceptive users (59%) fall in the 25-29 age
group (Table 6.6), followed by 57% in the 30-34 age group, and 56% in the 40-44 age group.
Married males above 40-49 tend to prefer female sterilization, whereas those 20-29 prefer
Orals. Condom use is highest among the 20-24 year olds (22%). For the 25-29 age group,
Condom use is at 14%, and 11% for the 30-34 year age group.
Contraceptive use as, indicated in Table 6.7, increases after one child, and is greatest
after two children. After three children, female sterilization increases to 18%, and to 28%
with four children. Thereafter it falls back to 19% with five children.
Table 6.8 shows that contraceptive use increases with years of education. With 1-7
years of education, it is at 43%; 48% with 8 years, 54% with 9-12 years, and 65% with 13 or
more years of education. Female sterilization and Orals are the most used methods (14% and
13%, respectively)
Condom use is greatest among married men with more years of education from 2%
with no education, to 14% with more than 13 years of education.
Table 6.9 indicates that contraceptive use among married men increases with more
amenities. Contraceptive use increases from 24% with 0-2 amenities to 49% with 0-7 and to
58% with 8-10 amenities.
Female sterilization and use of Orals occur among partners of married men with more
amenities. Female sterilization is at 20%, and Orals, at 14% among partners of men with 8-
10 amenities; Condoms are at 12% usage among men with 8-10 amenities. Contraceptive use
does not appear to be affected by the working status of married men. As is shown in Table
6.10, 49% of working men, and the same percentage of non-working men, use
contraceptives. In contrast, as the female family health survey for 1999 shows, 61% of
married women currently using contraceptives are employed while 54% are not working.
39
Table 6.11 indicates that contraceptive use is greatest among married Creole men
(54%), followed by Mestizo and Garifuna (49% each). Married Creole men prefer Orals
(18%) followed by Condoms (17%), and female sterilization (12%). Mestizo men prefer
Female Sterilization (17%) followed by Orals (13%), and Condom (8%). Garifuna men
prefer Condoms (18%), injection (9%) and Orals (8%).
Of those currently married men who are currently using contraceptives, table 6.12
shows that the highest percentage of users are of no professed religion (54%) followed by
Protestants (51%) and Catholic (48%). Female sterilization is highest among partners of
currently married Protestant men (15.4%), closely followed by Catholic men (15.0%).
Among men and their partners professing no religion, Female Sterilization is 8%. Condom
use is highest among currently married men with no religion (18%), followed by Catholic
men at 10%. It is 7% for Protestant men. Fifty one percent of currently married men are
currently not using contraceptive methods. Among the married men, currently married
Catholic men are the least likely (51%) to be using a contraceptive method.
Table 6.13 indicates that use of contraceptives is higher in urban (55%) than in rural
(45%) areas, for all ages. The table also shows that use is generally higher for men at all
education levels in urban areas. Further, use of contraceptives is positively associated with
the possession of household amenities. The data here also show that use is more likely as the
number of living children increases up to 2 living children. Thereafter, use of contraceptives
decreases with the number of children alive. In general, this pattern for all the various
characteristics is replicated in both the urban and rural areas. Finally, at the national level,
there is no significant difference in use of contraceptives depending on the man’s working
status. However, the table shows clearly that for the urban men, use is more likely when they
are working. Surprisingly, the opposite is true for the men residing in rural areas.
6.5 Reasons for Currently Using Contraceptives
Of currently married men whose partner had a pregnancy in the last 5 years, 51% are
using a contraceptive (Table 6.15). Overall, the most frequently used method is Female
Sterilization (15%).
Of the men in the survey, 38% use contraceptives in order to limit pregnancies and
49% want to space pregnancies (Table 6.16). An equal proportion (49%) of urban and rural
men use contraceptives to space pregnancies. In terms of limiting pregnancies however, this
40
pattern is not the same, since more urban (40%) than rural (36%) men use contraceptives to
limit pregnancies. The data in this table also show that spacing is more important than
limiting pregnancies for younger age groups. Limiting pregnancies becomes more important
as men age. For example, for the age group 25-29, 67% want to space their births, whereas
25% want to limit them. However, in the age group (40-44), the parallel percentages are
33% and 43%, respectively.
For currently married men with 0 or 1 living child, spacing is obviously more
important than limiting pregnancies. As the number of living children increases however,
limiting pregnancies become much more important than spacing. In general also, the use of
contraceptives for the spacing of pregnancies increases with the number of years of education
of the man. However, use of contraceptives for the purpose of limiting pregnancies decreases
as the number of years of education increases.
Table 6.16 also shows that the most frequently used method of contraception among
currently married men who are spacing pregnancies is injection (81%), and the least used
method is Female Sterilization (7%). For those men who wish to limit pregnancies, the most
frequently used method of contraception is Female Sterilization (74%) and the least popular
method is the use of Injectables. Among the various ethnic groups of Belize, the data show
that currently married Maya/Kekchi and Mestizo men are the most likely to use
contraceptives to space pregnancies (50%). The Maya/Ketchi men are the least likely (27%)
to use contraceptives for limiting pregnancies.
6.6 Characteristics at First Contraceptive Use
Mean number of children for urban men at the time of first use of contraception is
0.6, whereas their mean age at this time is 19.0 years (Table 6.17). The corresponding figures
for the rural men are 0.9 and 20.4 years. Men with more education tend to have fewer
children at the time of first use of contraceptives. The data also show that the less education
a man has, the later, the first use of contraceptives. For example, men with no education,
tend to start using contraceptives at 25.9 years of age, whereas those with 13 or more years of
education start at 18.1. The implication here is that early fathering of children will be higher
among males with less education. Intensified Sexual and Reproductive Health education
targeted at men with lower levels of education should reduce unplanned pregnancies.
41
Table 6.17 also shows that men with 0-2 amenities begin using contraception after
fathering 1.9 children on average, while those with 8-10 amenities begin using contraception
after fathering 0.4 children. Also, men with 0-2 amenities will begin using contraception at
age 22, whereas men with 8-10 amenities will begin using contraception at age 19. In terms
of ethnicity, the ethnic group (Creole) with the lowest mean number of children (0.4) will
begin using contraception at the earliest age (18.6) compared with the other ethnic groups.
The Maya/Kekchi have the most children (2.5) and are the oldest (24.7) at first use.
For younger men (15-29), first use of contraception is greatest with no children, and
generally decreases with more children (Table 6.21). For older men (30-44), first use of
contraceptives tends to be less frequent with no children, and increases with more children.
The pattern is less clear among older men.
As indicated in Table 6.19, the most frequent source of contraception for currently
married men who are currently using contraceptives is the pharmacy (53%), and the least
frequent source is ‘Outside of Belize’ (3%). Approximately 15% of men obtain their
contraceptive products from the BFLA, the second most popular source. This pattern is
repeated in the urban and rural areas.
Level of education is an important factor in the choice of source of contraception
(Table 6.20). The pharmacy is used most by those with nine or more years of education
(55%), decreasing to 53% for men with 0-7 years of education. BFLA is used most by the
group with 8 years of education (16%), falling to 11% for men with nine or more years of
education.
Table 6.21 presents data on the source of contraception by ethnic group. It is clear
from the table that with respect to the most popular source which is the pharmacy, Creoles
(65%) tend to use this source more so than other ethnic groups. The Maya/Ketchi group uses
the BFLA (36%) and the Government Facility (15%) for their contraceptives supplies more
so than any other ethnic group.
6.7 Reasons for Non-Use of Contraceptives
Of currently married men 15-64 years, 32% reported reasons for non-use related to
pregnancy, fecundity, and sexual activity (Table 6.22). Of those in this group, 11% had
partners who are ‘Currently Pregnant’, 7% were ‘Not Sexually Active’, and 11% desired
42
their partner to become pregnant. Almost 3% reported that they were infertile. The other
68% offer ‘Other Reasons’ for non-use of contraceptives ranging from ‘Does Not Want’
(23%), ‘Advanced Age’ (12%) and ‘Fear of Side Effects’ (7%). In this group also, 5% do
not use contraceptives because of ‘Health Reasons’.
In general, this national pattern of non-use is repeated among the urban men. Among
the rural men however, although the major proportions are similar, there are significant
deviations from the national pattern in terms of the detailed reasons for non-use of
contraceptives.
Table 6.23 presents the percent distribut ion of reasons for not currently using
contraceptives by the years of education of the currently married men aged 15-64. The data
show that among the 32% who stated reasons for non-use related to pregnancy, fecundity and
sexual activity, the higher the number of years of education of the man, the more likely that
he would state a reason related to this category. For the other 68% who gave ‘Other Reasons’
however, the more educated men were less likely to state these reasons.
6.8 Reasons for Discontinued Use of Contraceptives
Table 6.24 shows that the highest percentage (30%) of married men 15-64 years
stopped using contraceptives because they desire pregnancy. Most of these (31%) had been
using Condoms. Another 11% stopped using for health or medical reasons, and a further
11% stopped because they did not like or want to use contraceptives. Eight percent stopped
because of fears of side effects, and among these, 14% had been using Orals. Of those
discontinuing for health or medical reasons, 23% last used Orals. Less than 1% cited a lack
of money as the reason for discontinuing the use of contraceptives.
6.9 Desire to Use Contraceptives in the Future
A desire to use contraceptives in the future is stated by 21% of currently married men
15-64 years who are not currently using contraceptives (Table 6.25). Seventy six percent of
these know where to obtain their preferred method. Twenty one percent of the urban men and
an equal proportion of those in the rural areas desire to use contraceptives in the future. Of
these, 90% of the urban dwellers as against 65% of those in the rural areas know where to
obtain the method. The desire to use contraceptives in the future is greatest among those 25-
29 years (40%). The 30-34 age group are the second most interested (38%) in future use.
The table also shows that the desire to use contraceptives in the future is highest among men
43
with 4 living children (31%). The desire generally declines for men with 6 or more living
children (17%).
The desire to use contraceptives in the future among men with 0-7 years of education
is 20%, and is 26% among men with nine or more years of education. This desire is highest
among Garifuna men (30%) but lowest among the Mestizo men.
According to Table 6.26, the most frequent method identified by non-users who
desire to use a method in the future is the Condoms (25%), followed by Orals (21%). Female
Sterilization (16%) and the Injection (16%) are also popular methods for future use among
non-users. Among urban male non-users, Orals (29%) followed by Condoms (25%) are the
preferred methods for future use. The data show that for the rural men however, the preferred
methods are Condoms (24%) followed by the Injection (21%).
Among all men in the survey, the Pharmacy is cited as the preferred source for future
access to contraceptives (37%). The Pharmacy is also the preferred future source among
either urban (47%) or rural (27%) men. As the preferred source of contraceptives in the
future, the BFLA is three times as popular among rural men than among their urban
counterparts.
6.10 Summary
Knowledge of all contraceptives generally increases with years of education. Orals
are the most known method among men. Knowledge is also higher among English-speaking
and bilingual men, than among Spanish-speaking men. Knowledge is also higher among
urban than among rural males. Knowledge of the fertile period is highest among the 50-59
year age group for all respondents. Thirty-nine percent (39%) of all men, and 49% of all
married men are using a contraceptive.
Spacing pregnancies is more important for younger age than limiting. Limiting
pregnancies becomes more important among men as they age. The pharmacy is the most
frequent source of contraception. The highest percent of married men stop using
contraceptives because they desire a pregnancy (30%). The desire to use contraception
increases with years of education and varies among ethnic groups.
44
CHAPTER 7
FAMILY LIFE EDUCATION
7.1 Introduction
Family life education includes topics such as sexually transmitted infections
(including HIV/AIDS), Human Reproduction, Contraception, Human Growth and
Development, as well as aspects of self-esteem and life planning skills. This chapter looks at
topics men think should be included in a programme of family life education, topics that have
been offered in such programmes, the appropriate age of children for introducing the topics,
and the preferred sources of information on family life education. It also reports whether
men knew where to go for information about sexually transmitted infections.
7.2 Findings
As indicated in Table 7.1, there is strong support for having schools include on their
curricula, classes on Sexually Transmitted Infections (STIs) including HIV/AIDS (96%),
Human Reproduction (94%), and Contraception (93%).
When respondents were asked to state the age when these topics could be introduced
on the curricula, the majority thought that the topic of STIs, including HIV/AIDS (70%),
Human Reproduction (71%), and Contraception (68%) should be introduced to students
between the ages of 10 and 13 years (Table 7.2). Within this age range, 28% of respondents
identify age 12 as the best age for introducing the topic STI including HIV/AIDS, 29% of
respondents think this is the most appropriate age for introducing the topic of Human
Reproduction, and 27% think it is the best age for introducing the topic of Contraception.
Respondents were also asked whether Parents or Guardians provided them
information on pregnancy. Table 7.3 shows that 62% of the young men received such
information from their parents or guardians, and Table 7.4 further shows that such
information is often passed on at age 13-16 years. Seventy four percent of the men (Table
7.5) currently aged 13-34 also receive information from parent or guardian about birth
control methods when they are between the ages of 12-15 (Table 7.6). In addition, these data
show that most (56%) had not received information about Family Life or Sex Education in
school (Table 7.7). Of those, who did receive information about Family Life or Sex
Education in school, most (69%) are between the ages of 12 and 15 according to Table 7.8.
45
Also, as shown in Table 7.9, of those who received the latter information while in school,
most (41%) were in Primary School. Another 32% first received such information in
Secondary School.
Table 7.10 displays information about the main persons who taught the respondents
their first class or course about Family Life or Sex Education in school. By far, the School
Teacher (83%) is the main person to teach these topics first. Only 5% of the respondents
reported a Counsellor/Psychologist or a Physician/Nurse as the main person to teach them
these topics first. In most (54%) cases, these classes or courses included information on
Counselling, as Table 7.11 shows, whereas 42% of the classes included Clinic Services or
Distribution of Contraceptives
In terms of such classes or courses anywhere outside the school or home, table 7.12
shows that only 12% of the respondents received these. The major organizations offering
such classes or courses are through Peer Group (28%) and the BFLA (23%), as shown in
Table 7.13. Further, the main persons to teach these first classes or courses are Peers/Friends
(26%), the BFLA (16%) and a Counselor/Psychologist (11%), as can be seen in Table 7.14.
Respondents were also asked whether the first class or course on family life or sex
education taught in school included specific topics of high interest for young people.
According to Table 7.15, 78% affirmed that information on Human Reproductive System
was included in such classes. Seventy six percent (76%) also reported that the classes or
courses included topics on Pregnancy and How it Works, and 91% affirmed that topics on
diseases that can result from sexual contact were included. Eighty seven percent (87%) also
stated that their first class, in these areas, in school, included information on STI’s including
HIV/AIDS, and 85% reported that information relating to Condoms was also taught. Other
topics which were popular, judging from the rate of the responses were modern birth control
methods like the Pill or the IUD (58%), Parenting (73%), the woman’s menstrual cycle
(84%), and values and roles (55%). Further, as Table 7.16 indicates, 63% affirmed that
information on Counselling services was also included in these clases. Fifty seven percent
(57%) of the respondents also reported that information on ‘Clinic Services’ was included
and 52% said that the Distribution of Contraceptives was also discussed in these classes.
When the men aged 13-34 were asked to give their preferred source of information
about Family Life or Sex Education Topics, Table 7.17 indicates that this preferred source of
information is as follows: Books and Publications (18%), Parent or Guardian (18%),
46
Peers/Friends (12%), Teachers (11%), the Media (11%), Health Personnel (10%), and the
BFLA (8%). Table 7.18 further shows that 66% of the men know where to go for
information about family life or sex education topics.
When the men aged 13-34 were asked to name the sources of information most
frequently cited for information about Sex or Contraception topics, Table 7.19 indicates that
they responded as follows: the Belize Family Life Association (29%), Government
Clinic/Health Center (23%), and Government Hospital (15%). This table also shows that less
than 1% cited the Churches as their preferred source of such information.
On the issue of where to go if they need information on STI’s, Table 7.20 shows that
70% of the men aged 13-34 know where to go for such information. Table 7.21 further
shows that the sources for information about sexually transmitted infection most frequently
cited by men are the Belize Family Life Association (25%), Government Clinic/Health
Center (24%), Government Hospital (21%), and Private Doctors/Clinic (18%).
Finally, the men, currently aged 13-34 were also asked if they knew where to go for
information about HIV/AIDS. Seventy percent (70%) know where to go for such information
as Table 7.22 indicates. The sources of information about HIV/AIDS most frequently cited
by men are Government Clinic/Health Center (24%), the Belize Family Life Association
(23%), Government Hospital (23%), and Private Doctors/Clinic (16%).
7.3 Summary
There is strong support for the provision of Family Life Education in schools. Most
of the men, currently aged 13–34, receive information from Parent or Guardian about Birth
Control methods, between the ages of 12 and 15. They also first receive a class or course
about Family Life and Sex Education in school from their teachers (83%). This group
indicates that their preferred source of information about Family Life and Sex Education
topics is books and publications. Seventy percent of the same group knew where to go for
information on sexually transmitted infections. The most frequently cited source for
information was BFLA (25%), and Government Health Center (24%).
47
CHAPTER 8
THE USE AND POTENTIAL DEMAND FOR SURGICAL
CONTRACEPTION
8.1 Introduction
Vasectomy is one of the methods of contraception tha t is least known and used by
men in Belize. Of the 1,581 men aged 15 to 64 interviewed in this survey, only 4 reported
having had a vasectomy. While more than seventy percent of men have heard of condoms
and orals, less than half (45%) were aware of the existence of male sterilization (Table 6.1).
Similarly, more than half of the male population aged 15 to 64 were not knowledgeable of
the effects of vasectomy (see chapter 5).
The four men who reported having had a vasectomy were in union and older than 35
years. Two were from the rural areas. Three of them stated having the vasectomy because
they did not want more children and one because of complications on the last pregnancy or
labour. Only one person regrets having the surgery and does not recommend a vasectomy.
Moreover, three of them stated that their sexual relations was the same as before having the
surgery and one stated that his sexual relations are now more satisfactory.
8.2 Demand for Vasectomy
In this section we examine the interest that exists in vasectomy among married men
aged 15 to 64 years who want to limit their family size.
We also explore:
Ø the reasons why those who have expressed interest have not undertaken the
surgery,
Ø the reasons for not opting for this method among men who do not want any
more children, and
Ø the reasons why men would not be interested in vasectomy when they have
the desired number of children, among men who wish to have more children.
Married men between ages 15 to 64 who have not had a vasectomy were asked if they
want to have any more children. Of these men, 59% stated that they do not want to have
anymore children (Table 8.1). The proportion of men who do not want to have any more
48
children was greater among those from the urban areas. As expected, the proportion of men
who do not want to have any more children increased with their age and the number of living
children they currently have. It is interesting to note that more than half of the men, who
have 2 living children, do not want any more children. The proportion of men who do not
want to have more children was greater among men who have not completed their secondary
education. A possible reason for this is that perhaps those with no education or with primary
only, may already be fathering quite a few living children.
The sample of currently married men who stated that they do not want to have
anymore children were therefore asked whether they are currently using contraceptive, and if
so, what type of contraceptive method they are currently using. Even though more than half
of the men do not want to have any more children, only 50% of these reported currently
using a method of contraception (Table 8.2). The most common methods being used were
female sterilization (22%), orals (10%) and condom (7%). It is important to note that a
negligible percentage was using the Rhythm/Billings method, and that the non-use of
contraceptives is more likely among those in the rural areas.
All the men who did not want any more children and who are not interested in a
vasectomy were also asked why they are not interested2. Table 8.3 shows that the major
reason given is that they prefer to use other methods (24%). Advanced age (16%) and ‘Does
not Like or Want to use’ (15%) are also popular reasons stated. A further 10% fear the
operation, and 4% claim that they may meet another person in the future who wants children.
Allied to this latter reason is another 3% who state that the operation is ‘Difficult to Reverse’.
These reasons given are similar in both urban and rural areas.
All the currently married men who stated that they do not want to have any more
children and who were interested in vasectomy were asked why they have not taken the
operation. The reasons given were: needs more information, lack of money, far distance to
source, difficult to reverse, and may meet another partner in the future who wants children.
A vigorous and effective educational program can address the first reason. The second and
third reasons can be addressed by offering the services on vasectomy at a lower cost and
available at convenient hours for men.
2 Excludes 16 cases for whom the reason for not having interest in vasectomy is unknown.
49
Men who want to have more children were asked if they would be interested in being
operated when they have the desired number of children. Only 8% (28 cases on the survey)
expressed an interest in surgical contraception when they have the desired number of
children. The men who expressed interest in the operation had an average of 2.8 children
alive and were 31.4 years. It should be noted that the percentage of men who reported being
interested in a vasectomy after having the desired number of children is higher than the
percentage who reported being interested in vasectomy and do not want to have anymore
children. This indicates that in the future the demand for vasectomy may slightly increase in
Belize. In general, however, vasectomy is unlikely to become more in demand in the future
for men who have not had their desired number of children.
Men who wanted to have more children but were not interested in vasectomy after
having the desired number of children, were asked why they were not interested in the
surgery. The most common reasons stated were: prefers using other methods to limit their
family size (36%), does not like or want to use vasectomy (19%) and fear of the operation
(10%) (Table 8.4). These men, however, did not have advanced age as a common response
since the majority were young and wanted to have children.
The reasons for not having a vasectomy for men in the urban areas were similar to
those given by men who lived in the rural (Table 8.4). The men in the rural areas, however,
expressed their preference for other methods (37%) stronger than the men in the urban areas
(34%). It is evident that men from both the urban and rural areas need information on
vasectomy although the men in the rural areas seem to be slightly less informed than those in
the urban. Educational programs on this method are thus necessary for both urban and rural
men to actually consider vasectomy as an alternative contraceptive method.
8.3 Summary
In this chapter the reasons why men have not obtained or are not interested in
vasectomy were explored. Table 8.5 lists, in order of importance, the principal reasons why
men in Belize are not interested in vasectomy. With a few exceptions, the majority of
reasons for not being interested in vasectomy can be addressed through an effective
educational program. Men need reproductive health programs reaching out to them. As long
as the lack of knowledge on vasectomy is prevalent, it is highly unlikely for men to be
interested in this surgical contraception. Some important factors on the success of programs
50
on vasectomy have been identified by previous studies done on this topic. Some of these
include:
Ø Quality of services
Ø Leadership
Ø Attention to the basic necessity of men
Ø Well focused program design
Ø Multiple channels of communication
The programs that have been successful in Latin America show that beliefs that
vasectomy will never be successful among men are false.
51
CHAPTER 9
KNOWLEDGE OF HIV/AIDS 9.1 Introduction
Statistics from the National Health Information Unit show that, of the people in
Belize living with HIV/AIDS, the male population outnumbers the female population in all
age groups. The age group with the highest number of HIV incidence for both males and
females is the 25-34 age group, with the 15-24 and 35-44 age groups being next in line.
These are the groups with the highest levels of sexual activity, but also the ones when people
are most productive.
9.2 Men who have heard of AIDS
The survey data show that, of all men aged 15-64 who were interviewed, 95%
reported having heard of AIDS (Table 9.1), the same proportion as for women. But while
98% of urban men had heard of AIDS, only 92% of rural men had and, as in the case of
women, for every age category, urban men were more likely to have heard of AIDS than
rural men; except that, in the case of men, it is the oldest age groups which show the largest
differentials.
Again, as among women, knowledge of AIDS among men was also found to be
directly related to educational achievement, that is, the higher the level of education, the
more likely men would know about AIDS. This applies to both rural and urban men. But
when education is controlled by residence, differences in knowledge between urban and rural
men become evident at the first two levels of education only.
Differences in knowledge of AIDS also emerge when ethnic groups are controlled by
residence. The Maya/Ketchi reported the lowest percentage with knowledge of AIDS (87%).
While 97% of urban Maya/Ketchi men reported having heard of AIDS, only 84% reported
doing so in rural areas. Similar differences are found in the case of Maya/Ketchi women.
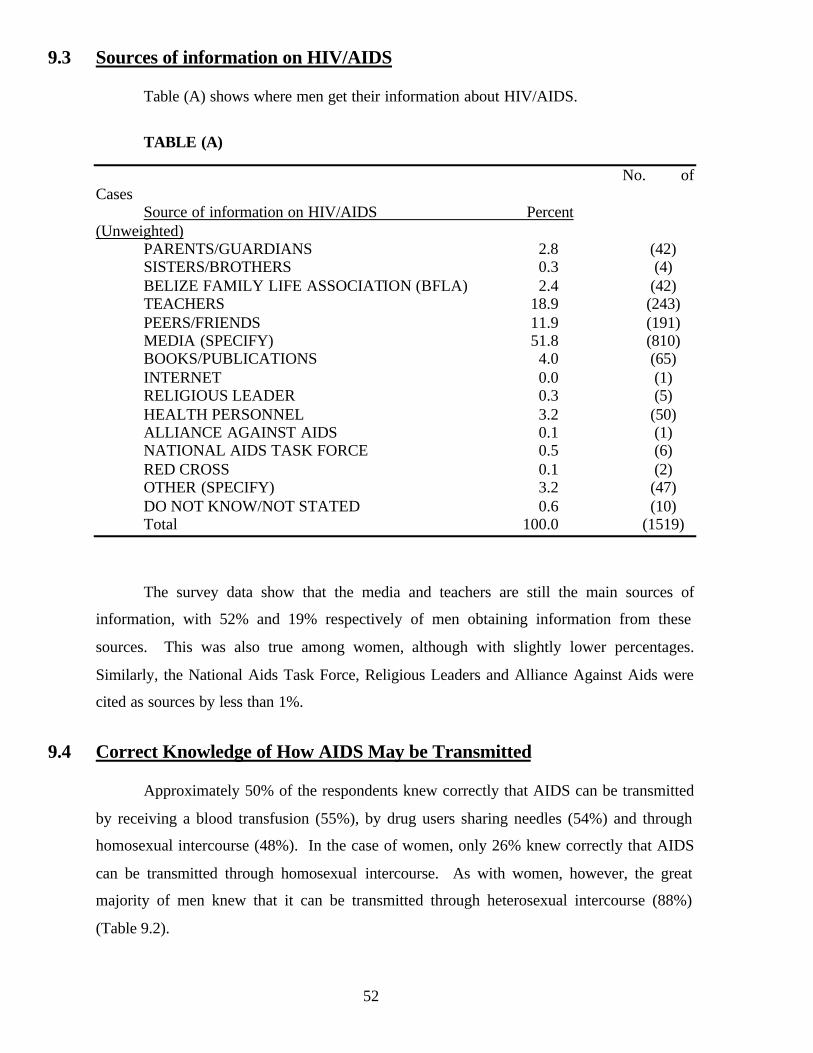
52
9.3 Sources of information on HIV/AIDS Table (A) shows where men get their information about HIV/AIDS.
TABLE (A)
No. of Cases
Source of information on HIV/AIDS Percent (Unweighted)
PARENTS/GUARDIANS 2.8 (42) SISTERS/BROTHERS 0.3 (4) BELIZE FAMILY LIFE ASSOCIATION (BFLA) 2.4 (42) TEACHERS 18.9 (243) PEERS/FRIENDS 11.9 (191) MEDIA (SPECIFY) 51.8 (810) BOOKS/PUBLICATIONS 4.0 (65) INTERNET 0.0 (1) RELIGIOUS LEADER 0.3 (5) HEALTH PERSONNEL 3.2 (50) ALLIANCE AGAINST AIDS 0.1 (1) NATIONAL AIDS TASK FORCE 0.5 (6) RED CROSS 0.1 (2) OTHER (SPECIFY) 3.2 (47) DO NOT KNOW/NOT STATED 0.6 (10) Total 100.0 (1519)
The survey data show that the media and teachers are still the main sources of
information, with 52% and 19% respectively of men obtaining information from these
sources. This was also true among women, although with slightly lower percentages.
Similarly, the National Aids Task Force, Religious Leaders and Alliance Against Aids were
cited as sources by less than 1%.
9.4 Correct Knowledge of How AIDS May be Transmitted
Approximately 50% of the respondents knew correctly that AIDS can be transmitted
by receiving a blood transfusion (55%), by drug users sharing needles (54%) and through
homosexual intercourse (48%). In the case of women, only 26% knew correctly that AIDS
can be transmitted through homosexual intercourse. As with women, however, the great
majority of men knew that it can be transmitted through heterosexual intercourse (88%)
(Table 9.2).
53
In general, urban men were better informed on this subject than rural ones, with the
largest differential between the two groups being on receiving blood transfusion (61%
compared to 49%).
While there is no clear pattern of correct knowledge by age group, there is a close
relationship between levels of education and correct knowledge about AIDS transmission.
As was the case with women, the largest differential in knowledge for men was on getting
AIDS from a blood transfusion: while only 41% of the low education group knew correctly
this was a way AIDS could be transmitted, fully 68% of the high education group did so.
And the smallest differential between the two groups was in respect of heterosexual
intercourse, 87% compared to 91%.
With regards to ethnicity, Maya/Ketchi men were the least likely to have correct
knowledge of the different modes of AIDS transmission, with one surprising exception,
namely, heterosexual intercourse, where they came in first with 90%. Otherwise, it was the
Garifuna and the Creoles who were generally best informed on these modes of transmission.
In Belize, the majority of those infected with HIV/AIDS are heterosexuals (70%),
with bisexuals making up 15% and homosexuals 7%. Six percent contracted the disease
perinatally and 2% through blood transfusion.
9.5 Incorrect Knowledge of How AIDS May be Transmitted
Five incorrect ways of transmitting HIV were prompted to the respondents: shaking
hands or hugging, being in a room with a person with AIDS, sharing personal items, giving
blood, and being bitten by an insect (Table 9.3).
As was the case with women, fairly low percentages of the male respondents (less
than 8% in each case) believed that AIDS could be transmitted by shaking hands or hugging,
being in a room with a person with AIDS, sharing personal items or being bitten by an insect.
But these percentages were slightly higher in each case than for women. A much higher
percentage of men (29%) believed that AIDS could be transmitted by giving blood. This was
much higher than the proportion of women who believed that AIDS could be transmitted by
giving blood (20%).
54
In general, a lower percentage of urban men than rural ones believed these were
correct ways of transmitting AIDS. The one exception was giving blood where, surprisingly,
a lower proportion of rural men than urban ones believed this to be a legitimate way of
transmitting AIDS. The same was true for women.
There was no clear pattern of incorrect knowledge with respect to age or education
level. With regards to ethnicity, however, it was the Mestizo and the Creole who appeared to
be best informed, since these two groups had the lowest percentages of respondents who
believed that AIDS could be transmitted in any of the five ways mentioned above.
9.6 Perceived Risk of Getting AIDS Among Men
Of the men who had heard of AIDS, less than one- third, or 28%, felt they were at
some risk of getting AIDS (Table 9.4). This proportion includes men who responded that
they were “at great risk”, “some risk”, or “not much risk” of getting AIDS. This figure is
three points lower than that for women. On the other hand, 68% did not consider themselves
to be at risk, and 3% did not know.
Unlike women, the same percentage of urban men as rural men (28%) believe
themselves to be at some risk of getting AIDS, but more rural than urban men are uncertain
about their risk. These percentages, 5% and 2% respectively, are lower than those for
women, leading to the conclusion that men are better informed.
The highest percentage of men who believe themselves to be at some risk (42%) is in
the 20-24 age group, just as in the case of women, while the lowest percentage is in the oldest
(60-64) group (12%). And as the level of education increases, so does the proportion of men
who consider themselves to be in the “some risk” category, from 26% for those at the lowest
level to 34% for those with over nine years of education.
As among women, marital status appears to be a determining factor in
perceived AIDS risk among men. The highest proportion of men who see themselves as
being at some risk of getting AIDS (55%) was in the visiting partner category. The
proportion for women is 51%. But, unlike women, the category of men with the lowest
percentage of perceived risk was married/in union (24%), not single.
55
9.7 Perceived Risk and Condom Use
The gap between perceived risk and behaviour among men in Belize is not as wide as
it is among women (Table 9.5). For example, of the men who perceive themselves to be at
either great or some risk of getting AIDS, 97% know of condoms, 68% have ever used them
and 45% are currently using them. By comparison, while almost as many women know of
condoms, only 48% have ever used them and only 14% are currently using them. Also, the
differentials between urban and rural men are not as great as in the case of urban and rural
women. Thus, while 98% of urban men reported knowing of condoms, 95% of rural ones
did so. And while 49% of urban men reported currently using condoms, 35% of rural ones
reported doing so. This compares with 21% and 6% for urban and rural women respectively.
The survey shows that it was men aged 15-29 who were the most likely to report
current use of condoms. But the highest percentage of men who reported current use are in
the 20-24 age group (61%), while the second highest are in the 15-19 age group (49%). The
same is true for women, except that the proportions are lower, that is, 20% and 17%
respectively.
Use of condoms by men increases with education. All the major ethnic groups show
a high proportion of knowledge of condoms, with the Maya/Ketchi showing the lowest
(92%). This group also had the lowest proportion of past use of condoms (23%) and was the
least likely to be currently using them (5%), lower even than Maya/Ketchi. While Creole
men showed the highest percentage of knowledge (98%), the Garifuna were the ones most
likely to be using them (60%).
Men in visiting partner relationships showed the highest proportion of knowledge of
condoms (100%), and current use (75%). The next group with the second highest percentage
of current use of condoms were married/in union men (33%), followed closely by single men
(32%).
56
9.8 Summary
This chapter has dealt with the very important topic of HIV/AIDS, men’s knowledge
of it, their sources of information about it, of how it may be transmitted, their perceived risk
and how this risk has affected their use of condoms in sexual relations.
The survey data show that 95% of all men interviewed reported having heard of
HIV/AIDS, the same proportion s for women, with the media and teachers being the main
sources of information on the subject. The data also show that the great majority of men
knew that the virus can be transmitted through heterosexual intercourse, with only about half
of them reporting that it can be transmitted through blood transfusion, sharing needles and
homosexual intercourse. Fairly low percentages of respondents believed that HIV/AIDS
could be transmitted by shaking hands or hugging, being in a room with a person with AIDS,
sharing personal items or being bitten by an insect.
Of the men who had heard of AIDS, less than one-third felt they were at some risk of
contracting the virus, with the highest proportion (42%) being in the 20-24 age group. The
lowest percentage (12%) is in the oldest (60-64) group.
57
CHAPTER 10
CONDOM USE
10.1 Introduction
In this chapter, knowledge and use of condoms among males is examined. For some
time now, information about the use of condoms as a powerful form of contraception, and
more recently, as a prevention against STI’s and HIVAIDS has been commonly disseminated
even within developing countries. During the family health survey of males in Belize, several
questions relating to knowledge and use of condoms were asked. The main objectives of
these questions are to assess the effectiveness of the efforts made to provide objective
information which people can use to make sensible decisions. Hopefully, the results of the
survey will provide a yardstick to determine whether the efforts exerted thus far are adequate
or whether these need to be intensified and more focused.
10.2 Knowledge and Use of Condoms
Table 6.1 presents data relating to the knowledge of contraceptive methods among
males 15-64 years old. It is clear from the table that the second most known method is the
Condom (74%). This is true whether the respondent resides in the urban or rural areas of the
country. Table 6.5 further shows that of the 39% of the males currently using a form of
contraception, the highest percentage (17%) were using condoms. Interestingly, a condom is
more likely to be used among men who have a ‘Visiting Partner’ (58%) or are ‘Not in Union’
(16%) than it is among men who are ‘In Union’ (10%). In addition it shows that even though
half of all married men are more likely to use a form of contraceptive, only 10% resort to the
use of condoms.
Information on condom use by various socio-economic characteristics can be very
useful since such information can provide guidance for more focused intervention. Tables
10.1 and 10.2 present information on use of condom by the age of the respondent and his
educational level completed. It is clear from these sources that use of condom is more likely
(49%) among men who are less than thirty (30) years old, increasing with age, and peaking
(20%) at the age group 25-29. After age 30, use of condom reduces incrementally with age. It
is interesting to note that even at age 50-54 years, approximately 5% of sexually active men
are still using condoms. Also, with respect to educational level completed, table 10.2 shows
58
that men with no formal level of education or with ‘Incomplete Primary’ level are the most
likely not to use a condom, whereas those who have completed primary or secondary levels
are much more likely to use condoms.
10.3 Frequency of Use with Steady and Non-Steady Partners
Respondents who use condoms were asked how often they use them with steady
partners. Table 10.3 shows the results to this question. Of those who use condoms with their
steady partners, 50% reported that they use condoms ‘Always’, whereas 8% ‘Never’ use
condoms. Another 14% ‘Seldom’ use condoms and 22% use them ‘Most of the Time’ with
their steady partner. Those respondents who reported that they seldom or never use condoms,
were further asked why. Table 10.4 shows the results to this question. The main reason why
condoms are used with steady partners is to avoid unwanted pregnancies (88%). It is noted
that only 37% use condoms to prevent HIV/AIDS, and 29% to prevent STI’s. A very likely
reason for this is the fact that the couples are steady and fidelity may by high. They may
therefore feel that the risk of contracting HIV/AIDS or another STI is small. Those who
reported that they ‘Seldom’ or ‘Never’ use condoms were further asked why. Table 10.5
presents the reasons why these males seldom or never use condoms. These results show that
the main reason why they seldom use condoms is because the relationship is steady in the
sense that they have only one partner (34%). The second major reason here is because they
use condoms only when their partner is not using another contraceptive method (27%). It is
interesting to note that only 7% reported that they seldom or never use condoms because the
condoms limit pleasure or that they are not comfortable using them.
Men who have sexual intercourse with a non-steady partner were also asked how
often they use condoms during intercourse. Table 10.6 shows that over half of those who use
condoms reported that they do so ‘Always’. Only 8% reported using condoms ‘Most of the
Time’ and another 3% reported ‘Seldom’ using them. However, it is worth noting that 32%
report that they never have sex with a non-steady partner. These men in non-steady
relationships were then asked why they use condoms with a non-steady partner. Table 10.7
presents the results to this question. This table shows that the main reason why these men use
condoms is to prevent being infected with HIV/AIDS (75%). The second most popular
reason was to prevent unwanted pregnancies (70%). Prevention of STIs is also of concern to
men in non-steady relationships, since 59% reported using condoms to avoid these infections.
It is noted that, as would be expected, the percentage here is much higher than for those in
59
steady relationships. In the latter relationships, men are more confident of their partner’s
health, and they can therefore take more risks. Men who have a non-steady partner and who
reported that they ‘Seldom’ or ‘Never’ use condoms during sexual intercourse with their
partner were also asked why they seldom or never use condoms. Surprisingly, as Table 10.8
reveals, 40% claim to seldom or never use a condom because they are faithful to each other.
What is not clear is whether this fidelity is certain. Surely, fidelity is more likely in a steady
rather than in a non-steady relationship. Without being aware of it, therefore, these men may
be at a much higher risk of infection.
10.4 Other Matters Relating to Condom Use
All men who reported that they had ever used a condom were further asked to share
other experiences relating to the use of it. Since, from time to time, males report that
condoms cause some inconvenience or discomfort, the respondents in the survey were asked
to report the specific problem that use of condoms may cause. Table 10.9 presents these
results. This table shows that only 16% of condom users reported that they experienced some
inconvenience or discomfort with the use of the condom. The table further reveals that the
main problem seems to be with the ‘Sensitivity’ (67%) of the condom. Although it is not
very clear from the survey, for the few who reported this problem, it may be that the condom
disrupts the natural pleasure of sexual intercourse, as anecdotal evidence suggests. The data
from this survey, as captured in Table 10.9, show that the least problem reported was that the
condom ‘Irritates the Partner’ (4%). There are some milder concerns about condom use like
‘Interruption of Sexual Act when you put on the Condom’ (27%), ‘Condom Breaks’ (19%),
and that it ‘Stayed Inside’ (15%). The overwhelming majority of 83% who reported no
discomfort or inconvenience using a condom is convincing that more use of the condom
during sexual intercourse could be successfully promoted.
Respondents were also asked for the brand name of condoms they use most. The
reliability of the answers given to this question may be questionable, however, since there is
no objective means of verifying the respondents’ reliable recall of brand names. It is usual for
people to buy products without taking much note of brand names. However, the results to
this question presented in Table 10.10 may indicate a trend in preference for one brand name
over another. ‘Rough Rider’ brand of condoms appears to be the most popular (39%) brand
that men use, followed by ‘Vive’ (12%). Six (6%) prefer using ‘Wet and Wild’ or
‘Bareback’. It is interesting to note that most of the men do not care about the brand name of
60
condoms. Surely, these men could either not recall the brand name or may indeed be using
cheaper condoms with no brand name.
In the case of those who reported that they have never used a condom, they were asked
whether they know where to obtain condoms. In all cases, the major sources of purchase of
condoms, as summarized in Table 10.11, is the pharmacy and the supermarket/bar/grocery
store. In the case of those presently using condoms, 68% reported that they obtain them from
a ‘Pharmacy or Drug Store’. Another 24% obtained their condoms from a supermarket, ‘Bar
or Grocery Store’. Only 2% obtained condoms from a hospital. The latter may be reflecting
the passive support for condom use by established hospitals. As documented above, this
pattern in the source of purchase is similar among those who have used condoms, but are not
presently doing so. Seventy three percent (73%) of these men reported that they often
obtained their condoms from the ‘Pharmacy or Drug Store’ and 14% from the ‘Supermarket,
Bar or Grocery Store’. Surprisingly, another 6% said that they obtained their condoms from
‘Friends, Neighbours or Family Members’. Only 1% of men in this category obtained
condoms from a ‘ Government Hospital’, and another 2% from the ‘Belize Family Life
Association’. The pattern among those who have never used condoms deviates only slightly
somewhat from the above. Among these men, 74% know that condoms are obtainable from
the ‘Pharmacy or Drug Store’, 14% know of the ‘Supermarket, Bar or Grocery Store’ as a
source of purchase, but strangely, 1.5% report that condoms can be obtained from the
‘Government Facility’, and 5% get them from a friend. A further 3% stated the BFLA as the
main source and another 3% reported that ‘Private Facility’ is the main source that they know
of.
Since the effectiveness of condoms reduces with age as well as with improper care
and storage, and since information here is very useful in order to properly educate the user,
questions relating to these issues were asked of respondents in the survey. All who are
currently using condoms were asked if they normally keep condoms. Eighty one percent
(81%) (result not shown) reported that they often keep condoms. These were further asked to
name the place where they keep their condoms. Table 10.12 shows these results. The
‘Wallet’ (43%) is the most common place to keep condoms. The second most common place
is in the ‘Cupboard or Drawer’ (37%). Ten percent (10%) of the men reported that they keep
their condoms in their ‘Pockets’ and another 3% keep them in their ‘Car’.
Even if males use condoms regularly, they may still be at risk of contracting
HIV/AIDS or another STI, if the condom used is not in a good condition. To get some
61
indications of how well men know whether condoms are good or not, respondents were
asked relevant questions about the ‘goodness’ of packaged condoms. Table 10.13 shows
these results. Almost 59% confirmed that ‘The Expiry Date’ on condoms can tell you if a
packaged condom is still good. Thirty nine percent (39%) agreed that if the package does not
have any ‘Holes, Tears or Leakage of Lubricant’ then you can tell if the packaged condom is
good. Only 12% mentioned that if there is ‘Air inside the Package’ one can tell if the condom
is good, whereas 13% reported that they can assess ‘goodness’ if the condom has ‘Lubricant
after Opening’.
Finally, respondents were all asked whether they agree or not with some common
statements that are often used in association with condom use. The results to these questions
are tabulated in Table 10.14. The first such statement was that ‘Condoms reduce sexual
pleasure’. Thirty nine percent (39%) agreed with this statement, whereas 22% disagreed.
Secondly, respondents were asked whether ‘Condoms should be used if partner requests’. A
very large percentage (66%) agreed with this and only 10% disagreed. It would be good if
comparative figures for this statement relating to men’s opinion were available for ten (10)
years ago. A common belief is that if the female partner requests the use of a condom, the
male would strongly object. These figures are disputing this belief, which may only have
been true some years ago. The statement that ‘Condoms cause irritation on the penis and
vagina’ may also be an outdated belief, since the table is also showing that only 19% of the
men in the survey who use condoms, agreed with this statement. However, a rather large
percentage (67%) agree that ‘A new condom should be used in every ejaculation’, and 56%
confirmed that ‘A man does not need to use a condom if he is faithful to his partner’.
10.5 Summary
As a conclusion, the following summary is in order. The second most known method
of contraception is the use of the condom. Yet, of the just under 40% currently using a form
of contraception, approximately 16% use condoms during sexual intercourse. Younger men
less than thirty years old are more likely to use condoms. Half of the men in ‘Steady’ or
‘Non-Steady’ relationships use condoms always during sexual intercourse. In the case of the
former, the main reason is to avoid an unwanted pregnancy. In the case of the latter, the main
reason is to avoid contracting HIV/AIDS. Available data show that only 17% reported that
they have problems using a condom, and this problem is mainly with the sensitivity of the
condom. It appears that the condom reduces sensitivity. Condom users show a preference for
the ‘Rough Rider’ brand name of condoms over the others, since approximately 38%

62
reported using this brand. The pharmacy or drug store is the main source of purchase of
condoms for men, followed by the supermarket, bar or grocery store. The ‘Wallet’ is the
place named by most condom users for storage of their condoms. The ‘Drawer or Cupboard’
is the second most popular place. A large number of men who use condoms report that a
good way of knowing whether they are good is by the ‘Expiry Date’.
63
CHAPTER 11
DRUG USE AND DOMESTIC VIOLENCE
11.1 Introduction
Seventy seven percent of men aged 15 to 64 stated that family violence is a
significant issue in society (see Chapter 5). In Belize, a serious limitation in addressing the
problem of domestic violence is the lack of intervention programmes targeted at a clearly
defined population of high risk. Given that drug use can be a cause of violence, this chapter
covers the use of alcohol, cigarette, and marijuana among men aged 15 to 64 years, along
with the men's experience as victims of abuse and their opinions on violence against two
victims: their partner and their children.
To explore more on the health profile of Belizean men, questions were asked on drug
use. The most popular drug among men aged 15 to 64 years is alcohol (see Graph 11-1).
Out of every ten men, seven stated ever drinking alcohol. Only 58% of men are presently
consuming alcohol. In order of highest to lowest consumption, other drugs ever consumed
are cigarette (47%), marijuana (20%), crack/cocaine (2%) and heroin (less than 1%). Men
reported to have decreased their consumption levels on all these drugs. It should be noted
that almost half of men who smoked cigarette report that they are no longer smoking, and
seventy percent of men who smoked marijuana state the same. Similarly, eighty percent of
men who consumed crack/cocaine report that they are no longer consuming crack/cocaine.
Only four men stated that they ever used heroin, while only two are presently using heroin.
Although the significant decrease of drug consumption is favourable, it may be that the true
picture of drug use among men remains hidden.
11.2 Alcoholic Beverages
Alcohol is highly consumed by all men aged 15 to 64 years, regardless of place of
residence, marital status, age and educational level (Table 11.1). It is well known that in
Belize, alcohol is consumed on special occasions, whether they be happy occasions (baptism,
confirmation, wedding, public functions, birthday parties, etc.) or moments of sadness
(‘wakes’, etc.). Belize even produces its own rum and beer from cane and other products.
Even if the law states that alcohol should only be sold to persons 18 years or older, it is well
64
known that this law is not enforced in many cases. The only restriction for not being able to
consume alcohol seems to be the inability to pay for the beverage.
Fifty three percent of men 15 to19 years indicated ever drinking alcohol, while 92%
of men aged 50-54 years have consumed alcoholic beverages at some time in the past. The
experience of drinking alcohol is higher among men in the urban areas, visiting partners,
married men and men with a higher level of education.
In general, the likelihood of men stopping the consumption of alcohol increases with
age. Note also that educational level has a direct relationship with the likelihood of drinking
alcohol. Men from the urban areas have a much higher consumption level of alcohol than
men in the rural areas. Men in the rural areas report having a 22 percentage points decrease
in alcohol consumption compared to 17 percentage points decrease in the urban.
Almost 67% of men aged 15 to 64 years drink 1 to 9 drinks per occasion, while 20%
drink 10 or more drinks during the same period (Table 11.2). Men who drink 10 drinks or
more tend to be men in union, men aged 35 to 64, and men who have completed primary
level education. The tendency of drinking 10 drinks is higher among older men. Eighteen
percent of male youths aged 15-24 years who are presently drinking, consume 10 or more
drinks of alcohol per occasion. Although more men in the urban areas report to be presently
drinking alcohol, men from the rural areas have a higher probability of drinking 15 or more
drinks per occasion than men from urban areas.
11.3 Cigarette Smoking
Cigarette smoking is a principal risk factor of cardiovascular diseases and cancer. Of
all men aged 15 to 64 years, 47% indicate ever smoking cigarette. However, only 23%
report that they are presently smoking (Table 11.3). The likelihood of ever smoking cigarette
is higher among men in the urban areas, men aged 50 to 54 years, men in union and men with
no education. Note that 27% of youths aged 15 to 19 years have experimented with smoking
cigarettes.
Almost one of every four men aged 15 to 64 is currently smoking cigarettes.
Cigarette smoking is more prevalent among men in the urban areas, men in union, men aged
50 to 54 years, and men with no level of education. Nonetheless, there is a high percentage
of men aged 15-19 (16%) and 20 to 24 years (18%) who are presently smoking. As the
65
educational level of men increases, the probability of smoking cigarette decreases. For
instance, 17% of men with post secondary education are currently smoking cigarette
compared with 38% among men with no level of education. A high percentage of men with
post secondary education report experimenting with cigarette smoking at least once in their
lifetime but they are the ones who are more likely to discontinue its use.
Information was also collected on the number of cigarettes smoked daily. More than
half of the men who smoke, consume 1 to 4 cigarettes daily (Table 11.4). Out of every ten
men who smoke, two smoke more than 10 cigarettes daily. It is interesting to note that 5% of
men are smoking a pack or more of cigarettes (20 or more cigarettes) daily.
The number of cigarettes smoked daily does not vary significantly by residence. The
prevalence of smoking 10 or more cigarettes daily is higher among married men, men 35 to
64 years and men with complete primary education. Note that 3% of men aged 15 to 24
years are smoking 20 or more cigarettes daily. In general, cigarette smokers who are either
15-24 years or with secondary or higher level of education completed are the ones who
smoke the least number of cigarettes daily.
11.4 Marijuana Consumption
Marijuana is an illicit drug in Belize. Nonetheless, almost one out of every five men
aged 15 to 64 years report to have smoked marijuana at some time in their lives (Table 11.5).
There is a higher probability for men in the urban areas to have experimented with marijuana
than men in the rural areas. The likelihood of experimenting with marijuana is higher among
men who are visiting partners (31%), men 35 to 64 years (22%) and men with post secondary
education (23%). The probability of ever experimenting with this illicit drug increases with
educational level.
Only 6% of men report that they are presently smoking marijuana. This represents 14
percentage points difference from those who report ever using this drug. Men who have the
highest likelihood to be presently consuming marijuana are men from the urban areas (8%),
men who are visiting partners (15%), men aged 15 to 24 years (7%) and men with secondary
level of education completed (7%).
It is important to note that while men with post secondary education are the most
likely to experiment with marijuana in the past, they are the least likely to be currently
66
smoking marijuana. Although male youths 15 to 24 years have the lowest probability of ever
using marijuana, they have the highest probability of presently smoking this illicit drug.
Note that men aged 15 to 24 are the least likely to be presently drinking alcohol and smoking
cigarettes. The young male population shows more preference for harder drugs than older
men.
11.5 Domestic Violence
Cross-cultural research has shown that violence is an integral part of virtually all
cultures. A review of 35 prevalence studies in industrial and developing countries showed
that one-quarter to more than one-half of the women reported having been physically abused
by a male partner. Given the importance of domestic violence in Belize, men aged 15 to 64
years were asked to state how they handle relationship conflicts. It is interesting to note that
half of the men state that they discuss the problems and 21% state that they rather go out
when faced with a relationship conflict (Table 11.6). A lower percentage of men say that
they never have conflicts (15%), while others state that they prefer to set the rules and
regulations (4%). Nonetheless, one (1) percent of men aged 15 to 64 state that they respond
violently.
It is important to note that the likelihood to discuss the problem when faced with a
conflict relationship is high among all men regardless of residence, marital status, age and
educational level. Men who discuss the problem are more likely to be in the urban areas,
married, aged 25 to 34 years and with post secondary level of education. However, men
who opt to go out as a way of handling relationship conflicts are men who are visiting
partners, men aged 15 to 24 years and men who have completed primary school. The
likelihood of going out or stating that they never have conflicts increases with age.
The way of handling conflicts in relationships varies significantly between men who
have been abused and those who have not been abused, with the only exception being among
those who state that they prefer to discuss the problems, where the proportion is the same.
Men who have been abused are more likely to go out or set the rules and regulations when
they are faced with relationship problems, where the proportion is the same. Men who have
never been abused have a higher probability of never having relationship conflicts (16%)
than men who have been abused (6%).
67
All men aged 15 to 64 years were asked if they have ever been abused either
physically, emotionally or sexually, as a child in their home. About nine percent of men
stated being victims of child abuse (Table 11.7). The probability of being abused was higher
among men in the rural areas, men who were visiting partners, men aged 15 to 24 years and
men with secondary level education. As the age and the educational level decreases, the
tendency of reporting being a victim of child abuse increases for all men in the sample.
Men's opinion under what circumstances they think it is acceptable to beat a woman
vary for men who have been abused compared to men who have not been abused (Table
11.8). About three out of every ten men agree that it is acceptable to beat a woman when she
has an affair. A lower but significant percentage agree that it is okay to beat a woman when
she is getting on your nerves (6%) and when she yells at you (6%). More than 95% of men
agree, however, that it is not right to beat a woman when the woman does not want sex, when
the food is not on time, when the kids are too noisy, and when they are tired.
In most circumstances the agreement to beat a woman is more strongly expressed
among men who have been abused. For instance, 36% of men who have been abused stated
that it is acceptable to beat a woman when she has an affair compared to 28% of men who
have never been abused.
Men were also asked to state under which circumstances it is in order to beat a child.
Men tend to strongly agree that it is acceptable to beat children when they do not listen or are
disobedient (63%) or when they are upset (47%) (Table 11.9). A lower percentage of men
believe that it is right to beat children when they get home late (20%) or when they have bad
grades at school (11%). More than ninety percent of men disagree that it is okay to beat
children when the children are too noisy or when the man is tired. In general, men consider
it more acceptable to beat a child than to beat a woman under different circumstances.
As expected, men who have been abused as a child have a higher likelihood to
believe that it is okay to beat children under different circumstances than men who have not
been abused. The difference in opinion is most outstanding between the two groups when
the reason is they do not listen or are disobedient. Beating a child can be considered a form
of corporal punishment that can have long term consequences. It is interesting to note that
men who have been abused as children tend to accept more the beating of a woman or a child
under different circumstances, than men who have not been abused. Several studies have
68
shown that physical abuse during childhood is a risk factor for depression, hopelessness,
alcohol abuse, suicide, violence against peers, physical abuse of one's own children, and
physical assaults on partners.
Table 11.10 shows that a higher percentage of men who have been abused are
presently drinking alcohol. Also, men who are presently drinking alcohol tend to have a
higher knowledge of situations considered as abuse in a home. It is interesting to note that
91% of men who currently drink alcohol believe that bruises, cuts or bullet wounds are a
form of abuse in a home compared to 89% of men who do not drink alcohol.
Forms of physical abuse (bruises, cuts, bullet wounds, slapping, punching, pushing)
are more likely to be considered as abuse in a home for men aged 15 to 64 years. Sexual
abuse (forcing partner into sexual behaviour not acceptable to him/her or having sex without
consent) are less likely considered as abuse in a home. Emotional abuse (threats, cursing,
name-calling, not allowing partners to visit friends, partners, or other family members) is the
least likely to be considered as a form of abuse.
Since men who have been abused in childhood expressed a higher acceptance of
abuse at home, it is necessary to note that men who have been abused were first abused when
they were 10 years and of these, half were physically abused (Table 11.11). Moreover, one
out of every five men who were abused were both physically and emotionally abused. Half
of the men who were abused also indicated that the father was responsible for the abuse
while 18% stated that the mother was responsible.
Men who were both physically and emotionally abused have a high likelihood to be
presently consuming alcohol. Similarly, men who were abused by a person other than their
parents or grandparents are more likely to be currently drinking alcohol. Studies have shown
that excessive consumption of alcohol is a risk factor for victimization as well as violence
against women and against persons who are non-relatives.
11.6 Summary
Men aged 15 to 64 years consume the following drugs, in order of higher to lower
preference: alcohol, cigarette, marijuana, crack/cocaine and heroine. A significant
percentage of men who have experimented with these drugs are no longer using them. Male
youths tend to have a high likelihood to be involved in harder drugs such as marijuana.
69
Men who have been abused in their childhood expressed a higher acceptance of beating a
woman or a child under different circumstances. They also have a lower probability of not having
relationship conflicts. These men were first abused at the age of ten and the abuser was more likely
to be the father. Men who were abused also have a higher
chance of presently consuming alcohol. In general, the negative consequences of child abuse are
strongly expressed in a higher acceptance of the various forms of abuse at home and more alcohol
consumption.
Only fifty percent of men discuss the problem when faced with relationship conflicts. Men
find it more acceptable to beat a child than to beat a woman under different circumstances. Sixty
three percent of men believe it is acceptable to beat a child when they do not listen or are disobedient
and 29% agree that it is unacceptable to beat a woman when she is unfaithful. In general, Belizean
men still highly accept corporal punishment as a means of discipline for their children and physical
abuse against women for reasons of infidelity. They are also more likely to consider physical abuse
as a form of abuse and are less likely to consider sexual and emotional abuse as a form of abuse.
Emotional abuse is the least accepted form of abuse. In general, the cycle of abuse seems to be
prevalent in Belize. In order to reduce drug abuse and domestic violence, violence intervention
programmes should be targeted especially to the parents and youths. Fathers, in particular, should be
targeted more in intervention programmes. Corporal punishment, drug abuse and domestic violence
are present among Belizean men aged 15 to 64 years and should be urgently treated as a public
health problem.

70
Appendix I
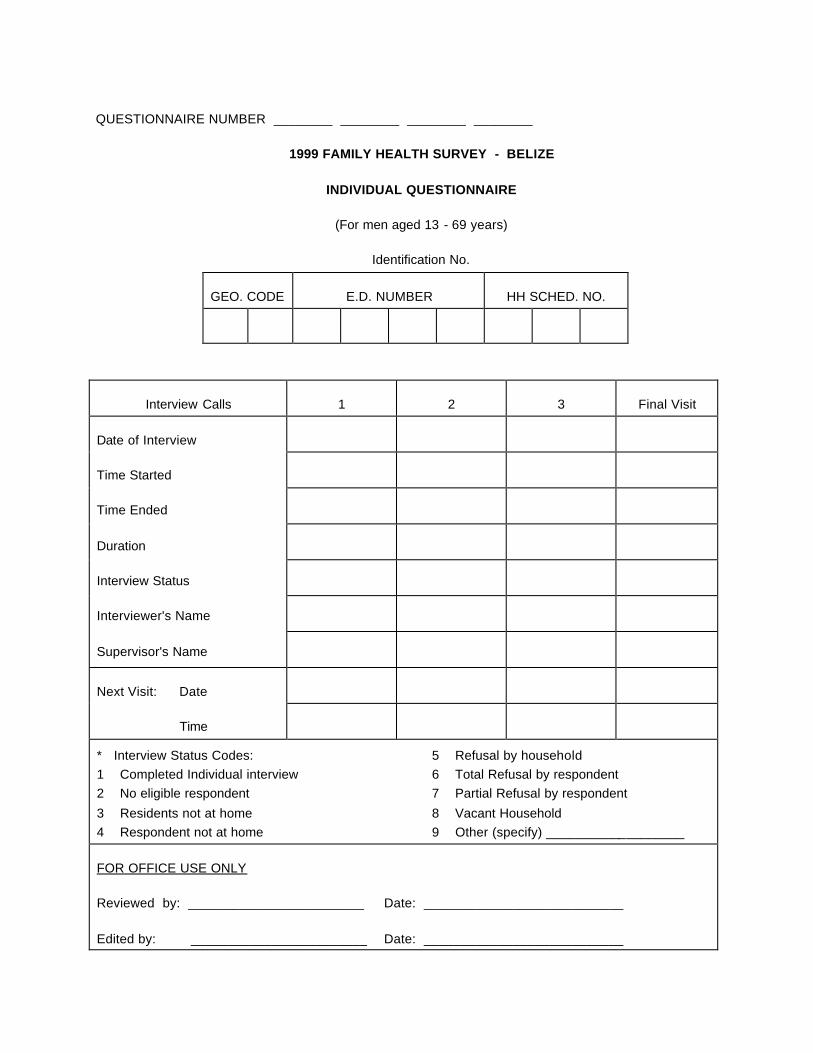
QUESTIONNAIRE NUMBER ________ ________ ________ ________
1999 FAMILY HEALTH SURVEY - BELIZE
INDIVIDUAL QUESTIONNAIRE
(For men aged 13 - 69 years)
Identification No.
GEO. CODE E.D. NUMBER HH SCHED. NO.
Interview Calls 1 2 3 Final Visit
Date of Interview
Time Started
Time Ended
Duration
Interview Status
Interviewer's Name
Supervisor's Name
Next Visit: Date
Time
* Interview Status Codes: 5 Refusal by household 1 Completed Individual interview 6 Total Refusal by respondent 2 No eligible respondent 7 Partial Refusal by respondent
3 Residents not at home 8 Vacant Household 4 Respondent not at home 9 Other (specify) ___________________
FOR OFFICE USE ONLY
Reviewed by: ________________________ Date: ___________________________
Edited by: ________________________ Date: ___________________________
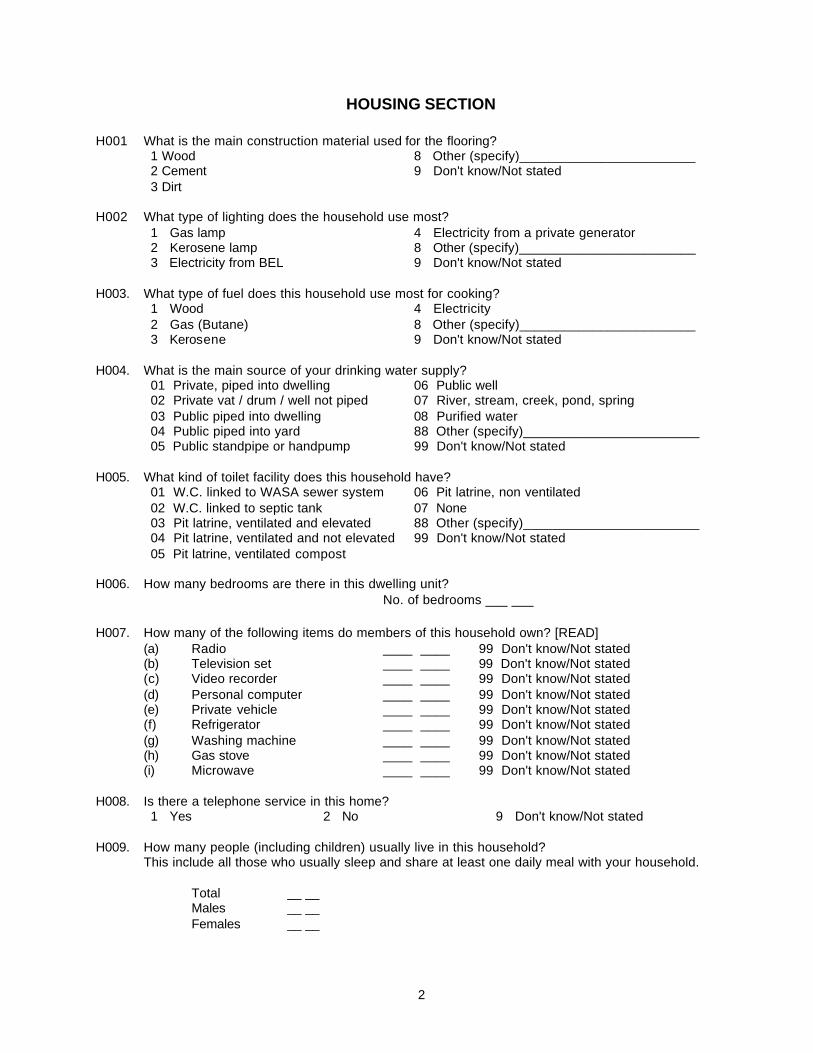
2
HOUSING SECTION H001 What is the main construction material used for the flooring?
1 Wood 8 Other (specify)________________________ 2 Cement 9 Don't know/Not stated 3 Dirt
H002 What type of lighting does the household use most?
1 Gas lamp 4 Electricity from a private generator 2 Kerosene lamp 8 Other (specify)________________________ 3 Electricity from BEL 9 Don't know/Not stated
H003. What type of fuel does this household use most for cooking?
1 Wood 4 Electricity 2 Gas (Butane) 8 Other (specify)________________________ 3 Kerosene 9 Don't know/Not stated
H004. What is the main source of your drinking water supply?
01 Private, piped into dwelling 06 Public well 02 Private vat / drum / well not piped 07 River, stream, creek, pond, spring 03 Public piped into dwelling 08 Purified water 04 Public piped into yard 88 Other (specify)________________________ 05 Public standpipe or handpump 99 Don't know/Not stated
H005. What kind of toilet facility does this household have?
01 W.C. linked to WASA sewer system 06 Pit latrine, non ventilated 02 W.C. linked to septic tank 07 None 03 Pit latrine, ventilated and elevated 88 Other (specify)________________________ 04 Pit latrine, ventilated and not elevated 99 Don't know/Not stated 05 Pit latrine, ventilated compost
H006. How many bedrooms are there in this dwelling unit?
No. of bedrooms ___ ___ H007. How many of the following items do members of this household own? [READ]
(a) Radio ____ ____ 99 Don't know/Not stated (b) Television set ____ ____ 99 Don't know/Not stated (c) Video recorder ____ ____ 99 Don't know/Not stated (d) Personal computer ____ ____ 99 Don't know/Not stated (e) Private vehicle ____ ____ 99 Don't know/Not stated (f) Refrigerator ____ ____ 99 Don't know/Not stated (g) Washing machine ____ ____ 99 Don't know/Not stated (h) Gas stove ____ ____ 99 Don't know/Not stated (i) Microwave ____ ____ 99 Don't know/Not stated
H008. Is there a telephone service in this home?
1 Yes 2 No 9 Don't know/Not stated H009. How many people (including children) usually live in this household? This include all those who usually sleep and share at least one daily meal with your household.
Total __ __ Males __ __ Females __ __
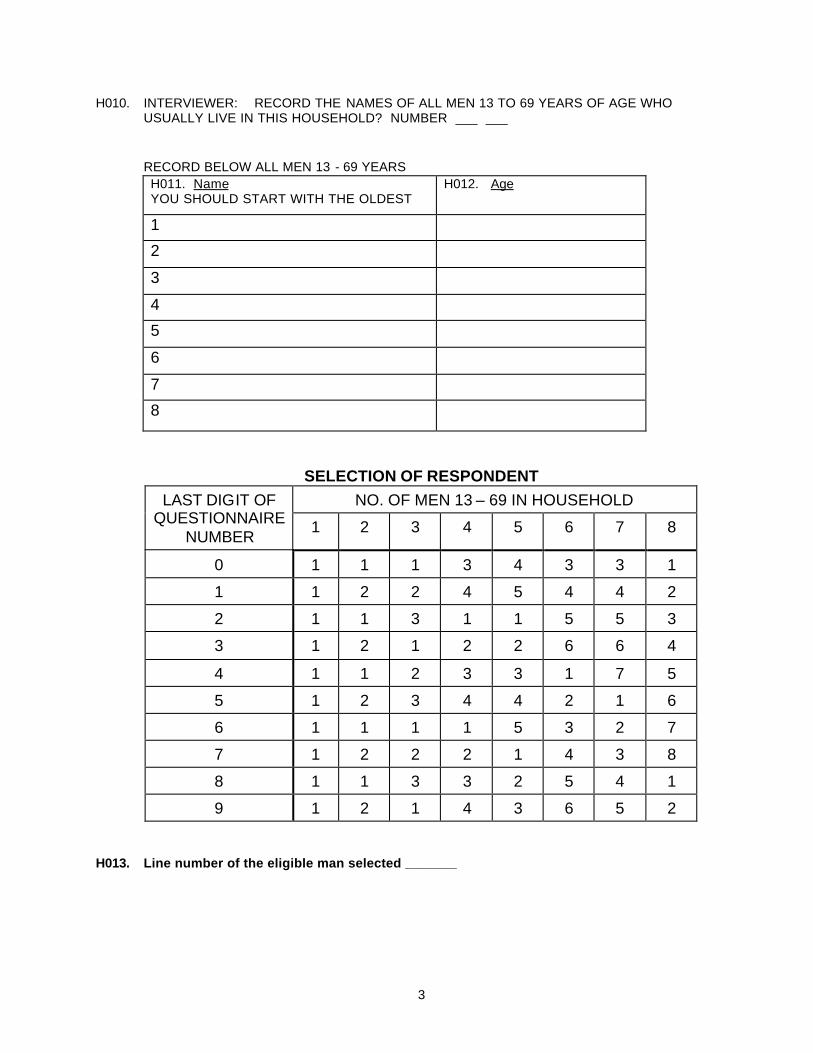
3
H010. INTERVIEWER: RECORD THE NAMES OF ALL MEN 13 TO 69 YEARS OF AGE WHO USUALLY LIVE IN THIS HOUSEHOLD? NUMBER ___ ___ RECORD BELOW ALL MEN 13 - 69 YEARS H011. Name YOU SHOULD START WITH THE OLDEST
H012. Age
1
2
3
4
5
6
7
8
SELECTION OF RESPONDENT NO. OF MEN 13 – 69 IN HOUSEHOLD LAST DIGIT OF
QUESTIONNAIRE NUMBER
1 2 3 4 5 6 7 8
0 1 1 1 3 4 3 3 1
1 1 2 2 4 5 4 4 2
2 1 1 3 1 1 5 5 3
3 1 2 1 2 2 6 6 4
4 1 1 2 3 3 1 7 5
5 1 2 3 4 4 2 1 6
6 1 1 1 1 5 3 2 7
7 1 2 2 2 1 4 3 8
8 1 1 3 3 2 5 4 1
9 1 2 1 4 3 6 5 2
H013. Line number of the eligible man selected _______
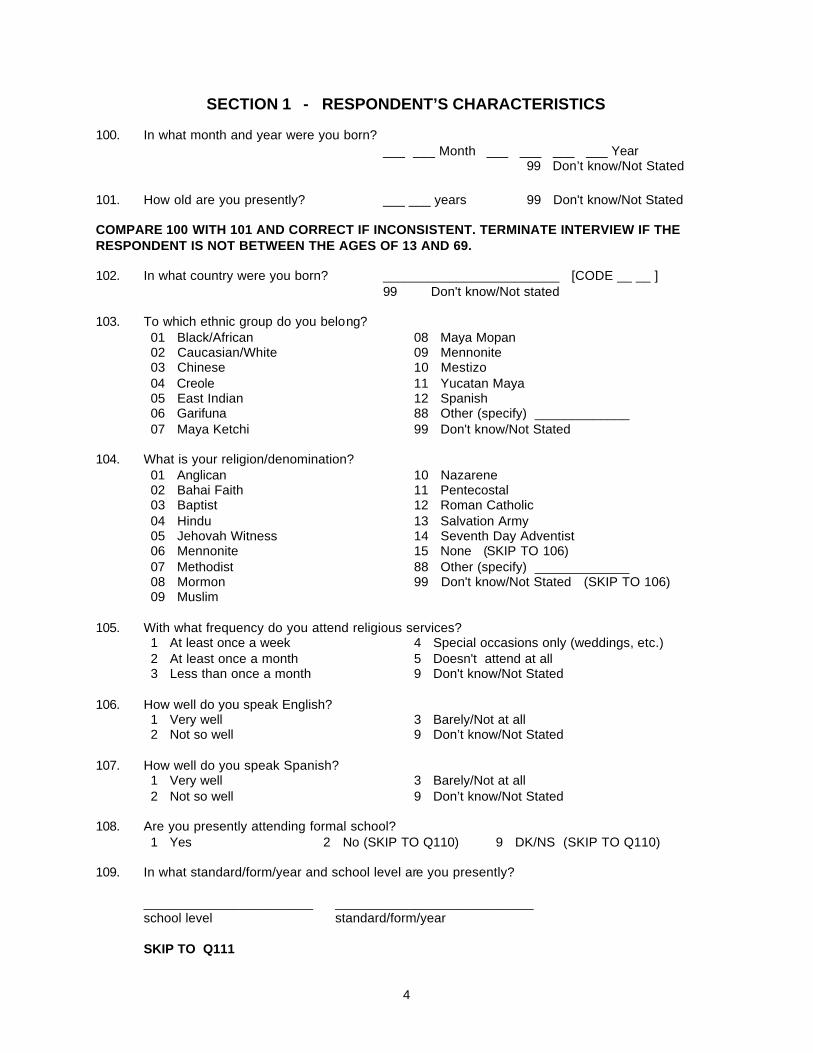
4
SECTION 1 - RESPONDENT’S CHARACTERISTICS 100. In what month and year were you born?
___ ___ Month ___ ___ ___ ___ Year 99 Don’t know/Not Stated
101. How old are you presently? ___ ___ years 99 Don't know/Not Stated COMPARE 100 WITH 101 AND CORRECT IF INCONSISTENT. TERMINATE INTERVIEW IF THE RESPONDENT IS NOT BETWEEN THE AGES OF 13 AND 69. 102. In what country were you born? ________________________ [CODE __ __ ]
99 Don't know/Not stated 103. To which ethnic group do you belong?
01 Black/African 08 Maya Mopan 02 Caucasian/White 09 Mennonite 03 Chinese 10 Mestizo 04 Creole 11 Yucatan Maya 05 East Indian 12 Spanish 06 Garifuna 88 Other (specify) _____________ 07 Maya Ketchi 99 Don't know/Not Stated
104. What is your religion/denomination?
01 Anglican 10 Nazarene 02 Bahai Faith 11 Pentecostal 03 Baptist 12 Roman Catholic 04 Hindu 13 Salvation Army 05 Jehovah Witness 14 Seventh Day Adventist 06 Mennonite 15 None (SKIP TO 106) 07 Methodist 88 Other (specify) _____________ 08 Mormon 99 Don't know/Not Stated (SKIP TO 106) 09 Muslim
105. With what frequency do you attend religious services?
1 At least once a week 4 Special occasions only (weddings, etc.) 2 At least once a month 5 Doesn't attend at all 3 Less than once a month 9 Don't know/Not Stated
106. How well do you speak English?
1 Very well 3 Barely/Not at all 2 Not so well 9 Don’t know/Not Stated
107. How well do you speak Spanish?
1 Very well 3 Barely/Not at all 2 Not so well 9 Don’t know/Not Stated
108. Are you presently attending formal school?
1 Yes 2 No (SKIP TO Q110) 9 DK/NS (SKIP TO Q110) 109. In what standard/form/year and school level are you presently?
_______________________ ___________________________ school level standard/form/year SKIP TO Q111
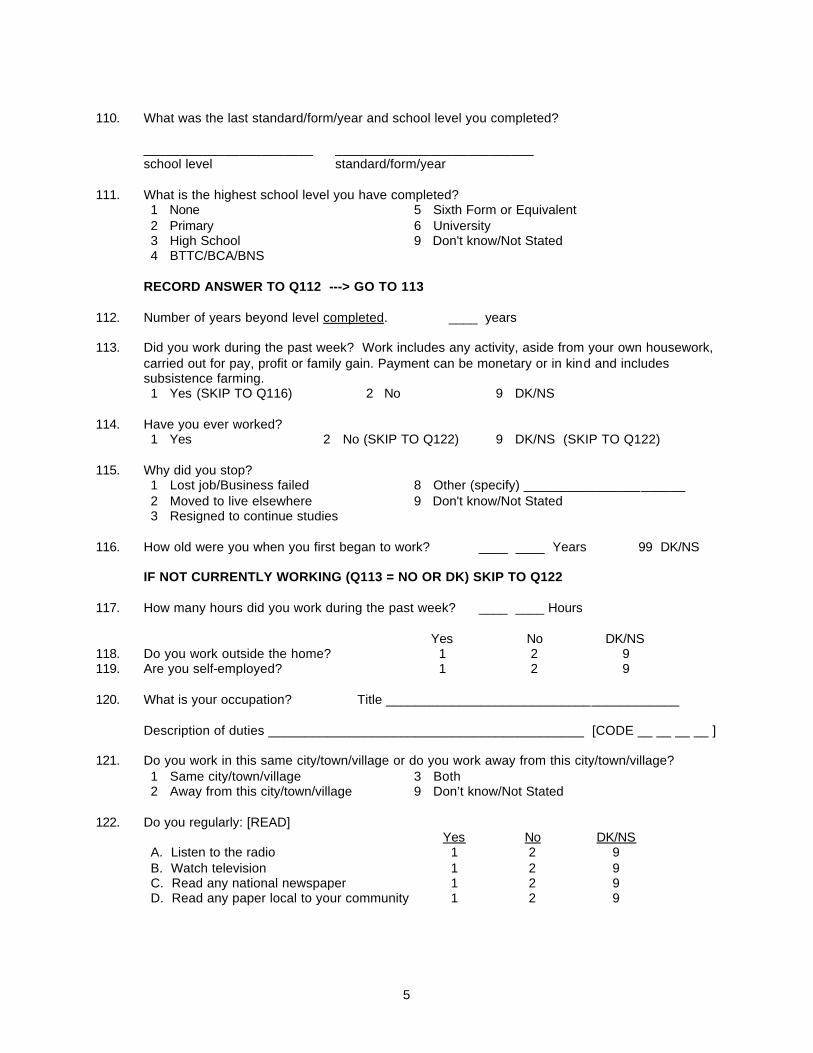
5
110. What was the last standard/form/year and school level you completed?
_______________________ ___________________________ school level standard/form/year
111. What is the highest school level you have completed?
1 None 5 Sixth Form or Equivalent 2 Primary 6 University 3 High School 9 Don't know/Not Stated 4 BTTC/BCA/BNS
RECORD ANSWER TO Q112 ---> GO TO 113
112. Number of years beyond level completed. ____ years 113. Did you work during the past week? Work includes any activity, aside from your own housework,
carried out for pay, profit or family gain. Payment can be monetary or in kind and includes subsistence farming. 1 Yes (SKIP TO Q116) 2 No 9 DK/NS
114. Have you ever worked?
1 Yes 2 No (SKIP TO Q122) 9 DK/NS (SKIP TO Q122) 115. Why did you stop?
1 Lost job/Business failed 8 Other (specify) ______________________ 2 Moved to live elsewhere 9 Don't know/Not Stated 3 Resigned to continue studies
116. How old were you when you first began to work? ____ ____ Years 99 DK/NS
IF NOT CURRENTLY WORKING (Q113 = NO OR DK) SKIP TO Q122
117. How many hours did you work during the past week? ____ ____ Hours
Yes No DK/NS 118. Do you work outside the home? 1 2 9 119. Are you self-employed? 1 2 9 120. What is your occupation? Title ________________________________________
Description of duties ___________________________________________ [CODE __ __ __ __ ] 121. Do you work in this same city/town/village or do you work away from this city/town/village?
1 Same city/town/village 3 Both 2 Away from this city/town/village 9 Don’t know/Not Stated
122. Do you regularly: [READ]
Yes No DK/NS A. Listen to the radio 1 2 9 B. Watch television 1 2 9 C. Read any national newspaper 1 2 9 D. Read any paper local to your community 1 2 9
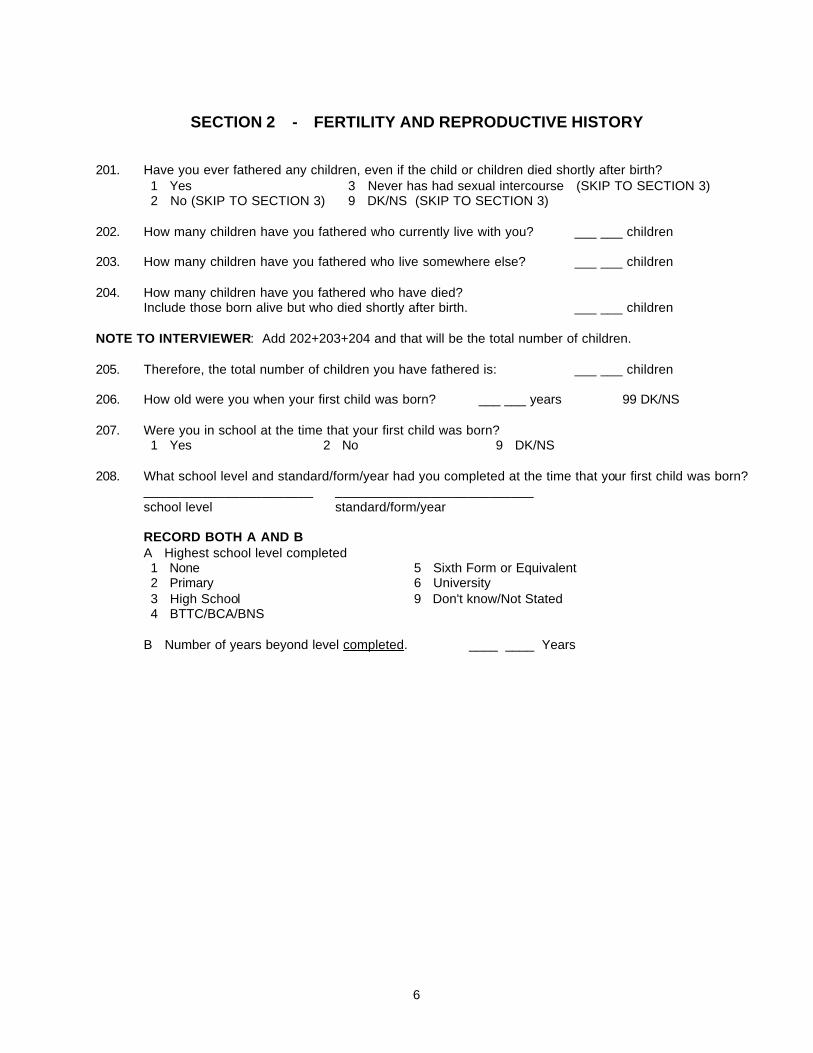
6
SECTION 2 - FERTILITY AND REPRODUCTIVE HISTORY
201. Have you ever fathered any children, even if the child or children died shortly after birth?
1 Yes 3 Never has had sexual intercourse (SKIP TO SECTION 3) 2 No (SKIP TO SECTION 3) 9 DK/NS (SKIP TO SECTION 3)
202. How many children have you fathered who currently live with you? ___ ___ children 203. How many children have you fathered who live somewhere else? ___ ___ children 204. How many children have you fathered who have died? Include those born alive but who died shortly after birth. ___ ___ children NOTE TO INTERVIEWER: Add 202+203+204 and that will be the total number of children. 205. Therefore, the total number of children you have fathered is: ___ ___ children 206. How old were you when your first child was born? ___ ___ years 99 DK/NS 207. Were you in school at the time that your first child was born?
1 Yes 2 No 9 DK/NS 208. What school level and standard/form/year had you completed at the time that your first child was born?
_______________________ ___________________________ school level standard/form/year
RECORD BOTH A AND B
A Highest school level completed 1 None 5 Sixth Form or Equivalent 2 Primary 6 University 3 High School 9 Don't know/Not Stated 4 BTTC/BCA/BNS
B Number of years beyond level completed. ____ ____ Years
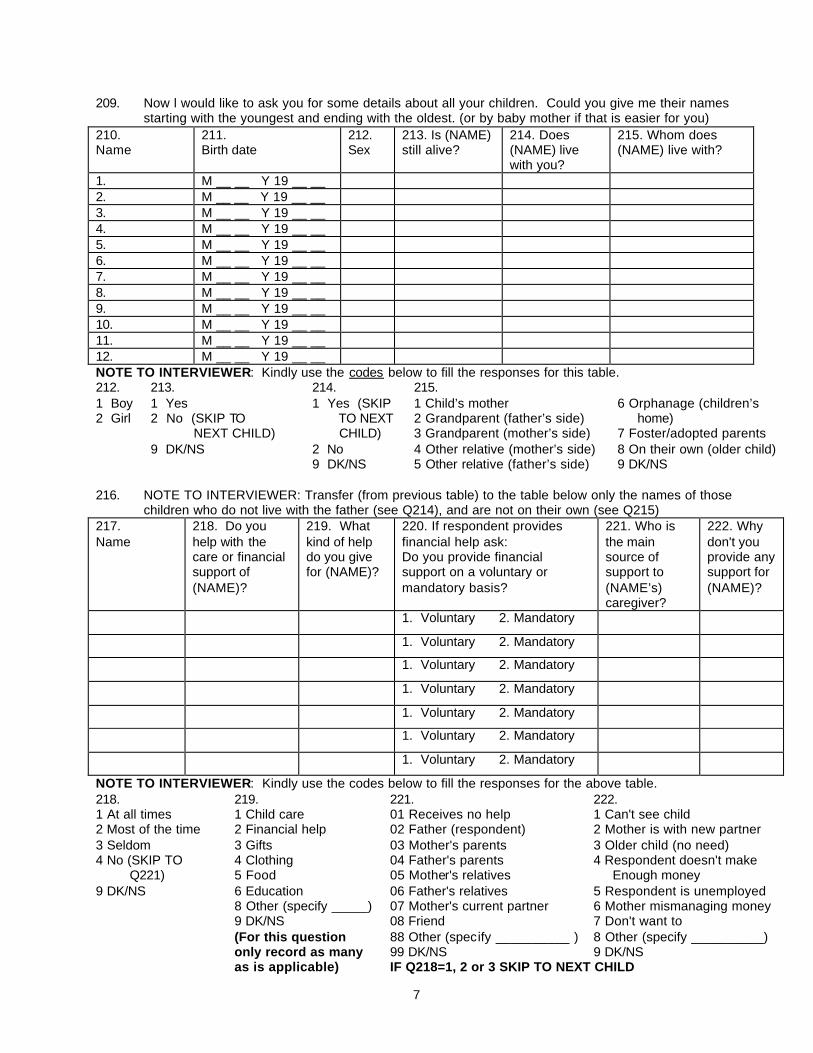
7
209. Now l would like to ask you for some details about all your children. Could you give me their names starting with the youngest and ending with the oldest. (or by baby mother if that is easier for you)
210. Name
211. Birth date
212. Sex
213. Is (NAME) still alive?
214. Does (NAME) live with you?
215. Whom does (NAME) live with?
1. M __ __ Y 19 __ __ 2. M __ __ Y 19 __ __ 3. M __ __ Y 19 __ __ 4. M __ __ Y 19 __ __ 5. M __ __ Y 19 __ __ 6. M __ __ Y 19 __ __ 7. M __ __ Y 19 __ __ 8. M __ __ Y 19 __ __ 9. M __ __ Y 19 __ __ 10. M __ __ Y 19 __ __ 11. M __ __ Y 19 __ __ 12. M __ __ Y 19 __ __ NOTE TO INTERVIEWER: Kindly use the codes below to fill the responses for this table. 212. 213. 214. 215. 1 Boy 1 Yes 1 Yes (SKIP 1 Child’s mother 6 Orphanage (children’s 2 Girl 2 No (SKIP TO TO NEXT 2 Grandparent (father’s side) home) NEXT CHILD) CHILD) 3 Grandparent (mother’s side) 7 Foster/adopted parents 9 DK/NS 2 No 4 Other relative (mother’s side) 8 On their own (older child) 9 DK/NS 5 Other relative (father’s side) 9 DK/NS 216. NOTE TO INTERVIEWER: Transfer (from previous table) to the table below only the names of those
children who do not live with the father (see Q214), and are not on their own (see Q215) 217. Name
218. Do you help with the care or financial support of (NAME)?
219. What kind of help do you give for (NAME)?
220. If respondent provides financial help ask: Do you provide financial support on a voluntary or mandatory basis?
221. Who is the main source of support to (NAME’s) caregiver?
222. Why don't you provide any support for (NAME)?
1. Voluntary 2. Mandatory
1. Voluntary 2. Mandatory
1. Voluntary 2. Mandatory
1. Voluntary 2. Mandatory
1. Voluntary 2. Mandatory
1. Voluntary 2. Mandatory
1. Voluntary 2. Mandatory
NOTE TO INTERVIEWER: Kindly use the codes below to fill the responses for the above table. 218. 219. 221. 222. 1 At all times 1 Child care 01 Receives no help 1 Can't see child 2 Most of the time 2 Financial help 02 Father (respondent) 2 Mother is with new partner 3 Seldom 3 Gifts 03 Mother's parents 3 Older child (no need) 4 No (SKIP TO 4 Clothing 04 Father's parents 4 Respondent doesn't make Q221) 5 Food 05 Mother's relatives Enough money 9 DK/NS 6 Education 06 Father's relatives 5 Respondent is unemployed 8 Other (specify _____) 07 Mother's current partner 6 Mother mismanaging money 9 DK/NS 08 Friend 7 Don't want to (For this question 88 Other (specify __________ ) 8 Other (specify __________) only record as many 99 DK/NS 9 DK/NS as is applicable) IF Q218=1, 2 or 3 SKIP TO NEXT CHILD
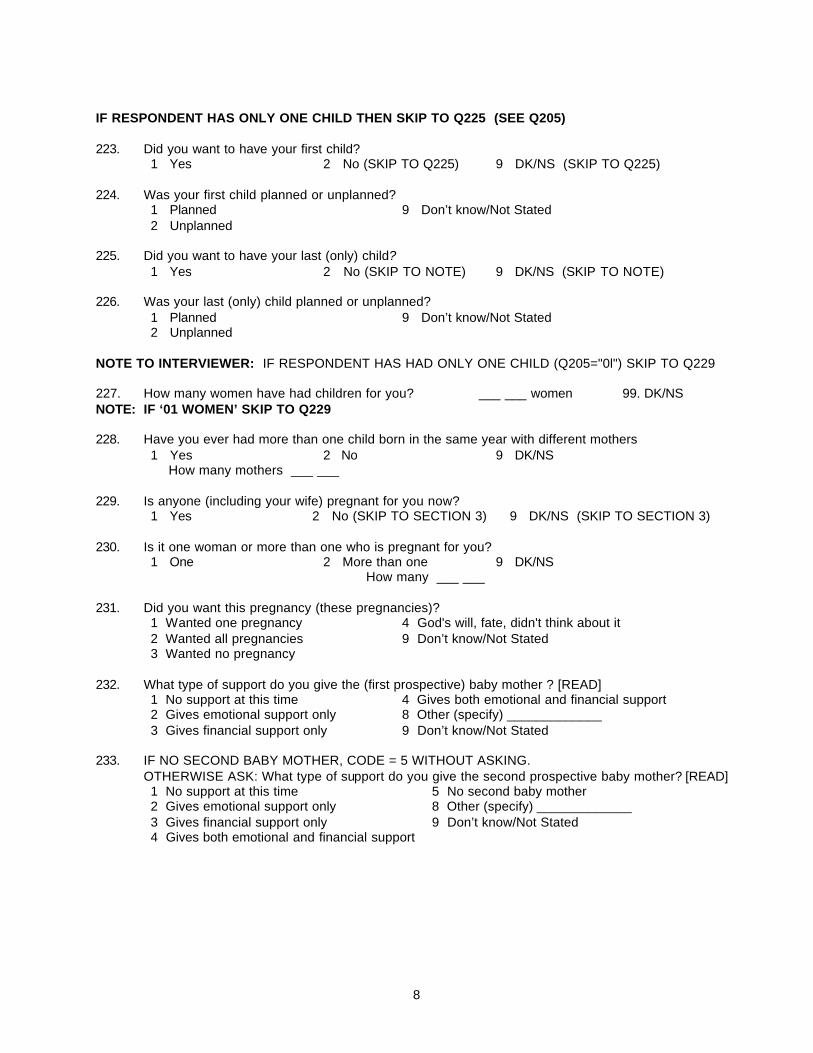
8
IF RESPONDENT HAS ONLY ONE CHILD THEN SKIP TO Q225 (SEE Q205) 223. Did you want to have your first child?
1 Yes 2 No (SKIP TO Q225) 9 DK/NS (SKIP TO Q225) 224. Was your first child planned or unplanned?
1 Planned 9 Don’t know/Not Stated 2 Unplanned
225. Did you want to have your last (only) child?
1 Yes 2 No (SKIP TO NOTE) 9 DK/NS (SKIP TO NOTE) 226. Was your last (only) child planned or unplanned?
1 Planned 9 Don’t know/Not Stated 2 Unplanned
NOTE TO INTERVIEWER: IF RESPONDENT HAS HAD ONLY ONE CHILD (Q205="0l") SKIP TO Q229 227. How many women have had children for you? ___ ___ women 99. DK/NS NOTE: IF ‘01 WOMEN’ SKIP TO Q229 228. Have you ever had more than one child born in the same year with different mothers
1 Yes 2 No 9 DK/NS How many mothers ___ ___
229. Is anyone (including your wife) pregnant for you now?
1 Yes 2 No (SKIP TO SECTION 3) 9 DK/NS (SKIP TO SECTION 3)
230. Is it one woman or more than one who is pregnant for you? 1 One 2 More than one 9 DK/NS How many ___ ___
231. Did you want this pregnancy (these pregnancies)?
1 Wanted one pregnancy 4 God's will, fate, didn't think about it 2 Wanted all pregnancies 9 Don’t know/Not Stated 3 Wanted no pregnancy
232. What type of support do you give the (first prospective) baby mother ? [READ]
1 No support at this time 4 Gives both emotional and financial support 2 Gives emotional support only 8 Other (specify) _____________ 3 Gives financial support only 9 Don’t know/Not Stated
233. IF NO SECOND BABY MOTHER, CODE = 5 WITHOUT ASKING.
OTHERWISE ASK: What type of support do you give the second prospective baby mother? [READ] 1 No support at this time 5 No second baby mother 2 Gives emotional support only 8 Other (specify) _____________ 3 Gives financial support only 9 Don’t know/Not Stated 4 Gives both emotional and financial support
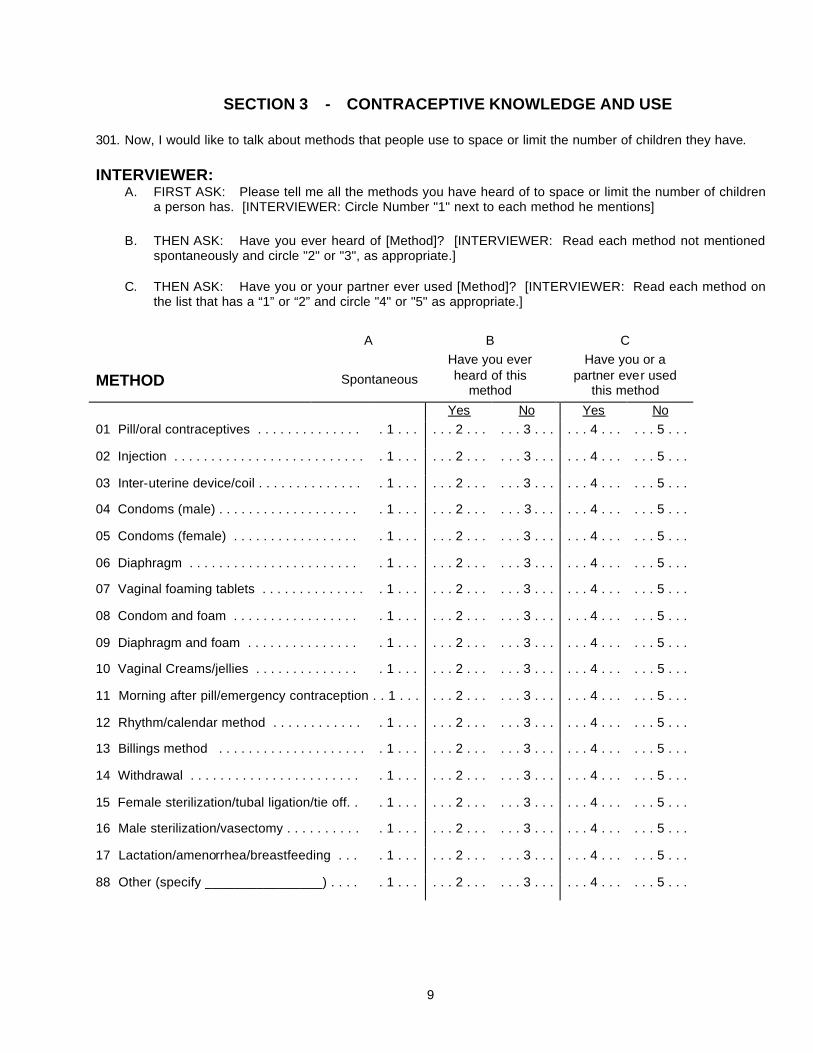
9
SECTION 3 - CONTRACEPTIVE KNOWLEDGE AND USE
301. Now, I would like to talk about methods that people use to space or limit the number of children they have. INTERVIEWER:
A. FIRST ASK: Please tell me all the methods you have heard of to space or limit the number of children a person has. [INTERVIEWER: Circle Number "1" next to each method he mentions]
B. THEN ASK: Have you ever heard of [Method]? [INTERVIEWER: Read each method not mentioned
spontaneously and circle "2" or "3", as appropriate.] C. THEN ASK: Have you or your partner ever used [Method]? [INTERVIEWER: Read each method on
the list that has a “1” or “2” and circle "4" or "5" as appropriate.]
A B C
METHOD
Spontaneous
Have you ever heard of this
method
Have you or a partner ever used
this method
Yes No Yes No 01 Pill/oral contraceptives . . . . . . . . . . . . . . . 1 . . . . . . 2 . . . . . . 3 . . . . . . 4 . . . . . . 5 . . .
02 Injection . . . . . . . . . . . . . . . . . . . . . . . . . . . 1 . . . . . . 2 . . . . . . 3 . . . . . . 4 . . . . . . 5 . . .
03 Inter-uterine device/coil . . . . . . . . . . . . . . . 1 . . . . . . 2 . . . . . . 3 . . . . . . 4 . . . . . . 5 . . .
04 Condoms (male) . . . . . . . . . . . . . . . . . . . . 1 . . . . . . 2 . . . . . . 3 . . . . . . 4 . . . . . . 5 . . .
05 Condoms (female) . . . . . . . . . . . . . . . . . . 1 . . . . . . 2 . . . . . . 3 . . . . . . 4 . . . . . . 5 . . .
06 Diaphragm . . . . . . . . . . . . . . . . . . . . . . . . 1 . . . . . . 2 . . . . . . 3 . . . . . . 4 . . . . . . 5 . . .
07 Vaginal foaming tablets . . . . . . . . . . . . . . . 1 . . . . . . 2 . . . . . . 3 . . . . . . 4 . . . . . . 5 . . .
08 Condom and foam . . . . . . . . . . . . . . . . . . 1 . . . . . . 2 . . . . . . 3 . . . . . . 4 . . . . . . 5 . . .
09 Diaphragm and foam . . . . . . . . . . . . . . . . 1 . . . . . . 2 . . . . . . 3 . . . . . . 4 . . . . . . 5 . . .
10 Vaginal Creams/jellies . . . . . . . . . . . . . . . 1 . . . . . . 2 . . . . . . 3 . . . . . . 4 . . . . . . 5 . . .
11 Morning after pill/emergency contraception . . 1 . . . . . . 2 . . . . . . 3 . . . . . . 4 . . . . . . 5 . . .
12 Rhythm/calendar method . . . . . . . . . . . . . 1 . . . . . . 2 . . . . . . 3 . . . . . . 4 . . . . . . 5 . . .
13 Billings method . . . . . . . . . . . . . . . . . . . . . 1 . . . . . . 2 . . . . . . 3 . . . . . . 4 . . . . . . 5 . . .
14 Withdrawal . . . . . . . . . . . . . . . . . . . . . . . . 1 . . . . . . 2 . . . . . . 3 . . . . . . 4 . . . . . . 5 . . .
15 Female sterilization/tubal ligation/tie off. . . 1 . . . . . . 2 . . . . . . 3 . . . . . . 4 . . . . . . 5 . . .
16 Male sterilization/vasectomy . . . . . . . . . . . 1 . . . . . . 2 . . . . . . 3 . . . . . . 4 . . . . . . 5 . . .
17 Lactation/amenorrhea/breastfeeding . . . . 1 . . . . . . 2 . . . . . . 3 . . . . . . 4 . . . . . . 5 . . .
88 Other (specify ________________) . . . . . 1 . . . . . . 2 . . . . . . 3 . . . . . . 4 . . . . . . 5 . . .
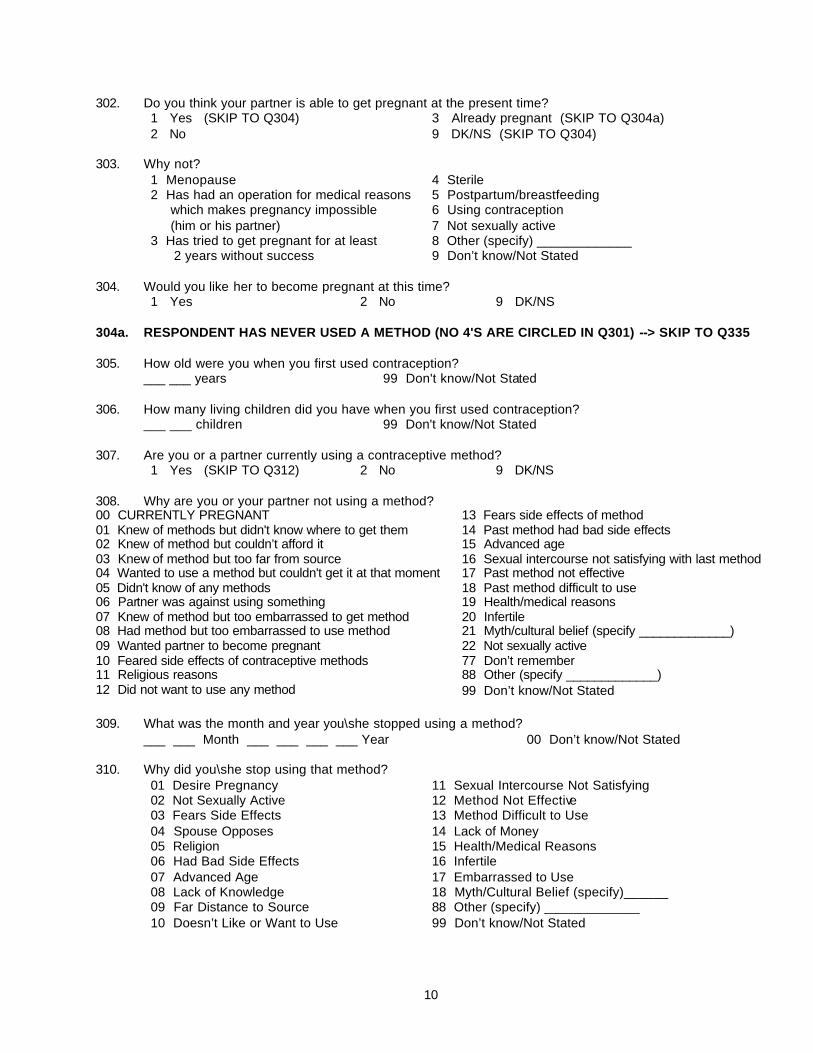
10
302. Do you think your partner is able to get pregnant at the present time? 1 Yes (SKIP TO Q304) 3 Already pregnant (SKIP TO Q304a) 2 No 9 DK/NS (SKIP TO Q304)
303. Why not?
1 Menopause 4 Sterile 2 Has had an operation for medical reasons 5 Postpartum/breastfeeding which makes pregnancy impossible 6 Using contraception (him or his partner) 7 Not sexually active 3 Has tried to get pregnant for at least 8 Other (specify) _____________ 2 years without success 9 Don’t know/Not Stated
304. Would you like her to become pregnant at this time?
1 Yes 2 No 9 DK/NS 304a. RESPONDENT HAS NEVER USED A METHOD (NO 4'S ARE CIRCLED IN Q301) --> SKIP TO Q335 305. How old were you when you first used contraception? ___ ___ years 99 Don't know/Not Stated 306. How many living children did you have when you first used contraception? ___ ___ children 99 Don't know/Not Stated 307. Are you or a partner currently using a contraceptive method?
1 Yes (SKIP TO Q312) 2 No 9 DK/NS 308. Why are you or your partner not using a method? 00 CURRENTLY PREGNANT 13 Fears side effects of method 01 Knew of methods but didn't know where to get them 14 Past method had bad side effects 02 Knew of method but couldn’t afford it 15 Advanced age 03 Knew of method but too far from source 16 Sexual intercourse not satisfying with last method 04 Wanted to use a method but couldn't get it at that moment 17 Past method not effective 05 Didn't know of any methods 18 Past method difficult to use 06 Partner was against using something 19 Health/medical reasons 07 Knew of method but too embarrassed to get method 20 Infertile 08 Had method but too embarrassed to use method 21 Myth/cultural belief (specify _____________) 09 Wanted partner to become pregnant 22 Not sexually active 10 Feared side effects of contraceptive methods 77 Don’t remember 11 Religious reasons 88 Other (specify _____________) 12 Did not want to use any method 99 Don’t know/Not Stated 309. What was the month and year you\she stopped using a method?
___ ___ Month ___ ___ ___ ___ Year 00 Don’t know/Not Stated
310. Why did you\she stop using that method? 01 Desire Pregnancy 11 Sexual Intercourse Not Satisfying 02 Not Sexually Active 12 Method Not Effective 03 Fears Side Effects 13 Method Difficult to Use 04 Spouse Opposes 14 Lack of Money 05 Religion 15 Health/Medical Reasons 06 Had Bad Side Effects 16 Infertile 07 Advanced Age 17 Embarrassed to Use 08 Lack of Knowledge 18 Myth/Cultural Belief (specify)______ 09 Far Distance to Source 88 Other (specify) _____________ 10 Doesn’t Like or Want to Use 99 Don’t know/Not Stated
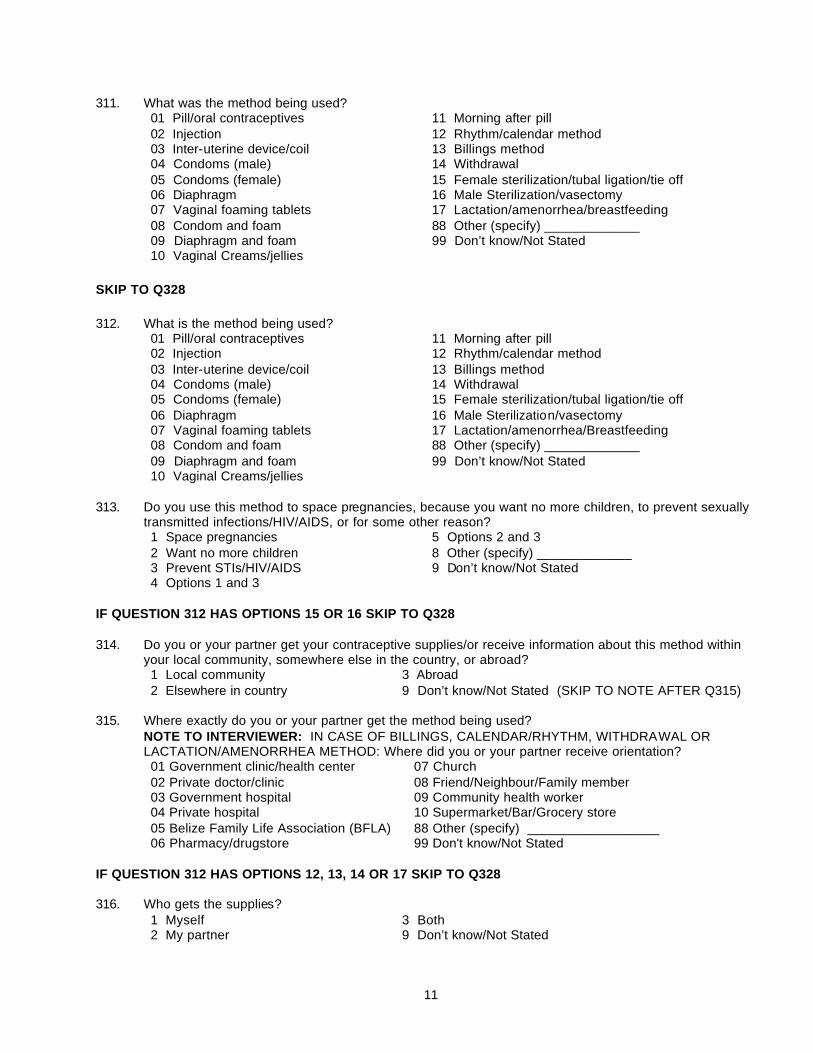
11
311. What was the method being used? 01 Pill/oral contraceptives 11 Morning after pill 02 Injection 12 Rhythm/calendar method 03 Inter-uterine device/coil 13 Billings method 04 Condoms (male) 14 Withdrawal 05 Condoms (female) 15 Female sterilization/tubal ligation/tie off 06 Diaphragm 16 Male Sterilization/vasectomy 07 Vaginal foaming tablets 17 Lactation/amenorrhea/breastfeeding 08 Condom and foam 88 Other (specify) _____________ 09 Diaphragm and foam 99 Don’t know/Not Stated 10 Vaginal Creams/jellies
SKIP TO Q328 312. What is the method being used?
01 Pill/oral contraceptives 11 Morning after pill 02 Injection 12 Rhythm/calendar method 03 Inter-uterine device/coil 13 Billings method 04 Condoms (male) 14 Withdrawal 05 Condoms (female) 15 Female sterilization/tubal ligation/tie off 06 Diaphragm 16 Male Sterilization/vasectomy 07 Vaginal foaming tablets 17 Lactation/amenorrhea/Breastfeeding 08 Condom and foam 88 Other (specify) _____________ 09 Diaphragm and foam 99 Don’t know/Not Stated 10 Vaginal Creams/jellies
313. Do you use this method to space pregnancies, because you want no more children, to prevent sexually
transmitted infections/HIV/AIDS, or for some other reason? 1 Space pregnancies 5 Options 2 and 3 2 Want no more children 8 Other (specify) _____________ 3 Prevent STIs/HIV/AIDS 9 Don’t know/Not Stated 4 Options 1 and 3
IF QUESTION 312 HAS OPTIONS 15 OR 16 SKIP TO Q328 314. Do you or your partner get your contraceptive supplies/or receive information about this method within
your local community, somewhere else in the country, or abroad? 1 Local community 3 Abroad 2 Elsewhere in country 9 Don’t know/Not Stated (SKIP TO NOTE AFTER Q315)
315. Where exactly do you or your partner get the method being used?
NOTE TO INTERVIEWER: IN CASE OF BILLINGS, CALENDAR/RHYTHM, WITHDRAWAL OR LACTATION/AMENORRHEA METHOD: Where did you or your partner receive orientation? 01 Government clinic/health center 07 Church 02 Private doctor/clinic 08 Friend/Neighbour/Family member 03 Government hospital 09 Community health worker 04 Private hospital 10 Supermarket/Bar/Grocery store 05 Belize Family Life Association (BFLA) 88 Other (specify) __________________ 06 Pharmacy/drugstore 99 Don't know/Not Stated
IF QUESTION 312 HAS OPTIONS 12, 13, 14 OR 17 SKIP TO Q328 316. Who gets the supplies?
1 Myself 3 Both 2 My partner 9 Don’t know/Not Stated
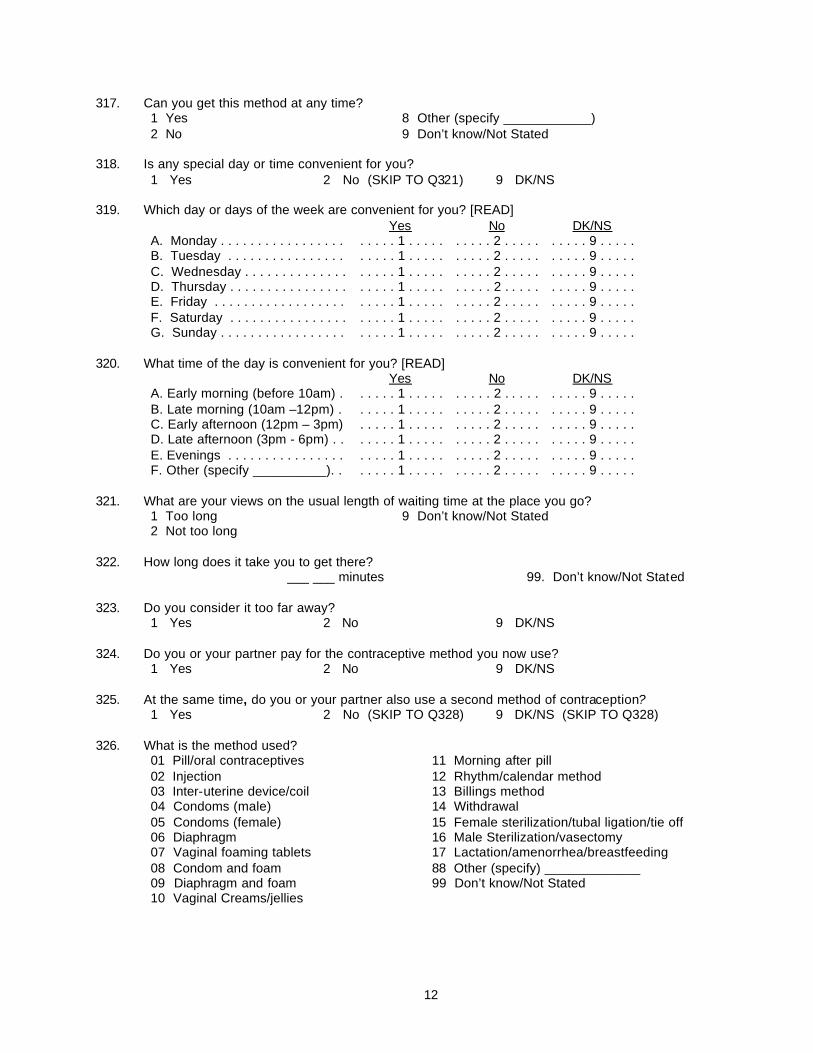
12
317. Can you get this method at any time? 1 Yes 8 Other (specify ____________) 2 No 9 Don’t know/Not Stated
318. Is any special day or time convenient for you?
1 Yes 2 No (SKIP TO Q321) 9 DK/NS 319. Which day or days of the week are convenient for you? [READ]
Yes No DK/NS A. Monday . . . . . . . . . . . . . . . . . . . . . . 1 . . . . . . . . . . 2 . . . . . . . . . . 9 . . . . . B. Tuesday . . . . . . . . . . . . . . . . . . . . . 1 . . . . . . . . . . 2 . . . . . . . . . . 9 . . . . . C. Wednesday . . . . . . . . . . . . . . . . . . . 1 . . . . . . . . . . 2 . . . . . . . . . . 9 . . . . . D. Thursday . . . . . . . . . . . . . . . . . . . . . 1 . . . . . . . . . . 2 . . . . . . . . . . 9 . . . . . E. Friday . . . . . . . . . . . . . . . . . . . . . . . 1 . . . . . . . . . . 2 . . . . . . . . . . 9 . . . . . F. Saturday . . . . . . . . . . . . . . . . . . . . . 1 . . . . . . . . . . 2 . . . . . . . . . . 9 . . . . . G. Sunday . . . . . . . . . . . . . . . . . . . . . . 1 . . . . . . . . . . 2 . . . . . . . . . . 9 . . . . .
320. What time of the day is convenient for you? [READ]
Yes No DK/NS A. Early morning (before 10am) . . . . . . 1 . . . . . . . . . . 2 . . . . . . . . . . 9 . . . . . B. Late morning (10am –12pm) . . . . . . 1 . . . . . . . . . . 2 . . . . . . . . . . 9 . . . . . C. Early afternoon (12pm – 3pm) . . . . . 1 . . . . . . . . . . 2 . . . . . . . . . . 9 . . . . . D. Late afternoon (3pm - 6pm) . . . . . . . 1 . . . . . . . . . . 2 . . . . . . . . . . 9 . . . . . E. Evenings . . . . . . . . . . . . . . . . . . . . . 1 . . . . . . . . . . 2 . . . . . . . . . . 9 . . . . . F. Other (specify __________). . . . . . . 1 . . . . . . . . . . 2 . . . . . . . . . . 9 . . . . .
321. What are your views on the usual length of waiting time at the place you go?
1 Too long 9 Don’t know/Not Stated 2 Not too long
322. How long does it take you to get there?
___ ___ minutes 99. Don’t know/Not Stated 323. Do you consider it too far away?
1 Yes 2 No 9 DK/NS 324. Do you or your partner pay for the contraceptive method you now use?
1 Yes 2 No 9 DK/NS 325. At the same time, do you or your partner also use a second method of contraception?
1 Yes 2 No (SKIP TO Q328) 9 DK/NS (SKIP TO Q328) 326. What is the method used?
01 Pill/oral contraceptives 11 Morning after pill 02 Injection 12 Rhythm/calendar method 03 Inter-uterine device/coil 13 Billings method 04 Condoms (male) 14 Withdrawal 05 Condoms (female) 15 Female sterilization/tubal ligation/tie off 06 Diaphragm 16 Male Sterilization/vasectomy 07 Vaginal foaming tablets 17 Lactation/amenorrhea/breastfeeding 08 Condom and foam 88 Other (specify) _____________ 09 Diaphragm and foam 99 Don’t know/Not Stated 10 Vaginal Creams/jellies
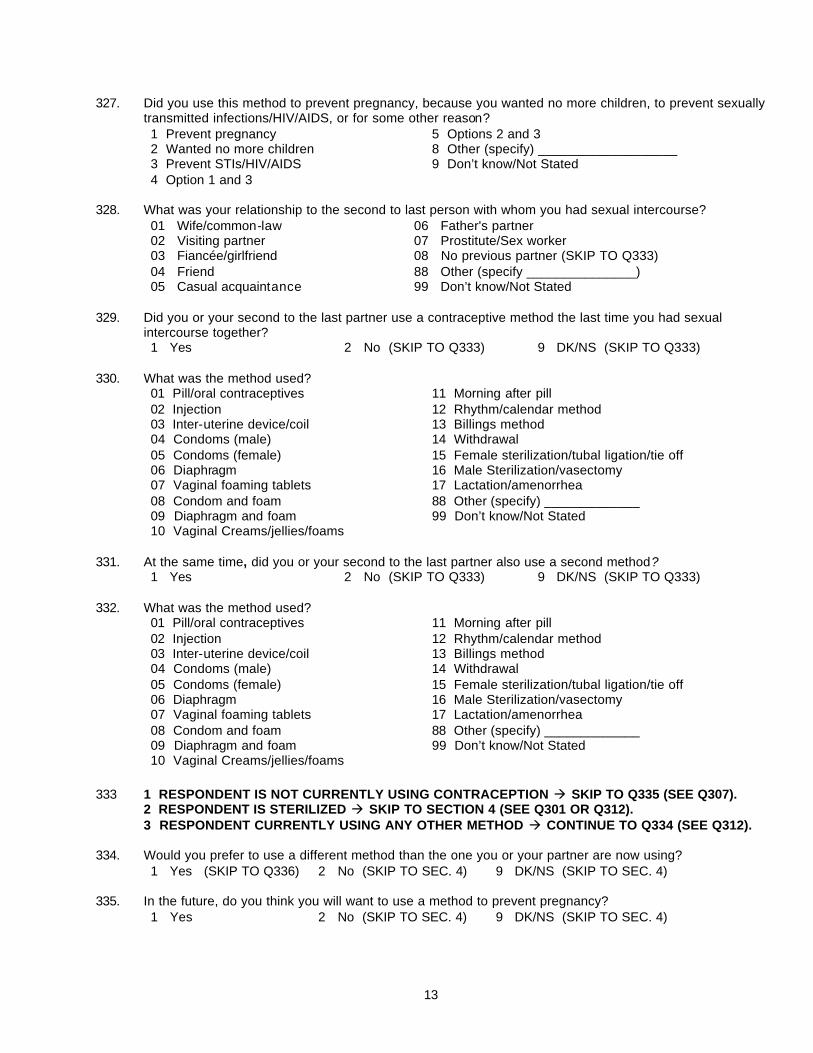
13
327. Did you use this method to prevent pregnancy, because you wanted no more children, to prevent sexually transmitted infections/HIV/AIDS, or for some other reason? 1 Prevent pregnancy 5 Options 2 and 3 2 Wanted no more children 8 Other (specify) ___________________ 3 Prevent STIs/HIV/AIDS 9 Don’t know/Not Stated 4 Option 1 and 3
328. What was your relationship to the second to last person with whom you had sexual intercourse?
01 Wife/common-law 06 Father's partner 02 Visiting partner 07 Prostitute/Sex worker 03 Fiancée/girlfriend 08 No previous partner (SKIP TO Q333) 04 Friend 88 Other (specify _______________) 05 Casual acquaintance 99 Don’t know/Not Stated
329. Did you or your second to the last partner use a contraceptive method the last time you had sexual
intercourse together? 1 Yes 2 No (SKIP TO Q333) 9 DK/NS (SKIP TO Q333)
330. What was the method used?
01 Pill/oral contraceptives 11 Morning after pill 02 Injection 12 Rhythm/calendar method 03 Inter-uterine device/coil 13 Billings method 04 Condoms (male) 14 Withdrawal 05 Condoms (female) 15 Female sterilization/tubal ligation/tie off 06 Diaphragm 16 Male Sterilization/vasectomy 07 Vaginal foaming tablets 17 Lactation/amenorrhea 08 Condom and foam 88 Other (specify) _____________ 09 Diaphragm and foam 99 Don’t know/Not Stated 10 Vaginal Creams/jellies/foams
331. At the same time, did you or your second to the last partner also use a second method?
1 Yes 2 No (SKIP TO Q333) 9 DK/NS (SKIP TO Q333) 332. What was the method used?
01 Pill/oral contraceptives 11 Morning after pill 02 Injection 12 Rhythm/calendar method 03 Inter-uterine device/coil 13 Billings method 04 Condoms (male) 14 Withdrawal 05 Condoms (female) 15 Female sterilization/tubal ligation/tie off 06 Diaphragm 16 Male Sterilization/vasectomy 07 Vaginal foaming tablets 17 Lactation/amenorrhea 08 Condom and foam 88 Other (specify) _____________ 09 Diaphragm and foam 99 Don’t know/Not Stated 10 Vaginal Creams/jellies/foams
333 1 RESPONDENT IS NOT CURRENTLY USING CONTRACEPTION à SKIP TO Q335 (SEE Q307).
2 RESPONDENT IS STERILIZED à SKIP TO SECTION 4 (SEE Q301 OR Q312). 3 RESPONDENT CURRENTLY USING ANY OTHER METHOD à CONTINUE TO Q334 (SEE Q312).
334. Would you prefer to use a different method than the one you or your partner are now using?
1 Yes (SKIP TO Q336) 2 No (SKIP TO SEC. 4) 9 DK/NS (SKIP TO SEC. 4) 335. In the future, do you think you will want to use a method to prevent pregnancy?
1 Yes 2 No (SKIP TO SEC. 4) 9 DK/NS (SKIP TO SEC. 4)
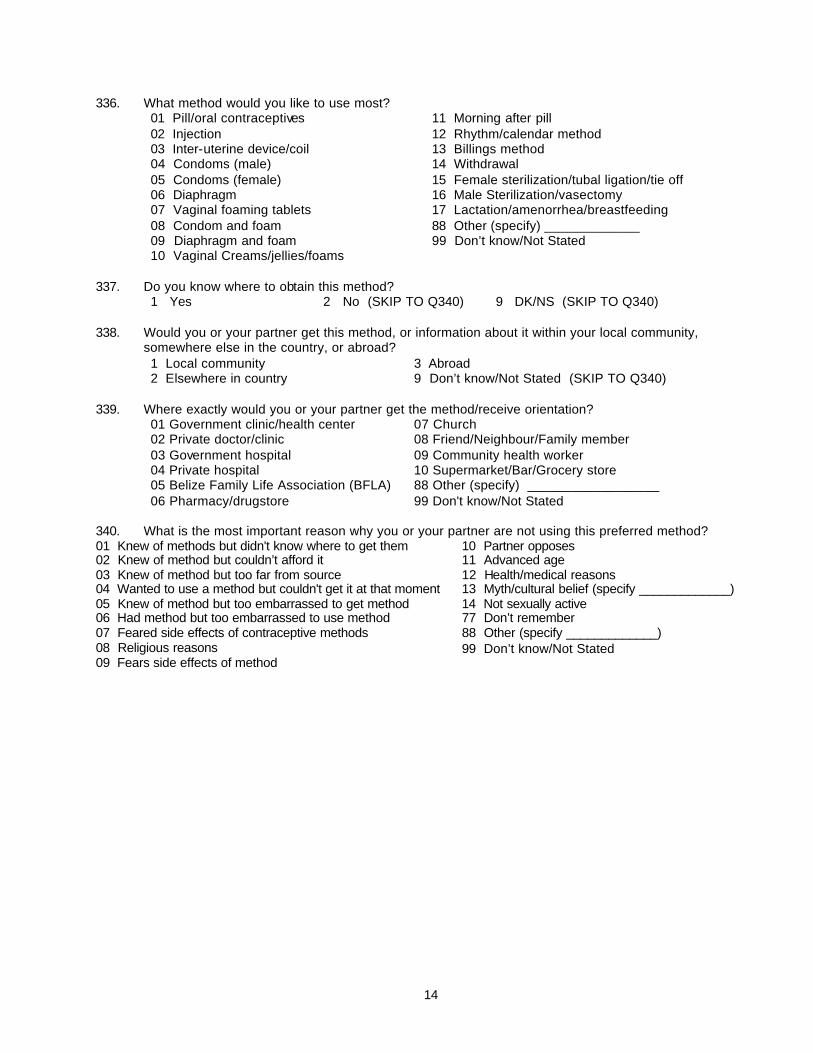
14
336. What method would you like to use most? 01 Pill/oral contraceptives 11 Morning after pill 02 Injection 12 Rhythm/calendar method 03 Inter-uterine device/coil 13 Billings method 04 Condoms (male) 14 Withdrawal 05 Condoms (female) 15 Female sterilization/tubal ligation/tie off 06 Diaphragm 16 Male Sterilization/vasectomy 07 Vaginal foaming tablets 17 Lactation/amenorrhea/breastfeeding 08 Condom and foam 88 Other (specify) _____________ 09 Diaphragm and foam 99 Don’t know/Not Stated 10 Vaginal Creams/jellies/foams
337. Do you know where to obtain this method?
1 Yes 2 No (SKIP TO Q340) 9 DK/NS (SKIP TO Q340) 338. Would you or your partner get this method, or information about it within your local community,
somewhere else in the country, or abroad? 1 Local community 3 Abroad 2 Elsewhere in country 9 Don’t know/Not Stated (SKIP TO Q340)
339. Where exactly would you or your partner get the method/receive orientation?
01 Government clinic/health center 07 Church 02 Private doctor/clinic 08 Friend/Neighbour/Family member 03 Government hospital 09 Community health worker 04 Private hospital 10 Supermarket/Bar/Grocery store 05 Belize Family Life Association (BFLA) 88 Other (specify) __________________ 06 Pharmacy/drugstore 99 Don't know/Not Stated
340. What is the most important reason why you or your partner are not using this preferred method? 01 Knew of methods but didn't know where to get them 10 Partner opposes 02 Knew of method but couldn’t afford it 11 Advanced age 03 Knew of method but too far from source 12 Health/medical reasons 04 Wanted to use a method but couldn't get it at that moment 13 Myth/cultural belief (specify _____________) 05 Knew of method but too embarrassed to get method 14 Not sexually active 06 Had method but too embarrassed to use method 77 Don’t remember 07 Feared side effects of contraceptive methods 88 Other (specify _____________) 08 Religious reasons 99 Don’t know/Not Stated 09 Fears side effects of method
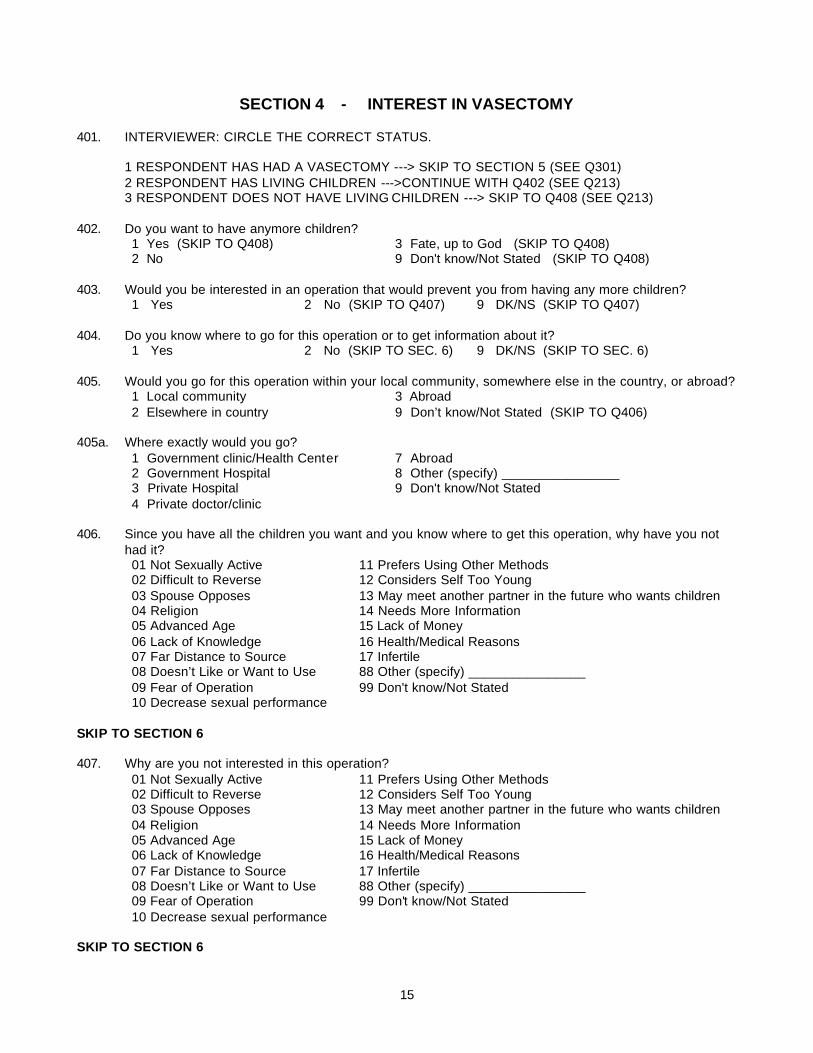
15
SECTION 4 - INTEREST IN VASECTOMY 401. INTERVIEWER: CIRCLE THE CORRECT STATUS.
1 RESPONDENT HAS HAD A VASECTOMY ---> SKIP TO SECTION 5 (SEE Q301) 2 RESPONDENT HAS LIVING CHILDREN --->CONTINUE WITH Q402 (SEE Q213) 3 RESPONDENT DOES NOT HAVE LIVING CHILDREN ---> SKIP TO Q408 (SEE Q213)
402. Do you want to have anymore children?
1 Yes (SKIP TO Q408) 3 Fate, up to God (SKIP TO Q408) 2 No 9 Don't know/Not Stated (SKIP TO Q408)
403. Would you be interested in an operation that would prevent you from having any more children?
1 Yes 2 No (SKIP TO Q407) 9 DK/NS (SKIP TO Q407) 404. Do you know where to go for this operation or to get information about it?
1 Yes 2 No (SKIP TO SEC. 6) 9 DK/NS (SKIP TO SEC. 6) 405. Would you go for this operation within your local community, somewhere else in the country, or abroad?
1 Local community 3 Abroad 2 Elsewhere in country 9 Don’t know/Not Stated (SKIP TO Q406)
405a. Where exactly would you go?
1 Government clinic/Health Center 7 Abroad 2 Government Hospital 8 Other (specify) ________________ 3 Private Hospital 9 Don't know/Not Stated 4 Private doctor/clinic
406. Since you have all the children you want and you know where to get this operation, why have you not
had it? 01 Not Sexually Active 11 Prefers Using Other Methods 02 Difficult to Reverse 12 Considers Self Too Young 03 Spouse Opposes 13 May meet another partner in the future who wants children 04 Religion 14 Needs More Information 05 Advanced Age 15 Lack of Money 06 Lack of Knowledge 16 Health/Medical Reasons 07 Far Distance to Source 17 Infertile 08 Doesn’t Like or Want to Use 88 Other (specify) ________________ 09 Fear of Operation 99 Don't know/Not Stated 10 Decrease sexual performance
SKIP TO SECTION 6 407. Why are you not interested in this operation?
01 Not Sexually Active 11 Prefers Using Other Methods 02 Difficult to Reverse 12 Considers Self Too Young 03 Spouse Opposes 13 May meet another partner in the future who wants children 04 Religion 14 Needs More Information 05 Advanced Age 15 Lack of Money 06 Lack of Knowledge 16 Health/Medical Reasons 07 Far Distance to Source 17 Infertile 08 Doesn’t Like or Want to Use 88 Other (specify) ________________ 09 Fear of Operation 99 Don't know/Not Stated 10 Decrease sexual performance
SKIP TO SECTION 6
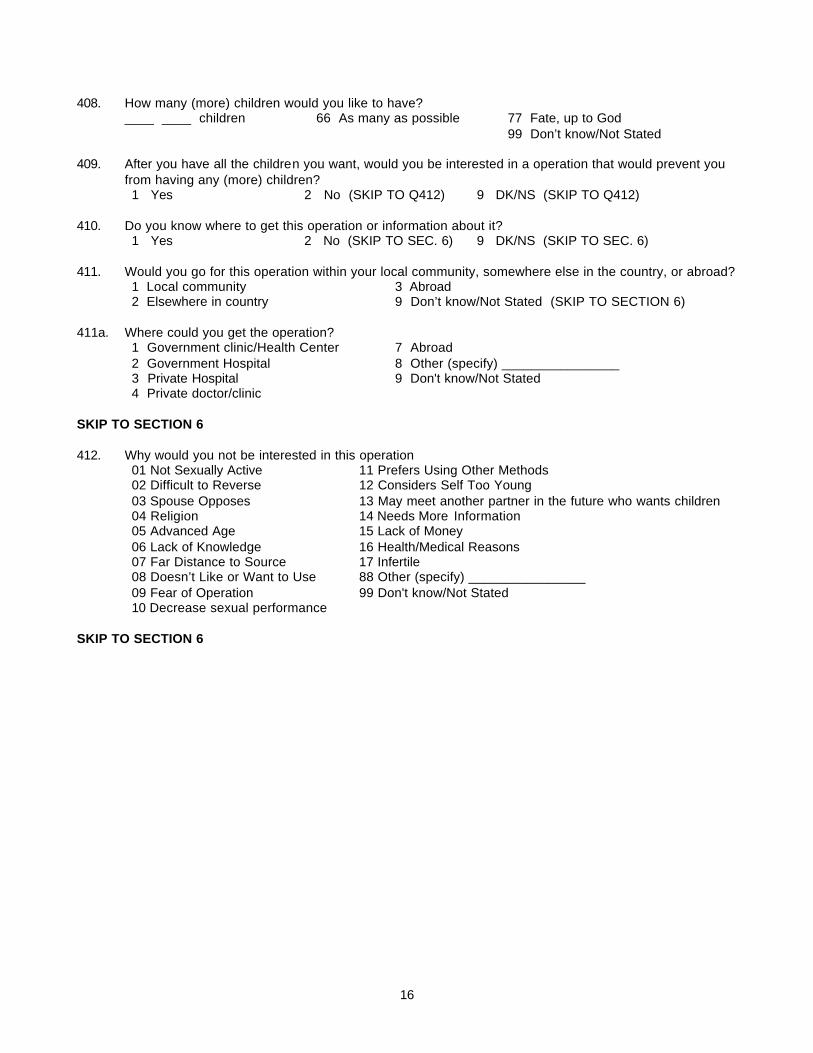
16
408. How many (more) children would you like to have? ____ ____ children 66 As many as possible 77 Fate, up to God
99 Don’t know/Not Stated
409. After you have all the children you want, would you be interested in a operation that would prevent you from having any (more) children? 1 Yes 2 No (SKIP TO Q412) 9 DK/NS (SKIP TO Q412)
410. Do you know where to get this operation or information about it?
1 Yes 2 No (SKIP TO SEC. 6) 9 DK/NS (SKIP TO SEC. 6) 411. Would you go for this operation within your local community, somewhere else in the country, or abroad?
1 Local community 3 Abroad 2 Elsewhere in country 9 Don’t know/Not Stated (SKIP TO SECTION 6)
411a. Where could you get the operation?
1 Government clinic/Health Center 7 Abroad 2 Government Hospital 8 Other (specify) ________________ 3 Private Hospital 9 Don't know/Not Stated 4 Private doctor/clinic
SKIP TO SECTION 6
412. Why would you not be interested in this operation
01 Not Sexually Active 11 Prefers Using Other Methods 02 Difficult to Reverse 12 Considers Self Too Young 03 Spouse Opposes 13 May meet another partner in the future who wants children 04 Religion 14 Needs More Information 05 Advanced Age 15 Lack of Money 06 Lack of Knowledge 16 Health/Medical Reasons 07 Far Distance to Source 17 Infertile 08 Doesn’t Like or Want to Use 88 Other (specify) ________________ 09 Fear of Operation 99 Don't know/Not Stated 10 Decrease sexual performance
SKIP TO SECTION 6
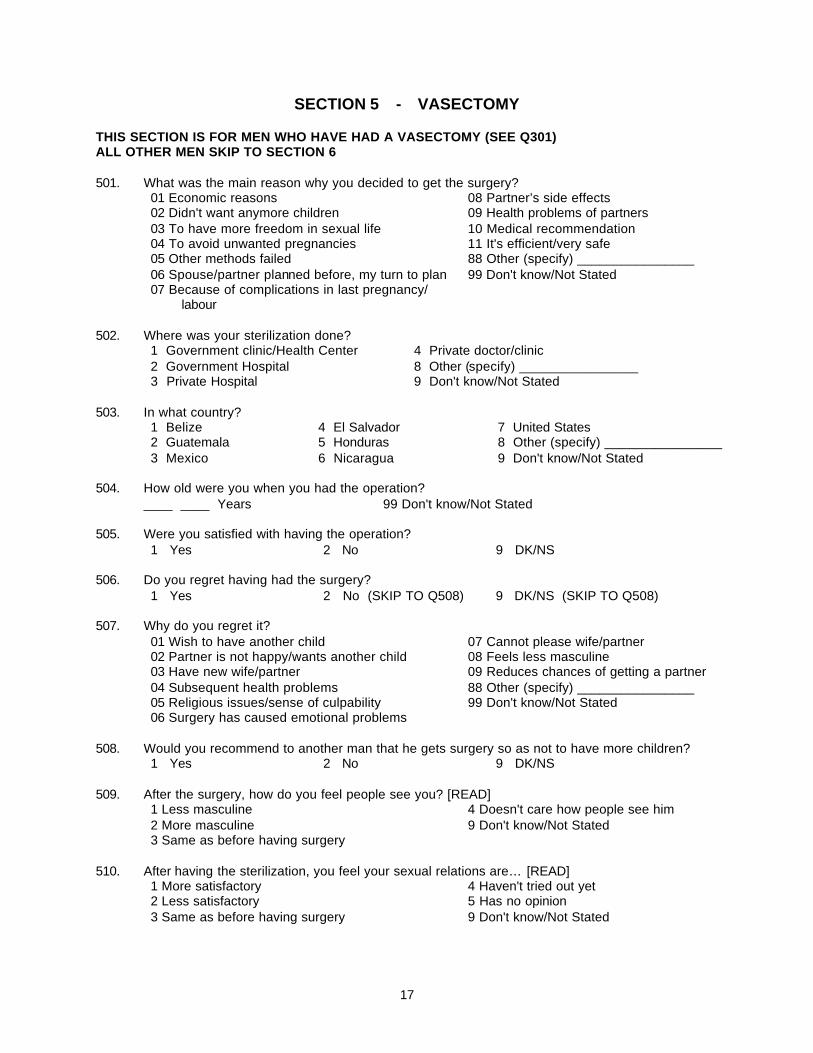
17
SECTION 5 - VASECTOMY THIS SECTION IS FOR MEN WHO HAVE HAD A VASECTOMY (SEE Q301) ALL OTHER MEN SKIP TO SECTION 6 501. What was the main reason why you decided to get the surgery?
01 Economic reasons 08 Partner’s side effects 02 Didn't want anymore children 09 Health problems of partners 03 To have more freedom in sexual life 10 Medical recommendation 04 To avoid unwanted pregnancies 11 It's efficient/very safe 05 Other methods failed 88 Other (specify) ________________ 06 Spouse/partner planned before, my turn to plan 99 Don't know/Not Stated 07 Because of complications in last pregnancy/ labour
502. Where was your sterilization done?
1 Government clinic/Health Center 4 Private doctor/clinic 2 Government Hospital 8 Other (specify) ________________ 3 Private Hospital 9 Don't know/Not Stated
503. In what country?
1 Belize 4 El Salvador 7 United States 2 Guatemala 5 Honduras 8 Other (specify) ________________ 3 Mexico 6 Nicaragua 9 Don't know/Not Stated
504. How old were you when you had the operation?
____ ____ Years 99 Don't know/Not Stated 505. Were you satisfied with having the operation?
1 Yes 2 No 9 DK/NS 506. Do you regret having had the surgery?
1 Yes 2 No (SKIP TO Q508) 9 DK/NS (SKIP TO Q508) 507. Why do you regret it?
01 Wish to have another child 07 Cannot please wife/partner 02 Partner is not happy/wants another child 08 Feels less masculine 03 Have new wife/partner 09 Reduces chances of getting a partner 04 Subsequent health problems 88 Other (specify) ________________ 05 Religious issues/sense of culpability 99 Don't know/Not Stated 06 Surgery has caused emotional problems
508. Would you recommend to another man that he gets surgery so as not to have more children?
1 Yes 2 No 9 DK/NS 509. After the surgery, how do you feel people see you? [READ]
1 Less masculine 4 Doesn't care how people see him 2 More masculine 9 Don't know/Not Stated 3 Same as before having surgery
510. After having the sterilization, you feel your sexual relations are… [READ]
1 More satisfactory 4 Haven't tried out yet 2 Less satisfactory 5 Has no opinion 3 Same as before having surgery 9 Don't know/Not Stated
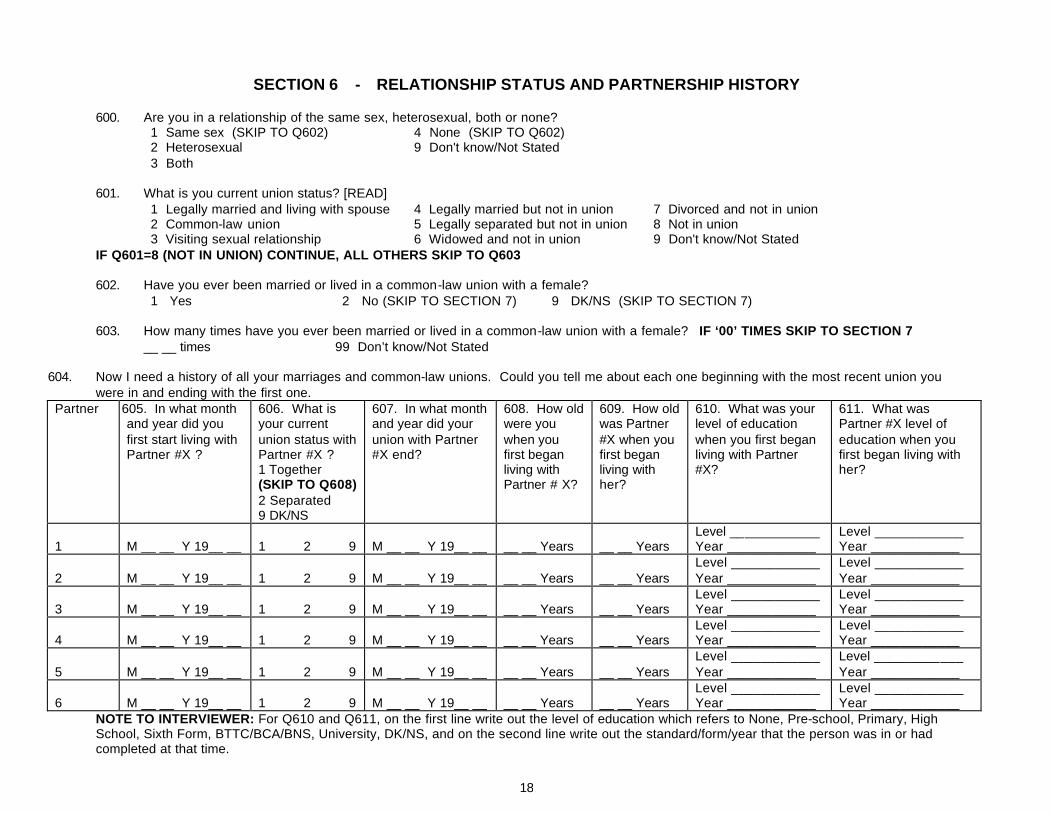
18
SECTION 6 - RELATIONSHIP STATUS AND PARTNERSHIP HISTORY 600. Are you in a relationship of the same sex, heterosexual, both or none?
1 Same sex (SKIP TO Q602) 4 None (SKIP TO Q602) 2 Heterosexual 9 Don't know/Not Stated 3 Both
601. What is you current union status? [READ]
1 Legally married and living with spouse 4 Legally married but not in union 7 Divorced and not in union 2 Common-law union 5 Legally separated but not in union 8 Not in union 3 Visiting sexual relationship 6 Widowed and not in union 9 Don't know/Not Stated
IF Q601=8 (NOT IN UNION) CONTINUE, ALL OTHERS SKIP TO Q603 602. Have you ever been married or lived in a common-law union with a female?
1 Yes 2 No (SKIP TO SECTION 7) 9 DK/NS (SKIP TO SECTION 7) 603. How many times have you ever been married or lived in a common-law union with a female? IF ‘00’ TIMES SKIP TO SECTION 7
__ __ times 99 Don’t know/Not Stated
604. Now I need a history of all your marriages and common-law unions. Could you tell me about each one beginning with the most recent union you were in and ending with the first one.
Partner 605. In what month and year did you first start living with Partner #X ?
606. What is your current union status with Partner #X ? 1 Together (SKIP TO Q608) 2 Separated 9 DK/NS
607. In what month and year did your union with Partner #X end?
608. How old were you when you first began living with Partner # X?
609. How old was Partner #X when you first began living with her?
610. What was your level of education when you first began living with Partner #X?
611. What was Partner #X level of education when you first began living with her?
1
M __ __ Y 19__ __
1 2 9
M __ __ Y 19__ __
__ __ Years
__ __ Years
Level ____________ Year ____________
Level ____________ Year ____________
2
M __ __ Y 19__ __
1 2 9
M __ __ Y 19__ __
__ __ Years
__ __ Years
Level ____________ Year ____________
Level ____________ Year ____________
3
M __ __ Y 19__ __
1 2 9
M __ __ Y 19__ __
__ __ Years
__ __ Years
Level ____________ Year ____________
Level ____________ Year ____________
4
M __ __ Y 19__ __
1 2 9
M __ __ Y 19__ __
__ __ Years
__ __ Years
Level ____________ Year ____________
Level ____________ Year ____________
5
M __ __ Y 19__ __
1 2 9
M __ __ Y 19__ __
__ __ Years
__ __ Years
Level ____________ Year ____________
Level ____________ Year ____________
6
M __ __ Y 19__ __
1 2 9
M __ __ Y 19__ __
__ __ Years
__ __ Years
Level ____________ Year ____________
Level ____________ Year ____________
NOTE TO INTERVIEWER: For Q610 and Q611, on the first line write out the level of education which refers to None, Pre-school, Primary, High School, Sixth Form, BTTC/BCA/BNS, University, DK/NS, and on the second line write out the standard/form/year that the person was in or had completed at that time.
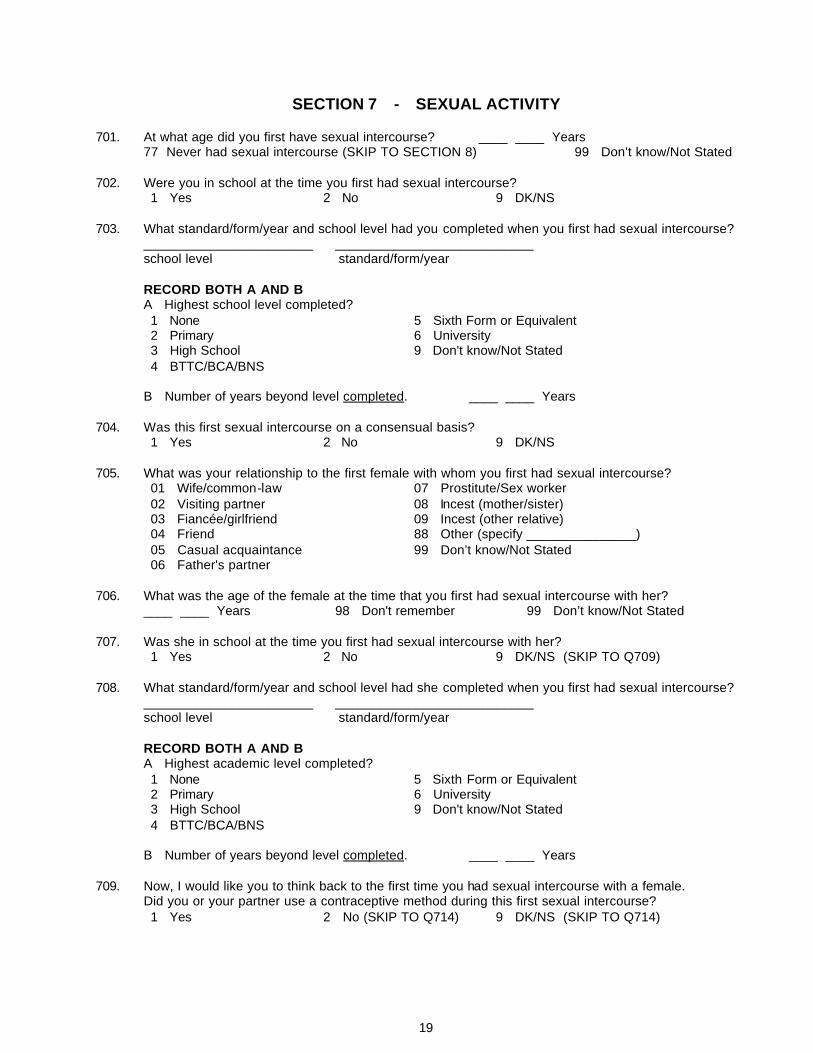
19
SECTION 7 - SEXUAL ACTIVITY
701. At what age did you first have sexual intercourse? ____ ____ Years 77 Never had sexual intercourse (SKIP TO SECTION 8) 99 Don’t know/Not Stated
702. Were you in school at the time you first had sexual intercourse?
1 Yes 2 No 9 DK/NS 703. What standard/form/year and school level had you completed when you first had sexual intercourse?
_______________________ ___________________________ school level standard/form/year
RECORD BOTH A AND B
A Highest school level completed? 1 None 5 Sixth Form or Equivalent 2 Primary 6 University 3 High School 9 Don't know/Not Stated 4 BTTC/BCA/BNS
B Number of years beyond level completed. ____ ____ Years
704. Was this first sexual intercourse on a consensual basis?
1 Yes 2 No 9 DK/NS 705. What was your relationship to the first female with whom you first had sexual intercourse?
01 Wife/common-law 07 Prostitute/Sex worker 02 Visiting partner 08 Incest (mother/sister) 03 Fiancée/girlfriend 09 Incest (other relative) 04 Friend 88 Other (specify _______________) 05 Casual acquaintance 99 Don’t know/Not Stated 06 Father's partner
706. What was the age of the female at the time that you first had sexual intercourse with her?
____ ____ Years 98 Don't remember 99 Don’t know/Not Stated 707. Was she in school at the time you first had sexual intercourse with her?
1 Yes 2 No 9 DK/NS (SKIP TO Q709) 708. What standard/form/year and school level had she completed when you first had sexual intercourse?
_______________________ ___________________________ school level standard/form/year
RECORD BOTH A AND B
A Highest academic level completed? 1 None 5 Sixth Form or Equivalent 2 Primary 6 University 3 High School 9 Don't know/Not Stated 4 BTTC/BCA/BNS
B Number of years beyond level completed. ____ ____ Years
709. Now, I would like you to think back to the first time you had sexual intercourse with a female.
Did you or your partner use a contraceptive method during this first sexual intercourse? 1 Yes 2 No (SKIP TO Q714) 9 DK/NS (SKIP TO Q714)
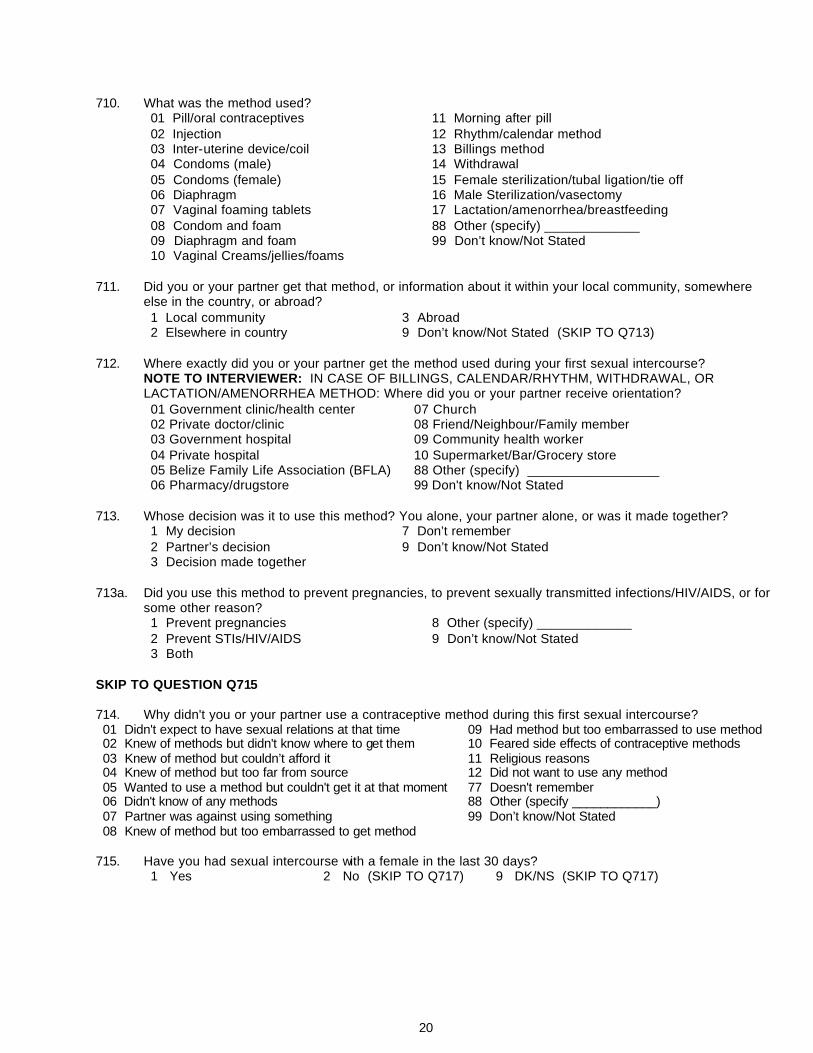
20
710. What was the method used? 01 Pill/oral contraceptives 11 Morning after pill 02 Injection 12 Rhythm/calendar method 03 Inter-uterine device/coil 13 Billings method 04 Condoms (male) 14 Withdrawal 05 Condoms (female) 15 Female sterilization/tubal ligation/tie off 06 Diaphragm 16 Male Sterilization/vasectomy 07 Vaginal foaming tablets 17 Lactation/amenorrhea/breastfeeding 08 Condom and foam 88 Other (specify) _____________ 09 Diaphragm and foam 99 Don’t know/Not Stated 10 Vaginal Creams/jellies/foams
711. Did you or your partner get that method, or information about it within your local community, somewhere
else in the country, or abroad? 1 Local community 3 Abroad 2 Elsewhere in country 9 Don’t know/Not Stated (SKIP TO Q713)
712. Where exactly did you or your partner get the method used during your first sexual intercourse?
NOTE TO INTERVIEWER: IN CASE OF BILLINGS, CALENDAR/RHYTHM, WITHDRAWAL, OR LACTATION/AMENORRHEA METHOD: Where did you or your partner receive orientation? 01 Government clinic/health center 07 Church 02 Private doctor/clinic 08 Friend/Neighbour/Family member 03 Government hospital 09 Community health worker 04 Private hospital 10 Supermarket/Bar/Grocery store 05 Belize Family Life Association (BFLA) 88 Other (specify) __________________ 06 Pharmacy/drugstore 99 Don't know/Not Stated
713. Whose decision was it to use this method? You alone, your partner alone, or was it made together?
1 My decision 7 Don’t remember 2 Partner’s decision 9 Don’t know/Not Stated 3 Decision made together
713a. Did you use this method to prevent pregnancies, to prevent sexually transmitted infections/HIV/AIDS, or for
some other reason? 1 Prevent pregnancies 8 Other (specify) _____________ 2 Prevent STIs/HIV/AIDS 9 Don’t know/Not Stated 3 Both
SKIP TO QUESTION Q715 714. Why didn't you or your partner use a contraceptive method during this first sexual intercourse? 01 Didn't expect to have sexual relations at that time 09 Had method but too embarrassed to use method 02 Knew of methods but didn't know where to get them 10 Feared side effects of contraceptive methods 03 Knew of method but couldn’t afford it 11 Religious reasons 04 Knew of method but too far from source 12 Did not want to use any method 05 Wanted to use a method but couldn't get it at that moment 77 Doesn't remember 06 Didn't know of any methods 88 Other (specify ____________) 07 Partner was against using something 99 Don’t know/Not Stated 08 Knew of method but too embarrassed to get method
715. Have you had sexual intercourse with a female in the last 30 days?
1 Yes 2 No (SKIP TO Q717) 9 DK/NS (SKIP TO Q717)
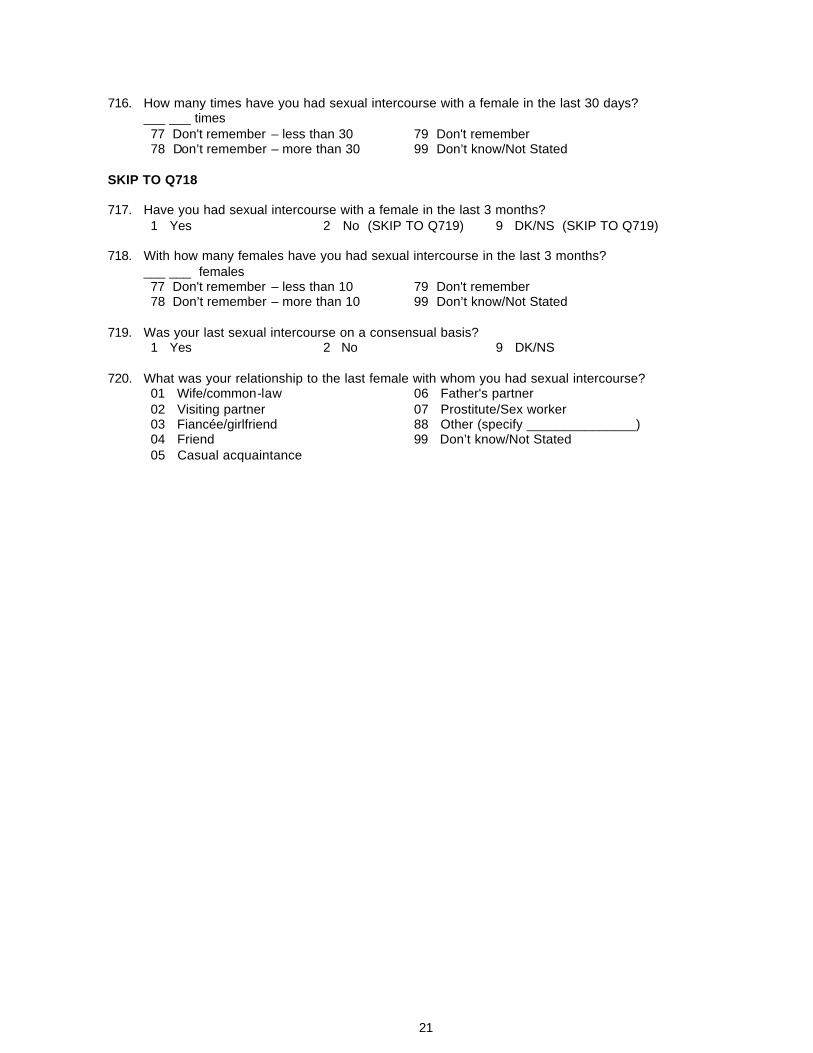
21
716. How many times have you had sexual intercourse with a female in the last 30 days? ___ ___ times
77 Don't remember – less than 30 79 Don't remember 78 Don’t remember – more than 30 99 Don’t know/Not Stated
SKIP TO Q718
717. Have you had sexual intercourse with a female in the last 3 months?
1 Yes 2 No (SKIP TO Q719) 9 DK/NS (SKIP TO Q719)
718. With how many females have you had sexual intercourse in the last 3 months? ___ ___ females
77 Don't remember – less than 10 79 Don't remember 78 Don’t remember – more than 10 99 Don’t know/Not Stated
719. Was your last sexual intercourse on a consensual basis?
1 Yes 2 No 9 DK/NS
720. What was your relationship to the last female with whom you had sexual intercourse? 01 Wife/common-law 06 Father's partner 02 Visiting partner 07 Prostitute/Sex worker 03 Fiancée/girlfriend 88 Other (specify _______________) 04 Friend 99 Don’t know/Not Stated 05 Casual acquaintance
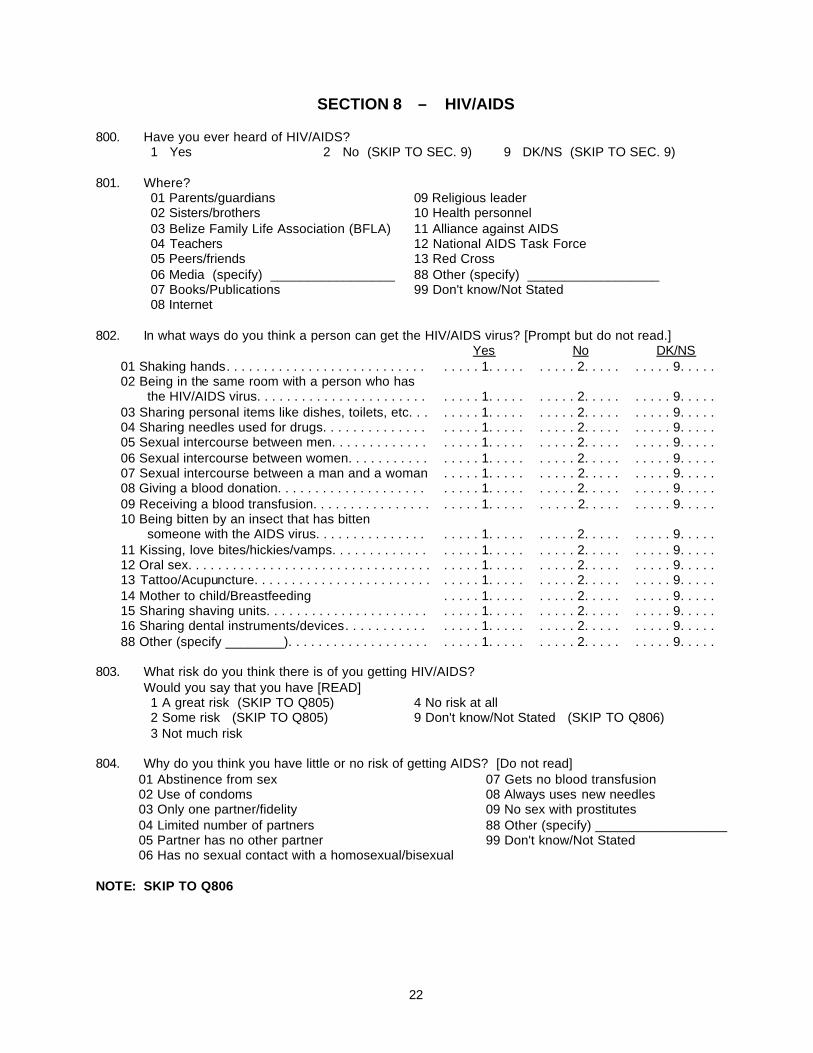
22
SECTION 8 – HIV/AIDS
800. Have you ever heard of HIV/AIDS? 1 Yes 2 No (SKIP TO SEC. 9) 9 DK/NS (SKIP TO SEC. 9)
801. Where?
01 Parents/guardians 09 Religious leader 02 Sisters/brothers 10 Health personnel 03 Belize Family Life Association (BFLA) 11 Alliance against AIDS 04 Teachers 12 National AIDS Task Force 05 Peers/friends 13 Red Cross 06 Media (specify) _________________ 88 Other (specify) __________________ 07 Books/Publications 99 Don't know/Not Stated 08 Internet
802. In what ways do you think a person can get the HIV/AIDS virus? [Prompt but do not read.]
Yes No DK/NS 01 Shaking hands. . . . . . . . . . . . . . . . . . . . . . . . . . . . . . . . 1. . . . . . . . . . 2. . . . . . . . . . 9. . . . . 02 Being in the same room with a person who has the HIV/AIDS virus. . . . . . . . . . . . . . . . . . . . . . . . . . . . 1. . . . . . . . . . 2. . . . . . . . . . 9. . . . . 03 Sharing personal items like dishes, toilets, etc. . . . . . . . 1. . . . . . . . . . 2. . . . . . . . . . 9. . . . . 04 Sharing needles used for drugs. . . . . . . . . . . . . . . . . . . 1. . . . . . . . . . 2. . . . . . . . . . 9. . . . . 05 Sexual intercourse between men. . . . . . . . . . . . . . . . . . 1. . . . . . . . . . 2. . . . . . . . . . 9. . . . . 06 Sexual intercourse between women. . . . . . . . . . . . . . . . 1. . . . . . . . . . 2. . . . . . . . . . 9. . . . . 07 Sexual intercourse between a man and a woman . . . . . 1. . . . . . . . . . 2. . . . . . . . . . 9. . . . . 08 Giving a blood donation. . . . . . . . . . . . . . . . . . . . . . . . . 1. . . . . . . . . . 2. . . . . . . . . . 9. . . . . 09 Receiving a blood transfusion. . . . . . . . . . . . . . . . . . . . . 1. . . . . . . . . . 2. . . . . . . . . . 9. . . . . 10 Being bitten by an insect that has bitten someone with the AIDS virus. . . . . . . . . . . . . . . . . . . . 1. . . . . . . . . . 2. . . . . . . . . . 9. . . . . 11 Kissing, love bites/hickies/vamps. . . . . . . . . . . . . . . . . . 1. . . . . . . . . . 2. . . . . . . . . . 9. . . . . 12 Oral sex. . . . . . . . . . . . . . . . . . . . . . . . . . . . . . . . . . . . . . 1. . . . . . . . . . 2. . . . . . . . . . 9. . . . . 13 Tattoo/Acupuncture. . . . . . . . . . . . . . . . . . . . . . . . . . . . . 1. . . . . . . . . . 2. . . . . . . . . . 9. . . . . 14 Mother to child/Breastfeeding . . . . . 1. . . . . . . . . . 2. . . . . . . . . . 9. . . . . 15 Sharing shaving units. . . . . . . . . . . . . . . . . . . . . . . . . . . 1. . . . . . . . . . 2. . . . . . . . . . 9. . . . . 16 Sharing dental instruments/devices. . . . . . . . . . . . . . . . 1. . . . . . . . . . 2. . . . . . . . . . 9. . . . . 88 Other (specify ________). . . . . . . . . . . . . . . . . . . . . . . . 1. . . . . . . . . . 2. . . . . . . . . . 9. . . . .
803. What risk do you think there is of you getting HIV/AIDS?
Would you say that you have [READ] 1 A great risk (SKIP TO Q805) 4 No risk at all 2 Some risk (SKIP TO Q805) 9 Don't know/Not Stated (SKIP TO Q806) 3 Not much risk
804. Why do you think you have little or no risk of getting AIDS? [Do not read]
01 Abstinence from sex 07 Gets no blood transfusion 02 Use of condoms 08 Always uses new needles 03 Only one partner/fidelity 09 No sex with prostitutes 04 Limited number of partners 88 Other (specify) __________________ 05 Partner has no other partner 99 Don't know/Not Stated 06 Has no sexual contact with a homosexual/bisexual
NOTE: SKIP TO Q806
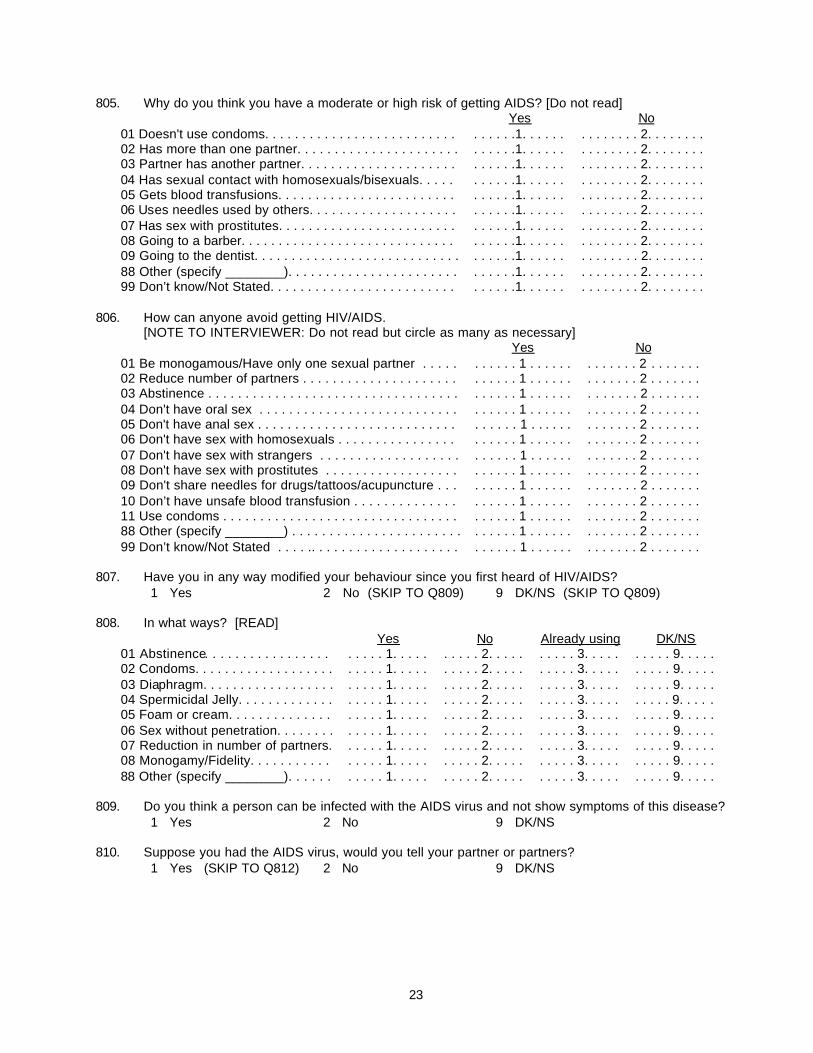
23
805. Why do you think you have a moderate or high risk of getting AIDS? [Do not read] Yes No 01 Doesn't use condoms. . . . . . . . . . . . . . . . . . . . . . . . . . . . . . . .1. . . . . . . . . . . . . . 2. . . . . . . . 02 Has more than one partner. . . . . . . . . . . . . . . . . . . . . . . . . . . .1. . . . . . . . . . . . . . 2. . . . . . . . 03 Partner has another partner. . . . . . . . . . . . . . . . . . . . . . . . . . .1. . . . . . . . . . . . . . 2. . . . . . . . 04 Has sexual contact with homosexuals/bisexuals. . . . . . . . . . .1. . . . . . . . . . . . . . 2. . . . . . . . 05 Gets blood transfusions. . . . . . . . . . . . . . . . . . . . . . . . . . . . . .1. . . . . . . . . . . . . . 2. . . . . . . . 06 Uses needles used by others. . . . . . . . . . . . . . . . . . . . . . . . . .1. . . . . . . . . . . . . . 2. . . . . . . . 07 Has sex with prostitutes. . . . . . . . . . . . . . . . . . . . . . . . . . . . . .1. . . . . . . . . . . . . . 2. . . . . . . . 08 Going to a barber. . . . . . . . . . . . . . . . . . . . . . . . . . . . . . . . . . .1. . . . . . . . . . . . . . 2. . . . . . . . 09 Going to the dentist. . . . . . . . . . . . . . . . . . . . . . . . . . . . . . . . . .1. . . . . . . . . . . . . . 2. . . . . . . . 88 Other (specify ________). . . . . . . . . . . . . . . . . . . . . . . . . . . . .1. . . . . . . . . . . . . . 2. . . . . . . . 99 Don’t know/Not Stated. . . . . . . . . . . . . . . . . . . . . . . . . . . . . . .1. . . . . . . . . . . . . . 2. . . . . . . .
806. How can anyone avoid getting HIV/AIDS.
[NOTE TO INTERVIEWER: Do not read but circle as many as necessary] Yes No 01 Be monogamous/Have only one sexual partner . . . . . . . . . . . 1 . . . . . . . . . . . . . 2 . . . . . . . 02 Reduce number of partners . . . . . . . . . . . . . . . . . . . . . . . . . . . 1 . . . . . . . . . . . . . 2 . . . . . . . 03 Abstinence . . . . . . . . . . . . . . . . . . . . . . . . . . . . . . . . . . . . . . . . 1 . . . . . . . . . . . . . 2 . . . . . . . 04 Don't have oral sex . . . . . . . . . . . . . . . . . . . . . . . . . . . . . . . . . 1 . . . . . . . . . . . . . 2 . . . . . . . 05 Don't have anal sex . . . . . . . . . . . . . . . . . . . . . . . . . . . . . . . . . 1 . . . . . . . . . . . . . 2 . . . . . . . 06 Don't have sex with homosexuals . . . . . . . . . . . . . . . . . . . . . . 1 . . . . . . . . . . . . . 2 . . . . . . . 07 Don't have sex with strangers . . . . . . . . . . . . . . . . . . . . . . . . . 1 . . . . . . . . . . . . . 2 . . . . . . . 08 Don't have sex with prostitutes . . . . . . . . . . . . . . . . . . . . . . . . 1 . . . . . . . . . . . . . 2 . . . . . . . 09 Don't share needles for drugs/tattoos/acupuncture . . . . . . . . . 1 . . . . . . . . . . . . . 2 . . . . . . . 10 Don’t have unsafe blood transfusion . . . . . . . . . . . . . . . . . . . . 1 . . . . . . . . . . . . . 2 . . . . . . . 11 Use condoms . . . . . . . . . . . . . . . . . . . . . . . . . . . . . . . . . . . . . . 1 . . . . . . . . . . . . . 2 . . . . . . . 88 Other (specify ________) . . . . . . . . . . . . . . . . . . . . . . . . . . . . . 1 . . . . . . . . . . . . . 2 . . . . . . . 99 Don’t know/Not Stated . . . . .. . . . . . . . . . . . . . . . . . . . . . . . . . 1 . . . . . . . . . . . . . 2 . . . . . . .
807. Have you in any way modified your behaviour since you first heard of HIV/AIDS?
1 Yes 2 No (SKIP TO Q809) 9 DK/NS (SKIP TO Q809) 808. In what ways? [READ]
Yes No Already using DK/NS 01 Abstinence. . . . . . . . . . . . . . . . . . . . . . 1. . . . . . . . . . 2. . . . . . . . . . 3. . . . . . . . . . 9. . . . . 02 Condoms. . . . . . . . . . . . . . . . . . . . . . . . 1. . . . . . . . . . 2. . . . . . . . . . 3. . . . . . . . . . 9. . . . . 03 Diaphragm. . . . . . . . . . . . . . . . . . . . . . . 1. . . . . . . . . . 2. . . . . . . . . . 3. . . . . . . . . . 9. . . . . 04 Spermicidal Jelly. . . . . . . . . . . . . . . . . . 1. . . . . . . . . . 2. . . . . . . . . . 3. . . . . . . . . . 9. . . . . 05 Foam or cream. . . . . . . . . . . . . . . . . . . 1. . . . . . . . . . 2. . . . . . . . . . 3. . . . . . . . . . 9. . . . . 06 Sex without penetration. . . . . . . . . . . . . 1. . . . . . . . . . 2. . . . . . . . . . 3. . . . . . . . . . 9. . . . . 07 Reduction in number of partners. . . . . . 1. . . . . . . . . . 2. . . . . . . . . . 3. . . . . . . . . . 9. . . . . 08 Monogamy/Fidelity. . . . . . . . . . . . . . . . 1. . . . . . . . . . 2. . . . . . . . . . 3. . . . . . . . . . 9. . . . . 88 Other (specify ________). . . . . . . . . . . 1. . . . . . . . . . 2. . . . . . . . . . 3. . . . . . . . . . 9. . . . .
809. Do you think a person can be infected with the AIDS virus and not show symptoms of this disease?
1 Yes 2 No 9 DK/NS 810. Suppose you had the AIDS virus, would you tell your partner or partners?
1 Yes (SKIP TO Q812) 2 No 9 DK/NS
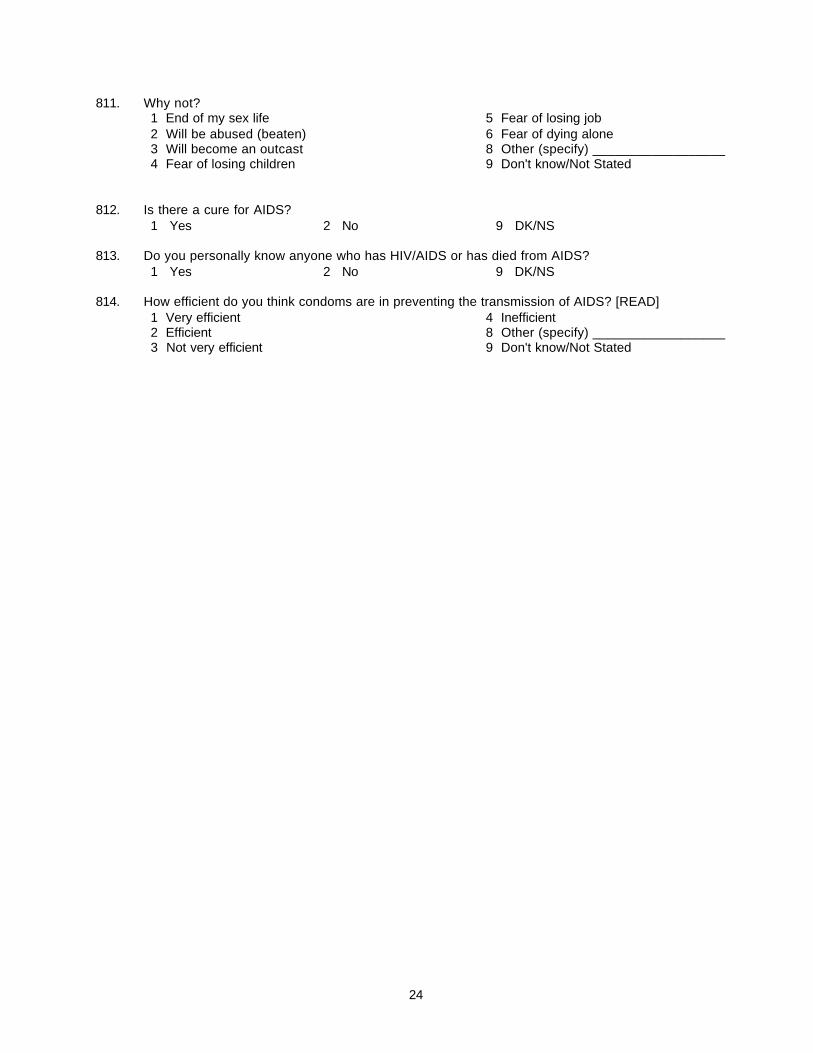
24
811. Why not? 1 End of my sex life 5 Fear of losing job 2 Will be abused (beaten) 6 Fear of dying alone 3 Will become an outcast 8 Other (specify) __________________ 4 Fear of losing children 9 Don't know/Not Stated
812. Is there a cure for AIDS?
1 Yes 2 No 9 DK/NS 813. Do you personally know anyone who has HIV/AIDS or has died from AIDS?
1 Yes 2 No 9 DK/NS 814. How efficient do you think condoms are in preventing the transmission of AIDS? [READ]
1 Very efficient 4 Inefficient 2 Efficient 8 Other (specify) __________________ 3 Not very efficient 9 Don't know/Not Stated
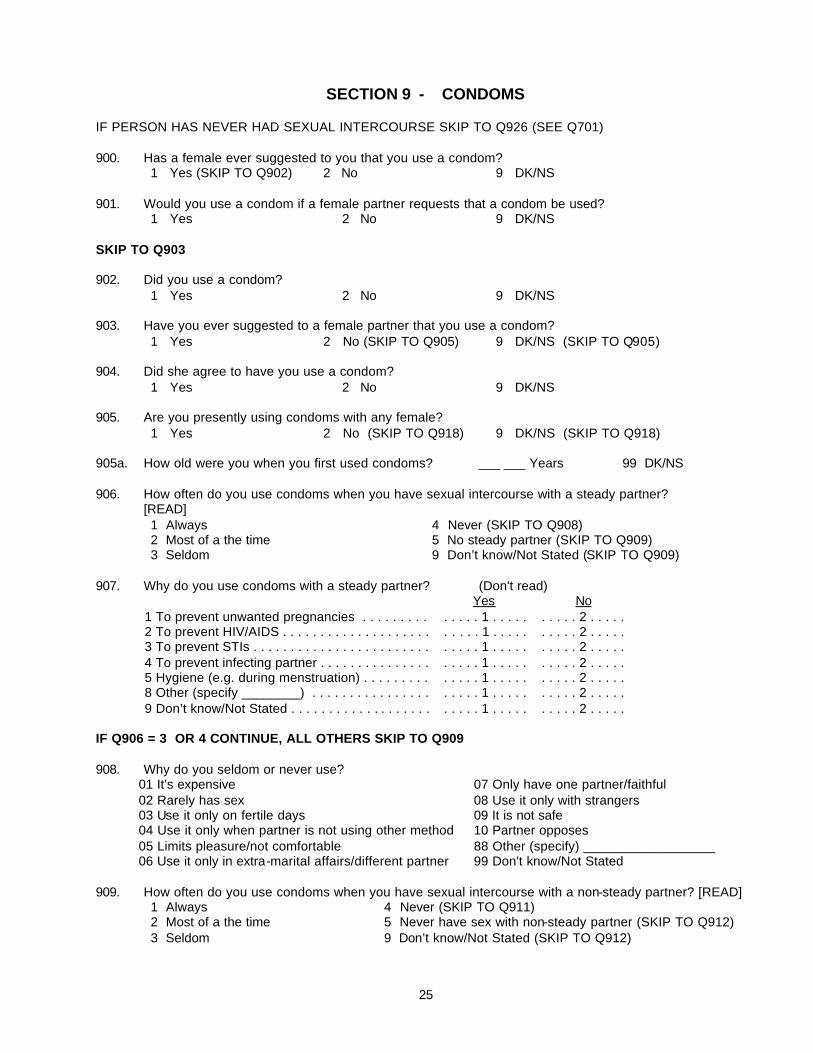
25
SECTION 9 - CONDOMS IF PERSON HAS NEVER HAD SEXUAL INTERCOURSE SKIP TO Q926 (SEE Q701) 900. Has a female ever suggested to you that you use a condom?
1 Yes (SKIP TO Q902) 2 No 9 DK/NS
901. Would you use a condom if a female partner requests that a condom be used? 1 Yes 2 No 9 DK/NS
SKIP TO Q903 902. Did you use a condom?
1 Yes 2 No 9 DK/NS 903. Have you ever suggested to a female partner that you use a condom?
1 Yes 2 No (SKIP TO Q905) 9 DK/NS (SKIP TO Q905)
904. Did she agree to have you use a condom? 1 Yes 2 No 9 DK/NS
905. Are you presently using condoms with any female?
1 Yes 2 No (SKIP TO Q918) 9 DK/NS (SKIP TO Q918)
905a. How old were you when you first used condoms? ___ ___ Years 99 DK/NS 906. How often do you use condoms when you have sexual intercourse with a steady partner? [READ]
1 Always 4 Never (SKIP TO Q908) 2 Most of a the time 5 No steady partner (SKIP TO Q909) 3 Seldom 9 Don’t know/Not Stated (SKIP TO Q909)
907. Why do you use condoms with a steady partner? (Don't read)
Yes No 1 To prevent unwanted pregnancies . . . . . . . . . . . . . . 1 . . . . . . . . . . 2 . . . . . 2 To prevent HIV/AIDS . . . . . . . . . . . . . . . . . . . . . . . . . 1 . . . . . . . . . . 2 . . . . . 3 To prevent STIs . . . . . . . . . . . . . . . . . . . . . . . . . . . . . 1 . . . . . . . . . . 2 . . . . . 4 To prevent infecting partner . . . . . . . . . . . . . . . . . . . . 1 . . . . . . . . . . 2 . . . . . 5 Hygiene (e.g. during menstruation) . . . . . . . . . . . . . . 1 . . . . . . . . . . 2 . . . . . 8 Other (specify ________) . . . . . . . . . . . . . . . . . . . . . 1 . . . . . . . . . . 2 . . . . . 9 Don’t know/Not Stated . . . . . . . . . . . . . . . . . . . . . . . . 1 . . . . . . . . . . 2 . . . . .
IF Q906 = 3 OR 4 CONTINUE, ALL OTHERS SKIP TO Q909 908. Why do you seldom or never use?
01 It’s expensive 07 Only have one partner/faithful 02 Rarely has sex 08 Use it only with strangers 03 Use it only on fertile days 09 It is not safe 04 Use it only when partner is not using other method 10 Partner opposes 05 Limits pleasure/not comfortable 88 Other (specify) __________________ 06 Use it only in extra-marital affairs/different partner 99 Don't know/Not Stated
909. How often do you use condoms when you have sexual intercourse with a non-steady partner? [READ]
1 Always 4 Never (SKIP TO Q911) 2 Most of a the time 5 Never have sex with non-steady partner (SKIP TO Q912) 3 Seldom 9 Don’t know/Not Stated (SKIP TO Q912)
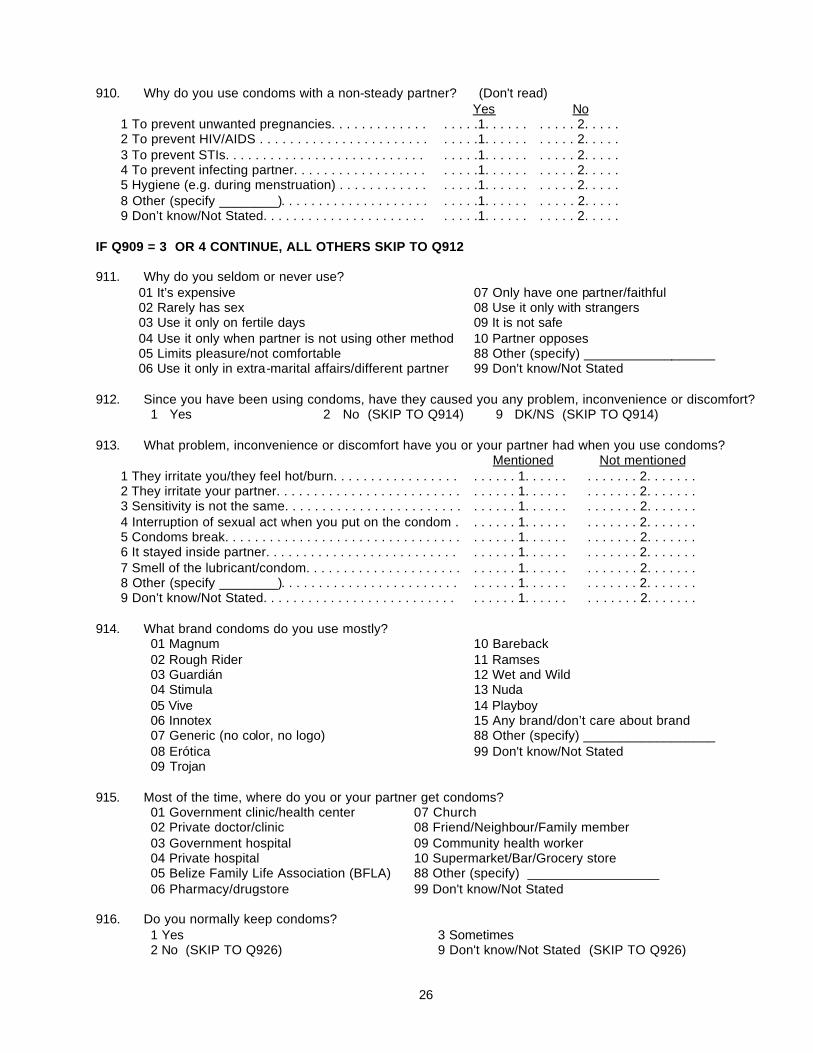
26
910. Why do you use condoms with a non-steady partner? (Don't read) Yes No 1 To prevent unwanted pregnancies. . . . . . . . . . . . . . . . . .1. . . . . . . . . . . 2. . . . . 2 To prevent HIV/AIDS . . . . . . . . . . . . . . . . . . . . . . . . . . . .1. . . . . . . . . . . 2. . . . . 3 To prevent STIs. . . . . . . . . . . . . . . . . . . . . . . . . . . . . . . .1. . . . . . . . . . . 2. . . . . 4 To prevent infecting partner. . . . . . . . . . . . . . . . . . . . . . .1. . . . . . . . . . . 2. . . . . 5 Hygiene (e.g. during menstruation) . . . . . . . . . . . . . . . . .1. . . . . . . . . . . 2. . . . . 8 Other (specify ________). . . . . . . . . . . . . . . . . . . . . . . . .1. . . . . . . . . . . 2. . . . . 9 Don’t know/Not Stated. . . . . . . . . . . . . . . . . . . . . . . . . . .1. . . . . . . . . . . 2. . . . .
IF Q909 = 3 OR 4 CONTINUE, ALL OTHERS SKIP TO Q912 911. Why do you seldom or never use?
01 It’s expensive 07 Only have one partner/faithful 02 Rarely has sex 08 Use it only with strangers 03 Use it only on fertile days 09 It is not safe 04 Use it only when partner is not using other method 10 Partner opposes 05 Limits pleasure/not comfortable 88 Other (specify) __________________ 06 Use it only in extra-marital affairs/different partner 99 Don't know/Not Stated
912. Since you have been using condoms, have they caused you any problem, inconvenience or discomfort?
1 Yes 2 No (SKIP TO Q914) 9 DK/NS (SKIP TO Q914) 913. What problem, inconvenience or discomfort have you or your partner had when you use condoms?
Mentioned Not mentioned 1 They irritate you/they feel hot/burn. . . . . . . . . . . . . . . . . . . . . . . 1. . . . . . . . . . . . . 2. . . . . . . 2 They irritate your partner. . . . . . . . . . . . . . . . . . . . . . . . . . . . . . . 1. . . . . . . . . . . . . 2. . . . . . . 3 Sensitivity is not the same. . . . . . . . . . . . . . . . . . . . . . . . . . . . . . 1. . . . . . . . . . . . . 2. . . . . . . 4 Interruption of sexual act when you put on the condom . . . . . . . 1. . . . . . . . . . . . . 2. . . . . . . 5 Condoms break. . . . . . . . . . . . . . . . . . . . . . . . . . . . . . . . . . . . . . 1. . . . . . . . . . . . . 2. . . . . . . 6 It stayed inside partner. . . . . . . . . . . . . . . . . . . . . . . . . . . . . . . . 1. . . . . . . . . . . . . 2. . . . . . . 7 Smell of the lubricant/condom. . . . . . . . . . . . . . . . . . . . . . . . . . . 1. . . . . . . . . . . . . 2. . . . . . . 8 Other (specify ________). . . . . . . . . . . . . . . . . . . . . . . . . . . . . . 1. . . . . . . . . . . . . 2. . . . . . . 9 Don’t know/Not Stated. . . . . . . . . . . . . . . . . . . . . . . . . . . . . . . . 1. . . . . . . . . . . . . 2. . . . . . .
914. What brand condoms do you use mostly?
01 Magnum 10 Bareback 02 Rough Rider 11 Ramses 03 Guardián 12 Wet and Wild 04 Stimula 13 Nuda 05 Vive 14 Playboy 06 Innotex 15 Any brand/don’t care about brand 07 Generic (no color, no logo) 88 Other (specify) __________________ 08 Erótica 99 Don't know/Not Stated 09 Trojan
915. Most of the time, where do you or your partner get condoms?
01 Government clinic/health center 07 Church 02 Private doctor/clinic 08 Friend/Neighbour/Family member 03 Government hospital 09 Community health worker 04 Private hospital 10 Supermarket/Bar/Grocery store 05 Belize Family Life Association (BFLA) 88 Other (specify) __________________ 06 Pharmacy/drugstore 99 Don't know/Not Stated
916. Do you normally keep condoms?
1 Yes 3 Sometimes 2 No (SKIP TO Q926) 9 Don't know/Not Stated (SKIP TO Q926)
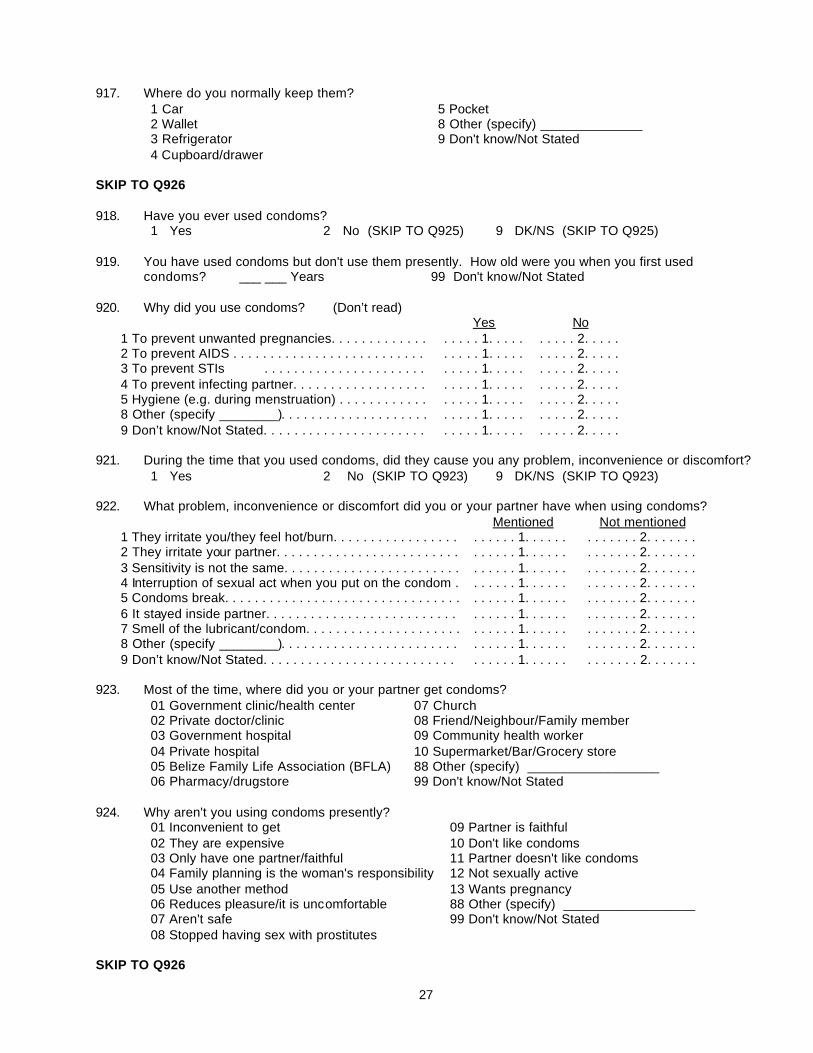
27
917. Where do you normally keep them? 1 Car 5 Pocket 2 Wallet 8 Other (specify) ______________ 3 Refrigerator 9 Don't know/Not Stated 4 Cupboard/drawer
SKIP TO Q926 918. Have you ever used condoms?
1 Yes 2 No (SKIP TO Q925) 9 DK/NS (SKIP TO Q925) 919. You have used condoms but don't use them presently. How old were you when you first used
condoms? ___ ___ Years 99 Don't know/Not Stated 920. Why did you use condoms? (Don’t read)
Yes No 1 To prevent unwanted pregnancies. . . . . . . . . . . . . . . . . . 1. . . . . . . . . . 2. . . . . 2 To prevent AIDS . . . . . . . . . . . . . . . . . . . . . . . . . . . . . . . 1. . . . . . . . . . 2. . . . . 3 To prevent STIs . . . . . . . . . . . . . . . . . . . . . . . . . . . 1. . . . . . . . . . 2. . . . . 4 To prevent infecting partner. . . . . . . . . . . . . . . . . . . . . . . 1. . . . . . . . . . 2. . . . . 5 Hygiene (e.g. during menstruation) . . . . . . . . . . . . . . . . . 1. . . . . . . . . . 2. . . . . 8 Other (specify ________). . . . . . . . . . . . . . . . . . . . . . . . . 1. . . . . . . . . . 2. . . . . 9 Don’t know/Not Stated. . . . . . . . . . . . . . . . . . . . . . . . . . . 1. . . . . . . . . . 2. . . . .
921. During the time that you used condoms, did they cause you any problem, inconvenience or discomfort?
1 Yes 2 No (SKIP TO Q923) 9 DK/NS (SKIP TO Q923) 922. What problem, inconvenience or discomfort did you or your partner have when using condoms?
Mentioned Not mentioned 1 They irritate you/they feel hot/burn. . . . . . . . . . . . . . . . . . . . . . . 1. . . . . . . . . . . . . 2. . . . . . . 2 They irritate your partner. . . . . . . . . . . . . . . . . . . . . . . . . . . . . . . 1. . . . . . . . . . . . . 2. . . . . . . 3 Sensitivity is not the same. . . . . . . . . . . . . . . . . . . . . . . . . . . . . . 1. . . . . . . . . . . . . 2. . . . . . . 4 Interruption of sexual act when you put on the condom . . . . . . . 1. . . . . . . . . . . . . 2. . . . . . . 5 Condoms break. . . . . . . . . . . . . . . . . . . . . . . . . . . . . . . . . . . . . . 1. . . . . . . . . . . . . 2. . . . . . . 6 It stayed inside partner. . . . . . . . . . . . . . . . . . . . . . . . . . . . . . . . 1. . . . . . . . . . . . . 2. . . . . . . 7 Smell of the lubricant/condom. . . . . . . . . . . . . . . . . . . . . . . . . . . 1. . . . . . . . . . . . . 2. . . . . . . 8 Other (specify ________). . . . . . . . . . . . . . . . . . . . . . . . . . . . . . 1. . . . . . . . . . . . . 2. . . . . . . 9 Don’t know/Not Stated. . . . . . . . . . . . . . . . . . . . . . . . . . . . . . . . 1. . . . . . . . . . . . . 2. . . . . . .
923. Most of the time, where did you or your partner get condoms?
01 Government clinic/health center 07 Church 02 Private doctor/clinic 08 Friend/Neighbour/Family member 03 Government hospital 09 Community health worker 04 Private hospital 10 Supermarket/Bar/Grocery store 05 Belize Family Life Association (BFLA) 88 Other (specify) __________________ 06 Pharmacy/drugstore 99 Don't know/Not Stated
924. Why aren't you using condoms presently?
01 Inconvenient to get 09 Partner is faithful 02 They are expensive 10 Don't like condoms 03 Only have one partner/faithful 11 Partner doesn't like condoms 04 Family planning is the woman's responsibility 12 Not sexually active 05 Use another method 13 Wants pregnancy 06 Reduces pleasure/it is uncomfortable 88 Other (specify) __________________ 07 Aren't safe 99 Don't know/Not Stated 08 Stopped having sex with prostitutes
SKIP TO Q926
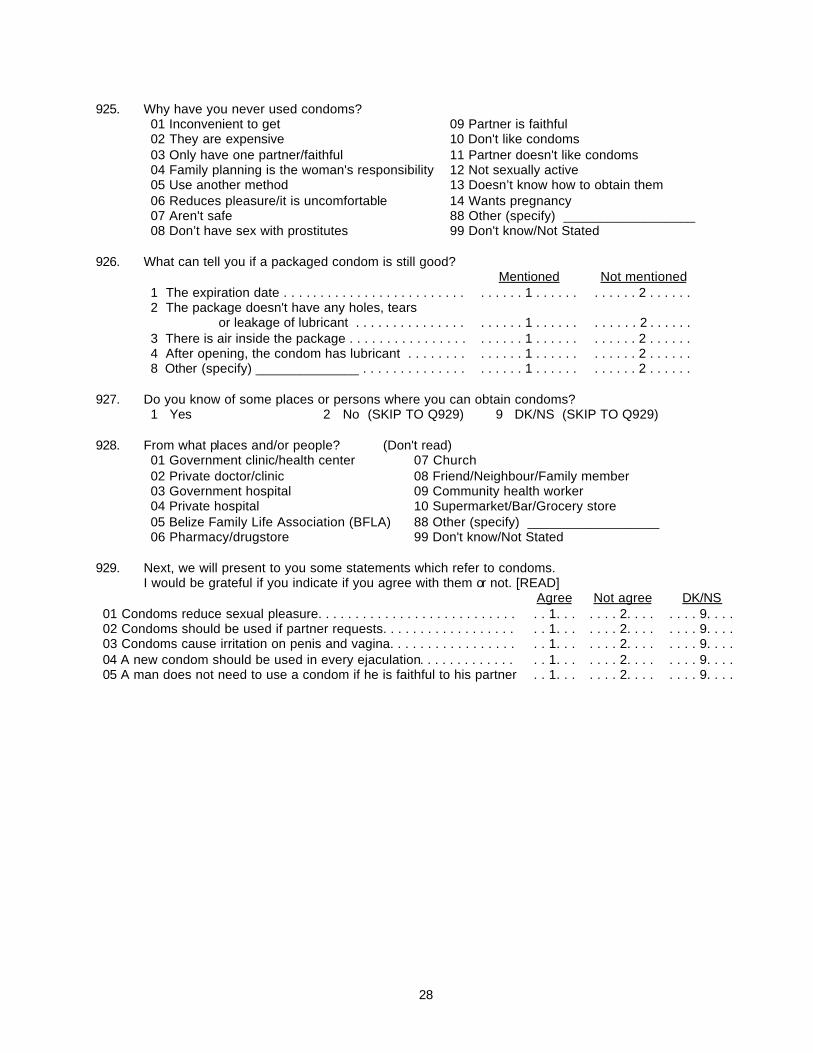
28
925. Why have you never used condoms?
01 Inconvenient to get 09 Partner is faithful 02 They are expensive 10 Don't like condoms 03 Only have one partner/faithful 11 Partner doesn't like condoms 04 Family planning is the woman's responsibility 12 Not sexually active 05 Use another method 13 Doesn’t know how to obtain them 06 Reduces pleasure/it is uncomfortable 14 Wants pregnancy 07 Aren't safe 88 Other (specify) __________________ 08 Don’t have sex with prostitutes 99 Don't know/Not Stated
926. What can tell you if a packaged condom is still good?
Mentioned Not mentioned 1 The expiration date . . . . . . . . . . . . . . . . . . . . . . . . . . . . . . . 1 . . . . . . . . . . . . 2 . . . . . . 2 The package doesn't have any holes, tears or leakage of lubricant . . . . . . . . . . . . . . . . . . . . . 1 . . . . . . . . . . . . 2 . . . . . . 3 There is air inside the package . . . . . . . . . . . . . . . . . . . . . . 1 . . . . . . . . . . . . 2 . . . . . . 4 After opening, the condom has lubricant . . . . . . . . . . . . . . 1 . . . . . . . . . . . . 2 . . . . . . 8 Other (specify) ______________ . . . . . . . . . . . . . . . . . . . . 1 . . . . . . . . . . . . 2 . . . . . .
927. Do you know of some places or persons where you can obtain condoms?
1 Yes 2 No (SKIP TO Q929) 9 DK/NS (SKIP TO Q929) 928. From what places and/or people? (Don't read)
01 Government clinic/health center 07 Church 02 Private doctor/clinic 08 Friend/Neighbour/Family member 03 Government hospital 09 Community health worker 04 Private hospital 10 Supermarket/Bar/Grocery store 05 Belize Family Life Association (BFLA) 88 Other (specify) __________________ 06 Pharmacy/drugstore 99 Don't know/Not Stated
929. Next, we will present to you some statements which refer to condoms. I would be grateful if you indicate if you agree with them or not. [READ] Agree Not agree DK/NS 01 Condoms reduce sexual pleasure. . . . . . . . . . . . . . . . . . . . . . . . . . . . . 1. . . . . . . 2. . . . . . . . 9. . . . 02 Condoms should be used if partner requests. . . . . . . . . . . . . . . . . . . . 1. . . . . . . 2. . . . . . . . 9. . . . 03 Condoms cause irritation on penis and vagina. . . . . . . . . . . . . . . . . . . 1. . . . . . . 2. . . . . . . . 9. . . . 04 A new condom should be used in every ejaculation. . . . . . . . . . . . . . . 1. . . . . . . 2. . . . . . . . 9. . . . 05 A man does not need to use a condom if he is faithful to his partner . . 1. . . . . . . 2. . . . . . . . 9. . . .
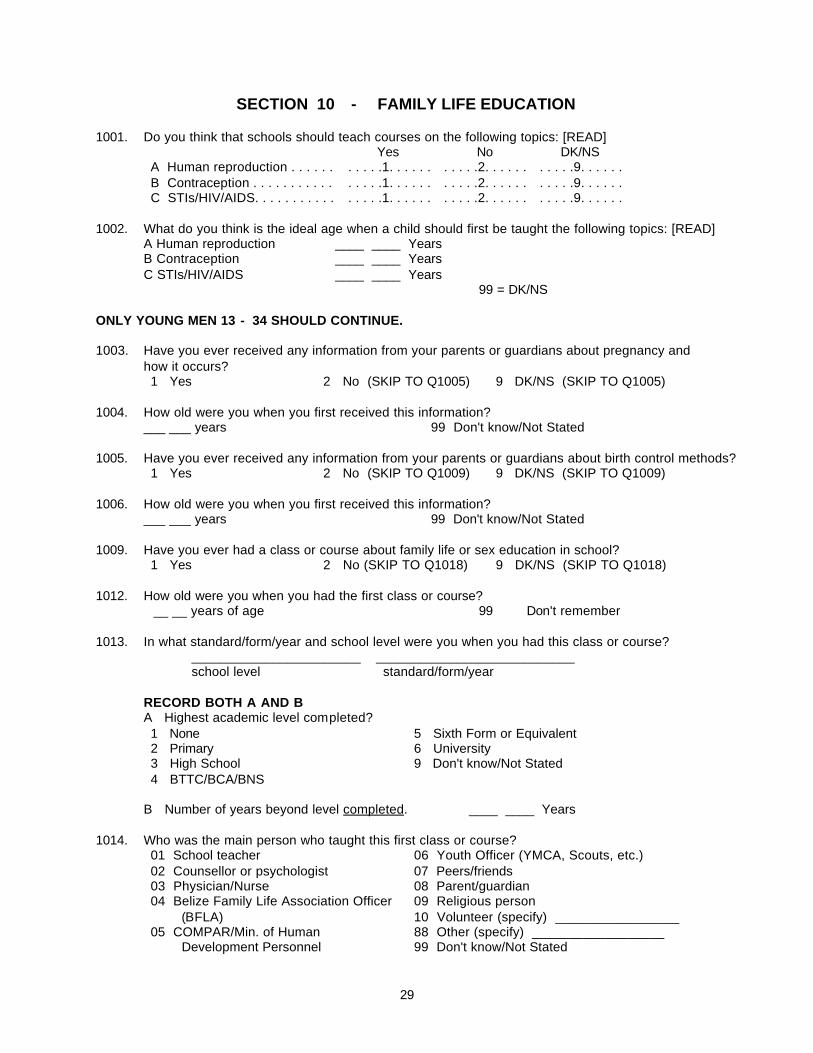
29
SECTION 10 - FAMILY LIFE EDUCATION 1001. Do you think that schools should teach courses on the following topics: [READ]
Yes No DK/NS A Human reproduction . . . . . . . . . . .1. . . . . . . . . . .2. . . . . . . . . . .9. . . . . . B Contraception . . . . . . . . . . . . . . . .1. . . . . . . . . . .2. . . . . . . . . . .9. . . . . . C STIs/HIV/AIDS. . . . . . . . . . . . . . . .1. . . . . . . . . . .2. . . . . . . . . . .9. . . . . .
1002. What do you think is the ideal age when a child should first be taught the following topics: [READ]
A Human reproduction ____ ____ Years B Contraception ____ ____ Years C STIs/HIV/AIDS ____ ____ Years
99 = DK/NS ONLY YOUNG MEN 13 - 34 SHOULD CONTINUE. 1003. Have you ever received any information from your parents or guardians about pregnancy and
how it occurs? 1 Yes 2 No (SKIP TO Q1005) 9 DK/NS (SKIP TO Q1005)
1004. How old were you when you first received this information? ___ ___ years 99 Don't know/Not Stated 1005. Have you ever received any information from your parents or guardians about birth control methods?
1 Yes 2 No (SKIP TO Q1009) 9 DK/NS (SKIP TO Q1009) 1006. How old were you when you first received this information? ___ ___ years 99 Don't know/Not Stated 1009. Have you ever had a class or course about family life or sex education in school?
1 Yes 2 No (SKIP TO Q1018) 9 DK/NS (SKIP TO Q1018) 1012. How old were you when you had the first class or course?
__ __ years of age 99 Don't remember 1013. In what standard/form/year and school level were you when you had this class or course?
_______________________ ___________________________ school level standard/form/year
RECORD BOTH A AND B
A Highest academic level completed? 1 None 5 Sixth Form or Equivalent 2 Primary 6 University 3 High School 9 Don't know/Not Stated 4 BTTC/BCA/BNS
B Number of years beyond level completed. ____ ____ Years
1014. Who was the main person who taught this first class or course?
01 School teacher 06 Youth Officer (YMCA, Scouts, etc.) 02 Counsellor or psychologist 07 Peers/friends 03 Physician/Nurse 08 Parent/guardian 04 Belize Family Life Association Officer 09 Religious person (BFLA) 10 Volunteer (specify) _________________ 05 COMPAR/Min. of Human 88 Other (specify) __________________ Development Personnel 99 Don't know/Not Stated
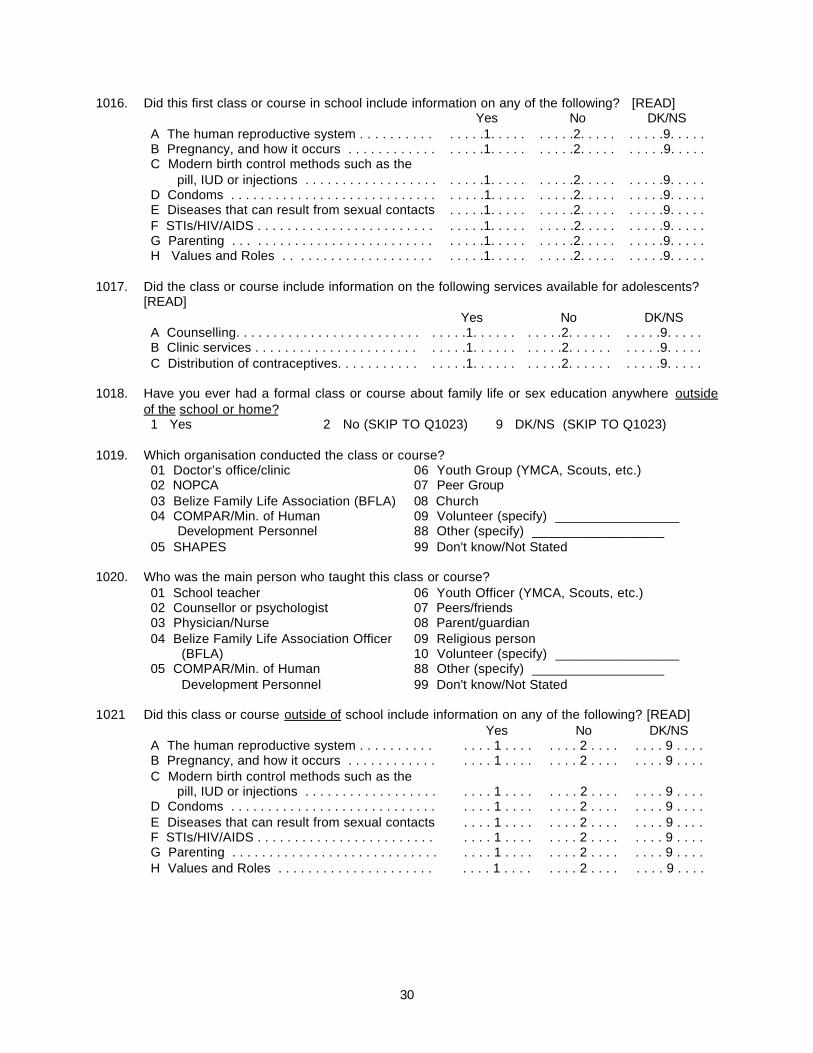
30
1016. Did this first class or course in school include information on any of the following? [READ] Yes No DK/NS A The human reproductive system . . . . . . . . . . . . . . .1. . . . . . . . . .2. . . . . . . . . .9. . . . . B Pregnancy, and how it occurs . . . . . . . . . . . . . . . . .1. . . . . . . . . .2. . . . . . . . . .9. . . . . C Modern birth control methods such as the pill, IUD or injections . . . . . . . . . . . . . . . . . . . . . . .1. . . . . . . . . .2. . . . . . . . . .9. . . . . D Condoms . . . . . . . . . . . . . . . . . . . . . . . . . . . . . . . . .1. . . . . . . . . .2. . . . . . . . . .9. . . . . E Diseases that can result from sexual contacts . . . . .1. . . . . . . . . .2. . . . . . . . . .9. . . . . F STIs/HIV/AIDS . . . . . . . . . . . . . . . . . . . . . . . . . . . . .1. . . . . . . . . .2. . . . . . . . . .9. . . . . G Parenting . . . . . . . . . . . . . . . . . . . . . . . . . . . . . . . .1. . . . . . . . . .2. . . . . . . . . .9. . . . . H Values and Roles . . . . . . . . . . . . . . . . . . . . . . . . .1. . . . . . . . . .2. . . . . . . . . .9. . . . .
1017. Did the class or course include information on the following services available for adolescents?
[READ] Yes No DK/NS A Counselling. . . . . . . . . . . . . . . . . . . . . . . . . . . . . .1. . . . . . . . . . .2. . . . . . . . . . .9. . . . . B Clinic services . . . . . . . . . . . . . . . . . . . . . . . . . . .1. . . . . . . . . . .2. . . . . . . . . . .9. . . . . C Distribution of contraceptives. . . . . . . . . . . . . . . .1. . . . . . . . . . .2. . . . . . . . . . .9. . . . .
1018. Have you ever had a formal class or course about family life or sex education anywhere outside
of the school or home? 1 Yes 2 No (SKIP TO Q1023) 9 DK/NS (SKIP TO Q1023)
1019. Which organisation conducted the class or course?
01 Doctor’s office/clinic 06 Youth Group (YMCA, Scouts, etc.) 02 NOPCA 07 Peer Group 03 Belize Family Life Association (BFLA) 08 Church 04 COMPAR/Min. of Human 09 Volunteer (specify) _________________ Development Personnel 88 Other (specify) __________________ 05 SHAPES 99 Don't know/Not Stated
1020. Who was the main person who taught this class or course?
01 School teacher 06 Youth Officer (YMCA, Scouts, etc.) 02 Counsellor or psychologist 07 Peers/friends 03 Physician/Nurse 08 Parent/guardian 04 Belize Family Life Association Officer 09 Religious person (BFLA) 10 Volunteer (specify) _________________ 05 COMPAR/Min. of Human 88 Other (specify) __________________ Development Personnel 99 Don't know/Not Stated
1021 Did this class or course outside of school include information on any of the following? [READ]
Yes No DK/NS A The human reproductive system . . . . . . . . . . . . . . 1 . . . . . . . . 2 . . . . . . . . 9 . . . . B Pregnancy, and how it occurs . . . . . . . . . . . . . . . . 1 . . . . . . . . 2 . . . . . . . . 9 . . . . C Modern birth control methods such as the pill, IUD or injections . . . . . . . . . . . . . . . . . . . . . . 1 . . . . . . . . 2 . . . . . . . . 9 . . . . D Condoms . . . . . . . . . . . . . . . . . . . . . . . . . . . . . . . . 1 . . . . . . . . 2 . . . . . . . . 9 . . . . E Diseases that can result from sexual contacts . . . . 1 . . . . . . . . 2 . . . . . . . . 9 . . . . F STIs/HIV/AIDS . . . . . . . . . . . . . . . . . . . . . . . . . . . . 1 . . . . . . . . 2 . . . . . . . . 9 . . . . G Parenting . . . . . . . . . . . . . . . . . . . . . . . . . . . . . . . . 1 . . . . . . . . 2 . . . . . . . . 9 . . . . H Values and Roles . . . . . . . . . . . . . . . . . . . . . . . . . 1 . . . . . . . . 2 . . . . . . . . 9 . . . .
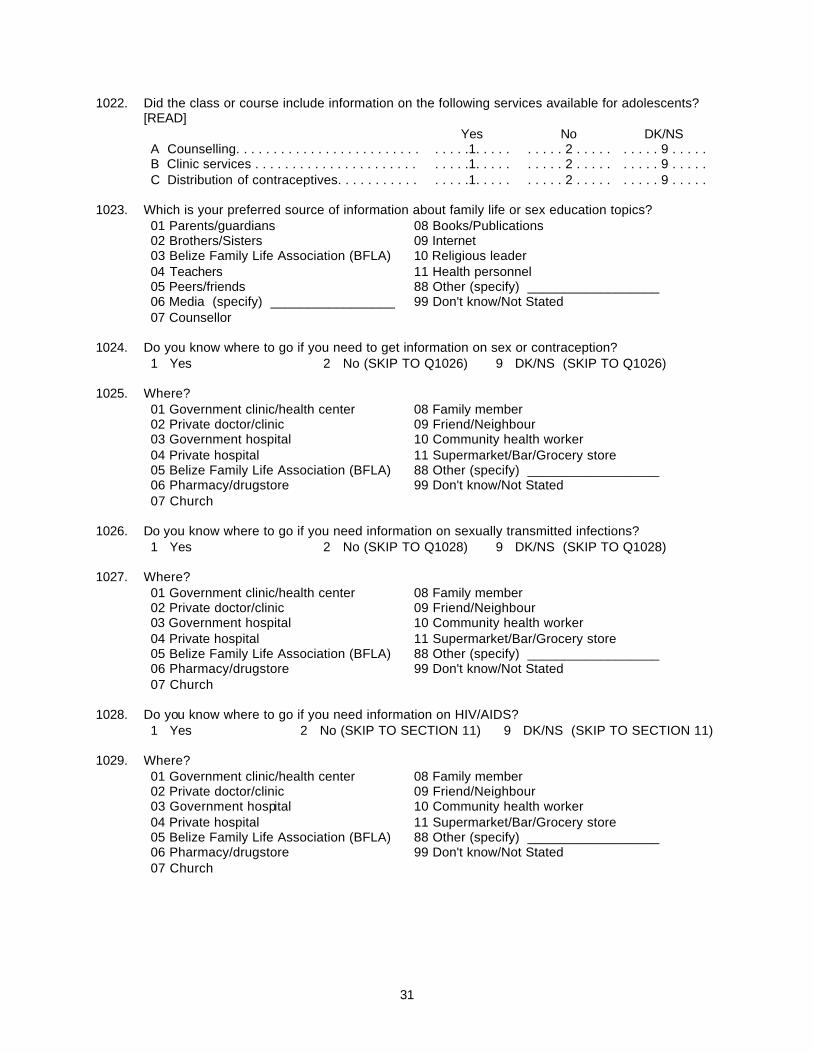
31
1022. Did the class or course include information on the following services available for adolescents? [READ] Yes No DK/NS A Counselling. . . . . . . . . . . . . . . . . . . . . . . . . . . . . .1. . . . . . . . . . 2 . . . . . . . . . . 9 . . . . . B Clinic services . . . . . . . . . . . . . . . . . . . . . . . . . . .1. . . . . . . . . . 2 . . . . . . . . . . 9 . . . . . C Distribution of contraceptives. . . . . . . . . . . . . . . .1. . . . . . . . . . 2 . . . . . . . . . . 9 . . . . .
1023. Which is your preferred source of information about family life or sex education topics?
01 Parents/guardians 08 Books/Publications 02 Brothers/Sisters 09 Internet 03 Belize Family Life Association (BFLA) 10 Religious leader 04 Teachers 11 Health personnel 05 Peers/friends 88 Other (specify) __________________ 06 Media (specify) _________________ 99 Don't know/Not Stated 07 Counsellor
1024. Do you know where to go if you need to get information on sex or contraception?
1 Yes 2 No (SKIP TO Q1026) 9 DK/NS (SKIP TO Q1026) 1025. Where?
01 Government clinic/health center 08 Family member 02 Private doctor/clinic 09 Friend/Neighbour 03 Government hospital 10 Community health worker 04 Private hospital 11 Supermarket/Bar/Grocery store 05 Belize Family Life Association (BFLA) 88 Other (specify) __________________ 06 Pharmacy/drugstore 99 Don't know/Not Stated 07 Church
1026. Do you know where to go if you need information on sexually transmitted infections?
1 Yes 2 No (SKIP TO Q1028) 9 DK/NS (SKIP TO Q1028) 1027. Where?
01 Government clinic/health center 08 Family member 02 Private doctor/clinic 09 Friend/Neighbour 03 Government hospital 10 Community health worker 04 Private hospital 11 Supermarket/Bar/Grocery store 05 Belize Family Life Association (BFLA) 88 Other (specify) __________________ 06 Pharmacy/drugstore 99 Don't know/Not Stated 07 Church
1028. Do you know where to go if you need information on HIV/AIDS?
1 Yes 2 No (SKIP TO SECTION 11) 9 DK/NS (SKIP TO SECTION 11) 1029. Where?
01 Government clinic/health center 08 Family member 02 Private doctor/clinic 09 Friend/Neighbour 03 Government hospital 10 Community health worker 04 Private hospital 11 Supermarket/Bar/Grocery store 05 Belize Family Life Association (BFLA) 88 Other (specify) __________________ 06 Pharmacy/drugstore 99 Don't know/Not Stated 07 Church
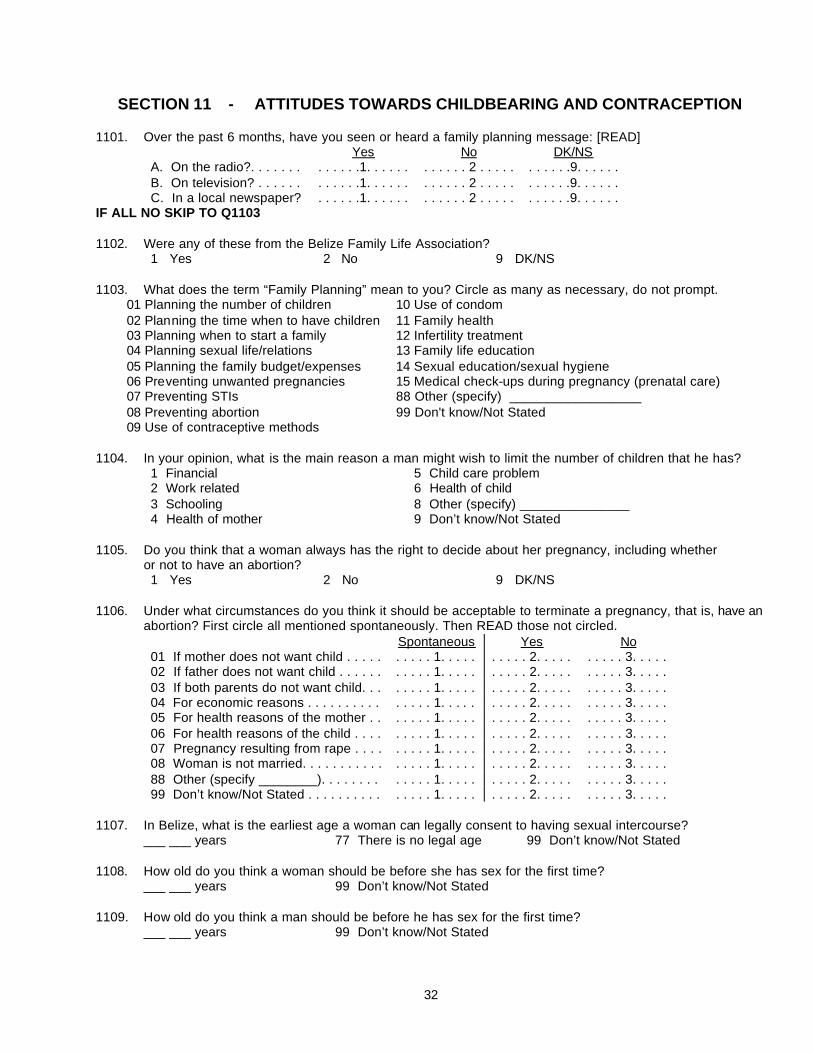
32
SECTION 11 - ATTITUDES TOWARDS CHILDBEARING AND CONTRACEPTION 1101. Over the past 6 months, have you seen or heard a family planning message: [READ]
Yes No DK/NS A. On the radio?. . . . . . . . . . . . .1. . . . . . . . . . . . 2 . . . . . . . . . . .9. . . . . . B. On television? . . . . . . . . . . . .1. . . . . . . . . . . . 2 . . . . . . . . . . .9. . . . . . C. In a local newspaper? . . . . . .1. . . . . . . . . . . . 2 . . . . . . . . . . .9. . . . . .
IF ALL NO SKIP TO Q1103 1102. Were any of these from the Belize Family Life Association?
1 Yes 2 No 9 DK/NS 1103. What does the term “Family Planning” mean to you? Circle as many as necessary, do not prompt.
01 Planning the number of children 10 Use of condom 02 Planning the time when to have children 11 Family health 03 Planning when to start a family 12 Infertility treatment 04 Planning sexual life/relations 13 Family life education 05 Planning the family budget/expenses 14 Sexual education/sexual hygiene 06 Preventing unwanted pregnancies 15 Medical check-ups during pregnancy (prenatal care) 07 Preventing STIs 88 Other (specify) __________________ 08 Preventing abortion 99 Don't know/Not Stated 09 Use of contraceptive methods
1104. In your opinion, what is the main reason a man might wish to limit the number of children that he has?
1 Financial 5 Child care problem 2 Work related 6 Health of child 3 Schooling 8 Other (specify) _______________ 4 Health of mother 9 Don’t know/Not Stated
1105. Do you think that a woman always has the right to decide about her pregnancy, including whether
or not to have an abortion? 1 Yes 2 No 9 DK/NS
1106. Under what circumstances do you think it should be acceptable to terminate a pregnancy, that is, have an
abortion? First circle all mentioned spontaneously. Then READ those not circled. Spontaneous Yes No 01 If mother does not want child . . . . . . . . . . 1. . . . . . . . . . 2. . . . . . . . . . 3. . . . . 02 If father does not want child . . . . . . . . . . . 1. . . . . . . . . . 2. . . . . . . . . . 3. . . . . 03 If both parents do not want child. . . . . . . . 1. . . . . . . . . . 2. . . . . . . . . . 3. . . . . 04 For economic reasons . . . . . . . . . . . . . . . 1. . . . . . . . . . 2. . . . . . . . . . 3. . . . . 05 For health reasons of the mother . . . . . . . 1. . . . . . . . . . 2. . . . . . . . . . 3. . . . . 06 For health reasons of the child . . . . . . . . . 1. . . . . . . . . . 2. . . . . . . . . . 3. . . . . 07 Pregnancy resulting from rape . . . . . . . . . 1. . . . . . . . . . 2. . . . . . . . . . 3. . . . . 08 Woman is not married. . . . . . . . . . . . . . . . 1. . . . . . . . . . 2. . . . . . . . . . 3. . . . . 88 Other (specify ________). . . . . . . . . . . . . 1. . . . . . . . . . 2. . . . . . . . . . 3. . . . . 99 Don’t know/Not Stated . . . . . . . . . . . . . . . 1. . . . . . . . . . 2. . . . . . . . . . 3. . . . .
1107. In Belize, what is the earliest age a woman can legally consent to having sexual intercourse? ___ ___ years 77 There is no legal age 99 Don’t know/Not Stated 1108. How old do you think a woman should be before she has sex for the first time? ___ ___ years 99 Don’t know/Not Stated 1109. How old do you think a man should be before he has sex for the first time? ___ ___ years 99 Don’t know/Not Stated
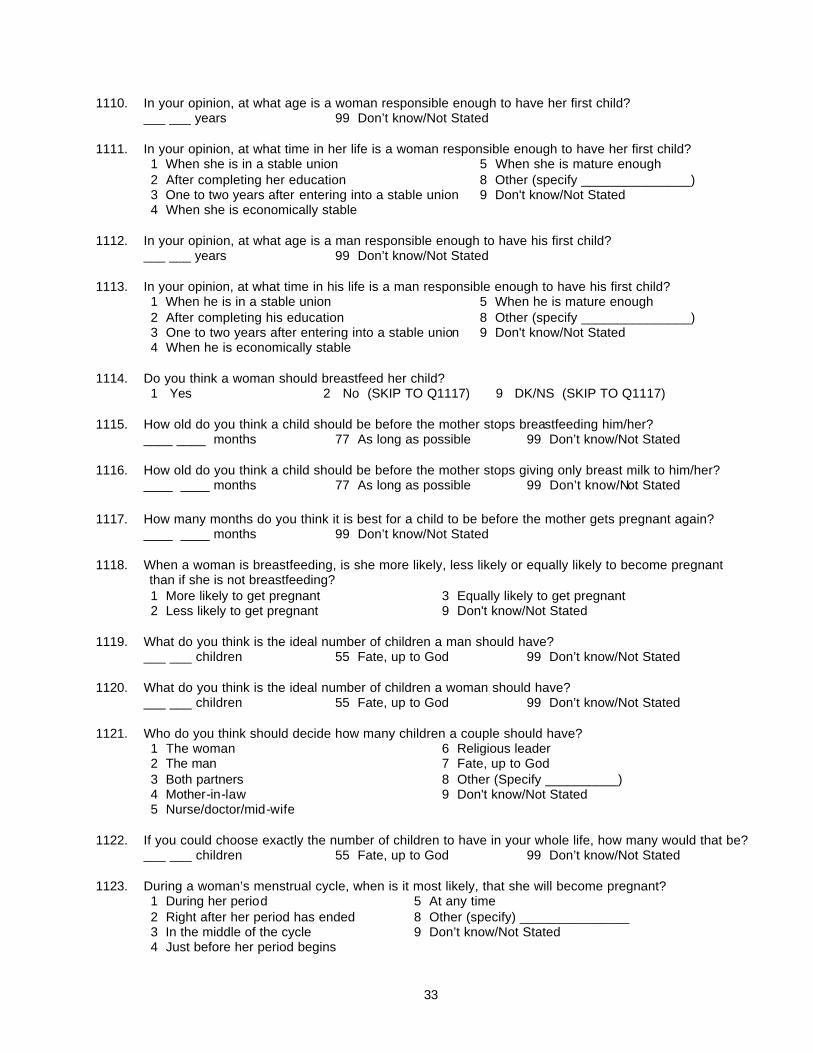
33
1110. In your opinion, at what age is a woman responsible enough to have her first child? ___ ___ years 99 Don’t know/Not Stated 1111. In your opinion, at what time in her life is a woman responsible enough to have her first child?
1 When she is in a stable union 5 When she is mature enough 2 After completing her education 8 Other (specify _______________) 3 One to two years after entering into a stable union 9 Don't know/Not Stated 4 When she is economically stable
1112. In your opinion, at what age is a man responsible enough to have his first child? ___ ___ years 99 Don’t know/Not Stated 1113. In your opinion, at what time in his life is a man responsible enough to have his first child?
1 When he is in a stable union 5 When he is mature enough 2 After completing his education 8 Other (specify _______________) 3 One to two years after entering into a stable union 9 Don't know/Not Stated 4 When he is economically stable
1114. Do you think a woman should breastfeed her child?
1 Yes 2 No (SKIP TO Q1117) 9 DK/NS (SKIP TO Q1117) 1115. How old do you think a child should be before the mother stops breastfeeding him/her? ____ ____ months 77 As long as possible 99 Don’t know/Not Stated 1116. How old do you think a child should be before the mother stops giving only breast milk to him/her?
____ ____ months 77 As long as possible 99 Don’t know/Not Stated 1117. How many months do you think it is best for a child to be before the mother gets pregnant again?
____ ____ months 99 Don’t know/Not Stated 1118. When a woman is breastfeeding, is she more likely, less likely or equally likely to become pregnant than if she is not breastfeeding?
1 More likely to get pregnant 3 Equally likely to get pregnant 2 Less likely to get pregnant 9 Don't know/Not Stated
1119. What do you think is the ideal number of children a man should have? ___ ___ children 55 Fate, up to God 99 Don’t know/Not Stated 1120. What do you think is the ideal number of children a woman should have? ___ ___ children 55 Fate, up to God 99 Don’t know/Not Stated 1121. Who do you think should decide how many children a couple should have?
1 The woman 6 Religious leader 2 The man 7 Fate, up to God 3 Both partners 8 Other (Specify __________) 4 Mother-in-law 9 Don't know/Not Stated 5 Nurse/doctor/mid-wife
1122. If you could choose exactly the number of children to have in your whole life, how many would that be? ___ ___ children 55 Fate, up to God 99 Don’t know/Not Stated 1123. During a woman’s menstrual cycle, when is it most likely, that she will become pregnant?
1 During her period 5 At any time 2 Right after her period has ended 8 Other (specify) _______________ 3 In the middle of the cycle 9 Don’t know/Not Stated 4 Just before her period begins
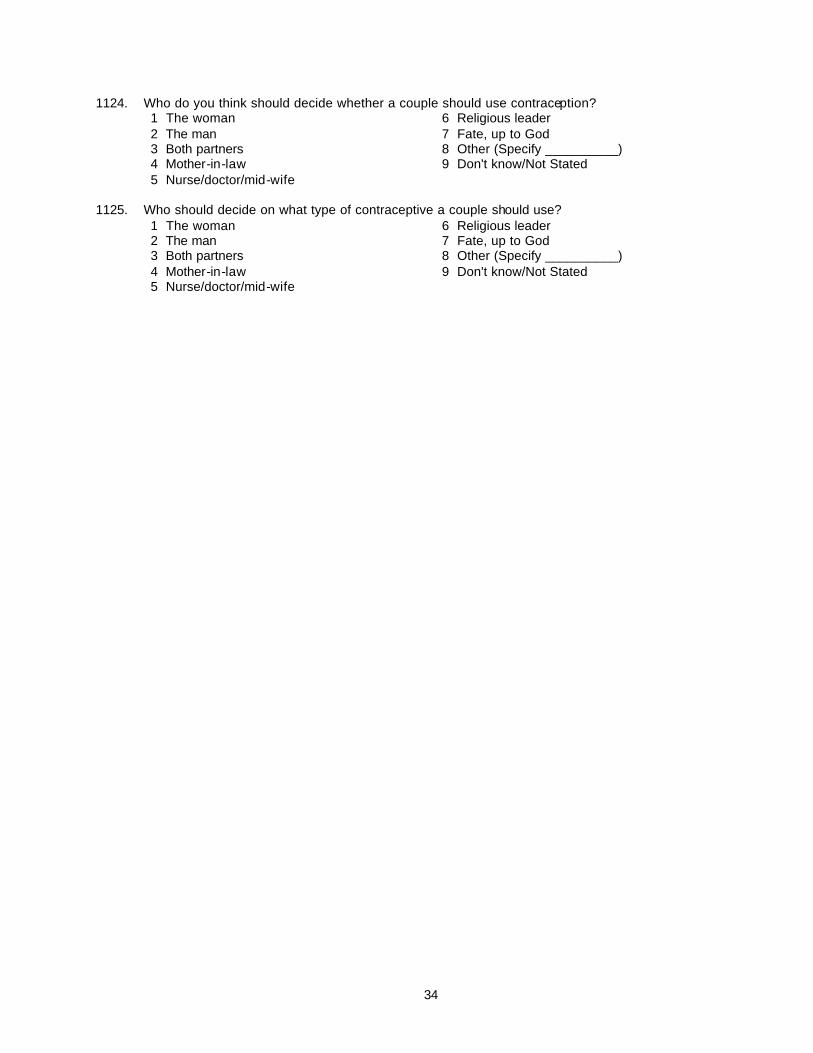
34
1124. Who do you think should decide whether a couple should use contraception? 1 The woman 6 Religious leader 2 The man 7 Fate, up to God 3 Both partners 8 Other (Specify __________) 4 Mother-in-law 9 Don't know/Not Stated 5 Nurse/doctor/mid-wife
1125. Who should decide on what type of contraceptive a couple should use?
1 The woman 6 Religious leader 2 The man 7 Fate, up to God 3 Both partners 8 Other (Specify __________) 4 Mother-in-law 9 Don't know/Not Stated 5 Nurse/doctor/mid-wife
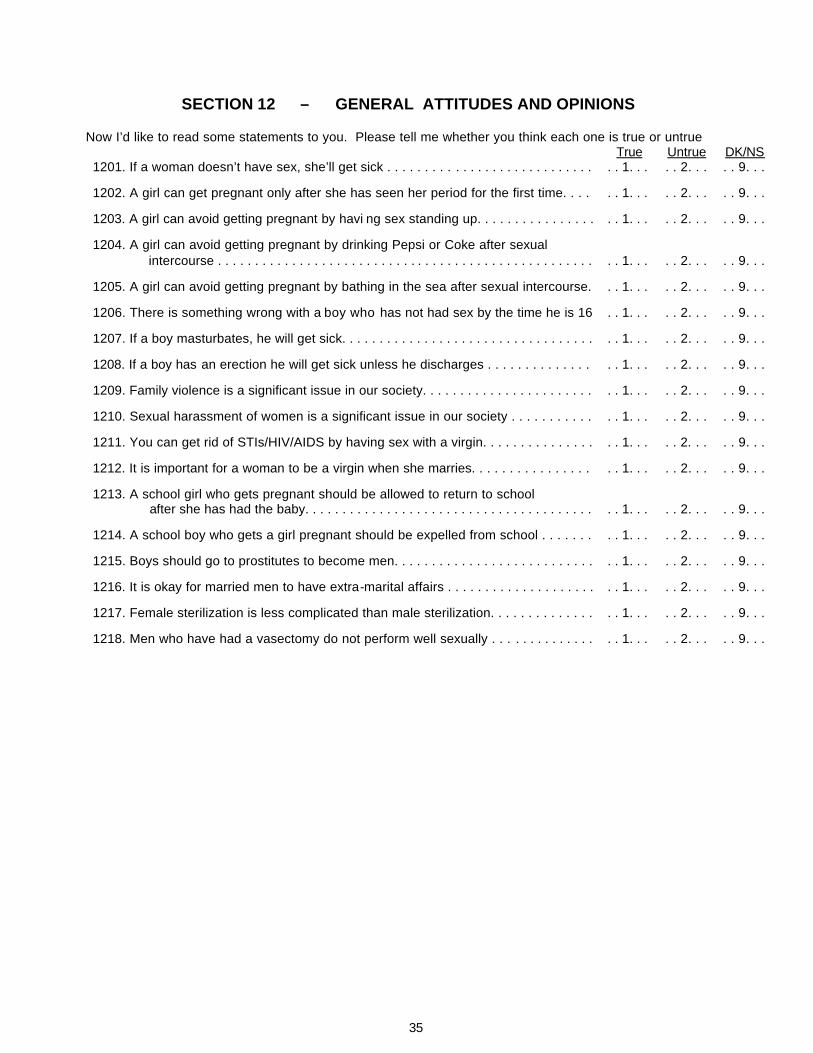
35
SECTION 12 – GENERAL ATTITUDES AND OPINIONS Now I’d like to read some statements to you. Please tell me whether you think each one is true or untrue True Untrue DK/NS 1201. If a woman doesn’t have sex, she’ll get sick . . . . . . . . . . . . . . . . . . . . . . . . . . . . . . 1. . . . . 2. . . . . 9. . . 1202. A girl can get pregnant only after she has seen her period for the first time. . . . . . 1. . . . . 2. . . . . 9. . . 1203. A girl can avoid getting pregnant by havi ng sex standing up. . . . . . . . . . . . . . . . . . 1. . . . . 2. . . . . 9. . . 1204. A girl can avoid getting pregnant by drinking Pepsi or Coke after sexual intercourse . . . . . . . . . . . . . . . . . . . . . . . . . . . . . . . . . . . . . . . . . . . . . . . . . . . . . 1. . . . . 2. . . . . 9. . . 1205. A girl can avoid getting pregnant by bathing in the sea after sexual intercourse. . . 1. . . . . 2. . . . . 9. . . 1206. There is something wrong with a boy who has not had sex by the time he is 16 . . 1. . . . . 2. . . . . 9. . . 1207. If a boy masturbates, he will get sick. . . . . . . . . . . . . . . . . . . . . . . . . . . . . . . . . . . . 1. . . . . 2. . . . . 9. . . 1208. If a boy has an erection he will get sick unless he discharges . . . . . . . . . . . . . . . . 1. . . . . 2. . . . . 9. . . 1209. Family violence is a significant issue in our society. . . . . . . . . . . . . . . . . . . . . . . . . 1. . . . . 2. . . . . 9. . . 1210. Sexual harassment of women is a significant issue in our society . . . . . . . . . . . . . 1. . . . . 2. . . . . 9. . . 1211. You can get rid of STIs/HIV/AIDS by having sex with a virgin. . . . . . . . . . . . . . . . . 1. . . . . 2. . . . . 9. . . 1212. It is important for a woman to be a virgin when she marries. . . . . . . . . . . . . . . . . . 1. . . . . 2. . . . . 9. . . 1213. A school girl who gets pregnant should be allowed to return to school after she has had the baby. . . . . . . . . . . . . . . . . . . . . . . . . . . . . . . . . . . . . . . . . 1. . . . . 2. . . . . 9. . . 1214. A school boy who gets a girl pregnant should be expelled from school . . . . . . . . . 1. . . . . 2. . . . . 9. . . 1215. Boys should go to prostitutes to become men. . . . . . . . . . . . . . . . . . . . . . . . . . . . . 1. . . . . 2. . . . . 9. . . 1216. It is okay for married men to have extra-marital affairs . . . . . . . . . . . . . . . . . . . . . . 1. . . . . 2. . . . . 9. . . 1217. Female sterilization is less complicated than male sterilization. . . . . . . . . . . . . . . . 1. . . . . 2. . . . . 9. . . 1218. Men who have had a vasectomy do not perform well sexually . . . . . . . . . . . . . . . . 1. . . . . 2. . . . . 9. . .
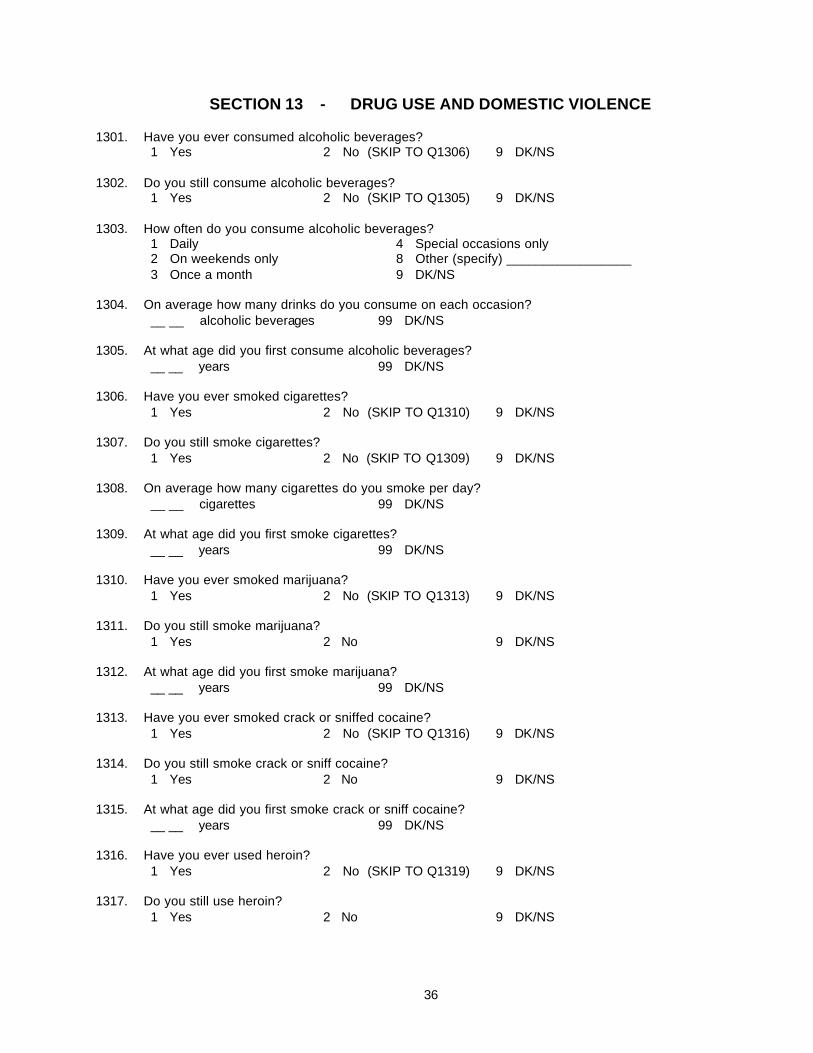
36
SECTION 13 - DRUG USE AND DOMESTIC VIOLENCE 1301. Have you ever consumed alcoholic beverages?
1 Yes 2 No (SKIP TO Q1306) 9 DK/NS 1302. Do you still consume alcoholic beverages?
1 Yes 2 No (SKIP TO Q1305) 9 DK/NS 1303. How often do you consume alcoholic beverages?
1 Daily 4 Special occasions only 2 On weekends only 8 Other (specify) _________________ 3 Once a month 9 DK/NS
1304. On average how many drinks do you consume on each occasion?
__ __ alcoholic beverages 99 DK/NS 1305. At what age did you first consume alcoholic beverages?
__ __ years 99 DK/NS 1306. Have you ever smoked cigarettes?
1 Yes 2 No (SKIP TO Q1310) 9 DK/NS 1307. Do you still smoke cigarettes?
1 Yes 2 No (SKIP TO Q1309) 9 DK/NS 1308. On average how many cigarettes do you smoke per day?
__ __ cigarettes 99 DK/NS 1309. At what age did you first smoke cigarettes?
__ __ years 99 DK/NS 1310. Have you ever smoked marijuana?
1 Yes 2 No (SKIP TO Q1313) 9 DK/NS 1311. Do you still smoke marijuana?
1 Yes 2 No 9 DK/NS 1312. At what age did you first smoke marijuana?
__ __ years 99 DK/NS 1313. Have you ever smoked crack or sniffed cocaine?
1 Yes 2 No (SKIP TO Q1316) 9 DK/NS 1314. Do you still smoke crack or sniff cocaine?
1 Yes 2 No 9 DK/NS 1315. At what age did you first smoke crack or sniff cocaine?
__ __ years 99 DK/NS 1316. Have you ever used heroin?
1 Yes 2 No (SKIP TO Q1319) 9 DK/NS 1317. Do you still use heroin?
1 Yes 2 No 9 DK/NS
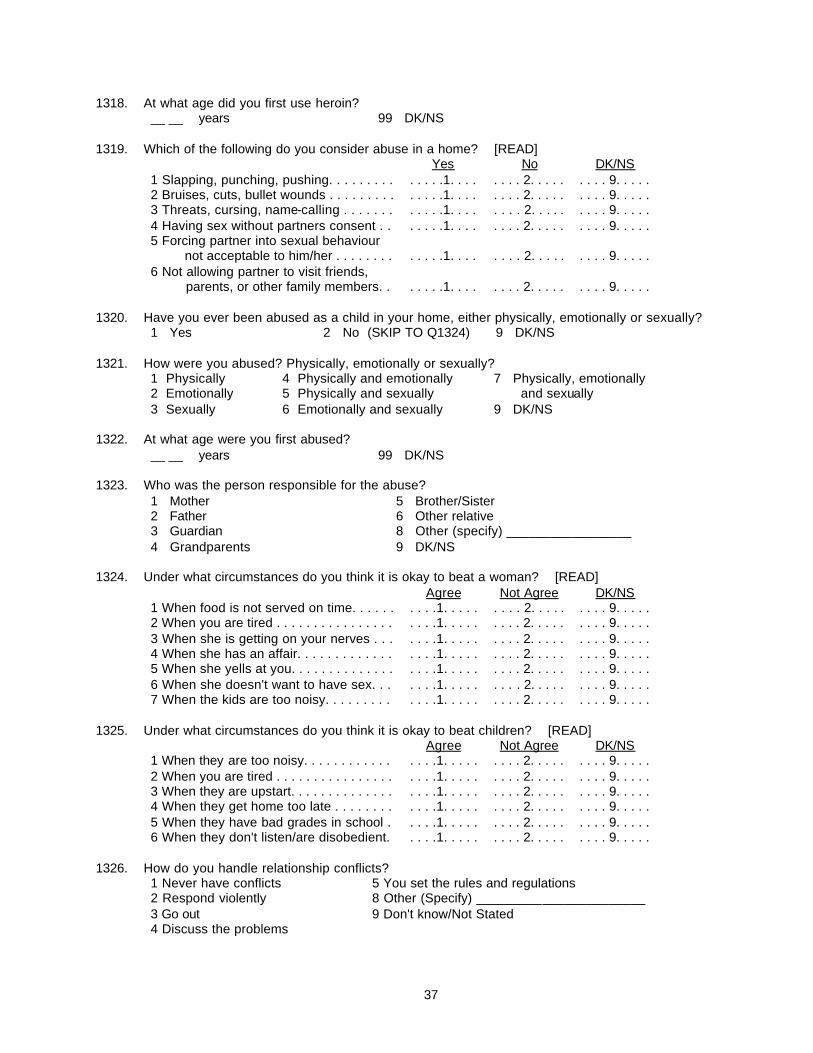
37
1318. At what age did you first use heroin? __ __ years 99 DK/NS
1319. Which of the following do you consider abuse in a home? [READ]
Yes No DK/NS 1 Slapping, punching, pushing. . . . . . . . . . . . . .1. . . . . . . . 2. . . . . . . . . 9. . . . . 2 Bruises, cuts, bullet wounds . . . . . . . . . . . . . .1. . . . . . . . 2. . . . . . . . . 9. . . . . 3 Threats, cursing, name-calling . . . . . . . . . . . .1. . . . . . . . 2. . . . . . . . . 9. . . . . 4 Having sex without partners consent . . . . . . .1. . . . . . . . 2. . . . . . . . . 9. . . . . 5 Forcing partner into sexual behaviour not acceptable to him/her . . . . . . . . . . . . .1. . . . . . . . 2. . . . . . . . . 9. . . . . 6 Not allowing partner to visit friends, parents, or other family members. . . . . . .1. . . . . . . . 2. . . . . . . . . 9. . . . .
1320. Have you ever been abused as a child in your home, either physically, emotionally or sexually?
1 Yes 2 No (SKIP TO Q1324) 9 DK/NS 1321. How were you abused? Physically, emotionally or sexually?
1 Physically 4 Physically and emotionally 7 Physically, emotionally 2 Emotionally 5 Physically and sexually and sexually 3 Sexually 6 Emotionally and sexually 9 DK/NS
1322. At what age were you first abused?
__ __ years 99 DK/NS 1323. Who was the person responsible for the abuse?
1 Mother 5 Brother/Sister 2 Father 6 Other relative 3 Guardian 8 Other (specify) _________________ 4 Grandparents 9 DK/NS
1324. Under what circumstances do you think it is okay to beat a woman? [READ]
Agree Not Agree DK/NS 1 When food is not served on time. . . . . . . . . .1. . . . . . . . . 2. . . . . . . . . 9. . . . . 2 When you are tired . . . . . . . . . . . . . . . . . . . .1. . . . . . . . . 2. . . . . . . . . 9. . . . . 3 When she is getting on your nerves . . . . . . .1. . . . . . . . . 2. . . . . . . . . 9. . . . . 4 When she has an affair. . . . . . . . . . . . . . . . .1. . . . . . . . . 2. . . . . . . . . 9. . . . . 5 When she yells at you. . . . . . . . . . . . . . . . . .1. . . . . . . . . 2. . . . . . . . . 9. . . . . 6 When she doesn't want to have sex. . . . . . .1. . . . . . . . . 2. . . . . . . . . 9. . . . . 7 When the kids are too noisy. . . . . . . . . . . . .1. . . . . . . . . 2. . . . . . . . . 9. . . . .
1325. Under what circumstances do you think it is okay to beat children? [READ]
Agree Not Agree DK/NS 1 When they are too noisy. . . . . . . . . . . . . . . .1. . . . . . . . . 2. . . . . . . . . 9. . . . . 2 When you are tired . . . . . . . . . . . . . . . . . . . .1. . . . . . . . . 2. . . . . . . . . 9. . . . . 3 When they are upstart. . . . . . . . . . . . . . . . . .1. . . . . . . . . 2. . . . . . . . . 9. . . . . 4 When they get home too late . . . . . . . . . . . .1. . . . . . . . . 2. . . . . . . . . 9. . . . . 5 When they have bad grades in school . . . . .1. . . . . . . . . 2. . . . . . . . . 9. . . . . 6 When they don't listen/are disobedient. . . . .1. . . . . . . . . 2. . . . . . . . . 9. . . . .
1326. How do you handle relationship conflicts?
1 Never have conflicts 5 You set the rules and regulations 2 Respond violently 8 Other (Specify) _______________________ 3 Go out 9 Don't know/Not Stated 4 Discuss the problems

71
Appendix II
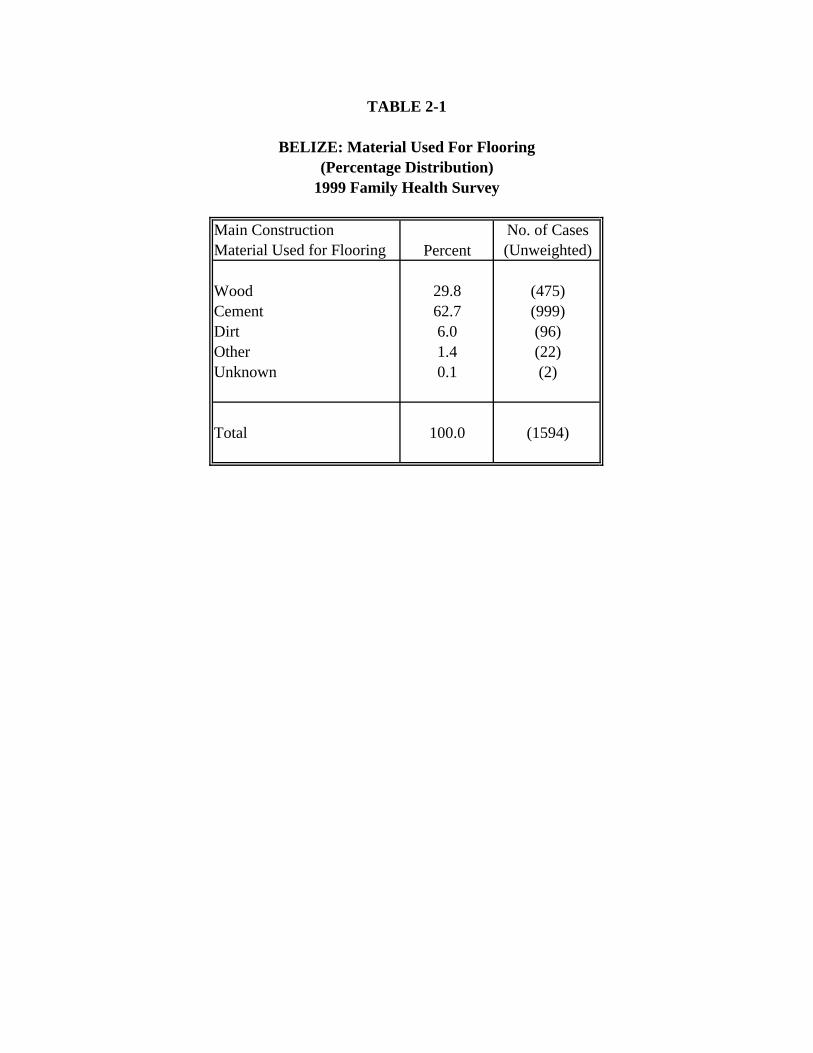
TABLE 2-1
BELIZE: Material Used For Flooring(Percentage Distribution)
1999 Family Health Survey
Main Construction Material Used for Flooring Percent
No. of Cases (Unweighted)
Wood 29.8 (475)Cement 62.7 (999)Dirt 6.0 (96)Other 1.4 (22)Unknown 0.1 (2)
Total 100.0 (1594)
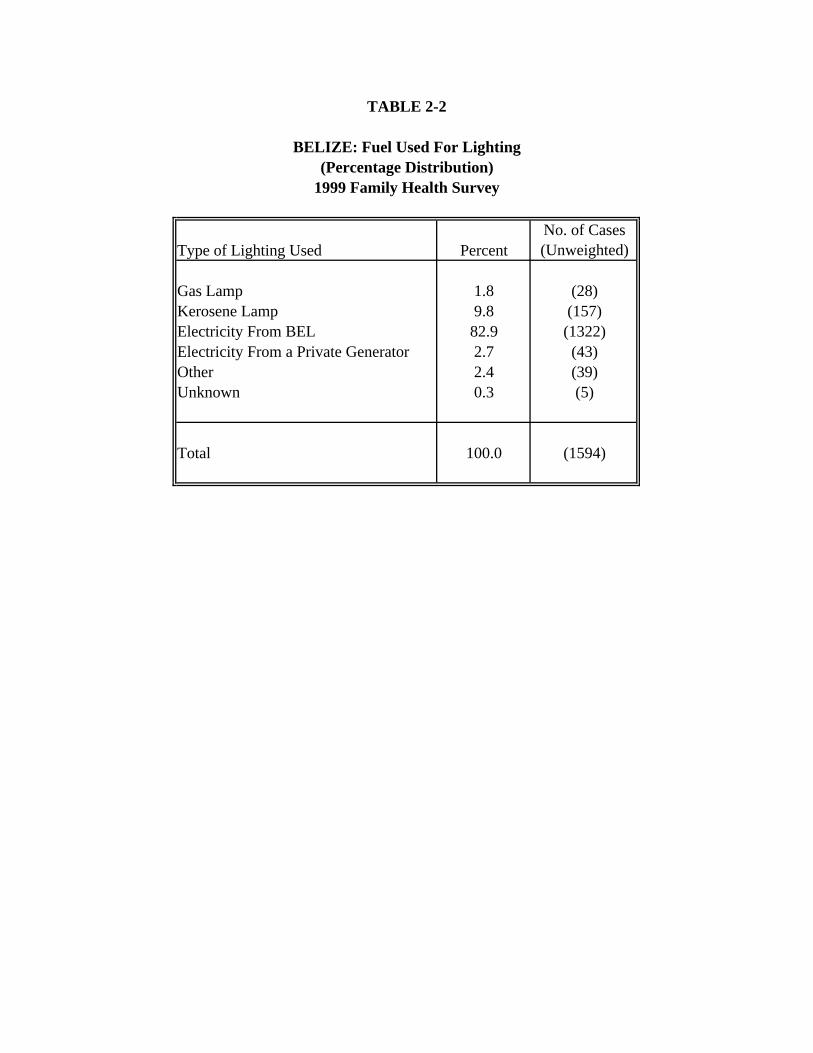
TABLE 2-2
BELIZE: Fuel Used For Lighting(Percentage Distribution)
1999 Family Health Survey
Type of Lighting Used PercentNo. of Cases (Unweighted)
Gas Lamp 1.8 (28)Kerosene Lamp 9.8 (157)Electricity From BEL 82.9 (1322)Electricity From a Private Generator 2.7 (43)Other 2.4 (39)Unknown 0.3 (5)
Total 100.0 (1594)
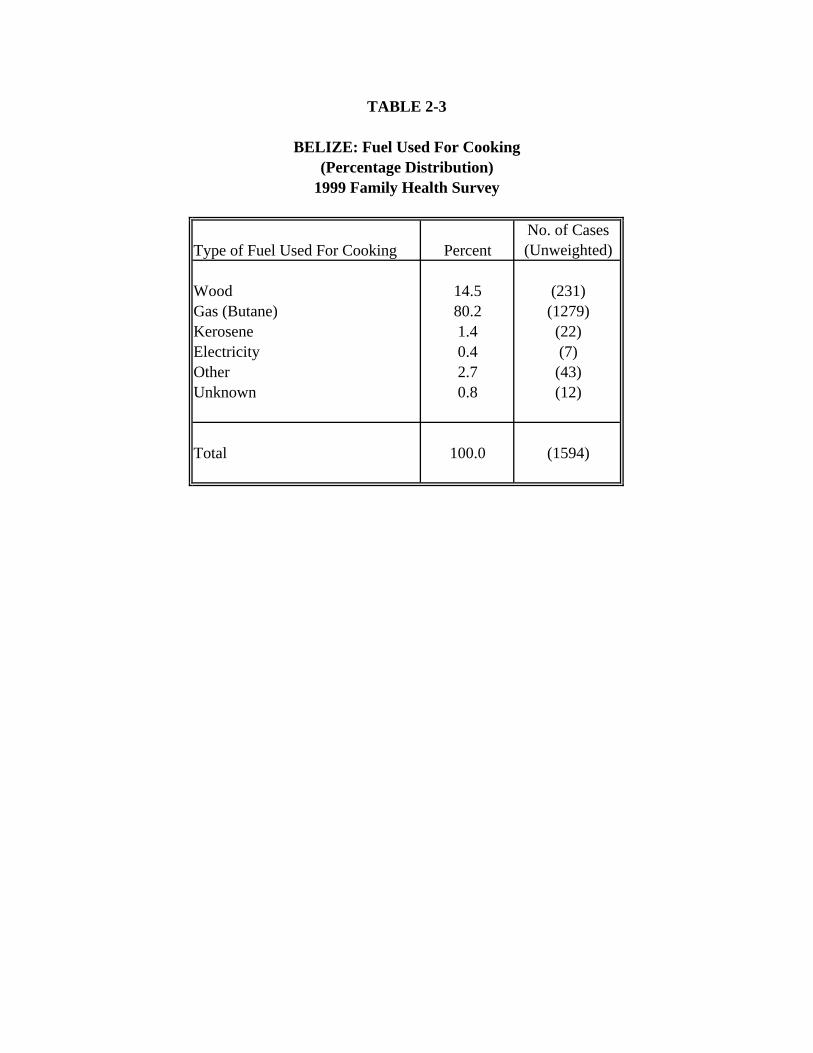
TABLE 2-3
BELIZE: Fuel Used For Cooking(Percentage Distribution)
1999 Family Health Survey
Type of Fuel Used For Cooking PercentNo. of Cases (Unweighted)
Wood 14.5 (231)Gas (Butane) 80.2 (1279)Kerosene 1.4 (22)Electricity 0.4 (7)Other 2.7 (43)Unknown 0.8 (12)
Total 100.0 (1594)
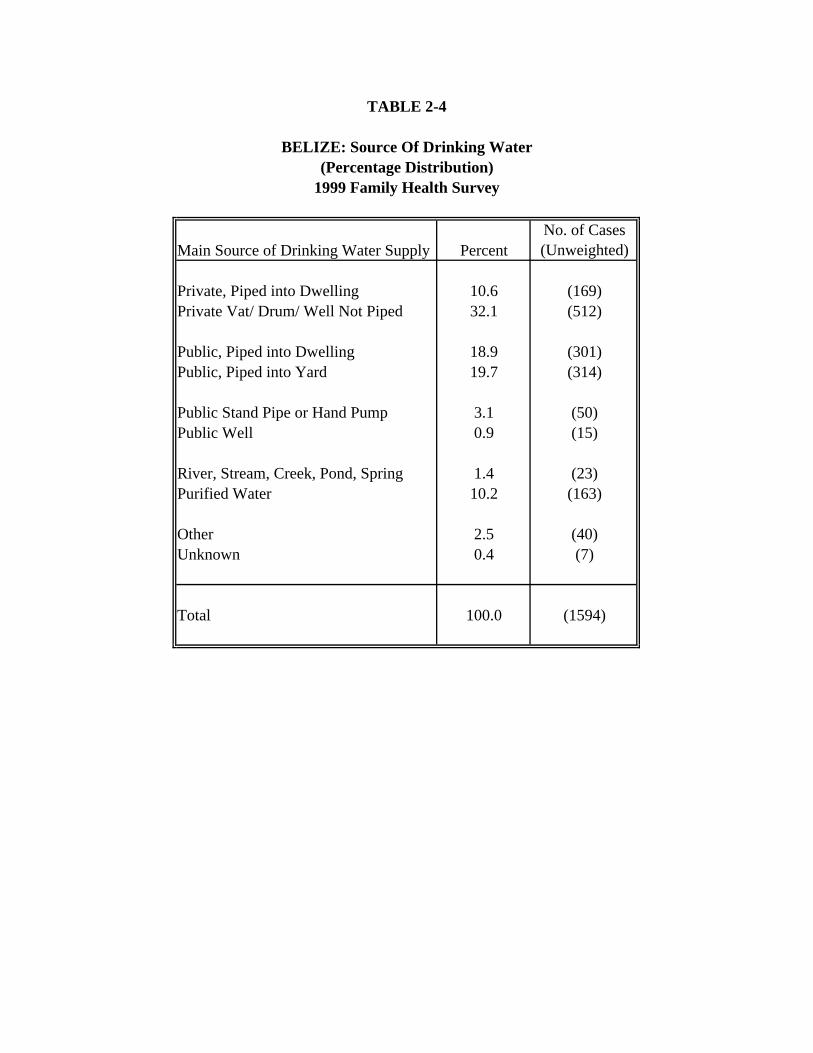
TABLE 2-4
BELIZE: Source Of Drinking Water(Percentage Distribution)
1999 Family Health Survey
Main Source of Drinking Water Supply PercentNo. of Cases (Unweighted)
Private, Piped into Dwelling 10.6 (169)Private Vat/ Drum/ Well Not Piped 32.1 (512)
Public, Piped into Dwelling 18.9 (301)Public, Piped into Yard 19.7 (314)
Public Stand Pipe or Hand Pump 3.1 (50)Public Well 0.9 (15)
River, Stream, Creek, Pond, Spring 1.4 (23)Purified Water 10.2 (163)
Other 2.5 (40)Unknown 0.4 (7)
Total 100.0 (1594)
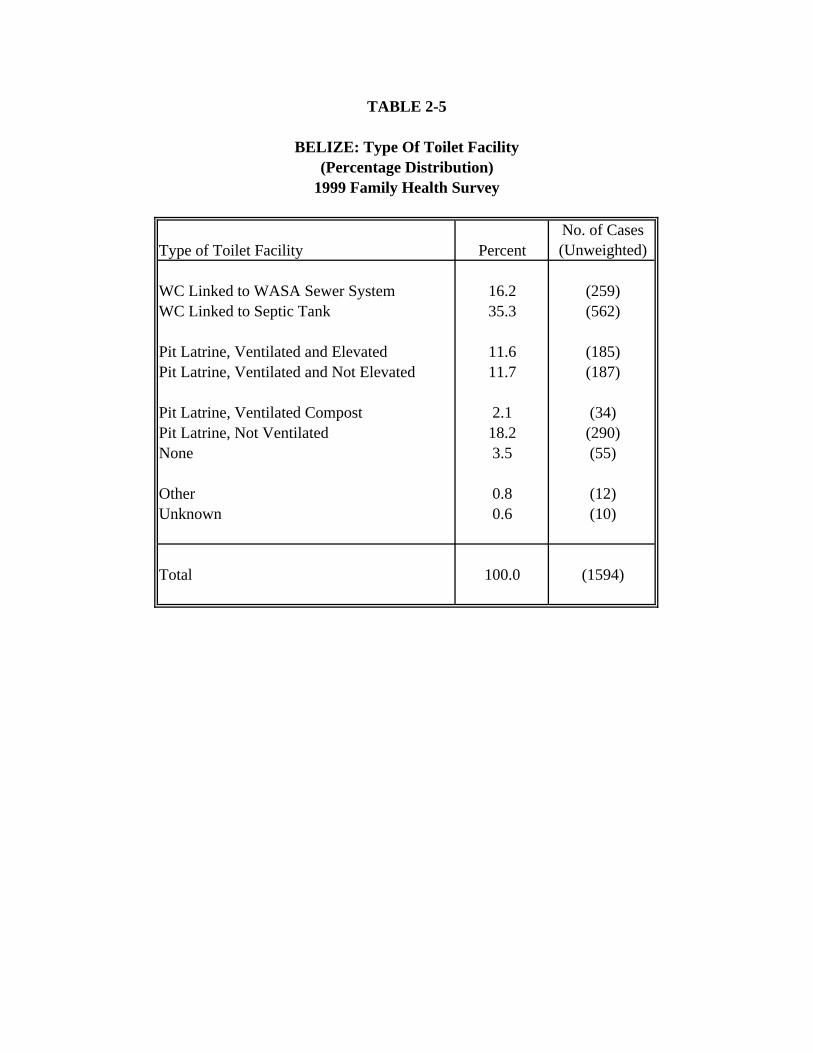
TABLE 2-5
BELIZE: Type Of Toilet Facility(Percentage Distribution)
1999 Family Health Survey
Type of Toilet Facility PercentNo. of Cases (Unweighted)
WC Linked to WASA Sewer System 16.2 (259)WC Linked to Septic Tank 35.3 (562)
Pit Latrine, Ventilated and Elevated 11.6 (185)Pit Latrine, Ventilated and Not Elevated 11.7 (187)
Pit Latrine, Ventilated Compost 2.1 (34)Pit Latrine, Not Ventilated 18.2 (290)None 3.5 (55)
Other 0.8 (12)Unknown 0.6 (10)
Total 100.0 (1594)
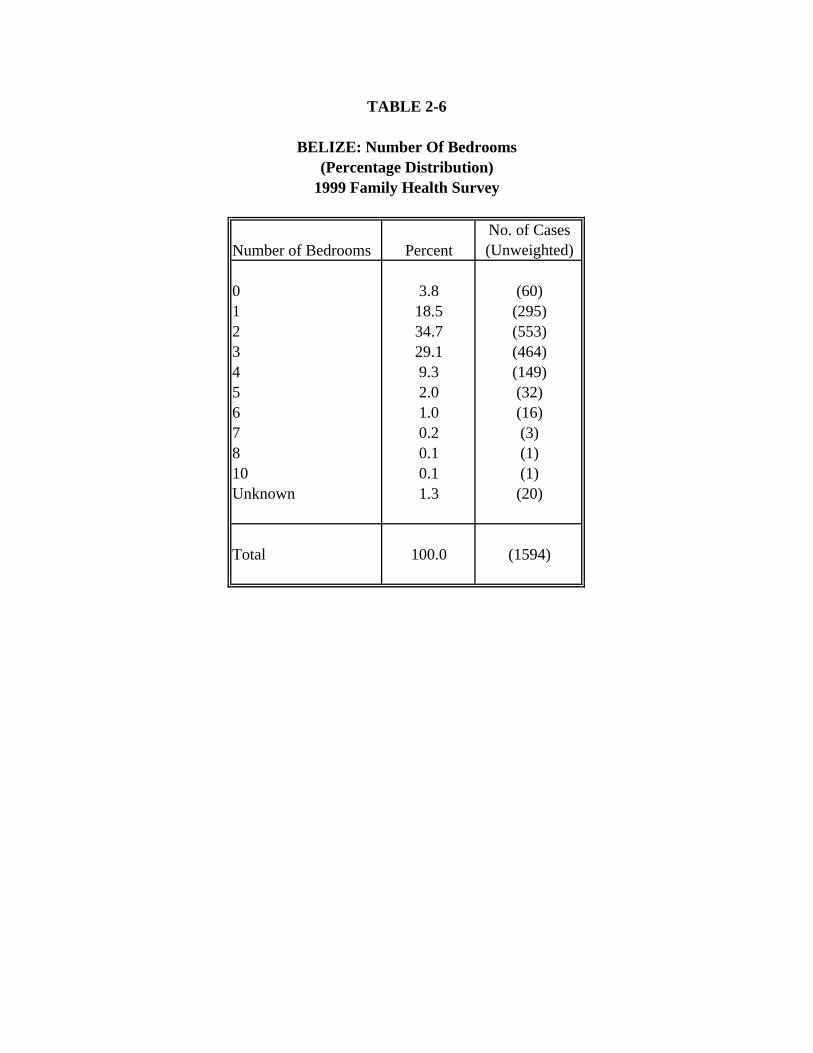
TABLE 2-6
BELIZE: Number Of Bedrooms(Percentage Distribution)
1999 Family Health Survey
Number of Bedrooms PercentNo. of Cases (Unweighted)
0 3.8 (60)1 18.5 (295)2 34.7 (553)3 29.1 (464)4 9.3 (149)5 2.0 (32)6 1.0 (16)7 0.2 (3)8 0.1 (1)10 0.1 (1)Unknown 1.3 (20)
Total 100.0 (1594)
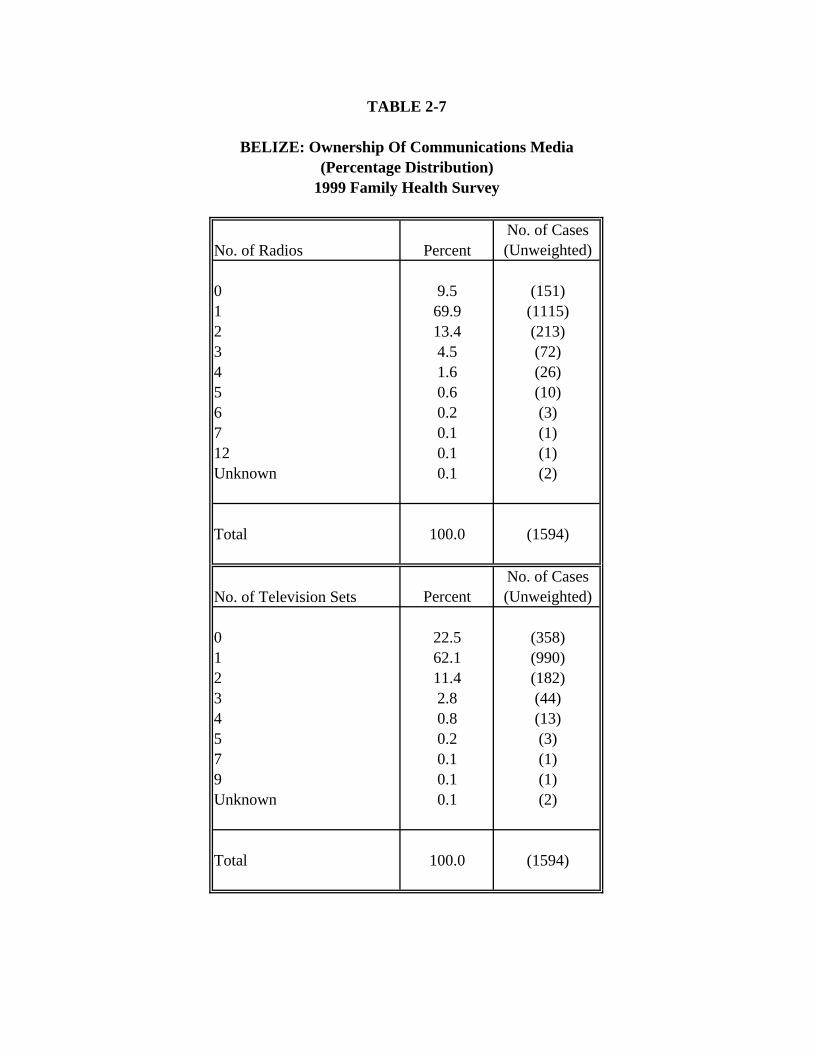
TABLE 2-7
BELIZE: Ownership Of Communications Media(Percentage Distribution)
1999 Family Health Survey
No. of Radios PercentNo. of Cases (Unweighted)
0 9.5 (151)1 69.9 (1115)2 13.4 (213)3 4.5 (72)4 1.6 (26)5 0.6 (10)6 0.2 (3)7 0.1 (1)12 0.1 (1)Unknown 0.1 (2)
Total 100.0 (1594)
No. of Television Sets PercentNo. of Cases (Unweighted)
0 22.5 (358)1 62.1 (990)2 11.4 (182)3 2.8 (44)4 0.8 (13)5 0.2 (3)7 0.1 (1)9 0.1 (1)Unknown 0.1 (2)
Total 100.0 (1594)
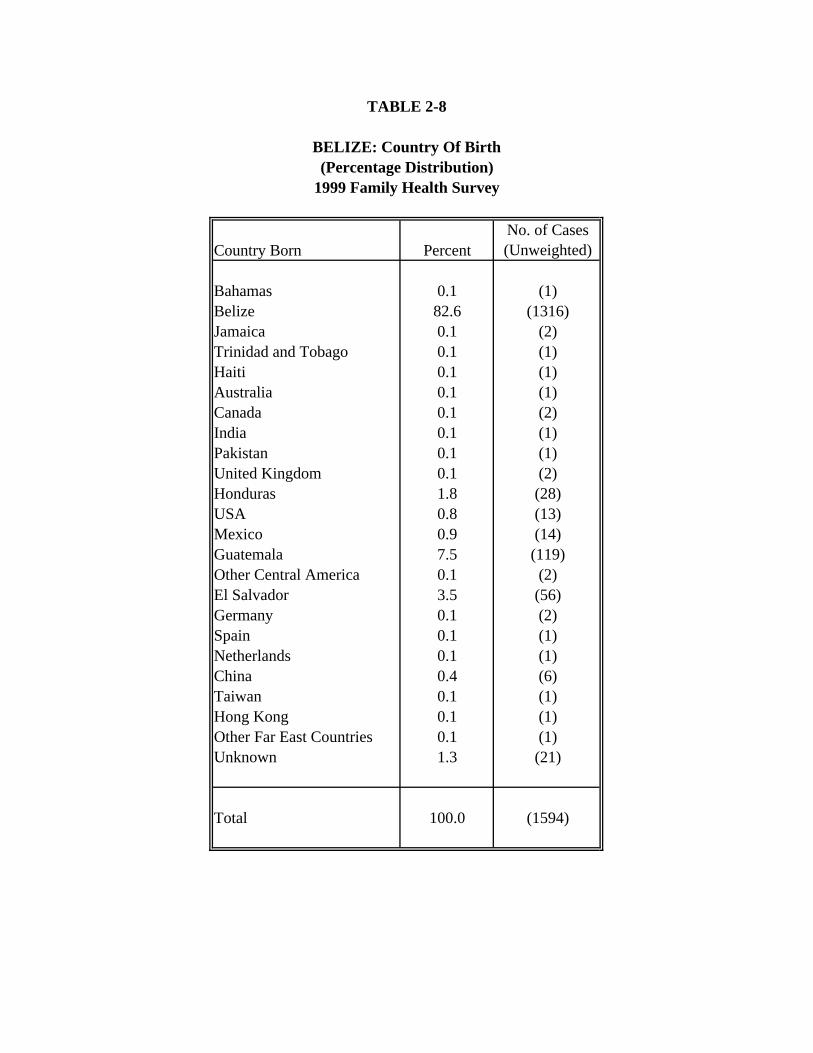
TABLE 2-8
BELIZE: Country Of Birth(Percentage Distribution)
1999 Family Health Survey
Country Born PercentNo. of Cases (Unweighted)
Bahamas 0.1 (1)Belize 82.6 (1316)Jamaica 0.1 (2)Trinidad and Tobago 0.1 (1)Haiti 0.1 (1)Australia 0.1 (1)Canada 0.1 (2)India 0.1 (1)Pakistan 0.1 (1)United Kingdom 0.1 (2)Honduras 1.8 (28)USA 0.8 (13)Mexico 0.9 (14)Guatemala 7.5 (119)Other Central America 0.1 (2)El Salvador 3.5 (56)Germany 0.1 (2)Spain 0.1 (1)Netherlands 0.1 (1)China 0.4 (6)Taiwan 0.1 (1)Hong Kong 0.1 (1)Other Far East Countries 0.1 (1)Unknown 1.3 (21)
Total 100.0 (1594)
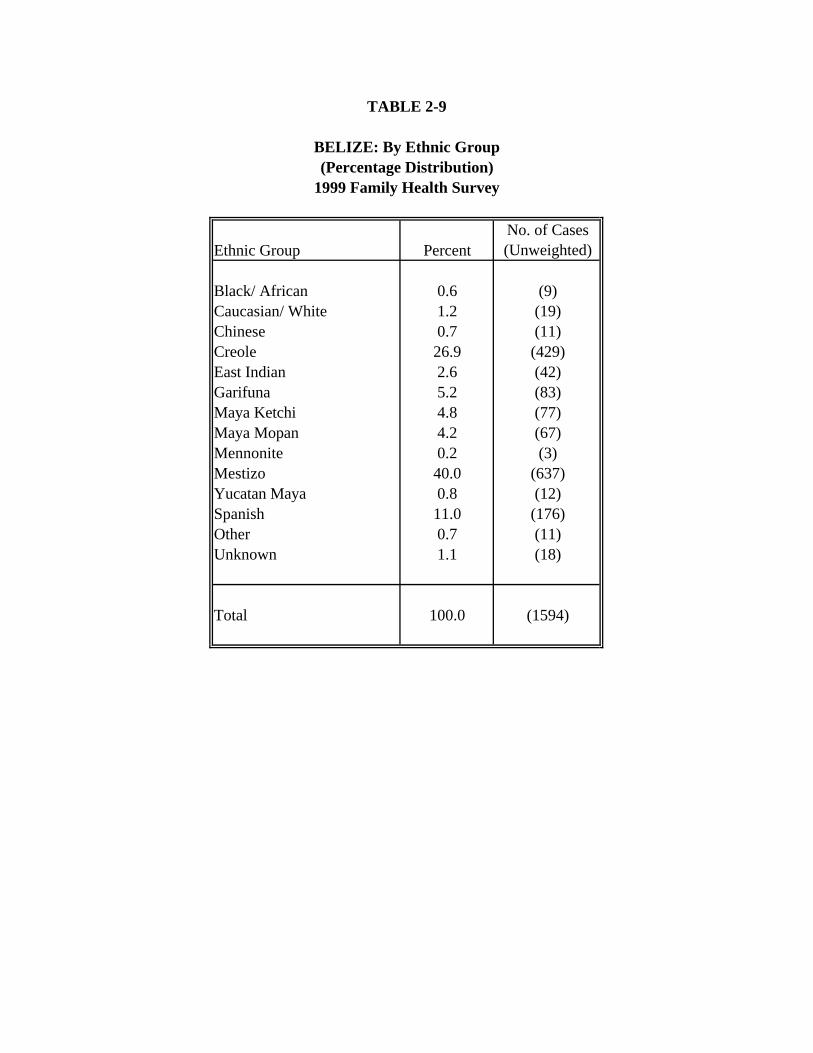
TABLE 2-9
BELIZE: By Ethnic Group(Percentage Distribution)
1999 Family Health Survey
Ethnic Group PercentNo. of Cases (Unweighted)
Black/ African 0.6 (9)Caucasian/ White 1.2 (19)Chinese 0.7 (11)Creole 26.9 (429)East Indian 2.6 (42)Garifuna 5.2 (83)Maya Ketchi 4.8 (77)Maya Mopan 4.2 (67)Mennonite 0.2 (3)Mestizo 40.0 (637)Yucatan Maya 0.8 (12)Spanish 11.0 (176)Other 0.7 (11)Unknown 1.1 (18)
Total 100.0 (1594)
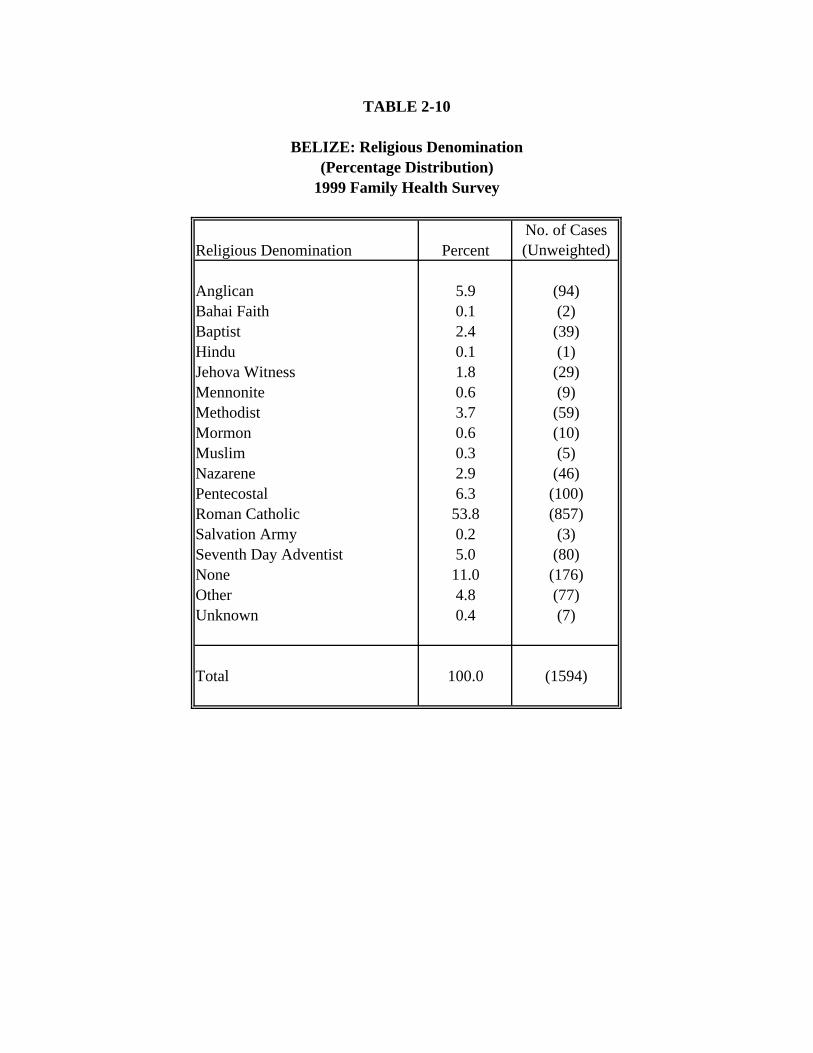
TABLE 2-10
BELIZE: Religious Denomination(Percentage Distribution)
1999 Family Health Survey
Religious Denomination PercentNo. of Cases (Unweighted)
Anglican 5.9 (94)Bahai Faith 0.1 (2)Baptist 2.4 (39)Hindu 0.1 (1)Jehova Witness 1.8 (29)Mennonite 0.6 (9)Methodist 3.7 (59)Mormon 0.6 (10)Muslim 0.3 (5)Nazarene 2.9 (46)Pentecostal 6.3 (100)Roman Catholic 53.8 (857)Salvation Army 0.2 (3)Seventh Day Adventist 5.0 (80)None 11.0 (176)Other 4.8 (77)Unknown 0.4 (7)
Total 100.0 (1594)
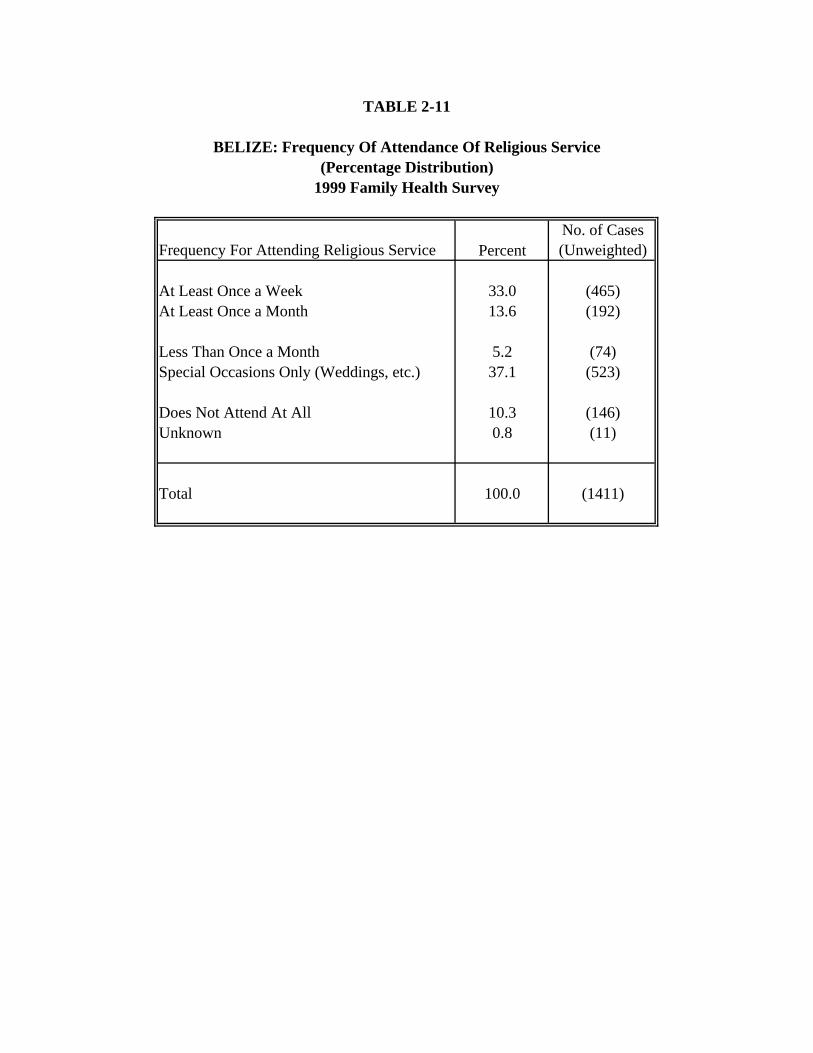
TABLE 2-11
BELIZE: Frequency Of Attendance Of Religious Service(Percentage Distribution)
1999 Family Health Survey
Frequency For Attending Religious Service PercentNo. of Cases (Unweighted)
At Least Once a Week 33.0 (465)At Least Once a Month 13.6 (192)
Less Than Once a Month 5.2 (74)Special Occasions Only (Weddings, etc.) 37.1 (523)
Does Not Attend At All 10.3 (146)Unknown 0.8 (11)
Total 100.0 (1411)
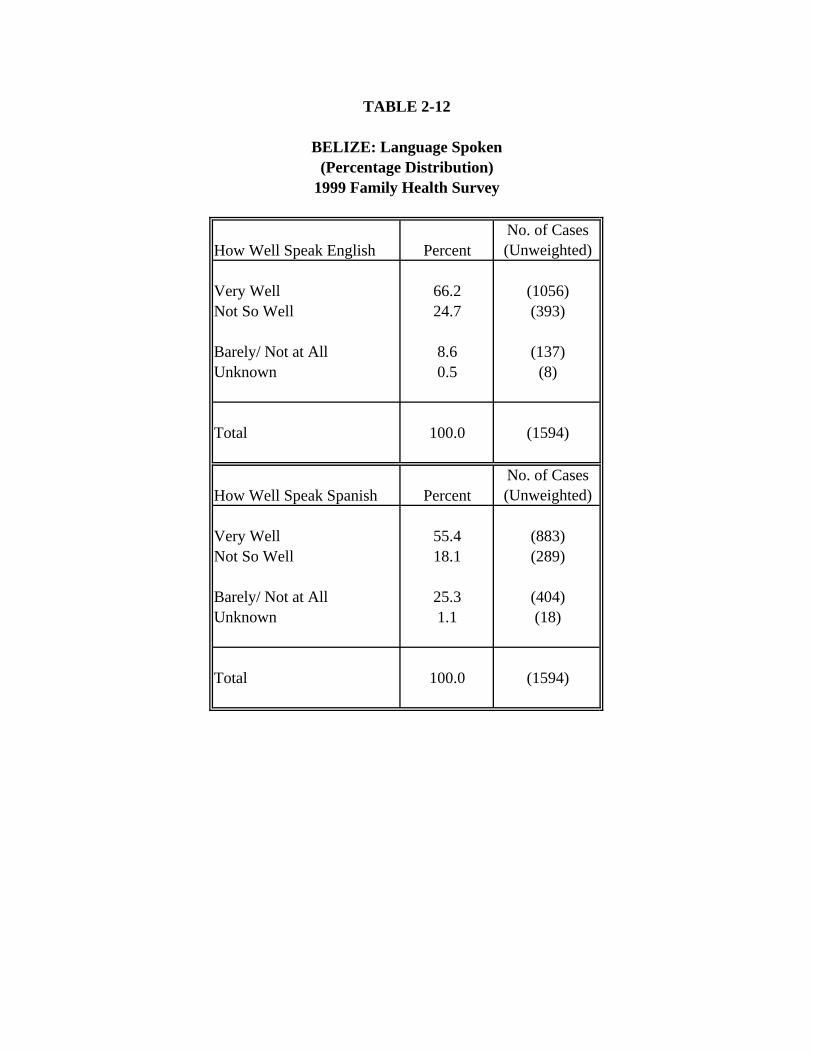
TABLE 2-12
BELIZE: Language Spoken(Percentage Distribution)
1999 Family Health Survey
How Well Speak English PercentNo. of Cases (Unweighted)
Very Well 66.2 (1056)Not So Well 24.7 (393)
Barely/ Not at All 8.6 (137)Unknown 0.5 (8)
Total 100.0 (1594)
How Well Speak Spanish PercentNo. of Cases (Unweighted)
Very Well 55.4 (883)Not So Well 18.1 (289)
Barely/ Not at All 25.3 (404)Unknown 1.1 (18)
Total 100.0 (1594)
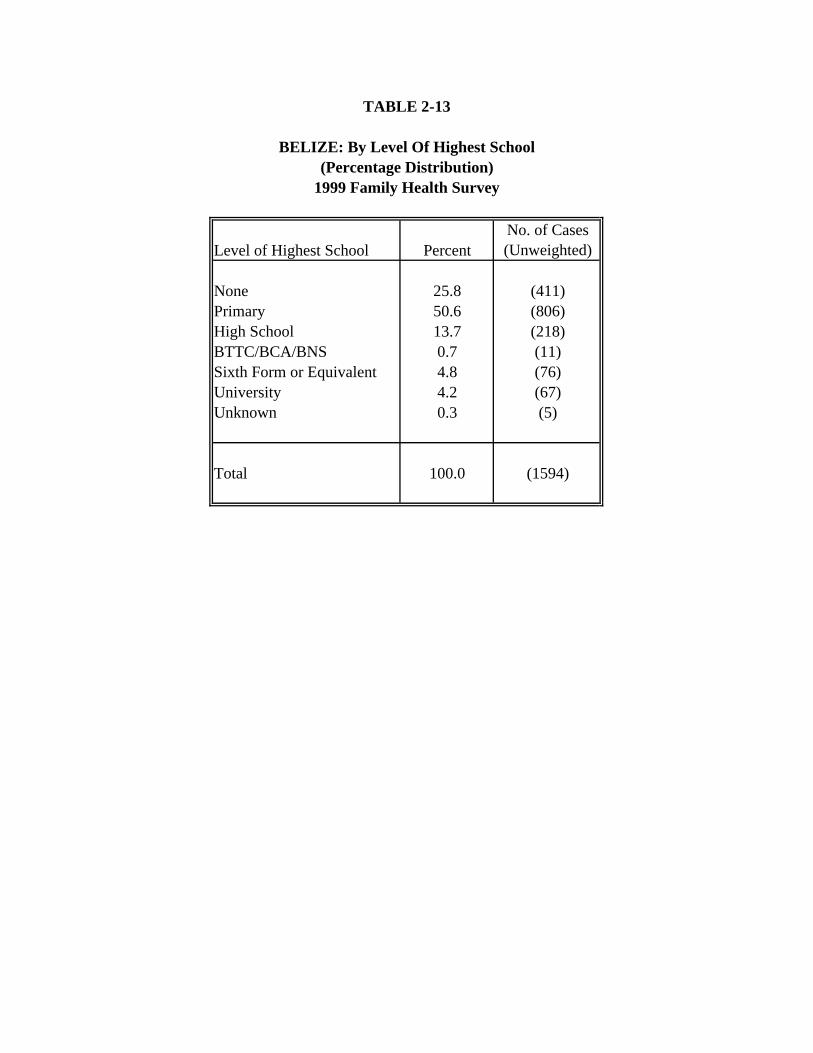
TABLE 2-13
BELIZE: By Level Of Highest School(Percentage Distribution)
1999 Family Health Survey
Level of Highest School PercentNo. of Cases (Unweighted)
None 25.8 (411)Primary 50.6 (806)High School 13.7 (218)BTTC/BCA/BNS 0.7 (11)Sixth Form or Equivalent 4.8 (76)University 4.2 (67)Unknown 0.3 (5)
Total 100.0 (1594)
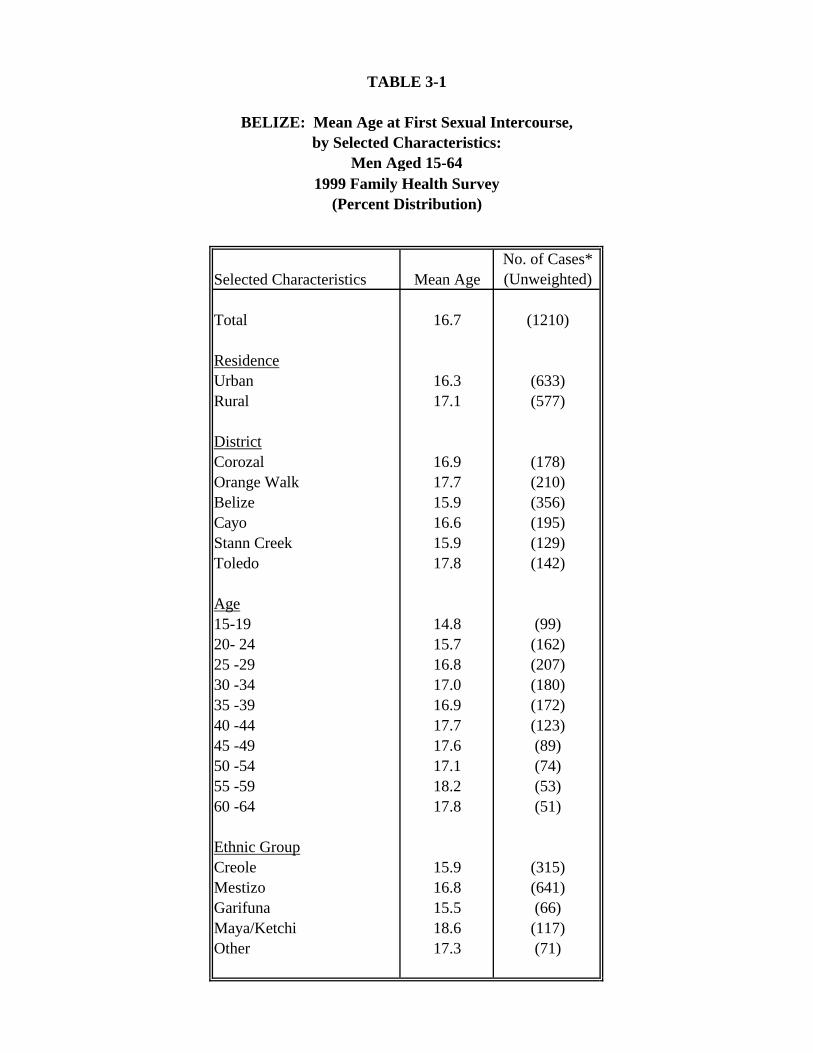
TABLE 3-1
BELIZE: Mean Age at First Sexual Intercourse,by Selected Characteristics:
Men Aged 15-64
Selected Characteristics Mean AgeNo. of Cases* (Unweighted)
Total 16.7 (1210)
ResidenceUrban 16.3 (633)Rural 17.1 (577)
DistrictCorozal 16.9 (178)Orange Walk 17.7 (210)Belize 15.9 (356)Cayo 16.6 (195)Stann Creek 15.9 (129)Toledo 17.8 (142)
Age15-19 14.8 (99)20- 24 15.7 (162)25 -29 16.8 (207)30 -34 17.0 (180)35 -39 16.9 (172)40 -44 17.7 (123)45 -49 17.6 (89)50 -54 17.1 (74)55 -59 18.2 (53)60 -64 17.8 (51)
Ethnic GroupCreole 15.9 (315)Mestizo 16.8 (641)Garifuna 15.5 (66)Maya/Ketchi 18.6 (117)Other 17.3 (71)
1999 Family Health Survey(Percent Distribution)
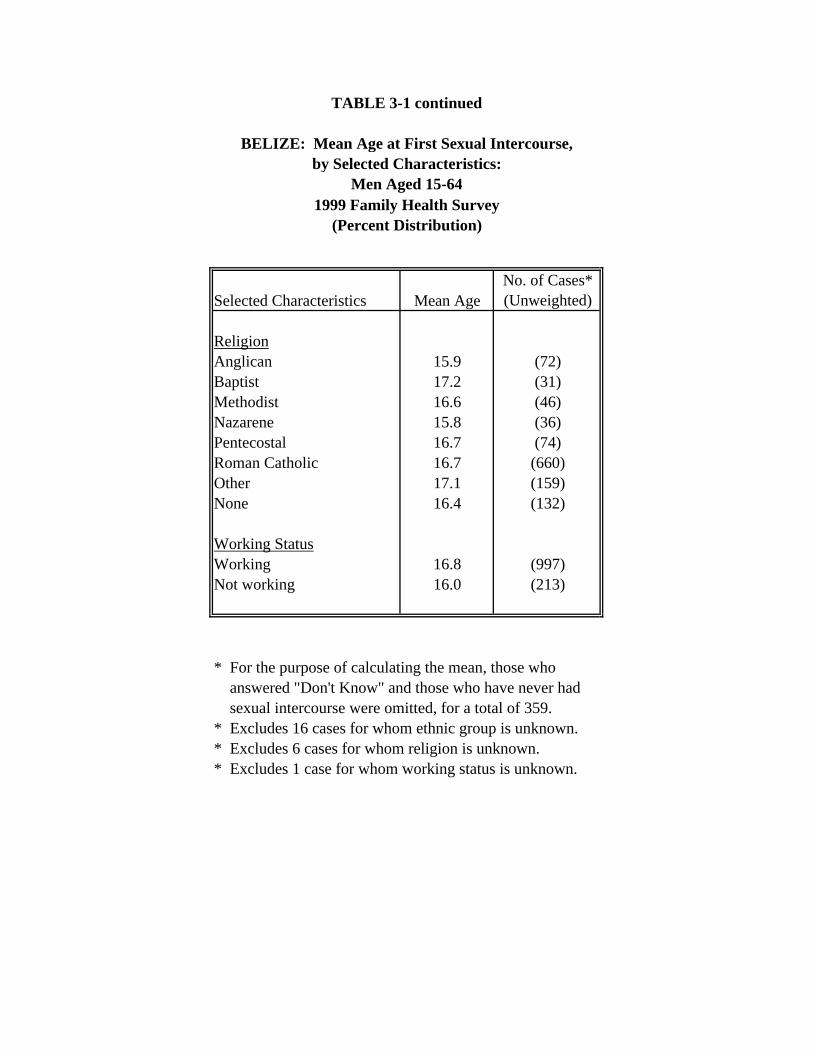
TABLE 3-1 continued
BELIZE: Mean Age at First Sexual Intercourse,by Selected Characteristics:
Men Aged 15-64
Selected Characteristics Mean AgeNo. of Cases* (Unweighted)
ReligionAnglican 15.9 (72)Baptist 17.2 (31)Methodist 16.6 (46)Nazarene 15.8 (36)Pentecostal 16.7 (74)Roman Catholic 16.7 (660)Other 17.1 (159)None 16.4 (132)
Working StatusWorking 16.8 (997)Not working 16.0 (213)
* For the purpose of calculating the mean, those who answered "Don't Know" and those who have never had sexual intercourse were omitted, for a total of 359.* Excludes 16 cases for whom ethnic group is unknown.* Excludes 6 cases for whom religion is unknown.* Excludes 1 case for whom working status is unknown.
(Percent Distribution)1999 Family Health Survey
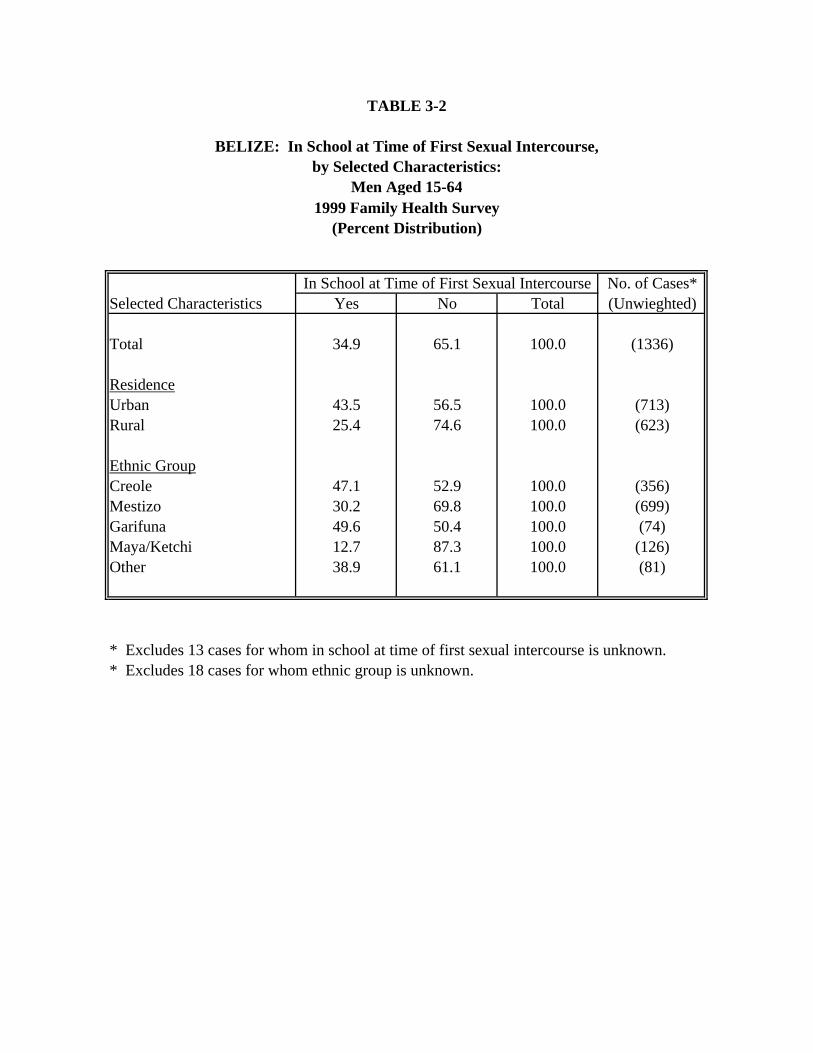
TABLE 3-2
BELIZE: In School at Time of First Sexual Intercourse,by Selected Characteristics:
Men Aged 15-64
In School at Time of First Sexual Intercourse No. of Cases*Selected Characteristics Yes No Total (Unwieghted)
Total 34.9 65.1 100.0 (1336)
ResidenceUrban 43.5 56.5 100.0 (713)Rural 25.4 74.6 100.0 (623)
Ethnic GroupCreole 47.1 52.9 100.0 (356)Mestizo 30.2 69.8 100.0 (699)Garifuna 49.6 50.4 100.0 (74)Maya/Ketchi 12.7 87.3 100.0 (126)Other 38.9 61.1 100.0 (81)
* Excludes 13 cases for whom in school at time of first sexual intercourse is unknown.* Excludes 18 cases for whom ethnic group is unknown.
1999 Family Health Survey(Percent Distribution)
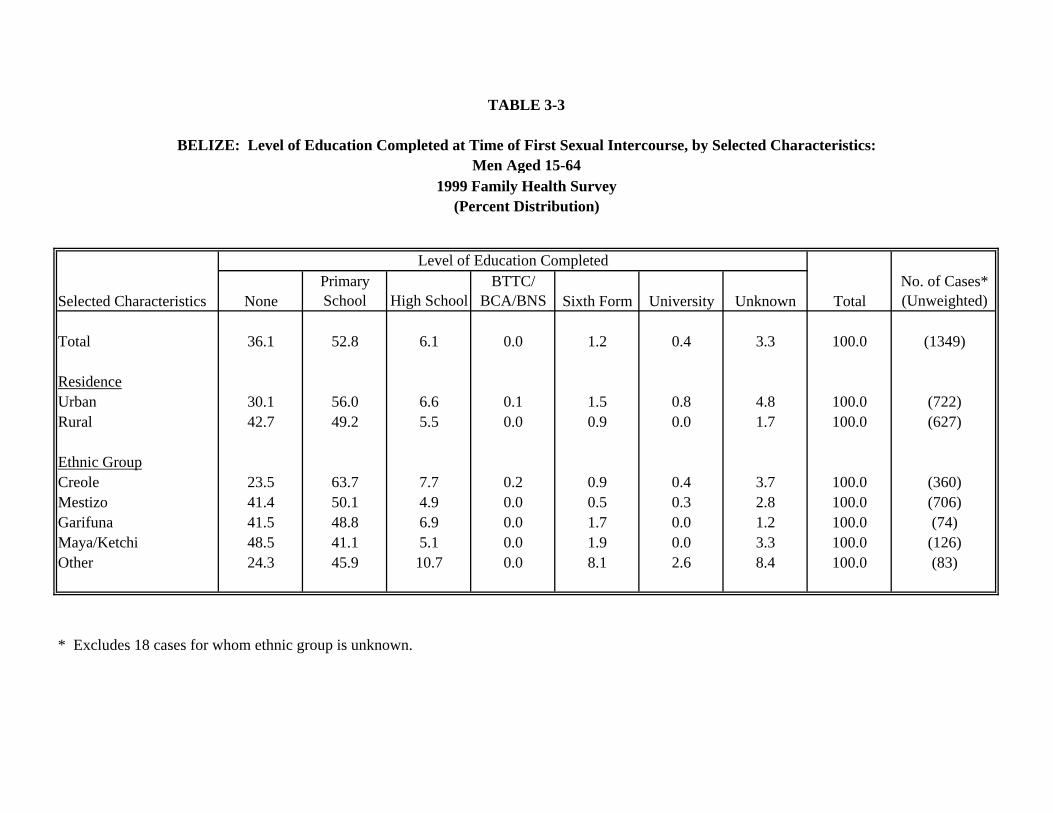
TABLE 3-3
BELIZE: Level of Education Completed at Time of First Sexual Intercourse, by Selected Characteristics:Men Aged 15-64
Level of Education Completed
Selected Characteristics NonePrimary School High School
BTTC/ BCA/BNS Sixth Form University Unknown Total
No. of Cases* (Unweighted)
Total 36.1 52.8 6.1 0.0 1.2 0.4 3.3 100.0 (1349)
ResidenceUrban 30.1 56.0 6.6 0.1 1.5 0.8 4.8 100.0 (722)Rural 42.7 49.2 5.5 0.0 0.9 0.0 1.7 100.0 (627)
Ethnic GroupCreole 23.5 63.7 7.7 0.2 0.9 0.4 3.7 100.0 (360)Mestizo 41.4 50.1 4.9 0.0 0.5 0.3 2.8 100.0 (706)Garifuna 41.5 48.8 6.9 0.0 1.7 0.0 1.2 100.0 (74)Maya/Ketchi 48.5 41.1 5.1 0.0 1.9 0.0 3.3 100.0 (126)Other 24.3 45.9 10.7 0.0 8.1 2.6 8.4 100.0 (83)
* Excludes 18 cases for whom ethnic group is unknown.
1999 Family Health Survey(Percent Distribution)
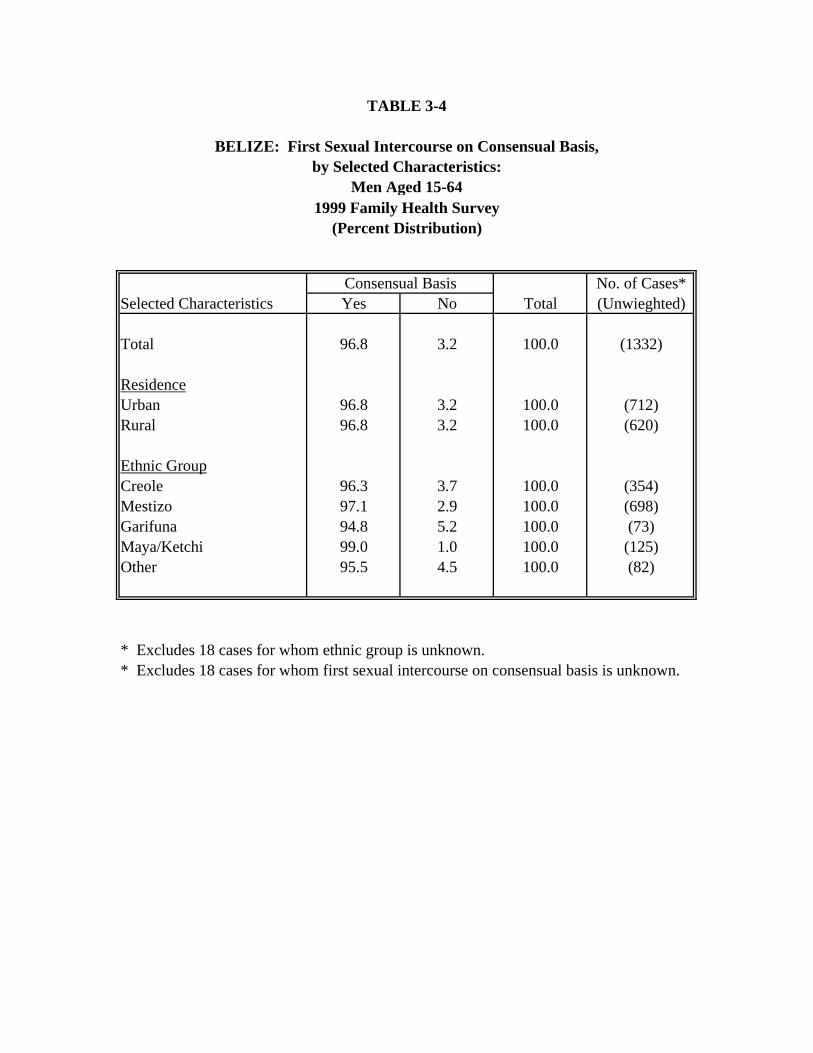
TABLE 3-4
BELIZE: First Sexual Intercourse on Consensual Basis,by Selected Characteristics:
Men Aged 15-64
Consensual Basis No. of Cases*Selected Characteristics Yes No Total (Unwieghted)
Total 96.8 3.2 100.0 (1332)
ResidenceUrban 96.8 3.2 100.0 (712)Rural 96.8 3.2 100.0 (620)
Ethnic GroupCreole 96.3 3.7 100.0 (354)Mestizo 97.1 2.9 100.0 (698)Garifuna 94.8 5.2 100.0 (73)Maya/Ketchi 99.0 1.0 100.0 (125)Other 95.5 4.5 100.0 (82)
* Excludes 18 cases for whom ethnic group is unknown.* Excludes 18 cases for whom first sexual intercourse on consensual basis is unknown.
1999 Family Health Survey(Percent Distribution)
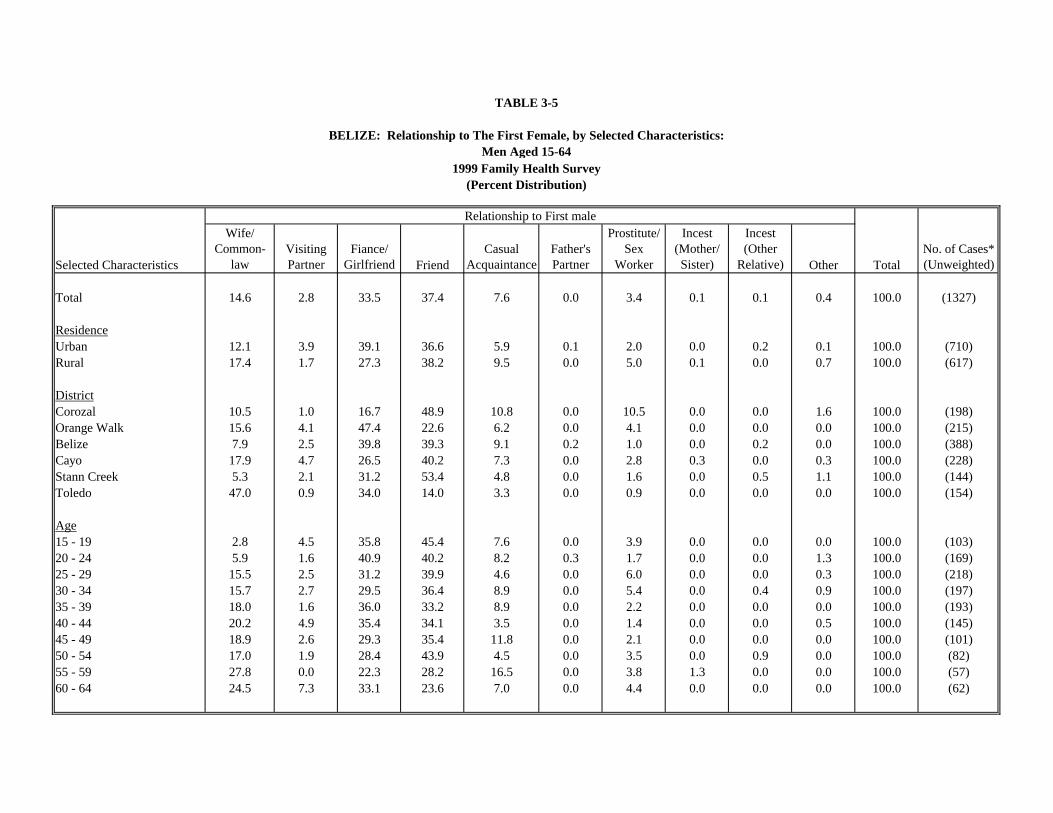
TABLE 3-5
BELIZE: Relationship to The First Female, by Selected Characteristics:Men Aged 15-64
Relationship to First male
Selected Characteristics
Wife/ Common-
lawVisiting Partner
Fiance/ Girlfriend Friend
Casual Acquaintance
Father's Partner
Prostitute/ Sex
Worker
Incest (Mother/ Sister)
Incest (Other
Relative) Other TotalNo. of Cases* (Unweighted)
Total 14.6 2.8 33.5 37.4 7.6 0.0 3.4 0.1 0.1 0.4 100.0 (1327)
ResidenceUrban 12.1 3.9 39.1 36.6 5.9 0.1 2.0 0.0 0.2 0.1 100.0 (710)Rural 17.4 1.7 27.3 38.2 9.5 0.0 5.0 0.1 0.0 0.7 100.0 (617)
DistrictCorozal 10.5 1.0 16.7 48.9 10.8 0.0 10.5 0.0 0.0 1.6 100.0 (198)Orange Walk 15.6 4.1 47.4 22.6 6.2 0.0 4.1 0.0 0.0 0.0 100.0 (215)Belize 7.9 2.5 39.8 39.3 9.1 0.2 1.0 0.0 0.2 0.0 100.0 (388)Cayo 17.9 4.7 26.5 40.2 7.3 0.0 2.8 0.3 0.0 0.3 100.0 (228)Stann Creek 5.3 2.1 31.2 53.4 4.8 0.0 1.6 0.0 0.5 1.1 100.0 (144)Toledo 47.0 0.9 34.0 14.0 3.3 0.0 0.9 0.0 0.0 0.0 100.0 (154)
Age15 - 19 2.8 4.5 35.8 45.4 7.6 0.0 3.9 0.0 0.0 0.0 100.0 (103)20 - 24 5.9 1.6 40.9 40.2 8.2 0.3 1.7 0.0 0.0 1.3 100.0 (169)25 - 29 15.5 2.5 31.2 39.9 4.6 0.0 6.0 0.0 0.0 0.3 100.0 (218)30 - 34 15.7 2.7 29.5 36.4 8.9 0.0 5.4 0.0 0.4 0.9 100.0 (197)35 - 39 18.0 1.6 36.0 33.2 8.9 0.0 2.2 0.0 0.0 0.0 100.0 (193)40 - 44 20.2 4.9 35.4 34.1 3.5 0.0 1.4 0.0 0.0 0.5 100.0 (145)45 - 49 18.9 2.6 29.3 35.4 11.8 0.0 2.1 0.0 0.0 0.0 100.0 (101)50 - 54 17.0 1.9 28.4 43.9 4.5 0.0 3.5 0.0 0.9 0.0 100.0 (82)55 - 59 27.8 0.0 22.3 28.2 16.5 0.0 3.8 1.3 0.0 0.0 100.0 (57)60 - 64 24.5 7.3 33.1 23.6 7.0 0.0 4.4 0.0 0.0 0.0 100.0 (62)
1999 Family Health Survey(Percent Distribution)
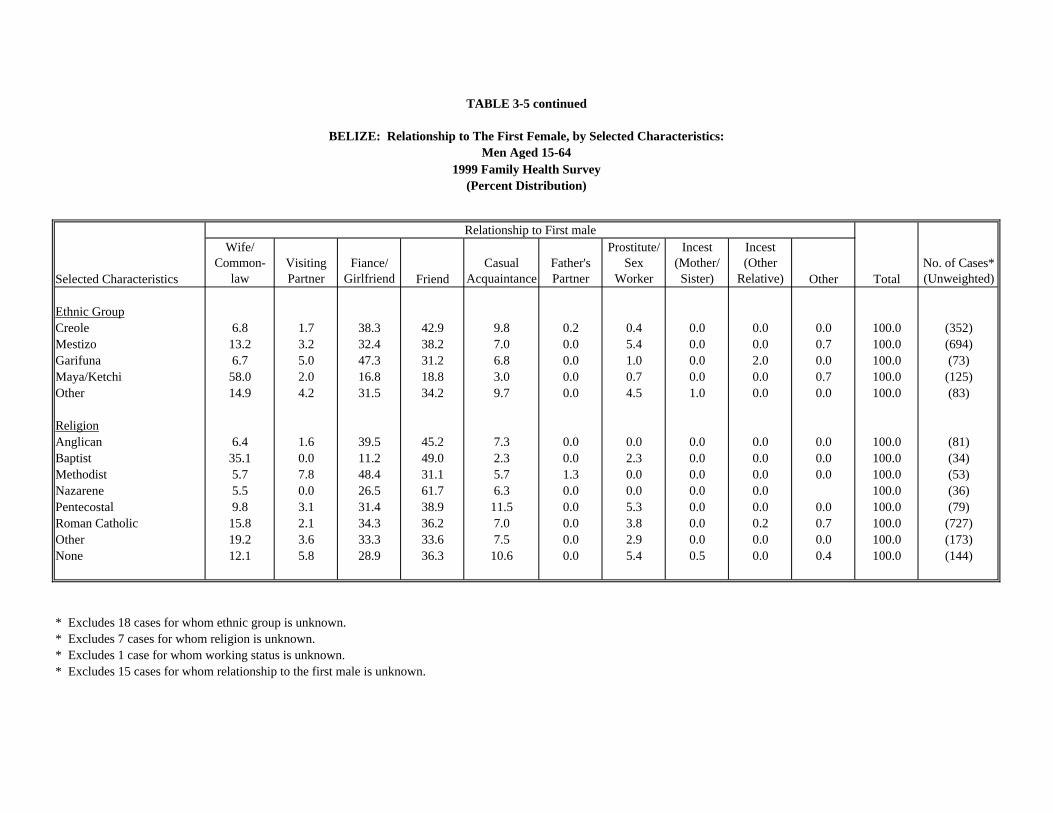
TABLE 3-5 continued
BELIZE: Relationship to The First Female, by Selected Characteristics:Men Aged 15-64
Relationship to First male
Selected Characteristics
Wife/ Common-
lawVisiting Partner
Fiance/ Girlfriend Friend
Casual Acquaintance
Father's Partner
Prostitute/ Sex
Worker
Incest (Mother/ Sister)
Incest (Other
Relative) Other TotalNo. of Cases* (Unweighted)
Ethnic GroupCreole 6.8 1.7 38.3 42.9 9.8 0.2 0.4 0.0 0.0 0.0 100.0 (352)Mestizo 13.2 3.2 32.4 38.2 7.0 0.0 5.4 0.0 0.0 0.7 100.0 (694)Garifuna 6.7 5.0 47.3 31.2 6.8 0.0 1.0 0.0 2.0 0.0 100.0 (73)Maya/Ketchi 58.0 2.0 16.8 18.8 3.0 0.0 0.7 0.0 0.0 0.7 100.0 (125)Other 14.9 4.2 31.5 34.2 9.7 0.0 4.5 1.0 0.0 0.0 100.0 (83)
ReligionAnglican 6.4 1.6 39.5 45.2 7.3 0.0 0.0 0.0 0.0 0.0 100.0 (81)Baptist 35.1 0.0 11.2 49.0 2.3 0.0 2.3 0.0 0.0 0.0 100.0 (34)Methodist 5.7 7.8 48.4 31.1 5.7 1.3 0.0 0.0 0.0 0.0 100.0 (53)Nazarene 5.5 0.0 26.5 61.7 6.3 0.0 0.0 0.0 0.0 100.0 (36)Pentecostal 9.8 3.1 31.4 38.9 11.5 0.0 5.3 0.0 0.0 0.0 100.0 (79)Roman Catholic 15.8 2.1 34.3 36.2 7.0 0.0 3.8 0.0 0.2 0.7 100.0 (727)Other 19.2 3.6 33.3 33.6 7.5 0.0 2.9 0.0 0.0 0.0 100.0 (173)None 12.1 5.8 28.9 36.3 10.6 0.0 5.4 0.5 0.0 0.4 100.0 (144)
* Excludes 18 cases for whom ethnic group is unknown.* Excludes 7 cases for whom religion is unknown.* Excludes 1 case for whom working status is unknown.* Excludes 15 cases for whom relationship to the first male is unknown.
1999 Family Health Survey(Percent Distribution)
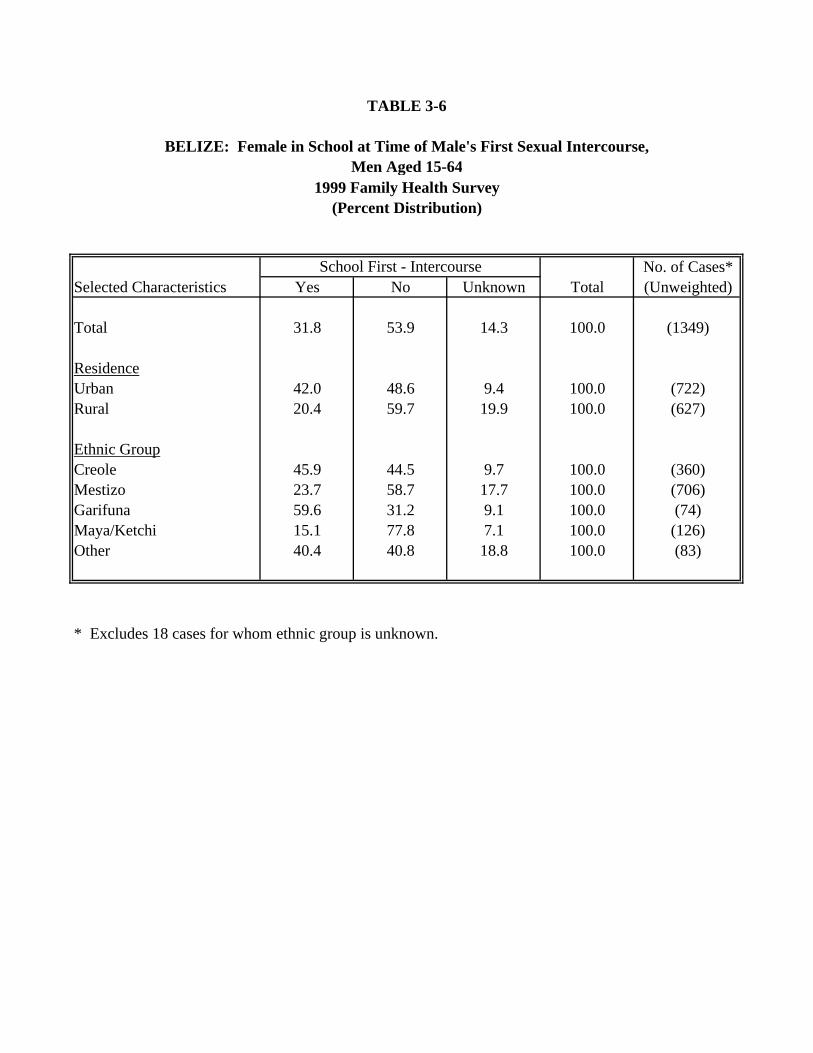
TABLE 3-6
BELIZE: Female in School at Time of Male's First Sexual Intercourse,Men Aged 15-64
School First - Intercourse No. of Cases*Selected Characteristics Yes No Unknown Total (Unweighted)
Total 31.8 53.9 14.3 100.0 (1349)
ResidenceUrban 42.0 48.6 9.4 100.0 (722)Rural 20.4 59.7 19.9 100.0 (627)
Ethnic GroupCreole 45.9 44.5 9.7 100.0 (360)Mestizo 23.7 58.7 17.7 100.0 (706)Garifuna 59.6 31.2 9.1 100.0 (74)Maya/Ketchi 15.1 77.8 7.1 100.0 (126)Other 40.4 40.8 18.8 100.0 (83)
* Excludes 18 cases for whom ethnic group is unknown.
1999 Family Health Survey(Percent Distribution)
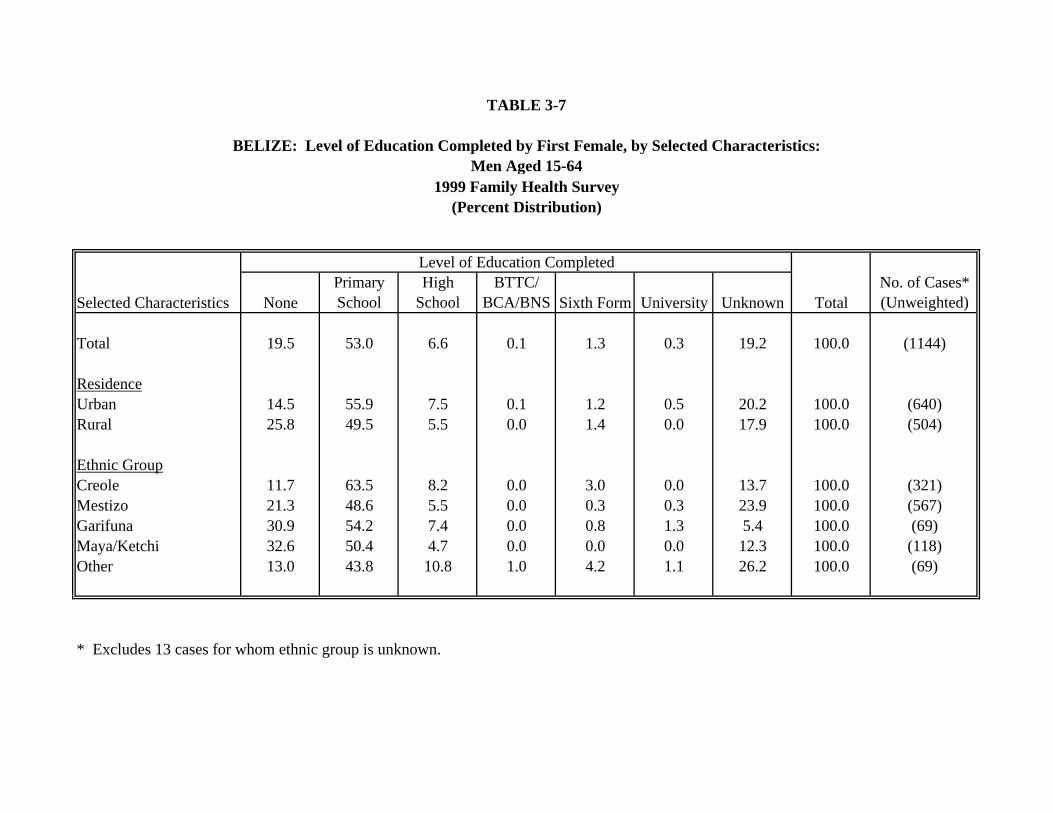
TABLE 3-7
BELIZE: Level of Education Completed by First Female, by Selected Characteristics:Men Aged 15-64
Level of Education Completed
Selected Characteristics NonePrimary School
High School
BTTC/ BCA/BNS Sixth Form University Unknown Total
No. of Cases* (Unweighted)
Total 19.5 53.0 6.6 0.1 1.3 0.3 19.2 100.0 (1144)
ResidenceUrban 14.5 55.9 7.5 0.1 1.2 0.5 20.2 100.0 (640)Rural 25.8 49.5 5.5 0.0 1.4 0.0 17.9 100.0 (504)
Ethnic GroupCreole 11.7 63.5 8.2 0.0 3.0 0.0 13.7 100.0 (321)Mestizo 21.3 48.6 5.5 0.0 0.3 0.3 23.9 100.0 (567)Garifuna 30.9 54.2 7.4 0.0 0.8 1.3 5.4 100.0 (69)Maya/Ketchi 32.6 50.4 4.7 0.0 0.0 0.0 12.3 100.0 (118)Other 13.0 43.8 10.8 1.0 4.2 1.1 26.2 100.0 (69)
* Excludes 13 cases for whom ethnic group is unknown.
1999 Family Health Survey(Percent Distribution)
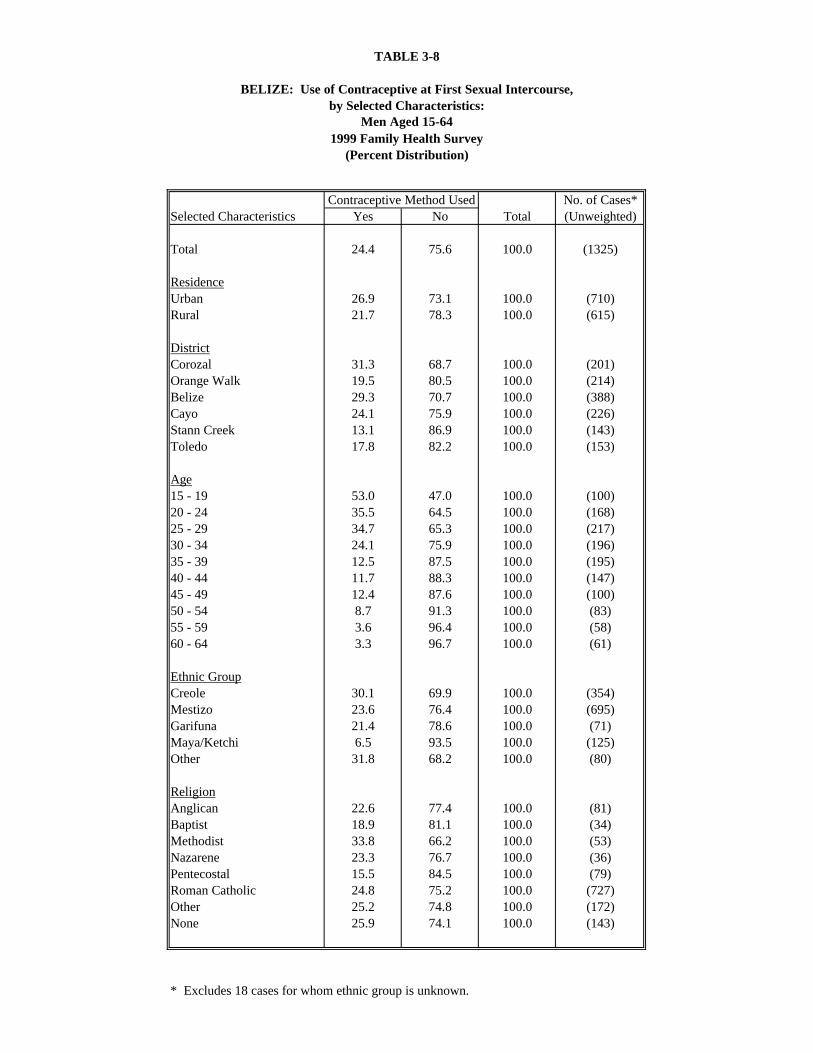
TABLE 3-8
BELIZE: Use of Contraceptive at First Sexual Intercourse,by Selected Characteristics:
Men Aged 15-64
Contraceptive Method Used No. of Cases*Selected Characteristics Yes No Total (Unweighted)
Total 24.4 75.6 100.0 (1325)
ResidenceUrban 26.9 73.1 100.0 (710)Rural 21.7 78.3 100.0 (615)
DistrictCorozal 31.3 68.7 100.0 (201)Orange Walk 19.5 80.5 100.0 (214)Belize 29.3 70.7 100.0 (388)Cayo 24.1 75.9 100.0 (226)Stann Creek 13.1 86.9 100.0 (143)Toledo 17.8 82.2 100.0 (153)
Age15 - 19 53.0 47.0 100.0 (100)20 - 24 35.5 64.5 100.0 (168)25 - 29 34.7 65.3 100.0 (217)30 - 34 24.1 75.9 100.0 (196)35 - 39 12.5 87.5 100.0 (195)40 - 44 11.7 88.3 100.0 (147)45 - 49 12.4 87.6 100.0 (100)50 - 54 8.7 91.3 100.0 (83)55 - 59 3.6 96.4 100.0 (58)60 - 64 3.3 96.7 100.0 (61)
Ethnic GroupCreole 30.1 69.9 100.0 (354)Mestizo 23.6 76.4 100.0 (695)Garifuna 21.4 78.6 100.0 (71)Maya/Ketchi 6.5 93.5 100.0 (125)Other 31.8 68.2 100.0 (80)
ReligionAnglican 22.6 77.4 100.0 (81)Baptist 18.9 81.1 100.0 (34)Methodist 33.8 66.2 100.0 (53)Nazarene 23.3 76.7 100.0 (36)Pentecostal 15.5 84.5 100.0 (79)Roman Catholic 24.8 75.2 100.0 (727)Other 25.2 74.8 100.0 (172)None 25.9 74.1 100.0 (143)
* Excludes 18 cases for whom ethnic group is unknown.
1999 Family Health Survey(Percent Distribution)
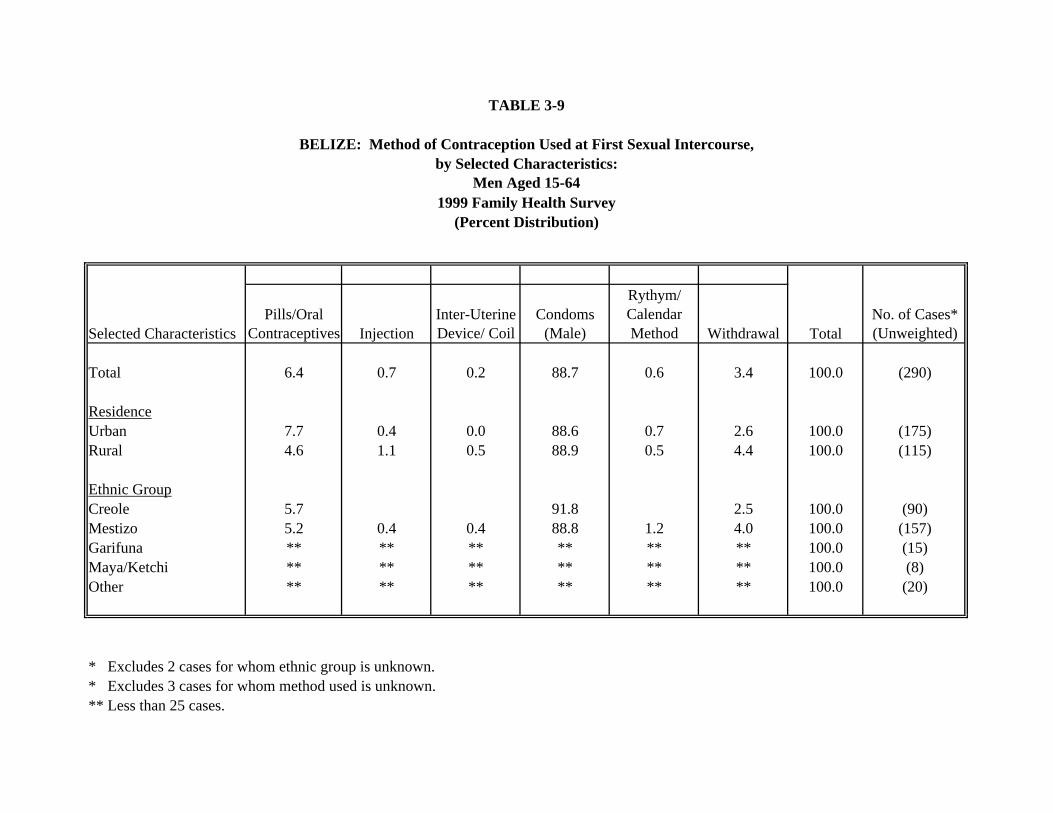
TABLE 3-9
BELIZE: Method of Contraception Used at First Sexual Intercourse,by Selected Characteristics:
Men Aged 15-64
Selected CharacteristicsPills/Oral
Contraceptives InjectionInter-Uterine Device/ Coil
Condoms (Male)
Rythym/ Calendar Method Withdrawal Total
No. of Cases* (Unweighted)
Total 6.4 0.7 0.2 88.7 0.6 3.4 100.0 (290)
ResidenceUrban 7.7 0.4 0.0 88.6 0.7 2.6 100.0 (175)Rural 4.6 1.1 0.5 88.9 0.5 4.4 100.0 (115)
Ethnic GroupCreole 5.7 91.8 2.5 100.0 (90)Mestizo 5.2 0.4 0.4 88.8 1.2 4.0 100.0 (157)Garifuna ** ** ** ** ** ** 100.0 (15)Maya/Ketchi ** ** ** ** ** ** 100.0 (8)Other ** ** ** ** ** ** 100.0 (20)
* Excludes 2 cases for whom ethnic group is unknown.* Excludes 3 cases for whom method used is unknown.** Less than 25 cases.
1999 Family Health Survey(Percent Distribution)
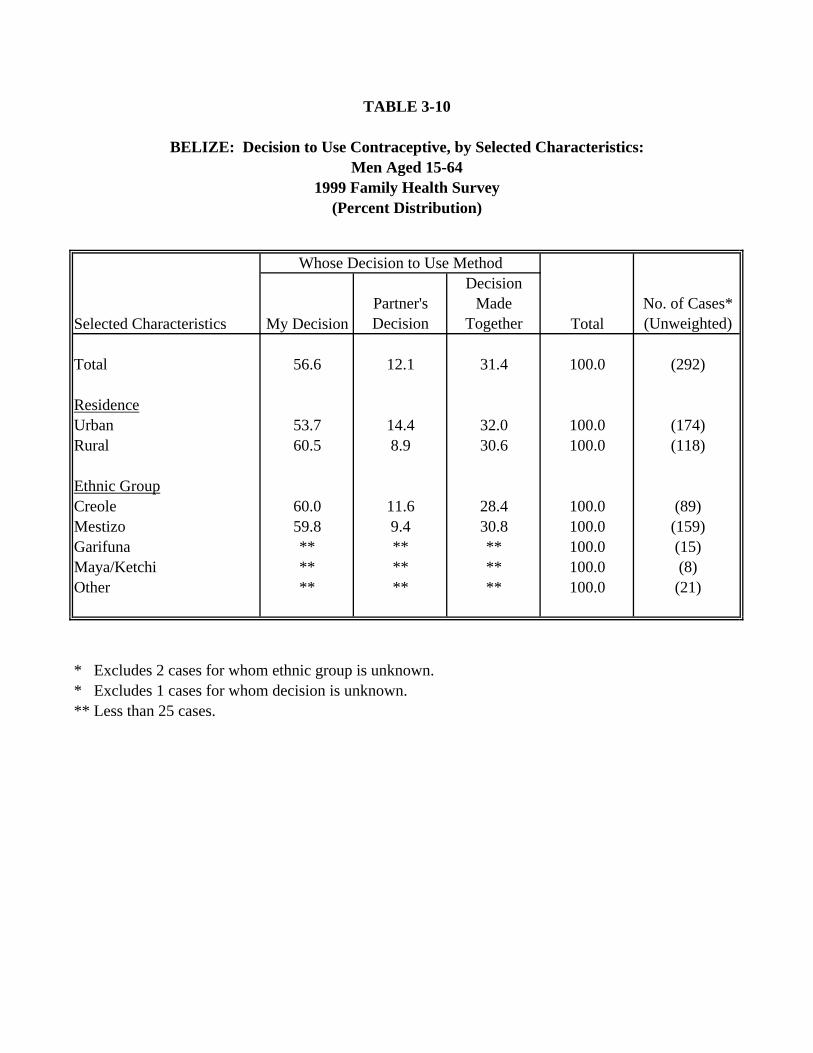
TABLE 3-10
BELIZE: Decision to Use Contraceptive, by Selected Characteristics:
Whose Decision to Use Method
Selected Characteristics My DecisionPartner's Decision
Decision Made
Together TotalNo. of Cases* (Unweighted)
Total 56.6 12.1 31.4 100.0 (292)
ResidenceUrban 53.7 14.4 32.0 100.0 (174)Rural 60.5 8.9 30.6 100.0 (118)
Ethnic GroupCreole 60.0 11.6 28.4 100.0 (89)Mestizo 59.8 9.4 30.8 100.0 (159)Garifuna ** ** ** 100.0 (15)Maya/Ketchi ** ** ** 100.0 (8)Other ** ** ** 100.0 (21)
* Excludes 2 cases for whom ethnic group is unknown.* Excludes 1 cases for whom decision is unknown.** Less than 25 cases.
Men Aged 15-641999 Family Health Survey
(Percent Distribution)
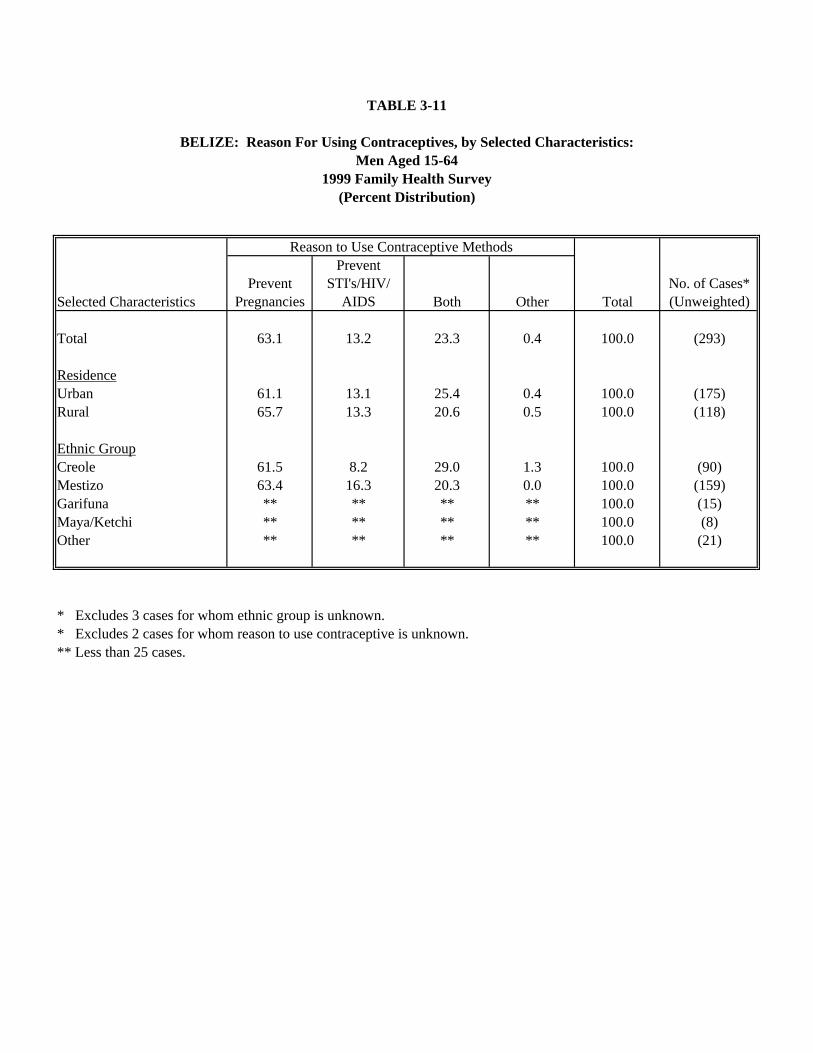
TABLE 3-11
BELIZE: Reason For Using Contraceptives, by Selected Characteristics:
Reason to Use Contraceptive Methods
Selected CharacteristicsPrevent
Pregnancies
Prevent STI's/HIV/
AIDS Both Other TotalNo. of Cases* (Unweighted)
Total 63.1 13.2 23.3 0.4 100.0 (293)
ResidenceUrban 61.1 13.1 25.4 0.4 100.0 (175)Rural 65.7 13.3 20.6 0.5 100.0 (118)
Ethnic GroupCreole 61.5 8.2 29.0 1.3 100.0 (90)Mestizo 63.4 16.3 20.3 0.0 100.0 (159)Garifuna ** ** ** ** 100.0 (15)Maya/Ketchi ** ** ** ** 100.0 (8)Other ** ** ** ** 100.0 (21)
* Excludes 3 cases for whom ethnic group is unknown.* Excludes 2 cases for whom reason to use contraceptive is unknown.** Less than 25 cases.
Men Aged 15-641999 Family Health Survey
(Percent Distribution)
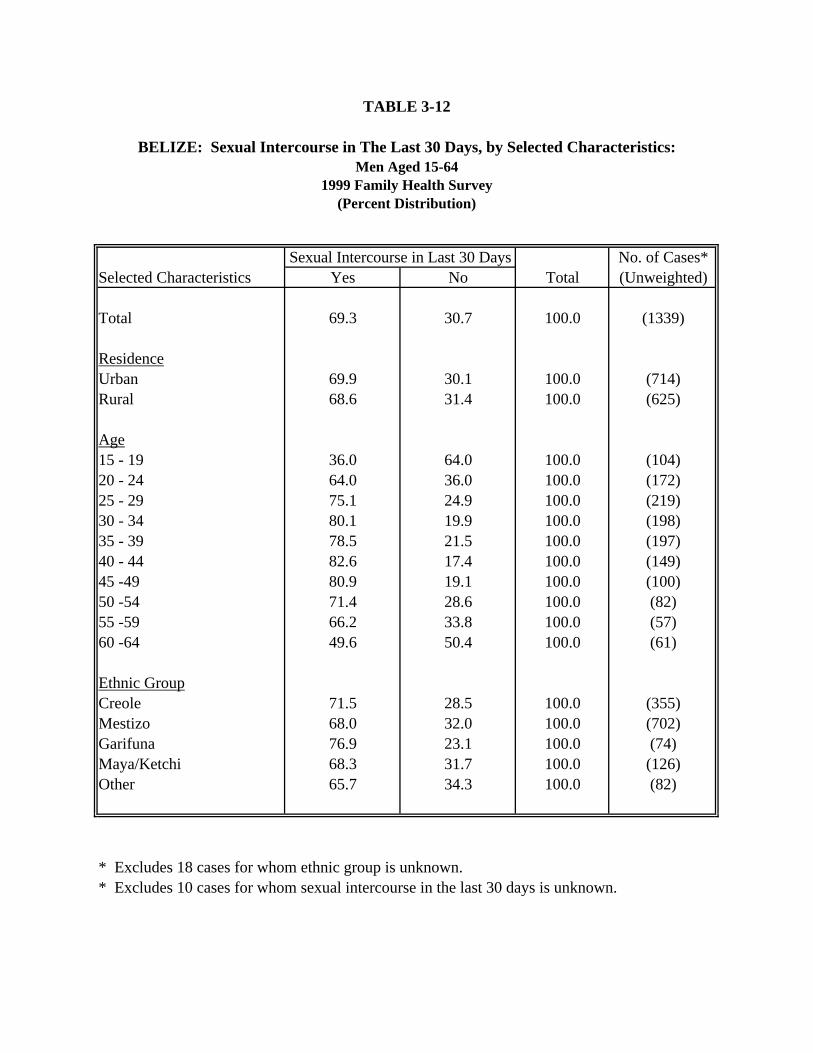
TABLE 3-12
BELIZE: Sexual Intercourse in The Last 30 Days, by Selected Characteristics:
Sexual Intercourse in Last 30 Days No. of Cases*Selected Characteristics Yes No Total (Unweighted)
Total 69.3 30.7 100.0 (1339)
ResidenceUrban 69.9 30.1 100.0 (714)Rural 68.6 31.4 100.0 (625)
Age15 - 19 36.0 64.0 100.0 (104)20 - 24 64.0 36.0 100.0 (172)25 - 29 75.1 24.9 100.0 (219)30 - 34 80.1 19.9 100.0 (198)35 - 39 78.5 21.5 100.0 (197)40 - 44 82.6 17.4 100.0 (149)45 -49 80.9 19.1 100.0 (100)50 -54 71.4 28.6 100.0 (82)55 -59 66.2 33.8 100.0 (57)60 -64 49.6 50.4 100.0 (61)
Ethnic GroupCreole 71.5 28.5 100.0 (355)Mestizo 68.0 32.0 100.0 (702)Garifuna 76.9 23.1 100.0 (74)Maya/Ketchi 68.3 31.7 100.0 (126)Other 65.7 34.3 100.0 (82)
* Excludes 18 cases for whom ethnic group is unknown.* Excludes 10 cases for whom sexual intercourse in the last 30 days is unknown.
Men Aged 15-641999 Family Health Survey
(Percent Distribution)
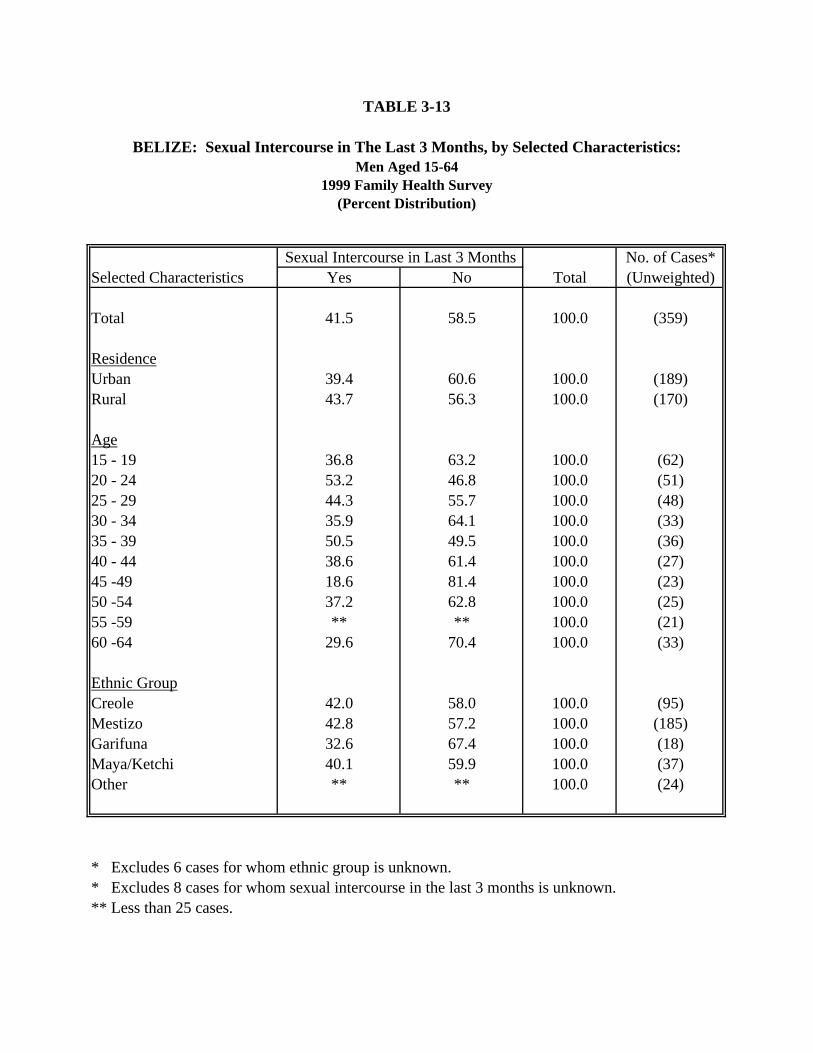
TABLE 3-13
BELIZE: Sexual Intercourse in The Last 3 Months, by Selected Characteristics:
Sexual Intercourse in Last 3 Months No. of Cases*Selected Characteristics Yes No Total (Unweighted)
Total 41.5 58.5 100.0 (359)
ResidenceUrban 39.4 60.6 100.0 (189)Rural 43.7 56.3 100.0 (170)
Age15 - 19 36.8 63.2 100.0 (62)20 - 24 53.2 46.8 100.0 (51)25 - 29 44.3 55.7 100.0 (48)30 - 34 35.9 64.1 100.0 (33)35 - 39 50.5 49.5 100.0 (36)40 - 44 38.6 61.4 100.0 (27)45 -49 18.6 81.4 100.0 (23)50 -54 37.2 62.8 100.0 (25)55 -59 ** ** 100.0 (21)60 -64 29.6 70.4 100.0 (33)
Ethnic GroupCreole 42.0 58.0 100.0 (95)Mestizo 42.8 57.2 100.0 (185)Garifuna 32.6 67.4 100.0 (18)Maya/Ketchi 40.1 59.9 100.0 (37)Other ** ** 100.0 (24)
* Excludes 6 cases for whom ethnic group is unknown.* Excludes 8 cases for whom sexual intercourse in the last 3 months is unknown.** Less than 25 cases.
Men Aged 15-641999 Family Health Survey
(Percent Distribution)
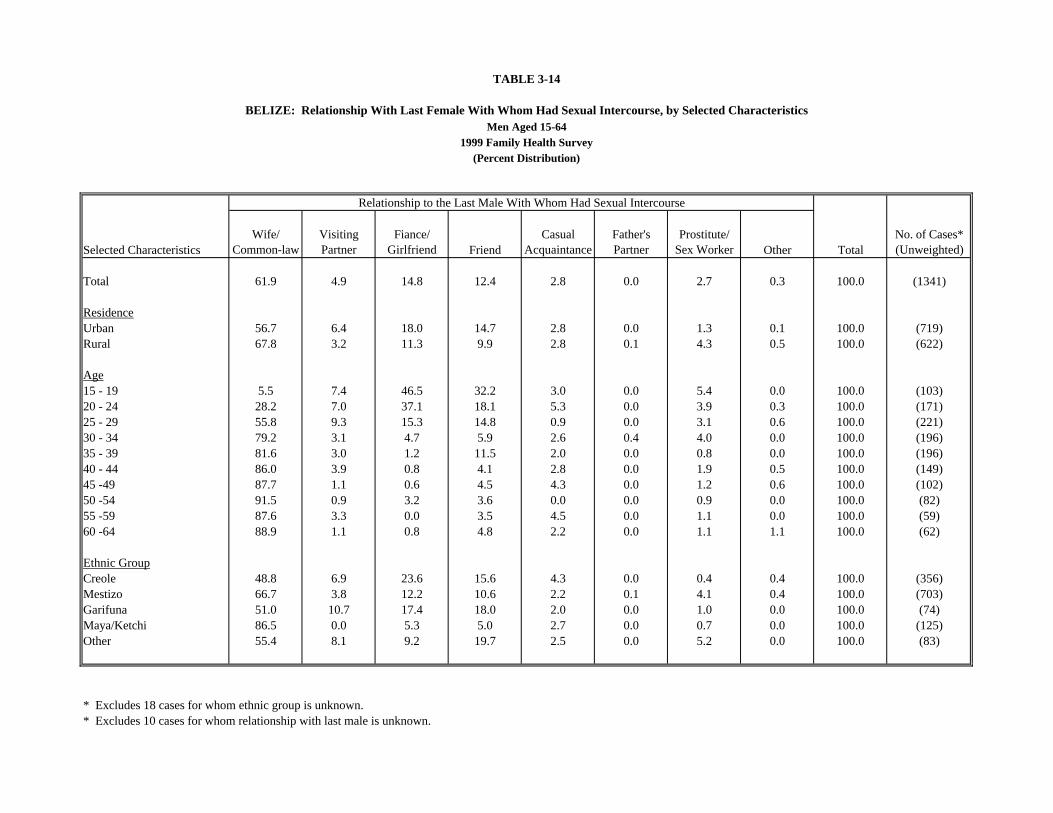
TABLE 3-14
BELIZE: Relationship With Last Female With Whom Had Sexual Intercourse, by Selected Characteristics
Relationship to the Last Male With Whom Had Sexual Intercourse
Selected CharacteristicsWife/
Common-lawVisiting Partner
Fiance/ Girlfriend Friend
Casual Acquaintance
Father's Partner
Prostitute/ Sex Worker Other Total
No. of Cases* (Unweighted)
Total 61.9 4.9 14.8 12.4 2.8 0.0 2.7 0.3 100.0 (1341)
ResidenceUrban 56.7 6.4 18.0 14.7 2.8 0.0 1.3 0.1 100.0 (719)Rural 67.8 3.2 11.3 9.9 2.8 0.1 4.3 0.5 100.0 (622)
Age15 - 19 5.5 7.4 46.5 32.2 3.0 0.0 5.4 0.0 100.0 (103)20 - 24 28.2 7.0 37.1 18.1 5.3 0.0 3.9 0.3 100.0 (171)25 - 29 55.8 9.3 15.3 14.8 0.9 0.0 3.1 0.6 100.0 (221)30 - 34 79.2 3.1 4.7 5.9 2.6 0.4 4.0 0.0 100.0 (196)35 - 39 81.6 3.0 1.2 11.5 2.0 0.0 0.8 0.0 100.0 (196)40 - 44 86.0 3.9 0.8 4.1 2.8 0.0 1.9 0.5 100.0 (149)45 -49 87.7 1.1 0.6 4.5 4.3 0.0 1.2 0.6 100.0 (102)50 -54 91.5 0.9 3.2 3.6 0.0 0.0 0.9 0.0 100.0 (82)55 -59 87.6 3.3 0.0 3.5 4.5 0.0 1.1 0.0 100.0 (59)60 -64 88.9 1.1 0.8 4.8 2.2 0.0 1.1 1.1 100.0 (62)
Ethnic GroupCreole 48.8 6.9 23.6 15.6 4.3 0.0 0.4 0.4 100.0 (356)Mestizo 66.7 3.8 12.2 10.6 2.2 0.1 4.1 0.4 100.0 (703)Garifuna 51.0 10.7 17.4 18.0 2.0 0.0 1.0 0.0 100.0 (74)Maya/Ketchi 86.5 0.0 5.3 5.0 2.7 0.0 0.7 0.0 100.0 (125)Other 55.4 8.1 9.2 19.7 2.5 0.0 5.2 0.0 100.0 (83)
* Excludes 18 cases for whom ethnic group is unknown.* Excludes 10 cases for whom relationship with last male is unknown.
Men Aged 15-641999 Family Health Survey
(Percent Distribution)
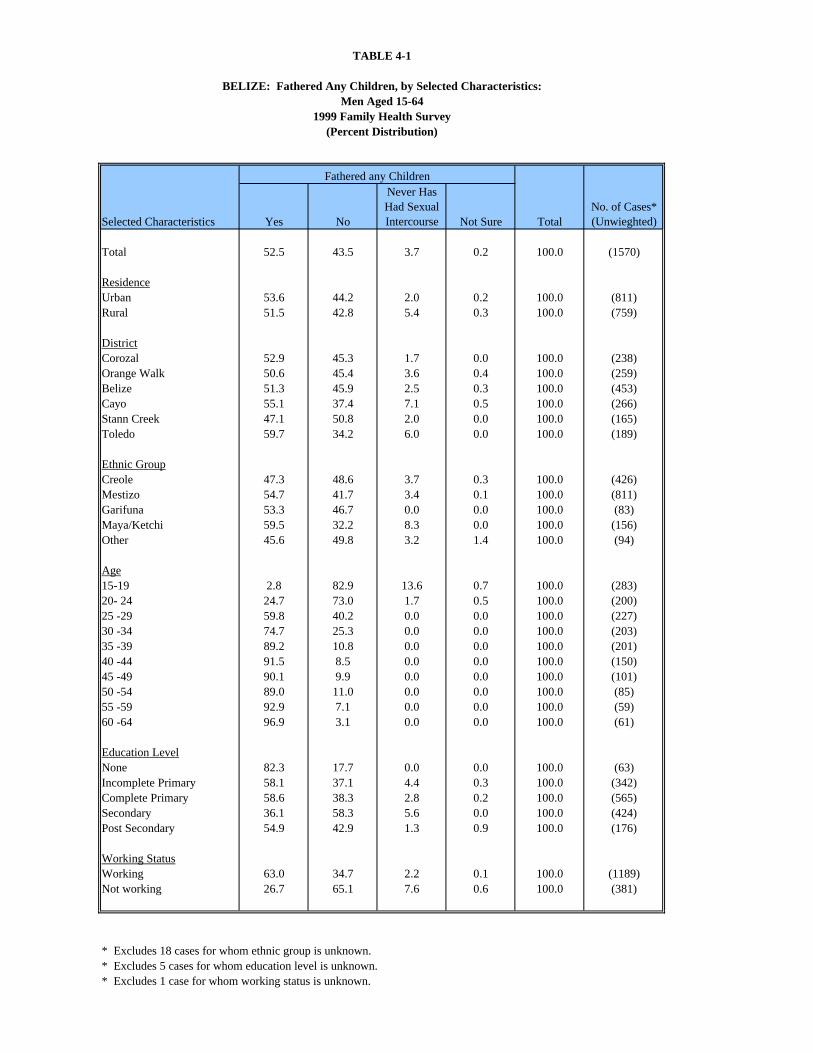
TABLE 4-1
BELIZE: Fathered Any Children, by Selected Characteristics:Men Aged 15-64
Fathered any Children
Selected Characteristics Yes No
Never Has Had Sexual Intercourse Not Sure Total
No. of Cases* (Unwieghted)
Total 52.5 43.5 3.7 0.2 100.0 (1570)
ResidenceUrban 53.6 44.2 2.0 0.2 100.0 (811)Rural 51.5 42.8 5.4 0.3 100.0 (759)
DistrictCorozal 52.9 45.3 1.7 0.0 100.0 (238)Orange Walk 50.6 45.4 3.6 0.4 100.0 (259)Belize 51.3 45.9 2.5 0.3 100.0 (453)Cayo 55.1 37.4 7.1 0.5 100.0 (266)Stann Creek 47.1 50.8 2.0 0.0 100.0 (165)Toledo 59.7 34.2 6.0 0.0 100.0 (189)
Ethnic GroupCreole 47.3 48.6 3.7 0.3 100.0 (426)Mestizo 54.7 41.7 3.4 0.1 100.0 (811)Garifuna 53.3 46.7 0.0 0.0 100.0 (83)Maya/Ketchi 59.5 32.2 8.3 0.0 100.0 (156)Other 45.6 49.8 3.2 1.4 100.0 (94)
Age15-19 2.8 82.9 13.6 0.7 100.0 (283)20- 24 24.7 73.0 1.7 0.5 100.0 (200)25 -29 59.8 40.2 0.0 0.0 100.0 (227)30 -34 74.7 25.3 0.0 0.0 100.0 (203)35 -39 89.2 10.8 0.0 0.0 100.0 (201)40 -44 91.5 8.5 0.0 0.0 100.0 (150)45 -49 90.1 9.9 0.0 0.0 100.0 (101)50 -54 89.0 11.0 0.0 0.0 100.0 (85)55 -59 92.9 7.1 0.0 0.0 100.0 (59)60 -64 96.9 3.1 0.0 0.0 100.0 (61)
Education LevelNone 82.3 17.7 0.0 0.0 100.0 (63)Incomplete Primary 58.1 37.1 4.4 0.3 100.0 (342)Complete Primary 58.6 38.3 2.8 0.2 100.0 (565)Secondary 36.1 58.3 5.6 0.0 100.0 (424)Post Secondary 54.9 42.9 1.3 0.9 100.0 (176)
Working StatusWorking 63.0 34.7 2.2 0.1 100.0 (1189)Not working 26.7 65.1 7.6 0.6 100.0 (381)
* Excludes 18 cases for whom ethnic group is unknown.* Excludes 5 cases for whom education level is unknown.* Excludes 1 case for whom working status is unknown.
1999 Family Health Survey(Percent Distribution)
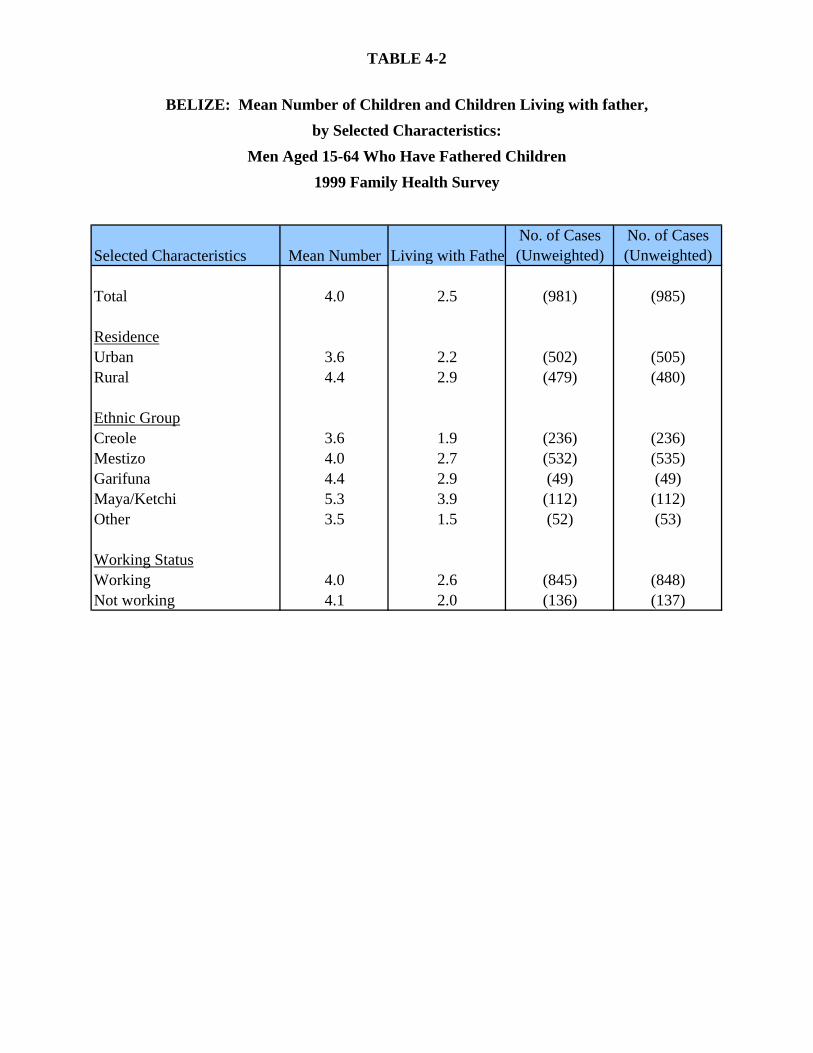
Selected Characteristics Mean Number Living with FatherNo. of Cases (Unweighted)
No. of Cases (Unweighted)
Total 4.0 2.5 (981) (985)
ResidenceUrban 3.6 2.2 (502) (505)Rural 4.4 2.9 (479) (480)
Ethnic GroupCreole 3.6 1.9 (236) (236)Mestizo 4.0 2.7 (532) (535)Garifuna 4.4 2.9 (49) (49)Maya/Ketchi 5.3 3.9 (112) (112)Other 3.5 1.5 (52) (53)
Working StatusWorking 4.0 2.6 (845) (848)Not working 4.1 2.0 (136) (137)
1999 Family Health Survey
TABLE 4-2
by Selected Characteristics:
BELIZE: Mean Number of Children and Children Living with father,
Men Aged 15-64 Who Have Fathered Children
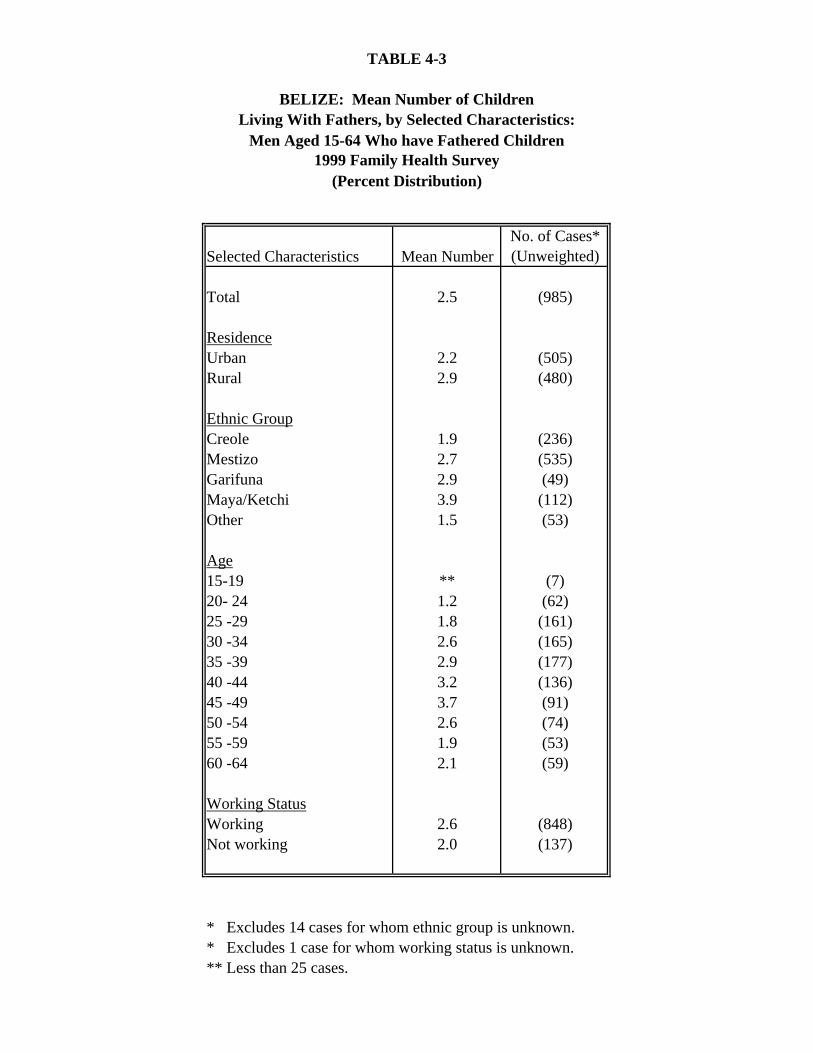
TABLE 4-3
BELIZE: Mean Number of ChildrenLiving With Fathers, by Selected Characteristics:
1999 Family Health Survey
Selected Characteristics Mean NumberNo. of Cases* (Unweighted)
Total 2.5 (985)
ResidenceUrban 2.2 (505)Rural 2.9 (480)
Ethnic GroupCreole 1.9 (236)Mestizo 2.7 (535)Garifuna 2.9 (49)Maya/Ketchi 3.9 (112)Other 1.5 (53)
Age15-19 ** (7)20- 24 1.2 (62)25 -29 1.8 (161)30 -34 2.6 (165)35 -39 2.9 (177)40 -44 3.2 (136)45 -49 3.7 (91)50 -54 2.6 (74)55 -59 1.9 (53)60 -64 2.1 (59)
Working StatusWorking 2.6 (848)Not working 2.0 (137)
* Excludes 14 cases for whom ethnic group is unknown.* Excludes 1 case for whom working status is unknown.** Less than 25 cases.
Men Aged 15-64 Who have Fathered Children
(Percent Distribution)
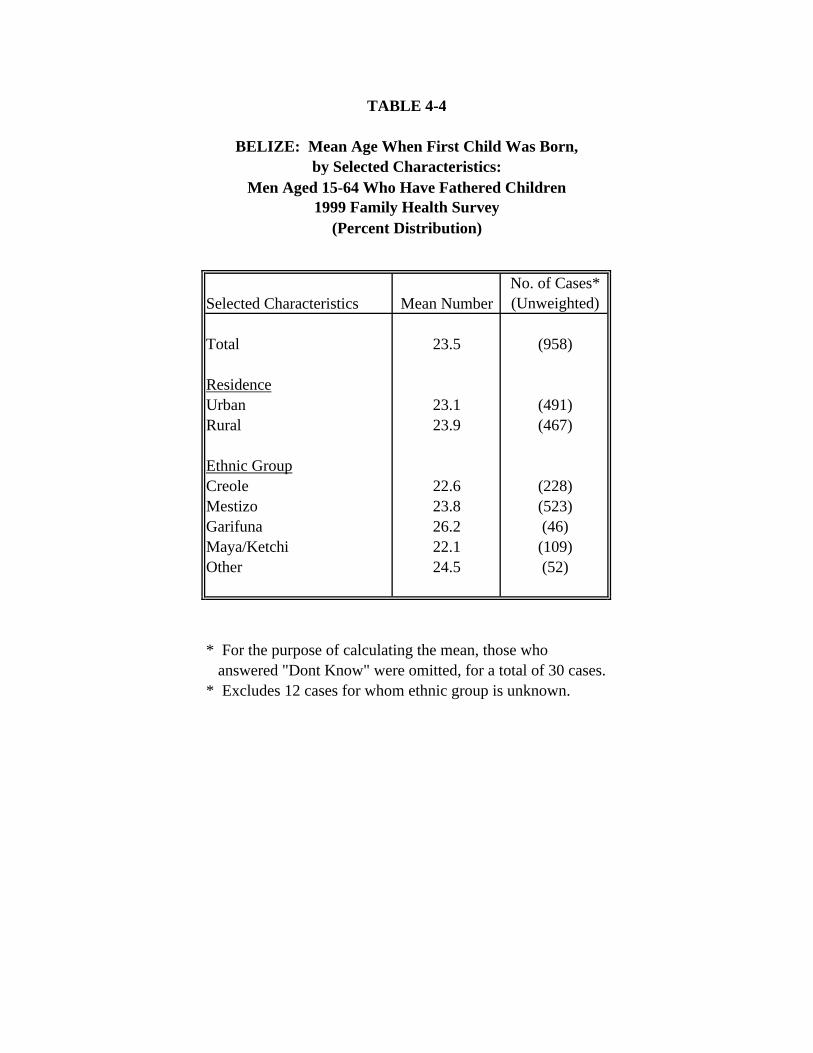
TABLE 4-4
BELIZE: Mean Age When First Child Was Born,by Selected Characteristics:
1999 Family Health Survey
Selected Characteristics Mean NumberNo. of Cases* (Unweighted)
Total 23.5 (958)
ResidenceUrban 23.1 (491)Rural 23.9 (467)
Ethnic GroupCreole 22.6 (228)Mestizo 23.8 (523)Garifuna 26.2 (46)Maya/Ketchi 22.1 (109)Other 24.5 (52)
* For the purpose of calculating the mean, those who answered "Dont Know" were omitted, for a total of 30 cases.* Excludes 12 cases for whom ethnic group is unknown.
Men Aged 15-64 Who Have Fathered Children
(Percent Distribution)
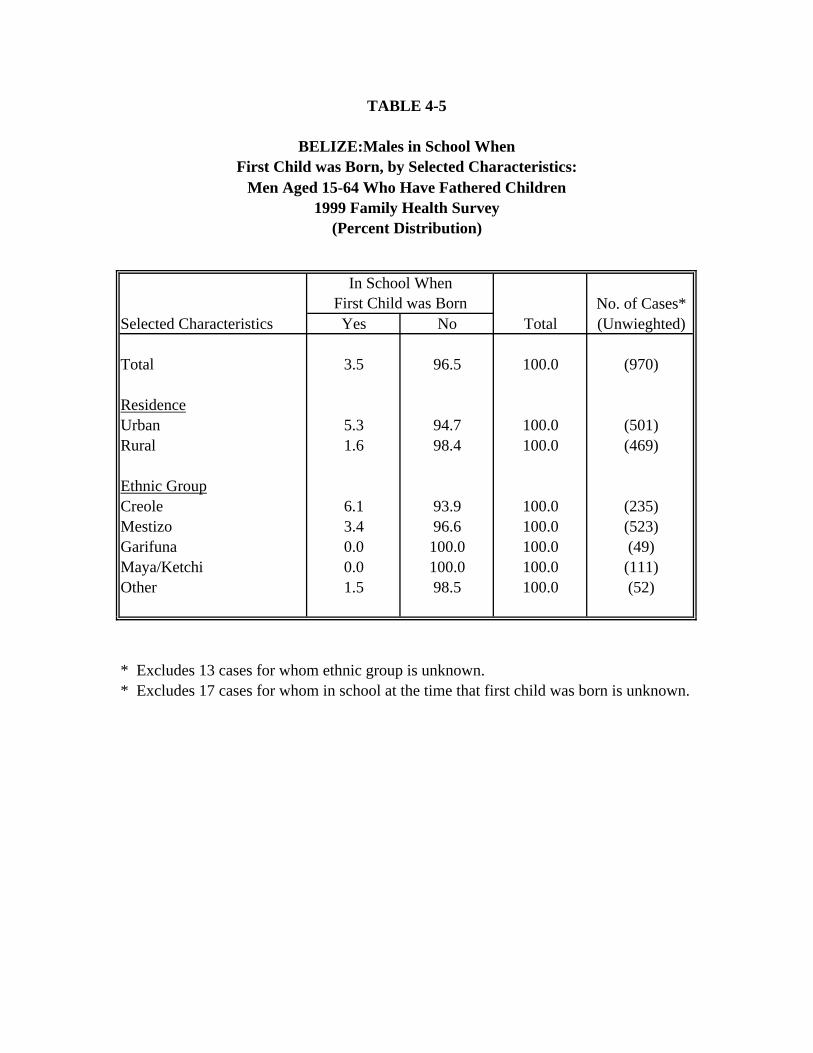
TABLE 4-5
BELIZE:Males in School WhenFirst Child was Born, by Selected Characteristics:
In School When First Child was Born No. of Cases*
Selected Characteristics Yes No Total (Unwieghted)
Total 3.5 96.5 100.0 (970)
ResidenceUrban 5.3 94.7 100.0 (501)Rural 1.6 98.4 100.0 (469)
Ethnic GroupCreole 6.1 93.9 100.0 (235)Mestizo 3.4 96.6 100.0 (523)Garifuna 0.0 100.0 100.0 (49)Maya/Ketchi 0.0 100.0 100.0 (111)Other 1.5 98.5 100.0 (52)
* Excludes 13 cases for whom ethnic group is unknown.* Excludes 17 cases for whom in school at the time that first child was born is unknown.
Men Aged 15-64 Who Have Fathered Children1999 Family Health Survey
(Percent Distribution)
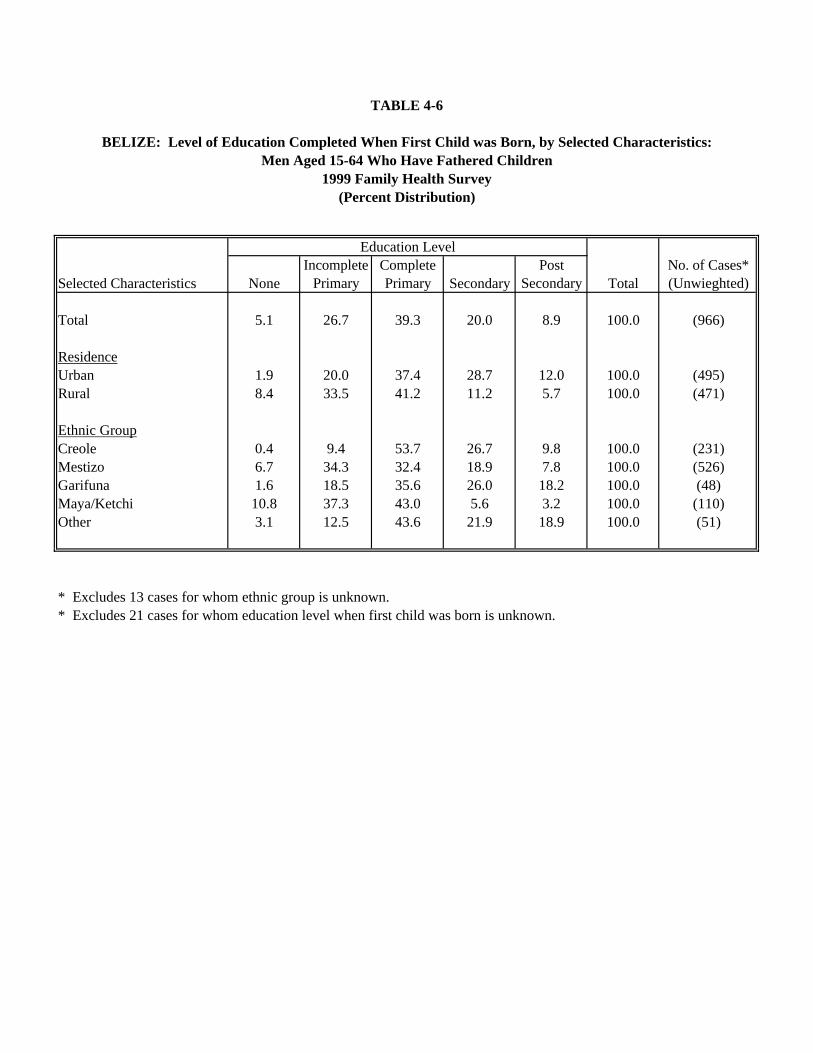
TABLE 4-6
BELIZE: Level of Education Completed When First Child was Born, by Selected Characteristics:
Education Level
Selected Characteristics NoneIncomplete
PrimaryComplete Primary Secondary
Post Secondary Total
No. of Cases* (Unwieghted)
Total 5.1 26.7 39.3 20.0 8.9 100.0 (966)
ResidenceUrban 1.9 20.0 37.4 28.7 12.0 100.0 (495)Rural 8.4 33.5 41.2 11.2 5.7 100.0 (471)
Ethnic GroupCreole 0.4 9.4 53.7 26.7 9.8 100.0 (231)Mestizo 6.7 34.3 32.4 18.9 7.8 100.0 (526)Garifuna 1.6 18.5 35.6 26.0 18.2 100.0 (48)Maya/Ketchi 10.8 37.3 43.0 5.6 3.2 100.0 (110)Other 3.1 12.5 43.6 21.9 18.9 100.0 (51)
* Excludes 13 cases for whom ethnic group is unknown.* Excludes 21 cases for whom education level when first child was born is unknown.
Men Aged 15-64 Who Have Fathered Children1999 Family Health Survey
(Percent Distribution)
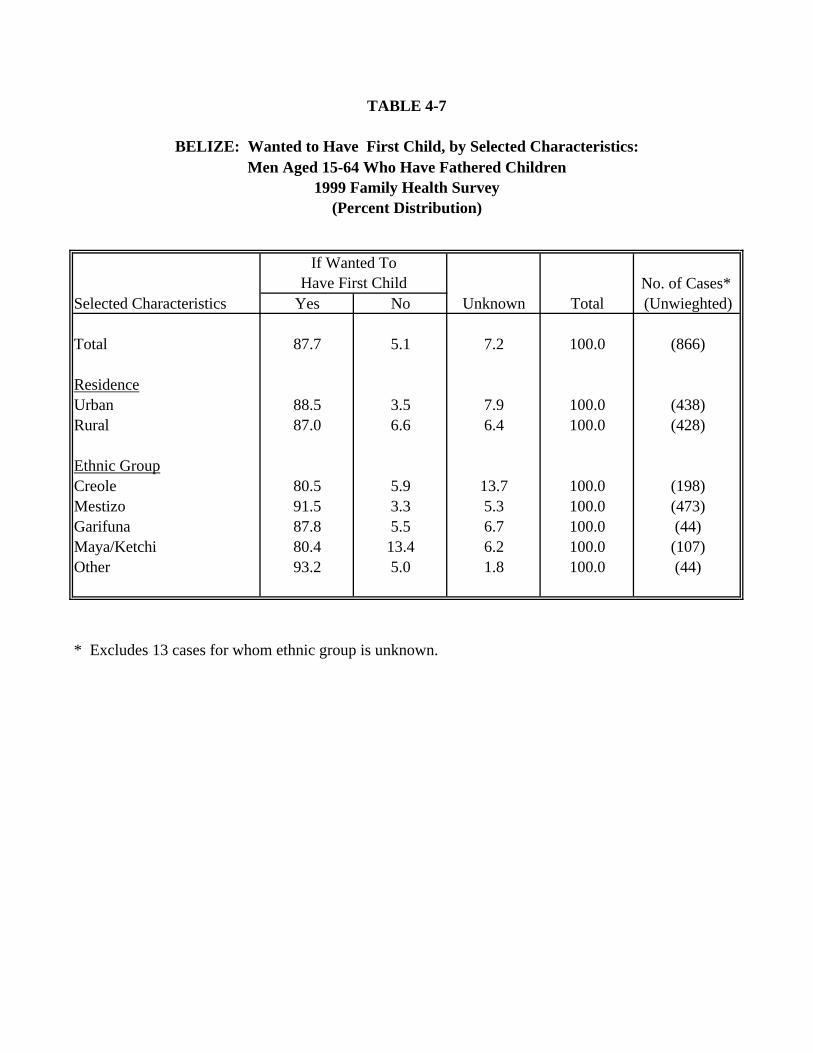
TABLE 4-7
BELIZE: Wanted to Have First Child, by Selected Characteristics:
If Wanted To Have First Child No. of Cases*
Selected Characteristics Yes No Unknown Total (Unwieghted)
Total 87.7 5.1 7.2 100.0 (866)
ResidenceUrban 88.5 3.5 7.9 100.0 (438)Rural 87.0 6.6 6.4 100.0 (428)
Ethnic GroupCreole 80.5 5.9 13.7 100.0 (198)Mestizo 91.5 3.3 5.3 100.0 (473)Garifuna 87.8 5.5 6.7 100.0 (44)Maya/Ketchi 80.4 13.4 6.2 100.0 (107)Other 93.2 5.0 1.8 100.0 (44)
* Excludes 13 cases for whom ethnic group is unknown.
Men Aged 15-64 Who Have Fathered Children1999 Family Health Survey
(Percent Distribution)
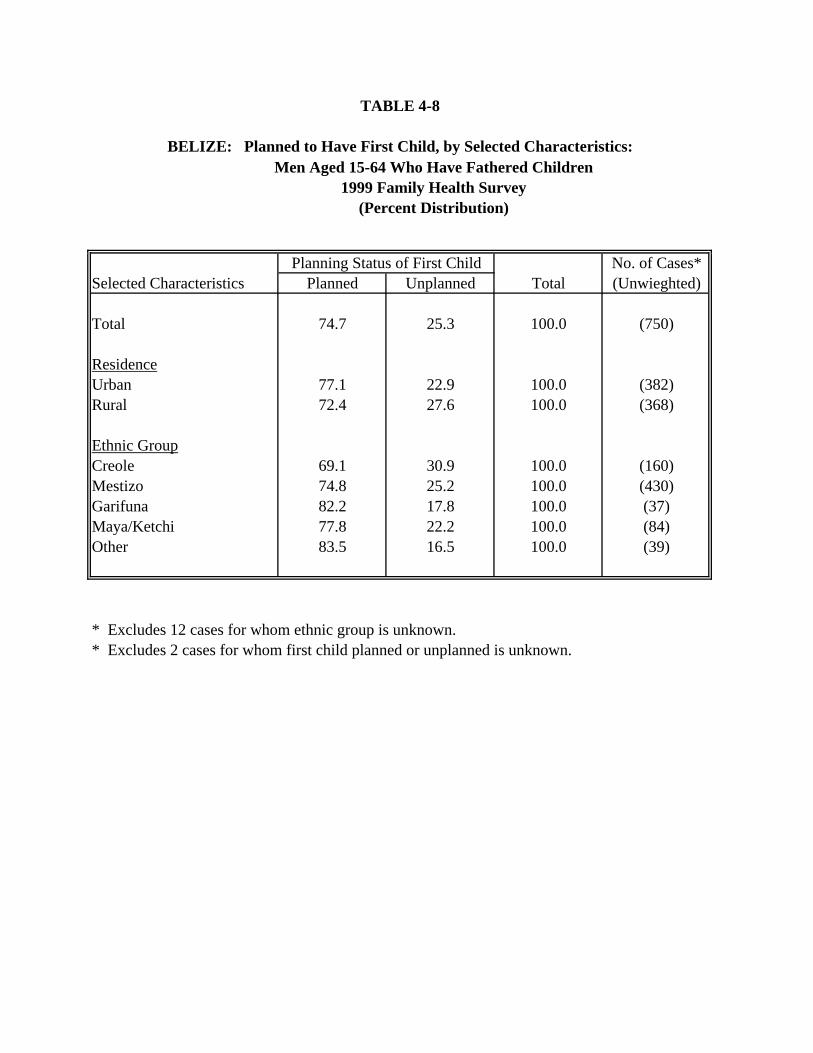
TABLE 4-8
BELIZE: Planned to Have First Child, by Selected Characteristics:
Planning Status of First Child No. of Cases*Selected Characteristics Planned Unplanned Total (Unwieghted)
Total 74.7 25.3 100.0 (750)
ResidenceUrban 77.1 22.9 100.0 (382)Rural 72.4 27.6 100.0 (368)
Ethnic GroupCreole 69.1 30.9 100.0 (160)Mestizo 74.8 25.2 100.0 (430)Garifuna 82.2 17.8 100.0 (37)Maya/Ketchi 77.8 22.2 100.0 (84)Other 83.5 16.5 100.0 (39)
* Excludes 12 cases for whom ethnic group is unknown.* Excludes 2 cases for whom first child planned or unplanned is unknown.
Men Aged 15-64 Who Have Fathered Children1999 Family Health Survey
(Percent Distribution)
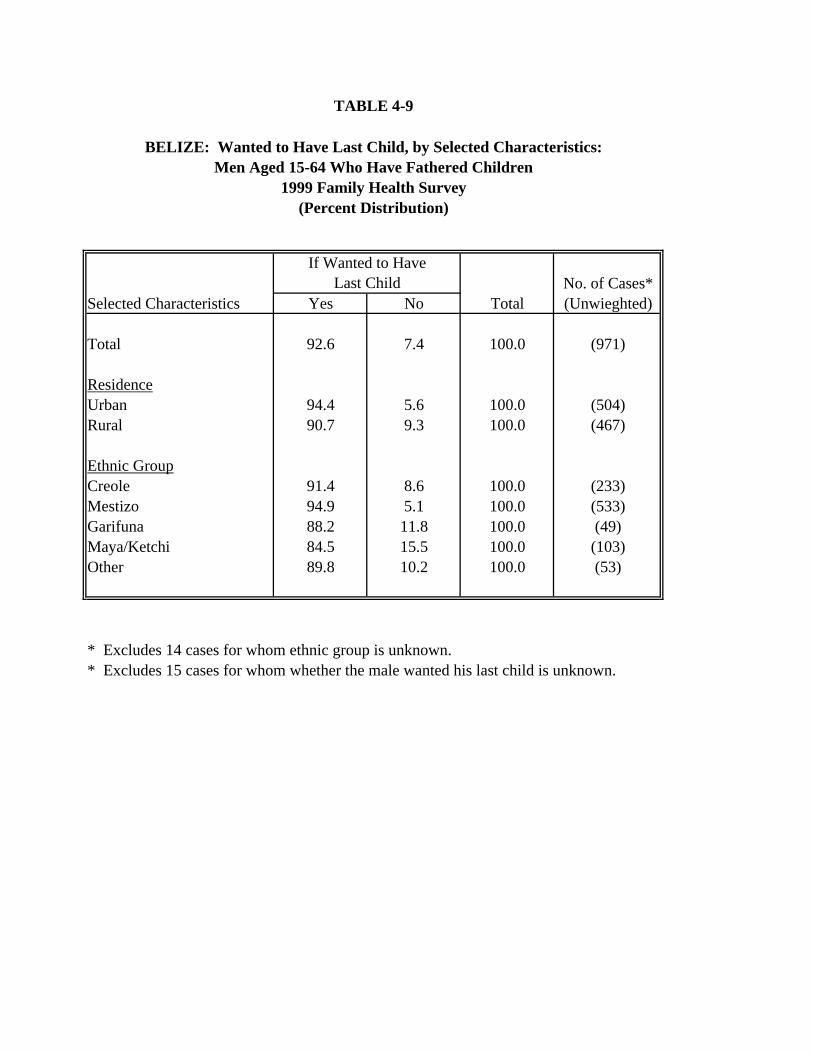
TABLE 4-9
If Wanted to Have Last Child No. of Cases*
Selected Characteristics Yes No Total (Unwieghted)
Total 92.6 7.4 100.0 (971)
ResidenceUrban 94.4 5.6 100.0 (504)Rural 90.7 9.3 100.0 (467)
Ethnic GroupCreole 91.4 8.6 100.0 (233)Mestizo 94.9 5.1 100.0 (533)Garifuna 88.2 11.8 100.0 (49)Maya/Ketchi 84.5 15.5 100.0 (103)Other 89.8 10.2 100.0 (53)
* Excludes 14 cases for whom ethnic group is unknown.* Excludes 15 cases for whom whether the male wanted his last child is unknown.
BELIZE: Wanted to Have Last Child, by Selected Characteristics:Men Aged 15-64 Who Have Fathered Children
1999 Family Health Survey(Percent Distribution)
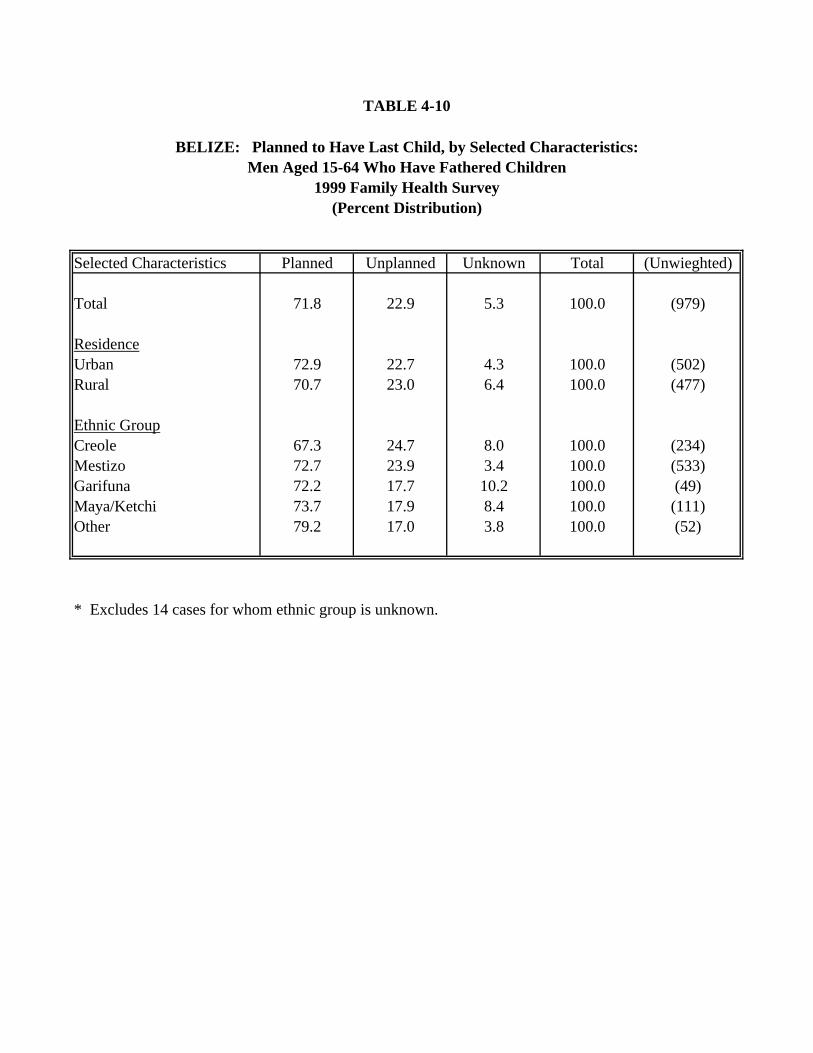
TABLE 4-10
Selected Characteristics Planned Unplanned Unknown Total (Unwieghted)
Total 71.8 22.9 5.3 100.0 (979)
ResidenceUrban 72.9 22.7 4.3 100.0 (502)Rural 70.7 23.0 6.4 100.0 (477)
Ethnic GroupCreole 67.3 24.7 8.0 100.0 (234)Mestizo 72.7 23.9 3.4 100.0 (533)Garifuna 72.2 17.7 10.2 100.0 (49)Maya/Ketchi 73.7 17.9 8.4 100.0 (111)Other 79.2 17.0 3.8 100.0 (52)
* Excludes 14 cases for whom ethnic group is unknown.
Men Aged 15-64 Who Have Fathered Children1999 Family Health Survey
(Percent Distribution)
BELIZE: Planned to Have Last Child, by Selected Characteristics:
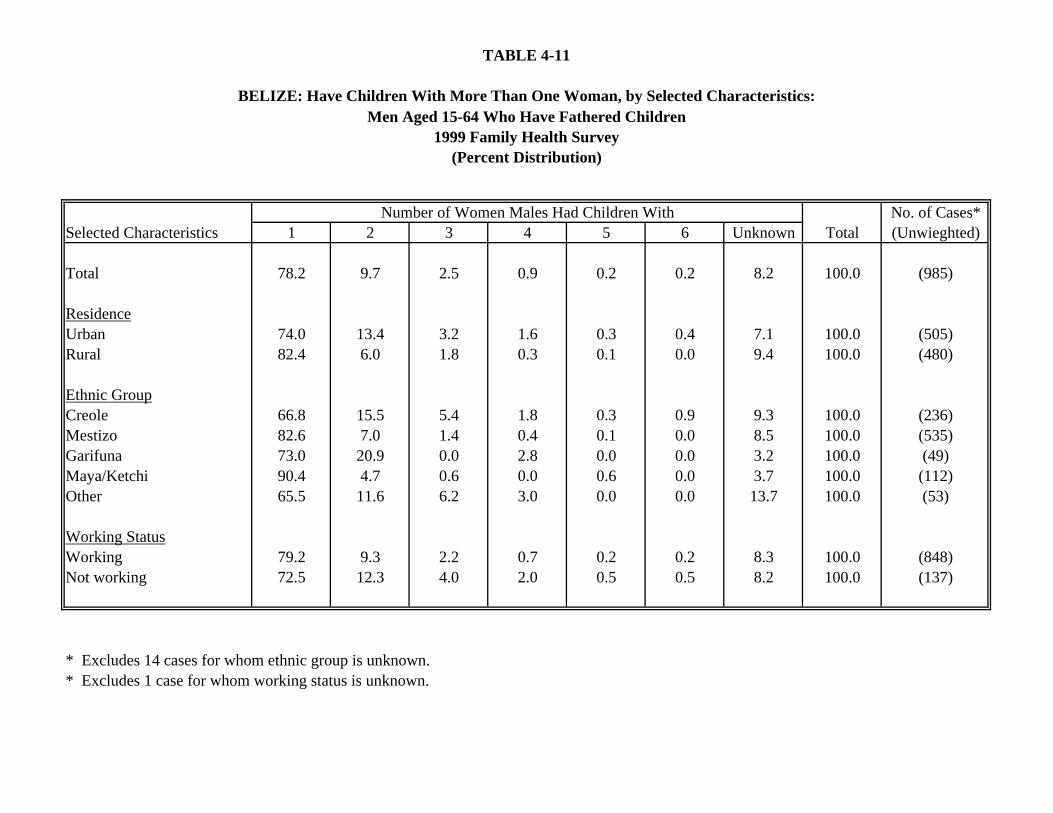
TABLE 4-11
BELIZE: Have Children With More Than One Woman, by Selected Characteristics:
Number of Women Males Had Children With No. of Cases*Selected Characteristics 1 2 3 4 5 6 Unknown Total (Unwieghted)
Total 78.2 9.7 2.5 0.9 0.2 0.2 8.2 100.0 (985)
ResidenceUrban 74.0 13.4 3.2 1.6 0.3 0.4 7.1 100.0 (505)Rural 82.4 6.0 1.8 0.3 0.1 0.0 9.4 100.0 (480)
Ethnic GroupCreole 66.8 15.5 5.4 1.8 0.3 0.9 9.3 100.0 (236)Mestizo 82.6 7.0 1.4 0.4 0.1 0.0 8.5 100.0 (535)Garifuna 73.0 20.9 0.0 2.8 0.0 0.0 3.2 100.0 (49)Maya/Ketchi 90.4 4.7 0.6 0.0 0.6 0.0 3.7 100.0 (112)Other 65.5 11.6 6.2 3.0 0.0 0.0 13.7 100.0 (53)
Working StatusWorking 79.2 9.3 2.2 0.7 0.2 0.2 8.3 100.0 (848)Not working 72.5 12.3 4.0 2.0 0.5 0.5 8.2 100.0 (137)
* Excludes 14 cases for whom ethnic group is unknown.* Excludes 1 case for whom working status is unknown.
Men Aged 15-64 Who Have Fathered Children1999 Family Health Survey
(Percent Distribution)
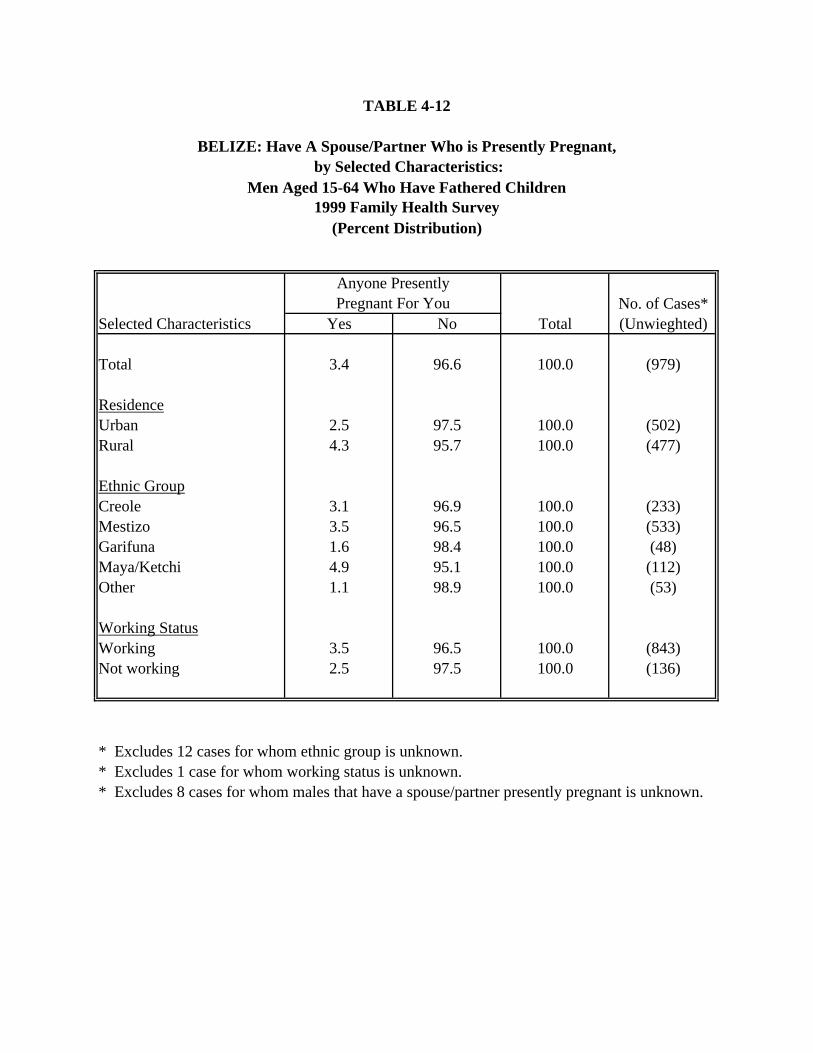
TABLE 4-12
BELIZE: Have A Spouse/Partner Who is Presently Pregnant, by Selected Characteristics:
1999 Family Health Survey
Anyone Presently Pregnant For You No. of Cases*
Selected Characteristics Yes No Total (Unwieghted)
Total 3.4 96.6 100.0 (979)
ResidenceUrban 2.5 97.5 100.0 (502)Rural 4.3 95.7 100.0 (477)
Ethnic GroupCreole 3.1 96.9 100.0 (233)Mestizo 3.5 96.5 100.0 (533)Garifuna 1.6 98.4 100.0 (48)Maya/Ketchi 4.9 95.1 100.0 (112)Other 1.1 98.9 100.0 (53)
Working StatusWorking 3.5 96.5 100.0 (843)Not working 2.5 97.5 100.0 (136)
* Excludes 12 cases for whom ethnic group is unknown.* Excludes 1 case for whom working status is unknown.* Excludes 8 cases for whom males that have a spouse/partner presently pregnant is unknown.
Men Aged 15-64 Who Have Fathered Children
(Percent Distribution)
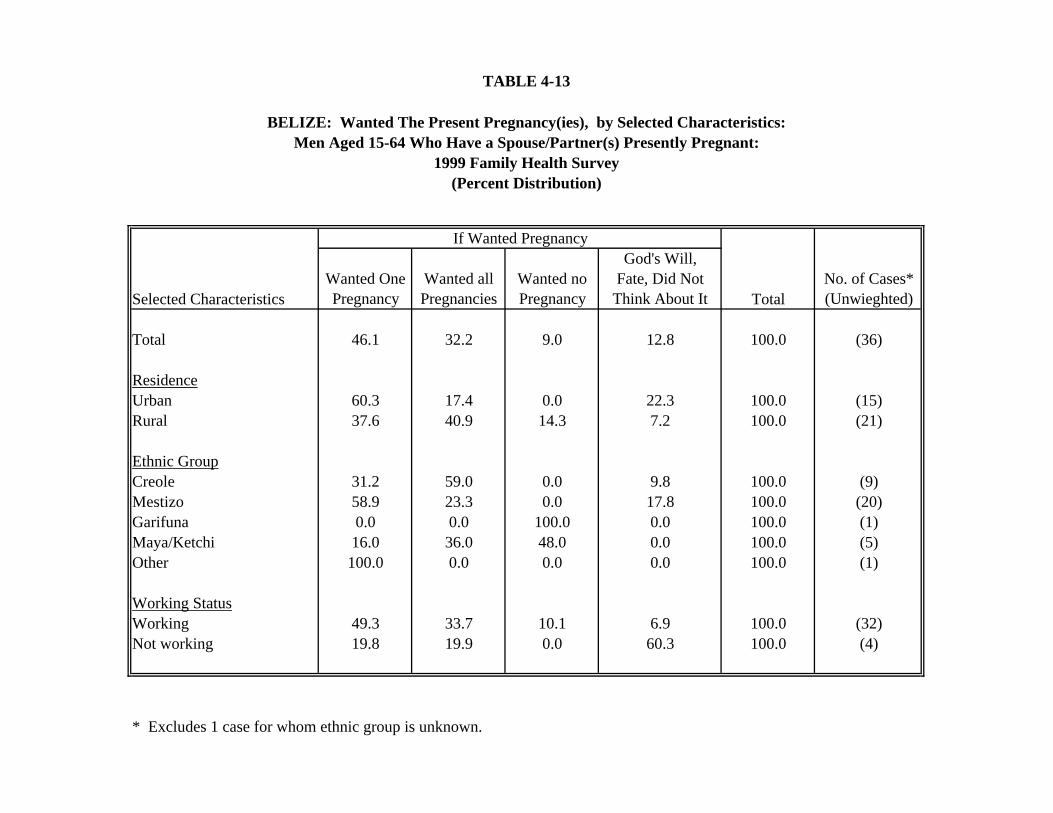
TABLE 4-13
If Wanted Pregnancy
Selected CharacteristicsWanted One Pregnancy
Wanted all Pregnancies
Wanted no Pregnancy
God's Will, Fate, Did Not
Think About It TotalNo. of Cases* (Unwieghted)
Total 46.1 32.2 9.0 12.8 100.0 (36)
ResidenceUrban 60.3 17.4 0.0 22.3 100.0 (15)Rural 37.6 40.9 14.3 7.2 100.0 (21)
Ethnic GroupCreole 31.2 59.0 0.0 9.8 100.0 (9)Mestizo 58.9 23.3 0.0 17.8 100.0 (20)Garifuna 0.0 0.0 100.0 0.0 100.0 (1)Maya/Ketchi 16.0 36.0 48.0 0.0 100.0 (5)Other 100.0 0.0 0.0 0.0 100.0 (1)
Working StatusWorking 49.3 33.7 10.1 6.9 100.0 (32)Not working 19.8 19.9 0.0 60.3 100.0 (4)
* Excludes 1 case for whom ethnic group is unknown.
(Percent Distribution)
BELIZE: Wanted The Present Pregnancy(ies), by Selected Characteristics:Men Aged 15-64 Who Have a Spouse/Partner(s) Presently Pregnant:
1999 Family Health Survey
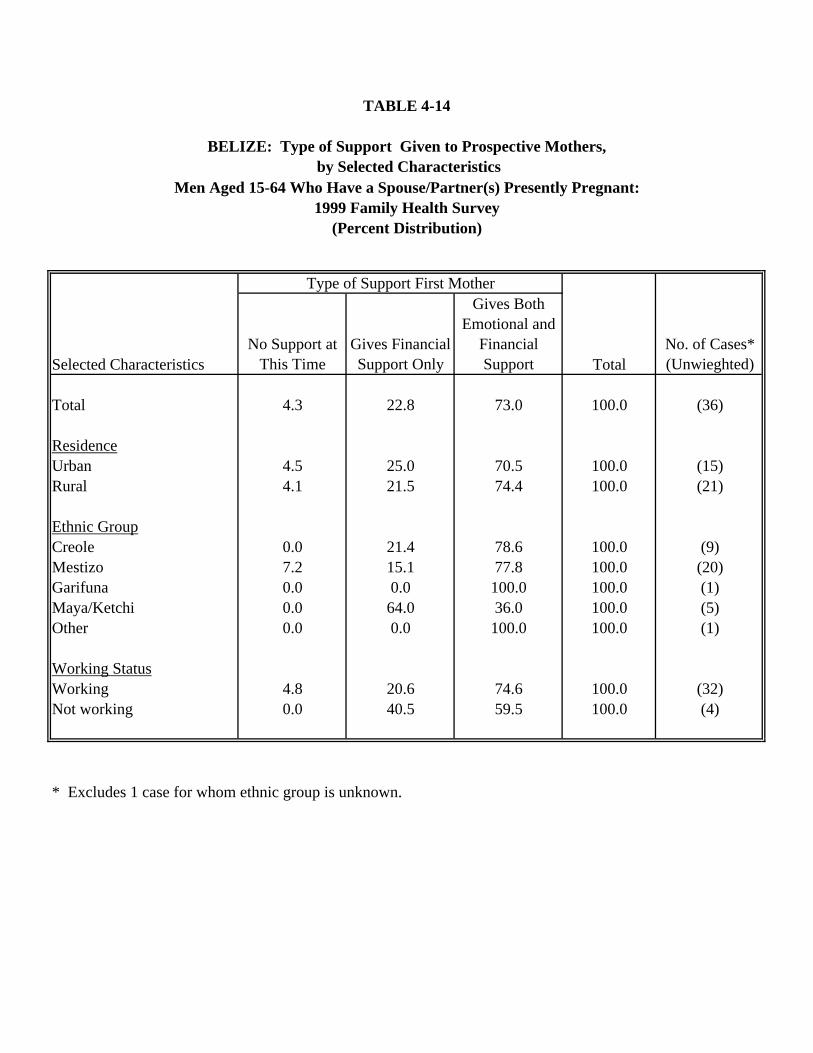
TABLE 4-14
BELIZE: Type of Support Given to Prospective Mothers, by Selected Characteristics
Type of Support First Mother
Selected CharacteristicsNo Support at
This TimeGives Financial Support Only
Gives Both Emotional and
Financial Support Total
No. of Cases* (Unwieghted)
Total 4.3 22.8 73.0 100.0 (36)
ResidenceUrban 4.5 25.0 70.5 100.0 (15)Rural 4.1 21.5 74.4 100.0 (21)
Ethnic GroupCreole 0.0 21.4 78.6 100.0 (9)Mestizo 7.2 15.1 77.8 100.0 (20)Garifuna 0.0 0.0 100.0 100.0 (1)Maya/Ketchi 0.0 64.0 36.0 100.0 (5)Other 0.0 0.0 100.0 100.0 (1)
Working StatusWorking 4.8 20.6 74.6 100.0 (32)Not working 0.0 40.5 59.5 100.0 (4)
* Excludes 1 case for whom ethnic group is unknown.
Men Aged 15-64 Who Have a Spouse/Partner(s) Presently Pregnant:1999 Family Health Survey
(Percent Distribution)
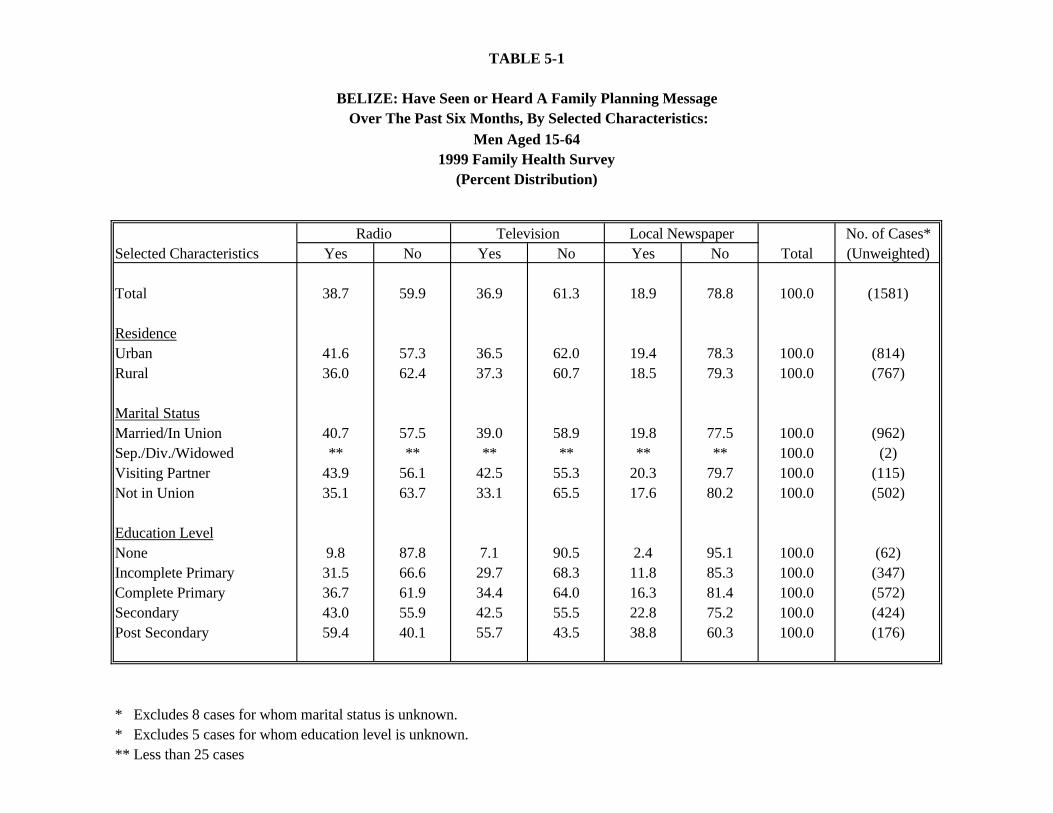
Radio No. of Cases*Selected Characteristics Yes No Yes No Yes No Total (Unweighted)
Total 38.7 59.9 36.9 61.3 18.9 78.8 100.0 (1581)
ResidenceUrban 41.6 57.3 36.5 62.0 19.4 78.3 100.0 (814)Rural 36.0 62.4 37.3 60.7 18.5 79.3 100.0 (767)
Marital StatusMarried/In Union 40.7 57.5 39.0 58.9 19.8 77.5 100.0 (962)Sep./Div./Widowed ** ** ** ** ** ** 100.0 (2)Visiting Partner 43.9 56.1 42.5 55.3 20.3 79.7 100.0 (115)Not in Union 35.1 63.7 33.1 65.5 17.6 80.2 100.0 (502)
Education LevelNone 9.8 87.8 7.1 90.5 2.4 95.1 100.0 (62)Incomplete Primary 31.5 66.6 29.7 68.3 11.8 85.3 100.0 (347)Complete Primary 36.7 61.9 34.4 64.0 16.3 81.4 100.0 (572)Secondary 43.0 55.9 42.5 55.5 22.8 75.2 100.0 (424)Post Secondary 59.4 40.1 55.7 43.5 38.8 60.3 100.0 (176)
* Excludes 8 cases for whom marital status is unknown.* Excludes 5 cases for whom education level is unknown.** Less than 25 cases
BELIZE: Have Seen or Heard A Family Planning Message
TABLE 5-1
Television Local Newspaper
Over The Past Six Months, By Selected Characteristics:
1999 Family Health SurveyMen Aged 15-64
(Percent Distribution)
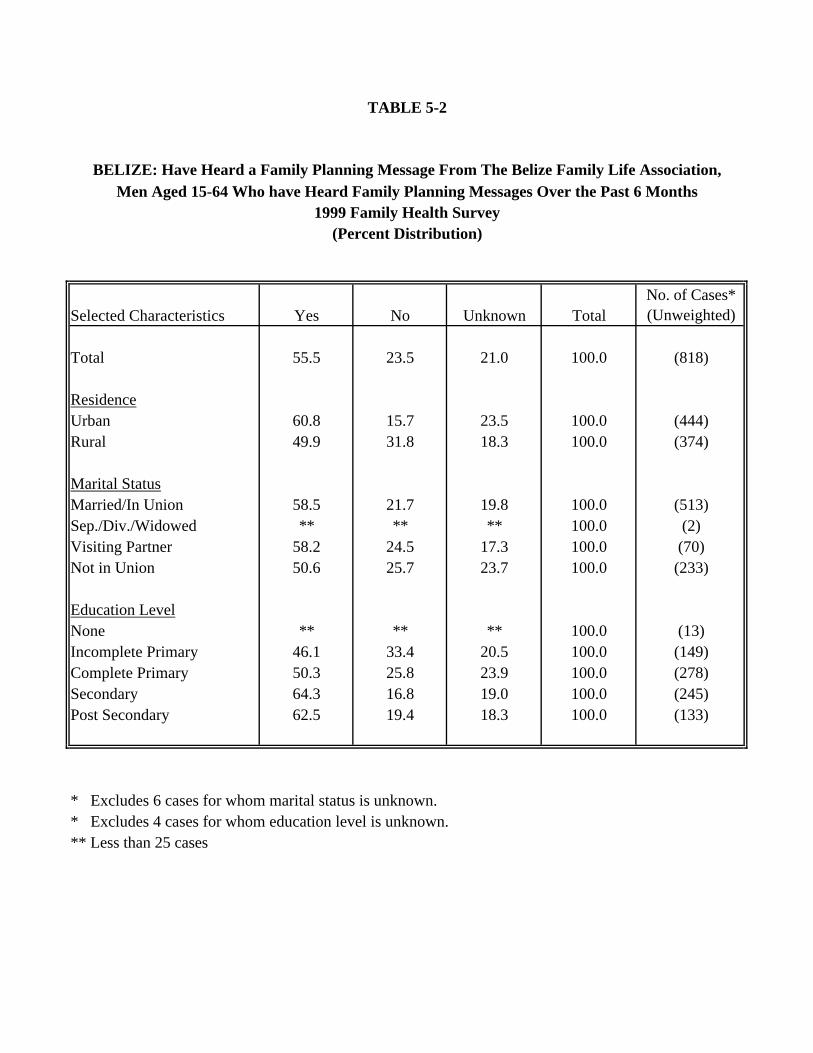
TABLE 5-2
BELIZE: Have Heard a Family Planning Message From The Belize Family Life Association,
Selected Characteristics Yes No Unknown TotalNo. of Cases* (Unweighted)
Total 55.5 23.5 21.0 100.0 (818)
ResidenceUrban 60.8 15.7 23.5 100.0 (444)Rural 49.9 31.8 18.3 100.0 (374)
Marital StatusMarried/In Union 58.5 21.7 19.8 100.0 (513)Sep./Div./Widowed ** ** ** 100.0 (2)Visiting Partner 58.2 24.5 17.3 100.0 (70)Not in Union 50.6 25.7 23.7 100.0 (233)
Education LevelNone ** ** ** 100.0 (13)Incomplete Primary 46.1 33.4 20.5 100.0 (149)Complete Primary 50.3 25.8 23.9 100.0 (278)Secondary 64.3 16.8 19.0 100.0 (245)Post Secondary 62.5 19.4 18.3 100.0 (133)
* Excludes 6 cases for whom marital status is unknown.* Excludes 4 cases for whom education level is unknown.** Less than 25 cases
Men Aged 15-64 Who have Heard Family Planning Messages Over the Past 6 Months1999 Family Health Survey
(Percent Distribution)
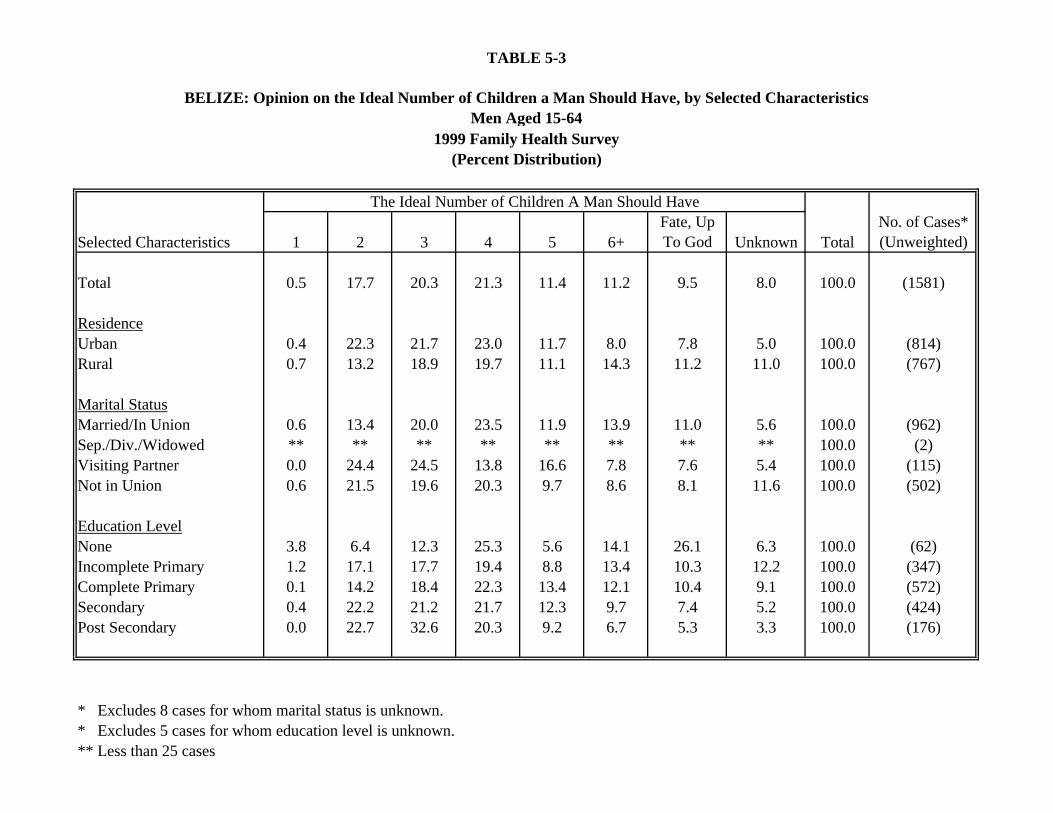
TABLE 5-3
BELIZE: Opinion on the Ideal Number of Children a Man Should Have, by Selected CharacteristicsMen Aged 15-64
1999 Family Health Survey
The Ideal Number of Children A Man Should Have
Selected Characteristics 1 2 3 4 5 6+Fate, Up To God Unknown Total
No. of Cases* (Unweighted)
Total 0.5 17.7 20.3 21.3 11.4 11.2 9.5 8.0 100.0 (1581)
ResidenceUrban 0.4 22.3 21.7 23.0 11.7 8.0 7.8 5.0 100.0 (814)Rural 0.7 13.2 18.9 19.7 11.1 14.3 11.2 11.0 100.0 (767)
Marital StatusMarried/In Union 0.6 13.4 20.0 23.5 11.9 13.9 11.0 5.6 100.0 (962)Sep./Div./Widowed ** ** ** ** ** ** ** ** 100.0 (2)Visiting Partner 0.0 24.4 24.5 13.8 16.6 7.8 7.6 5.4 100.0 (115)Not in Union 0.6 21.5 19.6 20.3 9.7 8.6 8.1 11.6 100.0 (502)
Education LevelNone 3.8 6.4 12.3 25.3 5.6 14.1 26.1 6.3 100.0 (62)Incomplete Primary 1.2 17.1 17.7 19.4 8.8 13.4 10.3 12.2 100.0 (347)Complete Primary 0.1 14.2 18.4 22.3 13.4 12.1 10.4 9.1 100.0 (572)Secondary 0.4 22.2 21.2 21.7 12.3 9.7 7.4 5.2 100.0 (424)Post Secondary 0.0 22.7 32.6 20.3 9.2 6.7 5.3 3.3 100.0 (176)
* Excludes 8 cases for whom marital status is unknown.* Excludes 5 cases for whom education level is unknown.** Less than 25 cases
(Percent Distribution)
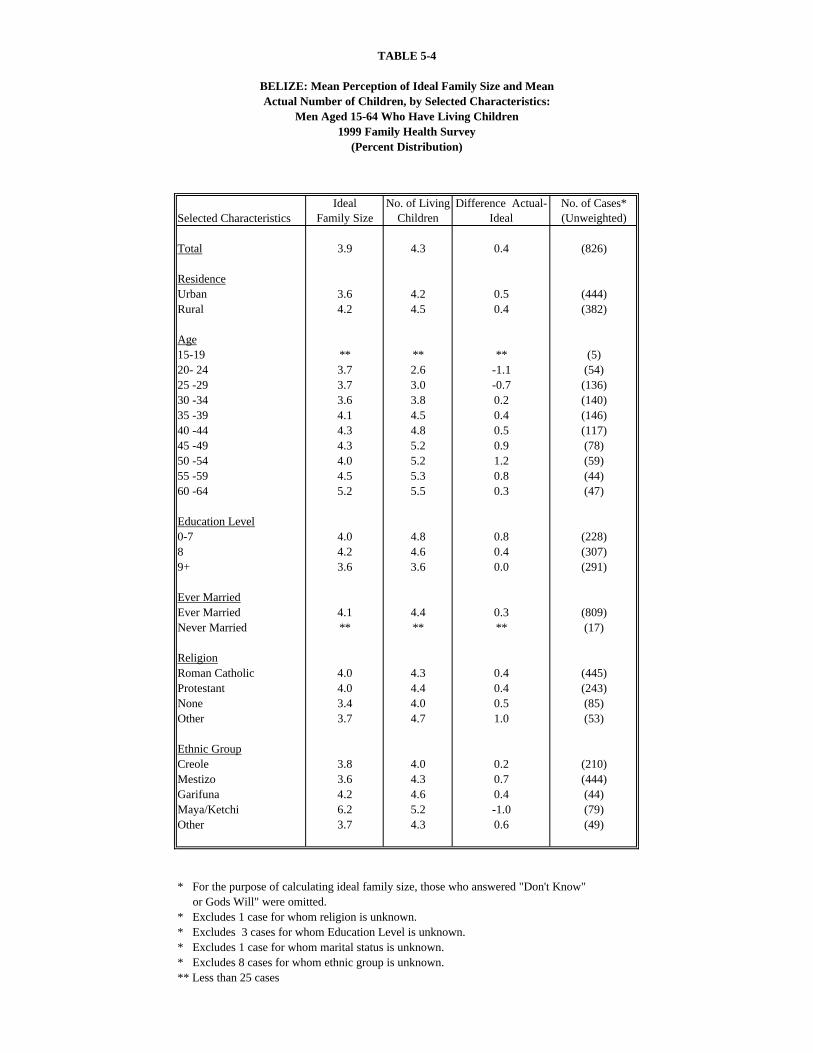
TABLE 5-4
BELIZE: Mean Perception of Ideal Family Size and MeanActual Number of Children, by Selected Characteristics:
Men Aged 15-64 Who Have Living Children1999 Family Health Survey
Selected CharacteristicsIdeal
Family SizeNo. of Living
ChildrenDifference Actual-
IdealNo. of Cases* (Unweighted)
Total 3.9 4.3 0.4 (826)
ResidenceUrban 3.6 4.2 0.5 (444)Rural 4.2 4.5 0.4 (382)
Age15-19 ** ** ** (5)20- 24 3.7 2.6 -1.1 (54)25 -29 3.7 3.0 -0.7 (136)30 -34 3.6 3.8 0.2 (140)35 -39 4.1 4.5 0.4 (146)40 -44 4.3 4.8 0.5 (117)45 -49 4.3 5.2 0.9 (78)50 -54 4.0 5.2 1.2 (59)55 -59 4.5 5.3 0.8 (44)60 -64 5.2 5.5 0.3 (47)
Education Level0-7 4.0 4.8 0.8 (228)8 4.2 4.6 0.4 (307)9+ 3.6 3.6 0.0 (291)
Ever MarriedEver Married 4.1 4.4 0.3 (809)Never Married ** ** ** (17)
ReligionRoman Catholic 4.0 4.3 0.4 (445)Protestant 4.0 4.4 0.4 (243)None 3.4 4.0 0.5 (85)Other 3.7 4.7 1.0 (53)
Ethnic GroupCreole 3.8 4.0 0.2 (210)Mestizo 3.6 4.3 0.7 (444)Garifuna 4.2 4.6 0.4 (44)Maya/Ketchi 6.2 5.2 -1.0 (79)Other 3.7 4.3 0.6 (49)
* For the purpose of calculating ideal family size, those who answered "Don't Know" or Gods Will" were omitted.* Excludes 1 case for whom religion is unknown.* Excludes 3 cases for whom Education Level is unknown. * Excludes 1 case for whom marital status is unknown.* Excludes 8 cases for whom ethnic group is unknown.** Less than 25 cases
(Percent Distribution)
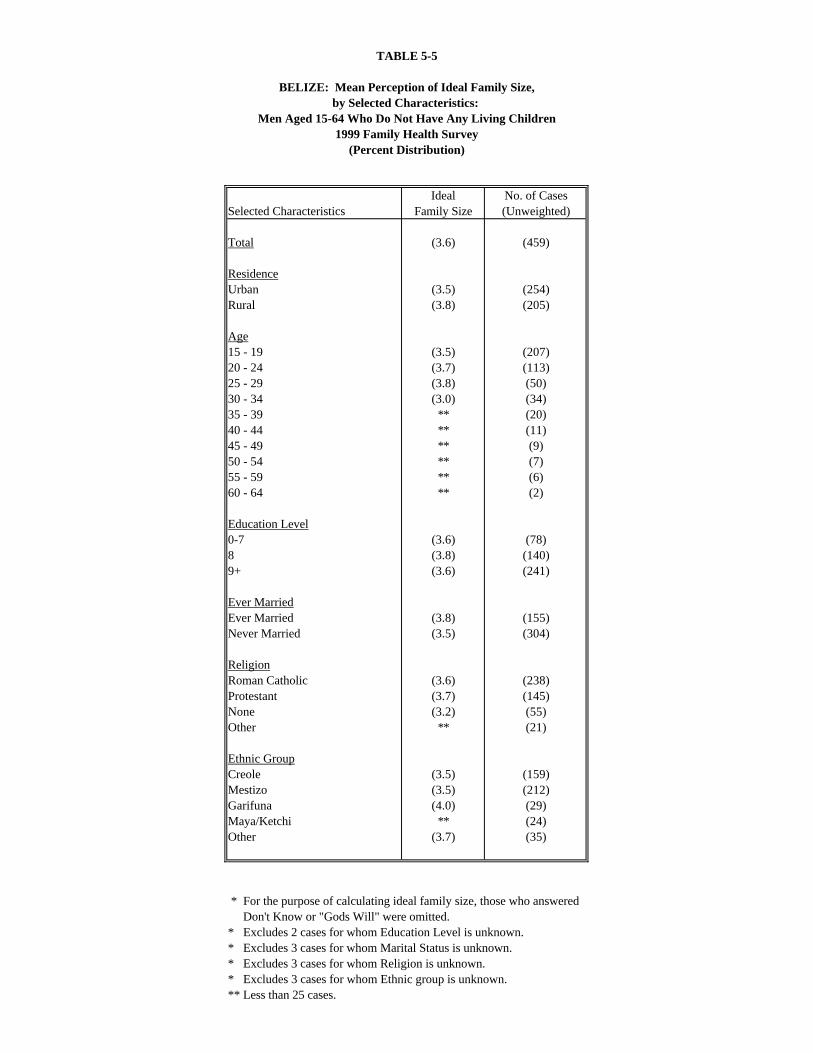
TABLE 5-5
BELIZE: Mean Perception of Ideal Family Size,by Selected Characteristics:
Men Aged 15-64 Who Do Not Have Any Living Children1999 Family Health Survey
Selected CharacteristicsIdeal
Family SizeNo. of Cases (Unweighted)
Total (3.6) (459)
ResidenceUrban (3.5) (254)Rural (3.8) (205)
Age15 - 19 (3.5) (207)20 - 24 (3.7) (113)25 - 29 (3.8) (50)30 - 34 (3.0) (34)35 - 39 ** (20)40 - 44 ** (11)45 - 49 ** (9)50 - 54 ** (7)55 - 59 ** (6)60 - 64 ** (2)
Education Level0-7 (3.6) (78)8 (3.8) (140)9+ (3.6) (241)
Ever MarriedEver Married (3.8) (155)Never Married (3.5) (304)
ReligionRoman Catholic (3.6) (238)Protestant (3.7) (145)None (3.2) (55)Other ** (21)
Ethnic GroupCreole (3.5) (159)Mestizo (3.5) (212)Garifuna (4.0) (29)Maya/Ketchi ** (24)Other (3.7) (35)
* For the purpose of calculating ideal family size, those who answered Don't Know or "Gods Will" were omitted.* Excludes 2 cases for whom Education Level is unknown.* Excludes 3 cases for whom Marital Status is unknown.* Excludes 3 cases for whom Religion is unknown.* Excludes 3 cases for whom Ethnic group is unknown.** Less than 25 cases.
(Percent Distribution)
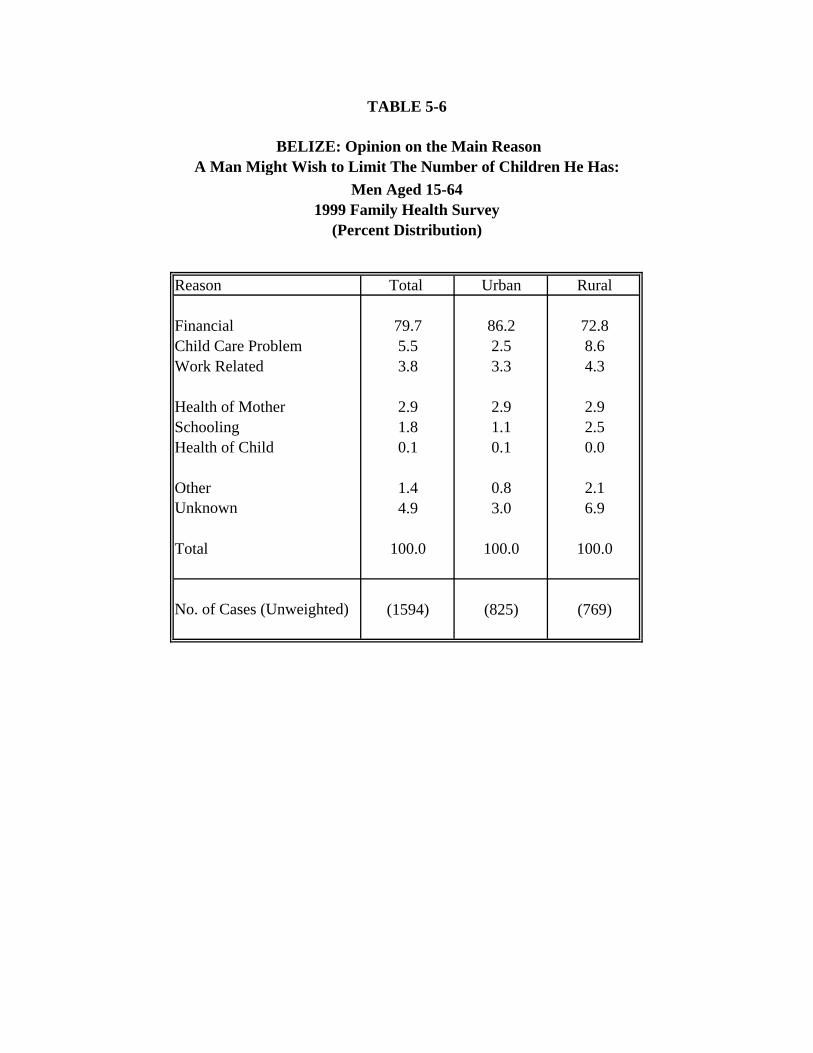
BELIZE: Opinion on the Main ReasonA Man Might Wish to Limit The Number of Children He Has:
Reason Total Urban Rural
Financial 79.7 86.2 72.8Child Care Problem 5.5 2.5 8.6Work Related 3.8 3.3 4.3
Health of Mother 2.9 2.9 2.9Schooling 1.8 1.1 2.5Health of Child 0.1 0.1 0.0
Other 1.4 0.8 2.1Unknown 4.9 3.0 6.9
Total 100.0 100.0 100.0
No. of Cases (Unweighted) (1594) (825) (769)
(Percent Distribution)
TABLE 5-6
1999 Family Health SurveyMen Aged 15-64
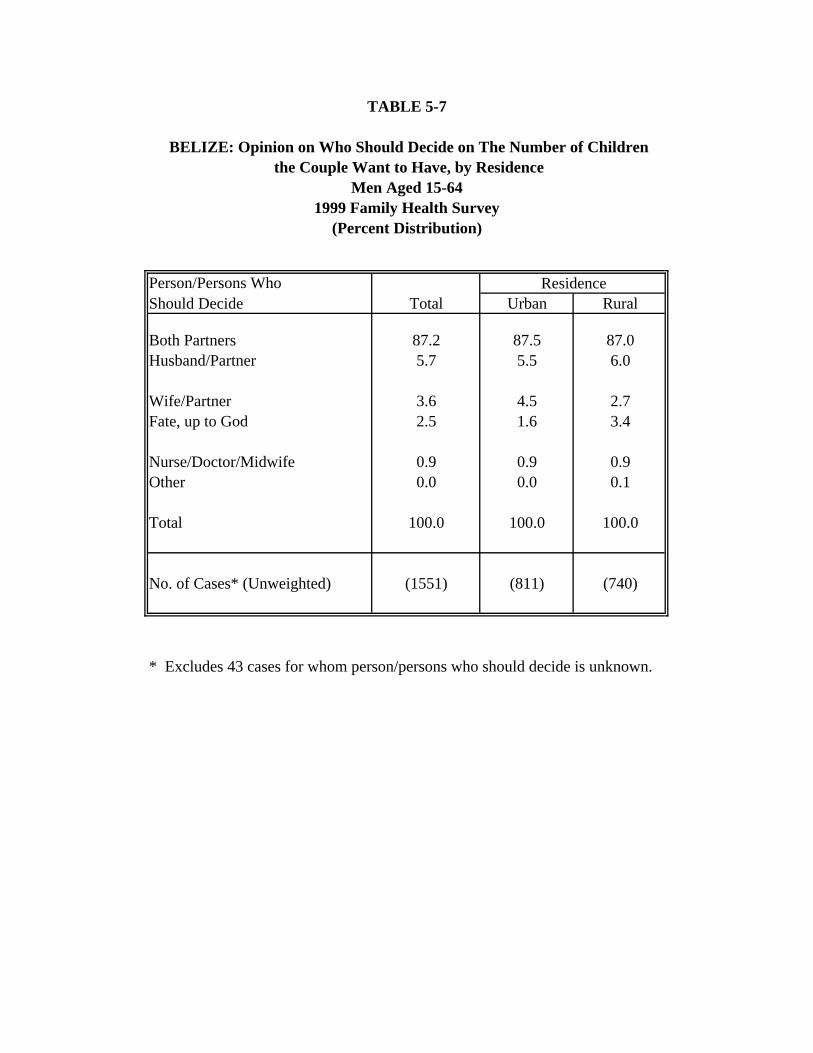
TABLE 5-7
BELIZE: Opinion on Who Should Decide on The Number of Children the Couple Want to Have, by Residence
Person/Persons Who ResidenceShould Decide Total Urban Rural
Both Partners 87.2 87.5 87.0Husband/Partner 5.7 5.5 6.0
Wife/Partner 3.6 4.5 2.7Fate, up to God 2.5 1.6 3.4
Nurse/Doctor/Midwife 0.9 0.9 0.9Other 0.0 0.0 0.1
Total 100.0 100.0 100.0
No. of Cases* (Unweighted) (1551) (811) (740)
* Excludes 43 cases for whom person/persons who should decide is unknown.
Men Aged 15-641999 Family Health Survey
(Percent Distribution)
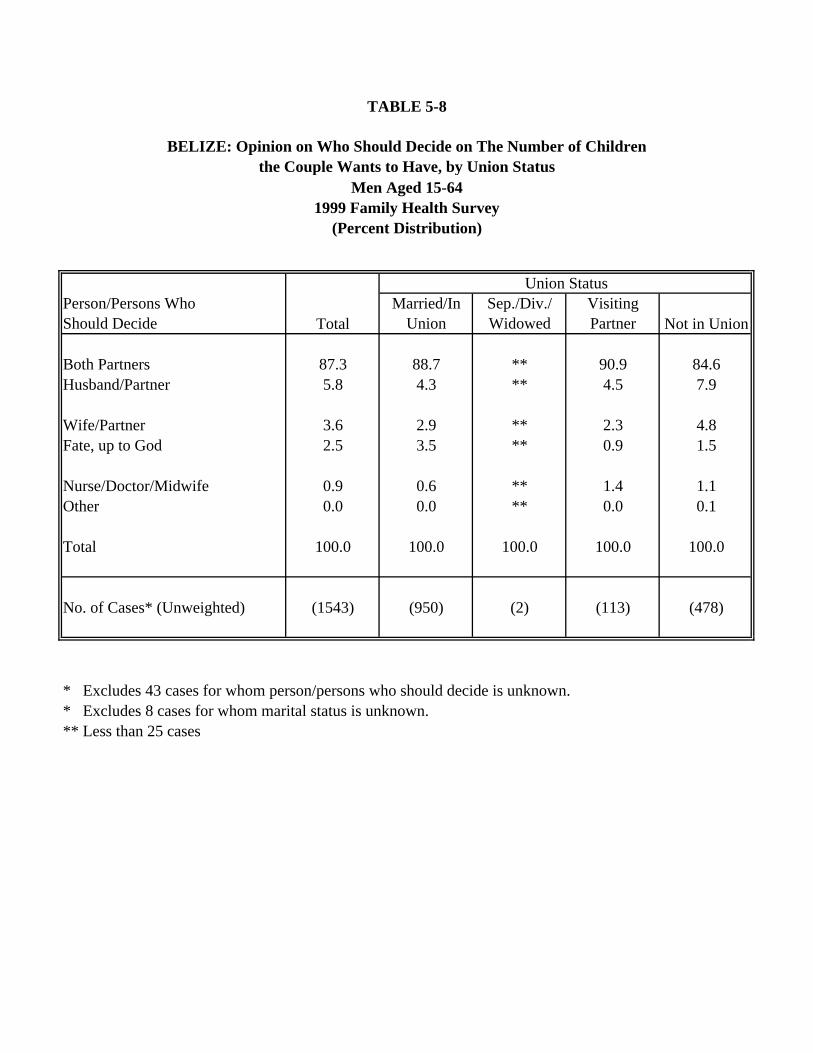
TABLE 5-8
BELIZE: Opinion on Who Should Decide on The Number of Childrenthe Couple Wants to Have, by Union Status
Union StatusPerson/Persons Who Should Decide Total
Married/In Union
Sep./Div./ Widowed
Visiting Partner Not in Union
Both Partners 87.3 88.7 ** 90.9 84.6Husband/Partner 5.8 4.3 ** 4.5 7.9
Wife/Partner 3.6 2.9 ** 2.3 4.8Fate, up to God 2.5 3.5 ** 0.9 1.5
Nurse/Doctor/Midwife 0.9 0.6 ** 1.4 1.1Other 0.0 0.0 ** 0.0 0.1
Total 100.0 100.0 100.0 100.0 100.0
No. of Cases* (Unweighted) (1543) (950) (2) (113) (478)
* Excludes 43 cases for whom person/persons who should decide is unknown.* Excludes 8 cases for whom marital status is unknown.** Less than 25 cases
Men Aged 15-641999 Family Health Survey
(Percent Distribution)
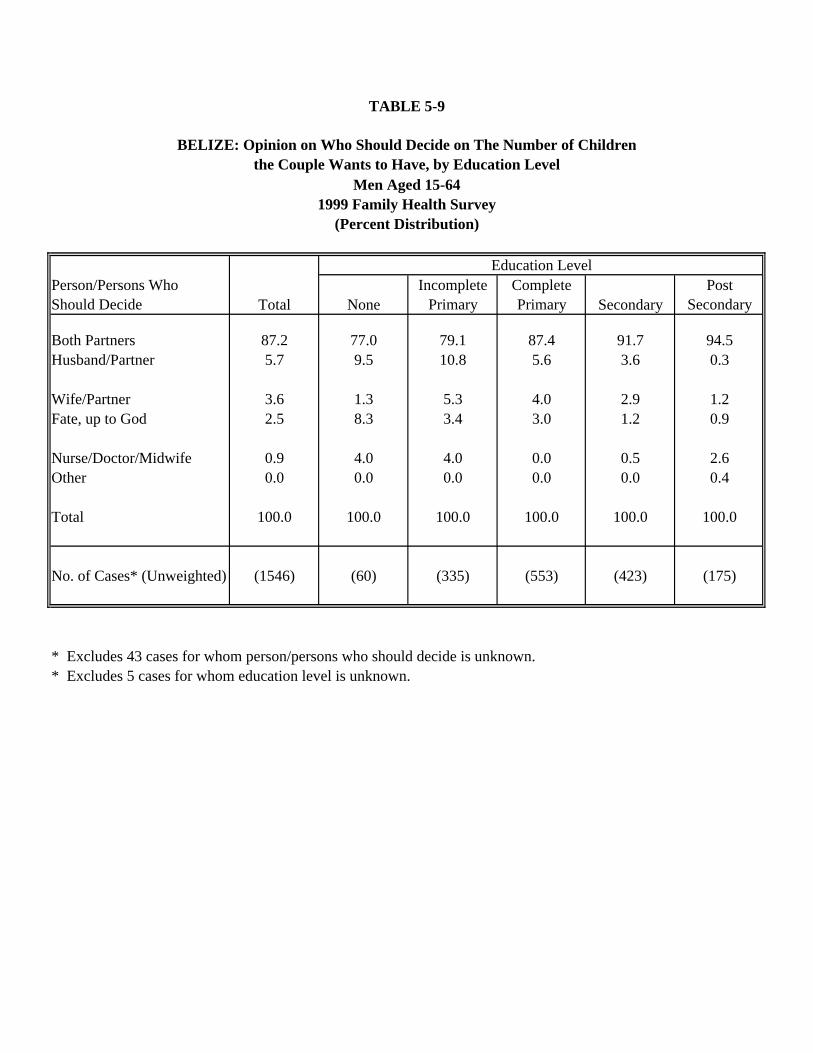
TABLE 5-9
BELIZE: Opinion on Who Should Decide on The Number of Childrenthe Couple Wants to Have, by Education Level
Education LevelPerson/Persons Who Should Decide Total None
Incomplete Primary
Complete Primary Secondary
Post Secondary
Both Partners 87.2 77.0 79.1 87.4 91.7 94.5Husband/Partner 5.7 9.5 10.8 5.6 3.6 0.3
Wife/Partner 3.6 1.3 5.3 4.0 2.9 1.2Fate, up to God 2.5 8.3 3.4 3.0 1.2 0.9
Nurse/Doctor/Midwife 0.9 4.0 4.0 0.0 0.5 2.6Other 0.0 0.0 0.0 0.0 0.0 0.4
Total 100.0 100.0 100.0 100.0 100.0 100.0
No. of Cases* (Unweighted) (1546) (60) (335) (553) (423) (175)
* Excludes 43 cases for whom person/persons who should decide is unknown.* Excludes 5 cases for whom education level is unknown.
Men Aged 15-641999 Family Health Survey
(Percent Distribution)
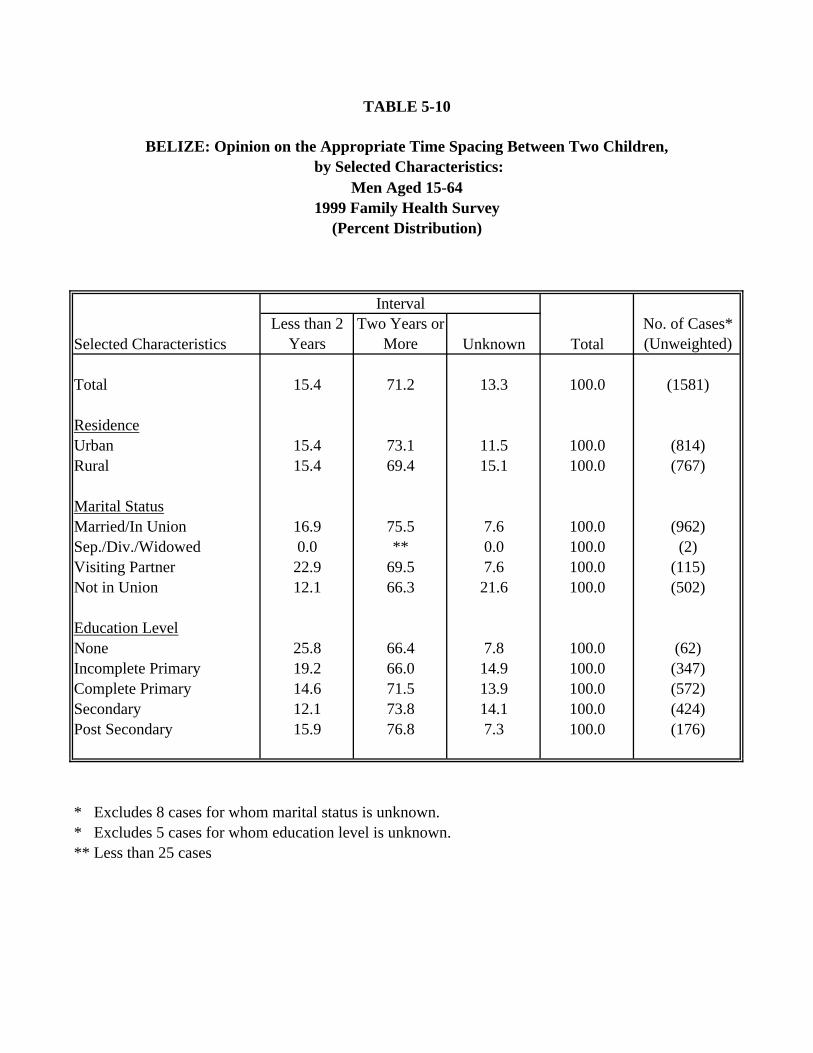
TABLE 5-10
BELIZE: Opinion on the Appropriate Time Spacing Between Two Children, by Selected Characteristics:
Interval
Selected CharacteristicsLess than 2
YearsTwo Years or
More Unknown TotalNo. of Cases* (Unweighted)
Total 15.4 71.2 13.3 100.0 (1581)
ResidenceUrban 15.4 73.1 11.5 100.0 (814)Rural 15.4 69.4 15.1 100.0 (767)
Marital StatusMarried/In Union 16.9 75.5 7.6 100.0 (962)Sep./Div./Widowed 0.0 ** 0.0 100.0 (2)Visiting Partner 22.9 69.5 7.6 100.0 (115)Not in Union 12.1 66.3 21.6 100.0 (502)
Education LevelNone 25.8 66.4 7.8 100.0 (62)Incomplete Primary 19.2 66.0 14.9 100.0 (347)Complete Primary 14.6 71.5 13.9 100.0 (572)Secondary 12.1 73.8 14.1 100.0 (424)Post Secondary 15.9 76.8 7.3 100.0 (176)
* Excludes 8 cases for whom marital status is unknown.* Excludes 5 cases for whom education level is unknown.** Less than 25 cases
Men Aged 15-641999 Family Health Survey
(Percent Distribution)
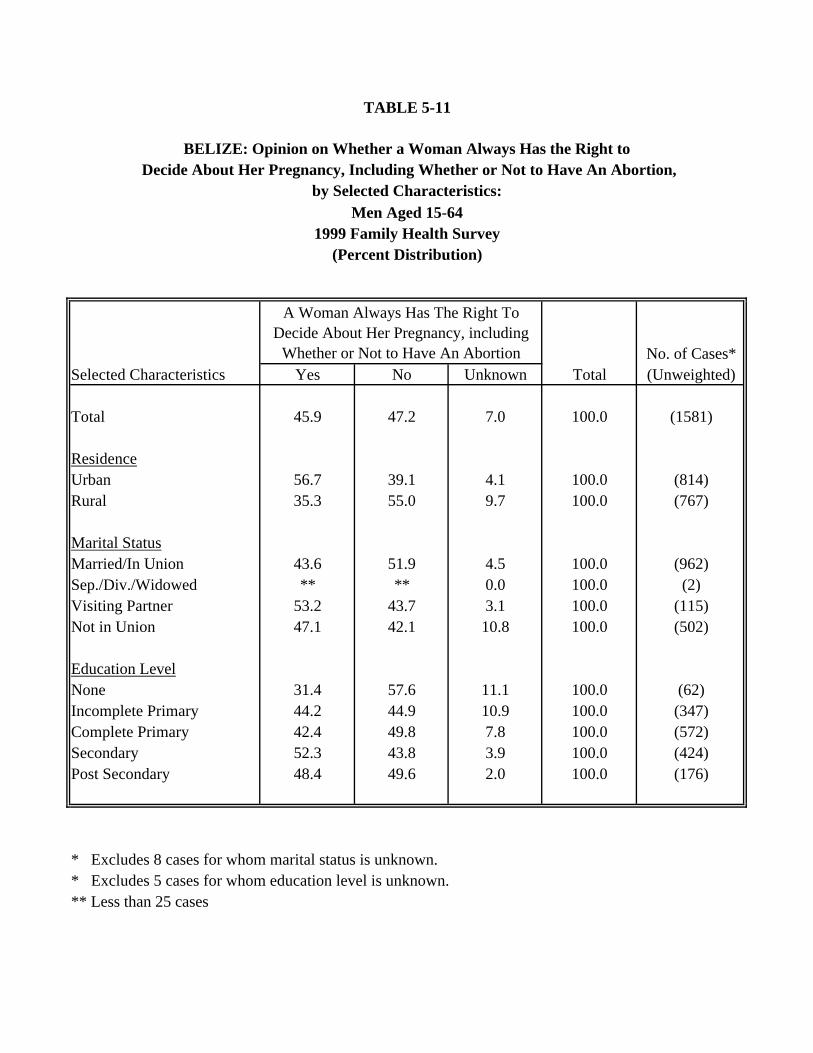
TABLE 5-11
BELIZE: Opinion on Whether a Woman Always Has the Right to Decide About Her Pregnancy, Including Whether or Not to Have An Abortion,
by Selected Characteristics:
A Woman Always Has The Right To Decide About Her Pregnancy, including
Whether or Not to Have An Abortion No. of Cases*Selected Characteristics Yes No Unknown Total (Unweighted)
Total 45.9 47.2 7.0 100.0 (1581)
ResidenceUrban 56.7 39.1 4.1 100.0 (814)Rural 35.3 55.0 9.7 100.0 (767)
Marital StatusMarried/In Union 43.6 51.9 4.5 100.0 (962)Sep./Div./Widowed ** ** 0.0 100.0 (2)Visiting Partner 53.2 43.7 3.1 100.0 (115)Not in Union 47.1 42.1 10.8 100.0 (502)
Education LevelNone 31.4 57.6 11.1 100.0 (62)Incomplete Primary 44.2 44.9 10.9 100.0 (347)Complete Primary 42.4 49.8 7.8 100.0 (572)Secondary 52.3 43.8 3.9 100.0 (424)Post Secondary 48.4 49.6 2.0 100.0 (176)
* Excludes 8 cases for whom marital status is unknown.* Excludes 5 cases for whom education level is unknown.** Less than 25 cases
Men Aged 15-641999 Family Health Survey
(Percent Distribution)
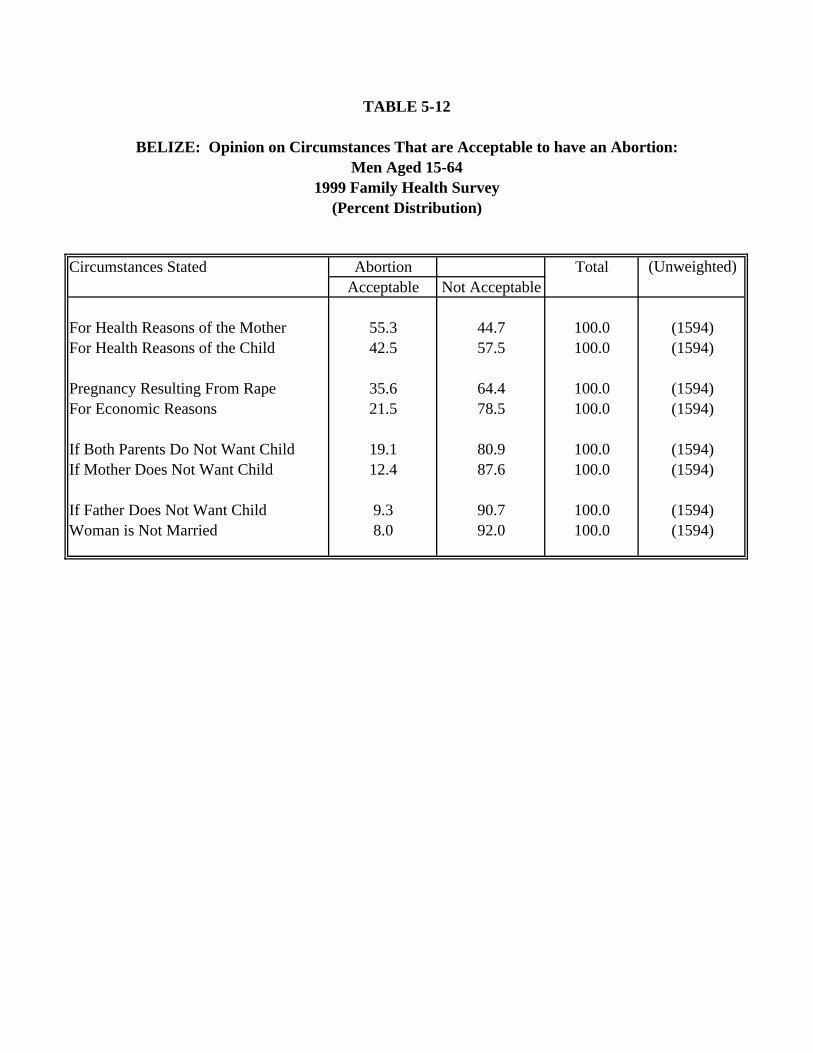
Circumstances Stated Abortion Total (Unweighted)Acceptable Not Acceptable
For Health Reasons of the Mother 55.3 44.7 100.0 (1594)For Health Reasons of the Child 42.5 57.5 100.0 (1594)
Pregnancy Resulting From Rape 35.6 64.4 100.0 (1594)For Economic Reasons 21.5 78.5 100.0 (1594)
If Both Parents Do Not Want Child 19.1 80.9 100.0 (1594)If Mother Does Not Want Child 12.4 87.6 100.0 (1594)
If Father Does Not Want Child 9.3 90.7 100.0 (1594)Woman is Not Married 8.0 92.0 100.0 (1594)
1999 Family Health SurveyMen Aged 15-64
(Percent Distribution)
TABLE 5-12
BELIZE: Opinion on Circumstances That are Acceptable to have an Abortion:
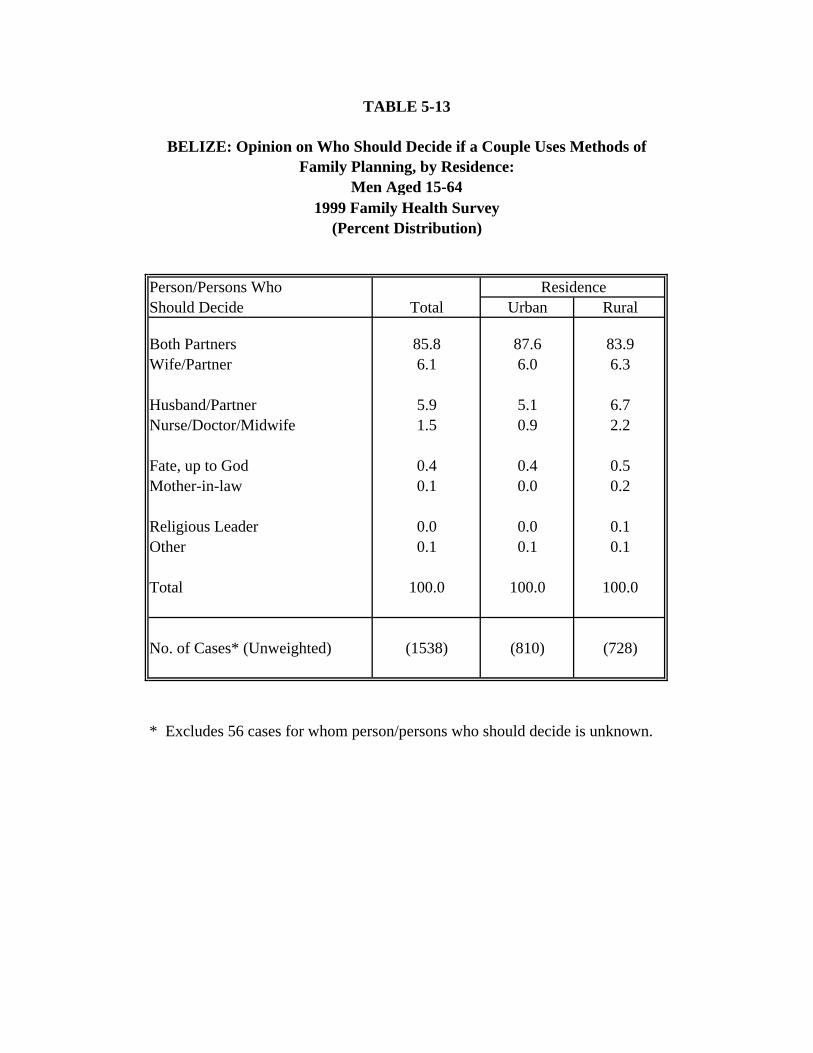
TABLE 5-13
BELIZE: Opinion on Who Should Decide if a Couple Uses Methods of Family Planning, by Residence:
Men Aged 15-641999 Family Health Survey
Person/Persons Who ResidenceShould Decide Total Urban Rural
Both Partners 85.8 87.6 83.9Wife/Partner 6.1 6.0 6.3
Husband/Partner 5.9 5.1 6.7Nurse/Doctor/Midwife 1.5 0.9 2.2
Fate, up to God 0.4 0.4 0.5Mother-in-law 0.1 0.0 0.2
Religious Leader 0.0 0.0 0.1Other 0.1 0.1 0.1
Total 100.0 100.0 100.0
No. of Cases* (Unweighted) (1538) (810) (728)
* Excludes 56 cases for whom person/persons who should decide is unknown.
(Percent Distribution)
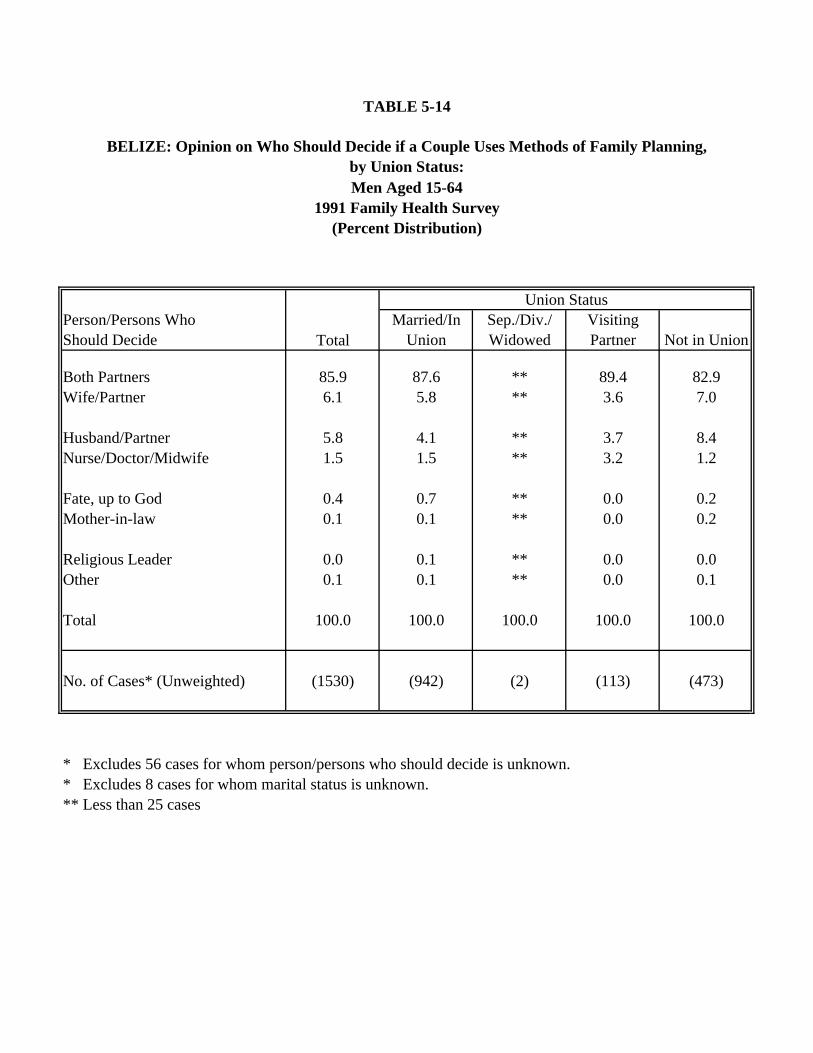
TABLE 5-14
BELIZE: Opinion on Who Should Decide if a Couple Uses Methods of Family Planning,by Union Status:
Union StatusPerson/Persons Who Should Decide Total
Married/In Union
Sep./Div./ Widowed
Visiting Partner Not in Union
Both Partners 85.9 87.6 ** 89.4 82.9Wife/Partner 6.1 5.8 ** 3.6 7.0
Husband/Partner 5.8 4.1 ** 3.7 8.4Nurse/Doctor/Midwife 1.5 1.5 ** 3.2 1.2
Fate, up to God 0.4 0.7 ** 0.0 0.2Mother-in-law 0.1 0.1 ** 0.0 0.2
Religious Leader 0.0 0.1 ** 0.0 0.0Other 0.1 0.1 ** 0.0 0.1
Total 100.0 100.0 100.0 100.0 100.0
No. of Cases* (Unweighted) (1530) (942) (2) (113) (473)
* Excludes 56 cases for whom person/persons who should decide is unknown.* Excludes 8 cases for whom marital status is unknown.** Less than 25 cases
Men Aged 15-641991 Family Health Survey
(Percent Distribution)
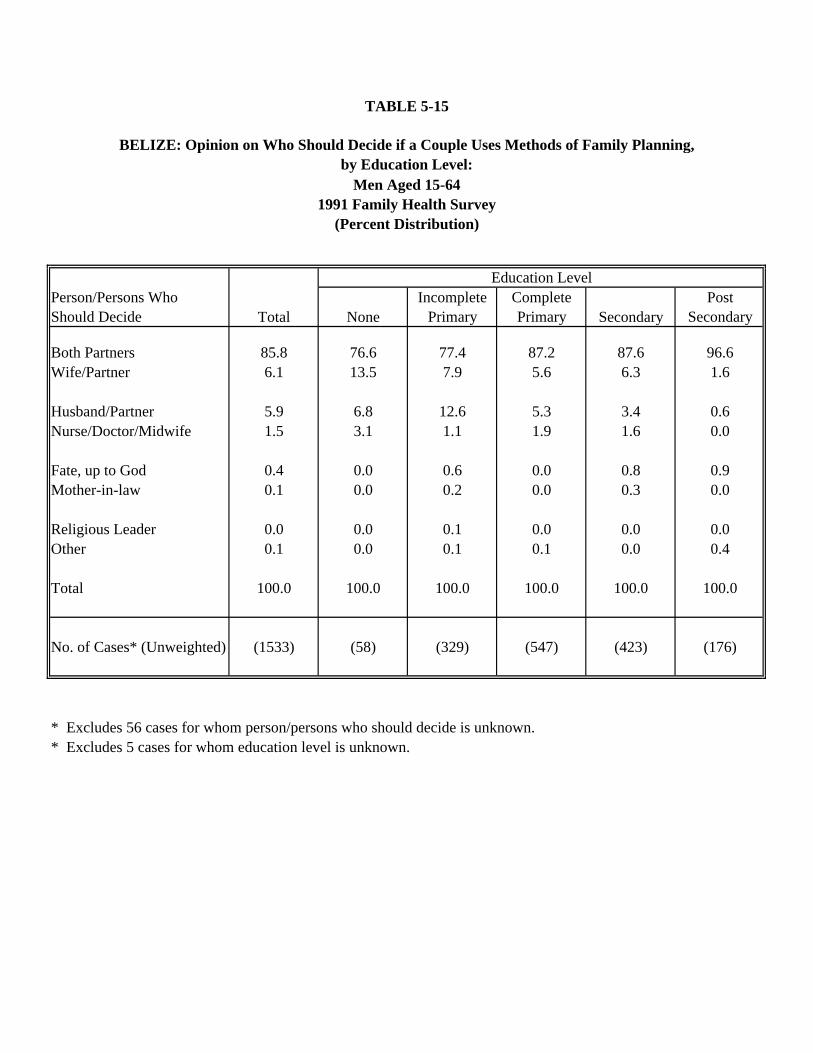
TABLE 5-15
BELIZE: Opinion on Who Should Decide if a Couple Uses Methods of Family Planning,by Education Level:
Education LevelPerson/Persons Who Should Decide Total None
Incomplete Primary
Complete Primary Secondary
Post Secondary
Both Partners 85.8 76.6 77.4 87.2 87.6 96.6Wife/Partner 6.1 13.5 7.9 5.6 6.3 1.6
Husband/Partner 5.9 6.8 12.6 5.3 3.4 0.6Nurse/Doctor/Midwife 1.5 3.1 1.1 1.9 1.6 0.0
Fate, up to God 0.4 0.0 0.6 0.0 0.8 0.9Mother-in-law 0.1 0.0 0.2 0.0 0.3 0.0
Religious Leader 0.0 0.0 0.1 0.0 0.0 0.0Other 0.1 0.0 0.1 0.1 0.0 0.4
Total 100.0 100.0 100.0 100.0 100.0 100.0
No. of Cases* (Unweighted) (1533) (58) (329) (547) (423) (176)
* Excludes 56 cases for whom person/persons who should decide is unknown.* Excludes 5 cases for whom education level is unknown.
Men Aged 15-641991 Family Health Survey
(Percent Distribution)
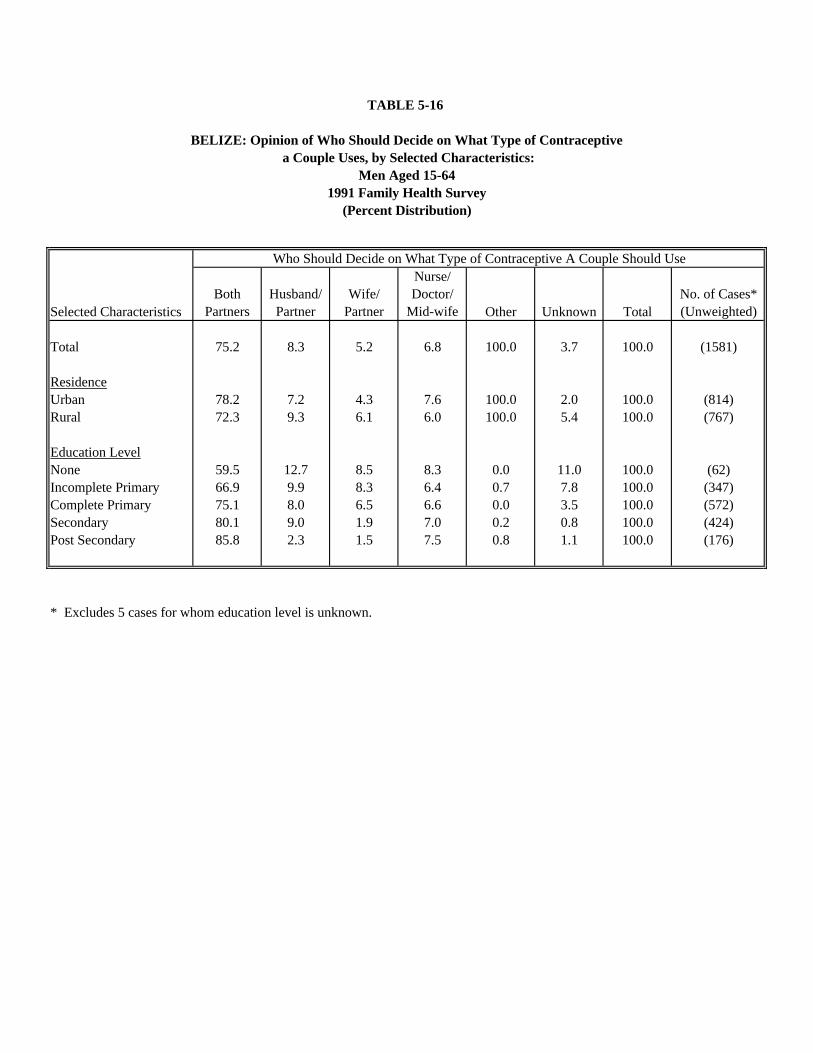
a Couple Uses, by Selected Characteristics:
Selected CharacteristicsBoth
PartnersHusband/ Partner
Wife/ Partner
Nurse/ Doctor/
Mid-wife Other Unknown TotalNo. of Cases* (Unweighted)
Total 75.2 8.3 5.2 6.8 100.0 3.7 100.0 (1581)
ResidenceUrban 78.2 7.2 4.3 7.6 100.0 2.0 100.0 (814)Rural 72.3 9.3 6.1 6.0 100.0 5.4 100.0 (767)
Education LevelNone 59.5 12.7 8.5 8.3 0.0 11.0 100.0 (62)Incomplete Primary 66.9 9.9 8.3 6.4 0.7 7.8 100.0 (347)Complete Primary 75.1 8.0 6.5 6.6 0.0 3.5 100.0 (572)Secondary 80.1 9.0 1.9 7.0 0.2 0.8 100.0 (424)Post Secondary 85.8 2.3 1.5 7.5 0.8 1.1 100.0 (176)
* Excludes 5 cases for whom education level is unknown.
TABLE 5-16
Who Should Decide on What Type of Contraceptive A Couple Should Use
BELIZE: Opinion of Who Should Decide on What Type of Contraceptive
Men Aged 15-641991 Family Health Survey
(Percent Distribution)

TABLE 5-17
BELIZE: Opinion of the Ideal Age a Man Should be Before He HasSexual Intercourse, by Residence:
Men Aged 15-64
ResidenceIdeal Age Total Urban Rural
<12 0.2 0.2 0.212 1.6 1.3 1.913 1.5 2.4 0.614 3.5 3.5 3.615 8.7 7.7 9.7
16 11.4 12.4 10.317 7.6 7.4 7.818 40.0 38.5 41.519 3.2 4.3 2.220 - 24 11.7 14.0 9.4
25 + 0.6 0.4 0.8Unknown 10.0 8.0 12.0
Total 100.0 100.0 100.0
No. of Cases (Unweighted) (1594) (825) (769)
1999 Family Health Survey(Percent Distribution)
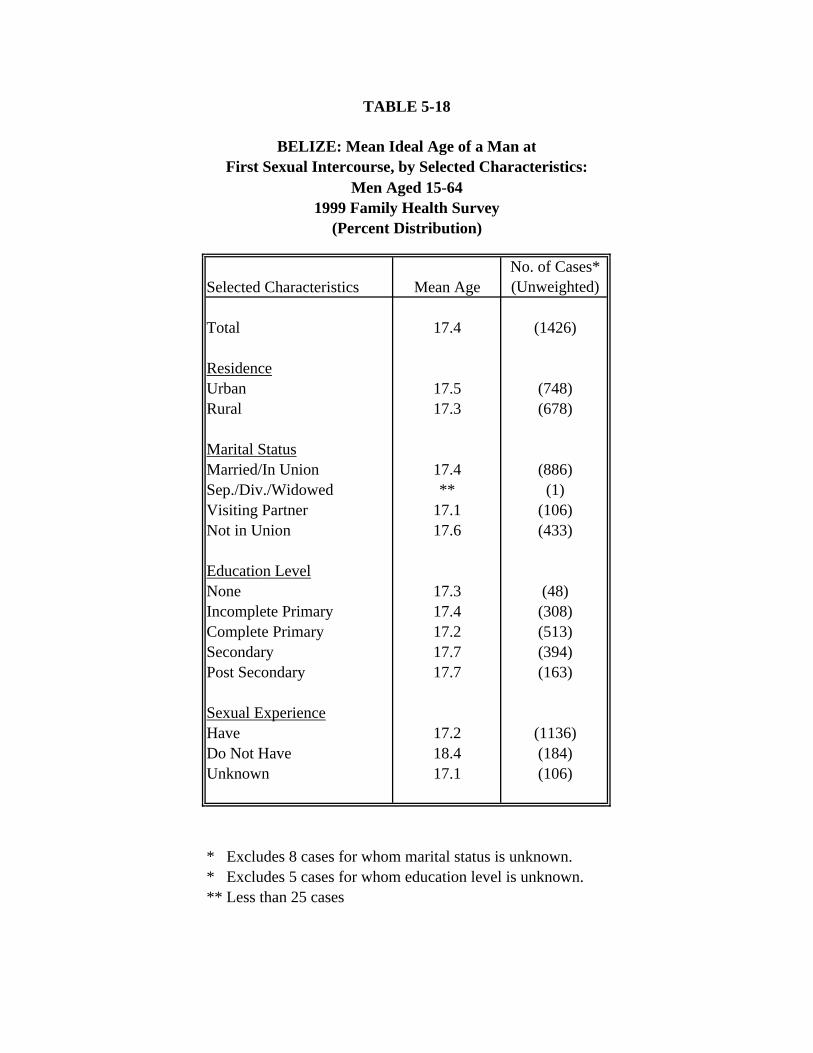
TABLE 5-18
BELIZE: Mean Ideal Age of a Man atFirst Sexual Intercourse, by Selected Characteristics:
Selected Characteristics Mean AgeNo. of Cases* (Unweighted)
Total 17.4 (1426)
ResidenceUrban 17.5 (748)Rural 17.3 (678)
Marital StatusMarried/In Union 17.4 (886)Sep./Div./Widowed ** (1)Visiting Partner 17.1 (106)Not in Union 17.6 (433)
Education LevelNone 17.3 (48)Incomplete Primary 17.4 (308)Complete Primary 17.2 (513)Secondary 17.7 (394)Post Secondary 17.7 (163)
Sexual ExperienceHave 17.2 (1136)Do Not Have 18.4 (184)Unknown 17.1 (106)
* Excludes 8 cases for whom marital status is unknown.* Excludes 5 cases for whom education level is unknown.** Less than 25 cases
Men Aged 15-641999 Family Health Survey
(Percent Distribution)
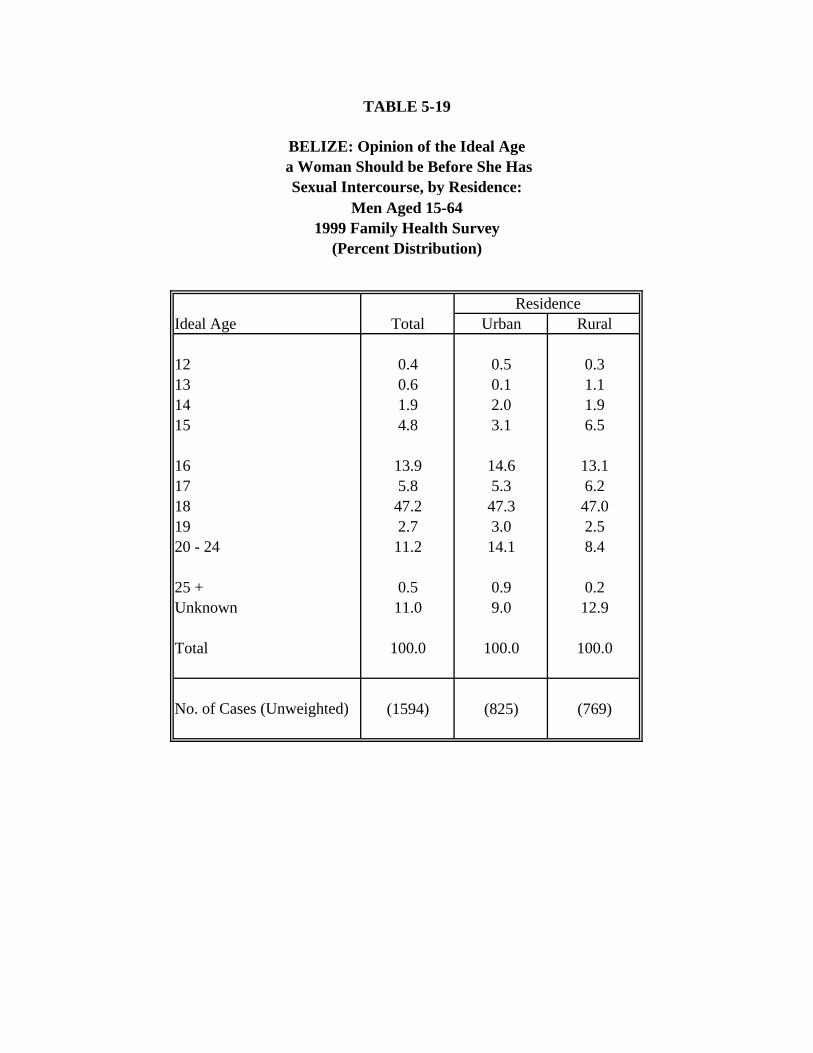
TABLE 5-19
BELIZE: Opinion of the Ideal Age a Woman Should be Before She Has
Sexual Intercourse, by Residence:Men Aged 15-64
ResidenceIdeal Age Total Urban Rural
12 0.4 0.5 0.313 0.6 0.1 1.114 1.9 2.0 1.915 4.8 3.1 6.5
16 13.9 14.6 13.117 5.8 5.3 6.218 47.2 47.3 47.019 2.7 3.0 2.520 - 24 11.2 14.1 8.4
25 + 0.5 0.9 0.2Unknown 11.0 9.0 12.9
Total 100.0 100.0 100.0
No. of Cases (Unweighted) (1594) (825) (769)
1999 Family Health Survey(Percent Distribution)
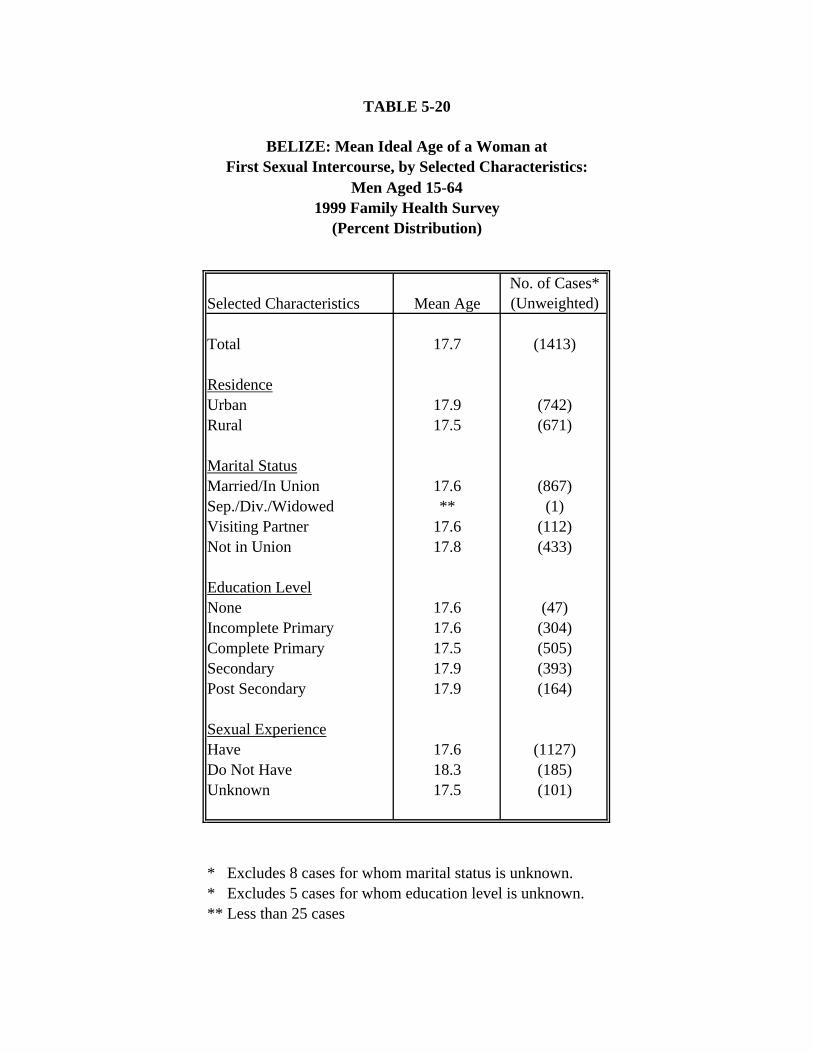
TABLE 5-20
BELIZE: Mean Ideal Age of a Woman atFirst Sexual Intercourse, by Selected Characteristics:
Selected Characteristics Mean AgeNo. of Cases* (Unweighted)
Total 17.7 (1413)
ResidenceUrban 17.9 (742)Rural 17.5 (671)
Marital StatusMarried/In Union 17.6 (867)Sep./Div./Widowed ** (1)Visiting Partner 17.6 (112)Not in Union 17.8 (433)
Education LevelNone 17.6 (47)Incomplete Primary 17.6 (304)Complete Primary 17.5 (505)Secondary 17.9 (393)Post Secondary 17.9 (164)
Sexual ExperienceHave 17.6 (1127)Do Not Have 18.3 (185)Unknown 17.5 (101)
* Excludes 8 cases for whom marital status is unknown.* Excludes 5 cases for whom education level is unknown.** Less than 25 cases
Men Aged 15-641999 Family Health Survey
(Percent Distribution)
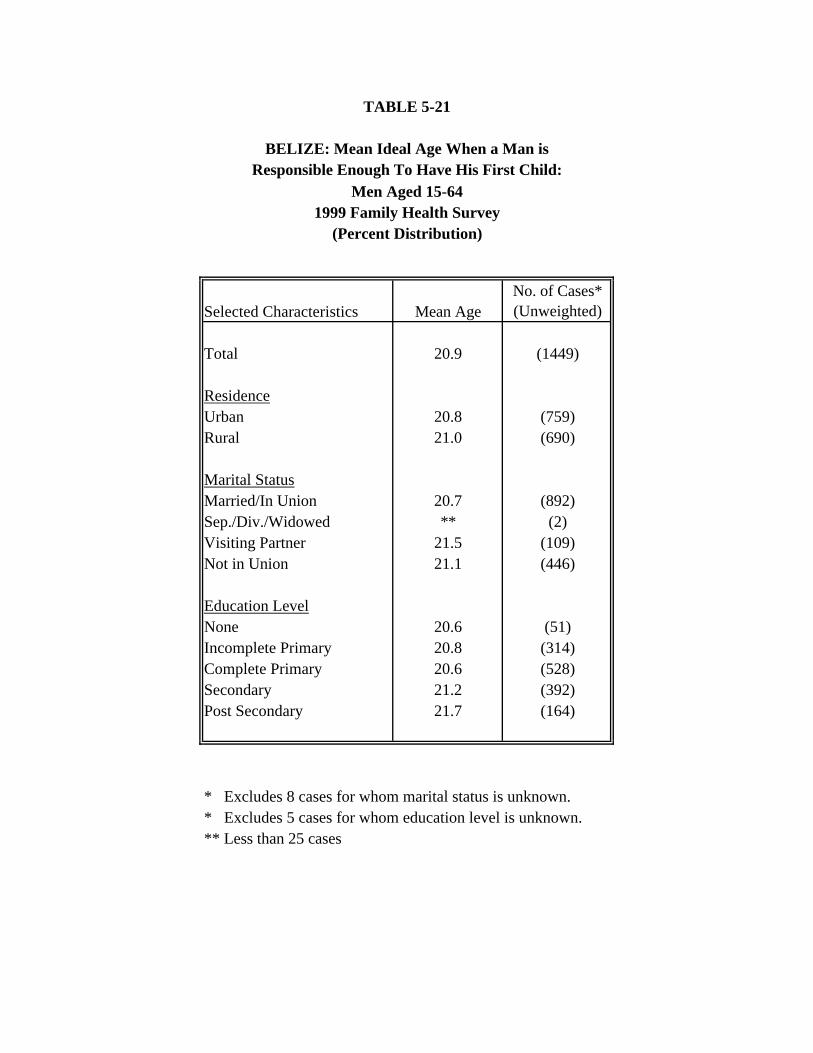
TABLE 5-21
BELIZE: Mean Ideal Age When a Man is Responsible Enough To Have His First Child:
Selected Characteristics Mean AgeNo. of Cases* (Unweighted)
Total 20.9 (1449)
ResidenceUrban 20.8 (759)Rural 21.0 (690)
Marital StatusMarried/In Union 20.7 (892)Sep./Div./Widowed ** (2)Visiting Partner 21.5 (109)Not in Union 21.1 (446)
Education LevelNone 20.6 (51)Incomplete Primary 20.8 (314)Complete Primary 20.6 (528)Secondary 21.2 (392)Post Secondary 21.7 (164)
* Excludes 8 cases for whom marital status is unknown.* Excludes 5 cases for whom education level is unknown.** Less than 25 cases
Men Aged 15-641999 Family Health Survey
(Percent Distribution)

TABLE 5-22
BELIZE: Mean Ideal Age When A Woman isResponsible Enough To Have Her First Child:
Selected Characteristics Mean AgeNo. of Cases* (Unweighted)
Total 20.3 (1438)
ResidenceUrban 20.4 (761)Rural 20.2 (677)
Marital StatusMarried/In Union 20.0 (883)Sep./Div./Widowed ** (2)Visiting Partner 20.7 (111)Not in Union 20.6 (442)
Education LevelNone 19.9 (51)Incomplete Primary 19.8 (306)Complete Primary 20.1 (517)Secondary 20.7 (400)Post Secondary 20.6 (164)
* Excludes 8 cases for whom marital status is unknown.* Excludes 5 cases for whom education level is unknown.** Less than 25 cases
Men Aged 15-641999 Family Health Survey
(Percent Distribution)
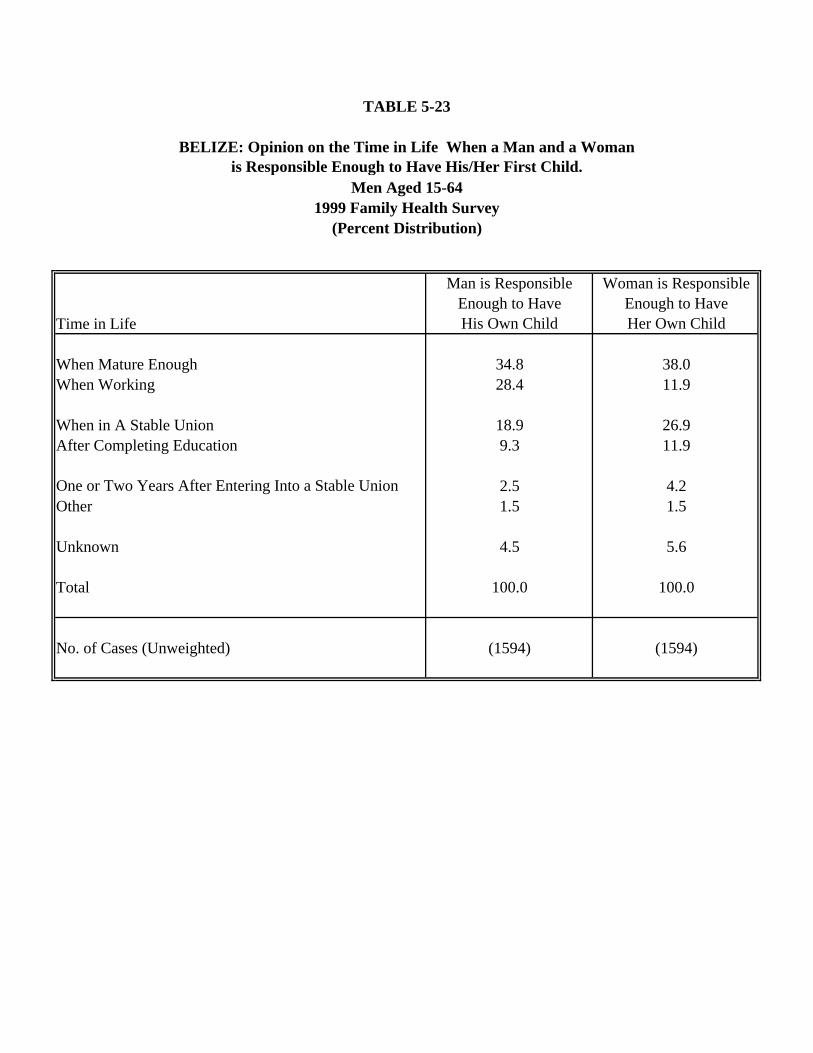
is Responsible Enough to Have His/Her First Child.
Time in Life
Man is Responsible Enough to Have His Own Child
Woman is Responsible Enough to Have Her Own Child
When Mature Enough 34.8 38.0When Working 28.4 11.9
When in A Stable Union 18.9 26.9After Completing Education 9.3 11.9
One or Two Years After Entering Into a Stable Union 2.5 4.2Other 1.5 1.5
Unknown 4.5 5.6
Total 100.0 100.0
No. of Cases (Unweighted) (1594) (1594)
(Percent Distribution)
TABLE 5-23
BELIZE: Opinion on the Time in Life When a Man and a Woman
Men Aged 15-641999 Family Health Survey
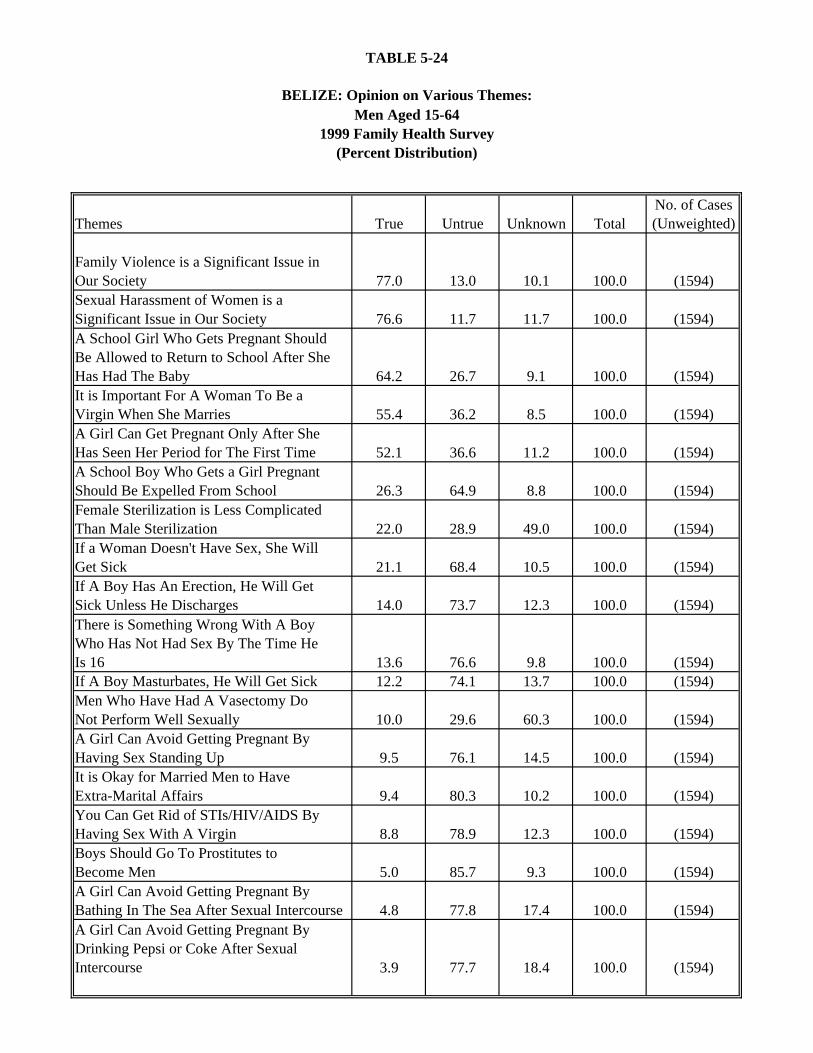
TABLE 5-24
BELIZE: Opinion on Various Themes:
Themes True Untrue Unknown TotalNo. of Cases (Unweighted)
Family Violence is a Significant Issue in Our Society 77.0 13.0 10.1 100.0 (1594)Sexual Harassment of Women is a Significant Issue in Our Society 76.6 11.7 11.7 100.0 (1594)A School Girl Who Gets Pregnant Should Be Allowed to Return to School After She Has Had The Baby 64.2 26.7 9.1 100.0 (1594)It is Important For A Woman To Be a Virgin When She Marries 55.4 36.2 8.5 100.0 (1594)A Girl Can Get Pregnant Only After She Has Seen Her Period for The First Time 52.1 36.6 11.2 100.0 (1594)A School Boy Who Gets a Girl Pregnant Should Be Expelled From School 26.3 64.9 8.8 100.0 (1594)Female Sterilization is Less Complicated Than Male Sterilization 22.0 28.9 49.0 100.0 (1594)If a Woman Doesn't Have Sex, She Will Get Sick 21.1 68.4 10.5 100.0 (1594)If A Boy Has An Erection, He Will Get Sick Unless He Discharges 14.0 73.7 12.3 100.0 (1594)There is Something Wrong With A Boy Who Has Not Had Sex By The Time He Is 16 13.6 76.6 9.8 100.0 (1594)If A Boy Masturbates, He Will Get Sick 12.2 74.1 13.7 100.0 (1594)Men Who Have Had A Vasectomy Do Not Perform Well Sexually 10.0 29.6 60.3 100.0 (1594)A Girl Can Avoid Getting Pregnant By Having Sex Standing Up 9.5 76.1 14.5 100.0 (1594)It is Okay for Married Men to Have Extra-Marital Affairs 9.4 80.3 10.2 100.0 (1594)You Can Get Rid of STIs/HIV/AIDS By Having Sex With A Virgin 8.8 78.9 12.3 100.0 (1594)Boys Should Go To Prostitutes to Become Men 5.0 85.7 9.3 100.0 (1594)A Girl Can Avoid Getting Pregnant By Bathing In The Sea After Sexual Intercourse 4.8 77.8 17.4 100.0 (1594)A Girl Can Avoid Getting Pregnant By Drinking Pepsi or Coke After Sexual Intercourse 3.9 77.7 18.4 100.0 (1594)
Men Aged 15-641999 Family Health Survey
(Percent Distribution)

TABLE 5-25
BELIZE: Opinion on Whether a 'Woman Will Get Sick if She Does Not Have Sex,' by Selected Characteristics:
If a Woman Does Not Have Sex, She Will Get Sick No. of Cases*
Selected Characteristics Yes No Unknown Total (Unweighted)
Total 21.2 68.3 10.5 100.0 (1581)
ResidenceUrban 17.2 72.9 10.0 100.0 (814)Rural 25.2 63.8 11.0 100.0 (767)
Marital StatusMarried/In Union 24.8 67.8 7.3 100.0 (962)Sep./Div./Widowed ** ** ** 100.0 (2)Visiting Partner 14.7 82.2 3.1 100.0 (115)Not in Union 18.2 65.7 16.0 100.0 (502)
Education LevelNone 26.2 57.7 16.2 100.0 (62)Incomplete Primary 30.8 54.0 15.1 100.0 (347)Complete Primary 24.7 63.0 12.3 100.0 (572)Secondary 12.6 80.7 6.7 100.0 (424)Post Secondary 9.3 88.4 2.3 100.0 (176)
* Excludes 8 cases for whom marital status is unknown.* Excludes 5 cases for whom education level is unknown.** Less than 25 cases
Men Aged 15-641999 Family Health Survey
(Percent Distribution)
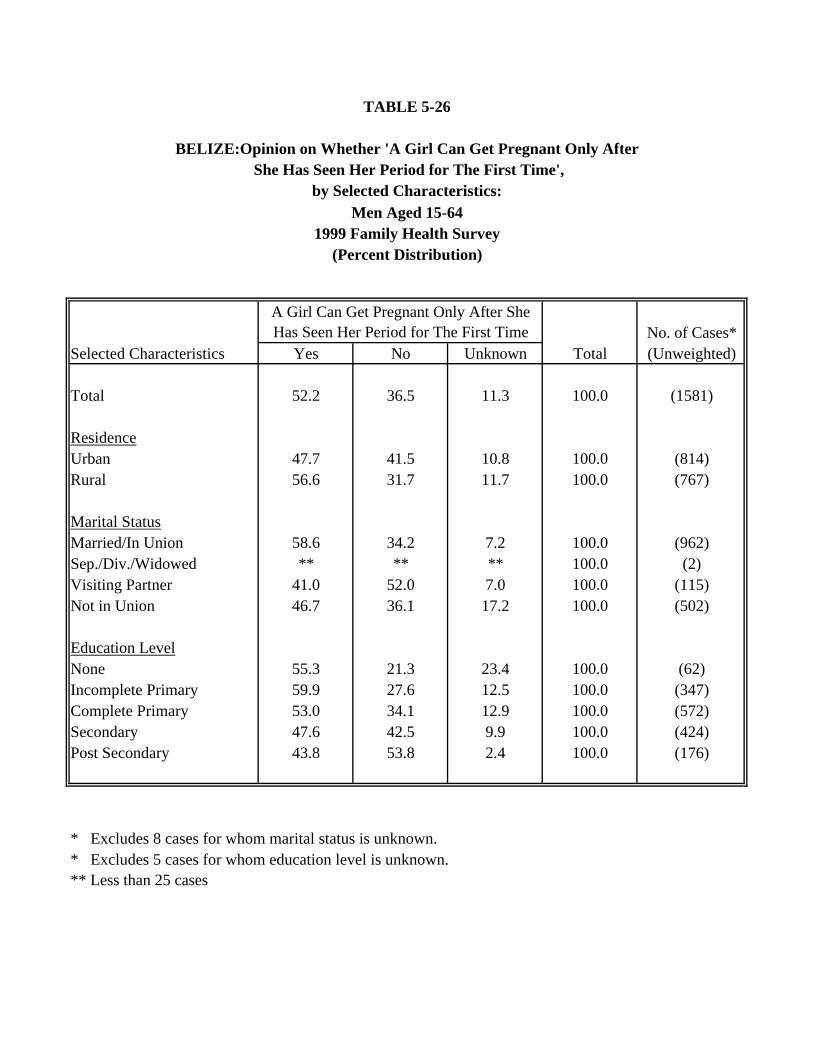
TABLE 5-26
BELIZE:Opinion on Whether 'A Girl Can Get Pregnant Only After She Has Seen Her Period for The First Time',
by Selected Characteristics:
A Girl Can Get Pregnant Only After She Has Seen Her Period for The First Time No. of Cases*
Selected Characteristics Yes No Unknown Total (Unweighted)
Total 52.2 36.5 11.3 100.0 (1581)
ResidenceUrban 47.7 41.5 10.8 100.0 (814)Rural 56.6 31.7 11.7 100.0 (767)
Marital StatusMarried/In Union 58.6 34.2 7.2 100.0 (962)Sep./Div./Widowed ** ** ** 100.0 (2)Visiting Partner 41.0 52.0 7.0 100.0 (115)Not in Union 46.7 36.1 17.2 100.0 (502)
Education LevelNone 55.3 21.3 23.4 100.0 (62)Incomplete Primary 59.9 27.6 12.5 100.0 (347)Complete Primary 53.0 34.1 12.9 100.0 (572)Secondary 47.6 42.5 9.9 100.0 (424)Post Secondary 43.8 53.8 2.4 100.0 (176)
* Excludes 8 cases for whom marital status is unknown.* Excludes 5 cases for whom education level is unknown.** Less than 25 cases
Men Aged 15-641999 Family Health Survey
(Percent Distribution)
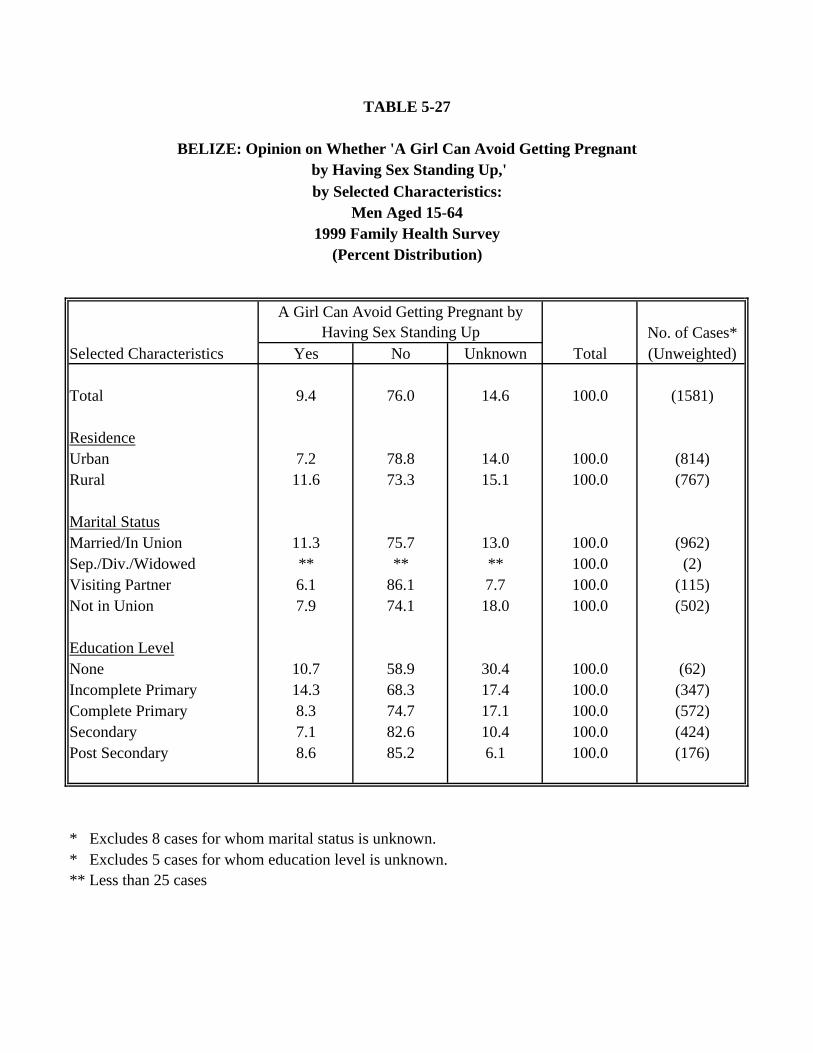
TABLE 5-27
BELIZE: Opinion on Whether 'A Girl Can Avoid Getting Pregnant by Having Sex Standing Up,'
A Girl Can Avoid Getting Pregnant by Having Sex Standing Up No. of Cases*
Selected Characteristics Yes No Unknown Total (Unweighted)
Total 9.4 76.0 14.6 100.0 (1581)
ResidenceUrban 7.2 78.8 14.0 100.0 (814)Rural 11.6 73.3 15.1 100.0 (767)
Marital StatusMarried/In Union 11.3 75.7 13.0 100.0 (962)Sep./Div./Widowed ** ** ** 100.0 (2)Visiting Partner 6.1 86.1 7.7 100.0 (115)Not in Union 7.9 74.1 18.0 100.0 (502)
Education LevelNone 10.7 58.9 30.4 100.0 (62)Incomplete Primary 14.3 68.3 17.4 100.0 (347)Complete Primary 8.3 74.7 17.1 100.0 (572)Secondary 7.1 82.6 10.4 100.0 (424)Post Secondary 8.6 85.2 6.1 100.0 (176)
* Excludes 8 cases for whom marital status is unknown.* Excludes 5 cases for whom education level is unknown.** Less than 25 cases
by Selected Characteristics:Men Aged 15-64
1999 Family Health Survey(Percent Distribution)
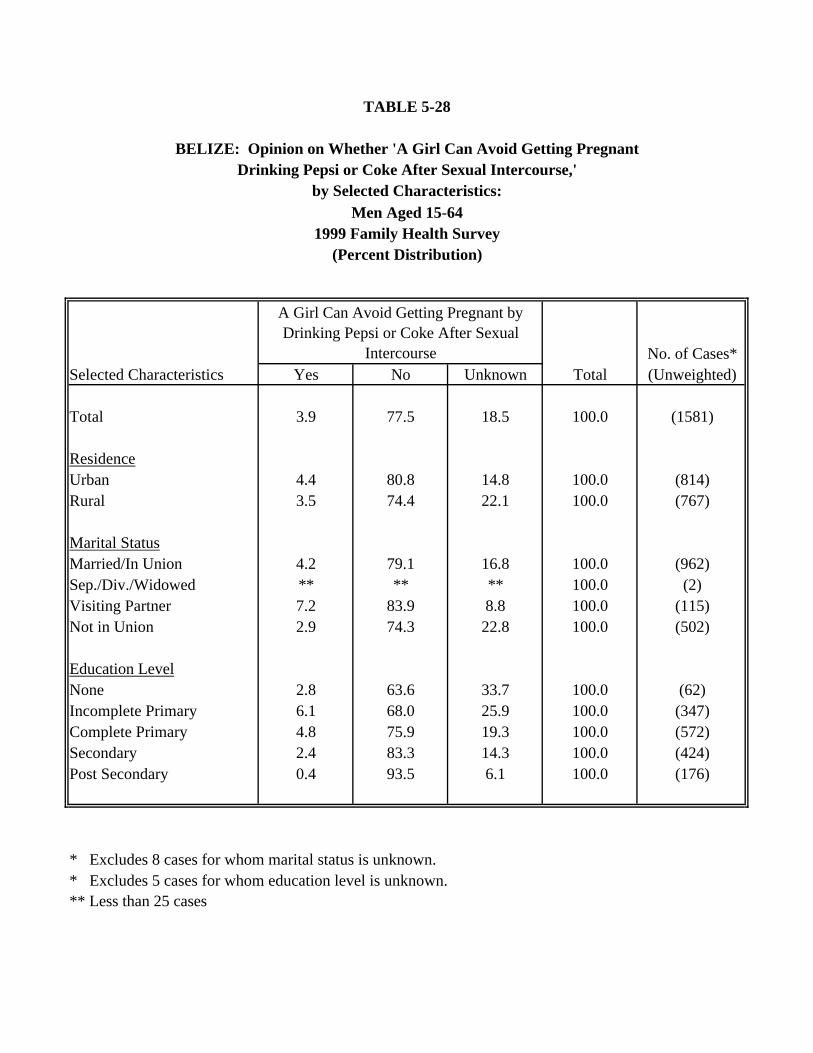
TABLE 5-28
BELIZE: Opinion on Whether 'A Girl Can Avoid Getting PregnantDrinking Pepsi or Coke After Sexual Intercourse,'
by Selected Characteristics:
A Girl Can Avoid Getting Pregnant by Drinking Pepsi or Coke After Sexual
Intercourse No. of Cases*Selected Characteristics Yes No Unknown Total (Unweighted)
Total 3.9 77.5 18.5 100.0 (1581)
ResidenceUrban 4.4 80.8 14.8 100.0 (814)Rural 3.5 74.4 22.1 100.0 (767)
Marital StatusMarried/In Union 4.2 79.1 16.8 100.0 (962)Sep./Div./Widowed ** ** ** 100.0 (2)Visiting Partner 7.2 83.9 8.8 100.0 (115)Not in Union 2.9 74.3 22.8 100.0 (502)
Education LevelNone 2.8 63.6 33.7 100.0 (62)Incomplete Primary 6.1 68.0 25.9 100.0 (347)Complete Primary 4.8 75.9 19.3 100.0 (572)Secondary 2.4 83.3 14.3 100.0 (424)Post Secondary 0.4 93.5 6.1 100.0 (176)
* Excludes 8 cases for whom marital status is unknown.* Excludes 5 cases for whom education level is unknown.** Less than 25 cases
Men Aged 15-641999 Family Health Survey
(Percent Distribution)
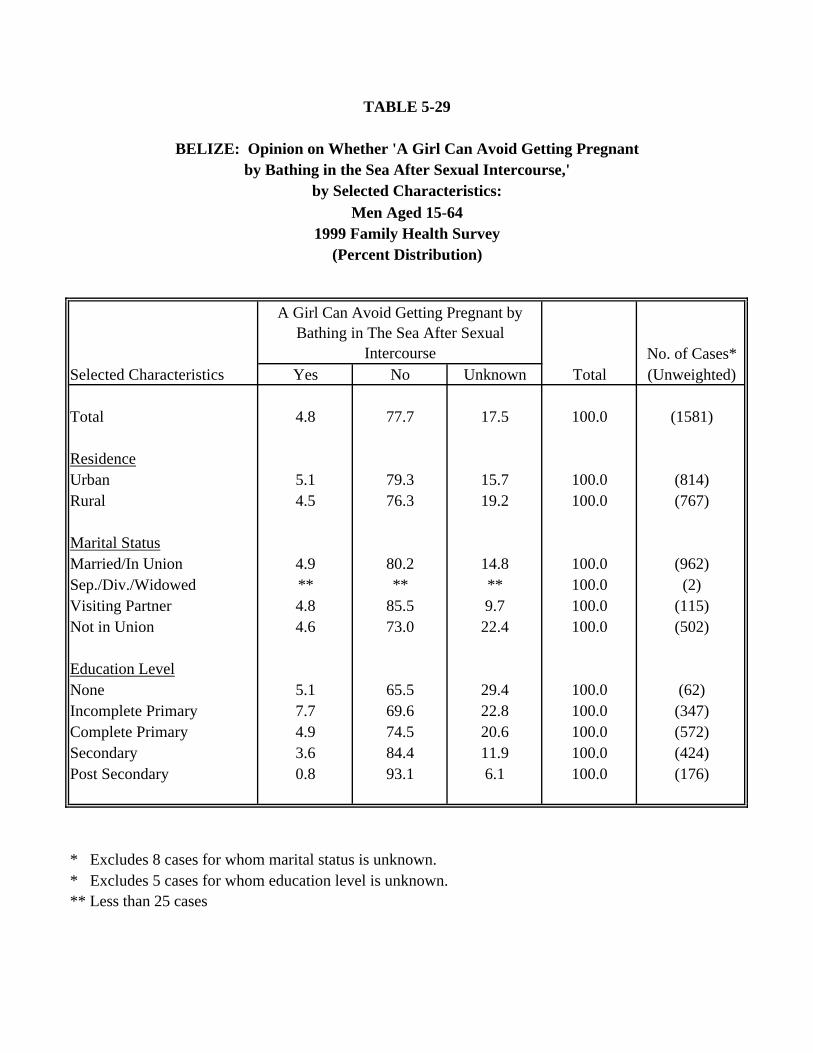
TABLE 5-29
BELIZE: Opinion on Whether 'A Girl Can Avoid Getting Pregnantby Bathing in the Sea After Sexual Intercourse,'
by Selected Characteristics:
A Girl Can Avoid Getting Pregnant by Bathing in The Sea After Sexual
Intercourse No. of Cases*Selected Characteristics Yes No Unknown Total (Unweighted)
Total 4.8 77.7 17.5 100.0 (1581)
ResidenceUrban 5.1 79.3 15.7 100.0 (814)Rural 4.5 76.3 19.2 100.0 (767)
Marital StatusMarried/In Union 4.9 80.2 14.8 100.0 (962)Sep./Div./Widowed ** ** ** 100.0 (2)Visiting Partner 4.8 85.5 9.7 100.0 (115)Not in Union 4.6 73.0 22.4 100.0 (502)
Education LevelNone 5.1 65.5 29.4 100.0 (62)Incomplete Primary 7.7 69.6 22.8 100.0 (347)Complete Primary 4.9 74.5 20.6 100.0 (572)Secondary 3.6 84.4 11.9 100.0 (424)Post Secondary 0.8 93.1 6.1 100.0 (176)
* Excludes 8 cases for whom marital status is unknown.* Excludes 5 cases for whom education level is unknown.** Less than 25 cases
Men Aged 15-641999 Family Health Survey
(Percent Distribution)
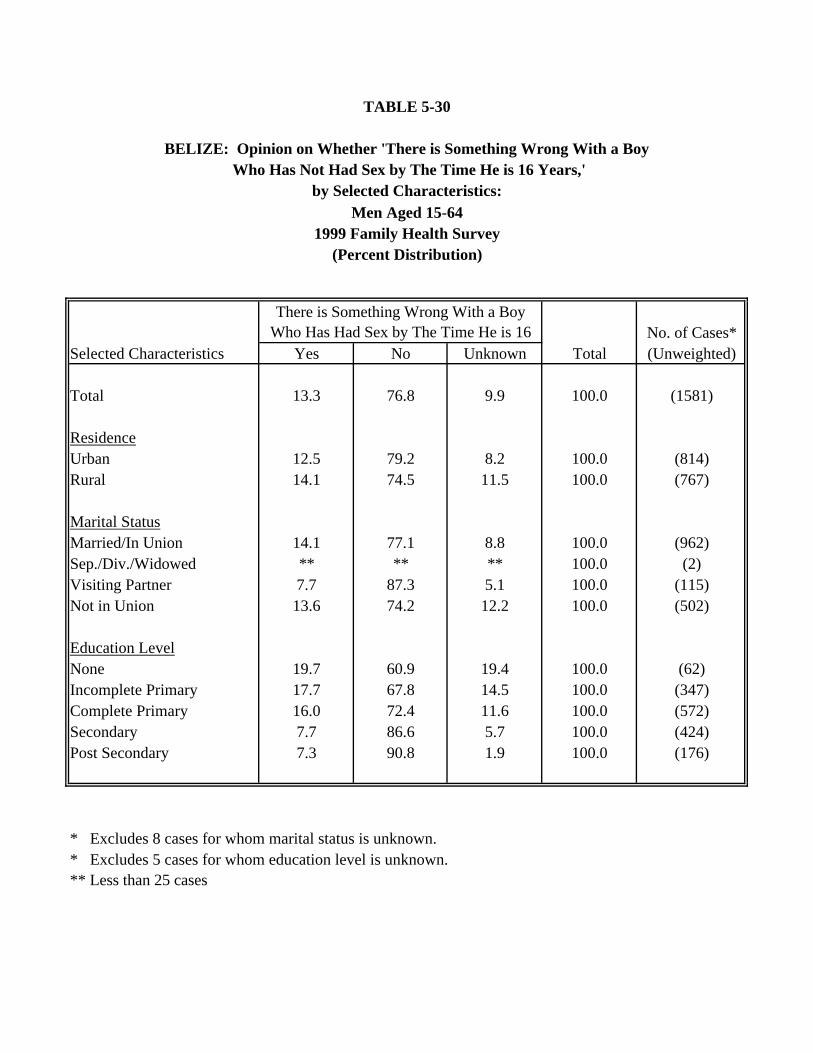
TABLE 5-30
BELIZE: Opinion on Whether 'There is Something Wrong With a Boy Who Has Not Had Sex by The Time He is 16 Years,'
by Selected Characteristics:
There is Something Wrong With a Boy Who Has Had Sex by The Time He is 16 No. of Cases*
Selected Characteristics Yes No Unknown Total (Unweighted)
Total 13.3 76.8 9.9 100.0 (1581)
ResidenceUrban 12.5 79.2 8.2 100.0 (814)Rural 14.1 74.5 11.5 100.0 (767)
Marital StatusMarried/In Union 14.1 77.1 8.8 100.0 (962)Sep./Div./Widowed ** ** ** 100.0 (2)Visiting Partner 7.7 87.3 5.1 100.0 (115)Not in Union 13.6 74.2 12.2 100.0 (502)
Education LevelNone 19.7 60.9 19.4 100.0 (62)Incomplete Primary 17.7 67.8 14.5 100.0 (347)Complete Primary 16.0 72.4 11.6 100.0 (572)Secondary 7.7 86.6 5.7 100.0 (424)Post Secondary 7.3 90.8 1.9 100.0 (176)
* Excludes 8 cases for whom marital status is unknown.* Excludes 5 cases for whom education level is unknown.** Less than 25 cases
Men Aged 15-641999 Family Health Survey
(Percent Distribution)
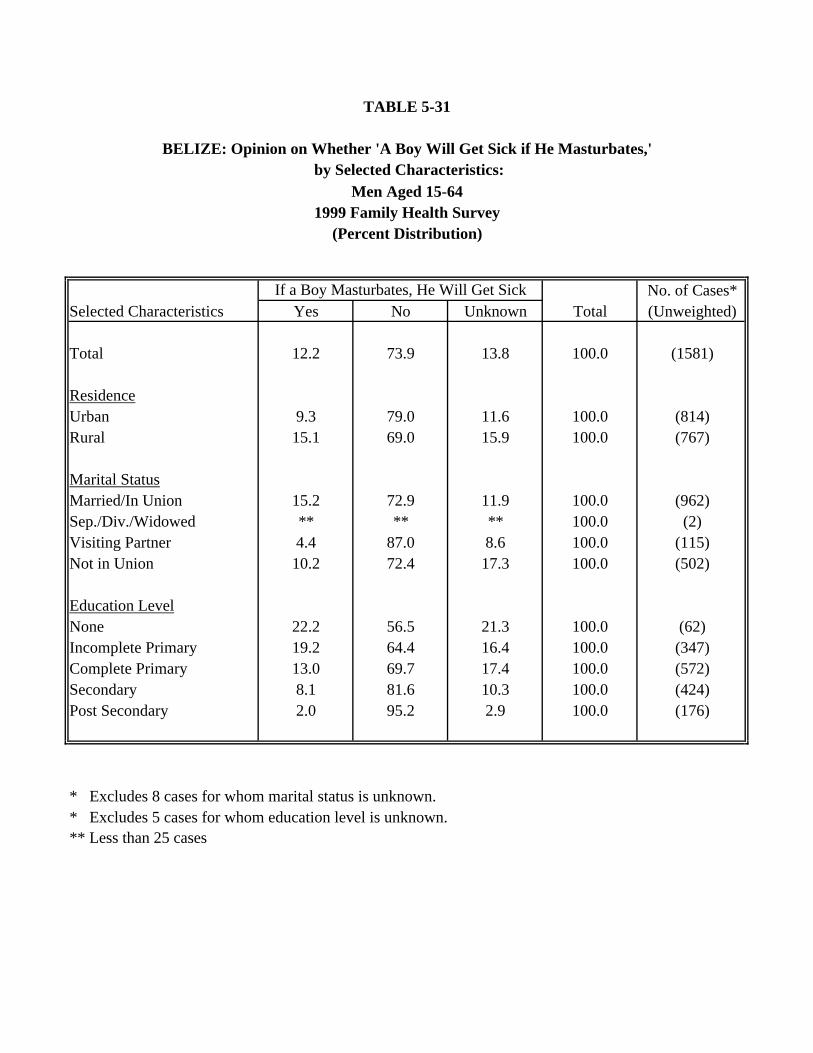
TABLE 5-31
BELIZE: Opinion on Whether 'A Boy Will Get Sick if He Masturbates,' by Selected Characteristics:
If a Boy Masturbates, He Will Get Sick No. of Cases*Selected Characteristics Yes No Unknown Total (Unweighted)
Total 12.2 73.9 13.8 100.0 (1581)
ResidenceUrban 9.3 79.0 11.6 100.0 (814)Rural 15.1 69.0 15.9 100.0 (767)
Marital StatusMarried/In Union 15.2 72.9 11.9 100.0 (962)Sep./Div./Widowed ** ** ** 100.0 (2)Visiting Partner 4.4 87.0 8.6 100.0 (115)Not in Union 10.2 72.4 17.3 100.0 (502)
Education LevelNone 22.2 56.5 21.3 100.0 (62)Incomplete Primary 19.2 64.4 16.4 100.0 (347)Complete Primary 13.0 69.7 17.4 100.0 (572)Secondary 8.1 81.6 10.3 100.0 (424)Post Secondary 2.0 95.2 2.9 100.0 (176)
* Excludes 8 cases for whom marital status is unknown.* Excludes 5 cases for whom education level is unknown.** Less than 25 cases
Men Aged 15-641999 Family Health Survey
(Percent Distribution)
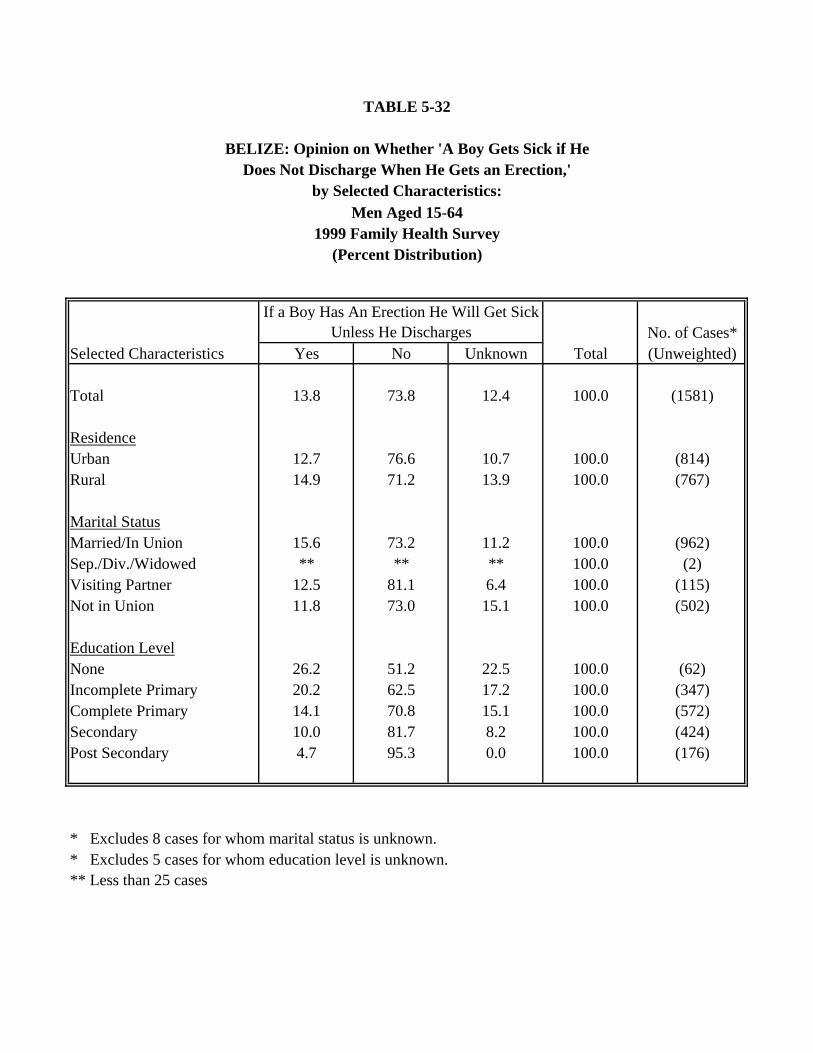
TABLE 5-32
BELIZE: Opinion on Whether 'A Boy Gets Sick if He Does Not Discharge When He Gets an Erection,'
by Selected Characteristics:
If a Boy Has An Erection He Will Get Sick Unless He Discharges No. of Cases*
Selected Characteristics Yes No Unknown Total (Unweighted)
Total 13.8 73.8 12.4 100.0 (1581)
ResidenceUrban 12.7 76.6 10.7 100.0 (814)Rural 14.9 71.2 13.9 100.0 (767)
Marital StatusMarried/In Union 15.6 73.2 11.2 100.0 (962)Sep./Div./Widowed ** ** ** 100.0 (2)Visiting Partner 12.5 81.1 6.4 100.0 (115)Not in Union 11.8 73.0 15.1 100.0 (502)
Education LevelNone 26.2 51.2 22.5 100.0 (62)Incomplete Primary 20.2 62.5 17.2 100.0 (347)Complete Primary 14.1 70.8 15.1 100.0 (572)Secondary 10.0 81.7 8.2 100.0 (424)Post Secondary 4.7 95.3 0.0 100.0 (176)
* Excludes 8 cases for whom marital status is unknown.* Excludes 5 cases for whom education level is unknown.** Less than 25 cases
Men Aged 15-641999 Family Health Survey
(Percent Distribution)
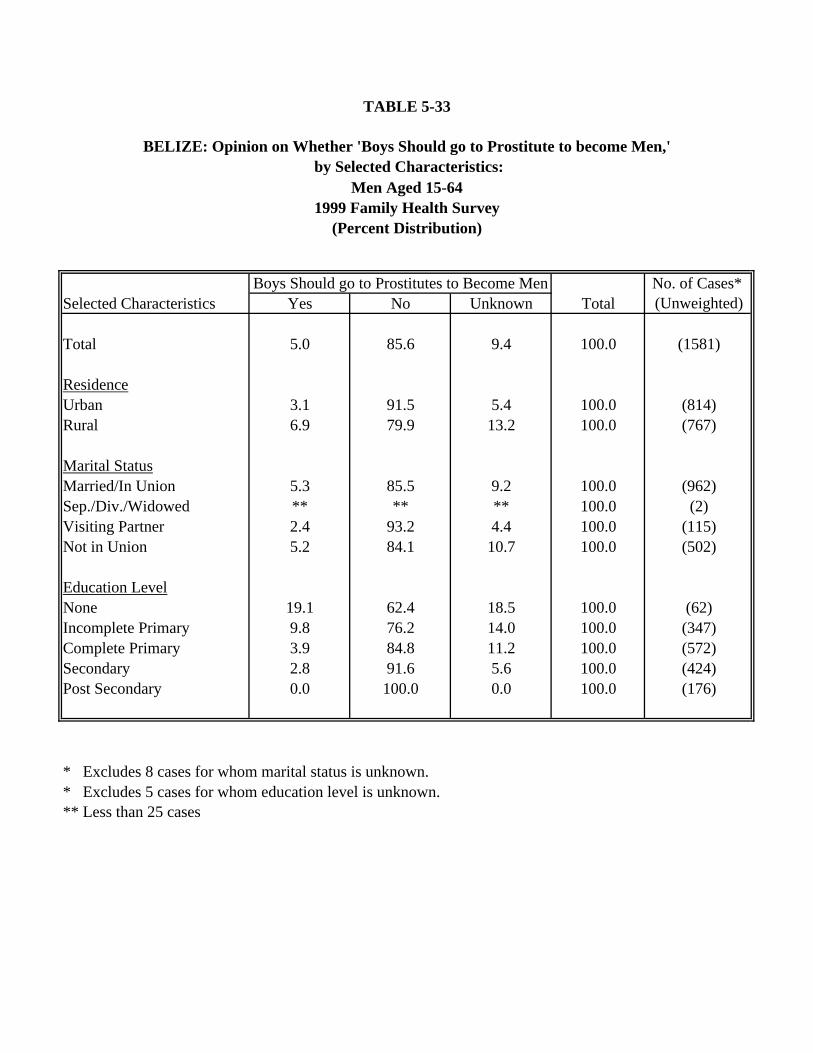
TABLE 5-33
BELIZE: Opinion on Whether 'Boys Should go to Prostitute to become Men,' by Selected Characteristics:
Boys Should go to Prostitutes to Become Men No. of Cases* Selected Characteristics Yes No Unknown Total (Unweighted)
Total 5.0 85.6 9.4 100.0 (1581)
ResidenceUrban 3.1 91.5 5.4 100.0 (814)Rural 6.9 79.9 13.2 100.0 (767)
Marital StatusMarried/In Union 5.3 85.5 9.2 100.0 (962)Sep./Div./Widowed ** ** ** 100.0 (2)Visiting Partner 2.4 93.2 4.4 100.0 (115)Not in Union 5.2 84.1 10.7 100.0 (502)
Education LevelNone 19.1 62.4 18.5 100.0 (62)Incomplete Primary 9.8 76.2 14.0 100.0 (347)Complete Primary 3.9 84.8 11.2 100.0 (572)Secondary 2.8 91.6 5.6 100.0 (424)Post Secondary 0.0 100.0 0.0 100.0 (176)
* Excludes 8 cases for whom marital status is unknown.* Excludes 5 cases for whom education level is unknown.** Less than 25 cases
Men Aged 15-641999 Family Health Survey
(Percent Distribution)
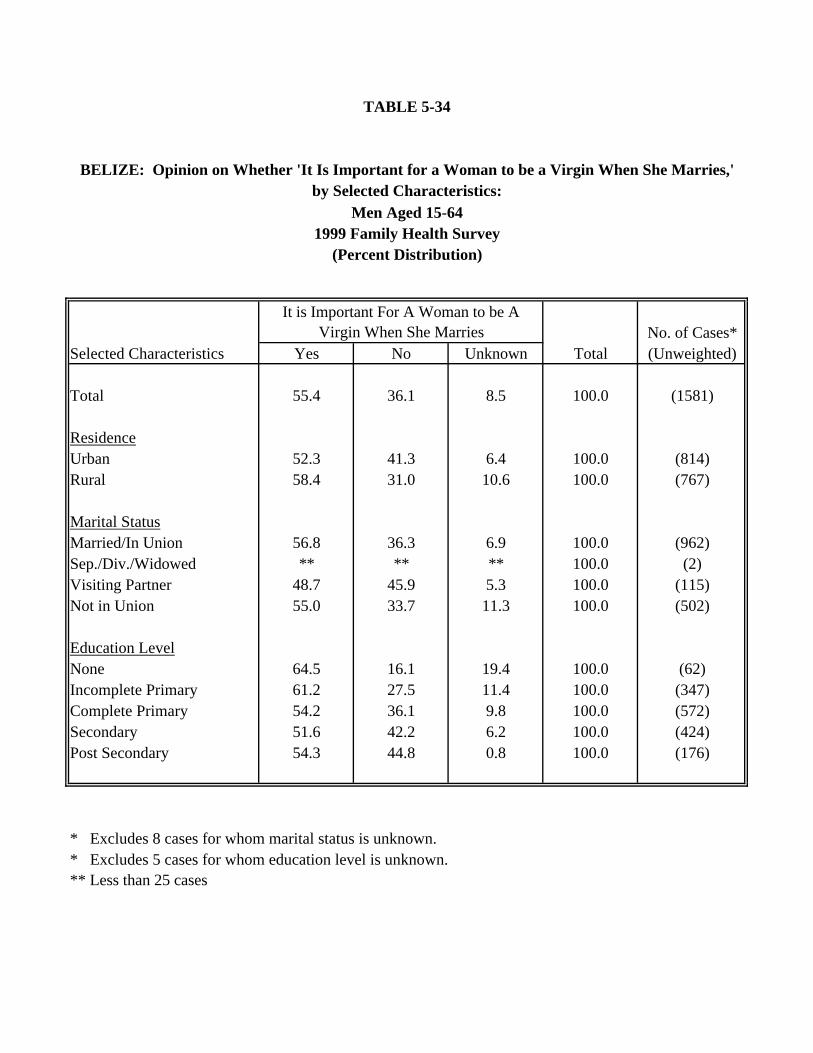
TABLE 5-34
BELIZE: Opinion on Whether 'It Is Important for a Woman to be a Virgin When She Marries,'by Selected Characteristics:
It is Important For A Woman to be A Virgin When She Marries No. of Cases*
Selected Characteristics Yes No Unknown Total (Unweighted)
Total 55.4 36.1 8.5 100.0 (1581)
ResidenceUrban 52.3 41.3 6.4 100.0 (814)Rural 58.4 31.0 10.6 100.0 (767)
Marital StatusMarried/In Union 56.8 36.3 6.9 100.0 (962)Sep./Div./Widowed ** ** ** 100.0 (2)Visiting Partner 48.7 45.9 5.3 100.0 (115)Not in Union 55.0 33.7 11.3 100.0 (502)
Education LevelNone 64.5 16.1 19.4 100.0 (62)Incomplete Primary 61.2 27.5 11.4 100.0 (347)Complete Primary 54.2 36.1 9.8 100.0 (572)Secondary 51.6 42.2 6.2 100.0 (424)Post Secondary 54.3 44.8 0.8 100.0 (176)
* Excludes 8 cases for whom marital status is unknown.* Excludes 5 cases for whom education level is unknown.** Less than 25 cases
Men Aged 15-641999 Family Health Survey
(Percent Distribution)

TABLE 5-35
BELIZE: Opinion on Whether 'A Man Can Get Rid of STIs/HIV/AIDS by Having Sex With a Virgin,' by Selected Characteristic
You Can Get Rid of STIs/HIV/AIDS by Having Sex With A Virgin No. of Cases*
Selected Characteristics Yes No Unknown Total (Unweighted)
Total 8.8 78.8 12.4 100.0 (1581)
ResidenceUrban 5.8 85.1 9.2 100.0 (814)Rural 11.8 72.7 15.5 100.0 (767)
Marital StatusMarried/In Union 8.4 80.7 10.9 100.0 (962)Sep./Div./Widowed ** ** ** 100.0 (2)Visiting Partner 4.9 91.1 4.0 100.0 (115)Not in Union 10.0 73.9 16.0 100.0 (502)
Education LevelNone 15.0 52.5 32.6 100.0 (62)Incomplete Primary 11.2 69.9 18.9 100.0 (347)Complete Primary 8.8 76.5 14.7 100.0 (572)Secondary 6.5 87.5 6.1 100.0 (424)Post Secondary 7.9 91.2 0.8 100.0 (176)
* Excludes 8 cases for whom marital status is unknown.* Excludes 5 cases for whom education level is unknown.** Less than 25 cases
Men Aged 15-641999 Family Health Survey
(Percent Distribution)
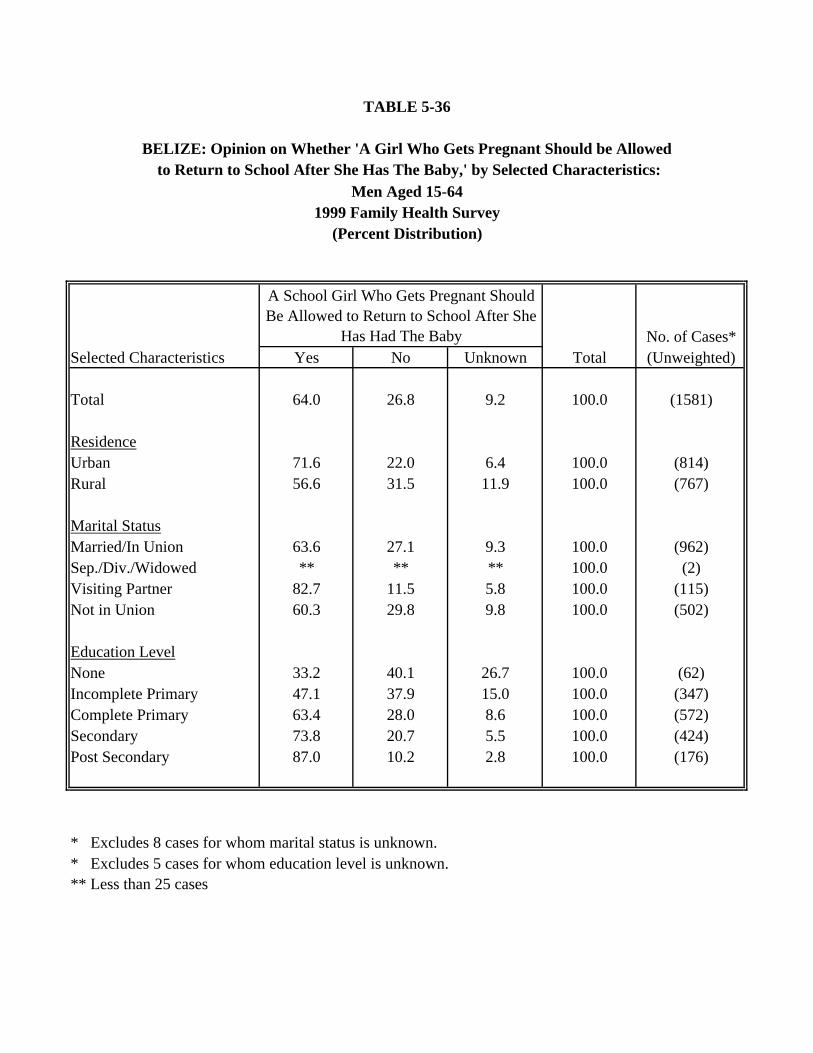
TABLE 5-36
BELIZE: Opinion on Whether 'A Girl Who Gets Pregnant Should be Allowed to Return to School After She Has The Baby,' by Selected Characteristics:
A School Girl Who Gets Pregnant Should Be Allowed to Return to School After She
Has Had The Baby No. of Cases*Selected Characteristics Yes No Unknown Total (Unweighted)
Total 64.0 26.8 9.2 100.0 (1581)
ResidenceUrban 71.6 22.0 6.4 100.0 (814)Rural 56.6 31.5 11.9 100.0 (767)
Marital StatusMarried/In Union 63.6 27.1 9.3 100.0 (962)Sep./Div./Widowed ** ** ** 100.0 (2)Visiting Partner 82.7 11.5 5.8 100.0 (115)Not in Union 60.3 29.8 9.8 100.0 (502)
Education LevelNone 33.2 40.1 26.7 100.0 (62)Incomplete Primary 47.1 37.9 15.0 100.0 (347)Complete Primary 63.4 28.0 8.6 100.0 (572)Secondary 73.8 20.7 5.5 100.0 (424)Post Secondary 87.0 10.2 2.8 100.0 (176)
* Excludes 8 cases for whom marital status is unknown.* Excludes 5 cases for whom education level is unknown.** Less than 25 cases
Men Aged 15-641999 Family Health Survey
(Percent Distribution)
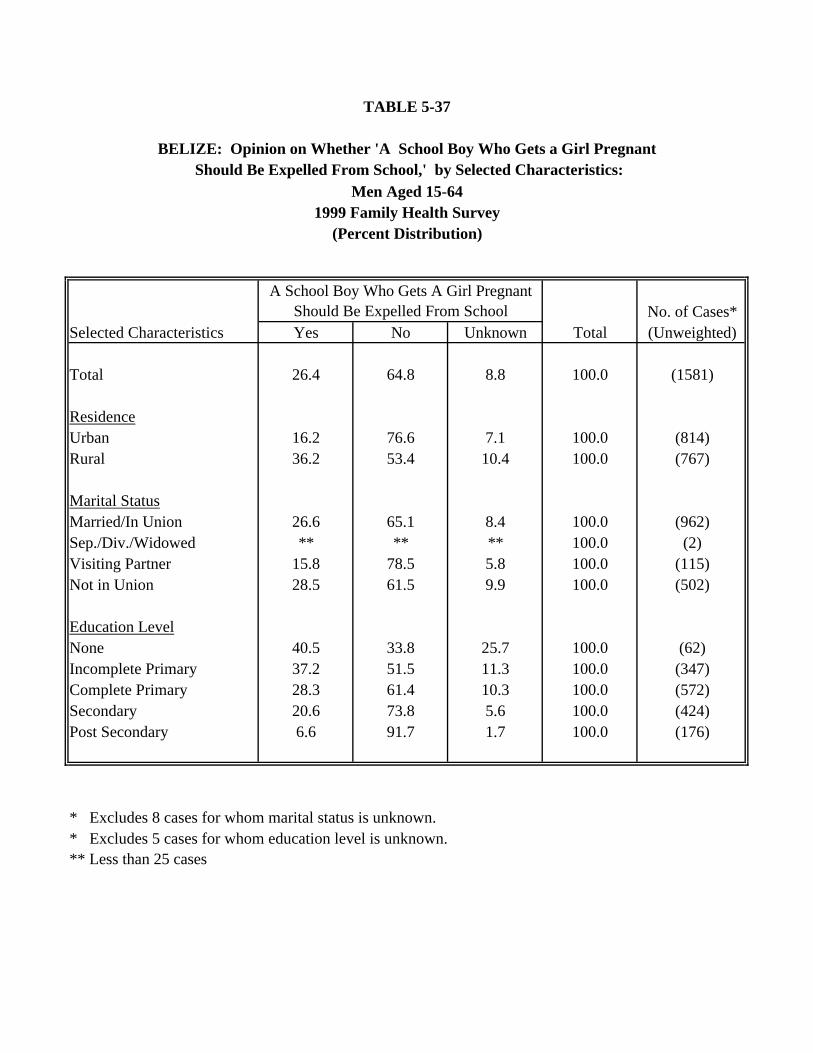
TABLE 5-37
BELIZE: Opinion on Whether 'A School Boy Who Gets a Girl Pregnant Should Be Expelled From School,' by Selected Characteristics:
A School Boy Who Gets A Girl Pregnant Should Be Expelled From School No. of Cases*
Selected Characteristics Yes No Unknown Total (Unweighted)
Total 26.4 64.8 8.8 100.0 (1581)
ResidenceUrban 16.2 76.6 7.1 100.0 (814)Rural 36.2 53.4 10.4 100.0 (767)
Marital StatusMarried/In Union 26.6 65.1 8.4 100.0 (962)Sep./Div./Widowed ** ** ** 100.0 (2)Visiting Partner 15.8 78.5 5.8 100.0 (115)Not in Union 28.5 61.5 9.9 100.0 (502)
Education LevelNone 40.5 33.8 25.7 100.0 (62)Incomplete Primary 37.2 51.5 11.3 100.0 (347)Complete Primary 28.3 61.4 10.3 100.0 (572)Secondary 20.6 73.8 5.6 100.0 (424)Post Secondary 6.6 91.7 1.7 100.0 (176)
* Excludes 8 cases for whom marital status is unknown.* Excludes 5 cases for whom education level is unknown.** Less than 25 cases
Men Aged 15-641999 Family Health Survey
(Percent Distribution)
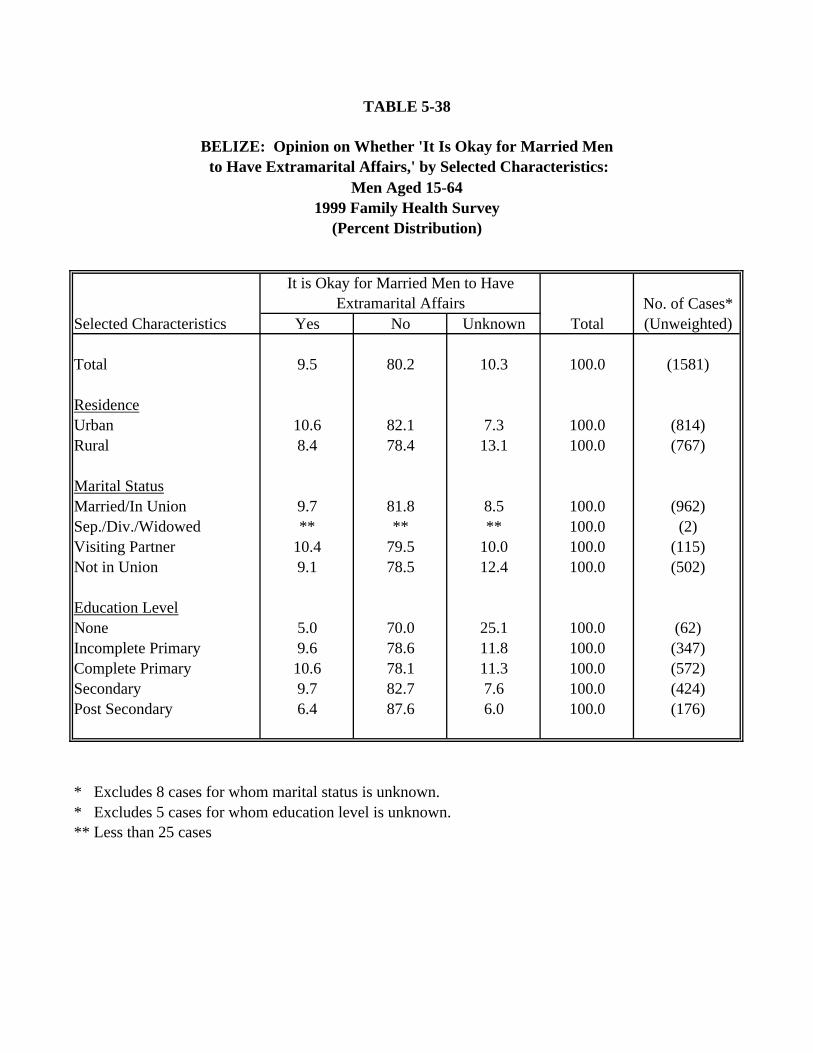
TABLE 5-38
BELIZE: Opinion on Whether 'It Is Okay for Married Men to Have Extramarital Affairs,' by Selected Characteristics:
It is Okay for Married Men to Have Extramarital Affairs No. of Cases*
Selected Characteristics Yes No Unknown Total (Unweighted)
Total 9.5 80.2 10.3 100.0 (1581)
ResidenceUrban 10.6 82.1 7.3 100.0 (814)Rural 8.4 78.4 13.1 100.0 (767)
Marital StatusMarried/In Union 9.7 81.8 8.5 100.0 (962)Sep./Div./Widowed ** ** ** 100.0 (2)Visiting Partner 10.4 79.5 10.0 100.0 (115)Not in Union 9.1 78.5 12.4 100.0 (502)
Education LevelNone 5.0 70.0 25.1 100.0 (62)Incomplete Primary 9.6 78.6 11.8 100.0 (347)Complete Primary 10.6 78.1 11.3 100.0 (572)Secondary 9.7 82.7 7.6 100.0 (424)Post Secondary 6.4 87.6 6.0 100.0 (176)
* Excludes 8 cases for whom marital status is unknown.* Excludes 5 cases for whom education level is unknown.** Less than 25 cases
Men Aged 15-641999 Family Health Survey
(Percent Distribution)
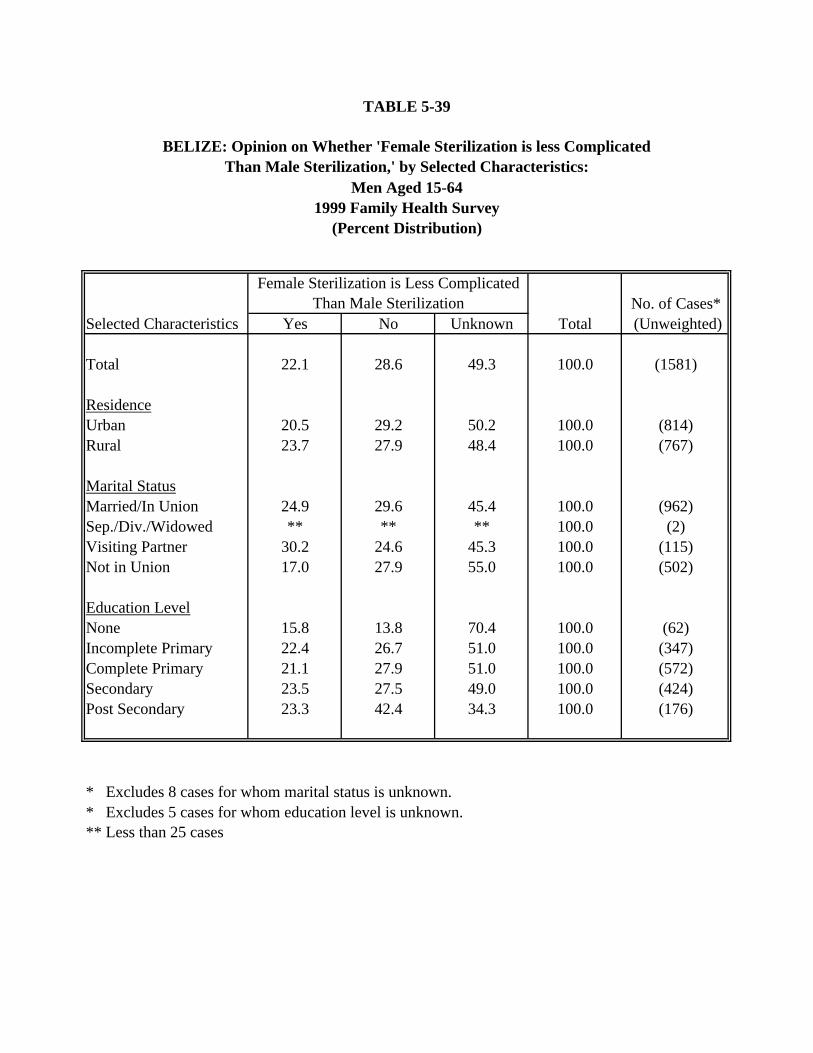
TABLE 5-39
BELIZE: Opinion on Whether 'Female Sterilization is less ComplicatedThan Male Sterilization,' by Selected Characteristics:
Female Sterilization is Less Complicated Than Male Sterilization No. of Cases*
Selected Characteristics Yes No Unknown Total (Unweighted)
Total 22.1 28.6 49.3 100.0 (1581)
ResidenceUrban 20.5 29.2 50.2 100.0 (814)Rural 23.7 27.9 48.4 100.0 (767)
Marital StatusMarried/In Union 24.9 29.6 45.4 100.0 (962)Sep./Div./Widowed ** ** ** 100.0 (2)Visiting Partner 30.2 24.6 45.3 100.0 (115)Not in Union 17.0 27.9 55.0 100.0 (502)
Education LevelNone 15.8 13.8 70.4 100.0 (62)Incomplete Primary 22.4 26.7 51.0 100.0 (347)Complete Primary 21.1 27.9 51.0 100.0 (572)Secondary 23.5 27.5 49.0 100.0 (424)Post Secondary 23.3 42.4 34.3 100.0 (176)
* Excludes 8 cases for whom marital status is unknown.* Excludes 5 cases for whom education level is unknown.** Less than 25 cases
Men Aged 15-641999 Family Health Survey
(Percent Distribution)
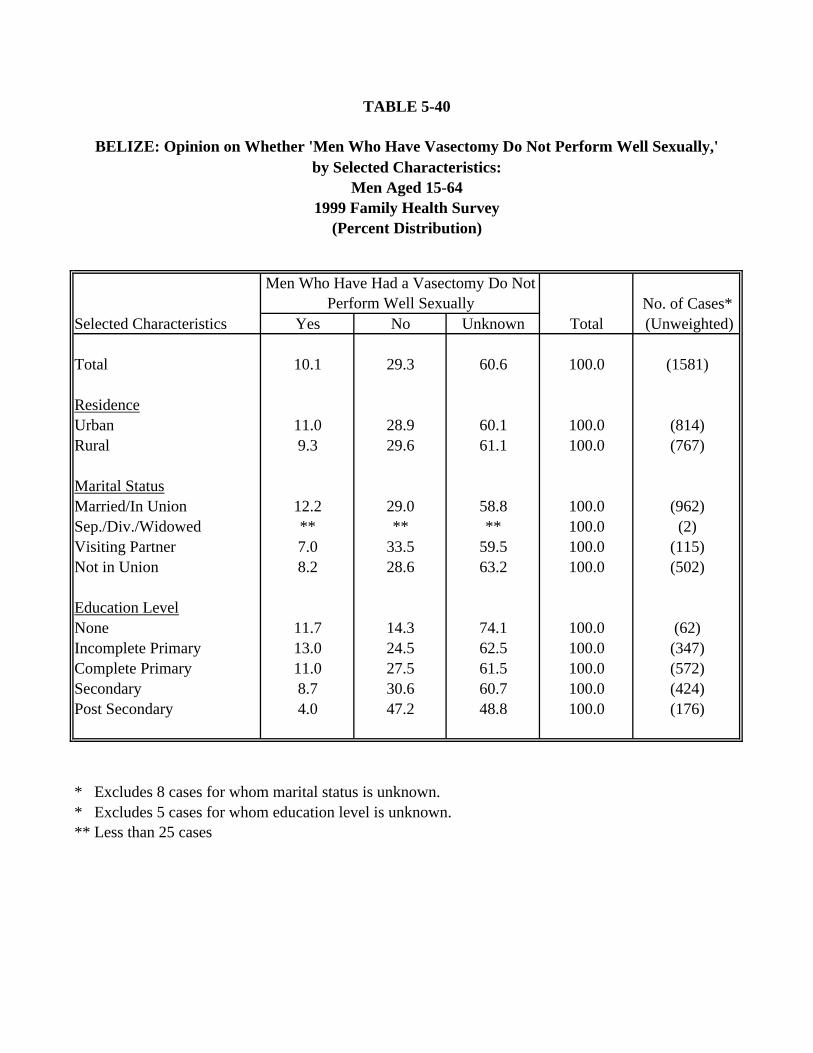
TABLE 5-40
BELIZE: Opinion on Whether 'Men Who Have Vasectomy Do Not Perform Well Sexually,'by Selected Characteristics:
Men Who Have Had a Vasectomy Do Not Perform Well Sexually No. of Cases*
Selected Characteristics Yes No Unknown Total (Unweighted)
Total 10.1 29.3 60.6 100.0 (1581)
ResidenceUrban 11.0 28.9 60.1 100.0 (814)Rural 9.3 29.6 61.1 100.0 (767)
Marital StatusMarried/In Union 12.2 29.0 58.8 100.0 (962)Sep./Div./Widowed ** ** ** 100.0 (2)Visiting Partner 7.0 33.5 59.5 100.0 (115)Not in Union 8.2 28.6 63.2 100.0 (502)
Education LevelNone 11.7 14.3 74.1 100.0 (62)Incomplete Primary 13.0 24.5 62.5 100.0 (347)Complete Primary 11.0 27.5 61.5 100.0 (572)Secondary 8.7 30.6 60.7 100.0 (424)Post Secondary 4.0 47.2 48.8 100.0 (176)
* Excludes 8 cases for whom marital status is unknown.* Excludes 5 cases for whom education level is unknown.** Less than 25 cases
Men Aged 15-641999 Family Health Survey
(Percent Distribution)

TABLE 5-41
BELIZE: Opinion on Whether ' Family Violence is a Significant Issue In Our Society,' by Selected Characteristics:
Family Violence is A Significant Issue In Our Society No. of Cases*
Selected Characteristics Yes No Unknown Total (Unweighted)
Total 76.9 12.9 10.2 100.0 (1581)
ResidenceUrban 80.8 12.1 7.0 100.0 (814)Rural 73.1 13.7 13.2 100.0 (767)
Marital StatusMarried/In Union 77.4 14.2 8.4 100.0 (962)Sep./Div./Widowed ** ** ** 100.0 (2)Visiting Partner 89.6 6.7 3.7 100.0 (115)Not in Union 73.6 12.8 13.7 100.0 (502)
Education LevelNone 60.7 18.4 20.9 100.0 (62)Incomplete Primary 66.1 17.8 16.1 100.0 (347)Complete Primary 77.1 12.8 10.1 100.0 (572)Secondary 82.9 9.7 7.4 100.0 (424)Post Secondary 89.1 9.6 1.4 100.0 (176)
* Excludes 8 cases for whom marital status is unknown.* Excludes 5 cases for whom education level is unknown.** Less than 25 cases
Men Aged 15-641999 Family Health Survey
(Percent Distribution)
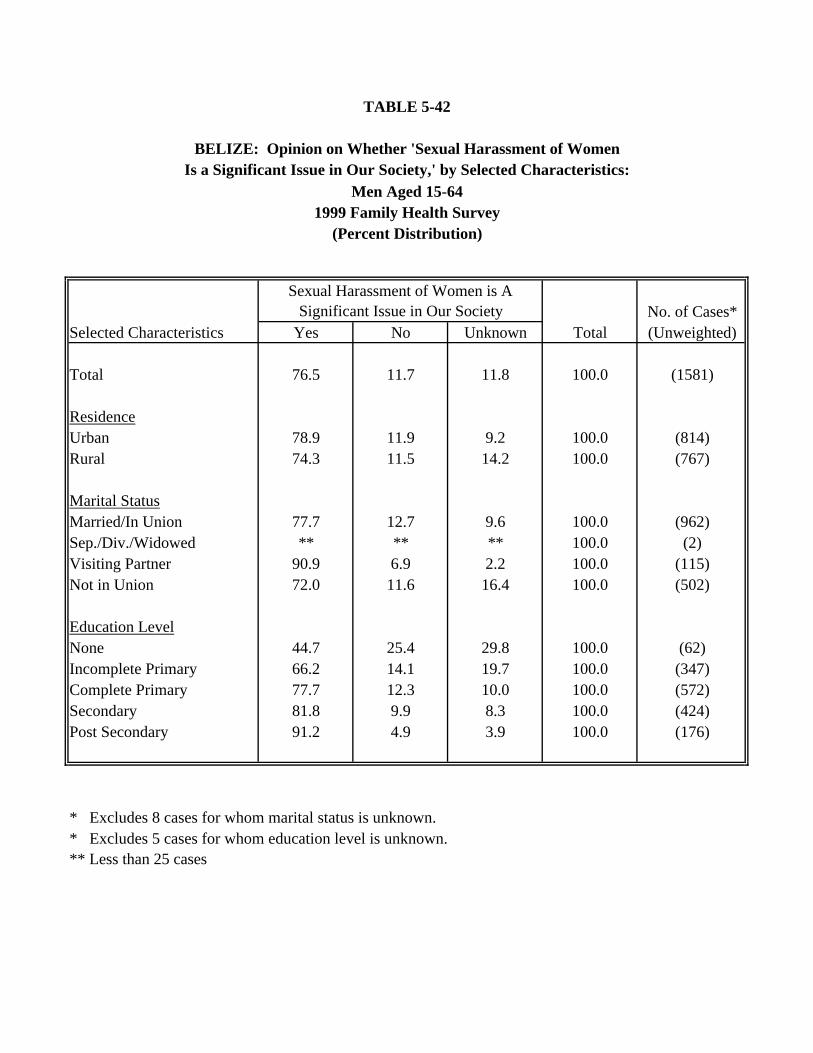
TABLE 5-42
BELIZE: Opinion on Whether 'Sexual Harassment of Women Is a Significant Issue in Our Society,' by Selected Characteristics:
Sexual Harassment of Women is A Significant Issue in Our Society No. of Cases*
Selected Characteristics Yes No Unknown Total (Unweighted)
Total 76.5 11.7 11.8 100.0 (1581)
ResidenceUrban 78.9 11.9 9.2 100.0 (814)Rural 74.3 11.5 14.2 100.0 (767)
Marital StatusMarried/In Union 77.7 12.7 9.6 100.0 (962)Sep./Div./Widowed ** ** ** 100.0 (2)Visiting Partner 90.9 6.9 2.2 100.0 (115)Not in Union 72.0 11.6 16.4 100.0 (502)
Education LevelNone 44.7 25.4 29.8 100.0 (62)Incomplete Primary 66.2 14.1 19.7 100.0 (347)Complete Primary 77.7 12.3 10.0 100.0 (572)Secondary 81.8 9.9 8.3 100.0 (424)Post Secondary 91.2 4.9 3.9 100.0 (176)
* Excludes 8 cases for whom marital status is unknown.* Excludes 5 cases for whom education level is unknown.** Less than 25 cases
Men Aged 15-641999 Family Health Survey
(Percent Distribution)
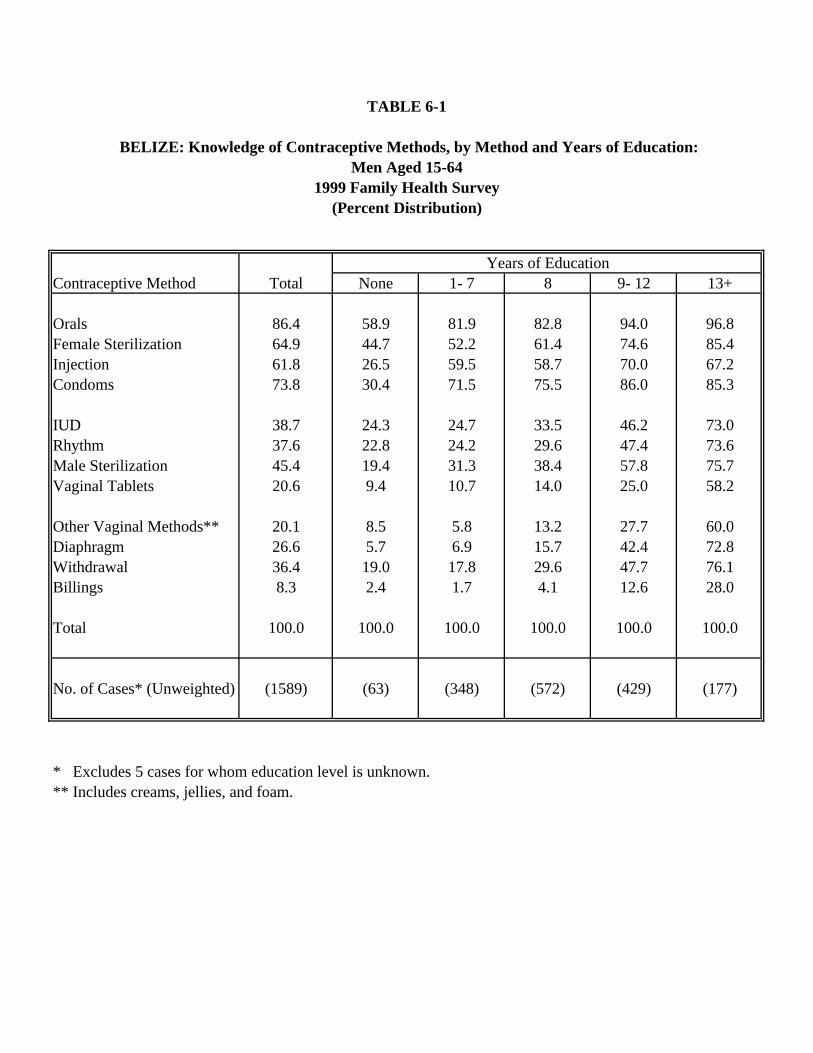
TABLE 6-1
BELIZE: Knowledge of Contraceptive Methods, by Method and Years of Education:Men Aged 15-64
1999 Family Health Survey
Years of EducationContraceptive Method Total None 1- 7 8 9- 12 13+
Orals 86.4 58.9 81.9 82.8 94.0 96.8Female Sterilization 64.9 44.7 52.2 61.4 74.6 85.4Injection 61.8 26.5 59.5 58.7 70.0 67.2Condoms 73.8 30.4 71.5 75.5 86.0 85.3
IUD 38.7 24.3 24.7 33.5 46.2 73.0Rhythm 37.6 22.8 24.2 29.6 47.4 73.6Male Sterilization 45.4 19.4 31.3 38.4 57.8 75.7Vaginal Tablets 20.6 9.4 10.7 14.0 25.0 58.2
Other Vaginal Methods** 20.1 8.5 5.8 13.2 27.7 60.0Diaphragm 26.6 5.7 6.9 15.7 42.4 72.8Withdrawal 36.4 19.0 17.8 29.6 47.7 76.1Billings 8.3 2.4 1.7 4.1 12.6 28.0
Total 100.0 100.0 100.0 100.0 100.0 100.0
No. of Cases* (Unweighted) (1589) (63) (348) (572) (429) (177)
* Excludes 5 cases for whom education level is unknown.** Includes creams, jellies, and foam.
(Percent Distribution)
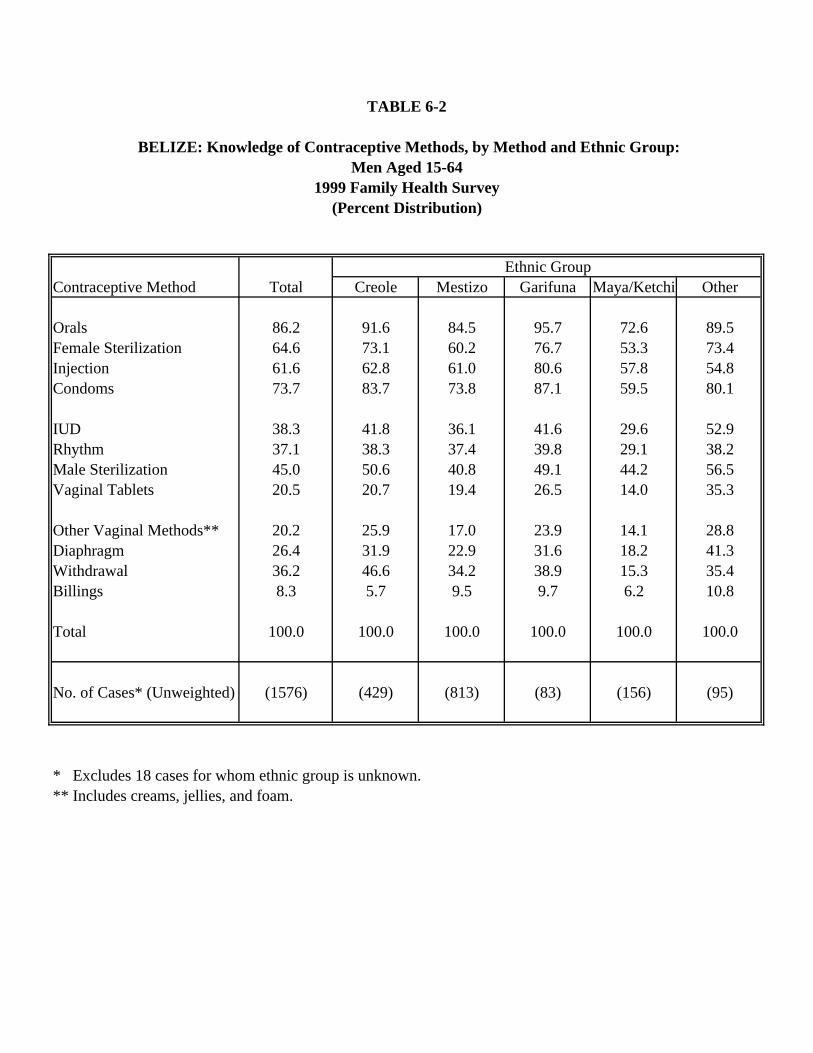
TABLE 6-2
BELIZE: Knowledge of Contraceptive Methods, by Method and Ethnic Group:Men Aged 15-64
1999 Family Health Survey
Ethnic GroupContraceptive Method Total Creole Mestizo Garifuna Maya/Ketchi Other
Orals 86.2 91.6 84.5 95.7 72.6 89.5Female Sterilization 64.6 73.1 60.2 76.7 53.3 73.4Injection 61.6 62.8 61.0 80.6 57.8 54.8Condoms 73.7 83.7 73.8 87.1 59.5 80.1
IUD 38.3 41.8 36.1 41.6 29.6 52.9Rhythm 37.1 38.3 37.4 39.8 29.1 38.2Male Sterilization 45.0 50.6 40.8 49.1 44.2 56.5Vaginal Tablets 20.5 20.7 19.4 26.5 14.0 35.3
Other Vaginal Methods** 20.2 25.9 17.0 23.9 14.1 28.8Diaphragm 26.4 31.9 22.9 31.6 18.2 41.3Withdrawal 36.2 46.6 34.2 38.9 15.3 35.4Billings 8.3 5.7 9.5 9.7 6.2 10.8
Total 100.0 100.0 100.0 100.0 100.0 100.0
No. of Cases* (Unweighted) (1576) (429) (813) (83) (156) (95)
* Excludes 18 cases for whom ethnic group is unknown.** Includes creams, jellies, and foam.
(Percent Distribution)
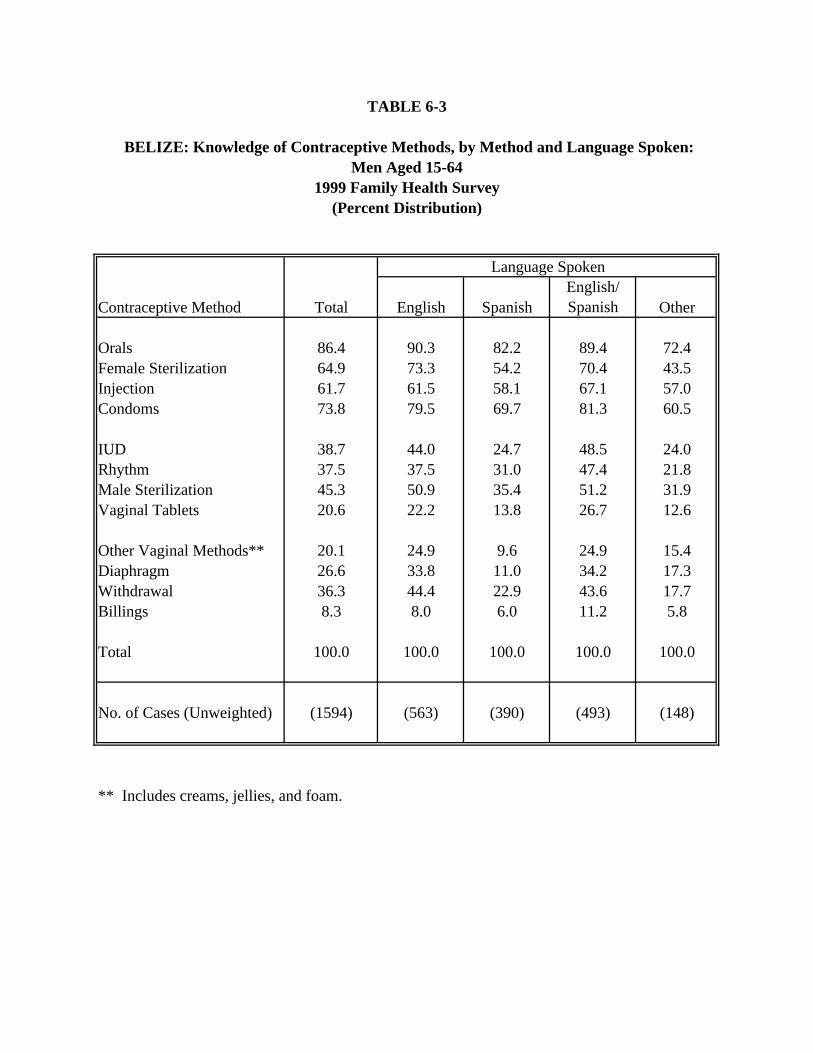
TABLE 6-3
Language Spoken
Contraceptive Method Total English SpanishEnglish/ Spanish Other
Orals 86.4 90.3 82.2 89.4 72.4Female Sterilization 64.9 73.3 54.2 70.4 43.5Injection 61.7 61.5 58.1 67.1 57.0Condoms 73.8 79.5 69.7 81.3 60.5
IUD 38.7 44.0 24.7 48.5 24.0Rhythm 37.5 37.5 31.0 47.4 21.8Male Sterilization 45.3 50.9 35.4 51.2 31.9Vaginal Tablets 20.6 22.2 13.8 26.7 12.6
Other Vaginal Methods** 20.1 24.9 9.6 24.9 15.4Diaphragm 26.6 33.8 11.0 34.2 17.3Withdrawal 36.3 44.4 22.9 43.6 17.7Billings 8.3 8.0 6.0 11.2 5.8
Total 100.0 100.0 100.0 100.0 100.0
No. of Cases (Unweighted) (1594) (563) (390) (493) (148)
** Includes creams, jellies, and foam.
BELIZE: Knowledge of Contraceptive Methods, by Method and Language Spoken:Men Aged 15-64
1999 Family Health Survey(Percent Distribution)
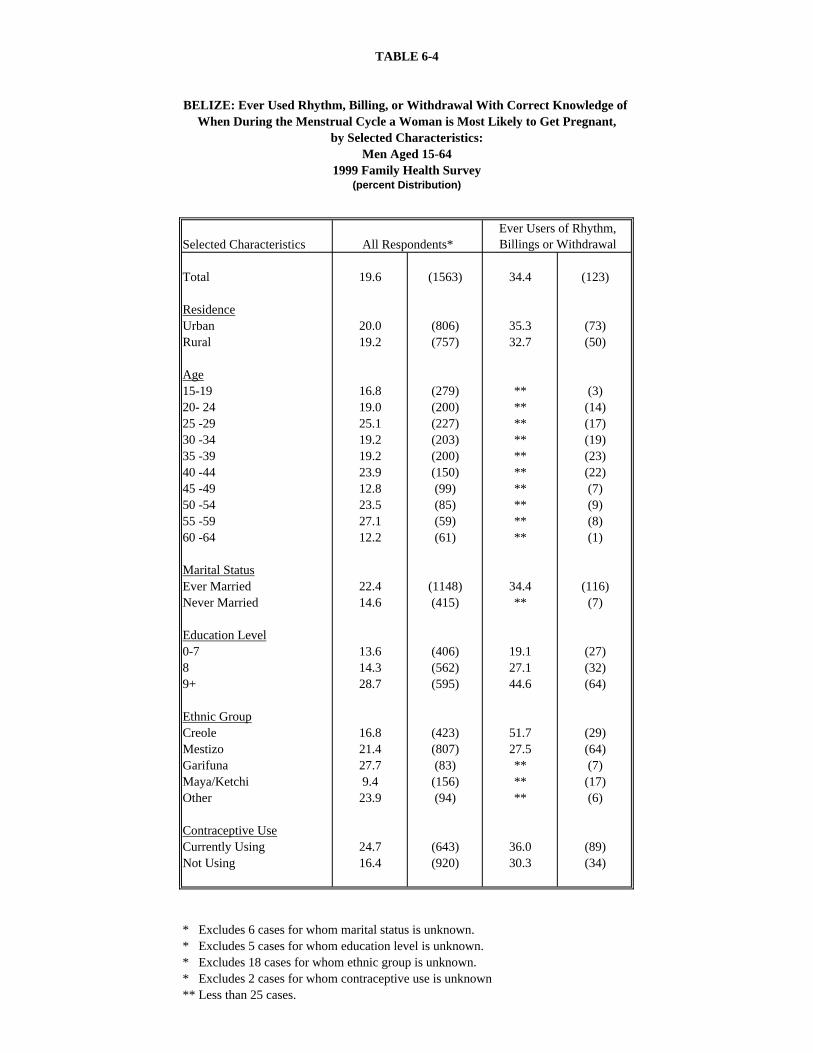
TABLE 6-4
BELIZE: Ever Used Rhythm, Billing, or Withdrawal With Correct Knowledge of When During the Menstrual Cycle a Woman is Most Likely to Get Pregnant,
by Selected Characteristics:
Selected Characteristics All Respondents*Ever Users of Rhythm, Billings or Withdrawal
Total 19.6 (1563) 34.4 (123)
ResidenceUrban 20.0 (806) 35.3 (73)Rural 19.2 (757) 32.7 (50)
Age15-19 16.8 (279) ** (3)20- 24 19.0 (200) ** (14)25 -29 25.1 (227) ** (17)30 -34 19.2 (203) ** (19)35 -39 19.2 (200) ** (23)40 -44 23.9 (150) ** (22)45 -49 12.8 (99) ** (7)50 -54 23.5 (85) ** (9)55 -59 27.1 (59) ** (8)60 -64 12.2 (61) ** (1)
Marital StatusEver Married 22.4 (1148) 34.4 (116)Never Married 14.6 (415) ** (7)
Education Level0-7 13.6 (406) 19.1 (27)8 14.3 (562) 27.1 (32)9+ 28.7 (595) 44.6 (64)
Ethnic GroupCreole 16.8 (423) 51.7 (29)Mestizo 21.4 (807) 27.5 (64)Garifuna 27.7 (83) ** (7)Maya/Ketchi 9.4 (156) ** (17)Other 23.9 (94) ** (6)
Contraceptive UseCurrently Using 24.7 (643) 36.0 (89)Not Using 16.4 (920) 30.3 (34)
* Excludes 6 cases for whom marital status is unknown.* Excludes 5 cases for whom education level is unknown.* Excludes 18 cases for whom ethnic group is unknown.* Excludes 2 cases for whom contraceptive use is unknown** Less than 25 cases.
Men Aged 15-641999 Family Health Survey
(percent Distribution)
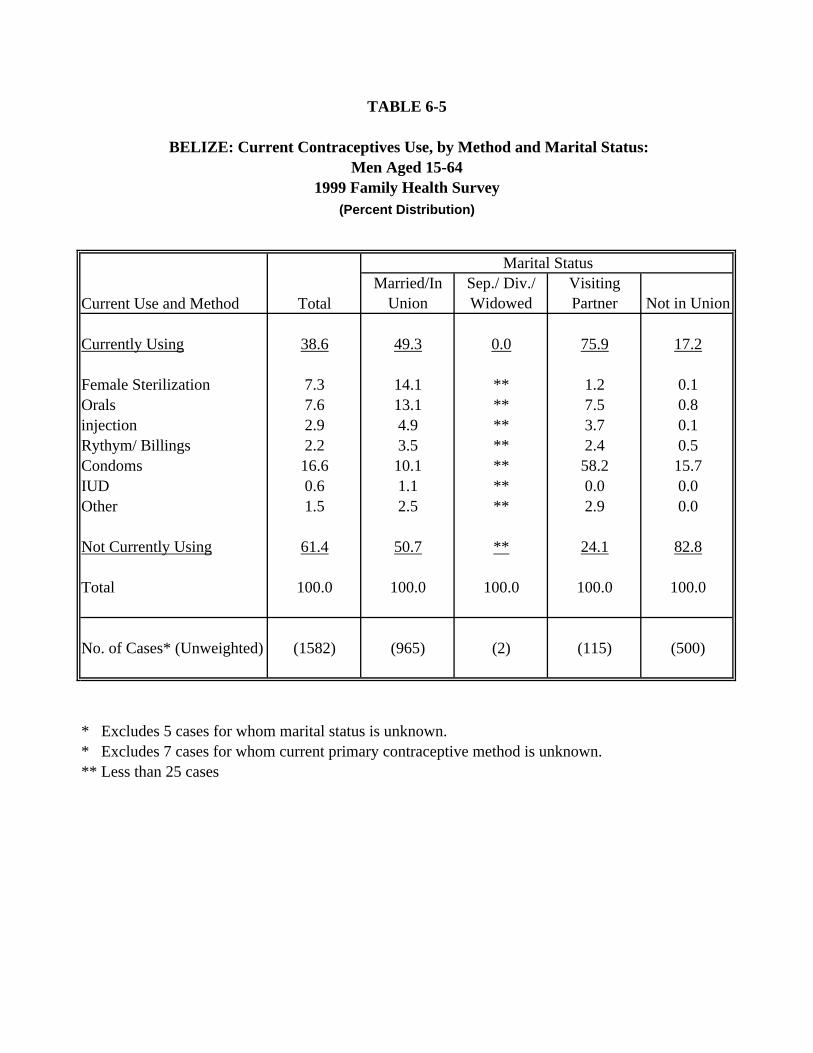
TABLE 6-5
BELIZE: Current Contraceptives Use, by Method and Marital Status:
Marital Status
Current Use and Method TotalMarried/In
UnionSep./ Div./ Widowed
Visiting Partner Not in Union
Currently Using 38.6 49.3 0.0 75.9 17.2
Female Sterilization 7.3 14.1 ** 1.2 0.1Orals 7.6 13.1 ** 7.5 0.8injection 2.9 4.9 ** 3.7 0.1Rythym/ Billings 2.2 3.5 ** 2.4 0.5Condoms 16.6 10.1 ** 58.2 15.7IUD 0.6 1.1 ** 0.0 0.0Other 1.5 2.5 ** 2.9 0.0
Not Currently Using 61.4 50.7 ** 24.1 82.8
Total 100.0 100.0 100.0 100.0 100.0
No. of Cases* (Unweighted) (1582) (965) (2) (115) (500)
* Excludes 5 cases for whom marital status is unknown.* Excludes 7 cases for whom current primary contraceptive method is unknown.** Less than 25 cases
Men Aged 15-641999 Family Health Survey
(Percent Distribution)
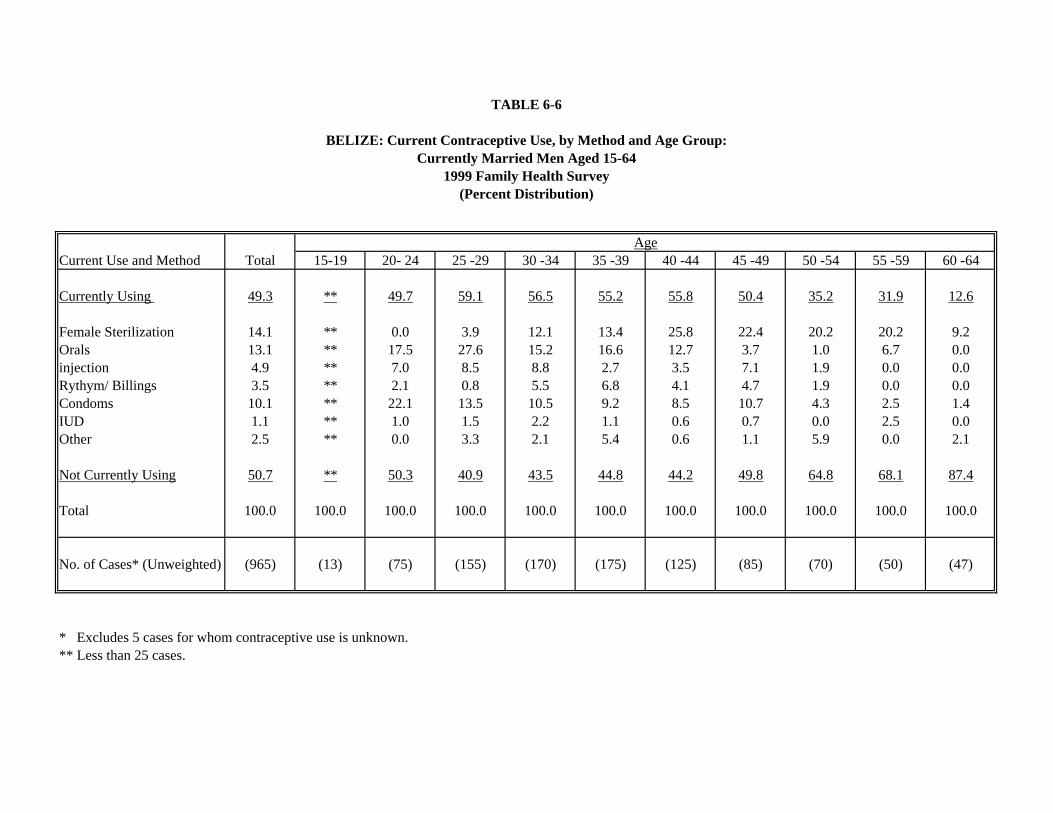
TABLE 6-6
BELIZE: Current Contraceptive Use, by Method and Age Group:
AgeCurrent Use and Method Total 15-19 20- 24 25 -29 30 -34 35 -39 40 -44 45 -49 50 -54 55 -59 60 -64
Currently Using 49.3 ** 49.7 59.1 56.5 55.2 55.8 50.4 35.2 31.9 12.6
Female Sterilization 14.1 ** 0.0 3.9 12.1 13.4 25.8 22.4 20.2 20.2 9.2Orals 13.1 ** 17.5 27.6 15.2 16.6 12.7 3.7 1.0 6.7 0.0injection 4.9 ** 7.0 8.5 8.8 2.7 3.5 7.1 1.9 0.0 0.0Rythym/ Billings 3.5 ** 2.1 0.8 5.5 6.8 4.1 4.7 1.9 0.0 0.0Condoms 10.1 ** 22.1 13.5 10.5 9.2 8.5 10.7 4.3 2.5 1.4IUD 1.1 ** 1.0 1.5 2.2 1.1 0.6 0.7 0.0 2.5 0.0Other 2.5 ** 0.0 3.3 2.1 5.4 0.6 1.1 5.9 0.0 2.1
Not Currently Using 50.7 ** 50.3 40.9 43.5 44.8 44.2 49.8 64.8 68.1 87.4
Total 100.0 100.0 100.0 100.0 100.0 100.0 100.0 100.0 100.0 100.0 100.0
No. of Cases* (Unweighted) (965) (13) (75) (155) (170) (175) (125) (85) (70) (50) (47)
* Excludes 5 cases for whom contraceptive use is unknown.** Less than 25 cases.
1999 Family Health Survey(Percent Distribution)
Currently Married Men Aged 15-64
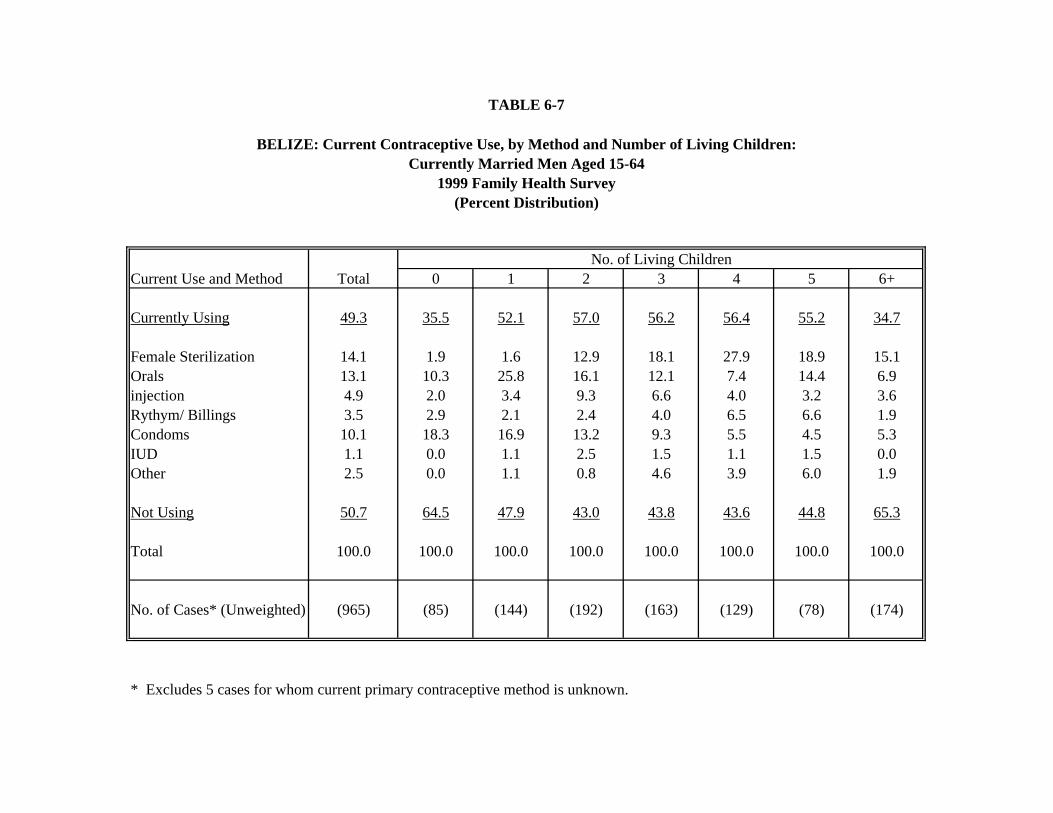
TABLE 6-7
No. of Living ChildrenCurrent Use and Method Total 0 1 2 3 4 5 6+
Currently Using 49.3 35.5 52.1 57.0 56.2 56.4 55.2 34.7
Female Sterilization 14.1 1.9 1.6 12.9 18.1 27.9 18.9 15.1Orals 13.1 10.3 25.8 16.1 12.1 7.4 14.4 6.9injection 4.9 2.0 3.4 9.3 6.6 4.0 3.2 3.6Rythym/ Billings 3.5 2.9 2.1 2.4 4.0 6.5 6.6 1.9Condoms 10.1 18.3 16.9 13.2 9.3 5.5 4.5 5.3IUD 1.1 0.0 1.1 2.5 1.5 1.1 1.5 0.0Other 2.5 0.0 1.1 0.8 4.6 3.9 6.0 1.9
Not Using 50.7 64.5 47.9 43.0 43.8 43.6 44.8 65.3
Total 100.0 100.0 100.0 100.0 100.0 100.0 100.0 100.0
No. of Cases* (Unweighted) (965) (85) (144) (192) (163) (129) (78) (174)
* Excludes 5 cases for whom current primary contraceptive method is unknown.
BELIZE: Current Contraceptive Use, by Method and Number of Living Children:Currently Married Men Aged 15-64
1999 Family Health Survey(Percent Distribution)
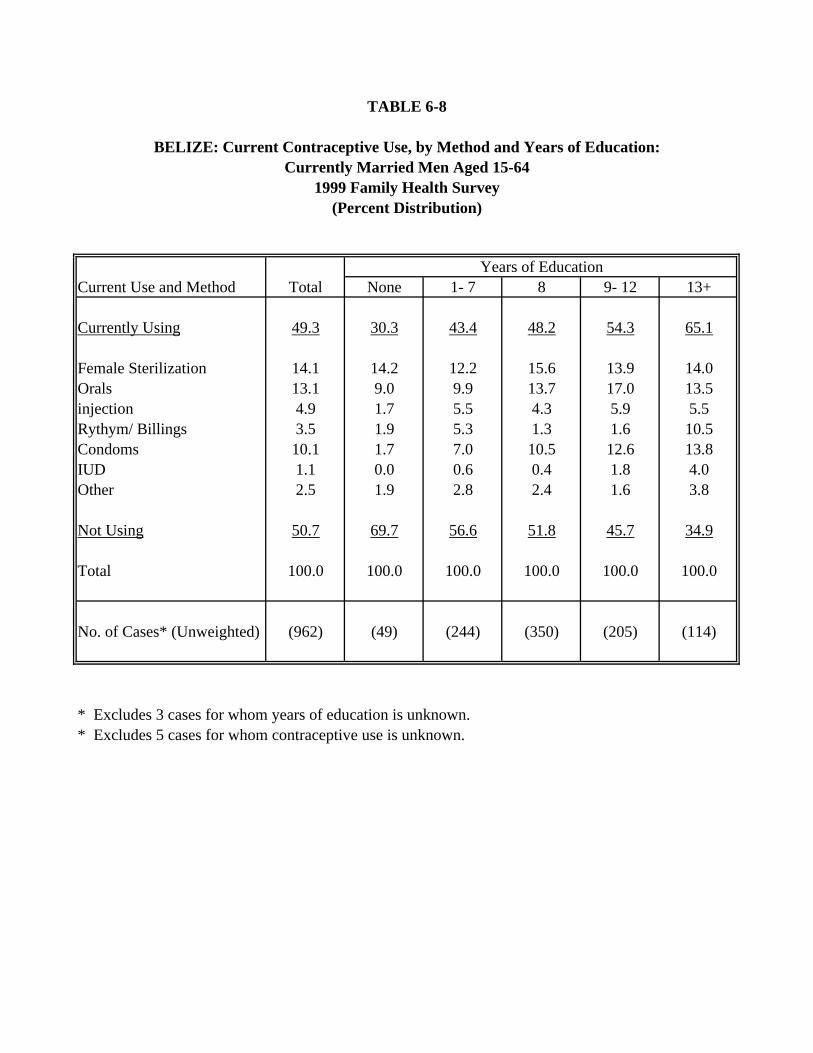
TABLE 6-8
Years of EducationCurrent Use and Method Total None 1- 7 8 9- 12 13+
Currently Using 49.3 30.3 43.4 48.2 54.3 65.1
Female Sterilization 14.1 14.2 12.2 15.6 13.9 14.0Orals 13.1 9.0 9.9 13.7 17.0 13.5injection 4.9 1.7 5.5 4.3 5.9 5.5Rythym/ Billings 3.5 1.9 5.3 1.3 1.6 10.5Condoms 10.1 1.7 7.0 10.5 12.6 13.8IUD 1.1 0.0 0.6 0.4 1.8 4.0Other 2.5 1.9 2.8 2.4 1.6 3.8
Not Using 50.7 69.7 56.6 51.8 45.7 34.9
Total 100.0 100.0 100.0 100.0 100.0 100.0
No. of Cases* (Unweighted) (962) (49) (244) (350) (205) (114)
* Excludes 3 cases for whom years of education is unknown.* Excludes 5 cases for whom contraceptive use is unknown.
BELIZE: Current Contraceptive Use, by Method and Years of Education:Currently Married Men Aged 15-64
1999 Family Health Survey(Percent Distribution)
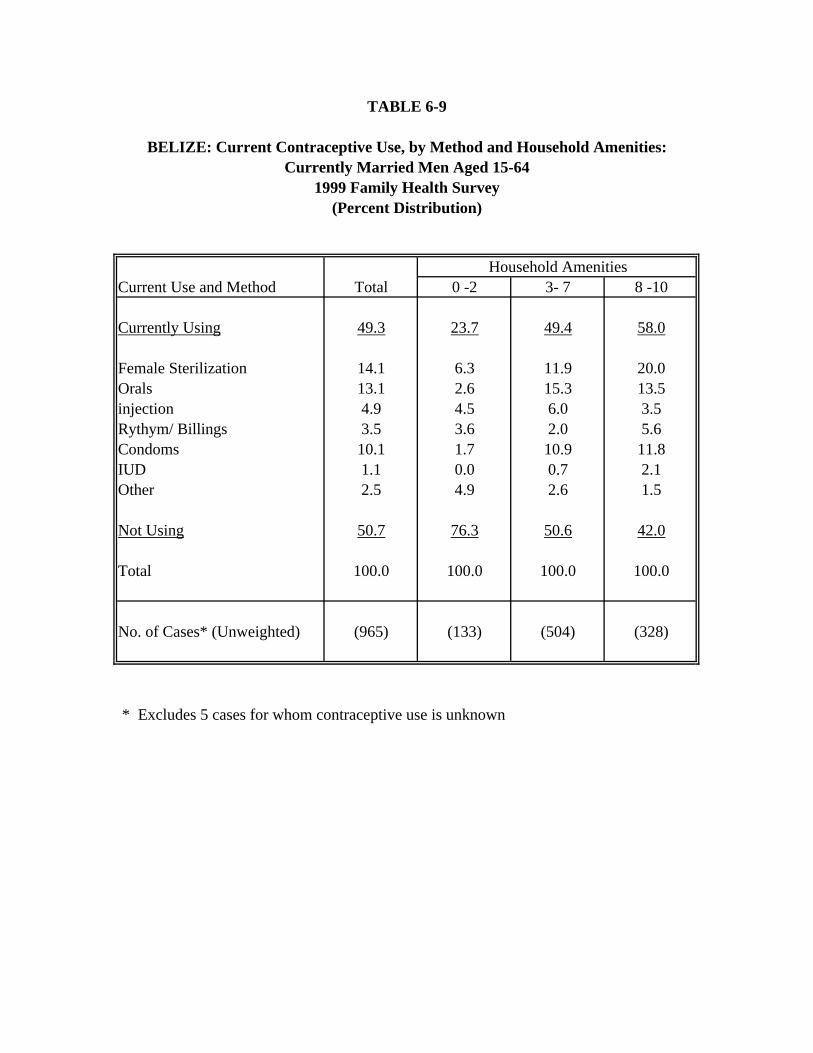
TABLE 6-9
Household AmenitiesCurrent Use and Method Total 0 -2 3- 7 8 -10
Currently Using 49.3 23.7 49.4 58.0
Female Sterilization 14.1 6.3 11.9 20.0Orals 13.1 2.6 15.3 13.5injection 4.9 4.5 6.0 3.5Rythym/ Billings 3.5 3.6 2.0 5.6Condoms 10.1 1.7 10.9 11.8IUD 1.1 0.0 0.7 2.1Other 2.5 4.9 2.6 1.5
Not Using 50.7 76.3 50.6 42.0
Total 100.0 100.0 100.0 100.0
No. of Cases* (Unweighted) (965) (133) (504) (328)
* Excludes 5 cases for whom contraceptive use is unknown
BELIZE: Current Contraceptive Use, by Method and Household Amenities:Currently Married Men Aged 15-64
1999 Family Health Survey(Percent Distribution)
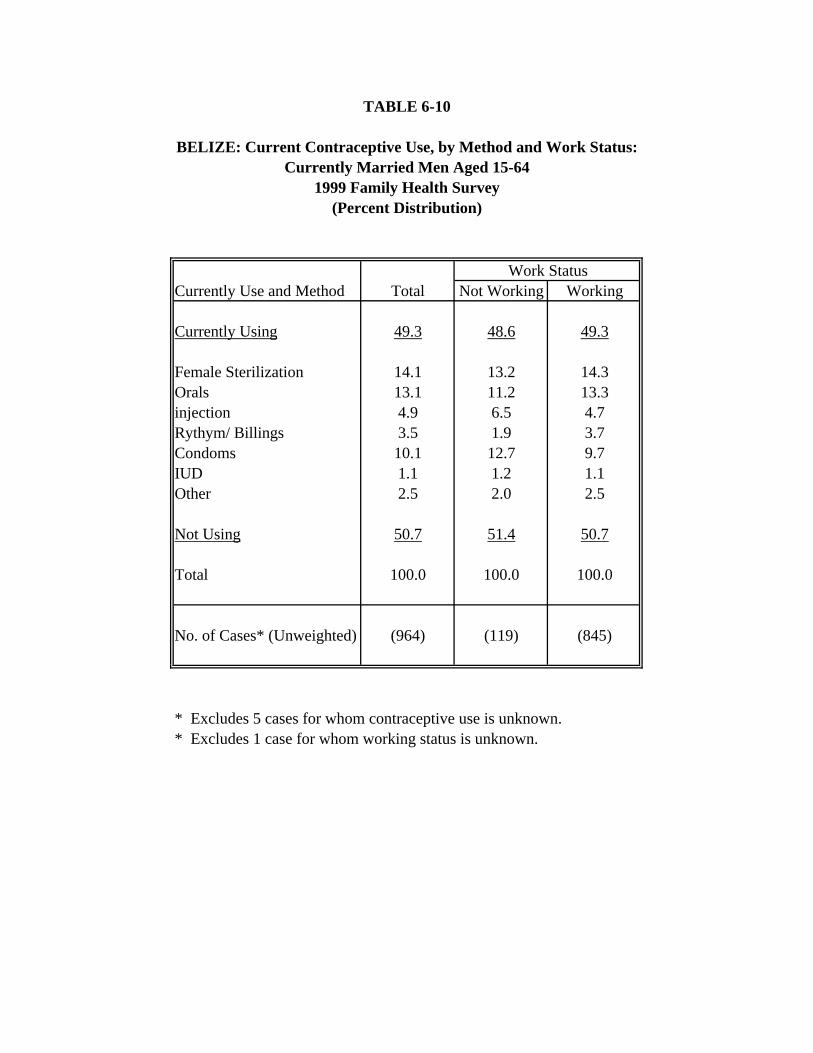
TABLE 6-10
Work StatusCurrently Use and Method Total Not Working Working
Currently Using 49.3 48.6 49.3
Female Sterilization 14.1 13.2 14.3Orals 13.1 11.2 13.3injection 4.9 6.5 4.7Rythym/ Billings 3.5 1.9 3.7Condoms 10.1 12.7 9.7IUD 1.1 1.2 1.1Other 2.5 2.0 2.5
Not Using 50.7 51.4 50.7
Total 100.0 100.0 100.0
No. of Cases* (Unweighted) (964) (119) (845)
* Excludes 5 cases for whom contraceptive use is unknown.* Excludes 1 case for whom working status is unknown.
BELIZE: Current Contraceptive Use, by Method and Work Status:Currently Married Men Aged 15-64
1999 Family Health Survey(Percent Distribution)
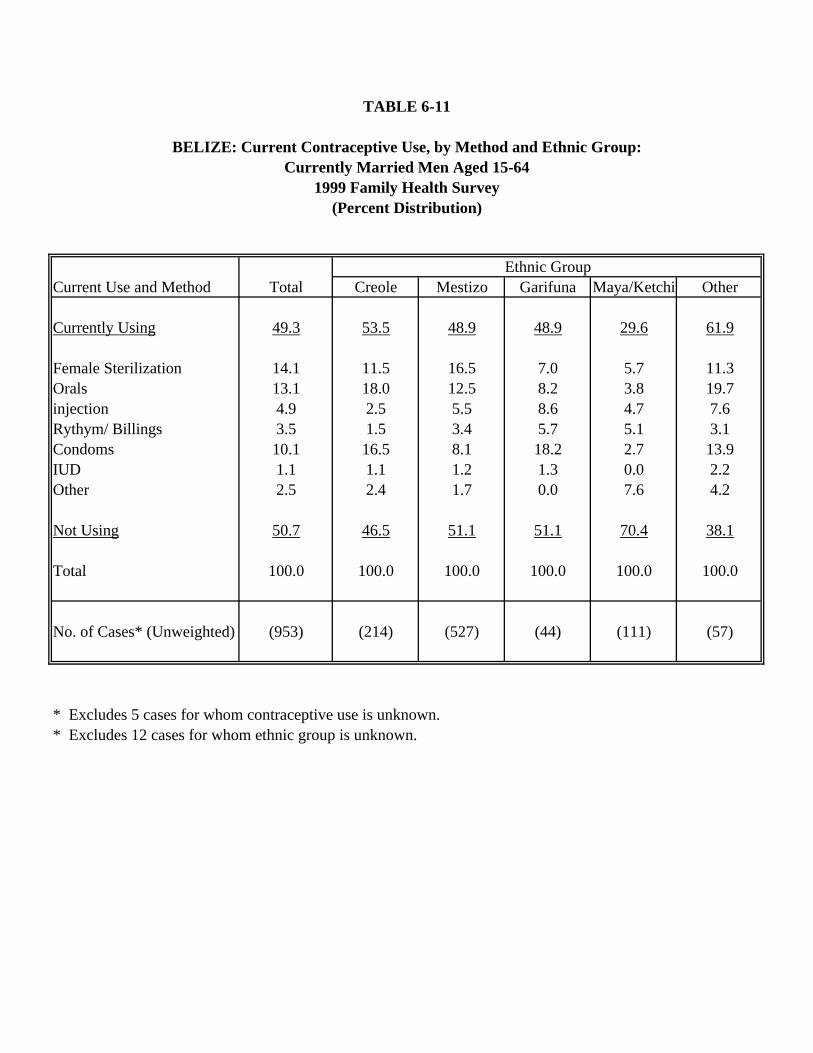
TABLE 6-11
Ethnic GroupCurrent Use and Method Total Creole Mestizo Garifuna Maya/Ketchi Other
Currently Using 49.3 53.5 48.9 48.9 29.6 61.9
Female Sterilization 14.1 11.5 16.5 7.0 5.7 11.3Orals 13.1 18.0 12.5 8.2 3.8 19.7injection 4.9 2.5 5.5 8.6 4.7 7.6Rythym/ Billings 3.5 1.5 3.4 5.7 5.1 3.1Condoms 10.1 16.5 8.1 18.2 2.7 13.9IUD 1.1 1.1 1.2 1.3 0.0 2.2Other 2.5 2.4 1.7 0.0 7.6 4.2
Not Using 50.7 46.5 51.1 51.1 70.4 38.1
Total 100.0 100.0 100.0 100.0 100.0 100.0
No. of Cases* (Unweighted) (953) (214) (527) (44) (111) (57)
* Excludes 5 cases for whom contraceptive use is unknown.* Excludes 12 cases for whom ethnic group is unknown.
BELIZE: Current Contraceptive Use, by Method and Ethnic Group:Currently Married Men Aged 15-64
1999 Family Health Survey(Percent Distribution)
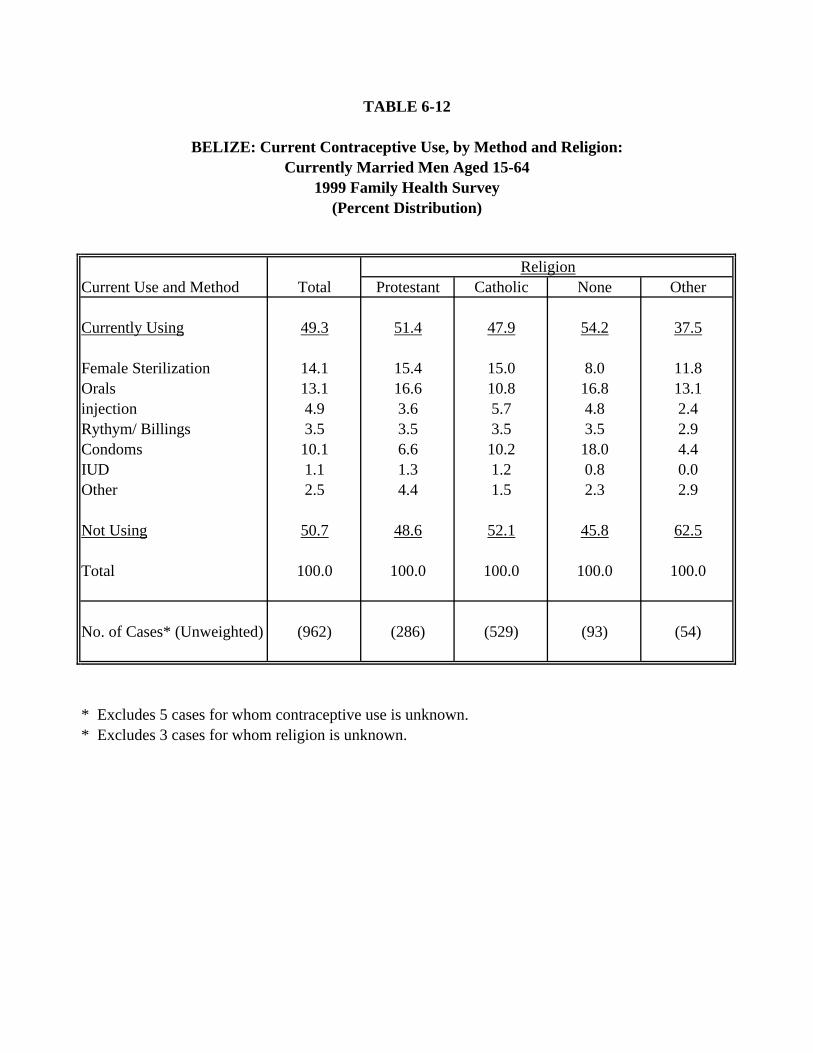
TABLE 6-12
ReligionCurrent Use and Method Total Protestant Catholic None Other
Currently Using 49.3 51.4 47.9 54.2 37.5
Female Sterilization 14.1 15.4 15.0 8.0 11.8Orals 13.1 16.6 10.8 16.8 13.1injection 4.9 3.6 5.7 4.8 2.4Rythym/ Billings 3.5 3.5 3.5 3.5 2.9Condoms 10.1 6.6 10.2 18.0 4.4IUD 1.1 1.3 1.2 0.8 0.0Other 2.5 4.4 1.5 2.3 2.9
Not Using 50.7 48.6 52.1 45.8 62.5
Total 100.0 100.0 100.0 100.0 100.0
No. of Cases* (Unweighted) (962) (286) (529) (93) (54)
* Excludes 5 cases for whom contraceptive use is unknown.* Excludes 3 cases for whom religion is unknown.
1999 Family Health Survey(Percent Distribution)
BELIZE: Current Contraceptive Use, by Method and Religion:Currently Married Men Aged 15-64
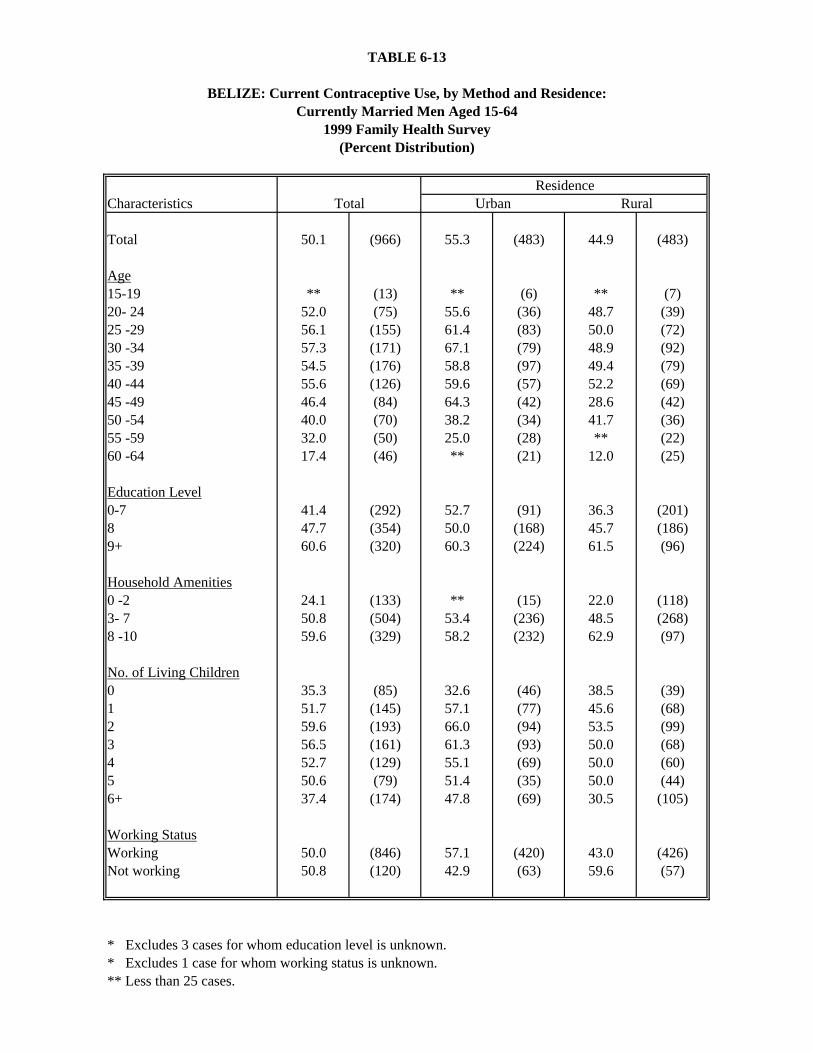
TABLE 6-13
ResidenceCharacteristics Total Urban Rural
Total 50.1 (966) 55.3 (483) 44.9 (483)
Age15-19 ** (13) ** (6) ** (7)20- 24 52.0 (75) 55.6 (36) 48.7 (39)25 -29 56.1 (155) 61.4 (83) 50.0 (72)30 -34 57.3 (171) 67.1 (79) 48.9 (92)35 -39 54.5 (176) 58.8 (97) 49.4 (79)40 -44 55.6 (126) 59.6 (57) 52.2 (69)45 -49 46.4 (84) 64.3 (42) 28.6 (42)50 -54 40.0 (70) 38.2 (34) 41.7 (36)55 -59 32.0 (50) 25.0 (28) ** (22)60 -64 17.4 (46) ** (21) 12.0 (25)
Education Level0-7 41.4 (292) 52.7 (91) 36.3 (201)8 47.7 (354) 50.0 (168) 45.7 (186)9+ 60.6 (320) 60.3 (224) 61.5 (96)
Household Amenities0 -2 24.1 (133) ** (15) 22.0 (118)3- 7 50.8 (504) 53.4 (236) 48.5 (268)8 -10 59.6 (329) 58.2 (232) 62.9 (97)
No. of Living Children0 35.3 (85) 32.6 (46) 38.5 (39)1 51.7 (145) 57.1 (77) 45.6 (68)2 59.6 (193) 66.0 (94) 53.5 (99)3 56.5 (161) 61.3 (93) 50.0 (68)4 52.7 (129) 55.1 (69) 50.0 (60)5 50.6 (79) 51.4 (35) 50.0 (44)6+ 37.4 (174) 47.8 (69) 30.5 (105)
Working StatusWorking 50.0 (846) 57.1 (420) 43.0 (426)Not working 50.8 (120) 42.9 (63) 59.6 (57)
* Excludes 3 cases for whom education level is unknown.* Excludes 1 case for whom working status is unknown.** Less than 25 cases.
BELIZE: Current Contraceptive Use, by Method and Residence:Currently Married Men Aged 15-64
1999 Family Health Survey(Percent Distribution)
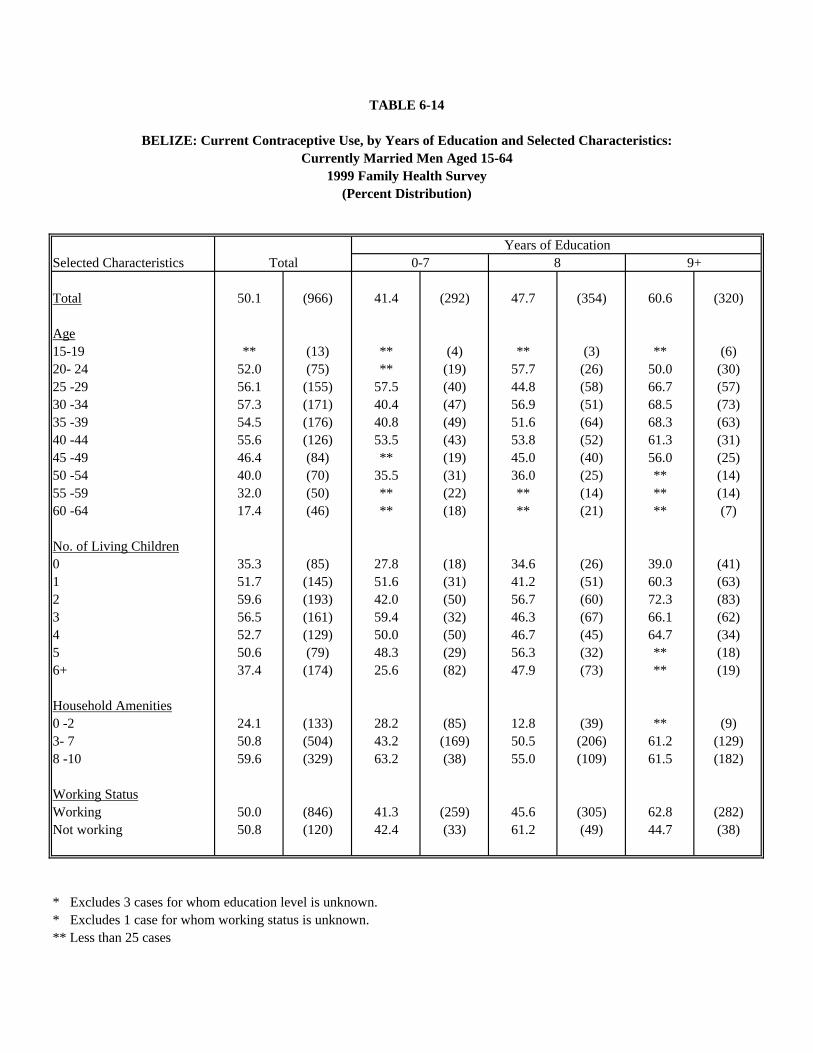
TABLE 6-14
Years of EducationSelected Characteristics Total 0-7 8 9+
Total 50.1 (966) 41.4 (292) 47.7 (354) 60.6 (320)
Age15-19 ** (13) ** (4) ** (3) ** (6)20- 24 52.0 (75) ** (19) 57.7 (26) 50.0 (30)25 -29 56.1 (155) 57.5 (40) 44.8 (58) 66.7 (57)30 -34 57.3 (171) 40.4 (47) 56.9 (51) 68.5 (73)35 -39 54.5 (176) 40.8 (49) 51.6 (64) 68.3 (63)40 -44 55.6 (126) 53.5 (43) 53.8 (52) 61.3 (31)45 -49 46.4 (84) ** (19) 45.0 (40) 56.0 (25)50 -54 40.0 (70) 35.5 (31) 36.0 (25) ** (14)55 -59 32.0 (50) ** (22) ** (14) ** (14)60 -64 17.4 (46) ** (18) ** (21) ** (7)
No. of Living Children0 35.3 (85) 27.8 (18) 34.6 (26) 39.0 (41)1 51.7 (145) 51.6 (31) 41.2 (51) 60.3 (63)2 59.6 (193) 42.0 (50) 56.7 (60) 72.3 (83)3 56.5 (161) 59.4 (32) 46.3 (67) 66.1 (62)4 52.7 (129) 50.0 (50) 46.7 (45) 64.7 (34)5 50.6 (79) 48.3 (29) 56.3 (32) ** (18)6+ 37.4 (174) 25.6 (82) 47.9 (73) ** (19)
Household Amenities0 -2 24.1 (133) 28.2 (85) 12.8 (39) ** (9)3- 7 50.8 (504) 43.2 (169) 50.5 (206) 61.2 (129)8 -10 59.6 (329) 63.2 (38) 55.0 (109) 61.5 (182)
Working StatusWorking 50.0 (846) 41.3 (259) 45.6 (305) 62.8 (282)Not working 50.8 (120) 42.4 (33) 61.2 (49) 44.7 (38)
* Excludes 3 cases for whom education level is unknown.* Excludes 1 case for whom working status is unknown.** Less than 25 cases
BELIZE: Current Contraceptive Use, by Years of Education and Selected Characteristics:Currently Married Men Aged 15-64
1999 Family Health Survey(Percent Distribution)
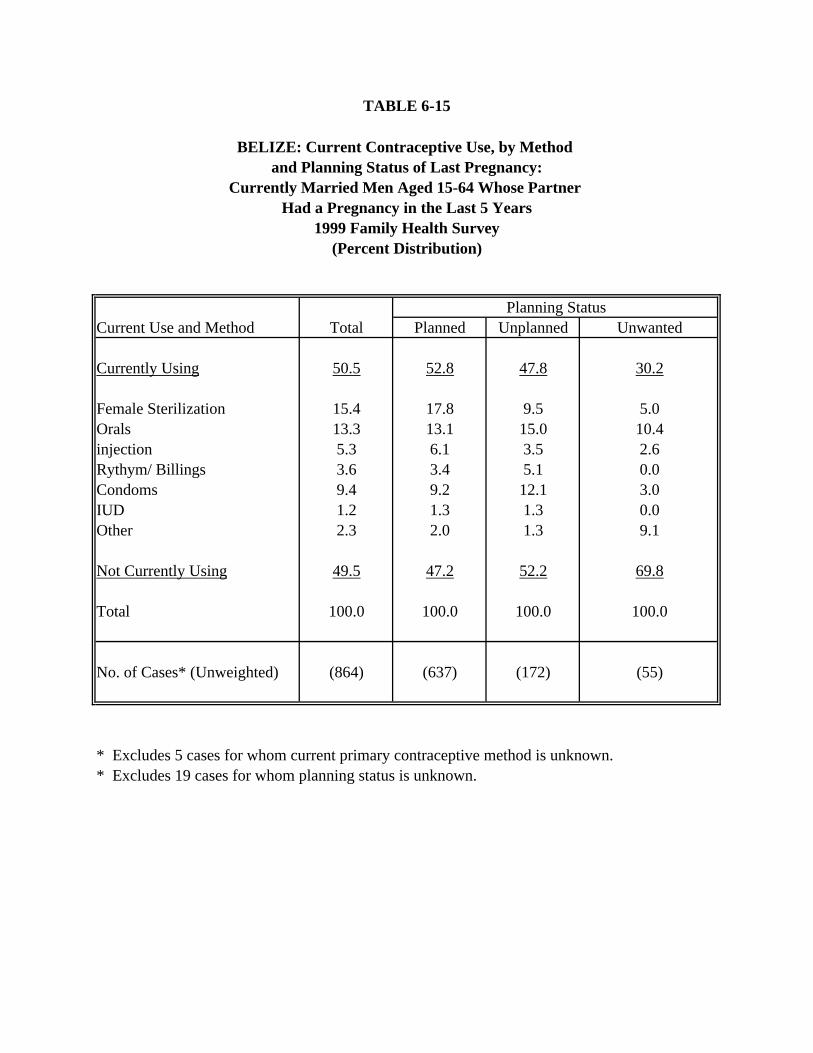
TABLE 6-15
Planning StatusCurrent Use and Method Total Planned Unplanned Unwanted
Currently Using 50.5 52.8 47.8 30.2
Female Sterilization 15.4 17.8 9.5 5.0Orals 13.3 13.1 15.0 10.4injection 5.3 6.1 3.5 2.6Rythym/ Billings 3.6 3.4 5.1 0.0Condoms 9.4 9.2 12.1 3.0IUD 1.2 1.3 1.3 0.0Other 2.3 2.0 1.3 9.1
Not Currently Using 49.5 47.2 52.2 69.8
Total 100.0 100.0 100.0 100.0
No. of Cases* (Unweighted) (864) (637) (172) (55)
* Excludes 5 cases for whom current primary contraceptive method is unknown.* Excludes 19 cases for whom planning status is unknown.
(Percent Distribution)
and Planning Status of Last Pregnancy:
Had a Pregnancy in the Last 5 Years
BELIZE: Current Contraceptive Use, by Method
Currently Married Men Aged 15-64 Whose Partner
1999 Family Health Survey
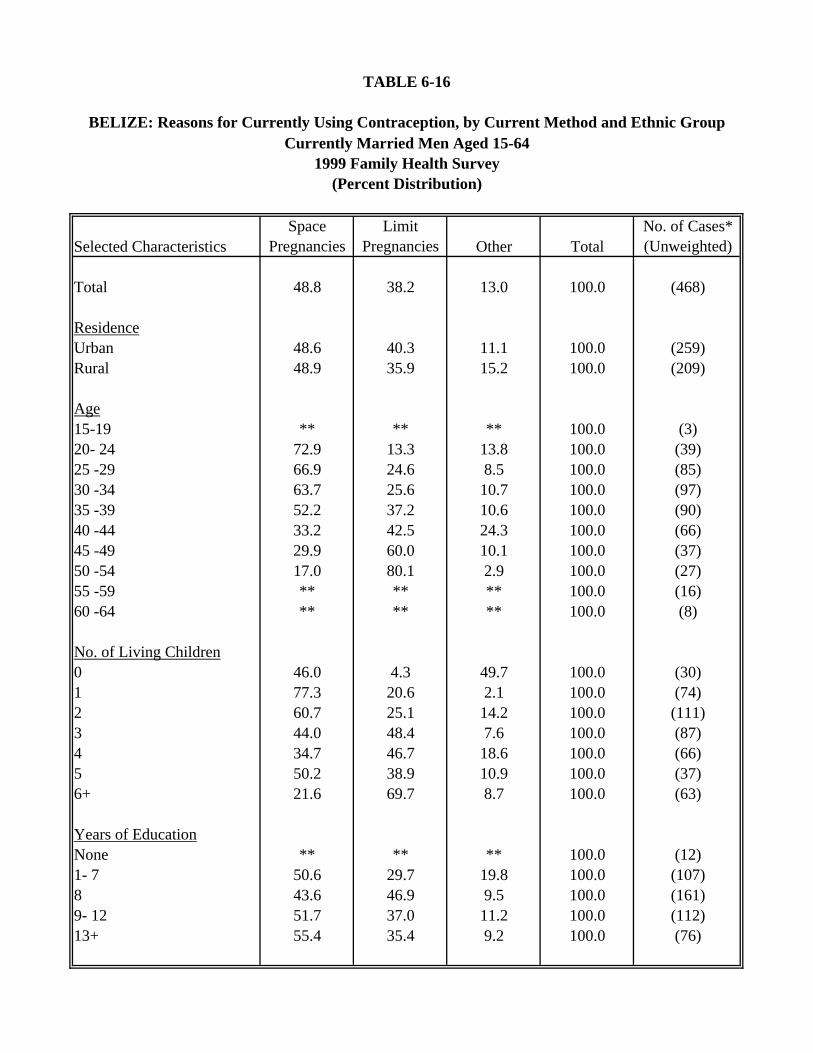
TABLE 6-16
BELIZE: Reasons for Currently Using Contraception, by Current Method and Ethnic Group
Selected CharacteristicsSpace
PregnanciesLimit
Pregnancies Other TotalNo. of Cases* (Unweighted)
Total 48.8 38.2 13.0 100.0 (468)
ResidenceUrban 48.6 40.3 11.1 100.0 (259)Rural 48.9 35.9 15.2 100.0 (209)
Age15-19 ** ** ** 100.0 (3)20- 24 72.9 13.3 13.8 100.0 (39)25 -29 66.9 24.6 8.5 100.0 (85)30 -34 63.7 25.6 10.7 100.0 (97)35 -39 52.2 37.2 10.6 100.0 (90)40 -44 33.2 42.5 24.3 100.0 (66)45 -49 29.9 60.0 10.1 100.0 (37)50 -54 17.0 80.1 2.9 100.0 (27)55 -59 ** ** ** 100.0 (16)60 -64 ** ** ** 100.0 (8)
No. of Living Children0 46.0 4.3 49.7 100.0 (30)1 77.3 20.6 2.1 100.0 (74)2 60.7 25.1 14.2 100.0 (111)3 44.0 48.4 7.6 100.0 (87)4 34.7 46.7 18.6 100.0 (66)5 50.2 38.9 10.9 100.0 (37)6+ 21.6 69.7 8.7 100.0 (63)
Years of EducationNone ** ** ** 100.0 (12)1- 7 50.6 29.7 19.8 100.0 (107)8 43.6 46.9 9.5 100.0 (161)9- 12 51.7 37.0 11.2 100.0 (112)13+ 55.4 35.4 9.2 100.0 (76)
Currently Married Men Aged 15-641999 Family Health Survey
(Percent Distribution)
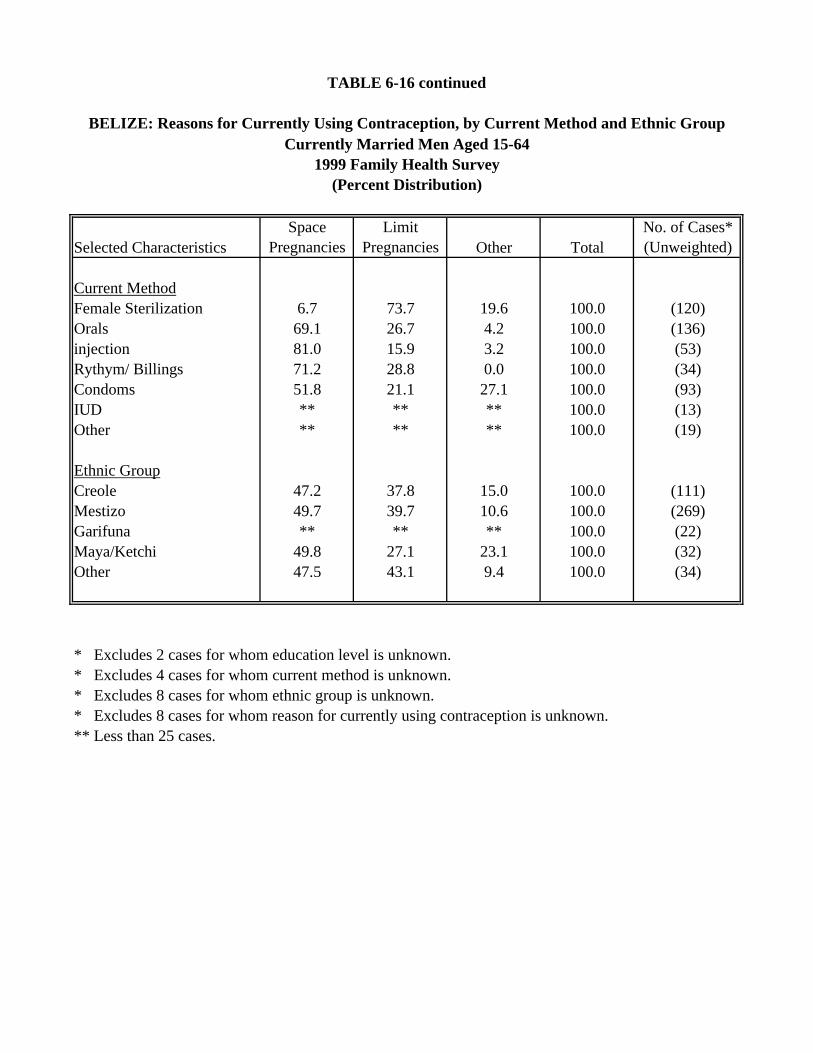
TABLE 6-16 continued
BELIZE: Reasons for Currently Using Contraception, by Current Method and Ethnic Group
Selected CharacteristicsSpace
PregnanciesLimit
Pregnancies Other TotalNo. of Cases* (Unweighted)
Current MethodFemale Sterilization 6.7 73.7 19.6 100.0 (120)Orals 69.1 26.7 4.2 100.0 (136)injection 81.0 15.9 3.2 100.0 (53)Rythym/ Billings 71.2 28.8 0.0 100.0 (34)Condoms 51.8 21.1 27.1 100.0 (93)IUD ** ** ** 100.0 (13)Other ** ** ** 100.0 (19)
Ethnic GroupCreole 47.2 37.8 15.0 100.0 (111)Mestizo 49.7 39.7 10.6 100.0 (269)Garifuna ** ** ** 100.0 (22)Maya/Ketchi 49.8 27.1 23.1 100.0 (32)Other 47.5 43.1 9.4 100.0 (34)
* Excludes 2 cases for whom education level is unknown.* Excludes 4 cases for whom current method is unknown.* Excludes 8 cases for whom ethnic group is unknown.* Excludes 8 cases for whom reason for currently using contraception is unknown.** Less than 25 cases.
Currently Married Men Aged 15-641999 Family Health Survey
(Percent Distribution)
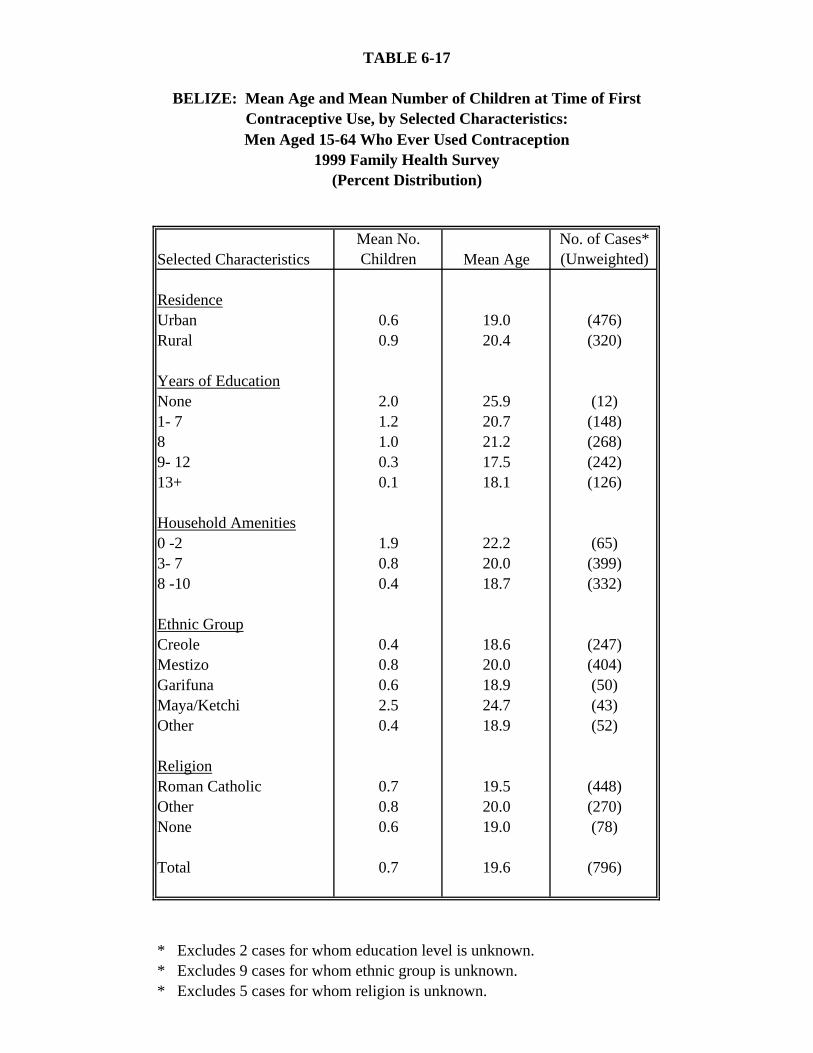
TABLE 6-17
BELIZE: Mean Age and Mean Number of Children at Time of FirstContraceptive Use, by Selected Characteristics:
Selected CharacteristicsMean No. Children Mean Age
No. of Cases* (Unweighted)
ResidenceUrban 0.6 19.0 (476)Rural 0.9 20.4 (320)
Years of EducationNone 2.0 25.9 (12)1- 7 1.2 20.7 (148)8 1.0 21.2 (268)9- 12 0.3 17.5 (242)13+ 0.1 18.1 (126)
Household Amenities0 -2 1.9 22.2 (65)3- 7 0.8 20.0 (399)8 -10 0.4 18.7 (332)
Ethnic GroupCreole 0.4 18.6 (247)Mestizo 0.8 20.0 (404)Garifuna 0.6 18.9 (50)Maya/Ketchi 2.5 24.7 (43)Other 0.4 18.9 (52)
ReligionRoman Catholic 0.7 19.5 (448)Other 0.8 20.0 (270)None 0.6 19.0 (78)
Total 0.7 19.6 (796)
* Excludes 2 cases for whom education level is unknown.* Excludes 9 cases for whom ethnic group is unknown.* Excludes 5 cases for whom religion is unknown.
Men Aged 15-64 Who Ever Used Contraception1999 Family Health Survey
(Percent Distribution)
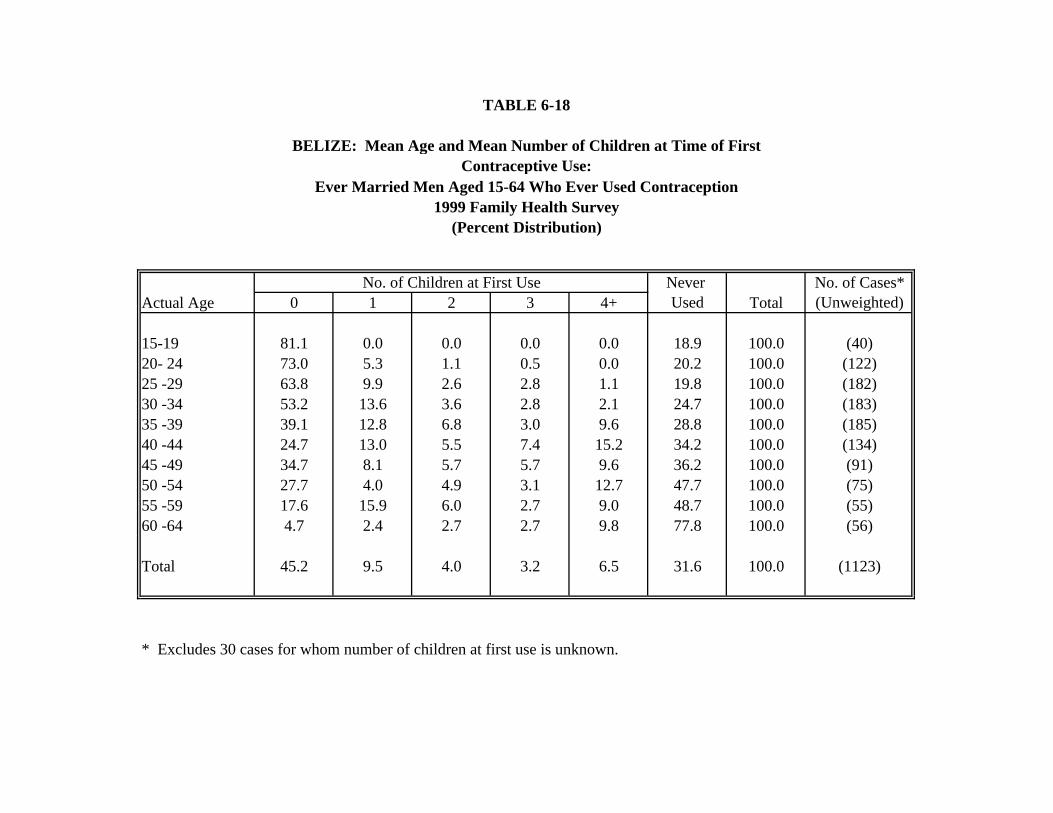
TABLE 6-18
BELIZE: Mean Age and Mean Number of Children at Time of FirstContraceptive Use:
No. of Children at First Use Never No. of Cases*Actual Age 0 1 2 3 4+ Used Total (Unweighted)
15-19 81.1 0.0 0.0 0.0 0.0 18.9 100.0 (40)20- 24 73.0 5.3 1.1 0.5 0.0 20.2 100.0 (122)25 -29 63.8 9.9 2.6 2.8 1.1 19.8 100.0 (182)30 -34 53.2 13.6 3.6 2.8 2.1 24.7 100.0 (183)35 -39 39.1 12.8 6.8 3.0 9.6 28.8 100.0 (185)40 -44 24.7 13.0 5.5 7.4 15.2 34.2 100.0 (134)45 -49 34.7 8.1 5.7 5.7 9.6 36.2 100.0 (91)50 -54 27.7 4.0 4.9 3.1 12.7 47.7 100.0 (75)55 -59 17.6 15.9 6.0 2.7 9.0 48.7 100.0 (55)60 -64 4.7 2.4 2.7 2.7 9.8 77.8 100.0 (56)
Total 45.2 9.5 4.0 3.2 6.5 31.6 100.0 (1123)
* Excludes 30 cases for whom number of children at first use is unknown.
Ever Married Men Aged 15-64 Who Ever Used Contraception1999 Family Health Survey
(Percent Distribution)
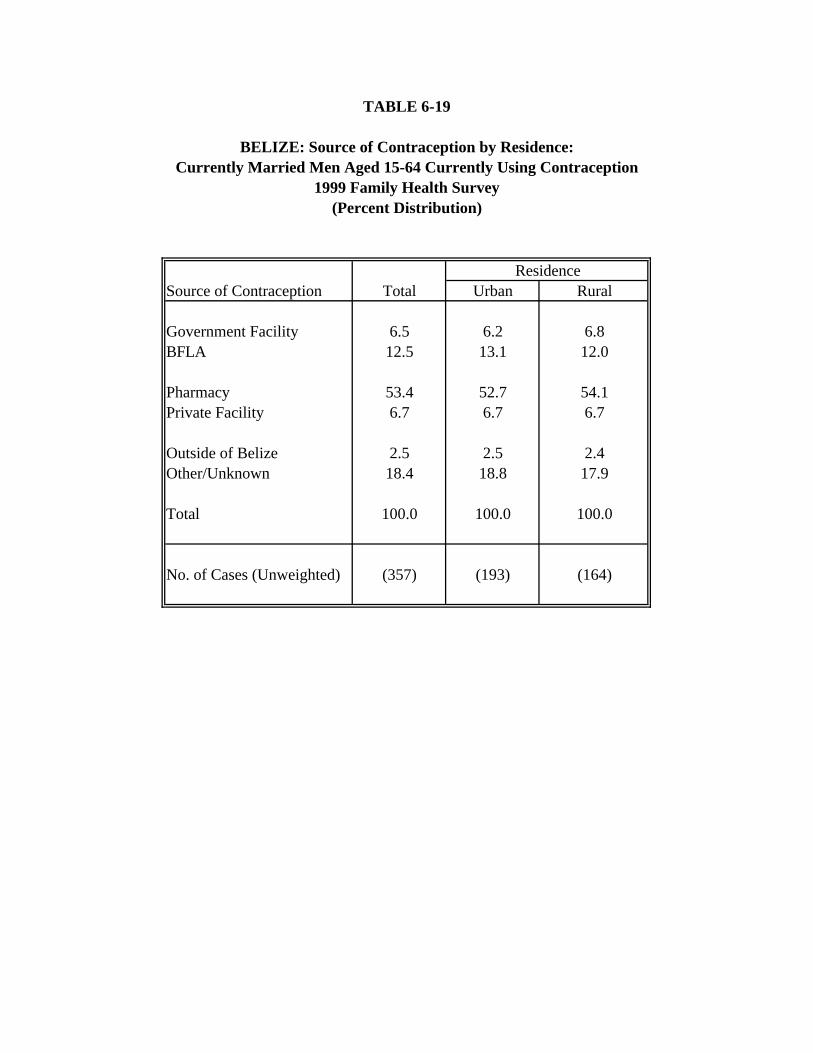
TABLE 6-19
BELIZE: Source of Contraception by Residence:
ResidenceSource of Contraception Total Urban Rural
Government Facility 6.5 6.2 6.8BFLA 12.5 13.1 12.0
Pharmacy 53.4 52.7 54.1Private Facility 6.7 6.7 6.7
Outside of Belize 2.5 2.5 2.4Other/Unknown 18.4 18.8 17.9
Total 100.0 100.0 100.0
No. of Cases (Unweighted) (357) (193) (164)
Currently Married Men Aged 15-64 Currently Using Contraception1999 Family Health Survey
(Percent Distribution)
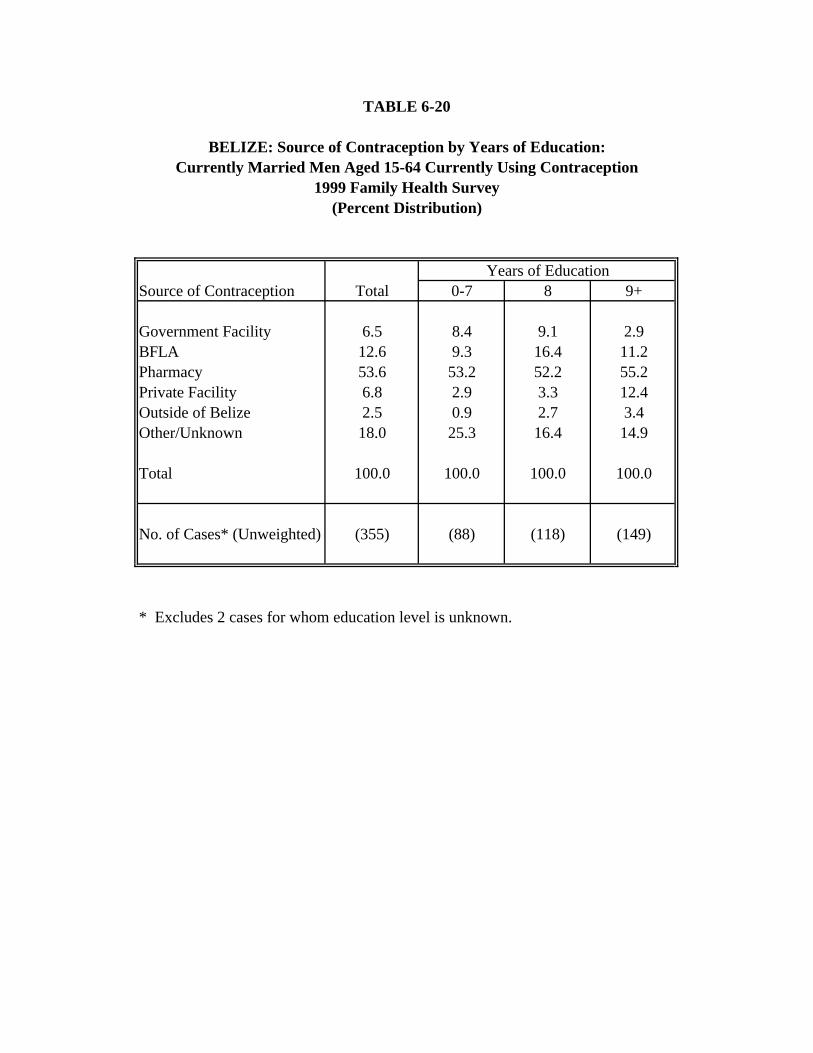
TABLE 6-20
BELIZE: Source of Contraception by Years of Education:
Years of EducationSource of Contraception Total 0-7 8 9+
Government Facility 6.5 8.4 9.1 2.9BFLA 12.6 9.3 16.4 11.2Pharmacy 53.6 53.2 52.2 55.2Private Facility 6.8 2.9 3.3 12.4Outside of Belize 2.5 0.9 2.7 3.4Other/Unknown 18.0 25.3 16.4 14.9
Total 100.0 100.0 100.0 100.0
No. of Cases* (Unweighted) (355) (88) (118) (149)
* Excludes 2 cases for whom education level is unknown.
Currently Married Men Aged 15-64 Currently Using Contraception1999 Family Health Survey
(Percent Distribution)
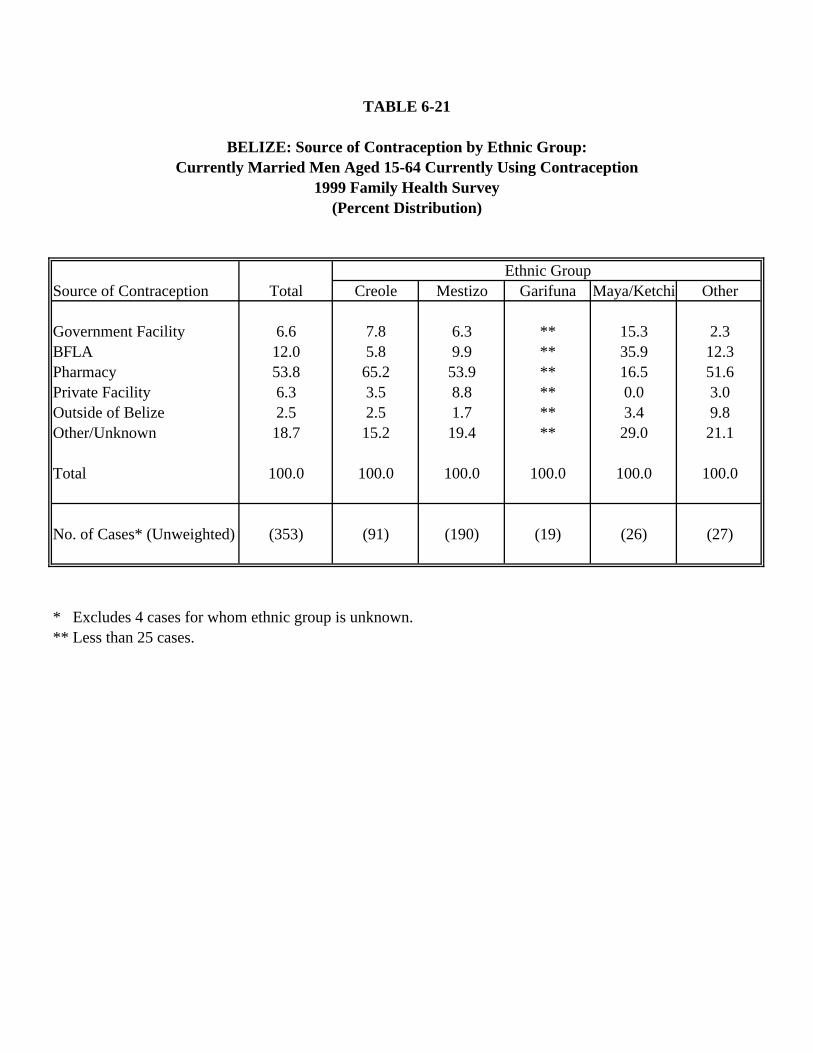
TABLE 6-21
BELIZE: Source of Contraception by Ethnic Group:
Ethnic GroupSource of Contraception Total Creole Mestizo Garifuna Maya/Ketchi Other
Government Facility 6.6 7.8 6.3 ** 15.3 2.3BFLA 12.0 5.8 9.9 ** 35.9 12.3Pharmacy 53.8 65.2 53.9 ** 16.5 51.6Private Facility 6.3 3.5 8.8 ** 0.0 3.0Outside of Belize 2.5 2.5 1.7 ** 3.4 9.8Other/Unknown 18.7 15.2 19.4 ** 29.0 21.1
Total 100.0 100.0 100.0 100.0 100.0 100.0
No. of Cases* (Unweighted) (353) (91) (190) (19) (26) (27)
* Excludes 4 cases for whom ethnic group is unknown.** Less than 25 cases.
Currently Married Men Aged 15-64 Currently Using Contraception1999 Family Health Survey
(Percent Distribution)
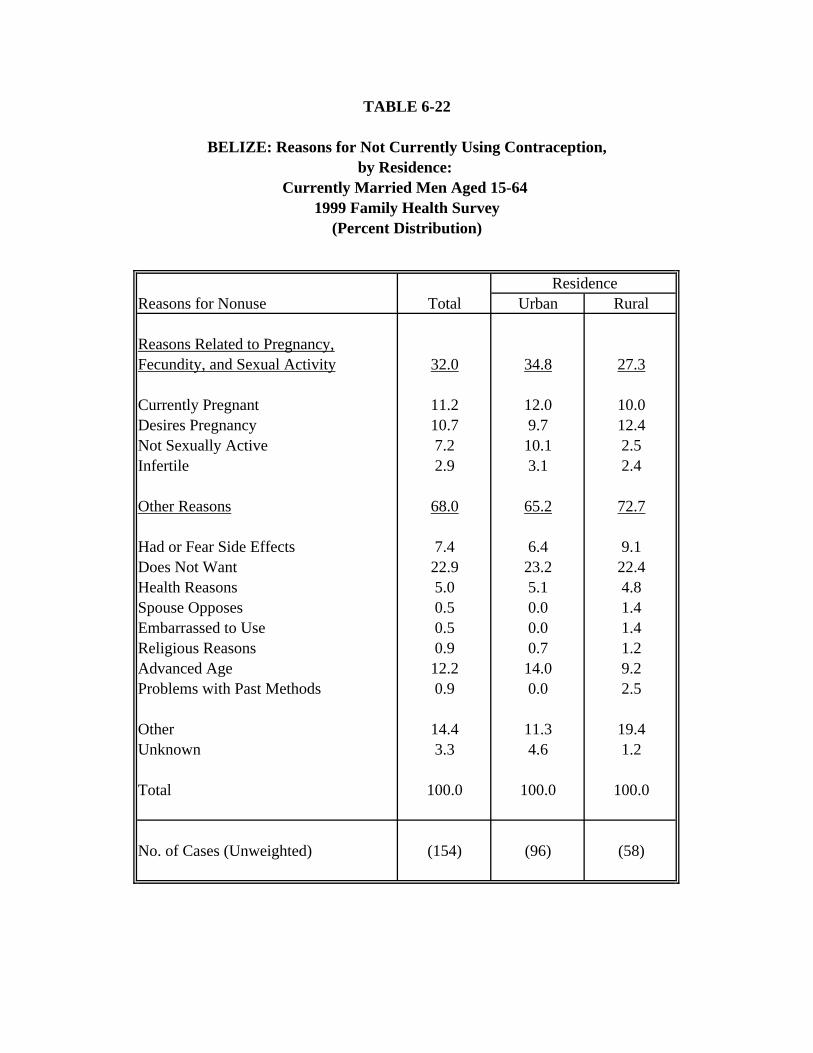
TABLE 6-22
ResidenceReasons for Nonuse Total Urban Rural
Reasons Related to Pregnancy,Fecundity, and Sexual Activity 32.0 34.8 27.3
Currently Pregnant 11.2 12.0 10.0Desires Pregnancy 10.7 9.7 12.4Not Sexually Active 7.2 10.1 2.5Infertile 2.9 3.1 2.4
Other Reasons 68.0 65.2 72.7
Had or Fear Side Effects 7.4 6.4 9.1Does Not Want 22.9 23.2 22.4Health Reasons 5.0 5.1 4.8Spouse Opposes 0.5 0.0 1.4Embarrassed to Use 0.5 0.0 1.4Religious Reasons 0.9 0.7 1.2Advanced Age 12.2 14.0 9.2Problems with Past Methods 0.9 0.0 2.5
Other 14.4 11.3 19.4Unknown 3.3 4.6 1.2
Total 100.0 100.0 100.0
No. of Cases (Unweighted) (154) (96) (58)
(Percent Distribution)
BELIZE: Reasons for Not Currently Using Contraception,
Currently Married Men Aged 15-64 by Residence:
1999 Family Health Survey
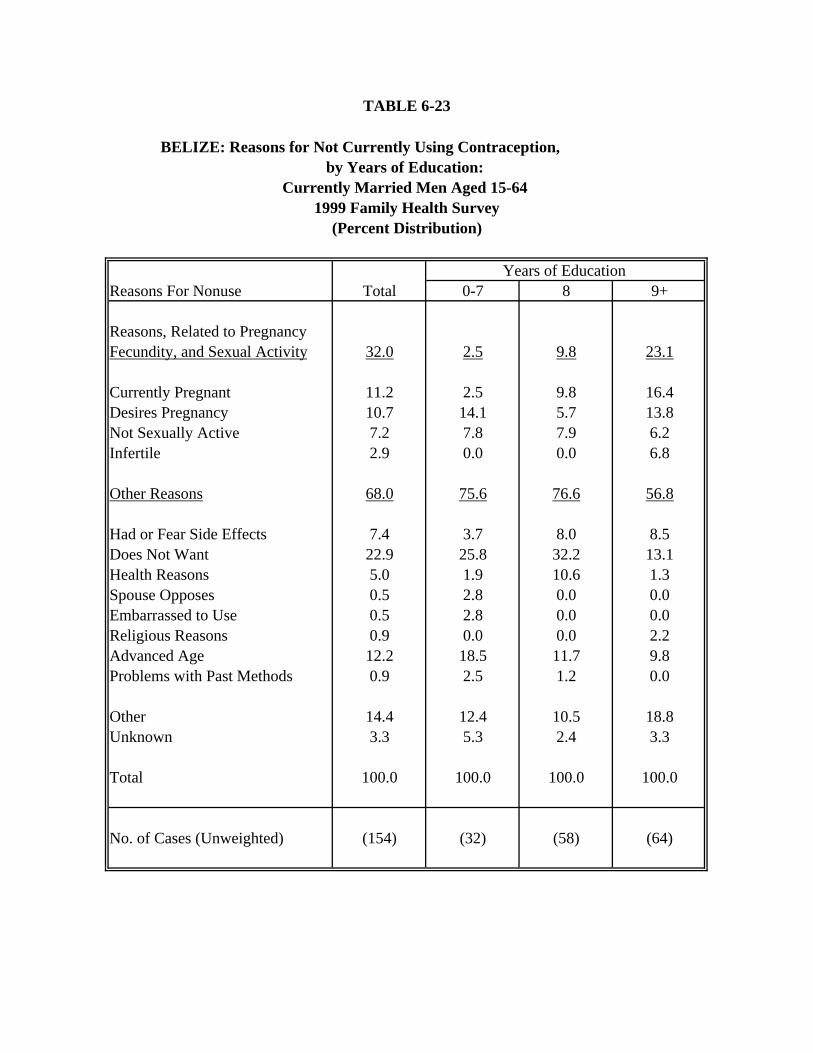
TABLE 6-23
BELIZE: Reasons for Not Currently Using Contraception,
Years of Education Reasons For Nonuse Total 0-7 8 9+
Reasons, Related to PregnancyFecundity, and Sexual Activity 32.0 2.5 9.8 23.1
Currently Pregnant 11.2 2.5 9.8 16.4Desires Pregnancy 10.7 14.1 5.7 13.8Not Sexually Active 7.2 7.8 7.9 6.2Infertile 2.9 0.0 0.0 6.8
Other Reasons 68.0 75.6 76.6 56.8
Had or Fear Side Effects 7.4 3.7 8.0 8.5Does Not Want 22.9 25.8 32.2 13.1Health Reasons 5.0 1.9 10.6 1.3Spouse Opposes 0.5 2.8 0.0 0.0Embarrassed to Use 0.5 2.8 0.0 0.0Religious Reasons 0.9 0.0 0.0 2.2Advanced Age 12.2 18.5 11.7 9.8Problems with Past Methods 0.9 2.5 1.2 0.0
Other 14.4 12.4 10.5 18.8Unknown 3.3 5.3 2.4 3.3
Total 100.0 100.0 100.0 100.0
No. of Cases (Unweighted) (154) (32) (58) (64)
Currently Married Men Aged 15-64 1999 Family Health Survey
(Percent Distribution)
by Years of Education:
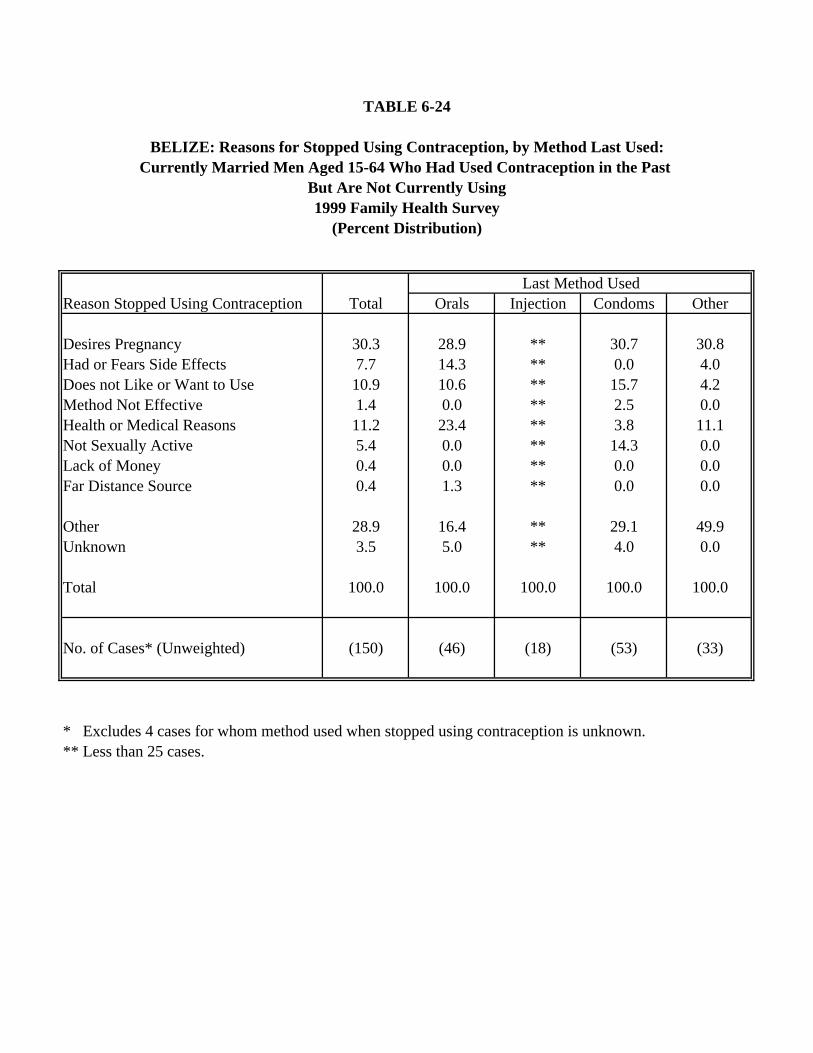
TABLE 6-24
BELIZE: Reasons for Stopped Using Contraception, by Method Last Used:Currently Married Men Aged 15-64 Who Had Used Contraception in the Past
But Are Not Currently Using
Last Method UsedReason Stopped Using Contraception Total Orals Injection Condoms Other
Desires Pregnancy 30.3 28.9 ** 30.7 30.8Had or Fears Side Effects 7.7 14.3 ** 0.0 4.0Does not Like or Want to Use 10.9 10.6 ** 15.7 4.2Method Not Effective 1.4 0.0 ** 2.5 0.0Health or Medical Reasons 11.2 23.4 ** 3.8 11.1Not Sexually Active 5.4 0.0 ** 14.3 0.0Lack of Money 0.4 0.0 ** 0.0 0.0Far Distance Source 0.4 1.3 ** 0.0 0.0
Other 28.9 16.4 ** 29.1 49.9Unknown 3.5 5.0 ** 4.0 0.0
Total 100.0 100.0 100.0 100.0 100.0
No. of Cases* (Unweighted) (150) (46) (18) (53) (33)
* Excludes 4 cases for whom method used when stopped using contraception is unknown.** Less than 25 cases.
1999 Family Health Survey(Percent Distribution)
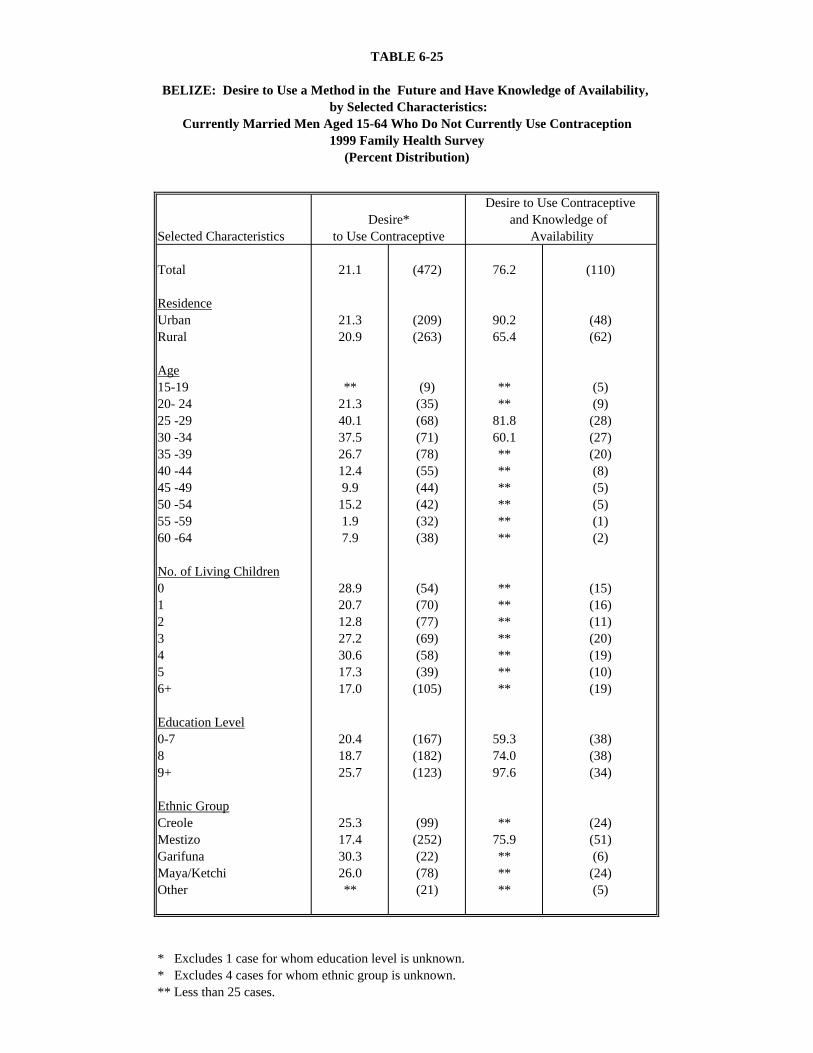
TABLE 6-25
BELIZE: Desire to Use a Method in the Future and Have Knowledge of Availability, by Selected Characteristics:
Desire to Use Contraceptive Desire* and Knowledge of
Selected Characteristics to Use Contraceptive Availability
Total 21.1 (472) 76.2 (110)
ResidenceUrban 21.3 (209) 90.2 (48)Rural 20.9 (263) 65.4 (62)
Age15-19 ** (9) ** (5)20- 24 21.3 (35) ** (9)25 -29 40.1 (68) 81.8 (28)30 -34 37.5 (71) 60.1 (27)35 -39 26.7 (78) ** (20)40 -44 12.4 (55) ** (8)45 -49 9.9 (44) ** (5)50 -54 15.2 (42) ** (5)55 -59 1.9 (32) ** (1)60 -64 7.9 (38) ** (2)
No. of Living Children0 28.9 (54) ** (15)1 20.7 (70) ** (16)2 12.8 (77) ** (11)3 27.2 (69) ** (20)4 30.6 (58) ** (19)5 17.3 (39) ** (10)6+ 17.0 (105) ** (19)
Education Level0-7 20.4 (167) 59.3 (38)8 18.7 (182) 74.0 (38)9+ 25.7 (123) 97.6 (34)
Ethnic GroupCreole 25.3 (99) ** (24)Mestizo 17.4 (252) 75.9 (51)Garifuna 30.3 (22) ** (6)Maya/Ketchi 26.0 (78) ** (24)Other ** (21) ** (5)
* Excludes 1 case for whom education level is unknown.* Excludes 4 cases for whom ethnic group is unknown.** Less than 25 cases.
Currently Married Men Aged 15-64 Who Do Not Currently Use Contraception1999 Family Health Survey
(Percent Distribution)
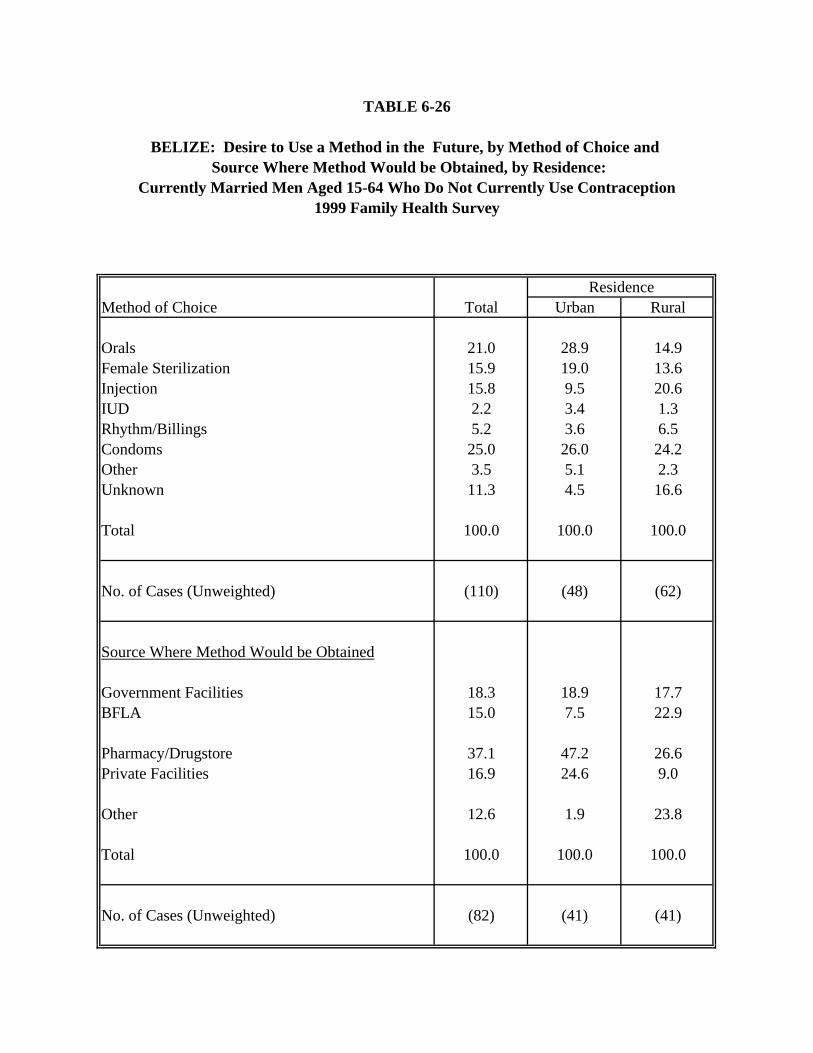
TABLE 6-26
ResidenceMethod of Choice Total Urban Rural
Orals 21.0 28.9 14.9Female Sterilization 15.9 19.0 13.6Injection 15.8 9.5 20.6IUD 2.2 3.4 1.3Rhythm/Billings 5.2 3.6 6.5Condoms 25.0 26.0 24.2Other 3.5 5.1 2.3Unknown 11.3 4.5 16.6
Total 100.0 100.0 100.0
No. of Cases (Unweighted) (110) (48) (62)
Source Where Method Would be Obtained
Government Facilities 18.3 18.9 17.7BFLA 15.0 7.5 22.9
Pharmacy/Drugstore 37.1 47.2 26.6Private Facilities 16.9 24.6 9.0
Other 12.6 1.9 23.8
Total 100.0 100.0 100.0
No. of Cases (Unweighted) (82) (41) (41)
BELIZE: Desire to Use a Method in the Future, by Method of Choice and Source Where Method Would be Obtained, by Residence:
Currently Married Men Aged 15-64 Who Do Not Currently Use Contraception1999 Family Health Survey
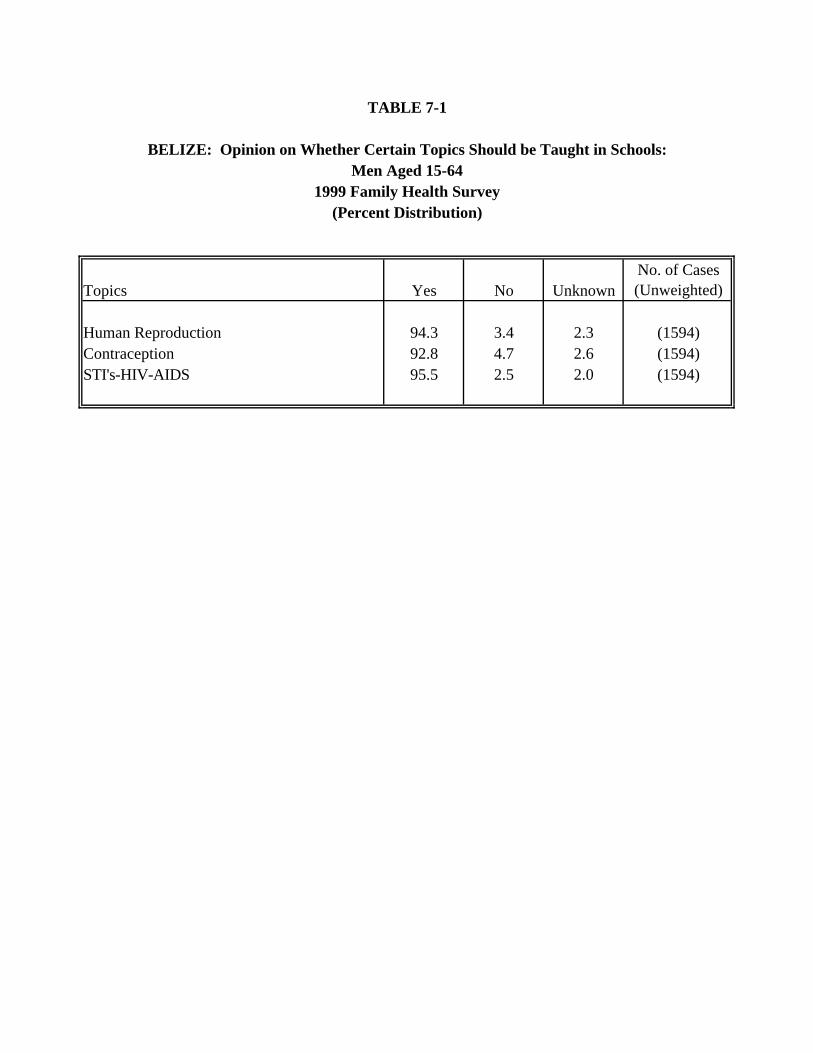
TABLE 7-1
BELIZE: Opinion on Whether Certain Topics Should be Taught in Schools:
1999 Family Health Survey
Topics Yes No UnknownNo. of Cases (Unweighted)
Human Reproduction 94.3 3.4 2.3 (1594)Contraception 92.8 4.7 2.6 (1594)STI's-HIV-AIDS 95.5 2.5 2.0 (1594)
Men Aged 15-64
(Percent Distribution)
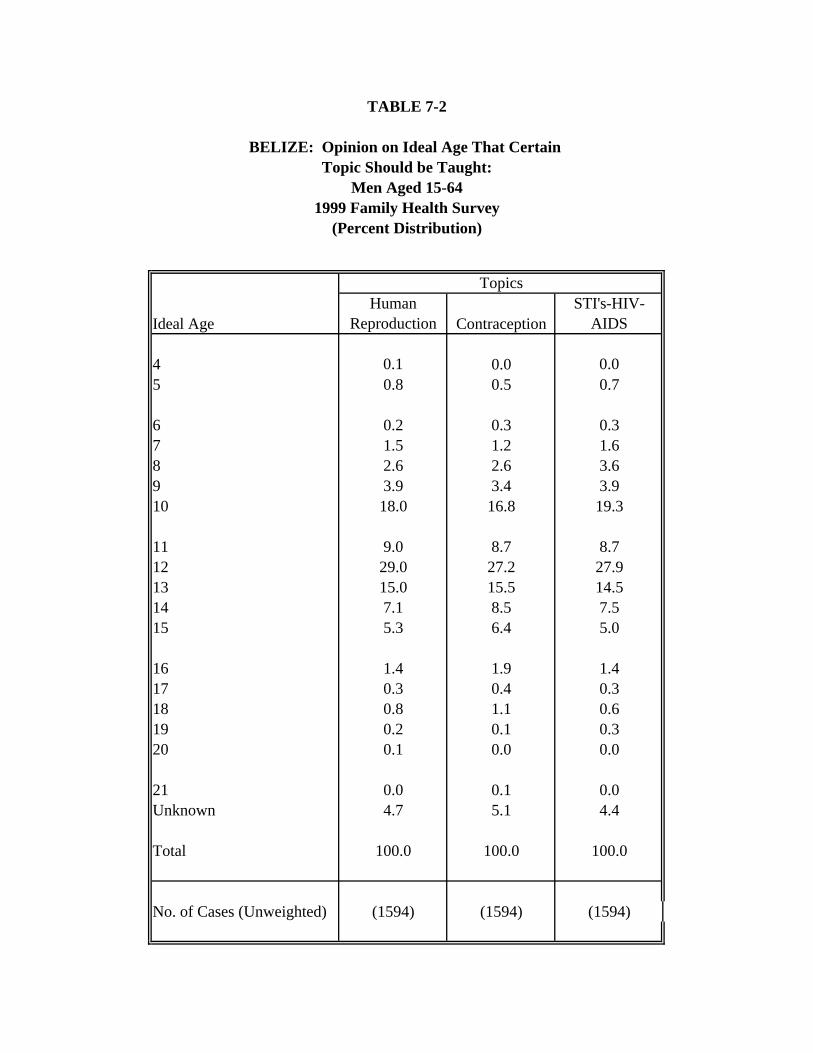
TABLE 7-2
BELIZE: Opinion on Ideal Age That Certain Topic Should be Taught:
Topics
Ideal AgeHuman
Reproduction ContraceptionSTI's-HIV-
AIDS
4 0.1 0.0 0.05 0.8 0.5 0.7
6 0.2 0.3 0.37 1.5 1.2 1.68 2.6 2.6 3.69 3.9 3.4 3.910 18.0 16.8 19.3
11 9.0 8.7 8.712 29.0 27.2 27.913 15.0 15.5 14.514 7.1 8.5 7.515 5.3 6.4 5.0
16 1.4 1.9 1.417 0.3 0.4 0.318 0.8 1.1 0.619 0.2 0.1 0.320 0.1 0.0 0.0
21 0.0 0.1 0.0Unknown 4.7 5.1 4.4
Total 100.0 100.0 100.0
No. of Cases (Unweighted) (1594) (1594) (1594)
Men Aged 15-641999 Family Health Survey
(Percent Distribution)
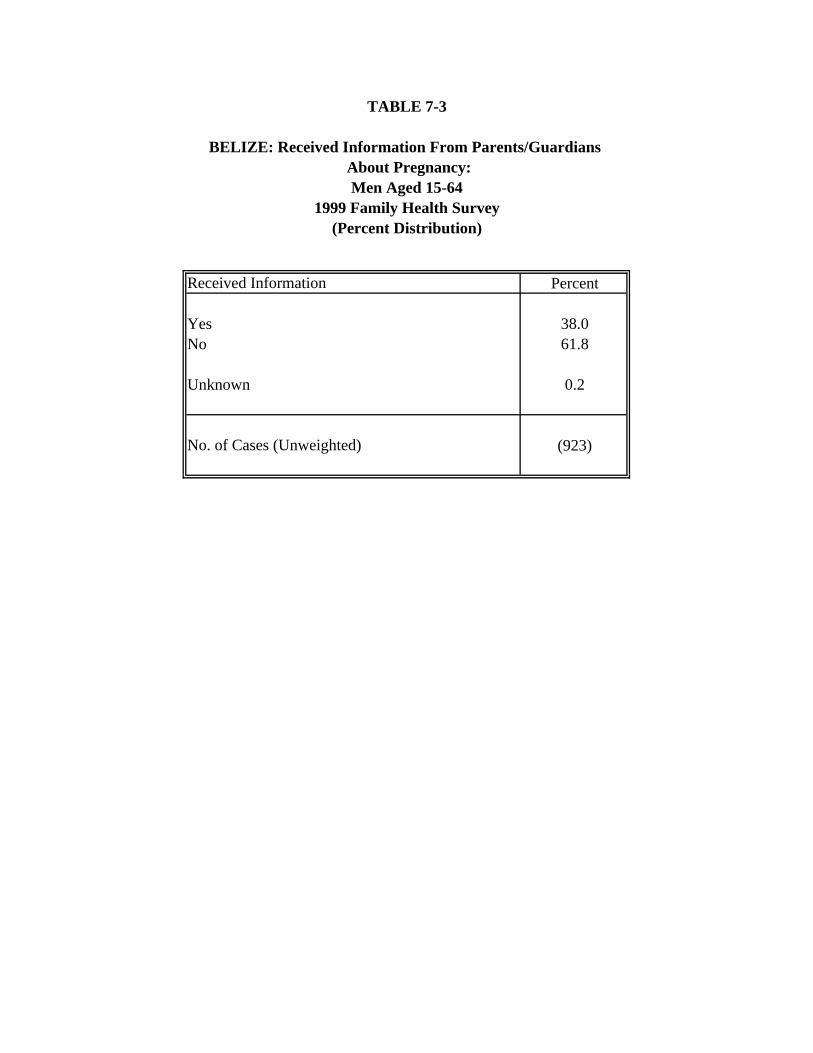
TABLE 7-3
BELIZE: Received Information From Parents/Guardians About Pregnancy:
Received Information Percent
Yes 38.0No 61.8
Unknown 0.2
No. of Cases (Unweighted) (923)
Men Aged 15-641999 Family Health Survey
(Percent Distribution)
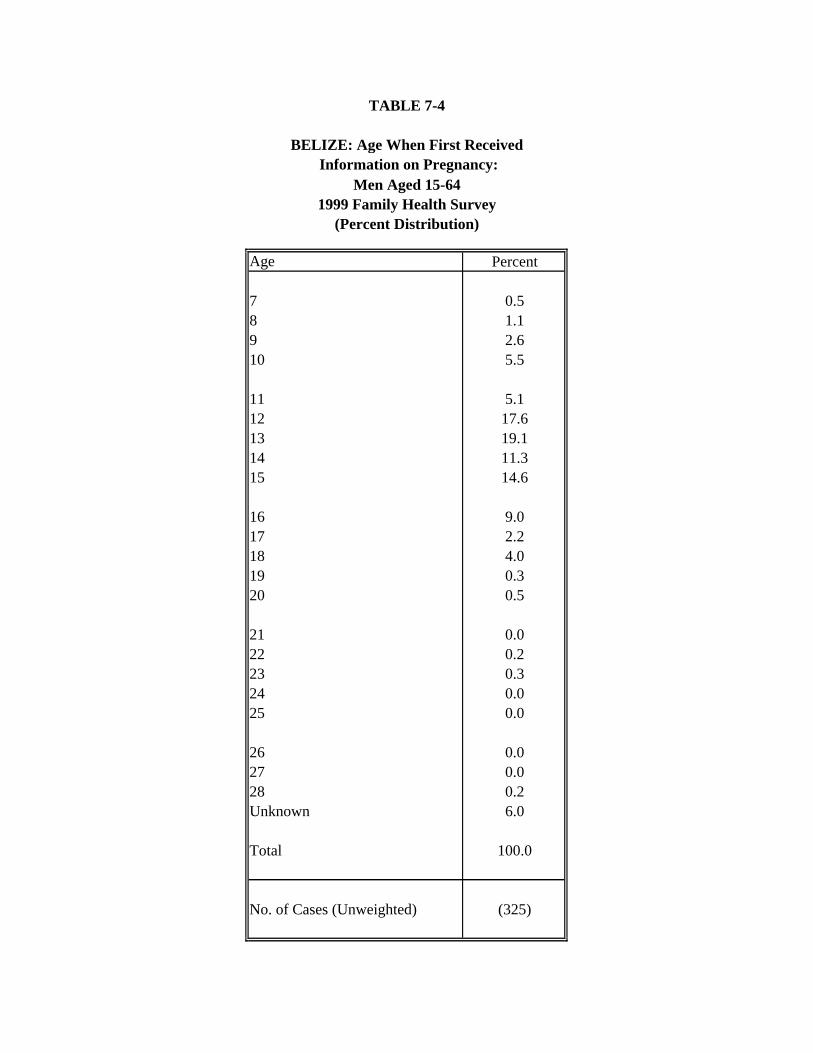
TABLE 7-4
BELIZE: Age When First Received Information on Pregnancy:
Age Percent
7 0.58 1.19 2.610 5.5
11 5.112 17.613 19.114 11.315 14.6
16 9.017 2.218 4.019 0.320 0.5
21 0.022 0.223 0.324 0.025 0.0
26 0.027 0.028 0.2Unknown 6.0
Total 100.0
No. of Cases (Unweighted) (325)
Men Aged 15-641999 Family Health Survey
(Percent Distribution)
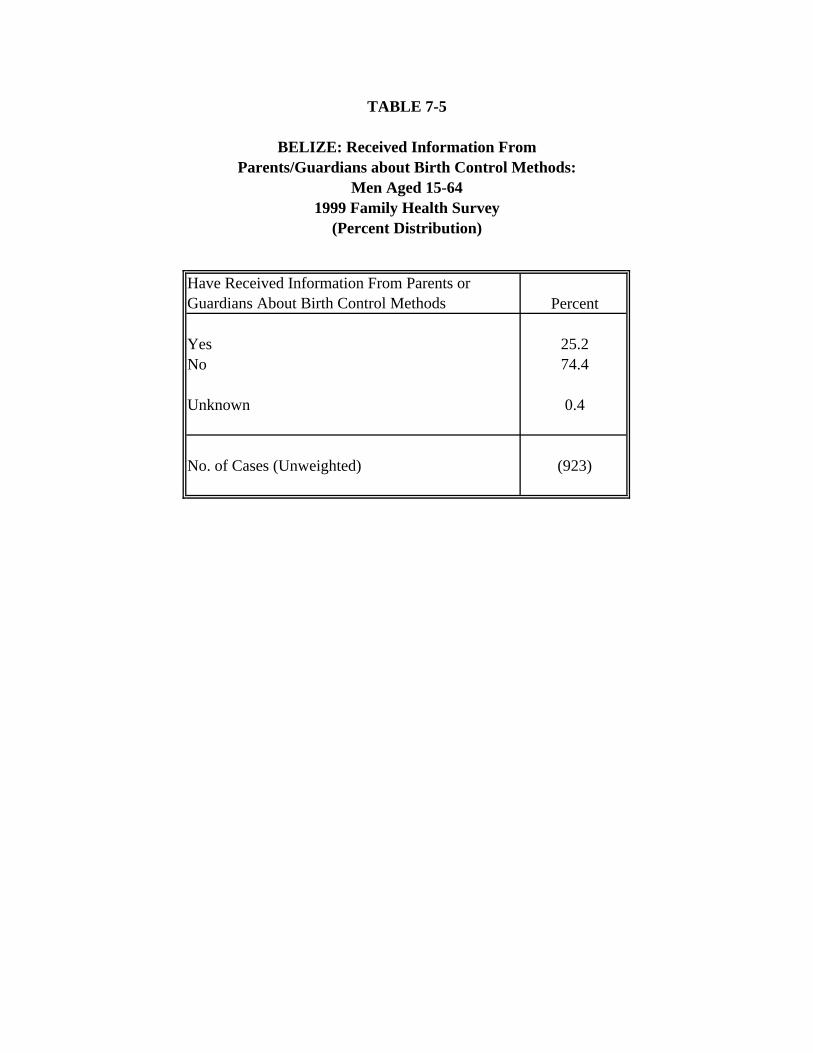
TABLE 7-5
BELIZE: Received Information FromParents/Guardians about Birth Control Methods:
Have Received Information From Parents or Guardians About Birth Control Methods Percent
Yes 25.2No 74.4
Unknown 0.4
No. of Cases (Unweighted) (923)
Men Aged 15-641999 Family Health Survey
(Percent Distribution)
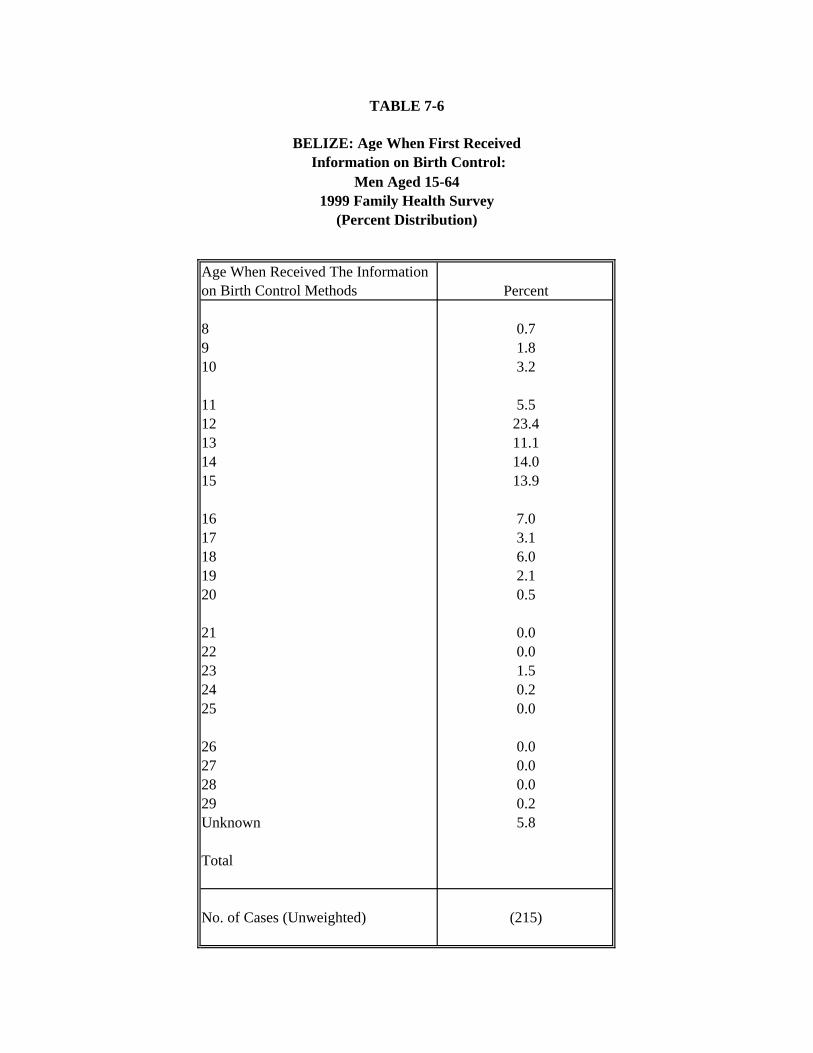
TABLE 7-6
BELIZE: Age When First Received Information on Birth Control:
Age When Received The Information on Birth Control Methods Percent
8 0.79 1.810 3.2
11 5.512 23.413 11.114 14.015 13.9
16 7.017 3.118 6.019 2.120 0.5
21 0.022 0.023 1.524 0.225 0.0
26 0.027 0.028 0.029 0.2Unknown 5.8
Total
No. of Cases (Unweighted) (215)
Men Aged 15-641999 Family Health Survey
(Percent Distribution)
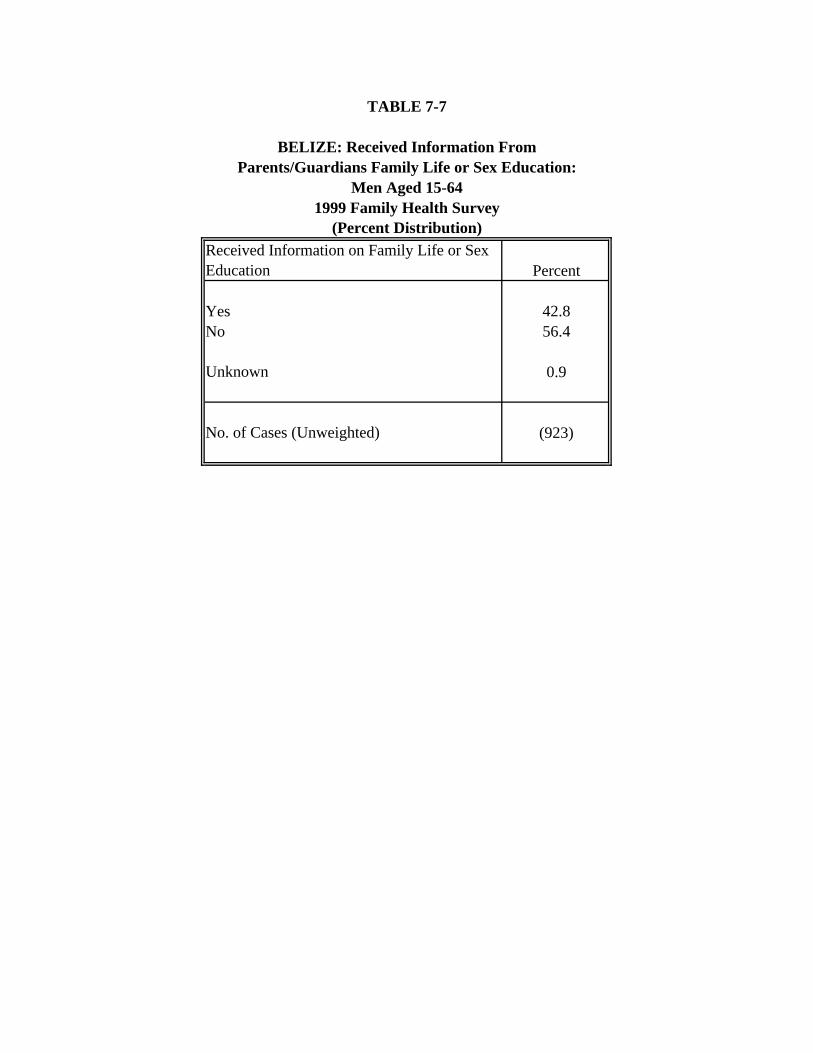
TABLE 7-7
BELIZE: Received Information FromParents/Guardians Family Life or Sex Education:
Received Information on Family Life or Sex Education Percent
Yes 42.8No 56.4
Unknown 0.9
No. of Cases (Unweighted) (923)
Men Aged 15-641999 Family Health Survey
(Percent Distribution)
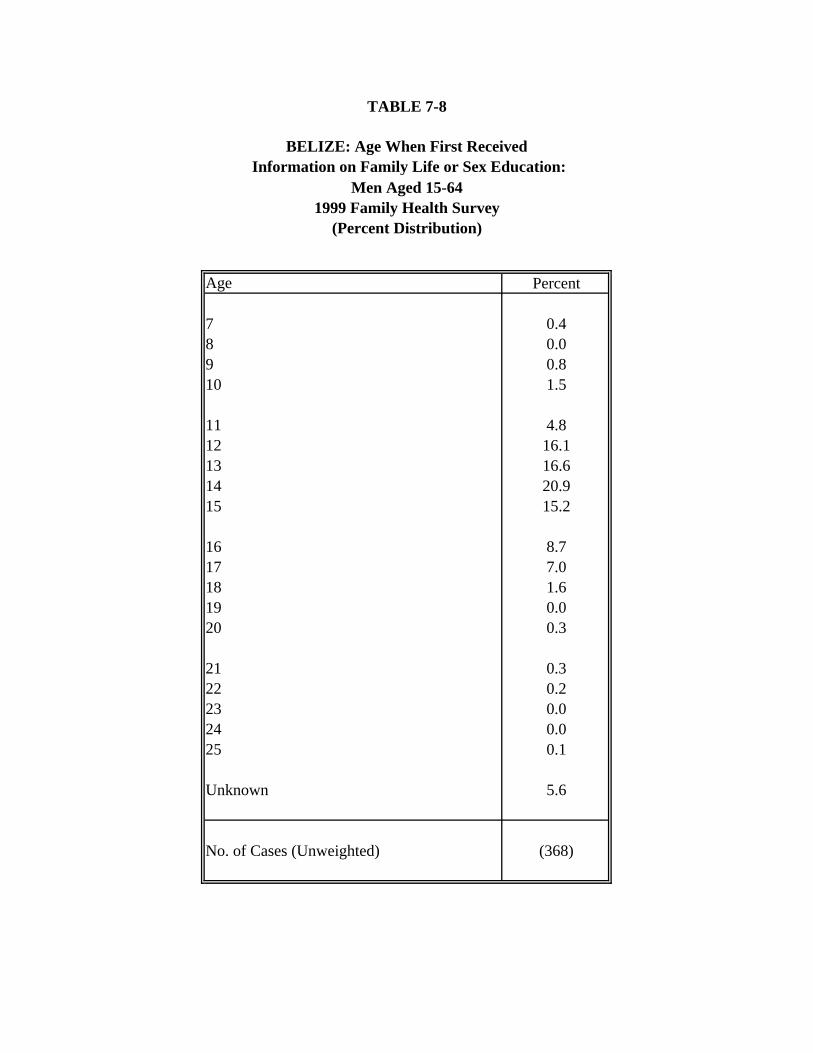
TABLE 7-8
BELIZE: Age When First Received Information on Family Life or Sex Education:
Age Percent
7 0.48 0.09 0.810 1.5
11 4.812 16.113 16.614 20.915 15.2
16 8.717 7.018 1.619 0.020 0.3
21 0.322 0.223 0.024 0.025 0.1
Unknown 5.6
No. of Cases (Unweighted) (368)
Men Aged 15-641999 Family Health Survey
(Percent Distribution)
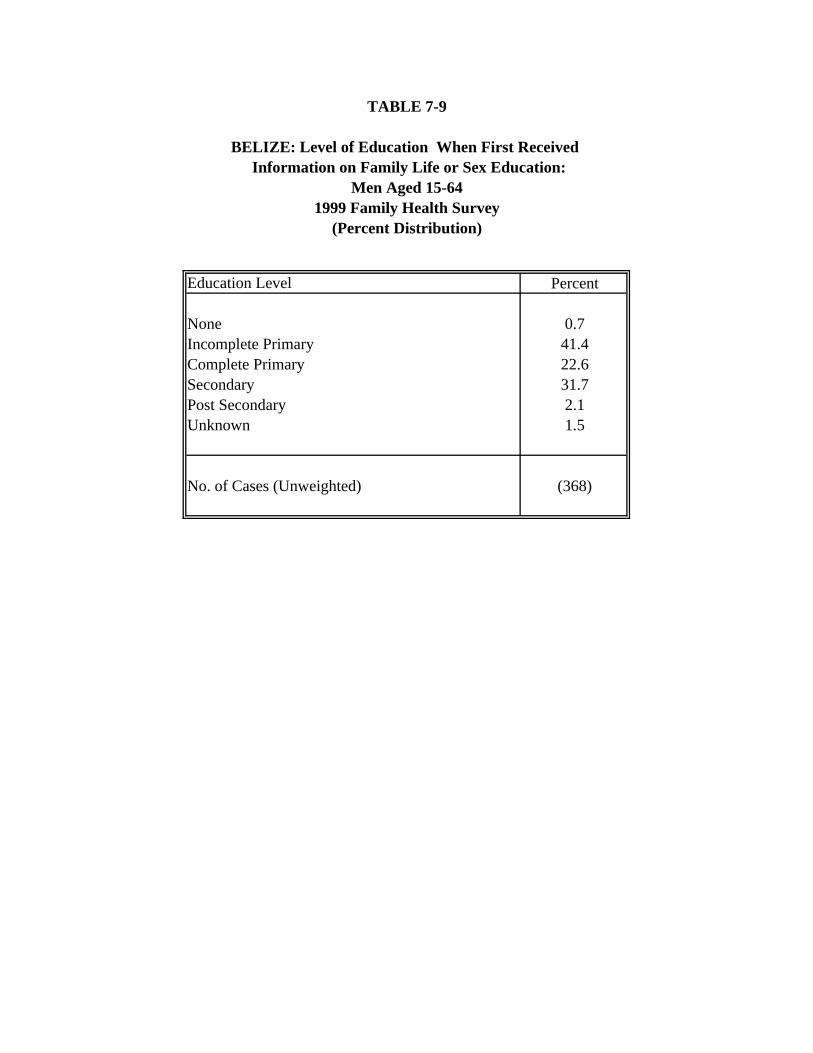
TABLE 7-9
BELIZE: Level of Education When First Received Information on Family Life or Sex Education:
Education Level Percent
None 0.7Incomplete Primary 41.4Complete Primary 22.6Secondary 31.7Post Secondary 2.1Unknown 1.5
No. of Cases (Unweighted) (368)
Men Aged 15-641999 Family Health Survey
(Percent Distribution)
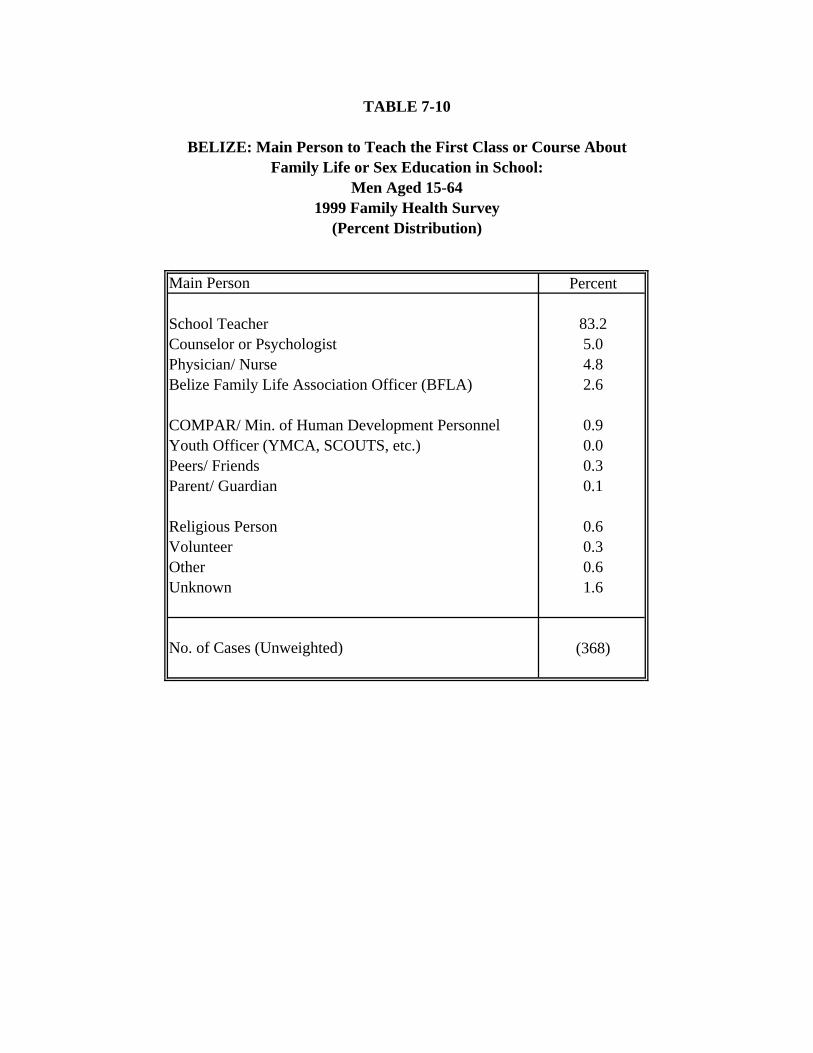
TABLE 7-10
BELIZE: Main Person to Teach the First Class or Course AboutFamily Life or Sex Education in School:
Main Person Percent
School Teacher 83.2Counselor or Psychologist 5.0Physician/ Nurse 4.8Belize Family Life Association Officer (BFLA) 2.6
COMPAR/ Min. of Human Development Personnel 0.9Youth Officer (YMCA, SCOUTS, etc.) 0.0Peers/ Friends 0.3Parent/ Guardian 0.1
Religious Person 0.6Volunteer 0.3Other 0.6Unknown 1.6
No. of Cases (Unweighted) (368)
Men Aged 15-641999 Family Health Survey
(Percent Distribution)
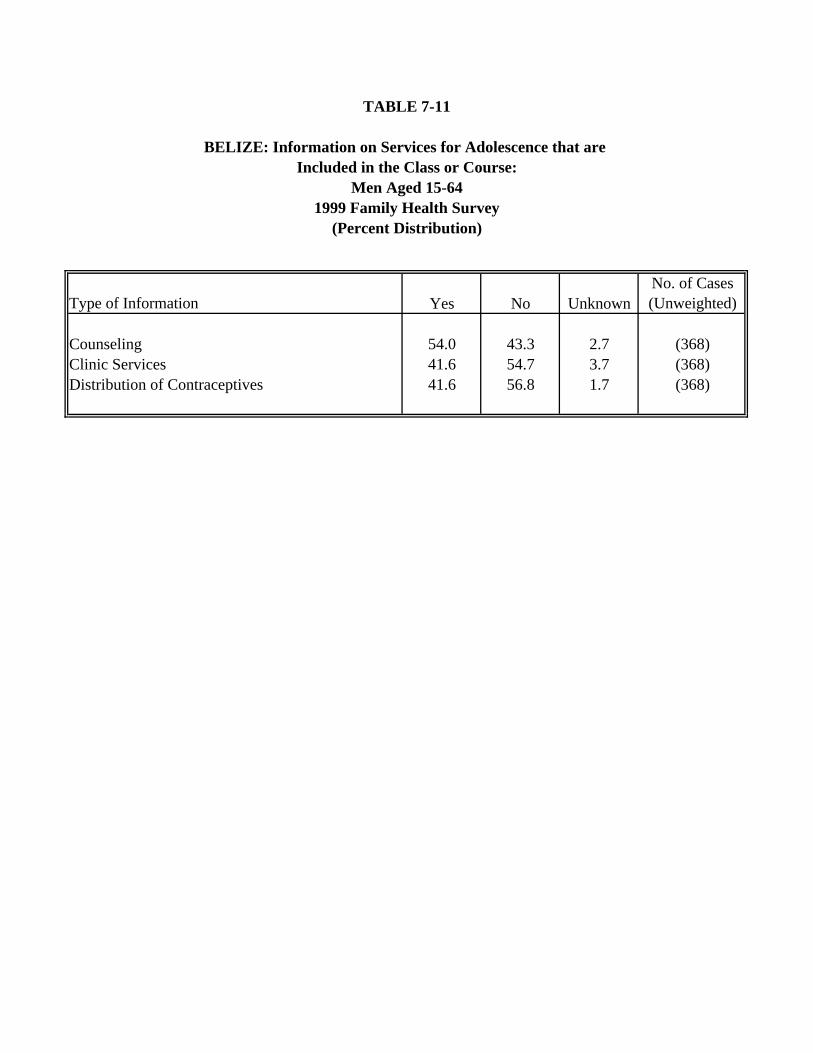
TABLE 7-11
BELIZE: Information on Services for Adolescence that are
Type of Information Yes No UnknownNo. of Cases (Unweighted)
Counseling 54.0 43.3 2.7 (368)Clinic Services 41.6 54.7 3.7 (368)Distribution of Contraceptives 41.6 56.8 1.7 (368)
(Percent Distribution)
Men Aged 15-641999 Family Health Survey
Included in the Class or Course:
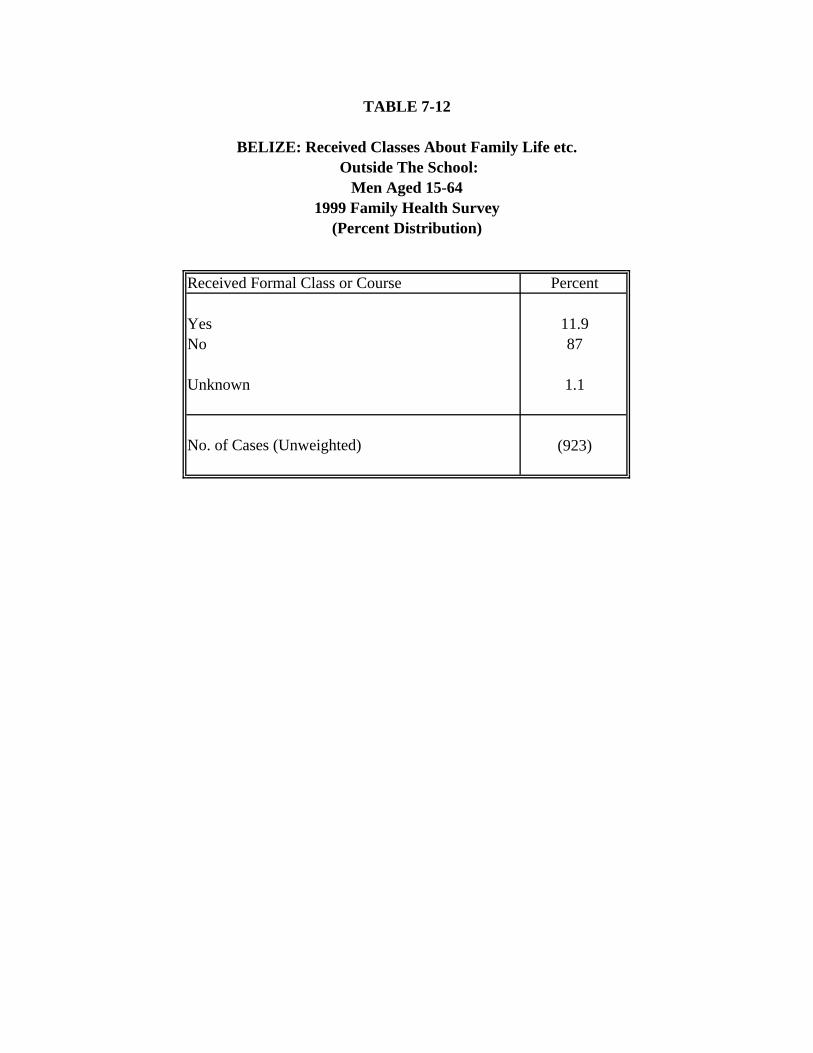
TABLE 7-12
BELIZE: Received Classes About Family Life etc. Outside The School:
Received Formal Class or Course Percent
Yes 11.9No 87
Unknown 1.1
No. of Cases (Unweighted) (923)
Men Aged 15-641999 Family Health Survey
(Percent Distribution)
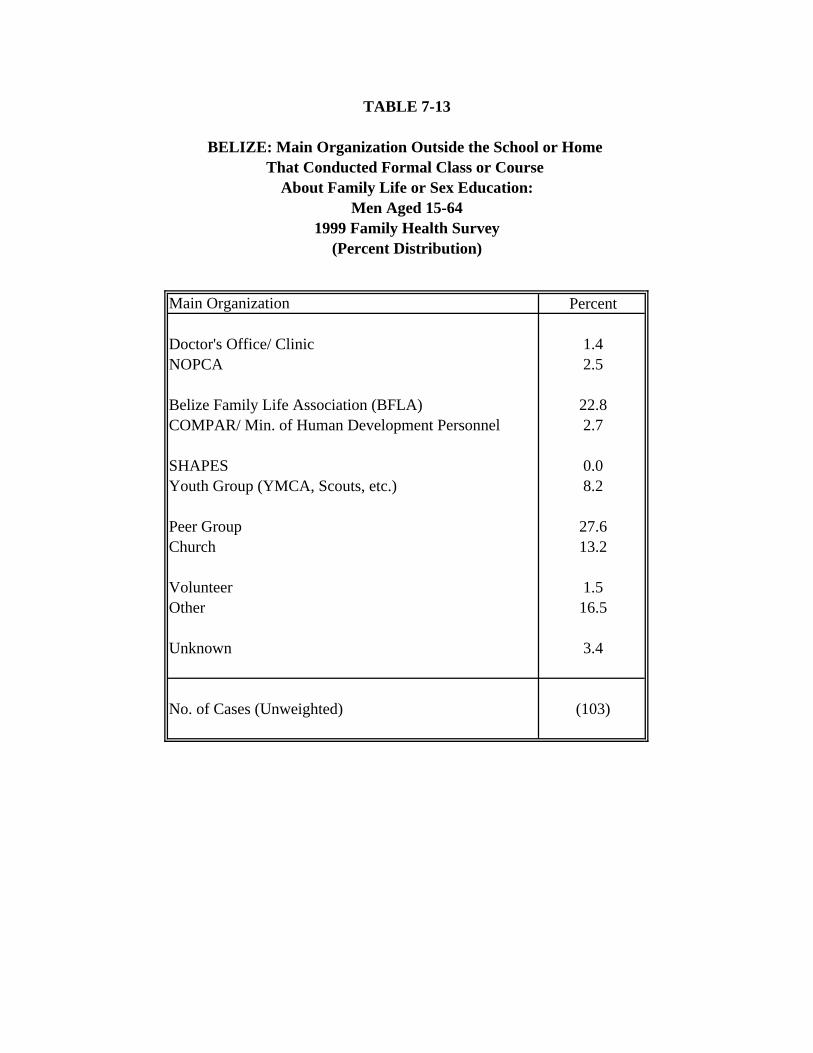
TABLE 7-13
BELIZE: Main Organization Outside the School or Home That Conducted Formal Class or Course
About Family Life or Sex Education:
Main Organization Percent
Doctor's Office/ Clinic 1.4NOPCA 2.5
Belize Family Life Association (BFLA) 22.8COMPAR/ Min. of Human Development Personnel 2.7
SHAPES 0.0Youth Group (YMCA, Scouts, etc.) 8.2
Peer Group 27.6Church 13.2
Volunteer 1.5Other 16.5
Unknown 3.4
No. of Cases (Unweighted) (103)
1999 Family Health SurveyMen Aged 15-64
(Percent Distribution)

TABLE 7-14
BELIZE: Main Person To TeachFamily Life etc. Outside The School or Home:
Main Person Percent
School Teacher 9.0Counselor or Psychologist 10.5Physician/ Nurse 8.3Belize Family Life Association Officer (BFLA) 15.9
COMPAR/ Min. of Human Development Personnel 2.7Youth Officer (YMCA, SCOUTS, etc.) 7.3Peers/ Friends 25.8Parent/ Guardian 2.3
Religious Person 6.9Volunteer 2.2Other 5.2Unknown 3.8
No. of Cases (Unweighted) (103)
Men Aged 15-641999 Family Health Survey
(Percent Distribution)
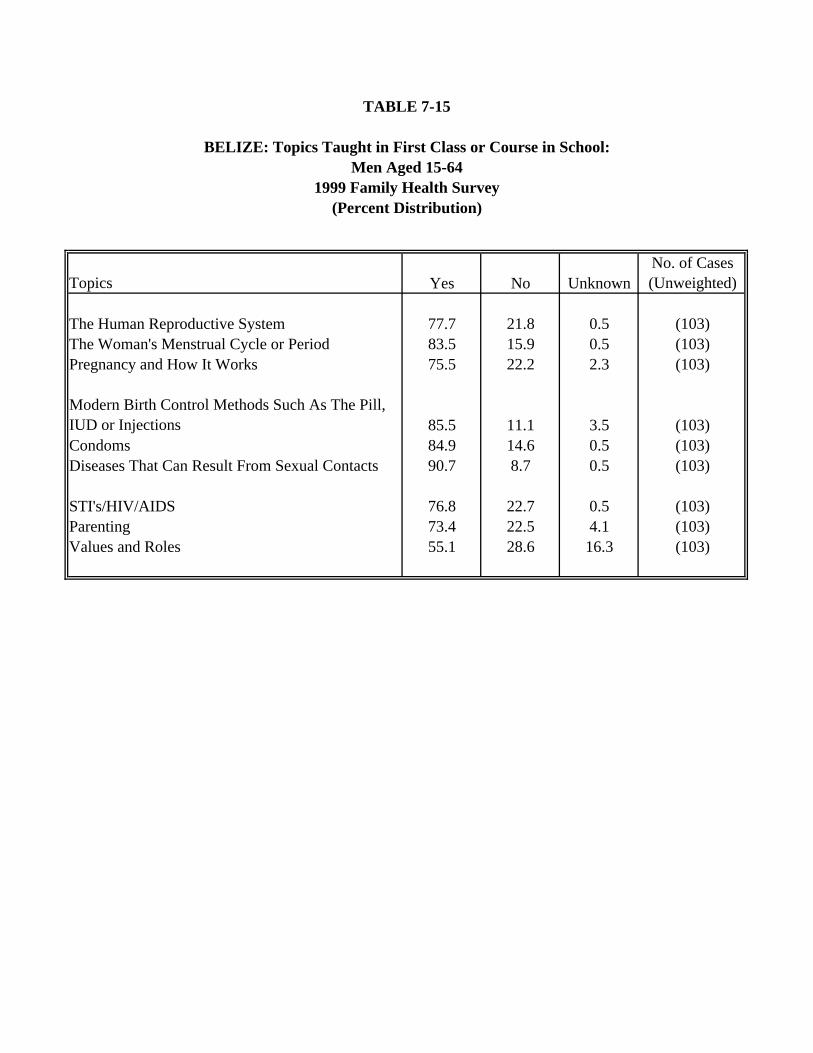
TABLE 7-15
BELIZE: Topics Taught in First Class or Course in School:
Topics Yes No UnknownNo. of Cases (Unweighted)
The Human Reproductive System 77.7 21.8 0.5 (103)The Woman's Menstrual Cycle or Period 83.5 15.9 0.5 (103)Pregnancy and How It Works 75.5 22.2 2.3 (103)
Modern Birth Control Methods Such As The Pill, IUD or Injections 85.5 11.1 3.5 (103)Condoms 84.9 14.6 0.5 (103)Diseases That Can Result From Sexual Contacts 90.7 8.7 0.5 (103)
STI's/HIV/AIDS 76.8 22.7 0.5 (103)Parenting 73.4 22.5 4.1 (103)Values and Roles 55.1 28.6 16.3 (103)
Men Aged 15-641999 Family Health Survey
(Percent Distribution)
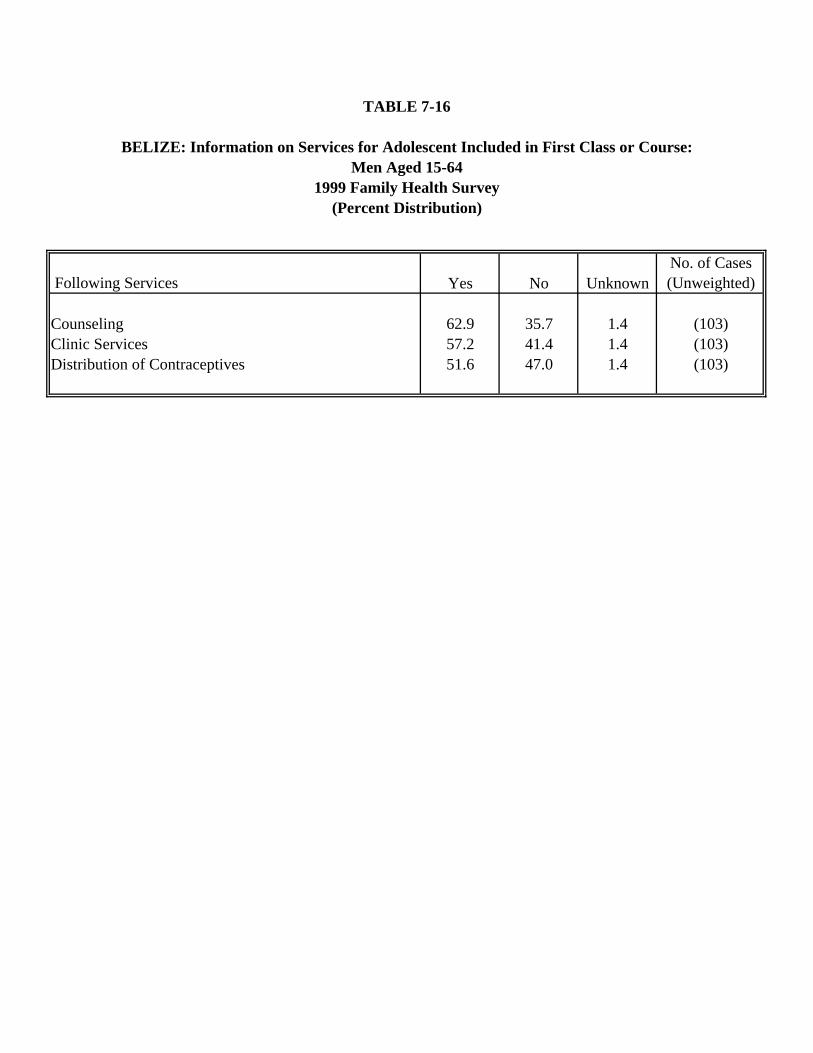
TABLE 7-16
BELIZE: Information on Services for Adolescent Included in First Class or Course:
Following Services Yes No UnknownNo. of Cases (Unweighted)
Counseling 62.9 35.7 1.4 (103)Clinic Services 57.2 41.4 1.4 (103)Distribution of Contraceptives 51.6 47.0 1.4 (103)
Men Aged 15-641999 Family Health Survey
(Percent Distribution)
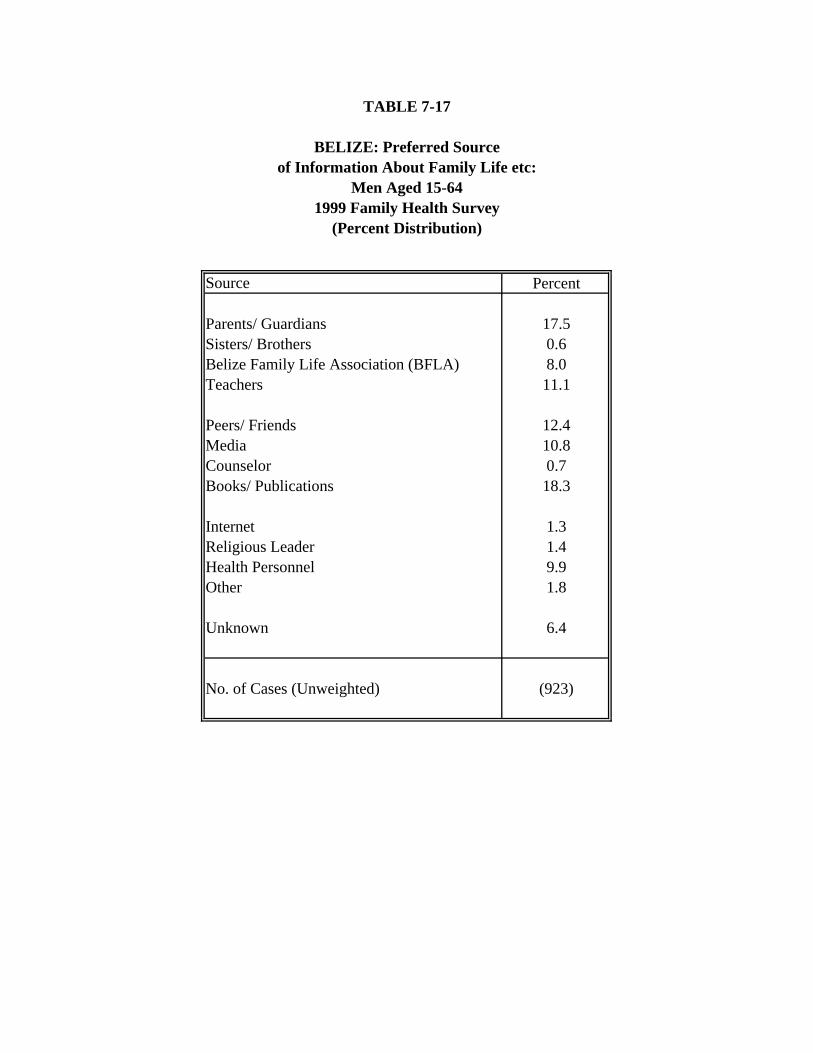
TABLE 7-17
BELIZE: Preferred Sourceof Information About Family Life etc:
Source Percent
Parents/ Guardians 17.5Sisters/ Brothers 0.6Belize Family Life Association (BFLA) 8.0Teachers 11.1
Peers/ Friends 12.4Media 10.8Counselor 0.7Books/ Publications 18.3
Internet 1.3Religious Leader 1.4Health Personnel 9.9Other 1.8
Unknown 6.4
No. of Cases (Unweighted) (923)
Men Aged 15-641999 Family Health Survey
(Percent Distribution)
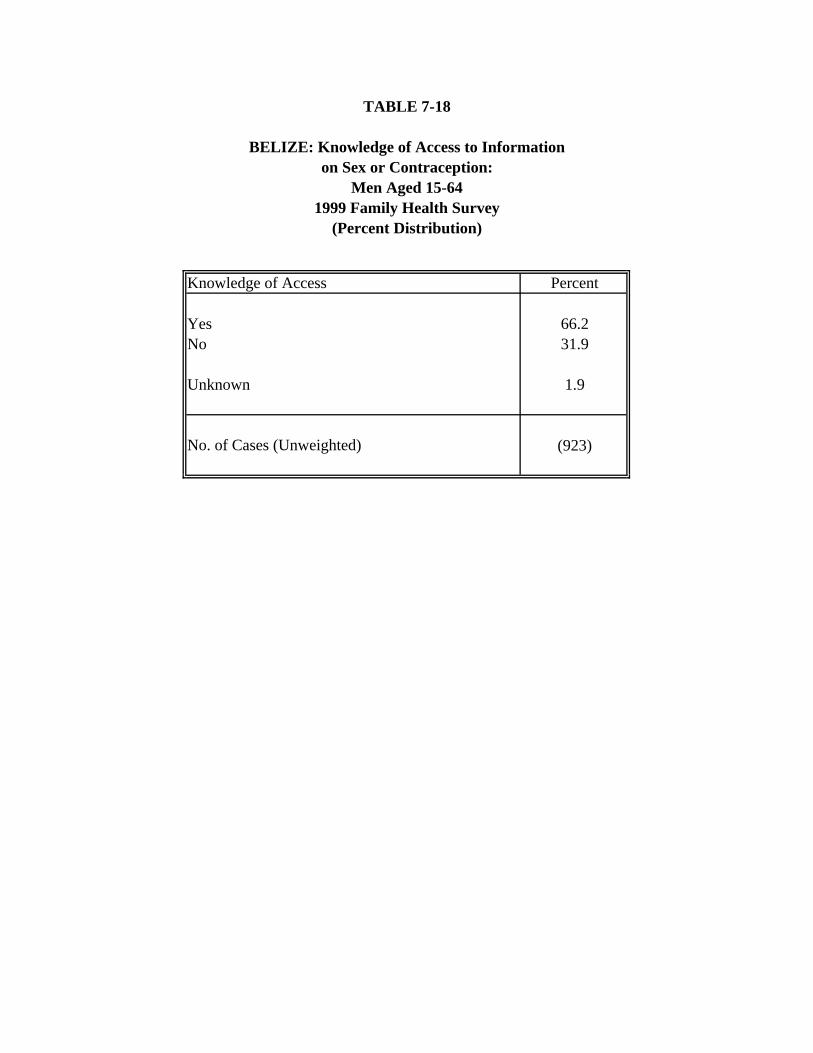
TABLE 7-18
BELIZE: Knowledge of Access to Informationon Sex or Contraception:
Knowledge of Access Percent
Yes 66.2No 31.9
Unknown 1.9
No. of Cases (Unweighted) (923)
Men Aged 15-641999 Family Health Survey
(Percent Distribution)
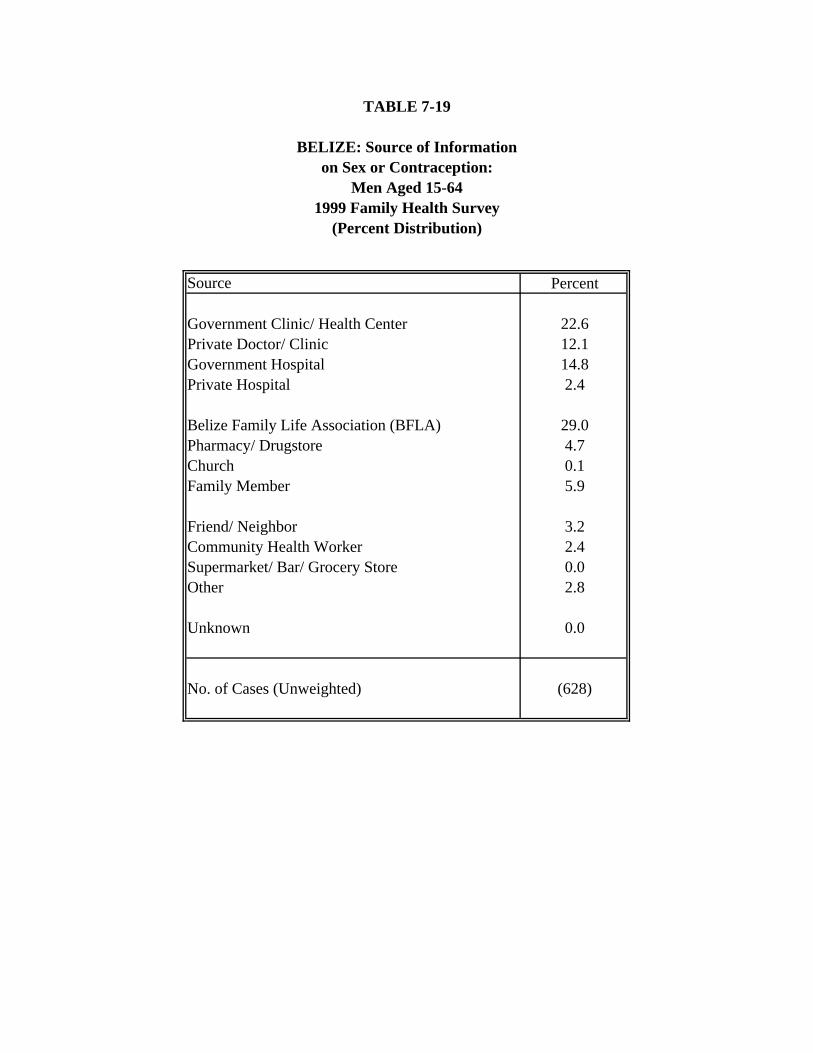
TABLE 7-19
BELIZE: Source of Informationon Sex or Contraception:
Source Percent
Government Clinic/ Health Center 22.6Private Doctor/ Clinic 12.1Government Hospital 14.8Private Hospital 2.4
Belize Family Life Association (BFLA) 29.0Pharmacy/ Drugstore 4.7Church 0.1Family Member 5.9
Friend/ Neighbor 3.2Community Health Worker 2.4Supermarket/ Bar/ Grocery Store 0.0Other 2.8
Unknown 0.0
No. of Cases (Unweighted) (628)
Men Aged 15-641999 Family Health Survey
(Percent Distribution)
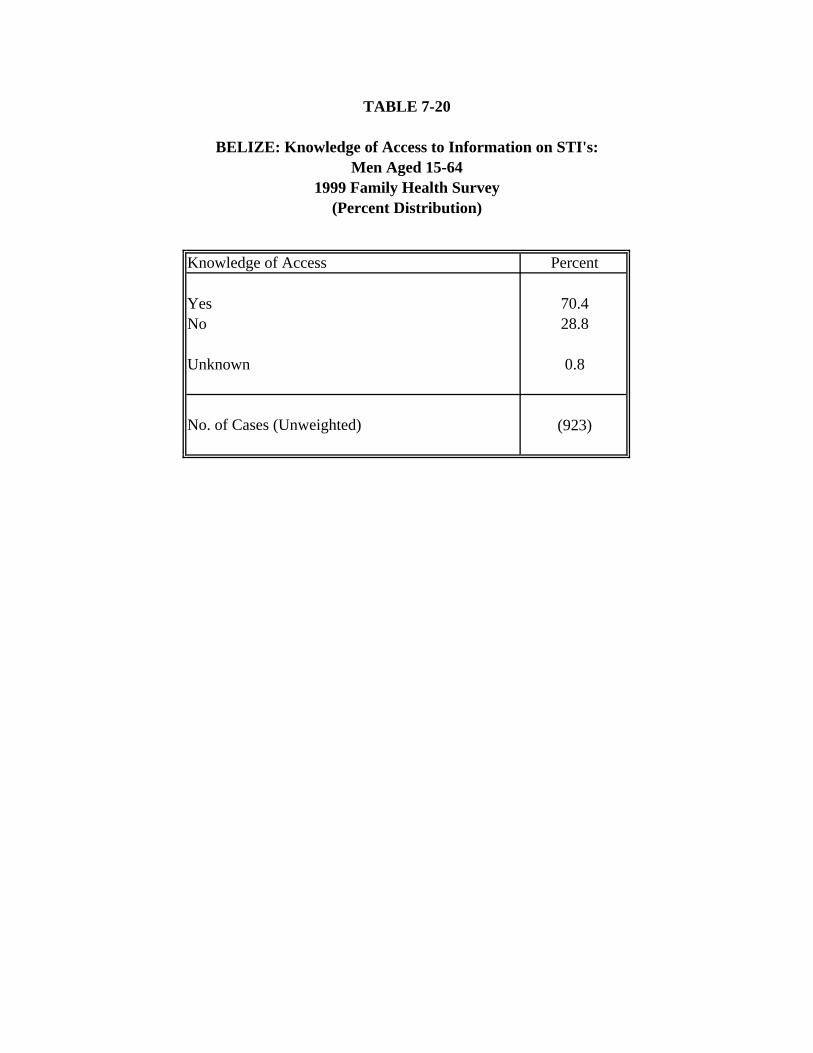
TABLE 7-20
BELIZE: Knowledge of Access to Information on STI's:
Knowledge of Access Percent
Yes 70.4No 28.8
Unknown 0.8
No. of Cases (Unweighted) (923)
Men Aged 15-641999 Family Health Survey
(Percent Distribution)
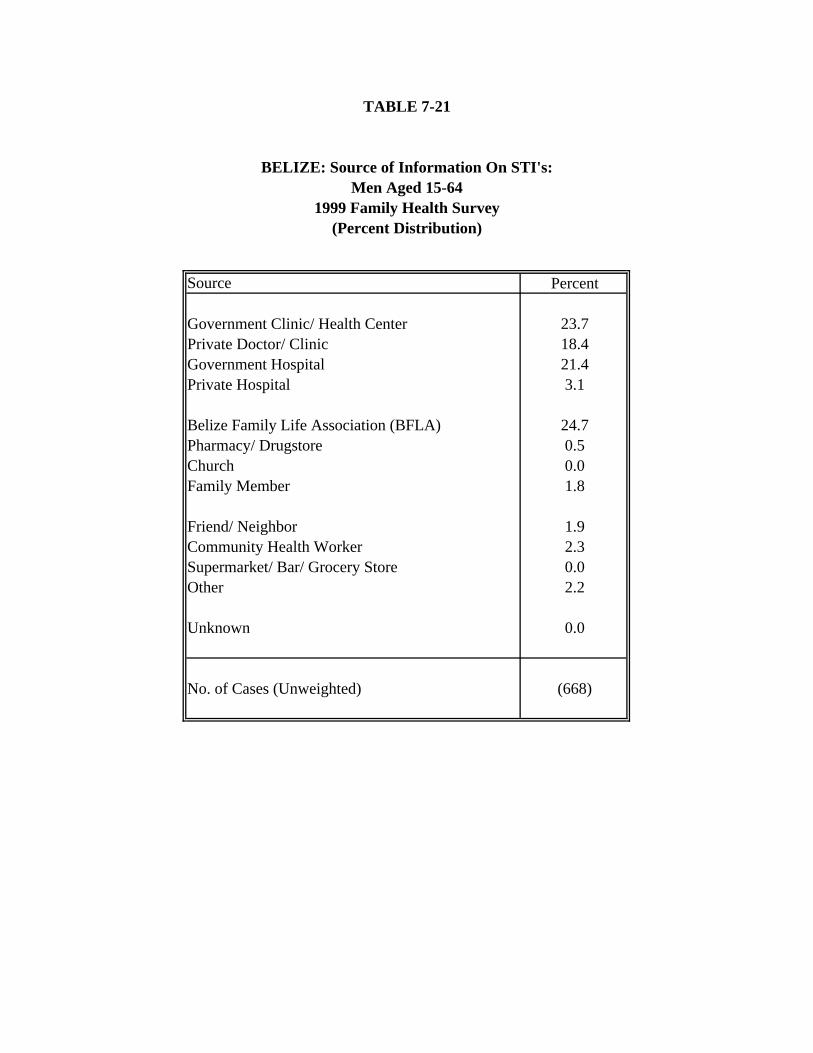
TABLE 7-21
BELIZE: Source of Information On STI's:
Source Percent
Government Clinic/ Health Center 23.7Private Doctor/ Clinic 18.4Government Hospital 21.4Private Hospital 3.1
Belize Family Life Association (BFLA) 24.7Pharmacy/ Drugstore 0.5Church 0.0Family Member 1.8
Friend/ Neighbor 1.9Community Health Worker 2.3Supermarket/ Bar/ Grocery Store 0.0Other 2.2
Unknown 0.0
No. of Cases (Unweighted) (668)
Men Aged 15-641999 Family Health Survey
(Percent Distribution)
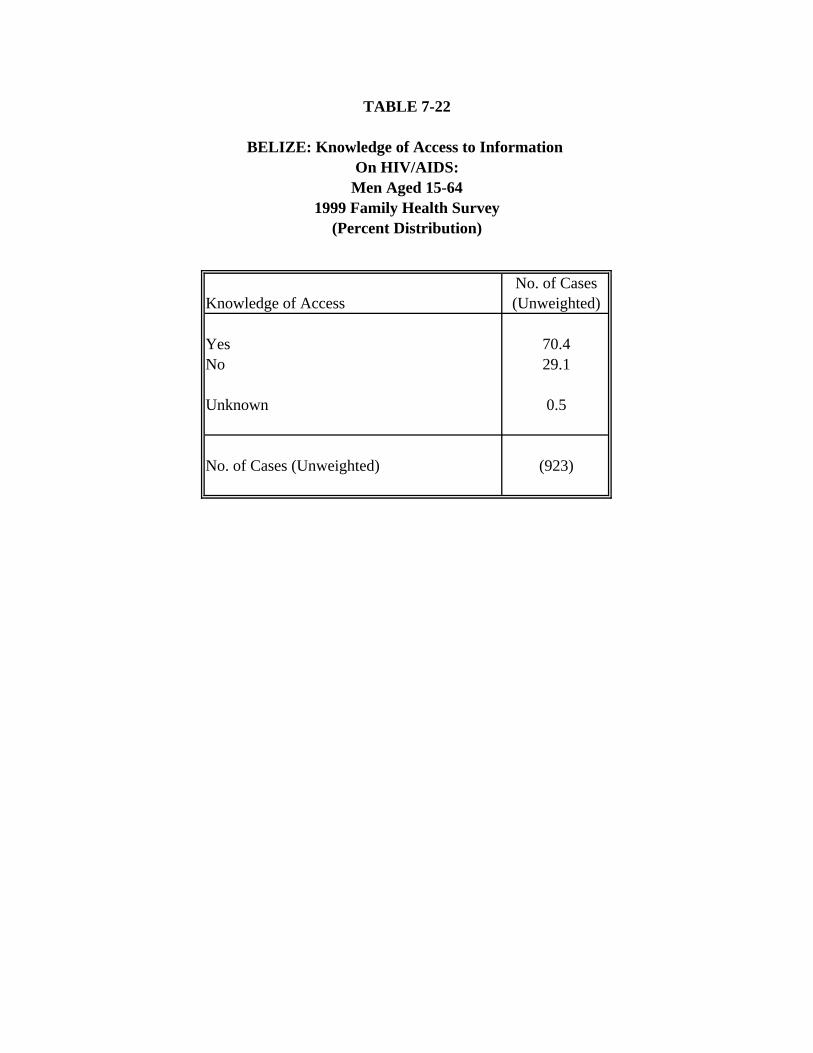
TABLE 7-22
BELIZE: Knowledge of Access to Information On HIV/AIDS:
Knowledge of AccessNo. of Cases (Unweighted)
Yes 70.4No 29.1
Unknown 0.5
No. of Cases (Unweighted) (923)
Men Aged 15-641999 Family Health Survey
(Percent Distribution)
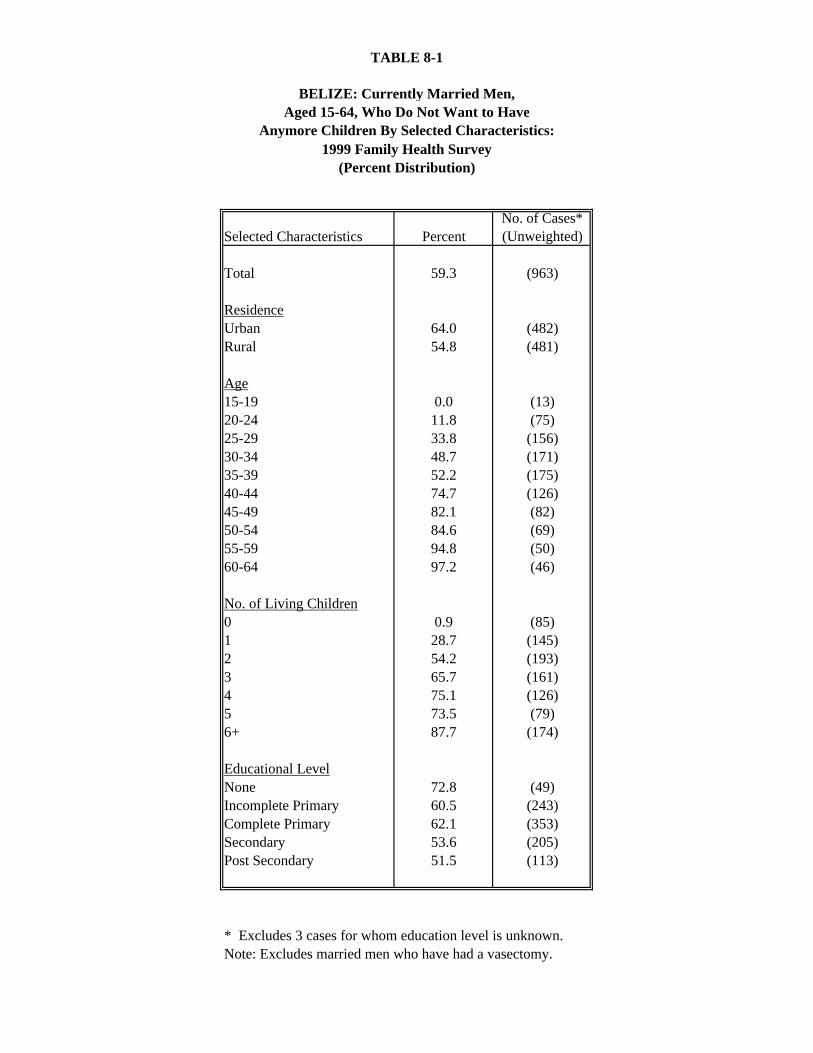
BELIZE: Currently Married Men,Aged 15-64, Who Do Not Want to Have
Anymore Children By Selected Characteristics:
Selected Characteristics PercentNo. of Cases* (Unweighted)
Total 59.3 (963)
ResidenceUrban 64.0 (482)Rural 54.8 (481)
Age15-19 0.0 (13)20-24 11.8 (75)25-29 33.8 (156)30-34 48.7 (171)35-39 52.2 (175)40-44 74.7 (126)45-49 82.1 (82)50-54 84.6 (69)55-59 94.8 (50)60-64 97.2 (46)
No. of Living Children0 0.9 (85)1 28.7 (145)2 54.2 (193)3 65.7 (161)4 75.1 (126)5 73.5 (79)6+ 87.7 (174)
Educational LevelNone 72.8 (49)Incomplete Primary 60.5 (243)Complete Primary 62.1 (353)Secondary 53.6 (205)Post Secondary 51.5 (113)
* Excludes 3 cases for whom education level is unknown.Note: Excludes married men who have had a vasectomy.
TABLE 8-1
1999 Family Health Survey(Percent Distribution)
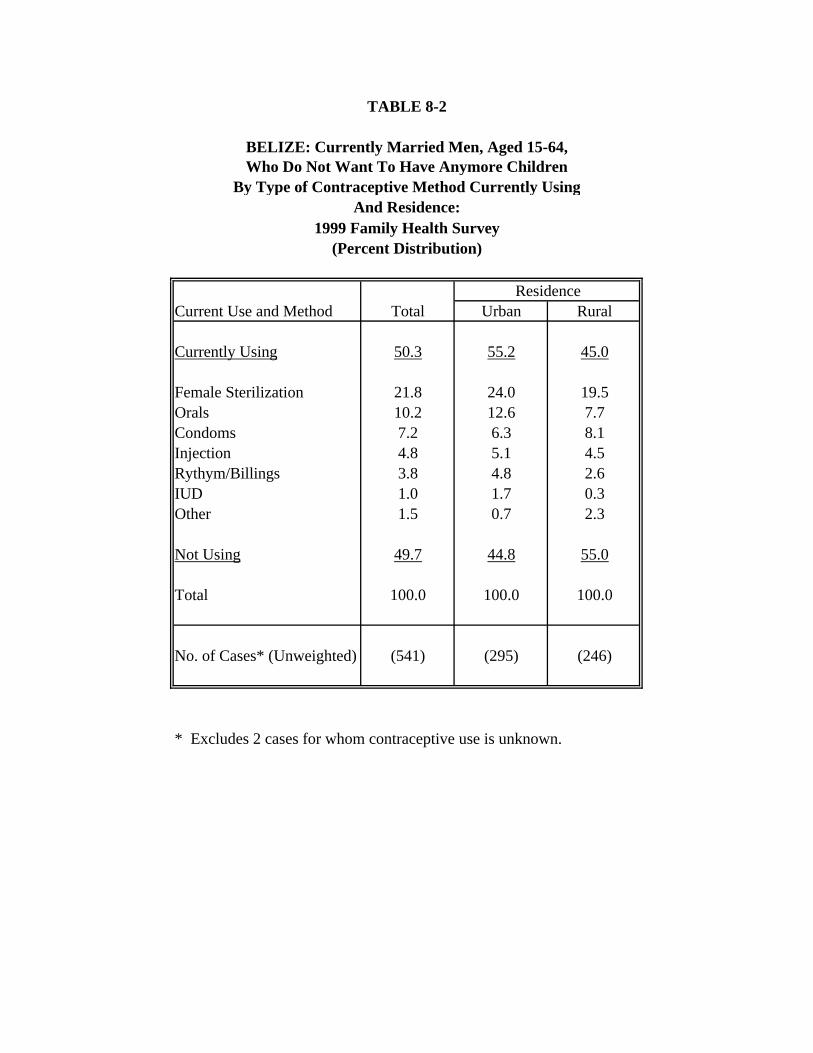
Who Do Not Want To Have Anymore ChildrenBy Type of Contraceptive Method Currently Using
And Residence:
Urban Rural
Currently Using 50.3 55.2 45.0
Female Sterilization 21.8 24.0 19.5Orals 10.2 12.6 7.7Condoms 7.2 6.3 8.1Injection 4.8 5.1 4.5Rythym/Billings 3.8 4.8 2.6IUD 1.0 1.7 0.3Other 1.5 0.7 2.3
Not Using 49.7 44.8 55.0
Total 100.0 100.0 100.0
No. of Cases* (Unweighted) (541) (295) (246)
* Excludes 2 cases for whom contraceptive use is unknown.
ResidenceCurrent Use and Method Total
TABLE 8-2
BELIZE: Currently Married Men, Aged 15-64,
1999 Family Health Survey(Percent Distribution)
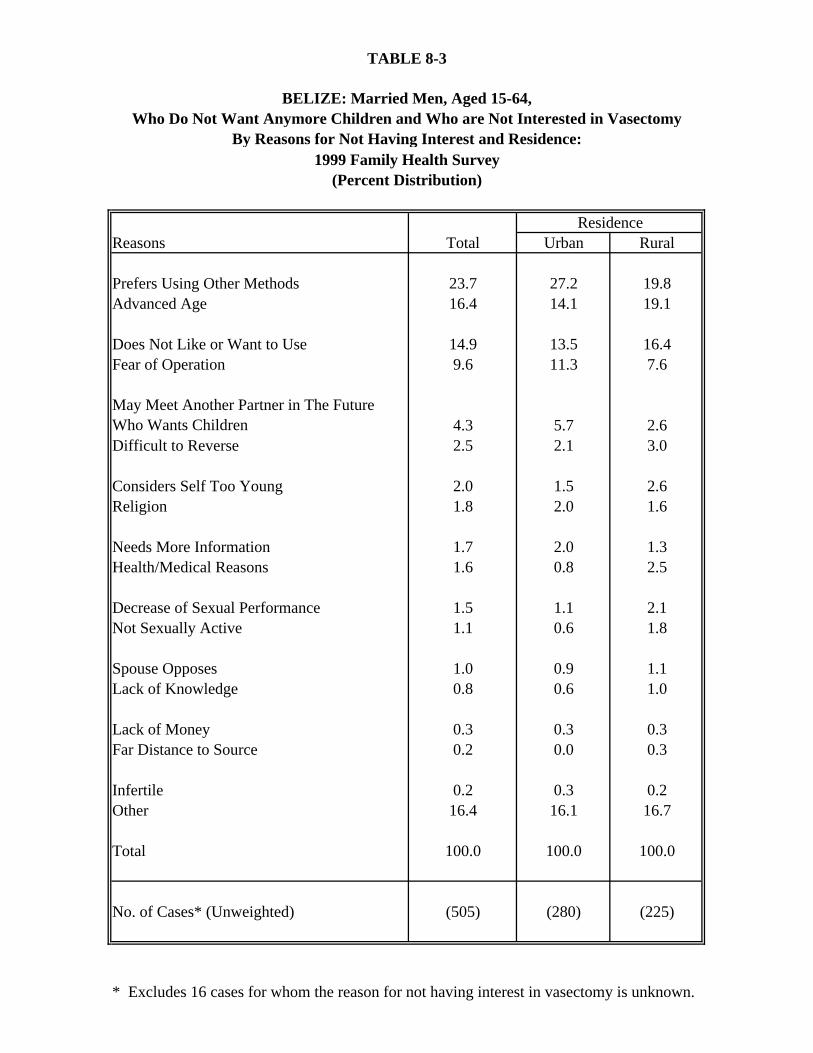
BELIZE: Married Men, Aged 15-64,Who Do Not Want Anymore Children and Who are Not Interested in Vasectomy
By Reasons for Not Having Interest and Residence:
Urban Rural
Prefers Using Other Methods 23.7 27.2 19.8Advanced Age 16.4 14.1 19.1
Does Not Like or Want to Use 14.9 13.5 16.4Fear of Operation 9.6 11.3 7.6
May Meet Another Partner in The Future Who Wants Children 4.3 5.7 2.6Difficult to Reverse 2.5 2.1 3.0
Considers Self Too Young 2.0 1.5 2.6Religion 1.8 2.0 1.6
Needs More Information 1.7 2.0 1.3Health/Medical Reasons 1.6 0.8 2.5
Decrease of Sexual Performance 1.5 1.1 2.1Not Sexually Active 1.1 0.6 1.8
Spouse Opposes 1.0 0.9 1.1Lack of Knowledge 0.8 0.6 1.0
Lack of Money 0.3 0.3 0.3Far Distance to Source 0.2 0.0 0.3
Infertile 0.2 0.3 0.2Other 16.4 16.1 16.7
Total 100.0 100.0 100.0
No. of Cases* (Unweighted) (505) (280) (225)
TABLE 8-3
* Excludes 16 cases for whom the reason for not having interest in vasectomy is unknown.
ResidenceTotalReasons
1999 Family Health Survey(Percent Distribution)
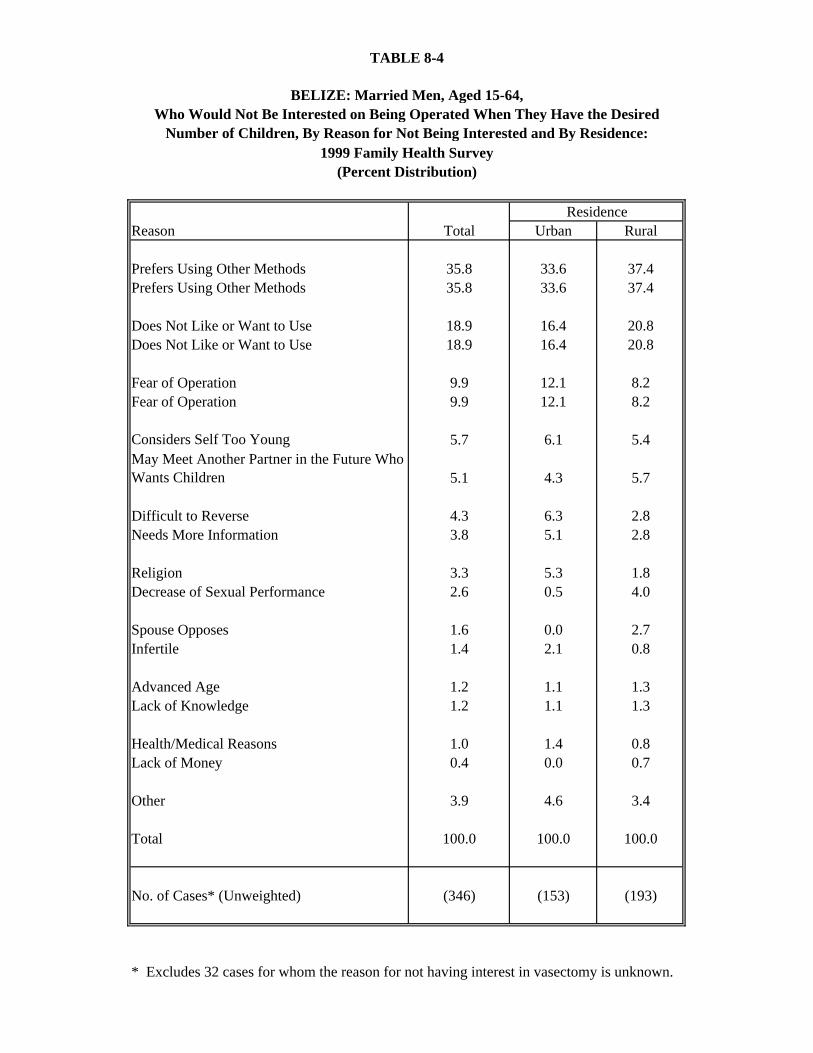
BELIZE: Married Men, Aged 15-64,Who Would Not Be Interested on Being Operated When They Have the Desired
Number of Children, By Reason for Not Being Interested and By Residence:
Urban Rural
Prefers Using Other Methods 35.8 33.6 37.4Prefers Using Other Methods 35.8 33.6 37.4
Does Not Like or Want to Use 18.9 16.4 20.8Does Not Like or Want to Use 18.9 16.4 20.8
Fear of Operation 9.9 12.1 8.2Fear of Operation 9.9 12.1 8.2
Considers Self Too Young 5.7 6.1 5.4May Meet Another Partner in the Future Who Wants Children 5.1 4.3 5.7
Difficult to Reverse 4.3 6.3 2.8Needs More Information 3.8 5.1 2.8
Religion 3.3 5.3 1.8Decrease of Sexual Performance 2.6 0.5 4.0
Spouse Opposes 1.6 0.0 2.7Infertile 1.4 2.1 0.8
Advanced Age 1.2 1.1 1.3Lack of Knowledge 1.2 1.1 1.3
Health/Medical Reasons 1.0 1.4 0.8Lack of Money 0.4 0.0 0.7
Other 3.9 4.6 3.4
Total 100.0 100.0 100.0
No. of Cases* (Unweighted) (346) (153) (193)
* Excludes 32 cases for whom the reason for not having interest in vasectomy is unknown.
TABLE 8-4
1999 Family Health Survey
Reason TotalResidence
(Percent Distribution)
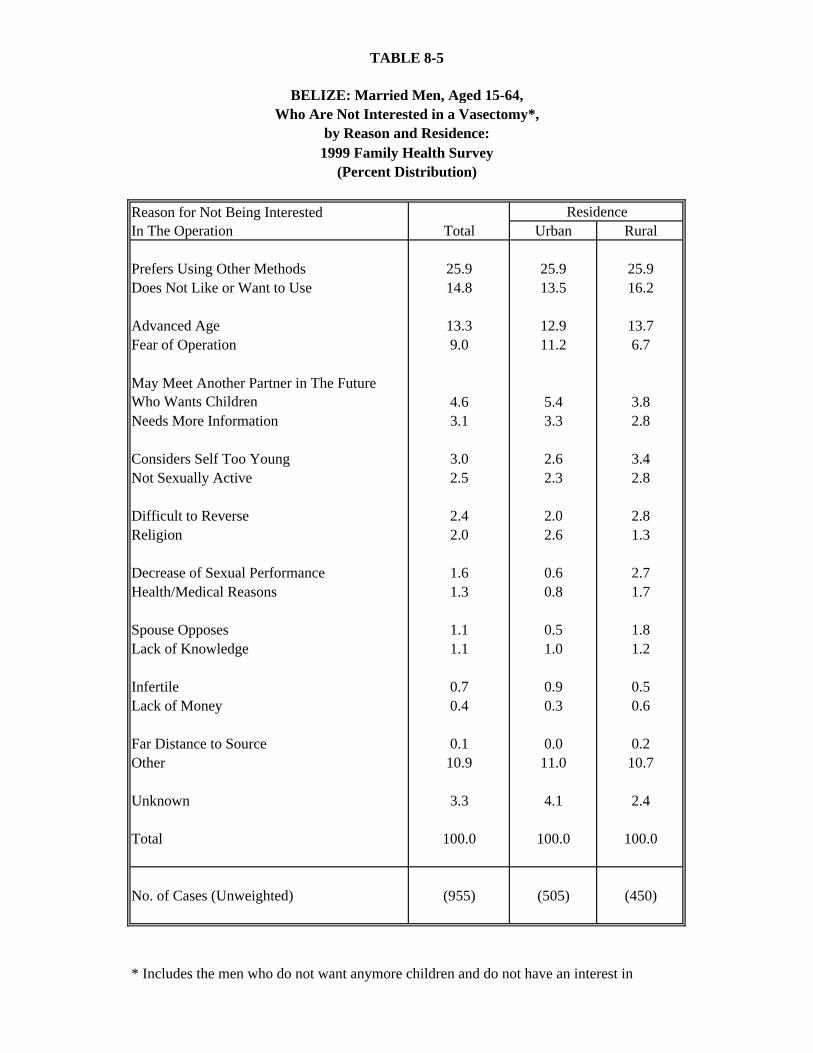
BELIZE: Married Men, Aged 15-64,Who Are Not Interested in a Vasectomy*,
by Reason and Residence:
Urban Rural
Prefers Using Other Methods 25.9 25.9 25.9Does Not Like or Want to Use 14.8 13.5 16.2
Advanced Age 13.3 12.9 13.7Fear of Operation 9.0 11.2 6.7
May Meet Another Partner in The Future Who Wants Children 4.6 5.4 3.8Needs More Information 3.1 3.3 2.8
Considers Self Too Young 3.0 2.6 3.4Not Sexually Active 2.5 2.3 2.8
Difficult to Reverse 2.4 2.0 2.8Religion 2.0 2.6 1.3
Decrease of Sexual Performance 1.6 0.6 2.7Health/Medical Reasons 1.3 0.8 1.7
Spouse Opposes 1.1 0.5 1.8Lack of Knowledge 1.1 1.0 1.2
Infertile 0.7 0.9 0.5Lack of Money 0.4 0.3 0.6
Far Distance to Source 0.1 0.0 0.2Other 10.9 11.0 10.7
Unknown 3.3 4.1 2.4
Total 100.0 100.0 100.0
No. of Cases (Unweighted) (955) (505) (450)
* Includes the men who do not want anymore children and do not have an interest in
TABLE 8-5
1999 Family Health Survey
Reason for Not Being Interested In The Operation Total
Residence
(Percent Distribution)
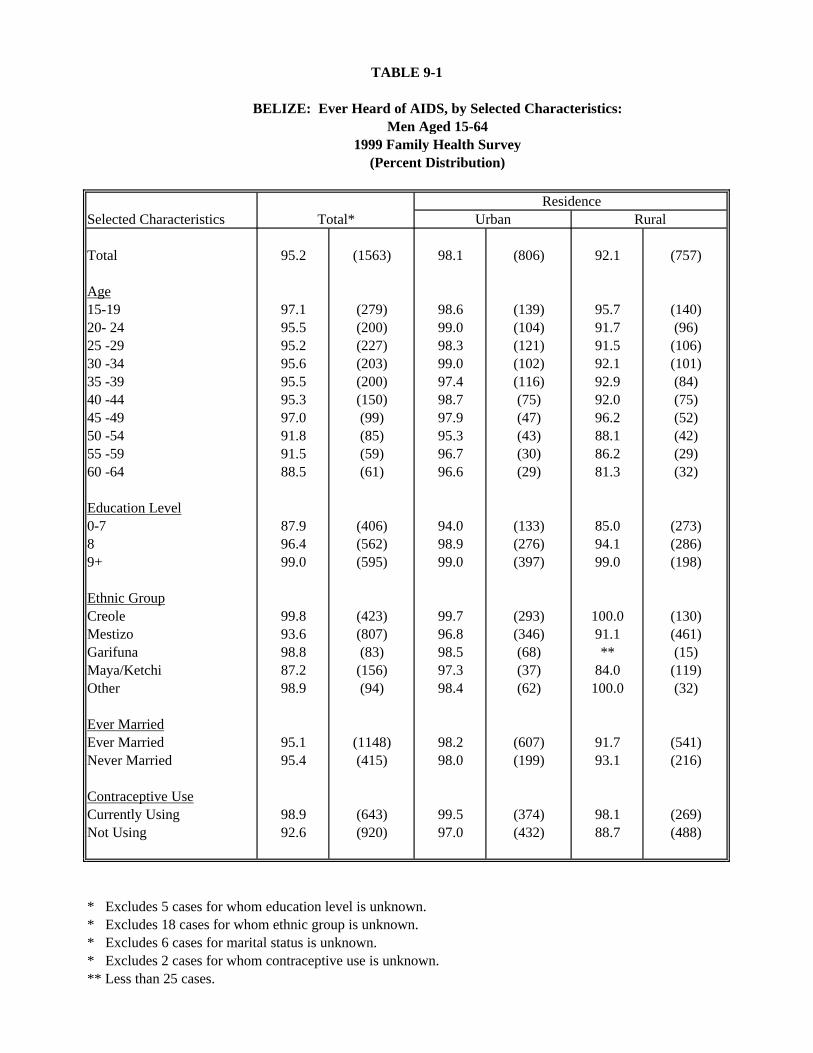
TABLE 9-1
BELIZE: Ever Heard of AIDS, by Selected Characteristics:Men Aged 15-64
1999 Family Health Survey(Percent Distribution)
ResidenceSelected Characteristics Total* Urban Rural
Total 95.2 (1563) 98.1 (806) 92.1 (757)
Age15-19 97.1 (279) 98.6 (139) 95.7 (140)20- 24 95.5 (200) 99.0 (104) 91.7 (96)25 -29 95.2 (227) 98.3 (121) 91.5 (106)30 -34 95.6 (203) 99.0 (102) 92.1 (101)35 -39 95.5 (200) 97.4 (116) 92.9 (84)40 -44 95.3 (150) 98.7 (75) 92.0 (75)45 -49 97.0 (99) 97.9 (47) 96.2 (52)50 -54 91.8 (85) 95.3 (43) 88.1 (42)55 -59 91.5 (59) 96.7 (30) 86.2 (29)60 -64 88.5 (61) 96.6 (29) 81.3 (32)
Education Level0-7 87.9 (406) 94.0 (133) 85.0 (273)8 96.4 (562) 98.9 (276) 94.1 (286)9+ 99.0 (595) 99.0 (397) 99.0 (198)
Ethnic GroupCreole 99.8 (423) 99.7 (293) 100.0 (130)Mestizo 93.6 (807) 96.8 (346) 91.1 (461)Garifuna 98.8 (83) 98.5 (68) ** (15)Maya/Ketchi 87.2 (156) 97.3 (37) 84.0 (119)Other 98.9 (94) 98.4 (62) 100.0 (32)
Ever MarriedEver Married 95.1 (1148) 98.2 (607) 91.7 (541)Never Married 95.4 (415) 98.0 (199) 93.1 (216)
Contraceptive UseCurrently Using 98.9 (643) 99.5 (374) 98.1 (269)Not Using 92.6 (920) 97.0 (432) 88.7 (488)
* Excludes 5 cases for whom education level is unknown.* Excludes 18 cases for whom ethnic group is unknown.* Excludes 6 cases for marital status is unknown.* Excludes 2 cases for whom contraceptive use is unknown.** Less than 25 cases.
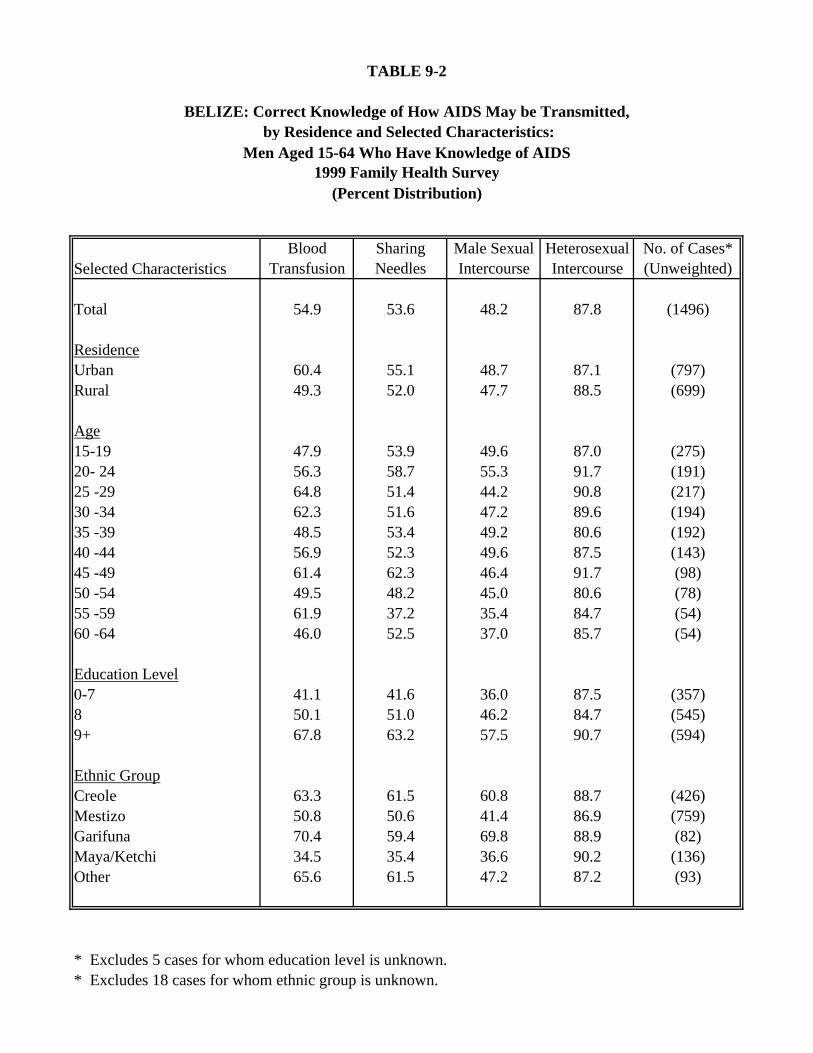
TABLE 9-2
BELIZE: Correct Knowledge of How AIDS May be Transmitted, by Residence and Selected Characteristics:
1999 Family Health Survey
Selected CharacteristicsBlood
TransfusionSharing Needles
Male Sexual Intercourse
Heterosexual Intercourse
No. of Cases* (Unweighted)
Total 54.9 53.6 48.2 87.8 (1496)
ResidenceUrban 60.4 55.1 48.7 87.1 (797)Rural 49.3 52.0 47.7 88.5 (699)
Age15-19 47.9 53.9 49.6 87.0 (275)20- 24 56.3 58.7 55.3 91.7 (191)25 -29 64.8 51.4 44.2 90.8 (217)30 -34 62.3 51.6 47.2 89.6 (194)35 -39 48.5 53.4 49.2 80.6 (192)40 -44 56.9 52.3 49.6 87.5 (143)45 -49 61.4 62.3 46.4 91.7 (98)50 -54 49.5 48.2 45.0 80.6 (78)55 -59 61.9 37.2 35.4 84.7 (54)60 -64 46.0 52.5 37.0 85.7 (54)
Education Level0-7 41.1 41.6 36.0 87.5 (357)8 50.1 51.0 46.2 84.7 (545)9+ 67.8 63.2 57.5 90.7 (594)
Ethnic GroupCreole 63.3 61.5 60.8 88.7 (426)Mestizo 50.8 50.6 41.4 86.9 (759)Garifuna 70.4 59.4 69.8 88.9 (82)Maya/Ketchi 34.5 35.4 36.6 90.2 (136)Other 65.6 61.5 47.2 87.2 (93)
* Excludes 5 cases for whom education level is unknown.* Excludes 18 cases for whom ethnic group is unknown.
Men Aged 15-64 Who Have Knowledge of AIDS
(Percent Distribution)
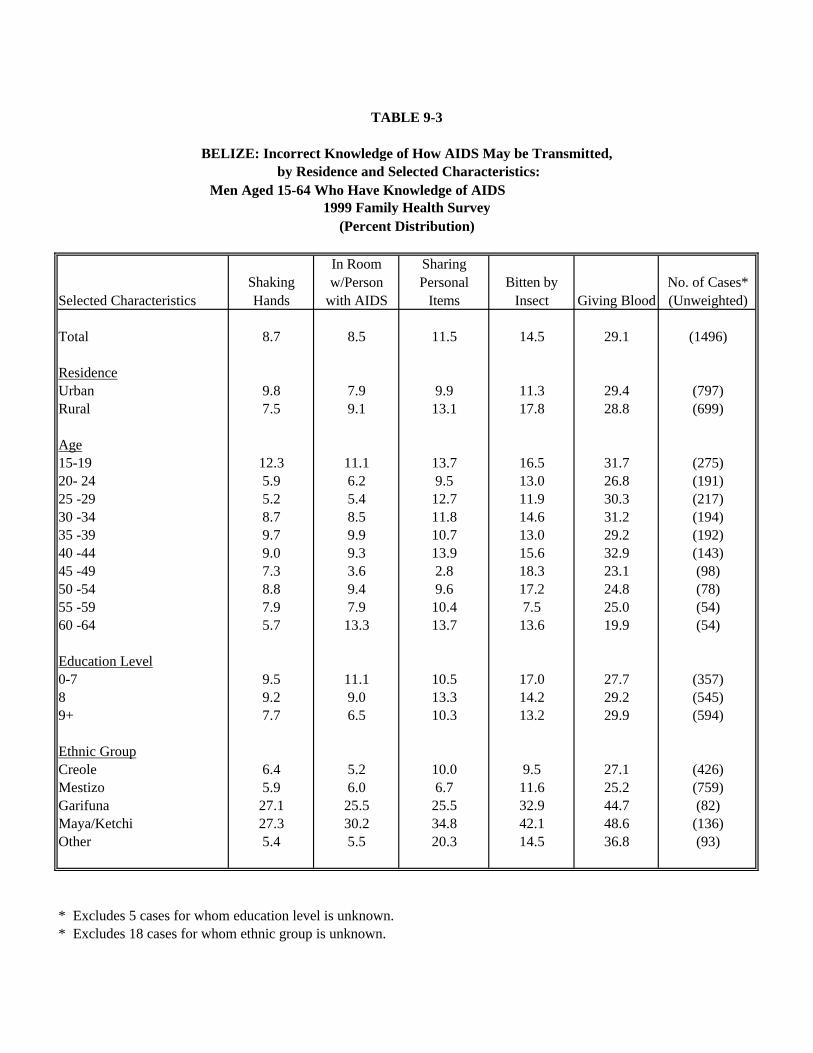
TABLE 9-3
BELIZE: Incorrect Knowledge of How AIDS May be Transmitted, by Residence and Selected Characteristics:
1999 Family Health Survey
Selected CharacteristicsShaking Hands
In Room w/Person
with AIDS
Sharing Personal
ItemsBitten by
Insect Giving BloodNo. of Cases* (Unweighted)
Total 8.7 8.5 11.5 14.5 29.1 (1496)
ResidenceUrban 9.8 7.9 9.9 11.3 29.4 (797)Rural 7.5 9.1 13.1 17.8 28.8 (699)
Age15-19 12.3 11.1 13.7 16.5 31.7 (275)20- 24 5.9 6.2 9.5 13.0 26.8 (191)25 -29 5.2 5.4 12.7 11.9 30.3 (217)30 -34 8.7 8.5 11.8 14.6 31.2 (194)35 -39 9.7 9.9 10.7 13.0 29.2 (192)40 -44 9.0 9.3 13.9 15.6 32.9 (143)45 -49 7.3 3.6 2.8 18.3 23.1 (98)50 -54 8.8 9.4 9.6 17.2 24.8 (78)55 -59 7.9 7.9 10.4 7.5 25.0 (54)60 -64 5.7 13.3 13.7 13.6 19.9 (54)
Education Level0-7 9.5 11.1 10.5 17.0 27.7 (357)8 9.2 9.0 13.3 14.2 29.2 (545)9+ 7.7 6.5 10.3 13.2 29.9 (594)
Ethnic GroupCreole 6.4 5.2 10.0 9.5 27.1 (426)Mestizo 5.9 6.0 6.7 11.6 25.2 (759)Garifuna 27.1 25.5 25.5 32.9 44.7 (82)Maya/Ketchi 27.3 30.2 34.8 42.1 48.6 (136)Other 5.4 5.5 20.3 14.5 36.8 (93)
* Excludes 5 cases for whom education level is unknown.* Excludes 18 cases for whom ethnic group is unknown.
Men Aged 15-64 Who Have Knowledge of AIDS
(Percent Distribution)
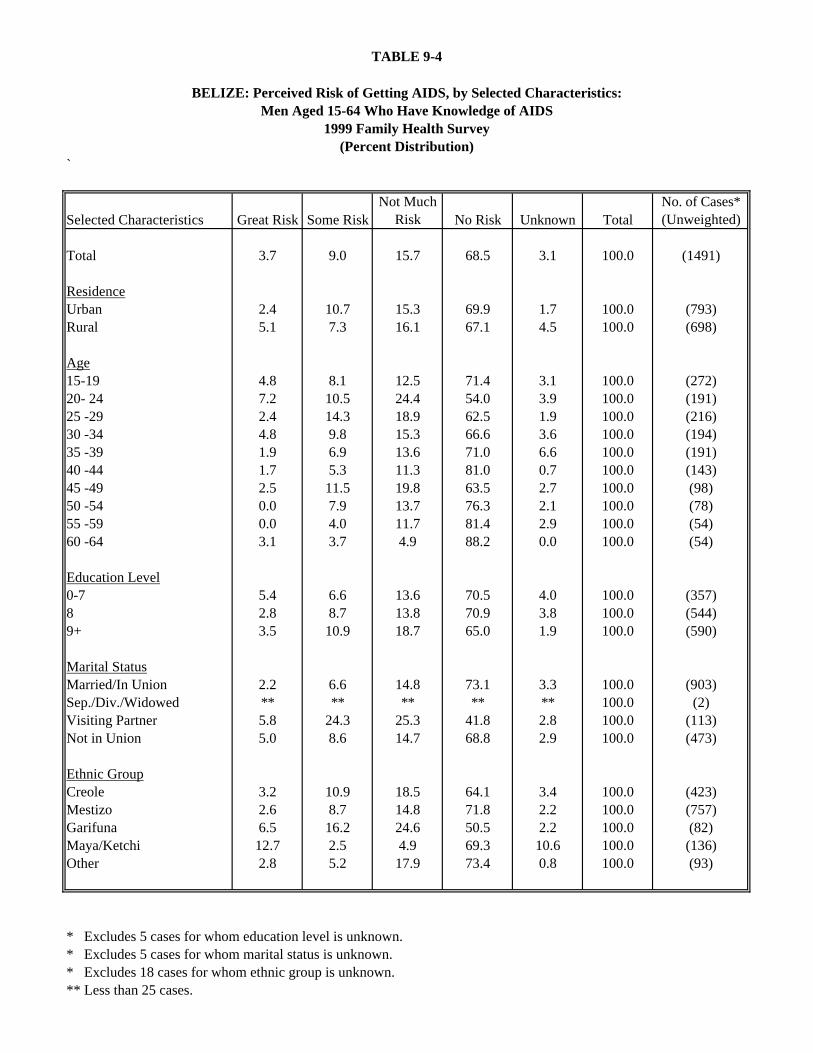
TABLE 9-4
`
Selected Characteristics Great Risk Some RiskNot Much
Risk No Risk Unknown TotalNo. of Cases* (Unweighted)
Total 3.7 9.0 15.7 68.5 3.1 100.0 (1491)
ResidenceUrban 2.4 10.7 15.3 69.9 1.7 100.0 (793)Rural 5.1 7.3 16.1 67.1 4.5 100.0 (698)
Age15-19 4.8 8.1 12.5 71.4 3.1 100.0 (272)20- 24 7.2 10.5 24.4 54.0 3.9 100.0 (191)25 -29 2.4 14.3 18.9 62.5 1.9 100.0 (216)30 -34 4.8 9.8 15.3 66.6 3.6 100.0 (194)35 -39 1.9 6.9 13.6 71.0 6.6 100.0 (191)40 -44 1.7 5.3 11.3 81.0 0.7 100.0 (143)45 -49 2.5 11.5 19.8 63.5 2.7 100.0 (98)50 -54 0.0 7.9 13.7 76.3 2.1 100.0 (78)55 -59 0.0 4.0 11.7 81.4 2.9 100.0 (54)60 -64 3.1 3.7 4.9 88.2 0.0 100.0 (54)
Education Level0-7 5.4 6.6 13.6 70.5 4.0 100.0 (357)8 2.8 8.7 13.8 70.9 3.8 100.0 (544)9+ 3.5 10.9 18.7 65.0 1.9 100.0 (590)
Marital StatusMarried/In Union 2.2 6.6 14.8 73.1 3.3 100.0 (903)Sep./Div./Widowed ** ** ** ** ** 100.0 (2)Visiting Partner 5.8 24.3 25.3 41.8 2.8 100.0 (113)Not in Union 5.0 8.6 14.7 68.8 2.9 100.0 (473)
Ethnic GroupCreole 3.2 10.9 18.5 64.1 3.4 100.0 (423)Mestizo 2.6 8.7 14.8 71.8 2.2 100.0 (757)Garifuna 6.5 16.2 24.6 50.5 2.2 100.0 (82)Maya/Ketchi 12.7 2.5 4.9 69.3 10.6 100.0 (136)Other 2.8 5.2 17.9 73.4 0.8 100.0 (93)
* Excludes 5 cases for whom education level is unknown.* Excludes 5 cases for whom marital status is unknown.* Excludes 18 cases for whom ethnic group is unknown.** Less than 25 cases.
BELIZE: Perceived Risk of Getting AIDS, by Selected Characteristics:Men Aged 15-64 Who Have Knowledge of AIDS
1999 Family Health Survey(Percent Distribution)
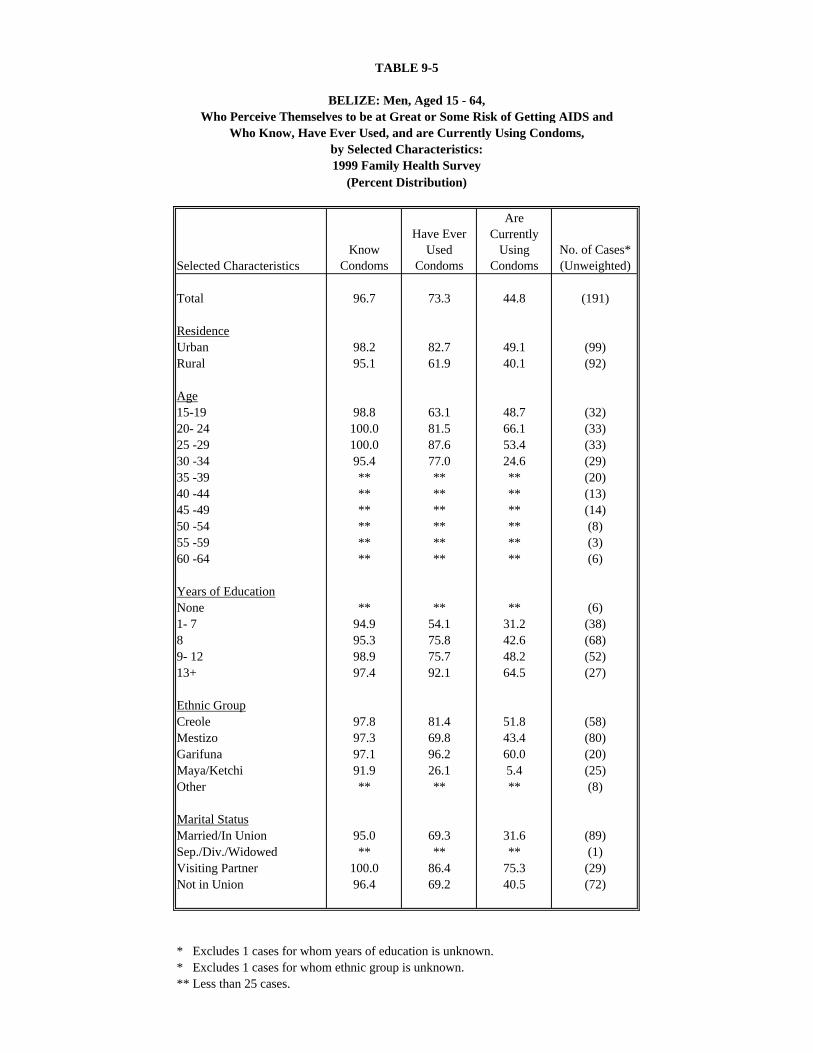
TABLE 9-5
BELIZE: Men, Aged 15 - 64,Who Perceive Themselves to be at Great or Some Risk of Getting AIDS and
Who Know, Have Ever Used, and are Currently Using Condoms,by Selected Characteristics:1999 Family Health Survey
Selected CharacteristicsKnow
Condoms
Have Ever Used
Condoms
Are Currently
Using Condoms
No. of Cases* (Unweighted)
Total 96.7 73.3 44.8 (191)
ResidenceUrban 98.2 82.7 49.1 (99)Rural 95.1 61.9 40.1 (92)
Age15-19 98.8 63.1 48.7 (32)20- 24 100.0 81.5 66.1 (33)25 -29 100.0 87.6 53.4 (33)30 -34 95.4 77.0 24.6 (29)35 -39 ** ** ** (20)40 -44 ** ** ** (13)45 -49 ** ** ** (14)50 -54 ** ** ** (8)55 -59 ** ** ** (3)60 -64 ** ** ** (6)
Years of EducationNone ** ** ** (6)1- 7 94.9 54.1 31.2 (38)8 95.3 75.8 42.6 (68)9- 12 98.9 75.7 48.2 (52)13+ 97.4 92.1 64.5 (27)
Ethnic GroupCreole 97.8 81.4 51.8 (58)Mestizo 97.3 69.8 43.4 (80)Garifuna 97.1 96.2 60.0 (20)Maya/Ketchi 91.9 26.1 5.4 (25)Other ** ** ** (8)
Marital StatusMarried/In Union 95.0 69.3 31.6 (89)Sep./Div./Widowed ** ** ** (1)Visiting Partner 100.0 86.4 75.3 (29)Not in Union 96.4 69.2 40.5 (72)
* Excludes 1 cases for whom years of education is unknown.* Excludes 1 cases for whom ethnic group is unknown.** Less than 25 cases.
(Percent Distribution)
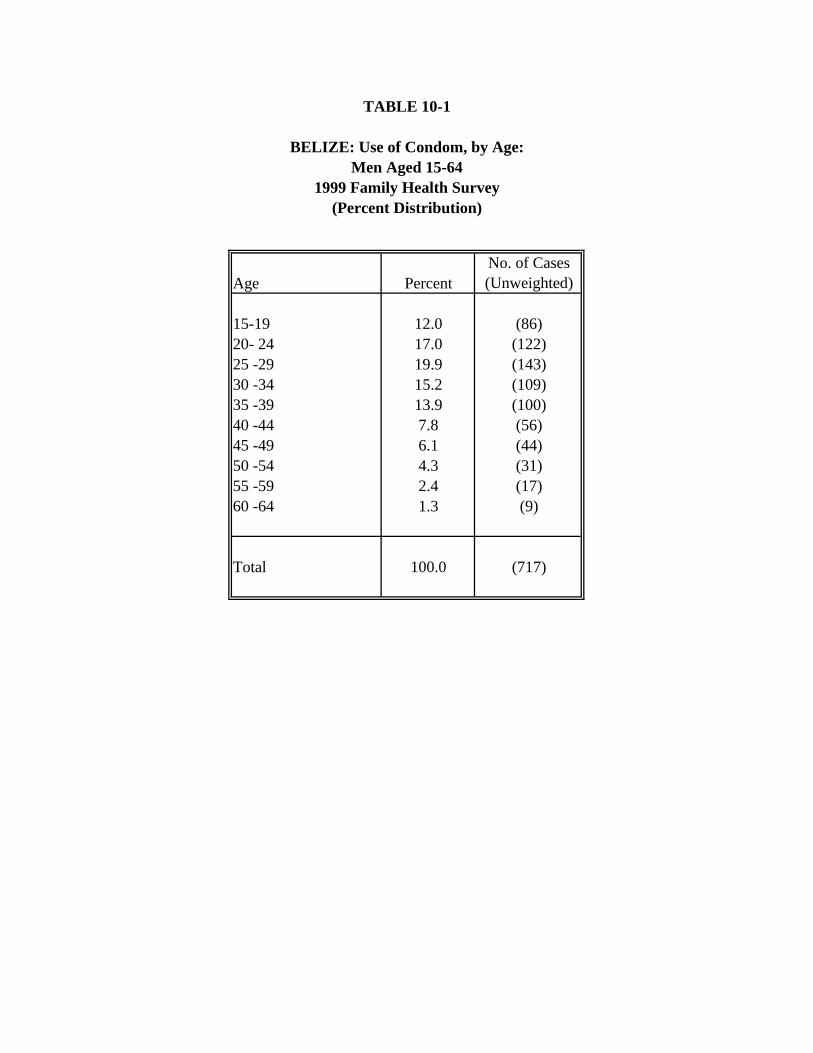
TABLE 10-1
BELIZE: Use of Condom, by Age:
Age PercentNo. of Cases (Unweighted)
15-19 12.0 (86)20- 24 17.0 (122)25 -29 19.9 (143)30 -34 15.2 (109)35 -39 13.9 (100)40 -44 7.8 (56)45 -49 6.1 (44)50 -54 4.3 (31)55 -59 2.4 (17)60 -64 1.3 (9)
Total 100.0 (717)
1999 Family Health SurveyMen Aged 15-64
(Percent Distribution)
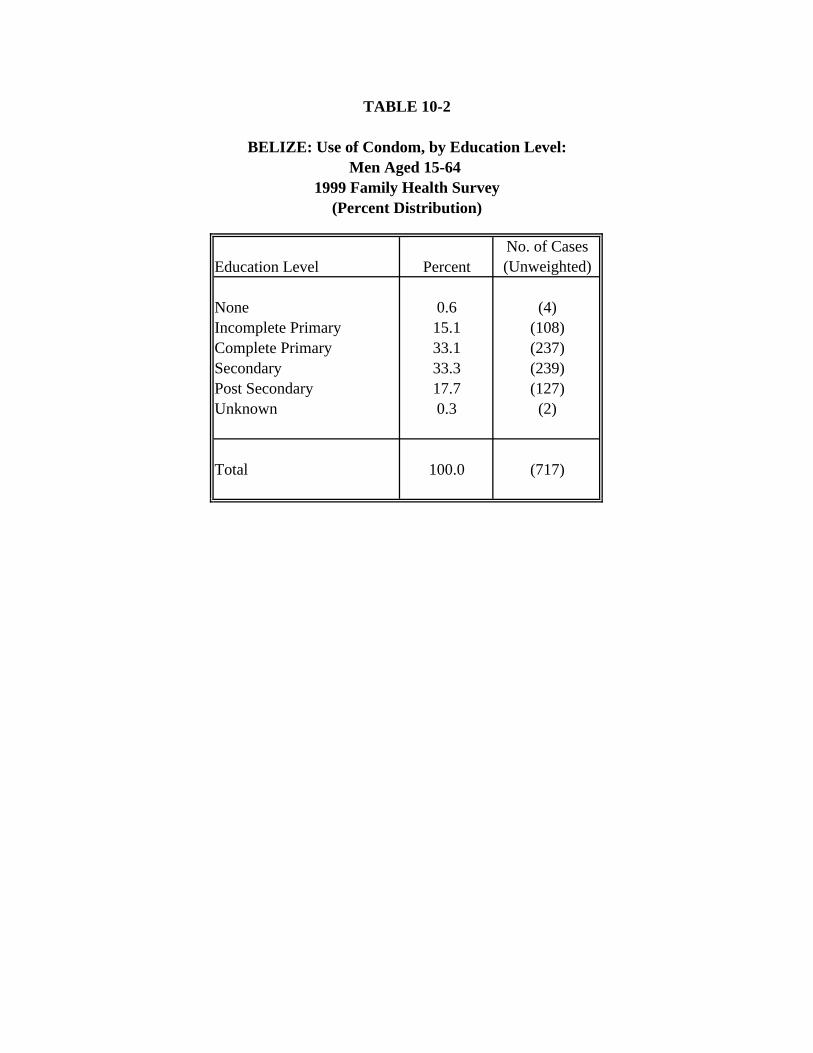
TABLE 10-2
BELIZE: Use of Condom, by Education Level:
Education Level PercentNo. of Cases (Unweighted)
None 0.6 (4)Incomplete Primary 15.1 (108)Complete Primary 33.1 (237)Secondary 33.3 (239)Post Secondary 17.7 (127)Unknown 0.3 (2)
Total 100.0 (717)
Men Aged 15-64 1999 Family Health Survey
(Percent Distribution)
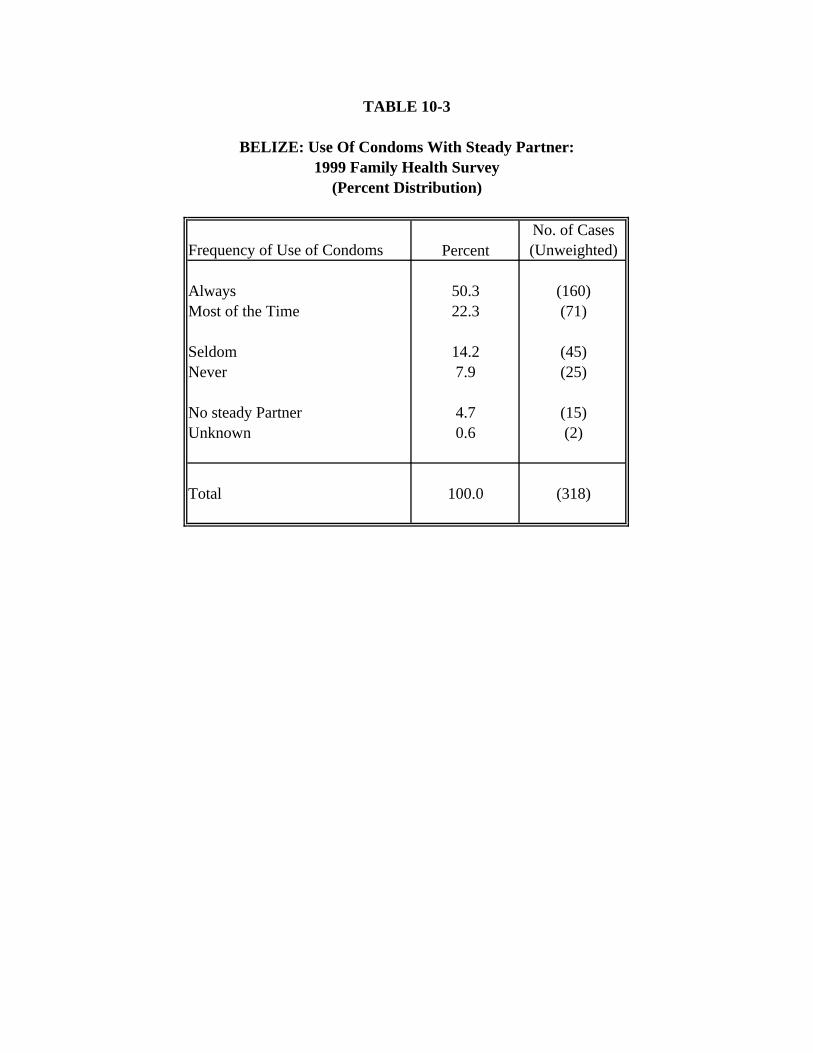
TABLE 10-3
BELIZE: Use Of Condoms With Steady Partner:1999 Family Health Survey
Frequency of Use of Condoms PercentNo. of Cases (Unweighted)
Always 50.3 (160)Most of the Time 22.3 (71)
Seldom 14.2 (45)Never 7.9 (25)
No steady Partner 4.7 (15)Unknown 0.6 (2)
Total 100.0 (318)
(Percent Distribution)
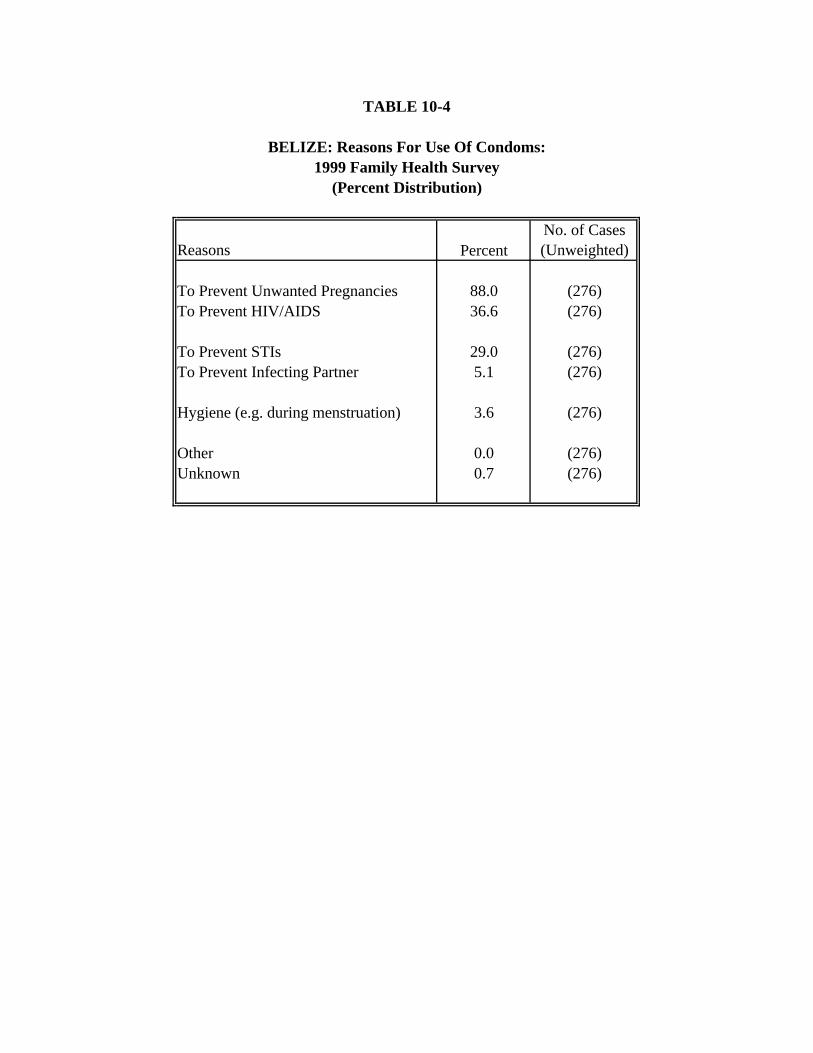
TABLE 10-4
BELIZE: Reasons For Use Of Condoms:1999 Family Health Survey
Reasons PercentNo. of Cases (Unweighted)
To Prevent Unwanted Pregnancies 88.0 (276)To Prevent HIV/AIDS 36.6 (276)
To Prevent STIs 29.0 (276)To Prevent Infecting Partner 5.1 (276)
Hygiene (e.g. during menstruation) 3.6 (276)
Other 0.0 (276)Unknown 0.7 (276)
(Percent Distribution)
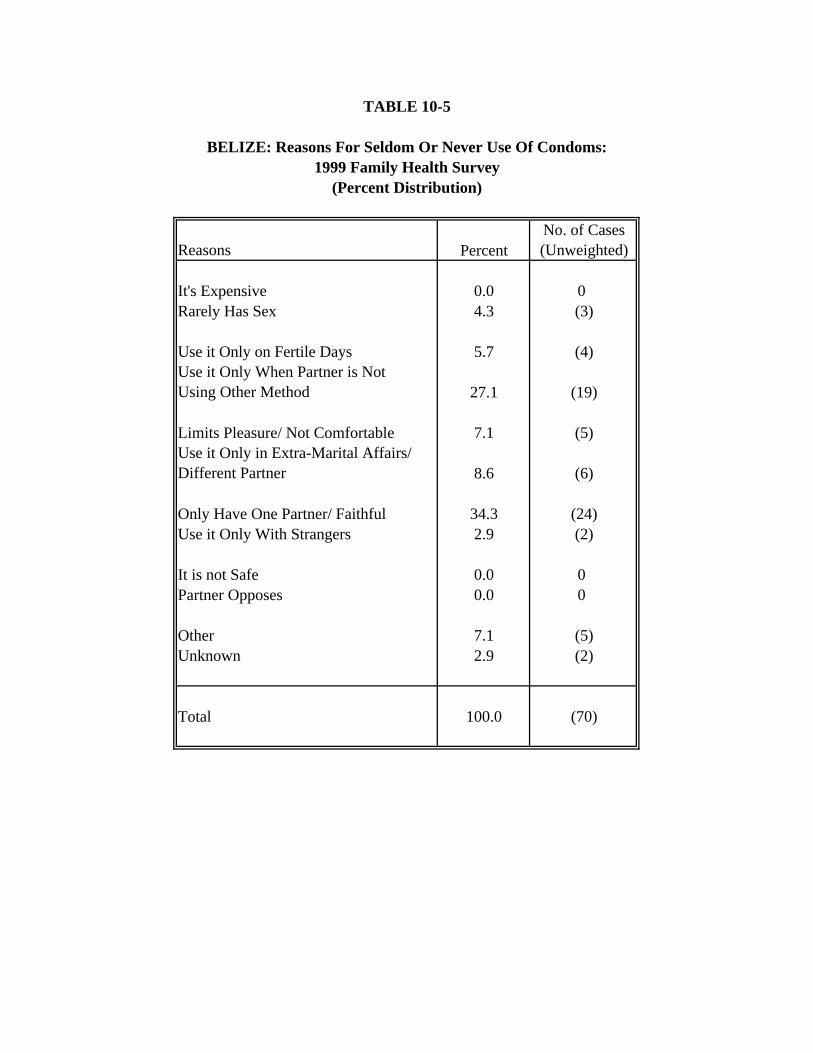
TABLE 10-5
BELIZE: Reasons For Seldom Or Never Use Of Condoms:1999 Family Health Survey
Reasons PercentNo. of Cases (Unweighted)
It's Expensive 0.0 0Rarely Has Sex 4.3 (3)
Use it Only on Fertile Days 5.7 (4)Use it Only When Partner is Not Using Other Method 27.1 (19)
Limits Pleasure/ Not Comfortable 7.1 (5)Use it Only in Extra-Marital Affairs/ Different Partner 8.6 (6)
Only Have One Partner/ Faithful 34.3 (24)Use it Only With Strangers 2.9 (2)
It is not Safe 0.0 0Partner Opposes 0.0 0
Other 7.1 (5)Unknown 2.9 (2)
Total 100.0 (70)
(Percent Distribution)
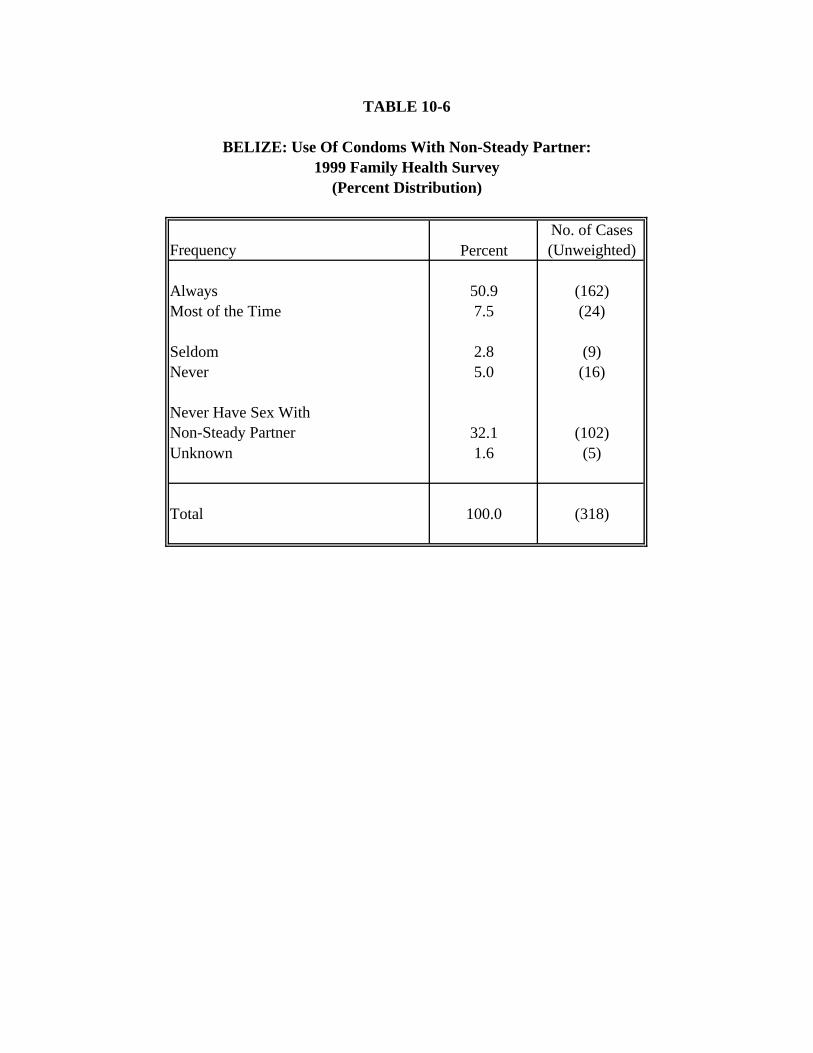
TABLE 10-6
BELIZE: Use Of Condoms With Non-Steady Partner:1999 Family Health Survey
Frequency PercentNo. of Cases (Unweighted)
Always 50.9 (162)Most of the Time 7.5 (24)
Seldom 2.8 (9)Never 5.0 (16)
Never Have Sex With Non-Steady Partner 32.1 (102)Unknown 1.6 (5)
Total 100.0 (318)
(Percent Distribution)
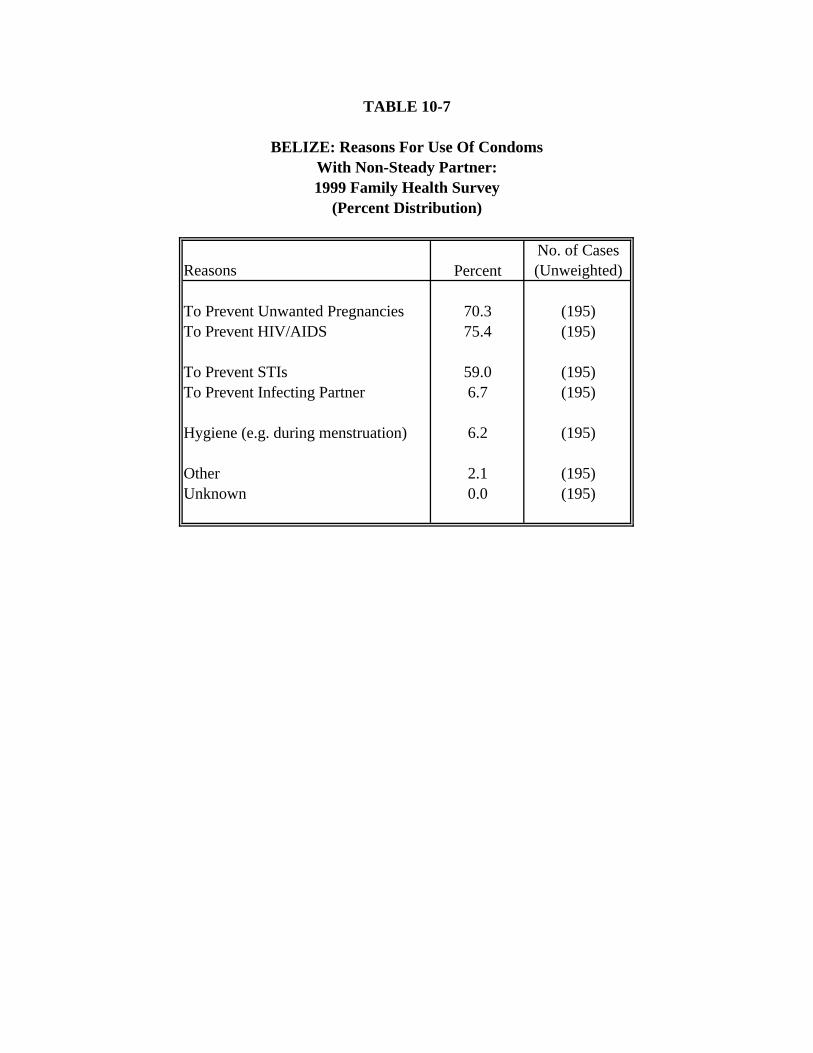
TABLE 10-7
BELIZE: Reasons For Use Of CondomsWith Non-Steady Partner:1999 Family Health Survey
Reasons PercentNo. of Cases (Unweighted)
To Prevent Unwanted Pregnancies 70.3 (195)To Prevent HIV/AIDS 75.4 (195)
To Prevent STIs 59.0 (195)To Prevent Infecting Partner 6.7 (195)
Hygiene (e.g. during menstruation) 6.2 (195)
Other 2.1 (195)Unknown 0.0 (195)
(Percent Distribution)
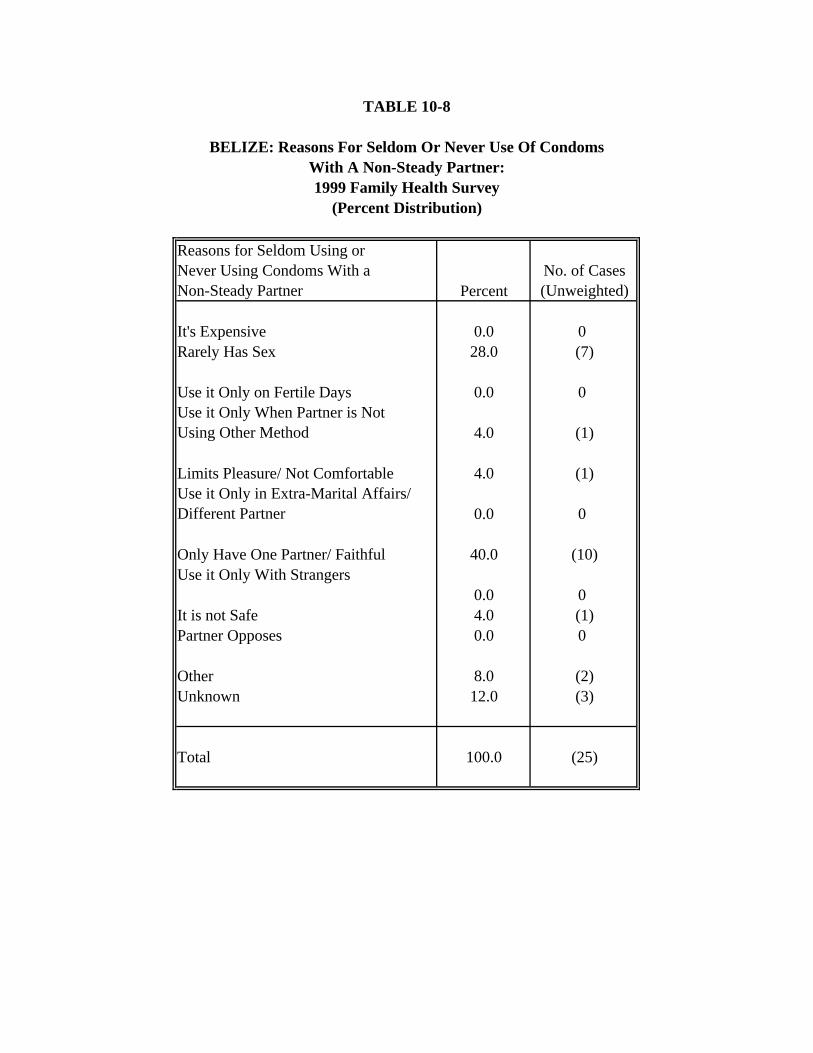
TABLE 10-8
BELIZE: Reasons For Seldom Or Never Use Of CondomsWith A Non-Steady Partner:1999 Family Health Survey
Reasons for Seldom Using or Never Using Condoms With a Non-Steady Partner Percent
No. of Cases (Unweighted)
It's Expensive 0.0 0Rarely Has Sex 28.0 (7)
Use it Only on Fertile Days 0.0 0Use it Only When Partner is Not Using Other Method 4.0 (1)
Limits Pleasure/ Not Comfortable 4.0 (1)Use it Only in Extra-Marital Affairs/ Different Partner 0.0 0
Only Have One Partner/ Faithful 40.0 (10)Use it Only With Strangers
0.0 0It is not Safe 4.0 (1)Partner Opposes 0.0 0
Other 8.0 (2)Unknown 12.0 (3)
Total 100.0 (25)
(Percent Distribution)
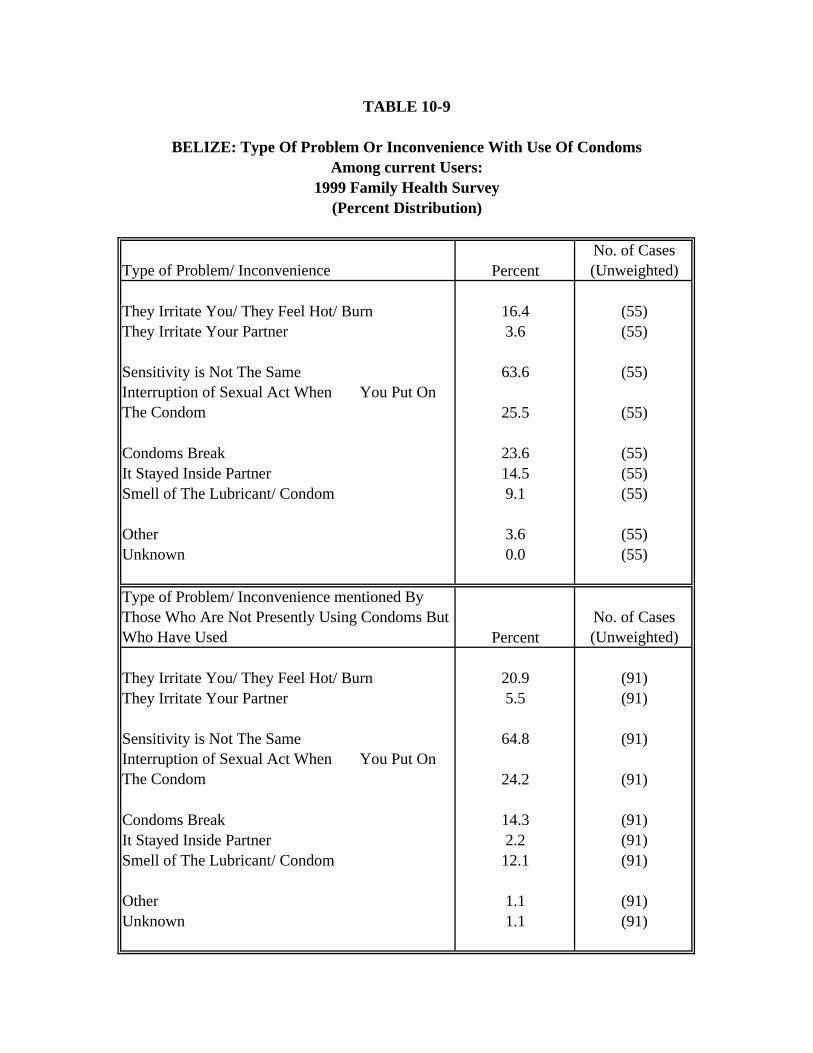
TABLE 10-9
BELIZE: Type Of Problem Or Inconvenience With Use Of CondomsAmong current Users:
Type of Problem/ Inconvenience PercentNo. of Cases (Unweighted)
They Irritate You/ They Feel Hot/ Burn 16.4 (55)They Irritate Your Partner 3.6 (55)
Sensitivity is Not The Same 63.6 (55)Interruption of Sexual Act When You Put On The Condom 25.5 (55)
Condoms Break 23.6 (55)It Stayed Inside Partner 14.5 (55)Smell of The Lubricant/ Condom 9.1 (55)
Other 3.6 (55)Unknown 0.0 (55)
Type of Problem/ Inconvenience mentioned By Those Who Are Not Presently Using Condoms But Who Have Used Percent
No. of Cases (Unweighted)
They Irritate You/ They Feel Hot/ Burn 20.9 (91)They Irritate Your Partner 5.5 (91)
Sensitivity is Not The Same 64.8 (91)Interruption of Sexual Act When You Put On The Condom 24.2 (91)
Condoms Break 14.3 (91)It Stayed Inside Partner 2.2 (91)Smell of The Lubricant/ Condom 12.1 (91)
Other 1.1 (91)Unknown 1.1 (91)
(Percent Distribution)1999 Family Health Survey
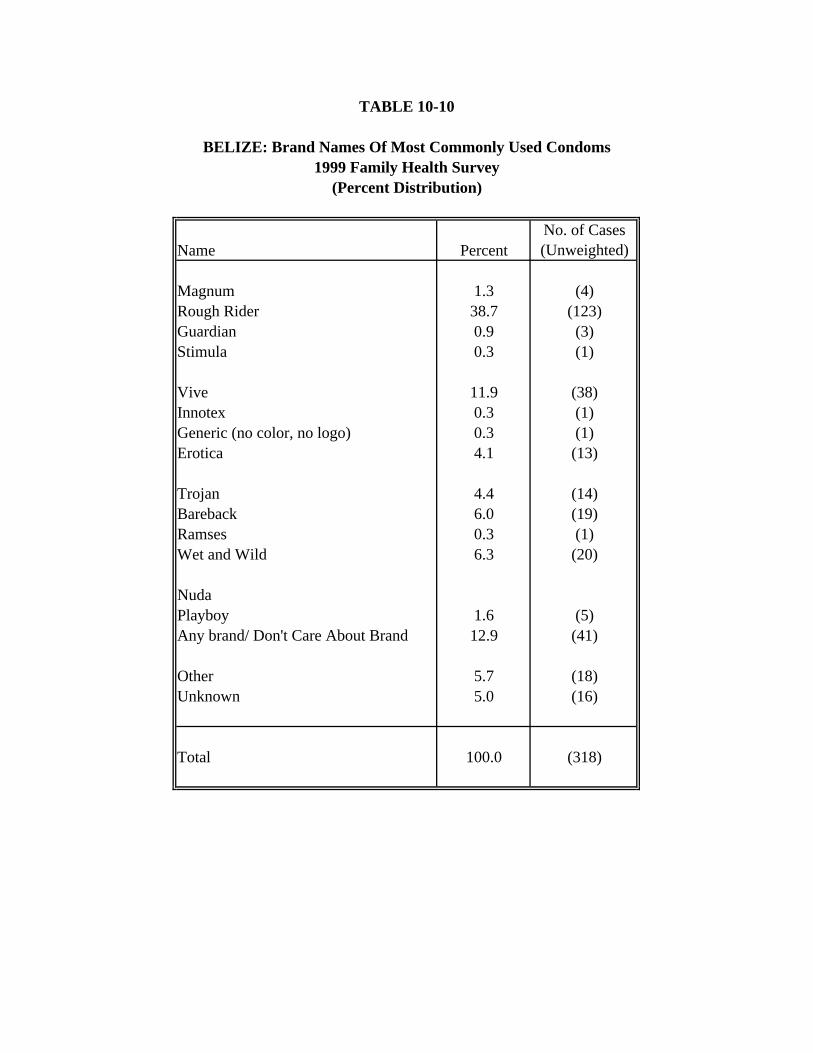
TABLE 10-10
BELIZE: Brand Names Of Most Commonly Used Condoms1999 Family Health Survey
Name PercentNo. of Cases (Unweighted)
Magnum 1.3 (4)Rough Rider 38.7 (123)Guardian 0.9 (3)Stimula 0.3 (1)
Vive 11.9 (38)Innotex 0.3 (1)Generic (no color, no logo) 0.3 (1)Erotica 4.1 (13)
Trojan 4.4 (14)Bareback 6.0 (19)Ramses 0.3 (1)Wet and Wild 6.3 (20)
NudaPlayboy 1.6 (5)Any brand/ Don't Care About Brand 12.9 (41)
Other 5.7 (18)Unknown 5.0 (16)
Total 100.0 (318)
(Percent Distribution)
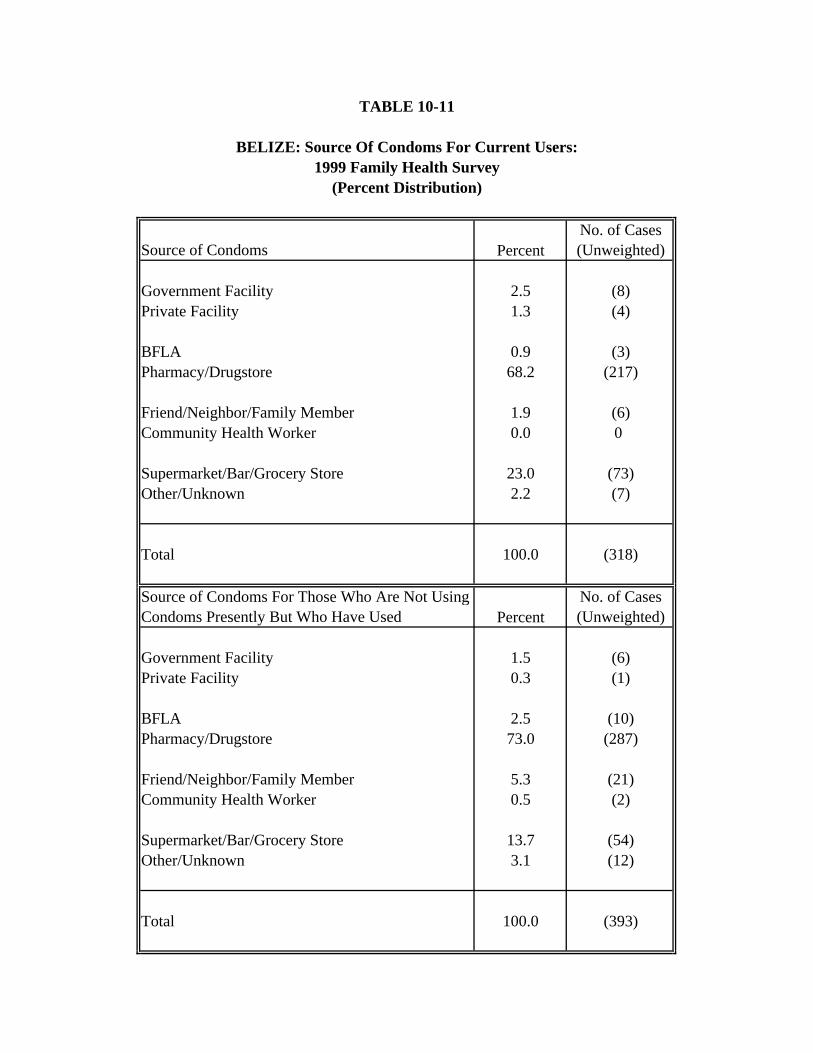
TABLE 10-11
BELIZE: Source Of Condoms For Current Users:1999 Family Health Survey
Source of Condoms PercentNo. of Cases (Unweighted)
Government Facility 2.5 (8)Private Facility 1.3 (4)
BFLA 0.9 (3)Pharmacy/Drugstore 68.2 (217)
Friend/Neighbor/Family Member 1.9 (6)Community Health Worker 0.0 0
Supermarket/Bar/Grocery Store 23.0 (73)Other/Unknown 2.2 (7)
Total 100.0 (318)
Source of Condoms For Those Who Are Not Using Condoms Presently But Who Have Used Percent
No. of Cases (Unweighted)
Government Facility 1.5 (6)Private Facility 0.3 (1)
BFLA 2.5 (10)Pharmacy/Drugstore 73.0 (287)
Friend/Neighbor/Family Member 5.3 (21)Community Health Worker 0.5 (2)
Supermarket/Bar/Grocery Store 13.7 (54)Other/Unknown 3.1 (12)
Total 100.0 (393)
(Percent Distribution)
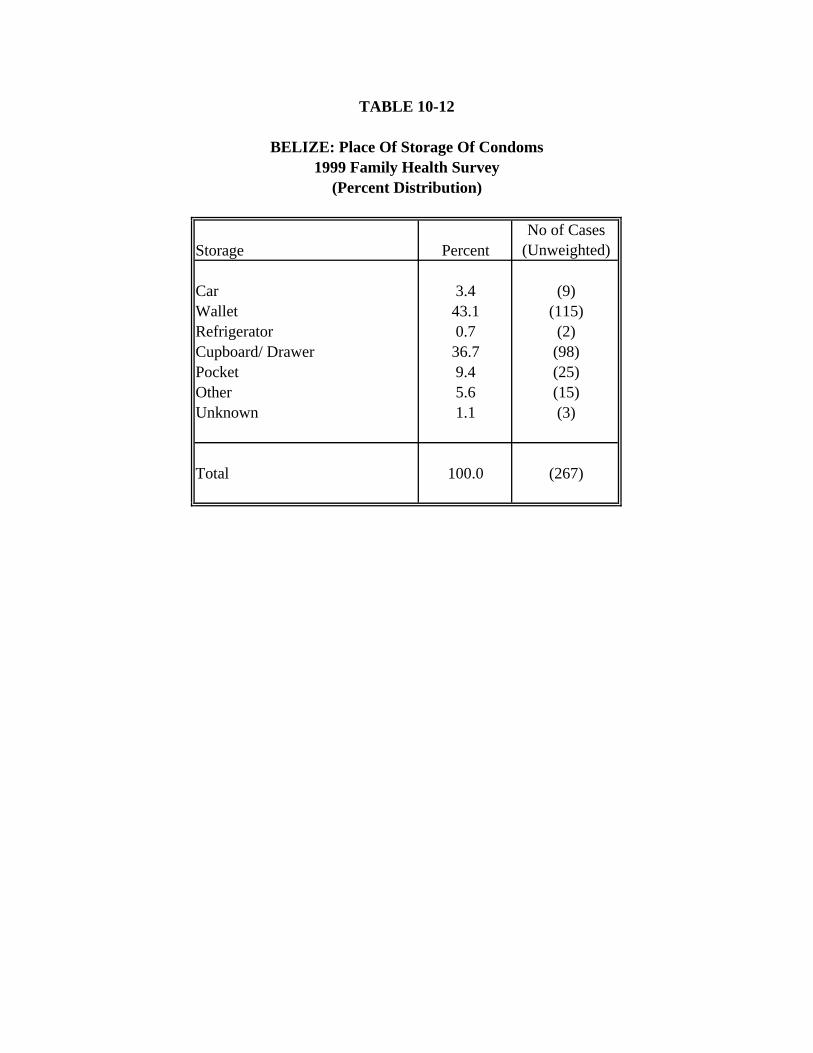
TABLE 10-12
BELIZE: Place Of Storage Of Condoms1999 Family Health Survey
Storage PercentNo of Cases
(Unweighted)
Car 3.4 (9)Wallet 43.1 (115)Refrigerator 0.7 (2)Cupboard/ Drawer 36.7 (98)Pocket 9.4 (25)Other 5.6 (15)Unknown 1.1 (3)
Total 100.0 (267)
(Percent Distribution)
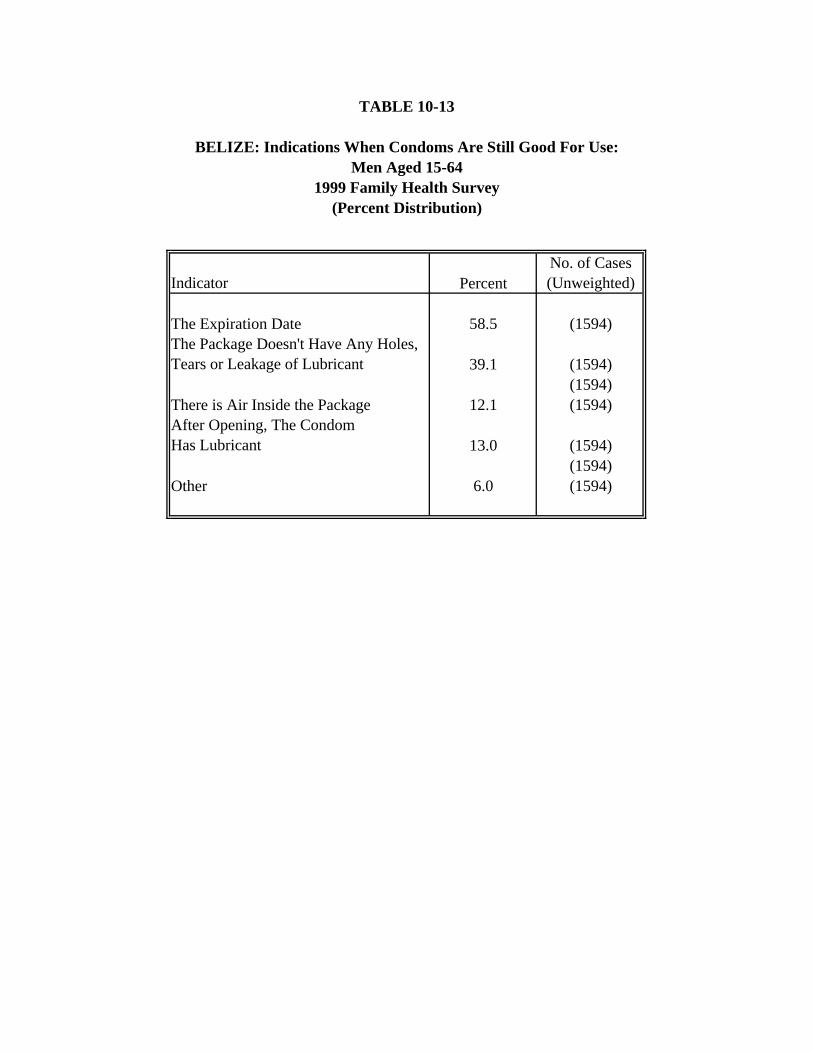
TABLE 10-13
BELIZE: Indications When Condoms Are Still Good For Use:
1999 Family Health Survey
Indicator PercentNo. of Cases (Unweighted)
The Expiration Date 58.5 (1594)The Package Doesn't Have Any Holes, Tears or Leakage of Lubricant 39.1 (1594)
(1594)There is Air Inside the Package 12.1 (1594)After Opening, The Condom Has Lubricant 13.0 (1594)
(1594)Other 6.0 (1594)
(Percent Distribution)
Men Aged 15-64
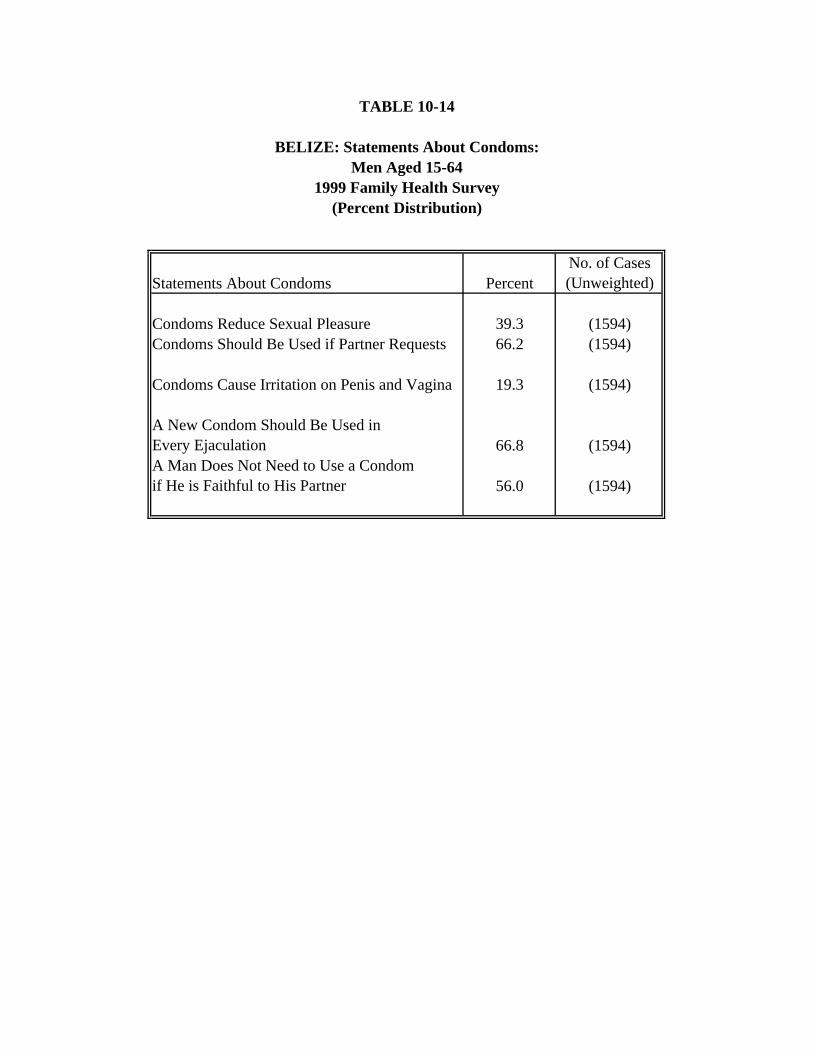
TABLE 10-14
BELIZE: Statements About Condoms:
1999 Family Health Survey
Statements About Condoms PercentNo. of Cases (Unweighted)
Condoms Reduce Sexual Pleasure 39.3 (1594)Condoms Should Be Used if Partner Requests 66.2 (1594)
Condoms Cause Irritation on Penis and Vagina 19.3 (1594)
A New Condom Should Be Used in Every Ejaculation 66.8 (1594)A Man Does Not Need to Use a Condom if He is Faithful to His Partner 56.0 (1594)
(Percent Distribution)
Men Aged 15-64
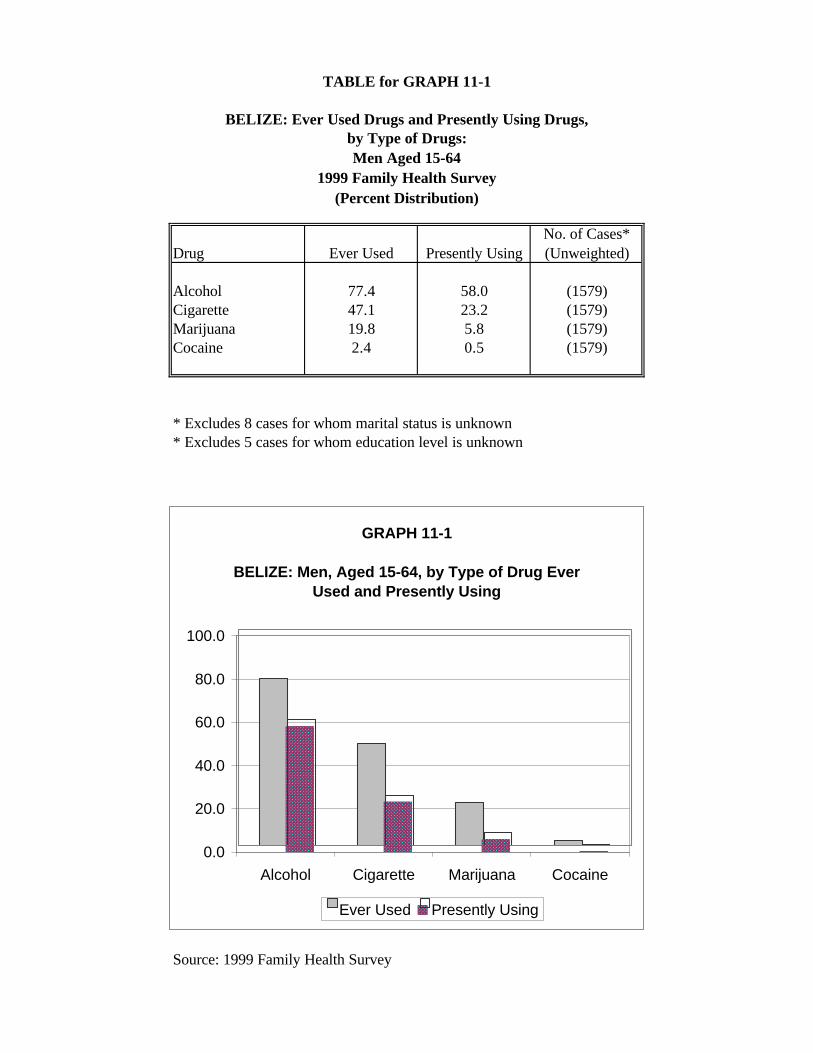
Men Aged 15-641999 Family Health Survey
Drug Ever Used Presently UsingNo. of Cases* (Unweighted)
Alcohol 77.4 58.0 (1579)Cigarette 47.1 23.2 (1579)Marijuana 19.8 5.8 (1579)Cocaine 2.4 0.5 (1579)
* Excludes 8 cases for whom marital status is unknown* Excludes 5 cases for whom education level is unknown
Source: 1999 Family Health Survey
(Percent Distribution)
by Type of Drugs:BELIZE: Ever Used Drugs and Presently Using Drugs,
TABLE for GRAPH 11-1
GRAPH 11-1
BELIZE: Men, Aged 15-64, by Type of Drug Ever Used and Presently Using
0.0
20.0
40.0
60.0
80.0
100.0
Alcohol Cigarette Marijuana Cocaine
Ever Used Presently Using
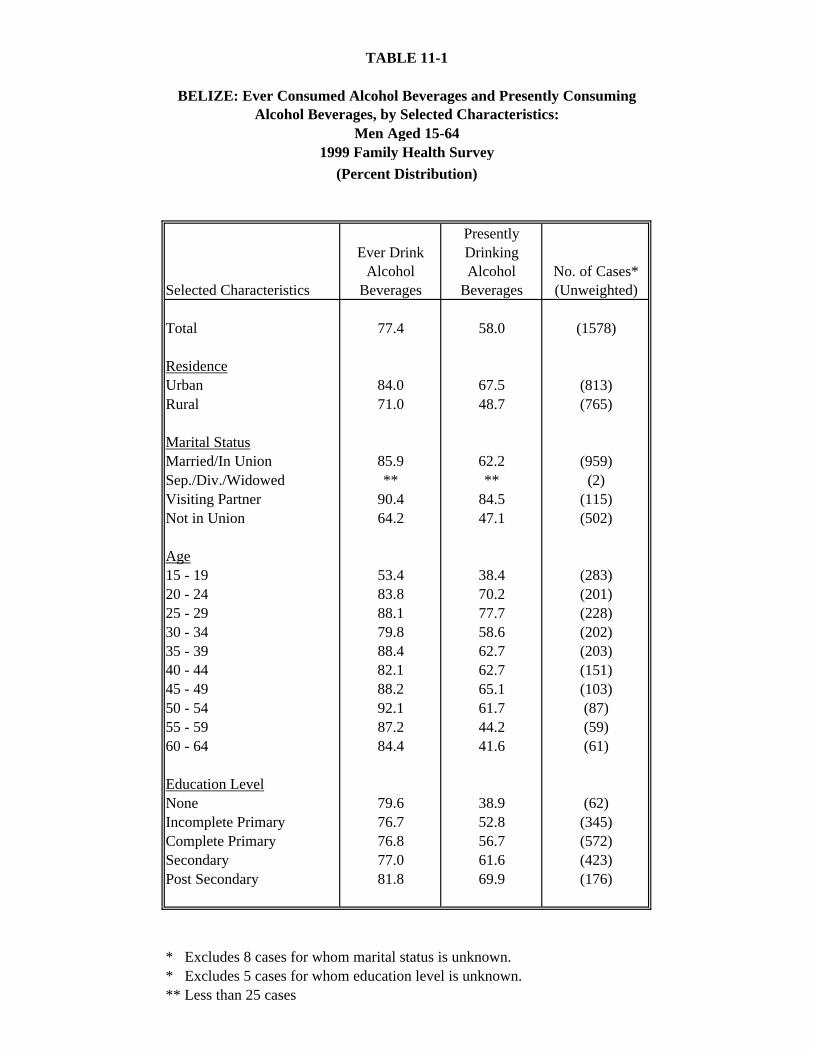
BELIZE: Ever Consumed Alcohol Beverages and Presently Consuming Alcohol Beverages, by Selected Characteristics:
Men Aged 15-641999 Family Health Survey
Selected Characteristics
Ever Drink Alcohol
Beverages
Presently Drinking Alcohol
Beverages No. of Cases* (Unweighted)
Total 77.4 58.0 (1578)
ResidenceUrban 84.0 67.5 (813)Rural 71.0 48.7 (765)
Marital StatusMarried/In Union 85.9 62.2 (959)Sep./Div./Widowed ** ** (2)Visiting Partner 90.4 84.5 (115)Not in Union 64.2 47.1 (502)
Age15 - 19 53.4 38.4 (283)20 - 24 83.8 70.2 (201)25 - 29 88.1 77.7 (228)30 - 34 79.8 58.6 (202)35 - 39 88.4 62.7 (203)40 - 44 82.1 62.7 (151)45 - 49 88.2 65.1 (103)50 - 54 92.1 61.7 (87)55 - 59 87.2 44.2 (59)60 - 64 84.4 41.6 (61)
Education LevelNone 79.6 38.9 (62)Incomplete Primary 76.7 52.8 (345)Complete Primary 76.8 56.7 (572)Secondary 77.0 61.6 (423)Post Secondary 81.8 69.9 (176)
* Excludes 8 cases for whom marital status is unknown.* Excludes 5 cases for whom education level is unknown.** Less than 25 cases
TABLE 11-1
(Percent Distribution)
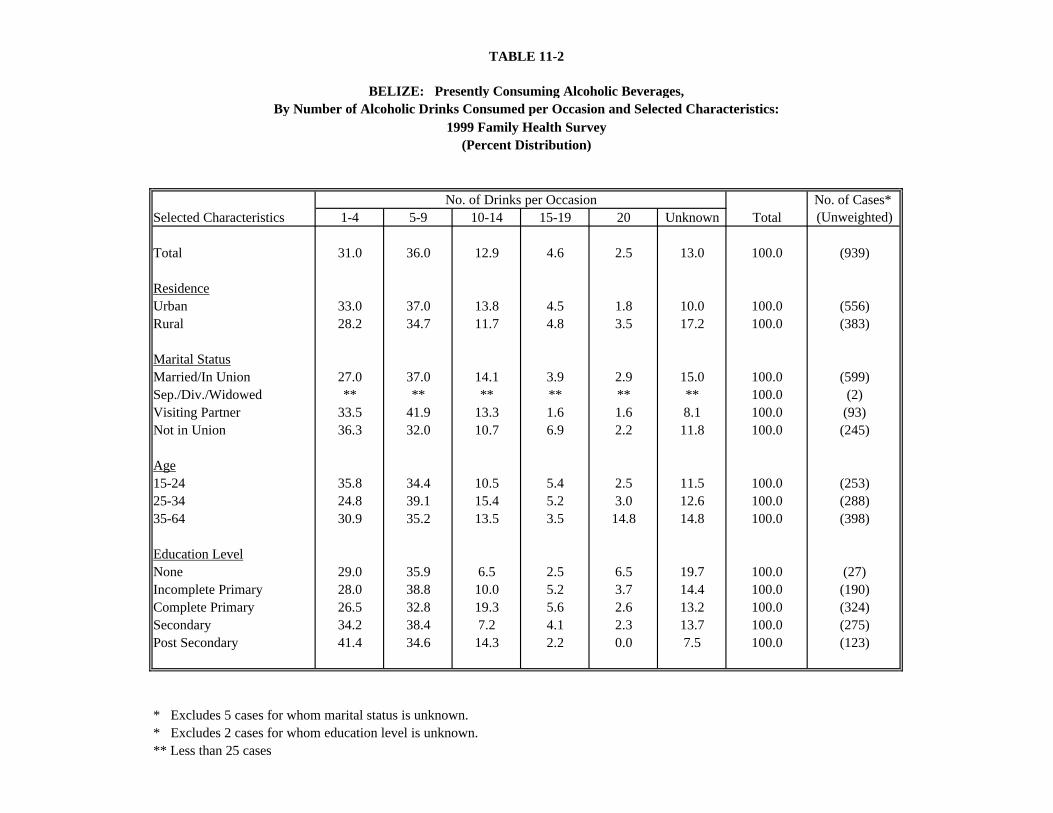
BELIZE: Presently Consuming Alcoholic Beverages,By Number of Alcoholic Drinks Consumed per Occasion and Selected Characteristics:
No. of Drinks per Occasion No. of Cases* Selected Characteristics 1-4 5-9 10-14 15-19 20 Unknown (Unweighted)
Total 31.0 36.0 12.9 4.6 2.5 13.0 100.0 (939)
ResidenceUrban 33.0 37.0 13.8 4.5 1.8 10.0 100.0 (556)Rural 28.2 34.7 11.7 4.8 3.5 17.2 100.0 (383)
Marital StatusMarried/In Union 27.0 37.0 14.1 3.9 2.9 15.0 100.0 (599)Sep./Div./Widowed ** ** ** ** ** ** 100.0 (2)Visiting Partner 33.5 41.9 13.3 1.6 1.6 8.1 100.0 (93)Not in Union 36.3 32.0 10.7 6.9 2.2 11.8 100.0 (245)
Age15-24 35.8 34.4 10.5 5.4 2.5 11.5 100.0 (253)25-34 24.8 39.1 15.4 5.2 3.0 12.6 100.0 (288)35-64 30.9 35.2 13.5 3.5 14.8 14.8 100.0 (398)
Education LevelNone 29.0 35.9 6.5 2.5 6.5 19.7 100.0 (27)Incomplete Primary 28.0 38.8 10.0 5.2 3.7 14.4 100.0 (190)Complete Primary 26.5 32.8 19.3 5.6 2.6 13.2 100.0 (324)Secondary 34.2 38.4 7.2 4.1 2.3 13.7 100.0 (275)Post Secondary 41.4 34.6 14.3 2.2 0.0 7.5 100.0 (123)
* Excludes 5 cases for whom marital status is unknown.* Excludes 2 cases for whom education level is unknown.** Less than 25 cases
Total
(Percent Distribution)
TABLE 11-2
1999 Family Health Survey
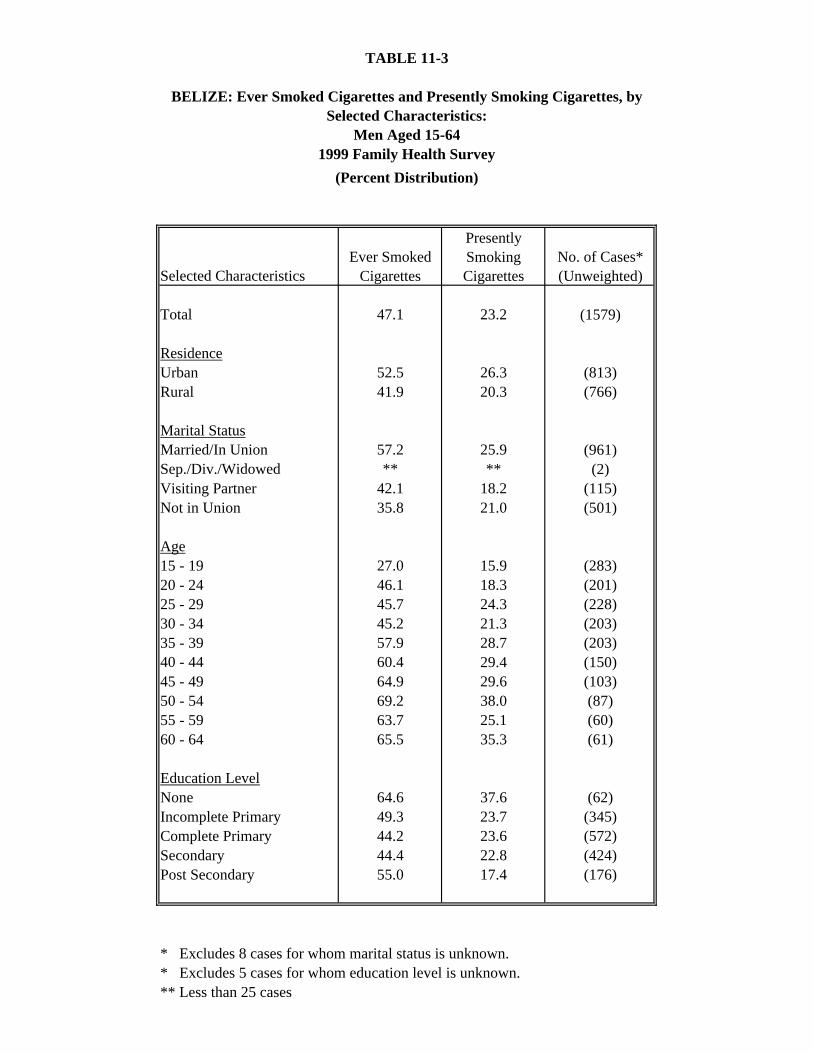
BELIZE: Ever Smoked Cigarettes and Presently Smoking Cigarettes, by Selected Characteristics:
Men Aged 15-641999 Family Health Survey
Selected CharacteristicsEver Smoked
Cigarettes
Presently Smoking Cigarettes
No. of Cases* (Unweighted)
Total 47.1 23.2 (1579)
ResidenceUrban 52.5 26.3 (813)Rural 41.9 20.3 (766)
Marital StatusMarried/In Union 57.2 25.9 (961)Sep./Div./Widowed ** ** (2)Visiting Partner 42.1 18.2 (115)Not in Union 35.8 21.0 (501)
Age15 - 19 27.0 15.9 (283)20 - 24 46.1 18.3 (201)25 - 29 45.7 24.3 (228)30 - 34 45.2 21.3 (203)35 - 39 57.9 28.7 (203)40 - 44 60.4 29.4 (150)45 - 49 64.9 29.6 (103)50 - 54 69.2 38.0 (87)55 - 59 63.7 25.1 (60)60 - 64 65.5 35.3 (61)
Education LevelNone 64.6 37.6 (62)Incomplete Primary 49.3 23.7 (345)Complete Primary 44.2 23.6 (572)Secondary 44.4 22.8 (424)Post Secondary 55.0 17.4 (176)
* Excludes 8 cases for whom marital status is unknown.* Excludes 5 cases for whom education level is unknown.** Less than 25 cases
TABLE 11-3
(Percent Distribution)
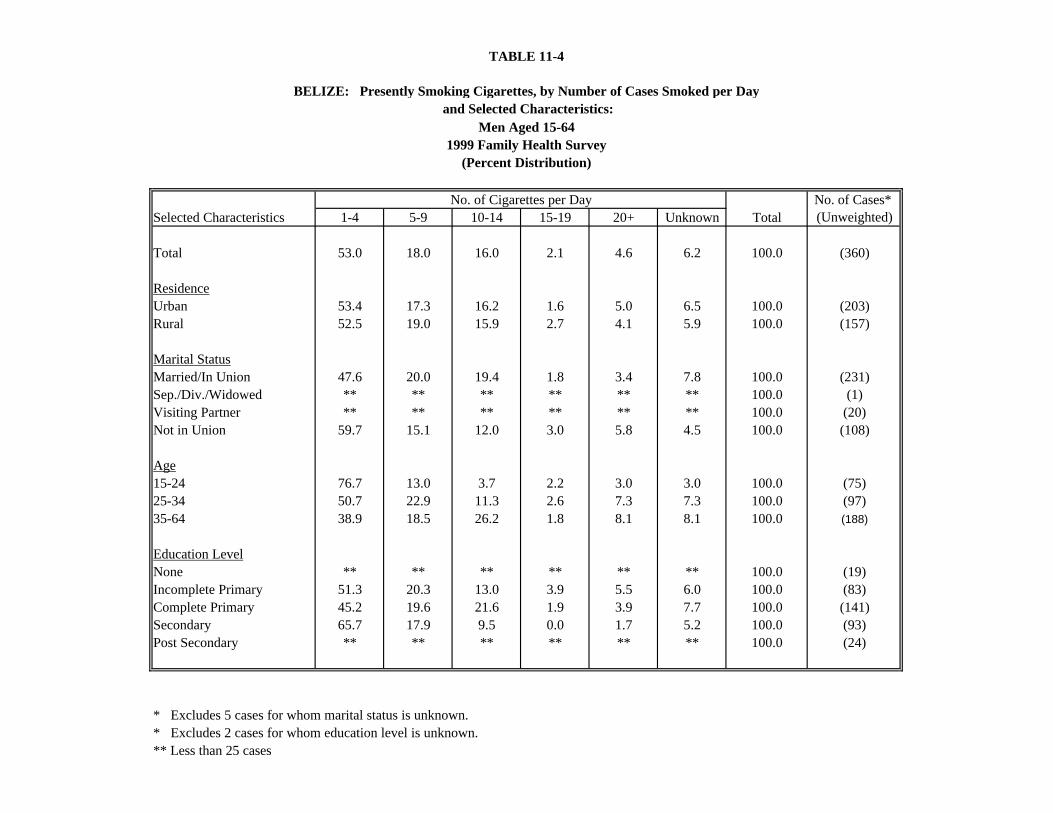
BELIZE: Presently Smoking Cigarettes, by Number of Cases Smoked per Day and Selected Characteristics:
No. of Cigarettes per Day No. of Cases* 1-4 5-9 10-14 15-19 20+ Unknown (Unweighted)
Total 53.0 18.0 16.0 2.1 4.6 6.2 100.0 (360)
ResidenceUrban 53.4 17.3 16.2 1.6 5.0 6.5 100.0 (203)Rural 52.5 19.0 15.9 2.7 4.1 5.9 100.0 (157)
Marital StatusMarried/In Union 47.6 20.0 19.4 1.8 3.4 7.8 100.0 (231)Sep./Div./Widowed ** ** ** ** ** ** 100.0 (1)Visiting Partner ** ** ** ** ** ** 100.0 (20)Not in Union 59.7 15.1 12.0 3.0 5.8 4.5 100.0 (108)
Age15-24 76.7 13.0 3.7 2.2 3.0 3.0 100.0 (75)25-34 50.7 22.9 11.3 2.6 7.3 7.3 100.0 (97)35-64 38.9 18.5 26.2 1.8 8.1 8.1 100.0 (188)
Education LevelNone ** ** ** ** ** ** 100.0 (19)Incomplete Primary 51.3 20.3 13.0 3.9 5.5 6.0 100.0 (83)Complete Primary 45.2 19.6 21.6 1.9 3.9 7.7 100.0 (141)Secondary 65.7 17.9 9.5 0.0 1.7 5.2 100.0 (93)Post Secondary ** ** ** ** ** ** 100.0 (24)
* Excludes 5 cases for whom marital status is unknown.* Excludes 2 cases for whom education level is unknown.** Less than 25 cases
TABLE 11-4
Selected Characteristics
1999 Family Health Survey
Total
Men Aged 15-64
(Percent Distribution)
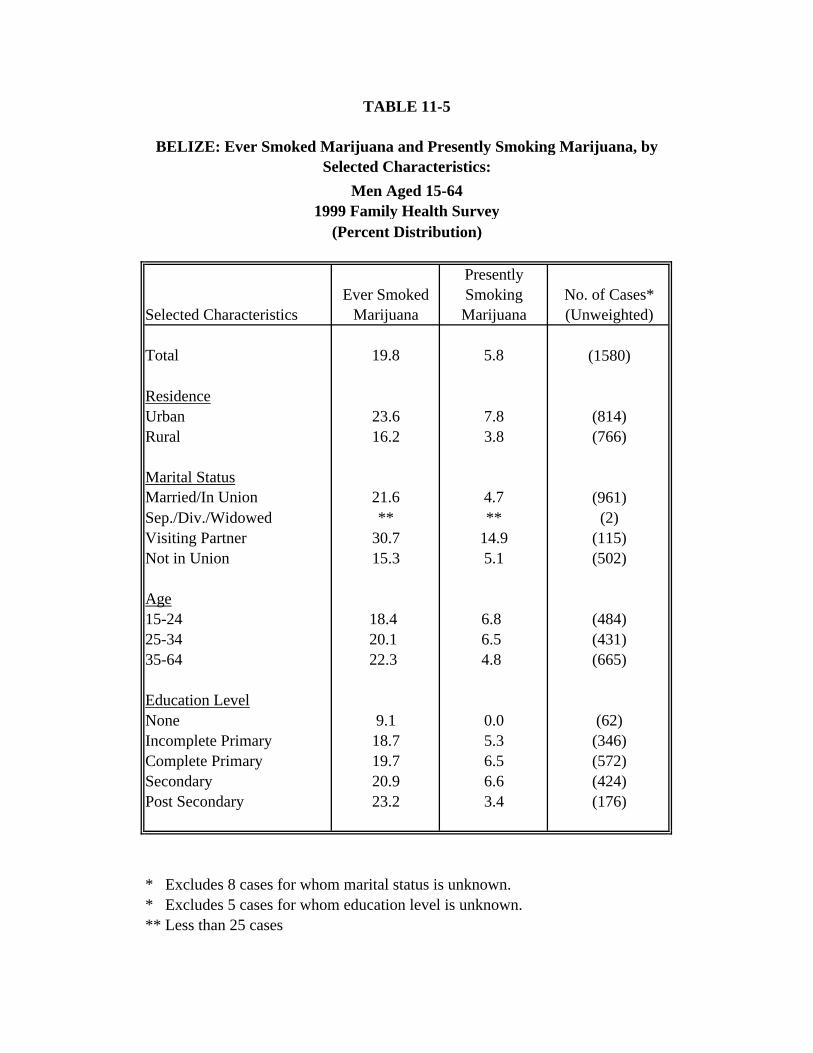
BELIZE: Ever Smoked Marijuana and Presently Smoking Marijuana, by Selected Characteristics:
Men Aged 15-641999 Family Health Survey
Selected CharacteristicsEver Smoked
Marijuana
Presently Smoking Marijuana
No. of Cases* (Unweighted)
Total 19.8 5.8 (1580)
ResidenceUrban 23.6 7.8 (814)Rural 16.2 3.8 (766)
Marital StatusMarried/In Union 21.6 4.7 (961)Sep./Div./Widowed ** ** (2)Visiting Partner 30.7 14.9 (115)Not in Union 15.3 5.1 (502)
Age15-24 18.4 6.8 (484)25-34 20.1 6.5 (431)35-64 22.3 4.8 (665)
Education LevelNone 9.1 0.0 (62)Incomplete Primary 18.7 5.3 (346)Complete Primary 19.7 6.5 (572)Secondary 20.9 6.6 (424)Post Secondary 23.2 3.4 (176)
* Excludes 8 cases for whom marital status is unknown.* Excludes 5 cases for whom education level is unknown.** Less than 25 cases
TABLE 11-5
(Percent Distribution)
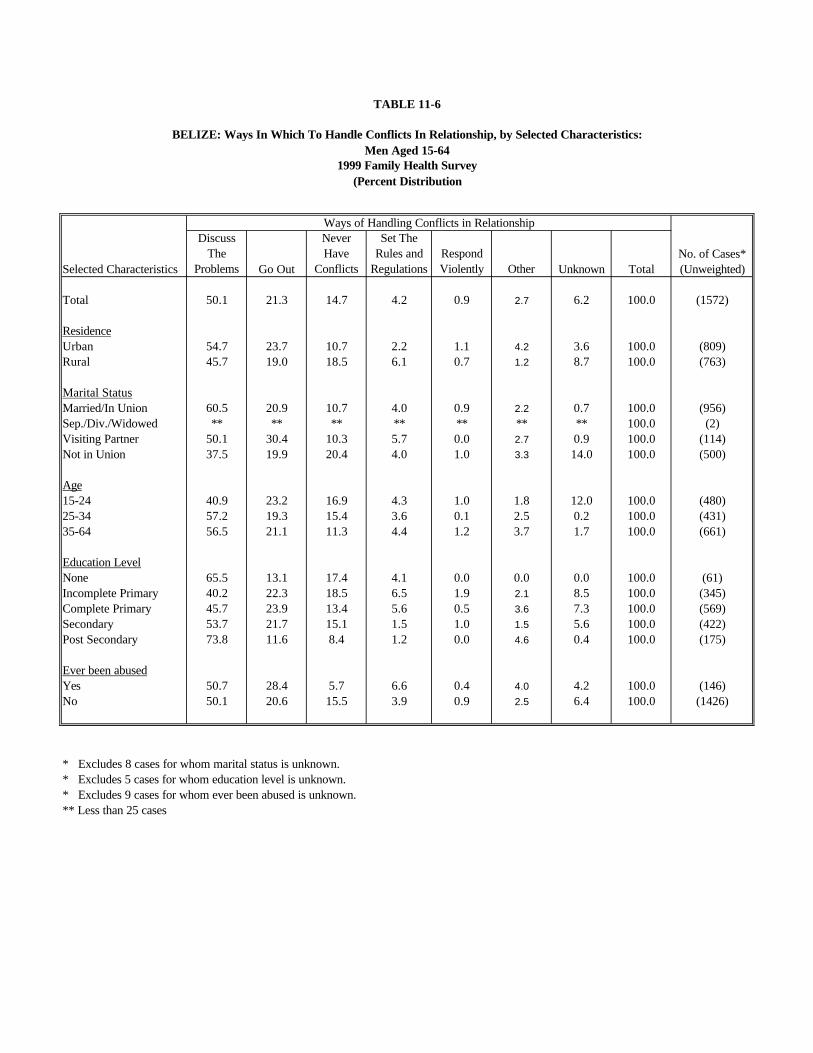
BELIZE: Ways In Which To Handle Conflicts In Relationship, by Selected Characteristics:
1999 Family Health Survey
Ways of Handling Conflicts in Relationship
Selected Characteristics
Discuss The
Problems Go Out
Never Have
Conflicts
Set The Rules and
RegulationsRespond Violently Other Unknown Total
Total 50.1 21.3 14.7 4.2 0.9 2.7 6.2 100.0 (1572)
ResidenceUrban 54.7 23.7 10.7 2.2 1.1 4.2 3.6 100.0 (809)Rural 45.7 19.0 18.5 6.1 0.7 1.2 8.7 100.0 (763)
Marital StatusMarried/In Union 60.5 20.9 10.7 4.0 0.9 2.2 0.7 100.0 (956)Sep./Div./Widowed ** ** ** ** ** ** ** 100.0 (2)Visiting Partner 50.1 30.4 10.3 5.7 0.0 2.7 0.9 100.0 (114)Not in Union 37.5 19.9 20.4 4.0 1.0 3.3 14.0 100.0 (500)
Age15-24 40.9 23.2 16.9 4.3 1.0 1.8 12.0 100.0 (480)25-34 57.2 19.3 15.4 3.6 0.1 2.5 0.2 100.0 (431)35-64 56.5 21.1 11.3 4.4 1.2 3.7 1.7 100.0 (661)
Education LevelNone 65.5 13.1 17.4 4.1 0.0 0.0 0.0 100.0 (61)Incomplete Primary 40.2 22.3 18.5 6.5 1.9 2.1 8.5 100.0 (345)Complete Primary 45.7 23.9 13.4 5.6 0.5 3.6 7.3 100.0 (569)Secondary 53.7 21.7 15.1 1.5 1.0 1.5 5.6 100.0 (422)Post Secondary 73.8 11.6 8.4 1.2 0.0 4.6 0.4 100.0 (175)
Ever been abusedYes 50.7 28.4 5.7 6.6 0.4 4.0 4.2 100.0 (146)No 50.1 20.6 15.5 3.9 0.9 2.5 6.4 100.0 (1426)
* Excludes 8 cases for whom marital status is unknown.* Excludes 5 cases for whom education level is unknown.* Excludes 9 cases for whom ever been abused is unknown.** Less than 25 cases
TABLE 11-6
No. of Cases* (Unweighted)
(Percent Distribution
Men Aged 15-64
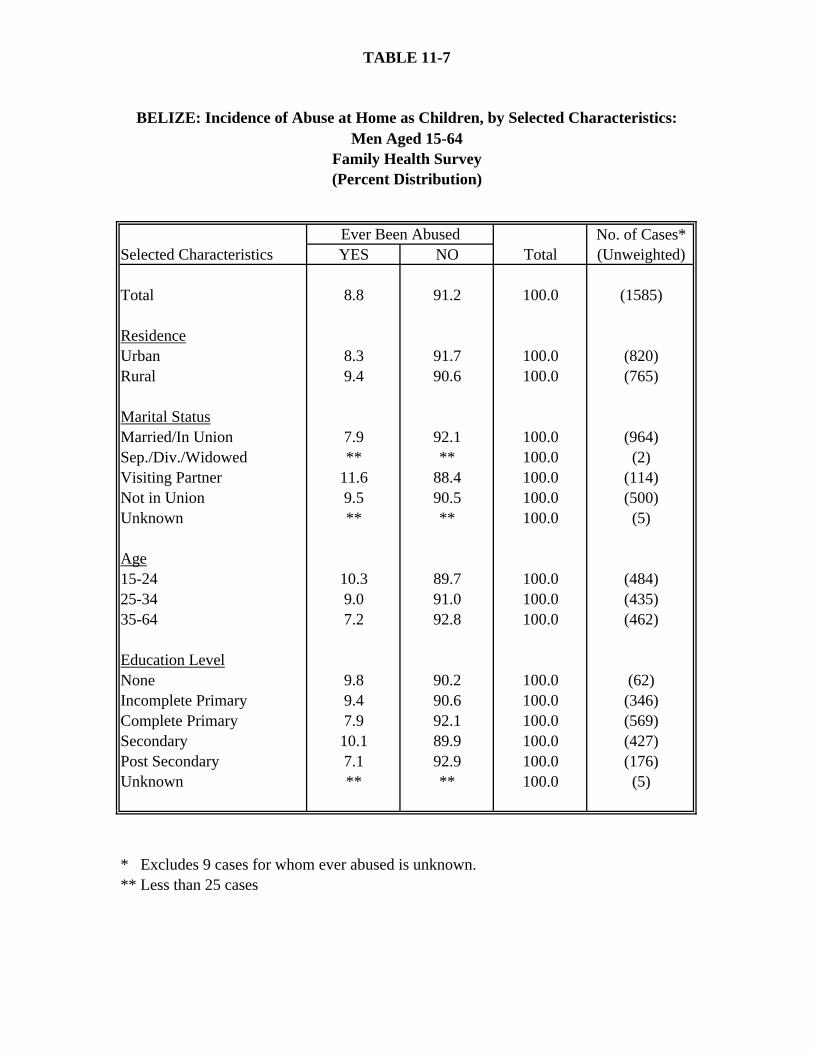
BELIZE: Incidence of Abuse at Home as Children, by Selected Characteristics:
Ever Been AbusedSelected Characteristics YES NO
Total 8.8 91.2 100.0 (1585)
ResidenceUrban 8.3 91.7 100.0 (820)Rural 9.4 90.6 100.0 (765)
Marital StatusMarried/In Union 7.9 92.1 100.0 (964)Sep./Div./Widowed ** ** 100.0 (2)Visiting Partner 11.6 88.4 100.0 (114)Not in Union 9.5 90.5 100.0 (500)Unknown ** ** 100.0 (5)
Age15-24 10.3 89.7 100.0 (484)25-34 9.0 91.0 100.0 (435)35-64 7.2 92.8 100.0 (462)
Education LevelNone 9.8 90.2 100.0 (62)Incomplete Primary 9.4 90.6 100.0 (346)Complete Primary 7.9 92.1 100.0 (569)Secondary 10.1 89.9 100.0 (427)Post Secondary 7.1 92.9 100.0 (176)Unknown ** ** 100.0 (5)
* Excludes 9 cases for whom ever abused is unknown.** Less than 25 cases
TotalNo. of Cases* (Unweighted)
TABLE 11-7
Men Aged 15-64Family Health Survey(Percent Distribution)
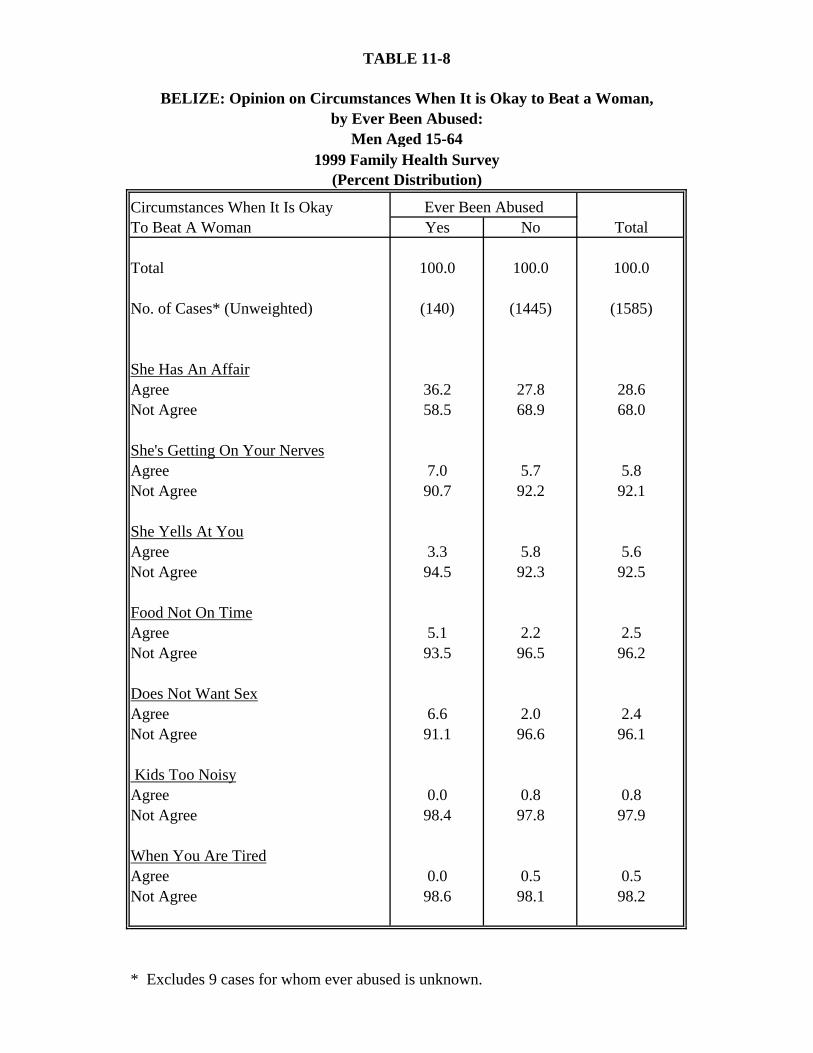
BELIZE: Opinion on Circumstances When It is Okay to Beat a Woman, by Ever Been Abused:
Men Aged 15-64
Yes No
Total 100.0 100.0 100.0
No. of Cases* (Unweighted) (140) (1445) (1585)
She Has An AffairAgree 36.2 27.8 28.6Not Agree 58.5 68.9 68.0
She's Getting On Your NervesAgree 7.0 5.7 5.8Not Agree 90.7 92.2 92.1
She Yells At YouAgree 3.3 5.8 5.6Not Agree 94.5 92.3 92.5
Food Not On TimeAgree 5.1 2.2 2.5Not Agree 93.5 96.5 96.2
Does Not Want SexAgree 6.6 2.0 2.4Not Agree 91.1 96.6 96.1
Kids Too NoisyAgree 0.0 0.8 0.8Not Agree 98.4 97.8 97.9
When You Are TiredAgree 0.0 0.5 0.5Not Agree 98.6 98.1 98.2
* Excludes 9 cases for whom ever abused is unknown.
Ever Been AbusedTotal
TABLE 11-8
Circumstances When It Is Okay To Beat A Woman
1999 Family Health Survey(Percent Distribution)
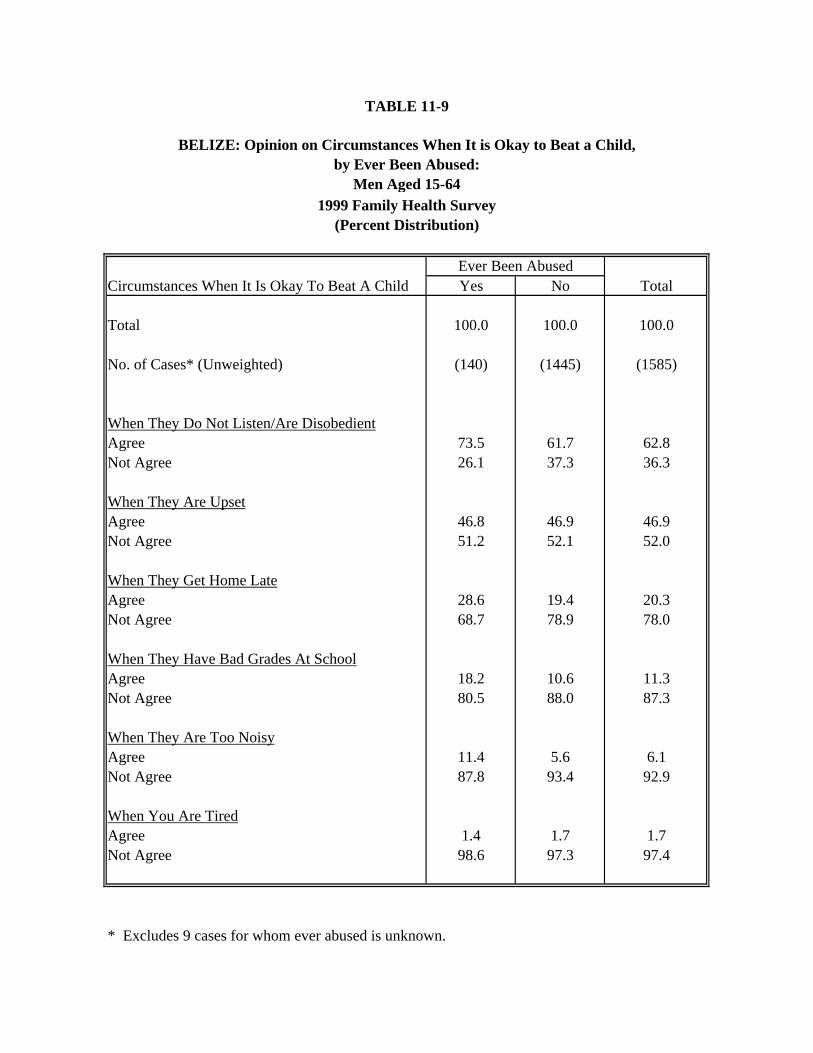
BELIZE: Opinion on Circumstances When It is Okay to Beat a Child, by Ever Been Abused:
Men Aged 15-64
Ever Been AbusedYes No
Total 100.0 100.0 100.0
No. of Cases* (Unweighted) (140) (1445) (1585)
When They Do Not Listen/Are DisobedientAgree 73.5 61.7 62.8Not Agree 26.1 37.3 36.3
When They Are UpsetAgree 46.8 46.9 46.9Not Agree 51.2 52.1 52.0
When They Get Home LateAgree 28.6 19.4 20.3Not Agree 68.7 78.9 78.0
When They Have Bad Grades At SchoolAgree 18.2 10.6 11.3Not Agree 80.5 88.0 87.3
When They Are Too NoisyAgree 11.4 5.6 6.1Not Agree 87.8 93.4 92.9
When You Are TiredAgree 1.4 1.7 1.7Not Agree 98.6 97.3 97.4
* Excludes 9 cases for whom ever abused is unknown.
TABLE 11-9
1999 Family Health Survey
TotalCircumstances When It Is Okay To Beat A Child
(Percent Distribution)
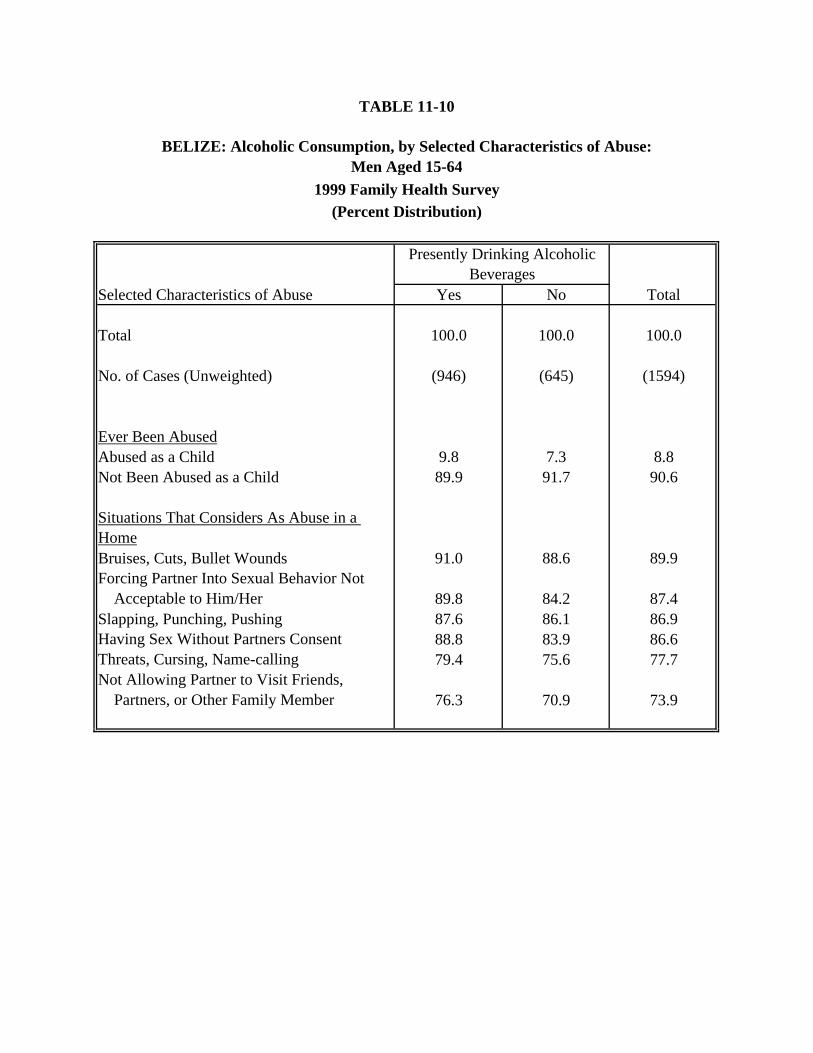
BELIZE: Alcoholic Consumption, by Selected Characteristics of Abuse:Men Aged 15-64
Presently Drinking Alcoholic Beverages
Yes No
Total 100.0 100.0 100.0
No. of Cases (Unweighted) (946) (645) (1594)
Ever Been AbusedAbused as a Child 9.8 7.3 8.8Not Been Abused as a Child 89.9 91.7 90.6
Situations That Considers As Abuse in a HomeBruises, Cuts, Bullet Wounds 91.0 88.6 89.9Forcing Partner Into Sexual Behavior Not Acceptable to Him/Her 89.8 84.2 87.4Slapping, Punching, Pushing 87.6 86.1 86.9Having Sex Without Partners Consent 88.8 83.9 86.6Threats, Cursing, Name-calling 79.4 75.6 77.7Not Allowing Partner to Visit Friends, Partners, or Other Family Member 76.3 70.9 73.9
Selected Characteristics of Abuse Total
TABLE 11-10
1999 Family Health Survey(Percent Distribution)
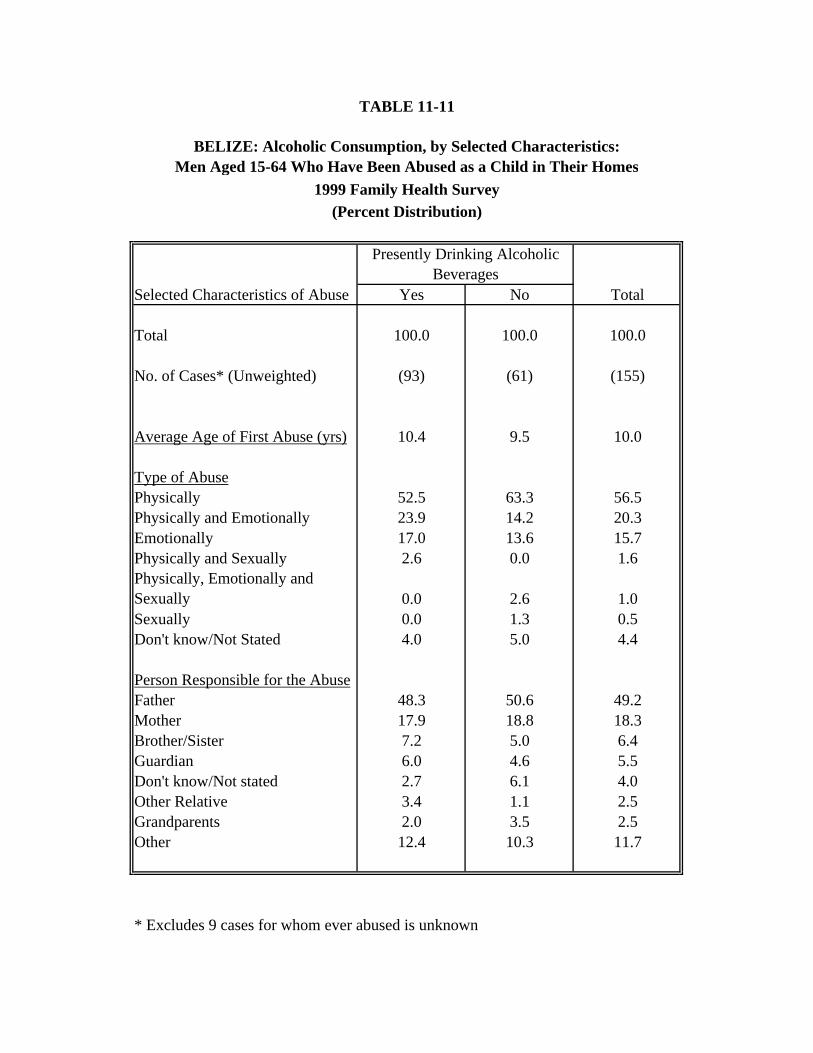
BELIZE: Alcoholic Consumption, by Selected Characteristics:Men Aged 15-64 Who Have Been Abused as a Child in Their Homes
Presently Drinking Alcoholic Beverages
Yes No
Total 100.0 100.0 100.0
No. of Cases* (Unweighted) (93) (61) (155)
Average Age of First Abuse (yrs) 10.4 9.5 10.0
Type of AbusePhysically 52.5 63.3 56.5Physically and Emotionally 23.9 14.2 20.3Emotionally 17.0 13.6 15.7Physically and Sexually 2.6 0.0 1.6Physically, Emotionally and Sexually 0.0 2.6 1.0Sexually 0.0 1.3 0.5Don't know/Not Stated 4.0 5.0 4.4
Person Responsible for the AbuseFather 48.3 50.6 49.2Mother 17.9 18.8 18.3Brother/Sister 7.2 5.0 6.4Guardian 6.0 4.6 5.5Don't know/Not stated 2.7 6.1 4.0Other Relative 3.4 1.1 2.5Grandparents 2.0 3.5 2.5Other 12.4 10.3 11.7
* Excludes 9 cases for whom ever abused is unknown
TABLE 11-11
1999 Family Health Survey
Selected Characteristics of Abuse Total
(Percent Distribution)
72
BIBLIOGRAPHY
Central Statistical Office et al , 1991 Belize Family Health Survey, Final Report, May 1992
Central Statistical Office, Abstract of Statistics, October, 1999
Central Statistical Office, Ministry of Finance, Government of Belize: Belize Labour Force Survey
1997 to 1999 (draft)
Ministry of Health and Sports, November 1996: The Quest for Equity, Belize National Health Plan
1996-2000.
PAHO: Belize Health Systems and Services Profile
Population Unit, Ministry of Human Resources, Women & Youth: Belize National Population and
Development Policy, (draft)
The National Aids Task Force, USAID, 1999: A Situational Analysis of HIV/AIDS in Belize
George A.O. Alleyne, Director. Presented at the Global Health Council’s 26th. Annual Conference:
Who Pays? Health Care Reform and Financing in Developing Countries, Arlington, Virginia, 20
June, 1999.
Aday,. L.A. and R.M., Anderson (1981). Equity of Access to Medical Care: a Conceptual and
Empirical Overview. Med. Care 19 supplement 12:4-27
Social Indicators Committee, 1998. Belize 1996 Social Indicators Report
National Health Information Surveillance Unit, Maternal and Child Health, 1999 & 2000: Monthly
Reports
OMS/UNICEF, Proteccion, promocion y apoyo de la lactancia natural. Espana. Edit.
GraficasReunidos, 1989
Atkins, B.S. Jezowski, T.W. (1983). Report on the First International Conference on Vasectomy:
Studies in Family Planning, 14(3)
Orpinal P. (1999), Who is Violent?: Factors Associated with Aggressive Behaviours in Latin
America and Spain. Editorial, Rev PANAM Salud Publica/Pan Am J Public Health 5 (4/5), 1999
Orpinas P. and de los Rios, R. (1999) La Violencia: del conocimiento a la prevencion. Editorial, Rev
PANAM Salud Publica/ Pan Am J Public Health 5 (4/5), 1999
Related Documents