FERTILIZER RESPONSE FUNCTIONS OF RICE IN SRI LANKA: ESTIMATION AND SOME APPLICATIONS by Masao Kikuchi and P. B. Aluwihare April 1990 International Irrigation Management Institute P. 0. Box 2075, Colombo, Sri Lanka

Welcome message from author
This document is posted to help you gain knowledge. Please leave a comment to let me know what you think about it! Share it to your friends and learn new things together.
Transcript
....
_.___ .......
FERTILIZER RESPONSE FUNCTIONS OF RICE IN SRI LANKA:
ESTIMATION AND SOME APPLICATIONS
by
Masao Kikuchi and P. B. Aluwihare
April 1990
International Irrigation Management Institute
P. 0. Box 2075, Colombo, Sri Lanka
FERTILIZER RESPONSE FUNCTIONS OF RICE IN SRI LANKA: ESTIMATION AND SOME APPLICATIONS
Masao Kikuchi and P. B. Aluwihare
International Irrigation Management Institute Colombo, Sri Lanka
SUMMARY
.
Rice fertilizer response functions, at the farm level as well as at the experiment station level, were estimated by type of variety and by type of irrigation condition, and applied to i) explain the long-term growth path of rice production in Sri Lanka after the independence; ii) identify the degree of contribution of the rice varietal improvements to the increase in rice production; iii) check the consistency of the past and current fertilizer recommendations f o r rice; and iv) examine the possible impacts of fertilizer subsidy withdrawal on rice production in the country.
The estimated response functions at the farm level reproduce well the macro growth path of rice production except for the 1970s when new improved varieties performed less satisfactory due to their susceptibility to insect, pest and drought. More than forty percent of the increase in rice production in the last four decades is attributable to the varietal improvements. The past and present fertilizer recommendations for rice are consistent with the response functions estimated. The long-run impacts of withdrawal of fertilizer subsidy in the rice sector would not be large as far as its yield impacts are concerned.
INTRODUCTION
Sri Lanka's records on rice production increase in the last four decades are impressive. Total rice production in the country increased at an annual compound growth rate as high as 5 . 1 percent from the time right after the independence to the late-l980s, the highest among 17 major Asian countries (Barker and Herdt 1985; 4 5 ) , bringing the country from a state in which 60 percent of domestic rice consumption was met by rice import up to near self- sufficiency in rice. A critical factor that has brought about such a dramatic increase in rice production in Sri Lanka is, as in other Asian countries, the introduction and diffusion of new fertilizer-responsive rice varieties; the centerpiece of the trinity of "green revolution technology", i.e., modern variety, fertilizer, and irrigation (Barker and Herdt, 1985). *
In the history of green revolution in Asia, Sri Lanka takes a unique position, in that, unlike in other countries in the Asian tropics where the >
1

.
revolution began with the modern varieties developed by the International Rice Research Institute in the late-l960s, the process commenced more than one decade earlier, based on the improved varieties developed by indigenous research efforts within the country. Traditional (local) varieties were first replaced by ‘old improved varieties’ which were in turn replaced by ‘new improved varieties’ (as to the history of rice varietal improvements in Sri Lanka, see, e.g., Senadhira a. 1980).
Whenever one wants to analyze the process, impacts and consequences of developments in rice production technology, the most basic information needed is the functional relationship between rice yield and fertilizer under different types of irrigation conditions at the farm fields. In spite of the importance of having general knowledge on this, it seems that few systematic attempts have been made so far to consolidate scattered data, while keeping consistency with the unique nature of the technology developments specific to Sri Lanka, into a solid form that can be used as a basis for analyses in this field. An attempt to provide a set of rice fertilizer response functions in Sri Lanka was made by Herdt and Capule (1983). Unfortunately, however, since their study was intended to be a comprehensive overview of the issue in Asia covering 11 Asian countries, no detailed explanations of the estimation process were provided for Sri Lankan as well as for other country cases.
A major purpose of this paper is to fill this gap by estimating rice fertilizer response functions by type of variety and by type of irrigation condition. variety-fertilizer trials carried out in various agricultural experiment stations in the country for a period from 1957 to date, and adjust them to the farmers’ fields. Then, using the estimated fertilizer response functions, we simulate the long-term macro growth path of rice production after the independence; identify the contributions to the production growth of varietal improvements, increases in fertilizer use and development of irrigation infrastructure; check consistency of the past and current fertilizer recommendations for rice; and examine the possible production impacts of withdrawal of the fertilizer subsidies that is currently under way in the country.
We first estimate the response functions using the data on
ESTIMATION OF FERTILIZER RESPONSE FUNCTIONS
Among the three major nutrients of fertilizer, nitrogen has the most significant impact on rice yield. Although the application of phosphorus and potassium fertilizers is certainly essential to rice growth, their direct yield effects are generally far less appreciable than nitrogen (see, e.g., Constable 1966; Nagarajah 1980; and Shibata u. 1990). It is a well established convention to represent the fertilizer-yield response relation by a quadratic equation of the following form:
Y = a t bN - cN* (1)
where \i denotes rice yield per hectare, N denotes nitrogen input per hectare, and a, b and c are parameters. Our aim in this section is to estimate farm-
n
i

c
level response functions of this form, that can be considered as the average, or typical, functions for the country as a whole by type of variety and by type of irrigation condition.
There are two ways to attain this objective; first to estimate the farm- level functions directly using farm survey data, and second to estimate first the functions using the data generated in agricultural experiment stations and then adjust them down to the farm-level. Since there is no available farm survey data comprehensive enough to make the estimation of rice fertilizer response functions as required here possible, we adopt the latter method.
Response Functions at Experimental Fields
In order to estimate the response functions at the experimental field level, data on variety and fertilizer trials conducted in the agricultural experiment stations scattered around the country during the period from 1957 to date were gathered and sorted out into three variety groups; traditional, old improved, and new improved varieties.
The data used for the analysis are presented in Appendix by variety group. Although the best efforts were made to collected as much data as possible, we have to admit that the data set we collected is only a small part of the total variety and fertilizer trial experiments conducted in the country in the past. ( A great difficulty encountered in this data collection process was that many records of past experiments have been scattered and lost because of non-existence of systematic data reporting system in the agricultural experiment stations. Many records of experiments conducted in these stations pertain to the researchers who conducted the experiments, and, therefore, difficult to get access after they left the stations. In order to make the maximum use of agricultural research, it is highly desirable to establish a well organized system for reporting and preserving the results of various experiments conducted in the stations.)
The response functions of the form Equation (1) were estimated using these experimental data by type of variety. Needless to say, fertilizer responsiveness differs from variety to variety even within a variety group. It is also well known that a variety shows different fertilizer responsiveness between the wet (maha) and dry (yalal seasons. There may exist differences among locations and years of experiments. In order to control these differences and arrive at the average function, intercept dummies were introduced in the estimation for season (maha-yala), growth duration (short-long), individual variety, location, and year. The results of estimation by using the ordinary least squares method are summarized in Table 1. Since the number of dummy variables included in each equation is large, their coefficients are not shown in the table except for the season and growth duration dummies.
The goodness of fit is satisfactory for all equations estimated. Even for the traditional varieties which reveal a wide variation in the yield level across individual varieties, 66 percent of the total variation is explained by the level of nitrogen and dummy variables. The estimated
3

coefficients of nitrogen linear and nitrogen square are statistically different from zero, except for the coefficient of nitrogen square for old improved varieties, which is not significant at the conventional significance level but is different from zero at the 15 percent probability level. Such results support our model for fertilizer responsiveness of quadratic form.
It is clearly shown that the yield response to nitrogen becomes higher when one shifts from traditional varieties to old improved varieties, and further to new improved varieties. The average intercept, which is estimated by evaluating all dummy variables at their respective means, also increase from 2.7 (metric) tons for traditional varieties to 3 . 2 tons for old improved varieties, and to 4.0 tons for new improved varieties, suggesting that even with zero nitrogen newer varieties have higher yield potentials. As expected, the yield in the yala season is significantly higher than in the maha season except for traditional varieties. The growth duration dummy shows any significant impact on rice yield neither for old nor for new improved varieties.
Response Functions at Farm Level
The next step is to adjust the estimated response functions at the experimental field level down to the farm level. It is expected that the response functions at the farm level reveal less fertilizer responsiveness than at the experimental fields which have ideally controlled conditions in terms of soil, water, pest, disease and weed controls, and so on. Critical information needed for this adjustment is about a possible gap in the response functions between the experiment station and farm field levels, after controlling levels of fertilizer as well as other inputs. Only well designed experiments using both experimental and farmers’ fields give appropriate information of this kind.
Jayawardena u. (1983; 8 9 ) gives such an estimate. Their estimates of the yield gap between research stations and farmers fields center around 60%. Adopting this rate of gap, the response functions in Table 1 were adjusted vertically downward to arrive at the farm level functions under the irrigated condition. For old and new improved varieties, this adjustment was made including the (average) intercepts. For traditional varieties, the intercept of the farm level function was determined by referring to the national average rice yield fok the period 1951-57, while adjusting for the nitrogen input per hectare during the same period. The period 1951-57 was chosen because this was the period when 100% of paddy fields were planted with traditional varieties: the first year when old improved varieties appeared in farmers’ fields was 1958.
The response functions at the farm level thus estimated were further adjusted downward to reach those under the rainfed condition. For doing this, it is necessary to find out an appropriate adjustment coefficient. Such a coefficient was obtained for new improved varieties from the production cost surveys conducted and compiled by the Department of Agriculture (1985, 1987, and 1988). This series, which gives the data on rice production including yield and nitrogen levels by district, includes some districts for which the costs are reported both for irrigated and for
.

.
rainfed rice production. available is 15 for the maha 1984/85, 12 for the maha 1985/86, and 9 for the maha 1986/87. It should be noted that these seasons were selected for deriving the coefficient because the overwhelming majority of the sample farmers planted new improved varieties in these recent years. The adjustment coefficient was constructed by taking the average yield gap, over three seasons, between irrigated and rainfed fields for these districts, after accounting for the difference in nitrogen input levels. Based on this gap coefficient, 1:0.803, the response functions under the irrigated condition were reduced to 80% both vertically and horizontally.
The number of districts for which such data are
The rice fertilizer response functions by variety group and by type of irrigation thus estimated are summarized as follows:
Traditional varieties; irrigated Y 1500 t 10N - 0.09NZ Traditional varieties; rainfed Y = 1200 t 10N - 0.12NZ Old improved varieties; irrigated Y = 1900 t 14N - 0.06N2 Old improved varieties; rainfed Y = 1500 t 14N - 0.08NZ
New improved varieties: irrigated Y = 2400 t 21N - 0.08N2 New improved varieties; rainfed Y = 1700 t 21N - O.lONZ
These functions are quite similar to those presented by Herdt and Capule (1983; 5 3 ) , except that the intercepts of o u r functions are consistently lower than theirs. It is also noted that our estimates are comparable to those of the Philippines (David and Barker 1978; 183) and of other countries presented in Herdt and Capule (1983; 53).
APPLICATIONS
Long-Term Rice Production Growth Path in Sri Lanka
The rice fertilizer response functions estimated in the previous section are based on many heroic assumptions. How close these functions represent the national average response functions by type of variety and by type of irrigation? As a way to check it, we attempt to simulate the log-term growth path of rice production in the country based 6n the estimated response functions. The total rice production in the country can be estimated by, first, substituting actual levels of nitrogen input per hectare by type of variety and type of irrigation into respective response functions to obtain estimated yields per hectare; multiplying the estimated yields and actual harvested areas for respective categories; and then summing up over the six categories.
Actual levels of these variables are shown in Table 2 for selected years, together with the actual levels of total rice production. A l l data in the table are expressed in terms of five-year averages to deal with the long- term trend. Unfortunately, the data on actual nitrogen level per hectare of rice area harvested are available only fo r the overall average, not by type of variety and type of irrigation. Similarly, the data on percentage share
5

of area planted to certain variety groups are available only for the country as a whole. To overcome these problems, the following assumptions were made: i) the differences in actual levels of nitrogen input per hectare by type of variety and type of irrigation are proportional to the differences in the optimum levels of nitrogen input per hectare by these types under the actual price ratio between nitrogen and rice; and ii) the varieties in a newer variety group, when they appeared, were first planted on the irrigated area. The data on nitrogen-rice price ratio are available only in and after 1958. For the prior years, the ratio is assumed to be 4:l. Since the nitrogen use
possible biases in this assumption would not bring in any substantial biases in our production estimates.
for rice production during the 1950s was minimal as shown in Table 2, .I
The series of estimated rice production is depicted in Figure 1, together with the actual series. levels for selected years are as follows:
The gaps between the actual and estimated
Actual Estimated (1000 mt)
1955 613 637 1960 864 822 1965 990 1036 1970 1409 1381 1975 1400 1725 1980 2065 2305 1985 2605 2663
Discrepancy ( % I -4
-5 2
-23 -12 - 2
3
Except the 1970s during which our series overestimates the actual levels more than 20%, the response functions succeed to reproduce the actual levels of total rice production in the country within a range plus and minus 5%.
It should be noted that Sri Lanka experienced serious set-backs in the rice production during the 1970s; as shown in Figure 1, the total rice production decreased even in terms of five-year moving averages. These set- backs were the combined results of lower yields per hectare and lower rice harvested areas during the period, the former being much more serious than the latter. The national average rice yield that had once reached a level more than 2.5 &/ha in 1969 started to decline towards the mid-l970s, and it declined to a level as low as 1.9 mt/ha in 1975. It was in 1980 that the 1969 yield level was recovered. As the trend of actual rice production returned to its long run trend line towards the early-l980s, the discrepancy between the actual and estimated rice production nearly disappeared.
Thus, the set-hacks in rice yields experienced in many countries in Asia in the mid-1970s due mainly to susceptibility of new rice varieties to such adverse growing conditions as insects, pests, and drought exerted pressure for the rice production in Sri Lanka to diverge from its long-term trend. The discrepancy between the actual and estimated rice production could be an indicator to measure the degree of damage that Sri Lanka suffered from the ‘food crisis’ in the 1970s.
Contributing Factors to Rice Production Growth .
6

. The fact that our rice fertilizer response functions, coupled with changing shares of variety groups and increasing levels of irrigated rice area and nitrogen input, simulate well the actual growth path of rice production implies that these factors have been major contributors to the production growth. An interesting question to be raised then is the relative contributions of these factors in the total rice production growth. It is difficult to give an exact answer to this question, partly because these factors are highly complimentary each other and partly because other factors that are not taken into account here, such as labor inputs, also affect the level of rice production. However, rough orders of contributions derived from these three factors could be worked out as follows:
First, estimate the rice production with the 1952 (1950-54 average) levels of variety ratio, nitrogen input per hectare, and irrigation ratio, and with the 1985 (1983-87 average) level of total rice harvested area, and subtract this from the estimated 1985 rice production. This difference represents the effects of all technological changes associated with varieties, fertilizer, and irrigati~n'~] between 1952 and 1985. Second, estimate the rice production with the 1985 level of total rice harvested area, but substituting separately one of the three factors at the 1952 level while keeping other two factors at the 1985 levels. Subtracting the resulting rice production estimates from the estimated 1985 rice production, the effect of technology change in a certain factor is singled out. However, because of complementarity among the three factors, the sum of individual effects over the three factors exceeds the total effect estimated in the first step. that the sum equals the total effect.
The contributions of each factors are adjusted proportionally so
Third, subtract the estimated 1952 rice production from the production estimate obtained i n the first step. This difference represents the contribution of harvested area increase to the increase in rice production. As made clear by Thorbecke and Svejnar (1987) , the increase in rice harvested area in Sri Lanka during the post independence period has been due largely to the irrigation investments made in the dry zone. It may be, therefore, not a serious mistake to add up this contribution to the 'productivity' effect of irrigation obtained in the second step. Lastly, the total increase in rice production is obtained by subtracting the estimated 1985 production from the estimated 1952 production.
The total increase in rice production between 1952 and 1985, and contributions of variety, fertilizer, and irrigation are summarized as follows:
(1000 mt) ( X )
Total increase 2087 (100) Increase due to:
Variety 861 ( 4 1 ) Fertilizer 561 ( 27) Irrigation 665 ( 32)
The impact of varietal improvements on the rice production increase was

large. A hypothetical growth path of rice production in Sri Lanka, if there had been no varietal improvements (no old as well as new improved varieties), is depicted in Figure 2. This hypothetical growth path was estimated assuming that the rice varieties planted remain as in 1952 (traditional varieties 100%) and that other factors, nitrogen, irrigation ratio, and harvested area, increase as actually did.
Optimum Nitrogen Levels and Fertilizer Recommendations for Rice
There have been five fertilizer recommendations in Sri Lanka, including the current one, How are the recommended levels of nitrogen in these fertilizer recommendations for rice compared to the optimum levels of nitrogen derived from the response functions? The optimum nitrogen levels by type of variety and type of irrigation can be obtained by equating the first derivative of the response functions with the nitrogen-rice price ratio:
( P f / P r ) = b - 2cN (2)
where Pf = price of nitrogen, Pr = price of rice, and the right hand side of the equation is the first derivative of Equation ( 1 ) . Table 3 summarizes the optimum, actual, and recommended levels of nitrogen per hectare for selected years.
A distinct feature of Sri Lanka with respect to fertilizer use in the rice sector is that the price ratio between fertilizer and rice has been low because of heavy subsidies given to fertilizers. As shown in the table, the nitrogen-rice price ratio has been far below 2.0 except in 1960. As a result, the optimum levels of nitrogen have been quite high for all types of variety; throughout the period after 1960, it has been within a range from about 40 kg/ha for traditional varieties under the rainfed condition to 120 kg/ha for new improved varieties under the irrigated condition. These optimum levels are very close to the respective maximum nitrogen levels that correspond to the maximum attainable yields. The actual levels of nitrogen per hectare were lower than the optimum levels. The gaps between these two levels, however, had become narrower over time, and by 1985 the actual nitrogen use per hectare for each category reached a level that was 70% of the respective optimum level.
The recommended nitrogen levels have been revised upward from the first to the latest recommendations. The largest revision was made between the 1967 and 1971 recommendations, in which the highest nitrogen level was raised nearly twice as high as the previous level. 1971 and 1980 recommendations is closer to, but yet within, the optimum level for new improved varieties under the irrigated condition. It is interesting to note that the lower bound recommended nitrogen level too was adjusted downward after the 1967 recommendations so that the optimum nitrogen level for traditional varieties under the rainfed condition fell within the recommended range. The fertilizer recommendations for rice in 1971 as well as in 1980 are thus consistent with the optimum levels of nitrogen derived from the fertilizer response functions.
The highest level given in the
. 8

Impact of Fertilizer Subsidy Withdrawal on Rice Production
As from January 1990, the government of Sri Lanka lifted up the heavy subsidies that had been put on fertilizers for a quite a long time. This withdrawal of subsidies would affect rice production negatively through raising fertilizer prices. A question is how serious the impact will be.
An answer could be given by applying the response functions as follows. First derive the demand function for fertilizer by rearranging Equation (2):
N = b(1/2~) - (1/2c)(Pf/Pr) ( 3 )
Second, estimate new nitrogen levels for different variety groups under different irrigation conditions by substituting the new price ratio after subsidy withdrawal into Equation ( 3 ) . Third, estimate new yield levels by substituting the new nitrogen levels into respective fertilizer response functions. Then, obtain the weighted average of yields for different variety groups under different irrigation regimes using percentage shares of each group as weights. The impact of subsidy withdrawal on rice yield is assessed by comparing the yields before and after the subsidy withdrawal.
An alternative way, which is more convenient for exposition, is to assume constant elasticity functions for fertilizer demand and rice yield, i.e.,
N = aP-“
Y = 13N6
( 4 )
( 5 )
where N = nitrogen demand, P = price of nitrogen relative to rice price, u = price elasticity, a = other demand shifters, Y = rice yield per hectare, 6 = production elasticity, and 13 = other yield shifters. By definition, -0 = (dN/dP)/(P/N) and 6 = (dY/dN)/(N/Y). Then, the following relations are derived:
(N’/N) = (P’/P)-” ( 6 )
(Y’/Y) = (N’/N)S (7)
where the variables with ( ’ 1 denote their respective level after subsidy withdrawal. By substituting Equation ( 6 ) into Equation (71 , the impact of subsidy withdrawal on rice yield is expressed as:
(Y’/Y) = (P’/P)-06 ( 8 ) I
Let us evaluate u and 6 as the point estimates using the composite fertilizer response function at the 1985 (1983-87 average) variable levels. Given the percentage shares of areas planted to each variety group under each irrigation regime as in 1985, the response functions are aggregated into the following composite function:
Y = 2140 t 20.4N - 0.086N2 ( 9 )
9

With this function and the nitrogen-rice price ratio of 1.75, the elasticities are estimated as a = 0.135 and 6 = 0.175.
The rate of subsidy given to nitrogen was, on the average for 1985-1987, R s 3 . 4 per kg of nitrogen, while its retail price was Rs 6.7 per kg (NFS, 1988). (the information from NFS). will be raised by 50 to 70% if the subsidy is totally withdrawn.
It was Rs 5.7 per kg, with the retail price of Rs 8.5 per kg in 1989 These data indicate that the nitrogen price
Let us assume here that the nitrogen price be increased by 100% because of subsidy withdrawal while the farm-gate price of rice is kept constant. Substituting 2.0 into Equation ( 8 ) , we obtain (Y’/Y) = 0.984. That is, the percentage decline in rice yield due to the subsidy withdrawal for nitrogen would be 1.6%. Assuming no change in the rice area harvested, this implies a decrease in the total rice production of about 42,000 mt (in paddy term). This order of change could be said ‘small’; any small changes in other factors related to rice production, particularly changes in rice price and weather, would cancel out, or obscure, the impact of fertilizer subsidy withdrawal. The first method to assess the impact of subsidy withdrawal gives essentially the same result.
It should be noted that such a small impact of subsidy withdrawal is projected primarily because of the low price elasticity of nitrogen demand, which is a result of the fact that the pre-withdrawal level of nitrogen intensity in rice farming in Sri Lanka was quite high. Should the intensity be lower and therefore the elasticity be higher the impact of withdrawal could be much larger. In other words, the ‘matured’ nature of rice farming in Sri Lanka in terms of seed-fertilizer technology absorbs the shock to be created by the fertilizer subsidy withdrawal.
Regarding this exercise, two qualifications should be in order. First, the impact assessed here is of long run nature; ceteris paribus, the level of impact projected here will be realized in the long run. In the short run, an actual impact could be larger than the long run impact, because of the adjustment process involved. Second, not only yield but also area planted to rice will be affected by a higher fertilizer price due to subsidy withdrawal. To the extent that shifts in area planted, either away from or to rice, are induced by changes in fertilizer-output relative prices for rice and non-rice crops, the impact on total rice production diverges from the impact on yield. In order to assess the total impact, it is necessary to have an area response function, in addition to the yield response function.
CONCLUSIONS
In this paper, we estimated rice fertilizer response functions at the farm level by type of variety and by type of irrigation condition through estimating first those at the experiment field level by using variety and fertilizer trial data and then adjusting them t o the farm level. The estimated functions could reproduce well the long run macro growth path of rice production i n Sri Lanka in the post independence period, except for the
.
10

1970s when the actual levels of total rice production diverged from its long term trend line because of less satisfactory performance of new improved varieties then due to their susceptibility to insect, pest and drought.
Among three critical factors, i.e., variety, fertilizer, and irrigation, that brought about the increase in rice production, varietal improvements contributed most, about 40% of the total increase, and other two factors contributed about 30% each. The recommended nitrogen levels in the fertilizer recommendations for rice are consistent with the optimum levels derived from the estimated response functions. The present recommended levels could be applicable even after the withdrawal of fertilizer subsidies. It was estimated that the yield impact of fertilizer subsidy withdrawal would be small in the long run, in the order of 1 to 2%. Such a small impact is due primarily to the fact that the price elasticity of nitrogen demand is quite low because of the high nitrogen intensity before the subsidy withdrawal.
ACKNOWLEDGEMENTS
This study was carried out as a part of a research project in the International Irrigation Management Institute with a grant from the Japan International Cooperation Agency. The authors are grateful to Dr. C. R. Panabokke for valuable suggestions and comments given in the course of this study. Their acknowledgement also goes to Mr. C. A. Sandanayaka and Mr. W . M. A. D. B. Wickramasinghe of the Batalagoda Agricultural Experiment Station, who gave the authors invaluable help in searching data on fertilizer trials in various stations in Sri Lanka. All possible cavities and errors in the paper are due to the authors.
REFERENCES
Barker, R., and R.W. Herdt. 1985. The rice economy of Asia. Washington,D.C., Resources for the Future.
Constable, D.H. 1960. Fertilizer evaluation on rice in cultivators fields in Ceylon. In D.V.W. Abeygunawardena ed. Research and production of rice in Ceylon. Peradeniya, Department of Agriculture, pp.71-82.
David, C.C., and R . Barker. 1978. Modern rice varieties and fertilizer consumption." In Economic consequences of the new rice technology. Los Banos, the Philippines, International Rice Research Institute, pp.175- 211.
Department of Agriculture. 1985, 1987, and 1988. Cost of cultivation of agricultural crops, Vol.1, paddy; maha 1984/85; and maha 1985/86; maha 1986/87. Peradeniya, Department of Agriculture.
11

Department of Census and Statistics. 1988. Agricultural statistics of S r i Lanka. Colombo, Department of Census and Statistics, ministry of Plan and Implementation.
Department of Census and Statistics. Various issues. Statistical abstract of Democratic Republic of Sri Lanka (Statistical abstract of Ceylon until 1970). Colombo, Department of Census and Statistics, ministry of Plan and Implementation.
Herdt, R.W., and C. Capule. 1983. Adoption, spread, and production impact of modern rice varieties in Asia. Los Banos, the Philippines, International Rice Research Institute.
International Rice Research Institute. 1988. World rice statistics. Los Banos, the Philippines, International Rice Research Institute.
Jayawardena, S.D.J., K. Tanaka and T. Watabe. 1983. Potential productivity of rice in the low-country wet zone of Sri Lanka. JARQ. 17(2), pp.87- 91 I
Nagarajah, S . 1980. Fertilizer research for rice cultivation. In Rice symposium 80. Peradeniya, Department of Agriculture, pp.159-198.
Nagarajah, S. 1985-86. Fertilizer recommendations fo r rice in Sri Lanka: A historical review. Journal of the soil science society of Sri Lanka. V01.4, 1985-86, pp.3-29.
National Fertilizer Secretariat. 1988. Review of fertilizer: Year 1987 Colombo, Ministry of Plan Implementation.
Senadhira, D., M.P. Dhanapala, and C.A. Sandanayaka. 1980. Progress of rice varietal improvement in the dry and intermediate zones of Sri Lanka. In Rice symposium 80. Peradeniya, Department of Agriculture, pp.15-31.
Shibata, T., W.G.G. J . Costa and G. Ratnayake. 1990. Summary of the agronomic studies on rice cultivation conducted at demonstration and experiment farm of Integrated Agricultural Development Demonstration Project in System ‘C’, Mahaweli area. Colombo, Mahaweli Economic Agency and Japan International Cooperation Agency.
Thorbecke, E., and J. Svejnar. 1987. Economic policies and agricultural performance in Sri Lanka, 1960-1984. Paris, OECD.
I
1 2

. Table 1. Estimated fertilizer response functions at the experiment station
field.a) -
Traditional Old New Variable improved improved
Interceptb 1 2515 4359 4834
varieties varieties varieties
(12.491) (22.298) (12.312)
N
NZ
SeasonC 1
16.4 24.2 34.3 (2.949) (3.967) (12.641)
-0.125 -0,098 (-1.645) (-1.434)
-0.129 (-6.666)
-354 -678 -627 (-1.443) (-5.271) (-4.864)
The fertilizer response function is of the following quadratic equation: Y=atbN-cNZ, where Y-rice yield (kg/ha) and N=nitrogen input (kg/ha). Figures inside parenthesis are t-ratio. In the estimation, intercept dummy to represent variety and location and time of experiments were included in addition to those listed in this table. The intercepts represents the yala season; the long-duration varieties: Bathalagoda Experiment Station: 1957 for traditional and old improved varieties and 1966 for new improved varieties: and Pachcha Perumal traditional varieties, H-4 for old improved varieties, and BG 11-11 for new improved varieties. Season dummy: aaha = 1, yala = 0. Growth duration dummy: short-duration (3-3.5 months) = 1, long- duration (4 months or longer) = 0. The average intercept when all intercept dummy variables are evaluated at their mean. The number of dummy variables included in the regression analysis except for the two dummy variables listed in the table. For old improved varieties, two slope dummies are included in the analysis, but, since the regression coefficients of these dummies are not statistically different from zero at the conventional confidence level, they are not shown in the table.
For the data used in the estimation, see Appendix.

Table 2. Total rice production, rice harvested area, nitrogen inputs used for rice production per hectare, irrigation ratio, and rice variety composition in the post independence period in Sri Lanka.e)
Total Harvested Nitrogen Irrigation Variety ratioC) rice per
(1000 mt) (1000 ha) (kg/ha) production area hectare ratiob) TV OIV NIV
( X ) (---.. % ----)
(1) (2) (3) (4) (5)
- - 1952 494 423 1.7 48 100 1960 864 545 8.3 57 87 13 - 1970 1409 667 32.9 60 32 59 9 1980 2065 802 57.2 62 13 15 72 1985 2605 842 75.5 66 2 6 92
Note: a) Five-year averages centering the years shown. b) c) Percentage share of rice varieties planted: TV=traditional
Irrigated rice planted area/total rice planted area.
varieties; OIV=old improved varieties; NIV=new improved varieties.
Source: (1): Department of Census and Statistics (1988). (2) and (4): Department of Census and Statistics (various issues). (3): for 1950-60, estimated from IRRI (1988); for 1961-86, Department of Census and Statistics (various issues). (5): Rice Breeding Center of the Department of Agriculture.
.

Table 3. Fertilizer-rice price ratios, and optimum, actual and recommended levels of nitrogen after 1960.
Fertilieer- Optimum nitrogen leveleJ Recommended rice nitrogen price TV OIV NIV levelb J
ratio Irri- Rain- Irri- Rain- Irri- Rain- gated fed gated fed gated fed
(Rs/Rs)
1960 2.16
1965 1.49
1970 1.26
1975 1.82
1980 1.53
1985 1.75
74 - - 12-51 (1959)
- - 21-57 (1964) (13) 78 (20) 80 123 99 43-57 (1967)
( 3 2 ) (50) (40)
(32) (50) (40) 80 120 96 35-108 (1971)
78 121 97 30-108 (1980)
77 120 96 30-108 (1980) (44) (69) (55)
(53) (83) (66)
Note: a) Derived by equating the fertilizer-rice price ratio with the first derivative of the response functions. Figures inside parenthesis are the actual nitrogen input per hectare at the farmers’ fields.
recommendations were made. b) The years in parenthesis are those when the fertilizer
Source: Rice prices from Department of Census and Statistics (various issues), nitrogen prices from IRRI (1988) and National Fertilizer Secretariat (1987), recommended nitrogen levels from Nagarajah (1985-86; 12).

\
A% 0,
0 0 0 0 4 0 In
0 in
0 0 0 0 0 0
0 in 0 c3 N N
0 0 d l-l

.
Experiment Year Season Variety Duration Nitrogen L y ie ld levels Source s ta t i on (Kg/Ht-Kg p6ddylHa)
I. l r a d i t l o n a l va r ie t i es
Oathalagoda 1951 Oathalagoda 1951 Bath6lagoda 1951 Bathalagoda 1951 Bathalagoda 1958 Bathalagoda 1958 Oathalagod6 1958 lathalagodr I958 Oathalagoda 1958 l a t h t l a p o d l 1959 Oathalagod6 1959 Oathalagoda 1959 Oathalapod6 1959 Oathalagoda 1959 Oathalagoda 1959 Bathalagod6 1964 Oathalagoda 1964 BathahgQda 1965 Oathalagoda 1361
11. O l d inproved var ie t ies
1951 1951 I951 1058 1958 1958 1958 1958
1959 1959 1960 1960 I960 1960 1960 1961 1961 1961 1961 1961 1961 1961 I961
195a
#ah6 R6ha Maha yala iaha yala yala ya la y a l a naha raha yala yala yala yala yala yala yala naha
iaha n6ha iaha iaha maha iaha n6ha yala yala Mhl yala Mha
06h6 yala yalc 16h6 l6h6
06h6 naha
POOIYEE KOHUNAYEE KUAULUIHUO 1 3 0 2 1 3 0 2 n-302 OAHIULA 11-301 PP2462/11
113
PP2462/11 SUOUYEE 1 3 0 2 PP2462/11 PP2462/ll PP2462/11 POOIYEE 18
v i2ao i i
n301
H4 HS HI H5 H4 H5 H4 HS H4 H4 H I HI05 HSOI HI04 HI05 H501 H-6 60-1136 HIDL HI01
H I n l o l HSOI
nsoi
long long long long long long long long long long long long long long long long long long long
long short long short long short long short long long long long long long long long long long long long long long long long
0-2015 33.1-2334 61.4-2691 0-2149 33.1-3060 61.4-3519 0-2594 33.1-2951 61-4-2951 0-2801 22.5-3008 44.9-3008 61.4-3216
0-1423 33.1-3603 61.4-3838 0-3008 33.1-3415 61.4-3268 0-3112 33.1-3181 61.4-3521 0-2594 33.1-2801 61.4-2430 0-2023 33.1-2542 61.4-2691
0-2905 33.1-3060 61.4-3060 0-2905 33.1-3312 61.4-3320 0-2951 33.1-3423 61.4-3320 0-3320 33.1-3135 61.4-3683 0-2121 33.1-3112 61.4-3060 0-2645 33.1-2813 67.4-3268
0-2230 33.1-3268 61.4-383a
0-2015 3 3 . i - z 4 ~ 61.4-2853
0-3521 33.1-4oga 61.4-409a 0-2490 44.9-3060 (9.8-3112
0-3135 22.5-4301 0-3683 22.5-4150
0-2954 33.1-3631 0-2334 33.1-3519 0-2691 22.5-3423 0-2853 22.1-3423 0-3890 33.1-4201
0-2334 33.1-2853 0-2853 33.1-3423 0-2121 33.1-3008
0-2015 33.1-2386 0-2015 33.1- 3060 0-2542 33.1-3164
0-1164 33.1-2431 0-3141 44.9-3828 0-2954 44.9-3851 0-3210 44.9-4101
0-3394 44.9-5011 0-3911 44.9-4318
o-300s 22.5-126a
0-3415 33.1-3a90
0-2015 33.1-243a
o - i a i s 33.1-2119
0-2981 41.9-(a28
44.1-4351 61.4-4409 89.8-4351
44.9-3527 61.4-3519 18.6-3631 61. 4-4400 61.4-4668
44.9-4305 61.4-4513 89.8-5291 61.4-4253 61.4-4253 61.4-3312
61.4-3423 61.4-2951 61.4-3112 61.4-3683 6 1 .4-40!8 61.4-2282 61.4-3008 89.64131 89.8-4182 89.8-4328
89.8-5436 89.8-4655
44.1-4253 61.4-4351 a9.a-4305
44.9-3994 61.4-4668 89.a-5181
61.4-3683
a9.a-5990
1 1 1 1 1 1 1 1 1 1 1 1 1 1 1 1 1 1 1
1 1 1 1 1 1 1 1 1 1 1 1 1 1 1 1 1 1 1 1 1 1 1 1
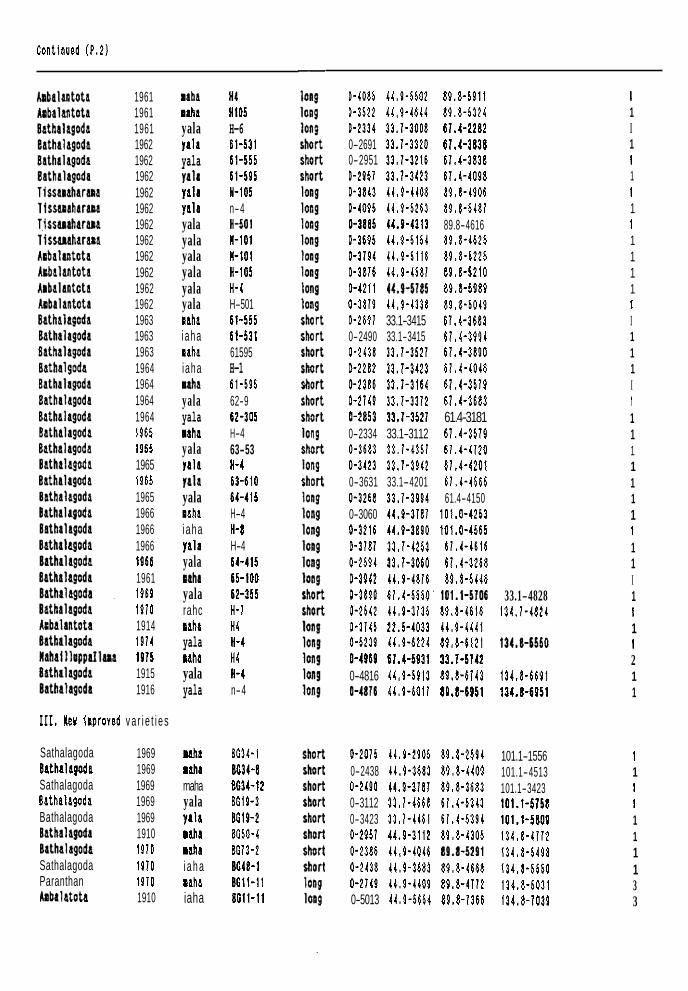
Continued ( P . 2 )
1961 1961 1961 1962 1962 1962 1962 1962 1962 1962 1962 1962 1962 1962 1963 1963 1963 1964 1964 1964 1964 I965 1965 1965 1965 1965 1966 1966 1966 1966 1961 1969 1910 1914 1914 1915 1915 1916
111. Weu i l p rbved v a r i e t i e s
Sathalagoda Sithalagoda Sathalagoda lathalagada Bathalagoda Sathahgoda Sathal69bd6 Sathalagoda Paranthan AEbalatbta
1969 1969 1969 1969 1969 1910 1910 1910 1910 1910
M h 6 rlha yala yalt yala ytla ytlc ytla yala yala yala yala yala yala maha i aha i t h a iaha
yala yala ilha yala yala yala yala raha i aha ytla yala
yala rahc maha yala
yala yala
Mlh6
l t h a
M h a
llht iaha maha yala yrla i l h a Mha i a h a l aha iaha
H I H105 H-6 61-531 61-555 61-595 n-105 n-4 n-501 1-101 n-101 H-105
H-501 61-555 61-531 61595 H-1 61-595 62-9 62-305
63-53
63-610 64-415
H-8 H-4 64-415 65-100 62-355
m-4
H-4
n-4
H-4
m - i n4 n-4 m4 n-4 n-4
SC34-1 8031-8 8634-12 8619-3 SG19-2 SGSO-4 8613-2 8648-1 8611-11 8611-11
0-4085 44.9-5502 89.8-5911 0-3522 44 .94644 89.8-5324 0-2334 33.1-3008 61.4-2282 0-2691 33.1-3320 61.4-3838 0-2951 33.1-3216 61.4-3838 0-2951 33.1-3423 61.4-4098 0-3843 14.9-4408 1 9 . 8 4 9 0 6 0-4095 44.9-5263 89.8-5481 0-3885 44.9-4313 89.8-4616
0-3194 44.9-5116 89 .84225 0-3695 44.9-5154 89.8-4625
0-3116 44.9-MI 89.8-5210 0-4211 ~ - 5 1 8 5 89.a-5080 0-3819 44.9-4338 89.8-5049 0-2691 33.1-3415 61-1-3683 0-2490 33.1-3415 61.4-3994
0-2282 33-1-3123 61.4-4046 0-2386 33.1-3164 61.4-3519 0-2149 31.1-3312 61.4-3683 0-2853 33.1-3521 61.4-3181 0-2334 33.1-3112 61.4-3519 0-3683 33.1-4351 61 .4-4120 0-3423 33.1-3942 61.4-4201 0-3631 33.1-4201 81.4-4565 0-3268 33-1-3991 61.4-4150 0-3060 44.9-3181 101.0-4253 0-3216 44.9-3890 101.0-4561 0-3181 33.1-4253 61.4-4616 0-2594 13.1-3060 61.4-3268 0-3942 44,9-4816 89.1-5446 0-3890 61.4-5550' 101,1-5106 33.1-4828
0-3145 22.5-4033 44.9-4441
0-4969 61.4-5931 33.1-5142 0-4816 41-9-5913 89.8-6143 134.8-6691 04E16 44.9-6011 89.8-6951 134.8-6951
0-2438 33.1-3521 61.4-3890
0-2542 44.9-3135 a9.1-4616 i34.1-48~4
0-5239 44.9-6224 a9.8-6121 134.a-wo
0-2015 44.9-2905 89.8-2594 0-2438 41.9-3683 89.8-4409 0-2490 44.9-3181 89-1-3683 0-3112 33.1-466E 61.4-5343 0-3423 33.1-4461 61.4-5394 0-2951 44.9-3112 89.8-4305
0-2438 14.9-3683 89.8-4668 0-2149 44.9-4409 89.8-4112 0-5013 44.9-5654 89.8-1366
0-2366 44.9-4046 a 9 . a - w i
101.1-1556 101.1-4513 101.1-3423 101.1-5158 101.1-5809 134.8-4112 134.8-5498 134.1-5550
134.8-1039 134.8-5031
1 1 I 1 1 1 1 1 1 1 1 1 1 1 I 1 1 1 I 1 1 1 1 1 1 1 1 1 1 1 I 1 1 1 1 2 1 1
1 1 1 1 1 1 1 1 3 3
I
.
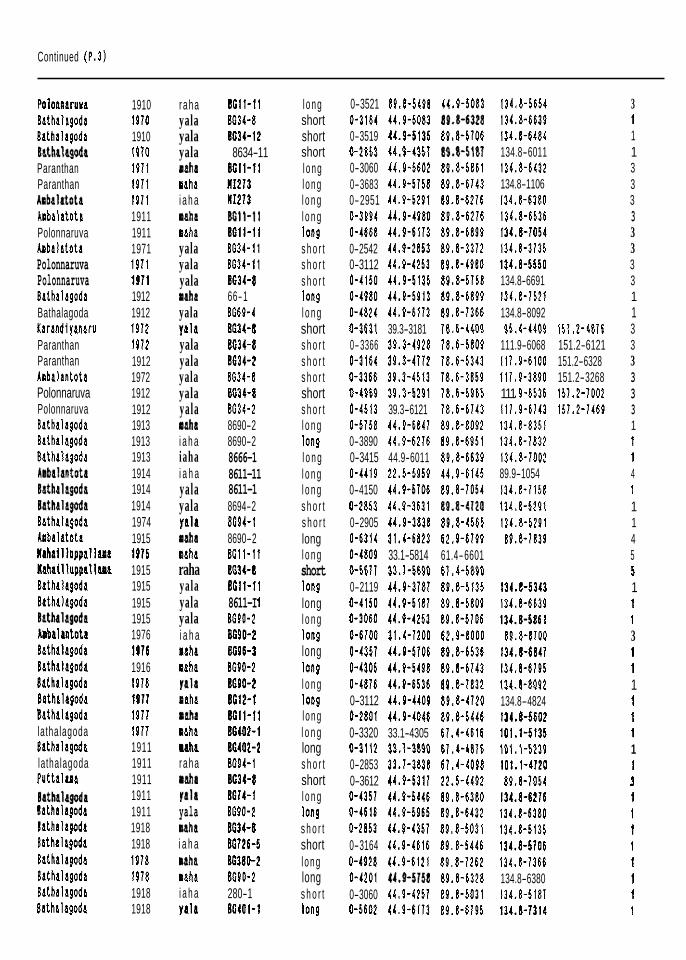
Continued (P.3)
Poloanaruva l a t h a l a9oda Bathalagoda
Paranthan Paranthan
B t t h t l t g o b a
A P b a l l t O t l Anbalatota Polonnaruva Ambalatota Polonnaruva Polonnaruva Bathalagoda Bathalagoda Karandl yanaru Paranthan Paranthan Arbalantota Polonnaruva Polonnaruva
Bathalagoda Bathalagoda
l a t h a h g o d 6
l O b t h t O t 6 86thahgod6 BathAlt9Oda Bathalagoda k b a l t t o t a llhaillnppallara Kahailluppallw Sathalagod6 Iathala9oda
Bathalagoda Sathalagodl lathalagoda 81thalagoda 'bathalagoda lathalagoda Sathalaloda lathalagoda Putta lcPa
' h t h t k g o d a l i t h a l a g o d 6 l a t h a l a g d t . lathala9oda Dathalapoda Sathalagod8 Kathalagoda Bathalagoda
h t h t h g O d 6 Lnbalantota
1910 1910 1910 1970 1911 I911 1911 1911 1911 1971 I911 1911 1912 1912 1912 I972 1912 1972 1912 1912 1913 1913 1913 1914 1914 1914 1974 1915 1915 1915 1915 1915 1915 1976 I916 1916 I916 1911 1911 I 9 1 1 1911 1911 1911 1911 1911 1918 1918 1918 I918 1918 1918
r a h a yala yala yala
naha i a h a
maha yala yala yala
yala yala yala yala yala yala yala
i a h a iaha i a h a yala yala y t la
l a h a
aah6
U h 6
i t h a
Paha M h 6 raha yala yala yala i a h a
aaha
#aha
l 6 h l
yaia
laha M h 6 1ah4 r a h a l a h a y a k yala i 6 h 6
I 6 h t i a h a
l a h a i a h a y a l l
8611-11 8634-8 1634-12 8634-11 8611-ll 1112~3 111213 a c i i - i i 8611-11 8634-11 8634-11 8631-8 66-1 8669-4 8634-8 8634-8 8634-2 8834-8 8634-8 8634-2 8690-2 8690-2 8666-1 8611-11 8611-1 8694-2 8694-1 8690-2 8611-11 8634-8 8611-11 8611-I 1 8690-2 8690-2 8696-3 1690-2 1690-2 8612-1 BG11-11 116402-1 86402-2 8094-1 8634-8 8674-1 1690-2 8634-8 86126-5 16380-2 8690-2 280-1 86401-1
l o n g short short short l o n g l o n g l o n g l o n g Ion9 s h o r t s h o r t s h o r t Ion9 l o n g short s h o r t s h o r t s h o r t short s h o r t l o n g Ion9 l o n g l o n g l o n g s h o r t s h o r t long l o n g short Ion9 long l o n g I o n 9 long I o n 9 l o n g l o n g l o n g l o n g long s h o r t short l o n g Ion9 s h o r t short l o n g long s h o r t Ion9
0-3521 89.8-5498 41.9-5083 0-3164 44.9-5083 89.8-63t8 0-3519 41.9-1135 89.8-5706
0-3060 14.9-5602 89.8-5161 0-3683 44.9-5158 89.8-6143 0-2951 44.9-5291 69.8-6216 0-3991 44.94980 89.8-6216 0-4668 14.9-6113 89.8-6899 0-2542 44.9-2853 89.8-3372 0-3112 14.9-4253 89.8-1980 0-4150 44.9-5135 89.8-5158 0-4980 11.9-5913 89.8-6899 0-4824 44.9-6173 89.8-1366 0-3631 39.3-3181 18.6-4Mt 0-3366 39.3-4928 18.6-5809 0-3161 39.3-4112 18.6-5343 0-3366 39.3-4513 18.6-3859 0-4989 39.3-3291 18 .64965 0-4513 39.3-6121 18.6-6143 0-5158 44.9-6841 89.8-8092 0-3890 44.9-6216 89.8-6951 0-3415 44.9-6011 69.8-6639 0-4419 22.5-5959 44.9-6145 0-4150 44.9-5106 89.8-1051
0-2905 44.9-3838 89.8-4565 0-6311 31.4-6823 62.9-6199 0-4809 33.1-5814 61.4-6601 0-5611 33.1-5690 6l.I-SS90 0-2119 44.9-3181 88.8-5135 0-6150 44.9-5181 89.8-5809
0-6100 31.1-1200 62.9-8000 0-4351 44.9-5106 89.8-6536 0-4305 44.9-5498 89.1-6143 0-4816 44.9-6536 89.8-1832 0-3112 44.9-4409 89.8-4120 0-2801 44.9-1046 89.8-5446 0-3320 33.1-4305 61.4-4616 0-3112 33.1-3190 61.4-4816 0-2853 33.1-3838 61.4-4098 0-3612 44.9-5311 22.5-4492 0-4351 44,94446 89.8-6380 0-4616 44.9-5965 89.8-6432 0-2853 44.9-4351 89.8-5031 0-3164 44.9-4616 89.8-5446 0-4928 44.9-6121 89.8-1262
0-3060 44.9-4251 89.8-5031 0-5602 14.9-6173 89.8-6195
0-2853 44.9-(351 a9.s-sw
0-2853 4 4 . ~ 3 1 tt.a-4120
o-3060 44.9-4253 89.8-5106
0-4201 44.9-51st 89.8-6328
134.8-5654 134.8-6639 134.8-6481 134.8-6011 134.8-6432 134.8-1106 134.8-6380 134.8-6536 131.8-1054 134.8-3135 134.8-1550 134.8-6691 134.1-1521 134.8-8092 95.4-4409 151.2-4816
111.9-6068 151.2-6121 117.9-6100 151.2-6328 117.9-3890 151.2-3268 111 I 9-6536 151.2-1002 111.9-6143 157.2-7469 134.8-8351 134.8-1832 134.8-1002 89.9-1054 131.8-1158 134.8-5291 134.8-5291 89.8-1839
134.8-5313 134.8-6639 131.8-586 1
89.8-8100 134.8-6841 134.8-6195 134.8-8092 134.8-4824 134.8-5602 101.1-5135 101.1-5239 101.1-4120 89.8-1054 134.8-8216 134.8-6380 134.8-5135 136.8-5106 134.8-1366 134.8-6380 134.8-5181 134.8-1314
3 1 1 1 3 3 3 3 3 3 3 3 1 1 3 3 3 3 3 3 1 1 1 4 1 1 1 4 5 5 1 1 1 3 1 1 1 1 1 1 1 1 3 1 1 1 1 1 1 1 1

Continued ( P . 0
Bathalgoda Iatht lagoda la th i lagoda Eathalagoda Bathalagoda
Sathalagoda Bathalagoda Bathallgoda fiathalagoda Nahai 1 lppallaa Gall Cal l call Kalutara Kalutara
Girandurukotte Girtndurukotte Girandurukotte Girtndurukotte Girandurukotte Girandurukotte
Hahai l lUppal lMa
Kalutara
~
I918 I918 1918 1918 1919 I919 1919 1919 1980 I980 1980 1980 1980 1980 I980 I980 I980 1986 1986 1981 1988 1988 1989
~-
yala ya la
yala iaha naha yala yala yala yala yala yala ya la yala yala yala Tala #aha 7618 rtla maha yala yala
yal6
~
16301-2 86400-1 11690-2 8694-1
lG94-l 86319-3 8600-2 86319-2 8690-2 lG94-l 81212-6 811212-6 811212-6 811261-3 81261-3 11261-3 86915 11643-8 86915 861165-3 861165-3 861165-3
aw-1
short long long shor t shor t long long long long long shor t shor t short shor t long long long short short short shor t short short
0-5158 44.9-6631 (9.8-1151 0-5343 44.9-6691 (9.8-1366 0-5343 44.9-1051 89.8-1781 0-5654 44.9-6216 19.8-6380 0-3256 33-1-3136 61.4-4451 0-3258 30-3836 60 -1341
0-5106 44.9-6691 89.8-6899 0-5106 44.9-6951 89.8-1611 0-5809 44.9-1361 89.8-1181 0-4603 33.1-4981 61.4-5525 0-2150 15 -3080 45 -3110 0-3910 25 -4150 45 -4560 0-2180 25 -3500 45 -3150 0-4110 25 -4950 45 -5910 0-4150 25 -4210 45 -1510
0-3965 40 -4591 80 - 5550 0-3133 40 -4560 KO -5229 0-4500 40 -4100 80 -5200 0-4090 40 -4420 80 -5380 0-4980 40 -5580 80 - 6850
60-4210 80 -5090 100 -5490
o-s49a 44.9-6432 89.8-1106
0-3520 2s -4210 4s -1180
134.8-1314 134.8-1158 134.8-7129 134.8-6484 112.3-4633 100 -4633 134.8-6951 134.8-1002 134.8-1832 134.8-1884 112.3-5510
65 -3200 85-3050 65 -4270 85-4230 65 -3860 115-3310 65 -5480 85-5330 65 -1320 85-4260 6 5 -4510 85-4030
120 -5549 120 -5514 120 -5110 120 - 5250 120 -6820 120 - 5120
~~
i iota: 1. Bathalagoda r i c e breeding center, the Oepartnent o f Agriculture.
2. Agr i cu l tu ra l research s ta t ion, h h t i l l U p p a l l M a , o f the Department of Agriculture. 3. Office o f the Deputy Oirector Research, the Departlent o f Agriculture. 4. AgriCUltUr6l research s ta t i on bnbalantota, the Department o f Agriculture. 5. Puar ter ly repor ts o f the ag r l cu l tu ra l research s ta t ion, l aha i l l uppa l l ua . 6. Jayauardena, S.D.G., et 61, JAR4 I1 ( 2 ) , 1983. I , Shibata e t a l . (1990).
L
1 1 1 1 1 2 1 1 1 1 2 6 6 6 6 6 6 1 1 1 1 1 1
"
Related Documents