Number 51 n April 12, 2012 Fertility of Men and Women Aged 15–44 Years in the United States: National Survey of Family Growth, 2006–2010 by Gladys Martinez, Ph.D.; Kimberly Daniels, Ph.D.; and Anjani Chandra, Ph.D., Division of Vital Statistics Abstract Objective—This report presents national estimates of the fertility of men and women aged 15–44 years in the United States in 2006–2010 based on the National Survey of Family Growth (NSFG). Data are compared with similar measures for 2002. Methods—Descriptive tables of numbers, percentages, and means are presented and discussed. Data were collected through inperson interviews of a nationally representative sample of the household population aged 15–44 years in the United States between July 2006 and June 2010. The 2006–2010 NSFG sample is comprised of 22,682 respondents including 10,403 men and 12,279 women. The overall response rate for the 2006–2010 NSFG was 77%, 75% for men and 78% for women. Results—Many of the fertility measures among men and women aged 15–44 based on the 2006–2010 NSFG were generally similar to those reported based on the 2002 NSFG. The mean age at first child’s birth for women was 23 and the mean age at first child’s birth for men was 25. Onehalf of first births to women were in their 20s and twothirds of first births were fathered by men who were in their 20s. On average, women aged 15–44 have 1.3 children as of the time of the interview. By age 40, 85% of women had had a birth, and 76% of men had fathered a child. In 2006–2010, 22% of first births to women occurred within cohabiting unions, up from 12% in 2002. These measures differed by Hispanic origin and race and other demographic characteristics. Keywords: parity • number of children born • age at first birth • marital status at birth • nonmarital births Introduction This report presents national estimates of different fertility measures for both men and women in the United States for the period 2006–2010. Fertility refers to the number of live births that occur to an individual. In 2008, there were 4.2 million births in the United States (1). The average fertility of women in the United States was about seven children at the beginning of the 19th century, it declined slowly and by 1960 it was 3.7 children per woman (2,3). Fertility in the United States dropped to its lowest point in 1976 at an average of 1.7 children per woman and has remained relatively stable at around 2.1 children per woman (1,4–7). While fertility in the United States has remained stable since the 1970s, there is variation by subgroups including age, race, ethnicity, education, and measures of socioeconomic status. Researchers have often examined the intermediate characteristics that help to explain fertility such as fecundity (the ability to have children), timing of sexual intercourse, time spent in sexual relationships, and use of contraception (8). Others have looked at timing of fertility, the composition of those who have children, the number of children born, the union status at childbirth, etc (9–14). The National Survey of Family Growth (NSFG) has collected data on fertility and the intermediate factors that explain fertility in the United States since 1973. The Centers for Disease Control and Prevention’s National Center for Health Statistics (NCHS) conducts the NSFG. The NSFG is jointly planned and funded by NCHS and several other programs of the U.S. Department of Health and Human Services (see Acknowledgments). This report presents selected data on the U.S. DEPARTMENT OF HEALTH AND HUMAN SERVICES Centers for Disease Control and Prevention National Center for Health Statistics

Welcome message from author
This document is posted to help you gain knowledge. Please leave a comment to let me know what you think about it! Share it to your friends and learn new things together.
Transcript
7/27/2019 Fertility of Men and Women in the United States_Family Growth 2006-2010_2012_nhsr051
http://slidepdf.com/reader/full/fertility-of-men-and-women-in-the-united-statesfamily-growth-2006-20102012nhsr051 1/29
Number 51 n April 12, 2012
Fertility of Men and Women Aged 15–44 Years in the United States: National Survey of Family Growth,
2006–2010 by Gladys Martinez, Ph.D.; Kimberly Daniels, Ph.D.; and Anjani Chandra, Ph.D., Division of Vital Statistics
Abstract Objective—This report presents national estimates of the fertility of men and
women aged 15–44 years in the United States in 2006–2010 based on the National Survey of Family Growth (NSFG). Data are compared with similar measures for 2002.
Methods—Descriptive tables of numbers, percentages, and means are presented and discussed. Data were collected through inperson interviews of a nationally representative sample of the household population aged 15–44 years in the United States between July 2006 and June 2010. The 2006–2010 NSFG sample is comprised of 22,682 respondents including 10,403 men and 12,279 women. The overall response rate for the 2006–2010 NSFG was 77%, 75% for men and 78% for women.
Results—Many of the fertility measures among men and women aged 15–44 based on the 2006–2010 NSFG were generally similar to those reported based on the 2002 NSFG. The mean age at first child’s birth for women was 23 and the mean age at first child’s birth for men was 25. Onehalf of first births to women were in their 20s and twothirds of first births were fathered by men who were in their 20s. On average, women aged 15–44 have 1.3 children as of the time of the interview. By age 40, 85% of women had had a birth, and 76% of men had fathered a child. In 2006–2010, 22% of first births to women occurred within cohabiting unions, up from 12% in 2002. These measures differed by Hispanic origin and race and other demographic characteristics. Keywords: parity • number of children born • age at first birth • marital status at birth • nonmarital births Introduction
This report presents national estimates of different fertility measures for both men and women in the United States for the period 2006–2010. Fertility refers to the number of live
births that occur to an individual. In 2008, there were 4.2 million births in the United States (1). The average fertility of women in the United States was about seven children at the beginning of the 19th century, it declined slowly and by 1960 it was 3.7
children per woman (2,3). Fertility in the United States dropped to its lowest point in 1976 at an average of 1.7 children per woman and has remained relatively stable at around 2.1 children per woman (1,4–7).
While fertility in the United States has remained stable since the 1970s, there is variation by subgroups including age, race, ethnicity, education, and measures of socioeconomic status. Researchers have often examined the intermediate characteristics that help to explain fertility such as fecundity (the ability to have children), timing of sexual intercourse, time spent in sexual relationships, and use of contraception (8). Others have looked at timing of fertility, the composition of those who have children, the number of children born, the union status at childbirth, etc (9–14).
The National Survey of Family Growth (NSFG) has collected data on fertility and the intermediate factors that explain fertility in the United States since 1973. The Centers for Disease Control and Prevention’s National Center for Health Statistics (NCHS) conducts the NSFG. The NSFG is jointly planned and funded by NCHS and several other programs of the U.S. Department of Health and Human Services (see Acknowledgments). This report presents selected data on the
U.S. DEPARTMENT OF HEALTH AND HUMAN SERVICES
Centers for Disease Control and Prevention
National Center for Health Statistics

7/27/2019 Fertility of Men and Women in the United States_Family Growth 2006-2010_2012_nhsr051
http://slidepdf.com/reader/full/fertility-of-men-and-women-in-the-united-statesfamily-growth-2006-20102012nhsr051 2/29
Page 2 National Health Statistics Reports n Number 51 n April 12, 2012 fertility experience of 15–44yearold males and females in the United States using the 2006–2010 NSFG, and also presents trends in these measures since 2002.
Background
In the last two decades, fertility research in the United States has focused on timing of childbearing (e.g., adolescent childbearing), the context of fertility (e.g., nonmarital childbearing), and on high fertility groups. Early childbearing
The United States’ teenage birth rate in 2010 was 34.3 births per 1,000 females aged 15–19 (5,15). Although this represents a 44% decline from the peak rate in 1991, the United States’ teenage birth rate continues to be higher than that of other developed countries (16). Within the United States there are large variations in the teenage birth rate by various characteristics including Hispanic origin and race. Having a child at an early age (e.g., teenagers) is associated with negative social, economic, and health consequences for the young woman and her child (1,17–19). There is debate on how much of the consequences of a teenage birth are the result of the mother’s earlier background characteristics rather than the birth itself (20,21). Nonetheless, teenage childbearing in the United States cost taxpayers at least $10.9 billion in 2008 (22). Nonmarital childbearing
Over the past several decades, nonmarital childbearing has increased among women in all ages and Hispanic origin and race subgroups. In 1970, 11% of all live births were to unmarried women compared with 41% of all live births in 2009 (5). At the same time, there has been an increase in the proportion of women living in cohabiting unions and a greater proportion of nonmarital births occur to women living with a partner. One of the concerns with the increase in nonmarital childbearing is that children born outside of a marital union experience
more family transitions, less stability, and may have fewer resources (23,24). Another concern with nonmarital childbearing is that a large proportion of births outside of marriage occur to women who did not intend the conception. Among births between 1999 and 2002, 77% of those to married women were intended at conception, while only 35% of those to nevermarried women were intended at conception (25). Because of this observed relationship, increases in nonmarital childbearing raise public health concerns given the documented adverse effects to babies born to women who did not intend to become pregnant and for the women themselves (26–29). Variations by race, ethnicity, and education
Fertility levels are also known to vary across population subgroups such as race and ethnicity and educational attainment (5,25,30). Women with lower educational attainment have earlier and higher total fertility than those with more education (30). A significant proportion of this difference can be explained by higher levels of unintended births among women with less education (13). In addition, women with less education are less likely than others to use contraception (31). At least some of the association between early fertility and educational attainment results from some young women leaving school early when they become pregnant. Racial and ethnic variation is seen in both the timing of fertility and total fertility. On average, the Hispanic and nonHispanic black populations have earlier and higher fertility than other racial and ethnic groups (1,30). Considerable research attention has been focused on the high fertility of immigrant groups; for example, the fertility of foreignborn Mexican women is, on average, higher than those who are U.S. born (32). Methods Data collection
The NSFG was established and first conducted by NCHS in 1973. Since
then, the NSFG has been conducted seven times by NCHS—in 1973, 1976, 1982, 1988, 1995, 2002, and most recently, in 2006–2010. In 1973 and in 1976, the survey interviewed women aged 15–44 years who were currently married or had been married; it was then considered too sensitive to interview nevermarried women on fertilityrelated topics. In 1982, as the percentage of births to unmarried women continued to increase, the survey was expanded to include women aged 15–44 regardless of marital experience. Thus, the sample began to include all females aged 15–44 including nevermarried teenagers and women. In 2002, the NSFG began to interview males aged 15–44, allowing analysis of a nationally representative sample of males as well.
The 2006–2010 NSFG was based on 22,682 facetoface interviews— 12,279 with women and 10,403 with men aged 15–44 years in the household population of the United States. Men and women living on military bases or in institutions were not included in the survey. The sample did include persons temporarily living away from the household in a college dormitory, sorority, or fraternity (33). The interviews
were
administered
in
person
by trained female interviewers primarily in the respondents’ homes. The 2006– 2010 sample is a nationally representative multistage area probability sample drawn from 110 areas, or ‘‘Primary Sampling Units’’ (PSUs) across the country. To protect the respondent’s privacy, only one person was interviewed in each selected household. In 2006–2010, persons aged 15–19 and black and Hispanic adults were sampled at higher rates than others. All respondents were given written and oral information about the survey and informed that participation was voluntary. Adult respondents aged 18–44 years were asked to sign a consent form, but were not required to do so; a very small percentage of adult respondents declined to sign the consent form. For minors aged 15–17 years, signed consent was required first from a parent or guardian, and then signed assent was

7/27/2019 Fertility of Men and Women in the United States_Family Growth 2006-2010_2012_nhsr051
http://slidepdf.com/reader/full/fertility-of-men-and-women-in-the-united-statesfamily-growth-2006-20102012nhsr051 3/29
National Health Statistics Reports n Number 51 n April 12, 2012 Page 3
required from the minor: If either the parent or the minor declined to give written consent, the minor did not participate in the survey. The response rate for the 2006–2010 NSFG was 77% overall and 75% for men and 78% for women. The interviews lasted an average of about 80 minutes for females and 60 minutes for males. More detailed information about the methods and procedures of the NSFG and its sample design, weighting, imputation, and variance estimation has been published (33). Demographic variables used in this report
The fertility data presented in this report are shown with respect to several key demographic characteristics— including age, marital status, education, parental living arrangements in adolescence, and Hispanic origin and race. Age of respondent, marital status, and educational attainment reflect status at the time of the interview. Educational attainment is shown only for respondents aged 22–44 because large percentages of those aged 15–21 are still attending school. Fertility indicators are also shown for proxy measures of the respondent’s
socioeconomic
status.
These include the educational attainment of the respondent’s mother and parental living arrangements at age 14.
The definition of Hispanic origin and race used in this report takes into account the reporting of more than one race, in accordance with the 1997 guidelines from the Office of Management and Budget (34,35). For most tables in this report, separate estimates are presented for single race and nonHispanic respondents who are black, white, or Asian. Hispanic respondents, regardless of their racial identification, are shown separately, and where sample sizes permit, are categorized by their nativity status. For convenience in writing, the term ‘‘black’’ or ‘‘nonHispanic black’’ will be used instead of the full phrase, ‘‘nonHispanic black or African American, single race.’’ Similarly, the term ‘‘white’’ or ‘‘nonHispanic white’’ will be used instead of the full phrase
‘‘nonHispanic white, single race.’’ Further technical details and definition of terms can be found in the technical notes and in earlier NSFG reports (25). Strengths and limitations of the
data
The strengths of the data in this
report, based primarily on the 2006– 2010 NSFG, include the following: +The data are drawn from interviews with large nationally representative samples of men and women in the reproductive ages 15–44 years of age.
+The data from each survey were processed and coded to make them as comparable as possible, so that trends could be measured reliably across cycles.
+The interviews in each cycle were conducted in person by professional, trained, female interviewers. Interviewers were supplied with visual aids, such as showcards, lifehistory calendars, and ‘‘help screens’’ containing definitions of terms and other guides. These were used to help clarify terms and concepts for the respondent, so that meanings were standardized across respondents, thereby enhancing the quality of the data.
+The NSFG includes an array of characteristics to measure different aspects of male and female fertility. In addition, the NSFG collected extensive data on intermediate characteristics that influence fertility such as age at menarche, sexual activity, contraceptive use, union status, breastfeeding, and other childbearing experiences. The NSFG also collects information on the context of fertility and the relationship with a partner at the time of the birth.
+The response rates for the survey have been high—about 80% in 2002, and despite an increasingly challenging climate for surveys, response rates remained high for 2006–2010 at 77%. The data in this report also have
some limitations:
+Like all survey data, these data are subject to sources of nonsampling error. These include interviewer and respondent factors such as possible misunderstanding of questions on the part of the interviewer or respondent and bias due to giving socially desirable answers. The preparation and the conduct of the survey were designed specifically to minimize these sources of error (33).
+Because the NSFG is a crosssectional survey, it is also subject to recall error. Questions rely on respondents’ recall when reporting on their past experiences. Given the detail asked of women, the NSFG uses a life history calendar to help women remember specific dates by writing down other key demographic markers (e.g., dates of high school graduation, marriages and dissolutions, and children’s births) to help their recall. While no life history calendar is used for the male survey, men are asked fewer dates than women and are asked about children within the context of a relationships to help with recall.
+The NSFG is designed to provide national estimates by demographic subgroups; it is not designed to yield estimates for individual states.
+The data presented in this report are bivariate associations that may be explained by controlling for other factors that our tables do not take into account. For example, the relationship between parental living arrangement at age 14 and some of these fertility measures may be explained by differential economic resources between single parent households and two parent households rather than the household structure itself.
Statistical analysis All estimates in this report were
weighted to reflect the approximately 62 million men and 62 million women aged 15–44 in the household population of the United States. Statistics for this report were produced using SAS software, Version 9.2 (http://www.sas. com). For most tables we used PROC

7/27/2019 Fertility of Men and Women in the United States_Family Growth 2006-2010_2012_nhsr051
http://slidepdf.com/reader/full/fertility-of-men-and-women-in-the-united-statesfamily-growth-2006-20102012nhsr051 4/29
Page 4 National Health Statistics Reports n Number 51 n April 12, 2012 SURVEYFREQ to produce weighted cross tabulations that took into account the complex sampling design of the NSFG in calculating estimates of standard errors. Each table in this report includes standard errors as a measure of the precision of each point estimate. In addition, PROC LIFETEST was used for Table 8 to calculate probabilities of a first birth at selected ages from 18 to 40 years using life table methodology. Data are presented for ages 18, 20, 25, 30, 35, and 40 years. Probabilities are calculated based on retrospective reporting of the age at the first birth.
Significance of differences among subgroups was determined by standard twotailed t tests using point estimates and their standard errors. No adjustments were made for multiple comparisons. The difference between any two estimates is mentioned in the text only if it is statistically significant. However, if a comparison is not made, it may or may not be significant. Otherwise, terms such as ‘‘similar’’ or ‘‘no significant differences’’ are used to indicate that the estimates being compared were not significantly different.
In the description of the results below, when the percentage being cited is
below
10%,
the
text
will
cite
the
percentage to one decimal point. To make reading easier and to remind the reader that the results are based on samples and subject to sampling error, percentages above 10 will generally be shown rounded to the nearest whole percentage. Readers should pay close attention to the sampling errors for small groups. In this report, percentages are not shown if the sample denominator is less than 100 cases, or the numerator is less than 5 cases. When a percentage or other statistic is not shown for this reason, the table contains an asterisk (*) signifying that the ‘‘statistic does not meet standards of reliability or precision.’’ For most statistics presented in this report, the numerators and denominators are much larger. This report is intended to present selected statistics on trends and differences in selected measures of the fertility of men and women in the United States through 2006–2010. The
results presented in this report are descriptive and do not attempt to demonstrate causeandeffect relationships. Results Number of children born and childlessness
The parenthood experience of U.S. men and women aged 15–44 in the last decade is very similar. There was no change between 2002 and 2006–2010 in the percentage of men and women that had a biological child (Table 1). By ‘‘had a biological child’’ we mean that the woman gave birth to a biological child or that the man fathered a biological child, regardless if the child lives with them now. In 2006–2010 as in 2002, women (56%) in this age range were more likely than men (45%) to have had a child. +Higher educational attainment was associated with lower percentages of women with a biological child. For example, 53% of women with a bachelor’s degree or higher had a biological child compared with 88% with less than a high school diploma.
+Hispanic women are more likely to have had a biological child (65%) than nonHispanic white women (52%), but there were no differences between Hispanic and nonHispanic black (62%) women. Meanwhile, a higher percentage of Hispanic men had a biological child (54%) compared with both white (41%) and black (49%) men.
+ Looking at nativity, higher percentages of foreignborn Hispanic men and women had a child compared with those born in the United States. For foreignborn Hispanic women, 78% had a biological child compared with 51% of U.S.born Hispanic women. The percentage of U.S.born Hispanic women with a biological child is similar to that of white women. While the majority of women have
had a child, a large percentage of women at any point are childless. The NSFG data can be used to characterize
childless women as temporarily childless, voluntarily childless, or nonvoluntarily childless (Table 2). Most childless women aged 15–44 years are ‘temporarily childless,’ meaning that that they expect to have one or more children in the future. Voluntarily childless women are those who expect to have no children in their lifetimes, and are either fecund (physically able to have a birth) or are surgically sterile for contraceptive reasons. Nonvoluntarily childless women are those who expect to have no children in their lifetimes, but have impaired fecundity or are surgically sterile for reasons other than contraception. +Among the 61.8 million women aged 15–44 years in 2006–2010, 43% were childless; of those who were childless 34% were temporarily childless, 2.3% nonvoluntarily childless, and 6.0% voluntarily childless. The percentage voluntarily childless is similar to previous rounds of the NSFG: 6.2% in 2002, 6.6% in 1995, 6.2% in 1988, and 4.9% in 1982 (9).
+ Table 2 also describes the characteristics of women with children and childless women. For example, women with children were more
likely
to
be
older
and
currently
married than childless women overall. Childless women were more likely to be younger, never married, with some college or higher education, and white compared with women with children.
+Among the childless women, voluntarily childless women were more likely to be older, currently married or currently cohabiting, and white compared with temporarily childless women. Nonvoluntarily childless women were more likely to be older and currently married compared with voluntarily childless women.
+Hispanic women accounted for a higher percentage of mothers (20%) and those temporarily childless (15%) than those voluntarily (8.8%) or nonvoluntarily (9.0%) childless. Black women accounted for a higher percentage of mothers (15%) than the childless (12%).

7/27/2019 Fertility of Men and Women in the United States_Family Growth 2006-2010_2012_nhsr051
http://slidepdf.com/reader/full/fertility-of-men-and-women-in-the-united-statesfamily-growth-2006-20102012nhsr051 5/29
National Health Statistics Reports n Number 51 n April 12, 2012 Page 5
NOTE: GED is General Educational Development high school equivalency diploma.
SOURCES: CDC/NCHS, National Survey of Family Growth, 2006–2010. Tables 3 and 4 in this report.
0
1
2
3
4
Bachelor's degreeor higher
Some collegeHigh schooldiploma or GED
No high schooldiploma or GED
A v e
r a g e
MenWomen
2.5
1.71.8
1.31.5
1.0 1.1 1.0
Figure 1. Average number of children ever born or fathered for women and men aged 22–44 years, by education: United States, 2006–2010
The number of children born to women aged 15–44 overall varies widely by selected characteristics (Table 3). + The mean or average number of children born to women aged 15–44 is unchanged between 2002 and 2006–2010 at 1.3 births per woman. By age 40–44, the mean number of children born to women was 2.1, which is consistent with the mean number of children born to women in the United States based on vital statistics (1).
+ Women who were currently married or formerly married had the highest mean number of children born, 1.9 and 2.0, respectively.
+ Table 1 shows that men and women with lower levels of education were more likely to have had a child. They also had higher average numbers of children born (Tables 3, 4, and Figure 1). Additionally, nearly one in four women with less than a high school diploma had four or more children (24%), more than twice the percentage for any other education group.
+ Women with household incomes less than 150% of the poverty level at the time of interview were more likely to have four or more children than those with higher incomes.
+ The mean number of children born was higher for foreignborn Hispanic women (2.1) compared with U.S.-
born Hispanic women (1.2). The mean number of children born for U.S.born Hispanic women was similar to that of white women. Variations in the distribution and
mean (average) number of biological children fathered by men aged 15–44 are presented in Table 4 and complement the data for women in Table 3. +The mean number of children fathered by men in 2006–2010 (.9 children) was similar to 2002 (1.0).
+Currently married men had the highest mean number of children fathered (1.7 children), followed by formerly married men (1.5 children).
+Education was not only associated with the likelihood of having had a child, but also with the number of children fathered. Men with a bachelor’s degree or higher had a lower mean number of children fathered (1.0) compared with men with less than a high school diploma (1.7) or to those with a high school diploma (1.3). There was no difference in the mean number of children fathered between men with some college education and those with a bachelor’s degree or higher.
+Men with the lowest level of education were more likely to have four or more children (10%). Only 3.1% of men with a bachelor’s degree or higher had four or more children. The differences in the percentage of
men with four or more children among other educational groups were not significant.
+As was true for women, foreignborn Hispanic men had a higher mean number of children born than U.S.born Hispanic men. Fertility estimates for the United
States are also available from CDC’s NCHS’ National Vital Statistics System (NVSS). NSFG data approximate the number of births recorded in the NVSS—especially for women (see ‘‘Technical Notes’’ table). Data on male fertility is less precise from the NVSS because mothers are the primary reporter of data for the birth registration system. Estimates of male fertility from the NSFG come from male’s reporting of their children. Births expected
Variations in the mean number of children born, additional births expected, and the total births expected for men and women are presented in Table 5.
There were no changes between 2002 and 2006–2010 in the mean number of children born, additional births expected, and total births expected for men or women. +As expected, women who were noncontraceptively sterile or had impaired fecundity expected fewer births. While men’s sterility status (36) cannot be defined in a comparable manner, nonsurgically sterile men expected a lower mean number of total births (1.2) compared with men in the other sterility status categories shown (2.2–2.4).
+For men and women, those with less than a high school diploma expected a higher number of total births compared with those with other education levels. There were no differences in total births expected among men and women across the other education levels. Table 5 and Figure 2 show that
foreignborn Hispanic women expected more births than U.S.born Hispanic women. The mean number of births expected for foreignborn Hispanic women was 2.9 and for U.S.born

7/27/2019 Fertility of Men and Women in the United States_Family Growth 2006-2010_2012_nhsr051
http://slidepdf.com/reader/full/fertility-of-men-and-women-in-the-united-statesfamily-growth-2006-20102012nhsr051 6/29
SOURCES: CDC/NCHS, National Survey of Family Growth, 2006–2010. Table 5 in this report.
A v e r a g e
Average number of additionalchildren expected
Average number of children born
0
1
2
3
4
AsianBlackWhiteU.S.-born
Hispanic
Foreign-born
Hispanic
Hispanic
2.7
1.1
1.6
2.9
0.8
2.1
1.4
1.2
2.6
2.2
1.1
1.1
2.4
1.0
1.4
2.2
1.2
1.0
Figure 2. Average number of children born, additional children expected, and total births expected for women aged 15–44 years, by Hispanic origin and race: United States, 2006–2010
Page 6 National Health Statistics Reports n Number 51 n April 12, 2012
Hispanic women it was 2.6. The same relationship holds true for men.
Looking at all women aged 15–44 years in 2006–2010, 8.3% of women expected to have no children in their lifetimes, similar to the 8.9% in 2002 (Table 6). + Women aged 22–44 with less than a high school diploma were less likely to expect no children than women with higher levels of education. For example, 5% of women with less than a high school education expected no children compared with 10% of college graduates.
+ Patterns are similar by poverty status. About 5% of low income women expected to remain childless compared with 12% of higher income women.
+ Overall, fewer Hispanic (4.3%) and black women (7.2%) expected to remain childless than did white women (9.8%). A higher percentage of U.S.born Hispanic women expected to remain childless (5.6%) than foreignborn Hispanic women (3.0%).
+ The most commonly reported number of children expected among women in 2006–2010 was two children (41%). That is, about two out of every five women aged 15–44 in the United States expected to have a total of two children. About one out of
every four women expected to have a total of three children.
+Hispanic women were more likely (31%) than white (23%), black (25%), or Asian (21%) women to expect three births. Foreignborn Hispanic women were more likely (34%) than U.S.born Hispanic women (27%) to expect three births.
+Women who did not graduate from high school were more likely to expect four or more births. While 31% of women who did not graduate from high school expected four or more births, only 9.2% of those with a college degree or higher expected four or more births.
Age at first birth Age at first birth for men and
women aged 15–44 has been fairly stable since 2002 (Table 7). In 2006– 2010 the mean age at first birth was 23 for women and 25 for men, similar to the mean age at first birth in 2002. +More than onehalf of first births occur to women in their twenties and nearly onethird occur to women younger than age 20. For men, about twothirds of first births occur to those in their twenties, and one out of five first births occur to those aged 30 years and over.
+The percentage of women who in 2006–2010 reported their first birth
occurred at age 30 or over is similar to 2002. Currently married women had higher percentages (19%) whose first birth was at age 30 or over than women who were not currently married (3.6%–7.6%). College educated women were also more likely to have a first birth at age 30 or over (36%) than women with lower levels of education (3.5%– 10.7%).
+For both men and women aged 22–44 years, the higher the level of education, the lower the percentage who had a first birth before age 20. For example, 58% of women who had less than a high school education had a first birth before age 20 compared with 4% of women with a bachelor’s degree or higher (Figure 3).
+The mean age at first birth was higher for white women (24.1) than for Hispanic and black women (21.2 and 20.9, respectively). Within each Hispanic origin and race group, married men and women had a higher mean age at first birth than unmarried men and women. The text table shows the number of
children born to women aged 15–44 years by their age at first birth for 1995 and
2006–2010.
Given
trends
over
the
last decades toward later childbearing, particularly among women with higher education, parity of older firsttime mothers would ideally be examined within education and income groups. However, first births beyond age 35 years were too rare to break down by education and income, particularly for 1995. Among all women whose first birth occurred at aged 35–44 years, there was a significant increase in the percentage that had at least two children, from 26% in 1995 to nearly 40% in 2006–2010. Given the age range of the NSFG (aged 15–44 years), the ‘‘children ever born’’ measure is truncated for women who may not complete their fertility until beyond age 44 years. According to vital statistics data, about 7,500 women gave birth at age 45 years and over in 2008 comprising 0.2% of all births (1).
Another way to look at childbearing by age uses life table methodology to

7/27/2019 Fertility of Men and Women in the United States_Family Growth 2006-2010_2012_nhsr051
http://slidepdf.com/reader/full/fertility-of-men-and-women-in-the-united-statesfamily-growth-2006-20102012nhsr051 7/29
0
20
40
60
80
National Health Statistics Reports n Number 51 n April 12, 2012 Page 7
compared with 11% of those with the 100
Less than High school Some college Bachelor’s degreehigh school or higher
SOURCES: CDC/NCHS, National Survey of Family Growth, 2006–2010. Table 7 in this report.
Figure 3. Age at first birth for women aged 22–44 years, by education: United States, 2006–2010
30–4436
25–29
20–2420
under 20
4
8
31
7
15
22
11
41
4
44
24
44
35
58
lowest income. Although most men and women had
a birth by age 40 (76% of men and 85%
P e r c e n
t
of women), there are differences by poverty level and Hispanic origin and race in the percentage with a birth by age 40. Birth intervals
Variations in birth intervals between the first and second birth among women aged 15–44 in the United States are presented in Table 9. Women with short birth intervals are at higher risk of preterm deliveries, low birthweight, and adverse maternal outcomes (37,38). +About one-third of women in the
United States have only one child. One-third of women had their second birth between 13 and 36 months of the first birth; and one-third had their second birth more than 3 years (37 months or higher) after their first birth.
+ The distribution in the interval between first birth and second birth in 2006–2010 is similar to that in 2002.
Marital status at birth The timing of women’s first birth
relative to their first marriage is shown in Table 10. Births that occurred to women who have never married or to women before they were married are
calculate the probability of having had a birth by selected ages between ages 18 and 40 (Table 8 and Figure 4). As expected, the probability of having had a birth increases with age (Figure 4). In 2006–2010, the probability of a woman having had a birth by age 18 was 8% compared with 85% by age 40. For males, the probability of having fathered a child by age 40 was 76%. These probabilities were similar to those in 2002.
There are significant differences by Hispanic origin and race in the probability of having had a first birth by age 20. Non-Hispanic Asian women
(5%) and white women (14%) had the lowest probability of having a birth by this age. Hispanic women (30%) and black women (32%) had higher probabilities of having a birth by age 20. The same relationship holds true for males but the probabilities are lower.
Early childbearing is associated with living in poverty. While 6% of women with household incomes at 300% of the poverty or higher had a birth by age 20, 36% of women with household incomes less than 150% of poverty had a birth by age 20. Among males, 4% of men with the highest income fathered a child by age 20
SOURCES: CDC/NCHS, National Survey of Family Growth, 2006–2010. Table 8 in this report.
Age
0.08
0.19
0.45
0.65
0.800.85
0.760.68
0.52
0.29
0.070.02
Female
Male
P r o b a
b i l i t y
0.0
0.2
0.4
0.6
0.8
1.0
403530252018
Figure 4. Probability of a first birth, by selected ages for males and females aged 15–44 years: United States, 2006–2010
categorized as premarital births. Births that occurred within 0 to 7 months after marriage are, for the most part, considered as marital births from premarital conceptions. The timing of women’s first birth relative to their first marriage changed little overall between 2002 and 2006–2010 (Table 10). In 2006–2010, about 25% of women aged 15–44 had a first birth before their first marriage, 44% had not yet had a birth, and 5.2% had a birth within 7 months of marriage; the remaining 26% of women had a first birth 8 months or longer after their first marriage.

7/27/2019 Fertility of Men and Women in the United States_Family Growth 2006-2010_2012_nhsr051
http://slidepdf.com/reader/full/fertility-of-men-and-women-in-the-united-statesfamily-growth-2006-20102012nhsr051 8/29
Text Table. Number of children born to women aged 15–44 years, by age at first birth: United States, 1995 and 2006–2010 1995
Number of children born
Characteristic Number in thousands
Mean (standard
error) Total 1 2 3 or more Number in thousands
Mean (standard
error) Total
Percent distribution (standard error) Total . . . . . . . . . . . . . . . . . . . . . 34,958 2.1 (0.0) 100.0 30.6 (0.6) 39.7 (0.7) 29.7 (0.7) 34,353 1.3 (0.0) 100.0
Age at first birth 15–29 years . . . . . . . . . . . . . . . . 31,561 2.2 (0.0) 100.0 28.2 (0.7) 39.9 (0.7) 32.0 (0.7) 29,667 2.4 (0.0) 100.0
30–34 years . . . . . . . . . . . . . . . . 2,797 1.6 (0.0) 100.0 49.1 (2.6) 41.9 (2.4) 9.0 (1.2) 3,709 1.7 (0.0) 100.0
35–44 years . . . . . . . . . . . . . . . . 601 1.3 (0.1) 100.0 74.3 (4.1) 19.6 (3.8) 6.0 (2.1) 976 1.4 (0.1) 100.0
0.0 Quantity more than zero but less than 0.05. NOTES: Percentages may not add to 100 due to rounding. This table is limited to women with one or more births. SOURCE: CDC/NCHS, National Survey of Family Growth (2002 and 2006–2010).

7/27/2019 Fertility of Men and Women in the United States_Family Growth 2006-2010_2012_nhsr051
http://slidepdf.com/reader/full/fertility-of-men-and-women-in-the-united-statesfamily-growth-2006-20102012nhsr051 9/29
2006–2010200280
Female Male 62
55
12
2225 24
66
59
18
25
16 16
60
P e r c e
n t
40
20
0Married Cohabiting Neither Married Cohabiting Neither
married nor married nor cohabiting cohabiting
SOURCES: CDC/NCHS, National Survey of Family Growth, 2006–2010. Table 11 in this report.
Figure 5. Marital or cohabiting status at first birth for females and males aged 15–44 years: United States, 2002 and 2006–2010
National Health Statistics Reports n Number 51 n April 12, 2012 Page 9
+ Women whose first marriage was more recent were more likely to have had a premarital first birth: 31% of women who were first married in 2003 or later, compared with 7.0% of women who were first married before 1985.
+ Women who lived with both parents at age 14 were less likely (20%) to have had a premarital first birth than those who experienced other living arrangements at age 14 (34%).
+ Higher proportions of premarital first births were seen among black women (49%) and Hispanic women (34%) than among white women (17%) and Asian women (6.4%). Although premarital first births were fairly equally split among ‘‘never married’’ and ‘‘before first marriage’’ for Hispanic, white, and Asian women, most first births for black women were among ‘‘never married’’ (30%) rather than ‘‘before first marriage’’ (19%). Marital or cohabiting status at first
birth for men and women aged 15–44 who had a biological child is presented in Table 11 and Figure 5. Based on differences in how the data are collected, we show somewhat different categories for women and men (See ‘‘Technical Notes’’). + For both men and women, there was a significant increase between 2002 and 2006–2010 in the percentage of first births that occurred within a cohabiting union (Figure 5). Among the 46% of first births that were premarital in 2006–2010, nearly onehalf were to women in cohabiting unions.
+ Among women, a higher percentage of recent first births were within cohabiting unions. Among first births in 2003 and later years, 27% were to cohabiting couples, compared with 9.4% of first births before 1985. But for men there was no significant comparable trend.
+ Parental living arrangement at age 14 was associated with having a premarital first birth for both men and women. Among men who lived with both parents at age 14, 35% had a premarital first birth, compared with
55% of men who experienced other types of living arrangements.
+Hispanic origin and race were strongly associated with marital or cohabiting status at first birth for both men and women. About 80% of first births to black women and 73% of first births to black men were premarital. This compares with 53% of first births to Hispanic women, 56% of first births to Hispanic men, 34% of first births to white women, and 30% of first births to white men. Nearly 4 out of 10 (39%) first births to Hispanic men and 3 out of 10 (30%) first births to Hispanic women were within cohabiting unions, the highest of any race and Hispanic origin group.
+Men and women currently living in lower income households were significantly more likely than those in higher income households to have had a premarital first birth. For example, 64% of women currently living at 150% of the poverty level or lower had a premarital first birth, compared with 21% of those currently living at 300% of the poverty level or higher. Variations in the marital or
cohabiting status of all births within the 5 years before the interview are illustrated in Table 12. Focusing on
births in this recent time period helps to minimize respondent recall bias. +Women who were older at their first sexual intercourse were more likely to have been married at time of birth—34% of recent births to women whose first intercourse occurred when they were younger than age 15 were married at delivery, compared with 83% of births to women who first had intercourse at age 20 years and over.
+Higher education among respondents’ mothers was associated with higher percentages of recent births that were within marriage. About 75% of recent births to women whose own mothers had a bachelor’s degree or higher were marital births, compared with 51% of those whose mothers had less than a high school education.
+Recent births to women currently living in higher income households, particularly 300% of poverty or higher were more likely to be marital births.
+While 72% of recent births to white women were marital births, about onehalf of recent births to Hispanic women (49%) and onethird of recent births to black women were marital births (Figure 6). Among Hispanic mothers, a higher proportion of recent births occurred within cohabiting

7/27/2019 Fertility of Men and Women in the United States_Family Growth 2006-2010_2012_nhsr051
http://slidepdf.com/reader/full/fertility-of-men-and-women-in-the-united-statesfamily-growth-2006-20102012nhsr051 10/29
P e r c e n t
100
80
60
40
20
0
169
46
82
8
10 Neither married nor cohabiting
Cohabiting
Married
19
35
7224
49
30
Hispanic Non- Non- Non-Hispanic Hispanic Hispanic
white black Asian
SOURCES: CDC/NCHS, National Survey of Family Growth, 2006–2010. Table 12 in this report.
Figure 6. Marital or cohabitation status at time of delivery of births in the last 5 years to women aged 15–44 years, by Hispanic origin and race: United States, 2006–2010
Page 10 National Health Statistics Reports n Number 51 n April 12, 2012
unions (35%) than noncohabiting (16%)—and no difference was seen by nativity status. Among black mothers, a much lower proportion of recent births were in cohabiting relationships (24%), than in noncohabiting unions (46%). Among men and women who have
ever had a biological child, nearly onehalf had a child outside of marriage (Table 13). Of those same men and women who have ever had a biological child, about one in three had that child in a cohabiting union. + Since 2002, there has been an increase in the percentages of men and women who have had a nonmarital birth. This finding matches increasing trends based on vital statistics data (1,37). Among women who ever had a live birth, the percentage with a nonmarital birth increased from 42% in 2002 to 49% in 2006–2010, and among men, the percentage of nonmarital births rose from 40% to 47%.
+ The percentage of mothers who had a birth within a cohabiting relationship nearly doubled from 17% in 2002 to 30% in 2006–2010. The increase in births within a cohabiting relationship for men was more modest, rising from 25% to 33%.
+ Men and women who lived with both parents at age 14 were less likely to
have had a nonmarital birth: 40 to 41%, compared with 62 to 64% among those with other living arrangements at age 14. Similar differences were seen in the percentages of men and women who had a child within a nonmarital, cohabiting relationship by their living arrangement at age 14.
+Among those who had a biological child, black men (79%) and black women (82%) were most likely to have had a nonmarital birth, followed by Hispanic men (61%) and Hispanic women (57%).
Conclusion This report presented data from the
2006–2010 and 2002 NSFG on the fertility behaviors of men and women aged 15–44 in the United States. It focused on several measures of fertility including the number of children born, the number of births expected, and the context of the first birth, including marital status at first birth. The fertility experience of men and women differs across various characteristics including education, childhood living arrangements, poverty, and Hispanic origin and race. The results in this report are generally similar to those based on the 2002 NSFG.
Among the 62 million men and 62 million women aged 15–44 in the
United States, 35 million men and 35 million women have had a biological child. The average number of children born as of 2006–2010 to women was 1.3 and the average number of children fathered by men was 0.9. There were no changes between 2002 and 2006–2010 in the average number of children born, and additional births expected for men and women. In this report, the number of children born is not the same as completed fertility because the sample includes young men and women who have not started having children or who are not yet done with childbearing.
The mean age at first birth in 2006–2010 remains unchanged from 2002—age 23 for women and age 25 for men. While more than onehalf of births to women occur in their twenties, twothirds of births to men occur in their twenties. The reason for this difference is that a higher percentage of women have children before age 20 than men. By age 40, 85% of women have had a birth and 76% of men have fathered a child.
The timing of women’s first birth relative to their first marriage changed between 2002 and 2006–2010. During this time there was an increase in the percentage of men and women who had a nonmarital
birth
and
also
in
the
percentage of nonmarital births that occurred within a cohabiting union (39). Among women in 2002, 12% of first births were within a cohabiting union and by 2006–2010 this increased to 22% of first births.
The widely documented difference in fertility and fertility patterns between Hispanic, white, and black men and women continues. Hispanic women and men have more children than white and black women and men, in part explained by the early age at first birth. Onehalf of first births to Hispanic women are nonmarital and about onehalf of these are within cohabiting unions. White women have the fewest number of children and the highest average age at first birth compared with Hispanic and black women. In addition, white men and white women have the lowest percentage of nonmarital first births and about onehalf of them are within a cohabiting union. Black women have

7/27/2019 Fertility of Men and Women in the United States_Family Growth 2006-2010_2012_nhsr051
http://slidepdf.com/reader/full/fertility-of-men-and-women-in-the-united-statesfamily-growth-2006-20102012nhsr051 11/29
National Health Statistics Reports n Number 51 n April 12, 2012 Page 11
fewer children than Hispanic women but more than white women. The mean age at first birth for black women is the youngest of the three groups. Although the majority of first births to black women are nonmarital, the majority are also outside of a cohabiting union.
These are some of the key findings on the fertility of men and women in the United States. One of the limitations of this report is that it does not cover persons beyond the age of 44 years. This limitation does not allow us to see if women who start childbearing at a later age go on to have the same number of children as women who started childbearing at an earlier age. Similarly, the summary fertility measures for men are not complete because men are more likely than women to father children beyond age 44 years. Nonetheless, the NSFG is a rich source of data on measures of fertility of men and women in the United States. References 1. Martin JA, Hamilton BE, Sutton PD,
Ventura SJ, Mathews TJ, Osterman MJK. Births: Final data for 2008. National vital statistics reports; vol 59 no1. Hyattsville, MD: National Center for Health Statistics. 2010. Available from: http://www.cdc.gov/ nchs/data/nvsr/nvsr59/nvsr59_01.pdf .
2. Pratt WF, Mosher WD, Bachrach CA, Horn MC. Understanding U.S. fertility: Findings from the National Survey of Family Growth, Cycle III. Popul Bull 39(5). 1984.
3. McFalls Jr JA. Population: A lively introduction. Popul Bull 46(2). 1991.
4. World Development Indicators. The World Bank. 2011. Available from: http://data.worldbank.org/data-
catalog/worlddevelopment-
indicators.
5. Hamilton BE, Martin JA, Ventura SJ. Births: Preliminary data for 2010. National vital statistics reports; vol 60 no 2. Hyattsville, MD: National Center for Health Statistics. 2011. Available from: http://www.cdc.gov/ nchs/data/nvsr/nvsr60/nvsr60_02.pdf .
6. World fact book. The world fact book, 2009. Washington, DC: Central Intelligence Agency. 2009. Available
from: https://www.cia.gov/library/ publications/theworldfactbook/ index.html.
7. U.S. Census Bureau. 2010 Current Population Survey. Fertility of American women: 2010, detailed tables, Table 2. Available from: http://www.census.gov/hhes/fertility/ data/cps/2010.html.
8. Bongaarts J. A framework for analyzing the proximate determinants of fertility. Popul Dev Rev 4(1):105– 32. 1978.
9. Abma JC, Martinez GM. Childlessness among older women in the United States: Trends and profiles. J Marriage Fam 68(4):1045– 56. 2006.
10. Hynes K, Joyner K, Peters HE, DeLeone FY. The transition to early fatherhood: National estimates based on
multiple
surveys.
Demogr
Res
18:337–76. 2008.
11. Manning W. Childbearing in cohabiting unions: Racial and ethnic differences. Fam Plann Perspect 33(5):217–23. 2001.
12. Manlove J, Ryan S, Wildsmith E, Franzetta K. The relationship context of nonmarital childbearing in the U.S. Demogr Res 23:615–53. 2010.
13. Musick K, England P, Edgington S, Kangas N. Education differences in intended and unintended fertility. Soc Forces 88(2):543–72. 2009.
14. Raley
RK.
Increasing
fertility
in
cohabiting unions: Evidence for the second demographic transition in the United States. Demography 38(1):59–66. 2001.
15. Ventura SJ, Hamilton BE. U.S. teenage birth rate resumes decline. NCHS data brief, no 58. Hyattsville, MD: National Center for Health Statistics. 2011. Available from: http://www.cdc.gov/nchs/data/ databriefs/db58.htm.
16. United Nations. Demographic yearbook, 2008. Available from: http://unstats.un.org/unsd/ demographic/products/dyb/ dyb2008.htm.
17. Pazol K, Warner L, Gavin L, Callaghan WM, et al. Vital signs: Teen pregnancy—United States, 1991–2009. MMWR 60(13). 414–20. 2011. Available from: http:// www.cdc.gov/mmwr/pdf/wk/ mm6013.pdf .
18. Suellentrop K. The odyssey years: Preventing teen pregnancy among
older teens. Washington, DC: The National Campaign to Prevent Teen and Unplanned Pregnancy. 2010. Available from: http://www.the nationalcampaign.org/resources/pdf/ pubs/odyssey_years.pdf .
19. Abma JC, Martinez GM, Copen CE. Teenagers in the United States: Sexual activity, contraceptive use, and childbearing, National Survey of Family Growth 2006–2008. National Center for Health Statistics. Vital Health Stat 23(30). 2010. Available from: http://www.cdc.gov/nchs/data/ series/sr_23/sr23_030.pdf .
20. Hoffman SD. Teenage childbearing is not so bad after all or is it? A Review of the New Literature. Fam Plann Perspect 30(5):236–43. 1998.
21. Moffitt R. Remarks on the analysis of causal relationships in population research.
Demography
42(1):91–108.
2005.
22. The National Campaign to Prevent Teen Pregnancy. COUNTING IT UP the public costs of teen childbearing: Key data. Washington, DC. 2011. Available from: http://www.the nationalcampaign.org/costs/pdf/ countingitup/keydata.pdf .
23. Ventura SJ, Bachrach CA. Nonmarital childbearing in the United States, 1940–99. National Center for Health Statistics. Vital Health Stat 48(16). 2000. Available from:
http://www.cdc.gov/nchs/data/
nvsr/nvsr48/nvs48_16.pdf .
24. Cherlin A. Demographic trends in the United States: A review of research in the 2000s. J Marriage Fam 72:403–19. 2010.
25. Chandra A, Martinez GM, Mosher WD, Abma JC, Jones J. Fertility, family planning, and reproductive health of U.S. women: Data from the 2002 National Survey of Family Growth. National Center for health Statistics. Vital Health Stat 23(25). 2005. Available from: http://www. cdc.gov/nchs/data/series/sr_23/ sr23_025.pdf .
26. Brown S, Eisenberg L. (Eds). The best intentions: Unintended pregnancy and the wellbeing of children and families. Washington, DC: National Academy Press. 1995.
27. David HP. Born unwanted, 35 years later: The Prague study. Reproductive Health Matters 14 (27): 181–90. 2006.
28. Logan C, Holcombe E, Manlove J, Ryan S. The consequences of

7/27/2019 Fertility of Men and Women in the United States_Family Growth 2006-2010_2012_nhsr051
http://slidepdf.com/reader/full/fertility-of-men-and-women-in-the-united-statesfamily-growth-2006-20102012nhsr051 12/29
Page 12 National Health Statistics Reports n Number 51 n April 12, 2012 unintended childbearing: A white paper. May 2007. Available from: http://www.thenationalcampaign.org/ resources/pdf/consequences.pdf .
29. Mosher WD, Abma JA, Jones J. Intended and unintended births in the United States: Data from the 2006–2010
National
Survey
of
Family Growth. National health statistics reports. Forthcoming.
30. Dye JL. Fertility of American women. Current Population Reports P20–563. U.S. Census Bureau. Washington, DC. June 2008. Available from: http://www.cdc.gov/ NCHS/data/series/sr_23/sr23_029.pdf .
31. Bachrach CA. Cohabitation and reproductive behavior in the U.S. Demography 24(4):623–37. 1987.
32. Landale NS, Oropesa RS. Hispanic families: Stability and change. Annu Rev Sociol 33:381–405. 2007. 33. Lepkowski JM, Mosher WD, Davis KE, Groves RM, Van Hoewyk J. The 2006–2010 National Survey of Family Growth: Sample design and analysis of a continuous survey. National Center for Health Statistics. Vital Health Stat 2(150). 2010. Available from: http://www.cdc.gov/ nchs/data/series/sr_02/sr02_150.pdf .
34. Office of Management and Budget. Race and ethnic standards for federal statistics and administrative reporting. Statistical Policy Directive 15. 1977. Available from: http:// wonder.cdc.gov/wonder/help/ populations/bridgedrace/ Directive15.html.
35. Office of Management and Budget. Revisions to the standards for the classification of federal data on race and ethnicity. Federal Register 62FR58781–58790. Statistical Policy Directive 15. 1997. Available from: http://www.whitehouse.gov/omb/ fedreg_1997standards/ .
36. Martinez GM, Chandra A, Abma JC, Jones J, Mosher WD. Fertility, contraception, and fatherhood: Data on men and women from Cycle 6 (2002) of the National Survey of Family Growth. National Center for Health Statistics. Vital Health Stat 23(26). 2006. Available from: http://www.cdc.gov/nchs/data/series/ sr_23/sr23_026.pdf .
37. Bresle E. Women with two closely spaced pregnancies risk early delivery, especially if the first ended in a term birth. Fam Plann Perspect 30(5):252. 1998.
38. King JC. The risk of maternal nutritional depletion and poor outcomes increases in early or closely spaced pregnancies. J Nutr 133(5):1732S–6S. 2003.
39. Ventura SJ. Changing patterns of nonmarital childbearing in the United States. NCHS data brief, no 18. Hyattsville, MD: National Center for Health Statistics. 2009. Available from: http://www.cdc.gov/nchs/data/ databriefs/db18.htm.

7/27/2019 Fertility of Men and Women in the United States_Family Growth 2006-2010_2012_nhsr051
http://slidepdf.com/reader/full/fertility-of-men-and-women-in-the-united-statesfamily-growth-2006-20102012nhsr051 13/29
National Health Statistics Reports n Number 51 n April 12, 2012 Page 13
Table 1. Women and men aged 15–44 years who ever had a biological child: United States, 2006–2010 Women Men
Characteristic Total, 2002. . . . . . . . . . . . . . . . . . . . . . . . . . . . . . . . Total, 2006–20101 . . . . . . . . . . . . . . . . . . . . . . . . . . .
Age 15–19 years. . . . . . . . . . . . . . . . . . . . . . . . . . . . . . . 20–24 years. . . . . . . . . . . . . . . . . . . . . . . . . . . . . . . 25–44 years. . . . . . . . . . . . . . . . . . . . . . . . . . . . . . .
25–29 years . . . . . . . . . . . . . . . . . . . . . . . . . . . . . 30–34 years . . . . . . . . . . . . . . . . . . . . . . . . . . . . . 35–39 years . . . . . . . . . . . . . . . . . . . . . . . . . . . . . 40–44 years . . . . . . . . . . . . . . . . . . . . . . . . . . . . .
Marital or cohabiting status Currently married. . . . . . . . . . . . . . . . . . . . . . . . . . . . Currently cohabiting . . . . . . . . . . . . . . . . . . . . . . . . . . Never married, not cohabiting . . . . . . . . . . . . . . . . . . . . Formerly married, not cohabiting . . . . . . . . . . . . . . . . . .
Education2 No high school diploma or GED. . . . . . . . . . . . . . . . . . . High school diploma or GED. . . . . . . . . . . . . . . . . . . . . Some college, no bachelor’s degree . . . . . . . . . . . . . . . . Bachelor’s degree or higher . . . . . . . . . . . . . . . . . . . . .
Parental living arrangements at age 14 years Both biological parents . . . . . . . . . . . . . . . . . . . . . . . . O t h e r . . . . . . . . . . . . . . . . . . . . . . . . . . . . . . . . . . .
Hispanic origin and race, marital status, and age Hi spa nic . . . . . . . . . . . . . . . . . . . . . . . . . . . . . . . . .
U.S . b orn . . . . . . . . . . . . . . . . . . . . . . . . . . . . . . . Foreign born . . . . . . . . . . . . . . . . . . . . . . . . . . . . . Married . . . . . . . . . . . . . . . . . . . . . . . . . . . . . . . . Unmarried. . . . . . . . . . . . . . . . . . . . . . . . . . . . . . . 15–24 years . . . . . . . . . . . . . . . . . . . . . . . . . . . . . 25–44 years . . . . . . . . . . . . . . . . . . . . . . . . . . . . .
NonHispanic white, single race. . . . . . . . . . . . . . . . . . . Married . . . . . . . . . . . . . . . . . . . . . . . . . . . . . . . . Unmarried. . . . . . . . . . . . . . . . . . . . . . . . . . . . . . . 15–24 years . . . . . . . . . . . . . . . . . . . . . . . . . . . . . 25–44 years . . . . . . . . . . . . . . . . . . . . . . . . . . . . .
NonHispanic black or African American, single race . . . . . . Married . . . . . . . . . . . . . . . . . . . . . . . . . . . . . . . . Unmarried. . . . . . . . . . . . . . . . . . . . . . . . . . . . . . . 15–24 years . . . . . . . . . . . . . . . . . . . . . . . . . . . . . 25–44 years . . . . . . . . . . . . . . . . . . . . . . . . . . . . .
Number in thousands
61,561 61,755
10,478 10,365 40,912 10,535
9,188 10,538 10,652
25,605 6,910
23,581 5,659
6,844 11,578 13,702 15,083
40,310 21,444
10,474 5,369 5,104 4,199 6,274 3,637 6,836
37,384 17,235 20,149 12,207 25,177
8,451 2,033 6,418 3,059 5,392
Percent (Standard
error) 58.4 (1.0) 55.6 (1.1)
6.7 (0.8) 29.7 (2.0) 74.7 (1.0) 54.9 (1.9) 76.7 (1.5) 82.9 (1.2) 84.6 (1.3)
80.3 (1.3) 63.1 (1.9) 19.7 (1.2) 84.3 (1.4)
88.4 (1.4) 80.3 (1.4) 67.9 (1.6) 52.8 (1.7)
54.3 (1.3) 58.2 (1.3)
64.5 (1.4) 51.4 (2.1) 78.4 (1.9) 90.3 (1.7) 47.3 (1.6) 27.3 (2.1) 84.4 (1.7) 52.3 (1.4) 77.2 (1.6) 31.1 (1.5) 13.2 (1.1) 71.3 (1.3) 61.7 (1.7) 84.8 (2.7) 54.4 (2.0) 28.8 (2.2) 80.4 (1.5)
Number in thousands
61,147 62,128
10,816 10,394 40,917 10,758
9,228 10,405 10,526
23,357 7,554
27,967 3,250
9,004 12,068 13,206 12,781
42,923 19,205
11,847 5,747 6,100 4,143 7,704 3,831 8,016
37,283 14,982 22,301 12,703 24,580
7,341 1,976 5,365 2,923 4,418
Percent (Standard
error) 46.7 (1.5) 44.8 (1.1)
2.6 (0.4) 15.3 (1.8) 63.4 (1.2) 42.4 (1.7) 61.6 (2.0) 73.7 (1.7) 76.4 (1.7)
79.2 (1.5) 57.5 (2.6)
9.1 (0.7) 74.7 (2.4)
73.5 (1.6) 63.9 (1.9) 50.3 (2.2) 47.5 (2.1)
44.4 (1.3) 45.5 (1.4)
54.2 (1.4) 39.9 (2.2) 67.7 (2.0) 90.3 (1.9) 34.8 (1.8) 16.1 (2.1) 72.3 (2.1) 41.1 (1.5) 75.0 (1.8) 18.3 (1.4)
5.7 (0.9) 59.4 (1.5) 49.1 (2.0) 86.1 (2.3) 35.5 (2.2) 14.8 (1.9) 71.7 (2.0)
1Includes persons of other or multiple race and origin groups, not shown separately. 2Limited to persons aged 22–44 years at time of interview. GED is General Educational Development high school equivalency diploma. SOURCE: CDC/NCHS, National Survey of Family Growth (2002 and 2006–2010).

7/27/2019 Fertility of Men and Women in the United States_Family Growth 2006-2010_2012_nhsr051
http://slidepdf.com/reader/full/fertility-of-men-and-women-in-the-united-statesfamily-growth-2006-20102012nhsr051 14/29
Page 14 National Health Statistics Reports n Number 51 n April 12, 2012 Table 2. Childlessness status among women aged 15–44 years: United States, 2006–2010
Childless women Women Non
All with voluntarily Characteristic women children Total Temporarily Voluntarily childless
Percent distribution (standard error) Total, 2002 . . . . . . . . . . . . . . . . . . . . . . . . . . . . . . . 100.0 59.9 (1.0) 40.1 (1.0) 31.5 (0.9) 6.2 (0.4) 2.5 (0.2) Total, 2006–20101 . . . . . . . . . . . . . . . . . . . . . . . . . . . 100.0 57.4 (1.1) 42.6 (1.1) 34.3 (1.0) 6.0 (0.4) 2.3 (0.2)
Number in thousands Total, 2006–20101 . . . . . . . . . . . . . . . . . . . . . . . . . . . 61,755 35,419 26,336 21,210 3,735 1,390
Percent distribution (standard error) 100.0 100.0 100.0 100.0 100.0 100.0
Age 15–19 years . . . . . . . . . . . . . . . . . . . . . . . . . . . . . . . 17.0 (0.5) 2.5 (0.2) 36.4 (1.1) 41.3 (1.3) 20.0 (2.3) 4.8 (1.4) 20–24 years . . . . . . . . . . . . . . . . . . . . . . . . . . . . . . . 16.8 (0.7) 9.6 (0.5) 26.4 (1.1) 28.6 (1.3) 18.7 (2.2) 13.5 (3.4) 25–44 years . . . . . . . . . . . . . . . . . . . . . . . . . . . . . . . 66.2 (0.8) 87.8 (0.6) 37.2 (1.2) 30.1 (1.1) 61.3 (2.9) 81.8 (3.5)
25–29 years . . . . . . . . . . . . . . . . . . . . . . . . . . . . . 17.1 (0.6) 17.3 (0.6) 16.7 (0.9) 17.5 (1.0) 12.2 (1.6) 16.4 (3.6) 30–34 years . . . . . . . . . . . . . . . . . . . . . . . . . . . . . 14.9 (0.6) 20.2 (0.7) 7.7 (0.6) 7.0 (0.5) 9.7 (1.5) 12.1 (3.1) 35–39 years . . . . . . . . . . . . . . . . . . . . . . . . . . . . . 17.1 (0.6) 24.8 (0.8) 6.6 (0.5) 3.9 (0.4) 17.9 (2.4) 18.0 (3.0) 40–44 years . . . . . . . . . . . . . . . . . . . . . . . . . . . . . 17.2 (0.6) 25.5 (0.9) 6.2 (0.5) 1.6 (0.3) 21.5 (2.3) 35.2 (4.8)
Marital or cohabiting status Currently ma rrie d. . . . . . . . . . . . . . . . . . . . . . . . . . . . 41.5 (0.9) 59.5 (1.1) 17.2 (1.0) 15.1 (1.2) 21.9 (2.4) 36.3 (4.5) Currently cohabiting . . . . . . . . . . . . . . . . . . . . . . . . . 11.2 (0.5) 13.1 (0.6) 8.6 (0.7) 8.1 (0.7) 11.8 (1.6) 8.9 (2.8) Never married, not cohabiting . . . . . . . . . . . . . . . . . . . 38.2 (0.9) 13.9 (0.8) 70.8 (1.1) 74.9 (1.2) 59.2 (2.7) 40.3 (4.8) Formerly married, not cohabiting . . . . . . . . . . . . . . . . . . 9.2 (0.4) 13.5 (0.6) 3.4 (0.4) 2.0 (0.3) 7.1 (1.4) 14.5 (3.2)
Education2 No high school diploma or GE D. . . . . . . . . . . . . . . . . . . 14.5 (0.9) 18.4 (1.2) 5.2 (0.7) 3.9 (0.7) 9.5 (2.1) 6.7 (2.2) High school diploma or G E D . . . . . . . . . . . . . . . . . . . . . 24.5 (0.9) 28.2 (1.0) 15.7 (1.2) 12.6 (1.3) 20.5 (2.6) 29.1 (5.3) Some college, no bachelor’s degree . . . . . . . . . . . . . . . . 29.0 (0.9) 28.5 (1.0) 30.3 (1.6) 30.6 (1.8) 27.7 (2.7) 33.1 (5.0) Bachelor’s degree or higher . . . . . . . . . . . . . . . . . . . . . 32.0 (1.3) 24.9 (1.3) 48.9 (1.8) 52.9 (1.9) 42.3 (3.3) 31.1 (5.5)
Parental living arrangements at age 14 years Both biological parents . . . . . . . . . . . . . . . . . . . . . . . . 65.3 (0.9) 63.5 (1.0) 28.8 (1.0) 68.1 (1.2) 64.3 (2.5) 69.0 (3.7) Other . . . . . . . . . . . . . . . . . . . . . . . . . . . . . . . . . . . 34.7 (0.9) 36.5 (1.0) 13.8 (0.5) 31.9 (1.2) 35.7 (2.5) 31.0 (3.7)
Hispanic origin and race Hispanic . . . . . . . . . . . . . . . . . . . . . . . . . . . . . . . . . 16.9 (1.8) 19.5 (2.2) 13.5 (1.3) 14.6 (1.4) 8.8 (1.5) 9.0 (2.0)
U.S. born . . . . . . . . . . . . . . . . . . . . . . . . . . . . . . . 8.7 (0.9) 8.1 (1.0) 9.5 (0.9) 10.4 (1.1) 6.0 (1.2) 5.8 (1.6) Foreign born . . . . . . . . . . . . . . . . . . . . . . . . . . . . . 8.3 (0.9) 11.4 (1.3) 4.0 (0.5) 4.2 (0.6) 2.9 (0.8) 3.2 (1.2)
NonHispanic: White, single race . . . . . . . . . . . . . . . . . . . . . . . . . . 60.5 (1.8) 57.2 (2.3) 65.0 (1.5) 63.5 (1.7) 72.0 (2.3) 69.8 (3.6) Black or African American, single race . . . . . . . . . . . . . 13.7 (1.1) 15.2 (1.3) 11.7 (0.9) 11.6 (0.9) 11.1 (1.6) 13.8 (2.5) Asian, single race . . . . . . . . . . . . . . . . . . . . . . . . . . 4.0 (0.4) 3.5 (0.4) 4.7 (0.5) 5.1 (0.6) 3.3 (1.0) 1.6 (1.1)
1Includes women of other or multiple race and origin groups, not shown separately. 2Limited to women aged 22–44 years at time of interview. GED is General Educational Development high school equivalency diploma.NOTE: Percentages may not add to 100 due to rounding.SOURCE: CDC/NCHS, National Survey of Family Growth (2002 and 2006–2010).

7/27/2019 Fertility of Men and Women in the United States_Family Growth 2006-2010_2012_nhsr051
http://slidepdf.com/reader/full/fertility-of-men-and-women-in-the-united-statesfamily-growth-2006-20102012nhsr051 15/29
National Health Statistics Reports n Number 51 n April 12, 2012 Page 15
Table 3. Number of children ever born to women aged 15–44 years: United States, 2006–2010 Number of children ever born
Mean Number in (standard
Characteristic thousands error) Total None 1 2 3 4 or more Percent distribution (standard error)
Total, 1995 . . . . . . . . . . . . . . . . . . . . . . . . . . . . . . . 60,201 1.2 (0.0) 100.0 41.9 (0.7) 17.8 (0.4) 23.0 (0.5) 11.6 (0.3) 5.7 (0.3) Total, 2002 . . . . . . . . . . . . . . . . . . . . . . . . . . . . . . . 61,561 1.3 (0.0) 100.0 41.6 (1.0) 18.2 (0.5) 21.8 (0.6) 11.6 (0.6) 6.8 (0.6) Total, 2006–20101 . . . . . . . . . . . . . . . . . . . . . . . . . . . 61,755 1.3 (0.0) 100.0 44.4 (1.1) 16.2 (0.5) 21.0 (0.8) 11.5 (0.5) 6.9 (0.5)
Age 15–19 years . . . . . . . . . . . . . . . . . . . . . . . . . . . . . . . 10,478 0.1 (0.0) 100.0 93.3 (0.8) 5.4 (0.7) 1.2 (0.3) 0.1 (0.1) 0.0 (0.0) 20–24 years . . . . . . . . . . . . . . . . . . . . . . . . . . . . . . . 10,365 0.5 (0.0) 100.0 70.3 (2.0) 17.5 (1.3) 9.0 (1.2) 2.4 (0.4) 0.9 (0.3) 25–44 years . . . . . . . . . . . . . . . . . . . . . . . . . . . . . . . 40,912 1.8 (0.0) 100.0 25.3 (1.0) 18.7 (0.7) 29.1 (0.9) 16.8 (0.7) 10.2 (0.7)
25–29 years . . . . . . . . . . . . . . . . . . . . . . . . . . . . . 10,535 1.1 (0.0) 100.0 45.1 (1.9) 19.5 (1.1) 20.8 (1.5) 10.7 (1.1) 3.8 (0.4) 30–34 years . . . . . . . . . . . . . . . . . . . . . . . . . . . . . 9,188 1.7 (0.1) 100.0 23.3 (1.5) 22.0 (1.5) 28.2 (1.6) 17.6 (1.4) 8.9 (0.9) 35–39 years . . . . . . . . . . . . . . . . . . . . . . . . . . . . . 10,538 2.0 (0.1) 100.0 17.1 (1.2) 18.4 (1.3) 32.2 (1.8) 18.7 (1.4) 13.6 (1.3) 40–44 years . . . . . . . . . . . . . . . . . . . . . . . . . . . . . 10,652 2.1 (0.1) 100.0 15.4 (1.3) 15.2 (1.2) 35.0 (1.9) 20.2 (1.5) 14.2 (1.6)
Marital or cohabiting status Currently ma rrie d. . . . . . . . . . . . . . . . . . . . . . . . . . . . 25,605 1.9 (0.0) 100.0 19.7 (1.3) 18.6 (0.9) 34.0 (1.2) 18.2 (0.9) 9.5 (0.8) Currently cohabiting . . . . . . . . . . . . . . . . . . . . . . . . . . 6,910 1.3 (0.1) 100.0 36.9 (1.9) 24.1 (1.4) 20.1 (1.4) 10.4 (1.3) 8.5 (1.3) Never married, not cohabiting . . . . . . . . . . . . . . . . . . . . 23,581 0.4 (0.0) 100.0 80.3 (1.2) 9.9 (0.7) 5.5 (0.5) 2.4 (0.4) 1.9 (0.3) Formerly married, not cohabiting . . . . . . . . . . . . . . . . . . 5,659 2.0 (0.1) 100.0 15.7 (1.4) 22.2 (1.9) 27.4 (2.2) 20.6 (1.9) 14.0 (1.7)
Education2 No high school diploma or GE D. . . . . . . . . . . . . . . . . . . 6,844 2.5 (0.1) 100.0 11.6 (1.4) 13.9 (1.2) 27.0 (1.7) 23.4 (1.6) 24.1 (1.6) High school diploma or G E D . . . . . . . . . . . . . . . . . . . . . 11,578 1.8 (0.1) 100.0 19.7 (1.4) 20.8 (1.5) 31.8 (1.4) 18.4 (1.5) 9.3 (1.0) Some college, no bachelor’s degree . . . . . . . . . . . . . . . . 13,702 1.5 (0.1) 100.0 32.1 (1.6) 20.5 (1.0) 26.0 (1.4) 14.1 (1.0) 7.2 (1.1) Bachelor’s degree or higher . . . . . . . . . . . . . . . . . . . . . 15,083 1.1 (0.0) 100.0 47.2 (1.7) 17.3 (1.0) 23.0 (1.5) 9.2 (0.8) 3.4 (0.7)
Percent of poverty level3 0–149% . . . . . . . . . . . . . . . . . . . . . . . . . . . . . . . . . 16,695 2.0 (0.1) 100.0 23.5 (1.4) 16.6 (1.0) 24.1 (1.2) 19.4 (1.0) 16.4 (1.2)
0–99% . . . . . . . . . . . . . . . . . . . . . . . . . . . . . . . . 10,554 2.1 (0.1) 100.0 24.4 (1.9) 16.0 (1.0) 22.4 (1.4) 19.0 (1.4) 18.2 (1.5) 150%–299% . . . . . . . . . . . . . . . . . . . . . . . . . . . . . . 14,992 1.6 (0.0) 100.0 31.1 (1.6) 19.4 (1.0) 25.7 (1.5) 15.5 (1.1) 8.4 (0.8) 300% or higher . . . . . . . . . . . . . . . . . . . . . . . . . . . . . 19,590 1.0 (0.0) 100.0 46.2 (1.6) 19.2 (1.0) 25.3 (1.2) 7.9 (0.7) 1.3 (0.4)
Parental living arrangements at age 14 years Both biological parents . . . . . . . . . . . . . . . . . . . . . . . . 40,310 1.2 (0.0) 100.0 45.7 (1.3) 15.3 (0.6) 21.4 (0.9) 11.3 (0.6) 6.1 (0.5) Other . . . . . . . . . . . . . . . . . . . . . . . . . . . . . . . . . . . 21,444 1.3 (0.0) 100.0 41.8 (1.3) 17.9 (0.8) 20.1 (1.0) 11.9 (0.7) 8.3 (0.7)
Hispanic origin and race Hispanic . . . . . . . . . . . . . . . . . . . . . . . . . . . . . . . . . 10,474 1.6 (0.1) 100.0 35.5 (1.4) 16.1 (1.0) 18.9 (1.0) 16.8 (1.4) 12.8 (0.9)
U.S. born . . . . . . . . . . . . . . . . . . . . . . . . . . . . . . . 5,369 1.2 (0.1) 100.0 48.6 (2.1) 16.8 (1.2) 14.9 (1.3) 11.4 (1.2) 8.2 (1.1) Foreign born . . . . . . . . . . . . . . . . . . . . . . . . . . . . . 5,104 2.1 (0.1) 100.0 21.6 (1.9) 15.3 (1.9) 23.1 (1.6) 22.4 (2.0) 17.5 (1.4)
NonHispanic: White, single race . . . . . . . . . . . . . . . . . . . . . . . . . . 37,384 1.1 (0.0) 100.0 47.7 (1.4) 15.7 (0.7) 21.8 (1.0) 10.6 (0.6) 4.2 (0.4) Black or African American, single race . . . . . . . . . . . . . 8,451 1.4 (0.1) 100.0 38.3 (1.7) 19.4 (1.0) 21.3 (1.2) 11.3 (0.9) 9.8 (1.0) Asian, single race . . . . . . . . . . . . . . . . . . . . . . . . . . 2,456 1.0 (0.1) 100.0 50.8 (3.5) 15.9 (2.7) 22.9 (3.1) 7.1 (2.0) 3.4 (1.3)
0.0 Quantity more than zero but less than 0.05.1Includes women of other or multiple race and origin groups not shown separately. 2Limited to women aged 22–44 years at time of interview. GED is General Educational Development high school equivalency diploma.3Limited to women aged 20–44 years at time of interview. NOTE: Percentages may not add to 100 due to rounding.SOURCE: CDC/NCHS, National Survey of Family Growth (1995, 2002 and 2006–2010).

7/27/2019 Fertility of Men and Women in the United States_Family Growth 2006-2010_2012_nhsr051
http://slidepdf.com/reader/full/fertility-of-men-and-women-in-the-united-statesfamily-growth-2006-20102012nhsr051 16/29
Page 16 National Health Statistics Reports n Number 51 n April 12, 2012 Table 4. Number of biological children fathered by men aged 15–44 years: United States, 2006–2010
Number of children Mean
Number in (standard 4 Characteristic thousands error) Total None 1 2 3 or more
Percent distribution (standard error) Total, 2002 . . . . . . . . . . . . . . . . . . . . . . . . . . . . . . . 61,147 1.0 (0.0) 100.0 53.3 (1.5) 17.1 (0.9) 16.1 (0.8) 8.3 (0.7) 5.2 (0.6) Total, 2006–20101 . . . . . . . . . . . . . . . . . . . . . . . . . . . 62,128 0.9 (0.0) 100.0 55.2 (1.1) 15.8 (0.6) 17.0 (0.7) 7.9 (0.5) 4.1 (0.3)
Age 15–19 years . . . . . . . . . . . . . . . . . . . . . . . . . . . . . . . 10,816 0.0 (0.0) 100.0 97.4 (0.4) 2.3 (0.4) 0.3 (0.2) . . . . . . 20–24 years . . . . . . . . . . . . . . . . . . . . . . . . . . . . . . . 10,394 0.2 (0.0) 100.0 84.7 (1.8) 11.5 (1.5) 2.7 (0.5) 0.7 (0.3) 0.3 (0.2) 25–44 years . . . . . . . . . . . . . . . . . . . . . . . . . . . . . . . 40,917 1.3 (0.0) 100.0 36.6 (1.2) 20.4 (0.8) 25.0 (1.0) 11.8 (0.7) 6.2 (0.5)
25–29 years . . . . . . . . . . . . . . . . . . . . . . . . . . . . . 10,758 0.7 (0.0) 100.0 57.6 (1.7) 22.2 (1.5) 13.4 (1.3) 5.5 (0.8) 1.4 (0.4) 30–34 years . . . . . . . . . . . . . . . . . . . . . . . . . . . . . 9,228 1.3 (0.1) 100.0 38.4 (2.0) 21.2 (1.4) 23.6 (1.6) 11.3 (1.4) 5.5 (0.8) 35–39 years . . . . . . . . . . . . . . . . . . . . . . . . . . . . . 10,405 1.6 (0.0) 100.0 26.3 (1.7) 20.1 (1.7) 32.1 (2.0) 13.2 (1.4) 8.3 (1.1) 40–44 years . . . . . . . . . . . . . . . . . . . . . . . . . . . . . 10,526 1.8 (0.1) 100.0 23.6 (1.7) 18.2 (1.6) 31.2 (2.1) 17.4 (1.6) 9.5 (1.3)
Marital or cohabiting status Currently ma rrie d. . . . . . . . . . . . . . . . . . . . . . . . . . . . 23,357 1.7 (0.0) 100.0 20.8 (1.5) 22.3 (1.2) 33.6 (1.4) 15.4 (1.0) 7.9 (0.7) Currently cohabiting . . . . . . . . . . . . . . . . . . . . . . . . . . 7,554 1.1 (0.1) 100.0 42.5 (2.6) 26.7 (2.0) 15.9 (1.6) 9.7 (1.4) 5.2 (0.9) Never married, not cohabiting . . . . . . . . . . . . . . . . . . . . 3,250 0.1 (0.0) 100.0 90.9 (0.7) 6.1 (0.5) 1.9 (0.3) 0.5 (0.1) 0.5 (0.1) Formerly married, not cohabiting . . . . . . . . . . . . . . . . . . 27,967 1.5 (0.1) 100.0 25.3 (2.4) 26.7 (3.1) 29.7 (2.9) 13.0 (2.0) 5.3 (1.2)
Education2 No high school diploma or GE D. . . . . . . . . . . . . . . . . . . 9,004 1.7 (0.1) 100.0 26.5 (1.6) 24.0 (1.6) 21.7 (1.7) 17.4 (1.6) 10.4 (1.2) High school diploma or G E D . . . . . . . . . . . . . . . . . . . . . 12,068 1.3 (0.0) 100.0 36.1 (1.9) 21.0 (1.4) 25.8 (1.7) 12.2 (1.4) 5.0 (0.7) Some college, no bachelor’s degree . . . . . . . . . . . . . . . . 13,206 1.0 (0.0) 100.0 49.7 (2.2) 19.7 (1.6) 19.2 (1.5) 6.8 (0.9) 4.6 (0.7) Bachelor’s degree or higher . . . . . . . . . . . . . . . . . . . . . 12,781 1.0 (0.1) 100.0 52.5 (2.1) 14.2 (1.2) 22.4 (1.9) 7.7 (1.0) 3.1 (0.7)
Percent of poverty level3 0–149% . . . . . . . . . . . . . . . . . . . . . . . . . . . . . . . . . 12,498 1.3 (0.1) 100.0 41.6 (2.2) 17.3 (1.4) 20.0 (1.6) 13.1 (1.3) 8.0 (0.9)
0–99% . . . . . . . . . . . . . . . . . . . . . . . . . . . . . . . . . 7,656 1.2 (0.1) 100.0 45.8 (2.2) 16.9 (1.6) 17.4 (1.6) 12.1 (1.4) 7.8 (1.0) 150%–299%. . . . . . . . . . . . . . . . . . . . . . . . . . . . . . . 14,841 1.3 (0.1) 100.0 42.0 (1.8) 19.3 (1.2) 20.1 (1.4) 10.4 (1.2) 8.1 (0.9) 300% or higher . . . . . . . . . . . . . . . . . . . . . . . . . . . . . 23,972 0.9 (0.0) 100.0 51.5 (1.7) 18.8 (1.2) 21.1 (1.4) 7.2 (0.7) 1.4 (0.3)
Parental living arrangements at age 14 years Both biological parents . . . . . . . . . . . . . . . . . . . . . . . . 42,923 0.9 (0.0) 100.0 55.6 (1.3) 14.6 (0.7) 17.8 (0.9) 7.9 (0.7) 4.1 (0.4) Other . . . . . . . . . . . . . . . . . . . . . . . . . . . . . . . . . . . 19,205 0.9 (0.0) 100.0 54.5 (1.4) 18.4 (0.9) 15.2 (0.9) 7.9 (0.8) 4.1 (0.5)
Hispanic origin and race Hispanic . . . . . . . . . . . . . . . . . . . . . . . . . . . . . . . . . 11,847 1.2 (0.0) 100.0 45.8 (1.4) 17.5 (0.9) 17.9 (1.2) 11.8 (1.1) 7.0 (0.7)
U.S. born . . . . . . . . . . . . . . . . . . . . . . . . . . . . . . . 5,747 0.8 (0.1) 100.0 60.1 (2.2) 16.7 (1.4) 12.9 (1.4) 6.2 (1.1) 4.1 (1.0) Foreign born . . . . . . . . . . . . . . . . . . . . . . . . . . . . . 6,100 1.6 (0.1) 100.0 32.3 (2.0) 18.2 (1.3) 22.7 (1.7) 17.0 (2.0) 9.8 (1.2)
NonHispanic: White, single race . . . . . . . . . . . . . . . . . . . . . . . . . . 37,283 0.8 (0.0) 100.0 58.9 (1.5) 14.9 (0.9) 17.0 (1.0) 6.6 (0.6) 2.6 (0.3) Black or African American, single race . . . . . . . . . . . . . 7,341 1.1 (0.1) 100.0 50.9 (2.0) 18.3 (1.3) 14.3 (1.4) 8.5 (1.2) 8.1 (1.1) Asian, single race . . . . . . . . . . . . . . . . . . . . . . . . . . 2,406 0.7 (0.1) 100.0 61.5 (3.4) 18.6 (3.2) 13.0 (2.4) 6.4 (2.1) *
0.0 Quantity more than zero but less than 0.05.. . . Category not applicable.* Figure does not meet standards of reliability or precision.1Includes men of other or multiple race and origin groups not shown separately. 2Limited to men 22–44 years of age at time of interview. GED is General Educational Development high school equivalency diploma.3Limited to men 20–44 years of age at time of interview. NOTE: Percentages may not add to 100 due to rounding.SOURCE: CDC/NCHS, National Survey of Family Growth (2002 and 2006–2010).

7/27/2019 Fertility of Men and Women in the United States_Family Growth 2006-2010_2012_nhsr051
http://slidepdf.com/reader/full/fertility-of-men-and-women-in-the-united-statesfamily-growth-2006-20102012nhsr051 17/29
National Health Statistics Reports n Number 51 n April 12, 2012 Page 17
Table 5. Mean number of children ever born, additional births expected, and total births expected for women and men aged 15–44 years: United States, 2006–2010
Women Men Additional Total Additional Total
Number in Children births births Number in Children births births Characteristic thousands ever born expected expected thousands ever born expected expected
Mean number (standard error) Mean number (standard error) Total, 2002 . . . . . . . . . . . . . . . . . . . . . . . . . . . . . . . 61,561 1.3 (0.0) 1.0 (0.0) 2.3 (0.0) 61,147 1.0 (0.0) 1.2 (0.0) 2.2 (0.0) Total, 2006–20101 . . . . . . . . . . . . . . . . . . . . . . . . . . . 61,755 1.3 (0.0) 1.1 (0.0) 2.3 (0.0) 62,128 0.9 (0.0) 1.3 (0.0) 2.2 (0.0)
Age 15–19 years . . . . . . . . . . . . . . . . . . . . . . . . . . . . . . . 10,478 0.1 (0.0) 2.2 (0.1) 2.3 (0.1) 10,816 0.0 (0.0) 2.2 (0.0) 2.2 (0.0) 20–24 years . . . . . . . . . . . . . . . . . . . . . . . . . . . . . . . 10,365 0.5 (0.0) 1.9 (0.1) 2.4 (0.1) 10,394 0.2 (0.0) 2.1 (0.1) 2.3 (0.1) 25–44 years . . . . . . . . . . . . . . . . . . . . . . . . . . . . . . . 40,912 1.8 (0.0) 0.6 (0.0) 2.3 (0.0) 40,917 1.3 (0.0) 0.8 (0.0) 2.2 (0.0)
25–29 years . . . . . . . . . . . . . . . . . . . . . . . . . . . . . 10,535 1.1 (0.0) 1.2 (0.1) 2.4 (0.0) 10,758 0.7 (0.0) 1.6 (0.1) 2.3 (0.0) 30–34 years . . . . . . . . . . . . . . . . . . . . . . . . . . . . . 9,188 1.7 (0.1) 0.7 (0.0) 2.4 (0.0) 9,228 1.3 (0.1) 1.0 (0.0) 2.2 (0.0) 35–39 years . . . . . . . . . . . . . . . . . . . . . . . . . . . . . 10,538 2.0 (0.1) 0.3 (0.0) 2.4 (0.1) 10,405 1.6 (0.0) 0.5 (0.0) 2.1 (0.1) 40–44 years . . . . . . . . . . . . . . . . . . . . . . . . . . . . . 10,652 2.1 (0.1) 0.1 (0.0) 2.2 (0.1) 10,526 1.8 (0.1) 0.2 (0.0) 2.0 (0.1)
Marital or cohabiting status Currently marri ed . . . . . . . . . . . . . . . . . . . . . . . . . . . . 25,605 1.9 (0.0) 0.6 (0.0) 2.5 (0.0) 23,357 1.7 (0.0) 0.7 (0.1) 2.4 (0.0)
First marriage . . . . . . . . . . . . . . . . . . . . . . . . . . . . 22,466 1.8 (0.0) 0.7 (0.0) 2.5 (0.1) 20,348 1.7 (0.0) 0.7 (0.1) 2.4 (0.1) Second marriage or higher . . . . . . . . . . . . . . . . . . . . 3,139 2.2 (0.1) 0.2 (0.1) 2.5 (0.1) 3,009 2.1 (0.1) 0.4 (0.0) 2.5 (0.1)
Currently cohabiting . . . . . . . . . . . . . . . . . . . . . . . . . . 6,910 1.3 (0.1) 0.9 (0.0) 2.3 (0.1) 7,554 1.1 (0.1) 1.0 (0.0) 2.1 (0.1) Never married, not cohabiting . . . . . . . . . . . . . . . . . . . 23,581 0.4 (0.0) 1.8 (0.1) 2.2 (0.0) 27,967 0.1 (0.0) 2.0 (0.0) 2.1 (0.0) Formerly married, not cohabiting . . . . . . . . . . . . . . . . . . 5,659 2.0 (0.1) 0.3 (0.0) 2.4 (0.1) 3,250 1.5 (0.1) 0.6 (0.1) 2.2 (0.1)
Fecundity status Surgically sterile:
Contraceptive . . . . . . . . . . . . . . . . . . . . . . . . . . . . 13,112 2.6 (0.0) 0.0 (0.0) 2.6 (0.0) . . . . . . . . . . . . Noncontraceptive . . . . . . . . . . . . . . . . . . . . . . . . . . 898 1.8 (0.2) 0.0 (0.0) 1.8 (0.2) . . . . . . . . . . . .
Impaired fecundity . . . . . . . . . . . . . . . . . . . . . . . . . . . 6,707 1.1 (0.1) 0.9 (0.0) 1.9 (0.1) . . . . . . . . . . . . Fecund . . . . . . . . . . . . . . . . . . . . . . . . . . . . . . . . . . 41,038 0.8 (0.0) 1.5 (0.1) 2.3 (0.0) . . . . . . . . . . . .
Sterility status Surgically sterile . . . . . . . . . . . . . . . . . . . . . . . . . . . . . . . . . . . . . . . . 3,671 2.4 (0.1) 0.0 (0.0) 2.4 (0.1) Nonsurgically sterile . . . . . . . . . . . . . . . . . . . . . . . . . . . . . . . . . . . . . . 1,364 1.2 (0.2) 0.0 (0.0) 1.2 (0.2) All ot he rs. . . . . . . . . . . . . . . . . . . . . . . . . . . . . . . . . . . . . . . . . . . . . 57,093 0.8 (0.0) 1.4 (0.0) 2.2 (0.0)
Education2 No high school diploma or GE D. . . . . . . . . . . . . . . . . . . 6,844 2.5 (0.1) 0.4 (0.0) 3.0 (0.1) 9,004 1.7 (0.1) 0.8 (0.0) 2.4 (0.1) High school diploma or G E D . . . . . . . . . . . . . . . . . . . . . 11,578 1.8 (0.1) 0.5 (0.0) 2.3 (0.1) 12,068 1.3 (0.0) 0.8 (0.0) 2.2 (0.0) Some college, no bachelor’s degree . . . . . . . . . . . . . . . . 13,702 1.5 (0.1) 0.8 (0.0) 2.3 (0.1) 13,206 1.0 (0.0) 1.2 (0.1) 2.2 (0.1) Bachelor’s degree or higher . . . . . . . . . . . . . . . . . . . . . 15,083 1.1 (0.0) 1.0 (0.1) 2.1 (0.1) 12,781 1.0 (0.1) 1.1 (0.1) 2.1 (0.0)
Percent of poverty level3 0–149% . . . . . . . . . . . . . . . . . . . . . . . . . . . . . . . . . 16,695 2.0 (0.1) 0.8 (0.1) 2.8 (0.1) 12,498 1.3 (0.1) 1.1 (0.1) 2.5 (0.1)
0–99% . . . . . . . . . . . . . . . . . . . . . . . . . . . . . . . . 10,554 2.1 (0.1) 0.8 (0.1) 2.9 (0.1) 7,656 1.2 (0.1) 1.2 (0.1) 2.4 (0.1) 150%–299% . . . . . . . . . . . . . . . . . . . . . . . . . . . . . . 14,992 1.6 (0.0) 0.8 (0.0) 2.4 (0.1) 14,841 1.3 (0.1) 1.0 (0.0) 2.3 (0.0) 300% or higher . . . . . . . . . . . . . . . . . . . . . . . . . . . . . 19,590 1.0 (0.0) 0.9 (0.0) 1.9 (0.0) 23,972 0.9 (0.0) 1.1 (0.0) 2.0 (0.0)
Parental living arrangements at age 14 years Both biological parents . . . . . . . . . . . . . . . . . . . . . . . . 40,310 1.2 (0.0) 1.1 (0.1) 2.3 (0.5) 42,923 0.9 (0.0) 1.3 (0.1) 2.2 (0.0) Other . . . . . . . . . . . . . . . . . . . . . . . . . . . . . . . . . . . 21,444 1.3 (0.0) 1.0 (0.0) 2.3 (0.0) 19,205 0.9 (0.0) 1.3 (0.0) 2.2 (0.0)
Hispanic origin and race Hispanic . . . . . . . . . . . . . . . . . . . . . . . . . . . . . . . . . 10,474 1.6 (0.1) 1.1 (0.0) 2.7 (0.0) 11,847 1.2 (0.0) 1.3 (0.0) 2.5 (0.0)
U.S. born . . . . . . . . . . . . . . . . . . . . . . . . . . . . . . . 5,369 1.2 (0.1) 1.4 (0.1) 2.6 (0.1) 5,747 0.8 (0.1) 1.5 (0.1) 2.3 (0.1) Foreign born . . . . . . . . . . . . . . . . . . . . . . . . . . . . . 5,104 2.1 (0.1) 0.8 (0.0) 2.9 (0.1) 6,100 1.6 (0.1) 1.0 (0.1) 2.6 (0.1)
NonHispanic: White, single race . . . . . . . . . . . . . . . . . . . . . . . . . . 37,384 1.1 (0.0) 1.1 (0.1) 2.2 (0.1) 37,283 0.8 (0.0) 1.3 (0.1) 2.1 (0.1) Black or African American, single race . . . . . . . . . . . . . 8,451 1.4 (0.1) 1.0 (0.0) 2.4 (0.1) 7,341 1.1 (0.1) 1.3 (0.0) 2.4 (0.1) Asian, single race . . . . . . . . . . . . . . . . . . . . . . . . . . 2,456 1.0 (0.1) 1.2 (0.1) 2.2 (0.1) 2,406 0.7 (0.1) 1.3 (0.1) 2.0 (0.1)
0.0 Quantity more than zero but less than 0.05.. . . Category not applicable because men’s sterility status cannot be defined in a comparable fashion as women’s fecundity status.1Includes persons of other or multiple race and origin groups not shown separately. 2Limited to persons aged 22–44 years at time of interview. GED is General Educational Development high school equivalency diploma.3Limited to persons aged 20–44 years of age at time of interview.NOTE: Total births may not equal the sum of children ever born and additional births expected due to rounding.SOURCE: CDC/NCHS, National Survey of Family Growth (2002 and 2006–2010).

7/27/2019 Fertility of Men and Women in the United States_Family Growth 2006-2010_2012_nhsr051
http://slidepdf.com/reader/full/fertility-of-men-and-women-in-the-united-statesfamily-growth-2006-20102012nhsr051 18/29
Page 18 National Health Statistics Reports n Number 51 n April 12, 2012 Table 6. Total births expected by women aged 15–44 years: United States, 2006–2010
Total number of births expected Number in
Characteristic thousands Total 0 1 2 3 4 or more
Percent distribution (standard error) Total, 2002 . . . . . . . . . . . . . . . . . . . . . . . . . . . . . . . 61,561 100.0 8.9 (0.4) 13.4 (0.4) 42.1 (0.8) 22.1 (0.7) 13.5 (0.7) Total, 2006–20101 . . . . . . . . . . . . . . . . . . . . . . . . . . . 61,755 100.0 8.3 (0.4) 12.5 (0.5) 40.9 (0.9) 24.0 (0.6) 14.3 (1.2)
Age 15–19 years . . . . . . . . . . . . . . . . . . . . . . . . . . . . . . . 10,478 100.0 7.8 (0.8) 11.5 (1.1) 46.0 (1.7) 23.3 (1.3) 11.5 (1.5) 20–24 years . . . . . . . . . . . . . . . . . . . . . . . . . . . . . . . 10,365 100.0 8.5 (0.9) 8.6 (0.9) 42.2 (2.2) 25.3 (1.5) 15.4 (2.8) 25–44 years . . . . . . . . . . . . . . . . . . . . . . . . . . . . . . . 40,912 100.0 8.4 (0.5) 13.8 (0.6) 39.3 (1.0) 23.8 (0.8) 14.8 (1.0)
25–29 years . . . . . . . . . . . . . . . . . . . . . . . . . . . . . 10,535 100.0 6.5 (0.8) 10.6 (1.0) 42.2 (1.7) 27.3 (1.3) 13.4 (1.6) 30–34 years . . . . . . . . . . . . . . . . . . . . . . . . . . . . . 9,188 100.0 5.8 (0.8) 13.2 (1.3) 40.8 (1.9) 25.1 (1.5) 15.1 (1.2) 35–39 years . . . . . . . . . . . . . . . . . . . . . . . . . . . . . 10,538 100.0 8.7 (0.9) 15.8 (1.1) 37.3 (1.8) 22.2 (1.4) 16.0 (1.4) 40–44 years . . . . . . . . . . . . . . . . . . . . . . . . . . . . . 10,652 100.0 12.1 (1.1) 15.3 (1.2) 37.0 (2.0) 20.9 (1.5) 14.6 (1.7)
Marital or cohabiting status Currently ma rried . . . . . . . . . . . . . . . . . . . . . . . . . . . . 3,971 100.0 5.2 (0.5) 10.8 (0.7) 41.9 (1.4) 26.5 (1.1) 15.7 (1.6)
First marriage . . . . . . . . . . . . . . . . . . . . . . . . . . . . 3,487 100.0 4.8 (0.5) 10.7 (0.7) 42.7 (1.6) 26.3 (1.2) 15.4 (1.7) Second marriage or higher . . . . . . . . . . . . . . . . . . . . 484 100.0 7.6 (1.9) 11.2 (1.7) 36.2 (2.8) 27.8 (2.7) 17.1 (2.2)
Currently cohabiting . . . . . . . . . . . . . . . . . . . . . . . . . . 1,451 100.0 8.1 (1.1) 15.6 (1.3) 39.3 (1.7) 20.9 (1.6) 16.1 (1.7) Never married, not cohabiting . . . . . . . . . . . . . . . . . . . . 5,597 100.0 11.8 (0.7) 12.3 (0.7) 41.9 (1.2) 22.1 (0.8) 11.8 (1.4) Formerly married, not cohabiting . . . . . . . . . . . . . . . . . . 1,260 100.0 8.2 (1.2) 17.3 (1.8) 34.0 (2.1) 24.2 (1.8) 16.3 (1.7)
Parity No births . . . . . . . . . . . . . . . . . . . . . . . . . . . . . . . . . 27,401 100.0 18.7 (0.9) 12.3 (0.8) 41.6 (1.3) 18.0 (0.8) 9.3 (1.9) 1 b i rt h . . . . . . . . . . . . . . . . . . . . . . . . . . . . . . . . . . . 10,011 100.0 . . . 43.5 (1.7) 37.5 (1.4) 15.0 (1.0) 3.9 (0.6) 2 births . . . . . . . . . . . . . . . . . . . . . . . . . . . . . . . . . . 12,955 100.0 . . . . . . 77.9 (1.2) 17.1 (1.0) 5.0 (0.7) 3 births . . . . . . . . . . . . . . . . . . . . . . . . . . . . . . . . . . 7,126 100.0 . . . . . . . . . 86.2 (1.5) 13.8 (1.5) 4 or more births . . . . . . . . . . . . . . . . . . . . . . . . . . . . 4,261 100.0 . . . . . . . . . . . . 100.0 (0.0)
Education2 No high school diploma or GE D. . . . . . . . . . . . . . . . . . . 6,844 100.0 5.0 (0.9) 8.8 (0.9) 27.2 (1.8) 28.0 (1.6) 31.0 (1.9) High school diploma or G E D . . . . . . . . . . . . . . . . . . . . . 11,578 100.0 8.0 (0.9) 14.6 (1.2) 39.1 (1.6) 24.8 (1.5) 13.4 (1.2) Some college, no bachelor’s degree . . . . . . . . . . . . . . . . 13,702 100.0 8.5 (0.8) 13.6 (1.0) 39.9 (1.7) 24.4 (1.3) 13.6 (1.8) Bachelor’s degree or higher . . . . . . . . . . . . . . . . . . . . . 15,083 100.0 10.1 (0.9) 13.5 (1.0) 46.7 (1.7) 20.5 (1.2) 9.2 (1.8)
Percent of poverty level3 0–149% . . . . . . . . . . . . . . . . . . . . . . . . . . . . . . . . . 16,695 100.0 5.4 (0.6) 9.0 (0.6) 32.0 (1.5) 29.0 (1.2) 24.7 (1.7)
0–99% . . . . . . . . . . . . . . . . . . . . . . . . . . . . . . . . . 10,554 100.0 5.2 (0.8) 8.2 (0.7) 31.2 (1.6) 28.2 (1.6) 27.1 (2.0) 150%–299%. . . . . . . . . . . . . . . . . . . . . . . . . . . . . . . 14,992 100.0 7.1 (0.7) 12.5 (0.9) 38.7 (1.7) 25.9 (1.4) 15.8 (1.6) 300% or higher . . . . . . . . . . . . . . . . . . . . . . . . . . . . . 19,590 100.0 12.0 (0.8) 16.1 (1.0) 47.4 (1.3) 18.6 (0.9) 5.9 (1.1)
Parental living arrangements at age 14 years Both biological parents . . . . . . . . . . . . . . . . . . . . . . . . 40,310 100.0 8.3 (0.5) 11.5 (0.6) 42.1 (1.2) 24.3 (0.8) 13.7 (1.6) Other . . . . . . . . . . . . . . . . . . . . . . . . . . . . . . . . . . . 21,444 100.0 8.2 (0.7) 14.3 (0.7) 38.6 (1.1) 23.3 (0.9) 15.5 (1.0)
Hispanic origin and race Hispanic . . . . . . . . . . . . . . . . . . . . . . . . . . . . . . . . . 10,474 100.0 4.3 (0.5) 9.3 (0.9) 33.3 (1.3) 30.5 (1.2) 22.6 (1.3)
U.S. born . . . . . . . . . . . . . . . . . . . . . . . . . . . . . . . 5,369 100.0 5.6 (0.9) 11.7 (1.5) 37.1 (1.8) 27.0 (1.6) 18.6 (1.8) Foreign born . . . . . . . . . . . . . . . . . . . . . . . . . . . . . 5,104 100.0 3.0 (0.6) 6.9 (0.8) 29.2 (1.9) 34.2 (1.8) 26.8 (1.6)
NonHispanic: White, single race . . . . . . . . . . . . . . . . . . . . . . . . . . 37,384 100.0 9.8 (0.5) 12.4 (0.7) 44.1 (1.3) 22.6 (0.8) 11.1 (1.7) Black
or
African
American,
single
race
. . . . . . . . . . . . .
8,451
100.0
7.2
(0.7)
15.3
(1.0)
36.8
(1.7)
24.6
(1.5)
16.0
(1.1)
Asian, single race . . . . . . . . . . . . . . . . . . . . . . . . . . 2,456 100.0 6.0 (1.7) 13.1 (2.6) 51.0 (3.2) 21.3 (2.7) 8.6 (2.2)
. . . Category not applicable.1Includes women of other or multiple race and origin groups, not shown separately. 2Limited to women aged 22–44 years at time of interview. GED is General Educational Development high school equivalency diploma.3Limited to women aged 20–44 years age at time of interview.NOTE: Percentages may not add to 100 due to rounding.SOURCE: CDC/NCHS, National Survey of Family Growth (2002 and 2006–2010).

7/27/2019 Fertility of Men and Women in the United States_Family Growth 2006-2010_2012_nhsr051
http://slidepdf.com/reader/full/fertility-of-men-and-women-in-the-united-statesfamily-growth-2006-20102012nhsr051 19/29

7/27/2019 Fertility of Men and Women in the United States_Family Growth 2006-2010_2012_nhsr051
http://slidepdf.com/reader/full/fertility-of-men-and-women-in-the-united-statesfamily-growth-2006-20102012nhsr051 20/29
Table 7. Age at first child’s birth for women and men aged 15–44 years: United States, 2006–2010—Con. Women
Age at first child’s birth Mean Mean
Number in (standard Under 20 20–24 25–29 30–44 Number in (standard Characteristic thousands error) Total years years years years thousands error) Total
Percent distribution (standard error)
Non-Hispanic black
or
African
American,
single race . . . . . . . . . . . . . . . . . . . . . 5,216 20.9 (0.2) 100.0 46.3 (1.8) 35.2 (1.9) 12.4 (1.8) 6.1 (1.0) 3,603 23.3 (0.3) 100.0 2
Married . . . . . . . . . . . . . . . . . . . . . . . 1,724 22.8 (0.4) 100.0 29.9 (3.4) 39.2 (3.9) 18.9 (3.8) 11.9 (2.6) 1,700 24.5 (0.4) 100.0 2
Unmarried . . . . . . . . . . . . . . . . . . . . . 3,493 20.0 (0.2) 100.0 54.4 (1.8) 33.2 (2.2) 9.2 (1.5) 3.2 (0.7) 1,903 22.3 (0.3) 100.0 2
15–24 years. . . . . . . . . . . . . . . . . . . . 880 18.3 (0.2) 100.0 71.0 (3.4) 29.0 (3.4) . . . . . . 434 19.3 (0.4) 100.0 5
25–44 years . . . . . . . . . . . . . . . . . . . . 4,336 21.5 (0.2) 100.0 41.3 (2.1) 36.5 (1.9) 14.9 (2.2) 7.3 (1.2) 3,169 23.8 (0.3) 100.0 2
. . . Category not applicable.1Includes persons of other or multiple race and origin groups, not shown separately. 2Limited to persons aged 22–44 years at time of interview. GED is General Educational Development high school equivalency diploma.NOTE: Percentages may not add to 100 due to rounding.SOURCE: CDC/NCHS, National Survey of Family Growth (2002 and 2006–2010).

7/27/2019 Fertility of Men and Women in the United States_Family Growth 2006-2010_2012_nhsr051
http://slidepdf.com/reader/full/fertility-of-men-and-women-in-the-united-statesfamily-growth-2006-20102012nhsr051 21/29

7/27/2019 Fertility of Men and Women in the United States_Family Growth 2006-2010_2012_nhsr051
http://slidepdf.com/reader/full/fertility-of-men-and-women-in-the-united-statesfamily-growth-2006-20102012nhsr051 22/29
Page 22 National Health Statistics Reports n Number 51 n April 12, 2012 Table 9. Number of months from first birth to second birth for women aged 15–44 years who had at least one birth: United States, 2006–2010
Interval between first and second birth1
Number in No 12 months 13–24 25–36 37–48 49 or Characteristic thousands Total second birth or less months months months more months
Percent distribution (standard error) Total, 2002 . . . . . . . . . . . . . . . . . . . . . . . . . . . 35,938 100.0 31.7 (0.8) 2.7 (0.3) 17.8 (0.8) 16.4 (0.8) 10.8 (0.6) 20.6 (1.0) Total, 2006–20102 . . . . . . . . . . . . . . . . . . . . . . 34,353 100.0 30.0 (1.0) 2.5 (0.3) 17.5 (0.7) 17.2 (0.7) 12.3 (0.7) 20.6 (0.8)
Age at first birth Under 20 years . . . . . . . . . . . . . . . . . . . . . . . . 10,692 100.0 20.6 (1.1) 4.8 (0.8) 18.7 (1.2) 17.2 (1.3) 12.3 (1.2) 26.4 (1.4)
Under 18 yea rs. . . . . . . . . . . . . . . . . . . . . . . 4,549 100.0 15.7 (1.4) 4.6 (1.3) 20.6 (1.7) 18.9 (2.2) 11.1 (1.6) 29.1 (1.9) 18–19 ye ars. . . . . . . . . . . . . . . . . . . . . . . . . 6,143 100.0 24.1 (1.7) 5.0 (1.0) 17.4 (1.6) 16.0 (1.5) 13.2 (1.6) 24.3 (1.9)
20–24 years . . . . . . . . . . . . . . . . . . . . . . . . . . 11,856 100.0 29.0 (1.3) 1.8 (0.4) 16.1 (1.0) 16.9 (1.3) 12.8 (1.1) 23.4 (1.4) 25–44 years . . . . . . . . . . . . . . . . . . . . . . . . . . 11,806 100.0 39.5 (1.6) 1.1 (0.3) 17.9 (1.2) 17.5 (1.2) 11.6 (1.1) 12.5 (1.0)
25–29 yea rs. . . . . . . . . . . . . . . . . . . . . . . . . 7,120 100.0 31.8 (1.8) 1.3 (0.5) 19.0 (1.7) 18.0 (1.5) 13.2 (1.4) 16.6 (1.4) 30–44 yea rs. . . . . . . . . . . . . . . . . . . . . . . . . 4,686 100.0 51.2 (2.8) 0.6 (0.3) 16.1 (2.0) 16.7 (1.9) 9.2 (1.5) 6.2 (1.1)
Marital or cohabiting status at first birth Married . . . . . . . . . . . . . . . . . . . . . . . . . . . . . 18,254 100.0 27.6 (1.4) 1.7 (0.3) 19.5 (1.1) 20.4 (1.2) 13.3 (1.1) 17.5 (1.0) Cohabiting . . . . . . . . . . . . . . . . . . . . . . . . . . . 7,532 100.0 35.0 (1.6) 3.2 (0.6) 16.8 (1.3) 13.9 (1.2) 12.4 (1.2) 18.7 (1.4) Formerly
married,
not
cohabiting
. . . . . . . . . . . . .
471
100.0
40.0
(8.6)
- 18.9
(5.8)
14.9
(5.4)
8.4
(4.1)
17.7
(4.9)
Never married, not cohabiting . . . . . . . . . . . . . . . 8,097 100.0 30.1 (1.6) 3.6 (0.8) 13.6 (1.0) 13.2 (1.2) 10.0 (1.2) 29.4 (1.7)
Education3 No high school diploma or GED . . . . . . . . . . . . . . 6,049 100.0 15.8 (1.4) 4.6 (1.0) 23.7 (1.7) 18.6 (1.6) 11.5 (1.5) 25.7 (2.0) High school diploma or GED . . . . . . . . . . . . . . . . 9,300 100.0 26.9 (1.8) 2.3 (0.4) 15.6 (1.2) 17.4 (1.3) 12.8 (1.2) 25.0 (1.5) Some college, no bachelor’s degree . . . . . . . . . . . 9,299 100.0 30.7 (1.4) 2.3 (0.8) 16.8 (1.1) 14.7 (1.2) 14.5 (1.2) 21.1 (1.3) Bachelor’s degree or higher . . . . . . . . . . . . . . . . 7,970 100.0 34.6 (2.0) 0.8 (0.4) 17.0 (1.4) 20.8 (1.6) 11.8 (1.4) 15.1 (1.6)
Percent of poverty level4 0 –14 9%. . . . . . . . . . . . . . . . . . . . . . . . . . . . . 12,778 100.0 22.0 (1.3) 3.4 (0.5) 20.0 (1.2) 18.1 (1.1) 12.9 (1.1) 23.6 (1.2)
0–99% . . . . . . . . . . . . . . . . . . . . . . . . . . . . 7,979 100.0 21.4 (1.4) 3.4 (0.6) 21.3 (1.3) 17.2 (1.3) 12.4 (1.2) 24.3 (1.5) 150%–299% . . . . . . . . . . . . . . . . . . . . . . . . . . 10,336 100.0 28.9 (1.4) 3.4 (0.7) 17.7 (1.1) 16.3 (1.2) 11.6 (1.2) 22.0 (1.5) 300% or higher . . . . . . . . . . . . . . . . . . . . . . . . 10,540 100.0 37.4 (1.7) 0.3 (0.1) 14.8 (1.1) 18.0 (1.3) 12.9 (1.3) 16.7 (1.2)
Parental living arrangements at age 14 years Both biological parents . . . . . . . . . . . . . . . . . . . 21,871 100.0 29.3 (1.2) 2.3 (0.4) 17.8 (1.0) 17.1 (0.8) 13.2 (1.0) 20.3 (0.9) Other . . . . . . . . . . . . . . . . . . . . . . . . . . . . . . 12,482 100.0 31.1 (1.3) 2.8 (0.5) 17.0 (1.0) 17.4 (1.2) 10.7 (0.9) 21.1 (1.3)
Hispanic origin and race Hispanic . . . . . . . . . . . . . . . . . . . . . . . . . . . . 6,760 100.0 25.1 (1.9) 3.0 (0.8) 20.2 (1.3) 16.4 (1.5) 12.3 (2.0) 23.0 (1.4)
U.S. born . . . . . . . . . . . . . . . . . . . . . . . . . . 2,758 100.0 32.9 (2.4) 3.8 (1.5) 16.6 (2.1) 15.5 (2.1) 11.8 (2.4) 19.4 (2.1) Foreign born . . . . . . . . . . . . . . . . . . . . . . . . 4,002 100.0 19.8 (2.4) 2.5 (0.7) 22.8 (1.9) 17.0 (1.8) 12.6 (2.2) 25.4 (2.0)
NonHispanic: White, single race . . . . . . . . . . . . . . . . . . . . . 19,565 100.0 31.1 (1.3) 1.7 (0.3) 17.0 (1.0) 18.4 (1.0) 13.0 (1.0) 18.7 (1.0) Black or African American, single race . . . . . . . . 5,216 100.0 32.2 (1.6) 3.5 (0.7) 16.4 (1.3) 12.7 (1.1) 11.0 (1.4) 24.2 (1.7) Asian, single race . . . . . . . . . . . . . . . . . . . . . 1,208 100.0 33.9 (5.3) 0.6 (0.3) 15.0 (4.3) 14.7 (3.2) 7.6 (2.9) 28.2 (5.3)
Data not available.1Refers to intervals between deliveries, not intervals between first and second babies born as a multiple birth. Pregnancies resulting in multiple births (e.g., twins) are considered one delivery.2Includes women of other or multiple race and origin groups not shown separately. 3Limited to women aged 22–44 years at time of interview. GED is General Educational Development high school equivalency diploma.4Limited to women aged 20–44 years at time of interview. NOTE: Percentages may not add to 100 due to rounding.SOURCE: CDC/NCHS, National Survey of Family Growth (2002 and 2006–2010).

7/27/2019 Fertility of Men and Women in the United States_Family Growth 2006-2010_2012_nhsr051
http://slidepdf.com/reader/full/fertility-of-men-and-women-in-the-united-statesfamily-growth-2006-20102012nhsr051 23/29
National Health Statistics Reports n Number 51 n April 12, 2012 Page 23
Table 10. Timing of first birth in relation to first marriage for women aged 15–44 years: United States, 2006–2010 Timing of first birth in relation to first marriage
All premarital
Characteristic Number in thousands Total No births Subtotal for
premarital Never married Before
marriage 0–7
months after
8–47 months
after 48 or
more months after
Percent distribution (standard error) Total, 2002 . . . . . . . . . . . . . . . . . . . . . . . . . . . 61,561 100.0 41.6 (1.0) 21.5 (0.8) 10.5 (0.6) 11.1 (0.6) 6.2 (0.4) 22.1 (0.9) 8.6 (0.4) Total, 2006–20101 . . . . . . . . . . . . . . . . . . . . . . 61,755 100.0 44.4 (1.1) 24.7 (0.9) 12.3 (0.6) 12.4 (0.6) 5.2 (0.3) 18.1 (0.6) 7.6 (0.6) Never married . . . . . . . . . . . . . . . . . . . . . . . . . 28,851 100.0 73.6 (1.1) 26.4 (1.1) 26.4 (1.1) . . . . . . . . . . . . Ever married. . . . . . . . . . . . . . . . . . . . . . . . . . 32,904 100.0 18.7 (1.1) 23.3 (1.0) . . . 23.3 (1.0) 9.8 (0.6) 34.0 (1.0) 14.2 (1.0)
Age at first marriage: Under 18 years . . . . . . . . . . . . . . . . . . . . . 4,126 100.0 6.8 (1.7) 12.6 (1.6) . . . 12.6 (1.6) 25.5 (2.3) 39.9 (2.6) 15.3 (2.2) 18–19 years . . . . . . . . . . . . . . . . . . . . . . . 2,748 100.0 10.1 (2.1) 18.0 (2.2) . . . 18.0 (2.2) 17.8 (2.7) 38.0 (3.3) 16.1 (2.6) 20–22 years . . . . . . . . . . . . . . . . . . . . . . . 8,655 100.0 17.7 (1.9) 23.6 (1.6) . . . 23.6 (1.6) 9.7 (1.3) 33.8 (1.8) 15.3 (1.5) 23 years and over . . . . . . . . . . . . . . . . . . . 17,375 100.0 23.5 (1.5) 26.6 (1.6) . . . 26.6 (1.6) 4.9 (0.5) 32.0 (1.4) 13.1 (1.1)
Year of first marriage: 2003 or later . . . . . . . . . . . . . . . . . . . . . . . 8,472 100.0 44.1 (2.4) 31.0 (2.2) . . . 31.0 (2.2) 6.9 (0.9) 16.8 (1.3) 1.2 (0.5) 1997–2002 . . . . . . . . . . . . . . . . . . . . . . . . 8,896 100.0 12.8 (1.3) 28.0 (1.7) . . . 28.0 (1.7) 7.7 (0.9) 39.5 (1.9) 12.0 (1.4) 1990–1996 . . . . . . . . . . . . . . . . . . . . . . . . 9,290 100.0 9.0 (1.1) 19.0 (1.6) . . . 19.0 (1.6) 10.9 (1.3) 38.4 (1.8) 22.6 (1.9) 1985–1989 . . . . . . . . . . . . . . . . . . . . . . . . 4,506 100.0 8.0 (1.5) 14.8 (2.0) . . . 14.8 (2.0) 13.3 (1.8) 41.7 (2.9) 22.1 (2.7) Before 1985 . . . . . . . . . . . . . . . . . . . . . . . 1,740 100.0 5.2 (1.6) 7.0 (2.0) . . . 7.0 (2.0) 19.3 (3.2) 45.8 (4.8) 22.7 (3.9)
Year of first birth 2003 or later . . . . . . . . . . . . . . . . . . . . . . . . . . 8,899 100.0 . . . 44.9 (2.0) 36.1 (2.0) 8.8 (0.9) 6.8 (0.8) 31.4 (2.0) 17.0 (1.6) 1997–2002 . . . . . . . . . . . . . . . . . . . . . . . . . . . 10,219 100.0 . . . 41.9 (1.7) 21.8 (1.3) 20.1 (1.4) 7.2 (0.9) 32.6 (1.9) 18.3 (1.6) 1990–1996 . . . . . . . . . . . . . . . . . . . . . . . . . . . 9,205 100.0 . . . 43.2 (1.7) 14.8 (1.2) 28.4 (1.5) 10.6 (1.3) 34.4 (1.7) 11.8 (1.5) 1985–1989 . . . . . . . . . . . . . . . . . . . . . . . . . . . 4,466 100.0 . . . 48.7 (3.3) 12.9 (1.7) 35.8 (2.8) 13.3 (1.7) 33.6 (2.8) 4.4 (1.3) Before 1985 . . . . . . . . . . . . . . . . . . . . . . . . . . 1,565 100.0 . . . 54.7 (4.8) 14.8 (3.2) 39.8 (4.0) 20.2 (4.0) 25.1 (4.0) 0.0 (0.0)
Parental living arrangements at age 14 years Both biological parents . . . . . . . . . . . . . . . . . . . 40,310 100.0 45.7 (1.3) 19.7 (0.9) 9.2 (0.5) 10.5 (0.6) 4.8 (0.4) 20.9 (0.8) 8.8 (0.7) Other . . . . . . . . . . . . . . . . . . . . . . . . . . . . . . 21,444 100.0 41.8 (1.3) 34.2 (1.2) 18.2 (0.9) 16.0 (0.9) 6.0 (0.6) 12.8 (0.8) 5.1 (0.6)
Hispanic origin and race Hispanic . . . . . . . . . . . . . . . . . . . . . . . . . . . . 10,474 100.0 35.5 (1.4) 34.0 (1.4) 17.7 (0.8) 16.3 (1.0) 6.0 (0.7) 20.0 (1.3) 4.5 (0.6)
U.S. born . . . . . . . . . . . . . . . . . . . . . . . . . . 5,369 100.0 48.6 (2.1) 32.0 (1.6) 17.7 (1.3) 14.4 (1.3) 5.0 (0.9) 10.8 (1.4) 3.5 (0.7) Foreign born . . . . . . . . . . . . . . . . . . . . . . . . 5,104 100.0 21.6 (1.9) 36.1 (2.2) 17.6 (1.2) 18.4 (1.9) 7.1 (0.9) 29.7 (1.8) 5.6 (0.9) NonHispanic:
White, single race . . . . . . . . . . . . . . . . . . . . . 37,384 100.0 47.7 (1.4) 17.1 (0.8) 7.0 (0.5) 10.1 (0.6) 5.5 (0.5) 19.8 (0.8) 9.9 (0.8) Black or African American, single race . . . . . . . . 8,451 100.0 38.3 (1.7) 49.0 (1.8) 30.1 (1.5) 19.0 (1.6) 3.1 (0.6) 7.8 (0.9) 1.8 (0.3) Asian, single race . . . . . . . . . . . . . . . . . . . . . 2,456 100.0 50.8 (3.5) 6.4 (1.9) 2.9 (1.3) 3.6 (1.4) 5.0 (1.8) 28.4 (4.0) 9.4 (2.6)
. . . Category not applicable. 0.0 Quantity more than zero but less than 0.05. 1Includes women of other or multiple race and origin groups not shown separately. NOTE: Percentages may not add to 100 due to rounding. SOURCE: CDC/NCHS, National Survey of Family Growth (2002 and 2006–2010).
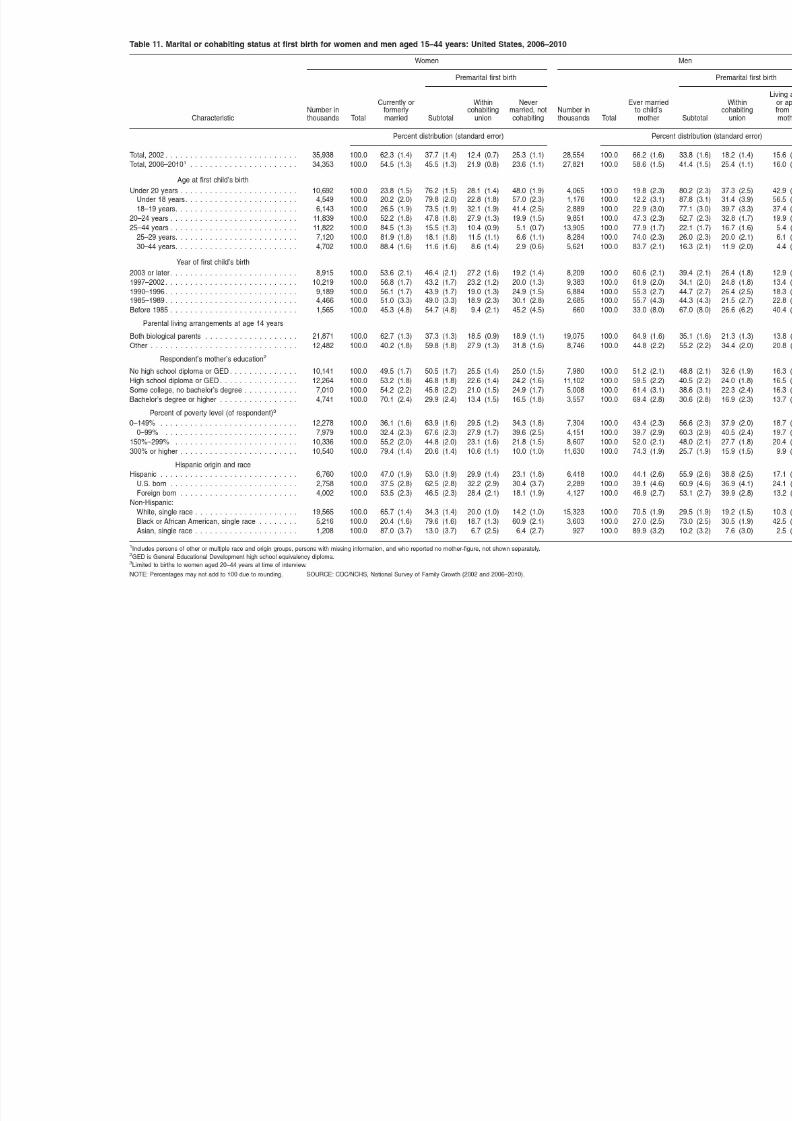
7/27/2019 Fertility of Men and Women in the United States_Family Growth 2006-2010_2012_nhsr051
http://slidepdf.com/reader/full/fertility-of-men-and-women-in-the-united-statesfamily-growth-2006-20102012nhsr051 24/29

7/27/2019 Fertility of Men and Women in the United States_Family Growth 2006-2010_2012_nhsr051
http://slidepdf.com/reader/full/fertility-of-men-and-women-in-the-united-statesfamily-growth-2006-20102012nhsr051 25/29
National Health Statistics Reports n Number 51 n April 12, 2012 Page 25
Table 12. Marital or cohabitation status at time of delivery of births in the last 5 years to women aged 15–44 years: United States, 2006–2010
Unmarried Number in Not
Characteristic thousands Total Married Subtotal Cohabiting cohabiting Percent distribution (standard error)
Total, 2 0 0 2 . . . . . . . . . . . . . . . . . . . . . . . . . . . . . . . . 21,018 100.0 64.4 (1.6) 35.6 (1.6) 14.3 (1.0) 21.3 (1.2) Total, 2006–20101 . . . . . . . . . . . . . . . . . . . . . . . . . . . 21,161 100.0 59.7 (1.6) 40.3 (1.6) 23.4 (1.2) 16.9 (1.1)
Parental living arrangements at age 14 years Both biological parents . . . . . . . . . . . . . . . . . . . . . . . . 13,288 100.0 68.4 (1.7) 31.6 (1.7) 19.9 (1.5) 11.6 (1.0) Other . . . . . . . . . . . . . . . . . . . . . . . . . . . . . . . . . . . 7,873 100.0 45.0 (2.3) 55.0 (2.3) 29.2 (1.6) 25.8 (1.9)
Age at first sexual intercourse Under 15 years . . . . . . . . . . . . . . . . . . . . . . . . . . . . . 3,221 100.0 34.1 (3.1) 65.9 (3.1) 33.7 (2.8) 32.1 (2.8) 15–17 years . . . . . . . . . . . . . . . . . . . . . . . . . . . . . . . 10,476 100.0 54.8 (2.2) 45.2 (2.2) 26.8 (1.7) 18.4 (1.5) 18–19 years . . . . . . . . . . . . . . . . . . . . . . . . . . . . . . . 3,924 100.0 72.9 (2.7) 27.1 (2.7) 17.4 (2.5) 9.6 (1.6) 20 years and over . . . . . . . . . . . . . . . . . . . . . . . . . . . 3,533 100.0 82.8 (3.0) 17.2 (3.0) 10.6 (2.2) 6.6 (1.5)
Age at birth Under 20 years . . . . . . . . . . . . . . . . . . . . . . . . . . . . . 2,283 100.0 14.7 (3.1) 85.3 (3.1) 38.9 (3.1) 46.5 (3.9)
Under 18 years . . . . . . . . . . . . . . . . . . . . . . . . . . . 763 100.0 8.8 (5.0) 91.2 (5.0) 29.3 (4.8) 61.9 (6.0) 18–19 years . . . . . . . . . . . . . . . . . . . . . . . . . . . . . 1,520 100.0 17.6 (2.8) 82.4 (2.8) 43.7 (3.7) 38.7 (4.0)
20–24 years . . . . . . . . . . . . . . . . . . . . . . . . . . . . . . . 5,243 100.0 40.8 (2.5) 59.2 (2.5) 37.4 (1.7) 21.8 (2.1) 25–44 years
25–29 years . . . . . . . . . . . . . . . . . . . . . . . . . . . . . 5,970 100.0 68.0 (2.2) 32.0 (2.2) 19.4 (1.8) 12.5 (1.3) 30–44 years . . . . . . . . . . . . . . . . . . . . . . . . . . . . . 7,665 100.0 79.6 (1.9) 20.4 (1.9) 12.3 (1.6) 8.1 (1.0)
Respondent’s mother’s education2 No high school diploma or GE D. . . . . . . . . . . . . . . . . . . 5,753 100.0 51.3 (2.0) 48.7 (2.0) 28.7 (2.2) 20.0 (2.0) High school diploma or G E D . . . . . . . . . . . . . . . . . . . . . 7,141 100.0 59.0 (2.5) 41.0 (2.5) 24.5 (2.0) 16.6 (1.5) Some college, no bachelor’s degree . . . . . . . . . . . . . . . . 4,677 100.0 60.9 (3.2) 39.1 (3.2) 23.2 (2.0) 15.9 (2.0) Bachelor’s degree or higher . . . . . . . . . . . . . . . . . . . . . 3,426 100.0 74.5 (2.7) 25.5 (2.7) 12.5 (1.9) 13.0 (2.1)
Percent of poverty level3 0–149% . . . . . . . . . . . . . . . . . . . . . . . . . . . . . . . . . 8,589 100.0 41.7 (2.1) 58.3 (2.1) 33.1 (1.7) 25.1 (1.8)
0–99% . . . . . . . . . . . . . . . . . . . . . . . . . . . . . . . . 5,460 100.0 35.0 (2.8) 65.0 (2.8) 34.3 (2.5) 30.7 (2.3) 150%–299%
. . . . . . . . . . . . . . . . . . . . . . . . . . . . . .
6,140
100.0
65.7
(2.6)
34.3
(2.6)
23.1
(1.9)
11.2
(1.6)
300% or higher . . . . . . . . . . . . . . . . . . . . . . . . . . . . . 5,593 100.0 88.6 (1.9) 11.4 (1.9) 6.5 (1.4) 4.9 (1.2)
Hispanic origin and race Hispanic . . . . . . . . . . . . . . . . . . . . . . . . . . . . . . . . . 4,546 100.0 49.1 (2.1) 50.9 (2.1) 34.5 (1.9) 16.4 (1.7)
U.S. born . . . . . . . . . . . . . . . . . . . . . . . . . . . . . . . 1,966 100.0 44.0 (3.3) 56.0 (3.3) 36.4 (2.6) 19.6 (2.9) Foreign born . . . . . . . . . . . . . . . . . . . . . . . . . . . . . 2,581 100.0 53.0 (3.1) 47.0 (3.1) 33.0 (2.9) 14.0 (1.9)
NonHispanic: White, single race . . . . . . . . . . . . . . . . . . . . . . . . . . 11,600 100.0 71.7 (1.9) 28.3 (1.9) 19.2 (1.4) 9.1 (1.0) Black or African American, single race . . . . . . . . . . . . . 3,256 100.0 29.6 (2.7) 70.4 (2.7) 24.4 (1.7) 46.0 (2.4) Asian, single race . . . . . . . . . . . . . . . . . . . . . . . . . . 788 100.0 81.9 (6.9) 18.1 (6.9) 8.1 (4.5) 10.0 (4.5)
1Includes births to women of other or multiple races and origin groups, to women with missing information on age at first intercourse, and to women who reported no motherfigure, not shownseparately. 2GED is General Educational Development high school equivalency diploma.3Limited to births to women aged 20–44 years at time of interview. NOTES: Percentages may not add to 100 due to rounding. Not cohabiting at delivery includes some who were formerly married.SOURCE: CDC/NCHS, National Survey of Family Growth (2002 and 2006–2010).

7/27/2019 Fertility of Men and Women in the United States_Family Growth 2006-2010_2012_nhsr051
http://slidepdf.com/reader/full/fertility-of-men-and-women-in-the-united-statesfamily-growth-2006-20102012nhsr051 26/29
Page 26 National Health Statistics Reports n Number 51 n April 12, 2012 Table 13. Nonmarital births and births within a cohabiting union among women and men aged 15–44 years who have ever had a biological child: United States, 2006–2010
Women 15–44 who ever had a live birth Men 15–44 who ever fathered a biological child
Characteristic Number in thousands
Ever had a nonmarital
birth
Ever had a nonmarital birth within
cohabiting union Number in thousands
Ever fathered a child
outside of marriage
Ever fathered a child within
a cohabiting union Percent (standard error) Percent (standard error)
Total, 2 0 0 2 . . . . . . . . . . . . . . . . . . . . . . . . . . . . . . . . Total, 2006–20101 . . . . . . . . . . . . . . . . . . . . . . . . . . .
35,938 34,353
42.2 (1.4) 49.3 (1.3)
17.3 (0.8) 30.3 (1.0)
35,938 27,821
39.6 (1.7) 47.3 (1.6)
24.8 (1.3) 33.0 (1.3)
Age 15–19 years . . . . . . . . . . . . . . . . . . . . . . . . . . . . . . . 20–24 years . . . . . . . . . . . . . . . . . . . . . . . . . . . . . . . 25–44 years . . . . . . . . . . . . . . . . . . . . . . . . . . . . . . .
25–29 years . . . . . . . . . . . . . . . . . . . . . . . . . . . . . 30–34 years . . . . . . . . . . . . . . . . . . . . . . . . . . . . . 35–39 years . . . . . . . . . . . . . . . . . . . . . . . . . . . . . 40–44 years . . . . . . . . . . . . . . . . . . . . . . . . . . . . .
699 3,083
30,572 5,784 7,042 8,733 9,013
93.9 (2.3) 78.0 (2.5) 45.3 (1.3) 65.2 (2.1) 49.7 (2.2) 40.1 (2.0) 34.2 (2.0)
39.8 (5.4) 45.6 (2.8) 28.5 (1.0) 43.5 (2.0) 34.6 (2.0) 25.0 (1.6) 17.6 (1.5)
280 1,591
25,950 4,559 5,680 7,669 8,042
96.3 (3.4) 77.9 (3.0) 44.9 (1.6) 61.1 (2.8) 48.6 (2.4) 38.0 (2.6) 40.0 (2.6)
25.6 (6.6) 55.7 (4.3) 31.6 (1.4) 43.1 (2.9) 35.9 (2.4) 26.6 (2.3) 26.9 (2.4)
Parental living arrangements at age 14 years Both
biological
parents
. . . . . . . . . . . . . . . . . . . . . . . .
Other . . . . . . . . . . . . . . . . . . . . . . . . . . . . . . . . . . . 21,871
12,482 40.8
(1.4)
64.1 (1.7) 24.9
(1.2)
39.7 (1.5) 19,075
8,746 40.4
(1.7)
62.3 (2.4) 27.6
(1.4)
44.6 (2.3)
Respondent’s mother’s education No high school diploma or GED . . . . . . . . . . . . . . . . . . . High school diploma or G E D . . . . . . . . . . . . . . . . . . . . . Some college, no bachelor’s degree . . . . . . . . . . . . . . . . Bachelor’s degree or higher . . . . . . . . . . . . . . . . . . . . .
10,141 12,264
7,010 4,741
55.2 (1.7) 50.2 (1.8) 49.0 (2.4) 33.6 (2.6)
35.9 (1.6) 31.1 (1.5) 28.3 (1.7) 18.5 (1.8)
7,980 11,102
5,008 3,557
55.5 (2.2) 47.1 (2.3) 43.4 (2.8) 34.2 (3.0)
41.6 (2.1) 32.3 (2.1) 27.5 (2.3) 22.5 (2.5)
Percent of poverty level2 0–149% . . . . . . . . . . . . . . . . . . . . . . . . . . . . . . . . .
0–99% . . . . . . . . . . . . . . . . . . . . . . . . . . . . . . . . 150%–299% . . . . . . . . . . . . . . . . . . . . . . . . . . . . . . 300% or higher . . . . . . . . . . . . . . . . . . . . . . . . . . . . .
12,778 7,979
10,336 10,540
68.6 (1.6) 72.9 (2.2) 48.8 (2.0) 23.3 (1.5)
44.8 (1.4) 45.3 (2.0) 29.9 (1.8) 12.5 (1.1)
7,304 4,151 8,607
11,629
64.5 (2.5) 67.7 (2.9) 55.8 (2.4) 29.0 (1.9)
48.3 (2.0) 51.7 (2.7) 38.6 (2.3) 19.3 (1.7)
Hispanic origin and race Hispanic . . . . . . . . . . . . . . . . . . . . . . . . . . . . . . . . .
U.S. born . . . . . . . . . . . . . . . . . . . . . . . . . . . . . . . Foreign born . . . . . . . . . . . . . . . . . . . . . . . . . . . . .
NonHispanic: White, single race . . . . . . . . . . . . . . . . . . . . . . . . . . Black or African American, single race . . . . . . . . . . . . . Asian, single race . . . . . . . . . . . . . . . . . . . . . . . . . .
6,760 2,758 4,002
19,565 5,216 1,208
56.5 (1.9) 65.9 (2.8) 50.1 (2.4) 38.4 (1.6) 82.0 (1.6) 17.2 (5.0)
40.6 (1.9) 45.2 (2.9) 37.4 (2.5) 25.4 (1.2) 35.2 (1.7)
8.0 (3.3)
6,418 2,290 4,127
15,323 3,603
927
61.0 (2.9) 68.6 (5.1) 56.7 (2.8) 36.1 (2.1) 78.6 (2.1) 11.4 (3.8)
47.3 (2.8) 49.6 (4.6) 46.1 (2.9) 25.1 (1.6) 45.6 (2.1)
7.6 (3.0) 1Includes women of other or multiple race and origin groups, women who reported no motherfigure, not shown separately. 2Limited to women aged 20–44 years at time of interview. NOTE: GED is General Educational Development high school equivalency diploma.SOURCE: CDC/NCHS, National Survey of Family Growth (2002 and 2006–2010).

7/27/2019 Fertility of Men and Women in the United States_Family Growth 2006-2010_2012_nhsr051
http://slidepdf.com/reader/full/fertility-of-men-and-women-in-the-united-statesfamily-growth-2006-20102012nhsr051 27/29
National Health Statistics Reports n Number 51 n April 12, 2012 Page 27
Technical Notes The National Survey of Family Growth’s measurement of fertility
Basic information on the NSFG variables used in this report was provided in the ‘‘Methods’’ section. Further detail on some key fertility measures is provided below.
Number of children born or fathered —For women, the number of biological children she ever had was ascertained from a pregnancy history and each pregnancy that resulted in a live birth (PARITY recode). For males, the number of biological children ever fathered (variable BIOKIDS) is compiled across the interview as he reports children he has fathered with women in different relationships (married, cohabiting, other).
Interval from first marriage to first birth (recode MAR1BIR1)—This recode is the number of months between the first marriage and the first birth. If the respondent has ever been married but has not had any live births, it is the number of months between first marriage and the date of interview. A special
code
identifies
respondents
who
had a live birth but have never been married.
Additional births expected (recode ADDEXP)—Currently married or cohabiting men and women were asked about their joint expectations for children in the future. That is, the joint expectations were reported by either the woman or the man because there are two independent samples of men and women. Not currently married or cohabiting men and women were asked about their individual expectations for children in the future. First, they are asked if they intend additional children and how many they intend. If they were not sure of an exact number they expected they were asked to give a range of lowest and highest number of children expected.
Total births expected —This is the sum of the number of children born and the number of additional birth expected—both described above.
Marital or cohabiting status at mother’s report. Compared with vital birth—This variable is based on the statistics data, the NSFG underrepresents RMAROUT6 recode for women and a births fathered by men aged 15–44. One combination of directly asked questions notable exception to the undercounting for men. The way in which the female of births in the NSFG is among births variable is derived, it can only be fathered by men aged 15–19 years determined that she was married or where the NSFG estimates are about cohabiting at the time of delivery, and twice (2.07) the numbers of births to not whether she was specifically married teenage fathers as indicated by vital to or cohabiting with the child’s father. records for births in 2002–2006. However, based on crosschecks of the Comparisons cannot be made by pregnancy dates against relationship Hispanic origin and race of the father dates, very few women in the married or because of the extent of missing data in cohabiting categories had other partners the vital statistics. Father’s marital status in the timeframe of the child’s birth. For is not directly collected in vital statistics men, the questions are organized and is therefore not included in these differently, and it is asked directly comparisons. whether he was married to or living with the child’s mother at time of the birth. Also, due to the relatively small sample sizes of women who were formerly married at time of delivery, and the focus on premarital compared with all nonmarital births, births to formerly married women were grouped with currently married women (‘‘see Technical Notes’’ table).
This table (‘‘Technical Notes’’ table) compares the numbers of births estimated for 2002–2006 based on the 2006–2010 NSFG and the NVSS. Given that the U.S. birth registration system only
includes
births
inside
the
United
States, the NSFG estimates for women in this comparison are limited to births to women who were born in the United States, or to those births that occurred after women who were born outside the United States came to stay. Across all years and population subgroups shown, NSFG data continue to approximate the number of births recorded in the NVSS—especially for women.
Vital statistics data represents a less precise benchmark for comparisons to male survey reports, such as those from the NSFG, because mothers report information for the birth registration system. Not all mothers report information about the fathers of their babies, and if they do, their reports of the father’s age and other characteristics may not be accurate. Father’s age as shown in this table for the NSFG is based on the male respondent’s selfreport, while for vital statistics father’s age is generally based on the

7/27/2019 Fertility of Men and Women in the United States_Family Growth 2006-2010_2012_nhsr051
http://slidepdf.com/reader/full/fertility-of-men-and-women-in-the-united-statesfamily-growth-2006-20102012nhsr051 28/29

7/27/2019 Fertility of Men and Women in the United States_Family Growth 2006-2010_2012_nhsr051
http://slidepdf.com/reader/full/fertility-of-men-and-women-in-the-united-statesfamily-growth-2006-20102012nhsr051 29/29
U.S. DEPARTMENT OF HEALTH & HUMAN SERVICES Centers for Disease Control and Prevention National Center for Health Statistics 3311 Toledo Road Hyattsville, MD 20782
FIRST CLASS MAILPOSTAGE & FEES PAID
CDC/NCHSPERMIT NO. G-284
OFFICIAL BUSINESS PENALTY FOR PRIVATE USE, $300
National Health Statistics Reports n Number 51 n April 12, 2012
Acknowledgments The 2006–2010 National Survey of Family Growth (NSFG) was conducted by the Centers for Disease Control and Prevention’s (CDC) National Center for Health Statistics (NCHS) with the support and assistance of a number of other organizations and individuals. Interviewing and other tasks were carried out by the University of Michigan’s Survey Research Center, Institute for Social Research, under a contract with NCHS. The 2006–2010 NSFG was jointly planned and funded by the following programs and agencies of the U.S. Department of Health and Human Services: • Eunice Kennedy Shriver National Institute for Child Health and Human Development • Office of Population Affairs • NCHS, CDC • Division of HIV/AIDS Prevention, CDC • Division of Sexually Transmitted Disease Prevention, CDC • Division of Reproductive Health, CDC • Children’s Bureau of the Administration for Children and Families • The Office of the Assistant Secretary for Planning and Evaluation NCHS gratefully acknowledges the contributions of these programs and agencies, and all others who assisted in designing and carrying out the 2006–2010 NSFG. This report was prepared under the general direction of Charles J. Rothwell, Director of NCHS’s Division of Vital Statistics (DVS), and Stephanie J. Ventura, Chief of the Reproductive Statistics Branch (RSB), DVS. The authors are also grateful for the valuable comments provided by Stephanie Ventura, RSB; Julia Holmes, DVS Associate Director for Science; Jennifer Madans, NCHS Associate Director for Science. We also thank Yashodhara Patel and Veena Billioux for their helpful contributions to the preparation of this report. The report was produced by CDC/OSELS/NCHS/OD/Office of Information Services, Information Design and Publishing Staff: Typesetting was done by Annette F. Holman, and graphics were produced by Odell Eldridge (contractor). Edited by vendor.
Suggested citation Martinez GM, Daniels K, Chandra A. Fertility of men and women aged 15–44 years in the United States: National Survey of Family Growth, 2006–2010. National health statistics reports; no. 51. Hyattsville, MD: National Center for Health Statistics. 2012.
Copyright information All material appearing in this report is in the public domain and may be reproduced or copied without permission; citation as to source, however, is appreciated.
National Center for Health Statistics Edward J. Sondik, Ph.D., Director
Jennifer H. Madans, Ph.D., Associate Director for Science
Division of Vital Statistics Charles J. Rothwell, M.S., Director
Related Documents