1 M. Woods, SLAC Aug. 29, 2006 MDI Studies at the ILC MDI Studies at the ILC & Test Beam Program at & Test Beam Program at SLAC's SLAC's End Station A Facility End Station A Facility Fermilab Seminar, August 29, 2006 M. Woods, SLAC

Welcome message from author
This document is posted to help you gain knowledge. Please leave a comment to let me know what you think about it! Share it to your friends and learn new things together.
Transcript

1M. Woods, SLAC Aug. 29, 2006
MDI Studies at the ILC MDI Studies at the ILC & Test Beam Program at & Test Beam Program at
SLAC'sSLAC's End Station A FacilityEnd Station A FacilityFermilab Seminar, August 29, 2006
M. Woods, SLAC

2M. Woods, SLAC Aug. 29, 2006
OutlineOutlineMachine-Detector Interface at the ILC
Impact of ILC on Detector design and Physics reach(beyond simply the luminosity and energy reach)
Impact of Detectors and Physics reach on ILC design and parameters• Collimation and Backgrounds• (L,E,P) measurements: Luminosity, Energy, Polarization• Forward Region Detectors• IR Magnets (solenoid + anti-solenoids, DID—detector integrated dipole) • IR and Linac Crossing Angles• EMI (electro-magnetic interference) in IR
MDI-related Experiments at SLAC’s End Station A• Collimator Wakefield Studies• Energy spectrometer prototypes• EMI studies• Bunch length measurements• IR background studies

3M. Woods, SLAC Aug. 29, 2006
Energy dithering region
MDI for SLAC E158MDI for SLAC E158(experiment that measured ~130 parts per billion parity-violating asymmetry
in elastic electron-electron scattering)
• ~1/2 experimental DAQ was for beam instrumentation• experimental control of optics for polarized source laser, implementing feedback
from BPM and toroid diagnostics• automated dithering of beam phase space (energy, x, x’, y, y’)• VME crates in polarized source laser room and at 1 GeV,
with fiber optic links to ESA DAQ
2-mile LINAC

4M. Woods, SLAC Aug. 29, 2006
ILCSC document, Sept. 30, 2003www.fnal.gov/directorate/icfa/LC_parameters.pdf
Baseline Machine Parameters1. Energy reach: 500 GeV center-of-mass energy.2. Luminosity: integrate 500 fb-1 in 4 years3. Energy variability: 200-500 GeV4. Energy stability and precision: sub-0.1%5. >80% electron polarization6. 2 IRs7. 90 GeV operation for calibration at the Z
Parameters for the Linear ColliderParameters for the Linear Collider
ILC NewsLine

5M. Woods, SLAC Aug. 29, 2006
Background tolerance levels
Subdetector Chrgd trks γ n (~ 1MeV) μ
Vertex detector
6 / mm2
100/mm2/tr300 / mm2 3×109 cm-2y-1
1×1010 cm-2y-1-
Si Tracker 0.2 /cm2/BX 10 /cm2/BX
TPC 2500 1.25×10⁶ 2.5×10⁷ 2500
Calorimeter - ~40000 -
Muonsystem - - - 100/cm2/s
Three levels of criteria:- Radiation damage- Pile up- Pattern recognition
Table is from W. Kozaneck (Collimation Task Force Workshop, SLAC, 2002)GLD and SiD answers included.
From T. Maruyama’s plenary talk on Backgrounds, at Snowmass 2005

6M. Woods, SLAC Aug. 29, 2006
Background simulations
• Simulations from BDS to Dump– EGS4, Decay TURTLE, STRUCT, MARS, FLUKA,
BDSIM, GEANT3, GEANT4• Three detectors• 10 ILC beam parameters • 2 crossing angles• Many background sources
• Requires a tremendous amount of work to complete.• A great deal of work has been done, but much more
studies are needed.
From T. Maruyama’s plenary talk on Backgrounds, at Snowmass 2005
Ongoing work at Fermilab using MARS and STRUCT byN. Mokhov. A. Drozhdin, X. Yang et al.

7M. Woods, SLAC Aug. 29, 2006
(L,E,P)(L,E,P) Measurements at ILCMeasurements at ILCElectron-Positron Colliders have an advantage of a well-defined initial state,
providing good resolving power for precision measurements and elucidating new physics.
Electroweak Physics (examples from LEP and SLC)
• mZ, ΓZ (LEP-I) Lumi Energy• mW (LEP-II) Energy• sin2θW (SLC) Energy Polarizaton
Input needed from beam instrumentation
Mandate: provide necessary Beam Instrumentation for the LC physics program!

8M. Woods, SLAC Aug. 29, 2006
Energy• Top mass: 200 ppm (35 MeV)• Higgs mass: 200 ppm (25 MeV for 120 GeV Higgs)• W mass: 50 ppm (4 MeV) ??• ‘Giga’-Z ALR: 200 ppm (20 MeV) (comparable to ~0.25% polarimetry)
50 ppm (5 MeV) (for sub-0.1% polarimetry with e+ pol) ??
L,E,PL,E,P Measurement Goals at ILCMeasurement Goals at ILC
Luminosity, Luminosity Spectrum
• Total cross sections: absolute δL/L to ~0.1%• Z-pole calibration scan for Giga-Z: relative δL/L to ~0.02%• threshold scans (ex. top mass): relative δL/L to 1%
+L(E) spectrum: core width to <0.05% andtail population to <1%
Polarization• Standard Model asymmetries: < 0.5%• ‘Giga’-Z ALR: < 0.25%

9M. Woods, SLAC Aug. 29, 2006
PP
EEwtlum
wtlum
≠
≠−
−
The beam diagnostics measure <E>, <P>. The beam diagnostics measure <E>, <P>. For physics we need to know <E>For physics we need to know <E>lumlum--wtwt, <P>, <P>lumlum--wtwt ..
Strategy is to use a combination of beam diagnostics andphysics-based detector measurements. Need to understand L(E) spectrumand how it is affected from beamstrahlung and energy spread,as well as from initial state radiation.
100-200 ppm physics goal for determining <E><E>lumlum--wtwt
<< 1000ppm energy spread <<< 40,000 ppm energy loss due to beamstrahlung!

10M. Woods, SLAC Aug. 29, 2006
disrupted beam(w/ beamstrahlung radiation
effect included)
radiative Bhabhasfrom pair production
Energy spectrum of electrons in extraction line after IP
Beamsstrahlung at the Linear ColliderBeamsstrahlung at the Linear Collider
~4% of the beam energygets radiated into photons due to beamstrahlung(at SLC this was 0.1%)

11M. Woods, SLAC Aug. 29, 2006
Wakefields + Disruption Y-Z Kink instability
E-Spread + E-Z correlation + Y-Z Kink instability ECM Bias
,21
21
EEEEE
Ewtlum
CMBiasCM +
−+=
−
E1 and E2 are beam energies measured by theenergy spectrometers. (ISR and beamstrahlungare initially turned off for this study.)
LC Machine Design
<ECMbias>
(Δy = 0)σ(ECM
bias)(Δy = 0)
Max(ECMbias)
vary Δy, ηy
WARM-500 +520 ppm 170 ppm +1000 ppmCOLD-500 +50 ppm 30 ppm +250 ppm
Summary of ECMbias
One bias in determining <EOne bias in determining <ECMCM>>lumlum--wtwt
is the is the yy--zz Kink InstabilityKink Instability

12M. Woods, SLAC Aug. 29, 2006
LC Machine Design
<ECMbias>
(Δy = 0)σ(ECM
bias)(Δy = 0)
Max(ECMbias)
vary Δy, ηy
WARM-500 +520 ppm 170 ppm +1000 ppmCOLD-500 +50 ppm 30 ppm +250 ppmNLC'-500 0 ppm 10 ppm +50 ppm
Summary of ECMbias w/ beamsstrahlung off
NLC
TESLA
NLC’

13M. Woods, SLAC Aug. 29, 2006
Definition of EDefinition of ECMCMbias (Beamsstrahlung OFF)bias (Beamsstrahlung OFF)
,21
21
EEEEE
Ewtlum
CMBiasCM +
−+=
−
E1 and E2 are beam energies measured by theenergy spectrometers. (ISR and beamstrahlungare turned off for this study.)
Definition of EDefinition of ECMCMbias (Beamsstrahlung ON)bias (Beamsstrahlung ON)
Vary cutoff energy from 480-495 GeV
ECM for NLC-500

14M. Woods, SLAC Aug. 29, 2006
TESLATESLA w/ random-
ordered energy
TESLATESLA w/ random-
ordered energy
TESLATESLA w/ random-ordered
energy
TESLATESLA w/ random-ordered
energy
Tails are similar in both E1+E2 andE1-E2 distributions
Negligible differencein 2 distributions
Clear differencein 2 distributions
Study of distributions for i) EStudy of distributions for i) ECM CM (cannot measure this)(cannot measure this)ii) E1ii) E1--E2 (closely related to E2 (closely related to BhabhaBhabha acolinearityacolinearity))

15M. Woods, SLAC Aug. 29, 2006
LC Machine Design
<ECMbias>
(Δy = 0)σ(ECM
bias)(Δy = 0)
Max(ECMbias)
vary Δy, ηy
WARM-500 +960 ppm 150 ppm + 1120 ppm
COLD-500 +150 ppm 30 ppm +350 ppm
NLC'-500 ~0 ppm 20 ppm <50 ppm
Summary of ECMbias in presence of Beamsstrahlung
Summary of ECMbias without Beamsstrahlung
LC Machine Design
<ECMbias>
(Δy = 0)σ(ECM
bias)(Δy = 0)
Max(ECMbias)
vary Δy, ηy
WARM-500 +520 ppm 170 ppm +1000 ppm
COLD-500 +50 ppm 30 ppm +250 ppm
NLC'-500 0 ppm 20 ppm <50 ppm
→ Energy spectrometers and Bhabha acolinearity alone are not sufficient tocorrect for this bias. Need beam dynamics modeling and other inputfrom annihilation data, disrupted energy measurements, …

16M. Woods, SLAC Aug. 29, 2006
Physics Measurement of Luminosity SpectrumPhysics Measurement of Luminosity Spectrum
Bhabha Acolinearity
θ1θ2
z-axis
p1
p2θ
θ
θθθ
sin
21
21
A
beam
A
pp
ppp
≈Δ
−=Δ−=
( )( )2121
2121
sinsinsinsinsinsin'
θθθθθθθθ
+++
+−+=
ss
In (single) colinear photon approximation,
Use Endcap Bhabhas (~120-400 mrad)

17M. Woods, SLAC Aug. 29, 2006
Physics Measurements of Physics Measurements of <E><E>lumlum--wtwt
Use γZ, ZZ, WW events and the known Z and W masses
Use μ-pair events and muon momentum measurements
Example of radiative return (γZ)analysis from LEP
18M. Woods, SLAC Aug. 29, 2006
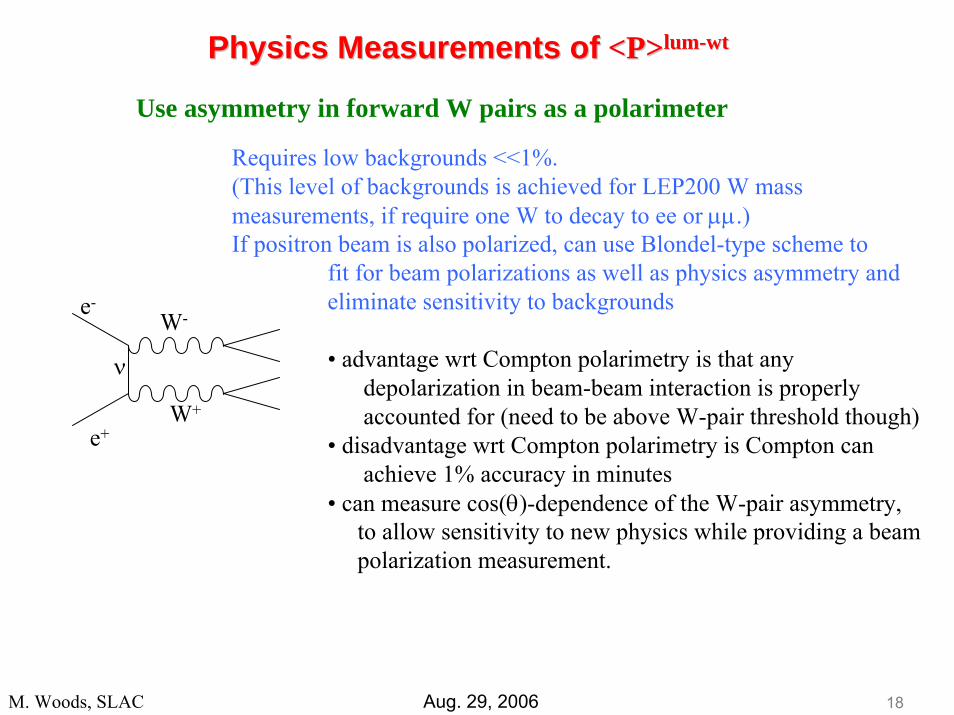
Physics Measurements ofPhysics Measurements of <P><P>lumlum--wtwt
Use asymmetry in forward W pairs as a polarimeter
Requires low backgrounds <<1%.(This level of backgrounds is achieved for LEP200 W massmeasurements, if require one W to decay to ee or μμ.)If positron beam is also polarized, can use Blondel-type scheme to
fit for beam polarizations as well as physics asymmetry andeliminate sensitivity to backgrounds
• advantage wrt Compton polarimetry is that anydepolarization in beam-beam interaction is properlyaccounted for (need to be above W-pair threshold though)
• disadvantage wrt Compton polarimetry is Compton canachieve 1% accuracy in minutes
• can measure cos(θ)-dependence of the W-pair asymmetry,to allow sensitivity to new physics while providing a beampolarization measurement.
e-
e+
W-
W+
ν

19M. Woods, SLAC Aug. 29, 2006
If electron and positron beams both polarized,
%50%,90 == +− PP
%25.0%,25.0 == +
+
−
−
PP
PP δδ
%55.961
=+
+= +−
+−
PPPPPeff
%10.0=eff
eff
PPδ
LReffRLLR
RLLR APNNNN
=+−
Can also use ‘Blondel scheme’ to determine beam polarizations directly:
LRLLRLRR
LLRLRR
LRRRRLLL
RRRLLL
APNNNNNNNN
APNNNNNNNN
LR
LR
LR
LR
+
−
=+++−−+
=+++−−+
• just need Compton polarimeters for measuring polarization differences between L,R states
• this technique directly measures lum-wted polarizations

20M. Woods, SLAC Aug. 29, 2006
Instrumentation for Luminosity, Luminosity SpectraInstrumentation for Luminosity, Luminosity Spectraand Luminosity Tuningand Luminosity Tuning
LuminosityBhabha LumiCAL detector from 40-120 mrad
Luminosity SpectrumBhabha acolinearity measurements using forward tracking
and calorimetry from 120-400 mrad+ additional input from beam energy, energy spread and energy spectrum
measurements
Luminosity TuningIP BPMsPair BeamCAL detector from 5-40 mradBeamsstrahlung detector? Radiative Bhabhas?
21M. Woods, SLAC Aug. 29, 2006
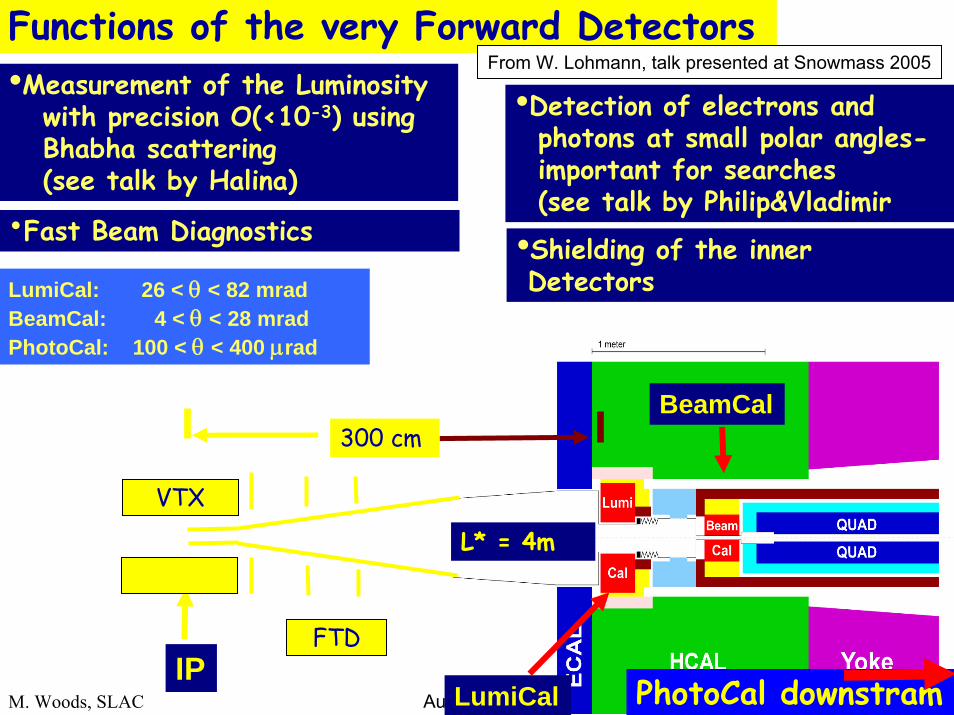
Functions of the very Forward Detectors
•Fast Beam Diagnostics
•Detection of electrons and photons at small polar angles-important for searches(see talk by Philip&Vladimir
•Measurement of the Luminosity with precision O(<10-3) usingBhabha scattering(see talk by Halina)
LumiCal: 26 < θ < 82 mradBeamCal: 4 < θ < 28 mradPhotoCal: 100 < θ < 400 μrad
IP
VTX
FTD
300 cm
LumiCal
BeamCal
L* = 4m
PhotoCal downstram
•Shielding of the inner Detectors
From W. Lohmann, talk presented at Snowmass 2005

22M. Woods, SLAC Aug. 29, 2006
Luminosity measurement sensitivities
ΔL/L1.0x10-4
Inner radius 4.2μm
Radial offset 640μm
Distance to cals. 300μm
Long. Offset 18mm
Tilt of cal. 14mrad
Beam tilt 0.63mrad
Beam size negligible
H Abramowicz,Tel Aviv U. and FCAL Collaboration;Study for Snowmass 2005
e e e e+ − + −→
42503000
300
250
2800
3 m 4 m
80
Val
ve
82.0 mrad
26.2 mrad
3.9 mrad
82.0 mrad82.0 mrad82.0 mrad82.0 mrad 250280
80
12
92.0 mrad
LumCal
BeamCal
BeamCal 3650...3850
Pump 3350..3500
LumCal 3050...3250
L* 4050
long. distances
EC
AL
EC
AL
HCAL
HCAL
VTX−Elec
VTX−Elec
ElecElec
ElecElecLumCal
LumCal
BeamCal
BeamCal
Goal of FCAL Collaboration –measure L at ILC with accuracy
410LL
−Δ≤
4 4
4 4
( : / 3 10 ( ) 5.4 10 ( ))( : / 6 10 ( ) 6.1 10 ( ))OPAL L L stat theoALEPH L L stat theo
− −
− −
Δ = × ⊕ ×
Δ = × ⊕ ×
LumiCAL Requirements
23M. Woods, SLAC Aug. 29, 2006
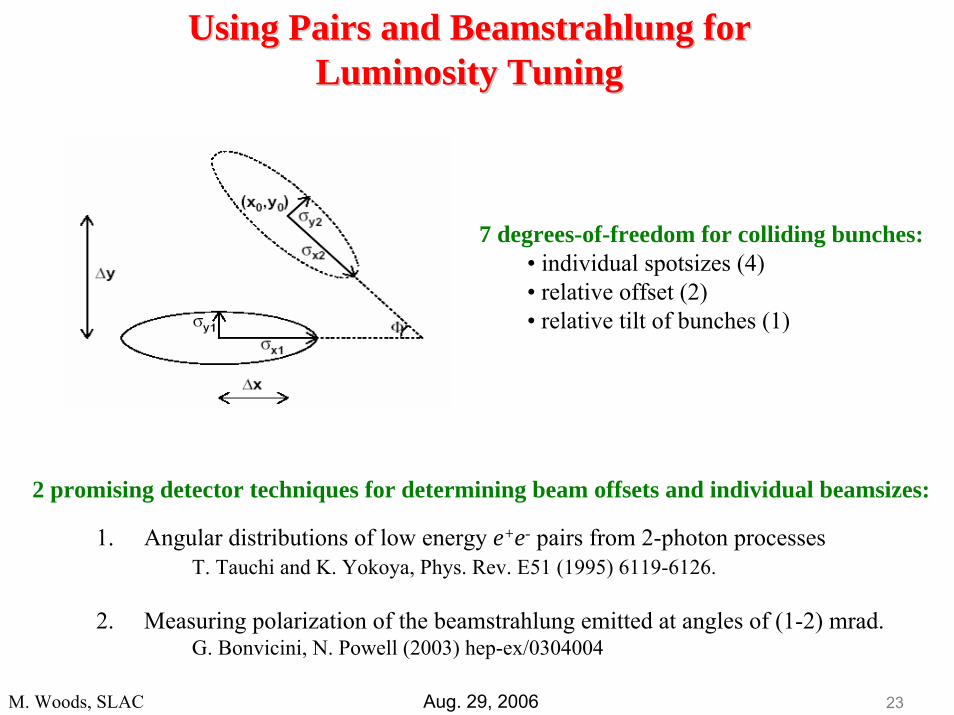
Using Pairs and Using Pairs and BeamstrahlungBeamstrahlung forforLuminosity TuningLuminosity Tuning
1. Angular distributions of low energy e+e- pairs from 2-photon processesT. Tauchi and K. Yokoya, Phys. Rev. E51 (1995) 6119-6126.
2. Measuring polarization of the beamstrahlung emitted at angles of (1-2) mrad.G. Bonvicini, N. Powell (2003) hep-ex/0304004
2 promising detector techniques for determining beam offsets and individual beamsizes:
7 degrees-of-freedom for colliding bunches:• individual spotsizes (4)• relative offset (2)• relative tilt of bunches (1)

24M. Woods, SLAC Aug. 29, 2006
• “LEP-Type”: BPM-based, bend angle measurement w/ θ = 3.77 mrad
• “SLC-Type”: SR-stripe based, bend angle measurement
27 cm
11-946142A1
THE EXTRACTION LINE SPECTROMETER BEAM OPTICAL ELEMENTS
(Electron ELS Shown)
Initial Stripe
Final Stripe
WISRDWire
Arrays
Dump
e+
e–
Horizontal Bends forSynchrotron Radiation
SpectrometerMagnetVertical
QuadrupoleDoublet
15 m
ec B dpθ = ⋅∫ lp
⇒ “upstream”
⇒ “downstream”
2 Energy Spectrometers 2 Energy Spectrometers proposed for ILCproposed for ILC

25M. Woods, SLAC Aug. 29, 2006
Primary Method: “NMR Magnetic Model”
∫= BdsecEb π2• Uses resonant depolarization (RDP) data to calibrate at 40-60 GeV• Uses 16 NMR probes to determine B-fields• Uses rf frequency and BPM measurements to determine closed orbit length
Additional methods / cross checks:1. Flux loop measurements to compare with NMR measurements2. BPM Energy Spectrometer3. Synchrotron tune
NMR magnetic model, RDP and Synchrotron tune methods can’t be used at ILC!
Beam Energy Measurements at LEPBeam Energy Measurements at LEP--IIII(~120 ppm accuracy achieved)(~120 ppm accuracy achieved)

26M. Woods, SLAC Aug. 29, 2006
Beam Energy Measurements at SLCBeam Energy Measurements at SLC
Primary Method: WISRD Synchrotron Stripe Spectrometer• systematic error estimated to be 220 ppm• estimated ECM uncertainty 20 MeV
Z-pole calibration scan performed, using mZ measurement from LEP-I→ Determined that WISRD ECM result needed to be
corrected by 46 ± 25 MeV (SLD Note 264);(500 ppm correction)
Lessons from LEP-II and SLC:more than one technique is required for precision measurements!

27M. Woods, SLAC Aug. 29, 2006
Upstream EUpstream E--spectrometer chicanespectrometer chicane
Energy collimation
Energy spectrometer

28M. Woods, SLAC Aug. 29, 2006
16.13
16.13
• 230 μrad bend angle (LEP-II was 3.8mrad)
• 5mm dispersion at mid-chicane(100ppm : 500nm!)
• reverse polarity for calibration• ~55 meters z-space required
Upstream Energy Spectrometer Chicane
50μm

29M. Woods, SLAC Aug. 29, 2006
20mrad IR downstream diagnostics layout
K.Moffeit, Y.Nosochkov, et al
ILC Extraction Line Diagnostics ILC Extraction Line Diagnostics for 20mrad IRfor 20mrad IR

30M. Woods, SLAC Aug. 29, 2006
http://www-project.slac.stanford.edu/ilc/testfac/ESA/esa.html
Collimator design, wakefields (T-480)BPM energy spectrometer (T-474)Synch Stripe energy spectrometer (T-475)Linac BPM prototypesIP BPMs/kickers—background studies (T-488)EMI (electro-magnetic interference)Bunch length diagnostics (…, T-487)
ILC Beam Tests in End Station AILC Beam Tests in End Station A

31M. Woods, SLAC Aug. 29, 2006
SLAC End Station A FacilitySLAC End Station A Facility

32M. Woods, SLAC Aug. 29, 2006
Beam Parameters at SLAC ESA and ILCBeam Parameters at SLAC ESA and ILCParameter SLAC ESA ILC-500Repetition Rate 10 Hz 5 Hz
Energy 28.5 GeV 250 GeV
Bunch Charge 2.0 x 10¹⁰ 2.0 x 10¹⁰
Energy Spread 0.2% 0.1%
Bunches per train 1 (2*) 2820
Microbunch spacing - (20-400ns*) 337 ns
Bunch Length 300 μm 300 μm
*possible, using undamped beam

33M. Woods, SLAC Aug. 29, 2006
B. Gould’s ESA c. 1970s
Inside ESA,Inside ESA,
… 8- and 20-GeV spectrometers wereremoved for E158 in late ’90s

34M. Woods, SLAC Aug. 29, 2006
ESA Equipment LayoutESA Equipment Layout
18 feet
4 rf BPMs for incoming trajectory 1st Ceramic gap w/ 4 diodes (16GHz, 23GHz, 2 @ 100GHz), 2 EMI antennas
Wakefield box Wire Scanners rf BPMs
blue=April ’06green=July ’06red=FY07
UpstreamDipoles + Undulator
+ T-487 for longitudinal bunch profile (location tbd)using pyroelectric detectors for Smith-Purcell radiation
“IP BPM” Module
Ceramic gap BLMs+ ceramic gap (downstream of3BPM11, not shown) for EMI studies

35M. Woods, SLAC Aug. 29, 2006
Installation of Beamline ComponentsInstallation of Beamline Components

36M. Woods, SLAC Aug. 29, 2006
PIs: Steve Molloy (SLAC), Nigel Watson (U. of Birmingham)Collaborating Institutions: U. of Birmingham,
CCLRC-ASTeC + engineering, CERN, DESY,Manchester U., Lancaster U., SLAC, TEMF TU
Concept of Experiment
Vertical mover
BPMBPM
2 doublets
~40m
BPM BPM
Two triplets
~16m
TT--480: Collimator Wakefields480: Collimator WakefieldsCollimators remove beam halo, but excite wakefields.Goal is to determine optimal collimator material and geometry. These studies address achieving theILC design luminosity.

37M. Woods, SLAC Aug. 29, 2006
1500mm
Concept of Experiment
Vertical mover
BPMBPM
2 doublets
~40m
BPM BPM
Two triplets
~16m
TT--480: Collimator Wakefields480: Collimator Wakefields
Vertical mover

38M. Woods, SLAC Aug. 29, 2006
Collimators to study resistive wakefield effects in Cu Collimators to study 2-step tapers in Cu
TT--480: Collimator Wakefields480: Collimator Wakefields
8 new collimators were fabricated in UK

39M. Woods, SLAC Aug. 29, 2006
TT--480 Preliminary Results480 Preliminary Results
1000mm OFE Cu, ½ gap 1.4mm

40M. Woods, SLAC Aug. 29, 2006
TT--474, T474, T--475: Energy Spectrometers475: Energy Spectrometers• Precision energy measurements, 50-200 parts per million,
needed for Higgs boson and top quark mass msmts• BPM (T-474) & synch. stripe (T-475) spectrometers will be
evaluated in a common 4-magnet chicane. • These studies address achieving the ILC precise energy
measurement goals: resolution, stability & systematics
For BPM spectrometer, δE/E=100ppm → δx= 500nm,
at BPMs 3-4(same as for ILC design)
study calibration procedure, whichincludes reversing the chicane polarity,study sensitivity to: beam trajectory,beam tilt, bunch length, beam shape, …

41M. Woods, SLAC Aug. 29, 2006
TT--474 and T474 and T--475475
T-474 BPM Energy Spectrometer:PIs: Mike Hildreth (U. of Notre Dame) & Stewart Boogert (RHUL)Collaborating Institutions: U. of Cambridge, DESY, Dubna, Royal Holloway, SLAC, UC Berkeley, UC London, U. of Notre Dame
T-475 Synchrotron Stripe Energy Spectrometer:PI: Eric Torrence (U. of Oregon)Collaborating Institutions: SLAC, U. of Oregon
Prototype quartz fiber detector:8 100-micron fibers + 8 600-micron fibersw/ multi-anode PMT readout

42M. Woods, SLAC Aug. 29, 2006
TT--474474
from B. Maiheu, talk at Vancouver 2006 ALCPG

43M. Woods, SLAC Aug. 29, 2006
TT--474474from B. Maiheu, talk at Vancouver 2006 ALCPG

44M. Woods, SLAC Aug. 29, 2006
TT--474 Prelim. Results474 Prelim. Results
550nm BPM res.
Resolution for new Linac BPM Prototype, 3BPM3-5
S-Band BPM Design(36 mm ID, 126 mm OD)
y5 (mm)
y4 (m
m)
Q~500 for single bunchresolution

45M. Woods, SLAC Aug. 29, 2006
TT--474474
from B. Maiheu, talk at Vancouver 2006 ALCPG

46M. Woods, SLAC Aug. 29, 2006
Beam RF effects at Beam RF effects at CollidersColliders
SLCProblem with EMI for SLD’s VXD3 Vertex Detector• Loss of lock between front end boards and DAQ boards• Solved with 10 μsec blanking around beamtime – front end boards
ignore commands during this period
PEP-IIHeating of beamline components near IR due to High-order Modes (HOMs)• S. Ecklund et al., High Order Mode Heating Observations in the PEP-II IR,
SLAC-PUB-9372 (2002).• A. Novokhatski and S. Weathersby, RF Modes in the PEP-II Shielded
Vertex Bellows, SLAC-PUB-9952 (2003).• Heating of button BPMs, sensitive to 7GHz HOM, causes BPMs to fall out
HERABeampipe heating and beam-gas backgrounds• HOM-heating related to short positron bunch length
UA1Initial beam pipe at IP too thin• not enough skin depths for higher beam rf harmonics

47M. Woods, SLAC Aug. 29, 2006
Beam RF effects at ILC IR?Beam RF effects at ILC IR?
SLC PEP-II e+ ILCElectrons/Bunch, Q 4.0 x 10¹⁰ 5.0 x 10¹⁰ 2.0 x 10¹⁰
Bunch Length, σZ 1 mm 12 mm 0.3 mm
Bunch Spacing 8 ms 4.2 ns 337 nsAverage Current 7 nA 1.7 A 50 μA(Q/σZ)2 relative 92 1 256
PEP-II experience• HOM heating scales as (Q/σZ)2
- same scaling for EMI affecting detector electronics?- does scaling extend to mm and sub-mm bunch lengths?- need a cavity of suitable dimensions to excite
• IR geometry (aperture transitions, BPMs) has similar complexity as for ILC• VXD and other readout systems ok for EMI in signal processing
ILC Considerations• HOM heating ok because of small average beam current• EMI affecting Signal Processing and DAQ? Impact on Detector Design and
Signal Processing Architecture?

48M. Woods, SLAC Aug. 29, 2006
EMI Studies in ESA EMI Studies in ESA US-Japan funds; Y. Sugimoto (KEK),G. Bower (SLAC), N. Sinev (U. of Oregon)
• Characterize EMI along ESA beamline using antennas & fast 2.5GHz scope• Measured dependence of EMI antenna signals on bunch charge, bunch length
Linear dependence on bunch chargeNo dependence on bunch length (only see dependence for 100GHz detectors)
• Reproduced failure mode observed with SLD’s vertex detector
100GHz A100GHz B
23GHz
( ) ⎟⎟⎠
⎞⎜⎜⎝
⎛−⋅∝ 2
222 exp
cQP zσωω
Radiated Power Spectrum
for σz=500um, 1/e decreaseis at f=100GHz
Bunch length has strong dependence onbeam phase wrt Linac rf (phaseramp)
Bunch Length Diode Signals
7.5GHz antenna near ceramic gapAlso, WR10 and WR90 waveguides to Diode Detectors
Run 1 Data

49M. Woods, SLAC Aug. 29, 2006
100GHz Diode, WR10 waveguide and horn
• too much signal on 100GHzdiodes necessitated removing horn and backing waveguide~4” away from ceramic gap
• WR90 waveguide also againstceramic gap; 30-meter lengthof this to 2 diode detectors in ChA
WR10 and WR90 waveguidesat ceramic gap
( ) ⎟⎟⎠
⎞⎜⎜⎝
⎛−⋅∝ 2
222 exp
cQP zσωω
Radiated Power Spectrum
for σz=500um, 1/e decreaseis at f=100GHz
WR10 Waveguide(0.1 x 0.05 inches)
WR90 Waveguide(0.9 x 0.4 inches)
to 16GHz, 23GHz Diodes
Ceramic Gap
To 100 GHz Diode
Beam Pipe
~8 cm
Bunch length detectorsBunch length detectorsat ceramic gapat ceramic gap

50M. Woods, SLAC Aug. 29, 2006
For July ’06 Run:• additional broadband pyroelectric detectors at new ceramic gap
• many iterations to improve signal:noise, shielding gap except for collecting horn to detector
• sensitive to shorter bunches than 100GHz detector• used transverse “LOLA” cavity at end of Linac to measure
bunch length and E-z correlation of bunch (see next slide)
T-487 in FY07• array of 11 pyroelectric detectors to measure
frequency spectrum of Smith-Purcell radiation(coherent radiation from beam passing close to periodic structure), to allow determinationof bunch longitudinal profile
• PI is G. Doucas at U. of Oxford
New ceramic gap for July ’06 Run
3WS1 wirescanner
Bunch length Bunch length msmtsmsmts

51M. Woods, SLAC Aug. 29, 2006
σz = 0.523 ± 0.009 mmmeasured bunchlength
σσzz = 0.734 mm= 0.734 mm
LiTrack Simulation: Linac RF phase = -10 deg, N = 1.6E10, VRTL = 38.5 MV
BunchlengthBunchlength + Energy+ Energy--Z correlation MeasurementsZ correlation Measurementsat end of Linac with Transverse at end of Linac with Transverse ““LOLALOLA”” cavitycavity
LiTrack Simulation
Head
Tail
A-Line Synchrotron Light Monitor signalw/ LOLA on. 1-m dispersion for horizontal
axis. Calibrated vertical scale to be 0.32mm/deg; 1deg at S-band ~300um.
Head
Tail

52M. Woods, SLAC Aug. 29, 2006
TT--488: IR Mockup in ESA488: IR Mockup in ESAfor FONT IP BPM studiesfor FONT IP BPM studies
PI: Phil Burrows, U. of OxfordCollaboration: U. of Oxford, Daresbury Lab, SLAC
BeamCalMockup
Low Z Absorber
FONT IP BPM
QFEX1AMockup
• stripline IP BPM commissioned & calibrated with primary beam• simulate ILC pairs hitting components in forward region of ILC Detector near IP bpms,
exceeding maximum ILC energy density of 1000 GeV/mm2 by up to factor 100
One version of the IR layout
Low Z Absorber
BeamCal QFEX1A
“BPM Module” for ESA Tests

53Aug. 29, 2006
BPM
e+e- pairs
Low Z maskPairPair--induced EM backgroundsinduced EM backgrounds
TT--488 FONT 488 FONT Test ModuleTest Module
Carbon Mask InsertStripline BPM
(goes here)
BeamCAL mockupQFEX1A mockup

54Aug. 29, 2006
Beam scan across module12-Jul-06 data
Noticeabledegradation of signals
107 e-/bunch,1mm rms spotsize
Scintillator viewed by ccd camerafor profile monitor. Central square is1cm x 1cm. (starry sky background fromradiation damage to pixels)
TT--488 Prelim. Results488 Prelim. Results

55M. Woods, SLAC Aug. 29, 2006
Summary RemarksSummary RemarksMDI encompasses a broad range of topics involving ILC RDR work, Detector concepts, MDI Panel, GDE
MDI studies impact ILC design choices: examples includeIR and Linac crossing angles, 1 IR vs 2 IR, IR magnet design,ILC options for e+ polarization, e-e-, γ-γ
• Collimation & Backgrounds: critical to achieving design luminosity;many ILC and detector parameters, many detailed studies needed
• Precise Beam Instrumentation measurements needed, in particularfor (L,E,P) measurements
• Forward Region Detectors important for luminosity tuning and precise luminosity msmts, + for SUSY studies and identifying 2-photon bkgds
Important beam test program underway at SLAC’s End Station A(collimator wakefields, E-spectrometers, backgrounds & EMI, σZ msmts)
+, not discussed in this talk, very important test beam program underway at ATF facility at KEK, and in the future there with ATF2:beam instrumentation, feedback and controls, tuning procedures toachieve small 35-nm spotsizes with <10-nm stability

56M. Woods, SLAC Aug. 29, 2006
IP Crossing Angle and Solenoid EffectsIP Crossing Angle and Solenoid Effectsx
z
e- e+
z
y
θy
e-
e+
SiD with B = 5T, θy ~ 100 μrad
e+e- collisions:
(Reference: A. Seryi and B. Parker, LCC-143)
θc = 10 mrad
Beams still collide head-on

57M. Woods, SLAC Aug. 29, 2006
IP Crossing Angle and Solenoid EffectsIP Crossing Angle and Solenoid Effects
e-e- collisions:
z
y
θy
e-e-
Significant Luminosity loss, unless additional compensation provided!
SiD with B = 5T, θy ~ 100 μrad(Reference: A. Seryi and B. Parker, LCC-143)
Beams collide with vertical θC
x
z
e- e-
θc = 10 mrad

58M. Woods, SLAC Aug. 29, 2006
IP Crossing Angle and Solenoid EffectsIP Crossing Angle and Solenoid Effects
Three reasons to compensate the resulting vertical steering :• want no vertical crossing angle for e-e- collisions• alignment of extraction line should be energy-independent• want no net bend angle wrt upstream or downstream polarimeters
Compensation techniques:• additional vertical bends• serpentine solenoid winding (add vertical bend to solenoid field; BNL work)
Spin precession and misalignment of Compton IP to collider IP:• will have ~100 μrad bend angle between Compton IP (upstream or downstream)
and collider IP• angle is small compared to disruption angles, but still undesirable

59M. Woods, SLAC Aug. 29, 2006
The IP angle can be compensated by the Detector Integrated Dipole (Serpentine) Corrector and offsets of QD0 and QF1
With compensation
IP
Without compensation
IP
• Adds ~ 0.01 of Bz along x in detector• TPC tracking → map Bz to 0.0005 to control distortions• Larger backgrounds and steering of the spent beam;
steering compensated with external dipoles
IP
The Serpentine increases transverse field seen by the outgoing beam and pairs. The extraction angle can be compensated by external dipoles.
Compensation of Solenoid Steering Effects w/ Crossing Angle
Related Documents


