Fermilab MC Workshop April 30, 2003 Rick Field - Florida/CDF Page 1 The “Underlying Event” The “Underlying Event” in Run 2 at CDF in Run 2 at CDF Study the “underlying event” as defined by the leading “charged particle jet” and compare with the Run I analysis. Outline of Talk Study the “underlying event” as defined by the leading “calorimeter jet” and compare with the “charged particle jet” analysis. Study the relationship between “charged particle jets” and “calorimeter jets”. C harged Particle Jet Calorim eter Jet JetClu R = 0.7

Fermilab MC Workshop April 30, 2003 Rick Field - Florida/CDFPage 1 The “Underlying Event” in Run 2 at CDF Study the “underlying event” as defined by.
Dec 14, 2015
Welcome message from author
This document is posted to help you gain knowledge. Please leave a comment to let me know what you think about it! Share it to your friends and learn new things together.
Transcript

Fermilab MC Workshop April 30, 2003
Rick Field - Florida/CDF Page 1
The “Underlying Event”The “Underlying Event”in Run 2 at CDFin Run 2 at CDF
Study the “underlying event” as defined by the leading “charged particle jet” and compare with the Run I analysis.
Outline of Talk
Study the “underlying event” as defined by the leading “calorimeter jet” and compare with the “charged particle jet” analysis.
Study the relationship between “charged particle jets” and “calorimeter jets”.
Charged Particle Jet
Calorimeter Jet
JetClu R = 0.7

Fermilab MC Workshop April 30, 2003
Rick Field - Florida/CDF Page 2
The “Underlying Event”The “Underlying Event”in Run 2 at CDFin Run 2 at CDF
Study the “underlying event” as defined by the leading “charged particle jet” and compare with the Run I analysis.
Outline of Talk
Study the “underlying event” as defined by the leading “calorimeter jet” and compare with the “charged particle jet” analysis.
Study the relationship between “charged particle jets” and “calorimeter jets”.
Charged Particle Jet
Calorimeter Jet
Look at charged particle correlations relative to the
leading “charged particle jet”.
Look at charged particle correlations relative to the leading “calorimeter jet”.
Look at correlations between the leading “charged particle jet” and “calorimeter jets”.
JetClu R = 0.7
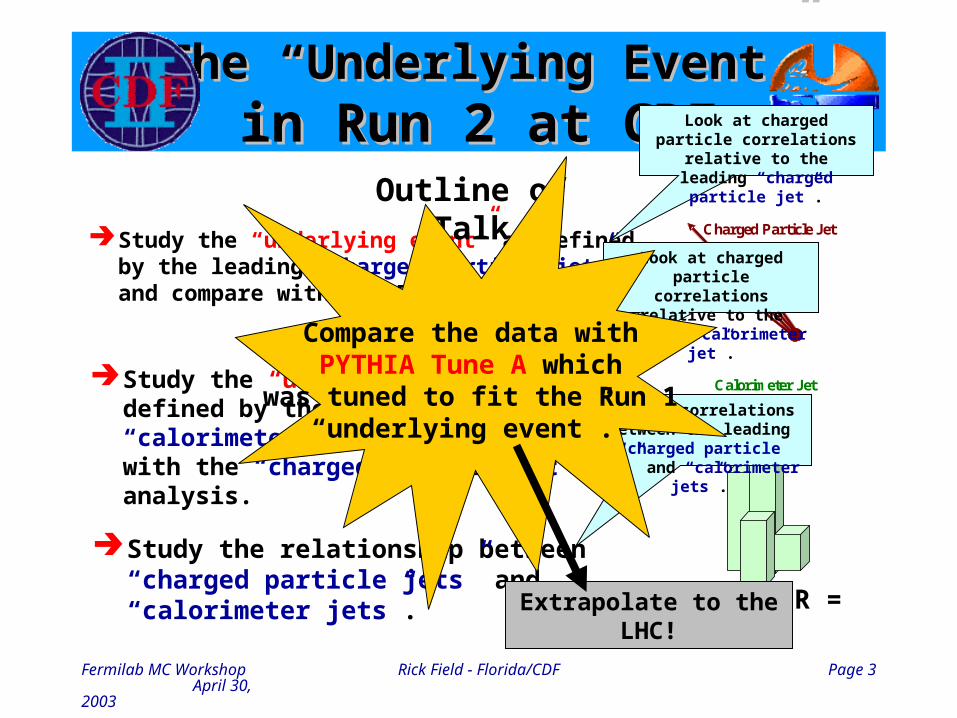
Fermilab MC Workshop April 30, 2003
Rick Field - Florida/CDF Page 3
The “Underlying Event”The “Underlying Event”in Run 2 at CDFin Run 2 at CDF
Study the “underlying event” as defined by the leading “charged particle jet” and compare with the Run I analysis.
Outline of Talk
Study the “underlying event” as defined by the leading “calorimeter jet” and compare with the “charged particle jet” analysis.
Study the relationship between “charged particle jets” and “calorimeter jets”.
Charged Particle Jet
Calorimeter Jet
Look at charged particle correlations relative to the
leading “charged particle jet”.
Look at charged particle correlations relative to the leading “calorimeter jet”.
Look at correlations between the leading “charged particle jet” and “calorimeter jets”.
JetClu R = 0.7
Compare the data withPYTHIA Tune A which
was tuned to fit the Run 1“underlying event”.
Extrapolate to the LHC!

Fermilab MC Workshop April 30, 2003
Rick Field - Florida/CDF Page 4
““Underlying Event”Underlying Event”as defined by “Charged particle Jets”as defined by “Charged particle Jets”
Charged Jet #1Direction
“Transverse” “Transverse”
“Toward”
“Away”
“Toward-Side” Jet
“Away-Side” Jet
Look at charged particle correlations in the azimuthal angle relative to the leading charged particle jet.
Define || < 60o as “Toward”, 60o < || < 120o as “Transverse”, and || > 120o as “Away”. All three regions have the same size in - space, x = 2x120o = 4/3.
Charged Jet #1Direction
“Toward”
“Transverse” “Transverse”
“Away”
Charged Particle Correlations PT > 0.5 GeV/c || < 1
Toward-side “jet”(always)
Away-side “jet”(sometimes)
Perpendicular to the plane of the 2-to-2 hard scattering
“Transverse” region is very sensitive to the “underlying event”!
-1 +1
2
0
Leading ChgJet
Toward Region
Transverse Region
Transverse Region
Away Region
Away Region
Look at the charged particle density in the “transverse” region!

Fermilab MC Workshop April 30, 2003
Rick Field - Florida/CDF Page 5
CDF Run 1 “Min-Bias” DataCDF Run 1 “Min-Bias” DataCharged Particle DensityCharged Particle Density
Shows CDF “Min-Bias” data on the number of charged particles per unit pseudo-rapidity at 630 and 1,800 GeV. There are about 4.2 charged particles per unit in “Min-Bias” collisions at 1.8 TeV (|| < 1, all PT).
Charged Particle Pseudo-Rapidity Distribution: dN/d
0
1
2
3
4
5
6
7
-4 -3 -2 -1 0 1 2 3 4
Pseudo-Rapidity
dN
/d
CDF Min-Bias 1.8 TeV
CDF Min-Bias 630 GeV all PT
CDF Published
<dNchg/d> = 4.2
Charged Particle Density: dN/dd
0.0
0.2
0.4
0.6
0.8
1.0
-4 -3 -2 -1 0 1 2 3 4
Pseudo-Rapidity
dN
/d d
CDF Min-Bias 630 GeV
CDF Min-Bias 1.8 TeV all PT
CDF Published
<dNchg/dd> = 0.67
Convert to charged particle density, dNchg/dd by dividing by 2. There are about 0.67 charged particles per unit - in “Min-Bias” collisions at 1.8 TeV (|| < 1, all PT).
= 1
= 1
x = 1
0.67

Fermilab MC Workshop April 30, 2003
Rick Field - Florida/CDF Page 6
CDF Run 1 “Min-Bias” DataCDF Run 1 “Min-Bias” DataCharged Particle DensityCharged Particle Density
Shows CDF “Min-Bias” data on the number of charged particles per unit pseudo-rapidity at 630 and 1,800 GeV. There are about 4.2 charged particles per unit in “Min-Bias” collisions at 1.8 TeV (|| < 1, all PT).
Charged Particle Pseudo-Rapidity Distribution: dN/d
0
1
2
3
4
5
6
7
-4 -3 -2 -1 0 1 2 3 4
Pseudo-Rapidity
dN
/d
CDF Min-Bias 1.8 TeV
CDF Min-Bias 630 GeV all PT
CDF Published
<dNchg/d> = 4.2
Charged Particle Density: dN/dd
0.0
0.2
0.4
0.6
0.8
1.0
-4 -3 -2 -1 0 1 2 3 4
Pseudo-Rapidity
dN
/d d
CDF Min-Bias 630 GeV
CDF Min-Bias 1.8 TeV all PT
CDF Published
<dNchg/dd> = 0.67
Convert to charged particle density, dNchg/dd by dividing by 2. There are about 0.67 charged particles per unit - in “Min-Bias” collisions at 1.8 TeV (|| < 1, all PT).
= 1
= 1
x = 1
0.67 There are about 0.25 charged particles per unit - in “Min-Bias” collisions at 1.8 TeV (|| < 1, PT > 0.5 GeV/c).
0.25

Fermilab MC Workshop April 30, 2003
Rick Field - Florida/CDF Page 7
Run 1 Charged Particle DensityRun 1 Charged Particle Density
“Transverse” P“Transverse” PTT Distribution Distribution
Compares the average “transverse” charge particle density with the average “Min-Bias” charge particle density (||<1, PT>0.5 GeV). Shows how the “transverse” charge particle density and the Min-Bias charge particle density is distributed in PT.
Factor of 2!
“Min-Bias”
"Transverse" Charged Particle Density: dN/dd
0.00
0.25
0.50
0.75
1.00
0 5 10 15 20 25 30 35 40 45 50
PT(charged jet#1) (GeV/c)
"Tra
nsv
erse
" C
har
ged
Den
sity
CDF Min-Bias
CDF JET20CDF Run 1data uncorrected
1.8 TeV ||<1.0 PT>0.5 GeV/c
Charged Particle Jet #1 Direction
“Toward”
“Transverse” “Transverse”
“Away”

Fermilab MC Workshop April 30, 2003
Rick Field - Florida/CDF Page 8
Run 1 Charged Particle DensityRun 1 Charged Particle Density
“Transverse” P“Transverse” PTT Distribution Distribution
Compares the average “transverse” charge particle density with the average “Min-Bias” charge particle density (||<1, PT>0.5 GeV). Shows how the “transverse” charge particle density and the Min-Bias charge particle density is distributed in PT.
CDF Run 1 Min-Bias data<dNchg/dd> = 0.25
PT(charged jet#1) > 30 GeV/c“Transverse” <dNchg/dd> = 0.56
Factor of 2!
“Min-Bias”
"Transverse" Charged Particle Density: dN/dd
0.00
0.25
0.50
0.75
1.00
0 5 10 15 20 25 30 35 40 45 50
PT(charged jet#1) (GeV/c)
"Tra
nsv
erse
" C
har
ged
Den
sity
CDF Min-Bias
CDF JET20CDF Run 1data uncorrected
1.8 TeV ||<1.0 PT>0.5 GeV/c
Charged Particle Density
1.0E-06
1.0E-05
1.0E-04
1.0E-03
1.0E-02
1.0E-01
1.0E+00
0 2 4 6 8 10 12 14
PT(charged) (GeV/c)C
har
ged
Den
sity
dN
/d
d d
PT
(1/
GeV
/c)
CDF Run 1data uncorrected
1.8 TeV ||<1 PT>0.5 GeV/c
Min-Bias
"Transverse"PT(chgjet#1) > 5 GeV/c
"Transverse"PT(chgjet#1) > 30 GeV/c

Fermilab MC Workshop April 30, 2003
Rick Field - Florida/CDF Page 9
PYTHIA: Multiple PartonPYTHIA: Multiple PartonInteraction ParametersInteraction Parameters
Pythia uses multiple partoninteractions to enhancethe underlying event.
Parameter Value
Description
MSTP(81) 0 Multiple-Parton Scattering off
1 Multiple-Parton Scattering on
MSTP(82) 1 Multiple interactions assuming the same probability, with an abrupt cut-off PTmin=PARP(81)
3 Multiple interactions assuming a varying impact parameter and a hadronic matter overlap consistent with a single Gaussian matter distribution, with a smooth turn-off PT0=PARP(82)
4 Multiple interactions assuming a varying impact parameter and a hadronic matter overlap consistent with a double Gaussian matter distribution (governed by PARP(83) and PARP(84)), with a smooth turn-off PT0=PARP(82)
Hard Core
Multiple parton interaction more likely in a hard
(central) collision!
and now HERWIG
!
Jimmy: MPIJ. M. Butterworth
J. R. ForshawM. H. Seymour
Proton AntiProton
Multiple Parton Interactions
PT(hard)
Outgoing Parton
Outgoing Parton
Underlying EventUnderlying Event

Fermilab MC Workshop April 30, 2003
Rick Field - Florida/CDF Page 10
PYTHIA: Multiple PartonPYTHIA: Multiple PartonInteraction ParametersInteraction Parameters
Pythia uses multiple partoninteractions to enhancethe underlying event.
Parameter Value
Description
MSTP(81) 0 Multiple-Parton Scattering off
1 Multiple-Parton Scattering on
MSTP(82) 1 Multiple interactions assuming the same probability, with an abrupt cut-off PTmin=PARP(81)
3 Multiple interactions assuming a varying impact parameter and a hadronic matter overlap consistent with a single Gaussian matter distribution, with a smooth turn-off PT0=PARP(82)
4 Multiple interactions assuming a varying impact parameter and a hadronic matter overlap consistent with a double Gaussian matter distribution (governed by PARP(83) and PARP(84)), with a smooth turn-off PT0=PARP(82)
Hard Core
Multiple parton interaction more likely in a hard
(central) collision!
and now HERWIG
!
Jimmy: MPIJ. M. Butterworth
J. R. ForshawM. H. Seymour
Proton AntiProton
Multiple Parton Interactions
PT(hard)
Outgoing Parton
Outgoing Parton
Underlying EventUnderlying Event
Same parameter that cuts-off the hard 2-to-2 parton cross sections!
Note that since the same cut-off parameters govern both the primary
hard scattering and the secondary MPI interaction, changing the amount of MPIalso changes the amount of hard primary scattering in PYTHIA Min-Bias events!
Fermilab MC Workshop April 30, 2003
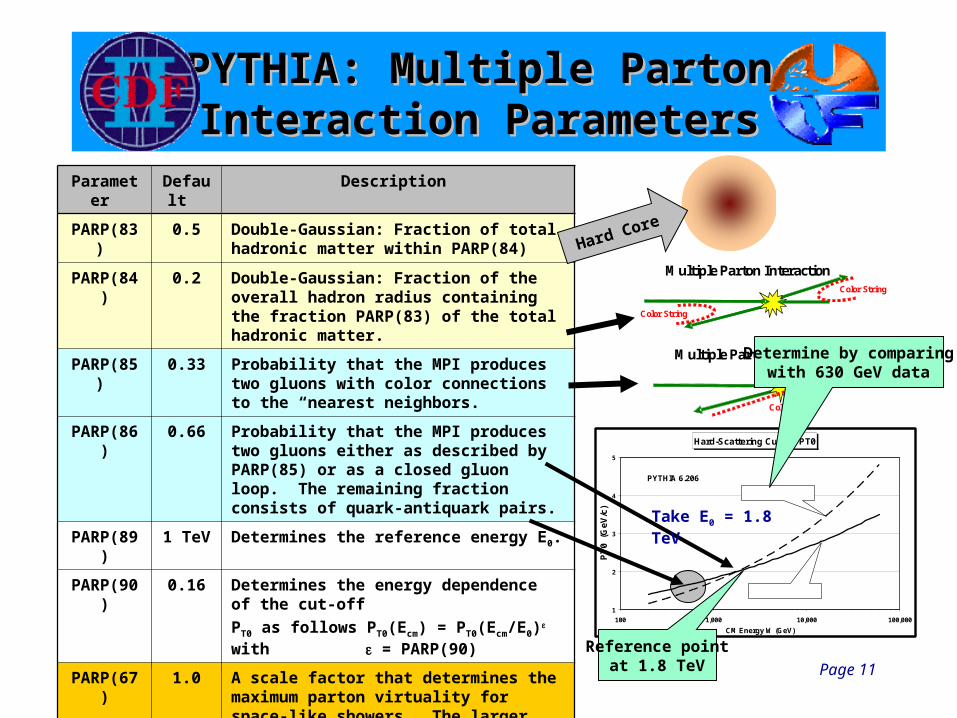
Rick Field - Florida/CDF Page 11
PYTHIA: Multiple PartonPYTHIA: Multiple PartonInteraction ParametersInteraction Parameters
Parameter Default
Description
PARP(83) 0.5 Double-Gaussian: Fraction of total hadronic matter within PARP(84)
PARP(84) 0.2 Double-Gaussian: Fraction of the overall hadron radius containing the fraction PARP(83) of the total hadronic matter.
PARP(85) 0.33 Probability that the MPI produces two gluons with color connections to the “nearest neighbors.
PARP(86) 0.66 Probability that the MPI produces two gluons either as described by PARP(85) or as a closed gluon loop. The remaining fraction consists of quark-antiquark pairs.
PARP(89) 1 TeV Determines the reference energy E0.
PARP(90) 0.16 Determines the energy dependence of the cut-off
PT0 as follows PT0(Ecm) = PT0(Ecm/E0) with = PARP(90)
PARP(67) 1.0 A scale factor that determines the maximum parton virtuality for space-like showers. The larger the value of PARP(67) the more initial-state radiation.
Hard Core
Multiple Parton Interaction
Color String
Color String
Multiple Parton Interaction
Color String
Hard-Scattering Cut-Off PT0
1
2
3
4
5
100 1,000 10,000 100,000
CM Energy W (GeV)
PT
0
(Ge
V/c
)
PYTHIA 6.206
= 0.16 (default)
= 0.25 (Set A))
Take E0 = 1.8 TeV
Reference pointat 1.8 TeV
Determine by comparingwith 630 GeV data
Fermilab MC Workshop April 30, 2003
Rick Field - Florida/CDF Page 12
Old PYTHIA default(more initial-state radiation)New PYTHIA default
(less initial-state radiation)
Parameter Tune B Tune A
MSTP(81) 1 1
MSTP(82) 4 4
PARP(82) 1.9 GeV 2.0 GeV
PARP(83) 0.5 0.5
PARP(84) 0.4 0.4
PARP(85) 1.0 0.9
PARP(86) 1.0 0.95
PARP(89) 1.8 TeV 1.8 TeV
PARP(90) 0.25 0.25
PARP(67) 1.0 4.0
New PYTHIA default(less initial-state radiation)
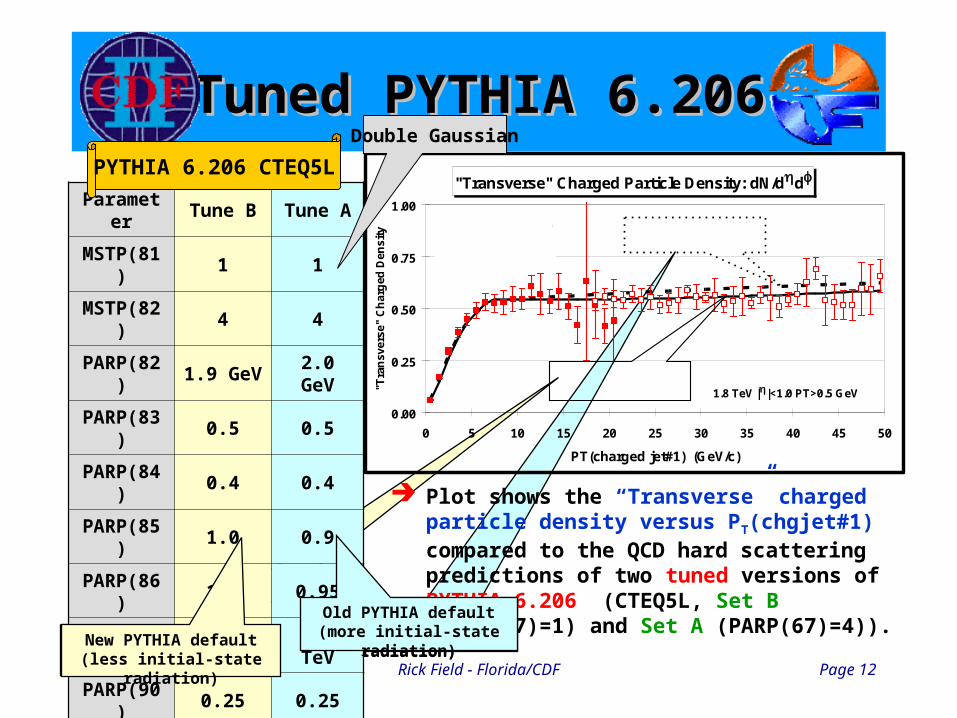
Tuned PYTHIA 6.206Tuned PYTHIA 6.206
Plot shows the “Transverse” charged particle density versus PT(chgjet#1) compared to the QCD hard scattering predictions of two tuned versions of PYTHIA 6.206 (CTEQ5L, Set B (PARP(67)=1) and Set A (PARP(67)=4)).
PYTHIA 6.206 CTEQ5L"Transverse" Charged Particle Density: dN/dd
0.00
0.25
0.50
0.75
1.00
0 5 10 15 20 25 30 35 40 45 50
PT(charged jet#1) (GeV/c)
"Tra
nsv
erse
" C
har
ged
Den
sity
1.8 TeV ||<1.0 PT>0.5 GeV
CDF Preliminarydata uncorrectedtheory corrected
CTEQ5L
PYTHIA 6.206 (Set A)PARP(67)=4
PYTHIA 6.206 (Set B)PARP(67)=1
Double Gaussian
Old PYTHIA default(more initial-state radiation)

Fermilab MC Workshop April 30, 2003
Rick Field - Florida/CDF Page 13
Tuned PYTHIA 6.206Tuned PYTHIA 6.206“Transverse” P“Transverse” PTT Distribution Distribution
"Transverse" Charged Particle Density: dN/dd
0.00
0.25
0.50
0.75
1.00
0 5 10 15 20 25 30 35 40 45 50
PT(charged jet#1) (GeV/c)
"Tra
nsv
erse
" C
har
ged
Den
sity
1.8 TeV ||<1.0 PT>0.5 GeV
CDF Preliminarydata uncorrectedtheory corrected
CTEQ5L
PYTHIA 6.206 (Set A)PARP(67)=4
PYTHIA 6.206 (Set B)PARP(67)=1
Can we distinguish between PARP(67)=1 and PARP(67)=4?
No way! Right!
Compares the average “transverse” charge particle density (||<1, PT>0.5 GeV) versus PT(charged jet#1) and the PT distribution of the “transverse” density, dNchg/dddPT with the QCD Monte-Carlo predictions of two tuned versions of PYTHIA 6.206 (PT(hard) > 0, CTEQ5L, Set B (PARP(67)=1) and Set A (PARP(67)=4)).

Fermilab MC Workshop April 30, 2003
Rick Field - Florida/CDF Page 14
Tuned PYTHIA 6.206Tuned PYTHIA 6.206“Transverse” P“Transverse” PTT Distribution Distribution
"Transverse" Charged Particle Density: dN/dd
0.00
0.25
0.50
0.75
1.00
0 5 10 15 20 25 30 35 40 45 50
PT(charged jet#1) (GeV/c)
"Tra
nsv
erse
" C
har
ged
Den
sity
1.8 TeV ||<1.0 PT>0.5 GeV
CDF Preliminarydata uncorrectedtheory corrected
CTEQ5L
PYTHIA 6.206 (Set A)PARP(67)=4
PYTHIA 6.206 (Set B)PARP(67)=1
PARP(67)=4.0 (old default) is favored over PARP(67)=1.0 (new default)!
PT(charged jet#1) > 30 GeV/c
"Transverse" Charged Particle Density
1.0E-06
1.0E-05
1.0E-04
1.0E-03
1.0E-02
1.0E-01
1.0E+00
0 2 4 6 8 10 12 14
PT(charged) (GeV/c)C
har
ged
Den
sity
dN
/d d
dP
T (
1/G
eV/c
)
CDF Datadata uncorrectedtheory corrected
1.8 TeV ||<1 PT>0.5 GeV/c
PT(chgjet#1) > 5 GeV/c
PT(chgjet#1) > 30 GeV/c
PYTHIA 6.206 Set APARP(67)=4
PYTHIA 6.206 Set BPARP(67)=1
Compares the average “transverse” charge particle density (||<1, PT>0.5 GeV) versus PT(charged jet#1) and the PT distribution of the “transverse” density, dNchg/dddPT with the QCD Monte-Carlo predictions of two tuned versions of PYTHIA 6.206 (PT(hard) > 0, CTEQ5L, Set B (PARP(67)=1) and Set A (PARP(67)=4)).
Fermilab MC Workshop April 30, 2003
Rick Field - Florida/CDF Page 15
Charged Particle Density
1.0E-05
1.0E-04
1.0E-03
1.0E-02
1.0E-01
1.0E+00
0 2 4 6 8 10 12 14
PT(charged) (GeV/c)C
har
ged
Den
sity
dN
/d d
dP
T (
1/G
eV/c
)
CDF Run 1data uncorrectedtheory corrected
1.8 TeV ||<1 PT>0.5 GeV/c
CDF Min-Bias
"Transverse"PT(chgjet#1) > 5 GeV/c
"Transverse"PT(chgjet#1) > 30 GeV/c
PYTHIA 6.206 Set A
CTEQ5L
"Transverse" Charged Particle Density: dN/dd
0.00
0.25
0.50
0.75
1.00
0 5 10 15 20 25 30 35 40 45 50
PT(charged jet#1) (GeV/c)
"Tra
nsv
erse
" C
har
ged
Den
sity
1.8 TeV ||<1.0 PT>0.5 GeV/c
CDF Run 1data uncorrectedtheory corrected
PYTHIA 6.206 Set A
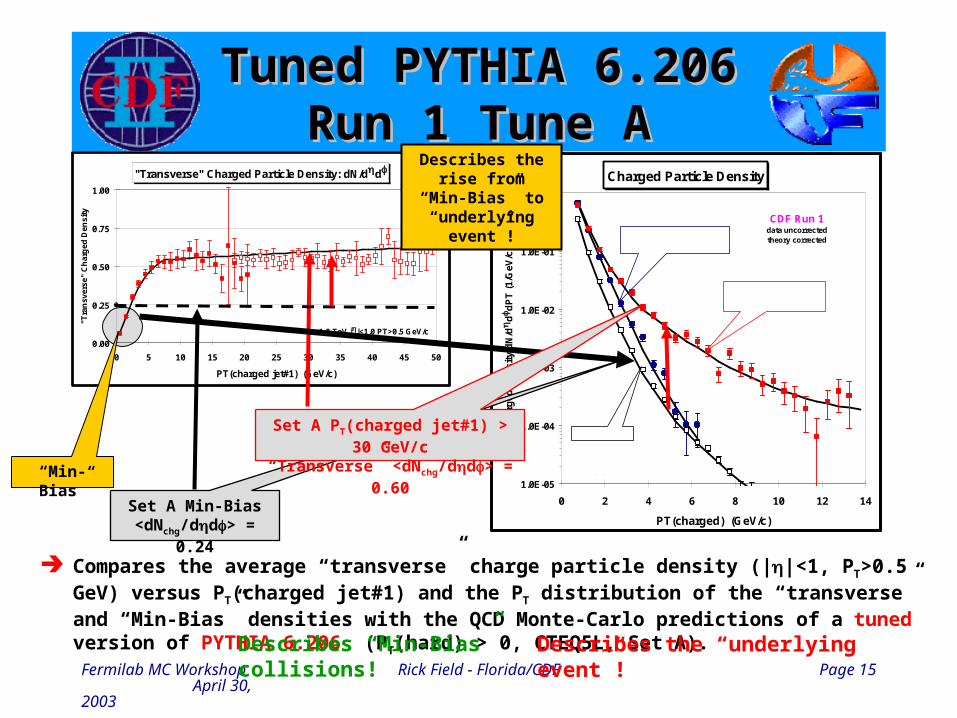
Tuned PYTHIA 6.206Tuned PYTHIA 6.206Run 1 Tune ARun 1 Tune A
Compares the average “transverse” charge particle density (||<1, PT>0.5 GeV) versus PT(charged jet#1) and the PT distribution of the “transverse” and “Min-Bias” densities with the QCD Monte-Carlo predictions of a tuned version of PYTHIA 6.206 (PT(hard) > 0, CTEQ5L, Set A).
Set A Min-Bias<dNchg/dd> = 0.24
Describes “Min-Bias” collisions! Describes the “underlying event”!
“Min-Bias”
Set A PT(charged jet#1) > 30 GeV/c“Transverse” <dNchg/dd> = 0.60
Describes the rise from “Min-Bias” to “underlying event”!
Fermilab MC Workshop April 30, 2003
Rick Field - Florida/CDF Page 16
Charged Particle Jet #1 Direction
“Toward”
“Transverse” “Transverse”
“Away”
"Transverse" Charged Particle Density: dN/dd
0.00
0.25
0.50
0.75
1.00
1.25
0 5 10 15 20 25 30 35 40 45 50
PT(charged jet#1) (GeV/c)"T
ran
sver
se"
Ch
arg
ed D
ensi
ty
CDF Run 1 Min-Bias
CDF Run 1 JET20CDF Run 1 Data
data uncorrected
1.8 TeV ||<1.0 PT>0.5 GeV
“ “Transverse” Transverse” Charged Particle DensityCharged Particle Density
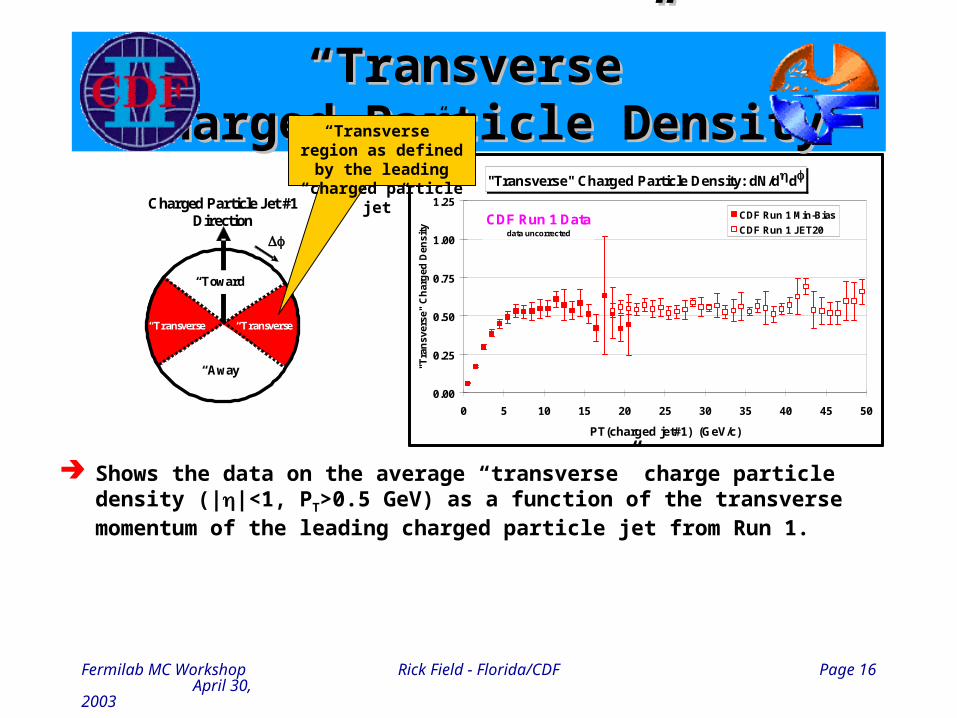
Shows the data on the average “transverse” charge particle density (||<1, PT>0.5 GeV) as a function of the transverse momentum of the leading charged particle jet from Run 1.
“Transverse” region as defined by the leading “charged particle jet”
Fermilab MC Workshop April 30, 2003
Rick Field - Florida/CDF Page 17
Charged Particle Jet #1 Direction
“Toward”
“Transverse” “Transverse”
“Away”
"Transverse" Charged Particle Density: dN/dd
0.00
0.25
0.50
0.75
1.00
1.25
0 5 10 15 20 25 30 35 40 45 50
PT(charged jet#1) (GeV/c)"T
ran
sver
se"
Ch
arg
ed D
ensi
ty
CDF Run 1 Min-Bias
CDF Run 1 JET20CDF Run 1 Data
data uncorrected
1.8 TeV ||<1.0 PT>0.5 GeV
"Transverse" Charged Particle Density: dN/dd
0.00
0.25
0.50
0.75
1.00
1.25
0 10 20 30 40 50 60 70 80 90 100 110 120 130 140 150
PT(charged jet#1) (GeV/c)"T
ran
sver
se"
Ch
arg
ed D
ensi
ty
CDF Run 1 Min-Bias
CDF Run 1 JET20
||<1.0 PT>0.5 GeV
CDF Preliminarydata uncorrected
“ “Transverse” Transverse” Charged Particle DensityCharged Particle Density
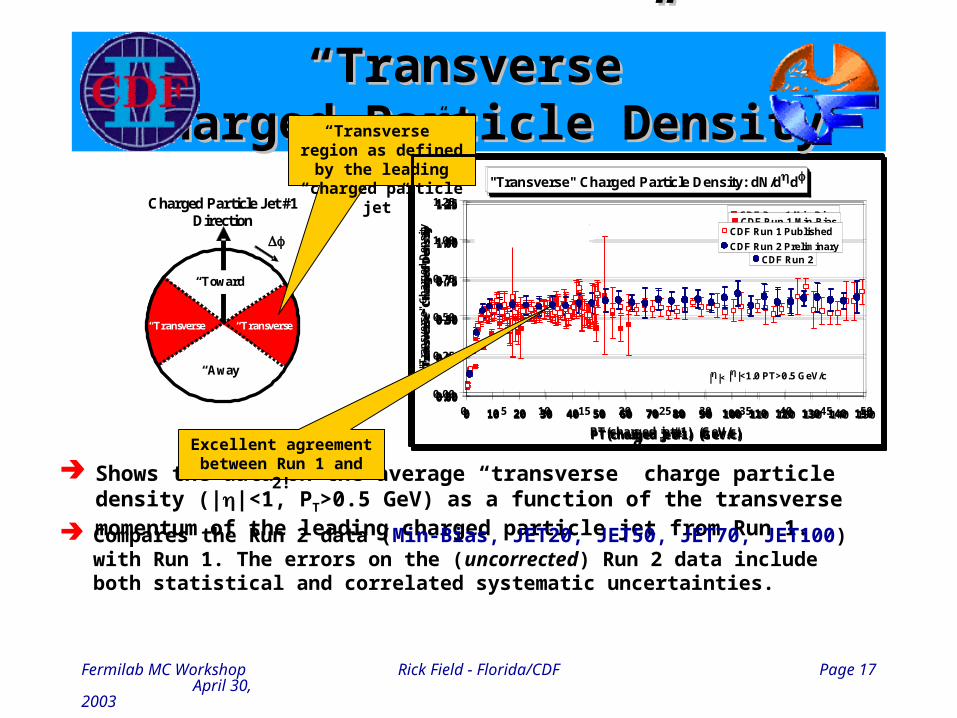
Shows the data on the average “transverse” charge particle density (||<1, PT>0.5 GeV) as a function of the transverse momentum of the leading charged particle jet from Run 1.
Compares the Run 2 data (Min-Bias, JET20, JET50, JET70, JET100) with Run 1. The errors on the (uncorrected) Run 2 data include both statistical and correlated systematic uncertainties.
"Transverse" Charged Particle Density: dN/dd
0.00
0.25
0.50
0.75
1.00
1.25
0 10 20 30 40 50 60 70 80 90 100 110 120 130 140 150
PT(charged jet#1) (GeV/c)"T
ran
sver
se"
Ch
arg
ed D
ensi
ty
CDF Run 2
“Transverse” region as defined by the leading “charged particle jet”
"Transverse" Charged Particle Density: dN/dd
0.00
0.25
0.50
0.75
1.00
1.25
0 10 20 30 40 50 60 70 80 90 100 110 120 130 140 150
PT(charged jet#1) (GeV/c)"T
ran
sver
se"
Ch
arg
ed D
ensi
ty CDF Run 1 Published
CDF Run 2 Preliminary
||<1.0 PT>0.5 GeV/c
CDF Preliminarydata uncorrected
Excellent agreement between Run 1 and 2!
Fermilab MC Workshop April 30, 2003
Rick Field - Florida/CDF Page 18
Charged Particle Jet #1 Direction
“Toward”
“Transverse” “Transverse”
“Away”
"Transverse" Charged Particle Density: dN/dd
0.00
0.25
0.50
0.75
1.00
1.25
0 5 10 15 20 25 30 35 40 45 50
PT(charged jet#1) (GeV/c)"T
ran
sver
se"
Ch
arg
ed D
ensi
ty
CDF Run 1 Min-Bias
CDF Run 1 JET20CDF Run 1 Data
data uncorrected
1.8 TeV ||<1.0 PT>0.5 GeV
"Transverse" Charged Particle Density: dN/dd
0.00
0.25
0.50
0.75
1.00
1.25
0 10 20 30 40 50 60 70 80 90 100 110 120 130 140 150
PT(charged jet#1) (GeV/c)"T
ran
sver
se"
Ch
arg
ed D
ensi
ty
CDF Run 1 Min-Bias
CDF Run 1 JET20
||<1.0 PT>0.5 GeV
CDF Preliminarydata uncorrected
“ “Transverse” Transverse” Charged Particle DensityCharged Particle Density
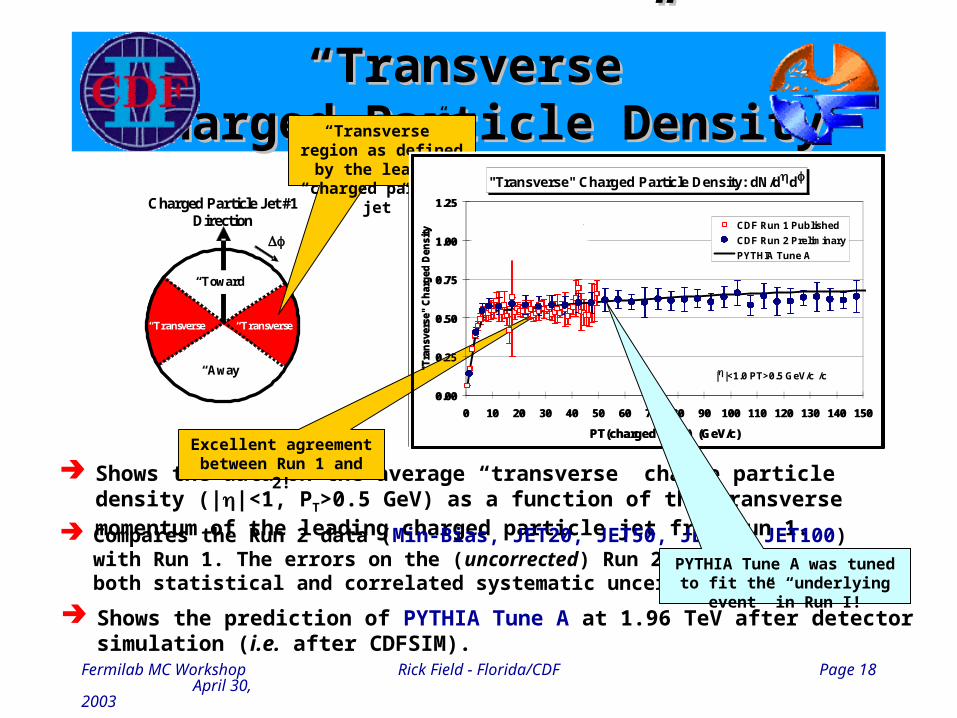
Shows the data on the average “transverse” charge particle density (||<1, PT>0.5 GeV) as a function of the transverse momentum of the leading charged particle jet from Run 1.
Compares the Run 2 data (Min-Bias, JET20, JET50, JET70, JET100) with Run 1. The errors on the (uncorrected) Run 2 data include both statistical and correlated systematic uncertainties.
"Transverse" Charged Particle Density: dN/dd
0.00
0.25
0.50
0.75
1.00
1.25
0 10 20 30 40 50 60 70 80 90 100 110 120 130 140 150
PT(charged jet#1) (GeV/c)"T
ran
sver
se"
Ch
arg
ed D
ensi
ty
CDF Run 2
“Transverse” region as defined by the leading “charged particle jet”
"Transverse" Charged Particle Density: dN/dd
0.00
0.25
0.50
0.75
1.00
1.25
0 10 20 30 40 50 60 70 80 90 100 110 120 130 140 150
PT(charged jet#1) (GeV/c)"T
ran
sver
se"
Ch
arg
ed D
ensi
ty CDF Run 1 Published
CDF Run 2 Preliminary
||<1.0 PT>0.5 GeV/c
CDF Preliminarydata uncorrected
Excellent agreement between Run 1 and 2!
"Transverse" Charged Particle Density: dN/dd
0.00
0.25
0.50
0.75
1.00
1.25
0 10 20 30 40 50 60 70 80 90 100 110 120 130 140 150
PT(charged jet#1) (GeV/c)"T
ran
sver
se"
Ch
arg
ed D
ensi
ty
CDF Run 1 Published
CDF Run 2 Preliminary
PYTHIA Tune A
||<1.0 PT>0.5 GeV/c
CDF Preliminarydata uncorrectedtheory corrected
PYTHIA Tune A was tuned to fit the “underlying event” in Run I!
Shows the prediction of PYTHIA Tune A at 1.96 TeV after detector simulation (i.e. after CDFSIM).

Fermilab MC Workshop April 30, 2003
Rick Field - Florida/CDF Page 19
“ “Transverse” Transverse” Charged PTsum DensityCharged PTsum Density
Shows the data on the average “transverse” charged PTsum density (||<1, PT>0.5 GeV) as a function of the transverse momentum of the leading charged particle jet from Run 1.
"Transverse" Charged PTsum Density: dPTsum/dd
0.00
0.25
0.50
0.75
1.00
1.25
0 5 10 15 20 25 30 35 40 45 50
PT(charged jet#1) (GeV/c)"T
ran
sver
se"
PT
sum
Den
sity
(G
eV) CDF JET20
CDF Min-BiasCDF Run 1 Data
data uncorrected
1.8 TeV ||<1.0 PT>0.5 GeV
Charged Particle Jet #1 Direction
“Toward”
“Transverse” “Transverse”
“Away”
“Transverse” region as defined by the leading “charged particle jet”
Fermilab MC Workshop April 30, 2003
Rick Field - Florida/CDF Page 20
“ “Transverse” Transverse” Charged PTsum DensityCharged PTsum Density
Shows the data on the average “transverse” charged PTsum density (||<1, PT>0.5 GeV) as a function of the transverse momentum of the leading charged particle jet from Run 1.
"Transverse" Charged PTsum Density: dPTsum/dd
0.00
0.25
0.50
0.75
1.00
1.25
0 5 10 15 20 25 30 35 40 45 50
PT(charged jet#1) (GeV/c)"T
ran
sver
se"
PT
sum
Den
sity
(G
eV) CDF JET20
CDF Min-BiasCDF Run 1 Data
data uncorrected
1.8 TeV ||<1.0 PT>0.5 GeV
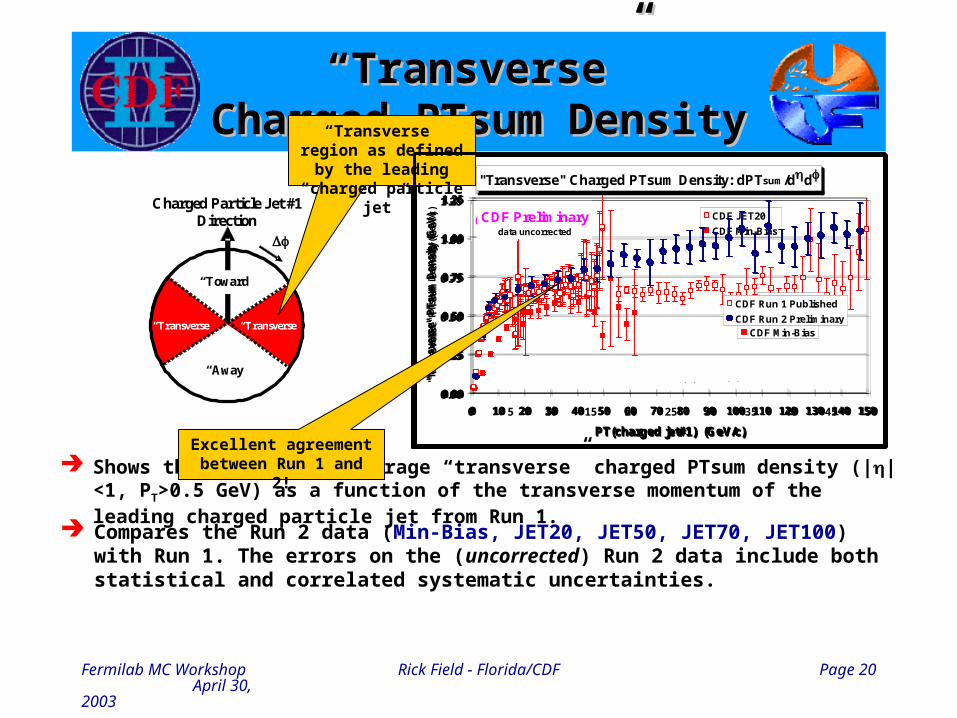
Compares the Run 2 data (Min-Bias, JET20, JET50, JET70, JET100) with Run 1. The errors on the (uncorrected) Run 2 data include both statistical and correlated systematic uncertainties.
"Transverse" Charged PTsum Density: dPTsum/dd
0.00
0.25
0.50
0.75
1.00
1.25
0 10 20 30 40 50 60 70 80 90 100 110 120 130 140 150
PT(charged jet#1) (GeV/c)"T
ran
sver
se"
PT
sum
Den
sity
(G
eV)
CDF JET20
CDF Min-Bias
CDF Preliminarydata uncorrected
||<1.0 PT>0.5 GeV
Charged Particle Jet #1 Direction
“Toward”
“Transverse” “Transverse”
“Away”
"Transverse" Charged PTsum Density: dPTsum/dd
0.00
0.25
0.50
0.75
1.00
1.25
0 10 20 30 40 50 60 70 80 90 100 110 120 130 140 150
PT(charged jet#1) (GeV/c)"T
ran
sver
se"
PT
sum
Den
sity
(G
eV)
CDF Run 2
“Transverse” region as defined by the leading “charged particle jet”
"Transverse" Charged PTsum Density: dPTsum/dd
0.00
0.25
0.50
0.75
1.00
1.25
0 10 20 30 40 50 60 70 80 90 100 110 120 130 140 150
PT(charged jet#1) (GeV/c)"T
ran
sver
se"
PT
sum
Den
sity
(G
eV/c
)
CDF Run 1 Published
CDF Run 2 Preliminary
CDF Preliminarydata uncorrected
||<1.0 PT>0.5 GeV/c
Excellent agreement between Run 1 and 2!

Fermilab MC Workshop April 30, 2003
Rick Field - Florida/CDF Page 21
“ “Transverse” Transverse” Charged PTsum DensityCharged PTsum Density
Shows the data on the average “transverse” charged PTsum density (||<1, PT>0.5 GeV) as a function of the transverse momentum of the leading charged particle jet from Run 1.
"Transverse" Charged PTsum Density: dPTsum/dd
0.00
0.25
0.50
0.75
1.00
1.25
0 5 10 15 20 25 30 35 40 45 50
PT(charged jet#1) (GeV/c)"T
ran
sver
se"
PT
sum
Den
sity
(G
eV) CDF JET20
CDF Min-BiasCDF Run 1 Data
data uncorrected
1.8 TeV ||<1.0 PT>0.5 GeV
Compares the Run 2 data (Min-Bias, JET20, JET50, JET70, JET100) with Run 1. The errors on the (uncorrected) Run 2 data include both statistical and correlated systematic uncertainties.
"Transverse" Charged PTsum Density: dPTsum/dd
0.00
0.25
0.50
0.75
1.00
1.25
0 10 20 30 40 50 60 70 80 90 100 110 120 130 140 150
PT(charged jet#1) (GeV/c)"T
ran
sver
se"
PT
sum
Den
sity
(G
eV)
CDF JET20
CDF Min-Bias
CDF Preliminarydata uncorrected
||<1.0 PT>0.5 GeV
Charged Particle Jet #1 Direction
“Toward”
“Transverse” “Transverse”
“Away”
"Transverse" Charged PTsum Density: dPTsum/dd
0.00
0.25
0.50
0.75
1.00
1.25
0 10 20 30 40 50 60 70 80 90 100 110 120 130 140 150
PT(charged jet#1) (GeV/c)"T
ran
sver
se"
PT
sum
Den
sity
(G
eV)
CDF Run 2
“Transverse” region as defined by the leading “charged particle jet”
"Transverse" Charged PTsum Density: dPTsum/dd
0.00
0.25
0.50
0.75
1.00
1.25
0 10 20 30 40 50 60 70 80 90 100 110 120 130 140 150
PT(charged jet#1) (GeV/c)"T
ran
sver
se"
PT
sum
Den
sity
(G
eV/c
)
CDF Run 1 Published
CDF Run 2 Preliminary
CDF Preliminarydata uncorrected
||<1.0 PT>0.5 GeV/c
Excellent agreement between Run 1 and 2!
"Transverse" Charged PTsum Density: dPTsum/dd
0.00
0.25
0.50
0.75
1.00
1.25
0 10 20 30 40 50 60 70 80 90 100 110 120 130 140 150
PT(charged jet#1) (GeV/c)"T
ran
sver
se"
PT
sum
Den
sity
(G
eV/c
)
CDF Run 1 Published
CDF Run 2 Preliminary
PYTHIA Tune A
CDF Preliminarydata uncorrectedtheory corrected
||<1.0 PT>0.5 GeV/c
Shows the prediction of PYTHIA Tune A at 1.96 TeV after detector simulation (i.e. after CDFSIM).
PYTHIA Tune A was tuned to fit the “underlying event” in Run I!

Fermilab MC Workshop April 30, 2003
Rick Field - Florida/CDF Page 22
Charged Particle DensityCharged Particle Density “Transverse” P “Transverse” PTT Distribution Distribution
Compares the average “transverse” charge particle density (||<1, PT>0.5 GeV) versus PT(charged jet#1) with the PT distribution of the “transverse” density, dNchg/dddPT. Shows how the “transverse” charge particle density is distributed in PT.
Charged Particle Density
1.0E-07
1.0E-06
1.0E-05
1.0E-04
1.0E-03
1.0E-02
1.0E-01
1.0E+00
0 2 4 6 8 10 12 14 16 18 20
PT(charged) (GeV/c)
Ch
arg
ed D
ensi
ty d
N/d
d d
PT
(1/
GeV
/c)
CDF Run 1data uncorrected
Charged Particles || < 1.0
Min-Bias
"Transverse"PT(chgjet#1) > 30 GeV/c
"Transverse" Charged Particle Density: dN/dd
0.00
0.25
0.50
0.75
1.00
1.25
0 10 20 30 40 50 60 70 80 90 100 110 120 130 140 150
PT(charged jet#1) (GeV/c)
"Tra
nsv
erse
" C
har
ged
Den
sity
CDF Run 1 Min-Bias
CDF Run 1 JET20
||<1.0 PT>0.5 GeV
CDF Preliminarydata uncorrected

Fermilab MC Workshop April 30, 2003
Rick Field - Florida/CDF Page 23
Charged Particle DensityCharged Particle Density “Transverse” P “Transverse” PTT Distribution Distribution
Compares the average “transverse” charge particle density (||<1, PT>0.5 GeV) versus PT(charged jet#1) with the PT distribution of the “transverse” density, dNchg/dddPT. Shows how the “transverse” charge particle density is distributed in PT.
Compares the Run 2 data (Min-Bias, JET20, JET50, JET70, JET100) with Run 1.
Charged Particle Density
1.0E-07
1.0E-06
1.0E-05
1.0E-04
1.0E-03
1.0E-02
1.0E-01
1.0E+00
0 2 4 6 8 10 12 14 16 18 20
PT(charged) (GeV/c)
Ch
arg
ed D
ensi
ty d
N/d
d d
PT
(1/
GeV
/c)
CDF Run 1data uncorrected
Charged Particles || < 1.0
Min-Bias
"Transverse"PT(chgjet#1) > 30 GeV/c
"Transverse" Charged Particle Density: dN/dd
0.00
0.25
0.50
0.75
1.00
1.25
0 10 20 30 40 50 60 70 80 90 100 110 120 130 140 150
PT(charged jet#1) (GeV/c)
"Tra
nsv
erse
" C
har
ged
Den
sity
CDF Run 1 Min-Bias
CDF Run 1 JET20
||<1.0 PT>0.5 GeV
CDF Preliminarydata uncorrected
"Transverse" Charged Particle Density: dN/dd
0.00
0.25
0.50
0.75
1.00
1.25
0 10 20 30 40 50 60 70 80 90 100 110 120 130 140 150
PT(charged jet#1) (GeV/c)
"Tra
nsv
erse
" C
har
ged
Den
sity
CDF Run 2
Charged Particle Density
1.0E-07
1.0E-06
1.0E-05
1.0E-04
1.0E-03
1.0E-02
1.0E-01
1.0E+00
0 2 4 6 8 10 12 14 16 18 20
PT(charged) (GeV/c)
Ch
arg
ed D
ensi
ty d
N/d
d d
PT
(1/
GeV
/c)
CDF Preliminarydata uncorrected
Charged Particles || < 1.0
"Transverse" Charged Particle Density: dN/dd
0.00
0.25
0.50
0.75
1.00
1.25
0 10 20 30 40 50 60 70 80 90 100 110 120 130 140 150
PT(charged jet#1) (GeV/c)
"Tra
nsv
erse
" C
har
ged
Den
sity CDF Run 1 Published
CDF Run 2 Preliminary
||<1.0 PT>0.5 GeV/c
CDF Preliminarydata uncorrected
Charged Particle Density
1.0E-07
1.0E-06
1.0E-05
1.0E-04
1.0E-03
1.0E-02
1.0E-01
1.0E+00
0 2 4 6 8 10 12 14 16 18 20
PT(charged) (GeV/c)
Ch
arg
ed D
ensi
ty d
N/d
d d
PT
(1/
GeV
/c)
Run 2 Min-Bias Preliminary
Run 1 Min-Bias Preliminary
Run 2 Preliminary
Run 1 Published
CDF Preliminarydata uncorrected
Charged Particles || < 1.0
Min-Bias
"Transverse"PT(chgjet#1) > 30 GeV/c
Excellent agreement between Run 1 and 2!
Fermilab MC Workshop April 30, 2003
Rick Field - Florida/CDF Page 24
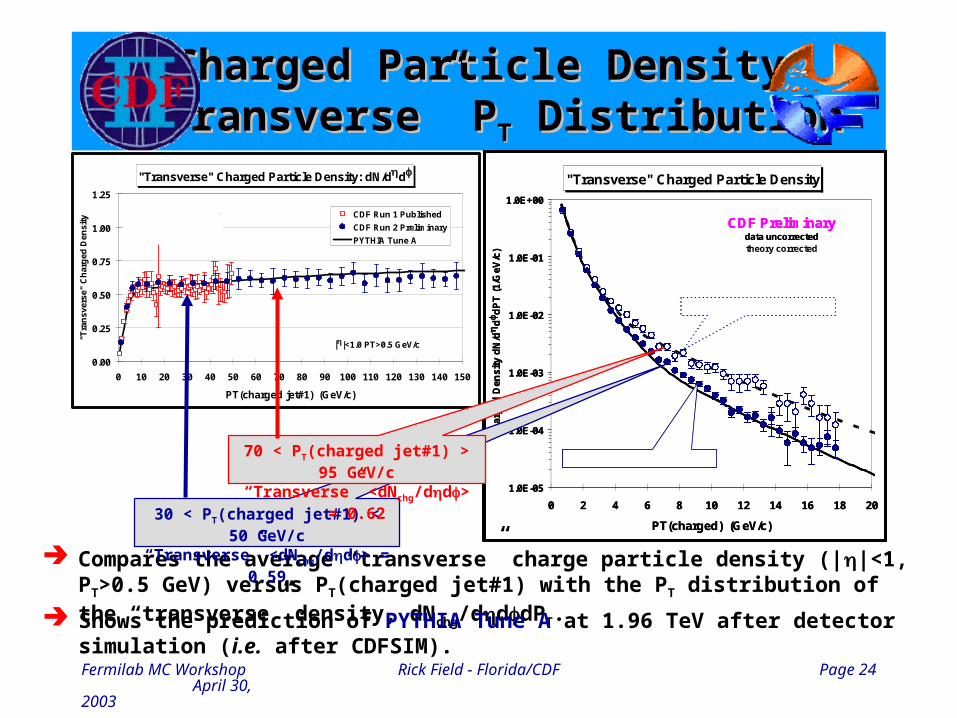
Charged Particle DensityCharged Particle Density “Transverse” P “Transverse” PTT Distribution Distribution
Compares the average “transverse” charge particle density (||<1, PT>0.5 GeV) versus PT(charged jet#1) with the PT distribution of the “transverse” density, dNchg/dddPT.
"Transverse" Charged Particle Density: dN/dd
0.00
0.25
0.50
0.75
1.00
1.25
0 10 20 30 40 50 60 70 80 90 100 110 120 130 140 150
PT(charged jet#1) (GeV/c)
"Tra
nsv
erse
" C
har
ged
Den
sity CDF Run 1 Published
CDF Run 2 Preliminary
||<1.0 PT>0.5 GeV/c
CDF Preliminarydata uncorrected
"Transverse" Charged Particle Density
1.0E-05
1.0E-04
1.0E-03
1.0E-02
1.0E-01
1.0E+00
0 2 4 6 8 10 12 14 16 18 20
PT(charged) (GeV/c)
Ch
arg
ed D
ensi
ty d
N/d
d d
PT
(1/
GeV
/c)
CDF Preliminarydata uncorrected
1.96 TeV ||<1.0
30 < PT(chgjet#1) < 70 GeV/c
70 < PT(chgjet#1) < 95 GeV/c
"Transverse" Charged Particle Density: dN/dd
0.00
0.25
0.50
0.75
1.00
1.25
0 10 20 30 40 50 60 70 80 90 100 110 120 130 140 150
PT(charged jet#1) (GeV/c)
"Tra
nsv
erse
" C
har
ged
Den
sity
CDF Run 1 Published
CDF Run 2 Preliminary
PYTHIA Tune A
||<1.0 PT>0.5 GeV/c
CDF Preliminarydata uncorrectedtheory corrected
"Transverse" Charged Particle Density
1.0E-05
1.0E-04
1.0E-03
1.0E-02
1.0E-01
1.0E+00
0 2 4 6 8 10 12 14 16 18 20
PT(charged) (GeV/c)
Ch
arg
ed D
ensi
ty d
N/d
d d
PT
(1/
GeV
/c)
CDF Preliminarydata uncorrectedtheory corrected
PYTHIA Tune A 1.96 TeV
30 < PT(chgjet#1) < 70 GeV/c
70 < PT(chgjet#1) < 95 GeV/c
Shows the prediction of PYTHIA Tune A at 1.96 TeV after detector simulation (i.e. after CDFSIM).
30 < PT(charged jet#1) < 50 GeV/c“Transverse” <dNchg/dd> = 0.59
70 < PT(charged jet#1) > 95 GeV/c“Transverse” <dNchg/dd> = 0.62

Fermilab MC Workshop April 30, 2003
Rick Field - Florida/CDF Page 25
Shows the ratio of PT(chgjet#1) to the “matched” JetClu jet ET versus PT(chgjet#1).
Relationship BetweenRelationship Between“Calorimeter” and “Charged Particle” Jets“Calorimeter” and “Charged Particle” Jets
Shows the “matched” JetClu jet ET versus the transverse momentum of the leading “charged particle jet” (closest jet within R = 0.7 of the leading chgjet).
Shows the EM fraction of the “matched” JetClu jet and the EM fraction of a typical JetClu jet.
ET(matched jet) vs PT(charged jet#1)
0
20
40
60
80
100
120
140
160
180
0 10 20 30 40 50 60 70 80 90 100 110 120 130 140 150
PT(charged jet#1) (GeV/c)
Mat
ched
Jet
ET
(G
eV)
PYTHIA Tune A
CDF Run 2 Preliminary
CDF Preliminarydata uncorrectedtheory corrected
Charged Particles (||<1.0, PT>0.5 GeV/c)
JetClu (R = 0.7, |(jet#1)| < 2)
PT(chgjet#1)/ET(matched jet) vs PT(chgjet#1)
0.2
0.4
0.6
0.8
1.0
1.2
0 10 20 30 40 50 60 70 80 90 100 110 120 130 140 150
PT(charged jet#1) (GeV/c)
PT
(ch
gje
t#1)
/ET
(mat
ched
jet
)
PYTHIA Tune A
CDF Run 2 Preliminary
CDF Preliminarydata uncorrectedtheory corrected Charged Particles (||<1.0, PT>0.5 GeV/c)
JetClu (R = 0.7, |(jet#1)| < 2)

Fermilab MC Workshop April 30, 2003
Rick Field - Florida/CDF Page 26
Shows the ratio of PT(chgjet#1) to the “matched” JetClu jet ET versus PT(chgjet#1).
Relationship BetweenRelationship Between“Calorimeter” and “Charged Particle” Jets“Calorimeter” and “Charged Particle” Jets
Shows the “matched” JetClu jet ET versus the transverse momentum of the leading “charged particle jet” (closest jet within R = 0.7 of the leading chgjet).
Shows the EM fraction of the “matched” JetClu jet and the EM fraction of a typical JetClu jet.
ET(matched jet) vs PT(charged jet#1)
0
20
40
60
80
100
120
140
160
180
0 10 20 30 40 50 60 70 80 90 100 110 120 130 140 150
PT(charged jet#1) (GeV/c)
Mat
ched
Jet
ET
(G
eV)
PYTHIA Tune A
CDF Run 2 Preliminary
CDF Preliminarydata uncorrectedtheory corrected
Charged Particles (||<1.0, PT>0.5 GeV/c)
JetClu (R = 0.7, |(jet#1)| < 2)
PT(chgjet#1)/ET(matched jet) vs PT(chgjet#1)
0.2
0.4
0.6
0.8
1.0
1.2
0 10 20 30 40 50 60 70 80 90 100 110 120 130 140 150
PT(charged jet#1) (GeV/c)
PT
(ch
gje
t#1)
/ET
(mat
ched
jet
)
PYTHIA Tune A
CDF Run 2 Preliminary
CDF Preliminarydata uncorrectedtheory corrected Charged Particles (||<1.0, PT>0.5 GeV/c)
JetClu (R = 0.7, |(jet#1)| < 2)
The leading chgjet comes from a JetClu jet that is, on the average,
about 90% charged!
"Calorimeter Jet" EM Fraction
0.2
0.3
0.4
0.5
0.6
0.7
0.8
0 25 50 75 100 125 150 175 200 225 250
PT(chgjet#1) or ET(jet#1) (GeV)
Ele
ctro
mag
net
ic F
ract
ion
JetClu R = 0.7
Jet matching ChgJet#1
Leading Jet |(jet)| < 0.7
CDF Preliminarydata uncorrectedtheory corrected
PYTHIA Tune A 1.96 TeV

Fermilab MC Workshop April 30, 2003
Rick Field - Florida/CDF Page 27
JetClu Jet #1 Direction
“Transverse” “Transverse”
“Toward”
“Away”
“Toward-Side” Jet
“Away-Side” Jet
““Underlying Event”Underlying Event”as defined by “Calorimeter Jets”as defined by “Calorimeter Jets”
Look at charged particle correlations in the azimuthal angle relative to the leading JetClu jet.
Define || < 60o as “Toward”, 60o < || < 120o as “Transverse”, and || > 120o as “Away”. All three regions have the same size in - space, x = 2x120o = 4/3.
Charged Particle Correlations PT > 0.5 GeV/c || < 1
Away-side “jet”(sometimes)
Perpendicular to the plane of the 2-to-2 hard scattering
“Transverse” region is very sensitive to the “underlying event”!
JetClu Jet #1 Direction
“Toward”
“Transverse” “Transverse”
“Away”
-1 +1
2
0
Leading Jet
Toward Region
Transverse Region
Transverse Region
Away Region
Away Region
Look at the charged particle density in the “transverse” region!

Fermilab MC Workshop April 30, 2003
Rick Field - Florida/CDF Page 28
““Transverse” Transverse” Charged Particle DensityCharged Particle Density
Shows the data on the average “transverse” charge particle density (||<1, PT>0.5 GeV) as a function of the transverse energy of the leading JetClu jet (R = 0.7, |(jet)| < 2) from Run 2.
JetClu Jet #1 Direction
“Toward”
“Transverse” “Transverse”
“Away”
JetClu Jet #1 or ChgJet#1
Direction
“Toward”
“Transverse” “Transverse”
“Away”
, compared with PYTHIA Tune A after CDFSIM.
"Transverse" Charged Particle Density: dN/dd
0.00
0.25
0.50
0.75
1.00
0 25 50 75 100 125 150 175 200 225 250
ET(jet#1) (GeV)
"Tra
nsv
erse
" C
har
ged
Den
sity
CDF Preliminarydata uncorrected
Charged Particles (||<1.0, PT>0.5 GeV/c)
JetClu (R = 0.7, |(jet#1)| < 2)
"Transverse" Charged Particle Density: dN/dd
0.00
0.25
0.50
0.75
1.00
0 25 50 75 100 125 150 175 200 225 250
ET(jet#1) (GeV)
"Tra
nsv
erse
" C
har
ged
Den
sity
PYTHIA Tune A
CDF Run 2 PreliminaryCDF Preliminary
data uncorrectedtheory corrected
Charged Particles (||<1.0, PT>0.5 GeV/c)
JetClu (R = 0.7, |(jet#1)| < 2)
“Transverse” region as defined by the leading
“calorimeter jet”
Fermilab MC Workshop April 30, 2003
Rick Field - Florida/CDF Page 29
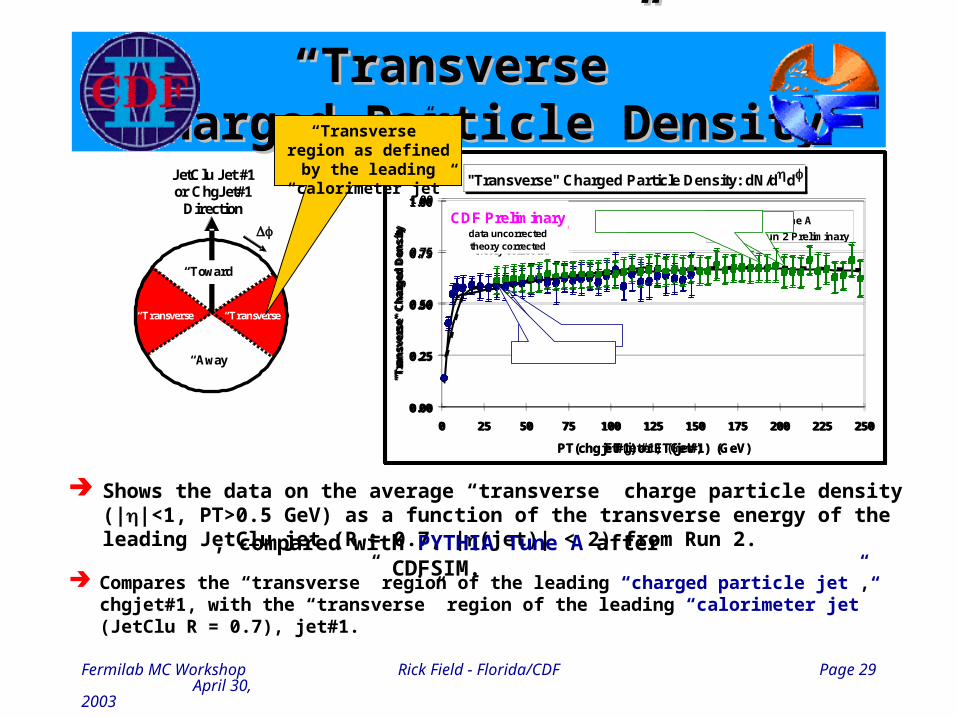
““Transverse” Transverse” Charged Particle DensityCharged Particle Density
Shows the data on the average “transverse” charge particle density (||<1, PT>0.5 GeV) as a function of the transverse energy of the leading JetClu jet (R = 0.7, |(jet)| < 2) from Run 2.
JetClu Jet #1 Direction
“Toward”
“Transverse” “Transverse”
“Away”
Compares the “transverse” region of the leading “charged particle jet”, chgjet#1, with the “transverse” region of the leading “calorimeter jet” (JetClu R = 0.7), jet#1.
JetClu Jet #1 or ChgJet#1
Direction
“Toward”
“Transverse” “Transverse”
“Away”
, compared with PYTHIA Tune A after CDFSIM.
"Transverse" Charged Particle Density: dN/dd
0.00
0.25
0.50
0.75
1.00
0 25 50 75 100 125 150 175 200 225 250
ET(jet#1) (GeV)
"Tra
nsv
erse
" C
har
ged
Den
sity
CDF Preliminarydata uncorrected
Charged Particles (||<1.0, PT>0.5 GeV/c)
JetClu (R = 0.7, |(jet#1)| < 2)
"Transverse" Charged Particle Density: dN/dd
0.00
0.25
0.50
0.75
1.00
0 25 50 75 100 125 150 175 200 225 250
ET(jet#1) (GeV)
"Tra
nsv
erse
" C
har
ged
Den
sity
PYTHIA Tune A
CDF Run 2 PreliminaryCDF Preliminary
data uncorrectedtheory corrected
Charged Particles (||<1.0, PT>0.5 GeV/c)
JetClu (R = 0.7, |(jet#1)| < 2)
"Transverse" Charged Particle Density: dN/dd
0.00
0.25
0.50
0.75
1.00
0 25 50 75 100 125 150 175 200 225 250
PT(chgjet#1) or ET(jet#1) (GeV)
"Tra
nsv
erse
" C
har
ged
Den
sity CDF Preliminary
data uncorrected
Charged Particles (||<1.0, PT>0.5 GeV/c)
ChgJet#1 R = 0.7
JetClu Jet#1 (R = 0.7,|(jet)|<2)
"Transverse" Charged Particle Density: dN/dd
0.00
0.25
0.50
0.75
1.00
0 25 50 75 100 125 150 175 200 225 250
PT(chgjet#1) or ET(jet#1) (GeV)
"Tra
nsv
erse
" C
har
ged
Den
sity
CDF Preliminarydata uncorrectedtheory corrected
Charged Particles (||<1.0, PT>0.5 GeV/c)
ChgJet#1 R = 0.7
JetClu Jet#1 (R = 0.7, |(jet)|<2)
PYTHIA Tune A 1.96 TeV
“Transverse” region as defined by the leading
“calorimeter jet”

Fermilab MC Workshop April 30, 2003
Rick Field - Florida/CDF Page 30
““Transverse” Transverse” Charged PTsum DensityCharged PTsum Density
Shows the data on the average “transverse” charged PTsum density (||<1, PT>0.5 GeV) as a function of the transverse energy of the leading JetClu jet (R = 0.7, |(jet)| < 2) from Run 2.
JetClu Jet #1 Direction
“Toward”
“Transverse” “Transverse”
“Away”
JetClu Jet #1 or ChgJet#1
Direction
“Toward”
“Transverse” “Transverse”
“Away”
, compared with PYTHIA Tune A after CDFSIM.
"Transverse" Charged PTsum Density: dPTsum/dd
0.0
0.5
1.0
1.5
0 25 50 75 100 125 150 175 200 225 250
ET(jet#1) (GeV)
"Tra
nsv
erse
" P
Tsu
m D
ensi
ty (
GeV
/c)
CDF Preliminarydata uncorrected
Charged Particles (||<1.0, PT>0.5 GeV/c)
JetClu (R = 0.7, |(jet#1)| < 2)
"Transverse" Charged PTsum Density: dPTsum/dd
0.0
0.5
1.0
1.5
0 25 50 75 100 125 150 175 200 225 250
ET(jet#1) (GeV)
"Tra
nsv
erse
" P
Tsu
m D
ensi
ty (
GeV
/c)
PYTHIA Tune A
CDF Run 2 Preliminary
CDF Preliminarydata uncorrectedtheory corrected
Charged Particles (||<1.0, PT>0.5 GeV/c)
JetClu (R = 0.7, |(jet#1)| < 2)
“Transverse” region as defined by the leading
“calorimeter jet”
Fermilab MC Workshop April 30, 2003
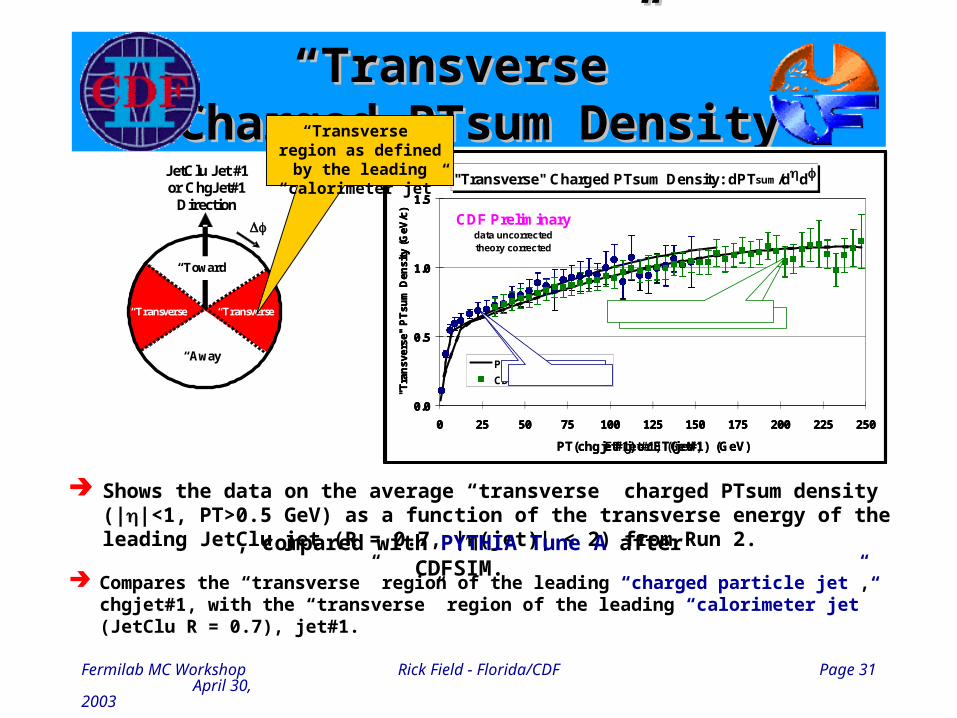
Rick Field - Florida/CDF Page 31
““Transverse” Transverse” Charged PTsum DensityCharged PTsum Density
Shows the data on the average “transverse” charged PTsum density (||<1, PT>0.5 GeV) as a function of the transverse energy of the leading JetClu jet (R = 0.7, |(jet)| < 2) from Run 2.
JetClu Jet #1 Direction
“Toward”
“Transverse” “Transverse”
“Away”
Compares the “transverse” region of the leading “charged particle jet”, chgjet#1, with the “transverse” region of the leading “calorimeter jet” (JetClu R = 0.7), jet#1.
JetClu Jet #1 or ChgJet#1
Direction
“Toward”
“Transverse” “Transverse”
“Away”
, compared with PYTHIA Tune A after CDFSIM.
"Transverse" Charged PTsum Density: dPTsum/dd
0.0
0.5
1.0
1.5
0 25 50 75 100 125 150 175 200 225 250
ET(jet#1) (GeV)
"Tra
nsv
erse
" P
Tsu
m D
ensi
ty (
GeV
/c)
CDF Preliminarydata uncorrected
Charged Particles (||<1.0, PT>0.5 GeV/c)
JetClu (R = 0.7, |(jet#1)| < 2)
"Transverse" Charged PTsum Density: dPTsum/dd
0.0
0.5
1.0
1.5
0 25 50 75 100 125 150 175 200 225 250
ET(jet#1) (GeV)
"Tra
nsv
erse
" P
Tsu
m D
ensi
ty (
GeV
/c)
PYTHIA Tune A
CDF Run 2 Preliminary
CDF Preliminarydata uncorrectedtheory corrected
Charged Particles (||<1.0, PT>0.5 GeV/c)
JetClu (R = 0.7, |(jet#1)| < 2)
"Transverse" Charged PTsum Density: dPTsum/dd
0.0
0.5
1.0
1.5
0 25 50 75 100 125 150 175 200 225 250
PT(chgjet#1) or ET(jet#1) (GeV)
"Tra
nsv
erse
" P
Tsu
m D
ensi
ty (
GeV
/c)
CDF Preliminarydata uncorrected
Charged Particles (||<1.0, PT>0.5 GeV/c) ChgJet#1 R = 0.7
JetClu Jet#1 (R = 0.7,|(jet)|<2)
"Transverse" Charged PTsum Density: dPTsum/dd
0.0
0.5
1.0
1.5
0 25 50 75 100 125 150 175 200 225 250
PT(chgjet#1) or ET(jet#1) (GeV)
"Tra
nsv
erse
" P
Tsu
m D
ensi
ty (
GeV
/c)
CDF Preliminarydata uncorrectedtheory corrected
Charged Particles (||<1.0, PT>0.5 GeV/c) ChgJet#1 R = 0.7
JetClu Jet#1 (R = 0.7,|(jet)|<2)
PYTHIA Tune A 1.96 TeV
“Transverse” region as defined by the leading
“calorimeter jet”

Fermilab MC Workshop April 30, 2003
Rick Field - Florida/CDF Page 32
Charged Particle DensityCharged Particle Density “Transverse” P “Transverse” PTT Distribution Distribution
Compares the average “transverse” charge particle density (||<1, PT>0.5 GeV) versus ET(jet#1) with the PT distribution of the “transverse” density, dNchg/dddPT.
"Transverse" Charged Particle Density: dN/dd
0.00
0.25
0.50
0.75
1.00
0 25 50 75 100 125 150 175 200 225 250
ET(jet#1) (GeV)
"Tra
nsv
erse
" C
har
ged
Den
sity
CDF Preliminarydata uncorrected
Charged Particles (||<1.0, PT>0.5 GeV/c)
JetClu (R = 0.7, |(jet#1)| < 2)
"Transverse" Charged Particle Density
1.0E-06
1.0E-05
1.0E-04
1.0E-03
1.0E-02
1.0E-01
1.0E+00
0 5 10 15 20 25
PT(charged) (GeV/c)
Ch
arg
ed D
ensi
ty d
N/d
d d
PT
(1/
GeV
/c)
CDF Preliminarydata uncorrected
30 < ET(jet#1) < 70 GeV
95 < ET(jet#1) < 130 GeV
JetClu R = 0.7 |(jet)| < 2
Charged Particles || < 1.0
"Transverse" Charged Particle Density: dN/dd
0.00
0.25
0.50
0.75
1.00
0 25 50 75 100 125 150 175 200 225 250
ET(jet#1) (GeV)
"Tra
nsv
erse
" C
har
ged
Den
sity
PYTHIA Tune A
CDF Run 2 PreliminaryCDF Preliminary
data uncorrectedtheory corrected
Charged Particles (||<1.0, PT>0.5 GeV/c)
JetClu (R = 0.7, |(jet#1)| < 2)
"Transverse" Charged Particle Density
1.0E-06
1.0E-05
1.0E-04
1.0E-03
1.0E-02
1.0E-01
1.0E+00
0 5 10 15 20 25
PT(charged) (GeV/c)
Ch
arg
ed D
ensi
ty d
N/d
d d
PT
(1/
GeV
/c)
CDF Preliminarydata uncorrectedtheory corrected
PYTHIA Tune A 1.96 TeV
30 < ET(jet#1) < 70 GeV
95 < ET(jet#1) < 130 GeV
JetClu R = 0.7 |(jet)| < 2
Charged Particles || < 1.0
Shows the prediction of PYTHIA Tune A at 1.96 TeV after detector simulation (i.e. after CDFSIM).
30 < ET(jet#1) < 70 GeV/c“Transverse” <dNchg/dd> = 0.61
95 < ET(jet#1) > 130 GeV“Transverse” <dNchg/dd> = 0.65

Fermilab MC Workshop April 30, 2003
Rick Field - Florida/CDF Page 33
Charged Particle DensityCharged Particle Density “Transverse” P “Transverse” PTT Distribution Distribution
Compares the average “transverse” as defined by “calorimeter jets” (JetClu R = 0.7) with the “transverse” region defined by “charged particle jets”.
Shows the prediction of PYTHIA Tune A at 1.96 TeV after detector simulation (i.e. after CDFSIM).
"Transverse" Charged Particle Density: dN/dd
0.00
0.25
0.50
0.75
1.00
0 25 50 75 100 125 150 175 200 225 250
PT(chgjet#1) or ET(jet#1) (GeV)
"Tra
nsv
erse
" C
har
ged
Den
sity CDF Preliminary
data uncorrected
Charged Particles (||<1.0, PT>0.5 GeV/c)
ChgJet#1 R = 0.7
JetClu Jet#1 (R = 0.7,|(jet)|<2)
"Transverse" Charged Particle Density
1.0E-06
1.0E-05
1.0E-04
1.0E-03
1.0E-02
1.0E-01
1.0E+00
0 5 10 15 20 25
PT(charged) (GeV/c)
"Tra
nsv
erse
" D
ensi
ty d
N/d
d d
PT
(1/
GeV
/c)
Charged Particles || < 1.0
CDF Preliminarydata uncorrectedtheory corrected
1.96 TeV
30 < ET(jet#1) < 70 GeV
30 < PT(chgjet#1) < 70 GeV/c
"Transverse" Charged Particle Density: dN/dd
0.00
0.25
0.50
0.75
1.00
0 25 50 75 100 125 150 175 200 225 250
PT(chgjet#1) or ET(jet#1) (GeV)
"Tra
nsv
erse
" C
har
ged
Den
sity
CDF Preliminarydata uncorrectedtheory corrected
Charged Particles (||<1.0, PT>0.5 GeV/c)
ChgJet#1 R = 0.7
JetClu Jet#1 (R = 0.7, |(jet)|<2)
PYTHIA Tune A 1.96 TeV
"Transverse" Charged Particle Density
1.0E-06
1.0E-05
1.0E-04
1.0E-03
1.0E-02
1.0E-01
1.0E+00
0 5 10 15 20 25
PT(charged) (GeV/c)
"Tra
nsv
erse
" D
ensi
ty d
N/d
d d
PT
(1/
GeV
/c)
Charged Particles || < 1.0
CDF Preliminarydata uncorrectedtheory corrected
PYTHIA Tune A 1.96 TeV
30 < ET(jet#1) < 70 GeV
30 < PT(chgjet#1) < 70 GeV/c
30 < ET(jet#1) < 70 GeV/c“Transverse” <dNchg/dd> = 0.61
30 < PT(charged jet#1) < 50 GeV/c“Transverse” <dNchg/dd> = 0.59

Fermilab MC Workshop April 30, 2003
Rick Field - Florida/CDF Page 34
Tuned PYTHIA (Set A)Tuned PYTHIA (Set A)LHC PredictionsLHC Predictions
"Transverse" Charged Particle Density: dN/dd
0.0
0.5
1.0
1.5
2.0
2.5
3.0
0 5 10 15 20 25 30 35 40 45 50
PT(charged jet#1) (GeV/c)
"Tra
nsv
erse
" C
har
ged
Den
sity
||<1.0 PT>0 GeV
1.8 TeV
14 TeV
CTEQ5L
HERWIG 6.4
PYTHIA 6.206 Set A
Shows the average “transverse” charge particle and PTsum density (||<1, PT>0) versus PT(charged jet#1) predicted by HERWIG 6.4 (PT(hard) > 3 GeV/c, CTEQ5L). and a tuned versions of PYTHIA 6.206 (PT(hard) > 0, CTEQ5L, Set A) at 1.8 TeV and 14 TeV.
"Transverse" Charged PTsum Density: dPTsum/dd
0.0
0.5
1.0
1.5
2.0
2.5
0 5 10 15 20 25 30 35 40 45 50
PT(charged jet#1) (GeV/c)
"Tra
nsv
erse
" P
Tsu
m D
ensi
ty (
GeV
)
HERWIG 6.4
PYTHIA 6.206 Set A
||<1.0 PT>0 GeV CTEQ5L
14 TeV
1.8 TeV
Factor of 2!
At 14 TeV tuned PYTHIA (Set A) predicts roughly 2.3 charged particles per unit - (PT > 0) in the “transverse” region (14 charged particles per unit ) which is larger than the HERWIG prediction.
At 14 TeV tuned PYTHIA (Set A) predicts roughly 2 GeV/c charged PTsum per unit - (PT > 0) in the “transverse” region at PT(chgjet#1) = 40 GeV/c which is a factor of 2 larger than at 1.8 TeV and much larger than the HERWIG prediction.

Fermilab MC Workshop April 30, 2003
Rick Field - Florida/CDF Page 36
Tuned PYTHIA (Set A)Tuned PYTHIA (Set A)LHC PredictionsLHC Predictions
"Transverse" Charged PTsum Density: dPTsum/dd
0.0
0.5
1.0
1.5
2.0
2.5
0 10 20 30 40 50 60 70 80 90 100
PT(charged jet#1) (GeV/c)
"Tra
nsv
erse
" P
Tsu
m D
ensi
ty (
GeV
)
HERWIG 6.4
PYTHIA 6.206 Set A
14 TeV ||<1.0 PT>0 GeV CTEQ5L
"Transverse" Charged Particle Density: dN/dd
0.0
0.5
1.0
1.5
2.0
2.5
3.0
0 10 20 30 40 50 60 70 80 90 100
PT(charged jet#1) (GeV/c)
"Tra
nsv
erse
" C
har
ged
Den
sity
14 TeV ||<1.0 PT>0 GeV CTEQ5L
HERWIG 6.4
PYTHIA 6.206 Set A
Shows the average “transverse” charge particle and PTsum density (||<1, PT>0) versus PT(charged jet#1) predicted by HERWIG 6.4 (PT(hard) > 3 GeV/c, CTEQ5L). and a tuned versions of PYTHIA 6.206 (PT(hard) > 0, CTEQ5L, Set A) at 1.8 TeV and 14 TeV. Also shown is the 14 TeV prediction of PYTHIA 6.206 with the default value = 0.16.
Tuned PYTHIA (Set A) predicts roughly 2.5 GeV/c per unit - (PT > 0) from charged particles in the “transverse” region for PT(chgjet#1) = 100 GeV/c. Note, however, that the “transverse” charged PTsum density increases as PT(chgjet#1) increases.
3.8 GeV/c (charged)in cone of
radius R=0.7at 14 TeV
Big difference!

Fermilab MC Workshop April 30, 2003
Rick Field - Florida/CDF Page 37
Tuned PYTHIA (Set A)Tuned PYTHIA (Set A)LHC PredictionsLHC Predictions
Charged Particle Density: dN/dd
0.0
0.2
0.4
0.6
0.8
1.0
1.2
1.4
-6 -4 -2 0 2 4 6
Pseudo-Rapidity
dN
/d
d
all PT
CDF Data Pythia 6.206 Set A
630 GeV
1.8 TeV
14 TeV
PYTHIA was tuned to fit the “underlying event” in hard-scattering processes at 1.8 TeV and 630 GeV.
Charged Particle Density: dN/dd
0.0
0.2
0.4
0.6
0.8
1.0
1.2
1.4
10 100 1,000 10,000 100,000
CM Energy W (GeV)
Ch
arg
ed
de
ns
ity
dN
/d
d
Pythia 6.206 Set ACDF DataUA5 DataFit 2Fit 1
= 0
Shows the center-of-mass energy dependence of the charged particle density, dN chg/dd for “Min-Bias” collisions compared with the a tuned version of PYTHIA 6.206 (Set A) with PT(hard) > 0.
PYTHIA (Set A) predicts a 42% rise in dNchg/dd at = 0 in going from the Tevatron (1.8 TeV) to the LHC (14 TeV).
LHC?

Fermilab MC Workshop April 30, 2003
Rick Field - Florida/CDF Page 38
Tuned PYTHIA (Set A)Tuned PYTHIA (Set A)LHC PredictionsLHC Predictions
Charged Particle Density
1.0E-06
1.0E-05
1.0E-04
1.0E-03
1.0E-02
1.0E-01
1.0E+00
0 2 4 6 8 10 12 14
PT(charged) (GeV/c)
Ch
arg
ed D
ensi
ty d
N/d
d d
PT
(1/
GeV
/c)
CDF Data
||<1
630 GeV
Pythia 6.206 Set A
1.8 TeV
14 TeV
Hard-Scattering in Min-Bias Events
0%
10%
20%
30%
40%
50%
100 1,000 10,000 100,000
CM Energy W (GeV)
% o
f E
ve
nts
PT(hard) > 5 GeV/c
PT(hard) > 10 GeV/c
Pythia 6.206 Set A
Shows the center-of-mass energy dependence of the charged particle density, dNchg/dddPT, for “Min-Bias” collisions compared with the a tuned version of PYTHIA 6.206 (Set A) with PT(hard) > 0.
This PYTHIA fit predicts that 1% of all “Min-Bias” events at 1.8 TeV are a result of a hard 2-to-2 parton-parton scattering with PT(hard) > 10 GeV/c which increases to 12% at 14 TeV!
1% of “Min-Bias” events have PT(hard) > 10 GeV/c!
12% of “Min-Bias” events have PT(hard) > 10 GeV/c!
LHC?

Fermilab MC Workshop April 30, 2003
Rick Field - Florida/CDF Page 39
The “Underlying Event”The “Underlying Event”Summary & ConclusionsSummary & Conclusions
The “Underlying Event”
There is excellent agreement between the Run 1 and the Run 2. The “underlying event” is the same in Run 2 as in Run 1 but now we can study the evolution out to much higher energies!
PYTHIA Tune A does a good job of describing the “underlying event” in the Run 2 data as defined by “charged particle jets” and as defined by “calorimeter jets”. HERWIG Run 2 comparisons will be coming soon!
Lots more CDF Run 2 data to come including MAX/MIN “transverse” and MAX/MIN “cones”.
Proton AntiProton
PT(hard)
Outgoing Parton
Outgoing Parton
Underlying Event Underlying Event
Initial-State Radiation
Final-State Radiation

Fermilab MC Workshop April 30, 2003
Rick Field - Florida/CDF Page 40
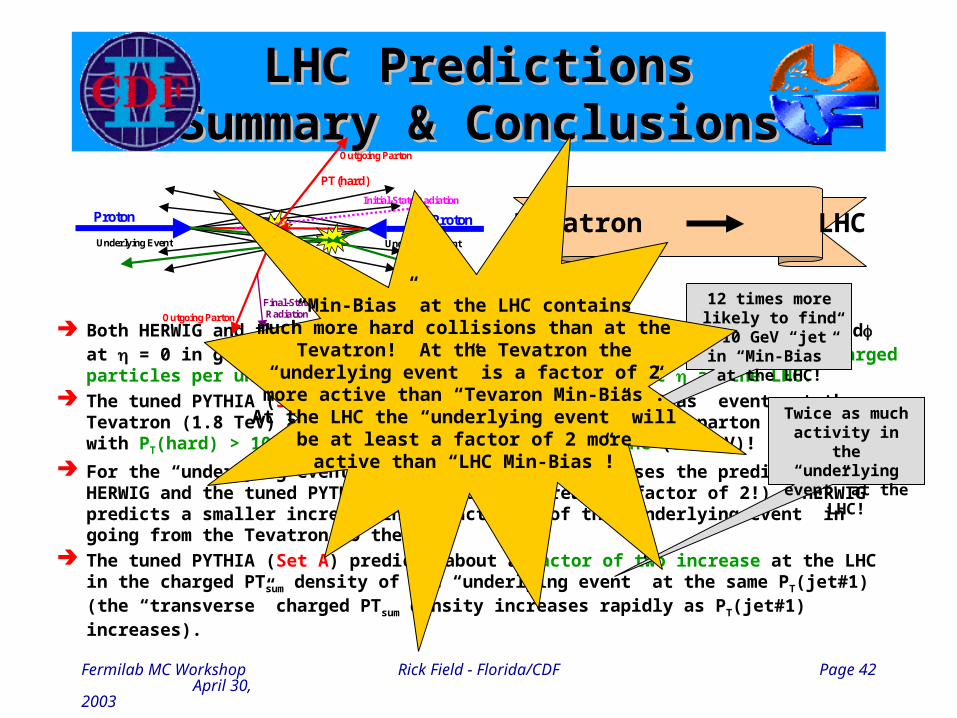
LHC PredictionsLHC PredictionsSummary & ConclusionsSummary & Conclusions
Tevatron LHC
Both HERWIG and the tuned PYTHIA (Set A) predict a 40-45% rise in dNchg/dd at = 0 in going from the Tevatron (1.8 TeV) to the LHC (14 TeV). 4 charged particles per unit at the Tevatron becomes 6 per unit at the LHC.
The tuned PYTHIA (Set A) predicts that 1% of all “Min-Bias” events at the Tevatron (1.8 TeV) are the result of a hard 2-to-2 parton-parton scattering with PT(hard) > 10 GeV/c which increases to 12% at LHC (14 TeV)!
For the “underlying event” in hard scattering processes the predictions of HERWIG and the tuned PYTHIA (Set A) differ greatly (factor of 2!). HERWIG predicts a smaller increase in the activity of the “underlying event” in going from the Tevatron to the LHC.
The tuned PYTHIA (Set A) predicts about a factor of two increase at the LHC in the charged PTsum density of the “underlying event” at the same PT(jet#1) (the “transverse” charged PTsum density increases rapidly as PT(jet#1) increases).
Proton AntiProton
PT(hard)
Outgoing Parton
Outgoing Parton
Underlying Event Underlying Event
Initial-State Radiation
Final-State Radiation

Fermilab MC Workshop April 30, 2003
Rick Field - Florida/CDF Page 41
LHC PredictionsLHC PredictionsSummary & ConclusionsSummary & Conclusions
Tevatron LHC
Both HERWIG and the tuned PYTHIA (Set A) predict a 40-45% rise in dNchg/dd at = 0 in going from the Tevatron (1.8 TeV) to the LHC (14 TeV). 4 charged particles per unit at the Tevatron becomes 6 per unit at the LHC.
The tuned PYTHIA (Set A) predicts that 1% of all “Min-Bias” events at the Tevatron (1.8 TeV) are the result of a hard 2-to-2 parton-parton scattering with PT(hard) > 10 GeV/c which increases to 12% at LHC (14 TeV)!
For the “underlying event” in hard scattering processes the predictions of HERWIG and the tuned PYTHIA (Set A) differ greatly (factor of 2!). HERWIG predicts a smaller increase in the activity of the “underlying event” in going from the Tevatron to the LHC.
The tuned PYTHIA (Set A) predicts about a factor of two increase at the LHC in the charged PTsum density of the “underlying event” at the same PT(jet#1) (the “transverse” charged PTsum density increases rapidly as PT(jet#1) increases).
Proton AntiProton
PT(hard)
Outgoing Parton
Outgoing Parton
Underlying Event Underlying Event
Initial-State Radiation
Final-State Radiation
12 times more likely to find a 10 GeV
“jet” in “Min-Bias” at the LHC!
Twice as much activity in the
“underlying event” at the LHC!
Fermilab MC Workshop April 30, 2003
Rick Field - Florida/CDF Page 42
LHC PredictionsLHC PredictionsSummary & ConclusionsSummary & Conclusions
Tevatron LHC
Both HERWIG and the tuned PYTHIA (Set A) predict a 40-45% rise in dNchg/dd at = 0 in going from the Tevatron (1.8 TeV) to the LHC (14 TeV). 4 charged particles per unit at the Tevatron becomes 6 per unit at the LHC.
The tuned PYTHIA (Set A) predicts that 1% of all “Min-Bias” events at the Tevatron (1.8 TeV) are the result of a hard 2-to-2 parton-parton scattering with PT(hard) > 10 GeV/c which increases to 12% at LHC (14 TeV)!
For the “underlying event” in hard scattering processes the predictions of HERWIG and the tuned PYTHIA (Set A) differ greatly (factor of 2!). HERWIG predicts a smaller increase in the activity of the “underlying event” in going from the Tevatron to the LHC.
The tuned PYTHIA (Set A) predicts about a factor of two increase at the LHC in the charged PTsum density of the “underlying event” at the same PT(jet#1) (the “transverse” charged PTsum density increases rapidly as PT(jet#1) increases).
Proton AntiProton
PT(hard)
Outgoing Parton
Outgoing Parton
Underlying Event Underlying Event
Initial-State Radiation
Final-State Radiation
12 times more likely to find a 10 GeV
“jet” in “Min-Bias” at the LHC!
Twice as much activity in the
“underlying event” at the LHC!
“Min-Bias” at the LHC containsmuch more hard collisions than at the
Tevatron! At the Tevatron the“underlying event” is a factor of 2
more active than “Tevaron Min-Bias”.At the LHC the “underlying event” will
be at least a factor of 2 moreactive than “LHC Min-Bias”!
Related Documents