i Andreia Sofia Soares de Medeiros Graduated in Cellular and Molecular Biology Fermentation of fruit juices by the osmotolerant yeast Candida magnoliae Dissertation for the degree of Master in Biotechnology Supervisor: Prof. Dr. Madalena Salema Oom, Assistant Professor, Instituto Superior de Ciências da Saúde Egas Moniz and Researcher, Faculdade de Ciências e Tecnologia/Universidade Nova de Lisboa Co-supervisor: Prof. Dr. Paula Gonçalves, Assistant Professor and Researcher, Faculdade de Ciências e Tecnologia/Universidade Nova de Lisboa Jury: President: Prof. Dr. Carlos Alberto Gomes Salgueiro, Assistant Professor, Faculdade de Ciências e Tecnologia da Universidade Nova de Lisboa Examiner: Prof. Dr. Catarina Paula Guerra Geoffroy Prista, Assistant Professor, Instituto Superior de Agronomia da Universidade de Lisboa Examiner: Prof. Dr. Madalena Salema Oom, Researcher, Faculdade de Ciências e Tecnologia da Universidade Nova de Lisboa September, 2014 brought to you by CORE View metadata, citation and similar papers at core.ac.uk provided by Repositório da Universidade Nova de Lisboa

Welcome message from author
This document is posted to help you gain knowledge. Please leave a comment to let me know what you think about it! Share it to your friends and learn new things together.
Transcript
i
Andreia Sofia Soares de Medeiros
Graduated in Cellular and Molecular Biology
Fermentation of fruit juices by the osmotolerant
yeast Candida magnoliae
Dissertation for the degree of Master in Biotechnology
Supervisor: Prof. Dr. Madalena Salema Oom, Assistant Professor, Instituto Superior de Ciências da Saúde Egas Moniz and Researcher, Faculdade de Ciências e Tecnologia/Universidade Nova de Lisboa
Co-supervisor: Prof. Dr. Paula Gonçalves, Assistant Professor and Researcher, Faculdade de Ciências e Tecnologia/Universidade Nova de Lisboa
Jury:
President: Prof. Dr. Carlos Alberto Gomes Salgueiro, Assistant Professor,
Faculdade de Ciências e Tecnologia da Universidade Nova de Lisboa
Examiner: Prof. Dr. Catarina Paula Guerra Geoffroy Prista, Assistant
Professor, Instituto Superior de Agronomia da Universidade de Lisboa
Examiner: Prof. Dr. Madalena Salema Oom, Researcher, Faculdade de
Ciências e Tecnologia da Universidade Nova de Lisboa
September, 2014
brought to you by COREView metadata, citation and similar papers at core.ac.uk
provided by Repositório da Universidade Nova de Lisboa

ii

iii
Fermentation of fruit juices by the osmotolerant yeast Candida magnoliae
Copyright © Andreia Sofia Soares de Medeiros, Faculdade de Ciências e Tecnologia,
Universidade Nova de Lisboa
A Faculdade de Ciências e Tecnologia e a Universidade Nova de Lisboa têm o direito, perpétuo
e sem limites geográficos, de arquivar e publicar esta dissertação através de exemplares
impressos reproduzidos em papel ou de forma digital, ou por qualquer outro meio conhecido ou
que venha a ser inventado, e de a divulgar através de repositórios científicos e de admitir a sua
cópia e distribuição com objectivos educacionais ou de investigação, não comerciais, desde que
seja dado crédito ao autor e editor.

iv

v
Agradecimentos
Agradeço em primeiro lugar às minhas orientadoras, Professora Doutora Madalena Salema Oom e Professora Doutora Paula Gonçalves, que tornaram possível a realização desta dissertação e em especial à Professora Madalena Salema Oom que foi um pilar na concretização deste trabalho desde o primeiro ao último dia, estou muito grata por toda a sua dedicação e empenho.
Ao Departamento de Ciências da Vida, mais concretamente ao Centro de Recursos
Microbiológicos (CREM), pela disponibilidade na realização da componente laboratorial. A todos os meus colegas de laboratório e com um carinho especial à Rita Pais e à Marta
Duarte que não só facilitaram a minha integração no trabalho laboratorial como foram duas ajudas cruciais em todo o desenvolvimento deste estudo, foram sem dúvida um apoio incondicional em todos os momentos.
À Sumol+Compal pela disponibilização dos sumos de fruta permitindo direcionar este
estudo para o ramo da biotecnologia industrial e ao Senhor Engenheiro José Capelo pela partilha de conhecimentos e simpatia demonstrada ao longo do trabalho laboratorial.
À técnica do Departamento de Ciências da Vida, Nicole, que foi extremamente profissional na disponibilização do material necessário.
A todos os meus familiares e especialmente aos meus pais que, mesmo estando longe,
foram sempre a minha força motriz e são os responsáveis pelo meu desenvolvimento pessoal e financiamento de todo o meu desenvolvimento académico, sem eles não seria a pessoa que sou hoje.
Ao meu namorado, Luis, que foi um apoio incondicional durante todos estes anos e
sempre acreditou que eu seria capaz. Por fim, agradeço a todos os meus amigos, tanto dos Açores como de Portugal
Continental, pelo carinho e ânimo demonstrados.

vi
vii
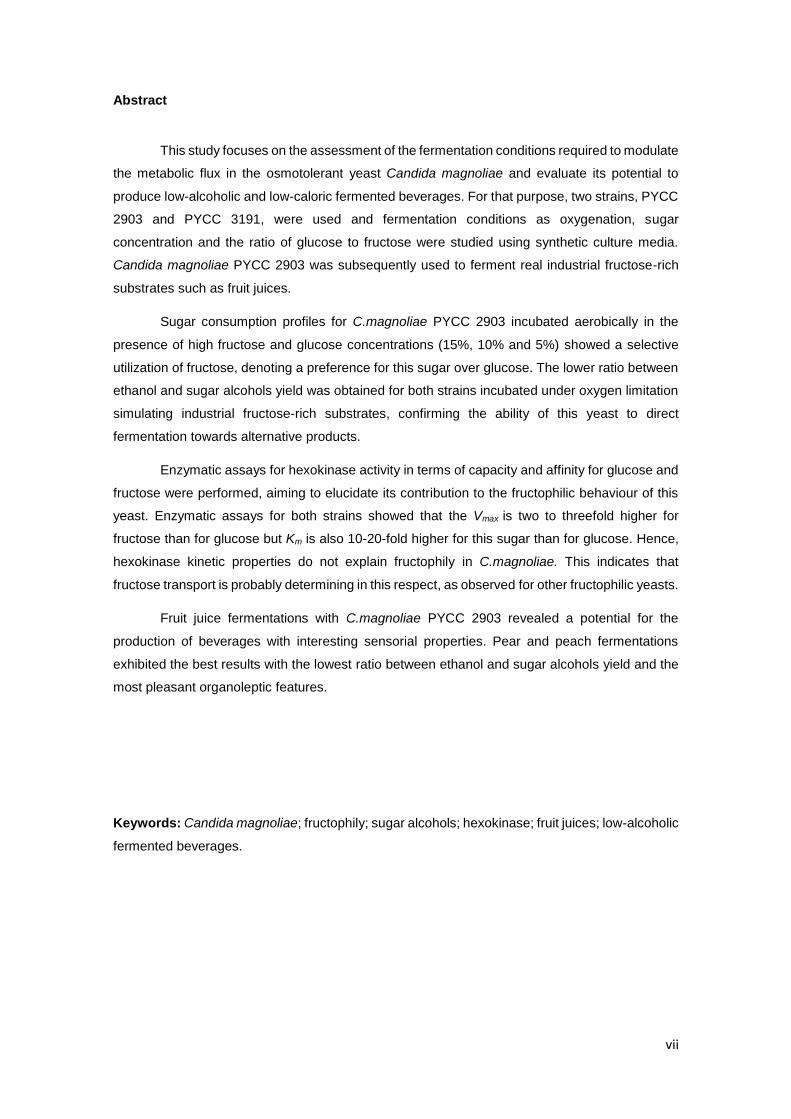
Abstract
This study focuses on the assessment of the fermentation conditions required to modulate
the metabolic flux in the osmotolerant yeast Candida magnoliae and evaluate its potential to
produce low-alcoholic and low-caloric fermented beverages. For that purpose, two strains, PYCC
2903 and PYCC 3191, were used and fermentation conditions as oxygenation, sugar
concentration and the ratio of glucose to fructose were studied using synthetic culture media.
Candida magnoliae PYCC 2903 was subsequently used to ferment real industrial fructose-rich
substrates such as fruit juices.
Sugar consumption profiles for C.magnoliae PYCC 2903 incubated aerobically in the
presence of high fructose and glucose concentrations (15%, 10% and 5%) showed a selective
utilization of fructose, denoting a preference for this sugar over glucose. The lower ratio between
ethanol and sugar alcohols yield was obtained for both strains incubated under oxygen limitation
simulating industrial fructose-rich substrates, confirming the ability of this yeast to direct
fermentation towards alternative products.
Enzymatic assays for hexokinase activity in terms of capacity and affinity for glucose and
fructose were performed, aiming to elucidate its contribution to the fructophilic behaviour of this
yeast. Enzymatic assays for both strains showed that the Vmax is two to threefold higher for
fructose than for glucose but Km is also 10-20-fold higher for this sugar than for glucose. Hence,
hexokinase kinetic properties do not explain fructophily in C.magnoliae. This indicates that
fructose transport is probably determining in this respect, as observed for other fructophilic yeasts.
Fruit juice fermentations with C.magnoliae PYCC 2903 revealed a potential for the
production of beverages with interesting sensorial properties. Pear and peach fermentations
exhibited the best results with the lowest ratio between ethanol and sugar alcohols yield and the
most pleasant organoleptic features.
Keywords: Candida magnoliae; fructophily; sugar alcohols; hexokinase; fruit juices; low-alcoholic
fermented beverages.

viii
ix
Resumo
O presente trabalho teve como objectivo avaliar as condições de fermentação
necessárias para modular o fluxo metabólico na levedura osmotolerante Candida magnoliae e o
seu potencial para produzir bebidas fermentadas com reduzido teor alcoólico e calórico. Para
este propósito foram utilizadas duas estirpes, PYCC 2903 e PYCC 3191, e estudadas as
condições de fermentação como a oxigenação, a concentração de açúcar e o rácio entre a
glucose e a frutose utilizando um meio de cultura sintético. A estirpe Candida magnoliae PYCC
2903 foi posteriormente utilizada para fermentar substratos industriais reais ricos em frutose tais
como os sumos de fruta.
Os perfis de consumo de açúcar para a C.magnoliae PYCC 2903 incubada em condições
aeróbias e com concentrações elevadas de frutose e glucose (15%, 10% e 5%) mostraram uma
utilização selectiva da frutose, evidenciando uma preferência por este açúcar relativamente à
glucose. O menor rácio entre o rendimento do etanol e dos açúcares álcoois foi obtido para
ambas as estirpes incubadas em condições de limitação de oxigénio simulando substratos
industriais ricos em frutose, confirmando a capacidade desta levedura para direcionar a
fermentação para produtos alternativos.
Foram realizados ensaios enzimáticos para a actividade da hexocinase em termos de
capacidade e afinidade para a glucose e a frutose com o intuito de elucidar acerca do seu
contributo para o comportamento frutofílico desta levedura. Os ensaios enzimáticos para ambas
as estirpes mostraram que o Vmax é duas a três vezes superior para a frutose do que para a
glucose mas o Km também é 10-20 vezes superior para este açúcar do que para a glucose.
Portanto, as propriedades cinéticas da hexocinase não explicam a frutofilia em C.magnoliae. Isto
indica que o transporte da frutose é provavelmente determinante neste contexto, como
observado para outras leveduras frutofílicas.
As fermentações de sumos de fruta com a C.magnoliae PYCC 2903 revelaram um
potencial para a produção de bebidas com propriedades sensoriais interessantes. As
fermentações de pêra e pêssego exibiram os melhores resultados com o menor rácio entre o
rendimento do etanol e dos açúcares álcoois e as características organolépticas mais
agradáveis.
Palavras-chave: Candida magnoliae; frutofilia; açúcares álcoois; hexocinase; sumos de fruta;
bebidas fermentadas com reduzido teor alcoólico.

x

xi
Table of contents
Copyright ©.................................................................................................................................... iii
Agradecimentos............................................................................................................................. v
Abstract ........................................................................................................................................ vii
Resumo ......................................................................................................................................... ix
Table of contents ........................................................................................................................... xi
List of Figures ............................................................................................................................... xv
List of Tables ............................................................................................................................... xix
List of Abbreviations .................................................................................................................... xxi
1. Introduction ............................................................................................................................ 1
1.1 Food fermentations ............................................................................................................. 2
1.1.1 Historical perspective of food preservation and fermentation ...................................... 2
1.1.2 Role of microorganisms responsible for the fermented foods ...................................... 4
1.1.3 Alcoholic fermentation carried out by yeasts ................................................................ 7
1.2 Beverages industry .............................................................................................................. 8
1.2.1 Alcoholic, low- and non-alcoholic fermented beverages .............................................. 8
1.2.2 Biotechnological application of specific yeasts to yield low-alcoholic and low-caloric
fermented beverages .......................................................................................................... 10
1.3 Fructophily phenomenon ................................................................................................... 12
1.3.1 Fructophilic behaviour basis and role of fructophilic yeasts ....................................... 12
1.3.2 Fructose membrane transporters ............................................................................... 14
1.3.3 Sugars phosphorylation by hexokinase enzyme activity ............................................ 18
1.4 Candida magnoliae ........................................................................................................... 19
1.4.1 Yeast with unusual properties .................................................................................... 19
1.4.2 Biotechnological application of Candida magnoliae to yield low-alcoholic and low-
caloric fermented beverages from fructose-rich substrates ................................................ 22
2. Materials and Methods ........................................................................................................ 25
2.1 Yeast strains ...................................................................................................................... 26
2.2 Growth and fermentation conditions ................................................................................. 26
2.2.1 Pre-inoculum preparation ........................................................................................... 26
2.2.2 Growth on YP medium with different sugar concentrations ....................................... 26
2.2.3 Fermentation on YP medium with different ratios between sugars............................ 26
xii
2.2.4 Fruit juices used for fermentation ............................................................................... 26
2.2.4.1 Juices preparation and initial control ................................................................... 27
2.2.4.2 Juice inoculation and fermentation ...................................................................... 27
2.2.4.3 Fermented juice pasteurization, bottling and sensorial evaluation ..................... 28
2.3 Analytical methods: Quantification by HPLC ..................................................................... 28
2.4 pH measurement and acidity titration ................................................................................ 29
2.5 Hexokinase activity assays ............................................................................................... 29
2.5.1 Crude extracts preparation for enzymatic assays ...................................................... 29
2.5.2 Protein quantification assay ....................................................................................... 29
2.5.3 Enzymatic assays ....................................................................................................... 30
3. Results and Discussion ....................................................................................................... 31
3.1 Part I Fermentation profiles of two Candida magnoliae strains, including sugar consumption
and fermentation products in different conditions, using synthetic culture medium ................ 32
3.1.1 Growth curves and specific growth rates ................................................................... 34
3.1.2 Glucose and fructose consumption. Fructophily analysis and fermentation products 36
3.1.2.1 Aerobiose ............................................................................................................ 37
3.1.2.2 Oxygen limitation ................................................................................................. 43
3.1.3 Fermentations inoculated with high cell density ......................................................... 48
3.1.3.1 Aerobiose ............................................................................................................ 48
3.1.3.2 Oxygen limitation ................................................................................................. 52
3.2 Part II Enzymatic contribution for Candida magnoliae fructophilic behaviour: Study of
hexokinase activity in terms of capacity (Vmax) and sugar affinity (Km) ................................... 58
3.2.1 Hexokinase preliminary validation tests ..................................................................... 59
3.2.2 Enzyme capacity (Vmax) and affinity (Km) .................................................................... 63
3.3 Part III Evaluation the potential of Candida magnoliae yeast to yield low-alcoholic
fermented beverages using real industrial fructose-rich substrates as fruit juices ................. 67
3.3.1 Sugar composition profile of fruit substrates .............................................................. 68
3.3.2 Fruit juice fermentations ............................................................................................. 69
3.3.3 Fermentation products ............................................................................................... 71
3.3.4 Juices pH and titratable acidity................................................................................... 72
3.3.5 Organoleptic evaluation: Texture, smell and taste ..................................................... 73
4. Conclusions ......................................................................................................................... 75
xiii
5. References .......................................................................................................................... 77
Appendices .................................................................................................................................. 82
Appendix I. Growth curves for Candida magnoliae strains incubated aerobically at different
sugar concentrations ............................................................................................................... 83
Appendix II. Growth curves for Candida magnoliae strains incubated with oxygen limitation at
different sugar concentrations ................................................................................................. 84

xiv
xv
List of Figures
Figure 1.1- Some major events in food fermentation and preservation through the years (adapted
from Ross et al., 2002). ................................................................................................................. 2
Figure 1.2- Metabolic pathway of alcoholic fermentation in S.cerevisiae. Abbreviations: HK
(hexokinase), PGI (phosphoglucose isomerase), PFK (phosphofructokinase), FBPA (fructose
bisphosphate aldolase), TPI (triose phosphate isomerase), GAPDH (glyceraldehyde-3-phosphate
dehydrogenase), PGK (phosphoglycerate kinase), PGM (phosphoglyceromutase), ENO
(enolase), PYK (pyruvate kinase), PDC (pyruvate decarboxylase) and ADH (alcohol
dehydrogenase) (from Bai et al., 2008). ........................................................................................ 8
Figure 1.3- Representation of central sugar metabolism in yeast cells (typical microorganism
S.cerevisiae) evidencing main steps that differs between glucose and fructose metabolism.
Abbreviations: Hxk (hexokinase), Glc-6-P (Glucose-6-phosphate), Frc-6-P (Fructose-6-
phosphate), PGI (Phosphoglucose isomerase), PFK (Phosphofructokinase), Frc-1,6-P2
(Fructose-1,6-biphosphate), ALD (Aldolase), DHAP (Dihydroxyacetone phosphate), GA3P
(Glyceraldehyde 3-phosphate), TPI (Triosephosphate isomerase), GAPDH (Glyceraldehyde-3-
phosphate dehydrogenase), 1,3BPG (1,3-biphosphoglycerate), PGK (Phosphoglycerate kinase),
3PG (3-Phosphoglycerate), PGM (Phosphoglycerate mutase), 2PG (2-Phosphoglycerate), ENO
(Enolase), PEP (Phosphoenolpyruvate), PYK (Pyruvate kinase), PDC (pyruvate decarboxylase),
CO2 (carbon dioxide) and ADH (Alcohol dehydrogenase) (based on Meier et al., 2011). .......... 13
Figure 1.4- Pathway of erythritol biosynthesis in yeast. Abbreviations: Hxk (hexokinase), Frc-6-
P (Fructose-6-phosphate), PGI (Phosphoglucose isomerase), Glc-6-P (Glucose-6-phosphate),
E4PK (Erythrose-4-phosphate kinase), ER (Erythrose Reductase), NAD(P)H (Nicotinamide
adenine dinucleotide phosphate reduced form) and NAD(P)+ (Nicotinamide adenine dinucleotide
phosphate oxidized form) (adapted from Moon et al., 2010). ..................................................... 20
Figure 1.5- Pathway of mannitol biosynthesis in yeast. Abbreviations: HXK (hexokinase), ATP
(Adenosine triphosphate), ADP (Adenosine diphosphate), NADH (Nicotinamide adenine
dinucleotide reduced form), NAD+ (Nicotinamide adenine dinucleotide oxidized form), MPD
(mannitol 1-phosphate dehydrogenase), MPP (mannitol-1-phosphate phosphatase), Pi (inorganic
phosphate), MDH (mannitol dehydrogenase), NADPH (Nicotinamide adenine dinucleotide
phosphate reduced form) and NADP+ (Nicotinamide adenine dinucleotide phosphate oxidized
form) (based on Akinterinwa et al., 2008). .................................................................................. 21
Figure 1.6- Pathway of glycerol biosynthesis in yeast. Abbreviations: Hxk (hexokinase), Glc-6-P
(Glucose-6-phosphate), Frc-6-P (Fructose-6-phosphate), PGI (Phosphoglucose isomerase), PFK
(Phosphofructokinase), Frc-1,6-P2 (Fructose-1,6-biphosphate), ALD (Aldolase), DHAP
(Dihydroxyacetone phosphate), GA3P (Glyceraldehyde 3-phosphate), TPI (Triosephosphate
isomerase), NADH (Nicotinamide adenine dinucleotide reduced form), NAD (Nicotinamide
adenine dinucleotide oxidized form) and G3PDH (Glyceraldehyde 3-phosphate dehydrogenase)
(based on Wang et al., 2001). ..................................................................................................... 22

xvi
Figure 2.1- (A) Schematic diagram of a High-Performance Liquid Chromatography. (1) Eluent
reservoir, (2) Eluent degasser, (3) Gradient valve, (4) Mixing vessel for delivery of the mobile
phase, (5) High pressure pump, (6) Switching valve, (7) Pre-column (Bio-Rad), (8) Analytical
column (Bio-Rad), (9) IR Detector, (10) UV Detector, (11) Waste and (12) Data acquisition. (B)
Picture of HPLC equipment used. ............................................................................................... 28
Figure 3.1- Comparison between specific growth rates of Candida magnoliae strains, (A) PYCC
2903 and (B) PYCC 3191, incubated aerobically ( ) or under oxygen limitation ( ) at different
sugar concentrations. Bars for 10% and 5% sugars represent mean values with standard
deviation (SD) (n=2). ................................................................................................................... 35
Figure 3.2- Glucose ( ) and fructose ( ) consumption rates for Candida magnoliae strains
incubated aerobically at different sugar concentrations (15%, 10%, 5%, 1% of each sugar) (A.1)
and (B.1). The lower graphs (A.2 and B.2) are duplicates for 10% and 5% sugar concentrations.
..................................................................................................................................................... 37
Figure 3.3- Glucose ( ) and fructose ( ) consumption rates for Candida magnoliae strains, (A)
PYCC 2903 and (B) PYCC 3191, incubated aerobically at low sugar concentrations (1% glucose
and fructose). Data re-plotted from Figure 3.2. ........................................................................... 38
Figure 3.4- Glucose (A) and fructose (B) consumption rates and fructophily analysis (C) for
Candida magnoliae strains, PYCC 2903 ( ) and PYCC 3191 ( ) incubated aerobically at
increasing sugar concentrations. For 277.5 and 555.1mM (5 and 10%) of each sugar, bars
represent mean values ±SD (n=2). ............................................................................................. 40
Figure 3.5- Ethanol ( ), glycerol ( ), erythritol ( ) and mannitol ( ) yield for Candida magnoliae
strains, (A) PYCC 2903 and (B) PYCC 3191, incubated aerobically at different sugar
concentrations. Bars for 10% and 5% sugars represent mean values with standard deviation (SD)
(n=2). ........................................................................................................................................... 42
Figure 3.6- Glucose ( ) and fructose ( ) consumption rates for Candida magnoliae strains, (A)
PYCC 2903 and (B) PYCC 3191, incubated with oxygen limitation at different sugar
concentrations (15%, 10%, 5%, 1% of each sugar). ................................................................... 44
Figure 3.7- Glucose ( ) and fructose ( ) consumption rates for Candida magnoliae strains, (A)
PYCC 2903 and (B) PYCC 3191, incubated with oxygen limitation at low sugar concentrations
(1% glucose and fructose). Data re-plotted from Figure 3.6. ...................................................... 44
Figure 3.8- Glucose (A) and fructose (B) consumption rates and fructophily analysis (C) for
Candida magnoliae PYCC 2903 ( ) and PYCC 3191 ( ) incubated with oxygen limitation at
increasing sugar concentrations. For 277.5 and 555.1mM (5 and 10%) of each sugar, bars
represent mean values ±SD (n=2). ............................................................................................. 46
Figure 3.9- Ethanol ( ), glycerol ( ), erythritol ( ) and mannitol ( ) yield for Candida magnoliae
strains, (A) PYCC 2903 and (B) PYCC 3191, incubated with oxygen limitation at different sugar
concentrations. ............................................................................................................................ 47
Figure 3.10- Glucose ( ) and fructose ( ) consumption rates for Candida magnoliae PYCC 2903
incubated aerobically at different and equal sugar ratios (A) 10% Glucose, (B) 10% Fructose, (C)
7% Glucose and 3% Fructose, (D) 3% Glucose and 7% Fructose and (E) 5% of each sugar. .. 49
xvii
Figure 3.11- Glucose (A) and fructose (B) consumption rates and fructophily analysis (C) for
Candida magnoliae PYCC 2903 ( ) incubated aerobically at different and equal sugar ratios. 51
Figure 3.12- Ethanol ( ), glycerol ( ), erythritol ( ) and mannitol ( ) yield for Candida magnoliae
PYCC 2903 incubated aerobically at different and equal sugar ratios........................................ 52
Figure 3.13- Glucose ( ) and fructose ( ) consumption rates for Candida magnoliae PYCC 2903
and PYCC 3191 incubated with oxygen limitation at different and equal sugar ratios (A) 10%
Glucose, (B) 7% Glucose and 3% Fructose, (C) 5% of both sugars, (D) 3% Glucose and 7%
Fructose and (E) 10% Fructose. ................................................................................................. 54
Figure 3.14- Glucose (A) and fructose (B) consumption rates and fructophily analysis (C) for
Candida magnoliae PYCC 2903 ( ) and PYCC 3191 ( ) incubated with oxygen limitation at
different and equal sugar ratios. .................................................................................................. 55
Figure 3.15- Ethanol ( ), glycerol ( ), erythritol ( ) and mannitol ( ) yield for Candida magnoliae
strains, (A) PYCC 2903 and (B) PYCC 3191, incubated with oxygen limitation at different and
equal sugar ratios. ....................................................................................................................... 56
Figure 3.16- Illustrative scheme of hexokinase activity and subsequent steps used for this
enzyme activity measurement. Abbreviations: ATP (Adenosine triphosphate), ADP (Adenosine
diphosphate), Frc-6-P (Fructose-6-phosphate), Glc-6-P (Glucose-6-phosphate), NADP+
(Nicotinamide adenine dinucleotide phosphate oxidized form), NADPH (Nicotinamide adenine
dinucleotide phosphate reduced form) and 6-PG (6-phosphogluconate). .................................. 59
Figure 3.17- (A) Effect of hexokinase amount on the reaction rate, measured by the increase of
NADPH over the first 60s after the addition of 50mM glucose. Cell extracts were prepared from
Candida magnoliae PYCC 2903 grown in 10% of glucose and fructose. ................................... 60
Figure 3.18- (A) Effect of G-6-PDH amount on the reaction rate, measured by the increase of
NADPH over the first 60s after the addition of 50mM glucose. S.cerevisiae ( ), C.magnoliae
PYCC 2903 ( ) and PYCC 3191 ( ). (B) Enzymatic conditions used for the assay with
S.cerevisiae, C.magnoliae PYCC 2903 and PYCC 3191. .......................................................... 61
Figure 3.19- (A) Effect of hexokinase amount on the reaction rate, measured by the increase of
NADPH over the first 60s after the addition of 50mM fructose. Cell extracts were prepared from
Candida magnoliae PYCC 2903 grown in 1% of glucose and fructose. ..................................... 61
Figure 3.20- (A) Effect of PGI amount on the reaction rate, measured by the increase of NADPH
over the first 60s after the addition of 50mM fructose. Cell extracts were prepared from Candida
magnoliae PYCC 2903 grown in 1% of glucose and fructose. ................................................... 62
Figure 3.21- Michaelis-Menten plots of glucose phosphorylation by hexokinase of Candida
magnoliae strains. (A.1) and (A.2) PYCC 2903 assay 1 and 2. (B.1) and (B.2) PYCC 3191 assay
1 and 2. Dots for (A.1), (B.1) and (B.2) represent mean values with standard deviation (SD) (n=2).
..................................................................................................................................................... 64
Figure 3.22- Michaelis-Menten plots of fructose phosphorylation by hexokinase of Candida
magnoliae strains, (A) PYCC 2903 and (B) PYCC 3191. Dots represent mean values with
standard deviation (SD) for (A) with n=3 and for (B) with n=4. ................................................... 65

xviii
Figure 3.23- (A) Sugar composition profile of orange, apple, pear and peach juices used in
fermentation assays. Sucrose ( ), glucose ( ) and fructose ( ). (B) Comparison of
fructose/glucose ratio between fermentations simulating industrial fructose-rich substrates of Part
I and fruit juices. .......................................................................................................................... 68
Figure 3.24- Juices fermentation, orange ( ), apple ( ), pear ( ) and peach ( ), conducted by
C.magnoliae PYCC 2903 at 25ºC and Log (CFU/mL) in these fructose-rich substrates. ........... 69
Figure 3.25- Ethanol ( ), glycerol ( ), erythritol ( ) and mannitol ( ) yield from different
fermented fructose-rich substrates such as orange, apple, pear and peach juice. .................... 71
Figure 3.26- Comparison between pH ( ) and TTA (g citrate/100mL) ( ) in different fruit
juices. (A) Orange, (B) Apple, (C) Pear and (D) Peach. ............................................................. 72
xix
List of Tables
Table 1.1- Several common fermented foods and some of the most well-known players in the
fermentation ecosystem (from Scott and Sullivan, 2008). ............................................................ 5
Table 1.2- Examples of strategies and methods used in low-alcoholic fermented beverages
production (based on Brányik et al., 2012; Francesco et al., 2014; Pickering, 2000). ................ 10
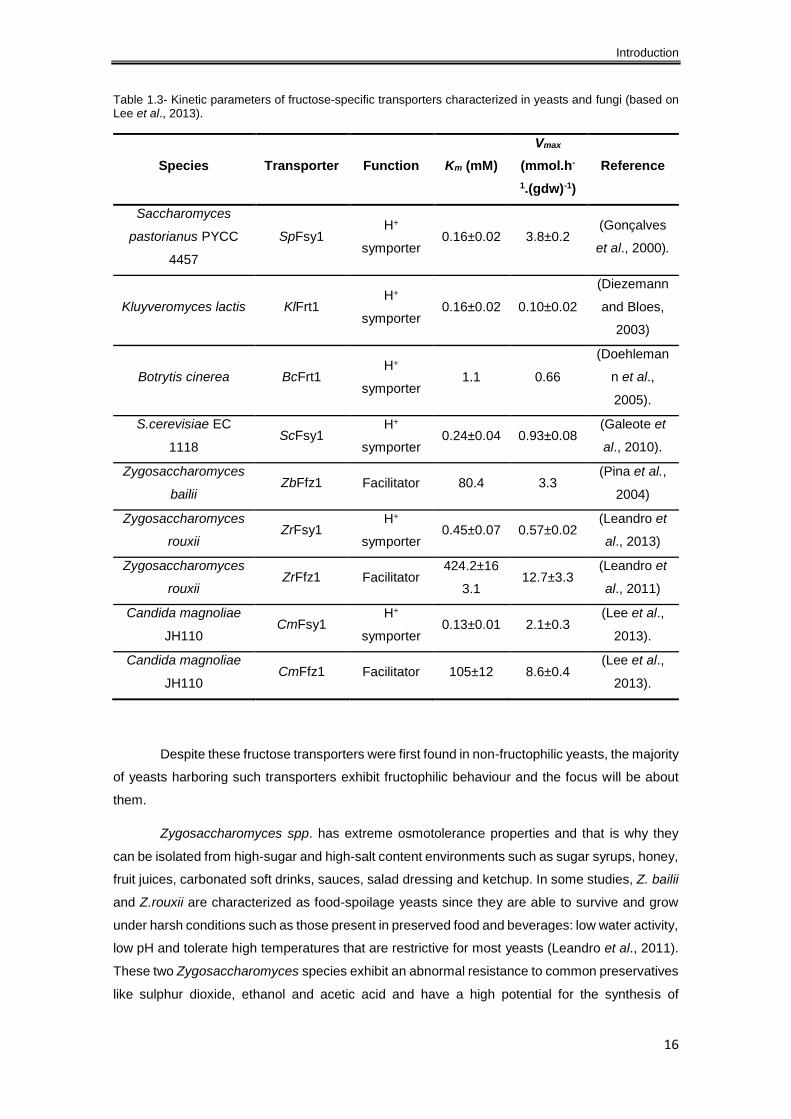
Table 1.3- Kinetic parameters of fructose-specific transporters characterized in yeasts and fungi
(based on Lee et al., 2013). ........................................................................................................ 16
Table 1.4- Kinetic parameters, Km and Vmax, of Saccharomyces cerevisiae hexokinase I and II
(based on Berthels et al., 2008). ................................................................................................. 19
Table 1.5- Contents (g/100mL) of fructose, glucose and sucrose in some of the most consumed
fresh fruit juices worldwide (from Sanz et al., 2004). .................................................................. 23
Table 2.1- Sugar composition of fruit juices used for Candida magnoliae fermentation. ........... 27
Table 2.2- Stock solutions prepared for hexokinase activity assays. ......................................... 30
Table 3.1- Conditions used to study and characterize the growth and fermentation profiles of two
Candida magnoliae strains, PYCC 2903 and PYCC 3191. ........................................................ 33
Table 3.2- Specific growth rates for Candida magnoliae strains, PYCC 2903 and PYCC 3191,
incubated aerobically at different sugar concentrations. ............................................................. 34
Table 3.3- Specific growth rates for C.magnoliae strains, PYCC 2903 and PYCC 3191, incubated
under oxygen limitation at different sugar concentrations. .......................................................... 35
Table 3.4- Glucose and fructose consumption rates and fructophily analysis for Candida
magnoliae PYCC 2903 and PYCC 3191 incubated aerobically at different sugar concentrations.
..................................................................................................................................................... 39
Table 3.5- Glucose and fructose consumption rates and fructophily analysis for Candida
magnoliae PYCC 2903 and PYCC 3191 incubated with oxygen limitation at different sugar
concentrations. ............................................................................................................................ 45
Table 3.6- Glucose and fructose consumption rates and fructophily analysis for Candida
magnoliae PYCC 2903 incubated aerobically at different and equal sugar ratios. ..................... 50
Table 3.7- Glucose and fructose consumption rates and fructophily analysis for Candida
magnoliae PYCC 2903 and PYCC 3191 incubated with oxygen limitation at different and equal
sugar ratios. ................................................................................................................................. 54
Table 3.8- Candida magnoliae PYCC 2903 and PYCC 3191 hexokinase capacity (Vmax) results
using 20, 50 or 100mM glucose or fructose for cells grown in 1%, 5% and 10% of each sugar. 63
Table 3.9- Candida magnoliae PYCC 2903 and PYCC 3191 hexokinase kinetic parameters,
capacity (Vmax) and affinity (Km), and their ratio between glucose and fructose. ........................ 65
Table 3.10- Fermented juices sugar reduction (%)..................................................................... 70
Table 3.11- Fermented fruit juices organoleptic evaluation in terms of texture, smell and taste
with an overall appreciation. ........................................................................................................ 73

xx

xxi
List of Abbreviations
Abs- Absorbance
ATP- Adenosine Triphosphate
BSA- Bovine Serum Albumin
C.magnoliae- Candida magnoliae yeast
CBS- Centraalbureau voor
Schimmelcultures Fungal Biodiversity
Centre
CFU- Colony-Forming Units
CREM- Centre for Microbial Resources
DCV- Department of Life Sciences
DTT- Dithiothreitol
Fruc- Fructose
G-6-PDH- Glucose-6-Phosphate
Dehydrogenase enzyme
Gluc- Glucose
HPLC- High-performance liquid
chromatography
Hxk- Hexokinase enzyme
IR- Infrared
KCCM- Korean Culture Center of
Microorganisms
KFCC- Korean Federation of Culture
Collections
Km- Michaelis-Menten constant
MgCl2- Magnesium Chloride
NADP+- Nicotinamide Adenine Dinucleotide
Phosphate
NaOH- Sodium hydroxide
O.D- Optical density
oBrix- Degrees Brix
PGI- Phosphoglucose Isomerase enzyme
PMSF- Phenylmethylsulfonyl Fluoride
PYCC- Portuguese Yeast Culture
Collection
S.cerevisiae- Saccharomyces cerevisiae
yeast
Sucr- Sucrose
TRIS- Triethanolamine Hydrochloride
TSS- Total soluble solids
TTA- Titratable acidity
UV- Ultraviolet
UV-Vis- Ultraviolet-Visible
Vmax- Maximum velocity
YP- Yeast extract-Peptone
YPD- Yeast extract-Peptone-Dextrose

xxii

1
1. Introduction

Introduction
2
1.1 Food fermentations
1.1.1 Historical perspective of food preservation and fermentation
Fermentation is a widely practiced and ancient technology dependent on the biological
activity of microorganisms for production of a range of metabolites which can suppress the growth
and survival of undesirable microflora in foodstuffs. Such an old process is used for food and
beverages preservation and has been an effective form of extending the shelf-life of foods for
millennia. Traditionally, foods were preserved through naturally occurring fermentations that
ensure not only increased shelf-life and microbiological safety of a food but also made some foods
more digestible. Nowadays due to modern industrialization, also known as large-scale production,
there is an exploration of the use of defined strain starter systems to ensure consistency and
quality in the final product. In addition to that, to ensure that food is maintained at a suitable level
of quality from the time of manufacture through to the time of consumption, modern food
processing is dependent on a range of preservative technologies (Caplice and Fitzgerald, 1999;
Ross et al., 2002).
Traditional fermentation resulting from a natural occurrence was used during thousands
of years for food transformation and preservation by many different people, even before the entire
microbiological and biochemical basis behind the process was known. As far back as 8000 years
ago the art of cheese-making was developed at a time when plants and animals were just being
domesticated, in the fertile Crescent between Tigris and the Euphrates rivers in Iraq (Figure 1.1).
Figure 1.1- Some major events in food fermentation and preservation through the years (adapted from Ross et al., 2002).

Introduction
3
Later, alcoholic fermentations involved in winemaking and brewing are thought to have
been developed during the period 2000–4000 BC by the Egyptians and Sumerians (Figure 1.1).
The Egyptians also developed dough fermentations used in the production of leavened bread. As
mentioned, fermentations have been exploited as a preservation method of food and beverages
for thousands of years however, microorganisms were recognized as being responsible for the
fermentation process only in the most recent past when pasteurization was also developed.
Coincident with this discovery, was the time of the industrial revolution (Figure 1.1) (Ross et al.,
2002).
By the middle of the 19th century two key events occurred that had a very important impact
on the manner in which food fermentations were performed and on our understanding about the
process. Firstly, the industrial revolution that resulted in the concomitant concentration of large
masses of population in towns making impractical the traditional method of food supplying within
local communities. So, after this historical event, a dramatic shift from food production for local
communities to large-scale food production occurred. This allowed the development of large scale
fermentation processes for commercial production of fermented foods and alcoholic beverages.
Beyond the requirement to produce in large amounts, there was a need to industrialize the
manufacturing process to service these new markets. Secondly, from the 1850s onwards, the
developing of microbiology as a science resulted on the understanding the biological basis of
fermentation. Thus, the essential role of bacteria, yeasts and moulds in the generation of
fermented foods became understood and such knowledge resulted in more controlled and
efficient fermentations (Caplice and Fitzgerald, 1999).
The coincidence between industrialization of fermented foods and scientific advances at
a microbiological level was fortunate. The beginning of retailing and mass marketing required the
availability of products with consistent quality and safety (Caplice and Fitzgerald, 1999; Ross et
al., 2002). Towards the end of the 19th century, characterization of the microorganisms
responsible for fermentation led to the isolation of starter cultures for many fermented foods and
particularly milk-derived products. These cultures could be produced on a large scale and are
required to supply factories involved in the manufacture of products in large amounts. Although
the world has evolved towards industrialization using sophisticated technologies which are
capable of producing large amounts in a short time, there are regions, even in Europe, where
fermented foods remain manufactured in a traditional way. For some cheeses and fermented
meats and vegetables the concept of backslopping, which consists in the insertion of a small
portion of a previous batch of fermented food into the start of new batch of food to be fermented,
was kept. Most of the products that result from this process retain flavour and aroma
characteristics that the industrialized fermented foods have lost and thus are considered of better
quality. However, considering the emerging popularity and consequent rising demand of these
products, it appears to be inevitable that the only way for this expanding market to be satisfied is
to upscale the manufacturing process (Ross et al., 2002).
Introduction
4
One of the most interesting challenges about this issue regards allowing the large-scale
production of fermented foods without losing the particular traits associated with products made
in a traditional manner, taking advantage of the benefits produced by both methods. Initially,
fermenting food substrates had, as its main purpose, preservation of final product, however,
increasing and continuous development of several alternative techniques for food preservation
replaced this essential role of fermentation. Thus, the majority of fermented foods began to be
produced because their particular characteristics such as aroma, flavour and texture, which are
very appreciated by the consumer. Nonetheless the environment generated by the fermentation
is crucial in ensuring the shelf-life and microbiological safety of the products but this aim is
modulated depending on the world region and the way in which the fermentation process is
carried out. In certain parts of the world where the fermentation process continues performed on
an artisanal manner, the preservation still the major purpose.
During the fermentation process, end-products or by-products such as acids, alcohols
and carbon dioxide are normally produced resulting from carbohydrates metabolism. These
compounds play an important role in modifying the organoleptic features of the initial substrate,
providing nutritional benefit to consumer.
Since the dawn of civilization methods have been described for the fermentation of
different substrates such as plant and animal products. Fermented foods enriches human dietary
through a wide diversity of flavors, textures and aromas and different compounds as vitamins,
proteins, amino acids and fatty acids (Blandino et al., 2003; Caplice and Fitzgerald, 1999;
Steinkraus, 2002).
The chemical definition of fermentation describe this process as strictly anaerobic,
nonetheless, the general understanding of the process involve both aerobic and anaerobic
carbohydrate breakdown (Caplice and Fitzgerald, 1999).
1.1.2 Role of microorganisms responsible for the fermented foods
One of the oldest food processing technologies known to man is the production of
fermented foods. Nowadays, the numerous microorganisms (living components) that are
responsible from biochemical transformation in the fermentation process are well known and the
vast majority are filamentous or unicellular fungi and bacteria. Table 1.1 illustrates the most
common fermented foods produced worldwide from different raw materials by biological activity
of different microorganisms. Wild fermentation bacteria and yeast cover the continents and
permeate ecosystems, in the air, soil, water, plants and animals being a natural resource available
to people all over the world. Thus, there are two kingdoms of life in fermentation ecosystems
which comprises fungi and bacteria. Fungi includes yeasts (unicellular) which are mainly
associated with the production of alcoholic beverages and molds (multicellular) used for instances
for cheese production. Bacteria are responsible for pickles, cheese and cured sausages
production (Bennett, 1998).

Introduction
5
There are different ways to classify food fermentations and one of them is concerning the
raw material from which fermented food is produced. Considering the most common fermented
foods illustrated in Table 1.1 is possible distinguish two major categories: (1) Plant products that
includes substrates as cereals, vegetables and fruits and (2) Animal products as milk and meat
(Scott and Sullivan, 2008).
There are many different types of commercial fermentations from vegetables substrates
including the most economically profitable: olives, cucumbers (pickles) and cabbage (sauerkraut,
Korean kimchi). Most vegetable
fermentations occur by providing
specific conditions for the growth
of microorganisms already
present in the raw material. In
some cases, microorganism
selection are accomplished by
added salt thereby favouring the
lactic acid bacteria. Those
bacteria convert vegetable
fermentable sugars into lactic
acid, and are mainly Lactobacillus
(Lb. plantarum, Lb. brevis and Lb.
bulgaricus), Leuconostoc (Lc.
mesenteroides and Lc.
plantarum) and Lactococcus spp.
(Caplice and Fitzgerald, 1999;
Steinkraus, 2002). Another
vegetable that is also widely used
to produce fermented foods is soy
bean. This raw material is able to
produce different types of Asian
foods such as soy sauce, tempeh
and miso in which fermentation
process is conducted by
Aspergillus oryzae or Rhyzopus
oligosporus (Bennett, 1998;
Blandino et al., 2003). Concerning
fruits and fruit juices, the
fermented products more spread
worldwide are wines, wine vinegars, cider and perry. Wines are produced from grapes and is the
result of alcoholic fermentation by the yeast Saccharomyces (S.cerevisiae, S.pastorianus,
S.bayanus). Wine vinegar production requires two stages, the first one is an alcoholic
Table 1.1- Several common fermented foods and some of the most well-known players in the fermentation ecosystem (from Scott and Sullivan, 2008).
Introduction
6
fermentation performed by the yeast S.cerevisiae capable to produce ethanol which is
subsequently transformed in acetic acid during the second stage (acetic fermentation) by acetic
acid bacteria (AAB) such Gluconobacter spp. and Acetobacter spp. Cider (not shown in Table
1.1) is produced from apple juice and alcoholic fermentation is mainly carried by Saccharomyces
yeasts (S.cerevisiae and S.bayanus). Perry (not shown in Table 1.1), as well as wine and cider,
is produced using the same alcoholic fermentation process with the difference that starting
material are pears instead of grapes and apples (Ghorai et al., 2009).
Plant products such as malt and flour grains are used as raw material for the production
of cereal-based fermented foods. Although cereals are deficient for example in essential
aminoacids, fermentation could be the most simple and economical method of improving their
nutritional value, sensorial properties and functional qualities (Blandino et al., 2003). One of the
most manufactured cereal-based fermented alcoholic beverages is beer which results from
alcoholic fermentation carried out mostly by S.cerevisiae (Bennett, 1998; Blandino et al., 2003).
Another fermented alcoholic beverage produced worldwide that is traditional of Japan and China
is sake, also known as rice wine (not shown in Table 1.1). Sake is produced from polished and
steamed rice rich in starch (Blandino et al., 2003). A fungus, Aspergillus oryzae, which is capable
of converting the starch into simple sugars assimilable by yeasts is inoculated to grow on the
surface of the rice. Afterwards, rice mash is fermented through lactic acid fermentation using
some bacteria and yeasts (Ghorai et al., 2009). Grain flour is used for bread manufacturing and
in this case alcoholic fermentation conducted by S.cerevisiae has as main purpose carbon dioxide
formation instead of ethanol (Ghorai et al., 2009).
Fermented foods from animal products include predominantly cheeses, yogurts and
sausages. Cheeses are produced from milk and in spite of the fact that some of these products
depend on the natural lactic flora present in this raw material, large scale production uses specific
starter cultures. Lactic acid bacteria present in unpasteurized milk are responsible for lactose
fermentation (milk sugar) into lactic acid (Steinkraus, 2002). Cheese production results from lactic
acid fermentation carried by lactic acid bacteria such Lactobacillus (Lb. bulgaricus), Lactococcus
spp. and Streptococcus thermophilus (Ross et al., 2002). In some processes, depending on the
end product, a secondary microorganism is added (Propionibacter spp.) which is able to affect
texture. Besides lactic acid bacteria other microorganisms such as moulds mainly Penicillium (P.
roqueforti and P. camemberti) that can influence the flavor, yeasts and bacteria can be added
(Bennett, 1998). Like cheeses, yogurts are produced from milk and result from lactic acid
fermentation. Starter cultures used for yogurt production consists in an equal mixture of two lactic
acid bacteria, Lb. bulgaricus and S. thermophilus, which are able to grow in different stages of
production since they tolerate distinct pH ranges (Caplice and Fitzgerald, 1999).
Another fermented food produced from animal sources, in particular the meat, are the
sausages. Fermented sausages are produced as a result of lactic acid fermentation of a mixture
of minced meat, fat, salt, curing agents (nitrate/nitrite), sugar and spices. Starter cultures used for
fermented sausage production consists in a mixture of lactic acid bacteria such as Lactobacillus

Introduction
7
spp. and Pediococcus spp. In addition to bacteria, starter cultures with yeasts (Debaryomyces
hansenii known as Candida famata) and moulds (Penicillium nalgiovense and Penicillium
chrysogenum) are available for the production of these fermented foods (Caplice and Fitzgerald,
1999).
1.1.3 Alcoholic fermentation carried out by yeasts
Many years ago, alcoholic fermentation was accidentally discovered and afterwards
yeasts were found to be the driving force behind it. Briefly, ethanol fermentation is a biological
process that occurs under anaerobic conditions, i.e. independent of oxygen and consists in the
direct conversion of sugars such as glucose and fructose into cellular energy producing as by-
products carbon dioxide and ethanol. Fermentable sugars that are rapidly converted into ethanol
and CO2 are present in different types of substrates such as fruit juices, diluted honey, sugarcane
juice, palm sap, germinated cereal grains or hydrolyzed starch, which are used for alcoholic
fermentation process. Ethanol and carbon dioxide are produced nearly in equimolar amounts and
CO2 is responsible for flushing out the residual oxygen present, maintaining fermentation under
anaerobic conditions (Steinkraus, 2002).
Several reports have been published about production of ethanol through fermentation
by microorganisms, and various bacteria and yeasts have been reportedly used for this
production. Therefore, there are many microorganisms capable of accumulating high ethanol
concentrations, yielding this as the major product. However, Saccharomyces cerevisiae still
remains the most commonly used and preferred microorganism for alcoholic fermentation. This
typical yeast is also generally recognized as safe (GRAS) as a food additive for human
consumption (Lin and Tanaka, 2006).
The main metabolic pathway involved in ethanol fermentation is glycolysis, which consists
in the metabolism of one molecule of glucose with a final production of two molecules of pyruvate.
Under anaerobic conditions or sugar excess, the pyruvate can be further reduced to ethanol with
the release of carbon dioxide (Figure 1.2).
To drive biosynthesis, which involves a variety of energy-requiring reactions, and the
maintenance of the yeast viability, yeast cells used the two ATPs produced in glycolysis. If ATPs
are not continuously consumed, the glycolytic metabolism of glucose will be interrupted due to
intracellular accumulation of ATP, which inhibits one of the most important enzymes in this
process (phosphofructokinase).

Introduction
8
Figure 1.2- Metabolic pathway of alcoholic fermentation in S.cerevisiae. Abbreviations: HK (hexokinase),
PGI (phosphoglucose isomerase), PFK (phosphofructokinase), FBPA (fructose bisphosphate aldolase), TPI (triose phosphate isomerase), GAPDH (glyceraldehyde-3-phosphate dehydrogenase), PGK (phosphoglycerate kinase), PGM (phosphoglyceromutase), ENO (enolase), PYK (pyruvate kinase), PDC (pyruvate decarboxylase) and ADH (alcohol dehydrogenase) (from Bai et al., 2008).
Various by-products are also produced during alcoholic fermentation besides ethanol and
CO2 (Ross et al., 2002). The main one is glycerol produced from dehydroxyacetone phosphate
(DHAP) conversion resulting in the release of oxidized NAD. Glycerol biosynthesis is a
consequence of the utilization of glycolytic intermediates to produce DHAP decreasing the flux of
pyruvate formation. In addition to ethanol, CO2 and glycerol other by-products such as organic
acids and higher alcohols are produced at a much lower levels. This by-product production as
well as the growth of yeast cells direct some glycolytic intermediates to the corresponding
metabolic pathways, decreasing the ethanol yield (Bai et al., 2008).
1.2 Beverages industry
1.2.1 Alcoholic, low- and non-alcoholic fermented beverages
Alcoholic fermented beverages dominate the market of fermented beverages since
industrialization of the process. The market for alcoholic fermented beverages is enormous and
is mostly controlled by sales of wine and beer followed by cider and sake. Nowadays there is a
huge variety of these products that mainly depends on the type and quality of substrate used,
fermentation conditions, region of the world and manufacturing process. Over recent years,
alcoholic fermented beverages-consumption has faced a duality. On the one hand, consumption

Introduction
9
tend to increase due to social events and ever earlier consumption by adolescents, and on the
other hand, consumption tends to decrease due to health concerns in modern society and low
consumer purchasing power. The decline in consumption, relative to health concerns, is mainly
caused by the scientific advances about the effects of alcohol and prevention campaigns to
educate the population. The harmful effects of alcohol are much better known, however, recent
findings regarding this subject showed that low and moderate alcohol intake enhanced health and
well-being (Brányik et al., 2012). The major harmful effects of alcohol consumption are mostly
accidents, violence and chronic alcohol abuse leading to chronic health and nutritional problems
(Brányik et al., 2012; Room et al., 2005). Despite all these negative effects on the human body,
alcohol continues to be consumed throughout the world and still dominates the market of
fermented beverages.
The production of low-alcoholic fermented beverages has different historical reasons.
During World Wars (1914-1918 and 1939-1945) there was a shortage of raw materials forcing the
use of adjuncts and, such blends of substrates, led to the production of beverages with low alcohol
content. Furthermore, in the years between 1919 and 1933 the prohibition to manufacture, sell
and consume alcohol increased the production of this low- alcoholic kind of beverage.
In recent years, a new concept of low- and non-alcoholic fermented beverages arose,
typically defined as containing an alcoholic strength greatly reduced or even inexistent when
compared with alcoholic beverages. The production of low- and non-alcoholic fermented
beverages is an alternative to soft drinks and alcoholic beverages in food industry and in spite of
the fact that these type of beverages are a small percentage of the output of food industry, a
significant growth of these products recently occurred, revealing the global trend for a healthier
lifestyle (Brányik et al., 2012).
Low- and non-alcoholic fermented beverages market was based on the creation of
healthier versions with reduced alcohol content from a variety of beers and wines. These versions
of alcoholic fermented beverages claim beneficial effects on health with a simultaneous effect of
the lower energy intake and minimization of negative impacts of alcohol consumption. In addition
to historical reasons there are many other factors that contribute to the increase in demand for
low-alcohol and alcohol-free beverages such health, safety, diet or even prohibition of alcohol
consumption due to labor protection laws. In addition, these beverages are recommend for
specific groups of people as pregnant woman, people with cardiovascular and hepatic
pathologies, sporting professionals and medicated people (Brányik et al., 2012; Francesco et al.,
2014; Pickering, 2000). The legal definition of low- and non-alcoholic beverage varies from one
country to another and the final content of ethanol influences this distinct classification (Brányik
et al., 2012; Francesco et al., 2014; Pickering, 2000). In Europe, a non-alcoholic or alcohol-free
wine and beer will usually have a final alcohol by volume content lower than 0.5% v/v, whereas a
low-alcohol wine and beer ethanol content is between 0.5 and 1.2% v/v. (Francesco et al., 2014;
Pickering, 2000) Wines can also be classified as reduced-alcohol in which ethanol content is
between 1.2 and 6.5% v/v (Pickering, 2000).
Introduction
10
The commercialization of beverages with reduced or absent ethanol content have to
overcome some technical and marketing challenges. Since this is a relatively recent market still
exist many limitations at the quality and economic level which have to be evaluated and improved
(Pickering, 2000).
1.2.2 Biotechnological application of specific yeasts to yield low-alcoholic and low-
caloric fermented beverages
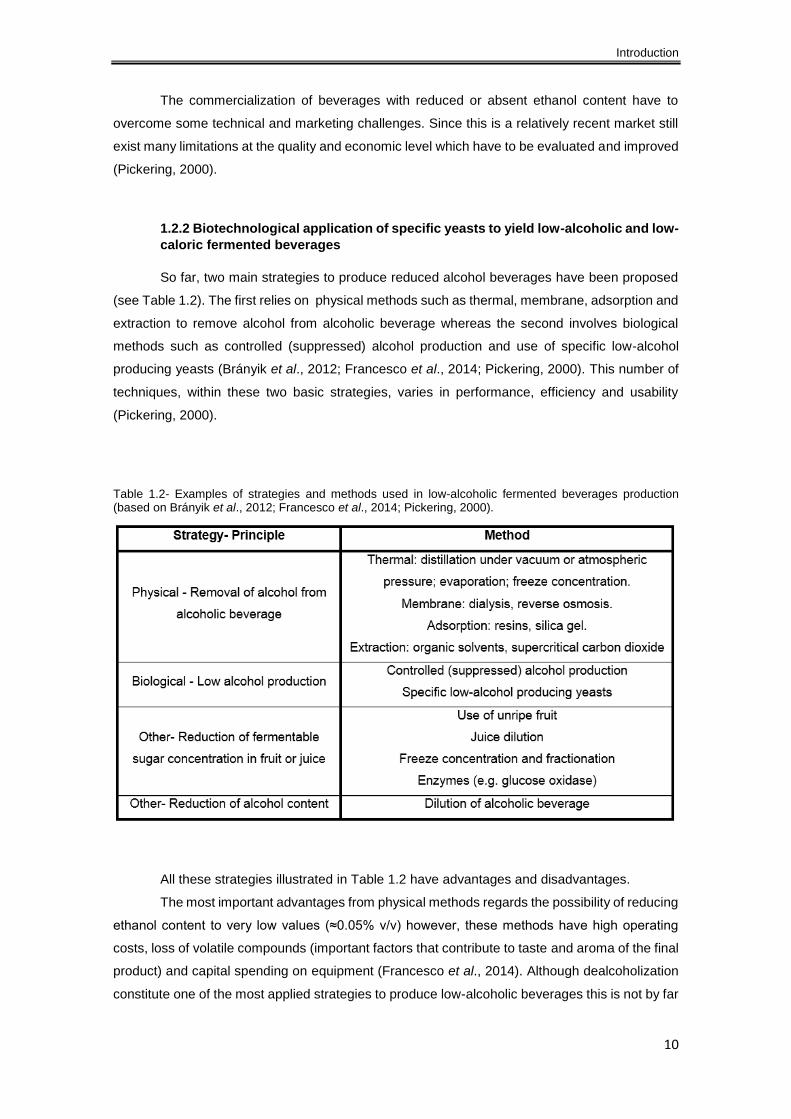
So far, two main strategies to produce reduced alcohol beverages have been proposed
(see Table 1.2). The first relies on physical methods such as thermal, membrane, adsorption and
extraction to remove alcohol from alcoholic beverage whereas the second involves biological
methods such as controlled (suppressed) alcohol production and use of specific low-alcohol
producing yeasts (Brányik et al., 2012; Francesco et al., 2014; Pickering, 2000). This number of
techniques, within these two basic strategies, varies in performance, efficiency and usability
(Pickering, 2000).
All these strategies illustrated in Table 1.2 have advantages and disadvantages.
The most important advantages from physical methods regards the possibility of reducing
ethanol content to very low values (≈0.05% v/v) however, these methods have high operating
costs, loss of volatile compounds (important factors that contribute to taste and aroma of the final
product) and capital spending on equipment (Francesco et al., 2014). Although dealcoholization
constitute one of the most applied strategies to produce low-alcoholic beverages this is not by far
Table 1.2- Examples of strategies and methods used in low-alcoholic fermented beverages production (based on Brányik et al., 2012; Francesco et al., 2014; Pickering, 2000).
Introduction
11
the one that produces the best results, at least in terms of costs and end product organoleptic
characteristics (Pickering, 2000).
Other common way to make low- and non-alcoholic fermented beverages consists in
monitoring alcohol formation at very low values by arrest of fermentation. The fermentation activity
can be arrested (stopped or checked) quickly by temperature inactivation (cooling to 0ºC or
pasteurization) and/or by removal of yeast from fermenting must (filtration or centrifugation).
Fermentation arrest is a simple and widespread method, without additional costs because it uses
the same resources as for standard alcoholic fermentation. Nonetheless, this suppression of
fermentation also prevents formation of essential compounds important for flavour, affecting final
product quality (Brányik et al., 2012; Francesco et al., 2014; Pickering, 2000).
Another strategy to reduce alcohol content in beverages regards the reduction of
fermentable sugar (glucose, fructose and sucrose) in fruit or fruit juice. Harvesting fruit at an early
stage of maturation result in a beverage with low-alcohol content since unripe fruit have much
lower sugar concentration. However, fermenting unripe fruit has its drawbacks, particularly with
respect to the aromas, because it originates a product with high acid levels (Pickering, 2000). A
method also used for reduction of fermentable sugar is freeze, concentration and fractionation
which involves the separation of fruit juice into a high-sugar and low-sugar fraction by freezing,
forming a slush. Low-sugar fraction supplemented with high-sugar fraction volatile compounds
are fermented to produce low-alcohol beverages (Pickering, 2000). This method also implies
specific equipment investment. Other methods used for alcohol content reduction involves dilution
with water, reduced-alcohol or partially fermented beverage to correct sensory imbalances
(Pickering, 2000).
Last strategy (biological) capable of producing fermented beverages with low-alcoholic
and low-caloric content is the use of specific low-alcohol producing yeasts. This kind of approach
is still under development and so it can be quite explored as a possibility for the future. This
process requires a specific yeast able to convert sugars into other end-products reducing ethanol
production. Over the past years several studies have been made regarding this particular subject
to screen yeast strains that might be used to yield this type of beverages. One approach included
S.cerevisiae genetic manipulation by diverting sugar metabolism into glycerol production reducing
ethanol formation (Pickering, 2000). However, genetic modified yeasts generates controversy
among consumers who have a negative attitude towards the use of these microorganisms in the
food industry. Additionally to ethical obstacles, improvements in typical yeasts like S.cerevisiae
increase the process costs due to the construction of intentional modified microorganisms
capable of producing low alcohol content. Therefore, the screening of specific yeast strains
capable of consuming fermentable sugars and naturally producing lower amounts of ethanol
could be an excellent option to overcome deadlocks associated with microbial improvement
(Brányik et al., 2012). Although it is a relatively recent strategy, it is deemed a great alternative
compared with the other methods because it is a biological technique that takes advantage of
microbial natural fermentative activity and does not require any additional investment in specific
Introduction
12
equipment. In addition to that, depending on the yeast it is possible to guide the fermentation
process towards low ethanol production using sugars to yield other fermentation products such
as sugar alcohols (glycerol, mannitol and erythritol) enriching the organoleptic properties of the
final low–alcoholic and low–caloric beverage.
Pichia stipitis proved to be able to remove more than 50% of juice sugar with no need to
add nutrients and with practically no adverse effects on sensorial qualities. It has also been
reported that Pichia stipitis and Candida tropicalis when incubated under aerobic conditions
produce 25-30% less alcohol compared with typical alcoholic fermentation yeast (S.cerevisiae)
and the end product displays an acceptable taste (Pickering, 2000).
Due to greater information about the benefits and risks of certain foods, nowadays
consumers are more concerned about health issues that may result from a poor diet. For this
reason, they try to reconcile a healthy product, preferably without added preservatives, with high
sensorial quality (Renuka et al., 2009). To try to satisfy this demand of modern society, besides
grape juice there is a possibility of fermenting other fruits aiming to produce healthier versions of
alcoholic beverages, taking advantage of those natural substrates for a healthy diet. Such
beverages can offer to consumers excellent alternatives, satisfying nutritional and sensorial
needs.
1.3 Fructophily phenomenon
1.3.1 Fructophilic behaviour basis and role of fructophilic yeasts
Fruits used to produce alcoholic or other beverages are composed by different types and
concentration of sugars. Usually, in the production of these beverages, typical yeasts
preferentially consume glucose compared with the other sugars.
The basis of the phenomenon of fructophily in yeasts was first investigated by Sols in
1956 (Sousa-dias et al., 1996). While most yeasts show a glucophilic behaviour such as
Saccharomyces cerevisiae (a typical wine and beer yeast) preferentially fermenting glucose
compared to other sugars, there are other yeasts which have an opposite behaviour (Leandro et
al., 2013; Yu et al., 2008). For those microorganisms, when glucose and fructose are both
available in the medium, fructose is utilized more rapidly than glucose. Such fructophilic behaviour
is characteristic of specific yeasts which are called fructophilic yeasts (Sousa-dias et al., 1996).
Fructophilic character of these microorganisms might prove to be important since the
fruits normally have higher content of fructose than glucose. This peculiar characteristic has been
investigated and is believed to be mainly associated with membrane transporters specific for
fructose. These transporters in the yeast membrane, increase cellular input of this sugar. In
addition, fructophily can also be linked to hexokinase enzymatic activity. This enzyme is
responsible for the phosphorylation of glucose into glucose-6-phosphate and fructose into
Introduction
13
fructose-6-phosphate and different kinetic parameters for glucose and fructose may also explain
fructose preference.
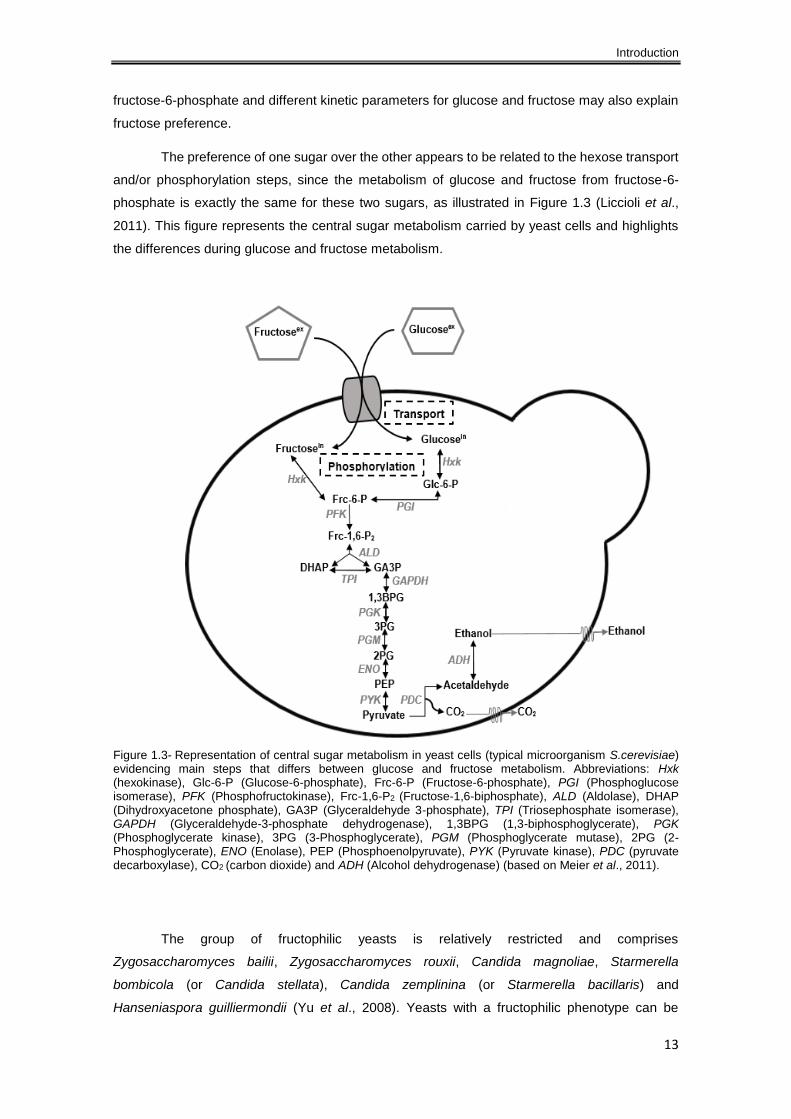
The preference of one sugar over the other appears to be related to the hexose transport
and/or phosphorylation steps, since the metabolism of glucose and fructose from fructose-6-
phosphate is exactly the same for these two sugars, as illustrated in Figure 1.3 (Liccioli et al.,
2011). This figure represents the central sugar metabolism carried by yeast cells and highlights
the differences during glucose and fructose metabolism.
Figure 1.3- Representation of central sugar metabolism in yeast cells (typical microorganism S.cerevisiae) evidencing main steps that differs between glucose and fructose metabolism. Abbreviations: Hxk (hexokinase), Glc-6-P (Glucose-6-phosphate), Frc-6-P (Fructose-6-phosphate), PGI (Phosphoglucose isomerase), PFK (Phosphofructokinase), Frc-1,6-P2 (Fructose-1,6-biphosphate), ALD (Aldolase), DHAP (Dihydroxyacetone phosphate), GA3P (Glyceraldehyde 3-phosphate), TPI (Triosephosphate isomerase), GAPDH (Glyceraldehyde-3-phosphate dehydrogenase), 1,3BPG (1,3-biphosphoglycerate), PGK (Phosphoglycerate kinase), 3PG (3-Phosphoglycerate), PGM (Phosphoglycerate mutase), 2PG (2-Phosphoglycerate), ENO (Enolase), PEP (Phosphoenolpyruvate), PYK (Pyruvate kinase), PDC (pyruvate decarboxylase), CO2 (carbon dioxide) and ADH (Alcohol dehydrogenase) (based on Meier et al., 2011).
The group of fructophilic yeasts is relatively restricted and comprises
Zygosaccharomyces bailii, Zygosaccharomyces rouxii, Candida magnoliae, Starmerella
bombicola (or Candida stellata), Candida zemplinina (or Starmerella bacillaris) and
Hanseniaspora guilliermondii (Yu et al., 2008). Yeasts with a fructophilic phenotype can be
Introduction
14
isolated from different natural environments characterized by high sugar concentrations, where
the main sugar present is fructose. Some examples of these environments are fruit juices and
honeycombs. The discovery of these yeasts allowed a large number of studies to try to overcome
one of the major problems in wine fermentation. Saccharomyces cerevisiae preference for
consuming glucose before fructose can sometimes generate incomplete or stuck and slow or
sluggish fermentations. Stuck fermentations are characterized by having higher than desired
residual sugar content at the end of alcoholic fermentation and sluggish fermentations are defined
as low utilization sugar rate fermentations (Liccioli et al., 2011).
Thus, during alcoholic fermentation carried by S.cerevisiae the consumption of both
sugars follows a predetermined pattern with glucose content decreasing faster than fructose. This
effect is reflected more clearly in the end of the fermentation where the discrepancy between
glucose and fructose concentration is too high. Consequently, during the late stages of alcoholic
fermentation fructose becomes the main sugar present since glucose was practically all
consumed (Liccioli et al., 2011). The stress created from these conditions result in sluggish
fermentations since yeasts, may became unable to ferment this sugar in the presence of large
amounts of ethanol causing the termination of the fermentation.
Therefore, as a possible strategy to overcome this issue, a combination between
glucophilic and fructophilic yeasts could be used, where the first ones dominate the early stage,
consuming preferentially glucose, and the second takes over the later stage of fermentation
process, depleting remaining fructose from the medium. Furthermore, non-Saccharomyces
species might use fructose to produce other secondary metabolites that contribute to increased
complexity of organoleptic features in end product.
1.3.2 Fructose membrane transporters
One of the main targets for fructose preference in some yeasts regards fructose transport
carried by specific membrane transporters. These transporters are responsible for the rate limiting
step of glycolytic flux and are capable of transporting the sugar from the outside to inside the cell.
Hence, the fructophilic phenotype basis might reside in the performance of transport systems for
hexose (Lee et al., 2013).
In most organisms, including yeasts, sugar transporters are crucial for supplying cells with
energy and a source of carbon. Hexose transporters (Hxt) identified in S.cerevisiae, which
mediate hexose (glucose and fructose) import, are membrane-spanning transport proteins
(permeases) that transport sugar through passive, energy-independent facilitated diffusion down
a concentration gradient. These transporters belong to the diverse Major Facilitator Superfamily.
Sugar transporters, other than Hxt, that are members of this superfamily can operate via active
proton symport mechanisms (Leandro et al., 2011). The kinetic characterization of S.cerevisiae
low and high affinity transport systems revealed that affinity is always five or ten times higher for
glucose than fructose. This affinity difference for glucose compared to fructose would support a
Introduction
15
link between glucose preference and a glucophilic behaviour shown by S.cerevisiae (Liccioli et
al., 2011; Pina et al., 2004; Sousa-dias et al., 1996).
However, in some non-Saccharomyces cerevisiae yeasts such as Zygosaccharomyces
bailii (Z.bailii), Zygosaccharomyces rouxii (Z.rouxii) and Candida magnoliae (C.magnoliae)
transport systems with a clear preference for fructose have been recently characterized,
suggesting the emergence of a new family of sugar transporters (Leandro et al., 2011; Leandro
et al., 2013; Lee et al., 2013). Curiously, or not, these yeasts who have fructose-specific
transporters exhibit a fructophilic behaviour, consuming fructose faster than glucose, and are
called fructophilic yeasts (Pina et al., 2004; Sousa-dias et al., 1996). This particular behaviour in
these two Zygosaccharomyces species, mainly at high sugar content, is based on three different
mechanisms: The high capacity of the specific fructose transporter; the competition of fructose
and glucose for the hexose transport system; and the inactivation of the glucose facilitator by high
fructose concentrations (Sousa-dias et al., 1996). The two main fructose-specific transport
systems identified and characterized in these three fructophilic yeasts are Fsy1, a specific high-
affinity, low-capacity energy-dependent H+ symporter that mediates fructose transport, and Ffz1,
a low-affinity, high-capacity facilitated diffusion system specific for fructose with a poor homology
to other facilitated diffusion systems like Hxt family. Usually, sugar-proton symporters only operate
when relatively low sugar content is available, where facilitated diffusion would not be efficient
enough due to their low affinity, and are able to transport sugar against its concentration gradient
simultaneously with the movement of protons. Facilitators are employed when sufficient amount
of sugar is present, so the transported molecules are rapidly metabolized inside the cells and an
efficient facilitated diffusion occurs due to maintenance of the inward gradient of sugar (Leandro
et al., 2013).
Nevertheless, the first fructose-specific transporters were identified and characterized in
non-fructophilic yeasts and fungi. The first high-affinity fructose-specific symporter (SpFsy1)
characterized was from Saccharomyces pastorianus PYCC 4457, the type strain of S.
carlsbergensis. Later, other high-affinity fructose symporters were found in the aerobic milk yeast
Kluyveromyces lactis (KlFrt1) and the gray mold Botrytis cinerea (BcFrt1). More recently, a high-
affinity fructose symporter (ScFsy1) from the commercial wine yeast S.cerevisiae EC 1118 was
reported. Moreover, three other fructose-specific transporters were characterized from
Zygosaccharomyces bailii (ZbFfz1) and Zygosaccharomyces rouxii (ZrFsy1 and ZrFfz1), which
in contrast with the previous these two are fructophilic yeasts. Recently, two fructose-specific
transporters from the fructophilic yeast Candida magnoliae JH110 (CmFsy1 and CmFfz1) were
also identified and characterized (Lee et al., 2013). The kinetic parameters of these yeasts and
fungi fructose-specific transporters are illustrated in Table 1.3.
Introduction
16
Table 1.3- Kinetic parameters of fructose-specific transporters characterized in yeasts and fungi (based on Lee et al., 2013).
Despite these fructose transporters were first found in non-fructophilic yeasts, the majority
of yeasts harboring such transporters exhibit fructophilic behaviour and the focus will be about
them.
Zygosaccharomyces spp. has extreme osmotolerance properties and that is why they
can be isolated from high-sugar and high-salt content environments such as sugar syrups, honey,
fruit juices, carbonated soft drinks, sauces, salad dressing and ketchup. In some studies, Z. bailii
and Z.rouxii are characterized as food-spoilage yeasts since they are able to survive and grow
under harsh conditions such as those present in preserved food and beverages: low water activity,
low pH and tolerate high temperatures that are restrictive for most yeasts (Leandro et al., 2011).
These two Zygosaccharomyces species exhibit an abnormal resistance to common preservatives
like sulphur dioxide, ethanol and acetic acid and have a high potential for the synthesis of
Species Transporter Function Km (mM)
Vmax
(mmol.h-
1.(gdw)-1)
Reference
Saccharomyces
pastorianus PYCC
4457
SpFsy1 H+
symporter 0.16±0.02 3.8±0.2
(Gonçalves
et al., 2000).
Kluyveromyces lactis KlFrt1 H+
symporter 0.16±0.02 0.10±0.02
(Diezemann
and Bloes,
2003)
Botrytis cinerea BcFrt1 H+
symporter 1.1 0.66
(Doehleman
n et al.,
2005).
S.cerevisiae EC
1118 ScFsy1
H+
symporter 0.24±0.04 0.93±0.08
(Galeote et
al., 2010).
Zygosaccharomyces
bailii ZbFfz1 Facilitator 80.4 3.3
(Pina et al.,
2004)
Zygosaccharomyces
rouxii ZrFsy1
H+
symporter 0.45±0.07 0.57±0.02
(Leandro et
al., 2013)
Zygosaccharomyces
rouxii ZrFfz1 Facilitator
424.2±16
3.1 12.7±3.3
(Leandro et
al., 2011)
Candida magnoliae
JH110 CmFsy1
H+
symporter 0.13±0.01 2.1±0.3
(Lee et al.,
2013).
Candida magnoliae
JH110 CmFfz1 Facilitator 105±12 8.6±0.4
(Lee et al.,
2013).

Introduction
17
undesired by-products and off-flavours like acetic acid or acetaldehyde (Leandro et al., 2013; Pina
et al., 2004). On the other hand, Candida spp. are a heterogeneous genus of yeasts, containing
endosymbionts of animal hosts, commensals of the skin, the gastrointestinal and the
genitourinary tracts, plant pathogens as well as species utilized in the refinement of food and
beverages. Candida magnoliae is a species from this genus that is able to grow over a wide range
of pH values, under high sugar concentrations and also have a different fermentative profile,
producing sugar alcohols instead ethanol (Lee et al., 2013).
In Z. bailii and Z.rouxii, sugar transporters, designed as Ffz (Fructose Facilitator of
Zygosaccharomyces) have been identified and characterized. ZrFfz1 and ZrFfz 2 transporters in
Z.rouxii are two similar low-affinity high-capacity facilitators that transport specifically fructose or
both fructose and glucose, respectively (Leandro et al., 2013). ZrFfz1 transports fructose with a
Km of 400mM and a Vmax of 13 mmol.h-1.g-1, while ZrFfz2 transports glucose and fructose with
similar affinity, Km of 200mM and capacity, Vmax of 4 mmol.h-1.g-1, values (Leandro et al., 2011).
A study about the transport systems in Z. bailii demonstrated that fructose was transported by a
specific low-affinity, high-capacity transport system with a Km of 65.6mM and a Vmax of 6.7mmol.g-
1.h-1 (Sousa-dias et al., 1996). Another investigation, showed for this yeast that fructose uptake
involve facilitated diffusion mechanisms and is carried by a high-capacity, low-affinity transporter
specific for this sugar and a second system that transports with low-capacity and high-affinity
sugars like glucose, fructose and 2-deoxyglucose. The fructose-specific transporter Ffz1
(permease) exhibited a Km of 80.4mM and Vmax of 3.3 mmol.h-1.g-1 and was the first known
facilitated diffusion system specific for fructose (Pina et al., 2004). These three proteins, ZrFfz1,
ZrFfz2 and ZbFfz1, belong to a new family of sugar transport systems capable of mediating the
uptake of hexoses via facilitated diffusion mechanism and their primary protein structure have
more homology with drug/H+ antiporters than with the other yeast sugar transporters members of
the Major Facilitator Superfamily (Leandro et al., 2011; Leandro et al., 2013).
Zygosaccharomyces rouxii also has a high-affinity, low capacity fructose/H+ symporter called
ZrFsy1. Kinetic parameters of this transporter revealed a Km of 0.45±0.07mM and a Vmax of
0.57±0.02 mmol.h-1.(gdw)-1 (Leandro et al., 2013). The existence of this fructose/H+ symporter
was unexpected since Z.rouxii import sugars through low-affinity, high-capacity facilitators (ZrFfz1
and ZrFfz2) without spending energy on symport with protons. Thus, in environments with low
sugar concentrations the yeasts invest energy in transport through active maintenance of the
proton motive force, whereas when sugar concentration is high the concentration gradient across
the plasma membrane is enough to maintain an active catabolism. In contrast with the two
facilitators, ZrFsy1 is phylogenetically related with the other sugar transporters that belong to the
Major Facilitator Superfamily and is closely related to the other already characterized specific
fructose/H+ symporters (Leandro et al., 2013).
In the osmotolerant and fructophilic yeast Candida magnoliae JH110 two fructose-specific
transporters, CmFsy1 and CmFfz1 were also identified and characterized, which demonstrate

Introduction
18
high homology with known fructose transporters of other yeasts such as Z.rouxii (ZrFsy1, ZrFfz1,
ZrFfz2) and Z.bailii (ZbFfz1), described above (Lee et al., 2013). Kinetic analysis showed that
CmFsy1 is a high-affinity, low-capacity fructose-proton symporter with a Km of 0.13±0.01mM and
a Vmax of 2.1±0.3 mmol.h-1.(gdw)-1, while CmFfz1 is a low-affinity, high-capacity fructose-specific
facilitator with a Km of 105±12mM and a Vmax of 8.6±0.7 mmol.h-1.(gdw)-1. CmFfz1 along with
ZrFfz1, ZrFfz2 and ZbFfz1 form a new fructose transport family. As for Z.rouxii, when C.magnoliae
JH110 is under low fructose concentration environments utilizes a proton motive force for fructose
transport through the CmFsy1 transporter whereas, when fructose is present in high amounts the
yeast transport this sugar through facilitated diffusion employing the CmFfz1 transporter (Lee et
al., 2013).
1.3.3 Sugars phosphorylation by hexokinase enzyme activity
As already mentioned, one of the main steps that differs between glucose and fructose
metabolism is the phosphorylation carried out by the enzyme hexokinase. Thus, another further
likely target for fructose preference, apart from transport, is the hexose phosphorylation the first
step of sugar metabolism. This is one of the key steps associated with the regulation of the
fermentative metabolism in yeasts. Once the sugars (hexoses) such as glucose and fructose have
been imported into the cell, hexokinase is responsible for phosphorylating them into their hexose-
6-phosphate form and for this makes use of ATP as a phosphate group donor cofactor.
The yeast S.cerevisiae have three distinct isozymes involved in glucose phosphorylation,
hexokinase I and II (Hxk I and II) and glucokinase. In a fermentation environment, hexokinase
type II appears to play the main role during sugar phosphorylation, since it is the predominant
enzyme during growth on glucose or fructose (Liccioli et al., 2011). Kinetic parameters values of
S.cerevisiae Hxk I and II (Table 1.4) illustrate that affinity for fructose is the same in both enzymes
but the affinity for glucose is slightly different between these two hexokinases. Km values of Hxk I
and II show that is 13 and 6 times higher for fructose, respectively. As Km values are inversely
proportional to affinity this indicate that Hxk I and II have a higher affinity for glucose. In terms of
capacity, an interesting data is that Hxk I has a threefold higher Vmax with fructose as a substrate
than with glucose, while for Hxk II glucose and fructose Vmax values are quite similar. Therefore,
the higher affinity for glucose instead fructose displayed by S.cerevisiae hexokinases may play a
critical role on the development of the glucophilic behaviour of this yeast (Berthels et al., 2008).

Introduction
19
Table 1.4- Kinetic parameters, Km and Vmax, of Saccharomyces cerevisiae hexokinase I and II (based on Berthels et al., 2008).
As already mentioned, enzymatic phosphorylation of sugars, glucose and fructose, has
been proposed as one of the two possible triggers for the development of phenotypical hexose
preference in yeasts. Although the enzyme responsible for this first step of sugar metabolism is
the same, hexokinase, its activity might be modelled in terms of affinity and capacity depending
on the substrate. Thus, the preference for phosphorylating a sugar rather than the other can be
reflected on the final behaviour of the yeast, being glucophilic or fructophilic.
1.4 Candida magnoliae
1.4.1 Yeast with unusual properties
The osmotolerant yeast Candida magnoliae has very peculiar characteristics compared
to other typical yeasts, facts that make it very interesting for industrial uses (Park et al., 2011; Yu
et al., 2008). One of the particularities of this yeast is its fructophilic behaviour, i.e. in a mixture of
sugars, it is able to consume fructose quickly compared to other sugars. This yeast is also able
to grow under a wide range of pH values (at least between 2.5 and 8.0) in the presence of high
concentrations of sugar (≥300g/L glucose and fructose) and can produce organic acids and sugar
alcohols like erythritol, mannitol and glycerol (Kim et al., 2013; Yu et al., 2008). The nature,
composition and concentration of media constituents directly influence the composition of sugar
alcohols produced by this yeast (Savergave et al., 2011). This ability to withstand high solute
content (hyper-osmotic environments) namely high sugar concentrations is called osmotolerance
(Kim et al., 2013; Savergave et al., 2011; Yu et al., 2008). As mentioned above, C.magnoliae is
able to produce sugar alcohols that are also found naturally in fruits and vegetables in small
quantities. These compounds are a class of polyols in which the sugar’s carbonyl (aldehyde or
ketone) is reduced to the corresponding primary or secondary hydroxyl group therefore, they have
characteristics similar to sugar and are used to improve the nutritional profile of food products
(Akinterinwa et al., 2008).
Erythritol is a sugar alcohol that comprises four carbon atoms, has a pleasant taste, is
non-cariogenic, since it cannot be fermented by dental caries-producing bacteria, and lack of
insulin-stimulating properties, hence its use as a low-calorie sweetener (0.3 kcal.g-1) and
pharmaceutical excipient safe for diabetics (Park et al., 2011; Yu et al., 2006; Yu et al., 2008).
This sugar alcohol is allowed to be used as a flavor enhancer, formulation aid, humectant, non-
Hexokinase Km (mM)
Km Fruc/Km Gluc Vmax Fruc/Vmax Gluc Glucose Fructose
Hxk I 0.12 1.5 13 3
Hxk II 0.25 1.5 6 ≈1
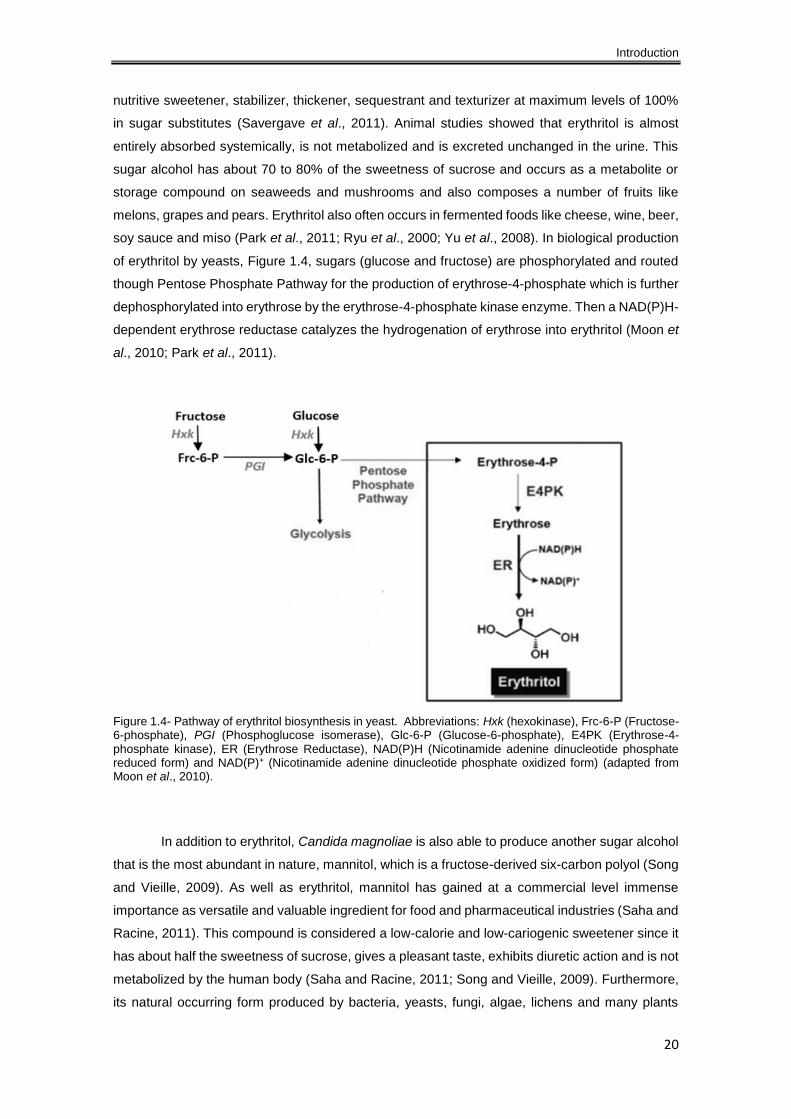
Introduction
20
nutritive sweetener, stabilizer, thickener, sequestrant and texturizer at maximum levels of 100%
in sugar substitutes (Savergave et al., 2011). Animal studies showed that erythritol is almost
entirely absorbed systemically, is not metabolized and is excreted unchanged in the urine. This
sugar alcohol has about 70 to 80% of the sweetness of sucrose and occurs as a metabolite or
storage compound on seaweeds and mushrooms and also composes a number of fruits like
melons, grapes and pears. Erythritol also often occurs in fermented foods like cheese, wine, beer,
soy sauce and miso (Park et al., 2011; Ryu et al., 2000; Yu et al., 2008). In biological production
of erythritol by yeasts, Figure 1.4, sugars (glucose and fructose) are phosphorylated and routed
though Pentose Phosphate Pathway for the production of erythrose-4-phosphate which is further
dephosphorylated into erythrose by the erythrose-4-phosphate kinase enzyme. Then a NAD(P)H-
dependent erythrose reductase catalyzes the hydrogenation of erythrose into erythritol (Moon et
al., 2010; Park et al., 2011).
Figure 1.4- Pathway of erythritol biosynthesis in yeast. Abbreviations: Hxk (hexokinase), Frc-6-P (Fructose-6-phosphate), PGI (Phosphoglucose isomerase), Glc-6-P (Glucose-6-phosphate), E4PK (Erythrose-4-phosphate kinase), ER (Erythrose Reductase), NAD(P)H (Nicotinamide adenine dinucleotide phosphate reduced form) and NAD(P)+ (Nicotinamide adenine dinucleotide phosphate oxidized form) (adapted from Moon et al., 2010).
In addition to erythritol, Candida magnoliae is also able to produce another sugar alcohol
that is the most abundant in nature, mannitol, which is a fructose-derived six-carbon polyol (Song
and Vieille, 2009). As well as erythritol, mannitol has gained at a commercial level immense
importance as versatile and valuable ingredient for food and pharmaceutical industries (Saha and
Racine, 2011). This compound is considered a low-calorie and low-cariogenic sweetener since it
has about half the sweetness of sucrose, gives a pleasant taste, exhibits diuretic action and is not
metabolized by the human body (Saha and Racine, 2011; Song and Vieille, 2009). Furthermore,
its natural occurring form produced by bacteria, yeasts, fungi, algae, lichens and many plants
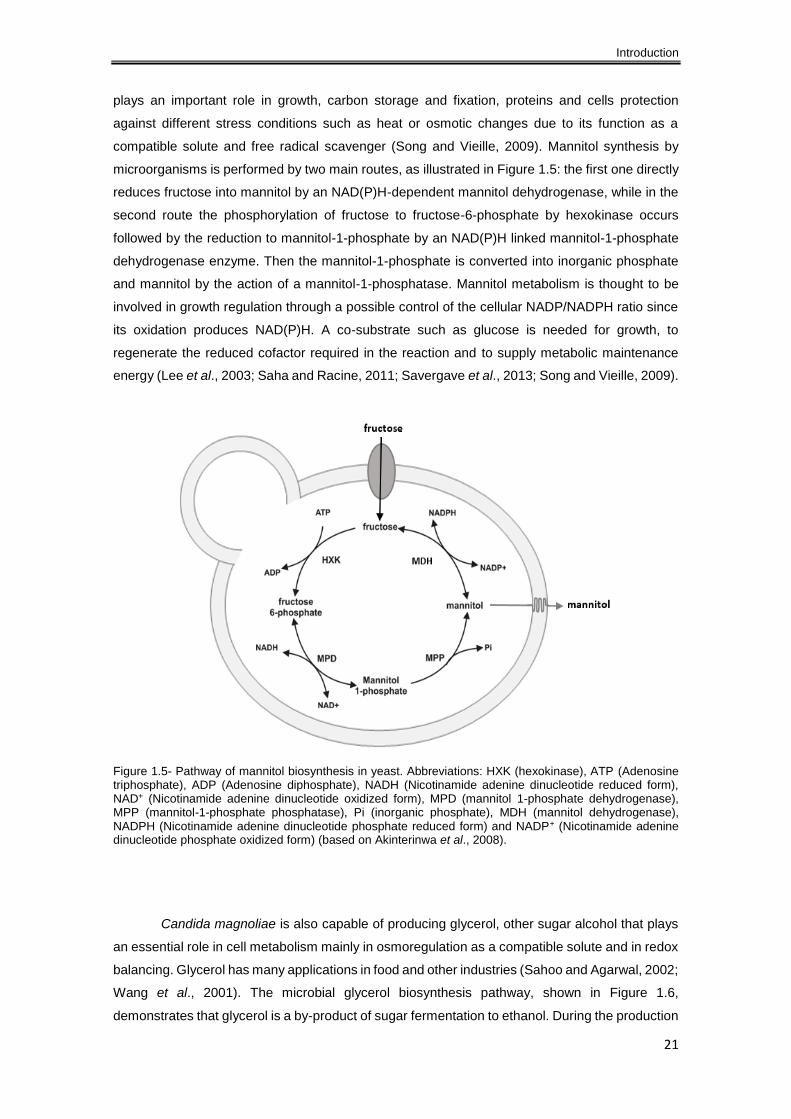
Introduction
21
plays an important role in growth, carbon storage and fixation, proteins and cells protection
against different stress conditions such as heat or osmotic changes due to its function as a
compatible solute and free radical scavenger (Song and Vieille, 2009). Mannitol synthesis by
microorganisms is performed by two main routes, as illustrated in Figure 1.5: the first one directly
reduces fructose into mannitol by an NAD(P)H-dependent mannitol dehydrogenase, while in the
second route the phosphorylation of fructose to fructose-6-phosphate by hexokinase occurs
followed by the reduction to mannitol-1-phosphate by an NAD(P)H linked mannitol-1-phosphate
dehydrogenase enzyme. Then the mannitol-1-phosphate is converted into inorganic phosphate
and mannitol by the action of a mannitol-1-phosphatase. Mannitol metabolism is thought to be
involved in growth regulation through a possible control of the cellular NADP/NADPH ratio since
its oxidation produces NAD(P)H. A co-substrate such as glucose is needed for growth, to
regenerate the reduced cofactor required in the reaction and to supply metabolic maintenance
energy (Lee et al., 2003; Saha and Racine, 2011; Savergave et al., 2013; Song and Vieille, 2009).
Figure 1.5- Pathway of mannitol biosynthesis in yeast. Abbreviations: HXK (hexokinase), ATP (Adenosine triphosphate), ADP (Adenosine diphosphate), NADH (Nicotinamide adenine dinucleotide reduced form), NAD+ (Nicotinamide adenine dinucleotide oxidized form), MPD (mannitol 1-phosphate dehydrogenase), MPP (mannitol-1-phosphate phosphatase), Pi (inorganic phosphate), MDH (mannitol dehydrogenase), NADPH (Nicotinamide adenine dinucleotide phosphate reduced form) and NADP+ (Nicotinamide adenine dinucleotide phosphate oxidized form) (based on Akinterinwa et al., 2008).
Candida magnoliae is also capable of producing glycerol, other sugar alcohol that plays
an essential role in cell metabolism mainly in osmoregulation as a compatible solute and in redox
balancing. Glycerol has many applications in food and other industries (Sahoo and Agarwal, 2002;
Wang et al., 2001). The microbial glycerol biosynthesis pathway, shown in Figure 1.6,
demonstrates that glycerol is a by-product of sugar fermentation to ethanol. During the production
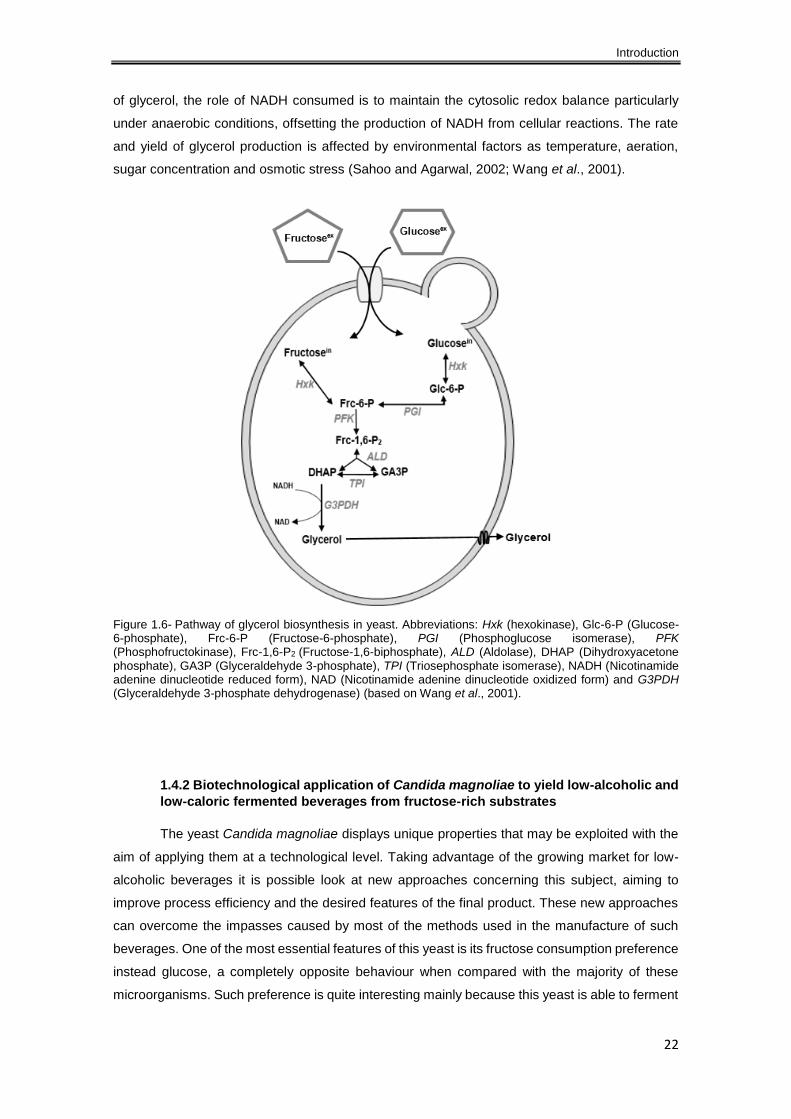
Introduction
22
of glycerol, the role of NADH consumed is to maintain the cytosolic redox balance particularly
under anaerobic conditions, offsetting the production of NADH from cellular reactions. The rate
and yield of glycerol production is affected by environmental factors as temperature, aeration,
sugar concentration and osmotic stress (Sahoo and Agarwal, 2002; Wang et al., 2001).
Figure 1.6- Pathway of glycerol biosynthesis in yeast. Abbreviations: Hxk (hexokinase), Glc-6-P (Glucose-6-phosphate), Frc-6-P (Fructose-6-phosphate), PGI (Phosphoglucose isomerase), PFK (Phosphofructokinase), Frc-1,6-P2 (Fructose-1,6-biphosphate), ALD (Aldolase), DHAP (Dihydroxyacetone phosphate), GA3P (Glyceraldehyde 3-phosphate), TPI (Triosephosphate isomerase), NADH (Nicotinamide adenine dinucleotide reduced form), NAD (Nicotinamide adenine dinucleotide oxidized form) and G3PDH (Glyceraldehyde 3-phosphate dehydrogenase) (based on Wang et al., 2001).
1.4.2 Biotechnological application of Candida magnoliae to yield low-alcoholic and
low-caloric fermented beverages from fructose-rich substrates
The yeast Candida magnoliae displays unique properties that may be exploited with the
aim of applying them at a technological level. Taking advantage of the growing market for low-
alcoholic beverages it is possible look at new approaches concerning this subject, aiming to
improve process efficiency and the desired features of the final product. These new approaches
can overcome the impasses caused by most of the methods used in the manufacture of such
beverages. One of the most essential features of this yeast is its fructose consumption preference
instead glucose, a completely opposite behaviour when compared with the majority of these
microorganisms. Such preference is quite interesting mainly because this yeast is able to ferment
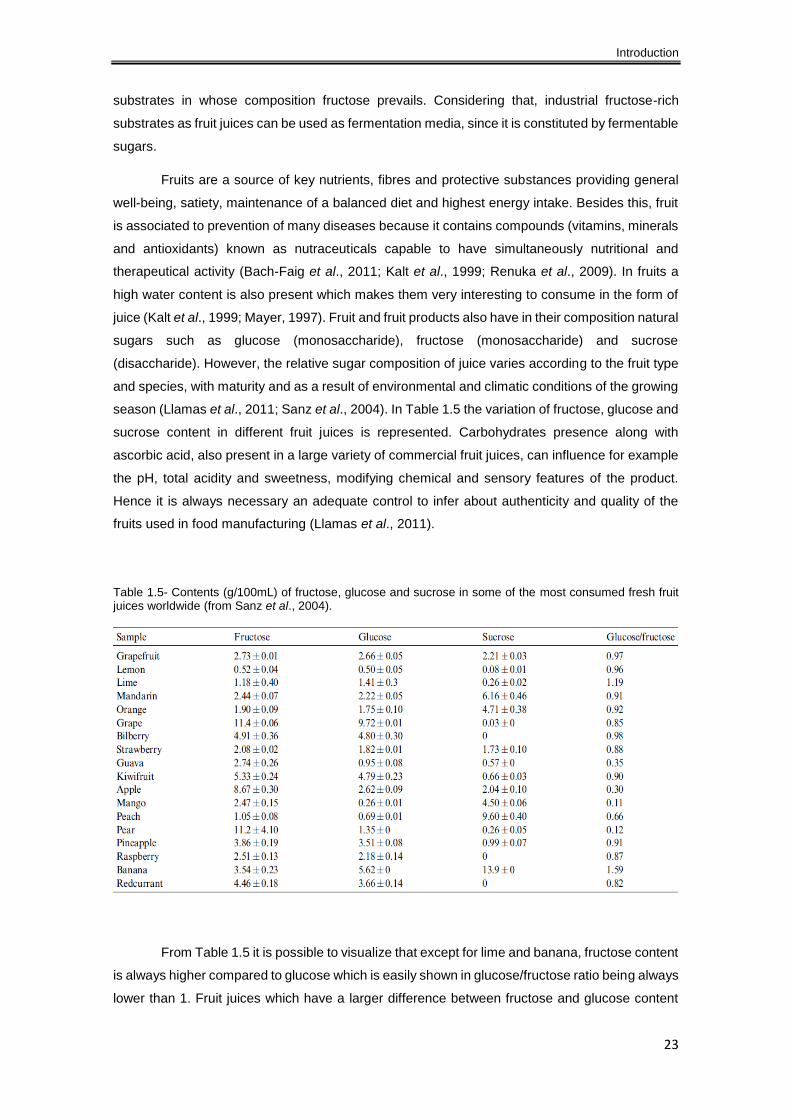
Introduction
23
substrates in whose composition fructose prevails. Considering that, industrial fructose-rich
substrates as fruit juices can be used as fermentation media, since it is constituted by fermentable
sugars.
Fruits are a source of key nutrients, fibres and protective substances providing general
well-being, satiety, maintenance of a balanced diet and highest energy intake. Besides this, fruit
is associated to prevention of many diseases because it contains compounds (vitamins, minerals
and antioxidants) known as nutraceuticals capable to have simultaneously nutritional and
therapeutical activity (Bach-Faig et al., 2011; Kalt et al., 1999; Renuka et al., 2009). In fruits a
high water content is also present which makes them very interesting to consume in the form of
juice (Kalt et al., 1999; Mayer, 1997). Fruit and fruit products also have in their composition natural
sugars such as glucose (monosaccharide), fructose (monosaccharide) and sucrose
(disaccharide). However, the relative sugar composition of juice varies according to the fruit type
and species, with maturity and as a result of environmental and climatic conditions of the growing
season (Llamas et al., 2011; Sanz et al., 2004). In Table 1.5 the variation of fructose, glucose and
sucrose content in different fruit juices is represented. Carbohydrates presence along with
ascorbic acid, also present in a large variety of commercial fruit juices, can influence for example
the pH, total acidity and sweetness, modifying chemical and sensory features of the product.
Hence it is always necessary an adequate control to infer about authenticity and quality of the
fruits used in food manufacturing (Llamas et al., 2011).
Table 1.5- Contents (g/100mL) of fructose, glucose and sucrose in some of the most consumed fresh fruit juices worldwide (from Sanz et al., 2004).
From Table 1.5 it is possible to visualize that except for lime and banana, fructose content
is always higher compared to glucose which is easily shown in glucose/fructose ratio being always
lower than 1. Fruit juices which have a larger difference between fructose and glucose content
Introduction
24
are guava, apple, mango, peach and pear. Besides the variation between glucose and fructose,
sucrose also shows different concentration patterns depending on the fruit. Higher values for
fructose compared to sucrose are displayed for most fruits excluding mandarin, orange, mango,
peach and banana (Sanz et al., 2004). Considering these data, the majority of fruit juices
consumed worldwide are excellent fermentable substrates but with fructose being the main sugar.
Hence, fruit juices can be used as a substrate for fermentation maintaining its nutritional value,
flavor and color even after the process, allowing the obtention of a low-caloric end product with
significant quality.
Therefore, it might be practicable to use the behaviour of Candida magnoliae to ferment
fructose, as well as the other sugars, to yield low-calory fermented beverages. In addition to that,
is the ability of this yeast to direct the fermentation process to sugar alcohol formation reducing
ethanol production. Also taking advantage of this feature there is a potential to apply C.magnoliae
as a biological strategy to yield low-alcoholic fermented beverages.
The absence or presence of low-alcohol content is the main condition to produce low-
alcoholic beverages however, such as alcoholic beverages these must meet certain requirements
such as stability and organoleptic/sensory quality that depends on the complex balance between
flavor, color, body and viscosity. Sugar alcohols produced by this yeast play an important role in
achieving organoleptic characteristics required for the quality of the product. Given the reduced
or absent ethanol production at the end of the fermentation process carried by this specific yeast
there’s no need for a dealcoholization step so there will be no loss of volatile compounds which
are very important for flavor.
Thus, the implementation of this biological strategy might be an outstanding possibility
since it does not require additional costs for equipment, makes use of accessible natural
substrates like fruit juices which provide all compounds needed for fermentation, is based on a
biological method equal to that used since thousands of years ago employing a microorganism
and it can produce low-alcoholic and low-caloric fermented beverages with pleasant sensorial
features.

25
2. Materials and Methods
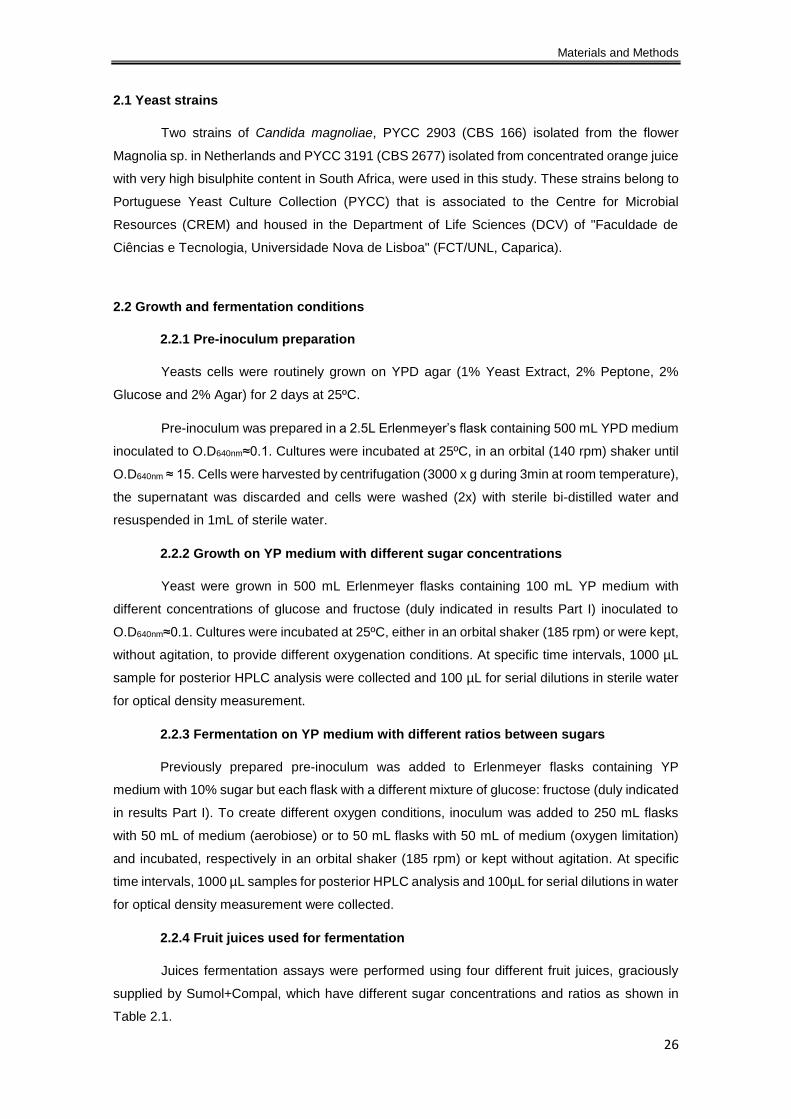
Materials and Methods
26
2.1 Yeast strains
Two strains of Candida magnoliae, PYCC 2903 (CBS 166) isolated from the flower
Magnolia sp. in Netherlands and PYCC 3191 (CBS 2677) isolated from concentrated orange juice
with very high bisulphite content in South Africa, were used in this study. These strains belong to
Portuguese Yeast Culture Collection (PYCC) that is associated to the Centre for Microbial
Resources (CREM) and housed in the Department of Life Sciences (DCV) of "Faculdade de
Ciências e Tecnologia, Universidade Nova de Lisboa" (FCT/UNL, Caparica).
2.2 Growth and fermentation conditions
2.2.1 Pre-inoculum preparation
Yeasts cells were routinely grown on YPD agar (1% Yeast Extract, 2% Peptone, 2%
Glucose and 2% Agar) for 2 days at 25ºC.
Pre-inoculum was prepared in a 2.5L Erlenmeyer’s flask containing 500 mL YPD medium
inoculated to O.D640nm≈0.1. Cultures were incubated at 25ºC, in an orbital (140 rpm) shaker until
O.D640nm ≈ 15. Cells were harvested by centrifugation (3000 x g during 3min at room temperature),
the supernatant was discarded and cells were washed (2x) with sterile bi-distilled water and
resuspended in 1mL of sterile water.
2.2.2 Growth on YP medium with different sugar concentrations
Yeast were grown in 500 mL Erlenmeyer flasks containing 100 mL YP medium with
different concentrations of glucose and fructose (duly indicated in results Part I) inoculated to
O.D640nm≈0.1. Cultures were incubated at 25ºC, either in an orbital shaker (185 rpm) or were kept,
without agitation, to provide different oxygenation conditions. At specific time intervals, 1000 µL
sample for posterior HPLC analysis were collected and 100 µL for serial dilutions in sterile water
for optical density measurement.
2.2.3 Fermentation on YP medium with different ratios between sugars
Previously prepared pre-inoculum was added to Erlenmeyer flasks containing YP
medium with 10% sugar but each flask with a different mixture of glucose: fructose (duly indicated
in results Part I). To create different oxygen conditions, inoculum was added to 250 mL flasks
with 50 mL of medium (aerobiose) or to 50 mL flasks with 50 mL of medium (oxygen limitation)
and incubated, respectively in an orbital shaker (185 rpm) or kept without agitation. At specific
time intervals, 1000 µL samples for posterior HPLC analysis and 100µL for serial dilutions in water
for optical density measurement were collected.
2.2.4 Fruit juices used for fermentation
Juices fermentation assays were performed using four different fruit juices, graciously
supplied by Sumol+Compal, which have different sugar concentrations and ratios as shown in
Table 2.1.
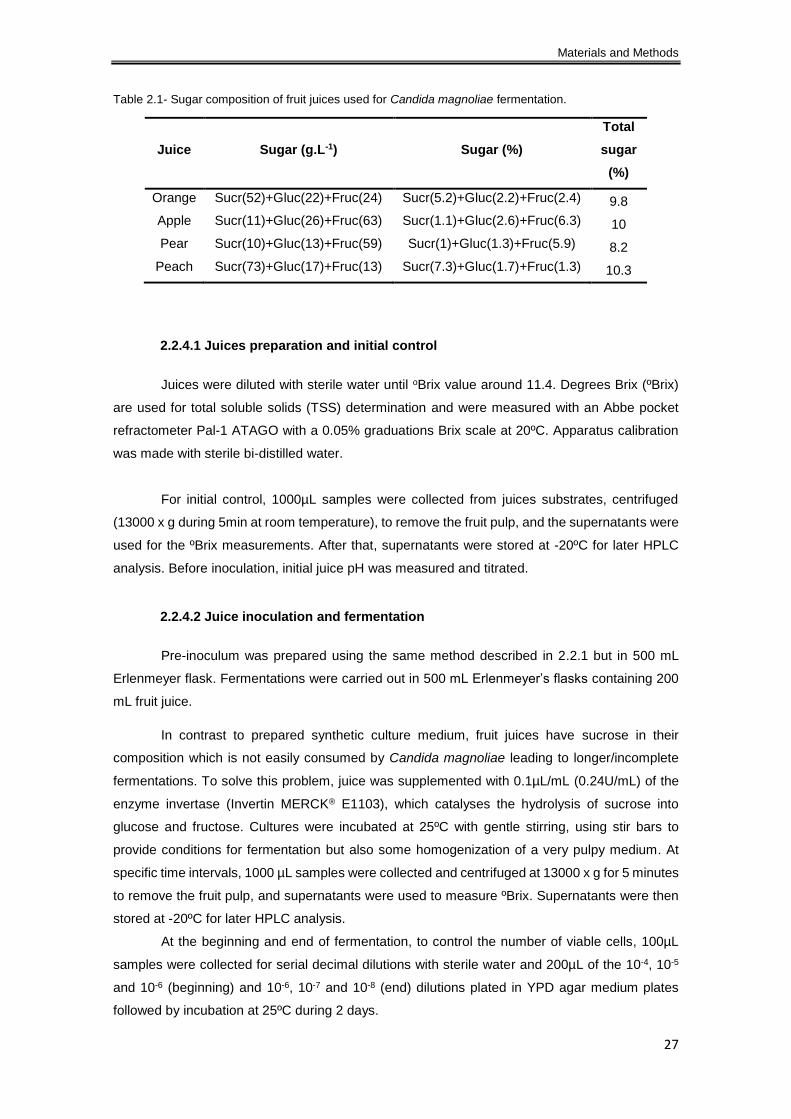
Materials and Methods
27
Table 2.1- Sugar composition of fruit juices used for Candida magnoliae fermentation.
Juice Sugar (g.L-1) Sugar (%)
Total
sugar
(%)
Orange Sucr(52)+Gluc(22)+Fruc(24) Sucr(5.2)+Gluc(2.2)+Fruc(2.4) 9.8
Apple Sucr(11)+Gluc(26)+Fruc(63) Sucr(1.1)+Gluc(2.6)+Fruc(6.3) 10
Pear Sucr(10)+Gluc(13)+Fruc(59) Sucr(1)+Gluc(1.3)+Fruc(5.9) 8.2
Peach Sucr(73)+Gluc(17)+Fruc(13) Sucr(7.3)+Gluc(1.7)+Fruc(1.3) 10.3
2.2.4.1 Juices preparation and initial control
Juices were diluted with sterile water until oBrix value around 11.4. Degrees Brix (ºBrix)
are used for total soluble solids (TSS) determination and were measured with an Abbe pocket
refractometer Pal-1 ATAGO with a 0.05% graduations Brix scale at 20ºC. Apparatus calibration
was made with sterile bi-distilled water.
For initial control, 1000µL samples were collected from juices substrates, centrifuged
(13000 x g during 5min at room temperature), to remove the fruit pulp, and the supernatants were
used for the ºBrix measurements. After that, supernatants were stored at -20ºC for later HPLC
analysis. Before inoculation, initial juice pH was measured and titrated.
2.2.4.2 Juice inoculation and fermentation
Pre-inoculum was prepared using the same method described in 2.2.1 but in 500 mL
Erlenmeyer flask. Fermentations were carried out in 500 mL Erlenmeyer’s flasks containing 200
mL fruit juice.
In contrast to prepared synthetic culture medium, fruit juices have sucrose in their
composition which is not easily consumed by Candida magnoliae leading to longer/incomplete
fermentations. To solve this problem, juice was supplemented with 0.1µL/mL (0.24U/mL) of the
enzyme invertase (Invertin MERCK® E1103), which catalyses the hydrolysis of sucrose into
glucose and fructose. Cultures were incubated at 25ºC with gentle stirring, using stir bars to
provide conditions for fermentation but also some homogenization of a very pulpy medium. At
specific time intervals, 1000 µL samples were collected and centrifuged at 13000 x g for 5 minutes
to remove the fruit pulp, and supernatants were used to measure ºBrix. Supernatants were then
stored at -20ºC for later HPLC analysis.
At the beginning and end of fermentation, to control the number of viable cells, 100µL
samples were collected for serial decimal dilutions with sterile water and 200µL of the 10-4, 10-5
and 10-6 (beginning) and 10-6, 10-7 and 10-8 (end) dilutions plated in YPD agar medium plates
followed by incubation at 25ºC during 2 days.
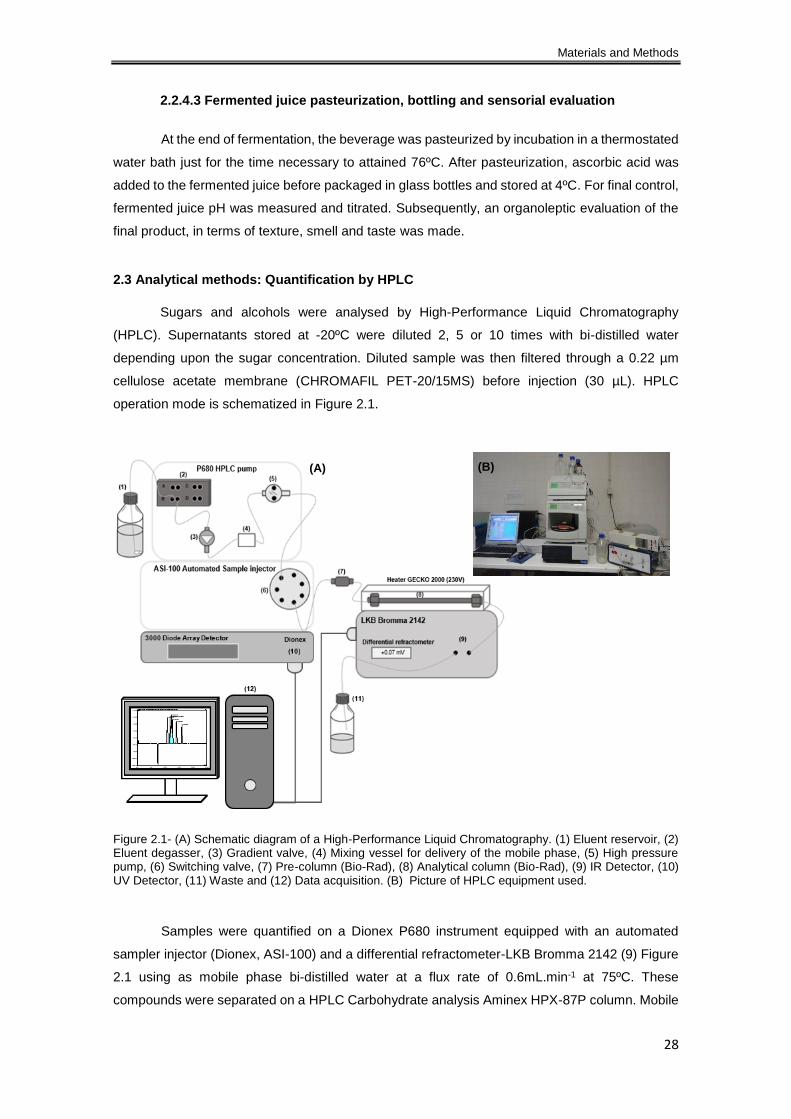
Materials and Methods
28
2.2.4.3 Fermented juice pasteurization, bottling and sensorial evaluation
At the end of fermentation, the beverage was pasteurized by incubation in a thermostated
water bath just for the time necessary to attained 76ºC. After pasteurization, ascorbic acid was
added to the fermented juice before packaged in glass bottles and stored at 4ºC. For final control,
fermented juice pH was measured and titrated. Subsequently, an organoleptic evaluation of the
final product, in terms of texture, smell and taste was made.
2.3 Analytical methods: Quantification by HPLC
Sugars and alcohols were analysed by High-Performance Liquid Chromatography
(HPLC). Supernatants stored at -20ºC were diluted 2, 5 or 10 times with bi-distilled water
depending upon the sugar concentration. Diluted sample was then filtered through a 0.22 µm
cellulose acetate membrane (CHROMAFIL PET-20/15MS) before injection (30 µL). HPLC
operation mode is schematized in Figure 2.1.
Figure 2.1- (A) Schematic diagram of a High-Performance Liquid Chromatography. (1) Eluent reservoir, (2) Eluent degasser, (3) Gradient valve, (4) Mixing vessel for delivery of the mobile phase, (5) High pressure pump, (6) Switching valve, (7) Pre-column (Bio-Rad), (8) Analytical column (Bio-Rad), (9) IR Detector, (10) UV Detector, (11) Waste and (12) Data acquisition. (B) Picture of HPLC equipment used.
Samples were quantified on a Dionex P680 instrument equipped with an automated
sampler injector (Dionex, ASI-100) and a differential refractometer-LKB Bromma 2142 (9) Figure
2.1 using as mobile phase bi-distilled water at a flux rate of 0.6mL.min-1 at 75ºC. These
compounds were separated on a HPLC Carbohydrate analysis Aminex HPX-87P column. Mobile
(A) (B)
Materials and Methods
29
phase were prepared, filtered through a 0.22µm membrane filters and degassed under vacuum
with a pump.
Peak identification was made by comparing the retention times of the sample peaks with
those from pure standards. Calibration curves were made by sequentially diluting a multi-
component standard containing sucrose, glucose, fructose, glycerol, mannitol, erythritol and
ethanol between 10 and 25 g/L. Peak data was collected and processed by the CHROMELEON
chromatography management system, version 6.8 (Dionex).
2.4 pH measurement and acidity titration
The pH was measured with a WTW pH-Electrode SenTix20 using a Radiometer PHM 82
Standard pH Meter as detector.
Titration was performed with 10 mL of juice diluted with 50 mL of bi-distilled water using
a stir bar for correct homogenization. NaOH with a concentration of 0.1M was added until pH 8.1
(neutrality) and the volume of NaOH (mL) used for titrate acidity (TTA) was used in calculation
(results Part III).
2.5 Hexokinase activity assays
2.5.1 Crude extracts preparation for enzymatic assays
Yeast cells, Candida magnoliae and Saccharomyces cerevisiae, were grown as
explained in 2.2.2. Cultures were incubated at 25ºC with orbital agitation (185 rpm) until mid
exponential phase (≈ after 24h of growth). Then cells were harvested by centrifugation (9000 rpm
during 10 minutes at 4ºC), washed twice with TRIS buffer (50mM triethanolamine hydrochloride
and 1µM PMSF pH 7.6), concentrated fourfold, and stored at -80ºC.
Immediately before assaying, cells were thawed, washed and resuspended in 400 µL of
TRIS buffer. To disrupted cells, 400 µL of lysis buffer (0.1M triethanolamine hydrochloride, 2mM
MgCl2, 1mM DTT and 1µM PMSF) and 200 µL glass beads (230–320 nm) were subsequently
added to the suspension followed by six alternating cycles of 1 minute vortexing alternated by 1
minute cooling on ice. Cell debris were removed by centrifugation (13000 rpm during 20 minutes
at 4ºC) and supernatant was used for enzymatic assays.
2.5.2 Protein quantification assay
Total protein concentration in crude extracts was determined using BCA protein assay
kit (PIERCE) with bovine serum albumin (BSA) as a standard according to manufacturer’s
instructions.
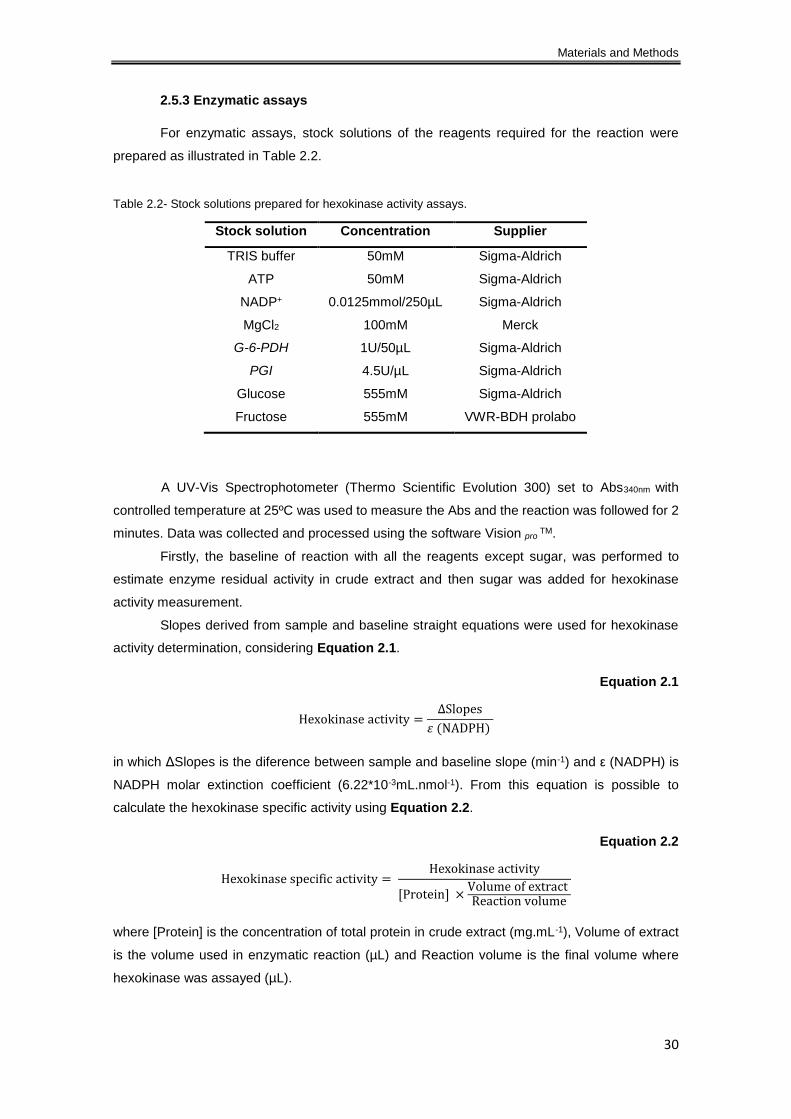
Materials and Methods
30
2.5.3 Enzymatic assays
For enzymatic assays, stock solutions of the reagents required for the reaction were
prepared as illustrated in Table 2.2.
Table 2.2- Stock solutions prepared for hexokinase activity assays.
Stock solution Concentration Supplier
TRIS buffer 50mM Sigma-Aldrich
ATP 50mM Sigma-Aldrich
NADP+ 0.0125mmol/250µL Sigma-Aldrich
MgCl2 100mM Merck
G-6-PDH 1U/50µL Sigma-Aldrich
PGI 4.5U/µL Sigma-Aldrich
Glucose 555mM Sigma-Aldrich
Fructose 555mM VWR-BDH prolabo
A UV-Vis Spectrophotometer (Thermo Scientific Evolution 300) set to Abs340nm with
controlled temperature at 25ºC was used to measure the Abs and the reaction was followed for 2
minutes. Data was collected and processed using the software Vision pro TM.
Firstly, the baseline of reaction with all the reagents except sugar, was performed to
estimate enzyme residual activity in crude extract and then sugar was added for hexokinase
activity measurement.
Slopes derived from sample and baseline straight equations were used for hexokinase
activity determination, considering Equation 2.1.
Equation 2.1
Hexokinase activity =ΔSlopes
𝜀 (NADPH)
in which ΔSlopes is the diference between sample and baseline slope (min-1) and ε (NADPH) is
NADPH molar extinction coefficient (6.22*10-3mL.nmol-1). From this equation is possible to
calculate the hexokinase specific activity using Equation 2.2.
Equation 2.2
Hexokinase specific activity = Hexokinase activity
[Protein] ×Volume of extract Reaction volume
where [Protein] is the concentration of total protein in crude extract (mg.mL-1), Volume of extract
is the volume used in enzymatic reaction (µL) and Reaction volume is the final volume where
hexokinase was assayed (µL).
31
3. Results and Discussion

32
3.1 Part I
Fermentation profiles of two Candida magnoliae strains, including sugar consumption and
fermentation products in different conditions, using synthetic culture medium
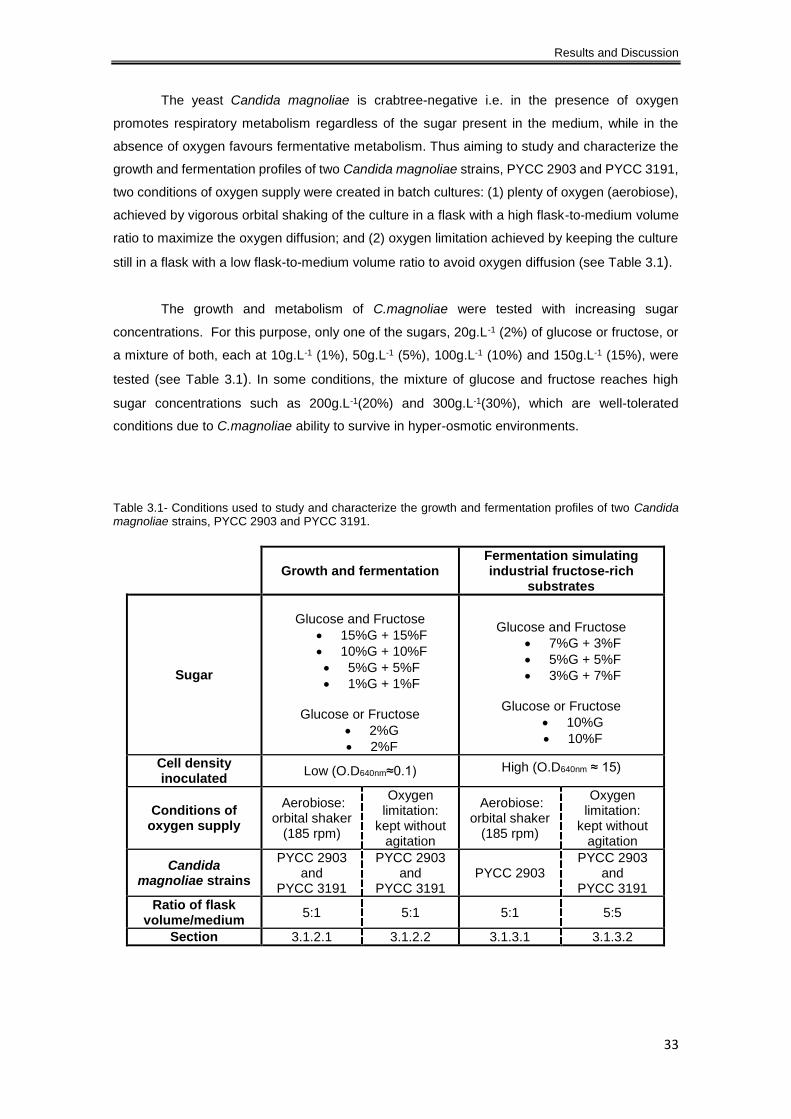
Results and Discussion
33
The yeast Candida magnoliae is crabtree-negative i.e. in the presence of oxygen
promotes respiratory metabolism regardless of the sugar present in the medium, while in the
absence of oxygen favours fermentative metabolism. Thus aiming to study and characterize the
growth and fermentation profiles of two Candida magnoliae strains, PYCC 2903 and PYCC 3191,
two conditions of oxygen supply were created in batch cultures: (1) plenty of oxygen (aerobiose),
achieved by vigorous orbital shaking of the culture in a flask with a high flask-to-medium volume
ratio to maximize the oxygen diffusion; and (2) oxygen limitation achieved by keeping the culture
still in a flask with a low flask-to-medium volume ratio to avoid oxygen diffusion (see Table 3.1).
The growth and metabolism of C.magnoliae were tested with increasing sugar
concentrations. For this purpose, only one of the sugars, 20g.L-1 (2%) of glucose or fructose, or
a mixture of both, each at 10g.L-1 (1%), 50g.L-1 (5%), 100g.L-1 (10%) and 150g.L-1 (15%), were
tested (see Table 3.1). In some conditions, the mixture of glucose and fructose reaches high
sugar concentrations such as 200g.L-1(20%) and 300g.L-1(30%), which are well-tolerated
conditions due to C.magnoliae ability to survive in hyper-osmotic environments.
Table 3.1- Conditions used to study and characterize the growth and fermentation profiles of two Candida magnoliae strains, PYCC 2903 and PYCC 3191.
Growth and fermentation Fermentation simulating industrial fructose-rich
substrates
Sugar
Glucose and Fructose
15%G + 15%F
10%G + 10%F
5%G + 5%F
1%G + 1%F
Glucose or Fructose
2%G
2%F
Glucose and Fructose
7%G + 3%F
5%G + 5%F
3%G + 7%F
Glucose or Fructose
10%G
10%F
Cell density inoculated
Low (O.D640nm≈0.1) High (O.D640nm ≈ 15)
Conditions of oxygen supply
Aerobiose: orbital shaker
(185 rpm)
Oxygen limitation:
kept without agitation
Aerobiose: orbital shaker
(185 rpm)
Oxygen limitation:
kept without agitation
Candida magnoliae strains
PYCC 2903 and
PYCC 3191
PYCC 2903 and
PYCC 3191 PYCC 2903
PYCC 2903 and
PYCC 3191
Ratio of flask volume/medium
5:1 5:1 5:1 5:5
Section 3.1.2.1 3.1.2.2 3.1.3.1 3.1.3.2
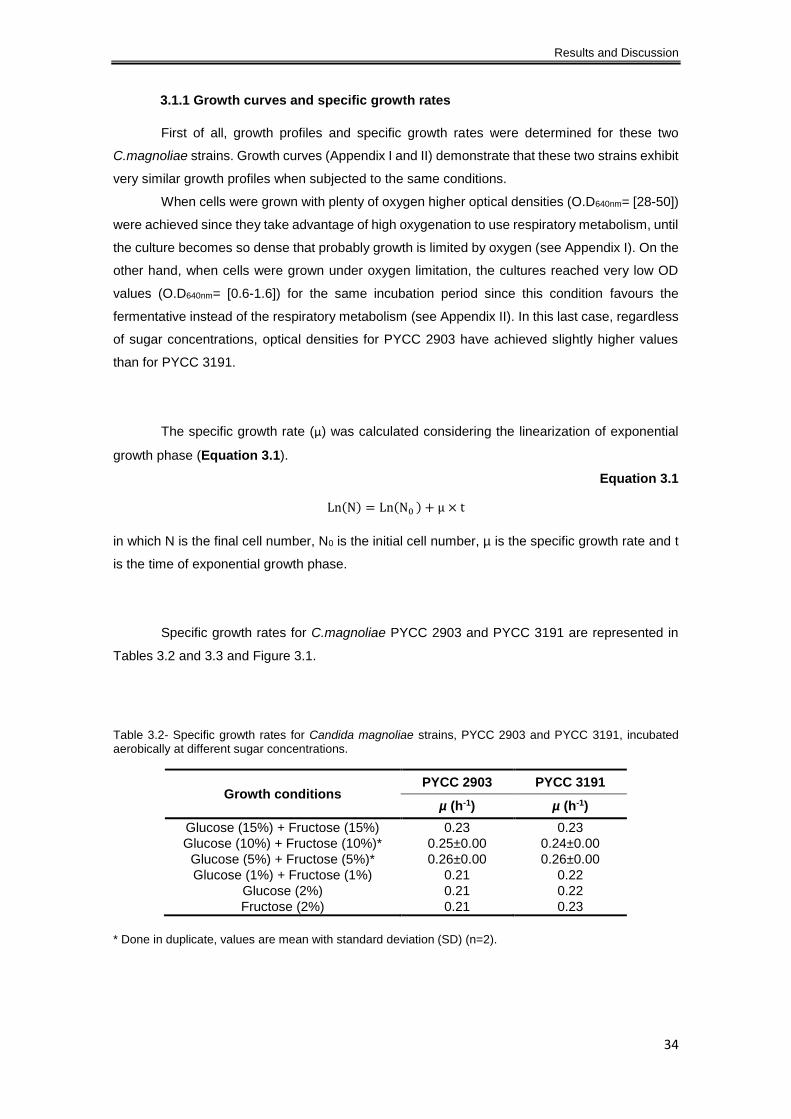
Results and Discussion
34
3.1.1 Growth curves and specific growth rates
First of all, growth profiles and specific growth rates were determined for these two
C.magnoliae strains. Growth curves (Appendix I and II) demonstrate that these two strains exhibit
very similar growth profiles when subjected to the same conditions.
When cells were grown with plenty of oxygen higher optical densities (O.D640nm= [28-50])
were achieved since they take advantage of high oxygenation to use respiratory metabolism, until
the culture becomes so dense that probably growth is limited by oxygen (see Appendix I). On the
other hand, when cells were grown under oxygen limitation, the cultures reached very low OD
values (O.D640nm= [0.6-1.6]) for the same incubation period since this condition favours the
fermentative instead of the respiratory metabolism (see Appendix II). In this last case, regardless
of sugar concentrations, optical densities for PYCC 2903 have achieved slightly higher values
than for PYCC 3191.
The specific growth rate (µ) was calculated considering the linearization of exponential
growth phase (Equation 3.1).
Equation 3.1
Ln(N) = Ln(N0 ) + µ × t
in which N is the final cell number, N0 is the initial cell number, µ is the specific growth rate and t
is the time of exponential growth phase.
Specific growth rates for C.magnoliae PYCC 2903 and PYCC 3191 are represented in
Tables 3.2 and 3.3 and Figure 3.1.
Table 3.2- Specific growth rates for Candida magnoliae strains, PYCC 2903 and PYCC 3191, incubated aerobically at different sugar concentrations.
Growth conditions PYCC 2903 PYCC 3191
µ (h-1) µ (h-1)
Glucose (15%) + Fructose (15%) 0.23 0.23
Glucose (10%) + Fructose (10%)* 0.25±0.00 0.24±0.00
Glucose (5%) + Fructose (5%)* 0.26±0.00 0.26±0.00
Glucose (1%) + Fructose (1%) 0.21 0.22
Glucose (2%) 0.21 0.22
Fructose (2%) 0.21 0.23
* Done in duplicate, values are mean with standard deviation (SD) (n=2).
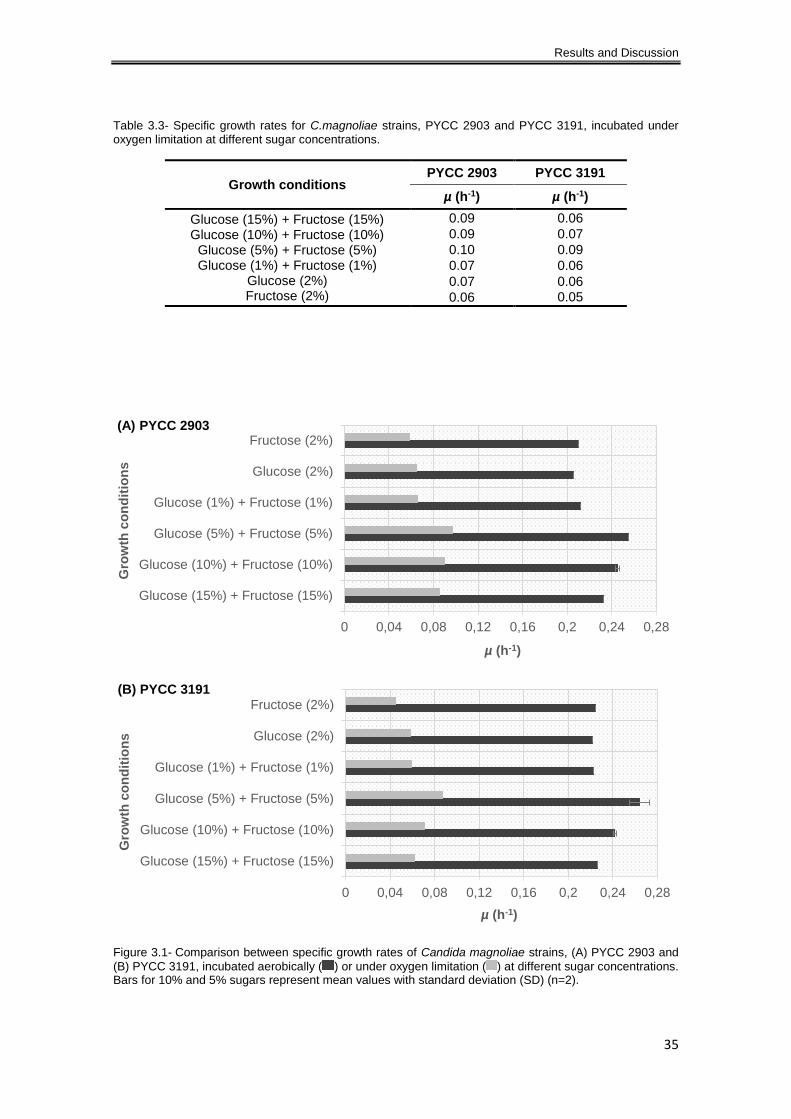
Results and Discussion
35
Table 3.3- Specific growth rates for C.magnoliae strains, PYCC 2903 and PYCC 3191, incubated under oxygen limitation at different sugar concentrations.
Growth conditions PYCC 2903 PYCC 3191
µ (h-1) µ (h-1)
Glucose (15%) + Fructose (15%) Glucose (10%) + Fructose (10%)
Glucose (5%) + Fructose (5%) Glucose (1%) + Fructose (1%)
Glucose (2%) Fructose (2%)
0.09 0.06
0.09 0.07
0.10 0.09
0.07 0.06
0.07 0.06
0.06 0.05
Figure 3.1- Comparison between specific growth rates of Candida magnoliae strains, (A) PYCC 2903 and
(B) PYCC 3191, incubated aerobically ( ) or under oxygen limitation ( ) at different sugar concentrations. Bars for 10% and 5% sugars represent mean values with standard deviation (SD) (n=2).
0 0,04 0,08 0,12 0,16 0,2 0,24 0,28
Glucose (15%) + Fructose (15%)
Glucose (10%) + Fructose (10%)
Glucose (5%) + Fructose (5%)
Glucose (1%) + Fructose (1%)
Glucose (2%)
Fructose (2%)
µ (h-1)
Gro
wth
co
nd
itio
ns
(A) PYCC 2903
0 0,04 0,08 0,12 0,16 0,2 0,24 0,28
Glucose (15%) + Fructose (15%)
Glucose (10%) + Fructose (10%)
Glucose (5%) + Fructose (5%)
Glucose (1%) + Fructose (1%)
Glucose (2%)
Fructose (2%)
µ (h-1)
Gro
wth
co
nd
itio
ns
(B) PYCC 3191
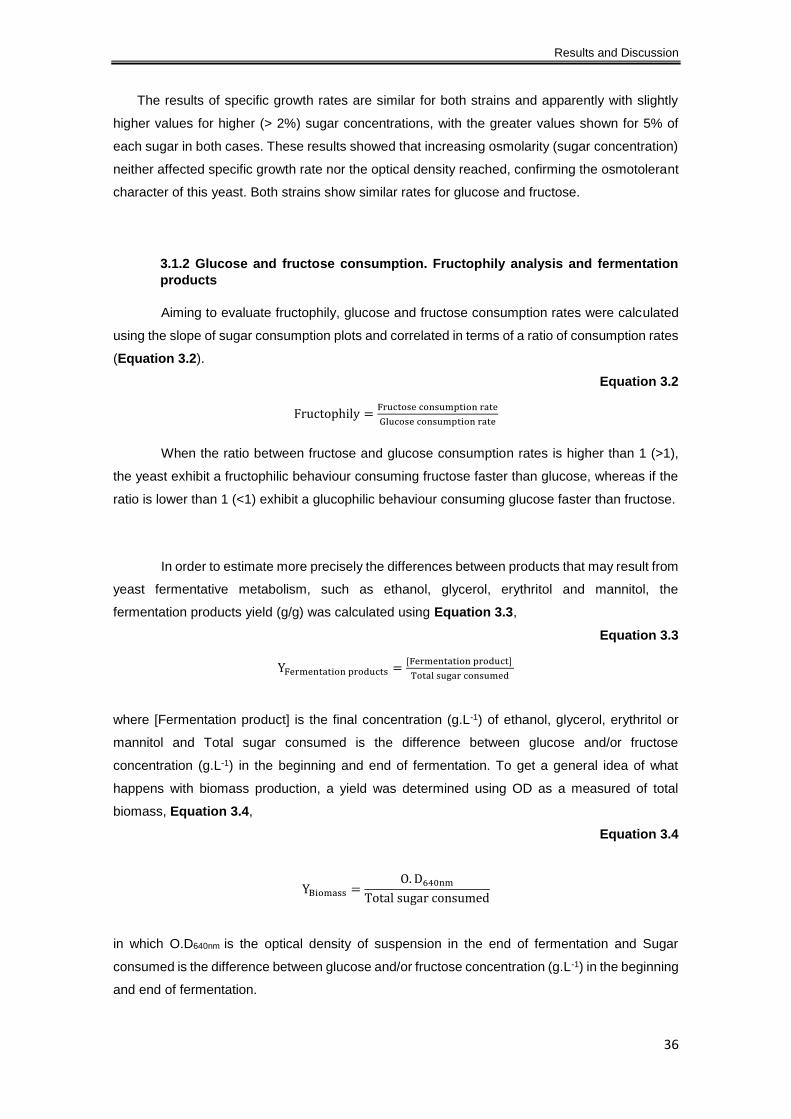
Results and Discussion
36
The results of specific growth rates are similar for both strains and apparently with slightly
higher values for higher (> 2%) sugar concentrations, with the greater values shown for 5% of
each sugar in both cases. These results showed that increasing osmolarity (sugar concentration)
neither affected specific growth rate nor the optical density reached, confirming the osmotolerant
character of this yeast. Both strains show similar rates for glucose and fructose.
3.1.2 Glucose and fructose consumption. Fructophily analysis and fermentation
products
Aiming to evaluate fructophily, glucose and fructose consumption rates were calculated
using the slope of sugar consumption plots and correlated in terms of a ratio of consumption rates
(Equation 3.2).
Equation 3.2
Fructophily =Fructose consumption rate
Glucose consumption rate
When the ratio between fructose and glucose consumption rates is higher than 1 (>1),
the yeast exhibit a fructophilic behaviour consuming fructose faster than glucose, whereas if the
ratio is lower than 1 (<1) exhibit a glucophilic behaviour consuming glucose faster than fructose.
In order to estimate more precisely the differences between products that may result from
yeast fermentative metabolism, such as ethanol, glycerol, erythritol and mannitol, the
fermentation products yield (g/g) was calculated using Equation 3.3,
Equation 3.3
YFermentation products =[Fermentation product]
Total sugar consumed
where [Fermentation product] is the final concentration (g.L-1) of ethanol, glycerol, erythritol or
mannitol and Total sugar consumed is the difference between glucose and/or fructose
concentration (g.L-1) in the beginning and end of fermentation. To get a general idea of what
happens with biomass production, a yield was determined using OD as a measured of total
biomass, Equation 3.4,
Equation 3.4
YBiomass =O. D640nm
Total sugar consumed
in which O.D640nm is the optical density of suspension in the end of fermentation and Sugar
consumed is the difference between glucose and/or fructose concentration (g.L-1) in the beginning
and end of fermentation.
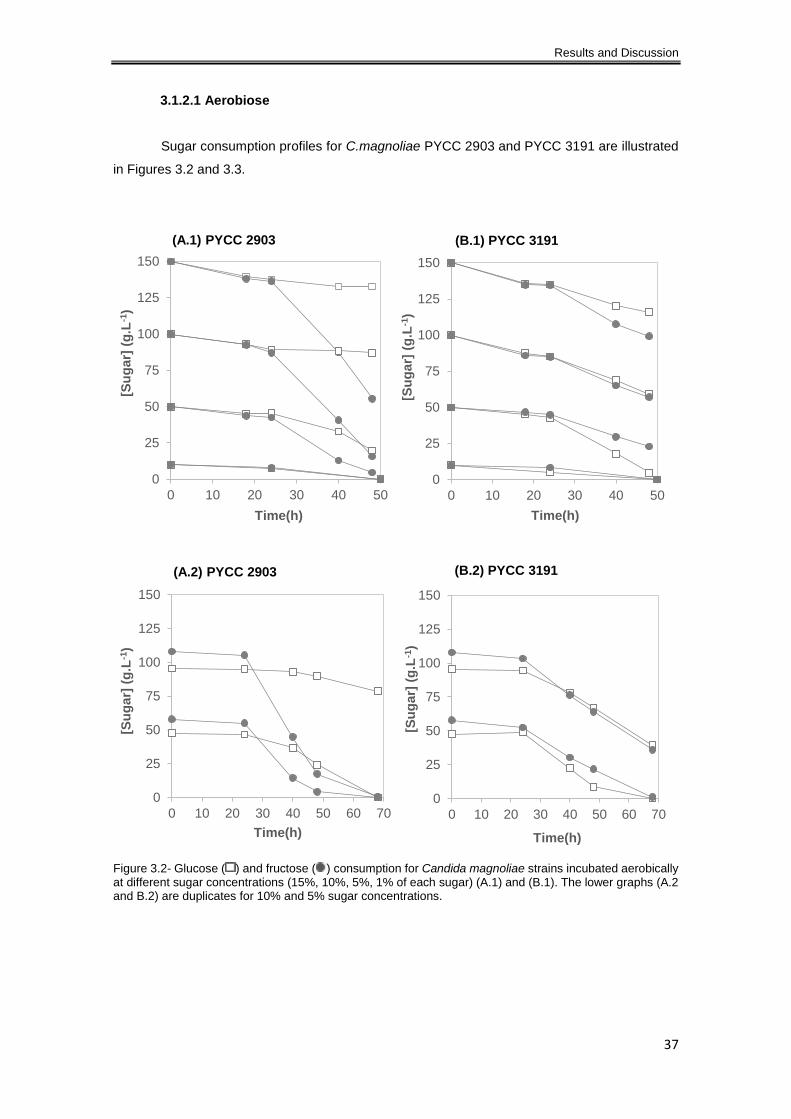
Results and Discussion
37
3.1.2.1 Aerobiose
Sugar consumption profiles for C.magnoliae PYCC 2903 and PYCC 3191 are illustrated
in Figures 3.2 and 3.3.
Figure 3.2- Glucose ( ) and fructose ( ) consumption for Candida magnoliae strains incubated aerobically at different sugar concentrations (15%, 10%, 5%, 1% of each sugar) (A.1) and (B.1). The lower graphs (A.2 and B.2) are duplicates for 10% and 5% sugar concentrations.
0
25
50
75
100
125
150
0 10 20 30 40 50
[Su
gar]
(g
.L-1
)
Time(h)
(A.1) PYCC 2903
0
25
50
75
100
125
150
0 10 20 30 40 50
[Su
gar]
(g
.L-1
)
Time(h)
(B.1) PYCC 3191
0
25
50
75
100
125
150
0 10 20 30 40 50 60 70
[Su
gar]
(g
.L-1
)
Time(h)
(A.2) PYCC 2903
0
25
50
75
100
125
150
0 10 20 30 40 50 60 70
[Su
gar]
(g
.L-1
)
Time(h)
(B.2) PYCC 3191
Results and Discussion
38
Figure 3.3- Glucose ( ) and fructose ( ) consumption for Candida magnoliae strains, (A) PYCC 2903 and (B) PYCC 3191, incubated aerobically at low sugar concentrations (1% glucose and fructose). Data re-plotted from Figure 3.2.
Experimental results for sugar concentrations with 5% and 10% of glucose and fructose
are separated into two different graphs, Figure 3.2, because in assays A.2 and B.2 (duplicates of
the assays 1) the fermentation time were extended so that the entire fructose initially added
became depleted.
Graphs represented in Figures 3.2 and 3.3 show that sugar consumption occurs at a
lower rate during the early stage (until ≈ 24h) and at a faster rate from 24h until the end, which
may be due to different factors: Exponential increase of cell number in the presence of oxygen
that leads to a higher cell density responsible for consuming sugar faster; Furthermore, when the
yeast switches to fermentative metabolism, most probably because of oxygen limitation, sugar
starts to be consumed at a higher rate (see Appendix I and Figure 3.5).
For higher sugar concentrations, both C.magnoliae strains show a preference for fructose
over glucose, although this is more evident for PYCC 2903 than for PYCC 3191. Selective
utilization of fructose by the first strain is observed in the presence of high sugar concentrations
such as 15%, 10% and 5%, while for PYCC 3191 occurs only with 15% of both sugars. For these
two strains in the presence of 1% of both sugars (re-plotted in Figure 3.3), the preferential
consumption of fructose is not demonstrated but the trend towards fructose is still marked for
PYCC 2903 whereas PYCC 3191, at 1% each sugar, shows the usual glucophilic behaviour
present in the majority of yeast.
0
1
2
3
4
5
6
7
8
9
10
0 10 20 30 40 50
[Su
gar]
(g
.L-1
)
Time (h)
(A) PYCC 2903
0
1
2
3
4
5
6
7
8
9
10
0 10 20 30 40 50
[Su
gar]
(g
.L-1
)
Time (h)
(B) PYCC 3191
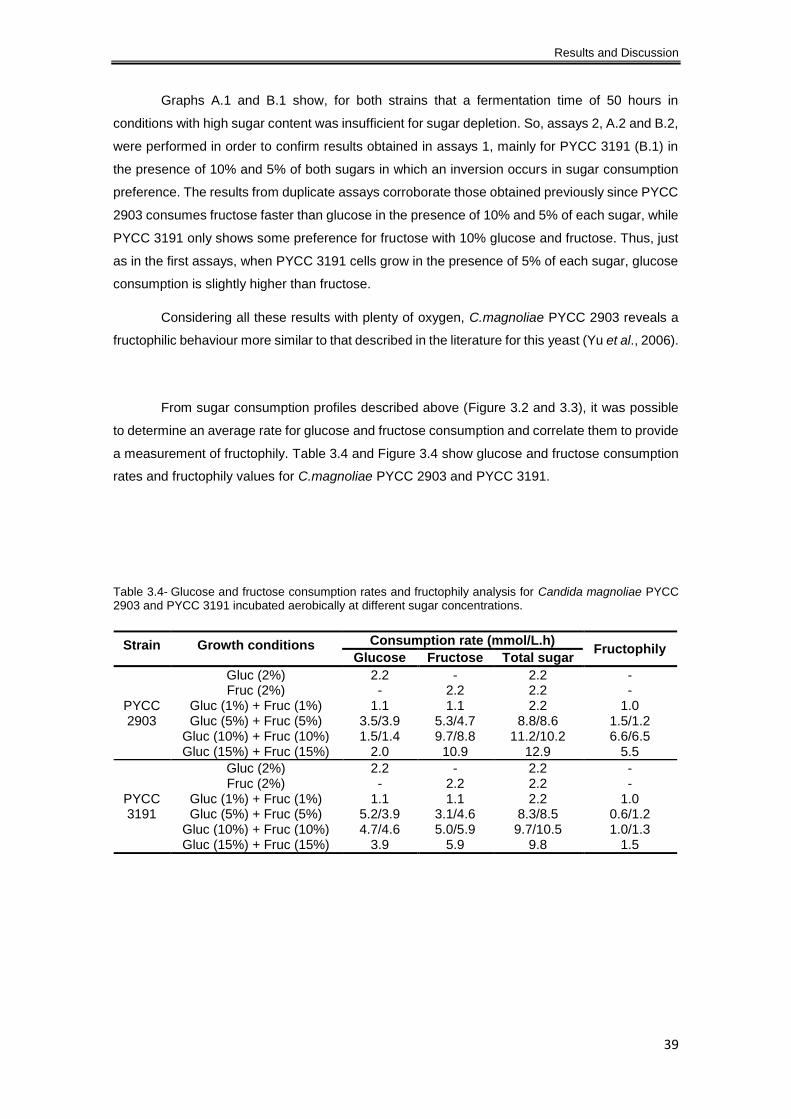
Results and Discussion
39
Graphs A.1 and B.1 show, for both strains that a fermentation time of 50 hours in
conditions with high sugar content was insufficient for sugar depletion. So, assays 2, A.2 and B.2,
were performed in order to confirm results obtained in assays 1, mainly for PYCC 3191 (B.1) in
the presence of 10% and 5% of both sugars in which an inversion occurs in sugar consumption
preference. The results from duplicate assays corroborate those obtained previously since PYCC
2903 consumes fructose faster than glucose in the presence of 10% and 5% of each sugar, while
PYCC 3191 only shows some preference for fructose with 10% glucose and fructose. Thus, just
as in the first assays, when PYCC 3191 cells grow in the presence of 5% of each sugar, glucose
consumption is slightly higher than fructose.
Considering all these results with plenty of oxygen, C.magnoliae PYCC 2903 reveals a
fructophilic behaviour more similar to that described in the literature for this yeast (Yu et al., 2006).
From sugar consumption profiles described above (Figure 3.2 and 3.3), it was possible
to determine an average rate for glucose and fructose consumption and correlate them to provide
a measurement of fructophily. Table 3.4 and Figure 3.4 show glucose and fructose consumption
rates and fructophily values for C.magnoliae PYCC 2903 and PYCC 3191.
Table 3.4- Glucose and fructose consumption rates and fructophily analysis for Candida magnoliae PYCC 2903 and PYCC 3191 incubated aerobically at different sugar concentrations.
Strain Growth conditions Consumption rate (mmol/L.h) Fructophily
Glucose Fructose Total sugar
PYCC 2903
Gluc (2%) 2.2 - 2.2 - Fruc (2%) - 2.2 2.2 -
Gluc (1%) + Fruc (1%) 1.1 1.1 2.2 1.0 Gluc (5%) + Fruc (5%) 3.5/3.9 5.3/4.7 8.8/8.6 1.5/1.2
Gluc (10%) + Fruc (10%) 1.5/1.4 9.7/8.8 11.2/10.2 6.6/6.5 Gluc (15%) + Fruc (15%) 2.0 10.9 12.9 5.5
PYCC 3191
Gluc (2%) 2.2 - 2.2 - Fruc (2%) - 2.2 2.2 -
Gluc (1%) + Fruc (1%) 1.1 1.1 2.2 1.0 Gluc (5%) + Fruc (5%) 5.2/3.9 3.1/4.6 8.3/8.5 0.6/1.2
Gluc (10%) + Fruc (10%) 4.7/4.6 5.0/5.9 9.7/10.5 1.0/1.3 Gluc (15%) + Fruc (15%) 3.9 5.9 9.8 1.5
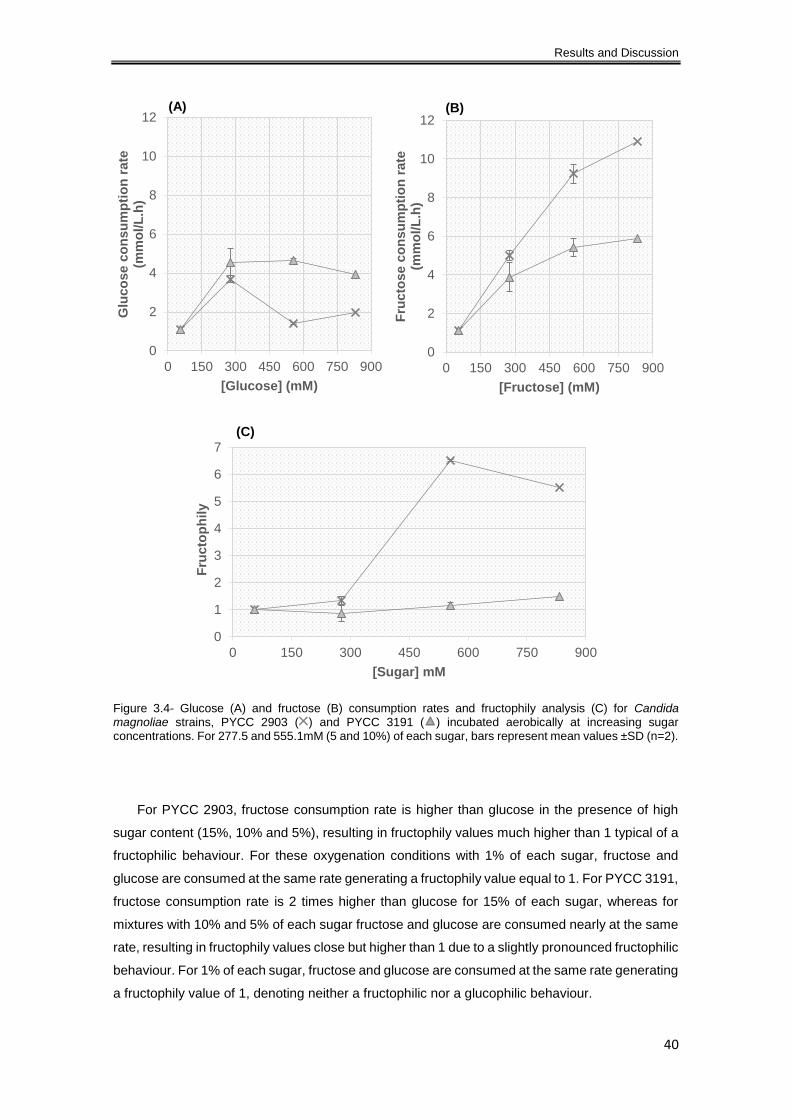
Results and Discussion
40
Figure 3.4- Glucose (A) and fructose (B) consumption rates and fructophily analysis (C) for Candida magnoliae strains, PYCC 2903 ( ) and PYCC 3191 ( ) incubated aerobically at increasing sugar concentrations. For 277.5 and 555.1mM (5 and 10%) of each sugar, bars represent mean values ±SD (n=2).
For PYCC 2903, fructose consumption rate is higher than glucose in the presence of high
sugar content (15%, 10% and 5%), resulting in fructophily values much higher than 1 typical of a
fructophilic behaviour. For these oxygenation conditions with 1% of each sugar, fructose and
glucose are consumed at the same rate generating a fructophily value equal to 1. For PYCC 3191,
fructose consumption rate is 2 times higher than glucose for 15% of each sugar, whereas for
mixtures with 10% and 5% of each sugar fructose and glucose are consumed nearly at the same
rate, resulting in fructophily values close but higher than 1 due to a slightly pronounced fructophilic
behaviour. For 1% of each sugar, fructose and glucose are consumed at the same rate generating
a fructophily value of 1, denoting neither a fructophilic nor a glucophilic behaviour.
0
2
4
6
8
10
12
0 150 300 450 600 750 900
Glu
co
se c
on
su
mp
tio
n r
ate
(m
mo
l/L
.h)
[Glucose] (mM)
(A)
0
2
4
6
8
10
12
0 150 300 450 600 750 900
Fru
cto
se c
on
su
mp
tio
n r
ate
(m
mo
l/L
.h)
[Fructose] (mM)
(B)
0
1
2
3
4
5
6
7
0 150 300 450 600 750 900
Fru
cto
ph
ily
[Sugar] mM
(C)
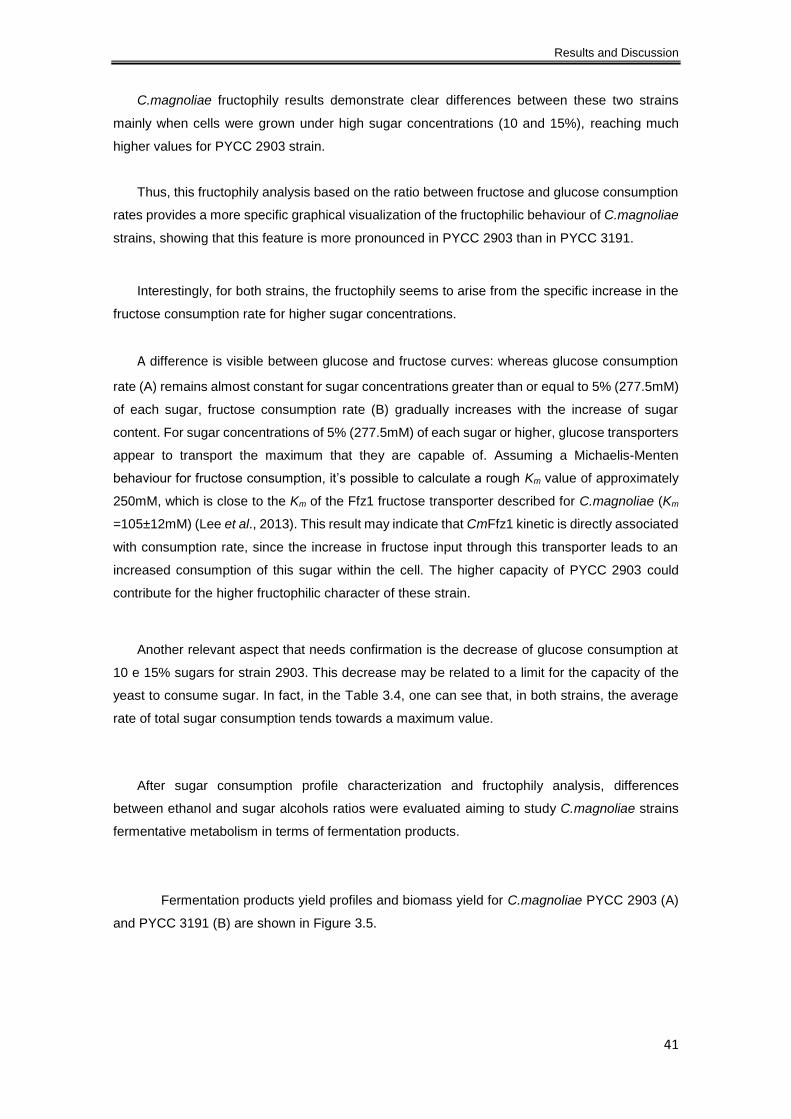
Results and Discussion
41
C.magnoliae fructophily results demonstrate clear differences between these two strains
mainly when cells were grown under high sugar concentrations (10 and 15%), reaching much
higher values for PYCC 2903 strain.
Thus, this fructophily analysis based on the ratio between fructose and glucose consumption
rates provides a more specific graphical visualization of the fructophilic behaviour of C.magnoliae
strains, showing that this feature is more pronounced in PYCC 2903 than in PYCC 3191.
Interestingly, for both strains, the fructophily seems to arise from the specific increase in the
fructose consumption rate for higher sugar concentrations.
A difference is visible between glucose and fructose curves: whereas glucose consumption
rate (A) remains almost constant for sugar concentrations greater than or equal to 5% (277.5mM)
of each sugar, fructose consumption rate (B) gradually increases with the increase of sugar
content. For sugar concentrations of 5% (277.5mM) of each sugar or higher, glucose transporters
appear to transport the maximum that they are capable of. Assuming a Michaelis-Menten
behaviour for fructose consumption, it’s possible to calculate a rough Km value of approximately
250mM, which is close to the Km of the Ffz1 fructose transporter described for C.magnoliae (Km
=105±12mM) (Lee et al., 2013). This result may indicate that CmFfz1 kinetic is directly associated
with consumption rate, since the increase in fructose input through this transporter leads to an
increased consumption of this sugar within the cell. The higher capacity of PYCC 2903 could
contribute for the higher fructophilic character of these strain.
Another relevant aspect that needs confirmation is the decrease of glucose consumption at
10 e 15% sugars for strain 2903. This decrease may be related to a limit for the capacity of the
yeast to consume sugar. In fact, in the Table 3.4, one can see that, in both strains, the average
rate of total sugar consumption tends towards a maximum value.
After sugar consumption profile characterization and fructophily analysis, differences
between ethanol and sugar alcohols ratios were evaluated aiming to study C.magnoliae strains
fermentative metabolism in terms of fermentation products.
Fermentation products yield profiles and biomass yield for C.magnoliae PYCC 2903 (A)
and PYCC 3191 (B) are shown in Figure 3.5.

Results and Discussion
42
Figure 3.5- Ethanol ( ), glycerol ( ), erythritol ( ) and mannitol ( ) yield for Candida magnoliae strains, (A) PYCC 2903 and (B) PYCC 3191, incubated aerobically at different sugar concentrations. Bars for 10% and 5% sugars represent mean values with standard deviation (SD) (n=2).
0,0
0,5
1,0
1,5
2,0
2,5
0,00
0,05
0,10
0,15
0,20
0,25
0,30
0,35
0,40
0,45
Fructose(2%)
Glucose(2%)
Glucose(1%)+
Fructose(1%)
Glucose(5%)+
Fructose(5%)
Glucose(10%)+
Fructose(10%)
Glucose(15%)+
Fructose(15%)
Yie
ld B
iom
ass
(O.D
/g.L
-1)
Yie
ld F
erm
en
tati
on
pro
du
cts
(g
/g)
Growth conditions
(A) PYCC 2903
0,0
0,5
1,0
1,5
2,0
2,5
0,00
0,05
0,10
0,15
0,20
0,25
0,30
0,35
0,40
0,45
Fructose(2%)
Glucose(2%)
Glucose(1%)+
Fructose(1%)
Glucose(5%)+
Fructose(5%)
Glucose(10%)+
Fructose(10%)
Glucose(15%)+
Fructose(15%)
Yie
ld B
iom
ass
(O
.D/g
.L-1
)
Yie
ld F
erm
en
tati
on
pro
du
cts
(g
/g)
Growth conditions
(B) PYCC 3191

Results and Discussion
43
In Figure 3.5, it is possible to observe that higher fermentation product yields occur when
cells grow under high sugar concentrations (15%, 10% and 5%). At these concentrations, cell
density became very high thereby oxygen gets limited and the yeast switch to fermentative
metabolism, raising the fermentation product yields. C.magnoliae PYCC 3191 (B) when
compared with the other strain produces slightly less ethanol resulting in a higher sugar alcohol
production. For this strain (B), ethanol yield varies between 0.21-0.28g/g and 0.01-0.06g/g for
high and low sugar content, respectively. Glycerol yield is in a range between 0.01-0.1g/g,
erythritol 0-0.04g/g and mannitol 0-0.08g/g. For PYCC 2903 (A), yield values for ethanol are
among 0.27-0.34g/g and 0.06-0.11g/g for high and low sugar concentrations, respectively. Under
high and low sugar content conditions glycerol yield is between 0.01-0.06g/g, erythritol 0-0.02g/g
and mannitol 0-0.02g/g.
Interestingly, it is also observed that when glucose is absent from the culture medium
(2% Fructose), ethanol production yield reaches its lowest value, 0.01 and 0.06g/g for PYCC 3191
(B) and PYCC 2903 (A), respectively, indicating that fructose might favour sugar alcohol
formation. Fermentation product profiles illustrated in Figure 3.5 also show for both strains that
mannitol production was only detected when a mixture of sugars, at high concentrations is
present.
These fermentation product profiles (Figure 3.5) reveal that the type and yield of
fermentation products varies between sugar concentrations and also differs from strains.
For both strains, in these oxygenation conditions, biomass yield curve (Figure 3.5) show
higher values (1.55-2.40) for low sugar concentrations (1% each sugar and 2% glucose or
fructose), while lower values (0.25-0.53) are for high sugar concentrations (5%, 10% and 15%).
This indicates that the sugar consumed in the presence of low sugar content was used to produce
biomass, hence the yield of fermentation products is low. For high sugar content the opposite
occurs, sugar consumed was mostly to produce fermentation products instead of biomass.
3.1.2.2 Oxygen limitation
Sugar consumption profiles for C.magnoliae PYCC 2903 and PYCC 3191 are illustrated
in Figures 3.6 and 3.7.
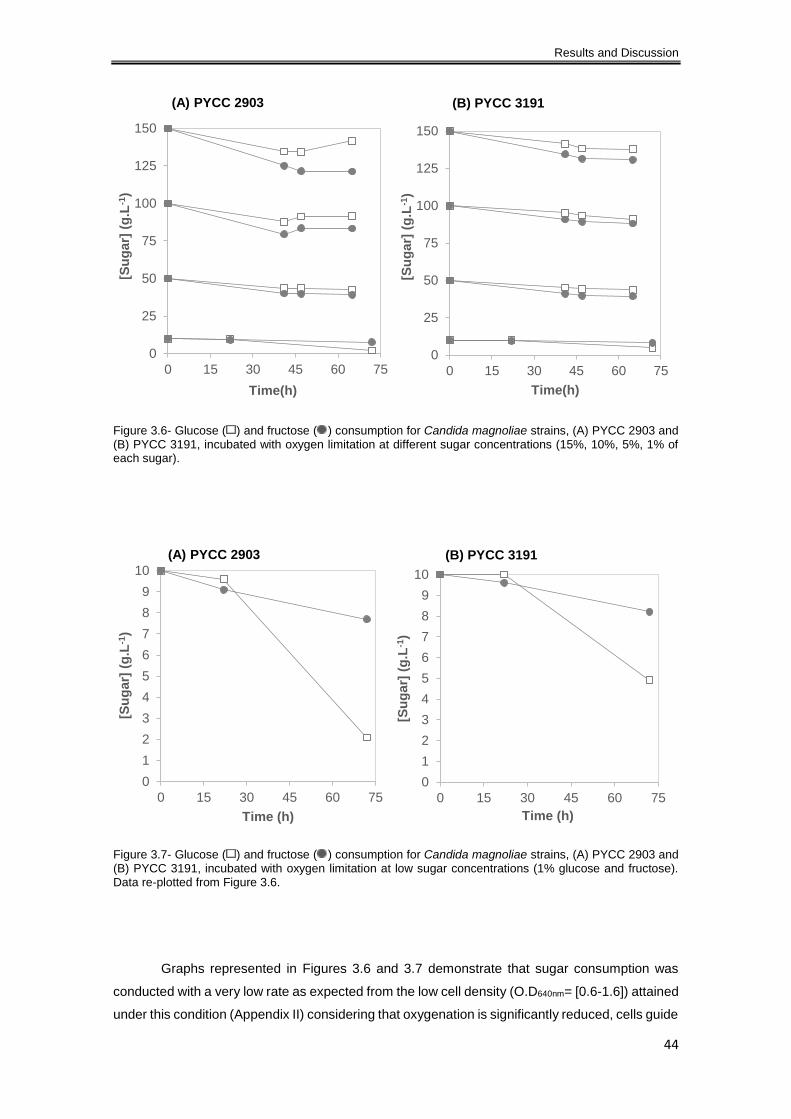
Results and Discussion
44
Figure 3.6- Glucose ( ) and fructose ( ) consumption for Candida magnoliae strains, (A) PYCC 2903 and (B) PYCC 3191, incubated with oxygen limitation at different sugar concentrations (15%, 10%, 5%, 1% of each sugar).
Figure 3.7- Glucose ( ) and fructose ( ) consumption for Candida magnoliae strains, (A) PYCC 2903 and (B) PYCC 3191, incubated with oxygen limitation at low sugar concentrations (1% glucose and fructose). Data re-plotted from Figure 3.6.
Graphs represented in Figures 3.6 and 3.7 demonstrate that sugar consumption was
conducted with a very low rate as expected from the low cell density (O.D640nm= [0.6-1.6]) attained
under this condition (Appendix II) considering that oxygenation is significantly reduced, cells guide
0
25
50
75
100
125
150
0 15 30 45 60 75
[Su
gar]
(g
.L-1
)
Time(h)
(A) PYCC 2903
0
25
50
75
100
125
150
0 15 30 45 60 75
[Su
gar]
(g
.L-1
)Time(h)
(B) PYCC 3191
0
1
2
3
4
5
6
7
8
9
10
0 15 30 45 60 75
[Su
gar]
(g
.L-1
)
Time (h)
(A) PYCC 2903
0
1
2
3
4
5
6
7
8
9
10
0 15 30 45 60 75
[Su
gar]
(g
.L-1
)
Time (h)
(B) PYCC 3191
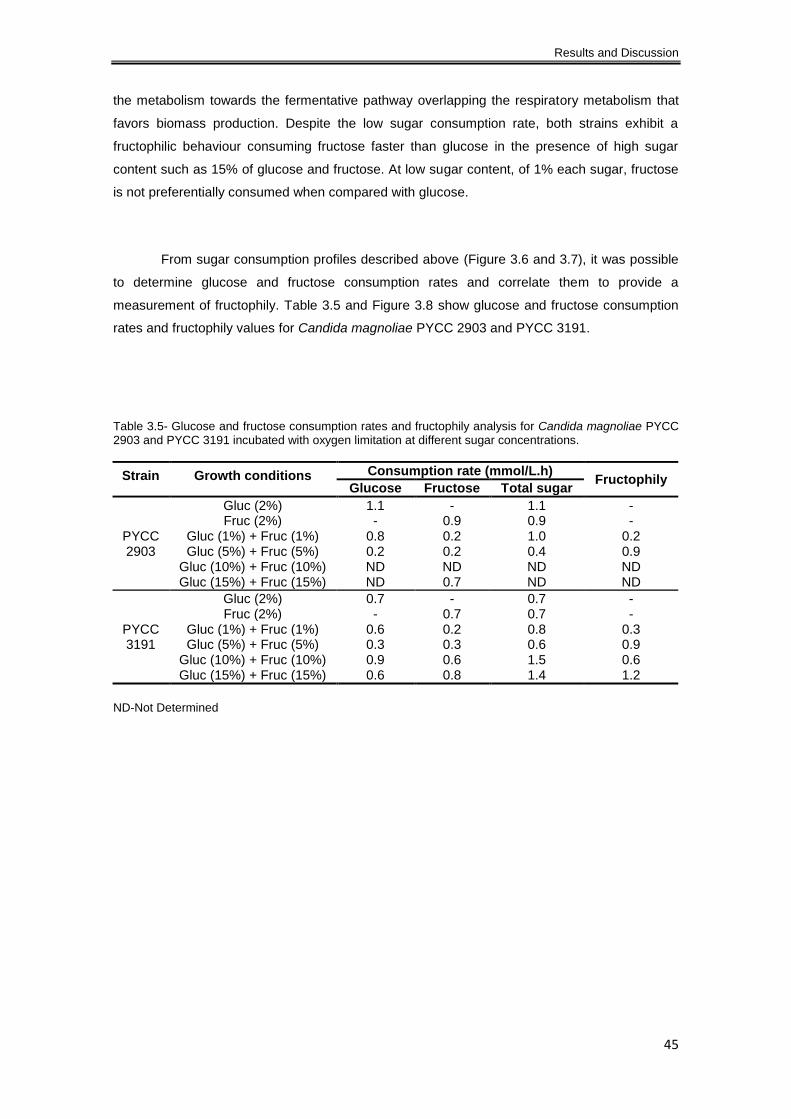
Results and Discussion
45
the metabolism towards the fermentative pathway overlapping the respiratory metabolism that
favors biomass production. Despite the low sugar consumption rate, both strains exhibit a
fructophilic behaviour consuming fructose faster than glucose in the presence of high sugar
content such as 15% of glucose and fructose. At low sugar content, of 1% each sugar, fructose
is not preferentially consumed when compared with glucose.
From sugar consumption profiles described above (Figure 3.6 and 3.7), it was possible
to determine glucose and fructose consumption rates and correlate them to provide a
measurement of fructophily. Table 3.5 and Figure 3.8 show glucose and fructose consumption
rates and fructophily values for Candida magnoliae PYCC 2903 and PYCC 3191.
Table 3.5- Glucose and fructose consumption rates and fructophily analysis for Candida magnoliae PYCC 2903 and PYCC 3191 incubated with oxygen limitation at different sugar concentrations.
ND-Not Determined
Strain Growth conditions Consumption rate (mmol/L.h) Fructophily
Glucose Fructose Total sugar
PYCC 2903
Gluc (2%) 1.1 - 1.1 - Fruc (2%) - 0.9 0.9 -
Gluc (1%) + Fruc (1%) 0.8 0.2 1.0 0.2 Gluc (5%) + Fruc (5%) 0.2 0.2 0.4 0.9
Gluc (10%) + Fruc (10%) ND ND ND ND Gluc (15%) + Fruc (15%) ND 0.7 ND ND
PYCC 3191
Gluc (2%) 0.7 - 0.7 - Fruc (2%) - 0.7 0.7 -
Gluc (1%) + Fruc (1%) 0.6 0.2 0.8 0.3 Gluc (5%) + Fruc (5%) 0.3 0.3 0.6 0.9
Gluc (10%) + Fruc (10%) 0.9 0.6 1.5 0.6 Gluc (15%) + Fruc (15%) 0.6 0.8 1.4 1.2

Results and Discussion
46
Figure 3.8- Glucose (A) and fructose (B) consumption rates and fructophily analysis (C) for Candida magnoliae PYCC 2903 ( ) and PYCC 3191 ( ) incubated with oxygen limitation at increasing sugar concentrations. For 277.5 and 555.1mM (5 and 10%) of each sugar, bars represent mean values ±SD (n=2).
Both strains exhibit a less pronounced fructophilic pattern to what was observed under
aerobic conditions, once fructophily values are lower or close to 1, indicating that under these
conditions glucose is consumed at the same rate or faster than fructose (Table 3.5 and Figure
3.8).
Fermentation products yield profiles and biomass yield for C.magnoliae PYCC 2903 (A)
and PYCC 3191 (B) are shown in Figure 3.9.
0
2
4
6
8
10
12
0 150 300 450 600 750 900
Glu
co
se c
on
su
mp
tio
n r
ate
(m
mo
l/L
.h)
[Glucose] (mM)
(A)
0
2
4
6
8
10
12
0 150 300 450 600 750 900
Fru
cto
se c
on
su
mp
tio
n r
ate
(m
mo
l/L
.h)
[Fructose] (mM)
(B)
0
1
2
3
4
5
6
7
0 150 300 450 600 750 900
Fru
cto
ph
ily
[Sugar] mM
(C)
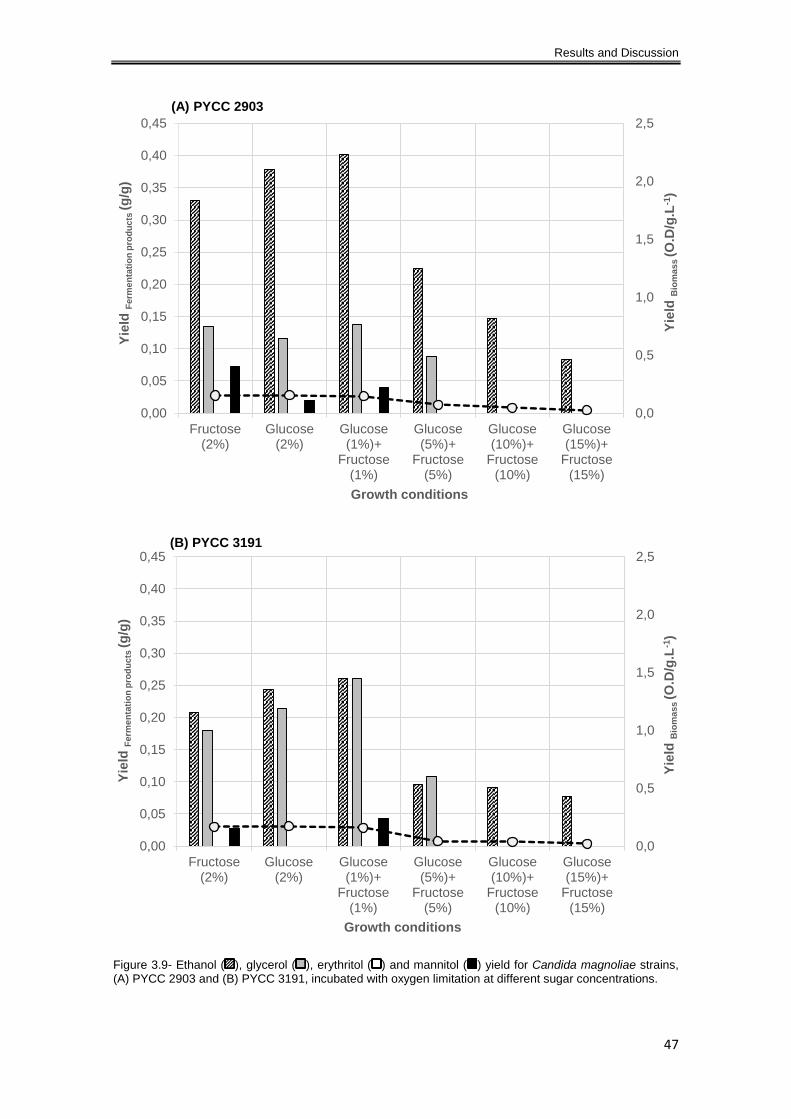
Results and Discussion
47
Figure 3.9- Ethanol ( ), glycerol ( ), erythritol ( ) and mannitol ( ) yield for Candida magnoliae strains, (A) PYCC 2903 and (B) PYCC 3191, incubated with oxygen limitation at different sugar concentrations.
0,0
0,5
1,0
1,5
2,0
2,5
0,00
0,05
0,10
0,15
0,20
0,25
0,30
0,35
0,40
0,45
Fructose(2%)
Glucose(2%)
Glucose(1%)+
Fructose(1%)
Glucose(5%)+
Fructose(5%)
Glucose(10%)+
Fructose(10%)
Glucose(15%)+
Fructose(15%)
Yie
ld B
iom
ass
(O
.D/g
.L-1
)
Yie
ld F
erm
en
tati
on
pro
du
cts
(g
/g)
Growth conditions
(A) PYCC 2903
0,0
0,5
1,0
1,5
2,0
2,5
0,00
0,05
0,10
0,15
0,20
0,25
0,30
0,35
0,40
0,45
Fructose(2%)
Glucose(2%)
Glucose(1%)+
Fructose(1%)
Glucose(5%)+
Fructose(5%)
Glucose(10%)+
Fructose(10%)
Glucose(15%)+
Fructose(15%)
Yie
ld B
iom
ass
(O
.D/g
.L-1
)
Yie
ld F
erm
en
tati
on
pro
du
cts
(g
/g)
Growth conditions
(B) PYCC 3191

Results and Discussion
48
For lower sugar concentrations, and as expected under oxygen limitation, the
fermentation metabolism predominated and ethanol and other fermentation products were
produced. As was already observed in Figure 3.5, mannitol was produced by both strains
confirming that this is a normal fermentation product for this species.
In this fermentation conditions, the higher sugar alcohols yield observed for PYCC 3191
in the previous section is even more evident. This strain has a more equilibrated distribution
between glycerol and mannitol production and ethanol production. PYCC 2903 produces ethanol
with a yield between 0.33-0.4g/g, glycerol 0.12-0.14g/g and mannitol 0.02-0.07g/g while for the
other strain (B) ethanol yield is among 0.21-0.26g/g, glycerol 0.18-0.26g/g and mannitol 0-
0.04g/g. Fermentation products profiles illustrated in Figure 3.9 also show for both strains, the
lower yield of ethanol production is for 2% fructose considering the lower sugar concentrations
(1% of each sugar and 2% of glucose or fructose).
These fermentation products profiles (Figure 3.9) reveal that the type and yield of
fermentation products varies between sugar concentrations and also differs between strains.
For both strains, under these oxygen limitation conditions, biomass yield curve (Figure
3.9) show very low values (0.02-0.17) for low and high sugar concentrations. This suggests that
regardless the sugar content, sugar was consumed for fermentation products formation rather
than biomass production. However the results for the higher sugar concentrations are unclear
and require further analysis.
3.1.3 Fermentations inoculated with high cell density
Aiming to evaluate the potential of C.magnoliae strains, PYCC 2903 and PYCC 3191, to
yield low-alcoholic fermented beverages, a simulation of industrial fructose-rich substrates, such
as fruit juices, was tested, using mixtures of sugars (glucose and fructose) in different and equal
ratios or just one of the sugars maintaining the final concentration at 100g.L-1 (10%). For this
study, cultures were inoculated with high cell density (O.D640nm ≈ 15) (see Table 3.1).
3.1.3.1 Aerobiose
Sugar consumption profiles for C.magnoliae PYCC 2903 simulating industrial fructose-
rich substrates are demonstrated in Figure 3.10.
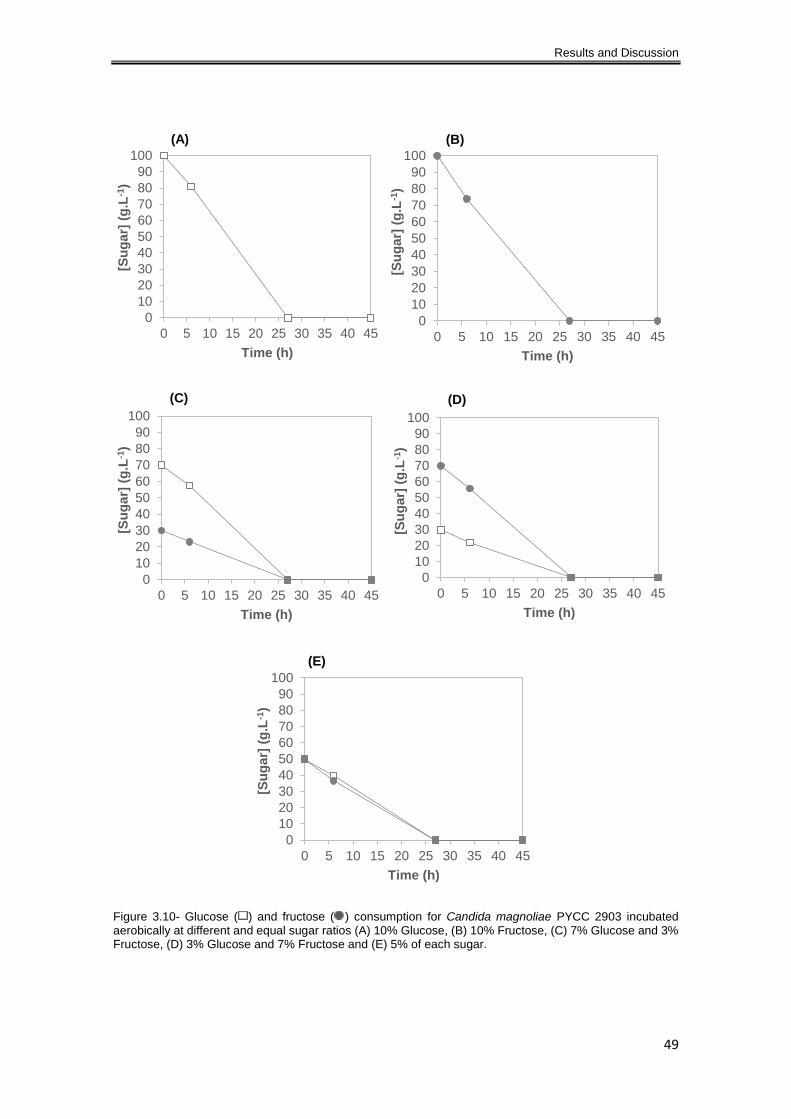
Results and Discussion
49
Figure 3.10- Glucose ( ) and fructose ( ) consumption for Candida magnoliae PYCC 2903 incubated aerobically at different and equal sugar ratios (A) 10% Glucose, (B) 10% Fructose, (C) 7% Glucose and 3% Fructose, (D) 3% Glucose and 7% Fructose and (E) 5% of each sugar.
0
10
20
30
40
50
60
70
80
90
100
0 5 10 15 20 25 30 35 40 45
[Su
gar]
(g
.L-1
)
Time (h)
(A)
0
10
20
30
40
50
60
70
80
90
100
0 5 10 15 20 25 30 35 40 45
[Su
gar]
(g
.L-1
)
Time (h)
(B)
0
10
20
30
40
50
60
70
80
90
100
0 5 10 15 20 25 30 35 40 45
[Su
gar]
(g
.L-1
)
Time (h)
(C)
0
10
20
30
40
50
60
70
80
90
100
0 5 10 15 20 25 30 35 40 45
[Su
gar]
(g
.L-1
)
Time (h)
(D)
0
10
20
30
40
50
60
70
80
90
100
0 5 10 15 20 25 30 35 40 45
[Su
gar]
(g
.L-1
)
Time (h)
(E)
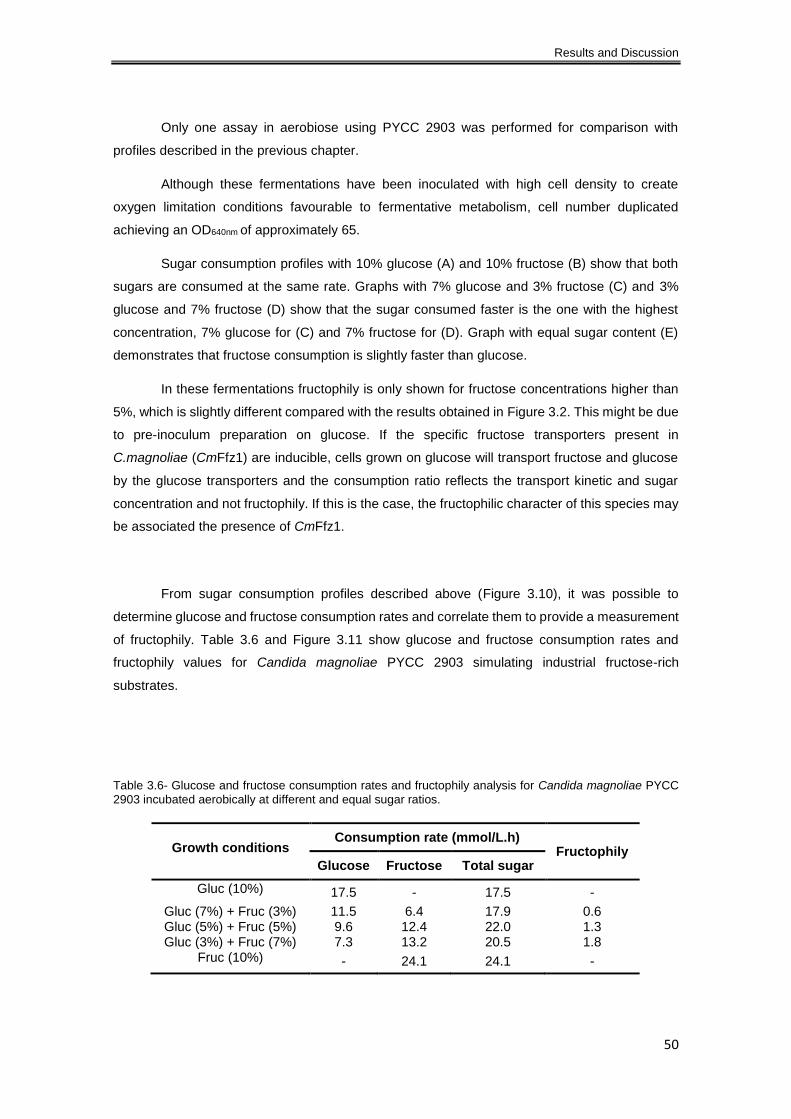
Results and Discussion
50
Only one assay in aerobiose using PYCC 2903 was performed for comparison with
profiles described in the previous chapter.
Although these fermentations have been inoculated with high cell density to create
oxygen limitation conditions favourable to fermentative metabolism, cell number duplicated
achieving an OD640nm of approximately 65.
Sugar consumption profiles with 10% glucose (A) and 10% fructose (B) show that both
sugars are consumed at the same rate. Graphs with 7% glucose and 3% fructose (C) and 3%
glucose and 7% fructose (D) show that the sugar consumed faster is the one with the highest
concentration, 7% glucose for (C) and 7% fructose for (D). Graph with equal sugar content (E)
demonstrates that fructose consumption is slightly faster than glucose.
In these fermentations fructophily is only shown for fructose concentrations higher than
5%, which is slightly different compared with the results obtained in Figure 3.2. This might be due
to pre-inoculum preparation on glucose. If the specific fructose transporters present in
C.magnoliae (CmFfz1) are inducible, cells grown on glucose will transport fructose and glucose
by the glucose transporters and the consumption ratio reflects the transport kinetic and sugar
concentration and not fructophily. If this is the case, the fructophilic character of this species may
be associated the presence of CmFfz1.
From sugar consumption profiles described above (Figure 3.10), it was possible to
determine glucose and fructose consumption rates and correlate them to provide a measurement
of fructophily. Table 3.6 and Figure 3.11 show glucose and fructose consumption rates and
fructophily values for Candida magnoliae PYCC 2903 simulating industrial fructose-rich
substrates.
Table 3.6- Glucose and fructose consumption rates and fructophily analysis for Candida magnoliae PYCC
2903 incubated aerobically at different and equal sugar ratios.
Growth conditions Consumption rate (mmol/L.h)
Fructophily Glucose Fructose Total sugar
Gluc (10%) 17.5 - 17.5 -
Gluc (7%) + Fruc (3%) 11.5 6.4 17.9 0.6 Gluc (5%) + Fruc (5%) 9.6 12.4 22.0 1.3 Gluc (3%) + Fruc (7%) 7.3 13.2 20.5 1.8
Fruc (10%) - 24.1 24.1 -
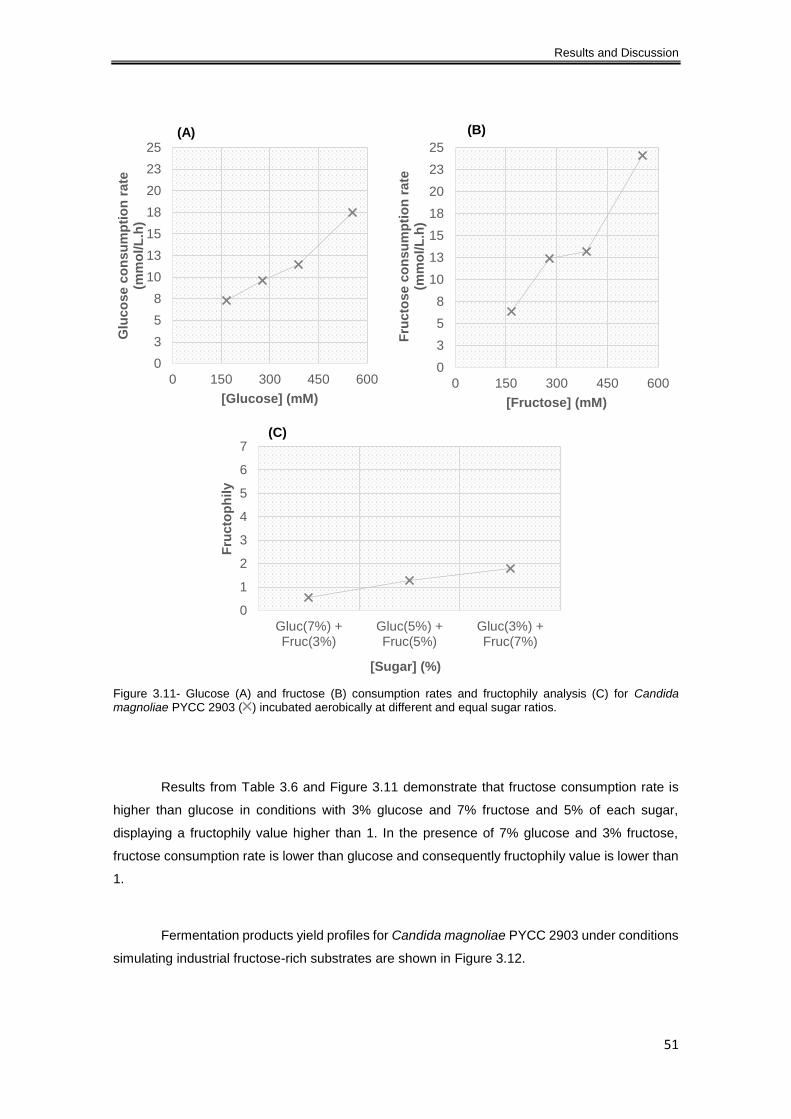
Results and Discussion
51
Figure 3.11- Glucose (A) and fructose (B) consumption rates and fructophily analysis (C) for Candida magnoliae PYCC 2903 ( ) incubated aerobically at different and equal sugar ratios.
Results from Table 3.6 and Figure 3.11 demonstrate that fructose consumption rate is
higher than glucose in conditions with 3% glucose and 7% fructose and 5% of each sugar,
displaying a fructophily value higher than 1. In the presence of 7% glucose and 3% fructose,
fructose consumption rate is lower than glucose and consequently fructophily value is lower than
1.
Fermentation products yield profiles for Candida magnoliae PYCC 2903 under conditions
simulating industrial fructose-rich substrates are shown in Figure 3.12.
0
3
5
8
10
13
15
18
20
23
25
0 150 300 450 600
Glu
co
se c
on
su
mp
tio
n r
ate
(m
mo
l/L
.h)
[Glucose] (mM)
(A)
0
3
5
8
10
13
15
18
20
23
25
0 150 300 450 600
Fru
cto
se c
on
su
mp
tio
n r
ate
(m
mo
l/L
.h)
[Fructose] (mM)
(B)
0
1
2
3
4
5
6
7
Gluc(7%) +Fruc(3%)
Gluc(5%) +Fruc(5%)
Gluc(3%) +Fruc(7%)
Fru
cto
ph
ily
[Sugar] (%)
(C)
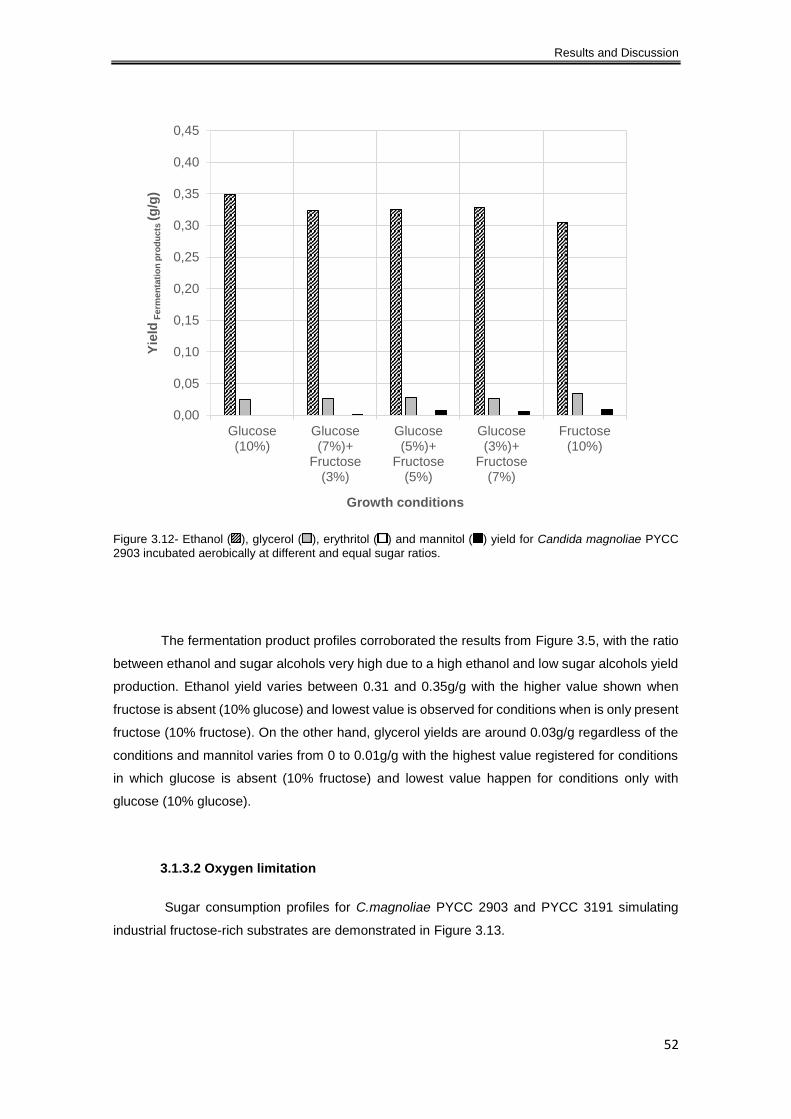
Results and Discussion
52
Figure 3.12- Ethanol ( ), glycerol ( ), erythritol ( ) and mannitol ( ) yield for Candida magnoliae PYCC
2903 incubated aerobically at different and equal sugar ratios.
The fermentation product profiles corroborated the results from Figure 3.5, with the ratio
between ethanol and sugar alcohols very high due to a high ethanol and low sugar alcohols yield
production. Ethanol yield varies between 0.31 and 0.35g/g with the higher value shown when
fructose is absent (10% glucose) and lowest value is observed for conditions when is only present
fructose (10% fructose). On the other hand, glycerol yields are around 0.03g/g regardless of the
conditions and mannitol varies from 0 to 0.01g/g with the highest value registered for conditions
in which glucose is absent (10% fructose) and lowest value happen for conditions only with
glucose (10% glucose).
3.1.3.2 Oxygen limitation
Sugar consumption profiles for C.magnoliae PYCC 2903 and PYCC 3191 simulating
industrial fructose-rich substrates are demonstrated in Figure 3.13.
0,00
0,05
0,10
0,15
0,20
0,25
0,30
0,35
0,40
0,45
Glucose(10%)
Glucose(7%)+
Fructose(3%)
Glucose(5%)+
Fructose(5%)
Glucose(3%)+
Fructose(7%)
Fructose(10%)
Yie
ldF
erm
en
tati
on
pro
du
cts
(g
/g)
Growth conditions
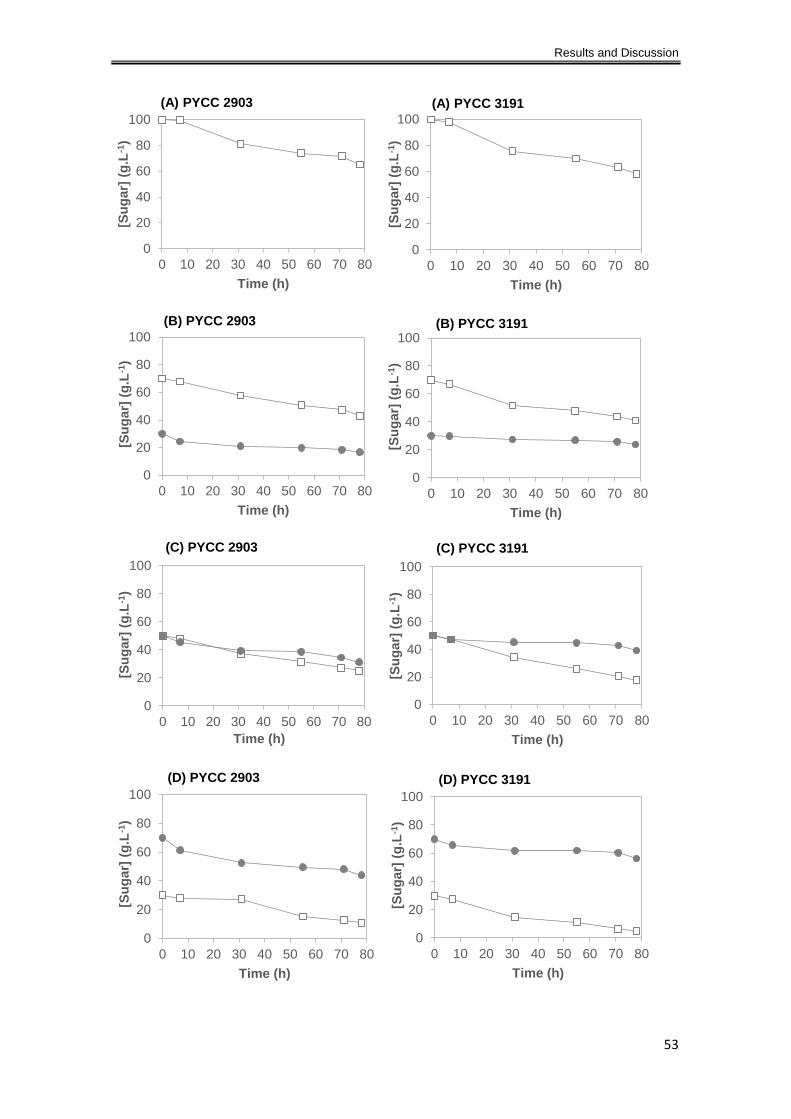
Results and Discussion
53
0
20
40
60
80
100
0 10 20 30 40 50 60 70 80
[Su
gar]
(g
.L-1
)
Time (h)
(A) PYCC 2903
0
20
40
60
80
100
0 10 20 30 40 50 60 70 80
[Su
gar]
(g
.L-1
)
Time (h)
(A) PYCC 3191
0
20
40
60
80
100
0 10 20 30 40 50 60 70 80
[Su
gar]
(g
.L-1
)
Time (h)
(B) PYCC 2903
0
20
40
60
80
100
0 10 20 30 40 50 60 70 80
[Su
gar]
(g
.L-1
)
Time (h)
(B) PYCC 3191
0
20
40
60
80
100
0 10 20 30 40 50 60 70 80
[Su
gar]
(g
.L-1
)
Time (h)
(C) PYCC 2903
0
20
40
60
80
100
0 10 20 30 40 50 60 70 80
[Su
gar]
(g
.L-1
)
Time (h)
(C) PYCC 3191
0
20
40
60
80
100
0 10 20 30 40 50 60 70 80
[Su
gar]
(g
.L-1
)
Time (h)
(D) PYCC 2903
0
20
40
60
80
100
0 10 20 30 40 50 60 70 80
[Su
gar]
(g
.L-1
)
Time (h)
(D) PYCC 3191
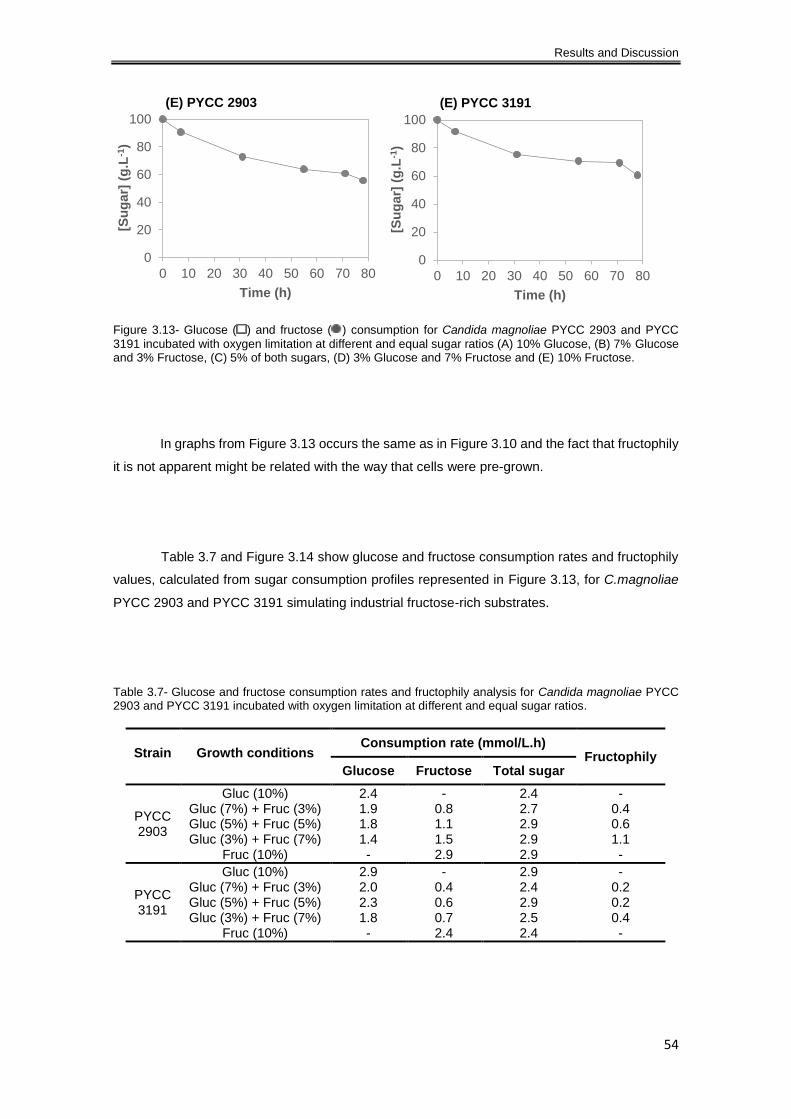
Results and Discussion
54
Figure 3.13- Glucose ( ) and fructose ( ) consumption for Candida magnoliae PYCC 2903 and PYCC
3191 incubated with oxygen limitation at different and equal sugar ratios (A) 10% Glucose, (B) 7% Glucose and 3% Fructose, (C) 5% of both sugars, (D) 3% Glucose and 7% Fructose and (E) 10% Fructose.
In graphs from Figure 3.13 occurs the same as in Figure 3.10 and the fact that fructophily
it is not apparent might be related with the way that cells were pre-grown.
Table 3.7 and Figure 3.14 show glucose and fructose consumption rates and fructophily
values, calculated from sugar consumption profiles represented in Figure 3.13, for C.magnoliae
PYCC 2903 and PYCC 3191 simulating industrial fructose-rich substrates.
Table 3.7- Glucose and fructose consumption rates and fructophily analysis for Candida magnoliae PYCC 2903 and PYCC 3191 incubated with oxygen limitation at different and equal sugar ratios.
0
20
40
60
80
100
0 10 20 30 40 50 60 70 80
[Su
gar]
(g
.L-1
)
Time (h)
(E) PYCC 2903
0
20
40
60
80
100
0 10 20 30 40 50 60 70 80
[Su
gar]
(g
.L-1
)
Time (h)
(E) PYCC 3191
Strain Growth conditions Consumption rate (mmol/L.h)
Fructophily Glucose Fructose Total sugar
PYCC 2903
Gluc (10%) 2.4 - 2.4 - Gluc (7%) + Fruc (3%) 1.9 0.8 2.7 0.4 Gluc (5%) + Fruc (5%) 1.8 1.1 2.9 0.6 Gluc (3%) + Fruc (7%) 1.4 1.5 2.9 1.1
Fruc (10%) - 2.9 2.9 -
PYCC 3191
Gluc (10%) 2.9 - 2.9 - Gluc (7%) + Fruc (3%) 2.0 0.4 2.4 0.2 Gluc (5%) + Fruc (5%) 2.3 0.6 2.9 0.2 Gluc (3%) + Fruc (7%) 1.8 0.7 2.5 0.4
Fruc (10%) - 2.4 2.4 -
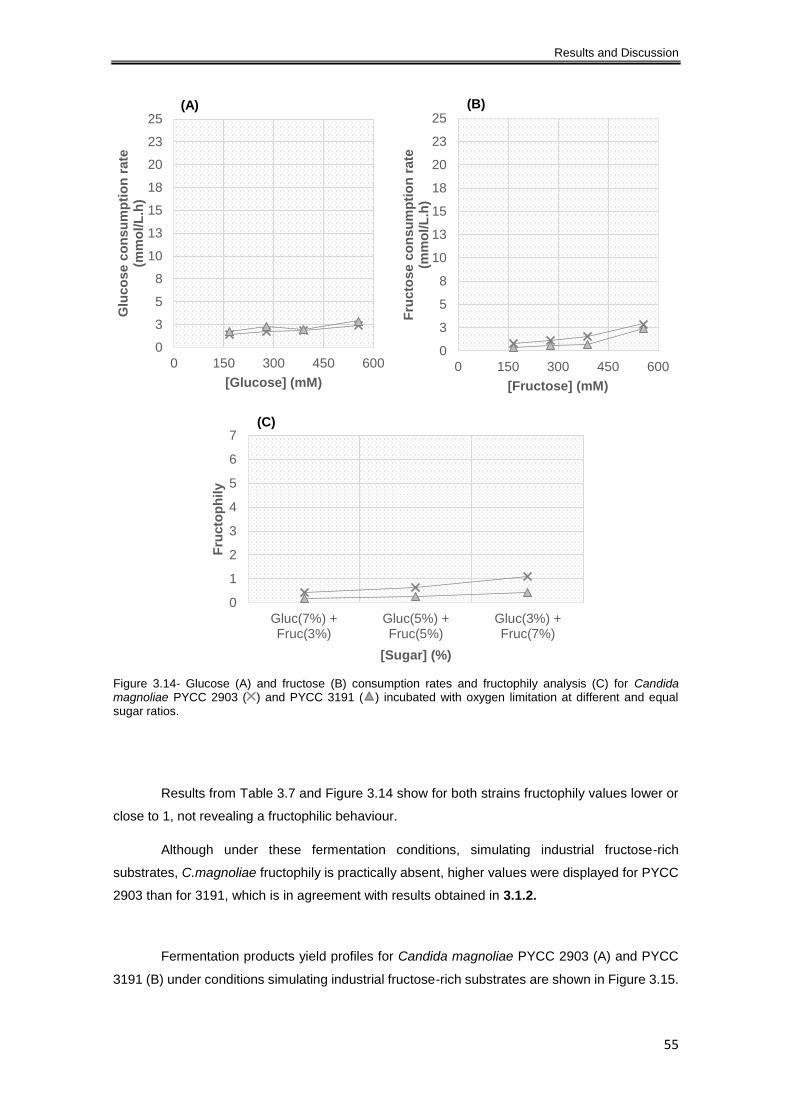
Results and Discussion
55
Figure 3.14- Glucose (A) and fructose (B) consumption rates and fructophily analysis (C) for Candida magnoliae PYCC 2903 ( ) and PYCC 3191 ( ) incubated with oxygen limitation at different and equal sugar ratios.
Results from Table 3.7 and Figure 3.14 show for both strains fructophily values lower or
close to 1, not revealing a fructophilic behaviour.
Although under these fermentation conditions, simulating industrial fructose-rich
substrates, C.magnoliae fructophily is practically absent, higher values were displayed for PYCC
2903 than for 3191, which is in agreement with results obtained in 3.1.2.
Fermentation products yield profiles for Candida magnoliae PYCC 2903 (A) and PYCC
3191 (B) under conditions simulating industrial fructose-rich substrates are shown in Figure 3.15.
0
3
5
8
10
13
15
18
20
23
25
0 150 300 450 600
Glu
co
se c
on
su
mp
tio
n r
ate
(m
mo
l/L
.h)
[Glucose] (mM)
(A)
0
3
5
8
10
13
15
18
20
23
25
0 150 300 450 600
Fru
cto
se c
on
su
mp
tio
n r
ate
(m
mo
l/L
.h)
[Fructose] (mM)
(B)
0
1
2
3
4
5
6
7
Gluc(7%) +Fruc(3%)
Gluc(5%) +Fruc(5%)
Gluc(3%) +Fruc(7%)
Fru
cto
ph
ily
[Sugar] (%)
(C)
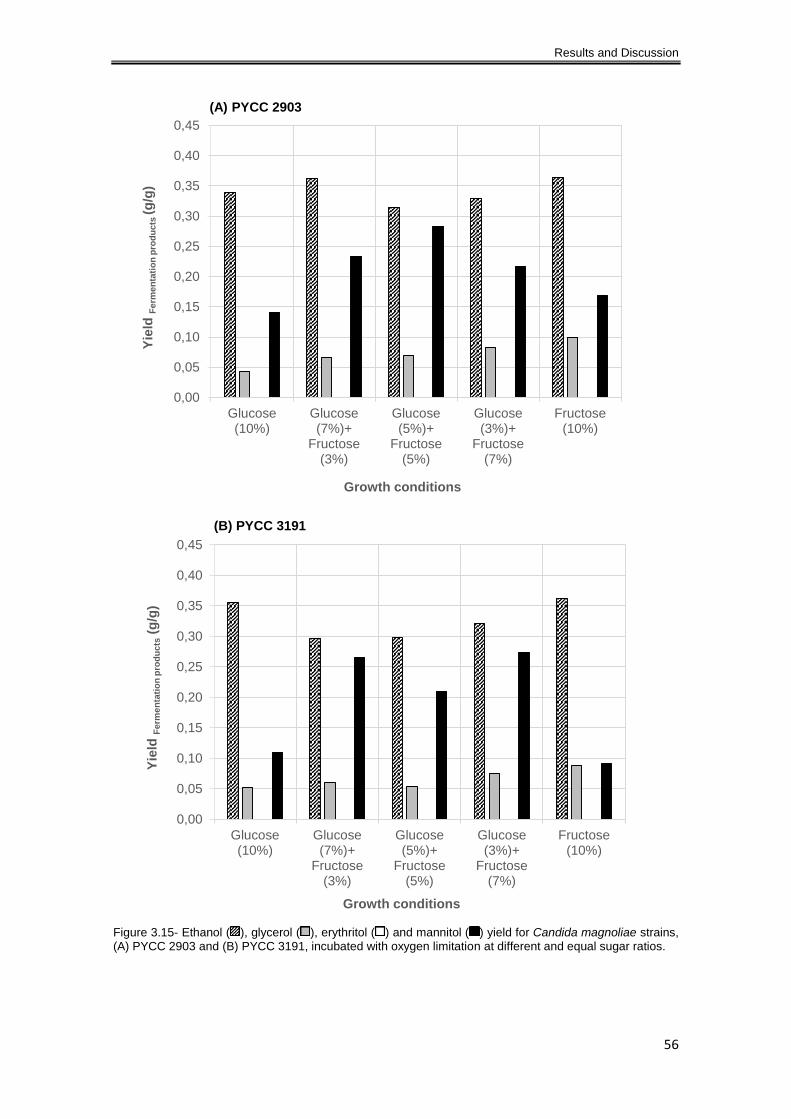
Results and Discussion
56
Figure 3.15- Ethanol ( ), glycerol ( ), erythritol ( ) and mannitol ( ) yield for Candida magnoliae strains, (A) PYCC 2903 and (B) PYCC 3191, incubated with oxygen limitation at different and equal sugar ratios.
0,00
0,05
0,10
0,15
0,20
0,25
0,30
0,35
0,40
0,45
Glucose(10%)
Glucose(7%)+
Fructose(3%)
Glucose(5%)+
Fructose(5%)
Glucose(3%)+
Fructose(7%)
Fructose(10%)
Yie
ld F
erm
en
tati
on
pro
du
cts
(g
/g)
Growth conditions
(A) PYCC 2903
0,00
0,05
0,10
0,15
0,20
0,25
0,30
0,35
0,40
0,45
Glucose(10%)
Glucose(7%)+
Fructose(3%)
Glucose(5%)+
Fructose(5%)
Glucose(3%)+
Fructose(7%)
Fructose(10%)
Yie
ld F
erm
en
tati
on
pro
du
cts
(g/g
)
Growth conditions
(B) PYCC 3191

Results and Discussion
57
The conditions used in these experiments are likely to be those representing a better
approach to anaerobiosis. In fact, the diffusion of oxygen is reduced due to the non-agitated
cultures on flasks with a small headspace and the high cell density used as inoculum, which
rapidly consumes some available oxygen. Graphs (A) and (B) in Figure 3.15 show that when
oxygen is really limited, these strains use more sugar for the formation of glycerol and mannitol.
These fermentation products profiles exhibit a different pattern when compared with Figure 3.12,
representing a similar experiment but in agitation conditions on flask with high headspace.
Apparently, the relative metabolic flux of glucose and fructose does not significantly contribute to
modulate the fermentation products.
For both strains, ethanol production yield is between 0.3 and 0.37 g/g with the lowest
value obtained in the presence of 5% of each sugar. Mannitol production yield is the one with a
wider range, between 0.09 and 0.28 g/g, and the higher value differs from strains: for PYCC 2903
occurs for 5% glucose and fructose and for PYCC 3191 occurs with 3% glucose and 7% fructose.
Glycerol production yield is also higher than in profile illustrated in Figure 3.12 with the values
varying between 0.04 and 0.1 g/g and for both strains the higher value is displayed when culture
medium simply have fructose (10% fructose). For these conditions, as well as in Figure 3.12,
erythritol is not produced by both C.magnoliae strains, so the yield for this sugar alcohol formation
is zero.
Results obtained for fermentation profiles of Candida magnoliae PYCC 2903 and PYCC
3191 slightly differs from that described in the literature mainly in terms of fermentation products
(Lee et al., 2003; Ryu et al., 2000; Yu et al., 2006). These works described C.magnoliae as non-
producing ethanol and to be a high erythritol producer, which is not observed for the strains used
in the present work. The fermentation conditions such as temperature, shaking or stirring speed,
sugar ratio and concentration and fermentation time for complete fructose depletion varies from
those used in this work and all these variations might modulate the outcomes. C.magnoliae
strains, wild type (KFCC 11023 and KCCM-10252) and a mutant (M2) with improve erythritol
productivity, used in previous studies, were isolated in Korea from a fermentation sludge and
honeycomb.

58
3.2 Part II
Enzymatic contribution for Candida magnoliae fructophilic behaviour: Study of
hexokinase activity in terms of capacity (Vmax) and sugar affinity (Km)

Results and Discussion
59
Candida magnoliae fructophily might be due to the two main steps that differ in glucose
and fructose metabolism: (1) Transport carried out by fructose transporters and/or (2) Sugar
phosphorylation performed by hexokinases. In this project attention was given to phosphorylation
step.
With the purpose of trying to explain this particular behaviour in this yeast, enzymatic
assays were performed to evaluate the activity of this enzyme in terms of capacity (Vmax) and
affinity (Km) for glucose and fructose.
During these enzymatic assays, hexokinase activity was indirectly measured considering
the scheme in Figure 3.16. This enzyme integrates the glycolytic pathway and is responsible for
phosphorylation of glucose to glucose-6-phosphate (Glc-6-P) and fructose to fructose-6-
phosphate (Frc-6-P). However, the conversion of ATP cofactor into ADP resulting from the sugars
phosphorylation cannot be measured directly. Therefore, it was necessary to make use of
glucose-6-phosphate dehydrogenase as a coupling enzyme. This reaction consists in the
formation of NADPH resulting from Glucose-6-phosphate dehydrogenase activity, which converts
glucose-6-phosphate (Glc-6-P) into 6-phosphogluconate (6-PG). In the case of fructose a second
coupled enzyme is necessary to convert Fructose-6-phosphate into Glucose-6-phodphate.
Figure 3.16- Illustrative scheme of hexokinase activity and subsequent steps used for this enzyme activity measurement. Abbreviations: ATP (Adenosine triphosphate), ADP (Adenosine diphosphate), Frc-6-P (Fructose-6-phosphate), Glc-6-P (Glucose-6-phosphate), NADP+ (Nicotinamide adenine dinucleotide phosphate oxidized form), NADPH (Nicotinamide adenine dinucleotide phosphate reduced form) and 6-PG (6-phosphogluconate).
3.2.1 Hexokinase preliminary validation tests
Before hexokinase capacity and affinity assays, different preliminary validation tests were
performed to confirm the rate-limitation conditions of the enzymatic assay, i.e. to confirm that the
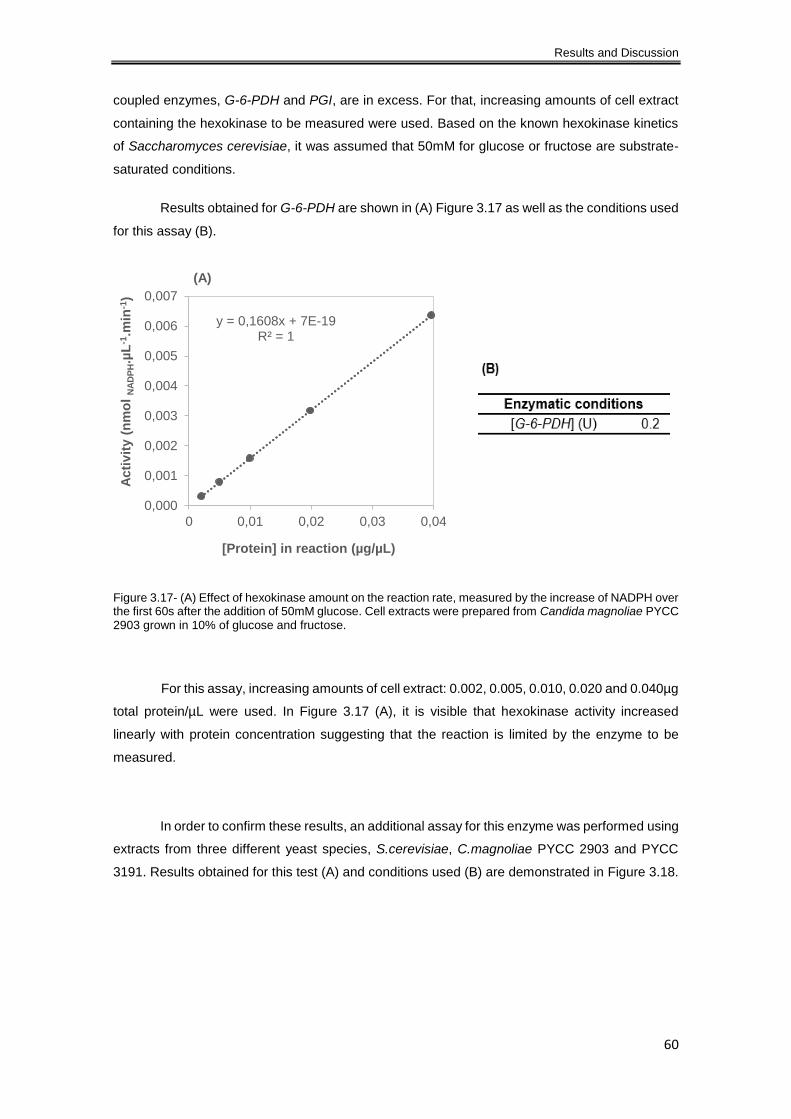
Results and Discussion
60
coupled enzymes, G-6-PDH and PGI, are in excess. For that, increasing amounts of cell extract
containing the hexokinase to be measured were used. Based on the known hexokinase kinetics
of Saccharomyces cerevisiae, it was assumed that 50mM for glucose or fructose are substrate-
saturated conditions.
Results obtained for G-6-PDH are shown in (A) Figure 3.17 as well as the conditions used
for this assay (B).
Figure 3.17- (A) Effect of hexokinase amount on the reaction rate, measured by the increase of NADPH over the first 60s after the addition of 50mM glucose. Cell extracts were prepared from Candida magnoliae PYCC 2903 grown in 10% of glucose and fructose.
For this assay, increasing amounts of cell extract: 0.002, 0.005, 0.010, 0.020 and 0.040µg
total protein/µL were used. In Figure 3.17 (A), it is visible that hexokinase activity increased
linearly with protein concentration suggesting that the reaction is limited by the enzyme to be
measured.
In order to confirm these results, an additional assay for this enzyme was performed using
extracts from three different yeast species, S.cerevisiae, C.magnoliae PYCC 2903 and PYCC
3191. Results obtained for this test (A) and conditions used (B) are demonstrated in Figure 3.18.
y = 0,1608x + 7E-19R² = 1
0,000
0,001
0,002
0,003
0,004
0,005
0,006
0,007
0 0,01 0,02 0,03 0,04
Acti
vit
y (
nm
ol
NA
DP
H.µ
L-1
.min
-1)
[Protein] in reaction (µg/µL)
(A)
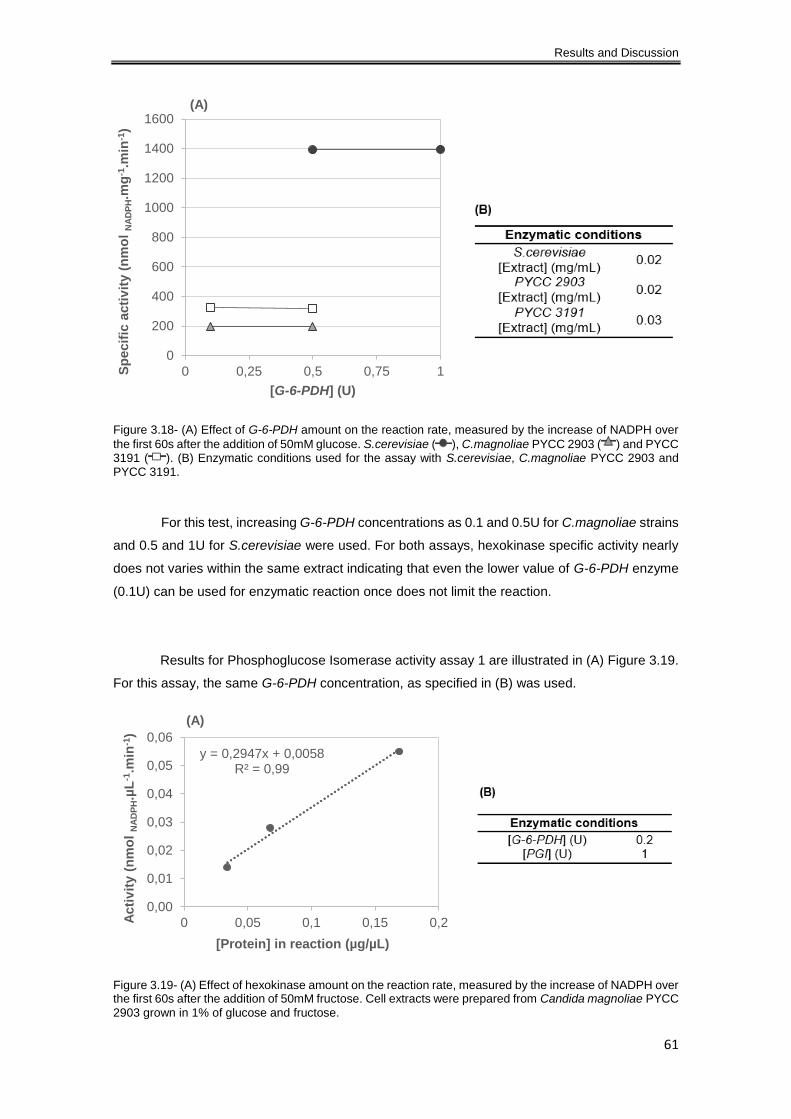
Results and Discussion
61
Figure 3.18- (A) Effect of G-6-PDH amount on the reaction rate, measured by the increase of NADPH over
the first 60s after the addition of 50mM glucose. S.cerevisiae ( ), C.magnoliae PYCC 2903 ( ) and PYCC 3191 ( ). (B) Enzymatic conditions used for the assay with S.cerevisiae, C.magnoliae PYCC 2903 and PYCC 3191.
For this test, increasing G-6-PDH concentrations as 0.1 and 0.5U for C.magnoliae strains
and 0.5 and 1U for S.cerevisiae were used. For both assays, hexokinase specific activity nearly
does not varies within the same extract indicating that even the lower value of G-6-PDH enzyme
(0.1U) can be used for enzymatic reaction once does not limit the reaction.
Results for Phosphoglucose Isomerase activity assay 1 are illustrated in (A) Figure 3.19.
For this assay, the same G-6-PDH concentration, as specified in (B) was used.
Figure 3.19- (A) Effect of hexokinase amount on the reaction rate, measured by the increase of NADPH over the first 60s after the addition of 50mM fructose. Cell extracts were prepared from Candida magnoliae PYCC
2903 grown in 1% of glucose and fructose.
0
200
400
600
800
1000
1200
1400
1600
0 0,25 0,5 0,75 1Sp
ecif
ic a
cti
vit
y (
nm
ol
NA
DP
H.m
g-1
.min
-1)
[G-6-PDH] (U)
(A)
y = 0,2947x + 0,0058R² = 0,99
0,00
0,01
0,02
0,03
0,04
0,05
0,06
0 0,05 0,1 0,15 0,2Acti
vit
y (
nm
ol
NA
DP
H.µ
L-1
.min
-1)
[Protein] in reaction (µg/µL)
(A)

Results and Discussion
62
For this assay, increasing amounts of cell extract as 0.03, 0.07 and 0.17µg (total
protein)/µL were used. In this test, hexokinase activity increased linearly with protein
concentration indicating that 1U of PGI enzyme does not limit the reaction.
In order to confirm these results, an additional assay for this enzyme was performed using
the same G-6-PDH concentration in the reaction, as demonstrated in (B) Figure 3.20, however
changing PGI concentration. Results for this test are shown in (A) Figure 3.20.
Figure 3.20- (A) Effect of PGI amount on the reaction rate, measured by the increase of NADPH over the first 60s after the addition of 50mM fructose. Cell extracts were prepared from Candida magnoliae PYCC 2903 grown in 1% of glucose and fructose.
In this assay, increasing concentrations of PGI enzyme as 0.25, 1, 2 and 3U were used.
Results derived from this assay show that hexokinase specific activity is slightly lower (326
nmol.mg-1.min-1) when was added to reaction 0.25U of PGI enzyme. Despite the similarity of
specific activity values, such results evidence that lower PGI concentration can slightly interferes
in reaction and to make sure that this is not a limiting step, at least 1U of enzyme should be added
to enzymatic reaction. This confirms the previous test for PGI wherein 1U of this enzyme is not a
limiting condition for hexokinase activity measurement.
After performing these preliminary tests, the conditions used during enzymatic reaction
were standardized and hexokinase activity measurement assays in terms of capacity (Vmax) and
affinity (Km) for glucose and fructose were accomplished.
0
50
100
150
200
250
300
350
400
450
500
0 0,5 1 1,5 2 2,5 3
Sp
ecif
ic a
cti
vit
y (
nm
ol
NA
DP
H.m
g-1
.min
-1)
[PGI] (U)
(A)
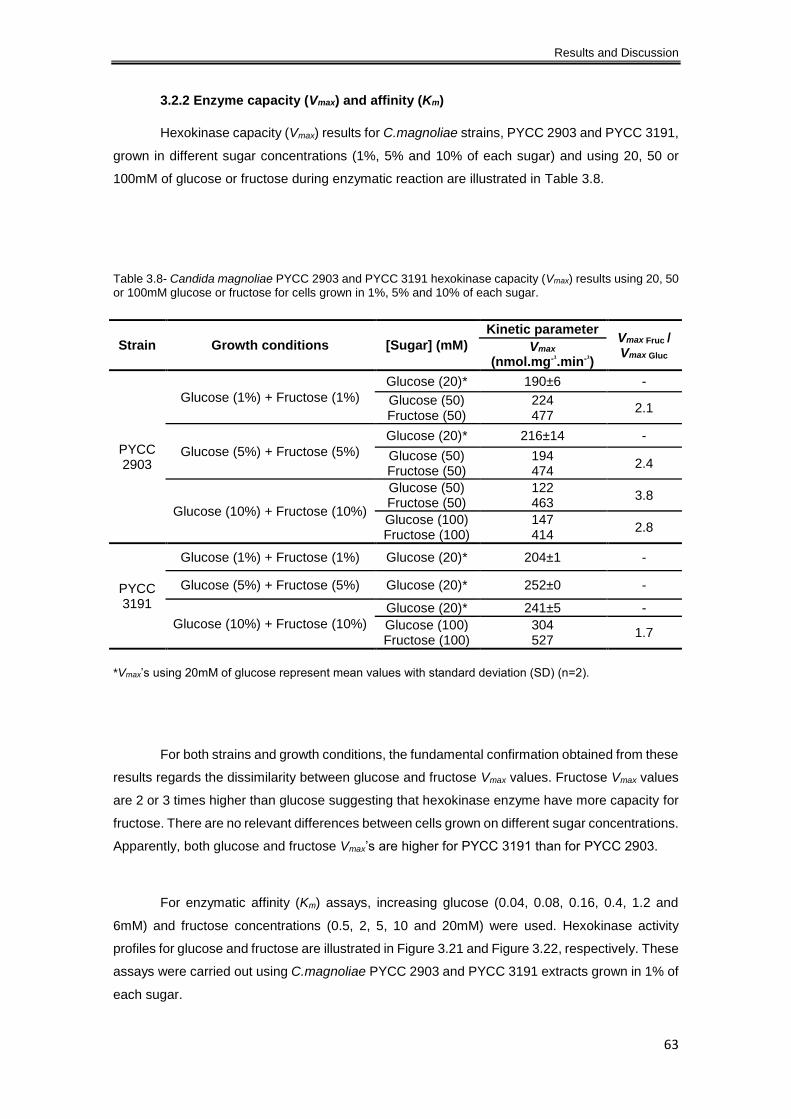
Results and Discussion
63
3.2.2 Enzyme capacity (Vmax) and affinity (Km)
Hexokinase capacity (Vmax) results for C.magnoliae strains, PYCC 2903 and PYCC 3191,
grown in different sugar concentrations (1%, 5% and 10% of each sugar) and using 20, 50 or
100mM of glucose or fructose during enzymatic reaction are illustrated in Table 3.8.
Table 3.8- Candida magnoliae PYCC 2903 and PYCC 3191 hexokinase capacity (Vmax) results using 20, 50 or 100mM glucose or fructose for cells grown in 1%, 5% and 10% of each sugar.
*Vmax’s using 20mM of glucose represent mean values with standard deviation (SD) (n=2).
For both strains and growth conditions, the fundamental confirmation obtained from these
results regards the dissimilarity between glucose and fructose Vmax values. Fructose Vmax values
are 2 or 3 times higher than glucose suggesting that hexokinase enzyme have more capacity for
fructose. There are no relevant differences between cells grown on different sugar concentrations.
Apparently, both glucose and fructose Vmax’s are higher for PYCC 3191 than for PYCC 2903.
For enzymatic affinity (Km) assays, increasing glucose (0.04, 0.08, 0.16, 0.4, 1.2 and
6mM) and fructose concentrations (0.5, 2, 5, 10 and 20mM) were used. Hexokinase activity
profiles for glucose and fructose are illustrated in Figure 3.21 and Figure 3.22, respectively. These
assays were carried out using C.magnoliae PYCC 2903 and PYCC 3191 extracts grown in 1% of
each sugar.
Strain Growth conditions [Sugar] (mM)
Kinetic parameter Vmax Fruc / Vmax Gluc
Vmax (nmol.mg-¹.min-¹)
PYCC 2903
Glucose (1%) + Fructose (1%)
Glucose (20)* 190±6 -
Glucose (50) 224 2.1
Fructose (50) 477
Glucose (5%) + Fructose (5%)
Glucose (20)* 216±14 -
Glucose (50) 194 2.4
Fructose (50) 474
Glucose (10%) + Fructose (10%)
Glucose (50) 122 3.8
Fructose (50) 463
Glucose (100) 147 2.8
Fructose (100) 414
PYCC 3191
Glucose (1%) + Fructose (1%) Glucose (20)* 204±1 -
Glucose (5%) + Fructose (5%) Glucose (20)* 252±0 -
Glucose (10%) + Fructose (10%)
Glucose (20)* 241±5 -
Glucose (100) 304 1.7
Fructose (100) 527
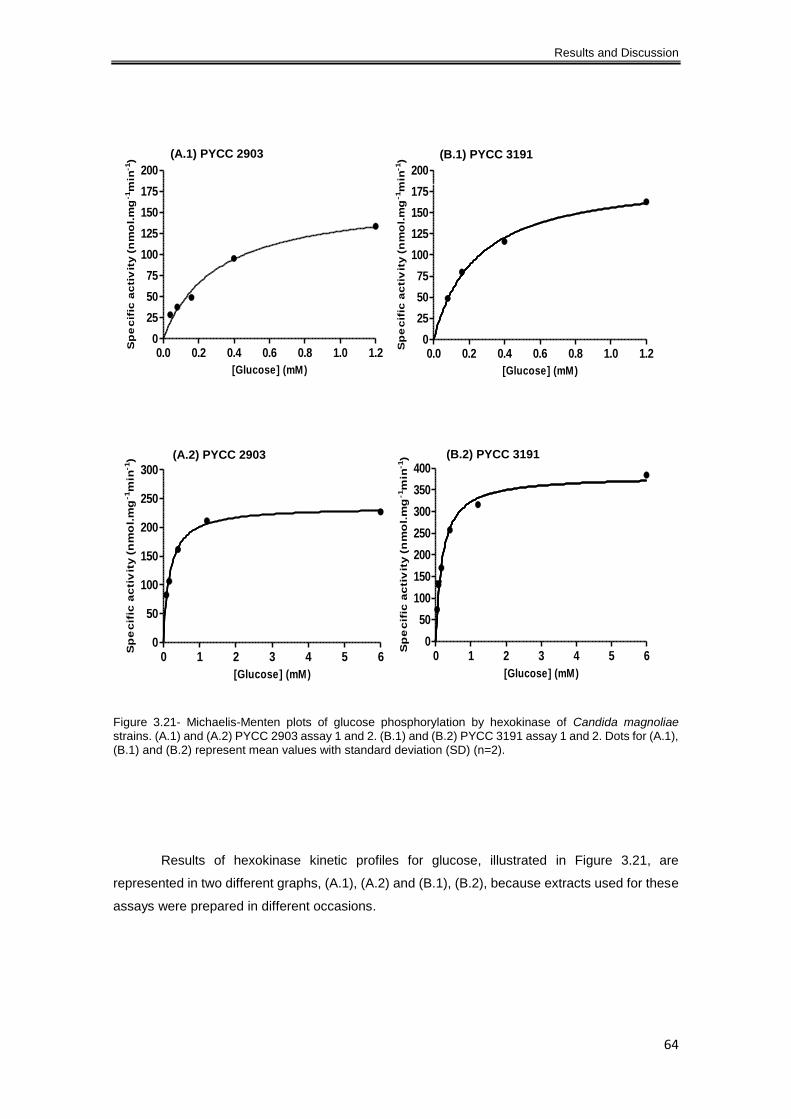
Results and Discussion
64
Figure 3.21- Michaelis-Menten plots of glucose phosphorylation by hexokinase of Candida magnoliae strains. (A.1) and (A.2) PYCC 2903 assay 1 and 2. (B.1) and (B.2) PYCC 3191 assay 1 and 2. Dots for (A.1), (B.1) and (B.2) represent mean values with standard deviation (SD) (n=2).
Results of hexokinase kinetic profiles for glucose, illustrated in Figure 3.21, are
represented in two different graphs, (A.1), (A.2) and (B.1), (B.2), because extracts used for these
assays were prepared in different occasions.
0.0 0.2 0.4 0.6 0.8 1.0 1.20
25
50
75
100
125
150
175
200
[Glucose] (mM)
Sp
ec
ific
ac
tiv
ity (
nm
ol.
mg
-1m
in-1)
0 1 2 3 4 5 60
50
100
150
200
250
300
[Glucose] (mM)
Sp
ec
ific
ac
tiv
ity (
nm
ol.
mg
-1m
in-1)
0.0 0.2 0.4 0.6 0.8 1.0 1.20
25
50
75
100
125
150
175
200
[Glucose] (mM)
Sp
ec
ific
ac
tiv
ity (
nm
ol.
mg
-1m
in-1)
0 1 2 3 4 5 60
50
100
150
200
250
300
350
400
[Glucose] (mM)
Sp
ec
ific
ac
tiv
ity (
nm
ol.
mg
-1m
in-1)
(A.1) PYCC 2903
(B.1) PYCC 3191
(A.2) PYCC 2903
(B.2) PYCC 3191

Results and Discussion
65
Figure 3.22- Michaelis-Menten plots of fructose phosphorylation by hexokinase of Candida magnoliae
strains, (A) PYCC 2903 and (B) PYCC 3191. Dots represent mean values with standard deviation (SD) for (A) with n=3 and for (B) with n=4.
Table 3.9 resumes C.magnoliae strains hexokinase kinetic parameters values obtained
from these assays (Figure 3.21 and Figure 3.22) and compares affinity and capacity of this
enzyme between glucose and fructose.
Table 3.9- Candida magnoliae PYCC 2903 and PYCC 3191 hexokinase kinetic parameters, capacity (Vmax) and affinity (Km), and their ratio between glucose and fructose.
These Vmax results, Table 3.9, corroborate those previously, once hexokinase capacity is
2 or 3 times higher for fructose than glucose.
For both strains, glucose Vmax from assay 1 and 2 are different however, these values are
always lower than the Vmax for fructose. On the other hand, glucose Km values between assay 1
and 2 remain almost unchanged. For these two strains, glucose affinity values are quite similar,
Strain Assay
Kinetic parameters Km
Fruc / Km
Gluc
Vmax
Fruc / Vmax
Gluc
Glucose Fructose
Km (mM) Vmax
(nmol.mg-¹.min-¹) Km (mM)
Vmax
(nmol.mg-¹.min-¹)
PYCC 2903
A.1 0.3±0.04 167±9 3.6±0.5 417±17
12 2.5 A.2 0.2±0.02 236±6 18 1.8
PYCC 3191
B.1 0.2±0.02 194±4 2.2±0.4 752±35
11 3.9 B.2 0.2±0.02 383±8 11 2.0
0 2 4 6 8 10 12 14 16 18 200
50
100
150
200
250
300
350
400
[Fructose] (mM)
Sp
ec
ific
ac
tiv
ity (
nm
ol.
mg
-1m
in-1)
0 2 4 6 8 10 12 14 16 18 200
100
200
300
400
500
600
700
800
[Fructose] (mM)
Sp
ec
ific
ac
tiv
ity (
nm
ol.
mg
-1m
in-1)
(A) PYCC 2903 (B) PYCC 3191
Results and Discussion
66
around 0.2mM, but fructose varies, namely 3.6mM and 2.2mM for PYCC 2903 and PYCC 3191,
respectively. Thus, C.magnoliae hexokinase Km for fructose is between 11 and 18 times higher
than for glucose. This condition implies that affinity for fructose is much lower than for glucose,
so hexokinase affinity constant does not explain Candida magnoliae fructophilic behaviour.
C.magnoliae PYCC 2903 and PYCC 3191 hexokinase results suggests a similarity with
hexokinase I of Saccharomyces cerevisiae which has a Km for glucose of 0.12mM and for fructose
of 1.5mM and a Vmax three times higher for fructose than glucose (Berthels et al., 2008).
67
3.3 Part III
Evaluation the potential of Candida magnoliae yeast to yield low-alcoholic fermented
beverages using real industrial fructose-rich substrates as fruit juices
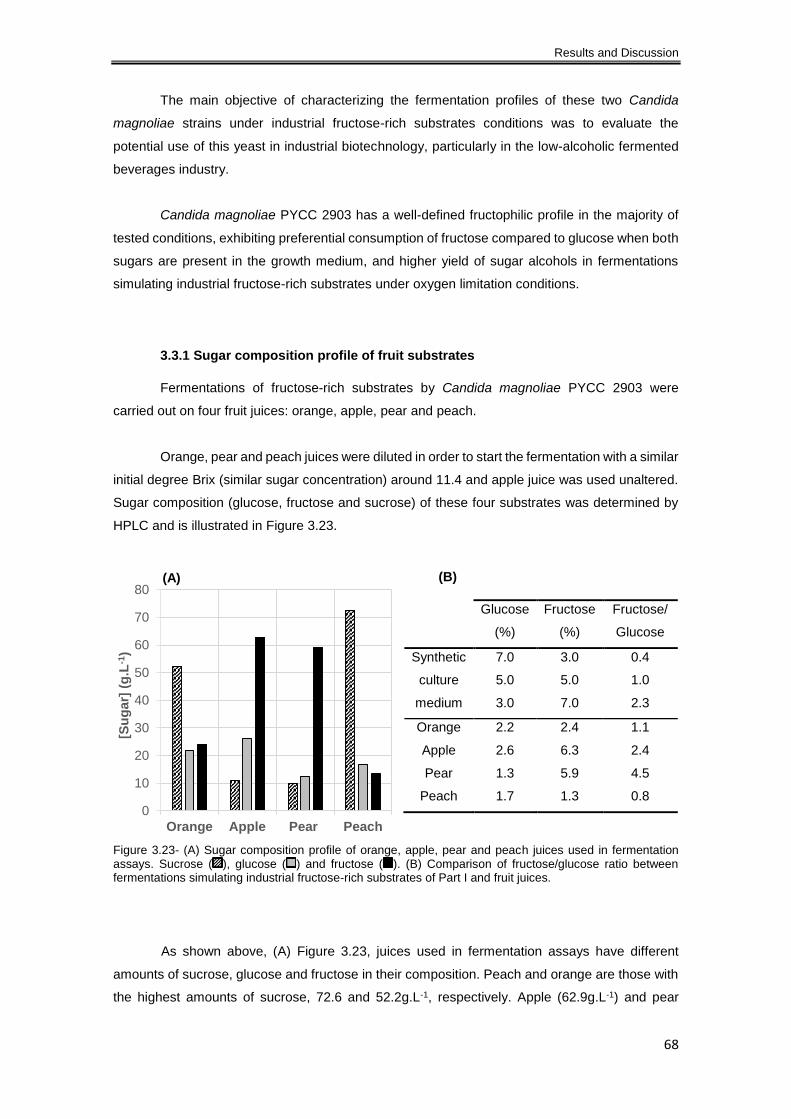
Results and Discussion
68
The main objective of characterizing the fermentation profiles of these two Candida
magnoliae strains under industrial fructose-rich substrates conditions was to evaluate the
potential use of this yeast in industrial biotechnology, particularly in the low-alcoholic fermented
beverages industry.
Candida magnoliae PYCC 2903 has a well-defined fructophilic profile in the majority of
tested conditions, exhibiting preferential consumption of fructose compared to glucose when both
sugars are present in the growth medium, and higher yield of sugar alcohols in fermentations
simulating industrial fructose-rich substrates under oxygen limitation conditions.
3.3.1 Sugar composition profile of fruit substrates
Fermentations of fructose-rich substrates by Candida magnoliae PYCC 2903 were
carried out on four fruit juices: orange, apple, pear and peach.
Orange, pear and peach juices were diluted in order to start the fermentation with a similar
initial degree Brix (similar sugar concentration) around 11.4 and apple juice was used unaltered.
Sugar composition (glucose, fructose and sucrose) of these four substrates was determined by
HPLC and is illustrated in Figure 3.23.
Figure 3.23- (A) Sugar composition profile of orange, apple, pear and peach juices used in fermentation assays. Sucrose ( ), glucose ( ) and fructose ( ). (B) Comparison of fructose/glucose ratio between fermentations simulating industrial fructose-rich substrates of Part I and fruit juices.
As shown above, (A) Figure 3.23, juices used in fermentation assays have different
amounts of sucrose, glucose and fructose in their composition. Peach and orange are those with
the highest amounts of sucrose, 72.6 and 52.2g.L-1, respectively. Apple (62.9g.L-1) and pear
Glucose
(%)
Fructose
(%)
Fructose/
Glucose
Synthetic
culture
medium
7.0 3.0 0.4
5.0 5.0 1.0
3.0 7.0 2.3
Orange 2.2 2.4 1.1
Apple 2.6 6.3 2.4
Pear 1.3 5.9 4.5
Peach 1.7 1.3 0.8 0
10
20
30
40
50
60
70
80
Orange Apple Pear Peach
[Su
gar]
(g
.L-1
)
(A) (B)
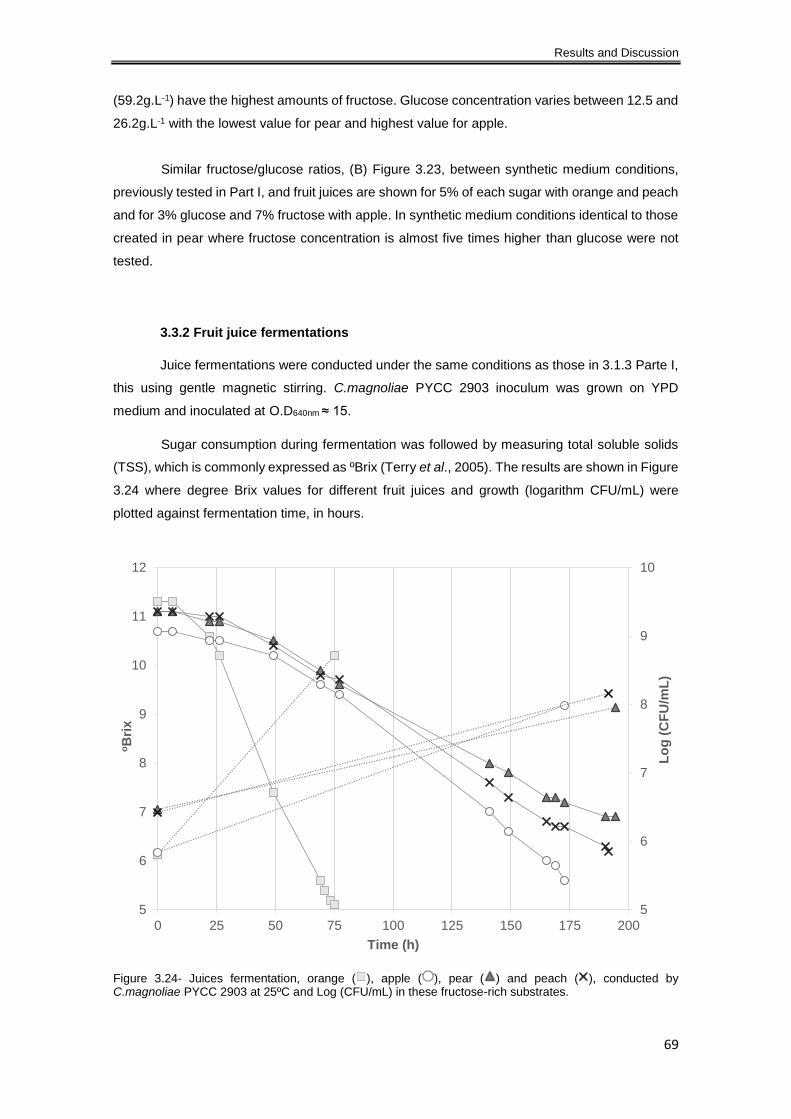
Results and Discussion
69
(59.2g.L-1) have the highest amounts of fructose. Glucose concentration varies between 12.5 and
26.2g.L-1 with the lowest value for pear and highest value for apple.
Similar fructose/glucose ratios, (B) Figure 3.23, between synthetic medium conditions,
previously tested in Part I, and fruit juices are shown for 5% of each sugar with orange and peach
and for 3% glucose and 7% fructose with apple. In synthetic medium conditions identical to those
created in pear where fructose concentration is almost five times higher than glucose were not
tested.
3.3.2 Fruit juice fermentations
Juice fermentations were conducted under the same conditions as those in 3.1.3 Parte I,
this using gentle magnetic stirring. C.magnoliae PYCC 2903 inoculum was grown on YPD
medium and inoculated at O.D640nm ≈ 15.
Sugar consumption during fermentation was followed by measuring total soluble solids
(TSS), which is commonly expressed as ºBrix (Terry et al., 2005). The results are shown in Figure
3.24 where degree Brix values for different fruit juices and growth (logarithm CFU/mL) were
plotted against fermentation time, in hours.
Figure 3.24- Juices fermentation, orange ( ), apple ( ), pear ( ) and peach ( ), conducted by C.magnoliae PYCC 2903 at 25ºC and Log (CFU/mL) in these fructose-rich substrates.
5
6
7
8
9
10
5
6
7
8
9
10
11
12
0 25 50 75 100 125 150 175 200
Lo
g (
CF
U/m
L)
oB
rix
Time (h)
Results and Discussion
70
Orange juice started with 11.3 ºBrix, pear and peach with 11.1 ºBrix and apple with 10.7
ºBrix. In orange juice fermentation sugars were consumed fastest. A ºBrix value of 5.1 was
reached in just in 75 hours. Fermentation medium texture might explain such difference when
compared with the other fruit juice fermentations. Orange juice being less viscous, it is easier to
achieve, through gentle stirring, an equal distribution of the nutrients, allowing yeast access to the
entire medium.
Pear, peach and apple juices exhibit a similar sugar reduction profile with a fermentation
length between 170 and 195 hours, which are two and three times higher than orange. In the end
of these fermentations, ºBrix values were 5.6, 6.9 and 6.2 for apple, pear and peach, respectively,
which are higher values than for orange juice, probably due to the hampered access to sugars
imposed by the high viscosity.
For both fruit juices, cell number immediately after inoculation is between 5.8 and 6.5 Log
(CFU/mL) and at the end of fermentation process is between 8.0 and 8.7 Log (CFU/mL). CFU/mL
results indicate that higher growth occurred when inoculation was performed in orange juice (8.7)
which is not surprising since due to its lower viscosity, there is an equal distribution of nutrients
and a higher oxygenation of the medium, and cells can take advantage of this sugar and oxygen
availability to grow.
Table 3.10 displays total sugar reduction after the fermentations. Sugar concentrations
(g.L-1) were determined by HPLC and total sugar reduction was calculated using Equation 3.5.
Equation 3.5
Total sugar reduction (%) = (1 −Sugar consumed
Total [Sugar]initial
) × 100
where “Sugar consumed” is the difference between the sum of glucose, fructose or sucrose
concentrations at the beginning and end of fermentation and Total [Sugar]initial is the sum of
glucose, fructose and sucrose concentration at the beginning of fermentation.
Table 3.10- Fermented juices sugar reduction (%).
Juice Total [Sugar]initial
(g.L-1) Total [Sugar]final
(g.L-1) Total sugar
reduction (%)
Orange 98.2 5.3 94.6
Apple 100 22.1 77.9
Pear 81.7 7.8 90.5 Peach 102.7 20.9 79.6
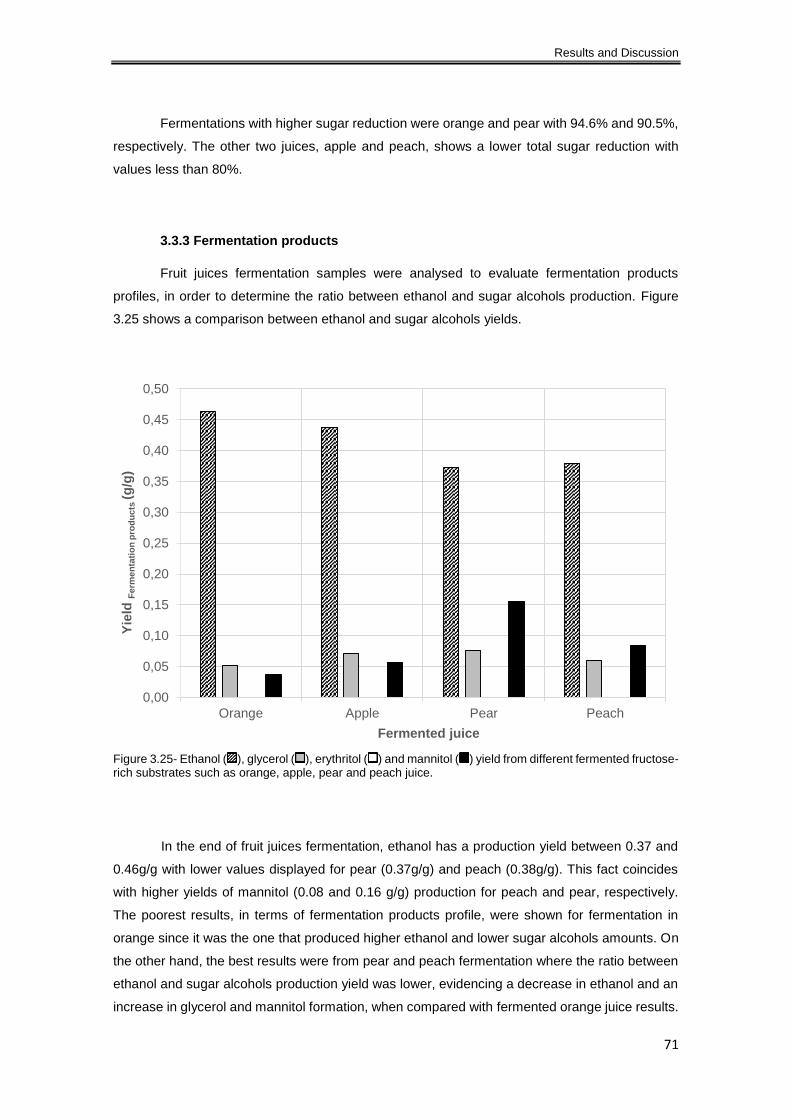
Results and Discussion
71
Fermentations with higher sugar reduction were orange and pear with 94.6% and 90.5%,
respectively. The other two juices, apple and peach, shows a lower total sugar reduction with
values less than 80%.
3.3.3 Fermentation products
Fruit juices fermentation samples were analysed to evaluate fermentation products
profiles, in order to determine the ratio between ethanol and sugar alcohols production. Figure
3.25 shows a comparison between ethanol and sugar alcohols yields.
Figure 3.25- Ethanol ( ), glycerol ( ), erythritol ( ) and mannitol ( ) yield from different fermented fructose-rich substrates such as orange, apple, pear and peach juice.
In the end of fruit juices fermentation, ethanol has a production yield between 0.37 and
0.46g/g with lower values displayed for pear (0.37g/g) and peach (0.38g/g). This fact coincides
with higher yields of mannitol (0.08 and 0.16 g/g) production for peach and pear, respectively.
The poorest results, in terms of fermentation products profile, were shown for fermentation in
orange since it was the one that produced higher ethanol and lower sugar alcohols amounts. On
the other hand, the best results were from pear and peach fermentation where the ratio between
ethanol and sugar alcohols production yield was lower, evidencing a decrease in ethanol and an
increase in glycerol and mannitol formation, when compared with fermented orange juice results.
0,00
0,05
0,10
0,15
0,20
0,25
0,30
0,35
0,40
0,45
0,50
Orange Apple Pear Peach
Yie
ld F
erm
en
tati
on
pro
du
cts
(g
/g)
Fermented juice
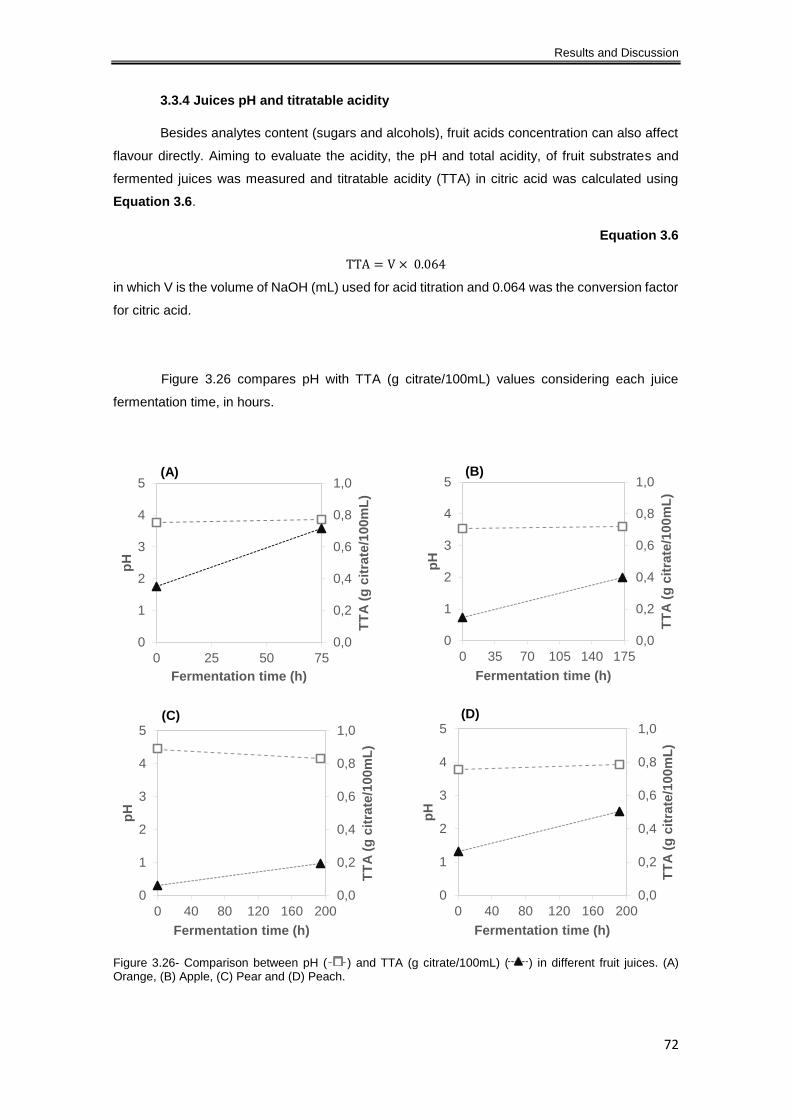
Results and Discussion
72
3.3.4 Juices pH and titratable acidity
Besides analytes content (sugars and alcohols), fruit acids concentration can also affect
flavour directly. Aiming to evaluate the acidity, the pH and total acidity, of fruit substrates and
fermented juices was measured and titratable acidity (TTA) in citric acid was calculated using
Equation 3.6.
Equation 3.6
TTA = V × 0.064
in which V is the volume of NaOH (mL) used for acid titration and 0.064 was the conversion factor
for citric acid.
Figure 3.26 compares pH with TTA (g citrate/100mL) values considering each juice
fermentation time, in hours.
Figure 3.26- Comparison between pH ( ) and TTA (g citrate/100mL) ( ) in different fruit juices. (A) Orange, (B) Apple, (C) Pear and (D) Peach.
0,0
0,2
0,4
0,6
0,8
1,0
0
1
2
3
4
5
0 25 50 75
TT
A (
g c
itra
te/1
00m
L)
pH
Fermentation time (h)
(A)
0,0
0,2
0,4
0,6
0,8
1,0
0
1
2
3
4
5
0 35 70 105 140 175T
TA
(g
cit
rate
/100m
L)
pH
Fermentation time (h)
(B)
0,0
0,2
0,4
0,6
0,8
1,0
0
1
2
3
4
5
0 40 80 120 160 200
TT
A (
g c
itra
te/1
00m
L)
pH
Fermentation time (h)
(C)
0,0
0,2
0,4
0,6
0,8
1,0
0
1
2
3
4
5
0 40 80 120 160 200
TT
A (
g c
itra
te/1
00m
L)
pH
Fermentation time (h)
(D)

Results and Discussion
73
Graphs from Figure 3.26 show small variations in pH values between fruit substrates and
fermented juices with the values within a range of 3.54 and 4.44. Lower values were observed for
apple (3.54 and 3.60) and higher for pear (4.44 and 4.16).
As illustrated above (Figure 3.26), TTA values are more variable between fruit substrates
and fermented juices and also among juices. Higher (0.35 and 0.71 g citrate/100mL) and lower
(0.06 and 0.19 g citrate/100mL) total acidity was showed for orange and pear, respectively.
3.3.5 Organoleptic evaluation: Texture, smell and taste
The fermented fruit juices were sensorially evaluated in terms of texture, smell and taste.
For that, a sensorial evaluation was accomplished by two different non professional appraisers.
Results of fermented juices organoleptic appreciation are described in Table 3.11.
Table 3.11- Fermented fruit juices organoleptic evaluation in terms of texture, smell and taste with an overall appreciation.
Appraiser Juice Texture Smell Taste Overall
evaluation
1
Orange Soft and
liquid
Oxidized
orange Dry flavour +/-
Apple Very
pulpy Apple nectar
Floury apple; No
yeasty flavour +
Pear Pulpy Pear nectar Fruity flavour; No
yeasty flavour ++
Peach Very
pulpy Peach nectar
Freshly cut fruit; No
yeasty flavour ++
2
Orange Soft and
liquid
Oxidized
orange Very dry flavour +/-
Apple Very
pulpy Apple nectar
Floury apple; No
yeasty flavour +
Pear Very
pulpy
Freshly cut
pear
Fruity flavour; No
yeasty flavour +++
Peach Very
pulpy Peach nectar
Freshly cut fruit; No
yeasty flavour ++

Results and Discussion
74
Sensorial evaluation of fruit substrates fermented by Candida magnoliae PYCC 2903,
Table 3.11, show, in general, a positive result. Fermented pear and peach were those with high
classification (+++ or ++) showing minimal changes to original fruit substrates. These juices
exhibit pleasant taste features without a yeasty flavour and smells like nectar or freshly cut fruit.
Fermented apple achieved a classification lower than the previous ones (+) even so
demonstrating enjoyable attributes such nectar smell and no yeasty flavour. As in initial substrate,
apple, pear and peach juices have a pulpy texture. Fermented juice with less pleasurable
sensorial characteristics was orange with a classification of (+/-). Despite orange fermentation
having been the fastest consuming sugars, the final product smells like oxidized fruit and its taste
is dry.

75
4. Conclusions

Conclusions
76
In this work, the assessment of fermentation profiles of two Candida magnoliae strains,
PYCC 2903 and PYCC 3191, brought to light differences in sugar consumption preference and
fermentation product yields. In general, PYCC 2903 strain showed the best results with well-
defined fructophilic profile in the majority of the conditions tested and with the higher yield of sugar
alcohols in fermentations simulating industrial fructose-rich substrates under oxygen limitation
conditions. However, fermentation profiles of those C.magnoliae strains demonstrated some
variations when compared with literature results for this yeast, mainly in terms of fermentation
products. These works described C.magnoliae as non-producing ethanol and to be a high
erythritol producer which is opposite to the results obtained from this study. Such differences
might be due to differences in the yeast strains and fermentation conditions used.
The attempt to uncover the basis of the fructophilic behaviour in this yeast, through
evaluation of hexokinase enzyme activity in terms of capacity (Vmax) and affinity (Km) for glucose
and fructose was not successful, since the kinetic profile does not explain the preferential
consumption of fructose by C.magnoliae. For both strains, fructose Vmax and Km values are higher
than glucose suggesting that hexokinase has more capacity to transport fructose but lower affinity
for this sugar than for glucose.
The use of C.magnoliae PYCC 2903 in fermentation of fructose-rich substrates aiming to
evaluate the potential of this yeast in low-alcoholic fermented beverages industry revealed
satisfying results. Although pear and peach fermentations have been the slowest, they exhibited
the best results. These fermentations showed the lowest ratio between ethanol and sugar alcohol
production yields, as a result of a decrease in ethanol and an increase in glycerol and mannitol
formation. Moreover, sensorial evaluation of pear and peach fermented juices were those with
the highest classification exhibiting pleasant taste and smell.
77
5. References

References
78
Akinterinwa, O., Khankal, R. and Cirino, P.C. 2008. Metabolic engineering for bioproduction of sugar alcohols. Current Opinion in Biotechnology. 19; 461-467. Bach-Faig, A., Berry, E.M., Lairon, D., Reguant, J., Trichopoulou, A., Dernini, S., Medina, F.X., Battino, M., Belahsen, R., Miranda, G. and Serra-Majem, L. 2011. Mediterranean diet pyramid today. Science and cultural updates. Public Health Nutrition. 14; 2274-2284. Bai, F.W., Anderson, W.A. and Moo-Young, M. 2008. Ethanol fermentation technologies from sugar and starch feedstocks. Biotechnology Advances. 26; 89-105. Bennett, J.W. 1998. Mycotechnology: the role of fungi in biotechnology. Journal of Biotechnology. 66; 101-107. Berthels, N.J., Otero, R.R.C., Bauer, F.F., Pretorius, I.S. and Thevelein, J.M. 2008. Correlation between glucose/fructose discrepancy and hexokinase kinetic properties in different Saccharomyces cerevisiae wine yeast strains. Applied Microbiology and Biotechnology. 77; 1083-1091.
Blandino, A., Al-Aseeri, M.E., Pandiella, S.S., Cantero, D. and Webb, C. 2003. Cereal-based fermented foods and beverages. Food Research International. 36; 527-543. Brányik, T., Silva, D.P., Baszczynski, M., Lehnert, R. and Almeida e Silva, J.B. 2012. A review of methods of low alcohol and alcohol-free beer production. Journal of Food Engineering. 108; 493-506. Caplice, E. and Fitzgerald, G.F. 1999. Food fermentations: role of microorganisms in food production and preservation. International Journal of Food Microbiology. 50; 131-149. Diezemann, A. and Boles, E. 2003. Functional characterization of the Frt1 sugar transporter and of fructose uptake in Kluyveromyces lactis. Current Genetics. 43; 281-288. Doehlemann, G., Molitor, F. and Hahn, M. 2005. Molecular and functional characterization of a fructose specific transporter from the gray mold fungus Botrytis cinerea. Fungal Genetics and Biology. 42; 601-610. Francesco, G.D., Freeman, G., Lee, E., Marconi, O. and Perretti, G. 2014. Effects of Operating Conditions during Low-Alcohol Beer Production by Osmotic Distillation. Journal of Agricultural and Food Chemistry. 62; 3279-3286. Galeote, V., Novo, M., Salema-Oom, M., Brion, C., Valério, E., Gonçalves, P. and Dequin, S. 2010. FSY1, a horizontally transferred gene in the Saccharomyces cerevisiae EC1118 wine yeast strain, encodes a high-affinity fructose/H+ symporter. Microbiology. 156; 3754-3761. Ghorai, S., Banik, S.P., Verma, D., Chowdhury, S., Mukherjee, S. and Khowola, S. 2009. Fungal biotechnology in food and feed processing. Food Research International. 42; 577-587.

References
79
Gonçalves, P., Sousa, H.R. and Spencer-Martins, I. 2000. FSY1, a novel gene encoding a specific fructose/H+ symporter in the type strain of Saccharomyces carlsbergensis. Journal of Bacteriology. 182; 5628-5630. Kalt, W., Forney, C.F., Martin, A. and Prior, R.L. 1999. Antioxidant Capacity, Vitamin C, Phenolics, and Anthocyanins after Fresh Storage of Small Fruits. Journal of Agricultural and Food Chemistry. 47; 4638-4644. Kim, H.J., Lee, H-R., Kim, C.S., Jin, Y-S. and Seo, J-H. 2013. Investigation of protein expression profiles of erythritol-producing Candida magnoliae in response to glucose perturbation. Enzyme and Microbial Technology. 53; 174-180. Leandro, M.J., Sychrová, H., Prista, C. and Loureiro-Dias, M.C. 2011. The osmotolerant fructophilic yeast Zygosaccharomyces rouxii employs two plasma-membrane fructose uptake systems belonging to a new family of yeast sugar transporters. Microbiology. 157; 601-608. Leandro, M.J., Sychrova, H., Prista, C. and Loureiro-Dias, M.C. 2013. ZrFsy1, a High-Affinity Fructose/H+ Symporter from Fructophilic Yeast Zygosaccharomyces rouxii. Public Library of Science. 8; 1-10. Lee, D-H., Kim, S-J. and Seo, J-H. 2013. Molecular cloning and characterization of two novel fructose.specific transporters from the osmotolerant and fructophilic yeast Candida magnoliae JH110. Applied Microbiology and Biotechnology. 98; 3569-3578. Lee, J-K., Song, J-Y. and Kim, S-Y. 2003. Controlling Substrate Concentration in Fed-Batch Candida magnoliae Culture Increases Mannitol Production. Biotechnology Progress. 19; 768-775. Liccioli, T., Chambers, P.J. and Jiranek, V. 2011. A novel methodology independent of fermentation rate for assessment of the fructophilic character of wine yeast strains. Journal of Industrial Microbiology and Biotechnology. 38; 833-843. Lin, Y. and Tanaka, S. 2006. Ethanol fermentation from biomass resources: current state and prospects. Applied Microbiology and Biotechnology. 69; 627-642. Llamas, N.E., Nezio, M.S.D. and Band, B.S.F. 2011. Flow-injection spectrophotometric method with on-line photodegradation for determination of ascorbic acid and total sugars in fruit juices. Journal of Food Composition and Analysis. 24; 127-130. Mayer, A-M. 1997. Historical changes in the mineral content of fruits and vegetables. British Food Journal. 99; 207-211. Meier, S., Karlsson, M., Jensen, P.R., Lerche, M.H. and Duus, J. 2011. Metabolic pathway visualization in living yeast by DNP-NMR. Molecular BioSystems. 7; 2834-2836. Moon, H-J., Jeya, M., Kim, I-W. and Lee, J-K. 2010. Biotechnological production of erythritol and its applications. Applied Microbiology and Biotechnology. 86; 1017-1025.
References
80
Park, E-H., Lee, H-Y., Ryu, Y-W., Seo, J-H. and Kim, M-D. 2011. Role of Osmotic and Salt Stress in the Expression of Erythrose Reductase in Candida magnoliae. Journal of Microbiology and Biotechnology. 21; 1064-1068. Pickering, G.J. 2000. Low- and Reduced-alcohol Wine: A Review. Journal of Wine Research. 11; 129-144. Pina, C., Gonçalves, P., Prista, C. and Loureiro-Dias, M.C. 2004. Ffz1, a new transporter specific for fructose from Zygosaccharomyces bailii. Microbiology. 150; 2429-2433. Renuka, B., Kulkarni, S.G., Vijayanand, P. and Prapulla, S.G. 2009. Fructooligosaccharide fortification of selected fruit juice beverages: Effect on the quality characteristics. Food Science and Technology. 42; 1031-1033. Room, R., Babor, T. and Rehm, J. 2005. Alcohol and public health. Lancet. 365; 519-530. Ross, R.P., Morgan, S. and Hill, C. 2002. Preservation and fermentation: past, present and future. International Journal of Food Microbiology. 79; 3-16. Ryu, Y-W., Park, C.Y., Park, J.B., Kim, S-Y. and Seo, J-H. 2000. Optimization of erythritol production by Candida magnoliae in fed-batch culture. Journal of industrial Microbiology & Biotechnology. 25; 100-103. Saha, B.C. and Racine, F.M. 2011. Biotechnological production of mannitol and its applications. Applied Microbiology and Biotechnology. 89; 879-891. Sahoo, D.K. and Agarwal, G.P. 2002. Effect of Oxygen Transfer on Glycerol Biosynthesis by an Osmophilic Yeast Candida magnoliae I2B. Biotechnology and Bioengineering. 78; 545-554. Sanz, M.L., Villamiel, M. and Martínez-Castro, I. 2004. Inositols and carbohydrates in different fresh fruit juices. Food Chemistry. 87; 325-328. Savergave, L.S., Gadre, R.V., Vaidya, B.K. and Jogdand, V.V. 2013. Two-stage fermentation process for enhanced mannitol production using Candida magnoliae mutant R9. Bioprocess and Biosystems Engineering. 36; 193-203. Savergave, L.S., Gadre, R.V., Vaidya, B.K. and Narayanan, K. 2011. Strain improvement and statistical media optimization for enhanced erythritol production with minimal by-products from Candida magnoliae mutant R23. Biochemical Engineering Journal. 55; 92-100. Scott, R. and Sullivan, W.C. 2008. Ecology of Fermented Foods. Human Ecology Review. 15; 25-31. Song, S.H. and Vieille, C. 2009. Recent advances in the biological production of mannitol. Applied Microbiology and Biotechnology. 84; 55-62.
References
81
Sousa-Dias, S., Gonçalves, T., Leyva, J.S., Peinado, J.M. and Loureiro-Dias, M.C. 1996. Kinetics and regulation of fructose and glucose transport systems are responsible for fructophily in Zygosaccharomyces bailii. Microbiology. 142; 1733-1738. Steinkraus, K.H. 2002. Fermentation in World Food Processing. Comprehensive Reviews in Food Science and Food Safety. 1; 23-32. Terry, L.A., White, S.F. and Tigwell, L.J. 2005. The Application of Biosensors to Fresh Produce and the Wider Food Industry. Journal of Agricultural and Food Chemistry. 53; 1309-1316. Wang, Z-X., Zhuge, J., Fang, H. and Prior, B.A. 2001. Glycerol production by microbial fermentation: A review. Biotechnology Advances. 19; 201-223. Yu, J-H., Lee, D-H., Oh, Y-J., Han, K-C., Ryu, Y-W. and Seo, J-H. 2006. Selective Utilization of Fructose to Glucose by Candida magnoliae, an Erythritol Producer. Applied Biochemistry and Biotechnology. 131; 870-879. Yu, J-H., Lee, D-H., Park, Y-C., Lee, M-G., Kim, D-O., Ryu, Y-W. and Seo, J-H. 2008. Proteomic Analysis of Fructophilic Properties of Osmotolerant Candida magnoliae. Journal of Microbiology and Biotechnology. 18; 248-254.
82
Appendices

Appendices
83
Appendix I. Growth curves for Candida magnoliae strains incubated aerobically at different sugar
concentrations
Figure A.1- Growth curves for Candida magnoliae PYCC 2903 ( ) and PYCC 3191 ( ) incubated aerobically at different sugar concentrations. (A) 15% Glucose and fructose, (B) 10% Glucose and fructose, (C) 5% Glucose and fructose, (D) 1% Glucose and fructose, (E) 2% Glucose and (F) 2% Fructose.
0,01
0,1
1
10
100
0 10 20 30 40 50O.D
640n
m
Time(h)
(A)
0,01
0,1
1
10
100
0 15 30 45 60 75O.D
640n
m
Time(h)
(B)
0,01
0,1
1
10
100
0 15 30 45 60 75
O.D
640n
m
Time(h)
(C)
0,01
0,1
1
10
100
0 10 20 30 40 50O.D
640n
m
Time(h)
(D)
0,01
0,1
1
10
100
0 10 20 30 40 50O.D
640n
m
Time(h)
(E)
0,01
0,1
1
10
100
0 10 20 30 40 50O.D
640n
m
Time(h)
(F)

Appendices
84
Appendix II. Growth curves for Candida magnoliae strains incubated with oxygen limitation at
different sugar concentrations
Figure A.2- Growth curves for Candida magnoliae PYCC 2903 ( ) and PYCC 3191 ( ) incubated with oxygen limitation at different sugar concentrations. (A) 15% Glucose and fructose, (B) 10% Glucose and fructose, (C) 5% Glucose and fructose, (D) 1% Glucose and fructose, (E) 2% Glucose and (F) 2% Fructose.
0,01
0,1
1
10
100
0 10 20 30 40 50 60 70
O.D
640n
m
Time(h)
(A)
0,01
0,1
1
10
100
0 10 20 30 40 50 60 70
O.D
640n
m
Time(h)
(B)
0,01
0,1
1
10
100
0 10 20 30 40 50 60 70O.D
640n
m
Time(h)
(C)
0,01
0,1
1
10
100
0 10 20 30 40 50 60 70 80
O.D
640n
m
Time(h)
(D)
0,01
0,1
1
10
100
0 10 20 30 40 50 60 70 80
O.D
640n
m
Time(h)
(E)
0,01
0,1
1
10
100
0 10 20 30 40 50 60 70 80
O.D
640n
m
Time(h)
(F)
Related Documents