Dissertation Submitted to the Combined Faculties of the Natural Sciences and Mathematics Of the Ruperto-Carola- University of Heidelberg, Germany For the degree of Doctor of Natural Science Put forward by Ruth Sahler Born in Wiesbaden Oral examination Date: 13th of September 2019

Welcome message from author
This document is posted to help you gain knowledge. Please leave a comment to let me know what you think about it! Share it to your friends and learn new things together.
Transcript

Dissertation
Submitted to the
Combined Faculties of the Natural Sciences and Mathematics
Of the Ruperto-Carola- University of Heidelberg, Germany
For the degree of
Doctor of Natural Science
Put forward by
Ruth Sahler
Born in Wiesbaden
Oral examination Date: 13th of
September 2019

Page ii
Femtosecond Laser Induced Refractive Index Change in Acrylic
Polymers used to Create a Modification of the Optical Performance
of an Existing Intraocular Lens
Referees:
Prof. Dr. Josef F. Bille
Prof. Dr. Selim Jochim

Page iii
Zusammenfassung Eine Femtosekundenlaser-basierte Hydrophilizitätsänderung wurde entwickelt, welche
den Brechungsindex der Acryl-Polymermaterialien verändert. Die Kombination der präzisen
Modulation der Brechungsindexänderung in Stärke und Position ermöglicht die Erstellung einer
modulo-2π Gradientenlinse innerhalb einer implantierten Intaokularlinse (IOL).
Multifaktorielle prä-, intra- und postoperative Prozesse können die Zielrefraktion für
Patienten mit einem Grauen Star beeinflussen. In etwa 25,7% der Kataraktoperationen wird eine
Zielrefraktionsabweichung von mehr als 0,5D gemessen [1]. Zusätzlich haben 37.8% der Patienten
einen Astigmatismus von mindestens 1,0 D [2]. Diese Daten deuten darauf hin, dass eine große
Anzahl von Patienten von einem postoperativen Anpassungsverfahren profitieren würden.
Die Brechungsindex Veränderung würde in diesen Situationen eine Möglichkeit bieten die
bereits implantierte monofokale oder multifokale Linse anzupassen, um damit eine invasive
Operation zu vermeiden. Dieser Vorgang kann theoretisch mehrfach durchgeführt werden.
Nach einer langen Optimierungsphase wurde dieses Verfahren erfolgreich im Labor und
auch im Kaninchenmodell getestet. Weitere Studien wurden durchgeführt, welche die Qualität
der Linsen, Lichtdurchlässigkeit und die Biokompatibilität dieses Prozesses getestet haben.
Abstract
A femtosecond laser-based hydrophilicity change was developed to alter the refractive
index of acrylic polymeric materials. The combination of the precise modulation of the refractive
index change in magnitude and position allows the creation of a phase-wrapped, gradient lens
inside an implanted intraocular lens (IOL).
Preoperative, intraoperative and postoperative factors can impact the visual outcome of
a patient after cataract surgery. About 25.7% of cataract patients have postoperative spherical
error of more than 0.5D [1]. Additionally, 37.8% of cataract patients have a residual astigmatism
of at least 1 D [2]. These considerations indicate that a large number of patients would benefit
from a post cataract surgery adjustment method.
The refractive index shaping (RIS) process is designed to turn standard monofocal and
multifocal IOLs into adjustable lenses which in theory could be modified multiple times to adjust
the post-cataract patient’s vision without requiring invasive surgeries.
After a lengthy optimization phase this procedure was successfully used to alter existing
IOLs in-vitro and in-vivo in a rabbit model. Additional studies were performed to investigate and
validate the effect of the process on IOL quality, light transmission and biocompatibility.

Page iv
Acknowledgements
I would like to thank my advisor Prof. Dr. Bille for his support and encouragement
during the related research and my thesis.
Besides my advisor, I would like to thank the rest of my thesis committee: Prof. Dr.
Jochim, Prof. Dr. Bartelmann and Prof. Dr. Oberthaler for their feedback and the opportunity
they provided.
Additionally, I am grateful to my research team at Perfect Lens and Steven Smathers
who became my mentor in non-science related topics.
Furthermore, I am thankful to Dr. Johann Engelhardt at the DKFZ, Hans-Robert Volpp,
Abdelmoutalib Laghouissa at the Physikalisch-Chemisches Institute at the University of
Heidelberg, Zhongxiang Jiang at Leica Microsystems in Mannheim for their help and
contributions, and Dr. Motzkus for his support of the thesis.
In addition, I am grateful to all people and companies who have been involved in the
research discussions over the years. Heidelberg Engineering Inc. for their training, discussions
and help, especially Dr. Olivier LaSchiazza and Dr. Gerhard Zinser. Günter Giese at the MPI for
his help and support during the initial research phase while looking into wavelength
dependencies of the refractive index change. Dr. David Sliney and Mr. Bruce Stuck for their
insights and help with laser safety. The Moran Eye Center for their support, the research and
discussions they provided. Special thanks to Dr. Liliana Werner, Dr. Nick Mamalis and Dr.
Randy Olson. The Perfect Lens medical advisory board which helped tremendously to
understand the patient’s and operator’s needs. Especially Dr. Susan MacDonald, Dr. George
Waring IV and Dr. Doug Koch who contributed a lot of time further educating me on the
medical side of the ophthalmology product development.
I am thankful to my family, specifically my parents (Irmgard, Ralf, Manfred and Dolors)
who have supported and encouraged me all these years. Their hard work and determination
have inspired me, and their unconditional love have provided strength and encouragement. I
am grateful to my brothers who always cheer me up and never cease to amaze me on their
willingness and readiness to support me. Being a twin is part of my identity, I consider myself
very lucky for this. Lastly, I also want to mention my grandparents Christl, Hans and Marianne
who have always encouraged me to find my path and to pursue my dreams.

Page v
Cover Page Abstract Table of Content
1. Introduction ........................................................................................................................ 1 1.1 Objective ....................................................................................................................... 3 1.2 Thesis Overview ............................................................................................................ 3
2. Background ......................................................................................................................... 4 2.1 State of the Art ............................................................................................................. 4 2.2 Current Problems / Challenges..................................................................................... 5
3. Femtosecond Laser based Refractive Index Change .......................................................... 8 3.1 Initial Refractive Index Change in Hydrophobic Polymers ........................................... 8 3.2 Diffractive Grating Efficiency Measurements ............................................................ 15 3.3 Conclusion .................................................................................................................. 21
4. Hydrophilicity Based Refractive Index Change................................................................. 22 4.1 Water Weight Experiment .......................................................................................... 22 4.2 Contact Angle Method Experiment ............................................................................ 23 4.3 Conclusion .................................................................................................................. 27
5. Chemical Basis .................................................................................................................. 28 5.1 Laser Induced Fluorescence (LIF) microscopy, STED-contrast ................................... 28 5.2 Coherent Anti-Stokes Raman Scattering (CARS) microscopy ..................................... 36 5.3 Raman Microscopy ..................................................................................................... 42 5.4 Conclusion .................................................................................................................. 45
6. Refractive Index Lens Shaping .......................................................................................... 48 6.1 Proof of Concept and Repeatability ........................................................................... 48 6.2 Lens Quality and Lens Types ....................................................................................... 57 6.3 Conclusion .................................................................................................................. 69
7. RIS Effect on Optical Quality ............................................................................................ 70 7.1 Materials and Methods .............................................................................................. 70 7.2 Results ........................................................................................................................ 73 7.3 Conclusion .................................................................................................................. 77
8. Biocompatibility ............................................................................................................... 79 8.1 Materials and Methods .............................................................................................. 79 8.2 Results ........................................................................................................................ 82 8.3 Conclusion .................................................................................................................. 87
9. Discussions ....................................................................................................................... 89 10. Future Outlook ............................................................................................................... 91 Bibliographies ....................................................................................................................... 92
Abbreviations.................................................................................................................... 92 Figure Legends: ................................................................................................................. 93 Table Legends ................................................................................................................... 96 Authors Publications (Papers, Book Chapters, Presentations, Posters, Patents) ............ 97 All References ................................................................................................................. 102

Page 1
1. Introduction
Cataract surgery with IOL implantation is the most common surgical procedure in the
US [3]. In 2016, over 4.2 million cataract surgeries were performed in the US and more than
27 million were performed worldwide [4] [5].
Patient satisfaction is a constant pursuit in cataract surgery. In order to enhance the
chance of each patient’s postoperative satisfaction, cataract surgeons measure the refraction
of the eye preoperatively and attempt to select the appropriate IOL for the patient, based on
not only those measurements but also on the patient’s needs and expectations [6].
Nevertheless, studies suggest that a considerable number of patients will require
spectacle prescriptions after cataract surgery. About 25.7% of patients who undergo
conventional phacoemulsification and about 28% who undergo laser-assisted cataract surgery
have a postoperative spherical error of more than 0.50 D, which is enough to adversely affect
their distance vision [1]. Additionally, a clinical study by Dr. Hill found that 37.8% of cataract
patients had an astigmatism of more than 1.00 D [2] and Villegas et al. reported that
postoperative astigmatism of greater than 0.75 D has an adverse effect on the performance
for monofocal IOLs [7] which suggests that these patients would also benefit from toric IOL or
a post-surgery correction [6].
Furthermore, cataract surgery is generally performed in the elderly population, so
most patients who do not choose multifocal IOL implantation will require reading correction
postoperatively. Market Scope estimates that more than 90% of post-cataract patients are
presbyopic [4] and only 3% of implanted IOLs are designed to correct for it [8]. Taken together,
these considerations indicate that large number of patients would benefit from a correction
after cataract surgery [6].
Most hydrophobic and hydrophilic IOLs are composed of stable and acrylic polymers.
Those IOL materials are also flexible enough to be implanted using an injector in which the
IOL is folded and therefore fit through a smaller incision. These stable flexible polymers are
the preferable platform (82% [8]) and thus the ability to adjust these materials post
implantation is a significant benefit to surgeons and patients.
Postoperatively the IOL will settle in place and during this process the IOL can still
adjust its position. A multifocal or toric IOL is more sensitive to decentration or tilt compared
to a standard IOL, decentration or tilt will have a greater adverse effect on the vision produced

Page 2
by a multifocal or toric IOL [6]. This increased adverse effect suggests that post-surgery
multifocal or toric treatments might be beneficial.
Currently there is no ability to adjust a standard acrylic polymer IOL. The options for
the patient and the surgeon in the event of an undesired refractive outcome range from
spectacles, to refractive surgery or lens explantation [6].
This thesis introduces a new process and device wherein molecules within an existing
IOL’s polymeric material change hydrophilicity [9]. This change occurs when the polymeric
material is immersed in an aqueous medium, while it is exposed to femtosecond laser
radiation. The aqueous medium and the femtosecond laser radiation provide the chemical
requirement for the hydrophilicity-based refractive index change. After the exposure of the
polymeric material to femtosecond laser radiation, water slowly diffuses into the treated
areas changes the hydrophilicity [6].
The RIS process can alter the refractive properties of an IOL after it has been implanted
and has settled in the eye. Preclinical studies indicate that this process can adjust acrylic IOLs
such that spherical, toric, and presbyopia issues can be addressed [6].
Lens quality, light transmission and biocompatibility are very important when
discussing a post-surgery IOL adjustment application. Therefore, an additional objective of
this thesis is the assessment of the impact of the RIS process on the optical quality of adjusted
hydrophobic IOLs. Parameters such as lens quality, light transmittance, and light scattering
[10] were evaluated in-vitro. Additionally, biocompatibility and efficacy of this technology
were assessed using a rabbit model [11].

Page 3
1.1 Objective
The objective of this research was the development of a laser induced refractive index
change in acrylic polymeric materials in combination with the creation of a process to create
lenses inside those materials. This RIS process can ultimately be used to adjust the refractive
characteristics of an implanted IOL. A post-surgery IOL adjustment process has the benefit of
a known IOL position and patient refraction before the shaping process is used to optimize
the IOL.
The RIS process is based on a laser material interaction which can be optimization
through the refinement of laser, scanner and shaping parameters. While this allows the
procedure to be selected post cataract surgery, the main challenge for the RIS process is the
optimization of a large number of interconnected parameters, while working with In-vivo time
constrains and quality standards.
Additional consideration is given to the optical quality of the shaping process and tests
of biocompatibility.
1.2 Thesis Overview
The thesis is organized in 10 chapters. Two standard initial chapters provide the
introduction and the background information. These chapters are followed by six research
chapters (Femtosecond Laser based Refractive Index Shaping, Hydrophilicity Based Refractive
Index Change, Chemical Basis, RIS Lens Shaping, RIS Effects on Optical Quality and
Biocompatibility). Some of those chapters are divided into additional subsections to avoid a
lengthy and sometimes difficult grouping of the information into one section of Materials and
Methods and another subsection of Results. This structure was selected to allow an individual
discussion of the materials, processes, research steps, setups and results, while maintaining
a clear structure for the reader. Each chapter has an individual Conclusion section at the end
of the chapter.
The last two chapters are Discussions and Future Outlook, these chapters facilitate an
interconnected chapter discussion and concentrate on the main highlights of the thesis. The
next steps of the research are summarized in the last chapter.

Page 4
2. Background
2.1 State of the Art
Non-invasive post cataract surgery options for residual refractive error correction
normally are limited to glasses or contact lenses.
Currently, there are several surgical approaches for the correction of residual refractive
error, all are invasive surgeries with known complications including endothelial cell damage,
retinal detachment and endophthalmitis [12]. A common surgical option is a Lasik procedure
or secondary IOL implant (piggy back surgery), while the most invasive option is an IOL
explantation. An IOL explantation is highly invasive and will necessitate an additional ocular
surgery and manipulation of the anterior segment. Another frequently used option is post-
cataract PRK, LASIK or Small incision lenticule extraction (SMILE). This require manipulating
the cornea curvature with a laser [5]. The outcome, healing process, cornea stability, or
complications can vary with these techniques.
A post-operative minimally invasive in office procedure to correct residual refractive
errors would be a major advancement in ophthalmology, allowing the improvement of the
patient’s vision while avoiding additional surgical treatment [5].
The only currently approved light adjustable IOL technology is the RxSight Light
Adjustable Lens (LAL) [13], which is a three-piece silicone lens. It can be fine-tuned after
cataract surgery using a UV light source and its technology is based on a patented material
process. The lens can be adjusted one time after surgery and requires the patient to wear UV
light filtering photochromic spectacles for 10 to 21 days. Two lock-in treatments are necessary
to consume all the remaining photoactive macromers in the lens [14] and the IOL must be
selected prior to cataract surgery [15].
Multicomponent or Modular IOLs are recently developed option and are designed to
provide some adjustability after cataract surgery, this new IOL type is based on the idea that
each IOL has two or multiple independent components. They have a separate optical
component which can be surgically exchanged after implantation surgery to obtain a desired
refraction. The Modular IOLs should have less complications and risk during the second
surgery compared to a traditional lens exchange [16] [17]. For example, the Clarvista Harmoni
modular IOL system allows the exchange of the optics part while leaving the IOL base in
position and it therefore is less invasive than a comparable full IOL exchange [18].

Page 5
Currently there is no ability to adjust an IOL post-surgery. The only alternatives,
discussed above, allow a limited change post-surgery or requires the selection of a special
three-piece silicone lens pre-surgery.
A preferable material process would be based on a technology which would work on
existing and already implanted hydrophilic and hydrophobic IOLs. A refractive index change
inside the material of an implanted IOL would allow for such a process.
The use of the femtosecond laser to create refractive index change in various materials
has been studied for years. Ohnmachi et al. (1972) showed a refractive index change of 0.056
in glass [19] using a femtosecond laser. Ding (2006) used a femtosecond laser to obtain a
refractive index change of up to 0.06 in hydrogel polymers [12] [15].
Different theories regarding femtosecond laser material interactions which affect the
refractive index change have been offered. The Rochester Group hypothesized that the light
from the femtosecond laser induced crosslinking within a hydrophilic material and thus
created an increase in the refractive index [20]. Takeshima et al. (2004) believed the refractive
index change in glass was caused by local heat effects from phase separation [21], while
Katayama (2002) proposed that all changes resulted from either: i) crosslinking, ii) phase
separation, or iii) decomposition [22] [15].
2.2 Current Problems / Challenges
Significant advances in ophthalmology have made cataract surgery safer and more
effective. Those developments involved improved i) surgical techniques, ii) IOL technology and
iii) preoperative evaluation. With current innovations patient expectations and goals of
surgery have expanded beyond restoring patient’s vision, to improving the vision, allowing the
patient to see their best and be spectacle independent [5].
Even with the expectation of excellent visual outcomes, the most frequent
complication following cataract surgery is residual refractive error. Residual refractive error
leaves a patient with suboptimal uncorrected vision. Refractive errors include hyperopia,
myopia, astigmatism, spherical aberration and presbyopia. Brandser et al. reported that only
45% of 298 patients having phacoemulsification or extracapsular cataract surgery had results
within 0.5 D of the intended target [23]. Murphy et al. reported, only 72.3% of 1676 eyes
having cataract extraction were within 1.0 D and 6.4% were beyond 2.0 D of the planned
refraction [24][5]. A clinical study by Warren Hill, MD, found that 37.7% of cataract patients

Page 6
had preoperative astigmatism of more than 1.00D [2]. Pablo Artal, PhD, has reported that
postoperative astigmatism of greater than 0.75 D has an adverse effect on the performance
of a monofocal IOL [7][25]. Mamalis et al [26] [27] [28] [29] [30] has reported several studies
which shows that incorrect IOL power was among the highest overall indications
(approximately 20% to 40% depending on the year) for explanting 1-piece and 3-piece IOLs
[5]. A significant residual refractive error, which leads to lens explantation, was reported for
about 0.77% [31].
For cataract surgeons, the achievement of optimal outcomes is a constant pursuit. To
facilitate this undertaking, numerous technologies and techniques have emerged, most of are
utilized during the preoperative and intraoperative periods. Surgeons work diligently to
measure the refraction of the affected eye, select the most suitable IOL, set appropriate
patient expectations, and confirm the accuracy of their measurements. All these steps are
taken in an attempt to ensure the patient’s postoperative satisfaction and, thus, prevent the
need for spectacles or lens explantation and/or exchange [32].
Current challenges for a precise and predictable post-surgical refractive outcome can
be divided into three separate problem areas:
a) Preoperative,
b) Intraoperative and
c) Postoperative challenges.
Pre-surgery challenges include the IOL manufacturing, the IOL selection and the
refraction measurement. Incorrect IOL power calculation resulting from incorrect
measurements of the eye is the most likely cause of postoperative refractive errors after
cataract surgery [16]. Furthermore, current standards regarding IOL power labeling allow a
certain tolerance (0.5 D steps), and therefore the power stated on the label may not be the
actual power of the IOL [33] [10].
During surgery the IOL positioning and incision sizes are the main contributors to post-
surgical refractive error. A large incision size can affect the astigmatism of the eye. A changed
or non-optimal position of the IOL can further adversely affect the visual outcome for the
patient.
Postoperative causes of residual refractive error include anterior movement of the IOL
resulting from postoperative capsular bag fibrosis and contraction. Unexpected wound

Page 7
healing or lens settling process can further contribute to post surgery refractive errors and are
commonly known as refractive surprises. Studies have indicated that mean myopic shifts in
spherical equivalent refraction of 0.70 D from can be measured two months after the initial
first day postoperatively refraction measurement [5].
The combination of these challenges encourages the development of postoperative
IOL adjustment technologies using existing IOLs [16][33][10].
Page 8
3. Femtosecond Laser based Refractive Index Change
This chapter is divided into two sub-chapters which summarize the initial experiments
which focused on creating a refractive index change. This section uses three different
methods, seven materials, and a total of four lasers in two different laser processing stations.
3.1 Initial Refractive Index Change in Hydrophobic Polymers
The initial phase of the research was focused on the creation of a refractive index
change using a femtosecond laser in an acrylic, hydrophobic material. Prior to this research
there were publications of measured refractive index changes in different materials like glass
or hydrogels but not in ophthalmic hydrophobic materials. The initial steps therefore focused
on the possibility and the feasibility of a refractive index change in hydrophobic materials.
Admittedly it was a very cumbersome process to get even the slightest homogenous change
without any material destruction.
3.1.1 Materials and Methods
3.1.1.1 Materials
The main material used was an acrylic polymer with a yellow dye (blue blocking)
additive [34]. This material had a refractive index of 1.49, a water absorption of 0.3% and an
overall diameter of 13mm. The button (Figure 1) has the same physical characteristics as the
IOL (Figure 2) except that the IOL has been cut to create a light directing surface (a “Lens”).
The button has been cut down to one millimeter in height and tumbled to provide a smooth
surface [15]. The standard material used in research contained 0.8% UV absorber to block UV
light and 150 parts per million (ppm) of yellow dye to minimize amount of blue light reaching
the retina.
During the initial phase of the research, additional material dopants were used to
facilitate the research. In total six material variations of the standard material were created
which focused on increased amount of the yellow dye or UV absorber content.

Page 9
The yellow dye amount was increased from 150ppm to 500ppm and 1000ppm (Figure
3) and the UV absorber increased from 0.8% to 2%, 4%, 8% and 12%. The yellow dye amount
had an impact on the color appearance, but the UV absorber content did not.
Figure 3: Yellow Dye Dopants (left: 150ppm, center: 500ppm, right: 1000ppm) [35]
3.1.1.2 Setup and Measurement Devices
The initial setup used the HRA (Heidelberg Retina Angiograph) 2 from Heidelberg
Engineering Inc. as the system base and had different laser mount options (IMRA AX20:
10mW, IMRA AX20: 20mW, Calmar Mendocino: 40mW, Calmar Custom Mendocino: 500mW).
The initial three lasers had no energy modulation option and the laser mount was modified
for the 500mW fiber laser to incorporate an acoustic-optic modulator (AOM) to allow the
modulation of the output power. All lasers had the same repetition rate (50MHz) and
wavelength (780nm) [35].
The system was mounted either vertically or horizontally and a 2D (X and Y) stage
system was mounted in front of the objective lens to move the sample in position. The Zaber
Technology stage system was computer controlled and adjustable to allow different stage
types for different stage speed requirements.
Figure 1: IOL material button [15] Figure 2: IOL [15]

Page 10
Differential Interference Contrast Microscope (DIC)
A Zeiss Axioscope DIC microscope was used in combination with different objective
lens magnifications (10x, 20x, 40x and 60x). A refractive index change can be visualized using
a DIC microscope. In some situations it can also be used to compare parameter settings if the
same exposure settings and automatizations are used. Ambient light, sample thickness and
position provide a limitation to the refractive index change comparison but in general the DIC
microscope is an exceptional tool to determine if any refractive index change has occurred in
the material and how homogenous the change has been.
3.1.1.3 Methods
Two different methods have been used to investigate this behavior of the refractive
index change for different material concentrations. Both methods were very similar in the
concept, but a second method was needed to work around hardware limitation of the first
method.
RIS Min and RIS Max Speed Method
The initial method did not show any refractive index change. The energy threshold
between a refractive index change and the threshold for material destruction was so close
that any refractive index change was lost in the material destruction. The method was
modified to differentiate the refractive index change from material destruction and to identify
those thresholds. The RIS min and max speed experiment basic theory is depicted in Figure 4.
It is based on the idea that he refractive index change threshold is near the material
destruction threshold and therefore the experiment initially looks for the RIS min speed and
afterward increases the stage speed in very small increments to find the RIS max speed.
A fixed laser energy was used for this experimental method and the stage system was
programmed to move in a constant speed for two vertical lines with a short horizontal
movement in between those lines. For the initial experiment the speed was set to the
minimum stage speed, followed by another set of two vertical lines each with an increased
stage speed. Each experiment was grouped into 10 speed experiment.
Additional stage speed range was tested if double vertical lines of the last speed test
showed a refractive change. The RIS min speed identified the speed where optical breakdown
(material burns) started and the RIS max speed identified the speed which had the last visible
refractive index change. The DIC microscope was used for the evaluation.

Page 11
Figure 4: RIS min and max speed [36]
Energy Dependency Evaluation of the RIS Process
The RIS max speed experiment was run for four different lasers and a total of 8
different energy levels were tested to determine the impact of the laser output power on the
maximum scanner speed. The initial three lasers had output powers of 10mW, 20mW and
40mW and no energy modulation option. The fourth laser was a 500mW fiber laser and the
laser head mount was modified to have an additional AOM, allowing the option for energy
modulation and five additional energy (40mW, 80mW, 160mW, 320mW and 500mW) setups
were tested.
For the yellow dye evaluation impact on the RIS max speed, the experiment was run
for three different lasers (10mW, 20mW and 40mW) and three different yellow dye dopant
concentrations (150ppm, 500ppm and 1000ppm).
For the UV absorption impact only two UV absorber concentrations (0.8% and 4%)
were tested with a 40mW average output power. .
Overlay Method
The RIS max speed evaluation method reached its limits when the desired stage speed
exceeded the maximum possible stage speed. In that moment another comparison method

Page 12
was developed which I named Overlay test. This method used a fixed and very fast scan speed
and compared the number of overlays (treatment repeats) needed for a refractive index
change. This technique was also beneficial when predicting required laser and scanner
settings for a future device [36].
Both the yellow dye (150ppm, 500ppm, and 1000ppm) dopants and the UV absorber
(0.8%, 2%, 4%, 8% and 12%) dopants were tested for overlay repeats to determine the
number of overlays required to achieve a minimal refractive index change [36]. This
experiment was designed to compare yellow dye and UV absorber percentages and their
impact on the refractive index change.
3.1.2 Results
3.1.2.1 Result: Energy per pulse dependency on Max Scan Speed
The RIS Max speed results showed a dominant energy per pulse impact on the RIS max
speed. Figure 5 shows the RIS max speed for 10, 20 and 40mW output power and quadrupling
pulse energy allowed for an increase in the RIS max scan speed from 3um/s to 75um/s (factor
of 25). The 500mW laser output power (figure 6) showed the same impact of the output
power on the max RIS speed. In the standard, undoped material the stage speed reached
389mm/s while still showing a refractive index change.
Figure 5: 10, 20, 40mW RIS max speed results.
[35]
Figure 6:40mW, 80mW, 160mW, 320mW, and 500mW RIS max
speed results [35].

Page 13
3.1.2.2 Results: Yellow Dye Dopant
The yellow dye dopant experiment showed a scan speed improvement for the
500ppm and 1000ppm materials compared to the standard material.
Figure 7: Left: Standard material RIS max results for 3 different laser powers. Center: 500ppm material dopant results for 3
different laser powers. Right: 100ppm material dopant results for RIS max speed for 3 different laser powers [35].
The 1000ppm material (6.67 times the yellow dye) resulted in a scan speed
improvement of a factor of 2.5 for the 40mW laser.
3.1.2.3 Results: UV Absorber Dopant
The UV absorber experiment did show a higher impact compared to the yellow dye
experiment. The 4% UV absorber had a significant higher scan speed of 430um/s and for the
40mW laser showed a linear impact of UV absorber and speed improvement.
Figure 8: UV dopant RIS max speed results [35]

Page 14
3.1.2.4 Results: Overlays
Figure 9: Yellow Dye Dopant Overlay Result [36].
The yellow dye overlay results showed that higher yellow dye dopants required a
significant lower number of overlays to achieve the same effect compared to the standard
hydrophobic lens material with 150ppm.
Figure 10: UV Doping Overlay Results [36].
The UV dopant overlay results also show a significant reduction of required overlays
as the UV absorber percentage increases. The results of overlays and maximum RIS speed
experiments showed that the main contributing factor was related to the pulse energy but
that both yellow dye and UV absorber dopants could be used to facilitate the process.

Page 15
3.2 Diffractive Grating Efficiency Measurements
3.2.1 Materials and Methods
A diffractive grating setup provides a precise measurement technique to compare
laser or shaping parameters.
3.2.1.1 Materials
The hydrophobic 150ppm yellow dye and 8% UV absorber material was used in this
section (3.1.1.1).
3.2.1.2 Setup and Measurement Devices
The setup for the creation of diffractive index gratins was an open breadboard setup
(Figure 11), which contained the wavelength tunable MaiTai HP (Spectra Physics) laser,
several optics for beam shaping and beam delivery, an AOM (Crystal Technology), a high
numerical aperture objective (40X/0.8NA Olympus), and a nano-meter precise stage system
(XPS Newport Technology) [15].
The refractive index change was measured using a diffractive grating and a laser setup
(Figure 12) where the laser was directed through the grating and the different diffraction
orders were visualized on a screen with some distance to the grating to allow individual power
measurements.
Figure 11: Material research breadboard (3D Z 3-dimensional; AOM Z acoustic-optic modulator) [15].

Page 16
Figure 12: Diffraction grating measurement setup [15].
The diffraction grating efficiency measurement station consisted of i) a JDSU 633nm
Helium Neon Gas Laser; ii) a sample holder; iii) a screen; and iv) a power meter [15].
Refractive grating efficiency measurements were used to optimize the various
variables. The grating measurements show the impact of i) energy per pulse; ii) wavelength;
iii) pulses per spot (scan speed); iv) x-spacing (the spacing between the lines); and v) z-spacing
(the spacing between the layers) [15].
An example of a DIC image of a diffractive gratings is visible in Figure 13 and an example of
the diffractive orders visualized on the screen is visible in Figure 14.
Figure 13: Example image of a DIC image, showing a diffractive grating [37]
Figure 14: Example of a diffractive grating

Page 17
The diffraction grating efficiency, ŋ, was calculated using the zeroth and first order
diffraction measurement [15].
The Δn change is a function of the efficiency and can be calculated using the equation
reported by Mailis et al [38] [15].
η=tanh2(Δnπd /λcosθ)
The wavelength (λ), the angle (ϴ), and the grid parameter d were kept constant
throughout the measurement and the shaping process, which allowed the use of the grid
efficiency to compare the parameter impact [15].
3.2.1.3 Method
The initial two methods of 3.1 were used to create a refractive index change and to
quantify the effects of the laser power and the material dopants. Afterward a standard
diffractive grating measurement setup were used to determine the benefit of other laser
parameters in addition to the evaluation of shaping parameters impacts.
Figure 11 shows the measurement setup; the sample holder allowed the sample to be
mounted for measurement and the screen was placed at a distance of approximately 3m. A
power meter was used for the individual measurement of the diffraction orders [15].
3.1.4.5 Experiment: Scan speed vs efficiency
10 different diffractive gratings with varying scan speed (30, 40, 70, 80, 90, 100, 150,
200, 250, 300mm/s) were shaped into the material. This experiment was designed to evaluate
the scanner speed impact on the diffraction grating efficiency. A refractive index change
which is based on heat, will always prefer a large number of pulses to be accumulated rather
than less pulses with higher pulse energy. This experiment was designed to investigate if the
accumulation of heat was necessary for the refractive index change. For this reason, the pulse
energy was kept constant and only the scan speed was varied. A heat dependent effect was
expected to show a large exponential falloff compared to a linear falloff for a non-heat
depended effect [9].
3.1.4.6 Experiment: Diffractive Grating Stability Measurement

Page 18
The parameter optimization lead to larger refractive index changes and more efficient
diffractive gratings. A side effect of this was a larger visible number of diffractive orders. The
measurement of these diffractive orders took more time and identified an unexpected side
effect. The already measured orders appeared less bright and a measurement confirmed an
overall reduction in the refractive index change. The following experiment was designed to
validate this effect and to identify the possible cause.
For this experiment a diffraction grating (3mm x 3mm with a 18um x spacing) was
shaped inside the acrylic polymeric material. The sample was afterward soaked in water and
mounted into the measurement setup. The 10 diffractive orders and the zeroth order were
measured 15 times throughout a 7.5-hour period. The sample position was monitored, and
additional time power meter position marked on the screen [9].
Additional care was given in observation of sample position changes, power meter
position variations and measurement repeatability.
3.1.4.7 Experiment: Water Dependent Lens Diopter measurement
An additional experiment focused on measurement repeatability and the impact of
the measurement setup and length. The same sample was measured over a 7.5-hour period,
but the measurement time was limited to less than 30 minutes and the material was kept in
its water vial storage during the measurements.
3.2.2 Results
The diffractive grating results is visible in figure 15, and the efficiency calculation for
the different scan speeds are visible in figure 16.
Figure 15: Diffractive Grating Orders [9]

Page 19
Figure 16: Scan Speed vs Efficiency [9].
The scan speed vs efficiency speed showed that a faster scan speed had a smaller
efficiency but that even with 300mm/s a first order measurement could be measured. Slower
speeds showed some heat effect, but faster speeds showed less heat effect. For example, the
200mm/s measurement roughly has half the efficiency of the 100mm/s measurement.
3.2.6 Water De-absorption
Figure 17 shows the 10 order diffraction measurements for overall time period of 7.5
hours. With time the diffraction efficiency decreased for all 10 orders in a similar way.
Figure 17: water de-absorption [9].

Page 20
The initial 30-minute measurement had only slight changes in the power
measurement, but large changes had already been visible after two hours and after four hours
the diffraction efficiency flatlined for a number of orders.
Figure 18: Water de-absorption, zero order [9].
The zero-order measurement showed the predicted behavior, the diffractive grating
energy of the higher orders went into the zero-order measurement over time [9].
Observations of the sample position or the power meter position did not provide
additional insight into this effect. An interesting effect was noted regarding the measurement
times and measurement length. Fast measurement showed repeatable results and stable
outcomes. This measured instability was not impacted by the shaping time of the sample and
was only connected to the measurement length itself.
3.2.7 Water Absorption
The sample measured repeatably within measurement acuity if each measurement
was fast and the sample was not in dry conditions for more than 30 minutes. This test also
showed that even if the sample dried out and the refractive change disappeared, the
refractive change reappeared if the material was placed back to the water vial storage
environment for sufficient time.

Page 21
3.3 Conclusion
The experiments showed that a refractive index change could be created in a
hydrophobic polymer.
The process indicated an energy per pulse dependency. Increasing the output power
from 80mW to 500mW allowed a RIS max speed increased of a factor of 256. Additional
experiments highlighted that both the UV absorber and the yellow dye dopant of the original
material impact the amount of refractive index change. The comparison between the two
dopants favored the UV absorber dopants. They allowed a higher RIS max speed and showed
less heat dependency. The scan speed experiment indicated that the refractive index change
could be optimized with large scan speeds. This was a very important finding, allowing a
possibility for an in-vivo lens shaping process because of the short processing time
requirements.
The experiments discovered that the process was water dependent and an impact of
the storage conditions which was unknown prior to these experiments. The material’s
absorption of water was a significant discovery and indicated that a new laser material
interaction was responsible for the refractive index change.

Page 22
4. Hydrophilicity Based Refractive Index Change
Initial results (3.2.2) indicated a water dependency to the refractive index change. Two
experiments were designed to further demonstrate this dependency of the refractive index
change. The water weight experiment was designed to validate this theory and the contact
angle method was used to verify that this water absorption was changing the hydrophilicity
of the treated material.
4.1 Water Weight Experiment
4.1.1 Materials and Methods
The water weight gain experiment (Figure 19) used a relatively large blue blocking,
hydrophobic material (3.1.1.1) sample (14.35mm x 1.91mm x 1.33mm) . This sample was large
enough to allow multiple RIS volume treatments. Each treatment was designed to treat a
2mm x 2mm x 165um area. A total of three areas were shaped and the weight was measured
in five different conditions (dry sample, water-soaked sample, sample after first treatment,
sample after second treatment, sample after third treatment).
For this experiment the following laser parameters were used. Femtosecond laser
source (pulse width: 200fs, repetition rate: 50MHz, energy per pulse: 5.4nJ, wavelength:
780nm [9].
a) sample b) sample after soaking
c) sample after 1st treatment
d) sample after 2nd treatment
e) sample after 3rd treatment
Figure 19: Water Weight Gain Experiment
4.1.2 Results
The material strip measured 38.2mg prior to the experiment and 38.9mg at the last
measurement. Each treatment increased the weight by approximately 0.2mg. This represents
an approximate 30% water absorption by the treated region (0.2mg ÷ 2x1.9x0.165 = 0.318 =

Page 23
32%). The weight gains after each laser treatment are summarized in the graph depicted in
Figure 20 [9]
Figure 20: Weight Gain Due to Water Absorption [9].
4.2 Contact Angle Method Experiment
4.2.1 Materials and Methods
The contact angle method was used to quantify the hydrophilicity (wettability) of a
solid surface.
A Mamur's definition of a contact angle is that “the contact angle is defined as the
angle between the tangent to the liquid-fluid interface and the tangent to the solid surface at
the contact line between the three phases. A low contact angle means that the solid is well
wetted by the liquid (hygrophilic solid surface) while a high contact angle indicates a
preference for solid-fluid contact (hygrophobic solid surface)” [39]. Figure 21 shows three
simulated different contact angle examples.

Page 24
Figure 21: Simulation showing three water drops on a polymer. From left to right the contact angle increases, indicating a more hydrophobic material.
RIS treatment exposed to surface
An approximately 2mm thick blue blocking, hydrophobic, acrylic polymer material
(3.1.1.1) button, normally used for IOL manufacturing. Both top and bottom surface were
lathed off using an Optoform precision ophthalmic lathe.
a) Prior to treatment b) After treatment c) After laith, RIS change exposed to surface
Figure 22: Contact Angle Test I
After an area of 3 x 3 mm was treated within the block, the top surface of the button
was again lathed to expose the treated area to the surface. Afterward two water droplets
were placed on the button. One directly on the treated area and one on a not treated area
(Figure 23).

Page 25
Figure 23: Example of the water droplet placement [40]
Pictures are taken from the setup and the contact angle of both water droplets are
measured and compared.
RIS treatment not exposed to surface
a) Prior to treatment b) After treatment
Figure 24: Contact Angle Test II
The second contact angle test (Figure 24) was designed to investigate the laser
interaction with the material surface. This test is identical to the first two steps of the first
contact angle experiment and but does not involve lathing off the top surface of the button.
If the hydrophilicity change is localized within the button (not exposed to the surface)
water droplet would show the same contact angle on the surface of the treated and untreated
material (figure 25).
Figure 25: Contact angle method on uncut button [40]

Page 26
4.2.2 Results
RIS treatment exposed to surface
Figure 26: Hydrophilicity based Δn change [6]
The angle of the water droplet on top of the treated material in Figure 26 (left) is
approximately 64 degrees, which indicates that it is in contact with a hydrophilic surface. The
angle of the droplet on top of the untreated material in Figure 26 (right) is approximately 87
degrees, which indicates that the drop is in contact with a hydrophobic surface [15].
The contact angle for the treated material measured more hydrophilic compared to
the untreated area.
RIS treatment not exposed to surface
See Figure 27 shows the contact angle method for two water droplets in which the
interior of the material was treated but the angle of the water droplets (~87°) on the surface
indicate the surface of the material remains hydrophobic. The surface and the untreated
Figure 27: Contact angle measurement when the treatment is located inside the material and not exposed to the surface [15].

Page 27
interior area of the lens material is unaffected by the creation of a hydrophilic area within the
IOL [15].
4.3 Conclusion
This experiment verified the initial findings and indicated that a new laser material
interaction had resulted from the exposure of the acrylic material to the laser energy.
The water weight and the contact angle method both verified that water was critical
to this laser material interaction. The RIS process is water dependent and changes the
hydrophilicity of the treated area. This hydrophilicity change affects the refractive index of
the material and the precise modulation of this effect allows the modification of a the IOL.
The change in hydrophilicity drives a change in refractive characteristics, which does
not depend on the accumulation of heat. Consequently, large scan speeds can be used, which
allow for the fast processing times required for in-vivo application [6].
Page 28
5. Chemical Basis
This chapter is focused on the material interaction-based research to further identify
the laser material interaction which causes the hydrophilicity based refractive index change.
The minute refractive index change in combination with a small ratio of treated vs untreated
material in the IOL complicated this research step.
Three different microscope setups have been used for the study: i) Laser Induced
Fluorescence (LIF) microscopy (5.1), ii) Coherent Anti-Stokes Raman Scattering (CARS)
microscopy (5.2), and iii) Raman microscopy (5.3). Three different materials including
hydrophilic and hydrophobic IOL materials were studied. Each microscope was used with the
intention to identify the underlying molecular changes occur upon exposure of the polymeric
material to the femtosecond laser [41].
5.1 Laser Induced Fluorescence (LIF) microscopy, STED-contrast
5.1.1 Materials and Methods
5.1.1.1 Materials
The microscopic study was performed on three different IOL materials.
• A clear hydrophobic IOL material, with a refractive index of 1.47, a 6mm optics and an
overall diameter of 13mm. Containing their standard UV absorber and no yellow dye
[42].
• A blue blocking hydrophobic IOL material (3.1.1.1).
• A clear hydrophilic acrylic (25%) IOL material, with a refractive index of 1.46 and a
6mm biconvex optic and an overall length of 11mm. Containing their standard UV
absorber and no yellow dye [43].
5.1.1.2 Setup
The STED (Stimulated Emission Depletion) microscope uses a low power pulsed
supercontinuum laser source (WhiteLase SC450-PP-HE, Fianium, Southampton, UK) for
excitation at virtually any optical wavelength [44]. The IR part of the supercontinuum
spectrum was removed using a 760 nm short pass filter. An acousto-optical tunable filter
(AOTF, PCAOM-VIS, Crystal Technologies, Palo Alto, USA) was used to select the desired

Page 29
excitation wavelength. To further minimize the undesired wavelength range, the beam was
directed through the AOTF three times. This technique of the triple pass suppressed the
unwanted wavelength range 1000 times better than a regular single pass. The STED laser is a
frequency-doubled pulsed fiber laser with a pulse width of 600ps, a pulse energy of up to 40nJ
per pulse and a wavelength of 775nm (Katana-08 HPKA/40/07750/600/1600/FS). The STED
laser can be triggered electronically over a wide frequency range (25/40 MHz) which greatly
simplifies the synchronization of the excitation and STED pulses. The STED laser is triggered
by the pulsed supercontinuum laser operating at 38.6 MHz [41].
5.1.1.3 Method
To facilitate the measurement the 4mm lenses were also shaped into material buttons
of the same material (Figure 28). Afterward the button were cut into side strips. This
minimized surface interactions because of the homogenous straight surface. Additionally it
exposed the treated area to the side surface of the side strip. The LIF microscope was used to
visualize the treated area. Afterward simultaneous scans with two different wavelengths, 600
nm (fluorescence detection at 628 nm) and 650 nm (fluorescence detection at 708 nm) were
performed. The images were overlaid to investigate homogeneity of the treatment and
stability.
Figure 28: Simulation of the RIS lens inside a button and also a side strip.

Page 30
5.1.2 Results
5.1.2.1 Hydrophilic Stripe [41]
Figure 29: (a) Schematic sketch of hydrophilic acrylic lens (5 diopters), RIS-treated area 4 mm circle in the center of the IOL. (b) Fluorescence image of a RIS-lens inscribed in the hydrophilic acrylic lens [6].
The schematic sketch of the 5 D hydrophilic IOL is shown in Figure 29(a). Figure 29(b)
shows the newly formed hydrophilic molecules in the laser-treated area using LIF microscopy.
The phase-wrapped RIS-lens is visualized by green fluorescent light emission, with blue
excitation and wide field illumination (10x objective). Different shades of green correspond
to different amounts of fluorescence light, indicating different amounts of newly formed
hydrophilic polar molecules. The fluorescence image reflects the homogeneity and
repeatability of refractive index change in the laser treated areas [6].
The top part of Figure 30 displays the transmission image. A Laser Induced
Fluorescence image of a hydrophilic stripe is visible in the bottom. Two RIS lenses were
created inside a hydrophilic stripe of polymeric material, at the right and left side of the stripe
(Figure 30, arrows) [41].
Figure 30: Hydrophilic Stripe: transmission image (top) and fluorescence image (bottom) and the RIS-pattern indicated by arrows [41].

Page 31
The edge of the RIS-pattern in the hydrophilic stripe is shown in Figure 31 [41].
Figure 31: Edge of RIS-Pattern in Hydrophilic Stripe (Zone boundary of Fresnel lens) [41].
Image Wavelength Fluorescence detection
wavelength
Left 600nm 628nm
Right 650nm 708nm
Table 1: Simultaneous scanning wavelength
In Figure 32, the simultaneous scanning of a laser excited area with two different
wavelengths are visible [6].
Figure 32: Simultaneous scans at 600 and 650 nm. Left image- fluorescence detection at 628 nm, right image- fluorescence
detection at 708 nm [6].
The wavelengths used for each picture is displayed in Table 1. This microscope study
demonstrated the detection of spatially distributed fluorophores in “On/Off” states. When

Page 32
the fluorophore was exposed to light of the correct wavelength it absorbed energy and
creates fluorescent light. This so-called “Blinking” indicates the presence of single
fluorophores, with active or silent behavior. In the upper middle part, the two instantaneous
images are overlaid, labeling the left image in red color and the right image in green color [6].
5.1.2.2 Blue Blocking Hydrophobic Stripe
In Figure 33, transmission (top) and fluorescence (bottom) images of a hydrophobic
stripe are depicted. A RIS lens was shaped (arrows) in the center of the hydrophobic stripe
[41].
Figure 33: Hydrophobic Stripe: transmission image (top) and fluorescence image (bottom) and the RIS- patterns are
indicated by arrows [41].
In Figure 34, fluorescence spectra from the RIS-pattern of the yellow hydrophobic
stripe are shown, with excitation/emission at 405/500 nm, and 488/535 nm, respectively (TCS
SP8 X (Leica Microsystems GmbH)).
Figure 34: Fluorescence spectra, excitation at 405 nm and emission max. at 500 nm (left), excitation at 488 nm and emission max. at 535 nm (right). (Sample: Yellow hydrophobic stripe) [41]

Page 33
Figure 35 shows two different scans (left and right), each side displays simultaneous
xz-scans at three excitation wavelengths. For the left side, the fluorescence appeared
strongest at 470 nm excitation. The intensity drops after a few microns inside the bulk
material. This is probably caused by a mismatch of the refractive index between the
immersion oil and the bulk material [41].
Image Location of
scan Area within
Image Excitation
wavelength Emission wavelength
Left Surface Left 470nm 525/50nm Right 605nm 628/32nm Bottom 650nm 708/75nm
Right 3um inside the material
Left 470nm 525/50nm Right 605nm 628/32nm Bottom 650nm 708/75nm
Table 2: Figure 34 excitation and emission wavelength information
For Figure 35 (right) the xy scans were taken ca. 3 µm inside the yellow hydrophobic
material. The fluorescence appears brightest with blue excitation, while the fluorescence
appears homogenous at blue excitation. It exhibits brighter diffraction limited small spots
above a homogenous fluorescence level in the red ranges. The spots are not co-localized in
the two red channels. The images were taken quasi simultaneously in line multiplexing
scanning mode. As discussed previously in the case of the clear hydrophilic material (Figure
32), in the yellow hydrophobic material similarly spatially distributed fluorescent molecules
in “On/Off” states are detected; this so-called “Blinking” indicates the presence of single
fluorescent molecules, with active or silent behavior [41].
Figure 35: Magnified xz-slice. Simultaneous scans at 470 nm, resp. 605 nm, resp. 650 nm excitation. Left: side view, Right:
top view [41]

Page 34
5.1.2.3 Clear Hydrophobic Strip
In Figure 36 displays transmission (top) and fluorescence (bottom) images of a
hydrophobic strip. A RIS lens was shaped (Figure 36, arrows) in the center of the hydrophobic
strip [6].
Figure 36: (left) Hydrophobic clear strip (bird view): transmission image (top), fluorescence image (bottom) and the RIS patterns indicated by arrows. (right) Hydrophobic clear strip (sideview): transmission image (top), fluorescence image
(bottom) [6].
In Figure 37, fluorescence spectra from the RIS-pattern of the clear hydrophobic
material are shown, with excitation/emission at 405/500 nm, and 488/535 nm, respectively.
The spectra closely resemble the spectra of the RIS pattern of yellow hydrophobic material,
as well as the spectra from the hydrophilic material [6].
Figure 37: Fluorescence spectra, excitation at 405 nm and emission max. at 500 nm (top), excitation at 488 nm and emission max. at 535 nm (bottom) (Sample: Clear hydrophobic strip [42]) [6].

Page 35
Figure 38 (left) displays three excitation wavelengths for simultaneous xz scan. The
upper left image uses an excitation wavelength of 470 nm and an emission wavelength of
525/50 nm. The upper right image uses an excitation wavelength 605 nm and an emission
wavelength of 628/32 nm. The lower left images has an excitation wavelength of 650 nm and
an emission wavelength of 708/75 nm. The bright spot marks the surface of the clear
hydrophobic material [6].
Figure 38: Fluorescence images, simultaneously taken at 470 nm, resp. 605 nm, resp. 650 nm excitation [6].
The fluorescence images show a μm sized, magnified confocal xz-slice (side view)
across a bright part of the Fresnel pattern. The right side shows a magnified confocal xy-
slice (top view, at the samples surface) at a bright part of the Fresnel pattern [6].
The fluorescence appeared strongest at 605 nm excitation while it was very weak at
blue light excitation. Inside the bulk material the intensity drops after a few microns. This is
probably caused by a mismatch of the refractive index between the immersion oil and the
bulk material. The lower narrow line marks the coverslip glass surface on top of which the
sample was mounted [6].
Figure 39: High resolution fluorescence xy- images (top view) of clear hydrophobic strip [6].

Page 36
Figure 39 displays high resolution fluorescence images of a clear hydrophobic material
strip. The left side shows a darker squared field of an area which was previously scanned and
gradually bleached. The right side displays a bright band, which indicates an area where the
STED beam was switched off temporarily while the full image was scanned. Thus, the newly
created fluorophores show analogous behavior (bleaching and stimulated emission) like
regular fluorescent dyes [6].
The clear hydrophobic material was imaged at two fluorescence bands simultaneously
(see Figure 38 (right)) (excitation wavelength of 605 nm, emission wavelength of 628/32 nm
(upper left) and excitation wavelength of 650 nm, emission wavelength of 708/75 nm (upper
right). The fluorescence emissions appear homogeneous in both wavelength bands at a
diffraction limited resolution level of 230 nm. The regions imaged in Figure 38 are only approx.
10 μm in size, and are selected in fully treated areas, resulting in homogeneous appearances
[6].
5.2 Coherent Anti-Stokes Raman Scattering (CARS) microscopy
5.2.1 Materials and Methods
5.2.1.1 Materials
• A clear hydrophilic IOL material (5.1.1.1)
• A blue blocking hydrophobic material (3.1.1.1)
• A clear hydrophobic material (5.1.1.1)
5.2.1.2 Setup
CARS [45] images were acquired with a Leica TCS SP8 CARS system (Leica
Microsystems, Mannheim, Germany). The picoEmerald laser (APE, Berlin, Germany) offering
a fixed line of 1064.5 nm and a tunable line from an optical parametric oscillator (780-940
nm) was coupled to a TCS SP8 confocal microscope. The laser combination of the fixed Stokes
line and tunable pump line allows detection of CARS signal in the vibration range of 1300-
3400 cm-1. A HC PL IRAPO 40x water immersion objective was used for the imaging and CARS
signal was selected with a band path filter and detected with a non-descanned photon
multiplier tube (PMT) detector at the transmitted light side [41].

Page 37
5.2.1.3 Method
The confocal capability of the system was used to take the overview images with
fluorescence and bright field images of the samples. A HC PL APO 10x/0.40 CS objective was
used. Images are stitched to the overview after multi-position scanning. Also, the emission
spectra at different excitation wavelengths were acquired with the TCS SP8 CARS system [41].
5.2.2 Results
5.2.2.1 Clear Hydrophilic
Figure 40: (a) Excitation/Emission Spectra of fluorescent molecule. (b) Identification of fluorescent molecule [6].
The excitation/emission spectra of a laser excited area are plotted in a three-
dimensional graph, with the excitation wavelengths on the abscissa and the emission
wavelengths on the ordinate (See Figure 40(a)). The z-axis is depicting the intensity of the
fluorescence light, emitted by the fluorophores. The fluorescence excitation and emission
scan were done with a TCS SP8 X system. Data analysis and the graphs were generated using
the Leica confocal software LASX. The microscope was equipped with a white light laser. The
highest fluorescence light emission was generated at a wavelength of 470 nm of the white
light laser. The corresponding emission spectrum extends over a broad spectral region, from
500 nm to 650 nm, indicating the formation of hydrophilic polar molecules. This graph
demonstrates the sensitivity of the polymer molecules to laser light excitation [6].
With an excitation wavelength of 472 nm, the emission spectrum of the fluorophore
is centered at 527 nm, as depicted in the lower left of Figure 40(b) (TCS SP8 X). In the upper
left of Figure 40(b), a typical excitation/emission spectrum of an aromatic carboxylic acid

Page 38
Rhodamine Green Carboxylic Acid is plotted for comparison, with excitation at 480 nm and
emission centered at 525 nm. For comparison, the excitation/emission spectra of a pure
acrylic material, e.g. PMMA, are shown on the lower right side, which are positioned in the
deep UV, indicating that the UV-absorber molecules, which get excited by two-photon
absorption, are essential to initiate the observed molecular changes [6].
5.2.2.2 Blue Blocking Hydrophobic Stipe
In Figure 41, a CARS spectrum of the yellow hydrophobic stripe is depicted, subtending
the frequency range from 1700 cm-1 to 1750 cm-1. The peak frequency amounts to 1735 cm-
1, indicating the C=O molecular vibration (stretching mode). On the abscissa, the tunable
pump laser wavelengths are plotted (in nanometers), as well as the related vibrational mode
frequencies (in wavenumbers cm-1) [41].
Figure 41: CARS-Spectrum yellow hydrophobic lens (1700-1750 cm-1), max. at 1735 cm-1 (C=O molecular vibration (stretching mode)) [41].
In Figure 42, a CARS image, taken at a frequency of 2954 cm-1, corresponding to
CH/CH2 molecular vibrations, is plotted in the upper right, with the fluorescence image in the
upper left and the overlay of CARS/fluorescence images in the lower left.

Page 39
Figure 42: CARS (2954 cm-1) and fluorescence images (TCS SP8 CARS, Leica Microsystems GmbH) [41].
The cross-section profiles of the CARS (lower graph) and fluorescence (upper graph)
signals along the lines indicated in Figure 43 are plotted. The variation of the CARS signal is
due to overlay mismatch of the pump and Stokes beams, generating the CARS signal, towards
the edges of the image field, as can be seen from the color variances in the upper right image,
shown in Figure 43. The dips in the CARS signal at the zone boundaries of the Fresnel lens (see
Figure 43), which can be recognized in the CARS image (Figure 42, upper right), too, are
essentially caused by a slight mismatch of the foci of the pump and Stokes beams at the zone
boundaries, due to the refractive index step, imposed by the laser treated area of the IOL
material [41].
Figure 43: Correlation CARS and fluorescence cross-sections, yellow hydrophobic lens [41].

Page 40
5.2.2.3 Clear Hydrophobic
In Figure 44, a CARS spectrum of the clear hydrophobic stripe is depicted, subtending
the frequency range from 1700 cm-1 to 1750 cm-1. The peak frequency amounts to 1735 cm-
1, indicating the C=O molecular vibration (stretching mode). On the abscissa, the tunable
pump laser wavelengths are plotted (in nanometers), as well as the related vibrational mode
frequencies (in wavenumbers cm-1) [41].
Figure 44: CARS-Spectrum clear hydrophobic lens (1700-1750 cm-1), max. at 1735 cm-1 (C=O molecular vibration) [41].
In Figure 45 left, a CARS image, taken at a frequency of 1720 cm-1 is plotted in the
upper right, with the fluorescence image in the upper left and the overlay of
CARS/fluorescence images in the lower left. In Figure 46 left, the cross-section profiles of the
CARS (lower graph) and fluorescence (upper graph) signals along the lines indicated in Figure
45 left are plotted. The variation of the CARS signal is due to overlay mismatch of the pump
and Stokes beams, generating the CARS signal, towards the edges of the image field, as can
be seen from the color variances in the upper right image, shown in Figure 45 left. The dips in
the CARS signal at the zone boundaries of the Fresnel lens (see Figure 46 left), which can be
clearly recognized in the CARS image (Figure 45 left, upper right), too, are essentially caused

Page 41
by a slight mismatch of the foci of the pump and Stokes beams at the zone boundaries, due
to the refractive index step, imposed by the laser treated area of the IOL material [41].
Figure 45: TCS SP8 CARS images (left) CARS (1720 cm-1) and fluorescence images (right) CARS (2954 cm-1, CH/CH2
vibrational mode) and fluorescence images [41].
In Figure 45 right, a CARS image, taken at a frequency of 2954 cm-1, corresponding to
the CH/CH2 molecular vibrations, (stretching mode), is plotted in the upper left, with the
fluorescence image in the upper right and the overlay of CARS/fluorescence images in the
lower left.
Figure 46: (left) Correlation CARS (C=O mode) and fluorescence cross-sections, clear hydrophobic lens. (right) Correlation
CARS (CH/CH2 mode) and fluorescence cross-sections, clear hydrophobic lens [41].
The cross-section profiles of the CARS (lower graph) and fluorescence (upper graph)
signals along the lines indicated in Figure 46 right are plotted. The variation of the CARS signal
is due to overlay mismatch of the pump and Stokes beams, generating the CARS signal,
towards the edges of the image field, as can be seen from the color variances in the upper
left image, shown in Figure 45 right. The dips in the CARS signal at the zone boundaries of the
Fresnel lens (see Figure 46 right), which can be clearly recognized in the CARS image (Figure
45 right, upper left), too, are essentially caused by a slight mismatch of the foci of the pump
and Stokes beams at the zone boundaries, due to the refractive index step, imposed by the

Page 42
laser treated area of the IOL material, affecting the pump and Stokes beam differently, due
to dispersion [41].
In Figure 47, various RIS lens types, written in clear hydrophobic lens material [42] are
imaged with fluorescence microscopy (Cylindrical RIS lens (Figure 47a), Spherical RIS lens
(Figure 47b), Spherocylindrical RIS lens (Figure 47c))[6].
The visible block structure in the images is a side effect of the software stitching the
images into one and not part of the lens shaping process.
Figure 47: Fluorescence images of hydrophobic RIS lenses [6].
5.3 Raman Microscopy
The first two microscope studies (5.1 and 5.2) further validated the hydrophilicity
component of the RIS process. Hydrolysis or oxidation had both been investigated to be the
most possible cause of the hydrophilicity change. Hydrolysis is defined as a type of
decomposition reaction were one reactant is water [46]. The reaction involves the breaking
of a bond in a molecule using water [47]. If the amount of change is sufficiently large a Raman
spectrum expected to identify a newly created peak. The definition of oxidation describes the
loss of electrons during a reaction by a molecule, atom or ion [48]. This microscope study was
designed to identify if the hydrophilicity change created by the RIS process was due to
hydrolysis or oxidation.
5.3.1 Materials and Methods
5.3.1.1 Materials
The clear hydrophilic IOL material (5.1.1.1) was used for this section. It is the most
reactive to the hydrophilicity change and therefore was expected to the best suited material

Page 43
for this experiment. The sample was cutting into strips (10 mm x 2 mm x 2mm) to allow direct
access to the treated area.
5.3.1.2 Setup and Method
Raman spectra were recorded on a commercial HORIBA XploRA PLUS Raman
Microscope (HORIBA Jobin Yvon GmbH, Bensheim, Germany). All spectra were measured with
a 10x objective with a 600 gr/mm grating. The wavelength of the continuous wave excitation
laser source was 785 nm (with a laser output of approximately 100 mW). Raman spectra were
acquired both in the fingerprint (200-1800 cm-1) and high-wavenumber (2400-3800 cm-1)
regions [49] [41].
5.3.2. Results
Figure 48: Raman spectra of a hydrophilic material: a) High-frequency part, b) Low-frequency part. Dashed dotted
horizontal lines represent the zero signal base lines of the respective Raman spectra, which were shifted vertically for the sake of clarity [6].
In Figure 48, Raman spectra are depicted which were recorded at three different
positions of the hydrophilic material: Left (RIS-pattern, blue), Right (RIS-pattern, red), Center
(Untreated area, black). The high wavenumber (2400-3800 cm-1) region of the Raman spectra
shown in Figure 48(a) is dominated by two features. The sharp feature in the region 2800-
3000 cm-1, which is composed of three distinct vibrational bands, can be assigned to
stretching vibrations of CH, and CH2 functional groups [50]. The relatively broad feature
ranging from 3100 cm-1 up to ca. 3600 cm-1 with a frequency maximum around 3300 cm-1 is
characteristic for stretching vibrations of hydrogen bonded OH groups of water molecules in
the hydrophilic polymer material [51]. The assignments of several distinct spectral features in

Page 44
the fingerprint region (200-1800 cm-1), which are assigned in the Raman spectra of Figure
48(b), indicate that the base material of the hydrophilic strip largely resembles the molecular
structure of a poly-2-hydroxyethylmethacrylate (PHEMA) polymer [50][52]. In the latter case
the capability for the high-water uptake of the material can be attributed to the presence of
OH groups along the flexible polymer backbone, which can form primary hydrogen bonds with
water molecules [6].
As can be seen in Figure 48 (a) the overall OH band intensity is significantly diminished
in the Raman spectra measured in the laser-treated areas (Left and Right) as compared to the
untreated area (Center) of the strip [6].
Frequency in cm-1 Possible assignments
550-610 CCO stretch
890-900 COC stretch
1080-1120 C-C stretch
1340-1375 CH2 twist and rock
1400-1460 CH2 in-plane bending, CH deformation
1600-1620 COOH stretch
1650-1750 C=O stretch
2800-3000 C-H stretch (of CH, CH2 groups)
3100-3600 O-H stretch
Table 3: Spectral band assignments
In the hydrophilic material this is consistent with consumption of H2O molecules in
the laser-treated areas indicating a photo-induced hydrolysis reaction. Furthermore, the
reduction of the OH band intensity in the laser-treated region is paralleled by a significant
increase of the CH and CH2 stretching vibration band intensities, which further indicates
reaction of the polymer material upon femtosecond laser treatment. This is also confirmed
by the observed significant change of the low frequency range Raman spectra (Figure 48(b))
upon laser treatment. The Raman spectra taken within the treated area (Right, Left in Figure
48(b)) exhibit a noticeable contribution of background fluorescence light in the low frequency

Page 45
region (200-2500 cm-1), due to excitation/emission processes of newly created fluorophores.
In contrast, there is almost no fluorescence background in the untreated area (Center in
Figure 48(b)), demonstrating, that fluorophores are solely generated by the irradiation with
the femtosecond laser. Considering the possible presence of UV-blocker/stabilizers in the
polymer material (such as e.g. benzotriazole derivatives [53][54]) the newly created
fluorescent molecules might be phenazine derivatives, which could be formed by reaction
sequence initiated by the femtosecond two-photon laser induced photochemical activation
of the benzotriazole copolymer derivatives. Those molecules would remain in their existing
place and are modified by the exposure to the laser light. Furthermore, a new molecular
vibration in the region 1600-1620 cm-1 that is observed in the laser-treated area (Figure 48(b),
Left) which can be assigned to an aryl carboxylic acid COOH moiety [55]. This entity is a
residual of the original reaction initiated by the laser light. The laser generated fluorophores
could be phenazine-1- carboxylic acid molecules (see Table 3) [6].
5.4 Conclusion
The overall refractive index change is small and the investigation of the underlying
effects therefore cumbersome. The hydrophilic material is very responsive to the laser
material interaction and therefore easier to investigate compared to the hydrophobic
material where the change is around 1%. The different soaking behaviors of the different
materials in different temperatures environments also provided an additional challenge. The
already minute change can easily be overlooked.
The chosen microscopic techniques provide additional information of the chemical
nature of the process, on the electronic (fluorescence) as well as the molecular (Raman) level.
CARS-microscopy is sensitive to refractive index changes, due to the four-wave mixing
feature. The three microscope results further validated a water dependency and showed a
hydrophilicity based refractive index change. It is believed that either hydrolysis or oxidation
would be responsible for the hydrophilicity change.
Laser Induced Fluorescence microscopy indicated that similar fluorescent molecules
are generated in hydrophilic and hydrophobic materials [6]. Indicating a similar reaction in all
three materials.

Page 46
Raman Microscopy in the hydrophilic material indicated that the spectral signature of
the femtosecond laser generated polar molecule was similar to the characteristics of an
aromatic carboxylic acid.
The experimental findings, regarding emission of fluorescent light in the laser-treated
areas in polymeric materials, closely resemble coloring effects in glass-materials, which are
exposed to high doses of femtosecond laser radiation [56] [57] [58] [59] [60]. As shown above,
the irradiation with femtosecond laser pulses can induce considerable absorption in
polymeric materials at the visible spectral region. In glass, at femtosecond laser fluences close
to the dielectric breakdown (approx. 10 J/cm2), the formation of color centers is observed.
Electrons and holes are generated due to the nonlinear excitation of the material by
femtosecond laser pulses [61][62]. A model was developed [56], associating the excitations
created initially by the femtosecond laser to the formation of Frenkel excitons, which
comprise localized electron-hole pairs. In contrast to glass, the polymeric material is doped
with UV-absorber molecules which are excited by two-photon processes, generating
hydrophilic molecules, and instilling the observed emission of fluorescent light [41].
Figure 49: Mechanism of Action [5].
Since the femtosecond laser treatment of the lens material was conducted in aqueous
media, water molecules are available for photo-induced process [5].
The hydrophilicity increase is expected to be facilitated by photo-induced hydrolysis
of polymeric material in aqueous media. Among many possible mechanisms, the
transformation of the ester group into an acid group and an alcohol group may be involved;
thus, the ester group produced two hydrophilic functional groups increasing the
hydrophilicity of the treated polymer. The spectral signature for hydrophilic materials
identifies one of the femtosecond laser generated polar molecules as benzenamines, like N-
phenyl-4-(phenylazo)-benzenamine (C18H15N3). Furthermore, the Raman spectra indicate,
that another laser generated fluorophore could be phenazine-1-carboxylic acid (C13H8N2O2)

Page 47
molecules. Since the femtosecond laser treatment of the lens material was conducted in
aqueous media, water molecules are available for photo-induced hydrolysis of the ester. The
hydrogen bonding between water molecules and the hydrophilic groups of acid and alcohol
is well established. As a result, the refractive index of the treated polymer is between the
refractive index of the untreated polymer and the refractive index of water (1.33) [41].

Page 48
6. Refractive Index Lens Shaping
This chapter introduces the RIS lens creation process and the different concepts which
are required to achieve a high quality and fast adjustment to an implanted IOL. The initial
subchapter could be considered an in-vitro proof of concept. It is an introduction into lens
creation, phase wrapping and gradient lenses. Different system setups have been used during
this research phase and the results are focused on providing an overview of the possibilities,
precision and repeatability of the hydrophilicity based refractive index shaping process.
6.1 Proof of Concept and Repeatability
6.1.1 Material and Methods
This subchapter focuses on the proof of concept and the different steps required to
shape a RIS lens into an IOL.
6.1.1.1 Materials
Yellow hydrophobic IOLs have been used for this research (3.1.1.1).
6.1.1.2 Setup and Measurement Devices
The prototype setup for the creation of the RIS Lens is shown in Figure 50.
Figure 50: Setup for refractive index shaping lens shaping (3D Z 3-dimensional; AOM Z acoustic-optic modulator) [15].
After proper beam shaping, the laser beam was delivered to the galvo-scanners
(Cambridge), which directed the beam through an objective lens to the sample. The polymer
sample was positioned inside a water tank, allowing the sample to be covered by water at all
times during the treatment. Water is critical to the process, without immersion in water, the
laser may affect the hydrophobic material but there is no significant change in refractive index
[15].

Page 49
The sample holder was positioned on nanometer precise linear motors, which allowed
the precise positioning of the lens. The quadratic field size of the objective lens was about
10mm, therefore, a full-size lens with a diameter of 4.8mm can be created using one block
and circle shaping [15].
A USB board camera (5 megapixel) was used for the positioning and centering of the
lens. The refractive index shaping process is invisible during the shaping process to regular
cameras and microscopes, and therefore is not monitored in real time during the creation of
the RIS Lens [15].
A DIC microscope (3.1.1.2) was used for imaging purposes and the PMTF was utilized
to measure the diopter and the MTF of the lens before and after treatment [15].
The polymer sample used for all experiments in this study was the yellow, standard
hydrophobic material (3.1.1.1). For this study, standard IOLs and flat buttons of the same
material had been used. The sample was stored in deionized (DI) water overnight before any
experiment was performed [15].
Figure 51 Image of IOL holder [15].
During the shaping process, flat buttons were placed in a fixed position inside the
sample holder and the IOLs were placed inside a custom IOL holder (Figure 51) [15].
Figure 52 Image of new focal plane finder [15]

Page 50
The sample holder was mounted horizontally on the 3D linear motor stage setup and
laser pulses were focused into the hydrophobic material using a high numerical aperture
microscope objective [15].
For calibration purposes, an initial program called “focal plane finder” (Figure 52) was
run prior to any experiment to verify that the RIS Lens was being created in the correct plane
within the targeted material (button or IOL). This process varies depending on the material
platform (button or IOL). For the button, the focal plane finder is positioned on the left edge
of the button. For the IOL, no focal plane finder was burned into the material, but a camera
based automated focusing system was used. The RIS Lens is created approximately 100µm
underneath the surface. The maximum energy per pulse, as measured after the objective lens,
was 560nJ at 520nm. For these experiments, the RIS Lenses were created using a 520nm
wavelength [15].
PMTF Measurement Device
The PMTF diopter and MTF measurement device from Lambda X was used for the
before and after measurements of the IOLs. It is designed to be ISO 11979-2 [14] compliant.
The PMTF can measure refractive and diffractive lenses in power range of -10 to 40D and has
a repeatability variance of 0.01D. The software offers single focus, multifocal and through
focus measurements. Additionally it has an Integrated USAF & Siemens target [63].
6.1.1.3 Methods
The RIS process utilizes i) the change in the refractive index of the acrylic polymer and
ii) the creation of a lens structure within the IOL (Figure 53).

Page 51
Figure 53 Refractive Index Shaping (RIS), Femtosecond (FS) laser, refractive index of IOL (n1) and refractive index of RIS lens (n2) [6].
A traditional lens diopter is calculated using the following equation:
𝐷 = ∆𝑛 ∗ 𝐶 = (𝑛 − 𝑛′ ) ∗ 1
𝑟
Where D is the diopter, ∆n the refractive index change, n the refractive index of the
lens material, n’ the refractive index of the material surrounding the lens, C is the curvature
of the lens and r is the radius of the curvature of the lens [5].
A refractive lens effect requires both properties to work together, for a quality lens the
refractive index change, and the curvature creation needs to be repeatable, predictable and
precise. For a limited or low refractive index change, the curvature is main component which
can provide a large diopter change but for a traditional lens a large curvature also requires a
large height/depth [5].
Figure 54: Visualization of the limited space inside an IOL [5].

Page 52
Figure 54 shows a large diopter traditional convex lens on the left and on the right side
a simulation on why that particular lens would not fit into an IOL. Modern IOLs are based on
a bi-convex design and rely on a relatively large refractive index change between the IOL
material (n~1.47 to 1.49) and the refractive index of the surrounding aqueous humor (n~1.34).
The IOL has a relatively thin body and is normally less than 1mm in height, while providing an
optic of almost 6mm in diameter. The area of an IOL which is not affected by either the top or
bottom convex component of the IOL is only about 200um [5].
In a traditional convex lens, one would be limited to an area with a height of 200 µm
(central slab area) in order to adjust the optical power of the IOL. The power for a 6 mm lens
with a height of 200 µm would be 0.44 diopter (Δn = 0.01) [41].
A traditional convex lens within the IOL would therefore not provide enough space
inside the IOL to allow a large diopter change while using low refractive index change [5].
Phase Wrapped technology
Phase wrapping is a process which allows the RIS process to create an enhanced
diopter change within a limited space [41]. To create a significant diopter change in such a
small area the lens needs to be collapsed into a “phase wrapped” structure (Figure 55). The
phase wrapped structure does not rely on a conventional convex or concave lens height to
direct the light, rather the phase wrapped lens contains the entire curvature of the traditional
convex or concave lens [15].
Figure 55 Introduction to the phase-wrapped lens. Simulation of the collapsing curvature into one layer [5].

Page 53
The phase wrapped lens is a theoretically perfect Fresnel lens. The following are
differences between a regularly manufactured Fresnel lens and the phase wrapped process
used in creation of the RIS Lens: i) the curvature of the phase wrapped lens is preserved
through the precision of the femtosecond laser (a traditional Fresnel lens will approximate
the curvature with an angle); ii) the RIS Lens can be shaped with a 90 degree angle between
the zones, a Fresnel lens is typically molded with an angle other than 90 degrees; and iii) the
process can be shaped with micrometer precision [15].
Figure 56 Phase Wrapping [6].
Figure 56 shows a simulation of a phase wrapped lens inside an IOL. A traditional phase
wrapped lens is created using a constant refractive index and by creating an actual curvature.
For the in-vivo application of this multiple layer technique would not be practical because it
would require too much time and also would not allow any tolerances for vibrations or
movement [5].
Figure 57:Phase wrapped gradient lens [5].
Page 54
Figure 57 shows a simulation of a phase wrapped gradient lens inside an IOL. The lens
is created within one layer, but the curvature of the lens is created by using a modulation of
the refractive index change. The blue color variations are supposed to visualize the difference
in water absorption and therefore the difference in the refractive index change [5].
The existing IOLs and the diopter power and MTF quality are recorded before and after
the shaping process. The IOLs are soaked in DI water for a minimum of 24 hours prior to the
shaping process and the measurement after shaping is performed after the IOL has finalized
its soaking process.
Experiment: Proof of Concept
The initial proof of concept lens for the standard hydrophobic IOL material was shaped
using measurement setup I and yellow hydrophobic material (3.1.1.1). The base for the
experiment was a 5D IOL and the RIS lens was designed to be -2D.
The multifocal creation proof of concept was also shaped in a 5D IOL and the lens was
designed to have two diopter areas. A refractive +2D lens was shaped in the outside area and
a refractive -2D RIS lens was shaped in the smaller IOL area.
Experiment: Repeatability
To test repeatability, the same parameter to create a -2D RIS lens was shaped into 9
different IOLs.

Page 55
6.1.2 Results
6.1.2.1 2D Refractive Index Shaped Lens
Figure 58: Creation of a -2D RIS change inside one IOL. Diopter readings and MTF before (a) and after (b) RIS treatment [6].
In Figure 58, the original proof of concept for a 2 diopter RIS lens within an IOL is
depicted, with a starting diopter of 5.05D. The creation of the RIS lens altered the overall lens
diopter to 2.91D. The pre-lens MTF was 0.53 for 100 lp/mm, the post-lens MTF was 0.40 for
100 lp/mm. The shaping algorithm was further improved since then to keep the final MTF on
a minimum of 0.43 for spherical changes [6].

Page 56
6.1.2.2 Refractive Index Changed Multifocal Lens
Figure 59: Creation of a -2D and +2D RIS change inside one IOL. Modulation map and diopter power map readings before (a) and after (b) RIS treatment [6].
In Figure 59, the original proof of concept for multifocal lenses is displayed. The top
shows the original modulation map and the bottom the diopter power map measured using
the Nimo from Lambda X. The original IOL measured 5D and the outside area was treated to
have a +2D change while the inside area had a -2D RIS change, resulting in a refractive
multifocal IOL [64] [6].
6.1.2.3 Repeatability
Figure 60: Repeatability of a -2D refractive index shaping lens [6].

Page 57
As illustrated by Figure 60 and table 4 the same -2D RIS lens was successfully shaped
into 9 different IOLs. The graph shows the diopter measurement of the RIS lens for each
shaping. The summary of the of the IOL measurement before and after the shaping is shown
in Table 4. All 9 lenses were shaped in sequence on the same day [15].
Lens # 1 2 3 4 5 6 7 8 9
Before 19.52 19.77 19.67 19.47 19.64 19.44 19.34 19.5 19.42
After 17.53 17.75 17.63 17.48 17.57 17.47 17.39 17.43 17.4
RIS -1.99 -2.02 -2.04 -2.09 -2.07 -1.97 -1.96 -2.07 -2.02
Table 4: Repeatability Measurement [15]
6.2 Lens Quality and Lens Types
6.2.1 Methods and Materials
6.2.1.1 Materials
During this research 10 different materials from 8 different manufacturers were
investigated and tested successfully [32]. This section is focusing on three (hydrophobic and
hydrophilic) materials.
• Material A: A yellow, blue blocking hydrophobic IOL (3.1.1.1).
• Material B: A clear hydrophobic IOL (5.1.1.1)
• Material C: A clear hydrophilic IOL (5.1.1.1)
6.2.1.2 Setup
The setup from 6.1 was used for refractive lenses (1 Refractive Change) and the
multifocal removal (3 Multifocal Removal) in this section, the other lens types the system
was optimized for space and movability.

Page 58
Figure 61: The Perfector [32].
The compact machine housing of the in-vivo femtosecond laser system is displayed in
Figure 61, it. The system is mobile and uses a proprietary docking attachment. The usability
of the system was improved compared to the protype system (6.1.1.2). The operator enters
the details of the IOL and the desired change to the IOL into the computer console of the
system. The lens location and treatment area are identified via an optical coherence
tomography (OCT). The computer console on the Perfector shows the operator exactly where
the laser is focused within the IOL. Once the OCT has accurately determined the focus
position, the operator initiates the laser [32].
6.2.1.3 Methods
The process from 6.1 was further optimized for quality, reduction of scan speed and
to work with additional IOL materials.
The modulation transfer function is used when discussing lens quality. The ISO 11979-
2 defines the standards for IOL manufacturers and has been updated since released in 1999.
The current version is from 2014 and provides clear MTF requirements for the measurement
with an eye model 1 and 2. For refractive lenses (e.g. monofocal or toric) and the eye model
1 the standard sets the minimum MTF requirement for the 100 lp/mm measurement to be

Page 59
greater or equal to 0.43 or as an alternative 70% of the maximum theoretical attainable
modulation, which is equal or greater to 0.28.
A large number of different lens types and diopter changes had been performed to
validate the RIS shaping technology. A selection of lenses is summarized in the following
tables.
Spherical RIS lenses
A spherical refractive index change is a diopter change to the sphere in either the plus
or minus direction.
ID Sub ID Lens Parameter Material
1 Refractive Change (Diopter Variation)
a) 0.5D A
b) +0.5D A
c) -2D A
d) +2D A
e) +4D A
Table 5: Spherical Refractive Index Change
Multifocal creation
A regular monofocal IOL is designed with one main focal point and optimized to enable
the patient to see at distance after cataract surgery. A multifocal IOL is designed to have two
or more foci, enabling the patient to also see near, intermediate or both. Those IOL types can
be used to address presbyopia [65]. Multifocal IOLs do not only vary in the number of focal
points but also in the diopter add and diopter split. The diopter add provides the information
to the near focus position and the split provides the information of the light split between the
different focal points.
The eye before presbyopia accommodates distance and near vision through
biomechanical adjustments to the crystalline lens. A multifocal IOL provides multiple images
and relies on neuroadaptation. The brain learns to pick the relevant image out of the different
images provided and therefore allows different images depth to be used [66].

Page 60
ID Sub ID Lens Parameter Material
2 Multifocal Creation
a) 3.1D add with a 60/40 split B
b) 3.6D add with 50/50 split A
c) 3.6D add with 60/40 split A
d) 3.6D add with 70/30 split A
Table 6: Multifocal Creation
Multifocal Removal
For some patients, a multifocal IOL causes vision abnormalities. In those cases, the
physician and the patient would want to remove the multi-focality
ID Sub ID Lens Parameter Material
3 Multifocal Removal
-3.6D with negative add of 50/50 split C
Table 7: Multifocal Removal
Multiple Treatments, Creation of Multifocality and Removal
Creating multifocality while the IOL is already settled has a number of benefits. Certain
aberrations like a larger or abnormal astigmatism can cause the patient to experience
problems with the multifocality and therefore an option to remove the created multifocality
is preferred. This test evaluates the lens quality of a monofocal IOL which has two treatments.
First a multifocal creation and afterward removal.
ID Sub ID Lens Parameter Material
4 Multifocal Creation and Removal
1st +3.6D with add of 60/40 split A
2nd -3.6D with add of 40/60
Table 8: Multifocal Removal
Astigmatism Correction
The creation of a cylinder lens is done to cancel the existing astigmatism of a patient.
In the case that the refraction is plano and only astigmatism is present, a pure cylinder lens is
created to cancel the patient’s astigmatism. In case the patient has a refractive error and
astigmatism, a sphere-cylindrical lens is created.

Page 61
ID Sub ID Lens Parameter Material
5 Toric
a) Cylinder add B
b) Sphere and Cylinder B
Table 9: Creation of Cylinder and Sphere-Cylinder Lenses
Creation of Asphericity
A traditional spherical IOL is designed to restore the visual acuity after cataract.
Aspherical IOLs are used to enhance visual quality. They are designed to correct for aspherical
aberrations of the cornea [67].
ID Sub ID Lens Parameter Material
6 Creation of Asphericity
a) Shaping of 6 lenses with increased conic constant
A
b) Shaping of 6 lenses with decreased conic constant
A
Table 10: Creation of Asphericity
6.2.2 Results
The lens shaping results refractive, multifocal, toric and aspheric RIS lenses are
summarized in this chapter.
6.2.2.1 Refractive Change (Diopter Variation)
Detailed measurements of the refractive RIS lens changes for section 1) a through e
are displayed in Figure 62 through 65 and the measurements are summarized in Table 11
through 14.

Page 62
1a) -0.5D RIS Change
Figure 62 : MTF curve of a- 0.5D RIS change, the let image shows the before measurement and the right the after measurement [15]
Diopter MTF Orientation Before After Change Average Before After Change Average H 21.92 21.39 -0.53 -0.51 0.66 0.56 0.1 -0.11 V 21.86 21.37 -0.49 0.65 0.54 0.11
Table 11: -0.5D RIS Change
The goal for Figure 62 was to reduce the diopter of an IOL by 0.5. The original IOL had
a 21.86 diopter and a MTF at 100 lines of 0.65. The same IOL with the RIS Lens had a 21.37
diopter and a MTF at 100 lines of 0.54 [15].
1b) +0.5D RIS Change
Figure 63 MTF curve of a 0.5D RIS change, the let image shows the before measurement and the right the after measurement [15]
The goal for the IOL in Figure 63 was to increase the diopter by 0.5. The original IOL
had a diopter of 21.49 and a MTF at 100 of 0.62. The same IOL with the RIS Lens had a diopter
of 21.98 with a MTF at 100 line of 0.61 [15].
Diopter MTF Orientation Before After Change Average Before After Change Average
H 21.47 21.98 0.51 0.5 0.64 0.60 -0.04 -0.03 V 21.49 21.98 0.49 0.63 0.61 -0.020 Table 12: +0.5D RIS Change
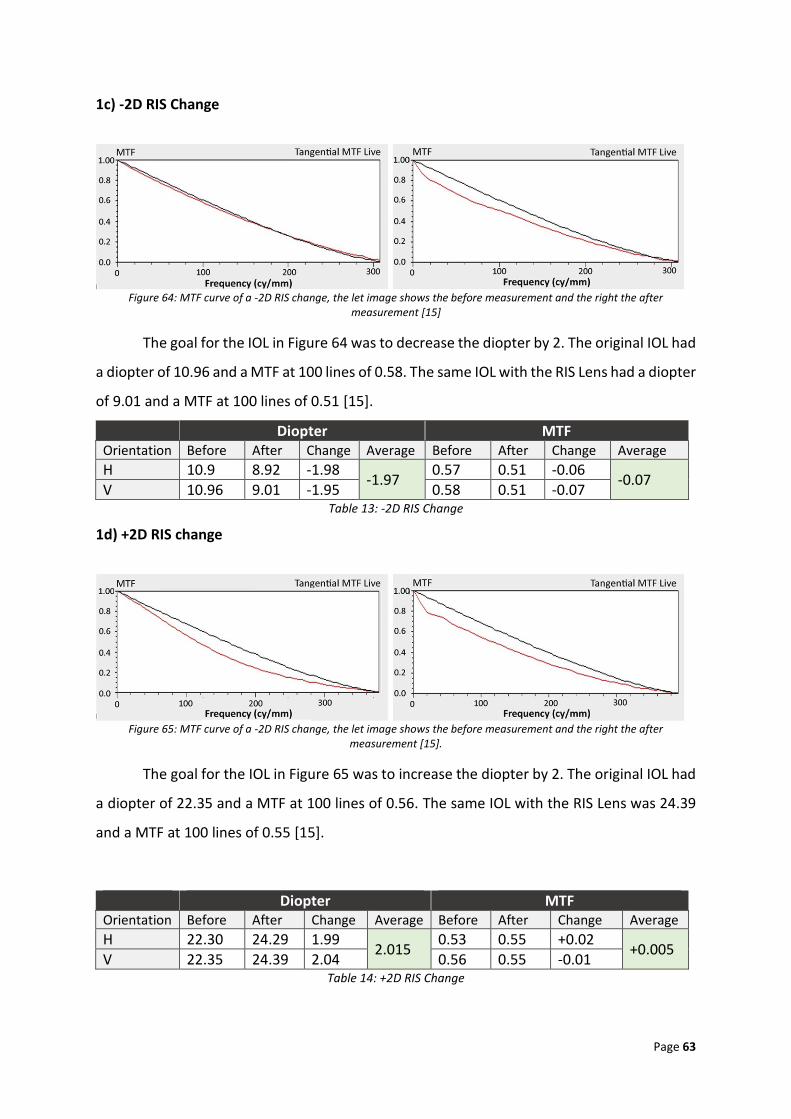
Page 63
1c) -2D RIS Change
Figure 64: MTF curve of a -2D RIS change, the let image shows the before measurement and the right the after measurement [15]
The goal for the IOL in Figure 64 was to decrease the diopter by 2. The original IOL had
a diopter of 10.96 and a MTF at 100 lines of 0.58. The same IOL with the RIS Lens had a diopter
of 9.01 and a MTF at 100 lines of 0.51 [15].
Diopter MTF Orientation Before After Change Average Before After Change Average H 10.9 8.92 -1.98 -1.97 0.57 0.51 -0.06 -0.07 V 10.96 9.01 -1.95 0.58 0.51 -0.07
Table 13: -2D RIS Change
1d) +2D RIS change
Figure 65: MTF curve of a -2D RIS change, the let image shows the before measurement and the right the after measurement [15].
The goal for the IOL in Figure 65 was to increase the diopter by 2. The original IOL had
a diopter of 22.35 and a MTF at 100 lines of 0.56. The same IOL with the RIS Lens was 24.39
and a MTF at 100 lines of 0.55 [15].
Diopter MTF Orientation Before After Change Average Before After Change Average H 22.30 24.29 1.99 2.015 0.53 0.55 +0.02 +0.005 V 22.35 24.39 2.04 0.56 0.55 -0.01
Table 14: +2D RIS Change

Page 64
1e) +4D RIS change
In Figure 66, the creation of a refractive +4D RIS lens is depicted. The original IOL
measured 16.59 with an MTF of 0.5 for 100 lp/mm, after RIS the IOL measured 20.59D with
an MTF of 0.49 lp/mm [68]. Thus, the RIS technology can be used to change an existing IOL
diopter of up to 4D while keeping a good MTF [6].
Figure 66: Diopter readings and MTF before (a) and after (b) RIS treatment [6]
6.2.2.2 Conversion from Monofocal to Multifocal
2a) Creation of a 3.1D 60/40 multifocal RIS change
Figure 67: Conversion of a monofocal IOL to multifocal IOL, before (a) and after (b) RIS [6]
In Figure 67, the inverse process, i.e. creation of multifocality in a monofocal
hydrophobic IOL, is shown. Before treatment, the IOL power was 25.82D, with an MTF of 0.54
for 100 lp/mm. After treatment, the IOL measures 2 foci, the original lens diopter and an
additional 3.1D add with a 62/38 split. Thus, the RIS technology can be used to add
multifocality to a monofocal IOL [6].

Page 65
2b) Creation of a 3.6D 50/50 multifocal RIS change
Figure 68: Results before (A) and after (B) RIS, showing the creation of multifocality, 3.6add with 50/50 split [32].
Figure 68 shows the precision of the RIS process for the creation of a multifocal IOL.
The left image shows the measurement prior to the treatment. The IOL measures 20.13D and
has an MTF of 0.58. After the treatment the IOL measures two foci and has an additional add
diopter of 3.54D and the energy split is 51/49.
2c) Creation of a 3.6D 60/40 multifocal RIS change
Figure 69: Results before (A) and after (B) RIS, showing the creation of multifocality, 3.6add with 60/40 split [69].
The target for the multifocal change was a 3.6D add with a 60/40 light split and the
lens measured a 3.54D add with a 61/39 light split.
2d) Creation of a 3.6D 70/30 multifocal RIS change
The target for the multifocal change was a 3.6D add with a 70/30 light split. The lens
measured a 3.51D add with a 69/31 light split.

Page 66
Figure 70: Results before (A) and after (B) RIS, showing the creation of multifocality, 3.6add with 70/30 split [69].
6.2.2.3 Conversion of a Multifocal to a Monofocal
This process is especially beneficial when it comes to medical necessity and when
trying to avoid a lens explanation. For example, when a patient cannot tolerate a multifocal
IOL. In that case there might be different solutions using the RIS technology. The multifocal
component could be removed, turning the IOL into a monofocal like demonstrated in table
15 [5].
Diopter MTF
Far Near Far Near
Before 20.85D + 3.58D 0.37 0.26
After RIS 21.04 NA 0.57 NA
Table 15: Multifocal Cancellation [5]
The original multifocal IOL measured 20.85D with a 3.58D add and with a MTF for the
far of 0.37 and a MTF for the near of 0.26 for the 100lp/mm measurement. A Refractive Index
Shaping Lens design was created to match the opposite add and split to the existing lens and
was shaped inside the IOL. After treatment the monofocal IOL measured 21.04D with an MTF
of 0.57 for the 100lp/mm measurement [5].
There are also might be other alternative treatment options depending on the reason
why the patient cannot tolerate / adapt to the multifocal IOL. For example, if the
neuroadaptation is ineffective because of a high residual astigmatism or a combination of a
residual astigmatism and residual refractive error, it would be more elegant to treat the
problem and keep the multifocality of the IOL [5].

Page 67
6.2.2.4 Conversion from Monofocal Multifocal to a Monofocal
Figure 71: Monofocal to Multifocal to Monofocal [69].
A original monofocal IOL measured 18.92D with a MTF of 0.56 at 100lp/mm. After the
first treatment the IOL measured a second focus with a 3.54D add and a 62/38 split. The
second treatment turned the IOL back to a monofocal lens measuring 19.06D with a MTF of
0.51lp/mm.
6.2.2.5 Conversion from Monofocal to a Toric IOL
5a) 3D Cylinder change
The following figure shows the creation of a toric lens, the original monofocal IOL
measures 22D and after RIS a 3D astigmatism correction in one axis can be measured [70] [6].
Figure 72: Converting monofocal IOL into a toric IOL (a); before (b) and after (c) RIS [6]
Figure 72 shows how an original monofocal IOL was turned into a toric IOL. The left
side is the before RIS PMTF measurement and the right side the after RIS measurement. Both
measurements used the same setup, a through focus range of 19 to 29D, a 3mm aperture.
For the original image the blue line shows the 50lp/mm measurement and the red line the

Page 68
100lp/mm measurement. The through focus curve for the toric lens uses the 100lp/mm
measurement for both colors but uses the colors to separate between the horizontal and
vertical measurement. A 3D cylindrical change was measured [5].
5b) Conversion of a Monofocal to a Toric, adding sphere and cylinder
Figure 73 shows how an original monofocal IOL had a spherical and cylindrical change
by moving the original IOL diopter by 2D and creating a toric change of 1D. The left side shows
the original untreated IOL and the right side the measurement after RIS [5].
Figure 73: Example of creation of a spherical and cylindrical component [5].
The RIS procedure is especially beneficial when it comes to treating a stable
astigmatism, the lens has already settled and the toric adjustment will therefore be centered
and the axis is fixed [6].
6.2.2.5 Creation of Asphericity
Figure 74: Creation of Asphericity [71].

Page 69
The Results for the 12 lenses are displayed in Figure 74. The spherical asphericity of
the lens can be precisely controlled using the conic constant k value.
6.3 Conclusion
The refractive index can be modulated precisely and predictable to allow the creation
of a high-quality lens inside the acrylic polymer.
Different lens types and lens materials have been tested. One material was used to
test a large variety of lens types and shaping options, including asphericity, toricity, diffractive
multifocal lenses, refractive multifocal lenses, multifocality cancellation, multiple treatments,
and cancellation of the shaped lenses. All were done successfully [32].
The consistency and precision of the power changes induced by the laser have been
shown to be within 0.1 D of the targeted change without a significant reduction in the MTF.
As shown in Figure 60, the same −2.0 D refractive index shaping lens was shaped into 9 IOLs
to assess the repeatability of the process [15].
The repeatability test showed stability and repeatability of the process [15]. The
additional lens types (Sphere, multifocal, cylinder, toric and aspheric lens) highlight the lens
creation possibilities of the hydrophilicity based refractive index change. This chapter
provided a proof of concept for in-vitro RIS lens creation.
This chapter demonstrated the ability to use a femtosecond laser to alter the
hydrophilicity of defined zones within an IOL. The RIS process alters the refractive
characteristics of the IOL.

Page 70
7. RIS Effect on Optical Quality
Lens quality includes light transmission and scattering are very important properties
of lenses. This chapter therefore investigates the impact of the RIS process on the existing
lens quality, light transmission and scattering.
7.1 Materials and Methods
The in-vivo shaping station (6.2) was used alter existing IOLs. All experiments were
performed on one material and three different measurement devices were used. The
measurements and evaluations of the transmission and back scattering were performed by
the Moran Eye Center.
7.1.1 Materials
Ten CT LUCIA 601PY, commercially available single-piece, hydrophobic acrylic yellow
lenses; Zeiss (3.1.1.1), IOLs were used in this study. The IOLs were placed in vials containing
distilled water and allowed to hydrate at room temperature for at least 1 day before the
measurements. All measurements described below were performed in hydrated conditions
[10].
7.1.2 Setup and Measurement Devices
The following measurement devices had been used in this chapter.
• Light photomicrographs camera
• PMTF was used for the diopter and MTF measurement (6.1.1.2).
• Lambda 35 UV/Vis spectrophotometer (Perkin-Elmer, Inc.) was used for the
transmission measurements.
• 1000 Scheimpflug (Nidek EAS) was used for the back-scattering evaluation.

Page 71
7.1.3 Method
Each IOL went through a visual inspection (light photomicrographs), light transmission
measurement, back-scattering measurement and a diopter and MTF measurement using the
methods described in this chapter.
Light photomicrographs
Light photomicrography was used to take a picture of each IOL for a visual inspection.
7.1.3.1 Power and MTF Measurements:
All measurements were made using the PMTF (6.1.1.2). The IOLs have been measured
before and after RIS treatment using a 3mm aperture. The MTF is expressed for the 100lp/mm
measurement.
7.1.3.2 Light Transmittance:
Light transmittance measurements were performed using the Lambda 35 UV/Vis
spectrophotometer (Perkin-Elmer, Inc.). The system was operated in a single-beam
configuration with an RSA PE-20 integrating sphere (Labsphere, Inc.). A custom 5.0mm IOL
holder insert was used to hold the IOL in position. This holder was afterward mounted on a
standard rectangular quartz cuvette filled with distilled water. The vial was checked for air
bubbles prior placing the assembly directly in front of the integrating sphere opening. The
holder was positioned so that the anterior surface of the IOL was facing the light source. A
background correction was performed prior to the measurements. This step requires an
empty inserter immersed in a balanced salt solution inside the quartz cuvette. Background
transmittance spectra were checked to ensure that 100% - 0.5% (SD) transmittance was
achieved. Afterward the IOL spectra were then collected at room temperature. The following
settings had been used for the measurements: wavelength range was set to 850 to 300 nm,
wavelength range for the result table was 700nm to 400nm to show transmittance in the
visible light spectrum; slit width 2 nm; scan speed 120 nm/min; data interval 1 nm. The
background transmittance was verified every other sample to ensure that it did not shift
during measurements [72][73][74][75][76] [10].

Page 72
7.1.3.3 Back Light Scattering:
Back light scattering was also measured using a Nidek EAS- 1000 Scheimpflug camera.
A custom 3-piece dark eye model with a poly(methyl methacrylate) (PMMA) cornea was used
to hold the IOLs under immersion in distilled water. During setup and assembly, the eye model
was checked for air bubbles. The balanced salt solution–filled model containing the IOL was
then placed in front of a Nidek EAS- 1000 Scheimpflug camera (cornea facing the device), and
the room lights were turned off. A cross-sectional image of the IOL inside the model was then
obtained (settings: flash level 200 W; slit length 10.0 mm; meridian angle 0) and analyzed
using the densitometry peak function. Back light scattering was measured at the center of the
IOL optic substance, within the laser treated area (after treatment), along the axis of a line
that crossed perpendicularly through the center of the IOL optic. Results were expressed in
computer compatible tape (CCT). This is a measure of brightness or intensity of reflected
(scattered) light on a scale of 0 (black) to 255 (white) [72][73][74][75][76] [10].
7.1.3.4 Forward Scattering
Artigas et al. proposed a method to determine forward scattering for explanted IOLs
[77]. The method is based on the idea that forward scattering can be determined by
subtracting the direct transmission of the total transmission of the IOL. This is light, which is
transmitted through the IOL, therefore not absorbed or back scattered but did not reach the
target position. The total transmission is the combination of the scattered light and the direct
transmitted light. It can be measured using the Lambda 35 in combination with the integrated
sphere (LabSphere RSA PE 20). The direct transmission is measured the same way we
measured it this chapter in section 7.1.3.2. The Lambda 35 sphere was not available during
our measurement and this section is therefore using a modified method which is based on
the idea presented by Artigas et al. Comparing the transmission of an IOL before and after the
RIS process shows the total lost light from the process. This method ignores the forward
scattering induced by the original lens and adds side effects like back scattering or absorption
into the maximum forward scattering amount.

Page 73
7.1.3.5 Air Force Target after RIS process
The refractive index change is not an instant process but requires time to allow the
water to soak into the material. This process is temperature and material dependent and at
36°C takes less than 24 hours and for this material less than four hours.
The air force target was measured in a separate test with the same material to
investigate the soaking behavior and to predict the visual quality for the patient during this
process. For this test the treated IOL was kept at ~36°C and measurements had been
performed regularly until no visual change in the air force target was observed.
7.2 Results
Figure 75 shows light photomicrographs of one of the lenses included in this study,
before (a) and after (b) laser treatment. The study was performed in a laboratory setting (non-
sterile-conditions) and therefore surface contaminants, such as small fibers and dust-like
deposits were observed on the surface of some lenses. [10]
Figure 75: Light microscope images [10].

Page 74
The phase wrapped structure was visible and centered for all treated lenses. None of
the lenses showed the presence of damage, deformation, pitting, or marks [10].
7.2.1 Power and MTF Measurement
Dioptric power and modulation transfer (MTF) results from the 10 lenses used in this
study, measured before and after laser treatment are visible in table 16 [10].
Before laser After laser Change
IOL # Power MTF Power MTF Power change MTF change 1 19.11 0.56 17.14 0.52 -1.97 -0.04 2 19.08 0.62 17.06 0.51 -2.02 -0.11 3 19.06 0.61 17.04 0.52 -2.02 -0.09 4 19.23 0.61 17.15 0.51 -2.08 -0.1 5 18.83 0.62 16.81 0.53 -2.02 -0.09 6 29.25 0.44 27.18 0.5 -2.07 +0.06 7 29.38 0.63 27.33 0.55 -2.05 -0.08 8 29.44 0.57 27.35 0.49 -2.09 -0.08 9 29.08 0.52 26.99 0.51 -2.09 -0.01 10 29.12 0.59 27.16 0.49 -1.96 -0.1
Table 16: Power and MTF measurement for 10 lenses before and after RIS treatment. The mean change in
power after laser treatment was -2.037, which was associated with a mean change in MTF of -0.064 [10].
7.2.2 Light Transmittance
Light transmittance results from the 10 lenses used in this study, measured before and
after laser treatment are visible in table 17 [10].
IOL # Transmission before RIS [%] Transmission after RIS [%] %T change 1 82.91 83.33 +0.42 2 84.69 83.53 -1.16 3 84.99 83.66 -1.33 4 84.41 83.45 -0.96 5 85.06 83.32 -1.74 6 81.17 79.71 -1.46 7 82.14 80.96 -1.18 8 82.11 78.62 -3.49 9 83.81 81.56 -2.25 10 81.55 80.02 -1.53 Table 17: Light transmittance in percentage of transmission (average value in the spectrum 400 to 700 nm)
[10].

Page 75
Figure 76: Light-transmittance graph, before and after RIS process [10].
Light transmittance curves of a representative lens, before and after laser treatment
is shown in Figure 76. The average change in transmission after the RIS process was -1.46 %.
The graphs show that the majority of the transmission change occurred between the 420 to
560 nm range, with an increase between 420-460 nm (violet/blue range; %T from 55.00 +/-
5.33 to 57.88 +/- 5.23), and a decrease between 470-560 nm (blue/cyan/green range; %T from
90.35 +/- 7.17 to 85.73 +/- 7.87) [10].
7.2.3 Back Light Scattering
IOL # Before RIS [CCT] After RIS [CCT] CCT change 1 1 76 +75 2 3 57 +54 3 1 81 +80 4 0 58 +58 5 2 71 +69 6 2 45 +43 7 2 46 +44 8 4 41 +37 9 2 65 +63 10 3 48 +45
Table 18: Back light scattering (light on a scale of 0 to 255) [10].

Page 76
Figure 77 shows Scheimpflug photographs of a representative lens, before and after
laser treatment. The increase in back light scattering within the optic substance of the lens
after laser treatment appeared to correspond to the area of increased hydrophilicity within
the substance of the lenses, created by the laser shaping [10].
Figure 77: Scheimpflug photographs of study IOL 6 before (A) and after (B) laser treatment. Increased backlight scattering outlines the phase-wrapped pattern within the substance of the treated IOL (B) [10].
7.2.4 Forward scattering
The measured overall light transmission before the RIS process measured 83.28% and
81.82% afterward (7.2.2). Therefore an average change of -1.46% and an average light loss of
0.98%, which includes back light scattering (7.2.3), absorption and forward scattering. The RIS
process induced forward scattered light is therefore minimal, this result supports the results
from lens quality MTF measurements from section 7.2.1.
7.2.5 Air Force Target after RIS process
The air force target was measured during the soaking process to investigate the visual
change for the patient. Figure 78 highlights that a faint air force target is already visible 15
minutes after treatment and that during the soaking process the quality improves.

Page 77
Figure 78: Air Force Target measurement after RIS [68].
7.3 Conclusion
Overall light transmittance was evaluated and showed that the mean change in these
lenses was small (from 83.28% to 81.82%). Most of the change in the light transmittance
occurred between 420 to 560 nm. The treated area became slightly darker in color, almost
orange, which would work as an additional blue blocker in the already blue light blocking IOL.
The increase in back light scattering observed appeared to correspond to the area of
increased hydrophilicity within the substance of the lenses, created by the laser shaping. The
levels observed are not expected to be clinically significant according to previous studies using
Scheimpflug photography [73][75][76]. The Scheimpflug technique assesses back light
scattering only, which is the dispersion of light reflected out of the eye that can be seen by an
external observer. Back scatter is not necessarily linked to image quality degradation but is a
helpful tool in Ophthalmology to observe changes to an implanted system where forward
scattering measurements are not possible [10].
Forward Light scattering has the potential to degrade image quality by creating a
roughly uniform veil over the true image. This would impact the overall lens quality and be
visible in the MTF curves. The change in MTF observed in this study was minimal (average

Page 78
change of -0.064), indicating that stray light after laser shaping was not significant [76] [10].
The transmission date before and after RIS treatment have also been used to discuss the RIS
effect on total scattering (back light and forward) and found to be minimal (within 1.5%).
All ten lenses have been measured within 0.1 D of the initial target of -2.0 D, further
affirming the accuracy and repeatability of this process [10].
The air force target measurement showed a fast diopter transition to the new focus
in about four hours between at the 36°C measurement.

Page 79
8. Biocompatibility
In-vivo experiments are very different from in-vitro verifications. A rabbit model is the
standard pre-clinical trial verification in ophthalmology apart from the rhesus monkey to
insure biocompatibility of the process and to minimize risks.
8.1 Materials and Methods
8.1.1 Materials
For the study the yellow hydrophobic IOL material (3.1.1.1) was used.
Rabbit Model
Pre-clinical trials for IOLs in ophthalmology are performed in animal models. This is a
standard method medical device with such complexity and risk possibility. In-vitro
experiments can be used for a number of validation processes and to assess risks or possible
complications. Unfortunately, there is always a possibility that an in-vitro model might have
simplified the complexity of the living system and that unknown problems arise. A rabbit
model is used in this situation because of their sensitivity to minimally toxic events. Similarly,
how canaries are used in coal mines to detect gas, a rabbit is a preferred animal model in
ophthalmology.
Six New Zealand white female rabbits, weighing 2.8-3.2 kg were acquired from
approved vendors in accordance with the requirements of the Animal Welfare Act for use in
this study. All rabbits were treated in accordance with guidelines set forth by the Association
for Research in Vision and Ophthalmology (ARVO), and the Animal Welfare Act regulations as
well as the “Guide for the Care and Use of Laboratory Animals” [11].
Dilation Drugs
1% cyclopentolate hydrochloride and 2.5% phenylephrine drops
Anesthesia Drugs
Ketamine hydrochloride (50 mg/kg) and xylazine (7 mg/Kg) in a mixture of 7:1
Ophthalmic viscosurgical device
OVD; Amvisc Plus, Bausch & Lomb

Page 80
Phaco handpiece
Infiniti system, Alcon Laboratories
8.1.2 Setup and Measurement Devices
The in-vivo system was transported to the Moran Eye Center for this study. A number
of challenges had to be overcome to prepare for an in-vivo test. A patient attachment, initially
designed for human patients, had to be adjusted to work with the much smaller rabbit eye. A
special 3D printed rabbit bed (allowing rotation/tilt of the animal in different directions) was
built to facilitate the docking process.
Figure 79: A: Setup for the in vivo rabbit study with the laser system and the support/bed for the animal, constructed with a 3-dimension printer. B: Rabbit eye docked to a cup filled with a balanced salt solution (liquid interface) before laser
treatment of the IOL [11].
The following measurement devices had been used in this chapter.
• PMTF was used for the diopter and MTF measurement (6.1.1.2)
• Slit Lamp (Zeiss SL 120). This is a low-power microscope combined with a light source.
which uses a narrow but intense beam of light to examine the interior of the eye.
• Light microscopy to evaluate the explanted lenses
8.1.3 Methods
The ophthalmologists at the Moran Eye Center performed IOL surgeries and the
biocompatibility evaluations including slit lamp measurements, ACO, PCO, Soemmering's
rings formation and gross examination. A detailed description was published by Werner et al.
[11]. Some of the language in this chapter was taken directly from that publication.

Page 81
Slit Lamp
The ophthalmologists performed Slit lamp examination of the eyes immediately after
laser treatment and weekly examinations had been performed post-surgery. Apart from
ocular inflammation a standard scoring method was used in 11 categories at each
examination. Those categories including assessment of corneal edema, as well as the
presence of cell and flare within the anterior chamber. Retro-illumination images with the
pupil dilated were obtained for photographic documentation regarding inflammatory
reactions, as well as anterior capsule opacification (ACO), posterior capsule opacification
(PCO), and any observed capsular fibrosis. ACO was scored from 0 to 4, at the area of anterior
capsule contacting the anterior optic surface. PCO was scored from 0 to 4 behind the IOL optic
[11].
IOL power adjustment by laser
Postoperative IOL power adjustment was performed only in one eye per rabbit two
weeks after IOL implantation. Afterward the rabbits were followed clinically for additional
two weeks. For the laser adjustment, each animal was prepared by pupil dilation and
anesthesia as done for the surgical implantation procedure. The 3D printed rabbit bed was
used to position the rabbit horizontally with the designated eye facing up to allow the docking
to the patient interface (Figure 79A). The interface (Figure 79B) was especially designed for
the smaller rabbit eye, based on measurements taken by Werner at al. [78]. The 3rd eyelid
(nictating membrane) was displaced using forceps immediately before docking The OCT and
camera system was used for the alignment of the rabbit eye and the docking process. After
the completed docking process the OCT was used for the focal plane identification and
subsequent laser treatment was performed with a targeted +3.6 D power change. Afterward
the patient attachment was undocked, and the rabbits were removed from the 3D printed
bed [11].
Clinical Examination
Final clinical examination was performed at four weeks, the animals were
anesthetized and humanely euthanized with a 1-ml intravenous injection of pentobarbital
sodium/phenytoin sodium. The globes were enucleated and placed in 10% neutral buffered
formalin. They were then bisected coronally just anterior to the equator. Gross examination

Page 82
from the posterior aspect (Miyake-Apple view) was performed to assess ACO and PCO
development. A scoring system from 0 to 4 was used for ACO (at the area of anterior capsule
contacting the anterior optic surface), central PCO (related to the central 3 mm behind the
optic), peripheral PCO (related to the peripheral area behind optic), Soemmering’s ring
formation (related to proliferative material within the equatorial region of the capsular bag,
outside of the optic), and area (related to the number of quadrants involving the highest
intensity) [11].
The ophthalmologists carefully removed the IOLs from the capsular bag of each eye
(treated and non-treated lenses). Proliferative material attached to the lenses was carefully
removed by using surgical sponges. Afterward the IOLs were immersed in vials containing
distilled water. Light microscopy was then performed at room temperature to evaluate the
explanted lenses, and photomicrographs were taken with a camera coupled to the light
microscope. The lenses were re-placed in the vials and were returned for power
measurements. The globes were sectioned, with the anterior segments including any
remaining capsular bags processed for standard light microscopy and stained with
hematoxylin and eosin (H & E). Histopathological analyses focused on the presence of any
signs of inflammatory reaction or toxicity in the different structures of the anterior segment
of the eyes [11].
IOL Power measurement
The PMTF system (6.1.1.2) was used for the IOL measurements after lens explantation.
The IOLs had not been measured prior to implantation to keep IOL sterility. The same diopter
IOLs had been implanted into the both eyes. The IOL power was measured for the controls
(base diopter) and for the treated IOLs.
8.2 Results
All implantation procedures were overall uneventful, and the IOLs were fully injected
within the capsular bag. Examination after one week showed a mild inflammatory reaction
with fibrin in front of the lens or at the level of the capsulorhexis edge in practically all
operated eyes. Fibrin formation had completely resolved by the second week of examination,
when a mild amount of PCO started to be observed in practically all eyes. Most eyes at this

Page 83
time point also exhibited proliferative lens cortical material or pearl formation in front of the
IOL [11].
Figure 80: Slit lamp examination of a rabbit eye after laser treatment. A: Immediately after adjustment of the IOL power by the laser. B: Five hours after laser adjustment [11].
All laser power adjustment procedures were also uneventful. The slit lamp
examination showed for the treated lenses the phase-wrapped structure created by the laser.
Examination also showed the formation of gas bubbles between the posterior surface of the
IOL and the posterior capsule, which disappeared within five hours (Figure 80). Other
observations included mild corneal edema and conjunctival injection, which could be related
to the eye remaining open during the alignment step of the procedure. Aqueous flare, cells,
iris hyperemia, or fibrin formation were not observed at any of the post laser slit lamp exams.
The process did not create any glistening in the IOLs [11].
At the third week, examinations showed that most eyes with pearl formation had
developed posterior synechia formation in 1 quadrant. PCO formation progressively
increased in intensity throughout the clinical follow up (Figure 81). At the forth week
examination PCO was scored and the results are summarized in table 19. ACO was observed
in all eyes (usually as a fibrotic rim at the level of the capsulorhexis edge), and two non-treated
eyes developed capsulorhexis phimosis [11].
Treated Non-treated eyes Two-tail P
PCO 2.25 +/- 0.68 2.91 +/- 0.66 0.06
Table 19: PCO scoring at fourth week

Page 84
Figure 81: Slit lamp examination of both eyes of the same rabbit, 3 weeks postoperatively (1 week after laser adjustment of 1 of the lenses); PCO formation is similar between both eyes. A: Treated eye. B: Untreated eye [11].
The Miyake-Apple view gross examination of the anterior segments of the enucleated
eyes showed that all the lenses were symmetrically fixated within the capsular bag and overall
centered in relation to the ciliary processes (Figure 82). Capsular bag opacification was scored
and is summarized in table 20 [11].
Treated Non-treated eyes Two-tail P
Central PCO 1.5 +/- 1 2 +/- 0.63 0.27
Peripheral PCO 2.33 +/- 0.81 2.5 +/- 0.54 0.61
Soemmering’s ring formation
(intensity X area):
8.33 +/- 0.51 8 +/- 0 0.17
Table 20: Biocompatibility Results
The t-Test Paired values had been calculated for sample using Excel. Table 20
summarizes the results for central PCO, peripheral PCO and Soemmering’s ring formation.
There were no significant differences noted in any of the parameters studied when comparing
study and control eyes under clinical and gross, postmortem evaluation [11].

Page 85
Figure 82: Gross examination from the posterior view of the anterior segment (Miyake-Apple view) of both
eyes of the same rabbit. A: Treated eye. B: Untreated eye [11].
Figure 83 shows the explanted IOLs from two eyes of the same rabbit The IOL fixation
and centration, as well as capsular bag opacification were similar between both eyes. Small
amounts of proliferative material can be seen attached to the surface of the IOLs. The phase-
wrapped pattern can also be seen within the substance of the treated IOL.
IOL power (D) RIS
Rabbit Treated Contralateral Untreated Change
1 +26.5 +23.2 +3.3
2 +26.9 +23.2 +3.7
3 +27.0 +23.7 +3.3
4 +26.7 +23.1 +3.6
5 +27.0 +23.0 +4.0
6 +26.8 +23.2 +3.6 Table 21: Power of the IOLs implanted in the rabbit eyes, measured after explantation of the lenses 4 weeks
postoperatively [11].
Table 21 summarizes the IOL measurements after the lens explantation. The mean
refractive-index shaping lens diopter change was measured after full hydration of the
explanted IOLs. The mean diopter difference between the refractive-index shaping diopter

Page 86
and the control lens diopter was 3.58+/-0.26 D. The change in power obtained was consistent,
and the mean was within 0.1 D of the target [11].
After explantation the phase-wrapped structure created by the laser was visible with
light microscopy in all treated lenses. The phase-wrapped structure was mildly decentered in
some of the lenses. Small amounts of proliferative material were also found on the surface of
most of the explants. None of the lenses showed the presence of damage, deformation,
pitting, or marks (Figure 83) [11].
Figure 83: Light photomicrographs of the explanted IOLs. A: Treated IOL. B: Untreated IOL [11].
Examination of multiple histopathological sections cut from each eye under the light
microscope showed that there was no sign of untoward toxicity or inflammation in neither
the study eyes, which underwent laser treatment of the IOL, nor the control eyes (Figure 84)
[11].

Page 87
Figure 84: Light photomicrographs of histopathological sections from both eyes of the same rabbit. A and B: Untreated eye. C and D: Treated eye [11].
Figure 84 shows light photomicrographs of histopathological sections. 83A and 83C
show that the anterior chamber is clear and deep. The iris is normal with no sign of
inflammation. The trabecular meshwork is unremarkable. Both sections show artifactual
postmortem separation of corneal endothelium observed in the corneal periphery. B and D
show that the corneal epithelium, stroma, and endothelium are unremarkable (hematoxylin–
eosin stain; original magnification 100) [11].
8.3 Conclusion
An in-vivo study on rabbit eyes confirmed that postoperative outcomes in terms of
uveal and capsular biocompatibility were similar for treated lenses and untreated lenses. The
laser power adjustment procedure did not induce inflammatory reactions in the eye or
damage to the IOL optic [6].
Overall, all implantation procedures were uneventful and the IOLs could be fully
injected within the capsular bag. At the 1-week examination, nearly all operated eyes had a

Page 88
mild inflammatory reaction with fibrin in front of the lens or at the level of the capsulorhexis
edge. Fibrin formation had completely resolved by the 2-week examination, when a mild
amount of PCO started to be observed in nearly all eyes. Most eyes at this timepoint also had
proliferative lens cortical material or pearl formation in front of the IOL [6].
All laser power adjustment procedures were also uneventful, and the duration of the
laser treatment per se was fast (23 seconds). Under slit lamp examination, the phase-wrapped
structure created by the laser could be observed within the optic substance of all treated IOLs.
No aqueous flare, cells, iris hyperemia, or fibrin formations were observed at any of the post-
laser slit lamp examinations, and the process did not create glistening in the IOLs [11] [10] [6].
The in-vivo study confirmed that postoperative outcomes in terms of uveal and
capsular biocompatibility were similar between treated lenses and untreated lenses, as
shown during clinical examination and by complete histopathology. The laser power
adjustment procedure did not induce inflammatory reactions in the eye or damage to the IOL
optic. Alignment of the rabbit eye under the laser system for the adjustment procedure was
challenging because it was necessary to anesthetize the animal, which would not be the case
in a clinical situation. Even though an eye interface had to be specially designed for this study,
which was also the first performed in vivo, the change in power obtained was consistent in
the group of treated eyes. It is noteworthy that power measurements of the IOLs were not
performed before implantation in the rabbit eyes to avoid compromising the sterility of the
IOLs because the main objective of the current study was to evaluate biocompatibility after
laser treatment. Therefore, the method used to estimate the changes in power after laser
treatment was based on measurements done with the power and MTF device after IOL
explantation [6].

Page 89
9. Discussions
The RIS process uses a femtosecond laser to change the hydrophilicity of the targeted
area within an IOL, which creates a change in the refractive index of the IOL material. This
effect in combination with a two-dimensional scan pattern and the required energy
modulation creates a refractive or diffractive lens inside the material [6]. The lens creation
process requires the creation of a phase wrapped, gradient lens inside the IOL.
A photochemical process was investigated, wherein hydrophilic polar functional
groups are generated by photo-induced hydrolysis of polymeric material, in areas which are
exposed to a femtosecond laser. The newly formed functional groups, e.g. amines and
carboxylic acids, are strongly hydrophilic. These molecules remain in their existing place and
are modified by the exposure to the laser light. In three different polymeric materials,
fluorophores with identical spectral signatures were detected. Thus, photo-induced change
results in rearrangements of chemical bonds, essentially within the UV-absorber molecule,
preserving the integrity of the polymeric material. Based on fluorescence-microscopy, STED-
microscopy and Raman-microscopy, no leachable are generated. Also, standard leachable-
tests have been performed on RIS-modified IOLs, and no leachable were found [6].
In-vitro experiments highlighted the precision and repeatability. Different lens types,
including spherical, aspherical, multifocal and toric lenses have been successfully created. The
lens quality, transmission and scattering had also been investigated and demonstrated.
The results of the first in vivo study evaluating the biocompatibility of this new
application of the femtosecond laser are reported. The process did not induce inflammatory
reactions and uveal and capsular biocompatibility were similar between treated lenses and
untreated lenses.
In conclusion the RIS process can be applied to commercially available acrylic
hydrophobic or hydrophilic IOLs. The dioptric power of the IOL can be increased or decreased
to account for surgical errors, IOL tilt, IOL decentration, or a change in the physical
characteristics of the eye. Multiple adjustments to the same IOL can theoretically be
performed. Premium functions can be added to the IOL and removed later, if necessary. An
added multifocal pattern can, for example, be canceled by application of a pattern with
opposite characteristics [6].

Page 90
The RIS process is an exciting technology and has the potential to change the course
of ophthalmic cataract surgery and lens accuracy in the future. It is hopeful that this
technology will allow a minimally invasive in office procedure for the management of
refractive surprises after cataract surgery [6].

Page 91
10. Future Outlook
While it is exciting to imagine a treatment to improve residual refractor errors with a
minimally invasive office procedure, there are several challenges in the medical product
development [5].
The next steps for the femtosecond laser material interaction research are focused on
the hydrophobic lens material. Material samples with larger changed areas and higher
refractive index change will be used to develop greater detail as to the mechanism of the
photo induced refractive index change. Additionally the originally doped hydrophobic UV
absorber material will be used since it may be an easier material to use for this investigation.
Additional tests on the hydrophobic lens material using Raman microscopy are planned.
Increased forward scattering can impact the patient vision and additional studies can
be performed to further investigate the impact of RIS on forward scattering. The total light
transmission measurement would provide additional information. The proposed method
does not discern between surface light scattering and internal light scattering [77]. The after
RIS measurement therefore would be predicted to show a higher forward scattering value
simply because the IOL handling during the different steps would most likely create additional
surface light scattering.
The next steps are focused around clinical trials and first in man study. Additional
engineering steps regarding for the production phase are planned and involve streamlining
the device and automating operator functions.
The regulatory approval process for any medical device is lengthy and has different
challenges depending on the location of the approval. For example, the required in-vitro and
in-vivo experiments, the required length of the observation and patient count for the study
might vary based upon jurisdiction.
The RIS process does work for different materials and also for multiple types of
adjustments but depending on the jurisdiction and the approval body initial approval of the
approval first system might be limited in the process options.

Page 92
Bibliographies
Abbreviations
ACO = Anterior Capsule Opacification AOM = Acoustic-Optic Modulator AOTF = Acousto-Optical Tunable Filter ARVO = Association for Research in Vision and Ophthalmology C13H8N2O2 = phenazine-1-carboxylic acid C18H15N3 = N-phenyl-4-(phenylazo)-benzenamine CARS = Coherent Anti-Stokes Raman Scattering CCT = Computer Compatible Tape DI = Deionized DIC = Differential Interference Contrast H & E = Hematoxylin and Eosin HRA = Heidelberg Retina Angiograph IOL = Intraocular Lens LAL =Light Adjustable Lens LIF =Laser Induced Fluorescence MTF = Modulation Transfer Function OCT = Optical Coherence Tomography PCO = Posterior Capsule Opacification PMMA = poly(methyl methacrylate) PMTF = Power and Modulation Transfer Function ( measurement device by Lambda X) RIS = Refractive Index Shaping SD = Standard Deviation SMILE = Small Incision Lenticule Extraction STED = Stimulated Emission Depletion

Page 93
Figure Legends:
Figure 1: IOL material button [15] ............................................................................................. 9 Figure 2: IOL [15] ........................................................................................................................ 9 Figure 3: Yellow Dye Dopants (left: 150ppm, center: 500ppm, right: 1000ppm) [35].............. 9 Figure 4: RIS min and max speed [36]...................................................................................... 11 Figure 5: 10, 20, 40mW RIS max speed results. [35] ............................................................... 12 Figure 6:40mW, 80mW, 160mW, 320mW, and 500mW RIS max speed results [35]. ............ 12 Figure 7: Left: Standard material RIS max results for 3 different laser powers. Center: 500ppm material dopant results for 3 different laser powers. Right: 100ppm material dopant results for RIS max speed for 3 different laser powers [35]. ...................................... 13 Figure 8: UV dopant RIS max speed results [35] ...................................................................... 13 Figure 9: Yellow Dye Dopant Overlay Result [36]. ................................................................... 14 Figure 10: UV Doping Overlay Results [36]. ............................................................................. 14 Figure 11: Material research breadboard (3D Z 3-dimensional; AOM Z acoustic-optic modulator) [15]. ....................................................................................................................... 15 Figure 12: Diffraction grating measurement setup [15]. ......................................................... 16 Figure 13: Example image of a DIC image, showing a diffractive grating [37] ........................ 16 Figure 14: Example of a diffractive grating .............................................................................. 16 Figure 15: Diffractive Grating Orders [9] ................................................................................. 18 Figure 16: Scan Speed vs Efficiency [9]. ................................................................................... 19 Figure 17: water de-absorption [9]. ......................................................................................... 19 Figure 18: Water de-absorption, zero order [9]. ..................................................................... 20 Figure 19: Water Weight Gain Experiment .............................................................................. 22 Figure 20: Weight Gain Due to Water Absorption [9]. ............................................................ 23 Figure 21: Simulation showing three water drops on a polymer. From left to right the contact angle increases, indicating a more hydrophobic material. ........................................ 24 Figure 22: Contact Angle Test I ................................................................................................ 24 Figure 23: Example of the water droplet placement [40] ....................................................... 25 Figure 24: Contact Angle Test II ............................................................................................... 25 Figure 25: Contact angle method on uncut button [40] .......................................................... 25 Figure 26: Hydrophilicity based Δn change [6] ........................................................................ 26 Figure 27: Contact angle measurement when the treatment is located inside the material and not exposed to the surface [15]. ....................................................................................... 26 Figure 28: Simulation of the RIS lens inside a button and also a side strip. ............................ 29 Figure 29: (a) Schematic sketch of hydrophilic acrylic lens (5 diopters), RIS-treated area 4 mm circle in the center of the IOL. (b) Fluorescence image of a RIS-lens inscribed in the hydrophilic acrylic lens [6]. ...................................................................................................... 30 Figure 30: Hydrophilic Stripe: transmission image (top) and fluorescence image (bottom) and the RIS-pattern indicated by arrows [41]. ........................................................................ 30 Figure 31: Edge of RIS-Pattern in Hydrophilic Stripe (Zone boundary of Fresnel lens) [41]. .. 31 Figure 32: Simultaneous scans at 600 and 650 nm. Left image- fluorescence detection at 628 nm, right image- fluorescence detection at 708 nm [6]. ......................................................... 31 Figure 33: Hydrophobic Stripe: transmission image (top) and fluorescence image (bottom) and the RIS- patterns are indicated by arrows [41]. ................................................................ 32 Figure 34: Fluorescence spectra, excitation at 405 nm and emission max. at 500 nm (left), excitation at 488 nm and emission max. at 535 nm (right). (Sample: Yellow hydrophobic stripe) [41] ................................................................................................................................ 32

Page 94
Figure 35: Magnified xz-slice. Simultaneous scans at 470 nm, resp. 605 nm, resp. 650 nm excitation. Left: side view, Right: top view [41] ....................................................................... 33 Figure 36: (left) Hydrophobic clear strip (bird view): transmission image (top), fluorescence image (bottom) and the RIS patterns indicated by arrows. (right) Hydrophobic clear strip (sideview): transmission image (top), fluorescence image (bottom) [6]. ............................... 34 Figure 37: Fluorescence spectra, excitation at 405 nm and emission max. at 500 nm (top), excitation at 488 nm and emission max. at 535 nm (bottom) (Sample: Clear hydrophobic strip [42]) [6]. ........................................................................................................................... 34 Figure 38: Fluorescence images, simultaneously taken at 470 nm, resp. 605 nm, resp. 650 nm excitation [6]. ..................................................................................................................... 35 Figure 39: High resolution fluorescence xy- images (top view) of clear hydrophobic strip [6]................................................................................................................................................... 35 Figure 40: (a) Excitation/Emission Spectra of fluorescent molecule. (b) Identification of fluorescent molecule [6]. ......................................................................................................... 37 Figure 41: CARS-Spectrum yellow hydrophobic lens (1700-1750 cm-1), max. at 1735 cm-1 (C=O molecular vibration (stretching mode)) [41]. ................................................................. 38 Figure 42: CARS (2954 cm-1) and fluorescence images (TCS SP8 CARS, Leica Microsystems GmbH) [41]. .............................................................................................................................. 39 Figure 43: Correlation CARS and fluorescence cross-sections, yellow hydrophobic lens [41]................................................................................................................................................... 39 Figure 44: CARS-Spectrum clear hydrophobic lens (1700-1750 cm-1), max. at 1735 cm-1 (C=O molecular vibration) [41]. ............................................................................................... 40 Figure 45: TCS SP8 CARS images (left) CARS (1720 cm-1) and fluorescence images (right) CARS (2954 cm-1, CH/CH2 vibrational mode) and fluorescence images [41]. ........................ 41 Figure 46: (left) Correlation CARS (C=O mode) and fluorescence cross-sections, clear hydrophobic lens. (right) Correlation CARS (CH/CH2 mode) and fluorescence cross-sections, clear hydrophobic lens [41]. .................................................................................................... 41 Figure 47: Fluorescence images of hydrophobic RIS lenses [6]. .............................................. 42 Figure 48: Raman spectra of a hydrophilic material: a) High-frequency part, b) Low-frequency part. Dashed dotted horizontal lines represent the zero signal base lines of the respective Raman spectra, which were shifted vertically for the sake of clarity [6]. ............. 43 Figure 49: Mechanism of Action [5]. ........................................................................................ 46 Figure 50: Setup for refractive index shaping lens shaping (3D Z 3-dimensional; AOM Z acoustic-optic modulator) [15]. ............................................................................................... 48 Figure 51 Image of IOL holder [15]. ......................................................................................... 49 Figure 52 Image of new focal plane finder [15] ....................................................................... 49 Figure 53 Refractive Index Shaping (RIS), Femtosecond (FS) laser, refractive index of IOL (n1) and refractive index of RIS lens (n2) [6]. .................................................................................. 51 Figure 54: Visualization of the limited space inside an IOL [5]. ............................................... 51 Figure 55 Introduction to the phase-wrapped lens. Simulation of the collapsing curvature into one layer [5]. ..................................................................................................................... 52 Figure 56 Phase Wrapping [6]. ................................................................................................. 53 Figure 57:Phase wrapped gradient lens [5]. ............................................................................ 53 Figure 58: Creation of a -2D RIS change inside one IOL. Diopter readings and MTF before (a) and after (b) RIS treatment [6]. ............................................................................................... 55 Figure 59: Creation of a -2D and +2D RIS change inside one IOL. Modulation map and diopter power map readings before (a) and after (b) RIS treatment [6]. ............................................ 56

Page 95
Figure 60: Repeatability of a -2D refractive index shaping lens [6]. ........................................ 56 Figure 61: The Perfector [32]. .................................................................................................. 58 Figure 62 : MTF curve of a- 0.5D RIS change, the let image shows the before measurement and the right the after measurement [15] .............................................................................. 62 Figure 63 MTF curve of a 0.5D RIS change, the let image shows the before measurement and the right the after measurement [15] ..................................................................................... 62 Figure 64: MTF curve of a -2D RIS change, the let image shows the before measurement and the right the after measurement [15] ..................................................................................... 63 Figure 65: MTF curve of a -2D RIS change, the let image shows the before measurement and the right the after measurement [15]. .................................................................................... 63 Figure 66: Diopter readings and MTF before (a) and after (b) RIS treatment [6] ................... 64 Figure 67: Conversion of a monofocal IOL to multifocal IOL, before (a) and after (b) RIS [6] 64 Figure 68: Results before (A) and after (B) RIS, showing the creation of multifocality, 3.6add with 50/50 split [32]. ................................................................................................................ 65 Figure 69: Results before (A) and after (B) RIS, showing the creation of multifocality, 3.6add with 60/40 split [69]. ................................................................................................................ 65 Figure 70: Results before (A) and after (B) RIS, showing the creation of multifocality, 3.6add with 70/30 split [69]. ................................................................................................................ 66 Figure 71: Monofocal to Multifocal to Monofocal [69]. .......................................................... 67 Figure 72: Converting monofocal IOL into a toric IOL (a); before (b) and after (c) RIS [6] ...... 67 Figure 73: Example of creation of a spherical and cylindrical component [5]. ....................... 68 Figure 74: Creation of Asphericity [71]. ................................................................................... 68 Figure 75: Light microscope images [10]. ................................................................................ 73 Figure 76: Light-transmittance graph, before and after RIS process [10]. .............................. 75 Figure 77: ScheimpflugphotographsofstudyIOL6before(A)and after (B) laser treatment. Increased backlight scattering outlines the phase-wrapped pattern within the substance of the treated IOL (B) [10]. ........................................................................................................... 76 Figure 78: Air Force Target measurement after RIS [68]. ........................................................ 77 Figure 79: A: Setup for the in vivo rabbit study with the laser system and the support/bed for the animal, constructed with a 3-dimension printer. B: Rabbit eye docked to a cup filled with a balanced salt solution (liquid interface) before laser treatment of the IOL [11]. ........ 80 Figure 80: Slit lamp examination of a rabbit eye after laser treatment. A: Immediately after adjustment of the IOL power by the laser. B: Five hours after laser adjustment [11]. ........... 83 Figure 81: Slit lamp examination of both eyes of the same rabbit, 3 weeks postoperatively (1 week after laser adjustment of 1 of the lenses); PCO formation is similar between both eyes. A: Treated eye. B: Untreated eye [11]. .................................................................................... 84 Figure 82: Gross examination from the posterior view of the anterior segment (Miyake-Apple view) of both eyes of the same rabbit. A: Treated eye. B: Untreated eye [11]. ........... 85 Figure 83: Light photomicrographs of the explanted IOLs. A: Treated IOL. B: Untreated IOL [11]. .......................................................................................................................................... 86 Figure 84: Light photomicrographs of histopathological sections from both eyes of the same rabbit. A and B: Untreated eye. C and D: Treated eye [11]. .................................................... 87

Page 96
Table Legends
Table 1: Simultaneous scanning wavelength Table 2: Figure 34 excitation and emission wavelength information Table 3: Spectral band assignments Table 4: Repeatability Measurement [15] Table 5: Spherical Refractive Index Change Table 6: Multifocal Creation Table 7: Multifocal Removal Table 8: Multifocal Removal Table 9: Creation of Cylinder and Sphere-Cylinder Lenses Table 10: Creation of Asphericity Table 11: -0.5D RIS Change Table 12: +0.5D RIS Change Table 13: -2D RIS Change Table 14: +2D RIS Change Table 15: Multifocal Cancellation [5] Table 16: Power and MTF measurement for 10 lenses before and after RIS treatment. The mean change in power after laser treatment was -2.037, which was associated with a mean change in MTF of -0.064 [10]. Table 17: Light transmittance in percentage of transmission (average value in the spectrum 400 to 700 nm) [10]. Table 18: Back light scattering (light on a scale of 0 to 255) [10]. Table 19: PCO scoring at fourth week Table 20: Biocompatibility Results Table 21: Power of the IOLs implanted in the rabbit eyes, measured after explantation of the lenses 4 weeks postoperatively.

Page 97
Authors Publications (Papers, Book Chapters, Presentations, Posters, Patents)
The following paper, book chapters, presentations, posters and patents are all related to the topic of this thesis. They have been incorporated in this thesis in one way or another. All references used directly in this thesis have been cited in the “All Reference” section. Papers
• R. Sahler, JF. Bille, S. Enright. S. Chhoeung, K. Chan. Creation of a refractive lens within an existing intraocular lens using a femtosecond laser. J Cataract Refract Surg. AUG 2016
• JF. Bille, J. Engelhardt, H. Volpp, A. Laghouissa, M. Motzkus, Z. Jiang, R. Sahler. Chemical basis for alteration of an intraocular lens using a femtosecond laser. Biomedical Optics Express MAR 2017
• R. Sahler, JF. Bille. Alteration of an Implanted IOL. Lens-shaping technology has been used successfully in rabbits. CRSToday July/August:34-36 2017
• L. Werner, J. Ludlow, J. Nguyen, J. Aliancy, L. Ha, B. Masino, S. Enright, RK. Alley, R. Sahler, N. Mamalis. Biocompatibility of intraocular lens power adjustment using a femtosecond laser in a rabbit model. J Cataract Refract Surg. AUG 2017
• J. Nguyen, L. Werner, J. Ludlow, J. Aliancy, L. Ha, B. Masino, S. Enright, R. Alley. R. Sahler. Intraocular lens power adjustment by a femtosecond laser: In vitro evaluation of power change, modulation transfer function, light transmission, and light scattering in a blue light–filtering lens. J Cataract Refract Surg. MAR 2018
Books Chapters
• R. Sahler, JF. Bile. Refractive Index Shaping – In-Vivo Optimization of an Implanted Intraocular Lens (IOL). High Resolution Imaging in Microscopy and Ophthalmology. Chapter 15. Springer 2019
• R. Sahler, S. MacDonald, G. Waring IV, JF. Bille. Refractive Index Shaping Customized treatment of Intraocular lenses. Femtosecond Lasers in Cornea and Lens Surgery. SLACK 2019
Conference Presentations (First Author)
• R. Sahler, S. Enright, K. Chan, JF. Bille, S. Chhoeung. Large-Diopter Toric Change Inside a Hydrophobic IOL Using Refractive Index Shaping. ASCRS 2018
• R. Sahler, S. Enright. S. Chhoeung, K. Chan. JF. Bille, R. Alley. Progressive Soaking Process of the Refractive Index-Shaped Lens. ASCRS 2018
• R. Sahler, S. Enright, S. Chhoeung, K. Chan, R. Alley, JF. Bille. The Effect of Eye Movement on the Refractive Index Shaped Lens Quality. ASCRS 2018
• R. Sahler, JF. Bille, S. Enright, S. Chhoeung, K. Chan, R. Alley. S. MacDonald. Simultaneous refractive and toric creation inside a standard hydrophobic intraocular lens using a femtosecond laser. ESCRS 2017
• R. Sahler. Next Generation: Adjusting the Power of IOLs in the Eye. WIO Summer Symposium 2017
• R. Sahler, JF. Bille, S. Enright, R. Alley, S. Chhoeung. K. Chan. Multiple Changes to the Same Intraocular Lens Using Refractive Index Shaping. ASCRS 2017
• R. Sahler. Alteration of an implanted intraocular lens. Industry Spotlight Symposium, ASCRS 2017
• R. Sahler. Refractive Index Shaping Technology. CTILII 2017

Page 98
• R. Sahler, JF. Bille, S. Enright. Creation of a Lens Within a Standard Hydrophobic IOL in a Model Eye. ASCRS 2016
• R. Sahler, JF. Bille. Customizable aspheric refractive index shaped lens inside intraocular lens. ESCRS 2015
• R. Sahler, JF. Bille, S. Enright, S. Chhoeung, K. Chan, J. Matten. Customizable IOL: Full-Sized Lens Created Inside Existing IOL Using Laser-Induced Refractive Index Change. ASCRS 2015
Conference Presentation (Co-Author)
• JF. Bille, R. Sahler. Photochemical Mechanism for Alteration of an IOL Using a Femtosecond Laser. ASCRS 2018
• J. Nguyen, L. Werner, J. Aliancy, J. Ludlow, B. Masino, L. Ha, S. Enright, R. Alley, R. Sahler, N. Mamalis. Optical Quality After In Vitro Intraocular Lens Power Adjustment Using a Femtosecond Laser. ARVO 2018
• JF. Bille, R. Sahler. Femtosecond Laser induced Refractive Index Shaping (RIS) in an intraocular lens. BSRS 2017
• DD. Koch, R. Sahler, JF. Bille, S. MacDonald. Accuracy of IOL Spherical Power Modification Using RIS Technology. ASCRS 2017
• S. MacDonald, R. Sahler, JF. Bille. Creation of Multifocality in a Monofocal IOL That Has Been Implanted in a Cadaver Rabbit Eye. ASCRS 2017
• J. Nguyen, L. Werner, J. Aliancy, JP Ludlow, S. Enright, RK. Alley R. Sahler, N. Mamalis. IOL Power Adjustment By a Femtosecond Laser: In Vitro Evaluation of Light Scattering, Light Transmission, and MTF. ASCRS 2017
• JJ. Jones, R. Sahler, JF. Bille, S. MacDonald. Postoperative Custom Asphericity Adjustment. ASCRS. 2017
• YR. Chu, R. Sahler, S. MacDonald. Postoperative Refractive IOL Fine-Tuning. ASCRS 2017
• DJ. Schanzlin, R. Sahler, JF. Bille, S. MacDonald. Proof of Concept: Changing Intraocular Lens Power with Refractive Index Shaping. ASCRS 2017
• B. Youssefzadeh, R. Sahler, JF. Bille, DJ. Schanzlin. Refractive Lens Diopter Adjustment in Rabbit Cadaver Eye. ASCRS 2017
• D. Schanzlin. R. Sahler. Solutions to Multifocal IOL problems. CSTILII 2017 • G. Waring IV, R. Sahler. Hydrophilicity Based Refractive Index Shaping Process. CSTILII
2017 • JF. Bille, R. Sahler, S. Enright, R. Alley, S. Chhoeung, K. Chan. Chemical Basis for
Alteration of an intraocular lens using a Femtosecond Laser. ESCRS 2016 • JF. Bille, R. Sahler. Modification of an implanted intraocular lens. ESCRS 2015 • JF. Bille, R. Sahler, S. Enright, S. Chhoeung, K. Chan. Manufacture of Custom IOL Using
Femtosecond Laser for Innovator Session. ASCRS 2015 • JF. Bille, R. Sahler. R. Aguilera. S. Zhou. DJ. Schanzlin. In Situ Fine-Tuning of Customized
IOLs Using Focused Femtosecond Pulses. ESCRS 2011 • JF. Bille, R. Sahler, R. Aguilera, S. Zhou, DJ. Schanzlin. Generation and in Situ
Modification of Customized IOLs. ASCRS 2011 • JF. Bille, R. Sahler. S. Zhou, R. Aguilera. DJ. Schanzlin. Refractive Index Shaping of 3-D
Structures Inside Hydrophobic IOL Material Using Femtosecond Laser Pulses. AAO

Page 99
2011 JF. Bille, R. Sahler, R. Aguilera, D. Schanzlin. Generation and in Situ Modification of Customized IOLs. AAO 2010
Posters
• L. Werner, J. Ludlow, J. Nguyen, J. Aliancy, N. Ellis, J. Heczko, B. Jiang, R. Peterson, S. Enright, R. Alley, R. Sahler, N. Mamalis. In Vivo Intraocular Lens Power Adjustment Using a Femtosecond Laser in the Rabbit Model. ARVO 2018
• J. Nguyen, L. Werner, J. Aliancy, J. Ludlow, B. Masino, L. Ha, S. Enright, R. Alley, R. Sahler, N. Mamalis. Optical Quality After In Vitro Intraocular Lens Power Adjustment Using a Femtosecond Laser. ARVO 2018
• L. Werner, N. Mamalis, J. Nguyen, J. Aliancy, J. Ludlow, S. Enright, RK. Alley, R. Sahler. Evaluation of the Biocompatibility of Intraocular Lens Power Adjustment Using a Femtosecond Laser. ASCRS 2017
• G. Waring IV, R. Sahler, JF. Bille, S. MacDonald. Post-Operative Custom Direct Multifocal IOL Adjustment with a Femtosecond Laser. ASCRS 2017
• T. O'Brian, R. Sahler. JF. Bille, S. MacDonald. Post-Operative Refraction Error Correction. ASCRS 2017
• S. MacDonald. R. Sahler. Patient Comfort and Safety, the Next Generation of Patient Interfaces. ASCRS 2017
• JF. Bille, R. Sahler. Microscope Study regarding the Chemical Basis for Alteration of an Intraocular Lens Using Refractive Index Shaping ("RIS") Technology. ASCRS 2017
• JF. Bille, R. Sahler, S. Zhou, R. Aguilera, D. Schanzlin. Refractive Index Shaping Of Intraocular Lenses Using The 2 Phase Wrapping Algorithm. ARVO 2011
• R. Sahler. JF. Bille. Non-Invasive In-Situ Power Adjustment Of Intraocular Lenses By Refractive Index Shaping. ARVO 2011
Patents Granted/Issued
• 1. US Patent No. US9023257 - Hydrophilicity Alteration System and Method. Granted 5/5/15
o 1a. Australian Patent No. 2013345322. Granted July 14, 2016 o 1b. Canadian Patent No. 2,891,470. Issued June 28, 2016 o 1c. Chinese Patent Application ZL201380070309.1. Issued April 26, 2017 o 1d. European Patent No. 3040051. (Validated in France, Germany, Italy, Spain,
Switzerland, United Kingdom) Granted March 15, 2017 o 1e. Hong Kong Patent No. HK1210741. Issued February 23. 2018 o 1f. Japanese Patent No. 5887030. Issued February 19, 2016 o 1g. Korean Patent No. 1718261. Issued March 14, 2017 o 1h. Korean Patent No. 1718298. Issued March 14. 2017 o 1i. Mexican Patent No. 344938. Issued January 12, 2017
• 2. US Patent No US9186242 - Hydrophilicity Alteration System and Method. Granted November 17, 2015
o 2a. Australian Patent No. 2016206381. Granted June 1, 2017 o 2b. Chinese Patent No. ZL201510660661.1. Granted May 31. 2017 o 2c. European Patent No. 2919975. Granted January 5, 2017 o 2d. Japanese Patent No. 5969101. Issued July 15, 2016 o 2e. Hong Kong Patent No. HK1215664. Granted March 29, 2018

Page 100
• 3. US Patent No US9107746 - Hydrophilicity Alteration System and Method. Issued August 18, 2015
o 3a. Australian Patent Application No. 2016206244. Granted May 18, 2017 o 3b. Chinese Patent No. ZL201510534979.5. Granted May 31, 2017 o 3c. European Patent No. 3040052. Granted January 5, 2017 o 3d. Hong Kong Patent No. HK1214120. Granted March 29, 2018
• 4. US Patent No US9925621 - Intraocular Lens (IOL) Fabrication System and Method. Granted March 27, 2018
• 5. US Patent No US10219948 - Ophthalmic laser treatment system and method. Granted March 5, 2019
Patents Applications
• Brazilian Patent Application No. BR 1020160101158 (Intraocular Lens (IOL) Fabrication System and Method)
• Indian Patent Application No. 201624014652 (Intraocular Lens (IOL) Fabrication System and Method)
• Indian Divisional Patent Application No. 201625038121 (Intraocular Lens (IOL) Fabrication System and Method)
• International Application No. PCT/US2017/019180 (Ophthalmic Laser Treatment System and Method)
• US Provisional Patent Application No. 62/460,043 (Ophthalmic Lens Customization System and Method)
• US Continuation-in-Part Application No. 15/898,100 (Ophthalmic Lens Customization System and Method)
• International Application No. PCT/US2018/018501 (Ophthalmic Lens Customization System and Method)
• US Provisional Patent Application No. 62/783,320 (Drug Delivery System and Method)
Awards
• Woman of the Year award in the category research during WIO meeting at the AAO 2017
• Best Paper of Session (BPOS) Winners 2016- Session: 4-D CATARACT - ASCRS 2016 • Best Paper of Session (BPOS) Winners 2015 - Session: 3-P CATARACT- ASCRS 2015
Awards (Co-Author)
• L. Werner, R. Sahler, S. Enright, R. Alley, N. Ellis, J. Heczko, N. Mamalis. Principles of Refractive Index Shaping of IOLs With Femtosecond Laser. Best of Show. AAO 2018
• L. Werner, R. Sahler, S. Enright, R. Alley, N. Ellis, J. Heczko, N. Mamalis. Principles of Refractive Index Shaping of IOLs With Femtosecond Laser. Grand Film Festival Prize. APACRS 2018
• L. Werner, R. Sahler, S. Enright, R. Alley, N. Ellis, J. Heczko, N. Mamalis. Principles of Refractive Index Shaping of IOLs With Femtosecond Laser. Grand Film Festival Prize. BRASCRS 2018

Page 101
• L. Werner. N. Mamalis, J. Aiancy, J. Nguyen, J. Ludlow, S. Enright, RK. Alley, R. Sahler. Fun with Femtosecond Lasers: Episode II – Adjustment of IOL Power. ESCRS Video Competition Award – Innovative – co-author. ESCRS 2017
• L. Werner. N. Mamalis, J. Aiancy, J. Nguyen, J. Ludlow, S. Enright, RK. Alley, R. Sahler. Fun with Femtosecond Lasers: Episode II – Adjustment of IOL Power. Video Award, Best of Show2017 AAO
• N. Mamalis, L. Werner, J. Nguyen, MD, J. Aliancy, MD, J. Ludlow, MD, S. Enright, RK. Alley, and R. Sahler. “Evaluation of the Biocompatibility of Intraocular Lens Power Adjustment Using a Femtosecond Laser,” First prize in the poster category. ASCRS 2017
• L. Werner. N. Mamalis, J. Aiancy, J. Nguyen, J. Ludlow, S. Enright, RK. Alley, R. Sahler. “Fun with Femtosecond Lasers: Episode II – Adjustment of IOL Power “Film Festival Award in the Instruments & Devices/Intraocular Lens Category. ASCRS 2017

Page 102
All References
[1] S. Manning, P. Barry, Y. Henry, P. Rosen, U. Stenevi, D. Young, M. Lundstrom. Femtosecond laser-assisted cataract surgery versus standard phacoemulsification cataract surgery: Study from the European Registry of Quality Outcomes for Cataract and Refractive Surgery. J Cataract Refract Surg. 2016; 42:1779-1790. [2] W. Hill. Distribution of Corneal Astigmatism – Normal Adult Population. https://www.doctor-hill.com/iol-main/astigmatism_chart.htm. Accessed 4/22/2019 [3] Healthgrades, ME. Dallas. The Most Common Surgeries in the US. https://www.healthgrades.com/right-care/preparing-for-surgery/the-10-most-common-surgeries-in-the-us?cid=63emsh. Accessed 4/22/2019 [4] Market Scope. 2017 Cataract Surgical Equipment Report: A Global Market Analysis for 2016 to 2022. 9859 Big Bend Blvd. Suite 202 St. Louis, MO 63122 market-scope.com [5] R. Sahler, S. MacDonald, G. Waring IV, JF. Bille. Refractive Index Shaping Customized treatment of Intraocular lenses. Femtosecond Lasers in Cornea and Lens Surgery. SLACK 2019 [6] R. Sahler, JF. Bile. Refractive Index Shaping – In-Vivo Optimization of an Implanted Intraocular Lens (IOL). High Resolution Imaging in Microscopy and Ophthalmology. Chapter 15. Springer 2019 [7] EA. Villegas, E. Alcon, P. Artal. Minimum amount of astigmatism that should be corrected. J Cataract Refract Surg. 2014; 40:13-19. [8] Market Scope 2016 IOL Report: A Global Market Analysis for 2015 to 2021 market-cope.com [9] R. Sahler, SQ. Zhou, and JF. Bille. Hydrophilicity alteration system and method. U.S patent 9186242 B2 (2015). [10] J. Nguyen, L. Werner, J. Ludlow, J. Aliancy, L. Ha, B. Masino, S. Enright, RK. Alley. R. Sahler. Intraocular lens power adjustment by a femtosecond laser: In vitro evaluation of power change, modulation transfer function, light transmission, and light scattering in a blue light–
filtering lens. J Cataract Refract Surg. 2018; 44:226–230 [11] L. Werner, J. Ludlow, J. Nguyen, J. Aliancy, L. Ha, B. Masino, S. Enright, RK. Alley, R. Sahler, N. Mamalis. Biocompatibility of intraocular lens power adjustment using a femtosecond laser in a rabbit model. J Cataract Refract Surg. 2017; 43:1100–1106 [12] L. Ding. Micro-Processing of Polymers and Biological Materials Using High Repetition Rate Femtosecond Laser Pulses (PhD Thesis) University of Rochester, Rochester, New York (2009) [13] A. Lichtinger. The Light Adjustable Lens – a Review. Europ Ophthalmic Rev 2012; 6:108–
111. [14] International Organization for Standardization. Ophthalmic Implants – Intraocular Lenses – Part 2: Optical Properties and Test Methods. Geneva, Switzerland, ISO 11979–2:2014 [15] R. Sahler, JF. Bille, S. Enright. S. Chhoeung, K. Chan. Creation of a refractive lens within an existing intraocular lens using a femtosecond laser. J Cataract Refract Surg. 2016; 42:1207–
1215 [16] J. Ford, L. Werner, N. Mamalis. Adjustable intraocular lens power technology. J Cataract Refract Surg. 2014; 40:1205-1223

Page 103
[17] TP. Werblin. Multicomponent Intraocular Lens. Journal of Refractive Surgery. 1996; 12:187-189 [18] JJ. Guan, GD. Kramer, K. MacLean, A. Farukhi, H. Li, NE. Reiter, L. Werner, N. Mamalis. Optic replacement in a novel modular intraocular lens system. Clinical & Experimental Ophthalmology. 2016; 44: 817-823 [19] L. Ding, R. Blackwell, JF. Künzler, WH. Knox. Large Refractive Index Change in Silicone-based and non-silicone-based Hydrogel Polymers Induced by Femtosecond Laser Micro-Machining. Opt Express. 2006; 14:11901–11909. [20] N. Takeshima, Y. Kuroiwa, Y. Narita, S. Tanaka, K. Hirao. Fabrication of a periodic structure with a High Refractive-Index Difference by Femtosecond Laser Pulses. Opt Express. 2004; 12:4019– 4024. [21] S. Katayama, M. Horiike. Plastic Object. U.S. Patent Application Publication 2002/0117624. [22] Y. Yuan, TR. Lee. Contact Angle and Wetting Properties. In: Bracco G, Holst B, eds, Surface Science Techniques. Springer-Verlag. 2013; 3–34 [23] R. Brandser, E. Haaskjold, L. Drolsum. Accuracy of IOL Calculation in Cataract Surgery. Acta Ophthalmol Scand. 1997; 75:162– 165. [24] C. Murphy, S.J. Tuft, D.C. Minassian Refractive error and visual outcome after cataract extraction J Cataract Refract Surg. 2002; 28: 62-66 [25] R. Sahler, JF. Bille. Alteration of an Implanted IOL. Lens-shaping technology has been used successfully in rabbits. CRSToday. 2017;July/August: 34-36 [26] N. Mamalis, J. Brubaker, D. Davis, L. Espandar, L. Werner. Complications of foldable intraocular lenses requiring explantation or secondary intervention—2007 survey update J Cataract Refract Surg. 2008; 34: 1584-1591 [27] N. Mamalis. Complications of foldable intraocular lenses requiring explantation or secondary intervention – 1998 survey. J Cataract Refract Surg. 2000; 26:766–772 [28] N. Mamalis, T.S. Spencer. Complications of foldable intraocular lenses requiring explantation or secondary intervention – 2000 survey update J Cataract Refract Surg. 2001; 27: 1310-1317 [29] N. Mamalis Complications of foldable intraocular lenses requiring explantation or secondary intervention – 2001 survey update J Cataract Refract Surg. 2002; 28:2193-2201 [30] N. Mamalis, B. Davis, C.D. Nilson, M.S. Hickman, R.M. Leboyer Complications of foldable intraocular lenses requiring explantation or secondary intervention—2003 survey update J Cataract Refract Surg. 2004; 30:2209-2218 [31] R Fernandez-Buenaga, JL Alio. Intraocular Lens Explantation After Cataract Surgery: Indications, Results, and Explantation Techniques. Asia-Pac J Ophthalmol. 2017; 6:372-380 [32] R. Sahler. JF. Bille, D. Schanzlin. In Vivo IOL Modification. MillennialEye Nov/Dec 2016 [33] KJ. Hoffer, D. Calogero, RW. Faaland, IK. Ilev. Testing the dioptric power accuracy of exact-power-labeled intraocular lenses. J Cataract Refract Surg. 2009; 35:1995-1999.

Page 104
[34] Carl Zeiss Meditec, CT LUCIA 211P Technical Specifications. https://www.zeiss.com/meditec/int/products/ophthalmology-optometry/cataract/iol-implantation/hydrophobic-c-loop-iols/ct-lucia.html#technical-data. Accessed 4/22/2019 [35] JF. Bille, R. Sahler, R. Aguilera, D. Schanzlin. Generation and in Situ Modification of Customized IOLs. AAO 2010 [36] R. Sahler. JF. Bille. Non-Invasive In-Situ Power Adjustment Of Intraocular Lenses By Refractive Index Shaping. ARVO 2011 [37] JF. Bille, R. Sahler, S. Enright, S. Chhoeung, K. Chan. Manufacture of Custom IOL Using Femtosecond Laser for Innovator Session. ASCRS 2015 [38] S. Mailis, AA. Anderson, SJ. Barrington, WS. Brocklesby, R. Greef, HN. Rutt, RW. Eason, NA. Vainos, C. Grivas. Photosensitivity of lead germanate glass waveguides grown by pulsed laser deposition. Opt Lett. 1998; 23:1751–1753 [39] A. Marmur. Chapter: A Guide to the Equilibrium Contact Angle Maze. Book: Contact Angle, Wettability and Adhesion. VSP 2009 -p 4 https://books.google.com/books?id=FojOBQAAQBAJ&printsec=frontcover&source=gbs_atb#v=onepage&q&f=false [40] R. Sahler, S. Enright, K. Chan, JF. Bille, S. Chhoeung. Large-Diopter Toric Change Inside a Hydrophobic IOL Using Refractive Index Shaping. ASCRS 2018 [41] JF. Bille, J. Engelhardt, HR. Volpp, A. Laghouissa, M. Motzkus, Z. Jiang, R. Sahler. Chemical basis for alteration of an intraocular lens using a femtosecond laser. Biomedical Optics Express. 2017; 8 (3):1390-1404 [42] J&J Vision, “Tecnis Monofocal IOLs, https://www.surgical.jnjvision.com/iols/monofocal/tecnis-1-piece#specifications. Accessed 4/22/2019 [43] Carl Zeiss Meditec, AT LISA multifocal MICS IOLs. https://applications.zeiss.com/C1257A290053AE30/0/4F091E41A284675AC1257A2900575595/$FILE/AT_LISAfamilyFolder_GB_FINAL.pdf. Accessed 4/22/2019 [44] F. Görlitz, P. Hoyer P, HJ Falk, L. Kastrup, J. Engelhardt, SW. Hell, A STED Microscope Designed for Routine Biomedical Applications. Prog. Electromagnetics Res. 2014; 147:57–68 [45] Leica MicroSystems CMS GmbH, TCS SP8 Confocal Microscope User Manual, https://microscopy.utk.edu/docs/SP8%20specs%20@%20UTK.pdf. Accessed 4/22/2019 [46] ThoughtCo: Hydrolysis: Definition and Examples, https://www.thoughtco.com/definition-of-hydrolysis-605225. Accessed 4/22/2019 [47] Chemistry LibreTexts. Hydrolysis. https://chem.libretexts.org/Bookshelves/Physical_and_Theoretical_Chemistry_Textbook_Maps/Supplemental_Modules_(Physical_and_Theoretical_Chemistry)/Equilibria/Solubilty/Hydrolysis. Accessed 4/22/2019 [48] ThoughtCo: Oxidation: Definition and Examples, https://www.thoughtco.com/definition-of-oxidation-in-chemistry-605456. Accessed 4/22/2019

Page 105
[49] Horiba, XploRATM Plus System, Technical Manualhttp://www.horiba.com/fileadmin/uploads/Scientific/Documents/Raman/Brochure_XploRA_Series-062016-B.pdf. Accessed 4/22/2019 [50] E. Kemal and S. Deb. Design and Synthesis of Three-Dimensional Hydrogel Scaffolds for Intervertebral Disc Repair. J. Mater. Chem. 2012; 22(21):10725–10734 [51] T. S. Perova, J. K. Vij, and H. Xu. Fourier Transform Infrared Study of poly (2-hydroxyethyl methacrylate) PHEMA. Colloid Polym. Sci. 1997; 275(4):323–332 [52] A. Bertoluzza, P. Monti, JV. Garcia-Ramos, R. Simoni, R. Caramazza, and A. Calzavara. Applications of Raman Spectroscopy to the Ophthalmological Field: Raman Spectra of Soft Contact Lenses made of poly-2-hydroxyethylmethacrylate (PHEMA). J. Molecular Structure. 1986; 143(1–2):469–472 [53] T. Werner. Triplet Deactivation in Benzotriazole-Type Ultraviolet Stabilizers. The Journal of Physical Chemistry. 1979; 83(3):320–325 [54] P. M. Miladinova and T. N. Konstantinova, “Photostabilizers for Polymers - New Trends,”
J. Chemical Technology and Metallurgy. 2015; 50(3):229–239 [55] G. Mabilleau, C. Cincu, MF. Baslé, and D. Chappard. Polymerization of 2-(hydroxyethyl) methacrylate by two different initiator/accelerator systems: a Raman spectroscopic monitoring. J. Raman Spectrosc. 2008; 39(7):767–771 [56] JB. Lonzaga, SM. Avaneysyan, SC. Langford and JT. Dickinson. Color Center Formation in Soda-Lime Glass with Femtosecond Laser Pulses. Journal of Applied Physics. 2003; 94:4332-4340 [57] SM. Avanesyan, S. Orlando, C. Langford and JT. Dickinson. Generation of Color Centers by Femtosecond Laser Pulses in Wide Band Gap Materials. Proc. SPIE. 2004; 5352:169-179 [58] SM. Eaton, G. Cerullo, and R. Osellame. Fundamentals of Femtosecond Laser Modification of Bulk Dielectrics (Chapter 1). in R. Osellame et al (Eds.), Femtosecond Laser Micromachining. Topics in Applied Physics. 2012; 123:3-18 [59] LC. Courrol, RE. Samad, L. Gomes, IM. Ranieri, SL. Baldochi, A. Zanardi de Freitas and N.D. Vieira Junior. Color Center Production by Femtosecond Pulse Laser Irradiation in LIF Crystals. Optics Express. 2004; 12 (2):288-293 [60] F. Vega, J. Armengol, V. Diez-Blanco, J. Siegel, J. Solis, B. Barcones, A. Pérez-Rodriguez and P. Loza-Alvarez. Mechanism of Refractive Index Modification during Femtosecond Laser Writing of Waveguides In Alkaline Lead-Oxide Silicate Glass. Applied Physics Letters. 2005; 87: 021109 [61] RR. Gattas and E. Mazur. Femtosecond Laser Micromachining in Transparent Materials. Nature photonics. 2008; 2:219-225 [62] K. Sugioka and Y. Cheng. Ultrafast Lasers – Reliable Tools for Advanced Materials Processing. Light: Science & Applications. 2014; 3(4):e149 [63] PMTF Booklet https://www.lambda-x.com/sites/default/files/2018-10/lambda-x_booklet_pmtf.pdf. Accessed 4/22/2019 [64] R. Sahler, JF. Bille, S. Enright, S. Chhoeung, K. Chan. Customizable IOL: Full-Sized Lens Created Inside Existing IOL Using Laser Induced Refractive Index Change. ASCRS 2015

Page 106
[65] Buznego C, Trattler WB. Presbyopia-Correcting Intraocular Lenses. Curr Opin Ophthalmol 2009; 20:13–18 [66] JL. Alio, J. Pikkel. Multifocal Intraocular Lenses: The Art and the Practice). Springer 2014 [67] R. Montes-Mico, T. Ferrer-Blasco, A. Cervino. Analysis of the possible benefits of aspheric intraocular lenses: Review of the literature. J Cataract Refract Surg. 2009; 35: 172-181 [68] R. Sahler, S. Enright, S. Chhoeung, K. Chan. JF. Bille, RK. Alley. Progressive Soaking Process of the Refractive Index-Shaped Lens. ASCRS 2018 [69] R. Sahler. Next Generation: Adjusting the Power of IOLs in the Eye. WIO Summer Symposium 2017 [70] R. Sahler, JF. Bille, S. Enright, S. Chhoeung, K. Chan, S. MacDonald. Simultaneous refractive and toric creation inside a standard hydrophobic intraocular lens using a femtosecond laser. ESCRS 2017 [71] JJ. Jones, R. Sahler, JF. Bille, S. MacDonald. Postoperative Custom Asphericity Adjustment. ASCRS 2017 [72] J. Michelson, L. Werner, A. Ollerton, L. Leishman, Z. Bodnar. Light Scattering and Light Transmittance in Intraocular Lenses Explanted because of Optic Opacification. J Cataract Refract Surg. 2012; 38:1476-1485. [73] L. Werner, C. Morris, E. Liu, S. Stallings, A. Floyd, A. Ollerton, L. Leishman, Z. Bodnar. Light Transmittance of 1-Piece Hydrophobic Acrylic Intraocular Lenses with Surface Light Scattering Removed from Cadaver Eyes. J Cataract Refract Surg. 2014; 40:114–120. [74] D. Barra, L. Werner, JLP. Costa, C. Morris, T. Ribeiro, BV. Ventura, F. Dornelles. Light Scattering and Light Transmittance in a Series of Calcified Single-Piece Hydrophilic Acrylic Intraocular Lenses of the Same Design. J Cataract Refract Surg. 2014; 40:121-128. [75] C. Morris, L. Werner, D. Barra, E. Liu, S. Stallings, A. Floyd. Light Scattering and Light Transmittance of Cadaver Eye–Explanted Intraocular Lenses of Different Materials. J Cataract Refract Surg. 2014; 40:129–137. [76] L. Werner, JC. Stover, J. Schwiegerling, KK. Das. Light Scattering, Straylight, and Optical Quality in Hydrophobic Acrylic Intraocular Lenses with Subsurface Nanoglistenings. J Cataract Refract Surg. 2016; 42(1):148-156. [77] JM. Artigas, A. Felipe, A. Navea, MC. Garcia-Domene, A. Pons, J. Mataix. Determination of Scattering in Intraocular Lenses by Spectrophotometric Measurements. Journal of Biomedical Optics. 2014; 19(12): 127001-6 [78] L. Werner, J. Chew, N. Mamalis. Experimental Evaluation of Ophthalmic Devices and Solutions using Rabbit Models. Vet Ophthalmol. 2006; 9:281-291.
Related Documents