University of Massachusetts Amherst University of Massachusetts Amherst ScholarWorks@UMass Amherst ScholarWorks@UMass Amherst Doctoral Dissertations Dissertations and Theses October 2018 Female Students’ Academic Engagement and Achievement in Female Students’ Academic Engagement and Achievement in Science and Engineering: Exploring the Influence of Gender Science and Engineering: Exploring the Influence of Gender Grouping in Small Group Work in Design-Based Learning Contexts Grouping in Small Group Work in Design-Based Learning Contexts in High School Biology in High School Biology Miancheng Guo University of Massachusetts Amherst Follow this and additional works at: https://scholarworks.umass.edu/dissertations_2 Part of the Curriculum and Instruction Commons, Science and Mathematics Education Commons, and the Secondary Education Commons Recommended Citation Recommended Citation Guo, Miancheng, "Female Students’ Academic Engagement and Achievement in Science and Engineering: Exploring the Influence of Gender Grouping in Small Group Work in Design-Based Learning Contexts in High School Biology" (2018). Doctoral Dissertations. 1349. https://doi.org/10.7275/12765143 https://scholarworks.umass.edu/dissertations_2/1349 This Open Access Dissertation is brought to you for free and open access by the Dissertations and Theses at ScholarWorks@UMass Amherst. It has been accepted for inclusion in Doctoral Dissertations by an authorized administrator of ScholarWorks@UMass Amherst. For more information, please contact [email protected].

Welcome message from author
This document is posted to help you gain knowledge. Please leave a comment to let me know what you think about it! Share it to your friends and learn new things together.
Transcript
University of Massachusetts Amherst University of Massachusetts Amherst
ScholarWorks@UMass Amherst ScholarWorks@UMass Amherst
Doctoral Dissertations Dissertations and Theses
October 2018
Female Students’ Academic Engagement and Achievement in Female Students’ Academic Engagement and Achievement in
Science and Engineering: Exploring the Influence of Gender Science and Engineering: Exploring the Influence of Gender
Grouping in Small Group Work in Design-Based Learning Contexts Grouping in Small Group Work in Design-Based Learning Contexts
in High School Biology in High School Biology
Miancheng Guo University of Massachusetts Amherst
Follow this and additional works at: https://scholarworks.umass.edu/dissertations_2
Part of the Curriculum and Instruction Commons, Science and Mathematics Education Commons, and
the Secondary Education Commons
Recommended Citation Recommended Citation Guo, Miancheng, "Female Students’ Academic Engagement and Achievement in Science and Engineering: Exploring the Influence of Gender Grouping in Small Group Work in Design-Based Learning Contexts in High School Biology" (2018). Doctoral Dissertations. 1349. https://doi.org/10.7275/12765143 https://scholarworks.umass.edu/dissertations_2/1349
This Open Access Dissertation is brought to you for free and open access by the Dissertations and Theses at ScholarWorks@UMass Amherst. It has been accepted for inclusion in Doctoral Dissertations by an authorized administrator of ScholarWorks@UMass Amherst. For more information, please contact [email protected].

FEMALE STUDENTS’ ACADEMIC ENGAGEMENT AND ACHIEVEMENT IN
SCIENCE AND ENGINEERING: EXPLORING THE INFLUENCE OF GENDER
GROUPING IN SMALL GROUP WORK IN DESIGN-BASED LEARNING
CONTEXTS IN HIGH SCHOOL BIOLOGY
A Dissertation Presented
by
MIANCHENG GUO
Submitted to the Graduate School of the
University of Massachusetts Amherst in partial fulfillment
of the requirements for the degree of
DOCTOR OF PHILOSOPHY
September 2018
College of Education
Teacher Education and Curriculum Studies
Mathematics, Science, and Learning Technologies

© Copyright by Miancheng Guo 2018
All Rights Reserved
FEMALE STUDENTS’ ACADEMIC ENGAGEMENT AND ACHIEVEMENT IN
SCIENCE AND ENGINEERING: EXPLORING THE INFLUENCE OF GENDER
GROUPING IN SMALL GROUP WORK IN DESIGN-BASED LEARNING
CONTEXTS IN HIGH SCHOOL BIOLOGY
A Dissertation Presented
By
MIANCHENG GUO
Approved as to style and content by: Martina Nieswandt, Chair Elizabeth McEneaney, Member Susannah Howe, Member
Cynthia Gerstl-Pepin, Dean
College of Education

iv
ACKNOWLEDGMENTS
I’d like to thank my advisor, Dr. Martina Nieswandt, for her years of unique
education, guidance and support which I couldn’t have found anywhere else. I am
profoundly grateful for her patience, encouragement and warm friendship throughout
every step of this long journey of mine. I also would like to thank Dr. Elizabeth
McEneaney for her years of unique education, guidance and support which I also
couldn’t have found anywhere else. I am also profoundly grateful for her patience,
encouragement and warm friendship throughout every step of this long journey of mine.
In addition, I deeply appreciate it that they allowed me to be a part of their NSF-funded
Small Group project, without which none of this would have been possible. My sincere
thanks to Dr. Susannah Howe, too, for being my committee member and providing
guidance for my dissertation, and also for allowing me to learn more about engineering
design in her classroom.
Dr. Jessica Pearlman from the UMass Amherst Institute for Social Science
Research helped me a lot by advising me on some cutting-edge statistical analysis
techniques, so she also deserves my sincere thanks.
Thank you too, Dr. Julie Robinson and Stephanie Purington, for helping me
establish the trustworthiness of my data analysis.
I also want to express my heartfelt thanks to Dr. Vincent Lunetta and Dr. Judith
Zawojewski, who have been my longtime teachers and friends.
Lastly, thanks to my family and all my friends who provided support for me in
various ways.

v
ABSTRACT
FEMALE STUDENTS’ ACADEMIC ENGAGEMENT AND ACHIEVEMENT IN
SCIENCE AND ENGINEERING: EXPLORING THE INFLUENCE OF GENDER
GROUPING IN SMALL GROUP WORK IN DESIGN-BASED LEARNING
CONTEXTS IN HIGH SCHOOL BIOLOGY
SEPTEMBER 2018
MIANCHENG GUO, B.E. WUHAN UNIVERSITY OF TECHNOLOGY
M.A. BEIJING NORMAL UNIVERSITY
Ph.D. UNIVERSITY OF MASSACHUSETTS AMHERST
Directed by: Professor Martina Nieswandt
In the past 30 years, although much effort has been made to narrow the gender
gap in science, technology, engineering and mathematics (STEM), females are still
largely underrepresented in some important STEM fields, such as physics and
engineering (NSF, 2007). To deal with this situation, people from different sectors have
long reached a common understanding: Educators must improve school girls’ interest,
participation and engagement in STEM subjects (e.g., Office of Science and Technology
Policy, 2013). In the K-12 classroom, small group work has been shown to promote an
equitable environment for girls’ learning in science and have a positive impact on their
persistence in STEM disciplines (e.g., Davis & Rosser, 1996). Further research shows
that same-gender grouping enhances girls’ engagement and achievement in STEM fields
(e.g., Riordan, 1990). However, little research has been done in design-based science
(DBS), a pedagogy that allows students to learn science through engineering design,
vi
which is considered as important as inquiry-based learning (NGSS, 2013). This study
was an effort to make contributions in this aspect.
In two DBS tasks in high school biology, this study arranged various small group
gender compositions: from 33% to 100% female. In these contexts, this study explored
(1) How gender composition influenced girls’ and boys’ engagement; (2) how student
engagement influenced their achievement, and (3) how group gender composition
influenced girls’ and boys’ achievement in engineering practices and biology content.
Results show that higher group female percent led to higher engagement levels and
engineering practice achievement of girls. However, group cohesion and positive group
interaction were indispensable as they were needed for girls (and boys, in certain cases)
to develop senses of relatedness and collective efficacy, which were necessary for their
engagement and learning. Also, results show that group gender composition wasn’t only
directly correlated with girls’ achievement, but also indirectly correlated with this
variable through the mediation of the girls’ behavioral, emotional and cognitive
engagement, respectively. Based on these findings, implications for classroom teaching
and future research are provided.

vii
TABLE OF CONTENTS
Page
ACKNOWLEDGMENTS ................................................................................................. iv
ABSTRACT ........................................................................................................................ v
LIST OF TABLES .............................................................................................................. x
LIST OF FIGURES .......................................................................................................... xii
CHAPTER
1. INTRODUCTION .......................................................................................................... 1
2. LITERATURE REVIEW ............................................................................................... 5
The Relationship between Gender Grouping and Student Engagement ..................... 6
The Relationship between Gender Grouping and Student Achievement .................. 14
Literature Review Conclusions ................................................................................. 18
3. CONCEPTUAL FRAMEWORK ................................................................................. 22
Engineering Design ................................................................................................... 22
Design-Based Science ............................................................................................... 26
Student Engagement .................................................................................................. 28
Student Achievement ................................................................................................. 30
Theories Regarding Factors Influencing Student Engagement and Achievement .... 32
4. METHODS ................................................................................................................... 39
Participants ................................................................................................................ 43
Group Nomenclature ................................................................................................. 46
Gaining Entry and Informed Consent ........................................................................ 48
The Design-Based Science Contexts ......................................................................... 48
Data Collection .......................................................................................................... 50
Data Analysis ............................................................................................................. 52
Quantitative data analysis ..................................................................................... 52
Inter-rater reliability of quantitative video coding ................................................ 68
Qualitative data analysis ....................................................................................... 69
Trustworthiness of qualitative data analysis ......................................................... 81

viii
5. RESULTS ..................................................................................................................... 84
Relationships between Student Engagement and Group Gender Composition ......... 85
Student subgroups’ engagement sequences .......................................................... 86
Relationships between group gender composition and subgroup engagement .. 112
Factors influencing girls’ and boys’ emotional and cognitive engagement in
female-majority and gender-parity groups.......................................................... 119
Relationships between Student Achievement and Engagement .............................. 163
Relationships between Student Achievement and Group Gender Composition ..... 168
Summary .................................................................................................................. 173
6. DISCUSSION ............................................................................................................. 176
Group Female Percent was Positively Related to Girls’ Engagement and
Achievement ............................................................................................................ 178
Female Subgroup Cohesion and Interaction as Central Group Work Process
Factors Influencing Girls’ Emotional and Cognitive Engagement .......................... 182
Perceived Relatedness as the Central Psychological Process Affecting Girls’
Engagement ............................................................................................................. 186
Girls’ Cross-Task Engagement and Achievement Differences ............................... 191
Limitations of the Study .......................................................................................... 193
Implications for Practitioners .................................................................................. 195
Implications for Future Research ............................................................................. 203
APPENDICES
1. THE HEART VALVE LESSON PLAN .................................................................... 211
2. OIL SPILL CLEANUP LESSON PLAN ................................................................... 219
3. STUDENT FOCUS GROUP INTERVIEW QUESTIONS ....................................... 224
4. STUDENT INTEREST IN BIOLOGY QUESTIONNAIRE ..................................... 227
5. STUDENT INTEREST IN CURRENT BIOLOGY CLASS QUESTIONNAIRE .... 228
6. STUDENT COMPETENCE IN SCIENCE LABS QUESTIONNAIRE ................... 230
7. BIOLOGY PRETEST ................................................................................................. 232
8. HEART VALVE PROTOCOL................................................................................... 235
9. OIL SPILL POSTTEST .............................................................................................. 236
10. INDICATORS FOR BEHAVIORAL/EMOTIONAL/COGNITIVE
ENGAGEMENT ............................................................................................................. 237

ix
11. CORRELATION BETWEEN FEMALE SUBGROUPS’ PHELs AND GROUP
FEMALE PERCENT ...................................................................................................... 243
12. CORRELATIONS BETWEEN MALE SUBGROUPS’ PHELs AND GROUP
FEMALE PERCENT ...................................................................................................... 244
REFERENCES ............................................................................................................... 245

x
LIST OF TABLES
Table Page
1. Demographic of participating schools, classes, teachers and groups ............................45
2. Gender composition of video-taped student groups ......................................................47
3. Different engagement levels and their numerical values and color codes .....................55
4. Scoring rubric for assessing student achievement in making tradeoffs .........................60
5. Scoring rubric for evaluating student achievement in practicing iterations ..................61
6. Independent, dependent and covariates in the analyses of relationships between
student achievement and engagement and between student achievement and group
gender composition ............................................................................................................63
7. Example of calculating pooled estimates from MI models for the effect of group
female percent on girls’ posttest-based achievement in biology content in Heart
Valve ..................................................................................................................................67
8. Descriptive Statistic for Student Subgroups’ behavioral engagement PHEL in
Heart Valve and Oil Spill .................................................................................................115
9. Groups selected for qualitative analysis and rationale for selection ............................121
10. Correlations between girls’ video-based engineering practice achievement and
engagement in Heart Valve ..............................................................................................164
11. Correlations between boys’ video-based engineering practice achievement and
engagement in Heart Valve ..............................................................................................165
12. Correlations between girls’ video-based engineering practice achievement and
engagement in Oil Spill ...................................................................................................166
13. Correlations between boys’ video-based engineering practice achievement and
engagement in Oil Spill ...................................................................................................167
14. Relationship between group female percent and girls’ posttest-based achievement
in Heart Valve (HLM model using MI-generated data) 17 ............................................169
15. Relationship between group female percent and boys’ posttest-based achievement
in Heart Valve (HLM model using MI-generated data)12 ..............................................170
16. Relationship between group female percent and girls’ posttest-based achievement
in Oil Spill (HLM model using MI-generated data)12 ....................................................170

xi
17. Relationship between group female percent and boys’ posttest-based achievement
in Oil Spill (HLM model using MI-generated data)12 ....................................................171
xii
LIST OF FIGURES
Figure Page
1. The engineering design process (Massachusetts Department of Elementary and
Secondary Education, 2016. p.100) ..................................................................................23
2. Self-systems process model adapted and applied to educational settings (Appleton
et al., 2008, p. 380). ...........................................................................................................34
3. Illustration of the stereotype inoculation model (Dasgupta, 2011, p. 234) ....................36
4. Conceptual framework of this study: a synthesis of Connell and Wellborn’s (1991)
self-system processes model and Dasgupta’s (2011) stereotype inoculation model.
Note. Adapted from Connell and Wellborn’s (1991, p. 54); Appleton, Christenson &
Furlong (2008, p. 380); and Dasgupta (2011, p. 234)........................................................37
5. Study design ...................................................................................................................40
6. Group 12’s cognitive engagement sequence – an example of how PHEL is
calculated based on an engagement sequence ...................................................................56
7. The process of intepretational analysis of qualitative data ............................................70
8. An example of coding interview transcript using interpretational analysis ...................72
9. An example of grouping segments under the same theme ............................................74
10. An example of reviewing themes and creating sets of themes ....................................75
11. An example of comparing themes ...............................................................................77
12. An example of part of the ERRs table .........................................................................80
13. An example of a partial Brief Summary section of ERRs ...........................................80
14. Female subgroups' behavioral engagement in Heart Valve .........................................87
15. Female subgroups' emotional engagement in Heart Valve ..........................................90
16.Female subgroups’ cognitive engagement in Heart Valve ...........................................92
17. Male subgroups' behavioral engagement in Heart Valve ............................................94
18. Male subgroups’ emotional engagement in Heart Valve .............................................96

xiii
19. Male subgroups’ cognitive engagement in Heart Valve ..............................................98
20. Female subgroups’ behavioral engagement in Oil Spill ............................................100
21. Female subgroups’ emotional engagement in Oil Spill .............................................102
22. Female subgroups’ cognitive engagement in Oil Spill ..............................................104
23.Male subgroups’ behavioral engagement in Oil Spill.................................................106
24. Male subgroups’ emotional engagement in Oil Spill ................................................108
25. Male subgroups’ cognitive engagement in Oil Spill ..................................................110
26. Group 92’s sequence of emotional engagement in Heart Valve ................................122
27. ERRs episode showing Group 92’s female subgroup’s cognitive engagement ........127
28. ERRs episodes showing Taylor’s leadership role in Group 92 .................................128
29. ERRs episode showing the emotional engagement of the girls in Group 92.............130
30. Group 41’s emotional engagement sequences in Heart Valve ..................................133
31. ERRs episode showing the girls’ verbal participation being interrupted by the
boys in Group 41 ..............................................................................................................139
32. ERRs episode showing Mary’s behavioral participation being interrupted by
boys in Group 41 ..............................................................................................................140
33. ERRs episode showing Helen being ignored by the boys in Group 41 .....................141
34. Group 12’s sequence of cognitive engagement in Heart Valve .................................144
35. ERRs episode showing the girls’ social and emotional positive interactions in
Group 12 ..........................................................................................................................146
36. ERRs episode showing the girls’ cognitive positive interactions in Group 12..........148
37.. Group 72’s sequences of cognitive engagement in Heart Valve ..............................150
38. ERRs episode showing Talia’s verbal participation being ignored by Parker and
Brian in Group 72 ............................................................................................................159
39. ERRs episode showing Brian and Parker’s exclusive interaction with each other ....160

xiv
40. Mediation effect of group female percent on female students’ Iteration
Achievement in Oil Spill through behavioral, emotional and cognitive engagement,
respectively. .....................................................................................................................179
41. A revised synthesis of Connell and Wellborn’s (1991) self-system processes
model and Dasgupta’s (2011) stereotype inoculation model. Note. Adapted from
Connell and Wellborn’s (1991, p. 54); Appleton, Christenson & Furlong
(2008, p. 380); and Dasgupta (2011, p. 234) ...................................................................189

1
CHAPTER 1
INTRODUCTION
In the past 30 years, much effort has been made to narrow the gender gap in
science, technology, engineering and mathematics (STEM), and much progress has been
achieved. For example, in biological sciences women are now well represented; in
agricultural sciences, geosciences and chemistry their representations approach equity
(NSF, 2007). However, they are still largely underrepresented in physics, computer
science, and engineering (NSF, 2007; Hill, Corbett & St. Rose, 2010). Also, if one looks
at the whole picture, the proportion of female scientists and engineers in the USA was
only 24% in 2009 (Beede, Julian & Langdon, 2011). Particularly, women make up only
13% of the engineering workforce in the U.S. (Silbey, 2016). These facts are the results
of a phenomenon named “the leaky pipeline” – as girls and women go through the
pipeline of science education and careers, more and more are lost through high rates of
attrition along the way with only a small fraction remaining at the end. This situation has
been considered both an equity issue (U.S. Department of Education Office for Civil
Rights, 2012; Office of Science and Technology Policy, 2013) and an economic issue
(Beede et al., 2011; Executive Office of the President, 2013; Office of Science and
Technology Policy, 2013).
To deal with this situation, people from different sectors (i.e., government, NGOs,
business, and education, etc.) have long reached a common understanding: to improve K-
12 female students’ interest, participation and engagement in STEM subjects as well as
their college and career readiness in these areas (U. S. Department of Education Office of
Educational Research and Improvement, 2000; U.S. Department of Education Office for

2
Civil Rights, 2012; Office of Science and Technology Policy, 2013; National Math +
Science Initiative,1 2015; Girl Scout Research Institute, 2012; UMass Donahue Institute
Research and Evaluation Group, 2011; NGSS Lead States, 2013).
In the K-12 classroom, small group work has been shown to promote an equitable
environment for girls’ learning in science and to have a positive impact on their
persistence in science and other STEM disciplines (Campbell, Jolly, Hoey & Perlman,
2002; Davis & Rosser, 1996; Hansen, Sunny, Walker, Joyce, Flom & Barbara, 1995;
Koch, 2002; Raes, ScHelens & De Wever, 2013). Further research shows that gender
grouping enhances girls’ participation, engagement and achievement in STEM fields
(e.g., Riordan, 1990; DeBarthe, 1997; Chennabathni & Rgskind, 1997; Estrada, 2007;
Hamilton, 1985; Klebosits & Perrone, 1998; Norfleet James & Richards, 2003). This is
particularly noteworthy because research in mathematics classrooms indicated female
students’ increased mathematics anxiety to be related to their perceived intimidating
presence of male students (Campbell & Evans, 1997).
Although a certain amount of research regarding gender grouping has been done
in different STEM fields, little is seen in design-based science (DBS), a science pedagogy
providing students with the opportunity to learn science through engineering design,
which is emerging to be one of the “hottest” current focuses in science education and is
advocated by the Next Generation Science Standards (NGSS) (Capobianco, Yu &
French, 2014; NGSS Lead States, 2013).
Would gender grouping in small group work in DBS have an influence on girls’
engagement and achievement in science? Although, as mentioned above, much relevant
1 This is a public-private partnership, led by private donors such as Exxon Mobil Corporation, the Bill and
Melinda Gates Foundation and the Michael and Susan Dell Foundation.

3
research has been done in mathematics and science, this question is still worth good
attention given that:
• Research in gender grouping in mathematics and science (including DBS) has
produced mixed findings regarding female students’ engagement and achievement
in science (this will be reported in more detail in the Literature Review section),
therefore no reliable inference can be made about the influence of gender
grouping in DBS, even if DBS may have similarities with inquiry-based science;
• DBS may be able to provide a context that makes differences for girls:
o College-bound high school girls tend to focus on people-oriented fields
when choosing a STEM major (Miller, Blessing & Schwartz, 2006), and
the very aim of engineering design is to meet human needs and wants
(NRC, 2012).
o Girls want to see the relevance of science to their lives or its social value
(Burke, 2007), and the pedagogical focus on engineering design in DBS is
considered to be inclusive of students who may have experienced science
as not being relevant to their lives/future or traditionally been
marginalized in school science (NGSS Lead States, 2013).
Further, with the release of NGSS, engineering design as a set of core concepts
and a set of practices has been formally integrated into K-12 science education and has
been attached the same importance as scientific inquiry (NGSS Lead States, 2013).
Accordingly, students’ understanding of engineering design concepts and acquisition of
engineering design practices are included in their science achievement (NGSS Lead
States, 2013).

4
Therefore, in this study I not only focused on whether gender grouping in small
group work in DBS activities influenced female students’ engagement and achievement
in science content, but also explored whether it influenced female students’ engagement
and achievement in engineering practices.

5
CHAPTER 2
LITERATURE REVIEW
Gender grouping has been studied in various fields, such as science, mathematics,
and engineering. In science, it has been studied in formal and informal settings (Draper,
2004) and with more conventional pedagogies, such as group discussion and inquiry-
based science (e.g., Bennett, Hogarth, Lubben, Campbell & Robinson, 2010; Kemp,
2005; Estrada, 2007) as well as with a relatively new pedagogy – DBS (e.g., Watson &
Lyons, 2009). Various formats of student activities have been used in these studies, such
as paper-and-pencil problem solving (e.g., Dasgupta, Scircle & Hunsinger, 2015;
Harskamp, Ding & Suhre, 2005), computer-aided virtual scientific inquiry (e.g., Kemp,
2005), real-life hands-on scientific inquiry (e.g., Estrada, 2007) and engineering design
(e.g., Gnesdilow, Evenstone, Rutledge, Sullivan & Puntambekar, 2013), or exposure to
authentic lab research experiences (e.g., Hirsch, Berliner-Heyman, Cano, Carpinelli &
Kimmel, 2014). Also, the term “group” has been used widely in these studies and
referred to various units of students, including pairs (e.g., Harskamp, Ding & Suhre,
2008), small groups (e.g., Dasgupta, Scircle and Hunsinger, 2015; Gnesdilow et al.,
2013), classes (e.g., Häussler & Hoffmann, 2002; Friend, 2006), programs (e.g.,
Richardson et al., 2003), or even camps (e.g., Hughes, Nzekwe & Molyneaux, 2013).
In this chapter, I review all these types of studies, with particular attention paid to
three relationships: the relationship between group gender composition and girls’
engagement/participation, between group gender composition and girls’ achievement,
and between girls’ engagement/participation and achievement.

6
The Relationship between Gender Grouping and Student Engagement
Given the importance of student engagement in predicting their
achievement/performance (Fredricks, Blumenfeld & Paris, 2004; Dasgupta, 2011;
Appleton, Christenson & Furlong, 2008), this variable has received much attention from
authors who are interested in gender grouping research.
In this subsection (and throughout this study), student engagement is defined to
include three dimensions: behavioral, emotional and cognitive (Fredricks et al., 2004).
Behavioral engagement refers to various kinds of learning-related and academic-oriented
behaviors, actions and involvements that students engage in (Fredricks et al., 2004), thus,
it includes student participation (Nguyen, Cannata & Miller, 2018). Emotional
engagement refers to students’ affective reactions to their teachers, classmates, academic
contents/activities, and school (Fredricks et al., 2004). Examples of components of
emotional engagement include students’ self-efficacy in academics, their sense of
belonging in the school context and attitudes toward school, their interest in academic
content, their perception of relatedness to teachers and other students, as well as their
emotions such as happiness, sadness, anxiety, boredom, etc. (Fredricks et al., 2004;
Bundick, et al., 2014). Cognitive engagement involves three important aspects (Fredricks
et al., 2004; Bundick, et al., 2014): (1) A psychological investment that incorporates
thoughtfulness and willingness to make efforts to comprehend complex ideas and master
difficult skills (e.g., a desire to go beyond requirements, a preference for challenges, etc.);
(2) self-regulated learning (e.g., the use of strategies such as planning and monitoring
learning and evaluating one’s thinking); and (3) cognitive processes (e.g., analyzing and

7
synthesizing). Under this broad framework, in this subsection a number of studies
investigating various engagement variable are included.
Estrada (2007) investigated student attitude. She conducted an action research to
investigate the effects of single-gender groups in inquiry-based learning on second-grade
female students’ participation and attitude in science. Students’ attitudes before and after
working in single-gender groups were measured by surveys and interviews. Their
participation was recorded by observations based on the behaviors that they exhibited –
passive/assisting, active/leading, or active/manipulating. The researcher also collected
student journals recording their understanding of science content. Data analysis revealed
that, compared with their regular mixed-gender groups, inquiry-based learning in single-
gender groups helped improve girls’ attitudes towards science (emotional engagement),
and also promoted their active participation (behavioral engagement). However, whether
girls’ science attitudes were related to their participation was not investigated; therefore,
it’s hard for the reader to know whether the improved participation was the result of
improved attitudes or the context of single-gender groups, or both.
Baker (2002) examined the impact of single-gender middle school science and
mathematics classrooms on affect, peer interactions and teacher-student interactions, and
discovered that the single-gender environment contributed to girls’, and not boys’,
positive affect and perceptions of empowerment and peer support (i.e., emotional
engagement). However, the author did not analyze the mechanism of how the all-girl
setting contributed to the girls’ emotional engagement.
Friend (2006) also investigated the effects of gender grouping at the classroom
level. She hypothesized that all-boy and all-girl classes would have a more positive

8
classroom atmosphere than mixed-gender classes. However, her results showed that
single-gender classes did not create a more positive classroom atmosphere (i.e.,
emotional engagement).
At the classroom level, a more systematic study was conducted by Häussler and
Hoffmann (2002) to examine female students’ interest, self-concept and competence in
coeducational vs. single-gender physics classes. These researchers’ intervention included
several components: adapting physics curriculum to the interests of girls, training
teachers to support girls to develop positive self-concept related to physics, splitting
classes in half (to explore the effect of class size), and teaching girls and boys separately.
Six schools in northern Germany with 6 physics teachers and 12 classes (150 girls and
139 boys) participated in the intervention, another two schools with seven classes (103
girls and 64 boys) and 6 teachers participated as the control group. Through their one-
school-year intervention, the researchers discovered that teaching boys and girls
separately had positive impacts on girls’ interest and competence (i.e., emotional
engagement). However, the researchers pointed out that these influences were not only
closely related to gender grouping, but also dependent on a girl-friendly curriculum and a
gender-fair teacher. Here, again, the authors did not explain how the all-girl context
promoted the girls’ emotional engagement.
Hughes, Nzekwe and Molyneaux (2013) extended this line of research beyond the
classroom by investigating the influence of two informal science camps (one
coeducational and one all-female) on middle school students’ STEM identity formation.
They defined STEM identity as containing three key areas (Eccles 2007; Rittmayer &
Beier, 2009; Fadigan & Hammrich 2004): (1) interest in STEM and STEM careers; (2)

9
self-concept related to STEM domains, and (3) the influence of role models on students’
perceptions of STEM professionals. Thirty-two girls formed the all-female camp and 27
students (13 girls and 14 boys) participated in the coeducational camp. Both camps were
housed within a national laboratory of high magnetic field research. The campers
participated in a variety of activities that were aimed to affect their STEM identity: they
were shown possible STEM careers and the relevance of these fields to their lives; they
worked on hands-on problem solving and interacted with STEM professionals and had
their abilities recognized by these experts; and met STEM professionals, observed their
work and daily jobs. The researchers found that these activities were equally successful in
improving girls’ in both camps STEM interest, self-concept, and their perceptions of
STEM professionals. These various experiences affected participants, particularly girls,
more than the single-gender or coeducational aspect of the program. Therefore, they
concluded that the single-gender context was not as important to girls’ STEM identity as
the pedagogy used in the program.
Another program that had informal components reported different findings. In a
three-year program named Sisters in Science, fourth- and fifth-grade students were
exposed to gender-sensitive, constructivist, and integrated mathematics and science
instruction in school, after school, and during the summer. As a result, participants
showed improvements in attitudes in science and mathematics. Particularly, girls were
found to become expressive and motivated to do science when they had opportunities to
work with other girls on inquiry-based tasks without feeling the threat of competition
from boys (Richardson et al., 2003). In other words, working with each other enhanced
10
girls’ emotional engagement (expressiveness and perceived empowerment) in science
and mathematics.
At the small group level, Dasgupta, Scircle and Hunsinger (2015) conducted a
study with college female engineering students. They explored whether varying gender
composition (75% female, 50% female, and 25% female) in small learning groups (four
members per group) in an engineering problem solving context had any influence on
these students’ participation and career aspirations. The researchers discovered that
different group gender compositions had important psychological and behavioral effects
on women in engineering:
• Female-majority groups (75% female) influenced women positively in terms
of diminishing stereotypes and increasing psychological safety, self-efficacy,
verbal/behavioral participation in group learning activity, and aspiration for
engineering careers; in contrast, women in female-minority groups (25%
female) showed low measures on these variables;
• Gender-parity groups (50% female) displayed mixed effects: On the positive
side, women felt less threatened and more challenged2 in gender-parity groups
than in female-minority groups, especially as newcomers to engineering; also,
gender-parity groups helped women to deflect stereotypes and protect their
confidence and career aspirations. On the negative side, women spoke far less
during group work in gender-parity groups than in female-majority groups, no
matter whether they were beginners or advanced students.
2 Here, by “challenged” the authors meant the female students believed they had the inner resources to
handle the task demands and felt eager about the upcoming group task.

11
The researchers concluded that creating small groups with high proportions of
females is a way to keep them engaged in engineering and interested in engineering
careers and that although sometimes the gender-parity group composition works, it is not
sufficient to promote women’s verbal and behavioral participation in group work, which
usually influence learning. These findings show that a group with higher percent of
female students promoted female students’ emotional and behavioral engagement.
Another small group study with college students was carried out by Meadows and
Sekaquaptewa (2011). They investigated the roles and behaviors female and male
students adopt as a function of the gender composition of the group in a required
introductory engineering course. Since only about 25% of all U.S. engineering
undergraduate students are female they inferred that small groups assigned to work on
course projects would reflect male-dominant behavior. Analysis of video recordings of
175 final group design project presentations (4-6 students per group; 29 female-majority
groups, 37 gender-parity groups, and 73 male-majority groups) showed female students
adopting less active roles than male students in project presentations. Particularly, women
presented significantly more non-technical material, while male students presented more
technical information and female students spoke for shorter periods of time than male
students. Within the framework of engagement, it seems that the minority status hindered
female students’ behavioral and cognitive engagement. The authors did not explore what
“microscopic” factors led to female students’ low behavioral and cognitive engagement
nor did they articulated whether they observed group composition-specific behaviors.
Based on observations in her own seventh-grade classes of female students being
more withdrawn than male students Kemp (2005) designed an intervention (computer-

12
assisted, problem-based inquiry activity) to encourage female students to be more self-
confident and actively engaged in scientific inquiry. She placed students in groups of four
with different gender compositions (all female, female majority, gender parity, and all
male). Results show that in all-female groups girls didn’t want anyone to feel bad so they
were more agreeable to ideas being presented and avoided challenging them; in mixed-
gender groups girls used reasoning and persuasion in the discussions, but the outcomes
were more original because the male group members provided more critical analysis of
proposed ideas. Furthermore, Kemp found no correlation between the gender
composition of the group and girls’ attitude toward science or the specific activity. Based
on these findings, the author concluded that mixed-gender grouping could promote
favorable behaviors and thought processes in both girls and boys participating in
computer-assisted, problem-based learning. In other words, mixed-gender groups
promoted girls’ cognitive engagement, while group gender composition did not influence
girls’ emotional engagement.
Bennett, Hogarth, Lubben, Campbell and Robinson (2010) comprehensive review
of the literature of small group research in school science showed that single-gender
groups functioned more purposefully toward understanding the topics (i.e., better
cognitive engagement), while mixed-gender groups interacted in a more constrained way
with more conflicts among students of different genders. Particularly, they noticed that
girls in single-gender groups worked together to search for common features of their
explanations and resolve conflicting explanations (i.e., better cognitive engagement).
Harskamp, Ding and Suhre (2008) investigated whether dyads (students working
in pairs) influence female high school students’ learning to solve physics problems, and

13
what role female communication style plays during these cooperative learning process. A
total of 62 high school students (31 female and 31 male) were randomly assigned to pairs
and three research conditions: 15 mixed-gender pairs, eight female–female pairs and
eight male–male pairs. All students solved the same physics problems in four 50-minute
sessions. In each session, students were asked to solve three new paper-and-pencil
problems working together as pairs. For data analysis purposes, the researchers
distinguished among four groups: females in the mixed-gender condition, females in the
female-female condition, males in the mixed-gender condition, and males in the male-
male condition. Data analysis revealed that female students in the mixed-gender pairs
devoted less time to actively seeking solutions and spent more time asking questions to
their teammates than their male partners or the females in the all-female dyads. The
researchers concluded that in the mixed-gender pairs their partner’s gender influenced
females’ solution-seeking behavior. That is, working with boys hindered girls’ deep
cognitive engagement while working with each other promoted girls’ deep cognitive
engagement. However, the research did not explore what factors (e.g., interest, self- or
collective efficacy) were related to such a difference.
Summary. The above reviewed studies presented mixed findings regarding how
gender grouping influenced girls’ engagement. While most of them reported positive
effects of all-female or female-majority gender composition of the learning context on
girls’ engagement (behavioral and/or emotional and/or cognitive), some of them were
inconclusive. Also, while some studies (e.g. Dasgupta, et al., 2015) analyzed specific
factors (e.g., psychological safety and self-efficacy) through which the gender

14
composition of the learning context affected engagement, a large proportion of these
reviewed studies did not consider such factors.
The Relationship between Gender Grouping and Student Achievement
In this subsection (and throughout this study), student achievement is defined as
“the status of subject-matter knowledge, understandings, and skills at one point in time”
(National Board for Professional Teaching Standards, 2011, p. 28). Under this
framework, I included studies regarding various measures of achievement, including
STEM content knowledge, problem-solving skills and science/engineering practices.
With the perception that existing research on how gender composition within
groups influences individual outcomes in science is not only sparse but also conflicting,
Gnesdilow, Evenstone, Rutledge, Sullivan and Puntambekar (2013) explored this issue in
a DBS context asking: Do differences in gender composition impact middle school
science students’ learning in small groups? The context for this study was a 12-week
physics curriculum on forces, motion, work, and energy in which 637 middle school
students worked in three- or four-member groups to design a fun, safe, and efficient roller
coaster for an amusement park which was suffering waning attendance. To examine the
effects of gender composition, the researchers arranged five different gender ratios: all
boys, mostly boys, even split between boys and girls, mostly girls, and all girls. Pre- and
post-test data were collected on students’ content knowledge in physics and science
practices (such as making inferences and using data to back up reasoning). Posttest
results showed that students in the mostly-girl groups had the largest mean score for both
content knowledge and science practice, followed by students in mostly-boy groups and
students in even-split groups. Students in the all-girl and all-boy groups had the lowest

15
means on the posttests. Furthermore, both content knowledge score and science practice
score were significantly higher for students in mixed-gender groups than for students in
same-gender groups. Based on these findings, the researchers concluded that the presence
of at least one member of the opposite gender increased students’ achievement on both
science content and practices. However, as they realized themselves, they would need to
qualitatively examine the interactions among students in all types of groups to better
understand how these outcomes may have occurred. That is, they need to measure student
engagement and examine its relationship with achievement. Also, they did not compare
students of the same gender across groups of different gender composition (for example,
girls in the all-girl groups vs. girls in the most-boy groups).
Among the studies reviewed in the last subsection, some went beyond the
relationship between gender grouping and student engagement and also examined student
achievement. These studies are introduced below.
Harskamp, Ding and Suhre (2008) investigated whether students’ gender in
learning dyads influenced high school girls’ learning to solve physics problems, and the
role female communication style played in their cooperative learning process. While they
found that girls in mixed-gender pairs had shallower cognitive engagement than girls in
all-girl pairs, they also found that girls in the former dyad did not learn to solve physics
problems as well as girls in the all-girls pairs (as reflected by their test scores). They
attributed the difference in achievement to the differences in solution-seeking behavior
(cognitive engagement).
Similarly, in their literature review on small group work in school science,
Bennett and colleagues (2010) found that girls in single-gender groups had better

16
cognitive engagement (i.e., groups functioned more purposefully toward understanding
topics and worked better to resolve conflicting understandings) than girls in mixed-
gender groups. However, they also found that improvements in understanding were
independent of gender composition of groups. Unlike Harskamp and colleagues (2008),
these authors did not explore what factors led to students’ improved achievement.
Similarly, Kemp (2005) did not explain why the gender composition of the group during
a computer-assisted, problem-based inquiry activity did not influence girls’ achievement
of science. Though, she found that mixed-gender middle school student groups promoted
girls’ cognitive engagement (girls in mixed-gender groups used more reasoning than all-
female groups) and not influence girls’ emotional engagement (attitudes toward science
and this specific activity).
Baker (2002) examining the impact of single-gender middle school science and
mathematics classrooms on achievement, affect, peer, and teacher-student interactions,
found that female students’ higher grades in mathematics and science were not
attributable to the single-gender environment, although such an environment was found
to promote girls’ emotional engagement (i.e., perceptions of empowerment and peer
support). As the above researchers, he did not examine the relationship between
achievement and emotional engagement, that is, why girls’ higher emotional engagement
did not lead to higher achievement.
Friend (2006) didn’t find any significant correlations in her inquiry into the
effects of gender grouping on classroom. While she found that single-gender classes did
not create a more positive classroom atmosphere (i.e., students’ emotional engagement),

17
she also found that gender grouping did not produce significant differences in students’
science achievement.
Häussler and Hoffmann’s (2002) study of female students’ interest, competence
and achievement in coeducational vs. single-gender physics classes, though
demonstrating positive impacts of teaching boys and girls separately on girls’ interest and
competence (i.e., emotional engagement) and on girls’ immediate and delayed
achievement in physics, did not probe whether girls’ improved achievement was
correlated with their interest and competence (i.e., emotional engagement)
Richardson and colleagues (2003) investigated a three-year program offering
gender-sensitive and integrated mathematics and science elementary instruction in
various instructional contexts (school, after school, and summer camp). They found that
girls’ working with each other had enhanced emotional engagement (i.e., attitudes,
expressiveness and perceived empowerment) and improved achievement in science and
mathematics. However, it is not clear whether their achievement was related to their
emotional engagement because the researcher did not explore such a relationship.
Summary. The studies reviewed in this subsection showed mixed findings
regarding the influence of gender grouping and student achievement; some found that
single gender contexts promoted girls’ achievement, others didn’t. Furthermore, most of
these studies did not explore possible relationships between engagement and achievement
and thus did not explain how the gender composition of the learning context influenced
achievement.

18
Literature Review Conclusions
From the above literature review, a number of patterns can be seen.
First, gender grouping has been studied in various disciplines (science,
mathematics, and engineering); instructional context (formal and informal settings; e.g.,
Draper, 2004; Kemp, 2005); and groupings such as pairs (e.g., Harskamp, Ding & Suhre,
2008), small groups (e.g., e.g., Dasgupta, Scircle and Hunsinger, 2015; Gnesdilow et al.,
2013), or classes and programs (single gender vs. co-ed; e.g., e.g., Häussler & Hoffmann,
2002; Friend, 2006). These studies were conducted in inquiry-based science (e.g.,
Bennett, Hogarth, Lubben, Campbell & Robinson, 2010; Kemp, 2005; Estrada, 2007) or
DBS contexts (e.g., Watson & Lyons, 2009) and stressed various types of student
activities (e.g., paper-and-pencil problem solving, computer-aided virtual scientific
inquiry, real-life hands-on scientific inquiry, engineering design, or authentic lab research
experiences; e.g., Dasgupta, Scircle & Hunsinger, 2015; Harskamp, Ding & Suhre, 2005;
Kemp, 2005; Estrada, 2007; Gnesdilow, Evenstone, Rutledge, Sullivan & Puntambekar,
2013). With respect to research methodology, some researchers simply compared single-
gender student units and mixed-gender student units (e.g., Friend, 2006; Hughes et al.,
2013; Häussler and Hoffmann, 2002) and others systematically varied the gender
composition of student units (e.g., 25% female, 50% female, 75% female; Dasgupta et
al., 2015). Finally, these studies measured a wide variety of variables, such as student
identity (e.g., Hughes et al., 2013), attitudes (e.g., Watson & Lyons, 2009), competence
(e.g., Häussler & Hoffmann, 2002), interest (e.g., Häussler & Hoffmann, 2002; Hughes et
al., 2013), self-efficacy (e.g., Dasgupta et al., 2016), engagement (e.g., Bennett et al.,

19
2010), career aspiration (e.g., Dasgupta et al., 2016), classroom atmosphere (e.g., Friend,
2006), and achievement (e.g., Kemp, 2005; Baker, 2005; Richardson et al., 2003).
Second, these studies showed mixed findings. While some researchers found
gender grouping to be related to improved levels of girls’ attitudes, interest, engagement
and achievement (e.g., Dasgupta, et al., 2015; Estrada, 2007), others did not see such
effects or even revealed reversed effects – boys improved results (e.g., Gnesdilow et al.,
2013). Other researchers have also noticed this phenomenon in the literature (e.g., LePore
& Warren, 1997; Ferney & Domingue, 2000; Sanders, 1994).
Third, although small group work has many great advantages, such as improving
student interest and engagement and supporting the learning of scientific and engineering
practices (Mills & Alexander, 2013; UMass Donahue Institute Research and Evaluation
Group, 2011), only a small number of studies on gender grouping in STEM fields have
been conducted at the small group level (e.g., , Estrada, 2007; Bennett et al., 2010) –
most studies are at the pair, class and program levels (e.g., Häussler & Hoffmann, 2002;
Friend, 2006).
Fourth, as noted by Gnesdilow, Evenstone, Rutledge, Sullivan and Puntambekar
(2013) and based on my own literature research, gender grouping research in DBS is
sparse and particularly on the small group level.
Fifth, while many studies have researched the relationship between gender
grouping and student engagement/participation (e.g., Dasgupta, 2011; Kemp, 2005;),
none of them defined and thus explored engagement on its behavioral, emotional and
cognitive dimensions (Fredricks, Blumenfeld & Paris, 2004) and explored the
relationship between each of them and gender grouping.

20
Sixth, many of the studies which reported a significant effects between gender
composition and student achievement did not explore the relationship between
engagement and achievement (e.g., Harskamp et al., 2008; Häussler and Hoffmann,
2002).
In summary, none of the gender grouping studies investigated the following
aspects at the same time and systematically:
• Gender grouping’s possible influences on girls’ engagement at the small group
level in a DBS context;
• Variation of student groups’ gender composition (i.e., 25% female, 50% female,
and so on);
• Microanalysis of the three dimensions of engagement – behavioral, emotional,
and cognitive engagement;
A result, my research addressed these issues and asked the following overarching
questions: Will female students’ engagement in DBS tasks in high school biology differ
depending on the varying gender composition of their small groups? How does their
engagement influence their achievement? More specifically, I asked five questions:
1. How does female and male students’ behavioral engagement in each step of the
design process vary across groups of different gender compositions? (Label: RQ1:
Behavioral Engagement and Group Gender Composition.)
2. How does female and male students’ emotional engagement in each step of the
design process vary across groups of different gender compositions? (Label: RQ2:
Emotional Engagement and Group Gender Composition.)

21
3. How does female and male students’ cognitive engagement in each step of the
design process vary across groups of different gender compositions? (Label: RQ3:
Cognitive Engagement and Group Gender Composition.)
4. How does female and male students’ achievement in engineering practice relate to
their behavioral, emotional and cognitive engagement? (Label: RQ4:
Achievement and Engagement.)
5. How does female and male students’ achievement in biology content and
engineering practice differ across groups of different gender compositions?
(Label: RQ5: Achievement and Group Gender Composition.)

22
CHAPTER 3
CONCEPTUAL FRAMEWORK
In order to answer my research questions, I draw from a conceptual framework
which is composed of several elements – key concepts that are essential in this study
(e.g., the engineering design process, student engagement) and two theories about factors
that influence student engagement and achievement. This framework guided my research
design, data analysis, and the interpretation of results.
Engineering Design
Generally speaking, engineering is both a body of knowledge and a process. The
engineering process is design – “the process of devising a system, component, or process
to meet desired needs” (ABET, 2010, p.5) – which is commonly considered to be the
central and distinguishing activity of engineering (Dym, Agogino, Eris, Frey, & Leifer,
2005).
In the K-12 setting in the USA, engineering design is defined by recent major
reform documents as a systematic process for achieving best solutions (i.e., a device,
system or process) to particular human problems (NRC, 2012; NGSS Lead States, 2013;
NAE, 2009). Also, these national documents introduce three components of the design
process: (1) defining and delimiting engineering problems, (2) designing solutions to
engineering problems, and (3) optimizing the design solution (NRC, 2012; NGSS Lead
States, 2013).
In Massachusetts (where this study was conducted), the 2016 Massachusetts
Science and Technology/Engineering Curriculum Framework (referred to as the 2016
Massachusetts Framework hereinafter) provides a more detailed version of the design

23
process which contains the following steps: Identify a Need or Problem, Research,
Design, Prototype, Test and Evaluate, Communicate, Explain, and Share, and Provide
Feedback (see Figure 1 for a visual illustration).
Figure 1. The engineering design process (Massachusetts Department of Elementary
and Secondary Education, 2016. p.100)
The 2016 Massachusetts Framework provides the following definitions of the
design steps (Massachusetts Department of Elementary and Secondary Education, 2016,
p.100):
• Identify a Need or a Problem. To begin engineering design, a need or problem
must be identified that an attempt can be made to solve, improve and/or fix.
This typically includes articulation of criteria and constraints that will define a
successful solution.
• Research. Research is done to learn more about the identified need or problem
and potential solution strategies. Research can include primary resources such

24
as research websites, peer-reviewed journals, and other academic services, and
can be an ongoing part of design.
• Design. All gathered information is used to inform the creations of designs.
Design includes modeling possible solutions, refining models, and choosing
the model(s) that best meets the original need or problem.
• Prototype. A prototype is constructed based on the design model(s) and used
to test the proposed solution. A prototype can be a physical, computer,
mathematical, or conceptual instantiation of the model that can be
manipulated and tested.
• Test and Evaluate. The feasibility and efficiency of the prototype must be
tested and evaluated relative to the problem criteria and constraints. This
includes the development of a method of testing and a system of evaluating
the prototype’s performance. Evaluation includes drawing on mathematical
and scientific concepts, brainstorming possible solutions, testing and
critiquing models, and refining the need or problem.
• Provide Feedback. Feedback through oral or written comments provides
constructive criticism to improve a solution and design. Feedback can be
asked for and/or given at any point during engineering design. Determining
how to communicate and act on feedback is critical.
• Communicate, Explain, and Share. Communicating, explaining, and sharing
the solution and design is essential to conveying how it works and does (or
does not), solving the identified need or problem, and meeting the criteria and
constraints. Communication of explanations must be clear and analytical.

25
Overall, the above steps can fit into the three components of the design process
defined by the national documents. So, these can be considered two different ways of
depicting the same process.
Because my study was conducted in Massachusetts, I adopted the Massachusetts
version of the design process. However, to fit this framework into the specific learning
contexts of my study (i.e., small group work in two design tasks, which will in introduced
in the Methods chapter), I adapted it.
In these tasks, the problem, which was clearly defined, was given by the teacher.
So the first design step, Identify a Need or a Problem, was skipped by the students and
not included in this study.
Given that “Research” can have a broad meaning and that the in my study’s
design tasks students were doing background research toward understanding and solving
the given problems, I renamed this step “Researching the Problem”.
The step named “Design” in the 2016 Massachusetts Framework is not clear
because the whole engineering design process can also be called “design”. So, I followed
Pahl and Beitz’s (1996) nomenclature and renamed it “Conceptual Design”. Importantly,
such a concept’s definition matches the definition of the “Design” step in the 2016
Massachusetts Framework, which includes generating design options and evaluating and
selecting design options.
The design step “Prototype” in the 2016 Massachusetts Framework is merely a
noun that does not explicitly reflect the fact that students manually constructed a
prototype based on the outcome of the Conceptual Design step. So, again I followed Pahl
and Beitz’s (1996) nomenclature and renamed it “Embodiment Design”, which conveys
26
the meaning that the design option generated and selected in the Conceptual Design step
is embodied in this step.
In the 2016 Massachusetts Framework, the Test and Evaluate step’s name doesn’t
reflect the fact that students tested, evaluated and refined the prototype in this step. So, I
renamed it “Test and Refine”.
In the students’ actual small group work on the two design tasks in this study,
their design step of Communicate, Explain, and Share happened at the end of the tasks
the whole-class level as group presentations and is beyond the scope of my study. Also,
their Provide Feedback step was performed by their teacher, so was not included in my
study.
Design-Based Science
Along with the release of the NGSS, which advocate integrating engineering
design into science education (NGSS Lead States, 2013), the idea of DBS has gained
unprecedented attention and popularity. But it is not a new notion. During the last two
decades, DBS has emerged as an approach to science teaching and learning rather than to
engineering/technology education, and with various labels, such as design-based learning,
Learning by DesignTM, learning through design, and performance Project-based Science
curriculum (pPBSc), etc. (Haury, 2002; Apedoe, Reynolds, Ellefson, & Schunn, 2008;
Doppelt & Schunn, 2008).
Despite all these different labels, DBS has a relatively clear meaning - it generally
refers to the science pedagogy where students work in groups to construct new scientific
knowledge and problem-solving skills in the context of designing artifacts (Fortus,
Krajcik, Dershimer, Marx & Mamlok‐Naaman, 2005; Kolodner, 2002; Doppelt, Mehalik,

27
Schunn, Silk & Krysinski, 2008). Importantly, it should be noticed that although through
engineering design students will acquire problem-solving skills in both science and
engineering (Apedoe, Reynolds, Ellefson & Schunn 2008), it is mainly used as a tool for
students to better learn science/engineering and not as a field unto itself (Leonard &
Derry, 2011). In other words, in K-12 DBS, the implementation of engineering design is
primarily a framework where students reinforce scientific knowledge and skills through
pursuing design activities that necessitate investigations into or applications of given
science topics (Nieswandt & McEneaney, 2012).
In an effort to further define DBS operationally, Crismond (2001) developed a list
of central features of pedagogically solid design activities, based on many other
researchers’ related work (e.g. Hmelo, Holton, & Kolodner, 2000; NRC, 1996; Miller,
1995; Mann, 1981; Sadler, Coyle, & Schwartz, 2000):
• Design challenges should involve students in authentic hands-on tasks.
• The products of students’ designs should be made from familiar and easy-to-
work materials using known fabrication skills.
• Design tasks should possess well-defined outcomes that allow for multiple
solution pathways.
• Design tasks should promote student-centered collaborative work and higher-
order thinking.
• Design tasks should allow for multiple design iterations to improve the
product.
• Design tasks should provide clear links to limited number of science and
engineering concepts.

28
These principles were followed as much as possible during the development of
the design activities that would be used in this study.
Student Engagement
The notion of engagement with reference to students’ learning has been
conceptualized in many different and often inconsistent ways, and has been referred to by
various terms, such as school engagement, student engagement, academic engagement, or
engagement in schoolwork (Bundick, Quaglia, Corso & Haywood, 2014; Fredricks et al.,
2004). In an effort to clarify all the different definitions, discuss limitations of current
research, and suggest improvements, Fredricks and colleagues (2004) conducted an
extensive literature review and identified three highly interwoven but conceptually
distinct dimensions of engagement: behavioral, emotional, and cognitive.
According to Fredricks et al. (2004), behavioral engagement refers to various
kinds of learning-related and academic-oriented behaviors, actions and involvements that
students engage in. Examples of this type of student engagement include following
school rules, attending classes, concentrating on academic tasks, asking questions,
contributing to class discussion, completing assignments, etc.
This definition provides a foundation for identifying students’ behavioral
engagement at the individual level. However, in this study I am focusing on students’
engagement at the group level, and this means I must take into account the social
interactions among group members during their group work which play a key role in
affecting learning in small groups (Linnenbrink-Garcia, Rogat & Koskey, 2011).
Therefore, it is necessary to introduce another construct – social-behavioral engagement
(Linnenbrink-Garcia, et al., 2011).

29
According to Linnenbrink-Garcia et al. (2011), social-behavioral engagement
refers to social forms of engagement around academic tasks, including participation with
classmates as well as the quality of social interactions. Further, they operationalized this
construct in terms of the following two components (Linnenbrink-Garcia, et al., 2011):
• Social loafing: this construct refers to the tendency that individual students
exert less effort when working collectively than working alone, leading to
disengagement from group work on task (Karau & Williams, 1995).
• Quality of group interactions: this construct refers to “the way in which group
members support or undermine each other’s participation; it can range from
positive (e.g., actively working to support fellow group members’
engagement, respecting other group members, working cohesively) to
negative (e.g., discouraging other students from participating, disrespecting
other group members, statements or actions that convey low cohesion)”
(Linnenbrink-Garcia, et al., 2011, p. 14).
Therefore, in my study, behavioral engagement does not only refer to individual
academic-oriented behaviors/actions as defined by Fredricks et al. (2004), but also
include students’ social loafing and quality of group interactions during their group work.
Emotional engagement refers to students’ affective reactions to their teachers,
classmates, academic contents/activities, and school. For example, students’ self-efficacy
in academics, their sense of belonging in the school context and attitudes toward school,
their interest in academic content, their perception of relatedness to teachers and other
students, as well as their emotions such as happiness, sadness, anxiety, boredom, etc.

30
(Fredricks et al., 2004; Bundick, et al., 2014). Importantly, this type of engagement is
presumed to influence students’ willingness to do their work (Fredricks et al., 2004).
Cognitive engagement involves three important aspects (Fredricks et al., 2004;
Bundick, et al., 2014): (1) A psychological investment that incorporates thoughtfulness
and willingness to make efforts to comprehend complex ideas and master difficult skills
(e.g., a desire to go beyond requirements, a preference for challenges, etc.); (2) self-
regulated learning (e.g., the use of strategies such as planning and monitoring learning,
and evaluating one’s thinking); and (3) cognitive processes.
As a meta construct (Fredricks et al. 2004), student engagement also has an
important characteristic – it is context-dependent. That is, it is a result of the interaction
of the individual with the context and is responsive to environmental variations (Connell,
1990; Finn & Rock, 1997). For example, a student may feel socially connected to a
particular teacher but not to another teacher or teachers in general, and her interest and
psychological investment in learning particular content may be much higher in the class
of the teacher to who she feels connected than contents in the other teachers’ classes
(Bundick, et al., 2014).
It was within this three-dimensional construct of engagement that the present
study intended to explore high school girls’ engagement in single- and mixed-gender
four-member groups in DBS contexts.
Student Achievement
According to the National Board for Professional Teaching Standards (2011),
student achievement refers to “the status of subject-matter knowledge, understandings,

31
and skills at one point in time” (p. 28). In my study I measured all these types of
variables.
In the context of my study which included two engineering design activities in
high school biology, the student knowledge and understanding involved their post-
activity knowledge (i.e., how much they remember) and understanding (i.e., how well
they understand some important concepts) in biology and engineering.
As for skills, since students participated in engineering design activities, only
their engineering design skills were included in this study. In light with the NGSS, I
defined engineering design skills in terms of students’ performance in engineering design
practices (NGSS Lead States, 2013). In addition, for evaluation purposes, I defined
students’ performance as the number of the occurrences of their engagement in certain
engineering practices.
Two specific engineering design practices were assessed:
• Making decisions on tradeoffs that account for constraints
• Practicing multiple iterations of one or more steps of the design cycle to
improve design
• Evaluating student achievement in these two aspects is important because:
• The first engineering practice (i.e., making tradeoffs) is a central feature of
engineering design (Vermaas, Kroes, Light & Moore, 2008) and also is
included in the engineering design performance expectations for high school
students (i.e., HS-ETS1-3) in the NGSS (NGSS Lead States, 2013).
• The second engineering practice (i.e., engaging in multiple iterations) is also
an inherent feature of the engineering design process and plays an important

32
role in shaping the outcomes of design in terms of cost, time, and quality
(Costa & Sobek II, 2003). Also, obtaining this practice is required by the
NGSS as one of the performance expectations for engineering design for
secondary students (NGSS Lead States, 2013). As for my study’s participants,
I learned from the teachers that they had never learned about engineering
design before. Therefore, it was meaningful to assess their performance in this
aspect.
Theories Regarding Factors Influencing Student Engagement and Achievement
Student engagement is influenced by a variety of factors, such as culture (Mehan,
Villanueva, Hubbard, Lintz, Okamato, & Adams, 1996), community (Ogbu, 2003),
family (Hughes & Kwok, 2007) and educational context (Connell & Wellborn, 1991). In
K-12 education, research has identified factors influencing student engagement on three
different levels (school level, classroom level, and individual student level; see Fredricks
et al., 2004; Connell, Spencer & Aber, 1994; Skinner & Belmont, 1993; Kindermann,
1993; New Zealand Ministry of Education Research Division, 2010).
Similarly, factors within K-12 education that influence student academic
achievement have been identified at different levels such as school district-level factors
(e.g., policies, budget; Leithwood, Louis, Anderson & Wahlstrom, 2004); school level
factors (e.g., school size, student-teacher ratio; Rugutt & Chemosit, 2005; Gemici & Lu,
2014); classroom level factors (e.g., curriculum, teacher qualification and experience,
Reyes, Brackett, Rivers, White & Salovey, 2012; Rugutt & Chemosit, 2005); and
individual student factors (e.g., physical, emotional and social health, academic aspiration

33
and engagement, De Maio, Zubrick, Silburn, Lawrence, Mitrou, Dalby, Blair, Griffin,
Milroy & Cox, 2005).
In this study, my focus was on student’s academic engagement and achievement
at the individual and group levels. Specifically, I explored how gender grouping (a group-
level variable) may influence female (and male) students’ behavioral, emotional and
cognitive engagement (subgroup-level variables) in their small group work in the DBS
activities and in turn how their behavioral, emotional and cognitive engagement may
influence their achievement in biology content and engineering practice (individual-level
variables).
Regarding the relationships among context, self, action and outcome, a major
theory is Connell and Wellborn’s (1991) self-system processes model. This model
explains linkages among individuals' experience of the social context, their self-system
processes (i.e., perceived competence, autonomy and relatedness), their patterns of action
(i.e., behavioral, emotional, and cognitive engagement vs. disaffection), and the outcomes
of their actions. A simple model of this process can be illustrated as CONTEXT → SELF
→ ACTION → OUTCOME (adapted from Skinner, Wellborn, & Connell, 1990, p. 23).
According to this model, an individual’s self-system processes are influenced by the
contingency and involvement experienced by him/her and result in engaged or
disaffected patterns of action that then have an impact on the outcomes of his/her actions
(Skinner et al., 1990). Further, Furrer, Skinner, Marchand and Kindermann (2006)
pointed out that it is important to understand that engagement can change through cyclic
interplay with contextual factors and influence later outcomes, which are the products of
these context-related changes in engagement. With this reminder, Appleton and
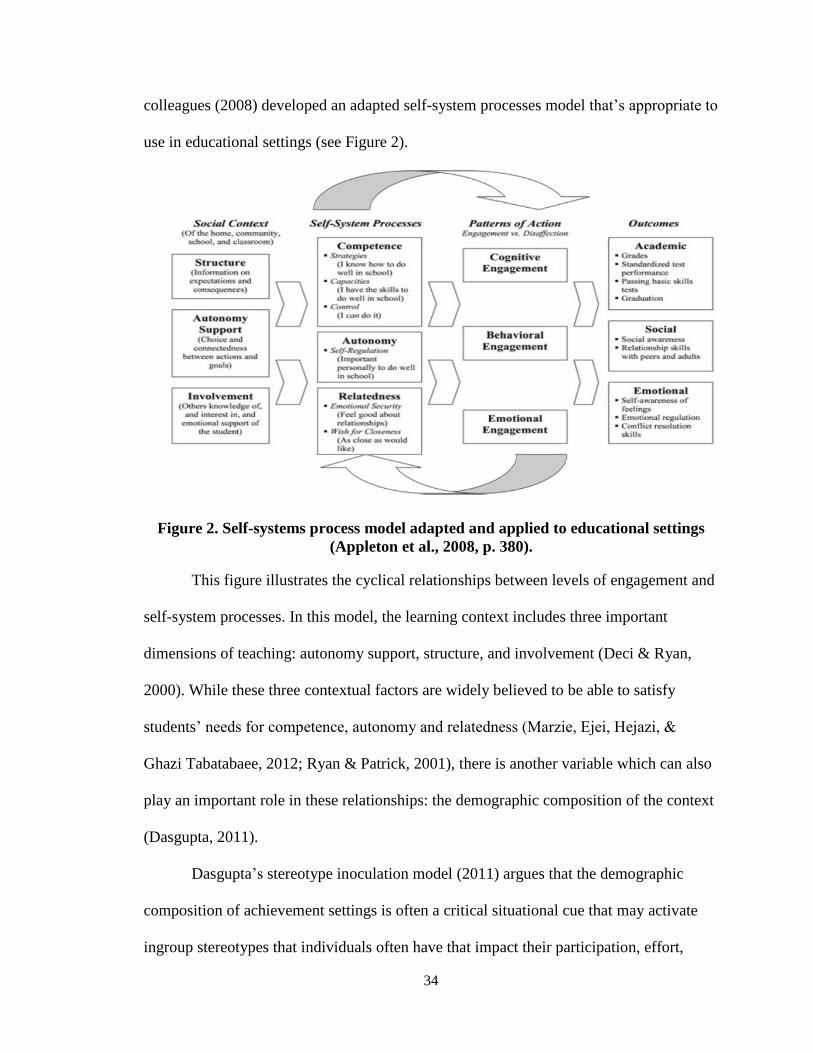
34
colleagues (2008) developed an adapted self-system processes model that’s appropriate to
use in educational settings (see Figure 2).
This figure illustrates the cyclical relationships between levels of engagement and
self-system processes. In this model, the learning context includes three important
dimensions of teaching: autonomy support, structure, and involvement (Deci & Ryan,
2000). While these three contextual factors are widely believed to be able to satisfy
students’ needs for competence, autonomy and relatedness (Marzie, Ejei, Hejazi, &
Ghazi Tabatabaee, 2012; Ryan & Patrick, 2001), there is another variable which can also
play an important role in these relationships: the demographic composition of the context
(Dasgupta, 2011).
Dasgupta’s stereotype inoculation model (2011) argues that the demographic
composition of achievement settings is often a critical situational cue that may activate
ingroup stereotypes that individuals often have that impact their participation, effort,
Figure 2. Self-systems process model adapted and applied to educational settings
(Appleton et al., 2008, p. 380).

35
performance and other outcome variables via their perceived social belonging, self-
efficacy, challenge and threat. Therefore, contact with ingroup experts/peers in
achievement contexts functions, just like a medical vaccine, as a “social vaccine” that
inoculates individuals against stereotype-based self-doubt. Based on this, several
predictions can be made (see Figure 3 for a visual illustration) (Dasgupta, 2011). First,
such contact will enhance individuals’ positive attitudes toward the achievement domain,
their identification with it, their self-efficacy, and their motivation to pursue career goals
in the domain. Second, such contact is particularly important for those whose ingroup is a
minority and negatively stereotyped, and less important for those whose ingroup is the
majority and expected to succeed by default. For example, in the workplace where
women face negative stereotypes regarding their competence, encountering high-
performing ingroup members enhances their self-concept more than men’s (Lockwood,
2006). Third, such contact will be most beneficial if the individual perceives a sense of
connection or identification with her/his ingroup peers/experts. Finally, four intertwined
processes are proposed as the psychological mechanisms that inoculate the self-concept
when individuals encounter ingroup peers/experts in achievement/professional contexts:
enhanced sense of belonging in the context, increased self-efficacy, feeling positively

36
challenged by difficulty, and feeling less threatened.
Figure 3. Illustration of the stereotype inoculation model (Dasgupta, 2011, p. 234)
Figure 3 shows a CONTEXT → SELF → ACTION (e.g., participation) AND
OUTCOME (e.g., performance) link, which is similar to the CONTEXT → SELF →
ACTION → OUTCOME link shown in Figure 2, so it is possible to synthesize them; that
is, to synthesize Connell and Wellborn’s (1991) self-system processes model and
Dasgupta’s (2011) stereotype inoculation model. Such a synthesis creates the conceptual
framework for my study, and is illustrated by Figure 4.

37
Figure 4. Conceptual framework of this study: a synthesis of Connell and
Wellborn’s (1991) self-system processes model and Dasgupta’s (2011) stereotype
inoculation model. Note. Adapted from Connell and Wellborn’s (1991, p. 54);
Appleton, Christenson & Furlong (2008, p. 380); and Dasgupta (2011, p. 234)
In this figure, the gender composition of the learning context is included as a
contextual factor that influences later variables in the learning process. This variable is
the embodiment of the variable of demographic composition of achievement context in
stereotype inoculation model, given that I am researching the effects of gender grouping.
The self-system process variables in this new framework include autonomy, relatedness,
and self-efficacy, which is consistent with Connell and Wellborn’s (1991) self-system
processes model. Perceived challenge and threat from stereotype inoculation model are

38
not included in the new framework. According to Dasgupta (2011), if students believe
they have the mental resources to deal with the task they will feel positively challenged,
but if they believe their inner resources are overwhelmed by task demands then they will
feel threatened. Therefore, these two process variables are very similar to the concept of
self-efficacy and I considered that they are incorporated in this concept. In the Outcomes
column, I only included academic achievement as social and emotional outcome
variables are beyond the scope of my study.
As Figure 4 displays, all the contextual factors, with gender composition
moderated by female students’ perceived similarity or identification with their ingroup
peers (i.e., other girls in the same group in this case) (Dasgupta, 2011), may impact their
perceived self-efficacy, autonomy, and social relatedness; in turn, these psychological
processes may influence their behavioral, emotional and cognitive engagement, which
finally lead to their academic achievement.
It is under the guidance of such a conceptual framework that I conducted my
study – the design of the study (including varying gender composition of student groups),
the collection and analysis of data, the interpretation of data analysis results and the
arrival of conclusions.
Note, although I use arrows to connect students’ social learning context,
psychological processes, patterns of action (engagement), and learning outcome in Figure
4, these arrows don’t represent causal relationships. My proposed research design
allowed me only to infer correlational relationships.
39
CHAPTER 4
METHODS
My overall research question was: How does group gender composition in student
small group work in design-based science (DBS) activities in high school biology
influence students’ engagement and achievement? More specifically, I asked the
following research questions:
1. How does female and male students’ behavioral engagement in each step of the
design process vary across groups of different gender compositions? (Label: RQ1:
Behavioral Engagement and Group Gender Composition.)
2. How does female and male students’ emotional engagement in each step of the
design process vary across groups of different gender compositions? (Label: RQ2:
Emotional Engagement and Group Gender Composition.)
3. How does female and male students’ cognitive engagement in each step of the
design process vary across groups of different gender compositions? (Label: RQ3:
Cognitive Engagement and Group Gender Composition.)
4. How does female and male students’ achievement in engineering practice relate to
their behavioral, emotional and cognitive engagement? (Label: RQ4:
Achievement and Engagement.)
5. How does female and male students’ achievement in biology content and
engineering practice differ across groups of different gender compositions?
(Label: RQ5: Achievement and Group Gender Composition.)
To answer these questions, I conducted a mixed methods study (Teddlie &
Tashakkori, 2009) using qualitative data (videotaped small group work, student focus

40
group interviews) and quantitative data (attitudinal and achievement questionnaires) that
had been collected in a NSF-funded research study, Managing Small Groups to Meet the
Social and Psychological Demands of Scientific and Engineering Practices in High
School Science (referred to as the Small Group Project hereafter), with Drs. Martina
Nieswandt and Elizabeth McEneaney as Co-PIs (see DRL-1252339).
As outlined in Figure 5, I investigated the relationships among three major
variables: group gender composition (i.e., group female percent), engagement (of student
subgroups), and achievement (of individual students), and these relationships correspond
to my five research questions.
The research design of my study is a mono-strand conversion design – a mixed
methods research design that has only one strand and in which quantitative and
qualitative approaches are mixed (Teddlie & Tashakkori, 2009). With respect to my
study, I employed quantitative and qualitative data and approaches as well as data
Figure 5. Study design

41
conversion (Teddlie & Tashakkori, 2009) - some of my qualitative data were converted
into numerical information that was analyzed statistically – in order to analyze student
engagement. Specifically, to answer my first three research questions (i.e., relationships
between group gender composition and student engagement), I used sequence analysis to
analyze student group work videos; and in this process the qualitative video data were
converted to quantitative data represented by a variable named PHEL3 indicating the
student subgroup’s4 level of engagement (see Box ④). To quantitatively answer my first
three research questions, I statistically analyzed the correlations between group gender
composition and subgroup PHELs, as indicated by the arrow between Circle ① and Box
④. Below this arrow, “G% , female PHEL , male PHEL ” represents the two
hypotheses I developed for analyzing these correlations: The higher the percentage of
girls in a group (G% stands for group female percent), the higher the PHEL of the female
subgroup, and the lower the PHEL of the male subgroup. Above the arrow, “Spearman’s
rho” indicates that I used this measure to test these hypotheses. More details of this
analysis will be reported in the quantitative data analysis subsection. To deeply
understand the results of such statistical analysis, I also qualitatively analyzed the
students’ engagement by qualitatively analyzing student focus group interviews using
interpretational analysis. According to Bryman (2006), such use of one data source to
help explain the findings generated by another is one of the most frequently cited
rationales for conducting mixed methods research. To establish the trustworthiness of this
3 PHEL stands for percent of higher engagement levels. This will be explained in more detail in the
Quantitative data analysis subsection. 4 In this study, the student subgroup is the gender-specific subgroup of a group: all girls in a group make
the female subgroup of this group, and all boys in a group make the male subgroup of this group. In the
case of a single-gender group (i.e., an all-girl group or all-boy group), the subgroup is the group itself.

42
analysis I qualitatively analyzed student engagement by qualitatively analyzing the group
work videos using a technique named elaborated running records (ERRs) (see Boxes ⑤
and ⑥). Therefore, to answer my first three questions, I not only converted qualitative
data into quantitative data, but also integrated quantitative and qualitative data analyses.
To answer my fourth research question (RQ4: Achievement and Engagement), I
also conducted data conversion. As Box ⑦ in Figure 5 shows, I converted student group
work videos into two sets of quantitative achievement data: Iteration Achievement and
Tradeoff Achievement,5 and then statistically analyzed the correlations between these
variables and the student subgroup engagement variable PHEL using Spearman’s rho
(see the arrow between Boxes ④ and ⑦).
To answer my fifth research question (RQ5: Achievement and Group Gender
Composition), I statistically analyzed the relationships between group female percent and
individual student’s achievement. As Figure 5 shows, this research question is broken
into two parts6 – (1) the relationship between group female percent and student posttest
scores (see the arrow between Circle ① and Box ⑦) and, (2) the relationship between
group female percent and student video-based engineering practice scores (see the arrow
between Circle ① and Box ⑧). For the first part, I used HLM (hierarchical linear
modeling) as the data analysis method; for the second part, I used Spearman’s rho as the
data analysis method.
5 These are scores of the students’ engineering practices of conducting multiple iterations of the design
process and making tradeoff-based decisions. More details will be reported in the Quantitative data analysis
subsection. 6 The reason why this question is broken into two parts will be reported in the Quantitative data analysis
subsection.

43
Participants
A total of 185 students participated in the Small Group Project, which also
encompasses the participants of my study. Table 1 provides demographic information.
Students were from nine classes in four schools in Massachusetts and Vermont. School 1
was located in a small suburban area, Schools 2 in an urban area, and School 3 and 4 in
rural areas. While the population in all areas was predominantly white (over 85%), the
schools’ demographics varied, i.e., in School 1 the student population consisted of 75.6%
White, 12.9% Hispanic, 3% African American, 4.3% Asian, and 4.2% from other races;
in School 2 the student population consisted of 53.2% White, 39.1% Hispanic, 3.9%
African American, 1.7% Asian, and 2.1% from other races; in School 3 the student
population consisted of 86% White, 6% Hispanic, 2% Asian, 1% African American, and
4% from other races; and in School 4 the student population consisted of 92% White, 2%
African American, 1% Hispanic, 1% Asian, and 4% from other races. Also, the schools
had different student/teacher ratios: in School 1, it was 15.3; in School 2, it was 10.9; in
School 3, it was 16.0; and in School 4 it was 15.1 (Massachusetts Department of
Elementary and Secondary Education, 2017; Vermont Agency of Education, 2017).
In School 1, four Biology classes participated in the research; all classes were
taught by the same white female teacher with over 20 years of teaching experience. In
School 2, two classes were involved: one Biology honors class taught by a white female
teacher with over 20 years of teaching experience and one general Biology class taught
by a white female teacher with three years of teaching experience. In School 3, two
Biology classes participated and both taught by the same white male teacher with nine

44
years of teaching experience. In School 4, one class was involved and taught by a white
female teacher with over 20 years of teaching experience.

45
Table 1. Demographic of participating schools, classes, teachers and groups
School School Profile Teacher Class Number
Student
Group ID
Number
School 1
(suburban)
Student
demographics:
75.6% White, 12.9%
Hispanic, 3%
African American,
4.3% Asian, and
4.2% from other
races.
Student/teacher
ratio: 15.3
Teacher 1:
White female
with a teaching
experience of
20 years.
Class 1 (Period
1 in Fall 2014) 11-15
Class 2 (Period
2 in Fall 2014) 21-26
Class 3 (Period
4 in Fall 2014) 31-34
Class 4 (Period
3 in Spring
2015)
41-47
School 2
(urban)
Student
demographics:
53.2% White, 39.1%
Hispanic, 3.9%
African American,
1.7% Asian, and
2.1% from other
races.
Student/teacher
ratio: 10.9
Teacher 2:
White female
with a teaching
experience of
22 years.
Class 5 (an
honors class)
(Fall 2014-
Spring 2015)
51-55
Teacher 3:
White female
with a teaching
experience of 3
years.
Class 6 (Fall
2014-Spring
2015)
61-65
School 3
(rural)
Student
demographics: 86%
White, 6% Hispanic,
2% Asian, 1%
African American,
and 4% from other
races.
Student/teacher
ratio: 16.0
Teacher 4:
White male
with a teaching
experience of 9
years.
Class 7 (Spring
2015) 71-73
Class 8 (Spring
2015) 81-86
School 4
(rural)
Student
demographics: 92%
White, 2% African
American, 1%
Hispanic, 1% Asian,
and 4% from other
races.
Student/teacher
ratio: 15.1
Teacher 5:
White female
with a teaching
experience of
23 years.
Class 9 (Spring
2015) 91-95

46
Four-member student groups were formed based on the results of a biology
interest inventory (Marsh, Köller, Trautwein, Lüdtke, & Baumert, 2005) that students
completed prior to the creation of the groups – students with similar levels of interest
were grouped together. Two groups per class were videotaped, so the total number of
videotaped groups is 18. These 18 groups reflected a variety of gender compositions.
Specifically, there were three 100%-female groups, five 75%-female groups, one 66%-
female groups (one student was absent, so there were three students in the group: two
girls and one boy), five 50%-female groups, one 33%-female groups (one student was
absent, so there were three students in the group: one girl and two boys), and two 100%-
male groups. The NSF funded project goal required groups to be based on interest. The
current study therefore used the funded project data as secondary data, and so there was
no opportunity to arrange the groups by gender. However, there was enough variability in
the gender compositions of the groups to address the research questions.
One of my goals was to explore how gender grouping may influence girls’ and
boys’ engagement, I therefore, analyzed student engagement in gender-specific
subgroups; female subgroups (i.e., all the girls in the group) and male subgroups (i.e., all
the boys in the group), separately. This resulted in 16 female subgroups and 15 male
subgroups. In the case of a 100%-female group, the female subgroup was the group itself;
similarly, in the case of a 100%-male group, the male subgroup was the group itself). For
more specific information, refer to Table 2 below.
Group Nomenclature
For the Project’s data analysis purposes, one of the Small Group project leaders
and I developed a system to numerically represent these schools, classes, teachers, and

47
groups. To assign a group number to each of the groups, we followed a two-step
procedure. First, we numbered the groups within each class. Groups “1” and “2” are
videotaped groups in each class, and groups with numbers “3”, “4” or higher are non-
videotaped groups. Second, we added the class number in front of each group’s number
resulting in two digits group numbers. For example, Group 1, a videotaped group in Class
3 now became Group 31. Groups with a group number ending in “1” or “2” are
videotaped groups, Groups with ending numbers of 3, 4 or higher are non-videotaped
groups. All the videotaped groups are: 11, 12, 21, 22, 31, 32, 41, 42, 51, 52, 61, 62, 71,
72, 81, 82, 91, and 92.
In order to indicate the gender composition of a group, I use an “xgyb” string. In
such a string, “g” stands for girls, “b” stands for boys, x is the number of girls in this
group and y is the number of boys in this group. For example, 3g1b indicates a group that
has three girls and one boy (see Table 2). This string will also be used to label the results
of my sequence analysis of the videos as engagement data (this will be reported in the
next chapter).
Table 2. Gender composition of video-taped student groups
Group
Female
Percentage
Group
Gender
Composition
Group
Number
Number of
Groups
Number of
Female
Subgroups
Number of
Male
Subgroups
100% 4g0b 12, 32, 51 3 3 0
75% 3g1b 22, 61, 72,
82, 92 5 5 5
66% 2g1b 11 1 1 1
50% 2g2b 31, 52, 62,
81, 91 5 5 5
33% 1g2b 41 1 1 1
0% 0g4b 42 1 0 1
0g3b 71 1 0 1
Total
Amount N/A N/A 18 16 15

48
Gaining Entry and Informed Consent
Consent for the study (principals, teachers, parental consent for student
participation) was conducted as part of the Small Group project, which had received
approval to conduct the study by the University of Massachusetts Amherst Institutional
Review Board (IRB). For my study, I approached each teacher verbally with a
description of my project and how it relates to the Small Group project. Students in the
participating classes in each of the four schools were given a short presentation in class
introducing the Small Group project by Drs. Nieswandt and McEneaney and then given a
project description and an Informed Consent Form to share with their parents. Only
students who had received parental consent were considered when forming groups to be
videotaped. Because my study utilized subsets of the Small Group project data for its
analysis and did not require any further measures or modifications, no additional consent
was required beyond that for the Small Group project.
The Design-Based Science Contexts
While the Small Group Project participants completed three engineering design
and three scientific inquiry tasks, for the purpose of my study I chose two of the three
engineering activities: Heart Valve Design and Oil Spill Cleanup.7
Activity 1: Heart Valve Design (it will be referred to as Heart Valve hereafter).
This was a biomedical engineering task in which students used their knowledge of the
human heart to design an artificial heart valve for a hypothetical patient who needed a
7 There is another engineering task named Pill Coating Design in which students designed a coating for
aspirin pills for a girl whose stomach is easily irritated by this medicine. The main reason why I decided
not to use this task is that during the design process when students applied their designed coating onto the
pills they had to wait for a long time (sometimes overnight) for the coatings to dry and this long wait
interrupted the flow of their design process and in some cases changed some students’ interest/persistence,
and thus their engagement, in this task.

49
replacement for his damaged mitral valve. The task included constrains that students had
to deal with in their design process: (1) time: students had to finish their whole design
process in assigned class times; (2) materials: there were only 12 kinds of materials
available, although students could choose which to use freely; and (3) cost: students
needed to keep their cost as low as possible while they tried to make sure their heart
valve design would meet the final design requirements: (1) The heart valve design must
allow blood to flow in one direction from one chamber to another and (2) not allow blood
to flow back the other direction.
The criteria that the teacher used to evaluate student design included: (1) the
percentage of blood cells (simulated by marbles) that moved through the mitral valve
from the left atrium to the left ventricle when the heart (simulated by a box) was tilted;
(2) the percentage of blood cells that stayed in the left ventricle when the heart was tilted
back; (3) the total cost of the heart valve model (to mimic the one-way movement of the
blood); and (4) whether the mitral valve had two leaflets (if yes, then the team would get
bonus points). For the lesson plan of this task, see Appendix 1.
Activity 2: Oil Spill Cleanup (it will be referred to as Oil Spill hereafter). This
was an environmental engineering task in which students designed an oil spill removal
system that cleaned up a simulated oil spill that was caused by a hypothetical company.
In their design process, students needed to take into account a range of
constraints, including: (1) time: students must finish the whole design process in assigned
class times; (2) materials: there were only 10 kinds of materials available, although
students could freely choose which to use; and (3) cost: students needed to keep their cost
as low as possible while they tried to develop an effective oil spill cleanup system that

50
would meet the design requirements. The design requirements included: (1) the system
must be able to remove the maximum amount of oil; (2) the system must be able to
prevent oil from reaching the shore; and (3) the budget of the project must not exceed 20
million dollars. Each student group’s design was evaluated by the sum of the scores that
the group received in these aspects. For the lesson plan of this task (including the specific
scoring rules), see Appendix 2 .
Data Collection
For research questions #1 to 3 which addressed the relationships between group
gender composition and student engagement, qualitative data were collected by
videotaping each student group’s interactions while they were engaged in Heart Valve
and Oil Spill and follow-up focus group interviews. The latter were conducted soon after
the activities and focused on:
• general perceptions about the activities
• perceptions of how the group worked together (e.g., how students liked
working with peers in their group, what aspect(s) of group work they
would like to see improved next time)
• individual contributions during group work (e.g., whether a student
thought s/he had a particular role during the group work, how her/his
emotions affected the work with her/his peers), and
• group task management issues (e.g., what students did when they had
different opinions regarding a problem, when they decided to ask for the
teacher’s help when facing a difficulty)

51
All interviews were videotaped. For a complete list of all the student focus group
interview questions see Appendix 3 (Nieswandt & McEneaney, 2012).
For research question #5 which addresses the relationship between group gender
composition and student achievement, quantitative and qualitative data were collected.
The quantitative data included: students’ pre-activity interest in biology and pre-activity
interest in the current biology class (see items in Appendices 4 and 5; Marsh, Köller,
Trautwein, Lüdtke, & Baumert, 2005); pre-activity competence in science labs (see
items in Appendix 6; McAuley, Duncan, & Tammen, 1987); a pretest assessing students’
knowledge about scientific inquiry and engineering design (see Appendix 7; Nieswandt
& McEneaney, 2012); and two posttests (one for each DBS task) assessing students’
biology content knowledge and engineering practice knowledge (see Appendices 8 and 9;
Nieswandt & McEneaney, 2012). The qualitative data here were also the group work
videos. I used these data to assess the students’ achievement in engineering design
practice by observing the videos and identifying and scoring two specific engineering
design practices that the students engaged in during their group work (the details of what
these practices were and how they were scored will be introduced in the Data Analysis
section).
For research question #4 which addresses the relationship between students’
engagement and achievement, I used the above-mentioned pre-activity data sets and the
quantitative engagement levels of student subgroups, which are the results of data
analyzed for questions #1 to 3.

52
Data Analysis
To answer my first three research questions, I investigated whether the varying
gender composition of student groups influenced girls’ and boys’ engagement by
quantitatively analyzing group work videos at the gender-specific subgroup level. That is,
my unit of analysis was the subgroup. Also, I qualitatively analyzed the group work
videos and student focus group interviews in order to gain deeper understandings of the
quantitative data analysis results.
To answer my fourth research question, I explored how student subgroup
engagement might have influenced student achievement. To answer my fifth research
question, I explored how student group gender composition might have influenced
student achievement. In these two cases, my unit of analysis was the individual student.
Quantitative data analysis. My quantitative video data analysis was conducted
to visualize and quantify student subgroups’ engagement levels in each step of their
engineering design process. Different engineering design steps may require different
behavioral, emotional and cognitive engagement, for example, conceptual design is
considered one of the most cognitive intensive among other design steps (Kim, 2011).
Therefore, depending on where the students were in the design process, they may have
engaged in their work differently; that is, the videos reflect temporal data.
In order to analyze temporal data, I used sequence analysis – a temporal data
analysis method (Abbott & Hrycak, 1990; Abbott, 1995; Aisenbrey & Fasang, 2010).
Sequence analysis is originally a set of methods designed in bioinformatics to analyze
DNA, RNA or peptide sequence. When applied in social science, it becomes “a body of
questions about social processes and a collection of techniques available to answer them”

53
(Abbott, 1995, p.93). So, it is not a particular technique. Broadly, there are two types of
sequence analysis: step-by-step methods and whole sequence methods (Abbott, 1995). In
this study, I used a specific step-by-step method.
I divided each group’s video(s) into a number of two-minute segments and
watched and compared each segment with predetermined indicators (main indicators and
sub-indicators) that reflected the three types of engagement, for this group’s female and
male subgroup respectively. This way, I recorded the presence of each type of
engagement for each student subgroup.
Originally, these indicators were developed by Nieswandt and McEneaney (2012)
for analyzing students’ construction of a three-dimensional problem-solving space
(content, social and affective dimensions) during students’ small group work in scientific
inquiry and engineering design tasks. Comparing these indicators with the definitions of
the three types of engagement, I found that they adequately represent these definitions.
Therefore, I used these indicators to code student engagement in my video data. A table
comprising these indicators and the definitions of the three types of engagement is
available in Appendix 10. This table shows how the indicators and sub-indicators
represent each type of engagement. For example, for behavioral engagement (as defined
in the Conceptual Framework section, this concept includes a social component), main
indicators Social Loafing and Social Cohesion represent its social component, and other
main indicators such as Doing Hands-on Work represent its behavioral component. For
emotional engagement, there are main indicators such as Interest and Activity emotions
that represent students’ emotional reactions to academic content and also their peers
(Skinner & Belmont, 1993; Fredircks et al, 2004; Connell & Wellborn, 1991). For

54
cognitive engagement, there are main indicators such as Asking Exploratory Questions
and Cumulative Reasoning that represent students’ cognitive investment and actual effort
for mastery (Fredircks et al, 2004).
The two-minute value of the length of a video segment was determined based on
the trials that I conducted with another Small Group project team member. Given that the
lengths of the videos spanned from about 30 to over 90 minutes, setting the value to be
one minute would produce sequences that would be too long to analyze and display. I did
trials on two- and three-minute segments and found that two-minute segments were ideal
for coding student behavior without losing information and that the produced sequence
lengths were appropriate for further analyzing and displaying results.
Using the list of predetermined indicators, I identified students’ behavioral,
emotional and cognitive engagement in each 2-minute segment. Following this analysis, I
determined that in each segment, if all, or the majority, or half, or the minority, or none
(this will be denoted as all/majority/half/minority/none) of the students in a subgroup
showed a sign of behavioral engagement for over 60 seconds, then I labelled this segment
as all/majority/half/minority/none engaged behaviorally engaged for that subgroup. Sixty
seconds, that is, half of a 2-minute segment, was a reasonable threshold value because the
behavioral engagement sub-indicators represented relatively long-lasting
behaviors/actions. If a student was engaged in such behaviors/actions (e.g., observing
other group members work or building an artifact) for less than 60 seconds in a two-
minute time period, then I considered it inadequate. I did a similar analysis for emotional
and cognitive engagement, but set the threshold time period to 30 seconds because the
videos recorded a considerable number of instances in which students showed clear signs

55
of emotional/cognitive engagement for less than 60 seconds (e.g., excitement about their
successful model testing, making a drawing of their design, etc.). Previous studies
confirmed that a 30-second threshold value was appropriate allowing to capture most of
the short-lived signs of emotional/cognitive engagement (e.g., Guo, Nieswandt,
McEneaney & Howe, 2016; Guo, McEneaney & Nieswandt, 2017).
To record a subgroup’s engagement level in a segment, I assigned a numerical
value to each level (from 0 none subgroup engaged to 4 all engaged; see Table 3) in order
to conduct the statistical analysis in the TraMineR module in R (a statistical
computing/graphics software). The results were visual representations (i.e., sequences) of
each subgroup’s three types of engagement (see Figure 6). During this process, within R,
I assigned a color to each level of engagement to better visualize the different levels in a
sequence (McEneaney & Guo, 2015). Table 3 reports these color codes and Figure 6
shows an example of a sequence.
Table 3. Different engagement levels and their numerical values and color codes
As discussed in the Conceptual Framework, the design process is comprised of
different steps. Following the R-analysis, I divided each sequence into several sections
according to a group’s actual work process, with each section corresponding to a certain
design step. This way, sequence analysis provided a microscopic perspective through
which I could explore the relationships between group gender composition and student
Subgroup Engagement Level Numerical Value Color Code
All engaged 4 Dark green
Majority engaged 3 Light green
Half engaged 2 Yellow
Minority engaged 1 Purple
None engaged 0 Red

56
engagement in the different design steps. Also, as will be shown below, these
relationships could be visualized.
While the sequences provided a good visual illustration of the student subgroups’
behavioral, emotional and cognitive engagement in each step of their engineering design
processes, simple qualitative descriptions of these sequences were not powerful enough
for adequately answering the first three research questions in that they would not allow
statistical analysis that could reveal the quantitative relationships between student
engagement and group gender composition. Thus, I created a quantitative variable:
percentage of higher engagement levels (PHEL) as the total number of segments of
higher engagement levels (“all engaged” and “majority engaged”) in a sequence (m)
divided by the total number of all segments in a sequence (M):
PHEL = m/M [1]
Figure 6 below shows the cognitive engagement sequence of Group 12, a four-girl
group. The dark green segments represent students as “all engaged” and light green as
“majority engaged”. Thus, for this sequence, the PHEL is calculated by dividing the total
number of all dark and light green segments (n=10) by the total number of all segments in
this sequence (N=27) resulting in PHEL=37%.
Figure 6. Group 12’s cognitive engagement sequence – an example of how PHEL is
calculated based on an engagement sequence

57
According to Dasgupta’s (2011) stereotype inoculation model theory, a girl’s
contact with other girls in a group promotes her engagement in the group’s work on a
task. Based on this prediction, in the context of my study, I hypothesized:
• H1: The higher the percentage of girls in a group, the higher the PHEL of the
female subgroup.
In a previous study I found in one group comprised of three girls and one boy, the
boy’s behavioral and emotional engagement levels were relatively low while the girls’
engagement levels were high (Guo, Nieswandt, McEneaney & Howe, 2016). In order to
assess whether this finding was unique to the group in my previous research or can be
seen in other classes as well, I hypothesized:
• H2: The higher the percentage of girls in a group, the lower the PHEL of
the male subgroup.
To test hypothesis H1, I ran a Spearman’s rho to explore the correlation between
group female percent and female subgroups’ PHELs of behavioral, emotional and
cognitive engagement, respectively, in both Heart Valve and Oil Spill. My sample sizes
(n=15 for Heart Valve, and n=11 for Oil Spill) were smaller than 25 so using Pearson’s r
wouldn’t be able to produce accurate p values for the correlation coefficients (Bonett &
Wright, 2000). Therefore, I used Spearman’s rho rather than Pearson’s r.
To test hypothesis H2, I ran a Spearman’s rho to explore the correlation between
group female percent and male subgroups’ PHELs of behavioral, emotional and cognitive
engagement, respectively, in Heart Valve and Oil Spill, respectively. Similarly, the
reason why I used Spearman’s rho was that my sample sizes (n=14 for Heart Valve, and

58
n=10 for Oil Spill) were smaller than 25 so Pearson’s r was not appropriate (Bonett &
Wright, 2000).
For answering research questions #4 (RQ4: Achievement and Engagement) and
#5 (RQ5: Achievement and Group Gender Composition), student achievement data were
analyzed. Due to some students’ absence and failure to complete certain survey and test
items, there were missing values in these data. In preparation for statistical analysis of
such data, I processed the missing values.8
A number of ad hoc approaches exist for dealing with missing data. These include
filling missing cases with values imputed from the observed data (e.g., the mean of the
observed values for a variable), using a missing theme indicator (Vach & Blettner, 1991),
replacing missing cases with values generated by the expectation-maximization algorithm
(Enders, 2003) or using the last available measurement (the last-value-carried-forward
method) (Carpenter & Kenward, 2008). Although these methods are commonly used,
none of them is statistically valid in general, because they are all based on single
imputation, which usually causes standard errors to be too small; it fails to account for the
fact that the researcher is uncertain about the missing values (Sterne, White, Carlin,
Spratt, Royston, Kenward, … Carpenter, 2009).
A popular alternative to these methods is multiple imputation (MI). Instead of
using a single imputed value to fill in a missing case, Rubin’s (1987) MI method replaces
each missing case with a set of plausible values that encompass the uncertainty about the
right value to impute, resulting in the creation of multiple completed datasets. Then,
standard procedures are applied to analyze each completed dataset, and finally the
8 Given that my sample sizes for boys and girls were both small, I processed missing values (instead of
deleting cases with missing values) to achieve the maximal statistical powers.

59
multiple sets of data analysis results are combined to yield a single inference (He, 2010;
Yuan, 2010).
In my study, to replace the missing values in the student achievement data, I used
MI by following the procedure that’s created by Rubin (1987). Rubin’s original
description of this procedure was relatively complex and technical, so Hutcheson and
Pampaka (2012, p232) summarized it as the following:
• Impute missing values using an appropriate model that incorporates random
variation;
• Do this M times, producing M complete data sets;
• Perform the desired analysis on each data set using standard complete-data
methods;
• Average the values of the parameter estimates across the M samples to produce a
single-point estimate;
o Calculate the standard errors by (a) averaging the squared standard errors
of the M estimates, (b) calculating the variance of the M parameter
estimates across samples, and (c) combining the two quantities using an
adjustment term (i.e. 1+1/M).
In SPSS, I used this procedure to process missing values in the posttest-based student
achievement dataset. As a result, SPSS produced five imputed datasets, with each of them
containing slightly different replacements for the missing values. Then, I used these five
imputed datasets as the posttest-based student achievement data in the analysis of the
relationships between student group gender composition and their achievement (RQ5). The
specific processes of these analyses will be reported later in this section.

60
For answering my fifth research question (RQ5: Achievement and Group Gender
Composition), I also utilized the group work video data. Specifically, I used such data to
assess student achievement in two engineering practices:
• making decisions on tradeoffs that accounted for constraints
• practicing multiple iterations of one or more steps of the design cycle to
improve design
Table 4. Scoring rubric for assessing student achievement in making tradeoffs
Design Action Score for Each Occurrence
of Design Action
Voluntarily mentioning one or more constraints and/or
initiating a discussion regarding constraints 2
Participating in such a discussion and contributing an
idea for making a tradeoff among competing constrains 2
Participating in such a discussion but not contributing
an idea 1
Not participating in such a discussion 0
To assess student achievement in the engineering practice of making tradeoff-
based decisions, I watched each video and recorded the occurrence of each instance of a
student’s initiation of or participation in a consideration/discussion about how to balance
competing constraints to achieve an optimal design solution. I identified four design
actions that are distinguished by the level of participation: voluntarily or initiating,
participating and contributing, participating without contribution, and not participating.
The first two levels indicate a higher level of engagement and were scored with a value of
2, the third level reflects a medium level with a value of 1 and no- participation was
scored with 0 (see Table 4). Based on this scoring rubric, I calculated and recorded each
student’s total score for this engineering practice, and named this dataset Tradeoff
Achievement.

61
Table 5. Scoring rubric for evaluating student achievement in practicing iterations
Design Action Score for Each Occurrence of Design
Action
Voluntarily mentioning the desire to
repeat one or more design steps for
improving prototype or initiating such an
iteration
2
Participating in such an iteration and
contributing an idea for improving design
2
Initiating such an iteration based on
teacher requirement
1
Participating in such an iteration but not
contributing an idea
1
Not participating in such an iteration 0
Similarly, to assess student achievement in practicing multiple iterations, I
watched the videos and identified the different ways in which students engaged in such
actions resulting in four different design actions: voluntarily initiating and participating
and contributing (both on a high-level engagement with a score of 2), initiating based on
teacher requirement (medium level with score of 1), not participating (score of 0). Table
5 shows this rubric. Based on this scoring rubric, I calculated and recorded each student’s
total score on this engineering practice, and named this dataset Iteration Achievement.
These two video-based engineering practice achievement datasets (i.e., Tradeoff
Achievement and Iteration Achievement), together with all the student engagement level
datasets and the pre- and posttest datasets, constituted all the quantitative data that were
analyzed for answering research questions #4 (RQ4: Achievement and Engagement) and
#5 (RQ5: Achievement and Group Gender Composition). In the data analysis for
answering research questions #4, the posttest-based achievement data were not included,
because they were non-matchable to the student subgroups and consequently their
correlations with the student subgroup PHELs could not be analyzed. Table 6 provides a

62
summary of all these datasets divided into outcome and predictor variables as well as the
sample size for the different variables. The outcome variables (i.e., dependent variables
or DVs) include the video-based engineering practice scores of Tradeoff Achievement
and Iteration Achievement, and the posttest-based scores of student biology knowledge,
engineering practice and these two areas combined. The predictor variables include two
subtypes: independent variables (IVs) and covariates. Independent variables include
student subgroups’ PHELs of behavioral, emotional and cognitive engagement,
respectively (these variables were used for answering RQ4: Achievement and
Engagement) and group female percent (this variable was used for answering RQ5:
Achievement and Group Gender Composition). The covariates include the pretest-based
student pre-activity: (1) interest in biology, (2) interest in current biology class, and (3)
knowledge about scientific inquiry and engineering design. All the outcome variables and
covariates are at the individual student level (i.e., level 1). The engagement PHELs are at
the student subgroup level (for RQ 4, this is level 2), and the group female percent is at
the student group level (for RQ 5, this is level 2).
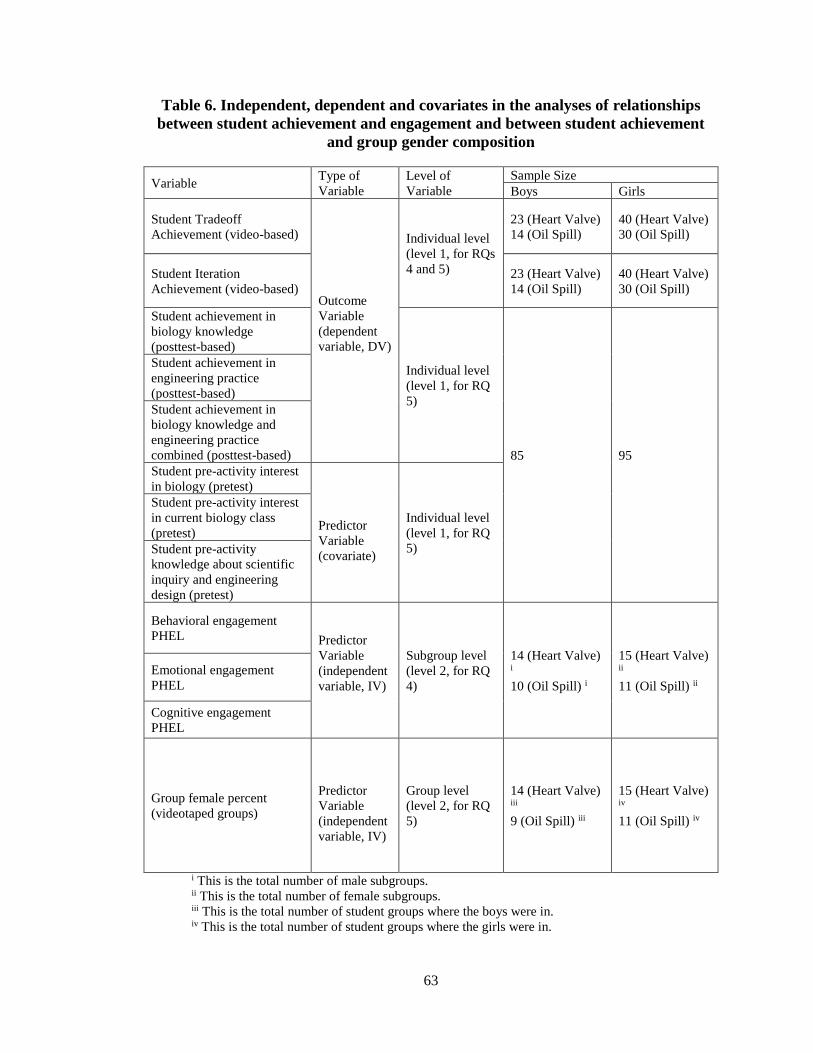
63
Table 6. Independent, dependent and covariates in the analyses of relationships
between student achievement and engagement and between student achievement
and group gender composition
Variable Type of
Variable
Level of
Variable
Sample Size
Boys Girls
Student Tradeoff
Achievement (video-based)
Outcome
Variable
(dependent
variable, DV)
Individual level
(level 1, for RQs
4 and 5)
23 (Heart Valve)
14 (Oil Spill)
40 (Heart Valve)
30 (Oil Spill)
Student Iteration
Achievement (video-based)
23 (Heart Valve)
14 (Oil Spill)
40 (Heart Valve)
30 (Oil Spill)
Student achievement in
biology knowledge
(posttest-based)
Individual level
(level 1, for RQ
5)
85 95
Student achievement in
engineering practice
(posttest-based)
Student achievement in
biology knowledge and
engineering practice
combined (posttest-based)
Student pre-activity interest
in biology (pretest)
Predictor
Variable
(covariate)
Individual level
(level 1, for RQ
5)
Student pre-activity interest
in current biology class
(pretest)
Student pre-activity
knowledge about scientific
inquiry and engineering
design (pretest)
Behavioral engagement
PHEL Predictor
Variable
(independent
variable, IV)
Subgroup level
(level 2, for RQ
4)
14 (Heart Valve) i
10 (Oil Spill) i
15 (Heart Valve) ii
11 (Oil Spill) ii
Emotional engagement
PHEL
Cognitive engagement
PHEL
Group female percent
(videotaped groups)
Predictor
Variable
(independent
variable, IV)
Group level
(level 2, for RQ
5)
14 (Heart Valve) iii
9 (Oil Spill) iii
15 (Heart Valve) iv
11 (Oil Spill) iv
i This is the total number of male subgroups. ii This is the total number of female subgroups.
iii This is the total number of student groups where the boys were in. iv This is the total number of student groups where the girls were in.

64
• The different units of analysis (individual student, subgroup, group) are
necessary to answer my research questions. Though, an individual student’s
engineering practice of making tradeoff-based decisions (level-1 variable) is
nested in his/her subgroup engagement (level-2 variable). To analyze such
nested data (e.g., the relationships between student posttest-based biology
content and engineering practice scores), I used hierarchical linear modeling
(HLM) (Woltman, Feldstain, Mackay & Rocchi, 2012). HLM is an expanded
form of regression that is used to analyze the variance in the outcome
variables when the predictor variables are situated at different hierarchical
levels (Woltman et al., 2012; Huta, 2014). Specifically, it:
• can simultaneously analyze relationships within and between hierarchical
levels of data, making it more powerful at accounting for variance among
variables of different levels than other analytical techniques (Woltman et al.,
2012);
• allows effect size estimates and standard errors to remain undistorted and
potentially meaningful variance neglected by simple linear regression methods
(i.e., aggregation and disaggregation) to be retained (Beaubien, Hamman, Holt
& Boehm-Davis, 2001; Gill, 2003); and
• requires fewer assumptions to be met than other statistical methods
(Raudenbush & Bryk, 2002). Specifically, it can accommodate the lack of
independence of observations and of sphericity9, small and/or discrepant
9 Sphericity refers to the situation where the variances of the differences between all pairs of within-subject
conditions (i.e., levels of the independent variable) are equal. Generally, this is interpreted as the need for
equal variances within the subject conditions, and equal correlations between all pairs of within-subject
conditions (Huynh and Feldt, 1970).

65
group sample sizes, missing data, and heterogeneity of variance across
repeated measures (Woltman et al., 2012).
Since my data were located at two hierarchical levels (and thus simple linear
regression would not be appropriate), lacked independence of observations, may have
lacked sphericity, and had small and discrepant group sample sizes, HLM seems the most
appropriate technique to use for analyzing these data.
The following are the HLM models of the relationship between the posttest-based
outcome variables and the predictor variables at each level.
Level-1 model:
Yij = π0j + π1ja1ij + π2ja2ij + π3ja3ij + π5ja5ij + eij [2]
where:
Yij = achievement of individual i in group j;
a1ij = pre-activity interest in the domain of biology of student i in group j;
a2ij= pre-activity interest in current biology class of student i in group j;
a3ij= pre-activity knowledge about inquiry and design of student i in group j;
π0ij = intercept for individual i in group j;
eij = level-1 random effect that represents the deviation of student ij's score from
the predicted score based on the student-level model.
Level-2 model:
In the level-2 models, the regression coefficients at level-1 (π 0j, π 1j, π 2j, and π 3j)
were used as outcome variables and were related to each of the predictor variables at
level-2. Level-2 models are called between-unit models because they describe the
66
variability across different level-2 units (Gill, 2003). In this study’s case, the level-2
model can be expressed as the following equation:
πpj = p0 + 𝑝1𝑋1𝑗+rpj [3]
where:
p0 = the intercept;
X1j = is the level-2 predictor variable, in this case, the percent of female students
in the group;
p1 = the corresponding coefficient that represents the direction and strength of
association between X1j and πpj;
rpj = a level-2 random effect that represents the deviation of individual j's level-1
coefficient, πpj,
from its predicted value based on the group-level model.
The MI method for processing missing values in the posttest-based student
achievement data produced five imputed datasets to be analyzed in HLM. Because the
HLM software was not able to process these five imputed datasets as a whole, I processed
them separately. That is, for any given dependent variable (DV) (e.g., students’ achievement
in biology content in Oil Spill), I used HLM to analyze these five imputed datasets separately
and produced five sets of results, with each set including four estimates for the effects of the
independent variable (IV) (i.e., group female percent): coefficient, standard error, t-ratio, and
p-value. To pool these results, I first calculated the means for the five coefficient estimates,
and then used the following formula to calculate the standard error for the mean of the
coefficient estimates (Paul Allison, 2001, p. 30):

67
In this formula, S.E. denotes standard error, M denotes the number of imputations, rk
denotes the correlation in imputation k, and sk denotes the estimated standard error in
imputation k. According to Rubin (1987), this formula can be used for any parameter that’s
estimated by MI.
With the coefficient and standard error estimates available, the t-ratio then could be
easily calculated by dividing the former by the latter. Then, I obtained the p-value by referring
to the t-table. For an example of how I calculated these pooled estimates, see Table 7.
Table 7. Example of calculating pooled estimates from MI models for the effect of
group female percent on girls’ posttest-based achievement in biology content in
Heart Valve
Estimate Imputation Number Value
Coefficient Imputation 1 -9.83
Imputation 2 -9.57
Imputation 3 -9.61
Imputation 4 -10.89
Imputation 5 -7.08
Pooled (mean) -9.34
Standard error (SE) Imputation 1 7.16
Imputation 2 7.12
Imputation 3 6.93
Imputation 4 6.78
Imputation 5 6.72
Pooled 7.11
t-ratio (coefficient/SE) Pooled -1.31
p-value Pooled 0.10
In the data analysis for answering research question #4 (RQ4: Achievement and
Engagement), the predictor variables are female and male subgroups’ behavioral,

68
emotional and cognitive engagement PHELs, and the outcome variables are the video-
based Iteration Achievement and Tradeoff Achievement summarized scores.
As introduced above, these data are also hierarchical and using HLM to analyze
them should be considered. However, as Table 6 shows, for the video-based student
achievement variables (Iteration Achievement and Tradeoff Achievement), the level-2
sample sizes (i.e., the number of student groups) were all below 30 which is the smallest
acceptable number in educational research for HLM analysis to produce unbiased and
accurate standard errors (Maas & Hox, 2005). Therefore, HLM was inappropriate and I used a
nonparametric correlation analysis - Spearman's rank correlation to analyze these data.
Inter-rater reliability of quantitative video coding. In my sequence analysis of
student subgroups’ engagement, in order to ensure the trustworthiness of video data
coding, I and a fellow researcher and member of the Small Group Project team who I had
trained in how to use sequence analysis to code video data using the indicator system,
independently coded a random sample of about 10% of all the video data (measured by
temporal length of the videos). As we compared our results, we achieved a percent
agreement-based consensus estimate of inter-rater reliability of 92.3%. Given that this
value is significantly higher than the acceptable value of 70% (Stemler, 2004), I
considered the results of the coding of any one of us to be trustworthy (Stemler, 2004).
According to Stemler (2004), “Consensus estimates of interrater reliability are based on
the assumption that reasonable observers should be able to come to exact agreement
about how to apply the various levels of a scoring rubric to the observed behaviors. …. If
judges can be trained to the point where they agree on how to interpret a rating scale, then
scores given by the two judges may be treated as equivalent.”(p. 2).The reason why I

69
chose the consensus estimate approach to estimating inter-rater reliability was that in my
coding method the levels of rating scale (i.e., all/majority/half/minority/none engaged)
represented a linear continuum of the concept of engagement level and were ordinal in
nature, and under such circumstances consensus estimate is appropriate to use (Stemler,
2004).
To establish inter-rater reliability for video data coding for scoring the students’
Iteration Achievement and Tradeoff Achievement, I and a Small Group project team
member who has a master’s degree in engineering adopted the same procedure as
described above, using the scoring rubrics for assessing these two engineering practices
(see Tables 4 and 5). We achieved a percent agreement-based consensus estimate of
inter-rater reliability of 93.5%. Given that this value is significantly higher than the
acceptable value of 70% (Stemler, 2004), I considered that the results of the coding of
any one of us would be trustworthy and used all the scores produced by this colleague.
Qualitative data analysis. The quantitative data analysis addresses the
relationship between student subgroups’ engagement levels and group gender
composition. Though, specific factors that explaining possible changes of student
subgroups’ engagement levels are not revealed with quantitative data analysis. In an
effort to identify such factors, I also qualitatively analyzed student focus group interviews
and group work videos.
To analyze interview data, I used interpretational analysis. In a computer software
named MAXQDA, I followed the interpretational analysis approach, which is “the
process of examining case study data closely in order to find constructs, themes, and
patterns that can be used to describe and explain the phenomenon being studied” (Gall,

70
Gall & Borg, 2007, p. 453). Figure 7 shows the analysis process of the interview data in
five steps.
Step 1: Segmenting transcript. Interviews were fully transcribed and then divided
into segments or analysis units (Gall, Gall & Borg, 2007). Each segment constituted an
interview question and students’ answers.
Step 2: Developing main themes and themes. In this critical step, I developed a set
of themes that adequately summarize the data. A theme is a construct that refers to a
certain type of phenomenon recorded in the transcript. To develop themes, I decided what
is worth taking note of in each segment of the transcript (Gall, Gall & Borg, 2007) based
on my main purpose: determine factors that may have influenced girls’ and boys’
engagement. I pre-determined two main themes: Engagement Factors and Disengagement
Factors. Then, I read through each interview transcript, and based on what students stated
developed initial themes (Gall, Gall & Borg, 2007) that fit into these two main themes.
For example, in Group 12 all four girls mentioned/agreed that friendship was really
important for them to work well together, so I created a theme named Friendship under
the main theme Engagement Factors. In Group 41 (two boys and two girls), the girls
mentioned that the boys both tried to take leadership (and incurred conflicts between
Figure 7. The process of interpretational analysis of qualitative data

71
themselves) and saw this as a problem (because they had conflicts that they did not
handle well). Meanwhile, the boys also admitted their competing roles and talked about
being frustrated with each other. A boy even mentioned that sometimes he simply
ignored the others and carried out his own plans. Because the girls also mentioned such
behavior as a problem, it is conceivable that such behaviors of the boys had negative
influences on the others’ engagement, so I created a theme named Leadership under the
main theme Disengagement Factors. As can be seen from these examples, themes are
useful for detecting relational patterns in case study data (Gall, Gall & Borg, 2007).
Step 3: Coding segments. With initial themes developed, I coded all the segments
in the transcript. I examined each segment and decided whether the phenomena reported
by the students fit the initial themes. If a phenomenon matched a theme, then I put an
abbreviation for the theme next to the segment. An example of my coding is shown in
the screenshot below.

72
Figure 8. An example of coding interview transcript using interpretational analysis

73
Figure 8 is part of my coding of the interview transcript of Group 92 (three girls
and one boy). As can be seen from this picture, in lines 100-117 students were talking
about how they all contributed ideas for solving problems and how they constructively
resolved cognitive conflicts, and in lines 104-117 they were talking about their
perceptions of how Taylor served the group as their leader. So, I labelled lines 110-117
“PGI” (which stands for “positive group interaction”), and labelled lines 104-117
“LDRSHP” (which stands for “leadership”).
Step 4: Grouping theme segments. In this step, I first gathered together all the
segments that were labelled with the same code for each theme. Then, I followed the
constant comparison method (Strauss & Corbin, 1998) to re-examine all the themes. In
each group of segments (i.e., all the segments tagged with the same code), I examined all
the segments and reconsidered whether they sensibly corresponded to their own theme.
The e following screenshot shows an example of how I did this (Figure 9).

74
Figure 9. An example of grouping segments under the same theme

75
As Figure 9 displays, MAXQDA allowed me to gather all the segments with the
same code PGI (standing for “positive group interaction”) together and can display each
segment’s content. I re-read all these segments’ contents, and found that they call fit well
into the theme Positive Group Interaction. As I did this for the other themes, I didn’t
identify any mismatch.
Next, I compared different themes to determine whether some of them were
overlapping, confusing, irrelevant or particularly important to my purpose. The
screenshots below serve as an example that shows how I did this.
Figure 10. An example of reviewing themes and creating sets of themes

76
As can be seen in Figure 10, in MAXQDA all the themes’ codes are put together
so I could review and compare them altogether. Also, for those themes that were
relatively closely related, I could put them together to form a set so I can closely examine
them in order to see whether they should be merged or revised. For example, as can be
seen in the screenshot above, I put AE (standing for Activitiy Emotions) and INT
(standing for Interest) together10 and formed Set 2. In this set, I re-read and compared
each theme’s content, and determined that they did make two distinct themes, as shown
by Figure 11 below. I did this for all the sets that I created, and as a result, I did not find it
necessary to further revise any of the themes.
10 I did this because activity emotions and interest both belong to the affective domain, so I wanted to see
whether there were overlapping contents in these themes that would require recoding.

77
Figure 11. An example of comparing themes
78
Step 5: Drawing conclusions. In this final step, I summarized all the themes as
factors that may have positively or negatively influenced girls’ and boys’ engagement. In
the summary, I paid particular attention to the factors that were directly gender-related,
such as boys’ interactions with girls, girls’ interactions with each other and with boys.
Themes that did not directly seem to be related to gender, such as some groups’ common
understanding of the cognitive benefit of group work, students’ interest in
science/biology, were also included. All these themes will be discussed in-depth in the
next chapter in terms of how they relate to girls’ and boys’ engagement through certain
microscopic psychological processes.
Elaborated running records (ERRs) are running records that go beyond capturing
the interactions between the group members, to also describing actions/behaviors relevant
to the variables of interest (e.g., facial expressions, gestures, tone used in speaking);
importantly, these records are meant to be descriptions without viewer interpretation
(Rogat & Linnenbrink-Garcia, 2011). As comprehensive records of how a group worked
on their task, ERRs present detailed descriptions of group members’ individual behavior,
the interaction among them (including verbal exchanges), and their interaction with their
task.
For the group work videos, I used this method to qualitatively capture the
interactions among group members and other salient phenomena that were related to their
behavioral, emotional and cognitive engagement. While I developed the ERRs for Heart
Valve, the ERRs for Oil Spill were written by another member of the Small Group
project research team. Before the research team wrote ERRs, the team members were
trained on how to use this research technique. Training of the purpose and process of

79
ERRs was provided by the PIs of the Small Group project. Each team member
independently watched the same student groupwork video and wrote an ERR. These
ERRs were then shared and discussed with the team in order to establish common criteria
and process for writing of ERRs. First, I developed an ERRs table which contained three
columns: Time, Running Record, and Reviewer Comments. I analyzed ERRs for each
video and identified each event/phenomenon that was a manifestation of or related to
students’ behavioral/emotional/cognitive engagement based on the predetermined
indicator system. I recorded the event/phenomenon as a narrative description with master
indicators inserted in the passage in the Running Record column. A master indicator is a
single letter put in a square bracket denoting a certain type of engagement. Social-
behavioral engagement was denoted as a “[S]”, emotional engagement as an “[E]”, and
cognitive engagement as a “[C]”. In addition, I also identified gender-related interactions
between group members and denoted such phenomena with a “[G].” In the Time
column, I recorded the time interval in which an event/phenomenon happened. In the
Reviewer Comments column, I put any materials that I thought were helpful for
understanding the contents in the Running Record columns such as notes and screenshots
from the video. An example of part of an ERRs table is depicted in Figure 12.

80
Figure 12. An example of part of the ERRs table
Each ERR was completed with a Brief Summary of students’ overall group work
with respect to the three types of engagement and the gender relationship in this group.
An example of a partial Brief Summary section is illustrated in Figure 13.
Figure 13. An example of a partial Brief Summary section of ERRs

81
Trustworthiness of qualitative data analysis. The best-known criteria for
evaluating the trustworthiness of qualitative data analysis are credibility, dependability,
confirmability and transferability, as defined by Lincoln and Guba (1985).
Credibility refers to the extent to which the research findings represent the “truth”
of the research participants with which and the context in which the investigation was
conducted (Guba, 1981). Strategies for ensuring credibility include triangulation
(including data triangulation, investigator triangulation and method triangulation),
prolonged engagement, persistent observation, and member check (Korstjens & Moser,
2018). In this study, I used data triangulation to establish the credibility of my qualitative
data analysis.
When I have generated initial themes regarding factors influencing girls’ and
boys’ engagement from the student focus group interview data, I used another data source
– the video-based ERRs to confirm or disconfirm these findings. For example, in Group
92 (3g1b), when asked how they felt about working as a group, a girl reported that she
thought they felt comfortable working with each other, and then all three other group
members verbally agreed with her. Based on this data, I developed the theme “Group
Cohesion”. However, the ERRs of this group showed that the actual scenario in this
group was that the three girls formed a socially and cognitively cohesive subgroup and
worked together in it, and the boy didn’t participate in their work at all, showing no
engagement. Thus, when reporting on “Group Cohesion” I described the gender gap in
this group and also created two subthemes: “Female subgroup social cohesion” and
“Female subgroup cognitive cohesion”. This way, data triangulation helped me establish

82
confidence in the “truth” of these themes and subthemes for the students in their context,
strengthening the trustworthiness of these findings.
Further, the ERRs also provided concrete illustrations of student interactions as
evidence for establishing confidence that the themes and subthemes regarding factors
influencing student engagement are not figments of my imagination as the researcher but
clearly derived from the actual data, thus ensuring confirmability; that is, these findings
can be confirmed by other researchers (Lincoln & Guba, 1985). In addition, as shown
throughout this chapter, the research steps taken from the start of this project until the last
step of the data analysis process are transparently reported, presenting the audit trail of
this study for inspection and thus enhancing the confirmability of this study, as well as its
dependability (Lincoln & Guba, 1985; Sim & Sharp, 1998) which refers to the reliability
and consistency of the findings and the extent to which the research procedure is
documented that allow an outsider to audit the research process (Sandelowski, 1986;
Speziale, Streubert & Carpenter, 2011; Polit, Beck & Hungler, 2006).
A fourth criterion for evaluating the trustworthiness of qualitative research is
transferability, which is defined as describing not only the behavior and experiences of
the participants, but also their context, so that an outsider can make meaning of their
behavior and experiences (Lincoln & Guba, 1985). To establish transferability, the
researcher should provide a thick description of the participants and the research
procedure so as to enable others to assess whether the findings can be transferred to their
own setting (Lincoln & Guba, 1985; Sim & Sharp, 1998; Korstjens & Moser, 2018). As
can be seen throughout this chapter, I reported the overall research design of this study
(i.e., mixed methods design) and the rationale for choosing such a design, the detailed

83
information of the participants, their group settings and the DBS tasks as their learning
contexts, sample sizes, the data collection tools and procedure, specific data sets
collected in relation to their corresponding research questions, data analysis procedure
and methods (including the rationales for adopting these methods). Thus, this thick
description facilitates the transferability judgment by a potential reader/user of my
research report (Lincoln & Guba, 1985).
To sum up, the credibility of my qualitative data analysis was ensured by data
triangulation, its dependability and confirmability ensured by the audit trail, and its
transferability facilitated by a thick description of the participants, contexts and the
research process (Lincoln & Guba, 1985; Sim & Sharp, 1998; Korstjens & Moser, 2018).
Thus, the trustworthiness of my qualitative data analysis findings was established
(Lincoln & Guba, 1985).

84
CHAPTER 5
RESULTS
In this chapter, I will report the results of the data analyses that I did toward
answering my research questions. These questions are:
1. How does female and male students’ behavioral engagement in each step
of the design process vary across groups of different gender compositions? (Label: RQ1:
Behavioral Engagement and Group Gender Composition.)
2. How does female and male students’ emotional engagement in each step
of the design process vary across groups of different gender compositions? (Label: RQ2:
Emotional Engagement and Group Gender Composition.)
3. How does female and male students’ cognitive engagement in each step of
the design process vary across groups of different gender compositions? (Label: RQ3:
Cognitive Engagement and Group Gender Composition.)
4. How does female and male students’ achievement in engineering practice
relate to their behavioral, emotional and cognitive engagement? (Label: RQ4:
Achievement and Engagement.)
5. How does female and male students’ achievement in biology content and
engineering practice differ across groups of different gender compositions? (Label: RQ5:
Achievement and Group Gender Composition.)
Among these five research questions, the first three are about the relationship
between group gender composition and student subgroup engagement, the fourth
question is about the relationship between individual student achievement and student

85
subgroup engagement, and the fifth question is about the relationship between individual
student achievement and student group gender composition.
In this chapter, I will report the data analysis results that can answer all these
questions in three sections. In the first section, I will report results regarding the
relationship between student engagement and group gender composition in three
subsections: First, I will present all the student subgroups’ behavioral engagement
sequences in Heart Valve and Oil Spill and qualitatively describe them; second, I will
report how subgroup engagement levels are statistically correlated with group gender
composition; and third, I will report findings from my qualitative analysis of chosen
groups – the factors that were closely related to girls’ and boys’ emotional and cognitive
engagement in groups of different gender compositions.
In the second and third sections of this chapter, I will report the statistical results
regarding the relationship between student achievement and engagement and between
student achievement and group gender composition.
Relationships between Student Engagement and Group Gender Composition
In this section, I will first present the results of sequence analysis of student
engagement – the visualized student subgroup engagement sequences. Then, I will report
the results of my statistical analysis of quantitative student engagement data that were
generated from these sequences. Last, I will report the findings from my qualitative
analysis of four selected student groups – the factors influencing girls’ and boys’
emotional and cognitive engagement in female-majority and gender-parity groups. All
these results address my research questions #1 (RQ1: Behavioral Engagement and Group

86
Gender Composition), #2 (RQ2: Emotional Engagement and Group Gender
Composition), and #3 (RQ3: Cognitive Engagement and Group Gender Composition).
Student subgroups’ engagement sequences. All female and male student
subgroups’ sequences of behavioral, emotional and cognitive engagement for the Heart
Valve task are displayed by Figures 14-19, and their sequences of behavioral, emotional
and cognitive engagement for the Oil Spill task are displayed by Figures 20-25.
As can be seen from all these figures, the title of the figure indicates the name of
the task that the students did, the type of engagement the sequences represent and the
gender of all the subgroups in the figure. For example, the title of Figure 14 is “Female
subgroups’ behavioral engagement in Heart Valve”, and it tells that in this figure, all the
sequences are sequences of female subgroups, representing their levels of behavioral
engagement in the Heart Valve task.
Each sequence consists of four parts. First, as Figure 14 below shows, the most
prominent part is the body of the sequence which contains a number of segments. Given
that the duration of each group’s design process was different, these sequences have
different lengths and thus different numbers of segments. Each segment represents a two-
minute time period and all segments together represent a group’s design process. Each
segment has a color indicating a level of engagement of the subgroup: Green indicates
“all engaged” (i.e., all members of the subgroup were engaged), light green indicates
“majority engaged” (i.e., the majority of the subgroup were engaged ), yellow indicates
“half engaged” (i.e., half of the subgroup were engaged), purple indicates “minority
engaged” (the minority of the subgroup were engaged), and red indicates “none engaged”
(i.e., no one in the subgroup was engaged).

87
Figure 14. Female subgroups' behavioral engagement in Heart Valve

88
Second, to the left of each engagement sequence are the group number and the
group’s gender composition information in the number of boys and girls in the group and
percent of girls or boys in the group. Due to space limit, in the figures I used an “xgyb”
format to show the number of girls and boys in a group. In this string, “g” stands for
“girl” and “b” stands for “boy”, and x is the number of girls and y is the number of boys.
For example, in Figure 14, the title of this figure is Female subgroups’ behavioral
engagement in Heart Valve, on the left of the second sequence are “Group 41”, “2g2b”,
and “50% female”. These pieces of information mean that this is the sequence of the
female subgroup of Group 41, that this group constitutes two girls and two boys, and that
it has 50% female. Furthermore, Group 41 is put together with two other groups, Groups
52 and 61, to form a sequence cluster, because all of them have the same gender
composition (i.e., the same percent of girls).
Third, under the body of each engagement sequence are acronyms denoting each
step of the group’s design process as determined in my conceptual framework. Possible
steps were: Researching the Problem (RP), Conceptual Design (CD), Embodiment
Design (ED), Test (T), and Test and Refine (T&R).11 According to what the students in a
group actually did, a group may lack one or more of these steps. For example, in Figure
14, Group 31 has all four steps, but Group 41 lacks RP. In these sequences, a noticeable
phenomenon is that some groups have intertwined steps – these groups intertwined two
adjacent design steps and it was analytically impossible to distinguish them. For example,
in Figure 14, in the sequence of Group 52 there is a step labelled “CD+ED”; thus,
students behavior reflects an interweaving of the design steps of CD and ED.
11 Some groups only tested their prototype and did not refine it while some groups did both, so, there was
the step of Test (T) and the step of Test and Refine (T&R).

89
The fourth and final piece of information of a sequence is the quantified
engagement level index (PHEL), which is located to the right of each sequence, and
which is a measure of a subgroup’s overall level of engagement in a specific task. As
reported in the Methods chapter, I used this index to develop two hypotheses toward
answering my first three research questions. Such a variable, together with the group
female percent variable, made statistical analyses of the sequences possible, and the
results of such analyses are presented in the next section.
With all these pieces of information, Figures 14-19 are able to provide: (1) an
overall picture of the levels of a certain type of engagement in a certain task of all the
female and male subgroups, which enables a visual comparison of these engagement
levels across groups of different gender compositions; and (2) a foundation for further
statistical analysis of the quantitative relationship between engagement level and group
gender composition.
Below, I will first present the rest of the figures and report visual-based
qualitative analysis results for the engagement sequences, then, in the next section, I will
report my statistical analysis results.
The following is Figures 15 , showing all the female subgroups’ emotional and
cognitive engagement sequences in the Heart Valve task.

90
Figure 15. Female subgroups' emotional engagement in Heart Valve

91
In Figure 15, from the top to the bottom, the decrease of the concentration of red
and yellow segments and increase of the concentration of green segments (including both
dark and light green; similarly hereinafter) in the sequences indicate that across sequence
clusters of different gender composition (from 33% to 100% group female) the female
subgroups’ emotional engagement levels in Heart Valve elevated. In contrast, in Figure
14 (female subgroups’ behavioral engagement in Heart Valve) there is not such a pattern,
as can be seen from the evenly distributed green segments which dominate the whole
figure, indicating that all the female subgroups’ levels of behavioral engagement in Heart
Valve are similarly high or relatively high.
Below, Figure 16 will show the female subgroups’ levels of cognitive engagement
in Heart Valve.

92
Figure 16.Female subgroups’ cognitive engagement in Heart Valve

93
In this figure, it can be seen that there is a relatively even distribution of red,
yellow, purple and green segments, and this indicates that across all the groups, there was
not a unidirectional increase or decrease of the female subgroups’ level of cognitive
engagement in Heart Valve along with the increase of group female percent across all the
sequence clusters.
Below, Figures 17-19 show male subgroups’ levels of behavioral, emotional and
cognitive engagement in Heart Valve, respectively. Differently than the figures of the
female subgroups, in the leftmost part of these figures, the information shows the percent
of boys in the group.
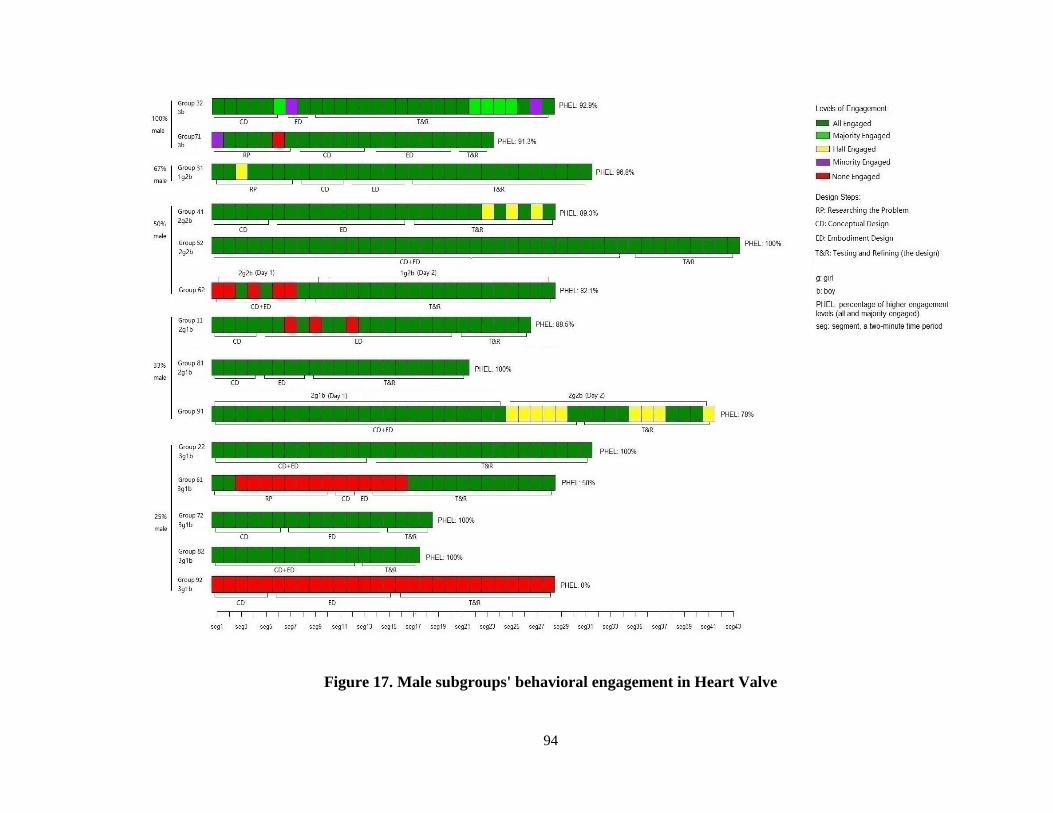
94
Figure 17. Male subgroups' behavioral engagement in Heart Valve

95
In this figure, it is easy to notice that: (1) the two “reddest” sequences (i.e., the
sequences of the male subgroups in Groups 92 and 61) are in the sequence cluster with
the lowest male percent, 25% (that is, the highest female percent among groups with male
presence, 75%); (2) excluding these two extreme cases, green is the dominant color and is
quite evenly distributed; and (3) the “greenest” sequences (i.e., those with the highest
PHELs, which are higher than 90%) are present in all the sequence clusters.
What does all this mean? Is there a unidirectional relationship between group
gender composition and the male subgroups’ level of behavioral engagement in Heart
Valve? While it is hard to tell by the above observations, later PHEL-based statistical
analysis will be able to determine this relationship.
Apart from trying to identify a pattern in such a relationship, I also paid attention
to the “outlier” – the male subgroup in Group 92 (i.e., the only boy in this 3g1b group).
What happened that’s related to this boys’ total disengagement in this task? Was it related
to the girls? To answer these questions, I qualitatively analyzed this group’s interview
and ERRs data, and the results will be reported in the last subsection of this section.

96
Figure 18. Male subgroups’ emotional engagement in Heart Valve

97
Similarly to Figure 17, in Figure 18 it can be seen that the lowest PHELs exist in
the sequence cluster with the lowest group male percent, 25% (i.e., the highest group
female percent in groups with male presence, 75%), but at the same time the highest
PHELs (i.e., those that are over 90%) exist in almost all the clusters of sequences.
Does this mean that there is or isn’t a unidirectional correlation between group
gender composition and the male subgroups’ level of emotional engagement in Heart
Valve? Later statistical analysis results will be able to answer this question.

98
Figure 19. Male subgroups’ cognitive engagement in Heart Valve

99
Differently than the last two figures, Figure 19 shows a relatively even
distribution of sequences that are dominated by red, purple and yellow colors across all
the sequence clusters of different gender compositions. So, it appears that there is not a
unidirectional correlation between group gender composition and male subgroups’
cognitive engagement in Heart Valve.
In Oil Spill, the male subgroups’ behavioral engagement levels are somewhat
similar to their engagement levels in Heart Valve, but the female subgroups’ engagement
levels have different patterns. Below, I will present figures showing the sequences of all
these student subgroups’ engagement in this task.
In these Oil Spill figures (Figures 20-25), there are not as many subgroups as in
the Heart Valve figures (Figures 14-19). This is because in School 1, Teacher 1 did not
implement Oil Spill in Classes 1-3, and therefore Groups 11, 12, 21, 22, 31 and 32 are
absent from the Oil Spill figures.

100
Figure 20. Female subgroups’ behavioral engagement in Oil Spill

101
In Figure 20, one can see that with only two exceptions all the sequences are
dominated by green colors, indicating that almost all the female subgroups behaviorally
engaged in the Oil Spill task at high levels. However, it can also be seen that: (1) Most of
the red segments exist in the sequence clusters which have a group female percent of
50% or less; (2) in the clusters which have a group female percent of over 50% the
concentration of green segments is obviously higher than in the clusters with a group
female percent of 50% or less; and (3) in the 100%-group-female cluster the
concentration of green segments is even higher than in the 75%-group-female cluster.
So, it appears that there might be a unidirectional positive correlation between group
female percent and the female subgroups’ level of behavioral engagement in the Oil Spill
task.

102
Figure 21. Female subgroups’ emotional engagement in Oil Spill

103
Similarly to Figure 20, Figure 21 shows that in the 33%- and 50%-group-female
sequence clusters the concentration of red and yellow segments is much higher than in
the 75%- and 100%-group-female clusters; also, in the former clusters the concentration
of green segments is considerably lower than in the latter clusters. Also, similarly to
Figure 20, in Figure 21 the concentration of green segments in the 100%-group-female
cluster is higher than in the 75%-group-female cluster. So, it appears that there exists a
unidirectional positive correlation between group female percent and the female
subgroups’ levels of emotional engagement in the Oil Spill task.
In Figure 22 below, a similar pattern can also be observed between the clusters
with a group female percent of 50% or lower and those with a group female percent
higher than 50%: The concentration of red and yellow segments is much higher in the
former clusters than in the latter, and the concentration of green segments is much lower
in the former clusters than in the latter. Also, again, between the 75%-group-female
cluster and the 100%-group-female cluster, the concentration of red and purple segments
is higher in the former than in the latter, and the concentration of green segments is lower
in the higher in the former than in the latter. Thus, it appears that there is a unidirectional
positive correlation between group female percent and the female subgroups’ levels of
cognitive engagement in the Oil Spill task.

104
Figure 22. Female subgroups’ cognitive engagement in Oil Spill

105
Below are figures that show the male subgroups’ engagement in Oil Spill (Figures
23-25). In these figures, the patterns that can be observed in the female subgroups’
figures do not exist. Instead, within each type of engagement, these male subgroups’
sequences have one
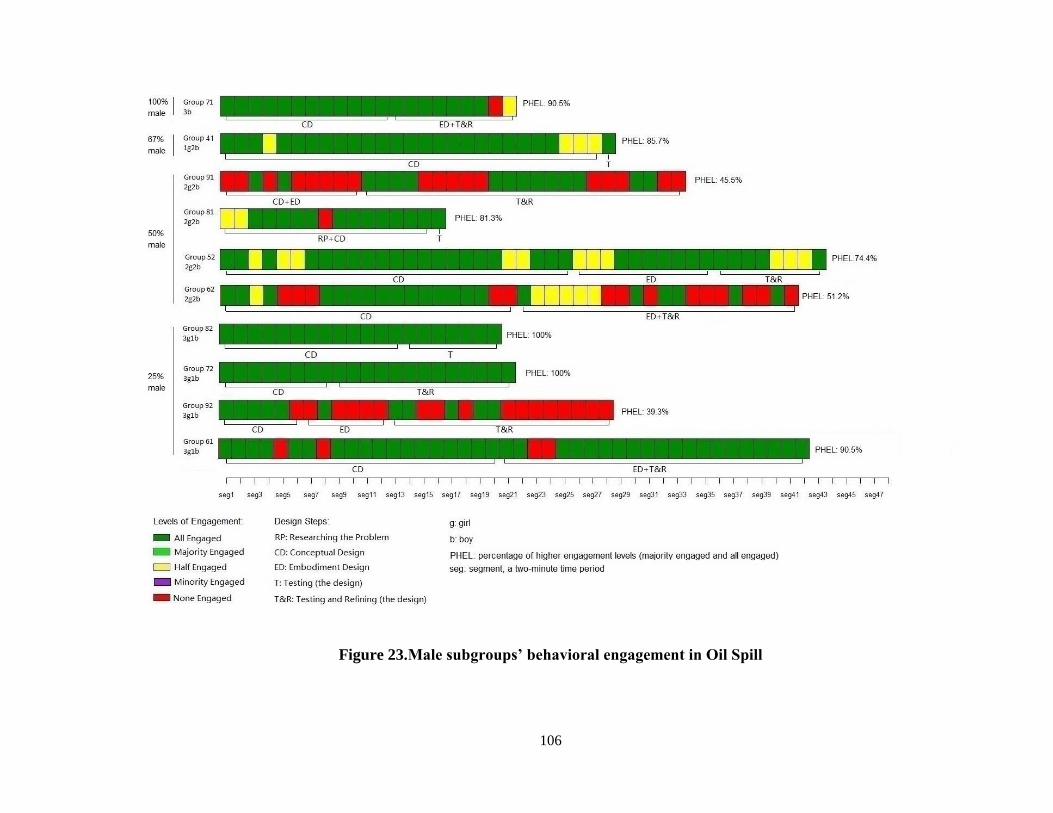
106
Figure 23.Male subgroups’ behavioral engagement in Oil Spill

107
In Figure 23, it is easily visible that the green color is dominant and green
segments are quite evenly distributed across sequence clusters of different group gender
compositions. Also, red segments are also relatively evenly distributed among all these
clusters. Thus, it appears that there lacks a unidirectional relationship between group
gender composition and the male subgroups’ levels of behavioral engagement in Oil
Spill.

108
Figure 24. Male subgroups’ emotional engagement in Oil Spill

109
Similarly to Figure 23, Figure 24 also shows that the green color is dominant and
has a relatively even distribution across sequence clusters with different gender
compositions and that the red and yellow colors also have a relatively even distribution
across these sequence clusters. So, there appears to be a lack of a unidirectional
correlation between group gender composition and the male subgroups’ levels of
emotional engagement in Oil Spill.

110
Figure 25. Male subgroups’ cognitive engagement in Oil Spill

111
Different than in Figures 23 and 24, in Figure 25 the dominant colors are red and
yellow, but similarly to those two figures, these dominant colors are relatively evenly
distributed across the sequence clusters of all the different gender compositions.
Therefore, there seems to be an absence of a unidirectional relationship between group
gender composition and the male subgroups’ levels of cognitive engagement in Oil Spill.
To sum up, the engagement sequences provided a visual display of the student
subgroups’ levels of behavioral, emotional and cognitive engagement in the two tasks,
and thus an opportunity for an initial qualitative assessment of the relationship between
subgroup engagement and group gender composition.
For the female subgroups, there appears to be a positive correlation between
group female percent and their levels of all three types of engagement in Oil Spill, and
their level of emotional engagement in Heart Valve, respectively. In contrast, such a
pattern doesn’t seem to exist for the correlations between group female percent and the
female subgroups’ levels of behavioral and cognitive engagement in Heart Valve; nor
does it seem to exist for the correlations between group female percent and the male
subgroups’ levels of behavioral, emotional or cognitive engagement in Heart Valve or Oil
Spill (in the cases of the correlations between group female percent and the male
subgroups’ behavioral and emotional engagement in Heart Valve, it’s difficulty to make
an initial judgement from the sequences). In a previous study (Guo, Nieswandt,
McEneaney & Howe, 2016) which was also part of the Small Group project, there was a
case in which in a 3g1b group the boy’s levels of emotional and cognitive engagement
were low while the girls’ were high; also, in the present study, in Group 92 (3g1b), the
boy was totally non-engaged behaviorally, emotionally and cognitively while the girls’

112
engagement levels were high (this case will be reported in detail in the Results chapter).
So, at least in the Small Group project’s case, it might have been true that sometimes in
female-majority groups the solo boy was marginalized by the girls and his engagement
was hindered. Therefore, here, in discussing the relationship between group female
percent and male subgroup’s engagement levels, my underlying hypothesis was that
group female percent may have an influence on boys’ engagement. Also, later I tested
this hypothesis (see H2 below).
In addition to this preliminary qualitative analysis, I conducted a quantitative data
analysis which determined these relationships statistically, and this will be reported in the
next section.
Relationships between group gender composition and subgroup engagement.
In this subsection, I will report the statistical data analysis results regarding how student
group gender composition correlates to subgroup engagement levels, which address my
first three research questions (RQ1: Behavioral Engagement and Group Gender
Composition, RQ2: Emotional Engagement and Group Gender Composition, and RQ3:
Cognitive Engagement and Group Gender Composition).
As reported in the Methods chapter, I used the variable PHEL (Percentage of
Higher Engagement Level) to develop two hypotheses regarding the relationships
between group gender composition and subgroup engagement:
• H1: The higher the percentage of girls in a group, the higher the PHEL of
the female subgroup.
• H2: The higher the percentage of girls in a group, the lower the PHEL of
the male subgroup.

113
To test H1 and H2, I ran Spearman's correlations across all groups and for each
type of engagement component. For Heart Valve, the results show a significant and
positive correlation between group female percent and a female subgroup’s emotional
engagement PHEL (rs = .53, n = 15, p = .04). This indicates that when a group had a
higher percentage of girls, the girls’ (i.e., the female subgroup’s) levels of emotional
engagement were significantly higher. For the other two types of engagement, the
correlations between group female percent and a female subgroup’s PHEL are positive
but not significant (rs = .23, n = 15, p = .42, for behavioral engagement; and rs = .09, n =
15, p = .76, for cognitive engagement). Thus, the girls’ subgroup level of behavioral
engagement or cognitive engagement does not significantly increase when there were
more girls in a group.
In contrast to the Heart Valve task, for the Oil Spill task, I found a significant and
positive correlation between group female percent and a female subgroup’s behavioral
engagement PHEL (rs = .70, n = 11, p = .02), emotional engagement PHEL (rs = .67, n =
11, p =.02), and cognitive engagement PHEL (rs= .61, n = 11, p =.05). These results
indicate that in this task, when the percent of girls in a group increased, the girls’
subgroup levels of behavioral, emotional, and cognitive engagement also increased
significantly.
For male subgroups, no significant correlations were found between group female
percent and a subgroup’s behavioral, emotional, or cognitive engagement PHEL, for both
Heart Valve and Oil Spill. The correlations between group female percent and a male
subgroup’s emotional and cognitive engagement PHELs are negative, but they don’t
approach significance. Therefore, there is no evidence to believe that in Heart Valve or

114
Oil Spill, when there were more girls in a group, the boys’ (i.e., the male subgroup’s)
PHEL of any of the three types of engagement significantly decreased. For tables
showing all these results, refer to Appendices 11 and 12.
From Figures 14-25, an obvious difference between the students’ (both girls’ and
boys’) behavioral engagement sequences and their emotional and cognitive engagement
sequences in both tasks can be noticed: In the behavioral engagement sequences (Figures
14, 17, 20, and 23) there is little variation because almost all the student subgroups’
levels of behavioral engagement are similarly high, while in the emotional engagement
sequences (Figures 15, 18, 21, and 24) and the cognitive engagement sequences (Figures
16, 19, 22, and 25) there are considerably high variations that can be easily observed.
To quantitatively determine whether the variations in the student subgroups’
behavioral engagement sequences can be considered low, I conducted descriptive
statistical analysis of the PHELs of these sequences and also calculated their coefficients
of variation (CV). The results are shown in Table 8.

115
Table 8. Descriptive Statistic for Student Subgroups’ behavioral engagement PHEL
in Heart Valve and Oil Spill
N Minimum Maximum
Mean
(μ)
Standard
Deviation (σ)
Coefficient of
Variation (σ/μ)
Female subgroups’
behavioral engagement
PHEL in Heart Valve
15 .68 1.00 .89 .10 .11
Male subgroups’
behavioral engagement
PHEL in Heart Valve
14 .00 1.00 .83 .28 .34
Female subgroups’
behavioral engagement
PHEL in Oil Spill
11 .51 1.00 .85 .17 .20
Male subgroups’
behavioral engagement
PHEL in Oil Spill
10 .39 1.00 .76 .23 .30
As can be seen in Table 8, in both tasks, for female and male subgroups’
behavioral engagement PHELs, the means are all high, and the standard deviations are all
low. As a result, all the CVs are considerably below one. Given that a CV that’s smaller
than one indicates a low variation (Su, 2015), all the variations of the student subgroups’
behavioral engagement PHELs can be considered as very low. These results indicate that:
(1) Overall, the female and male subgroups’ levels of behavioral engagement in Heart
Valve are high, and (2) both female and male subgroups’ behavioral engagement levels in
both tasks were minimally correlated with their group’s gender composition.
However, as Figure 17 (see below) shows, there is an extreme case – in Group 92
which has three girls and one boy, the boy’s behavioral engagement PHEL in Heart

116
Valve is as low as zero. Obviously, this is an outlier that doesn’t fit into the patterns
reported above, and it will be analyzed in the qualitative data analysis results subsection
below.

117
Figure 17. Male subgroups' behavioral engagement in Heart Valve

118
In summary, these results statistically confirmed all the significant and non-
significant correlations between group female percent and female and male subgroups’
engagement levels in both tasks that were inferred by visually inspecting the sequences;
also, they statistically determined the correlations between group female percent and the
male subgroups’ behavioral and emotional engagement in Heart Valve, which were hard
to determine only by observing the corresponding sequences.
As reported above: (1) There is a significant positive correlation between group
female percent and the female subgroups’ levels of behavioral, emotional and cognitive
engagement in Oil Spill and level of emotional engagement in Heart Valve, respectively;
(2) there doesn’t exist such a relationship between group female percent and the female
subgroups’ behavioral and cognitive engagement in Heart Valve; and (3) there doesn’t
exist such a relationship between group female percent and the male subgroups’
behavioral, emotional and cognitive engagement in Heart Valve or Oil Spill.
While these results answered my first three research questions which are about the
relationships between group gender composition and subgroup engagement, they tell only
part of the story and they say little about what’s behind the colorful sequences and the
various values of the PHEL . Questions arise such as : Why is the cognitive engagement
PHEL of the female subgroup in Group 72 (see Figure 16) so low, while it’s actually in a
female-majority group? This result would be contradictory to Dasgupta’s (2011)
stereotype inoculation model. To answer questions like this, that is, to actually test
Dasgupta’s theory, I conducted in-depth qualitative analysis of four specific groups, and
the results will be presented below.

119
Factors influencing girls’ and boys’ emotional and cognitive engagement in
female-majority and gender-parity groups. According to Dasgupta’s (2011) stereotype
inoculation model, in the context of this study, in female-majority and all-female groups
girls’ engagement should be promoted upon “contact with” (p. 233) or “exposure to”
(p.233) their in-group peers (i.e., other girls in the same group). Two underlying
psychological mechanisms contribute to their engagement: (1) a stronger and more stable
sense of belonging in the environment, and (2) increased self-efficacy. In examining this
theory, I explored three different scenarios of female subgroup engagement:
(1) In female-majority or all-female groups with high girls’ engagement levels
whether the major gender-related factors that supported girls’ engagement are closely
related to the four psychological mechanisms suggested by stereotype inoculation model;
(2) In female-majority or all-female groups with low girls’ engagement levels,
what are the major gender-related factors that influenced girls’ engagement; that is, I
intended to see why stereotype inoculation model may fail to predict girls’ engagement
levels in such groups, and
(3) In gender-parity or female-minority groups with low engagement levels of
girls, whether gender interaction was the main factor that hindered the girls’ engagement.
The examining of the stereotype inoculation model would also require exploring a
fourth scenario – gender-parity or female-minority groups with the female subgroup’s
high level of emotional or cognitive engagement. However, in all the sequences of the
female subgroups’ emotional and cognitive engagement in Heart Valve,12 there were no
12 Between the two tasks, I only chose Heart Valve for doing the qualitative analysis of the selected groups,
and the rationale will be reported below.

120
groups that matched this criterion.13 Therefore, in my analysis, such a scenario is not
present.
As reported previously, all subgroups’ behavioral engagement levels across both
tasks are high and have very low variations across groups of all the different gender
compositions (indicating a lack of strong relationship between behavioral engagement
and group gender composition), while I found large variations across subgroups in the
other two types of engagement. Therefore, for the qualitative analysis, I focus on
emotional and cognitive engagement.
Between the two tasks of Heart Valve and Oil Spill, I chose Heart Valve. This is
because, as can be seen from the above statistical results, in Oil Spill there are significant
positive correlations between the female subgroups’ emotional and cognitive engagement
levels and group female percent; in contrast, in Heart Valve, such a relationship only
exists for the girls’ emotional engagement and not for their cognitive engagement. Thus,
the female subgroups’ cognitive engagement in Heart Valve is not consistent with
Dasgupta’s (2011) stereotype inoculation model. Such an inconsistency is considerable
because cognitive engagement could be important for student achievement (Boekarts,
Pintrich, & Zeidner, 2000; Nystrand & Gamoran, 1991).
Of all the female subgroups, I identified only the following four groups matching
the different scenarios of female subgroup engagement: Group 92, a female-majority
group with girls’ high level of emotional engagement matching the first scenario; Group
41, a gender-parity group with girls’ low level of emotional engagement matching the
13 There was a gender-parity group, Group 62, which had a high level of cognitive engagement of the
female subgroup (see the fourth sequence in Figure 16). However, as can be seen from the figure, on Day 1
all four group members were present but on Day 2 there were only three group members and one girl was
absent, resulting in a change of the female subgroup. Therefore, I did not select this group.

121
third scenario; Group 12, an all-female group with a high level of cognitive engagement
matching the first scenario; and Group 72, a female-majority group with low level of
cognitive engagement matching the second scenario. None of the other groups matched
any of the criteria as Dasgupta’s (2011) stereotype inoculation model might suggest or
showed high or low levels of engagement that would be in opposition to her model, such
as a female minority sub-group with high level of engagement. Table 9 provides an
overview of these groups.
Table 9. Groups selected for qualitative analysis and rationale for selection
Group
Number
Gender
Composition
Type and Level of Female
Subgroup Engagement to be
Analyzed
Type and Level of Male
Subgroup Engagement to
be Analyzed
Group
92
3g1b (female
majority)
High level of emotional
engagement
Emotional disengagement
Group
41
2g2b (gender
parity)
Low level of emotional
engagement
High level of emotional
engagement
Group
12
4g (all
female)
High level of cognitive
engagement
N/A
Group
72
3g1b (female
majority)
Low level of cognitive
engagement
High level of cognitive
engagement

122
The results of the qualitative analysis of these groups are presented below, case by case.
Group 92: Three girls’ high and one boy’s zero levels of emotional engagement in Heart Valve. In this group there were
three white girls (Tina14, Anna, Taylor) and one white boy (Andrew). The sequences of their emotional engagement in the
Heart Valve task is depicted in the figure below.
Figure 26. Group 92’s sequence of emotional engagement in Heart Valve
14 This name and all other student names in this dissertation are pseudonyms.

123
Figure 26 shows two major phenomena: First, the dominance of green colors in its
sequence (all/majority engaged) and a PHEL value of 87.8% (for all female subgroups,
M = 81.4%, n = 15, SD =18.3), and complete red – no engagement for the boy, Andrew.
Thus, while the female subgroup’s emotional engagement in Heart Valve is high,
Andrew’s is non-existent. He also attended group work on this task only on the first day
and was absent on the second day.
What gender-related factor(s) supported the girls’ high levels of emotional
engagement during their group work process? Why was Andrew fully non-engaged
emotionally? To answer these questions, I used the focus group interview and ERRs data.
The focus group interview of this group was conducted at the end of the semester,
a few days after the students finished all six tasks for the Small Group project. In these
six tasks, the first three were scientific inquiry activities, and the last three were
engineering design ones (Heart Valve was the first among these three).
Three major themes (Group cohesion; positive group interaction; and activity
emotions) and sub-themes (social cohesion, cognitive cohesion) emerged from the focus
group interview data as well as from the ERRs data .
Group cohesion. The presence or absence of social cohesion at the group or
subgroup level significantly influenced the students’ emotional engagement. Specifically,
at the group level, there was a lack of social cohesion between the boy (Andrew) and the
girls (i.e., a gender gap between them) which negatively influenced Andrew’s emotional
engagement; at the subgroup level, the three girls formed a socially cohesive team, which
helped promoting their emotional engagement. Also, in addition to the social dimension
of the female subgroup’s cohesion, there was a cognitive dimension – the girls’ perceived
124
cognitive benefits of group work and their actual cognitive work together, and such
cognitive cohesion of the female subgroup also helped promote their emotional
engagement. These sub-themes are introduced below.
(1) Female subgroup social cohesion. A very obvious phenomenon in this group’s
work is that there lacked a group-level social cohesion, as evidenced by the behavior of
Andrew and the three girls during the interview. Though all four students were present in
the interview, and the interviewer consciously paid equal attention to all of them when
posing questions and responding to their comments, not all students participated equally.
A single search of their names in the interview transcription found that during the
interview, Taylor talked 31 times, Tina talked 22 times, Anna talked 16 times, and
Andrew only talked 12 times. Further, among Andrew’s 12 utterances, only five were
voluntary and seven were passive responses to the questions that the interviewer directed
specifically to him. In all these seven cases, the interviewer particularly wanted his
response because all the girls had responded to her question but Andrew had not. In
contrast, all of the utterances of all the girls were voluntary answers to the interviewer’s
question/comments or further comments that they added to their own answers. Also,
another noticeable phenomenon is that in responding to the interviewer’s questions the
three girls not only talked with the interviewer but also talked with each other; however,
Andrew only talked to the interviewer and never to the girls, although once Taylor
expressed an agreement with a comment made by him.
A very similar group work structure can be found in the ERRs. Although Andrew
was physically present on the first day of this task, socially the three girls formed a
subgroup by working well together, and Andrew was outside of it. During the whole class

125
period, Andrew participated only three times. First, he answered a question Tina asked by
saying a simple “yes” (due to sound quality Tina’s question was inaudible); and in both
of the other situations, he helped pick up marbles from the table or ground with a
minimal number of behavioral interactions with the girls. None of the girls made any
effort to involve Andrew in the work, and Andrew himself also didn’t make such an
effort. In contrast, the girls worked together as a socially cohesive subgroup. In response
to the interviewer’s question about how they felt working with each other, the students
responded positively and introduced how they achieved their group’s cohesion (as they
reported about it). According to them, before they started to work on these inquiry and
engineering tasks, they didn’t know each other. Taylor reported that they didn’t usually
talk to each other on a daily basis, and Tina even said she “freaked out” when she first
learned that they were going to be working in the same group. But later on, as the
semester went on and the tasks unfolded one by one, they developed a better and better
group work relationship. Importantly, such a relationship underwent a leap after the first
three inquiry tasks; that is, for the later three engineering tasks, their group work
mechanism became considerably better than before. Regarding this, Taylor said: “We
ended up getting more comfortable with each other toward the end. In the last three labs,
it was different.” “I think we worked better with each other as time went on.” With these
statements, all three other group members agreed verbally, including Andrew.
However, Andrew’s behavior during the Heart Valve activity is in contrast to his
statement in the interview. An analysis of the ERRs of the other five tasks that the group
did shows that in the first three inquiry tasks, Andrew’s participation in group work
declined over time throughout the first three tasks (all inquiry tasks) to almost non-

126
existent in the Heart Valve task. His participation in the two engineering tasks following
the Heart Valve increased slightly but altogether was still at very low levels as indicated
in the ERRs.
Therefore, in this group, social cohesion was absent at the group level and only
existed at the subgroup level, within the three girls.
(2) Female subgroup cognitive cohesion. In addition to the girls’ perception of
working together in this specific group, they also talked about their understanding of
group work in a more general sense. When responding to the interviewer’s question about
their preference for solo work versus group work in doing inquiry and engineering tasks,
all three girls expressed that they would prefer group work, as they saw that such a
format could help them gain more and diversified ideas for solving problems:
Taylor: I think that a lot of people were okay with sharing these ideas. So I think it
made it easier to like put together better ideas, ‘cause we had more to feed off of.
Tina: This overall thing has actually changed my view on group work. I used to
hate being in groups. This showed me the positive things about working in a
group can do for you.
Anna: I feel like it just makes it easier, ‘cause you don’t have just one person’s
opinion and that will just help you get through the project.
An examination of the ERRs found that these perceptions were consistent with the
girls’ actual group work, as they worked together and contributed ideas for solving
problems, including difficult ones, during the different steps of their design process.
Positive subgroup interaction (leadership induced). As introduced above, the girls
perceived that they worked well in their socially and cognitively cohesive subgroup.

127
Closely related to their perception of working well together is their recognition that such
work was going on under the leadership of Taylor. Tina felt that “Taylor kind of knew
what to do all the time. She was kind of the leader.” Taylor agreed with Tina’s
impression when asked by the interviewer.
The ERRs of the Heart Valve task of this group also confirm the girls’ assessment
of Taylor as their group leader. Taylor was the sole leader during this task, cognitively
and behaviorally, and she also was the most active group member emotionally. For
example, the girls began their Conceptual Design with a discussion under Taylor’s
leadership, although all girls were nearly equally engaged. The following ERRs episode
depicts this behavior indicating high level of cognitive engagement.
Figure 27. ERRs episode showing Group 92’s female subgroup’s cognitive
engagement
In the ERRs, in the Embodiment Design and Test and Refine steps of this group’s
design process, there are also similar recordings of the girls working well together under

128
Taylor’s leadership. In addition to her cognitive leadership, Taylor also took on the role
of the subgroup’s behavioral leader, as indicated by her doing most of the hands-on
construction, testing, and asking/telling what the other girls should do. However, her
prominent behavioral leadership role did not marginalize the other two girls; instead, she
involved them in their subgroup’s doing and thinking. The following ERR excerpts
during their Embodiment Design step demonstrate this behavior.
Figure 28. ERRs episodes showing Taylor’s leadership role in Group 92
Activity emotions. In the interview, the group also reported their feelings about
the tasks that they did. Specifically about Heart Valve, they all reported that they didn’t
like it, including Andrew (although he almost didn’t do anything in this task):
Interviewer: Were there any of these tasks that you didn’t like at all?
Tina: The Heart Valve one was pretty…
[Anna and Taylor laugh and shake their heads.]

129
Interviewer: Yeah that was pretty unanimous, do you agree with that too? Why?
Andrew: Yeah that one was tricky.
Taylor: A lot of trial and error that one was hard to figure out.
From this conversation, one might infer that these students felt frustrated by the
Heart Valve task. While this conversation does not contain direct evidence for such a
speculation, the ERRs make a solid basis for it.
In the ERRs, it is recorded that when the girls again and again experienced failure
(e.g., the heart valve failed to allow all the marbles to flow through it during the first tilt;
the heart valve failed to prevent all the marbles from flowing back through it during the
second tilt), Taylor began to show her feelings. In most cases, the other two girls were
also emotionally involved. The example below is a scenario that happened before,
during, and after the group’s fourth test of their heart valve prototype.

130
Figure 29. ERRs episode showing the emotional engagement of the girls in Group 92
As can be seen in this episode, before the girls’ third prototype testing, Taylor
verbally and behaviorally expressed her being scared that she didn’t want to witness
another possible failure, and the other two girls showed their sympathy by smiling. After
the unsuccessful test, facing the difficulty of getting the marbles that passed through the
heart valve back to their original position (they used tape to seal the interface between the
upper and lower part of their model so disassembling wouldn’t be easy), Taylor teased
their own awkward design, and the other two girls also laughed with her.

131
Later, as the girls went ahead to do more revisions and tests, Taylor also showed
some positive and seemingly quite negative emotions. Right after their third test, in
coping with the difficulty mentioned above, Taylor had an idea and showed confidence
by saying: “Ok, let’s do this, it’s going to work, I know this.” While she implemented her
idea, the other two girls provided their own ideas for solving this problem and also for
improving their heart valve design. Later, after another failure, Taylor showed her deep
frustration by telling her peers: “I hate this, I quit. I’m never doing this again.” As she
said this, the other girls smiled. But then, Taylor still went on to revise their design with
the other two girls’ help. Like this, they continued until it was time for them to present
their design.
In summary, during the Test and Refine step the girls showed strong activity
emotions (Pekrun & Stephens, 2010). Taylor as the leader showed more various and
stronger emotions than the other two girls; still, these two girls were emotionally,
cognitively and behaviorally engaged. They participated in Taylor’s manual construction
work, shared their ideas for solving problems and emotionally responded to Taylor’s
externalized feelings.
Summary. The qualitative analysis clearly shows a gender gap in this group: the
three girls worked together as a cohesive subgroup and Andrew, the boy, was outside of
it. Andrew’s lack of emotional (and behavioral and cognitive) engagement during the
group work is in stark contrast to the three girls’ cohesiveness and high levels of
emotional engagement. The reason why Andrew didn’t engage in the group work is not
directly tangible. It might be possible that the girls’ trajectory towards a more and more

132
cohesive subgroup during the inquiry tasks didn’t provide space for Andrew. He felt
more and more marginalized, and thus became less and less engaged.
Factors that supported the girls’ subgroup emotional engagement are their social
cohesiveness, though developed over time, Taylor’s leadership that not only moved the
group work forward but also included the less active girls, and their positive group
interaction under Taylor’s leadership. According to the two theories that constitute my
conceptual framework – self-system processes model (Connell & Wellborn, 1991) and
stereotype inoculation model (Dasgupta, 2011), these factors may have enhanced the
girls’ (especially the less active girls’) perceived relatedness. Also, their commonly
perceived cognitive benefit that group work could generate more ideas for solving
problems (i.e., their cognitive cohesiveness) as reflected in the interview and the group
work (ERRs) may have increased their self-efficacy (Connell & Wellborn, 1991,
Dasgupta, 2011). Consequently, elevated levels of perceived relatedness and self-efficacy
led to elevated levels of emotional engagement (Connell & Wellborn, 1991; Appleton et
al., 2008). More easily visibly, the girls’ activity emotions, which they generated as a
cohesive subgroup, directly contributed to their high emotional engagement levels.
Group 41: Two boys’ high and two girls’ low emotional engagement. This group
is constituted of two white girls, Mary and Helen, one white boy, Jerry, and one black
boy, Andre. For this group, the Heart Valve activity was the third task that they did for
the Small Group project. Before Heart Valve, they did two inquiry tasks; after Heart
Valve, they did another three tasks, including two engineering and one inquiry tasks. One
focus group interview with this group was conducted after Heart Valve, and an additional

133
one was conducted when they had completed all six tasks.
Figure 30. Group 41’s emotional engagement sequences in Heart Valve
Figure 30 shows the group’s emotional engagement sequence during the Heart
Valve task. The major dark green segments in the male subgroups indicate high
emotional engagement levels of both boys, while the high number of yellow segments in
the girls’ subgroup indicate that mostly only one of the girls was engaged. These
differences in the engagement level is also reflected in the PHEL: 92.9% for the male
subgroup (for all the male subgroups, M = 74.5%, n = 14, SD = 33.0), and 32.1% for the
female subgroup (for all the female subgroups, M = 81.4%, n = 15, SD =18.3). These
data show that in this gender-parity group the girls’ subgroup didn’t engage as high
emotionally as the boys’ subgroup. What led to this situation? Analysis of the focus
group interview and ERR revealed four themes (group social cohesion, group interaction,
interest in science and confidence in science) and two sub-themes within the theme group
interaction (negative: obstacles to girl’s participation and scarcity of female subgroup
interaction; lack of positive interaction: a minimal number of interactions between girls)
that provide insights into the group’s engagement pattern.
Group social cohesion. During the first focus group interview (conducted after the
Heart Valve activity) the students reported that they knew each other but didn’t talk much
and were not friends with each other. They told the interviewer that it was their teacher

134
who put them together as a group, and they would have chosen different peers if they had
been allowed to choose their own groups. However, through working as a group on the
different tasks they felt comfortable working with each other. The students didn’t
explicitly make such a statement but implied this through talking about how they worked
together. Then, when the interviewer directly asked about this, they gave affirmative
answers. The conversations went as the following.
[The first focus group interview, after Heart Valve had been done.]
Interviewer: So what do you think you learned from all these three activities?
Jerry: I mean I think they were all sort of about problem solving and working
with the groups.
Mary: Yeah and they included us in our own learning.
Jerry: I thought it was sort of, we got out of solving our problems with a group
and having to interact with people.
Helen: Yeah it definitely helped with group work, I hadn’t talked to all of these
guys in the beginning but now we all talk and have different ideas but we all put
them together, so it was after a while it was a lot easier.
Interviewer: Okay so did you know each other before?
Helen: Yeah well I knew Andre but we didn’t really speak much.
Interviewer: Well you knew each other, but you weren’t very familiar. But then
during this group work you got familiar with each other, and now you feel really
comfortable with each other?
Group say: Yeah.

135
Similarly to the first interview, during the second focus group interview, at the
end of all six Small Group project tasks, students were asked about how they worked
together as a group and whether they knew each other prior to starting the groupwork.
Researcher: Ok. So, how did you come together as a group?
Helen: Ms. D put us together, like, here’s your group.
Mary: Yeah.
Andre: If we actually picked our own group it would have been different.
Mary: Yeah.
Helen: Yeah, probably like friend-based groups.
Researcher: So, at the beginning, you were not friends yet?
Helen: I had known Andre for a couple of years.
Researcher: But not all of you were friends.
Mary: We were acquaintances.
Andre: We already knew each other.
Researcher: But not too well?
Andre, Mary, and Helen all agreed.
Researcher: But now you feel much more comfortable with each other?
All agreed.
These excerpts show that, although the students in this group didn’t know each
other well at the beginning of the school year, through working together, they developed
social cohesion as a group. However, further detailed analysis of this groups interactions
shows that such cohesion didn’t result in each group member’s similar levels of
emotional engagement.

136
Group interaction. Students’ emotional engagement was affected by how their
interacted as a group: The boys’ dominance or leadership and the girls’ scarce of
interactions among themselves constituted barriers to the girls’ engagement.
(1) Negative group interaction: boys’ hyperactive leadership. In the second
interview of this group, when answering the interviewer’s question about what the
students had learned from doing all the tasks, Jerry mentioned “arguing with people”,
then it ignited a heated conversation about the boys’ leadership in handling cognitive
conflicts:
Interviewer: Ok, that’s very nice. For all six activities, do you have anything else
to say in terms of what you have learned?
Jerry: I guess, it was like, we were all centered around having a problem, and
figuring out with other people how to solve that problem, so I think…[He didn’t
finish.]
[Both girls began to laugh. Jerry turned to them with a half-joking-and-half-
serious look on his face. Both girls kept on laughing for a few more seconds and
then stopped. Mary peeked at Jerry.]
Jerry: So I think probably from it I must’ve gained some skills, I don’t know, I
mean…
Interviewer: Problem solving skills?
Jerry: Yeah, or even, arguing with people.
Interviewer: OK, argumentation skills, that’s very important in science, too. OK,
then that implies you guys had some arguments among yourselves, right?

137
Helen: [Spoke very fast. Inaudible as Mary was talking at the same time. Both
girls pointing at both boys while speaking.] But it always worked out in the end.
So… [She didn’t finish.]
Jerry: I would say it’s inevitable that people have different ideas.
Helen: [Pointing at both boys. Spoke very fast. Inaudible as Mary and the boys
were talking at the same time.] … Trying to incorporate both sides into one
thing…
Andre: We usually had reasoning on either side … we usually compromise …
Helen: Yeah, something in the middle.
Interviewer to both girls: OK. So, you pointed at these two guys for several times.
Does that mean that they were the main thinkers?
Mary: It’s like, [pointing at both boys] they would try to take leadership, but they
both did, so…
Interviewer: So that’s a problem?
Mary: Yeah.
Helen: Yeah.
Interviewer: When you ran into that kind of situation, can you tell me how you
solved the problem?
Jerry: I would be saying we should do it this way because of this, he would be
saying we should do it that way because of that …
Helen: [To the boys] usually you guys could find some kind of, like, compromise,
then we kind of like, …[She didn’t finish.]

138
Andre: There were definitely points where I completely gave up on explaining
things and I just did it, and then afterwards you guys were like “oh wow you did
it”…
Based on the above conversation, it’s tangible that in the perceptions of all the
group members (including the boys themselves), the boys were cognitive leaders, and
they handled most (if not all) of the cognitive conflicts between themselves at the male
subgroup level or within themselves at the individual level. Also, it may be inferred that
during such processes the girls were involved much less than the boys or even excluded.
The ERRs of the Heart Valve task provide confirmation.
During the group’s Conceptual Design step a heated discussion took place. The
group was brainstorming the design of their heart valve, and everybody was expressing
his/her own ideas. During this process, cognitively consecutive conversations mainly
happened between the boys, and they interrupted the girls quite a few times when they
tried to say something. The excerpt of the ERRs shows how this happened: 15
15 Given the length of this excerpt, I highlighted the most relevant sentences.

139
Figure 31. ERRs episode showing the girls’ verbal participation being interrupted
by the boys in Group 41
As this scenario shows, the boys eagerly articulated their own ideas and engaged
in cumulative reasoning, while at the same time they interrupted the girls who had their
own ideas and/or wanted to build on the boys’ comments. While the male subgroup was
emotionally engaged (as indicated by their enthusiasm and confidence), only Mary (half
of the female subgroup) showed emotional engagement, as indicated by her active
enthusiasm and persistence in participating in the boys’ discussion (especially her
provoked higher volume) and her interest in the design task. In contrast, Helen didn’t do
much to show that she’s emotionally engaged. However, importantly, she did for once try
to say something, but she was interrupted by Andre. Such an interruption, together with
the boys’ heated discussion, might have more or less suppressed her desire to participate

140
again. As a matter of fact, similar scenarios occurred again later, and might have
magnified such an effect.
In addition to the boys’ cognitive leadership (as indicated by their content-related
behaviors described above), they also demonstrated behavioral leadership that included
ignoring the girls’ contributions. During the Conceptual Design step, the students’ main
form of work was brainstorming, drawing and discussing design ideas. When they
transitioned to the next steps, Embodiment Design and Test and Refine, physical hands-
on work such as prototype construction and testing became dominant, although at times
they still discussed design ideas. In these steps, the boys did most of the group’s manual
work (behavioral leadership), while the two girls behaved differently in staying on task.
Most of the time, Mary was active in participating in the boys’ manual work and
discussions, although she was seldom taken seriously or as seen in the following ERRs
excerpt, was stopped in participating in the hands-on activity.
Figure 32. ERRs episode showing Mary’s behavioral participation being
interrupted by boys in Group 41

141
Helen, in contrast to Mary, sat or stood and looked at the others’ work with a low
amount of manual and verbal participation and when participating the boys ignored her as
seen in the ERR excerpt below:
Figure 33. ERRs episode showing Helen being ignored by the boys in Group 41
(2) Absence of interactions between girls. Less salient than the boys’ interruptions
and ignoring but also quite noticeable is the scarcity of interactions between the girls. In
the Brief Summary part of the ERRs, it is summarized that:
Mary is always actively participating in the construction work and very
enthusiastically helping with the boys’ (mainly Andre’s) hands-on work. Also, she talks a
lot with the boys. Although for quite a few times she is ignored when she tries to say
something or to get attention, her enthusiasm doesn’t seem to have been influenced. In
contrast, she does not pay much attention to Helen. Likewise, Helen does not talk much
with her.
A search of the girls’ names in the ERRs found that during the whole class period,
there were eight scenarios of Helen talking with the boys, 23 scenarios of Mary talking
with the boys, but only one scenario of Helen and Mary talking with each other (this was
an on-task conversation about the boys’ rationales for making some task-related

142
decisions). Notably, such a conversation happened when the boys were out of the group.
So, it seems that only when there was no one else to talk to did the girls talked with each
other. Further, no behavioral interaction between the girls was noted. Therefore, in this
group, the number of interactions between the girls was minimal. That is, the girls did not
play a role in increasing each other’s emotional engagement.
Interest (in engineering and the Heart Valve task). As introduced in the
Conceptual Framework section, interest is a component of emotional engagement as it is
students’ emotional reaction to academic content (Fredricks, et al., 2004). Such a form of
emotional engagement can also be seen in this group.
In both interviews, all the group members expressed that they liked the
engineering tasks better than the inquiry ones, and that they liked the Heart Valve task.
Mary, Helen and Jerry all said it’s because this task was hands-on, and Mary particularly
stressed one point:
I just thought it (Heart Valve) was more fun, the most fun, because…it was not
like a lot of thinking in it, [laughing], it was like building, constructing, which is
fun.
Also, Andre added a more cognitive reason in the second interview when he
compared the engineering and the inquiry tasks: “In the other activities you had to come
up with the experiments, you didn’t have a set goal, for the other ones, like for the
engineering ones there was always a goal you were trying to reach, like, it was much
more straightforward.”
Self-efficacy in science. Another factor explaining Helen’s low emotional
engagement is her low perception of self-efficacy in science. In the focus group

143
interview, when asked about how they handled the difficulties they had in their
communications with each other, Helen mentioned her self-efficacy in science:
… Like stronger academically, I think, such as I’m not as confident in science as
I’m in English, so if this was an English thing, I’d be like all into it, ‘cause I
understand the criteria really well, while in science I’m a little less enthusiastic
about it, so I’d be like, listening to everyone else, and putting in small opinions
when I understand.
Although Helen told the interviewer that she liked the Heart Valve task, she still
lacked confidence and enthusiasm in science, and this affected her behavior in group
work.
Summary. Although in the interview all the group members perceived their
group as cohesive and staying on task together the whole time, the ERRs show extremely
low number of group-wide positive interactions. The two boys dominated cognitively and
behaviorally and frequently interrupted or ignored the two girls when they tried to
verbally or behaviorally participate in the group work. The girls’ reaction to this behavior
was quite different. Mary kept her momentum with a high level of emotional
engagement, while Helen’s emotional (and also cognitive) engagement faded. How can
such a stark contrast be explained? Because Mary enjoyed the Heart Valve task very
much her enthusiasm was not affected by the boys’ physical hyperactivity and
aggressiveness (Price, 2017). Although Helen also reported she liked this task, she
articulated at the same time, that she felt less confident in science than in English.
Together with the boys’ dominant behavior and ignorance of her attempts to contribute,
she withdrew from the group work emotionally, cognitively, and behaviorally.
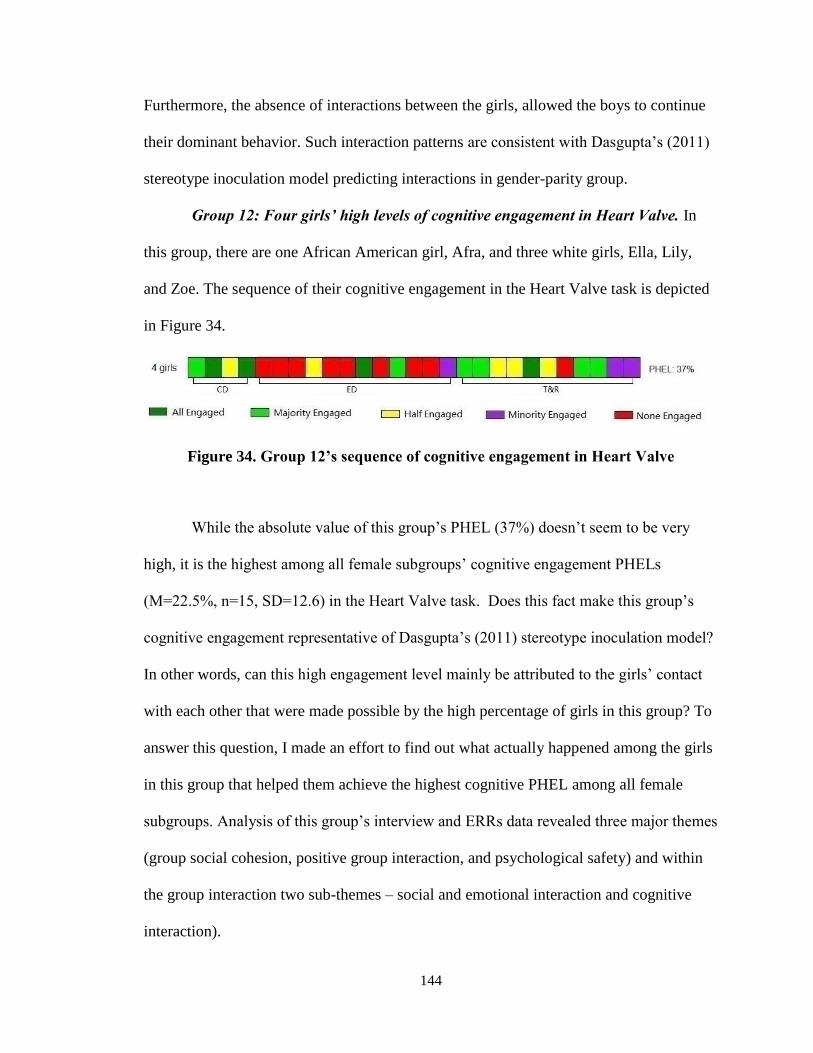
144
Furthermore, the absence of interactions between the girls, allowed the boys to continue
their dominant behavior. Such interaction patterns are consistent with Dasgupta’s (2011)
stereotype inoculation model predicting interactions in gender-parity group.
Group 12: Four girls’ high levels of cognitive engagement in Heart Valve. In
this group, there are one African American girl, Afra, and three white girls, Ella, Lily,
and Zoe. The sequence of their cognitive engagement in the Heart Valve task is depicted
in Figure 34.
Figure 34. Group 12’s sequence of cognitive engagement in Heart Valve
While the absolute value of this group’s PHEL (37%) doesn’t seem to be very
high, it is the highest among all female subgroups’ cognitive engagement PHELs
(M=22.5%, n=15, SD=12.6) in the Heart Valve task. Does this fact make this group’s
cognitive engagement representative of Dasgupta’s (2011) stereotype inoculation model?
In other words, can this high engagement level mainly be attributed to the girls’ contact
with each other that were made possible by the high percentage of girls in this group? To
answer this question, I made an effort to find out what actually happened among the girls
in this group that helped them achieve the highest cognitive PHEL among all female
subgroups. Analysis of this group’s interview and ERRs data revealed three major themes
(group social cohesion, positive group interaction, and psychological safety) and within
the group interaction two sub-themes – social and emotional interaction and cognitive
interaction).

145
Group social cohesion. In the focus group interview, the way the girls talked
about their relationship with each other strongly implied that they were a socially
cohesive group. When asked about whether they knew each other before their first Small
Group task, the girls referred to their pre-task relationship as friendship. Specifically, as
they reported, Lily, Afra and Ella had been friends for years; Zoe had just transferred
from another school for the academic year, and she was invited into this group by the
other girls whom she called “new friends”. Also, perhaps to show that they really knew
each other well, Zoe added that her perception of Lily was that “she’s like always super
positive”. Similarly, Afra added that she thought Zoe was “awesome”.
In the ERRs of this group, such group cohesion is also present, as shown by the
following excerpt from the “Social” subsection of the “Brief Summary” section of the
ERRs:
Positive group interaction. In this group, positive group interaction is a salient
theme that is related to the girls’ high levels of emotional engagement.
(1) Social and emotional positive group interaction. When asked how they felt
about working together as a group, the girls all clearly expressed positive feelings.
Particularly, Zoe stood out among the girls by telling the interviewer that she “wanted to
work in the group like forever”. Why did they think they worked well together? The girls
had different perspectives. Zoe said their group was “like a good group to work with” and
working on different tasks in this group was “fun”. Lily reported that it was because they

146
“all enjoyed each other’s company”. Afra added that an important factor was that they all
wanted to contribute and they all did contribute. Then, Ella went further and linked their
desires to contribute to their common goal of getting a good grade.
Throughout the group’s design process the ERRs show multiple recordings of the
girls working well together and in a joyful way. For example, in their Test and Refine
step, the following model testing scenario happened.
Figure 35. ERRs episode showing the girls’ social and emotional positive
interactions in Group 12
This scenario shows that all the girls took part in their model testing and the
pictures show their positive emotional reaction to the failure of the model. Afra further
concludes that this design was to be abandoned and they needed to develop a new design.
Accordingly, soon after this scenario, they engaged in their next iteration.
(2) Cognitive positive group interaction. While the girls were talking about how
they felt about working together as a group, a theme that’s closely related to their

147
cognitive engagement was mentioned repeatedly – they listened well to each other and
cared about what each other thought.
When the interviewer asked the group to elaborate on their perception that they
worked well together (including how they handled different ideas), Afra, Zoe and Lily all
had something to say:
Interviewer: … So you said that you worked really well together in the group. So
can you elaborate a little on this, what you mean?
Afra: Well we mostly had similar ideas about what we were going to do, and that
helped a lot, but if someone had different ideas, we listened to them, and we
talked about it, and I think we were able to work out any differences of opinion
that we had in a positive way rather than arguing about it.
Interviewer: So can you give me an example, how did you do it?
Zoe: We acknowledged her idea, because a big part of being a good group of
people is even if you don’t use the idea, you at least acknowledge that the idea
exists.
Later, when the interviewer asked again about how they handled cognitive
conflicts in a slightly different way, Lily responded:
Interviewer: Did it ever happen that you were in the group and couldn’t agree
with each other?
Lily: We would just say if we took a vote, and it was half and half we would just
combine everything, but there was like a strong three to one, but it didn’t really
matter that much, because we would still sort of combine everything.

148
Afra: If someone had different ideas than everyone else we would try to include
all of the ideas in the experiment because it was good to see what would happen.
The above self-reported group work behaviors can be confirmed by examples
from the ERRs. Below is an example that shows how the girls begin their Conceptual
Design step together.
Figure 36. ERRs episode showing the girls’ cognitive positive interactions in Group
12
As this scenario shows, the girls worked as a cohesive group when designing their
heart valve – three out of the four group members presented design ideas, and listened to
and watched each other when their teammate was presenting, and also built on each
other’s thoughts.

149
Psychological safety. Another theme that emerged from the interview data that
may have contributed to this group’s high cognitive engagement levels is psychological
safety. In response to the interviewer’s question asking whether there was a time when
the girls felt frustrated with the task that they were doing, Afra said they were all “pretty
chill people”, then Zoe quickly added that she herself was different because she would
“get really stressed out easily”. But, she was also quick to add that the other girls were
“just like, calm down, it’s okay”. The interviewer then asked the other girls whether it
disturbed them when Zoe freaked out, and they all gave negative answers. Thus, no one
in this group rejected Zoe when she reacted emotionally during the activity. Instead, they
tried to comfort her, thus creating a psychological safe space in which Zoe and the other
three girls could be themselves.
Creating such a safe psychological space may have been closely related to their
high levels of cognitive engagement. In this regard, something that Afra reported might
serve as indirect evidence. In response to the interviewer’s question about how they
handled cognitive conflicts, Afra said: “Everyone wasn’t afraid to contribute their ideas
and so, that helped a lot.”
Summary. In the Heart Valve task, this 100%-female group had the highest
cognitive engagement PHEL among all the female subgroups (also their emotional
engagement PHEL is among the highest). Based on the girls’ close friendship (which is
featured by their positive impressions of each other) and their common goal of doing well
on this task, they formed a highly cohesive and psychologically safe group with plenty of
socially, emotionally and cognitively positive interactions. Conceivably, all these factors
enhanced their perceived relatedness to each other and their self- and collective efficacy,

150
and thus elevated their levels of cognitive engagement (Dasgupta, 2012; Connell &
Wellborn, 1991). Also, their cognitive interactions with each other directly contributed to
their high levels of cognitive engagement.
Group 72: Three girls’ low and one boy’s high levels of cognitive engagement
in Heart Valve. This group is comprised of two white girls, Parker and Talia, one Latino
girl, Sophie, and one white boy, Brian. The sequences of their cognitive engagement in
the Heart Valve task are shown in Figure 37.
Figure 37. Group 72’s sequences of cognitive engagement in Heart Valve
Clearly, the girls’ and the boy’s sequences are very different. The boy’s sequence
displays his high cognitive engagement (72.2%) of the whole duration of the task, and
this is actually the highest PHEL value among all male subgroups (M = 28%, n = 14, SD
=18.8). In contrast, the PHEL of the girls’ sequence is among the lowest in all female
subgroups (M = 22.5%, n = 15, SD =12.6). Further, the prevalent purple color in this
sequence indicates that for most of the time, there was only one girl who was cognitively
engaged. An examination of the ERRs and the video revealed that it was Parker who was
consistently cognitively engaged. She was the primary cognitive leader of this group (and
the boy, Brian, was the secondary cognitive leader). As for the other two girls, Talia was
mainly a cognitive follower, and Sophie was never cognitively engaged.
151
What supported Parker’s (and Brian’s) cognitive engagement? Why weren’t the
other two girls cognitively engaged in this female-majority group? My analysis of the
interview data and ERRs provided clues, and they can be organized into several themes:
group cohesion with the sub-themes pre-activity interpersonal relationship and subgroup-
level social and cognitive cohesion, group interaction with the sub-themes of subgroup-
level positive and negative interaction, and interest in biology/science:
Group cohesion. Like Group 92 (three high engaged girls and one socially and
cognitively low engaged boy), this group was also not a cohesive group. But unlike
Group 92 it was a girl who was socially and cognitively apart from the rest of the group.
Three sub-themes can be identified that explain the observed behavior.
(1) Pre-activity interpersonal relationship. In the focus group interview, when
asked about how their group was formed, the students reported that it was determined by
their teacher, and they also talked about how they got to know each other. Before the
formation of their group, Parker, Brian and Talia knew each other, and Parker and Brian
worked together, but Sophie didn’t know them. When Talia said they were friends,
Parker used body language to show disagreement, which resulted in Talia changing her
perception of their relationship:
Interviewer: So you, your, this group got decided for you. Correct? You were,
[students nodding] okay. Did you know each other ahead of time?
Parker: I knew Talia pretty well and I worked with Brian on one of the
assignments, so kind of. I’ve never really worked with Sophie before, but …
Talia: Yeah.
Interviewer: Were you friends outside of the group, or?

152
Talia: Yeah.
[Parker shrugs.]
Interviewer: Or just kind of knew each other?
Parker: Yeah.
Talia: Yeah. We just knew each other.
Since Brian didn’t participate in this interaction it’s unclear how he percieved
their relationship. Parker doesn’t view her relationship to Talia as being friends, though
Talia seem to view Parker as a friend. This uneven perception of their relationship might
have had an influence on the interaction between these two girls (an example will be
reported later in this subsection). As for Sophie, she was not friends with any of her
teammates, as shown in the sub-theme directly below.
(2) Lack of group social cohesion (lack of female subgroup social cohesion).
Consistent with the absence of friendship among the girls, there was a lack of social
cohesion in this female subgroup. During the focus group interview, Sophie was very
quiet and talked very little, even when asked directly by the interviewer. There were five
times when the interivewer had to ask Sophie to respond to a question that’s already
answered by the other students. Among these five times, she only responded once, and
her response was simply a nod. Not surprisingly, the ERRs record the same phenomenon
(that Sophie was very inactive). In the Brief Summary part of the ERRs, it is recorded
that “Sophie hardly says anything during the whole process. She definitely does not
contribute any ideas to the group’s design job. Also there’s no sign that she cognitively
keeps up with the leaders of this group, Parker and Brian.” Why did Sophie act like this?
In the interview the other group members said something that’s relevant.

153
During the interview, when the students talked about their roles in the group
work, Parker mentioned that Sophie didn’t like to talk to other group members, and
Sophie confirmed it:
Interviewer: So Sophie, you’re kind of quiet. Did you find a way to contribute
some of your ideas?
[Long pause. No response from Sophie.]
Interviewer: Do you guys think that she contributed ideas? I mean, or was there a
way for her to put those out there?
Parker: She doesn’t like to talk to us.
Interviewer: Is that true?
Sophie nods slightly.
This interaction shows that Sophie didn’t cognitively engage with her group
during the Heart Valve task because she didn’t like to talk with other group members,
though neither Sophie nor any of the other group members provided information about
the reasons for her behavior. An examination of the ERRs of an earlier Small Group
project activity showed a similar behavior as shown in the Brief Summary section of the
ERRs:
[Content Space] Sophie is the only one who has no active role, only when she is
invited by Talia to time for one trial.
[Social Space] While Talia and Sophie are not as actively involved, they attend
and listen the whole time and offer support. (Sophie is selectively mute, as confirmed by
the teacher, so rarely speaks.)

154
[Social Space] They all have roles and tasks except for Sophie. There is no
evidence that she is trying to loaf or get out of work – rather, due to her selective mutism,
it is likely she is simply too shy to know how to engage.
So, it can be seen that it’s Sophie’s consistent behavior that she’s always socially
and cognitively apart from the rest of the group. Thus, for these four students there was a
lack of group social cohesion. Specifically, in terms of the female subgroup’s
engagement, it should be noted that this is also a lack of female subgroup social cohesion.
Although Sophie didn’t talk and thus had no cognitive contributions during the
Heart Valve activity, she was not really off task. Actually, she seemed to be emotionally
engaged - she always kept her eye on what they were doing. Sometimes she looked like
she’s thinking. These behaviors indicate that she’s interested in this task, and interest is a
component of emotional engagement. An inspection of this female subgroup’s emotional
engagement sequence found that all 18 segments but one are of dark green color
(denoting “all engaged”), indicating that all the girls, including Sophie, were emotionally
engaged 94% of the whole duration of this task. The Heart Valve ERRs revealed that all
of the entries of emotional engagement of the group members are related to their
emotional reactions to the academic content and none is related to their emotional
reactions to each other:
Quite a few [E]’s were put in the table, but all of them correspond to various sub-
codes under main code Interest.
What supported Sophie’s emotional engagement while she’s not at all part of the
group’s cognitive work space? The next theme may be able to provide a clue.

155
(3) Lack of group cognitive cohesion (lack of female subgroup cognitive
cohesion). Closely related to the lack of social cohesion in the group and the female
subgroup, there was also a lack of cognitive cohesion. In the interview, when asked
whether there were any of the tasks that they had done that they didn’t like, Parker, Brian
and Talia were all negative, and then Talia added that she “enjoyed working as a group
together”. Then, the interviewer asked the other group members how they thought about
this. Parker confirmed that she also enjoyed their group work, and then she added
comments indicating that her enjoyment was related to her perceived cognitive benefits
of group work. Following this, Brian and Talia voluntarily showed quick agreement and
also reported their similar perceptions of group work. The conversation went as the
following:
Interviewer: … So you already mentioned that you really liked working in the
group. That, uh, you know, was something that was, is that different for you? Is
that something that you have…
Parker: No, I thought, like I enjoyed it. I’d have rather been like working in the
group like in these big tasks than trying to like figure it out by myself.
[Brian and Talia nodding.]
Interviewer: Okay. So what did, what else did you like about it? You said you
liked not having to figure it all out by yourself. What else worked for you? What
else did you like?
Talia: Well working in a group, like, you can have different opinions, and you
can like make like, if one opinion is not working, then we can have another idea
that can work.

156
Brian: Yeah, there’s the collective. It’s a lot of different brains work better than
one.
Apparently, Parker, Brian and Talia all shared the perception that group work has
the cognitive benefit of gathering more intellectual resources and generating more ideas
for the task to be completed. Also, the way how Parker responded to the interviewer’s
first question and the way how Talia and Brian responded to the interviewer’s follow-up
questions suggest that these three students had only one reason for enjoying working
together – their perceived group work as having cognitive benefits. That is, their fondness
of group work didn’t appear to have an emotional dimension. This inference is actually
consistent with the ERRs as stated in the Brief Summary section:
As for the sub-code “Group enjoys working together”, there were no obvious
signs. Although Brian, Parker and Talia (especially Brian and Parker) worked well
together, there were almost no joyful interactions among them, they worked as quite
objective individuals.
So, it seems that in this subgroup, cognition was much more salient than
emotions, and such an orientation may have contributed to these students’ cognitive
engagement. Again, Sophie didn’t participate in the above conversation. Also, in the
ERRs, there are no recordings of her cognitive engagement in the group’s work, and this
is consistent with the interview excerpt in the last sub-theme showing that she had no
cognitive contributions to the group. As for Parker and Talia, from the interview excerpt
above, it seems that they worked well cognitively, but the above ERRs excerpt, as it
mentions “especially Brian and Parker”, implies this might not be true. What’s the actual
situation in the group work? The following theme will provide more information.
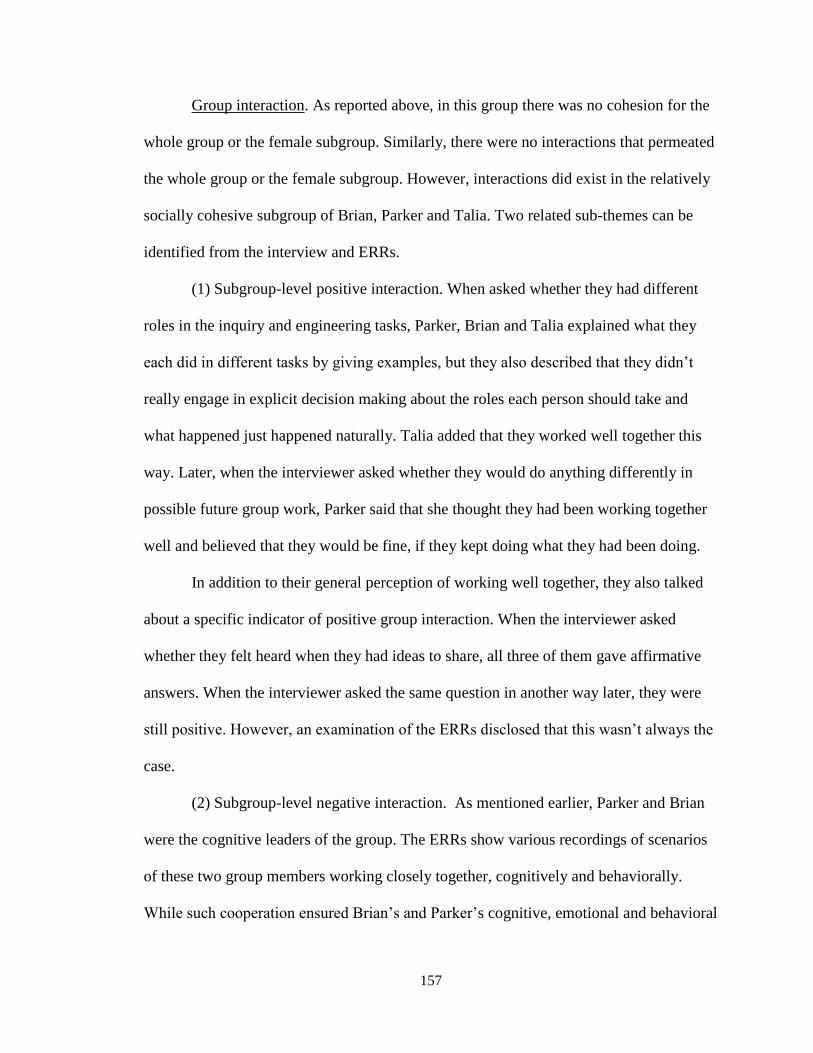
157
Group interaction. As reported above, in this group there was no cohesion for the
whole group or the female subgroup. Similarly, there were no interactions that permeated
the whole group or the female subgroup. However, interactions did exist in the relatively
socially cohesive subgroup of Brian, Parker and Talia. Two related sub-themes can be
identified from the interview and ERRs.
(1) Subgroup-level positive interaction. When asked whether they had different
roles in the inquiry and engineering tasks, Parker, Brian and Talia explained what they
each did in different tasks by giving examples, but they also described that they didn’t
really engage in explicit decision making about the roles each person should take and
what happened just happened naturally. Talia added that they worked well together this
way. Later, when the interviewer asked whether they would do anything differently in
possible future group work, Parker said that she thought they had been working together
well and believed that they would be fine, if they kept doing what they had been doing.
In addition to their general perception of working well together, they also talked
about a specific indicator of positive group interaction. When the interviewer asked
whether they felt heard when they had ideas to share, all three of them gave affirmative
answers. When the interviewer asked the same question in another way later, they were
still positive. However, an examination of the ERRs disclosed that this wasn’t always the
case.
(2) Subgroup-level negative interaction. As mentioned earlier, Parker and Brian
were the cognitive leaders of the group. The ERRs show various recordings of scenarios
of these two group members working closely together, cognitively and behaviorally.
While such cooperation ensured Brian’s and Parker’s cognitive, emotional and behavioral

158
engagement, it may have resulted in Talia’s low cognitive engagement. The ERRs record
multiple cases of Talia being ignored when she wanted to participate in Parker’s and
Brian’s cognitive work (in contrast, it was much easier for her to become part of their
behavioral work, such as model construction and testing). An examination of the ERRs
found that there were five times that Parker and Brian ignored Talia’s comments. The
following excerpt of the ERRs shows a couple these incidents: 16
16 Due to the large amount of words in the excerpt, I highlighted the sentences that are most relevant and
omitted some contents that are least relevant.

159
Figure 38. ERRs episode showing Talia’s verbal participation being ignored by Parker and Brian in Group 72

160
While this excerpt shows the little attention Talia receives from Parker and Brian,
it also shows Parker’s tendency to automatically collaborate cognitively with Brian (see
for example, the last highlighted sentence in the above excerpt). Other parts of the ERRs
show recordings of Brian doing the same – automatically setting Parker as partner for a
cognitive conversation. An example is as follows:
As reported above, in the interview Parker said that she and Brian had worked
together before, and also she didn’t think she and Talia were friends. Such factors may be
related to her and Brian’s tendency to automatically see each other as cognitive partners
and their tendency to ignore Talia. Although Talia tried to take part in their interactions,
she was ignored, which resulted in the end, for most of the task duration, as not being
cognitively engaged.
Interest (in biology/science). When asked whether they enjoyed their biology
class, Parker, Talia and Brian were all positive. Parker reported that she liked biology and
experiments, and Talia and Brian reported that they liked science. Sophie didn’t respond
Figure 39. ERRs episode showing Brian and Parker’s exclusive interaction with
each other
161
to this question, but later when the interviewer asked her whether she would take some
science courses in college, she nodded. Among the five times when she was asked a
question directly by the interviewer, this was the only time she responded. So, this could
be understood as an indicator that she at least had an interest in science, and it should be
this factor that supported her emotional engagement in the Heart Valve activity.
Summary. Through the above findings, it can be seen that in this group, those
who were cognitively engaged engaged for similar reasons and those who were not
cognitively engaged disengaged for different reasons. Parker and Brian were cognitively
engaged as a pair for most of the duration of the group’s design process, because they
liked biology/science, had a prior history of working together, understood the format of
group work as being beneficial for coping with cognitive challenges and thus appreciated
their group work, and accordingly had a lot of positive group interactions in their work
process. Closely related to their pair work was Talia’s extremely low level of cognitive
engagement. Parker and Brian worked closely together, acted as cognitive parters and
ignored Talia, although she was physically always in close proximity to Parker and Brian
and tried to participate cognitively a few times. In contrast, Sophie never made such an
effort. Her peers stated in the interview that she didn’t want to talk to any of the other
three group members, though none of them made any effort to involve her in the group’s
work, and thus she stayed cognitively disengaged the whole time.
What is noteworthy is that there is a discrepancy between the students’ self-
reported perception of how they worked together and the reality. In the interview, Brian,
Parker and Talia reported that they worked well together, however the video-based ERRs
do not provide confirmation.

162
Instead, these records show that for quite a few times Talia’s effort to contribute
ideas was ignored by Parker and Brian, resulting in her low levels of cognitive
engagement.
So, although this was a female-majority group and the girls had “contact with”
(Dasgupta, 2011, p. 233) or “exposure to” (Dasgupta, 2011, p. 233) their ingroup peers, it
seems that the lack of adequate levels of cohesion and interaction among all of them,
contact or exposure to same gender peers did not help ensure all girls’ cognitive
engagement.
Summary. Although these four cases are different, a cross-case comparison can
still identify some patterns regarding girls’ engagement.
Overall, it can be seen that a higher percentage of girls in the group did create an
environment that had the potential to help promote girls’ emotional and cognitive
engagement; however, for high levels of engagement to occur, the social and/or cognitive
cohesion and positive interaction of the female subgroup were indispensable. In the
female-majority Group 92 and all-female Group 12, these factors played an essential role
in helping the girls develop senses of relatedness and collective efficacy which led to
their high levels of emotional and cognitive engagement. In the 50%-female Group 41
and the 75%-female Group 72, with an absence of these factors, the female subgroups
lacked perceived relatedness and collective efficacy, and thus showed low levels of
emotional and cognitive engagement, although at the individual level some girls did have
factors that helped them maintain a certain level of emotional or cognitive engagement
(such as the enthusiasm for hands-on work that Mary showed in Group 41). Therefore, in
affecting girls’ engagement, female subgroup cohesion (social and/or cognitive) and

163
positive interaction were the most important group work process factors and relatedness
and collective efficacy were the most important psychological factors.
Relationships between Student Achievement and Engagement
In this section, I will report the data analysis results for answering my fourth research
question which explores the relationship between student achievement and engagement.
As reported in the Methods chapter, the achievement data consist of three
components: posttest-based scores in biology content, posttest-based scores in engineering
practice, and video-based scores in engineering practice (i.e., Tradeoff Achievement and
Iteration Achievement). For the first two components, the student population is all the Small
Group project participants; for the third component, the student population is the video-taped
participants. For this fourth research question, the student achievement data are Tradeoff
Achievement and Iteration Achievement, and I used Spearman's rank correlation to
analyze these data. Below, Tables 10-13 present the correlations revealed by such data
analysis.
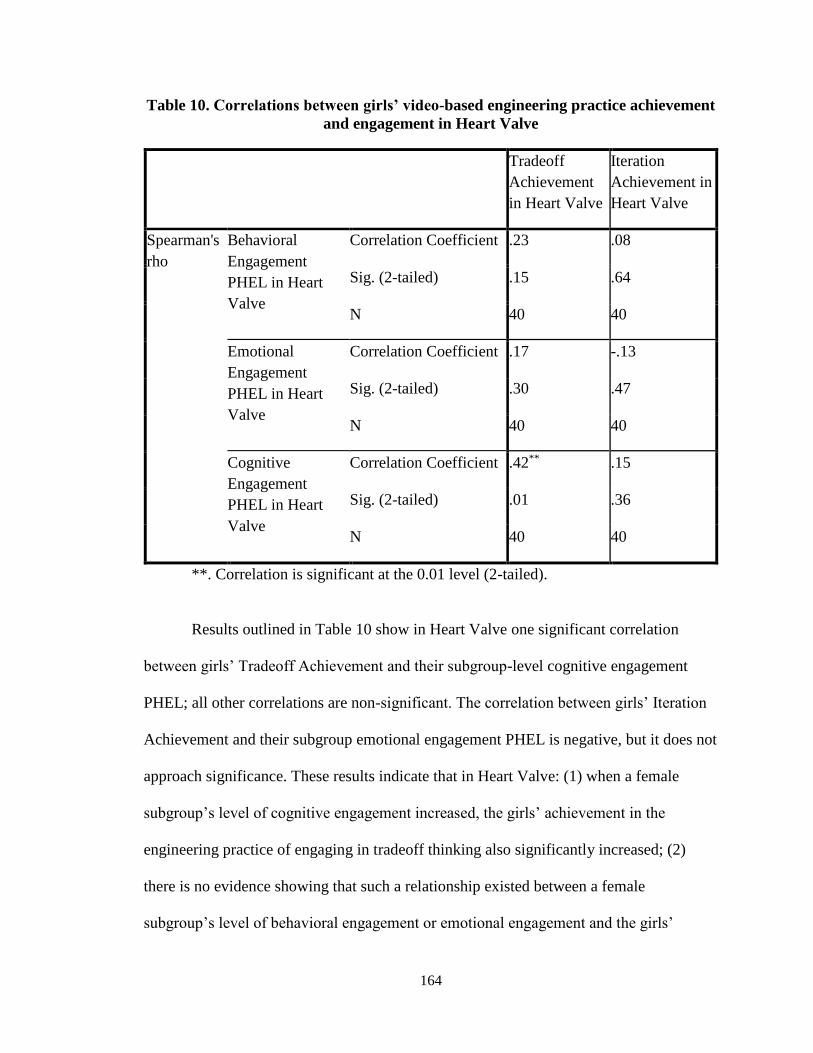
164
Table 10. Correlations between girls’ video-based engineering practice achievement
and engagement in Heart Valve
Tradeoff
Achievement
in Heart Valve
Iteration
Achievement in
Heart Valve
Spearman's
rho
Behavioral
Engagement
PHEL in Heart
Valve
Correlation Coefficient .23 .08
Sig. (2-tailed) .15 .64
N 40 40
Emotional
Engagement
PHEL in Heart
Valve
Correlation Coefficient .17 -.13
Sig. (2-tailed) .30 .47
N 40 40
Cognitive
Engagement
PHEL in Heart
Valve
Correlation Coefficient .42** .15
Sig. (2-tailed) .01 .36
N 40 40
**. Correlation is significant at the 0.01 level (2-tailed).
Results outlined in Table 10 show in Heart Valve one significant correlation
between girls’ Tradeoff Achievement and their subgroup-level cognitive engagement
PHEL; all other correlations are non-significant. The correlation between girls’ Iteration
Achievement and their subgroup emotional engagement PHEL is negative, but it does not
approach significance. These results indicate that in Heart Valve: (1) when a female
subgroup’s level of cognitive engagement increased, the girls’ achievement in the
engineering practice of engaging in tradeoff thinking also significantly increased; (2)
there is no evidence showing that such a relationship existed between a female
subgroup’s level of behavioral engagement or emotional engagement and the girls’
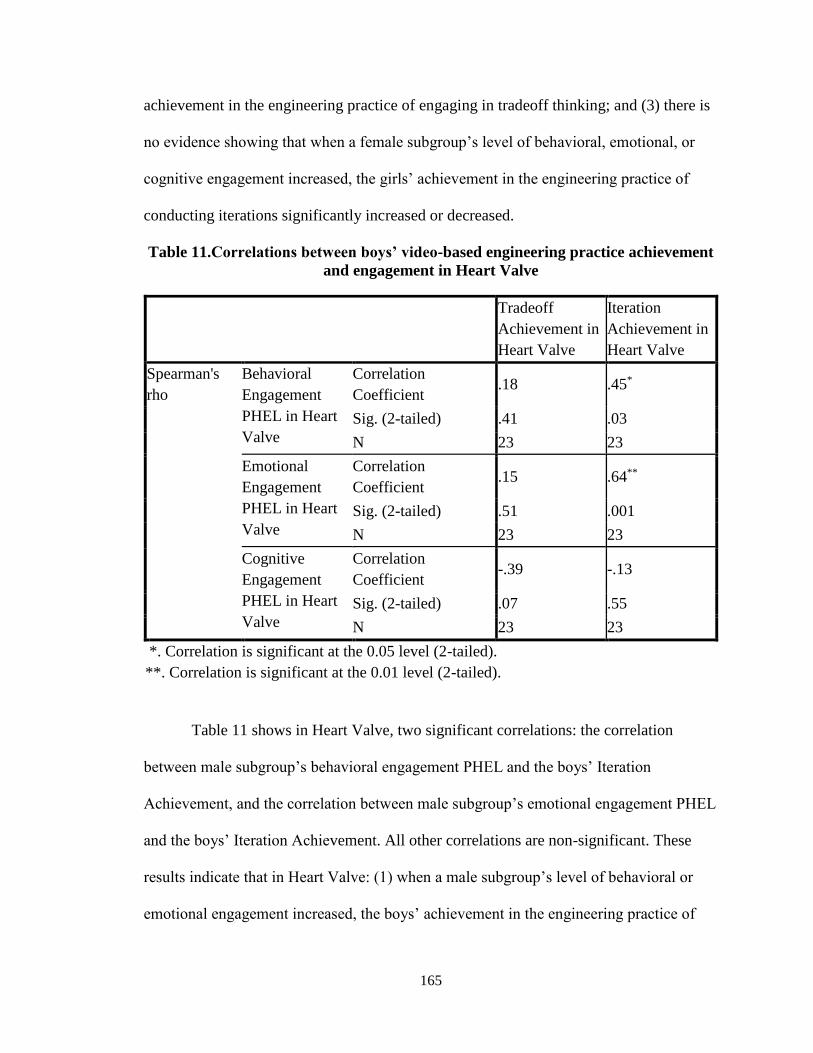
165
achievement in the engineering practice of engaging in tradeoff thinking; and (3) there is
no evidence showing that when a female subgroup’s level of behavioral, emotional, or
cognitive engagement increased, the girls’ achievement in the engineering practice of
conducting iterations significantly increased or decreased.
Table 11.Correlations between boys’ video-based engineering practice achievement
and engagement in Heart Valve
Tradeoff
Achievement in
Heart Valve
Iteration
Achievement in
Heart Valve
Spearman's
rho
Behavioral
Engagement
PHEL in Heart
Valve
Correlation
Coefficient .18 .45*
Sig. (2-tailed) .41 .03
N 23 23
Emotional
Engagement
PHEL in Heart
Valve
Correlation
Coefficient .15 .64**
Sig. (2-tailed) .51 .001
N 23 23
Cognitive
Engagement
PHEL in Heart
Valve
Correlation
Coefficient -.39 -.13
Sig. (2-tailed) .07 .55
N 23 23
*. Correlation is significant at the 0.05 level (2-tailed).
**. Correlation is significant at the 0.01 level (2-tailed).
Table 11 shows in Heart Valve, two significant correlations: the correlation
between male subgroup’s behavioral engagement PHEL and the boys’ Iteration
Achievement, and the correlation between male subgroup’s emotional engagement PHEL
and the boys’ Iteration Achievement. All other correlations are non-significant. These
results indicate that in Heart Valve: (1) when a male subgroup’s level of behavioral or
emotional engagement increased, the boys’ achievement in the engineering practice of

166
conducting multiple iterations also significantly increased; (2) there is no evidence
showing that when a male subgroup’s level of cognitive engagement increased the boys’
achievement in the engineering practice of conducting multiple iterations significantly
decreased or increased; and (3) there is no evidence showing that when a male
subgroup’s level of behavioral, emotional, or cognitive engagement increased, the boys’
achievement in the engineering practice of engaging in tradeoff thinking significantly
decreased or increased.
Table 12. Correlations between girls’ video-based engineering practice achievement
and engagement in Oil Spill
Iteration
Achievement
in Oil Spill
Tradeoff
Achievement
in Oil Spill
Spearman's
rho
Behavioral
Engagement PHEL
in Oil Spill
Correlation Coefficient .56** .21
Sig. (2-tailed) .001 .27
N 30 30
Emotional
Engagement PHEL
in Oil Spill
Correlation Coefficient .44* .08
Sig. (2-tailed) .02 .69
N 30 30
Cognitive
Engagement PHEL
in Oil Spill
Correlation Coefficient .39* .11
Sig. (2-tailed) .03 .58
N 30 30
**. Correlation is significant at the 0.01 level (2-tailed).
*. Correlation is significant at the 0.05 level (2-tailed).
In Oil Spill, all of the correlations between a female subgroup’s behavioral,
emotional and cognitive engagement PHELs and girls’ Iteration Achievement are
significant, and none of the correlations between a female subgroup’s behavioral,
emotional and cognitive engagement PHELs and girls’ Tradeoff Achievement are
significant (see Table 12). These results indicate that: (1) when a female subgroup’s level
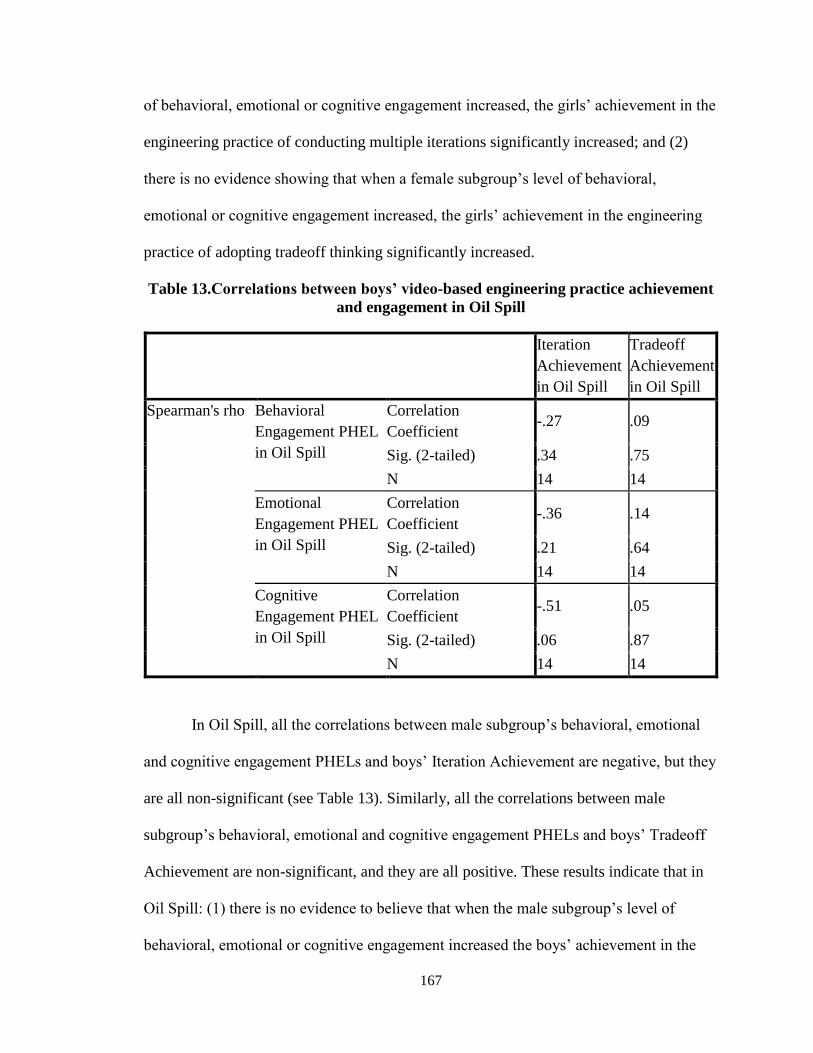
167
of behavioral, emotional or cognitive engagement increased, the girls’ achievement in the
engineering practice of conducting multiple iterations significantly increased; and (2)
there is no evidence showing that when a female subgroup’s level of behavioral,
emotional or cognitive engagement increased, the girls’ achievement in the engineering
practice of adopting tradeoff thinking significantly increased.
Table 13.Correlations between boys’ video-based engineering practice achievement
and engagement in Oil Spill
Iteration
Achievement
in Oil Spill
Tradeoff
Achievement
in Oil Spill
Spearman's rho Behavioral
Engagement PHEL
in Oil Spill
Correlation
Coefficient -.27 .09
Sig. (2-tailed) .34 .75
N 14 14
Emotional
Engagement PHEL
in Oil Spill
Correlation
Coefficient -.36 .14
Sig. (2-tailed) .21 .64
N 14 14
Cognitive
Engagement PHEL
in Oil Spill
Correlation
Coefficient -.51 .05
Sig. (2-tailed) .06 .87
N 14 14
In Oil Spill, all the correlations between male subgroup’s behavioral, emotional
and cognitive engagement PHELs and boys’ Iteration Achievement are negative, but they
are all non-significant (see Table 13). Similarly, all the correlations between male
subgroup’s behavioral, emotional and cognitive engagement PHELs and boys’ Tradeoff
Achievement are non-significant, and they are all positive. These results indicate that in
Oil Spill: (1) there is no evidence to believe that when the male subgroup’s level of
behavioral, emotional or cognitive engagement increased the boys’ achievement in the

168
engineering practice of conducting multiple iterations significantly decreased; and (2)
there is no evidence to believe that when the male subgroup’s level of behavioral,
emotional or cognitive engagement increased the boys’ achievement in the engineering
practice of engaging in tradeoff thinking significantly increased.
Relationships between Student Achievement and Group Gender Composition
In this section, I will report data analysis results for answering my fifth research
question, which explores the relationship between student achievement and group gender
composition. For this research question, the student achievement data include all the
achievement datasets: posttest-based scores in biology content (N=185, all student who
participated in the Small Group project), posttest-based scores in engineering practice
(N=185, all student who participated in the Small Group project), and video-based scores in
engineering practice [i.e., Tradeoff Achievement and Iteration Achievement; N(girls, Heart
Valve) = 40, N(girls, Oil Spill) = 30, N(boys, Heart Valve) = 23, and N(boys, Oil Spill) =
14].
As reported in the Methods chapter, to analyze the posttest-based scores, I first
used MI to process the missing values in these data and then used HLM to analyze the
completed datasets. The data analysis results are reported in Table 14-17.
Table 14 shows the relationships between group female percent (IV) and girls’
posttest-based achievement in Heart Valve, including their achievement in biology
content (DV), achievement in engineering practices (DV), and achievement in both areas
combined (DV).

169
Table 14. Relationship between group female percent and girls’ posttest-based
achievement in Heart Valve (HLM model using MI-generated data) 17
Estimates for
group female
percent (IV)
Achievement in
biology content
(DV)
Achievement in
engineering practice
(DV)
Achievement in
both areas
combined (DV)
Coefficient -9.34 2.05 -11.37
Standard error 7.11 6.41 6.21
t-score -1.31 0.32 -1.83
p-value 0.20 0.74 0.06
Note. 1. Control variables included in HLM analysis: pre-activity knowledge on
scientific inquiry and engineering design, pre-activity general interest in biology, and
pre-activity specific interest in biology class. 2. N(groups) = 41; N(girls) = 95.
As can be seen from Table 14, in Heart Valve there is a negative correlation
between group female percent and girls’ posttest-based achievement in biology content,
and this correlation is not significant. Also, the correlation between group female percent
and girls’ posttest-based achievement in engineering practice is positive and non-
significant. When these two types of achievement are combined, the correlation was
negative and not significant (at the .05 level). These results indicate that for Heart Valve:
(1) there is no evidence showing that when there were more girls in a group, the girls’
posttest-based achievement in biology content or engineering practice significantly
increased or decreased; and (2) there is no evidence showing that when there were more
girls in a group, the girls’ total posttest-based achievement in both areas combined
significantly decreased.
Table 15 presents the relationships between group female percent (IV) and boys’
posttest-based achievement in Heart Valve, including their achievement in biology
content (DV), achievement in engineering practices (DV), and achievement in both areas
combined (DV).

170
Table 15. Relationship between group female percent and boys’ posttest-based
achievement in Heart Valve (HLM model using MI-generated data)12
Estimates for
group female
percent (IV)
Achievement in
biology content
(DV)
Achievement in
engineering practice
(DV)
Achievement in
both areas
combined (DV)
Coefficient 1.49 6.52 5.19
Standard error 6.95 5.21 6.26
t-score 0.21 1.25 0.83
p-value 0.84 0.42 0.82
Note. 1. Control variables included in HLM analysis: pre-activity knowledge on
scientific inquiry and engineering design, pre-activity general interest in biology, and
pre-activity specific interest in biology class. 2. N(groups) = 43; N(boys) = 85.
As Table 15 shows, there is no significant correlation between group female percent
and boys’ posttest-based achievement in biology content or engineering practice, or the two
areas combined. These results indicate that for Heart Valve there is no evidence that when
there were more girls in a group, the boys’ posttest-based achievement in any of the two areas
or in the two areas combined significantly increased.
Table 16 displays the relationships between group female percent (IV) and girls’
posttest-based achievement in Oil Spill, including their achievement in biology content
(DV), achievement in engineering practices (DV), and achievement in both areas
combined (DV).
Table 16. Relationship between group female percent and girls’ posttest-based
achievement in Oil Spill (HLM model using MI-generated data)12
Estimates for
group female
percent (IV)
Achievement in
biology content
(DV)
Achievement in
engineering practice
(DV)
Achievement in
both areas
combined (DV)
Coefficient 6.33 11.28 5.82
Standard error 9.89 8.30 9.04
t-score 0.64 1.36 0.64
p-value 0.52 0.18 0.52
Note. 1. Control variables included in HLM analysis: pre-activity knowledge on
scientific inquiry and engineering design, pre-activity general interest in biology, and
pre-activity specific interest in biology class. 2. N(groups) = 41; N(girls)= 95.

171
Table 16 demonstrates that in the Oil Spill activity there is no significant correlation
between group female percent and the girls’ posttest-based achievement in biology content or
engineering practice, or the two areas combined. These results indicate that for Oil Spill there
is no evidence that when there were more girls in a group, the girls’ posttest-based
achievement in any of the two areas or in the two areas combined significantly increased.
Table 17 presents the relationships between group female percent (IV) and boys’
posttest-based achievement in Oil Spill, including their achievement in biology content
(DV), achievement in engineering practices (DV), and achievement in both areas
combined (DV).
Table 17. Relationship between group female percent and boys’ posttest-based
achievement in Oil Spill (HLM model using MI-generated data)12
Estimates for
group female
percent (IV)
Achievement in
biology content
(DV)
Achievement in
engineering practice
(DV)
Achievement in
both areas
combined (DV)
Coefficient 13.21 4.38 14.11
Standard error 8.17 6.34 6.49
t-score 1.62 0.69 2.17
p-value 0.22 0.98 0.06
Note. 1. Control variables included in HLM analysis: pre-activity knowledge on
scientific inquiry and engineering design, pre-activity general interest in biology, and
pre-activity specific interest in biology class. 2. N(groups) = 43; N(boys) = 85.
As can be seen from Table 17, in Oil Spill there is no significant correlation between
group female percent and boys’ posttest-based achievement in biology content or engineering
practice. Also, between group female percent and boys’ posttest-based achievement in
biology content and engineering practice combined, the correlation is non-significant (at
the .05 level). These results indicate that for Oil Spill: (1) there is no evidence to believe that
when there were more girls in a group, the boys’ posttest-based achievement in biology
content or engineering practice significantly increased; and (2) there is no evidence showing

172
that when there were more girls in the group, the boys’ posttest-based achievement in biology
content and engineering practice combined significantly increased.
For the relationship between group female percent and video-based engineering
practice achievement (i.e., Tradeoff Achievement and Iteration Achievement, as measured by
pre-determined scoring rubric), as reported in the Methods chapter, my group-level sample
sizes were too small for HLM to produce unbiased and accurate standard errors (Maas & Hox,
2005), therefore I used a nonparametric correlation analysis - Spearman's rank correlation to
analyze such data.
The data analyses results show that in Heart Valve: (1) there is not a significant
correlation between group female percent and girls’ Tradeoff Achievement (rs = -.02, n = 40,
p=.88) or Iteration Achievement (rs = .20, n = 40, p = .22), and (2) there is not a significant
correlation between group female percent and boys’ Tradeoff Achievement (rs = -.23, n = 23,
p=.29) or Iteration Achievement (rs = -.19, n = 23, p = .39). These results indicate that for
Heart Valve, there is no evidence that group female percent significantly influenced the
achievement in the engineering practice of conducting multiple iterations or making tradeoff
considerations of the girls or boys.
For Oil Spill, the results are slightly different. The Spearman’s rho correlation test
revealed that: (1) there is a significant correlation between group female percent and girls’
Iteration Achievement (rs = .42 , n = 30, p= .02), but no significant relationship between group
female percent and girls’ Tradeoff Achievement (rs = .24, n = 30, p= .20), and (2) no
significant correlation between group female percent and boys’ Iteration Achievement (rs
= .43, n = 14, p= .13) or Tradeoff Achievement (rs = .33 n = 14, p= .24). These results
indicate that in Oil Spill when there were more girls in the group, girls significantly
173
engaged more in the engineering practice of conducting multiple iterations; however,
there is no evidence showing that such a relationship exists for girls between group
female percent and their achievement in the engineering practice of engaging in tradeoff-
based thinking. Also, there is no evidence that such a relationship exists for boys between
group female percent and their achievement in the engineering practice of conducting
multiple iterations or engaging in tradeoff-based thinking.
Summary
In this chapter, results of multiple sets are presented toward answering my
research questions.
My first three research questions ask how group gender composition may
influence student subgroups’ engagement. My data analysis results show that when there
was a higher percent of girls in the group, female subgroups’ levels of all three types of
engagement in Oil Spill significantly increased and their level of emotional engagement
in Heart Valve also significantly increased. Such a pattern was not found for the
relationships between group female percent and the female subgroups’ behavioral or
cognitive engagement in the Heart Valve task; also, it was not found between group
female percent and the male subgroups’ behavioral, emotional or cognitive engagement
in either the Heart Valve or the Oils Spill task.
My fourth research question asks how student subgroup engagement may
influence students’ achievement in two engineering practices: conducting multiple
iterations of the design process or part of it (Iteration Achievement) and making tradeoff-
based decisions (Tradeoff Achievement). The results show that in Oil Spill when the
female subgroup had a higher level of behavioral, emotional or cognitive engagement, the
174
girls showed significantly higher Iteration Achievement; similarly, in Heart Valve, when
the female subgroup had a higher level of cognitive engagement, the girls showed
significantly higher Tradeoff Achievement. However, such a pattern does not exist for the
correlation between the female subgroup’s behavioral, emotional or cognitive
engagement and the girls’ Tradeoff Achievement in Oil Spill; also, in Heart Valve, it
does not exist for the correlation between the female subgroup’s behavioral or emotional
engagement and the girls’ Tradeoff Achievement, nor does it exist for the correlation
between any of the three types of engagement and the girls’ Iteration Achievement.
For the boys, such a pattern could only be found for the correlation between the
male subgroup’s behavioral or emotional engagement and their Iteration Achievement in
Heart Valve. In Heart Valve or Oil Spill, no additional significant correlations were
found. Thus, the evidence for a positive correlation between the various kinds of
engagement and achievement, as coded in the videos, is quite mixed, with somewhat
stronger evidence that engagement is related to achievement for girls than for boys.
My fifth research question asks how group gender composition may influence
student achievement as measured by individual student answers to written items. No
significant effects were found of group female percent on the girls’ or boys’ posttest-
based achievement in biology content, engineering practice or both areas combined.
Similarly, no significant correlations were found between group female percent and the
girls’ or boys’ video-based Iteration Achievement or Tradeoff Achievement in Heart
Valve. In Oil Spill, for both girls and boys, only one significant correlation was found:
When there was a higher female group percent, the girls’ Iteration Achievement
significantly increased. Other than this, no additional significant correlations were found.

175
While all these results can provide answers to each of these individual research
questions, a more comprehensive picture needs to and can be drawn from an
interconnected perspective. For example, in the relationship between student achievement
and group gender composition, did engagement play any role? In other words, is this a
direct relationship or is it mediated by engagement? Also, other important questions that
are directly related to my research purpose may arise from these data analysis results. For
example, in the context of this study, was Dasgupta’s (2011) stereotype inoculation
model able to successfully predict the female subgroups’ engagement and achievement
levels? That is, is it true that there is a positive relationship between group female percent
and girls’ engagement and achievement? Is this relationship the same for all three types
of engagement? Why is this relationship different for Heart Valve and Oil Spill? In the
next chapter, I will discuss questions like these. Based on these discussions, I present
possible implications for improving Dasgupta’s (2011) stereotype inoculation model,
future research and classroom teaching.

176
CHAPTER 6
DISCUSSION
Although much work has been done to increase the representation of females in
STEM fields, the “leaky pipeline” phenomenon – the observation that fewer women than
men enter STEM fields and more women than men leave – still remains (Dasgupta,
2014). Thus, research is still needed to inform continued efforts to fix the “leaky
pipeline”. In K-12 education, the “traditional” gender gap exists in science and
mathematics. Now, along with the release and implementation of NGSS, school science
has been expanded to include engineering as an important component (NGSS Lead
States, 2013). Under such circumstances, special attention is needed to identify and cope
with the potential gender-related problems in engineering education. In light of this, the
present study aimed to add to the body of research exploring this issue by examining how
gender grouping may be related to female (and male) students’ engagement and
achievement during small group work on two engineering design tasks (Heart Valve and
Oil Spill) in 9th and 10th grade high school biology.
Guided by Dasgupta’s stereotype inoculation model (2011) and Connell and
Wellborn’s (1991) self-system processes model, this study explored three major research
questions: (1) How gender composition may have influenced girls’ and boys’ behavioral,
emotional and cognitive engagement in small group work in engineering design tasks in
high school biology; (2) how student engagement may have influenced their
achievement, and (3) how group gender composition may have influenced girls’ and
boys’ achievement in engineering practices and biology content in these design tasks.

177
Through a mixed methods research design, I collected and analyzed quantitative and
qualitative data toward answering these questions.
In general, my findings provide empirical support for Dasgupta’s stereotype
inoculation model (2011), though only fully for the Oil Spill task: When a group is
comprised of a higher proportion of girls (learning context), it allows individual girls to
have more opportunities to connect with other girls, which enhances their sense of
relatedness and self-efficacy (emotional engagement) and thus improve achievement
(learning outcome). In Oil Spill, I found such effects also for the girls’ behavioral and
cognitive engagement. However, with respect to achievement, only one achievement
variable showed an effect: Iteration Achievement – the score on the engineering practice
of conducing multiple iterations of the design cycle or part of it. For the other
achievement variables – Tradeoff Achievement (the score on the engineering practice of
making tradeoff-based decisions), posttest-based biology content knowledge and
engineering practices, such a pattern does not apply.
In Heart Valve, results were different. Only the girls’ emotional engagement level
increased significantly when they were in the majority, though this did not result in
higher achievement for the girls. As for the boys, neither their engagement nor their
achievement in Heart Valve or Oil Spill significantly changed when there was a higher
proportion of girls in the group. However, this does not indicate any contradiction to
Dasgupta’s (2011) theory, because this theory would not predict gender composition to
affect boys’ engagement because in general in the male-dominated field of engineering
boys don’t have to be ‘inoculated’ against stereotypes.
178
In the following, I will discuss the major results under the guidance of my
conceptual framework, reflect on the limitations of this study, and consider implications
for classroom teaching and future research.
Group Female Percent was Positively Related to Girls’ Engagement and
Achievement
A major finding of this study is that in the Oil Spill activity girls’ Iteration
Achievement is significantly positively related to group female percent (i.e., a direct link
between group female percent and girls’ Iteration Achievement); and female subgroups’
behavioral, emotional and cognitive engagement levels are significantly positively related
to group female percent and Iteration Achievement. Thus, the relationship between group
female percent and girls’ Iteration Achievement might have been mediated by the female
groups’ behavioral, emotional and cognitive engagement. Figure 40 shows these possible
relationships with arrows indicating the directions of the correlations and plus signs the
significant positive correlations.

179
Figure 40. Mediation effect of group female percent on female students’ Iteration
Achievement in Oil Spill through behavioral, emotional and cognitive engagement,
respectively.
These results indicate that all three types of student engagement – behavioral,
emotional, and cognitive engagement – may function as mediating the effect of group
composition (group female percent) on girls’ science achievement (here Iteration
Achievement). This is an important finding because it indicates empirical support for the
relationships outlined in my conceptual framework – a synthesis of Connell and
Wellborn’s (1991) self-system processes model and Dasgupta’s (2011) stereotype
inoculation model (see Figure 4 below). Such a synthesis is an advancement of both
theories, because it addresses gender composition of the learning context missing in
Connell and Wellborn’s (1991) self-system processes model, and in contrast to Dasgupta
(2011) distinguishes among the three dimensions of engagement (behavioral, emotional
and cognitive), and positions achievement as an outcome of engagement.

180
Figure 4. Conceptual framework of this study: a synthesis of Connell and
Wellborn’s (1991) self-system processes model and Dasgupta’s (2011) stereotype
inoculation model. Note. Adapted from Connell and Wellborn’s (1991, p. 54);
Appleton, Christenson & Furlong (2008, p. 380); and Dasgupta (2011, p. 234)
The finding of a mediated effect of group gender composition on achievement by
way of the three types of engagement provides significant implications for teachers as
they plan and implement small group tasks. Simply putting girls in all-female or female-
majority groups will not necessarily result in learning because the group’s composition
also influences girls’ achievement through their engagement. Therefore, during the girls’
group work, the teacher will need to monitor and support their behavioral (i.e., social
behavioral), emotional and cognitive engagement; they need to be as engaged as possible

181
to maximize learning and achievement. Strategies on how a teacher may do this will be
presented in the section titled “Implications for Practitioners” below.
Findings of mediated effects of learning context variables on learning outcome
variables are not common in educational research as Wigfield and colleagues (2008) and
Wang and Holcombe (2010) indicated, therefore, my study’s results are a first step in
understanding the influence of various aspects of learning environments on student
achievement.
Though researchers have reported various benefits of student engagement, its
effect on academic achievement is mixed, as shown by Lee’s (2014) extensive literature
review. Various studies found positive correlations between emotional engagement and
student performance on standardized tests (e.g., Gonzalez & Padilla, 1997; Voelkl,1997),
but emotional engagement has not been found to be a consistent predictor of student deep
understanding of the material (Fredricks, et al., 2004). Voelkl (1997) reported that school
identification, a composite of value and perceived school belonging, was significantly
correlated with achievement test scores for white students but not for black students.
Gonzalez and Padilla (1997) found significant relationship between student sense of
relatedness and academic achievement whereas Finn (1993) and Williams (2003) did not
find any relationships. In contrast, my research shows significant correlations between all
three types of girls’ engagement – behavioral, emotional and cognitive – on their
achievement.
Most previous research on engagement measures achievement with standardized
tests stressing basic knowledge and skills (Fredricks et al., 2004). In contrast, my
research used more specific and comprehensive measure of student achievement.

182
Iteration Achievement assesses student performance on an engineering practice that
requires higher-order thinking (e.g., analyzing and evaluating the results of the testing of
prototype), willingness to persist in improving a design (i.e., deciding on conducting
another iteration of the design process or part of it based on the evaluation of the
prototype), and actual hands-on participation as an effort to do so. Therefore, my study
makes contributions to this area of research by presenting evidence showing significant
relationships between such an achievement variable and engagement, which are not
commonly documented in the literature. First, my study revealed a significant positive
correlation between behavioral and emotional engagement and Iteration Achievement
(for girls), respectively. Second, my study revealed a significant positive correlation
between Iteration Achievement and various aspects of cognitive engagement: the
thoughtfulness and willingness to make the effort in order to comprehend complex ideas
and master difficult skills (Fredricks et al., 2004; Casimiro, 2016), and the actual effort of
thinking deeply about concepts/ideas and making meaning of the material presented to
them (Lawson & Lawson, 2013). This is a unique contribution, given that in the
literature evidence of the link between cognitive engagement and achievement is mainly
concentrated on one aspect of cognitive engagement – strategy use (Fredricks, et al.,
2004).
Female Subgroup Cohesion and Interaction as Central Group Work Process
Factors Influencing Girls’ Emotional and Cognitive Engagement
Another major finding of this study is the difference between student emotional
and cognitive engagement, group gender composition and task, while all subgroups’
behavioral engagement levels across both tasks are high and don’t vary across group

183
gender compositions. In Oil Spill, female subgroups’ levels of all three types of
engagement are significantly positively correlated with group female percent. Consistent
with Dasgupta’s stereotype inoculation model, in Oil Spill, in groups where the
proportion of girls was higher, female subgroup had significantly higher levels of
behavioral, emotional and cognitive engagement, respectively. However, in Heart Valve,
such a pattern does not exist across all groups. In this task a significant relationship only
exists for the girls’ emotional engagement and not for their cognitive engagement. The
qualitative analysis of the four selected groups during the Heart Valve task point to
various factors explaining these results.
In the female-majority and all-female groups (Group 92, 3g1b and Group 12, 4g)
girls had high levels of emotional and cognitive engagement. The most important themes
that promoted girls’ engagement were female subgroup17 cohesion and positive female
subgroup interaction. Female subgroup cohesion was manifested in two forms: social
cohesion and cognitive cohesion. According to Dasgupta’s (2011) stereotype inoculation
model, it’s highly likely that such cohesion enhanced the girls’ perceived relatedness and
self-efficacy. Particularly, in the case of Group 92, cognitive cohesion – the girls’
common understanding, reported in the focus group interview, that group work could
gather more intellectual resources and generate more ideas for solving problems – went
hand-in-hand with a demonstration of collective efficacy (a component of emotional
engagement), which in turn helped them stay together and retain their persistence in
finishing the task despite the difficulties they encountered. Similarly, all four girls of
Group 12 perceived such cognitive benefit of group work. This did not only elevate their
17 As explained previously, in the case of an all-girl group, the female subgroup is the whole group.

184
collective efficacy, but also led to very visible cognitive positive group interaction, which
directly promoted their cognitive engagement.
These results are consistent with other researchers’ findings. In a collaborative
learning context in an undergraduate educational psychology course, Wang and Lin
(2007) found that members of groups that had higher levels of collective efficacy showed
better skills at their cognitive engagement in the task. Similar to my findings, Cheng
(2013) showed that in project-based learning in college hospitality programs students did
not think that individual group members’ self-efficacy was the key factor influencing
their learning achievement. They inferred that collective efficacy may be more important
in affecting the students’ cognitive engagement because in their group work no one could
finish the task alone.
For the girls in my study who had low emotional or cognitive engagement levels
(Sophie and Talia in group 72 and Helen in Group 41), the most important theme is that
they lacked cohesion (social or cognitive) and positive interaction with other girls in their
female majority (#72) or female parity group (#41). Under such circumstances, although
they had “contact with” (Dasgupta, 2011, p. 233) or “exposure to” (Dasgupta, 2011, p.
233) the other girls in their group, neither Talia nor Helen developed a sense of
relatedness or collective efficacy, and thus did not become emotionally or cognitively
active in the group.
Looking more closely, this theme had different manifestations. With respect to the
girls in group 72, Sophie did not want to have any interactions with the rest of the group
(no cognitive engagement) nor did the subgroup (Parker and Brian) make any attempt to
draw her into the group. While Talia tried to be cognitively engaged, Parker and Brian

185
simply ignored her attempts. In the gender-parity Group 41, Helen and Mary’s behavior
varied as a result of the boys’ hyperactive leadership behavior and their own interest and
self-efficacy in science. Mary, driven by her strong interest in the Heart Valve activity
(mainly its hands-on nature as perceived by her), kept trying to behaviorally enter the
boys’ work space with a high level of emotional engagement. In contrast, Helen lacked
self-efficacy in her ability to do science and stayed away from the task. Similarly to
Group 72, the boys of Group 41 didn’t try to involve the girls, and the girls didn’t form
their own subgroup and positioned themselves in opposition to the boys, showing in this
case, that 50% of girls wasn’t sufficient to change behavior towards female subgroup
engagement.
To sum up, it can be seen from the above discussion that female subgroup
cohesion and positive interaction were the most important factors that were related to
girls’ emotional and cognitive engagement during their group work – in Groups 92 and
12, female subgroup cohesion and positive interaction were the central factors that
supported the female subgroups’ high levels of engagement; in Groups 41 and 72, female
subgroups’ low levels of engagement were closely related to the lack of these two factors.
As for the boys, only Andrew in Group 92 had a low engagement level. Being the
only boy in his group, the only member of a social group (a solo), might have influenced
his sense of belonging, self-efficacy and performance (Dasgupta, 2011). The fact that the
three girls never tried to include him into their work space, might have further
strengthened Andrew’s sense of not-belonging to the group. As reported in the Results
chapter, at first, students in this group didn’t know each other but throughout the semester
working on the six tasks, they developed a better group work relationship. However, the

186
results revealed that cohesion developed only among the girls, and Andrew always
remained marginalized. Over time he may have felt less and less related to the girls (i.e.,
the majority of the group) and thus, his engagement in the group work decreased. In the
literature, the numerical minority status that Andrew had, that is, being as the only
member of a social category in an environment comprising peers who belong to a
different social category, is called a solo status (Thompson & Sekaquaptewa, 2002).
When an individual finds himself/herself to be a solo in an environment, such a
perception typically reduces his/her sense of relatedness, self-efficacy, and performance
(Dasgupta, 2011). Although research has indicated that members of privileged
communities, such as Caucasians and males, have less negative experiences as solos than
do members of socially disadvantaged communities, such as females and racial minorities
(e.g., Niemann & Dovidio, 1998; Kanter, 1977), Andrew’s case is an example of such
negative experiences for members of a majority group.
Perceived Relatedness as the Central Psychological Process Affecting Girls’
Engagement
As discussed above and in the Results chapter, female subgroup cohesion and
positive interaction are the most important group work process factors and relatedness
and collective efficacy the most important psychological factors affecting girls’
engagement.
Further, as indicated in my conceptual framework (see Figure 4 above), my
findings provide support for what Appleton and colleagues (2008) describe as “cyclical
interactions” (p. 379) among psychological processes (e.g., perceived relatedness) and
engagement. In Group 92 the three girls were not friends, though they developed social

187
and cognitive cohesion and positive subgroup interactions (mainly induced by Taylor’s
leadership), which led to enhanced relatedness and collective efficacy. In Group 12 all
four girls were good friends and without a leader the girls’ group work was collaborative
and their interactions reflected their perceived relatedness. Relatedness fostered group
cohesion and positive group interaction, which resulted in a high level of cognitive
engagement. Therefore, it can be seen that there is no fixed mechanism; the relationship
between group cohesion and positive interaction and perceived relatedness reciprocally
impact each other. Outside of this cycle, group gender composition has an impact on it –
the higher the group female percent, the more likely that subgroup social/cognitive
cohesion and positive interaction and/or perceived relatedness and collective efficacy will
occur. However, there will be exceptions, such as seen in Group 72.
However, differently, the development of collective efficacy may require a
different mechanism. In both Groups 92 and 12 collective efficacy was developed as the
result of the girls’ subgroup cohesion and positive interaction.
Based on these findings, I revised my conceptual framework to reflect the
important presence of the group work processes of subgroup cohesion and positive
interaction and the psychological process of collective efficacy in affecting students’
engagement (and thus achievement). Figure 41 below is an illustration of such a
framework.
Figure 41 shows a CONTEXT → GROUP → SELF → ACTION → OUTCOME
link that depicts a more complete cycle of students’ group work process. Compared with
my conceptual framework (see Figure 4 above), which is a synthesis of Connell and
Wellborn’s (1991) self-system processes model and Dasgupta’s (2011) stereotype

188
inoculation model, this revised framework includes two new components – highlighted in
blue in Figure 41. First, the path from context (i.e., group gender composition, in this
case) to students’ self-system processes (e.g., perceived relatedness) – the group work
processes of subgroup cohesion (of ingroup peers, in this case, girls) and subgroup
positive interaction (of ingroup peers, in this case, girls); that is, gender composition of
the social context acts on students’ self-system processes through the channels of their
group work processes. Second, the revised framework includes a new self-system process
– student group/subgroup’s collective efficacy, which plays a role in promoting their
engagement. Importantly, this framework is not a theoretical creation, but is generated
from the findings of this empirical study.

189
Figure 41. A revised synthesis of Connell and Wellborn’s (1991) self-system processes model and Dasgupta’s (2011)
stereotype inoculation model. Note. Adapted from Connell and Wellborn’s (1991, p. 54); Appleton, Christenson &
Furlong (2008, p. 380); and Dasgupta (2011, p. 234)

190
Further, my results indicate that a sense of relatedness is more important than self-
efficacy. Low levels of individual self-efficacy may be compensated by a high level of
collective efficacy, but the latter can only be achieved in a cohesive group where
members feel related to each other as seen in the girl subgroup of Group 92 and 12.
However, when a group is divided as seen in Groups 41 and 72, then I also observed a
lack of relatedness. When one or two group members showed low engagement levels, I
also observed a lack of relatedness. Although group division and individual group
members’ low engagement levels could be indicative of lack of relatedness, they may not
be the real causes of it. For example, in Group 92 Andrew never disclosed why he was
not part of the group, and so did Sophie in Group 72. In Andrew’s case, as reported in the
Results chapter, it might be possible that the three girls’ trajectory towards a more and
more cohesive subgroup during the tasks before Heart Valve didn’t provide much space
for him, leading to his increased sense of being marginalized. To probe into the real
reasons for these students’ lack of relatedness, the researcher will need to use some
individual-oriented methods (e.g., an in-depth individual interview or a personal email);
the focus group interview setting might have been too public for both Andrew and Sophie
to speak up.
However, it is conceivable that if a divided gender-specific subgroup, for
example, Mary and Helen in Group 41, formed a cohesive subgroup in which they
positively interacted socially and cognitively with each other then it would have been
very likely that they could develop a collective efficacy which compensated Helen’s low
self-efficacy in science, thus improving her individual and also the female subgroup’s
emotional and cognitive engagement. Research demonstrates that such shared beliefs of

191
group members in their collective power to produce desired outcomes (Bandura, 1998)
predict student group performance more strongly than does individual group members’
self-efficacy (McLeod & Orta-Ramirez, 2018; Donohoo, Hattie & Eells, 2018; Lent,
Schmidt & Schmidt, 2006). Clearly, more research of groups is necessary to clearly
identify mechanisms affecting their engagement.
In summary, my findings indicate that perceived relatedness and efficacy
(including self- and collective efficacy) as components of emotional engagement
(Fredricks et al., 2004; Bundick, et al., 2014) affect students’ participation behavior and
cognitive engagement (Fredricks et al., 2004; Cheng, 2013; Wang and Lin, 2007).
Girls’ Cross-Task Engagement and Achievement Differences
A seemingly surprising finding of this study is that the female subgroups’ levels
of behavioral and cognitive engagement in Heart Valve are not significantly correlated
with group female percent, while in Oil Spill these variables are significantly positively
correlated with group female percent. Similarly, in Heart Valve girls’ Iteration
Achievement is not significantly related to group female percent, while in Oil Spill such a
significant positive relationship exists.
A possible explanation for these cross-task differences is that the two tasks are
different in several important aspects, making them distinct learning contexts for
students. However, student engagement is a context-specific variable (Fredricks et al.
2004); it is a result of the interaction of the individual with the context and as such is
responsive to environmental variations (Connell, 1990; Finn & Rock, 1997). Similarly,
student learning performance and workplace team performance are context-specific by

192
virtue of environmental factors (Nowakowski, Seeber, Maier & Frati, 2014; Mathieu,
Maynard, Rapp & Gilson,2008; Algesheimer, Dholakia & Gurău, 2011; Smith, 2007).
Though not intended when implemented, further analysis of Heart Valve and Oil
Spill revealed different types of models and thus, demanded different levels of
abstraction. Oil Spill modelled a real-life scenario by providing a simulated beach (sand
and ovals), ocean (water), oil spill (black colored cooking oil), and concrete tools
mimicking real-life oil spill cleanup methods (e.g., using a string to contain the oil spill,
using foam to absorb oil). In contrast, Heart Valve was considerably more abstract. A
file-folder box modelled the heart, red marbles the blood, and card board and tape to
design a heart valve. Also, Oil Spill addressed an important STSE (science-technology-
society-environment) issue (Zeyer & Kelsey, 2012) that is frequently seen in the news,
and thus may have been perceived as more closely-related to students’ daily lives. In
contrast, the need to replace heart valves may have been for the student participants in
this study to far from their own experiences (lower emotional connection) and as a result
was more intellectually challenging. Furthermore, this task required more hands-on work
skills; students had to work together in a smaller space than in the Oil Spill – access to
the model was more limited. All these contextual differences might have triggered less
interest in the girls in Heart Valve, hindered their development of self- and/or collective
efficacy in this task, led them to develop a higher perceived cost value (Eccles &
Wigfield, 2002), and a lower perceived utility value (Eccles & Wigfield, 2002) of this
task, which in turn all resulted in lower behavioral and cognitive engagement levels of
the girls, minimizing the possible influence of group female percent on these variables.
Therefore, girls in groups of higher group female percent did not show significantly

193
higher values of these variables in Heart Valve as they did in Oil Spill. Consequently, the
cross-task difference of girls’ Iteration Achievement follows the same pattern, given that
engagement has substantial influences on performance/achievement (Fredricks, et al.,
2004; Dasgupta, 2011; Bundick etc., 2014; Wang & Lin, 2007; Cheng, 2013; Guo, et al.,
2011).
Limitations of the Study
This study has several limitations that will need to be addressed in future research.
First, because I used data collected within the Small Group project which didn’t have
gender grouping as a research focus, certain group gender compositions were missing or
not numerically adequately represented in this study. Specifically, the group gender
composition of 25% group female was missing, making 33% group female the only
female minority group gender composition and there was only one group with such a
gender composition. Thus, this study’s power of discovering significant correlations
between female/male subgroup engagement levels and group gender composition and
between student achievement and group gender composition was reduced. Future
research should replicate this study with all possible group gender compositions and with
all of them numerically adequately represented.
Second, the non-experimental nature of this study limited its ability to provide
evidence for making causal inferences. Student engagement is influenced by many
factors (Larrier, 2018; Bundick, Quaglia, Corso & Haywood, 2014; Fredricks et al.,
2004), and therefore the variations of student subgroup engagement levels might have
been due to observed and unobserved variables other than group gender composition,
such as student interest and self-efficacy which were closely related to task

194
characteristics, as discussed above. Similarly, student achievement is also influenced by
multiple factors such as students’ prior knowledge and intelligence (Lim, Zhao, Chai &
Tsai, 2013; Kennedy & Sundberg, 2017; Yang, 2014), therefore the variations of student
scores might have been due to observed and unobserved variables other than group
gender composition and engagement. Future research should investigate these
relationships through experimental design or longitudinal design with multiple waves to
address reciprocal effects over time.
This study wasn’t able to directly discover the exact reasons why Sophie (in
Group 72) and Andrew (in Group 92) didn’t interact with their teammates. As reported in
the Results chapter, when the students were asked how they worked together with each
other, Andrew chose to echo his teammates when they reported that they worked well as
a group although it was not the actual case, and Sophie didn’t want to say anything but
only nodded when the other students had to answer the question for her by saying that she
didn’t like to talk to them. Indeed, focus groups can be an obstacle to talking about
private subjects (Farquhar, 1999), such as why Sophie and Andrew didn’t join their peers
in this case, because interviewees want to be socially desirable (Wang & Holcombe,
2010). Under such circumstances, in-depth interviews following the focus group
interview could have provided insight into Andrew and Sophie’s lack of group
participation. For future studies researchers should be conscientious about such processes
and if they occur, conduct individual interviews following the focus group interview, ask
students to respond to further questions by email, or an online survey addressing specific
issues that emerged from the focus group interview.

195
Another limitation of this study is that it adopted a binary view of the concept of
gender and did not take into account the possibility that some students may have had a
more fluid gender identity. In the Small Group project demographic survey, in addition to
“Female” and “Male”, a third gender identity option – “Other” – was provided for
students, but none of them chose this option. This was the main reason why in my study I
did not give consideration to the possible existence of a more fluid gender identity in the
students. However, in future research, watching for student behavior indicating gender
fluidity is necessary as such a gender-role attitude and its associated behavior may
influence student interactions, engagement and achievement (BrckaLorenz, A. & Laird,
T. F. N., 2015).
Implications for Practitioners
With small group work’s potential for multiple benefits, including promoting
more favorable attitudes toward learning, stronger engagement, greater academic
achievement, and increased persistence in STEM fields (Johnson & Johnson, 2009;
Springer, Stanne & Donovan, 1999), it has become a major instructional strategies used
in most learning contexts (Nieswandt, Affolter, McEneaney, 2014). To describe how
student collaboration in small group work influences their problem-solving outcomes,
Barron (2003) proposed that successful groups must attend to and develop a content
space (i.e., the problem to be solved) and a relational space (i.e., social interactions within
the group). Recently, Nieswandt and McEneaney (2012) advanced this theory by
proposing that students in successful small groups must co-construct a triple problem-
solving space which has three dimensions: the content (i.e., the problem to be solved), the
social/relational (i.e., social interactions within the group), and the affective dimension

196
(i.e., group emotions). My study confirms this theory demonstrating that student
subgroups’ behavioral (i.e., social-behavioral), emotional and cognitive engagement,
which largely correspond to the three dimensions of the triple problem-solving space,
influenced their engineering design achievement. Furthermore, as reported above, my
study stresses the pivotal importance of emotional engagement supporting Nieswandt and
McEneaney’s integration of the affective dimension and creation of a triple problem-
solving space model.
These results have various implications for teachers as they plan and implement
small group work in science. During students’ group work, teachers need to monitor
students’ engagement comprehensively in order to intervene when students experience
lack relatedness (e.g., Andrew and Sophie) or self- and/or collective efficacy (e.g.,
Helen). Since emotional engagement does not only directly relate to achievement but
affects participation behavior and cognitive engagement, teachers need to pay particularly
attention to students who are isolated, pushed aside, or place themselves outside of the
group space. These students are less likely to learn. As my results show, students’
perceived relatedness and self- and collective efficacy and their group participation
behavior (most importantly, their group cohesion and interaction) reciprocally impact
each other. Such interplays greatly influence other components of students’ emotional
engagement (e.g., task-related frustration and happiness), cognitive engagement and
achievement. Therefore, teachers will need to understand that students’ visible social
behaviors are indicators of their internal emotional processes. As Reyes, Brackett,
Rivers, White and Salovey (2012) pointed out, “authentic instruction cannot take place

197
unless teachers attend to the social and emotional aspects of learning” (p. 710). This quite
clearly seems to be true in the case of learning in small groups, according to my results.
As discussed above, my results indicate that being part of a cohesive group
(relatedness) is more important than self-efficacy, because low individual self-efficacy
may be compensated by a high collective efficacy which can only be achieved in a
cohesive group. Therefore, teachers should be conscious in providing support for
relatedness. In Group 72, Parker and Brian worked well together because (at least partly)
they had worked together before. In Group 12, the four girls worked closely together
because (at least partly) they had established friendship among themselves. Therefore,
one strategy teachers can use is to arrange some pre-task activities for students to work
together on, such as reading and discussing task-related articles. Through doing these
activities, the students would have the opportunities to develop a sense of relatedness
and/or friendship. Also, the teacher would have the opportunity to learn which students
might or might not work well together, and then he/she can form groups accordingly.
During students’ group work on the task, in order to foster relatedness among
group members, the teacher should encourage all members of the group to interact and
discuss ideas with each other (Wang & Holcombe, 2010; Battistich, Solomon, Watson, &
Schaps, 1997; Connell & Wellborn, 1991). Also, he/she should constantly observe each
group and regulate any observed boys’ typical male-pattern behavior (e.g., interrupting
girls’ verbal/behavioral participation) that may disengage girls or other boys, and
encourage all group members’ active participation (Burke, 2011). On the other hand, as
shown by the cases of Talia in Group 72 and Helen in Group 41, girls could also be
marginalized by girls. So, teachers should not automatically assume that girls always

198
work well together and need to monitor girl-girl relationships and promote interactions
among them, too.
To achieve these goals, the teacher assigns roles (e.g., leader/facilitator,
arbitrator/monitor, notetaker/time keeper) to group members, and follow up specifically
with students who have a particular role about how they performed individually and how
the group performed as a whole. Importantly, the teacher should develop clear rules for
certain roles so students with these roles will function toward helping group members
develop cohesion and positive interaction. For example, the leader/facilitator should
make sure that group members listen to each other carefully and build on each other’s
ideas by using phrases such as: “Thanks for your contribution, Alicia. What do you think
about Alicia’s idea, Mike?” The teacher should rotate student roles periodically, which
balances natural status differences of the various roles (e.g., note taker vs.
leader/facilitator; Cohen, 1986) and better shapes social processes in the group (e.g.,
interpersonal relationships, interactions, and group dynamics; Goodenow, 1992).
Another strategy teachers can use to maximize group cohesion and interaction is
to administer a group work participation quiz where students give feedback on the group
structure and dynamics (including their own roles in the group) in an anonymous manner
and how their addressed possible issues. With such information, teachers then can
monitor the groups with specific reported/identified issues in mind, detect these issues
relatively easily, and if necessary develop together with a group interventions
accordingly.
Based on my research and Dasgupta and colleague’s work (2011, 2015), gender-
majority and single-gender groups (male or female) are best to optimize girls’ and boys’
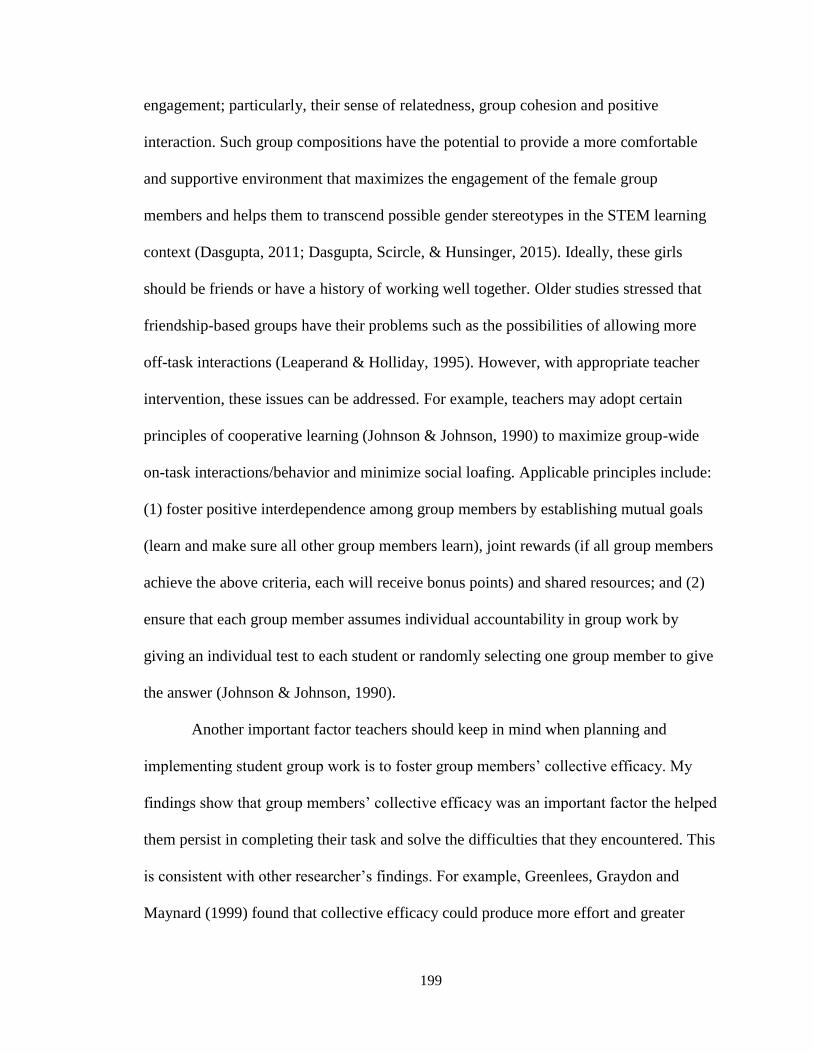
199
engagement; particularly, their sense of relatedness, group cohesion and positive
interaction. Such group compositions have the potential to provide a more comfortable
and supportive environment that maximizes the engagement of the female group
members and helps them to transcend possible gender stereotypes in the STEM learning
context (Dasgupta, 2011; Dasgupta, Scircle, & Hunsinger, 2015). Ideally, these girls
should be friends or have a history of working well together. Older studies stressed that
friendship-based groups have their problems such as the possibilities of allowing more
off-task interactions (Leaperand & Holliday, 1995). However, with appropriate teacher
intervention, these issues can be addressed. For example, teachers may adopt certain
principles of cooperative learning (Johnson & Johnson, 1990) to maximize group-wide
on-task interactions/behavior and minimize social loafing. Applicable principles include:
(1) foster positive interdependence among group members by establishing mutual goals
(learn and make sure all other group members learn), joint rewards (if all group members
achieve the above criteria, each will receive bonus points) and shared resources; and (2)
ensure that each group member assumes individual accountability in group work by
giving an individual test to each student or randomly selecting one group member to give
the answer (Johnson & Johnson, 1990).
Another important factor teachers should keep in mind when planning and
implementing student group work is to foster group members’ collective efficacy. My
findings show that group members’ collective efficacy was an important factor the helped
them persist in completing their task and solve the difficulties that they encountered. This
is consistent with other researcher’s findings. For example, Greenlees, Graydon and
Maynard (1999) found that collective efficacy could produce more effort and greater

200
persistence in a task when group members faced with failure; Kline and MacLeod (1997)
reported a significant positive correlation of collective efficacy to group problem solving
performance. As my findings and the findings of Lent, Schmidt and Schmidt (2006)
demonstrate, collective efficacy is strongly related to group cohesion; in order to help
student groups develop collective efficacy, the teacher should help students form
cohesive group/subgroups, using the strategies discussed above. In addition, the teacher
can use a group work participation quiz or exit ticket where students write down their
interest, strengths and needs in STEM fields as well as in group work. Based on students’
feedback the teacher can put students into groups or adjust memberships of different
groups with similar interests, strengths and needs accordingly. Also, during the groups
work, the teacher can observe individual students’ on- and off-task behaviors with their
reported needs in mind and provide appropriate support. To use Group 41 as an example,
using these strategies the teacher could discover that Jerry and Andre are highly self-
confident in themselves, Mary is very much interested in hands-on doing but not
explicitly enthusiastic about thinking, and Helen lacks confidence in science. Using an
exit ticket at the end of a class period or a certain engineering design step (e.g.,
Embodiment Design where boys may become hyperactive and push girls aside), the
teacher can ask the students whether all group members (especially the girls) have had
the chance to participate in the group’s manual work or expressed their own ideas
regarding specific design challenges, and whether they all feel they participated
adequately or were heard and taken seriously. Results can then be presented to the group
and solutions discussed. During the group work, the teacher could also specifically ask
Helen to contribute an idea for an identified design challenge, ask other group members

201
to provide feedback, and encourage more communications like this. Similarly, for Mary,
the teacher could ask her to talk about the difficulties that she has encountered during her
hands-on work process, how these difficulties relate to the task’s goal, how she thinks
they can be resolved, and ask other group members (especially Helen) to provide
comments. This way, the two girls will have more opportunities to meaningfully interact
with each other and develop a sense of relatedness and subgroup collective efficacy.
In addition to these interventions, it is important for the teacher to provide regular
feedback on students’ individual and group performance as such feedback leads to
improved team cognitive engagement (Baker, 2001). Further, given that the engineering
design process consists of different steps which are all important for students to
successfully accomplish the task, the teacher should provide feedback on student
performance in each step.
In my study, as reported in the Results chapter, I found that in a considerable
number of cases in which student groups did not clearly go through each engineering
design step; instead, they intertwined certain adjacent steps or skipped some step(s). In
Heart Valve, five out of 17 groups had intertwined design steps; in Oil Spill, nine out of
11 groups had intertwined or skipped design steps. For example, in Heart Valve, Group
62 started their design process by directly beginning to construct the Heart Valve
prototype that they would later test; during this process, they thought and talked about
how to design their heart valve. So, they did not engage in a substantial Conceptual
Design step. Teachers need to pay attention to such a phenomenon. In the 2016
Massachusetts Science and Technology/Engineering Curriculum Framework the design
process is clearly defined as consisting of all the steps as introduced in the Conceptual

202
Framework chapter, and students are being tested on the design process in state-wide
mandatory tests (Massachusetts Department of Elementary and Secondary Education,
2016). It is important that students learn to go through all steps of the design process;
though learn that the process is cyclical and not linear. Particularly, students should not
skip the Conceptual Design step. From an engineering perspective, student groups need
to substantially engage in this step, record their conceptual designs (including the original
and later revised ones) in order to be able to duplicate the best design for mass
production. From a science perspective, (in DBS tasks) the most substantial learning of
science concepts happens when student groups engage in the Conceptual Design step
where they will need to apply their learned scientific knowledge to develop their designs.
For example, in the Conceptual Design step of the Heart Valve task, students must first
review and discuss the position, structure, function and movement of the heart valve in
order to develop their own designs for the heart valve. Further, such learning of the
students was contextualized and intrinsically motivated, which was not easy to achieve in
many other learning contexts. Student groups identified as working in the Conceptual
Design step were highly engaged when they reviewed and discussed the relevant
knowledge. The real-life context of the tasks – saving a person’s life by designing an
artificial heart valve – encouraged them to draw on their knowledge to develop a design
for a real-life purpose. Therefore, it is conceivable that during this process, engaged
students deepened their understandings of heart valve-related knowledge (relationship
between structure and function, two important crosscutting concepts; NGSS Lead States,
2013) and retain this knowledge over time.

203
To make sure students substantially go through each design step during their
group work on a DBS or engineering task, the teacher should introduce the design
process with the definition of each step explicitly explained to students, clearly tell
students that they are required to engage in each step, assess student groups’ performance
on each step and make sure students are aware that they will be assessed. However,
importantly, the teacher also should make it clear to students that there is no cookbook
procedure of the design process (Mayhew, 1999), that is, there is not such a thing as a
single design process in which the design steps should be followed in a fixed order.
To achieve this, the teacher can for example, provide each student group with a
table that contains a column with each design step’s name and its succinct definition and
a column in which students describe what they did in each step as they go through their
design process. Such a process may minimize the possibility that the student groups
intertwine or skip certain design steps and at the same time allows the teacher to assess
the groups’ performance in each design step.
Implications for Future Research
As discussed above, one of the most important findings of my study is that in the
traditionally male-dominated field of engineering, mere contact with or exposure to other
girls in the small group context is not adequate to promote individual girls’ engagement
and achievement. Also necessary is the opportunity for girls to develop a cohesive
subgroup and engage in positive interactions with each other in this subgroup,18 because
such subgroup cohesion and interaction play a crucial role in shaping girls’ perceptions of
relatedness and developing and experiencing a collective efficacy. This finding suggests a
18 This does not exclude the opportunity for girls to work cohesively with and have positive interactions
with boys.
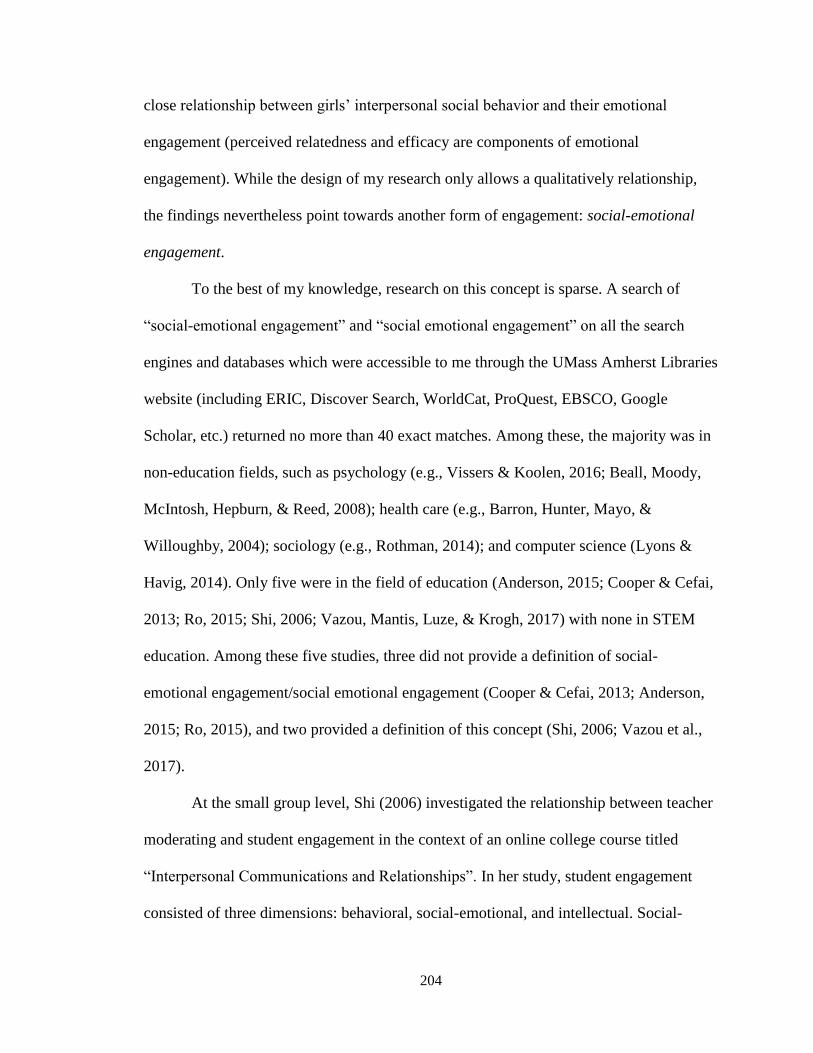
204
close relationship between girls’ interpersonal social behavior and their emotional
engagement (perceived relatedness and efficacy are components of emotional
engagement). While the design of my research only allows a qualitatively relationship,
the findings nevertheless point towards another form of engagement: social-emotional
engagement.
To the best of my knowledge, research on this concept is sparse. A search of
“social-emotional engagement” and “social emotional engagement” on all the search
engines and databases which were accessible to me through the UMass Amherst Libraries
website (including ERIC, Discover Search, WorldCat, ProQuest, EBSCO, Google
Scholar, etc.) returned no more than 40 exact matches. Among these, the majority was in
non-education fields, such as psychology (e.g., Vissers & Koolen, 2016; Beall, Moody,
McIntosh, Hepburn, & Reed, 2008); health care (e.g., Barron, Hunter, Mayo, &
Willoughby, 2004); sociology (e.g., Rothman, 2014); and computer science (Lyons &
Havig, 2014). Only five were in the field of education (Anderson, 2015; Cooper & Cefai,
2013; Ro, 2015; Shi, 2006; Vazou, Mantis, Luze, & Krogh, 2017) with none in STEM
education. Among these five studies, three did not provide a definition of social-
emotional engagement/social emotional engagement (Cooper & Cefai, 2013; Anderson,
2015; Ro, 2015), and two provided a definition of this concept (Shi, 2006; Vazou et al.,
2017).
At the small group level, Shi (2006) investigated the relationship between teacher
moderating and student engagement in the context of an online college course titled
“Interpersonal Communications and Relationships”. In her study, student engagement
consisted of three dimensions: behavioral, social-emotional, and intellectual. Social-

205
emotional engagement was defined as “the phenomenon that occurs when students see
themselves as part of a group rather than as individuals, and, therefore, make efforts to
build cohesion, acquire a sense of belonging, and render mutual support” (p. 435).
Cohesion was mainly measured by whether group members addressed each other by their
names and addressed the group as “we”, “us”, “our”, and “group”; sense of belonging
was measured by five indicators: expression of emotions, use of humor, showing personal
care, self-disclosure, and expression of compliment, appreciation, encouragement, and
agreement; and mutual support was measured by students’ online interaction behavior of
continuing with or replying to one or multiple previous messages rather than starting a
new thread. Vazou and colleagues’ (2017) study on the effects of a 12-week physical
activity program on preschoolers’ classroom engagement, perceived competence and peer
acceptance also provides a definition of social-emotional engagement that includes three
components: “(1) verbal engagement (i.e., asks and answers questions, participates in
discussions), (2) social engagement (i.e., interacts with other children, plays with at least
one other child), and (3) affective engagement (i.e., negative affect = looks bored,
unhappy, sad, angry through facial expressions and visible bodily manifestations; neutral
affect = does not express any affective tone; positive affect = looks interested in the
assigned activity, smiles, laughs, expresses signs that she/he is having fun)” (p.243-244).
Shi (2010) and Vazou and colleagues’ (2017) definitions of social-emotional engagement
have two components in common: interaction among students and students’ expression of
emotions. Shi’s (2010) definition includes components of group cohesion and sense of
belonging – her study was conducted at the small group level, while Vazou and
colleagues’ (2017) study was conducted at the classroom level and thus, didn’t include

206
these variables. The latter may indicate that group cohesion and sense of belonging are
more prominent/influential on student engagement at the small group level than at the
classroom level. The results of my study support this; the appearance of group cohesion
and sense of belonging on the small group level and thus, as in Shi’s definition being part
of social-emotional engagement. Though, additional components may be part of this
concept. As shown in my study, the variable of student subgroup/group collective
efficacy also plays an important role in promoting student engagement and is closely
related to subgroup/group cohesion, interaction and relatedness. Based on my findings, I
propose that the concept of social-emotional engagement may be comprised of the
following components: group cohesion (Sargent & Sue-Chan, 2001), group interaction
(Linnenbrink-Garcia, et al., 2011), relatedness (Dasgupta, 2011; Deci & Ryan, 1985), and
collective efficacy (Bandura, 1998).
Further research will be necessary to determine participants’ behavior as social-
emotional engagement quantitatively. A starting point could be measuring the four
components of social-emotional engagement (group cohesion, group interaction,
relatedness and collective efficacy) using well-established scales to a large sample of
students in a certain learning context (small group work on DBS task), and then use
exploratory factor analysis to examine whether a single factor containing all four
concepts would emerge. If it emerges, then it provides preliminary evidence that the
construct “social-emotional engagement” exists. Following such a study, further
empirical studies are necessary with various populations working in different learning
contexts. With respect to small group work, I can see the following research questions to
be meaningful: In small group work, what is the relationship between the group’s gender

207
distribution and girls’ and boys’ level of social-emotional engagement in DBS tasks?
Does social-emotional engagement predict girls’ and boys’ achievement in science
content and engineering practices? Do girls’ and boys’ perceived relatedness and self-
and/or collective efficacy that they bring into the group predict their social-emotional
engagement during group work? Does social-emotional engagement predict girls’ and
boys’ behavioral and cognitive engagement? Research on these questions should be able
to further deepen our understanding of girls’ and boys’ academic engagement and
learning in DBS, and thus be able to provide implications for the planning and
implementation of DBS teaching.
In my conceptual framework I proposed that various contextual factors such as
group gender composition (Social Context) influence student engagement (Patterns of
Action) through the psychological processes of autonomy, relatedness and self-efficacy.
However, while the latter two psychological processes emerged as factors that affected
student engagement in my qualitative data analysis results, autonomy did not. According
to Ryan and Connell (1989), autonomy refers to individuals’ desire to do things for
personal reasons rather than doing things as a result of being controlled by others.
Fredricks and colleagues (2004) further pointed out that students’ need for autonomy is
most likely to be met when they perceive that they have choice, shared decision making,
and relative freedom from external controls.
A similar perception actually was reported by Jerry in Group 41 (2g2b) in the
group’s interview. When comparing engineering tasks with inquiry tasks, Jerry told the
interviewer that he felt the engineering tasks were “less directive”:

208
The ones…there’s… labs where you had to come up with an experiment, and
there’s things where we got to actually build a model or something, test it, and I
think, that’s just, it’s less directive, I’d say than a …[Another student began to
talk so he didn’t finish.]
In this quote, although Jerry did not finish his last sentence, it’s quite clear he was
going to say something like “science lab” or “inquiry task”, because he was comparing
engineering design and scientific inquiry tasks. Andre echoed Jerry’s opinion by
repeating the exact words “you had to come up with an experiment”. As the researcher
who observed and videotaped this group’s all six inquiry and design tasks, I clearly
remember that in the classroom this group talked about their frustration regarding how
difficult it was to design an experiment for the inquiry tasks. With this background
information, it’s conceivable that by “had to” Jerry and Andre meant they didn’t have a
choice other than coming up with an experiment for completing the inquiry tasks
although it’s really difficult; by “less directive” Jerry meant the engineering tasks did not
demand that they must complete them in a certain way like the science tasks did. Thus,
Jerry and Andrew understood engineering tasks as providing more choice and freedom
from external controls, although they did not explicitly use these terms to express their
perceptions.
Notably, in this group none of the girls reported a similar perception. In a
previous study (Guo, Nieswandt, McEneaney & Howe, 2016), such an understanding
also emerged from interview data. In this study, when asked to compare inquiry and
engineering tasks of the Small Group project, a boy in a 3g1b group reported that he felt
“free” when doing the engineering tasks, because “you didn’t have to stick on one path

209
and do it certain ways, we just got to do it however we wanted to do it”. Similarly, in this
group none of the girls expressed a similar perception. Why did this only appear to be the
boys’ feeling? Did the girls actually also have the same or a similar feeling? The focus
group interview didn’t ask about students’ perception about autonomy in each of these
task environments, thus, it is not known whether girls have experienced something
similar or something different. Future research should explore whether girls and boys
have similar or different perceptions and needs for autonomy in DBS contexts. Such
research may provide insights for more deeply understanding the differences between
girls’ and boys’ engagement patterns in DBS tasks and implications for teachers as they
provide autonomy support for girls and boys in their DBS teaching.

210
ACKNOLWEDGEMENT
I wish to thank Dr. Susannah Howe for communicating with me regarding the process
and characteristics of engineering design.

211
APPENDIX 1
THE HEART VALVE LESSON PLAN
Saving a Life
An Engineering Design Lesson on Heart Valve Replacement
PURPOSE
Because diseases of the heart and circulatory system are a leading cause of death in the
U.S., artificial heart valves are a critical area of research for biomedical engineers.
Students use their knowledge about how healthy heart valves function to design,
construct, and implant prototype replacement mitral valves for hypothetical patients'
hearts.
OBJECTIVES
Upon completion of this activity, students will be able to:
Describe how real, healthy heart valves function.
List some diseases that can affect the heart valves.
Explain pros and cons of different types of artificial heart valves.
Engage in a full cycle of engineering design process.
Describe the engineering design process, including the steps consisting this process.
GRADE LEVEL
This lab is most applicable for high school biology and anatomy & physiology, but it
could be used at any grade level from 7-12.
PRIOR KNOWLEDGE

212
Students will need to be familiar with the circulatory system, path of blood flow through
the body and the heart, and heart valves. A suggested pre-lesson on the heart and heart
valves can be found at:
http://www.teachengineering.org/view_lesson.php?url=collection/cub_/lessons/cub_heart
valves/cub_heartvalves_lesson01.xml
TIME REQUIRED
Allow one period for this lab. Allow an additional period for presentations.
INCLUDING ALL STUDENTS
This lesson addresses all modalities of learning: tactile, visual, and auditory. Grouping of
students can be random (have students draw cards, etc.) or strategic (pair students willing
to help with those who need the help).
NEXT GENERATION SCIENCE STANDARDS
ETS1.B: Developing Possible Solutions (http://www.nextgenscience.org/hsets-ed-
engineering-design)
When evaluating solutions, it is important to take into account a range of constraints,
including cost, safety, reliability, and aesthetics, and to consider social, cultural, and
environmental impacts.
Both physical models and computers can be used in various ways to aid in the
engineering design process
HS-LS1.A: Structure and Function (http://www.nextgenscience.org/hsls-sfip-structure-
function-information-processing)
HS-LS1-2: Develop and use a model to illustrate the hierarchical organization of
interacting systems that provide specific functions within multicellular organisms.
[Clarification Statement: Emphasis is on functions at the organism system level such as
nutrient uptake, water delivery, and organism movement in response to neural stimuli. An
example of an interacting system could be an artery depending on the proper function of

213
elastic tissue and smooth muscle to regulate and deliver the proper amount of blood
within the circulatory system.] [Assessment Boundary: Assessment does not include
interactions and functions at the molecular or chemical reaction level.]
Multicellular organisms have a hierarchical structural organization, in which any one
system is made up of numerous parts and is itself a component of the next level. (HS-
LS1-2)
MA. STATE SCIENCE EDUCATION STANDARDS
4. Anatomy and Physiology: The structures and functions of organs determine their
relationships within body systems of an organism. Homeostasis allows the body to
perform its normal functions.
4.2 Explain how the circulatory system (heart, arteries, veins, capillaries, red blood cells)
transports nutrients and oxygen to cells and removes cell wastes.
1. Engineering Design:
Central Concepts: Engineering design involves practical problem solving, research,
development, and invention/innovation, and requires designing, drawing, building,
testing, and redesigning. Students should demonstrate the ability to use the engineering
design process to solve a problem or meet a challenge.
1.1 Identify and explain the steps of the engineering design process: identify the problem,
research the problem, develop possible solutions, select the best possible solution(s),
construct prototypes and/or models, test and evaluate, communicate the solutions, and
redesign.
1.2 Understand that the engineering design process is used in the solution of problems
and the advancement of society. Identify examples of technologies, objects, and
processes that have been modified to advance society, and explain why and how they
were modified.
1.5 Interpret plans, diagrams, and working drawings in the construction of prototypes or
models.
MATERIALS
• Model heart: cardboard box or container with divider wall and gap (represents left
side of heart, left atrium and ventricle)
• Divider wall made from cardboard
• Marbles

214
• Scissors and/or box cutter
• Marker
• Suggested materials for constructing valve: tissue and construction paper,
cardboard, brown paper bags, popsicle sticks, index cards, wooden toothpicks,
string, aluminum foil, duct tape, scotch tape
• Student worksheet
SAFETY
Make sure students use sharp instruments appropriately.
PREPARATION AND PROCEDURE
Divide the class into groups of four students each.
Pass out worksheets and have materials available for each group. Each group gets their
own model heart box.
Give background story and introduce the design challenge.
Briefly discuss how engineers approach a design problem.
Have groups complete first part of worksheet. Teacher initials when complete.
Students gather materials and work on next portion of worksheet (this includes
constructing prototype, testing, etc.)
Students should be following the design-test-redesign process until they reach a
satisfactory solution.
If necessary, assist students with guiding questions.
Conclude by reflecting on the activity in terms of the universal steps of the engineering
design process.
QUESTIONS TO ASK ALONG THE WAY
Part 1 (Before Activity): Why are heart valves so important? Can we live without
functional heart valves? What makes the mitral valve unique? What are some reasons a
person might need a replacement valve?

215
Part 2 (During Activity): Why did you choose those materials? How does your valve
allow marbles through in one direction and stop them in the other direction?
Part 3 (After Activity): What decisions did you make that might be similar to those made
by biomedical engineers? What is the best aspect of this design?
WHERE TO GO FROM HERE
After the first class period, a good extension for this activity is to have students research
actual replacements valves, including both biological and mechanical. They can compare
their prototypes with real engineered valves. Then, students can create a presentation that
includes a decision aid to assist providers and patients in making an optimal valve
selection. Students describe the valves they built and their effectiveness. They will also
explain why they chose certain materials, including the pros and cons of using those
materials. Based on which type their designs are more similar to, explain the pros and
cons of this type of artificial valve in terms of patient health and lifestyle.
SUGGESTIONS FOR ASSESSMENT
Formative: class/group discussion
Summative: group participation, student worksheet, group presentation (students create
decision aids for future patients)
REFERENCES AND RESOURCES
http://www.teachengineering.org/view_lesson.php?url=collection/cub_/lessons/cub_heart
valves/cub_heartvalves_lesson01.xml (this is a pre-lesson on heart valves for use before
the task)
http://www.teachengineering.org/view_activity.php?url=collection/cub_/activities/cub_h
eartvalves/cub_heartvalves_lesson01_activity1.xml
http://www.ncbi.nlm.nih.gov/pmc/articles/PMC3063655/
http://www.sts.org/patient-information/valve-repair/replacement-surgery/mitral-valve-
replacement#2
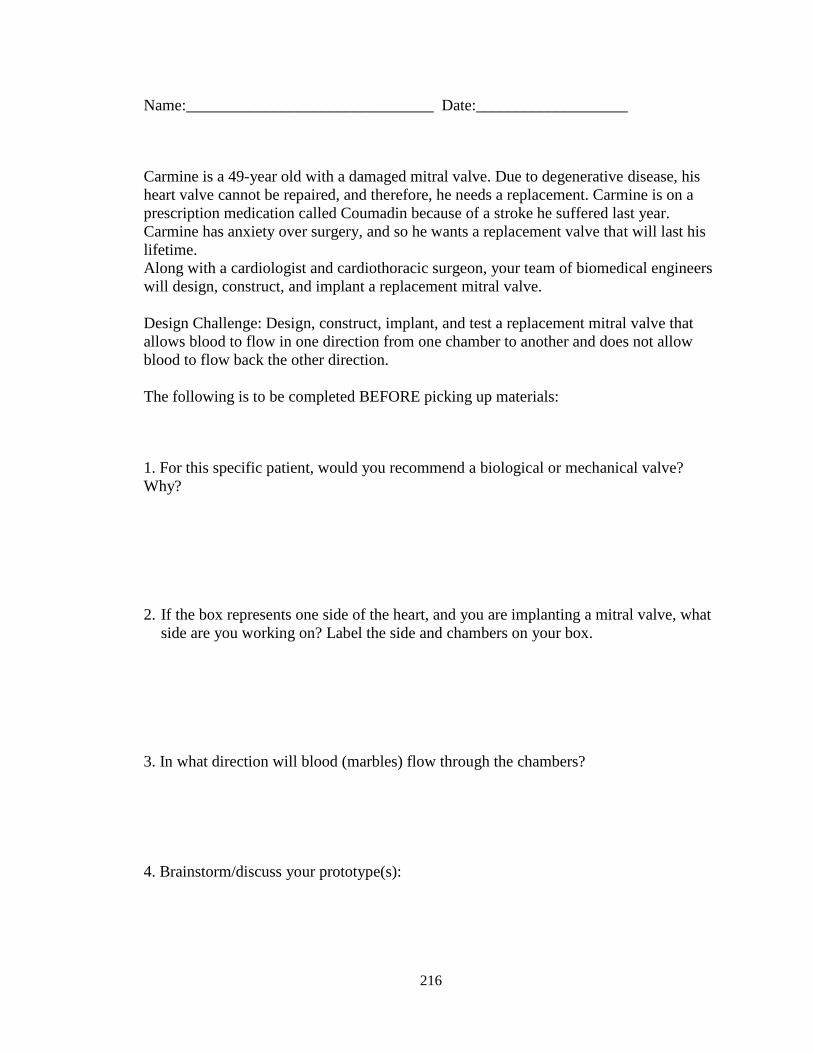
216
Name:_______________________________ Date:___________________
Carmine is a 49-year old with a damaged mitral valve. Due to degenerative disease, his
heart valve cannot be repaired, and therefore, he needs a replacement. Carmine is on a
prescription medication called Coumadin because of a stroke he suffered last year.
Carmine has anxiety over surgery, and so he wants a replacement valve that will last his
lifetime.
Along with a cardiologist and cardiothoracic surgeon, your team of biomedical engineers
will design, construct, and implant a replacement mitral valve.
Design Challenge: Design, construct, implant, and test a replacement mitral valve that
allows blood to flow in one direction from one chamber to another and does not allow
blood to flow back the other direction.
The following is to be completed BEFORE picking up materials:
1. For this specific patient, would you recommend a biological or mechanical valve?
Why?
2. If the box represents one side of the heart, and you are implanting a mitral valve, what
side are you working on? Label the side and chambers on your box.
3. In what direction will blood (marbles) flow through the chambers?
4. Brainstorm/discuss your prototype(s):

217
TEACHER’S INITIALS________________________
The following is to be completed AFTER picking up materials:
Be sure to only take enough material for one design at a time. A successful engineer does
not waste material!
5. How did you incorporate what you learned from testing into your next design
iteration?
6. How did you improve your design?

218
Teacher Background Information:
Heart valves are essential to the heart's ability to pump blood in one direction through all
the chambers of the heart and through the body. Blood returning from the body enters the
heart from the superior and inferior vena cava into the right atrium. From there, blood
flows through the tricuspid valve into the right ventricle. When the ventricle contracts,
blood moves through the pulmonary valve to the pulmonary artery to pick up oxygen and
release carbon dioxide in the lungs. Blood re-enters the heart from the pulmonary veins
into the left atrium. Then it moves through the mitral valve into the left ventricle. When
the ventricle contracts again it moves through the aortic valve into the aorta to return to
the body. All four valves mentioned are one-way valves that force blood to move in one
direction only. This is imperative for the body to maintain an appropriate blood pressure,
and for each heart contraction to move blood appropriately.
Our heart valves allow blood to flow through them in one direction only. The four valves
are the aortic valve, the mitral valve, the pulmonary valve and the tricuspid valve. Every
time the muscles in the heart contract to pump blood, certain valves open and others close
to make sure the blood is only pumped in the correct direction. All of the valves have
leaflets or flaps that are the moving pieces of the valve. When a valve opens, its leaflets
separate to allow blood flow, and when the valve closes, its leaflets come together to
block the blood flow.
Defective heart valves often need to be replaced, usually with either pig valves or
artificial components. Patients require immunosuppressive therapy to avoid the rejection
of the replacements and monitoring to ensure deposition does not occur with the
transplanted components.
Replacement valves can be made of animal tissue (such as porcine pericardium) or be
purely mechanical. Purely mechanical valves outlast the patient, but cause thrombosis
(clotting) unless the person takes blood-thinning medication and lives a more sedentary
lifestyle. Most young patients who need heart valve replacement go with this option.
Older patients typically have animal tissue valves installed. These valves only last about
10 years, but operate just like normal heart valves so the person can be active. Getting a
valve replaced is a traumatic process and involves open heart surgery. Biomedical
engineers are designing new surgical techniques and valves that are less invasive. For
example, the FDA recently approved a new valve device that is inserted into a small
opening in a person's leg artery and pushed through the blood vessels to access the
damaged or diseased valve.
Modified from the original source: http://www.teachengineering.org

219
APPENDIX 2
OIL SPILL CLEANUP LESSON PLAN
There’s No Crying Over Spilled Oil--Or Is There?
An Engineering Design Lesson on Oil Spill Solutions
PURPOSE
To explore how environmental engineers might approach solving the problem of an oil
spill. Engineers use various techniques to provide speedy solutions to oil spills or other
threats to natural water resources. Their contributions to environmental clean up are very
important in keeping our Earth's water and land useable.
OBJECTIVES
Upon completion of this activity, students will be able to:
· Describe how environmental engineers develop equipment and procedures to help
reduce environmental impact from accidental oil spills.
· Identify some causes and effects of oil spills on a water source and the organisms that
use that water.
GRADE LEVEL
This lab is most applicable for high school biology, environmental science, or chemistry,
but it could be used at any grade level from 7-12.
PRIOR KNOWLEDGE
Students will need to be familiar with oil spills and removal systems, ecology, basic
chemistry, and the engineering design process.
TIME REQUIRED
Allow two periods for this lab. Allow an additional period for group presentations.
INCLUDING ALL STUDENTS
This lesson addresses all modalities of learning: tactile, visual, and auditory. Grouping of
students can be random (have students draw cards, etc.) or strategic (pair students willing
to help with those who need the help).
NEXT GENERATION SCIENCE STANDARDS
LS2.A: Interdependent Relationships in Ecosystems
LS2.C: Ecosystem Dynamics, Functioning, and Resilience
ETS1.B: Developing Possible Solutions
ESS3.C: Human Impacts on Earth Systems
MA. STATE SCIENCE EDUCATION STANDARDS
6. Ecology

220
Central Concept: Ecology is the interaction among organisms and between organisms and
their environment.
6.2 Analyze changes in population size and biodiversity (speciation and extinction) that
result from the following: natural causes, changes in climate, human activity, and the
introduction of invasive, non-native species.
6.4 Explain how water, carbon, and nitrogen cycle between abiotic resources and organic
matter in an ecosystem, and how oxygen cycles through photosynthesis and respiration.
1. Engineering Design: Central Concepts: Engineering design involves practical
problem solving, research, development, and invention/innovation, and requires
designing, drawing, building, testing, and redesigning. Students should demonstrate the
ability
to use the engineering design process to solve a problem or meet a challenge.
MATERIALS
Each group will need:
· large clear pans, containers, or plastic bins for testing the oil spill
· “oil”, consisting of 200 ml vegetable oil mixed with cocoa powder or dark food coloring
· suggested materials for cleanup: rubber bands, paper towels, string, toothpicks, cotton
balls, plastic wrap, popsicle sticks, shredded wheat cereal, balloons, cooked rice, garden
peat moss, grass, cork, suction tube/cooking baster, spoon, dish soap, cheesecloth,
sponges, other items
· student worksheet
SAFETY
Be sure to stress that the "clean" water, no matter how clear, is not suitable for drinking.
Be aware of any food allergies students may have. The activity materials have the
potential to be extremely messy, so emphasize cleanliness and keep cleaning materials
nearby. Consider laying down newspaper on and around the desks as protection from
spills.
PREPARATION AND PROCEDURE
1. Divide the class into groups of four students each.
1. Pass out worksheets.
2. Have “oil spill” ready for each group (200 ml of “oil” with desired amount of water).
3. Have materials available for each group.
4. Assign values to each material (e.g., 20 ml dish soap is $10,000).
5. Give background story and introduce the design challenge.
6. Briefly discuss how engineers approach a design problem.
7. Have groups complete first part of worksheet. Teacher initials when complete.
8. Students gather materials and work on next portion of worksheet.
9. Students should be following the design-test-redesign process until they reach a
satisfactory solution -- Remind students to provide rational for their best solution.
10. If necessary, assist students with guiding questions.
11. Conclude by reflecting on the activity in terms of the universal steps of the
engineering design process.

221
QUESTIONS TO ASK ALONG THE WAY
· Part 1 (Before Activity): Why did you chose the materials you did?
· Part 2 (During Activity): Why is it so hard to clean up oil, and why does it take so long?
· Part 3 (After Activity): How did your clean up method affect the ecosystem? What are
some ways to prevent oil spills?
WHERE TO GO FROM HERE
After the first class period, a good extension for this activity is to have students research
different methods and oil removal systems. Students can refine their systems and retest
on another containment area. Then, students can present their findings and effectiveness
to Genesis Energy (presentation to the class).
SUGGESTIONS FOR ASSESSMENT
Formative: class/group discussion
Summative: group participation, student worksheet, group presentation (students present
findings to Genesis Energy)
REFERENCES AND RESOURCES
http://www.tryengineering.org/lessons/spillsolutions.pdf
http://www.teachengineering.org/view_activity.php?url=collection/cub_/activities/cub_e
nveng/cub_enveng_lesson01_activity1.xml

222
Name:_______________________________ Date:___________________
Genesis Energy owns thousands of miles of active oil pipelines on the seafloor in the
Gulf of Mexico. The company was just notified of an underwater pipeline that failed, and
it is currently spilling thousands of gallons of oil into the ocean and towards a coastal
settlement. Although the coast guard has contained part of the oil spill, Genesis Energy is
seeking the assistance of your environmental engineering team. As part of the
Environmental Protection Agency, your team must devise a plan and create a solution to
clean up the oil spill. Genesis Energy needs the oil cleaned up quickly, so that they do not
get sued by locals who may be affected by the spill. Genesis Energy will provide $50,000
towards the cleanup, and your team is responsible for the purchase of any materials.
Design Challenge: Design, construct, and test an oil removal system that cleans the spill
quickly. It is important to take into account a range of constraints, including cost, safety,
reliability, and aesthetics, and to consider environmental impacts. The effectiveness of
the clean up will be evaluated by Genesis Energy.
The following is to be completed BEFORE picking up materials:
1. What are some environmental issues caused by the oil spill?
2. What would make a successful oil removal system?
3. Calculate the cost of materials:
4. Brainstorm/discuss your prototype(s) here:
(Discuss the chemical and physical properties of materials for oil removal system.)
5. Explain/Draw how you will test your prototype(s):

223
TEACHER’S INITIALS________________________
The following is to be completed AFTER picking up materials:
Be sure to only take enough material for one test at a time. A successful (and
environmentally friendly) engineer does not waste material!
6. List/draw any observations of the oil after using your removal system. What
conclusions have you drawn?
7. Was your design successful in removing the oil? What evidence do you have?
8. How did you improve your design?
9. Rate the effectiveness of your system based on this scale:
No change 3/4 of oil
remains
1/2 of oil
remains
1/4 of water
remains
Water is clear
of all oil
0 1 2 3 4
10. As a group, develop a presentation to Genesis Energy. In addition to effectiveness,
make sure to include information about cost, safety, reliability, aesthetics, and
environmental impact. You may use any presentation tool (e.g., PowerPoint, video,
poster) to pitch your prototype as the best product to clean up an oil spill.
Adapted from original source: http://www.tryengineering.org/lessons/spillsolutions.pdf

224
APPENDIX 3
STUDENT FOCUS GROUP INTERVIEW QUESTIONS
During the last couple of weeks you worked together in a group on different labs and
activities: show and read aloud the list of different inquiry labs/design activities.
I would like to ask you a few questions on how you liked working in the group and how
you felt about it.
There is no right or wrong answer to my questions.
Have list of inquiry labs/design activities handy for students – just in case they cannot
remember what they did. Also, always refer to the specific inquiry and/or engineering
design task.
General perceptions about the inquiry labs/design activities
• How did you like the different labs/design activities you did during the last
couple of weeks?
• Was there a lab/design activity that you liked better than others? One that
you didn’t like at all? Why?
• What do you think you learned from the labs/design activities?
Students’ perceptions of how the group worked
• How did you like working in your group with your peers? What did you
like/what didn’t you like about working with your peers?
• Did you notice anything different when working on the inquiry lab (name
specific inquiry task) in comparison to the engineering design activity
(name specific task)?
• Do you think the tasks of the labs/activities were divided evenly among all
of you? Why/why not?
• What would you do differently as a group the next time you work together
on a lab/activity?
o [NOTE: open circle indicates possible probe or follow-up questions]
Thinking about future labs/activities, would you want to work as a group
again or would you prefer to work alone?
Individual contributions during group work – questions to be answered by each
group member

225
• How did you choose your group or how did you end up with this group? Are you
friends? Do you always work together in the science class? How about in other
classes?
• Did you see yourself having a particular task/role throughout the labs/activities
(e.g., do experiment, answer questions)?
o Did this role change during the inquiry lab (name specific tasks) vs.
engineering design activity (name specific tasks)?
o What did you do that helped your group to conduct the experiment and to
find answers to the lab questions?
o Do you think that your peers took your suggestions and comments
seriously? Why/why not?
o Do you think you knew what you should do for the different labs?
Why/why not?
• How did each of you feel working with your peers at the different labs/activities?
How did your feelings influence your work with your peers?
Group task management issues
• When you got stuck at a task, what did you do?
o Was there one person in your group who could help you the most?
o Did you listen to this person and/or to each other’s comments and
suggestions? Why/why not?
o What did you do when you couldn’t agree on how to proceed with the
experiment or to answer the lab/activity questions? When did you fell it
was OK to ask the teacher?
• Were there times that you were frustrated during the lab/activity? If so,
what did you do?
o Was there a specific lab that you felt was frustrating?
o Were there specific parts of a lab that were frustrating?
o Were there situations that you were frustrated with your peers’ work?
Ask a general questions about the class to finish formal interview:
• Did you enjoy your biology class? Why/why not?
Then give them their code page and ask them to write for a couple of minutes on the
back side: If there is anything else that you want to share with me about how your group
worked together during the labs/activities, then take a couple of minutes and write it
down here on the back site of your code page. Also, please answer the questions about
your grade.
Final question (is on bottom of code page but ask students as well):

226
If we have further questions, will it be OK to send them by email? If so, then please list
your email on the bottom of the code page
Source: Nieswandt and McEneaney (2012)

227
APPENDIX 4
STUDENT INTEREST IN BIOLOGY QUESTIONNAIRE
The following statements ask about your interest in Biology.
Strongly
Agree
Agree Disagree Strongly
Disagree
1. I enjoy working on Biology
questions.
2. Although I make a real effort,
Biology seems to be harder for me
than for my fellow students.
3. While working on a Biology
question, it sometimes happens that
I don’t notice time passing.
4. Some topics in Biology are just so
hard that I know from the start I’ll
never understand them.
5. It is important to me to be a good
Biology student.
6. Biology just isn’t my thing.
7. I would much prefer Biology if it
weren’t so hard.
8. Compared to other school subject, I
know a lot about Biology.
9. I would even give up some of my
spare time to learn new topics in
Biology.
10. Biology is one of the things that is
important to me personally.
11. Nobody’s perfect, but I’m just not
good at Biology.
Source: Adapted by Nieswandt and McEneaney (2012) from Marsh, Köller, Trautwein,
Lüdtke, & Baumert (2005).

228
APPENDIX 5
STUDENT INTEREST IN CURRENT BIOLOGY CLASS QUESTIONNAIRE
The following questions ask about your interest in this particular Biology class,
NOT about your interest in an individual Biology class period. Please circle the
answer that best fits your interest. Circle only one answer per question!
1. How important is it for you to learn a lot in your Biology class?
Not at all Not Neither important Important Very
important 1
important 2
nor unimportant 3
4
important 5
2. How important is it for you to remember what you have learned in your Biology
class?
Not at all Not Neither important Important Very
important 1
important 2
nor unimportant 3
4
important 5
3. Would you like your Biology class to be taught more often?
Not at all Just a little Somewhat Quite a bit Very much 1 2 3 4 5
4. How much do you look forward to your Biology class?
Not at all Just a little Somewhat Quite a bit Very much 1 2 3 4 5

229
5. Compared to mathematics, reading, and your favorite sport, how much Biology do
you know?
Not much at all Just a little Somewhat Quite a bit Very much 1 2 3 4 5
Source: Adapted by Nieswandt and McEneaney (2012) from Marsh, Köller, Trautwein,
Lüdtke, & Baumert (2005).

230
7
APPENDIX 6
STUDENT COMPETENCE IN SCIENCE LABS QUESTIONNAIRE
The following statements refer to laboratories that you do in Science classes.
You can answer from 1 to 7 with 1 = not at all true and 7 = very
true.
Here is an example:
I like doing labs in my Science class.
Make sure that you rate each statement by circling the appropriate number.
I think I am pretty good in
Science labs.
1
2
3
4
5
6
7
After working at Science labs
for a while, I feel pretty
competent.
1
2
3
4
5
6
7
I am pretty skilled at Science
labs.
1
2
3
4
5
6
7
I am satisfied with my
performance at Science labs.
1
2
3
4
5
6
7
I am anxious while working on
Science labs.
1
2
3
4
5
6
7
I do pretty well at Science lab
compared to other students.
1
2
3
4
5
6
7
I don’t feel nervous at all while
working on Science labs. 1 2 3 4 5 6 7
I don’t do well at Science labs. 1 2 3 4 5 6 7
I feel very tense while working
on Science labs. 1 2 3 4 5 6 7
I am very relaxed doing
Science labs. 1 2 3 4 5 6 7
I feel pressured while doing
Science labs. 1 2 3 4 5 6 7

231
Source: Adapted by Nieswandt and McEneaney (2012) from McAuley, Duncan and
Tammen (1987)

232
APPENDIX 7
BIOLOGY PRETEST
These questions are intended to help your teacher understand what kind of
background you already have in thinking about biology, science and
engineering/technology. Your answers will NOT count toward your grade.
Please circle the best or most appropriate answer.
1. Pat has two kinds of plant food, “Quickgrow” and “Supergrow.” What
would be the best way for Pat to find out which plant food helps a particular
type of houseplant grow the most?
a. Put some Quickgrow on a plant in the living room, put some Supergrow
on a plant of same type in the bedroom, and see which one grows the
most.
b. Find out how much each kind of plant food costs, because the most
expensive kind is probably better for growing plants.
c. Put some Quickgrow on a few plants, put the same amount of Supergrow
on a few other plants of the same type, put all the plants in the same place,
and see which group of plants grows the most.
d. Look at the advertisements for Quickgrow, look at the advertisements for
Supergrow, and see which one says it helps plants grow the most.
2. A student wanted to find out if marbles with larger diameters made deeper
craters when dropped into wet sand than marbles with smaller diameters.
The table below shows the student’s data.
Marble
Marble
Diameter
(millimeters)
Marble Mass
(grams)
Height to Drop
Marble (meters)
Crater Depth
(millimeters)
1 13 21 2 4
2 14 18 2 3
3 15 23 2 6
4 16 20 2 5
The student concluded marble diameter had no effect on crater depth. Which
is the MOST likely reason this conclusion is flawed?

233
a. The student should have used more than four marbles.
b. The student should have used marbles that have the same mass.
c. The student should have dropped marbles from different heights.
d. The student should have dropped the marbles in flour instead of sand.
3. The graph below indicates the growth of a rabbit population.
Which most likely occurred between 1987 and 1988?
a. There was a decrease in available amount of food.
b. There was an increase in competition.
c. There was a decrease in the predator population.
d. There was an illness among the population.
4. You are doing research on the properties of tennis balls under different
temperature conditions. Which of the following statements is properly
phrased as a hypothesis?
a. Frozen tennis balls do not bounce high.
b. If a tennis ball is heated up then it will bounce high.
c. If a tennis ball is frozen, then it will not bounce as high as before it was
frozen.
d. Tennis balls at different temperatures bounce different heights.
5. Juan is going to design a kite for mass production. After doing research,
Juan creates several different designs and selects the one he wants to use.
What are the next two steps Juan should do in the design process?
a. Build and finish full-sized kites.
b. Redesign the kite and evaluate it.

234
c. Build a prototype of the kite and test it.
d. Patent the kite design and sell it to others.
6. A group of students is going to design and build a new set of shelves for a
school. Which of the following describes the first steps of the design process
that the students need to do?
a. Draw a diagram of the shelf design on the computer, select the materials,
and build the shelves.
b. Find out why the shelves are needed, research current options, and
brainstorm possible solutions.
c. Measure the space for the shelves, select the possible materials, and get
prices for the materials proposed for use.
d. Brainstorm some ideas for the shelves, use the computer to design the
shelves, and find the strongest materials to build the shelves.
7. Engineers must understand the difference between requirements and
constraints. Let’s say a team of engineers is asked to design a pair of kids’
tennis shoes for less than $20. They determine that the only way to
manufacture shoes for this price is to use recycled materials.
What is the team’s constraint?
a. The shoes must be designed for kids
b. The shoes must be made out of recycled materials
c. The shoes must cost less than $20 to manufacture
8. When finding the solution to an engineering design problem, there is/are
usually…
a. only one possible correct solution
b. a very limited number of possible correct solutions
c. many possible correct solutions
Source: Nieswandt and McEneaney (2012)

235
APPENDIX 8
HEART VALVE PROTOCOL
1. What is the advantage of having a heart with four chambers?
a) There is extra capacity when needed.
b) Blood can be pumped separately to the lungs and to the rest of the body.
c) There is a chamber to supply blood to each of the four limbs (arms and legs).
d) It is twice as large as a heart with two chambers.
2. What happens to blood when it is pumped into the thin-walled blood vessels of the
lungs?
a) Platelets are exchanged for plasma.
b) Carbon dioxide is replaced with oxygen.
c) Blood fills the lungs and causes coughing.
d) Nothing -- the lungs are just a place blood goes through on its way back to the
heart.
3. The most important purpose of the valves in the heart is to _____________.
a) clean the blood
b) absorb oxygen
c) allow blood to flow in one direction
d) permit blood to circulate rapidly
4. An engineer has just finished building a prototype of a lawn tractor that is powered by
a hydrogen fuel cell. Which of the following should be the next step in the design
process?
a) Testing the prototype to evaluate its performance
b) Asking for funding to build more copies of the prototype
c) Building a second prototype that is different from the first
d) Making modifications to the prototype that will increase its performance
5. What is one way engineering and science differ? Explain.
Varies. Could mention engineering design cycle, need to build and test
prototypes according to design criteria; engineering involves a problem that
needs to be solved; science often involves developing hypotheses to
understand a phenomenon and an experiment to collect data to test
hypothesis while engineering does not.
Source: Nieswandt and McEneaney (2012)

236
APPENDIX 9
OIL SPILL POSTTEST
1. A group of students is doing a semester project to determine the best material for
textbook covers. During the project, they will conduct a one-month pilot study in
which a class of students will try out different types of textbook covers.
a. Identify one step in the engineering design process that the students should do
before starting the pilot study.
b. Explain in detail one step that the students should do after the pilot study.
c. Explain in detail why both of these steps are important.
2. Name two methods for cleaning up an oil spill.
3. It is necessary to use special methods to remove oil spills in the ocean because of
which of the following properties of oil?
a. Oil mixes with water
b. Oil sinks to the bottom
c. Oil does not mix with water
d. Oil changes color in water.
4. What is an advantage to using natural resources to clean oil spills?
a. Does not harm the environment
b. Soaks up a lot of water
c. Spreads out on the surface
d. Resource is hard to find
Source: Nieswandt and McEneaney (2012)

237
APPENDIX 10
INDICATORS FOR BEHAVIORAL/EMOTIONAL/COGNITIVE
ENGAGEMENT
Part 1. Indicators for behavioral engagement
Type of
Engagement
Definition of
Engagement
Indicators Explanation
Behavioral Various kinds of
learning-related and
academic-oriented
behaviors, actions and
involvements that
students engage in. For
example following
school rules, attending
classes, concentrating on
academic tasks, asking
questions, contributing to
class discussion,
completing assignments,
etc. (Fredricks et al.,
2004).
At the group level,
behavioral engagement
also includes social-
behavioral engagement,
which includes the
following components
(Linnenbrink-Garcia, et
al., 2011):
(1) Social loafing: this
construct refers to the
tendency that individual
students exert less effort
when working
collectively than
working alone, leading
to disengagement from
group work on task
(Karau & Williams,
1995).
(2) Quality of group
interactions: this
Main Indicator: Paying Attention
Sub-indicators:
• Listening to group members
• Talking to group members
• Watching group members’ on-task
behavior
• Listening to teacher
• Talking to teacher
Main Indicator: Doing Hands-on Work
Sub-indicators:
• Fetching, organizing, cleaning
necessary materials
• Manipulating and investigating
objects
• Constructing prototype
• Estimating
• Calculating, measuring
• Sketching, drawing
• Making notes
Main Indicator: Social loafing:
These main
indicators and
their sub-
indicators
adequately
match and
cover the
definition of
behavioral
engagement
(Fredricks et
al., 2004) and
the definition
of social-
behavioral
engagement
(Linnenbrink-
Garcia, et al.,
2011).

238
construct refers to “the
way in which group
members support or
undermine each other’s
participation; it can
range from positive (e.g.,
actively working to
support fellow group
members’ engagement,
respecting other group
members, working
cohesively) to negative
(e.g., discouraging other
students from
participating,
disrespecting other group
members, statements or
actions that convey low
cohesion)”( Linnenbrink-
Garcia, et al., 2011, p.
14).
Sub-indicators:
• Distribution of work – even,
uneven
• Listening to each other
• Solving problems
• Doing activities
• Doing difficult/hard parts of
task/activity
• Taking part in group
Main Indicator: Positive group interaction
Sub-indicators:
• Group enjoys working together
• Working well together
• Caring about what each person
thoughts
• Listening to each other
Main Indicator: Social Cohesion
Sub-indicators:
• Group members friends
• Feeling of belonging
• Getting along with members of
group
• Liking group

239
Part 2. Indicators for emotional engagement
Emotional Students’
affective reactions
to their teachers,
classmates,
academic
contents/activities,
and school. For
example,
students’ self-
efficacy in
academics, sense
of belonging in
the school
context, interest in
academic content,
perception of
connectedness to
teachers and other
students, as well
as their emotions
such as happiness,
sadness, anxiety,
boredom, etc.
(Fredricks et al.,
2004).
Main Indicator: Psychological Safety
Sub-indicators:
• Dealing with mistakes – how?
• Bringing up problems and tough
issues – reaction?
• Rejecting of members for being
different
• Safe to take risks
• Asking for help – easy, difficult
• Undermine efforts – deliberately, not
deliberately
• Valuing and utilizing of skills and
talents
Main Indicator: Interest
Sub-indicators:
• Depth of activity (low, medium, high;
we will need to define what each level
would be)
• Frequency of activity (and whether
typical for a particular lab or visible
across various labs)
• Curiosity – e.g., asking curiosity
questions
• Enjoyment – e.g., verbal expression of
having fun or liking tasks/activity
• Frustration – e.g., verbal expression of
frustration or negative feelings
• Eager to work – e.g., verbal
expression of starting to work or of
impatience with slower group
members
• Endurance working on problem/task –
e.g., verbal expression of doing more
than asked for, of continuing working
on problem/task at home, in free
period etc.
These main
indicators and
sub-indicators
address both
students’
affective
reactions to their
contents/activities
and to their peers.
In the case of this
activity, their
interaction with,
and thus affective
reaction to, their
teacher was
minimal, and
their affective
reaction to their
school was out of
the scope of
research.

240
• Attending to content voluntarily –
e.g., asking questions related to
task/activity
• Actively seeking feedback( this would
be different than lack of doing activity
on their own; it would be something
like asking 'why' and 'how' questions,
but students demonstrate that they are
in control of their work, know what to
do)
• Ability to work independently as
group – and if so, which activities are
these and which need
support/scaffolding from teachers,
peers;
• Attending to content forced by e.g.,
question from teacher or peers
• Help seeking from others (other
groups, teacher)
• Focused on problem/task
• Recognizing each other’s
contributions
Main Indicator: Activity Emotions
Expressed emotions (via gestures, facial
expressions, or language) directly related to
achievement activities such as inquiry or
engineering design activities.
Sub-indicators:
• Positive: enjoyment, happiness
• Negative: anger
• Positive and negative: frustration
• Neither positive nor negative: boredom

241
Part 3. Indicators for cognitive engagement
Type of
Engagement
Definition of
Engagement
Indicators Explanation
Cognitive Involves two
important
aspects
(Fredricks et
al., 2004): (1)
A
psychological
investment that
incorporates
thoughtfulness
and
willingness to
make efforts to
comprehend
complex ideas
and master
difficult skills
(e.g., a desire
to go beyond
requirements, a
preference for
challenges,
etc.) and (2)
self-regulated
learning (e.g.,
the use of
strategies such
as planning
and monitoring
learning and
self-
evaluation).
Main Indicator: Asking Exploratory Questions
Sub-indicators:
• Learning about content
• Articulating the specific need/problem for
the design task
• Examining the current state of the issue and
current solutions
• Understanding group member's views
• Confirming group members' explanations
• Alternative explanations
Main Indicator: Creating/Designing
• Brainstorming possible solutions
• Drawing on math and biology knowledge
• Articulating the possible solutions
• Refining the possible solutions
• Identifying the best solution
Main Indicator: Cumulative Reasoning
Sub-indicators:
• Elaborating on each other's arguments.
• Motivating arguments
• Explanations of group members completed
with explanations of other group members
• Drawing conclusions from information
discussed in group
• Making connections from information
discussed in group
All main
indicators
and all their
sub-
indicators
correspond
to the first
aspect of
cognitive
engagement.
In the case of
this activity,
the second
aspect of
cognitive
engagement
– self-
regulated
learning did
not exist.
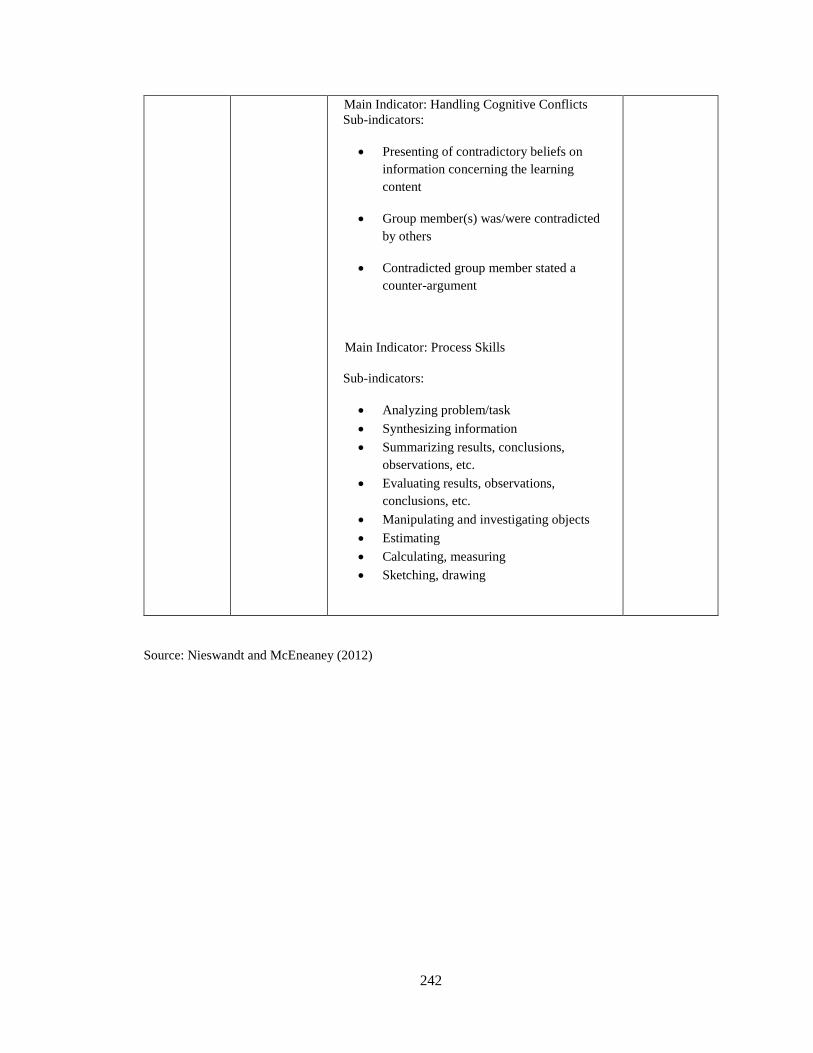
242
Main Indicator: Handling Cognitive Conflicts
Sub-indicators:
• Presenting of contradictory beliefs on
information concerning the learning
content
• Group member(s) was/were contradicted
by others
• Contradicted group member stated a
counter-argument
Main Indicator: Process Skills
Sub-indicators:
• Analyzing problem/task
• Synthesizing information
• Summarizing results, conclusions,
observations, etc.
• Evaluating results, observations,
conclusions, etc.
• Manipulating and investigating objects
• Estimating
• Calculating, measuring
• Sketching, drawing
Source: Nieswandt and McEneaney (2012)

243
APPENDIX 11
CORRELATION BETWEEN FEMALE SUBGROUPS’ PHELs AND GROUP FEMALE PERCENT
Group
Female
Percent PHELT_BE_HV PHELT_EE_HV PHELT_CE_HV PHELT_BE_OS PHELT_EE_OS PHELT_CE_OS
Spearman's rho Group Female
Percent
Correlation Coefficient 1.000 .226 .528* .085 .697* .672* .610*
Sig. (2-tailed) . .419 .043 .764 .017 .024 .046
N 15 15 15 15 11 11 11
Behavioral
engagement PHEL
in Heart Valve
Correlation Coefficient .226 1.000 .692** .005 .658* .492 .505
Sig. (2-tailed) .419 . .004 .985 .028 .124 .113
N 15 15 15 15 11 11 11
Emotional
engagement PHEL
in Heart Valve
Correlation Coefficient .528* .692** 1.000 .316 .799** .662* .674*
Sig. (2-tailed) .043 .004 . .251 .003 .026 .023
N 15 15 15 15 11 11 11
Cognitive
engagement PHEL
in Heart Valve
Correlation Coefficient .085 .005 .316 1.000 .018 -.018 .050
Sig. (2-tailed) .764 .985 .251 . .957 .957 .884
N 15 15 15 15 11 11 11
Behavioral
engagement PHEL
in Oil Spill
Correlation Coefficient .697* .658* .799** .018 1.000 .922** .876**
Sig. (2-tailed) .017 .028 .003 .957 . .000 .000
N 11 11 11 11 11 11 11
Emotional
engagement PHEL
in Oil Spill
Correlation Coefficient .672* .492 .662* -.018 .922** 1.000 .777**
Sig. (2-tailed) .024 .124 .026 .957 .000 . .005
N 11 11 11 11 11 11 11
Cognitive
engagement PHEL
in Oil Spill
Correlation Coefficient .610* .505 .674* .050 .876** .777** 1.000
Sig. (2-tailed) .046 .113 .023 .884 .000 .005 .
N 11 11 11 11 11 11 11
*. Correlation is significant at the 0.05 level (2-tailed).
**. Correlation is significant at the 0.01 level (2-tailed).

244
APPENDIX 12
CORRELATIONS BETWEEN MALE SUBGROUPS’ PHELs AND GROUP FEMALE PERCENT
GirlPercent PHELT_BE_HV PHELT_EE_HV PHELT_CE_HV PHELT_BE_OS PHELT_EE_OS PHELT_CE_OS
Spearman's rho GirlPercent Correlation Coefficient 1.000 .000 -.220 -.127 .208 .369 .172
Sig. (2-tailed) . 1.000 .449 .665 .564 .294 .635
N 14 14 14 14 10 10 10
Behavioral
engagement PHEL
in Heart Valve
Correlation Coefficient .000 1.000 .680** .236 .560 .650* .869**
Sig. (2-tailed) 1.000 . .008 .417 .092 .042 .001
N 14 14 14 14 10 10 10
Emotional
engagement PHEL
in Heart Valve
Correlation Coefficient -.220 .680** 1.000 .247 .541 .663* .907**
Sig. (2-tailed) .449 .008 . .395 .106 .037 .000
N 14 14 14 14 10 10 10
Cognitive
engagement PHEL
in Heart Valve
Correlation Coefficient -.127 .236 .247 1.000 .573 .358 .285
Sig. (2-tailed) .665 .417 .395 . .083 .310 .425
N 14 14 14 14 10 10 10
Behavioral
engagement PHEL
in Oil Spill
Correlation Coefficient .208 .560 .541 .573 1.000 .890** .665*
Sig. (2-tailed) .564 .092 .106 .083 . .001 .036
N 10 10 10 10 10 10 10
Emotional
engagement PHEL
in Oil Spill
Correlation Coefficient .369 .650* .663* .358 .890** 1.000 .830**
Sig. (2-tailed) .294 .042 .037 .310 .001 . .003
N 10 10 10 10 10 10 10
Cognitive
engagement PHEL
in Oil Spill
Correlation Coefficient .172 .869** .907** .285 .665* .830** 1.000
Sig. (2-tailed) .635 .001 .000 .425 .036 .003 .
N 10 10 10 10 10 10 10
**. Correlation is significant at the 0.01 level (2-tailed).
*. Correlation is significant at the 0.05 level (2-tailed).

245
REFERENCES
Abbott, A. & Hrycak, A. (1990). Measuring resemblance in sequence data: An optimal
matching analysis of musicians’ careers. American Journal of Sociology.
http://doi.org/10.1086/229495
Abbott, A. (1995). Sequence analysis: New methods for old ideas. Annual Review of
Sociology, 21(1995), 93–113.
http://doi.org/10.1146/annurev.so.21.080195.000521
Abbott, A., & Tsay, A. (2000). Sequence analysis and optimal matching methods in
sociology: Review and prospect. Sociological Methods & Research, 29, 3–33.
http://doi.org/10.1177/0049124100029001001
ABET (2012). Criteria for Accrediting Engineering Programs 2013-2014 Cycle
Retrieved from
http://www.abet.org/uploadedFiles/Accreditation/Accreditation_Step_by_Step/Ac
creditation_Documents/Current/2013_-_2014/eac-criteria-2013-2014.pdf
ABET. “A Guide to the Criteria Harmonization for Engineering Accreditation.” Accessed
at http://www.abet.org/Linked%20Documents-
UPDATE/Criteria%20and%20PP/EAC%20Readers%20Guide.pdf, January 7,
2010.
Aisenbrey, S., & Fasang, A. E. (2010). New life for old ideas: The “second wave” of
sequence analysis bringing the “course” back into the life course. Sociological
Methods & Research, 38, 420. Retrieved from
http://smr.sagepub.com/content/38/3/420.abstract\npapers://1aa359f0-a4fa-4e9a-
9435-15fa577db1cc/Paper/p2579
Alemdar, M., Lingle, J. A., Wind, S. A., & Moore, R. A. (2017). Developing an
engineering design process assessment using think-aloud interviews. International
Journal of Engineering Education, 33(1), 441–452.
Algesheimer, R., Dholakia, U. M., & Gurău, C. (2011). Virtual team performance in a
highly competitive environment. Group and Organization Management,
36(2):161-190. DOI: https://doi.org/10.1177/1059601110391251
Alldredge, J. R., & Ratti, J. T. (1986). Comparison of some statistical techniques for
analysis of resource selection. Journal of Wildlife Management, 50, 157–165.
Allison, P. D. (2001). Missing Data. Quantitative Applications in the Social Sciences,
104. https://doi.org/10.1136/bmj.38977.682025.2C

246
Anderson, A. (2015). Dance/movement therapy’s influence on adolescents’ mathematics,
social-emotional, and dance skills. Educational Forum, 79(3), 230–247.
https://doi.org/10.1080/00131725.2015.1037512
Apedoe, X. S., Reynolds, B., Ellefson, M. R., & Schunn, C. D. (2008). Bringing
engineering design into high school science classrooms: The heating/cooling unit.
Journal of Science Education and Technology, 17(5), 454–465.
Appleton, J. J., Christenson, S. L., & Furlong, M. J. (2008). Student engagement with
school: Critical conceptual and methodological issues of the construct.
Psychology in the Schools, 45, 369–386. doi:10.1002/pits.20303
Appleton, J. J., Christenson, S. L., Kim, D., & Reschly, A. L. (2006). Measuring
cognitive and psychological engagement: Validation of the Student Engagement
Instrument. Journal of School Psychology, 44, 427 – 445.
Baker, D. (2002). Good intentions: An experiment in middle school single-sex science
and mathematics classrooms with high minority enrolment. Journal of Women
and Minorities in Science and Engineering, 8, 1–23.
Baker, D. F. (2001). The development of collective efficacy in small task groups. Small
Group Research, 32(4), 451–474. https://doi.org/10.1177/104649640103200404
Barron, B. (2003). When smart groups fail. Journal of the Learning Sciences, 12(3), 307–
359. https://doi.org/10.1207/S15327809JLS1203_1
Battistich, V., Solomon, D., Watson, M., & Schaps, E. (1997). Caring school
communities. Educational Psychologist, 32, 137–151.
Beall, P. M., Moody, E. J., McIntosh, D. N., Hepburn, S. L., & Reed, C. L. (2008). Rapid
facial reactions to emotional facial expressions in typically developing children
and children with autism spectrum disorder. Journal of Experimental Child
Psychology, 101(3), 206–223. https://doi.org/10.1016/j.jecp.2008.04.004
Beaubien, J. M., Hamman, W. R., Holt, R. W., & Boehm- Davis, D. A. (2001). The
application of hierarchical linear modeling (HLM) techniques to commercial
aviation research. Proceedings of the 11th annual symposium on aviation
psychology, Columbus, OH: The Ohio State University Press.
Beede, D., Julian, T., & Langdon, D. (2011). Women in STEM : A Gender Gap to
Innovation. Economics and Statistics Administration Issue Brief No. 04-11, 1–11.
http://doi.org/10.2139/ssrn.1964782

247
Bennett, J., Hogarth, S., Lubben, F., Campbell, B., & Robinson, A. (2010). Talking
Science: The research evidence on the use of small group discussions in science
teaching. International Journal of Science Education.
doi:10.1080/09500690802713507
Blair, E. M., Zubrick, S. R., & Cox, A. H. (2005). The western australian aboriginal child
health survey: Findings to date on adolescents. The Medical Journal of Australia,
183(8), 433–5.
Boekarts, M., Pintrich, P. R., & Zeidner, M. (Eds.). (2000). Handbook of self-regulation:
Theory, research and applications. San Diego, CA: Academic Press.
Bonett, D. G., & Wright, T. A. (2000). Sample size requirements for estimating Pearson,
Kendall and Spearman correlations. Psychometrika, 65(1), 23–28.
https://doi.org/10.1007/BF02294183
Boone, H. N. J., & Boone, D. A. (2012). Analyzing Likert Data. Journal of Extension,
50(2).
BrckaLorenz, A. & Laird, , T. F. N. (2015). Exploring student engagement and gender
identity. Paper presented at the 2015 AAC&U’s Diversity, Learning, and Student
Success Conference, San Diego
Bryman, A. (2006). Integrating quantitative and qualitative research: how is it done?
Qualitative Research, 6(1), 97–113. https://doi.org/10.1177/1468794106058877
Bryson, S. E., Zwaigenbaum, L., & Roberts, W. (2004). The early detection of autism in
clinical practice. Pediatrics and Child Health. 9(4),
https://doi.org/10.1093/pch/9.4.219
Bundick, M. J., Quaglia, R, J., Corso, M., J., & Haywood, D. E. (2014). Promoting
student engagement in the classroom. Teachers College Record, 116, 1-34
Burke, A. (2011). Group work : How to use groups effectively. Journal of Effective
Teaching, 11(2), 87–95.
Burke, R. J. (2007). Women and minorities in STEM: A primer. In R. J. Burke & M. C.
Mattis (Eds.), Women and Minorities in Science, Technology, Engineering and
Mathematics (pp. 3-27). Northampton, MA: Edward Elgar Publishing.
Burleson, B. R. (2003). The experience and effects of emotional support : What the study
of cultural and gender differences can tell us about close relationships, emotion ,
and interpersonal communication. Personal Relationships, 10, 1–23.
http://doi.org/10.1111/1475-6811.00033

248
Campbell, K., & Evans, C. (1997). Gender issues in the classroom: A comparison of
mathematics anxiety. Education, 117 (3), 332-339.
Campbell, Patricia, Jolly, Eric, Hoey, Lesli & Perlman, Lesley (2002). Upping the
numbers: Using research-based decision making to increase the diversity in the
quantitative disciplines. Newton, MA: Education Development Center, Inc.
Capobianco, B.M., Yu, J.H., & French, B.F.(2014). Effects of engineering design-based
science on elementary school science students' engineering identity development
across gender and grade. Research in Science Education. 45(2), pp 275-292
Carpenter, J. R., & Kenward, M. G. (2008). A critique of common approaches to missing
data (&) MAR methods for quantitative data. In: Missing Data in Randomised
Controlled Trials - a Practical Guide. Retrieved from
www.hta.nhs.uk/nihrmethodology/reports/1589.pdf
Carter, N., Bryant-Lukosius, D., DiCenso, A., Blythe, J., & Neville, A. J. (2014). The use
of triangulation in qualitative research. Oncology Nursing Forum, 41(5), 545–
547. https://doi.org/10.1188/14.ONF.545-547
Cartney, P., & Rouse, A. (2006). The emotional impact of learning in small groups:
highlighting the impact on student progression and retention. Teaching in Higher
Education, 11(1), 79–91. http://doi.org/10.1080/13562510500400180
Casimiro, L. T. (2016). Cognitive engagement in online intercultural interactions:
Beyond analytics. International Journal of Information and Education
Technology, 6(6), 441–447. https://doi.org/10.7763/IJIET.2016.V6.729
Chen, Y. “GIS and Placemaking Using Social Media Data.” Reference Module in Earth
Systems and Environmental Sciences, Elsevier Inc, 2017, pp. 353–370.
DOI10.1016/B978-0-12-409548-9.09648-2
Cheng, S.-Y. “Sophie.” (2013). An empirical investigation of the effectiveness of project-
based course learning within hospitality programs: The mediating role of
cognitive engagement. Journal of Hospitality, Leisure, Sport & Tourism
Education, 13, 213–225. https://doi.org/10.1016/j.jhlste.2013.10.002
Chennabathni, R. & Rgskind, G (1997). Gender issues in collaborative learning,
Canadian Women Studies, 17 (4), 44-46
Clason, D. L., & Dormody, T. J. (1994) Analyzing data measured by individual Likert-
type items. Journal of Agricultural Education, 35(4), 31- 35.

249
Cohen, E. (1986). Designing groupwork. New York: Teachers College Press.
Comer, J. (1980). School power: Implications of an intervention project. New York: Free
Press.
Connell, J. P. (1990). Context, self, and action: A motivational analysis of self-system
processes across the life-span. In D. Cicchetti (Ed.), In The self in transition:
Infancy to childhood (pp. 61–97). Chicago: University of Chicago Press.
Connell, J. P., & Wellborn, J. G. (1991). Competence, autonomy, and relatedness: A
motivational analysis of self-system processes. In M. Gunnar & L. A. Sroufe
(Eds.), Minnesota Symposium on Child Psychology, Vol. 23 (pp. 43–77). Chicago:
University of Chicago Press.
Connell, J. P., Spencer, M. B., & Aber, J. L. (1994). Educational risk and resilience in
African-American youth: Context, self, action, and outcomes in school. Child
Development, 65, 493–506.
Cook, T. D., & Campbell, D. T. (1979). Quasiexperimentation: Design and analysis
issues. Boston, MA: Houghton Mifflin Company.
Cook-krieg, B. A. (n.d.). Are you man enough to be a nurse? The road less traveled.
doi:10.31274/etd-180810-238
Cooper, M.M, Cox, C.T., Nammouz, M. & Case, E. (2008). An assessment of the effect
of collaborative groups on students’ problem-solving strategies and abilities.
Journal of Chemical Education, 85 (6), 866-872
Cooper, P., & Cefai, C. (2013). Evidence-based approaches to social, emotional and
behavior difficulties in schools. KEDI Journal of Educational Policy, (SPEC.
ISSUE), 81–101.
Creswell, J. W., & Plano Clark, V. L. (2011). Designing and conducting mixed methods
research. SAGE Publications. http://doi.org/10.1111/j.1753-6405.2007.00096.x
Crismond, D. (2001). Learning and using science ideas when doing investigate-and-
redesign tasks: A study of naive, novice, and expert designers doing constrained
and scaffolded design work. Journal of Research in Science Teaching, 38, 791–
820. doi:10.1002/tea.1032
Dasgupta, N. (2011). Ingroup experts and peers as social vaccines who inoculate the self-
concept: The stereotype inoculation model. Psychological Inquiry.
http://doi.org/10.1080/1047840X.2011.607313

250
Dasgupta, N., Scircle, M.M., & Hunsinger, M. (2015). Female peers in small work
groups enhance women’s motivation, verbal participation, and career aspirations
in engineering. PNAS, 112(16), 4988 – 4993.
David, F. N. (1938). Tables of the ordinates and probability integral of the distribution of
the correlation coefficient in small samples. Cambridge: Cambridge University
Press.
Davis, C.-S., & Rosser, S. V. (1996). Program and curricular interventions. In The equity
equation: Fostering the advancement of women in the sciences, mathematics, and
engineering (pp. 232–264). San Francisco, CA: Jossey-Bass.
Davis, H. A., Summers, J. J., & Miller, L. M. (2012). An Interpersonal Approach to
Classroom Management: Strategies for Improving Student Engagement.
Classroom Insights from Educational Psychology. Corwin.
http://doi.org/http://dx.doi.org/10.4135/9781483387383
Davis, H. A., Summers, J. J., & Miller, L. M. (2012). An Interpersonal Approach to
Classroom Management: Strategies for Improving Student Engagement. Classroom
Insights from Educational Psychology. Corwin, 1–13.
DeBarthe, L. M. (1997). Effects of gender grouping and social structure on cooperative
learning in collegiate instruction (Doctoral dissertation, The University of Iowa,
1997). Dissertation Abstracts International, 58, 05A.
Deci, E. L., & Ryan, R. M. (1985). Intrinsic motivation and self-determination in human
behavior. New York: Plenum
Deci, E. L., & Ryan, R. M. (1987). The support of autonomy and the control of behavior.
Journal of Personality and Social Psychology, 53, 1024–1037.
Denzin, N.K. (1978). Sociological methods: A sourcebook. New York, NY: McGraw-
Hill.
Ding, N., & Harskamp, E. (2006). How partner gender influences female students’
problem-solving in physics education. Journal of Science Education and
Technology, 15, 331– 343.
Donohoo, J., Hattie, J., & Eells, R. (2018). The power of collective efficacy. Leading the
Energized School. 75(6). 40-44
Doppelt, Y., & Schunn, C. D. (2008). Identifying students’ perceptions of the important
classroom features affecting learning aspects of a design-based learning
environment. Learning Environments Research, 11(3), 195–209.

251
Doppelt, Y., Mehalik, M. M., Schunn, C. D., Silk, E., & Krysinski, D.
(2008).Engagement and achievements: A case study of design-based learning in a
science context. Journal of Science Education, 19(2), 22-39.
Draper, S. R. P. (2004). The effects of gender grouping and learning style on student
curiosity in modular technology education laboratories (Doctoral dissertation).
Retrieved from https://theses.lib.vt.edu/theses/available/etd-09272004-
141026/unrestricted/DraperSonya.pdf
Dupont, S., Galand, B. & Nils, F., (2014). Factors predicting postponement of a final
dissertation: Replication and extension . Psychologica Belgica . 54 ( 1 ) , pp . 33–
54 . DOI: http://doi.org/10.5334/pb.ac
Dym, C. L., Agogino, A. M., Eris, O., Frey, D. D., & Leifer, L. J. (2005). Engineering
Design Thinking, Teaching, and Learning. Journal of Engineering Education, 94,
103–120. doi:10.1002/j.2168-9830.2005.tb00832.x
Eccles, J. S. (2007). Where are all the women? Gender differences in participation in
physical science and engineering. In S. J. Ceci & W. M. Williams (Eds.), Why
aren’t more women in science? Top researchers debate the evidence (pp. 199–
210). Washington, DC: American Psychological Association.
Eccles, J.S., & Wigfield, A. (2002). Motivational beliefs, values, and goals. Annual
Review of Psychology, 53, 109–32.
Edwards, A.L. (1953). The relationship between the judged desirability of a trait and the
probability that it will be endorsed. Journal of Applied Psychology, 37, 90-93.
Enders, C. K. (2003). Using the expectation maximization algorithm to estimate
coefficient alpha for scales with item-level missing data. Psychological Methods,
8(3), 322-337.
Zeyer, A. & Kelsey, E. (2012). Environmental education in a cultural context. In
Stevenson, R. B., Brody, M., Dillon, J., & Wals, A. (2012). International
Handbook of Research on Environmental Education. New York and London:
Routledge Publishers
Estrada, E. (2007). The effects of inquiry and single-gender grouping on second grade
girls' attitudes and participation in science. University of Central Florida
Electronic Theses and Dissertations. Retrieved from
http://digital.library.ucf.edu/cdm/ref/collection/ETD/id/3705

252
Executive Office of the President (2013). Women and girls in science, technology,
engineering, and math (STEM). Retrieved at
https://www.whitehouse.gov/sites/default/files/microsites/ostp/stem_factsheet_20
13_07232013.pdf
Fadigan, K. A., & Hammrich, P. L. (2004). A longitudinal study of the educational and
career trajectories of female participants of an urban informal science education
program. Journal of Research in Science Teaching, 41(8), 835–860.
Fagot, B. I., Leinbach, M. D., & Hagan, R. (1986). Gender labeling and the adoption of
sex-typed behaviors. Developmental Psychology, 22(4), 440–443.
https://doi.org/10.1037/0012-1649.22.4.440
Farquhar (with Rita Das), C. (1999). Are focus groups suitable for ‘sensitive’ topics?. In
Barbour, R. S. & Kitzinger, J. Developing focus group research (pp. 47-63).
London: SAGE Publications Ltd. doi: 10.4135/9781849208857
Ferney, B., & Domingue, A. (2000). The relationship between type of schooling (single-
sex vs. co-educational) and gender roles. Retrieved from
http://clearinghouse.mwsc.edu/ manuscripts/295.asp/
Field, A. P. (2013). Discovering Statistics using IBM SPSS Statistics. Discovering
Statistics Using IBM SPSS Statistics, 297–321. https://doi.org/10.1016/B978-
012691360-6/50012-4
Finn, J. D., & Rock, D. A. (1997). Academic success among students at risk for school
failure. Journal of Applied Psychology, 82, 221–234.
Fortus, D., Dershimer, R. C., Krajcik, J., Marx, R. W., & Mamlok-Naaman, R. (2004).
Design-based science and student learning. Journal of Research in Science
Teaching, 41, 1081–1110. doi:10.1002/tea.20040
Fortus, D., Krajcik, J., Dershimer, R. C., Marx, R. W., & Mamlok‐Naaman, R. (2005).
Design‐based science and real‐world problem‐solving. International Journal of
Science Education. doi:10.1080/09500690500038165
Fredricks, J. A., Blumenfeld, P. C., & Paris, A. H. (2004). School Engagement: Potential
of the Concept, State of the Evidence. Review of Educational Research.
doi:10.3102/00346543074001059
Friend, J. (2006). Research on same-gender grouping in eighth grade science classrooms.
Research in Middle Level Education Online, 30, 1–15. Retrieved from
http://search.ebscohost.com/login.aspx?direct=true&AuthType=ip,cookie,url,uid
&db=ehh&AN=32831958&site=ehost-live

253
Furrer, C. J., Skinner, E., Marchand, G., & Kindermann, T. A. (2006, March).
Engagement vs. disaffection as central constructs in the dynamics of motivational
development. Paper presented at the annual meeting of the Society for Research
on Adolescence, San Francisco, CA.
Gall, M. D., Gall, J. P., & Borg, W. R. (2007). Educational Research: An Introduction
(7th Edition). Pearson Education, Inc.
Gemici, S., & Lu, T. (2014). Do schools influence student engagement in the high school
years? Longitudinal Surveys of Australian Youth - Research Reports, 69, 1–46.
Gill, J. (2003). Hierarchical linear models. In Kimberly Kempf-Leonard (Ed.),
Encyclopedia of social measurement. New York: Academic Press.
Girl Scout Research Institute (2012). Generation STEM: What girls say about science,
technology, engineering, and math. Retrieved at
https://www.girlscouts.org/research/pdf/generation_stem_full_report.pdf
Gnesdilow, D., Evenstone, A., Rutledge, J., Sullivan, S. & Puntambekar, S. (2013).
Group work in the science classroom: How gender composition may affect
individual performance. Paper presented at the 2013 Computer Supported
Collaborative Learning Conference, University of Wisconsin-Madison
Gokhale, A. a. (1995). Collaborative learning enhances critical thinking. Journal of
Technology Education, 7, 22–30. doi:10.1007/978-1-4419-1428-6_910
Goodenow, C. (1992). Strengthening the links between educational psychology and the
study of social contexts. Educational Psychologist, 27(2), 177–196.
https://doi.org/10.1207/s15326985ep2702_4
Greenlees, I. A., Graydon, J. K., & Maynard, I. W. (1999). The impact of collective
efficacy beliefs on effort and persistence in a group task. Journal of Sports
Sciences, 17(2), 151–158. https://doi.org/10.1080/026404199366253
Guba, E. G. (1981). Criteria for assessing the trustworthiness of naturalistic inquiries.
Educational Technology Research and Development, 29:75-91.
Guo, M., McEneaney, E. H. & Nieswandt, M. (2017, July). Student engagement in the
engineering design process in design-based learning: A mixed methods approach
to video data analysis. Paper presented at the 2017 Research in Engineering
Education Symposium, Bogota, Colombia

254
Guo, M., Nieswandt, M. & McEneaney, E. H. (2016, April). Students' engagement in
different steps of the engineering design process in a design-based biology
activity. A paper presented at the Annual Meeting of the National Association for
Research in Science Teaching, Baltimore, MD.
Guo, M., Nieswandt, M., McEneaney, E. H. & Howe, S.V. (2016, April). The influence
of gender grouping in design-based science on high school girls’ biology
engagement. Poster presented at the Annual Meeting of American Educational
Research Association, Washington, DC
Guo, Y., Connor, C. M. D., Tompkins, V., & Morrison, F. J. (2011). Classroom quality
and student engagement: Contributions to third-grade reading skills. Frontiers in
Psychology, 2(JUL). https://doi.org/10.3389/fpsyg.2011.00157
Guthrie, J. T., & Wigfield, A. (2000). Engagement and motivation in reading. In M.
Kamil & P. Mosenthal (Eds.), Handbook of reading research (Vol. 3, pp. 403–
422). Mahwah, NJ: Lawrence Erlbaum.
Hamilton, M. (1985). Performance levels in science and other subjects for Jamaican
adolescents attending single-sex and coeducational high schools. Science
Education, 69(4), 535–547.
Hansen, Sunny, Walker, Joyce & Flom, Barbara (1995). Growing smart: What's working
for girls in school. New York: American Association of University Women
Educational Foundation.
Harskamp, E., Ding, N. & Suhre, C. (2008). Group composition and its effect on female
and male problem-solving in science education. Educational Research, 50, 307–
318. http://doi.org/10.1080/00131880802499688
Hartman, H. (April, 2001). A gender lens on Rowan University’s College of Engineering,
Joint NAMEPA/WEPAN National Conference, Alexandria, Virginia, 32-38.
Haury, D. L. (2002). ED478715 2002-10-00 Learning Science through Design. ERIC
Digest. Retrieved from http://files.eric.ed.gov/fulltext/ED478715.pdf
Häussler, P., & Hoffmann, L. (2002). An intervention study to enhance girls’ interest,
self-concept, and achievement in physics classes. Journal of Research in Science
Teaching, 39(9), 870–888. http://doi.org/10.1002/tea.10048
He, Y. (2010). Missing data analysis using multiple imputation: getting to the heart of the
matter. Circulation. Cardiovascular Quality and Outcomes, 3(1), 98–105.
https://doi.org/10.1161/CIRCOUTCOMES.109.875658.
10.1161/circoutcomes.109.875658

255
Hickey, D. T., & Zuiker, S. J. (2005). Engaged participation: A sociocultural model of
motivation with implications for educational assessment. Educational Assessment.
doi:10.1207/s15326977ea1003_7
Hidi, S. (2006). Interest: A unique motivational variable. Educational Research Review,
1, 69–82.
Hill, C., Corbett, C. & St. Rose, A. (2010). Why so few? Women in science, technology,
engineering, and mathematics. Washington, DC: American Association of
University Women.
Hirsch, L. S., Berliner-Heyman, S., Cano, R., Carpinelli, J. & Kimmel, H., (June 2014).
The effects of single vs. mixed gender engineering enrichment programs on
elementary students’ perceptions of engineers. Paper presented at the 121st
American Society for Engineering Education Conference and Exposition,
Indianapolis, IN
Hmelo, C., Holton, D., & Kolodner, J. (2000). Designing to learn about complex systems.
Journal of the Learning Sciences, 9(3), 247 – 298
Hoffman, H. (2000). Engineering as a career choice: Strengthening the weakest link.
WEPAN National Conference, 137-143
Hughes, J., & Kwok, O.-M. (2007). Influence of student-teacher and parent-teacher
relationships on lower achieving readers’ engagement and achievement in the
primary grades. Journal of Educational Psychology, 99(1), 39–51.
http://doi.org/10.1037/0022-0663.99.1.39
Hughes, R. M., Nzekwe, B., & Molyneaux, K. J. (2013). The single sex debate for girls
in science: A comparison between two informal science programs on middle
school students’ STEM identity formation. Research in Science Education, 43(5),
1979–2007. http://doi.org/10.1007/s11165-012-9345-7
Huta, V. (2014). When to use hierarchical linear modeling. Tutorials in Quantitative
Methods for Psychology, 10(1), 13–28.
Hutcheson, G. & Pampaka, M. (2012). Missing Data: data replacement and imputation.
Journal of Modelling in Management. 7.2:221-233.
http://www.emeraldinsight.com/journals.htm?issn=1746-5664
Huynh, H. and Feldt, L. S. (1970). Conditions under which mean square ratios in
repeated measurements designs have exact f-distributions. J. Am. Stat. Assoc. 65,
1582–1589. doi: 10.1080/01621459.1970.10481187

256
Johnson, D. W., & Johnson, R. T. (1990). Cooperation in the classroom. Edina, MN:
Interaction Book Company
Johnson, D., R. Johnson, L. Scott, and B. Ramolae.(1985). Effects of single sex and
mixed sex cooperative interaction on science achievement and attitudes and cross-
handicap and cross-sex relationship. Journal of Research in Science Teaching, 22,
207–20.
Johnson, D.W., & Johnson, R.T. (2009). An educational psychology success story: Social
interdependence theory and cooperative learning. Educational Researcher, 38(5),
365-379.
Johnson, M. K., Crosnoe, R., & Elder, G. (2001). Students' attachment and academic
engagement: The role of the race and ethnicity. Sociology of Education, 74, 318–
340.
Johnson, R. B., & Onwuegbuzie, A. J. (2004). Mixed methods research: A research
paradigm whose time has come. Educational Researcher, 33(7), 14–26.
http://doi.org/10.3102/0013189X033007014
Kemp, R.L. (2005). The impact of gender-specific and mixed-gender cooperative groups
on female gifted students using computer-assisted, problem-based learning
(Doctoral Dissertation). Retrieved from
http://chiron.valdosta.edu/are/vol4no1/pdf/kemprarticle.pdf
Kennedy T.J., Sundberg C. (2017) International perspectives and recommendations on
equity and gender: Development studies in science education. In: Akpan B.
(eds) Science Education: A Global Perspective. Springer, Cham
Kim, J. (2011). Modeling cognitive and affective processes of designers in the early
stages of design: mental categorization of information processing (Doctoral
dissertation). Retrieved from: https://pastel.archives-ouvertes.fr/pastel-
00594203/document
Kindermann, T. A. (1993). Natural peer groups as contexts for individual development:
The case of children’s motivation in school. Developmental Psychology, 29, 970–
977.
Kindermann, T. A., McCollam, T., & Gibson, E. (1996). Peer networks and students’
classroom engagement during childhood and adolescence. In J. Juvonen & K.
Wentzel (Eds.), Social motivation: Understanding children’s school adjustment
(pp. 279–312). Cambridge, UK: Cambridge University Press.
257
Klebosits, P., & Perrone, B. (1998). Increasing student academic achievement through
the use of single and mixed gender cooperative grouping patterns. Chicago, IL:
Saint Xavier University. (ERIC Document Reproduction Service No. ED436358)
Kline, T. J. B., & MacLeod, M. (1997). Predicting organizational team performance.
Organizational Development Journal, 15, 77–84.
Koch, J. (April, 2002). Gender issues in the classroom: The past, the promise and the
future. Paper presented at the Annual American Educational Research Association
Meeting. New Orleans, LA.
Kolodner, L. J. (2002). Facilitating the learning of design practices: Lessons learned from
inquiry into science education. Journal of Industrial Teacher Education, 39(3).
Korstjens, I., & Moser, A. (2017). Series: Practical guidance to qualitative research. Part
4: Trustworthiness and publishing. European Journal of General Practice, pp. 1–
5. https://doi.org/10.1080/13814788.2017.1375092
Lanyon, R.I. & Goodstein, L.D. (1997). Personality assessment (3rd ed.). New York:
Wiley.
Larrier, Y. (2018). Student engagement is an ecological affair: Every piece matters.
Global Engagement and Transformation, 1(2). Retrieved from
https://scholarworks.iu.edu/journals/index.php/joget/article/view/24391
Lawson, M. A., & Lawson, H. A. (2013). New conceptual frameworks for student
engagement research, policy, and practice. Review of Educational Research,
83(3), 432–479. https://doi.org/10.3102/0034654313480891
Lay, M.M.( 1992). The androgynous collaborator: The impact of gender studies on
collaboration. In J. Forman (ed.), New visions of collaborative writing, 82–104.
Portsmouth, NH: Boynton/Cook.
Leaperand, C., & Holliday, H. (1995). Gossip in same‐gender and cross‐gender friends’
conversations. Personal Relationships, 2(3), 237–246.
https://doi.org/10.1111/j.1475-6811.1995.tb00089.x
Lee, J. (2014, Nov 26). The relationship between student engagement and academic
performance: Is it a myth or reality? The Journal of Educational Research,
107(3), 177- 185.
Leithwood, K., Louis, K. S., Anderson, S., & Wahlstrom, K. (2004). How leadership
influences student learning. The Wallace Foundation Center for Applied Research
and Educational Improvement and Ontario Institute for Studies in Education New
York NY, 2007 (October 20), 1–90. http://doi.org/10.1007/978-90-481-2660-6
258
Lent, R. W., Schmidt, J., & Schmidt, L. (2006). Collective efficacy beliefs in student
work teams: Relation to self-efficacy, cohesion, and performance. Journal of
Vocational Behavior, 68(1), 73–84. https://doi.org/10.1016/j.jvb.2005.04.001
Leonard, M. & Derry, S. J. (2011). What’s the science behind it? The interaction of
engineering and science goals, knowledge, and practices in a design-based science
activity. WCER Working Paper No. 2011-5. Wisconsin Center for Education
Research, University of Wisconsin-Madison. Retrieved from
http://www.wcer.wisc.edu/publications/workingPapers/papers.php#W11
LePore, P., & Warren, J. (1997). A comparison of single-sex and coeducational Catholic
secondary schooling: Evidence from the National Educational Longitudinal Study
of 1988. American Educational Research Journal, 34(3), 485–511.
Lewis, T. (2006). Design and inquiry: Bases for an accommodation between science and
technology education in the curriculum? Journal of Research in Science
Teaching, 43(3), 255–281. http://doi.org/10.1002/tea.20111
Li, Q.( 2002). Gender and computer-mediated communication: An exploration of
elementary students’ mathematics and science learning. Journal of Computers in
Mathematics and Science Teaching, 21(4),341–59.
Li, Y., Lerner, J. V., & Lerner, R. M. (2010). Personal and ecological assets and
academic competence in early adolescence: The mediating role of school
engagement. Journal of Youth and Adolescence, 39(7), 801–815.
https://doi.org/10.1007/s10964-010-9535-4
Liem, A.D., Lau, S., Nie, Y. (2008). The role of self-efficacy, task value, and
achievement goals. Contemporary Educational Psychology, 33, 486–512.
Lim, C.-P., Zhao, Y., Chai, C.-S., & Tsai, C.-C. (2013). Bridging the Gap : Technology
Trends and Use of Technology in Schools. Educational Technology & Society,
16(2), 59–68.
Lincoln, Y. S., & E. G. Guba. (1985). Naturalistic inquiry. SAGE, Newbury Park,
California, USA.
Lockwood, P. (2006). “Someone like me can be successful”: Do college students need
same-gender role models? Psychology of Women Quarterly, 30, 36–47.
Loftus, E. (2016, April). The fiction of memory. Paper presented at the Western
Psychological Association Convention. Long Beach, CA.

259
Lyons, J. B., & Havig, P. R. (2014). Transparency in a human-machine context:
Approaches for fostering shared awareness/intent. In Lecture Notes in Computer
Science (including subseries Lecture Notes in Artificial Intelligence and Lecture
Notes in Bioinformatics) (Vol. 8525 LNCS, pp. 181–190).
https://doi.org/10.1007/978-3-319-07458-0_18
Maas, C. J. M., & Hox, J. J. (2005). Sufficient sample sizes for multilevel modeling.
Methodology, 1(3), 86–92. https://doi.org/10.1027/1614-2241.1.3.86
MacKinnon, D. P. (2008). Introduction to statistical mediation analysis. New York, NY:
Erlbaum.
Mann, H. B., & Whitney, D. R. (1947). On a Test of Whether one of Two Random
Variables is Stochastically Larger than the Other. The Annals of Mathematical
Statistics, 18(1), 50–60. https://doi.org/10.1214/aoms/1177730491
Manwaring, Kristine C., "Emotional and Cognitive Engagement in Higher Education
Classrooms" (2017). All Theses and Dissertations. 6636.
https://scholarsarchive.byu.edu/etd/6636
Marks, H. M. (2000). Student engagement in instructional activity: Patterns in the
elementary, middle, and high school years. American Educational Research
Journal, 37, 153–184.
Markus, H. R., & Wurf, E. (1987). The dynamic self-concept: A social psychological
perspective. Annual Review of Psychology, 38, 299–337.
Markus, H., & Kunda, Z. (1986). Stability and malleability of the self-concept. Journal of
Personality and Social Psychology, 51, 858–866.
Markus, H.,& Nurius, P. (1986). Possible selves. American Psychologist, 41, 954–969.
Marsh, H. W., Köller, O., Trautwein, U., Lüdtke, O., & Baumert, J. (2005). Academic
self-concept, interest, grades, and standardized test scores: Reciprocal effects
models of causal ordering. Child Development, 76, 397–416.
Massachusetts Department of Education (2006). Massachusetts Science and
Technology/Engineering Curriculum Framework. Retrieved at
http://www.doe.mass.edu/frameworks/scitech/1006.pdf
Mathieu, J., Maynard, M. T., Rapp, T., & Gilson, L. (2008). Team effectiveness 1997-
2007: A review of recent advancements and a glimpse into the future. Journal of
Management, 34(3), 410–476. https://doi.org/10.1177/0149206308316061
260
Mayers, A. (2013). Introduction to Statistics and SPSS in Psychology. Harlow: Pearson
Mayhew, D. J. (1999). The usability engineering lifecycle. In CHI ’99 extended abstracts
on Human factors in computing systems - CHI ’99 (p. 147).
https://doi.org/10.1145/632716.632805
Mazrie, A., Ejei, J., Hejazi, E., & Ghazi Tabatabaee, S.M. (2012). Prediction of creativity
in students with perceived autonomy support, perceived structure and gender.
Journal of Psychology and Educational Studies, 9(16), 132-148.
Mazzoni, G. & Memon, A. (2003). Imagination can create false autobiographical
memories. Psychological Science, 14(2), 186–188
McAuley, E., Duncan, T., & Tammen, V. V. (1989). Psychometric properties of the
Intrinsic Motivation Inventory in a competitive sport setting: a confirmatory
factor analysis. Research Quarterly for Exercise and Sport, 60(1), 48–58.
http://doi.org/10.1080/02701367.1989.10607413
McEneaney, E.H. & Guo, M. (2015). Using sequence analysis and optimal matching to
analyze classroom-based video data. It’s About Time: 4th International Workshop
on Temporal Analyses of Learning Data, Learning Analytics and Knowledge
Conference, Poughkeepsie, NY.
McEneaney, E.H., & Nieswandt, M. (2015). Affective aspects of small group inquiry and
engineering activities in secondary biology. Biannual conference of ESERA,
Helsinki, Finland
McLeod, P. L., & Orta-Ramirez, A. (2018). Effects of collective efficacy, teamwork
attitudes, and experience on group project performance: Comparisons between 2
food science courses. Journal of Food Science Education, 17(1), 14–20.
https://doi.org/10.1111/1541-4329.12128
Meadows, L. A., & Sekaquaptewa, D. (2011). The effect of skewed gender composition
on student participation in undergraduate engineering project teams. American
Society for Engineering Education.
Mehan, H., Villanueva, I., Hubbard, L., Lintz, A., Okamato, D., & Adams, J. (1996).
Constructing school success: The consequence of untracking low-achieving
students. Cambridge, UK: Cambridge University Press
Mertler, C.A. & Vannatta, R.A. (2005). Advanced and Multivariate Statistical Methods:
Practical Application and Interpretation. Pyrczak Publishing, Glendale, CA
Miller, C.M. (1995). So you can build one? Learning through designing. Unpublished
doctoral dissertation, MIT, Cambridge, MA.

261
Miller, P. H., Blessing, J. S., & Schwartz, S. (2006). Gender differences in high‐school
students’views about science. International Journal of Science Education,
28(4), 363–381. http://doi.org/10.1080/09500690500277664
Mills, D., & Alexander, P. (2013). Small group teaching: A toolkit for learning. Higher
Education Academy, (March), 1-9.22-35. Retrieved from
https://www.heacademy.ac.uk/sites/default/files/resources/Small_group_teaching
_1.pdf
National Academy of Engineering (NAE). (2009). Engineering in k-12 education:
Understanding the status and improving the prospects. Engineering Education (p.
234). Retrieved from
http://www.nap.edu/openbook.php?record_id=12635&page=R1
National Board for Professional Teaching Standards (2011). Student learning, student
achievement: How do teachers measure up? Retrieved from
http://www.nbpts.org/sites/default/files/documents/research/NBPTS_Student%20
Learning%20Student%20Achievement%20(2).pdf
National Research Council (NRC) (2012). A Framework for K-12 Science Education:
Practices, Crosscutting Concepts, and Core Ideas. Washington, DC: The National
Academies Press.
National Research Council. (1996). National Science Education Standards. Washington,
DC: National Academy Press.
National Science Foundation (NSF) Division of Science Resources Statistics (2007).
Women, Minorities, and Persons with Disabilities in Science and Engineering:
NSF 07-315. Arlington, VA
New Zealand Ministry of Education Research Division (2010). Easing the Transition
from Primary to Secondary Schooling: Helpful information for schools to
consider. Wellington, NZ: New Zealand Ministry of Education
Newcomb, M.D., Huba, G.J. & Bentler, P.M. (1986). Desirability of various life change
events among adolescents: Effects of exposure, sex, age, and ethnicity. Journal of
Research in Personality, 20, 207-227.
NGSS Lead States. (2013). Next Generation Science Standards. Achieve, Inc.
Nguyen, T. D., Cannata, M., & Miller, J. (2018). Understanding student behavioral
engagement: Importance of student interaction with peers and teachers. Journal of
Educational Research, 111(2), 163–174.
https://doi.org/10.1080/00220671.2016.1220359

262
Nieswandt, M., Affolter, R., & McEneaney, E.H. (2014). Interest, Instructional
Strategies, and the Creation of Group Space. International Journal of Education
and Psychological Research, 3(3), 1-5
Nieswandt, M., McEneaney, E.H., Affolter, R. & Hunter, A. (2014). When do small
groups work during inquiry-based science laboratory activities? Paper presented
at the annual meeting of National Association for Research in Science Teaching,
Pittsburgh, PA.
Nieswandt, M.,& McEneaney, E.H. (2012).Managing small groups to meet the social and
psychological demands of scientific and engineering practices in high schools.
Unpublished proposal funded by the National Science Foundation (DRL-
1252339).
Norfleet James, A., & Richards, H. (2003). Escaping stereotypes: Educational attitudes of
male alumni of single-sex and coed schools. Psychology of Men & Masculinity,
4(2), 136–148.
Nowakowski, E., Seeber, I., Maier, R., & Frati, F. (2014). CoPrA2GO: An app for coding
collaboration processes. In CEUR Workshop Proceedings (Vol. 1293, pp. 76–90).
Nystrand, M., & Gamoran, A. (1991). Instructional discourse, student engagement, and
literature achievement. Research in the Teaching of English, 25, 261-290.
Oakley, B., Felder, R. M., Brent, R. & Elhajj, I. (2004). Turning Student Groups into
Effective Teams. Journal of Student Centered Learning, 2(1), 9–34.
Office of Science and Technology Policy (2013). Women in STEM. Retrieved at
https://www.whitehouse.gov/administration/eop/ostp/women
Ogbu, J. U. (1987). Variability in minority school performance: A problem in search of
an explanation. Anthropology and Education Quarterly, 18, 312–334.
Pahl, G., & Beitz, W. (1996). Engineering design: a systematic approach. Quality (Vol.
34). http://doi.org/10.1007/978-1-84628-319-2
Pascarella, E. T., & Terenzini, P. T. (2005). How college affects students: A third decade
of research. How College Affects Students: A Third Decade of Research.
https://doi.org/10.2307/1982025
Payne, B. K., Monk-Turner, E., Smith, D., & Sumter, M. (2006). Improving group work:
Voices of students. Education, 126(3), 441–449.

263
Pekrun, R., & Stephens, E. J. (2010). Achievement Emotions: A Control-Value
Approach. Social and Personality Psychology Compass, 4(4), 238–255.
https://doi.org/10.1111/j.1751-9004.2010.00259.x
Polit, D., Beck, F. C. T. & Hungler, B. P. (2006). Essentials of nursing research:
methods, appraisal, and utilization. Lippincott, New York, New York, USA.
Price, M. (2017). Study finds some significant differences in brains of men and women.
Brain & Behavior. doi:10.1126/science.aal1025
Rae, G. (1985).Quade's nonparametric analysis of covariance by matching. Behavior
Research Methods, Instruments, & Computers, J7 (3),421-422
Raes, A., Schellens, T., & De Wever, B. (2013). Web-based Collaborative Inquiry to
Bridge Gaps in Secondary Science Education. Journal of the Learning Sciences,
1–32. doi:10.1080/10508406.2013.836656
Raudenbush, S. W.& Bryk, A. S. (2002). Hierarchical linear models: Applications and
data analysis methods, second edition. Newbury Park, CA: Sage.
Reyes, M. R., Brackett, M. A., Rivers, S. E., White, M., & Salovey, P. (2012). Classroom
emotional climate, student engagement, and academic achievement. Journal of
Educational Psychology, 104(3), 700–712. https://doi.org/10.1037/a0027268
Richardson, G., Hammrich, P., & Livingston, B. (2003). Improving elementary school
girls’ attitudes, perception, and achievement in science and mathematics:
Hindsights and new visions of the sisters in science program as an equity reform
model. Journal of Women & Minorities in Science & Engineering, 9 (3/4), 333-
348.
Riordan, C. (1990). Girls and boys in school: Together or separate? New York: Teachers
College Press.
Ro, J. M. (2015), Promoting Social Emotional Engagement through a Universal Design
for Learning. Georgia Association for Positive Behavior Support Conference. 65.
Robinson, D. R., Schofield, J. W., & Steer-Wentzell, K. L. (2005). Peer and cross-age
tutoring in math: Outcomes and their design implications. Educational
Psychology Review, 17, 327– 362.
Rogat, T. K., & Linnenbrink-Garcia, L. (2011). Socially Shared Regulation in
Collaborative Groups: An Analysis of the Interplay Between Quality of Social
Regulation and Group Processes. Cognition and Instruction, 29(4), 375–415.
http://doi.org/10.1080/07370008.2011.607930

264
Rothman, J. (2014). From intragroup conflict to intergroup cooperation. Research in
Social Movements, Conflicts and Change, 37, 107–123.
https://doi.org/10.1108/S0163-786X20140000037004
Rubin, D. B. (1987). Multiple Imputation for Nonresponse in Surveys. New York: John
Wiley & Sons.
Rugutt, J. K., & Chemosit, C. C. (2005). A Study of Factors that Influence College
Academic Achievement: A Structural Equation Modeling Approach. Journal of
Educational Research Policy Studies, 5(1), 66–90.
Ryan, A. M., & Patrick, H. (2001). The classroom social environment and changes in
adolescents’ motivation and engagement during middle school. American
Educational Research Journal, 38, 437-460.
Ryan, R.M., & Deci, E.L. (2000). Self-determination theory and the facilitation of
intrinsic motivation, social development, and well-being. American Psychologist,
55, 68-78.
Sadler, P.M., Coyle, H.P., & Schwartz M. (2000). Engineering competitions in the
middle school classroom. Journal of Learning Sciences, 9(3), 299 - 328.
Sandelowski, M. (1986). The problem of rigor in qualitative research. ANS. Advances in
Nursing Science, 8(3), 27–37. https://doi.org/10.1097/00012272-198604000-
00005
Schacter, D. L. (1999). The seven sins of memory: Insights from psychology and
cognitive neuroscience. American Psychology, 54, 182203.
Shrum, W., Cheek, N. H., & Hunter, S. M. (1988). Friendship in school: Gender and
racial homophily. Sociology of Education, 61(4), 227–239.
https://doi.org/10.2307/2112441
Siegel, S. (1957). Nonparametric Statistics. The American Statistician, 11(3), 13–19.
https://doi.org/10.1080/00031305.1957.10501091
Silbey, S. S. (2016). Why Do So Many Women Who Study Engineering Leave the Field?
Harvard Business Review, August 23, 2016. Retrieved from
https://hbr.org/2016/08/why-do-so-many-women-who-study-engineering-leave-
the-field#
Sim, J., & Sharp, K. (1998). A critical appraisal of the role of triangulation in nursing
research. International Journal of Nursing Studies, 35(1/2), 23–31 9p.
https://doi.org/10.1016/S0020-7489(98)00014-5

265
Simpson, R. (2004). Masculinity at work: The experiences of men in female dominated
occupations. Work, Employment and Society, 18(2), 349–368.
https://doi.org/10.1177/09500172004042773
Skinner, E. A., & Belmont, M. J. (1993). Motivation in the classroom: Reciprocal effect
of teacher behavior and student engagement across the school year. Journal of
Educational Psychology, 85, 571–581.
Skinner, E. A., Wellborn, J. G., & Connell, J. P. (1990). What it takes to do well in
school and whether I’ve got it: The role of perceived control in children’s
engagement and school achievement. Journal of Educational Psychology, 82, 22–
32.
Smith, B. L., & MacGregor, J. T. (1992). "What is collaborative learning?" In Goodsell,
A. S., Maher, M. R., and Tinto, V. (Eds.), Collaborative Learning: A Sourcebook
for Higher Education. National Center on Postsecondary Teaching, Learning, &
Assessment, Syracuse University.
Smith, T. J. (2007). The ergonomics of learning: Educational design and learning
performance. Ergonomics, 50(10), 1530–1546.
https://doi.org/10.1080/00140130701587608
Speziale, H. S., Streubert, H. J., & Carpenter, D. R. (2011). Designing Data Generation
and Management Strategies. In Qualitative Research in Nursing: Advancing the
Humanistic Imperative (pp. 35–56). Lippincott Williams & Wilkins, Philadelphia,
Pennsylvania, USA
Springer, L., Stanne, M. E., & Donovan, S. S. (1999). Effects of small-group learning on
undergraduates in science, mathematics, engineering, and technology: A meta-
analysis. Review of Educational Research, 69, 21–51
Stemler, S. E. (2004). A comparison of consensus, consistency, and measurement
approaches to estimating interrater reliability. Practical Assessment Research
Evaluation, 9(4), 1–19.
Sterne, J. A. C., White, I. R., Carlin, J. B., Spratt, M., Royston, P., Kenward, M. G., …
Carpenter, J. R. (2009). Multiple imputation for missing data in epidemiological
and clinical research: potential and pitfalls. BMJ (Clinical Research Ed.), 338,
b2393. https://doi.org/10.1136/bmj.b2393
Strauss, A. & Corbin, J. 1998. Basics of Qualitative Research. Thousand Oaks, CA: Sage
Publications.
266
Streitmatter, J. (1997). An exploratory study of risk-taking and attitudes in a girls- only
middle school math class. The Elementary School Journal, 98 (1), 15-26
Su, E. (2015). Parallelization of EVOQSAR modeling framework and graphical user
interface using PYQT for drug design, Master’s thesis downloaded from
http://sdsu-
dspace.calstate.edu/bitstream/handle/10211.3/163439/Su_sdsu_0220N_11046.pdf
;sequence=1
Tasa, K., Taggar, S., & Seijts, G. H. (2007). The development of collective efficacy in
teams: A multilevel and longitudinal perspective. Journal of Applied Psychology,
92(1), 17–27. https://doi.org/10.1037/0021-9010.92.1.17
Teddlie, C. & Tashakkori, A. (2009). Foundations of mixed methods research. Los
Angeles: Sage.
Telford, R. M., Telford, R. D., Olive, L. S., Cochrane, T., & Davey, R. (2016). Why are
girls less physically active than boys? Findings from the LOOK longitudinal
study. PLoS ONE, 11(3). https://doi.org/10.1371/journal.pone.0150041
Thompson, M., & Sekaquaptewa, D. (2002). When Being Different Is Detrimental: Solo
Status and the Performance of Women and Racial Minorities. Analyses of Social
Issues and Public Policy, 2(1), 183–203.
https://doi.org/http://dx.doi.org/10.1111/j.1530-2415.2002.00037.x
U.S. Department of Education Office for Civil Rights (2012). Gender equity in education
– A data snapshot. Retrieved at
http://www2.ed.gov/about/offices/list/ocr/docs/gender-equity-in-education.pdf
UMass Donahue Institute Research and Evaluation Group (2011). Increasing Student
Interest in Science, Technology, Engineering, and Math (STEM): Massachusetts
STEM Pipeline Fund Programs Using Promising Practices. Retrieved at:
http://www.cssia.org/pdf/20000062-
IncreasingStudentInterestinScience,Technology,Engineering,andMath(STEM).pdf
Vach, W., & Blettner, M. (1991). Biased estimation of the odds ratio in case-control
studies due to the use of ad hoc methods of correcting for missing values for
confounding variables. American Journal of Epidemiology, 134(8), 895–907.
https://doi.org/10.1093/oxfordjournals.aje.a116164
Vazou, S., Mantis, C., Luze, G., & Krogh, J. S. (2017). Self-perceptions and social–
emotional classroom engagement following structured physical activity among
preschoolers: A feasibility study. Journal of Sport and Health Science, 6(2), 241–
247.

267
Vincent-Ruz, P., & Schunn, C. D. (2017). The increasingly important role of science
competency beliefs for science learning in girls. Journal of Research in Science
Teaching, 54(6), 790–822. https://doi.org/10.1002/tea.21387
Wang, D. Y., Lin, S. S. J., & Sun, C. T. (2007). DIANA: A computer-supported
heterogeneous grouping system for teachers to conduct successful small learning
groups. Computers in Human Behavior, 23(4), 1997–2010.
https://doi.org/10.1016/j.chb.2006.02.008
Wang, M. Te, & Eccles, J. S. (2011). Adolescent Behavioral, Emotional, and Cognitive
Engagement Trajectories in School and Their Differential Relations to
Educational Success. Journal of Research on Adolescence, 22(1), 31–39.
Wang, M.-T., & Holcombe, R. (2010). Adolescents’ Perceptions of School Environment,
Engagement, and Academic Achievement in Middle School. American
Educational Research Journal, 47(3), 633–662.
https://doi.org/10.3102/0002831209361209
Wang, S., & Lin, S. (2007). The effects of group composition of self-efficacy and
collective efficacy on computer-supported collaborative learning. Computers in
Human Behavior, 23(5), 2256–2268. https://doi.org/10.1016/j.chb.2006.03.005
Watson, J.& Lyons,J. (2009). Teaching engineering in single-gender middle-school
classrooms. Paper presented at ASEE Annual Conference and Exposition, Austin,
Texas, June 2009.
Webb, N. M. (1984). Sex differences in interaction and achievement in cooperative small
groups. Journal of Educational Psychology, 76, 33–44.
Wigfield, A., Guthrie, J. T., Perencevich, K. C., Taboada, A., Klauda, S. L., Mcrae, A., et
al. (2008). Role of reading engagement in mediating effects of reading
comprehension instruction on reading outcomes. Psychology in the Schools, 45,
432–445.
Wisdom, J., & Creswell, J. W. (2013). Mixed Methods: Integrating Quantitative and
Qualitative Data Collection and Analysis While Studying Patient-Centered
Medical Home Models. Rockville, MD: Agency for Healthcare Research and
Quality. AHRQ Publication No. 13-0028-EF
Woltman, H., Feldstain, A., Mackay, J. C., & Rocchi, M. (2012). An introduction to
hierarchical linear modeling. Tutorials in Quantitative Methods for Psychology,
8(1), 52–69. http://doi.org/10.2307/2095731

268
Yang X. (2014) Theoretical Orientations and Literature Review. In: Conception and
Characteristics of Expert Mathematics Teachers in China. Perspektiven der
Mathematikdidaktik. Springer Spektrum, Wiesbaden
Yuan, Y. (2010). Multiple imputation for missing data: Concepts and new development.
SAS Institute Inc, Rockville, MD, 1–13. https://doi.org/10.1002/nur.10015
Related Documents