Feed the Future Innovation Lab for Food Security Policy Research Paper 112 October 2018 ANALYSIS OF DISTRIBUTED COFFEE INPUTS IN RWANDA: PESTICIDE ACCESS AND FERTILIZER VOLUME By Andrew Gerard, Daniel C. Clay, Maria Claudia Lopez, Kathryn Bowman, and Daniel Rukazambuga

Welcome message from author
This document is posted to help you gain knowledge. Please leave a comment to let me know what you think about it! Share it to your friends and learn new things together.
Transcript

Feed the Future Innovation Lab for Food Security Policy Research Paper 112 October 2018
ANALYSIS OF DISTRIBUTED COFFEE INPUTS IN RWANDA: PESTICIDE ACCESS AND FERTILIZER VOLUME
By
Andrew Gerard, Daniel C. Clay, Maria Claudia Lopez, Kathryn Bowman, and Daniel Rukazambuga
ii
Food Security Policy Research Papers
This Research Paper series is designed to timely disseminate research and policy analytical outputs generated by the USAID funded Feed the Future Innovation Lab for Food Security Policy (FSP) and its Associate Awards. The FSP project is managed by the Food Security Group (FSG) of the Department of Agricultural, Food, and Resource Economics (AFRE) at Michigan State University (MSU), and implemented in partnership with the International Food Policy Research Institute (IFPRI) and the University of Pretoria (UP). Together, the MSU-IFPRI-UP consortium works with governments, researchers, and private sector stakeholders in Feed the Future focus countries in Africa and Asia to increase agricultural productivity, improve dietary diversity, and build greater resilience to challenges like climate change that affect livelihoods.
The papers are aimed at researchers, policy makers, donor agencies, educators, and international development practitioners. Selected papers will be translated into French, Portuguese, or other languages.
Copies of all FSP Research Papers and Policy Briefs are freely downloadable in pdf format from the following Web site: https://www.canr.msu.edu/fsp/publications/
Copies of all FSP papers and briefs are also submitted to the USAID Development Experience Clearing House (DEC) at: http://dec.usaid.gov/

iii
AUTHORS
Andrew Gerard is a PhD student in the Department of Community Sustainability, Michigan State University.
Daniel C. Clay is a Professor in the Department of Community Sustainability, Michigan State University.
Maria Claudia Lopez is an Assistant Professor in the Department of Community Sustainability, Michigan State University.
Kathryn Bowman is a Senior Program Officer at the Global Knowledge Initiative.
Daniel Rukazambuga is an Associate Professor in the Department of Crop Science, University of Rwanda.
Authors’ Acknowledgment
This research was undertaken by the Feed the Future Africa Great Lakes Region Coffee Support Program as an associate award under the Innovation Lab for Food Security Policy, implemented by Michigan State University and partners. The authors gratefully acknowledge support for this research from the United States Agency for International Development (USAID) Bureau of Food Security. The views expressed in this document do not necessarily reflect those of USAID or the U.S. Government. The authors wish to acknowledge the contributions of the AGLC public and private sector partners as well at the dedication of the Institute for Policy Analysis and Research – Rwanda (IPAR) field teams led by Roger Mugisha, Lillian Mutesi, Paul Kayira, and Linda Uwamahoro. We also Dr. Celestin Gatarayiha at Rwanda’s National Agricultural Export Development Board and Valens Nkeshimana at the Coffee Exporters and Processors Association of Rwanda for reviewing an earlier version of this report and suggesting changes. The authors also thank Patricia Johannes of MSU for her editing and formatting assistance.
This study is made possible by the generous support of the American people through the United States Agency for International Development (USAID) under the Feed the Future initiative. The contents are the responsibility of the study authors and do not necessarily reflect the views of USAID or the United States Government.
Copyright © 2018, Michigan State University. All rights reserved. This material may be reproduced for personal and not-for-profit use without permission from but with acknowledgment to MSU.
Published by the Department of Agricultural, Food, and Resource Economics, Michigan State University, Justin S. Morrill Hall of Agriculture, 446 West Circle Dr., Room 202, East Lansing, Michigan 48824, USA.
iv
EXECUTIVE SUMMARY
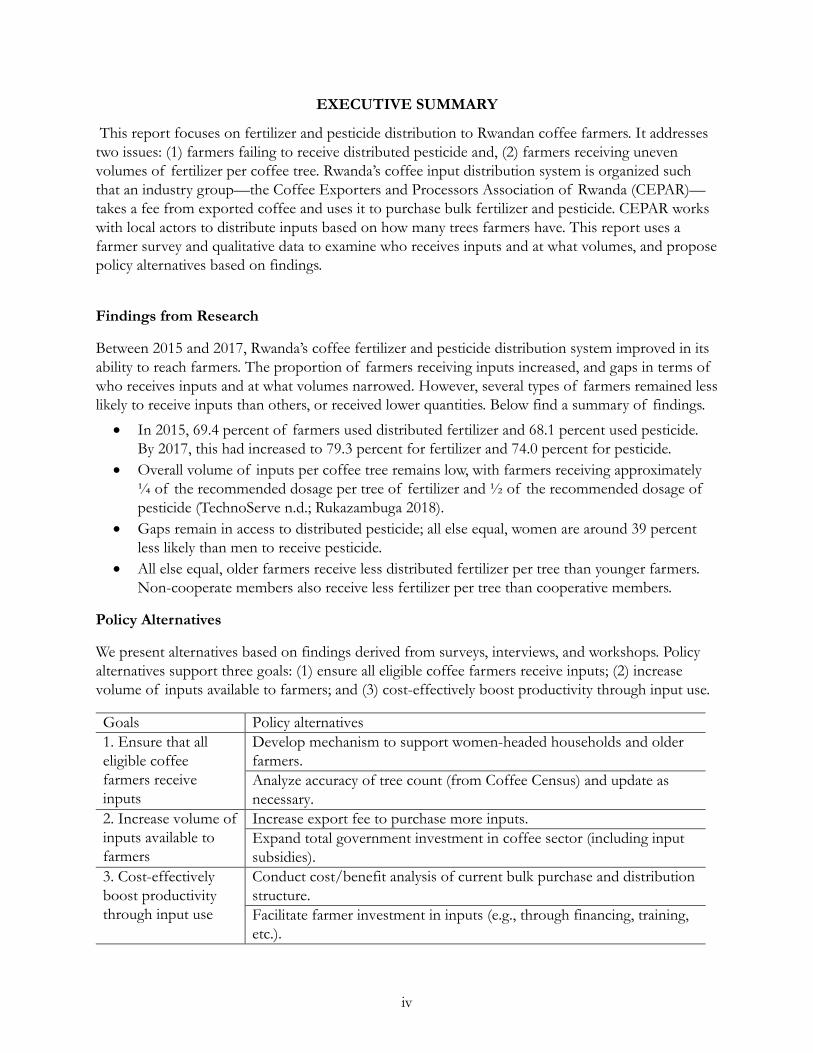
This report focuses on fertilizer and pesticide distribution to Rwandan coffee farmers. It addresses two issues: (1) farmers failing to receive distributed pesticide and, (2) farmers receiving uneven volumes of fertilizer per coffee tree. Rwanda’s coffee input distribution system is organized such that an industry group—the Coffee Exporters and Processors Association of Rwanda (CEPAR)—takes a fee from exported coffee and uses it to purchase bulk fertilizer and pesticide. CEPAR works with local actors to distribute inputs based on how many trees farmers have. This report uses a farmer survey and qualitative data to examine who receives inputs and at what volumes, and propose policy alternatives based on findings.
Findings from Research
Between 2015 and 2017, Rwanda’s coffee fertilizer and pesticide distribution system improved in its ability to reach farmers. The proportion of farmers receiving inputs increased, and gaps in terms of who receives inputs and at what volumes narrowed. However, several types of farmers remained less likely to receive inputs than others, or received lower quantities. Below find a summary of findings.
• In 2015, 69.4 percent of farmers used distributed fertilizer and 68.1 percent used pesticide. By 2017, this had increased to 79.3 percent for fertilizer and 74.0 percent for pesticide.
• Overall volume of inputs per coffee tree remains low, with farmers receiving approximately ¼ of the recommended dosage per tree of fertilizer and ½ of the recommended dosage of pesticide (TechnoServe n.d.; Rukazambuga 2018).
• Gaps remain in access to distributed pesticide; all else equal, women are around 39 percent less likely than men to receive pesticide.
• All else equal, older farmers receive less distributed fertilizer per tree than younger farmers. Non-cooperate members also receive less fertilizer per tree than cooperative members.
Policy Alternatives
We present alternatives based on findings derived from surveys, interviews, and workshops. Policy alternatives support three goals: (1) ensure all eligible coffee farmers receive inputs; (2) increase volume of inputs available to farmers; and (3) cost-effectively boost productivity through input use.
Goals Policy alternatives 1. Ensure that all eligible coffee farmers receive inputs
Develop mechanism to support women-headed households and older farmers. Analyze accuracy of tree count (from Coffee Census) and update as necessary.
2. Increase volume of inputs available to farmers
Increase export fee to purchase more inputs. Expand total government investment in coffee sector (including input subsidies).
3. Cost-effectively boost productivity through input use
Conduct cost/benefit analysis of current bulk purchase and distribution structure. Facilitate farmer investment in inputs (e.g., through financing, training, etc.).

v
TABLE OF CONTENTS
EXECUTIVE SUMMARY ............................................................................................................................. iii
LIST OF FIGURES ......................................................................................................................................... vi
LIST OF TABLES ........................................................................................................................................... vi
ACRONYMS ..................................................................................................................................................... vi
1. INTRODUCTION ....................................................................................................................................... 1
2. CONTEXT OF INPUT DISTRIBUTION IN RWANDAN COFFEE ............................................ 2
3. OVERVIEW OF FERTILIZER AND PESTICIDE USE DYNAMICS ........................................... 3
4. DATA AND METHODOLOGY ............................................................................................................. 5
4.1 Data ........................................................................................................................................................... 5
4.2 Methodology ............................................................................................................................................ 5
5. DESCRIPTIVE STATISTICS: DISTRIBUTED INPUT ACCESS AND VOLUMERECEIVED .................................................................................................................................................... 7
5.1 Influences on Receiving Inputs and Input Volume ........................................................................... 7
5.1.1 Gender ........................................................................................................................................... 7
5.1.2 Elevation ........................................................................................................................................ 8
5.1.3 Cooperative Membership ............................................................................................................ 8
5.1.4 Age .................................................................................................................................................. 8
5.1.5 Plantation Size ............................................................................................................................... 9
6. REGRESSIONS ON RECEIVING PESTICIDE AND VOLUME OF FERTILIZERRECEIVED .................................................................................................................................................. 10
6.1 Logistic Regressions on whether Farmers Receive Distributed Pesticide .................................... 10
6.2 Tobit Regressions on Distributed Fertilizer Volumes Received .............................................11
7. SUMMARY AND CONCLUSIONS ...................................................................................................... 13
8. POLICY ALTERNATIVES...................................................................................................................... 14
8.1 Goal 1: Ensure That All Eligible Coffee Farmers Receive Inputs ................................................ 14
8.2 Goal 2: Increase Volume of Inputs Available to Farmers .............................................................. 14
8.3 Goal 3: Cost-Effectively Boost Productivity through Input Use................................................... 15
REFERENCES................................................................................................................................................ 16

vi
LIST OF FIGURES
FIGURE PAGE 1. Percent of Farmers Using Distributed Inputs, 2015 and 2017............................................................... 3 2. Median Distributed Fertilizer per Tree, per Season (g/tree) ................................................................... 4 3. Median Distributed Pesticide per Tree, per Season (ml/tree) ................................................................ 4 4. Percent Farmers Using Distributed Pesticide by Gender, 2015 and 2017 ............................................ 7 5. G Distributed Fertilizer per Tree by Farmer Age (of Farmers Using Fertilizer) ................................. 9 6. M1 Distributed Pesticide per Tree by Farmer Age (of Farmers Using Pesticide) ............................... 9 7. Mean G Fertilizer Distributed per Tree (of Farmers Using Fertilizer) .................................................. 9 8. Mean M1 Pesticide Distributed per Tree (of Farmers Using Pesticide) ................................................ 9
LIST OF TABLES
TABLE PAGE 1. Logistic Regression on Receiving Distributed Pesticides ..................................................................... 11 2. Tobit Regression on Volume of Distributed Fertilizer Used (Grams per Tree) ................................ 12
ACRONYMS
AGLC Africa Great Lakes Region Coffee Support Program CEPAR Coffee Exporters and Processors Association of Rwanda CWS Coffee Washing Station G Gram IPAR Institute for Policy Analysis and Research – Rwanda Kg Kilogram M Meters Ml milliliter MSU Michigan State University NAEB National Agricultural Export Development Board RWF Rwanda Francs SMS Short message service (i.e., text message) USAID United States Agency for International Development USD US Dollars
1
1. INTRODUCTION
Between 2015 and 2017, Rwanda’s coffee fertilizer and pesticide distribution system improved substantially in its ability to reach farmers. The proportion of farmers receiving commercial pesticide and fertilizer increased, and disparities in terms of who receives pesticides and at what volumes narrowed. However, in 2017 several types of farmers remained less likely to receive inputs, or received lower quantities of inputs, as compared to others. Specifically, women were less likely than men to use distributed pesticide, and older farmers and non-cooperative members tended to receive lower volumes of fertilizer than other farmers received.
Rwanda’s coffee input distribution system is organized such that a private sector organization—the Coffee Exporters and Processors Association of Rwanda (CEPAR)—takes a fee from exported coffee and uses it to purchase bulk fertilizer (a Nitrogen, Phosphate, Potassium mix) and pesticide (Fastac: 10 percent alpha-cypermethrin). CEPAR then works with government and local actors to distribute inputs to farmers based on the number of trees on their plantation. Because all farmers pay into the input fund via the export fee, it is important to consider the disparity between those who receive sufficient volumes of inputs and those who do not, as well as ways to increase access.
This paper aims to describe these gaps in distribution and propose potential approaches to ensure all farmers can receive appropriate volumes of inputs. It specifically focuses on access to pesticide, because of persistent gender gaps in access, and volumes received of fertilizer because of variability in distribution.
It starts by describing the context of input distribution in Rwanda, and then puts forward the research questions being considered. Starting on page 5, the paper describes methods of data collection and analysis used. Pages 7-12 include descriptive statistics and simple regressions analyzing those variables that influence who receives pesticide and what quantities of fertilizer are received. Finally, pages 14-15 include policy alternatives to build on Rwanda’s success in distributing inputs.

2
2. CONTEXT OF INPUT DISTRIBUTION IN RWANDAN COFFEE
Coffee input distribution in Rwanda is organized such that fertilizer and pesticide are centrally purchased, and then distributed in a decentralized manner. CEPAR purchases fertilizer and pesticide in bulk, and then distributes them through local channels. Export fees of 108 Rwandan francs (RWF) per kilogram (kg) of exported green coffee for coffee graded 1 and 2 (high quality coffee), and 40.1 RFW per kg for coffee graded 3 and 4 (lower quality coffee) fund the purchase of inputs (CEPAR, 2018).1 A 2015 national coffee census is used to estimate volumes of fertilizer and pesticides to be purchased (CEPAR 2017). Volumes purchased are determined based on the number of productive trees from the census and on the amount of money raised through export fees in the previous year (AGLC 2017a). NAEB often tops up the fertilizer and pesticide funds, adding money to purchase inputs; however, generally the volume of fertilizer and pesticide purchased is not enough to provide all farmers the recommended dosages (CEPAR 2017; AGLC 2016a; AGLC 2018).
NAEB and CEPAR use a service provider to distribute inputs to farmers based on their quantity of productive trees. For fertilizer, they also take into consideration whether farmers maintain their plantations (CEPAR 2018; AGLC 2017a; AGLC 2016b). The service provider works with local government, cooperatives, and coffee washing stations (CWSs) to distribute inputs. Farmers retrieve inputs from designated locations such as government offices or the CWSs in their zone (AGLC 2017c). Farmers are sent SMS messages with information about how much fertilizer and pesticide is available for them (NAEB 2018). There is also a phone number that farmers can call if they cannot access the available inputs (NAEB 2018).
As the primary means for Rwandan coffee farmers to receive inputs, this distribution of fertilizer and pesticide is critically important. Because most farmers included in this sample—98.2 percent for fertilizer and 98.8 percent for pesticide —do not purchase fertilizer or pesticide, understanding the dynamics of who receives distributed inputs and in what volumes is important. Thus, this report seeks to answer two research questions:
(1) What barriers do farmers face in accessing distributed inputs? (2) What variables influence the volume of distributed inputs that farmers receive per coffee tree?
1 As of July 2018, this was approximately $0.12 USD and $0.05 USD per KG, respectively (XE 2018).

3
3. OVERVIEW OF FERTILIZER AND PESTICIDE USE DYNAMICS
Since 2015, the percentage of farmers using fertilizer or pesticide has increased. In 2015, 71 percent of farmers used fertilizer, and 68.9 percent used pesticide. By 2017, this had increased to 79.9 percent of farmers using fertilizer and 75.6 percent using pesticide. This is a major improvement, but means that 20.1 percent of sampled farmers still do not use fertilizer and 24.4 percent do not use pesticide. Because most farmers receive their inputs via distribution from CEPAR, the proportion of farmers receiving distributed inputs tracks closely with these percentages. 79.3 percent of farmers receive distributed fertilizer, compared to 79.9 percent of farmers who report using fertilizer. Seventy-four percent of farmers receive distributed pesticide compared to 75.6 percent who use pesticide. Figure 1 shows the increase in farmers using distributed inputs between 2015 and 2017. Note that all data in the following figures come from the AGLC baseline and endline surveys unless otherwise noted.
Figure 1. Percent of Farmers Using Distributed Inputs, 2015 and 2017
Source: all figure data from AGLC 2017b unless otherwise noted.
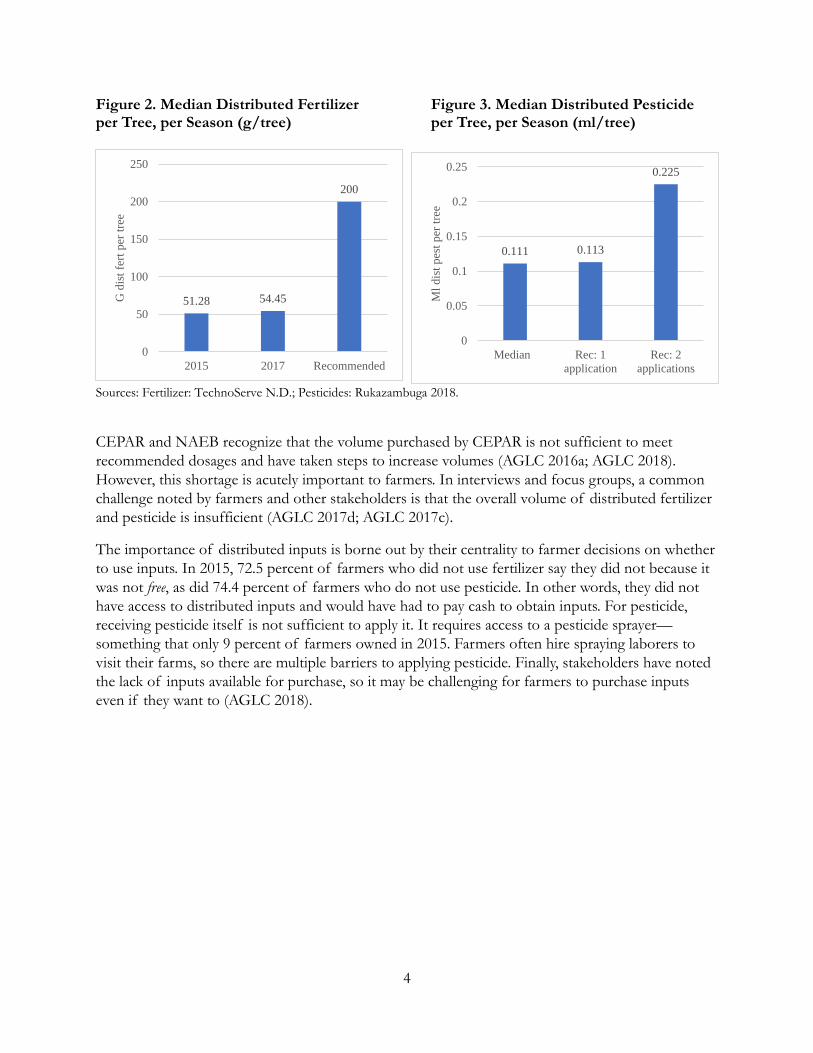
Beyond farmers not receiving inputs, many farmers who receive distributed inputs do not receive recommended volumes. Figures 2 and 3 below show the median distributed fertilizer and pesticide volumes among farmers who use fertilizer or pesticide, respectively. Although more farmers received inputs in 2017 than they did in 2015, the volume per tree for farmers who received them remained low. Because Rwanda moved from the pesticide Confidor to Fastac in 2016, and the two pesticides have different application volumes, it is not possible to directly compare volume used per tree between 2015 and 2017. In 2017, farmers had nearly enough for a single application (0.0111 ml per tree, when the recommended is 0.1125 ml per tree). However, experts recommend at least two sprays of Fastac per season, which means that farmers are receiving approximately half of the recommended dosage (Rukazambuga 2018; AGLC 2018).
69.468.1
79.3
74
6062646668707274767880
Use distributed fert Use distributed pest
% fa
rmer
s usi
ng
2015 2017
4
Figure 2. Median Distributed Fertilizer per Tree, per Season (g/tree)
Figure 3. Median Distributed Pesticide per Tree, per Season (ml/tree)
Sources: Fertilizer: TechnoServe N.D.; Pesticides: Rukazambuga 2018.
CEPAR and NAEB recognize that the volume purchased by CEPAR is not sufficient to meet recommended dosages and have taken steps to increase volumes (AGLC 2016a; AGLC 2018). However, this shortage is acutely important to farmers. In interviews and focus groups, a common challenge noted by farmers and other stakeholders is that the overall volume of distributed fertilizer and pesticide is insufficient (AGLC 2017d; AGLC 2017c).
The importance of distributed inputs is borne out by their centrality to farmer decisions on whether to use inputs. In 2015, 72.5 percent of farmers who did not use fertilizer say they did not because it was not free, as did 74.4 percent of farmers who do not use pesticide. In other words, they did not have access to distributed inputs and would have had to pay cash to obtain inputs. For pesticide, receiving pesticide itself is not sufficient to apply it. It requires access to a pesticide sprayer—something that only 9 percent of farmers owned in 2015. Farmers often hire spraying laborers to visit their farms, so there are multiple barriers to applying pesticide. Finally, stakeholders have noted the lack of inputs available for purchase, so it may be challenging for farmers to purchase inputs even if they want to (AGLC 2018).
0.111 0.113
0.225
0
0.05
0.1
0.15
0.2
0.25
Median Rec: 1application
Rec: 2applications
Ml d
ist p
est p
er tr
ee
51.28 54.45
200
0
50
100
150
200
250
2015 2017 Recommended
G d
ist f
ert p
er tr
ee

5
4. DATA AND METHODOLOGY
4.1 Data
This research draws upon a mix of quantitative and qualitative data collection methodologies. The 2015 AGLC baseline survey and the 2017 endline survey of coffee farmers are the primary sources of quantitative information reported. These are supplemented by key informant interviews with public and private sector industry leaders, notes from policy workshops, a 2016 survey of CWS managers, and direct correspondence with CEPAR and NAEB.
The baseline survey was conducted following the 2015 season, on a sample of 1,024 households randomly selected from listings of 16 CWSs geographically dispersed across four major coffee-growing districts representing Rwanda’s four agricultural provinces. The selected districts are Rutsiro, Huye, Kirehe, and Gakenke, representing Rwanda’s Western, Southern, Eastern, and Northern Provinces, respectively. Follow-on surveys of a random sample of 512 farmers (half of the original sample) were conducted following the 2016 and 2017 harvest seasons. A separate survey was conducted in 2016 of managers of all 16 AGLC sample CWSs. This CWS manager survey is used for contextual detail, and does not feature prominently in this report.
While this report largely uses data from the baseline and endline surveys, qualitative data provides depth and important context to the quantitative analysis. Interviews feature the perspectives of 16 stakeholders from government, private sector, and cooperatives. Additionally, focus groups with approximately 21 farmers from each district provide farmer perspectives. Furthermore, workshops held in 2016, 2017, and 2018 and attended by a diverse set of stakeholders focused on input distribution and use. Additional data on the input distribution system was received from CEPAR and NAEB in 2017 and 2018 via email and in-person meetings.
One challenge to interpreting AGLC survey data is in differentiating inputs distributed by CEPAR from those purchased by CWSs or cooperatives and provided for free to farmers. The baseline survey asked farmers what volume of free inputs they received, without specifying the source of those inputs. This is a reasonable approach, because farmers may not know whether the inputs they receive at a distribution location were purchased by CEPAR or, for example, their cooperative. However, qualitative analysis suggests that in Rwanda CEPAR purchases most inputs. We can also be reasonably confident that in this sample, free inputs largely refer to CEPAR-distributed inputs since none of the 16 CWSs associated with this project had purchased inputs for farmers as of 2016 (AGLC 2016b).
4.2 Methodology
This report analyzes barriers to distributed input availability and volume used using descriptive statistics, qualitative data, and statistical regressions. It begins with descriptive analysis from the baseline and endline surveys, with insight from qualitative analysis used in the interpretation of descriptive relationships.
This report uses regression analysis to clarify the relationships between relevant influences on distributed input availability and volume. All regressions use the endline survey, taken in 2017, to analyze influences on distributed input access. Some fixed household characteristics and other variables not collected in the endline come from baseline data. We first use a logistic regression

6
model to analyze variables influencing whether farmers receive distributed pesticide. We focus on pesticide because there is a gender gap in descriptive statistics on the use of these inputs, and because when controlling for relevant co-variates this relationship remains. Explanatory variables and controls, which include socio-economic and geographic characteristics, are chosen based on their theoretical potential to influence the dependent variables.
We then use a tobit regression to analyze influences on the volume of fertilizer available to farmers. As in the case of logit model, we focus on one input, fertilizer, because that is where there is more variability between types of farmers. Because there is censoring at 0 for inputs per tree (i.e., one cannot have less than 0 ml of pesticide per tree), we run a regression that is left-censored at zero. Tobit regressions use the same variables as the logit models to analyze the extent to which key variables influence volume of fertilizer received compared to their influence on receiving or not receiving inputs. We cluster Standard errors at the CWS level, because the farmer survey was randomized at the CWS level.
In all regressions, we control for farmers being in Rutsiro District. We do this because many farmers in the CWSs selected in Rutsiro are certified organic, and so choose not to use traditional fertilizer and pesticide. Note, however, that the Rutsiro District is included in all descriptive statistics.

7
5. DESCRIPTIVE STATISTICS: DISTRIBUTED INPUT ACCESS AND VOLUME RECEIVED
This section describes variables that correlate with farmers’ use of distributed inputs, and with the volumes received by farmers. It also provides a sense of changes that took place between 2015 and 2017. We include information on access and volume available for both fertilizer and pesticide to provide a sense of the differences between the two types of inputs. In regressions on pages 10-12, we focus on access to any amount of distributed pesticide, and volume received of distributed fertilizer. Note that some relationships described in this section are not statistically significant in multivariate regressions.
5.1 Influences on Receiving Inputs and Input Volume
5.1.1 Gender
For pesticide application, a greater percentage of farms with male household heads use distributed pesticide than do those with female household heads. As can be seen in Figure 4, in 2017, 75.7 percent of men used distributed pesticide, compared to 66.7 percent of women. The percentage of men and women who use distributed pesticide has increased since 2015; however, the gender gap has not closed (it remains at approximately 10 percent in 2017). It may be due to cultural and health reasons that women avoid applying pesticides, and instead tend to hire laborers to spray for them (AGLC 2017a). Many of the economic challenges faced by female-headed households in our sample are related to their marital status (many are widows) and availability of labor. While the percentage of female and male farmers using distributed fertilizer was similar, in 2017 female household heads received about 26 percent less fertilizer per tree than male-headed households, among those receiving fertilizer. This relationship, however, is not significant in multivariate regressions.
Figure 4. Percent Farmers Using Distributed Pesticide by Gender, 2015 and 2017
69.975.7
59.866.7
01020304050607080
2015 2017
% fa
rmer
s usi
ng d
ist p
est
Male Female

8
5.1.2 Elevation
In both 2015 and 2017, farm elevation correlated with whether farmers received distributed inputs. There are remarkably close averages for elevation between farmers receiving distributed fertilizer and those receiving distributed pesticide. Farmers who received distributed fertilizer in 2017 had farms at an average of 1,718 M above sea level and farmers who received distributed pesticide had farms at an average of 1,720 M above sea level, compared to farmers who did not receive distributed fertilizer with farms at an average of 1,678 M above sea level and farmers who did not receive distributed pesticide with farms at an average of 1,679 M above sea level.
It is unclear why farmers at higher elevations were more likely to receive inputs, but it is possible that CWSs at higher elevations are more serious or effective at distributing inputs in these areas because of the high quality and value of coffee at higher elevations. For the same reason, farmers may be more motivated to retrieve and apply inputs at these elevations.
5.1.3 Cooperative Membership
In 2015, cooperative membership was predictive of whether farmers received distributed inputs, with cooperative members being more likely to receive inputs. Fortunately, this gap in accessing inputs closed by 2017. However, volumes of distributed inputs per tree—assuming farmers received some distributed inputs—differed between cooperative members and non-members. For fertilizer, the gap in 2017 was small, with cooperative members receiving three percent more than non-cooperative members. With regard to pesticide, the gap was larger, with cooperative members receiving around 43.3 percent more pesticide per tree than non-cooperative members receive. In multivariate regressions, the relationship between cooperative membership and pesticide volume received is not significant. Previous AGLC publications have shown that Rwandan cooperatives are effective at ensuring members can access inputs (Ortega et al. 2016).
5.1.4 Age
While age was not predictive of whether farmers received inputs, in 2017 older farmers received smaller volumes per tree of fertilizer and pesticide. As can be seen in Figures 5 and 6, of farmers who received some distributed inputs, those 66 years and older used 29.2 percent less distributed fertilizer per tree than farmers 35 years old and younger and 48.3 percent less distributed pesticide per tree. Older farmers have a difficult time transporting and physically applying inputs. If they need to hire laborers to transport and/or apply inputs, they may be less likely to apply sufficient volumes. Note that the relationship between age and pesticide volume received is not significant in multivariate regressions.

9
Figure 5. G Distributed Fertilizer per Tree by Farmer Age (of Farmers Using Fertilizer)
Figure 6. M1 Distributed Pesticide per Tree by Farmer Age (of Farmers Using Pesticide)
5.1.5 Plantation Size
In 2015, the number of trees on farmers’ plantations was closely correlated with whether farmers received inputs. These effects largely went away by 2017, with little difference between farm sizes and likelihood of receiving fertilizer or pesticide. However, as Figures 7 and 8 show, in 2017, of farmers who used distributed inputs, smaller-scale farmers received more inputs per tree than larger scale farmers did. This suggests that distributors may not deliver based strictly on number of trees. Rather, farmers receive decreasing volumes of inputs per tree as their farm size increases. Stakeholders suggest that the 2015 tree census may be inaccurate, which could contribute to the lumpy distribution of inputs (AGLC 2017d; AGLC 2017a). Note that the relationship between farm size and distributed pesticide per tree is not significant in multivariate regressions.
Figure 7. Mean G Fertilizer Distributed per Tree (of Farmers Using Fertilizer)
Figure 8. Mean M1 Pesticide Distributed per Tree (of Farmers Using Pesticide)
109.2
85.376.5 72.4
57
0
20
40
60
80
100
120
0-180 181-300 301-500 501-1000 1000+
G d
ist f
ert p
er tr
ee
Number of trees
1.00
0.46
0.310.16
0.07
0.00
0.20
0.40
0.60
0.80
1.00
1.20
0-180 181-300 301-500 501-1000 1000+
Ml d
ist p
est p
er tr
ee
Number of trees
86.5 87.9
72.361.3
0102030405060708090
100
<=35 36-50 51-65 66+
G d
istri
bute
d fe
rt pe
r tre
e
Farmer age
0.60
0.350.31 0.31
0.00
0.10
0.20
0.30
0.40
0.50
0.60
0.70
<=35 36-50 51-65 66+
Ml d
istri
bute
d pe
st p
er tr
ee
Farmer age

10
6. REGRESSIONS ON RECEIVING PESTICIDE AND VOLUME OF FERTILIZER RECEIVED
Descriptive statistics are helpful in gaining a sense of the contours of the data on whether farmers receive inputs, and what volumes they receive. However, if variables correlate with each other, it can be difficult to disentangle what is driving relationships between variables. Thus, we use regression analysis to consider what variables, all else equal, influence whether farmers receive inputs, and in what volumes. As noted, policy-relevant gaps in access to inputs seem concentrated in pesticide, and differences in volume delivered are more prominent in fertilizer, so the logistic regression focuses on pesticide and the tobit regression focuses on fertilizer. Note that all regression results should be interpreted as all else equal. In other words, they hold other variables constant. Because these are regressions using cross sectional data, there is the potential for endogeneity, which makes it difficult to make causal claims. The relationships described below should be evaluated with this in mind. However, qualitative data buttresses the quantitative findings on age, cooperative membership, and gender, so we can be relatively confident in the described relationships.
6.1 Logistic Regressions on whether Farmers Receive Distributed Pesticide
Logistic regressions are used to analyze influences on whether farmers receive any distributed pesticide. The results, which are presented in Table 1 on the following page, suggest that gender and elevation matter for pesticide distribution. Women were 39.3 percent less likely than men to receive pesticide. Elevation also positively influenced receiving distributed pesticide, with an additional meter of elevation making receiving pesticide 0.16 percent more likely (i.e., 100 meters of elevation would make receiving pesticide 16 percent more likely). As noted, we control for farmers living in the Rutsiro District because many farmers in this district are certified organic, so some farmers choose not to use inorganic inputs.
6.2 Tobit Regressions on Distributed Fertilizer Volumes Received
We use tobit regressions to analyze influences on volumes of distributed fertilizer used by farmers. For fertilizer, farmer age, cooperative membership, total number of trees on a plantation, and non-coffee income influenced volume received. As can be seen in Table 2 on page 12, age is negatively associated with volume of distributed fertilizer. Each year of farmer age predicted receiving 0.0007 grams of fertilizer less per tree. Cooperative membership positively influenced volume of fertilizer available. Cooperative membership predicted receiving 0.021 grams more per tree compared to non-members.
Those with more non-coffee income also received more fertilizer per tree. For every additional 1,000 RWF of non-coffee income (approximately $1.16 USD), farmers received an additional 0.000028 grams of fertilizer per tree. This is not a large effect, but does suggest that farmers with additional assets may receive greater volumes of distributed inputs. Finally, those with more trees received less fertilizer per tree. For every additional tree, farmers received -0.000016 fewer grams of fertilizer (or for an additional 100 trees, they receive 0.0016 fewer grams per tree). This agrees with descriptive statistics that suggest that the volume of inputs delivered does not scale with farm size.

11
Table 1. Logistic Regression on Receiving Distributed Pesticides Odds ratio and standard error
(clustered at CWSs level) HHH Gender (2015) 0.6074* (0.1487) HHH can read and write (2015) 1.0315 (0.3241) Age of HHH (2015) 0.9916 (0.0070) HH size (2015) 0.9708 (0.0521) Member of co-op (2015) 1.1705 (0.3741) Total number of coffee trees (2017)
1.0000
(0.0002) Non-coffee income (x 1,000 RWF) (2017) 1.0000 (0.0000) Elevation of HH (m) (2015) 1.0016* (0.0007) HH Weeds, mulches, prunes coffee trees (2015) 0.5923 (0.2152) Rutsiro (2015) 0.6099* (0.1469) Constant 0.9862 (1.1738) Observations 512

12
Table 2. Tobit Regression on Volume of Distributed Fertilizer Used (Grams per Tree) Coefficient and standard error
(clustered at CWS level) HHH Gender (2015) -0.0122 (0.0083) HHH can read and write (2 groups) (2015) -0.0085 (0.0069) Age of HHH (2015) -0.0007** (0.0002) HH size (2015) -0.0008 (0.0022) Member of co-op (2015) 0.0192** (0.0060) Total number of coffee trees (2017) -0.0000*** (0.0000) Non-coffee income (x1000 RWF) (2017) 0.0000** (0.0000) Elevation of HH (m) (2017) 0.0000 (0.0000) HH Weeds, mulches, prunes coffee trees (2015) 0.0164 (0.0164) Rutsiro (2015) -0.0547** (0.0167) Constant 0.1003 (0.0595) Sigma 0.0871*** (0.0058) Observations 512

13
7. SUMMARY AND CONCLUSIONS
As noted, input distribution improved substantially between 2015 and 2017. However, disparities in input access and volume received remained in 2017. In terms of receiving any pesticide, women were less likely than men to receive distributed pesticide. In terms of fertilizer volume, older farmers received lower volumes of fertilizer than younger farmers received. In addition, non-cooperative members received smaller volumes of fertilizer than cooperative members received. As noted, small farmers received more per tree than expected, assuming they received any at all. It also seems that farmers with more non-coffee income received greater volumes of fertilizer, though this is not a large effect.
These findings present important considerations for Rwanda’s coffee stakeholders. For women and older farmers, even if inputs are available near where they live, they may not be able to access or apply them because of their gender or age. Non-cooperative members may not have as effective distribution networks as those held by cooperative members.
An important consideration when interpreting these data is whether it is sufficient that inputs are available for farmers at CWSs or local government offices, or whether vulnerable groups (in this case women and older farmers) require different channels for input access. For example, women-headed households often face labor shortages, and because of cultural and health reasons, women generally do not apply pesticide. If there is pesticide available, but no way for women to spray it, is this beneficial to them? Similarly, if there is fertilizer available to older farmers, but no way to transport or apply it, are these farmers benefiting? Ensuring that these farmers receive adequate volumes of inputs may require additional investment beyond simply purchasing inputs. An important question is who—if anyone—is responsible for ensuring that all farmers receive inputs and that they can apply them. It may be NAEB as the primary regulator, CEPAR as the organization in charge of input distribution, or CWSs that are in charge of geographic zones (discussed in Gerard, Clay, and Lopez 2017). In practice, it may be all three, with NAEB and CEPAR providing instructions, resources, and oversight to ensure that CWSs are providing inputs to all farmers.
An additional consideration is that—even beyond the ethical issue of ensuring access to inputs for vulnerable populations—pest control is important not just for the individual farmer, but for his or her neighbors. Antestia bugs, for example, tend to inhabit older, overgrown plantations. It is important for controlling antestia and the potato taste defect to control antestia in these plantations, whether or not the plantation owner is physically able to spray pesticide.
These findings do not on their own lead directly to specific policy alternatives. However, by triangulating these findings with qualitative data, we can suggest potential directions for policy alternatives. In the following section, we present several policy alternatives aimed at ensuring continued improvement in input distribution.

14
8. POLICY ALTERNATIVES
This section provides potential policy alternatives given the challenges that surfaced through quantitative and qualitative data analysis. Policy alternatives largely come from interviews and policy roundtables. They are aimed at reaching the following goals:
1. Ensure that all eligible coffee farmers receive inputs; 2. Increase volume of inputs available to farmers; and 3. Cost-effectively boost productivity through input use.
These alternatives require additional analysis. Some are mutually exclusive, and others may not—upon deeper analysis—be practical or effective in the Rwandan context. These are presented as fodder for in-depth analysis and policy development.
8.1 Goal 1: Ensure That All Eligible Coffee Farmers Receive Inputs
• Develop mechanisms to support woman headed households and older farmers. A first step may be to further analyze who is missing out on inputs. If additional analysis shows that women and older farmers are indeed systematically missing out on inputs, NAEB and CEPAR could work with local CWSs to develop mechanisms to ensure that these vulnerable populations can access inputs. For example, CWSs could be required to ask farmers within their zones if they need inputs delivered to their farms. Given cultural and health-related norms and the physical difficulty of spraying pesticides, it is worth considering a policy in which CWSs hire sprayers to visit each woman-headed household in their zone to spray pesticide. In short, mechanisms can be developed to ensure that input distributors (CWSs and local government) understand that they are responsible for ensuring not just that inputs are available, but that they reach all farmers and are applied in a timely manner. This may mean that these entities incur additional costs, or that NAEB or another entity subsidizes their additional costs.
• Analyze accuracy of tree count and update it as necessary. Stakeholders in policy
round-tables and interviews expressed concern that Rwanda’s tree count might be inaccurate, and that this may decrease the accuracy of distribution targeting. If numbers are inaccurate, this could explain why, using farm-level tree counts, it appears that the volume of inputs delivered per tree is not directly aligned with the number of trees on a farm (or if it is, there is an inverse relationship). NAEB could analyze the accuracy of this tree count, and update the count based on findings.
8.2 Goal 2: Increase Volume of Inputs Available to Farmers
• Increase export fee to purchase more inputs. Increasing the export fee would avail more inputs, but this policy change would need to be carefully executed because of the potential to harm farmers and other value chain actors. However, if designed well, increased productivity and quality could make coffee profitable for value chain actors despite higher input costs.
15
• Expand total government investment in coffee sector. The government could directly
subsidize inputs so that purchase is not solely based on an export fee. As discussed in previous AGLC reports, there are compelling reasons for supporting Rwanda’s coffee sector such as positive environmental externalities, growing global demand for specialty coffee, and positive effects on food security, among others (Clay 2017). NAEB supports input purchases to an extent, by topping up CEPAR’s funds. However, by increasing investment in inputs, Rwanda could boost productivity and incomes throughout the coffee value chain.
8.3 Goal 3: Cost-Effectively Boost Productivity through Input Use
• Conduct cost/benefit analysis of current bulk purchase and distribution structure. While most policy alternatives focus on improving the current input distribution system, it is worth analyzing the system itself in comparison to other structures (e.g., individual farmers buy inputs; cooperatives buy inputs; government subsidizes input purchase, etc.). Is it worth the costs of purchase and of transportation to deliver small volumes of inputs to farmers? At what volumes of purchase does it make sense to bulk purchase and distribute? Finally, might the current input distribution system crowd out a private sector input market? It may be possible to purchase and distribute higher volumes of inputs to the same locations at similar fixed transportation and administrative costs. If there are economies of scale for distribution, it could be cost effective to increase input purchases. A cost/benefit analysis could help in determining whether the current system is optimal, and at what volume of inputs it is most efficient.
• Facilitate farmer investment in inputs. If, rather than expanding distributed inputs, the
government decides to support expanded private sector involvement in inputs, other approaches might focus on facilitating farmer purchase of inputs. For example, the government could subsidize farmers to purchase inputs from agro-dealers in the short term, thus allowing for the growth of agro-dealer networks. Another option would be to back bank financing for farmers purchasing inputs. These options could be implemented at the individual farmer level, at the cooperative level, or at the level of zones. Facilitating farmer investment in inputs could be an effective way to increase input use. As noted, few farmers purchase inputs, and in interviews, respondents note that fertilizer and pesticide are prohibitively expensive for farmers.

16
REFERENCES
Africa Great Lakes Region Coffee Support Program (AGLC). 2016a. Notes from 2016 AGLC Year 1 Closing Workshop [Unpublished Data File]. East Lansing, MI: MSU.
AGLC. 2016b. Rwanda Coffee Washing Station Survey [Unpublished Data file]. East Lansing, MI: MSU.
AGLC. 2017a. Notes from 2017 AGLC Policy Advocacy Roundtables [Unpublished Data File]. East Lansing, MI: MSU.
AGLC. 2017b. Rwanda Baseline and Endline Farmer Survey Data [Unpublished Data File]. East Lansing, MI: MSU.
AGLC. 2017c. Rwanda Farmer Focus Groups [Unpublished Data File]. East Lansing, MI: MSU.
AGLC. 2017d. Rwanda Key Informant Interviews [Unpublished Data File]. East Lansing, MI: MSU.
AGLC. 2018. Notes from 2018 AGLC Project Closing Workshop [Unpublished Data File]. East Lansing, MI: MSU.
Clay, D. 2017. Pathways to Sustainable Growth for Rwanda’s Coffee Sector. Presented at the USAID Feed the Future AGLC Policy Roundtable on March 4, 2017. Kigali, Rwanda http://www.canr.msu.edu/resources/pathways-to-sustainable-growth-for-rwanda-s-coffee
Coffee Exporters and Processors Association of Rwanda (CEPAR). 2017. Personal correspondence with Andrew Gerard. Email exchanges August and December 2017.
CEPAR. 2018. Personal correspondence with Andrew Gerard. Email exchange January 2018.
Gerard, A., D. Clay, and M.C. Lopez. 2017. Stakeholder Perceptions on Geographic Zoning in Rwanda’s Coffee Sector and Opportunities for Policy Adjustment. Feed the Future Innovation Lab for Food Security Policy Research Brief No. 42. East Lansing, MI: MSU.
National Agricultural Export Development Board (NAEB). 2018. Personal correspondence with Andrew Gerard. Email exchange February 2018.
Ortega, D., A. Bro, D. Clay, M. Lopez, R. Church, and A. Bizoza. 2016. The Role of Cooperative on Adoption of Best Management Practices and Productivity in Rwanda’s Coffee Sector. Feed the Future Innovation Lab for Food Security Policy Research Paper No. 27. East Lansing, MI: MSU.
Rukazambuga, D. 2018. Personal correspondence with Andrew Gerard. Email exchange July 2018.
TechnoServe. n.d. Soil Survey of Rwandan Coffee Sector for Developing Area Specific Lime and Fertilizer Programs. Washington, DC: TechnoServe.
XE. 2018. XE Currency Converter: USD to RWF. XE Currency Converter. Retrieved from: http://www.xe.com/currencyconverter/convert/?Amount=1&From=USD&To=RWF.

www.feedthefuture.gov
Related Documents