Federated Network for Sharing Air Quality Data and Processing Services Center for Air Pollution Impact and Trend Analysis (CAPITA) Washington University, St. Louis, MO 63130 April 2005, [email protected] DRAFT Project Coordinators: Software Architecture: R. Husar Software Implementation: K. Höijärvi Data and Applications: S. Falke, R. Husar

Federated Network for Sharing Air Quality Data and Processing Services Center for Air Pollution Impact and Trend Analysis (CAPITA) Washington University,
Jan 02, 2016
Welcome message from author
This document is posted to help you gain knowledge. Please leave a comment to let me know what you think about it! Share it to your friends and learn new things together.
Transcript

Federated Network for Sharing Air Quality Data and Processing Services
Center for Air Pollution Impact and Trend Analysis (CAPITA)Washington University, St. Louis, MO 63130
April 2005, [email protected]
DRAFT
Project Coordinators:
Software Architecture: R. Husar
Software Implementation: K. Höijärvi
Data and Applications: S. Falke, R. Husar

AQ Data and Analysis: Challenges and Opportunities
• Shift from primary to secondary pollutants. Ozone and PM2,5, travel 500 + miles across boarders
• New Regulatory approach. Compliance based on ‘weight of evidence’ and emission tracking
• Shift from command & control to participatory management. Inclusion of state.. stakeholders.
Challenges• Broader user community. The information systems need to be extended to include all the
stakeholders
• A richer set of data and analysis. Establishing causality, ‘weight of evidence’, emissions tracking
Opportunities• Rich AQ data availability. Abundant high-grade monitoring data from EPA, NASA, NOAA available.
• New information technologies. DBMS, web-based cooperation/sharing and data exploration tools
The adoptive AQ management paradigm requires and agile supporting info system

Data Flow & Processing in AQ Management
AQ DATA
EPA Networks IMPROVE Visibility Satellite-PM Pattern
METEOROLOGY
Met. Data Satellite-Transport Forecast model
EMISSIONS
National Emissions Local Inventory Satellite Fire Locs
Status and Trends
AQ Compliance
Exposure Assess.
Network Assess.
Tracking Progress
AQ Management Reports
‘Knowledge’ Derived from Data
Primary Data Diverse Providers
Data ‘Refining’ Processes Filtering, Aggregation, Fusion

Loosely Coupled InfoSystems: Flow of Data and Flow of Control
Provider Push User Pull
Each management task can has a need for ‘actionable’ information that can be used for decision making. Thus, ideally, the consumers/managers should specify their information needs and other features of the supporting Infosystem However, they may not be fully aware of the available info resources and technologies, particularly in fast-changing conditions.
The information resources and tools are supplied by the data providers, custodians or integrator-mediatorsProviders and custodians can help ‘pushing’ the information toward the consumers by making it accessible and attractive to the usersHowever, the choice of which information is actually used is made by the by the consumer
Thus, data consumers, providers and mediators together form the info system
Flow of DataFlow of Control
AQ DATA
METEOROLOGY
EMISSIONS DATA
Informing Public
AQ Compliance
Status and Trends
Network Assess.
Tracking Progress
Data to Knowledge Transformation

DataFed Description
DataFed VisionBetter air quality management and science through by effective use of relevant data
DataFed GoalsFacilitate the access and flow of atmospheric data from provider to usersSupport the development of user-driven data processing value chainsParticipate in specific application projects
Approach: Mediation Between Users and Data ProvidersDataFed assumes spontaneous, autonomous emergence of AQ data (a la Internet)Non-intrusively wraps datasets for access by web servicesWS-based mediators provide homogeneous data views e.g. geo-spatial, time...
End-user programming of data access and processing through WS composition (limited)
ApplicationsBuilding browsers and analysis tools for distributed monitoring data Serve as data gateway for user programs; web pages, GIS, science toolsDataFed is currently focused on the mediation of air quality data

Mediator-Based Integration Architecture (Wiederhold, 1992) • The job of the mediator is to provide an answer to a user query (Ullman, 1997)
• In database theory sense, a mediator is a view of the data found in one or more sources • Heterogeneous sources are wrapped by translation software local to global language• Mediators (web services) obtain data from wrappers or other mediators and process it …
Wrapper Wrapper
Service
ServiceUser QueryViews
Heterogeneous Data
DataFed Multidimensional Data Model4 D Geo-Environmental Data Cube (X, Y, Z, T)
Environmental data represent measurements in the physical world which has space (X, Y, Z) and time (T) as its dimensions.
The specific inherent dimensions for geo-environmental data are: Longitude X, Latitude Y, Elevation Z and DateTime T.
The needs for finding, sharing and integration of geo-environmental data requires that data are ‘coded’ in this 4D data space – at the minimum.

DataFed SoftwareSoftware for the User
Data Catalog for finding and browsing the metadata of registered datasetsDataset Viewer/Editor for browsing specific datasets, linked to the CatalogData Views - geo-spatial, time, trajectory etc. views prepared by the userConsoles, collections of views on a web page for monitoring multiple datasetsMini-Apps, small web-programs using chained web services (e.g. CATT, PLUME)
Software for the DeveloperRegistration software for adding distributed datasets to the data federationWeb services for executing data access, processing and rendering tasksWeb service chaining facility for composing custom-designed data views
DataFed Technologies and ArchitectureForm-based, semi-automatic, third-party wrapping of distributed dataWeb services (based web standards) for the execution of specific tasksService Oriented Architecture for building loosely coupled application programs
Software IssuesReliability: Distributed computing issues: network reliability, bandwidth, etcChaining: Orchestrating distributed web services to act as a single applicationLinks: Linking users to providers and other federations (e.g. OGC, OPenDAP)

Anatomy of a Wrapper Service: TOMS Satellite Image Data
• Given the URL template and the image description, the wrapper service can access the image for any day, any spatial subset using a HTTP URL or SOAP protocol:
• Wrapper classes are available for geo-spatial (incl. satellite) images, SQL servers, text files,etc. The mediator classes are implemented as web services for uniform data access, transformation and portrayal.
src_img_width
src_
img_
heig
h t
src_margin_rightsrc_margin_left
src_margin_top
src_margin_bottom
src_lon_min src_lat_max
src_lat_min src_lon_max
Image Description for Data Access:
src_image_width=502 src_image_height=329
src_margin_bottom=105 src_margin_left=69 src_margin_right=69 src_margin_top=46
src_lat_min=-70 src_lat_max=70 src_lon_min=-180 src_lon_max=180
The daily TOMS images reside on the FTP archive, e.g. ftp://toms.gsfc.nasa.gov/pub/eptoms/images/aerosol/y2000/ea000820.gif
URL template: ftp://toms.gsfc.nasa.gov/pub/eptoms/images/aerosol/y[yyyy]/ea[yy][mm][dd].gif
Transparent colors for overlays
RGB(89,140,255) RGB(41,117,41) RGB(23,23,23) RGB(0,0,0)

Value-Added Processing in Service Oriented Architecture
Control
Data
Chain 1
Chain 2 Chain 3
Peer-to-peer network representation
Data ServiceCatalog
User
Data, services and users are distributed throughout the network
Users compose data processing chains form reusable services
Intermediate data are also exposed for possible further use
Chains can be linked to form compound value-adding processes
Service chain representation
User Tasks:
Find data and services
Compose service chains
Expose output
Chain 2
Chain 1 Chain 3
Data
Service
User Carries less Burden
In service-oriented peer-to peer architecture, the user is aided by software ‘agents’
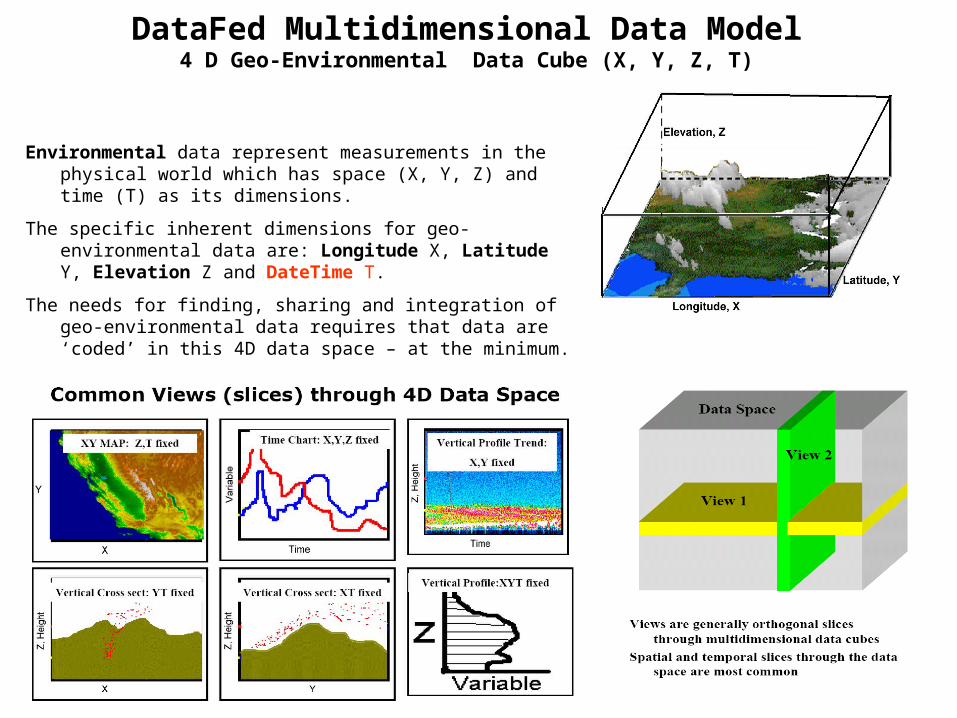
Generic Data Flow and Processing in DataFed
DataView 1
Data Processed Data
Portrayed Data
Process Data
Portrayal/ Render
Abstract Data Access
View Wrapper
Physical Data
Abstract Data
Physical Data
Resides in autonomous servers; accessed by view-specific wrappers which
yield abstract data ‘slices’
Abstract Data
Abstract data slices are requested by viewers;
uniform data are delivered by wrapper services
DataView 2
DataView 3
View Data
Processed data are delivered to the user as multi-layer views by portrayal and overlay web services
Processed Data
Data passed through filtering, aggregation, fusion and other web
services

SeaWiFS Satellite
SeaWiFS Satellite
Aerosol Chemical
Air Trajectory
Map Boarder
VIEW by Web Service Composition

• <ServiceFlow>• <View>• <MapImageMargin ref="ws_margins" />• <AnnotateImage ref="ws_title" icon_text="T" label="Title" execute="true" />• <StockAnnotation ref="DATAFED" />• <StockAnnotation ref="CIRA" />• <AnnotateImage ref="ws_cursor_annotation" icon_text="C" label="Cursor" execute="true" />• </View>• <Layers current="Traj_Grid" order="Traj_Grid Traj_Point Traj_Line MapImage_1">• <Layer id="Traj_Line" dataset_abbr="VIEWS_OL" visible="false" visibility="1" click_target="true">• <DataMapTimePoint ref="ws_data" label="Query Filter" />• <DataMapTrajectory ref="ws_traj_render" show_data="false" icon_text="TR" />• <AnnotateImage ref="ws_network_legend" icon_text="N" label="Network Legend" execute="true" execute_always="true" />• </Layer>• <Layer id="Traj_Point" dataset_abbr="VIEWS_OL" visible="true" visibility="1" click_target="true">• <DataMapPoint ref="ws_point_data" show_data="false" />• <DataMapPoint ref="ws_store_cursor_value" />• <RenderMapPoint ref="ws_point_render" icon_text="RP" label="point rendering" />• <MapParamLocationAccessRender ref="ws_loc" execute_always="true" />• <RenderLegend ref="ws_pntleg" icon_text="L" label="Point Legend" execute="true" execute_always="true" />• </Layer>• <Layer id="Traj_Grid" dataset_abbr="VIEWS_OL" visible="true" visibility="1">• <DataMapTimePoint ref="ws_ref_data" label="Reference Query Filter" />• <DataMapTrajectory ref="ws_ref_traj_grid" icon_text="TG" />• <DataMapTimePoint ref="ws_data" label="Query Filter" />• <DataMapTrajectory ref="ws_traj_grid" icon_text="TG" />• <MapGridOperator ref="ws_mgo" />• <RenderMapGrid ref="ws_rg" />• <RenderLegend ref="ws_rainbow" icon_text="L" label="Rainbow Legend" execute="true" execute_always="true" />• </Layer>• <Layer id="MapImage_1" dataset_abbr="MapImage" visible="true" visibility="1">• <MapImageAccessRender ref="ws_map_image" />• </Layer>• </Layers>• </ServiceFlow>
Service Flow Program for a VIEW
Layer
Layer
Layer
Layer
View

An Application Program: Voyager Data Browser
• The web-program consists of a stable core and adoptive input/output layers• The core maintains the state and executes the data selection, access and render services• The adoptive, abstract I/O layers connects the core to evolving web data, flexible displays and to the a
configurable user interface:– Wrappers encapsulate the heterogeneous external data sources and homogenize the access– Device Drivers translate generic, abstract graphic objects to specific devices and formats – Ports connect the internal parameters of the program to external controls– WDSL web service description documents
Data Sources
Controls
Displays
I/O Layer
Dev
ice
Dri
vers
Wra
pp
ers App State Data
Flow Interpreter
Core
Web Services
WSDL
Ports

Datasets Used in FASTNET
• Data are accessed from autonomous, distributed providers• DataFed ‘wrappers’ provide uniform geo-time referencing• Tools allow space/time overlay, comparisons and fusion
Near Real Time Data IntegrationDelayed Data Integration
Surface Air Quality AIRNOW O3, PM25 ASOS_STI Visibility, 300 sitesMETAR Visibility, 1200 sitesVIEWS_OL 40+ Aerosol Parameters
SatelliteMODIS_AOT AOT, Idea ProjectGASP Reflectance, AOTTOMS Absorption Indx, Refl.SEAW_US Reflectance, AOT
Model OutputNAAPS Dust, Smoke, Sulfate, AOTWRF Sulfate
Fire DataHMS_Fire Fire PixelsMODIS_Fire Fire Pixels
Surface MeteorologyRADAR NEXTRADSURF_MET Temp, Dewp, Humidity…SURF_WIND Wind vectorsATAD Trajectory, VIEWS locs.

A Sample of Datasets Accessible through ESIP MediationNear Real Time (~ day)
It has been demonstrated (project FASTNET) that these and other datasets can be accessed, repackaged and delivered by AIRNow through ‘Consoles’
MODIS Reflectance
MODIS AOT TOMS Index
GOES AOT
GOES 1km Reflec
NEXTRAD Radar
MODIS Fire Pix
NRL MODEL
NWS Surf Wind, Bext

FASTNET:
Inter-RPO pilot project, through NESCAUM, 2004
Web-based data, tools for community use
Built on DataFed infra-structure, NSF, NASA
Project fate depends on sponsor, user evaluation

Some of the Tools Used in FASTNET
– Data Catalog– Data Browser– PlumeSim, Animator– Combined Aerosol Trajectory Tool (CATT)
Consoles: Data from diverse sources are displayed to create a rich context for exploration and analysis
CATT: Combined Aerosol Trajectory Tool for the browsing backtrajectories for specified chemical conditions
Viewer: General purpose spatio-temporal data browser and view editor applicable for all DataFed datasets

Midwest HazeCam Image ConsoleImage Archive and Browser
• Hourly Midwest HazeCam Images are archived by DataFed data access system• Archived images for all cameras can be browsed through this console• HazeCam URL for a day: http://www.datafed.net/consoles/MWH_WebCams.asp?image_width=400&image_height=300&datetime=2005-01-31T13:00:00
• URL for a site and day: http://webapps.datafed.net/datasets/webcam/cincinnati/20050131-13mwhcincinnati.jpg
• URLs can be embedded as links into emails, bookmarks, web pages, PPT and PDF files.
Midwest HazeCam Image Browser
Select date and time Set image size and time MW HazeCam ConsoleOther FASTNET
Consoles

Aerosol Event Catalog: Web
pages
• Catalog of generic ‘web objects’ – pages, images, animations that relate to aerosol events
• Each ‘web object’ is cataloged by location, time and aerosol type.

Distribution of ResponsibilityDistribution of Responsibility
Distributed Distributed Responsibility in OpenDAP in OpenDAP
The data lies with the data providersThe data access protocol lies with OPeNDAPApplication programs with the developers (Matlab, .. Excel…)Data discovery with the GCMD and NVODS
Distributed Responsibility DataFed(??) Distributed Responsibility DataFed(??)
The data lies with the data providersThe wrappers and mediators with DataFed communityApplication programs with end user Data discovery with data & service registries
Related Documents