August 15,199' AUG 2 0 W96 Federal Reserve Bank U.S. Fmancial’Data TIIE DEKVI a kisekm; 5 HANK of ~ STlJlHlS •hiwi mwimi THE WEEK'S HIGHLIGHTS: */ Industrial production increased at a 1.7 percent annual rate in July, after surging at an 8 percent rate from March to June. July’s production was curtailed in part by a sharp drop in utilities output. ✓ Following a 2 percent rise in the first quarter, output per hour (productivity) in the business sector slowed to a 0.4 percent annual rate in the second quarter, as hours worked rose at their fastest pace in two years. ✓ The consumer price index (CPI) rose at a 3.1 percent annual rate in July, down slightly from the 3.5 percent pace that prevailed during the first half of 1996. Consumer prices are up 2.9 percent since July 1995. ✓ Producer prices for finished goods (PPI) remained unchanged in July. After rising at a 3.9 percent annual rate between October 1995 and April 1996, the PPI has since increased at a 0.3 percent rate. ✓ Retail sales advanced at a 0.8 percent annual rate in July after falling at a 6.4 percent rate in June. Sales at automotive dealers fell for the third time in the past four months; however, excluding auto sales, total sales have risen for five of the past six months. Retail sales figures are not adjustedfor inflation. All data are aeasonally adjusted unless otherwise indicated. U.S. Financial Data is published weekly by the Research Division of the Federal Reserve Bank of St. Louis. The cost for a subscription is $21 for one year (50 issues) or $36 for two years (100 issues). For more information on data, please call (314) 444-8590. To request an order form, please call (314) 444-8808 or (314) 444-8809. Sorry, no refunds. Information in this publication is also included in the Federal Reserve Economic Data (FRED) electronic bulletin board at (314) 621-1824 or internet World Wide Web server at http://www.stls.fib.org/fred. Digitized for FRASER http://fraser.stlouisfed.org Federal Reserve Bank of St. Louis

Welcome message from author
This document is posted to help you gain knowledge. Please leave a comment to let me know what you think about it! Share it to your friends and learn new things together.
Transcript

August 15,199'
AUG 2 0 W96Federal Reserve Bank
U.S. Fmancial’DataTIIE
DEKVIa kisekm;5 HAN K of ~ STlJlHlS
•hiwi mwimi
THE WEEK'S HIGHLIGHTS:*/ Industrial production increased at a 1.7 percent annual rate in
July, after surging at an 8 percent rate from March to June. July’s production was curtailed in part by a sharp drop in utilities output.
✓ Following a 2 percent rise in the first quarter, output per hour (productivity) in the business sector slowed to a 0.4 percent annual rate in the second quarter, as hours worked rose at their fastest pace in two years.
✓ The consumer price index (CPI) rose at a 3.1 percent annual rate in July, down slightly from the 3.5 percent pace that prevailed during the first half of 1996. Consumer prices are up 2.9 percent since July 1995.
✓ Producer prices for finished goods (PPI) remained unchanged in July. After rising at a 3.9 percent annual rate between October 1995 and April 1996, the PPI has since increased at a 0.3 percent rate.
✓ Retail sales advanced at a 0.8 percent annual rate in July after falling at a 6.4 percent rate in June. Sales at automotive dealers fell for the third time in the past four months; however, excluding auto sales, total sales have risen for five of the past six months. Retail sales figures are not adjusted for inflation.
All data are aeasonally adjusted unless otherwise indicated.
U.S. Financial Data is published weekly by the Research Division of the Federal Reserve Bank of St. Louis. The cost for a subscription is $21 for one year (50 issues) or $36 for two years (100 issues). For more information on data, please call (314) 444-8590. To request an order form, please call (314) 444-8808 or (314) 444-8809. Sorry, no refunds.
Information in this publication is also included in the Federal Reserve Economic Data (FRED) electronic bulletin board at (314) 621-1824 or internet World Wide Web server at http://www.stls.fib.org/fred.
Digitized for FRASER http://fraser.stlouisfed.org Federal Reserve Bank of St. Louis
2
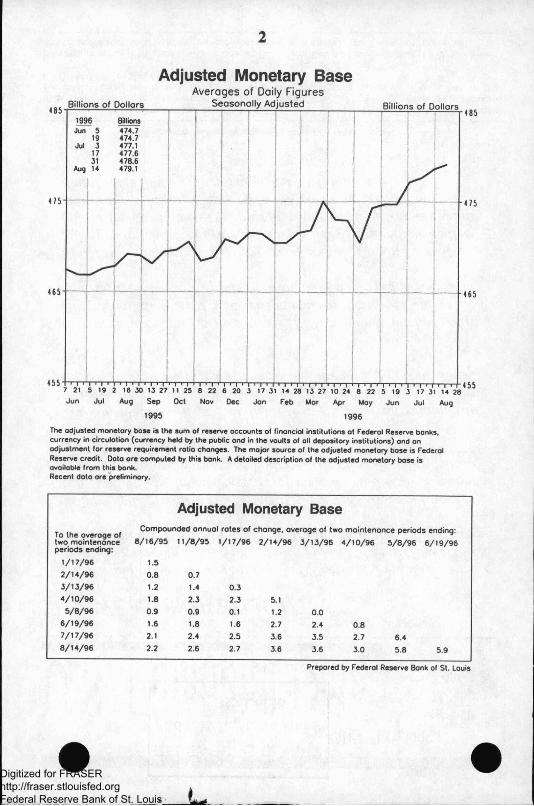
Adjusted Monetary BaseAverages of Doily Figures
Seasonally AdjustedBillions of Dollars Billions of DollarsBillions474.7474.7477.1477.6478.6479.1
7 21 5 19 2 16 30 13 27 11 25 8 22 6 20 3 17 31 14 28 13 27 10 24 22 5 19 3 17 31 14 28Aug Sep Oct Apr Moy Jun
The adjusted monetary base is the sum of reserve accounts of financial institutions ot Federal Reserve bonks, currency in circulation (currency held by the public and in the vaults of all depository institutions) ond an adjustment for reserve requirement rotio changes. The major source of the adjusted monetory base is Federol Reserve credit. Data ore computed by this bonk. A detailed description of the adjusted monetory base is available from this bonk.Recent data are preliminary.
Adjusted Monetary Base_ , Compounded onnuol rotes of change, averoge of two maintenance periods endinq:To the average of 4 , r *two mointenonce 8/16/95 11/8/95 1/17/96 2/14/96 3/13/96 4/10/96 5/8/96 6/19/96periods ending:
1/17/96 1.5
2/14/96 0.8 0.73/13/96 1.2 1.4 0.34/10/96 1.8 2.3 2.3 5.15/8/96 0.9 0.9 0.1 1.2 0.0
6/19/96 1.6 1.8 1.6 2.7 2.4 0.87/17/96 2.1 2.4 2.5 3.6 3.5 2.7 6.48/14/96 2.2 2.6 2.7 3.6 3.6 3.0 5.8
Prepared by Federol Reserve Bonk of St. Louis
Digitized for FRASER http://fraser.stlouisfed.org Federal Reserve Bank of St. Louis

Money Stock(M1) and Total Checkable DepositsAverages of Daily Figures
Seasonally AdjustedBillions of Dollars Billions of Dollars
Billions Billions728.9 715.1 712.5715.9719.3715.3
1106.01102.61160-1107.11111.3
Aug 5 1108.0 Aug 5
Ml (left scole)
1120-
TCD (right scale)
.-..f
15 29 12 26Aug Sep Oct Nov Oec Feb Mar Apr May Jun Jul Aug
1996
Ml is the sum of currency held by the nonbank public, demand deposits, other checkoble deposits and travelers checks. Total checkoble deposits is the sum of demand deposits and other checkoble deposits at depository institutions. Current doto appear in the Federal Reserve Board's H.6 release.
Money Stock (M1)To the average of four weeks ending:
Compounded annuol rates of chonge, overage of four weeks ending:
8/7/95 11/6/95 1/8/96 2/5/96 3/4/96 4/8/96 5/6/96
1/8/96 -4.52/5/96 -4.6 -4.63/4/96 -3.9 -3.3 -2.34/8/96 -2.3 -0.9 1.6 4.85/6/96 -2.8 -1.8 -0.5 1.0 1.06/3/96 -2.9 -2.2 -1.3 -0.3 -0.7 -5.87/8/96 -2.9 -2.2 -1.5 -0.8 -1.2 -4.68/5/96 -3.3 -2.9 -2.5 -2.0 -2.5 -5.4
6/3/96
Prepared by Federal Reserve Bank of St. Louis
3Digitized for FRASER http://fraser.stlouisfed.org Federal Reserve Bank of St. Louis

4
Adjusted ReservesSeasonally Adjusted
Billions of DollarsBillions of Oollors
Billions97.496.895.996.795.895.5
May 22Jun 5
Jul 3
3 17 31 14 28 13 27 10 24 22 5 19 3 17 31 14 287 21 5 19 2 16 30 13 27 11 25 8 22 6 20Moy JunAug Sep Oct
Adjusted reserves is the difference between the adjusted monetary base and the currency component of Ml.
Adjusted Reserves
To the overoge of two maintenance periods ending:
Compounded onnuol rotes of chonge, overoge of two maintenance periods ending:
6/2/95 10/25/95 1/3/96 1/31/96 2/28/96 3/27/96 4/24/96 6/5/96
1/3/96 -6.5
1/31/96 -6.5 -8.7
2/28/96 -4.6 -5.1 0.7
3/27/96 -3.0 -2.6 3.6 9.0
4/24/96 -4.5 -4.8 -1.7 0.0 -3.9
6/5/96 -3.9 -3.9 -1.2 0.0 -2.3 -6.7
7/3/96 -4.4 -4.6 -2.6 -1.9 -4.1 -7.7 -4.2
7/31/96 -4.7 -4.9 -3.4 -2.9 -4.8 -7.7 -5.3 -9.0
Prepored by Federal Reserve Bonk of St. Louis
Digitized for FRASER http://fraser.stlouisfed.org Federal Reserve Bank of St. Louis

Money MultiplierAverages of Daily Figures
Seasonally AdjustedRatio Ratio3.0
Compounded annuol rotes of chonge. overoge of the four weeks ending July 29. 1996, from the four weeks ending:
2.8- J u I 31.
May 20 2.355Jun 3 2.356
2.3532.340
-5. 1 2.318Jon 29 , -5 . 1Mar 11. -6.3
-8. 11 996 - 1 0!3
-10.3
3 17 31 14 28 1 1 25 9 23 6 20 4 18 15 29 12 28 1 1 25 8 22 6 20 15 29 12 26Sep Oct Apr Moy Jun
3.0
2.8
2.6
2.4
2.2
1995 1996Ratio of Ml to adjusted monetary base.
Currency Component of M1Averages of Daily Figures
Seasonally AdjustedBillions of Dollars Billions of Dollars
Compounded annuol rotes of chonge. overage of the four weeks ending August 5. 1996. from the four weeks ending:Aug 7. 1995 4.Nov 6. 1995 4.Feb 5. 1996 5.Mar 4. 1996 6.Apr 8. 1996 5.Moy 6. 1996 7.Jun 3. 1996 8.
380-
Billions380.4382.2381.5 382.7383.6384.2Aug 5
15 29 12 26Sep Oct Moy Jun
1995Current data oppeor in the Federol Reserve Board's H.6 releose.
1996
Prepared by Federol Reserve Bonk of St. Louis
5Digitized for FRASER http://fraser.stlouisfed.org Federal Reserve Bank of St. Louis

6
Yields on Selected SecuritiesAverages of Daily Figures
Percent Percent
Prime Rate
Corporate Aoo Bonds
Municipol Bonds
2 16 30 14 28 11 25 8 22 6 20 3 17 15 29 12 26 9 23 8 22 5 19 3 17 31 14 28 12 26 9 23Apr May
1995 1996
1996
30-Day Commercial
Paper90-Day
CDs
90-Day Bonkers*
AcceptancesCorporate Aao Bonds
Corporate Boo Bonds
Municipal Bonds ••
Moy 24 5.36 5.35 5.27 7.53 8.20 5.8731 5.38 5.36 5.30 7.61 8.27 5.94
Jun 7 5.42 5.42 5.34 7.67 8.34 5.9414 5.43 5.48 5.40 7.78 8.47 6.1221 5.46 5.47 5.39 7.74 8.44 6.0628 5.50 5.49 5.40 7.66 8.36 5.97
Jul 5 5.49 5.49 5.43 7.62 8.32 5.9412 5.45 5.57 5.47 7.73 8.42 6.0019 5.44 5.54 5.45 7.61 8.32 5.8826 5.40 5.51 5.44 7.62 8.34 5.86
Aug 2 5.43 5.52 5.44 7.55 C.27 5.799 5.39 5.41 5.33 7.35 8.08 5.67
16 5.38 5.39 5.31 7.34 8.07 N.A.
10.0
9.0
7.0
6.0
5.0
4.0
Current data ore from the Federal Reserve Board's H.15 release, and ore overoges of rotes ovoiloble for the week ending on August 16, 1996 .•• Bond Buyer's Average Index of 20 municipal bonds. Thursdoy dotoN A - Not Available ^ _ „ „ „ . „
Prepared by Federol Reserve Bonk of St. Louis
Digitized for FRASER http://fraser.stlouisfed.org Federal Reserve Bank of St. Louis

Selected Interest RatesAverages of Daily Figures
Percent Percent
10-YearTreasury Securities
- 6.0
Federal Funds Rate
Discount Rate5.0- - 5.0
3-Month Treasury Bill
2 16 30 14 20 11 25 8 22 6 20 3 17 15 29 12 26 8 22 5 19 3 17 31 14 28 12 26 9 23Apr May
1996Federal Funds ••
3-Month Treasury
Bill
1 -Year Treasury
Bill
5-YeorTreasury
Securities
10-YearTreasury
Securities
Long-TermTreasury
SecuritiesMay 24 5.22 5.04 5.27 6.41 6.65 6.93
31 5.19 5.04 5.39 6.55 6.77 7.02Jun 7 5.33 5.09 5.46 6.63 6.85 7.08
14 5.24 5.11 5.52 6.77 6.99 7.2321 5.45 5.09 5.48 6.73 6.95 7.1828 5.21 5.09 5.47 6.63 6.86 7.08
Jul 5 5.53 5.13 5.49 6.60 6.85 7.0412 5.26 5.15 5.57 6.72 6.95 7.1619 5.23 5.13 5.47 6.59 6.81 7.0426 5.25 5.16 5.53 6.62 6.85 7.05
Aug 2 5.53 5.15 5.48 6.52 6.76 6.969 5.38 5.03 5.30 6.28 6.54 6.77
16 • 5.10 5.12 5.29 6.30 6.55 6.79
Except for long-term Treasury securities, which ore computed by this Bonk, current doto appear in the Federal Reserve Board's H.15 release.• Averages of rates availoble•• Seven-doy overages for week ending two days earlier than dote shown
Prepored by Federol Reserve Bonk of St. Louis
7Digitized for FRASER http://fraser.stlouisfed.org Federal Reserve Bank of St. Louis

8
Money Stock(M2) and Non-M1 Components of M2Averages of Daily Figures
Seasonally Adjusted Billions of DollarsBillions of Dollars
Billions3749.4 3753.93747.5 3754.0 3756.3 3766.2Aug 5
M2 (left scale)■26003700-
■2500Non-Mi M2 (right scale)
Non-M1 M2Billions2631.4 .2647.92644.92646.9 2645.0 2658.2Aug 5
1 14 28 II 25 9 23 6 20 4 18 I 15 29 12 26 11 25 8 22 6 20 3 17 1 15 29 12 26Aug Sep Oct Apr May Jun
M2 is the sum of M1, savings (including money market deposit accounts), smoll time deposits and retoil money funds. Current dato appeor in the Federol Reserve Boord's H.6 releose.
Money Stock (M2)
To the averoge of four weeks ending:
Compounded annual rates of change, overage of four weeks ending:
8/7/95 11/6/95 1/8/96 2/5/96 3/4/96 4/8/96 5/6/96 6/3/96
1/8/96 4.5
2/5/96 4.6 5.2
3/4/96 5.0 5.8 6.3
4/8/96 5.6 6.6 7.5 8.6
5/6/96 5.0 5.4 5.6 5.7 4.9
6/3/96 4.5 4.7 4.5 4.4 3.4 -0.2
7/8/96 4.6 4.8 4.6 4.5 3.8 1.7 2.8
8/5/96 4.4 4.5 4.2 4.1 3.5 1.8 2.5 3.6
Prepored by Federol Reserve Bonk of St. Louis
Digitized for FRASER http://fraser.stlouisfed.org Federal Reserve Bank of St. Louis

Savings and Small Time DepositsAverages of Daily Figures
1360
1320-
1280
1200
1080
1 i ■Savings
1996 BillionJul 1 1207.(
8 1218.'15 1215.122 1212.29 1210/
— ----------- 1----------- !---------Small Time
996 BillionsJul 1 928.3
8 928.915 929.522 930.2
Srrtall Tinne (right see.le)*
_____
ug 5 9[
32.1
—
So zings 1—)eposi . :ts (left scale
_____L—0
T» i • i 1 i nr * 11 ■i ' i ' r» i ■ ..............
I
1055
1015
975
935
895
855
775Aug Sep Oct Nov Dec
Sovings deposits ond small time deposits ore at all depository institutions.
Apr May
1996
Aug
Large Time Deposits and Retail Money FundsAverages of Daily Figures
490
450
370
Large Time1996 BillionsJul 1 447.1
8 448.9 ..........
Retail Money 1996 BillionsJul 1 496.1
8 500.815 499.822 503.929 503.1
^ug 5 503.8Aug
152229
5
452.2454.9452.6452.5
Retail K/ oney
Loreje Tim e
rr'l I ' l ' » !' f | 1 ' l r n i »
Aug Sep
1995
Oct Nov18
Dec
530
Jon Feb Mor15 29 12 26
Jul AugApr May
1996Large time deposits and retoil money funds ore ot oil despository institutions. Large time deposits ore those ' C d®"orn,nal,on* of % 100,000 or more. Retoil money funds were originolly colled general purpose ond broker/dealer money market funds. v w w
Prepared by Federal Reserve Bonk of St. Louis
9Digitized for FRASER http://fraser.stlouisfed.org Federal Reserve Bank of St. Louis

10
Total BorrowingsFrom Federol Reserve Banks
Averages of Daily FiguresBillions of Dollars Billions of DollarsBillions
Jul 10
i.o-Aug 7 0.305
7 21 5 19 2 16 30 13 27 11 25 8 22 6 20 3 17 31 14 28 13 27 10 24 8 22 5 19 3 17 31 14 28Aug Sep Oct
1995 1996Borrowings include seasonal, adjustment and extended credit.
Bank Loans and CreditAll Commercial Banks in the United States ^
Seasonally AdjustedBillions of Dollars Billions of DollarsBonk Credit
Billions3672.43667.5 3668.93677.23675.3 3666.1
Jun 26Jul 3
Bonk Credit (left scale)2/
Loans&Leases Billions 2692.8 2692.52691.22698.02700.02698.3
Loons and Leases (right scale) Jun 26
7 21 5 19 2 16 30 13 27 II 23 8 22 6 20 3 17 31 14 28 13 27 10 24 8 22 5 19 3 17 31 14 28'
Sep Oct Apr Moy1995 1996
Current dato appear in the Federol Reserve Board's H.8 release.1/ includes foreign-related institutions 2/ Includes loons and leoses and securities
Prepared by Federol Reserve Bonk of St. Louis
Digitized for FRASER http://fraser.stlouisfed.org Federal Reserve Bank of St. Louis

Commercial Paper of Nonfinancial CompaniesNot Seasonally Adjusted
Billions of Dollars Billions of DollarsBillions199.629196.964199.933197.350196.430198.200
Jul 3
Aug 7200- - 200
- 180
7 21 5 19 2 16 30 13 27 11 25 3 17 31 14 28 13 27 10 24 22 5 19 3 17 31 14 28
1996
Commercial and Industrial LoansSeasonally Adjusted
Billions of Dollars Billions of Dollors
All BanksBillions740.4 739.9 738.0742.4 742.6 743.3
Jun 26- 400Jul 3
All Bonks (left scale)1/
700- - 360
Lorge Bonks (right scale)^/
Lorge BonksBillions
Jun 26 361.8
360.0361.5361.5
7 21 5 19 2 16 30 25 8 22 6 20
1995 1996
Current data appear in the Federal Reserve Boord's H.8 releose.1/ Includes foreign-related institutions 2/ Weekly reporting, domesticolly chartered banks
Prepared by Federal Reserve Bank of St. Louis
11Digitized for FRASER http://fraser.stlouisfed.org Federal Reserve Bank of St. Louis

Dollar's Trade-Weighted Exchange IndexAverages of Daily Figures
1973=100
JU 10
-100100-
3 17 31 14 28 13 27 10 24 8 22 5 19 3 17 31 14 287 21 5 19 2 16 30 13 27 11 25
1995 1996
Current data appear in the Federal Reserve Boord's H.10 release. Data ore weighted overages of the foreign-currency price of the U.S. dollar, computed using 10 industrial country currencies.
Prepored by Federol Reserve Bonk of St. Louis
xas<asCD
J0)
Digitized for FRASER http://fraser.stlouisfed.org Federal Reserve Bank of St. Louis
Related Documents