Published: January 12, 2011 r2011 American Chemical Society 1199 dx.doi.org/10.1021/es103192b | Environ. Sci. Technol. 2011, 45, 1199–1205 ARTICLE pubs.acs.org/est Fecal Contamination of Shallow Tubewells in Bangladesh Inversely Related to Arsenic Alexander van Geen,* ,† Kazi Matin Ahmed, ‡ Yasuyuki Akita, § Md. Jahangir Alam, ‡ Patricia J. Culligan, || Michael Emch, # Veronica Escamilla, # John Feighery, ^ Andrew S. Ferguson, || Peter Knappett, r Alice C. Layton, O Brian J. Mailloux, [ Larry D. McKay, r Jacob L. Mey, † Marc L. Serre, § P. Kim Streatfield, z Jianyong Wu, § and Mohammad Yunus z † Lamont-Doherty Earth Observatory of Columbia University, Palisades, New York 10964, United States ‡ Department of Geology, University of Dhaka, Dhaka, Bangladesh § Department of Environmental Sciences and Engineering, University of North Carolina at Chapel Hill, Chapel Hill, North Carolina 27599, United States # Department of Geography, University of North Carolina at Chapel Hill, Chapel Hill, North Carolina 27599, United States ) Department of Civil Engineering and Engineering Mechanics, Columbia University, New York, New York 10027, United States ^ Department of Earth and Environmental Engineering, Columbia University, New York, New York 10027, United States r Department of Earth and Planetary Sciences, University of Tennessee, Knoxville, Tennessee 37996, United States O Center for Environmental Biotechnology, University of Tennessee, Knoxville, Tennessee 37996, United States [ Department of Environmental Sciences, Barnard College, New York, New York 10027, United States z International Centre for Diarrhoeal Research, Bangladesh, Dhaka, Bangladesh b S Supporting Information ABSTRACT: The health risks of As exposure due to the installation of millions of shallow tubewells in the Bengal Basin are known, but fecal contamination of shallow aquifers has not systematically been examined. This could be a source of concern in densely populated areas with poor sanitation because the hydraulic travel time from surface water bodies to shallow wells that are low in As was previously shown to be considerably shorter than for shallow wells that are high in As. In this study, 125 tubewells 6-36 m deep were sampled in duplicate for 18 months to quantify the presence of the fecal indicator Escherichia coli. On any given month, E. coli was detected at levels exceeding 1 most probable number per 100 mL in 19-64% of all shallow tubewells, with a higher proportion typically following periods of heavy rainfall. The frequency of E. coli detection averaged over a year was found to increase with population surrounding a well and decrease with the As content of a well, most likely because of downward transport of E. coli associated with local recharge. The health implications of higher fecal contamination of shallow tubewells, to which millions of households in Bangladesh have switched in order to reduce their exposure to As, need to be evaluated. ’ INTRODUCTION Filtration through aquifer sands reduces the likelihood of fecal contamination of groundwater by orders of magnitudes compared to surface water. There is growing evidence, however, that even sandy aquifers, and not merely aquifers contained within fractured rocks or karst deposits, are vulnerable to fecal contamination. 1 In Bangladesh and neighboring countries with large sedimentary basins draining the Himalayas, much of the attention has focused instead on elevated levels of arsenic (As) in shallow groundwater pumped from tubewells installed by millions of households. 2 This is justified because the burden of disease caused by drinking tubewell water containing As concentrations often 10-100 fold higher than the WHO guideline of 10 μg/L will be significant for decades to come. 3 There is concern, however, that certain forms of As mitigation could lead to the substitution of exposure to As with exposure to fecal contaminants. 4-6 This study evaluates this possibility for well-switching, the most effective form of As mitiga- tion to date. 6 The present study focuses on the possibility of risk substitution caused by switching from a shallow (defined here as <36 m deep) private well that is high in As to a neighboring private well that is also shallow but low in As. Unless a deep well that is low in As has been installed nearby by the government or a nongovernmental organization, this has been the response of millions of households in Bangladesh after being informed that their well was high in As. 7-9 Dating of groundwater using the 3 H- 3 He method within a region with spatially variable As has previously demonstrated that groundwater is typically considerably younger in shallow low-As Received: May 25, 2010 Accepted: December 21, 2010 Revised: November 18, 2010

Welcome message from author
This document is posted to help you gain knowledge. Please leave a comment to let me know what you think about it! Share it to your friends and learn new things together.
Transcript
Published: January 12, 2011
r 2011 American Chemical Society 1199 dx.doi.org/10.1021/es103192b | Environ. Sci. Technol. 2011, 45, 1199–1205
ARTICLE
pubs.acs.org/est
Fecal Contamination of Shallow Tubewells in Bangladesh InverselyRelated to ArsenicAlexander van Geen,*,† Kazi Matin Ahmed,‡ Yasuyuki Akita,§ Md. Jahangir Alam,‡ Patricia J. Culligan,||
Michael Emch,# Veronica Escamilla,# John Feighery,^ Andrew S. Ferguson,|| Peter Knappett,r
Alice C. Layton,O Brian J. Mailloux,[ Larry D. McKay,r Jacob L. Mey,† Marc L. Serre,§ P. Kim Streatfield,z
Jianyong Wu,§ and Mohammad Yunusz
†Lamont-Doherty Earth Observatory of Columbia University, Palisades, New York 10964, United States‡Department of Geology, University of Dhaka, Dhaka, Bangladesh§Department of Environmental Sciences and Engineering, University of North Carolina at Chapel Hill, Chapel Hill, North Carolina27599, United States
#Department of Geography, University of North Carolina at Chapel Hill, Chapel Hill, North Carolina 27599, United States
)Department of Civil Engineering and Engineering Mechanics, Columbia University, New York, New York 10027, United States^Department of Earth and Environmental Engineering, Columbia University, New York, New York 10027, United StatesrDepartment of Earth and Planetary Sciences, University of Tennessee, Knoxville, Tennessee 37996, United StatesOCenter for Environmental Biotechnology, University of Tennessee, Knoxville, Tennessee 37996, United States[Department of Environmental Sciences, Barnard College, New York, New York 10027, United StateszInternational Centre for Diarrhoeal Research, Bangladesh, Dhaka, Bangladesh
bS Supporting Information
ABSTRACT: The health risks of As exposure due to the installation of millions of shallow tubewells in the Bengal Basin are known,but fecal contamination of shallow aquifers has not systematically been examined. This could be a source of concern in denselypopulated areas with poor sanitation because the hydraulic travel time from surface water bodies to shallow wells that are low in Aswas previously shown to be considerably shorter than for shallow wells that are high in As. In this study, 125 tubewells 6-36m deepwere sampled in duplicate for 18 months to quantify the presence of the fecal indicator Escherichia coli. On any given month, E. coliwas detected at levels exceeding 1 most probable number per 100 mL in 19-64% of all shallow tubewells, with a higher proportiontypically following periods of heavy rainfall. The frequency of E. coli detection averaged over a year was found to increase withpopulation surrounding a well and decrease with the As content of a well, most likely because of downward transport of E. coliassociated with local recharge. The health implications of higher fecal contamination of shallow tubewells, to which millions ofhouseholds in Bangladesh have switched in order to reduce their exposure to As, need to be evaluated.
’ INTRODUCTION
Filtration through aquifer sands reduces the likelihood of fecalcontamination of groundwater by orders of magnitudes comparedto surface water. There is growing evidence, however, that evensandy aquifers, and not merely aquifers contained within fracturedrocks or karst deposits, are vulnerable to fecal contamination.1 InBangladesh and neighboring countries with large sedimentarybasins draining the Himalayas, much of the attention has focusedinstead on elevated levels of arsenic (As) in shallow groundwaterpumped from tubewells installed bymillions of households.2 This isjustified because the burden of disease caused by drinking tubewellwater containing As concentrations often 10-100 fold higher thanthe WHO guideline of 10 μg/L will be significant for decades tocome.3 There is concern, however, that certain forms of Asmitigation could lead to the substitution of exposure to As withexposure to fecal contaminants.4-6 This study evaluates this
possibility for well-switching, the most effective form of As mitiga-tion to date.6
The present study focuses on the possibility of risk substitutioncaused by switching from a shallow (defined here as <36 m deep)private well that is high in As to a neighboring private well that isalso shallow but low in As. Unless a deep well that is low in As hasbeen installed nearby by the government or a nongovernmentalorganization, this has been the response of millions of householdsin Bangladesh after being informed that their well was high inAs.7-9 Dating of groundwater using the 3H-3He method within aregion with spatially variable As has previously demonstrated thatgroundwater is typically considerably younger in shallow low-As
Received: May 25, 2010Accepted: December 21, 2010Revised: November 18, 2010
1200 dx.doi.org/10.1021/es103192b |Environ. Sci. Technol. 2011, 45, 1199–1205
Environmental Science & Technology ARTICLE
wells than in shallow high-As wells.10 Further investigation hasshown that differences in the age (and therefore As content) ofshallow groundwater are related to the grain size of surface soils thatcap the underlying aquifer.11,12 Shallow groundwater can be <1 yearold in villages where the sandy aquifer essentially extends to thesurface and >10 year old at the same depth in neighboring villageswhere the shallow aquifer is instead capped by fine-grained claysand silts. Because attenuation of fecal contamination along aflowpath that starts in a shallow recharge zone depends on acombination of retention and die-off,13-15 this raises the possibilitythat shallow aquifers containing young/low-As groundwater couldbe particularly vulnerable to microbial contamination. Such acontrasting influence of local geology on E. coli and As contamina-tion of shallow aquifers was recently investigated in a pilot studycomparing two villages of Bangladesh during the dry season and thewet season.16 The present study takes this analysis further bycomparing E. coli and As variability within villages rather thanbetween villages and by taking into account local variations inpopulation density.
’METHODS
Study Sites. Two densely populated and geologically com-parable rural areas of Bangladesh were selected for this study(Figure 1a). The village of Char Para (23.796� N, 90.629� E) inAraihazar upazilla is located on a sand bar rising 1-3 m abovesurrounding fields and themeander of a small stream to the south(Figure 1b). Local recharge is likely an important factor thatmaintains As concentrations in shallow groundwater at generallylow levels in the center of Char Para, with As concentrationsincreasing toward the periphery of the village.17 Several hundredlatrines scattered throughout the villages and approximately fiftyponds, many of which receive discharge from latrines, arepotential sources of fecal pollution to the shallow aquifer ofChar Para. In Matlab upazilla (Figure 1c), the six villages ofBarahaldia (23.370� N, 90.646� E), Sardarkandi (23.352� N;90.656� E), Shakharipara (23.356� N, 90.646� E), Farazikandi(23.360� N, 90.637� E), Namapara (23.361� N, 90.628� E), andShankibhanga (23.370� N, 90.623� E) cover a range of deposi-tional environments and groundwater As concentrations.18 Therural sanitation infrastructure in the region ranges from simpleseptic tanks built of concrete rings to defecation directly intoponds and does not differ markedly between Araihazar andMatlab. The location of each household within the study areaswas recorded with hand-held GPS units to calculate the popula-tion residing within a given distance from each monitored well(Supporting Information).Precipitation and Water Levels. Daily rainfall was measured
in Barahaldia village starting in June 2008; data gaps were filledon the basis of rainfall data from Chittagong (Supporting In-formation). Fluctuations in the level of surface water and ground-water were recorded starting in September 2008 by installing data-logger pressure transducers (Solinst, Georgetown, ON, Canada) ina pond and a shallow well in Barahaldia, respectively. Pond waterlevels were only occasionally measured in Char Para in 2009, butgroundwater levels were measured with an electric tape over theentire sampling period.Well Sampling and As Analysis. Starting in May 2008, 33
and 92 shallow household wells in Char Para and the six Matlabvillages were sampled quasi-monthly until October and November2009, respectively. Duplicate 100 mL samples of well water werecollected for microbial analysis in sterile vials and stored in the dark
at∼4 �C for up to 8 h before processing. Water was also collectedwithout filtration in 20 mL scintillation vials with PolySeal caps.These samples were acidified to 1% HCl with high-purity acid atleast one week prior to analysis by high-resolution inductivelycoupled plasma mass spectrometry (HR ICP-MS19,20). Internalconsistency standards included with each run indicate a reproduc-ibility better than 3% (1 standard deviation) in the 50-500 μg/Lrange of As concentrations.Microbial Determinations. The most probable number
(MPN) of total coliforms and E. coli in well water samples wasdetermined using a U.S. EPA-approved commercial culture kit(Colilert, IDEXX Laboratories, Inc., Westbrook, Maine) accordingto the manufacturer’s directions. To combine duplicate measure-ments, positive wells in both trays were summed and converted to aMPN and 95% CI on the assumption that E. coli were homo-geneously distributed in well water.21 In this study, a sample wasconsidered positive forE. coli if both replicates contained detectableE. coli (i.e.,g 1MPN/100 mL). To determine the significance of adifference in the proportion of wells with detectable E. coli for
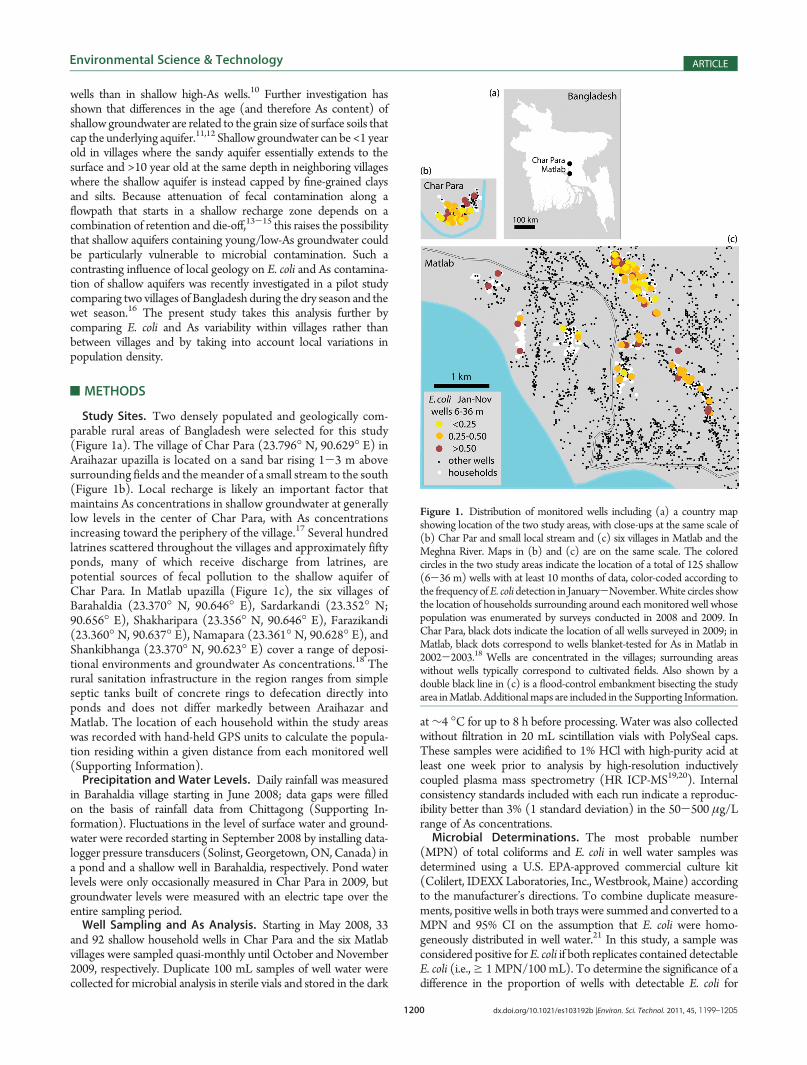
Figure 1. Distribution of monitored wells including (a) a country mapshowing location of the two study areas, with close-ups at the same scale of(b) Char Par and small local stream and (c) six villages in Matlab and theMeghna River. Maps in (b) and (c) are on the same scale. The coloredcircles in the two study areas indicate the location of a total of 125 shallow(6-36 m) wells with at least 10 months of data, color-coded according tothe frequency ofE. colidetection in January-November.White circles showthe location of households surrounding around each monitored well whosepopulation was enumerated by surveys conducted in 2008 and 2009. InChar Para, black dots indicate the location of all wells surveyed in 2009; inMatlab, black dots correspond to wells blanket-tested for As in Matlab in2002-2003.18 Wells are concentrated in the villages; surrounding areaswithout wells typically correspond to cultivated fields. Also shown by adouble black line in (c) is a flood-control embankment bisecting the studyarea inMatlab. Additionalmaps are included in the Supporting Information.
1201 dx.doi.org/10.1021/es103192b |Environ. Sci. Technol. 2011, 45, 1199–1205
Environmental Science & Technology ARTICLE
different categories of wells, we used the approximation(2 [p (1-p)/n]1/2 to estimate 95% confidence intervals (CIs), where p is theproportion of months when E. coli was detected for the group ofwells (a binary outcome) and n is the number of months when wellwater from the group of wells was analyzed.22 Further details aboutthe surveys, sampling, and measurements, as well as a test of Astoxicity toE. coli in groundwater collected from a subset of wells, areprovided in the Supporting Information.
’RESULTS
Precipitation andWater Levels. The precipitation pattern in2008 and 2009 was typical of the monsoonal climate of the region,with heavy rainfall during themonths of April throughOctober andlittle if any rain during the remaining months (Figure 2a). Inresponse, water levels in ponds monitored inside the embankmentin Matlab and Char Para varied by∼1 m between the dry and wetseason. Relatively deep ponds were selected for monitoring; manyponds dry out entirely during winter. The seasonal range ingroundwater levels measured within the embankment in Matlabis somewhat wider (∼1.5 m), more so outside the embankment(2.5 m) and even more so in Char Para (4 m). The differencebetween surface and groundwater levels is a roughly constant 0.5 m
downwardwithin the embankment inMatlab overmuch of the year(downward head gradient of 0.05 given the 10 m depth of themonitoring well), with the exception of March and April whengroundwater and pond levels were essentially the same (Figure 2a).The limited pond data available from Char Para indicate a morepronounced difference of 2 m between the pond and groundwater(downward gradient of 0.2) in June 2009 and no significantgradient later in August through October.Fecal Indicator Distribution. Groundwater was sampled
from the monitored tubewells in duplicate on a total of 2389occasions between May 2008 and November 2009. The 95%confidence intervals (Supporting Information) for duplicate sam-ples overlap in 96% of all cases. E. coli was detected 1023 times induplicate samples, i.e., on 43% of all sampling occasions. AverageE. coli concentrations calculated from duplicates were within rangesof 1-10, 10-100, and 100 to over the maximum quantifiable of2000 MPN/100 mL on 710 (30%), 223 (9%), and 90 (4%)sampling occasions, respectively.The frequency of E. coli detection (>1 MPN/100 mL) over a
year was calculated for each of the 125 wells having data availablefor at least 10 out of 11 months of the year (no wells were sampledin December 2008), averaging the result if a well was sampled inthe same month in 2008 and 2009. Such averaging avoids
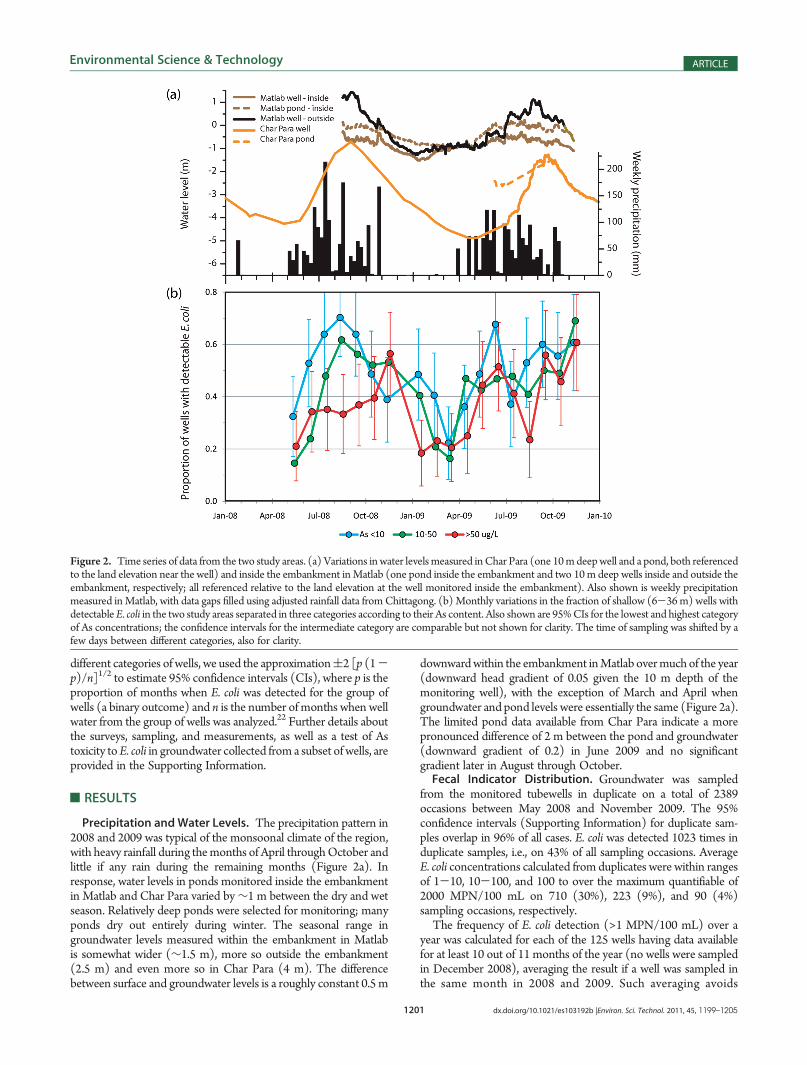
Figure 2. Time series of data from the two study areas. (a) Variations in water levelsmeasured inChar Para (one 10mdeepwell and a pond, both referencedto the land elevation near the well) and inside the embankment inMatlab (one pond inside the embankment and two 10m deep wells inside and outside theembankment, respectively; all referenced relative to the land elevation at the well monitored inside the embankment). Also shown is weekly precipitationmeasured inMatlab, with data gaps filled using adjusted rainfall data fromChittagong. (b) Monthly variations in the fraction of shallow (6-36 m) wells withdetectableE. coli in the two study areas separated in three categories according to their As content. Also shown are 95%CIs for the lowest and highest categoryof As concentrations; the confidence intervals for the intermediate category are comparable but not shown for clarity. The time of sampling was shifted by afew days between different categories, also for clarity.
1202 dx.doi.org/10.1021/es103192b |Environ. Sci. Technol. 2011, 45, 1199–1205
Environmental Science & Technology ARTICLE
over-representing those months that were sampled twice in theannual mean. Not a single well remained free of E. coli induplicate samples throughout the sampling period. E. coli wasdetected between four and six months of the year in a majority ofthe wells (67 out of 125, i.e., 54%). E. coli was detected no morethan four months of the year in only 25 (20%) of the total of 125wells monitored. Groundwater pumped from the remaining 33(26%) most-impacted wells contained detectable levels of E. colibetween six and nine months of the year. Annually averaged E. colidetection frequencies for the entire set of 125 wells do not followany clear geographic pattern (Figure 1b, c). Wells frequentlycontaminated with E. coli are interspersed with less contaminatedwells within individual villages, including themore densely sampledvillages of Char Para in Araihazar and Bara Haldia in Matlab.Well Arsenic. Unlike E. coli concentrations, the As content of
groundwater changed relatively little over time. Of the 116 wellsfrom which two samples collected in August 2008 andMarch 2009were analyzed by HR ICP-MS (the remaining 9 wells wereanalyzed for As only once), concentrations in the <1-500 μg/Lrange varied in all but 4 cases by less than 25% or less than 30 μg/L.The group of 125 shallow wells that were monitored is dividedroughly equally between average As concentrations below theWHO guideline of 10 μg/L (n = 37), within the 10-50 μg/L(n = 49) range, and above the Bangladesh standard of 50 μg/L (n=39). The distribution of As is mixed in the villages of Char Para inAraihazar and Bara Haldia in Matlab that were densely sampled(Figure S1 of the Supporting Information). Low-As wells werespecifically targeted in the five other villages of Matlab where high-As wells otherwise dominate.18
E. coli Time Series. Concentrations of E. coli in individual wellswere highly variable from one month to the next across the entirerange of annual frequencies of E. coli detection. E. coli concentra-tions occasionally exceeded 100MPN/100mL inwells for whichE.coliwas undetectable for much of the year. Conversely, E. coli levelswere at times undetectable for wells typically containing 10 MPN/100mLE. coli. Despite the variability ofE. coli levels, there is a broadseasonal pattern defined by the entire set of wells (Figure 2b). InJuly-November 2008 and again in June 2009 and in Septem-ber-November 2009, more than half the wells contained detect-able levels of E. coli. This contrasts withMay 2008 andMarch 2009when E. coli was detected in less than one-quarter of the wells.The proportion of wells with detectable E. coli containing up to
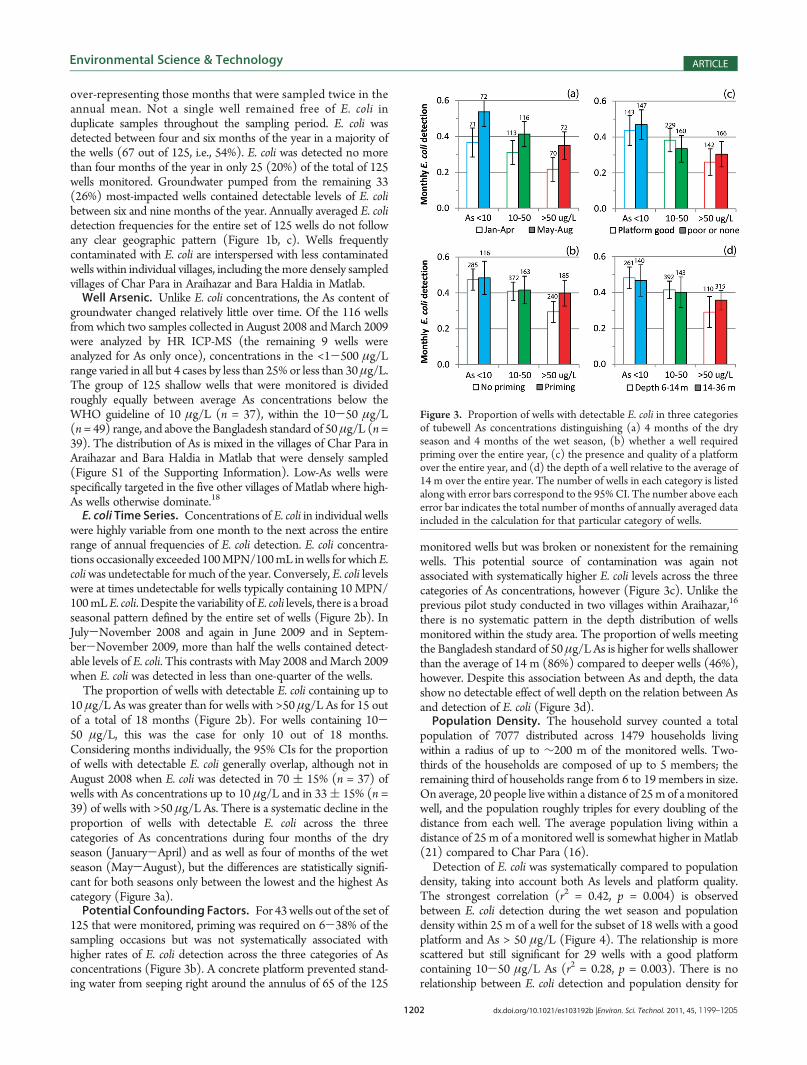
10 μg/L As was greater than for wells with >50 μg/L As for 15 outof a total of 18 months (Figure 2b). For wells containing 10-50 μg/L, this was the case for only 10 out of 18 months.Considering months individually, the 95% CIs for the proportionof wells with detectable E. coli generally overlap, although not inAugust 2008 when E. coli was detected in 70 ( 15% (n = 37) ofwells with As concentrations up to 10 μg/L and in 33( 15% (n =39) of wells with >50 μg/L As. There is a systematic decline in theproportion of wells with detectable E. coli across the threecategories of As concentrations during four months of the dryseason (January-April) and as well as four of months of the wetseason (May-August), but the differences are statistically signifi-cant for both seasons only between the lowest and the highest Ascategory (Figure 3a).Potential Confounding Factors. For 43wells out of the set of
125 that were monitored, priming was required on 6-38% of thesampling occasions but was not systematically associated withhigher rates of E. coli detection across the three categories of Asconcentrations (Figure 3b). A concrete platform prevented stand-ing water from seeping right around the annulus of 65 of the 125
monitored wells but was broken or nonexistent for the remainingwells. This potential source of contamination was again notassociated with systematically higher E. coli levels across the threecategories of As concentrations, however (Figure 3c). Unlike theprevious pilot study conducted in two villages within Araihazar,16
there is no systematic pattern in the depth distribution of wellsmonitored within the study area. The proportion of wells meetingthe Bangladesh standard of 50 μg/LAs is higher for wells shallowerthan the average of 14 m (86%) compared to deeper wells (46%),however. Despite this association between As and depth, the datashow no detectable effect of well depth on the relation between Asand detection of E. coli (Figure 3d).Population Density. The household survey counted a total
population of 7077 distributed across 1479 households livingwithin a radius of up to ∼200 m of the monitored wells. Two-thirds of the households are composed of up to 5 members; theremaining third of households range from 6 to 19 members in size.On average, 20 people live within a distance of 25m of amonitoredwell, and the population roughly triples for every doubling of thedistance from each well. The average population living within adistance of 25 m of a monitored well is somewhat higher in Matlab(21) compared to Char Para (16).Detection of E. coli was systematically compared to population
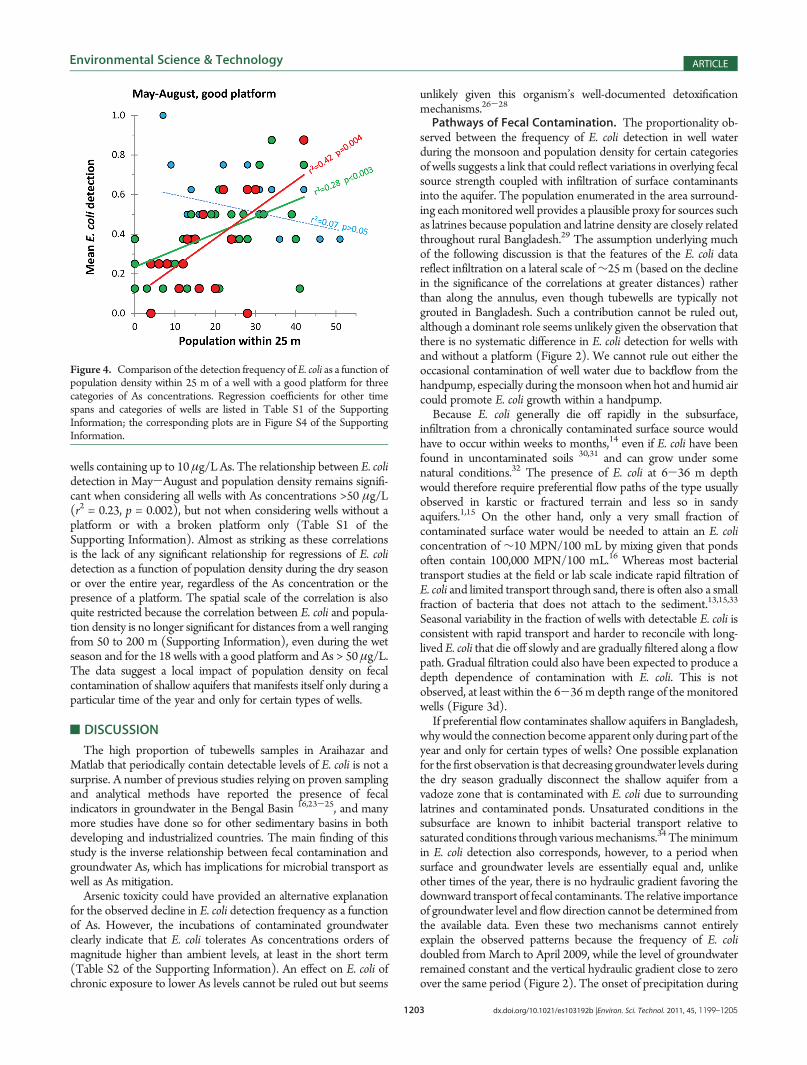
density, taking into account both As levels and platform quality.The strongest correlation (r2 = 0.42, p = 0.004) is observedbetween E. coli detection during the wet season and populationdensity within 25 m of a well for the subset of 18 wells with a goodplatform and As > 50 μg/L (Figure 4). The relationship is morescattered but still significant for 29 wells with a good platformcontaining 10-50 μg/L As (r2 = 0.28, p = 0.003). There is norelationship between E. coli detection and population density for
Figure 3. Proportion of wells with detectable E. coli in three categoriesof tubewell As concentrations distinguishing (a) 4 months of the dryseason and 4 months of the wet season, (b) whether a well requiredpriming over the entire year, (c) the presence and quality of a platformover the entire year, and (d) the depth of a well relative to the average of14 m over the entire year. The number of wells in each category is listedalong with error bars correspond to the 95%CI. The number above eacherror bar indicates the total number of months of annually averaged dataincluded in the calculation for that particular category of wells.
1203 dx.doi.org/10.1021/es103192b |Environ. Sci. Technol. 2011, 45, 1199–1205
Environmental Science & Technology ARTICLE
wells containing up to 10 μg/L As. The relationship between E. colidetection in May-August and population density remains signifi-cant when considering all wells with As concentrations >50 μg/L(r2 = 0.23, p = 0.002), but not when considering wells without aplatform or with a broken platform only (Table S1 of theSupporting Information). Almost as striking as these correlationsis the lack of any significant relationship for regressions of E. colidetection as a function of population density during the dry seasonor over the entire year, regardless of the As concentration or thepresence of a platform. The spatial scale of the correlation is alsoquite restricted because the correlation between E. coli and popula-tion density is no longer significant for distances from a well rangingfrom 50 to 200 m (Supporting Information), even during the wetseason and for the 18 wells with a good platform and As > 50 μg/L.The data suggest a local impact of population density on fecalcontamination of shallow aquifers that manifests itself only during aparticular time of the year and only for certain types of wells.
’DISCUSSION
The high proportion of tubewells samples in Araihazar andMatlab that periodically contain detectable levels of E. coli is not asurprise. A number of previous studies relying on proven samplingand analytical methods have reported the presence of fecalindicators in groundwater in the Bengal Basin 16,23-25, and manymore studies have done so for other sedimentary basins in bothdeveloping and industrialized countries. The main finding of thisstudy is the inverse relationship between fecal contamination andgroundwater As, which has implications for microbial transport aswell as As mitigation.
Arsenic toxicity could have provided an alternative explanationfor the observed decline in E. coli detection frequency as a functionof As. However, the incubations of contaminated groundwaterclearly indicate that E. coli tolerates As concentrations orders ofmagnitude higher than ambient levels, at least in the short term(Table S2 of the Supporting Information). An effect on E. coli ofchronic exposure to lower As levels cannot be ruled out but seems
unlikely given this organism’s well-documented detoxificationmechanisms.26-28
Pathways of Fecal Contamination. The proportionality ob-served between the frequency of E. coli detection in well waterduring the monsoon and population density for certain categoriesof wells suggests a link that could reflect variations in overlying fecalsource strength coupled with infiltration of surface contaminantsinto the aquifer. The population enumerated in the area surround-ing eachmonitored well provides a plausible proxy for sources suchas latrines because population and latrine density are closely relatedthroughout rural Bangladesh.29 The assumption underlying muchof the following discussion is that the features of the E. coli datareflect infiltration on a lateral scale of∼25 m (based on the declinein the significance of the correlations at greater distances) ratherthan along the annulus, even though tubewells are typically notgrouted in Bangladesh. Such a contribution cannot be ruled out,although a dominant role seems unlikely given the observation thatthere is no systematic difference in E. coli detection for wells withand without a platform (Figure 2). We cannot rule out either theoccasional contamination of well water due to backflow from thehandpump, especially during themonsoonwhen hot and humid aircould promote E. coli growth within a handpump.Because E. coli generally die off rapidly in the subsurface,
infiltration from a chronically contaminated surface source wouldhave to occur within weeks to months,14 even if E. coli have beenfound in uncontaminated soils 30,31 and can grow under somenatural conditions.32 The presence of E. coli at 6-36 m depthwould therefore require preferential flow paths of the type usuallyobserved in karstic or fractured terrain and less so in sandyaquifers.1,15 On the other hand, only a very small fraction ofcontaminated surface water would be needed to attain an E. coliconcentration of ∼10 MPN/100 mL by mixing given that pondsoften contain 100,000 MPN/100 mL.16 Whereas most bacterialtransport studies at the field or lab scale indicate rapid filtration ofE. coli and limited transport through sand, there is often also a smallfraction of bacteria that does not attach to the sediment.13,15,33
Seasonal variability in the fraction of wells with detectable E. coli isconsistent with rapid transport and harder to reconcile with long-lived E. coli that die off slowly and are gradually filtered along a flowpath. Gradual filtration could also have been expected to produce adepth dependence of contamination with E. coli. This is notobserved, at least within the 6-36m depth range of the monitoredwells (Figure 3d).If preferential flow contaminates shallow aquifers in Bangladesh,
whywould the connection become apparent only during part of theyear and only for certain types of wells? One possible explanationfor the first observation is that decreasing groundwater levels duringthe dry season gradually disconnect the shallow aquifer from avadoze zone that is contaminated with E. coli due to surroundinglatrines and contaminated ponds. Unsaturated conditions in thesubsurface are known to inhibit bacterial transport relative tosaturated conditions through variousmechanisms.34 Theminimumin E. coli detection also corresponds, however, to a period whensurface and groundwater levels are essentially equal and, unlikeother times of the year, there is no hydraulic gradient favoring thedownward transport of fecal contaminants. The relative importanceof groundwater level and flowdirection cannot be determined fromthe available data. Even these two mechanisms cannot entirelyexplain the observed patterns because the frequency of E. colidoubled fromMarch to April 2009, while the level of groundwaterremained constant and the vertical hydraulic gradient close to zeroover the same period (Figure 2). The onset of precipitation during
Figure 4. Comparison of the detection frequency of E. coli as a function ofpopulation density within 25 m of a well with a good platform for threecategories of As concentrations. Regression coefficients for other timespans and categories of wells are listed in Table S1 of the SupportingInformation; the corresponding plots are in Figure S4 of the SupportingInformation.
1204 dx.doi.org/10.1021/es103192b |Environ. Sci. Technol. 2011, 45, 1199–1205
Environmental Science & Technology ARTICLE
this transition, which could conceivably flush downward fecalmatter accumulated in surface soils during the dry season, suggestsyet another contributing and perhaps dominant factor that isconsistent with a connection between E. coli levels and populationdensity during the wet season only.Even if the physical forcing of rapid downgradient transport of
E. coli remains uncertain, the observed decline in detection frequencywith increasing As concentrations is consistent with a hydrogeolo-gical feature of shallow Bangladesh aquifers previously establishedon the basis of 3H-3He dating of groundwater relative to the timeof recharge. The range of depths and As concentrations of shallowwells monitored in Char Para and Matlab are comparable to sixnests of monitoring wells from Araihazar previously used todocument a broad increase of As concentrations with groundwaterage.10 This relationship has been linked to variations in the surfacepermeability of soil that modulate the rate of local recharge as wellas the buildup of As in shallow aquifers.11 The available data fromAraihazar indicate that shallow groundwater that is <1 year old andcontains <10 μg/L As is found in depositional environments wheresandy aquifers essentially extend to the surface. Such aquifers wouldbe particularly prone to microbial contamination, whereas fine-grained sediment overlying older aquifers with typically As con-centrations >50 μg/L As could be expected to offer some protec-tion. The new data suggests such a hydrogeological connectionmight play a role even if the rapid preferential flowpaths leading tofecal contamination of shallow aquifers are probably not the sameas those that set the bulk chemistry of groundwater, including Asand 3H-3He ages.Unlike the relation to population density, there is no a priori
reason to expect a linear relation between As concentrations andthe frequency of E. coli detection. Nevertheless, a bivariate regres-sion of E. coli detection over the entire year for all platformscombined (n = 125) yields coefficients for population density (p =0.03) andAs concentrations (p= 0.03) that are both significant andof the expected sign. Including depth as an independent variable inthe regression combining all wells does not affect the outcome, andthe regression coefficient for depth is not significantly differentfrom zero. In contrast to the present study, which takes advantageof variations within villages, the importance of depth or otherpotential village-level differences for fecal contamination could notbe ascertained in the previous pilot study conducted in Araihazar.16
Bivariate regressions of E. coli detection frequency as a function ofpopulation density and As for wells without a good platform doesnot yield statistically significant results for any time of the year. Thissuggests that conditions conducive to fecal contamination such aslow As concentrations (i.e., a sandy setting) or the lack of aprotective platform obscure the impact of population densitywithout markedly increasing the level of fecal contamination.The main caveat of our interpretation is that highly localized
microbial contamination along the annulus of the well cannot beruled out. Such an extreme case of short-circuiting of the flow pathsthat control the bulk composition of groundwater could in factpotentially generate some of the observed patterns, includingenhanced transport of E. coli during the monsoon and some degreeof proportionality of fecal contamination to local populationdensity. If sealing around the annulus of a well after installation isinfluenced by the grain size of surface sediment, thenmore frequentcontamination of low-As wells might be expected because surfacepermeability has been shown to affect the As content of shallowaquifers on a broader scale.11
Health Implications. According to the WHO,35 drinkingwater containing 1-100 MPN/100 mL E. coli carries a low to
moderate risk of significant health effects. The results of extensivewell sampling across time and space reported here confirm thewidespread presence of E. coli almost throughout the year, exceptfor the driest months at levels of up to 100 MPN/100 mL. Ofpotential significance in the context of As mitigation is the findingthat shallow tubewells thatmeet theWHOguideline of 10μg/L forAs in drinking water are more likely to contain detectable levels ofE. coli and, therefore, potentially also pathogens.36 The significanceof this finding is independent of the fact that the pathway for fecalcontamination of shallow groundwater remains insufficiently un-derstood. The relevance of drinking groundwater even moderatelycontaminated with fecal matter compared to other modes ofcontracting diarrheal disease in rural Bangladesh is presentlyunknown. At the same time, there is growing evidence of wide-spread and long-term disease caused by drinking well watercontaining high levels of As.37 In the absence of further knowledgeabout the health implications of the observed increase in fecalcontamination of tubewell water, well-switching to reduce Asexposure should therefore continue. Future mitigation campaigns,however, should be cognizant of the levels of microbial contamina-tion of shallow tubewells documented in this study.
’ASSOCIATED CONTENT
bS Supporting Information. Additional description of surveymethods, amap of the distribution of As,maps of the distribution ofE. coli in January-April and May-August, As toxicity studies,comparisons of E. coli and population density for different cate-gories of wells and As concentrations, and the characteristics and E.coli data for all 125 shallowwells that weremonitored. Thismaterialis available free of charge via the Internet at http://pubs.acs.org.
’AUTHOR INFORMATION
Corresponding Author*E-mail: [email protected]; phone þ1 (845) 3658644; fax þ1 (845) 365 8155.
’ACKNOWLEDGMENT
This study was supported by NIH/Forgarty InternationalCenter Grant 5R01TW8066-2, with additional funds provided bySuperfund Research Program Grant 1 P42 ES10349. We thankDhaka University students and Mohammad Rezaul Huq for theirhelp during numerous field trips as well local field staff in AraihazarandMatlab. This is Lamont-Doherty Earth Observatory Contribu-tion Number 7434.
’REFERENCES
(1) Embrey, S. S.; Runkle, D. L. Microbial Quality of the Nation’sGround-Water Resources, 1993-2004; Scientific Investigations Report2006-5290; U.S. Geological Survey : Reston, VA, 2006.
(2) Chowdhury, U. K.; Biswas, B. K.; Chowdhury, T. R.; Samanta,G.; Mandal, B. K.; Basu, G. C.; Chanda, C. R.; Lodh, D.; Saha, K. C.;Mukherjee, S. K.; Roy, S.; Kabir, S.; Quamruzzaman, Q.; Chakraborti, D.Groundwater arsenic contamination in Bangladesh and West Bengal,India. Environ. Health. Perspect. 2000, 108, 393–397.
(3) Smith, A. H.; Lingas, E. O.; Rahman, M. Contamination ofdrinking-water by arsenic in Bangladesh: A public health emergency.Bull. W. H. O. 2000, 78, 1093–1103.
(4) Lokuge, K. M.; Smith, W.; Caldwell, B.; Dear, K.; Milton, A. H.The effect of arsenic mitigation interventions on disease burden inBangladesh. Environ. Health Perspect. 2004, 112, 1172–1177.
1205 dx.doi.org/10.1021/es103192b |Environ. Sci. Technol. 2011, 45, 1199–1205
Environmental Science & Technology ARTICLE
(5) Howard, G.; Ahmed, M. F.; Shamsuddin, A. J.; Mahmud, S. G.;Deere, D. Risk assessment of arsenic mitigation options in Bangladesh.J. Health Pop. Nutr. 2006, 24, 346–355.(6) Ahmed, M. F.; Ahufa, S.; Alauddin, M.; Hug, S. J.; Lloyd, J. R.;
Pfaff, A.; Pichler, T.; Saltikov, C.; Stute, M.; van Geen, A. Ensuring safedrinking water in Bangladesh. Science 2006, 314, 1687–1688.(7) Chen, Y.; van Geen, A.; Graziano, J.; Pfaff, A.; Madajewicz, M.;
Parvez, F.; Hussain, I.; Cheng, Z.; Slavkovich, V.; Islam, T.; Ahsan, H.Reduction in urinary arsenic levels in response to arsenic mitigation inAraihazar, Bangladesh. Environ. Health Perspect. 2007, 115, 917–923.(8) Opar, A.; Pfaff, A.; Seddique, A. A.; Ahmed, K. M.; Graziano,
J. H.; van Geen, A. Responses of 6500 households to arsenic mitigationin Araihazar, Bangladesh. Health Place 2007, 13, 164–172.(9) van Geen, A.; Ahmed, K. M.; Seddique, A. A.; Shamsudduha, M.
Community wells to mitigate the current arsenic crisis in Bangladesh.Bull. W. H. O. 2003, 82, 632–638.(10) Stute, M.; Zheng, Y.; Schlosser, P.; Horneman, A.; Dhar, R. K.;
Hoque, M. A.; Seddique, A. A.; Shamsudduha, M.; Ahmed, K. M.; vanGeen, A. Hydrological control of As concentrations in Bangladeshgroundwater. Water Resour. Res. 2007, 43, 33–41.(11) Aziz, Z.; van Geen, A.; Stute, M.; Versteeg, R.; Horneman, A.;
Zheng, Y.; Goodbred, S.; Steckler, M.; Weinman, B.; Gavrieli, I.; Hoque,M. A.; Shamsudduha, M.; Ahmed, K. M. Impact of local recharge onarsenic concentrations in shallow aquifers inferred from the electro-magnetic conductivity of soils in Araihazar, Bangladesh. Water Resour.Res. 2008, 44, 242–256.(12) Weinman, B.; Goodbred, S. L., Jr.; Zheng, Y.; Aziz, Z.; Steckler,
M.; vanGeen, A.; Singhvi, A. K.; Nagar, Y. C. Contributions of floodplainstratigraphy and evolution to the spatial patterns of groundwater arsenicin Araihazar, Bangladesh. Geol. Soc. Am. Bull. 2008, 120, 1567–1580.(13) Foppen, J. W. A.; Schijven, J. F. Evaluation of data from the
literature on the transport and survival of Escherichia coli and thermo-tolerant coliforms in aquifers under saturated conditions. Water Res.2006, 30, 401–426.(14) Rozen, Y.; Belkin, S. Survival of enteric bacteria in seawater.
FEMS Microbiol. Rev. 2001, 25, 513–529.(15) Taylor, R.; Cronin, A.; Pedley, S.; Barker, J.; Atkinson, T. The
implications of groundwater velocity variations on microbial transportand wellhead protection: Review of field evidence. FEMSMicrobiol. Ecol.2004, 49, 17–26.(16) Leber, J.; Rahman, M. M.; Ahmed, K. M.; Mailloux, B.; van
Geen, A. Contrasting influence of geology on E. coli and arsenic levelsin sedimentary aquifers. Ground Water 201010.1111/j.1745-6584.-2010.00689.x.(17) Radloff, K. A.;Manning, A. R.;Mailloux, B.; Zheng, Y.; Rahman,
M. M.; Huq, M. R.; Ahmed, K. M.; Stute, M.; van Geen, A. Considera-tions for conducting incubations to study the mechanisms of As releasein reducing groundwater aquifers. Appl. Geochem. 2008, 23, 3224–3235.(18) Rahman, M.; Vater, M.; Wahed, M. A.; Sohel, N.; Yunus, M.;
Streatfield, P. K.; Arifeen, S. E.; Bhuiya, A.; Zaman, K.; Chowdhury,A. M. R.; Ekstrom, E. C.; Persson, K. A. Prevalence of arsenic exposureand skin lesions. A population based survey in Matlab, Bangladesh.J. Epidemiol. Community Health 2006, 60, 242–248.(19) Cheng, Z.; Zheng, Y.; Mortlock, R.; van Geen, A. Rapid multi-
element analysis of groundwater by high-resolution inductively coupledplasma mass spectrometry. Anal. Bioanal. Chem. 2004, 379, 513–518.(20) van Geen, A.; Cheng, Z.; Jia, Q.; Seddique, A. A.; Rahman,
M. W.; Rahman, M. M.; Ahmed, K. M. Monitoring 51 deep communitywells in Araihazar, Bangladesh, for up to 5 years: Implications for arsenicmitigation. J. Environ. Sci. Health, Part A 2007, 42, 1729–1740.(21) Hurley, M. A.; Roscoe, M. E. Automated statistical analysis of
microbial enumeration by dilution series. J. Appl. Microbiol. 1983, 55,159–164.(22) Gelman, A.; Hill, J. Data Analysis Using Regression and Multi-
level/Hierarchical Models. Cambridge University Press, New York, 2007.(23) McArthur, J. M.; Banerjee, D. M.; Hudson-Edwards, K. A.;
Mishra, R.; Purohit, R.; Ravenscroft, P.; Cronin, A.; Howarth, R. J.;Chatterjee, A.; Talukder, T.; Lowry, D.; Houghton, S.; Chahda, D. K.
Natural organic matter in sedimentary basins and its relation arsenic inanoxic ground water: The example of West Bengal and its worldwideimplications. Appl. Geochem. 2004, 19, 1255–1293.
(24) Hoque, B. A.; Hallman, K.; Levy, J.; Bouise, H.; Alif, N.; Khang,F.; Khanama, S.; Kabirg, M.; Hossaina, S.; Alam, M. S. Rural drinkingwater at supply and household levels: Quality and management. Int. J.Hyg. Environ. Health 2006, 209, 451–460.
(25) Luby, S. P.; Gupta, S. K.; Sheikh, M. A.; Johnston, R. B.; Ram,P. K.; Islam, M. S. Tubewell water quality and predictors of contamina-tion in three flood-prone areas in Bangladesh. J. Appl. Microbiol. 2008,105, 1002–1008.
(26) Markowitz, V. M.; Chen, I. M. A.; Palaniappan, K.; Chu, K.;Szeto, E.; Grechkin, Y.; Ratner, A.; Anderson, I.; Lykidis, A.;Mavromatis,K.; Ivanova, N. N.; Kyrpides, N. C. The integrated microbial genomessystem: An expanding comparative analysis resource. Nucleic Acids Res.2009, 1–9, 10.1093/nar/gkp887.
(27) Kaur, S.; Kamli, M. R.; Ali, A. Diversity of arsenate reductasegenes(arsC genes) from arsenic-resistant environmental isolates of E.coli. Curr. Microbiol. 2009, 59, 288–294.
(28) Meng, Y.; Liu, Z.; Rosen, B. P. As(III) and Sb(III) Uptake byGlpF and efflux by ArsB in Escherichia coli. J. Biol. Chem. 2004, 279,18334–18341.
(29) Emch, M. Diarrheal disease risk in Matlab, Bangladesh. Soc. Sci.Med. 1999, 49, 519–530.
(30) Ishii, S.; Ksoll, W. B.; Hicks, R. E.; Sadowsky, M. J. Presence andgrowth of naturalized Escherichia coli in temperate soils from LakeSuperior watersheds. Appl. Environ. Microbiol. 2006, 72, 612–621.
(31) Nautiyal, C. S.; Rehman, A.; Chauhan, P. S. EnvironmentalEscherichia coli occur as natural plant growth-promoting soil bacterium.Arch. Microbiol. 2010, 192, 185–193.
(32) Vital,M.; Hammes, F.; Egli, T. Escherichia coliO157 can grow innatural freshwater at low carbon concentrations. Environ. Microbiol.2008, 10, 2387–2396.
(33) Mailloux, B. J.; Fuller, M. E.; Onstott, T. C.; Hall, J.; Dong, H.;DeFlaun, M. F.; Streger, S. H.; Rothmel, R. K.; Green, M.; Swift, D. J. P.;Radke, J. The role of physical heterogeneity on the field-scale transportand attachment of bacteria.Water Resour. Res. 2003, 39, 1142, 10.1029/2002WR001591.
(34) Crane, S. R.; Moore, J. A. Bacterial pollution of groundwater: Areview. Water, Air, Soil Pollut. 1984, 22, 67–83.
(35) Guidelines for Drinking-Water Quality, Incorporating First andSecond Addenda to Third Edition; World Health Organization: Geneva,2008; Volume 1, Recommendations.
(36) Islam, M. S.; Siddika, A.; Khan, M. N. H.; Goldar, M. M.;Sadique, M. A.; Kabir, A. N. M. H.; Huq, A.; Colwell, R. R. Micro-biological analysis of tube-well water in a rural area of Bangladesh. Appl.Environ. Microbiol. 2001, 67, 3328–3330.
(37) Argos, M.; Kalra, T.; Rathouz, P. J.; Chen, Y.; Pierce, B.; Parvez,F.; Islam, T.; Ahmed, A.; Rakibuz-Zaman, M.; Hasan, R.; Sarwar, G.;Slavkovich, V.; van Geen, A.; Graziano, J.; Ahsan, H. A prospectivecohort study of arsenic exposure from drinking water and all-cause andchronic disease mortality in Bangladesh. The Lancet 201010.1016/S0140-6736(10)60481-3.
Related Documents