FEBRUARY 2022 VOLUME LXXVI NUMBER 2

Welcome message from author
This document is posted to help you gain knowledge. Please leave a comment to let me know what you think about it! Share it to your friends and learn new things together.
Transcript
FEBRUARY 2022
VOLUME LXXVI NUMBER 2
Chair Michael Debabrata Patra
Editorial Committee
Ajit R. JoshiDeba Prasad RathRajiv RanjanSitikantha PattanaikPallavi ChavanSnehal HerwadkarTushar Baran DasPulastya Bandyopadhyay
Editor
Shashidhar M. Lokare
The Reserve Bank of India Bulletin is issuedmonthly by the Department ofEconomic and Policy Research,Reserve Bank of India, under the direction ofthe Editorial Committee.The Central Board of the Bank is notresponsible for interpretation andopinions expressed. In the case of signedarticles, the responsibility is that of theauthor.
© Reserve Bank of India 2022
All rights reserved.Reproduction is permitted provided an acknowledgment of the source is made.
For subscription to Bulletin, please refer toSection ‘Recent Publications’
The Reserve Bank of India Bulletin can beaccessed at https://bulletin.rbi.org.in
CONTENTS
Governor’s Statement
Governor’s Statement 1
Monetary Policy Statement for 2021-22
Resolution of the Monetary Policy Committee (MPC) February 8-10, 2022 7
Statement on Developmental and Regulatory Policies
Statement on Developmental and Regulatory Policies 11
Speech
RBI’s Pandemic Response: Stepping out of Oblivion Michael Debabrata Patra 15
Articles
State of the Economy 23
Zombies and the Process of Creative Destruction 53
Bad Banks as Good Samaritans: Lessons from Cross-Country Experience for India 67
Impact of COVID-19 on Sentiments of Indian Manufacturers 79
Current Statistics 95
Recent Publications 142


GOVERNOR’S STATEMENT
Governor’s Statement

GOVERNOR’S STATEMENT
RBI Bulletin February 2022 1
Governor’s Statement
complemented by increased adoption of technology
in our workplaces and in our day-to-day lives. The
effort is to limit the extent of disruptions to economic
activity.
Deliberations of the Monetary Policy Committee
The Monetary Policy Committee (MPC) met on
8th, 9th and 10th February 2022 and based on an
assessment of the current macroeconomic situation
and the outlook, it voted unanimously to keep the
policy repo rate unchanged at 4 per cent. The MPC
decided by a majority of 5 to 1 to continue with the
accommodative stance as long as necessary to revive
and sustain growth on a durable basis and continue
to mitigate the impact of COVID-19 on the economy,
while ensuring that inflation remains within the target
going forward. The marginal standing facility (MSF)
rate and the Bank Rate remain unchanged at 4.25 per
cent. The reverse repo rate also remains unchanged at
3.35 per cent.
The MPC flagged the potential downside risks to
economic activity from the highly contagious Omicron
variant. Reassuringly, the symptoms have remained
relatively mild and the pace of infections is moderating
as quickly as it surged. There is, however, some loss of
momentum in economic activity as reflected in high
frequency indicators such as purchasing managers’
indices (PMI) for both manufacturing and services,
finished steel consumption and sales of tractors,
two wheelers and passenger vehicles. The demand
for contact-intensive services is still muted. Going
forward, positive impulses for quickening the pace
of recovery emanate from buoyant Rabi prospects,
robust export demand, accommodative monetary
and liquidity conditions, improving credit offtake,
and the continued push on capital expenditure and
infrastructure in the Union Budget 2022-23.
The MPC also noted that consumer price inflation
(CPI) has edged higher since its last meeting, but largely
along anticipated lines. The increase in inflation
As I make this statement, the pandemic holds
the global economy hostage once again. Despite signs
of moderation, record numbers of daily infections
in several countries and consequent containment
measures are denting the pace of economic activity,
especially in contact-intensive sectors, even as
supply disruptions persist and restrained workforce
participation tightens the labour markets. With
inflation at multi-decadal highs in a number of
countries, the evolving macroeconomic environment
is being rendered highly uncertain by divergent
monetary policy intentions and actions. Financial
market volatility and geopolitical tensions are adding
layers of ambivalence to the outlook.
Notwithstanding a highly transmissible third
wave driven by the Omicron variant of COVID-19,
India is charting a different course of recovery from
the rest of the world. India is poised to grow at the
fastest pace year-on-year among major economies,
according to projections made by the International
Monetary Fund (IMF). This recovery is supported
by large-scale vaccination and sustained fiscal and
monetary support. Once again, our frontline warriors
have admirably risen to the call of duty.
As we gain valuable experience from repeated
waves of the pandemic, our responses are also
becoming nuanced and calibrated. Protecting life is
paramount; and protecting livelihood is rising in the
hierarchy of priorities. The focus is on securing the
economic and financial conditions of the vulnerable,
the wage earners and all those who suffer the most.
Accordingly, the emphasis is shifting to targeted
containment strategies and a push towards universal
vaccination and booster doses. This approach is being
Governor’s Statement*Shaktikanta Das
* Governor’s Statement - February 10, 2022.
GOVERNOR’S STATEMENT
RBI Bulletin February 20222
Governor’s Statement
in December was entirely due to unfavourable base
effects despite month-on-month decline in prices.
Large buffer stocks of cereals and effective supply-side
measures augur well for food inflation. Core inflation
remains elevated, but demand-pull pressures are still
muted. The renewed surge in international crude oil
prices, however, needs close monitoring.
On balance, headline inflation is expected to peak
in Q4:2021-22 within the tolerance band and then
moderate closer to target in H2:2022-23, providing
room for monetary policy to remain accommodative.
At the same time, output is just barely above its pre-
pandemic level, while private consumption is still
lagging. Global headwinds are accentuating. Overall,
taking into consideration the outlook for inflation
and growth, in particular the comfort provided by the
improving inflation outlook, the uncertainties related
to Omicron and global spillovers, the MPC was of the
view that continued policy support is warranted for a
durable and broad-based recovery.
Domestic Growth
In India, real GDP growth at 9.2 per cent for 2021-
22 takes it modestly above the level of GDP in 2019-
20. Private consumption, the mainstay of domestic
demand, continues to trail its pre-pandemic level.
The persistent increase in international commodity
prices, surge in volatility of global financial markets
and global supply bottlenecks can exacerbate risks to
the outlook.
Going forward, government’s thrust on
capital expenditure and exports are expected
to enhance productive capacity and strengthen
aggregate demand. This would also crowd in private
investment. The conducive financial conditions
engendered by the RBI’s policy actions will provide
impetus to investment activity. The surveys done by
the RBI reveal that capacity utilisation is rising, and
the outlook on business and consumer confidence
remain in optimistic territory, which should support
investment as well as consumption demand. The
prospects for agriculture have brightened on good
progress of winter crop sowing.
Overall, there is some loss of the momentum
of near-term growth while global factors are turning
adverse. Looking ahead, domestic growth drivers are
gradually improving. Considering all these factors,
real GDP growth is projected at 7.8 per cent for 2022-
23 with Q1:2022-23 at 17.2 per cent; Q2 at 7.0 per
cent; Q3 at 4.3 per cent; and Q4 at 4.5 per cent.
Inflation
The CPI inflation trajectory has moved in close
alignment with our projections. In particular, the
softening of food prices is providing welcome relief.
The improving prospects for foodgrains production
and the expected easing of vegetable prices on fresh
winter crop arrivals are adding further optimism.
Moreover, the softening of pulses and edible oil prices
is likely to continue in response to strong supply-side
interventions by the Government and increase in
domestic production.
The hardening of crude oil prices, however,
presents a major upside risk to the inflation outlook.
Core inflation remains elevated at tolerance testing
levels, although the continuing pass through of tax
cuts relating to petrol and diesel last November would
help to moderate input cost pressures to some extent.
The transmission of input cost pressures to selling
prices remains muted in view of the continuing slack
in demand. Further, as risks from Omicron wane and
supply chain pressures moderate, there could be some
softening of core inflation. On balance, the inflation
projection for 2021-22 is retained at 5.3 per cent, with
Q4 at 5.7 per cent on account of unfavourable base
effects that ease subsequently. In particular, the CPI
reading for January 2022 is expected to move closer to
the upper tolerance band, largely due to adverse base
effects. Taking all these factors into consideration
and on the assumption of a normal monsoon, CPI
GOVERNOR’S STATEMENT
RBI Bulletin February 2022 3
Governor’s Statement
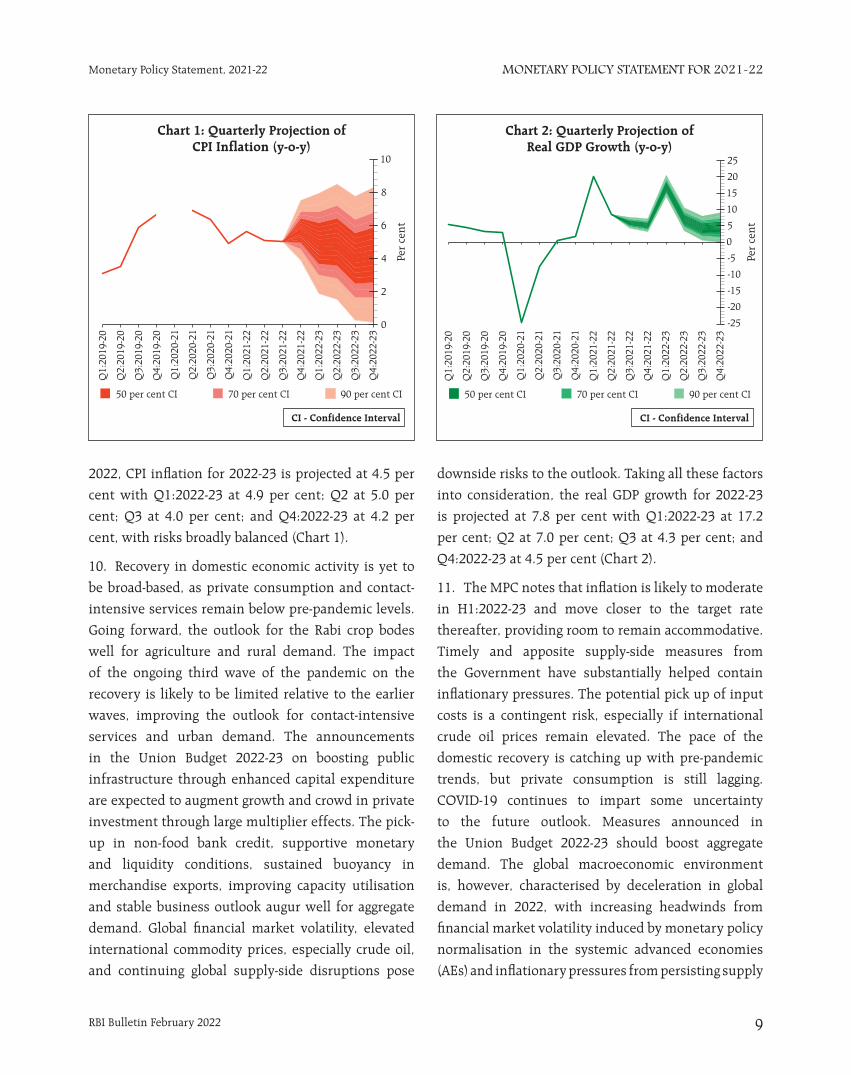
inflation for 2022-23 is projected at 4.5 per cent with
Q1:2022-23 at 4.9 per cent; Q2 at 5.0 per cent; Q3 at
4.0 per cent; and Q4 at 4.2 per cent, with risks broadly
balanced.
At the current juncture, the conduct of domestic
monetary policy is primarily attuned to the evolving
inflation and growth dynamics even as we remain
watchful of spillovers from the uncertain global
developments and divergent monetary policy
responses. Our monetary policy would continue to be
guided by its primary mandate of price stability over
the medium-term, while also ensuring a strong and
sustained economic recovery. As stated by me earlier,
our actions will be calibrated and well-telegraphed.
Financial Stability
A strong and well-functioning financial sector
fortifies the foundations of growth and development.
The Reserve Bank has accorded the highest priority
to preserving financial stability by taking quick and
decisive steps to ease liquidity constraints, restore
market confidence and prevent contagion to other
segments of the financial market. We have been
also strengthening the regulatory and supervisory
framework for both banking and non-bank financial
sectors to proactively identify, assess and deal with
vulnerabilities.
Thus, despite the pandemic induced bouts of
volatility, the Indian financial system has remained
resilient and is now in a better position to meet the
credit demands as recovery takes hold and investment
activity picks up. The balance sheets of Scheduled
Commercial Banks (SCBs) are relatively stronger
with higher capital adequacy, reduced NPA, higher
provisioning cover and improved profitability than in
the previous years.
We have to be, however, watchful of the impact of
the pandemic on the banking and NBFC sectors when
the effects of regulatory reliefs and resolutions fully
work their way through. Banks and other financial
entities would be well advised to further strengthen
their corporate governance and risk management
strategies to build resilience in an increasingly dynamic
and uncertain economic environment. They also need
to continue the process of capital augmentation and
building up of appropriate buffers.
Liquidity and Financial Market Conditions
The pandemic has delivered a once in a
century crisis, with a health shock morphing into
a macroeconomic and financial shock. The RBI
undertook a slew of measures to deal with such an
exceptional situation. As a consequence, borrowing
costs fell to their lowest levels in decades and
spreads narrowed across rating cohorts. Record
levels of government securities, corporate bonds
and debentures were issued. Corporate entities have
been able to deleverage seamlessly and reduce high-
cost debt while improving profitability and retained
earnings for future capex. Overall, the financial sector
has remained fully functional and has anchored the
process of recovery. In our assessment, the policy
actions of the RBI have yielded the desired results in a
smooth and orderly manner.
With these objectives being achieved on an
ongoing basis, the Reserve Bank has turned to
rebalancing liquidity on a dynamic basis, while
maintaining adequate liquidity in support of its
accommodative stance. This rebalancing has involved
two-sided operations: first, rebalancing liquidity
from the overnight fixed rate reverse repo towards
the 14-day variable rate reverse repo (VRRR) auction
as the main operation, supported by fine-tuning
auctions of varying tenors as envisaged in the Revised
Liquidity Management Framework of February 2020;
and second, conducting repo auctions of 1-3 day
maturities to meet transient liquidity mismatches
and shortages, as for instance in the recent case of
more than expected GST outflows during the third
week of January 2022. The key to effective liquidity
GOVERNOR’S STATEMENT
RBI Bulletin February 20224
Governor’s Statement
management is the ‘timing’ and having a nuanced and
nimble-footed approach that responds swiftly to the
manner in which liquidity tilts.
As a result of RBI’s rebalancing operations, the
daily average absorption under the fixed rate reverse
repo has moderated sharply since August 2021 when
rebalancing started. Overall system liquidity, however,
remains in large surplus, though it has moderated over
the same period. Reflecting the migration of surplus
liquidity from the overnight window to longer tenors,
the effective reverse repo rate - the weighted average
rate of the fixed rate reverse repo and the VRRRs of
longer maturity - increased from 3.37 per cent as at
end-August 2021 to 3.87 percent as on February 4,
2022.
It may be recalled that while instituting the
revised liquidity management framework on February
6, 2020, the daily fixed rate repo and the four 14-
day term repos within a reporting fortnight were
withdrawn. In view of the pandemic and related work
from home and social distancing protocols, the MSF
and the fixed rate reverse repo windows were made
operational throughout the day, instead of only at end
of the day under normal circumstances. This passive
mode of liquidity management worked well through
pandemic conditions in ensuring adequate provision/
absorption of liquidity as warranted by the evolving
market conditions.
With the progressive return of normalcy, including
transient demand for liquidity from the RBI, it is
logical to restore the revised liquidity management
framework in order to make it more flexible and agile.
Accordingly, four decisions have been taken. First,
variable rate repo operations of varying tenors will
henceforth be conducted as and when warranted by
the evolving liquidity and financial conditions within
the cash reserve ratio (CRR) maintenance cycle.
Second, variable rate repos (VRRs) and variable rate
reverse repos (VRRRs) of 14-day tenor will operate as
the main liquidity management tool based on liquidity
conditions and will be conducted to coincide with the
CRR maintenance cycle. Third, these main operations
will be supported by fine-tuning operations to tide over
any unanticipated liquidity changes during the reserve
maintenance period. Auctions of longer maturity will
also be conducted as warranted. Fourth, with effect
from March 1, 2022, the Fixed Rate Reverse Repo
and the MSF operations will be available only during
17.30-23.59 hours on all days and not during 09.00-
23.59 hours, as instituted from March 30, 2020 to deal
with the pandemic situation. Market participants are
advised to shift balances out of the fixed rate reverse
repo into VRRR auctions and avail the automated
sweep-in and sweep-out (ASISO) facility in the e-Kuber
portal for operational convenience1.
In the forex market, the Indian rupee (INR) has
shown resilience in the face of global spillovers,
even relative to EME peers. India’s external sector
sustainability is anchored by high foreign exchange
reserve buffers and a modest level of the current
account deficit (CAD). In H1:2021-22, the CAD was 0.2
per cent of GDP, underpinned by robust exports of
goods and services. The merchandise trade deficit has
widened in recent months partly due to elevated crude
oil prices and rise in non-oil imports in line with the
domestic economic recovery. Buoyant services exports
led by IT services with strong prospects going forward
are, however, likely to keep the CAD contained well
below 2.0 per cent of GDP during 2021-22. Moreover,
foreign direct investment (FDI) inflows remain strong,
which along with other forms of capital inflows, are
expected to comfortably finance this modest level of
the CAD.
1 To provide greater flexibility to banks in managing their day-end CRR bal-ances, the RBI has provided an optional automated sweep-in and sweep-out (ASISO) facility in August 2020 under which banks are able to pre-set a specific (or range) amount that they wish to maintain at the end of the day. Any shortfall or excess balances maintained by banks will automatically trigger marginal standing facility (MSF) or reverse repo bids, as the case may be, under the ASISO facility.
GOVERNOR’S STATEMENT
RBI Bulletin February 2022 5
Governor’s Statement
In a global environment rendered highly volatile and uncertain by diverging monetary policy stances, geopolitical tensions, elevated crude oil prices and persistent supply bottlenecks, emerging economies are vulnerable to destabilising global spillovers on an ongoing basis. Thus, policymakers face daunting challenges even as recovery from the pandemic remains incomplete. On its part, the Reserve Bank has been and will continue to insulate the domestic economy and financial markets from these spillovers. Further, while the RBI will continue to focus on smooth completion of the government borrowing programme, market participants also have a stake in the orderly evolution of financial conditions and the yield curve. It is expected that market participants will engage responsibly and contribute to cooperative outcomes that benefit all.
Additional Measures
Based on our continuing assessment, certain additional measures are also being announced today. The details of these measures are set out in the statement on developmental and regulatory policies (Part-B) of the Monetary Policy Statement. The additional measures are as follows:
Extension of On-tap Liquidity Facilities for Emergency Health Services and Contact-intensive Sectors
On-tap liquidity facilities of `50,000 crore and `15,000 crore for emergency health services and contact-intensive sectors, respectively, were announced in May and June 2021 during the second wave of the Pandemic. Banks were given certain incentives for lending under the two schemes. On account of the continued uncertainties brought on by the third wave, the two schemes are being extended from March 31, 2022 to June 30, 2022.
Voluntary Retention Route (VRR) - Enhancement of Limits
The Voluntary Retention Route (VRR) scheme
was introduced in March 2019 to facilitate long-term
investment by Foreign Portfolio Investors (FPIs) in
debt securities issued by the government and the
corporates. The response to the scheme has been very
encouraging. It is, therefore, proposed to enhance the
limit for investments under the scheme by `1.0 lakh
crore from `1.5 lakh crore at present to `2.5 lakh crore
with effect from April 1, 2022. This will provide access
to additional sources of capital for the domestic debt
market including g-secs.
Review of Credit Default Swaps (CDS) Guidelines
The guidelines for Credit Default Swaps (CDS)
initially issued in 2013 were reviewed and draft
guidelines were issued in February 2021 for public
comments. Taking into account the feedback received,
the final CDS Directions are being issued today. These
guidelines will facilitate the development of a credit
derivatives market and deepen the corporate bond
market in India.
Permission for Banks to deal in Foreign Currency Settled - Rupee Derivatives Market
Banks in India have already been permitted to
offer Rupee interest rate derivatives such as overnight
indexed swaps (OIS) to non-residents. Now it has
been decided to allow banks in India to undertake
transactions in the offshore Foreign Currency Settled-
Overnight Indexed Swap (FCS-OIS) market with non-
residents and other market makers. This will reduce
the segmentation between the onshore and offshore
markets, enable more efficient price discovery and
further deepen the interest rate derivatives market in
India.
Enhancement of the Cap under e-RUPI (Prepaid Digital Vouchers using UPI)
The e-RUPI pre-paid digital voucher developed
by the NPCI was launched in August 2021. The single
use cashless payment voucher has a cap of `10,000.
It is now proposed to increase the cap of e-RUPI
vouchers issued by the Central government and State
governments from `10,000 to `1,00,000 per voucher
GOVERNOR’S STATEMENT
RBI Bulletin February 20226
Governor’s Statement
and permit such e-RUPI vouchers to be used more than
once (until the amount of the voucher is completely
redeemed). This will further facilitate the delivery
of various government schemes to the beneficiaries
more efficiently.
Enabling Better Infrastructure for MSME Receivables Financing – Increasing NACH Mandate Limit for TReDS Settlements
The Trade Receivables Discounting System
(TReDS) facilitates the financing of trade receivables
of Micro, Small and Medium Enterprises (MSMEs).
Transactions in TReDS are settled through the National
Automated Clearing House (NACH) system. Keeping
in view the requests received from stakeholders and
to further enhance the ease of financing the growing
liquidity requirements of MSMEs, it is proposed to
increase the NACH mandate limit from `1 crore at
present to `3 crore for TReDS related settlements.
Master Direction (MD) on IT Outsourcing and Master Direction (MD) on Information Technology Governance, Risk, Controls and Assurance Practices
Extensive outsourcing of critical IT services,
leveraging of technology by the Regulated Entities
of RBI and increasing use of digital channels by
customers expose the Regulated Entities to significant
financial, operational and reputational risks. A need
was, therefore, felt to review and consolidate the
extant guidelines. Accordingly, two draft directions
will be issued for comments of stakeholders and
members of the public: (i) Reserve Bank of India (IT
Outsourcing) Directions, 2022; and (ii) Reserve Bank
of India (Information Technology Governance, Risk,
Controls and Assurance Practices) Directions, 2022.
Concluding Remarks
We are living in a world of Knightian
uncertainty2 in the absence of determinate knowledge
about the next mutation of COVID-19. The ability
to forecast the future course of the economy is so
contingent on the evolution of the virus that one
prognosis is as good or as bad as the other and as
ephemeral. If the last two years of living with the
virus have taught us anything, it is to remain humble,
but grounded in self-belief, never losing confidence
and optimism. As the great Lata Mangeshkar – whom
we lost recently – sang in her immortal voice: “aaj
phir jeene ki tamanna hai”. Together with the spirit
behind the next line of this beautiful song, she has
conveyed an eternal message of optimism.
We, in the Reserve Bank, have remained steadfast
in our commitment to safeguard trust and confidence
in the domestic financial system as we rebuild the
foundations of strong and sustainable growth with
macroeconomic stability. This has been our anchor in
the ocean of uncertainty. We are inspired by Mahatma
Gandhi’s spirit of constant striving amidst challenges:
“Satisfaction lies in the effort, …… Full effort is full
victory.”3
Thank you. Stay safe. Stay well. Namaskar.
2 In economics, Knightian uncertainty is a lack of any quantifiable knowl-edge about some possible occurrence, as opposed to quantifiable risk. It is an acknowledgement of imperfect knowledge that makes future events essentially unpredictable. The phenomenon is named after Frank Knight (1885-1972), an economist from the University of Chicago, whose seminal work Risk, Uncertainty, and Profit was published in 1921.
3 The Collected Works of Mahatma Gandhi (CWMG), Vol. 26, p. 293.
MONETARY POLICY STATEMENT FOR 2021-22
Resolution of the Monetary Policy Committee (MPC) February 8-10, 2022

MONETARY POLICY STATEMENT FOR 2021-22
RBI Bulletin February 2022 7
Monetary Policy Statement, 2021-22
global economic activity. The global composite
purchasing managers’ index (PMI) slipped to an 18
month low of 51.4 in January 2022, with weakness in
both services and manufacturing. World merchandise
trade continues to grow. There are, however,
headwinds emanating from persistent container
and labour shortages, and elevated freight rates.
In its January 2022 update of the World Economic
Outlook, the International Monetary Fund (IMF)
revised global output and trade growth projections for
2022 downward to 4.4 per cent and 6.0 per cent from
its earlier forecasts of 4.9 per cent and 6.7 per cent,
respectively.
3. After reversing the transient correction that had
occurred towards end-November, commodity prices
resumed hardening and accentuated inflationary
pressures. With several central banks focused on policy
normalisation, including ending asset purchases and
earlier than expected hikes in policy rates, financial
markets have turned volatile. Sovereign bond yields
firmed up across maturities and equity markets entered
correction territory. Currency markets in emerging
market economies (EMEs) have exhibited two-way
movements in recent weeks, driven by strong capital
outflows from equities with elevated uncertainty on
the pace and quantum of US rate hikes. The latter
also led to an increasing and volatile movement in US
bond yields.
Domestic Economy
4. The first advance estimates (FAE) of national
income released by the National Statistical Office
(NSO) on January 7, 2022 placed India’s real gross
domestic product (GDP) growth at 9.2 per cent for
2021-22, surpassing its pre-pandemic (2019-20) level.
All major components of GDP exceeded their 2019-20
levels, barring private consumption. In its January 31
release, the NSO revised real GDP growth for 2020-21
to (-) 6.6 per cent from the provisional estimates of (-)
7.3 per cent.
On the basis of an assessment of the current and
evolving macroeconomic situation, the Monetary
Policy Committee (MPC) at its meeting today (February
10, 2022) decided to:
• keep the policy repo rate under the liquidity
adjustment facility (LAF) unchanged at 4.0
per cent.
The reverse repo rate under the LAF remains
unchanged at 3.35 per cent and the marginal standing
facility (MSF) rate and the Bank Rate at 4.25 per cent.
• The MPC also decided to continue with the
accommodative stance as long as necessary
to revive and sustain growth on a durable
basis and continue to mitigate the impact of
COVID-19 on the economy, while ensuring
that inflation remains within the target going
forward.
These decisions are in consonance with the
objective of achieving the medium-term target for
consumer price index (CPI) inflation of 4 per cent
within a band of +/- 2 per cent, while supporting
growth.
The main considerations underlying the decision
are set out in the statement below.
Assessment
Global Economy
2. Since the MPC’s meeting in December 2021, the
rapid spread of the highly transmissible Omicron
variant and the associated restrictions have dampened
* Released on February 10, 2022.
Monetary Policy Statement, 2021-22 Resolution of the Monetary Policy Committee (MPC)*
RBI Bulletin February 20228
Monetary Policy Statement, 2021-22MONETARY POLICY STATEMENT, 2021-22
5. Available high frequency indicators suggest some
weakening of demand in January 2022 reflecting
the drag on contact-intensive services from the fast
spread of the Omicron variant in the country. Rural
demand indicators – two-wheeler and tractor sales
– contracted in December-January. Area sown under
Rabi up to February 4, 2022 was higher by 1.5 per cent
over the previous year. Amongst the urban demand
indicators, consumer durables and passenger vehicle
sales contracted in November-December on account of
supply constraints while domestic air traffic weakened
in January under the impact of Omicron. Investment
activity displayed a mixed picture – while import of
capital goods increased in December, production of
capital goods declined on a year-on-year (y-o-y) basis
in November. Merchandise exports remained buoyant
for the eleventh successive month in January 2022;
non-oil and non-gold imports also continued to
expand on the back of domestic demand.
6. The manufacturing PMI stayed in expansion
zone in January at 54.0, though it moderated from
55.5 in the preceding month. Among services sector
indicators, railway freight traffic, e-way bills, and toll
collections posted y-o-y growth in December-January;
petroleum consumption registered muted growth and
port traffic declined. While finished steel consumption
contracted y-o-y in January, cement production grew
in double digits in December. PMI services continued
to exhibit expansion at 51.5 in January 2022, though
the pace weakened from 55.5 in December.
7. Headline CPI inflation edged up to 5.6 per cent
y-o-y in December from 4.9 per cent in November due
to large adverse base effects. The food group registered
a significant decline in prices in December, primarily
on account of vegetables, meat and fish, edible
oils and fruits, but sharp adverse base effects from
vegetables prices resulted in a rise in y-o-y inflation.
Fuel inflation eased in December but remained in
double digits. Core inflation or CPI inflation excluding
food and fuel stayed elevated, though there was some
moderation from 6.2 per cent in November to 6.0
per cent in December, driven by transportation and
communication, health, housing and recreation and
amusement.
8. Overall system liquidity continued to be in large
surplus, although average absorption (through both
the fixed and variable rate reverse repos) under the
LAF declined from `8.6 lakh crore during October-
November 2021 to `7.6 lakh crore in January 2022.
Reserve money (adjusted for the first-round impact
of the change in the cash reserve ratio) expanded by
8.4 per cent (y-o-y) on February 4, 2022. Money supply
(M3) and bank credit by commercial banks rose (y-o-y)
by 8.4 per cent and 8.2 per cent, respectively, as on
January 28, 2022. India’s foreign exchange reserves
increased by US$ 55 billion in 2021-22 (up to February
4, 2022) to US$ 632 billion.
Outlook
9. Since the December 2021 MPC meeting, CPI
inflation has moved along the expected trajectory.
Going forward, vegetables prices are expected to ease
further on fresh winter crop arrivals. The softening
in pulses and edible oil prices is likely to continue in
response to strong supply-side interventions by the
Government and increase in domestic production.
Prospects of a good Rabi harvest add to the optimism
on the food price front. Adverse base effect, however,
is likely to prevent a substantial easing of food
inflation in January. The outlook for crude oil prices
is rendered uncertain by geopolitical developments
even as supply conditions are expected to turn more
favourable during 2022. While cost-push pressures
on core inflation may continue in the near term, the
Reserve Bank surveys point to some softening in the
pace of increase in selling prices by the manufacturing
and services firms going forward, reflecting subdued
pass-through. On balance, the inflation projection
for 2021-22 is retained at 5.3 per cent, with Q4 at 5.7
per cent. On the assumption of a normal monsoon in
MONETARY POLICY STATEMENT FOR 2021-22
RBI Bulletin February 2022 9
Monetary Policy Statement, 2021-22
2022, CPI inflation for 2022-23 is projected at 4.5 per
cent with Q1:2022-23 at 4.9 per cent; Q2 at 5.0 per
cent; Q3 at 4.0 per cent; and Q4:2022-23 at 4.2 per
cent, with risks broadly balanced (Chart 1).
10. Recovery in domestic economic activity is yet to
be broad-based, as private consumption and contact-
intensive services remain below pre-pandemic levels.
Going forward, the outlook for the Rabi crop bodes
well for agriculture and rural demand. The impact
of the ongoing third wave of the pandemic on the
recovery is likely to be limited relative to the earlier
waves, improving the outlook for contact-intensive
services and urban demand. The announcements
in the Union Budget 2022-23 on boosting public
infrastructure through enhanced capital expenditure
are expected to augment growth and crowd in private
investment through large multiplier effects. The pick-
up in non-food bank credit, supportive monetary
and liquidity conditions, sustained buoyancy in
merchandise exports, improving capacity utilisation
and stable business outlook augur well for aggregate
demand. Global financial market volatility, elevated
international commodity prices, especially crude oil,
and continuing global supply-side disruptions pose
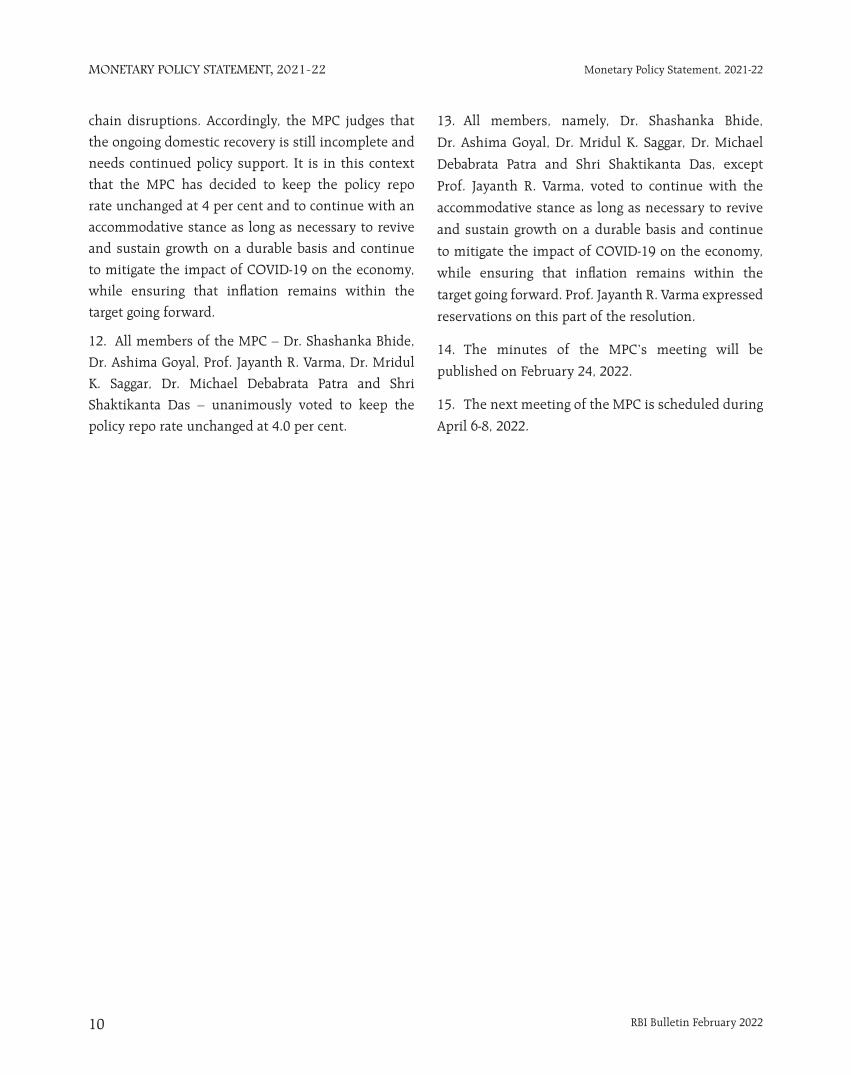
downside risks to the outlook. Taking all these factors
into consideration, the real GDP growth for 2022-23
is projected at 7.8 per cent with Q1:2022-23 at 17.2
per cent; Q2 at 7.0 per cent; Q3 at 4.3 per cent; and
Q4:2022-23 at 4.5 per cent (Chart 2).
11. The MPC notes that inflation is likely to moderate
in H1:2022-23 and move closer to the target rate
thereafter, providing room to remain accommodative.
Timely and apposite supply-side measures from
the Government have substantially helped contain
inflationary pressures. The potential pick up of input
costs is a contingent risk, especially if international
crude oil prices remain elevated. The pace of the
domestic recovery is catching up with pre-pandemic
trends, but private consumption is still lagging.
COVID-19 continues to impart some uncertainty
to the future outlook. Measures announced in
the Union Budget 2022-23 should boost aggregate
demand. The global macroeconomic environment
is, however, characterised by deceleration in global
demand in 2022, with increasing headwinds from
financial market volatility induced by monetary policy
normalisation in the systemic advanced economies
(AEs) and inflationary pressures from persisting supply
RBI Bulletin February 202210
Monetary Policy Statement, 2021-22MONETARY POLICY STATEMENT, 2021-22
chain disruptions. Accordingly, the MPC judges that
the ongoing domestic recovery is still incomplete and
needs continued policy support. It is in this context
that the MPC has decided to keep the policy repo
rate unchanged at 4 per cent and to continue with an
accommodative stance as long as necessary to revive
and sustain growth on a durable basis and continue
to mitigate the impact of COVID-19 on the economy,
while ensuring that inflation remains within the
target going forward.
12. All members of the MPC – Dr. Shashanka Bhide,
Dr. Ashima Goyal, Prof. Jayanth R. Varma, Dr. Mridul
K. Saggar, Dr. Michael Debabrata Patra and Shri
Shaktikanta Das – unanimously voted to keep the
policy repo rate unchanged at 4.0 per cent.
13. All members, namely, Dr. Shashanka Bhide,
Dr. Ashima Goyal, Dr. Mridul K. Saggar, Dr. Michael
Debabrata Patra and Shri Shaktikanta Das, except
Prof. Jayanth R. Varma, voted to continue with the
accommodative stance as long as necessary to revive
and sustain growth on a durable basis and continue
to mitigate the impact of COVID-19 on the economy,
while ensuring that inflation remains within the
target going forward. Prof. Jayanth R. Varma expressed
reservations on this part of the resolution.
14. The minutes of the MPC’s meeting will be
published on February 24, 2022.
15. The next meeting of the MPC is scheduled during
April 6-8, 2022.
STATEMENT ON DEVELOPMENTAL AND REGULATORY POLICIES
Statement on Developmental and Regulatory Policies

11
Statement on Developmental and Regulatory Policies STATEMENT ON DEVELOPMENTAL AND REGULATORY POLICIES
RBI Bulletin February 2022
This Statement sets out various developmental
and regulatory policy measures relating to (i) liquidity
measures; (ii) financial markets; (iii) payment
and settlement systems and (iv) regulation and
supervision.
I. Liquidity Measures
1. Extension of Term Liquidity Facility of `50,000
crore to Emergency Health Services
On May 5, 2021, an on-tap liquidity window of
`50,000 crore at the repo rate with tenors of up to
three years was announced to boost provision of
immediate liquidity for ramping up COVID-19 related
healthcare infrastructure and services in the country.
Banks were incentivised for quick delivery of credit
under the scheme through extension of priority sector
classification to such lending up to March 31, 2022.
Banks were expected to create a COVID-19 loan book
under the scheme. By way of an additional incentive,
such banks were eligible to park their surplus liquidity
up to the size of the COVID-19 loan book with the RBI
under the reverse repo window at a rate 25 bps lower
than the repo rate, i.e., 40 bps higher than the reverse
repo rate. Banks have deployed their own funds to the
tune of `9,654 crore (up to February 4, 2022) towards
COVID-19 related emergency health services. In view
of the response to the scheme, it is now proposed to
extend this window up to June 30, 2022 from March
31, 2022 as announced earlier.
2. Extension of On-tap Liquidity Window for
Contact-intensive Sectors
On June 4, 2021, it was decided to open a separate
liquidity window of `15,000 crore at the repo rate
with tenors of up to three years available till March
31, 2022 for certain contact-intensive sectors. By way
of an incentive, such banks were eligible to park their
surplus liquidity up to the size of the COVID-19 loan
book, created under this scheme with the RBI. The
amount in this COVID-19 loan book attracted a rate
which is 25 bps lower than the repo rate or, termed in
a different way, 40 bps higher than the reverse repo
rate. Banks desirous of deploying their own resources
without availing funds from the RBI under the scheme
for lending were also eligible for this incentive. Banks
have deployed their own funds to the tune of `5,041
crore (up to February 4, 2022) to the entities under
contact intensive sector. In view of the response to
the scheme, it is now proposed to extend this window
up to June 30, 2022.
II. Financial Markets
3. Voluntary Retention Route (VRR) – Enhancement of Limits
The Voluntary Retention Route (VRR) for
investment in government and corporate debt
securities by Foreign Portfolio Investors (FPIs)
was introduced on March 01, 2019 with a view to
facilitating stable investments in debt instruments
issued in the country. The Route sought to provide
a separate channel, broadly free of macro-prudential
controls, to FPIs with long-term investment horizons.
A dedicated investment limit of `1,50,000 crore
was set for investments under the VRR. Given the
positive response to the VRR as evident from the
near exhaustion of the current limit, it is proposed to
increase the investment limit under VRR by `1,00,000
crore to `2,50,000 crore with effect from April 1, 2022.
The revised investment limits are being notified today.
4. Review of Credit Default Swaps (CDS) Guidelines
Guidelines for Credit Default Swaps (CDS) were
last issued in January 2013. Given the importance of
the CDS market for the development of a liquid market
for corporate bonds, especially for the bonds of lower
rated issuers, it was announced in the Statement on
Developmental and Regulatory Policies of December
4, 2020 that these guidelines would be reviewed.
Statement on Developmental and Regulatory Policies
12
Statement on Developmental and Regulatory Policies STATEMENT ON DEVELOPMENTAL AND REGULATORY POLICIES
RBI Bulletin February 2022
Accordingly, draft guidelines were issued on February
16, 2021 for public consultation. Taking into account the feedback received, the final Directions are being issued today.
5. Permitting Banks to Deal in offshore Foreign Currency Settled Rupee Derivatives Market
Banks in India were permitted in June 2019 to offer Rupee interest rate derivatives to non-residents to hedge their interest rate risk. Overseas entities were also permitted to undertake Overnight Indexed Swap (OIS) transactions for purposes other than hedging with banks in India either directly or on a back-to-back basis through a foreign branch/parent/group entity (foreign counterpart) of the market-maker in India. The initiative has added to liquidity in the domestic OIS market, promoted diversity in participation and reduced the segmentation between the onshore and offshore markets. With a view to providing a further fillip to the interest rate derivative market in the country, removing the segmentation between onshore and offshore markets and improving the efficiency of price discovery, it has been decided to allow banks in India to undertake transactions in the offshore Foreign Currency Settled Overnight Indexed Swap (FCS-OIS) market with non-residents and other market makers. Banks may participate through their branches in India, their foreign branches or through their IFSC Banking Units. Necessary directions are being issued today.
III. Payment and Settlement Systems
6. Enhancement of the Cap under e-RUPI (Prepaid digital Vouchers using UPI)
The e-RUPI prepaid digital voucher, developed by the National Payments Corporation of India (NPCI) and launched in August 2021, is a person-specific and purpose-specific cashless voucher and can be used by individuals, corporates or governments. e-RUPI runs on the UPI platform and has a cap of `10,000/- per voucher and each voucher can be used / redeemed only once. e-RUPI vouchers are presently being used
largely for COVID-19 vaccination purposes. There are other use cases being actively considered by various State Government and Central Government Ministries / Departments.
To facilitate digital delivery of various government schemes to the beneficiaries, it is proposed to increase the cap on amount for e-RUPI vouchers issued by Governments to ̀ 1,00,000/- per voucher and allow use of the e-RUPI voucher multiple times (until the amount of the voucher is completely redeemed). Necessary instructions to NPCI will be issued separately.
7. Enabling Better Infrastructure for MSME Receivables Financing – Increasing NACH Mandate Limit for TReDS Settlements
Trade Receivables Discounting System (TReDS) facilitates discounting / financing of receivables of Micro, Small and Medium Enterprises (MSMEs). TReDS settlements are carried out through mandates in the National Automated Clearing House (NACH) system. Presently the amount of the NACH mandate is capped at `1 crore.
To encourage innovation and competition through increased participation, ‘on-tap’ authorisation of TReDS operators was introduced by Reserve Bank in October 2019. Effective July 1, 2020 the Central Government has revised the definition of MSMEs with linkage to their annual turnover as well. Keeping in view the growing liquidity requirements of the MSMEs and the requests received from the TReDS platforms, it is proposed to increase the NACH mandate limit to `3 crore for TReDS settlements.
Necessary instructions will be issued separately.
IV. Regulation and Supervision
8. Master Direction (MD) on IT Outsourcing and Master Direction (MD) on Information Technology Governance, Risk, Controls and Assurance Practices
The financial system is seeing extensive leveraging
and outsourcing of critical IT services by Regulated
Entities to get easier access to newer technologies
STATEMENT ON DEVELOPMENTAL AND REGULATORY POLICIES
13
Statement on Developmental and Regulatory Policies STATEMENT ON DEVELOPMENTAL AND REGULATORY POLICIES
RBI Bulletin February 2022
through financial technology players to improve
efficiencies. These arrangements expose them to
significant financial, operational and reputational
risks. Similarly, increasing dependence of customers
on digital channels to avail banking services makes
it imperative for Regulated Entities to focus on
operational resilience.
It is, therefore, felt that aspects such as risk
management framework for IT outsourcing, managing
concentration risk, periodic risk assessment and
outsourcing to foreign service providers require
suitable regulatory guidelines. Guidelines relating
to Information Security Governance and Controls,
Business Continuity Management and Information
Systems Audit also require to be updated and
consolidated.
Accordingly, the Reserve Bank proposes to issue
guidelines addressing the above aspects. Two draft
directions will be issued for comments of stakeholders
and members of the public: (i) Reserve Bank of India
(IT Outsourcing) Directions, 2022; and (ii) Reserve
Bank of India (Information Technology Governance,
Risk, Controls and Assurance Practices) Directions,
2022.

SPEECH
RBI’s Pandemic Response: Stepping out of Oblivion Michael Debabrata Patra

SPEECH
RBI Bulletin February 2022 15
RBI’s Pandemic Response: Stepping out of Oblivion
industry, namely, the Industrial Finance Corporation
of India (IFCI). He also played an important role in
the Bretton Woods Conference in New Hampshire,
USA in July 1944, which established the International
Monetary Fund (IMF) and the International Bank
for Reconstruction and Development (IBRD or the
World Bank). His vision and ideas still resonate in the
corridors of the RBI.
Among his many outstanding contributions to
society at large, Late Shri Deshmukh and his wife Late
Shrimati Durgabai Deshmukh played a pioneering
role in the establishment of the CSD in 1962 as a
leading research and policy studies institution. Today,
it is a matter of national pride that the CSD engages
in policy-oriented research with a special focus on
social aspects of development planning, social justice
and equity. Research at the CSD continues to evaluate
the diverse impacts of policies on the relationship
between the state and people. Our association with
the CSD also goes back to 1985 when the RBI Chair
Professorship was established. It is a matter of
considerable satisfaction that many of our officers
have been associated with the CSD in their self-
actualisation.
Against this backdrop, I turn to the theme of
my address today, which is the RBI’s response to the
pandemic1.
When COVID-19 engulfed the world in early 2020,
humans had become oblivious of pandemics past.
Yet, a hundred years ago and before – between 1817
and 1920 – cholera, plague and influenza pandemics
had visited the world repeatedly and wreaked havoc.
Of the estimated 70 million lives lost worldwide –
roughly the same as the casualties of the two World
Wars – India had accounted for nearly 60 per cent, and
yet somehow, we had erased those memories. After
all, astonishing progress had been made in the control
Professor Muchkund Dubey, President, Professor
Shanta Sinha, Chairperson, Managing Committee,
Professor Sujit Kumar Mishra, Regional Director (in-
Charge), Dr. Sunny Jose, RBI Chair Professor, faculty
and staff of the Council for Social Development,
Hyderabad, (hereafter CSD), students, researchers and
faculty joining this event from various universities and
research institutions across the country, colleagues
and friends! It is indeed an honour to share my
thoughts today under the prestigious C D Deshmukh
Memorial Lecture Series instituted by the CSD since
1997.
For the Reserve Bank of India (hereafter RBI),
this lecture series has a special significance. Late Shri
Chintaman Dwarakanath Deshmukh was the first
Indian Governor of the RBI from August 11, 1943 to
June 30, 1949. His association with the RBI began even
earlier in July 1939 when he was appointed Liaison
Officer to the RBI by the Government of India. Three
months later, he was appointed Secretary of the Central
Board of the Bank, two years later in December 1941
as the Deputy Governor, and then Governor on August
11, 1943. He presided over the transformation of the
RBI from a private shareholders’ bank to a nationalised
institution. Under his stewardship, a comprehensive
legislation for the regulation of banking companies
was enacted. Another landmark legislation under his
leadership led to the establishment of the first financial
institution for the provision of long-term credit to
RBI’s Pandemic Response: Stepping out of Oblivion*Michael Debabrata Patra
* Keynote Address delivered by Michael Debabrata Patra, Deputy Governor, Reserve Bank of India at the C D Deshmukh Memorial Lecture organised by the Council for Social Development, Hyderabad on January 28, 2022. Valuable comments from Sitikantha Pattanaik, Rajiv Ranjan, Indranil Bhattacharya, Abhilasha and editorial help from Vineet Kumar Srivastava are gratefully acknowledged.
1 The word ‘pandemic’ derives from the Greek word pandemos, which means common to all people.
SPEECH
RBI Bulletin February 202216
RBI’s Pandemic Response: Stepping out of Oblivion
of diseases, food and nutrition were more plentily
available and we had learned to deal with natural
calamities more effectively. As a result, longevity,
which was as low as 25 years in 1920, had risen to 70
years by 20202.
If we had remembered, we would have prepared
for the fact that influenza can evade pre-existing
immunity by mutations. We would have recalled that
infections occur in waves – in the case of the 1918
influenza pandemic, up to four waves occurred, lasting
up to 1920. Our consciousness would have stirred to
the fact that beyond the usual symptoms of fever
and body pain, infections turn pneumonic quickly,
allowing bacteria to attack the lungs. In hindsight,
it is this loss of collective accumulated knowledge
that allowed COVID-19 to catch us off-guard. In fact,
this loss of memory resulted in irrational actions –
the declaration of COVID-19 as a pandemic by the
World Health Organisation (WHO) on March 10, 2020
and India’s nationwide lockdown that followed set
off one of the biggest migrations in human history
as people fled cities in fear of what was perceived
widely as an urban disease only to find that the virus
pursued them to their villages. This amnesia was
global. To illustrate, the WHO, which is mandated to
declare pandemics, did so in respect of H1N1 in 2009,
but that came to be seriously questioned because it
turned out to be unusually mild, and scrutiny focused
on pharmaceutical industries which benefited from
the production and sale of vaccines. The Severe
Acute Respiratory Syndrome (SARS), the Middle East
Respiratory Syndrome-Coronavirus (MERS-COV) and
Ebola did spark pervasive alarm, but casualties were
relatively few and the incidence of infections was
localised.
The 2020 pandemic caused worldwide contagion,
and the precipitous loss of lives and livelihood. By the
end of 2021, several advanced economies may have
reached or exceeded pre-pandemic levels of output,
but middle income emerging economies have suffered
large losses of output, with the heaviest burden falling
on low income countries. This pandemic is also
noteworthy for the unprecedented policy response
mounted by governments and central banks. The IMF
estimates that since March 2020 and up to October
2021, US$16.9 trillion or 16.4 per cent of global GDP
had been pledged as fiscal support in response to the
pandemic, with US$ 14.5 trillion provided by advanced
economies (AEs) and US$ 2.4 trillion provided by
emerging market economies (EMEs), including the
least developed countries. The total monetary support
was US$19.0 trillion or 18.4 per cent of global GDP,
US$ 16.1 trillion by AEs and US$ 2.9 trillion by EMEs.
What guided this once-in-a-lifetime policy
response, given the collective oblivion that I talked
about earlier? It was the global financial crisis (GFC)
of 2008. Typically, in crises of global proportions,
it is governments or fiscal policy that assume a
vanguard role, while central banks, known for their
conservativeness and preference for the back office,
play a supportive role as lenders of the last resort. In
response to the GFC, however, it was central banks
that rushed to the frontline. Faced with a loss of
their main instrument – the interest rate – which
had fallen to zero, then considered the lower bound
to which interest rates can decline3, central banks
unleashed unconventional measures, using their
balance sheets to support economic activity, providing
forward guidance to stabilise expectations and anchor
the uncertain future, and directly influencing longer-
term yields at the cost of being accused of the cardinal
sin of effectively monetising stimulus-distended fiscal
deficits. In that sense, they did have some sort of a
template when the pandemic arrived.2 For these insights, I draw heavily on Chinmay Tumbe (2020): Age Of Pandemics (1817-1920): How they shaped India and the World, HarperCollins Publishers India.
3 More recently, interest rates have fallen even below zero to the negative zone.
SPEECH
RBI Bulletin February 2022 17
RBI’s Pandemic Response: Stepping out of Oblivion
Leaning against the Pandemic
Among the first steps that the RBI took within
six days of the WHO’s declaration of COVID-19 as a
pandemic was to create a business continuity bio-
bubble. In the event that the rest of us became infected,
150 selected officers, staff and service providers
were kept in isolation in the bubble to work 24X7 in
order to keep essential RBI services such as currency
issue, retail and wholesale payment and settlement
systems, financial markets regulation and supervision
and liquidity management, to name only a salient
few that impact the lives of citizens, businesses and
financial institutions on a regular basis. This turned
out to be farsighted. Within days of the national
lockdown being announced, financial markets in India
went into seizure, financial institutions were gripped
by liquidity evaporation, and finance, that keeps the
wheels of the economy turning, dried up.
From March 27, 2020 the RBI unfurled a panoply
of measures numbering more than a hundred in
total, some conventional and others out-of-the-
box, to address pandemic-induced dislocations and
constraints, both system level and also specific to
sectors, institutions and financial instruments.
In terms of conventional measures, the policy
repo rate was reduced by an unprecedented 115 bps
in two phases. The interest rate on the fixed rate
reverse repo rate under the liquidity adjustment
facility (LAF), under which market participants
deposit their surpluses with the RBI, was reduced
cumulatively by 155 bps and it became the effective
anchor for the evolution of money market rates
and even longer-term interest rates. Banks’ access
to liquidity under the marginal standing facility, a
lending window which is priced at 25 bps above the
policy repo rate, was expanded by close to `1,37,000
crore. System level liquidity was also enhanced
though large scale open market purchase operations
and a one percentage point reduction in the cash
reserve ratio (CRR) that freed up banks’ resources to
the extent of `1,37,000 crore.
Turning to unconventional measures, long-term repo operations (LTROs) and targeted long-term repo operations (TLTROs) were undertaken to augment systemic liquidity, lower the banks’ cost of funds and influence longer-term interest rates more directly. While LTROs enhanced the overall liquidity in the system, TLTROs ensured the distribution of liquidity to specific sectors in need of funds. Additionally, when redemption fears gripped the mutual fund industry, a special liquidity facility for mutual funds (SLFMF) was crafted virtually over a weekend. When these liquidity measures encountered risk aversion among banks in on-lending the RBI’s funds to troubled entities, special refinance facilities were provided to All India Financial Institutions (AIFIs) to mitigate sector-specific and small institution-specific liquidity constraints. On tap TLTROs provided liquidity to banks for deployment in corporate bonds, commercial paper, nonconvertible debentures and bank loans to specific sectors. In the first half of 2021-22, the RBI pledged its balance sheet to mitigating the impact of the pandemic and reviving the economy. From April through September 2021, the RBI engaged in asset purchases through a secondary market Government securities acquisition programme (G-SAP) which involved an upfront commitment on amounts to be purchased and impacted yields directly. Total G-SAP purchases amounted to `2.2 lakh crore. In addition, special open market operations (OMOs) involving simultaneous purchase and sale of securities, which were liquidity neutral, were undertaken to distribute liquidity more evenly across the yield curve, thereby facilitating monetary transmission. Overall, liquidity augmenting measures worth `17.2 lakh crore (8.7 per cent of nominal GDP of 2020-21) were announced since February 6, 20204.
4 The specific aspects of all these measures, including amounts sanctioned and utilised, are documented in https://www.rbi.org.in/scripts/bs_viewcontent.aspx?Id=3894.
SPEECH
RBI Bulletin February 202218
RBI’s Pandemic Response: Stepping out of Oblivion
Forward guidance (FG) gained prominence in the
RBI’s strategy. In every statement of the monetary
policy committee (MPC), it was reiterated that the
policy stance would remain accommodative, including
with explicit time-contingent and state-contingent
guidance. Financial markets were assured that the
Reserve Bank will maintain congenial financial
conditions for sustaining the recovery. This dispelled
illiquidity fears and bolstered market sentiment.
While monetary and liquidity measures
addressed the immediate panic, the dislocations in
everyday activity and access to finance brought to the
fore solvency concerns across individuals, small and
large businesses, and raised fears of impending asset
quality stress among banks and financial institutions.
Accordingly, the RBI launched a suite of regulatory
measures that included a loan moratorium; asset
classification standstill; easing of working capital
financing and deferment of interest; increasing of
group exposure norms; restructuring of advances
to micro, small, and medium enterprises (MSMEs);
and reduction of the liquidity coverage ratio (LCR)
requirements, to mention the main initiatives. These
steps provided a temporary reprieve to borrowers
affected by the pandemic and shored up the health of
lending institutions, thereby preserving the resilience
of the financial system. Several countercyclical
regulatory measures were also undertaken to ease
stress on both borrowers and the banking system:
rationalisation of risk weights for individual housing
loans; revised risk weights for banks’ regulatory retail
portfolio; and restrictions on banks from paying out
dividends.
On the technological front, the RBI adopted a
proactive approach by leveraging on technology to
facilitate digital penetration, innovative payment
options and consumer awareness on the road to a “less
cash” reliant society. A few initiatives were customised,
keeping in view social distancing and contact protocols
of the pandemic, including (i) ensuring availability
of digital banking channels, ATMs, internet/mobile
banking facilities; (ii) strengthening cyber security;
(iii) developing mechanisms for faster redressal of
customer grievances; and (iv) improving financial
literacy through sustained and focused campaigns
through RBI Kehta Hai5.
The Report Card so far
The impact of these measures is still unravelling
and even when the outcomes have fully formed, a one-
to-one correspondence may be difficult to establish,
given the many moving parts that are involved.
Notwithstanding this caveat, however, the overall
state of the economy and of financial markets – which
is what these measures sought to address – provides
some evidence of the efficacy or otherwise of the RBI’s
pandemic response.
Ahead of the pandemic’s onset, the Indian
economy was into a cyclical downturn, with real GDP
growth having decelerated in 2019-20 to its lowest
rate in a decade. Consequently, monetary policy had
turned accommodative from February 2019, with a
cumulative reduction of 135 bps in the policy rate up
to February 2020. System level liquidity was kept in
surplus from June 2019 in consonance with the stance
of monetary policy. At the end of February 2020,
market participants had deposited excess liquidity of
the order of `3 lakh crore under the LAF.
The first quarter of 2020-21 bore the full brunt of
the pandemic’s onslaught. With mobility of people and
goods dropping to all-time lows, real GDP contracted
by a precipitous 24.4 per cent, which was among the
deepest in the world. Unemployment peaked at 24
per cent in April, although in rural areas, farm activity
displayed pandemic proofing and the Mahatma
Gandhi National Rural Employment Guarantee Act
(MGNREGA) provided a measure of insulation. Exports
5 ‘RBI Kehta Hai’ is a 360-degree campaign initiated by the RBI using all mass media, including television, radio, newspapers, hoardings, web banners, gifs, social media and SMS.
SPEECH
RBI Bulletin February 2022 19
RBI’s Pandemic Response: Stepping out of Oblivion
plunged 61 per cent in April, with a commensurate
decline in imports. The National Statistical Office
(NSO) could not collect price quotations for compiling
the consumer price index due to the nation-wide
lockdown and had to resort to imputations.
By early June, the fury of the pandemic abated and
the pace of infections started to ebb. This emboldened
the unlocking of the economy in a phased manner that
took up to the end of December 2020 to be completed.
As businesses haltingly resumed operations and
mobility around workplaces, grocery stores and
pharmacies improved, outmigration started to reverse
and the unemployment rate eased to 10.2 per cent.
Supply and work disruptions showed up in inflation
surging to 6.2 per cent in June. The Indian economy
remained in contraction in the second quarter of 2020-
21 and it was only in the second half of the year that on
the back of policy stimulus, festival-related spending
and the release of pent-up demand a hesitant and
uneven recovery started taking shape. Meanwhile, the
RBI’s measures brought down borrowing costs to their
lowest in 17 years and narrowed spreads across rating
categories on corporate bonds, commercial paper and
debentures to pre-pandemic levels. By engendering
congenial financing conditions, the RBI supported
the recovery. Governments of various levels and
corporates utilised this opportunity to raise a record
volume of resources from financial markets. In the
corporate sector, deleveraging was facilitated and high
cost debt could be replaced, reducing vulnerabilities
and preparing the sector to participate in the ongoing
recovery. Abundant liquidity and the RBI’s measures
enabled a quick and full transmission of policy rate
cuts to deposit and lending rates, easing the cost of
funds for bank clientele.
The second wave dented the recovery in the first
quarter of 2021-22, but its impact turned out to be
relatively less severe. The Indian economy renewed
its tryst with the interrupted recovery, which gained
strength and pace through the rest of the year. It is
estimated that real GDP will rise by 9.2 per cent
during the current financial year, cresting pre-
pandemic levels, and marking a turnaround from the
decline of 7.3 per cent the year before. Exports have
been the silver lining, growing by 49.7 per cent year-
on-year in US dollars terms during April-December
2021 at a time when international trade has been
hamstrung by supply chain disruptions, shortages
and logistics impairments. Import demand has surged
on the back of the return of domestic demand to
normal conditions. Employment has yet to recover
fully though, and labour participation remains low.
Bank credit has begun to gain pace, helped by easing
of stress in banks’ balance sheets. Inflation has eased
from pandemic highs to more tolerable levels in
recent months, although it remains elevated amidst
high commodity prices, including of crude.
To summarise, the RBI’s measures have
contributed significantly in engineering the
turnaround in the Indian economy, supported by
rising financial inclusion and digitalisation. We are
on course to becoming among the fastest growing
economies of the world, but there is far to go. Private
consumption and investment are still work in
progress. The restoration of livelihoods and the revival
of MSMEs is a formidable task that lies ahead. The RBI
remains committed to revive and sustain growth on
a durable basis and continue to mitigate the impact
of COVID-19 on the economy, while ensuring that
inflation remains within the target going forward.
Governor’s Statements
When the definitive chronicle of this period
is recorded, history will judge the role of the RBI
in ameliorating the impact of COVID-19 and in
lifting the Indian economy out of the depths of the
pandemic’s contraction. I would not hazard the
audacity of anticipating the judgment of history, but
today, India is much better placed to deal with future
waves of the pandemic relative to the first wave. In
SPEECH
RBI Bulletin February 202220
RBI’s Pandemic Response: Stepping out of Oblivion
the documentation of this journey, however, what I
fear may not receive a fuller appreciation is that the
RBI’s pandemic response was fashioned around and
launched with a central anchor, a leit motif if you
will, that bound everything together into a coherent
whole. I refer to the Governor’s statements, which
have become an integral element of the institutional
edifice of the RBI’s pandemic response. I propose to
balance the future narrative upfront by sharing with
you an insider’s view of some noteworthy aspects of
these statements that may go unnoticed among the
minutiae of rationale, high frequency indicators and
measures.
Delving deep into hidden inner reserves of self-
belief, conviction and fortitude, and guided by the light
shone by the words of Mahatma Gandhi, Governor Shri
Shaktikanta Das has made 13 ‘pandemic’ statements
so far, starting on March 27, 2020 when the monetary
policy committee advanced its scheduled meeting
to deal with the extraordinary and unprecedented
situation.
The first noteworthy characteristic of the
statements is that they have been visionary. In fact,
the statement of February 6, 2020 ahead of the
formal declaration of the pandemic seemed to have a
premonition of the dark days that were to follow. This
is reflected in the manner in which it assured markets
that policy space is available for future action, which
needs to be ‘suitably timed’ and ‘used appropriately’.
The March 27, 2020 statement called on the nation
to mount a war effort to combat COVID-19, while
emphasising that ‘tough times never last; only tough
people and tough institutions do’. My sense is that a
vision of the unprecedented loss and isolation that
was to follow was already in the mind’s eye when that
statement soothed frayed and tense expectations by
stating that the RBI ‘is at work and in mission mode’. It
became the launching pad for aggressively unleashing
an array of instruments covering many of the liquidity
and regulatory measures enumerated in the preceding
section as well as deferment of prudential standards.
Second, the statements were a beacon of light
and hope amidst the encircling gloom. Besides the
steadfast encouragement to the nation to battle the
unseen assassin and emerge victorious, they cheered
the warriors at the frontline – government personnel;
employees of banks and financial institutions;
doctors, healthcare and medical staff; police and
law enforcement agencies; and all those who kept
essential services operational – commended their
tireless striving to beat the virus and inspired them
to raise the bar. For us in the RBI, the messages were
special and personalised, reaching out to those in the
bio-bubble and to those outside it, including those
who provided intellectual, analytical and logistics
support for the preparation of the statements. In
the thick of the second wave, the statements of
April 7 and June 4, 2021 reposed a belief in the
indomitable spirit of humanity to confront the ‘trial
by virus’, stating that the need of the hour is not to
be overwhelmed but to collectively overcome. The
August 6, 2021 statement emphasised that the RBI
remains in “whatever it takes” mode, with a readiness
to deploy all its policy levers - monetary, prudential
or regulatory. As the second wave waned, the October
2021 statement started guiding the economy on its
course to normalise and entrench the recovery in an
Indian trajectory, notwithstanding diverging paths of
growth globally and differing monetary policy stances.
By the time of the April 17, 2020 statement, it
was clear that providing system level liquidity was
not going to be enough because impediments like
risk aversion among banks were standing in the way
of further intermediation towards the small, the
disadvantaged and the truly credit constrained. This
brought out the third important characteristic of
Governor’s statements: a wide consultative approach,
which involved reaching out directly to all those
entities that had been impacted by the pandemic
the most, including small non-banking financial
SPEECH
RBI Bulletin February 2022 21
RBI’s Pandemic Response: Stepping out of Oblivion
companies (NBFCs) and micro finance institutions
(MFIs), and even vaccine manufacturers. When
inducements to banks to lend did not work, the RBI
reached out to all India financial institutions (AIFIs)
to onlend to rural and cooperative institutions, MFIs,
and HFCs. In subsequent months, this approach led
to the fashioning of liquidity lines and regulatory
relief to specific sectors identified for restructuring,
emergency health services, contact intensive services,
and even individuals and small businesses.
Fourth, the statements in themselves became
an instrument of policy by providing consistent
and credible forward guidance, especially to
financial markets. This assumes central relevance
because by that time, the RBI had already acted on
conventional instruments to the extent practicable,
and had embarked on unconventional ones, including
asymmetrically widening the policy interest rate
corridor and balance sheet policies, i.e., expansion
of its own balance sheet to infuse liquidity into
the system. The statements emphasised financial
stability, congenial financial conditions for growth
and the orderly evolution of the yield curve as public
goods and that both market participants and the RBI
have a shared responsibility in securing cooperative
solutions. By the time of the October 2020 statement,
Governor’s statements started contemplating the road
to recovery, looking back at the hitherto untravelled
road and calling upon the courage of hope to strive
and revive. Attention turned to qualitative aspects
like deepening financial markets, digital payments
security, financial inclusion, consumer protection
and innovations in payment and settlement. India
became one of the few nations in the world that ran
its real time gross settlement (RTGS) system of swift,
seamless and sound transfers of funds between banks
and thereby their customers 365x24x7.
Fifth, the statements became the glue of a new
innings in monetary and fiscal coordination. Pandemic-
related fiscal stimulus exacerbated fiscal deficits and
resulted in record levels of market borrowings by both
central and state governments. As the December 2020
statement pointed out, the RBI’s role as debt manager
and banker to the government was tested to the hilt.
A recurring theme in several statements has been
that the RBI’s policy measures ensured the lowest
borrowing costs in nearly two decades and the highest
maturity of the stock of public debt while ensuring
the smooth passage of the borrowing programme. For
the states, ways and means advances (WMA) limits
were enhanced and rules governing withdrawals from
the consolidated sinking fund were relaxed. Liquidity
facilities were linked with credit guarantee schemes
offered by the government. A shining example of
monetary fiscal coordination, which was placed on
record by the statement of April 7, 2021 was the
maintenance of status quo in the monetary policy
framework by the government, entrenching a regime
in which the inflation target is set by the government
and the RBI is mandated to achieve the target. Yet
another instance that the statements of June 4,
August 6, October 8 and December 8, 2021 underscore
is the set of strong supply-side interventions by the
government that broke the back of then stubborn food
inflation and brought headline inflation back into the
tolerance band.
Sixth, the statements brought to bear first-
hand views from Governor’s interactions in various
multilateral fora on global developments and outlook,
and the implications of global spillovers for the Indian
economy and for the setting of monetary policy. In
hindsight, these insights turned out to be invaluable.
In a situation in which several EMEs were jumping on
to the bandwagon of tightening monetary policy and
AEs were announcing normalisation or joining their
EMEs in raising policy rates, India held its ground
and is among a few countries that have retained an
accommodative monetary policy6, despite some views
6 In fact, the statement of December 8, 2021 states that “our motto is to ensure a soft landing that is well-timed.”
SPEECH
RBI Bulletin February 202222
RBI’s Pandemic Response: Stepping out of Oblivion
that we have fallen behind the curve. Only time will
tell whether or not India has got it right but so far, this
approach has served us well and helped in charting
a course into the future which is different from the
world.
Conclusion
In the hallowed tradition of central banks, the
RBI as an institution shuns the glare of the limelight,
preferring to remain unglorified and grounded. Yet
when the chips are down and crises loom, it rises up
from the depths that it inhabits and flings itself at the
gathering storm. When the job is done, the recovery
secured and macroeconomic and financial stability
ensured, it falls back, usually unsung, but always
on guard. The pandemic continues to shape the
future, but the RBI remains armed and battle ready.
Continuously evaluating highly volatile and uncertain
conditions and remaining prepared to protect the
economy from shocks, the RBI has committed all its
instruments to this objective, using conventional
measures and fashioning new ones, as the pandemic
experience showed. The lessons of the pandemic will
be imbibed and the RBI will emerge stronger and more
resilient than before, and committed to its mandate
of price stability, keeping in mind the objective of
growth.
ARTICLES
State of the Economy
Zombies and the Process of Creative Destruction
Bad Banks as Good Samaritans: Lessons from Cross-Country Experience for India
Impact of COVID-19 on Sentiments of Indian Manufacturers

ARTICLE
RBI Bulletin February 2022 23
State of the Economy
* This article has been prepared by Madhuresh Kumar, Shashidhar M. Lokare, Kunal Priyadarshi, Rajeev Jain, Vineet Kumar Srivastava, Harshita Keshan, Rigzen Yangdol, Prashant Kumar, Jobin Sebastian, Rachit Solanki, Saksham Sood, Priyanka Sachdeva, Abhinandan Borad, Deepika Rawat, Jibin Jose, Avnish Kumar, Rajas Saroy, Asish Thomas George, Deba Prasad Rath and Samir Ranjan Behera. Views expressed in this article are those of the authors and do not necessarily represent the views of the Reserve Bank of India.
State of the Economy*
Domestic macroeconomic conditions are striking a path that is diverging from global developments. In India, the recovery in economic activity is gaining strength and traction as it emerges from the third wave. Both manufacturing and services remain in expansion with optimism on demand parameters and uptick in consumer and business confidence. As businesses return to a new normal, the job landscape is expected to improve. Farm sector conditions remain robust albeit with some signs of rural demand slackening. Even as monetary policy remains accommodative, global spillovers have led to a tightening of financial conditions.
Introduction
Economic activity in India is recouping from a
brief spell of moderation in January in view of the
less virulent effects of Omicron. Better planning
and strategy, management of supply chain logistics
and accelerated digitalisation helped firms mitigate
pandemic risks. Unlike in the first two waves, overall
consumer and business confidence stayed resilient
on the back of the accelerated pace of vaccination,
better prospects on the general economic situation,
household incomes and spending.
The vaccination programme that commenced on
January 16, 2021 has progressed impressively, with
around 95 per cent of the adult population inoculated
with the first dose, while 77 per cent have received
both the doses. Thus far, 5.24 crore people have been
administered with the first dose in the 15-18 year age
group. As on February 16, 2022 over 1.79 crore people
in the 60 plus age group and frontline workers have
been inoculated with precautionary dose. With daily
infections and total number of infections on a waning
trajectory, India seems to be well past the third wave.
In February 2022, mobility indicators
have recovered to pre-pandemic levels while
unemployment dropped. As businesses return to
new normal, hiring activities have gained traction –
several Indian firms, global giants and startups have
announced massive hiring plans for India1. Buoyant
revenue collections under the goods and services
tax (GST), robust toll collections and e-way bill
generations are all reflective of the ongoing revival.
The farm sector remains upbeat on the back of
higher minimum support prices (MSPs) announced
by the Government. The manufacturing activity
remains in expansion with optimism on demand
parameters such as production volumes, new orders
and job landscape during Q4:2021-22. Firms expect
further improvement in capacity utilisation and
overall financial situation. Firms in the services
sector remained optimistic on demand conditions,
while their expectations on overall business
situation, turnover and employment conditions have
moderated marginally.
Set against this backdrop, rest of the article
is divided into five sections. The next section
encapsulates the evolving global economic and
financial market situation. Section III analyses
the current developments unfolding in domestic
economy. Section IV examines the evolving financial
market conditions. The last section sums up the
discussion.
II. Global Setting
The outlook for the global economy is beset with
downside risks. Omicron continues to weigh on overall
activity as mobility restrictions and containment
1 https://www.india.com/business/new-year-new-job-heres-a-list-of-companies-with-promising-hiring-plans-for-2022-employment-opportunities-5201022/
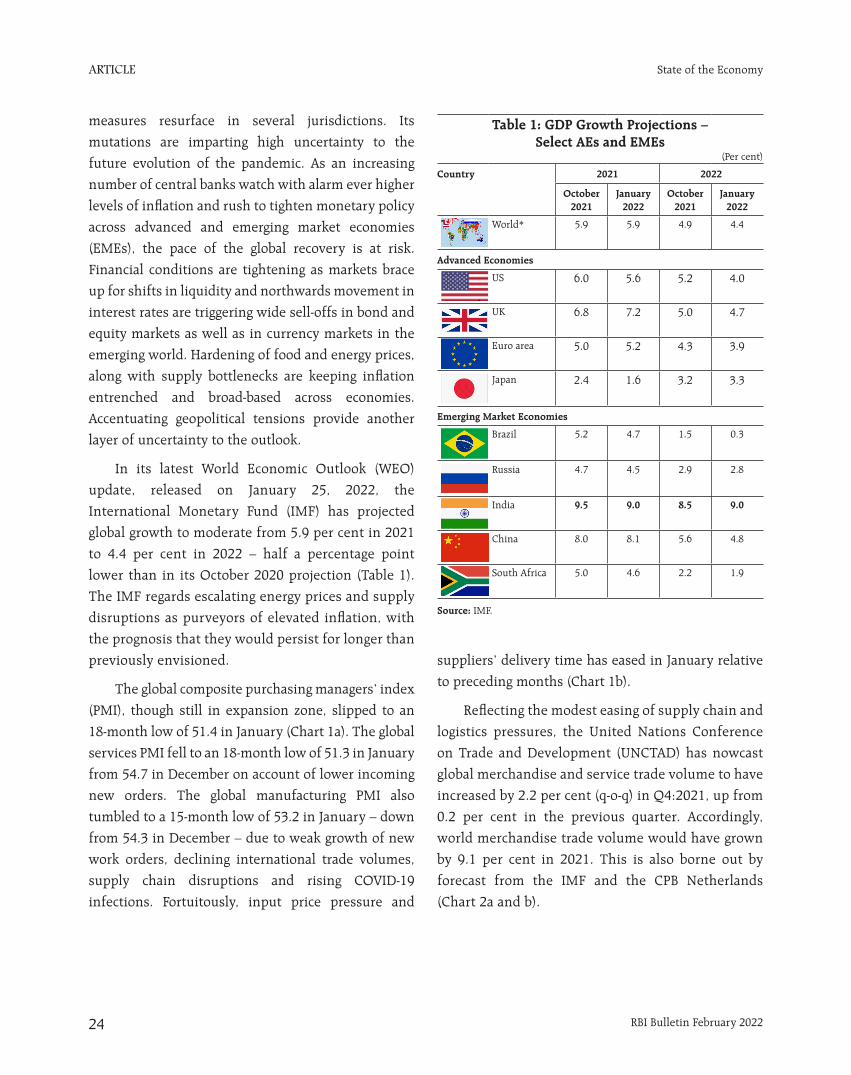
ARTICLE
RBI Bulletin February 202224
State of the Economy
Table 1: GDP Growth Projections – Select AEs and EMEs
(Per cent)
Country 2021 2022
October 2021
January 2022
October 2021
January 2022
World* 5.9 5.9 4.9 4.4
Advanced Economies
US 6.0 5.6 5.2 4.0
UK 6.8 7.2 5.0 4.7
Euro area 5.0 5.2 4.3 3.9
Japan 2.4 1.6 3.2 3.3
Emerging Market Economies
Brazil 5.2 4.7 1.5 0.3
Russia 4.7 4.5 2.9 2.8
India 9.5 9.0 8.5 9.0
China 8.0 8.1 5.6 4.8
South Africa 5.0 4.6 2.2 1.9
Source: IMF.
measures resurface in several jurisdictions. Its
mutations are imparting high uncertainty to the
future evolution of the pandemic. As an increasing
number of central banks watch with alarm ever higher
levels of inflation and rush to tighten monetary policy
across advanced and emerging market economies
(EMEs), the pace of the global recovery is at risk.
Financial conditions are tightening as markets brace
up for shifts in liquidity and northwards movement in
interest rates are triggering wide sell-offs in bond and
equity markets as well as in currency markets in the
emerging world. Hardening of food and energy prices,
along with supply bottlenecks are keeping inflation
entrenched and broad-based across economies.
Accentuating geopolitical tensions provide another
layer of uncertainty to the outlook.
In its latest World Economic Outlook (WEO)
update, released on January 25, 2022, the
International Monetary Fund (IMF) has projected
global growth to moderate from 5.9 per cent in 2021
to 4.4 per cent in 2022 – half a percentage point
lower than in its October 2020 projection (Table 1).
The IMF regards escalating energy prices and supply
disruptions as purveyors of elevated inflation, with
the prognosis that they would persist for longer than
previously envisioned.
The global composite purchasing managers’ index
(PMI), though still in expansion zone, slipped to an
18-month low of 51.4 in January (Chart 1a). The global
services PMI fell to an 18-month low of 51.3 in January
from 54.7 in December on account of lower incoming
new orders. The global manufacturing PMI also
tumbled to a 15-month low of 53.2 in January – down
from 54.3 in December – due to weak growth of new
work orders, declining international trade volumes,
supply chain disruptions and rising COVID-19
infections. Fortuitously, input price pressure and
suppliers’ delivery time has eased in January relative
to preceding months (Chart 1b).
Reflecting the modest easing of supply chain and
logistics pressures, the United Nations Conference
on Trade and Development (UNCTAD) has nowcast
global merchandise and service trade volume to have
increased by 2.2 per cent (q-o-q) in Q4:2021, up from
0.2 per cent in the previous quarter. Accordingly,
world merchandise trade volume would have grown
by 9.1 per cent in 2021. This is also borne out by
forecast from the IMF and the CPB Netherlands
(Chart 2a and b).
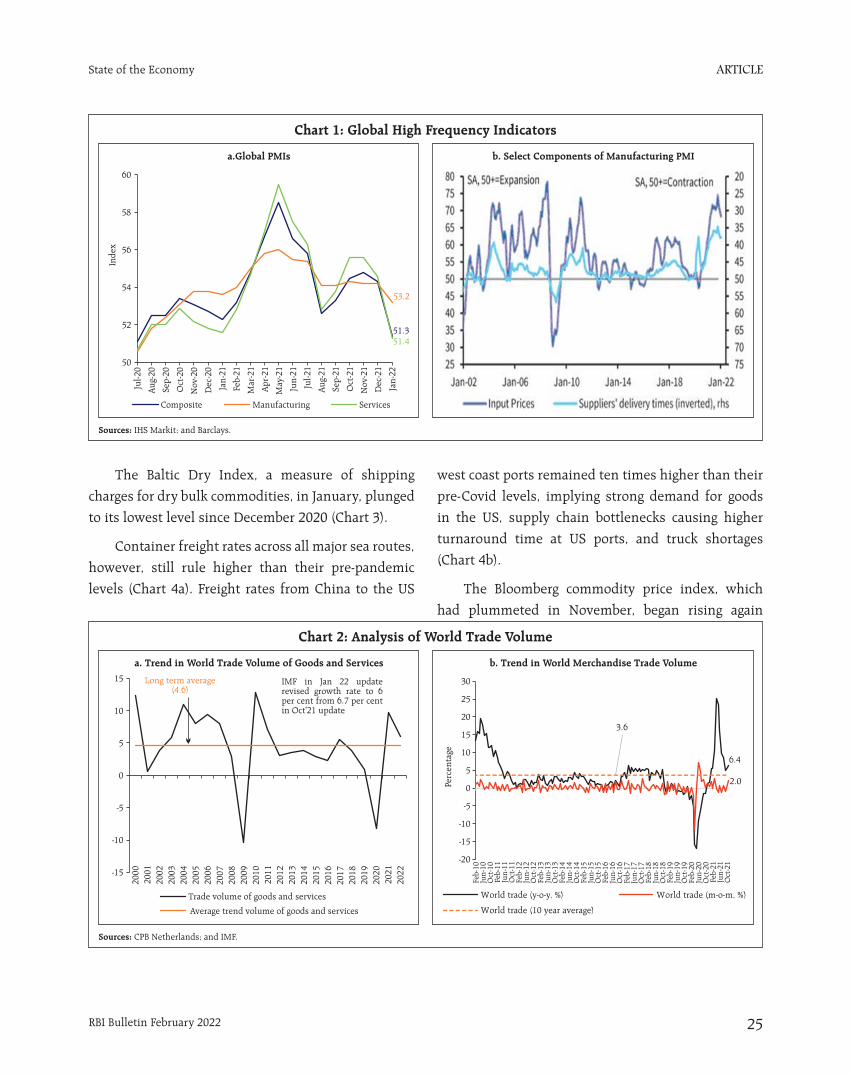
ARTICLE
RBI Bulletin February 2022 25
State of the Economy
The Baltic Dry Index, a measure of shipping
charges for dry bulk commodities, in January, plunged
to its lowest level since December 2020 (Chart 3).
Container freight rates across all major sea routes,
however, still rule higher than their pre-pandemic
levels (Chart 4a). Freight rates from China to the US
Chart 1: Global High Frequency Indicators
Sources: IHS Markit; and Barclays.
a.Global PMIs b. Select Components of Manufacturing PMI
Chart 2: Analysis of World Trade Volume
Sources: CPB Netherlands; and IMF.
a. Trend in World Trade Volume of Goods and Services b. Trend in World Merchandise Trade Volume
west coast ports remained ten times higher than their
pre-Covid levels, implying strong demand for goods
in the US, supply chain bottlenecks causing higher
turnaround time at US ports, and truck shortages
(Chart 4b).
The Bloomberg commodity price index, which
had plummeted in November, began rising again
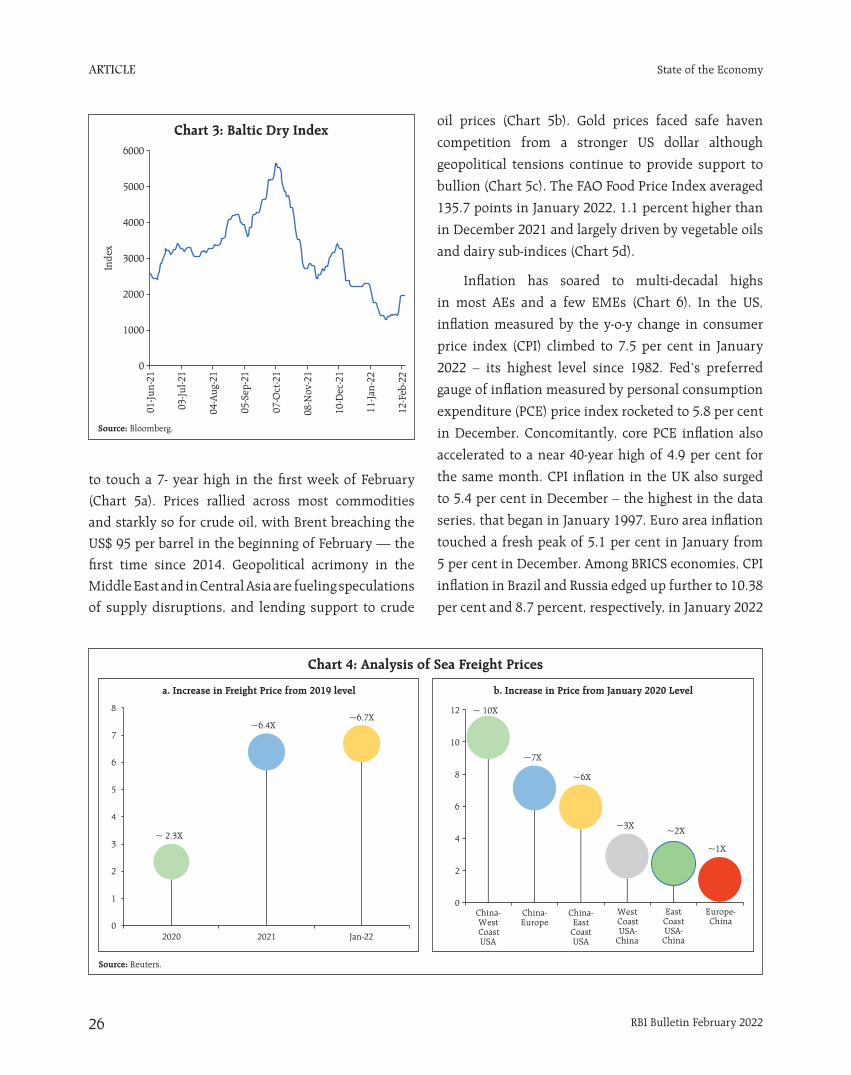
ARTICLE
RBI Bulletin February 202226
State of the Economy
to touch a 7- year high in the first week of February
(Chart 5a). Prices rallied across most commodities
and starkly so for crude oil, with Brent breaching the
US$ 95 per barrel in the beginning of February — the
first time since 2014. Geopolitical acrimony in the
Middle East and in Central Asia are fueling speculations
of supply disruptions, and lending support to crude
oil prices (Chart 5b). Gold prices faced safe haven
competition from a stronger US dollar although
geopolitical tensions continue to provide support to
bullion (Chart 5c). The FAO Food Price Index averaged
135.7 points in January 2022, 1.1 percent higher than
in December 2021 and largely driven by vegetable oils
and dairy sub-indices (Chart 5d).
Inflation has soared to multi-decadal highs
in most AEs and a few EMEs (Chart 6). In the US,
inflation measured by the y-o-y change in consumer
price index (CPI) climbed to 7.5 per cent in January
2022 – its highest level since 1982. Fed’s preferred
gauge of inflation measured by personal consumption
expenditure (PCE) price index rocketed to 5.8 per cent
in December. Concomitantly, core PCE inflation also
accelerated to a near 40-year high of 4.9 per cent for
the same month. CPI inflation in the UK also surged
to 5.4 per cent in December – the highest in the data
series, that began in January 1997. Euro area inflation
touched a fresh peak of 5.1 per cent in January from
5 per cent in December. Among BRICS economies, CPI
inflation in Brazil and Russia edged up further to 10.38
per cent and 8.7 percent, respectively, in January 2022
Chart 3: Baltic Dry Index
Source: Bloomberg.
Chart 4: Analysis of Sea Freight Prices
Source: Reuters.
a. Increase in Freight Price from 2019 level b. Increase in Price from January 2020 Level
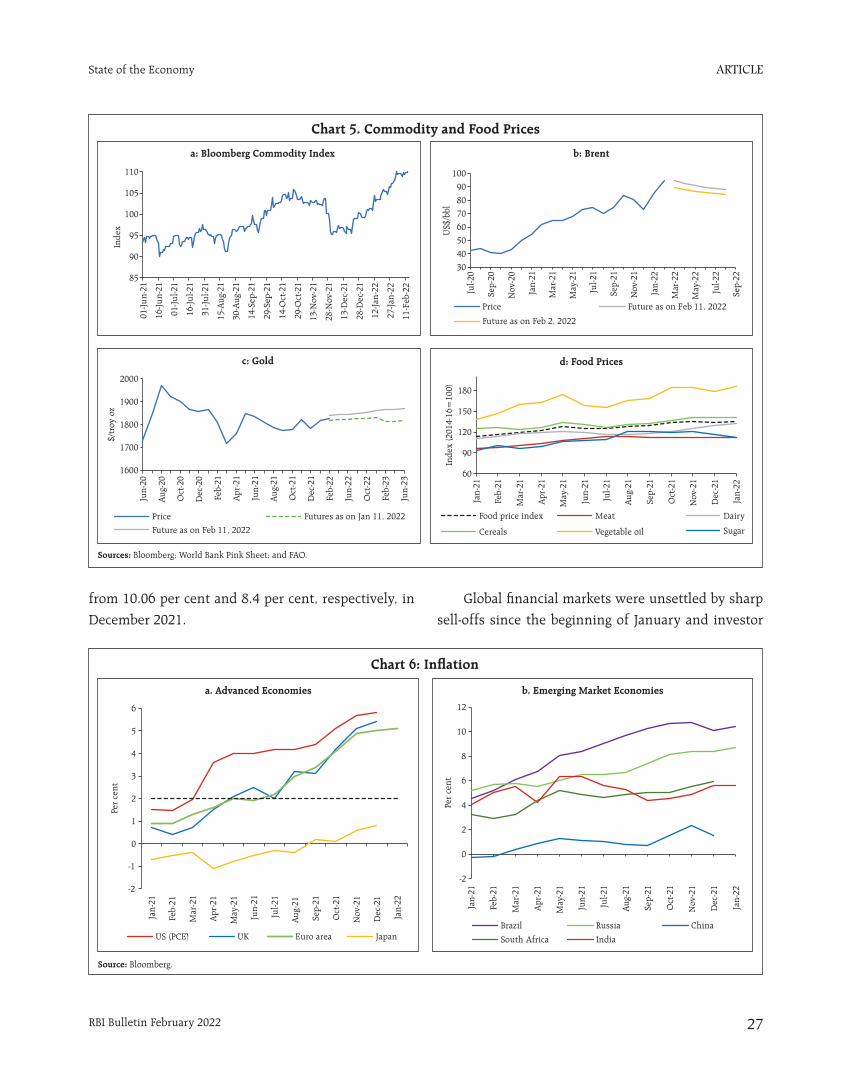
ARTICLE
RBI Bulletin February 2022 27
State of the Economy
from 10.06 per cent and 8.4 per cent, respectively, in
December 2021.
Global financial markets were unsettled by sharp
sell-offs since the beginning of January and investor
Chart 6: Inflation
Source: Bloomberg.
a. Advanced Economies b. Emerging Market Economies
Chart 5. Commodity and Food Prices
a: Bloomberg Commodity Index b: Brent
Sources: Bloomberg; World Bank Pink Sheet; and FAO.
c: Gold d: Food Prices
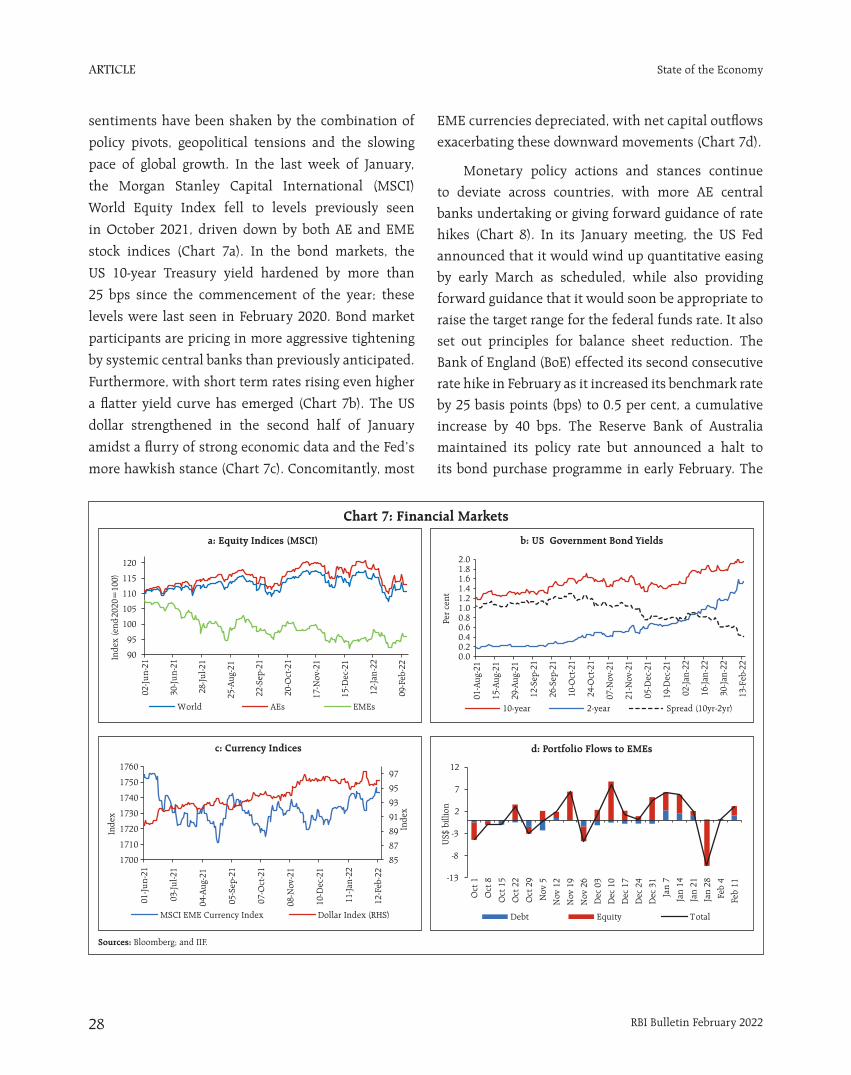
ARTICLE
RBI Bulletin February 202228
State of the Economy
sentiments have been shaken by the combination of
policy pivots, geopolitical tensions and the slowing
pace of global growth. In the last week of January,
the Morgan Stanley Capital International (MSCI)
World Equity Index fell to levels previously seen
in October 2021, driven down by both AE and EME
stock indices (Chart 7a). In the bond markets, the
US 10-year Treasury yield hardened by more than
25 bps since the commencement of the year; these
levels were last seen in February 2020. Bond market
participants are pricing in more aggressive tightening
by systemic central banks than previously anticipated.
Furthermore, with short term rates rising even higher
a flatter yield curve has emerged (Chart 7b). The US
dollar strengthened in the second half of January
amidst a flurry of strong economic data and the Fed’s
more hawkish stance (Chart 7c). Concomitantly, most
EME currencies depreciated, with net capital outflows
exacerbating these downward movements (Chart 7d).
Monetary policy actions and stances continue
to deviate across countries, with more AE central
banks undertaking or giving forward guidance of rate
hikes (Chart 8). In its January meeting, the US Fed
announced that it would wind up quantitative easing
by early March as scheduled, while also providing
forward guidance that it would soon be appropriate to
raise the target range for the federal funds rate. It also
set out principles for balance sheet reduction. The
Bank of England (BoE) effected its second consecutive
rate hike in February as it increased its benchmark rate
by 25 basis points (bps) to 0.5 per cent, a cumulative
increase by 40 bps. The Reserve Bank of Australia
maintained its policy rate but announced a halt to
its bond purchase programme in early February. The
Chart 7: Financial Markets
a: Equity Indices (MSCI) b: US Government Bond Yields
Sources: Bloomberg; and IIF.
c: Currency Indices d: Portfolio Flows to EMEs
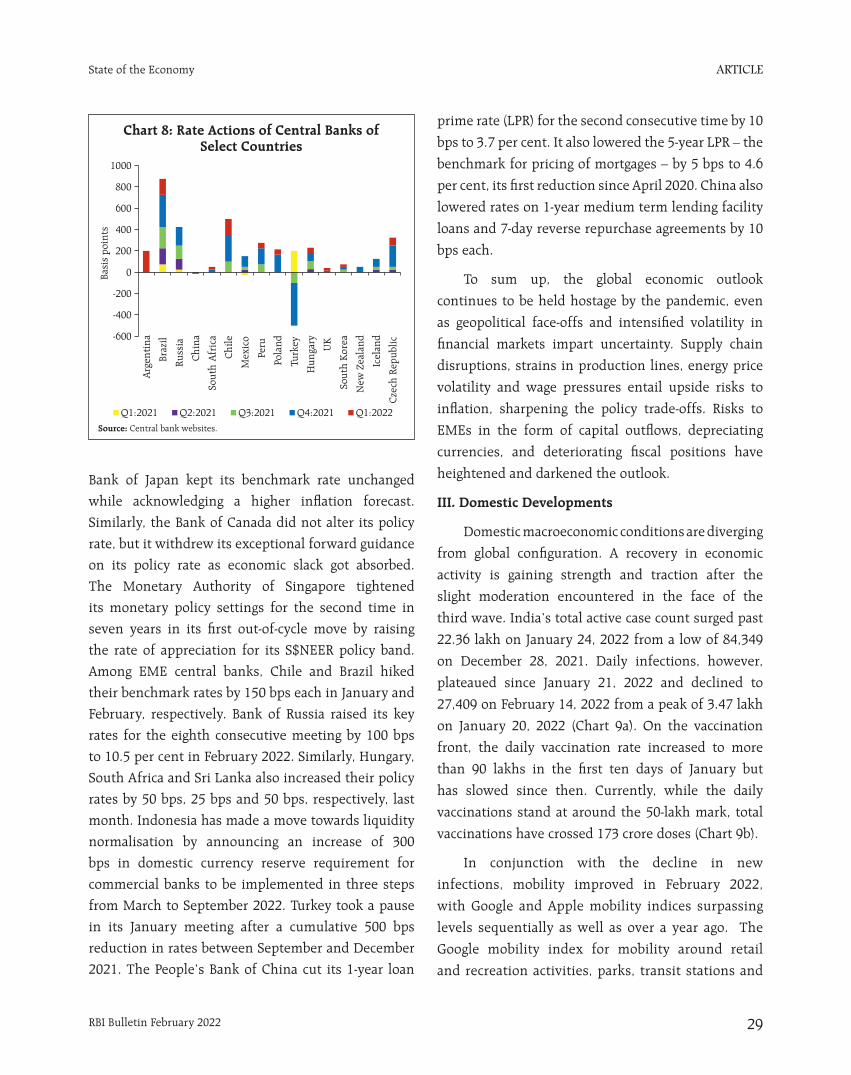
ARTICLE
RBI Bulletin February 2022 29
State of the Economy
Bank of Japan kept its benchmark rate unchanged
while acknowledging a higher inflation forecast.
Similarly, the Bank of Canada did not alter its policy
rate, but it withdrew its exceptional forward guidance
on its policy rate as economic slack got absorbed.
The Monetary Authority of Singapore tightened
its monetary policy settings for the second time in
seven years in its first out-of-cycle move by raising
the rate of appreciation for its S$NEER policy band.
Among EME central banks, Chile and Brazil hiked
their benchmark rates by 150 bps each in January and
February, respectively. Bank of Russia raised its key
rates for the eighth consecutive meeting by 100 bps
to 10.5 per cent in February 2022. Similarly, Hungary,
South Africa and Sri Lanka also increased their policy
rates by 50 bps, 25 bps and 50 bps, respectively, last
month. Indonesia has made a move towards liquidity
normalisation by announcing an increase of 300
bps in domestic currency reserve requirement for
commercial banks to be implemented in three steps
from March to September 2022. Turkey took a pause
in its January meeting after a cumulative 500 bps
reduction in rates between September and December
2021. The People’s Bank of China cut its 1-year loan
prime rate (LPR) for the second consecutive time by 10
bps to 3.7 per cent. It also lowered the 5-year LPR – the
benchmark for pricing of mortgages – by 5 bps to 4.6
per cent, its first reduction since April 2020. China also
lowered rates on 1-year medium term lending facility
loans and 7-day reverse repurchase agreements by 10
bps each.
To sum up, the global economic outlook
continues to be held hostage by the pandemic, even
as geopolitical face-offs and intensified volatility in
financial markets impart uncertainty. Supply chain
disruptions, strains in production lines, energy price
volatility and wage pressures entail upside risks to
inflation, sharpening the policy trade-offs. Risks to
EMEs in the form of capital outflows, depreciating
currencies, and deteriorating fiscal positions have
heightened and darkened the outlook.
III. Domestic Developments
Domestic macroeconomic conditions are diverging
from global configuration. A recovery in economic
activity is gaining strength and traction after the
slight moderation encountered in the face of the
third wave. India’s total active case count surged past
22.36 lakh on January 24, 2022 from a low of 84,349
on December 28, 2021. Daily infections, however,
plateaued since January 21, 2022 and declined to
27,409 on February 14, 2022 from a peak of 3.47 lakh
on January 20, 2022 (Chart 9a). On the vaccination
front, the daily vaccination rate increased to more
than 90 lakhs in the first ten days of January but
has slowed since then. Currently, while the daily
vaccinations stand at around the 50-lakh mark, total
vaccinations have crossed 173 crore doses (Chart 9b).
In conjunction with the decline in new
infections, mobility improved in February 2022,
with Google and Apple mobility indices surpassing
levels sequentially as well as over a year ago. The
Google mobility index for mobility around retail
and recreation activities, parks, transit stations and
Chart 8: Rate Actions of Central Banks of Select Countries
Source: Central bank websites.
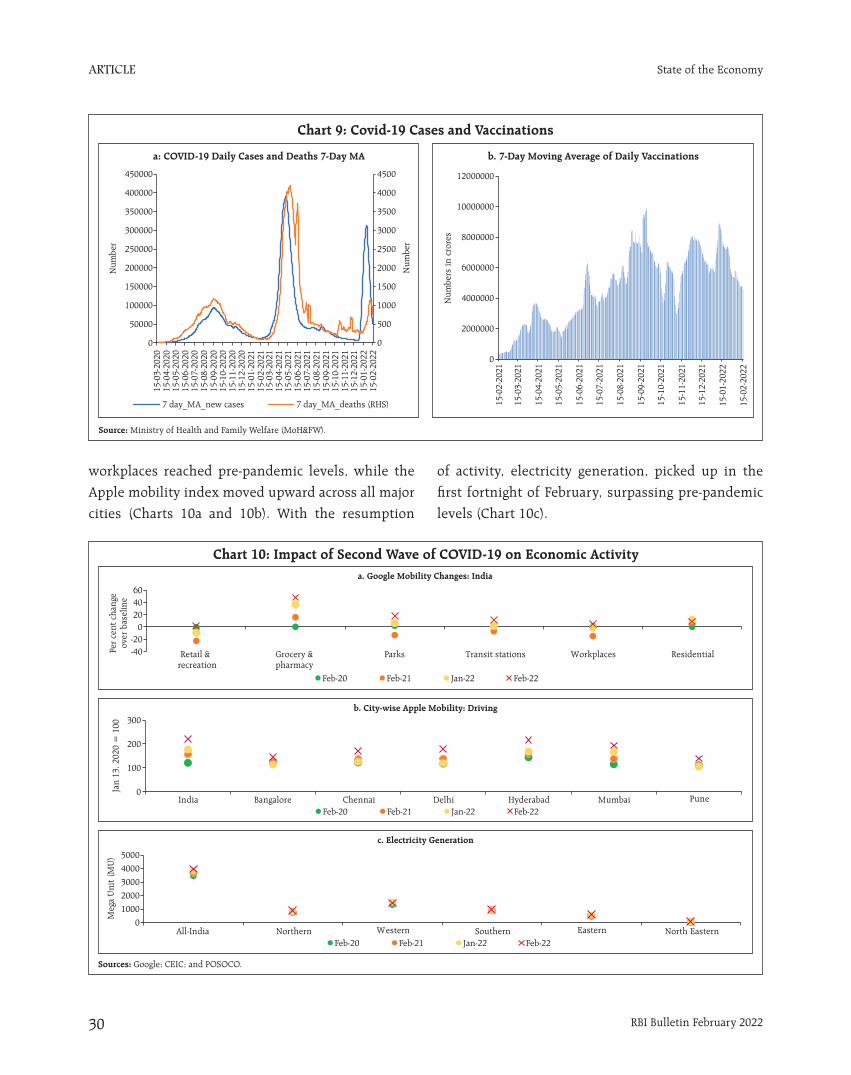
ARTICLE
RBI Bulletin February 202230
State of the Economy
workplaces reached pre-pandemic levels, while the
Apple mobility index moved upward across all major
cities (Charts 10a and 10b). With the resumption
Chart 9: Covid-19 Cases and Vaccinations
Source: Ministry of Health and Family Welfare (MoH&FW).
a: COVID-19 Daily Cases and Deaths 7-Day MA b. 7-Day Moving Average of Daily Vaccinations
of activity, electricity generation, picked up in the
first fortnight of February, surpassing pre-pandemic
levels (Chart 10c).
Chart 10: Impact of Second Wave of COVID-19 on Economic Activitya. Google Mobility Changes: India
b. City-wise Apple Mobility: Driving
c. Electricity Generation
Sources: Google; CEIC; and POSOCO.
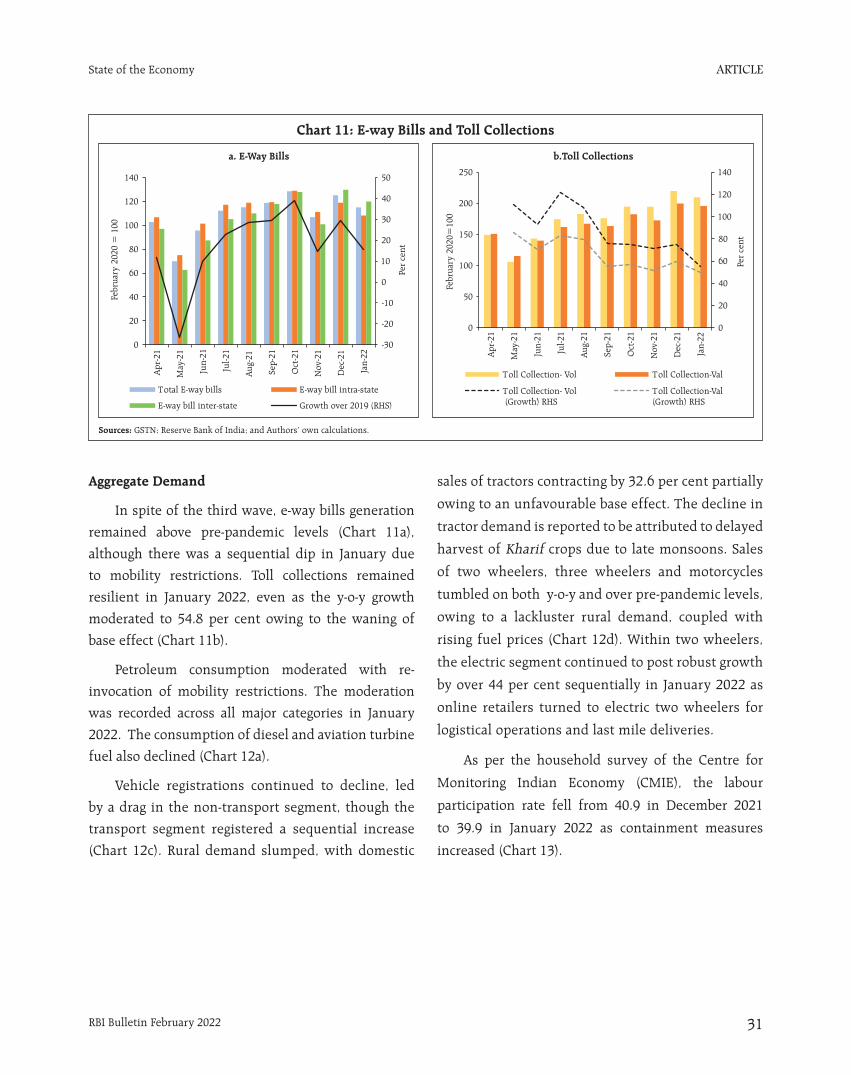
ARTICLE
RBI Bulletin February 2022 31
State of the Economy
Aggregate Demand
In spite of the third wave, e-way bills generation
remained above pre-pandemic levels (Chart 11a),
although there was a sequential dip in January due
to mobility restrictions. Toll collections remained
resilient in January 2022, even as the y-o-y growth
moderated to 54.8 per cent owing to the waning of
base effect (Chart 11b).
Petroleum consumption moderated with re-
invocation of mobility restrictions. The moderation
was recorded across all major categories in January
2022. The consumption of diesel and aviation turbine
fuel also declined (Chart 12a).
Vehicle registrations continued to decline, led
by a drag in the non-transport segment, though the
transport segment registered a sequential increase
(Chart 12c). Rural demand slumped, with domestic
sales of tractors contracting by 32.6 per cent partially
owing to an unfavourable base effect. The decline in
tractor demand is reported to be attributed to delayed
harvest of Kharif crops due to late monsoons. Sales
of two wheelers, three wheelers and motorcycles
tumbled on both y-o-y and over pre-pandemic levels,
owing to a lackluster rural demand, coupled with
rising fuel prices (Chart 12d). Within two wheelers,
the electric segment continued to post robust growth
by over 44 per cent sequentially in January 2022 as
online retailers turned to electric two wheelers for
logistical operations and last mile deliveries.
As per the household survey of the Centre for
Monitoring Indian Economy (CMIE), the labour
participation rate fell from 40.9 in December 2021
to 39.9 in January 2022 as containment measures
increased (Chart 13).
Chart 11: E-way Bills and Toll Collections
Sources: GSTN; Reserve Bank of India; and Authors’ own calculations.
a. E-Way Bills b.Toll Collections
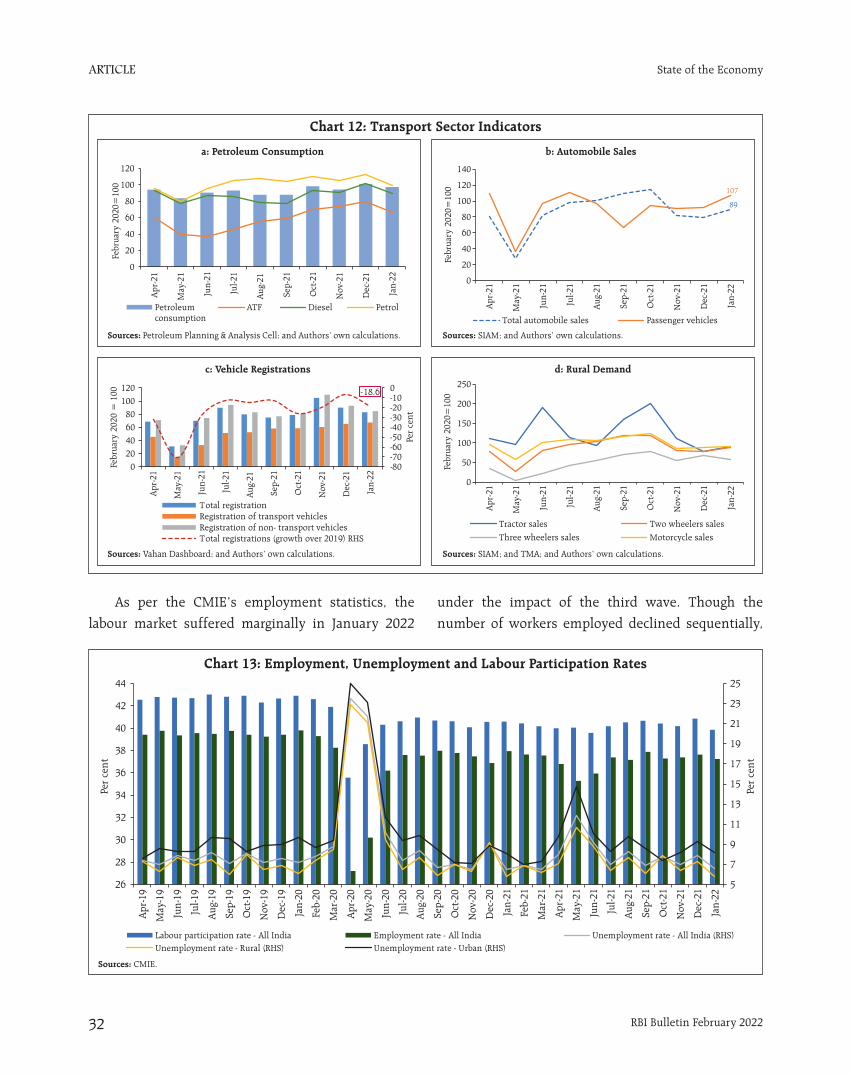
ARTICLE
RBI Bulletin February 202232
State of the Economy
As per the CMIE’s employment statistics, the
labour market suffered marginally in January 2022
under the impact of the third wave. Though the
number of workers employed declined sequentially,
Sources: Petroleum Planning & Analysis Cell; and Authors’ own calculations.
Sources: Vahan Dashboard; and Authors’ own calculations.
Sources: SIAM; and Authors’ own calculations.
Sources: SIAM; and TMA; and Authors’ own calculations.
Chart 12: Transport Sector Indicators
a: Petroleum Consumption
c: Vehicle Registrations
b: Automobile Sales
d: Rural Demand
Chart 13: Employment, Unemployment and Labour Participation Rates
Sources: CMIE.
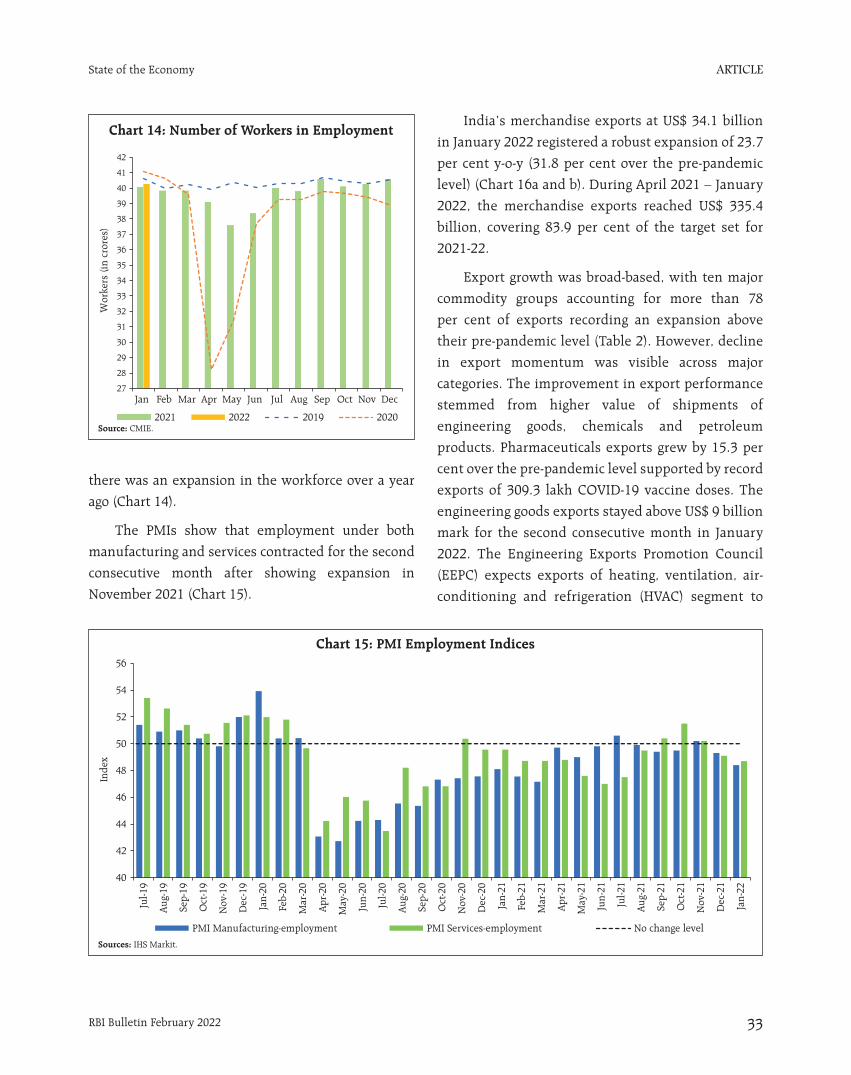
ARTICLE
RBI Bulletin February 2022 33
State of the Economy
there was an expansion in the workforce over a year
ago (Chart 14).
The PMIs show that employment under both
manufacturing and services contracted for the second
consecutive month after showing expansion in
November 2021 (Chart 15).
India’s merchandise exports at US$ 34.1 billion
in January 2022 registered a robust expansion of 23.7
per cent y-o-y (31.8 per cent over the pre-pandemic
level) (Chart 16a and b). During April 2021 – January
2022, the merchandise exports reached US$ 335.4
billion, covering 83.9 per cent of the target set for
2021-22.
Export growth was broad-based, with ten major
commodity groups accounting for more than 78
per cent of exports recording an expansion above
their pre-pandemic level (Table 2). However, decline
in export momentum was visible across major
categories. The improvement in export performance
stemmed from higher value of shipments of
engineering goods, chemicals and petroleum
products. Pharmaceuticals exports grew by 15.3 per
cent over the pre-pandemic level supported by record
exports of 309.3 lakh COVID-19 vaccine doses. The
engineering goods exports stayed above US$ 9 billion
mark for the second consecutive month in January
2022. The Engineering Exports Promotion Council
(EEPC) expects exports of heating, ventilation, air-
conditioning and refrigeration (HVAC) segment to
Chart 15: PMI Employment Indices
Sources: IHS Markit.
Chart 14: Number of Workers in Employment
Source: CMIE.
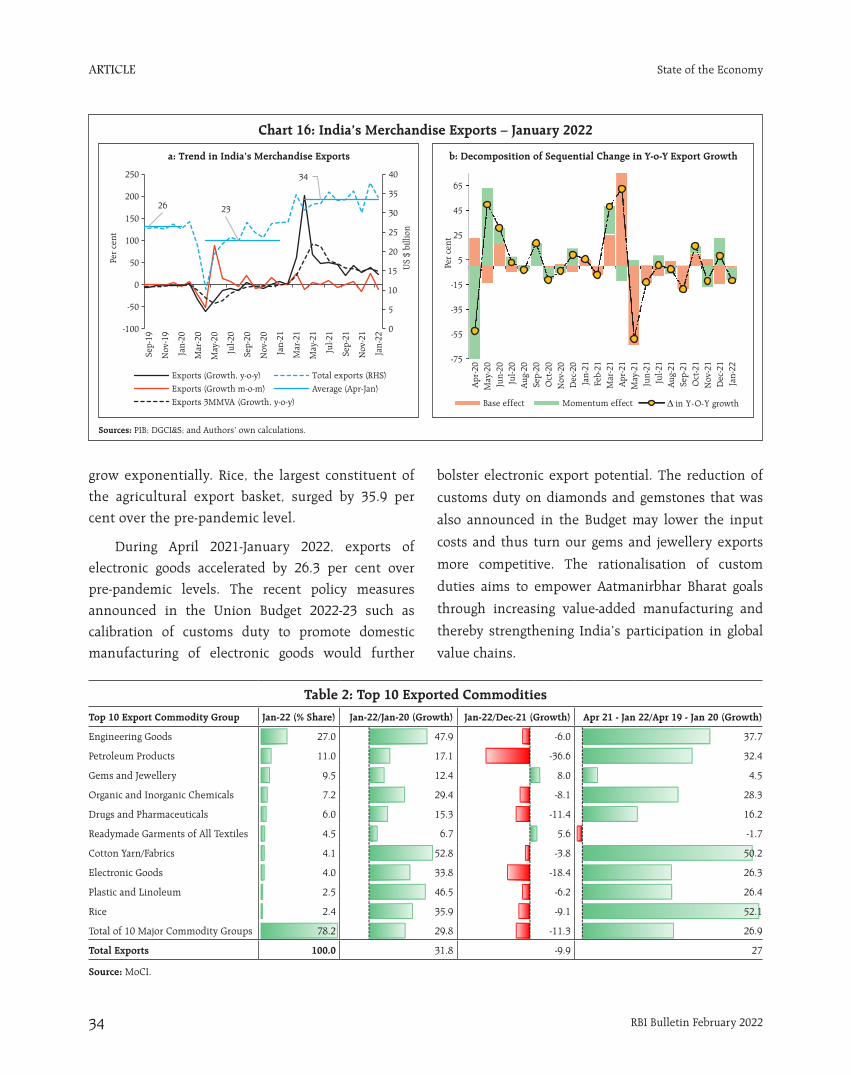
ARTICLE
RBI Bulletin February 202234
State of the Economy
grow exponentially. Rice, the largest constituent of
the agricultural export basket, surged by 35.9 per
cent over the pre-pandemic level.
During April 2021-January 2022, exports of
electronic goods accelerated by 26.3 per cent over
pre-pandemic levels. The recent policy measures
announced in the Union Budget 2022-23 such as
calibration of customs duty to promote domestic
manufacturing of electronic goods would further
bolster electronic export potential. The reduction of
customs duty on diamonds and gemstones that was
also announced in the Budget may lower the input
costs and thus turn our gems and jewellery exports
more competitive. The rationalisation of custom
duties aims to empower Aatmanirbhar Bharat goals
through increasing value-added manufacturing and
thereby strengthening India’s participation in global
value chains.
Chart 16: India’s Merchandise Exports – January 2022
Sources: PIB; DGCI&S; and Authors’ own calculations.
a: Trend in India’s Merchandise Exports b: Decomposition of Sequential Change in Y-o-Y Export Growth
Table 2: Top 10 Exported CommoditiesTop 10 Export Commodity Group Jan-22 (% Share) Jan-22/Jan-20 (Growth) Jan-22/Dec-21 (Growth) Apr 21 - Jan 22/Apr 19 - Jan 20 (Growth)
Engineering Goods 27.0 47.9 -6.0 37.7
Petroleum Products 11.0 17.1 -36.6 32.4
Gems and Jewellery 9.5 12.4 8.0 4.5
Organic and Inorganic Chemicals 7.2 29.4 -8.1 28.3
Drugs and Pharmaceuticals 6.0 15.3 -11.4 16.2
Readymade Garments of All Textiles 4.5 6.7 5.6 -1.7
Cotton Yarn/Fabrics 4.1 52.8 -3.8 50.2
Electronic Goods 4.0 33.8 -18.4 26.3
Plastic and Linoleum 2.5 46.5 -6.2 26.4
Rice 2.4 35.9 -9.1 52.1
Total of 10 Major Commodity Groups 78.2 29.8 -11.3 26.9
Total Exports 100.0 31.8 -9.9 27
Source: MoCI.
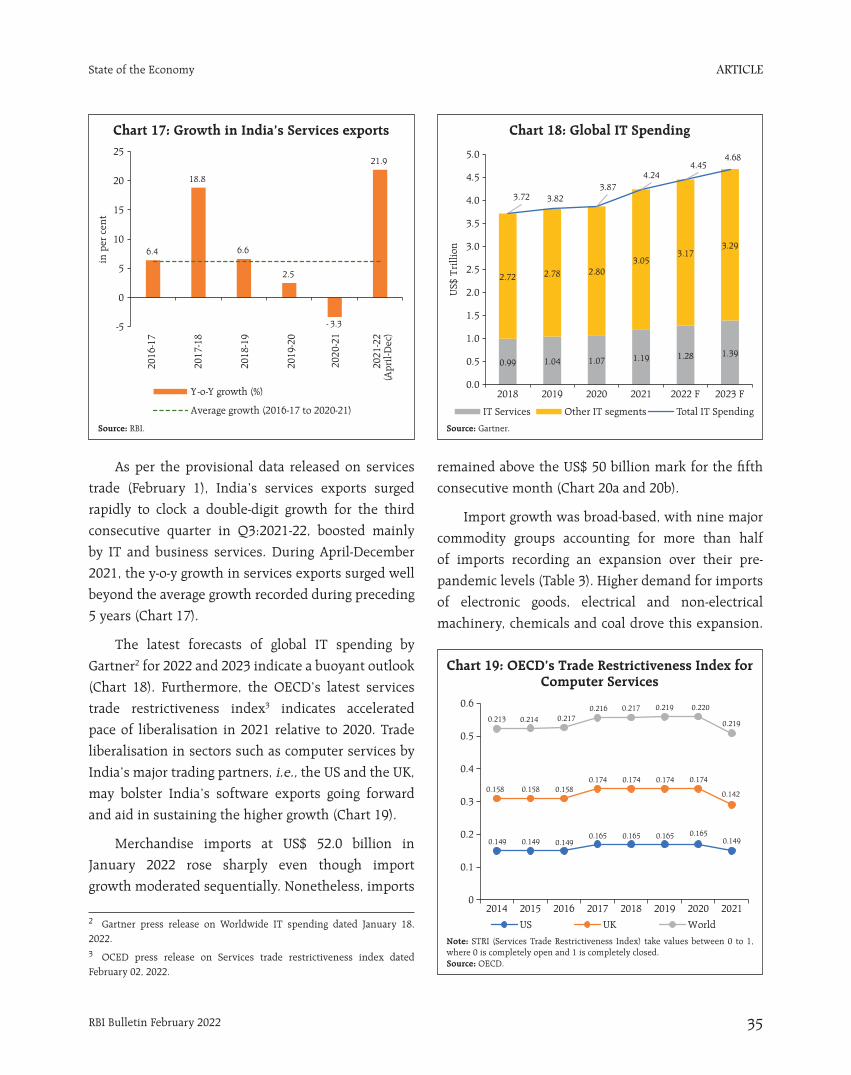
ARTICLE
RBI Bulletin February 2022 35
State of the Economy
As per the provisional data released on services
trade (February 1), India’s services exports surged
rapidly to clock a double-digit growth for the third
consecutive quarter in Q3:2021-22, boosted mainly
by IT and business services. During April-December
2021, the y-o-y growth in services exports surged well
beyond the average growth recorded during preceding
5 years (Chart 17).
The latest forecasts of global IT spending by
Gartner2 for 2022 and 2023 indicate a buoyant outlook
(Chart 18). Furthermore, the OECD’s latest services
trade restrictiveness index3 indicates accelerated
pace of liberalisation in 2021 relative to 2020. Trade
liberalisation in sectors such as computer services by
India’s major trading partners, i.e., the US and the UK,
may bolster India’s software exports going forward
and aid in sustaining the higher growth (Chart 19).
Merchandise imports at US$ 52.0 billion in
January 2022 rose sharply even though import
growth moderated sequentially. Nonetheless, imports
remained above the US$ 50 billion mark for the fifth
consecutive month (Chart 20a and 20b).
Import growth was broad-based, with nine major
commodity groups accounting for more than half
of imports recording an expansion over their pre-
pandemic levels (Table 3). Higher demand for imports
of electronic goods, electrical and non-electrical
machinery, chemicals and coal drove this expansion.
Chart 17: Growth in India’s Services exports Chart 18: Global IT Spending
Source: RBI. Source: Gartner.
Chart 19: OECD’s Trade Restrictiveness Index for Computer Services
Note: STRI (Services Trade Restrictiveness Index) take values between 0 to 1, where 0 is completely open and 1 is completely closed. Source: OECD.
2 Gartner press release on Worldwide IT spending dated January 18, 2022.3 OCED press release on Services trade restrictiveness index dated February 02, 2022.
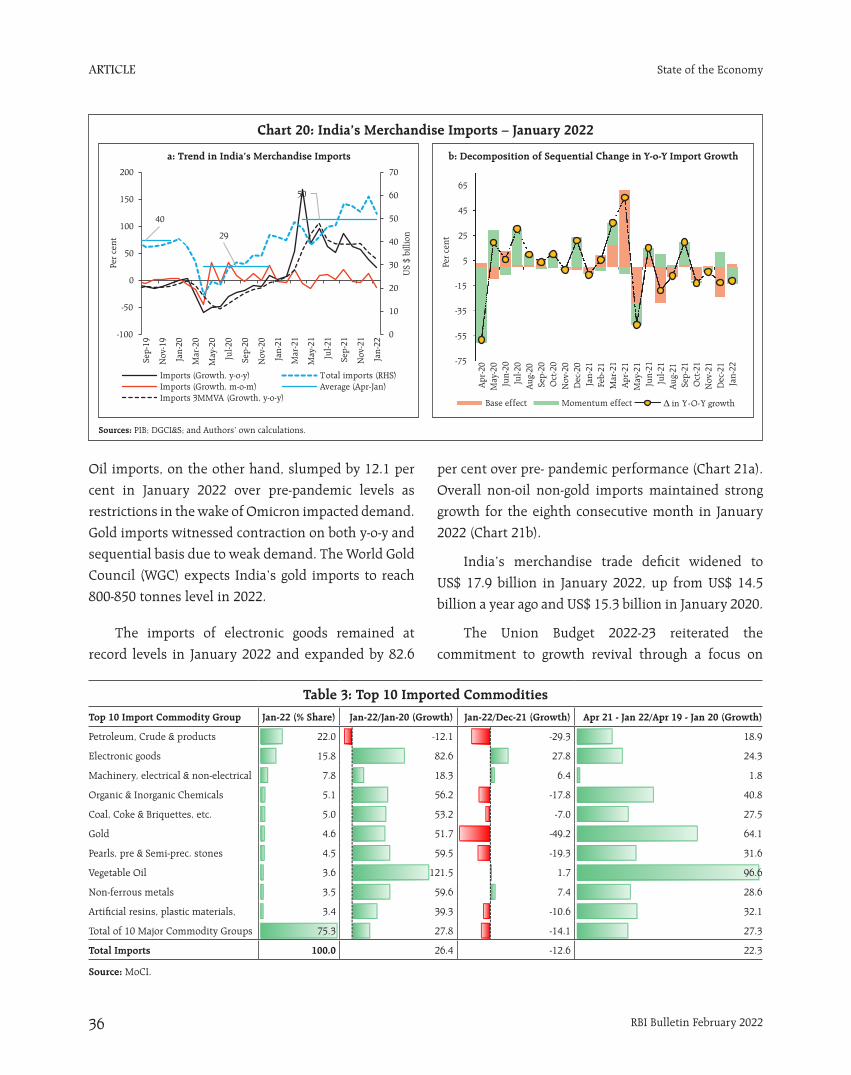
ARTICLE
RBI Bulletin February 202236
State of the Economy
Oil imports, on the other hand, slumped by 12.1 per
cent in January 2022 over pre-pandemic levels as
restrictions in the wake of Omicron impacted demand.
Gold imports witnessed contraction on both y-o-y and
sequential basis due to weak demand. The World Gold
Council (WGC) expects India’s gold imports to reach
800-850 tonnes level in 2022.
The imports of electronic goods remained at
record levels in January 2022 and expanded by 82.6
per cent over pre- pandemic performance (Chart 21a).
Overall non-oil non-gold imports maintained strong
growth for the eighth consecutive month in January
2022 (Chart 21b).
India’s merchandise trade deficit widened to
US$ 17.9 billion in January 2022, up from US$ 14.5
billion a year ago and US$ 15.3 billion in January 2020.
The Union Budget 2022-23 reiterated the
commitment to growth revival through a focus on
Chart 20: India’s Merchandise Imports – January 2022
Sources: PIB; DGCI&S; and Authors’ own calculations.
a: Trend in India’s Merchandise Imports b: Decomposition of Sequential Change in Y-o-Y Import Growth
Table 3: Top 10 Imported CommoditiesTop 10 Import Commodity Group Jan-22 (% Share) Jan-22/Jan-20 (Growth) Jan-22/Dec-21 (Growth) Apr 21 - Jan 22/Apr 19 - Jan 20 (Growth)
Petroleum, Crude & products 22.0 -12.1 -29.3 18.9
Electronic goods 15.8 82.6 27.8 24.3
Machinery, electrical & non-electrical 7.8 18.3 6.4 1.8
Organic & Inorganic Chemicals 5.1 56.2 -17.8 40.8
Coal, Coke & Briquettes, etc. 5.0 53.2 -7.0 27.5
Gold 4.6 51.7 -49.2 64.1
Pearls, pre & Semi-prec. stones 4.5 59.5 -19.3 31.6
Vegetable Oil 3.6 121.5 1.7 96.6
Non-ferrous metals 3.5 59.6 7.4 28.6
Artificial resins, plastic materials, 3.4 39.3 -10.6 32.1
Total of 10 Major Commodity Groups 75.3 27.8 -14.1 27.3
Total Imports 100.0 26.4 -12.6 22.3
Source: MoCI.
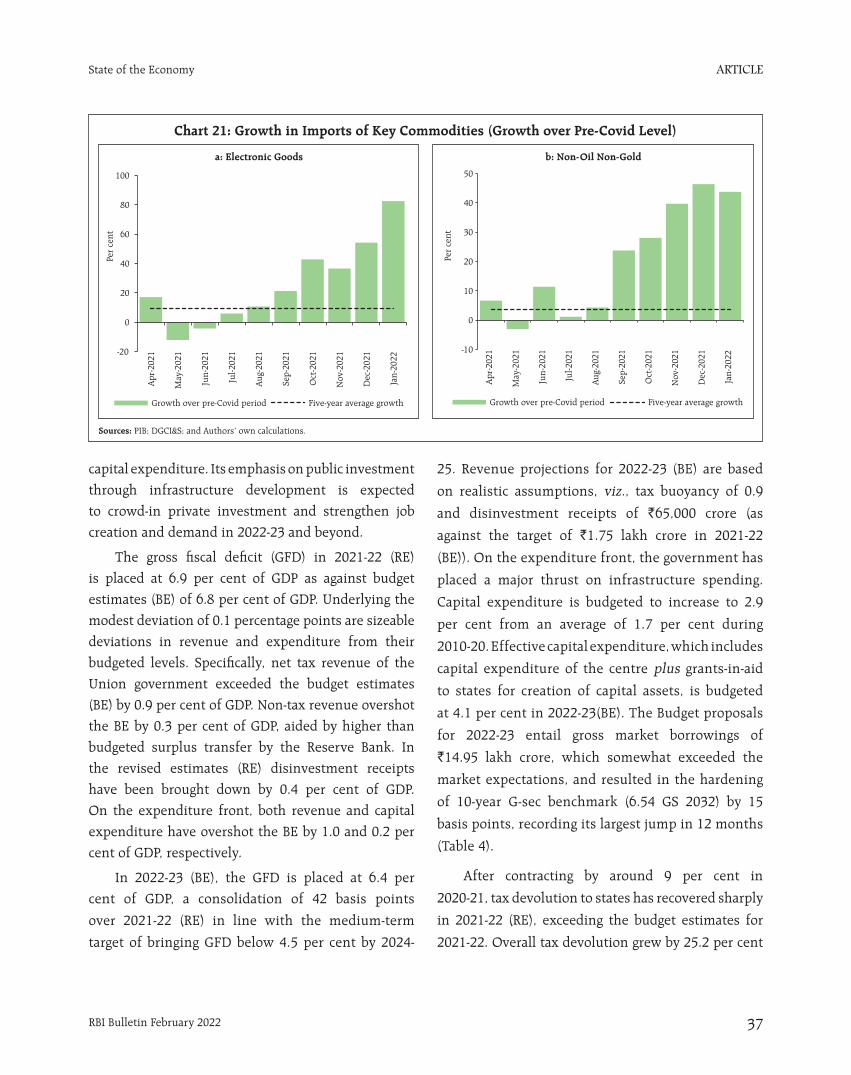
ARTICLE
RBI Bulletin February 2022 37
State of the Economy
capital expenditure. Its emphasis on public investment
through infrastructure development is expected
to crowd-in private investment and strengthen job
creation and demand in 2022-23 and beyond.
The gross fiscal deficit (GFD) in 2021-22 (RE)
is placed at 6.9 per cent of GDP as against budget
estimates (BE) of 6.8 per cent of GDP. Underlying the
modest deviation of 0.1 percentage points are sizeable
deviations in revenue and expenditure from their
budgeted levels. Specifically, net tax revenue of the
Union government exceeded the budget estimates
(BE) by 0.9 per cent of GDP. Non-tax revenue overshot
the BE by 0.3 per cent of GDP, aided by higher than
budgeted surplus transfer by the Reserve Bank. In
the revised estimates (RE) disinvestment receipts
have been brought down by 0.4 per cent of GDP.
On the expenditure front, both revenue and capital
expenditure have overshot the BE by 1.0 and 0.2 per
cent of GDP, respectively.
In 2022-23 (BE), the GFD is placed at 6.4 per
cent of GDP, a consolidation of 42 basis points
over 2021-22 (RE) in line with the medium-term
target of bringing GFD below 4.5 per cent by 2024-
25. Revenue projections for 2022-23 (BE) are based
on realistic assumptions, viz., tax buoyancy of 0.9
and disinvestment receipts of `65,000 crore (as
against the target of `1.75 lakh crore in 2021-22
(BE)). On the expenditure front, the government has
placed a major thrust on infrastructure spending.
Capital expenditure is budgeted to increase to 2.9
per cent from an average of 1.7 per cent during
2010-20. Effective capital expenditure, which includes
capital expenditure of the centre plus grants-in-aid
to states for creation of capital assets, is budgeted
at 4.1 per cent in 2022-23(BE). The Budget proposals
for 2022-23 entail gross market borrowings of
`14.95 lakh crore, which somewhat exceeded the
market expectations, and resulted in the hardening
of 10-year G-sec benchmark (6.54 GS 2032) by 15
basis points, recording its largest jump in 12 months
(Table 4).
After contracting by around 9 per cent in
2020-21, tax devolution to states has recovered sharply
in 2021-22 (RE), exceeding the budget estimates for
2021-22. Overall tax devolution grew by 25.2 per cent
Chart 21: Growth in Imports of Key Commodities (Growth over Pre-Covid Level)
Sources: PIB; DGCI&S; and Authors’ own calculations.
a: Electronic Goods b: Non-Oil Non-Gold
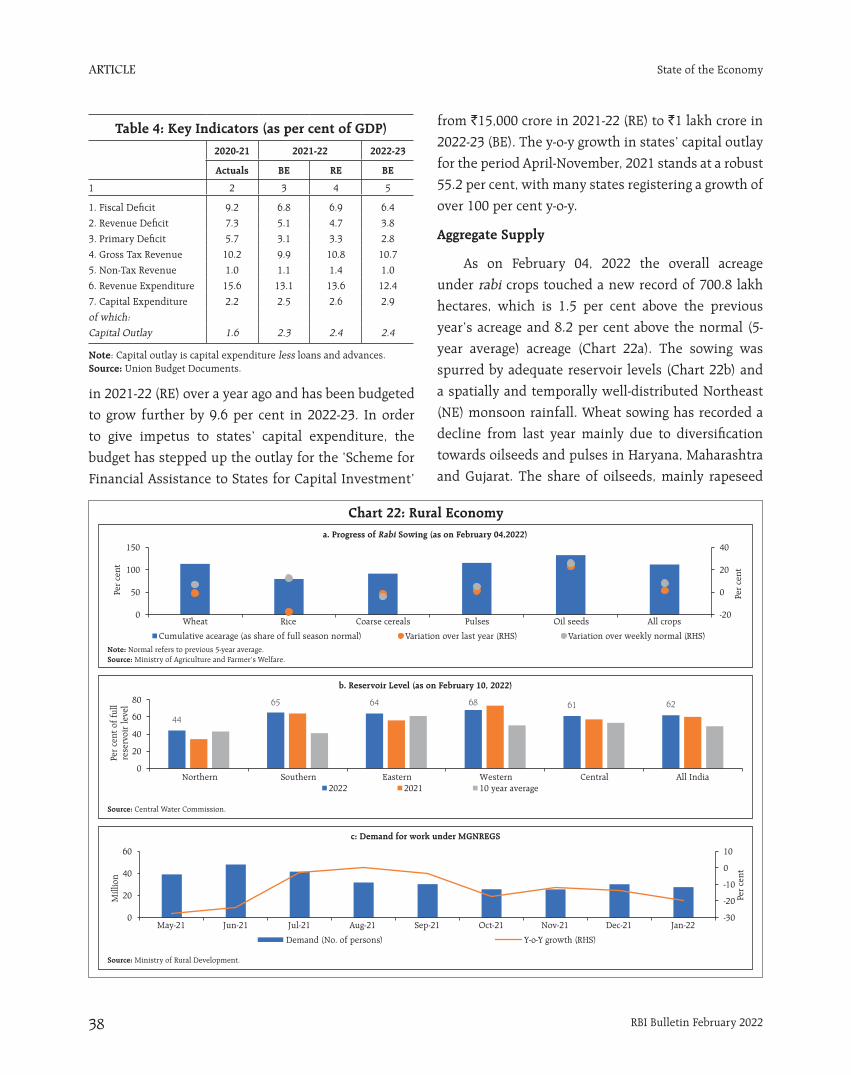
ARTICLE
RBI Bulletin February 202238
State of the Economy
in 2021-22 (RE) over a year ago and has been budgeted
to grow further by 9.6 per cent in 2022-23. In order
to give impetus to states’ capital expenditure, the
budget has stepped up the outlay for the ‘Scheme for
Financial Assistance to States for Capital Investment’
from `15,000 crore in 2021-22 (RE) to `1 lakh crore in
2022-23 (BE). The y-o-y growth in states’ capital outlay
for the period April-November, 2021 stands at a robust
55.2 per cent, with many states registering a growth of
over 100 per cent y-o-y.
Aggregate Supply
As on February 04, 2022 the overall acreage
under rabi crops touched a new record of 700.8 lakh
hectares, which is 1.5 per cent above the previous
year’s acreage and 8.2 per cent above the normal (5-
year average) acreage (Chart 22a). The sowing was
spurred by adequate reservoir levels (Chart 22b) and
a spatially and temporally well-distributed Northeast
(NE) monsoon rainfall. Wheat sowing has recorded a
decline from last year mainly due to diversification
towards oilseeds and pulses in Haryana, Maharashtra
and Gujarat. The share of oilseeds, mainly rapeseed
Table 4: Key Indicators (as per cent of GDP)2020-21 2021-22 2022-23
Actuals BE RE BE
1 2 3 4 5
1. Fiscal Deficit 9.2 6.8 6.9 6.4
2. Revenue Deficit 7.3 5.1 4.7 3.8
3. Primary Deficit 5.7 3.1 3.3 2.8
4. Gross Tax Revenue 10.2 9.9 10.8 10.7
5. Non-Tax Revenue 1.0 1.1 1.4 1.0
6. Revenue Expenditure 15.6 13.1 13.6 12.4
7. Capital Expenditure 2.2 2.5 2.6 2.9
of which:
Capital Outlay 1.6 2.3 2.4 2.4
Note: Capital outlay is capital expenditure less loans and advances.Source: Union Budget Documents.
Chart 22: Rural Economya. Progress of Rabi Sowing (as on February 04,2022)
b. Reservoir Level (as on February 10, 2022)
c: Demand for work under MGNREGS
Note: Normal refers to previous 5-year average.Source: Ministry of Agriculture and Farmer’s Welfare.
Source: Central Water Commission.
Source: Ministry of Rural Development.
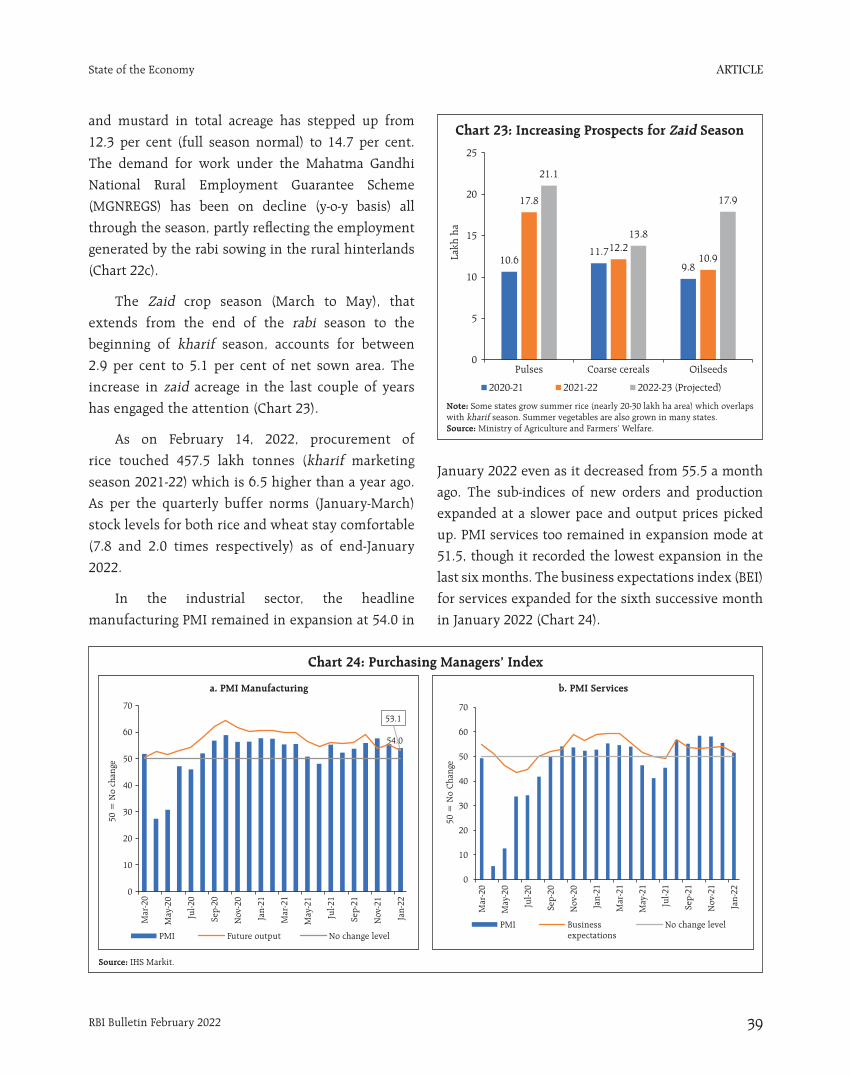
ARTICLE
RBI Bulletin February 2022 39
State of the Economy
and mustard in total acreage has stepped up from
12.3 per cent (full season normal) to 14.7 per cent.
The demand for work under the Mahatma Gandhi
National Rural Employment Guarantee Scheme
(MGNREGS) has been on decline (y-o-y basis) all
through the season, partly reflecting the employment
generated by the rabi sowing in the rural hinterlands
(Chart 22c).
The Zaid crop season (March to May), that
extends from the end of the rabi season to the
beginning of kharif season, accounts for between
2.9 per cent to 5.1 per cent of net sown area. The
increase in zaid acreage in the last couple of years
has engaged the attention (Chart 23).
As on February 14, 2022, procurement of
rice touched 457.5 lakh tonnes (kharif marketing
season 2021-22) which is 6.5 higher than a year ago.
As per the quarterly buffer norms (January-March)
stock levels for both rice and wheat stay comfortable
(7.8 and 2.0 times respectively) as of end-January
2022.
In the industrial sector, the headline
manufacturing PMI remained in expansion at 54.0 in
January 2022 even as it decreased from 55.5 a month
ago. The sub-indices of new orders and production
expanded at a slower pace and output prices picked
up. PMI services too remained in expansion mode at
51.5, though it recorded the lowest expansion in the
last six months. The business expectations index (BEI)
for services expanded for the sixth successive month
in January 2022 (Chart 24).
Chart 23: Increasing Prospects for Zaid Season
Note: Some states grow summer rice (nearly 20-30 lakh ha area) which overlaps with kharif season. Summer vegetables are also grown in many states.Source: Ministry of Agriculture and Farmers’ Welfare.
Chart 24: Purchasing Managers’ Index
Source: IHS Markit.
a. PMI Manufacturing b. PMI Services
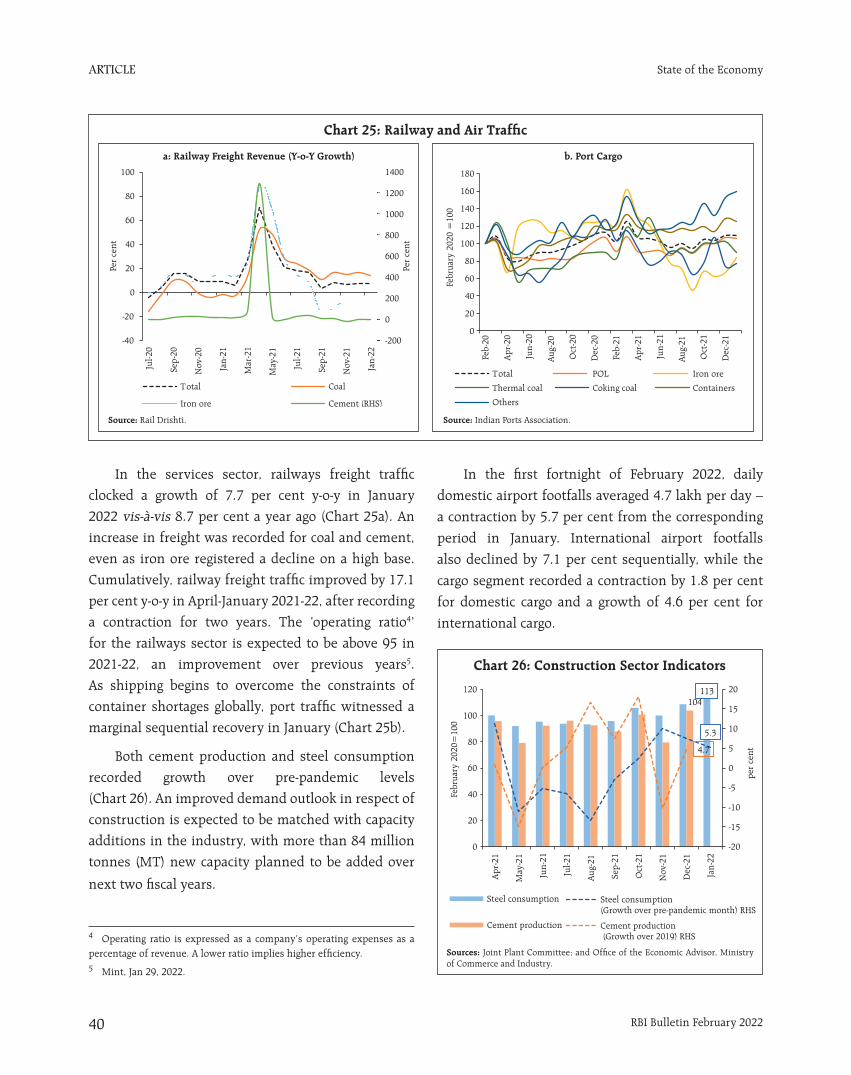
ARTICLE
RBI Bulletin February 202240
State of the Economy
In the services sector, railways freight traffic
clocked a growth of 7.7 per cent y-o-y in January
2022 vis-à-vis 8.7 per cent a year ago (Chart 25a). An
increase in freight was recorded for coal and cement,
even as iron ore registered a decline on a high base.
Cumulatively, railway freight traffic improved by 17.1
per cent y-o-y in April-January 2021-22, after recording
a contraction for two years. The ‘operating ratio4’
for the railways sector is expected to be above 95 in
2021-22, an improvement over previous years5.
As shipping begins to overcome the constraints of
container shortages globally, port traffic witnessed a
marginal sequential recovery in January (Chart 25b).
Both cement production and steel consumption
recorded growth over pre-pandemic levels
(Chart 26). An improved demand outlook in respect of
construction is expected to be matched with capacity
additions in the industry, with more than 84 million
tonnes (MT) new capacity planned to be added over
next two fiscal years.
In the first fortnight of February 2022, daily
domestic airport footfalls averaged 4.7 lakh per day –
a contraction by 5.7 per cent from the corresponding
period in January. International airport footfalls
also declined by 7.1 per cent sequentially, while the
cargo segment recorded a contraction by 1.8 per cent
for domestic cargo and a growth of 4.6 per cent for
international cargo.
Chart 25: Railway and Air Traffic
Source: Rail Drishti. Source: Indian Ports Association.
a: Railway Freight Revenue (Y-o-Y Growth) b. Port Cargo
4 Operating ratio is expressed as a company’s operating expenses as a percentage of revenue. A lower ratio implies higher efficiency. 5 Mint, Jan 29, 2022.
Chart 26: Construction Sector Indicators
Sources: Joint Plant Committee; and Office of the Economic Advisor, Ministry of Commerce and Industry.
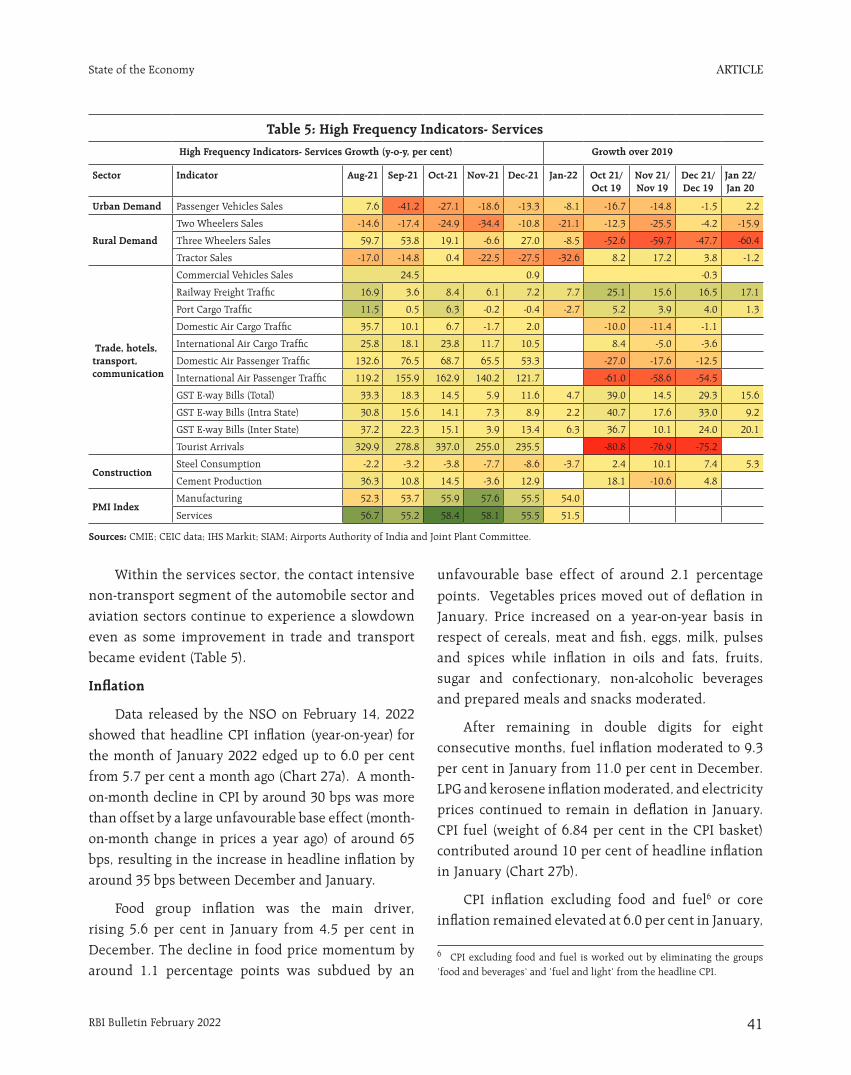
ARTICLE
RBI Bulletin February 2022 41
State of the Economy
Within the services sector, the contact intensive non-transport segment of the automobile sector and aviation sectors continue to experience a slowdown even as some improvement in trade and transport became evident (Table 5).
Inflation
Data released by the NSO on February 14, 2022 showed that headline CPI inflation (year-on-year) for the month of January 2022 edged up to 6.0 per cent from 5.7 per cent a month ago (Chart 27a). A month-on-month decline in CPI by around 30 bps was more than offset by a large unfavourable base effect (month-on-month change in prices a year ago) of around 65 bps, resulting in the increase in headline inflation by around 35 bps between December and January.
Food group inflation was the main driver, rising 5.6 per cent in January from 4.5 per cent in December. The decline in food price momentum by around 1.1 percentage points was subdued by an
unfavourable base effect of around 2.1 percentage
points. Vegetables prices moved out of deflation in January. Price increased on a year-on-year basis in respect of cereals, meat and fish, eggs, milk, pulses and spices while inflation in oils and fats, fruits, sugar and confectionary, non-alcoholic beverages and prepared meals and snacks moderated.
After remaining in double digits for eight consecutive months, fuel inflation moderated to 9.3 per cent in January from 11.0 per cent in December. LPG and kerosene inflation moderated, and electricity prices continued to remain in deflation in January. CPI fuel (weight of 6.84 per cent in the CPI basket) contributed around 10 per cent of headline inflation in January (Chart 27b).
CPI inflation excluding food and fuel6 or core inflation remained elevated at 6.0 per cent in January,
Table 5: High Frequency Indicators- ServicesHigh Frequency Indicators- Services Growth (y-o-y, per cent) Growth over 2019
Sector Indicator Aug-21 Sep-21 Oct-21 Nov-21 Dec-21 Jan-22 Oct 21/ Oct 19
Nov 21/ Nov 19
Dec 21/ Dec 19
Jan 22/ Jan 20
Urban Demand Passenger Vehicles Sales 7.6 -41.2 -27.1 -18.6 -13.3 -8.1 -16.7 -14.8 -1.5 2.2
Rural Demand
Two Wheelers Sales -14.6 -17.4 -24.9 -34.4 -10.8 -21.1 -12.3 -25.5 -4.2 -15.9
Three Wheelers Sales 59.7 53.8 19.1 -6.6 27.0 -8.5 -52.6 -59.7 -47.7 -60.4
Tractor Sales -17.0 -14.8 0.4 -22.5 -27.5 -32.6 8.2 17.2 3.8 -1.2
Trade, hotels, transport, communication
Commercial Vehicles Sales 24.5 0.9 -0.3
Railway Freight Traffic 16.9 3.6 8.4 6.1 7.2 7.7 25.1 15.6 16.5 17.1
Port Cargo Traffic 11.5 0.5 6.3 -0.2 -0.4 -2.7 5.2 3.9 4.0 1.3
Domestic Air Cargo Traffic 35.7 10.1 6.7 -1.7 2.0 -10.0 -11.4 -1.1
International Air Cargo Traffic 25.8 18.1 23.8 11.7 10.5 8.4 -5.0 -3.6
Domestic Air Passenger Traffic 132.6 76.5 68.7 65.5 53.3 -27.0 -17.6 -12.5
International Air Passenger Traffic 119.2 155.9 162.9 140.2 121.7 -61.0 -58.6 -54.5
GST E-way Bills (Total) 33.3 18.3 14.5 5.9 11.6 4.7 39.0 14.5 29.3 15.6
GST E-way Bills (Intra State) 30.8 15.6 14.1 7.3 8.9 2.2 40.7 17.6 33.0 9.2
GST E-way Bills (Inter State) 37.2 22.3 15.1 3.9 13.4 6.3 36.7 10.1 24.0 20.1
Tourist Arrivals 329.9 278.8 337.0 255.0 235.5 -80.8 -76.9 -75.2
ConstructionSteel Consumption -2.2 -3.2 -3.8 -7.7 -8.6 -3.7 2.4 10.1 7.4 5.3
Cement Production 36.3 10.8 14.5 -3.6 12.9 18.1 -10.6 4.8
PMI IndexManufacturing 52.3 53.7 55.9 57.6 55.5 54.0
Services 56.7 55.2 58.4 58.1 55.5 51.5
Sources: CMIE; CEIC data; IHS Markit; SIAM; Airports Authority of India and Joint Plant Committee.
6 CPI excluding food and fuel is worked out by eliminating the groups ‘food and beverages’ and ‘fuel and light’ from the headline CPI.
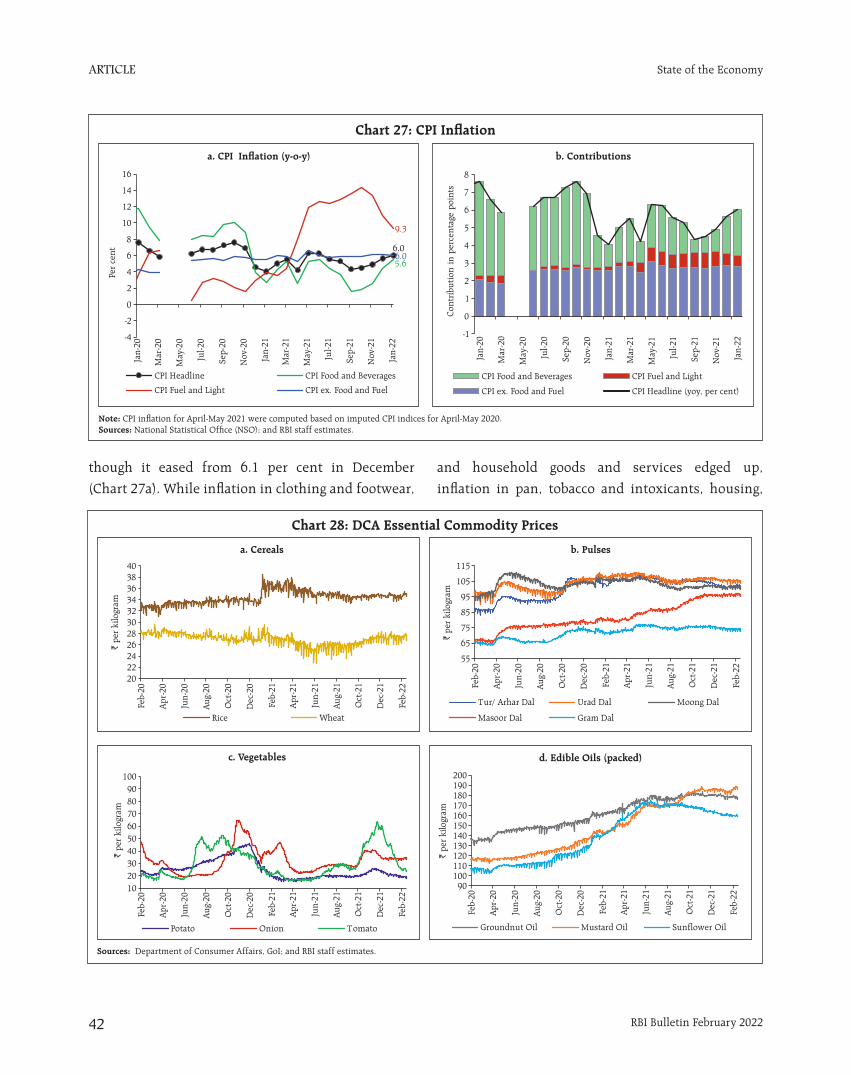
ARTICLE
RBI Bulletin February 202242
State of the Economy
though it eased from 6.1 per cent in December
(Chart 27a). While inflation in clothing and footwear,
and household goods and services edged up,
inflation in pan, tobacco and intoxicants, housing,
Chart 27: CPI Inflation
Note: CPI inflation for April-May 2021 were computed based on imputed CPI indices for April-May 2020.Sources: National Statistical Office (NSO); and RBI staff estimates.
a. CPI Inflation (y-o-y) b. Contributions
Chart 28: DCA Essential Commodity Prices
a. Cereals b. Pulses
Sources: Department of Consumer Affairs, GoI; and RBI staff estimates.
c. Vegetables d. Edible Oils (packed)
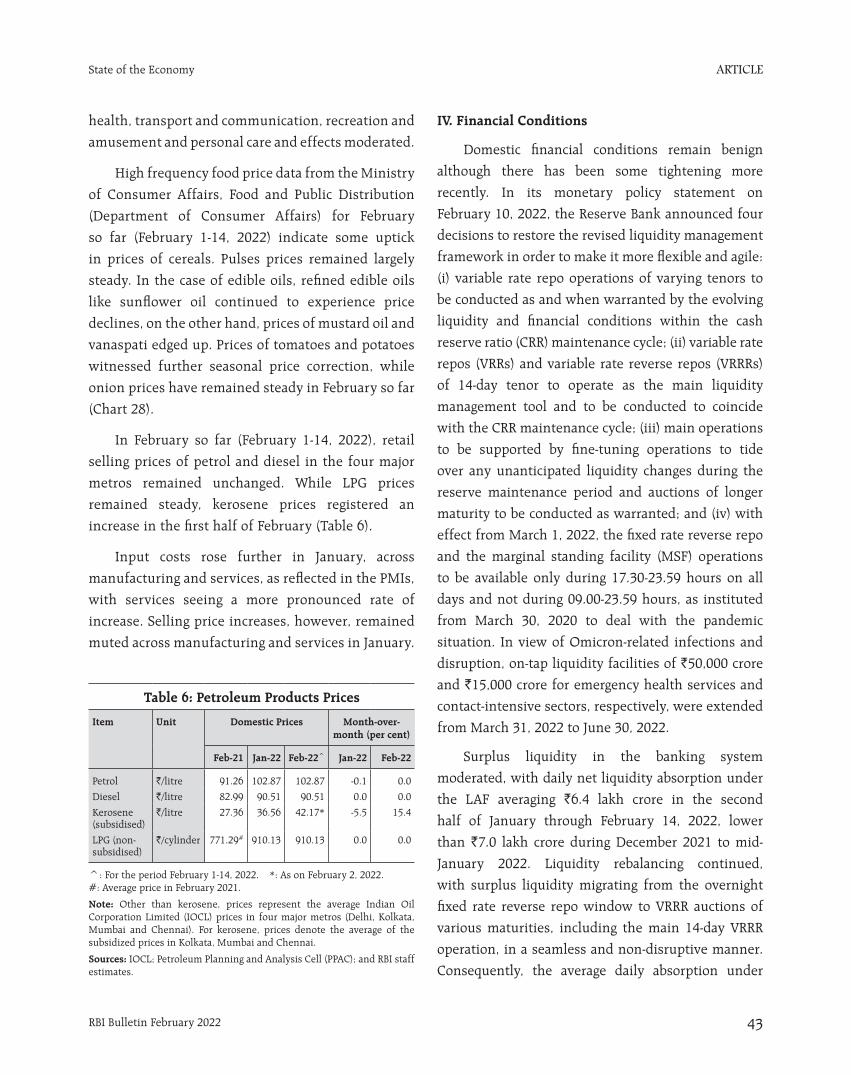
ARTICLE
RBI Bulletin February 2022 43
State of the Economy
health, transport and communication, recreation and
amusement and personal care and effects moderated.
High frequency food price data from the Ministry
of Consumer Affairs, Food and Public Distribution
(Department of Consumer Affairs) for February
so far (February 1-14, 2022) indicate some uptick
in prices of cereals. Pulses prices remained largely
steady. In the case of edible oils, refined edible oils
like sunflower oil continued to experience price
declines, on the other hand, prices of mustard oil and
vanaspati edged up. Prices of tomatoes and potatoes
witnessed further seasonal price correction, while
onion prices have remained steady in February so far
(Chart 28).
In February so far (February 1-14, 2022), retail
selling prices of petrol and diesel in the four major
metros remained unchanged. While LPG prices
remained steady, kerosene prices registered an
increase in the first half of February (Table 6).
Input costs rose further in January, across
manufacturing and services, as reflected in the PMIs,
with services seeing a more pronounced rate of
increase. Selling price increases, however, remained
muted across manufacturing and services in January.
IV. Financial Conditions
Domestic financial conditions remain benign
although there has been some tightening more
recently. In its monetary policy statement on
February 10, 2022, the Reserve Bank announced four
decisions to restore the revised liquidity management
framework in order to make it more flexible and agile:
(i) variable rate repo operations of varying tenors to
be conducted as and when warranted by the evolving
liquidity and financial conditions within the cash
reserve ratio (CRR) maintenance cycle; (ii) variable rate
repos (VRRs) and variable rate reverse repos (VRRRs)
of 14-day tenor to operate as the main liquidity
management tool and to be conducted to coincide
with the CRR maintenance cycle; (iii) main operations
to be supported by fine-tuning operations to tide
over any unanticipated liquidity changes during the
reserve maintenance period and auctions of longer
maturity to be conducted as warranted; and (iv) with
effect from March 1, 2022, the fixed rate reverse repo
and the marginal standing facility (MSF) operations
to be available only during 17.30-23.59 hours on all
days and not during 09.00-23.59 hours, as instituted
from March 30, 2020 to deal with the pandemic
situation. In view of Omicron-related infections and
disruption, on-tap liquidity facilities of `50,000 crore
and `15,000 crore for emergency health services and
contact-intensive sectors, respectively, were extended
from March 31, 2022 to June 30, 2022.
Surplus liquidity in the banking system
moderated, with daily net liquidity absorption under
the LAF averaging `6.4 lakh crore in the second
half of January through February 14, 2022, lower
than `7.0 lakh crore during December 2021 to mid-
January 2022. Liquidity rebalancing continued,
with surplus liquidity migrating from the overnight
fixed rate reverse repo window to VRRR auctions of
various maturities, including the main 14-day VRRR
operation, in a seamless and non-disruptive manner.
Consequently, the average daily absorption under
Table 6: Petroleum Products Prices
Item Unit Domestic Prices Month-over-month (per cent)
Feb-21 Jan-22 Feb-22^ Jan-22 Feb-22
Petrol `/litre 91.26 102.87 102.87 -0.1 0.0
Diesel `/litre 82.99 90.51 90.51 0.0 0.0
Kerosene (subsidised)
`/litre 27.36 36.56 42.17* -5.5 15.4
LPG (non-subsidised)
`/cylinder 771.29# 910.13 910.13 0.0 0.0
^: For the period February 1-14, 2022. *: As on February 2, 2022. #: Average price in February 2021.
Note: Other than kerosene, prices represent the average Indian Oil Corporation Limited (IOCL) prices in four major metros (Delhi, Kolkata, Mumbai and Chennai). For kerosene, prices denote the average of the subsidized prices in Kolkata, Mumbai and Chennai.
Sources: IOCL; Petroleum Planning and Analysis Cell (PPAC); and RBI staff estimates.
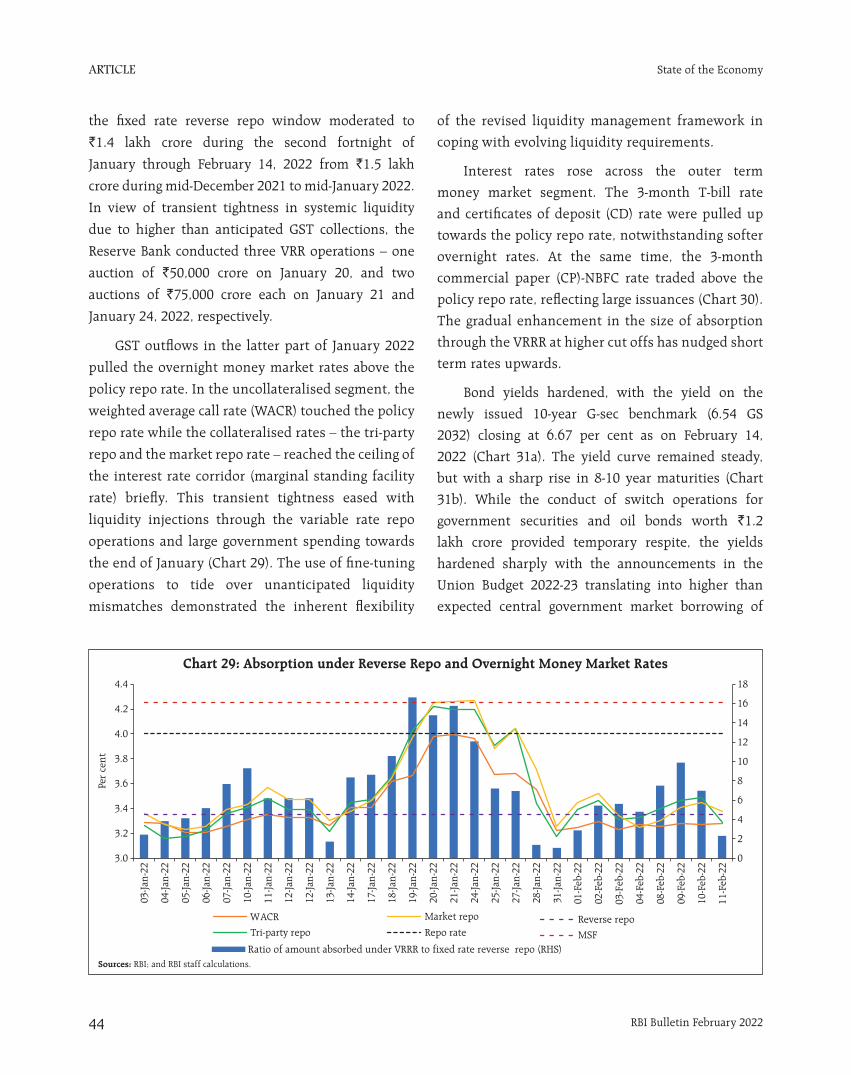
ARTICLE
RBI Bulletin February 202244
State of the Economy
the fixed rate reverse repo window moderated to
`1.4 lakh crore during the second fortnight of
January through February 14, 2022 from `1.5 lakh
crore during mid-December 2021 to mid-January 2022.
In view of transient tightness in systemic liquidity
due to higher than anticipated GST collections, the
Reserve Bank conducted three VRR operations – one
auction of `50,000 crore on January 20, and two
auctions of `75,000 crore each on January 21 and
January 24, 2022, respectively.
GST outflows in the latter part of January 2022
pulled the overnight money market rates above the
policy repo rate. In the uncollateralised segment, the
weighted average call rate (WACR) touched the policy
repo rate while the collateralised rates – the tri-party
repo and the market repo rate – reached the ceiling of
the interest rate corridor (marginal standing facility
rate) briefly. This transient tightness eased with
liquidity injections through the variable rate repo
operations and large government spending towards
the end of January (Chart 29). The use of fine-tuning
operations to tide over unanticipated liquidity
mismatches demonstrated the inherent flexibility
of the revised liquidity management framework in
coping with evolving liquidity requirements.
Interest rates rose across the outer term
money market segment. The 3-month T-bill rate
and certificates of deposit (CD) rate were pulled up
towards the policy repo rate, notwithstanding softer
overnight rates. At the same time, the 3-month
commercial paper (CP)-NBFC rate traded above the
policy repo rate, reflecting large issuances (Chart 30).
The gradual enhancement in the size of absorption
through the VRRR at higher cut offs has nudged short
term rates upwards.
Bond yields hardened, with the yield on the
newly issued 10-year G-sec benchmark (6.54 GS
2032) closing at 6.67 per cent as on February 14,
2022 (Chart 31a). The yield curve remained steady,
but with a sharp rise in 8-10 year maturities (Chart
31b). While the conduct of switch operations for
government securities and oil bonds worth `1.2
lakh crore provided temporary respite, the yields
hardened sharply with the announcements in the
Union Budget 2022-23 translating into higher than
expected central government market borrowing of
Chart 29: Absorption under Reverse Repo and Overnight Money Market Rates
Sources: RBI; and RBI staff calculations.
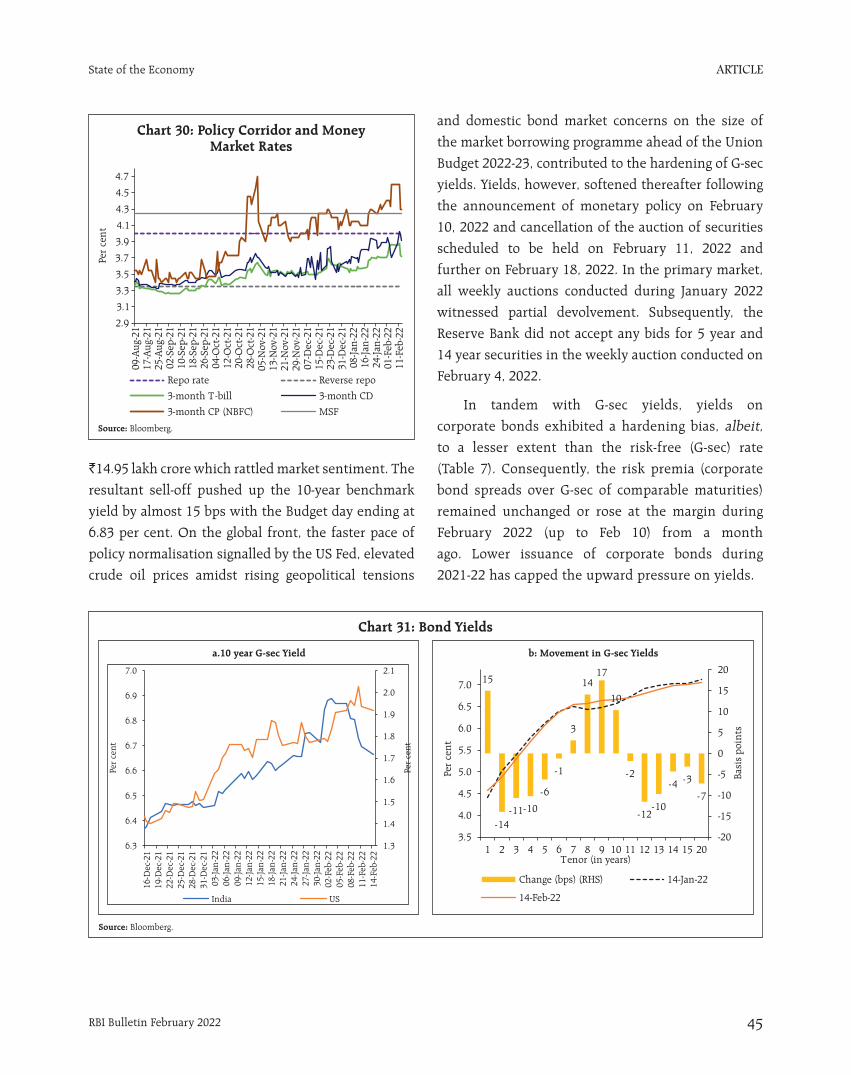
ARTICLE
RBI Bulletin February 2022 45
State of the Economy
`14.95 lakh crore which rattled market sentiment. The
resultant sell-off pushed up the 10-year benchmark
yield by almost 15 bps with the Budget day ending at
6.83 per cent. On the global front, the faster pace of
policy normalisation signalled by the US Fed, elevated
crude oil prices amidst rising geopolitical tensions
and domestic bond market concerns on the size of
the market borrowing programme ahead of the Union
Budget 2022-23, contributed to the hardening of G-sec
yields. Yields, however, softened thereafter following
the announcement of monetary policy on February
10, 2022 and cancellation of the auction of securities
scheduled to be held on February 11, 2022 and
further on February 18, 2022. In the primary market,
all weekly auctions conducted during January 2022
witnessed partial devolvement. Subsequently, the
Reserve Bank did not accept any bids for 5 year and
14 year securities in the weekly auction conducted on
February 4, 2022.
In tandem with G-sec yields, yields on
corporate bonds exhibited a hardening bias, albeit, to a lesser extent than the risk-free (G-sec) rate
(Table 7). Consequently, the risk premia (corporate
bond spreads over G-sec of comparable maturities)
remained unchanged or rose at the margin during
February 2022 (up to Feb 10) from a month
ago. Lower issuance of corporate bonds during
2021-22 has capped the upward pressure on yields.
Chart 30: Policy Corridor and Money Market Rates
Source: Bloomberg.
Chart 31: Bond Yields
Source: Bloomberg.
a.10 year G-sec Yield b: Movement in G-sec Yields
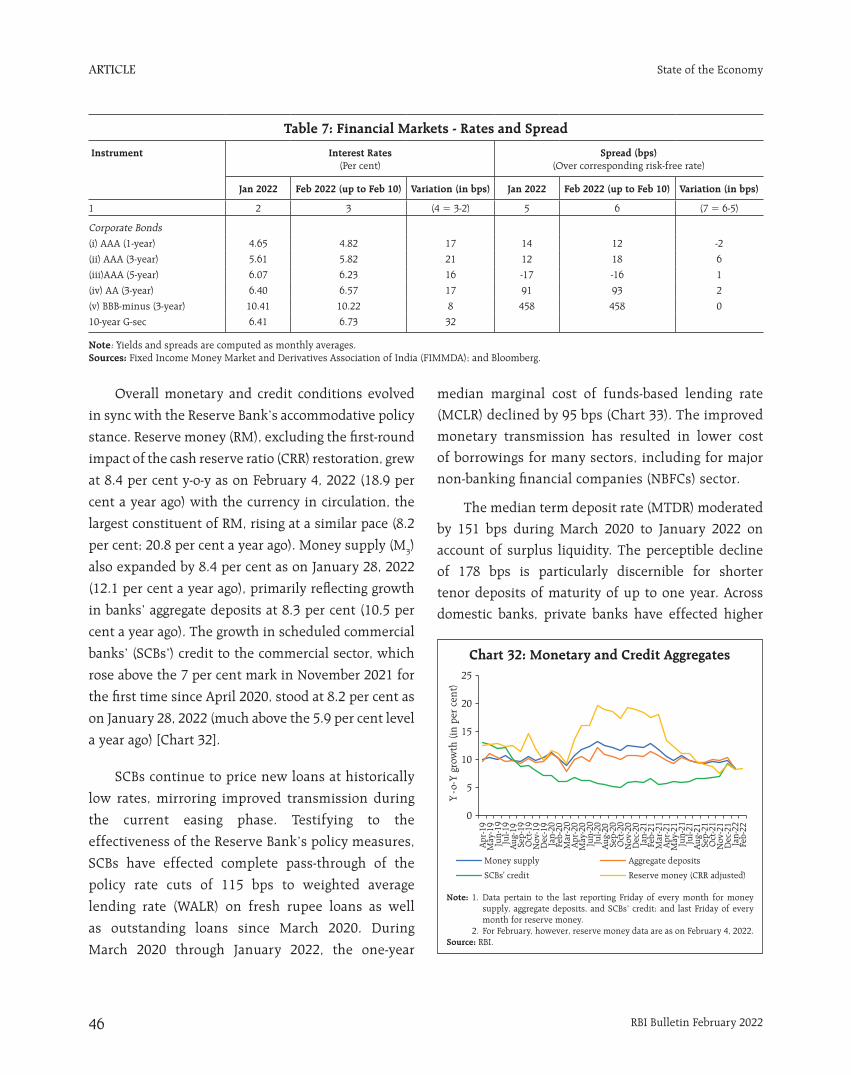
ARTICLE
RBI Bulletin February 202246
State of the Economy
Overall monetary and credit conditions evolved
in sync with the Reserve Bank’s accommodative policy
stance. Reserve money (RM), excluding the first-round
impact of the cash reserve ratio (CRR) restoration, grew
at 8.4 per cent y-o-y as on February 4, 2022 (18.9 per
cent a year ago) with the currency in circulation, the
largest constituent of RM, rising at a similar pace (8.2
per cent; 20.8 per cent a year ago). Money supply (M3)
also expanded by 8.4 per cent as on January 28, 2022
(12.1 per cent a year ago), primarily reflecting growth
in banks’ aggregate deposits at 8.3 per cent (10.5 per
cent a year ago). The growth in scheduled commercial
banks’ (SCBs’) credit to the commercial sector, which
rose above the 7 per cent mark in November 2021 for
the first time since April 2020, stood at 8.2 per cent as
on January 28, 2022 (much above the 5.9 per cent level
a year ago) [Chart 32].
SCBs continue to price new loans at historically
low rates, mirroring improved transmission during
the current easing phase. Testifying to the
effectiveness of the Reserve Bank’s policy measures,
SCBs have effected complete pass-through of the
policy rate cuts of 115 bps to weighted average
lending rate (WALR) on fresh rupee loans as well
as outstanding loans since March 2020. During
March 2020 through January 2022, the one-year
median marginal cost of funds-based lending rate
(MCLR) declined by 95 bps (Chart 33). The improved
monetary transmission has resulted in lower cost
of borrowings for many sectors, including for major
non-banking financial companies (NBFCs) sector.
The median term deposit rate (MTDR) moderated
by 151 bps during March 2020 to January 2022 on
account of surplus liquidity. The perceptible decline
of 178 bps is particularly discernible for shorter
tenor deposits of maturity of up to one year. Across
domestic banks, private banks have effected higher
Table 7: Financial Markets - Rates and Spread
Instrument Interest Rates(Per cent)
Spread (bps)(Over corresponding risk-free rate)
Jan 2022 Feb 2022 (up to Feb 10) Variation (in bps) Jan 2022 Feb 2022 (up to Feb 10) Variation (in bps)
1 2 3 (4 = 3-2) 5 6 (7 = 6-5)
Corporate Bonds
(i) AAA (1-year) 4.65 4.82 17 14 12 -2
(ii) AAA (3-year) 5.61 5.82 21 12 18 6
(iii)AAA (5-year) 6.07 6.23 16 -17 -16 1
(iv) AA (3-year) 6.40 6.57 17 91 93 2
(v) BBB-minus (3-year) 10.41 10.22 8 458 458 0
10-year G-sec 6.41 6.73 32
Note: Yields and spreads are computed as monthly averages.Sources: Fixed Income Money Market and Derivatives Association of India (FIMMDA); and Bloomberg.
Chart 32: Monetary and Credit Aggregates
Note: 1. Data pertain to the last reporting Friday of every month for money supply, aggregate deposits, and SCBs’ credit; and last Friday of every month for reserve money.
2. For February, however, reserve money data are as on February 4, 2022.Source: RBI.
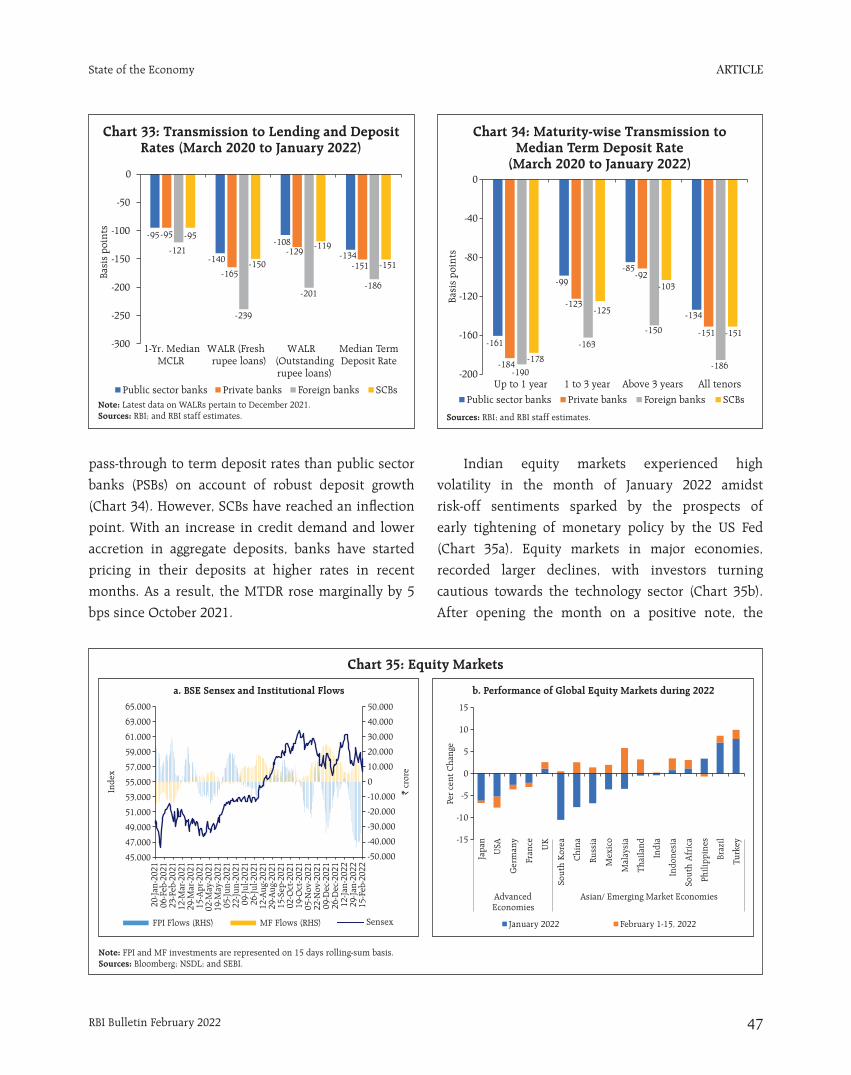
ARTICLE
RBI Bulletin February 2022 47
State of the Economy
pass-through to term deposit rates than public sector
banks (PSBs) on account of robust deposit growth
(Chart 34). However, SCBs have reached an inflection
point. With an increase in credit demand and lower
accretion in aggregate deposits, banks have started
pricing in their deposits at higher rates in recent
months. As a result, the MTDR rose marginally by 5
bps since October 2021.
Indian equity markets experienced high
volatility in the month of January 2022 amidst
risk-off sentiments sparked by the prospects of
early tightening of monetary policy by the US Fed
(Chart 35a). Equity markets in major economies,
recorded larger declines, with investors turning
cautious towards the technology sector (Chart 35b).
After opening the month on a positive note, the
Chart 33: Transmission to Lending and Deposit Rates (March 2020 to January 2022)
Note: Latest data on WALRs pertain to December 2021.Sources: RBI; and RBI staff estimates.
Chart 34: Maturity-wise Transmission to Median Term Deposit Rate
(March 2020 to January 2022)
Sources: RBI; and RBI staff estimates.
Chart 35: Equity Markets
Note: FPI and MF investments are represented on 15 days rolling-sum basis.Sources: Bloomberg; NSDL; and SEBI.
a. BSE Sensex and Institutional Flows b. Performance of Global Equity Markets during 2022
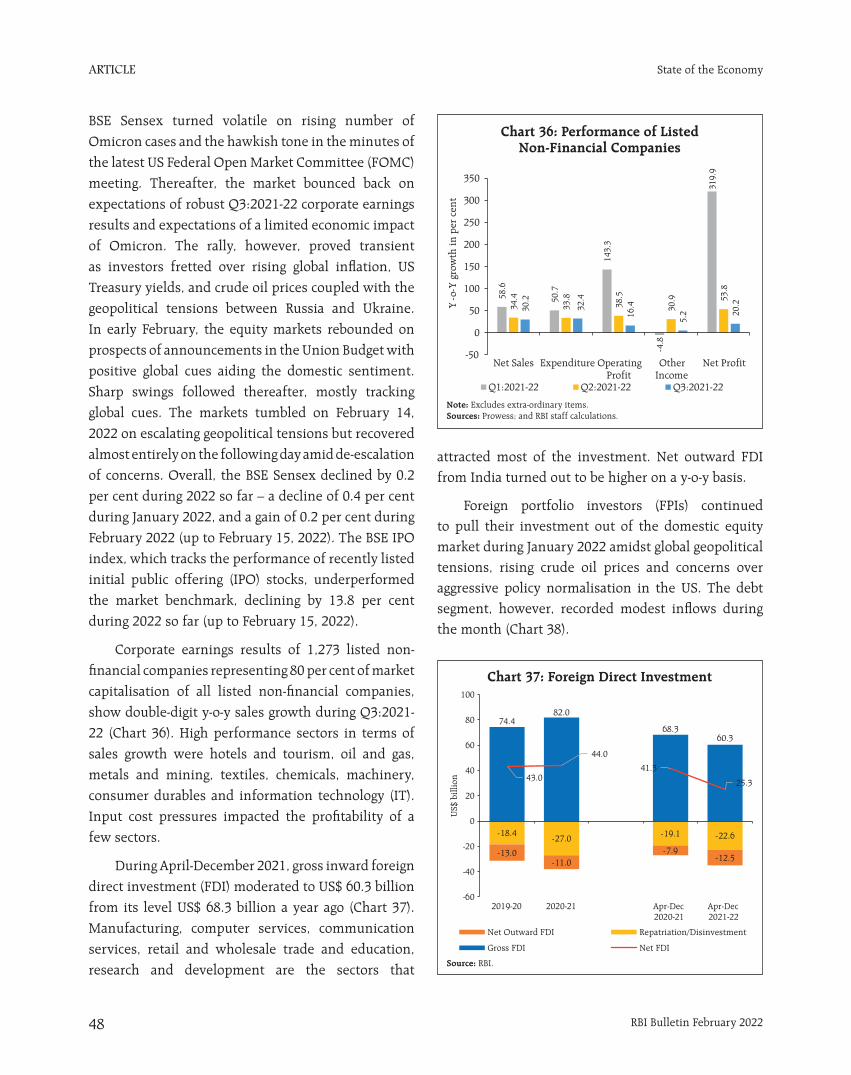
ARTICLE
RBI Bulletin February 202248
State of the Economy
BSE Sensex turned volatile on rising number of Omicron cases and the hawkish tone in the minutes of the latest US Federal Open Market Committee (FOMC) meeting. Thereafter, the market bounced back on expectations of robust Q3:2021-22 corporate earnings results and expectations of a limited economic impact of Omicron. The rally, however, proved transient as investors fretted over rising global inflation, US Treasury yields, and crude oil prices coupled with the geopolitical tensions between Russia and Ukraine. In early February, the equity markets rebounded on prospects of announcements in the Union Budget with positive global cues aiding the domestic sentiment. Sharp swings followed thereafter, mostly tracking global cues. The markets tumbled on February 14, 2022 on escalating geopolitical tensions but recovered almost entirely on the following day amid de-escalation of concerns. Overall, the BSE Sensex declined by 0.2 per cent during 2022 so far – a decline of 0.4 per cent during January 2022, and a gain of 0.2 per cent during February 2022 (up to February 15, 2022). The BSE IPO index, which tracks the performance of recently listed initial public offering (IPO) stocks, underperformed the market benchmark, declining by 13.8 per cent during 2022 so far (up to February 15, 2022).
Corporate earnings results of 1,273 listed non-financial companies representing 80 per cent of market capitalisation of all listed non-financial companies, show double-digit y-o-y sales growth during Q3:2021-22 (Chart 36). High performance sectors in terms of sales growth were hotels and tourism, oil and gas, metals and mining, textiles, chemicals, machinery, consumer durables and information technology (IT). Input cost pressures impacted the profitability of a few sectors.
During April-December 2021, gross inward foreign direct investment (FDI) moderated to US$ 60.3 billion from its level US$ 68.3 billion a year ago (Chart 37). Manufacturing, computer services, communication services, retail and wholesale trade and education, research and development are the sectors that
attracted most of the investment. Net outward FDI from India turned out to be higher on a y-o-y basis.
Foreign portfolio investors (FPIs) continued to pull their investment out of the domestic equity market during January 2022 amidst global geopolitical tensions, rising crude oil prices and concerns over aggressive policy normalisation in the US. The debt segment, however, recorded modest inflows during the month (Chart 38).
Chart 36: Performance of Listed Non-Financial Companies
Chart 37: Foreign Direct Investment
Note: Excludes extra-ordinary items.Sources: Prowess; and RBI staff calculations.
Source: RBI.
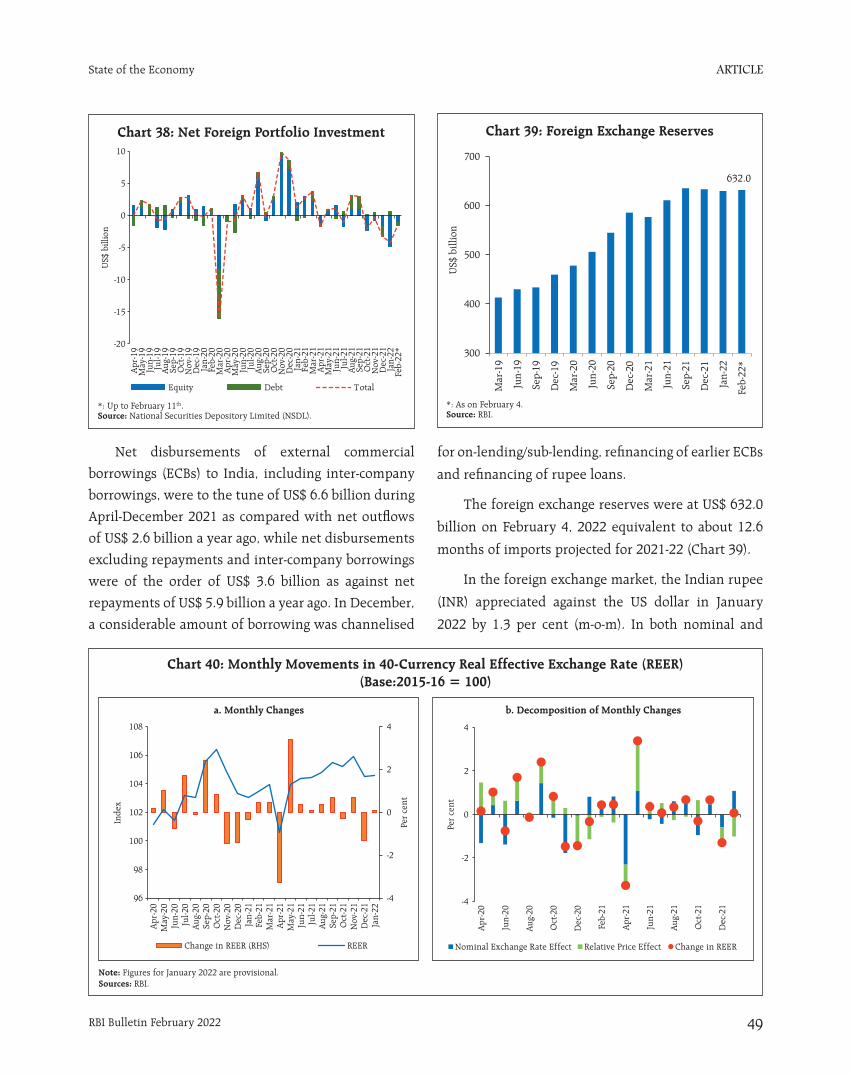
ARTICLE
RBI Bulletin February 2022 49
State of the Economy
Net disbursements of external commercial
borrowings (ECBs) to India, including inter-company
borrowings, were to the tune of US$ 6.6 billion during
April-December 2021 as compared with net outflows
of US$ 2.6 billion a year ago, while net disbursements
excluding repayments and inter-company borrowings
were of the order of US$ 3.6 billion as against net
repayments of US$ 5.9 billion a year ago. In December,
a considerable amount of borrowing was channelised
for on-lending/sub-lending, refinancing of earlier ECBs
and refinancing of rupee loans.
The foreign exchange reserves were at US$ 632.0
billion on February 4, 2022 equivalent to about 12.6
months of imports projected for 2021-22 (Chart 39).
In the foreign exchange market, the Indian rupee
(INR) appreciated against the US dollar in January
2022 by 1.3 per cent (m-o-m). In both nominal and
Chart 38: Net Foreign Portfolio Investment
Source: National Securities Depository Limited (NSDL).*: Up to February 11th.
Chart 39: Foreign Exchange Reserves
Source: RBI.*: As on February 4.
Chart 40: Monthly Movements in 40-Currency Real Effective Exchange Rate (REER) (Base:2015-16 = 100)
Note: Figures for January 2022 are provisional.Sources: RBI.
a. Monthly Changes b. Decomposition of Monthly Changes
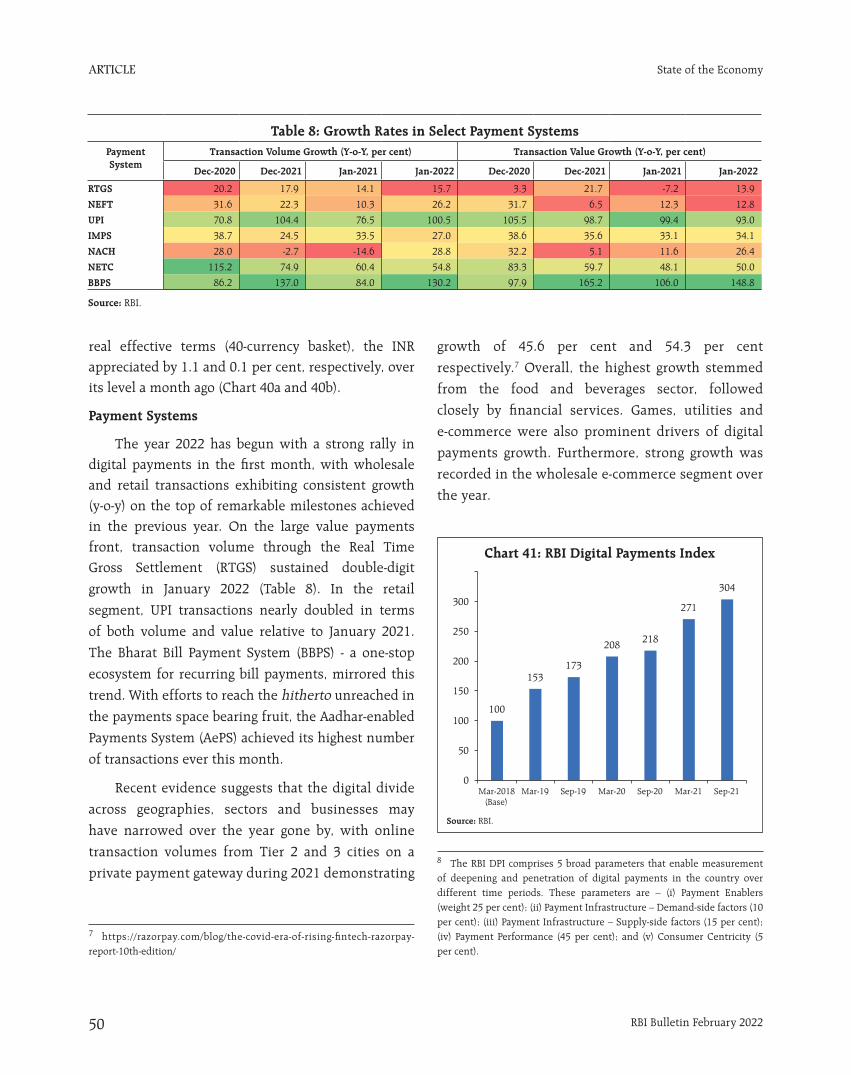
ARTICLE
RBI Bulletin February 202250
State of the Economy
real effective terms (40-currency basket), the INR appreciated by 1.1 and 0.1 per cent, respectively, over its level a month ago (Chart 40a and 40b).
Payment Systems
The year 2022 has begun with a strong rally in digital payments in the first month, with wholesale and retail transactions exhibiting consistent growth (y-o-y) on the top of remarkable milestones achieved in the previous year. On the large value payments front, transaction volume through the Real Time Gross Settlement (RTGS) sustained double-digit
growth in January 2022 (Table 8). In the retail
segment, UPI transactions nearly doubled in terms
of both volume and value relative to January 2021.
The Bharat Bill Payment System (BBPS) - a one-stop
ecosystem for recurring bill payments, mirrored this
trend. With efforts to reach the hitherto unreached in
the payments space bearing fruit, the Aadhar-enabled
Payments System (AePS) achieved its highest number
of transactions ever this month.
Recent evidence suggests that the digital divide
across geographies, sectors and businesses may
have narrowed over the year gone by, with online
transaction volumes from Tier 2 and 3 cities on a
private payment gateway during 2021 demonstrating
growth of 45.6 per cent and 54.3 per cent
respectively.7 Overall, the highest growth stemmed
from the food and beverages sector, followed
closely by financial services. Games, utilities and
e-commerce were also prominent drivers of digital
payments growth. Furthermore, strong growth was
recorded in the wholesale e-commerce segment over
the year.
7 https://razorpay.com/blog/the-covid-era-of-rising-fintech-razorpay-report-10th-edition/
8 The RBI DPI comprises 5 broad parameters that enable measurement of deepening and penetration of digital payments in the country over different time periods. These parameters are – (i) Payment Enablers (weight 25 per cent); (ii) Payment Infrastructure – Demand-side factors (10 per cent); (iii) Payment Infrastructure – Supply-side factors (15 per cent); (iv) Payment Performance (45 per cent); and (v) Consumer Centricity (5 per cent).
Chart 41: RBI Digital Payments Index
Source: RBI.
Table 8: Growth Rates in Select Payment SystemsPayment System
Transaction Volume Growth (Y-o-Y, per cent) Transaction Value Growth (Y-o-Y, per cent)
Dec-2020 Dec-2021 Jan-2021 Jan-2022 Dec-2020 Dec-2021 Jan-2021 Jan-2022
RTGS 20.2 17.9 14.1 15.7 3.3 21.7 -7.2 13.9
NEFT 31.6 22.3 10.3 26.2 31.7 6.5 12.3 12.8
UPI 70.8 104.4 76.5 100.5 105.5 98.7 99.4 93.0
IMPS 38.7 24.5 33.5 27.0 38.6 35.6 33.1 34.1
NACH 28.0 -2.7 -14.6 28.8 32.2 5.1 11.6 26.4
NETC 115.2 74.9 60.4 54.8 83.3 59.7 48.1 50.0
BBPS 86.2 137.0 84.0 130.2 97.9 165.2 106.0 148.8
Source: RBI.
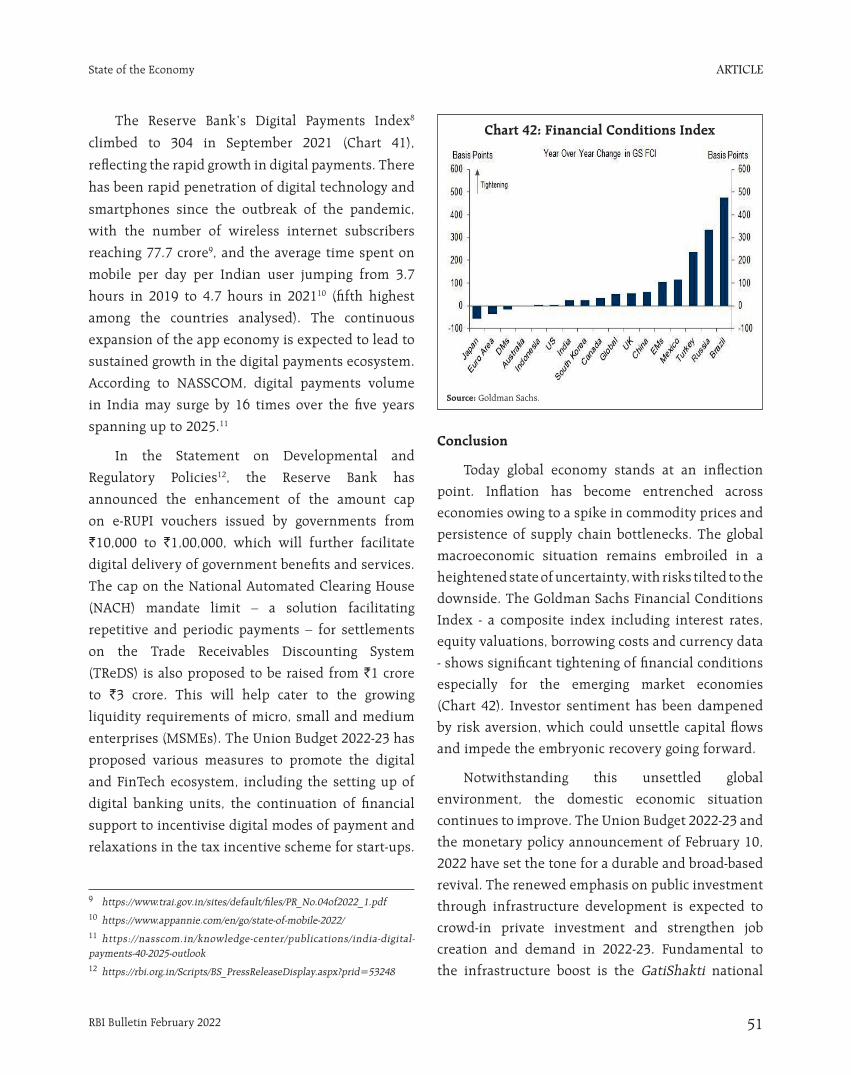
ARTICLE
RBI Bulletin February 2022 51
State of the Economy
The Reserve Bank’s Digital Payments Index8
climbed to 304 in September 2021 (Chart 41),
reflecting the rapid growth in digital payments. There
has been rapid penetration of digital technology and
smartphones since the outbreak of the pandemic,
with the number of wireless internet subscribers
reaching 77.7 crore9, and the average time spent on
mobile per day per Indian user jumping from 3.7
hours in 2019 to 4.7 hours in 202110 (fifth highest
among the countries analysed). The continuous
expansion of the app economy is expected to lead to
sustained growth in the digital payments ecosystem.
According to NASSCOM, digital payments volume
in India may surge by 16 times over the five years
spanning up to 2025.11
In the Statement on Developmental and
Regulatory Policies12, the Reserve Bank has
announced the enhancement of the amount cap
on e-RUPI vouchers issued by governments from
`10,000 to `1,00,000, which will further facilitate
digital delivery of government benefits and services.
The cap on the National Automated Clearing House
(NACH) mandate limit – a solution facilitating
repetitive and periodic payments – for settlements
on the Trade Receivables Discounting System
(TReDS) is also proposed to be raised from `1 crore
to `3 crore. This will help cater to the growing
liquidity requirements of micro, small and medium
enterprises (MSMEs). The Union Budget 2022-23 has
proposed various measures to promote the digital
and FinTech ecosystem, including the setting up of
digital banking units, the continuation of financial
support to incentivise digital modes of payment and
relaxations in the tax incentive scheme for start-ups.
Conclusion
Today global economy stands at an inflection
point. Inflation has become entrenched across
economies owing to a spike in commodity prices and
persistence of supply chain bottlenecks. The global
macroeconomic situation remains embroiled in a
heightened state of uncertainty, with risks tilted to the
downside. The Goldman Sachs Financial Conditions
Index - a composite index including interest rates,
equity valuations, borrowing costs and currency data
- shows significant tightening of financial conditions
especially for the emerging market economies
(Chart 42). Investor sentiment has been dampened
by risk aversion, which could unsettle capital flows
and impede the embryonic recovery going forward.
Notwithstanding this unsettled global
environment, the domestic economic situation
continues to improve. The Union Budget 2022-23 and
the monetary policy announcement of February 10,
2022 have set the tone for a durable and broad-based
revival. The renewed emphasis on public investment
through infrastructure development is expected to
crowd-in private investment and strengthen job
creation and demand in 2022-23. Fundamental to
the infrastructure boost is the GatiShakti national
9 https://www.trai.gov.in/sites/default/files/PR_No.04of2022_1.pdf10 https://www.appannie.com/en/go/state-of-mobile-2022/11 https://nasscom.in/knowledge-center/publications/india-digital-payments-40-2025-outlook 12 https://rbi.org.in/Scripts/BS_PressReleaseDisplay.aspx?prid=53248
Chart 42: Financial Conditions Index
Source: Goldman Sachs.
ARTICLE
RBI Bulletin February 202252
State of the Economy
master plan, which aims to achieve inclusive growth
through multi-modal connectivity and logistics
efficiency.
With inflation projected to stay within the
tolerance band in 2022-23, the Monetary Policy
Committee (MPC) decided to pause and persevere
with an accommodative policy stance. Governor
13 Governor’s statement on February 10, 2022.
Shri Shaktikanta Das emphasised that monetary
policy would continue in its endeavour to achieve
price stability, while ensuring a strong and sustained
economic recovery13. Higher spending and ease of
doing business have brightened the outlook. India
has once again emerged as the fastest growing
economy among the major economies of the world
according to the IMF.
ARTICLE
RBI Bulletin February 2022 53
Zombies and the Process of Creative Destruction
*
This article is prepared by Sitikantha Pattanaik, Silu Muduli and Jibin Jose, Department of Economic and Policy Research, Reserve Bank of India. The views expressed in this article are those of the authors and do not represent the views of the Reserve Bank of India.
Zombies and the Process of Creative Destruction*
The Schumpeterian creative destruction process requires a dynamic reallocation of resources from weak and vulnerable firms to strong firms having high growth potential. Zombie firms that often survive longer than desirable taking advantage of countercyclical policy support, however, tend to thwart that process. Using firm-level data for India, this article finds that monetary policy does not hinder the creative destruction process by misallocating credit flows to zombies during periods of economic slowdown, but zombies seem to have dampened the effectiveness of monetary policy at the margin as they use borrowed resources more for their survival than for undertaking new investment.
Introduction
There is a growing evidence-based realisation that
business cycles are costly and stabilisation policies are
more beneficial than widely thought (Jordà, Schularick
and Taylor, 2020). Because of the endogenous effects
from weak cyclical conditions on the growth trajectory,
aggressive and proactive countercyclical policy actions
may be optimal (Cerra, Fatás and Saxena, 2020). It has
often been argued that in the post-global financial crisis
(GFC) period, the slowdown in productivity growth –
a secular pre-GFC trend that was only amplified by
the crisis – might have also been partly the result of
ultra-accommodative monetary policy, that created an
enabling environment for weak banks to evergreen
loans to zombies and keep them alive (Obstfeld and
Duval, 2018).
The Schumpeterian creative destruction process
requires a dynamic reallocation of resources from
weak and vulnerable firms to strong firms with high
growth potential, but policy interventions to protect
weak firms and mitigate job losses can hinder medium-
term progress and involve technological “sclerosis”
(Caballero and Hammour, 1996). The countercyclical
policy response, thus, involves a choice – preserving
existing jobs versus encouraging creative destruction,
allowing jobs and resources to move away from
unsuccessful firms towards more successful firms
(G30, 2020).
Globally, there has been an increase in the
number of perpetually loss-making zombie firms,
who use more credit/external finance to service
debt regularly, enabling them to remain in business
(Banerjee and Hofmann, 2020). Weak banks often
lend to such zombie firms at higher interest rates,
enabling the survival of such weak banks in a financial
system. Accommodative monetary policy and low-
interest rates also help zombies – dubbed widely as
the “living dead” – to remain in business. Following
the unpleasant Japanese experience with the zombies
in the 1990s, it has been progressively realised
that zombification may be a global phenomenon,
and accordingly, research attention has shifted to
multiple facets of this challenge – zombies crowd-
out growth opportunities of more productive firms
and their rising presence in an economy can lower
potential growth (McGowan, Andrews and Millot,
2018); countries operating with weak banks and weak
insolvency regimes allow zombies to thrive (Andrews
and Petroulakis, 2019); the “zombie credit channel”
thrives in a weakly capitalised banking (financial)
system, and accommodative monetary policy in such
a system can propel a practice of “loan evergreening”
enabling weak banks and weak firms to stay afloat,
with the latter servicing debt timely using new
borrowings from the former, and the former thereby
also postponing recognition of bad assets to stay
above the minimum regulatory capital requirement
(Acharya, 2019); “…Schumpeter’s theory of creative
destruction is not corroborated in the data” (Bosio,
ARTICLE
RBI Bulletin February 202254
Zombies and the Process of Creative Destruction
Djankov, Jolevski and Ramalho, 2020); and, the risk of
death of a weak firm decreases the longer it survives
as a zombie (Nurmi, Vanhala and Virén, 2020).
The nature of the firms operating in an economy
– strong, weak or zombies – can often influence the
outcome of monetary policy response and the impact
of a shock on the economy. Strong firms may pile up
surplus cash in the event of a recession, deleverage
to strengthen the balance sheet and remain prepared
to take advantage of the cyclical pick-up. Weak firms,
with limited liquid assets and collaterals and poor
credit history, however, may face the heat of flight to
quality, leading to lower access to credit when they
may need it the most, that too at higher rates (or
external finance premium). Counter-cyclical monetary
policy can help contain the propagation of a shock by
protecting weak firms.
The creditworthiness of borrowers is endogenous
to an adverse shock, as they suffer cash-flow
disruptions (or liquidity stress) at a time when their
net worth (or capacity to present collateral or own
equity) goes down. While the net worth of a firm is
pro-cyclical (i.e., a recession lowers the capacity of
a firm to borrow), the external finance premium is
countercyclical (i.e., in a recession, given information
asymmetry, banks may either charge higher interest
rate or ration credit1), and therefore a counter-cyclical
monetary policy (that can mitigate the risk of excessive
increase in external finance premium and propel
credit supply from banks to the vulnerable) becomes
necessary. Both the balance sheet channel and credit
channel of monetary policy could help stabilise the
economy following an exogenous shock. As regards
the balance sheet channel, first, lower interest rates
may increase the value of marketable collaterals (such
as shares and bonds); second, debt servicing burden
may decline to the extent that loans are contracted at
variable rates of interest; and third, cash flows of firms
may improve when the aggregate demand situation
in the economy responds to the monetary stimulus.
All these three forces could help reduce the external
finance premium for the firms. The credit channel (or
the credit supply channel) can also mitigate the risk of
credit rationing.
In an atmosphere characterised by growing
presence of zombies, however, stabilisation policies
can potentially endanger the medium-term growth
trajectory by hampering creative destruction. Set
against this context, this article focuses on examining
how the influence of zombies in the Indian
economy has changed over time, and how zombies
respond to monetary policy vis-à-vis non-zombies.
Section II outlines the relevance of a clear distinction
between zombies and non-zombies in empirical firm-
level research to monetary policy analysis. It also
explains the approach followed in this paper for
the identification of zombies, and then presents a
factual assessment of how zombies have performed
relative to non-zombies over time in India. Section III
examines empirically the sensitivity of (a) borrowings
from banks, (b) investment, and (c) cost of finance of
zombies to changes in the monetary policy rate and
liquidity conditions relative to non-zombies. While
monetary policy is captured through the weighted
average call money rate (WACR) – it being the operating
target of monetary policy in India, liquidity condition
is captured through net surplus/deficit position under
the liquidity adjustment facility (LAF) as a percentage
of net demand and time liabilities (NDTL). Concluding
observations are presented in Section IV.
II. Some Evidence of Zombification in India
In India, the non-government non-financial
corporate sector comprises firms in both organised
and unorganised sectors. The information available
on the former has both listed and unlisted companies,
while many small and medium enterprises are in the
1 When banks manage to deal with the information asymmetry challenge (by say monitoring cash flows/balance sheet position) the cost of credit may rise (Beranke and Gertler, 1989), whereas when banks fail to overcome the problem of information asymmetry they may resort to credit rationing (Stiglitz and Weiss, 1981).
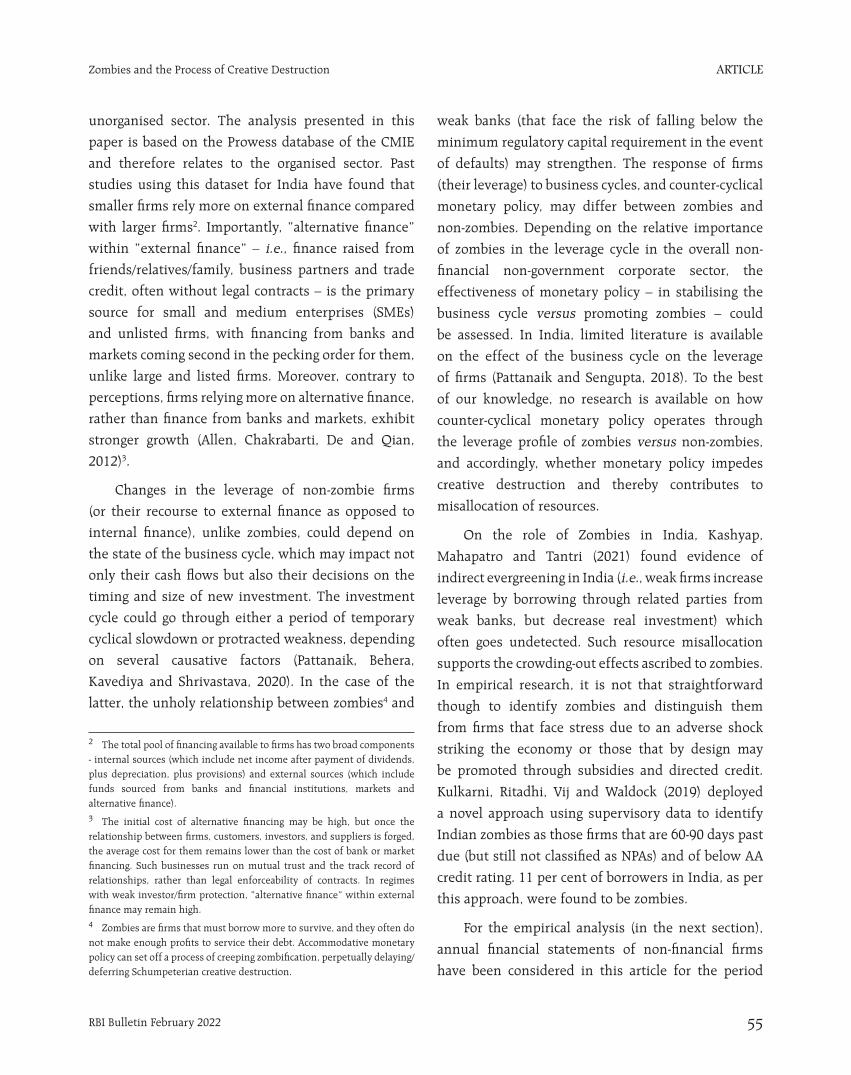
ARTICLE
RBI Bulletin February 2022 55
Zombies and the Process of Creative Destruction
unorganised sector. The analysis presented in this
paper is based on the Prowess database of the CMIE
and therefore relates to the organised sector. Past
studies using this dataset for India have found that
smaller firms rely more on external finance compared
with larger firms2. Importantly, “alternative finance”
within “external finance” – i.e., finance raised from
friends/relatives/family, business partners and trade
credit, often without legal contracts – is the primary
source for small and medium enterprises (SMEs)
and unlisted firms, with financing from banks and
markets coming second in the pecking order for them,
unlike large and listed firms. Moreover, contrary to
perceptions, firms relying more on alternative finance,
rather than finance from banks and markets, exhibit
stronger growth (Allen, Chakrabarti, De and Qian,
2012)3.
Changes in the leverage of non-zombie firms
(or their recourse to external finance as opposed to
internal finance), unlike zombies, could depend on
the state of the business cycle, which may impact not
only their cash flows but also their decisions on the
timing and size of new investment. The investment
cycle could go through either a period of temporary
cyclical slowdown or protracted weakness, depending
on several causative factors (Pattanaik, Behera,
Kavediya and Shrivastava, 2020). In the case of the
latter, the unholy relationship between zombies4 and
weak banks (that face the risk of falling below the
minimum regulatory capital requirement in the event
of defaults) may strengthen. The response of firms
(their leverage) to business cycles, and counter-cyclical
monetary policy, may differ between zombies and
non-zombies. Depending on the relative importance
of zombies in the leverage cycle in the overall non-
financial non-government corporate sector, the
effectiveness of monetary policy – in stabilising the
business cycle versus promoting zombies – could
be assessed. In India, limited literature is available
on the effect of the business cycle on the leverage
of firms (Pattanaik and Sengupta, 2018). To the best
of our knowledge, no research is available on how
counter-cyclical monetary policy operates through
the leverage profile of zombies versus non-zombies,
and accordingly, whether monetary policy impedes
creative destruction and thereby contributes to
misallocation of resources.
On the role of Zombies in India, Kashyap,
Mahapatro and Tantri (2021) found evidence of
indirect evergreening in India (i.e., weak firms increase
leverage by borrowing through related parties from
weak banks, but decrease real investment) which
often goes undetected. Such resource misallocation
supports the crowding-out effects ascribed to zombies.
In empirical research, it is not that straightforward
though to identify zombies and distinguish them
from firms that face stress due to an adverse shock
striking the economy or those that by design may
be promoted through subsidies and directed credit.
Kulkarni, Ritadhi, Vij and Waldock (2019) deployed
a novel approach using supervisory data to identify
Indian zombies as those firms that are 60-90 days past
due (but still not classified as NPAs) and of below AA
credit rating. 11 per cent of borrowers in India, as per
this approach, were found to be zombies.
For the empirical analysis (in the next section),
annual financial statements of non-financial firms
have been considered in this article for the period
2 The total pool of financing available to firms has two broad components - internal sources (which include net income after payment of dividends, plus depreciation, plus provisions) and external sources (which include funds sourced from banks and financial institutions, markets and alternative finance). 3 The initial cost of alternative financing may be high, but once the relationship between firms, customers, investors, and suppliers is forged, the average cost for them remains lower than the cost of bank or market financing. Such businesses run on mutual trust and the track record of relationships, rather than legal enforceability of contracts. In regimes with weak investor/firm protection, “alternative finance” within external finance may remain high.4 Zombies are firms that must borrow more to survive, and they often do not make enough profits to service their debt. Accommodative monetary policy can set off a process of creeping zombification, perpetually delaying/deferring Schumpeterian creative destruction.
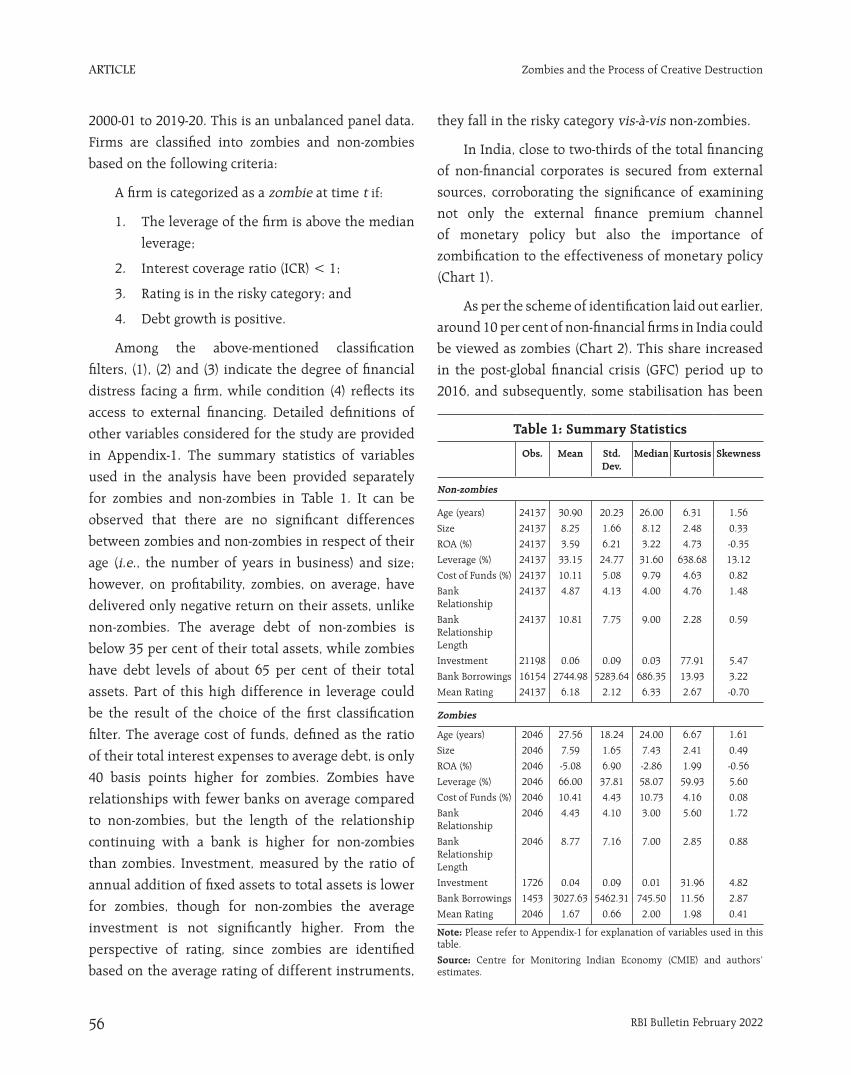
ARTICLE
RBI Bulletin February 202256
Zombies and the Process of Creative Destruction
2000-01 to 2019-20. This is an unbalanced panel data.
Firms are classified into zombies and non-zombies
based on the following criteria:
A firm is categorized as a zombie at time t if:
1. The leverage of the firm is above the median
leverage;
2. Interest coverage ratio (ICR) < 1;
3. Rating is in the risky category; and
4. Debt growth is positive.
Among the above-mentioned classification
filters, (1), (2) and (3) indicate the degree of financial
distress facing a firm, while condition (4) reflects its
access to external financing. Detailed definitions of
other variables considered for the study are provided
in Appendix-1. The summary statistics of variables
used in the analysis have been provided separately
for zombies and non-zombies in Table 1. It can be
observed that there are no significant differences
between zombies and non-zombies in respect of their
age (i.e., the number of years in business) and size;
however, on profitability, zombies, on average, have
delivered only negative return on their assets, unlike
non-zombies. The average debt of non-zombies is
below 35 per cent of their total assets, while zombies
have debt levels of about 65 per cent of their total
assets. Part of this high difference in leverage could
be the result of the choice of the first classification
filter. The average cost of funds, defined as the ratio
of their total interest expenses to average debt, is only
40 basis points higher for zombies. Zombies have
relationships with fewer banks on average compared
to non-zombies, but the length of the relationship
continuing with a bank is higher for non-zombies
than zombies. Investment, measured by the ratio of
annual addition of fixed assets to total assets is lower
for zombies, though for non-zombies the average
investment is not significantly higher. From the
perspective of rating, since zombies are identified
based on the average rating of different instruments,
they fall in the risky category vis-à-vis non-zombies.
In India, close to two-thirds of the total financing
of non-financial corporates is secured from external
sources, corroborating the significance of examining
not only the external finance premium channel
of monetary policy but also the importance of
zombification to the effectiveness of monetary policy
(Chart 1).
As per the scheme of identification laid out earlier,
around 10 per cent of non-financial firms in India could
be viewed as zombies (Chart 2). This share increased
in the post-global financial crisis (GFC) period up to
2016, and subsequently, some stabilisation has been
Table 1: Summary Statistics
Obs. Mean Std. Dev.
Median Kurtosis Skewness
Non-zombies
Age (years) 24137 30.90 20.23 26.00 6.31 1.56
Size 24137 8.25 1.66 8.12 2.48 0.33
ROA (%) 24137 3.59 6.21 3.22 4.73 -0.35
Leverage (%) 24137 33.15 24.77 31.60 638.68 13.12
Cost of Funds (%) 24137 10.11 5.08 9.79 4.63 0.82
Bank Relationship
24137 4.87 4.13 4.00 4.76 1.48
Bank Relationship Length
24137 10.81 7.75 9.00 2.28 0.59
Investment 21198 0.06 0.09 0.03 77.91 5.47
Bank Borrowings 16154 2744.98 5283.64 686.35 13.93 3.22
Mean Rating 24137 6.18 2.12 6.33 2.67 -0.70
Zombies
Age (years) 2046 27.56 18.24 24.00 6.67 1.61
Size 2046 7.59 1.65 7.43 2.41 0.49
ROA (%) 2046 -5.08 6.90 -2.86 1.99 -0.56
Leverage (%) 2046 66.00 37.81 58.07 59.93 5.60
Cost of Funds (%) 2046 10.41 4.43 10.73 4.16 0.08
Bank Relationship
2046 4.43 4.10 3.00 5.60 1.72
Bank Relationship Length
2046 8.77 7.16 7.00 2.85 0.88
Investment 1726 0.04 0.09 0.01 31.96 4.82
Bank Borrowings 1453 3027.63 5462.31 745.50 11.56 2.87
Mean Rating 2046 1.67 0.66 2.00 1.98 0.41
Note: Please refer to Appendix-1 for explanation of variables used in this table.
Source: Centre for Monitoring Indian Economy (CMIE) and authors’ estimates.
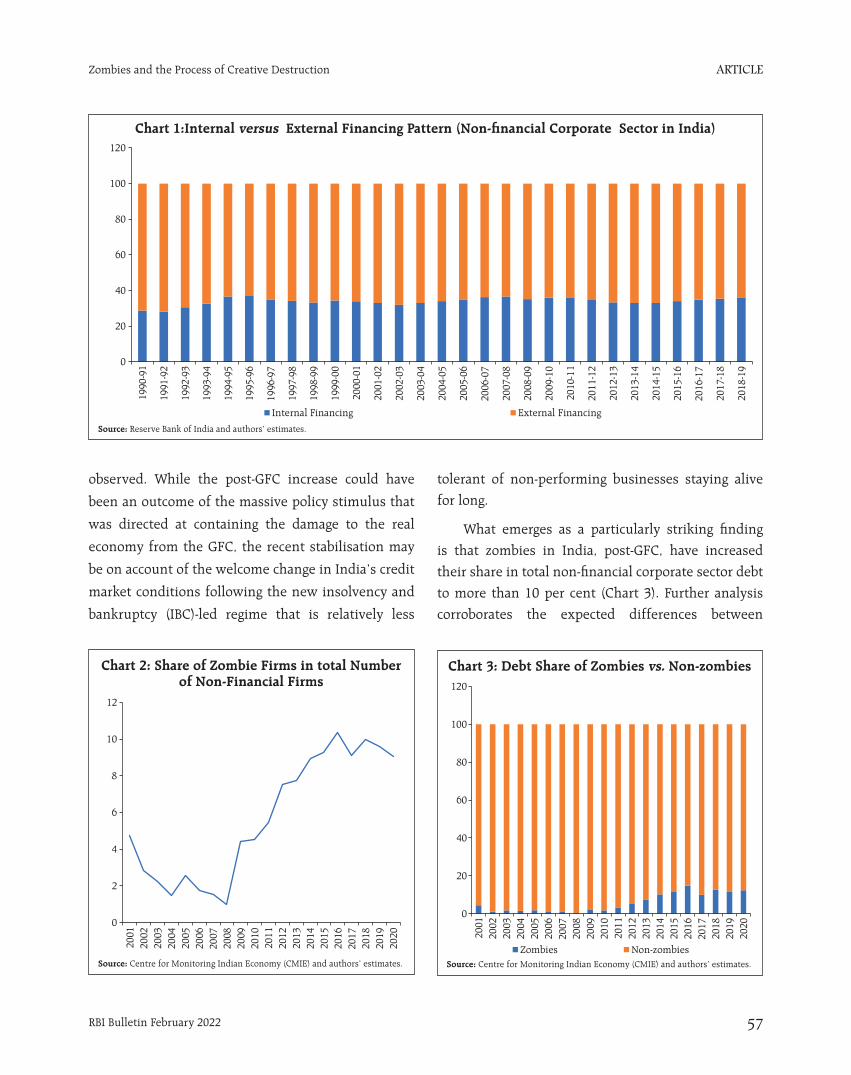
ARTICLE
RBI Bulletin February 2022 57
Zombies and the Process of Creative Destruction
observed. While the post-GFC increase could have
been an outcome of the massive policy stimulus that
was directed at containing the damage to the real
economy from the GFC, the recent stabilisation may
be on account of the welcome change in India’s credit
market conditions following the new insolvency and
bankruptcy (IBC)-led regime that is relatively less
tolerant of non-performing businesses staying alive
for long.
What emerges as a particularly striking finding
is that zombies in India, post-GFC, have increased
their share in total non-financial corporate sector debt
to more than 10 per cent (Chart 3). Further analysis
corroborates the expected differences between
Chart 1:Internal versus External Financing Pattern (Non-financial Corporate Sector in India)
Source: Reserve Bank of India and authors’ estimates.
Chart 2: Share of Zombie Firms in total Number of Non-Financial Firms
Source: Centre for Monitoring Indian Economy (CMIE) and authors’ estimates.
Chart 3: Debt Share of Zombies vs. Non-zombies
Source: Centre for Monitoring Indian Economy (CMIE) and authors’ estimates.
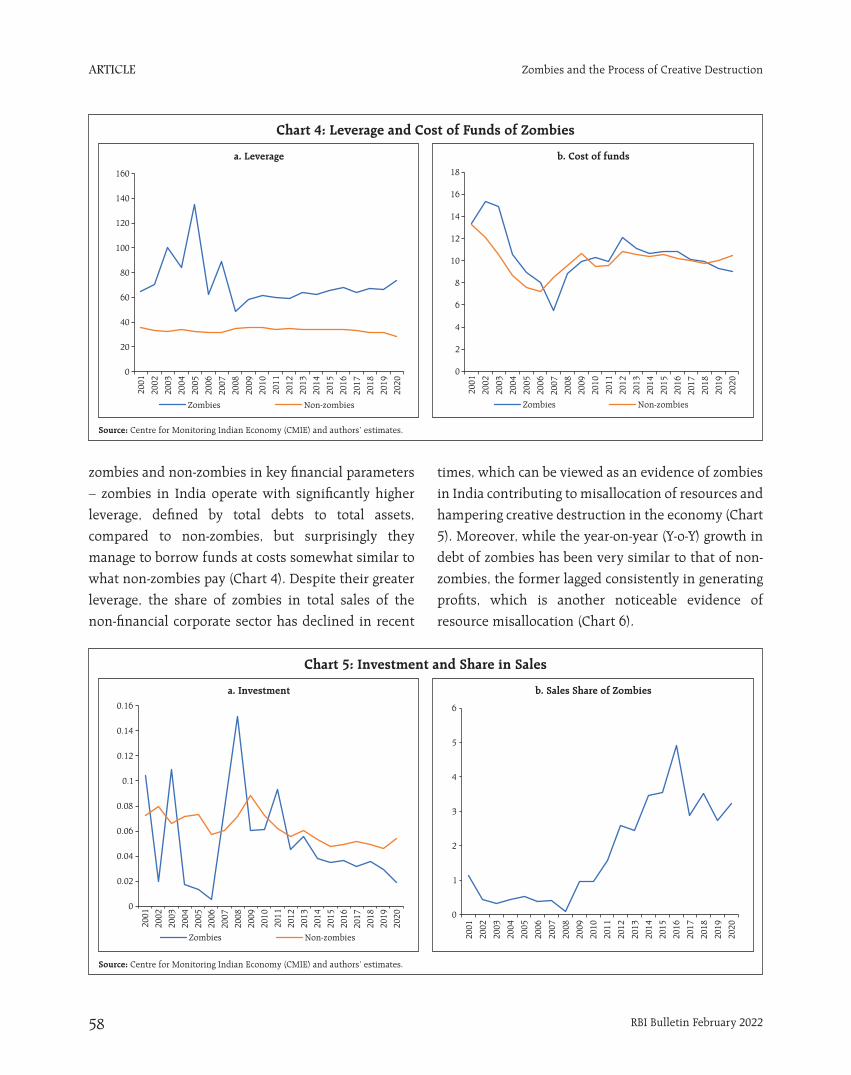
ARTICLE
RBI Bulletin February 202258
Zombies and the Process of Creative Destruction
zombies and non-zombies in key financial parameters
– zombies in India operate with significantly higher
leverage, defined by total debts to total assets,
compared to non-zombies, but surprisingly they
manage to borrow funds at costs somewhat similar to
what non-zombies pay (Chart 4). Despite their greater
leverage, the share of zombies in total sales of the
non-financial corporate sector has declined in recent
times, which can be viewed as an evidence of zombies
in India contributing to misallocation of resources and
hampering creative destruction in the economy (Chart
5). Moreover, while the year-on-year (Y-o-Y) growth in
debt of zombies has been very similar to that of non-
zombies, the former lagged consistently in generating
profits, which is another noticeable evidence of
resource misallocation (Chart 6).
Chart 4: Leverage and Cost of Funds of Zombies
Chart 5: Investment and Share in Sales
Source: Centre for Monitoring Indian Economy (CMIE) and authors’ estimates.
Source: Centre for Monitoring Indian Economy (CMIE) and authors’ estimates.
a. Leverage
a. Investment
b. Cost of funds
b. Sales Share of Zombies
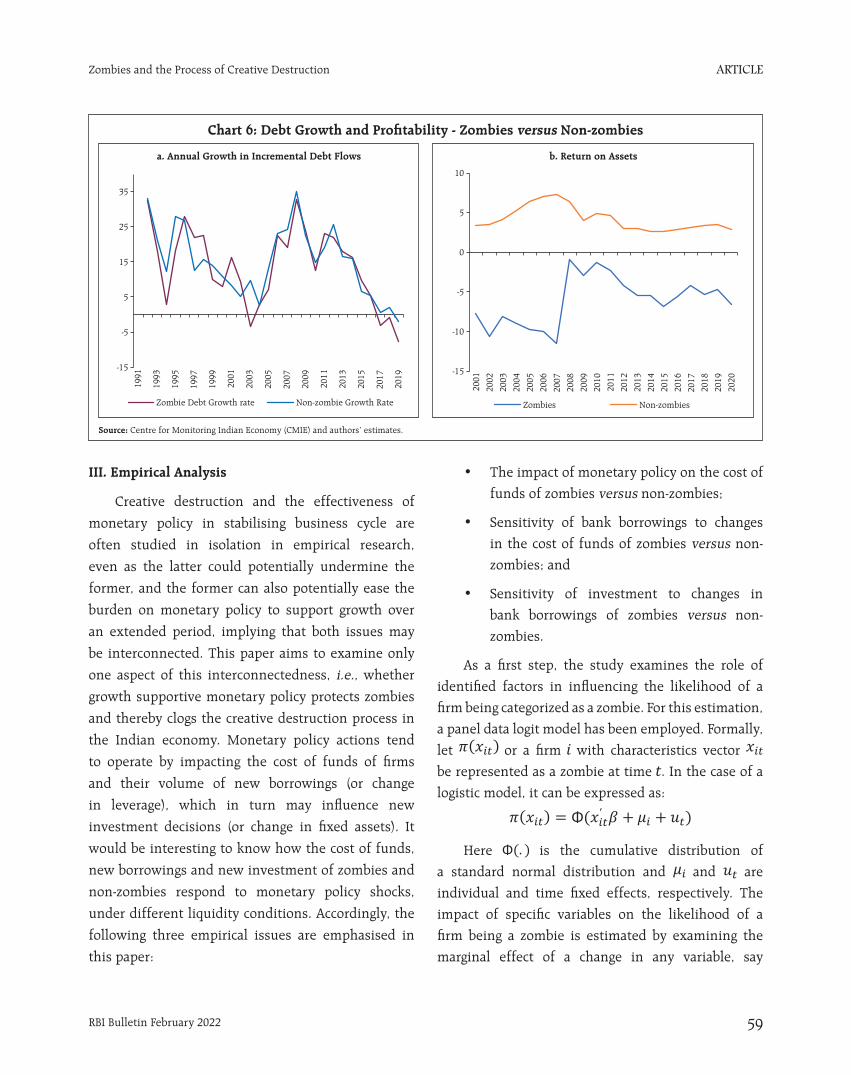
ARTICLE
RBI Bulletin February 2022 59
Zombies and the Process of Creative Destruction
III. Empirical Analysis
Creative destruction and the effectiveness of
monetary policy in stabilising business cycle are
often studied in isolation in empirical research,
even as the latter could potentially undermine the
former, and the former can also potentially ease the
burden on monetary policy to support growth over
an extended period, implying that both issues may
be interconnected. This paper aims to examine only
one aspect of this interconnectedness, i.e., whether
growth supportive monetary policy protects zombies
and thereby clogs the creative destruction process in
the Indian economy. Monetary policy actions tend
to operate by impacting the cost of funds of firms
and their volume of new borrowings (or change
in leverage), which in turn may influence new
investment decisions (or change in fixed assets). It
would be interesting to know how the cost of funds,
new borrowings and new investment of zombies and
non-zombies respond to monetary policy shocks,
under different liquidity conditions. Accordingly, the
following three empirical issues are emphasised in
this paper:
• The impact of monetary policy on the cost of
funds of zombies versus non-zombies;
• Sensitivity of bank borrowings to changes
in the cost of funds of zombies versus non-
zombies; and
• Sensitivity of investment to changes in
bank borrowings of zombies versus non-
zombies.
As a first step, the study examines the role of
identified factors in influencing the likelihood of a
firm being categorized as a zombie. For this estimation,
a panel data logit model has been employed. Formally,
let or a firm with characteristics vector
be represented as a zombie at time . In the case of a
logistic model, it can be expressed as:
Here is the cumulative distribution of
a standard normal distribution and and are
individual and time fixed effects, respectively. The
impact of specific variables on the likelihood of a
firm being a zombie is estimated by examining the
marginal effect of a change in any variable, say
Chart 6: Debt Growth and Profitability - Zombies versus Non-zombies
Source: Centre for Monitoring Indian Economy (CMIE) and authors’ estimates.
a. Annual Growth in Incremental Debt Flows b. Return on Assets
ARTICLE
RBI Bulletin February 202260
Zombies and the Process of Creative Destruction
on . So, the marginal effect of a unit change
in the characteristics of variables on the likelihood
of a firm being categorised as a zombie could be
approximated as:
Here is the normal probability density
function. These estimates show the incremental
impact of these variables on the likelihood of a firm
being classified as zombies.
As the next step, the following panel regression
framework is used to test the three specific empirical
hypotheses discussed earlier. The general specification
of the model is:
where is the dependent variable, is the vector
of explanatory variables, and is the error term
with individual fixed effect and time fixed effect
. For certain regression specifications in which
panel-invariant explanatory variables are included
(for instance, the monetary policy rate is the same for
all firms during a year), only firm-specific fixed effect
is considered for the estimation.
Monetary policy is captured through the weighted
average call rate (WACR) – the operating target of
monetary policy in India, to study the impact on the
cost of funds of firms. In addition to WACR, the role
of firm-specific factors such as their size, profitability,
and the number and length of banking relationships
that may determine the cost of funds are also
included in the model. To assess whether the credit
channel of monetary policy works at the firm level,
the differential bank borrowing pattern of zombies
and non-zombies in response to changes in their cost
of funds is also estimated. The response pattern is
separately studied for surplus and deficit liquidity phases [captured through annual average net liquidity adjustment facility (LAF) positions as a percentage of net demand and time liabilities (NDTL)]. To examine whether zombies borrow from banks to undertake new investment or to just survive by meeting current expenses, the sensitivity of investment of firms to new borrowings is studied next. Bank borrowings can be broadly categorised into two types: short-term borrowings and long-term borrowings, with the latter often indicating the intention of new investment by firms. In the data sample used in this paper, around 40 per cent of total bank borrowings are found to be of long-term.
Before proceeding to examine the three empirical issues, the importance of specific factors that may characterise a firm as a zombie (or influence the likelihood of a firm as a zombie) is assessed first (Table 2). A firm with a higher age profile (or that survives longer) is relatively less likely to be a zombie; but overall, zombies tend to succeed in surviving long enough, posing risks to creative destruction. A higher return on assets lowers a firm’s likelihood of being a zombie. There are two interesting findings on banking relationships: first, firms having relationships with a lesser number of banks are more likely to be zombies; second, firms with shorter banking relationships are also more likely to be zombies. A longer banking relationship helps banks in acquiring soft information about firms, which in turn may contribute to the realistic assessment of a firm’s creditworthiness. The banking relationship structure for zombies is expected to differ from that of non-zombies in a competitive banking system that may progressively assign greater importance to the risk-return profile and outlook of firms rather than the past relationship with a firm. Zombies tend to depend more on bank borrowings (evident for overall as well as long-term loans) as market sources may differentiate better between good and bad firms and deny access to the latter.
ARTICLE
RBI Bulletin February 2022 61
Zombies and the Process of Creative Destruction
On the first empirical issue of interest, estimates suggest that a 100-basis point reduction in WACR lowers the cost of funds of firms by 35 basis points in the same year (Table 3). Surprisingly, in some specifications, zombies seem to manage lower average cost of funds, which could be an indication of the impact of evergreening to avoid higher explicit recognition of NPAs and the associated higher capital charges by banks, or also simple relationship-based banking that some banks may prefer to protect as long as the magnitude of the problem is manageable. The interactive dummy coefficient highlights that compared to non-zombies, the cost of funds of zombies is more sensitive to changes in WACR. An interest rate shock, expectedly, matters more to zombies but, from the standpoint of the effectiveness of monetary policy, it is found that cost of funds of all firms (zombies and non-zombies) change in response to changes in WACR. Again, along the expected lines, firms that are larger and profitable have lower average costs of funds.
The lower average cost of funds tends to stimulate higher bank borrowings for all firms (Table 4). During liquidity surplus phases, borrowings are also generally higher, attesting to the overall effectiveness of monetary policy. As one would expect, bank borrowings of zombies are comparatively higher than non-zombies. However, importantly, zombies borrow relatively less compared to non-zombies during surplus liquidity conditions, which does not support the perception that pro-growth counter-cyclical monetary policy may at times clog the creative destruction process in the economy. Normally, in a period of economic slowdown, good firms may accumulate cash surpluses while bad firms may need more credit to survive. Banks that may be driven by credit growth targets could still meet the credit needs of the latter, but in a well-supervised banking system, the increasing emphasis on the risk sensitivity of new assets created by banks may refrain them from doing so, despite the challenge of being viewed as
risk-averse. Effective bank supervision and credible
insolvency and bankruptcy procedures could, thus,
lower the probability of accommodative monetary
policy impeding creative destruction in an economy.
An increase in bank borrowings in response to
an accommodative monetary policy shock is found
to raise the investment of firms, defined as the ratio
of incremental addition of fixed capital to total assets
(Table 5). The sensitivity of investment, however,
is found to be lower for zombies. The interactive
dummy coefficient validates similar results even
for long-term bank borrowings. Given that bank
borrowings of zombies account for around 10 per cent
of total bank credit absorbed by all non-financial firms
in the past five years, they seem to be dampening
the effectiveness of monetary policy to some extent.
The real investment response to an accommodative
monetary policy shock could strengthen if further
improvement in resource allocation in the banking
system could lower the share of zombies in the flow of
new credit from banks. An accommodative monetary
policy stance often aims at boosting the flow of credit
to productive sectors of the economy and by intent,
therefore, it does not work against the process of
creative destruction, which is also corroborated by the
empirical results of this article.
IV. Conclusion
In the post-Global Financial Crisis (GFC) period,
return to a robust and durable growth trajectory has
been elusive for a vast majority of countries, even
as counter-cyclical policies have experimented with
extreme variants of conventional and unconventional
measures to support growth. In the process of doing
so, a perception has developed that such policies
may be hindering creative destruction and thereby
contributing, quite inadvertently though, to lower
trend investment and productivity growth. With the
number of zombie firms – that cannot service debt,
but still manage to borrow more to survive – rising
ARTICLE
RBI Bulletin February 202262
Zombies and the Process of Creative Destruction
globally over time, empirical examination of the
relevance of this perception has acquired significance.
In India, zombies are estimated to account for
about 10 per cent of total debt of the non-financial
corporate sector and they have also absorbed about
10 per cent of total bank credit extended to all firms
in the economy. As one would expect, they are
found in general to be highly leveraged; generate a
negative return on assets over successive years and
borrow more to survive rather than undertake new
investment. Their average cost of funds is more
sensitive to monetary policy shocks. Their borrowings
from banks, however, often do not give rise to
higher real investment activity, unlike non-zombies.
This validates that accommodative monetary policy
is effective overall in lowering the cost of funds,
stimulating higher flow of credit and raising new
investment, but it gets dampened at the margin
by zombies who tend to use borrowed resources,
including long-term bank loans, less for new
investment and more for survival. Importantly, during
surplus liquidity conditions, which often accompany
accommodative phases of monetary policy, credit
flows to zombies remain weaker than flows to non-
zombies, which could largely be due to the salubrious
impact of risk-based supervision and the insolvency
and bankruptcy regime that may no longer support
evergreening of zombies. The empirical findings, i.e., no evidence of surplus liquidity flowing excessively to
zombies during phases of accommodative monetary
policy corroborate that monetary policy in India
has not hindered the creative destruction process
and, therefore, does not pose any attendant risks to
trend growth. With further improvement in resource
allocation through the banking system, however, there
is scope for enhancing the effectiveness of counter-
cyclical monetary policy.
References
Acharya, V. V. (2019). Creating zombies and disinflation:
A cul de sac for accommodative monetary policy.
VoxEU. Org, November 11.
Adalet McGowan, M., Andrews, D., & Millot, V. (2018).
The walking dead? Zombie firms and productivity
performance in OECD countries. Economic Policy,
33(96), 685–736.
Allen, F., Chakrabarti, R., De, S., & Qian, M. (2012).
Financing firms in India. Journal of Financial
Intermediation, 21(3), 409–445.
Andrews, D., & Petroulakis, F. (2019). Breaking the
shackles: Zombie firms, weak banks and depressed
restructuring in Europe. ECB Working Paper No 2240
/ February.
Banerjee, R., & Hofmann, B. (2020). Corporate zombies:
Anatomy and life cycle. BIS Working Papers No. 882,
September 2.
Beranke, B. S., & Gertler, M. (1989). Agency costs, net
worth, and business fluctuations. American Economic
Review, 79(1), 14–31.
Bosio, E., Djankov, S., Jolevski, F., & Ramalho, R. (2020).
Survival of Firms during Economic Crisis. World Bank
Policy Research Working Paper No. 9239.
Caballero, R. J., & Hammour, M. L. (1996). On the
timing and efficiency of creative destruction. The
Quarterly Journal of Economics, 111(3), 805–852.
Cerra, M. V., Fatás, A., & Saxena, M. S. C. (2020).
Hysteresis and business cycles. International
Monetary Fund Working Paper WP/20/73.
G30 (2020). Reviving and Restructuring the Corporate
Sector Post-Covid. URL: https://group30.org/
publications/detail/4820
ARTICLE
RBI Bulletin February 2022 63
Zombies and the Process of Creative Destruction
Jordà, Ò., Schularick, M., & Taylor, A. M. (2020).
Disasters everywhere: The costs of business cycles reconsidered. Federal Reserve Bank of San Francisco
Working Paper 2020-11. https://doi.org/10.24148/
wp2020-11
Kashyap, N., Mahapatro, S., & Tantri, P. L. (2021).
They Do It Anyway: Detecting Indirect Evergreening.
Available at SSRN 3775286.
Kulkarni, N., Ritadhi, S. K., Vij, S., & Waldock, K. (2019).
Unearthing zombies. Georgetown McDonough School of Business Research Paper No. 3495660.
Nurmi, S., Vanhala, J., & Virén, M. (2020). The life
and death of zombies--evidence from government
subsidies to firms. Bank of Finland Research Discussion Paper, (8).
Obstfeld, M., & Duval, R. (2018). Tight monetary policy
is not the answer to weak productivity growth. VoxEU, January 10.
Pattanaik, A., & Sengupta, R. (2018). Business cycle effect on leverage: A study of Indian non-financial firms. IGIDR Working Paper WP-2018-001 Indira
Gandhi Institute of Development Research: Mumbai,
India.
Pattanaik, S., Behera, H., Kavediya, R., & Shrivastava, A.
(2020). Investment slowdown in India--an assessment.
Macroeconomics and Finance in Emerging Market Economies, 1–16.
Stiglitz, J. E., & Weiss, A. (1981). Credit rationing in
markets with imperfect information. The American Economic Review, 71(3), 393–410.
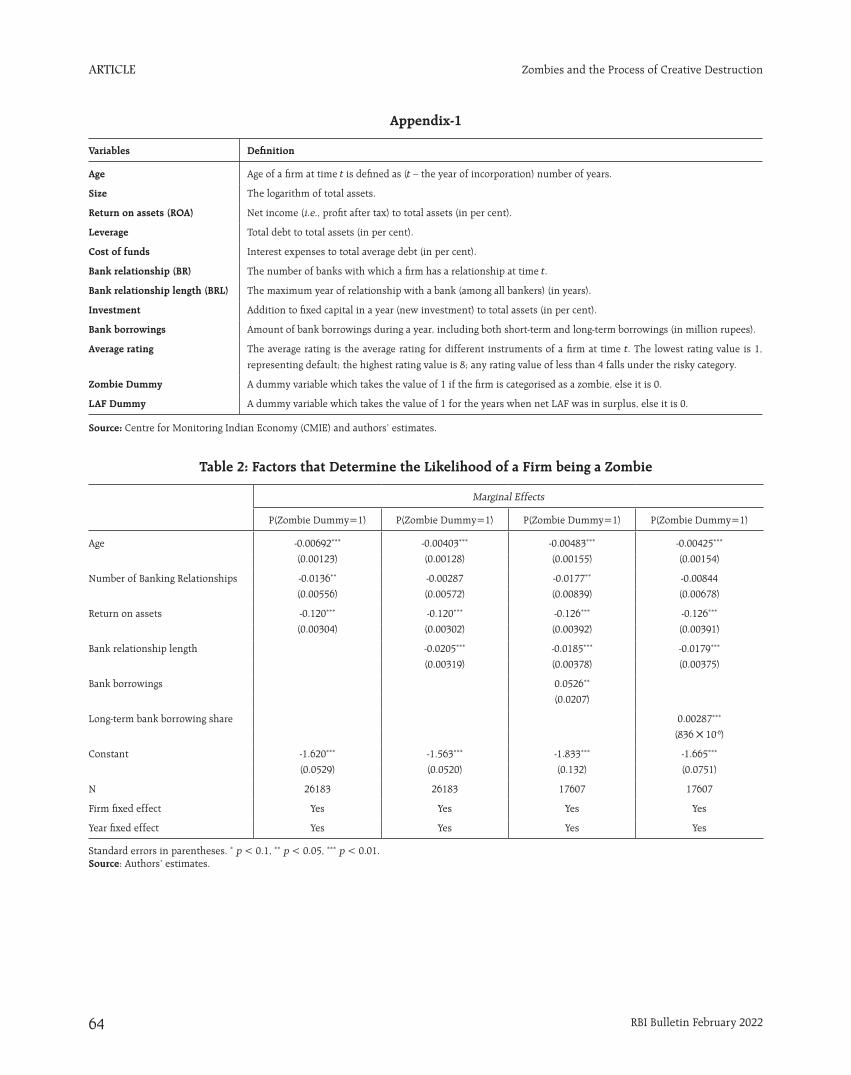
ARTICLE
RBI Bulletin February 202264
Zombies and the Process of Creative Destruction
Appendix-1
Variables Definition
Age Age of a firm at time is defined as ( – the year of incorporation) number of years.
Size The logarithm of total assets.
Return on assets (ROA) Net income (i.e., profit after tax) to total assets (in per cent).
Leverage Total debt to total assets (in per cent).
Cost of funds Interest expenses to total average debt (in per cent).
Bank relationship (BR) The number of banks with which a firm has a relationship at time .
Bank relationship length (BRL) The maximum year of relationship with a bank (among all bankers) (in years).
Investment Addition to fixed capital in a year (new investment) to total assets (in per cent).
Bank borrowings Amount of bank borrowings during a year, including both short-term and long-term borrowings (in million rupees).
Average rating The average rating is the average rating for different instruments of a firm at time . The lowest rating value is 1,
representing default; the highest rating value is 8; any rating value of less than 4 falls under the risky category.
Zombie Dummy A dummy variable which takes the value of 1 if the firm is categorised as a zombie, else it is 0.
LAF Dummy A dummy variable which takes the value of 1 for the years when net LAF was in surplus, else it is 0.
Source: Centre for Monitoring Indian Economy (CMIE) and authors’ estimates.
Table 2: Factors that Determine the Likelihood of a Firm being a Zombie
Marginal Effects
P(Zombie Dummy=1) P(Zombie Dummy=1) P(Zombie Dummy=1) P(Zombie Dummy=1)
Age -0.00692*** -0.00403*** -0.00483*** -0.00425***
(0.00123) (0.00128) (0.00155) (0.00154)
Number of Banking Relationships -0.0136** -0.00287 -0.0177** -0.00844
(0.00556) (0.00572) (0.00839) (0.00678)
Return on assets -0.120*** -0.120*** -0.126*** -0.126***
(0.00304) (0.00302) (0.00392) (0.00391)
Bank relationship length -0.0205*** -0.0185*** -0.0179***
(0.00319) (0.00378) (0.00375)
Bank borrowings 0.0526**
(0.0207)
Long-term bank borrowing share 0.00287***
(836 10-6)
Constant -1.620*** -1.563*** -1.833*** -1.665***
(0.0529) (0.0520) (0.132) (0.0751)
N 26183 26183 17607 17607
Firm fixed effect Yes Yes Yes Yes
Year fixed effect Yes Yes Yes Yes
Standard errors in parentheses. * p < 0.1, ** p < 0.05, *** p < 0.01. Source: Authors’ estimates.
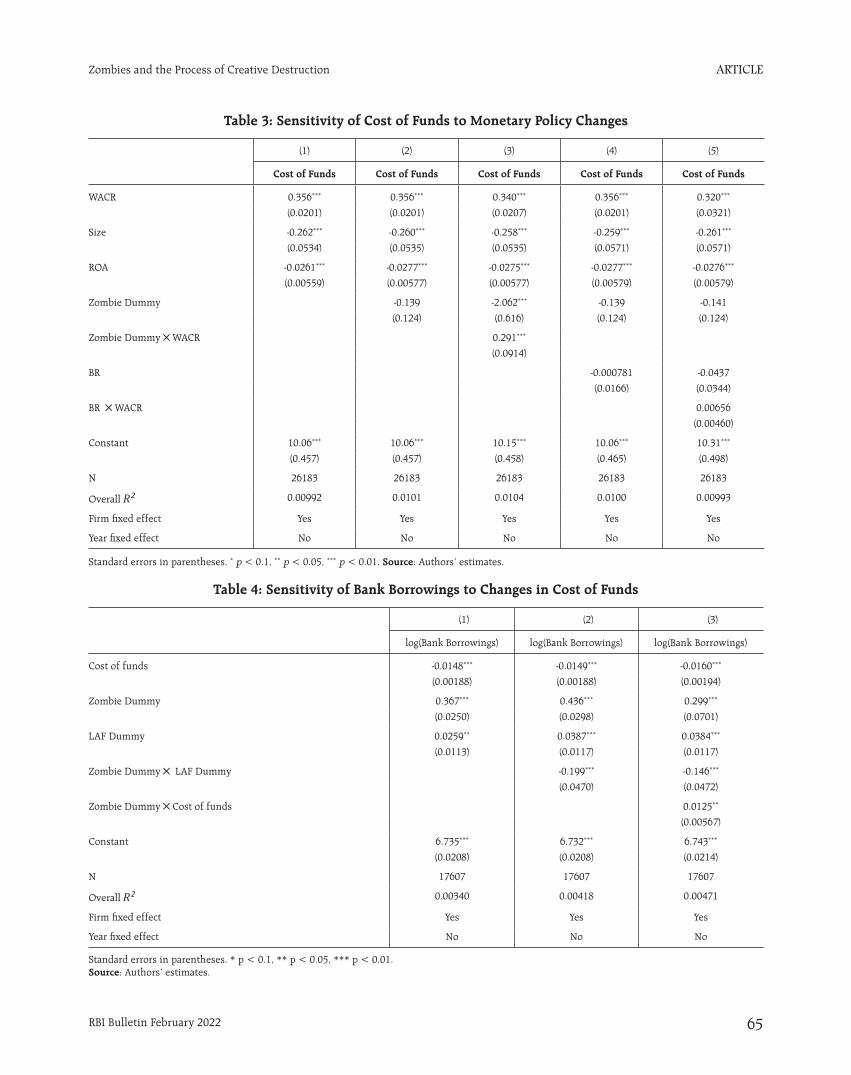
ARTICLE
RBI Bulletin February 2022 65
Zombies and the Process of Creative Destruction
Table 3: Sensitivity of Cost of Funds to Monetary Policy Changes
(1) (2) (3) (4) (5)
Cost of Funds Cost of Funds Cost of Funds Cost of Funds Cost of Funds
WACR 0.356*** 0.356*** 0.340*** 0.356*** 0.320***
(0.0201) (0.0201) (0.0207) (0.0201) (0.0321)
Size -0.262*** -0.260*** -0.258*** -0.259*** -0.261***
(0.0534) (0.0535) (0.0535) (0.0571) (0.0571)
ROA -0.0261*** -0.0277*** -0.0275*** -0.0277*** -0.0276***
(0.00559) (0.00577) (0.00577) (0.00579) (0.00579)
Zombie Dummy -0.139 -2.062*** -0.139 -0.141
(0.124) (0.616) (0.124) (0.124)
Zombie Dummy WACR 0.291***
(0.0914)
BR -0.000781 -0.0437
(0.0166) (0.0344)
BR WACR 0.00656
(0.00460)
Constant 10.06*** 10.06*** 10.15*** 10.06*** 10.31***
(0.457) (0.457) (0.458) (0.465) (0.498)
N 26183 26183 26183 26183 26183
Overall 0.00992 0.0101 0.0104 0.0100 0.00993
Firm fixed effect Yes Yes Yes Yes Yes
Year fixed effect No No No No No
Standard errors in parentheses. * p < 0.1, ** p < 0.05, *** p < 0.01. Source: Authors’ estimates.
Table 4: Sensitivity of Bank Borrowings to Changes in Cost of Funds
(1) (2) (3)
log(Bank Borrowings) log(Bank Borrowings) log(Bank Borrowings)
Cost of funds -0.0148*** -0.0149*** -0.0160***
(0.00188) (0.00188) (0.00194)
Zombie Dummy 0.367*** 0.436*** 0.299***
(0.0250) (0.0298) (0.0701)
LAF Dummy 0.0259** 0.0387*** 0.0384***
(0.0113) (0.0117) (0.0117)
Zombie Dummy LAF Dummy -0.199*** -0.146***
(0.0470) (0.0472)
Zombie Dummy Cost of funds 0.0125**
(0.00567)
Constant 6.735*** 6.732*** 6.743***
(0.0208) (0.0208) (0.0214)
N 17607 17607 17607
Overall 0.00340 0.00418 0.00471
Firm fixed effect Yes Yes Yes
Year fixed effect No No No
Standard errors in parentheses. * p < 0.1, ** p < 0.05, *** p < 0.01. Source: Authors’ estimates.
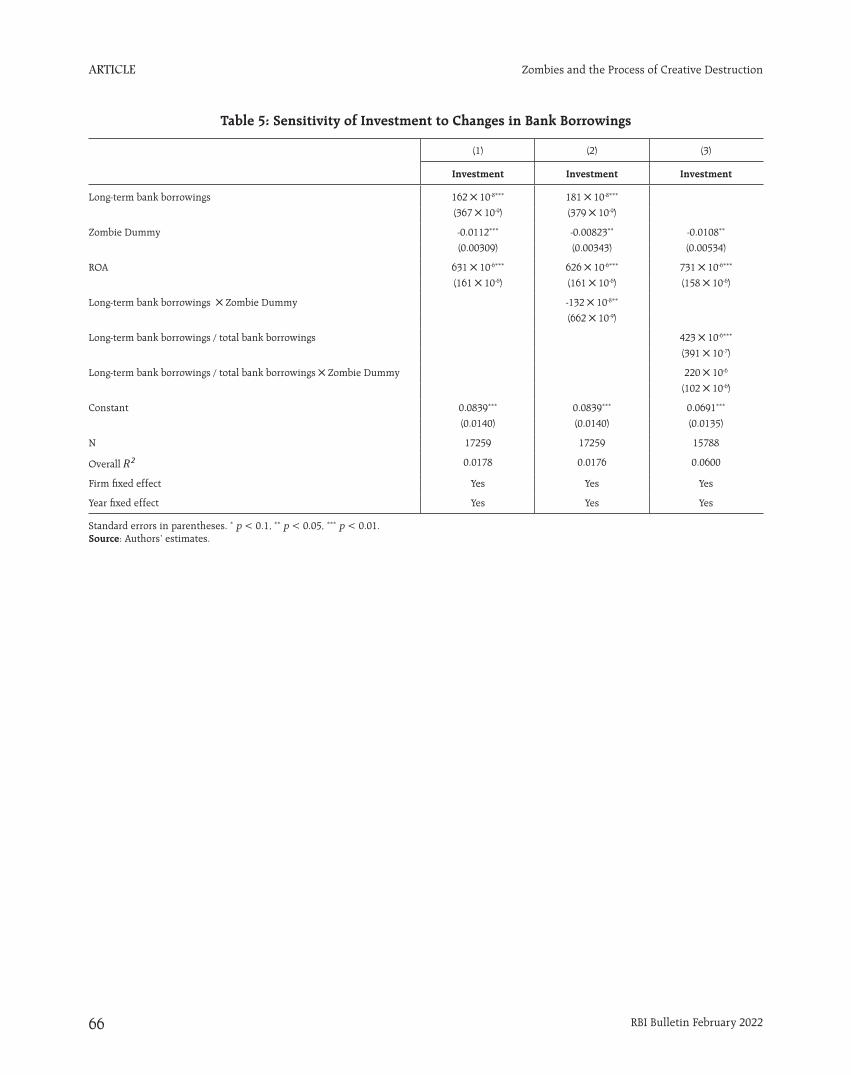
ARTICLE
RBI Bulletin February 202266
Zombies and the Process of Creative Destruction
Table 5: Sensitivity of Investment to Changes in Bank Borrowings
(1) (2) (3)
Investment Investment Investment
Long-term bank borrowings 162 10-8*** 181 10-8***
(367 10-9) (379 10-9)
Zombie Dummy -0.0112*** -0.00823** -0.0108**
(0.00309) (0.00343) (0.00534)
ROA 631 10-6*** 626 10-6*** 731 10-6***
(161 10-6) (161 10-6) (158 10-6)
Long-term bank borrowings Zombie Dummy -132 10-8**
(662 10-9)
Long-term bank borrowings / total bank borrowings 423 10-6***
(391 10-7)
Long-term bank borrowings / total bank borrowings Zombie Dummy 220 10-6
(102 10-6)
Constant 0.0839*** 0.0839*** 0.0691***
(0.0140) (0.0140) (0.0135)
N 17259 17259 15788
Overall 0.0178 0.0176 0.0600
Firm fixed effect Yes Yes Yes
Year fixed effect Yes Yes Yes
Standard errors in parentheses. * p < 0.1, ** p < 0.05, *** p < 0.01. Source: Authors’ estimates.
ARTICLE
RBI Bulletin February 2022 67
Bad Banks as Good Samaritans: Lessons from Cross-Country Experience for India
* The article is prepared by Dr. Snehal S. Herwadkar, Arpita Agarwal
and Sambhavi Dhingra from Banking Research Division of Department of Economic and Policy Research under the guidance of Ashok Sahoo, Adviser. The views expressed in this article are those of the authors and do not represent the views of the Reserve Bank of India. 1 Press Bureau of India, press release dated September 16, 2021, available at https://pib.gov.in/PressReleseDetailm.aspx?PRID=1755466.
Bad Banks as Good Samaritans: Lessons from Cross-Country Experience for India*
The cross-country experience in management of non-performing assets (NPAs) suggests that the establishment of a bad bank proves most effective when it has adequate government and legal backing. In the Indian context, the setting up of the National Asset Reconstruction Company Ltd. (NARCL), with a clear mandate and an explicit government guarantee, will help in alleviating the financial stress on commercial banks. NARCL will be an additional mechanism for resolution of large stressed assets, complementing the activities of existing asset management companies. Going forward, continued commitment, professional staff and transparency in operation will help in making the exercise cost and time effective.
1. Introduction
The establishment of the National Asset
Reconstruction Company Ltd. (NARCL) as a ‘bad bank’
and the recent announcement by the Government
to extend guarantee of `30,600 crore for its security
receipts (SRs) have been received with enthusiasm as
well as scepticism in equal measure1. While some have
hailed this development as a panacea for all ills, other
less sanguine analysts point out the pre-existence of
a multitude of avenues for resolution of distressed
assets and the challenges faced by them.
Such conflicting views represent the trade-offs
inherent in establishment of bad banks. The present
paper analyses cross-country practices of such banks
to understand the characteristics that helped in their
success. The features of the NARCL are then juxtaposed
against the lessons learnt from international
experience to gauge the possibility of its success. The
rest of the article is structured as follows- Section 2
explains the concept and the evolution of bad banks
and Section 3 elaborates upon cross-country design
elements. Sections 4 and 5 outline the advantages in
their creation and challenges faced in their operation,
respectively. The next section evaluates the features
of the NARCL vis-à-vis cross-country learnings, while
Section 7 concludes.
2. Concept and Development of Bad Banks
Globally, the policy options to deal with the
overhang of non-performing assets (NPAs) include loan
restructuring, harnessing and reforming insolvency
and resolution frameworks and operationalisation of
bad banks. Although these alternative mechanisms
have been tried and tested over a period across
countries, the bad bank remains one of the more
popular concepts, especially while dealing with
system-wide stressed assets.
The term ‘bad bank’ may be used to represent any
structure which enables a segregation of performing
assets from the non-performing, either on or off-
balance sheet. On-balance sheet models, where
bad assets are placed in a separate internal unit,
help increase transparency and work as a signalling
mechanism for the market, showcasing the bank’s
commitment to clean its balance sheet. The off-
balance sheet models, on the other hand, can take the
form of a special-purpose entity structure, wherein
bad assets are offloaded, securitized and sold to a
diverse set of investors. Alternatively, the bad assets
can be shifted to an external asset management or
reconstruction company (AMC/ARC). The latter model,
though complex and expensive, ensures maximum
risk transfer in comparison to the others (Martini, et
al., 2009).
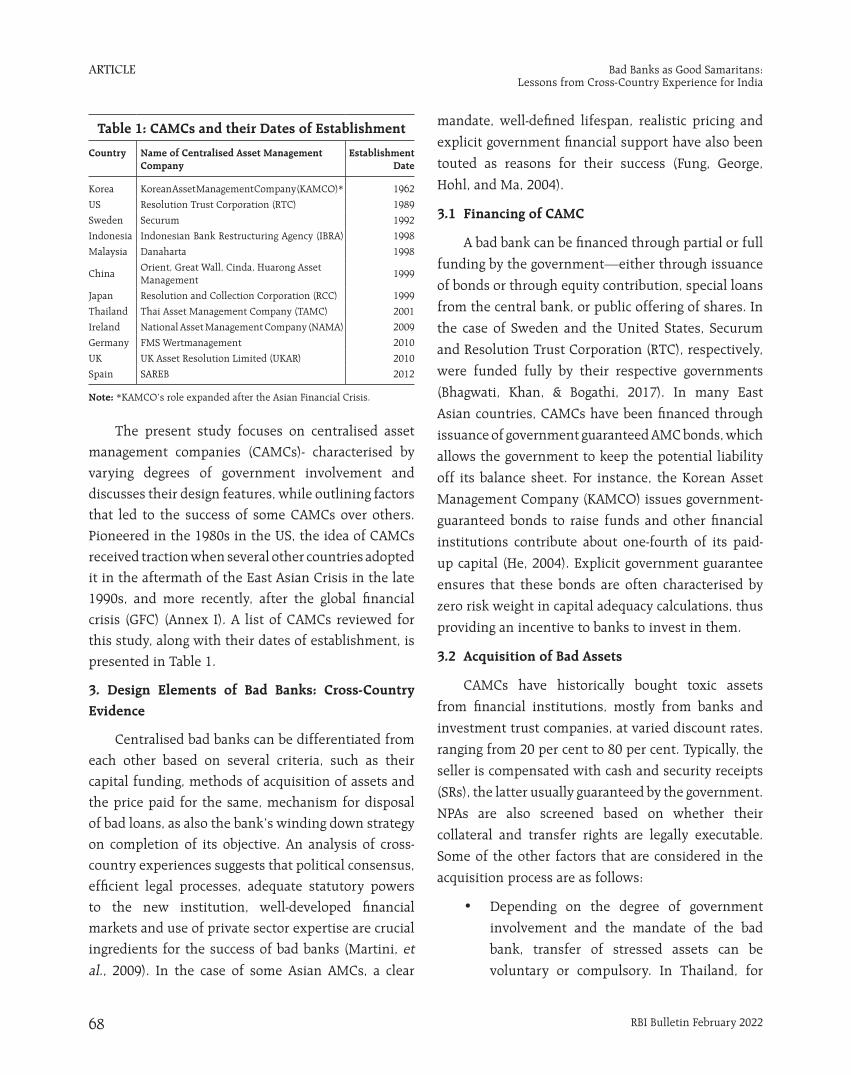
ARTICLE
RBI Bulletin February 202268
Bad Banks as Good Samaritans: Lessons from Cross-Country Experience for India
The present study focuses on centralised asset management companies (CAMCs)- characterised by varying degrees of government involvement and discusses their design features, while outlining factors that led to the success of some CAMCs over others. Pioneered in the 1980s in the US, the idea of CAMCs received traction when several other countries adopted it in the aftermath of the East Asian Crisis in the late 1990s, and more recently, after the global financial crisis (GFC) (Annex I). A list of CAMCs reviewed for this study, along with their dates of establishment, is presented in Table 1.
3. Design Elements of Bad Banks: Cross-Country Evidence
Centralised bad banks can be differentiated from each other based on several criteria, such as their capital funding, methods of acquisition of assets and the price paid for the same, mechanism for disposal of bad loans, as also the bank’s winding down strategy on completion of its objective. An analysis of cross-country experiences suggests that political consensus, efficient legal processes, adequate statutory powers to the new institution, well-developed financial markets and use of private sector expertise are crucial ingredients for the success of bad banks (Martini, et
al., 2009). In the case of some Asian AMCs, a clear
mandate, well-defined lifespan, realistic pricing and
explicit government financial support have also been
touted as reasons for their success (Fung, George,
Hohl, and Ma, 2004).
3.1 Financing of CAMC
A bad bank can be financed through partial or full
funding by the government—either through issuance
of bonds or through equity contribution, special loans
from the central bank, or public offering of shares. In
the case of Sweden and the United States, Securum
and Resolution Trust Corporation (RTC), respectively,
were funded fully by their respective governments
(Bhagwati, Khan, & Bogathi, 2017). In many East
Asian countries, CAMCs have been financed through
issuance of government guaranteed AMC bonds, which
allows the government to keep the potential liability
off its balance sheet. For instance, the Korean Asset
Management Company (KAMCO) issues government-
guaranteed bonds to raise funds and other financial
institutions contribute about one-fourth of its paid-
up capital (He, 2004). Explicit government guarantee
ensures that these bonds are often characterised by
zero risk weight in capital adequacy calculations, thus
providing an incentive to banks to invest in them.
3.2 Acquisition of Bad Assets
CAMCs have historically bought toxic assets
from financial institutions, mostly from banks and
investment trust companies, at varied discount rates,
ranging from 20 per cent to 80 per cent. Typically, the
seller is compensated with cash and security receipts
(SRs), the latter usually guaranteed by the government.
NPAs are also screened based on whether their
collateral and transfer rights are legally executable.
Some of the other factors that are considered in the
acquisition process are as follows:
• Depending on the degree of government
involvement and the mandate of the bad
bank, transfer of stressed assets can be
voluntary or compulsory. In Thailand, for
Table 1: CAMCs and their Dates of Establishment
Country Name of Centralised Asset Management Company
Establishment Date
Korea Korean Asset Management Company (KAMCO)* 1962
US Resolution Trust Corporation (RTC) 1989
Sweden Securum 1992
Indonesia Indonesian Bank Restructuring Agency (IBRA) 1998
Malaysia Danaharta 1998
ChinaOrient, Great Wall, Cinda, Huarong Asset Management
1999
Japan Resolution and Collection Corporation (RCC) 1999
Thailand Thai Asset Management Company (TAMC) 2001
Ireland National Asset Management Company (NAMA) 2009
Germany FMS Wertmanagement 2010
UK UK Asset Resolution Limited (UKAR) 2010
Spain SAREB 2012
Note: *KAMCO’s role expanded after the Asian Financial Crisis.
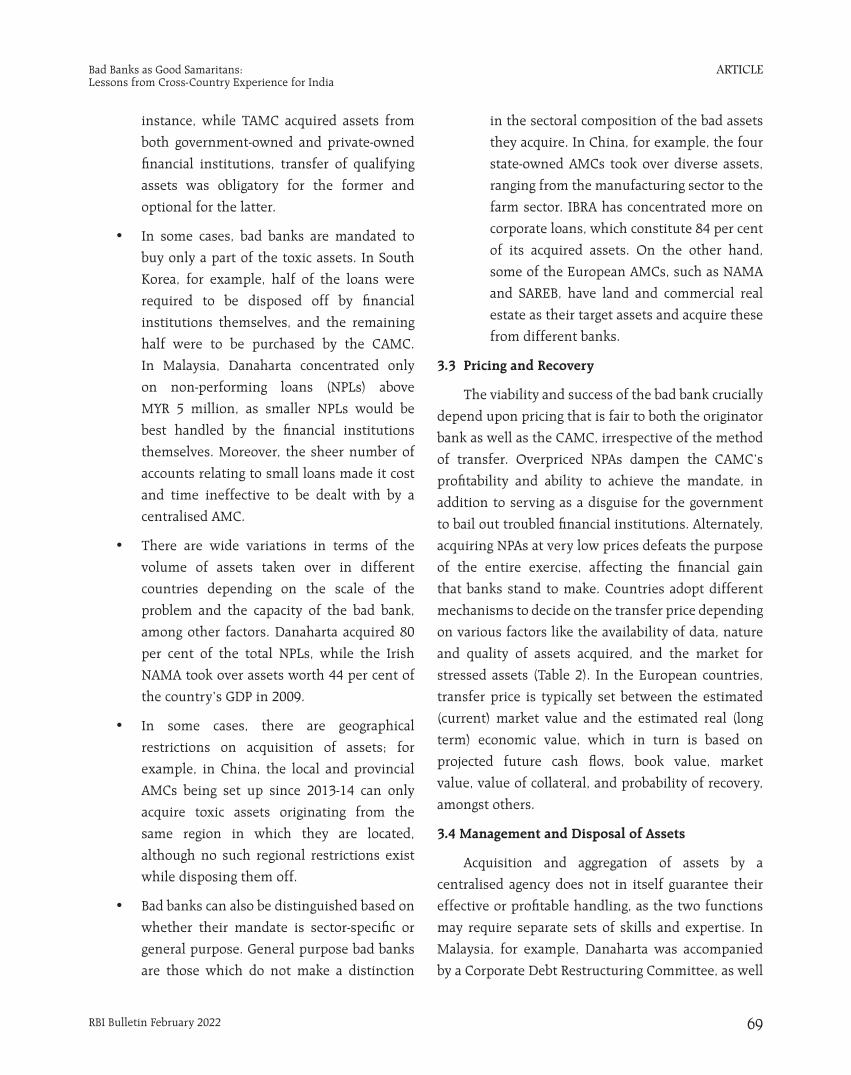
ARTICLE
RBI Bulletin February 2022 69
Bad Banks as Good Samaritans: Lessons from Cross-Country Experience for India
instance, while TAMC acquired assets from
both government-owned and private-owned
financial institutions, transfer of qualifying
assets was obligatory for the former and
optional for the latter.
• In some cases, bad banks are mandated to
buy only a part of the toxic assets. In South
Korea, for example, half of the loans were
required to be disposed off by financial
institutions themselves, and the remaining
half were to be purchased by the CAMC.
In Malaysia, Danaharta concentrated only
on non-performing loans (NPLs) above
MYR 5 million, as smaller NPLs would be
best handled by the financial institutions
themselves. Moreover, the sheer number of
accounts relating to small loans made it cost
and time ineffective to be dealt with by a
centralised AMC.
• There are wide variations in terms of the
volume of assets taken over in different
countries depending on the scale of the
problem and the capacity of the bad bank,
among other factors. Danaharta acquired 80
per cent of the total NPLs, while the Irish
NAMA took over assets worth 44 per cent of
the country’s GDP in 2009.
• In some cases, there are geographical
restrictions on acquisition of assets; for
example, in China, the local and provincial
AMCs being set up since 2013-14 can only
acquire toxic assets originating from the
same region in which they are located,
although no such regional restrictions exist
while disposing them off.
• Bad banks can also be distinguished based on
whether their mandate is sector-specific or
general purpose. General purpose bad banks
are those which do not make a distinction
in the sectoral composition of the bad assets
they acquire. In China, for example, the four
state-owned AMCs took over diverse assets,
ranging from the manufacturing sector to the
farm sector. IBRA has concentrated more on
corporate loans, which constitute 84 per cent
of its acquired assets. On the other hand,
some of the European AMCs, such as NAMA
and SAREB, have land and commercial real
estate as their target assets and acquire these
from different banks.
3.3 Pricing and Recovery
The viability and success of the bad bank crucially
depend upon pricing that is fair to both the originator
bank as well as the CAMC, irrespective of the method
of transfer. Overpriced NPAs dampen the CAMC’s
profitability and ability to achieve the mandate, in
addition to serving as a disguise for the government
to bail out troubled financial institutions. Alternately,
acquiring NPAs at very low prices defeats the purpose
of the entire exercise, affecting the financial gain
that banks stand to make. Countries adopt different
mechanisms to decide on the transfer price depending
on various factors like the availability of data, nature
and quality of assets acquired, and the market for
stressed assets (Table 2). In the European countries,
transfer price is typically set between the estimated
(current) market value and the estimated real (long
term) economic value, which in turn is based on
projected future cash flows, book value, market
value, value of collateral, and probability of recovery,
amongst others.
3.4 Management and Disposal of Assets
Acquisition and aggregation of assets by a
centralised agency does not in itself guarantee their
effective or profitable handling, as the two functions
may require separate sets of skills and expertise. In
Malaysia, for example, Danaharta was accompanied
by a Corporate Debt Restructuring Committee, as well
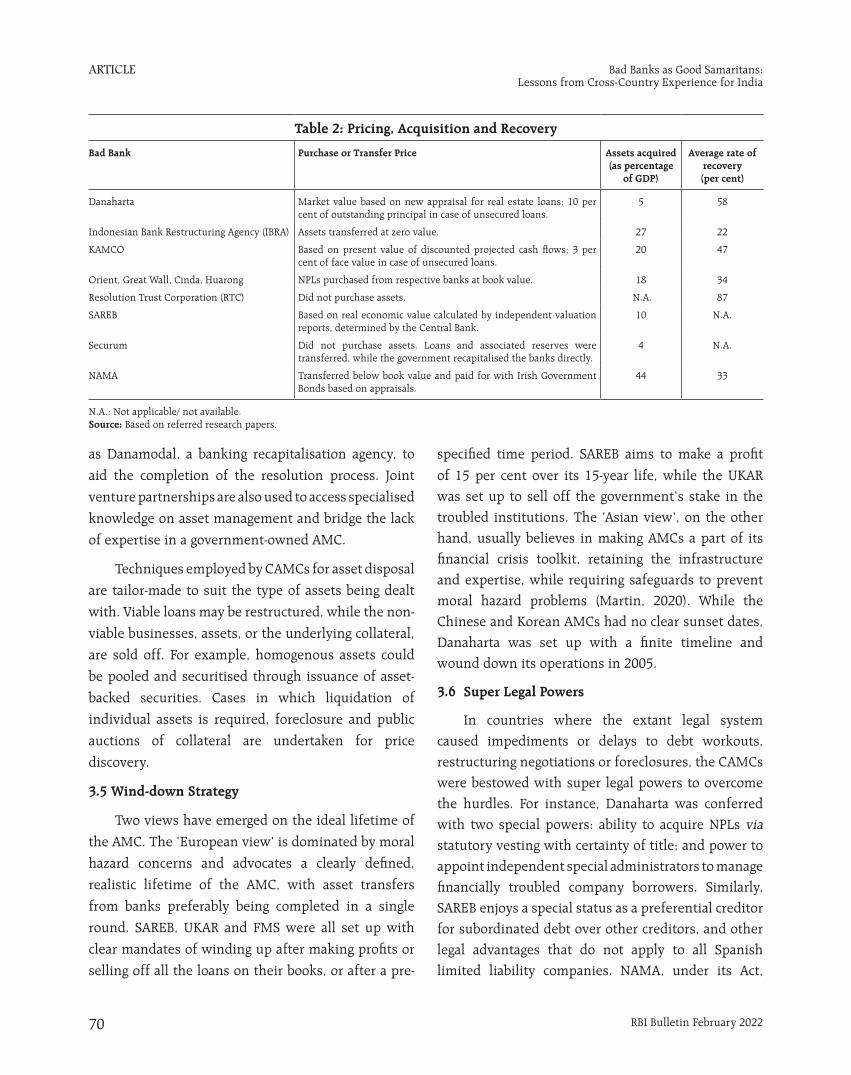
ARTICLE
RBI Bulletin February 202270
Bad Banks as Good Samaritans: Lessons from Cross-Country Experience for India
as Danamodal, a banking recapitalisation agency, to
aid the completion of the resolution process. Joint
venture partnerships are also used to access specialised
knowledge on asset management and bridge the lack
of expertise in a government-owned AMC.
Techniques employed by CAMCs for asset disposal
are tailor-made to suit the type of assets being dealt
with. Viable loans may be restructured, while the non-
viable businesses, assets, or the underlying collateral,
are sold off. For example, homogenous assets could
be pooled and securitised through issuance of asset-
backed securities. Cases in which liquidation of
individual assets is required, foreclosure and public
auctions of collateral are undertaken for price
discovery.
3.5 Wind-down Strategy
Two views have emerged on the ideal lifetime of
the AMC. The ‘European view’ is dominated by moral
hazard concerns and advocates a clearly defined,
realistic lifetime of the AMC, with asset transfers
from banks preferably being completed in a single
round. SAREB, UKAR and FMS were all set up with
clear mandates of winding up after making profits or
selling off all the loans on their books, or after a pre-
specified time period. SAREB aims to make a profit
of 15 per cent over its 15-year life, while the UKAR was set up to sell off the government’s stake in the troubled institutions. The ‘Asian view’, on the other hand, usually believes in making AMCs a part of its financial crisis toolkit, retaining the infrastructure and expertise, while requiring safeguards to prevent moral hazard problems (Martin, 2020). While the Chinese and Korean AMCs had no clear sunset dates, Danaharta was set up with a finite timeline and wound down its operations in 2005.
3.6 Super Legal Powers
In countries where the extant legal system caused impediments or delays to debt workouts, restructuring negotiations or foreclosures, the CAMCs were bestowed with super legal powers to overcome the hurdles. For instance, Danaharta was conferred with two special powers: ability to acquire NPLs via statutory vesting with certainty of title; and power to appoint independent special administrators to manage financially troubled company borrowers. Similarly, SAREB enjoys a special status as a preferential creditor for subordinated debt over other creditors, and other legal advantages that do not apply to all Spanish limited liability companies. NAMA, under its Act,
Table 2: Pricing, Acquisition and Recovery
Bad Bank Purchase or Transfer Price Assets acquired (as percentage
of GDP)
Average rate of recovery (per cent)
Danaharta Market value based on new appraisal for real estate loans; 10 per cent of outstanding principal in case of unsecured loans.
5 58
Indonesian Bank Restructuring Agency (IBRA) Assets transferred at zero value. 27 22
KAMCO Based on present value of discounted projected cash flows; 3 per cent of face value in case of unsecured loans.
20 47
Orient, Great Wall, Cinda, Huarong NPLs purchased from respective banks at book value. 18 34
Resolution Trust Corporation (RTC) Did not purchase assets. N.A. 87
SAREB Based on real economic value calculated by independent valuation reports, determined by the Central Bank.
10 N.A.
Securum Did not purchase assets. Loans and associated reserves were transferred, while the government recapitalised the banks directly.
4 N.A.
NAMA Transferred below book value and paid for with Irish Government Bonds based on appraisals.
44 33
N.A.: Not applicable/ not available. Source: Based on referred research papers.
ARTICLE
RBI Bulletin February 2022 71
Bad Banks as Good Samaritans: Lessons from Cross-Country Experience for India
has been allowed to take over commercial real estate
collateral from its insolvent debtors, a facility not
allowed for other lenders in Ireland.
4. Advantages of a Centralised Bad Bank
Evidence world-wide suggests that a centralised
bad bank can help in substantial stress reduction and
has various systemic benefits, complementing and
enabling the pre-existing stressed asset resolution
mechanisms.
• For selling banks, the clear segregation of
weak assets from the rest grants an occasion
and rationale to restructure its balance
sheet and reshape the business model,
while providing transparent insights to
customers and investors into the bank’s core
performance. By freeing up provisions and
thereby, boosting capital for lending, CAMCs
enable banks to support the economy. Scarce
human resources can also concentrate on
more important banking operations such as
new lending, rather than managing distressed
assets and corporate restructuring.
• The CAMC model can be relied upon when
banks do not have sufficient resources to
resolve large amounts of NPAs through
individual departments within banks or
through subsidiaries. As opposed to internal
restructuring, a CAMC provides a swift
vehicle to get stressed assets off a bank’s
balance sheet and reduces the need for fresh
recapitalisation either from the government
or from markets.
• Leveraging this mechanism, banks can avoid
fire sales of assets which result in lower
recovery values. Gradual sales through
CAMCs that have expertise in the field can
help in optimal recovery rates.
• CAMCs are usually driven by other concerns
in addition to value maximisation, such as
preserving the economic value of assets. For instance, RTC timed the sale of its real estate assets so as to not cause further deterioration in prices.
• Consolidation of stressed loans in bad banks and centralised ownership of collateral can effectively address the problems faced by individual banks in attracting investors for these assets. For instance, public AMCs in Asia provided a market for NPLs by giving banks an option to either sell their NPLs or through forcing them to offload the problematic assets (Lee, 2020).
• Centralised AMCs and public or private ARCs can complement each other, like in Thailand, and need not be substitutes in stressed assets management. Bad banks can hold assets which the private AMCs may not, due to their long gestation periods, or the assets that might not be adequately profitable in the medium term but are economically important and have significant positive externalities (Acharya, 2017)
• CAMCs are usually set up through special acts of law or through government orders. As such, they can be bestowed with special legal powers to accelerate loan recovery, as seen in some successful experiences such as Danaharta.
• The use of cash and/or coupon-paying government-guaranteed securities to purchase NPAs, apart from being more attractive than the SRs issued by private ARCs, improve banks’ balance sheets and add to the income of the financial institutions. It facilitates more efficient price discovery through creation of a vibrant market for distressed assets and a uniform valuation criterion as compared to private forces
working in isolation.
ARTICLE
RBI Bulletin February 202272
Bad Banks as Good Samaritans: Lessons from Cross-Country Experience for India
5. Challenges of a Centralised Bad Bank
Economists and policymakers have long
acknowledged that the establishment of a bad
bank is fraught with many trade-offs. These include
– how to relieve banking stress without encouraging
moral hazard; how to minimise the cost to the
government exchequer and how to arrive at a valuation
that is fair to both the acquiring entity as well as the
seller. In view of the following serious challenges,
utmost care needs to be taken in their design and
structure.
• Bad banks, essentially formed to ease the
burden off banks’ balance sheets, may
encourage further build-up of risky assets.
Knowing that they have the bad bank option
to fall back on, banks may become less vigilant
in giving out loans, leading to the problem of
moral hazard.
• The design of CAMCs needs to be carefully
crafted to suit country-specific and/or sector-
specific requirements. Furthermore, there is
also a tendency to deviate from the primary
objective as in the case of China’s big four
bad banks, wherein investments in financial
institutions—such as banks and insurance
companies—rather than in bad loans, now
constitute a major part of their business
(Ingves, Seelig, & He, 2004). There is also a
need to provide proper incentives to their
governing bodies and employees, as staff
recruitment and retention are problems that
often arise.
• Financing remains a dominant issue in
the context of a central bad bank. Unless
carefully designed and efficiently executed,
the cost of setting up a CAMC falls inevitably
on the resource-constrained government,
and ultimately, on the taxpayers. Even in
countries where the CAMC has succeeded in
reducing the NPLs, it has come at a cost to the
government exchequer (Fung, George, Hohl,
& Ma, 2004).
• Another challenge that emerges is keeping
the bad bank funded enough to tackle a major
share of NPLs. International experience
suggests that in certain cases, the bad bank’s
resources accounted for a miniscule share
of the bad assets, thus rendering the whole
exercise redundant.
• Market creation for distressed assets and
their fair valuation at both the buying and
selling stages is another operational challenge
that arises, as it determines the viability and
sustainability of the solution. Asset disposal
by state-owned AMCs may be disincentivised
by challenges such as political pressures
against selling of certain assets and the fear
of audit scrutiny relating to sell-offs (Fung,
George, Hohl, & Ma, 2004).
• The CAMCs, by virtue of being financed
by the government, are required to take
a macroeconomic perspective rather than
focusing on asset value maximisation. Thus,
their decisions relating to either sell-offs or
retaining the assets may be constrained by
the need to help stabilise asset markets.
• Lack of transparency in operations and lack of
reliable data can hinder the objective valuation
of assets and creation of optimal portfolios
for resale (Deloitte, 2020). In countries such
as Ireland and Spain, insufficient or missing
documentation created hurdles in smooth
functioning of their CAMCs (Cas & Peresa,
2016).
6. Stressed Assets Management in India
The Indian banking system has been weighed
down by mounting NPAs since 2012. Various
ARTICLE
RBI Bulletin February 2022 73
Bad Banks as Good Samaritans: Lessons from Cross-Country Experience for India
mechanisms like Lok Adalats, Debt Recovery
Tribunals, SARFAESI Act and the Insolvency and
Bankruptcy Code (IBC) are available to banks to deal
with the stress, while maintaining these assets in
their books till resolution. An internal restructuring
unit-like model has also been experimented in India,
but only with partial success. While the Specified
Undertaking of Unit Trust of India (SUUTI) was set up
as a special purpose entity with the primary function
of managing the bad loans of UTI and administering
redemptions, it is yet to be wound up. Other assets
that were transferred to SUUTI have subsequently
increased in value, disincentivising their disposal and
making their retention and continuation of SUUTI as
a going concern, beneficial.
Alternately, banks can exercise the option of
outright sale of bad loans to private ARCs against
the issue of SRs, albeit at a haircut. The ARC model
has proved to be constrained by several factors, like
vintage NPAs being passed on to them, lack of debt
aggregation, non-availability of additional funding for
stressed borrowers, difficulty in raising funds by the
ARCs, etc. Also, they lack the focus on recovery and
acquiring necessary skill sets for holistic resolution
of distressed borrowers (RBI, 2021). Further, the
uncertainty surrounding recovery makes the
secondary market for SRs illiquid, causing these SRs to
remain on the books of the subscribing entity, which
are often the original selling banks themselves (Yadav
& Chavan, 2021).
In the Indian case, majority of the bad assets
lie with public sector banks (PSBs) and their top
management have always faced a dilemma while
taking decisive action on stressed assets: what is
the right amount of haircut that could be assumed
without the fear of raising eyebrows now and the
possibility of vigilance action in the future?2 Deciding
the right price for a bad asset could be tricky and these
commercial decisions can go wrong with evolving circumstances. In such a situation, not taking bold actions for resolution now and kicking the can down the road may always be perceived as a pareto superior option.
The experience so far suggests that due to repeated litigations, the resolution processes drag on, leading to asset value erosion, which adversely affects the health of the banking sector in the meantime. The ineffectiveness of these mechanisms manifests itself in the large outstanding stock of bad assets, a major share of which (72.1 per cent as at end-September 2021) are in the balance sheets of PSBs, resulting in the burden of recapitalisation falling on the public exchequer. Moreover, the bad loan problem has dampened the risk-taking ability of the banks, affecting their credit growth.
Design Features of NARCL
Certain features of NARCL closely resemble successful models adopted elsewhere and may prove helpful in reducing the NPA stress.
• Structure: The establishment of NARCL for acquiring and consolidating stressed assets, along with the India Debt Resolution Company Limited (IDRCL) for managing these assets by engaging market professionals and turnaround experts, is similar to the mechanism followed in Malaysia, which proved highly successful in resolving its stressed assets.
• Ownership: NARCL, has an initial capital base of ̀ 6,000 crores, of which PSBs own a majority (51 per cent) stake while the remaining shareholding vests in private sector banks and non-bank finance companies3. This structure,
thus, does not put immediate strain on the
3 Accessed on February 14, 2022, from https://www.moneycontrol.com/ article dated October 5, 2021.
2 ‘CVC finds many flaws in sale of bad debt by banks’, Times of India dated March 18, 2019. Available on https://timesofindia.indiatimes.com, accessed on February 15, 2022.
ARTICLE
RBI Bulletin February 202274
Bad Banks as Good Samaritans: Lessons from Cross-Country Experience for India
government’s limited resources. The majority private shareholding of the IDRCL and the resultant professional and expert handling of bad assets is expected to ensure maximum and timely recovery.
• Acquisition: The NPAs will be acquired from banks by paying up to 15 per cent of the agreed or discounted value of the loans in cash, while issuing government-guaranteed SRs for the rest, following successful models such as Korea and Malaysia. Given that in phase I, assets worth `90,000 crores (out of total planned acquisition of `2,00,000 crores) that have already been fully provided for are expected to be acquired, recovery will instantly strengthen banks’ balance sheets. Further, by concentrating on legacy large value accounts of more than `500 crores, the NARCL may lead to faster resolution of overall stress4.
• Government guarantee: The guarantee of up to `30,600 crores may be invoked to make good the shortfall between the face value of the SR and the actual realisation. The time-bound nature of the guarantee, valid for 5 years conditional on resolution or liquidation, and gradual increase in guarantee fee payable to the government by NARCL, are expected to disincentivise any delays in resolution. The structure, ownership pattern and the government guarantee backing the SRs is expected to impart credibility to the institution and allay fears of banks regarding scrutiny by various regulators about their sell-off decisions.
• Security Receipts: Apart from reducing upfront capitalisation requirements of the bad bank, guarantees by the government
are bound to improve the liquidity and tradability of SRs, helping in development of a secondary market for them.
• Complementarity with existing ARCs: Under the proposed mechanism, NARCL is required to go for the “Swiss Challenge method”, where the 28 existing ARCs in India will be invited to make a better offer for the stressed asset. Rather than being substitutes or rivals as buyers in the market of stressed assets, the nationalised entity will act as a complement to the existing companies. They will help in debt consolidation, minimising the time taken for aggregating the bad loans, and avoiding the inter-lender litigations.
7. Conclusion
Creation of a bad bank at the current juncture may prove helpful in reducing banking stress and kick-start the credit cycle. The cross-country evidence suggests that if the logistical and financial challenges are carefully navigated, experiments of centralised bad bank can have more hits than misses. While it may be unfair to hail them as a universal antidote to deal with financial stress, they have proven to be a worthwhile exercise when armed with conducive institutional frameworks. Experience of international best practices suggests that the NARCL in India is likely to serve as a time-efficient mechanism, while reviving investor interest in primary as well as secondary markets for stressed assets and SRs, respectively. Going forward, continued commitment, professional staff and transparency in operation will help in making the exercise cost and time effective. At the same time, care needs to be taken to ensure that fresh slippages are arrested, and bank balance sheets are strengthened to avoid future build-up of stress.
References
Acharya, V. (2017). Some Ways to Decisively Resolve Bank Stressed Assets. Indian Banks’ Association
Banking Technology Conference. Mumbai.
4 At the time of publishing of this article, assets worth `50,000 crores are scheduled to be transferred to the NARCL by end-March 2022. Accessed from https://www.thehindubusinessline.com/ article dated January 28, 2022.
ARTICLE
RBI Bulletin February 2022 75
Bad Banks as Good Samaritans: Lessons from Cross-Country Experience for India
Bhagwati, J., Khan, M. S., & Bogathi, R. R. (2017).
Can Asset Reconstruction Companies (ARCs) be Part Solution to the Indian Debt Problem? Working Paper
No. 338, ICRIER.
Cas, S. M., & Peresa, I. (2016). What Makes a Good ‘Bad
Bank’? The Irish, Spanish and German Experience.
European Commission Discussion Paper No. 036.
Deloitte. (2020). Bad Banks in India.
European Commission. (2018). AMC Blueprint.
Brussels.
Fung, B., George, J., Hohl, S., & Ma, G. (2004). Public asset
management companies in East Asia- A comparative
study. Occasional paper, Financial Stability Institute.
He, D. (2004). The Role of KAMCO in Resolving
Nonperforming Loans in the Republic of Korea. IMF Working Paper.
Ingves, S., Seelig, S. A., & He, D. (2004). Issues in the
Establishment of Asset Management Companies. IMF Policy Discussion paper, PDP/04/3.
Klingebiel, D. (2000). The Use of Asset Management
Companies in the Resolution of Banking Crises: Cross-
Country Experience. World Bank Policy Research Working Paper No. 2284.
Lee, J. (2020). Country Case Studies on Resolving
Problem Loans in Asia. SEACEN Centre Seminar.
Manila: Asian Development Bank.
Martin, R. (2020). Asset Management Companies
and NPL Resolution. SEACEN Webinar. Joint Vienna
Institute.
Martini, L., Stegemann, U., Windhagen, E., Heuser, M.,
Schneider, S., Poppensieker, T., . . . Brenna, G. (2009).
Bad Banks: Finding the Right Exit from the Financial
Crisis. McKinsey Working Papers on Risk.
McCauley, R. (2003). Unifying government bond
markets in East Asia. paper presented at the Hong
Kong Institute of Monetary Research, Hong Kong SAR.
Reserve Bank of India (2021): Report of the Committee
to Review the Working of Asset Reconstruction
Companies (Chairman: Shri Sudarshan Sen).
Terada-Hagiwara, A., & Pasadilla, G. (2004). Experience
of Asian Asset Management Companies: Do They
Increase Moral Hazard?- Evidence from Thailand. ERD
Working Paper No. 55, Asian Development Bank.
Yadav, A., & Chavan, P. (2021, April). ARCs in India: A
Study of their Business Operations and Role in NPA
Resolution. RBI Bulletin.
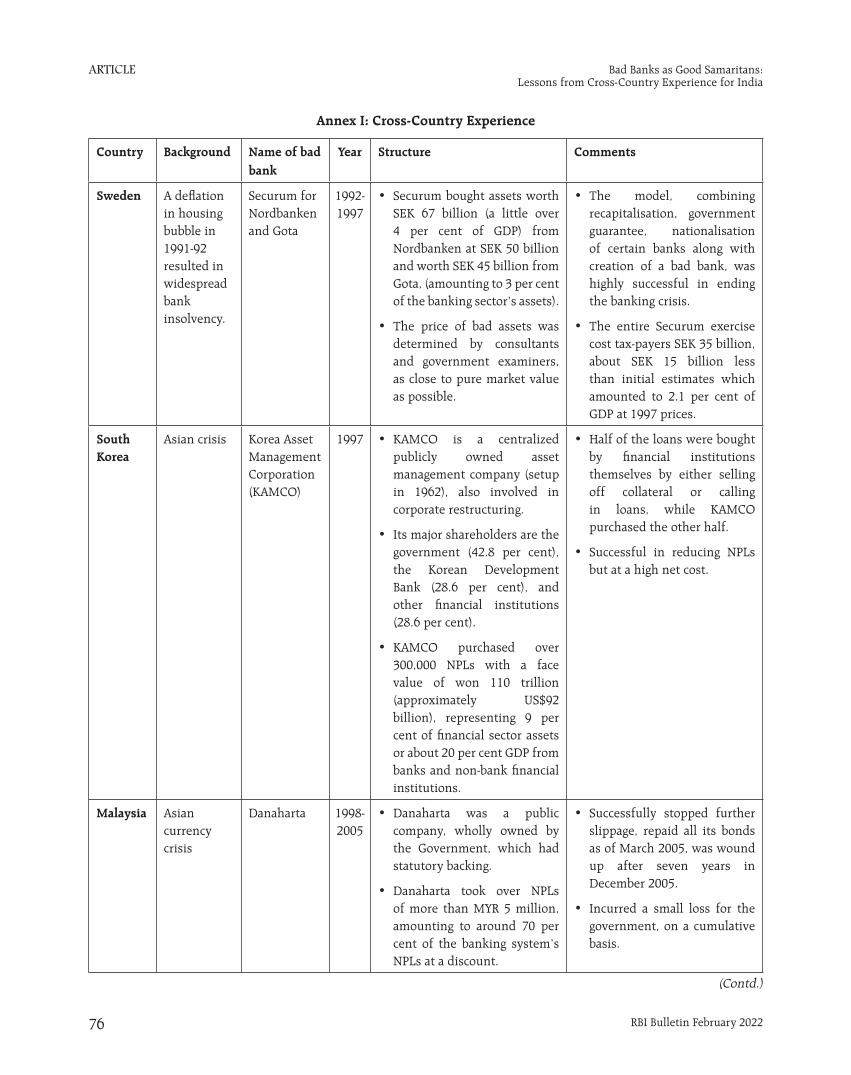
ARTICLE
RBI Bulletin February 202276
Bad Banks as Good Samaritans: Lessons from Cross-Country Experience for India
Annex I: Cross-Country Experience
Country Background Name of bad bank
Year Structure Comments
Sweden A deflation in housing bubble in 1991-92 resulted in widespread bank insolvency.
Securum for Nordbanken and Gota
1992-1997
• Securum bought assets worth SEK 67 billion (a little over 4 per cent of GDP) from Nordbanken at SEK 50 billion and worth SEK 45 billion from Gota, (amounting to 3 per cent of the banking sector’s assets).
• The price of bad assets was determined by consultants and government examiners, as close to pure market value as possible.
• The model, combining recapitalisation, government guarantee, nationalisation of certain banks along with creation of a bad bank, was highly successful in ending the banking crisis.
• The entire Securum exercise cost tax-payers SEK 35 billion, about SEK 15 billion less than initial estimates which amounted to 2.1 per cent of GDP at 1997 prices.
South Korea
Asian crisis Korea Asset Management Corporation (KAMCO)
1997 • KAMCO is a centralized publicly owned asset management company (setup in 1962), also involved in corporate restructuring.
• Its major shareholders are the government (42.8 per cent), the Korean Development Bank (28.6 per cent), and other financial institutions (28.6 per cent).
• KAMCO purchased over 300,000 NPLs with a face value of won 110 trillion (approximately US$92 billion), representing 9 per cent of financial sector assets or about 20 per cent GDP from banks and non-bank financial institutions.
• Half of the loans were bought by financial institutions themselves by either selling off collateral or calling in loans, while KAMCO purchased the other half.
• Successful in reducing NPLs but at a high net cost.
Malaysia Asian currency crisis
Danaharta 1998-2005
• Danaharta was a public company, wholly owned by the Government, which had statutory backing.
• Danaharta took over NPLs of more than MYR 5 million, amounting to around 70 per cent of the banking system’s NPLs at a discount.
• Successfully stopped further slippage, repaid all its bonds as of March 2005, was wound up after seven years in December 2005.
• Incurred a small loss for the government, on a cumulative basis.
(Contd.)
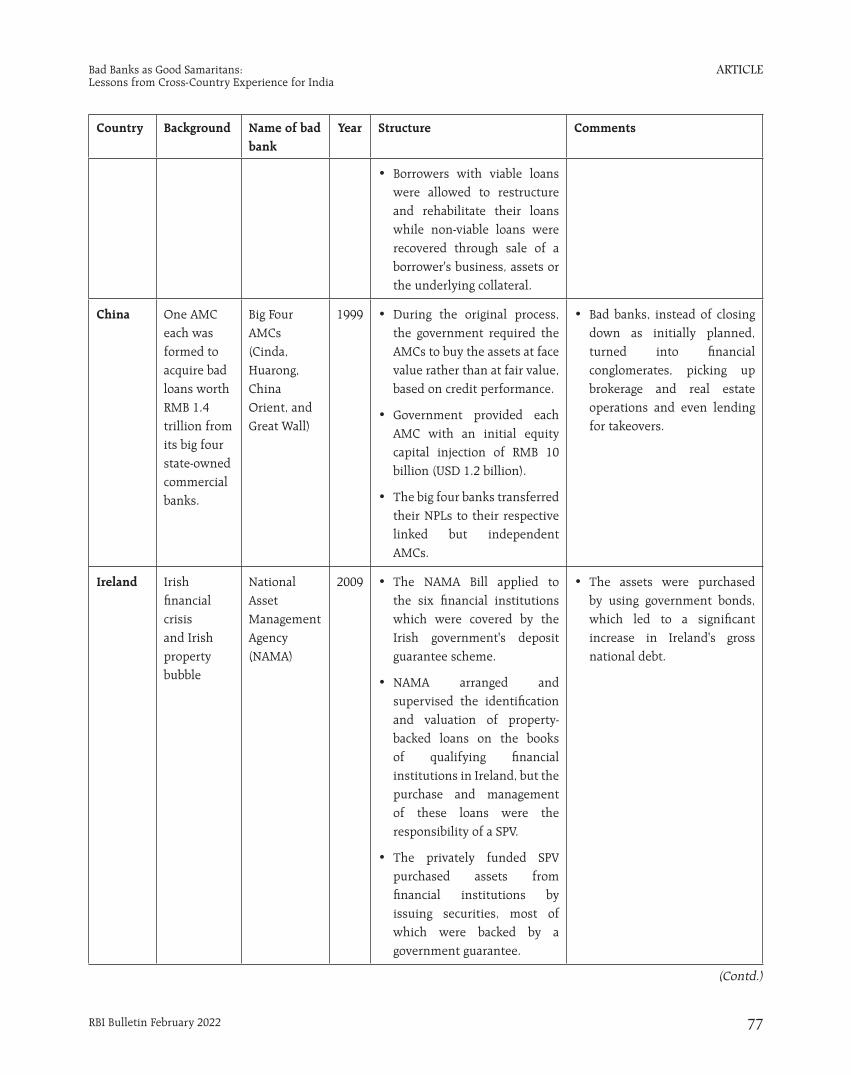
ARTICLE
RBI Bulletin February 2022 77
Bad Banks as Good Samaritans: Lessons from Cross-Country Experience for India
Country Background Name of bad bank
Year Structure Comments
• Borrowers with viable loans were allowed to restructure and rehabilitate their loans while non-viable loans were recovered through sale of a borrower's business, assets or the underlying collateral.
China One AMC each was formed to acquire bad loans worth RMB 1.4 trillion from its big four state-owned commercial banks.
Big Four AMCs (Cinda, Huarong, China Orient, and Great Wall)
1999 • During the original process, the government required the AMCs to buy the assets at face value rather than at fair value, based on credit performance.
• Government provided each AMC with an initial equity capital injection of RMB 10 billion (USD 1.2 billion).
• The big four banks transferred their NPLs to their respective linked but independent AMCs.
• Bad banks, instead of closing down as initially planned, turned into financial conglomerates, picking up brokerage and real estate operations and even lending for takeovers.
Ireland Irish financial crisis and Irish property bubble
National Asset Management Agency (NAMA)
2009 • The NAMA Bill applied to the six financial institutions which were covered by the Irish government's deposit guarantee scheme.
• NAMA arranged and supervised the identification and valuation of property-backed loans on the books of qualifying financial institutions in Ireland, but the purchase and management of these loans were the responsibility of a SPV.
• The privately funded SPV purchased assets from financial institutions by issuing securities, most of which were backed by a government guarantee.
• The assets were purchased by using government bonds, which led to a significant increase in Ireland's gross national debt.
(Contd.)
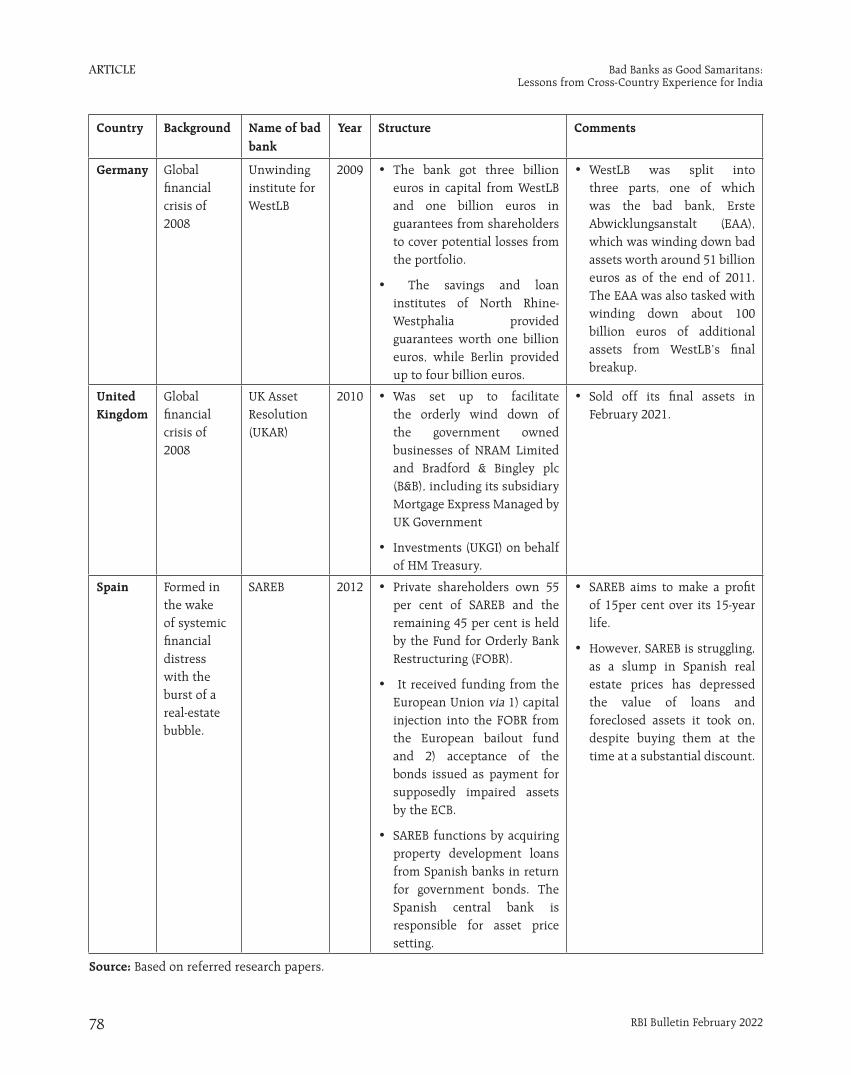
ARTICLE
RBI Bulletin February 202278
Bad Banks as Good Samaritans: Lessons from Cross-Country Experience for India
Country Background Name of bad bank
Year Structure Comments
Germany Global financial crisis of 2008
Unwinding institute for WestLB
2009 • The bank got three billion euros in capital from WestLB and one billion euros in guarantees from shareholders to cover potential losses from the portfolio.
• The savings and loan institutes of North Rhine-Westphalia provided guarantees worth one billion euros, while Berlin provided up to four billion euros.
• WestLB was split into three parts, one of which was the bad bank, Erste Abwicklungsanstalt (EAA), which was winding down bad assets worth around 51 billion euros as of the end of 2011. The EAA was also tasked with winding down about 100 billion euros of additional assets from WestLB’s final breakup.
United Kingdom
Global financial crisis of 2008
UK Asset Resolution (UKAR)
2010 • Was set up to facilitate the orderly wind down of the government owned businesses of NRAM Limited and Bradford & Bingley plc (B&B), including its subsidiary Mortgage Express Managed by UK Government
• Investments (UKGI) on behalf of HM Treasury.
• Sold off its final assets in February 2021.
Spain Formed in the wake of systemic financial distress with the burst of a real-estate bubble.
SAREB 2012 • Private shareholders own 55 per cent of SAREB and the remaining 45 per cent is held by the Fund for Orderly Bank Restructuring (FOBR).
• It received funding from the European Union via 1) capital injection into the FOBR from the European bailout fund and 2) acceptance of the bonds issued as payment for supposedly impaired assets by the ECB.
• SAREB functions by acquiring property development loans from Spanish banks in return for government bonds. The Spanish central bank is responsible for asset price setting.
• SAREB aims to make a profit of 15per cent over its 15-year life.
• However, SAREB is struggling, as a slump in Spanish real estate prices has depressed the value of loans and foreclosed assets it took on, despite buying them at the time at a substantial discount.
Source: Based on referred research papers.
ARTICLE
RBI Bulletin February 2022 79
Impact of COVID-19 on Sentiments of Indian Manufacturers
* This article is prepared by Nivedita Banerjee and S. Majumdar,
Division of Enterprise Surveys, Department of Statistics and Information Management (DSIM). The views expressed in the article are those of the authors only and do not necessarily represent the views of the Reserve Bank of India. The latest round of the survey data was released on February 10, 2022 on the RBI’s website at https://www.rbi.org.in/Scripts/PublicationsView.aspx?id=21001. The previous article was published in February 2020 issue of the RBI Bulletin and can be accessed at https://www.rbi.org.in/Scripts/BS_ViewBulletin.aspx?Id=18765.
Impact of COVID-19 on Sentiments of Indian Manufacturers*
This article lists the key findings of the industrial outlook survey (IOS) for the manufacturing sector conducted during 2019-21. The sentiments of the respondents reflected that the slowdown in growth momentum was mainly due to weakening of demand for three consecutive years beginning 2017-18. Just when the manufacturers’ outlook started looking up, the COVID-19-induced lockdown measures slowed down the revival process. The pandemic affected the producers’ sentiments negatively by bringing down the survey parameters to historic lows. While the impact of the second wave has been less pronounced than the first one, and various macro parameters related to manufacturing sector may soon attain their pre-COVID levels, the process of attaining their long-term trend levels may take some time.
Introduction
In early 2020, the COVID-19 pandemic spread
with alarming speed infecting millions and bringing
economic activity to a near-standstill. The economic
damage became evident and turned out to be the
largest economic shock the world has experienced in
decades. This posed tough challenges to policymakers.
As the forward-looking surveys play a major role
in supporting policy decisions, these were used by
majority of the central banks to capture the sentiments
of enterprises. The surveys helped to gauge the impact
of the pandemic as well as to assess the timing and
pace of the expected recovery process as perceived by
the enterprises.
The Industrial Outlook Survey (IOS) conducted
by the Reserve Bank plays an important role in
supporting monetary policy decision. Being a forward-
looking survey, IOS captures the sentiments of
enterprises engaged in manufacturing activities. The
perception includes the assessment of the current
quarter and expectations for next quarter. In the
wake of coronavirus outbreak in early 2020, along
with other sectors, the manufacturing industries also
got impacted adversely. After coping with the first
wave, the economy showed some signs of recovery
from Q3:2020-21. Although the second wave of the
pandemic again worsened the economic conditions,
the manufacturing sector quickly regained traction.
Though the economic activities were impacted by
sudden surge of omicron variant of the pandemic in
end-December 2021, the impact is likely to be much
lower.
Against this backdrop, the present article aims
to extract the stylised facts emanating from various
rounds of survey conducted since 2019. At the same
time, the outlook on the recovery process as perceived
by the manufacturers are also presented in this article.
During this period, total 11 rounds of the survey were
conducted by the Reserve Bank i.e., round 86 (April-
June 2019) to round 96 (October-December 2021).
This article also attempts to formulate a recovery
path of major macroeconomic variables, namely
Index of Industrial Production (IIP) and Gross Value
Added (GVA), for the manufacturing sector using
an analytical framework under specific assumed
scenarios based on the information available from
survey outlook.
The rest of the article is presented in four sections.
In Section II, the underlying sentiments of the
manufacturing units are presented. Section III focuses
on the expected recovery process after the pandemic
ARTICLE
RBI Bulletin February 202280
Impact of COVID-19 on Sentiments of Indian Manufacturers
shock, as perceived by the manufacturers. Section IV attempts to study the pandemic impact on the macro variables as well as the subsequent recovery using an analytical framework and Section V concludes with some policy implications.
II: Stylised Facts 2019-21
II.1 Sample Frame, Survey Questionnaire and Survey Methodology
The survey questionnaire1 is canvassed to a panel of manufacturing companies which undergoes periodic revision with addition of new companies and removal of closed/merged companies. The survey seeks qualitative responses from the senior management personnel or finance heads of manufacturing units. The questionnaire is structured in five blocks covering general information about the respondent companies; product details in order of sales; information on the size of few performance indicators; and assessment for current quarter and expectations for the next quarter. Owing to uncertainty on account of lockdown and restrictions imposed because of COVID-19 pandemic, an additional block was included since April-June 2020 quarter to capture expectations for two and three quarters ahead to get an outlook of the enterprises on the expected recovery process. The responses are collected on a three-point scale i.e., increase, no change and decrease and are converted into single quantitative measure viz., net response (NR)2 for
summarising the survey results. By construction, NR can take a value between -100 to +100 where a negative value represents contraction/pessimism and a positive NR signifies growth/optimism.
II.2 Key findings during 2019-21
The survey results are presented in terms of assessment (A) and expectations (E) of the companies on ‘demand conditions’, ‘financing conditions’, ‘price situation’ and ‘overall business situation’. In this article, the net responses (NR) for assessment quarter is termed as assessment NR (NRA) and the NR for expectations quarter is described as expectations NR (NRE).
a. Demand conditions
The sentiments on demand conditions, as captured through production (PR), order book (OB), capacity utilisation (CU), inventory of raw materials (IRM), exports (EXP), imports (IMP) and employment (EMP), deteriorated in early 2019-20. The assessment NRs were low in Q2:2019-20 and Q3:2019-20 as compared to previous quarters. However, there were some signs of improvement in Q4:2019-20 as demand started firming up. The resolution of the Monetary Policy Committee in March 2020 also mentioned that pick up in manufacturing in January 2020 pulled the industrial production in positive territory after contraction over the past five months. But the COVID-induced lockdown impacted the economic activity adversely and brought down the NRs to a historic low in Q1:2020-21.
With the easing of lockdown in a phased manner, a pickup in demand was seen, which was indicated through an upward movement in survey parameters. The sentiments of manufacturers started improving after a sharp decline in Q1:2020-21. But the demand condition again deteriorated in Q1:2021-22 due to second wave of the pandemic, but it triggered a comparatively lower reduction in production which,
in fact, quickly reversed in Q2:2021-22.
1 The questionnaire can be accessed at the link: https://www.rbi.org.in/Scripts/BS_ViewForms.aspx?FCId=40
2 If I, N and D correspond to proportion of ‘increase’, ‘no change’ and ‘decrease’, respectively for the response to the question on a particular parameter, the NR is calculated as, NR=100* (I-D) and no change (NC) or status quo is presented as NC=100*N. Usually the NR is calculated as proportion of optimistic responses minus proportions of pessimistic responses; considering an increase as an optimistic response for all parameters, except the cost related parameters; such as cost of raw materials, cost of finance etc., where, the decrease option signifies optimism from the viewpoint of a respondent company. However, NRs have been calculated as 100* (I-D) for all parameters in this article, to maintain uniformity and also directly linking with the macro variables.
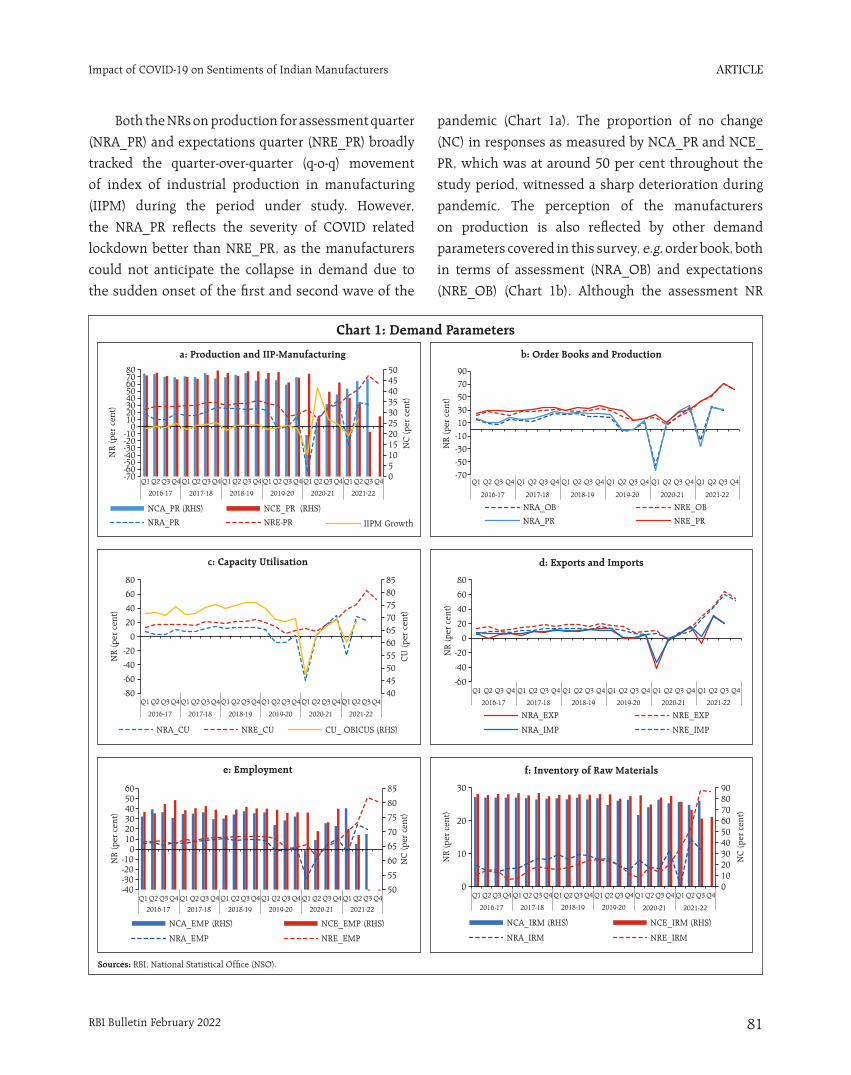
ARTICLE
RBI Bulletin February 2022 81
Impact of COVID-19 on Sentiments of Indian Manufacturers
Both the NRs on production for assessment quarter
(NRA_PR) and expectations quarter (NRE_PR) broadly
tracked the quarter-over-quarter (q-o-q) movement
of index of industrial production in manufacturing
(IIPM) during the period under study. However,
the NRA_PR reflects the severity of COVID related
lockdown better than NRE_PR, as the manufacturers
could not anticipate the collapse in demand due to
the sudden onset of the first and second wave of the
pandemic (Chart 1a). The proportion of no change
(NC) in responses as measured by NCA_PR and NCE_
PR, which was at around 50 per cent throughout the
study period, witnessed a sharp deterioration during
pandemic. The perception of the manufacturers
on production is also reflected by other demand
parameters covered in this survey, e.g. order book, both
in terms of assessment (NRA_OB) and expectations
(NRE_OB) (Chart 1b). Although the assessment NR
Chart 1: Demand Parameters
a: Production and IIP-Manufacturing b: Order Books and Production
Sources: RBI, National Statistical Office (NSO).
c: Capacity Utilisation
e: Employment
d: Exports and Imports
f: Inventory of Raw Materials
ARTICLE
RBI Bulletin February 202282
Impact of COVID-19 on Sentiments of Indian Manufacturers
reached below (-) 50 per cent due to sudden lockdown in Q1:2020-21, the impact was much less in second wave. However, the expectations NR remained in positive zone throughout the period under study.
An alternate demand parameter canvased in IOS is the capacity utilisation (CU) which is defined as the proportion of the actual capacity utilised by a manufacturing company to its installed capacity. The assessment and expectations NR for CU (NRA_CU and NRE_CU respectively), as captured in IOS, provided an early indication in the movement of CU which was later estimated based on another survey conducted by the Reserve Bank viz., order books, inventories and capacity utilisation survey (OBICUS)3 which collects the actual quantitative information on manufacturing CU. The NRA-CU tracked the actual CU (CU_OBICUS) better even during COVID-19 period when the economy experienced an unprecedented demand shock (Chart 1c). After witnessing a sharp fall in Q1:2020-21, respondents’ sentiments on exports and imports started recovering, which again dropped in Q1:2021-22 during second wave of the pandemic. It is also evident that, with the strengthening of demand conditions, the expectations on exports and imports improved significantly since the second half of the year 2020-21.
The proportion of respondents indicating no change (both NCA_EMP and NCE_EMP) usually dominate the responses on the slow-moving employment parameter.4 Although the job landscape started recovering in Q4:2019-20 after gradual decline in past one year, it collapsed in Q1:2020-21 due to pandemic. The optimism started firming up in subsequent quarters with abated effect of the pandemic (Chart 1e) but witnessed another shock during the second wave. IRM is considered another
slow-moving demand parameter as companies target to maintain a fixed level of IRM except when large changes are anticipated in demand or price. The responses on IRM are dominated by NC which remained around 80 per cent throughout the period under study, but sentiments were adversely impacted by the pandemic in past one and a half year (Chart 1f).
b. Financing Conditions
Sound financing conditions give impetus to companies to strengthen their businesses. The respondents expressed positive sentiments on overall financial situation (OFS) in pre-COVID period except Q2:2019-20. Sentiments for Q3:2019-20 were also positive but very low. Although the manufacturers’ sentiments dipped in Q1:2020-21, it was boosted immediately by several relief measures announced by the government to revive the business environment (Chart 2a). However, the second wave again clouded the sentiments of manufacturers. The cost of external finance (CoF) started showing some respite since 2019-20 signifying better avenues for the manufacturers to run their businesses (Chart 2b) which started edging up again since Q4:2020-21.
c. Price Situation
The price situation is assessed based on parameters like cost of raw materials (CRM), salary outgo and selling prices (SP) of enterprises as collected in IOS. It is important to evaluate how the demand conditions coupled with financial situation are factored into the business for deciding the profitability of the companies under the prevailing input cost pressure and market uncertainty.
The CRM, which captures the movement in WPI inflation of industrial raw materials5, remained an abiding concern for the manufacturers through Q1:2018-19 and softened thereafter. Yet, the cost again spiked up in Q2:2020-21 due to supply chain
3 The OBICUS data are released quarterly on RBI website and the latest such data release can be accessed through the link: https://www.rbi.org.in/Scripts/PublicationsView.aspx?id=21000
4 The employment parameter includes both full-time and part-time employees including casual labourers.
5 Comprises specific items from WPI with total weight being 18.1 per cent.
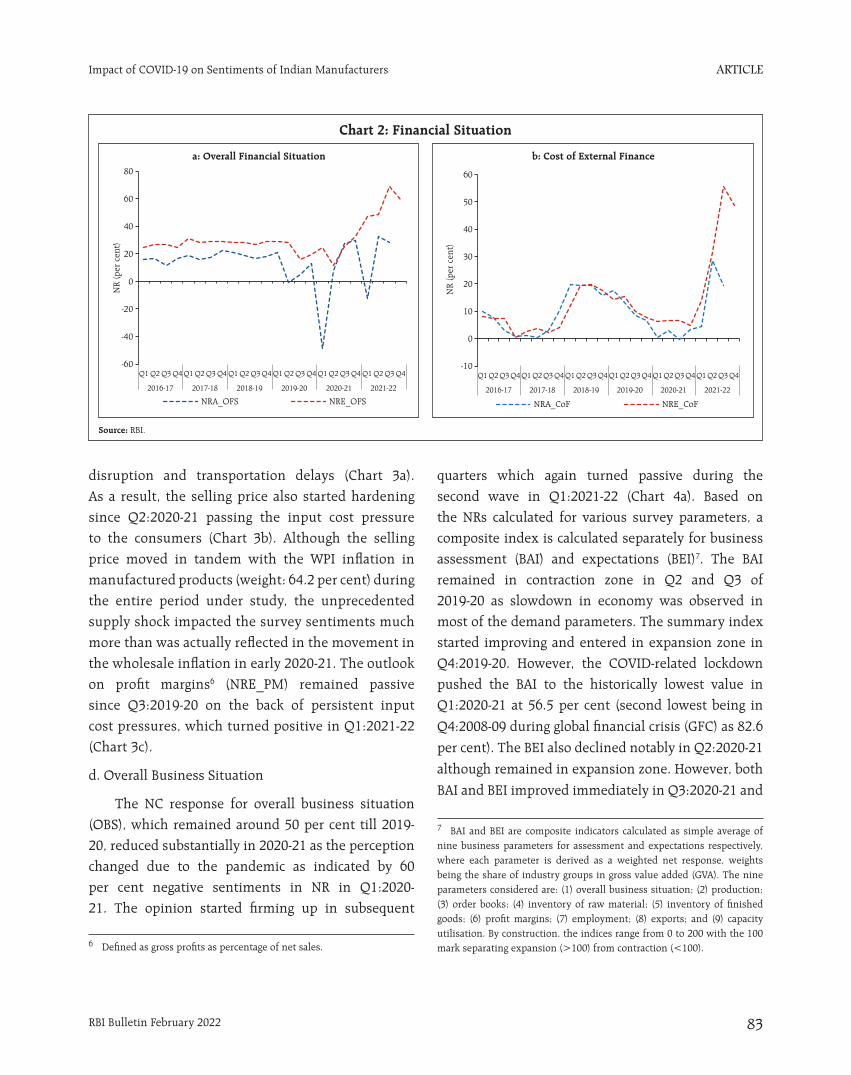
ARTICLE
RBI Bulletin February 2022 83
Impact of COVID-19 on Sentiments of Indian Manufacturers
disruption and transportation delays (Chart 3a). As a result, the selling price also started hardening since Q2:2020-21 passing the input cost pressure to the consumers (Chart 3b). Although the selling price moved in tandem with the WPI inflation in manufactured products (weight: 64.2 per cent) during the entire period under study, the unprecedented supply shock impacted the survey sentiments much more than was actually reflected in the movement in the wholesale inflation in early 2020-21. The outlook on profit margins6 (NRE_PM) remained passive since Q3:2019-20 on the back of persistent input cost pressures, which turned positive in Q1:2021-22 (Chart 3c).
d. Overall Business Situation
The NC response for overall business situation (OBS), which remained around 50 per cent till 2019-20, reduced substantially in 2020-21 as the perception changed due to the pandemic as indicated by 60 per cent negative sentiments in NR in Q1:2020-21. The opinion started firming up in subsequent
quarters which again turned passive during the second wave in Q1:2021-22 (Chart 4a). Based on the NRs calculated for various survey parameters, a composite index is calculated separately for business assessment (BAI) and expectations (BEI)7. The BAI remained in contraction zone in Q2 and Q3 of 2019-20 as slowdown in economy was observed in most of the demand parameters. The summary index started improving and entered in expansion zone in Q4:2019-20. However, the COVID-related lockdown pushed the BAI to the historically lowest value in Q1:2020-21 at 56.5 per cent (second lowest being in
Q4:2008-09 during global financial crisis (GFC) as 82.6
per cent). The BEI also declined notably in Q2:2020-21
although remained in expansion zone. However, both
BAI and BEI improved immediately in Q3:2020-21 and
Chart 2: Financial Situation
Source: RBI.
a: Overall Financial Situation b: Cost of External Finance
6 Defined as gross profits as percentage of net sales.
7 BAI and BEI are composite indicators calculated as simple average of nine business parameters for assessment and expectations respectively, where each parameter is derived as a weighted net response, weights being the share of industry groups in gross value added (GVA). The nine parameters considered are: (1) overall business situation; (2) production; (3) order books; (4) inventory of raw material; (5) inventory of finished goods; (6) profit margins; (7) employment; (8) exports; and (9) capacity utilisation. By construction, the indices range from 0 to 200 with the 100 mark separating expansion (>100) from contraction (<100).
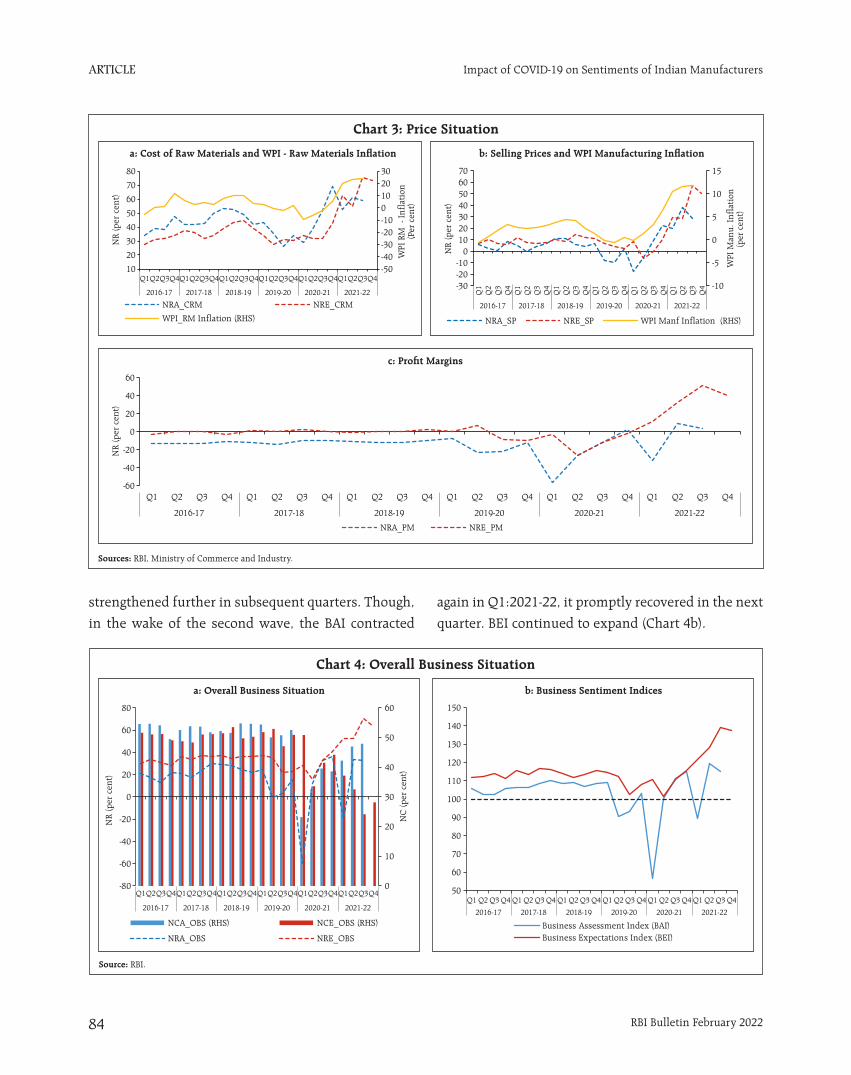
ARTICLE
RBI Bulletin February 202284
Impact of COVID-19 on Sentiments of Indian Manufacturers
strengthened further in subsequent quarters. Though,
in the wake of the second wave, the BAI contracted
again in Q1:2021-22, it promptly recovered in the next
quarter. BEI continued to expand (Chart 4b).
Chart 3: Price Situation
a: Cost of Raw Materials and WPI - Raw Materials Inflation b: Selling Prices and WPI Manufacturing Inflation
Sources: RBI, Ministry of Commerce and Industry.
c: Profit Margins
Chart 4: Overall Business Situation
Source: RBI.
a: Overall Business Situation b: Business Sentiment Indices
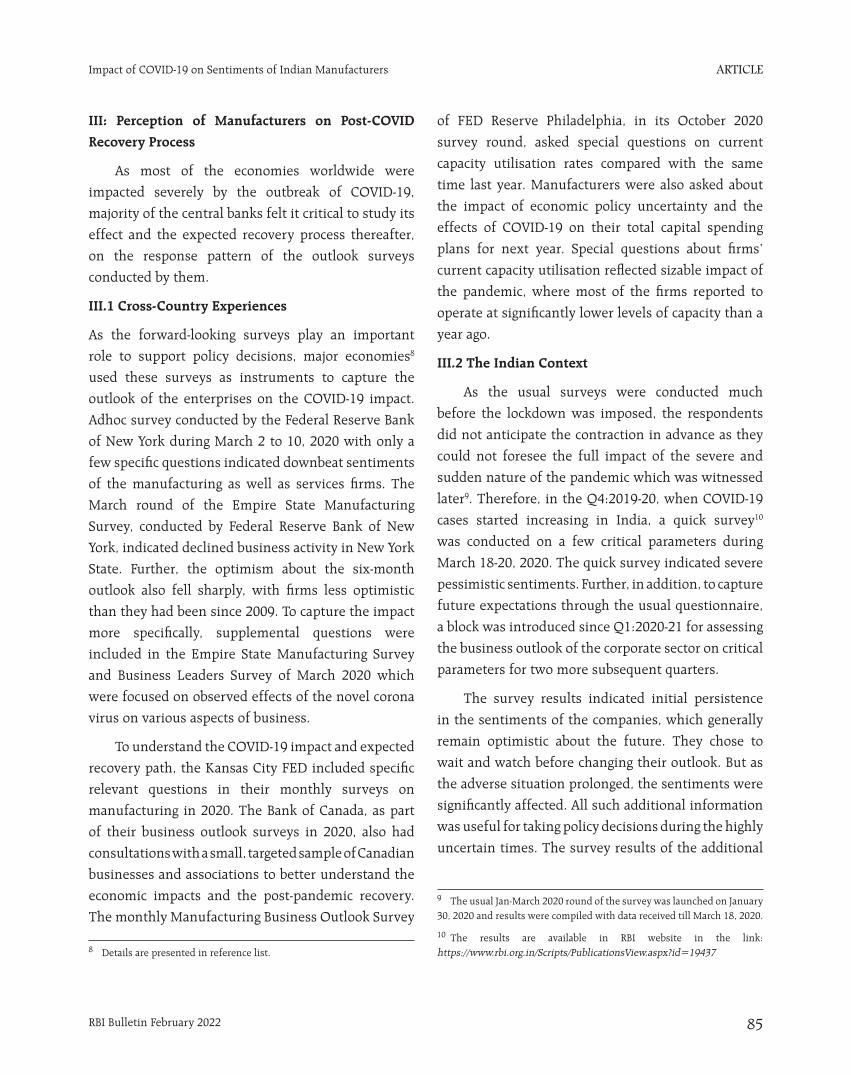
ARTICLE
RBI Bulletin February 2022 85
Impact of COVID-19 on Sentiments of Indian Manufacturers
III: Perception of Manufacturers on Post-COVID Recovery Process
As most of the economies worldwide were
impacted severely by the outbreak of COVID-19,
majority of the central banks felt it critical to study its
effect and the expected recovery process thereafter,
on the response pattern of the outlook surveys
conducted by them.
III.1 Cross-Country Experiences
As the forward-looking surveys play an important
role to support policy decisions, major economies8
used these surveys as instruments to capture the
outlook of the enterprises on the COVID-19 impact.
Adhoc survey conducted by the Federal Reserve Bank
of New York during March 2 to 10, 2020 with only a
few specific questions indicated downbeat sentiments
of the manufacturing as well as services firms. The
March round of the Empire State Manufacturing
Survey, conducted by Federal Reserve Bank of New
York, indicated declined business activity in New York
State. Further, the optimism about the six-month
outlook also fell sharply, with firms less optimistic
than they had been since 2009. To capture the impact
more specifically, supplemental questions were
included in the Empire State Manufacturing Survey
and Business Leaders Survey of March 2020 which
were focused on observed effects of the novel corona
virus on various aspects of business.
To understand the COVID-19 impact and expected
recovery path, the Kansas City FED included specific
relevant questions in their monthly surveys on
manufacturing in 2020. The Bank of Canada, as part
of their business outlook surveys in 2020, also had
consultations with a small, targeted sample of Canadian
businesses and associations to better understand the
economic impacts and the post-pandemic recovery.
The monthly Manufacturing Business Outlook Survey
of FED Reserve Philadelphia, in its October 2020
survey round, asked special questions on current
capacity utilisation rates compared with the same
time last year. Manufacturers were also asked about
the impact of economic policy uncertainty and the
effects of COVID-19 on their total capital spending
plans for next year. Special questions about firms’
current capacity utilisation reflected sizable impact of
the pandemic, where most of the firms reported to
operate at significantly lower levels of capacity than a
year ago.
III.2 The Indian Context
As the usual surveys were conducted much
before the lockdown was imposed, the respondents
did not anticipate the contraction in advance as they
could not foresee the full impact of the severe and
sudden nature of the pandemic which was witnessed
later9. Therefore, in the Q4:2019-20, when COVID-19
cases started increasing in India, a quick survey10
was conducted on a few critical parameters during
March 18-20, 2020. The quick survey indicated severe
pessimistic sentiments. Further, in addition, to capture
future expectations through the usual questionnaire,
a block was introduced since Q1:2020-21 for assessing
the business outlook of the corporate sector on critical
parameters for two more subsequent quarters.
The survey results indicated initial persistence
in the sentiments of the companies, which generally
remain optimistic about the future. They chose to
wait and watch before changing their outlook. But as
the adverse situation prolonged, the sentiments were
significantly affected. All such additional information
was useful for taking policy decisions during the highly
uncertain times. The survey results of the additional
8 Details are presented in reference list.
9 The usual Jan-March 2020 round of the survey was launched on January 30, 2020 and results were compiled with data received till March 18, 2020.
10 The results are available in RBI website in the link: https://www.rbi.org.in/Scripts/PublicationsView.aspx?id=19437
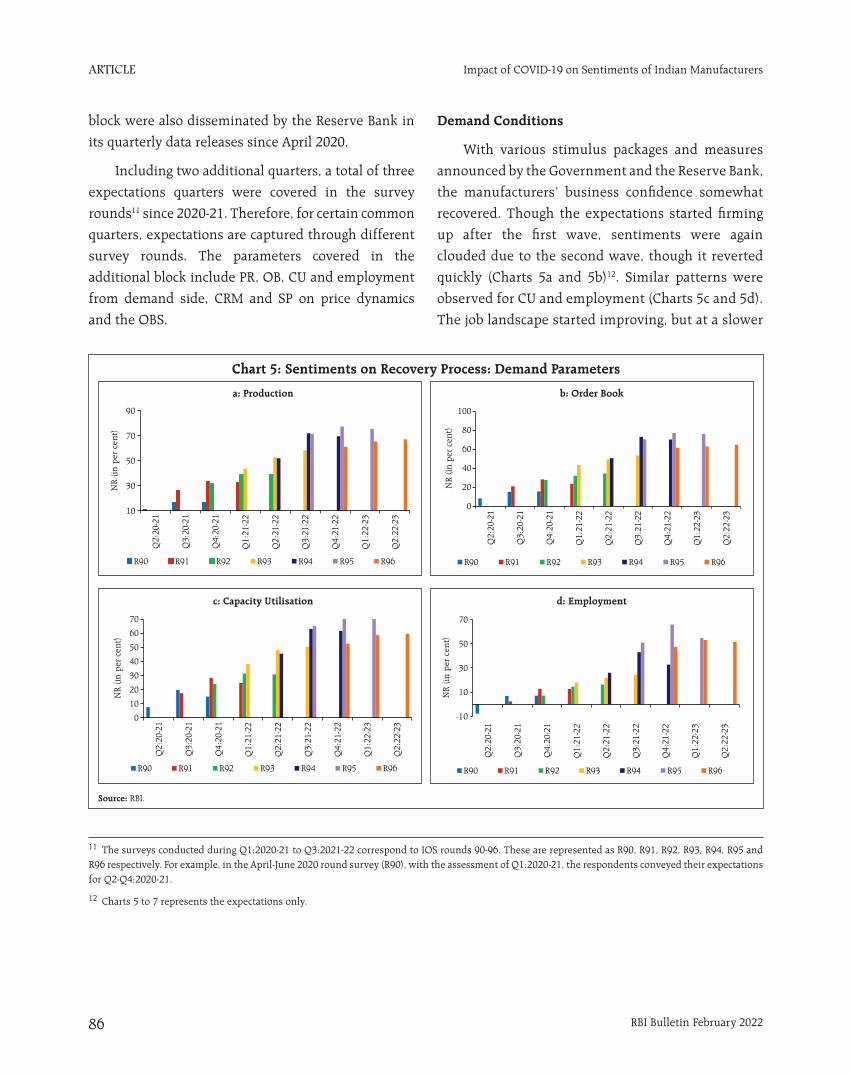
ARTICLE
RBI Bulletin February 202286
Impact of COVID-19 on Sentiments of Indian Manufacturers
block were also disseminated by the Reserve Bank in
its quarterly data releases since April 2020.
Including two additional quarters, a total of three
expectations quarters were covered in the survey
rounds11 since 2020-21. Therefore, for certain common
quarters, expectations are captured through different
survey rounds. The parameters covered in the
additional block include PR, OB, CU and employment
from demand side, CRM and SP on price dynamics
and the OBS.
Demand Conditions
With various stimulus packages and measures
announced by the Government and the Reserve Bank,
the manufacturers’ business confidence somewhat
recovered. Though the expectations started firming
up after the first wave, sentiments were again
clouded due to the second wave, though it reverted
quickly (Charts 5a and 5b)12. Similar patterns were
observed for CU and employment (Charts 5c and 5d).
The job landscape started improving, but at a slower
11 The surveys conducted during Q1:2020-21 to Q3:2021-22 correspond to IOS rounds 90-96. These are represented as R90, R91, R92, R93, R94, R95 and R96 respectively. For example, in the April-June 2020 round survey (R90), with the assessment of Q1:2020-21, the respondents conveyed their expectations for Q2-Q4:2020-21.
12 Charts 5 to 7 represents the expectations only.
Chart 5: Sentiments on Recovery Process: Demand Parameters
a: Production b: Order Book
Source: RBI.
c: Capacity Utilisation d: Employment
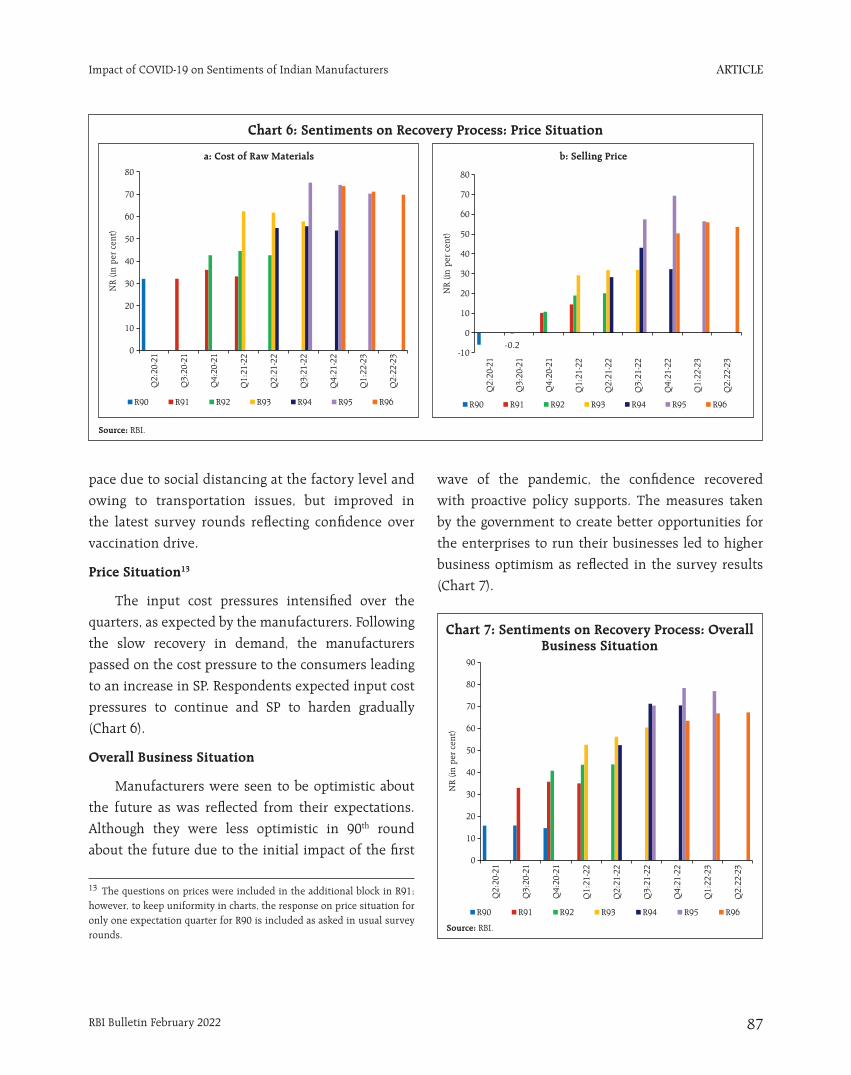
ARTICLE
RBI Bulletin February 2022 87
Impact of COVID-19 on Sentiments of Indian Manufacturers
pace due to social distancing at the factory level and
owing to transportation issues, but improved in
the latest survey rounds reflecting confidence over
vaccination drive.
Price Situation13
The input cost pressures intensified over the
quarters, as expected by the manufacturers. Following
the slow recovery in demand, the manufacturers
passed on the cost pressure to the consumers leading
to an increase in SP. Respondents expected input cost
pressures to continue and SP to harden gradually
(Chart 6).
Overall Business Situation
Manufacturers were seen to be optimistic about
the future as was reflected from their expectations.
Although they were less optimistic in 90th round
about the future due to the initial impact of the first
wave of the pandemic, the confidence recovered
with proactive policy supports. The measures taken
by the government to create better opportunities for
the enterprises to run their businesses led to higher
business optimism as reflected in the survey results
(Chart 7).
13 The questions on prices were included in the additional block in R91; however, to keep uniformity in charts, the response on price situation for only one expectation quarter for R90 is included as asked in usual survey rounds.
Chart 6: Sentiments on Recovery Process: Price Situation
Source: RBI.
a: Cost of Raw Materials b: Selling Price
Chart 7: Sentiments on Recovery Process: Overall Business Situation
Source: RBI.
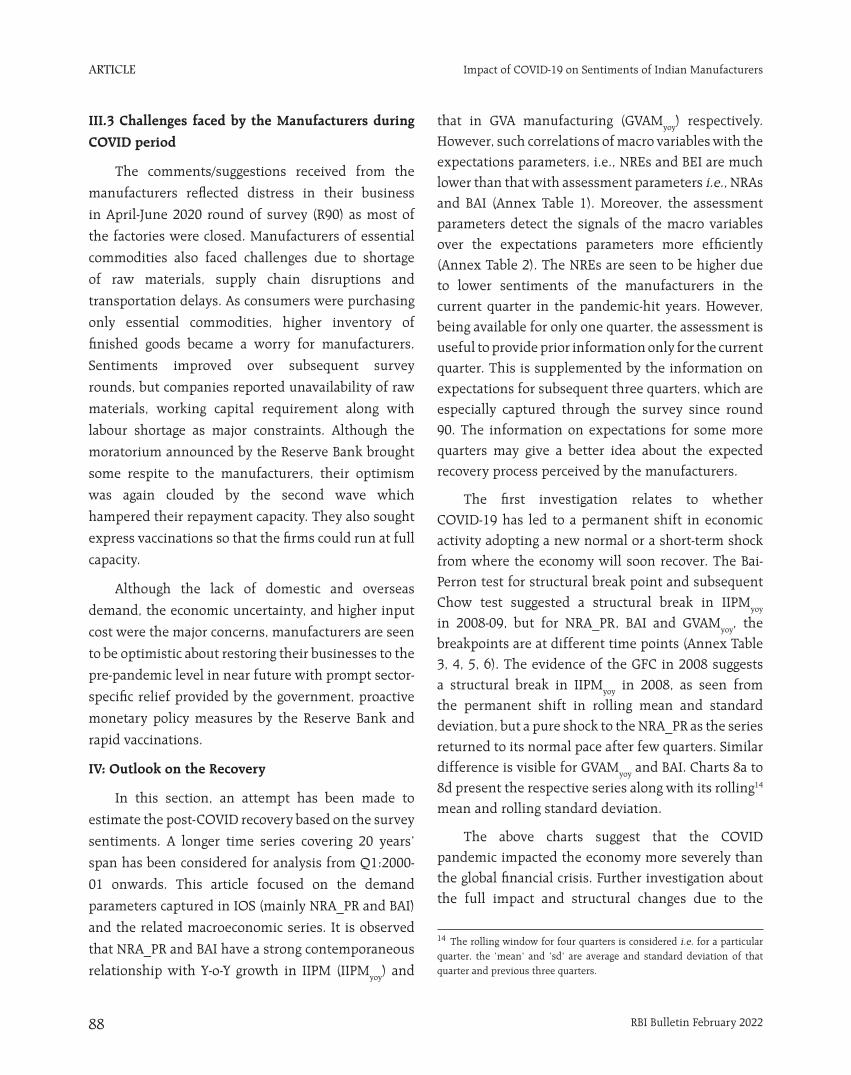
ARTICLE
RBI Bulletin February 202288
Impact of COVID-19 on Sentiments of Indian Manufacturers
III.3 Challenges faced by the Manufacturers during
COVID period
The comments/suggestions received from the
manufacturers reflected distress in their business
in April-June 2020 round of survey (R90) as most of
the factories were closed. Manufacturers of essential
commodities also faced challenges due to shortage
of raw materials, supply chain disruptions and
transportation delays. As consumers were purchasing
only essential commodities, higher inventory of
finished goods became a worry for manufacturers.
Sentiments improved over subsequent survey
rounds, but companies reported unavailability of raw
materials, working capital requirement along with
labour shortage as major constraints. Although the
moratorium announced by the Reserve Bank brought
some respite to the manufacturers, their optimism
was again clouded by the second wave which
hampered their repayment capacity. They also sought
express vaccinations so that the firms could run at full
capacity.
Although the lack of domestic and overseas
demand, the economic uncertainty, and higher input
cost were the major concerns, manufacturers are seen
to be optimistic about restoring their businesses to the
pre-pandemic level in near future with prompt sector-
specific relief provided by the government, proactive
monetary policy measures by the Reserve Bank and
rapid vaccinations.
IV: Outlook on the Recovery
In this section, an attempt has been made to
estimate the post-COVID recovery based on the survey
sentiments. A longer time series covering 20 years’
span has been considered for analysis from Q1:2000-
01 onwards. This article focused on the demand
parameters captured in IOS (mainly NRA_PR and BAI)
and the related macroeconomic series. It is observed
that NRA_PR and BAI have a strong contemporaneous
relationship with Y-o-Y growth in IIPM (IIPMyoy) and
that in GVA manufacturing (GVAMyoy) respectively. However, such correlations of macro variables with the expectations parameters, i.e., NREs and BEI are much lower than that with assessment parameters i.e., NRAs and BAI (Annex Table 1). Moreover, the assessment parameters detect the signals of the macro variables over the expectations parameters more efficiently (Annex Table 2). The NREs are seen to be higher due to lower sentiments of the manufacturers in the current quarter in the pandemic-hit years. However, being available for only one quarter, the assessment is useful to provide prior information only for the current quarter. This is supplemented by the information on expectations for subsequent three quarters, which are especially captured through the survey since round 90. The information on expectations for some more quarters may give a better idea about the expected recovery process perceived by the manufacturers.
The first investigation relates to whether COVID-19 has led to a permanent shift in economic activity adopting a new normal or a short-term shock from where the economy will soon recover. The Bai-Perron test for structural break point and subsequent Chow test suggested a structural break in IIPMyoy in 2008-09, but for NRA_PR, BAI and GVAMyoy, the breakpoints are at different time points (Annex Table 3, 4, 5, 6). The evidence of the GFC in 2008 suggests a structural break in IIPMyoy in 2008, as seen from the permanent shift in rolling mean and standard deviation, but a pure shock to the NRA_PR as the series returned to its normal pace after few quarters. Similar difference is visible for GVAMyoy and BAI. Charts 8a to 8d present the respective series along with its rolling14 mean and rolling standard deviation.
The above charts suggest that the COVID pandemic impacted the economy more severely than the global financial crisis. Further investigation about the full impact and structural changes due to the
14 The rolling window for four quarters is considered i.e. for a particular quarter, the ‘mean’ and ‘sd’ are average and standard deviation of that quarter and previous three quarters.
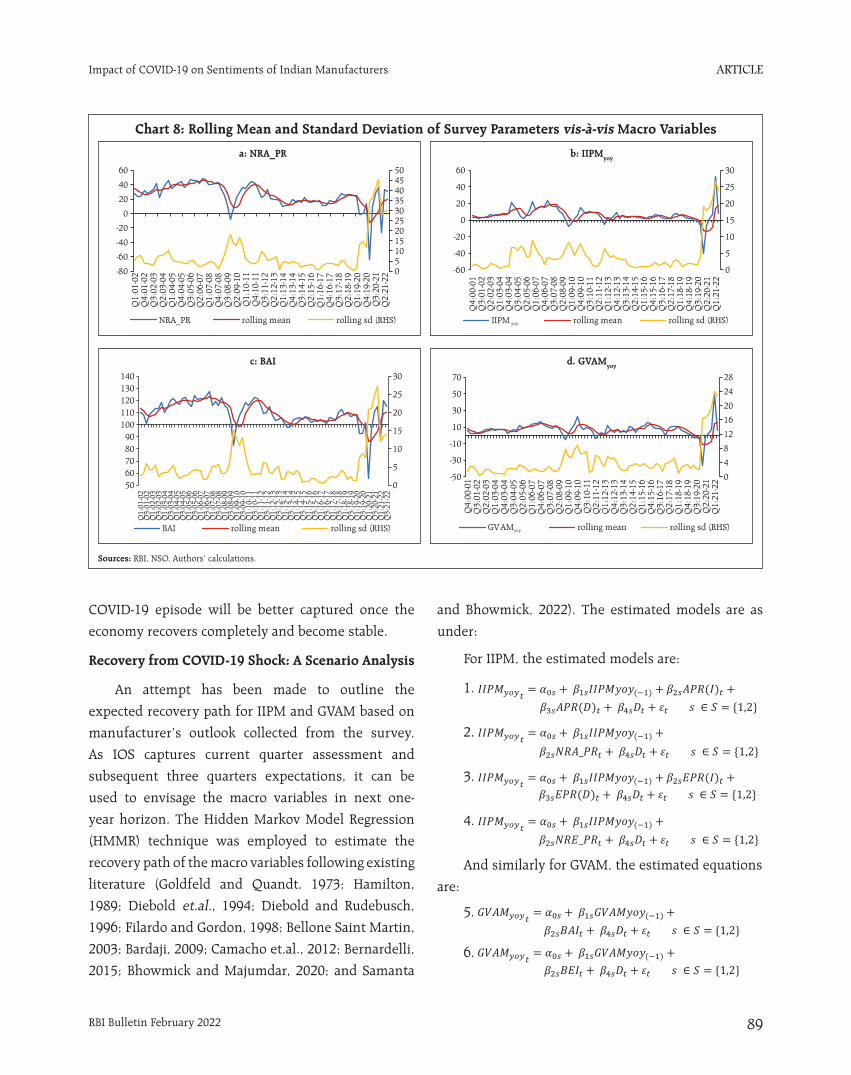
ARTICLE
RBI Bulletin February 2022 89
Impact of COVID-19 on Sentiments of Indian Manufacturers
COVID-19 episode will be better captured once the
economy recovers completely and become stable.
Recovery from COVID-19 Shock: A Scenario Analysis
An attempt has been made to outline the
expected recovery path for IIPM and GVAM based on
manufacturer’s outlook collected from the survey.
As IOS captures current quarter assessment and
subsequent three quarters expectations, it can be
used to envisage the macro variables in next one-
year horizon. The Hidden Markov Model Regression
(HMMR) technique was employed to estimate the
recovery path of the macro variables following existing
literature (Goldfeld and Quandt, 1973; Hamilton,
1989; Diebold et.al., 1994; Diebold and Rudebusch,
1996; Filardo and Gordon, 1998; Bellone Saint Martin,
2003; Bardaji, 2009; Camacho et.al., 2012; Bernardelli,
2015; Bhowmick and Majumdar, 2020; and Samanta
and Bhowmick, 2022). The estimated models are as
under:
For IIPM, the estimated models are:
1.
2.
3.
4.
And similarly for GVAM, the estimated equations
are:
5.
6.
Chart 8: Rolling Mean and Standard Deviation of Survey Parameters vis-à-vis Macro Variables
a: NRA_PR b: IIPMyoy
Sources: RBI, NSO, Authors’ calculations.
c: BAI d. GVAMyoy
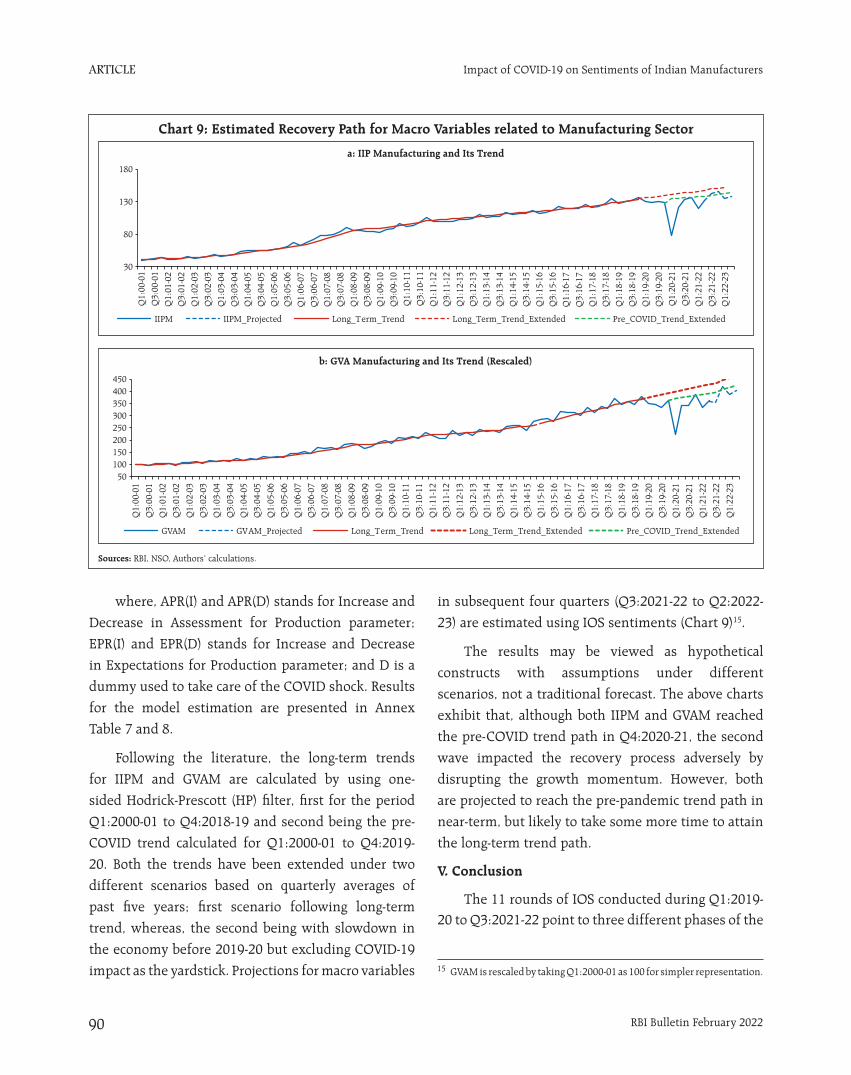
ARTICLE
RBI Bulletin February 202290
Impact of COVID-19 on Sentiments of Indian Manufacturers
where, APR(I) and APR(D) stands for Increase and
Decrease in Assessment for Production parameter;
EPR(I) and EPR(D) stands for Increase and Decrease
in Expectations for Production parameter; and D is a
dummy used to take care of the COVID shock. Results
for the model estimation are presented in Annex
Table 7 and 8.
Following the literature, the long-term trends
for IIPM and GVAM are calculated by using one-
sided Hodrick-Prescott (HP) filter, first for the period
Q1:2000-01 to Q4:2018-19 and second being the pre-
COVID trend calculated for Q1:2000-01 to Q4:2019-
20. Both the trends have been extended under two
different scenarios based on quarterly averages of
past five years; first scenario following long-term
trend, whereas, the second being with slowdown in
the economy before 2019-20 but excluding COVID-19
impact as the yardstick. Projections for macro variables
in subsequent four quarters (Q3:2021-22 to Q2:2022-
23) are estimated using IOS sentiments (Chart 9)15.
The results may be viewed as hypothetical
constructs with assumptions under different
scenarios, not a traditional forecast. The above charts
exhibit that, although both IIPM and GVAM reached
the pre-COVID trend path in Q4:2020-21, the second
wave impacted the recovery process adversely by
disrupting the growth momentum. However, both
are projected to reach the pre-pandemic trend path in
near-term, but likely to take some more time to attain
the long-term trend path.
V. Conclusion
The 11 rounds of IOS conducted during Q1:2019-20 to Q3:2021-22 point to three different phases of the
Chart 9: Estimated Recovery Path for Macro Variables related to Manufacturing Sector
a: IIP Manufacturing and Its Trend
Sources: RBI, NSO, Authors’ calculations.
b: GVA Manufacturing and Its Trend (Rescaled)
15 GVAM is rescaled by taking Q1:2000-01 as 100 for simpler representation.
ARTICLE
RBI Bulletin February 2022 91
Impact of COVID-19 on Sentiments of Indian Manufacturers
Indian economy. In 2019-20, the survey parameters reflected slowdown in the overall economy in terms of sentiments of the manufacturers. The first and second waves of the pandemic slowed down the economic activity, and the perception of the manufacturers was impacted adversely. The conditions improved with gradual resumption of normalcy. Going forward, this analysis can be further extended to understand the structural changes in macro variables, once the recovery materialises fully. At the same time, although the major macroeconomic variables are supposed to achieve their pre-COVID trend in near-term with improvement in demand conditions, they are expected to take time to return to their long-term trend path. Concurrently, the subsequent waves of the pandemic and the re-imposition of virus containment measures may dampen the manufacturers’ sentiments and slow down the recovery process. However, the accelerated rollout of vaccines, an inclusive growth-oriented Union Budget 2022-23 with fiscal and other reforms and enhanced infrastructure spending and sector-specific support, investment-oriented stimulus under various tranches of Aatma Nirbhar Bharat, easy financial conditions, etc. are expected to provide a strong impetus for revival of the economy and will facilitate regaining of the growth potential over the medium-term. Continued policy support in future may make the recovery smoother and faster.
References
Bank of Canada (2020), ‘Business Outlook Survey’, Spring, Summer and Autumn issue, https://www.bankofcanada.ca/2020/04/business-outlook-survey .
Bhowmick, S. and Majumdar, S. (2020). ‘Sentiments of Indian Manufacturers in 2018-19’, RBI Bulletin, February.
Dana E. Goin and Jennifer Ahern (2018). ‘Identification of Spikes in Time Series’, Division of Epidemiology, School of Public Health, University of California, Berkeley, California, January.
Federal Reserve Bank of Kansas City (2020), ‘Manufacturing Survey’, February issue, https://
www.kansascityfed.org/surveys/manufacturing-survey/202002-tenth-district-manufacturing-activity-increased-modestly-february/.
Federal Reserve Bank of Kansas City (2020),
‘Manufacturing Survey’, various monthly survey
reports, https://www.kansascityfed.org/research/indicatorsdata/mfg.
Federal Reserve Bank of New York (2020) ,
‘Business Leaders Survey’, March issue, https://www.newyorkfed.org/medialibrary/media/survey/business_leaders/2020/2020_03blsreport.pdf?la=en .
Federal Reserve Bank of New York (2020), ‘Empire
State Manufacturing Survey’, various issues https://www.newyorkfed.org/survey/empire/empiresurvey_archives .
Federal Reserve Bank of Philadelphia (2020),
‘Manufacturing Business Outlook Survey’, October
issue, https://www.philadelphiafed.org/-/media/frbp/assets/surveys-and-data/mbos/2020/bos1020.pdf?la=en .
Morten O. Ravn and Harald Uhlig (2002). ‘On
Adjusting the Hodrick-Prescott Filter for the Frequency
of Observations’, The Review of Economics and
Statistics, May 2002, 84(2): 371–380.
Piet de Jong; Jeremy Penzer (1998). ‘Diagnosing Shocks
in Time Series’, Journal of the American Statistical
Association, Vol. 93, No. 442. (Jun., 1998), pp. 796-806.
Reserve Bank of India (2020), ‘Industrial Outlook
Survey’, April, August, October issues https://w w w. r b i . o rg . i n / S c r i p t s / P u b l i c a t i o n s V i e w.aspx?id=19437/19717/19984.
Reserve Bank of India (2020), Monetary policy
resolution March 27, 2020, https://www.rbi.org.in/Scripts/BS_PressReleaseDisplay.aspx?prid=49581 .
Samanta, G. P. and Bhowmick, S. (2022). ‘Quantifying
Survey-based Qualitative Responses on Capacity
Utilisation-An Analysis for India’, RBI Working Paper
No. 05/2022.
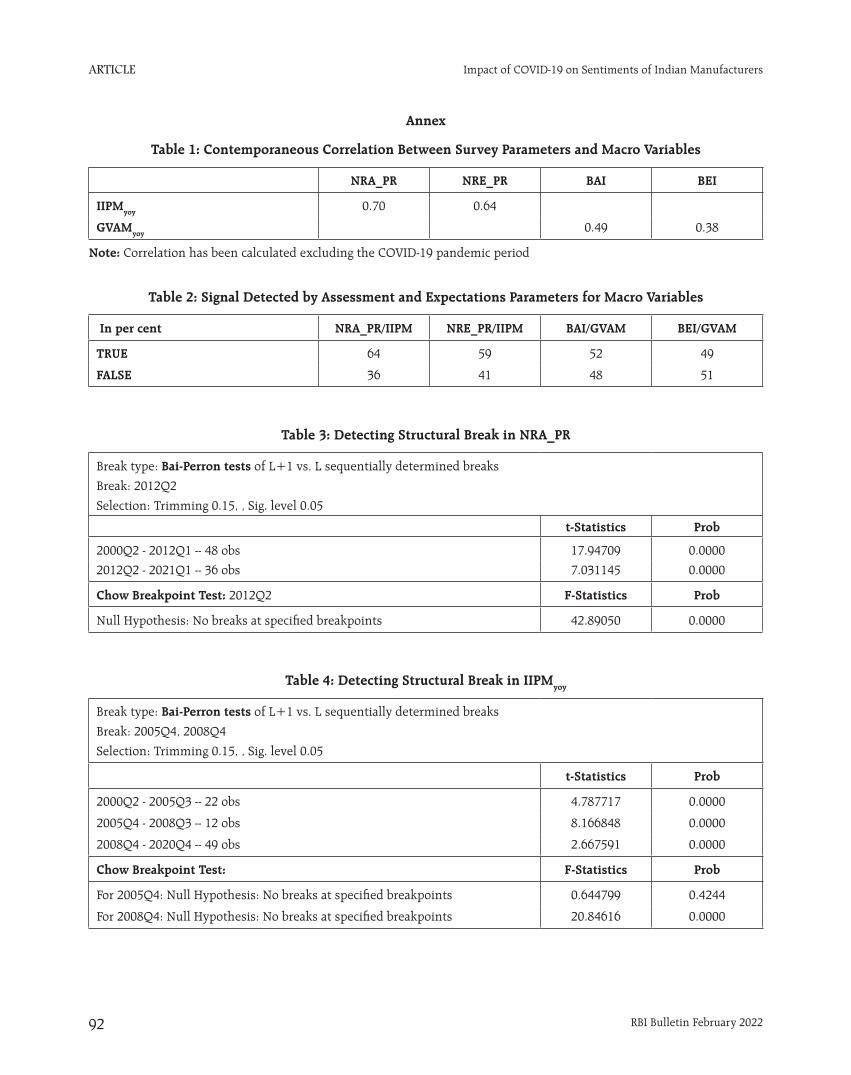
ARTICLE
RBI Bulletin February 202292
Impact of COVID-19 on Sentiments of Indian Manufacturers
Annex
Table 1: Contemporaneous Correlation Between Survey Parameters and Macro Variables
NRA_PR NRE_PR BAI BEI
IIPMyoy 0.70 0.64
GVAMyoy 0.49 0.38
Note: Correlation has been calculated excluding the COVID-19 pandemic period
Table 2: Signal Detected by Assessment and Expectations Parameters for Macro Variables
In per cent NRA_PR/IIPM NRE_PR/IIPM BAI/GVAM BEI/GVAM
TRUE 64 59 52 49
FALSE 36 41 48 51
Table 3: Detecting Structural Break in NRA_PR
Break type: Bai-Perron tests of L+1 vs. L sequentially determined breaks
Break: 2012Q2
Selection: Trimming 0.15, , Sig. level 0.05
t-Statistics Prob
2000Q2 - 2012Q1 -- 48 obs 17.94709 0.0000
2012Q2 - 2021Q1 -- 36 obs 7.031145 0.0000
Chow Breakpoint Test: 2012Q2 F-Statistics Prob
Null Hypothesis: No breaks at specified breakpoints 42.89050 0.0000
Table 4: Detecting Structural Break in IIPMyoy
Break type: Bai-Perron tests of L+1 vs. L sequentially determined breaks
Break: 2005Q4, 2008Q4
Selection: Trimming 0.15, , Sig. level 0.05
t-Statistics Prob
2000Q2 - 2005Q3 -- 22 obs 4.787717 0.0000
2005Q4 - 2008Q3 -- 12 obs 8.166848 0.0000
2008Q4 - 2020Q4 -- 49 obs 2.667591 0.0000
Chow Breakpoint Test: F-Statistics Prob
For 2005Q4: Null Hypothesis: No breaks at specified breakpoints 0.644799 0.4244
For 2008Q4: Null Hypothesis: No breaks at specified breakpoints 20.84616 0.0000
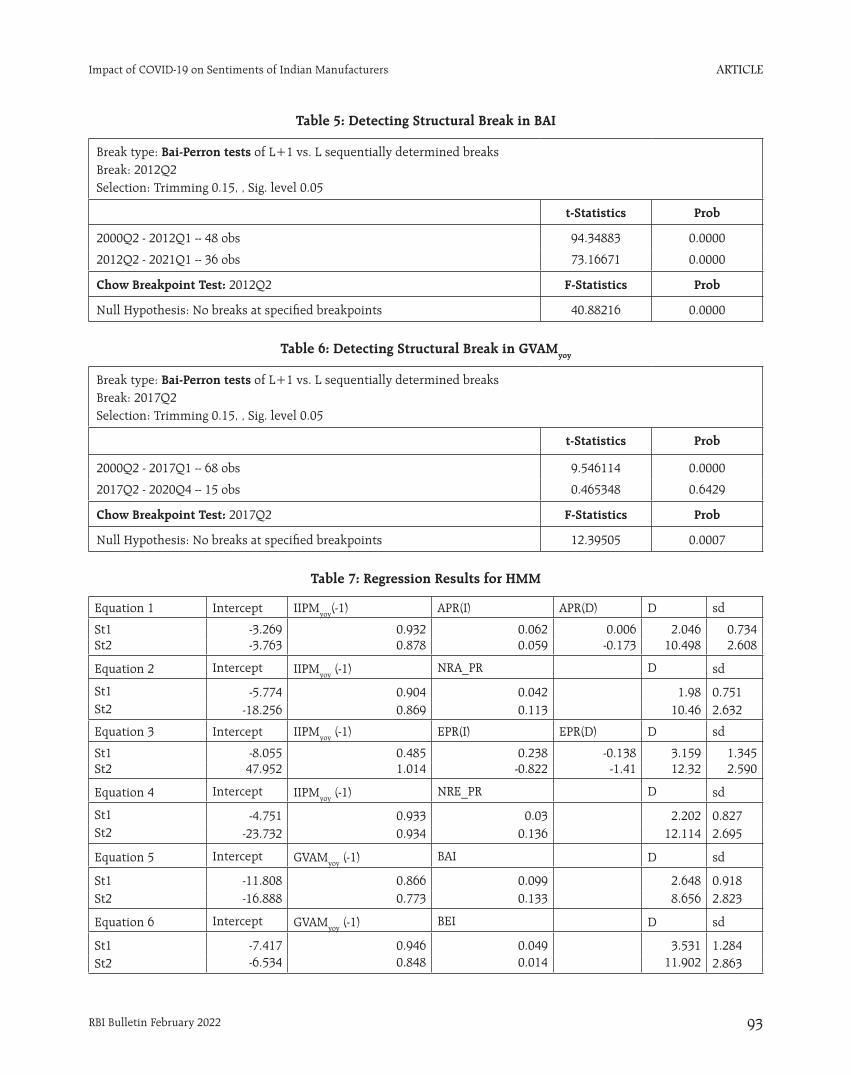
ARTICLE
RBI Bulletin February 2022 93
Impact of COVID-19 on Sentiments of Indian Manufacturers
Table 5: Detecting Structural Break in BAI
Break type: Bai-Perron tests of L+1 vs. L sequentially determined breaksBreak: 2012Q2Selection: Trimming 0.15, , Sig. level 0.05
t-Statistics Prob
2000Q2 - 2012Q1 -- 48 obs 94.34883 0.0000
2012Q2 - 2021Q1 -- 36 obs 73.16671 0.0000
Chow Breakpoint Test: 2012Q2 F-Statistics Prob
Null Hypothesis: No breaks at specified breakpoints 40.88216 0.0000
Table 6: Detecting Structural Break in GVAMyoy
Break type: Bai-Perron tests of L+1 vs. L sequentially determined breaksBreak: 2017Q2Selection: Trimming 0.15, , Sig. level 0.05
t-Statistics Prob
2000Q2 - 2017Q1 -- 68 obs 9.546114 0.0000
2017Q2 - 2020Q4 -- 15 obs 0.465348 0.6429
Chow Breakpoint Test: 2017Q2 F-Statistics Prob
Null Hypothesis: No breaks at specified breakpoints 12.39505 0.0007
Table 7: Regression Results for HMM
Equation 1 Intercept IIPMyoy(-1) APR(I) APR(D) D sd
St1 -3.269 0.932 0.062 0.006 2.046 0.734St2 -3.763 0.878 0.059 -0.173 10.498 2.608
Equation 2 Intercept IIPMyoy (-1) NRA_PR D sd
St1 -5.774 0.904 0.042 1.98 0.751St2 -18.256 0.869 0.113 10.46 2.632
Equation 3 Intercept IIPMyoy (-1) EPR(I) EPR(D) D sd
St1 -8.055 0.485 0.238 -0.138 3.159 1.345St2 47.952 1.014 -0.822 -1.41 12.32 2.590
Equation 4 Intercept IIPMyoy (-1) NRE_PR D sd
St1 -4.751 0.933 0.03 2.202 0.827St2 -23.732 0.934 0.136 12.114 2.695
Equation 5 Intercept GVAMyoy (-1) BAI D sd
St1 -11.808 0.866 0.099 2.648 0.918St2 -16.888 0.773 0.133 8.656 2.823
Equation 6 Intercept GVAMyoy (-1) BEI D sd
St1 -7.417 0.946 0.049 3.531 1.284St2 -6.534 0.848 0.014 11.902 2.863
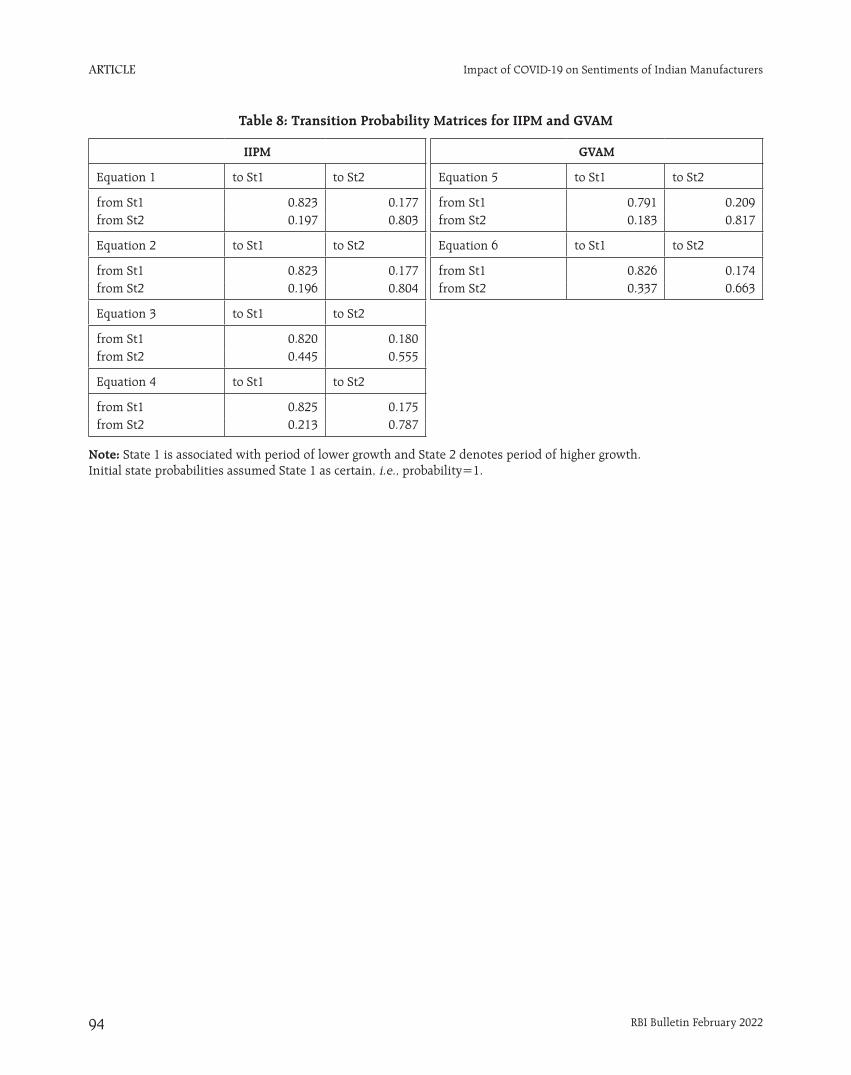
ARTICLE
RBI Bulletin February 202294
Impact of COVID-19 on Sentiments of Indian Manufacturers
Table 8: Transition Probability Matrices for IIPM and GVAM
IIPM GVAM
Equation 1 to St1 to St2 Equation 5 to St1 to St2
from St1 0.823 0.177 from St1 0.791 0.209from St2 0.197 0.803 from St2 0.183 0.817
Equation 2 to St1 to St2 Equation 6 to St1 to St2
from St1 0.823 0.177 from St1 0.826 0.174from St2 0.196 0.804 from St2 0.337 0.663
Equation 3 to St1 to St2
from St1 0.820 0.180from St2 0.445 0.555
Equation 4 to St1 to St2
from St1 0.825 0.175from St2 0.213 0.787
Note: State 1 is associated with period of lower growth and State 2 denotes period of higher growth. Initial state probabilities assumed State 1 as certain, i.e., probability=1.
CURRENT STATISTICS
Select Economic Indicators
Reserve Bank of India
Money and Banking
Prices and Production
Government Accounts and Treasury Bills
Financial Markets
External Sector
Payment and Settlement Systems
Occasional Series

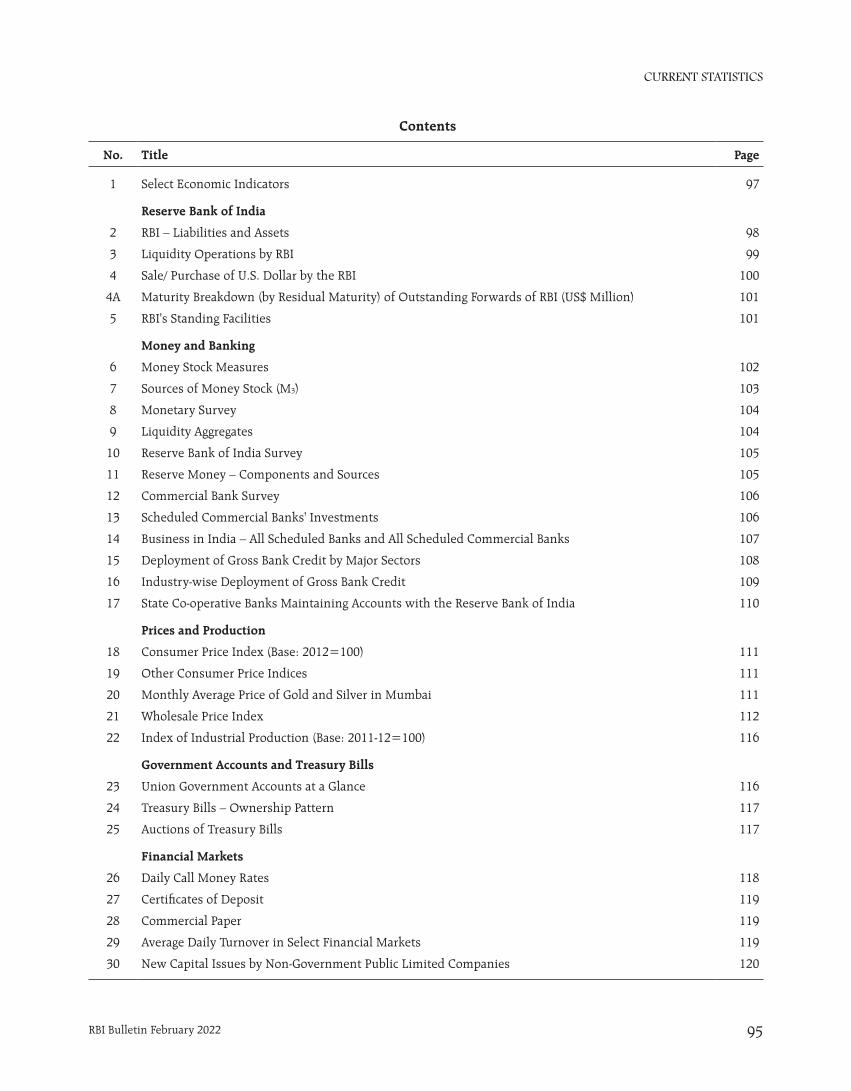
CURRENT STATISTICS
RBI Bulletin February 2022 95
No. Title Page
1 Select Economic Indicators 97
Reserve Bank of India
2 RBI – Liabilities and Assets 98
3 Liquidity Operations by RBI 99
4 Sale/ Purchase of U.S. Dollar by the RBI 100
4A Maturity Breakdown (by Residual Maturity) of Outstanding Forwards of RBI (US$ Million) 101
5 RBI's Standing Facilities 101
Money and Banking
6 Money Stock Measures 102
7 Sources of Money Stock (M3) 103
8 Monetary Survey 104
9 Liquidity Aggregates 104
10 Reserve Bank of India Survey 105
11 Reserve Money – Components and Sources 105
12 Commercial Bank Survey 106
13 Scheduled Commercial Banks' Investments 106
14 Business in India – All Scheduled Banks and All Scheduled Commercial Banks 107
15 Deployment of Gross Bank Credit by Major Sectors 108
16 Industry-wise Deployment of Gross Bank Credit 109
17 State Co-operative Banks Maintaining Accounts with the Reserve Bank of India 110
Prices and Production
18 Consumer Price Index (Base: 2012=100) 111
19 Other Consumer Price Indices 111
20 Monthly Average Price of Gold and Silver in Mumbai 111
21 Wholesale Price Index 112
22 Index of Industrial Production (Base: 2011-12=100) 116
Government Accounts and Treasury Bills
23 Union Government Accounts at a Glance 116
24 Treasury Bills – Ownership Pattern 117
25 Auctions of Treasury Bills 117
Financial Markets
26 Daily Call Money Rates 118
27 Certificates of Deposit 119
28 Commercial Paper 119
29 Average Daily Turnover in Select Financial Markets 119
30 New Capital Issues by Non-Government Public Limited Companies 120
Contents
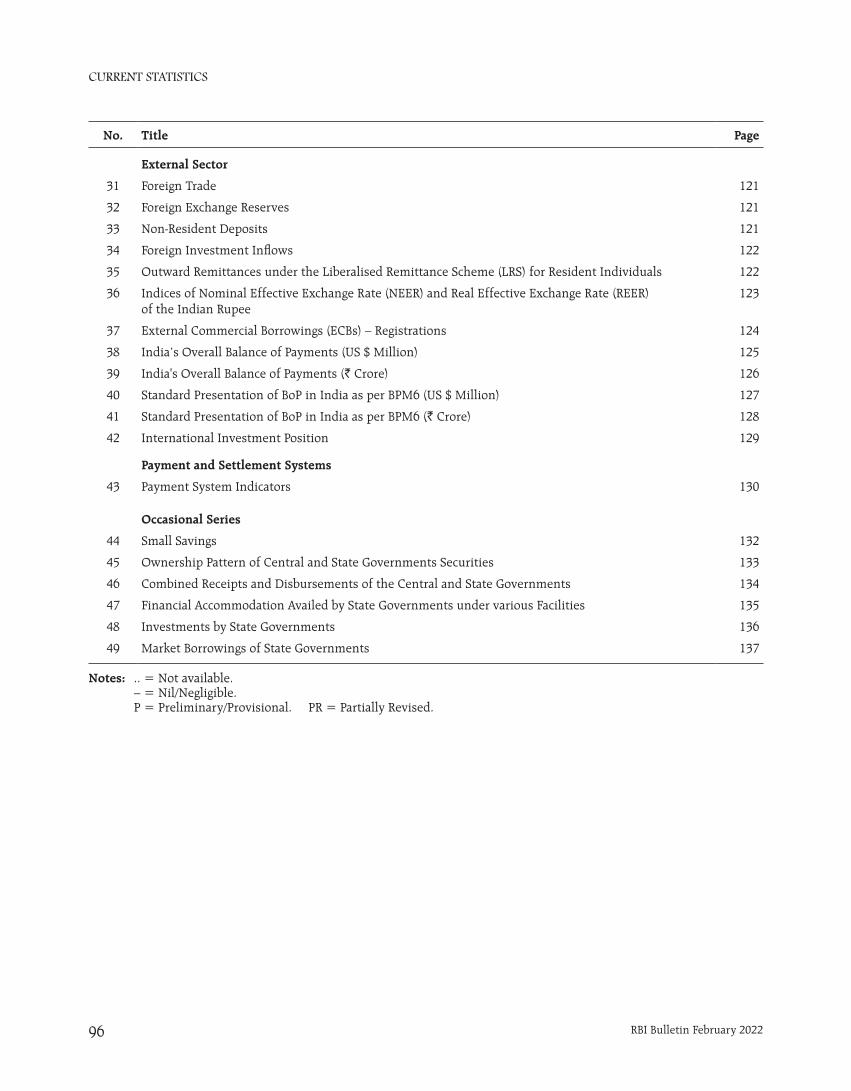
CURRENT STATISTICS
RBI Bulletin February 202296
No. Title Page
External Sector
31 Foreign Trade 121
32 Foreign Exchange Reserves 121
33 Non-Resident Deposits 121
34 Foreign Investment Inflows 122
35 Outward Remittances under the Liberalised Remittance Scheme (LRS) for Resident Individuals 122
36 Indices of Nominal Effective Exchange Rate (NEER) and Real Effective Exchange Rate (REER) of the Indian Rupee
123
37 External Commercial Borrowings (ECBs) – Registrations 124
38 India’s Overall Balance of Payments (US $ Million) 125
39 India's Overall Balance of Payments (` Crore) 126
40 Standard Presentation of BoP in India as per BPM6 (US $ Million) 127
41 Standard Presentation of BoP in India as per BPM6 (` Crore) 128
42 International Investment Position 129
Payment and Settlement Systems
43 Payment System Indicators 130
Occasional Series
44 Small Savings 132
45 Ownership Pattern of Central and State Governments Securities 133
46 Combined Receipts and Disbursements of the Central and State Governments 134
47 Financial Accommodation Availed by State Governments under various Facilities 135
48 Investments by State Governments 136
49 Market Borrowings of State Governments 137
Notes: .. = Not available. – = Nil/Negligible. P = Preliminary/Provisional. PR = Partially Revised.
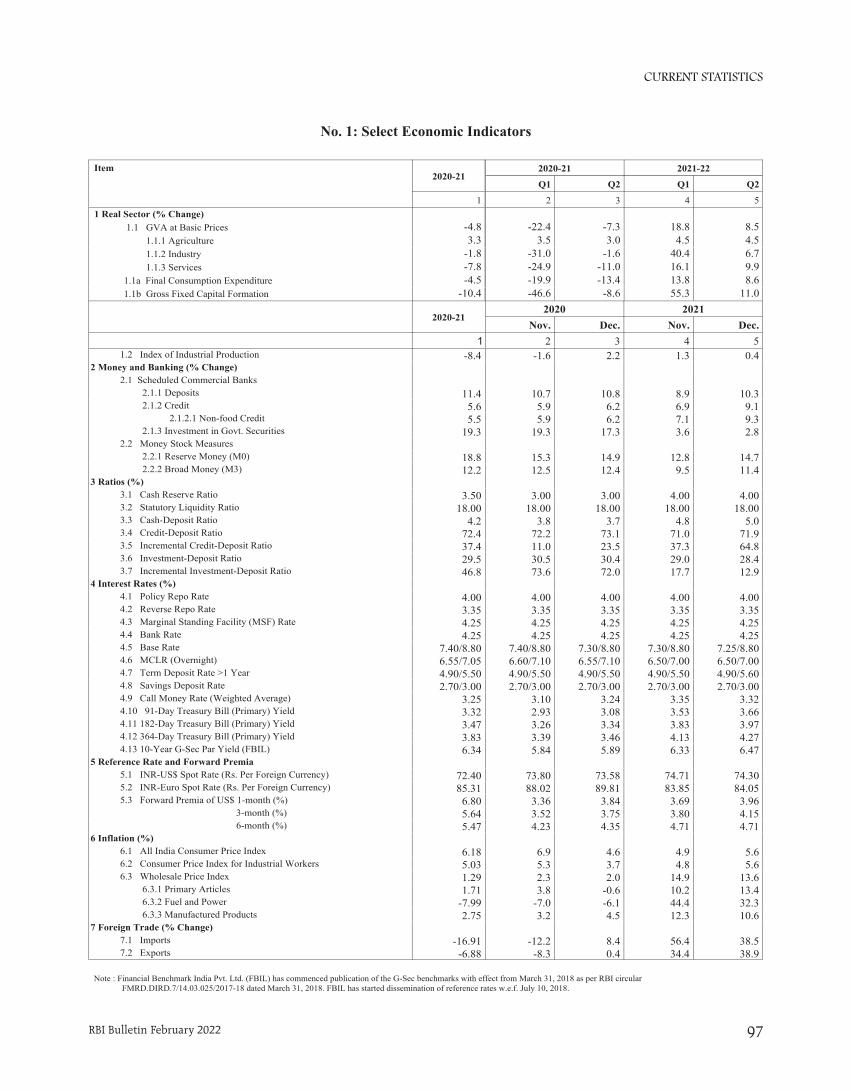
CURRENT STATISTICS
RBI Bulletin February 2022 97
2020-21 2021-22
Q1 Q2 Q1 Q2
2 3 4 5
-22.4 -7.3 18.8 8.53.5 3.0 4.5 4.5
-31.0 -1.6 40.4 6.7-24.9 -11.0 16.1 9.9-19.9 -13.4 13.8 8.6-46.6 -8.6 55.3 11.0
Item2020-21
11 Real Sector (% Change) 1.1 GVA at Basic Prices -4.8 1.1.1 Agriculture 3.3 1.1.2 Industry -1.8 1.1.3 Services -7.8 1.1a Final Consumption Expenditure -4.5 1.1b Gross Fixed Capital Formation -10.4
2020-21
1 1.2 Index of Industrial Production -8.42 Money and Banking (% Change) 2.1 Scheduled Commercial Banks 2.1.1 Deposits 11.4 2.1.2 Credit 5.6 2.1.2.1 Non-food Credit 5.5 2.1.3 Investment in Govt. Securities 19.3 2.2 Money Stock Measures 2.2.1 Reserve Money (M0) 18.8 2.2.2 Broad Money (M3) 12.23 Ratios (%) 3.1 Cash Reserve Ratio 3.50 3.2 Statutory Liquidity Ratio 18.00 3.3 Cash-Deposit Ratio 4.2 3.4 Credit-Deposit Ratio 72.4 3.5 Incremental Credit-Deposit Ratio 37.4 3.6 Investment-Deposit Ratio 29.5 3.7 Incremental Investment-Deposit Ratio 46.84 Interest Rates (%) 4.1 Policy Repo Rate 4.00 4.2 Reverse Repo Rate 3.35 4.3 Marginal Standing Facility (MSF) Rate 4.25 4.4 Bank Rate 4.25 4.5 Base Rate 7.40/8.80 4.6 MCLR (Overnight) 6.55/7.05 4.7 Term Deposit Rate >1 Year 4.90/5.50 4.8 Savings Deposit Rate 2.70/3.00 4.9 Call Money Rate (Weighted Average) 3.25 4.10 91-Day Treasury Bill (Primary) Yield 3.32 4.11 182-Day Treasury Bill (Primary) Yield 3.47 4.12 364-Day Treasury Bill (Primary) Yield 3.83 4.13 10-Year G-Sec Par Yield (FBIL) 6.345 Reference Rate and Forward Premia 5.1 INR-US$ Spot Rate (Rs. Per Foreign Currency) 72.40 5.2 INR-Euro Spot Rate (Rs. Per Foreign Currency) 85.31 5.3 Forward Premia of US$ 1-month (%) 6.80 3-month (%) 5.64 6-month (%) 5.476 Inflation (%) 6.1 All India Consumer Price Index 6.18 6.2 Consumer Price Index for Industrial Workers 5.03 6.3 Wholesale Price Index 1.29 6.3.1 Primary Articles 1.71 6.3.2 Fuel and Power -7.99 6.3.3 Manufactured Products 2.757 Foreign Trade (% Change) 7.1 Imports -16.91 7.2 Exports -6.88
No. 1: Select Economic Indicators
2020 2021Nov. Dec. Nov. Dec.
2 3 4 5-1.6 2.2 1.3 0.4
10.7 10.8 8.9 10.35.9 6.2 6.9 9.15.9 6.2 7.1 9.3
19.3 17.3 3.6 2.8
15.3 14.9 12.8 14.712.5 12.4 9.5 11.4
3.00 3.00 4.00 4.00
18.00 18.00 18.00 18.003.8 3.7 4.8 5.0
72.2 73.1 71.0 71.911.0 23.5 37.3 64.830.5 30.4 29.0 28.473.6 72.0 17.7 12.9
4.00 4.00 4.00 4.003.35 3.35 3.35 3.354.25 4.25 4.25 4.254.25 4.25 4.25 4.25
7.40/8.80 7.30/8.80 7.30/8.80 7.25/8.806.60/7.10 6.55/7.10 6.50/7.00 6.50/7.004.90/5.50 4.90/5.50 4.90/5.50 4.90/5.602.70/3.00 2.70/3.00 2.70/3.00 2.70/3.00
3.10 3.24 3.35 3.322.93 3.08 3.53 3.663.26 3.34 3.83 3.973.39 3.46 4.13 4.275.84 5.89 6.33 6.47
73.80 73.58 74.71 74.3088.02 89.81 83.85 84.05
3.36 3.84 3.69 3.963.52 3.75 3.80 4.154.23 4.35 4.71 4.71
6.9 4.6 4.9 5.65.3 3.7 4.8 5.62.3 2.0 14.9 13.63.8 -0.6 10.2 13.4
-7.0 -6.1 44.4 32.33.2 4.5 12.3 10.6
-12.2 8.4 56.4 38.5
-8.3 0.4 34.4 38.9
Note : Financial Benchmark India Pvt. Ltd. (FBIL) has commenced publication of the G-Sec benchmarks with effect from March 31, 2018 as per RBI circular FMRD.DIRD.7/14.03.025/2017-18 dated March 31, 2018. FBIL has started dissemination of reference rates w.e.f. July 10, 2018.
No. 1: Select Economic Indicators
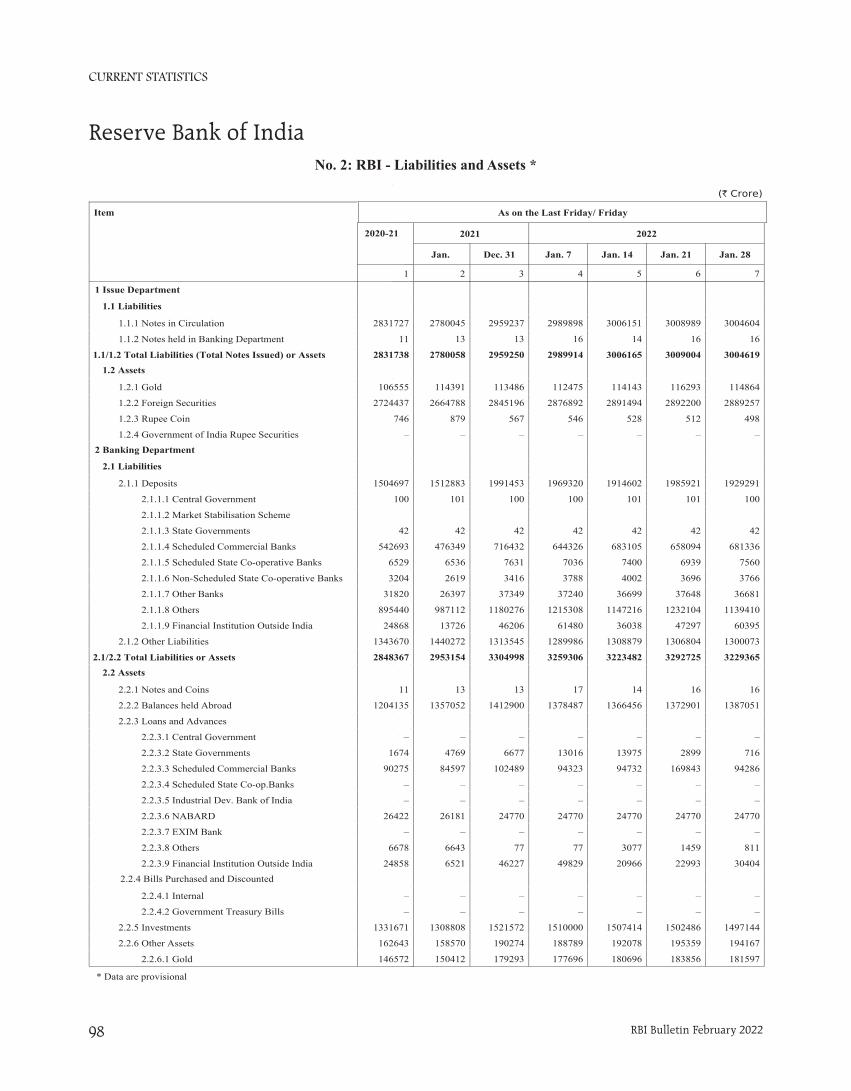
CURRENT STATISTICS
RBI Bulletin February 202298
No. 2: RBI - Liabilities and Assets *
(` Crore)
L 2021 2022
Jan. Dec. 31 Jan. 7 Jan. 14 Jan. 21 Jan. 28
2 3 4 5 6 7
1
1
1. 2780045 2959237 2989898 3006151 3008989 3004604
1. 13 13 16 14 16 16
1. 2780058 2959250 2989914 3006165 3009004 3004619
2
1. 114391 113486 112475 114143 116293 114864
1. 2664788 2845196 2876892 2891494 2892200 2889257
1. 879 567 546 528 512 498
1. – – – – – –
2
1
2. 1512883 1991453 1969320 1914602 1985921 1929291
2. 101 100 100 101 101 100
2.
2. 42 42 42 42 42 42
2. 476349 716432 644326 683105 658094 681336
2. 6536 7631 7036 7400 6939 7560
2. 2619 3416 3788 4002 3696 3766
2. 26397 37349 37240 36699 37648 36681
2. 987112 1180276 1215308 1147216 1232104 1139410
2. 13726 46206 61480 36038 47297 60395
2. 1440272 1313545 1289986 1308879 1306804 1300073
2. 2953154 3304998 3259306 3223482 3292725 3229365
2
2. 13 13 17 14 16 16
2. 1357052 1412900 1378487 1366456 1372901 1387051
2.
2. – – – – – –
2. 4769 6677 13016 13975 2899 716
2. 84597 102489 94323 94732 169843 94286
2. – – – – – –
2. – – – – – –
2. 26181 24770 24770 24770 24770 24770
2. – – – – – –
2. 6643 77 77 3077 1459 811
2. 6521 46227 49829 20966 22993 30404
2.
2. – – – – – –
2. – – – – – –
2. 1308808 1521572 1510000 1507414 1502486 1497144
2. 158570 190274 188789 192078 195359 194167
2. 150412 179293 177696 180696 183856 181597
Item
2020-21
1
1 Issue Department
1.1 Liabilities
1.1.1 Notes in Circulation 2831727
1.1.2 Notes held in Banking Department 11
1.1/1.2 Total Liabilities (Total Notes Issued) or Assets 2831738
1.2 Assets
1.2.1 Gold 106555
1.2.2 Foreign Securities 2724437
1.2.3 Rupee Coin 746
1.2.4 Government of India Rupee Securities –
2 Banking Department
2.1 Liabilities
2.1.1 Deposits 1504697
2.1.1.1 Central Government 100
2.1.1.2 Market Stabilisation Scheme
2.1.1.3 State Governments 42
2.1.1.4 Scheduled Commercial Banks 542693
2.1.1.5 Scheduled State Co-operative Banks 6529
2.1.1.6 Non-Scheduled State Co-operative Banks 3204
2.1.1.7 Other Banks 31820
2.1.1.8 Others 895440
2.1.1.9 Financial Institution Outside India 24868
2.1.2 Other Liabilities 1343670
2.1/2.2 Total Liabilities or Assets 2848367
2.2 Assets
2.2.1 Notes and Coins 11
2.2.2 Balances held Abroad 1204135
2.2.3 Loans and Advances
2.2.3.1 Central Government –
2.2.3.2 State Governments 1674
2.2.3.3 Scheduled Commercial Banks 90275
2.2.3.4 Scheduled State Co-op.Banks –
2.2.3.5 Industrial Dev. Bank of India –
2.2.3.6 NABARD 26422
2.2.3.7 EXIM Bank –
2.2.3.8 Others 6678
2.2.3.9 Financial Institution Outside India 24858
2.2.4 Bills Purchased and Discounted
2.2.4.1 Internal –
2.2.4.2 Government Treasury Bills –
2.2.5 Investments 1331671
2.2.6 Other Assets 162643
2.2.6.1 Gold 146572
As on the Last Friday/ Friday
* Data are provisional
Reserve Bank of IndiaNo. 2: RBI - Liabilities and Assets *
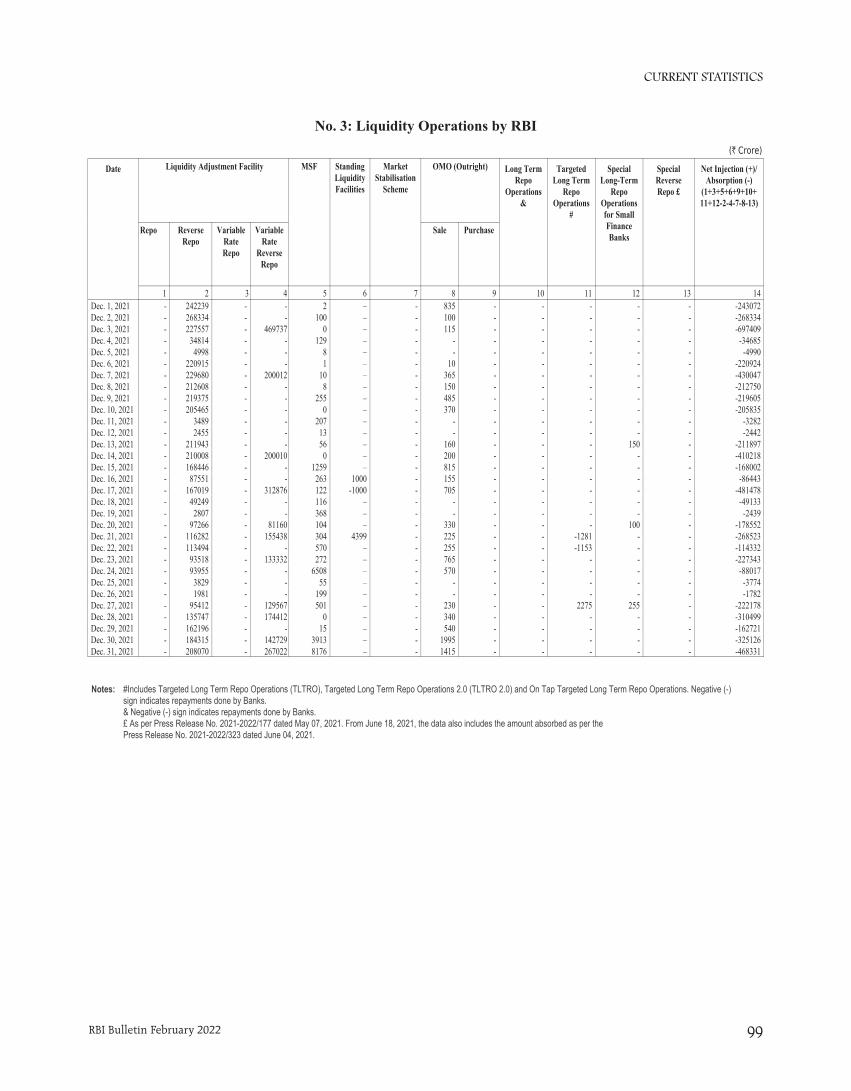
CURRENT STATISTICS
RBI Bulletin February 2022 99
No. 3: Liquidity Operations by RBI
(` Crore)
Date Liquidity Adjustment Facility MSF StandingLiquidityFacilities
MarketStabilisation
Scheme
OMO (Outright) Long TermRepo
Operations&
TargetedLong Term
RepoOperations
#
SpecialLong-Term
RepoOperationsfor SmallFinanceBanks
SpecialReverseRepo £
Net Injection (+)/Absorption (-)
(1+3+5+6+9+10+11+12-2-4-7-8-13)
Repo ReverseRepo
VariableRateRepo
VariableRate
ReverseRepo
Sale Purchase
1 2 3 4 5 6 7 8 9 10 11 12 13 14Dec. 1, 2021 - 242239 - - 2 – - 835 - - - - - -243072Dec. 2, 2021 - 268334 - - 100 – - 100 - - - - - -268334Dec. 3, 2021 - 227557 - 469737 0 – - 115 - - - - - -697409Dec. 4, 2021 - 34814 - - 129 – - - - - - - - -34685Dec. 5, 2021 - 4998 - - 8 – - - - - - - - -4990Dec. 6, 2021 - 220915 - - 1 – - 10 - - - - - -220924Dec. 7, 2021 - 229680 - 200012 10 – - 365 - - - - - -430047Dec. 8, 2021 - 212608 - - 8 – - 150 - - - - - -212750Dec. 9, 2021 - 219375 - - 255 – - 485 - - - - - -219605Dec. 10, 2021 - 205465 - - 0 – - 370 - - - - - -205835Dec. 11, 2021 - 3489 - - 207 – - - - - - - - -3282Dec. 12, 2021 - 2455 - - 13 – - - - - - - - -2442Dec. 13, 2021 - 211943 - - 56 – - 160 - - - 150 - -211897Dec. 14, 2021 - 210008 - 200010 0 – - 200 - - - - - -410218Dec. 15, 2021 - 168446 - - 1259 – - 815 - - - - - -168002Dec. 16, 2021 - 87551 - - 263 1000 - 155 - - - - - -86443Dec. 17, 2021 - 167019 - 312876 122 -1000 - 705 - - - - - -481478Dec. 18, 2021 - 49249 - - 116 – - - - - - - - -49133Dec. 19, 2021 - 2807 - - 368 – - - - - - - - -2439Dec. 20, 2021 - 97266 - 81160 104 – - 330 - - - 100 - -178552Dec. 21, 2021 - 116282 - 155438 304 4399 - 225 - - -1281 - - -268523Dec. 22, 2021 - 113494 - - 570 – - 255 - - -1153 - - -114332Dec. 23, 2021 - 93518 - 133332 272 – - 765 - - - - - -227343Dec. 24, 2021 - 93955 - - 6508 – - 570 - - - - - -88017Dec. 25, 2021 - 3829 - - 55 – - - - - - - - -3774Dec. 26, 2021 - 1981 - - 199 – - - - - - - - -1782Dec. 27, 2021 - 95412 - 129567 501 – - 230 - - 2275 255 - -222178Dec. 28, 2021 - 135747 - 174412 0 – - 340 - - - - - -310499Dec. 29, 2021 - 162196 - - 15 – - 540 - - - - - -162721Dec. 30, 2021 - 184315 - 142729 3913 – - 1995 - - - - - -325126Dec. 31, 2021 - 208070 - 267022 8176 – - 1415 - - - - - -468331
Notes: #Includes Targeted Long Term Repo Operations (TLTRO), Targeted Long Term Repo Operations 2.0 (TLTRO 2.0) and On Tap Targeted Long Term Repo Operations. Negative (-)sign indicates repayments done by Banks.& Negative (-) sign indicates repayments done by Banks.£ As per Press Release No. 2021-2022/177 dated May 07, 2021. From June 18, 2021, the data also includes the amount absorbed as per thePress Release No. 2021-2022/323 dated June 04, 2021.
No. 3: Liquidity Operations by RBI
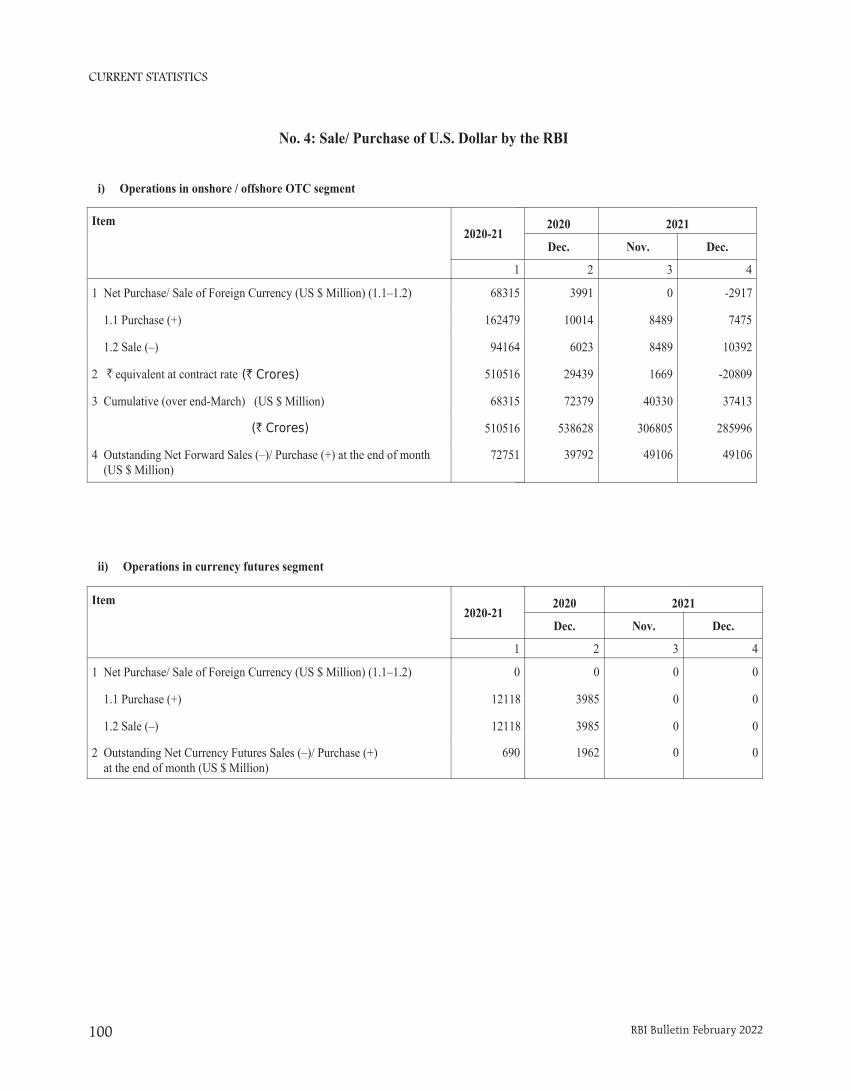
CURRENT STATISTICS
RBI Bulletin February 2022100
2020 2021
Dec. Nov. Dec.
2 3 4
3991 0 -2917
10014 8489 7475
6023 8489 10392
29439 1669 -20809
72379 40330 37413
538628 306805 285996
39792 49106 49106
No. 4: Sale/ Purchase of U.S. Dollar by the RBI
Item2020-21
1
1 Net Purchase/ Sale of Foreign Currency (US $ Million) (1.1–1.2) 68315
1.1 Purchase (+) 162479
1.2 Sale (–) 94164
2 equivalent at contract rate 510516
3 Cumulative (over end-March) (US $ Million) 68315
(` Crores) 510516
4 Outstanding Net Forward Sales (–)/ Purchase (+) at the end of month (US $ Million)
72751
Item2020-21
1
1 Net Purchase/ Sale of Foreign Currency (US $ Million) (1.1–1.2) 0
1.1 Purchase (+) 12118
1.2 Sale (–) 12118
2 Outstanding Net Currency Futures Sales (–)/ Purchase (+) at the end of month (US $ Million)
690
2020 2021
Dec. Nov. Dec.
2 3 4
0 0 0
3985 0 0
3985 0 0
1962 0 0
i) Operations in onshore / offshore OTC segment
ii) Operations in currency futures segment
` (` Crores)
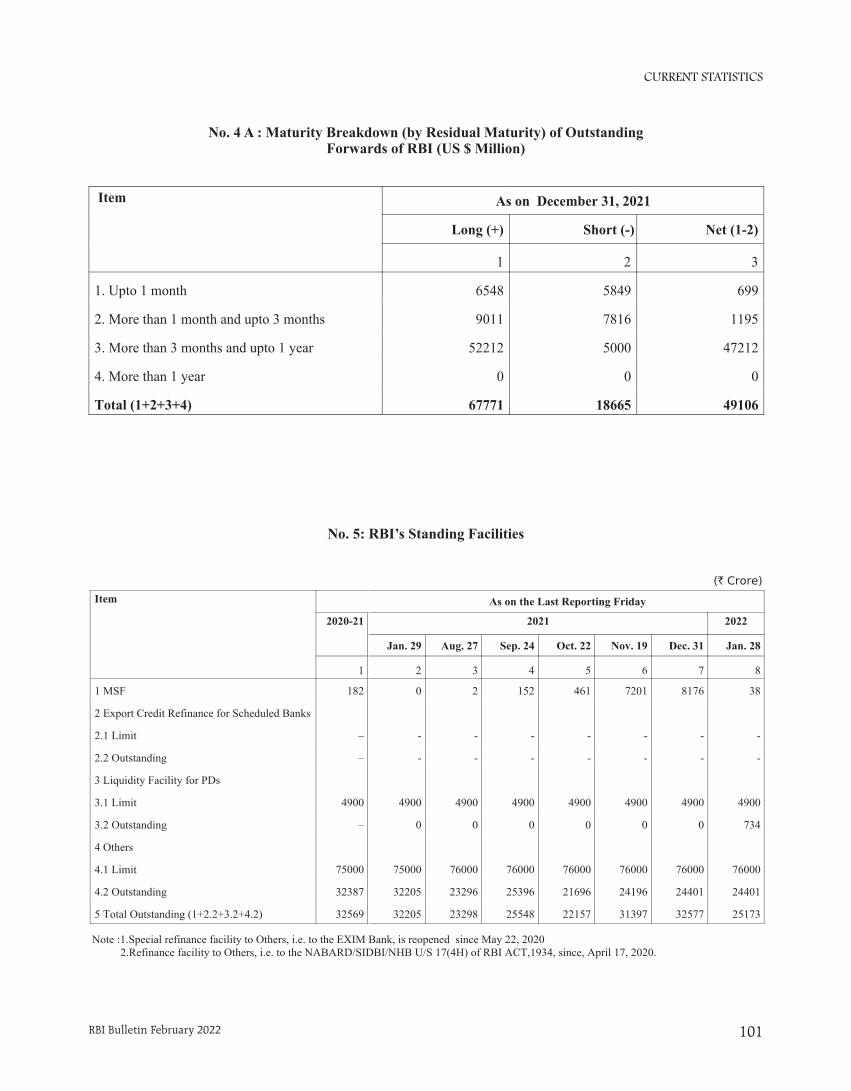
CURRENT STATISTICS
RBI Bulletin February 2022 101
Item As on December 31, 2021
Long (+) Short (-) Net (1-2)
1 2 3
1. Upto 1 month 6548 5849 699
2. More than 1 month and upto 3 months 9011 7816 1195
3. More than 3 months and upto 1 year 52212 5000 47212
4. More than 1 year 0 0 0
Total (1+2+3+4) 67771 18665 49106
No. 4 A : Maturity Breakdown (by Residual Maturity) of OutstandingForwards of RBI (US $ Million)
No. 5: RBI's Standing Facilities
Item
2020-21
1
1 MSF 182
2 Export Credit Refinance for Scheduled Banks
2.1 Limit –
2.2 Outstanding –
3 Liquidity Facility for PDs
3.1 Limit 4900
3.2 Outstanding –
4 Others
4.1 Limit 75000
4.2 Outstanding 32387
5 Total Outstanding (1+2.2+3.2+4.2) 32569
(` Crore)
2021 2022
Jan. 29 Aug. 27 Sep. 24 Oct. 22 Nov. 19 Dec. 31 Jan. 28
2 3 4 5 6 7 8
0 2 152 461 7201 8176 38
- - - - - - -
- - - - - - -
4900 4900 4900 4900 4900 4900 4900
0 0 0 0 0 0 734
75000 76000 76000 76000 76000 76000 76000
32205 23296 25396 21696 24196 24401 24401
32205 23298 25548 22157 31397 32577 25173
As on the Last Reporting Friday
Note :1.Special refinance facility to Others, i.e. to the EXIM Bank, is reopened since May 22, 2020 2.Refinance facility to Others, i.e. to the NABARD/SIDBI/NHB U/S 17(4H) of RBI ACT,1934, since, April 17, 2020.
No. 5: RBI’s Standing Facilities
No. 4 A : Maturity Breakdown (by Residual Maturity) of Outstanding Forwards of RBI (US $ Million)
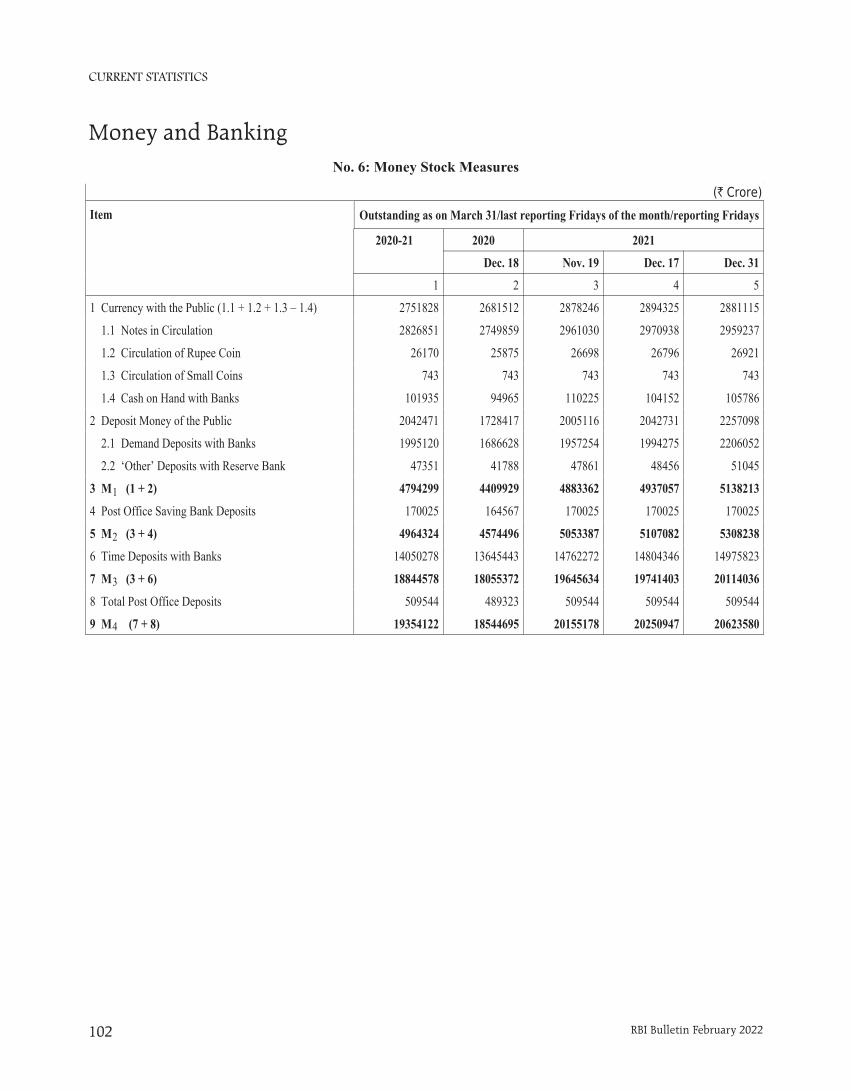
CURRENT STATISTICS
RBI Bulletin February 2022102
Money and Banking
Item
2020-21 2020 2021
Dec. 18 Nov. 19 Dec. 17 Dec. 31
1 2 3 4 5
1 Currency with the Public (1.1 + 1.2 + 1.3 – 1.4) 2751828 2681512 2878246 2894325 2881115
1.1 Notes in Circulation 2826851 2749859 2961030 2970938 2959237
1.2 Circulation of Rupee Coin 26170 25875 26698 26796 26921
1.3 Circulation of Small Coins 743 743 743 743 743
1.4 Cash on Hand with Banks 101935 94965 110225 104152 105786
2 Deposit Money of the Public 2042471 1728417 2005116 2042731 2257098
2.1 Demand Deposits with Banks 1995120 1686628 1957254 1994275 2206052
2.2 ‘Other’ Deposits with Reserve Bank 47351 41788 47861 48456 51045
3 M (1 + 2) 4794299 4409929 4883362 4937057 5138213
4 Post Office Saving Bank Deposits 170025 164567 170025 170025 170025
5 M (3 + 4) 4964324 4574496 5053387 5107082 5308238
6 Time Deposits with Banks 14050278 13645443 14762272 14804346 14975823
7 M (3 + 6) 18844578 18055372 19645634 19741403 20114036
8 Total Post Office Deposits 509544 489323 509544 509544 509544
9 M (7 + 8) 19354122 18544695 20155178 20250947 20623580
No. 6: Money Stock Measures
(` Crore)
Outstanding as on March 31/last reporting Fridays of the month/reporting Fridays
1
2
3
4
No. 6: Money Stock Measures
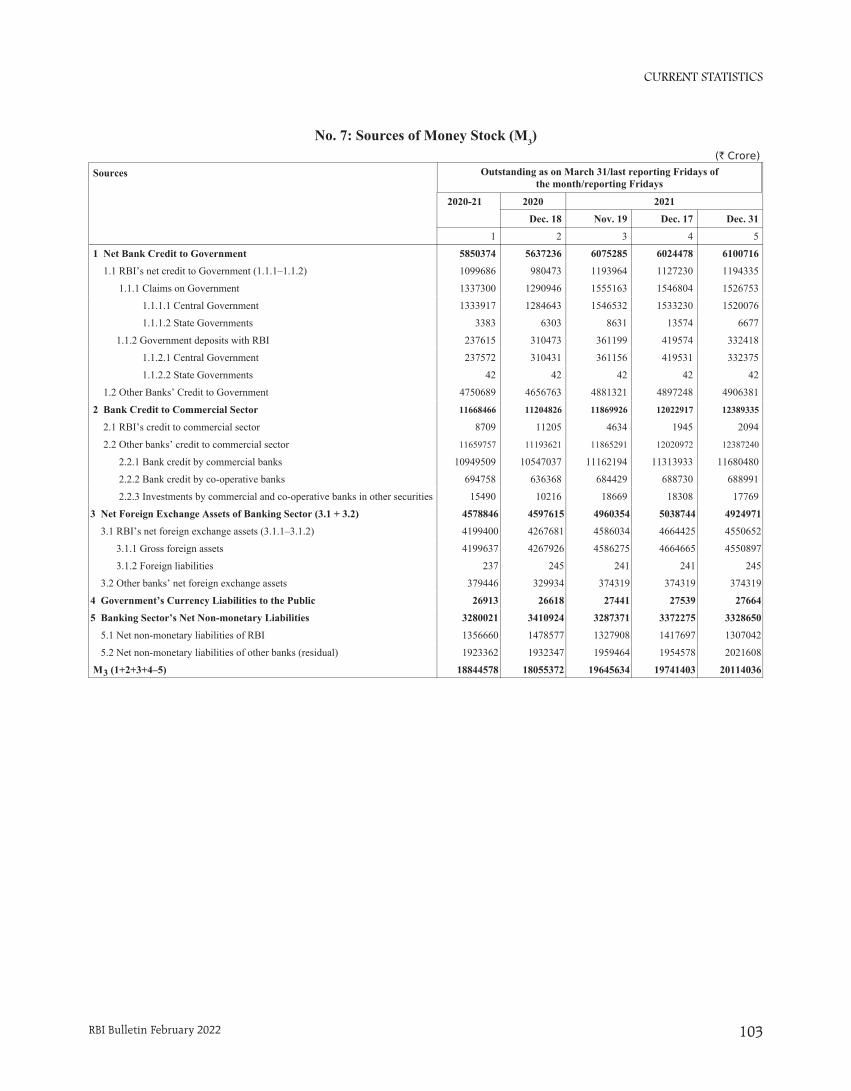
CURRENT STATISTICS
RBI Bulletin February 2022 103
No. 7: Sources of Money Stock (M )
Sources
2020-21 2020 2021
Dec. 18 Nov. 19 Dec. 17 Dec. 31
1 2 3 4 5
1 Net Bank Credit to Government 5850374 5637236 6075285 6024478 6100716
1.1 RBI’s net credit to Government (1.1.1–1.1.2) 1099686 980473 1193964 1127230 1194335
1.1.1 Claims on Government 1337300 1290946 1555163 1546804 1526753
1.1.1.1 Central Government 1333917 1284643 1546532 1533230 1520076
1.1.1.2 State Governments 3383 6303 8631 13574 6677
1.1.2 Government deposits with RBI 237615 310473 361199 419574 332418
1.1.2.1 Central Government 237572 310431 361156 419531 332375
1.1.2.2 State Governments 42 42 42 42 42
1.2 Other Banks’ Credit to Government 4750689 4656763 4881321 4897248 4906381
2 Bank Credit to Commercial Sector 11668466 11204826 11869926 12022917 12389335
2.1 RBI’s credit to commercial sector 8709 11205 4634 1945 2094
2.2 Other banks’ credit to commercial sector 11659757 11193621 11865291 12020972 12387240
2.2.1 Bank credit by commercial banks 10949509 10547037 11162194 11313933 11680480
2.2.2 Bank credit by co-operative banks 694758 636368 684429 688730 688991
2.2.3 Investments by commercial and co-operative banks in other securities 15490 10216 18669 18308 17769
3 Net Foreign Exchange Assets of Banking Sector (3.1 + 3.2) 4578846 4597615 4960354 5038744 4924971
3.1 RBI’s net foreign exchange assets (3.1.1–3.1.2) 4199400 4267681 4586034 4664425 4550652
3.1.1 Gross foreign assets 4199637 4267926 4586275 4664665 4550897
3.1.2 Foreign liabilities 237 245 241 241 245
3.2 Other banks’ net foreign exchange assets 379446 329934 374319 374319 374319
4 Government’s Currency Liabilities to the Public 26913 26618 27441 27539 27664
5 Banking Sector’s Net Non-monetary Liabilities 3280021 3410924 3287371 3372275 3328650
5.1 Net non-monetary liabilities of RBI 1356660 1478577 1327908 1417697 1307042
5.2 Net non-monetary liabilities of other banks (residual) 1923362 1932347 1959464 1954578 2021608
M (1+2+3+4–5) 18844578 18055372 19645634 19741403 20114036
(` Crore)
Outstanding as on March 31/last reporting Fridays ofthe month/reporting Fridays
3
3
No. 7: Sources of Money Stock (M3)
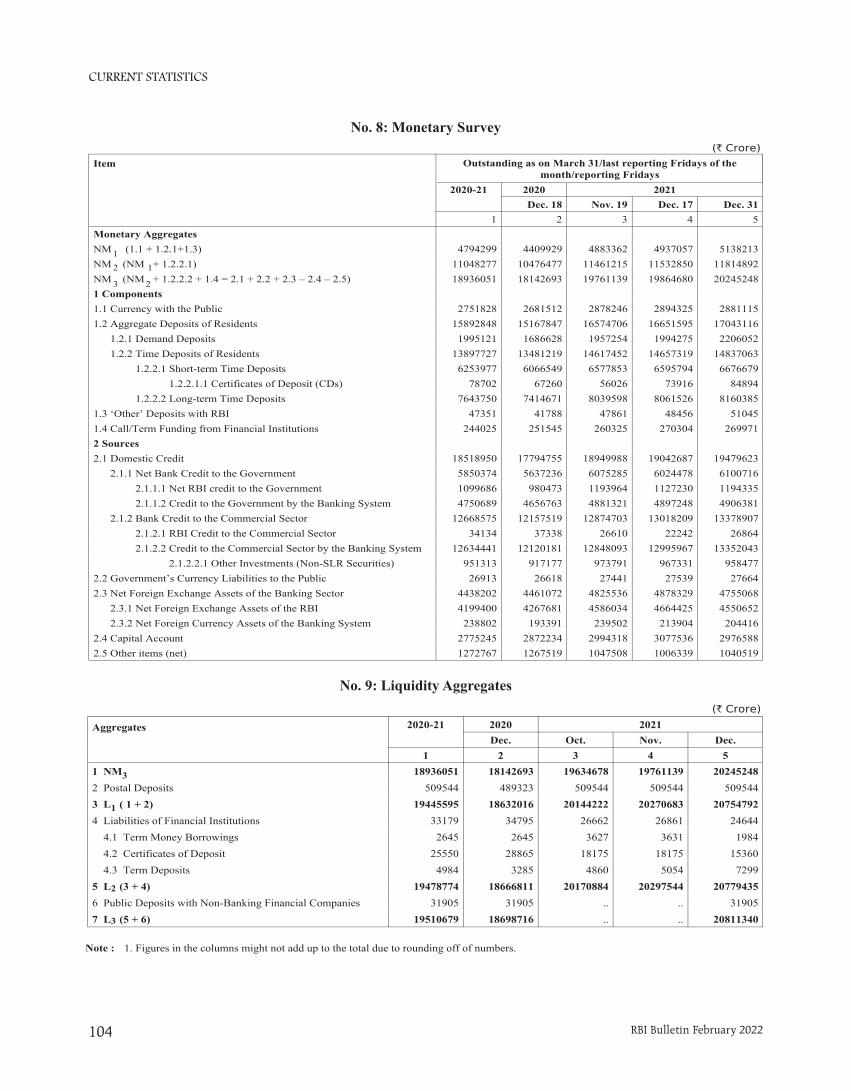
CURRENT STATISTICS
RBI Bulletin February 2022104
No. 8: Monetary Survey
Item
2020-21 2020 2021Dec. 18 Nov. 19 Dec. 17 Dec. 31
1 2 3 4 5Monetary AggregatesNM1 (1.1 + 1.2.1+1.3) 4794299 4409929 4883362 4937057 5138213NM (NM + 1.2.2.1) 11048277 10476477 11461215 11532850 11814892NM (NM + 1.2.2.2 + 1.4 = 2.1 + 2.2 + 2.3 – 2.4 – 2.5) 18936051 18142693 19761139 19864680 202452481 Components1.1 Currency with the Public 2751828 2681512 2878246 2894325 28811151.2 Aggregate Deposits of Residents 15892848 15167847 16574706 16651595 17043116 1.2.1 Demand Deposits 1995121 1686628 1957254 1994275 2206052 1.2.2 Time Deposits of Residents 13897727 13481219 14617452 14657319 14837063 1.2.2.1 Short-term Time Deposits 6253977 6066549 6577853 6595794 6676679 1.2.2.1.1 Certificates of Deposit (CDs) 78702 67260 56026 73916 84894 1.2.2.2 Long-term Time Deposits 7643750 7414671 8039598 8061526 81603851.3 ‘Other’ Deposits with RBI 47351 41788 47861 48456 510451.4 Call/Term Funding from Financial Institutions 244025 251545 260325 270304 2699712 Sources2.1 Domestic Credit 18518950 17794755 18949988 19042687 19479623 2.1.1 Net Bank Credit to the Government 5850374 5637236 6075285 6024478 6100716 2.1.1.1 Net RBI credit to the Government 1099686 980473 1193964 1127230 1194335 2.1.1.2 Credit to the Government by the Banking System 4750689 4656763 4881321 4897248 4906381 2.1.2 Bank Credit to the Commercial Sector 12668575 12157519 12874703 13018209 13378907 2.1.2.1 RBI Credit to the Commercial Sector 34134 37338 26610 22242 26864 2.1.2.2 Credit to the Commercial Sector by the Banking System 12634441 12120181 12848093 12995967 13352043 2.1.2.2.1 Other Investments (Non-SLR Securities) 951313 917177 973791 967331 9584772.2 Government’s Currency Liabilities to the Public 26913 26618 27441 27539 276642.3 Net Foreign Exchange Assets of the Banking Sector 4438202 4461072 4825536 4878329 4755068 2.3.1 Net Foreign Exchange Assets of the RBI 4199400 4267681 4586034 4664425 4550652 2.3.2 Net Foreign Currency Assets of the Banking System 238802 193391 239502 213904 2044162.4 Capital Account 2775245 2872234 2994318 3077536 29765882.5 Other items (net) 1272767 1267519 1047508 1006339 1040519
(` Crore)
Outstanding as on March 31/last reporting Fridays of themonth/reporting Fridays
12
3
1
2
No. 9: Liquidity Aggregates(` Crore)
Aggregates 2020-21 2020 2021Dec. Oct. Nov. Dec.
1 2 3 4 51 NM 18936051 18142693 19634678 19761139 20245248
2 Postal Deposits 509544 489323 509544 509544 5095443 L ( 1 + 2) 19445595 18632016 20144222 20270683 20754792
4 Liabilities of Financial Institutions 33179 34795 26662 26861 24644 4.1 Term Money Borrowings 2645 2645 3627 3631 1984 4.2 Certificates of Deposit 25550 28865 18175 18175 15360 4.3 Term Deposits 4984 3285 4860 5054 72995 L (3 + 4) 19478774 18666811 20170884 20297544 20779435
6 Public Deposits with Non-Banking Financial Companies 31905 31905 .. .. 319057 L (5 + 6) 19510679 18698716 .. .. 20811340
1
2
3
3
Note : 1. Figures in the columns might not add up to the total due to rounding off of numbers.
No. 8: Monetary Survey
No. 9: Liquidity Aggregates
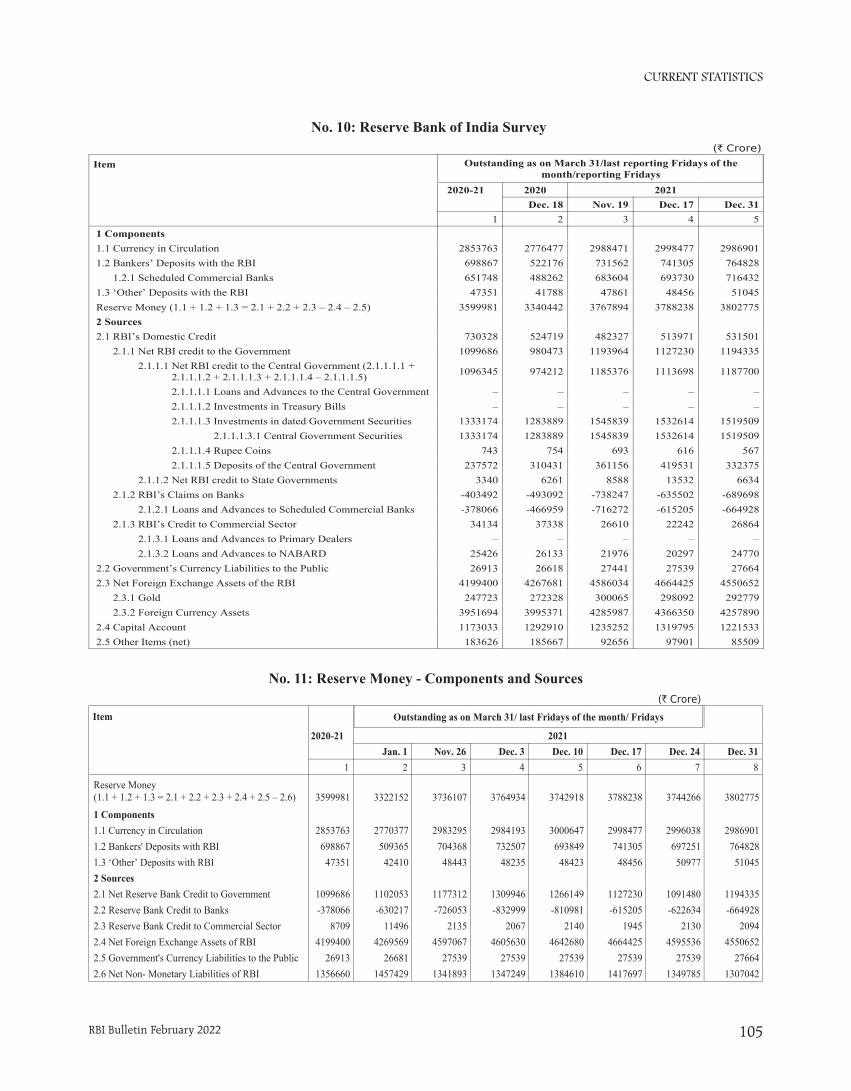
CURRENT STATISTICS
RBI Bulletin February 2022 105
No. 11: Reserve Money - Components and Sources
Item
2020-21 2021Jan. 1 Nov. 26 Dec. 3 Dec. 10 Dec. 17 Dec. 24 Dec. 31
1 2 3 4 5 6 7 8
Reserve Money(1.1 + 1.2 + 1.3 = 2.1 + 2.2 + 2.3 + 2.4 + 2.5 – 2.6) 3599981 3322152 3736107 3764934 3742918 3788238 3744266 3802775
1 Components1.1 Currency in Circulation 2853763 2770377 2983295 2984193 3000647 2998477 2996038 29869011.2 Bankers' Deposits with RBI 698867 509365 704368 732507 693849 741305 697251 7648281.3 ‘Other’ Deposits with RBI 47351 42410 48443 48235 48423 48456 50977 510452 Sources2.1 Net Reserve Bank Credit to Government 1099686 1102053 1177312 1309946 1266149 1127230 1091480 11943352.2 Reserve Bank Credit to Banks -378066 -630217 -726053 -832999 -810981 -615205 -622634 -6649282.3 Reserve Bank Credit to Commercial Sector 8709 11496 2135 2067 2140 1945 2130 20942.4 Net Foreign Exchange Assets of RBI 4199400 4269569 4597067 4605630 4642680 4664425 4595536 45506522.5 Government's Currency Liabilities to the Public 26913 26681 27539 27539 27539 27539 27539 276642.6 Net Non- Monetary Liabilities of RBI 1356660 1457429 1341893 1347249 1384610 1417697 1349785 1307042
(` Crore)
Outstanding as on March 31/ last Fridays of the month/ Fridays
No. 10: Reserve Bank of India Survey
Item
2020-21 2020 2021Dec. 18 Nov. 19 Dec. 17 Dec. 31
1 2 3 4 51 Components1.1 Currency in Circulation 2853763 2776477 2988471 2998477 29869011.2 Bankers’ Deposits with the RBI 698867 522176 731562 741305 764828 1.2.1 Scheduled Commercial Banks 651748 488262 683604 693730 7164321.3 ‘Other’ Deposits with the RBI 47351 41788 47861 48456 51045Reserve Money (1.1 + 1.2 + 1.3 = 2.1 + 2.2 + 2.3 – 2.4 – 2.5) 3599981 3340442 3767894 3788238 38027752 Sources2.1 RBI’s Domestic Credit 730328 524719 482327 513971 531501 2.1.1 Net RBI credit to the Government 1099686 980473 1193964 1127230 1194335 2.1.1.1 Net RBI credit to the Central Government (2.1.1.1.1 + 2.1.1.1.2 + 2.1.1.1.3 + 2.1.1.1.4 – 2.1.1.1.5) 1096345 974212 1185376 1113698 1187700
2.1.1.1.1 Loans and Advances to the Central Government – – – – – 2.1.1.1.2 Investments in Treasury Bills – – – – – 2.1.1.1.3 Investments in dated Government Securities 1333174 1283889 1545839 1532614 1519509 2.1.1.1.3.1 Central Government Securities 1333174 1283889 1545839 1532614 1519509 2.1.1.1.4 Rupee Coins 743 754 693 616 567 2.1.1.1.5 Deposits of the Central Government 237572 310431 361156 419531 332375 2.1.1.2 Net RBI credit to State Governments 3340 6261 8588 13532 6634 2.1.2 RBI’s Claims on Banks -403492 -493092 -738247 -635502 -689698 2.1.2.1 Loans and Advances to Scheduled Commercial Banks -378066 -466959 -716272 -615205 -664928 2.1.3 RBI’s Credit to Commercial Sector 34134 37338 26610 22242 26864 2.1.3.1 Loans and Advances to Primary Dealers – – – – – 2.1.3.2 Loans and Advances to NABARD 25426 26133 21976 20297 247702.2 Government’s Currency Liabilities to the Public 26913 26618 27441 27539 276642.3 Net Foreign Exchange Assets of the RBI 4199400 4267681 4586034 4664425 4550652 2.3.1 Gold 247723 272328 300065 298092 292779 2.3.2 Foreign Currency Assets 3951694 3995371 4285987 4366350 42578902.4 Capital Account 1173033 1292910 1235252 1319795 12215332.5 Other Items (net) 183626 185667 92656 97901 85509
(` Crore)
Outstanding as on March 31/last reporting Fridays of themonth/reporting Fridays
No. 10: Reserve Bank of India Survey
No. 11: Reserve Money - Components and Sources
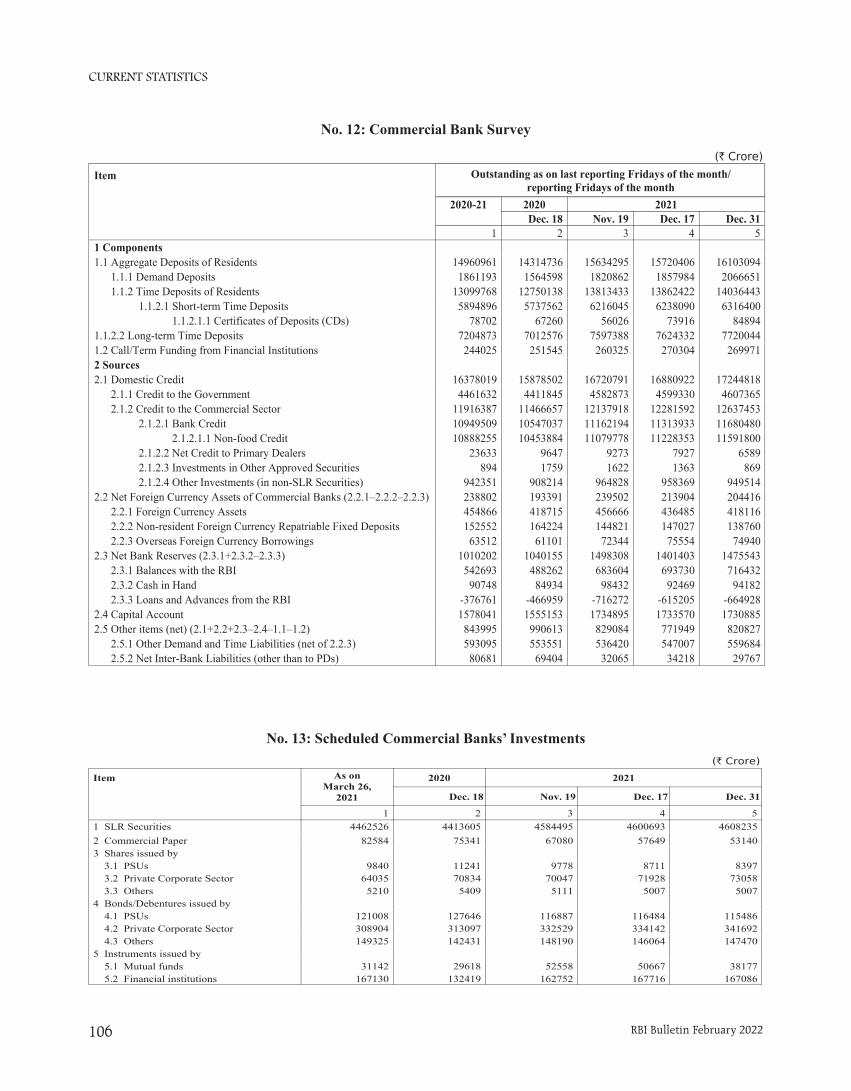
CURRENT STATISTICS
RBI Bulletin February 2022106
No. 13: Scheduled Commercial Banks' Investments
(` Crore)
Item As onMarch 26,
2021
2020 2021
Dec. 18 Nov. 19 Dec. 17 Dec. 31
1 2 3 4 51 SLR Securities 4462526 4413605 4584495 4600693 46082352 Commercial Paper 82584 75341 67080 57649 531403 Shares issued by 3.1 PSUs 9840 11241 9778 8711 8397 3.2 Private Corporate Sector 64035 70834 70047 71928 73058 3.3 Others 5210 5409 5111 5007 50074 Bonds/Debentures issued by 4.1 PSUs 121008 127646 116887 116484 115486 4.2 Private Corporate Sector 308904 313097 332529 334142 341692 4.3 Others 149325 142431 148190 146064 1474705 Instruments issued by 5.1 Mutual funds 31142 29618 52558 50667 38177 5.2 Financial institutions 167130 132419 162752 167716 167086
No. 12: Commercial Bank Survey
Item
2020-21 2020 2021Dec. 18 Nov. 19 Dec. 17 Dec. 31
1 2 3 4 51 Components1.1 Aggregate Deposits of Residents 14960961 14314736 15634295 15720406 16103094 1.1.1 Demand Deposits 1861193 1564598 1820862 1857984 2066651 1.1.2 Time Deposits of Residents 13099768 12750138 13813433 13862422 14036443 1.1.2.1 Short-term Time Deposits 5894896 5737562 6216045 6238090 6316400 1.1.2.1.1 Certificates of Deposits (CDs) 78702 67260 56026 73916 848941.1.2.2 Long-term Time Deposits 7204873 7012576 7597388 7624332 77200441.2 Call/Term Funding from Financial Institutions 244025 251545 260325 270304 2699712 Sources2.1 Domestic Credit 16378019 15878502 16720791 16880922 17244818 2.1.1 Credit to the Government 4461632 4411845 4582873 4599330 4607365 2.1.2 Credit to the Commercial Sector 11916387 11466657 12137918 12281592 12637453 2.1.2.1 Bank Credit 10949509 10547037 11162194 11313933 11680480 2.1.2.1.1 Non-food Credit 10888255 10453884 11079778 11228353 11591800 2.1.2.2 Net Credit to Primary Dealers 23633 9647 9273 7927 6589 2.1.2.3 Investments in Other Approved Securities 894 1759 1622 1363 869 2.1.2.4 Other Investments (in non-SLR Securities) 942351 908214 964828 958369 9495142.2 Net Foreign Currency Assets of Commercial Banks (2.2.1–2.2.2–2.2.3) 238802 193391 239502 213904 204416 2.2.1 Foreign Currency Assets 454866 418715 456666 436485 418116 2.2.2 Non-resident Foreign Currency Repatriable Fixed Deposits 152552 164224 144821 147027 138760 2.2.3 Overseas Foreign Currency Borrowings 63512 61101 72344 75554 749402.3 Net Bank Reserves (2.3.1+2.3.2–2.3.3) 1010202 1040155 1498308 1401403 1475543 2.3.1 Balances with the RBI 542693 488262 683604 693730 716432 2.3.2 Cash in Hand 90748 84934 98432 92469 94182 2.3.3 Loans and Advances from the RBI -376761 -466959 -716272 -615205 -6649282.4 Capital Account 1578041 1555153 1734895 1733570 17308852.5 Other items (net) (2.1+2.2+2.3–2.4–1.1–1.2) 843995 990613 829084 771949 820827 2.5.1 Other Demand and Time Liabilities (net of 2.2.3) 593095 553551 536420 547007 559684 2.5.2 Net Inter-Bank Liabilities (other than to PDs) 80681 69404 32065 34218 29767
(` Crore)
Outstanding as on last reporting Fridays of the month/reporting Fridays of the month
No. 12: Commercial Bank Survey
No. 13: Scheduled Commercial Banks’ Investments
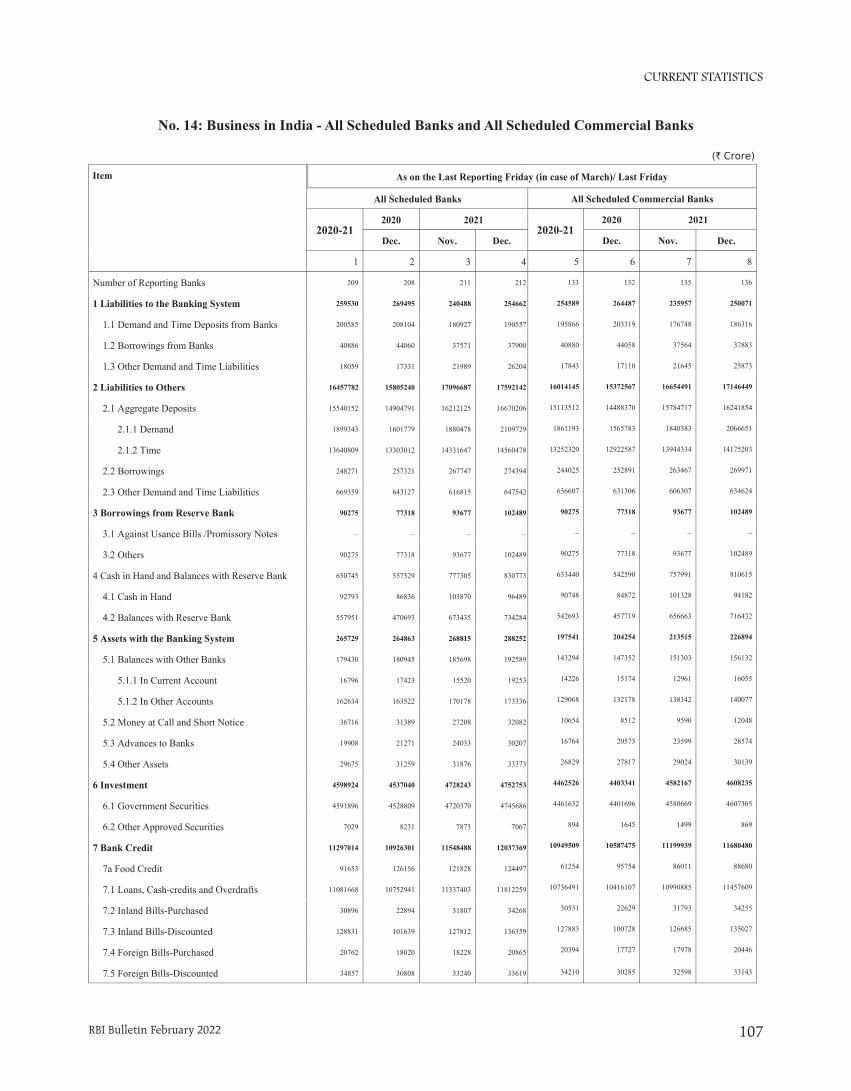
CURRENT STATISTICS
RBI Bulletin February 2022 107
No. 14: Business in India - All Scheduled Banks and All Scheduled Commercial Banks
(` Crore)
All Scheduled Commercial Banks
2020-212020 2021
Dec. Nov. Dec.
5 6 7 8
133 132 135 136
254589 264487 235957 250071
195866 203319 176748 186316
40880 44058 37564 37883
17843 17110 21645 25873
16014145 15372567 16654491 17146449
15113512 14488370 15784717 16241854
1861193 1565783 1840383 2066651
13252320 12922587 13944334 14175203
244025 252891 263467 269971
656607 631306 606307 634624
90275 77318 93677 102489
– – – –
90275 77318 93677 102489
633440 542590 757991 810615
90748 84872 101328 94182
542693 457719 656663 716432
197541 204254 213515 226894
143294 147352 151303 156132
14226 15174 12961 16055
129068 132178 138342 140077
10654 8512 9590 12048
16764 20573 23599 28574
26829 27817 29024 30139
4462526 4403341 4582167 4608235
4461632 4401696 4580669 4607365
894 1645 1499 869
10949509 10587475 11199939 11680480
61254 95754 86011 88680
10736491 10416107 10990885 11457609
30531 22629 31793 34255
127883 100728 126685 135027
20394 17727 17978 20446
34210 30285 32598 33143
Item
All Scheduled Banks
2020-212020 2021
Dec. Nov. Dec.
1 2 3 4
Number of Reporting Banks 209 208 211 212
1 Liabilities to the Banking System 259530 269495 240488 254662
1.1 Demand and Time Deposits from Banks 200585 208104 180927 190557
1.2 Borrowings from Banks 40886 44060 37571 37900
1.3 Other Demand and Time Liabilities 18059 17331 21989 26204
2 Liabilities to Others 16457782 15805240 17096687 17592142
2.1 Aggregate Deposits 15540152 14904791 16212125 16670206
2.1.1 Demand 1899343 1601779 1880478 2109729
2.1.2 Time 13640809 13303012 14331647 14560478
2.2 Borrowings 248271 257321 267747 274394
2.3 Other Demand and Time Liabilities 669359 643127 616815 647542
3 Borrowings from Reserve Bank 90275 77318 93677 102489
3.1 Against Usance Bills /Promissory Notes – – – –
3.2 Others 90275 77318 93677 102489
4 Cash in Hand and Balances with Reserve Bank 650745 557529 777305 830773
4.1 Cash in Hand 92793 86836 103870 96489
4.2 Balances with Reserve Bank 557951 470693 673435 734284
5 Assets with the Banking System 265729 264863 268815 288252
5.1 Balances with Other Banks 179430 180945 185698 192589
5.1.1 In Current Account 16796 17423 15520 19253
5.1.2 In Other Accounts 162634 163522 170178 173336
5.2 Money at Call and Short Notice 36716 31389 27208 32082
5.3 Advances to Banks 19908 21271 24033 30207
5.4 Other Assets 29675 31259 31876 33373
6 Investment 4598924 4537040 4728243 4752753
6.1 Government Securities 4591896 4528809 4720370 4745686
6.2 Other Approved Securities 7029 8231 7873 7067
7 Bank Credit 11297014 10926301 11548488 12037369
7a Food Credit 91653 126156 121828 124497
7.1 Loans, Cash-credits and Overdrafts 11081668 10752941 11337403 11812259
7.2 Inland Bills-Purchased 30896 22894 31807 34268
7.3 Inland Bills-Discounted 128831 101639 127812 136359
7.4 Foreign Bills-Purchased 20762 18020 18228 20865
7.5 Foreign Bills-Discounted 34857 30808 33240 33619
As on the Last Reporting Friday (in case of March)/ Last Friday
No. 14: Business in India - All Scheduled Banks and All Scheduled Commercial Banks
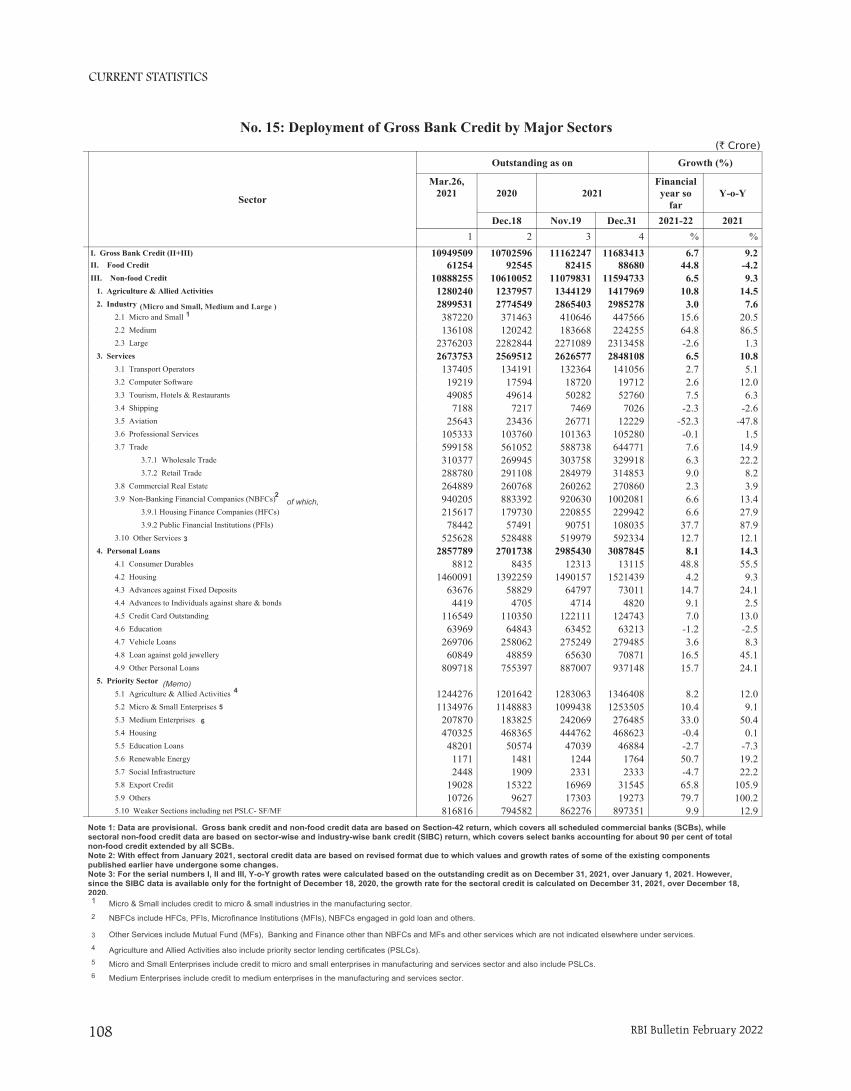
CURRENT STATISTICS
RBI Bulletin February 2022108
No. 15: Deployment of Gross Bank Credit by Major Sectors(` Crore)
Sector
Outstanding as on Growth (%)
Mar.26,2021 2020 2021
Financialyear so
farY-o-Y
Dec.18 Nov.19 Dec.31 2021-22 20211 2 3 4 % %
I. Gross Bank Credit (II+III) 10949509 10702596 11162247 11683413 6.7 9.2II. Food Credit 61254 92545 82415 88680 44.8 -4.2III. Non-food Credit 10888255 10610052 11079831 11594733 6.5 9.3 1. Agriculture & Allied Activities 1280240 1237957 1344129 1417969 10.8 14.5 2. Industry 2899531 2774549 2865403 2985278 3.0 7.6 2.1 Micro and Small 387220 371463 410646 447566 15.6 20.5 2.2 Medium 136108 120242 183668 224255 64.8 86.5 2.3 Large 2376203 2282844 2271089 2313458 -2.6 1.3 3. Services 2673753 2569512 2626577 2848108 6.5 10.8 3.1 Transport Operators 137405 134191 132364 141056 2.7 5.1 3.2 Computer Software 19219 17594 18720 19712 2.6 12.0 3.3 Tourism, Hotels & Restaurants 49085 49614 50282 52760 7.5 6.3 3.4 Shipping 7188 7217 7469 7026 -2.3 -2.6 3.5 Aviation 25643 23436 26771 12229 -52.3 -47.8 3.6 Professional Services 105333 103760 101363 105280 -0.1 1.5 3.7 Trade 599158 561052 588738 644771 7.6 14.9 3.7.1 Wholesale Trade 310377 269945 303758 329918 6.3 22.2 3.7.2 Retail Trade 288780 291108 284979 314853 9.0 8.2 3.8 Commercial Real Estate 264889 260768 260262 270860 2.3 3.9 3.9 Non-Banking Financial Companies (NBFCs) 940205 883392 920630 1002081 6.6 13.4 3.9.1 Housing Finance Companies (HFCs) 215617 179730 220855 229942 6.6 27.9 3.9.2 Public Financial Institutions (PFIs) 78442 57491 90751 108035 37.7 87.9 3.10 Other Services 525628 528488 519979 592334 12.7 12.1 4. Personal Loans 2857789 2701738 2985430 3087845 8.1 14.3 4.1 Consumer Durables 8812 8435 12313 13115 48.8 55.5 4.2 Housing 1460091 1392259 1490157 1521439 4.2 9.3 4.3 Advances against Fixed Deposits 63676 58829 64797 73011 14.7 24.1 4.4 Advances to Individuals against share & bonds 4419 4705 4714 4820 9.1 2.5 4.5 Credit Card Outstanding 116549 110350 122111 124743 7.0 13.0 4.6 Education 63969 64843 63452 63213 -1.2 -2.5 4.7 Vehicle Loans 269706 258062 275249 279485 3.6 8.3 4.8 Loan against gold jewellery 60849 48859 65630 70871 16.5 45.1 4.9 Other Personal Loans 809718 755397 887007 937148 15.7 24.1 5. Priority Sector 5.1 Agriculture & Allied Activities 1244276 1201642 1283063 1346408 8.2 12.0 5.2 Micro & Small Enterprises 1134976 1148883 1099438 1253505 10.4 9.1 5.3 Medium Enterprises 207870 183825 242069 276485 33.0 50.4 5.4 Housing 470325 468365 444762 468623 -0.4 0.1 5.5 Education Loans 48201 50574 47039 46884 -2.7 -7.3 5.6 Renewable Energy 1171 1481 1244 1764 50.7 19.2 5.7 Social Infrastructure 2448 1909 2331 2333 -4.7 22.2 5.8 Export Credit 19028 15322 16969 31545 65.8 105.9 5.9 Others 10726 9627 17303 19273 79.7 100.2 5.10 Weaker Sections including net PSLC- SF/MF 816816 794582 862276 897351 9.9 12.9
Note 1: Data are provisional. Gross bank credit and non-food credit data are based on Section-42 return, which covers all scheduled commercial banks (SCBs), whilesectoral non-food credit data are based on sector-wise and industry-wise bank credit (SIBC) return, which covers select banks accounting for about 90 per cent of totalnon-food credit extended by all SCBs.Note 2: With effect from January 2021, sectoral credit data are based on revised format due to which values and growth rates of some of the existing componentspublished earlier have undergone some changes.Note 3: For the serial numbers I, II and III, Y-o-Y growth rates were calculated based on the outstanding credit as on December 31, 2021, over January 1, 2021. However,since the SIBC data is available only for the fortnight of December 18, 2020, the growth rate for the sectoral credit is calculated on December 31, 2021, over December 18,2020.
1
2
3
4
5
6
1 Micro & Small includes credit to micro & small industries in the manufacturing sector.2 NBFCs include HFCs, PFIs, Microfinance Institutions (MFIs), NBFCs engaged in gold loan and others.
3 Other Services include Mutual Fund (MFs), Banking and Finance other than NBFCs and MFs and other services which are not indicated elsewhere under services.4 Agriculture and Allied Activities also include priority sector lending certificates (PSLCs).5 Micro and Small Enterprises include credit to micro and small enterprises in manufacturing and services sector and also include PSLCs.6 Medium Enterprises include credit to medium enterprises in the manufacturing and services sector.
of which,
(Memo)
(Micro and Small, Medium and Large )
No. 15: Deployment of Gross Bank Credit by Major Sectors
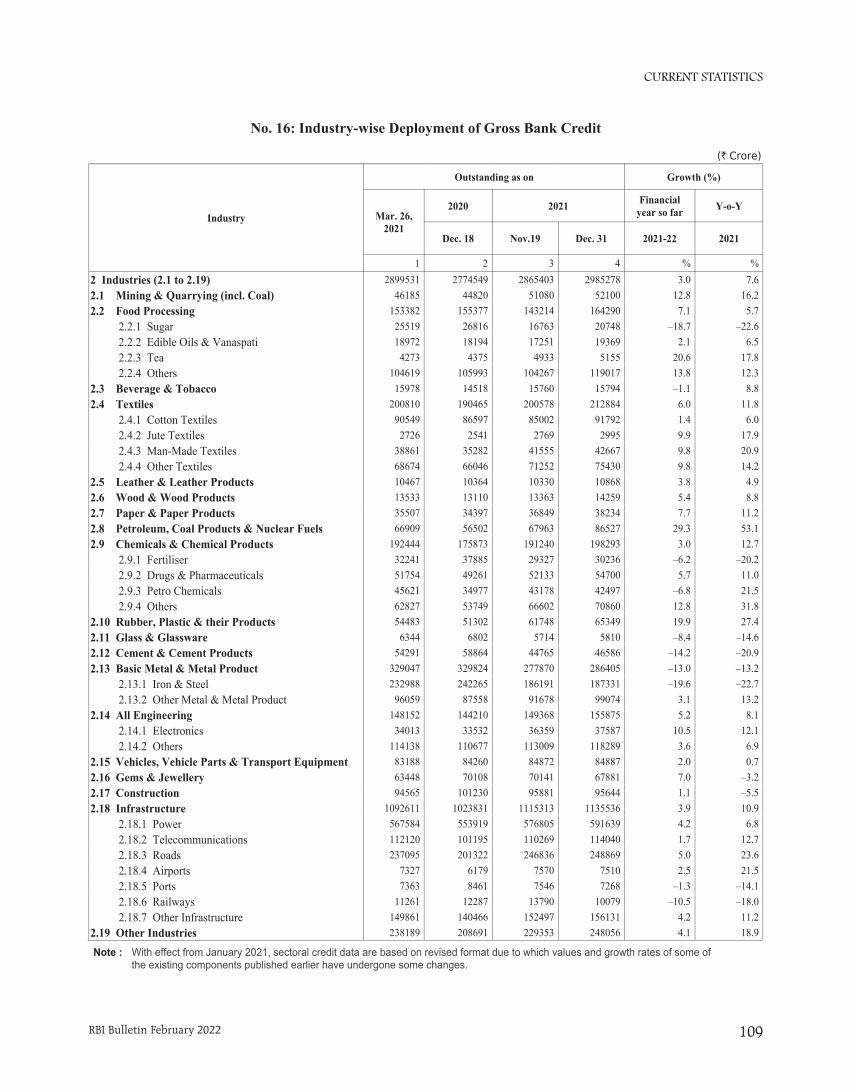
CURRENT STATISTICS
RBI Bulletin February 2022 109
No. 16: Industry-wise Deployment of Gross Bank Credit
(` Crore)
Industry
Outstanding as on Growth (%)
Mar. 26,2021
2020 2021 Financialyear so far Y-o-Y
Dec. 18 Nov.19 Dec. 31 2021-22 2021
1 2 3 4 % %2 Industries (2.1 to 2.19) 2899531 2774549 2865403 2985278 3.0 7.62.1 Mining & Quarrying (incl. Coal) 46185 44820 51080 52100 12.8 16.22.2 Food Processing 153382 155377 143214 164290 7.1 5.7 2.2.1 Sugar 25519 26816 16763 20748 –18.7 –22.6 2.2.2 Edible Oils & Vanaspati 18972 18194 17251 19369 2.1 6.5 2.2.3 Tea 4273 4375 4933 5155 20.6 17.8 2.2.4 Others 104619 105993 104267 119017 13.8 12.32.3 Beverage & Tobacco 15978 14518 15760 15794 –1.1 8.82.4 Textiles 200810 190465 200578 212884 6.0 11.8 2.4.1 Cotton Textiles 90549 86597 85002 91792 1.4 6.0 2.4.2 Jute Textiles 2726 2541 2769 2995 9.9 17.9 2.4.3 Man-Made Textiles 38861 35282 41555 42667 9.8 20.9 2.4.4 Other Textiles 68674 66046 71252 75430 9.8 14.22.5 Leather & Leather Products 10467 10364 10330 10868 3.8 4.92.6 Wood & Wood Products 13533 13110 13363 14259 5.4 8.82.7 Paper & Paper Products 35507 34397 36849 38234 7.7 11.22.8 Petroleum, Coal Products & Nuclear Fuels 66909 56502 67963 86527 29.3 53.12.9 Chemicals & Chemical Products 192444 175873 191240 198293 3.0 12.7 2.9.1 Fertiliser 32241 37885 29327 30236 –6.2 –20.2 2.9.2 Drugs & Pharmaceuticals 51754 49261 52133 54700 5.7 11.0 2.9.3 Petro Chemicals 45621 34977 43178 42497 –6.8 21.5 2.9.4 Others 62827 53749 66602 70860 12.8 31.82.10 Rubber, Plastic & their Products 54483 51302 61748 65349 19.9 27.42.11 Glass & Glassware 6344 6802 5714 5810 –8.4 –14.62.12 Cement & Cement Products 54291 58864 44765 46586 –14.2 –20.92.13 Basic Metal & Metal Product 329047 329824 277870 286405 –13.0 –13.2 2.13.1 Iron & Steel 232988 242265 186191 187331 –19.6 –22.7 2.13.2 Other Metal & Metal Product 96059 87558 91678 99074 3.1 13.22.14 All Engineering 148152 144210 149368 155875 5.2 8.1 2.14.1 Electronics 34013 33532 36359 37587 10.5 12.1 2.14.2 Others 114138 110677 113009 118289 3.6 6.92.15 Vehicles, Vehicle Parts & Transport Equipment 83188 84260 84872 84887 2.0 0.72.16 Gems & Jewellery 63448 70108 70141 67881 7.0 –3.22.17 Construction 94565 101230 95881 95644 1.1 –5.52.18 Infrastructure 1092611 1023831 1115313 1135536 3.9 10.9 2.18.1 Power 567584 553919 576805 591639 4.2 6.8 2.18.2 Telecommunications 112120 101195 110269 114040 1.7 12.7 2.18.3 Roads 237095 201322 246836 248869 5.0 23.6 2.18.4 Airports 7327 6179 7570 7510 2.5 21.5 2.18.5 Ports 7363 8461 7546 7268 –1.3 –14.1 2.18.6 Railways 11261 12287 13790 10079 –10.5 –18.0 2.18.7 Other Infrastructure 149861 140466 152497 156131 4.2 11.22.19 Other Industries 238189 208691 229353 248056 4.1 18.9
Note : With effect from January 2021, sectoral credit data are based on revised format due to which values and growth rates of some ofthe existing components published earlier have undergone some changes.
No. 16: Industry-wise Deployment of Gross Bank Credit
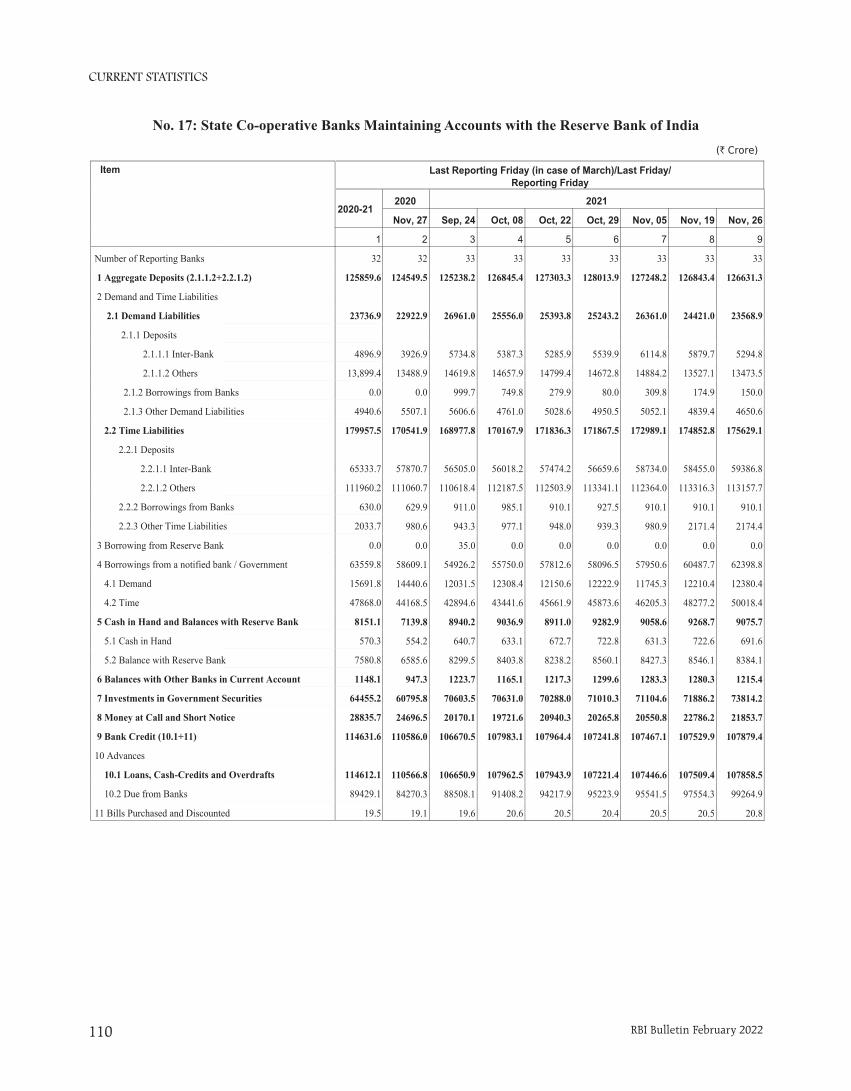
CURRENT STATISTICS
RBI Bulletin February 2022110
2020 2021
Nov, 27 Sep, 24 Oct, 08 Oct, 22 Oct, 29 Nov, 05 Nov, 19 Nov, 26
2 3 4 5 6 7 8 9
Number of Reporting Banks 32 33 33 33 33 33 33 33
1 Aggregate Deposits (2.1.1.2+2 124549.5 125238.2 126845.4 127303.3 128013.9 127248.2 126843.4 126631.3
2 Demand and Time Liabilities
2.1 Demand Liabilities 22922.9 26961.0 25556.0 25393.8 25243.2 26361.0 24421.0 23568.9
2.1.1 Deposits
2.1.1.1 Inter-Bank 3926.9 5734.8 5387.3 5285.9 5539.9 6114.8 5879.7 5294.8
2.1.1.2 Others 13488.9 14619.8 14657.9 14799.4 14672.8 14884.2 13527.1 13473.5
2.1.2 Borrowings from Banks 0.0 999.7 749.8 279.9 80.0 309.8 174.9 150.0
2.1.3 Other Demand Liabilities 5507.1 5606.6 4761.0 5028.6 4950.5 5052.1 4839.4 4650.6
2.2 Time Liabilities 170541.9 168977.8 170167.9 171836.3 171867.5 172989.1 174852.8 175629.1
2.2.1 Deposits
2.2.1.1 Inter-Bank-Bank 57870.7 56505.0 56018.2 57474.2 56659.6 58734.0 58455.0 59386.8
2.2.1.2 Others 111060.7 110618.4 112187.5 112503.9 113341.1 112364.0 113316.3 113157.7
2.2.2 Borrowings from Banks 629.9 911.0 985.1 910.1 927.5 910.1 910.1 910.1
2.2.3 Other Time Liabilities 980.6 943.3 977.1 948.0 939.3 980.9 2171.4 2174.4
3 Borrowing from Reserve Bank 0.0 35.0 0.0 0.0 0.0 0.0 0.0 0.0
4 Borrowings from a notified ban 58609.1 54926.2 55750.0 57812.6 58096.5 57950.6 60487.7 62398.8
4.1 Demand 14440.6 12031.5 12308.4 12150.6 12222.9 11745.3 12210.4 12380.4
4.2 Time 44168.5 42894.6 43441.6 45661.9 45873.6 46205.3 48277.2 50018.4
5 Cash in Hand and Balances wi 7139.8 8940.2 9036.9 8911.0 9282.9 9058.6 9268.7 9075.7
5.1 Cash in Hand 554.2 640.7 633.1 672.7 722.8 631.3 722.6 691.6
5.2 Balance with Reserve Bank 6585.6 8299.5 8403.8 8238.2 8560.1 8427.3 8546.1 8384.1
6 Balances with Other Banks in 947.3 1223.7 1165.1 1217.3 1299.6 1283.3 1280.3 1215.4
7 Investments in Government Se 60795.8 70603.5 70631.0 70288.0 71010.3 71104.6 71886.2 73814.2
8 Money at Call and Short Notic 24696.5 20170.1 19721.6 20940.3 20265.8 20550.8 22786.2 21853.7
9 Bank Credit (10.1+11) 110586.0 106670.5 107983.1 107964.4 107241.8 107467.1 107529.9 107879.4
10 Advances.
10.1 Loans, Cash-Credits and O 110566.8 106650.9 107962.5 107943.9 107221.4 107446.6 107509.4 107858.5
10.2 Due from Banks 84270.3 88508.1 91408.2 94217.9 95223.9 95541.5 97554.3 99264.9
11 Bills Purchased and Discount 19.1 19.6 20.6 20.5 20.4 20.5 20.5 20.8
Item
2020-21
1
Number of Reporting Banks 32
1 Aggregate Deposits (2.1.1.2+2.2.1.2) 125859.6
2 Demand and Time Liabilities
2.1 Demand Liabilities 23736.9
2.1.1 Deposits
2.1.1.1 Inter-Bank 4896.9
2.1.1.2 Others 13,899.4
2.1.2 Borrowings from Banks 0.0
2.1.3 Other Demand Liabilities 4940.6
2.2 Time Liabilities 179957.5
2.2.1 Deposits
2.2.1.1 Inter-Bank 65333.7
2.2.1.2 Others 111960.2
2.2.2 Borrowings from Banks 630.0
2.2.3 Other Time Liabilities 2033.7
3 Borrowing from Reserve Bank 0.0
4 Borrowings from a notified bank / Government 63559.8
4.1 Demand 15691.8
4.2 Time 47868.0
5 Cash in Hand and Balances with Reserve Bank 8151.1
5.1 Cash in Hand 570.3
5.2 Balance with Reserve Bank 7580.8
6 Balances with Other Banks in Current Account 1148.1
7 Investments in Government Securities 64455.2
8 Money at Call and Short Notice 28835.7
9 Bank Credit (10.1+11) 114631.6
10 Advances
10.1 Loans, Cash-Credits and Overdrafts 114612.1
10.2 Due from Banks 89429.1
11 Bills Purchased and Discounted 19.5
Last Reporting Friday (in case of March)/Last Friday/Reporting Friday
(` Crore)
No. 17: State Co-operative Banks Maintaining Accounts with the Reserve Bank of IndiaNo. 17: State Co-operative Banks Maintaining Accounts with the Reserve Bank of India
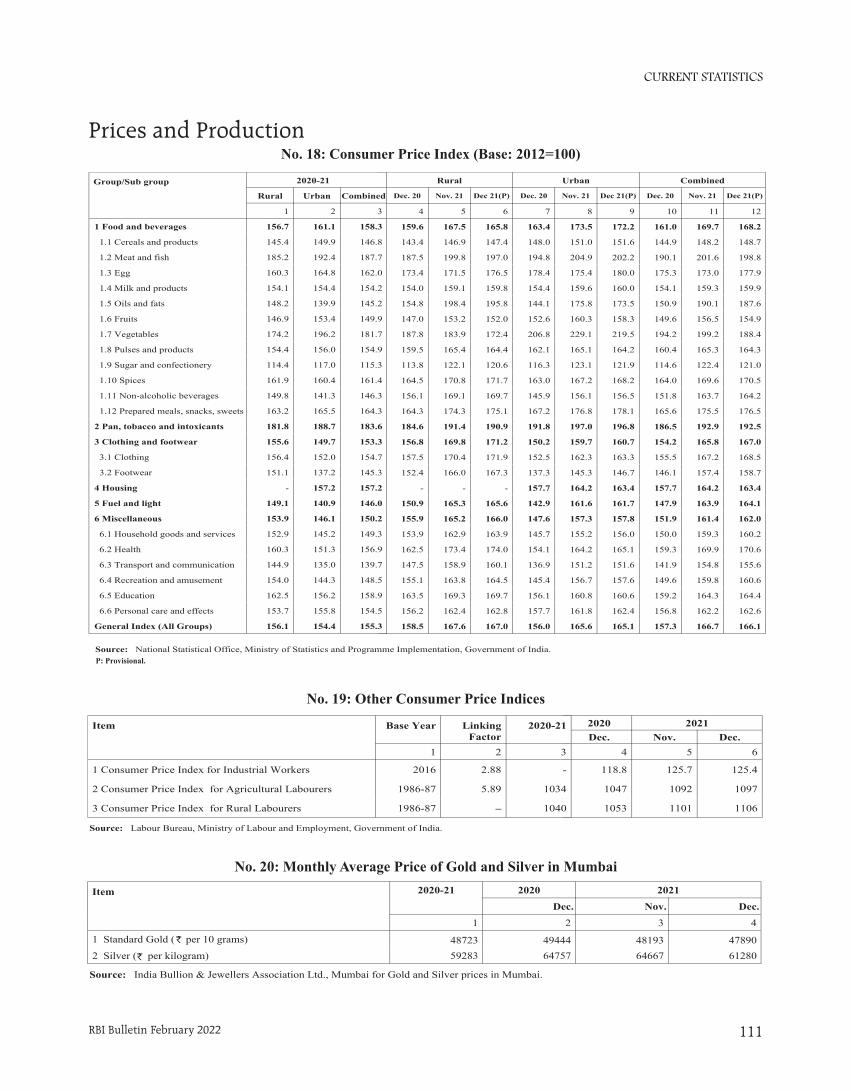
CURRENT STATISTICS
RBI Bulletin February 2022 111
No. 20: Monthly Average Price of Gold and Silver in Mumbai
Source: India Bullion & Jewellers Association Ltd., Mumbai for Gold and Silver prices in Mumbai.
Item 2020-21 2020 2021
Dec. Nov. Dec.
1 2 3 4
1 Standard Gold ( per 10 grams) 48723 49444 48193 478902 Silver ( per kilogram) 59283 64757 64667 61280
`
`
No. 19: Other Consumer Price Indices
2020 2021Dec. Nov. Dec.
4 5 6
118.8 125.7 125.4
1047 1092 1097
1053 1101 1106
Item Base Year LinkingFactor
2020-21
1 2 3
1 Consumer Price Index for Industrial Workers 2016 2.88 -
2 Consumer Price Index for Agricultural Labourers 1986-87 5.89 1034
3 Consumer Price Index for Rural Labourers 1986-87 – 1040
Source: Labour Bureau, Ministry of Labour and Employment, Government of India.
No. 19: Other Consumer Price Indices
No. 20: Monthly Average Price of Gold and Silver in Mumbai
No. 18: Consumer Price Index (Base: 2012=100)
Rural Urban Combined
Dec. 20 Nov. 21 Dec 21(P) Dec. 20 Nov. 21 Dec 21(P) Dec. 20 Nov. 21 Dec 21(P)
4 5 6 7 8 9 10 11 12
159.6 167.5 165.8 163.4 173.5 172.2 161.0 169.7 168.2
143.4 146.9 147.4 148.0 151.0 151.6 144.9 148.2 148.7
187.5 199.8 197.0 194.8 204.9 202.2 190.1 201.6 198.8
173.4 171.5 176.5 178.4 175.4 180.0 175.3 173.0 177.9
154.0 159.1 159.8 154.4 159.6 160.0 154.1 159.3 159.9
154.8 198.4 195.8 144.1 175.8 173.5 150.9 190.1 187.6
147.0 153.2 152.0 152.6 160.3 158.3 149.6 156.5 154.9
187.8 183.9 172.4 206.8 229.1 219.5 194.2 199.2 188.4
159.5 165.4 164.4 162.1 165.1 164.2 160.4 165.3 164.3
113.8 122.1 120.6 116.3 123.1 121.9 114.6 122.4 121.0
164.5 170.8 171.7 163.0 167.2 168.2 164.0 169.6 170.5
156.1 169.1 169.7 145.9 156.1 156.5 151.8 163.7 164.2
164.3 174.3 175.1 167.2 176.8 178.1 165.6 175.5 176.5
184.6 191.4 190.9 191.8 197.0 196.8 186.5 192.9 192.5
156.8 169.8 171.2 150.2 159.7 160.7 154.2 165.8 167.0
157.5 170.4 171.9 152.5 162.3 163.3 155.5 167.2 168.5
152.4 166.0 167.3 137.3 145.3 146.7 146.1 157.4 158.7
- - - 157.7 164.2 163.4 157.7 164.2 163.4
150.9 165.3 165.6 142.9 161.6 161.7 147.9 163.9 164.1
155.9 165.2 166.0 147.6 157.3 157.8 151.9 161.4 162.0
153.9 162.9 163.9 145.7 155.2 156.0 150.0 159.3 160.2
162.5 173.4 174.0 154.1 164.2 165.1 159.3 169.9 170.6
147.5 158.9 160.1 136.9 151.2 151.6 141.9 154.8 155.6
155.1 163.8 164.5 145.4 156.7 157.6 149.6 159.8 160.6
163.5 169.3 169.7 156.1 160.8 160.6 159.2 164.3 164.4
156.2 162.4 162.8 157.7 161.8 162.4 156.8 162.2 162.6
158.5 167.6 167.0 156.0 165.6 165.1 157.3 166.7 166.1
Group/Sub group 2020-21
Rural Urban Combined
1 2 3
1 Food and beverages 156.7 161.1 158.3
1.1 Cereals and products 145.4 149.9 146.8
1.2 Meat and fish 185.2 192.4 187.7
1.3 Egg 160.3 164.8 162.0
1.4 Milk and products 154.1 154.4 154.2
1.5 Oils and fats 148.2 139.9 145.2
1.6 Fruits 146.9 153.4 149.9
1.7 Vegetables 174.2 196.2 181.7
1.8 Pulses and products 154.4 156.0 154.9
1.9 Sugar and confectionery 114.4 117.0 115.3
1.10 Spices 161.9 160.4 161.4
1.11 Non-alcoholic beverages 149.8 141.3 146.3
1.12 Prepared meals, snacks, sweets 163.2 165.5 164.3
2 Pan, tobacco and intoxicants 181.8 188.7 183.6
3 Clothing and footwear 155.6 149.7 153.3
3.1 Clothing 156.4 152.0 154.7
3.2 Footwear 151.1 137.2 145.3
4 Housing - 157.2 157.2
5 Fuel and light 149.1 140.9 146.0
6 Miscellaneous 153.9 146.1 150.2
6.1 Household goods and services 152.9 145.2 149.3
6.2 Health 160.3 151.3 156.9
6.3 Transport and communication 144.9 135.0 139.7
6.4 Recreation and amusement 154.0 144.3 148.5
6.5 Education 162.5 156.2 158.9
6.6 Personal care and effects 153.7 155.8 154.5
General Index (All Groups) 156.1 154.4 155.3
Source: National Statistical Office, Ministry of Statistics and Programme Implementation, Government of India.
P: Provisional
P: Provisional.
No. 18: Consumer Price Index (Base: 2012=100)Prices and Production
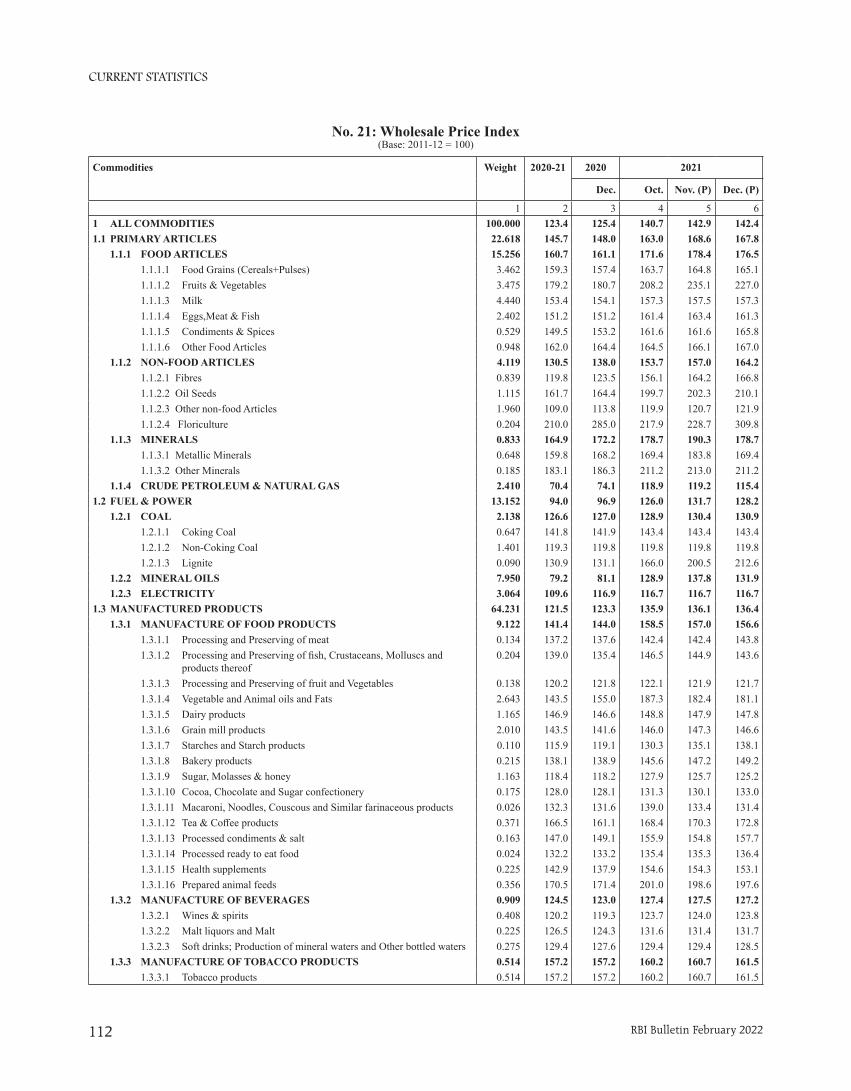
CURRENT STATISTICS
RBI Bulletin February 2022112
No. 21: Wholesale Price Index(Base: 2011-12 = 100)
Commodities Weight 2020-21 2020 2021
Dec. Oct. Nov. (P) Dec. (P)
1 2 3 4 5 61 ALL COMMODITIES 100.000 123.4 125.4 140.7 142.9 142.41.1 PRIMARY ARTICLES 22.618 145.7 148.0 163.0 168.6 167.8 1.1.1 FOOD ARTICLES 15.256 160.7 161.1 171.6 178.4 176.5 1.1.1.1 Food Grains (Cereals+Pulses) 3.462 159.3 157.4 163.7 164.8 165.1 1.1.1.2 Fruits & Vegetables 3.475 179.2 180.7 208.2 235.1 227.0 1.1.1.3 Milk 4.440 153.4 154.1 157.3 157.5 157.3 1.1.1.4 Eggs,Meat & Fish 2.402 151.2 151.2 161.4 163.4 161.3 1.1.1.5 Condiments & Spices 0.529 149.5 153.2 161.6 161.6 165.8 1.1.1.6 Other Food Articles 0.948 162.0 164.4 164.5 166.1 167.0 1.1.2 NON-FOOD ARTICLES 4.119 130.5 138.0 153.7 157.0 164.2 1.1.2.1 Fibres 0.839 119.8 123.5 156.1 164.2 166.8 1.1.2.2 Oil Seeds 1.115 161.7 164.4 199.7 202.3 210.1 1.1.2.3 Other non-food Articles 1.960 109.0 113.8 119.9 120.7 121.9 1.1.2.4 Floriculture 0.204 210.0 285.0 217.9 228.7 309.8 1.1.3 MINERALS 0.833 164.9 172.2 178.7 190.3 178.7 1.1.3.1 Metallic Minerals 0.648 159.8 168.2 169.4 183.8 169.4 1.1.3.2 Other Minerals 0.185 183.1 186.3 211.2 213.0 211.2 1.1.4 CRUDE PETROLEUM & NATURAL GAS 2.410 70.4 74.1 118.9 119.2 115.41.2 FUEL & POWER 13.152 94.0 96.9 126.0 131.7 128.2 1.2.1 COAL 2.138 126.6 127.0 128.9 130.4 130.9 1.2.1.1 Coking Coal 0.647 141.8 141.9 143.4 143.4 143.4 1.2.1.2 Non-Coking Coal 1.401 119.3 119.8 119.8 119.8 119.8 1.2.1.3 Lignite 0.090 130.9 131.1 166.0 200.5 212.6 1.2.2 MINERAL OILS 7.950 79.2 81.1 128.9 137.8 131.9 1.2.3 ELECTRICITY 3.064 109.6 116.9 116.7 116.7 116.71.3 MANUFACTURED PRODUCTS 64.231 121.5 123.3 135.9 136.1 136.4 1.3.1 MANUFACTURE OF FOOD PRODUCTS 9.122 141.4 144.0 158.5 157.0 156.6 1.3.1.1 Processing and Preserving of meat 0.134 137.2 137.6 142.4 142.4 143.8 1.3.1.2 ProcessingandPreservingoffish,Crustaceans,Molluscsand
products thereof0.204 139.0 135.4 146.5 144.9 143.6
1.3.1.3 Processing and Preserving of fruit and Vegetables 0.138 120.2 121.8 122.1 121.9 121.7 1.3.1.4 Vegetable and Animal oils and Fats 2.643 143.5 155.0 187.3 182.4 181.1 1.3.1.5 Dairy products 1.165 146.9 146.6 148.8 147.9 147.8 1.3.1.6 Grain mill products 2.010 143.5 141.6 146.0 147.3 146.6 1.3.1.7 Starches and Starch products 0.110 115.9 119.1 130.3 135.1 138.1 1.3.1.8 Bakery products 0.215 138.1 138.9 145.6 147.2 149.2 1.3.1.9 Sugar, Molasses & honey 1.163 118.4 118.2 127.9 125.7 125.2 1.3.1.10 Cocoa, Chocolate and Sugar confectionery 0.175 128.0 128.1 131.3 130.1 133.0 1.3.1.11 Macaroni, Noodles, Couscous and Similar farinaceous products 0.026 132.3 131.6 139.0 133.4 131.4 1.3.1.12 Tea&Coffeeproducts 0.371 166.5 161.1 168.4 170.3 172.8 1.3.1.13 Processed condiments & salt 0.163 147.0 149.1 155.9 154.8 157.7 1.3.1.14 Processed ready to eat food 0.024 132.2 133.2 135.4 135.3 136.4 1.3.1.15 Health supplements 0.225 142.9 137.9 154.6 154.3 153.1 1.3.1.16 Prepared animal feeds 0.356 170.5 171.4 201.0 198.6 197.6 1.3.2 MANUFACTURE OF BEVERAGES 0.909 124.5 123.0 127.4 127.5 127.2 1.3.2.1 Wines & spirits 0.408 120.2 119.3 123.7 124.0 123.8 1.3.2.2 Malt liquors and Malt 0.225 126.5 124.3 131.6 131.4 131.7 1.3.2.3 Soft drinks; Production of mineral waters and Other bottled waters 0.275 129.4 127.6 129.4 129.4 128.5 1.3.3 MANUFACTURE OF TOBACCO PRODUCTS 0.514 157.2 157.2 160.2 160.7 161.5 1.3.3.1 Tobacco products 0.514 157.2 157.2 160.2 160.7 161.5
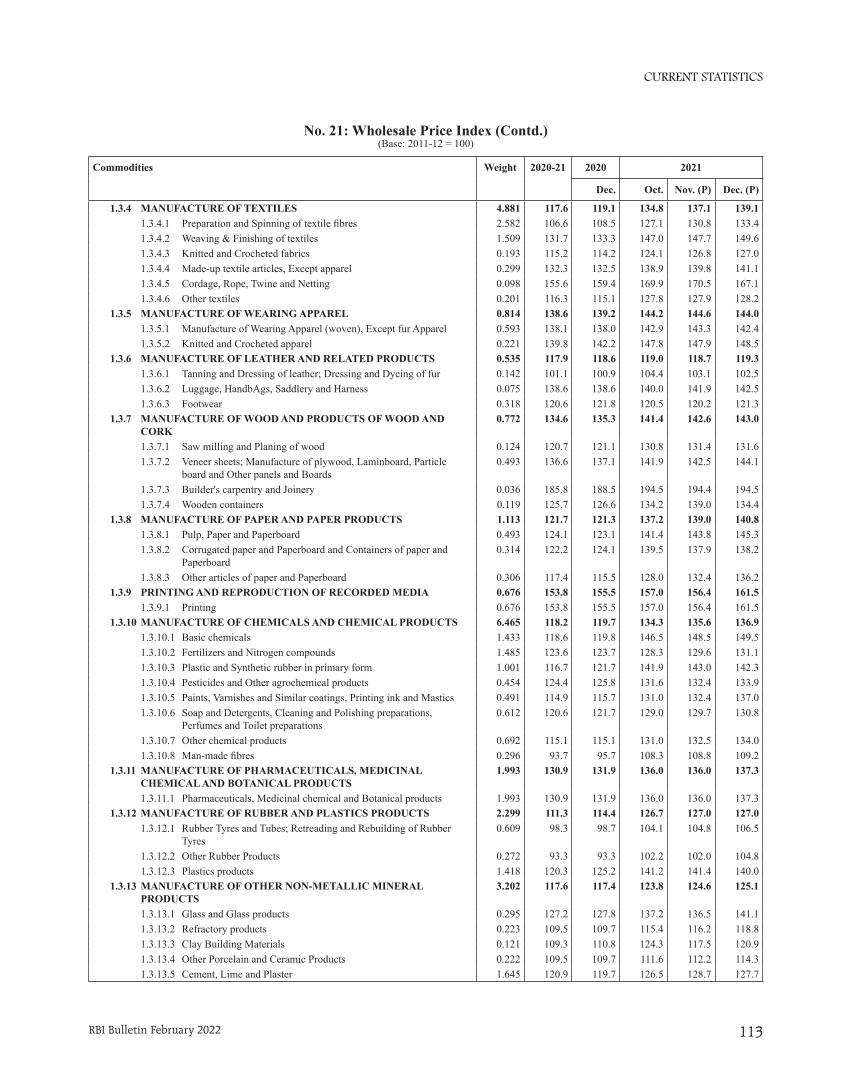
CURRENT STATISTICS
RBI Bulletin February 2022 113
No. 21: Wholesale Price Index (Contd.)(Base: 2011-12 = 100)
Commodities Weight 2020-21 2020 2021
Dec. Oct. Nov. (P) Dec. (P)
1.3.4 MANUFACTURE OF TEXTILES 4.881 117.6 119.1 134.8 137.1 139.1 1.3.4.1 PreparationandSpinningoftextilefibres 2.582 106.6 108.5 127.1 130.8 133.4 1.3.4.2 Weaving & Finishing of textiles 1.509 131.7 133.3 147.0 147.7 149.6 1.3.4.3 Knitted and Crocheted fabrics 0.193 115.2 114.2 124.1 126.8 127.0 1.3.4.4 Made-up textile articles, Except apparel 0.299 132.3 132.5 138.9 139.8 141.1 1.3.4.5 Cordage, Rope, Twine and Netting 0.098 155.6 159.4 169.9 170.5 167.1 1.3.4.6 Other textiles 0.201 116.3 115.1 127.8 127.9 128.2 1.3.5 MANUFACTURE OF WEARING APPAREL 0.814 138.6 139.2 144.2 144.6 144.0 1.3.5.1 Manufacture of Wearing Apparel (woven), Except fur Apparel 0.593 138.1 138.0 142.9 143.3 142.4 1.3.5.2 Knitted and Crocheted apparel 0.221 139.8 142.2 147.8 147.9 148.5 1.3.6 MANUFACTURE OF LEATHER AND RELATED PRODUCTS 0.535 117.9 118.6 119.0 118.7 119.3 1.3.6.1 Tanning and Dressing of leather; Dressing and Dyeing of fur 0.142 101.1 100.9 104.4 103.1 102.5 1.3.6.2 Luggage, HandbAgs, Saddlery and Harness 0.075 138.6 138.6 140.0 141.9 142.5 1.3.6.3 Footwear 0.318 120.6 121.8 120.5 120.2 121.3 1.3.7 MANUFACTURE OF WOOD AND PRODUCTS OF WOOD AND
CORK0.772 134.6 135.3 141.4 142.6 143.0
1.3.7.1 Saw milling and Planing of wood 0.124 120.7 121.1 130.8 131.4 131.6 1.3.7.2 Veneer sheets; Manufacture of plywood, Laminboard, Particle
board and Other panels and Boards0.493 136.6 137.1 141.9 142.5 144.1
1.3.7.3 Builder's carpentry and Joinery 0.036 185.8 188.5 194.5 194.4 194.5 1.3.7.4 Wooden containers 0.119 125.7 126.6 134.2 139.0 134.4 1.3.8 MANUFACTURE OF PAPER AND PAPER PRODUCTS 1.113 121.7 121.3 137.2 139.0 140.8 1.3.8.1 Pulp, Paper and Paperboard 0.493 124.1 123.1 141.4 143.8 145.3 1.3.8.2 Corrugated paper and Paperboard and Containers of paper and
Paperboard0.314 122.2 124.1 139.5 137.9 138.2
1.3.8.3 Other articles of paper and Paperboard 0.306 117.4 115.5 128.0 132.4 136.2 1.3.9 PRINTING AND REPRODUCTION OF RECORDED MEDIA 0.676 153.8 155.5 157.0 156.4 161.5 1.3.9.1 Printing 0.676 153.8 155.5 157.0 156.4 161.5 1.3.10 MANUFACTURE OF CHEMICALS AND CHEMICAL PRODUCTS 6.465 118.2 119.7 134.3 135.6 136.9 1.3.10.1 Basic chemicals 1.433 118.6 119.8 146.5 148.5 149.5 1.3.10.2 Fertilizers and Nitrogen compounds 1.485 123.6 123.7 128.3 129.6 131.1 1.3.10.3 Plastic and Synthetic rubber in primary form 1.001 116.7 121.7 141.9 143.0 142.3 1.3.10.4 Pesticides and Other agrochemical products 0.454 124.4 125.8 131.6 132.4 133.9 1.3.10.5 Paints, Varnishes and Similar coatings, Printing ink and Mastics 0.491 114.9 115.7 131.0 132.4 137.0 1.3.10.6 Soap and Detergents, Cleaning and Polishing preparations,
Perfumes and Toilet preparations0.612 120.6 121.7 129.0 129.7 130.8
1.3.10.7 Other chemical products 0.692 115.1 115.1 131.0 132.5 134.0 1.3.10.8 Man-madefibres 0.296 93.7 95.7 108.3 108.8 109.2 1.3.11 MANUFACTURE OF PHARMACEUTICALS, MEDICINAL
CHEMICAL AND BOTANICAL PRODUCTS1.993 130.9 131.9 136.0 136.0 137.3
1.3.11.1 Pharmaceuticals, Medicinal chemical and Botanical products 1.993 130.9 131.9 136.0 136.0 137.3 1.3.12 MANUFACTURE OF RUBBER AND PLASTICS PRODUCTS 2.299 111.3 114.4 126.7 127.0 127.0 1.3.12.1 Rubber Tyres and Tubes; Retreading and Rebuilding of Rubber
Tyres0.609 98.3 98.7 104.1 104.8 106.5
1.3.12.2 Other Rubber Products 0.272 93.3 93.3 102.2 102.0 104.8 1.3.12.3 Plastics products 1.418 120.3 125.2 141.2 141.4 140.0 1.3.13 MANUFACTURE OF OTHER NON-METALLIC MINERAL
PRODUCTS3.202 117.6 117.4 123.8 124.6 125.1
1.3.13.1 Glass and Glass products 0.295 127.2 127.8 137.2 136.5 141.1 1.3.13.2 Refractory products 0.223 109.5 109.7 115.4 116.2 118.8 1.3.13.3 Clay Building Materials 0.121 109.3 110.8 124.3 117.5 120.9 1.3.13.4 Other Porcelain and Ceramic Products 0.222 109.5 109.7 111.6 112.2 114.3 1.3.13.5 Cement, Lime and Plaster 1.645 120.9 119.7 126.5 128.7 127.7
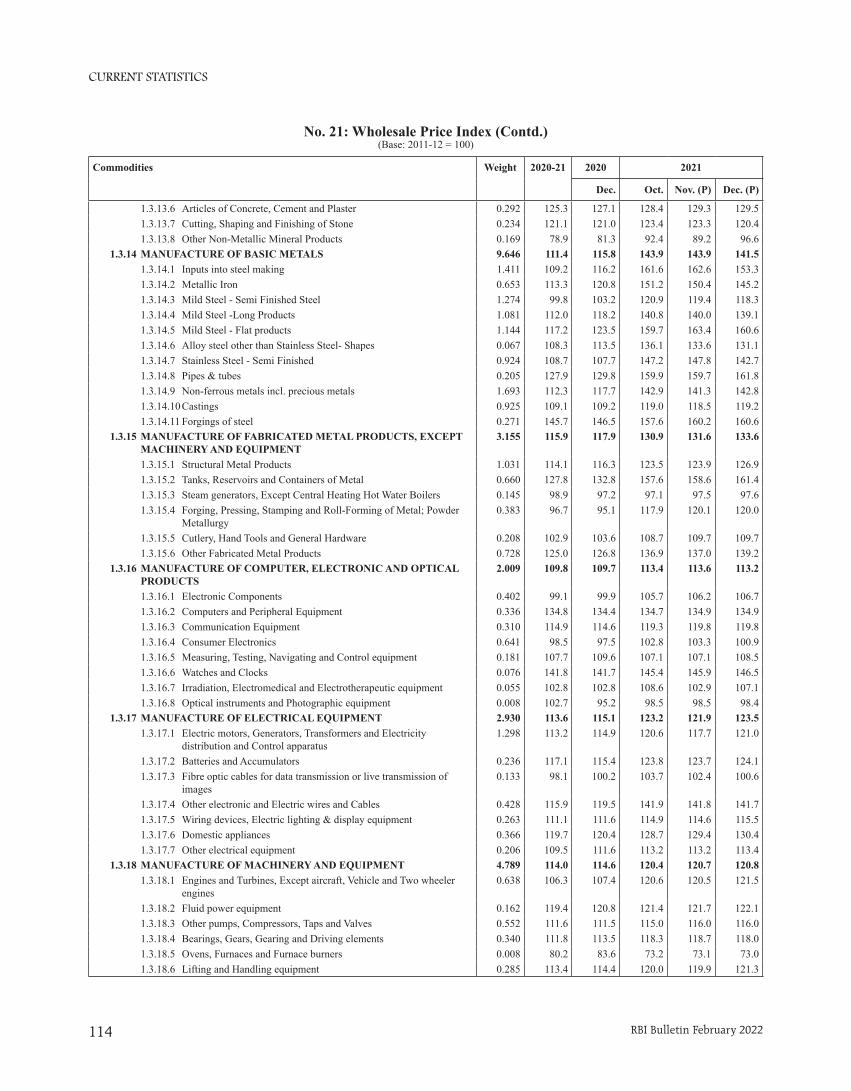
CURRENT STATISTICS
RBI Bulletin February 2022114
Commodities Weight 2020-21 2020 2021
Dec. Oct. Nov. (P) Dec. (P)
1.3.13.6 Articles of Concrete, Cement and Plaster 0.292 125.3 127.1 128.4 129.3 129.5 1.3.13.7 Cutting, Shaping and Finishing of Stone 0.234 121.1 121.0 123.4 123.3 120.4 1.3.13.8 Other Non-Metallic Mineral Products 0.169 78.9 81.3 92.4 89.2 96.6 1.3.14 MANUFACTURE OF BASIC METALS 9.646 111.4 115.8 143.9 143.9 141.5 1.3.14.1 Inputs into steel making 1.411 109.2 116.2 161.6 162.6 153.3 1.3.14.2 Metallic Iron 0.653 113.3 120.8 151.2 150.4 145.2 1.3.14.3 Mild Steel - Semi Finished Steel 1.274 99.8 103.2 120.9 119.4 118.3 1.3.14.4 Mild Steel -Long Products 1.081 112.0 118.2 140.8 140.0 139.1 1.3.14.5 Mild Steel - Flat products 1.144 117.2 123.5 159.7 163.4 160.6 1.3.14.6 Alloy steel other than Stainless Steel- Shapes 0.067 108.3 113.5 136.1 133.6 131.1 1.3.14.7 Stainless Steel - Semi Finished 0.924 108.7 107.7 147.2 147.8 142.7 1.3.14.8 Pipes & tubes 0.205 127.9 129.8 159.9 159.7 161.8 1.3.14.9 Non-ferrous metals incl. precious metals 1.693 112.3 117.7 142.9 141.3 142.8 1.3.14.10 Castings 0.925 109.1 109.2 119.0 118.5 119.2 1.3.14.11 Forgings of steel 0.271 145.7 146.5 157.6 160.2 160.6 1.3.15 MANUFACTURE OF FABRICATED METAL PRODUCTS, EXCEPT
MACHINERY AND EQUIPMENT3.155 115.9 117.9 130.9 131.6 133.6
1.3.15.1 Structural Metal Products 1.031 114.1 116.3 123.5 123.9 126.9 1.3.15.2 Tanks, Reservoirs and Containers of Metal 0.660 127.8 132.8 157.6 158.6 161.4 1.3.15.3 Steam generators, Except Central Heating Hot Water Boilers 0.145 98.9 97.2 97.1 97.5 97.6 1.3.15.4 Forging, Pressing, Stamping and Roll-Forming of Metal; Powder
Metallurgy0.383 96.7 95.1 117.9 120.1 120.0
1.3.15.5 Cutlery, Hand Tools and General Hardware 0.208 102.9 103.6 108.7 109.7 109.7 1.3.15.6 Other Fabricated Metal Products 0.728 125.0 126.8 136.9 137.0 139.2 1.3.16 MANUFACTURE OF COMPUTER, ELECTRONIC AND OPTICAL
PRODUCTS2.009 109.8 109.7 113.4 113.6 113.2
1.3.16.1 Electronic Components 0.402 99.1 99.9 105.7 106.2 106.7 1.3.16.2 Computers and Peripheral Equipment 0.336 134.8 134.4 134.7 134.9 134.9 1.3.16.3 Communication Equipment 0.310 114.9 114.6 119.3 119.8 119.8 1.3.16.4 Consumer Electronics 0.641 98.5 97.5 102.8 103.3 100.9 1.3.16.5 Measuring, Testing, Navigating and Control equipment 0.181 107.7 109.6 107.1 107.1 108.5 1.3.16.6 Watches and Clocks 0.076 141.8 141.7 145.4 145.9 146.5 1.3.16.7 Irradiation, Electromedical and Electrotherapeutic equipment 0.055 102.8 102.8 108.6 102.9 107.1 1.3.16.8 Optical instruments and Photographic equipment 0.008 102.7 95.2 98.5 98.5 98.4 1.3.17 MANUFACTURE OF ELECTRICAL EQUIPMENT 2.930 113.6 115.1 123.2 121.9 123.5 1.3.17.1 Electric motors, Generators, Transformers and Electricity
distribution and Control apparatus1.298 113.2 114.9 120.6 117.7 121.0
1.3.17.2 Batteries and Accumulators 0.236 117.1 115.4 123.8 123.7 124.1 1.3.17.3 Fibre optic cables for data transmission or live transmission of
images0.133 98.1 100.2 103.7 102.4 100.6
1.3.17.4 Other electronic and Electric wires and Cables 0.428 115.9 119.5 141.9 141.8 141.7 1.3.17.5 Wiring devices, Electric lighting & display equipment 0.263 111.1 111.6 114.9 114.6 115.5 1.3.17.6 Domestic appliances 0.366 119.7 120.4 128.7 129.4 130.4 1.3.17.7 Other electrical equipment 0.206 109.5 111.6 113.2 113.2 113.4 1.3.18 MANUFACTURE OF MACHINERY AND EQUIPMENT 4.789 114.0 114.6 120.4 120.7 120.8 1.3.18.1 Engines and Turbines, Except aircraft, Vehicle and Two wheeler
engines0.638 106.3 107.4 120.6 120.5 121.5
1.3.18.2 Fluid power equipment 0.162 119.4 120.8 121.4 121.7 122.1 1.3.18.3 Other pumps, Compressors, Taps and Valves 0.552 111.6 111.5 115.0 116.0 116.0 1.3.18.4 Bearings, Gears, Gearing and Driving elements 0.340 111.8 113.5 118.3 118.7 118.0 1.3.18.5 Ovens, Furnaces and Furnace burners 0.008 80.2 83.6 73.2 73.1 73.0 1.3.18.6 Lifting and Handling equipment 0.285 113.4 114.4 120.0 119.9 121.3
No. 21: Wholesale Price Index (Contd.)(Base: 2011-12 = 100)
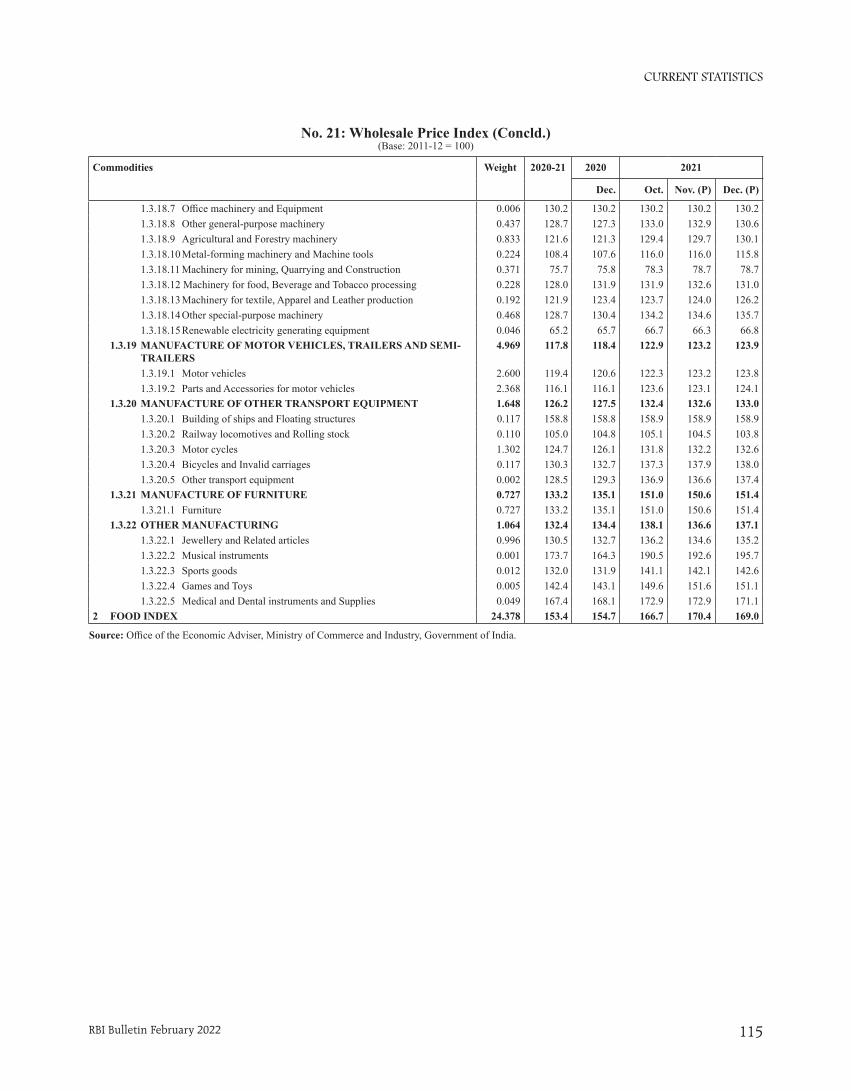
CURRENT STATISTICS
RBI Bulletin February 2022 115
No. 21: Wholesale Price Index (Concld.)(Base: 2011-12 = 100)
Commodities Weight 2020-21 2020 2021
Dec. Oct. Nov. (P) Dec. (P)
1.3.18.7 OfficemachineryandEquipment 0.006 130.2 130.2 130.2 130.2 130.2 1.3.18.8 Other general-purpose machinery 0.437 128.7 127.3 133.0 132.9 130.6 1.3.18.9 Agricultural and Forestry machinery 0.833 121.6 121.3 129.4 129.7 130.1 1.3.18.10 Metal-forming machinery and Machine tools 0.224 108.4 107.6 116.0 116.0 115.8 1.3.18.11 Machinery for mining, Quarrying and Construction 0.371 75.7 75.8 78.3 78.7 78.7 1.3.18.12 Machinery for food, Beverage and Tobacco processing 0.228 128.0 131.9 131.9 132.6 131.0 1.3.18.13 Machinery for textile, Apparel and Leather production 0.192 121.9 123.4 123.7 124.0 126.2 1.3.18.14 Other special-purpose machinery 0.468 128.7 130.4 134.2 134.6 135.7 1.3.18.15 Renewable electricity generating equipment 0.046 65.2 65.7 66.7 66.3 66.8 1.3.19 MANUFACTURE OF MOTOR VEHICLES, TRAILERS AND SEMI-
TRAILERS4.969 117.8 118.4 122.9 123.2 123.9
1.3.19.1 Motor vehicles 2.600 119.4 120.6 122.3 123.2 123.8 1.3.19.2 Parts and Accessories for motor vehicles 2.368 116.1 116.1 123.6 123.1 124.1 1.3.20 MANUFACTURE OF OTHER TRANSPORT EQUIPMENT 1.648 126.2 127.5 132.4 132.6 133.0 1.3.20.1 Building of ships and Floating structures 0.117 158.8 158.8 158.9 158.9 158.9 1.3.20.2 Railway locomotives and Rolling stock 0.110 105.0 104.8 105.1 104.5 103.8 1.3.20.3 Motor cycles 1.302 124.7 126.1 131.8 132.2 132.6 1.3.20.4 Bicycles and Invalid carriages 0.117 130.3 132.7 137.3 137.9 138.0 1.3.20.5 Other transport equipment 0.002 128.5 129.3 136.9 136.6 137.4 1.3.21 MANUFACTURE OF FURNITURE 0.727 133.2 135.1 151.0 150.6 151.4 1.3.21.1 Furniture 0.727 133.2 135.1 151.0 150.6 151.4 1.3.22 OTHER MANUFACTURING 1.064 132.4 134.4 138.1 136.6 137.1 1.3.22.1 Jewellery and Related articles 0.996 130.5 132.7 136.2 134.6 135.2 1.3.22.2 Musical instruments 0.001 173.7 164.3 190.5 192.6 195.7 1.3.22.3 Sports goods 0.012 132.0 131.9 141.1 142.1 142.6 1.3.22.4 Games and Toys 0.005 142.4 143.1 149.6 151.6 151.1 1.3.22.5 Medical and Dental instruments and Supplies 0.049 167.4 168.1 172.9 172.9 171.12 FOOD INDEX 24.378 153.4 154.7 166.7 170.4 169.0
Source: OfficeoftheEconomicAdviser,MinistryofCommerceandIndustry,GovernmentofIndia.
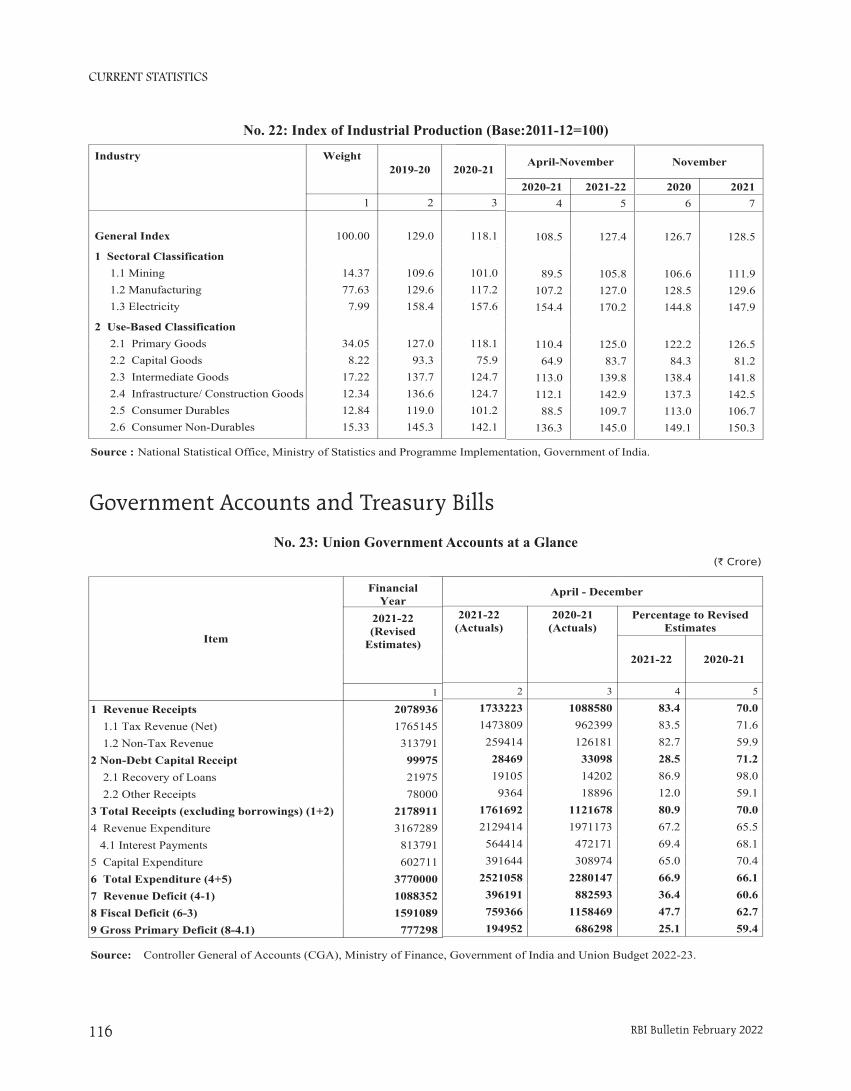
CURRENT STATISTICS
RBI Bulletin February 2022116
No. 23: Union Government Accounts at a Glance(` Crore)
Source: Controller General of Accounts (CGA), Ministry of Finance, Government of India and Union Budget 2022-23.
April - December
2021-22(Actuals)
2020-21(Actuals)
Percentage to RevisedEstimates
2021-22 2020-21
2 3 4 5
1733223 1088580 83.4 70.01473809 962399 83.5 71.6259414 126181 82.7 59.928469 33098 28.5 71.219105 14202 86.9 98.09364 18896 12.0 59.1
1761692 1121678 80.9 70.02129414 1971173 67.2 65.5564414 472171 69.4 68.1391644 308974 65.0 70.4
2521058 2280147 66.9 66.1396191 882593 36.4 60.6759366 1158469 47.7 62.7194952 686298 25.1 59.4
Item
FinancialYear
2021-22(Revised
Estimates)
1
1 Revenue Receipts 2078936 1.1 Tax Revenue (Net) 1765145 1.2 Non-Tax Revenue 3137912 Non-Debt Capital Receipt 99975 2.1 Recovery of Loans 21975 2.2 Other Receipts 780003 Total Receipts (excluding borrowings) (1+2) 21789114 Revenue Expenditure 3167289 4.1 Interest Payments 8137915 Capital Expenditure 6027116 Total Expenditure (4+5) 37700007 Revenue Deficit (4-1) 10883528 Fiscal Deficit (6-3) 15910899 Gross Primary Deficit (8-4.1) 777298
Gen Ge
Sect ElMa
Mi
Use-PriCa
Int
Inf
Co
Co
No. 22: Index of Industrial Production (Base:2011-12=100)
Industry Weight2019-20 2020-21
1 2 3General IndexGeneral Index 100.00 129.0 118.1
1 Sectoral Classification 1.1 Mining 14.37 109.6 101.0 1.2 Manufacturing 77.63 129.6 117.2 1.3 Electricity 7.99 158.4 157.6
2 Use-Based Classification 2.1 Primary Goods 34.05 127.0 118.1 2.2 Capital Goods 8.22 93.3 75.9 2.3 Intermediate Goods 17.22 137.7 124.7 2.4 Infrastructure/ Construction Goods 12.34 136.6 124.7 2.5 Consumer Durables 12.84 119.0 101.2 2.6 Consumer Non-Durables 15.33 145.3 142.1
Source : National Statistical Office, Ministry of Statistics and Programme Implementation, Government of India.
November
2020 20216 7
126.7 128.5
106.6 111.9128.5 129.6144.8 147.9
122.2 126.584.3 81.2
138.4 141.8137.3 142.5113.0 106.7149.1 150.3
April-November
2020-21 2021-224 5
108.5 127.4
89.5 105.8107.2 127.0154.4 170.2
110.4 125.064.9 83.7
113.0 139.8112.1 142.988.5 109.7
136.3 145.0
Government Accounts and Treasury Bills
No. 22: Index of Industrial Production (Base:2011-12=100)
No. 23: Union Government Accounts at a Glance
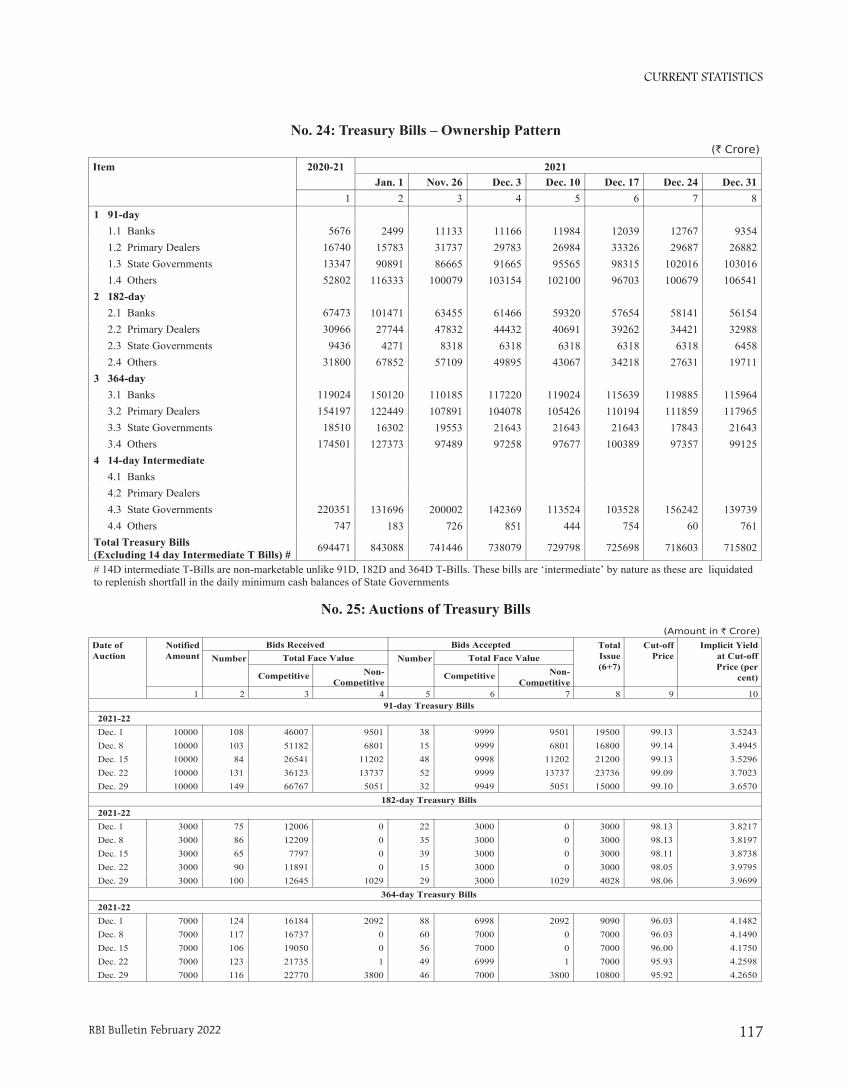
CURRENT STATISTICS
RBI Bulletin February 2022 117
(` Crore)
2021Jan. 1 Nov. 26 Dec. 3 Dec. 10 Dec. 17 Dec. 24 Dec. 31
2 3 4 5 6 7 8
2499 11133 11166 11984 12039 12767 935415783 31737 29783 26984 33326 29687 2688290891 86665 91665 95565 98315 102016 103016
116333 100079 103154 102100 96703 100679 106541
101471 63455 61466 59320 57654 58141 5615427744 47832 44432 40691 39262 34421 329884271 8318 6318 6318 6318 6318 6458
67852 57109 49895 43067 34218 27631 19711
150120 110185 117220 119024 115639 119885 115964122449 107891 104078 105426 110194 111859 11796516302 19553 21643 21643 21643 17843 21643
127373 97489 97258 97677 100389 97357 99125
131696 200002 142369 113524 103528 156242 139739183 726 851 444 754 60 761
843088 741446 738079 729798 725698 718603 715802
No. 24: Treasury Bills – Ownership Pattern
Item 2020-21
11 91-day
1.1 Banks 56761.2 Primary Dealers 167401.3 State Governments 133471.4 Others 52802
2 182-day2.1 Banks 674732.2 Primary Dealers 309662.3 State Governments 94362.4 Others 31800
3 364-day3.1 Banks 1190243.2 Primary Dealers 1541973.3 State Governments 185103.4 Others 174501
4 14-day Intermediate4.1 Banks4.2 Primary Dealers4.3 State Governments 2203514.4 Others 747
Total Treasury Bills (Excluding 14 day Intermediate T Bills) #
694471
# 14D intermediate T-Bills are non-marketable unlike 91D, 182D and 364D T-Bills. These bills are ‘intermediate’ by nature as these are liquidated to replenish shortfall in the daily minimum cash balances of State Governments
No. 25: Auctions of Treasury Bills
(Amount in ` Crore)
Date ofAuction
NotifiedAmount
Bids Received Bids Accepted TotalIssue(6+7)
Cut-offPrice
Implicit Yieldat Cut-offPrice (per
cent)
Number Total Face Value Number Total Face Value
Competitive Non-Competitive
Competitive Non-Competitive
1 2 3 4 5 6 7 8 9 1091-day Treasury Bills
2021-22 Dec. 1 10000 108 46007 9501 38 9999 9501 19500 99.13 3.5243Dec. 8 10000 103 51182 6801 15 9999 6801 16800 99.14 3.4945Dec. 15 10000 84 26541 11202 48 9998 11202 21200 99.13 3.5296Dec. 22 10000 131 36123 13737 52 9999 13737 23736 99.09 3.7023Dec. 29 10000 149 66767 5051 32 9949 5051 15000 99.10 3.6570
182-day Treasury Bills2021-22 Dec. 1 3000 75 12006 0 22 3000 0 3000 98.13 3.8217Dec. 8 3000 86 12209 0 35 3000 0 3000 98.13 3.8197Dec. 15 3000 65 7797 0 39 3000 0 3000 98.11 3.8738Dec. 22 3000 90 11891 0 15 3000 0 3000 98.05 3.9795Dec. 29 3000 100 12645 1029 29 3000 1029 4028 98.06 3.9699
364-day Treasury Bills2021-22 Dec. 1 7000 124 16184 2092 88 6998 2092 9090 96.03 4.1482Dec. 8 7000 117 16737 0 60 7000 0 7000 96.03 4.1490Dec. 15 7000 106 19050 0 56 7000 0 7000 96.00 4.1750Dec. 22 7000 123 21735 1 49 6999 1 7000 95.93 4.2598Dec. 29 7000 116 22770 3800 46 7000 3800 10800 95.92 4.2650
No. 24: Treasury Bills – Ownership Pattern
No. 25: Auctions of Treasury Bills
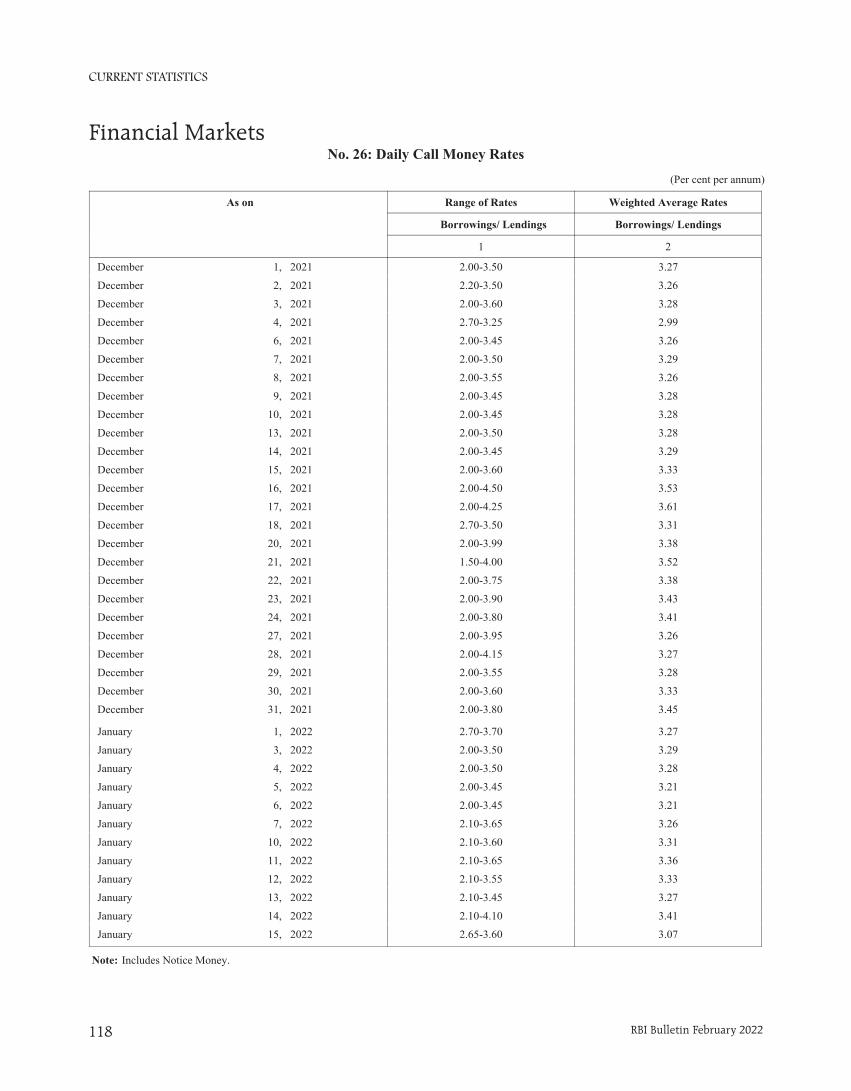
CURRENT STATISTICS
RBI Bulletin February 2022118
No. 26: Daily Call Money Rates
As on Range of Rates Weighted Average Rates
1 Borrowings/ Lendings Borrowings/ Lendings
1 2
December 1, 2021 2.00-3.50 3.27
December 2, 2021 2.20-3.50 3.26
December 3, 2021 2.00-3.60 3.28
December 4, 2021 2.70-3.25 2.99
December 6, 2021 2.00-3.45 3.26
December 7, 2021 2.00-3.50 3.29
December 8, 2021 2.00-3.55 3.26
December 9, 2021 2.00-3.45 3.28
December 10, 2021 2.00-3.45 3.28
December 13, 2021 2.00-3.50 3.28
December 14, 2021 2.00-3.45 3.29
December 15, 2021 2.00-3.60 3.33
December 16, 2021 2.00-4.50 3.53
December 17, 2021 2.00-4.25 3.61
December 18, 2021 2.70-3.50 3.31
December 20, 2021 2.00-3.99 3.38
December 21, 2021 1.50-4.00 3.52
December 22, 2021 2.00-3.75 3.38
December 23, 2021 2.00-3.90 3.43
December 24, 2021 2.00-3.80 3.41
December 27, 2021 2.00-3.95 3.26
December 28, 2021 2.00-4.15 3.27
December 29, 2021 2.00-3.55 3.28
December 30, 2021 2.00-3.60 3.33
December 31, 2021 2.00-3.80 3.45
January 1, 2022 2.70-3.70 3.27
January 3, 2022 2.00-3.50 3.29
January 4, 2022 2.00-3.50 3.28
January 5, 2022 2.00-3.45 3.21
January 6, 2022 2.00-3.45 3.21
January 7, 2022 2.10-3.65 3.26
January 10, 2022 2.10-3.60 3.31
January 11, 2022 2.10-3.65 3.36
January 12, 2022 2.10-3.55 3.33
January 13, 2022 2.10-3.45 3.27
January 14, 2022 2.10-4.10 3.41
January 15, 2022 2.65-3.60 3.07
(Per cent per annum)
Note: Includes Notice Money.
Financial MarketsNo. 26: Daily Call Money Rates
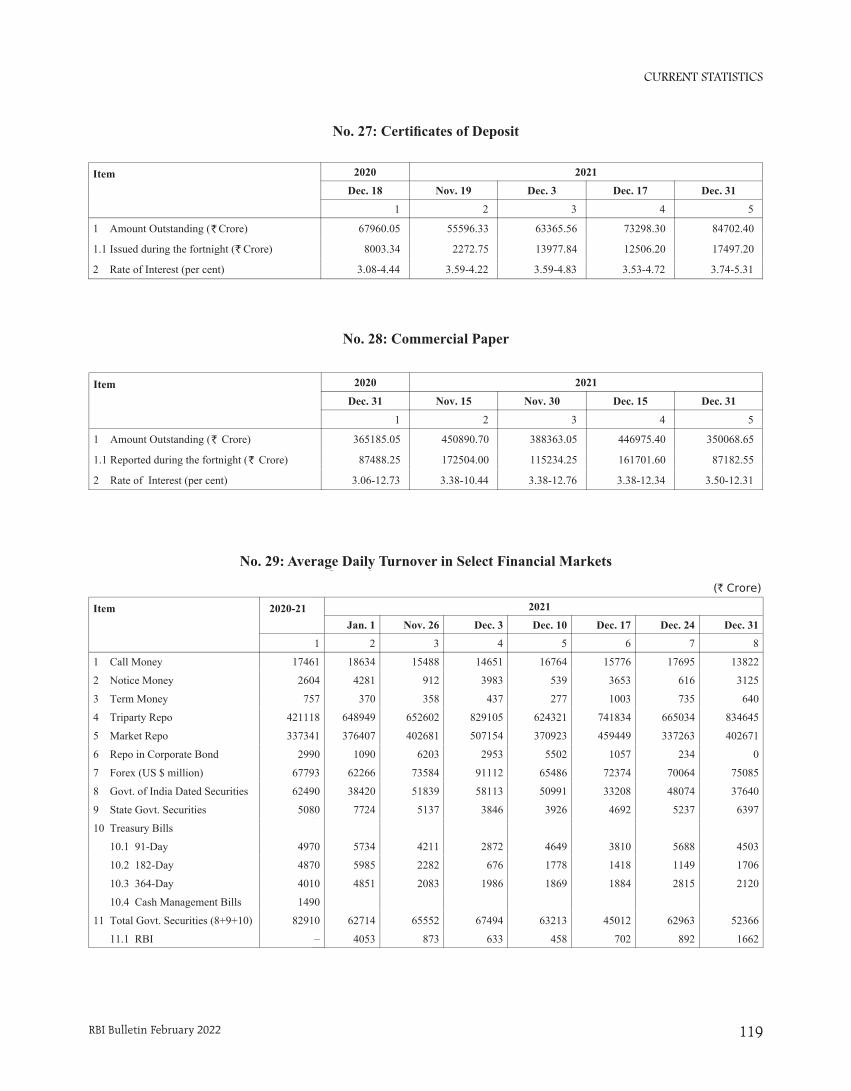
CURRENT STATISTICS
RBI Bulletin February 2022 119
(` Crore)
2021
Jan. 1 Nov. 26 Dec. 3 Dec. 10 Dec. 17 Dec. 24 Dec. 31
2 3 4 5 6 7 8
18634 15488 14651 16764 15776 17695 13822
4281 912 3983 539 3653 616 3125
370 358 437 277 1003 735 640
648949 652602 829105 624321 741834 665034 834645
376407 402681 507154 370923 459449 337263 402671
1090 6203 2953 5502 1057 234 0
62266 73584 91112 65486 72374 70064 75085
38420 51839 58113 50991 33208 48074 37640
7724 5137 3846 3926 4692 5237 6397
5734 4211 2872 4649 3810 5688 4503
5985 2282 676 1778 1418 1149 1706
4851 2083 1986 1869 1884 2815 2120
62714 65552 67494 63213 45012 62963 52366
4053 873 633 458 702 892 1662
No. 29: Average Daily Turnover in Select Financial Markets
Item 2020-21
1
1 Call Money 17461
2 Notice Money 2604
3 Term Money 757
4 Triparty Repo 421118
5 Market Repo 337341
6 Repo in Corporate Bond 2990
7 Forex (US $ million) 67793
8 Govt. of India Dated Securities 62490
9 State Govt. Securities 5080
10 Treasury Bills
10.1 91-Day 4970
10.2 182-Day 4870
10.3 364-Day 4010
10.4 Cash Management Bills 1490
11 Total Govt. Securities (8+9+10) 82910
11.1 RBI –
No. 27: Certificates of Deposit
Item 2020 2021
Dec. 18 Nov. 19 Dec. 3 Dec. 17 Dec. 31
1 2 3 4 5
1 Amount Outstanding ( Crore) 67960.05 55596.33 63365.56 73298.30 84702.40
1.1 Issued during the fortnight ( Crore) 8003.34 2272.75 13977.84 12506.20 17497.20
2 Rate of Interest (per cent) 3.08-4.44 3.59-4.22 3.59-4.83 3.53-4.72 3.74-5.31
`
`
No. 28: Commercial Paper
Item 2020 2021
Dec. 31 Nov. 15 Nov. 30 Dec. 15 Dec. 31
1 2 3 4 5
1 Amount Outstanding ( Crore) 365185.05 450890.70 388363.05 446975.40 350068.65
1.1 Reported during the fortnight ( Crore) 87488.25 172504.00 115234.25 161701.60 87182.55
2 Rate of Interest (per cent) 3.06-12.73 3.38-10.44 3.38-12.76 3.38-12.34 3.50-12.31
`
`
No. 27: Certificates of Deposit
No. 28: Commercial Paper
No. 29: Average Daily Turnover in Select Financial Markets
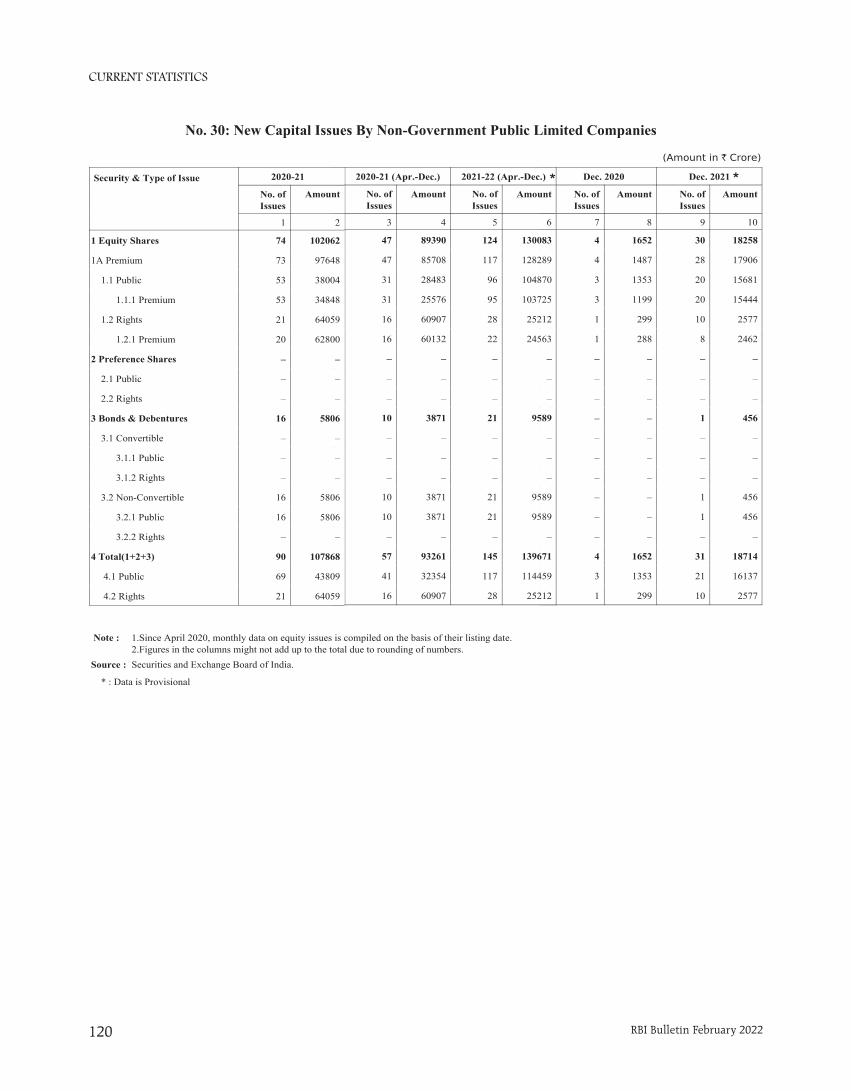
CURRENT STATISTICS
RBI Bulletin February 2022120
Dec. 2020 Dec. 2021
No. ofIssues
Amount No. ofIssues
Amount
7 8 9 10
1 4 1652 30 18258
1 4 1487 28 17906
1 3 1353 20 15681
1 3 1199 20 15444
1 1 299 10 2577
1 1 288 8 2462
2 – – – –
2 – – – –
2 – – – –
3 – – 1 456
3 – – – –
3 – – – –
3 – – – –
3 – – 1 456
3 – – 1 456
3 – – – –
5 4 1652 31 18714
5 3 1353 21 16137
5 1 299 10 2577
2020-21 (Apr.-Dec.) 2021-22 (Apr.-Dec.)
No. ofIssues
Amount No. ofIssues
Amount
3 4 5 6
1 47 89390 124 130083
1 47 85708 117 128289
1 31 28483 96 104870
1 31 25576 95 103725
1 16 60907 28 25212
1 16 60132 22 24563
2 – – – –
2 – – – –
2 – – – –
3 10 3871 21 9589
3 – – – –
3 – – – –
3 – – – –
3 10 3871 21 9589
3 10 3871 21 9589
3 – – – –
5 57 93261 145 139671
5 41 32354 117 114459
5 16 60907 28 25212
No. 30: New Capital Issues By Non-Government Public Limited Companies
Security & Type of Issue 2020-21
No. ofIssues
Amount
1 2
1 Equity Shares 74 102062
1A Premium 73 97648
1.1 Public 53 38004
1.1.1 Premium 53 34848
1.2 Rights 21 64059
1.2.1 Premium 20 62800
2 Preference Shares – –
2.1 Public – –
2.2 Rights – –
3 Bonds & Debentures 16 5806
3.1 Convertible – –
3.1.1 Public – –
3.1.2 Rights – –
3.2 Non-Convertible 16 5806
3.2.1 Public 16 5806
3.2.2 Rights – –
4 Total(1+2+3) 90 107868
4.1 Public 69 43809
4.2 Rights 21 64059
(Amount in ` Crore)
Note : 1.Since April 2020, monthly data on equity issues is compiled on the basis of their listing date.2.Figures in the columns might not add up to the total due to rounding of numbers.
Source : Securities and Exchange Board of India.
* *
* : Data is Provisional
No. 30: New Capital Issues By Non-Government Public Limited Companies
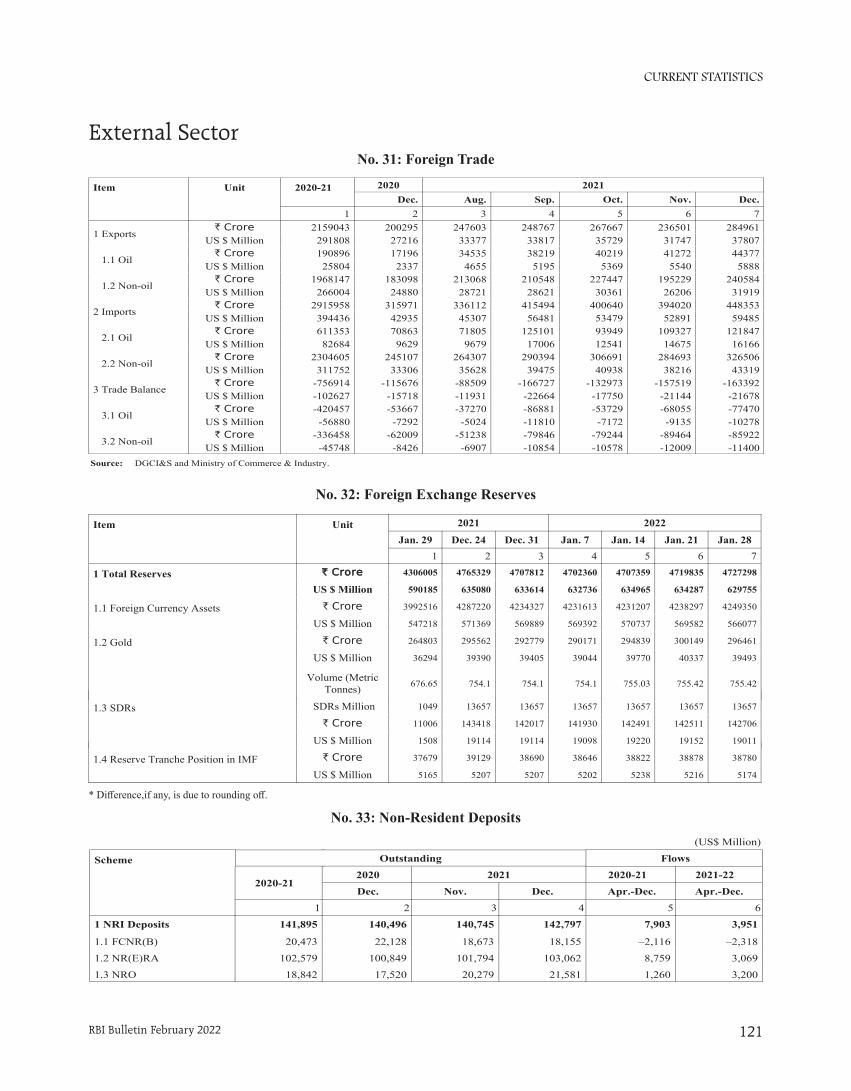
CURRENT STATISTICS
RBI Bulletin February 2022 121
No. 31: Foreign Trade
Item Unit 2020-21 2020 2021Dec. Aug. Sep. Oct. Nov. Dec.
1 2 3 4 5 6 7
1 Exports` Crore 2159043 200295 247603 248767 267667 236501 284961
US $ Million 291808 27216 33377 33817 35729 31747 37807
1.1 Oil` Crore 190896 17196 34535 38219 40219 41272 44377
US $ Million 25804 2337 4655 5195 5369 5540 5888
1.2 Non-oil` Crore 1968147 183098 213068 210548 227447 195229 240584
US $ Million 266004 24880 28721 28621 30361 26206 31919
2 Imports` Crore 2915958 315971 336112 415494 400640 394020 448353
US $ Million 394436 42935 45307 56481 53479 52891 59485
2.1 Oil` Crore 611353 70863 71805 125101 93949 109327 121847
US $ Million 82684 9629 9679 17006 12541 14675 16166
2.2 Non-oil` Crore 2304605 245107 264307 290394 306691 284693 326506
US $ Million 311752 33306 35628 39475 40938 38216 43319
3 Trade Balance` Crore -756914 -115676 -88509 -166727 -132973 -157519 -163392
US $ Million -102627 -15718 -11931 -22664 -17750 -21144 -21678
3.1 Oil` Crore -420457 -53667 -37270 -86881 -53729 -68055 -77470
US $ Million -56880 -7292 -5024 -11810 -7172 -9135 -10278
3.2 Non-oil` Crore -336458 -62009 -51238 -79846 -79244 -89464 -85922
US $ Million -45748 -8426 -6907 -10854 -10578 -12009 -11400Source: DGCI&S and Ministry of Commerce & Industry.
No. 33: Non-Resident Deposits
(US$ Million)
Flows
2020-21 2021-22
Apr.-Dec. Apr.-Dec.
5 6
7,903 3,951
–2,116 –2,318
8,759 3,069
1,260 3,200
2020 2021
Dec. Nov. Dec.
2 3 4
140,496 140,745 142,797
22,128 18,673 18,155
100,849 101,794 103,062
17,520 20,279 21,581
Scheme
2020-21
1
1 NRI Deposits 141,895
1.1 FCNR(B) 20,473
1.2 NR(E)RA 102,579
1.3 NRO 18,842
Outstanding
External SectorNo. 31: Foreign Trade
1.4 Reserve Tranche Position in IMF ` Crore 37679 39129 38690 38646 38822 38878 38780
US $ Million 5165 5207 5207 5202 5238 5216 5174
1.3 SDRs SDRs Million 1049 13657 13657 13657 13657 13657 13657
` Crore 11006 143418 142017 141930 142491 142511 142706
US $ Million 1508 19114 19114 19098 19220 19152 19011
No. 32: Foreign Exchange Reserves
Item Unit 2021 2022
Jan. 29 Dec. 24 Dec. 31 Jan. 7 Jan. 14 Jan. 21 Jan. 28
1 2 3 4 5 6 7
1 Total Reserves `̀ CCrroorree 4306005 4765329 4707812 4702360 4707359 4719835 4727298
US $ Million 590185 635080 633614 632736 634965 634287 629755
1.1 Foreign Currency Assets ` Crore 3992516 4287220 4234327 4231613 4231207 4238297 4249350
US $ Million 547218 571369 569889 569392 570737 569582 566077
1.2 Gold ` Crore 264803 295562 292779 290171 294839 300149 296461
US $ Million 36294 39390 39405 39044 39770 40337 39493
Volume (MetricTonnes) 676.65 754.1 754.1 754.1 755.03 755.42 755.42
* Difference, if any, is due to rounding off.
No. 32: Foreign Exchange Reserves
*Difference,ifany,isduetoroundingoff.
No. 33: Non-Resident Deposits
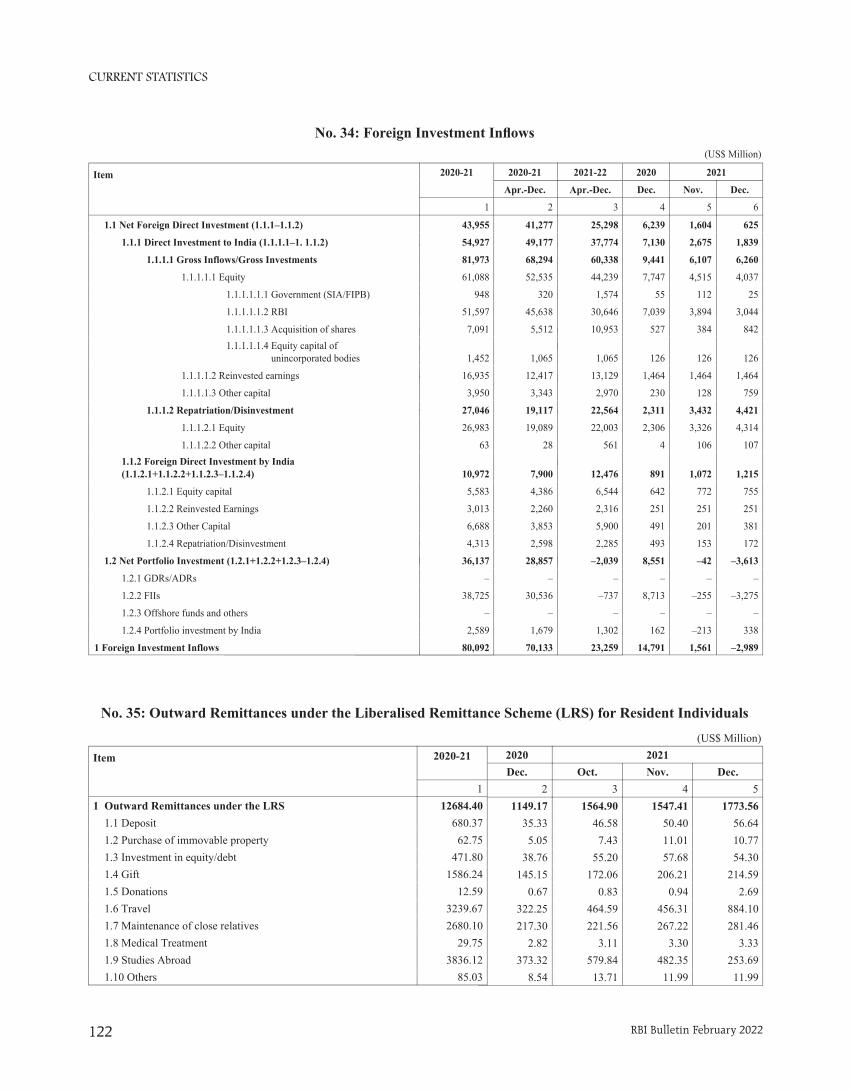
CURRENT STATISTICS
RBI Bulletin February 2022122
No. 34: Foreign Investment Inflows(US$ Million)
2020 2021
Dec. Nov. Dec.
4 5 6
1.1 Net Foreign Direct Investment (1.1.1–1.1.2) 6,239 1,604 625
1.1.1 Direct Investment to India (1.1.1.1–1. 1.1.2) 7,130 2,675 1,839
1.1.1.1 Gross Inflows/Gross Investments 9,441 6,107 6,260
1.1.1.1.1 Equity 7,747 4,515 4,037
1.1.1.1.1.1 Government (SIA/FI 55 112 25
1.1.1.1.1.2 RBI 7,039 3,894 3,044
1.1.1.1.1.3 Acquisition of shares 527 384 842 1.1.1.1.1.4 Equity capital of unincorporated bodie 126 126 126
1.1.1.1.2 Reinvested earnings 1,464 1,464 1,464
1.1.1.1.3 Other capital 230 128 759
1.1.1.2 Repatriation/Disinvestment 2,311 3,432 4,421
1.1.1.2.1 Equity 2,306 3,326 4,314
1.1.1.2.2 Other capital 4 106 107 1.1.2 Foreign Direct Investment by India (1.1.2.1+1.1.2.2+1.1.2.3–1.1.2.4) 891 1,072 1,215
1.1.2.1 Equity capital 642 772 755
1.1.2.2 Reinvested Earnings 251 251 251
1.1.2.3 Other Capital 491 201 381
1.1.2.4 Repatriation/Disinvestment 493 153 172
1.2 Net Portfolio Investment (1.2.1+1.2.2+1.2.3–1.2.4) 8,551 –42 –3,613
1.2.1 GDRs/ADRs – – –
1.2.2 FIIs 8,713 –255 –3,275
1.2.3 Offshore funds and others – – –
1.2.4 Portfolio investment by India 162 –213 338
1 Foreign Investment Inflows 14,791 1,561 –2,989
2020-21 2021-22
Apr.-Dec. Apr.-Dec.
2 3
1.1 Net Foreign Direct Investment (1.1.1–1.1.2) 41,277 25,298
1.1.1 Direct Investment to India (1.1.1.1–1. 1.1.2) 49,177 37,774
1.1.1.1 Gross Inflows/Gross Investments 68,294 60,338
1.1.1.1.1 Equity 52,535 44,239
1.1.1.1.1.1 Government (SIA/FI 320 1,574
1.1.1.1.1.2 RBI 45,638 30,646
1.1.1.1.1.3 Acquisition of shares 5,512 10,953 1.1.1.1.1.4 Equity capital of unincorporated bodie 1,065 1,065
1.1.1.1.2 Reinvested earnings 12,417 13,129
1.1.1.1.3 Other capital 3,343 2,970
1.1.1.2 Repatriation/Disinvestment 19,117 22,564
1.1.1.2.1 Equity 19,089 22,003
1.1.1.2.2 Other capital 28 561 1.1.2 Foreign Direct Investment by India (1.1.2.1+1.1.2.2+1.1.2.3–1.1.2.4) 7,900 12,476
1.1.2.1 Equity capital 4,386 6,544
1.1.2.2 Reinvested Earnings 2,260 2,316
1.1.2.3 Other Capital 3,853 5,900
1.1.2.4 Repatriation/Disinvestment 2,598 2,285
1.2 Net Portfolio Investment (1.2.1+1.2.2+1.2.3–1.2.4) 28,857 –2,039
1.2.1 GDRs/ADRs – –
1.2.2 FIIs 30,536 –737
1.2.3 Offshore funds and others – –
1.2.4 Portfolio investment by India 1,679 1,302
1 Foreign Investment Inflows 70,133 23,259
Item 2020-21
1
1.1 Net Foreign Direct Investment (1.1.1–1.1.2) 43,955
1.1.1 Direct Investment to India (1.1.1.1–1. 1.1.2) 54,927
1.1.1.1 Gross Inflows/Gross Investments 81,973
1.1.1.1.1 Equity 61,088
1.1.1.1.1.1 Government (SIA/FIPB) 948
1.1.1.1.1.2 RBI 51,597
1.1.1.1.1.3 Acquisition of shares 7,091 1.1.1.1.1.4 Equity capital of unincorporated bodies 1,452
1.1.1.1.2 Reinvested earnings 16,935
1.1.1.1.3 Other capital 3,950
1.1.1.2 Repatriation/Disinvestment 27,046
1.1.1.2.1 Equity 26,983
1.1.1.2.2 Other capital 63 1.1.2 Foreign Direct Investment by India (1.1.2.1+1.1.2.2+1.1.2.3–1.1.2.4) 10,972
1.1.2.1 Equity capital 5,583
1.1.2.2 Reinvested Earnings 3,013
1.1.2.3 Other Capital 6,688
1.1.2.4 Repatriation/Disinvestment 4,313
1.2 Net Portfolio Investment (1.2.1+1.2.2+1.2.3–1.2.4) 36,137
1.2.1 GDRs/ADRs –
1.2.2 FIIs 38,725
1.2.3 Offshore funds and others –
1.2.4 Portfolio investment by India 2,589
1 Foreign Investment Inflows 80,092
No. 35: Outward Remittances under the Liberalised Remittance Scheme (LRS) for Resident Individuals
(US$ Million)2020 2021Dec. Oct. Nov. Dec.
2 3 4 51149.17 1564.90 1547.41 1773.56
35.33 46.58 50.40 56.645.05 7.43 11.01 10.77
38.76 55.20 57.68 54.30145.15 172.06 206.21 214.59
0.67 0.83 0.94 2.69322.25 464.59 456.31 884.10217.30 221.56 267.22 281.46
2.82 3.11 3.30 3.33373.32 579.84 482.35 253.69
8.54 13.71 11.99 11.99
Item 2020-21
11 Outward Remittances under the LRS 12684.40 1.1 Deposit 680.37 1.2 Purchase of immovable property 62.75 1.3 Investment in equity/debt 471.80 1.4 Gift 1586.24 1.5 Donations 12.59 1.6 Travel 3239.67 1.7 Maintenance of close relatives 2680.10 1.8 Medical Treatment 29.75 1.9 Studies Abroad 3836.12 1.10 Others 85.03
No. 34: Foreign Investment Inflows
No. 35: Outward Remittances under the Liberalised Remittance Scheme (LRS) for Resident Individuals
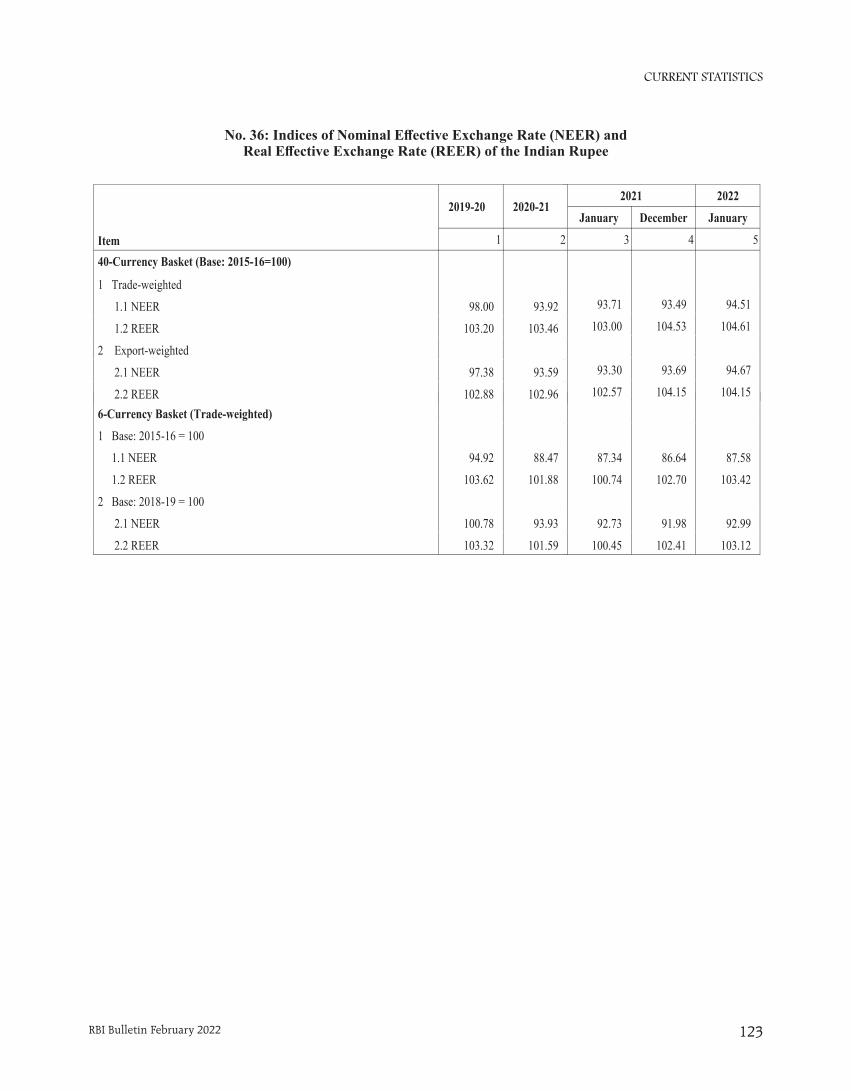
CURRENT STATISTICS
RBI Bulletin February 2022 123
No. 36: Indices of Nominal Effective Exchange Rate (NEER) and Real Effective Exchange Rate (REER) of the Indian Rupee
87.34 86.64 87.58
100.74 102.70 103.42
92.73 91.98 92.99
100.45 102.41 103.12
2021 2022
January December January
3 4 5
93.71 93.49 94.51
103.00 104.53 104.61
93.30 93.69 94.67
102.57 104.15 104.152019-20 2020-21 6-Currency Basket (Trade-weighted)
1 Base: 2015-16 = 100
1.1 NEER 94.92 88.47
1.2 REER 103.62 101.88
2 Base: 2018-19 = 100
2.1 NEER 100.78 93.93
2.2 REER 103.32 101.59
Item
2019-20 2020-21
1 2
40-Currency Basket (Base: 2015-16=100)
1 Trade-weighted
1.1 NEER 98.00 93.92
1.2 REER 103.20 103.46
2 Export-weighted
2.1 NEER 97.38 93.59
2.2 REER 102.88 102.96
No. 36: Indices of Nominal Effective Exchange Rate (NEER) and Real Effective Exchange Rate (REER) of the Indian Rupee
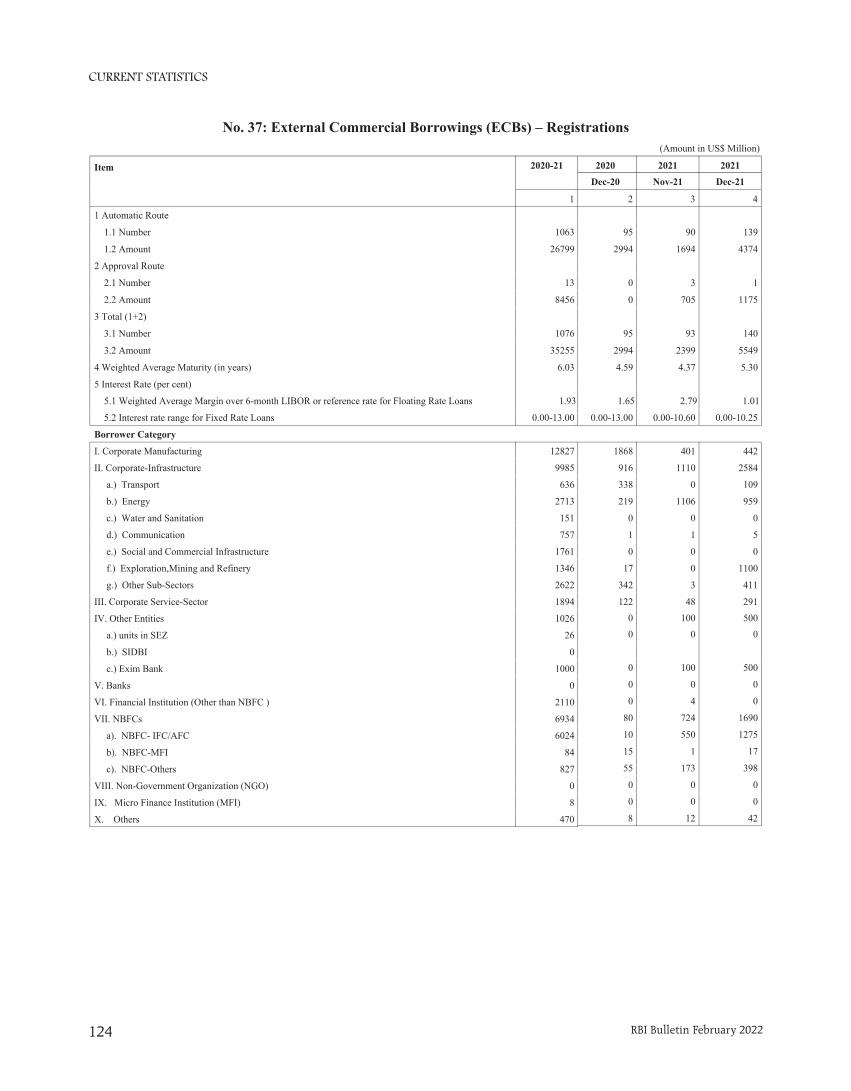
CURRENT STATISTICS
RBI Bulletin February 2022124
(Amount in US$ Million)
2020 2021 2021
Dec-20 Nov-21 Dec-21
2 3 4
95 90 139
2994 1694 4374
0 3 1
0 705 1175
95 93 140
2994 2399 5549
4.59 4.37 5.30
1.65 2.79 1.01
0.00-13.00 0.00-10.60 0.00-10.25
1868 401 442
916 1110 2584
338 0 109
219 1106 959
0 0 0
1 1 5
0 0 0
17 0 1100
342 3 411
122 48 291
0 100 500
0 0 0
0 100 500
0 0 0
0 4 0
80 724 1690
10 550 1275
15 1 17
55 173 398
0 0 0
0 0 0
8 12 42
No. 37: External Commercial Borrowings (ECBs) – Registrations
Item 2020-21
1
1 Automatic Route
1.1 Number 1063
1.2 Amount 26799
2 Approval Route
2.1 Number 13
2.2 Amount 8456
3 Total (1+2)
3.1 Number 1076
3.2 Amount 35255
4 Weighted Average Maturity (in years) 6.03
5 Interest Rate (per cent)
5.1 Weighted Average Margin over 6-month LIBOR or reference rate for Floating Rate Loans 1.93
5.2 Interest rate range for Fixed Rate Loans 0.00-13.00
Borrower Category
I. Corporate Manufacturing 12827
II. Corporate-Infrastructure 9985
a.) Transport 636
b.) Energy 2713
c.) Water and Sanitation 151
d.) Communication 757
e.) Social and Commercial Infrastructure 1761
f.) Exploration,Mining and Refinery 1346
g.) Other Sub-Sectors 2622
III. Corporate Service-Sector 1894
IV. Other Entities 1026
a.) units in SEZ 26
b.) SIDBI 0
c.) Exim Bank 1000
V. Banks 0
VI. Financial Institution (Other than NBFC ) 2110
VII. NBFCs 6934
a). NBFC- IFC/AFC 6024
b). NBFC-MFI 84
c). NBFC-Others 827
VIII. Non-Government Organization (NGO) 0
IX. Micro Finance Institution (MFI) 8
X. Others 470
No. 37: External Commercial Borrowings (ECBs) – Registrations
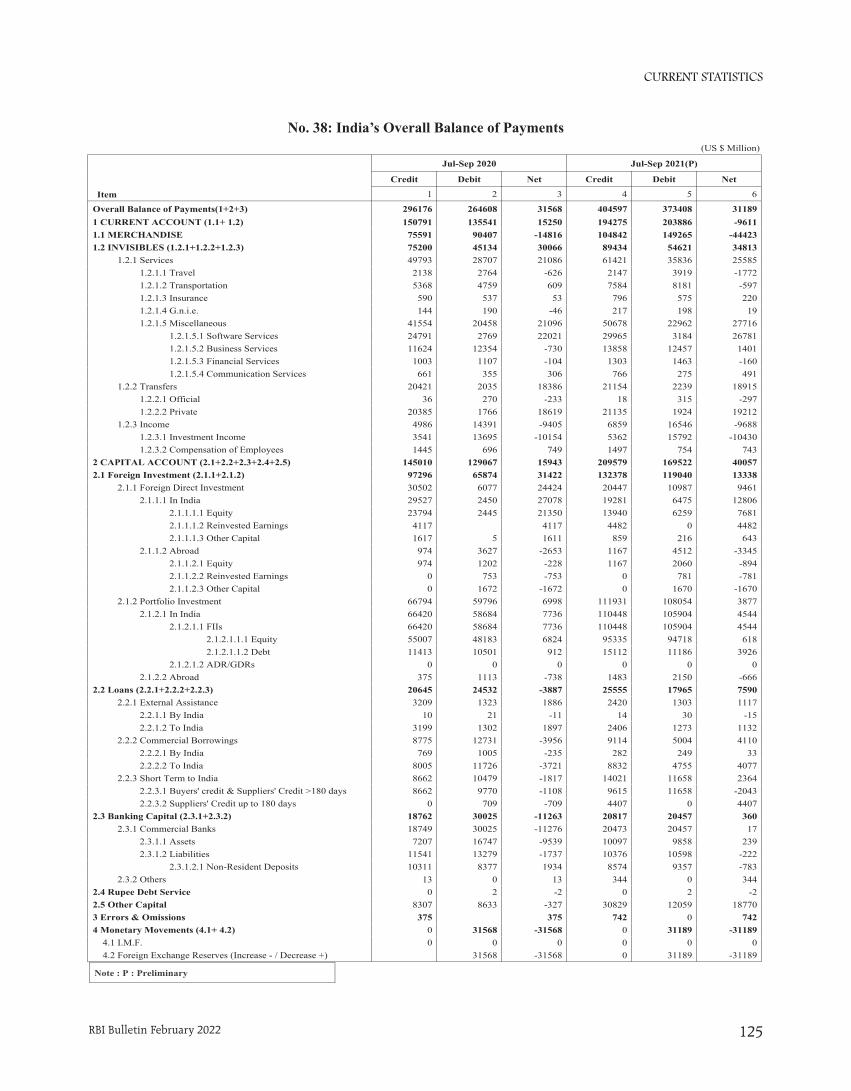
CURRENT STATISTICS
RBI Bulletin February 2022 125
No. 38: India's Overall Balance of Payments
(US $ Million)
Item
Jul-Sep 2020 Jul-Sep 2021(P)
Credit Debit Net Credit Debit Net
1 2 3 4 5 6
Overall Balance of Payments(1+2+3) 296176 264608 31568 404597 373408 311891 CURRENT ACCOUNT (1.1+ 1.2) 150791 135541 15250 194275 203886 -96111.1 MERCHANDISE 75591 90407 -14816 104842 149265 -444231.2 INVISIBLES (1.2.1+1.2.2+1.2.3) 75200 45134 30066 89434 54621 34813 1.2.1 Services 49793 28707 21086 61421 35836 25585 1.2.1.1 Travel 2138 2764 -626 2147 3919 -1772 1.2.1.2 Transportation 5368 4759 609 7584 8181 -597 1.2.1.3 Insurance 590 537 53 796 575 220 1.2.1.4 G.n.i.e. 144 190 -46 217 198 19 1.2.1.5 Miscellaneous 41554 20458 21096 50678 22962 27716 1.2.1.5.1 Software Services 24791 2769 22021 29965 3184 26781 1.2.1.5.2 Business Services 11624 12354 -730 13858 12457 1401 1.2.1.5.3 Financial Services 1003 1107 -104 1303 1463 -160 1.2.1.5.4 Communication Services 661 355 306 766 275 491 1.2.2 Transfers 20421 2035 18386 21154 2239 18915 1.2.2.1 Official 36 270 -233 18 315 -297 1.2.2.2 Private 20385 1766 18619 21135 1924 19212 1.2.3 Income 4986 14391 -9405 6859 16546 -9688 1.2.3.1 Investment Income 3541 13695 -10154 5362 15792 -10430 1.2.3.2 Compensation of Employees 1445 696 749 1497 754 7432 CAPITAL ACCOUNT (2.1+2.2+2.3+2.4+2.5) 145010 129067 15943 209579 169522 400572.1 Foreign Investment (2.1.1+2.1.2) 97296 65874 31422 132378 119040 13338 2.1.1 Foreign Direct Investment 30502 6077 24424 20447 10987 9461 2.1.1.1 In India 29527 2450 27078 19281 6475 12806 2.1.1.1.1 Equity 23794 2445 21350 13940 6259 7681 2.1.1.1.2 Reinvested Earnings 4117 4117 4482 0 4482 2.1.1.1.3 Other Capital 1617 5 1611 859 216 643 2.1.1.2 Abroad 974 3627 -2653 1167 4512 -3345 2.1.1.2.1 Equity 974 1202 -228 1167 2060 -894 2.1.1.2.2 Reinvested Earnings 0 753 -753 0 781 -781 2.1.1.2.3 Other Capital 0 1672 -1672 0 1670 -1670 2.1.2 Portfolio Investment 66794 59796 6998 111931 108054 3877 2.1.2.1 In India 66420 58684 7736 110448 105904 4544 2.1.2.1.1 FIIs 66420 58684 7736 110448 105904 4544 2.1.2.1.1.1 Equity 55007 48183 6824 95335 94718 618 2.1.2.1.1.2 Debt 11413 10501 912 15112 11186 3926 2.1.2.1.2 ADR/GDRs 0 0 0 0 0 0 2.1.2.2 Abroad 375 1113 -738 1483 2150 -6662.2 Loans (2.2.1+2.2.2+2.2.3) 20645 24532 -3887 25555 17965 7590 2.2.1 External Assistance 3209 1323 1886 2420 1303 1117 2.2.1.1 By India 10 21 -11 14 30 -15 2.2.1.2 To India 3199 1302 1897 2406 1273 1132 2.2.2 Commercial Borrowings 8775 12731 -3956 9114 5004 4110 2.2.2.1 By India 769 1005 -235 282 249 33 2.2.2.2 To India 8005 11726 -3721 8832 4755 4077 2.2.3 Short Term to India 8662 10479 -1817 14021 11658 2364 2.2.3.1 Buyers' credit & Suppliers' Credit >180 days 8662 9770 -1108 9615 11658 -2043 2.2.3.2 Suppliers' Credit up to 180 days 0 709 -709 4407 0 44072.3 Banking Capital (2.3.1+2.3.2) 18762 30025 -11263 20817 20457 360 2.3.1 Commercial Banks 18749 30025 -11276 20473 20457 17 2.3.1.1 Assets 7207 16747 -9539 10097 9858 239 2.3.1.2 Liabilities 11541 13279 -1737 10376 10598 -222 2.3.1.2.1 Non-Resident Deposits 10311 8377 1934 8574 9357 -783 2.3.2 Others 13 0 13 344 0 3442.4 Rupee Debt Service 0 2 -2 0 2 -22.5 Other Capital 8307 8633 -327 30829 12059 187703 Errors & Omissions 375 375 742 0 7424 Monetary Movements (4.1+ 4.2) 0 31568 -31568 0 31189 -31189 4.1 I.M.F. 0 0 0 0 0 0 4.2 Foreign Exchange Reserves (Increase - / Decrease +) 31568 -31568 0 31189 -31189
Note : P : Preliminary
No. 38: India’s Overall Balance of Payments
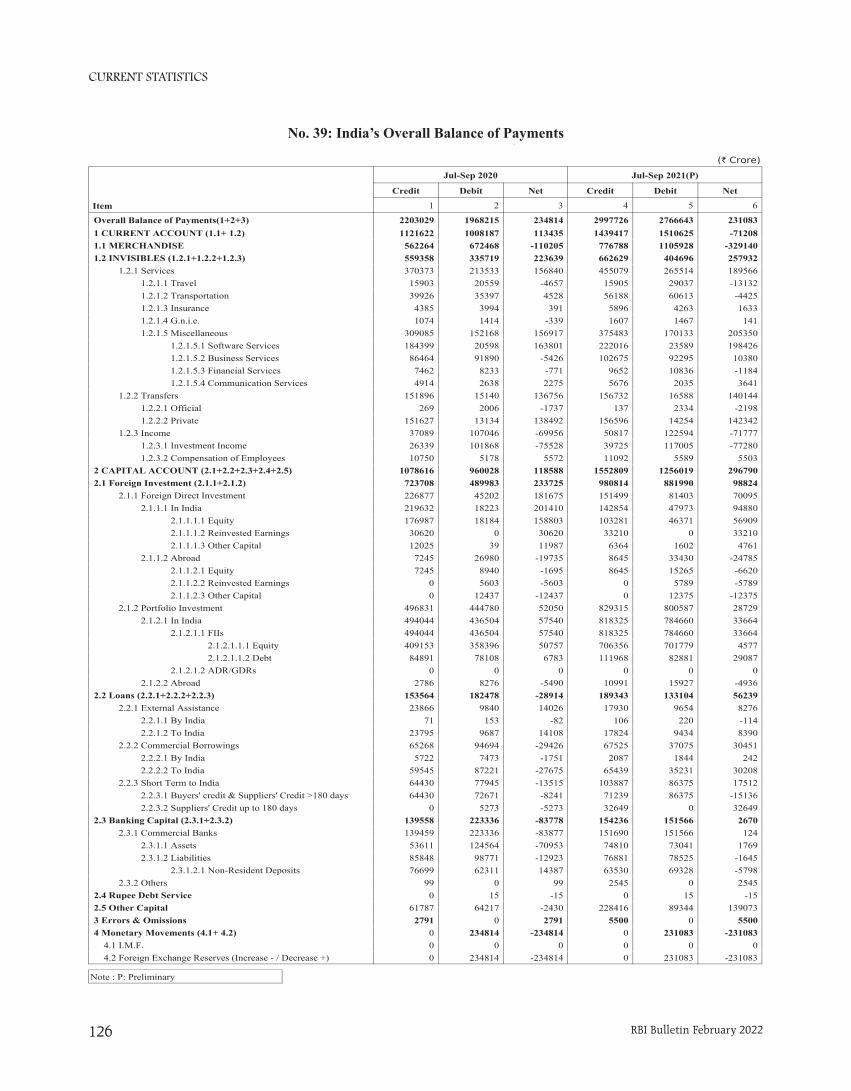
CURRENT STATISTICS
RBI Bulletin February 2022126
No. 39: India's Overall Balance of Payments
(` Crore)
Item
Jul-Sep 2020 Jul-Sep 2021(P)
Credit Debit Net Credit Debit Net
1 2 3 4 5 6
Overall Balance of Payments(1+2+3) 2203029 1968215 234814 2997726 2766643 2310831 CURRENT ACCOUNT (1.1+ 1.2) 1121622 1008187 113435 1439417 1510625 -712081.1 MERCHANDISE 562264 672468 -110205 776788 1105928 -3291401.2 INVISIBLES (1.2.1+1.2.2+1.2.3) 559358 335719 223639 662629 404696 257932 1.2.1 Services 370373 213533 156840 455079 265514 189566 1.2.1.1 Travel 15903 20559 -4657 15905 29037 -13132 1.2.1.2 Transportation 39926 35397 4528 56188 60613 -4425 1.2.1.3 Insurance 4385 3994 391 5896 4263 1633 1.2.1.4 G.n.i.e. 1074 1414 -339 1607 1467 141 1.2.1.5 Miscellaneous 309085 152168 156917 375483 170133 205350 1.2.1.5.1 Software Services 184399 20598 163801 222016 23589 198426 1.2.1.5.2 Business Services 86464 91890 -5426 102675 92295 10380 1.2.1.5.3 Financial Services 7462 8233 -771 9652 10836 -1184 1.2.1.5.4 Communication Services 4914 2638 2275 5676 2035 3641 1.2.2 Transfers 151896 15140 136756 156732 16588 140144 1.2.2.1 Official 269 2006 -1737 137 2334 -2198 1.2.2.2 Private 151627 13134 138492 156596 14254 142342 1.2.3 Income 37089 107046 -69956 50817 122594 -71777 1.2.3.1 Investment Income 26339 101868 -75528 39725 117005 -77280 1.2.3.2 Compensation of Employees 10750 5178 5572 11092 5589 55032 CAPITAL ACCOUNT (2.1+2.2+2.3+2.4+2.5) 1078616 960028 118588 1552809 1256019 2967902.1 Foreign Investment (2.1.1+2.1.2) 723708 489983 233725 980814 881990 98824 2.1.1 Foreign Direct Investment 226877 45202 181675 151499 81403 70095 2.1.1.1 In India 219632 18223 201410 142854 47973 94880 2.1.1.1.1 Equity 176987 18184 158803 103281 46371 56909 2.1.1.1.2 Reinvested Earnings 30620 0 30620 33210 0 33210 2.1.1.1.3 Other Capital 12025 39 11987 6364 1602 4761 2.1.1.2 Abroad 7245 26980 -19735 8645 33430 -24785 2.1.1.2.1 Equity 7245 8940 -1695 8645 15265 -6620 2.1.1.2.2 Reinvested Earnings 0 5603 -5603 0 5789 -5789 2.1.1.2.3 Other Capital 0 12437 -12437 0 12375 -12375 2.1.2 Portfolio Investment 496831 444780 52050 829315 800587 28729 2.1.2.1 In India 494044 436504 57540 818325 784660 33664 2.1.2.1.1 FIIs 494044 436504 57540 818325 784660 33664 2.1.2.1.1.1 Equity 409153 358396 50757 706356 701779 4577 2.1.2.1.1.2 Debt 84891 78108 6783 111968 82881 29087 2.1.2.1.2 ADR/GDRs 0 0 0 0 0 0 2.1.2.2 Abroad 2786 8276 -5490 10991 15927 -49362.2 Loans (2.2.1+2.2.2+2.2.3) 153564 182478 -28914 189343 133104 56239 2.2.1 External Assistance 23866 9840 14026 17930 9654 8276 2.2.1.1 By India 71 153 -82 106 220 -114 2.2.1.2 To India 23795 9687 14108 17824 9434 8390 2.2.2 Commercial Borrowings 65268 94694 -29426 67525 37075 30451 2.2.2.1 By India 5722 7473 -1751 2087 1844 242 2.2.2.2 To India 59545 87221 -27675 65439 35231 30208 2.2.3 Short Term to India 64430 77945 -13515 103887 86375 17512 2.2.3.1 Buyers' credit & Suppliers' Credit >180 days 64430 72671 -8241 71239 86375 -15136 2.2.3.2 Suppliers' Credit up to 180 days 0 5273 -5273 32649 0 326492.3 Banking Capital (2.3.1+2.3.2) 139558 223336 -83778 154236 151566 2670 2.3.1 Commercial Banks 139459 223336 -83877 151690 151566 124 2.3.1.1 Assets 53611 124564 -70953 74810 73041 1769 2.3.1.2 Liabilities 85848 98771 -12923 76881 78525 -1645 2.3.1.2.1 Non-Resident Deposits 76699 62311 14387 63530 69328 -5798 2.3.2 Others 99 0 99 2545 0 25452.4 Rupee Debt Service 0 15 -15 0 15 -152.5 Other Capital 61787 64217 -2430 228416 89344 1390733 Errors & Omissions 2791 0 2791 5500 0 55004 Monetary Movements (4.1+ 4.2) 0 234814 -234814 0 231083 -231083 4.1 I.M.F. 0 0 0 0 0 0 4.2 Foreign Exchange Reserves (Increase - / Decrease +) 0 234814 -234814 0 231083 -231083
Note : P: Preliminary
No. 39: India’s Overall Balance of Payments
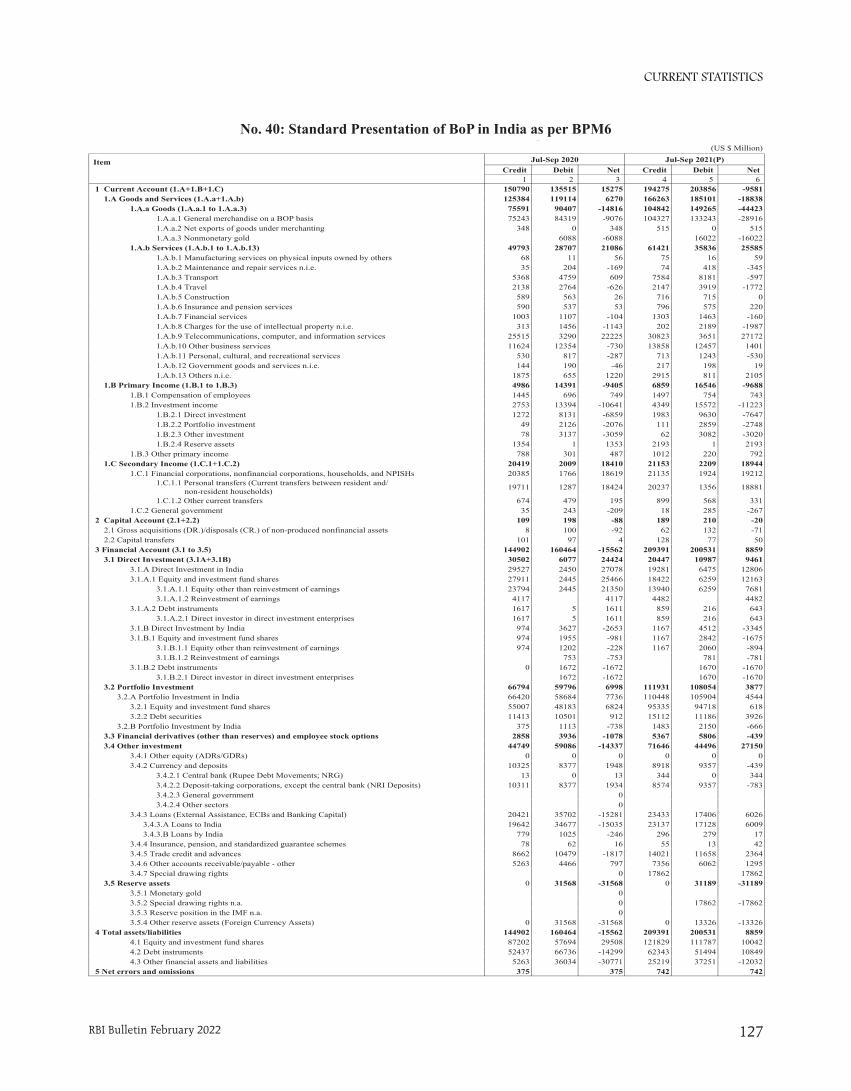
CURRENT STATISTICS
RBI Bulletin February 2022 127
(US $ Million)
Item Jul-Sep 2020 Jul-Sep 2021(P)Credit Debit Net Credit Debit Net
1 2 3 4 5 61 Current Account (1.A+1.B+1.C) 150790 135515 15275 194275 203856 -9581 1.A Goods and Services (1.A.a+1.A.b) 125384 119114 6270 166263 185101 -18838 1.A.a Goods (1.A.a.1 to 1.A.a.3) 75591 90407 -14816 104842 149265 -44423 1.A.a.1 General merchandise on a BOP basis 75243 84319 -9076 104327 133243 -28916 1.A.a.2 Net exports of goods under merchanting 348 0 348 515 0 515 1.A.a.3 Nonmonetary gold 6088 -6088 16022 -16022 1.A.b Services (1.A.b.1 to 1.A.b.13) 49793 28707 21086 61421 35836 25585 1.A.b.1 Manufacturing services on physical inputs owned by others 68 11 56 75 16 59 1.A.b.2 Maintenance and repair services n.i.e. 35 204 -169 74 418 -345 1.A.b.3 Transport 5368 4759 609 7584 8181 -597 1.A.b.4 Travel 2138 2764 -626 2147 3919 -1772 1.A.b.5 Construction 589 563 26 716 715 0 1.A.b.6 Insurance and pension services 590 537 53 796 575 220 1.A.b.7 Financial services 1003 1107 -104 1303 1463 -160 1.A.b.8 Charges for the use of intellectual property n.i.e. 313 1456 -1143 202 2189 -1987 1.A.b.9 Telecommunications, computer, and information services 25515 3290 22225 30823 3651 27172 1.A.b.10 Other business services 11624 12354 -730 13858 12457 1401 1.A.b.11 Personal, cultural, and recreational services 530 817 -287 713 1243 -530 1.A.b.12 Government goods and services n.i.e. 144 190 -46 217 198 19 1.A.b.13 Others n.i.e. 1875 655 1220 2915 811 2105 1.B Primary Income (1.B.1 to 1.B.3) 4986 14391 -9405 6859 16546 -9688 1.B.1 Compensation of employees 1445 696 749 1497 754 743 1.B.2 Investment income 2753 13394 -10641 4349 15572 -11223 1.B.2.1 Direct investment 1272 8131 -6859 1983 9630 -7647 1.B.2.2 Portfolio investment 49 2126 -2076 111 2859 -2748 1.B.2.3 Other investment 78 3137 -3059 62 3082 -3020 1.B.2.4 Reserve assets 1354 1 1353 2193 1 2193 1.B.3 Other primary income 788 301 487 1012 220 792 1.C Secondary Income (1.C.1+1.C.2) 20419 2009 18410 21153 2209 18944 1.C.1 Financial corporations, nonfinancial corporations, households, and NPISHs 20385 1766 18619 21135 1924 19212 1.C.1.1 Personal transfers (Current transfers between resident and/ non-resident households) 19711 1287 18424 20237 1356 18881
1.C.1.2 Other current transfers 674 479 195 899 568 331 1.C.2 General government 35 243 -209 18 285 -2672 Capital Account (2.1+2.2) 109 198 -88 189 210 -20 2.1 Gross acquisitions (DR.)/disposals (CR.) of non-produced nonfinancial assets 8 100 -92 62 132 -71 2.2 Capital transfers 101 97 4 128 77 503 Financial Account (3.1 to 3.5) 144902 160464 -15562 209391 200531 8859 3.1 Direct Investment (3.1A+3.1B) 30502 6077 24424 20447 10987 9461 3.1.A Direct Investment in India 29527 2450 27078 19281 6475 12806 3.1.A.1 Equity and investment fund shares 27911 2445 25466 18422 6259 12163 3.1.A.1.1 Equity other than reinvestment of earnings 23794 2445 21350 13940 6259 7681 3.1.A.1.2 Reinvestment of earnings 4117 4117 4482 4482 3.1.A.2 Debt instruments 1617 5 1611 859 216 643 3.1.A.2.1 Direct investor in direct investment enterprises 1617 5 1611 859 216 643 3.1.B Direct Investment by India 974 3627 -2653 1167 4512 -3345 3.1.B.1 Equity and investment fund shares 974 1955 -981 1167 2842 -1675 3.1.B.1.1 Equity other than reinvestment of earnings 974 1202 -228 1167 2060 -894 3.1.B.1.2 Reinvestment of earnings 753 -753 781 -781 3.1.B.2 Debt instruments 0 1672 -1672 1670 -1670 3.1.B.2.1 Direct investor in direct investment enterprises 1672 -1672 1670 -1670 3.2 Portfolio Investment 66794 59796 6998 111931 108054 3877 3.2.A Portfolio Investment in India 66420 58684 7736 110448 105904 4544 3.2.1 Equity and investment fund shares 55007 48183 6824 95335 94718 618 3.2.2 Debt securities 11413 10501 912 15112 11186 3926 3.2.B Portfolio Investment by India 375 1113 -738 1483 2150 -666 3.3 Financial derivatives (other than reserves) and employee stock options 2858 3936 -1078 5367 5806 -439 3.4 Other investment 44749 59086 -14337 71646 44496 27150 3.4.1 Other equity (ADRs/GDRs) 0 0 0 0 0 0 3.4.2 Currency and deposits 10325 8377 1948 8918 9357 -439 3.4.2.1 Central bank (Rupee Debt Movements; NRG) 13 0 13 344 0 344 3.4.2.2 Deposit-taking corporations, except the central bank (NRI Deposits) 10311 8377 1934 8574 9357 -783 3.4.2.3 General government 0 3.4.2.4 Other sectors 0 3.4.3 Loans (External Assistance, ECBs and Banking Capital) 20421 35702 -15281 23433 17406 6026 3.4.3.A Loans to India 19642 34677 -15035 23137 17128 6009 3.4.3.B Loans by India 779 1025 -246 296 279 17 3.4.4 Insurance, pension, and standardized guarantee schemes 78 62 16 55 13 42 3.4.5 Trade credit and advances 8662 10479 -1817 14021 11658 2364 3.4.6 Other accounts receivable/payable - other 5263 4466 797 7356 6062 1295 3.4.7 Special drawing rights 0 17862 17862 3.5 Reserve assets 0 31568 -31568 0 31189 -31189 3.5.1 Monetary gold 0 3.5.2 Special drawing rights n.a. 0 17862 -17862 3.5.3 Reserve position in the IMF n.a. 0 3.5.4 Other reserve assets (Foreign Currency Assets) 0 31568 -31568 0 13326 -133264 Total assets/liabilities 144902 160464 -15562 209391 200531 8859 4.1 Equity and investment fund shares 87202 57694 29508 121829 111787 10042 4.2 Debt instruments 52437 66736 -14299 62343 51494 10849 4.3 Other financial assets and liabilities 5263 36034 -30771 25219 37251 -120325 Net errors and omissions 375 375 742 742
No. 40: Standard Presentation of BoP in India as per BPM6
Note : P : Preliminary
No. 40: Standard Presentation of BoP in India as per BPM6
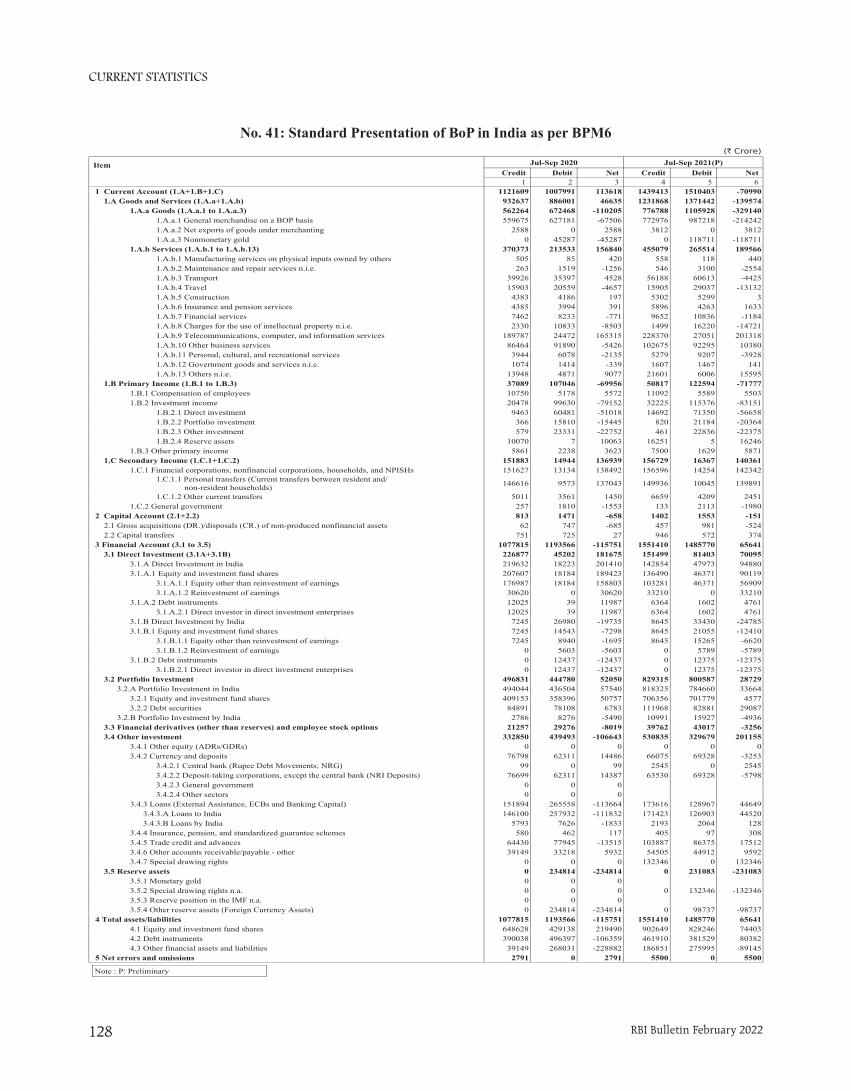
CURRENT STATISTICS
RBI Bulletin February 2022128
(` Crore)
Item Jul-Sep 2020 Jul-Sep 2021(P)Credit Debit Net Credit Debit Net
1 2 3 4 5 61 Current Account (1.A+1.B+1.C) 1121609 1007991 113618 1439413 1510403 -70990 1.A Goods and Services (1.A.a+1.A.b) 932637 886001 46635 1231868 1371442 -139574 1.A.a Goods (1.A.a.1 to 1.A.a.3) 562264 672468 -110205 776788 1105928 -329140 1.A.a.1 General merchandise on a BOP basis 559675 627181 -67506 772976 987218 -214242 1.A.a.2 Net exports of goods under merchanting 2588 0 2588 3812 0 3812 1.A.a.3 Nonmonetary gold 0 45287 -45287 0 118711 -118711 1.A.b Services (1.A.b.1 to 1.A.b.13) 370373 213533 156840 455079 265514 189566 1.A.b.1 Manufacturing services on physical inputs owned by others 505 85 420 558 118 440 1.A.b.2 Maintenance and repair services n.i.e. 263 1519 -1256 546 3100 -2554 1.A.b.3 Transport 39926 35397 4528 56188 60613 -4425 1.A.b.4 Travel 15903 20559 -4657 15905 29037 -13132 1.A.b.5 Construction 4383 4186 197 5302 5299 3 1.A.b.6 Insurance and pension services 4385 3994 391 5896 4263 1633 1.A.b.7 Financial services 7462 8233 -771 9652 10836 -1184 1.A.b.8 Charges for the use of intellectual property n.i.e. 2330 10833 -8503 1499 16220 -14721 1.A.b.9 Telecommunications, computer, and information services 189787 24472 165315 228370 27051 201318 1.A.b.10 Other business services 86464 91890 -5426 102675 92295 10380 1.A.b.11 Personal, cultural, and recreational services 3944 6078 -2135 5279 9207 -3928 1.A.b.12 Government goods and services n.i.e. 1074 1414 -339 1607 1467 141 1.A.b.13 Others n.i.e. 13948 4871 9077 21601 6006 15595 1.B Primary Income (1.B.1 to 1.B.3) 37089 107046 -69956 50817 122594 -71777 1.B.1 Compensation of employees 10750 5178 5572 11092 5589 5503 1.B.2 Investment income 20478 99630 -79152 32225 115376 -83151 1.B.2.1 Direct investment 9463 60481 -51018 14692 71350 -56658 1.B.2.2 Portfolio investment 366 15810 -15445 820 21184 -20364 1.B.2.3 Other investment 579 23331 -22752 461 22836 -22375 1.B.2.4 Reserve assets 10070 7 10063 16251 5 16246 1.B.3 Other primary income 5861 2238 3623 7500 1629 5871 1.C Secondary Income (1.C.1+1.C.2) 151883 14944 136939 156729 16367 140361 1.C.1 Financial corporations, nonfinancial corporations, households, and NPISHs 151627 13134 138492 156596 14254 142342 1.C.1.1 Personal transfers (Current transfers between resident and/ non-resident households) 146616 9573 137043 149936 10045 139891
1.C.1.2 Other current transfers 5011 3561 1450 6659 4209 2451 1.C.2 General government 257 1810 -1553 133 2113 -19802 Capital Account (2.1+2.2) 813 1471 -658 1402 1553 -151 2.1 Gross acquisitions (DR.)/disposals (CR.) of non-produced nonfinancial assets 62 747 -685 457 981 -524 2.2 Capital transfers 751 725 27 946 572 3743 Financial Account (3.1 to 3.5) 1077815 1193566 -115751 1551410 1485770 65641 3.1 Direct Investment (3.1A+3.1B) 226877 45202 181675 151499 81403 70095 3.1.A Direct Investment in India 219632 18223 201410 142854 47973 94880 3.1.A.1 Equity and investment fund shares 207607 18184 189423 136490 46371 90119 3.1.A.1.1 Equity other than reinvestment of earnings 176987 18184 158803 103281 46371 56909 3.1.A.1.2 Reinvestment of earnings 30620 0 30620 33210 0 33210 3.1.A.2 Debt instruments 12025 39 11987 6364 1602 4761 3.1.A.2.1 Direct investor in direct investment enterprises 12025 39 11987 6364 1602 4761 3.1.B Direct Investment by India 7245 26980 -19735 8645 33430 -24785 3.1.B.1 Equity and investment fund shares 7245 14543 -7298 8645 21055 -12410 3.1.B.1.1 Equity other than reinvestment of earnings 7245 8940 -1695 8645 15265 -6620 3.1.B.1.2 Reinvestment of earnings 0 5603 -5603 0 5789 -5789 3.1.B.2 Debt instruments 0 12437 -12437 0 12375 -12375 3.1.B.2.1 Direct investor in direct investment enterprises 0 12437 -12437 0 12375 -12375 3.2 Portfolio Investment 496831 444780 52050 829315 800587 28729 3.2.A Portfolio Investment in India 494044 436504 57540 818325 784660 33664 3.2.1 Equity and investment fund shares 409153 358396 50757 706356 701779 4577 3.2.2 Debt securities 84891 78108 6783 111968 82881 29087 3.2.B Portfolio Investment by India 2786 8276 -5490 10991 15927 -4936 3.3 Financial derivatives (other than reserves) and employee stock options 21257 29276 -8019 39762 43017 -3256 3.4 Other investment 332850 439493 -106643 530835 329679 201155 3.4.1 Other equity (ADRs/GDRs) 0 0 0 0 0 0 3.4.2 Currency and deposits 76798 62311 14486 66075 69328 -3253 3.4.2.1 Central bank (Rupee Debt Movements; NRG) 99 0 99 2545 0 2545 3.4.2.2 Deposit-taking corporations, except the central bank (NRI Deposits) 76699 62311 14387 63530 69328 -5798 3.4.2.3 General government 0 0 0 3.4.2.4 Other sectors 0 0 0 3.4.3 Loans (External Assistance, ECBs and Banking Capital) 151894 265558 -113664 173616 128967 44649 3.4.3.A Loans to India 146100 257932 -111832 171423 126903 44520 3.4.3.B Loans by India 5793 7626 -1833 2193 2064 128 3.4.4 Insurance, pension, and standardized guarantee schemes 580 462 117 405 97 308 3.4.5 Trade credit and advances 64430 77945 -13515 103887 86375 17512 3.4.6 Other accounts receivable/payable - other 39149 33218 5932 54505 44912 9592 3.4.7 Special drawing rights 0 0 0 132346 0 132346 3.5 Reserve assets 0 234814 -234814 0 231083 -231083 3.5.1 Monetary gold 0 0 0 3.5.2 Special drawing rights n.a. 0 0 0 0 132346 -132346 3.5.3 Reserve position in the IMF n.a. 0 0 0 3.5.4 Other reserve assets (Foreign Currency Assets) 0 234814 -234814 0 98737 -987374 Total assets/liabilities 1077815 1193566 -115751 1551410 1485770 65641 4.1 Equity and investment fund shares 648628 429138 219490 902649 828246 74403 4.2 Debt instruments 390038 496397 -106359 461910 381529 80382 4.3 Other financial assets and liabilities 39149 268031 -228882 186851 275995 -891455 Net errors and omissions 2791 0 2791 5500 0 5500
No. 41: Standard Presentation of BoP in India as per BPM6
Note : P: Preliminary
No. 41: Standard Presentation of BoP in India as per BPM6
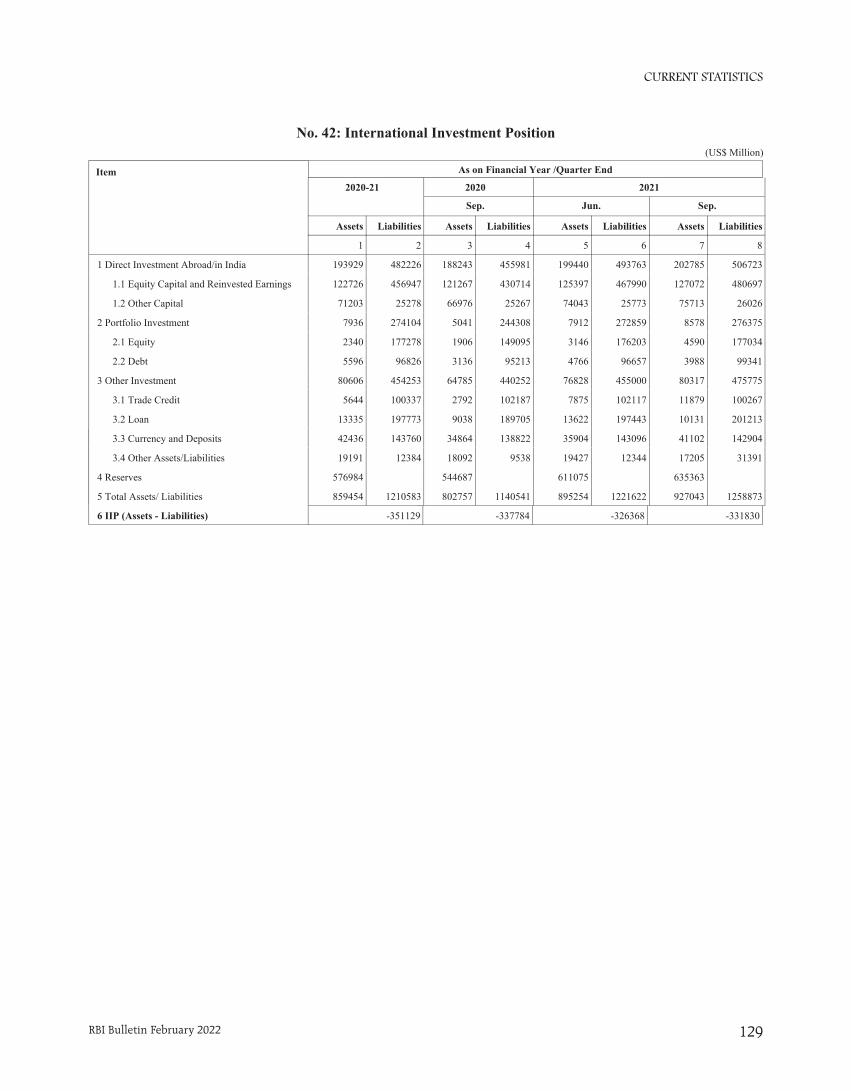
CURRENT STATISTICS
RBI Bulletin February 2022 129
(US$ Million)
2020 2021
Sep. Jun. Sep.
Assets Assets Assets
3 4 5
-337784 -326368 -331830
Item 2020-21
Assets
1
6 IIP (Assets - Liabilities) -351129
(US$ Million)
2020 2021
Sep. Jun. Sep.
Assets Liabilities Assets Liabilities Assets Liabilities
3 4 5 6 7 8
188243 455981 199440 493763 202785 506723
121267 430714 125397 467990 127072 480697
66976 25267 74043 25773 75713 26026
5041 244308 7912 272859 8578 276375
1906 149095 3146 176203 4590 177034
3136 95213 4766 96657 3988 99341
64785 440252 76828 455000 80317 475775
2792 102187 7875 102117 11879 100267
9038 189705 13622 197443 10131 201213
34864 138822 35904 143096 41102 142904
18092 9538 19427 12344 17205 31391
544687 611075 635363
802757 1140541 895254 1221622 927043 1258873
No. 42: International Investment Position
Item2020-21
Assets Liabilities
1 2
1 Direct Investment Abroad/in India 193929 482226
1.1 Equity Capital and Reinvested Earnings 122726 456947
1.2 Other Capital 71203 25278
2 Portfolio Investment 7936 274104
2.1 Equity 2340 177278
2.2 Debt 5596 96826
3 Other Investment 80606 454253
3.1 Trade Credit 5644 100337
3.2 Loan 13335 197773
3.3 Currency and Deposits 42436 143760
3.4 Other Assets/Liabilities 19191 12384
4 Reserves 576984
5 Total Assets/ Liabilities 859454 1210583
As on Financial Year /Quarter End
No. 42: International Investment Position
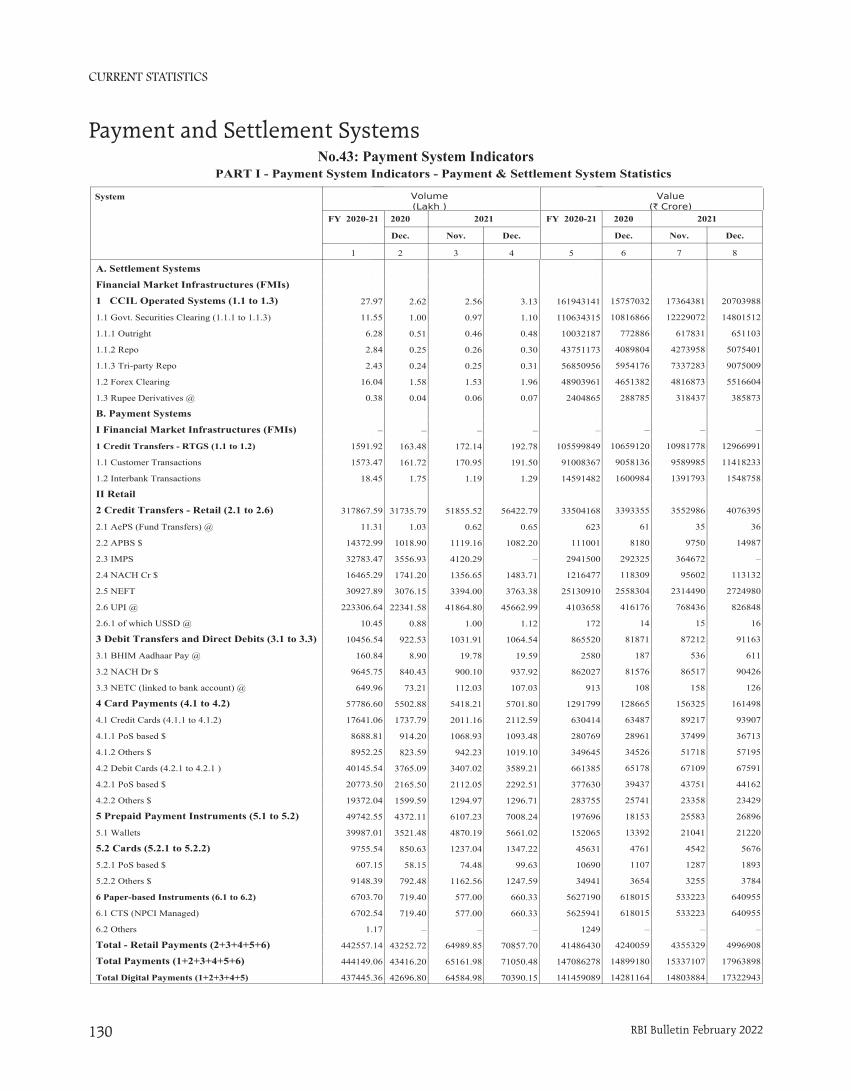
CURRENT STATISTICS
RBI Bulletin February 2022130
PART I - Payment System Indicators - Payment & Settlement System Statistics
Value (` Crore)
2020 2021
Dec. Nov. Dec.
6 7 8
– – –
– – –
15757032 17364381 20703988
10816866 12229072 14801512
772886 617831 651103
4089804 4273958 5075401
5954176 7337283 9075009
4651382 4816873 5516604
288785 318437 385873
– – –
– – –
10659120 10981778 12966991
9058136 9589985 11418233
1600984 1391793 1548758
– – –
3393355 3552986 4076395
61 35 36
8180 9750 14987
292325 364672 –
118309 95602 113132
2558304 2314490 2724980
416176 768436 826848
14 15 16
81871 87212 91163
187 536 611
81576 86517 90426
108 158 126
128665 156325 161498
63487 89217 93907
28961 37499 36713
34526 51718 57195
65178 67109 67591
39437 43751 44162
25741 23358 23429
18153 25583 26896
13392 21041 21220
4761 4542 5676
1107 1287 1893
3654 3255 3784
618015 533223 640955
618015 533223 640955
– – –
4240059 4355329 4996908
14899180 15337107 17963898
14281164 14803884 17322943
FY 2020-21
5
–
–
161943141
110634315
10032187
43751173
56850956
48903961
2404865
–
–
105599849
91008367
14591482
–
33504168
623
111001
2941500
1216477
25130910
4103658
172
865520
2580
862027
913
1291799
630414
280769
349645
661385
377630
283755
197696
152065
45631
10690
34941
5627190
5625941
1249
41486430
147086278
141459089
Volume(Lakh )
2020 2021
Dec. Nov. Dec.
2 3 4
– – –
– – –
2.62 2.56 3.13
1.00 0.97 1.10
0.51 0.46 0.48
0.25 0.26 0.30
0.24 0.25 0.31
1.58 1.53 1.96
0.04 0.06 0.07
– – –
– – –
163.48 172.14 192.78
161.72 170.95 191.50
1.75 1.19 1.29
– – –
31735.79 51855.52 56422.79
1.03 0.62 0.65
1018.90 1119.16 1082.20
3556.93 4120.29 –
1741.20 1356.65 1483.71
3076.15 3394.00 3763.38
22341.58 41864.80 45662.99
0.88 1.00 1.12
922.53 1031.91 1064.54
8.90 19.78 19.59
840.43 900.10 937.92
73.21 112.03 107.03
5502.88 5418.21 5701.80
1737.79 2011.16 2112.59
914.20 1068.93 1093.48
823.59 942.23 1019.10
3765.09 3407.02 3589.21
2165.50 2112.05 2292.51
1599.59 1294.97 1296.71
4372.11 6107.23 7008.24
3521.48 4870.19 5661.02
850.63 1237.04 1347.22
58.15 74.48 99.63
792.48 1162.56 1247.59
719.40 577.00 660.33
719.40 577.00 660.33
– – –
43252.72 64989.85 70857.70
43416.20 65161.98 71050.48
42696.80 64584.98 70390.15
System
FY 2020-21
1
A. Settlement Systems –
Financial Market Infrastructures (FMIs) –
1 CCIL Operated Systems (1.1 to 1.3) 27.97
1.1 Govt. Securities Clearing (1.1.1 to 1.1.3) 11.55
1.1.1 Outright 6.28
1.1.2 Repo 2.84
1.1.3 Tri-party Repo 2.43
1.2 Forex Clearing 16.04
1.3 Rupee Derivatives @ 0.38
B. Payment Systems –
I Financial Market Infrastructures (FMIs) –
1 Credit Transfers - RTGS (1.1 to 1.2) 1591.92
1.1 Customer Transactions 1573.47
1.2 Interbank Transactions 18.45
II Retail –
2 Credit Transfers - Retail (2.1 to 2.6) 317867.59
2.1 AePS (Fund Transfers) @ 11.31
2.2 APBS $ 14372.99
2.3 IMPS 32783.47
2.4 NACH Cr $ 16465.29
2.5 NEFT 30927.89
2.6 UPI @ 223306.64
2.6.1 of which USSD @ 10.45
3 Debit Transfers and Direct Debits (3.1 to 3.3) 10456.54
3.1 BHIM Aadhaar Pay @ 160.84
3.2 NACH Dr $ 9645.75
3.3 NETC (linked to bank account) @ 649.96
4 Card Payments (4.1 to 4.2) 57786.60
4.1 Credit Cards (4.1.1 to 4.1.2) 17641.06
4.1.1 PoS based $ 8688.81
4.1.2 Others $ 8952.25
4.2 Debit Cards (4.2.1 to 4.2.1 ) 40145.54
4.2.1 PoS based $ 20773.50
4.2.2 Others $ 19372.04
5 Prepaid Payment Instruments (5.1 to 5.2) 49742.55
5.1 Wallets 39987.01
5.2 Cards (5.2.1 to 5.2.2) 9755.54
5.2.1 PoS based $ 607.15
5.2.2 Others $ 9148.39
6 Paper-based Instruments (6.1 to 6.2) 6703.70
6.1 CTS (NPCI Managed) 6702.54
6.2 Others 1.17
Total - Retail Payments (2+3+4+5+6) 442557.14
Total Payments (1+2+3+4+5+6) 444149.06
Total Digital Payments (1+2+3+4+5) 437445.36
Value(` Crore)
Volume(Lakh )
Payment and Settlement SystemsNo.43: Payment System Indicators
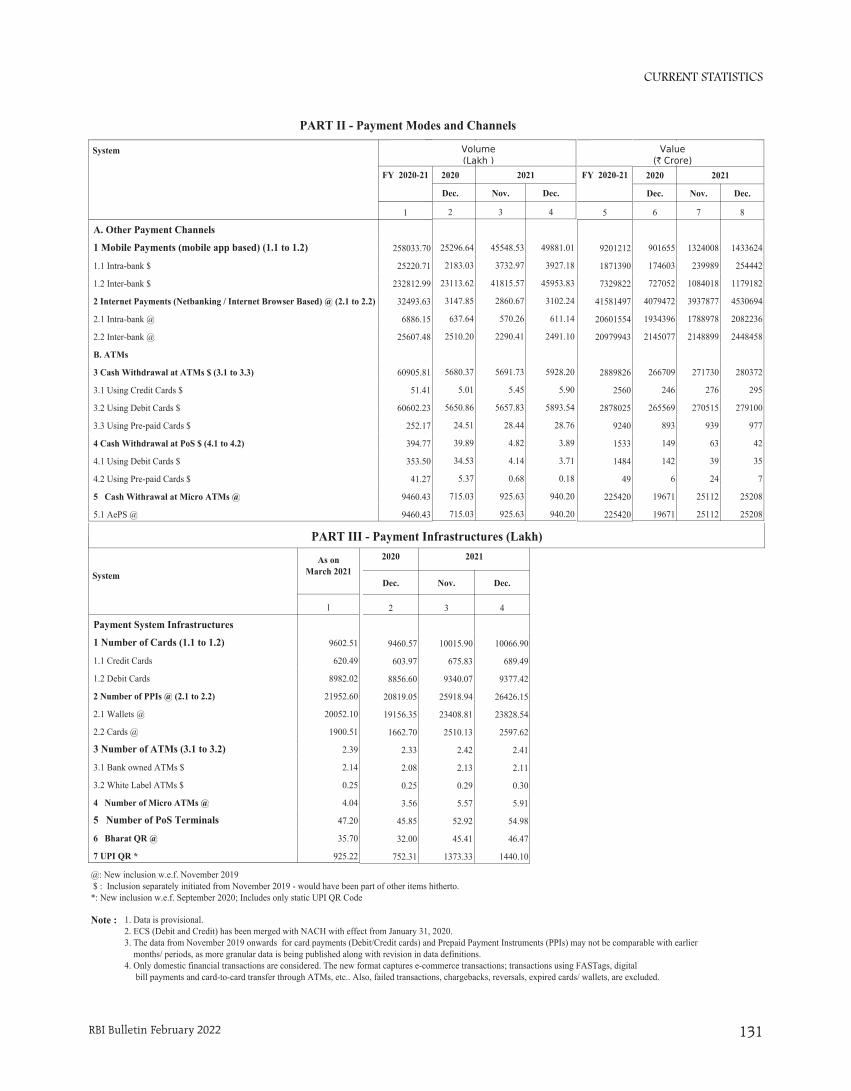
CURRENT STATISTICS
RBI Bulletin February 2022 131
PART II - Payment Modes and Channels
Value (` Crore)
2020 2021
Dec. Nov. Dec.
6 7 8
– – –
901655 1324008 1433624
174603 239989 254442
727052 1084018 1179182
4079472 3937877 4530694
1934396 1788978 2082236
2145077 2148899 2448458
– – –
266709 271730 280372
246 276 295
265569 270515 279100
893 939 977
149 63 42
142 39 35
6 24 7
19671 25112 25208
19671 25112 25208
Volume(Lakh )
2020 2021
Dec. Nov. Dec.
2 3 4
– – –
25296.64 45548.53 49881.01
2183.03 3732.97 3927.18
23113.62 41815.57 45953.83
3147.85 2860.67 3102.24
637.64 570.26 611.14
2510.20 2290.41 2491.10
– – –
5680.37 5691.73 5928.20
5.01 5.45 5.90
5650.86 5657.83 5893.54
24.51 28.44 28.76
39.89 4.82 3.89
34.53 4.14 3.71
5.37 0.68 0.18
715.03 925.63 940.20
715.03 925.63 940.20
System
FY 2020-21
1
A. Other Payment Channels –
1 Mobile Payments (mobile app based) (1.1 to 1.2) 258033.70
1.1 Intra-bank $ 25220.71
1.2 Inter-bank $ 232812.99
2 Internet Payments (Netbanking / Internet Browser Based) @ (2.1 to 2.2) 32493.63
2.1 Intra-bank @ 6886.15
2.2 Inter-bank @ 25607.48
B. ATMs –
3 Cash Withdrawal at ATMs $ (3.1 to 3.3) 60905.81
3.1 Using Credit Cards $ 51.41
3.2 Using Debit Cards $ 60602.23
3.3 Using Pre-paid Cards $ 252.17
4 Cash Withdrawal at PoS $ (4.1 to 4.2) 394.77
4.1 Using Debit Cards $ 353.50
4.2 Using Pre-paid Cards $ 41.27
5 Cash Withrawal at Micro ATMs @ 9460.43
5.1 AePS @ 9460.43
Note : 1. Data is provisional.2. ECS (Debit and Credit) has been merged with NACH with effect from January 31, 2020.3. The data from November 2019 onwards for card payments (Debit/Credit cards) and Prepaid Payment Instruments (PPIs) may not be comparable with earlier months/ periods, as more granular data is being published along with revision in data definitions.4. Only domestic financial transactions are considered. The new format captures e-commerce transactions; transactions using FASTags, digital bill payments and card-to-card transfer through ATMs, etc.. Also, failed transactions, chargebacks, reversals, expired cards/ wallets, are excluded.
2020 2021
Dec. Nov. Dec.
2 3 4
– – –
9460.57 10015.90 10066.90
603.97 675.83 689.49
8856.60 9340.07 9377.42
20819.05 25918.94 26426.15
19156.35 23408.81 23828.54
1662.70 2510.13 2597.62
2.33 2.42 2.41
2.08 2.13 2.11
0.25 0.29 0.30
3.56 5.57 5.91
45.85 52.92 54.98
32.00 45.41 46.47
752.31 1373.33 1440.10
System
As onMarch 2021
1
Payment System Infrastructures –
1 Number of Cards (1.1 to 1.2) 9602.51
1.1 Credit Cards 620.49
1.2 Debit Cards 8982.02
2 Number of PPIs @ (2.1 to 2.2) 21952.60
2.1 Wallets @ 20052.10
2.2 Cards @ 1900.51
3 Number of ATMs (3.1 to 3.2) 2.39
3.1 Bank owned ATMs $ 2.14
3.2 White Label ATMs $ 0.25
4 Number of Micro ATMs @ 4.04
5 Number of PoS Terminals 47.20
6 Bharat QR @ 35.70
7 UPI QR * 925.22
PART III - Payment Infrastructures (Lakh)
FY 2020-21
5
–
9201212
1871390
7329822
41581497
20601554
20979943
–
2889826
2560
2878025
9240
1533
1484
49
225420
225420
Volume(Lakh )
@: New inclusion w.e.f. November 2019 $ : Inclusion separately initiated from November 2019 - would have been part of other items hitherto.*: New inclusion w.e.f. September 2020; Includes only static UPI QR Code
Value(` Crore)
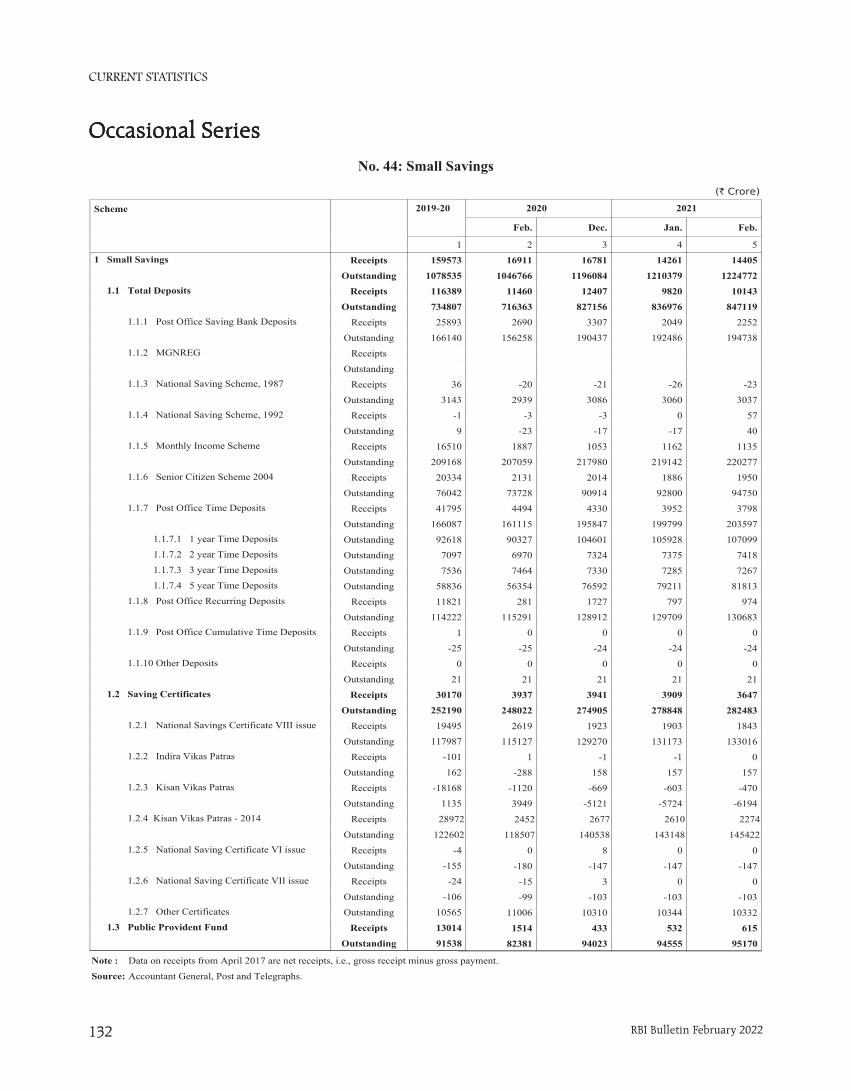
CURRENT STATISTICS
RBI Bulletin February 2022132
No. 44: Small Savings
(` Crore)
2020 2021
Feb. Dec. Jan. Feb.
2 3 4 5
16911 16781 14261 14405
1046766 1196084 1210379 1224772
11460 12407 9820 10143
716363 827156 836976 847119
2690 3307 2049 2252
156258 190437 192486 194738
-20 -21 -26 -23
2939 3086 3060 3037
-3 -3 0 57
-23 -17 -17 40
1887 1053 1162 1135
207059 217980 219142 220277
2131 2014 1886 1950
73728 90914 92800 94750
4494 4330 3952 3798
161115 195847 199799 203597
90327 104601 105928 107099
6970 7324 7375 7418
7464 7330 7285 7267
56354 76592 79211 81813
281 1727 797 974
115291 128912 129709 130683
0 0 0 0
-25 -24 -24 -24
0 0 0 0
21 21 21 21
3937 3941 3909 3647
248022 274905 278848 282483
2619 1923 1903 1843
115127 129270 131173 133016
1 -1 -1 0
-288 158 157 157
-1120 -669 -603 -470
3949 -5121 -5724 -6194
2452 2677 2610 2274
118507 140538 143148 145422
0 8 0 0
-180 -147 -147 -147
-15 3 0 0
-99 -103 -103 -103
11006 10310 10344 10332
1514 433 532 615
82381 94023 94555 95170
Scheme 2019-20
11 Small Savings Receipts 159573
Outstanding 1078535
1.1 Total Deposits Receipts 116389
Outstanding 734807
1.1.1 Post Office Saving Bank Deposits Receipts 25893
Outstanding 166140 1.1.2 MGNREG Receipts
Outstanding 1.1.3 National Saving Scheme, 1987 Receipts 36
Outstanding 3143 1.1.4 National Saving Scheme, 1992 Receipts -1
Outstanding 9 1.1.5 Monthly Income Scheme Receipts 16510
Outstanding 209168 1.1.6 Senior Citizen Scheme 2004 Receipts 20334
Outstanding 76042 1.1.7 Post Office Time Deposits Receipts 41795
Outstanding 166087 1.1.7.1 1 year Time Deposits Outstanding 92618 1.1.7.2 2 year Time Deposits Outstanding 7097 1.1.7.3 3 year Time Deposits Outstanding 7536 1.1.7.4 5 year Time Deposits Outstanding 58836 1.1.8 Post Office Recurring Deposits Receipts 11821
Outstanding 114222 1.1.9 Post Office Cumulative Time Deposits Receipts 1
Outstanding -25 1.1.10 Other Deposits Receipts 0
Outstanding 21 1.2 Saving Certificates Receipts 30170
Outstanding 252190
1.2.1 National Savings Certificate VIII issue Receipts 19495
Outstanding 117987 1.2.2 Indira Vikas Patras Receipts -101
Outstanding 162 1.2.3 Kisan Vikas Patras Receipts -18168
Outstanding 1135 1.2.4 Kisan Vikas Patras - 2014 Receipts 28972
Outstanding 122602 1.2.5 National Saving Certificate VI issue Receipts -4
Outstanding -155 1.2.6 National Saving Certificate VII issue Receipts -24 Outstanding -106 1.2.7 Other Certificates Outstanding 10565 1.3 Public Provident Fund Receipts 13014
Outstanding 91538
Note : Data on receipts from April 2017 are net receipts, i.e., gross receipt minus gross payment.
Source: Accountant General, Post and Telegraphs.
Occasional SeriesOccasional SeriesOccasional SeriesNo. 44: Small Savings
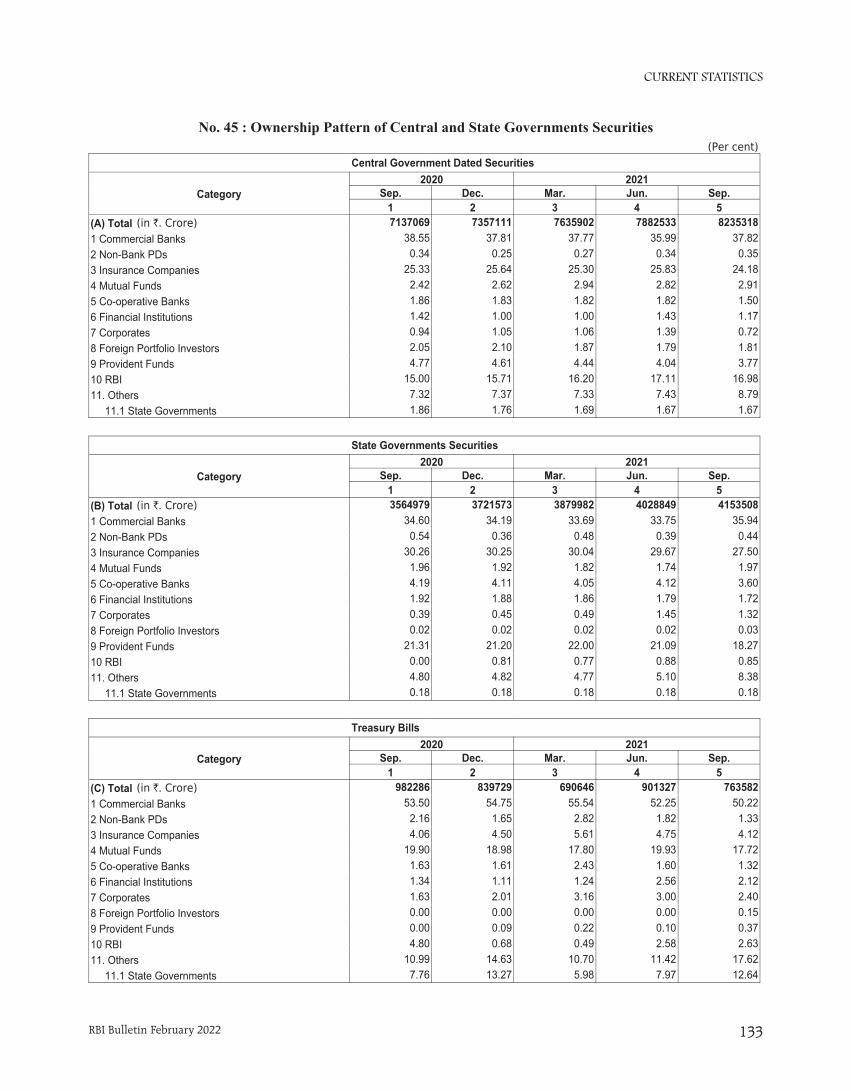
CURRENT STATISTICS
RBI Bulletin February 2022 133
TABLE 45 : OWNERSHIP PATTERN OF CENTRAL AND STATE GOVERNMENTS SECURITIES
Central Government Dated Securities
Central Government Dated Securities
Category2020 2021
Sep. Dec. Mar. Jun. Sep.1 2 3 4 5
(A) Total 7137069 7357111 7635902 7882533 82353181 Commercial Banks 38.55 37.81 37.77 35.99 37.822 Non-Bank PDs 0.34 0.25 0.27 0.34 0.353 Insurance Companies 25.33 25.64 25.30 25.83 24.184 Mutual Funds 2.42 2.62 2.94 2.82 2.915 Co-operative Banks 1.86 1.83 1.82 1.82 1.506 Financial Institutions 1.42 1.00 1.00 1.43 1.177 Corporates 0.94 1.05 1.06 1.39 0.728 Foreign Portfolio Investors 2.05 2.10 1.87 1.79 1.819 Provident Funds 4.77 4.61 4.44 4.04 3.7710 RBI 15.00 15.71 16.20 17.11 16.9811. Others 7.32 7.37 7.33 7.43 8.79 11.1 State Governments 1.86 1.76 1.69 1.67 1.67
(Per cent)
(in `. Crore)
State Development Loans
State Governments Securities
Category2020 2021
Sep. Dec. Mar. Jun. Sep.1 2 3 4 5
(B) Total 3564979 3721573 3879982 4028849 41535081 Commercial Banks 34.60 34.19 33.69 33.75 35.942 Non-Bank PDs 0.54 0.36 0.48 0.39 0.443 Insurance Companies 30.26 30.25 30.04 29.67 27.504 Mutual Funds 1.96 1.92 1.82 1.74 1.975 Co-operative Banks 4.19 4.11 4.05 4.12 3.606 Financial Institutions 1.92 1.88 1.86 1.79 1.727 Corporates 0.39 0.45 0.49 1.45 1.328 Foreign Portfolio Investors 0.02 0.02 0.02 0.02 0.039 Provident Funds 21.31 21.20 22.00 21.09 18.2710 RBI 0.00 0.81 0.77 0.88 0.8511. Others 4.80 4.82 4.77 5.10 8.38 11.1 State Governments 0.18 0.18 0.18 0.18 0.18
(in `. Crore)
Treasury Bills
Treasury Bills
Category2020 2021
Sep. Dec. Mar. Jun. Sep.1 2 3 4 5
(C) Total 982286 839729 690646 901327 7635821 Commercial Banks 53.50 54.75 55.54 52.25 50.222 Non-Bank PDs 2.16 1.65 2.82 1.82 1.333 Insurance Companies 4.06 4.50 5.61 4.75 4.124 Mutual Funds 19.90 18.98 17.80 19.93 17.725 Co-operative Banks 1.63 1.61 2.43 1.60 1.326 Financial Institutions 1.34 1.11 1.24 2.56 2.127 Corporates 1.63 2.01 3.16 3.00 2.408 Foreign Portfolio Investors 0.00 0.00 0.00 0.00 0.159 Provident Funds 0.00 0.09 0.22 0.10 0.3710 RBI 4.80 0.68 0.49 2.58 2.6311. Others 10.99 14.63 10.70 11.42 17.62 11.1 State Governments 7.76 13.27 5.98 7.97 12.64
(in `. Crore)
Notes : "-" represents nil of negligible1. The revised table format since June 2016, incorporates the ownership pattern of State Governments Securities and Treasury Bills along with the Central Government Securities.2. State Government Securities include special bonds issued under Ujwal DISCOM Assurance Yojana (UDAY) scheme. 3. Bank PDs are clubbed under Commercial Banks. However, they form very small fraction of total outstanding securities.4. The category ‘Others’ comprises State Governments, Pension Funds, PSUs, Trusts, HUF/Individuals etc.
No. 45 : Ownership Pattern of Central and State Governments Securities
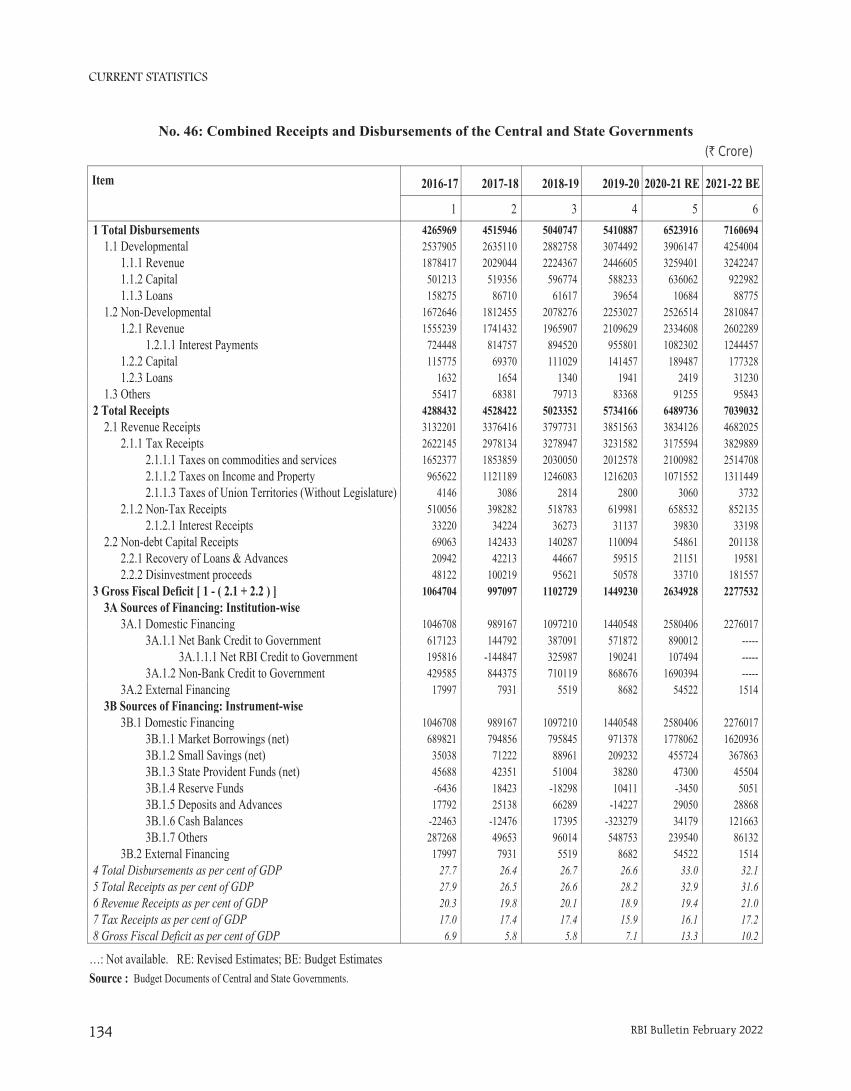
CURRENT STATISTICS
RBI Bulletin February 2022134
No. 46: Combined Receipts and Disbursements of the Central and State Governments (` Crore)
Item 2016-17 2017-18 2018-19 2019-20 2020-21 RE 2021-22 BE
1 2 3 4 5 61 Total Disbursements 4265969 4515946 5040747 5410887 6523916 7160694 1.1 Developmental 2537905 2635110 2882758 3074492 3906147 4254004 1.1.1 Revenue 1878417 2029044 2224367 2446605 3259401 3242247 1.1.2 Capital 501213 519356 596774 588233 636062 922982 1.1.3 Loans 158275 86710 61617 39654 10684 88775 1.2 Non-Developmental 1672646 1812455 2078276 2253027 2526514 2810847 1.2.1 Revenue 1555239 1741432 1965907 2109629 2334608 2602289 1.2.1.1 Interest Payments 724448 814757 894520 955801 1082302 1244457 1.2.2 Capital 115775 69370 111029 141457 189487 177328 1.2.3 Loans 1632 1654 1340 1941 2419 31230 1.3 Others 55417 68381 79713 83368 91255 958432 Total Receipts 4288432 4528422 5023352 5734166 6489736 7039032 2.1 Revenue Receipts 3132201 3376416 3797731 3851563 3834126 4682025 2.1.1 Tax Receipts 2622145 2978134 3278947 3231582 3175594 3829889 2.1.1.1 Taxes on commodities and services 1652377 1853859 2030050 2012578 2100982 2514708 2.1.1.2 Taxes on Income and Property 965622 1121189 1246083 1216203 1071552 1311449 2.1.1.3 Taxes of Union Territories (Without Legislature) 4146 3086 2814 2800 3060 3732 2.1.2 Non-Tax Receipts 510056 398282 518783 619981 658532 852135 2.1.2.1 Interest Receipts 33220 34224 36273 31137 39830 33198 2.2 Non-debt Capital Receipts 69063 142433 140287 110094 54861 201138 2.2.1 Recovery of Loans & Advances 20942 42213 44667 59515 21151 19581 2.2.2 Disinvestment proceeds 48122 100219 95621 50578 33710 1815573 Gross Fiscal Deficit [ 1 - ( 2.1 + 2.2 ) ] 1064704 997097 1102729 1449230 2634928 2277532 3A Sources of Financing: Institution-wise ----- ----- ----- ----- ----- ----- 3A.1 Domestic Financing 1046708 989167 1097210 1440548 2580406 2276017 3A.1.1 Net Bank Credit to Government 617123 144792 387091 571872 890012 ----- 3A.1.1.1 Net RBI Credit to Government 195816 -144847 325987 190241 107494 ----- 3A.1.2 Non-Bank Credit to Government 429585 844375 710119 868676 1690394 ----- 3A.2 External Financing 17997 7931 5519 8682 54522 1514 3B Sources of Financing: Instrument-wise ----- 997097 ----- ----- ----- ----- 3B.1 Domestic Financing 1046708 989167 1097210 1440548 2580406 2276017 3B.1.1 Market Borrowings (net) 689821 794856 795845 971378 1778062 1620936 3B.1.2 Small Savings (net) 35038 71222 88961 209232 455724 367863 3B.1.3 State Provident Funds (net) 45688 42351 51004 38280 47300 45504 3B.1.4 Reserve Funds -6436 18423 -18298 10411 -3450 5051 3B.1.5 Deposits and Advances 17792 25138 66289 -14227 29050 28868 3B.1.6 Cash Balances -22463 -12476 17395 -323279 34179 121663 3B.1.7 Others 287268 49653 96014 548753 239540 86132 3B.2 External Financing 17997 7931 5519 8682 54522 15144 Total Disbursements as per cent of GDP 27.7 26.4 26.7 26.6 33.0 32.15 Total Receipts as per cent of GDP 27.9 26.5 26.6 28.2 32.9 31.66 Revenue Receipts as per cent of GDP 20.3 19.8 20.1 18.9 19.4 21.07 Tax Receipts as per cent of GDP 17.0 17.4 17.4 15.9 16.1 17.28 Gross Fiscal Deficit as per cent of GDP 6.9 5.8 5.8 7.1 13.3 10.2
…: Not available. RE: Revised Estimates; BE: Budget EstimatesSource : Budget Documents of Central and State Governments.
Note : GDP data is based on 2011-12 base. GDP data from 2020-21 pertains to the Provisional Estimates of National Income released by NationalStatistical Office on May 31, 2021. GDP for 2021-22 is from Union Budget 2021-22.
Data pertains to all States and Union Territories.
Total receipts and total expenditure exclude National Calamity Contingency Fund expenditure.
1 & 2: Data are net of repayments of the Central Government (including repayments to the NSSF) and State Governments.
1.3: Represents compensation and assignments by States to local bodies and Panchayati Raj institutions.
2: Data are net of variation in cash balances of the Central and State Governments and includes borrowing receipts of the Central and StateGovernments.
3A.1.1: Data as per RBI records.
3B.1.1: Borrowings through dated securities.
3B.1.2: Represent net investment in Central and State Governments’ special securities by the National Small Savings Fund (NSSF). This data may vary from previous publications due to adjustments across components with availability of new data.3B.1.6: Include Ways and Means Advances by the Centre to the State Governments.
3B.1.7: Include Treasury Bills, loans from financial institutions, insurance and pension funds, remittances, cash balance investment account.
No. 46: Combined Receipts and Disbursements of the Central and State Governments
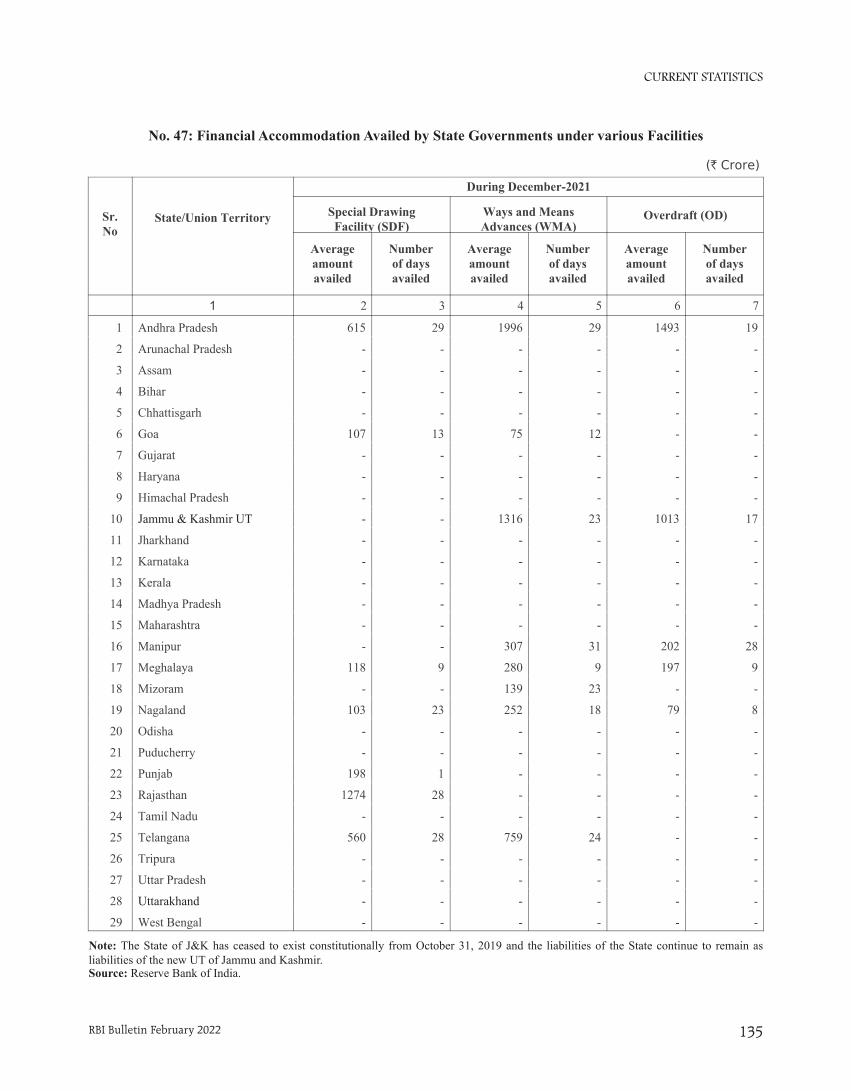
CURRENT STATISTICS
RBI Bulletin February 2022 135
No. 47: Financial Accommodation Availed by State Governments under various Facilities
Sr.No
During December-2021
State/Union Territory Special DrawingFacility (SDF)
Ways and MeansAdvances (WMA)
Overdraft (OD)
Averageamountavailed
Numberof daysavailed
Averageamountavailed
Numberof daysavailed
Averageamountavailed
Numberof daysavailed
1 2 3 4 5 6 7
1 Andhra Pradesh 615 29 1996 29 1493 19
2 Arunachal Pradesh - - - - - -
3 Assam - - - - - -
4 Bihar - - - - - -
5 Chhattisgarh - - - - - -
6 Goa 107 13 75 12 - -
7 Gujarat - - - - - -
8 Haryana - - - - - -
9 Himachal Pradesh - - - - - -
10 Jammu & Kashmir UT - - 1316 23 1013 17
11 Jharkhand - - - - - -
12 Karnataka - - - - - -
13 Kerala - - - - - -
14 Madhya Pradesh - - - - - -
15 Maharashtra - - - - - -
16 Manipur - - 307 31 202 28
17 Meghalaya 118 9 280 9 197 9
18 Mizoram - - 139 23 - -
19 Nagaland 103 23 252 18 79 8
20 Odisha - - - - - -
21 Puducherry - - - - - -
22 Punjab 198 1 - - - -
23 Rajasthan 1274 28 - - - -
24 Tamil Nadu - - - - - -
25 Telangana 560 28 759 24 - -
26 Tripura - - - - - -
27 Uttar Pradesh - - - - - -
28 Uttarakhand - - - - - -
29 West Bengal - - - - - -
(` Crore)
Notes: 1. SDF is availed by State Governments against the collateral of Consolidated Sinking Fund (CSF), Guarantee Redemption Fund (GRF) & Auction Treasury Bills (ATBs) balances and other investments in government securities.2. WMA is advance by Reserve Bank of India to State Governments for meeting temporary cash mismatches.3. OD is advanced to State Governments beyond their WMA limits.4. Average Availed is the total accommodation (SDF/WMA/OD) availed divided by number of days for which accommodation was extended during the month.5. - : Nil.6. The State of J&K has ceased to exist constitutionally from October 31, 2019 and the liabilities of the State continue to remain as liabilities of the new UT of Jammu and Kashmir.
Source: Reserve Bank of India.
Note: The State of J&K has ceased to exist constitutionally from October 31, 2019 and the liabilities of the State continue to remain as liabilities of the new UT of Jammu and Kashmir.Source: Reserve Bank of India.
No. 47: Financial Accommodation Availed by State Governments under various Facilities
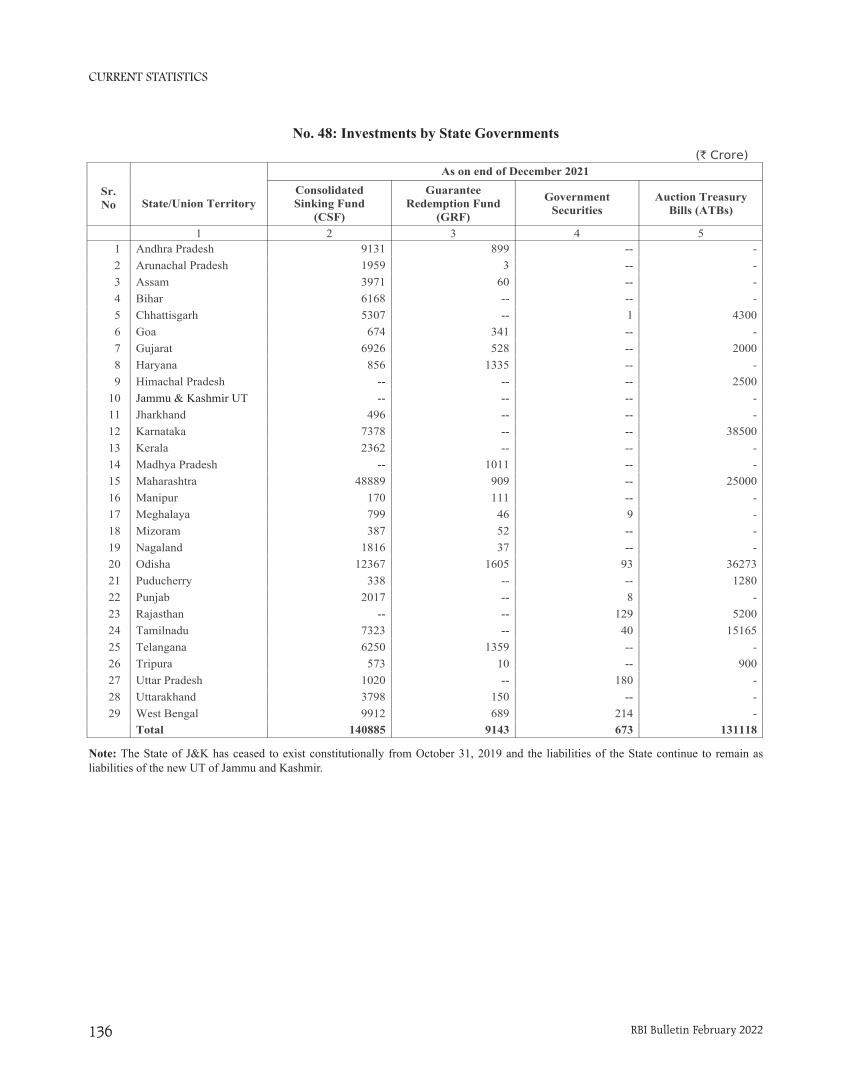
CURRENT STATISTICS
RBI Bulletin February 2022136
No. 48: Investments by State Governments
As on end of December 2021
Sr.No State/Union Territory
ConsolidatedSinking Fund
(CSF)
GuaranteeRedemption Fund
(GRF)
GovernmentSecurities
Auction TreasuryBills (ATBs)
1 2 3 4 51 Andhra Pradesh 9131 899 -- -2 Arunachal Pradesh 1959 3 -- -3 Assam 3971 60 -- -4 Bihar 6168 -- -- -5 Chhattisgarh 5307 -- 1 43006 Goa 674 341 -- -7 Gujarat 6926 528 -- 20008 Haryana 856 1335 -- -9 Himachal Pradesh -- -- -- 2500
10 Jammu & Kashmir UT -- -- -- -11 Jharkhand 496 -- -- -12 Karnataka 7378 -- -- 3850013 Kerala 2362 -- -- -14 Madhya Pradesh -- 1011 -- -15 Maharashtra 48889 909 -- 2500016 Manipur 170 111 -- -17 Meghalaya 799 46 9 -18 Mizoram 387 52 -- -19 Nagaland 1816 37 -- -20 Odisha 12367 1605 93 3627321 Puducherry 338 -- -- 128022 Punjab 2017 -- 8 -23 Rajasthan -- -- 129 520024 Tamilnadu 7323 -- 40 1516525 Telangana 6250 1359 -- -26 Tripura 573 10 -- 90027 Uttar Pradesh 1020 -- 180 -28 Uttarakhand 3798 150 -- -29 West Bengal 9912 689 214 -
Total 140885 9143 673 131118
(` Crore)
Note: 1. The State of J&K has ceased to exist constitutionally from October 31, 2019 and the liabilities of the State continue to remain as liabilities of the new UT of Jammu and Kashmir.
Note: The State of J&K has ceased to exist constitutionally from October 31, 2019 and the liabilities of the State continue to remain as liabilities of the new UT of Jammu and Kashmir.
No. 48: Investments by State Governments
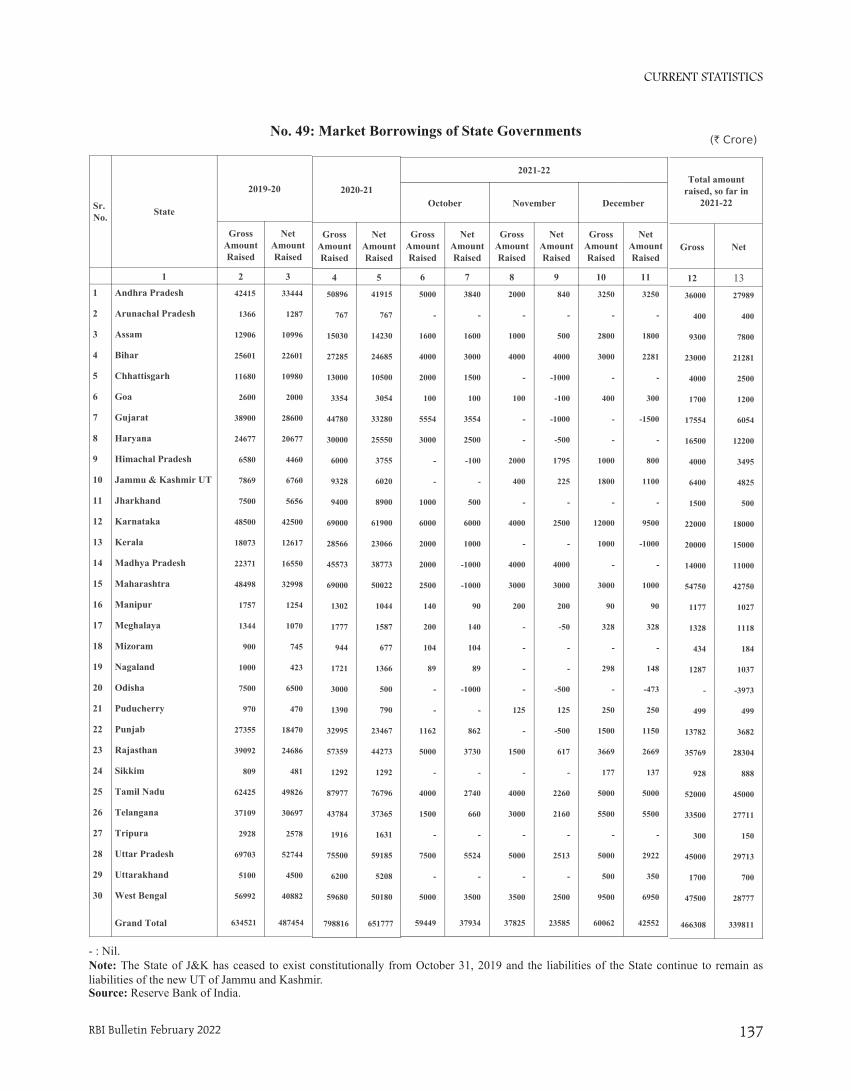
CURRENT STATISTICS
RBI Bulletin February 2022 137
No. 49: Market Borrowings of State Governments(` Crore)
- : Nil.
Total amountraised, so far in
2021-22
Gross Net
12 1336000 27989
400 400
9300 7800
23000 21281
4000 2500
1700 1200
17554 6054
16500 12200
4000 3495
6400 4825
1500 500
22000 18000
20000 15000
14000 11000
54750 42750
1177 1027
1328 1118
434 184
1287 1037
- -3973
499 499
13782 3682
35769 28304
928 888
52000 45000
33500 27711
300 150
45000 29713
1700 700
47500 28777
466308 339811
Sr. No. State
2019-20
GrossAmountRaised
NetAmountRaised
1 2 3
1 Andhra Pradesh 42415 33444
2 Arunachal Pradesh 1366 1287
3 Assam 12906 10996
4 Bihar 25601 22601
5 Chhattisgarh 11680 10980
6 Goa 2600 2000
7 Gujarat 38900 28600
8 Haryana 24677 20677
9 Himachal Pradesh 6580 4460
10 Jammu & Kashmir UT 7869 6760
11 Jharkhand 7500 5656
12 Karnataka 48500 42500
13 Kerala 18073 12617
14 Madhya Pradesh 22371 16550
15 Maharashtra 48498 32998
16 Manipur 1757 1254
17 Meghalaya 1344 1070
18 Mizoram 900 745
19 Nagaland 1000 423
20 Odisha 7500 6500
21 Puducherry 970 470
22 Punjab 27355 18470
23 Rajasthan 39092 24686
24 Sikkim 809 481
25 Tamil Nadu 62425 49826
26 Telangana 37109 30697
27 Tripura 2928 2578
28 Uttar Pradesh 69703 52744
29 Uttarakhand 5100 4500
30 West Bengal 56992 40882
Grand Total 634521 487454
2021-22
October November December
GrossAmountRaised
NetAmountRaised
GrossAmountRaised
NetAmountRaised
GrossAmountRaised
NetAmountRaised
6 7 8 9 10 11
5000 3840 2000 840 3250 3250
- - - - - -
1600 1600 1000 500 2800 1800
4000 3000 4000 4000 3000 2281
2000 1500 - -1000 - -
100 100 100 -100 400 300
5554 3554 - -1000 - -1500
3000 2500 - -500 - -
- -100 2000 1795 1000 800
- - 400 225 1800 1100
1000 500 - - - -
6000 6000 4000 2500 12000 9500
2000 1000 - - 1000 -1000
2000 -1000 4000 4000 - -
2500 -1000 3000 3000 3000 1000
140 90 200 200 90 90
200 140 - -50 328 328
104 104 - - - -
89 89 - - 298 148
- -1000 - -500 - -473
- - 125 125 250 250
1162 862 - -500 1500 1150
5000 3730 1500 617 3669 2669
- - - - 177 137
4000 2740 4000 2260 5000 5000
1500 660 3000 2160 5500 5500
- - - - - -
7500 5524 5000 2513 5000 2922
- - - - 500 350
5000 3500 3500 2500 9500 6950
59449 37934 37825 23585 60062 42552
Notes: 1. The State of J&K has ceased to exist constitutionally from October 31, 2019 and the liabilities of the State continue to remain as liabilities of the new UT of Jammu and Kashmir.
2020-21
GrossAmountRaised
NetAmountRaised
4 5
50896 41915
767 767
15030 14230
27285 24685
13000 10500
3354 3054
44780 33280
30000 25550
6000 3755
9328 6020
9400 8900
69000 61900
28566 23066
45573 38773
69000 50022
1302 1044
1777 1587
944 677
1721 1366
3000 500
1390 790
32995 23467
57359 44273
1292 1292
87977 76796
43784 37365
1916 1631
75500 59185
6200 5208
59680 50180
798816 651777
Source : Reserve Bank of India.
No. 49: Market Borrowings of State Governments
- : Nil.Note: The State of J&K has ceased to exist constitutionally from October 31, 2019 and the liabilities of the State continue to remain as liabilities of the new UT of Jammu and Kashmir. Source: Reserve Bank of India.
CURRENT STATISTICS
RBI Bulletin February 2022138
Explanatory Notes to the Current Statistics
Table No. 11.2& 6: Annual data are average of months.
3.5 & 3.7: Relate to ratios of increments over financial year so far.
4.1 to 4.4, 4.8,4.9 &5: Relate to the last friday of the month/financial year.
4.5, 4.6 & 4.7: Relate to five major banks on the last Friday of the month/financial year.
4.10 to 4.12: Relate to the last auction day of the month/financial year.
4.13: Relate to last day of the month/ financial year
7.1&7.2: Relate to Foreign trade in US Dollar.
Table No. 22.1.2: Include paid-up capital, reserve fund and Long-Term Operations Funds.
2.2.2: Include cash, fixed deposits and short-term securities/bonds, e.g., issued by IIFC (UK).
Table No. 4Maturity-wise position of outstanding forward contracts is available at http://nsdp.rbi.org.in under
‘‘Reserves Template’’.
Table No. 5 Special refinance facility to Others, i.e. to the EXIM Bank, is closed since March 31, 2013.
Table No. 6 For scheduled banks, March-end data pertain to the last reporting Friday.
2.2: Exclude balances held in IMF Account No.1, RBI employees’ provident fund, pension fund, gratuity and
superannuation fund.
Table Nos. 7 & 113.1 in Table 7 and 2.4 in Table 11: Include foreign currency denominated bonds issued by IIFC (UK).
Table No. 8NM2 and NM3 do not include FCNR (B) deposits.
2.4: Consist of paid-up capital and reserves.
2.5: includes other demand and time liabilities of the banking system.
Table No. 9Financial institutions comprise EXIM Bank, SIDBI, NABARD and NHB.
L1 and L2 are compiled monthly and L3 quarterly.
Wherever data are not available, the last available data have been repeated.
Table No. 13Data against column Nos. (1), (2) & (3) are Final and for column Nos. (4) & (5) data are Provisional.
CURRENT STATISTICS
RBI Bulletin February 2022 139
Table No. 14
Data in column Nos. (4) & (8) are Provisional.
Table No. 17
2.1.1: Exclude reserve fund maintained by co-operative societies with State Co-operative Banks
2.1.2: Exclude borrowings from RBI, SBI, IDBI, NABARD, notified banks and State Governments.
4: Include borrowings from IDBI and NABARD.
Table No. 24
Primary Dealers (PDs) include banks undertaking PD business.
Table No. 30
Exclude private placement and offer for sale.
1: Exclude bonus shares.
2: Include cumulative convertible preference shares and equi-preference shares.
Table No. 32
Exclude investment in foreign currency denominated bonds issued by IIFC (UK), SDRs transferred by Government
of India to RBI and foreign currency received under SAARC SWAP arrangement. Foreign currency assets in
US dollar take into account appreciation/depreciation of non-US currencies (such as Euro, Sterling, Yen and
Australian Dollar) held in reserves. Foreign exchange holdings are converted into rupees at rupee-US dollar RBI
holding rates.
Table No. 34
1.1.1.1.2 & 1.1.1.1.1.4: Estimates.
1.1.1.2: Estimates for latest months.
‘Other capital’ pertains to debt transactions between parent and subsidiaries/branches of FDI enterprises.
Data may not tally with the BoP data due to lag in reporting.
Table No. 35
1.10: Include items such as subscription to journals, maintenance of investment abroad, student loan repayments
and credit card payments.
Table No. 36
Increase in indices indicates appreciation of rupee and vice versa. For 6-Currency index, base year 2018-19 is a
moving one, which gets updated every year. REER figures are based on Consumer Price Index (combined). The
details on methodology used for compilation of NEER/REER indices are available in December 2005, April 2014
and January 2021 issues of the RBI Bulletin.
Table No. 37
Based on applications for ECB/Foreign Currency Convertible Bonds (FCCBs) which have been allotted loan
registration number during the period.
CURRENT STATISTICS
RBI Bulletin February 2022140
Table Nos. 38, 39, 40 & 41 Explanatory notes on these tables are available in December issue of RBI Bulletin, 2012.
Table No. 43
Part I-A. Settlement systems
1.1.3: Tri- party Repo under the securities segment has been operationalised from November 05, 2018.
Part I-B. Payments systems
4.1.2: ‘Others’ includes e-commerce transactions and digital bill payments through ATMs, etc.
4.2.2: ‘Others’ includes e-commerce transactions, card to card transfers and digital bill payments through
ATMs, etc.
5: Available from December 2010.
5.1: includes purchase of goods and services and fund transfer through wallets.
5.2.2: includes usage of PPI Cards for online transactions and other transactions.
6.1: Pertain to three grids – Mumbai, New Delhi and Chennai.
6.2: ‘Others’ comprises of Non-MICR transactions which pertains to clearing houses managed by 21 banks.
Part II-A. Other payment channels
1: Mobile Payments –
o Include transactions done through mobile apps of banks and UPI apps.
o The data from July 2017 includes only individual payments and corporate payments initiated,
processed, and authorised using mobile device. Other corporate payments which are not initiated,
processed, and authorised using mobile device are excluded.
2: Internet Payments – includes only e-commerce transactions through ‘netbanking’ and any financial
transaction using internet banking website of the bank.
Part II-B. ATMs
3.3 and 4.2: only relates to transactions using bank issued PPIs.
Part III. Payment systems infrastructure
3: Includes ATMs deployed by Scheduled Commercial Banks (SCBs) and White Label ATM Operators
(WLAOs). WLAs are included from April 2014 onwards.
Table No. 45(-): represents nil or negligible
The revised table format since June 2016, incorporates the ownership pattern of State Governments Securities
and Treasury Bills along with the Central Government Securities.
State Government Securities include special bonds issued under Ujwal DISCOM Assurance Yojana (UDAY) scheme.
Bank PDs are clubbed under Commercial Banks. However, they form very small fraction of total outstanding
securities.
The category ‘Others’ comprises State Governments, Pension Funds, PSUs, Trusts, HUF/Individuals etc.
CURRENT STATISTICS
RBI Bulletin February 2022 141
Time series data of ‘Current Statistics’ is available at https://dbie.rbi.org.in. Detailed explanatory notes are available in the relevant press releases issued by RBI and other publications/releases of the Bank such as Handbook of Statistics on the Indian Economy.
The concepts and methodologies for Current Statistics are available in Comprehensive Guide for Current Statistics of the RBI Monthly Bulletin (https://rbi.org.in/Scripts/PublicationsView.aspx?id=17618)
Table No. 46GDP data is based on 2011-12 base. GDP data from 2019-20 pertains to the Provisional Estimates of National Income released by National Statistics Office on 29th May 2020. GDP for 2020-21 is from Union Budget 2020-21.Data pertains to all States and Union Territories.Total receipts and total expenditure exclude National Calamity Contingency Fund expenditure.1 & 2: Data are net of repayments of the Central Government (including repayments to the NSSF) and State Governments.1.3: Represents compensation and assignments by States to local bodies and Panchayati Raj institutions.2: Data are net of variation in cash balances of the Central and State Governments and includes borrowing receipts of the Central and State Governments.3A.1.1: Data as per RBI records.3B.1.1: Borrowings through dated securities.3B.1.2: Represent net investment in Central and State Governments’ special securities by the National Small Savings Fund (NSSF).This data may vary from previous publications due to adjustments across components with availability of new data.3B.1.6: Include Ways and Means Advances by the Centre to the State Governments.3B.1.7: Include Treasury Bills, loans from financial institutions, insurance and pension funds, remittances, cash balance investment account.
Table No. 47SDF is availed by State Governments against the collateral of Consolidated Sinking Fund (CSF), Guarantee Redemption Fund (GRF) & Auction Treasury Bills (ATBs) balances and other investments in government securities.WMA is advance by Reserve Bank of India to State Governments for meeting temporary cash mismatches.OD is advanced to State Governments beyond their WMA limits.Average amount Availed is the total accommodation (SDF/WMA/OD) availed divided by number of days for which accommodation was extended during the month.- : Nil.
Table No. 48CSF and GRF are reserve funds maintained by some State Governments with the Reserve Bank of India.ATBs include Treasury bills of 91 days, 182 days and 364 days invested by State Governments in the primary market.--: Not Applicable (not a member of the scheme).
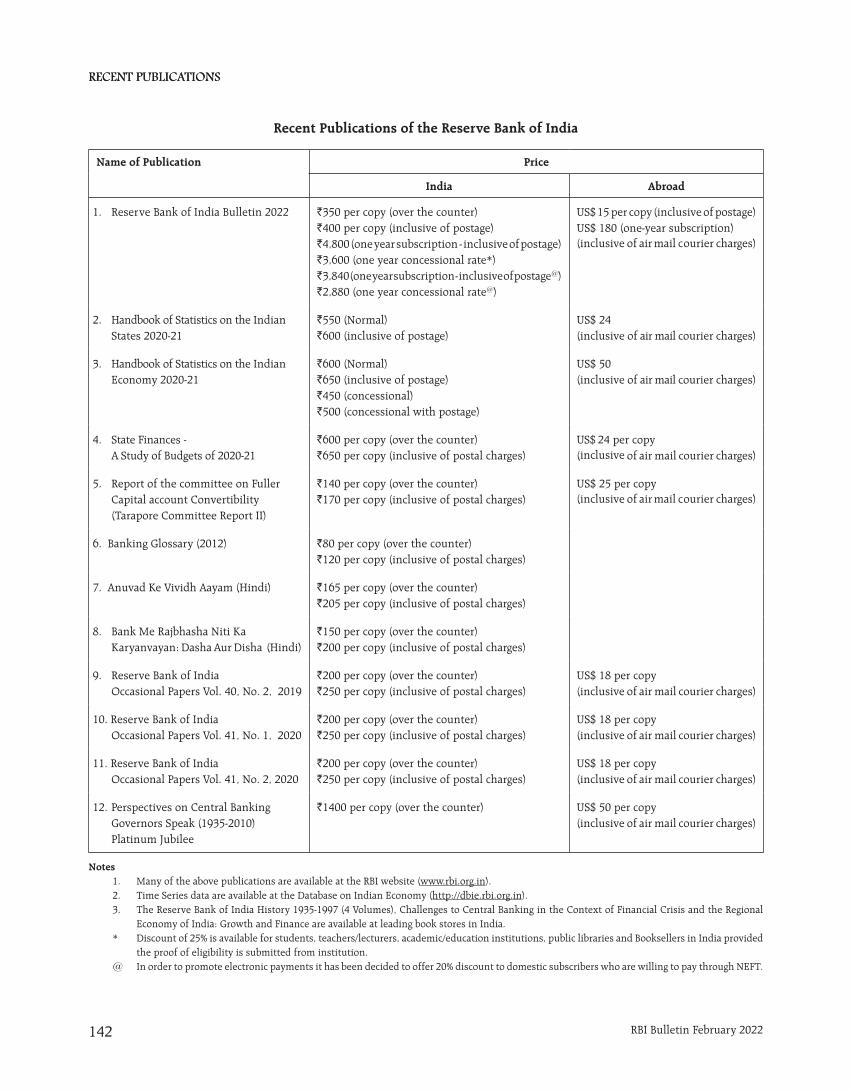
RECENT PUBLICATIONSRECENT PUBLICATIONS
142 RBI Bulletin February 2022
Name of Publication Price
India Abroad
1. Reserve Bank of India Bulletin 2022 `350 per copy (over the counter)`400 per copy (inclusive of postage)`4,800 (one year subscription - inclusive of postage)`3,600 (one year concessional rate*)`3,840 (one year subscription - inclusive of postage@)`2,880 (one year concessional rate@)
US$ 15 per copy (inclusive of postage) US$ 180 (one-year subscription)(inclusive of air mail courier charges)
2. Handbook of Statistics on the Indian States 2020-21
`550 (Normal)`600 (inclusive of postage)
US$ 24(inclusive of air mail courier charges)
3. Handbook of Statistics on the Indian Economy 2020-21
`600 (Normal)`650 (inclusive of postage)`450 (concessional)`500 (concessional with postage)
US$ 50(inclusive of air mail courier charges)
4. State Finances -A Study of Budgets of 2020-21
`600 per copy (over the counter)`650 per copy (inclusive of postal charges)
US$ 24 per copy(inclusive of air mail courier charges)
5. Report of the committee on Fuller Capital account Convertibility (Tarapore Committee Report II)
`140 per copy (over the counter)`170 per copy (inclusive of postal charges)
US$ 25 per copy(inclusive of air mail courier charges)
6. Banking Glossary (2012) `80 per copy (over the counter)`120 per copy (inclusive of postal charges)
7. Anuvad Ke Vividh Aayam (Hindi) `165 per copy (over the counter)`205 per copy (inclusive of postal charges)
8. Bank Me Rajbhasha Niti Ka Karyanvayan: Dasha Aur Disha (Hindi)
`150 per copy (over the counter)`200 per copy (inclusive of postal charges)
9. Reserve Bank of India Occasional Papers Vol. 40, No. 2, 2019
`200 per copy (over the counter)`250 per copy (inclusive of postal charges)
US$ 18 per copy(inclusive of air mail courier charges)
10. Reserve Bank of India Occasional Papers Vol. 41, No. 1, 2020
`200 per copy (over the counter)`250 per copy (inclusive of postal charges)
US$ 18 per copy(inclusive of air mail courier charges)
11. Reserve Bank of India Occasional Papers Vol. 41, No. 2, 2020
`200 per copy (over the counter)`250 per copy (inclusive of postal charges)
US$ 18 per copy(inclusive of air mail courier charges)
12. Perspectives on Central Banking Governors Speak (1935-2010) Platinum Jubilee
`1400 per copy (over the counter) US$ 50 per copy(inclusive of air mail courier charges)
Recent Publications of the Reserve Bank of India
Notes1. Many of the above publications are available at the RBI website (www.rbi.org.in).2. Time Series data are available at the Database on Indian Economy (http://dbie.rbi.org.in).3. The Reserve Bank of India History 1935-1997 (4 Volumes), Challenges to Central Banking in the Context of Financial Crisis and the Regional
Economy of India: Growth and Finance are available at leading book stores in India.* Discount of 25% is available for students, teachers/lecturers, academic/education institutions, public libraries and Booksellers in India provided
the proof of eligibility is submitted from institution.@ In order to promote electronic payments it has been decided to offer 20% discount to domestic subscribers who are willing to pay through NEFT.
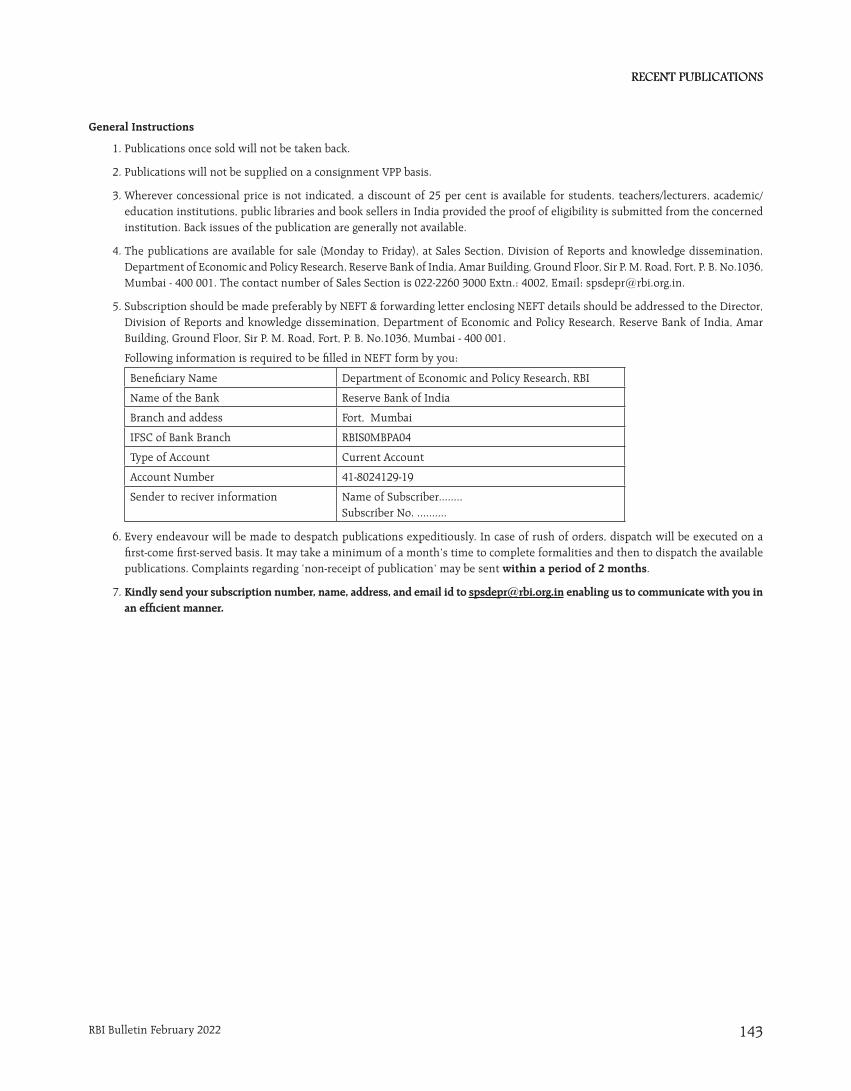
RECENT PUBLICATIONSRECENT PUBLICATIONS
143RBI Bulletin February 2022
General Instructions
1. Publications once sold will not be taken back.
2. Publications will not be supplied on a consignment VPP basis.
3. Wherever concessional price is not indicated, a discount of 25 per cent is available for students, teachers/lecturers, academic/education institutions, public libraries and book sellers in India provided the proof of eligibility is submitted from the concerned institution. Back issues of the publication are generally not available.
4. The publications are available for sale (Monday to Friday), at Sales Section, Division of Reports and knowledge dissemination, Department of Economic and Policy Research, Reserve Bank of India, Amar Building, Ground Floor, Sir P. M. Road, Fort, P. B. No.1036, Mumbai - 400 001. The contact number of Sales Section is 022-2260 3000 Extn.: 4002, Email: [email protected].
5. Subscription should be made preferably by NEFT & forwarding letter enclosing NEFT details should be addressed to the Director, Division of Reports and knowledge dissemination, Department of Economic and Policy Research, Reserve Bank of India, Amar Building, Ground Floor, Sir P. M. Road, Fort, P. B. No.1036, Mumbai - 400 001.
Following information is required to be filled in NEFT form by you:
Beneficiary Name Department of Economic and Policy Research, RBI
Name of the Bank Reserve Bank of India
Branch and addess Fort, Mumbai
IFSC of Bank Branch RBIS0MBPA04
Type of Account Current Account
Account Number 41-8024129-19
Sender to reciver information Name of Subscriber........Subscriber No. ..........
6. Every endeavour will be made to despatch publications expeditiously. In case of rush of orders, dispatch will be executed on a first-come first-served basis. It may take a minimum of a month’s time to complete formalities and then to dispatch the available publications. Complaints regarding ‘non-receipt of publication’ may be sent within a period of 2 months.
7. Kindly send your subscription number, name, address, and email id to [email protected] enabling us to communicate with you in an efficient manner.

Related Documents


