Relocation Information & Assistance 800.747.9962 CBS UCCESS . COM /R ELOCATION HOME SALES REPORT February 2017 (as of March 14, 2017)

Welcome message from author
This document is posted to help you gain knowledge. Please leave a comment to let me know what you think about it! Share it to your friends and learn new things together.
Transcript

Relocation Information & Assistance 800.747.9962CBSUCCESS.COM/RELOCATION
HOME SALES REPORT February 2017
(as of March 14, 2017)
March 14, 2017
February Home Sales Strong
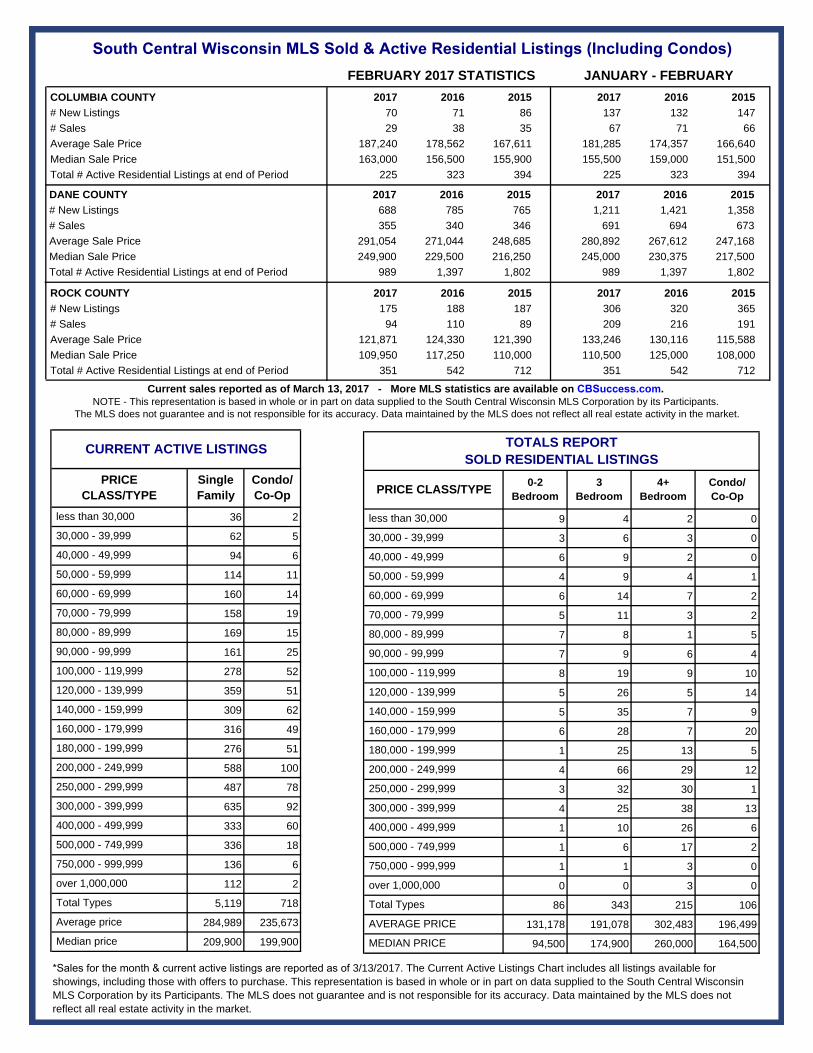
Residential single-family and condominium home sales in Dane County for the month of February were the highest since 2007 and 4.4% more than February 2016. To no one’s surprise, the monthly median sale price increased year-over-year for the 18th time in the past 19 months.
The story in the market continues to center on active inventory – or rather the significant lack thereof. The 688 new listings reported in Dane County is the lowest figure for the month since 2002. Total active listings at just 989 is the lowest number going back to 1997, which is the last year for which such records are available in the South Central Wisconsin MLS.
Currently there is a paltry 1.47 months of active inventory available for buyers to consider. Generally, 6 months of inventory is considered to represent a balanced market between buyers and sellers.
February Home Sales Report
- continued -
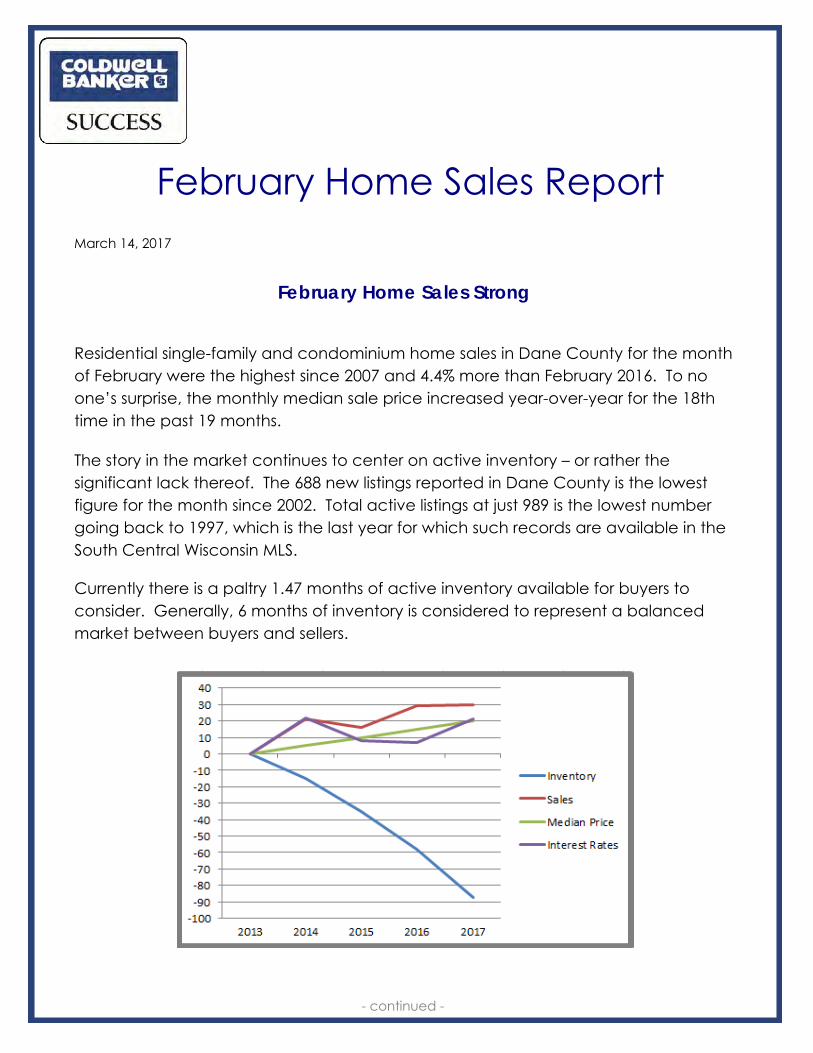
The graph on the previous page charts the percentage of change over the past 4 years with respect to sales, median sale prices, active inventory and 30-year mortgage interest rates for Dane County for the 12-month period March 1 – February 28.
As can be seen, median sale prices have had a steady increase while home sales increased just slightly this past year after a nice run. Interest rates have returned nearly to the level of February 2014. It is the dramatic decline in inventory that cannot help but be noticed.
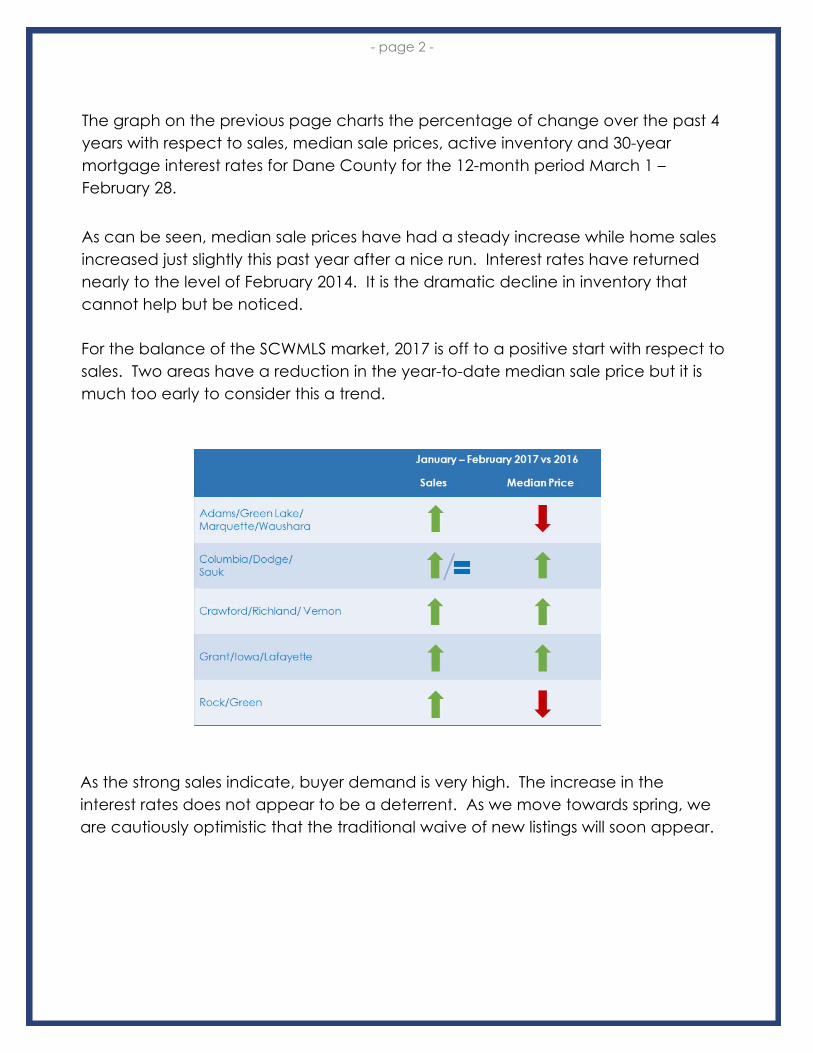
For the balance of the SCWMLS market, 2017 is off to a positive start with respect to sales. Two areas have a reduction in the year-to-date median sale price but it is much too early to consider this a trend.
As the strong sales indicate, buyer demand is very high. The increase in the interest rates does not appear to be a deterrent. As we move towards spring, we are cautiously optimistic that the traditional waive of new listings will soon appear.
- page 2 -
2017 2016 2015 2017 2016 2015
70 71 86 137 132 147
29 38 35 67 71 66
187,240 178,562 167,611 181,285 174,357 166,640
163,000 156,500 155,900 155,500 159,000 151,500
225 323 394 225 323 394
2017 2016 2015 2017 2016 2015
688 785 765 1,211 1,421 1,358
355 340 346 691 694 673
291,054 271,044 248,685 280,892 267,612 247,168
249,900 229,500 216,250 245,000 230,375 217,500
989 1,397 1,802 989 1,397 1,802
2017 2016 2015 2017 2016 2015
175 188 187 306 320 365
94 110 89 209 216 191
121,871 124,330 121,390 133,246 130,116 115,588
109,950 117,250 110,000 110,500 125,000 108,000
351 542 712 351 542 712
South Central Wisconsin MLS Sold & Active Residential Listings (Including Condos)
Average Sale Price
Median Sale Price
COLUMBIA COUNTY
# New Listings
# Sales
Average Sale Price
Median Sale Price
# New Listings
# Sales
FEBRUARY 2017 STATISTICS JANUARY - FEBRUARY
Current sales reported as of March 13, 2017 - More MLS statistics are available on CBSuccess.com.
NOTE - This representation is based in whole or in part on data supplied to the South Central Wisconsin MLS Corporation by its Participants.
The MLS does not guarantee and is not responsible for its accuracy. Data maintained by the MLS does not reflect all real estate activity in the market.
Total # Active Residential Listings at end of Period
DANE COUNTY
Total # Active Residential Listings at end of Period
Total # Active Residential Listings at end of Period
ROCK COUNTY
# New Listings
# Sales
Average Sale Price
Median Sale Price
36 2
62 5
94 6
114 11
160 14
158 19
169 15
161 25
278 52
359 51
309 62
316 49
276 51
588 100
487 78
635 92
333 60
336 18
136 6
112 2
5,119 718
284,989 235,673
209,900 199,900
Average price
less than 30,000
Condo/
Co-Op
PRICE
CLASS/TYPE
500,000 - 749,999
750,000 - 999,999
over 1,000,000
180,000 - 199,999
30,000 - 39,999
40,000 - 49,999
50,000 - 59,999
250,000 - 299,999
90,000 - 99,999
100,000 - 119,999
300,000 - 399,999
400,000 - 499,999
120,000 - 139,999
140,000 - 159,999
160,000 - 179,999
CURRENT ACTIVE LISTINGS
Single
Family
Median price
60,000 - 69,999
70,000 - 79,999
80,000 - 89,999
Total Types
200,000 - 249,999
09 4 2
6 033
0296
44 9 1
6 14 7 2
5 11 3 2
5187
497 6
8 19 9 10
5 26 5 14
5 35 7 9
6 28 7 20
1 25 13 5
4 66 29 12
3 32 30 1
4 25 38 13
1 10 26 6
1 6 17 2
0311
0 0 3 0
86 343 215 106
131,178 191,078 302,483 196,499
94,500 174,900 260,000 164,500
50,000 - 59,999
60,000 - 69,999
70,000 - 79,999
80,000 - 89,999
Condo/
Co-Op
TOTALS REPORT
SOLD RESIDENTIAL LISTINGS
over 1,000,000
Total Types
0-2
Bedroom
3
Bedroom
300,000 - 399,999
500,000 - 749,999
PRICE CLASS/TYPE
less than 30,000
30,000 - 39,999
4+
Bedroom
AVERAGE PRICE
180,000 - 199,999
200,000 - 249,999
250,000 - 299,999
90,000 - 99,999
120,000 - 139,999
140,000 - 159,999
40,000 - 49,999
100,000 - 119,999
750,000 - 999,999
160,000 - 179,999
400,000 - 499,999
MEDIAN PRICE
*Sales for the month & current active listings are reported as of 3/13/2017. The Current Active Listings Chart includes all listings available for
showings, including those with offers to purchase. This representation is based in whole or in part on data supplied to the South Central Wisconsin
MLS Corporation by its Participants. The MLS does not guarantee and is not responsible for its accuracy. Data maintained by the MLS does not
reflect all real estate activity in the market.
0
100
200
300
400
500
600
700
800
900
1000
1100
1200
1300
1400
1500
1600
1700
1800
1900
2000
2100Num
ber o
f Hom
es Sold
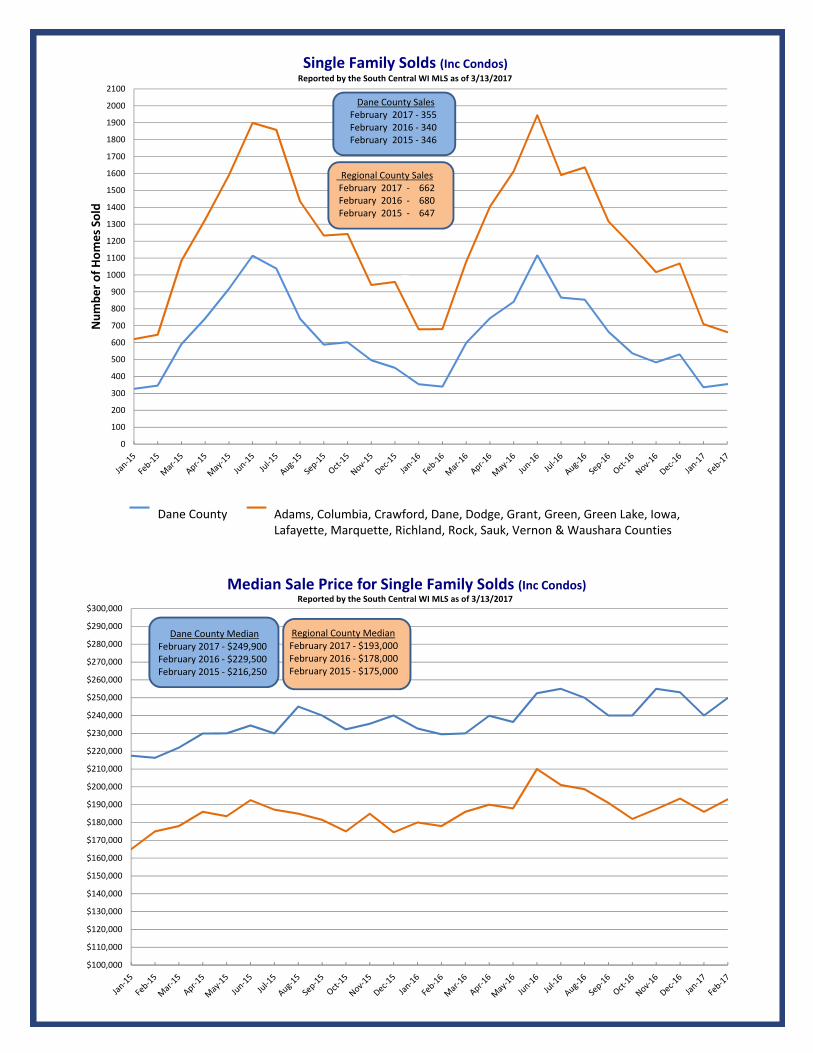
Single Family Solds (Inc Condos)Reported by the South Central WI MLS as of 3/13/2017
Dane County Adams, Columbia, Crawford, Dane, Dodge, Grant, Green, Green Lake, Iowa, Lafayette, Marquette, Richland, Rock, Sauk, Vernon & Waushara Counties
Dane County SalesFebruary 2017 ‐ 355February 2016 ‐ 340 February 2015 ‐ 346
Regional County SalesFebruary 2017 ‐ 662February 2016 ‐ 680February 2015 ‐ 647
$100,000
$110,000
$120,000
$130,000
$140,000
$150,000
$160,000
$170,000
$180,000
$190,000
$200,000
$210,000
$220,000
$230,000
$240,000
$250,000
$260,000
$270,000
$280,000
$290,000
$300,000
Median Sale Price for Single Family Solds (Inc Condos) Reported by the South Central WI MLS as of 3/13/2017
Dane County MedianFebruary 2017 ‐ $249,900February 2016 ‐ $229,500February 2015 ‐ $216,250
Regional County MedianFebruary 2017 ‐ $193,000February 2016 ‐ $178,000February 2015 ‐ $175,000
500
1,000
1,500
2,000
2,500
3,000
3,500
4,000
4,500
5,000
5,500
6,000
6,500
7,000
7,500
8,000
8,500
9,000
9,500
10,000Num
ber o
f Active Listings
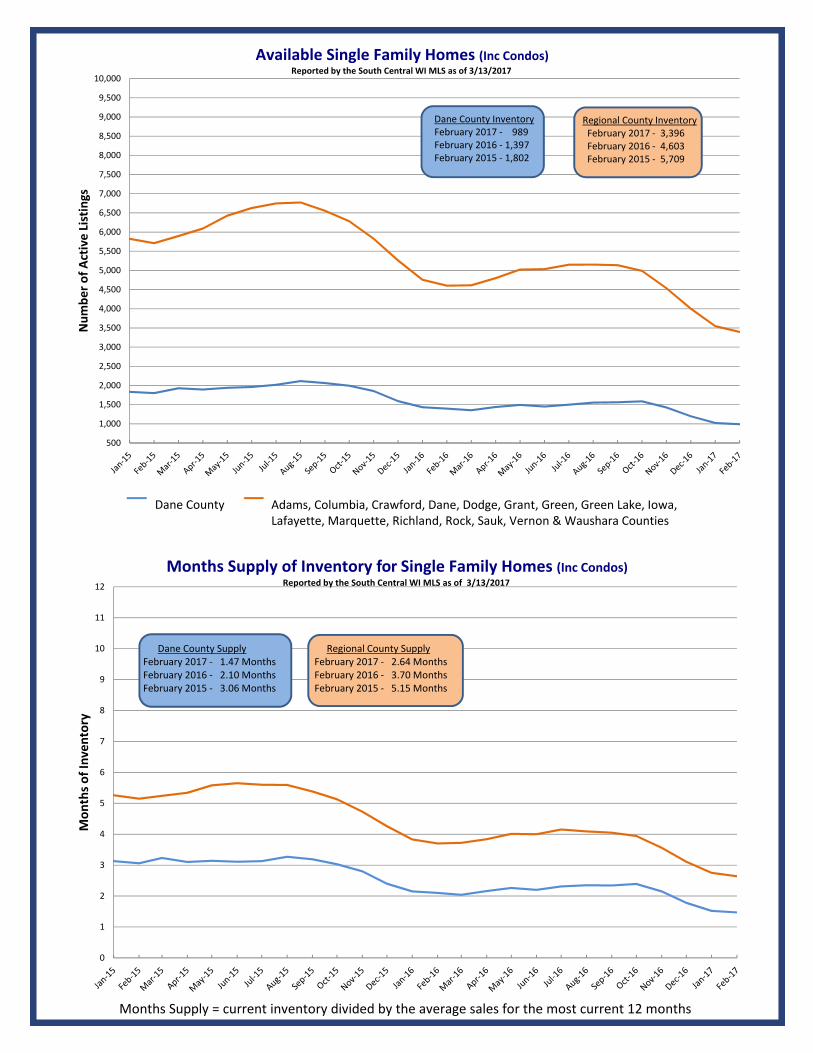
Available Single Family Homes (Inc Condos)Reported by the South Central WI MLS as of 3/13/2017
Dane County InventoryFebruary 2017 ‐ 989February 2016 ‐ 1,397February 2015 ‐ 1,802
Regional County InventoryFebruary 2017 ‐ 3,396February 2016 ‐ 4,603February 2015 ‐ 5,709
0
1
2
3
4
5
6
7
8
9
10
11
12
Mon
ths o
f Inven
tory
Months Supply of Inventory for Single Family Homes (Inc Condos)Reported by the South Central WI MLS as of 3/13/2017
Dane County SupplyFebruary 2017 ‐ 1.47 Months February 2016 ‐ 2.10 MonthsFebruary 2015 ‐ 3.06 Months
Regional County SupplyFebruary 2017 ‐ 2.64 MonthsFebruary 2016 ‐ 3.70 MonthsFebruary 2015 ‐ 5.15 Months
Months Supply = current inventory divided by the average sales for the most current 12 months
Dane County Adams, Columbia, Crawford, Dane, Dodge, Grant, Green, Green Lake, Iowa, Lafayette, Marquette, Richland, Rock, Sauk, Vernon & Waushara Counties
Market Update Video
View more Home Sales Reports &
Market Update Videos online
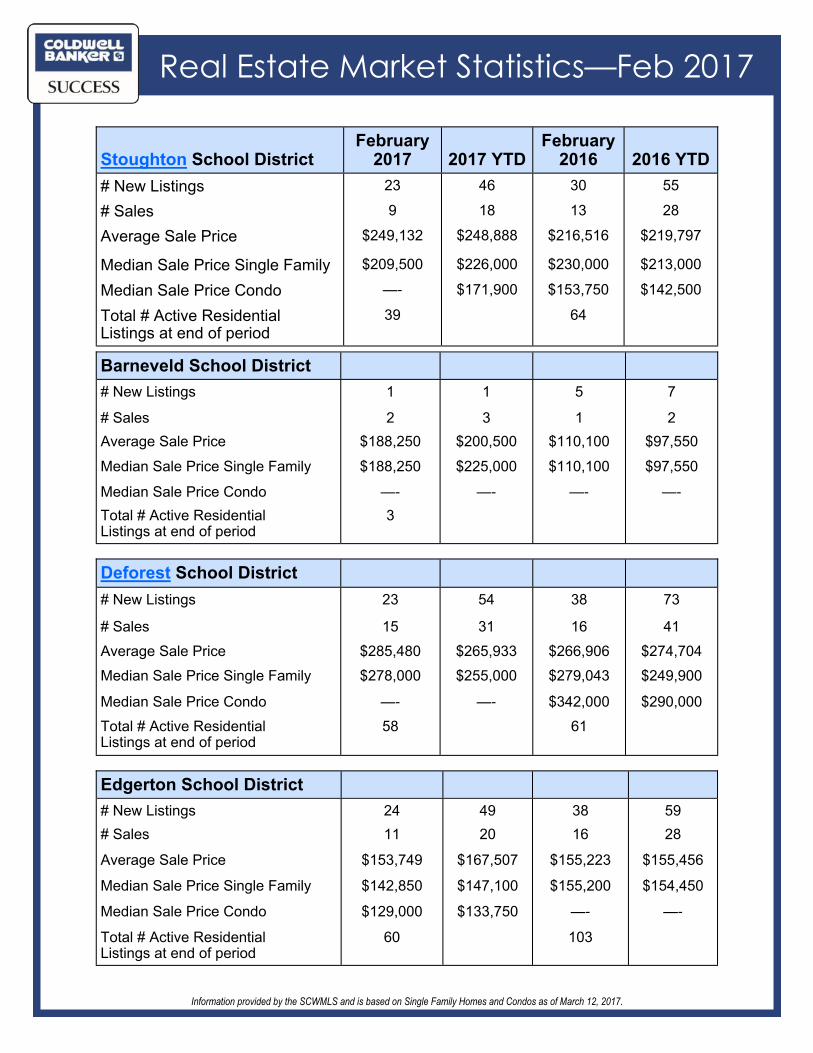
Real Estate Market Statistics—Feb 2017
Information provided by the SCWMLS and is based on Single Family Homes and Condos as of March 12, 2017.
Barneveld School District
# New Listings 1 1 5 7
# Sales 2 3 1 2
Average Sale Price $188,250 $200,500 $110,100 $97,550
Median Sale Price Single Family $188,250 $225,000 $110,100 $97,550
Median Sale Price Condo —- —- —- —-
Total # Active Residential Listings at end of period
3
Edgerton School District
# New Listings 24 49 38 59
# Sales 11 20 16 28
Average Sale Price $153,749 $167,507 $155,223 $155,456
Median Sale Price Single Family $142,850 $147,100 $155,200 $154,450
Median Sale Price Condo $129,000 $133,750 —- —-
Total # Active Residential Listings at end of period
60 103
Deforest School District
# New Listings 23 54 38 73
# Sales 15 31 16 41
Average Sale Price $285,480 $265,933 $266,906 $274,704
Median Sale Price Single Family $278,000 $255,000 $279,043 $249,900
Median Sale Price Condo —- —- $342,000 $290,000
Total # Active Residential Listings at end of period
58 61
Stoughton School District February
2017 2017 YTD February
2016 2016 YTD
# New Listings 23 46 30 55
# Sales 9 18 13 28
Average Sale Price $249,132 $248,888 $216,516 $219,797
Median Sale Price Single Family $209,500 $226,000 $230,000 $213,000
Median Sale Price Condo —- $171,900 $153,750 $142,500
Total # Active Residential Listings at end of period
39 64
Real Estate Market Statistics—Feb 2017
Information provided by the SCWMLS and is based on Single Family Homes and Condos as of March 12, 2017.
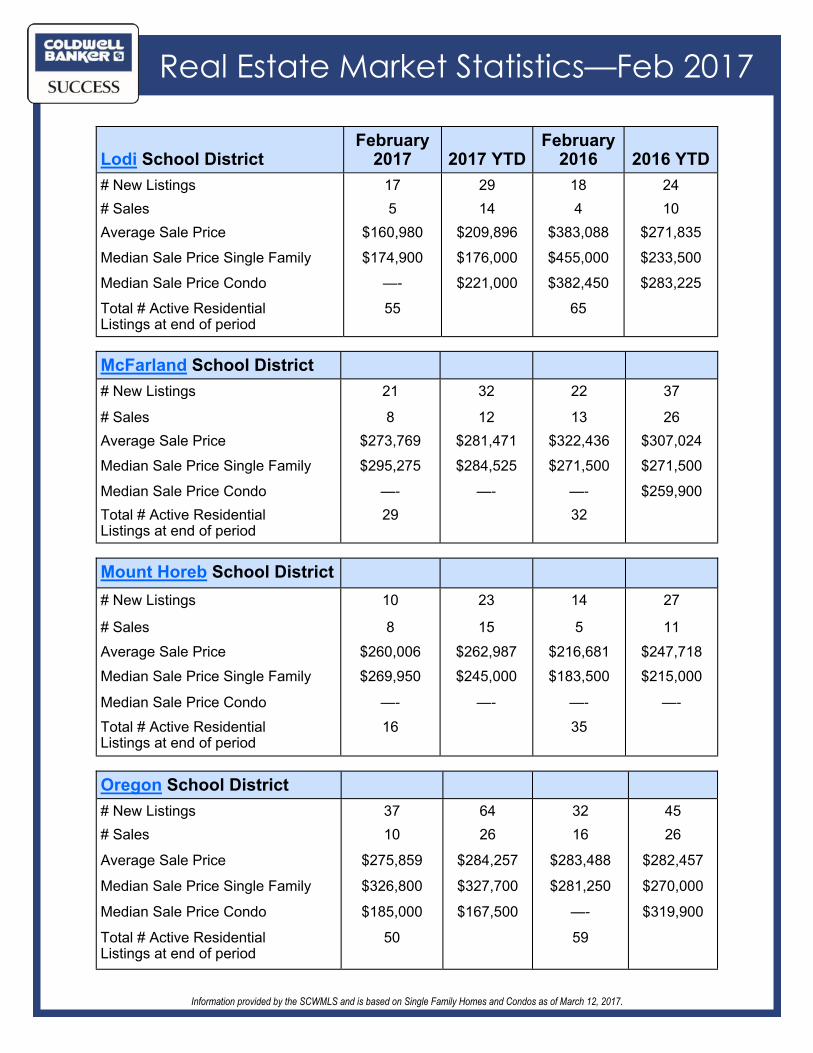
McFarland School District
# New Listings 21 32 22 37
# Sales 8 12 13 26
Average Sale Price $273,769 $281,471 $322,436 $307,024
Median Sale Price Single Family $295,275 $284,525 $271,500 $271,500
Median Sale Price Condo —- —- —- $259,900
Total # Active Residential Listings at end of period
29 32
Oregon School District
# New Listings 37 64 32 45
# Sales 10 26 16 26
Average Sale Price $275,859 $284,257 $283,488 $282,457
Median Sale Price Single Family $326,800 $327,700 $281,250 $270,000
Median Sale Price Condo $185,000 $167,500 —- $319,900
Total # Active Residential Listings at end of period
50 59
Mount Horeb School District
# New Listings 10 23 14 27
# Sales 8 15 5 11
Average Sale Price $260,006 $262,987 $216,681 $247,718
Median Sale Price Single Family $269,950 $245,000 $183,500 $215,000
Median Sale Price Condo —- —- —- —-
Total # Active Residential Listings at end of period
16 35
Lodi School District February
2017 2017 YTD February
2016 2016 YTD
# New Listings 17 29 18 24
# Sales 5 14 4 10
Average Sale Price $160,980 $209,896 $383,088 $271,835
Median Sale Price Single Family $174,900 $176,000 $455,000 $233,500
Median Sale Price Condo —- $221,000 $382,450 $283,225
Total # Active Residential Listings at end of period
55 65
Real Estate Market Statistics—Feb 2017
Information provided by the SCWMLS and is based on Single Family Homes and Condos as of March 12, 2017.
Community & Neighborhood Videos
Verona School District
# New Listings 41 69 42 80
# Sales 23 34 16 28
Average Sale Price $295,616 $331,687 $292,783 $249,136
Median Sale Price Single Family $320,000 $335,000 $312,034 $300,000
Median Sale Price Condo $175,000 $190,000 $182,000 $149,900
Total # Active Residential Listings at end of period
48 85
WI Heights School District
# New Listings 5 9 9 18
# Sales 4 5 4 9
Average Sale Price $347,734 $329,987 $121,375 $143,711
Median Sale Price Single Family $372,468 $324,937 $165,500 $172,700
Median Sale Price Condo —- —- $75,000 $75,000
Total # Active Residential Listings at end of period
15 29
Sun Prairie School District February
2017 2017 YTD February
2016 2016 YTD
# New Listings 77 122 70 130
# Sales 41 79 37 77
Average Sale Price $256,803 $251,523 $229,641 $235,627
Median Sale Price Single Family $243,950 $246,919 $218,500 $250,000
Median Sale Price Condo $162,900 $161,450 $141,500 $144,750
Total # Active Residential Listings at end of period
61 105
Real Estate Market Statistics—Feb 2017
Information provided by the SCWMLS and is based on Single Family Homes and Condos as of March 12, 2017.
Visit Coldwell Banker Success online:
CBSuccess.com
Market Update Videos
Home Sales Reports
Property Search
Find an Agent
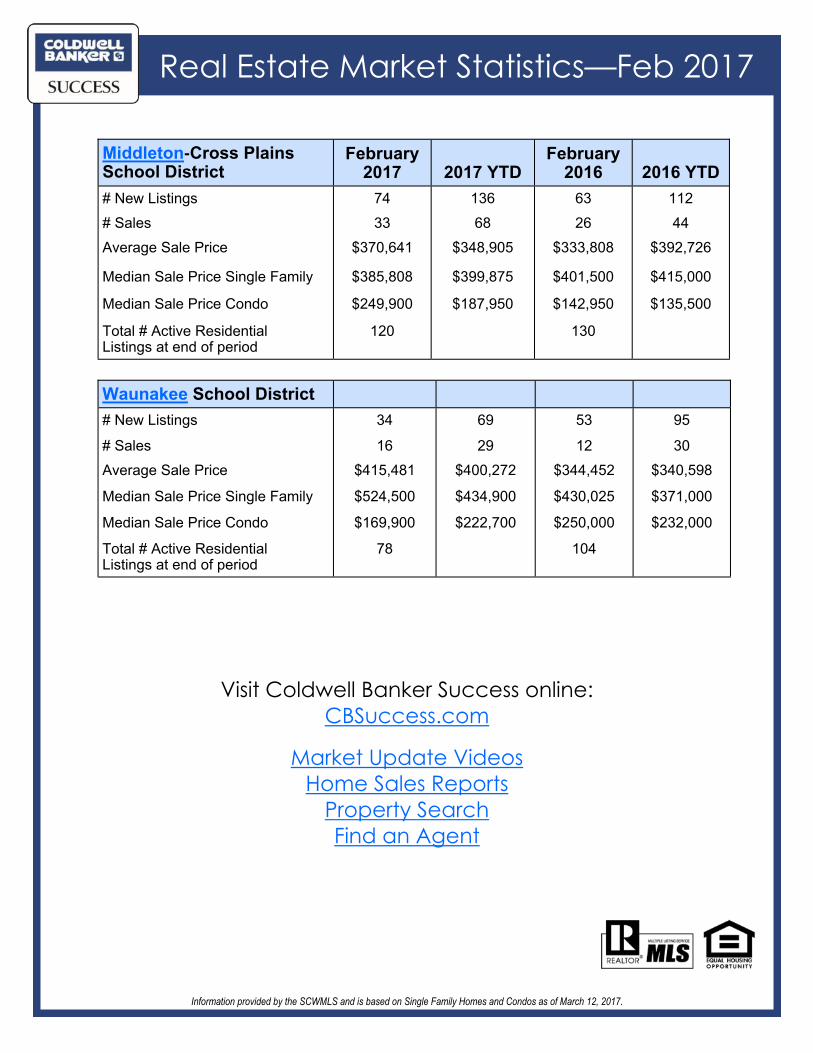
Middleton-Cross Plains School District
February 2017 2017 YTD
February 2016 2016 YTD
# New Listings 74 136 63 112
# Sales 33 68 26 44
Average Sale Price $370,641 $348,905 $333,808 $392,726
Median Sale Price Single Family $385,808 $399,875 $401,500 $415,000
Median Sale Price Condo $249,900 $187,950 $142,950 $135,500
Total # Active Residential Listings at end of period
120 130
Waunakee School District
# New Listings 34 69 53 95
# Sales 16 29 12 30
Average Sale Price $415,481 $400,272 $344,452 $340,598
Median Sale Price Single Family $524,500 $434,900 $430,025 $371,000
Median Sale Price Condo $169,900 $222,700 $250,000 $232,000
Total # Active Residential Listings at end of period
78 104
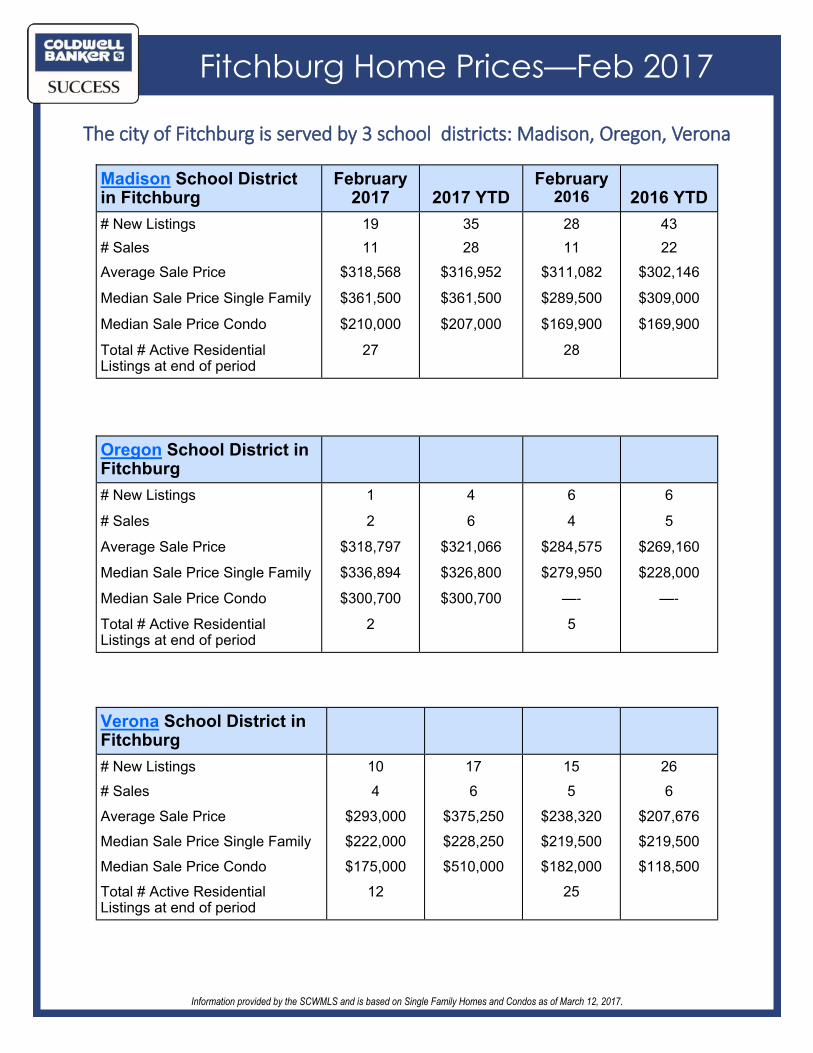
Fitchburg Home Prices—Feb 2017
Information provided by the SCWMLS and is based on Single Family Homes and Condos as of March 12, 2017.
Madison School District in Fitchburg
February 2017
2017 YTD
February 2016
2016 YTD
# New Listings 19 35 28 43
# Sales 11 28 11 22
Average Sale Price $318,568 $316,952 $311,082 $302,146
Median Sale Price Single Family $361,500 $361,500 $289,500 $309,000
Median Sale Price Condo $210,000 $207,000 $169,900 $169,900
Total # Active Residential Listings at end of period
27 28
Verona School District in Fitchburg
# New Listings 10 17 15 26
# Sales 4 6 5 6
Average Sale Price $293,000 $375,250 $238,320 $207,676
Median Sale Price Single Family $222,000 $228,250 $219,500 $219,500
Median Sale Price Condo $175,000 $510,000 $182,000 $118,500
Total # Active Residential Listings at end of period
12 25
Oregon School District in Fitchburg
# New Listings 1 4 6 6
# Sales 2 6 4 5
Average Sale Price $318,797 $321,066 $284,575 $269,160
Median Sale Price Single Family $336,894 $326,800 $279,950 $228,000
Median Sale Price Condo $300,700 $300,700 —- —-
Total # Active Residential Listings at end of period
2 5
The city of Fitchburg is served by 3 school districts: Madison, Oregon, Verona
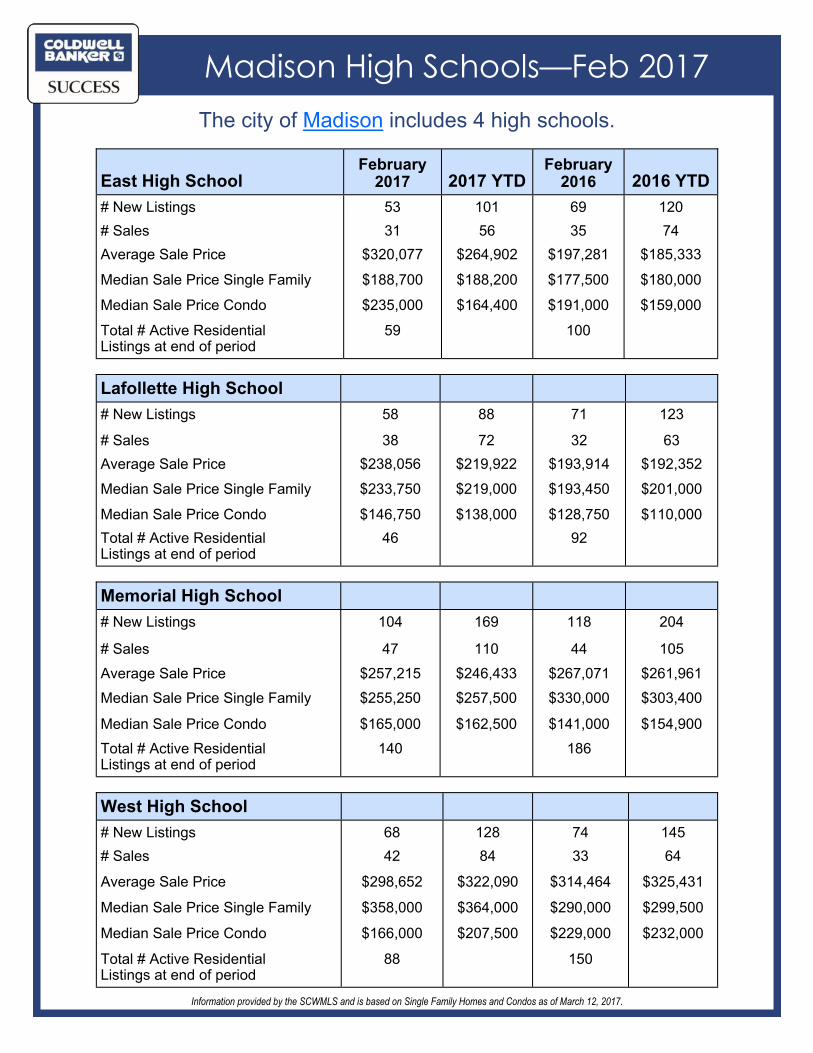
Madison High Schools—Feb 2017
Information provided by the SCWMLS and is based on Single Family Homes and Condos as of March 12, 2017.
Lafollette High School
# New Listings 58 88 71 123
# Sales 38 72 32 63
Average Sale Price $238,056 $219,922 $193,914 $192,352
Median Sale Price Single Family $233,750 $219,000 $193,450 $201,000
Median Sale Price Condo $146,750 $138,000 $128,750 $110,000
Total # Active Residential Listings at end of period
46 92
West High School
# New Listings 68 128 74 145
# Sales 42 84 33 64
Average Sale Price $298,652 $322,090 $314,464 $325,431
Median Sale Price Single Family $358,000 $364,000 $290,000 $299,500
Median Sale Price Condo $166,000 $207,500 $229,000 $232,000
Total # Active Residential Listings at end of period
88 150
Memorial High School
# New Listings 104 169 118 204
# Sales 47 110 44 105
Average Sale Price $257,215 $246,433 $267,071 $261,961
Median Sale Price Single Family $255,250 $257,500 $330,000 $303,400
Median Sale Price Condo $165,000 $162,500 $141,000 $154,900
Total # Active Residential Listings at end of period
140 186
East High School February
2017 2017 YTD February
2016 2016 YTD
# New Listings 53 101 69 120
# Sales 31 56 35 74
Average Sale Price $320,077 $264,902 $197,281 $185,333
Median Sale Price Single Family $188,700 $188,200 $177,500 $180,000
Median Sale Price Condo $235,000 $164,400 $191,000 $159,000
Total # Active Residential Listings at end of period
59 100
The city of Madison includes 4 high schools.
Related Documents