Feature integration in human vision Ilmari Kurki Department of Psychology University of Helsinki Finland Academic dissertation to be publicly discussed, by due permission of the Faculty of Behavioural Sciences at the University of Helsinki in Auditorium XV at the Main Building on the 12th of December, 2009 at 10 o’clock UNIVERSITY OF HELSINKI Department of Psychology Studies 63: 2009

Welcome message from author
This document is posted to help you gain knowledge. Please leave a comment to let me know what you think about it! Share it to your friends and learn new things together.
Transcript

Feature integration in human vision
Ilmari Kurki
Department of Psychology
University of Helsinki
Finland
Academic dissertation to be publicly discussed, by due permission of the Faculty of Behavioural Sciences
at the University of Helsinki in Auditorium XV at the Main Building on the 12th of December, 2009 at 10 o’clock
UNIVERSITY OF HELSINKI
Department of Psychology
Studies 63: 2009
2
Supervisors: Docent Jussi Saarinen
Department of Psychology
University of Helsinki, Finland
Professor Aapo Hyvärinen
Department of Mathematics and Statistics, Department of Computer
Science, Department of Psychology and Helsinki Institute of
Information Technology
University of Helsinki, Finland
Reviewers: Professor Lynn Olzak
Department of Psychology
Miami University, Oxford (OH), USA
Docent Simo Vanni
Low Temperature Laboratory,
Helsinki University of Technology, Finland
Opponent: Professor Dennis Levi
School of Optometry,
University of California, Berkeley (CA), USA

3
Contents
Abstract ........................................................................................................................... 4 Tiivistelmä ....................................................................................................................... 5 Acknowledgments ........................................................................................................... 6 List of original publications ........................................................................................... 7 1 Introduction ................................................................................................................. 8
1.1 From early features to configurations, surfaces and shapes ................................... 8 1.2 Background ............................................................................................................. 9
1.2.1 Processing in the primary visual cortex ........................................................... 9 1.2.2 Object recognition in extrastriate areas ......................................................... 11
1.3 Feature integration in early- and mid-vision psychophysics ................................ 12 1.3.1 Contrast detection and collinear facilitation .................................................. 12 1.3.2 Integration of surface brightness ................................................................... 14 1.3.3 Form integration in Glass patterns ................................................................ 16
2 The aims of the studies .............................................................................................. 19 3 Methods & results ...................................................................................................... 20
3.1 Classification image method ................................................................................ 20 3.1.1 Non-linear classification images ................................................................... 22
3.2 General experimental methods ............................................................................. 23 3.2.1 Subjects and apparatus................................................................................... 23
3.3 Study I: Mechanisms of collinear facilitation....................................................... 24 3.3.1 Stimuli, procedure and data analysis ............................................................. 24 3.3.2 Results ........................................................................................................... 25
3.4 Study II: Edge integration and brightness perception ......................................... 28 3.4.1 Stimuli, procedure and data analysis ............................................................. 29 3.4.2 Results ........................................................................................................... 31
3.5 Studies III & IV: Form integration in Glass patterns .......................................... 34 3.5.1 Stimuli and procedure .................................................................................... 35 3.5.2 Results ........................................................................................................... 37
4 Discussion ................................................................................................................... 40 4.1 Mechanisms of Collinear facilitation ................................................................... 40 4.2 Edge integration and brightness perception.......................................................... 41 4.3 Feature integration in Glass patterns .................................................................... 42
5 Conclusions ................................................................................................................ 44 7 References................................................................................................................... 45

4
Abstract The earliest stages of human cortical visual processing can be conceived as extraction of local stimulus features. However, more complex visual functions, such as object recognition, require integration of multiple features. Recently, neural processes underlying feature integration in the visual system have been under intensive study. A specialized “mid-level” stage preceding the object recognition stage has been proposed to account for the processing of contours, surfaces and shapes as well as configuration.
This thesis consists of four experimental, psychophysical studies on human visual feature integration. In two studies, classification image – a recently developed psychophysical reverse correlation method – was used. In this method visual noise is added to near-threshold stimuli. By investigating the relationship between random features in the noise and observer’s perceptual decision in each trial, it is possible to estimate what features of the stimuli are critical for the task. The method allows visualizing the critical features that are used in a psychophysical task directly as a spatial correlation map, yielding an effective “behavioral receptive field”.
Visual context is known to modulate the perception of stimulus features. Some of these interactions are quite complex, and it is not known whether they reflect early or late stages of perceptual processing. The first study investigated the mechanisms of collinear facilitation, where nearby collinear Gabor flankers increase the detectability of a central Gabor. The behavioral receptive field of the mechanism mediating the detection of the central Gabor stimulus was measured by the classification image method. The results show that collinear flankers increase the extent of the behavioral receptive field for the central Gabor, in the direction of the flankers. The increased sensitivity at the ends of the receptive field suggests a low-level explanation for the facilitation.
The second study investigated how visual features are integrated into percepts of surface brightness. A novel variant of the classification image method with brightness matching task was used. Many theories assume that perceived brightness is based on the analysis of luminance border features. Here, for the first time this assumption was directly tested. The classification images show that the perceived brightness of both an illusory Craik-O’Brien-Cornsweet stimulus and a “real” uniform step stimulus depends solely on the border. Moreover, the spatial tuning of the features remains almost constant when the stimulus size is changed, suggesting that brightness perception is based on the output of a single spatial frequency channel.
The third and fourth studies investigated global form integration in random-dot Glass patterns. In these patterns, a global form can be immediately perceived, if even a small proportion of random dots are paired to dipoles according to a geometrical rule. In the third study the discrimination of orientation structure in highly coherent concentric and Cartesian (straight) Glass patterns was measured. The results showed that the global form was more efficiently discriminated in concentric patterns. The fourth study investigated how form detectability depends on the global regularity of the Glass pattern. The local structure was either Cartesian or curved. It was shown that randomizing the local orientation deteriorated the performance only with the curved pattern. The results give support for the idea that curved and Cartesian patterns are processed in at least partially separate neural systems.

5
Tiivistelmä Varhaisin ihmisen kortikaalinen näkötiedon käsittely voidaan ymmärtää kuvainformaation paikallisten alkeispiirteiden koodaamisena. Monimutkaisemmat visuaaliset toiminnot, kuten esineiden havaitseminen edellyttävät useiden alkeispiirteiden integroimista. Viime aikoina aihetta on tutkittu intensiivisesti ja on esitetty, että piirteiden integraatio tapahtuu varsinaista objektintunnistusta varhaisempien ”keskitason” neuraalisten mekanismien avulla. Näiden mekanismien ajatellaan vastaavan mm. ääriviivojen, pintojen, konfiguraation ja muotojen hahmottamisesta.
Tässä väitöskirjassa tutkitaan visuaalisten piirteiden integraatiota ihmisen näköhavainnossa kokeellisesti psykofysiikan avulla. Kahdessa osatutkimuksessa käytetään viime aikoina psykofysiikassa kehitettyä käänteiskorrelaatioon perustuvaa luokittelukuva-menetelmää. Lähellä havaintokynnystä olevan ärsykkeen päälle lisätään satunnaiskohinaa. Tutkimalla kohinan sisältämien satunnaisten piirteiden vaikutusta kunkin koekerran havaintopäätökseen voidaan päätellä, mitä visuaalisia piirteitä havaintotehtävän suorittamisessa käytetään. Menetelmällä voidaan visualisoida havaintotehtävän suorituksen kannalta kriittiset piirteet korrelaatiokarttana tai ”behavioraalisena reseptiivinä kenttänä”.
Visuaalisen kontekstin tiedetään vaikuttavan siihen, kuinka yksittäiset piirteet havaitaan. Osa interaktioista on varsin monimutkaisia, ja on epäselvää, millä näkötiedon prosessoinnin tasolla ne tapahtuvat. Ensimmäisessä osatutkimuksessa tutkittiin kollineaarista fasilitaatiota, jossa lähelle asetetut kollineaariset sivumaskit parantavat keskellä olevan Gabor-ärsykkeen havaittavuutta. Luokittelukuvamenetelmää käytettiin keskellä olevan Gabor-ärsykkeen detektiosta vastaavan mekanismin behavioraalisen reseptiivisen kentän mittaamiseen. Tulokset osoittavat, että kollineaariset sivumaskit lisäävät behavioraalisen reseptiivisen kentän pituutta sivumaskien suuntaan. Parantunut herkkyys reseptiivisen kentän päissä viittaa siihen, että fasilitaatio tapahtuu matalan tason prosessoinnissa.
Toisessa osatutkimuksessa tutkittiin miten visuaaliset piirteet integroidaan pinnan kirkkauden havainnossa. Luokittelukuvamenetelmää sovellettiin uudella tavalla käyttämällä pinnan kirkkauden arviointitehtävää. Monet teoriat olettavat, että kirkkaushavainto perustuu pinnan reunojen piirteiden analyysiin. Tutkimuksessa oletusta testattiin ensimmäistä kertaa suoraan. Tulokset osoittivat, että sekä tasaisen pinta-ärsykkeen että illusorisen Craik-O’Brien-Cornsweet pinnan kirkkaus integroidaan yksinomaan reuna-informaation perusteella. Lisäksi piirteiden avaruudellinen skaala pysyy lähes vakiona kun ärsykkeen kokoa kasvatetaan, viitaten siihen, että kirkkaushavainto käsitellään ainoastaan yhdellä paikkataajuuskanavalla.
Kolmannessa ja neljännessä osatutkimuksessa tutkittiin kokonaismuotojen havaitsemista satunnaispisteistä muodostuvissa Glass-ärsykkeissä. Kolmannessa osatutkimuksessa mitattiin orientaatiorakenteen erotuskyky koherenteilla konsentrisillä (ympyrän muotoisilla) ja suorilla Glass-ärsykkeillä. Tulokset osoittivat, että kokonaismuoto voitiin havaita paremmin konsentrisillä ärsykkeillä. Neljännessä tutkimuksessa tutkittiin kuinka havaittavuus riippuu ärsykkeen säännönmukaisuudesta. Paikallinen rakenne oli joko kaareva tai suora. Paikallisen orientaation satunnaistaminen heikensi vain kaarevien muotojen havaitsemista Tämä antaa tukea näkemykselle, jonka mukaan kaarevat ja suorat muodot integroidaan ainakin osin eri neuraalisten järjestelmien avulla.

6
Acknowledgments The present study was carried out in the Visual Science Group of the Department of
Psychology in University of Helsinki as a joint project between Department of
Psychology and Neuroinformatics research group of Helsinki Institute of Information
Technology and Finnish Centre of Excellence for Algorithmic Data Analysis. I
gratefully acknowledge the financial support from the Academy of Finland (project
#203344) that enabled me to spend three years as a full-time researcher.
I feel very privileged to have two excellent advisors to whom I am deeply grateful
for superb guidance. Without inspiration and support from Docent Jussi Saarinen I
probably had not ever done a PhD thesis on visual perception. Professor Aapo
Hyvärinen’s guidance was crucial in introducing me to reverese-correlation methods
that were used in this thesis.
I remember warmly our past principal investigator, Docent Pentti Laurinen (1945-
2009). His strive for high scientific standards, originality and clear thinking has made
this research group very stimulating working environment. I express my warmest thanks
to Tarja Peromaa for the essential methodological and technical guidance and many
discussions that have improved my work. Many thanks for discussions and comments to
my other colleagues and friends who have been associated with this research group:
Viljami Salmela, Toni Saarela, Maria Olkkonen, Markku Kilpeläinen, Lari Vainio,
Lauri Nurmela, Miika Pihlaja and Kaisa Tiippana. I thank also my other colleagues at
the Department of Psychology for generating an ambitious working environment.
I am very grateful for Professor Lynn Olzak and Docent Simo Vanni for reviewing
my thesis and Kimmo Alho for being my supervising Professor.
I thank my parents Merja and Markku and my sister Inkeri for support and
encouragement they have provided through my life. I want also say thanks to my all my
friends both in Finland and abroad. Lastly, I thank my darling Sofi for her endless
support at every stage of this project.
7
List of original publications
I Kurki, I., Hyvärinen, A. & Laurinen, P. (2006). Collinear context (and learning)
change the profile of the perceptual filter. Vision Research, 46, 2009-14.
II Kurki, I., Peromaa, T., Saarinen, J. & Hyvärinen, A. (2009). Visual features
underlying perceived brightness as revealed by classification images. PLoS
ONE, 4, e7432.
III Kurki, I. & Saarinen, J. (2004). Shape perception in human vision: specialized
detectors for concentric spatial structures? Neuroscience Letters, 360, 100-2.
IV Kurki, I. & Saarinen, J. (2004). Detection of irregular spatial structures. Spatial
Vision, 19, 375-88.
The articles are reprinted with the permission of the copyright holders.

8
1 Introduction
1.1 From early features to configurations, surfaces and shapes
The first neural representation of the visual world is in the retina, where photoreceptors
sample the local illumination. The light pattern in the image is highly dependent on
lighting sources and shadows that provide no information about identity of objects.
Depending on the viewpoint and the distance, objects project to different locations, at
different angles and sizes on the retina. Higher visual functions like object recognition,
on the other hand are (generally) invariant of proximal aspects of stimulus such as
location, size and by and large, orientation. Recognition is possible from photographs,
line drawings, abstract paintings and caricatures, even when the physical signals bear
little similarity to the actual object, suggesting a higher level, abstract analysis of the
stimulus information. Computational theories of vision (Marr, 1982) suggest that this is
achieved by a series of processing stages where the representation of the scene becomes
increasingly symbolic.
Processing in the early vision is often conceived as coding of the retinal
representation by a set of elementary stimulus features. Cells in the primary visual
cortex can be conceived as neural filters selective to certain local features (roughly:
orientation and width) of the stimulus in a very limited spatial area. However, it is
evident that even for the most basic visual functions; this analysis is just the first step.
For example, contour curvature is not determined by any single orientation in the visual
field, but rather by the relative orientation of successive contour elements. Neural
computation of such higher-level features requires integration of responses over a
population of early filters.
It has become commonplace to think that the extraction of configural information
and integration of global structure in the spatial vision is done by at least somewhat
specialized a neural system, loosely termed mid-level vision (Loffler, 2008). The idea of
specific integrative functions in vision dates back to Gestalt school of psychology in the
early 1900s famous for the “laws” of perceptual organization (Westheimer, 1999). It
was demonstrated that the visual system tends to perceive isolated elements in the
stimulus as groups. Various aspects, such as the distance between the elements or their
similarity dramatically change the way the elements are grouped.
9
Compared to a fairly good understanding of the early vision, very little is known
about feature integration processes and representation in the mid-level vision. In this
thesis, results of four psychophysical investigations on feature integration in three
different tasks and domains are presented. Study I investigates contextual effects in
presumably low-level feature detection task. Study II investigates what visual features
determine the surface brightness. Integration of surfaces is assumed to happen in the
stages immediately following the early feature analysis. Studies III and IV investigated
the integration of local orientation signals to global forms by using Glass patterns.
A special emphasis is in the recent reverse-correlation based classification image
method (Eckstein & Ahumada, 2002). This method enables the direct measuring and
visualizing of the stimulus information that the visual system uses in a perceptual task,
deriving a behavioral receptive field. The method was used in the studies I and II.
1.2 Background
1.2.1 Processing in the primary visual cortex
Since the pioneering studies by Hubel and Wiesel (1959; 1962) it has become well
established that neurons in the primary visual cortex (V1) analyze the local orientation
and the spatial frequency content of the stimulus. Cells are excited by light patterns
(bar) that match the cell’s preferred orientation and spatial frequency (bar width). A
class of cells called simple cells show linear summation of the light pattern in the
receptive field that consists of distinct excitatory and inhibitory areas. The receptive
field structure of simple cells is often modeled by Gabor functions (Marcelja, 1980).
Another class of cells, complex cells do not sum light linearly, but respond to both light
increments and decrements while having similar orientation and spatial frequency
selectivity as simple cells. In mathematical terms, they show phase invariance. By using
linear systems theory, Campbell and associates (Campbell & Green, 1965; Campbell &
Robson, 1968) introduced the view that early processing can be understood as a local
Fourier analysis in which the stimulus is processed in multiple spatial resolutions
(spatial frequency channels) and orientations in a spatially localized manner.
There is a remarkable agreement between psychophysical system-level analysis of
stimulus detectability and electrophysiological recordings on the properties of the early
neural filters (De Valois & De Valois, 1988). Both psychophysical grating contrast
detection tasks and neurophysiological data suggest that early neural filters show almost

10
linear summation of the stimulus information in the receptive field, followed by a
nonlinear transducer function. The transducer is assumed to have a sigmoid shape:
therefore the contrast discrimination thresholds drop in comparison to the detection
threshold in very low baseline (pedestal) contrasts, referred often to as dipper effect
(Foley & Legge, 1981).
In this “classical” view of the V1 processing, the neural filters process only very
local stimulus information and all the integrative functions take place in subsequent
stages of vision. However, since 1980’s it has become clear that even when the stimuli
outside the classical receptive field does not drive the cell, it may change the way it is
activated by a stimulus in the receptive field. Psychophysical studies have shown that a
high-contrast surround grating decreases the perceived contrast of the central grating
(Cannon & Fullenkamp, 1991; Chubb, Sperling, & Solomon, 1989; Foley, 1994; Olzak
& Laurinen, 1999). Similarly, in contrast discrimination a simple transducer model falls
short of explaining the masker orientation effects in contrast discrimination (Foley,
1994).
Neurophysiological animal studies have shown that placing a stimulus outside the
classical receptive field typically suppresses the neuron’s response to the stimulus in the
receptive field [e.g. (Maffei & Fiorentini, 1976); for a review see (Series, Lorenceau, &
Fregnac, 2003)]. These interactions have been modeled by assuming that neuron’s
response depends on two mechanisms: an excitatory center mechanism corresponding to
the classical receptive field and spatially much larger, and more broadly tuned
inhibitory surround mechanism (Carandini, Heeger, & Movshon, 1997; Cavanaugh,
Bair, & Movshon, 2002; DeAngelis, Freeman, & Ohzawa, 1994; Sceniak, Hawken, &
Shapley, 2001). Many models assume that the nature of the suppression is divisive
(Carandini et al., 1997; Cavanaugh et al., 2002). According to one conceptualization,
the surrounds acts as a normalization mechanism, by regulating the cells response by the
integrated response of local cell population (Heeger, 1992).
The surround has shown to have a broad spatial frequency and orientation tuning. It
has been shown that in humans the suppression in V1 is the most likely neural substrate
for the perceptual suppression (Zenger-Landolt & Heeger, 2003). The surround
mechanism, however, may involve a feedback loop from higher visual areas (Angelucci
et al., 2002; Schwabe, Obermayer, Angelucci, & Bressloff, 2006).

11
1.2.2 Object recognition in extrastriate areas
In macaque monkey the neural stream involved in object and shape recognition runs
from V1 to V2 to V4 and further visual areas in inferior temporal cortex showing
selectivity for very complex feature combinations, for example stimuli resembling
monkey faces (Kobatake & Tanaka, 1994). Similar areas have also been identified in
humans with fMRI (see Kanwisher & Yovel, 2006).
Processing in the middle stages of the object recognition stream, especially area V4
has been linked to integration of features in the mid-level vision. V4 cells are known to
have large receptive fields (Gallant, Braun, & Van Essen, 1993; Pasupathy & Connor,
2001) and show transformation invariance to the absolute position of the stimulus in the
receptive field. Kobatake and Tanaka (1994) sought for the critical stimulus features
that activate V4 cells. They first showed pictures of natural objects to find out what
complex stimulus activates the cell maximally. Then, they removed step-by-step
features present in the stimulus to find the simplest feature configuration that still
activates the cell maximally. These responses were further compared with simple
stimuli like light bars. It was found out that a sizable proportion of the cells in V4
responded best to rather complex features containing multiple orientations, for example
crosses and circular patterns.
Gallant et al. (Gallant et al., 1993; Gallant, Connor, Rakshit, Lewis, & Van Essen,
1996) used Cartesian straight (“linear”) and polar (concentric and radial) gratings to
characterize V4 processing, motivated by the finding that cells in the early visual areas
prefer linear gratings. Theoretical considerations (Dodwell, 1983) suggest that radial
and concentric forms could be used for shape representation. It was found 16- 17 %
cells in V4 were more sensitive to either concentric or radial gratings than to linear
gratings, whereas very few cells showed preference for linear gratings. Thus the cells in
V4 are involved in a more complex analysis of form than early visual areas and show
less preference for linear forms. In another study (David, Hayden, & Gallant, 2006),
linearized spectral reverse correlation was used to estimate the Fourier power spectrum
of the stimulus features that drive V4 cells. It was found that receptive fields had a very
broad spatial frequency and orientation tuning. Bimodal orientation tuning, i.e.
responding best to a stimulus that have more than one orientation was common.
Another approach to V4 processing was taken by Pashupathy and Connor (1999;
2001) who investigated V4 shape representation by a set of contour features (angles and

12
curves). The properties of contour features (such as convexity/concavity, acuteness and
contour feature orientation) were systematically varied to measure a cell’s tuning. A
large majority of V4 cells responded more strongly to shape primitives than to simple
bars or edge stimuli. Many (about 30 %) of the cells showed systematic tuning for
contour feature parameters. A combined sensitivity to the contour feature components
could not explain the tuning, as was shown by permuting the positions of the component
features (Pasupathy & Connor, 2001). In addition to the specificity to a single feature,
many cells are modulated by the other features along the shape. However, individual V4
neurons are typically not selective to any specific global shape (Pasupathy & Connor,
2001; Pasupathy & Connor, 2002; Pasupathy & Connor, 2002).
Currently, it is not well known, how closely the neural circuits for shape processing
in macaque V4 resemble the structure of the human brain, as the human homologue of
macaque V4 is unclear (Orban, Van Essen, & Vanduffel, 2004).
1.3 Feature integration in early- and mid-vision psychophysics
1.3.1 Contrast detection and collinear facilitation
In the “classical view” of early vision, neural filters were thought to code the
elementary features independent of each other. However, complex perceptual
interactions between elementary stimulus features have been reported even in simple
detection and discrimination tasks, presumably reflecting the earliest cortical
processing. Polat and Sagi (1993; 1994a) measured psychophysically the contrast
detection thresholds for a small Gabor patch with spatially displaced, high-contrast
Gabor masks, flankers. Flanker location, orientation and the global configuration as well
as the relative position of the flankers and the target were varied.
It was found that when the flankers were added next to the target Gabor, they
suppressed the sensitivity to the Gabor largely irrespective of orientation, similarly to
what was previously found in grating surround suppression studies. However, placing
flankers further apart caused facilitation i.e. an increase in the detectability, compared to
the baseline with no flankers. The facilitation was specific to the spatial frequency and
the relative orientation of the flankers and the target. The facilitation was prominent
only in collinear (coaxial) configuration (figure 1 A), whereas orthogonal (1 B) or
parallel (1 C) flankers had little effect to the detectability.

Figure 1. Stimulus configuration
thresholds for the central Gabor
between the masks and the central Gabor (expressed as wavelength ) was varied as well as the relative
orientation between the target and the flankers.
configuration (A) when d > 2 whereas orthogonal
The most pronounced facilitation was found at flanker
but the effect was measurable to distances as long as 9
effects were reported later from single
Kasamatsu, & Norcia, 1998)
& Norcia, 1998).
The range and independence of the target phase
long-range configuration specific, excitatory interactions between neural filters. It was
suggested that the possible
primary visual cortex (Polat & Sagi, 1993; Polat & Sagi, 1994b)
have shown that there are orientation specific, long
between V1 cells (Gilbert & Wiesel, 1983; Gilbert & Wiesel, 1
1982)1. It was suggested that the long
feature integration, for example in contour integration
bridging the contour caps (Polat & Sagi, 1993; Polat & Sagi, 1994b)
Excitatory long-range interactions between the neural filters sensitive to the flankers
and the target have been modeled by assuming that the flankers increase the sensitivity
of the filters sensitive to the central Gabor 1 Note however that a more recent study suggests more l
connections (Angelucci et al., 2002)
13
. Stimulus configurations in the lateral masking paradigm (Polat & Sagi, 1993)
for the central Gabor were measured with static high-contrast flanker masks. Distance
between the masks and the central Gabor (expressed as wavelength ) was varied as well as the relative
orientation between the target and the flankers. Facilitation of the detection was observed with collinear
whereas orthogonal (B) and parallel (C) masks had little effect.
most pronounced facilitation was found at flanker-target distances around 2.5
the effect was measurable to distances as long as 9 (Polat & Sagi, 1993)
were reported later from single-cell recordings (Polat, Mizobe, Pettet,
Kasamatsu, & Norcia, 1998) as well as from VEP studies (Polat & Norcia, 1996; Polat
independence of the target phase, was interpreted as evidence for
specific, excitatory interactions between neural filters. It was
suggested that the possible neural substrate could be the horizontal connections in
(Polat & Sagi, 1993; Polat & Sagi, 1994b). Anatomical studies
have shown that there are orientation specific, long-range horizontal
(Gilbert & Wiesel, 1983; Gilbert & Wiesel, 1989; Rockland & Lund,
. It was suggested that the long range collinear facilitation may be involved in
feature integration, for example in contour integration (Polat & Bonneh, 2000)
(Polat & Sagi, 1993; Polat & Sagi, 1994b).
range interactions between the neural filters sensitive to the flankers
and the target have been modeled by assuming that the flankers increase the sensitivity
of the filters sensitive to the central Gabor (Adini, Sagi, & Tsodyks, 1997; Chen &
a more recent study suggests more limited functional range for the horizontal
(Angelucci et al., 2002)
(Polat & Sagi, 1993). Detection
ast flanker masks. Distance d
between the masks and the central Gabor (expressed as wavelength ) was varied as well as the relative
acilitation of the detection was observed with collinear
had little effect.
target distances around 2.5 – 3
(Polat & Sagi, 1993). Similar
(Polat, Mizobe, Pettet,
(Polat & Norcia, 1996; Polat
nterpreted as evidence for
specific, excitatory interactions between neural filters. It was
neural substrate could be the horizontal connections in
Anatomical studies
horizontal connections
989; Rockland & Lund,
cilitation may be involved in
(Polat & Bonneh, 2000) and
range interactions between the neural filters sensitive to the flankers
and the target have been modeled by assuming that the flankers increase the sensitivity
(Adini, Sagi, & Tsodyks, 1997; Chen &
mited functional range for the horizontal

14
Tyler, 2001; Chen & Tyler, 2002; Chen & Tyler, 2008; Zenger & Sagi, 1996). Often,
only filters at the location of the central Gabors are thought to convey the detection.
However, some studies have asked, whether excitatory interactions between the
neural filters have to be assumed at all. Solomon, Watson and Morgan (1999) proposed
that the non-optimal neural filters located between the target and the flankers may get a
weak signal from the flankers while also being sensitive to the target, even when the
flankers and the target are quite far away. The weak activation from the flankers acts
like the low-contrast pedestal stimulus in the dipper effect, thus explaining the collinear
facilitation without interactions between the filters. The model could explain the effect
of flankers with opposite phase (Solomon et al., 1999).
It is known that one fundamental limiting factor in visual pattern detection is the
uncertainty of the exact stimulus parameters (Pelli, 1985). The problem in the lateral
masking paradigm is that in addition to low-level factors, the high-contrast collinear
flankers may give cues about the location, spatial frequency and orientation of the target
compared to no-flankers condition. It has been proposed that high-level uncertainty
reduction might explain the facilitation (Williams & Hess, 1998).
Further, it has been argued that collinear contrast facilitation and contour integration
are not related processes, since contour integration is largely independent of the contrast
code (Hess, Dakin, & Field, 1998; Williams & Hess, 1998). Collinear facilitation may
be highly dependent on the specific stimulus configuration, as adding non-collinear
flankers cancels the facilitation (Solomon & Morgan, 2000). Some studies have even
suggested that collinear effects are restricted to patterns near the detection threshold
(Meese, Hess, & Williams, 2001)
1.3.2 Integration of surface brightness
Surfaces are among the most important building blocks of the visual world. However,
neural filters in the early visual areas are very sensitive to luminance differences but
typically give no response to uniform illumination (Hubel & Wiesel, 1959). It is often
assumed that the surface information is not explicitly presented in the early cortical
stages (V1), but is integrated from the early neural filter responses in the subsequent
processing [for attempts to localize the locus see for example: (Cornelissen, Wade,
Vladusich, Dougherty, & Wandell, 2006; Morrone & Burr, 1988; Perna, Tosetti,
Montanaro, & Morrone, 2005)]

15
Many models of brightness perception suggest that surface brightness information is
extrapolated from the border responses, either by an active filling-in process (Grossberg
& Todorovic, 1988) or by a symbolic interpretation of “edge” and “bar” border
responses (Morrone & Burr, 1988). Borders typically have a broad spatial frequency
band, whereas neural filters are narrowly tuned to spatial frequency. This raises the
question how the border information at different spatial scales is integrated in the
surface representation.
The structure of luminance borders can dramatically change the perceived brightness
of the surface. This is demonstrated in the illusory Craik-O’Brien-Cornsweet surface
(figure 2 A). A bright, homogenous surface is seen even when there is no increment in
the physical luminance outside the border area. Similarly, in the simultaneous contrast
illusion (figure 2 B) the background luminance modulates the brightness of identical
patches.
Figure 2. Brightness illusions show that the border structure generates and changes the perceived
brightness. A: Craik-O’Brien-Cornsweet illusion. Slowly changing luminance gradient generates an
illusion of a uniform bright surface, even when there is no physical increment in the middle of the surface
(intensity profile shown in the bottom). B: Simultaneous contrast illusion. Two patches have identical
physical luminance, but the patch on the dark background (right) appears brighter than the patch on the
bright background (left).

16
1.3.3 Form integration in Glass patterns
Integration of elementary features to global forms has been investigated by form
integration tasks. The most intensively studied class of form stimuli are the Glass
patterns (Glass, 1969). They are composed of random dots. A proportion of dots are
paired to form dipoles according to a certain geometrical rule (e.g. rotation, Cartesian
translation2). Even when the local structure consists of just random dots, the global form
is immediately perceived (figure 2).
Figure 3. Glass patterns. A geometrically translated (here: rotation) copy (B) is made of a random dot-
pattern (A). When superimposed with the original image, structure can be perceived (C) even when the
image contains just random dots.
The perception of global structure in the Glass stimulus implies that noisy local
orientation signals are integrated into a global form. The number of all dot pairings in a
pattern consisting of n dots is n(n-1)/2, but the number of “signal dipoles” is at most
n/2. The problem is how to find the “correct” signal dipoles and omit the dipoles at
random orientations. In spatial frequency domain, Glass patterns are broad band
stimulus, but only certain spatial scales (determined by the dot separation) contain the
orientation structure of the target and thus a problem in a filter-based stimulus analysis
is to find the relevant spatial scale (see e.g. Dakin, 1997).
Early studies suggested that the perception of Glass patterns was based on computing
the local spatial autocorrelation between the dots. The first stage was assumed to be
conveyed by V1 simple cells. The perception of the pattern is more difficult when the
separation between the dots is larger (Glass, 1969; Glass & Perez, 1973). If the dots
pairs in signal dipoles are of opposing polarity, the pattern cannot be seen (Glass & 2 In the original studies III and IV pattern with Cartesian translation is referred as linear.

17
Switkes, 1976). A competing hypothesis (Stevens, 1978) was that the integration of the
dipole orientation was done by an explicit grouping process, namely the nearest
neighborhood matching in a higher “symbolic” level. However, the detectability (d') of
the structure in Glass patterns followed Weber’s function of signal to noise ratio, and it
was shown to be possible even when there were 6-10 random dots closer than the
“correct” counterpart. This provided strong support to the idea that the structure
extraction is done by a local autocorrelation process, such as linear filtering (Maloney,
Mitchison, & Barlow, 1987) .
Current models of Glass pattern perception suggest that the first stage of processing
consists of filtering the stimulus by linear neural filters. Some models postulate
sophisticated algorithms which find the correct scale containing the signal (Dakin,
1997). However, recent models have shifted the focus away from the scale selection
problem. Instead of a general pattern detector they suggest that different geometric
translations are detected by specialized mechanisms.
The idea of a special mechanism was first proposed on the basis of spatial integration
results (Wilson, Wilkinson, & Asaad, 1997; Wilson & Wilkinson, 1998). It was
reported that concentric and radial Glass patterns show very strong area summation
(improvement of detectability when increasing the pattern size), whereas Cartesian
patterns show summation only with the smallest stimulus sizes (see however: Dakin &
Bex, 2003b; Kurki, Laurinen, Peromaa, & Saarinen, 2003). In addition, profoundly
lower thresholds were reported with concentric and radial (whole) patterns than with
translational patterns (Wilson et al., 1997; Wilson & Wilkinson, 1998).
The results were modeled by a filter-rectify-filter model, where in the second stage
linear and concentric patterns are integrated by different neural mechanisms. In the
mechanism sensitive to concentric orientation, the outputs of large second-order filters
are summed across the orientations (Wilson et al., 1997; Wilson & Wilkinson, 1998).
Support for concentric and radial detectors also comes from spiral Glass patterns
studies, showing that detection of spiral forms is inferior to concentric or radial (Seu &
Ferrera, 2001).
However, the stimuli used by Wilson et al. contained a possible artifact: the dots in
translational pattern cause a problem in the edge of the stimulus, since the translated
dots fall off from the original random dot area. The edge of the translated stimulus is
therefore jagged. This problem does not exist in a concentric pattern, since the dots are
always translated inside the stimulus area (Dakin & Bex, 2002). Dakin and Bex (2002)

18
used stimuli, where this edge artifact was controlled, either by using a square window or
by adding random dots to the background of the stimulus. The results showed no
difference in thresholds for concentric and translational patterns.

19
2 The aims of the studies Studies I and II used the new classification image method that allows direct estimation
of behavioral receptive field: a spatial correlation map of the stimulus features that are
used for perceptual decisions.
Study I investigated how the local collinear context (collinear flankers) changes
sensitivity to a Gabor stimulus in a detection task, presumably reflecting information
processing in the early visual areas. The classification image method was used to
measure behavioral receptive fields for a Gabor target and the same target, flanked by
two collinear high-contrast Gabor flankers.
Study II estimated, using the classification image method with a novel brightness
matching task, what stimulus features of a surface stimulus are critical for the perceived
brightness. Both “real”, step and illusory stimuli were used. Further, the size of the
target stimulus was varied, in order to see whether the results are determined by tuning
of low-level spatial frequency channel(s).
Studies III and IV used Glass patterns to investigate detection and integration of
spatial forms.
Study III investigated how highly visible forms are processed in a task, where
subjects had to discriminate highly coherent Glass patterns. Both Cartesian translational
and Polar concentric geometrical transformations were used to test the idea that they are
processed in separate neural systems.
Study IV tested the idea that linear and concentric (curved) forms are processed in
separate systems and the concentric form requires integration over larger area, thus
showing a greater dependency on the global form. Form integration was investigated by
introducing “irregularity” to the global form. Glass patterns were divided into patches,
which each had independently randomized local orientation (either: curved or
translational). The number of stimulus patches was varied.

20
3 Methods & results
3.1 Classification image method
In studies I and II a psychophysical reverse-correlation method known as classification
images was used3 (Ahumada & Beard, 1999; Beard & Ahumada, 1998; Chung, Levi, &
Tjan, 2005; Eckstein & Ahumada, 2002; Gold, Murray, Bennett, & Sekuler, 2000; Levi
& Klein, 2003; Li, Levi, & Klein, 2004; Neri & Heeger, 2002; Neri & Levi, 2006;
Solomon, 2002; Tjan & Nandy, 2006). The aim of this method is to directly estimate
what information in the stimulus correlates with the perceptual decision (e.g. seeing the
target stimulus) and thus estimate a systems-level “behavioral receptive field” for the
target stimulus and the task (e.g. detection, discrimination or assessing the brightness).
The result, a classification image, can be presented as a correlation map in the spatial
domain, revealing directly what features in the stimuli are important for the task. Key
benefits of the method are (1) the ability to measure the sensitivity of the perceptual
mechanism directly in the spatial domain (versus for example the spatial frequency
domain in the critical band masking paradigm); (2) relatively few a priori assumptions
about the observer have to be made (versus for example adaptation or spatial frequency
masking paradigm) and (3) the performance can be quantified and compared by a
mathematically exactly defined ideal observer.
Classification image analysis can, in principle, be applied to any psychophysical task
where visual noise added to the target has an effect. For simplicity, let us assume that
contrast detection task is used. On each trial, there is a 50 % change that a constant
target stimulus (e.g. Gabor patch) is presented, masked with white noise or white noise
without target. The stimuli are static, discretely sampled (pixels) that vary along the
luminance axis. Stimulus information can be expressed as (two dimensional) matrices of
local contrast relative to the mean luminance, negative values meaning decrements and
positive values increments. On each trial, the subject reports whether s/he saw the target
by answering either “yes” or “no”. The target contrast has been set to the detection
threshold so that both correct and incorrect responses are obtained.
The signal detection theory proposes that the outcome of the perceptual processing in
a detection task can be modeled by a one-dimensional variable, which represents the
(subjective) likelihood of the target being present (Green & Swets, 1974). Subject 3 The method is also known as noise image classification: psychophysical reverse-correlation

21
responds “yes”, if the value of this response variable exceeds a subjective criterion and
“no” otherwise. The subjective criterion is dependent on non-perceptual factors, such as
the subjective estimate of the likelihood of the target. It is often illustrative to think that
the observer’s response variable is the output of a single “perceptual mechanism” under
study. The classification image technique is easiest to understand if we assume that the
perceptual mechanism has a linear response to the stimulus information, as is often the
case especially in the early vision. In this case, the mechanism responds by weighting
the stimulus information by weights determined by the receptive field profile and then
summing the output.
Let us consider the influence of just a single pixel. The luminance in the pixel is the
sum of the random value of the noise mask and the fixed luminance value of the target,
either present or not. There are the following possibilities: (1) the pixel is not used for
the perceptual decision (2) the pixel is used for the perceptual decision and the
behavioral receptive field as a positive weight; an increment in this pixel “drives” the
perceptual mechanism, i.e. makes a “yes” response more likely. (3) The pixel is used for
the perceptual decision and the receptive field has a negative weight; a decrement is in
this pixel drives the perceptual mechanism. In case (1) obviously, whatever value the
noise has, it does not bear consequences for the decision. In case (2), if the random
value of the noise is positive (increment) it adds up to the value of the target and drives
the mechanism more, i.e. increases the possibility of “yes” response. If the value of the
noise is negative (decrement) it subtracts from the value of the target and lessens the
possibility of a “yes” response. Thus, there is a positive correlation between the pixels
luminance value and the “yes” response. In the case (3), the relation is opposite:
negative values in the noise add up to decrements in the stimulus and increase the
probability of a “yes” response and vice versa. Therefore, the correlation is negative.
When there are more pixels, the response is dependent on how the information from
individual pixels is integrated in the perceptual mechanism. Most often it is simply
assumed that the perceptual mechanism has a purely linear response (equation 1): every
pixel in the stimulus is first weighted by the weight of the receptive field and then
summed.

22
In order to estimate the weights a technique resembling linear regression can be used.
Since all the pixels in the random noise are mutually independent, the estimation
formula is particularly simple. A standard way to estimate classification image C, an
estimator for the behavioral receptive field is to take the average (overline) of the noise
masks N, classified by the trial types and outcomes.
In the equation (2), a denotes a subject’s response “yes” (a1) and ”no” (a0) and t the
target presence present t1 and absent t0 (Ahumada, 2002). This estimation formula
maximizes the expected signal-to-noise ratio of the estimated receptive field (Murray,
Bennett, & Sekuler, 2002). Thus, to see what common features all the noise masks that
cause “yes” responses have, the averages of the noise masks where the subject reported
seeing the target (whether it was present or not) are added together. The averages of the
noise masks where the subject reported that no target was present are then subtracted
from this. It should be noted that target profile is not used in the analysis, classification
images are averages of classified random noise. The two-alternative forced choice
method can be analyzed in similar way, computing first the pixel-wise difference
between the noise masks containing the target and the noise mask containing the
comparison stimulus and then subtracting the average of noise in incorrect trials from
the average noise in correct trials (Abbey & Eckstein, 1999).
3.1.1 Non-linear classification images
It can be shown that the linear perceptual mechanism with a receptive field profile
matching the target stimulus profile is the ideal strategy for detecting a “constant” signal
in white noise when its properties are known exactly (Green & Swets, 1974). For many
stimuli and paradigms an assumption of perfect knowledge may be unrealistic. A very
general limit in detection comes from an inability to focus optimally on the target
information: often subjects behave as if they were uncertain of the exact properties of
the stimulus, responding “yes” not only to target waveform, but all similar stimuli even
when they are able to discriminate them in a discrimination task (Pelli, 1985). For

23
example, if the target is at Gabor at [0,0], they would respond also “yes” to a Gabor at
[0,1’] or [0,-1’].
This phenomenon is called intrinsic uncertainty, in contrast to external or stimulus
uncertainty, where (some) parameters of the target stimulus are randomized. The
detection under uncertainty has been modeled by a maximum of outputs, “winner takes
all” model. For example, instead of using the output of a single receptive field, the
mechanism monitors over outputs of multiple receptive fields at [0,0] [0,1’] and [0,-1’]
and chooses the one with maximum output. It can be shown (Tjan & Nandy, 2006) that
under uncertainty, using the standard classification images analysis (equation 2) reveals
a superposition of all the monitored receptive fields. For example, spatial uncertainty
causes “smearing” of the receptive field profile in the classification image. One may
now erroneously conclude that the observer uses a single receptive field with a large
area whereas only local information over many locations is used.
To tackle this problem, it is important to minimize uncertainty in the experiment by
i.e. enabling the subjects to get accustomed with the stimuli and task, stabilize fixation
etc. Methods have been developed to test how well the linear model assumption
explains the observed performance in the experiment (Murray, Bennett, & Sekuler,
2005). Another possibility is to estimate how likely an uncertainty-based explanation is
by simulating a model perceptual mechanism (see study I). It is also possible to use a
paradigm specially tailored to isolate the effects of uncertainty. Tjan and Nandy showed
that the effect of uncertainty in classification images is most pronounced in target absent
trials. Using a high-contrast target and a special data analysis, it is possible to estimate
both the receptive field and the extent of the uncertainty (Tjan & Nandy, 2006).
3.2 General experimental methods
3.2.1 Subjects and apparatus
The subjects were volunteers. Both authors and subjects naïve to the purpose of the
studies participated. The results of the classification image experiments (study I & II)
shown here are individual data, Glass experiments use mean of 6 (study III) and 4
(study IV) subjects.
Experiments were conducted in a dimly lit laboratory. Stimuli were generated by
(study I) Cambridge Research Systems (Rochester, UK) 2/5, (study II) Cambridge

24
Research Systems ViSaGe and (studies III-IV) Vision Research Graphics (Durham,
NH) Vision Works environments providing 12-15 bit grayscale resolution. High-quality
linearized and calibrated CRT monitors were used.
3.3 Study I: Mechanisms of collinear facilitation
Collinear spatial interactions have been the object of intensive research, yet no
consensus exists whether they reflect interactions between neural filters or can be
explained by previously known classical effects such as dipper function and uncertainty
reduction. In study I, this was investigated by directly estimating the behavioral
receptive field mediating the target. Classification images were measured for a central
Gabor patch (no-flankers condition) and with collinear flanker stimuli in a configuration
where collinear facilitation is very strong.
Models which explain the facilitation by increased sensitivity in the neural filter,
conveyed by long-range interactions between the target and the flankers, predict an
increase in the signal-to-(internal) noise ratio of the classification image, i.e. amplitude.
If collinear facilitation is caused by reduction in uncertainty, the classification
images in no-flankers condition should show signs of using non-optimal orientation or
spatial frequency band of the target; or smearing of the classification image as a result
of spatial uncertainty. These effects should be reduced in collinear flankers condition.
The dipper effect model (Solomon et al., 1999) predicts that an increased sensitivity in
the area between the target and the flankers.
3.3.1 Stimuli, procedure and data analysis
The target was a low spatial frequency (1.5 cpd) Gabor (figure 3 A), masked by low-
contrast (rms 0.1 linear contrast units) white noise. Classification images were measured
for two conditions: target alone (figure 3 B) or the target surrounded by two high-
contrast (40%) flanking collinear Gabors at 1.7° (2.5 Gabor wavelength) distance
(figure 3 C). Large, low- spatial frequency stimuli and fixation crosshair were used to
reduce uncertainty effects. A two-interval forced-choice (2IFC) detection task was used.

25
Figure 3. Stimuli in the study I. Target was a low-frequency (1.5 cpd) Gabor patch, masked with low-
contrast white noise. In the first condition (B), classification images were measured for the target Gabor.
In the second condition (C), high-contrast static flankers were added. In the experiment, the contrast of
the target was much lower than in this illustration.
The classification images were analyzed using forced-choice version of equation 2
(Abbey & Eckstein, 1999). All the noise masks that were shown to the subject and the
corresponding responses (correct, incorrect) in every trial were recorded for later
analysis. 4,000-5,000 trials per subject per condition were measured. All behavioral
receptive fields as estimated from the classification images resembled Gabor stimuli
with varying parameters. To quantify the effect of the collinear context, Gabor functions
were fitted to the classification images. Confidence intervals for the Gabor function
parameters were obtained by using the Bootstrap method (Efron & Tibshirani, 1993).
3.3.2 Results
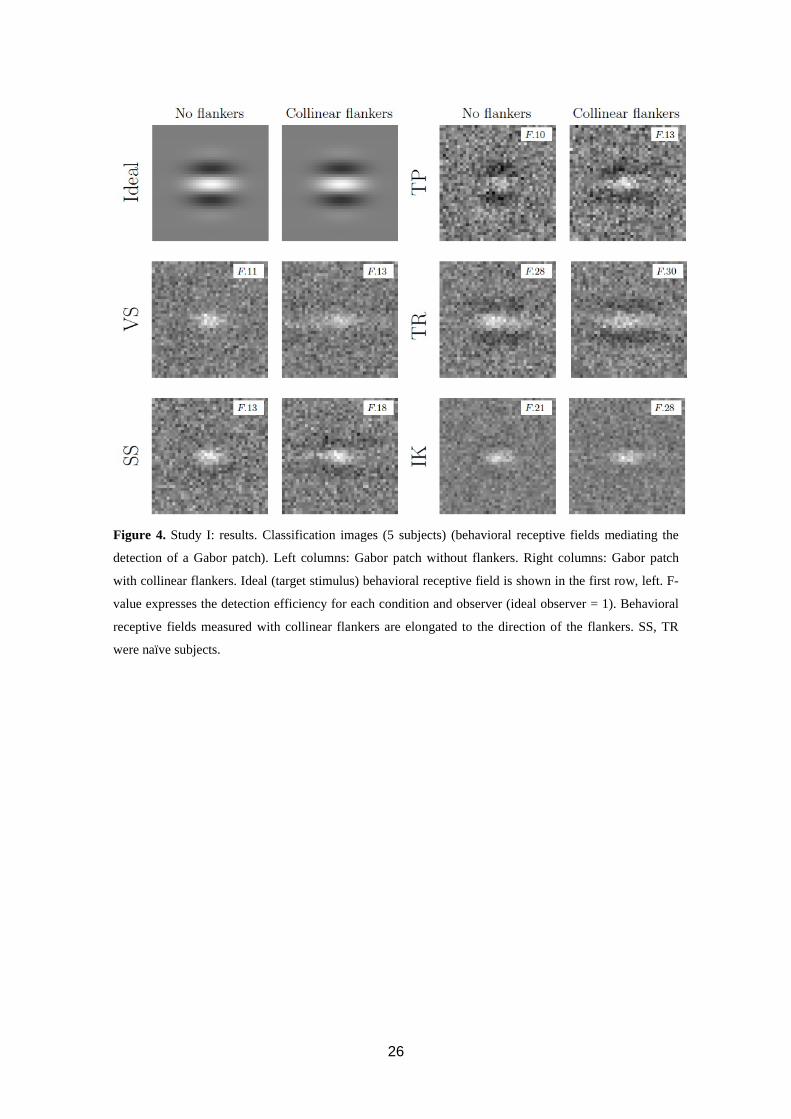
Classification images are shown in figure 4. Collinear flankers improved the absolute
detection efficiency (F) by 7 % - 30 %. In the collinear flankers-condition, the
behavioral receptive fields were clearly horizontally elongated towards the flankers
when compared to the no-flankers condition. Figure 5 shows the best-fitting parameters.
The horizontal extent of the behavioral receptive field is 22 % to 143 % wider than in
no-flankers condition. Other parameters, i.e. amplitude, show no consistent differences.
26
Figure 4. Study I: results. Classification images (5 subjects) (behavioral receptive fields mediating the
detection of a Gabor patch). Left columns: Gabor patch without flankers. Right columns: Gabor patch
with collinear flankers. Ideal (target stimulus) behavioral receptive field is shown in the first row, left. F-
value expresses the detection efficiency for each condition and observer (ideal observer = 1). Behavioral
receptive fields measured with collinear flankers are elongated to the direction of the flankers. SS, TR
were naïve subjects.

27
Figure 5. Study I results: vertical (height) and horizontal (width) extent of the behavioral receptive field
(best-fitting Gabor) for 5 subjects. Blue bars: no flankers, red bars: collinear flankers. Dashed line
represents the ideal (target stimulus) extent. Behavioral receptive fields measured with the collinear
flankers are systematically elongated. Error bars represent 95% confidence interval.
The (linear) sampling efficiency (the match between the behavioral receptive field and
the target stimulus) was estimated by computing the cross-correlation between the
(normalized) fit and the target stimulus. A notable increase was observed in just two
(out of 5) subjects.
Surprisingly, we found that the behavioral receptive fields changed in the course of
the data collection. In particular, the difference between conditions in horizontal extent
parameter is evident only at the beginning of the experiments (figure 6). Practice
apparently retunes the behavioral receptive fields so that they converge during the
learning, in time period of about two sessions.

28
Figure 6. Study I: results. Horizontal extents of the behavioral receptive fields analyzed separately from
the early sessions (first 2,000 trials) and from the late sessions (last 3,000 trials), two subjects. Solid lines:
no-flankers condition. Dashed lines: collinear flankers. The elongation of the behavioral receptive field is
apparent only in the early trials. Error bars represent 95 % confidence interval. Data from the other
subjects is comparable.
3.4 Study II: Edge integration and brightness perception
Study II investigated perception of surface brightness using the classification image
method with a novel brightness matching task. Noise causes small fluctuations in the
perceived brightness of the stimulus, depending on how the random visual features
within the noise match to the (unknown) receptive field of the perceptual mechanism
responsible for the neural brightness computation. By analyzing the correlation between
each point in the noise and the perceptual perceived brightness, it is possible to directly
estimate the receptive field profile, i.e. what parts of the stimulus are critical for the
brightness. Both illusory Craik-O’Brien-Cornsweet and “real” step stimuli were used.
Early filters typically have a narrow spatial frequency band (about 1 octave), whereas
stimulus borders are broad-band stimuli. How are the neural filters tuned to different
spatial scales integrated? By decreasing the stimulus size, the spatial frequency band
shifts to higher frequencies. It has been shown that in tasks like face (Nasanen, 1999)
(Pelli, 1999) and letter recognition (Majaj, Pelli, Kurshan, & Palomares, 2002; Solomon
& Pelli, 1994), the visual system uses just a very limited band of the broad-band
stimulus information. Recently, it has been suggested that brightness perception shows a
similar dependency on a single spatial frequency scale that is either low-frequency and
constant irrespective of the stimulus size (Perna & Morrone, 2007), or medium-
frequency and changes slightly with the stimulus size (Salmela & Laurinen, 2005).

29
Classification images were measured with three retinal sizes (4-fold difference) to
investigate the tuning and scaling of the behavioral receptive field mediating the
perceived brightness. Spatial frequency tuning of the classification images was
characterized by fitting exponential functions.
3.4.1 Stimuli, procedure and data analysis
In the first experiment, the test stimulus was a circularly symmetric illusory Craik-
O’Brien-Cornsweet patch (see figure 2). The radius of the stimulus was 1.33 deg and
peak-to-peak contrast 10 %. The luminance of the stimulus at the center was the
background luminance 50 cd/m2. The stimulus was masked by adding a one-
dimensional annular “ring noise”, made by randomizing the luminance (s.d. 2 cd/m2) of
64 concentric rings whose total was radius 2.67 deg.
In the second experiment, the test stimulus was a circular “step” patch of uniform
luminance (65 cd/m2), radius was varied (0.33, 0.66 or 1.33 deg). The stimulus was
masked by a ring noise mask (s.d. 3 cd/m2) composed of 64 rings, total radius 0.66, 1.33
or 2.67 deg. In both experiments, the target and the noise contrasts were chosen so that
the target stimuli were clearly above the detection threshold, but the noise masks had
still a noticeable effect on the perceived brightness.
The comparison stimulus was always an unmasked uniform circular patch with the
same radius as the test. The luminance was varied (4 levels, chosen so that the lowest
luminance resulted in ca. 10 % brighter-than judgments and the highest ca. 90 %).

30
Figure 7. Study II: stimuli and the method. Two presentation intervals, one containing the test stimulus
and the other containing the comparison stimulus were shown to the subject in random order in each trial.
The test stimulus was either a constant Craik-O’Brien-Cornsweet or a uniform step [in the illustration]
patch masked with white noise. Physical luminance of the comparison stimulus was varied (4 levels). The
subject chose the interval in which the stimulus appeared brighter.
The method of constant stimulus (MOCS) with a two-interval brightness matching task
was used. In every trial, subjects were asked to choose the interval in which the patch
(test or comparison, presented in random order) appeared brighter (figure 7). Noise
masks as well as comparison stimulus luminance and the response (comparison/test
brighter) were recorded for the classification image analysis.
Standard classification image analysis was used, except for first computing the
separate sub-classification images for each comparison stimulus level (see figure 8).

31
Figure 8. Study II: Data analysis. Classification images were analyzed in two steps. First, sub-
classification images CIk for each comparison stimulus luminance level were computed by taking the
average (across the trials) of the noise mask profile with a “target brighter than the comparison” response
n> and subtracting from this the average of the noise masks associated with “target not brighter” response
n<. The classification image CI was then computed by taking the average of the sub-classification images.
Classification image estimates the “total” weight the subject gives to each of the
different rings in the brightness task. However, as the area of a stimulus ring is directly
proportional to its distance from the center, the “raw“ classification images do not
reflect the sensitivity per unit area of the stimulus but per ring. Thus, even if the
sensitivity to the brightness information would be uniform in the area of the target
stimulus; the raw classification image would have more weight farther from the center.
Therefore, the classification images were normalized by the number of pixels in the
stimulus to estimate the sensitivity per unit area.
Finally, the Bootstrap method (Efron & Tibshirani, 1993) was used to estimate the
standard error of the classification images.
3.4.2 Results
Classification image profiles (both raw and normalized) for the brightness of illusory
Craik-Cornsweet-O’Brien stimulus are shown in figure 9. Classification images peak
inside the stimulus border of the patch and have negative peaks in the background, next
to the border. The normalized classification image has clearly a narrower positive lobe
than the stimulus profile and the weight drops close to zero in the “illusory” area.

32
Figure 9. Study II results: Craik-Cornsweet-O’Brien stimulus. Classification image profiles for three
subjects. The black line shows the target profile. The blue curve is the “raw” classification image and the
red curve is the spatially normalized classification image. The classification image reveals a positive peak
inside the border area. The weight is nonzero just at the border, whereas the illusory area is almost flat.
This implies that subjects use only stimulus information at the border when assessing the brightness of the
patch. Error bars: 1 standard error of the mean.
The mean perceived (point of subjective equality) brightness of the stimulus was about
77% of the peak luminance of the Craik-Cornsweet-O’Brien pattern, suggesting a vivid
illusion of a bright surface.
The results for the patch stimulus in the study II are shown in figure 10. The
classification image profiles peak at the location of the border, and have a less
prominent negative peak at the background. The tuning is clearly band-pass: lack of the
highest frequencies is evident with the smallest 0.33 deg stimulus in which the weight
drops gradually rather than sharply at the border. Lack of lowest spatial frequencies can
be seen from larger stimuli, as the weight of the classification images drops zero farther
from the center. Classification images for the 1.33 deg step stimulus and the illusory
Craik-Cornsweet-O’Brien stimuli are highly similar.

Figure 10. Study II results: uniform step patch. Classification image profiles for three subjects and three
stimulus sizes. Black curves: target profile. Blue curves “raw” classification images and red curves:
spatially normalized classification images.
border. The relative extent of the classification image profile compared to the target size is dependent on
the size: with small 0.33 deg stimulus, profile covers the entire
stimulus, it covers just the border
The tuning of the normalized classification images can be seen when plotted to the same
coordinates in figure 11. Classification image p
33
II results: uniform step patch. Classification image profiles for three subjects and three
stimulus sizes. Black curves: target profile. Blue curves “raw” classification images and red curves:
ification images. Classification image profiles peak inside the stimulus, near the
border. The relative extent of the classification image profile compared to the target size is dependent on
the size: with small 0.33 deg stimulus, profile covers the entire stimulus but with the large 1.33 deg
border. Error bar: 1 standard error of mean.
The tuning of the normalized classification images can be seen when plotted to the same
Classification image profiles largely overlap.
II results: uniform step patch. Classification image profiles for three subjects and three
stimulus sizes. Black curves: target profile. Blue curves “raw” classification images and red curves:
Classification image profiles peak inside the stimulus, near the
border. The relative extent of the classification image profile compared to the target size is dependent on
stimulus but with the large 1.33 deg
The tuning of the normalized classification images can be seen when plotted to the same

34
Figure 11. Study II results: normalized classification images profiles for the step stimuli plotted to the
same coordinates, for three subjects. Blue curve: 1.33 deg stimulus green curve: 0.66 deg stimulus red
curve 0.33 deg stimulus. Tuning of the classification image is almost invariant of the stimulus size.
3.5 Studies III & IV: Form integration in Glass patterns
Studies III and IV investigated the integration of form in Glass patterns.
Most of the Glass pattern studies have used near-threshold stimuli, measuring the
minimum proportion of signal fragments among the noise. How well do the results
generalize arguably more common suprathreshold stimuli? The relation is not always
trivial, for example contrast detection threshold does not predict the suprathreshold
apparent contrast of the gratings (Georgeson & Sullivan, 1975). In the study III the
sensitivity to concentric and translational orientation structures were investigated in a
suprathreshold regime using Glass patterns with a highly coherent structure. The target
pattern had 100 % proportion of the signal dots whereas the proportion of noise dots in
the comparison stimulus was varied. The task of the subject was to discriminate
between these two patterns, i.e. to detect the stimulus that had “more Glass pattern”.
In the study IV the spatial integration of concentric and translational Glass patterns
was investigated by introducing a global “irregularity”. Patterns were composed from a
number of areas which had a local coherent structure (translational or
concentric/curved) at random orientation. By increasing the number of areas, the
amount of globally coherent information in the pattern decreases while keeping the
signal area constant. We compared the effect of irregularity in (locally) translational and
curved patterns.

35
3.5.1 Stimuli and procedure
Target stimuli were Glass patterns, random dot stimuli where a proportion of black dots
(4.3 x 4.3 arc min) on a bright background are paired to coherently oriented signal
dipoles. Orientation of the dipoles is controlled by a geometrical rule (concentric or
translational). Presentation time was 125 ms, to avoid multiple fixations. An illustration
of the stimuli in study III is shown in figure 12.
The number of stimulus sub-areas in study IV was varied (1-4-9), keeping the size of
the whole stimulus constant (see figure 13). The orientation structure within each sub-
element was randomized (translational: horizontal or vertical; curved: ones of the four
quadrants of a global concentric pattern).
The comparison stimulus in the study III was identical to the standard stimulus,
except for that the proportion of signal dots was varied (100% in the target). The rest of
the dots (“noise”) were dipoles in random orientations. The comparison stimulus in the
study IV was identical to the standard stimulus, except for the signal dipoles being in
random orientations. Patterns were thus matched in distribution of dipole lengths.

Figure 12. Study III Glass pattern stimuli. Left:
orientation structure. Subject’s task was to discriminate between
coherent signal dots (in the figure) and the comparison stimuli, where a prop
orientations (< 100 % signal dots).
optimal 8.6 arc min to 21.5 arc min
2IFC procedure with an adaptive staircase method was used. Two stimulus intervals,
one containing the target and one containing the comparison was shown to the subject in
a random order. Subject chose the target interval.
proportion of signal dipoles to 77.9 % of correct choices.
36
ttern stimuli. Left: translational orientation structure
orientation structure. Subject’s task was to discriminate between a “perfect” Glass pattern with 100
coherent signal dots (in the figure) and the comparison stimuli, where a proportion of dots were at random
orientations (< 100 % signal dots). Dipole length (the separation between the signal dots)
21.5 arc min. The stimulus radius was 6.65 deg and the dot density 4.4 dots/deg
re with an adaptive staircase method was used. Two stimulus intervals,
one containing the target and one containing the comparison was shown to the subject in
random order. Subject chose the target interval. A staircase algorithm adjusted the
of signal dipoles to 77.9 % of correct choices.
orientation structure. Right: concentric
“perfect” Glass pattern with 100 %
ortion of dots were at random
between the signal dots) was varied from
dot density 4.4 dots/deg2.
re with an adaptive staircase method was used. Two stimulus intervals,
one containing the target and one containing the comparison was shown to the subject in
taircase algorithm adjusted the

Figure 13. Study IV: Glass pattern stimuli. The area of the stimulus was divided to a number of sub
areas. The local orientation of each area was randomized. Both curved and
used. A: curved pattern, 1 sub-area. B:
curved pattern, 9 sub-areas. The area of the whole stimulus was always
6.25 dots/deg2. Dipole length was
3.5.2 Results
Results of the study III, expressed as
stimulus at 79.4 % discrimination threshold are shown in figure
of the highly coherent patterns is easier for concentric than
across range of dipole lengths. In a control experiment, the stimulus border was
smoothed with a Gaussian spatial window. This did not cause a systematic effect (2
37
Study IV: Glass pattern stimuli. The area of the stimulus was divided to a number of sub
areas. The local orientation of each area was randomized. Both curved and translational
area. B: translational pattern, 1 sub-area. C: curved pattern, 4 sub
areas. The area of the whole stimulus was always 6 x 6 deg. The dot density was
Dipole length was 8.6 arc min.
, expressed as a proportion of random dots in the comparison
stimulus at 79.4 % discrimination threshold are shown in figure 14. The discriminability
highly coherent patterns is easier for concentric than for translational
across range of dipole lengths. In a control experiment, the stimulus border was
smoothed with a Gaussian spatial window. This did not cause a systematic effect (2
Study IV: Glass pattern stimuli. The area of the stimulus was divided to a number of sub-
translational patterns were
area. C: curved pattern, 4 sub-areas. D:
6 x 6 deg. The dot density was
proportion of random dots in the comparison
. The discriminability
anslational patterns
across range of dipole lengths. In a control experiment, the stimulus border was
smoothed with a Gaussian spatial window. This did not cause a systematic effect (2

observers), suggesting that the difference is not due to a “border arti
2002).
Figure 14. Results of the study III: discrimination thresholds of
a proportion of random orientation dipoles in the comparison stimulus versus
are mean of 6 subjects. Error bars represent
Results of the study IV, plotted as
are shown in figure 15. When increasing the number of sub
translational structure remains almost constant whereas thresholds for the curved Glass
pattern increase steeply. A possible problem with the experimental design was that the
number of possible orientations within each sub
in the translational. Observers might have more uncertainty of the local stimulus
orientation in the curved pattern, and thus use
could explain the difference. To rule out this possibili
which the orientations of the sub
The main result was the same: increasing the number of sub
38
observers), suggesting that the difference is not due to a “border artifact”
Results of the study III: discrimination thresholds of highly coherent Glass patterns
proportion of random orientation dipoles in the comparison stimulus versus the dipole length. Results
are mean of 6 subjects. Error bars represent ±1 standard error of mean.
, plotted as a detection threshold versus the number of sub
. When increasing the number of sub-areas, the
structure remains almost constant whereas thresholds for the curved Glass
pattern increase steeply. A possible problem with the experimental design was that the
number of possible orientations within each sub-area was 4 in the curved pattern but 2
. Observers might have more uncertainty of the local stimulus
orientation in the curved pattern, and thus use a less efficient detection strategy, which
could explain the difference. To rule out this possibility a control experiment was run in
the orientations of the sub-elements were fixed for the course of the experiment.
The main result was the same: increasing the number of sub-areas with
fact” (Dakin & Bex,
highly coherent Glass patterns plotted as
dipole length. Results
number of sub-areas
areas, the detectability of
structure remains almost constant whereas thresholds for the curved Glass
pattern increase steeply. A possible problem with the experimental design was that the
curved pattern but 2
. Observers might have more uncertainty of the local stimulus
less efficient detection strategy, which
a control experiment was run in
elements were fixed for the course of the experiment.
areas with the curved

patterns increases the threshold whereas the performanc
remains constant.
Figure 15. Results of the study IV: detection thresholds for
plotted as a function of the number of sub
curve: curved structure. Black curve:
independently randomized structure deteriorates performance with
with the translational patterns. Erro
39
patterns increases the threshold whereas the performance with the translational
Results of the study IV: detection thresholds for translational and curved Glass patterns
number of sub-areas in the stimulus. Results are the mean of 4 subjects.
curve: curved structure. Black curve: translational structure. Increasing the number of sub
independently randomized structure deteriorates performance with the curved patterns but has little effect
patterns. Error bars represent ±1 standard error of mean.
translational patterns
and curved Glass patterns
mean of 4 subjects. Blue
structure. Increasing the number of sub-areas with an
curved patterns but has little effect

40
4 Discussion
4.1 Mechanisms of Collinear facilitation
In the study I we directly measured how the behavioral receptive field changes with the
collinear context. With the collinear flankers, the behavioral receptive field is elongated
towards the flankers, i.e. the flankers increase the sensitivity in the collinear axis, at the
ends of the receptive field.
When the data was analyzed in two parts, the elongation was found to be significant
only in the early trials. It has been previously reported that also the collinear facilitation
disappears after prolonged perceptual practice when the flankers are placed at a single
distance (Polat & Sagi, 1994b). The similar dependence on the perceptual learning
provides further support that collinear facilitation without the noise masks and the
observed elongation of the behavioral receptive fields has a common neural cause.
Recently Petrov et al. (2006) showed that by cueing the spatial position of the Gabor
(without flankers) by a faint, low-contrast circle results in about the same improvement
in the detectability as a flanker-induced collinear facilitation; arguing that collinear
facilitation is spatial uncertainty reduction. However, Chan and Tyler (2008) observed
collinear facilitation in the contrast discrimination paradigm, which should be almost
immune to uncertainty effects.
Uncertainty-based explanation and especially spatial uncertainty based explanation is
problematic here, at the least: The flankers change only the length of the filter but not
the other properties, even when flankers could act as cues for the correct target spatial
frequency location, etc. Uncertainty effects were further investigated by a computer
simulation. It was found that only uncertainty about the orientation of the target may
cause “shrinking” of the behavioral receptive field and only with a massive uncertainty
about the target orientation. Moreover, our data shows that with some subjects (TP, TR,
VS; TR statistically significant at p<.05) the horizontal length of the behavioral
receptive field was longer than the ideal observer’s, which cannot be explained by a
reduction of orientation uncertainty. Lastly, the sampling efficiency of the behavioral
receptive field did not show systematic increase.
The classification images give more detailed picture of how the flankers change the
sensitivity to the target across the space. The results point towards a low-level
explanation of sensitivity changes between filters sensitive to the target. Arguably the

41
simplest such explanation is to assume that flankers act like pedestal stimulus. The
results do not rule out the possibility that even more complex interactions between
cortical filters have a role in collinear interactions, if these act by increasing selectively
the sensitivity of the filters situated near to the end of the target. However, no general
increase in the gain of the behavioral receptive field mediating the target was seen in
collinear flankers-condition, as estimated from the amplitude of the classification image.
These results give some support to the idea that collinear facilitation might be related to
processes like filling-in contour gaps, as it increases the sensitivity selectively along the
collinear axis, sometimes even outside the stimulus area.
From the viewpoint of natural image statistics, the elongation of the perceptual
receptive field could possibly be understood as visual system’s more general adaptation
to the statistical structure of the natural stimuli. Contours cause strong spatial
correlations in the orientation content natural images. If we think two collinear flanker
Gabors as two samples from a natural image, it is more likely that the space between
them contains also orientation signal at the same direction than not. In a preliminary
study, an “ecologically valid” model observer that utilizes the statistical structure of
natural scenes was constructed. It was shown that the ecologically valid model observer
had an elongated receptive field for the flankers condition compared with no flankers
condition (Hyvärinen, 2005). If this explanation is correct, it is interesting that
observer’s cannot switch off the “ecological” strategy, even when it is not ideal with
this detection task and white noise and even when they are well accustomed with the
stimuli.
4.2 Edge integration and brightness perception
Study II investigated what stimulus information the visual system uses to compute the
surface brightness, using the classification image paradigm with a novel brightness
matching task.
Behavioral receptive fields for both “real” step and illusory Cornsweet-O’Brien-
Craik surfaces peaked at the border of the surface, suggesting that brightness is
computed from the border information of the stimulus. Results provide direct support to
the idea that brightness representations of surfaces are perceptually completed or ‘filled-
in’ from the border information: stimulus information farther from the border does not
contribute to the surface brightness. The illusory Craik-O’Brien-Cornsweet stimulus and

42
the step stimulus had highly similar classification image profiles, supporting the idea
that the appearance of the illusion is because it shares the critical border features with a
“real” surface stimulus. Behavioral receptive field tuning for the illusory stimulus was
not wider than the stimulus profile. This is evidence against the “low-frequency
boosting” hypothesis of the Craik-O’Brien-Cornsweet illusion (Dakin & Bex, 2003a).
Changing the size of the step stimulus caused a remarkably small change to the
tuning of the behavioral receptive field estimated from the classification image. This
supports the idea that brightness information is processed in a specialized neural spatial
frequency channel (Perna & Morrone, 2007; Salmela & Laurinen, 2005). The tuning of
the channel, estimated from the exponential function fits, shows pass-band
characteristics with a low-frequency cut-off near 1 cpd. A similar low-frequency cut-off
was obtained also with a paradigm where the critical stimulus information for the
brightness was investigated by filtering the spatial frequency content of the stimulus
(Perna & Morrone, 2007).
Lastly, the classification images for the perceived brightness resemble closely the
classification images for contrast discrimination using similar stimuli (Shimozaki,
Eckstein, & Abbey, 2005). This supports the idea that perceived contrast and brightness
in simple stimulus displays (as here) reflect processing in similar mechanisms sensitive
to the border structure (Arend & Spehar, 1993a; Arend & Spehar, 1993b) .
4.3 Feature integration in Glass patterns
Studies III and IV investigated the form integration in Glass patterns. In the study III
discrimination of supra-threshold concentric and translational Glass patterns was
investigated. Detection of noise was easier (smaller proportion of noise dots) among
concentric than among translational Glass patterns, across a wide range of dot
separations. The results were not dependent on the border structure.
In study IV, a new paradigm to study the integration of translational and concentric
patterns was used by dividing the global Glass stimulus to a number of sub-areas that
each consisted of fragments of Glass patterns at random orientation. The number of sub-
areas was varied to test how the integration depends on the coherent global structure.
Dividing the stimulus to sub-areas caused a large drop in the detection performance of
concentric Glass pattern, whereas it had relatively little effect with the translational
patterns.

43
The results support the idea that concentric and translational patterns are processed in
at least partially separate neural systems. Concentric patterns are more sensitive to the
global stimulus structure, suggesting that they are detected in a relatively late stage. The
difference between concentric and translational patterns may be even more pronounced
in suprathreshold stimuli, as studies with near-threshold stimuli have given somewhat
inconsistent results (Dakin & Bex, 2003b).
As a further evidence for separate mechanisms, translational and concentric patterns
have shown to have different spatio-temporal integration characteristics (Aspell,
Wattam-Bell, & Braddick, 2006). In addition, recent fMRI studies show that higher
cortical areas, such as V4 show stronger BOLD responses to concentric and radial
compared to translational patterns (Dumoulin & Hess, 2007; Wilkinson et al., 2000).

44
5 Conclusions Despite a fairly good understanding of the early visual processing, relatively little is
known about the integration of the elementary features. Studies in this thesis
investigated integration of visual features in low- and mid-level visual tasks.
Two studies used recently developed classification image method (Eckstein &
Ahumada, 2002) to estimate directly in the spatial domain what stimulus information
the visual system uses in a psychophysical task. In study I, the effect of collinear
flanker stimuli that facilitate the visibility of a target was investigated. It was shown that
behavioral receptive fields measured with the flankers are elongated to the direction of
the flankers. The results provide direct information about how the local context changes
the visual processing and provides support for the idea that collinear facilitation
operates on the low-level neural filters. In Study II, the information the visual system
uses for brightness perception was measured using classification image method. A novel
brightness matching task with “real” step and illusory Craik-O’Brien-Cornsweet illusion
was used. The results show that brightness of a stimulus is computed from the
luminance borders of the surface. In addition, results provide support for the idea that
perceived brightness reflects the output of a fixed frequency channel.
Studies III and IV investigated form integration in Glass patterns. Study III
showed that concentric global form was more easily discriminated in highly coherent
patterns. Study IV showed that curved forms are more dependent on orientation
coherence of the pattern, measured by varying the number of stimulus sub-areas that
contained independently randomized local orientation.

45
7 References
Abbey, C. K., & Eckstein, M. P. (1999). Theory for estimating human-observer templates in two-alternative forced choice experiments. Information Processing in Medical Imaging: 17th International Conference, IPMI 2001, 24-36.
Adini, Y., Sagi, D., & Tsodyks, M. (1997). Excitatory-inhibitory network in the visual cortex: Psychophysical evidence. Proceedings of the National Academy of Sciences of the United States of America, 94, 10426-10431.
Ahumada, A. J. (2002). Classification image weights and internal noise level estimation. Journal of Vision, 2, 121-131.
Ahumada, A. J., & Beard, B. L. (1999). Classification images for detection. Investigative Ophthalmology and Visual Science, S3015.
Angelucci, A., Levitt, J. B., Walton, E. J., Hupe, J. M., Bullier, J., & Lund, J. S. (2002). Circuits for local and global signal integration in primary visual cortex. The Journal of Neuroscience : The Official Journal of the Society for Neuroscience, 22, 8633-8646.
Arend, L. E., & Spehar, B. (1993a). Lightness, brightness, and brightness contrast: 1. illuminance variation. Perception & Psychophysics, 54, 446-56.
Arend, L. E., & Spehar, B. (1993b). Lightness, brightness, and brightness contrast: 2. reflectance variation. Perception & Psychophysics, 54, 457-68.
Aspell, J. E., Wattam-Bell, J., & Braddick, O. (2006). Interaction of spatial and temporal integration in global form processing. Vision Research, 46, 2834-2841.
Beard, B. L., & Ahumada, A. J. (1998). Technique to extract relevant image features for visual tasks. Proceedings of SPIE, 3299 79-85.
Campbell, F. W., & Green, D. G. (1965). Optical and retinal factors affecting visual resolution. Journal of Physiology, 181, 576-93.
Campbell, F. W., & Robson, J. G. (1968). Application of fourier analysis to the visibility of gratings. Journal of Physiology (London), 197, 551-566.
Cannon, M. W., & Fullenkamp, S. C. (1991). Spatial interactions in apparent contrast: Inhibitory effects among grating patterns of different spatial frequencies, spatial positions and orientations. Vision Research, 31, 1985-1998.
Carandini, M., Heeger, D. J., & Movshon, J. A. (1997). Linearity and normalization in simple cells of the macaque primary visual coretex. Journal of Neuroscience, 17, 8621-8644.
Cavanaugh, J. R., Bair, W., & Movshon, J. A. (2002). Nature and interaction of signals from the receptive field center and surround in macaque V1 neurons. Journal of Neurophysiology, 88, 2530-2546.
Chen, C. C., & Tyler, C. W. (2001). Lateral sensitivity modulation explains the flanker effect in contrast discrimination. Proceedings of the Royal Society - Series B, 268, 509-516.
Chen, C. C., & Tyler, C. W. (2002). Lateral modulation of contrast discrimination: Flanker orientation effects. Journal of Vision, 2, 520-530.
Chen, C. C., & Tyler, C. W. (2008). Excitatory and inhibitory interaction fields of flankers revealed by contrast-masking functions. Journal of Vision, 8, 10.1-14.
Chubb, C., Sperling, G., & Solomon, J. A. (1989). Texture interactions determine percieved contrast. Proceedings of the National Academy of Sciences, U.S.A., 86, 9631-9635.

46
Chung, S. T., Levi, D. M., & Tjan, B. S. (2005). Learning letter identification in peripheral vision. Vision Research, 45, 1399-1412.
Cornelissen, F. W., Wade, A. R., Vladusich, T., Dougherty, R. F., & Wandell, B. A. (2006). No functional magnetic resonance imaging evidence for brightness and color filling-in in early human visual cortex. Journal of Neuroscience, 26, 3634-3641.
Dakin, S. C. (1997). The detection of structure in glass patterns: Psychophysics and computational models. Vision Research, 37, 2227-2246.
Dakin, S. C., & Bex, P. J. (2002). Summation of concentric orientation structure: Seeing the glass or the window? Vision Research, 42, 2013-2020.
Dakin, S. C., & Bex, P. J. (2003a). Natural image statistics mediate brightness 'filling in'. Proceedings of the Royal Society - Series B, 270, 2341-8.
Dakin, S. C., & Bex, P. J. (2003b). Response to wilson & wilkinson: Evidence for global processing but no evidence for specialised detectors in the visual processing of glass patterns. Vision Research, 43, 563-564.
David, S. V., Hayden, B. Y., & Gallant, J. L. (2006). Spectral receptive field properties explain shape selectivity in area V4. Journal of Neurophysiology, 96, 3492-3505.
De Valois, R. L., & De Valois, K. (1988). Spatial vision. New York: Oxford University Press.
DeAngelis, G. C., Freeman, R. D., & Ohzawa, I. (1994). Length and width tuning of neurons in the cat's primary visual cortex. Journal of Neurophysiology, 71, 347-374.
Dodwell, P. C. (1983). The lie transformation group model of visual perception. Perception & Psychophysics, 34, 1-16.
Dumoulin, S. O., & Hess, R. F. (2007). Cortical specialization for concentric shape processing. Vision Research, 47, 1608-1613.
Eckstein, M. P., & Ahumada, A. J. (2002). Classification images: A tool to analyze visual strategies. Journal of Vision, 2, i.
Efron, B., & Tibshirani, R. J. (1993). An introduction to the bootstrap. New York: Chapman & Hall.
Foley, J. M. (1994). Human luminance pattern-vision mechanisms: Masking experiments require a new model. Journal of the Optical Society of America, 11, 1710-1719.
Foley, J. M., & Legge, G. E. (1981). Contrast detection and near-threshold discrimination in human vision. Vision Research, 21, 1041-1053.
Gallant, J. L., Braun, J., & Van Essen, D. C. (1993). Selectivity for polar, hyperbolic, and cartesian gratings in macaque visual cortex. Science, 259, 100-103.
Gallant, J. L., Connor, C. E., Rakshit, S., Lewis, J. W., & Van Essen, D. C. (1996). Neural responses to polar, hyperbolic, and cartesian gratings in area V4 of the macaque monkey. Journal of Neurophysiology, 76, 2718-2739.
Georgeson, M. A., & Sullivan, G. D. (1975). Contrast constancy: Deblurring in human vision by spatial frequency channels. The Journal of Physiology, 252, 627-656.
Gilbert, C. D., & Wiesel, T. N. (1983). Clustered intrinsic connections in cat visual cortex. Journal of Neuroscience, 3, 1116-1133.
Gilbert, C. D., & Wiesel, T. N. (1989). Columnar specifity in instrinsic horizontal connections. Journal of Neuroscience, 9, 2432-2442.
Glass, L. (1969). Moire effect from random dots. Nature, 223, 578-580. Glass, L., & Perez, R. (1973). Perception of random dot interference patterns. Nature,
246, 360-362.

47
Glass, L., & Switkes, E. (1976). Pattern recognition in humans: Correlations which cannot be perceived. Perception, 5, 67-72.
Gold, J. M., Murray, R. F., Bennett, P. J., & Sekuler, A. B. (2000). Deriving behavioural receptive fields for visually completed contours. Current Biology, 10, 663-6.
Green, D. M., & Swets, J. A. (1974). Signal detection theory and psychophysics (Reprint ed.). New York: Jon Wiley and Sons.
Grossberg, S., & Todorovic, D. (1988). Neural dynamics of 1-D and 2-D brightness perception: A unified model of classical and recent phenomena. Perception & Psychophysics, 43, 241-77.
Heeger, D. J. (1992). Normalization of cell responses in cat striate cortex. Visual Neuroscience, 9, 181-197.
Hess, R. F., Dakin, S. C., & Field, D. J. (1998). The role of "contrast enchancement" in the detection and appearance of visual contours. Vision Research, 38, 783-787.
Hubel, D. H., & Wiesel, T. (1962). Receptive fields, binocular interaction and functional architecture in the cat's visual cortex. Journal of Physiology (London), 160, 106-154.
Hubel, D. H., & Wiesel, T. N. (1959). Receptive fields of single neurones in the cat's striate cortex. Journal of Physiology, 148, 574-591.
Hyvärinen, A. (2005). Classification images and ecologically ideal observers [Abstract]. Perception, 34 235.
Kanwisher, N., & Yovel, G. (2006). The fusiform face area: A cortical region specialized for the perception of faces. Philosophical Transactions of the Royal Society of London - Series B, 361, 2109-2128.
Kobatake, E., & Tanaka, K. (1994). Neuronal selectivities to complex object features in the ventral visual pathway of the macaque cerebral cortex. Journal of Neurophysiology, 71, 856-867.
Kurki, I., Laurinen, P., Peromaa, T., & Saarinen, J. (2003). Spatial integration in glass patterns. Perception, 32, 1211-1220.
Levi, D. M., & Klein, S. A. (2003). Noise provides new signals about the spatial vision of amblyopes. Journal of Neuroscience, 23, 2522-2526.
Li, R. W., Levi, D. M., & Klein, S. A. (2004). Perceptual learning improves efficiency by re-tuning the decision 'template' for position discrimination. Nature Neuroscience, 7, 178-183.
Loffler, G. (2008). Perception of contours and shapes: Low and intermediate stage mechanisms. Vision Research, 48, 2106-2127.
Maffei, L., & Fiorentini, A. (1976). The unresponsive regions of visual cortical receptive fields. Vision Research, 16, 1131-1139.
Majaj, N. J., Pelli, D. G., Kurshan, P., & Palomares, M. (2002). The role of spatial frequency channels in letter identification. Vision Research, 42, 1165-84.
Maloney, R. K., Mitchison, G. J., & Barlow, H. B. (1987). Limit to the detection of glass patterns in the presence of noise. Journal of the Optical Society of America A-Optics & Image Science, 4, 2336-2341.
Marcelja, S. (1980). Mathematical description of the responses of simple cortical cells. Journal of the Optical Society of America, 70, 1297-1300.
Marr, D. (1982). Vision. A computational investigation into the human representation and processing of visual information. New York, NY: W.H. Freeman.
Meese, T. S., Hess, R. F., & Williams, C. B. (2001). Spatial coherence does not affect contrast discrimination for multiple gabor stimuli. Perception, 30, 1411-1422.

48
Morrone, M. C., & Burr, D. C. (1988). Feature detection in human vision: A phase-dependent energy model. Proceedings of the Royal Society of London - Series B, 235, 221-45.
Murray, R. F., Bennett, P. J., & Sekuler, A. B. (2002). Optimal methods for calculating classification images: Weighted sums. Journal of Vision, 2, 79-104.
Murray, R. F., Bennett, P. J., & Sekuler, A. B. (2005). Classification images predict absolute efficiency. Journal of Vision, 5, 139-149.
Nasanen, R. (1999). Spatial frequency bandwidth used in the recognition of facial images. Vision Research, 39, 3824-33.
Neri, P., & Heeger, D. (2002). Spatiotemporal mechanisms for detecting and identifying image features in human vision. Nature Neuroscience, 5, 812-816.
Neri, P., & Levi, D. M. (2006). Receptive versus perceptive fields from the reverse-correlation viewpoint. Vision Research, 46, 2465-74.
Olzak, L. A., & Laurinen, P. I. (1999). Multiple gain control processes in contrast-contrast phenomena. Vision Research, 39, 3983-3987.
Orban, G. A., Van Essen, D., & Vanduffel, W. (2004). Comparative mapping of higher visual areas in monkeys and humans. Trends in Cognitive Sciences, 8, 315-324.
Pasupathy, A., & Connor, C. E. (1999). Responses to contour features in macaque area V4. Journal of Neurophysiology, 82, 2490-2502.
Pasupathy, A., & Connor, C. E. (2001). Shape representation in area V4: Position-specific tuning for boundary conformation. Journal of Neurophysiology, 86, 2505-2519.
Pasupathy, A., & Connor, C. E. (2002). Population coding of shape in area V4. Nature Neuroscience, 5, 1332-1338.
Pelli, D. G. (1985). Uncertainty explains many aspects of visual contrast detection and discrimination. Journal of the Optical Society of America A-Optics & Image Science, 2, 1508-1532.
Pelli, D. G. (1999). Close encounters--an artist shows that size affects shape. Science, 285, 844-6.
Perna, A., & Morrone, M. C. (2007). The lowest spatial frequency channel determines brightness perception. Vision Research, 47, 1282-91.
Perna, A., Tosetti, M., Montanaro, D., & Morrone, M. C. (2005). Neuronal mechanisms for illusory brightness perception in humans. Neuron, 47, 645-651.
Petrov, Y., Verghese, P., & McKee, S. P. (2006). Collinear facilitation is largely uncertainty reduction. Journal of Vision, 6, 170-178.
Polat, U., & Bonneh, Y. (2000). Collinear interactions and contour integration. Spatial Vision, 13, 393-401.
Polat, U., Mizobe, K., Pettet, M. W., Kasamatsu, T., & Norcia, A. M. (1998). Collinear stimuli regulate visual responses depending on cell's contrast threshold. Nature, 391, 580-584.
Polat, U., & Norcia, A. M. (1996). Neurophysical evidence for contrast dependent long-range facilitation and suppression in human visual cortex. Vision Research, 36, 2099-2109.
Polat, U., & Norcia, A. M. (1998). Elongated physiological summation pools in the human visual cortex. Vision Research, 38, 3735-3741.
Polat, U., & Sagi, D. (1993). Lateral interactions between spatial channels: Suppression and facilitation revealed by lateral masking experiments. Vision Research, 33, 993-999.
Polat, U., & Sagi, D. (1994a). The architecture of perceptual spatial interactions. Vision Research, 34, 73-78.

49
Polat, U., & Sagi, D. (1994b). Spatial interactions in human vision: From near to far via experience-dependent cascades of connections. Proceedings of the National Academy of Sciences, U.S.A., 91, 1206-1209.
Rockland, K. S., & Lund, J. (1982). Widespread periodic intrinsic connections in the tree shrew visual cortex. Science, 215, 1532-1534.
Salmela, V. R., & Laurinen, P. I. (2005). Spatial frequency tuning of brightness polarity identification. Journal of the Optical Society of America, A, Optics, Image Science, & Vision, 22, 2239-45.
Sceniak, M. P., Hawken, M. J., & Shapley, R. (2001). Visual spatial characterization of macaque V1 neurons. Journal of Neurophysiology, 85, 1873-1887.
Schwabe, L., Obermayer, K., Angelucci, A., & Bressloff, P. C. (2006). The role of feedback in shaping the extra-classical receptive field of cortical neurons: A recurrent network model. The Journal of Neuroscience, 26, 9117-9129.
Seu, L., & Ferrera, V. P. (2001). Detection thresholds for spiral glass patterns. Vision Research, 41, 3785-3790.
Shimozaki, S. S., Eckstein, M. P., & Abbey, C. K. (2005). Spatial profiles of local and nonlocal effects upon contrast detection/discrimination from classification images. Journal of Vision, 5, 45-57.
Solomon, J. A. (2002). Noise reveals visual mechanisms of detection and discrimination. Journal of Vision, 2, 105-120.
Solomon, J. A., & Morgan, M. J. (2000). Facilitation from collinear flanks is cancelled by non-collinear flanks. Vision Research, 40, 279-286.
Solomon, J. A., & Pelli, D. G. (1994). The visual filter mediating letter identification. Nature, 369, 395-7.
Solomon, J. A., Watson, A. B., & Morgan, M. J. (1999). Transducer model produces facilitation from opposite-sign flanks. Vision Research, 39, 287-292.
Stevens, K. A. (1978). Computation of locally parallel structure. Biological Cybernetics, 29, 19-28.
Tjan, B. S., & Nandy, A. S. (2006). Classification images with uncertainty. Journal of Vision, 6, 387-413.
Westheimer, G. (1999). Gestalt theory reconfigured: Max wertheimer's anticipation of recent developments in visual neuroscience. Perception, 28, 5-15.
Wilkinson, F., James, T. W., Wilson, H. R., Gati, J. S., Menon, R. S., & Goodale, M. A. (2000). An fMRI study of the selective activation of human extrastriate form vision areas by radial and concentric gratings. Current Biology, 10, 1455-1458.
Williams, C. B., & Hess, R. F. (1998). Relationship between facilitation at threshold and suprathreshold contour integration. Journal of Optical Society of America, 15, 2046-2051.
Wilson, H. R., & Wilkinson, F. (1998). Detection of global structure in glass patterns: Implications for form vision. Vision Research, 38, 2933-2947.
Wilson, H. R., Wilkinson, F., & Asaad, W. (1997). Concentric orientation summation in human form vision. Vision Research, 37, 2325-2330.
Zenger, B., & Sagi, D. (1996). Isolating excitatory and inhibitory nonlinear spatial interactions involved in contrast detection. Vision Research, 36, 2497-2513.
Related Documents