Feature (Gene) Selection in Gene Expression-Based Tumor Classification Momiao Xiong,* ,1 Wuju Li,* Jinying Zhao,* Li Jin,* and Eric Boerwinkle* , ² *Human Genetics Center, and ²Institute of Molecular Medicine, University of Texas–Houston Health Science Center, Houston, Texas Received December 6, 2000; published online June 27, 2001 There is increasing interest in changing the em- phasis of tumor classification from morphologic to molecular. Gene expression profiles may offer more information than morphology and provide an alter- native to morphology-based tumor classification systems. Gene selection involves a search for gene subsets that are able to discriminate tumor tissue from normal tissue, and may have either clear bio- logical interpretation or some implication in the molecular mechanism of the tumorigenesis. Gene selection is a fundamental issue in gene expression- based tumor classification. In the formation of a discriminant rule, the number of genes is large rel- ative to the number of tissue samples. Too many genes can harm the performance of the tumor clas- sification system and increase the cost as well. In this report, we discuss criteria and illustrate tech- niques for reducing the number of genes and select- ing an optimal (or near optimal) subset of genes from an initial set of genes for tumor classification. The practical advantages of gene selection over other methods of reducing the dimensionality (e.g., principal components), include its simplicity, fu- ture cost savings, and higher likelihood of being adopted in a clinical setting. We analyze the expres- sion profiles of 2000 genes in 22 normal and 40 colon tumor tissues, 5776 sequences in 14 human mam- mary epithelial cells and 13 breast tumors, and 6817 genes in 47 acute lymphoblastic leukemia and 25 acute myeloid leukemia samples. Through these three examples, we show that using 2 or 3 genes can achieve more than 90% accuracy of classification. This result implies that after initial investigation of tumor classification using microarrays, a small number of selected genes may be used as biomark- ers for tumor classification, or may have some rele- vance in tumor development and serve as a poten- tial drug target. In this report we also show that stepwise Fisher’s linear discriminant function is a practicable method for gene expression-based tu- mor classification. © 2001 Academic Press Key Words: gene expression; gene selection; Monte Carlo; microarray; tumor classification. Diagnostic pathology has traditionally relied on macro- and microscopic histology and tumor mor- phology as the basis for classifying tumors. Current classification frameworks, however, are unable to discriminate among tumors with similar histopatho- logic features that vary in clinical course and re- sponse to treatment (1). Recently, there is increas- ing interest in changing the emphasis of tumor classification from morphologic to molecular. In the past decade, array technologies have been developed that can be used to simultaneously assess the level of expression of thousands of genes (2–10). Several studies have used arrays to analyze gene expression in colon, breast, and other tumors, and these studies have demonstrated the potential utility of expres- sion profiling for classifying tumors (11,12). Gene expression profiles may offer more information than classic morphology and provide an alternative to morphology-based tumor classification systems. Feature (gene) selection is an important compo- nent for gene expression-based tumor classification systems. The great advantage of microarray is that it is able to simultaneously monitor the expression of thousands or even tens of thousands of genes and provide extremely useful biological information. Theoretically, having more features should give us 1 To whom correspondence and reprint requests should be addressed at Human Genetics Center, University of Texas– Houston, P.O. Box 20334, Houston, TX 77225. E-mail: [email protected]. Molecular Genetics and Metabolism 73, 239 –247 (2001) doi:10.1006/mgme.2001.3193, available online at http://www.idealibrary.com on 239 1096-7192/01 $35.00 Copyright © 2001 by Academic Press All rights of reproduction in any form reserved.

Welcome message from author
This document is posted to help you gain knowledge. Please leave a comment to let me know what you think about it! Share it to your friends and learn new things together.
Transcript

aHm
Molecular Genetics and Metabolism 73, 239–247 (2001)doi:10.1006/mgme.2001.3193, available online at http://www.idealibrary.com on
Feature (Gene) Selection in Gene Expression-BasedTumor Classification
Momiao Xiong,*,1 Wuju Li,* Jinying Zhao,* Li Jin,* and Eric Boerwinkle*,†
*Human Genetics Center, and †Institute of Molecular Medicine, University of Texas–Houston Health Science Center, Houston, Texas
Received December 6, 2000; published online June 27, 2001
nevtspm
There is increasing interest in changing the em-phasis of tumor classification from morphologic tomolecular. Gene expression profiles may offer moreinformation than morphology and provide an alter-native to morphology-based tumor classificationsystems. Gene selection involves a search for genesubsets that are able to discriminate tumor tissuefrom normal tissue, and may have either clear bio-logical interpretation or some implication in themolecular mechanism of the tumorigenesis. Geneselection is a fundamental issue in gene expression-based tumor classification. In the formation of adiscriminant rule, the number of genes is large rel-ative to the number of tissue samples. Too manygenes can harm the performance of the tumor clas-sification system and increase the cost as well. Inthis report, we discuss criteria and illustrate tech-niques for reducing the number of genes and select-ing an optimal (or near optimal) subset of genesfrom an initial set of genes for tumor classification.The practical advantages of gene selection overother methods of reducing the dimensionality (e.g.,principal components), include its simplicity, fu-ture cost savings, and higher likelihood of beingadopted in a clinical setting. We analyze the expres-sion profiles of 2000 genes in 22 normal and 40 colontumor tissues, 5776 sequences in 14 human mam-mary epithelial cells and 13 breast tumors, and 6817genes in 47 acute lymphoblastic leukemia and 25acute myeloid leukemia samples. Through thesethree examples, we show that using 2 or 3 genes canachieve more than 90% accuracy of classification.This result implies that after initial investigation oftumor classification using microarrays, a small
1 To whom correspondence and reprint requests should beddressed at Human Genetics Center, University of Texas–ouston, P.O. Box 20334, Houston, TX 77225. E-mail:
[email protected].239
umber of selected genes may be used as biomark-rs for tumor classification, or may have some rele-ance in tumor development and serve as a poten-ial drug target. In this report we also show thattepwise Fisher’s linear discriminant function is aracticable method for gene expression-based tu-or classification. © 2001 Academic Press
Key Words: gene expression; gene selection; MonteCarlo; microarray; tumor classification.
Diagnostic pathology has traditionally relied onmacro- and microscopic histology and tumor mor-phology as the basis for classifying tumors. Currentclassification frameworks, however, are unable todiscriminate among tumors with similar histopatho-logic features that vary in clinical course and re-sponse to treatment (1). Recently, there is increas-ing interest in changing the emphasis of tumorclassification from morphologic to molecular. In thepast decade, array technologies have been developedthat can be used to simultaneously assess the levelof expression of thousands of genes (2–10). Severalstudies have used arrays to analyze gene expressionin colon, breast, and other tumors, and these studieshave demonstrated the potential utility of expres-sion profiling for classifying tumors (11,12). Geneexpression profiles may offer more information thanclassic morphology and provide an alternative tomorphology-based tumor classification systems.
Feature (gene) selection is an important compo-nent for gene expression-based tumor classificationsystems. The great advantage of microarray is thatit is able to simultaneously monitor the expressionof thousands or even tens of thousands of genes andprovide extremely useful biological information.
Theoretically, having more features should give us1096-7192/01 $35.00Copyright © 2001 by Academic Press
All rights of reproduction in any form reserved.

se
240 XIONG ET AL.
more discriminating power. However, there is morethan one reason for the necessity to reduce the num-ber of features to a sufficient minimum. First, largenumbers of features increase computational com-plexity and cost. Second, although two features maycarry good classification information when treatedseparately, there is little gain if they are combinedtogether in a feature vector because of a high mu-tual correlation. Thus, complexity increases withoutmuch gain. Third, a large number of features willcompromise the generalization properties of theclassifier. It is recognized that the higher the ratio ofthe number of training samples to the number offree classifier parameters, the better the generaliza-tion properties of the resulting classifier (14). Alarge number of features is directly translated into alarge number of classifier parameters (e.g., weightsin a linear classifier, synaptic weights in a neuralnetwork). In general, the number of tissue samplesis two or three orders of magnitudes less, often con-sisting of 10–100 samples. Thus, for a limited num-ber of training samples, keeping the number of fea-tures as small as possible is in line with our desire todesign classifiers with good generalization capabili-ties. Fourth, a large number of features will harmthe estimation of the classification error. One impor-tant step in the design of a classification system isthe performance evaluation stage, in which the clas-sification error probability of the designed classifieris estimated. A small number of features will im-prove the estimation of classification error. There-fore, reducing the dimensionality of the gene expres-sion information is a key issue in developing asuccessful gene expression-based tumor classifica-tion system.
In addition to reducing noise and improving theaccuracy of tumor classification, selected subsets ofgenes with high accuracy of classification may beinvolved in the pathways or some biological pro-cesses leading to tumor development. The selectedsubsets of genes may have important biological in-terpretation and may be used for drug target discov-ery or identifying future possible research direc-tions.
Recently, Getz et al. (18) presented a coupled two-way clustering analysis of gene expression data toidentify subsets of genes and discussed feature se-lection in the cluster analysis. In this report, weaddress the gene selection issue under a classifica-tion framework that may be more relevant to clinicalapplication in diagnosis. Many sophisticated meth-ods for classification such as support vector ma-
chine, neural networks, and Baysian classification sbased on Gaussian process, and for feature selectionsuch as mixed-integer programming and genetic al-gorithm have been developed in the past severaldecades. The purpose of this report is to illustratethe principle of gene selection in tumor classifica-tion, but not to investigate and compare varioussophisticated statistical and computational methodsfor classification and feature selection. To do so, wepresent the use of a simple Fisher linear method forclassification and heuristic stepwise and MonteCarlo methods for selecting an optimal subset ofgenes that provide high accuracy for tumor classifi-cation. By analyzing the expression profiles of 2000genes in 22 normal and 40 tumors, 5776 cDNAclones in 14 human mammary epithelial cells and 13breast tumors, and 6817 genes in 47 acute lympho-blastic leukemia (ALL) and 25 acute myeloid leuke-mia (AML) samples, we show that only a few genescan achieve high accuracy of classification and thatthe selected genes can be used as biomarkers fortumor classification.
MATERIALS AND METHODS
Gene expression data from tumor and normal tis-sues. Three gene expression data sets were used toillustrate the gene selection methods. The first dataset consists of expression profiles of 2000 genes usingan Affymetrix oligonucleotide array from 22 normaland 40 colon tumor tissues which were originally re-trieved from www.molbio.princeton.edu/colondata (11)and are now posted in www.sph.uth.tmc.edu/hgc. Thesecond data set consists of expression profiles of 5776human sequences using a cDNA microarray from 14human mammary epithelial cells and 13 breast tu-mors and was retrieved from http://genome-www.stanford.edu/sbcmp (12). The third data set consists ofexpression profiles of 6817 genes from 47 ALL and25 AML samples and retrieved from http://waldo.wi.mit.edu/MPR/data-set-ALL-AML.html.
Discriminant analysis. We will use the Fisherlinear discriminant function for classifying tumorand normal tissues. The Fisher approach does notassume that the observations are normally distrib-uted. But, it does implicitly assume that the covari-ance matrices of the observed variables in the pop-ulations (normal and tumor) are equal (16). Tumorand normal tissues are classified on the basis of kselected feature variables. The feature variables canrepresent the level of expression of k genes or kummary measures representing the level of genexpression of any number of genes or other mea-
ures. Suppose that nN normal and nT tumor tissue
t
241GENE SELECTION IN TUMOR CLASSIFICATION
samples are examined. For tissue sample i, we havehe vector Y9i 5 (Yi1, Yi2, . . . , Yik). The Yi’s for the
normal (N) and tumor (T) samples constitute thefollowing data matrix,
YN 5 @YN1, YN2, . . . , YNnN#~k3nN! (1)
YT 5 @YT1, YT2, . . . , YTnT#~k3nT!. (2)
From these data matrices, the sample mean vectorsand covariance matrices are determined by
Y# N 51nN
Oi51
nN
YNi,
SN 51
nN 2 1 Oi51
nN
~YNi 2 Y# N!~YNi 2 Y# N!9 (3)
Y# T 51nT
Oi51
nT
YTi,
ST 51
nT 2 1 Oi51
nT
~YTi 2 Y# T!~YTi 2 Y# T!9 (4)
S 5~nN 2 1!SN 1 ~nT 2 1!ST
nN 1 nT 2 2 . (5)
Fisher’s idea was to transform the multivariateobservations YN and YT into univariate observationsZN and ZT such that the Z’s were separated as muchas possible. Fisher suggested taking linear combina-tions of the Y’s to generate Z’s, which can be easilymanipulated mathematically. The midpoint, m̂, be-tween the two univariate sample means, Z# N 5 (Y# N
2 Y# T)9S21YN and Z# T 5 (Y# N 2 Y# T)9S21YT, is given by
m̂ 512 ~Y# N 2 Y# T!9S 21~Y# N 1 Y# T!. (6)
The classification rule based on Fisher’s linear dis-criminant function for an unknown sample, Y 0, is asfollows:
Assign Y0 to N if ~Y# N 2 Y# T!9S 21Y0 $ m̂,
and
Assign Y0 to T if ~Y# N 2 Y# T!9S 21Y0 , m̂.
To evaluate the accuracy of the Fisher linear dis-criminant function with K selected genes for tumorclassification, which was defined as the percentageof correctly classified tissue samples, the tissue sam-ples (for both normal and tumor tissues) were ran-domly divided into two sets. The Fisher linear dis-criminant function was trained on the first set(training set), where the characteristic (e.g., normalvs tumor, subtypes of tumor) of the tissue sampleswas assumed to be known, and then tested on thesecond set (test set), where the characteristic of thetissue samples was assumed to be unknown. Threedifferent proportional partitioning of the tissue sam-ples were used for assessing the accuracy of theFisher linear discriminant function for tumor clas-sification: (1) 50% for training and 50% for testing;(2) 68% for training and 32% for testing; and (3) 95%for training and 5% for testing. To evaluate theperformance of selected genes, we randomly parti-tioned the total tissue samples into training and testsets 200 times for each of the three partitions andthen averaged the results.
Gene selection for tumor classification. The ulti-mate purpose of these investigations is to form arule for the allocation of subsequent unclassifiedtissue samples into similar classes (e.g., tumor vsnormal, subtypes of tumor). Therefore, the accuracyof classification, which is defined as the percentageof correctly classified normal and tumor tissues, orsubtypes of tumor tissues, will be used as a criterionfor comparing gene selection algorithms. The goal ofgene selection is to find an optimal (or near optimal)subset of K genes which have the highest (or nearhighest) accuracy of classification from the initialcomplete set of p genes.
Stepwise selection and Monte Carlo methods.Four methods were applied to the full array of datato select a subset of genes to be used in the discrimi-nant analyses: stepwise procedure, a Monte Carlomethod, t test, and the prediction strength (PS) sta-tistic suggested by Golub et al. (13). In the forwardstepwise selection procedure, we began with an op-timal subset of two genes which had the highestaccuracy of classification among all possible combi-nations of two genes. The accuracy of classificationwas then computed for the previous selected optimalsubset of genes and each of the remaining p-2 genesin the data set and the one that gives the highestaccuracy of classification is the next gene to enterthe optimal subset of genes. The procedure contin-
ues to select one additional gene at a time until the
tsfiitt
Msogrgs
iodufli
ataps
atmc
ormtaTthtot1n
242 XIONG ET AL.
accuracy of classification reaches a predeterminedthreshold or a fixed number of K is reached.
Using the Monte Carlo method, we randomly se-lected a subset of k genes n times (k begins with 1). Forhis study, we set n 5 200,000. We next identified theubset of k genes with the highest accuracy of classi-cation among all n subsets of k genes. The value k is
ncreased by 1 and the procedure was repeated untilhe accuracy of classification reaches the same prede-ermined threshold or a fixed value of k is reached.
Since the search by either stepwise procedure oronte Carlo method is not exhaustive, the selected
ubsets of genes may not have the highest accuracyf classification among all possible combinations ofenes. Therefore, such selected subsets of genes areeferred to optimal (or near optimal) subsets ofenes. It should also be pointed out that the optimalubsets of genes may not be unique.
t test. Those genes whose expressions are signif-cantly different between normal and tumor tissuesr between subtypes of tumor tissues are also can-idates for selection. A simple t test statistic can besed to measure the degree of gene expression dif-erence between normal and tumor tissues. We se-ect those K genes with the largest t statistic fornclusion in the discriminant analyses.
Prediction strength and gene selection. Golub etl. proposed the use of a collection of known sampleso generate a “class predictor” which is then able tossign a new sample to one of two classes (13). Thisredictor is created with the aid of “predictiontrength.” Let [m 1( g), s 1( g)] and [m 2( g), s 2( g)] de-
note the means and SD (standard deviation) of the logof the expression levels of gene g in the normal andtumor tissues, respectively. Then, PS is defined as
PS~g! 5m1~g! 2 m2~g!
s1~g! 1 s2~g!.
Genes with large PS are “informative” and are se-lected for tumor classification. We selected those Kgenes with the largest PS statistic for inclusion inthe discriminant analyses.
RESULTS
Number of genes with a certain accuracy of classi-fication. We initially evaluated the accuracy of pre-diction for each individually. Table 1 shows thenumber of genes whose accuracy of prediction fell
within the specified intervals. These data demon- pstrate that most genes individually do not offer goodpredictive ability, but a few genes do individuallyprovide very strong accuracy of prediction. For ex-ample, for predicting tumor versus normal breast,15 genes individually provided more than 90% accu-racy of prediction.
Optimal and near optimal sets of genes for tumorclassification. Table 2 shows the optimal or nearoptimal one-gene, two-gene, and three-gene subsetsfor tumor classification using the stepwise, MonteCarlo, t statistic, and PS methods of gene selection.Accuracy of classification was evaluated for the totalcollection of tissue samples. These data have twoimplications. First, using a small number of genescan achieve a high accuracy of classification. Second,the stepwise and Monte Carlo method of gene selec-tion performed consistently better than the t testnd PS methods. For example, considering onlyhree genes, both the stepwise and Monte Carloethods provided 93% accuracy of classification for
olon cancer.
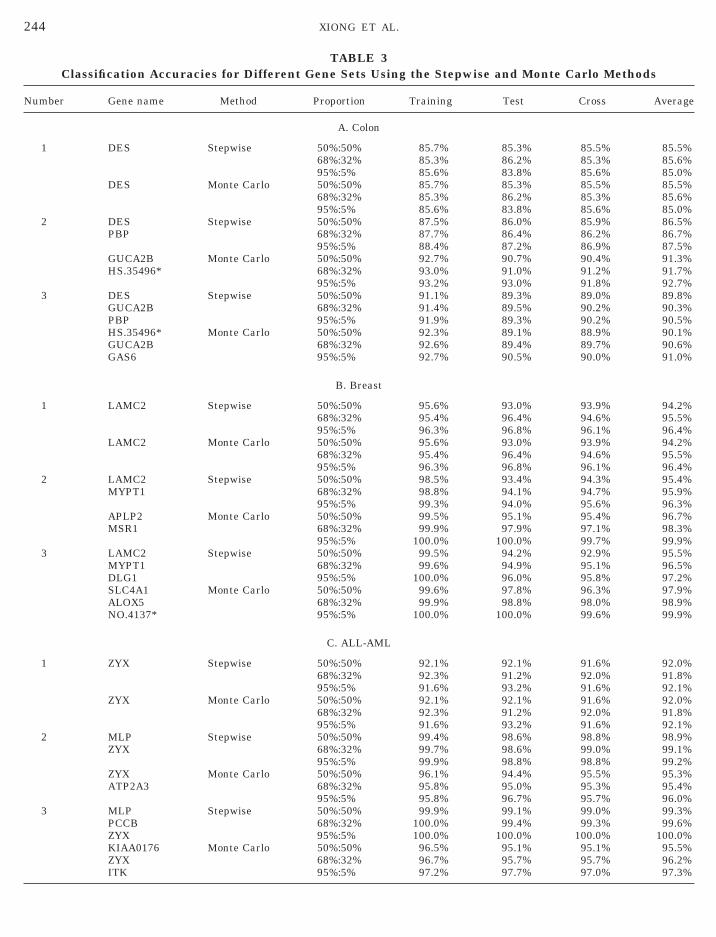
Evaluation of performance of selected optimal setsf genes for tumor classification. Table 3 summa-izes the accuracy of classification of selected opti-al or near optimal sets of genes using training and
est subsets of the tissue samples and the stepwisend Monte Carlo methods. The data presented inable 3 underscore the fact that using selected op-imal or near optimal sets of genes can achieve aigh accuracy of classification. In fact, using one,wo, or three genes yielded more than 85% accuracyf classification in all three proportions of the parti-ioning. To further illustrate this point, Figs. 1A andB show the expression of two selected genes inormal and tumor tissues. Figure 1C shows the ex-
TABLE 1Number of Genes with a Certain Accuracy
of Classification
Interval ofclassification
accuracy
Number of genes (ratio)
Colon cancer Breast cancer ALL-AML
[0.0, 0.5) 541 (27.05%) 1122 (19.43%) 843 (11.82%)[0.5, 0.6) 1049 (52.45%) 1813 (31.39%) 3672 (51.51%)[0.6, 0.7) 366 (18.30%) 1290 (22.33%) 2077 (29.13%)[0.7, 0.8) 40 (2.00%) 1176 (20.36%) 468 (6.56%)[0.8, 0.9) 4 (0.20%) 360 (6.23%) 66 (0.93%)[0.9, 1.0] 0 (0.00%) 15 (0.26%) 3 (0.042%)[0.0, 1.0] 2000 (100.00%) 5776 (100.00%) 7129 (100.00%)
ression of two selected genes in ALL and AML

MDSNM
ZZPZMZCDMKCC
1
243GENE SELECTION IN TUMOR CLASSIFICATION
tissues. It is apparent that normal and tumor tis-sues or ALL and AML tissues are well separated.Comparing among methods, the accuracy of classi-fication by the stepwise and Monte Carlo methods issimilar. However, the accuracy of classification bythe t statistic and PS methods is lower than that
TAOptimal or Near Optimal Sets
Gene name
A
DESDESGUCA2BPLKDES PBPHS.35496* GUCA2BGUCA2B KCNMB1PLK G3BPDES GUCA2B PBPHS.35496* GUCA2B GAS6GUCA2B KCNMB1 SSBPPLK G3BP HS.71968*
B
LAMC2LAMC2NO.1711†MYPT1MYPT1 LAMC2APLP2 MSR1NO.1711† DLG1
YPT1 NO.3112†LG1 MYPT1 LAMC2LC4A1 ALOX5 NO.4137†O.1711† DLG1 DDX21YPT1 NO.3112† DDX21
C. A
YXYXSMA6YXLP ZYX
YX ATP2A3CND3 PSMA6F ZYXLP PCCB ZYXIAA0176 ZYX ITKCND3 PSMA6 TCF3D33 DF ZYX
* The gene names here are represented by the UniGene SystemA have the same meaning.† The gene names here are represented by the order number i
provided by the stepwise and Monte Carlo methods.
Optimal size of selected sets of genes. Figure 2shows the relationship between the accuracy of tu-mor classification and the number of genes in aselected optimal (or near optimal) gene set using theacute leukemia tumor data. For all three partition-ings, three genes is an optimal number for tumor
2enes for Tumor Classification
Number Methods Accuracy
1 Stepwise 85.5%1 Monte Carlo 85.5%1 t test 75.8%1 PS 66.1%2 Stepwise 91.9%2 Monte Carlo 91.9%2 t test 74.2%2 PS 67.7%3 Stepwise 93.5%3 Monte Carlo 93.5%3 t test 74.2%3 PS 79.0%
t
1 Stepwise 96.3%1 Monte Carlo 96.3%1 t test 92.6%1 PS 92.6%2 Stepwise 100.0%2 Monte Carlo 100.0%2 t test 96.3%2 PS 88.9%3 Stepwise 100.0%3 Monte Carlo 100.0%3 t test 96.3%3 PS 92.6%
L
1 Stepwise 91.7%1 Monte Carlo 91.7%1 t test 83.3%1 PS 91.7%2 Stepwise 100.0%2 Monte Carlo 95.8%2 t test 81.9%2 PS 93.8%3 Stepwise 100.0%3 Monte Carlo 97.2%3 t test 83.3%3 PS 94.4%
se the designations are unique. The “*” in Table 3A, and Figure
nal retrieved gene expression file.
BLEof G
. Colon
. Breas
LL-AM
becau
n origi
classification. As the number of genes in an optimal
244 XIONG ET AL.
TABLE 3Classification Accuracies for Different Gene Sets Using the Stepwise and Monte Carlo Methods
Number Gene name Method Proportion Training Test Cross Average
A. Colon
1 DES Stepwise 50%:50% 85.7% 85.3% 85.5% 85.5%68%:32% 85.3% 86.2% 85.3% 85.6%95%:5% 85.6% 83.8% 85.6% 85.0%
DES Monte Carlo 50%:50% 85.7% 85.3% 85.5% 85.5%68%:32% 85.3% 86.2% 85.3% 85.6%95%:5% 85.6% 83.8% 85.6% 85.0%
2 DES Stepwise 50%:50% 87.5% 86.0% 85.9% 86.5%PBP 68%:32% 87.7% 86.4% 86.2% 86.7%
95%:5% 88.4% 87.2% 86.9% 87.5%GUCA2B Monte Carlo 50%:50% 92.7% 90.7% 90.4% 91.3%HS.35496* 68%:32% 93.0% 91.0% 91.2% 91.7%
95%:5% 93.2% 93.0% 91.8% 92.7%3 DES Stepwise 50%:50% 91.1% 89.3% 89.0% 89.8%
GUCA2B 68%:32% 91.4% 89.5% 90.2% 90.3%PBP 95%:5% 91.9% 89.3% 90.2% 90.5%HS.35496* Monte Carlo 50%:50% 92.3% 89.1% 88.9% 90.1%GUCA2B 68%:32% 92.6% 89.4% 89.7% 90.6%GAS6 95%:5% 92.7% 90.5% 90.0% 91.0%
B. Breast
1 LAMC2 Stepwise 50%:50% 95.6% 93.0% 93.9% 94.2%68%:32% 95.4% 96.4% 94.6% 95.5%95%:5% 96.3% 96.8% 96.1% 96.4%
LAMC2 Monte Carlo 50%:50% 95.6% 93.0% 93.9% 94.2%68%:32% 95.4% 96.4% 94.6% 95.5%95%:5% 96.3% 96.8% 96.1% 96.4%
2 LAMC2 Stepwise 50%:50% 98.5% 93.4% 94.3% 95.4%MYPT1 68%:32% 98.8% 94.1% 94.7% 95.9%
95%:5% 99.3% 94.0% 95.6% 96.3%APLP2 Monte Carlo 50%:50% 99.5% 95.1% 95.4% 96.7%MSR1 68%:32% 99.9% 97.9% 97.1% 98.3%
95%:5% 100.0% 100.0% 99.7% 99.9%3 LAMC2 Stepwise 50%:50% 99.5% 94.2% 92.9% 95.5%
MYPT1 68%:32% 99.6% 94.9% 95.1% 96.5%DLG1 95%:5% 100.0% 96.0% 95.8% 97.2%SLC4A1 Monte Carlo 50%:50% 99.6% 97.8% 96.3% 97.9%ALOX5 68%:32% 99.9% 98.8% 98.0% 98.9%NO.4137* 95%:5% 100.0% 100.0% 99.6% 99.9%
C. ALL-AML
1 ZYX Stepwise 50%:50% 92.1% 92.1% 91.6% 92.0%68%:32% 92.3% 91.2% 92.0% 91.8%95%:5% 91.6% 93.2% 91.6% 92.1%
ZYX Monte Carlo 50%:50% 92.1% 92.1% 91.6% 92.0%68%:32% 92.3% 91.2% 92.0% 91.8%95%:5% 91.6% 93.2% 91.6% 92.1%
2 MLP Stepwise 50%:50% 99.4% 98.6% 98.8% 98.9%ZYX 68%:32% 99.7% 98.6% 99.0% 99.1%
95%:5% 99.9% 98.8% 98.8% 99.2%ZYX Monte Carlo 50%:50% 96.1% 94.4% 95.5% 95.3%ATP2A3 68%:32% 95.8% 95.0% 95.3% 95.4%
95%:5% 95.8% 96.7% 95.7% 96.0%3 MLP Stepwise 50%:50% 99.9% 99.1% 99.0% 99.3%
PCCB 68%:32% 100.0% 99.4% 99.3% 99.6%ZYX 95%:5% 100.0% 100.0% 100.0% 100.0%KIAA0176 Monte Carlo 50%:50% 96.5% 95.1% 95.1% 95.5%ZYX 68%:32% 96.7% 95.7% 95.7% 96.2%ITK 95%:5% 97.2% 97.7% 97.0% 97.3%

245GENE SELECTION IN TUMOR CLASSIFICATION
(or near optimal) gene set exceeds 3, the accuracy ofclassification decreases. The colon and breast tumordata had similar patterns (data not shown).
Optimal or near optimal sets of genes form clus-ters. An optimal set of genes for classifying tumorand normal tissue may not be unique. There mayexist a number of sets of genes whose accuracy ofclassification is quite close. For example, there are15 pairs of genes whose expression provides an ac-curacy of prediction greater than 90.3% for the coloncancer data set. The 15 pairs of genes fall into twogroups, and the pairs are made up of one memberfrom Group 1 and one member from Group 2. Figure3 shows that these genes indeed form two clusters ofgenes. The genes marked with an asterisk are inGroup 1 and the genes without an asterisk are in theGroup 2. Similar patterns were observed for thebreast cancer data set (data not shown).
DISCUSSION
Simultaneously monitoring the expression ofthousands of genes holds great promise for betterunderstanding cancer biology and developing accu-
FIG. 1. Gene expression levels in tumor and normal tissue forGUCA2B and HS.35496 in colon (A) and HS.136016 and HB58 inbreast (B) and PSCD1 and ZYX in acute leukemia (C). The straightlines in the figures represent the Fisher linear discriminant function
FIG. 2. Comparison of ALL-AML tissue classification accura-cies for different numbers of genes selected using Monte Carlosimulation for different partition ratios of test and training data.
and demonstrate the separation of tissue types by only two genes.

accura
246 XIONG ET AL.
rate tumor classification schemes. However, thevery large amount of gene expression informationprovided by contemporary microarray technology(6–10) raises problems for both basic research andclinical application. First, the high cost of large-scalemicroarray experiments dictates that the samplesize is usually several orders of magnitude smallerthan the number of genes being monitored. As aresult, it is mathematically infeasible to use all ofthe gene expression information to develop a classi-fication algorithm for a relatively small number oftumors (14). It is also well documented in the sta-tistical literature that too many feature variables(i.e., genes) can harm the performance of the classi-fier (15). Therefore, development of an accurate tu-mor classification scheme must begin with selectionof a subset of the initially observed genes for tumorclassification. In the parlance of the classificationliterature, this is known as “pruning” or “feature setreduction.” Second, application of gene expressionanalyses for tumor classification and pathology re-quires cost-effective and stream-lined methodology.In other words, the cost and complexity of monitor-ing the expression of thousands of genes will not be
FIG. 3. Fifteen pairs of genes with each having more than 90%
necessary in a clinical setting if a handful of genes
provides an accurate tumor classification scheme.Third, only small numbers of genes are relevant fortumor development. The selected subset of geneswith high accuracy of classification may have someimplications in elucidating the molecular mecha-nism for tumor development. In this report, we pro-pose and characterize methods for selecting an op-timal subset of genes for tumor classification.
Selecting an optimal subset of genes poses two re-lated problems: first, determining the number of genesto be selected; second, determining which genes belongto the set. To begin to address these problems, we haveanalyzed available expression data from 2000 genes in22 normal and 40 colon cancer samples, 5776 cDNAclones in 14 mammary epithelial cells and 13 breasttumors, and 6817 genes in 47 ALL and 25 AML sam-ples. Our results indicate that expression informationfrom three or four genes is optimal for tumor classifi-cation in these three data sets. In fact, as few as twogenes achieve more than 90% accuracy in many in-stances. This result is appealing and has profoundimplications for clinical applications. It bodes well forthe following scenario. Initial basic research and clin-ical trials will monitor the expression of thousands of
cy of classification in the colon cancer data set form two clusters.
genes using microarrays to identify a handful of genes

247GENE SELECTION IN TUMOR CLASSIFICATION
providing optimal tumor classification information.Clinical applications will then monitor only this smallsubset of genes, thus avoiding the cost and complexityof large-scale gene expression arrays. Of course, thenumber of selected genes and the optimal set of thegenes will likely differ according to tumor type, andthus the clinical laboratory will still need the ability tomonitor a variety of genes.
There is no single best procedure for selecting anoptimal subset of genes for tumor classification. It isnot the purpose of this paper to survey the variousmethods for feature variable (gene) selection, butrather to illustrate how gene selection can be usefulto tumor classification and investigation of tumori-genesis. Any successful procedure will require a mixof statistical decision rules and expert knowledge. Inthis report, four statistical procedures were com-pared for their accuracy of tumor classification: step-wise discriminant analysis, Monte Carlo methods, tstatistic, and a PS statistic suggested by Golub et al.(13). The results indicate that the stepwise andMonte Carlo methods performed similarly, and bothmethods performed better than the t or PS statistics.However, the stepwise method demands much lesscomputational time than the Monte Carlo method,and, therefore, the stepwise discriminant analysisprovides a practical and accurate method for tumorclassification using gene expression profiles.
The level of expression of sets (i.e., clusters) of genesacross tissue samples is correlated (11). As a result, itis likely that the information contained in a largenumber of gene can be captured by a smaller numberwithout significant loss of information. This is a directresult of the fact that sets of genes are similarly regu-lated and, hence, play a similar role in tumor classifi-cation. It is known from pattern recognition theorythat a good feature subset is one that contains featureshighly correlated with the class, yet uncorrelated witheach other. In this report, we show that there are anumber of gene subsets that have similarly high accu-racies for tumor classification, and the genes in thesesubsets form two clusters. The expression levels ofgenes within the same cluster have a high correlation,and the expression levels of genes in different clustershave a low correlation. We speculate that the geneswithin a cluster lie in a single pathway or coregulatedpathways, and genes in different clusters lie in differ-ent pathways or pathways that are not coregulated.
REFERENCES
1. Stephenson J. Human genome studies expected to revolu-
tionize cancer classification. JMMA 282:927–928, 1999.2. Tlsty TD, Margolin BH, Lum K. Differences in the rates ofgene amplification in nontumorigenic and tumorigenic celllines as measured by Luria-Delbruck fluctuation analysis.Proc Natl Acad Sci USA 86:9441–9445, 1989.
3. Theillet C. Full speed ahead for tumor screening. NatureMed 4:767–768, 1998.
4. Strausberg RL, Austin MJF. Functional genomics: Techno-logical challenges and opportunities. Physiol Genomics1:25–32, 1999.
5. Iyer VR, Eisen MB, Ross DT, Schuler G, Moore T, Lee JCF,Trent JM, Staudt LM, Hudson J Jr, Boguski MS, LashkariD, Shalon D, Botstein D, Brown PO. The transcriptionalprogram in the response of human fibroblasts to serum.Science 283:83–87, 1999.
6. Lockhart DJ, Dong H, Byrne MC, Follettie MT, Gallo MV, CheeMS, Mittmann M, Wang C, Kobayashi M, Horton H, BrownEL. Expression monitoring by hybridization to high-densityoligonucleotide arrays. Nature Biotechnol 14:1675–1680, 1996.
7. Wodicka L, Dong H, Mittmann M, Ho MH, Lockhart DJ. Ge-nome-wide expression monitoring in Saccharomyces cerevi-siae. Nature Biotechnol 15:1359–1367, 1997.
8. Spellman PT, Sherlock G, Zhang MQ, Iyer VR, Anders K,Eisen MB, Brown PO, Botstein D, Futcher B. Comprehen-sive identification of cell cycle-regulated genes of the yeastSaccharomyces cerevisiae by microarray hybridization. MolBiol Cell 9:3273–3297, 1998.
9. Yang GP, Ross DT, Kuang WW, Brown PO, Weigel RJ. Com-prehensive identification of cell cycle-regulated genes of theyeast Saccharomyces cerevisiae by microarray hybridization.Nucleic Acids Res 27:1517–1523, 1999.
10. DeRisi J, Penland L, Brown PO, Bittner ML, Meltzer PS,Ray M, Chen Y, Su YA, Trent JM. Use of a cDNA microarrayto analyse gene expression patterns in human cancer. Na-ture Genet 14:457–460, 1996.
11. Alon U, Barkai N, Notterman DA, Gish K, Ybarra S, MackD, Levine AJ. Broad patterns of gene expression revealed byclustering analysis of tumor and normal colon tissuesprobed by oligonucleotide arrays. Proc Natl Acad Sci USA96:6745–6750, 1999.
12. Perou CM, Jeffrey SS, Rijn MVD, Rees CA, Eisen MB, RossRT, Pergamenschikov A, Williams CF, et al. Distinctive geneexpression patterns in human mammary epithelial cells andbreast cancers. Proc Natl Acad Sci USA 96:9212–9217, 1999.
13. Golub TR, Slonim DK, Tamayo P, Huard C, Gaasenbeek M,Mesirov JP, Coller H, Loh ML, Downing JR, Caligiuri MA,Bloomfield CD, Lander ES. Molecular classification of can-cer: Class discovery and class prediction by gene expressionmonitoring. Science 286:535–537, 1999.
14. Theodoridis S. Pattern Recognition. San Diego: AcademicPress, 1999.
15. McLachlan GJ. Discriminant Analysis and Statistical Pat-tern Recognition. New York: Wiley, 1992.
16. Johnson RA, Wichern DW. Applied Multivariate StatisticalAnalysis. Englewood Cliffs, NJ: Prentice-Hall, 1982.
17. Draper NR, Smith H. Applied Regression Analysis, 2nd ed.New York: Wiley, 1981.
18. Getz G, Levine E, Domany E. Coupled two-way clusteringanalysis of gene microarray data. Proc Natl Acad Sci USA
97:12079–12084, 2000.
Related Documents