21 September 2010 Vol. 22 No. 3 Engineering Management Journal Feasibility Study of Wind Power Generation System at Arctic Valley Hsueh-Ming Steve Wang, University of Alaska Anchorage Karl M. Spohn, WHPacific, Inc., Anchorage LuAnn Piccard, University of Alaska Anchorage Lei Yao, University of Alaska Anchorage learned from past projects, research studies, and an investigation into the field of wind science. e following sections will focus on some past work and how it could be applied to a wind project at Arctic Valley, Alaska, development of an Aſter Tax Analysis to verify a positive present worth of the project, and demonstration of how those major factors affect this project. Background e most important step in identifying a location for a potential wind farm is to understand the wind characteristics of the location under consideration. Aſter examining the wind resource map for Alaska, the wind resource map shows that Arctic Valley has a wind power classification of fair to good wind rating (see Exhibit 1). Once the preliminary site selection of the wind farm is performed, site specific wind and meteorological data is needed to successfully analyze the wind potential at the proposed location. is meteorological data can be obtained from the Western Regional Climate Data Center and the National Weather Service’s meteorological stations from their websites at: http://www.raws.dri.edu/wraws/akF.html • http://pafc.arh.noaa.gov/mesonet.php • No matter how the wind data is obtained, it needs to be checked and validated. First, the data should be examined for completeness. Also, data should be checked for duplicate time stamped data intervals and long durations of constantly recorded wind speeds. Duplication of time stamped data intervals and long durations of constantly recorded wind speeds should be considered suspect, since the anemometer may have become stuck or malfunctioned during operation (WRAH, 1997). Additionally, the data validation process is a good way of becoming familiar with the weather conditions at the site. e wind speeds need to be adjusted to the appropriated hub height of the wind turbine being considered at the site. is can be accomplished by using the following equation: (1) Here V 1 is the height wind speed, V 2 is the unknown wind speed, H 1 is the height measured height, H 2 is the unknown height, and α is the wind shear. A common value (1/7) will be used in all calculations for wind shear values at the Arctic Valley site, since this is considered a typical industry standard value used in wind study analysis (Alaska Energy Authority, Data Processing Procedures, 2006). e layout of the wind turbines is critical so that maximum energy can be produced from the wind site being developed. Refereed management tool manuscript Accepted by Associate Editor Merino. Abstract: Wind energy in south central Alaska may be a solution to balance the rising cost of electricity. is article examines key parameters for the design of a wind farm in the Arctic Valley in the Municipality of Anchorage. ese include recorded wind speeds near the site, selecting potential wind turbines, and the economic feasibility of the project using Aſter Tax Analysis. e results show the project is marginally suitable for generating electricity with the wind data examined including the renewable energy investment tax credit. If adequate wind speed could be proven to exist, this location could produce years of inexpensive electric energy. Keywords: Wind Power, Wind Analysis, Wind Farm, Aſter Tax Analysis, Investment Tax Credit EMJ Focus Areas: Economics of Engineering, Innovation & New Product Development, Systems Engineering, Technology Management A rctic Valley is located approximately 12 miles northeast of Anchorage in the Chugach Mountains. is research studied the feasibility of a wind farm running along the ridgeline that starts at 800 ſt. elevation and continues up to 4,000 ſt. elevation. Today the area is known as Site Summit and formerly was a Cold War Nike missile installation during the 1960s and 1970s. is area is currently owned and managed by the Department of Defense (Army) and is considered part of the Fort Richardson Army Reservation (Nike Site Summit Task Force, 2001). To research the feasibility of wind power at Arctic Valley, a comprehensive literature search was performed. at research provided insight into previous wind power findings, industry standards, as well as government incentives, and allowed for its incorporation throughout this project. e literature search examined three specific areas of wind power. First, wind power publications, journals, manuals, technical reviews, local climate data, and relative projects costs were studied. Second, research of individual wind turbine manufactures was performed. ird, research of current electric utility costs, consumer rates, and types of electric generation for south central Alaska was researched. Lastly, an Aſter Tax Analysis of the economic feasibility for this project indicated that a wind farm at Arctic Valley is economically feasible. e successful development of a productive wind farm is complex and requires an integrated method of producing renewable energy. To better understand this process, lessons can be

Welcome message from author
This document is posted to help you gain knowledge. Please leave a comment to let me know what you think about it! Share it to your friends and learn new things together.
Transcript

21September 2010Vol. 22 No. 3Engineering Management Journal
Feasibility Study of Wind Power Generation System at Arctic ValleyHsueh-Ming Steve Wang, University of Alaska Anchorage
Karl M. Spohn, WHPacific, Inc., Anchorage LuAnn Piccard, University of Alaska Anchorage
Lei Yao, University of Alaska Anchorage
learned from past projects, research studies, and an investigation into the field of wind science. The following sections will focus on some past work and how it could be applied to a wind project at Arctic Valley, Alaska, development of an After Tax Analysis to verify a positive present worth of the project, and demonstration of how those major factors affect this project.
BackgroundThe most important step in identifying a location for a potential wind farm is to understand the wind characteristics of the location under consideration. After examining the wind resource map for Alaska, the wind resource map shows that Arctic Valley has a wind power classification of fair to good wind rating (see Exhibit 1).
Once the preliminary site selection of the wind farm is performed, site specific wind and meteorological data is needed to successfully analyze the wind potential at the proposed location. This meteorological data can be obtained from the Western Regional Climate Data Center and the National Weather Service’s meteorological stations from their websites at:
http://www.raws.dri.edu/wraws/akF.html•http://pafc.arh.noaa.gov/mesonet.php•
No matter how the wind data is obtained, it needs to be checked and validated. First, the data should be examined for completeness. Also, data should be checked for duplicate time stamped data intervals and long durations of constantly recorded wind speeds. Duplication of time stamped data intervals and long durations of constantly recorded wind speeds should be considered suspect, since the anemometer may have become stuck or malfunctioned during operation (WRAH, 1997). Additionally, the data validation process is a good way of becoming familiar with the weather conditions at the site.
The wind speeds need to be adjusted to the appropriated hub height of the wind turbine being considered at the site. This can be accomplished by using the following equation:
(1)
Here V1 is the height wind speed, V2 is the unknown wind speed, H1 is the height measured height, H2 is the unknown height, and α is the wind shear. A common value (1/7) will be used in all calculations for wind shear values at the Arctic Valley site, since this is considered a typical industry standard value used in wind study analysis (Alaska Energy Authority, Data Processing Procedures, 2006).
The layout of the wind turbines is critical so that maximum energy can be produced from the wind site being developed.
Refereed management tool manuscript Accepted by Associate Editor Merino.
Abstract: Wind energy in south central Alaska may be a solution to balance the rising cost of electricity. This article examines key parameters for the design of a wind farm in the Arctic Valley in the Municipality of Anchorage. These include recorded wind speeds near the site, selecting potential wind turbines, and the economic feasibility of the project using After Tax Analysis. The results show the project is marginally suitable for generating electricity with the wind data examined including the renewable energy investment tax credit. If adequate wind speed could be proven to exist, this location could produce years of inexpensive electric energy.
Keywords: Wind Power, Wind Analysis, Wind Farm, After Tax Analysis, Investment Tax Credit
EMJ Focus Areas: Economics of Engineering, Innovation & New Product Development, Systems Engineering, Technology Management
Arctic Valley is located approximately 12 miles northeast of Anchorage in the Chugach Mountains. This research studied the feasibility of a wind farm running along
the ridgeline that starts at 800 ft. elevation and continues up to 4,000 ft. elevation. Today the area is known as Site Summit and formerly was a Cold War Nike missile installation during the 1960s and 1970s. This area is currently owned and managed by the Department of Defense (Army) and is considered part of the Fort Richardson Army Reservation (Nike Site Summit Task Force, 2001).
To research the feasibility of wind power at Arctic Valley, a comprehensive literature search was performed. That research provided insight into previous wind power findings, industry standards, as well as government incentives, and allowed for its incorporation throughout this project. The literature search examined three specific areas of wind power. First, wind power publications, journals, manuals, technical reviews, local climate data, and relative projects costs were studied. Second, research of individual wind turbine manufactures was performed. Third, research of current electric utility costs, consumer rates, and types of electric generation for south central Alaska was researched. Lastly, an After Tax Analysis of the economic feasibility for this project indicated that a wind farm at Arctic Valley is economically feasible.
The successful development of a productive wind farm is complex and requires an integrated method of producing renewable energy. To better understand this process, lessons can be

22 September 2010Vol. 22 No. 3Engineering Management Journal
First, it is necessary to know the prevailing wind direction. According to the Windustry’s Community Wind Toolbox (2007), “In the direction of the prevailing wind, the turbines should be spaced eight rotor diameters apart. In the direction perpendicular to the prevailing wind, the machines should be four rotor diameters apart.”
MethodologyThere are three goals for this research. The first goal of this site-specific wind analysis at Arctic Valley is to determine whether enough prevailing wind is available to generate electricity using wind turbines. The research activities include Arctic Valley location, wind data validation and analysis, wind frequency, prevailing wind direction, wind turbine selection, capacity factor, and the scope of wind farm. The second goal is to perform an economic analysis to determine the economic feasibility of the project. In this case, the After Tax Analysis algorithm developed by Hans and Merino (1993) was used. The third goal is to determine which factors have the highest level of sensitivity on the results of the project. The following flow chart shows the research process that was followed to examine the potential wind resource at Arctic Valley and to perform the economic feasibility assessment for this project.
Arctic Valley LocationFor the Arctic Valley wind analysis, wind and meteorological data was obtained from an existing weather station identified as Site Summit, located at the approximate latitude of 61º 26’ N, approximate longitude of 149º 53’ W, and with an approximate elevation of 3,924 feet. The meteorological data for Site Summit was obtained though the Western Regional Climate Data Center for January, 2001, to December, 2008.
Wind Data Validation and AnalysisThe wind data from the Site Summit Weather station was analyzed for completeness for the time period beginning January, 2001, through December, 2008. This consisted of checking the wind data for missing or flawed wind values.
First, each month of wind data was independently checked for completeness. During this analysis, only the data from months with wind data that were validated to a difference of less than 10% between the recorded and expected data numbers was accepted and used in the wind study. The data from months that did not meet the 10% quality control level were removed from the dataset,
Exhibit 1. Wind Power Classification Map (U.S. Department of Energy, National Renewable Energy Laboratory, 2006)
No
Yes
1. Design Scope of Wind Farm- Arctic Valley location- Wind data validation & analysis- Wind frequency- Prevailing wind direction- Wind turbine selection- Capacity factor- The Scope of Wind Farm
2. Capacity Scenarios for Cash Flow Analysis
3. Economic Analysis- Establish Economic Criteria (MARR, Tax Rate, etc.)- Use after Tax Analysis (ATA) Model- Calculate Life Cycle Costs (EUAC)
4. Decision Analysis- Conduct Economic Analysis- Conduct Sensitivity Analysis
5. Does Project Meet Criteria?- Economic
6. Final Decision
Exhibit 2. Research Methodology Flow Chat for Wind Farm
since the data was found to be an incomplete sampling of wind characteristics at Arctic Valley. Second, the wind data was checked for suspect records of lengthy, constant wind speed measurements that remained at the same value, to ensure that the weather station was not stuck at a single wind speed for a long duration of time. Third,
23September 2010Vol. 22 No. 3Engineering Management Journal
wind data directions were analyzed to make sure that all values ranged between 0º and 360º. All of the validated data fit this criteria. Fourth, hourly mean wind speeds between 0 and 59 miles per hour were analyzed.
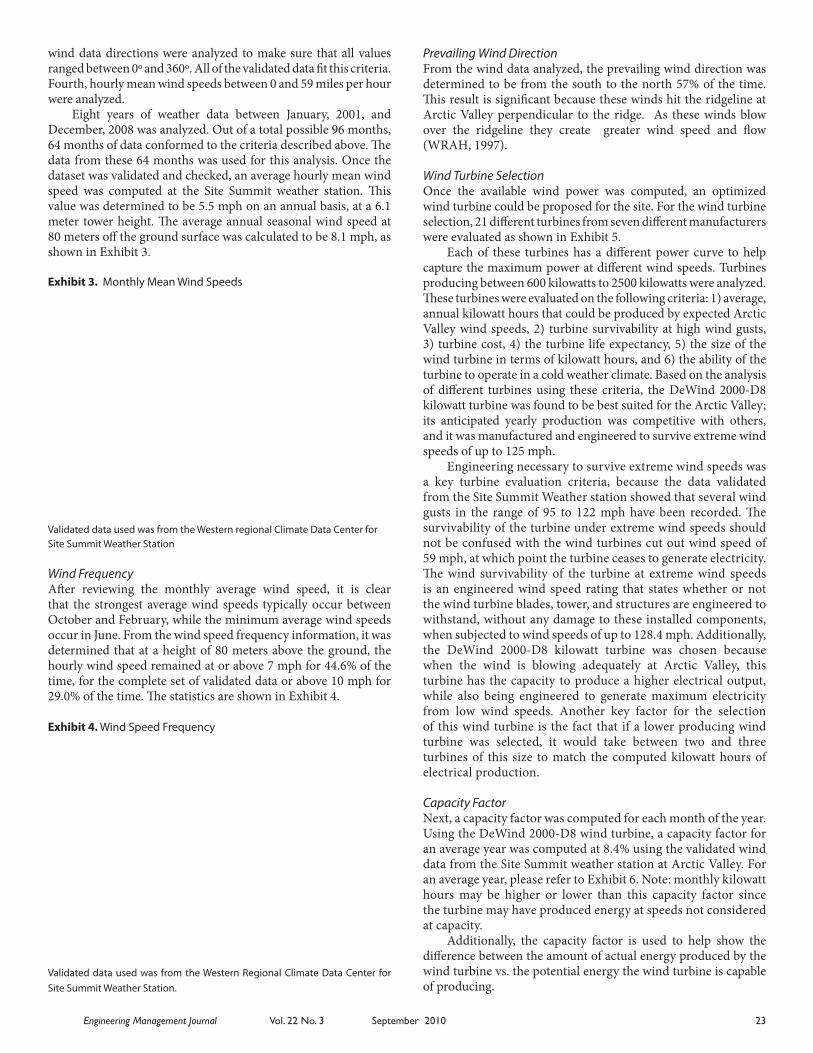
Eight years of weather data between January, 2001, and December, 2008 was analyzed. Out of a total possible 96 months, 64 months of data conformed to the criteria described above. The data from these 64 months was used for this analysis. Once the dataset was validated and checked, an average hourly mean wind speed was computed at the Site Summit weather station. This value was determined to be 5.5 mph on an annual basis, at a 6.1 meter tower height. The average annual seasonal wind speed at 80 meters off the ground surface was calculated to be 8.1 mph, as shown in Exhibit 3.
Exhibit 3. Monthly Mean Wind Speeds
Validated data used was from the Western regional Climate Data Center for Site Summit Weather Station
Wind FrequencyAfter reviewing the monthly average wind speed, it is clear that the strongest average wind speeds typically occur between October and February, while the minimum average wind speeds occur in June. From the wind speed frequency information, it was determined that at a height of 80 meters above the ground, the hourly wind speed remained at or above 7 mph for 44.6% of the time, for the complete set of validated data or above 10 mph for 29.0% of the time. The statistics are shown in Exhibit 4.
Exhibit 4. Wind Speed Frequency
Validated data used was from the Western Regional Climate Data Center for Site Summit Weather Station.
Prevailing Wind DirectionFrom the wind data analyzed, the prevailing wind direction was determined to be from the south to the north 57% of the time. This result is significant because these winds hit the ridgeline at Arctic Valley perpendicular to the ridge. As these winds blow over the ridgeline they create greater wind speed and flow (WRAH, 1997).
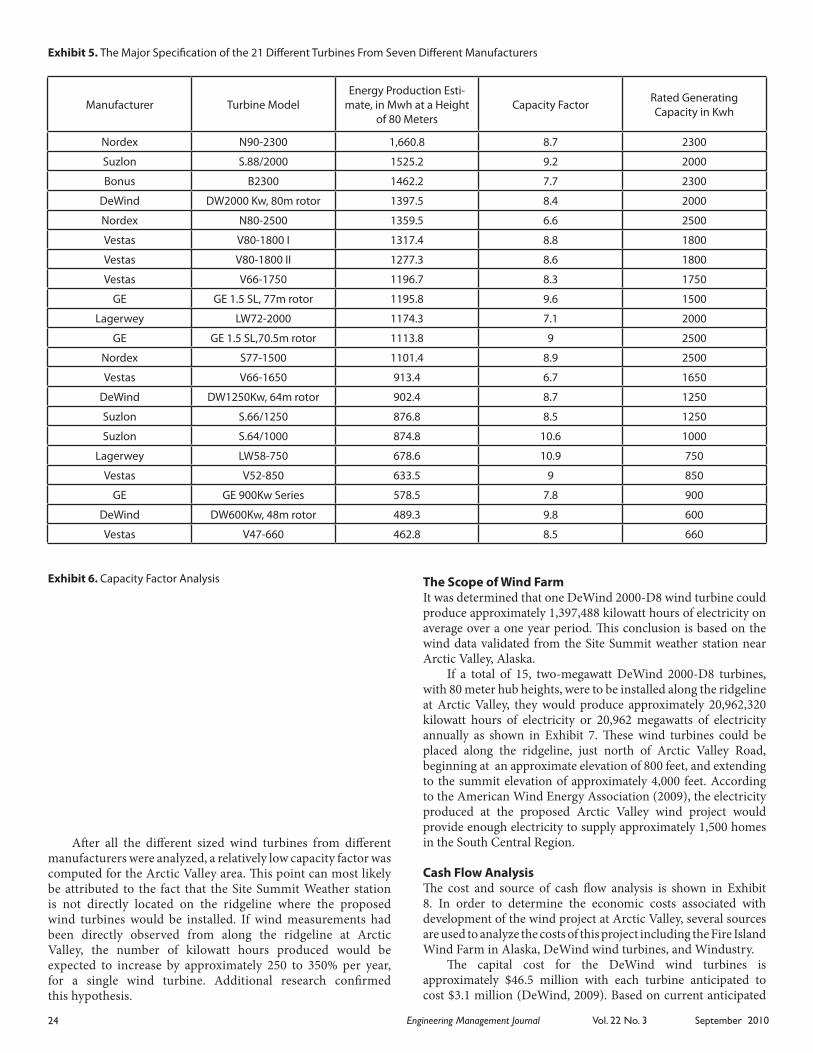
Wind Turbine SelectionOnce the available wind power was computed, an optimized wind turbine could be proposed for the site. For the wind turbine selection, 21 different turbines from seven different manufacturers were evaluated as shown in Exhibit 5.
Each of these turbines has a different power curve to help capture the maximum power at different wind speeds. Turbines producing between 600 kilowatts to 2500 kilowatts were analyzed. These turbines were evaluated on the following criteria: 1) average, annual kilowatt hours that could be produced by expected Arctic Valley wind speeds, 2) turbine survivability at high wind gusts, 3) turbine cost, 4) the turbine life expectancy, 5) the size of the wind turbine in terms of kilowatt hours, and 6) the ability of the turbine to operate in a cold weather climate. Based on the analysis of different turbines using these criteria, the DeWind 2000-D8 kilowatt turbine was found to be best suited for the Arctic Valley; its anticipated yearly production was competitive with others, and it was manufactured and engineered to survive extreme wind speeds of up to 125 mph.
Engineering necessary to survive extreme wind speeds was a key turbine evaluation criteria, because the data validated from the Site Summit Weather station showed that several wind gusts in the range of 95 to 122 mph have been recorded. The survivability of the turbine under extreme wind speeds should not be confused with the wind turbines cut out wind speed of 59 mph, at which point the turbine ceases to generate electricity. The wind survivability of the turbine at extreme wind speeds is an engineered wind speed rating that states whether or not the wind turbine blades, tower, and structures are engineered to withstand, without any damage to these installed components, when subjected to wind speeds of up to 128.4 mph. Additionally, the DeWind 2000-D8 kilowatt turbine was chosen because when the wind is blowing adequately at Arctic Valley, this turbine has the capacity to produce a higher electrical output, while also being engineered to generate maximum electricity from low wind speeds. Another key factor for the selection of this wind turbine is the fact that if a lower producing wind turbine was selected, it would take between two and three turbines of this size to match the computed kilowatt hours of electrical production.
Capacity FactorNext, a capacity factor was computed for each month of the year. Using the DeWind 2000-D8 wind turbine, a capacity factor for an average year was computed at 8.4% using the validated wind data from the Site Summit weather station at Arctic Valley. For an average year, please refer to Exhibit 6. Note: monthly kilowatt hours may be higher or lower than this capacity factor since the turbine may have produced energy at speeds not considered at capacity.
Additionally, the capacity factor is used to help show the difference between the amount of actual energy produced by the wind turbine vs. the potential energy the wind turbine is capable of producing.
24 September 2010Vol. 22 No. 3Engineering Management Journal
After all the different sized wind turbines from different manufacturers were analyzed, a relatively low capacity factor was computed for the Arctic Valley area. This point can most likely be attributed to the fact that the Site Summit Weather station is not directly located on the ridgeline where the proposed wind turbines would be installed. If wind measurements had been directly observed from along the ridgeline at Arctic Valley, the number of kilowatt hours produced would be expected to increase by approximately 250 to 350% per year, for a single wind turbine. Additional research confirmed this hypothesis.
The Scope of Wind Farm It was determined that one DeWind 2000-D8 wind turbine could produce approximately 1,397,488 kilowatt hours of electricity on average over a one year period. This conclusion is based on the wind data validated from the Site Summit weather station near Arctic Valley, Alaska.
If a total of 15, two-megawatt DeWind 2000-D8 turbines, with 80 meter hub heights, were to be installed along the ridgeline at Arctic Valley, they would produce approximately 20,962,320 kilowatt hours of electricity or 20,962 megawatts of electricity annually as shown in Exhibit 7. These wind turbines could be placed along the ridgeline, just north of Arctic Valley Road, beginning at an approximate elevation of 800 feet, and extending to the summit elevation of approximately 4,000 feet. According to the American Wind Energy Association (2009), the electricity produced at the proposed Arctic Valley wind project would provide enough electricity to supply approximately 1,500 homes in the South Central Region.
Cash Flow AnalysisThe cost and source of cash flow analysis is shown in Exhibit 8. In order to determine the economic costs associated with development of the wind project at Arctic Valley, several sources are used to analyze the costs of this project including the Fire Island Wind Farm in Alaska, DeWind wind turbines, and Windustry.
The capital cost for the DeWind wind turbines is approximately $46.5 million with each turbine anticipated to cost $3.1 million (DeWind, 2009). Based on current anticipated
Exhibit 5. The Major Specification of the 21 Different Turbines From Seven Different Manufacturers
Manufacturer Turbine ModelEnergy Production Esti-
mate, in Mwh at a Height of 80 Meters
Capacity Factor Rated Generating Capacity in Kwh
Nordex N90-2300 1,660.8 8.7 2300
Suzlon S.88/2000 1525.2 9.2 2000
Bonus B2300 1462.2 7.7 2300
DeWind DW2000 Kw, 80m rotor 1397.5 8.4 2000
Nordex N80-2500 1359.5 6.6 2500
Vestas V80-1800 I 1317.4 8.8 1800
Vestas V80-1800 II 1277.3 8.6 1800
Vestas V66-1750 1196.7 8.3 1750
GE GE 1.5 SL, 77m rotor 1195.8 9.6 1500
Lagerwey LW72-2000 1174.3 7.1 2000
GE GE 1.5 SL,70.5m rotor 1113.8 9 2500
Nordex S77-1500 1101.4 8.9 2500
Vestas V66-1650 913.4 6.7 1650
DeWind DW1250Kw, 64m rotor 902.4 8.7 1250
Suzlon S.66/1250 876.8 8.5 1250
Suzlon S.64/1000 874.8 10.6 1000
Lagerwey LW58-750 678.6 10.9 750
Vestas V52-850 633.5 9 850
GE GE 900Kw Series 578.5 7.8 900
DeWind DW600Kw, 48m rotor 489.3 9.8 600
Vestas V47-660 462.8 8.5 660
Exhibit 6. Capacity Factor Analysis

25September 2010Vol. 22 No. 3Engineering Management Journal
installation costs for the Fire Island wind project, located on Fire Island, Alaska, an additional $30.0 million would be needed for the installation of the wind turbines at Arctic Valley (Alaska Energy Authority: Fire Island Wind Farm Transmission Lines, 2008). This amount would cover the cost of installing new access roads, electrical wiring of the turbines to transmission lines, upgrades to the existing transmission lines, and the planning and engineering required to complete these tasks. The capital costs for the proposed wind project at Arctic Valley would total approximately $76.5 million and could potentially be financed by a onetime economic appropriation from the Alaska Energy Authority, if the funding is available. After the installation was completed, a yearly operating and maintenance cost of $450,000 per year was assumed and built into the economic model. Also, a major capital expenditure cost of $5 million made every 20 years for the overhaul of the wind generation units on each wind turbine was included. The economic model was analyzed using an interest rate of 7% for the life of the wind farm, over an 80 year system lifecycle. . Furthermore, no salvage value was included in the economic model since wind farms are typically just repowered at the end of their anticipated project life. Additionally, if a wind project is decommissioned, the reimbursed cost of steel, copper, and other metals in the wind turbines are enough to cover the costs associated with decommissioning (Windustry, 2009). Once these data are selected for the analysis, the Equivalent Uniform
Annual Cost (EUAC) can be calculated. The result shows that the breakeven cost is about 0.20 cents per kilowatt hour for the 80 year project life before After Tax Analysis. The details of the analysis of the economic models are:
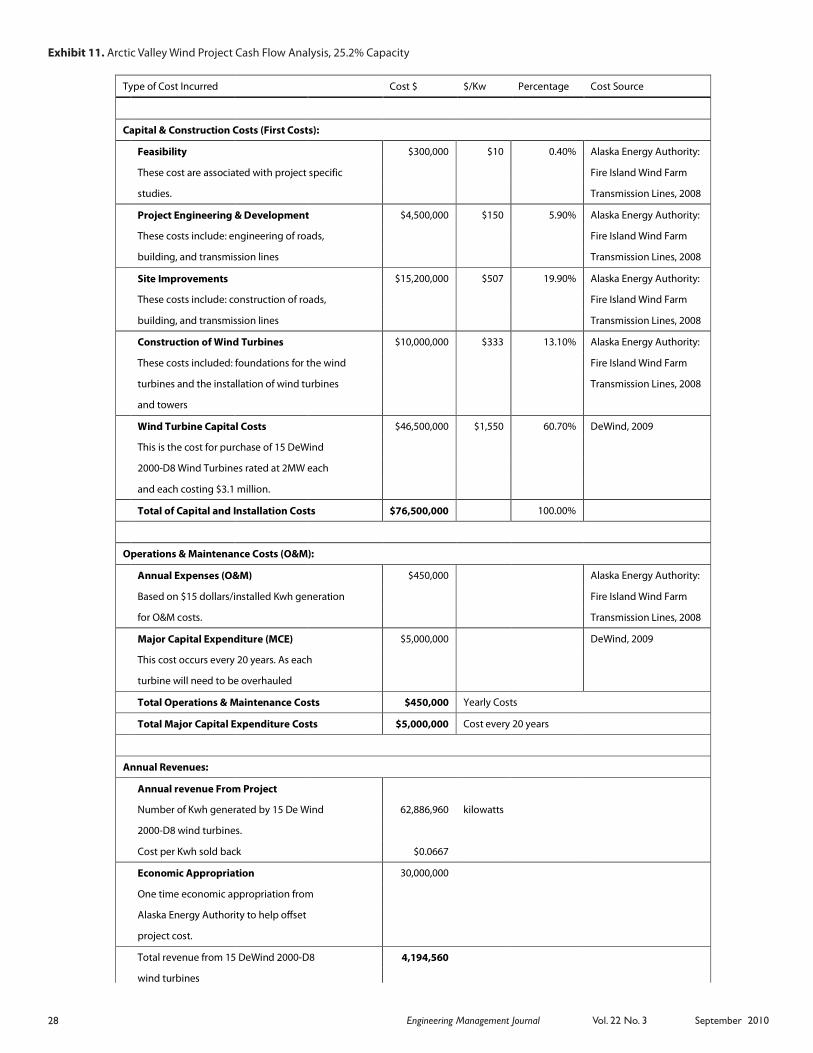
The wind farm data from the Site Summit weather station at 1. an 8.4% capacity factor as shown in Exhibit 9.The wind farm data from the Site Summit weather station 2. scaled two times to a 16.8% capacity factor as shown in Exhibit 10.The wind farm data from the Site Summit weather station 3. scaled three times to a 25.2% capacity factor as shown in Exhibit 11.
After Tax AnalysisIn the After Tax Analysis, a number of definitions and assumptions about the project were made based on best known and researched information. In this analysis, a 30% of investment tax credit and a 35% of income tax rate are assumed. For the financial borrowing cost for the project, an interest rate of 7% per year is assumed. The data is shown in Exhibit 12.
The After Tax Analysis assumes the loan rate of 7% for a 25-year loan. Because this project is publicly owned, it was assumed that a 90% loan could be obtained. This is comparable to other public projects. The Modified Accelerated Cost Recovery System (MACRS) depreciation method is used for this analysis. The After
Exhibit 7. Aerial View of Arctic Valley Wind Turbine Project. Approximate locations of 15 DeWind 2000-D8 wind turbines are shown (Google Earth, 2009)
Exhibit 8. Cost Information for Wind Power
No. Name Cost Range (million $) Source
1 Wind Turbine 2.9 - 3.1 DeWind, 2009
2 Feasibility 0.3 Alaska Energy Authority: Fire Island Wind Farm Transmission Lines, 2008
3 Project Engineering & Develop-ment
4.2 - 4.5 Alaska Energy Authority: Fire Island Wind Farm Transmission Lines, 2008; US bureau of labor
statistics
4 Site Improvements 14.9 - 15.2 Alaska Energy Authority: Fire Island Wind Farm Transmission Lines, 2008
5 Construction of Wind Turbines 9.3 - 10 DeWind, 2009; Alaska Energy Authority: Fire Island Wind Farm Transmission Lines, 2008

26 September 2010Vol. 22 No. 3Engineering Management Journal
Type of Cost Incurred Cost $ $/Kw Percentage Cost Source
Capital & Construction Costs (First Costs):
Feasibility $300,000 $10 0.40% Alaska Energy Authority:
These cost are associated with project specific Fire Island Wind Farm
studies. Transmission Lines, 2008
Project Engineering & Development $4,500,000 $150 5.90% Alaska Energy Authority:
These costs include: engineering of roads, Fire Island Wind Farm
building, and transmission lines Transmission Lines, 2008
Site Improvements $15,200,000 $507 19.90% Alaska Energy Authority:
These costs include: construction of roads, Fire Island Wind Farm
building, and transmission lines Transmission Lines, 2008
Construction of Wind Turbines $10,000,000 $333 13.10% Alaska Energy Authority:
These costs included:foundations for the wind Fire Island Wind Farm
turbines and the installation of wind turbines Transmission Lines, 2008
and towers
Wind Turbine Capital Costs $46,500,000 $1,550 60.70% DeWind, 2009
This is the cost for purchase of 15 DeWind
2000-D8 Wind Turbinesrated at 2MW each
and each costing $3.1 million.
Total of Capital and Installation Costs $76,500,000 100.00%
Operations & Maintenance Costs (O&M):
Annual Expenses (O&M) $450,000 Alaska Energy Authority:
Based on $15 dollars/installed Kwh generation Fire Island Wind Farm
for O&M costs. Transmission Lines, 2008
Major Capital Expenditure (MCE) $5,000,000 DeWind, 2009
This cost occurs every 20 years. As each
turbine will need to be overhauled
Total Operations & Maintenance Costs $450,000 Yearly Costs
Total Major Capital Expenditure Costs $5,000,000 Cost every 20 years
Annual Revenues:
Annual revenue From Project
Number of Kwh generated by 15 De Wind 20,962,320 kilowatts
2000-D8 wind turbines.
Cost per Kwh sold back $0.20
Economic Appropriation 30,000,000
One time economic appropriation from
Alaska Energy Authority to help offset
project cost.
Total revenue from 15 DeWind 2000-D8 4,192,464
wind turbines
Exhibit 9. Arctic Valley Wind Project Cash Flow Analysis, 8.4% capacity

27September 2010Vol. 22 No. 3Engineering Management Journal
Type of Cost Incurred Cost $ $/Kw Percentage Cost Source
Capital & Construction Costs (First Costs):
Feasibility $300,000 $10 0.40% Alaska Energy Authority:
These cost are associated with project specific Fire Island Wind Farm
studies. Transmission Lines, 2008
Project Engineering & Development $4,500,000 $150 5.90% Alaska Energy Authority:
These costs include: engineering of roads, Fire Island Wind Farm
building, and transmission lines Transmission Lines, 2008
Site Improvements $15,200,000 $507 19.90% Alaska Energy Authority:
These costs include: construction of roads, Fire Island Wind Farm
building, and transmission lines Transmission Lines, 2008
Construction of Wind Turbines $10,000,000 $333 13.10% Alaska Energy Authority:
These costs included:foundations for the wind Fire Island Wind Farm
turbines and the installation of wind turbines Transmission Lines, 2008
and towers
Wind Turbine Capital Costs $46,500,000 $1,550 60.70% DeWind, 2009
This is the cost for purchase of 15 DeWind
2000-D8 Wind Turbinesrated at 2MW each
and each costing $3.1 million.
Total of Capital and Installation Costs $76,500,000 100.00%
Operations & Maintenance Costs (O&M):
Annual Expenses (O&M) $450,000 Alaska Energy Authority:
Based on $15 dollars/installed Kwh generation Fire Island Wind Farm
for O&M costs. Transmission Lines, 2008
Major Capital Expenditure (MCE) $5,000,000 DeWind, 2009
This cost occurs every 20 years. As each
turbine will need to be overhauled
Total Operations & Maintenance Costs $450,000 Yearly Costs
Total Major Capital Expenditure Costs $5,000,000 Cost every 20 years
Annual Revenues:
Annual revenue From Project
Number of Kwh generated by 15 De Wind 41,924,640 kilowatts
2000-D8 wind turbines.
Cost per Kwh sold back $0.10
Economic Appropriation 30,000,000
One time economic appropriation from
Alaska Energy Authority to help offset
project cost.
Total revenue from 15 DeWind 2000-D8 4,192,464
wind turbines
Exhibit 10. Arctic Valley Wind Project Cash Flow Analysis, 16.8% Capacity
28 September 2010Vol. 22 No. 3Engineering Management Journal
Exhibit 10: Arctic Valley Wind Project Cash Flow Analysis, 16.8% capacity.
Type of Cost Incurred Cost $ $/Kw Percentage Cost Source
Capital & Construction Costs (First Costs):
Feasibility $300,000 $10 0.40% Alaska Energy Authority:
These cost are associated with project specific Fire Island Wind Farm
studies. Transmission Lines, 2008
Project Engineering & Development $4,500,000 $150 5.90% Alaska Energy Authority:
These costs include: engineering of roads, Fire Island Wind Farm
building, and transmission lines Transmission Lines, 2008
Site Improvements $15,200,000 $507 19.90% Alaska Energy Authority:
These costs include: construction of roads, Fire Island Wind Farm
building, and transmission lines Transmission Lines, 2008
Construction of Wind Turbines $10,000,000 $333 13.10% Alaska Energy Authority:
These costs included: foundations for the wind Fire Island Wind Farm
turbines and the installation of wind turbines Transmission Lines, 2008
and towers
Wind Turbine Capital Costs $46,500,000 $1,550 60.70% DeWind, 2009
This is the cost for purchase of 15 DeWind
2000-D8 Wind Turbines rated at 2MW each
and each costing $3.1 million.
Total of Capital and Installation Costs $76,500,000 100.00%
Operations & Maintenance Costs (O&M):
Annual Expenses (O&M) $450,000 Alaska Energy Authority:
Based on $15 dollars/installed Kwh generation Fire Island Wind Farm
for O&M costs. Transmission Lines, 2008
Major Capital Expenditure (MCE) $5,000,000 DeWind, 2009
This cost occurs every 20 years. As each
turbine will need to be overhauled
Total Operations & Maintenance Costs $450,000 Yearly Costs
Total Major Capital Expenditure Costs $5,000,000 Cost every 20 years
Annual Revenues:
Annual revenue From Project
Number of Kwh generated by 15 De Wind 62,886,960 kilowatts
2000-D8 wind turbines.
Cost per Kwh sold back $0.0667
Economic Appropriation 30,000,000
One time economic appropriation from
Alaska Energy Authority to help offset
project cost.
Total revenue from 15 DeWind 2000-D8 4,194,560
wind turbines
Exhibit 11. Arctic Valley Wind Project Cash Flow Analysis, 25.2% Capacity

29September 2010Vol. 22 No. 3Engineering Management Journal
Tax Analysis model, using an investment tax credit of 10%, a 15-year MACRS depreciation, a 35% income tax rate, a 7% loan interest rate, and a Minimum Attractive Rate of Return of 7% yielded a 10.58% IRR and $2.568 million net present worth. The results of the After Tax Analysis and the summary of the economic analysis are shown in Exhibits 13 and 14 respectively. .
Sensitivity AnalysisThe economic sensitivity of this project was analyzed by using a spider plot as shown in Exhibit 15. In this Exhibit, the interest rate, annual benefit, and equipment cost are the top three cost categories for this project.
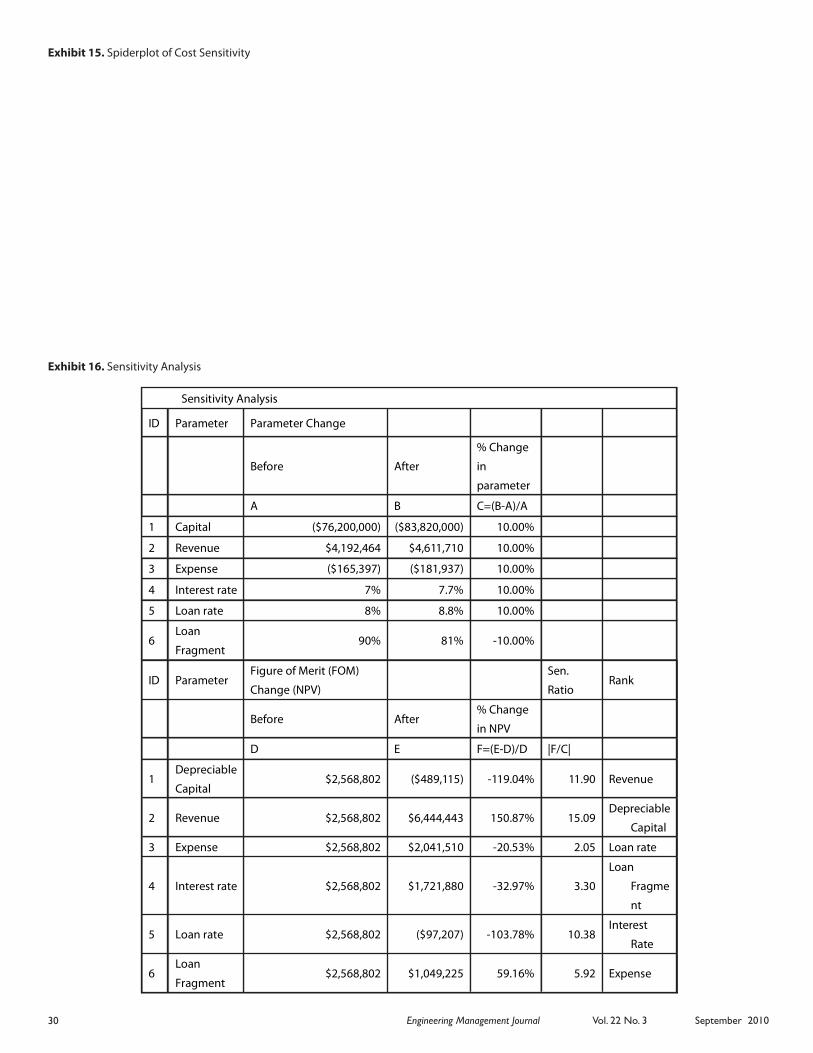
A sensitivity analysis based on the capital, revenue, expense, interest rate, loan rate, and loan fragment was developed. The result is shown in Exhibit 16. Revenue is the most sensitive factor in this model.
Additionally, the cost per kilowatt hour computed in this economic analysis is just an estimate. The break even cost of
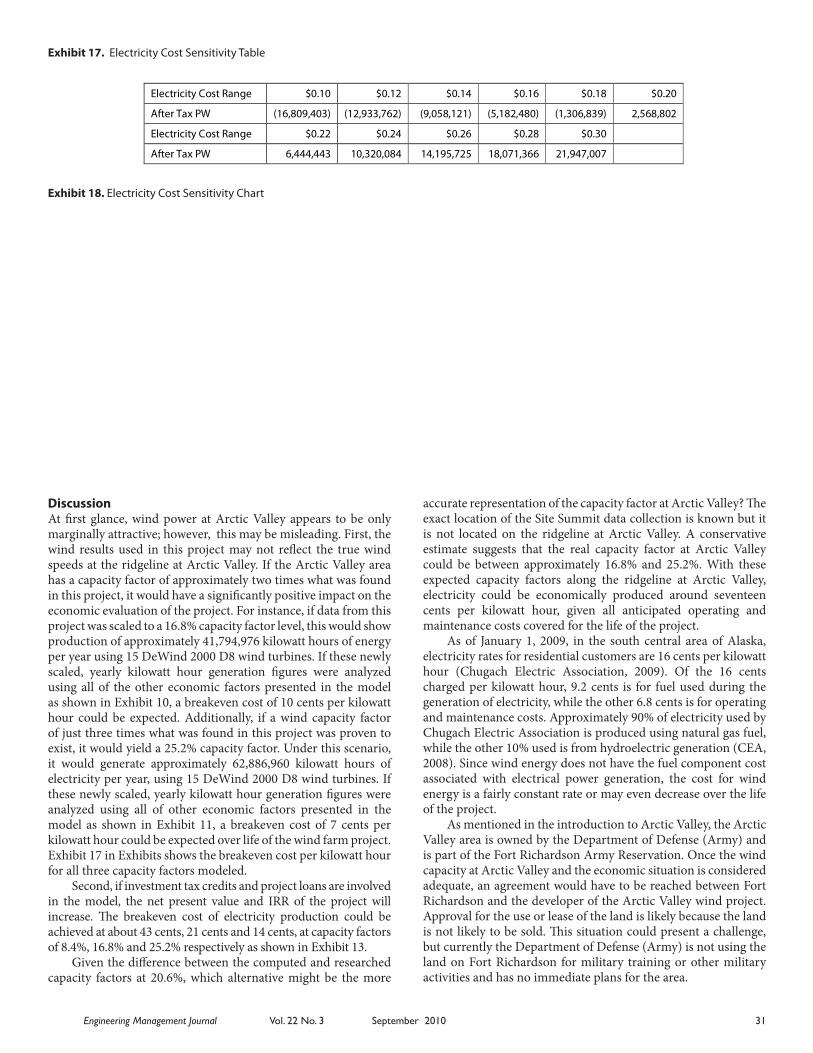
electric generation at Arctic Valley will not be known with certainty until the contractors’ bids are obtained. Based on the cost per KWh, an electricity cost sensitivity chart was developed according to the base electricity cost is 20 cents/KWh, and the range changes between 50% and 150% of the base cost. These results are shown in Exhibits 17 and 18.
Furthermore, wind projects in Alaska are able to apply and possibly secure additional state funding from the State of Alaska to help offset the cost of developing renewable energy like wind power. For example, the Fire Island wind project in 2008 secured $25 million from the Alaska Legislature to help offset the cost of developing this project (Alaska Energy Authority: Fire Island Wind Farm Transmission Lines, 2008). With this additional help in funding electrical generation by wind power, and the continuing increase in the cost for generating electricity by natural gas, wind electricity at Arctic Valley will continue to be more attractive in the years to come if more wind power can be proven to exist at Arctic Valley.
Project Definition and Assumptions
ID Capital Costs: Units Value
1 Project Life Cycle Years 80
2 MARR % / year 7%
3 Income Tax Rate % /year 35%
4 Investment Tax Credit (ITC) % /year 10%
Exhibit 12. Project Definition and Assumption
Exhibit 13. After Tax Analysis
After Tax Analysis
Non-depreciable
Capital ($300,000) N MACRS (yr) 15
Loan
Fraction 90%
Depreciable Capital ($76,200,000) Interest rate 7.0% Loan Amt ($20,883,660)
Salvage Value $0 Income Tax
Rate 35%
Loan
Payment ($1,792,038)
Annual Revenue $4,192,464 Loan Rate 7%
Annual Expense ($570,397) Loan N 25
Results:
After Tax Present
Worth $2,568,802 Cost/Kwh (capacity factor 8.4%) $0.43
After Tax IRR 10.58% Cost/Kwh (capacity factor 16.8%) $0.21
After Tax EUAC ($8,967,783) Cost/Kwh (capacity factor 25.2%) $0.14
ID Parameters Units Total
1 Net Present Value $ $2,568,802
2 Project Life Cycle Years 80
3 Internal Rate of Return % 10.58%
4 Minimum Acceptable Rate of Return % / Yr 7%
5 Life Cycle Costs - Equivalent Uniform Annual Cost (EUAC)
$/Yr ($570,397)
Exhibit 14. Summary of Economic Analysis
30 September 2010Vol. 22 No. 3Engineering Management Journal
Exhibit 15. Spiderplot of Cost Sensitivity
Sensitivity Analysis
ID Parameter Parameter Change
Before After
% Change
in
parameter
A B C=(B-A)/A
1 Capital ($76,200,000) ($83,820,000) 10.00%
2 Revenue $4,192,464 $4,611,710 10.00%
3 Expense ($165,397) ($181,937) 10.00%
4 Interest rate 7% 7.7% 10.00%
5 Loan rate 8% 8.8% 10.00%
6 Loan
Fragment 90% 81% -10.00%
ID Parameter Figure of Merit (FOM)
Change (NPV)
Sen.
Ratio Rank
Before After
% Change
in NPV
D E F=(E-D)/D |F/C|
1 Depreciable
Capital $2,568,802 ($489,115) -119.04% 11.90 Revenue
2 Revenue $2,568,802 $6,444,443 150.87% 15.09 Depreciable
Capital
3 Expense $2,568,802 $2,041,510 -20.53% 2.05 Loan rate
4 Interest rate $2,568,802 $1,721,880 -32.97% 3.30
Loan
Fragme
nt
5 Loan rate $2,568,802 ($97,207) -103.78% 10.38 Interest
Rate
6 Loan
Fragment $2,568,802 $1,049,225 59.16% 5.92 Expense
Exhibit 16. Sensitivity Analysis
31September 2010Vol. 22 No. 3Engineering Management Journal
Exhibit 17. Electricity Cost Sensitivity Table
Electricity Cost Range $0.10 $0.12 $0.14 $0.16 $0.18 $0.20
After Tax PW (16,809,403) (12,933,762) (9,058,121) (5,182,480) (1,306,839) 2,568,802
Electricity Cost Range $0.22 $0.24 $0.26 $0.28 $0.30
After Tax PW 6,444,443 10,320,084 14,195,725 18,071,366 21,947,007
Exhibit 18. Electricity Cost Sensitivity Chart
DiscussionAt first glance, wind power at Arctic Valley appears to be only marginally attractive; however, this may be misleading. First, the wind results used in this project may not reflect the true wind speeds at the ridgeline at Arctic Valley. If the Arctic Valley area has a capacity factor of approximately two times what was found in this project, it would have a significantly positive impact on the economic evaluation of the project. For instance, if data from this project was scaled to a 16.8% capacity factor level, this would show production of approximately 41,794,976 kilowatt hours of energy per year using 15 DeWind 2000 D8 wind turbines. If these newly scaled, yearly kilowatt hour generation figures were analyzed using all of the other economic factors presented in the model as shown in Exhibit 10, a breakeven cost of 10 cents per kilowatt hour could be expected. Additionally, if a wind capacity factor of just three times what was found in this project was proven to exist, it would yield a 25.2% capacity factor. Under this scenario, it would generate approximately 62,886,960 kilowatt hours of electricity per year, using 15 DeWind 2000 D8 wind turbines. If these newly scaled, yearly kilowatt hour generation figures were analyzed using all of other economic factors presented in the model as shown in Exhibit 11, a breakeven cost of 7 cents per kilowatt hour could be expected over life of the wind farm project. Exhibit 17 in Exhibits shows the breakeven cost per kilowatt hour for all three capacity factors modeled.
Second, if investment tax credits and project loans are involved in the model, the net present value and IRR of the project will increase. The breakeven cost of electricity production could be achieved at about 43 cents, 21 cents and 14 cents, at capacity factors of 8.4%, 16.8% and 25.2% respectively as shown in Exhibit 13.
Given the difference between the computed and researched capacity factors at 20.6%, which alternative might be the more
accurate representation of the capacity factor at Arctic Valley? The exact location of the Site Summit data collection is known but it is not located on the ridgeline at Arctic Valley. A conservative estimate suggests that the real capacity factor at Arctic Valley could be between approximately 16.8% and 25.2%. With these expected capacity factors along the ridgeline at Arctic Valley, electricity could be economically produced around seventeen cents per kilowatt hour, given all anticipated operating and maintenance costs covered for the life of the project.
As of January 1, 2009, in the south central area of Alaska, electricity rates for residential customers are 16 cents per kilowatt hour (Chugach Electric Association, 2009). Of the 16 cents charged per kilowatt hour, 9.2 cents is for fuel used during the generation of electricity, while the other 6.8 cents is for operating and maintenance costs. Approximately 90% of electricity used by Chugach Electric Association is produced using natural gas fuel, while the other 10% used is from hydroelectric generation (CEA, 2008). Since wind energy does not have the fuel component cost associated with electrical power generation, the cost for wind energy is a fairly constant rate or may even decrease over the life of the project.
As mentioned in the introduction to Arctic Valley, the Arctic Valley area is owned by the Department of Defense (Army) and is part of the Fort Richardson Army Reservation. Once the wind capacity at Arctic Valley and the economic situation is considered adequate, an agreement would have to be reached between Fort Richardson and the developer of the Arctic Valley wind project. Approval for the use or lease of the land is likely because the land is not likely to be sold. This situation could present a challenge, but currently the Department of Defense (Army) is not using the land on Fort Richardson for military training or other military activities and has no immediate plans for the area.

32 September 2010Vol. 22 No. 3Engineering Management Journal
Conclusion and RecommendationsThe Arctic Valley area presents a great opportunity to harness wind energy in the South Central Alaska region. Using wind turbines, wind energy could efficiently be turned into electricity and integrated into the existing electric transmission grid. Since the Arctic Valley location is situated close to one of the high voltage transmission lines connected to the state wide electric distribution system, electricity generated from Arctic Valley has the potential to be transmitted throughout the state of Alaska. This additional source of electricity would be considered beneficial since wind energy can be intermittent. The complete power generation system would rely on a combination of natural gas, hydro, and coal electric generation to offset times when the wind farm is not producing electricity.
After complete wind analysis at Arctic Valley, the results from this project showed that the area has marginal wind power potential. This conclusion is most likely due to the fact that the wind data used in this project is from a nearby weather station identified as Site Summit. The Site Summit weather station is not located directly on the ridgeline where wind turbines could be positioned and may be the reason that only a 8.4% capacity factor was found. Additionally, after further investigation, it was found that Chugach Electric Association installed an anemometer tower on the ridgeline at Arctic Valley for a wind power investigation. On February 3, 2009, an attempt was made to get a copy of this data, but Chugach Electric Association would not release the results of their evaluation. In a presentation by Steve Gilbert titled “Level Price Energy for Railbelt” (2007) at the Alaska Energy Authority (AEA) Railbelt Electrical Grid Authority (REGA) Technical Conference, he showed a statistic that showed the Arctic Valley area as having a 29% capacity factor. Comparing this figure with the the analyzed results from available data used for this project, it was determined that the results obtained might not be an accurate representation of ridgeline wind speeds. Using the more favorable data suggested by Mr. Gilbert, an attempt was made to scale the analysis results up to the 16.8% and 25.2% capacity factors to show how these variations in data would affect the project feasibility. Also using this same favorable data, , a scaled breakeven cost was found to be between approximately 14 cents per kilowatt hour if electricity is generated between these percentages.
The major findings of this feasibility analysis showed that the Arctic Valley area is located in an excellent area with the potential to utilize existing infrastructure; however, wind data along the ridgeline was not directly available for this study. For this feasibility analysis, the best available wind data was used, but future work should be done to validate this wind resource by placing anemometer towers on the ridgeline at Arctic Valley. To validate these results and conclusions, three wind anemometer towers should be placed on the ridgeline near the proposed wind turbines.
Given the results of this analysis, it is believed that the Arctic Valley wind project has the potential to provide long- term benefit and help stabilize electric energy costs in the south central region of Alaska, while producing clean renewable energy for years to come.
ReferencesAcker, Thomas. L., Susan K. Williams, Earl. P.N. Duque, Grant
Brummels, and Jason Buechler, “ Wind Resource Assessment in the State of Arizona: Inventory, Capacity Factor, and Cost,” Renewable Energy, 32:9 (2007), pp. 1453-1466.
Alaska Energy Authority, Anemometer program, Available from Internet: <http://www.akenergyauthority.org/programwindlanemometerloan.html> (cited 2009-01-09).
Alaska Energy Authority, Data processing procedures and definitions, (2006), Available from Internet: <http://www.akenergyauthority.orgprogramwind.html> (cited 2009-01-09).
Alaska Energy Authority, Fire Island Wind Farm Transmission Lines, (2008), Available from Internet: < www.legfin.state.ak.us/BudgetReports/GetBackupDocuments.php?Year=2008&Ty pe=proj&Number=49841&NumberType=LFD> (cited 2009-03-10).
American Wind Energy Association, The economics of wind energy, Available from Internet: <http://www.awea.org/pubs/factsheets/EconomicsOfWind- Feb2005.pdf> (cited 2009-02-27).
Bradley, David. (2004), “The great lakes as a regional renewable energy source,” Available from Internet:
<http://greengold.org/wind/documents/88.pdf> (cited 2009-01-04) Chugach Electric Association. (2008).
Chugach Electric Association, Inc., 2008 Annual Report, Available from Internet: < http://www.chugachelectric.com/pdfs/2008_annual_report.pdf > (cited 2009-03-10).
Chugach Electric Association, Rate information, (2008), Available from Internet: <
http://www.chugachelectric.com/customer/rate_info.html> (cited 2009-03-10).
Database of State Incentives for Renewable & Efficiency, Business Energy Investment Tax Credit (ITC), Available from Internet: <http://www.dsireusa.org/incentives/incentive.cfm?Incentive_Code=US02F> (cited 2009-12-02).
DeWind. DeWind 2000 D8.2 Technical Brochure, Available from Internet: <http://www.compositetechcorp.com/DeWind/Dewind_D8-2_A4_small.pdf> (cited 2009-01-11).
Gilbert, Steve, “Level price energy for railbelt,” REGA technical conference, (2007), Available from Internet: <http://www.akenergyauthority.org/REGAFiles/Gilbert_Steve.pdf> (cited 2009-02-19).
Golden Valley Electric Association, Bradley Lake Hydroelectric Project, Available from Internet: <http://www.gvea.com/about/generation/bradlake.php> (cited 2009-03-10).
Google Earth (2009), Image sources; U.S. Geological Survey, 2009 Digital Globe,
Municipality of Anchorage, Available from Internet: <maps.google.com> (cited 2009-01-27).
National Renewable Energy Laboratory, Wind Resource Assessment Handbook, (1997), Available from Internet: < http://www.nrel.gov/wind/pdfs/22223.pdf> (cited 2009-01-20).
Himri, Y., S. Rehman, B. Draoui, and S. Himri, “Wind Power Potential Assessment for Three Locations in Algeria,” Renewable & Sustainable Energy Reviews, 12:9 (2008, December), pp. 2495-2504.
Jaramillo, O.A., M.A. Borja, “Wind Speed Analysis in La Ventosa, Mexico: a Bimodal Probability Distribution Case,” Renewable Energy, 29 (2004), pp. 1613-1630.
Jensen, James, Wind resource assessment, (2001), Available from Internet: <http://www.aidea.org/aea/Reports%20and%20Presentations/2007Weats_wind_resourse_assesment.pdf> (cited 2008-12-09).
Jowder, Fawzi A.L., “Wind Power Analysis and Site Matching of Wind Turbine Generators in Kingdom of Bahrain,” Applied Energy, 86:4 (2008), pp. 538-545.

33September 2010Vol. 22 No. 3Engineering Management Journal
Lang, Hans J., and Donald N. Merino, The Selection Process for Capital Projects, John Wiley & Sons, Inc. (1993)
National Renewable Energy Laboratory, NREL Subcontract No. TAT-5-15283-01, Wind Resource Assessment Handbook (1997, April), Available from Internet: <http://www.nrel.gov/wind/pdfs/22223.pdf> (cited 2008-12-30).
National Weather Service, Anchorage office, Available from Internet: < http://pafc.arh.noaa.gov/mesonet.php> (cited 2009-01-20).
Nike Site Summit Task Force, Nike Site Summit Task Force, (2001), Available from Internet: <http://www.skialpenglow.com/documents/NSSTFMR2001.pdf> (cited 2009-02-19).
Ozerdem, Baris, Serra Ozer, and Mahir Tosun, “Feasibility Study of Wind Farms: A Case Study for Izmir, Turkey,” Journal of Wind Engineering and Industrial Aerodynamics, 94:10 (2006), pp. 725-743.
Papineau, John. (n.d.), “Analysis of Anchorage Downslope Windstorm,” National Weather Service Anchorage, Available from Internet: < http://pafc.arh.noaa.gov/papers/papers.php> (cited 2009-01-21).
Papineau, John, “The Nature of Gap Winds Through the Western Chugach Mountains,” National Weather Service Anchorage, (2008), Available from Internet: <http://pafc.arh.noaa.gov/papers/papers.php> (cited 2009-01-21).
Rehman, Shafiqur, and Aftab Ahmad, “Assessment of Wind Energy Potential for Coastal Locations of the Kingdom of Saudi Arabia,” Energy, 29:8 (2004), pp. 1105-1115.
Rehman, Shafiqur, I.M. El-Amin, F. Ahmad, S.M. Shaahid, A.M. Al-Shehri, and J.M. Bakhashwain, “Wind Power Resource Assessment for Rafha, Saudi Arabia,” Renewable and Sustainable Energy Reviews, 11:5 (2007), pp. 937-950.
Rehman, Shafiqur, T.O. Halawani, and M. Mohandes, “Wind Power Cost Assessment at Twenty Locations in the Kingdom of Saudi Arabia,” Renewable Energy, 28:4 (2003), pp. 573- 583.
Tetra Tech EC, Inc. and Nixon Peabody LLP, Wind Energy Siting Handbook, Available from Internet: <http://www.awea.org/sitinghandbook/downloads/AWEA_Siting_Handbook_Feb2008.pdf> (cited 2009-02-28).
U.S. Department of Energy: National Renewable Energy Laboratory, “Alaska Mainland Regions 50m Wind Power”, (2006), Available from Internet:
<http://www.windpoweringamerica.gov/images/windmaps/ak_50m_800.jpg> (cited 2009-01-08).
Western Regional Climate Date Center, “Site summit wind data”. Available from Internet: < http://www.raws.dri.edu/wraws/akF.html> (cited 2009-02-01).
Windustry, Community wind toolbox , (2008), Available from Internet: <http://www.windustry.org/sites/windustry.org/files/Full_CWT.pdf, p. 3> (cited 2009-02-02)
About the AuthorsHsueh-Ming Steve Wang is an associate professor of Engineering and Science Management and Project Management graduate departments of University of Alaska Anchorage. He graduated from Master of Manufacturing Engineering program of Northwestern University, and has his MS in management of technology and PhD in industrial and systems engineering from Lehigh University. His current research is focused on technology innovation management for sustainability.
Karl M. Spohn is a professional land surveyor at WHPacific, Inc., in Anchorage, Alaska. He has a MS in engineering management from the University of Alaska, Anchorage. During his career, Mr. Spohn has worked extensively on land survey projects throughout the State of Alaska.
LuAnn Piccard is an assistant professor in the Engineering and Science Management and Project Management graduate departments in the University of Alaska Anchorage School of Engineering. She holds a BS and MS in engineering from Stanford University. She has extensive international business experience in the high technology industry including executive and general management, operations, professional services, strategic marketing, acquisitions and R&D. She focuses on development of future leaders in engineering, science, and project management through practical and professional course material, instruction and application of knowledge.
Lei Yao is a research assistant of the Department of Engineering and Science Management at University of Alaska Anchorage. He joins the research project of “Economical Analysis of Alaskan Street Light by Using Light- Emitting Diode (LED) Technology” from the Federal fund for Alaska University Transportation Center. He has presented two papers on INFORMS and ASEM 2009. His research topics are related to LEDs, mini-scale nuclear reaction, smart grid, and renewable energy.
Contact: Hsueh-Ming Steve Wang, Associate Professor, University of Alaska Anchorage, ESM Department, 3211 Providence Dr., Anchorage, AK 99508; phone: 907-786-1914; fax: 907-786-1768; [email protected]
Related Documents