Draft Feasibility Report Appendix D - Economic Analysis Los Vaqueros Reservoir Expansion Investigation January 2018

Welcome message from author
This document is posted to help you gain knowledge. Please leave a comment to let me know what you think about it! Share it to your friends and learn new things together.
Transcript

Draft Feasibility Report Appendix D - Economic Analysis Los Vaqueros Reservoir Expansion Investigation
January 2018

Mission Statements The mission of the Department of the Interior is to protect and provide access to our Nation’s natural and cultural heritage and honor our trust responsibilities to Indian Tribes and our commitments to island communities.
The mission of the Bureau of Reclamation is to manage, develop, and protect water and related resources in an environmentally and economically sound manner in the interest of the American public.

Contents
Los Vaqueros Reservoir Expansion Investigation Public Draft Feasibility Report – Economic Analysis Appendix January 2018 – i
Contents
Chapter 1 Introduction ........................................................................................................ 1-1 Background ............................................................................................................................ 1-1 Study Location ....................................................................................................................... 1-2 Project Objectives .................................................................................................................. 1-3
Primary Planning Objectives ........................................................................................... 1-3 Secondary Planning Objective ......................................................................................... 1-3
Final Alternatives Considered in the Feasibility Report ........................................................ 1-3 Alternative 1A .................................................................................................................. 1-8 Alternative 1B .................................................................................................................. 1-8 Alternative 2A .................................................................................................................. 1-9 Alternative 4A .................................................................................................................. 1-9
Organization of This Appendix ............................................................................................. 1-9 Chapter 2 Economic Principles and Methods ................................................................... 2-1
Guidelines .............................................................................................................................. 2-1 National Economic Development Account ..................................................................... 2-3 Regional Economic Development Account ..................................................................... 2-3 Environmental Quality Account ...................................................................................... 2-4 Other Social Effects Account ........................................................................................... 2-4
Other Considerations ............................................................................................................. 2-4 NED Benefit Evaluation Procedures ..................................................................................... 2-5 Economic Valuation Methods ................................................................................................ 2-6
Actual or Simulated Market Prices Method ..................................................................... 2-7 Change in Net Income Method ........................................................................................ 2-7 Cost of the Most Likely Alternative Method ................................................................... 2-7 Administratively Established Values Methods ................................................................ 2-8
Los Vaqueros Expansion Alternative Valuation Approaches ............................................... 2-8 Economic Analysis Parameters ........................................................................................ 2-8 NED M&I Water Supply Reliability Benefits ................................................................. 2-9 NED Refuge Water Supply Benefits ............................................................................... 2-9 NED Agricultural Water Supply Benefits ..................................................................... 2-10 NED Emergency M&I Water Supply Benefits .............................................................. 2-10
Risk and Uncertainty............................................................................................................ 2-11 Chapter 3 NED Municipal and Industrial Water Supply Reliability Benefits .............. 3-1
M&I Water Supply Reliability ............................................................................................... 3-2 Water Transfer Pricing Estimation Method ........................................................................... 3-3
NED Benefit Estimation Procedures ............................................................................... 3-5 Water Supply ................................................................................................................... 3-5 Geographic Location ........................................................................................................ 3-5 Real Water Price Escalation ............................................................................................. 3-5 Buyer Type....................................................................................................................... 3-6 Seller Type ....................................................................................................................... 3-6
Contents
Public Draft Los Vaqueros Reservoir Expansion Investigation ii – January 2018 Feasibility Report – Economic Analysis Appendix
Drought Water Bank and Environmental Water Account ............................................... 3-6 Results .................................................................................................................................... 3-6
Equation 1 Discussion...................................................................................................... 3-8 Equation 2 Discussion...................................................................................................... 3-9
Future Water Market Prices ................................................................................................. 3-10 Estimated Conveyance Charges ........................................................................................... 3-10 Estimated Conveyance Losses ............................................................................................. 3-11 Market Price for Water to Municipal and Industrial Purposes ............................................ 3-12
Risk and Uncertainty...................................................................................................... 3-13 Chapter 4 NED Refuge Water Supply Benefits ................................................................ 4-1
Historical Acquisition of Incremental Level 4 Water Supplies ............................................. 4-2 Market Price for Water to Refuges ........................................................................................ 4-3
Risk and Uncertainty........................................................................................................ 4-6 Chapter 5 Agricultural Water Supply Benefits ................................................................. 5-1
Market Price for Water to Agriculture ................................................................................... 5-1 Risk and Uncertainty........................................................................................................ 5-3
Chapter 6 NED Emergency M&I Water Supply Benefits ............................................... 6-1 Previous Studies Considered.................................................................................................. 6-2 Benefits Estimation Method .................................................................................................. 6-4
Key Considerations .......................................................................................................... 6-4 Estimation Methodology .................................................................................................. 6-6
Results .................................................................................................................................. 6-11 Risk and Uncertainty...................................................................................................... 6-11
Chapter 7 NED Recreation Benefits ................................................................................... 7-1 Benefits Estimation Method .................................................................................................. 7-1 Results .................................................................................................................................... 7-3
Risk and Uncertainty........................................................................................................ 7-4 Chapter 8 Summary of Estimated NED Benefits .............................................................. 8-1 Chapter 9 References ........................................................................................................... 9-1
Figures
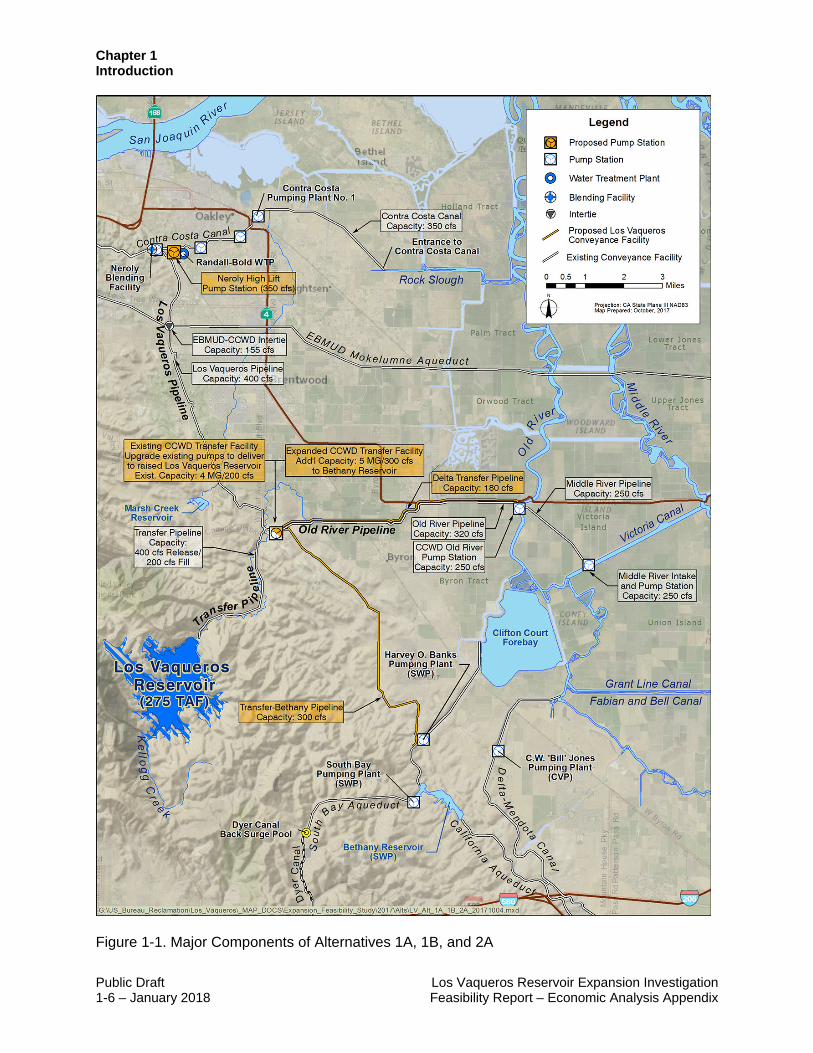
Figure 1-1. Major Components of Alternatives 1A, 1B, and 2A ................................................. 1-6
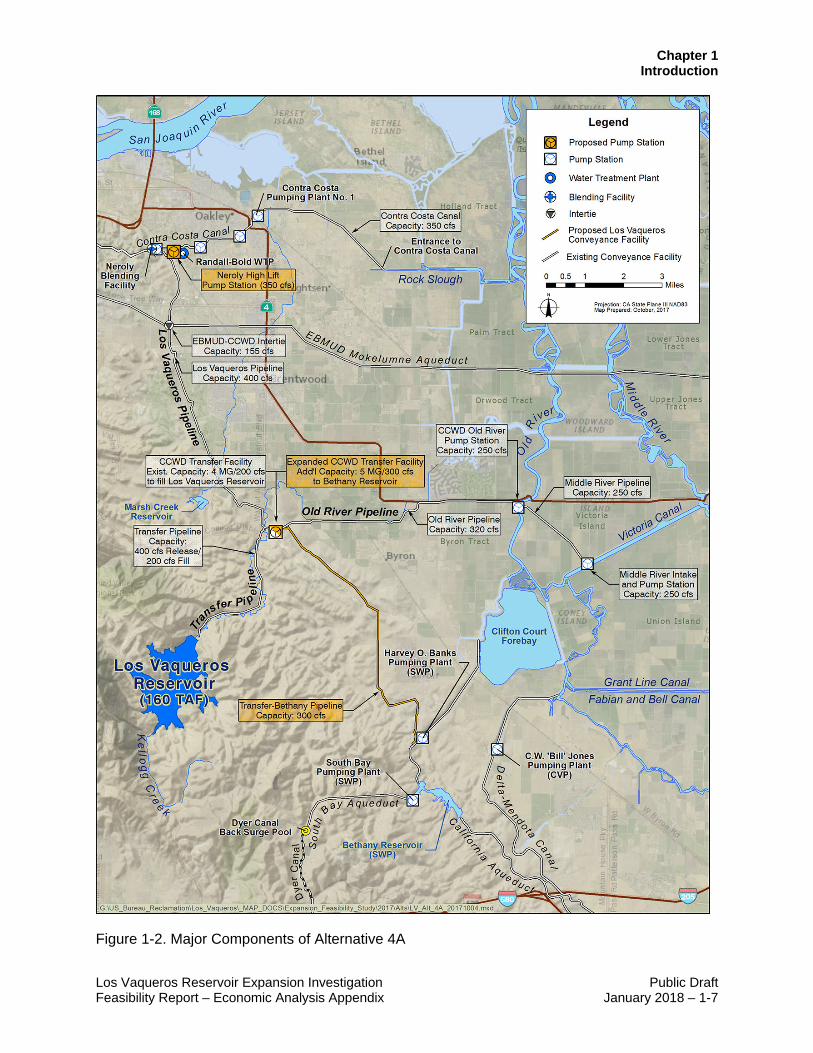
Figure 1-2. Major Components of Alternative 4A....................................................................... 1-7
Figure 3-1. General M&I Water Value Estimation Procedures ................................................... 3-1
Figure 7-1. Primary Service Area Population for Use in the Visitation Model ........................... 7-2
Tables
Table 1-1. Summary of Facilities for the Final Alternatives ....................................................... 1-5
Table 3-1. Average Annual Deliveries to Municipal and Industrial (TAF/year) ........................ 3-3
Table 3-2. Regression Results...................................................................................................... 3-7
Contents
Los Vaqueros Reservoir Expansion Investigation Public Draft Feasibility Report – Economic Analysis Appendix January 2018 – iii
Table 3-3. Estimated M&I Water Prices for San Francisco Bay Area Buyers ($/acre-foot/year) ........................................................................................................................ 3-10
Table 3-4. Estimated Power Costs by Region ........................................................................... 3-11
Table 3-5. Estimated 2030 Municipal and Industrial Water Cost by Year Type ...................... 3-12
Table 3-6. Estimated Annual NED M&I Water Supply Reliability Benefits by Final Alternative...................................................................................................................... 3-13
Table 4-1. Average Annual Incremental Level 4 Deliveries to Refuges (TAF/year) by the Project Alternatives .......................................................................................................... 4-1
Table 4-2. CVPIA Refuge Water Supply Program Incremental Level 4 Acquisitions (2006-2016)...................................................................................................................... 4-3
Table 4-3. Estimated 2030 Refuge Water Prices Paid to Seller by Year Type ........................... 4-5
Table 4-4. Estimated 2030 Refuge Water Supply Costs by Year Type ....................................... 4-6
Table 4-5. Estimated Refuge Water Supply NED Benefits by Final Alternative ........................ 4-6
Table 4-6. Use Benefits (Willingness-to-Pay) per Visitor by Activity and Water Delivery Scenario............................................................................................................................ 4-9
Table 4-7. Estimated Annual Benefits (in Year 2030) from Increased Recreation Visits to Refuges Under Alternative 1A ....................................................................................... 4-11
Table 4-8. Estimated Annual Benefits (in Year 2030) from Increased Recreation Visits to Refuges Under Alternative 1B ....................................................................................... 4-11
Table 4-9. Estimated Annual Benefits (in Year 2030) from Increased Recreation Visits to Refuges Under Alternative 2A ....................................................................................... 4-11
Table 4-10. Estimated Annual Benefits (in Year 2030) from Increased Recreation Visits to Refuges Under Alternative 4A .................................................................................. 4-11
Table 4-11. Sensitivity Analysis Comparison for Estimated Average Annual Incremental Level 4 Refuge Water Supply Benefits for the Final Alternatives ($ millions) ............ 4-12
Table 4-12. Incremental Level 4 Refuge Water Supplies Economic Benefits ($million per year) ............................................................................................................................... 4-13
Table 5-1. Average Annual Deliveries to South of Delta Agriculture (TAF/year) by the Project Alternatives .......................................................................................................... 5-1
Table 5-2. Estimated 2030 Agricultural Water Prices Paid to Seller by Year Type ................... 5-2
Table 5-3. Estimated 2030 Agricultural Water Supply Costs by Year Type ............................... 5-2
Table 5-4. Estimated Agricultural Water Supply NED Benefits by Final Alternative ................ 5-3
Table 5-5. Estimated 2030 Agricultural Water Unit Values ($/AF/yr) ....................................... 5-4
Contents
Public Draft Los Vaqueros Reservoir Expansion Investigation iv – January 2018 Feasibility Report – Economic Analysis Appendix
Table 5-6. Sensitivity Analysis Comparison for Estimated Average Annual Agricultural Water Supply Benefits for the Final Alternatives ............................................................ 5-4
Table 6-1. Average Annual Volume of Water in Storage Available for Emergency Delivery (TAF/year) by the Project Alternatives ............................................................. 6-2
Table 6-2. Probabilities of Delta Island Breach Scenarios .......................................................... 6-5
Table 6-3. Emergency Water Supply Beneficiary Demand ......................................................... 6-6
Table 6-4. Estimated Price Elasticities of Water Demand in California ..................................... 6-7
Table 6-5. Summary of Key Assumptions and Parameters ....................................................... 6-10
Table 6-6. Estimated Emergency Water Supply NED Benefits by Final Alternative ($ millions) ......................................................................................................................... 6-11
Table 6-7. Sensitivity Analysis Comparison for Estimated Average Annual Emergency Water Supply Benefits for Investigation Alternatives ($ million) ................................. 6-13
Table 7-1. Estimated Recreation NED Benefits by Final Alternative ......................................... 7-3
Table 8-1. Summary of Estimated NED Benefits by Final Alternative ($ millions) ................... 8-2
Abbreviations and Acronyms
ACWD Alameda County Water District AF acre-feet BAWSCA Bay Area Water Supply and Conservation Agency Bay Area San Francisco Bay Area CCWD Contra Costa Water District CVP Central Valley Project CVPIA Central Valley Project Improvement Act CWC California Water Commission Delta Sacramento-San Joaquin Delta DRMS Delta Risk Management Strategy DWR California Department of Water Resources EBMUD East Bay Municipal Utility District EIR Environmental Impact Report EIS Environmental Impact Statement EQ Environmental Quality ESA Endangered Species Act EWA Environmental Water Account Local Agency Partners Prospective Bay Area partner water agencies including Contra Costa
Water District, Alameda County Water District, anta Clara Valley Water District, Alameda County Flood Control and Water Conservation District, Zone 7, East Bay Municipal Utility District, Bay Area Water Supply and Conservation Agency, Byron-Bethany

Contents
Los Vaqueros Reservoir Expansion Investigation Public Draft Feasibility Report – Economic Analysis Appendix January 2018 – v
Irrigation District, City of Brentwood, East Contra Costa Irrigation District, San Francisco Public Utilities Commission, and San Luis Delta and Mendota Water Authority
Investigation Los Vaqueros Reservoir Expansion Investigation M&I municipal and industrial mgd million gallons per day NED National Economic Development NEPA National Environmental Policy Act NOD north of Delta OSE Other Social Effects P&G Federal Economic and Environmental Principles and Guidelines for
Water and Related Land Resources Implementation Studies PR&G Principles, Requirements and Guidelines for Water and Land Related
Resources Implementation Studies Reclamation U.S. Department of the Interior, Bureau of Reclamation Refuges wildlife refuges located south of the Delta that are designated in the
CVPIA RED Regional Economic Development RWSP Refuge Water Supply Program SBA South Bay Aqueduct SCVWD Santa Clara Valley Water District SFPUC San Francisco Public Utilities Commission SGMA Sustainable Groundwater Management Act SLDMWA San Luis Delta and Mendota Water Authority SOD south of Delta State Water Board State Water Resources Control Board SWAP Statewide Agricultural Production Model SWP State Water Project TAF thousand-acre-feet USACE U.S. Army Corps of Engineers Zone 7 Alameda County Flood Control and Water Conservation District, Zone 7

Contents
Public Draft Los Vaqueros Reservoir Expansion Investigation vi – January 2018 Feasibility Report – Economic Analysis Appendix
This page left blank intentionally.
Chapter 1 Introduction
Los Vaqueros Reservoir Expansion Investigation Public Draft Feasibility Report – Economic Analysis Appendix January 2018 – 1-1
Chapter 1 Introduction This technical appendix to the Feasibility Report for the Los Vaqueros Reservoir Expansion Investigation (Investigation) documents National Economic Development (NED) benefit analyses to support Federal plan formulation and evaluation. The benefit analysis herein also considers economic guidance by the California Water Commission (CWC) for the estimation of public benefits, in anticipation of potential funding eligibility under the State of California’s Water Quality, Supply, and Infrastructure Improvement Act of 2014. The Investigation is a feasibility study evaluating alternatives to develop environmental water supplies, and improve the reliability and quality of San Francisco Bay Area (Bay Area) water supplies, primarily through the expansion of Los Vaqueros Reservoir in Contra Costa County, California.
Background
Los Vaqueros Reservoir is located in the coastal foothills west of the Sacramento-San Joaquin Delta (Delta) in the eastern Bay Area. Contra Costa Water District (CCWD), owner and operator of the reservoir, provides water for 500,000 customers throughout central and eastern Contra Costa County as one of the largest urban water districts in California (CCWD 2017). CCWD completed construction of the original 100-thousand-acre-foot (TAF) Los Vaqueros Project in 1997. CCWD stores water in Los Vaqueros Reservoir that is diverted from the Delta when water quality is favorable, for later release and blending when Delta water quality is degraded. An initial expansion, Phase 1, to 160 TAF was completed in 2012. The primary purposes of both phases of the project are to address seasonal water quality degradation associated with CCWD’s Delta water supplies and CCWD’s dry year water supply reliability. The 160 TAF reservoir also provides important emergency water supply storage and, as secondary benefits, recreation and flood management.
Expansion of Los Vaqueros was one of five potential surface water storage projects identified by the CALFED Bay-Delta Program as warranting further study. In 2001, the U.S. Department of the Interior, Bureau of Reclamation (Reclamation), California Department of Water Resources (DWR), and CCWD began appraisal-level studies of the potential to expand Los Vaqueros Reservoir to address regional water quality and supply reliability needs. The appraisal-level studies indicated that expanding the reservoir to as much as 500 TAF capacity was technically feasible and could provide water quality and supply reliability to agencies in the region, as well as providing potential benefits to fisheries sensitive to water management operations in the Delta.
Subsequently, Reclamation was directed in Public Law 108-7 (Omnibus Appropriations Act of 2003) to conduct a feasibility-level investigation of the potential expansion of Los Vaqueros Reservoir. In 2004, voters in CCWD’s service area were asked to vote on whether CCWD should consider expanding the reservoir. The advisory ballot measure won approval, and as a result, the proposed expansion project was further developed and refined through preparation of

Chapter 1 Introduction
Public Draft Los Vaqueros Reservoir Expansion Investigation 1-2 – January 2018 Feasibility Report – Economic Analysis Appendix
environmental documentation in accordance with the National Environmental Policy Act (NEPA) and California Environmental Quality Act, and extensive public outreach.
After the Draft Environmental Impact Statement (EIS)/Environmental Impact Report (EIR) was published in 2009 by Reclamation and CCWD, a two-step approach was implemented for expanding Los Vaqueros Reservoir. This was done in order for CCWD to move forward with addressing urgent water supply and quality needs, particularly during dry years, while the feasibility-level investigation was still in process. The initial expansion was completed as a local action by CCWD, without financial assistance from the Federal government. Because it was done without State or Federal assistance, this feasibility-level investigation was put on hold until after completion of the initial expansion. To implement the initial expansion, the CCWD Board of Directors certified the EIS/EIR (Reclamation 2010) and approved an expansion from 100 TAF to 160 TAF on March 31, 2010. Reclamation issued a Record of Decision in February 2011 to enter into an Integrated Operations Agreement with CCWD based on the 2010 EIS/EIR. Construction on the initial expansion began in early 2011 and was completed in 2012.
Reclamation, DWR, and CCWD continue to investigate the feasibility of larger expansion alternatives, as documented in this appendix, because the earlier appraisal-level studies indicated that an additional expansion of Los Vaqueros Reservoir beyond the initial 60 TAF would provide additional regional water supply reliability and statewide environmental benefits. This feasibility-level investigation includes updates to the project plans and studies previously performed to account for significant changes to existing conditions that have occurred since the 2010 EIS/EIR was released, as well as to account for changes that are anticipated to take place within the coming years. These changes include CCWD’s initial expansion of Los Vaqueros Reservoir to 160 TAF and the operation of this expanded storage space, other local infrastructure changes (e.g., Contra Costa Canal Replacement Project), likely water management constraints resulting from regulatory actions in the Delta and large programs such as Bay Delta Conservation Plan, and new project beneficiaries participating in the Investigation.
Study Location
Los Vaqueros Reservoir is located in the Kellogg Creek watershed of Contra Costa County, California in the central and south Delta. The reservoir lies in the foothills west of the Delta in the eastern Bay Area. The study area for the Investigation includes the Los Vaqueros Reservoir watershed and associated facilities, central and south Delta, and service areas of potential local partner water agencies. The central and south Delta is roughly bound by the San Joaquin River on the north and the boundaries of the legal Delta to the south (as established in Section 12220 of the California Water Code). Potential local partner water agencies include CCWD, Alameda County Water District (ACWD), Santa Clara Valley Water District (SCVWD), the Alameda County Flood Control and Water Conservation District, Zone 7 (Zone 7), East Bay Municipal Utility District (EBMUD), Bay Area Water Supply and Conservation Agency (BAWSCA), Byron-Bethany Irrigation District, City of Brentwood, East
Chapter 1 Introduction
Los Vaqueros Reservoir Expansion Investigation Public Draft Feasibility Report – Economic Analysis Appendix January 2018 – 1-3
Contra Costa Irrigation District, San Francisco Public Utilities Commission (SFPUC), and San Luis & Delta-Mendota Water Authority (SLDMWA). These are collectively referred to as Local Agency Partners herein. Other potential partners include the California Department of Fish and Wildlife and the U.S. Fish and Wildlife Service, managing agencies of the south-of-Delta Central Valley Project Improvement Act (CVPIA)-designated wildlife refuges (Refuges), and the Grassland Water District which represents the landowners of those privately owned/managed wetlands also included in these fourteen total Refuges.
Due to the potential influence on other programs and projects, an extended study area was identified for the Investigation. The extended study area includes south-of-Delta Central Valley wildlife Refuges, operational areas of the Central Valley Project (CVP) and State Water Project (SWP), and the service areas of other Bay Area water agencies that may be indirectly affected by project operations.
Project Objectives
The Investigation focuses on using an expanded Los Vaqueros Project to accomplish the following planning objectives:
Primary Planning Objectives • Develop water supplies for environmental water management that supports fish
protection, habitat management, and other environmental water needs.
• Increase water supply reliability for water providers within the Bay Area to help meet municipal and industrial water demands during drought periods and emergencies or to address shortages due to regulatory and environmental restrictions.
Secondary Planning Objective • Improve the quality of water deliveries to municipal and industrial customers in the Bay
Area, without impairing the project’s ability to meet the environmental and water supply reliability objectives stated above.
Final Alternatives Considered in the Feasibility Report
The Final Alternatives being evaluated in the Feasibility Report are summarized in Table 1-1. These alternatives are refined options of the original four alternatives evaluated in the 2010 EIS/EIR and account for changes to existing conditions that have occurred since the 2010 EIS/EIR was released (e.g., expansion of Los Vaqueros Reservoir to 160 TAF, completion of other local projects). They also account for changes that are anticipated to take place within the coming years. These alternatives are operated to provide varying levels of emphasis to the above project objectives.
Alternatives 1A, 1B, and 2A would expand Los Vaqueros Reservoir storage from 160 TAF to 275 TAF, build a new Delta-Transfer Pipeline, and relocate the existing Marina Complex and Los Vaqueros Watershed trails and access roads that would be inundated by the reservoir
Chapter 1 Introduction
Public Draft Los Vaqueros Reservoir Expansion Investigation 1-4 – January 2018 Feasibility Report – Economic Analysis Appendix
expansion. None of these would occur under Alternative 4A. All of the action alternatives would upgrade the existing Transfer Facility, build a new Transfer-Bethany Pipeline, replace Pumping Plant #1, and add facilities to deliver water to the Transfer Facility from the Rock Slough Intake, which entails building a new Neroly High-Lift Pump Station.
A list of the major components for all the alternatives is provided in Table 1-1 below. Alternatives 1A, 1B, and 2A differ from one another only in the proposed operations of the facilities. Figure 1-1 shows the facilities associated with Alternatives 1A, 1B, and 2A. Figure 1-2 shows the facilities associated with Alternative 4A.

Chapter 1 Introduction
Los Vaqueros Reservoir Expansion Investigation Public Draft Feasibility Report – Economic Analysis Appendix January 2018 – 1-5
Table 1-1. Summary of Facilities for the Final Alternatives
No Action Alternatives 1A, 1B, 2A1 Alternative 4A
Existing Facilities (no change) Old River Intake 250 cfs 250 cfs 250 cfs Middle River Intake 250 cfs 250 cfs 250 cfs Old River Pipeline 320 cfs 320 cfs 320 cfs Los Vaqueros Pipeline 400 cfs 400 cfs 400 cfs Transfer-Los Vaqueros Pipeline (Fill/Release) 200/400 cfs 200/400 cfs 200/400 cfs EBMUD-CCWD Intertie 155 cfs 155 cfs 155 cfs Transfer Reservoir 4 million gallons 4 million gallons 4 million gallons Proposed Modifications to Existing Facilities Los Vaqueros Reservoir Capacity 160 TAF 275 TAF 160 TAF Los Vaqueros Reservoir Maximum Water Surface Elevation 507 feet 560 feet 507 feet
Transfer Pump Station Capacity 150 cfs 200 cfs 200 cfs Proposed New Facilities Transfer-Bethany Pipeline Capacity None 300 cfs 300 cfs Delta-Transfer Pipeline Capacity None 180 cfs None Expanded Transfer Facility Pump Station Capacity None 300 cfs 300 cfs
Expanded Transfer Facility Storage Reservoir Capacity None 5 million gallons 5 million gallons
Neroly High-Lift Pump Station Capacity None 350 cfs2 350 cfs2
Pumping Plant #1 Capacity 200 cfs 350 cfs 350 cfs Los Vaqueros Watershed Facilities Los Vaqueros Marina Complex No change Relocated upslope No change Los Vaqueros Watershed Trails None Expanded None Los Vaqueros Interpretive Center No change Improved Improved
Los Vaqueros Watershed Office Barn No change Seismically upgraded and improved
Seismically upgraded and improved
Associated Local Projects3 EBMUD Mokelumne Aqueduct relining None Included Included EBMUD Walnut Creek Pumping Plant Variable Frequency Drives None Included Included
EBMUD-CCWD Intertie Pump Station None 155 cfs 155 cfs Brentwood Pipeline None Included Included ECCID Intertie None 80 cfs 80 cfs
Note: 1 Alternatives 1A, 1B, and 2A differ from one another only in the proposed operations of the facilities. 2 Permitted capacity is 350 cfs as defined in the Supplement to the Final EIS/EIR. 300 cfs is the capacity modeled and designed
under the Feasibility Study to reflect the current operation requirements. 3 Local Projects developed separately from the Feasibility Study, but linked to the operations of the project. Key: CCWD = Contra Costa Water District cfs = cubic-feet per second EBMUD = East Bay Municipal Utility District ECCID = East Contra Costa Irrigation District TAF = 1,000 acre-feet
Chapter 1 Introduction
Public Draft Los Vaqueros Reservoir Expansion Investigation 1-6 – January 2018 Feasibility Report – Economic Analysis Appendix
Figure 1-1. Major Components of Alternatives 1A, 1B, and 2A
Chapter 1 Introduction
Los Vaqueros Reservoir Expansion Investigation Public Draft Feasibility Report – Economic Analysis Appendix January 2018 – 1-7
Figure 1-2. Major Components of Alternative 4A

Chapter 1 Introduction
Public Draft Los Vaqueros Reservoir Expansion Investigation 1-8 – January 2018 Feasibility Report – Economic Analysis Appendix
Alternative 1A Alternative 1A is formulated to maximize deliveries for water supply reliability to the Local Agency Partners, including drought and emergency supply reliability. The operations follow these four priorities:
1) Available water (Delta surplus and Local Agency Partners’ water rights and contracts) would first be delivered to meet Local Agency Partner demand, if any.
2) If water and CCWD system capacity were still available, water would then be stored in Los Vaqueros Reservoir for later use by the Local Agency Partners.
3) If additional CCWD system capacity were still available and if CVP north-of-Delta storage conditions allowed withdrawals (high storage conditions only), the next priority would be to wheel CVPIA Level 2 Refuge water through CCWD facilities for delivery to the Refuges. Conducted in coordination with Refuge managers, this operation would release capacity at Jones Pumping Plant that could them be used to move additional water to CVP south-of-Delta contractors. This wheeling operation would not provide additional water supply to the Refuges; rather the released capacity at Jones Pumping Plant could be used to make additional CVP allocations or water transfers.
4) If water and CCWD system capacity were still available after the above three operations, additional deliveries would then be made to help meet Incremental Level 4 Refuge demand.
Alternative 1B Alternative 1B includes the same facilities as Alternative 1A. Alternative 1B is formulated to maximize potential project deliveries to both Local Agency Partners and Refuges. Alternative 1B balances the priorities of water supply reliability to the Local Agency Partners with environmental water management for the Refuges. The operations follow these four priorities:
1) Available water (Delta surplus and Local Agency Partners’ water rights and contracts) would first be delivered to meet Local Agency Partner demand, if any.
2) If water and CCWD system capacity were still available, additional deliveries would then be made to help meet Incremental Level 4 Refuge allocations.
3) If water and CCWD system capacity were still available, water would then be stored in Los Vaqueros Reservoir for later use by the Local Agency Partners or Refuges.
4) If additional CCWD system capacity were still available after the above three operations, the next priority would be to wheel Delta surplus water through CVP facilities to meet Level 2 Refuge demands. Conducted in coordination with the Refuge managers, this operation would release capacity at Jones Pumping Plant to move additional water to CVP south-of-Delta contractors. Wheeling would not provide a new water supply to the Refuges; rather the released capacity at Jones Pumping Plant could be used to make additional CVP allocations or water transfers.
Chapter 1 Introduction
Los Vaqueros Reservoir Expansion Investigation Public Draft Feasibility Report – Economic Analysis Appendix January 2018 – 1-9
Alternative 2A Alternative 2A includes the same facilities as Alternatives 1A and 1B. Alternative 2A is formulated to maximize potential project deliveries to the Refuges, prioritizing environmental water management operations. The operations follow these three priorities:
1) Available water (Delta surplus and Local Agency Partners’ water rights and contracts) would first be delivered to help meet Incremental Level 4 Refuge allocations.
2) If water and CCWD system capacity were still available, water would then be stored in Los Vaqueros Reservoir for later use by the Refuges.
3) If water and CCWD system capacity were still available after the above two operations, additional deliveries would be made to meet any Local Agency Partner water supply needs.
Alternative 4A Alternative 4A would not expand the existing 160 TAF Los Vaqueros Reservoir storage capacity or build a new Delta-Transfer Pipeline but would make all of the other major physical improvements identified for Alternatives 1A, 1B, and 2A. Alternative 4A would include an upgrade of the Transfer Facility, a new Transfer-Bethany Pipeline, and facilities to enable filling of Los Vaqueros Reservoir from the Rock Slough Intake. Similar to Final EIS/EIR Alternative 4, Alternative 4A has a Los Vaqueros Reservoir storage capacity of 160 TAF. Alternative 4A uses similar operational priorities as Alternative 1B, with the exception of the wheeling operation, which is not included. Alternative 4A is formulated to maximize potential project deliveries to both the Local Agency Partners and Refuges, but without the benefit of expanded storage in Los Vaqueros Reservoir.
Organization of This Appendix
This appendix is organized as follows:
Chapter 1, Introduction, provides an overview of the Investigation.
Chapter 2, Economic Principles and Methods, describes methods for economics analysis in the Administrative Draft Feasibility Report, and specific valuation approaches for each benefit category.
Chapter 3, NED Municipal and Industrial Water Supply Reliability, describes municipal and industrial (M&I) water supply reliability benefits of the Final Alternatives.
Chapter 4, NED Refuge Water Supply Reliability Benefits, describes Refuge water supply reliability benefits of the Final Alternatives.
Chapter 5, NED Agricultural Water Supply Benefits, describes Agricultural water supply benefits of the Final Alternatives.
Chapter 1 Introduction
Public Draft Los Vaqueros Reservoir Expansion Investigation 1-10 – January 2018 Feasibility Report – Economic Analysis Appendix
Chapter 6, NED Emergency M&I Water Supply Benefits, describes emergency water supply benefits of the Final Alternatives.
Chapter 7, NED Recreation Benefits, describes recreation benefits of the Final Alternatives.
Chapter 8, Summary of Estimated NED Benefits, provides a summary of NED benefit results for the Final Alternatives.
Chapter 9, References, contains sources of information used to prepare the appendix.
Chapter 2 Economic Principles and Methods
Los Vaqueros Reservoir Expansion Investigation Public Draft Feasibility Report – Economic Analysis Appendix January 2018 – 2-1
Chapter 2 Economic Principles and Methods This chapter describes Federal economic principles and methods related to plan formulation, estimation of project benefits, and derivation of total annual equivalent benefits. This chapter also describes potential economic valuation methods, and the methods applied to the Investigation.
Guidelines
The economic valuation approach for Federal water resource projects and the Investigation is consistent with the Federal Economic and Environmental Principles and Guidelines for Water and Related Land Resources Implementation Studies (P&G) (WRC 1983). In 2015, the Council on Environmental Quality completed an interagency effort to update the 1983 P&G. This effort led to the development of the Principles, Requirements and Guidelines for Water and Land Related Resources Implementation Studies (PR&G). The PR&G apply only to plans or projects that are initiated after the PR&G take effect, therefore the P&G are the primary guidelines used for the Investigation. The approach to quantifying and monetizing benefits in the PR&G and the P&G are not significantly different (DOI 2015).
The P&G indicate the Federal objective of water and related land resources project planning is to contribute to national economic development consistent with protecting the Nation’s environment, pursuant to national environmental statutes, applicable executive orders, and other Federal planning requirements. Further, numerous Federal laws (e.g., the Endangered Species Act (ESA) (1973), Clean Water Act (1972)) establish policy and Federal interest in the protection, restoration, conservation, and management of protecting environmental quality.
The Federal Objective as updated and specified in the Water Resources Development Act of 2007 is that Federal water resources investments shall reflect national priorities, encourage economic development, and protect the environment by:
• seeking to maximize sustainable economic development;
• seeking to avoid the unwise use of floodplains and flood-prone areas and minimizing adverse impacts and vulnerabilities in any case in which a floodplain or flood-prone area must be used; and
• protecting and restoring the functions of natural systems and mitigating any unavoidable damage to natural systems.
In the Water Resources Development Act of 2007, Congress instructed the Secretary of the Army to develop a new P&G for the U.S. Army Corps of Engineers (USACE) to promote consistency and informed decision making among Federal agencies. In 2009 the Obama

Chapter 2 Economic Principles and Methods
Public Draft Los Vaqueros Reservoir Expansion Investigation 2-2 – January 2018 Feasibility Report – Economic Analysis Appendix
Administration began the process of updating the P&G for Federal agencies engaged in water resources planning, including USACE, Environmental Protection Agency, Department of Agriculture, Department of the Interior, National Oceanic and Atmospheric Administration, Tennessee Valley Authority, Federal Emergency Management Agency, and Office of Management and Budget.
In March 2013, the Administration released the Principles & Requirements that lay out broad principles to guide Federal investments in water management (Whitehouse 2013). In addition, Draft Interagency Guidelines for implementing the Principles & Requirements were also released. The modernized Principles & Requirements , together with agency specific Guidelines (PR&G), will allow agencies to better consider the full range of long-term economic, social, environmental, cultural, and other benefits of infrastructure projects.
In consideration of the many complex water management challenges and competing demands for limited Federal resources, it is intended that Federal investments in water resources should strive to maximize public benefits, particularly in comparison to costs. Public benefits encompass environmental, economic, and social goals, include monetary and non-monetary effects and allow for the inclusion of quantified and non-quantified measures. Stakeholders and decision makers expect the formulation and evaluation of a diverse range of alternative solutions. Such solutions may produce varying degrees of effects relative to the three goals specified above and as a result, tradeoffs among potential solutions will need to be assessed and properly communicated during the decision making process.
Thus, in addition to traditional, monetized economic development, projects that contribute to Federal ecosystem and species restoration goals, public health and safety, environmental justice, community benefits, and support recreation opportunities are relevant components of water project planning and development.
Economic evaluation provides a way to understand and evaluate trade-offs that can be quantified and monetized and that must be made between alternatives with respect to objectives, investments, and other social goals. It also provides a means to identify the plan that is acceptable, effective, efficient, and complete, and contributes the most favorably to national priorities. The Federal P&G established four main accounts for organizing, displaying, and analyzing project alternatives:
• NED
• Regional Economic Development (RED)
• Environmental Quality (EQ)
• Other Social Effects (OSE)
The above accounts encompass all significant effects of a plan, consistent with NEPA of 1970 (42 United States Code 4321 et seq.) and other Federal guidance. The NED account is the only required account under the 1983 P&Gs, although information that could affect Federal decision-

Chapter 2 Economic Principles and Methods
Los Vaqueros Reservoir Expansion Investigation Public Draft Feasibility Report – Economic Analysis Appendix January 2018 – 2-3
making should be presented in the other accounts. Only the NED benefits are quantified in this appendix.
National Economic Development Account The NED account identifies the alternative providing the greatest net economic benefits to the Nation. The NED account considers and displays the potential changes and effects in the total value of the national output of goods and services from an alternative plan, expressed in monetary units. Contributions to NED are increases in the total value of the national output of goods and services, expressed in monetary units. NED benefits are the direct net benefits that would be expected to accrue in the primary study area and the rest of the Nation should a project or program be implemented. They include increases in the net value of those goods and services that are marketed, and also of those that may not be marketed.
The NED account describes the portion of the NEPA human environment, as defined in 40 Code of Federal Regulations 1508.14 that identifies beneficial and adverse effects on the economy which occur as a result of water resources planning and development. The NED account considers the estimated benefits and costs of the action alternatives. Beneficial effects could include (1) increases in the economic value of the national output of goods and services from a plan, (2) the value of output resulting from external economies caused by a plan, and (3) the value associated with the use of otherwise unemployed or under-employed labor resources. Adverse effects in the NED account would be the opportunity costs of resources used in implementing a plan. Such opportunity costs could include decreases in output in other sectors, or employment losses. These effects usually include (1) implementation outlays, (2) associated costs, and (3) other direct costs.
After displaying and comparing the estimated benefits and costs for the Investigation alternative actions, the NED analysis considers the monetary and non-monetary trade-offs and culminates in identifying the alternative that would reasonably provide the greatest net economic benefits to the Nation while protecting the environment. As required by the P&G, the plan with the greatest net NED benefits (NED benefits minus NED costs) is identified as the NED Plan and is usually selected for recommendation to Congress for approval, unless the Secretary of the Interior grants an exception based on overriding considerations and merits of another plan. If another plan is recommended instead of the NED Plan, such as a locally preferred plan, the NED Plan is still presented as a basis of comparison to define the extent of Federal financial interest in the plan recommended for implementation.
Regional Economic Development Account The RED account examines and displays potential changes in the value of economic activity at the local or regional level for the alternative plans. RED analysis may reflect only a shift in economic productivity from one region to another, not the change in output at the national level required in Federal analysis. Because local and regional economic activity is of great interest to decision-makers and stakeholders, RED analysis may be included to assess changes in regional personal income and employment and can be part of an analysis of trade-offs as can the environmental quality account and other social effects account described below.

Chapter 2 Economic Principles and Methods
Public Draft Los Vaqueros Reservoir Expansion Investigation 2-4 – January 2018 Feasibility Report – Economic Analysis Appendix
Environmental Quality Account The EQ account examines and displays the effects of alternative plans on significant EQ resources and attributes of the NEPA human environment that is essential to a reasoned choice among alternative plans. Beneficial effects in the EQ account are favorable changes in the ecological, aesthetic, and cultural attributes of natural and cultural resources. Adverse effects in the EQ account are unfavorable changes in the ecological, aesthetic, and cultural attributes of natural and cultural resources.
Other Social Effects Account The OSE examines and displays the potential changes of alternative plans on other social effects not covered under the NED, RED, and EQ accounts. The effects quantified by OSE include urban and community impacts, such as effects on income or population distribution, fiscal conditions of the State and local governments, the quality of community life, and similar impacts. OSE includes impacts to life, health, and safety, including the risk of flood, drought, or disaster; the potential loss of life, property, and essential services; and environmental effects not covered under the NED and EQ accounts. OSE also includes the effects of the displacement of people, businesses, or farms; impacts to the long-term productivity of resources, such as agricultural land, for use by future generations; and effects on energy requirements and conservation.
Other Considerations
In addition to following Federal guidelines in development of economic analysis methods and procedures for the Investigation, consideration was given to economic guidance being developed by the CWC ( specifically the Draft Working Paper for Water Storage Investment Program Common Assumptions – Economics (July 29, 2015), available at: https://cwc.ca.gov/Pages/DocumentLibrary.aspx) related to the distribution of Water Storage Investment Program funding available through the Water Quality, Supply, and Infrastructure Improvement Act of 2014 (Proposition 1). This bond initiative dedicated $2.7 billion for investments in water storage projects and designated the CWC as the agency responsible for allocating these funds based on specific criteria (Proposition 1 funding criteria for investments in water storage projects is discussed further in the Cost Allocation Appendix and Chapter 6 of the main body of the Feasibility Report). The CWC may fund portions of project costs that contribute to the public benefits of these projects, which must also provide measurable benefits to the Delta ecosystem or its tributaries.
Projects that may receive State funding under Proposition 1 will be selected by the CWC through a competitive public process based on a project’s expected return on the public investment as measured by the magnitude of the public benefits provided. The public benefits categories defined by Proposition 1 include:
(1) Ecosystem improvements, including changing the timing of water diversions, improvement in flow conditions, temperature, or other benefits that contribute to restoration of aquatic ecosystems and native fish and wildlife, including those ecosystems and fish and wildlife in the Delta.
Chapter 2 Economic Principles and Methods
Los Vaqueros Reservoir Expansion Investigation Public Draft Feasibility Report – Economic Analysis Appendix January 2018 – 2-5
(2) Water quality improvements in the Delta, or in other river systems, that provide significant public trust resources, or that clean up and restore groundwater resources.
(3) Flood control benefits, including, but not limited to, increases in flood reservation space in existing reservoirs by exchange for existing or increased water storage capacity in response to the effects of changing hydrology and decreasing snow pack on California’s water and flood management system.
(4) Emergency response, including, but not limited to, securing emergency water supplies and flows for dilution and salinity repulsion following a natural disaster or act of terrorism.
(5) Recreational purposes, including, but not limited to, those recreational pursuits generally associated with the outdoors.
In recognition that the Investigation is a potentially eligible project to receive funding, economic guidance by the CWC related to the estimation of public benefits was considered as part of the Investigation. CWC proposed methods for estimating benefits are generally consistent with Federal guideline in general. The CWC guidelines were considered to ensure consistency in approach and methods.
NED Benefit Evaluation Procedures
In general, the objectives of Federally financed water resources projects are to enhance NED, the quality of the environment, the well-being of people in the United States, and regional economic development. NED costs and benefits are the decrease or increase in the value of the national output of goods and services, expressed in dollars. NED figures measure costs and benefits to the Nation, rather than to a particular region. This section generally describes the procedures used to identify the alternative that maximizes NED benefits.
As described in the P&G, water resources project plans shall be formulated to alleviate problems and take advantage of opportunities in ways that contribute to NED. The alternative plan with the greatest net NED economic benefit is identified as the NED plan and often has the greatest potential for Federal investment. The NED account includes the following categories of goods and services: (1) M&I water supply; (2) agricultural floodwater, erosion, and sediment reduction; (3) agricultural drainage; (4) agricultural irrigation; (5) urban flood damage reduction; (6) power (hydropower); (7) transportation (inland navigation); (8) transportation (deep draft navigation); (9) recreation; (10) commercial fishing; and, (11) other categories of benefits for which procedures are documented in the planning report and are consistent with the general measurement standard in the P&Gs. While multipurpose projects may provide additional types of benefits, these categories coincide with project purposes in which an established Federal financial interest exists. Other categories of benefits may be allowed or may be included in congressional authorization for a specific project.

Chapter 2 Economic Principles and Methods
Public Draft Los Vaqueros Reservoir Expansion Investigation 2-6 – January 2018 Feasibility Report – Economic Analysis Appendix
Environmental benefits, including fisheries and ecosystem resources, are typically included in the EQ account if monetary units cannot be attributed to these benefits. However, in some cases, environmental benefits may be developed as monetary units, and be included in the NED account under “other categories of benefits.” For this analysis, NED Refuge water supply benefits are based on the water transfer price, and a sensitivity analysis based on habitat productivity and related recreation visitation is conducted.
Other direct benefits in the NED evaluation are those direct effects of a project that are incidental to the purposes or objectives for which the project is being formulated. Other direct benefits may include improvement in commercial/industrial production possibilities with improved water quality (such as reduced water treatment process costs at industrial facilities) or in recreational opportunities. For the Investigation, other direct benefits include environmental benefits (potential reduced impacts to aquatic resources from changing the location and timing of Delta diversions, avoided costs associated with screening diversions, and improved water quality) and recreation benefits (increased water surface area and shoreline miles for recreation participation).
NED costs are the opportunity costs of resource use, and require consideration of the private and public uses that producers and consumers are making of available resources, now and in the future. For goods and services produced in a competitive market, price is often used to reflect opportunity cost. Consequently, market prices should be used to determine NED costs, provided market prices reflect the full economic value of a resource to society. The market price approach should reflect the interaction of supply and demand. If market prices do not reflect total resource values, surrogate values may be used that approximate opportunity costs based on an equivalent use or condition.
The two primary decision criteria used in a Federal economic analysis are net benefits and the benefit-cost ratio. The net benefit is the difference between the net present value of benefits and costs, and it measures the extent to which benefits to the Nation exceed project costs. The benefit-cost ratio is calculated by dividing annual project benefits by annual project costs. The net benefits and costs of alternative plans are compared to identify the plan that reasonably maximizes net benefits, or the NED plan. The NED Plan is not necessarily the plan with the greatest benefits, but rather the plan that maximizes benefits given the cost to the Nation. Section 1.10.2 of the P&G requires that the NED plan be selected unless the Secretary of the Interior grants an exception.
Economic Valuation Methods
Economic valuation methods generally fall into one of two categories: market valuation or nonmarket valuation. Market values refer to conditions for which a price can be observed, such as for human consumptive uses. Nonmarket valuation methods usually apply to a resource for which there is no established market to observe values, such as ecosystem restoration or wildlife conservation. As recommended in the P&G, economic benefits may be determined by one of four valuation approaches:
• Actual or simulated market prices
Chapter 2 Economic Principles and Methods
Los Vaqueros Reservoir Expansion Investigation Public Draft Feasibility Report – Economic Analysis Appendix January 2018 – 2-7
• Change in net income
• Cost of the most likely alternative
• Administratively established values
In general, the P&G indicate that the value of goods and services should be based on willingness to pay. Revealed and stated preferences are two approaches for measuring willingness to pay for goods and services. Revealed preferences are based on observed behavior that reflects preferences, while stated preferences are based on directly asking individuals to indicate preferences in a hypothetical setting. Demand functions cannot always be estimated for many goods and services due to a lack of observed market data or the ability to obtain survey data. In lieu of demand function estimation, the P&G recommend the use of actual or simulated market prices, where available, because they represent a close approximation of total willingness to pay value. Other generally acceptable approaches under the P&G include cost based approaches. In addition, benefits transfer, which uses values from previous economic studies (developed with any of the four valuation approaches indicated by the P&G), may be used to estimate willingness to pay provided they are relevant to the study area and output being valued. Each of the valuation approaches indicated by the P&G to estimate NED economic benefits is briefly described below.
Actual or Simulated Market Prices Method In cases when a demand curve cannot be directly estimated, market prices may be used to estimate society’s willingness to pay for a good or service. The P&G provide some limited guidance on the use of market prices when the output of the plan is expected to have a significant effect on market price. Prices should be expressed in real terms (inflation adjusted). Real prices should be adjusted throughout the planning period to account for expected changes in demand and supply conditions. The methods include: revealed preferences, which relies on market-based data; contingent valuation, which uses surveys to directly elicit consumer benefits; and benefits transfer. A well-designed contingent valuation survey represents one possible method to measure willingness to pay in a developing market. However, conducting a primary revealed preference or contingent valuation study is often prohibitively time-consuming and expensive.
Change in Net Income Method When willingness to pay and market price methods cannot be implemented, the P&G allow estimation of the change in net income to producers associated with a project to obtain an estimate of total value. This method is most frequently applied to circumstances when water supply from a project will be used as an input in a production process.
Cost of the Most Likely Alternative Method In situations where water supply alternatives to a proposed project exist, the cost of the most likely alternative to obtain the same level of output can be used as a proxy measure of NED benefits. When applying this method, it is important to consider alternatives that would realistically be implemented in the absence of the proposed project. This method is generally considered for benefit categories that cannot be estimated through the market-based methods described above. This cost of the most likely alternative method identifies the cost of obtaining or developing the next unit of a resource to meet a particular objective. The net benefit is estimated by subtracting the cost of developing the project under consideration from the cost of

Chapter 2 Economic Principles and Methods
Public Draft Los Vaqueros Reservoir Expansion Investigation 2-8 – January 2018 Feasibility Report – Economic Analysis Appendix
the alternative unit. For water supply reliability benefits, for example, the cost of the most likely alternative represents the next unit of water supply the water user would purchase or develop if the project under consideration were not in place. The cost of the alternative that would be reasonably expected to be implemented in the absence of the NED plan would be the most likely alternative. If the NED Plan provides the same output as the most likely alternative at a lower cost, the net benefit of the NED Plan is equal to the difference in the project costs.
Administratively Established Values Methods Administratively established values are representative values for specific goods and services that are cooperatively established by the water resources agencies. This method is the least preferred approach to estimating economic benefits identified in the P&G, and is only implemented when other options cannot be completed.
Los Vaqueros Expansion Alternative Valuation Approaches
This section briefly describes economic analysis parameters and economic benefit valuation approaches used for the Final Alternatives. Valuation approaches are presented for M&I water supply reliability, Refuge water supply, and emergency M&I water supply. Additional information on each benefit category and the valuation approaches is provided in the sections that follow.
Economic Analysis Parameters Economic parameters and future without-project conditions that form the basis for the economic analysis presented in this report are summarized below.
Parameters Economic analysis assumptions outlined in the P&G include those related to full employment, risk neutrality, and others. Parameters specific to the Investigation include period of analysis and discount rate, summarized briefly below.
• Period of analysis – The period of analysis is the anticipated period over which project effects are likely to accumulate. The P&G allow for a period of analysis for up to 100 years based on anticipated project life. A 100-year period of analysis is believed appropriate for the Investigation because of the anticipated longevity of a dam and reservoir project. The economic benefits of the project would begin to accrue the year construction is completed. In this analysis, annual benefits are estimated for the year 2030 as an approximation of the benefits that would be obtained from completion of a planning horizon analysis. By many accounts, real water values are rising faster than the current Federal discount rate. As a result, applying the estimated 2030 benefits is a conservative approach.
• Discount rate – The discount rate is the rate at which society as a whole is willing to trade off present for future benefits. NED impacts are compared at a common point in time in average annual equivalent terms. This is accomplished by discounting the benefit stream, deferred installation costs, and operation, maintenance, and replacement costs to the beginning of the period of analysis using an established Federal discount rate.

Chapter 2 Economic Principles and Methods
Los Vaqueros Reservoir Expansion Investigation Public Draft Feasibility Report – Economic Analysis Appendix January 2018 – 2-9
Installation costs (including construction costs) are brought forward to the end of the installation period by charging compound interest from the date costs are incurred (interest during construction). The Federal discount rate for plan formulation and evaluation is established annually by the Secretary of the Treasury pursuant to 42 United States Code 1962d-1. The Federal discount rate of 3.125 percent (fiscal year 2016) is used in this economic analysis.
NED M&I Water Supply Reliability Benefits Water supplies from the Final Alternatives would improve water supply reliability to M&I water users primarily located in the Bay Area.
In the absence of the Investigation, Bay Area urban water providers will pursue development of alternative water supply sources to satisfy dry-year and water supply reliability needs. Bay Area water agencies have identified various potential sources of future water supplies in their urban water management plans and other documents, including increasing reliance on out-of-basin water transfers, groundwater, conservation, recycling, and desalination. Few opportunities exist to develop new surface water supplies within the Bay Area. Groundwater is a largely developed resource and groundwater quality (because of saltwater intrusion and contamination) and groundwater overdraft are problematic for further development. Desalination of brackish water or seawater has been gaining interest in California and a group of Bay Area water providers is developing studies toward completion of a 25 million gallons per day (mgd) regional desalination plant that would operate in conjunction with Los Vaqueros Reservoir (BARDP, 2014). Other water providers in the Bay Area are considering smaller desalination projects of approximately 6.5 to 13 mgd (BAWSCA, 2015).
Opportunities to develop new onstream or offstream surface water storage in the Bay Area are limited, and out-of-basin water transfers are already relied upon in dry and critical years to meet current demands. In addition, during recent, extended, multi-year droughts in California the availability of out-of-basin water transfers has been limited. Consequently, the next increment of water supply reliability in the Bay Area would likely be obtained by higher-cost water transfers (either long term or short term), and increased reliance on desalination and recycled water projects.
This analysis applies a model that estimates the costs of water transfers to the Bay Area to estimate M&I water supply reliability benefits associated with the Final Alternatives. This method is consistent with the “cost of the most likely alternative” approach recommended by the P&G. In addition, available information on the potential strategies and costs to improve water supply reliability within the Bay Area are described to address risk and uncertainty associated with the M&I benefit estimates. Comparison of the projected costs associated with alternative water supply development strategies in the Bay Area allows a more complete understanding of the value of water supply reliability in the Bay Area and provides a useful comparison to the estimates developed using the water transfer pricing model to estimate NED M&I benefits.
NED Refuge Water Supply Benefits The Final Alternatives provide opportunities to improve long-term water supplies and habitat conditions for Refuges. Reclamation delivers water to wildlife refuges in the San Joaquin Valley as a requirement of the CVPIA, as Level 2 supply (firm supply) and Incremental Level 4 supply
Chapter 2 Economic Principles and Methods
Public Draft Los Vaqueros Reservoir Expansion Investigation 2-10 – January 2018 Feasibility Report – Economic Analysis Appendix
(acquired from willing parties). The expanded reservoir and conveyance facilities would allow for capture and deliveries of Delta surplus flows to Refuges. These new facilities would avoid the delivery limitations of the existing Federal and State pumps in the south Delta.
The economic benefits associated with Refuge water supplies provided by the Final Alternatives are also estimated using the same water transfer cost model used to estimate M&I water supply benefits. This approach is based on the premise that water supplies and operations for Refuge purposes developed through the Investigation project would improve water supply reliability and improve Refuge conditions with respect to water quantity, timing and location of supplies, and environmental benefits as compared to existing conditions. The general purpose and use of refuge water is not expected to change as a result of the source of the water (storage in an expanded Los Vaqueros Reservoir versus transfer market purchases or other existing sources).
In addition, to address risk and uncertainty, Refuge water supplies are valued according to the change in consumer surplus for Refuge recreation visitors associated with increased health of Refuges and improved wildlife viewing. Habitat production within the affected Refuges will be improved with a more reliable water supply due to greater available water for ecosystem functions and food production. The sensitivity analysis addresses the production value of additional water in terms of increased willingness to pay by recreation visitors to the affected Refuges.
NED Agricultural Water Supply Benefits The Final Alternatives provide opportunities to improve water supply to agricultural producers in the San Joaquin Valley. Currently, some agricultural production areas in the region rely upon temporary surface water purchases to meet crop water needs. The economic benefits associated with agricultural water supplies provided by the Final Alternatives are also estimated using the water transfer cost model applied to M&I and Refuge water supply benefits. This approach is based on the premise that water supplies agricultural purposes developed through the Investigation project would improve water supply reliability and limit the need for additional water purchases from other regions such as the Sacramento Valley.
In addition, to address risk and uncertainty, agricultural water supplies are valued according to recently published estimates developed using the Statewide Agricultural Production Model (SWAP).
NED Emergency M&I Water Supply Benefits An additional benefit related to water supply reliability is the creation of emergency storage in an expanded reservoir. These benefits are measured according to the willingness to pay to avoid water shortages in the event of emergencies that result in infrequent shortages or outages in water supply. This might include supply disruption caused by a levee failure in the Delta that causes water quality to degrade, or an earthquake that damages a major distribution or supply pipeline. For example, the existing Los Vaqueros Reservoir provides emergency water supply in the event that Delta water quality is significantly degraded by a levee failure. Estimation of the NED benefits associated with avoiding shortages in emergencies and outages requires careful consideration of (1) the types of emergencies likely to occur, (2) their expected intensity and frequency, and (3) the expected economic costs for each level of intensity and frequency in the without-project and with-project conditions. In this analysis, economic methods applied in
Chapter 2 Economic Principles and Methods
Los Vaqueros Reservoir Expansion Investigation Public Draft Feasibility Report – Economic Analysis Appendix January 2018 – 2-11
previous studies are used to estimate the economic effects of Delta levee failures and to estimate the value of emergency water supplies provided by the Final Alternatives.
Risk and Uncertainty
With each aspect of this report, certain assumptions were made based on engineering and scientific judgment regarding best available information, guidance, methods, and tools. Careful consideration was given to the methods, evaluations, and tools for hydrology and system operations, cost estimates, and biological analyses. Analyses were developed with advanced modeling and estimating tools using historical data and trends. While this is a standard method to help evaluate potential outcomes for future operations, biological conditions, and costs, many uncertainties could affect the findings of this appendix, including the magnitude of economic benefits. Various uncertainties and risks associated with the Investigation economic benefit valuations are discussed in relation to each benefit category below, and in Chapter 6, “National Economic Development Plan and Implementation Requirements,” of the Draft Feasibility Report. For example, different methods and tools are applied to some benefit categories to illustrate a range of uncertainty in the valuation estimates.
Chapter 2 Economic Principles and Methods
Public Draft Los Vaqueros Reservoir Expansion Investigation 2-12 – January 2018 Feasibility Report – Economic Analysis Appendix
This page left blank intentionally.

Chapter 3 NED Municipal and Industrial Water Supply Reliability Benefits
Los Vaqueros Reservoir Expansion Investigation Public Draft Feasibility Report – Economic Analysis Appendix January 2018 – 3-1
Chapter 3 NED Municipal and Industrial Water Supply Reliability Benefits Investigation Alternatives 1A, 1B, and 4A increase water supplies to M&I water users in all water year types. The M&I water supply benefits largely accrue to South Bay Aqueduct (SBA) users. In this analysis, the benefits to M&I water users are measured according to the cost of the most likely alternative water supply that would be pursued in the absence of development of the Final Alternatives. For water supply reliability benefits, the cost of the most likely alternative represents the next unit of water supply the water user would purchase, or develop, if the project under consideration were not in place. The cost of the most likely alternative assumes that if the preferred alternative is not implemented, the alternative action most likely to take place provides a relevant comparison. This valuation approach relies upon the costs associated with observed market transactions for water. As a result, the resulting estimates may underestimate willingness to pay.
M&I water users rely on the water transfer market to augment existing supplies and avoid shortages. For example, Bay Area water providers purchased more than 40,000 acre-feet (AF) during 2015 at unit prices between $300 and $700 per AF (not including conveyance costs). In addition, water market purchases are included as part of the long-term water supply portfolio for many water providers in the region. This analysis relies in part on market prices paid to purchase water on an annual basis from willing sellers. The market prices are reported according to the payments made directly to the sellers. The buyers incur additional costs to convey the water to their M&I service areas. These costs include both conveyance losses, which diminish the volume of water delivered to end users, as well as wheeling and power charges. Conveyance losses are incorporated into the adjusted water market price by dividing the estimated water market price paid to sellers by the proportion of acquired water that is delivered to the end use. The conveyance costs are estimated for M&I water users benefiting from the Final Alternatives, and added to the estimated market prices to acquire the water to develop an estimate of the full cost associated with additional water supply obtained in the transfer market. Figure 3-1 illustrates the information used to estimate the value of M&I water supplies.
Figure 3-1. General M&I Water Value Estimation Procedures
Chapter 3 NED Municipal and Industrial Water Supply Reliability Benefits
Public Draft Los Vaqueros Reservoir Expansion Investigation 3-2 – January 2018 Feasibility Report – Economic Analysis Appendix
M&I Water Supply Reliability
Water supply reliability in the Investigation study area is strongly linked to statewide water supply problems and shortages. Many Bay Area water agencies rely on CVP and/or SWP contract deliveries to meet a large portion of their demands. Many factors influence the amount of water available from the CVP and SWP for delivery to water users, including hydrology, the amount of water in storage, and facility and conveyance losses. In any given year, user allocations are based on available supplies and contractor requests, with the most significant supply reductions occurring in dry and critically dry years. Bay Area water agencies rely upon local supplies to meet demands within their service areas when CVP and SWP allocations are reduced. However, dry periods often coincide with periods when imported CVP and SWP supplies also are reduced, and opportunities are limited to develop new local supplies.
Population in the Bay Area is expected to grow from approximately 7.5 million today to 9.3 million by 2040 (Association of Bay Area Governments, 2013). Despite planned aggressive conservation and reuse programs, the region is projected to require development of additional water supplies.
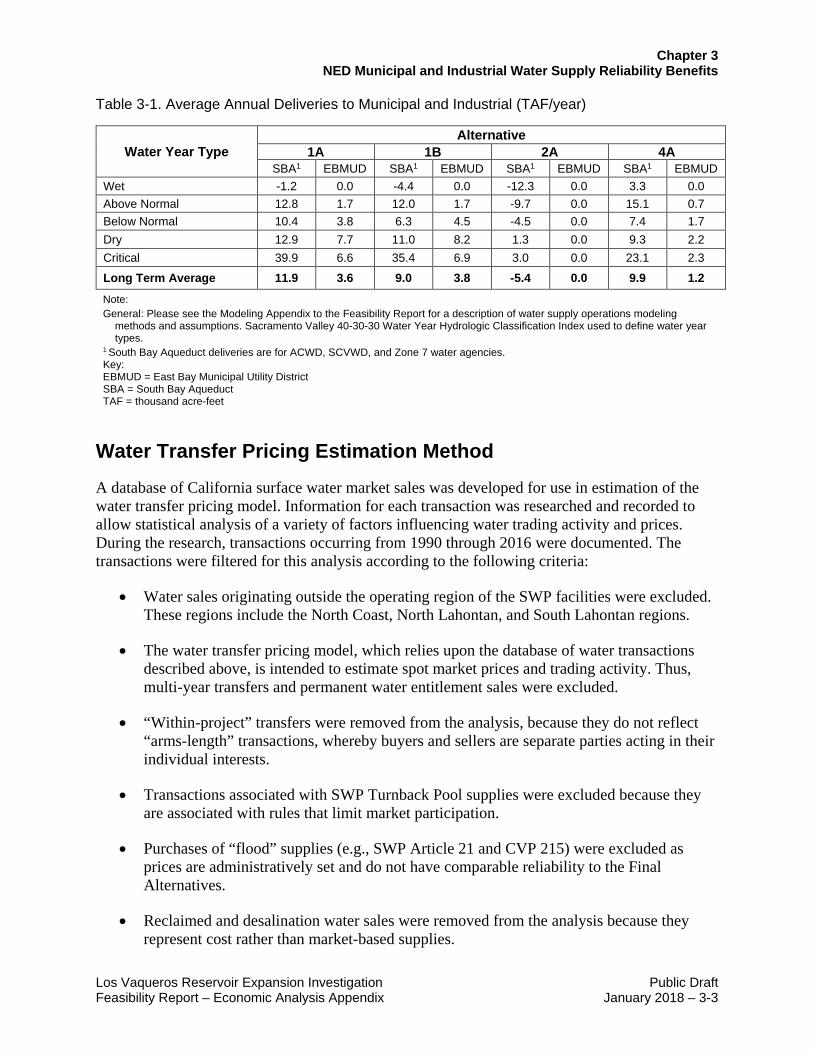
As currently formulated, each Investigation alternative contributes to M&I water supply reliability objective of the Investigation. Estimated urban water deliveries associated with the Final Alternatives to three water agencies receiving water from the SBA (ACWD, SCVWD, and Zone 7) and EBMUD are reported in Table 3-1 (please see the Modeling Appendix to the Feasibility Report for a description of water supply operations modeling methods and assumptions). For SBA users, deliveries from the Investigation were assumed to contribute to SWP Table A water supplies.
Chapter 3 NED Municipal and Industrial Water Supply Reliability Benefits
Los Vaqueros Reservoir Expansion Investigation Public Draft Feasibility Report – Economic Analysis Appendix January 2018 – 3-3
Table 3-1. Average Annual Deliveries to Municipal and Industrial (TAF/year)
Water Year Type
Wet Above Normal Below Normal Dry Critical
Long Term
Average
Alternative 1A 1B 2A 4A
SBA1 EBMUD SBA1 EBMUD SBA1 EBMUD SBA1 EBMUD -1.2 0.0 -4.4 0.0 -12.3 0.0 3.3 0.0 12.8 1.7 12.0 1.7 -9.7 0.0 15.1 0.7 10.4 3.8 6.3 4.5 -4.5 0.0 7.4 1.7 12.9 7.7 11.0 8.2 1.3 0.0 9.3 2.2 39.9 6.6 35.4 6.9 3.0 0.0 23.1 2.3
11.9 3.6 9.0 3.8 -5.4 0.0 9.9 1.2
Note: General: Please see the Modeling Appendix to the Feasibility Report for a description of water supply operations modeling
methods and assumptions. Sacramento Valley 40-30-30 Water Year Hydrologic Classification Index used to define water year types.
1 South Bay Aqueduct deliveries are for ACWD, SCVWD, and Zone 7 water agencies. Key: EBMUD = East Bay Municipal Utility District SBA = South Bay Aqueduct TAF = thousand acre-feet
Water Transfer Pricing Estimation Method
A database of California surface water market sales was developed for use in estimation of the water transfer pricing model. Information for each transaction was researched and recorded to allow statistical analysis of a variety of factors influencing water trading activity and prices. During the research, transactions occurring from 1990 through 2016 were documented. The transactions were filtered for this analysis according to the following criteria:
• Water sales originating outside the operating region of the SWP facilities were excluded. These regions include the North Coast, North Lahontan, and South Lahontan regions.
• The water transfer pricing model, which relies upon the database of water transactions described above, is intended to estimate spot market prices and trading activity. Thus, multi-year transfers and permanent water entitlement sales were excluded.
• “Within-project” transfers were removed from the analysis, because they do not reflect “arms-length” transactions, whereby buyers and sellers are separate parties acting in their individual interests.
• Transactions associated with SWP Turnback Pool supplies were excluded because they are associated with rules that limit market participation.
• Purchases of “flood” supplies (e.g., SWP Article 21 and CVP 215) were excluded as prices are administratively set and do not have comparable reliability to the Final Alternatives.
• Reclaimed and desalination water sales were removed from the analysis because they represent cost rather than market-based supplies.
Chapter 3 NED Municipal and Industrial Water Supply Reliability Benefits
Public Draft Los Vaqueros Reservoir Expansion Investigation 3-4 – January 2018 Feasibility Report – Economic Analysis Appendix
• Leases of groundwater pumping allocations within adjudicated groundwater basins were excluded because they take place within isolated markets with different regulatory conditions from the market for surface water.
• Water sales with incomplete or inadequate information were excluded.
From 1990 through 2016, the database contains information on approximately 6,000 spot market (single year) transactions. Many of these involve groundwater leases within adjudicated basins. Following application of the above criteria, 678 spot market transfers remained to support the statistical analysis. All prices were adjusted to July 2015 dollars using the Consumer Price Index1. As previously described, prices and volumes are presented from the seller’s perspective and do not include conveyance charges or losses.
Although Federal and State government agencies have recently been more active in recording some information related to water sales or leases, California has few sources that track water transfers between private individuals. Most of the recorded transfers involve a Federal or State government party either because an agency had to approve the transfer, as is the case when a transfer involves CVP or SWP water, or because the government agency was directly involved in the transfer as a purchaser or a seller. Transfers involving private parties are more difficult to track, because the State does not have any reporting requirements.
In California, single-year transfers of water entitlements issued before 1914 are allowed without review by the State Water Resources Control Board (State Water Board) as long as they do not adversely impact the water rights of a third party (CALFED 2000). For entitlements issued after 1914, the buyer and seller can petition the State Water Board for a 1-year temporary transfer. Nonetheless, prices for these transfers are not well documented. As a result, the data for this study were obtained from a mixture of public and private sources. Public sources include the following:
• Water Acquisition Program, Reclamation
• Resources Management Division, Environmental Water Account (EWA)
• State Water Bank, DWR
• OnTap database, DWR
• State Water Board, California Environmental Protection Agency
• Various irrigation districts and water agencies
These sources provided information on the Water Acquisition Program, EWA, State Water Bank, and other public water transfers. State Water Bank observations included transfers to the State Water Bank to capture the price the seller receives.
1 The Consumer Price Index is considered to be the most appropriate index for adjusting water prices as it is
commonly applied to adjust water prices in long-term agreements.
Chapter 3 NED Municipal and Industrial Water Supply Reliability Benefits
Los Vaqueros Reservoir Expansion Investigation Public Draft Feasibility Report – Economic Analysis Appendix January 2018 – 3-5
Information on water transfers was also obtained from the January 1990 through December 2010 issues of the Water Strategist. The publication, previously called Water Intelligence Monthly, assembles information on public and private water transfers. Although not all transfers are recorded in the Water Strategist, the publication represents a primary source for water market research. Many of the transfers reported in the Water Strategist were independently researched to obtain more specific information and confirm transaction terms. The Water Strategist ceased to report on transactions in 2010. In addition, transactions not covered by the Water Strategist were researched and verified through direct communication with the transfer participants.
NED Benefit Estimation Procedures This study applies a water transfer pricing regression model and builds on a previous analysis completed by Mann and Hatchett (2006) by applying an expanded data set and considering additional factors that influence water market trading activity and prices. Unlike the Mann and Hatchett analysis, which estimated a recursive regression model using Ordinary Least Squares techniques, the water transfer pricing model developed in this study is non-recursive, using Two-Stage Least-Squares. The first equation estimates the unit price for spot market water transfers, and the second estimates annual spot market trading activity. The coefficients from the models may be used to forecast 2030 water prices north of Delta (NOD) and south of Delta (SOD).
The regression model theorizes that prices and volume of water traded can be estimated through consideration of the following market factors: water supply, geographic location, real water price escalation, buyer type, and State and Federal water supply acquisition programs.2 These factors are described below.
Water Supply As previously described, hydrologic conditions are a primary driver of water transfer market activity and prices. Therefore, it is important to include variables that appropriately capture water supply conditions to describe water trading activity and prices. In this analysis, water supply conditions are measured using the final annual SWP allocation (DWR 2017a), the final CVP allocation (Reclamation 2017), and the Sacramento River Water Year Index (DWR 2017b).
Geographic Location Water prices and trading activity vary by location according to water year type. Consequently, the origin of the water source for each transaction is used to determine geographic differences in water prices. Water sales applied in the regression analysis were allocated among the hydrologic regions identified by DWR (DWR and Reclamation 2006). Binary variables are used to denote the different geographic regions of buyers and sellers including a variable identifying spot market transfers that involved through-Delta conveyance.
Real Water Price Escalation Due to the growing urban water demand in the State, water transfer prices are anticipated to increase over time. To test for hypothesized price appreciation, the model includes an independent variable taking on the value of the year in which the transfer occurred.
2 Additional demand and supply factors were tested in the model but did not result in an improvement in overall
explanatory power.
Chapter 3 NED Municipal and Industrial Water Supply Reliability Benefits
Public Draft Los Vaqueros Reservoir Expansion Investigation 3-6 – January 2018 Feasibility Report – Economic Analysis Appendix
Buyer Type Previous economic analyses of water prices have concluded that the type of buyer (e.g., M&I, agricultural, and environmental) influences water prices. The water pricing equation tests the influence of buyer type on water price and trading. In this analysis, binary variables are used to estimate price differences among environmental, urban, and agricultural buyers.
Seller Type CVP and SWP agricultural contractors are the most common water sellers in the spot market. In order to test the influence of the two projects on water prices, a binary variable identifying sellers that are SWP contractors is included in the model.
Drought Water Bank and Environmental Water Account The State has participated in the water market during drought years to facilitate trades. Under this program, DWR sets up a State Water Bank to facilitate water transfers, primarily from NOD agricultural users to SOD buyers. To account for the market conditions that existed during operation of the State Water Bank.
The EWA acquired water supplies for environmental purposes annually between 2001 and 2007. The implementation of the EWA impacted spot market trading and prices by introducing a large, new demand for water supplies. A dummy variable separating acquisitions by the EWA from other buyers is included to test for the price impacts of the program. A binary variable is included in the model to test the influence of the two programs on prices and trading activity.
Results
Two equations are constructed to estimate the economic benefits of increased M&I water supplies. The first equation forecasts water transfer prices based on hydrologic conditions, price appreciation over time, water supplier region, buyer type, buyer location, and premiums associated with DWR Drought Water Bank and EWA transactions. Information on 678 spot market water transfers is included in the data, allowing the model to forecast spot-market prices.
The second equation predicts the total annual volume of water traded in the spot market. Total annual trading volume is calculated using 678 spot market transfers, and is reported in thousands of acre-feet. The trading volume equation projects total annual volume traded based on hydrologic conditions, environmental water acquisition programs, and water transfer prices predicted by the first equation. The predicted water transfer prices obtained from Equation 1 are used as the explanatory price variable lnadjpricehat in Equation 2. Each equation’s specification and variables are defined, and the Two-Stage Least-Squares regression results are presented in Table 3-2.

Chapter 3 NED Municipal and Industrial Water Supply Reliability Benefits
Los Vaqueros Reservoir Expansion Investigation Public Draft Feasibility Report – Economic Analysis Appendix January 2018 – 3-7
Equation 1 lnadjprice=scbuyer+nodbuyer+nodsod+lnyear+lntwpper+ag+env+dwbewa+ swpseller+e lnadjprice=Natural Logarithm of Price per Acre-Foot, Adjusted to July 2015 Dollars
scbuyer=1 if South Coast Region Water Buyer (binary) nodbuyer=1 if the Buyer is North of the Delta (binary) nodtosod=1 if North of Delta Water Supplier and South of the Delta Buyer (binary) lnyear=Natural Log of the Year in which the Transfer Occured lntwpper=Natural Log of the Percentage of Project Water that was Allocated in the Year the Transfer Occured ag=1 if Agricultural Water End Use (binary) env=1 if Environmental Water End Use (binary) dwbewa=1 if State Water Bank/Dry Year Water Acquisitions or the Environmental Water Account (binary) swpseller=1 if the seller was a State Water Project contractor (binary) e=Error Term
Equation 2 lnspottaft=drycrit+lnadjpricehat+ewayear+ e lnspottaft=Natural Logarithm of Total Acre-Feet Traded Annually (Thousands) drycrit=1 if a dry or critical year as indicated by the Sacramento River Water Year Index (binary) lnadjpricehat=Values of the Variable lnadjprice Predicted by Equation 1 ewayear=1 if year in which the EWA operated (binary) e = Error Term
Table 3-2. Regression Results
Equation1 Dependent Variables Observations Parameters RMSE R-
Squared F-
Statistic P-Value (P > F)
lnadjprice 678 9 0.56 0.64 130.01 0 lnspottaft 678 3 0.35 0.34 120.34 0 Stage 1: Variable
Dependent lnadjprice
Independent Variables Coefficient Standard Error t-Statistic P-Value
(P > |t|) 95% Confidence
Interval scbuyer 0.25 0.08 3.01 0.00 0.09 0.42 nodbuyer -0.35 0.07 -4.74 0.00 -0.50 -0.21 nodtosod -0.16 0.07 -2.22 0.03 -0.30 -0.02 lnyear 117.97 5.80 20.35 0.00 106.61 129.34 lntwpper -0.79 0.07 -11.62 0.00 -0.92 -0.65 ag -0.15 0.07 -2.27 0.02 -0.29 -0.02 env -0.30 0.09 -3.40 0.00 -0.47 -0.13 dwbewa 0.29 0.05 5.63 0.00 0.19 0.39 swpseller 0.55 0.08 6.78 0.00 0.39 0.71 cons -892.28 44.07 -20.24 0.00 -978.67 -805.88 Stage 2: Variable
Dependent lnspottaft Independent Variables Coefficient Standard
Error t-Statistic P-Value (P > |t|)
95% Confidence Interval
drycrit 0.47 0.03 16.37 0.00 0.41 0.53 lnadjpricehat -0.06 0.02 -3.78 0.00 -0.10 -0.03 ewayear 0.38 0.04 9.54 0.00 0.30 0.45 cons
5.78 0.10 56.64 0.00 5.58 5.98 Note: 1 Equations and variables are defined in Equations 1 and 2 above. Key: RMSE = root-mean-square error
Chapter 3 NED Municipal and Industrial Water Supply Reliability Benefits
Public Draft Los Vaqueros Reservoir Expansion Investigation 3-8 – January 2018 Feasibility Report – Economic Analysis Appendix
All estimated relationships between dependent and independent variables are statistically significant at the 95 or 99 percent confidence level. The quality of the two-stage least squares modeling results are dependent upon the results of the first stage estimation.
Equation 1 Discussion The variable lntwpper is a measure of annual water availability. The amount of water available was calculated using the SWP and CVP maximum contract amounts, and the percentage of the maximum contract that was delivered each year to the different contractors. The SWP and CVP allocations decrease during drought conditions. Regulatory actions such as the Delta pumping constraints could further impact water deliveries. The statistical relationship between lnadjprice and lntwpper is attributable to increased demand for additional water supplies under the hydrologic and regulatory scarcity conditions that drive reduced water allocations. As an example, the coefficient value of -0.79 on the lntwpper variable indicates that water transfer prices increase by approximately 50 percent in response to a decrease in percentage of total project water allocation from 50 percent to 30 percent, all else held equal.
The coefficient value on the variable lnyear indicates that water transfer prices rose at a real annual rate of approximately 6 percent between 1990 and 2016.3
The binary variables in the price equation describe conditions that influence prices, but are qualitative in nature. The coefficients for env and ag represent the influence that end-water use has on price. When these variables are zero, the model estimates prices to urban water users. Agricultural and environmental water users generally paid less for water than urban users, as indicated by the negative coefficients on the two variables. The results show environmental water buyers have paid 26 percent less per acre-foot than urban buyers in the market, with all else being equal. Similarly, water leases for agricultural use were priced 14 percent per acre-foot less than urban water leases, with all else being equal. These results may reflect the relative budget constraints among the three buyer categories.
The variable dwbewa is an indicator that the lease was either a State water lease through the Drought Water Bank of 1991, 1992, 1994, and 2009, or a lease through the EWA program. The binary variable is used to account for the price premium that occurred during operation of the bank and the EWA program. The coefficient value indicates that water leased during the operation of the Drought Water Bank, and water that was purchased through the EWA program, was priced 33 percent higher than other transactions, with all else being equal.
The variable nodbuyer is a binary variable measuring the difference in spot market prices between water originating and remaining NOD, compared to water that originated SOD. Sales from NOD suppliers to NOD buyers were 30 percent lower than sales originating SOD, suggesting there is a higher value for water SOD.
The variable nodtosod is a binary variable that captures the difference in spot market prices between water transactions where the water originated NOD and was transferred SOD, compared to water that originated SOD. NOD to SOD sales were priced 15 percent lower than sales where
3 Example Calculation: 2.71828^(117.97*ln(YearT)) = A; 2.71828^(117.97*(ln(YearT-1)) = B; (A-B)/B = 6%.
Chapter 3 NED Municipal and Industrial Water Supply Reliability Benefits
Los Vaqueros Reservoir Expansion Investigation Public Draft Feasibility Report – Economic Analysis Appendix January 2018 – 3-9
water originated SOD. This discount is attributable to water losses and other challenges that occur for supplies conveyed through the Delta.
According to the coefficient estimated for scbuyer, water transactions involving buyers in the South Coast region were priced 29 percent higher than acquisitions by buyers in other regions, with all else being equal. Premium prices paid by South Coast buyers result from strong competition for water supplies in the region, and the relatively high-value water uses in the area.
The variable swpseller is a binary variable measuring the premium paid for purchasing SWP water. The coefficient on swpseller indicates SWP sellers receive a premium of approximately 74 percent over CVP and non-project sellers, on average.
Equation 2 Discussion The California water transfer market is governed by a complex set of legal, institutional, and physical conditions and is not an efficient (perfectly competitive) market. However, the successful estimation of the demand function (Equation 2) supports the use of water transfer prices for quantifying NED municipal and industrial water supply reliability benefits. The ability to estimate demand as a function of price in California’s water transfer market confirms that the market is active and, through prices, provides to both sellers and buyers the marginal value of water in its higher-valued uses (Brookshire et al. 2004). Thus, forecasted water transfer prices estimated by the model (Equation 1) represent an appropriate measure of NED municipal and industrial water supply reliability benefits. While Equation 2 is not directly used to estimate future water prices, it is included here because it helps to describe the annual water transfer market and provides further support for the use of Equation 1 in water supply benefits estimation.
Equation 2 estimates total annual water market activity in spot market transfers according to hydrologic conditions, demand, and the current range of water transfer prices.
The dependent variable in the second equation, lnspottaft, is measured as the natural logarithm of the total annual volume of water (in TAF) traded in regions within the SWP service area through the recorded spot market water transfers beginning in 1990. As expected, the level of market activity holds an inverse relationship with water transfer prices (lnadjpricehat), indicating a down-sloping demand curve. Under the same hydrologic and demand conditions, more water trading occurs as prices drop.
Several different proxies for physical water scarcity conditions were tested, including annual CVP allocations, the Sacramento River Water Year Index, and a binary variable separating dry and critically dry years from wetter years. The selected variable drycrit held the strongest statistical relationship with lnspottaft.
The binary variable ewayear estimates the impacts of environmental water acquisition programs on trading activity. The positive coefficients on each variable demonstrate that environmental water acquisition programs shift the water market demand curve out, resulting in a larger volume traded, with all else being equal.
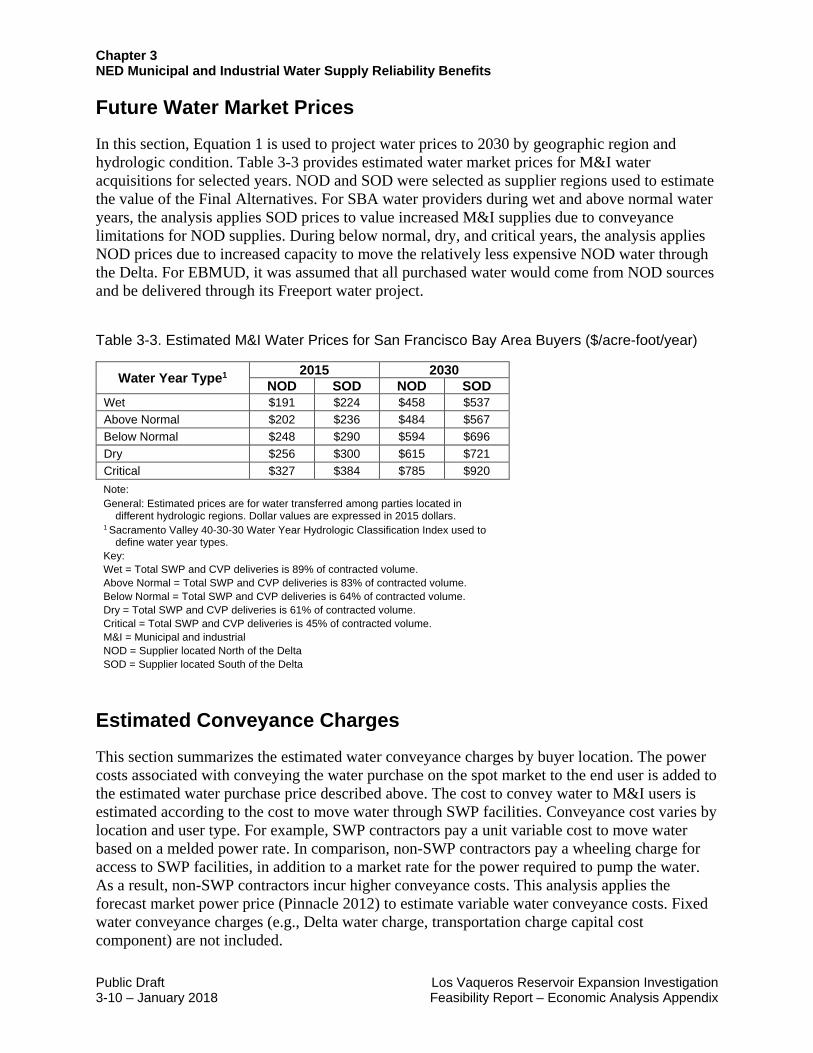
Chapter 3 NED Municipal and Industrial Water Supply Reliability Benefits
Public Draft Los Vaqueros Reservoir Expansion Investigation 3-10 – January 2018 Feasibility Report – Economic Analysis Appendix
Future Water Market Prices
In this section, Equation 1 is used to project water prices to 2030 by geographic region and hydrologic condition. Table 3-3 provides estimated water market prices for M&I water acquisitions for selected years. NOD and SOD were selected as supplier regions used to estimate the value of the Final Alternatives. For SBA water providers during wet and above normal water years, the analysis applies SOD prices to value increased M&I supplies due to conveyance limitations for NOD supplies. During below normal, dry, and critical years, the analysis applies NOD prices due to increased capacity to move the relatively less expensive NOD water through the Delta. For EBMUD, it was assumed that all purchased water would come from NOD sources and be delivered through its Freeport water project.
Table 3-3. Estimated M&I Water Prices for San Francisco Bay Area Buyers ($/acre-foot/year)
Water Year Type1
Wet Above Normal Below Normal Dry Critical
2015 2030 NOD SOD NOD SOD $191 $224 $458 $537 $202 $236 $484 $567 $248 $290 $594 $696 $256 $300 $615 $721 $327 $384 $785 $920
Note: General: Estimated prices are for water transferred among parties located in
different hydrologic regions. Dollar values are expressed in 2015 dollars. 1 Sacramento Valley 40-30-30 Water Year Hydrologic Classification Index used to
define water year types. Key: Wet = Total SWP and CVP deliveries is 89% of contracted volume. Above Normal = Total SWP and CVP deliveries is 83% of contracted volume. Below Normal = Total SWP and CVP deliveries is 64% of contracted volume. Dry = Total SWP and CVP deliveries is 61% of contracted volume. Critical = Total SWP and CVP deliveries is 45% of contracted volume. M&I = Municipal and industrial NOD = Supplier located North of the Delta SOD = Supplier located South of the Delta
Estimated Conveyance Charges
This section summarizes the estimated water conveyance charges by buyer location. The power costs associated with conveying the water purchase on the spot market to the end user is added to the estimated water purchase price described above. The cost to convey water to M&I users is estimated according to the cost to move water through SWP facilities. Conveyance cost varies by location and user type. For example, SWP contractors pay a unit variable cost to move water based on a melded power rate. In comparison, non-SWP contractors pay a wheeling charge for access to SWP facilities, in addition to a market rate for the power required to pump the water. As a result, non-SWP contractors incur higher conveyance costs. This analysis applies the forecast market power price (Pinnacle 2012) to estimate variable water conveyance costs. Fixed water conveyance charges (e.g., Delta water charge, transportation charge capital cost component) are not included.
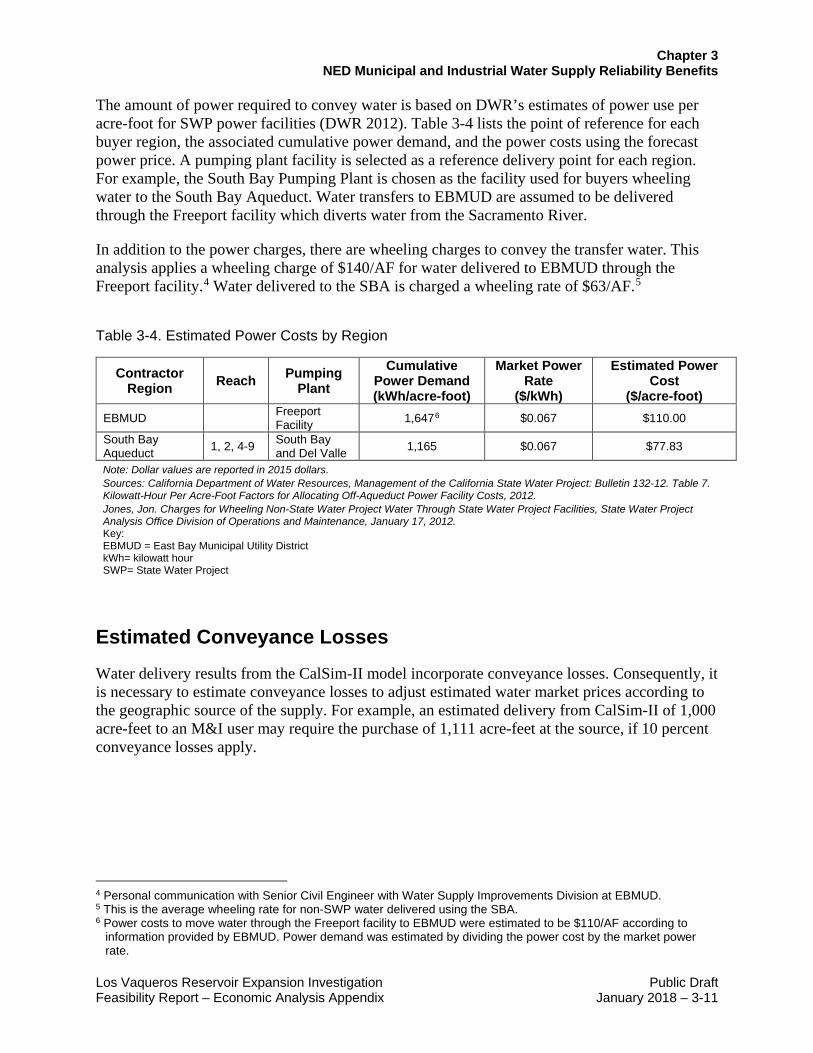
Chapter 3 NED Municipal and Industrial Water Supply Reliability Benefits
Los Vaqueros Reservoir Expansion Investigation Public Draft Feasibility Report – Economic Analysis Appendix January 2018 – 3-11
The amount of power required to convey water is based on DWR’s estimates of power use per acre-foot for SWP power facilities (DWR 2012). Table 3-4 lists the point of reference for each buyer region, the associated cumulative power demand, and the power costs using the forecast power price. A pumping plant facility is selected as a reference delivery point for each region. For example, the South Bay Pumping Plant is chosen as the facility used for buyers wheeling water to the South Bay Aqueduct. Water transfers to EBMUD are assumed to be delivered through the Freeport facility which diverts water from the Sacramento River.
In addition to the power charges, there are wheeling charges to convey the transfer water. This analysis applies a wheeling charge of $140/AF for water delivered to EBMUD through the Freeport facility.4 Water delivered to the SBA is charged a wheeling rate of $63/AF.5
Table 3-4. Estimated Power Costs by Region
Contractor Region Reach Pumping
Plant Cumulative
Power Demand (kWh/acre-foot)
Market Power Rate
($/kWh)
Estimated Power Cost
($/acre-foot) EBMUD Freeport
Facility 1,6476 $0.067 $110.00
South Bay Aqueduct 1, 2, 4-9 South Bay
and Del Valle 1,165 $0.067 $77.83
Note: Dollar values are reported in 2015 dollars. Sources: California Department of Water Resources, Management of the California State Water Project: Bulletin 132-12. Table 7. Kilowatt-Hour Per Acre-Foot Factors for Allocating Off-Aqueduct Power Facility Costs, 2012. Jones, Jon. Charges for Wheeling Non-State Water Project Water Through State Water Project Facilities, State Water Project Analysis Office Division of Operations and Maintenance, January 17, 2012. Key: EBMUD = East Bay Municipal Utility District kWh= kilowatt hour SWP= State Water Project
Estimated Conveyance Losses
Water delivery results from the CalSim-II model incorporate conveyance losses. Consequently, it is necessary to estimate conveyance losses to adjust estimated water market prices according to the geographic source of the supply. For example, an estimated delivery from CalSim-II of 1,000 acre-feet to an M&I user may require the purchase of 1,111 acre-feet at the source, if 10 percent conveyance losses apply.
4 Personal communication with Senior Civil Engineer with Water Supply Improvements Division at EBMUD. 5 This is the average wheeling rate for non-SWP water delivered using the SBA. 6 Power costs to move water through the Freeport facility to EBMUD were estimated to be $110/AF according to
information provided by EBMUD. Power demand was estimated by dividing the power cost by the market power rate.

Chapter 3 NED Municipal and Industrial Water Supply Reliability Benefits
Public Draft Los Vaqueros Reservoir Expansion Investigation 3-12 – January 2018 Feasibility Report – Economic Analysis Appendix
Due to limited information regarding conveyance losses and specific sources of the transfer water, this analysis applies a 25 percent conveyance loss to water originating NOD and delivered to the South Bay Aqueduct.7 Conveyance losses for water supplies to the South Bay Aqueduct originating SOD are assumed to be 10 percent. Water delivered to EBMUD through the Freeport Facility is assessed a 15 percent loss.8
Market Price for Water to Municipal and Industrial Purposes
Combined water market prices, carriage losses, and conveyance costs for SWP contractors are provided in Table 3-5. The values reflect the total cost of water (water price + conveyance losses + wheeling charges) to M&I water user by location and year type in 2030. These values are applied to the Investigation water deliveries by location and year type to estimate total M&I water supply reliability benefits.
Table 3-5. Estimated 2030 Municipal and Industrial Water Cost by Year Type
Water Year Type1 2030 SBA EBMUD
Wet $753 $833 Above Normal $787 $864 Below Normal $980 $993 Dry $1,008 $1,018 Critical $1,235 $1,218
Note: General: Dollar values are expressed in 2015 dollars. 1 Sacramento Valley 40-30-30 Water Year Hydrologic Classification Index used to define water
year types. Key: Above Normal = Total SWP and CVP deliveries are 83% of contracted volume. Below Normal = Total SWP and CVP deliveries are 64% of contracted volume. Critical = Total SWP and CVP deliveries are 45% of contracted volume. Dry = Total SWP and CVP deliveries are 61% of contracted volume. Wet = Total SWP and CVP deliveries is 89% of contracted volume.
Table 3-6 presents the estimated annual M&I water supply reliability benefits for each alternative plan. The estimated 2030 water prices shown in Table 3-5 are multiplied by the average annual M&I water deliveries by water year type shown in Table 3-1. Average annual M&I water supply reliability benefits are then estimated by weighting each water year type by its probability of occurrence. Alternative Plan 1A, which has the highest long-term annual average
7 This includes an estimated 20 percent conveyance loss for through-Delta transfers and a 5 percent conveyance
loss assigned to non-project water supplies conveyed through SOD canals. It should be noted that conveyance losses (or carriage water) vary according to a variety of factors including conditions in the Delta and water source. For example, through Delta conveyance losses have ranged from 20 percent to 30 percent from 2009 through 2013. The conveyance losses applied here are intended to reflect the average across all conditions. Source: Personal communication with Supervisory Engineer (Reclamation) and Chief of Water Management Branch (DWR).
8 Personal communication with Senior Civil Engineer from Water Supply Improvements Division at EBMUD.

Chapter 3 NED Municipal and Industrial Water Supply Reliability Benefits
Los Vaqueros Reservoir Expansion Investigation Public Draft Feasibility Report – Economic Analysis Appendix January 2018 – 3-13
new supply for Bay Area M&I water providers, has the highest M&I water supply reliability benefits.
Table 3-6. Estimated Annual NED M&I Water Supply Reliability Benefits by Final Alternative
Investigation Alternative 1A 1B 2A 4A M&I Water Supply Reliability Long Term Average (TAF/year) 15.5 12.9 -5.4 11.2
NED M&I Water Supply Reliability Benefits1 ($ millions)2 $12.4 $10.3 -$5.0 $9.5
Notes: 1 NED M&I water supply reliability benefits are based on weighted average water year type hydrologic conditions and
calculated as the weighted average of five water year type deliveries displayed in Table 3-1. Sacramento Valley 40-30-30 Water Year Hydrologic Classification Index used to define water year types.
2 Dollar values are expressed in 2015 dollars. Key: M&I = municipal and industrial NED = National Economic Development TAF = thousand acre-feet
Risk and Uncertainty As the population of California grows and the demand for adequate water supplies becomes more acute, the ability of the State to maintain a healthy and vibrant industrial and agricultural economy while protecting aquatic species will be increasingly difficult. Population growth is a driving factor in a trend toward an increase in the value of water in the future. Because of increasing demands on a relatively fixed water supply, existing water storage capacity is likely to grow increasingly valuable as water shortages become more frequent and severe. In addition, shifts in cropping patterns from field crops to fruits, nuts, and vegetables may contribute to future increases in the value of water supply reliability as more irrigation water is applied to high-valued commodities. Among the specialized commodities are permanent crops, such as almonds, walnuts, and grapes, which require reliable water supplies and will result in a “hardening” of water demand in the agricultural sector. As this trend continues, it is likely that agriculture will have less flexibility during dry years to transfer water supplies to other users. This demand hardening, in combination with increases in M&I water demand will result in increases in the value of reliable water supplies. Compounding these trends is the uncertainty associated with climate change. As California, the U.S., and others prepare for the contingencies of global warming, the demand for and value of water supply reliability will rise.
Available information on the potential strategies and costs to improve water supply reliability within the Bay area are described below to address risk and uncertainty associated with the M&I benefit estimates. Comparison of the projected costs associated with alternative water supply development strategies in the Bay Area allows a more complete understanding of the effects value of water supply reliability in the Bay Area and provides a useful comparison to the estimates developed using the water transfer pricing model described above.
BAWSCA recently completed an assessment of available strategies to meet long-term water supply reliability. BAWSCA consists of 26 members that receive at least a portion of their water supply from the SFPUC. In 2008, SFPUC established a drought allocation that limits the volume of water that wholesale customers can purchase from the San Francisco Regional Water System.
Chapter 3 NED Municipal and Industrial Water Supply Reliability Benefits
Public Draft Los Vaqueros Reservoir Expansion Investigation 3-14 – January 2018 Feasibility Report – Economic Analysis Appendix
This, combined with forecast water demand growth among BAWSCA member agencies resulted in a projected water supply shortage of 43 mgd by 2040 and prompted planning effort to develop a supply independent from SFPUC.9
The strategy report identified and evaluated a number of potential water supply development opportunities to meet dry year needs including water transfers, desalination, recycled water, rainwater harvest, and aquifer storage and recovery. According to the analysis, water transfers ranked the highest due to lower costs. However, desalination, recycled water, and groundwater development were also identified as options for filling the projected supply shortage. Estimated costs ranged from approximately $1,300/AF to nearly $5,000/AF. It is important to note that the analysis focused on dry year supplies which impacted the unit cost estimates and makes them somewhat difficult to directly compare to the Final Alternatives which would provide water supply during all hydrologic conditions.
EBMUD, SFPUC, CCWD, Zone 7, and SCVWD were partners in the Bay Area Regional Desalination Project and conducted a number of studies to explore the benefits and costs associated with the development of a 10-20 mgd brackish water desalination plant in Contra Costa County.10 A 2011 analysis of desalination project alternatives estimated the annual costs (including wheeling) to range from $1,695/AF to $2,225/AF.11
9 BAWSCA, February 2015. “Long-Term Reliable Water Supply Strategy: Strategy Phase II Final Report.” 10 http://www.regionaldesal.com/documents.html 11 BARDP, September 29, 2011. “Institutional Task Technical Memorandum #2, Analysis of Feasible Scenarios.”
Chapter 4 NED Refuge Water Supply Reliability Benefits
Los Vaqueros Reservoir Expansion Investigation Public Draft Feasibility Report – Economic Analysis Appendix January 2018 – 4-1
Chapter 4 NED Refuge Water Supply Benefits The Final Alternatives have the potential to improve water supply reliability for wildlife Refuges to maintain and improve habitat conditions. The 19 Federal wildlife refuges in the Central Valley are part of the U.S. Wildlife Refuge system. Through the passage of the CVPIA in 1992, fish and wildlife were given equal priority as other water uses in the CVP service area. As a result, the Federal government was required to provide a clean and reliable supply of water to wetland habitats in these refuges in support of fish and wildlife species. This is being accomplished through the Refuge Water Supply Program (Reclamation and USFWS 2009).
Reclamation delivers water to wildlife refuges in the Central Valley as Level 2 supply (firm supply) and Incremental Level 4 supply (acquired from willing parties). Currently, Incremental Level 4 refuge demands are not being fully met. An expanded Los Vaqueros Reservoir could provide dedicated storage and new conveyance facilities for the Refuge Water Supply Program to improve operational flexibility and increase annual deliveries to Refuges.
Table 4-1 provides the estimated average annual Incremental Level 4 deliveries to the Refuges for each Investigation alternative based on an 82 year period of simulation (1922-2003) (please see the Modeling Appendix to the Feasibility Report for water supply operations modeling methods and assumptions). The more reliable Incremental Level 4 Refuge water supply from the Investigation will improve habitat production within the affected Refuges due to greater availability of water for ecosystem functions and food production.
Table 4-1. Average Annual Incremental Level 4 Deliveries to Refuges (TAF/year) by the Project Alternatives
Water Year Type Alternative 1A 1B 2A 4A
Wet 77.5 96.3 126.1 88.3 Above Normal 33.3 49.2 80.5 44.3 Below Normal 17.2 25.8 49.1 21.3 Dry 13.3 15.1 32.3 12.7 Critical 3.2 1.5 12.2 1.7 Long Term
Average 35.8 45.7 69.0 41.2
Notes: General: Please see the Modeling Appendix to the Feasibility Report for a description of water supply operations
modeling methods and assumptions. Sacramento Valley 40-30-30 Water Year Hydrologic Classification Index used to define water year types.
Key: TAF = thousand acre-feet
This section addresses the NED Refuge water supply benefits that may be realized by providing additional Refuge water supplies to help meet Incremental Level 4 Refuge water needs. The approach to estimate NED Refuge water supply benefits considers the estimated short-term market purchase price as the most likely alternative in the absence of firm water supply from The Final

Chapter 4 NED Refuge Water Supply Reliability Benefits
Public Draft Los Vaqueros Reservoir Expansion Investigation 4-2 – January 2018 Feasibility Report – Economic Analysis Appendix
Alternatives. In addition, to address risk and uncertainty, a sensitivity analysis that addresses the habitat production value of additional water in terms of increased willingness to pay by recreation visitors to affected Refuges.
Historical Acquisition of Incremental Level 4 Water Supplies
Through passage of the CVPIA (Public Law 102-575) in 1992, fish and wildlife were given equal priority as other water uses in the CVP service area. CVPIA Section 3406(d) establishes Federal requirements for providing specific quantities of Level 2 and full Level 4 water supplies to Central Valley refuges and wildlife habitat areas. Level 2 makes up a portion of full Level 4 allocations. Both Level 2 and “Incremental Level 4” (the difference between Level 2 and full Level 4 quantities) are considered obligations under CVPIA. Level 2 water is primarily provided by reallocating the CVP yield (firm supply). Incremental Level 4 water is to be acquired through voluntary measures, meaning that it does not include involuntary reallocation of project yield (e.g. water purchases from willing sellers, groundwater, or other means).
The CVPIA Refuge Water Supply Program (RWSP) was established by Reclamation to implement Section 3406(d) of the CVPIA. The RWSP is administered by Reclamation, with a U.S. Fish and Wildlife Service co-lead representative. The RWSP is responsible for providing and delivering Level 2 and Incremental Level 4 refuge water supplies to Federal wildlife refuges and privately owned/managed wetlands (collectively referred to as refuges) designated in the CVPIA; this includes both acquiring water supplies and conveying these supplies to the refuges. The RWSP acquires Incremental Level 4 supplies primarily through short-term (annual) and medium-term (multi-year) purchases or exchanges from willing sellers of both surface water and groundwater supplies, with preference for long-term purchases and permanent water rights acquisition. Funding for the RWSP is provided primarily from the CVPIA Restoration Fund through annual Congressional appropriations, with some funding from other sources. The Restoration Fund is coordinated with Reclamation’s broader budget such that CVPIA-related activities use multiple funding sources. Available funding for water acquisitions varies annually based on level of appropriation, and the other competing CVPIA and RWSP needs (e.g., other CVPIA program activities or refuge conveyance improvements).
Incremental Level 4 refuge water supply targets established by the CVPIA are not being fully met at all refuges. Only during wet years has the program been able to acquire greater than 50 percent of supply targets at the refuges. For the period from 1994 to 2016, the RWSP acquired on average 56,406 acre-feet per year, representing about 43 percent of the Incremental Level 4 target of 131,521 acre-feet per year. When accounting for conveyance losses, average deliveries to the refuges to date represents about 37 percent of the total target (or 49,074 acre-feet). Historical deliveries have varied by location and by year type.
Table 4-2 shows RWSP historical acquisitions of Incremental Level 4 water supplies for the period 2006 to 2016. The average volume of short- and mid-term acquisitions during this period was 41,145 acre-feet per year, with an average price of $158 per acre-foot. Note that the prices listed in Table 4-2 do not include conveyance costs. The relatively low average cost of these acquisitions is influenced by groundwater acquisition agreements and no-cost exchanges, as well as annual funding priorities for the RWSP (which also funds conveyance improvements and other actions).
Chapter 4 NED Refuge Water Supply Reliability Benefits
Los Vaqueros Reservoir Expansion Investigation Public Draft Feasibility Report – Economic Analysis Appendix January 2018 – 4-3
Groundwater acquisitions are negotiated to cover pumping costs with local water districts with excess pumping capacity and ability to deliver water of suitable quality to refuge lands. Therefore, those transactions are typically lower costs than acquisitions of surface water on the spot market that are affected by hydrologic conditions and CVP allocations south of the Delta. For example, the RWSP was not able to acquire surface water supplies during 2014 and 2015 (drought years) because of limited supplies and high prices. During some periods of this drought, prices for water supplies south of the Delta exceeded $1,000 per acre-foot.12 Due to the high cost of water during some years, the RWSP has opted to use its limited funding for conveyance improvements and other actions. As a result, the average acquisition prices reported by the RWSP do not fully reflect these scarcity conditions, and are skewed towards accessible low cost transactions. RWSP has secured 9,300 acre-feet of permanent water supplies for Incremental Level 4 since the program was initiated in 1994. The cost of these permanent acquisitions was $700 per acre-foot.
Table 4-2. CVPIA Refuge Water Supply Program Incremental Level 4 Acquisitions (2006-2016)
Contract Water Year
Year Type1 Annual
Contracts (acre-feet)
Number of Short-term Contracts
Average Unit Cost ($/acre-foot)2
Total Costs of Short-term Contracts
2016 Below Normal 24,397 2 $343 $8,371,064
2015 Critical 8,519 1 $105 $894,495
2014 Critical 7,980 1 $85 $678,300
2013 Dry 33,925 4 $200 $6,781,905
2012 Below Normal 46,759 4 $192 $8,973,515
2011 Wet 81,810 7 $101 $8,292,353
2010 Below Normal 62,238 7 $144 $8,970,744
2009 Dry 31,726 3 $179 $5,681,927
2008 Critical 30,308 3 $179 $5,418,414
2007 Dry 41,111 2 $181 $7,429,980
2006 Wet 83,822 4 $120 $10,028,841
Source: Summarized from information provided by Sonya Nechanicky, Reclamation, Refuge Water Supply Program (August 2017). Notes: 1 Sacramento Valley 40-30-30 Water Year Hydrologic Classification Index used to define water year types. 2 Costs do not include conveyance and other O&M fees for delivering supplies to refuges. Key: CVPIA = Central Valley Project Improvement Act
Market Price for Water to Refuges
An alternative cost approach is used to value the increased Incremental Level 4 water deliveries with the project alternatives and estimate the NED Refuge water supply benefits. The alternative cost approach identifies the likely least-cost alternative for delivering a similar magnitude of supplies as projected from an expanded Los Vaqueros Reservoir. The cost of this alternative is 12 In 2014, an auction held by Buena Vista Water Storage District located in Kern County yielded 20 bids at $1,000 per
acre-foot or higher. Similarly, an auction held by Madera Irrigation District yielded bids in excess of $2,000 per acre-foot (Water Market Insider, West Water Research 2014).

Chapter 4 NED Refuge Water Supply Reliability Benefits
Public Draft Los Vaqueros Reservoir Expansion Investigation 4-4 – January 2018 Feasibility Report – Economic Analysis Appendix
then used to value the benefit of increased Incremental Level 4 deliveries. Two options are considered as alternatives for delivery a similar magnitude of supplies to the Refuges: (1) increased groundwater acquisitions, or (2) increased surface water purchases on the water market.
Groundwater acquisitions are available to refuges where local water districts have the ability to pump extra groundwater and deliver it to those refuges. Low-cost groundwater acquisitions and exchanges have been historically limited and insufficient to meet Incremental Level 4 targets, particularly in dry years; they are also constrained by groundwater quality in portions of the San Joaquin Valley. Further, the volume of groundwater that can be pumped for refuge purposes is limited by existing environmental approvals. In the future, it is likely that available groundwater will be even more limited under California’s Sustainable Groundwater Management Act (SGMA), which is focused on addressing groundwater overdraft and ensuring sustainable management of groundwater basins throughout the State. Groundwater overdraft in the San Joaquin Valley has resulted in substantial land subsidence that has affected the function of water canals, flood control facilities, and other Federal, State, and local infrastructure. With SGMA implementation, limits are likely to be placed on groundwater pumping in the San Joaquin Valley, which will affect both the volume of supplies available to Refuges and the prices of some of those supplies.
Consequently, short-term water market purchases are considered the most viable alternative for increasing Incremental Level 4 deliveries to the Refuges in the absence of firm water supplies from an expanded Los Vaqueros Reservoir.
Historically, Incremental Level 4 water supplies have been primarily obtained through water lease agreements. In this analysis, the benefits of Refuge water supply associated with the alternatives are measured according to the estimated cost of obtaining the water supply through continued spot market leases. The water transfer pricing model described in Chapter 3 is applied here to estimate the benefits of improved Refuge water supply. As previously described, the economic model consists of a statistical analysis of documented spot market water transactions in California. The model seeks to explain the factors that influence California water market prices and is used to forecast 2030 prices under a variety of conditions including seller and buyer location, buyer type, and hydrologic conditions.
The use of the water transfer pricing model for valuing environmental water supplies is appropriate in this analysis for the following reasons:
• It is consistent with Federal economic valuation policies. The Principles and Guidelines (1983) recommend the use of actual or simulated market prices, where available, because they represent a close approximation of total willingness to pay value.
• The California water market model used to estimate cost of refuge water supplies under 2030 conditions, is a widely accepted model that has been applied to prior Reclamation studies, including the Shasta Lake Water Resources Investigation and Upper San Joaquin San Joaquin Water Storage Investigation, and other State and local studies. The model is a regression-based tool that uses historical spot market transactions occurring from 1990 through 2016 to simulate market prices based on locations of supplies, location of buyer, type of buyer, length and nature of the contract, water year type, and inflation. The model

Chapter 4 NED Refuge Water Supply Reliability Benefits
Los Vaqueros Reservoir Expansion Investigation Public Draft Feasibility Report – Economic Analysis Appendix January 2018 – 4-5
also adjusted for conveyance losses, conveyance and pumping costs, and other typical transactional costs.
• Incremental Level 4 supplies provided by the Final Alternatives are not intended to replace current RWSP annual and short-term acquisitions. The RWSP should be able to maintain its ability to access all potential low- and no-cost exchanges. Investigation alternative-provided Incremental Level 4 supplies would increase deliveries above the current baseline.
Table 4-3 provides the estimated 2030 water market prices assuming the following:
• The water is being leased for environmental purposes. As shown by the coefficient value for model variable env (presented in Table 3-2, above), environmental buyers are typically able to acquire water for a lower price than urban buyers.
• Water is leased from lower priced NOD sources during below normal, dry, and critical years when Delta conveyance capacity is available. During above normal and wet year types water is leased from SOD sources.
• A 25 percent conveyance loss factor is applied to water leased from NOD sources and 10 percent to water leased from SOD sources.
Table 4-3. Estimated 2030 Refuge Water Prices Paid to Seller by Year Type
Water Year Type Water Transfer Price ($/acre-feet/year)
Wet $399 Above Normal $422 Below Normal $442 Dry $458 Critical $584
In addition to the market price for water, buyers incur conveyance costs that vary with location and infrastructure. This analysis assumes that the Refuge water delivered to the California Aqueduct is conveyed to the Dos Amigos Pumping Plant at a cost of approximately $30/AF. The power cost for Refuge water delivered to the Delta Mendota Canal is estimated at the Banks Pumping Plant and is approximately $20/AF.13 Combined water market prices, carriage losses, and conveyance costs for Refuge water supplies are provided in Table 4-4. The values reflect the total cost of water (water price + conveyance losses + wheeling charges + power charges) to environmental water users by location and year type in 2030. These values are applied to the Investigation water
13 Sources: California Department of Water Resources, Management of the California State Water Project: Bulletin
132-12. Table 7. Kilowatt-Hour Per Acre-Foot Factors for Allocating Off-Aqueduct Power Facility Costs, 2012. Jones, Jon. Charges for Wheeling Non-State Water Project Water through State Water Project Facilities, State Water Project Analysis Office Division of Operations and Maintenance, January 17, 2012.
Chapter 4 NED Refuge Water Supply Reliability Benefits
Public Draft Los Vaqueros Reservoir Expansion Investigation 4-6 – January 2018 Feasibility Report – Economic Analysis Appendix
deliveries by location and year type to estimate total Refuge water supply reliability benefits displayed in Table 4-5, below.
Table 4-4. Estimated 2030 Refuge Water Supply Costs by Year Type
Water Year Type1 2030 Refuge Water Supply
($/acre-feet/year) Costs2
California Aqueduct Delta Mendota Canal $489 $463 $515 $489 $636 $607 $657 $628 $826 $795
Wet Above Normal Below Normal Dry Critical
Notes: 1 Sacramento Valley 40-30-30 Water Year Hydrologic Classification Index used to define water
year types. 2 Dollar values are expressed in 2015 dollars. Key: Above Normal = Total SWP and CVP deliveries is 83% of contracted volume. Below Normal = Total SWP and CVP deliveries is 64% of contracted volume. Critical = Total SWP and CVP deliveries is 45% of contracted volume. Dry = Total SWP and CVP deliveries is 61% of contracted volume. Wet = Total SWP and CVP deliveries is 89% of contracted volume.
Table 4-5 provides a summary of the estimated benefits for the Final Alternatives. As shown, the estimated annual benefits range from approximately $17.9 million (Alternative 1A) to $37.4 million (Alternative 2A).
Table 4-5. Estimated Refuge Water Supply NED Benefits by Final Alternative
Investigation Alternative 1A 1B 2A 4A Incremental Level 4 Refuge Water Supply Reliability Long Term Average (TAF/year) 35.8 45.7 69.2 41.2
NED Refuge Water Supply Reliability Benefits1 ($ millions)2 $17.9 $23.6 $37.4 $21.1
Notes: 1 NED Refuge water supply reliability benefits are based on average water year type hydrologic conditions and
calculated as the weighted average of five water year types and values in Table 4-4, above. Sacramento Valley 40-30-30 Water Year Hydrologic Classification Index used to define water year types.
2 Dollar values are expressed in 2015 dollars. Key: Investigation = Los Vaqueros Reservoir Expansion Investigation NED = National Economic Development TAF = thousand acre-feet
Risk and Uncertainty In general terms, total economic value is measured as the combination of market and non-market components. For many common resource uses, such as agriculture or hydroelectric power generation, well established markets with considerable and publicly available price information provides a ready measure of “value.” For other resource uses, such as recreation, there is both market (e.g., admittance or user fee) and non-market components. However, for the largely non-market basis for value associated with ecosystem services, ecosystem improvements, or
Chapter 4 NED Refuge Water Supply Reliability Benefits
Los Vaqueros Reservoir Expansion Investigation Public Draft Feasibility Report – Economic Analysis Appendix January 2018 – 4-7
enhancement and/or protection of ESA-listed species, the information base is far more limited. There is normally a high reliance on site-specific biological, physical, and hydrologic information that is often not available. Although there is consensus among economists that non-market values exist and are positive, there is also recognition that methods for measuring these values are difficult. The lack of consensus about appropriate methods and varying levels of resource data and information contributes to uncertainty in the estimation of improved habitat condition, or ecosystem benefits.
The NED Refuge water supply reliability benefit estimates, discussed above, are based on short-term, spot-market pricing and represent some portion of the total value or willingness to pay for increased Refuge water supply reliability under the Final Alternatives. Although, the water transfer price, or spot-market price, is potentially a good approximation of NED benefit value, it may underestimate the total public willingness to pay for market and non-market components of value. To address risk and uncertainty of the NED Refuge water supply reliability benefits a sensitivity analysis was conducted and is discussed below. This sensitivity analysis is provided for information only and not included in the calculation of the total NED benefits, NED net benefits, or NED benefit-cost ratios. The sensitivity analysis estimates the value of refuge water supplies based on two approaches: (1) increased recreational participation (visitor days) related to improved refuge habitat conditions under the Final Alternatives, and (2) historical pricing of RWSP acquisitions. In the former, the analysis uses the habitat productivity value of California Central Valley wildlife refuges, and an economic model from appropriate literature (Creel and Loomis 1992). The results are then compared to those using the water market pricing approach. In the latter, historical Incremental Level 4 water acquisitions are compared against the market pricing approach.
Sensitivity Analysis: Refuge Water Supply Valuation using Increased Recreation Participation Wetlands are a primary and major component of California Central Valley refuges, and the recipient of the vast portion of water delivered to the refuges. Most of the remaining water deliveries are used in habitat support, including water for rivers and streams, and irrigation of food crops for migrating and resident waterfowl and other species. Refuge habitat production under the Final Alternatives will be improved with a more reliable water supply due to greater available water for ecosystem functions and food production, and the increased health of Refuges would affect recreation participation. This sensitivity analysis estimates the increased value for recreation participation related to improved Refuge habitat conditions under the Final Alternatives. Habitat productivity value of California Central Valley wildlife refuges, an economic model from the literature (Creel and Loomis 1992), economic values for refuge visitors, and sensitivity analysis estimates of refuge economic benefits are discussed below.
Habitat Productivity Value of California Central Valley Wildlife Refuges Wetlands are highly productive ecosystems, and provide many goods and services that are valuable to people. There is an extensive body of literature that has attempted to identify the range of ecological functions that provide services to humans; among those are some that are particularly important in the Central Valley refuges (adapted from Barbier, 1991):
• Habitat and nursery for plant and animal species
Chapter 4 NED Refuge Water Supply Reliability Benefits
Public Draft Los Vaqueros Reservoir Expansion Investigation 4-8 – January 2018 Feasibility Report – Economic Analysis Appendix
• Flood and flow control
• Sediment retention
• Groundwater recharge
• Water quality maintenance / nutrient discharge
• Biological diversity
• Natural environment
The public good nature of the characteristics of wetlands means that the value must generally be determined through non-market assessment approaches. In general, some functions have been and are easier to value than others, and certain characteristics (particularly habitat for plant and animal species) have been addressed most often in the literature. As such, the development of methods to value these functions are more advanced than others.
For this analysis, the focus is on the recreational participation of visitors directly to the Refuges. These broadly include those visiting for wildlife viewing, fishing, and hunting. This categorization ignores visitors who participate in multiple activities (focusing instead on the primary reason for visiting), and those with other purposes (e.g., education or scientific research). The analysis also underestimates the role of the Refuges in providing increased production for refuges elsewhere in the Pacific Flyway, and the accompanying visits by recreationists. In addition, the analysis does not consider the role and associated value of the Refuges in providing habitat for, and aiding in the recovery of, ESA-listed species. That is, to the extent that additional firm water to the Refuges allows for better habitat conditions for ESA-listed species, this analysis undervalues the ecosystem improvement.
Finally, the other components of value provided by the wildlife Refuges, as summarized in the above list, are not included in the analysis, but some or all may or may not provide additional benefits not otherwise captured.
Economic Model from the Literature: Creel and Loomis A large and growing body of literature provides a host of economic valuations upon which to draw. But an important aspect of wildlife Refuge (and wetland) valuations is that they reflect highly diverse habitats, ecological functions, and relationships to humans. As such, the usual approach of conducting “benefits transfer” approaches of adapting past studies to site specific locations requires considerable care for proper applicability.
Among the studies available for consideration is an analysis by Michael Creel and John Loomis (Creel and Loomis 1992). The study was derived from analysis of the CVPIA, and focused on methods to assess the recreational value of water for wetlands in the Central Valley. The 14 sites examined included National Wildlife Refuges (including some that are the focus of this analysis), state wildlife management areas, and six river destinations. A particular goal of the study was to determine the value of water allocations (in the CVPIA) to environmental purposes.

Chapter 4 NED Refuge Water Supply Reliability Benefits
Los Vaqueros Reservoir Expansion Investigation Public Draft Feasibility Report – Economic Analysis Appendix January 2018 – 4-9
The models in the study used data from a statewide survey of recreation visitors (although values are reported here associated only with San Joaquin Valley14 residents). Among respondents, only a subset reported any visitation at all to the wildlife areas; those that did not visit were assigned a $0 value. Therefore, all results are presented as being weighted by all residents. A key aspect of the model development recognizes that visitors to wildlife areas generally participate multiple times during a year; that as visits increase, the marginal value of the last trip decreases; and that the total value to a recreationist is the sum of all visits.
In the context of this analysis, the models consider the value of increased water supply, above the Level 2 quantity and up to the “optimal” water supply as identified by Refuge managers. It is recognized that the optimal supply (identified in Creel and Loomis as 62,880 AF) exceeds the amount anticipated in any alternative, and that proper adjustment is necessary. Furthermore, the use of water by the Refuge managers, according to Creel and Loomis, would lead to an improvement in the quality of the wildlife areas, either in terms of larger (and presumably more productive) wetlands, increased stream flows for fish, and increased waterfowl production.
Economic Values for Refuge Visitors For Refuge visitors engaging in recreation, the valuation of benefits would abide by a willingness to pay framework, as required by the P&G. Recreation is primarily a non-market good, and non-market benefits quantification is often difficult and time consuming. The “benefits transfer” approach was used to derive an estimate of consumer surplus, by essentially “borrowing” estimates of value for the same non-marketed commodity and applying them to this site.
The Creel and Loomis (1992) model provided estimates of the per-visit willingness to pay by visitors engaging in three primary activities, and under two water delivery scenarios. The two scenarios included “current” (essentially Level 2 deliveries) and “optimal” (full Level 4 deliveries, as determined with Refuge managers). The reported values have been converted to current (July 2015) dollars in Table 4-6 via the Gross Domestic Product Implicit Price Deflator (BEA 2016).
Table 4-6. Use Benefits (Willingness-to-Pay) per Visitor by Activity and Water Delivery Scenario
Water Delivery Wildlife Viewing Fishing Hunting Current Water Delivery $203 $218 $253 Optimum Water Delivery $238 $256 $294
Source: Creel, Michael, and John Loomis, Recreation Value of Water to Wetlands in the San Joaquin Valley: Linked Multinomial Logit and Count Data Trip Frequency Models, Water Resources Research, Vol. 10:28, October 1992. Note: 1 Dollar values are expressed in 2015 dollars.
The values per visitor presented above in Table 4-6 are uniformly higher for “optimum” water delivery rates. These are a reflection of the higher perceived quality of each recreational visit; that is, with “optimum” water, there would be more wildlife production and better viewing opportunities, and more fish and target hunting species present for presumably greater fishing and hunting success rates.
14 For purposes of the refuge NED benefits analysis, the counties of the San Joaquin Valley include Fresno, Kern,
Kings, Madera, Merced, San Joaquin, Stanislaus, and Tulare.
Chapter 4 NED Refuge Water Supply Reliability Benefits
Public Draft Los Vaqueros Reservoir Expansion Investigation 4-10 – January 2018 Feasibility Report – Economic Analysis Appendix
In addition to higher quality visits, the Creel and Loomis model predicted that the number of total visits would be higher under “optimum” water delivery as compared to “current” water delivery, and developed estimates of visitation for the three categories.
Each of the alternatives provide additional water to the Refuges, and although the amount varies considerably by alternative, with exception of one alternative (2A) deliveries are less than the “optimum.” In estimating benefits, the following assumptions were made:
1. Additional water provides for expanded wetlands and waterfowl production, for increased quantity and perceived improved quality of recreational experience.
2. Although water deliveries vary by year (see Table 4-1 above), the weighted average of all water years are used to estimate the benefits each year.
3. Benefits are measured in terms of consumer surplus (via Travel Cost Method) for participants in Refuge visits. This leads to higher value per participant, and greater overall participation.
4. The value per participant, and the total level of participation, would be less than would be under “optimum” water delivery rates on a linearly proportional basis. For example, for Alternative 1A, the anticipated increase of 35,800 AF to Refuges served by the Delta-Mendota Canal and California Aqueduct is 56.9 percent of the increase to “optimum” (i.e., 62,880 AF), and the values and visitors are scaled accordingly. For Alternative 2A, the deliveries are slightly higher than the “optimum” so benefits are constrained to the “optimum” delivery of 62,880 AF.
5. This estimate understates the total benefits of firm Level 4 water to Refuges by not quantifying benefits elsewhere in the Pacific Flyway (recreational participants), water quality improvements by waste assimilation, selenium management, groundwater recharge, flood control, ESA species enhancement and protection, and biodiversity protection.
Sensitivity Analysis Estimates of Refuge Water Supply Economic Benefits Table 4-7 through 4-10 summarizes the results for the recreational value of providing firm Level 4 water for each of the five alternatives. For each activity, the perceived willingness to pay value increases per visit for all visitors, due to increased quality of the site visit (e.g., greater numbers and diversity of wildlife viewed, and better fishing and hunting potential success). There is also a net increase in visits, both among existing participants and new visitors. The results of the analysis for Alternative 1A are shown in Table 4-7. Increased average annual deliveries to Refuges total 35.8 TAF with Alternative 1A, and estimated increases in recreation participation for wildlife viewing, fishing, and hunting are 16,552 visitors, 13,517 visitors, and 2,834 visitors, respectively. Total average annual benefits for Alternative 1A are $27.5 million. For Alternative 1B (Table 4-8), the combined totals of higher per-visit value plus increased visitors results in a total of $35.7 million for all three activities from the delivery of water (45.7 TAF). Alternative 2A provides the largest amount of deliveries to Refuges, totaling an additional 62.9 TAF. As shown in Table 4-9, the benefits from increased visitation and higher values per visitor amount to $49.6 million. For Alternative 4A, additional deliveries amount to 41.2 TAF, yielding benefits of $32.1 million (see Table 4-10).
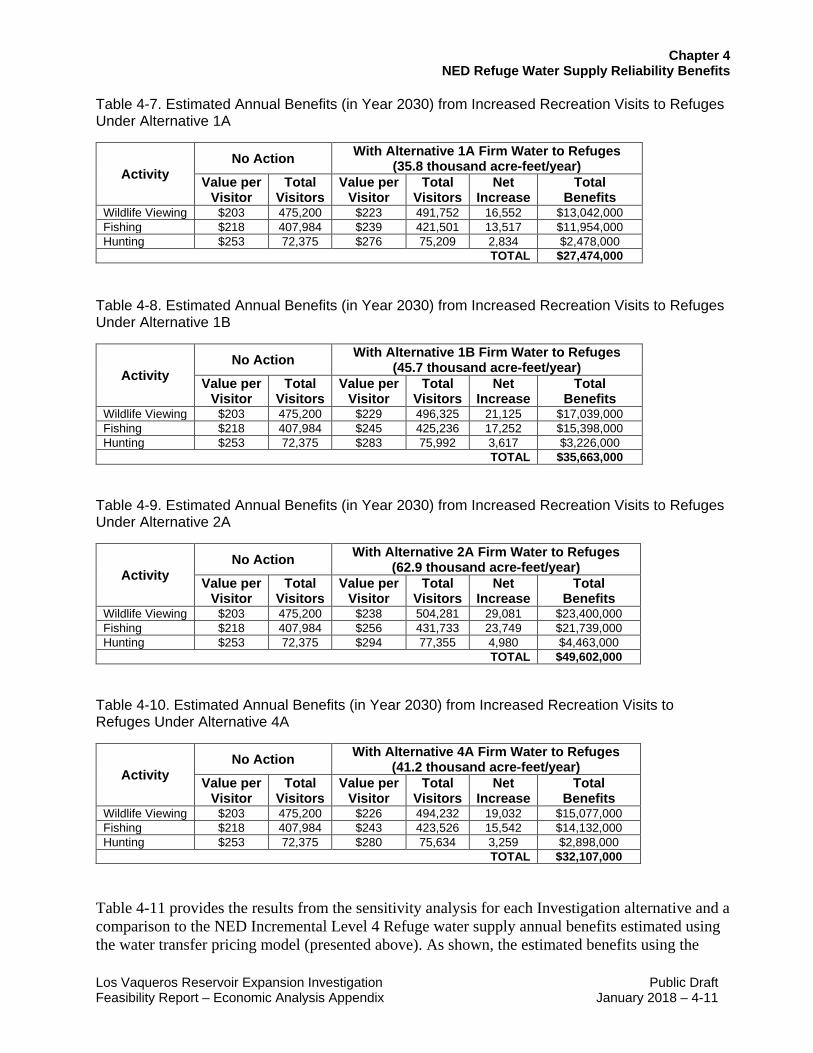
Chapter 4 NED Refuge Water Supply Reliability Benefits
Los Vaqueros Reservoir Expansion Investigation Public Draft Feasibility Report – Economic Analysis Appendix January 2018 – 4-11
Table 4-7. Estimated Annual Benefits (in Year 2030) from Increased Recreation Visits to Refuges Under Alternative 1A
Activity No Action With Alternative 1A Firm Water to Refuges
(35.8 thousand acre-feet/year) Value per
Visitor Total
Visitors Value per
Visitor Total
Visitors Net
Increase Total
Benefits Wildlife Viewing $203 475,200 $223 491,752 16,552 $13,042,000 Fishing $218 407,984 $239 421,501 13,517 $11,954,000 Hunting $253 72,375 $276 75,209 2,834 $2,478,000
TOTAL
$27,474,000
Table 4-8. Estimated Annual Benefits (in Year 2030) from Increased Recreation Visits to Refuges Under Alternative 1B
Activity No Action With Alternative 1B Firm Water to Refuges
(45.7 thousand acre-feet/year) Value per
Visitor Total
Visitors Value per
Visitor Total
Visitors Net
Increase Total
Benefits Wildlife Viewing $203 475,200 $229 496,325 21,125 $17,039,000 Fishing $218 407,984 $245 425,236 17,252 $15,398,000 Hunting $253 72,375 $283 75,992 3,617 $3,226,000
TOTAL $35,663,000
Table 4-9. Estimated Annual Benefits (in Year 2030) from Increased Recreation Visits to Refuges Under Alternative 2A
Activity No Action With Alternative 2A Firm Water to Refuges
(62.9 thousand acre-feet/year) Value per
Visitor Total
Visitors Value per
Visitor Total
Visitors Net
Increase Total
Benefits Wildlife Viewing $203 475,200 $238 504,281 29,081 $23,400,000 Fishing $218 407,984 $256 431,733 23,749 $21,739,000 Hunting $253 72,375 $294 77,355 4,980 $4,463,000
TOTAL $49,602,000
Table 4-10. Estimated Annual Benefits (in Year 2030) from Increased Recreation Visits to Refuges Under Alternative 4A
Activity No Action With Alternative 4A Firm Water to Refuges
(41.2 thousand acre-feet/year) Value per
Visitor Total
Visitors Value per
Visitor Total
Visitors Net
Increase Total
Benefits Wildlife Viewing $203 475,200 $226 494,232 19,032 $15,077,000 Fishing $218 407,984 $243 423,526 15,542 $14,132,000 Hunting $253 72,375 $280 75,634 3,259 $2,898,000
TOTAL $32,107,000
Table 4-11 provides the results from the sensitivity analysis for each Investigation alternative and a comparison to the NED Incremental Level 4 Refuge water supply annual benefits estimated using the water transfer pricing model (presented above). As shown, the estimated benefits using the
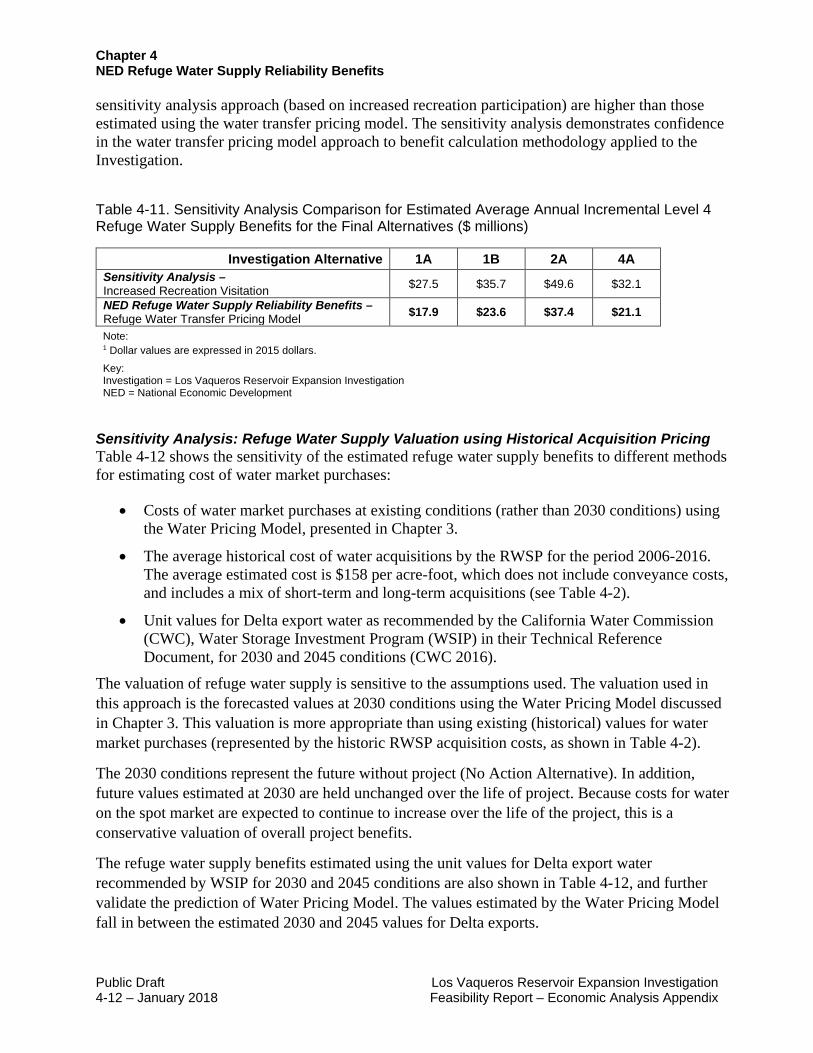
Chapter 4 NED Refuge Water Supply Reliability Benefits
Public Draft Los Vaqueros Reservoir Expansion Investigation 4-12 – January 2018 Feasibility Report – Economic Analysis Appendix
sensitivity analysis approach (based on increased recreation participation) are higher than those estimated using the water transfer pricing model. The sensitivity analysis demonstrates confidence in the water transfer pricing model approach to benefit calculation methodology applied to the Investigation.
Table 4-11. Sensitivity Analysis Comparison for Estimated Average Annual Incremental Level 4 Refuge Water Supply Benefits for the Final Alternatives ($ millions)
Investigation Alternative 1A 1B 2A 4A Sensitivity Analysis – Increased Recreation Visitation $27.5 $35.7 $49.6 $32.1
NED Refuge Water Supply Reliability Benefits – Refuge Water Transfer Pricing Model $17.9 $23.6 $37.4 $21.1
Note: 1 Dollar values are expressed in 2015 dollars. Key: Investigation = Los Vaqueros Reservoir Expansion Investigation NED = National Economic Development
Sensitivity Analysis: Refuge Water Supply Valuation using Historical Acquisition Pricing Table 4-12 shows the sensitivity of the estimated refuge water supply benefits to different methods for estimating cost of water market purchases:
• Costs of water market purchases at existing conditions (rather than 2030 conditions) using the Water Pricing Model, presented in Chapter 3.
• The average historical cost of water acquisitions by the RWSP for the period 2006-2016. The average estimated cost is $158 per acre-foot, which does not include conveyance costs, and includes a mix of short-term and long-term acquisitions (see Table 4-2).
• Unit values for Delta export water as recommended by the California Water Commission (CWC), Water Storage Investment Program (WSIP) in their Technical Reference Document, for 2030 and 2045 conditions (CWC 2016).
The valuation of refuge water supply is sensitive to the assumptions used. The valuation used in this approach is the forecasted values at 2030 conditions using the Water Pricing Model discussed in Chapter 3. This valuation is more appropriate than using existing (historical) values for water market purchases (represented by the historic RWSP acquisition costs, as shown in Table 4-2).
The 2030 conditions represent the future without project (No Action Alternative). In addition, future values estimated at 2030 are held unchanged over the life of project. Because costs for water on the spot market are expected to continue to increase over the life of the project, this is a conservative valuation of overall project benefits.
The refuge water supply benefits estimated using the unit values for Delta export water recommended by WSIP for 2030 and 2045 conditions are also shown in Table 4-12, and further validate the prediction of Water Pricing Model. The values estimated by the Water Pricing Model fall in between the estimated 2030 and 2045 values for Delta exports.
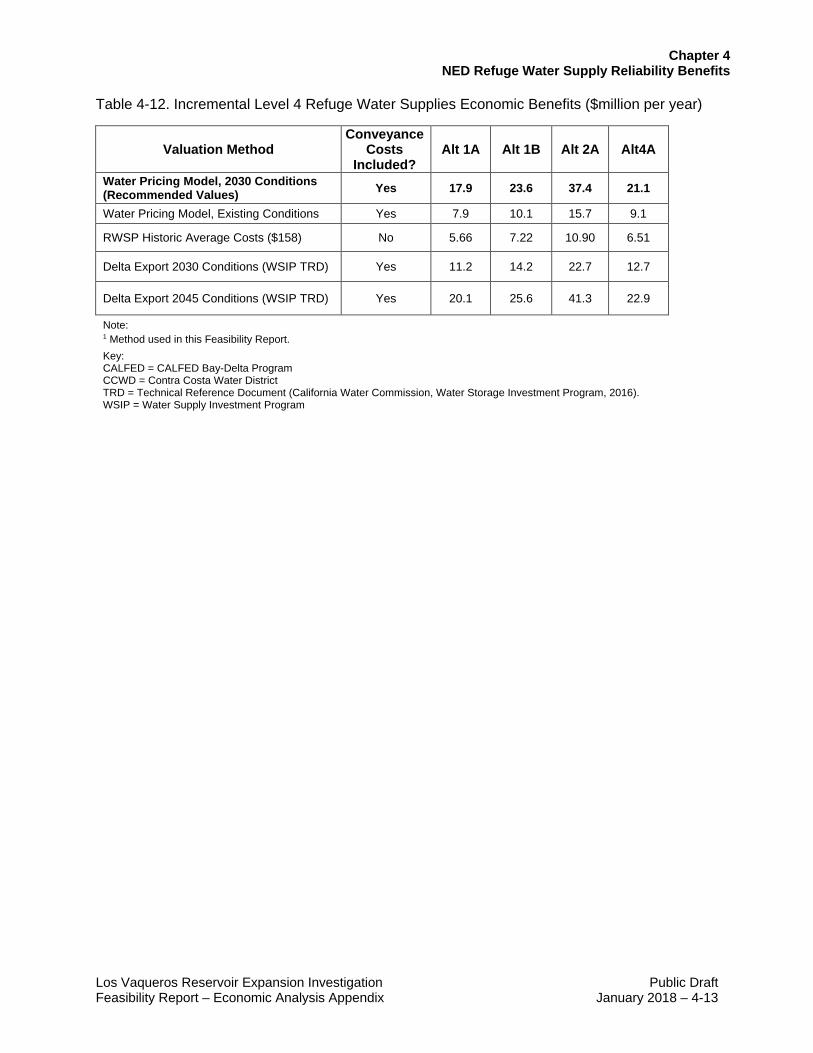
Chapter 4 NED Refuge Water Supply Reliability Benefits
Los Vaqueros Reservoir Expansion Investigation Public Draft Feasibility Report – Economic Analysis Appendix January 2018 – 4-13
Table 4-12. Incremental Level 4 Refuge Water Supplies Economic Benefits ($million per year)
Valuation Method Conveyance
Costs Included?
Alt 1A Alt 1B Alt 2A Alt4A
Water Pricing Model, 2030 Conditions (Recommended Values) Yes 17.9 23.6 37.4 21.1
Water Pricing Model, Existing Conditions Yes 7.9 10.1 15.7 9.1
RWSP Historic Average Costs ($158) No 5.66 7.22 10.90 6.51
Delta Export 2030 Conditions (WSIP TRD) Yes 11.2 14.2 22.7 12.7
Delta Export 2045 Conditions (WSIP TRD) Yes 20.1 25.6 41.3 22.9
Note: 1 Method used in this Feasibility Report. Key: CALFED = CALFED Bay-Delta Program CCWD = Contra Costa Water District TRD = Technical Reference Document (California Water Commission, Water Storage Investment Program, 2016). WSIP = Water Supply Investment Program

Chapter 4 NED Refuge Water Supply Reliability Benefits
Public Draft Los Vaqueros Reservoir Expansion Investigation 4-14 – January 2018 Feasibility Report – Economic Analysis Appendix
This page left blank intentionally.
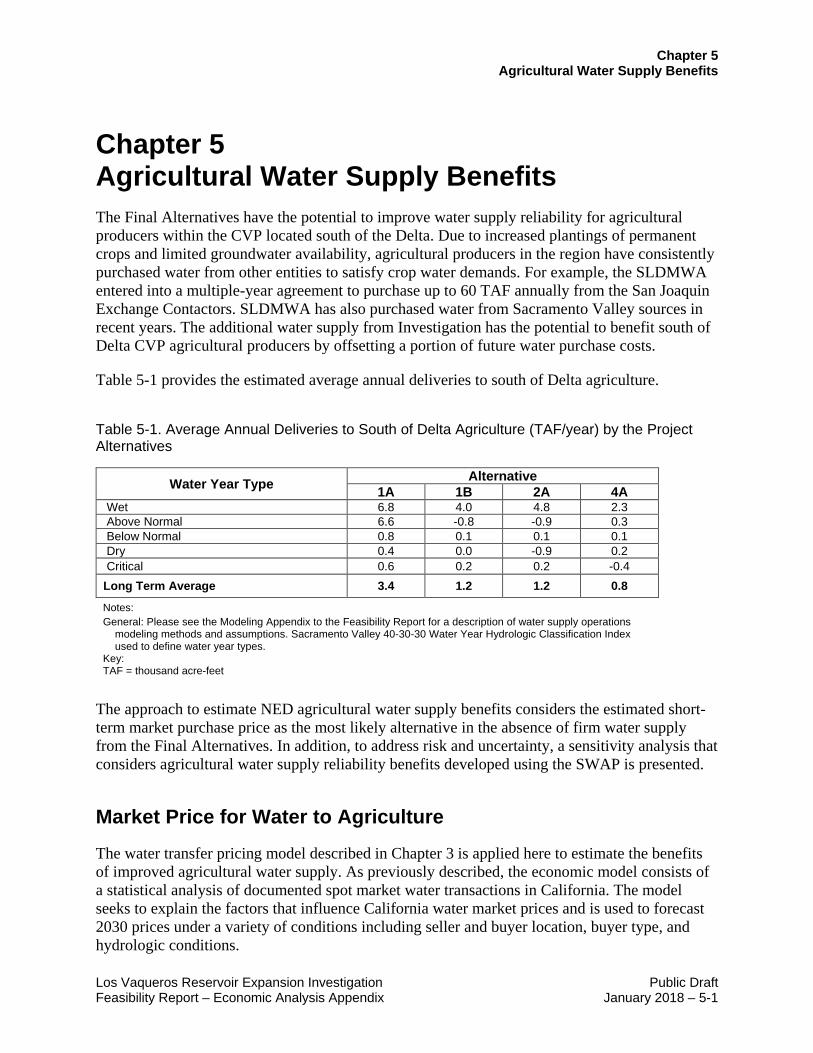
Chapter 5 Agricultural Water Supply Benefits
Los Vaqueros Reservoir Expansion Investigation Public Draft Feasibility Report – Economic Analysis Appendix January 2018 – 5-1
Chapter 5 Agricultural Water Supply Benefits The Final Alternatives have the potential to improve water supply reliability for agricultural producers within the CVP located south of the Delta. Due to increased plantings of permanent crops and limited groundwater availability, agricultural producers in the region have consistently purchased water from other entities to satisfy crop water demands. For example, the SLDMWA entered into a multiple-year agreement to purchase up to 60 TAF annually from the San Joaquin Exchange Contactors. SLDMWA has also purchased water from Sacramento Valley sources in recent years. The additional water supply from Investigation has the potential to benefit south of Delta CVP agricultural producers by offsetting a portion of future water purchase costs.
Table 5-1 provides the estimated average annual deliveries to south of Delta agriculture.
Table 5-1. Average Annual Deliveries to South of Delta Agriculture (TAF/year) by the Project Alternatives
Water Year Type Wet Above Normal Below Normal Dry Critical Long Term
Average
Alternative 1A 1B 2A 4A 6.8 4.0 4.8 2.3 6.6 -0.8 -0.9 0.3 0.8 0.1 0.1 0.1 0.4 0.0 -0.9 0.2 0.6 0.2 0.2 -0.4 3.4 1.2 1.2 0.8
Notes: General: Please see the Modeling Appendix to the Feasibility Report for a description of water supply operations
modeling methods and assumptions. Sacramento Valley 40-30-30 Water Year Hydrologic Classification Index used to define water year types.
Key: TAF = thousand acre-feet
The approach to estimate NED agricultural water supply benefits considers the estimated short-term market purchase price as the most likely alternative in the absence of firm water supply from the Final Alternatives. In addition, to address risk and uncertainty, a sensitivity analysis that considers agricultural water supply reliability benefits developed using the SWAP is presented.
Market Price for Water to Agriculture
The water transfer pricing model described in Chapter 3 is applied here to estimate the benefits of improved agricultural water supply. As previously described, the economic model consists of a statistical analysis of documented spot market water transactions in California. The model seeks to explain the factors that influence California water market prices and is used to forecast 2030 prices under a variety of conditions including seller and buyer location, buyer type, and hydrologic conditions.
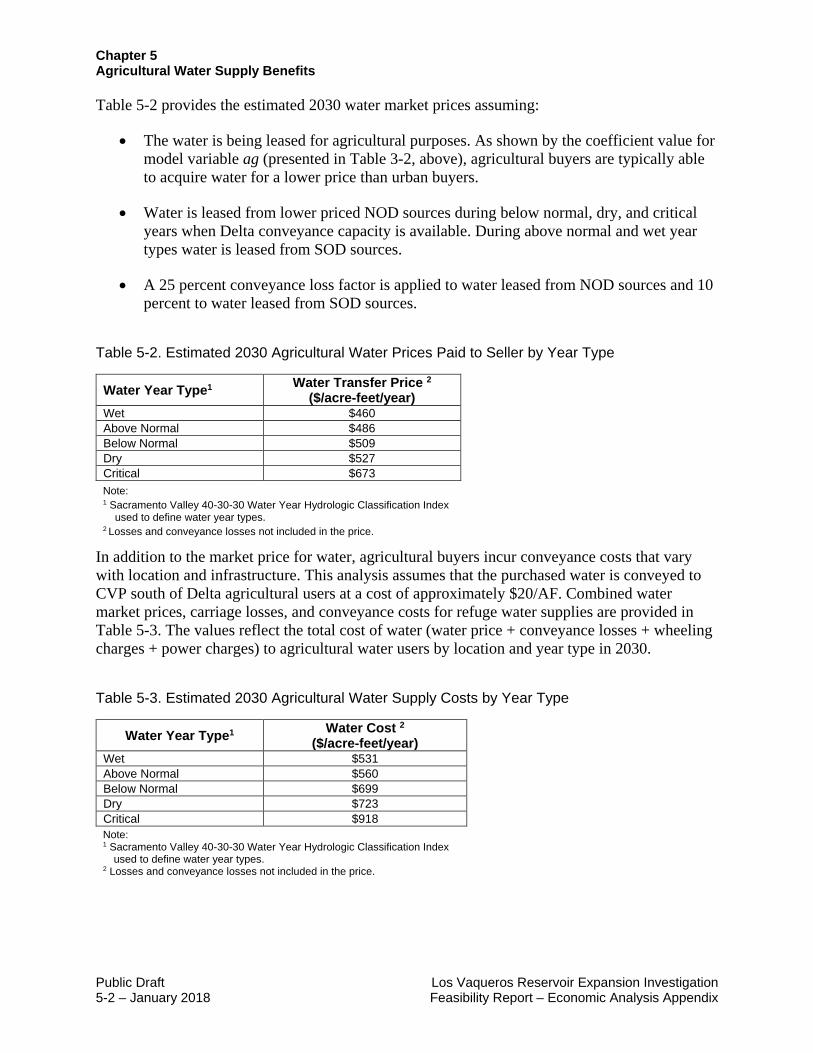
Chapter 5 Agricultural Water Supply Benefits
Public Draft Los Vaqueros Reservoir Expansion Investigation 5-2 – January 2018 Feasibility Report – Economic Analysis Appendix
Table 5-2 provides the estimated 2030 water market prices assuming:
• The water is being leased for agricultural purposes. As shown by the coefficient value for model variable ag (presented in Table 3-2, above), agricultural buyers are typically able to acquire water for a lower price than urban buyers.
• Water is leased from lower priced NOD sources during below normal, dry, and critical years when Delta conveyance capacity is available. During above normal and wet year types water is leased from SOD sources.
• A 25 percent conveyance loss factor is applied to water leased from NOD sources and 10 percent to water leased from SOD sources.
Table 5-2. Estimated 2030 Agricultural Water Prices Paid to Seller by Year Type
Water Year Type1 Water Transfer Price 2 ($/acre-feet/year)
Wet $460 Above Normal $486 Below Normal $509 Dry $527 Critical $673
Note: 1 Sacramento Valley 40-30-30 Water Year Hydrologic Classification Index
used to define water year types. 2 Losses and conveyance losses not included in the price.
In addition to the market price for water, agricultural buyers incur conveyance costs that vary with location and infrastructure. This analysis assumes that the purchased water is conveyed to CVP south of Delta agricultural users at a cost of approximately $20/AF. Combined water market prices, carriage losses, and conveyance costs for refuge water supplies are provided in Table 5-3. The values reflect the total cost of water (water price + conveyance losses + wheeling charges + power charges) to agricultural water users by location and year type in 2030.
Table 5-3. Estimated 2030 Agricultural Water Supply Costs by Year Type
Water Year Type1 Water Cost 2 ($/acre-feet/year)
Wet $531 Above Normal $560 Below Normal $699 Dry $723 Critical $918 Note: 1 Sacramento Valley 40-30-30 Water Year Hydrologic Classification Index
used to define water year types. 2 Losses and conveyance losses not included in the price.

Chapter 5 Agricultural Water Supply Benefits
Los Vaqueros Reservoir Expansion Investigation Public Draft Feasibility Report – Economic Analysis Appendix January 2018 – 5-3
These values are applied to the Investigation water deliveries by location and year type to estimate total agricultural water supply reliability benefits displayed in Table 5-4, below.
Table 5-4 provides a summary of the estimated benefits for the Final Alternatives. As shown, the estimated annual benefits range from approximately $0.4 million (Alternative 4A) to $2.1 million (Alternative 1A).
Table 5-4. Estimated Agricultural Water Supply NED Benefits by Final Alternative
Investigation Alternative 1A 1B 2A 4A Agricultural Water Supply Reliability Long Term Average (TAF/year) 3.4 1.2 1.2 0.8
NED Agricultural Water Supply Reliability Benefits1 ($ millions)2 $1.9 $0.6 $0.6 $0.4
Notes: 1 NED agricultural water supply reliability benefits are based on average water year type hydrologic conditions and calculated
as the weighted average of five water year types and values in Table 4-3, above. Sacramento Valley 40-30-30 Water Year Hydrologic Classification Index used to define water year types.
2 Dollar values are expressed in 2015 dollars. Key: NED = National Economic Development TAF = thousand acre-feet
Risk and Uncertainty This section provides a comparison of the agricultural water supply reliability benefits estimated using the water transfer pricing model to estimates developed using the SWAP. The approach follows guidance found in Reclamation’s Statewide Agricultural Production Model Update and Application to Federal Feasibility Analysis (Reclamation 2012). While the estimated water prices are supported by observed water market transactions, there is a possibility that the values estimated using the water transfer pricing model may not be financially sustainable for farms over the long-term with the potential for changes in crop markets and production costs. SWAP is an economic model of irrigated agriculture in California that is frequently applied for feasibility studies and policy analyses. It estimates the value of water supply reliability according to the change in agricultural net income associated with changes in water supply.
Recently, SWAP was applied to estimate the value of water supply benefits associated with water projects applying to the California Water Commission for financial support through the Water Storage Investment Program (CWC 2016). The analysis estimated agricultural water values within four regions: Sacramento Valley, Eastside San Joaquin Basin, Friant Service Area, and Delta Export Regions. Unit value ($/AF/year) estimates were provided for 2030 with and without assumptions regarding the future effects of the Sustainable Groundwater Management Act (SGMA) on groundwater pumping for crop irrigation. The Delta Export Region would benefit from the Final Alternatives and the estimated unit values are provided in Table 5-5. Unit values were only reported for average, dry, and critical water years. As shown, unit values range from $225 to $326 per AF without considering potential SGMA related groundwater pumping limits. With SGMA the unit values increase significantly and range from $519 to $1,056 per AF.
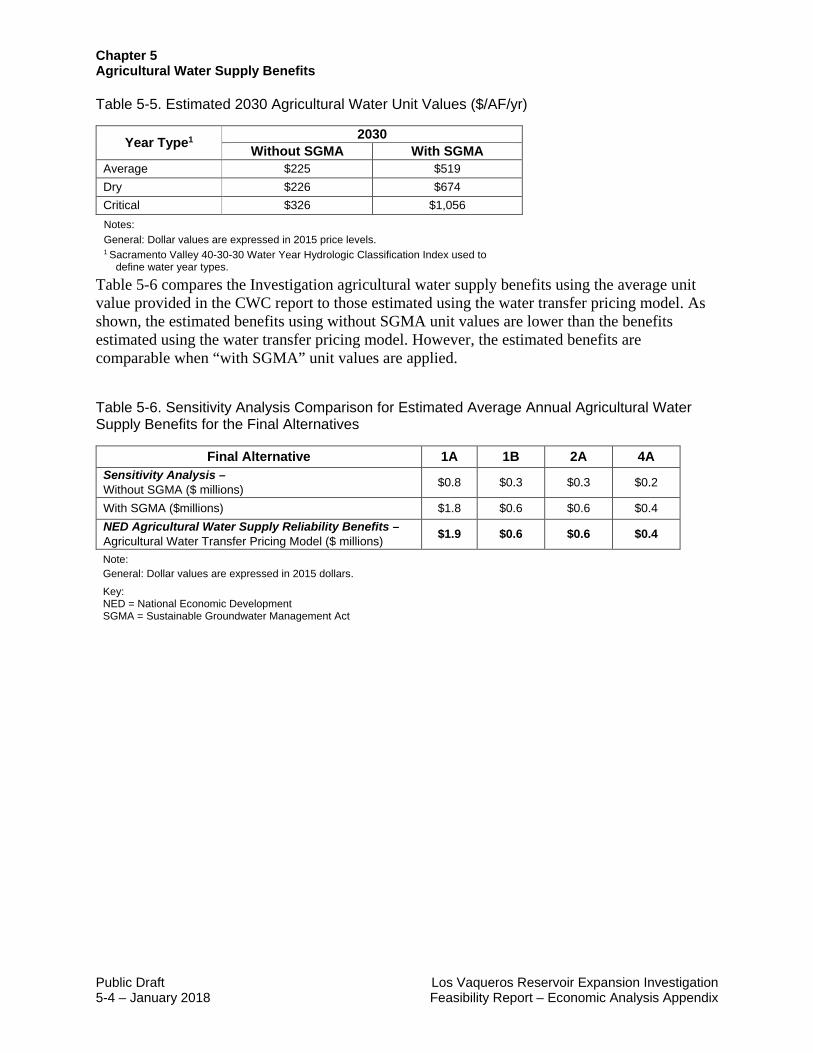
Chapter 5 Agricultural Water Supply Benefits
Public Draft Los Vaqueros Reservoir Expansion Investigation 5-4 – January 2018 Feasibility Report – Economic Analysis Appendix
Table 5-5. Estimated 2030 Agricultural Water Unit Values ($/AF/yr)
Year Type1
Average Dry Critical
2030 Without SGMA With SGMA
$225 $519 $226 $674 $326 $1,056
Notes: General: Dollar values are expressed in 2015 price levels. 1 Sacramento Valley 40-30-30 Water Year Hydrologic Classification Index used to
define water year types.
Table 5-6 compares the Investigation agricultural water supply benefits using the average unit value provided in the CWC report to those estimated using the water transfer pricing model. As shown, the estimated benefits using without SGMA unit values are lower than the benefits estimated using the water transfer pricing model. However, the estimated benefits are comparable when “with SGMA” unit values are applied.
Table 5-6. Sensitivity Analysis Comparison for Estimated Average Annual Agricultural Water Supply Benefits for the Final Alternatives
Final Alternative 1A 1B 2A 4A Sensitivity Analysis – Without SGMA ($ millions) $0.8 $0.3 $0.3 $0.2
With SGMA ($millions) $1.8 $0.6 $0.6 $0.4 NED Agricultural Water Supply Reliability Benefits – Agricultural Water Transfer Pricing Model ($ millions) $1.9 $0.6 $0.6 $0.4
Note: General: Dollar values are expressed in 2015 dollars.
Key: NED = National Economic Development SGMA = Sustainable Groundwater Management Act
Chapter 6 NED Emergency M&I Water Supply Benefits
Los Vaqueros Reservoir Expansion Investigation Public Draft Feasibility Report – Economic Analysis Appendix January 2018 – 6-1
Chapter 6 NED Emergency M&I Water Supply Benefits The Final Alternatives are operated primarily to provide Refuge and M&I supplies. However, the Final Alternatives could also provide emergency water supplies in the event of a disruption in Delta water supplies. For example, Delta levee failures due to an earthquake would result in significant disruption of imported water sources to the Bay Area and would prevent use of many “drought-proof” water assets such as in-lieu groundwater banking facilities This analysis considers the value of additional Bay Area water supplies available under the Final Alternatives to ACWD, SCVWP, and Zone 7 M&I water users during a Delta water supply outage due to seismic and flood events as a representative water supply shortage condition.
Emergency storage benefits are the value of water supplies stored in Los Vaqueros Reservoir that can be delivered in the event of a major levee failure in the Delta that would significantly degrade water quality, or a major earthquake in the Bay Area that would disrupt the ability of Bay Area water agencies to import water into their service areas. With a connection from Los Vaqueros to the SBA or Bethany Reservoir, the expanded reservoir could deliver (either directly or by exchange) to nearly any Bay Area water agency.
Table 6-1 provides the estimated average annual volume of water in storage available for emergency delivery for each Investigation alternative based on an 82 year period of simulation (1922-2003) (please see the Modeling Appendix to the Feasibility Report for water supply operations modeling methods and assumptions). For the purpose of this analysis, the amount of water available for emergency purposes is estimated as the average annual reservoir storage volume with each expanded reservoir alternative, less 70 TAF of existing CCWD dedicated emergency water supply storage. Emergency storage benefits are provided through the combination of two facilities (1) expanded storage, (2) Bethany-transfer pipeline that allows for conveyance of storage supplies to M&I partners. In the baseline (160 TAF reservoir), there is no means of delivering the emergency supplies to M&I partners who are reliant on Delta exports during a Delta outage emergency. Therefore, baseline emergency benefits for those partners are zero. With the construction of the Transfer-Bethany pipeline (included in all Alternatives), the emergency supplies available is assumed the entire available storage in the reservoir less 70 TAF reserved for CCWD own use.
On average, the expected available emergency storage supply varies from 71 TAF (Alternative 2A) to 168 TAF (Alternative 1A). However, the volume of water supplied for emergency purposes may exceed this volume because high salinity water from the Delta could be blended with low salinity water from the Investigation, depending on water supply conditions.
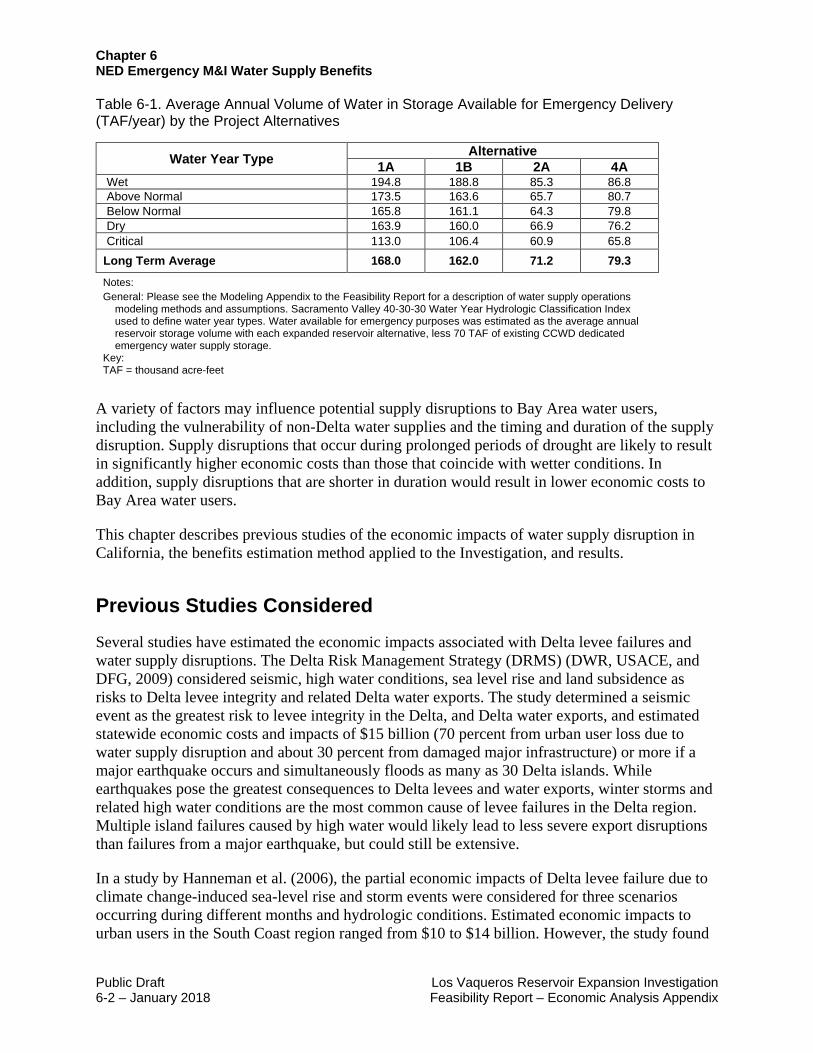
Chapter 6 NED Emergency M&I Water Supply Benefits
Public Draft Los Vaqueros Reservoir Expansion Investigation 6-2 – January 2018 Feasibility Report – Economic Analysis Appendix
Table 6-1. Average Annual Volume of Water in Storage Available for Emergency Delivery (TAF/year) by the Project Alternatives
Water Year Type Alternative 1A 1B 2A 4A
Wet 194.8 188.8 85.3 86.8 Above Normal 173.5 163.6 65.7 80.7 Below Normal 165.8 161.1 64.3 79.8 Dry 163.9 160.0 66.9 76.2 Critical 113.0 106.4 60.9 65.8 Long Term
Average 168.0 162.0 71.2 79.3
Notes: General: Please see the Modeling Appendix to the Feasibility Report for a description of water supply operations
modeling methods and assumptions. Sacramento Valley 40-30-30 Water Year Hydrologic Classification Index used to define water year types. Water available for emergency purposes was estimated as the average annual reservoir storage volume with each expanded reservoir alternative, less 70 TAF of existing CCWD dedicated emergency water supply storage.
Key: TAF = thousand acre-feet
A variety of factors may influence potential supply disruptions to Bay Area water users, including the vulnerability of non-Delta water supplies and the timing and duration of the supply disruption. Supply disruptions that occur during prolonged periods of drought are likely to result in significantly higher economic costs than those that coincide with wetter conditions. In addition, supply disruptions that are shorter in duration would result in lower economic costs to Bay Area water users.
This chapter describes previous studies of the economic impacts of water supply disruption in California, the benefits estimation method applied to the Investigation, and results.
Previous Studies Considered
Several studies have estimated the economic impacts associated with Delta levee failures and water supply disruptions. The Delta Risk Management Strategy (DRMS) (DWR, USACE, and DFG, 2009) considered seismic, high water conditions, sea level rise and land subsidence as risks to Delta levee integrity and related Delta water exports. The study determined a seismic event as the greatest risk to levee integrity in the Delta, and Delta water exports, and estimated statewide economic costs and impacts of $15 billion (70 percent from urban user loss due to water supply disruption and about 30 percent from damaged major infrastructure) or more if a major earthquake occurs and simultaneously floods as many as 30 Delta islands. While earthquakes pose the greatest consequences to Delta levees and water exports, winter storms and related high water conditions are the most common cause of levee failures in the Delta region. Multiple island failures caused by high water would likely lead to less severe export disruptions than failures from a major earthquake, but could still be extensive.
In a study by Hanneman et al. (2006), the partial economic impacts of Delta levee failure due to climate change-induced sea-level rise and storm events were considered for three scenarios occurring during different months and hydrologic conditions. Estimated economic impacts to urban users in the South Coast region ranged from $10 to $14 billion. However, the study found
Chapter 6 NED Emergency M&I Water Supply Benefits
Los Vaqueros Reservoir Expansion Investigation Public Draft Feasibility Report – Economic Analysis Appendix January 2018 – 6-3
that future development of water supplies for Southern California independent of the Delta would reduce the economic costs to urban users to between $1.8 and $4.0 billion. The analysis relied upon a short-run price elasticity of -0.05 and assumed a linear demand function to estimate the change in consumer surplus associated with the projected shortages (Hanneman et al. 2006). The analysis did not consider economic impacts of water shortages on commercial and industrial water users.
Brozovic et al. (2007) provided another estimate of the economic losses associated with water supply disruption to the Bay Area resulting from two potential earthquake scenarios affecting water supplies from the Hetch Hetchy system. Residential losses were estimated through measurement of changes in consumer surplus by applying a constant elasticity demand function to an estimate of price elasticity from empirical studies. The price elasticity used in this study (-0.41) was considerably larger than the elasticity applied in the Hanneman et al. (2006) study and is more representative of long-run elasticity estimates from empirical studies. The authors note that the estimates of economic losses are highly sensitive to the choice of price elasticity of demand and that the estimates should be considered a lower bound. Business losses are estimated through the use of loss functions with increasing marginal costs as shortages increase, as well as a minimum threshold water supply below which business output would cease. Study results indicated that a 60-day disruption of the Hetch Hetchy water supply would produce between $9.3 and $14.4 billion in business interruption losses, and between $37 and $279 million in residential welfare losses.
Reclamation’s Upper San Joaquin River Basin Storage Investigation employed the valuation approach used by Brozovic et al. (2007) to estimate economic losses from water shortages to M&I water users in California caused by seismic events and Delta levee failures. Information regarding the probabilities of Delta levee failures, potential levee failure scenarios, and associated projected shortages SOD were based on information developed for the Draft Delta Risk Management Strategy (DWR, USACE, and DFG 2009). This analysis is limited to disruptions as characterized by scenarios under which 1, 3, 10, 20, and 30 Delta islands would become inundated due to a seismic event. The economic value of emergency water supplies potentially provided by a Temperance Flat River Mile 274 Reservoir to southern California residential users was estimated by applying a short-run price elasticity (-0.22) to a constant elasticity demand function calibrated to observed price and quantity information from southern California water providers.
In addition, the Bay Delta Conservation Plan estimated the economic value of reduced seismic risk with the Brozovic et al. (2007) approach (DWR 2013). The analysis assumed a level of water supply availability potentially experienced due to a seismic event, and assumes a .02 probability of a seismic event occurring in any forecasted year. The Brozovic et al. (2007) approach was applied to residential, agricultural, commercial, and industrial sectors. An urban water price and consumption data set was constructed and used to estimate individual water agency price elasticities. The economic value of water supplies after a seismic event was estimated by applying each agency’s estimated elasticity to constant elasticity demand functions calibrated to observed price and quantity information from each water provider.
Chapter 6 NED Emergency M&I Water Supply Benefits
Public Draft Los Vaqueros Reservoir Expansion Investigation 6-4 – January 2018 Feasibility Report – Economic Analysis Appendix
Benefits Estimation Method
This section describes the method applied to estimate the benefits of emergency water supplies resulting from project alternatives, beginning with key considerations and followed by the estimation procedures.
Key Considerations Key considerations in estimating the economic cost of water supply disruptions include the probability that a supply disruption would occur, level of water supply shortage, and duration and timing of the supply disruption to urban water agencies.
Probability of a Supply Disruption Supply disruptions could arise from a variety of human and natural conditions. This analysis relies on estimates of Delta levee failures due to seismic, flood, and sunny-day hazard events. No attempt was made in this analysis to estimate the probability or potential water supply effects associated with additional environmental constraints on Delta pumping.
Information regarding the probabilities of Delta levee failures, potential levee failure scenarios, and associated projected Bay Area shortages was based on information developed for the DRMS (DWR, USACE, and DFG 2009). The annual probabilities associated with seismic, flood, and all hazard events for Delta island inundation scenarios considered in this analysis are listed in Table 6-2. Because sunny-day hazard events are only considered to occur one island at a time, the annual probability of occurrence for all hazards only includes the probability of a sunny-day occurrence in the 1-island breach scenario. This analysis assumes that seismic and flood events that result in a small number of levee breaches do not result in significant water shortages to M&I water suppliers. This analysis is limited to longer disruptions as characterized by the 20 and 30 Delta island inundation scenarios. The annual probabilities associated with the 20 and 30 Delta island inundation scenarios for all hazards applied in this analysis are 0.055 and 0.029, respectively. Annual emergency water supply benefits were estimated using an annual probability of occurrence of 0.042, which was derived by averaging the 20-island probability (0.055) and the 30-island probability (0.029) listed under the “All Hazards” column in Table 6-2.

Chapter 6 NED Emergency M&I Water Supply Benefits
Los Vaqueros Reservoir Expansion Investigation Public Draft Feasibility Report – Economic Analysis Appendix January 2018 – 6-5
Table 6-2. Probabilities of Delta Island Breach Scenarios
Delta Island Breach Scenario Annual Probability of Occurrence1 Seismic Flood All Hazards2
1-island 0.107 0.205 0.420
3-island 0.082 0.138 0.220
10-island 0.051 0.051 0.102
20-island 0.032 0.023 0.055
30-island
0.019 0.010 0.029
Notes: 1 Probabilities of occurrence were developed by the Delta Risk Management Strategy (DWR, USACE, and
DFG 2009). 2 All hazards includes the probability of seismic, flood, and sunny-day Delta island breach scenarios.
Because sunny-day failures are considered to occur one island at a time, the all hazards probability of occurrence only includes the probability of a sunny-day occurrence in the 1-island breach scenario.
Level of Water Supply Shortage Bay Area water providers rely on a variety of water sources to satisfy M&I water demand, including local surface water and groundwater, stored water, recycled water, desalination, and imported supplies. The diversity in potential water sources is indicative of the need to address the potential for an individual source to be affected by drought, poor water quality, or damages to conveyance infrastructure. Despite this, water providers in the Bay Area are particularly susceptible to a hazard event that would restrict water supplies from the Delta due to heavy reliance on water supplies upstream from the Delta. Imported water supplies susceptible to Delta disruptions comprise an estimated 48 percent of total water supplies to emergency water supply beneficiaries (ACWD, Zone 7, and SCVWD) during an average water year, and 31 percent during dry and critical years (DWR 2015). Groundwater banking agreements that may be exercised in dry and critical years are also susceptible to Delta disruptions because they generally involve in-lieu deliveries of SWP water. This analysis assumes longer water export disruptions (0.9 to 1.9 years) characterized by 20- and 30-island breach scenarios (DWR, USACE, and DFG 2007) would result in a shortage level of 30 percent of the forecast 2030 water demand to not overstate emergency water supply beneficiaries’ reliance on water supplies susceptible to a Delta island breach hazard under different hydrologic conditions.
Duration and Timing of Supply Disruption The economic effects of a water supply disruption would vary according to the length of time that water supplies from the Delta are shut down or curtailed, the season during which the disruption occurs, and the hydrologic conditions that exist at the time. For example, a Delta water supply disruption that occurs during or immediately following drought conditions would result in larger economic losses than a disruption that occurs during or immediately following a wetter period. Similarly, a disruption that occurs during the winter may have different effects than one occurring in the spring or summer, depending upon the duration of the water supply disruption. In this analysis, it was assumed that the disruption would occur during hydrologic conditions that would have resulted in water deliveries that meet demand in the Bay Area. As a result, the water supply shortage and associated economic value can be fully attributed to the reduction in Delta water supplies.

Chapter 6 NED Emergency M&I Water Supply Benefits
Public Draft Los Vaqueros Reservoir Expansion Investigation 6-6 – January 2018 Feasibility Report – Economic Analysis Appendix
Analyses summarized in the DRMS phase 1 Risk Analysis Summary Report (2007) determined that pumping from the Delta would be disrupted for extended periods as a result of the breach scenarios considered. According to the seismic hazard analysis, partial export pumping could resume in 0.9 to 1.8 years under the “20-island breach” scenario and 1.3 to 1.9 years under the “30-island breach” scenario. Depending on the number of flooded islands, timing and size of flood, and Delta salinity conditions, export disruptions under flood hazard conditions could be less significant than under seismic hazard conditions. It is assumed that under larger Delta island breach scenarios (i.e., 20- and 30-island breach scenarios) export disruptions could extend greater than one year. Based on these findings, this analysis assumed a Delta water supply disruption of 16 months.
Estimation Methodology Economic benefits from Investigation emergency water supplies are measured according to water users’ willingness to pay to avoid interruptions in water deliveries. The value of emergency supplies provided by the Investigation to M&I users was estimated by applying estimated short-run price elasticity to a constant elasticity demand function calibrated to observed price and quantity information from Bay Area water providers. This valuation approach was used by Jenkins, et al. (2003) and Brozovic (2007) to estimate economic losses from water shortages to M&I water users in California. Estimated benefits were weighted according to the probability of a Delta water supply disruption (DWR, USACE, and DFG 2009). Demand, price, price elasticity, and the demand function used in the analysis are discussed below.
Demand The existing Los Vaqueros Reservoir provides emergency water supply to CCWD in the event that Delta water quality is significantly degraded by a levee failure. Therefore, emergency water supply benefits from an expanded Los Vaqueros Reservoir are limited to ACWD, SCVWD, and Zone 7 service areas. Table 6-3 provides urban water management plan estimated 2010 and forecasted 2030 annual M&I water demand for emergency water supply beneficiaries.
Table 6-3. Emergency Water Supply Beneficiary Demand
Water Service Provider Population M&I Water Demand
(acre-feet/year) 2010 2030 2010 2030
Alameda County FC&WCD-Zone 7 220,000 290,000 48,900 69,600
Alameda County WD 340,000 394,600 29,100 35,400
Santa Clara Valley WD 1,822,000 2,310,800 302,900 383,190
Total 2,382,000 2,995,400 380,900 488,190 Key: Water Conservation District WD = Water District Zone 7 = Alameda County Flood Control and Water Conservation District, Zone 7
Price The 2010 water price used in this analysis is based on reported charges for Bay Area water providers (Raftelis 2011), and only the “commodity” charge is included in the price estimate to exclude fixed charges that do not vary with the volume of water delivered. The price used in this
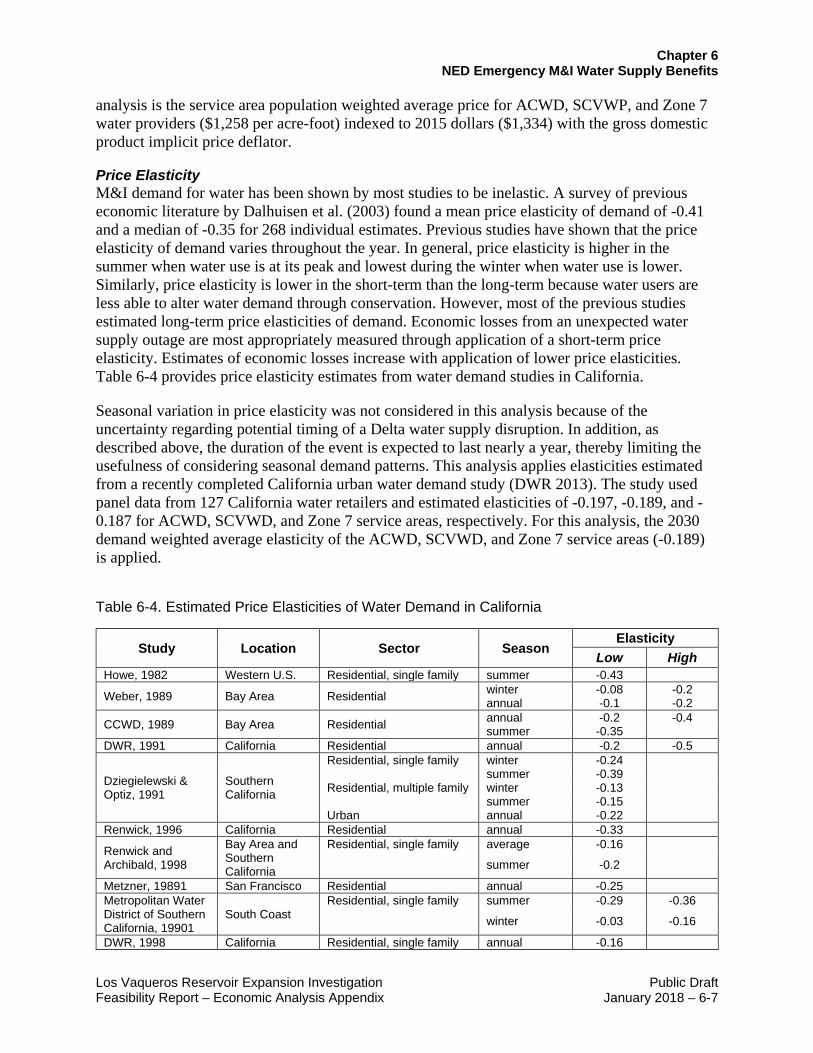
Chapter 6 NED Emergency M&I Water Supply Benefits
Los Vaqueros Reservoir Expansion Investigation Public Draft Feasibility Report – Economic Analysis Appendix January 2018 – 6-7
analysis is the service area population weighted average price for ACWD, SCVWP, and Zone 7 water providers ($1,258 per acre-foot) indexed to 2015 dollars ($1,334) with the gross domestic product implicit price deflator.
Price Elasticity M&I demand for water has been shown by most studies to be inelastic. A survey of previous economic literature by Dalhuisen et al. (2003) found a mean price elasticity of demand of -0.41 and a median of -0.35 for 268 individual estimates. Previous studies have shown that the price elasticity of demand varies throughout the year. In general, price elasticity is higher in the summer when water use is at its peak and lowest during the winter when water use is lower. Similarly, price elasticity is lower in the short-term than the long-term because water users are less able to alter water demand through conservation. However, most of the previous studies estimated long-term price elasticities of demand. Economic losses from an unexpected water supply outage are most appropriately measured through application of a short-term price elasticity. Estimates of economic losses increase with application of lower price elasticities. Table 6-4 provides price elasticity estimates from water demand studies in California.
Seasonal variation in price elasticity was not considered in this analysis because of the uncertainty regarding potential timing of a Delta water supply disruption. In addition, as described above, the duration of the event is expected to last nearly a year, thereby limiting the usefulness of considering seasonal demand patterns. This analysis applies elasticities estimated from a recently completed California urban water demand study (DWR 2013). The study used panel data from 127 California water retailers and estimated elasticities of -0.197, -0.189, and -0.187 for ACWD, SCVWD, and Zone 7 service areas, respectively. For this analysis, the 2030 demand weighted average elasticity of the ACWD, SCVWD, and Zone 7 service areas (-0.189) is applied.
Table 6-4. Estimated Price Elasticities of Water Demand in California
Study Location Sector Season Elasticity
Low -0.43 -0.08 -0.1 -0.2
-0.35 -0.2
-0.24 -0.39 -0.13 -0.15 -0.22 -0.33 -0.16
-0.2
-0.25 -0.29
-0.03
-0.16
High
-0.2 -0.2 -0.4
-0.5
-0.36
-0.16
Howe, 1982 Western U.S. Residential, single family summer
Weber, 1989 Bay Area Residential winter annual
CCWD, 1989 Bay Area Residential annual summer
DWR, 1991 California Residential annual
Dziegielewski & Optiz, 1991
Southern California
Residential, single family winter summer Residential, multiple family winter summer Urban annual
Renwick, 1996 California Residential annual
Renwick and Archibald, 1998
Bay Area and Southern California
Residential, single family average
summer
Metzner, 19891 San Francisco Residential annual Metropolitan Water District of Southern California, 19901
South Coast Residential, single family summer
winter
DWR, 1998 California Residential, single family annual
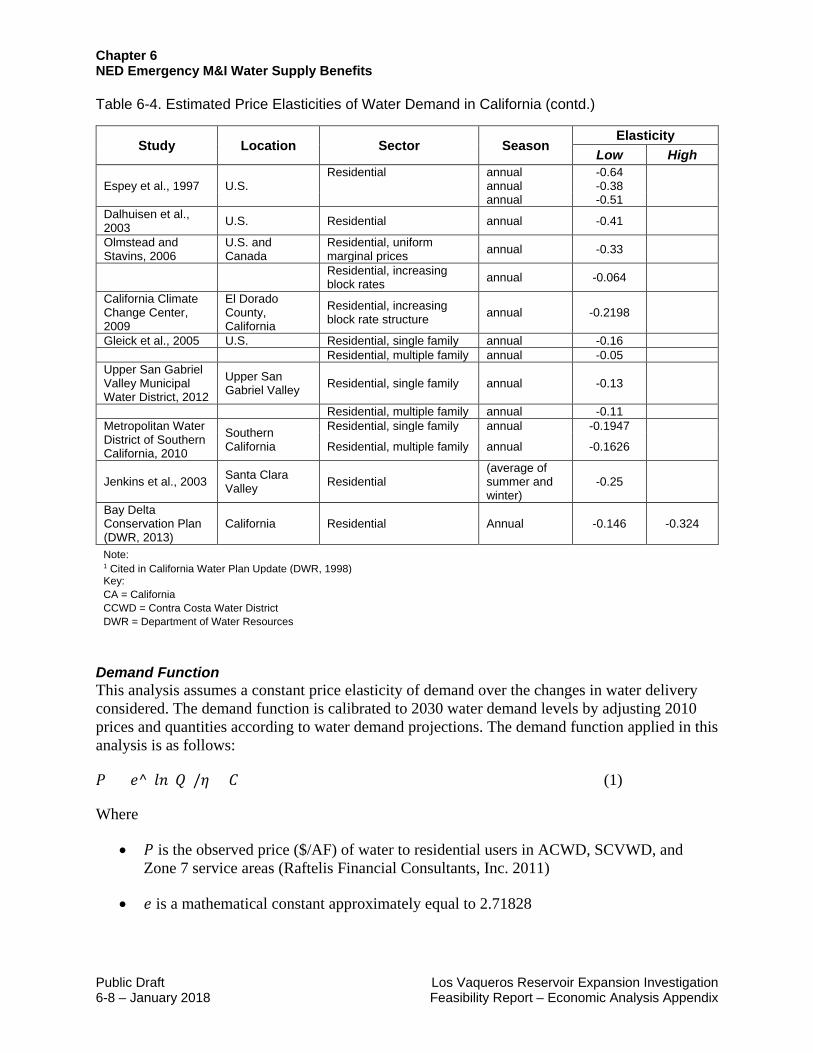
Chapter 6 NED Emergency M&I Water Supply Benefits
Public Draft Los Vaqueros Reservoir Expansion Investigation 6-8 – January 2018 Feasibility Report – Economic Analysis Appendix
Table 6-4. Estimated Price Elasticities of Water Demand in California (contd.)
Study Location Sector Season
Residential annual Espey et al., 1997 U.S.
annual annual
Dalhuisen et al., 2003 U.S. Residential annual
Olmstead and Stavins, 2006
U.S. and Canada
Residential, uniform marginal prices annual
Residential, increasing block rates annual
California Climate Change Center, 2009
El Dorado County, California
Residential, increasing block rate structure annual
Gleick et al., 2005 U.S. Residential, single family annual Residential, multiple family annual Upper San Gabriel Valley Municipal Water District, 2012
Upper San Gabriel Valley Residential, single family annual
Residential, multiple family annual Metropolitan Water District of Southern California, 2010
Southern California
Residential, single family
Residential, multiple family
annual
annual
Jenkins et al., 2003 Santa Clara Valley Residential
(average of summer and winter)
Bay Delta Conservation Plan California Residential Annual (DWR, 2013)
Elasticity Low High -0.64 -0.38 -0.51
-0.41
-0.33
-0.064
-0.2198
-0.16 -0.05
-0.13
-0.11 -0.1947
-0.1626
-0.25
-0.146 -0.324
Note: 1 Cited in California Water Plan Update (DWR, 1998) Key: CA = California CCWD = Contra Costa Water District DWR = Department of Water Resources
Demand Function This analysis assumes a constant price elasticity of demand over the changes in water delivery considered. The demand function is calibrated to 2030 water demand levels by adjusting 2010 prices and quantities according to water demand projections. The demand function applied in this analysis is as follows:
𝑃𝑃 = 𝑒𝑒^(𝑙𝑙𝑙𝑙 (𝑄𝑄)/𝜂𝜂 + 𝐶𝐶) (1)
Where
• 𝑃𝑃 is the observed price ($/AF) of water to residential users in ACWD, SCVWD, and Zone 7 service areas (Raftelis Financial Consultants, Inc. 2011)
• 𝑒𝑒 is a mathematical constant approximately equal to 2.71828
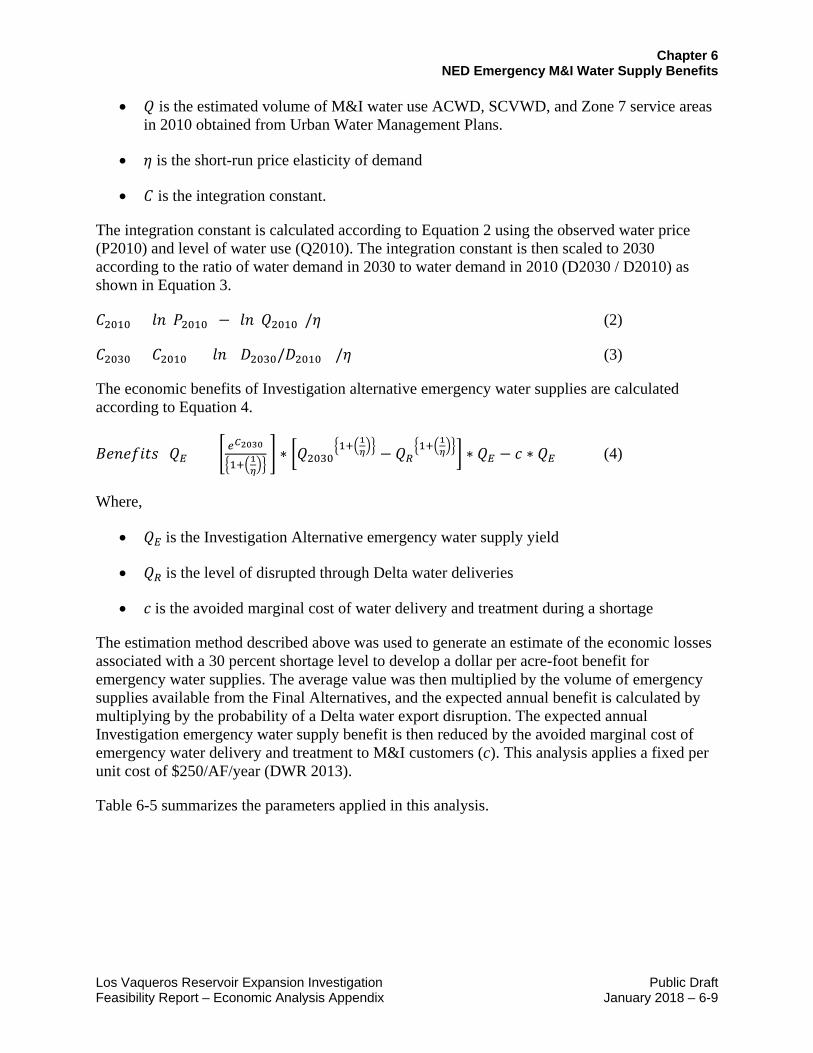
Chapter 6 NED Emergency M&I Water Supply Benefits
Los Vaqueros Reservoir Expansion Investigation Public Draft Feasibility Report – Economic Analysis Appendix January 2018 – 6-9
• 𝑄𝑄 is the estimated volume of M&I water use ACWD, SCVWD, and Zone 7 service areas in 2010 obtained from Urban Water Management Plans.
• 𝜂𝜂 is the short-run price elasticity of demand
• 𝐶𝐶 is the integration constant.
The integration constant is calculated according to Equation 2 using the observed water price (P2010) and level of water use (Q2010). The integration constant is then scaled to 2030 according to the ratio of water demand in 2030 to water demand in 2010 (D2030 / D2010) as shown in Equation 3.
𝐶𝐶2010 = 𝑙𝑙𝑙𝑙(𝑃𝑃2010) − {𝑙𝑙𝑙𝑙 (𝑄𝑄2010)/𝜂𝜂} (2)
𝐶𝐶2030 = 𝐶𝐶2010 + {𝑙𝑙𝑙𝑙 ((𝐷𝐷2030/𝐷𝐷2010))/𝜂𝜂} (3)
The economic benefits of Investigation alternative emergency water supplies are calculated according to Equation 4.
𝐵𝐵𝑒𝑒𝑙𝑙𝑒𝑒𝐵𝐵𝐵𝐵𝑡𝑡𝑡𝑡 (𝑄𝑄𝐸𝐸) = � 𝑒𝑒𝐶𝐶2030
�1+�1𝜂𝜂�� � ∗ �𝑄𝑄2030
�1+�1𝜂𝜂�� − 𝑄𝑄𝑅𝑅�1+�1𝜂𝜂��� ∗ 𝑄𝑄𝐸𝐸 − 𝑐𝑐 ∗ 𝑄𝑄𝐸𝐸 (4)
Where,
• 𝑄𝑄𝐸𝐸 is the Investigation Alternative emergency water supply yield
• 𝑄𝑄𝑅𝑅 is the level of disrupted through Delta water deliveries
• 𝑐𝑐 is the avoided marginal cost of water delivery and treatment during a shortage
The estimation method described above was used to generate an estimate of the economic losses associated with a 30 percent shortage level to develop a dollar per acre-foot benefit for emergency water supplies. The average value was then multiplied by the volume of emergency supplies available from the Final Alternatives, and the expected annual benefit is calculated by multiplying by the probability of a Delta water export disruption. The expected annual Investigation emergency water supply benefit is then reduced by the avoided marginal cost of emergency water delivery and treatment to M&I customers (c). This analysis applies a fixed per unit cost of $250/AF/year (DWR 2013).
Table 6-5 summarizes the parameters applied in this analysis.

Chapter 6 NED Emergency M&I Water Supply Benefits
Public Draft Los Vaqueros Reservoir Expansion Investigation 6-10 – January 2018 Feasibility Report – Economic Analysis Appendix
Table 6-5. Summary of Key Assumptions and Parameters
Variable Value Description Source
P2010 $1,334/ acre-foot Weighted average service rate (2015 dollars)1 for Zone 7, SCVWD, and ACWD
Raftelis 2011
Q2010 380,900 acre-feet Estimated 2010 annual M&I water demand in ACWD, SCVWP, and Zone 7
Urban Water Management Plans: Zone 7 (2010), SCVWD (2010), ACWD (2010).
Q2030 488,190 acre-feet
Forecast 2030 annual M&I water demand in ACWD, SCVWP, and Zone 7, including planned conservation
Urban Water Management Plans: Zone 7 (2010), SCVWD (2010), ACWD (2010).
QE
Alternative 1A = 168 TAF Alternative 1B = 162 TAF Alternative 2A = 71 TAF Alternative 4A = 79 TAF
Long-term average Investigation emergency water supply yield2
CalSim-II operations modeling conducted for the Final Alternatives (Modeling Appendix)
η -0.189 Short-term price elasticity of demand3
Bay Delta Conservation Plan (DWR 2013)
Shortage Level 30% Level of shortage to M&I users as a
percent of 2030 water demand
Urban Water Management Plans: Zone 7 (2010), SCVWD (2010), ACWD (2010). CalSim-II SWP Delivery Capability Studies (DWR 2015)
Shortage Duration 12 months Duration of the Delta water supply
disruption DRMS Phase 1 Summary Report (2007)
Probability 0.042 Annual probability of a Delta water supply export disruption during the planning period4
Delta Risk Management Strategy (DRMS) (DWR, USACE, and DFG 2009)
c $250/ acre-foot Marginal cost of delivery Bay Delta Conservation Plan (DWR 2013)
Notes: 1 For this analysis, only the “commodity” charge is included in the price estimate to exclude fixed charges that do not vary with the
volume of water delivered. Price level is July 2015. 2 Water available for emergency purposes was estimated as the average annual reservoir storage volume with each expanded
reservoir alternative, less 70 TAF of existing CCWD dedicated emergency water supply storage. 3 The short-term price elasticity of demand applied in this analysis is the 2030 demand weighted average elasticity of the ACWD,
SCVWD, and Zone 7 service areas estimated for the Bay Delta Conservation Plan (DWR, 2013). 4 The annual probability of a Delta water supply export disruption applied in this analysis is the average annual all hazards
probabilities for the 20 and 30 “island-breach” scenarios identified for the Delta Risk Management Strategy (DWR, USACE, and DFG, 2009).
Key: ACWD = Alameda County Water District Bay Area = San Francisco Bay Area Delta = Sacramento-San Joaquin Delta Investigation = Los Vaqueros Reservoir Expansion Investigation
SCVWD = Santa Clara Valley Water District TAF = thousand acre-feet Zone 7 = Alameda County Flood Control and Water
Conservation District, Zone 7
At the 2030 level of annual water demand (488,190 AF), a 30-percent shortage level for a period of 16 months results in a shortage of 219,686 acre-feet, more than the emergency water supply yield from the Final Alternatives.

Chapter 6 NED Emergency M&I Water Supply Benefits
Los Vaqueros Reservoir Expansion Investigation Public Draft Feasibility Report – Economic Analysis Appendix January 2018 – 6-11
Results
The economic losses from the water supply shortage described above totaled $548.3 million, or $3,744 per acre-foot, on average. Multiplying $3,744 per acre-foot by the total emergency water supply available from the Investigation provided an estimate of the economic benefit associated with volume of water supplied during the shortage event. The total was then multiplied by the annual probability of occurrence to obtain the expected annual benefit. The expected annual Investigation emergency water supply benefit is then reduced by the expected marginal cost of emergency water delivery to M&I customers. Table 6-6 summarizes the results of the analysis. As shown, the estimated annual value of NED emergency water supply benefits ranges from $10.4 to $24.7 million.
Table 6-6. Estimated Emergency Water Supply NED Benefits by Final Alternative ($ millions)
Investigation Alternative 1A 1B 2A 4A Expected Annual Seismic Emergency Water Supply Benefits $16.0 $15.5 $6.8 $7.5
Expected Annual Flood Emergency Water Supply Benefits $10.4 $10.0 $4.4 $4.9 Expected Annual All Hazards1 Emergency Water Supply Benefits $26.4 $25.5 $11.2 $12.4
Less: Expected Marginal Water Cost $1.8 $1.7 $0.7 $0.8 NED Emergency Water Supply Benefits – All Hazards1 $24.7 $23.8 $10.4 $11.6
Notes: General: Dollar values are expressed in 2015 dollars. 1 All hazards considers the probability of a Delta export disruption due to seismic and flood Delta-island breach scenarios
evaluated for the Delta Risk Management Strategy (DWR, USACE, and DFG 2009). Key: Investigation = Los Vaqueros Reservoir Expansion Investigation NED = National Economic Development
Risk and Uncertainty It is important to note that various factors affect the economic value attributed to emergency water supplies provided by the Final Alternatives beyond the quantity of water available in storage at the time of a Delta water export emergency. Several of these factors are discussed below:
• The forecasted 2030 level and duration of water supply shortages to the emergency water supply beneficiaries was estimated from information developed from the DRMS study (DWR, USACE, and DFG, 2009) and 2010 urban water management plans. Improvements to Delta levee conditions, continued water agency conservation activities, and unforeseen population changes could affect the probability of a Delta export disruption, shortage percentage, and duration assumptions employed in this analysis.
• The economic values of emergency water supplies provided by the Final Alternatives are estimated through application of a short-term demand function. The price elasticity of demand was obtained from previous studies of residential water demand in California, and there was a wide range of estimated elasticities. The results of the analysis are highly
Chapter 6 NED Emergency M&I Water Supply Benefits
Public Draft Los Vaqueros Reservoir Expansion Investigation 6-12 – January 2018 Feasibility Report – Economic Analysis Appendix
sensitive to the selection of price elasticity of demand. As a result, relatively small changes in the assumed elasticity can lead to large changes in estimated benefits.
• Depending on Delta salinity conditions at the time of a potential flood event, Delta export disruptions due to flooding may be minimal. As a result, the value of flood hazard emergency water supplies provided by pertinent Final Alternatives may be overstated. This is not considered to be the case because it is expected that the larger Delta-island breaches evaluated (i.e., 20- and 30-island breach scenarios) would result in significant Delta water export disruptions.
An emergency water supply benefit sensitivity analysis was conducted to address risk and uncertainty of the benefit estimates and is discussed below. The sensitivity analysis values are not included in the calculation of the total NED benefits or benefit-cost ratios.
Emergency Water Supply Benefit Sensitivity Analysis The NED emergency water supply benefit estimate described above is based on estimated 30-percent water shortage and -0.189 elasticity assumptions. To address risk and uncertainty related to water supply shortage and price elasticity, two different approaches are applied and are described briefly below:
• Sensitivity Approach 1 – a range of 20- and 40-percent water supply shortages are applied to estimate benefits.
• Sensitivity Approach 2 – Lowerbound (-0.146) and upperbound (-0.324) California water agency price elasticities estimated by the Bay Delta Conservation Plan (DWR 2013) are applied.
• Sensitivity Approach 3 – 20-percent water supply shortage with upperbound (-0.324) elasticity, and 40-percent water supply shortage with lowerbound (-0.146) elasticity are applied.
Results of these three approaches are displayed in Table 6-7, below. Results of the sensitivity analyses demonstrate that with each approach, benefit estimates may be larger or smaller depending on the magnitude of expected shortage and consumers’ willingness to pay to avoid water supply shortages. The average of sensitivity analyses results are greater than the NED emergency water supply benefit estimates for each alternative and are also presented in Table 6-7.

Chapter 6 NED Emergency M&I Water Supply Benefits
Los Vaqueros Reservoir Expansion Investigation Public Draft Feasibility Report – Economic Analysis Appendix January 2018 – 6-13
Table 6-7. Sensitivity Analysis Comparison for Estimated Average Annual Emergency Water Supply Benefits for Investigation Alternatives ($ million)
Investigation Alternative
Sensitivity Approach 11
Sensitivity Approach 22
Sensitivity Approach 33
Average of Sensitivity Approach Results
NED Benefit
Estimate4
1A
20% Shortage $15.8 Lower
Elast $36.1 20% with Upper Elast $11.6
$32.3 $24.7 40% Shortage $41.7 Upper
Elast $14.8 40% with Lower Elast $74.0
1B
20% Shortage $15.3 Lower
Elast $34.8 20% with Upper Elast $11.2
$31.2 $23.8 40% Shortage $40.2 Upper
Elast $14.3 40% with Lower Elast $71.4
2A
20% Shortage $6.7 Lower
Elast $15.2 20% with Upper Elast $4.9
$13.7 $10.4 40% Shortage $17.6 Upper
Elast $6.3 40% with Lower Elast $31.3
4A
20% Shortage $7.4 Lower
Elast $17.0 20% with Upper Elast $5.5
$15.2 $11.6 40% Shortage $19.6 Upper
Elast $7.0 40% with Lower Elast $34.8
Notes: General: Dollar values are expressed in 2015 dollars. 1 Imported water supplies susceptible to Delta disruptions comprise an estimated 48 percent of the total water supplies to
emergency water supply beneficiaries (ACWD, Zone 7, and SCVWD) during an average water year, and 31 percent during dry and critical years (DWR 2015). Depending on the water supply conditions in the Delta at the time of a seismic or flood event that affects Delta export capability, the water supply shortage experienced by emergency water supply beneficiaries may be greater or less than the 48 percent normal year reliance on water pumped from the Delta. NED benefits are estimated based on a 30 percent water shortage assumption. To demonstrate the variability in economic value under different water shortage conditions sensitivity approach 1 was performed for 20 and 40 percent water supply shortage conditions.
2 To address uncertainty in consumers’ willingness to pay to avoid a water supply shortage lowerbound (-0.146) and upperbound (-0.324) California water agency price elasticities estimated by the Bay Delta Conservation Plan (DWR 2013) are applied to the constant elasticity of demand function to estimate emergency water supply benefits with sensitivity approach 2.
3 To address uncertainty in the water supply shortage under different hydrologic conditions and consumers’ willingness to pay to avoid a water supply shortage, sensitivity approach 3 applies a 20 percent shortage and upperbound (-0.324) California water agency price elasticity estimated by the Bay Delta Conservation Plan (DWR 2013) and 40 percent shortage and lowerbound (-0.146) California water agency price elasticity estimated by the Bay Delta Conservation Plan (DWR 2013).
4 NED benefit estimates are estimated with a 30 percent water supply shortage and -0.189 price elasticity estimated by the Bay Delta conservation plan for emergency water supply beneficiaries (ACWD, Zone 7, and SCVWD).
Key: ACWD = Alameda County Water District Lower Elast = lowerbound elasticity NED = National Economic Development SCVWD = Santa Clara Valley Water District Upper Elast =upperbound elasticity Zone 7 = Alameda County Flood Control and Water Conservation District, Zone 7
Chapter 6 NED Emergency M&I Water Supply Benefits
Public Draft Los Vaqueros Reservoir Expansion Investigation 6-14 – January 2018 Feasibility Report – Economic Analysis Appendix
This page left blank intentionally.

Chapter 7 NED Recreation Benefits
Los Vaqueros Reservoir Expansion Investigation Public Draft Feasibility Report – Economic Analysis Appendix January 2018 – 7-1
Chapter 7 NED Recreation Benefits The Final Alternatives are operated primarily to provide Refuge and M&I water supplies. However, the Investigation operations would also offer year-round public recreation benefits. The reservoir expansion would provide additional opportunities for fishing and boating. In addition, expanded recreation facilities would bring additional value to educational activities. The reservoir also provides opportunities for other common recreational activities, including hiking, biking, picnicking, bird watching, and wildlife viewing. These benefits can be quantified as NED recreation benefits.
In addition, Investigation operations as an off-stream reservoir have historically allowed it to remain between 80 and 90 percent of capacity year round, maximizing its potential for more continuous, uninterrupted recreational opportunities than other on-stream reservoirs. The reservoir storage is expected to occasionally decline either due to prolonged droughts or to water storage emergencies in the Bay Area, which could impact benefits until such time as storage would recover as drought conditions receded and water supplies recovered. In times of low water storage, other types of public recreation, other than fishing and boating activities, would continue to be available, including educational access at the expanded Interpretive Center, hiking, biking, picnicking, bird-watching, wildlife viewing, and other events regularly held at Los Vaqueros such as astronomy nights and running races.
Expanding the reservoir will result in no permanent negative impacts on existing recreational benefits at the site or at nearby facilities/recreation areas. The Los Vaqueros Marina Complex and trails would be relocated as part of construction. However, it is expected that recreational opportunities at Los Vaqueros Reservoir would be limited during construction for a period of up to three years, particularly under Alternatives 1A, 1B, and 2A. No added recreational benefits are expected or included in Alternative 4A, which does not include expanding the reservoir or changes to reservoir facilities.
This chapter describes the benefits estimation method applied to the Investigation, and results.
Benefits Estimation Method
Expansion of Los Vaqueros Reservoir, along with enhancement to recreation facilities and trails in the Los Vaqueros watershed, would improve access to recreation opportunities around the expanded reservoir and the watershed. CCWD used a visitation model to predict increase in visitation due to expanded reservoir. The model of surface storage recreation visitation was based on visitation data for Los Vaqueros Reservoir prior to, and after, Phase 1 reservoir expansion (from 100 to 160 TAF). The statistical model was a set of regression equations that predict total monthly day visits. Key factors considered include the populations in the primary service area of the reservoir, and maximum surface acreage and average seasonal storage of the reservoir.
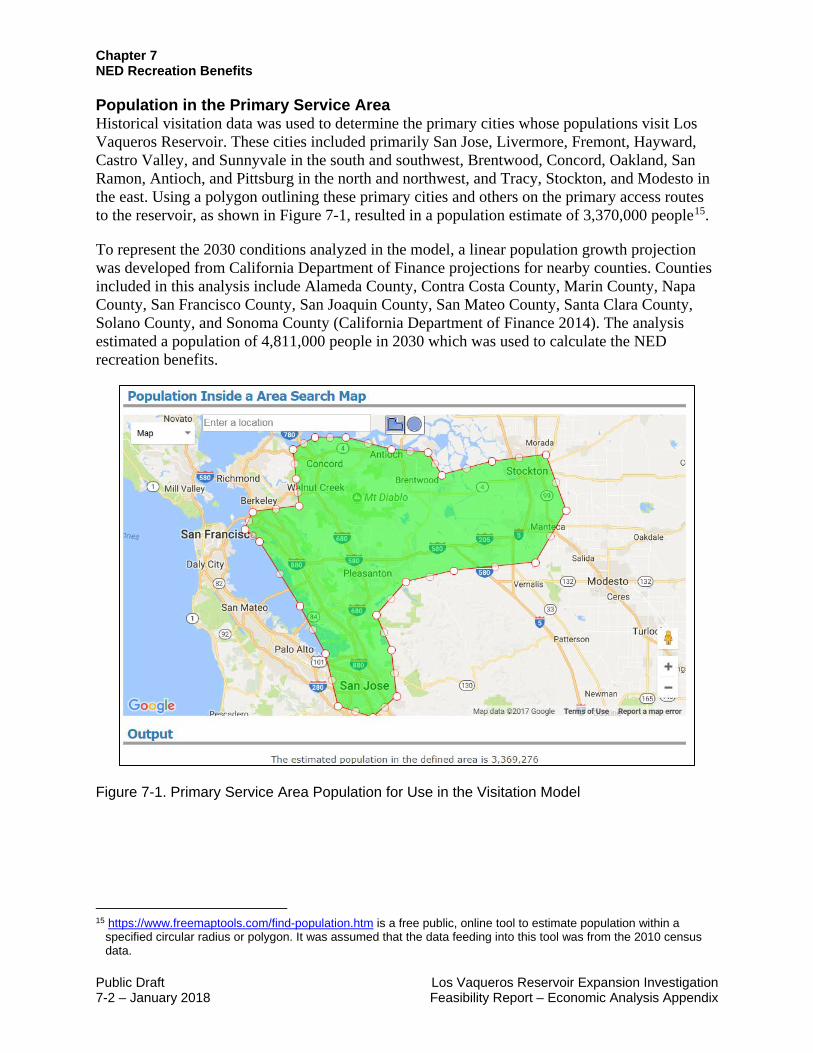
Chapter 7 NED Recreation Benefits
Public Draft Los Vaqueros Reservoir Expansion Investigation 7-2 – January 2018 Feasibility Report – Economic Analysis Appendix
Population in the Primary Service Area Historical visitation data was used to determine the primary cities whose populations visit Los Vaqueros Reservoir. These cities included primarily San Jose, Livermore, Fremont, Hayward, Castro Valley, and Sunnyvale in the south and southwest, Brentwood, Concord, Oakland, San Ramon, Antioch, and Pittsburg in the north and northwest, and Tracy, Stockton, and Modesto in the east. Using a polygon outlining these primary cities and others on the primary access routes to the reservoir, as shown in Figure 7-1, resulted in a population estimate of 3,370,000 people15.
To represent the 2030 conditions analyzed in the model, a linear population growth projection was developed from California Department of Finance projections for nearby counties. Counties included in this analysis include Alameda County, Contra Costa County, Marin County, Napa County, San Francisco County, San Joaquin County, San Mateo County, Santa Clara County, Solano County, and Sonoma County (California Department of Finance 2014). The analysis estimated a population of 4,811,000 people in 2030 which was used to calculate the NED recreation benefits.
Figure 7-1. Primary Service Area Population for Use in the Visitation Model
15 https://www.freemaptools.com/find-population.htm is a free public, online tool to estimate population within a
specified circular radius or polygon. It was assumed that the data feeding into this tool was from the 2010 census data.
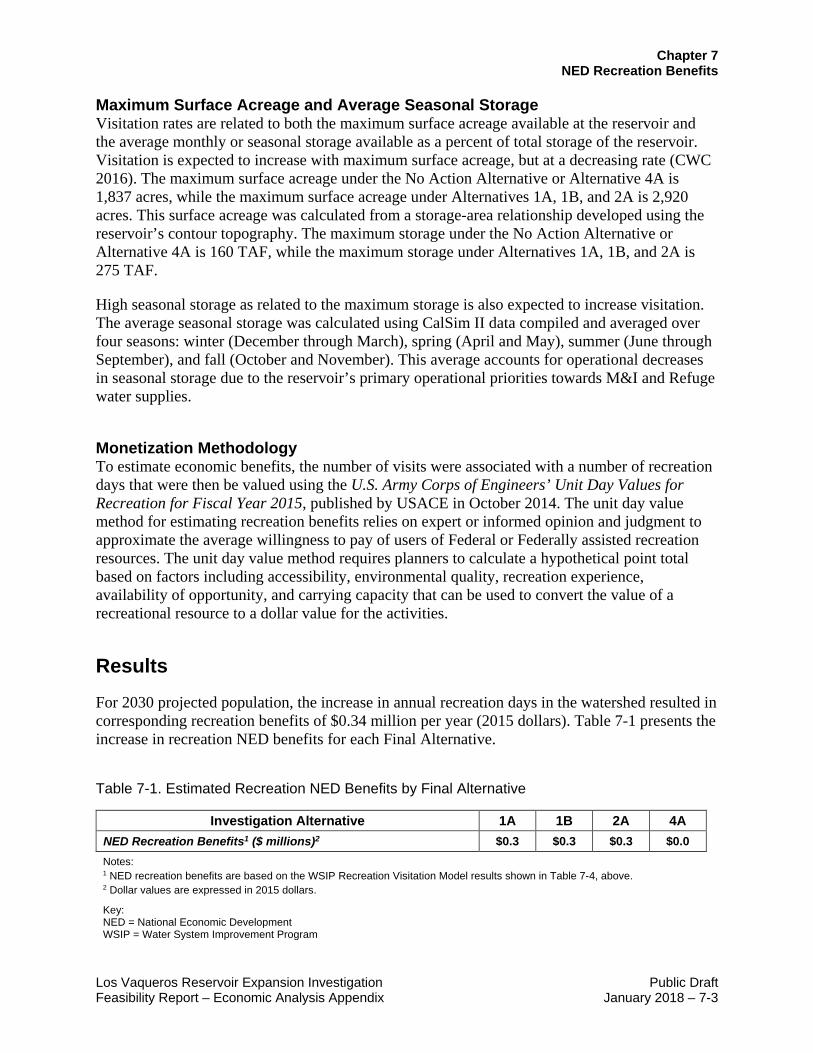
Chapter 7 NED Recreation Benefits
Los Vaqueros Reservoir Expansion Investigation Public Draft Feasibility Report – Economic Analysis Appendix January 2018 – 7-3
Maximum Surface Acreage and Average Seasonal Storage Visitation rates are related to both the maximum surface acreage available at the reservoir and the average monthly or seasonal storage available as a percent of total storage of the reservoir. Visitation is expected to increase with maximum surface acreage, but at a decreasing rate (CWC 2016). The maximum surface acreage under the No Action Alternative or Alternative 4A is 1,837 acres, while the maximum surface acreage under Alternatives 1A, 1B, and 2A is 2,920 acres. This surface acreage was calculated from a storage-area relationship developed using the reservoir’s contour topography. The maximum storage under the No Action Alternative or Alternative 4A is 160 TAF, while the maximum storage under Alternatives 1A, 1B, and 2A is 275 TAF.
High seasonal storage as related to the maximum storage is also expected to increase visitation. The average seasonal storage was calculated using CalSim II data compiled and averaged over four seasons: winter (December through March), spring (April and May), summer (June through September), and fall (October and November). This average accounts for operational decreases in seasonal storage due to the reservoir’s primary operational priorities towards M&I and Refuge water supplies.
Monetization Methodology To estimate economic benefits, the number of visits were associated with a number of recreation days that were then be valued using the U.S. Army Corps of Engineers’ Unit Day Values for Recreation for Fiscal Year 2015, published by USACE in October 2014. The unit day value method for estimating recreation benefits relies on expert or informed opinion and judgment to approximate the average willingness to pay of users of Federal or Federally assisted recreation resources. The unit day value method requires planners to calculate a hypothetical point total based on factors including accessibility, environmental quality, recreation experience, availability of opportunity, and carrying capacity that can be used to convert the value of a recreational resource to a dollar value for the activities.
Results
For 2030 projected population, the increase in annual recreation days in the watershed resulted in corresponding recreation benefits of $0.34 million per year (2015 dollars). Table 7-1 presents the increase in recreation NED benefits for each Final Alternative.
Table 7-1. Estimated Recreation NED Benefits by Final Alternative
Investigation Alternative 1A 1B 2A 4A NED Recreation Benefits1 ($ millions)2 $0.3 $0.3 $0.3 $0.0
Notes: 1 NED recreation benefits are based on the WSIP Recreation Visitation Model results shown in Table 7-4, above. 2 Dollar values are expressed in 2015 dollars. Key: NED = National Economic Development WSIP = Water System Improvement Program
Chapter 7 NED Recreation Benefits
Public Draft Los Vaqueros Reservoir Expansion Investigation 7-4 – January 2018 Feasibility Report – Economic Analysis Appendix
Risk and Uncertainty It is important to note that various factors affect the economic value attributed to recreational benefits provided by the Final Alternatives. Several of these factors are discussed below:
• The predicted number of recreation days per year may vary with the actual area which attracts visitors to the reservoir and the population growth of these areas over the project’s planning horizon. In addition, if new, more accessible, recreation areas become available, decreases in visitation rates would be expected.
• The effects of nearby substitute reservoirs is under-represented in the model. In addition, Los Vaqueros Reservoir has many substitute reservoirs in a 30-mile radius. Therefore, the impact of these substitute reservoirs could cause decreases in visitation rates to Los Vaqueros Reservoir
• The average storage values for the reservoir will depend on operational decisions and the impacts of climate change. The high level of uncertainty in precipitation projections across California, especially as related to the number and duration of drought events, may impact the level of storage available in Los Vaqueros Reservoir, and therefore the availability of recreational opportunities to attract visitors.

Chapter 8 Summary of Estimated NED Benefits
Los Vaqueros Reservoir Expansion Investigation Public Draft Feasibility Report – Economic Analysis Appendix January 2018 – 8-1
Chapter 8 Summary of Estimated NED Benefits This Draft Economic Analysis Appendix presents estimates of the economic benefits associated with the alternatives to expand Los Vaqueros Reservoir. Table 6-1 summarizes the estimated benefits according to each of the alternatives and benefit categories. Benefit categories include M&I water supply reliability, Refuge water supply reliability, agricultural water supply reliability, and emergency M&I water supply reliability.
M&I water supply reliability was valued according to the estimated costs of water transfers. Economic benefits of Refuge water (Incremental Level 4) supplied by the Investigation were evaluated using an econometric model of water market prices that estimated the costs of alternative water supplies in the absence of the Investigation. The water pricing model considered region and source of water supply, water year type, and population growth, among other factors, to predict water market prices over the planning period. The value of emergency water supplies from the Investigation was estimated through measurement of the consumer willingness to pay to avoid water supply shortages. During emergency supply periods, it was assumed that all available water from the Investigation would be used to alleviate shortages to urban water users in the Bay Area. To avoid double-counting, total benefits were weighted according to the estimated probability of an emergency water supply disruption during the planning period.
Table 8-1 summarizes the estimated annual benefits for the proposed project alternatives, which range from $42.6 million (Alternative 4A) to $59.6 million (Alternative 1B). The economic benefits estimated in this analysis rely on a set of assumptions. Changes in these assumptions will change the estimated benefits and could affect the applicability of the methods applied to estimate the benefits. Sensitivity analyses were conducted to address risk and uncertainty for each benefit category evaluated, and results of these analyses are contained at the end of the chapter describing each benefit category.

Chapter 8 Summary of Estimated NED Benefits
Public Draft Los Vaqueros Reservoir Expansion Investigation 8-2 – January 2018 Feasibility Report – Economic Analysis Appendix
Table 8-1. Summary of Estimated NED Benefits by Final Alternative ($ millions)
Benefit Category Alternative 1A
Alternative 1B
Alternative 2A
Alternative 4A
M&I Water Supplies1 $12.4 $10.3 -$5.0 $9.5
Emergency Water Supplies2 $24.7 $23.8 $10.4 $11.6
Incremental Level 4 Refuge Water Supplies3 $17.9 $23.6 $37.4 $21.1
Agricultural Water Supplies4 $1.9 $0.6 $0.6 $0.4
Recreation5 $0.3 $0.3 $0.3 $0.0
Total Annual NED Benefits6 $57.2 $58.6 $43.7 $42.6
Notes: General: M&I water supply, Agricultural water supply, and Refuge water supply benefits were adjusted according to the probability
of a Delta water supply disruption (4.2% per year) to avoid double-counting of benefits. Dollar values are expressed at in 2015 dollars.
1 Market-based estimates of the cost of water transfers to Bay Area M&I agencies. 2 Market-based estimates of water users’ willingness to pay to avoid interruptions in water deliveries 3 Market-based estimates of the cost of water transfers to wildlife Refuges in the San Joaquin Valley. 4 Market-based estimates of the cost of water transfers to agricultural users in the San Joaquin Valley. 5 Increase in visitation days are forecasted based on visitation data from the original and raised Los Vaqueros Dam. Monetized
visitation days estimate using the U.S. Army Corps of Engineers’ Unit Day Values for Recreation for Fiscal Year 2015. Key: M&I = municipal and industrial NED = National Economic Development
Chapter 9 References
Los Vaqueros Reservoir Expansion Investigation Public Draft Feasibility Report – Economic Analysis Appendix January 2018 – 9-1
Chapter 9 References Alameda County Water District. 2010. Urban Water Management Plan 2010-2015.
Association of Bay Area Governments. 2013. Projections 2013. December. Available from http://abag.ca.gov/planning/research/forecasts.html.
BARDP. See Bay Area Regional Desalination Project.
BAWSCA. See Bay Area Water Supply and Conservation Agency.
Bay Area Regional Desalination Project. 2014. Site Specific Analyses Final Report, Delta Modeling Tasks. Prepared by Contra Costa Water District. January.
Bay Area Water Supply and Conservation Agency. 2015. Long-Term Water Supply Strategy. Strategy Phase II Final Report. February.
BEA. See U.S. Bureau of Economic Analysis.
Brookshire, D.S., B. Colby, M. Ewers, and P.T. Ganderton. 2004. Market Prices for Water in the Semiarid West of the United States. Water Resources Research, 40, W09S04, doi: 10.1029/2003WR002846.
Brozovic, N., D.L. Sunding, and D. Zilberman. 2007. Estimating Business and Residential Water Supply Interruption Losses from Catastrophic Events. Water Resources Research, 43(8). February.
CALFED. See California Bay-Delta Program.
CALFED Bay-Delta Program (CALFED). 2000 Water Transfer Program Plan: Water Transfers Defined. Chapter 2. July.
California Climate Change Center. 2009. Price Impact on the Demand for Water and Energy in California Residences. August.
California Department of Finance. 2014. California County Population Estimates and Components of Change by Year—July 1, 2000–2010. Sacramento, California. December 2011. Available at: http://www.dof.ca.gov/Forecasting/Demographics/Estimates/E-2/2000-10/. Accessed September 20, 2016.
California Department of Water Resources (DWR). 1991. Urban Drought Guidebook.
_____. 1998. California Water Plan Update, DWR Bulletin 160-98. November.
Chapter 9 References
Public Draft Los Vaqueros Reservoir Expansion Investigation 9-2 – January 2018 Feasibility Report – Economic Analysis Appendix
_____. 2012. Management of the California State Water Project: Bulletin 132 12. Table 7. Kilowatt-Hour per Acre-Foot Factors for Allocating Off-Aqueduct Power Facility Costs.
_____. 2013. Economic Benefits of the Bay Delta Conservation Plan and Take Alternatives. Public Draft Bay Delta Conservation Plan, Appendix 9.A. November.
_____. 2015. CalSim-II SWP Delivery Capability Studies. Available at: http://baydeltaoffice.water.ca.gov/modeling/hydrology/CalSim/Downloads/CalSimDownloads/CalSim-IIStudies/SWPCapability2015/index.cfm.
_____. 2017a. SWPAO – Water Deliveries. Available from http://www.water.ca.gov/swpao/deliveries.cfm.
_____. 2017b. Cooperative Snow Surveys Website - snowpack. Available from http://cdec.water.ca.gov/cgi-progs/iodir_ss/wsihist.
California Department of Water Resources, U.S. Army Corps of Engineers, and California Department of Fish and Game. 2007. Draft Summary Report Phase 1 Risk Analysis. Delta Risk Management Strategy. June.
_____. 2009. Final Phase 1 Report. Risk Analysis 2005 Base Year Results, Risk Report: Section 14. Delta Risk Management Strategy. March.
California Water Commission. 2016. Water Storage Investment Program Technical Reference. November 2016.
CCWD. See Contra Costa Water District.
Central Valley Project Improvement Act (CVPIA). 1992. Public Law Number 102-575.
Clean Water Act. 1972. Public Law Number 92-500.
Contra Costa Water District (CCWD). 1989. Evaluation of Project Configurations, Future Water Demands, Los Vaqueros. Contra Costa Water District, Pleasant Hill, California.
_____. 2017. About Us. Contra Costa Water District. Available at: http://www.ccwater.com/27/About-Us. Assessed August 28, 2017.
Creel, Michael and Loomis, John. 1992. Recreation Value of Water to Wetlands in the San Joaquin Valley: Linked Multinomial Logit and Count Data Trip Frequency Models. Water Resources Research Volume 28. Number 10. October.
CVPIA. See Central Valley Project Improvement Act.
CWC. See California Water Commission.
Dalhuisen, J.M., R. Florax, H. de Groot, and P. Nijkamp. 2003. Price and Income Elasticities of Residential Water Demand. Tinbergen Institute Discussion Papers, 01-057/3.
Chapter 9 References
Los Vaqueros Reservoir Expansion Investigation Public Draft Feasibility Report – Economic Analysis Appendix January 2018 – 9-3
DOI. See U.S. Department of Interior.
DWR. See California Department of Water Resources.
DWR and Reclamation. See California Department of Water Resources and U.S. Department of the Interior, Bureau of Reclamation.
DWR, USACE, and DFG. See California Department of Water Resources, U.S. Army Corps of Engineers, and California Department of Fish and Game.
Dziegielewski, B., and E. Optiz. 1991. Municipal and Industrial Water Use in the Metropolitan Water District Service Area. Interim Report No. 4. Prepared for The Metropolitan Water District of Southern California.
Endangered Species Act (ESA). 1973. Public Law Number 93-205.
Espey, M., J. Espey, and W.D. Shaw. 1997. Price elasticity of residential demand for water: A meta-analysis. Water Resources Research, 33(6): 1369-1374.
Gleick, P.H., H. Cooley, and D. Groves. 2005. California Water 2030: An Efficient Future. A Report of the Pacific Institute, Oakland. September.
Hanneman, M., L. Dale, S. Vicuna, D. Bickett, C. and Dyckman. 2006. The Economic Cost of Climate Change Impact on California Water: A Scenario Analysis. July. Available at http://calclimate.berkeley.edu/research.html.
Howe, C. 1982. The Impact of Price on Residential Water Demand: Some New Insights. Water Resources Research, 18(4), 713-716.
Jenkins, M, J. Lund, and R. Howitt. 2003. Using Economic Loss Functions to Value Urban Water Scarcity in California. Journal American Water Works Association 95:2.
Jones, Jon. 2012. Charges for Wheeling Non-State Water Project Water Through State Water Project Facilities. State Water Project Analysis Office, Division of Operations and Maintenance. January 17.
Mann, Roger, and Stephen Hatchett. 2006. Report on Environmental Water Account Water Price Estimation for the Common Assumptions Economic Workgroup. Prepared for California Department of Water Resources and United States Department of the Interior, Bureau of Reclamation.
Metropolitan Water District of Southern California (MWD). 2010. Integrated Water Resources Plan 2010 Update: Technical Appendix.
MWD. See Metropolitan Water District of Southern California.
Chapter 9 References
Public Draft Los Vaqueros Reservoir Expansion Investigation 9-4 – January 2018 Feasibility Report – Economic Analysis Appendix
Olmstead, S.M., and R.N. Stavins. 2006. Managing Water Demand: Price vs. Non-Price Conservation Programs. Prepared for the Pioneer Institute for Public Policy Research, Boston, Massachusetts.
Omnibus Appropriations Act of 2003. 2003. Public Law Number 108-7.
Pinnacle. 2012. Economic Evaluation of Kerckhoff Plant. Raftelis. See Raftelis Financial Consultants, Inc. and American Water Works Association.
Raftelis Financial Consultants, Inc. and American Water Works Association (Raftelis). 2011 California-Nevada Water Rate Survey. California Nevada Section, American Water Works Association.
Reclamation. See U.S. Department of the Interior, Bureau of Reclamation.
Reclamation and USFWS. See U.S. Department of the Interior, Bureau of Reclamation (Reclamation) and U.S. Fish and Wildlife Service.
Renwick, M. 1996. An Econometric Model of Household Water Demand with Endogenous Technological Change Under Demand Side Management Policies. PhD. Diss., Stanford University.
Renwick, M., and S. Archibald. 1998. Demand Side Management Policies for Residential Water Use: Who Bears the Conservation Burden? Land Economics 74(3):343-59.
Santa Clara Valley Water District. 2010. Urban Water Management Plan.
Upper San Gabriel Valley Municipal Water District. 2012. Integrated Resources Plan. November.
USACE. See U.S. Army Corps of Engineers.
U.S. Army Corps of Engineers. 2014. Economic Guidance Memorandum, 15-03, Unit Day Values for Recreation for Fiscal Year 2015. October 28, 2014.
U.S. Bureau of Economic Analysis (BEA). 2016. Gross Domestic Product: Implicit Price Deflator. 1947-01-01 to 2015-07-01.
U.S. Department of the Interior. 2015. Agency Specific Procedures for Implementing the Council on Environmental Quality’s Principles, Requirements, and Guidelines for Water and Land Related Resources Implementation Studies. 707 DM 1 Handbook. November.
U.S. Department of Interior, Bureau of Reclamation (Reclamation). 2012. Statewide Agricultural Production (SWAP) Model Update and Application to Federal Feasibility Analysis.
U.S. Department of the Interior, Bureau of Reclamation (Reclamation). 2010. Environmental Impact Statement/Environmental Impact Report for Los Vaqueros Reservoir Expansion Project. March.

Chapter 9 References
Los Vaqueros Reservoir Expansion Investigation Public Draft Feasibility Report – Economic Analysis Appendix January 2018 – 9-5
U.S. Department of the Interior, Bureau of Reclamation (Reclamation) and U.S. Fish and Wildlife Service (USFWS). 2009. Undelivered Water: Fulfilling the CVPIA Promise. Central Valley Project Improvement Act. Refuge Water Supply Program. Report of the Independent Review Panel. November.
U.S. Department of Interior, Bureau of Reclamation (Reclamation) 2017. Summary of Water Supply Allocations, 1990-2016.
Water Resources Development Act. 2007. Public Law Number 110-114.
Water Strategist. January 1990–December 2010. Information on Water Transfers.
Weber, J.A. 1989. Forecasting Demand and Measuring Price Elasticity. Journal of American Water Works Association, 81(5) 57-65.
White House. 2013. Principles and Requirements for Federal Investments in Water Resources. March.
WRC. See U.S. Water Resources Council.
WRC. 1983. Economic and Environmental Principles and Guidelines for Water and Related Land Resources Implementation Studies. February.
Zone 7 Water Agency. 2010. Urban Water Management Plan. Livermore. December.

Chapter 9 References
Public Draft Los Vaqueros Reservoir Expansion Investigation 9-6 – January 2018 Feasibility Report – Economic Analysis Appendix
This page left blank intentionally.
Related Documents