http://jbx.sagepub.com/ Journal of Biomolecular Screening http://jbx.sagepub.com/content/17/6/713 The online version of this article can be found at: DOI: 10.1177/1087057112442962 2012 17: 713 originally published online 11 April 2012 J Biomol Screen Alison J. Smith, Michael K. Hancock, Kun Bi, John Andrews, Paula Harrison and Tristan J. Vaughan Assay Cascades for Antibody Drug Discovery Feasibility of Implementing Cell-Based Pathway Reporter Assays in Early High-Throughput Screening Published by: http://www.sagepublications.com On behalf of: Journal of Biomolecular Screening can be found at: Journal of Biomolecular Screening Additional services and information for http://jbx.sagepub.com/cgi/alerts Email Alerts: http://jbx.sagepub.com/subscriptions Subscriptions: http://www.sagepub.com/journalsReprints.nav Reprints: http://www.sagepub.com/journalsPermissions.nav Permissions: What is This? - Apr 11, 2012 OnlineFirst Version of Record - Jun 12, 2012 Version of Record >> by guest on October 11, 2013 jbx.sagepub.com Downloaded from by guest on October 11, 2013 jbx.sagepub.com Downloaded from by guest on October 11, 2013 jbx.sagepub.com Downloaded from by guest on October 11, 2013 jbx.sagepub.com Downloaded from by guest on October 11, 2013 jbx.sagepub.com Downloaded from by guest on October 11, 2013 jbx.sagepub.com Downloaded from by guest on October 11, 2013 jbx.sagepub.com Downloaded from by guest on October 11, 2013 jbx.sagepub.com Downloaded from by guest on October 11, 2013 jbx.sagepub.com Downloaded from by guest on October 11, 2013 jbx.sagepub.com Downloaded from by guest on October 11, 2013 jbx.sagepub.com Downloaded from by guest on October 11, 2013 jbx.sagepub.com Downloaded from by guest on October 11, 2013 jbx.sagepub.com Downloaded from by guest on October 11, 2013 jbx.sagepub.com Downloaded from by guest on October 11, 2013 jbx.sagepub.com Downloaded from

Welcome message from author
This document is posted to help you gain knowledge. Please leave a comment to let me know what you think about it! Share it to your friends and learn new things together.
Transcript
http://jbx.sagepub.com/Journal of Biomolecular Screening
http://jbx.sagepub.com/content/17/6/713The online version of this article can be found at:
DOI: 10.1177/1087057112442962
2012 17: 713 originally published online 11 April 2012J Biomol ScreenAlison J. Smith, Michael K. Hancock, Kun Bi, John Andrews, Paula Harrison and Tristan J. Vaughan
Assay Cascades for Antibody Drug DiscoveryFeasibility of Implementing Cell-Based Pathway Reporter Assays in Early High-Throughput Screening
Published by:
http://www.sagepublications.com
On behalf of:
Journal of Biomolecular Screening
can be found at:Journal of Biomolecular ScreeningAdditional services and information for
http://jbx.sagepub.com/cgi/alertsEmail Alerts:
http://jbx.sagepub.com/subscriptionsSubscriptions:
http://www.sagepub.com/journalsReprints.navReprints:
http://www.sagepub.com/journalsPermissions.navPermissions:
What is This?
- Apr 11, 2012OnlineFirst Version of Record
- Jun 12, 2012Version of Record >>
by guest on October 11, 2013jbx.sagepub.comDownloaded from by guest on October 11, 2013jbx.sagepub.comDownloaded from by guest on October 11, 2013jbx.sagepub.comDownloaded from by guest on October 11, 2013jbx.sagepub.comDownloaded from by guest on October 11, 2013jbx.sagepub.comDownloaded from by guest on October 11, 2013jbx.sagepub.comDownloaded from by guest on October 11, 2013jbx.sagepub.comDownloaded from by guest on October 11, 2013jbx.sagepub.comDownloaded from by guest on October 11, 2013jbx.sagepub.comDownloaded from by guest on October 11, 2013jbx.sagepub.comDownloaded from by guest on October 11, 2013jbx.sagepub.comDownloaded from by guest on October 11, 2013jbx.sagepub.comDownloaded from by guest on October 11, 2013jbx.sagepub.comDownloaded from by guest on October 11, 2013jbx.sagepub.comDownloaded from by guest on October 11, 2013jbx.sagepub.comDownloaded from
Journal of Biomolecular Screening17(6) 713 –726© 2012 Society for Laboratory Automation and ScreeningDOI: 10.1177/1087057112442962http://jbx.sagepub.com
IntroductionTherapeutic antibody drug discovery relies on the ability to identify leads from diverse repertoires of candidates, com-monly contained in antibody fragment combinatorial librar-ies or derived using traditional hybridoma technology.1 In contrast to small-molecule discovery, protein libraries are often initially screened from extracts or supernatants con-taining protein of variable and undetermined concentration, rather than using purified proteins. The starting point for antibody lead isolation thus frequently involves evaluating hybridoma supernatants2 following immunization in wild-type or transgenic mice3–5 or using large, diverse libraries of human antibodies in phage display format.6–8 Here, the single-chain Fv (scFv) repertoire has been cloned into phagemid vector pCantab6, where an amber codon allows switching between phage-displayed scFv (rescued using helper phage) and soluble scFv expression (induced with isopropyl-β-D-thio-galactoside [IPTG] via the lac promoter).9 Following
phage display selection from antibody libraries to enrich for target-specific clones,7 soluble scFv expression can be induced in Escherichia coli for further screening,10,11 resulting in highly focused, relatively low-throughput screening campaigns, typically around 10 to 20 000 scFv antibodies during lead isolation.
442962 JBXXXX10.1177/1087057112442962Smith et al.Journal of Biomolecular Screening
1MedImmune Ltd, Cambridge, UK2Life Technologies, Madison, WI, USA
Received Jan 6, 2012, and in revised form Feb 6, 2012. Accepted for publication Feb 26, 2012.
Supplementary material for this article is available on the Journal of Biomolecular Screening Web site at http://jbx.sagepub.com/supplemental.
Corresponding Author:Alison J. Smith, MedImmune Ltd, Milstein Building, Granta Park, Cambridge, CB21 6GH, UK Email: [email protected]
Feasibility of Implementing Cell-Based Pathway Reporter Assays in Early High-Throughput Screening Assay Cascades for Antibody Drug Discovery
Alison J. Smith1, Michael K. Hancock2, Kun Bi2, John Andrews1, Paula Harrison1, and Tristan J. Vaughan1
Abstract
Implementing functional cell-based screens in early antibody discovery has become increasingly important to select antibodies with the desired profile. However, this is limited by assay tolerance to crude antibody preparations and assay sensitivity. The current study aims to address this challenge and identify routes forward. Two common types of high-throughput screening (HTS) antibody sample, derived from either phage display or hybridoma techniques, have been screened across a wide range of CellSensor beta-lactamase reporter assays in a variety of cell backgrounds to more extensively characterize assay tolerance. Pathway-, sample-, and cell background–specific effects were observed. Reporter assays for agonism were less affected by crude antibody preparations, with 8 of 21 sample tolerant, and the potential to implement an additional 8 assays by choosing the best-tolerated sample type. Antagonist mode assays exhibited more complexity, with potentiating as well as inhibitory effects. However, 5 of 24 antagonist assays were fully tolerant, with the potential to implement an additional 11 assays. Different subsets of assays were affected in agonist versus antagonist mode, and hybridoma sample sets were better tolerated overall. The study clearly demonstrates the potential to use cell-based reporter assays in biologics HTS, particularly if the method of antibody production is considered in the context of the required assay mode (agonist/antagonist).
Keywords
antibody lead isolation, high-throughput screening assays, crude antibody samples, cell-based assay tolerance, reporter assays
Original Articles
714 Journal of Biomolecular Screening 17(6)
Common mechanisms of action for many therapeutic antibodies to date1,12 center on cell killing (engaging effec-tor function, directly triggering apoptosis, or delivering toxic payloads) or having an antagonistic or a neutralizing function.4,6,13 For blocking antibodies, successful screening campaigns have often been conducted using binding assays, such as biochemical receptor-ligand competition, to iden-tify inhibitory antibodies with high target specificity. Binding assays have also been used extensively in small-molecule screening, but widespread implementation of functional cell-based HTS (e.g., Kunapuli et al.14) has pro-vided opportunities to identify leads with more diverse sites or mechanisms of action. Target inhibition may not always be the desired mechanism, however, and there may be a rationale for developing antibodies with defined efficacy profiles such as agonists (e.g., Dobson et al.15), inverse ago-nists, and allosteric modulators.16 Another challenge is an increasing need to target complex multimembrane spanning receptors, which exist in dynamic conformational states and are challenging to screen in a nonmembrane context. Early implementation of functional cellular screens has thus become a more pressing need, with greater scope to identify functionally relevant epitopes17 and potentially reduce attrition.
Although later-stage titration and pharmacological char-acterization are likely to be done using purified proteins, primary HTS in hybridoma campaigns is initially conducted on crude antibody supernatants to prioritize which IgGs to take forward. In phage display campaigns, crude scFv extracts are again often the first-line screen, with subsequent purification or IgG conversion potentially rate limiting. Use of crude preparations has historically limited cell assay implementation in early antibody HTS cascades. The first issue is sensitivity of assays to detect effects of variable lev-els of crude, unpurified scFvs or IgGs during early lead iso-lation, before leads are affinity optimized. The expression level of scFv in E. coli is dependent on the primary sequence and can be extremely variable,11,18 with similar variations in protein concentration also observed in hybridoma superna-tants. Variable or low expression, the unknown concentra-tion of antibody fragments in crude preparations, a wide range of potential affinities,19 and potency shifts often observed between biochemical and cell assays all affect observed cellular responses.
The second issue is assay tolerance to crude bacterial preparations, with cell assays typically tolerating less than biochemical formats.17 By-products from bacterial cells and osmotic shock agents, used to release proteins from cells, can have adverse cellular effects, reducing responses or increasing variability. Pathogens express pathogen-associated molecular patterns (PAMPs), which are sensed by pattern recognition receptors (PRRs) and trigger innate immune responses.20 Toll-like receptors (TLRs) represent one of the most widely studied classes of PRRs, and many
recognize bacterial components.21 TLR subtypes use adap-tor molecules to elicit a wide range of signaling,20 with most converging on inflammatory pathways involving NFκB, JNK/p38/AP1, and interferon regulatory factors IRF3, 5, and 7. Lipopolysaccharide or endotoxin (LPS) is specifically recognized by TLR4, signaling via MyD88-dependent and -independent pathways to induce expres-sion of proinflammatory cytokines and interferons.22 There is also evidence for TLR-independent recognition of LPS, with HSP70/90, CXCR4, and GDF5 also poten-tially binding LPS.21 Components in hybridoma superna-tant medium, including serum/growth factors, may also affect functional cell assays.
To more fully characterize cell assay tolerance and examine the feasibility of implementing cell assays in early antibody screening cascades, the effects of two commonly used types of HTS antibody sample were systematically tested across a wide range of reporter assays. Unpurified E. coli–derived scFv and hybridoma supernatant samples, together with control medium and buffers, were screened in both ago-nist and antagonist modes across a broad panel of Life Technologies (Carlsbad, CA) CellSensor pathway reporter cell lines, encompassing a wide range of signaling path-ways in a variety of cell types. These assays use stable cell lines expressing the beta-lactamase reporter gene under control of pathway-specific transcriptional response ele-ments in various cell backgrounds. Beta-lactamase reporter technology is well suited for HTS due to its robust, ratio-metric fluorescence resonance energy transfer (FRET)–based readout that enables detection of subtle changes in signaling pathways.23 Here we show that some of these assays are tolerant to crude antibody HTS samples and have the potential to be applied in biologics HTS.
Materials and MethodsMaterials
Dulbecco’s modified Eagle’s medium (DMEM), gluta-mine, and penicillin/streptomycin were from Invitrogen (Paisley, UK); OPI media supplement and azaserine- hypoxanthine were from Sigma (Poole, UK); fetal bovine serum (FBS) was sourced from SAFC Biosciences (Lenexa, KS); and hybridoma cloning factor came from Roche Diagnostics (Mannheim, Germany). All other chemicals were standard analytical grade. For reporter assays, cell culture reagents, media, and LiveBLAzer kits were from Invitrogen (Madison, WI); control agonists were from Sigma or Invitrogen with the exceptions of tazobactam from LKT Laboratories (St. Paul, MN); mWnt3a, TGFb1, and sonic hedgehog from R&D Systems (Minneapolis, MN); doxycycline from MP Biomedicals (Solon, OH); and mitomycin C from Fermentek (Jerusalem, Israel).
Smith et al. 715
HTS Assay Sample Generation
The two representative antibody sample types, control buf-fers and control medium (Table 1), were produced at MedImmune (Cambridge, UK). Antigens used to generate antibody samples were carefully selected to minimize the likelihood of antibody-specific biological effects in the set of pathway assays chosen, with the aim of focusing more on generic screening conditions.
In E. coli, the secretion machinery directs proteins with specific signal sequences to the periplasm. Some may also leak into the culture supernatant, with the yield and relative periplasmic/supernatant expression of solu-ble scFv affected by growth and induction conditions.10 Here, periplasmic extracts containing unpurified soluble scFvs (peripreps) were prepared from E. coli TG1s using MS or MES osmotic shock buffers (Table 1). ScFv clones had been selected by phage display from antibody librar-ies using purified bovine thyroglobulin (a secreted thy-roid protein). Peripreps were pooled to generate a bulk sample containing a representative array of target-specific single chains. Buffer controls were also examined in parallel.
Hybridoma supernatant samples were generated fol-lowing a synthetic protein immunization in transgenic mice using a portion of the extracellular domain of a mam-malian ion channel; projects that had used cell-based immunizations were avoided. The transgenic mice pro-duce chimeric antibodies with human variable regions and mouse constant regions,3 and antibody-secreting hybrid-omas are generated following standard fusion techniques. Control medium and spent medium containing antibodies (Table 1) were both tested.
Reporter Assay Methodology
Cryopreserved, assay-ready banked vials of cells were thawed and resuspended in their designated assay medium (OptiMEM with 0.5% dialyzed FBS; DMEM + GlutaMax with 0.1% dialyzed FBS or OptiMEM with 0.5% newborn calf serum) and plated at 26 µL/well in 384-well plates (typically between 5000 and 25 000 cells/well). Cells were either preplated overnight or on the day of the assay, depend-ing on the cell line. Test samples were thawed at room tem-perature and the dilution series prepared in the designated assay medium, such that the final volume was normalized for delivering 10 µL/well. Samples were assessed for reporter assay effects over a range of concentrations repre-sentative of those that would typically be used in antibody HTS (1% to 25% final), in both agonist and antagonist modes (n = 4 wells/test). During the test sample preincuba-tion (30 min to 2 h), fresh control agonists were prepared at full-stimulation and EC
80 concentrations. Control agonists
were then applied to designated wells at 4 µL/well, with 4 µL/well of designated assay medium applied to the remain-ing wells (agonist mode test wells, unstimulated controls, and cell-free controls), giving a final volume of 40 µL/well in a 384-well format. Following 5 to 6 h of assay incuba-tion, 8 µL/well of 6× LiveBLAzer-FRET B/G (Invitrogen) substrate was applied to each well and incubated for 2 to 3 h at room temperature. Plates were read at 460 nm/530 nm emission on a Tecan Safire Tecan (Männedorf, Switzerland).
Data AnalysisData analysis was performed with Microsoft Excel (Microsoft, Redmond, WA). Background-subtracted
Table 1. Description Summary of the Sample Groups Tested
Sample Type and Abbreviation Composition
Control aqueous buffer (MS) 50 mM MOPS and 0.5 M sorbitol; pH 7.4Control aqueous buffer (MES) 50 mM MOPS, 0.5 mM EDTA, 0.5 M sorbitol; pH 7.4Periprep in MS buffer (MS_P) Unpurified single-chain antibodies expressed in Escherichia coli periplasm, recovered
by osmotic shock, centrifugation to remove cellular debris, and subsequent sampling of supernatant. Selections were performed using purified bovine thyroglobulin as antigen.
Periprep in MES buffer (MES_P) As above but in MES bufferControl hybridoma medium, not exposed
to cells (Hyb_C)Dulbecco’s modified Eagle’s medium (DMEM), 10% fetal bovine serum, hybridoma
cloning factora at 10%, 1% penicillin/streptomycin, 4 mM glutamine, OPI media supplement,b azaserine-hypoxanthinec
Hybridoma supernatant (Hyb_S) Spent medium (as above) in which hybridoma cultures had been grown. Supernatants contained murine antibodies raised following immunization with a synthetic peptide.
aContains 15% fetal calf serm, 1 mM oxaloacetate, 1 mM pyruvate, 0.2 µg/mL insulin, 1 ng/mL hIL6, and 10 ng/mL phorbol 12-myristate 13-acetate bFinal working concentration: 1 mM oxaloacetate, 0.45 mM pyruvate, 0.2 U/mL insulincFinal working concentration: 5.7 µM azaserine, 100 µM hypoxanthine.
716 Journal of Biomolecular Screening 17(6)
fluorescence was first calculated by subtracting mean sample-specific blue or green cell-free control values from the raw blue and green data. Background-subtracted blue data were divided by background-subtracted green data to produce 460/530-nm ratio values. Ratios were then con-verted to response ratios, normalizing the data by dividing sample blue/green ratios by mean unstimulated cell control values. Data were subsequently expressed as % activation relative to a control agonist or as % inhibition of an EC
80
agonist response in antagonist mode.Two-dimensional hierarchical cluster analysis of the
data set was performed to facilitate sample-to-sample, path-way-to-pathway, and cell background-to-background com-parisons. This was done using NCSS 2007 software (NCSS LLC, Kaysville, UT) and the group average (unweighted pair-group) linkage algorithm with Euclidean distance.
ResultsReporter Responses and Assay Performance
The panel of cell lines screened was chosen from Life Technologies’ portfolio of CellSensor pathway assays, with the current set encompassing 15 distinct signaling pathways in seven different cell types (Table 2). The widest range of response elements available was in a HEK293 background, and accordingly, the study compared sample effects across nine different pathways in those cells. Where the same response element was available in different backgrounds, including CHO-K1, Jurkat, HEK293T, or ME-180 (CRE in three backgrounds, NFκB in two backgrounds, NFAT in three backgrounds, AP1/c-fos pathways in two back-grounds), the effect of cellular context was also evaluated. Although primarily focused on cells commonly used to make recombinant cell lines such as HEK293 and CHO-K1, the study was extended to include the human epithelial colon cancer cell line HCT116 (three pathways), human epithelial cervical cancer lines HeLa and ME-180 (three pathways), and NIH3T3 mouse fibroblast cells (one path-way). Immune-derived cells, such as monocyte THP-1 and macrophage RAW264.7, were avoided due to a higher like-lihood of them expressing PRRs. An exception was 3 Jurkat (human T cell leukemia cell line) reporters used in cellular context comparisons for CRE, NFκB, and NFAT. Two con-trol CMV-bla lines (CHO-K1 and Jurkat backgrounds) were profiled in parallel to identify effects on general transcrip-tion, translation, or beta-lactamase enzyme activity.
Assay windows ranged from 2.5- to 25-fold above basal reporter gene levels (Suppl. Table S3). One cell line, NFAT HEK293T, had to be excluded due to low agonist responses (response ratio <2). Three cell lines (SBE HEK293T, AP1 ME-180, c-fos HEK293T) had maximum response ratios of between 2.5 and 3.0 but were deemed satisfactory for the purposes of the current study. Most assays were robust, with
full stimulation Z′ >0.60 for 67% of agonist assays and 79% of antagonist assays, increasing to 91% of agonist assays and 92% of antagonist assays at a lower Z′ cutoff of 0.40. In general, control full stimulation was broadly equivalent in agonist and antagonist runs, with the exception of NFκB assays, where a larger stimulation was noted in antagonist mode (performed on a different day) for both Jurkat and HEK293T. One of the advantages of the beta-lactamase reporter assay is that the FRET-based readout can provide an indication of cell viability in addition to the pathway reporter readout.14,23,24 With the exception of the FOXO3 assay, which appeared to be adversely affected by the high-est two concentrations of the MS/MES sample set, analysis of the raw data did not detect any obvious effects of the crude antibody samples on cell viability.
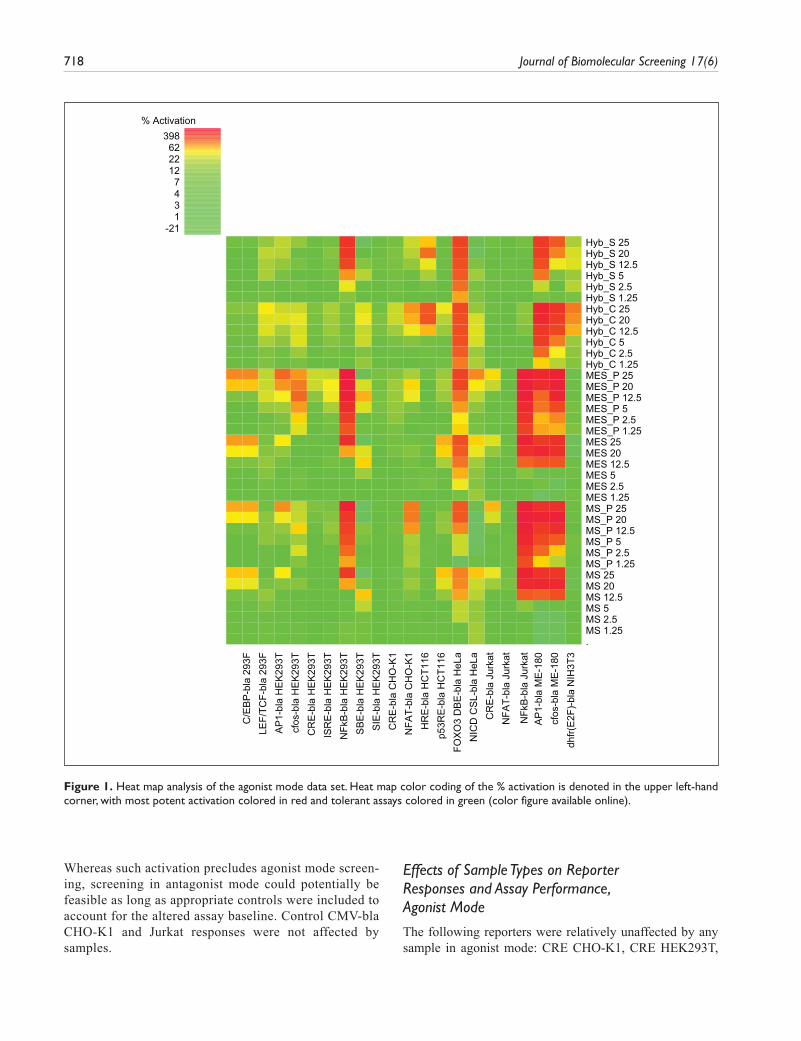
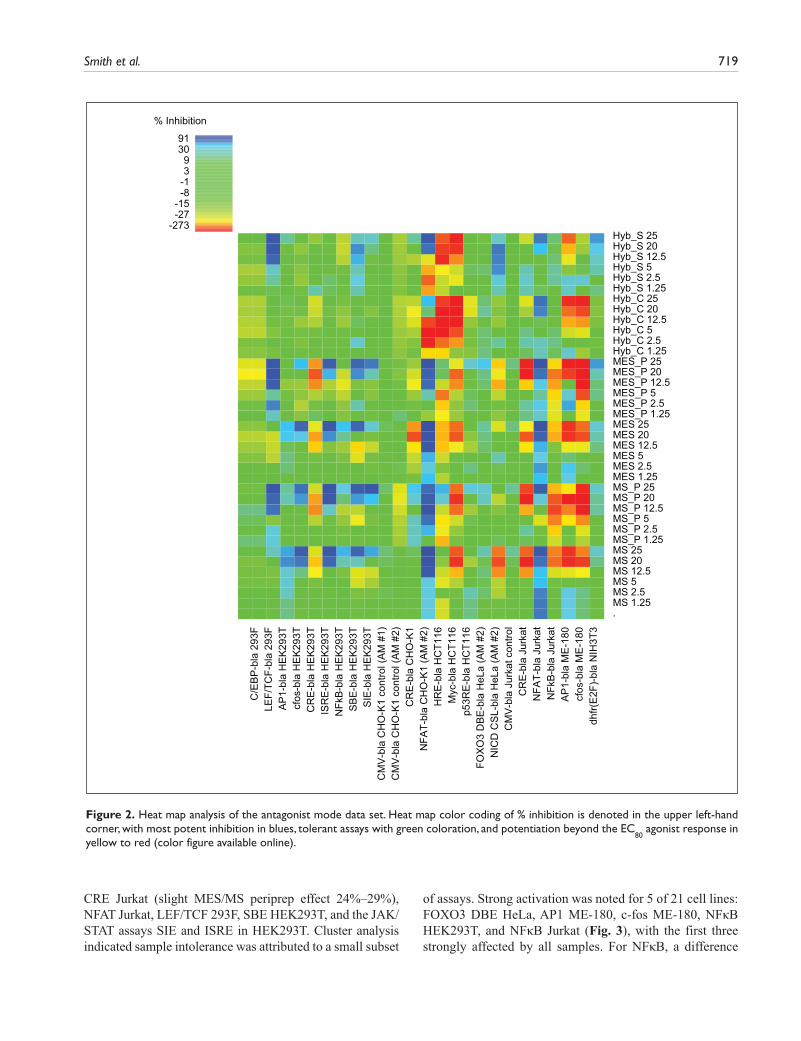
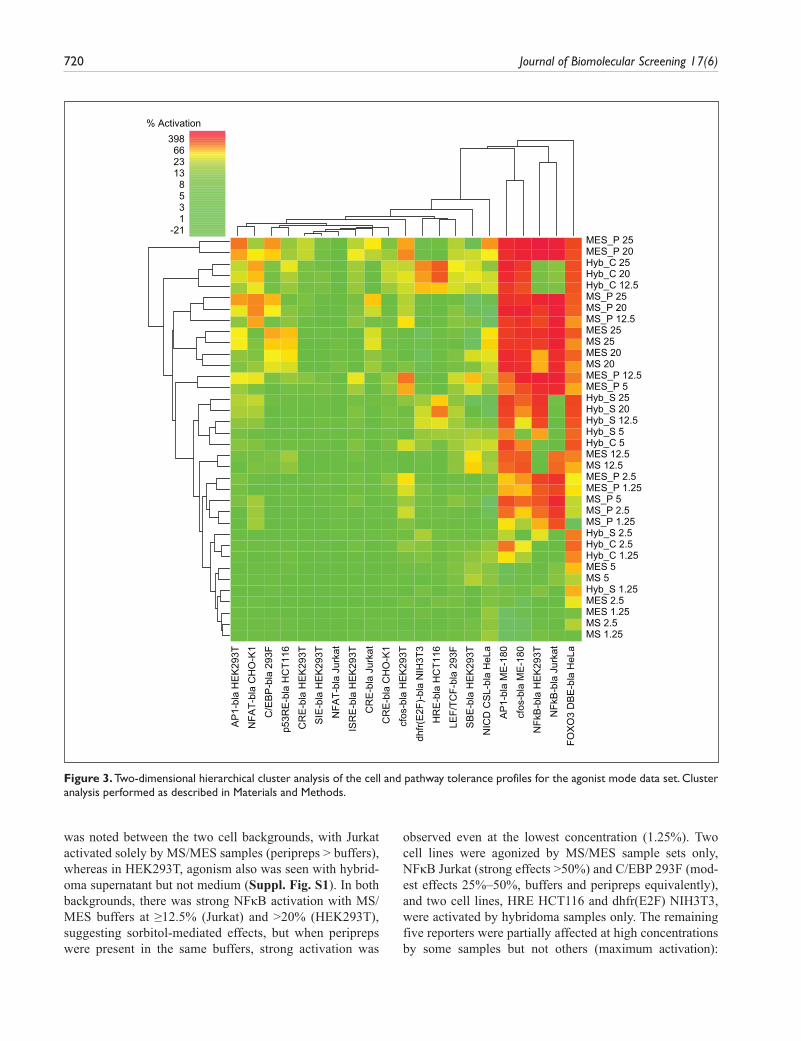
Agonist mode screening, in the basal state with no path-way stimulation, identified assays inherently susceptible to activation by generic antibody sample preparations and/or components of their respective controls. Antagonist mode screening, performed in the activated pathway state with known activators or using constitutively activated assays, was used to identify any inhibitory effects. Since significant activation or inhibition would diminish the potential assayable window, affected assays were flagged as intol-erant for screening antibodies generated using the described methods. To help interpret and visualize this complex data set and to analyze patterns in assay toler-ance, we performed 2D hierarchical cluster analysis of the data set. A set of heat maps was generated from the % activation or % inhibition normalized data sets (Figs. 1 and 2). These figures show the data sorted by cell back-ground, with sample types grouped together on the y-axis, but no clustering. Two-dimensional hierarchical cluster analysis was then applied, and the clustered data sets are shown in Figures 3 and 4. In agonist mode (Fig. 1), assays tolerant to the test samples are denoted in green and correspond to a cutoff of <25% activation. Assays exhibiting partial tolerance (25%–50% sample effects) are in yellow or pale orange, whereas intolerant assays are designated dark orange/red (>50% activation). Using these criteria (Fig. 3), 79% of the entire map area was green or relatively unaffected, suggesting most assays were tolerant to most samples in agonist mode. An addi-tional 8% of the map showed partial tolerance and 13% of samples were strongly activating, with assays therefore considered intolerant to those samples.
Antagonist mode (Fig. 2) is color-coded for tolerance in a similar manner, with greens representing assays that were relatively unaffected. It can be seen, however, that antagonist mode was more complex in that not only inhibitory effects (blues representing reduced tolerance) but also activating effects were detected (yellow to red gradation, as for agonist heat maps). As a result, only 63% of the antagonist heat map was clearly in the
Smith et al. 717
tolerant green zone (Fig. 4). Overall, 12% of the heat map displayed inhibition of the EC
80 agonist window,
with 6.3% exhibiting partial tolerance (25%–50% inhibi-tion, light blues) and 5.4% found to be intolerant (>50%
inhibition, dark blues). The remaining 25% of antagonist mode assays exhibited varying degrees of potentiation beyond the EC
80 control response, with yellow represent-
ing modest activation and red/orange strong activation.
Table 2. Description Summary of the Reporter Cell Lines Tested
Cell Line Response Element (RE) and Pathway Pathway
CRE-bla CHO-K1 cAMP RE: cAMP/PKA pathway activating CREB protein, which binds to CRE to modulate transcription
1
CRE-bla HEK293T As above CRE-bla Jurkat As above NFκB-bla Jurkat NFκB RE: NFκB pathway; activation of IkB kinase complex (IKK) phosphorylates
IkB proteins, releasing sequestered NFκB2
NFκB HEK293T As above NFAT-bla HEK293T Nuclear factor of activated T cells RE: PKC and Ca or T cell pathway, leading to
NFAT transcription factor activation3
NFAT-bla Jurkat As above NFAT-bla CHO-K1 As above LEF/TCF-bla 293F Lymphoid enhancer/T cell factor RE: Wnt/Frizzled/GSK3b/b-catenin pathway
activating TCF/LEF transcription factors4
C/EBP-bla 293F CCAAT/enhancer-binding protein family of bZIP transcription factors, regulating proliferation, differentiation, metabolism
5
SIE-bla HEK293T Sis-inducible element (SIE): JAK/STAT pathway; activated STAT3 homodimers or 3/1 heterodimers bind to the SIE promoter
6
ISRE-bla HEK293T Interferon stimulated RE: JAK/STAT pathway; activated STAT1/2 contribute to a complex (ISGF-3), which binds ISRE
7
SBE-bla HEK293T Smad binding element (SBE): TGFb pathway; phosphorylation of Smad 2/3 and recruitment of Smad4 for nuclear entry
8
AP1-bla HEK293T Activator protein-1 RE: PKC activation induces dimeric (jun/fos) AP-1 transcription complexes, which bind to AP-1 REs
9
AP1-bla ME-180 AP-1 RE: Ras/Raf/MAPK/AP-1 pathway in response to EGF; JAK/STAT1/3 and Ca/PKC also contribute to EGF signaling
cfos-bla HEK293T b-lac under control of c-fos promoter; the c-fos promoter contains 3 response elements: SIE, SRE (serum), and CRE (cAMP)
cfos-bla ME-180 c-fos promoter responding to many stimuli; JAK/STAT and MAPK pathways leading to c-Fos transcription and AP-1 activation
T-Rex NICD CSL-bla HeLa
Notch pathway; dox-inducible expression of NICD transcription factor, which interacts with transcriptional regulator CSL
10
T-Rex FOXO3 DBE-bla HeLa
FOXO3 RE: dox-induced expression of FOXO3 transcription factor is inhibited by insulin-stimulated PI3K/AKT signaling
11a
p53RE-bla HCT116 p53 RE: DNA damage/stress pathway; protein kinases activate tumor suppressor p53, causing cell cycle arrest via p21
12
HRE-bla HCT116 Hypoxia RE: hypoxia pathway; adaptation to hypoxia via transcriptional activation of genes by hypoxia-inducible factor 1
13
dhfr(E2F)-bla NIH3T3
Cell cycle pRB-E2F pathway; reporter under control of E2F/DP1 sequence from DHFR promoter; G1/S checkpoint control
14
Myc-bla HCT116 Reporter under control of Myc; constitutive activation of downstream genes such as Myc via expression of mutated β-catenin
15
CMV-bla CHO-K1 or Jurkat
Constitutive beta-lactamase expression; 1 mM of the beta-lactamase inhibitor tazobactam used as control
Control
All reporter cell lines were tested in both agonist and antagonist modes, with the exception of Myc-bla HCT116 due to its constitutive nature (antago-nist mode only); the assay window in this instance was defined with 1 mM of the beta-lactamase inhibitor tazobactam, as for the control cytomegalovi-rus (CMV) cell lines.aIn contrast to other reporter lines, which express increased beta-lactamase activity on pathway stimulation, the nature of the FOXO3-dependent reporter is unique in that when the pathway is stimulated by insulin, activation of AKT negatively regulates FOXO3, which decreases beta-lactamase activity.
718 Journal of Biomolecular Screening 17(6)
Whereas such activation precludes agonist mode screen-ing, screening in antagonist mode could potentially be feasible as long as appropriate controls were included to account for the altered assay baseline. Control CMV-bla CHO-K1 and Jurkat responses were not affected by samples.
Effects of Sample Types on Reporter Responses and Assay Performance, Agonist Mode
The following reporters were relatively unaffected by any sample in agonist mode: CRE CHO-K1, CRE HEK293T,
-211347
122262
398% Activation
C/E
BP
-bla
293
FLE
F/TC
F-bl
a 29
3FA
P1-
bla
HE
K29
3Tcf
os-b
la H
EK
293T
CR
E-b
la H
EK
293T
ISR
E-b
la H
EK
293T
NFk
B-b
la H
EK
293T
SB
E-b
la H
EK
293T
SIE
-bla
HE
K29
3TC
RE
-bla
CH
O-K
1N
FAT-
bla
CH
O-K
1H
RE
-bla
HC
T116
p53R
E-b
la H
CT1
16FO
XO
3 D
BE
-bla
HeL
aN
ICD
CS
L-bl
a H
eLa
CR
E-b
la J
urka
tN
FAT-
bla
Jurk
at
NFk
B-b
la J
urka
tA
P1-
bla
ME
-180
cfos
-bla
ME
-180
dhfr(
E2F
)-bl
a N
IH3T
3
.MS 1.25MS 2.5MS 5MS 12.5MS 20MS 25MS_P 1.25MS_P 2.5MS_P 5MS_P 12.5MS_P 20MS_P 25MES 1.25MES 2.5MES 5MES 12.5MES 20MES 25MES_P 1.25MES_P 2.5MES_P 5MES_P 12.5MES_P 20MES_P 25Hyb_C 1.25Hyb_C 2.5Hyb_C 5Hyb_C 12.5Hyb_C 20Hyb_C 25Hyb_S 1.25Hyb_S 2.5Hyb_S 5Hyb_S 12.5Hyb_S 20Hyb_S 25
Figure 1. Heat map analysis of the agonist mode data set. Heat map color coding of the % activation is denoted in the upper left-hand corner, with most potent activation colored in red and tolerant assays colored in green (color figure available online).
Smith et al. 719
CRE Jurkat (slight MES/MS periprep effect 24%–29%), NFAT Jurkat, LEF/TCF 293F, SBE HEK293T, and the JAK/STAT assays SIE and ISRE in HEK293T. Cluster analysis indicated sample intolerance was attributed to a small subset
of assays. Strong activation was noted for 5 of 21 cell lines: FOXO3 DBE HeLa, AP1 ME-180, c-fos ME-180, NFκB HEK293T, and NFκB Jurkat (Fig. 3), with the first three strongly affected by all samples. For NFκB, a difference
-273-27-15-8-139
3091
% Inhibition
C/E
BP
-bla
293
FLE
F/TC
F-bl
a 29
3FA
P1-
bla
HE
K29
3Tcf
os-b
la H
EK
293T
CR
E-b
la H
EK
293T
ISR
E-b
la H
EK
293T
NFk
B-b
la H
EK
293T
SB
E-b
la H
EK
293T
SIE
-bla
HE
K29
3TC
MV
-bla
CH
O-K
1 co
ntro
l (A
M #
1)C
MV
-bla
CH
O-K
1 co
ntro
l (A
M #
2)C
RE
-bla
CH
O-K
1N
FAT-
bla
CH
O-K
1 (A
M #
2)H
RE
-bla
HC
T116
Myc
-bla
HC
T116
p53R
E-b
la H
CT1
16FO
XO
3 D
BE
-bla
HeL
a (A
M #
2)N
ICD
CS
L-bl
a H
eLa
(AM
#2)
CM
V-b
la J
urka
t con
trol
CR
E-b
la J
urka
tN
FAT-
bla
Jurk
atN
FkB
-bla
Jur
kat
AP
1-bl
a M
E-1
80cf
os-b
la M
E-1
80dh
fr(E
2F)-
bla
NIH
3T3
.MS 1.25MS 2.5MS 5MS 12.5MS 20MS 25MS_P 1.25MS_P 2.5MS_P 5MS_P 12.5MS_P 20MS_P 25MES 1.25MES 2.5MES 5MES 12.5MES 20MES 25MES_P 1.25MES_P 2.5MES_P 5MES_P 12.5MES_P 20MES_P 25Hyb_C 1.25Hyb_C 2.5Hyb_C 5Hyb_C 12.5Hyb_C 20Hyb_C 25Hyb_S 1.25Hyb_S 2.5Hyb_S 5Hyb_S 12.5Hyb_S 20Hyb_S 25
Figure 2. Heat map analysis of the antagonist mode data set. Heat map color coding of % inhibition is denoted in the upper left-hand corner, with most potent inhibition in blues, tolerant assays with green coloration, and potentiation beyond the EC
80 agonist response in
yellow to red (color figure available online).
720 Journal of Biomolecular Screening 17(6)
was noted between the two cell backgrounds, with Jurkat activated solely by MS/MES samples (peripreps > buffers), whereas in HEK293T, agonism also was seen with hybrid-oma supernatant but not medium (Suppl. Fig. S1). In both backgrounds, there was strong NFκB activation with MS/MES buffers at ≥12.5% (Jurkat) and >20% (HEK293T), suggesting sorbitol-mediated effects, but when peripreps were present in the same buffers, strong activation was
observed even at the lowest concentration (1.25%). Two cell lines were agonized by MS/MES sample sets only, NFκB Jurkat (strong effects >50%) and C/EBP 293F (mod-est effects 25%–50%, buffers and peripreps equivalently), and two cell lines, HRE HCT116 and dhfr(E2F) NIH3T3, were activated by hybridoma samples only. The remaining five reporters were partially affected at high concentrations by some samples but not others (maximum activation):
-211358
132366
398% Activation
AP
1-bl
a H
EK
293T
NFA
T-bl
a C
HO
-K1
C/E
BP
-bla
293
F
p53R
E-b
la H
CT1
16
CR
E-b
la H
EK
293T
SIE
-bla
HE
K29
3T
NFA
T-bl
a Ju
rkat
ISR
E-b
la H
EK
293T
CR
E-b
la J
urka
t
CR
E-b
la C
HO
-K1
cfos
-bla
HE
K29
3T
dhfr(
E2F
)-bl
a N
IH3T
3
HR
E-b
la H
CT1
16
LEF/
TCF-
bla
293F
SB
E-b
la H
EK
293T
NIC
D C
SL-
bla
HeL
a
AP
1-bl
a M
E-1
80
cfos
-bla
ME
-180
NFk
B-b
la H
EK
293T
NFk
B-b
la J
urka
t
FOX
O3
DB
E-b
la H
eLa
MS 1.25MS 2.5MES 1.25MES 2.5Hyb_S 1.25MS 5MES 5Hyb_C 1.25Hyb_C 2.5Hyb_S 2.5MS_P 1.25MS_P 2.5MS_P 5MES_P 1.25MES_P 2.5MS 12.5MES 12.5Hyb_C 5Hyb_S 5Hyb_S 12.5Hyb_S 20Hyb_S 25MES_P 5MES_P 12.5MS 20MES 20MS 25MES 25MS_P 12.5MS_P 20MS_P 25Hyb_C 12.5Hyb_C 20Hyb_C 25MES_P 20MES_P 25
Figure 3. Two-dimensional hierarchical cluster analysis of the cell and pathway tolerance profiles for the agonist mode data set. Cluster analysis performed as described in Materials and Methods.
Smith et al. 721
NFAT CHO-K1 (hybridoma medium 37%, MS periprep 48%), AP1 HEK293T (MS/MES peripreps 39% and 53%), c-fos HEK293T (MES periprep 38%), p53 HCT116 (MS/MES buffers 27% and 31%), and NICD CSL HeLa (MES periprep 41%) (Fig. 1). Overall, hybridoma sample sets were less activating.
Closer examination of the affected assays identified both pathway and cell background–specific effects. The FOXO3 pathway in HeLa cells was the most overall affected in that all sample types had significant agonist effects with the exception of the lowest MS/MES buffer concentrations (≤5% final concentration). Regarding cell background influences,
-273-28-16-7-13
103191
% Inhibition
C/E
BP
-bla
293
FC
RE
-bla
CH
O-K
1A
P1-
bla
HE
K29
3TC
MV
-bla
CH
O-K
1 co
ntro
l (A
M #
1)C
MV
-bla
Jur
kat c
ontro
lFO
XO
3 D
BE
-bla
HeL
a (A
M #
2)dh
fr(E
2F)-
bla
NIH
3T3
p53R
E-b
la H
CT1
16cf
os-b
la H
EK
293T
NFk
B-b
la H
EK
293T
ISR
E-b
la H
EK
293T
SIE
-bla
HE
K29
3TC
MV
-bla
CH
O-K
1 co
ntro
l (A
M #
2)LE
F/TC
F-bl
a 29
3FS
BE
-bla
HE
K29
3TC
RE
-bla
HE
K29
3TC
RE
-bla
Jur
kat
NIC
D C
SL-
bla
HeL
a (A
M #
2)N
FkB
-bla
Jur
kat
cfos
-bla
ME
-180
AP
1-bl
a M
E-1
80N
FAT-
bla
Jurk
atH
RE
-bla
HC
T116
Myc
-bla
HC
T116
NFA
T-bl
a C
HO
-K1
(AM
#2)
MS 1.25MS 2.5MS 5MES 1.25MES 2.5MES 5MES_P 1.25MES_P 2.5MES_P 5Hyb_C 1.25Hyb_C 2.5Hyb_S 1.25Hyb_S 2.5Hyb_S 5MS_P 1.25MS_P 2.5MS_P 5MS 12.5MES 12.5Hyb_S 12.5Hyb_S 20Hyb_S 25Hyb_C 5Hyb_C 12.5Hyb_C 20Hyb_C 25MS_P 12.5MES_P 12.5MES_P 20MS 20MS 25MES 25MES 20MS_P 20MS_P 25MES_P 25
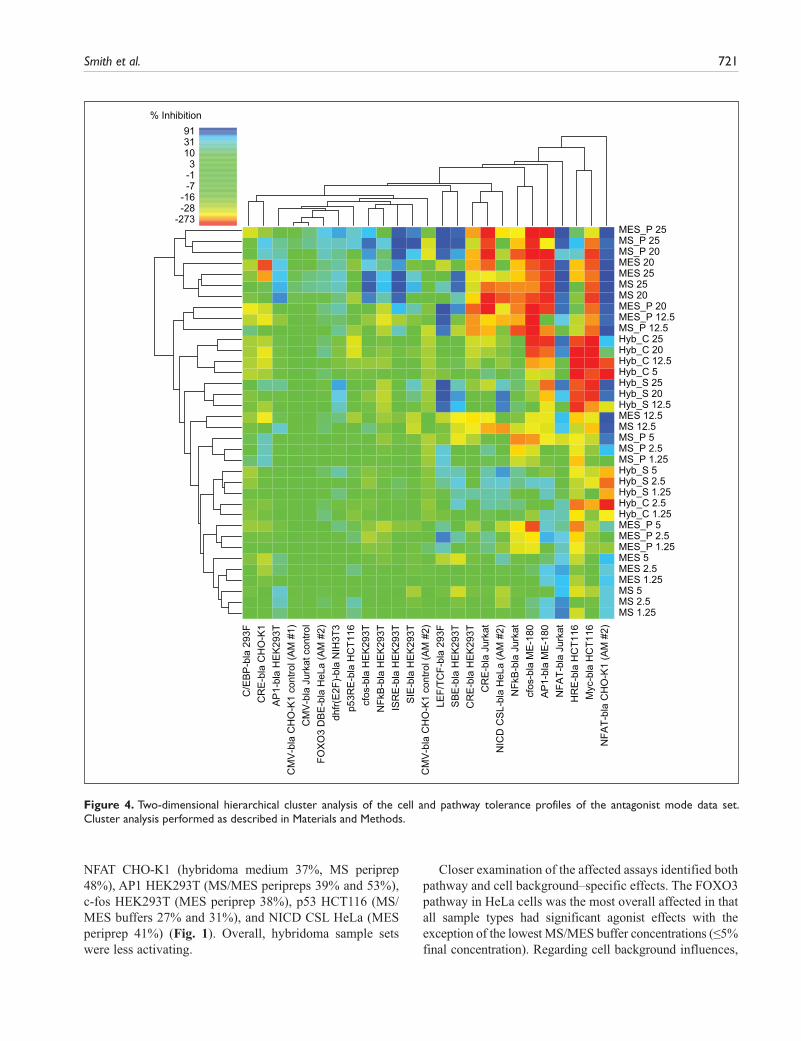
Figure 4. Two-dimensional hierarchical cluster analysis of the cell and pathway tolerance profiles of the antagonist mode data set. Cluster analysis performed as described in Materials and Methods.
722 Journal of Biomolecular Screening 17(6)
there was a pronounced difference in sample effects on the related MAPK pathway reporters AP1 and c-fos in ME-180 versus HEK293T cells. There was strong activation by all sample types in the context of an ME-180 background but to a much lesser extent, and by peripreps only, in the HEK293T background (Suppl. Fig. S2).
Effects of Sample Types on Reporter Responses and Assay Performance, Antagonist Mode
Detailed examination of the antagonist heat map indicated a number of tolerant cell lines, relatively unaffected by any sample: C/EBP 293F, FOXO3 HeLa, p53 HCT116, CMV CHO-K1, and CMV Jurkat. Cluster analysis was also used to compare the 24 antagonist mode assays, which were complicated by both inhibitory and activating effects. At the overview level, cluster analysis identified a large region in the data set that, with a few exceptions (e.g., LEF/TCF 293F) was relatively unaffected by test samples (Fig. 4, area below the MS_P 12.5 row for cell lines C/EBP 293F to NFκB Jurkat, left to right). The remaining cell lines to the right corresponded to a clus-tered subset of six assays affected by most sample types, whereas the area above the unaffected region corre-sponded to the clustered set of high concentration MS/MES peripreps and buffers, giving the most pronounced overall inhibition or activation. Since sorbitol is the pre-dominant component of these buffers by molar concentra-tion and is a known stressor, these effects may be attributable to the presence of sorbitol.
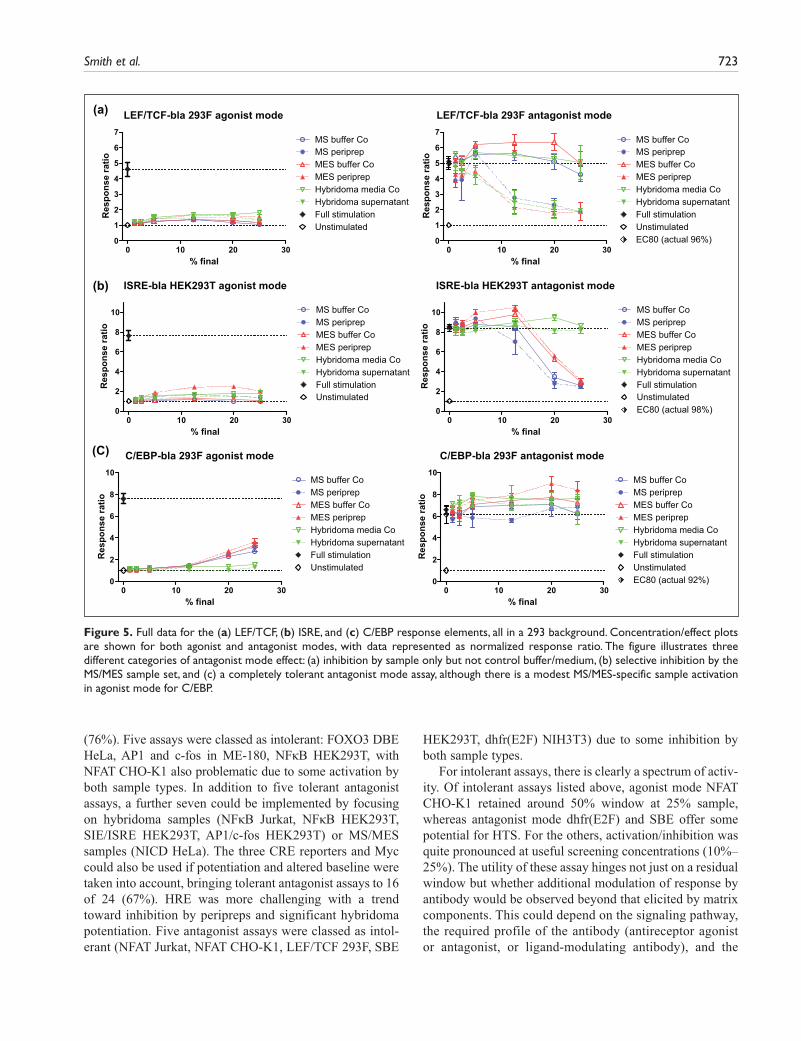
Nine cell lines showed a degree of strong inhibition (dark blue squares), typically at higher sample concentra-tions. MS/MES sample sets caused inhibition in eight of the cell lines tested and the hybridoma sample set in five (Fig. 2). Four reporters—NFAT CHO-K1, NFAT Jurkat, LEF/TCF 293F, and SBE HEK293T—were inhibited by all sample groups. Another four reporters were inhibited by the MS/MES sample sets only (AP1 HEK293T, c-fos HEK293T, ISRE HEK293T, and SIE HEK293T), and one was inhib-ited to a variable extent by hybridoma supernatant only (NICD HeLa). NFκB HEK293T was also selectively, but more modestly, inhibited by MS/MES samples. The assays most affected by strong inhibition in antagonist mode were NFAT CHO-K1 and NFAT Jurkat (Suppl. Fig. S3), where all samples inhibited, although in CHO-K1, there was a biphasic response to hybridoma samples with potentiation up to 12.5% and subsequent inhibition at ≥20%. These NFAT assays were either not affected (Jurkat) or modestly (CHO-K1) affected in agonist mode. LEF/TCF 293F was the next most inhibited but in a distinct pattern, by antibody samples but not control medium/buffers (Fig. 5a); other examples of differential responses in antagonist mode are
also shown in Figure 5. Overall, strong inhibition was more associated with MS/MES than with hybridoma sample sets.
In addition to inhibitory effects, further activation beyond EC
80 was also noted in antagonist mode. This strong poten-
tiation is denoted in red or dark orange in Figure 2 and generally affected a different subset of assays to those that showed inhibition. One exception, with mixed responses, was NFAT CHO-K1, where hybridoma samples potentiated at low doses but inhibited at >12.5%, whereas MS/MES sample sets were all strongly inhibitory, as above. Up to 10 assays showed some red coloration, with most clustering in the top right of the heat map, representing higher sample concentrations (Fig. 4).
Three reporters were potentiated by all sample groups in antagonist mode (Fig. 2): AP1 and c-fos were strongly potentiated beyond EC
80 in the ME-180 background, mirror-
ing the strong activation seen in agonist mode in these cells and contrasting with the parallel HEK293T background where MS/MES sample sets became inhibitory (Suppl. Fig. S2). The Myc reporter was also activated by all samples, above the con-stitutive level already inherent in this assay due to the myc-activating beta-catenin mutation in HCT116 cells. The hybridoma sample set, in addition to biphasic potentiation of NFAT-CHO-K1 responses, also selectively potentiated the HRE HCT116 reporter, reflecting the hybridoma-only activation in agonist mode. The dhfr(E2F) reporter, although activated by hybridoma samples in agonist mode, was not further potentiated by these samples in antagonist mode. For the MS/MES sample sets, Jurkat NFκB responses were selectively potentiated beyond EC
80, with peripreps exceed-
ing control buffers in a similar pattern to agonist mode, whereas in the parallel HEK293T background, the effects of these samples tended to became more inhibitory (Suppl. Fig. S1). Finally, NICD HeLa, CRE HEK293T, CRE Jurkat, and CRE CHO-K1 all exhibited some EC
80 potentiation in
response to MS/MES sample sets (Fig. 2). The CRE response elements were unusual in this regard in that activation in agonist mode was negligible.
DiscussionThe study identified three principal influences on reporter responses: bacterial component, osmotic stress, and serum/growth factor effects. The first two are represented in the MS/MES sample set and the third in the hybridoma set, which overall was better tolerated. In addition to assays with clear sample tolerance, potential to implement addi-tional assays was also identified. In addition to the eight tolerant agonist assays, NFκB Jurkat, C/EBP 293F, and AP1/c-fos HEK293T could also be implemented if run with hybridoma samples, whereas dhfr(E2F) NIH3T3 and HRE HCT116 could be used with MS/MES. There is also poten-tial to run NICD CSL HeLa and p53 HCT116 with hybrid-oma, bringing potentially tolerant agonist assays to 16 of 21
Smith et al. 723
(76%). Five assays were classed as intolerant: FOXO3 DBE HeLa, AP1 and c-fos in ME-180, NFκB HEK293T, with NFAT CHO-K1 also problematic due to some activation by both sample types. In addition to five tolerant antagonist assays, a further seven could be implemented by focusing on hybridoma samples (NFκB Jurkat, NFκB HEK293T, SIE/ISRE HEK293T, AP1/c-fos HEK293T) or MS/MES samples (NICD HeLa). The three CRE reporters and Myc could also be used if potentiation and altered baseline were taken into account, bringing tolerant antagonist assays to 16 of 24 (67%). HRE was more challenging with a trend toward inhibition by peripreps and significant hybridoma potentiation. Five antagonist assays were classed as intol-erant (NFAT Jurkat, NFAT CHO-K1, LEF/TCF 293F, SBE
HEK293T, dhfr(E2F) NIH3T3) due to some inhibition by both sample types.
For intolerant assays, there is clearly a spectrum of activ-ity. Of intolerant assays listed above, agonist mode NFAT CHO-K1 retained around 50% window at 25% sample, whereas antagonist mode dhfr(E2F) and SBE offer some potential for HTS. For the others, activation/inhibition was quite pronounced at useful screening concentrations (10%–25%). The utility of these assay hinges not just on a residual window but whether additional modulation of response by antibody would be observed beyond that elicited by matrix components. This could depend on the signaling pathway, the required profile of the antibody (antireceptor agonist or antagonist, or ligand-modulating antibody), and the
LEF/TCF-bla 293F agonist mode
0 10 20 300
1
2
3
4
5
6
7MS buffer CoMS periprepMES buffer CoMES periprepHybridoma media CoHybridoma supernatantFull stimulationUnstimulated
% final
Res
pons
e ra
tio
ISRE-bla HEK293T agonist mode
0 10 20 300
2
4
6
8
10 MS buffer CoMS periprepMES buffer CoMES periprepHybridoma media CoHybridoma supernatantFull stimulationUnstimulated
% final
Res
pons
e ra
tio
C/EBP-bla 293F agonist mode
0 10 20 300
2
4
6
8
10
Full stimulationUnstimulated
MS buffer CoMS periprepMES buffer CoMES periprepHybridoma media CoHybridoma supernatant
% final
Res
pons
e ra
tioLEF/TCF-bla 293F antagonist mode
0 10 20 300
1
2
3
4
5
6
7
Full stimulationUnstimulatedEC80 (actual 96%)
MS buffer CoMS periprepMES buffer CoMES periprepHybridoma media CoHybridoma supernatant
% final
Res
pons
e ra
tio
ISRE-bla HEK293T antagonist mode
0 10 20 300
2
4
6
8
10
Full stimulationUnstimulatedEC80 (actual 98%)
MS buffer CoMS periprepMES buffer CoMES periprepHybridoma media CoHybridoma supernatant
% finalR
espo
nse
ratio
C/EBP-bla 293F antagonist mode
0 10 20 300
2
4
6
8
10
Full stimulationUnstimulatedEC80 (actual 92%)
MS buffer CoMS periprepMES buffer CoMES periprepHybridoma media CoHybridoma supernatant
% final
Res
pons
e ra
tio
(a)
(b)
(C)
Figure 5. Full data for the (a) LEF/TCF, (b) ISRE, and (c) C/EBP response elements, all in a 293 background. Concentration/effect plots are shown for both agonist and antagonist modes, with data represented as normalized response ratio. The figure illustrates three different categories of antagonist mode effect: (a) inhibition by sample only but not control buffer/medium, (b) selective inhibition by the MS/MES sample set, and (c) a completely tolerant antagonist mode assay, although there is a modest MS/MES-specific sample activation in agonist mode for C/EBP.
724 Journal of Biomolecular Screening 17(6)
potential for cross-talk, synergy, or amplification in the pathway itself. The risks are that some leads may be missed or false positives identified.
The most affected agonist assay was FOXO3, which reports downstream of the PI3K/AKT pathway, well known to be modulated by serum/growth factors25, 26 and stress,27 including hyperosmotic shock. In antagonist mode, it was one of the least affected, which may be partly explained by its unique nature, where in the presence of the PI3K/AKT pathway agonist insulin, the FOXO3 reporter is inactivated. This renders it less sensitive in antagonist mode than assays either constitutively “on” or activated by their control ago-nists. NFκB and response elements in ME-180 cells were also subject to strong activation. ME-180 cells seemed hypersensitive to effects of all samples, and a general rec-ommendation would be to avoid this background. Reasons for the hyperresponsiveness are not clear, but the MAPK pathway in AP1 ME-180s can be stimulated by a wide vari-ety of ligands and receptors.28
NFκB is pivotal in orchestrating bacterial pattern recog-nition responses, evidenced here by strong periprep-induced NFκB activation. TLRs can also activate the AP1 and IRF families of transcription factors,20,22,29 and here, the AP1/c-fos HEK293T reporters were activated by peripreps. Effects of LPS on STAT transcription factors21 and the C/EBP family of basic leucine zipper transcription factors (e.g., C/EBPβ/δ30) have also been reported. Here, C/EBP was preferentially acti-vated by MS/MES sample sets, although less dramatically than NFκB, but interestingly to an equivalent extent by buf-fers and peripreps, suggesting a sorbitol effect. Conversely, JAK/STAT reporters (ISRE /SIE) were unaffected by any sample in agonist mode, although in antagonist mode, ISRE was strongly inhibited, and SIE more weakly, by peripreps and control buffers equally, suggesting a sorbitol sensitivity. Sorbitol can also affect MAPK/AP1 signaling. Sorbitol- or sucrose-induced hyperosmotic stress stimulates p38 MAP kinase, with prolonged exposure activating SAPK/JNK,31 leading to activation of the AP1 transcription complex.32 Here greater activation of AP1 and c-fos was observed with peripreps than with their buffers, although conversely in antagonist mode, inhibitory effects were seen in the HEK background, which were more pronounced with buffers. AP1 and c-fos effects thus appear to reflect a complex interplay between bacterial components and sorbitol.
For NFκB assays in both Jurkat and HEK293T, lower control full stimulation was noted in agonist versus antago-nist mode (3.63 vs. 8.04 and 5.13 vs. 23.75, respectively). The two modes were run on different days and may mean that sample effects in agonist mode were overestimated due to low control responses. However, agonism is still signifi-cant even if the full stimulation from antagonist mode is transposed onto agonist graphs, although this then makes HEK293T appear comparatively less strongly activated than Jurkat. Although strong activation of NFκB by MS/
MES samples was expected, particularly in Jurkat, addi-tional agonism by hybridoma supernatant in HEK293T versus Jurkat was unusual and requires further investiga-tion; none of the other reporters in 293F or 293T exhibited significant activation in response to hybridoma supernatant. The fact that some general activation of NFκB also occurred with control buffers also suggests a sorbitol effect.
For the two cell lines selectively stimulated by hybrid-oma samples, HRE HCT116 and dhfr(E2F) NIH3T3, results are likely explained by serum/growth factor effects. Serum activation of the hypoxia reporter has been previously reported in HRE HCT116 cells26 and also for the cell cycle reporter dhfr(E2F).33 In antagonist mode, a marked hybrid-oma-specific potentiation of the EC
80 response to deferox-
amine was observed in the HRE HCT116 reporter but not in serum-stimulated dhfr(E2F) NIH3T3, suggesting synergy between serum and deferoxamine, an iron chelator that sta-bilises HIF1α by inhibiting its degradation.
Most affected by strong inhibition in antagonist mode were the NFAT reporters, inhibited by all samples except for potentiation by low concentrations of hybridoma sample. The robustness of the latter effect needs to be further evalu-ated following this preliminary screen. In agonist mode, there was little or only modest activation of NFAT. Effects of sorbitol on Ca2+,34 protein kinases, and Rho-GTPases have been reported,32 with hyperosmotic stress inducing Ca2+ release from thapsigargin-sensitive intracellular stores.34 Dose-dependent depletion of Ca2+ stores by test sample pre-incubation could thus reduce thapsigargin’s subsequent abil-ity to release Ca2+ and drive NFAT signaling. Apart from NFAT assays, one striking thing about antagonist mode was the number of cell lines showing selective inhibition by the MS/MES sample set: NFκB HEK293T (strong activation in agonist mode), SIE HEK293T, ISRE HEK293T, SBE HEK293T (clean in agonist mode), AP1 HEK293T, and c-fos HEK293T (some activation in agonist mode). This may imply that sorbitol causes changes that affect subse-quent responses to the pathway agonist.
With regard to antagonist mode potentiation, the enhanced Myc activation, most pronounced with hybridoma samples, is likely due to serum stimulation of upstream mitogenic pathways such as MAPK/ERK/PI3K. The c-myc promoter contains sites for E2F transcription factor binding, which increases in response to serum.35 Potentiation of CRE report-ers in antagonist mode, typically more pronounced with MS/MES samples, was unusual in that agonist activation was negligible. This suggests that antagonist potentiation may be due to nonspecific synergistic effects with forskolin rather than direct cAMP/PKA activation. For example, stimulation of Ca2+ release by sorbitol34 has the potential to activate mul-tiple protein kinases, which could potentially synergize with the direct elevation of cAMP by forskolin.
In general, the pathway tended to influence sample responses more than the cell background. For CRE, samples
Smith et al. 725
behaved similarly across all three cell backgrounds in both modes, whereas for NFAT, no activation (Jurkat) or modest activation (CHO-K1) in agonist mode became strong inhi-bition for all samples in antagonist mode, although the hybridoma sample set was tolerated marginally better. Notable exceptions of cell background influencing observed pathway sample effects were NFκB in Jurkat versus HEK293T and the AP1/c-fos pathway in HEK293T versus ME-180. In the former, HEK293T but not Jurkat were affected by hybridoma supernatant in agonist mode, whereas in antagonist mode, MS/MES potentiation in Jurkat became inhibition in HEK293T. For AP1/c-fos there was a marked dif-ference in agonist mode activation between ME-180 and HEK293T, and in antagonist mode, ME-180 were further potentiated by MS/MES, whereas HEK293T were inhibited.
In addition to the principal influences on reporter responses identified here, a variety of other interactions are possible, including known pathway effects, nonspecific effects on transcription/translation affecting reporter activity, and path-way cross-talk. Agonist mode was generally less affected, with 79% of the heat map in the tolerant zone, reduced to 63% for antagonist mode. The latter also exhibited greater response variety, unsurprising given the potential for both direct potentiation or inhibition of agonist and indirect effects on signaling cascades. In general, different subsets of assays were affected in agonist versus antagonist mode, although there was some overlap in the agonist mode activa-tion and antagonist mode potentiation. This study is a useful initial screen of reporter assay tolerance to antibody HTS sam-ples and clearly demonstrates the potential to use cell-based reporter assays. Consideration of sample type or method of antibody production, in the context of the required assay mode, could further facilitate implementation of these assays.
Declaration of Conflicting Interests
The authors declared no potential conflicts of interest with respect to the research, authorship, and/or publication of this article.
Funding
The authors received no financial support for the research, author-ship, and/or publication of this article.
References
1. Albrecht, H.; Radosevich, J. A.; Babich, M. Fundamentals of Antibody-Related Therapy and Diagnostics. Drugs Today (Barc). 2009, 45(3), 199–211.
2. Kohler, G.; Milstein, C. Continuous Cultures of Fused Cells Secreting Antibody of Predefined Specificity. Nature 1975, 256, 495–497.
3. Valenzuela, D. M.; Murphy, A. J.; Frendewey, D.; Gale, N. W.; Economides, A. N.; Auerbach, W.; Poueymirou, W. T.; Adams, N. C.; Rojas, J.; Yasenchak, J.; et al. High-Throughput Engineering of the Mouse Genome Coupled with High-Resolution Expression Analysis. Nature Biotech. 2003, 21(6), 652–659.
4. Fuh, G.; Wu, P.; Liang, W.-C.; Ultsch, M.; Lee, C. V.; Moffat, B.; Wiesmann, C. Structure-Function Studies of Two Synthetic Anti-Vascular Endothelial Growth Factor Fabs and Comparison with the Avastin™ Fab. J. Biol. Chem. 2006, 281(10), 6625–6631.
5. Lonberg, N. Human Monoclonal Antibodies from Transgenic Mice. Handbook Exp. Pharmacol. 2008, 181, 69–97.
6. Machold, K. P.; Smolen, J. S. Adalimumab—A New TNF-alpha Antibody for Treatment of Inflammatory Joint Disease. Expert Opin. Biol. Ther. 2003, 3(2), 351–360.
7. Hoogenboom, H. R. Selecting and Screening Recombinant Antibody Libraries. Nat. Biotech. 2005, 23(9), 1105–1116.
8. Bradbury, A. R. M.; Sidhu, S.; Dubel, S.; McCafferty J. Beyond Natural Antibodies: The Power of In Vitro Display Technologies. Nat. Biotech. 2011, 29(3), 245–254.
9. Vaughan, T. V.; Williams, A. J.; Pritchard, K.; Osbourn, J. K.; Pope, A. R.; Earnshaw, J. C.; McCafferty, J.; Hodits, R. A.; Wilton, J.; Johnson, K. S. Human Antibodies with Sub- Nanomolar Affinities Isolated from a Large Non-Immunized Phage Display Library. Nat. Biotech. 1996, 14, 309–314.
10. Kipriyanov, S. M.; Moldenhauer, G.; Little, M. High Level Pro-duction of Soluble Single Chain Antibodies in Small-Scale Esch-erichia coli Cultures. J. Immunol. Methods. 1997, 200, 69–77.
11. Bradbury, A. R. M.; Marks, J. D. Antibodies from Phage Anti-body Libraries. J. Immunol. Methods. 2004, 290, 29–49.
12. Stockwin, L. H.; Holmes, S. The Role of Therapeutic Anti-bodies in Drug Discovery. Biochem. Soc. Trans. 2003, 31(2), 433–436.
13. Grütter, C.; Wilkinson, T.; Turner, R.; Podichetty, S.; Finch, D.; McCourt, M.; Loning, S.; Jermutus, L.; Grütter, M. G. A Cytokine-Neutralizing Antibody as a Structural Mimetic of 2 Receptor Interactions. Proc. Natl. Acad. Sci. U. S. A. 2008, 105(51), 20251–20256.
14. Kunapuli, P.; Ransom, R.; Murphy, K. L.; Pettibone, D.; Kerby, J.; Grimwood. S.; Zuck, P.; Hodder, P.; Lacson, R.; Hoffman, I.; et al. Development of an Intact Cell Reporter Gene Beta- Lactamase Assay for G Protein-Coupled Receptors for High-Throughput Screening. Anal. Biochem. 2003, 314(1), 16–29.
15. Dobson, C. L.; Main, S.; Newton, P.; Chodorge, M.; Cadwallader, K.; Humphreys, R.; Albert, V.; Vaughan, T. J.; Minter, P. R.; Edwards, B. M. Human Monomeric Antibody Fragments to TRAIL-R1 and TRAIL-R2 That Display Potent In Vitro Agonism. MAbs. 2009, 1(6), 552–562.
16. Kenakin, T. P. Ligand Detection in the Allosteric World. J. Biomol. Screen. 2010, 15(2), 119–130.
17. Cummins, E.; Luxenberg, D. P.; McAleese, F.; Widom, A.; Fennell, B. J.; Darmanin-Sheehan, A.; Whitters, M. J.; Bloom, L.; Gill, D.; Cunningham, O. A Simple High-Throughput Purifi-cation Method for Hit Identification in Protein Screening. J. Immunol. Methods. 2008, 339(1), 38–46.
18. Scott, N.; Reynolds, C. B.; Wright, M. J.; Qazi, O.; Fairweather, N.; Deonarain, M. P. Single-Chain Fv Phage Display Propensity Exhibits Strong Positive Correlation with Overall Expression Levels. BMC Biotechnol. 2008, 8, 97–107.

726 Journal of Biomolecular Screening 17(6)
19. Steukers, M.; Schaus, J.-M.; van Gool, R.; Hoyoux, A.; Richalet, P.; Sexton, D. J.; Nixon, A. E.; Vanhove, M. Rapid Kinetic-Based Screening of Human Fab Fragments. J. Immu-nol. Methods 2006, 310, 126–135.
20. Romagne, F. Current and Future Drugs Targeting One Class of Innate Immunity Receptors: The Toll-Like Receptors. Drug Discov. Today 2007, 12(1/2), 80–87.
21. Takeda, K.; Kaisho, T.; Akira, S. Toll-Like Receptors. Annu. Rev. Immunol. 2003, 21, 335–376.
22. Lu, Y.-C.; Yeh, W.-C.; Ohashi, P. S. LPS/TLR4 Signal Trans-duction Pathway. Cytokine 2008, 42, 145–151.
23. Xia, M.; Bi, K.; Huang, R.; Cho, M.-H.; Sakamuru, S.; Miller, S. C.; Li, H.; Sun, Y.; Printen, J.; Austin, C. P.; et al. Identification of Small Molecule Compounds That Inhibit the HIF-1 Signaling Pathway. Mol. Cancer 2009, 8, 117–129.
24. Hallis, T. M.; Kopp, A. L.; Gibson, J.; Lebakken, C. S.; Hancock, M.; VanDenHeuvel-Kramer, K.; Turek-Etienne, T. An Improved β-Lactamase Reporter Assay: Multiplexing with a Cytotoxicity Readout for Enhanced Accuracy of Hit Identifi-cation. J. Biomol. Screen. 2007, 12(5), 635–644.
25. Jiang, B.-H.; Jiang, G.; Zheng, J. Z.; Lu, Z.; Hunter, T.; Vogt, P. K. Phosphatidylinositol 3-Kinase Signaling Controls Levels of Hypoxia-Inducible Factor 1. Cell Growth Different. 2001, 12, 363–369.
26. Fukuda, R.; Hirota, K.; Fan, F.; Jung, Y. D.; Ellis, L. M.; Semenza, G. L. Insulin-Like Growth Factor 1 Induces Hypoxia-Inducible Factor 1–Mediated Vascular Endothelial Growth Factor Expression, Dependent on MAP kinase and Phosphati-dylinositol 3-Kinase Signaling in Colon Cancer Cells. J. Biol. Chem. 2002, 277(41), 38205–38211.
27. Ronai, Z. Deciphering the Mammalian Stress Response—A Stressful Task. Oncogene 1999, 18, 6084–6086.
28. Wilkinson, J. M.; Machleidt, T.; Echeverria, V. M.; VanDen-Heuvel-Kramer, K.; Honer, J.; Zhong, Z.; Bi, K. HTS Assays
Using a Disease-Relevant Cell Model for Interrogating the MAP Kinase Pathway Initiated by Multiple Receptors. Assay Drug. Dev. Technol. 2008, 6(3), 351–359.
29. McCoy, C. E.; Carpenter, S.; Palsson-McDermott, E. M.; Gearing, L. J.; O’Neil, L. A. Glucocorticoids Inhibit IRF3 Phosphorylation in Response to Toll-Like Receptor-3 and -4 by Targeting TBK1 Activation. J. Biol. Chem. 2008, 283(21), 14277–14285.
30. Lu, Y.-C.; Kim, I.; Lye, E.; Shen, F.; Suzuki, N.; Suzuki, S.; Gerondakis, S.; Akira, S.; Gaffen, S. L.; Yeh, W.-C.; et al. Differential Role for c-Rel and C/EBPβ/δ in TLR-Mediated Induction of Proinflammatory Cytokines. J. Immunol. 2009, 182, 7212–7221.
31. Lunn, J. A.; Rozengurt, E. Hyperosmotic Stress Induces Rapid Focal Adhesion Kinase Phosphorylation at Tyrosines 397 and 577. J. Biol. Chem. 2004, 279(43), 45266–45278.
32. Wang, L.; Payton, R.; Dai, W.; Lu, L. Hyperosmotic Stress-Induced ATF-2 Activation through Polo-Like Kinase 3 in Human Corneal Epithelial Cells. J. Biol. Chem. 2011, 286(3), 1951–1958.
33. Wells, J. M.; Illenye, S.; Magae, J.; Wu, C.-L.; Heintz, N. H. Accumulation of E2F-4.DP-1 DNA Binding Complexes Correlates with Induction of dhfr Gene Expression during the G1 to S Phase Transition. J. Biol. Chem. 1997, 272(7), 4483–4492.
34. Chiong, M.; Parra, V.; Eisner, V.; Ibarra, C.; Maldonado, C.; Criollo, A.; Bravo, R.; Quiroga, C.; Contreras, A.; Vicencio, J. M.; et al. Parallel Activation of Ca2+-Induced Survival and Death Pathways in Cardiomyocytes by Sorbitol-Induced Hyperos-motic Stress. Apoptosis 2010, 15, 887–903.
35. Mudryj, M.; Hiebert, S. W.; Nevins, J. A Role for the Adeno-virus Inducible E2F Transcription Factor in a Proliferation Dependent Signal Transduction Pathway. EMBO J. 1990, 9(7), 2179–2184.
Related Documents
![FELINE CORONAVIRUS (FCoV) [FIP] ANTIBODY TEST KIT · INSTRUCTION MANUAL Sufficient for 12/120 assays 22 APR 2018 FELINE CORONAVIRUS (FCoV) [FIP] ANTIBODY TEST KIT Biogal Galed Laboratories](https://static.cupdf.com/doc/110x72/5fd6f954c7247870b51a3ebf/feline-coronavirus-fcov-fip-antibody-test-kit-instruction-manual-sufficient.jpg)