Utah State University Utah State University DigitalCommons@USU DigitalCommons@USU Economic Research Institute Study Papers Economics and Finance 1996 Feasibility of Expanding the Market for Fish and Processed Fruit/ Feasibility of Expanding the Market for Fish and Processed Fruit/ Vegetables in Moab/Green River Vegetables in Moab/Green River DeeVon Bailey Utah State University Yasmin Adam Utah State University Follow this and additional works at: https://digitalcommons.usu.edu/eri Recommended Citation Recommended Citation Bailey, DeeVon and Adam, Yasmin, "Feasibility of Expanding the Market for Fish and Processed Fruit/ Vegetables in Moab/Green River" (1996). Economic Research Institute Study Papers. Paper 95. https://digitalcommons.usu.edu/eri/95 This Article is brought to you for free and open access by the Economics and Finance at DigitalCommons@USU. It has been accepted for inclusion in Economic Research Institute Study Papers by an authorized administrator of DigitalCommons@USU. For more information, please contact [email protected].

Welcome message from author
This document is posted to help you gain knowledge. Please leave a comment to let me know what you think about it! Share it to your friends and learn new things together.
Transcript
Utah State University Utah State University
DigitalCommons@USU DigitalCommons@USU
Economic Research Institute Study Papers Economics and Finance
1996
Feasibility of Expanding the Market for Fish and Processed Fruit/Feasibility of Expanding the Market for Fish and Processed Fruit/
Vegetables in Moab/Green River Vegetables in Moab/Green River
DeeVon Bailey Utah State University
Yasmin Adam Utah State University
Follow this and additional works at: https://digitalcommons.usu.edu/eri
Recommended Citation Recommended Citation Bailey, DeeVon and Adam, Yasmin, "Feasibility of Expanding the Market for Fish and Processed Fruit/Vegetables in Moab/Green River" (1996). Economic Research Institute Study Papers. Paper 95. https://digitalcommons.usu.edu/eri/95
This Article is brought to you for free and open access by the Economics and Finance at DigitalCommons@USU. It has been accepted for inclusion in Economic Research Institute Study Papers by an authorized administrator of DigitalCommons@USU. For more information, please contact [email protected].
Economic Research Institute Study Paper
ERI#96-29
FEASIBILITY OF EXPANDING THE MARKET FOR FISH AND
PROCESSED FRUITNEGETABLES IN MOAB/GREEN RIVER
by
DEEVON BAILEY
and
YASMINADAM
Department of Economics Utah State University
3530 University Boulevard Logan, UT 84322-3530
August 1996
FEASIBILITY OF EXPANDING THE MARKET FOR FRESH AND
PROCESSED FRUITNEGETABLES IN MOAB/GREEN RIVER
Dee V on Bailey, Professor Yasmin Adam, Research Assistant
Department of Economics Utah State University
3530 University Boulevard Logan, UT 84322-3530
11
The analyses and views reported in this paper are those of the author(s). They are not necessarily endorsed by the Department of Economics or by Utah State University.
Utah State University is committed to the policy that all persons shall have equal access to its programs and employment without regard to race, color, creed, religion, national origin, sex, age, marital status, disability, public assistance status, veteran status, or sexual orientation.
Information on other titles in this series may be obtained from: Department of Economics, Utah State University, 3530 University Boulevard, Logan, Utah 84322-3530.
Copyrigh t © 1996 by Dee V on Bailey and Yasmin Adam. All rights reserved. Readers may make verbatim copies of this document for noncommercial purposes by any means, provided that this copyright notice appears on all such copies.
FEASIBILITY OF EXPANDING THE MARKET FOR FRESH AND
PROCESSED FRUITNEGETABLES IN MOAB/GREEN RIVER
Dee Von Bailey and Yasmin Adam
ABSTRACT
111
The potential market size for a fresh fruit and vegetable market was estimated based on a
consumer survey of visitors to Moab and Green River during the first week of September 1995. It
is estimated that local growers could sell approximately $500,000 worth of locally growth produce
between June and October each year. A jam/jelly plant would likely be a profitable venture if the
plant is built in Green River and the products are marketed in both Moab and Green River.
LIST OF TABLES
Page
1. Descriptive Characteristics of Persons Surveyed in Moab and Green River . . . . . . . . . . . 3
2. Items Visitors Indicated They are Most Likely to Buy in the Moab and Green River Areas Listed in Descending Order of Preference . . . . . . . . . . . . . . . . . . . . . . . . . . . . . . . . . . . . 8
3. Characteristics of Fruit and Vegetable Markets and Items Purchased to Take Home that Visitors Indicated were Important to Them Listed in Descending Order of Preference .. 8
4. Estimates for Visitors to Moab, Food Expenditures, and Market Share for Fresh Fruits/Vegetables that Would be Purchased at a Farmers' Market . . .. . . .. . . . . ..... 10
5. Estimated Value of Sales of Local Produce at a Market in Moab . .. ... . .... . ..... 10
6. Estimates of Value of Purchases of Local Produce and Corresponding Acreage .. . . . .... . . . . . ... . . .. . ... . . . .... . ... . ....... . .. . ... .. . .... . . 12
7. Estimated Yields for Selected Fruit and Vegetable Crops . . . . . . . . . . . . . . . . . . . . . . . 13
8. Estimated Returns to Land and Management for Growing Selected Fruits and Vegetables and Selling at Wholesale Prices to Traditional First Handlers . .. ... . . . . ... . ... .. ... . . . . . . .. . . . . ... . ... . .... ... .. . ... . . .. 13
9. Estimated Market Size for a Local Jam/Jelly Business in Green River and Moab ... . . 15
10. Estimated Fixed and Variable Costs for a Jam/Jelly Plant ..... .. .. .. .... ........ 17
11. Estimated Costs per Year for Selected Variable Inputs at Different Levels of Production for the Green River Plant ($) ..... . ... . . . . .... . .. . ... . ... .. . .... .. .. .. . .. 18
12. Estimated Costs per Year for Selected Variable Inputs at Different Levels of Production for the Moab Plant ($) . . . . . . . . . . . . . . . . . . . . . . . . . . . . . . . . . . . . . . . . . . . . . . . . . 19
13. Break-Even, Fixed, Variable, and Labor Costs per Jar for the Moab and Green River Plants ($) . . . . . . . . . . . . . . . . . . . . . . . . . . . . . . . . . . . . . . . . . . . . . . . . . . . . . . . . . . . 20
14. Summary of Financial Measures for Green River and Moab Plants for Different Levels of Production . . . . . . . . . . . . . . . . . . . . . . . . . . . . . . . . . . . . . . . . . . . . . . . . . . . . . . . . . . 21

TABLE OF CONTENTS
Page
List of Tables . . . . . . . . . . . . . . . . . . . . . . . . . . . . . . . . . . . . . . . . . . . . . . . . . . . . . . . . . . . . . . iii
Introduction . . ...... ........... ... . .... .. . .... . .. . . .. . .. ... . .... . . . ... . . . .. 1
Survey of Visitors to Green RiverlMoab .... ... ... . ...... .. . . ....... .... .... . ... . . 2
Where do Visitors Buy Food? . . . ............ .... . . . ... ........ . .. ... . .. .. 2 What do Visitors Want to Buy and What Influences Them to Buy? .... .. .. . ....... 7
Estimated Sales for a Fresh Fruit/Vegetable Market in Moab . .. . . . .. .. ..... . ........... 9 Summary and Conclusions Regarding Fresh Fruit/Vegetable Market in Moab . ... .. . ... . .. 14 Analysis of Jam/Jelly Plant in Green River and Moab . . . .. . . . .... . .......... ....... .. 14
Fixed and Variable Costs . . . . . . . . . . . . . . . . . . . . . . . . . . . . . . . . . . . . . . . . . . . . . . . 16 Estimated Break-Even Prices and Financial Analysis ... ... . ................ . .. 19
Summary and Conclusions for Jam/Jelly Plant Analysis . ...... . .. . ... . .... .. ...... . .. 20 Appendix ... . . . .... .. .. .. . . .......... . ... .. . . ... .. . . .. ...... . . . ...... .. ... 22
FEASmILITY OF EXPANDING THE MARKET FOR FRESH AND
PROCESSED FRUITNEGETABLES IN MOAB/GREEN RIVER!
INTRODUCTION
Almost 1 million people visit the Moab area each year and over 2 million more pass through the city of Green River. Farmers in these areas are interested in developing markets for the crops they produce and are naturally interested in the possibility of producing products that could be sold to visitors in their area(s). This study was completed at the request of Grand and Emery Counties to ascertain which fresh fruit and vegetables would be in greatest demand by visitors and also to determine if processed fruit products (i.e., jams and jellies) could be produced and sold profitably to visitors.
For example, melons represent an important crop in Emery County, especially in the Green River area. Melon growers in Green River have successfully marketed melons (watermelons and cantaloupes) from roadside stands for many years. Green River melons have an excellent reputation in Utah, and people have been known to drive from the Wasatch Front area to buy melons in Green Riven when the melons are in season. Green River's location on I-70, a major east-west traffic artery, has also made selling melons from roadside stands attractive for many years. However, cool spring weather makes Green River's melon season come late in the summer, thus limiting market potential, since consumer demand for melons declines dramatically after Labor Day.
This seasonality problem has caused melon producers in the Green River area to consider alternatives for producing melon -based products which are not highly perishable and which could extend the marketing season. Some growers already sell some melon jellies at their roadside stands, and this study examined the feasibility of expanding melon jelly production.
Farmers in Moab are interested not only in the jam and jelly market but also in developing the market for locally grown fruits and vegetables. While Green River is widely known for it melons, Moab has some additional advantages that may also make it a good candidate for expanding the amount of fruits and vegetables produced there. For example, the growing season in Moab in longer than in Green River and visitors also stay longer in Moab than Green River. This offers the possibility of producing a greater variety of fruit and vegetable crops in Moab and also offers a larger potential market than exists in Green River. This
lResults obtained under contract between Grand County and Utah State University.
study examines the feasibility of expanding the amount of fruits and vegetables that could be grown and sold in the Moab area as well as presenting a market analysis for jams and jellies plant that might be built in Moab.
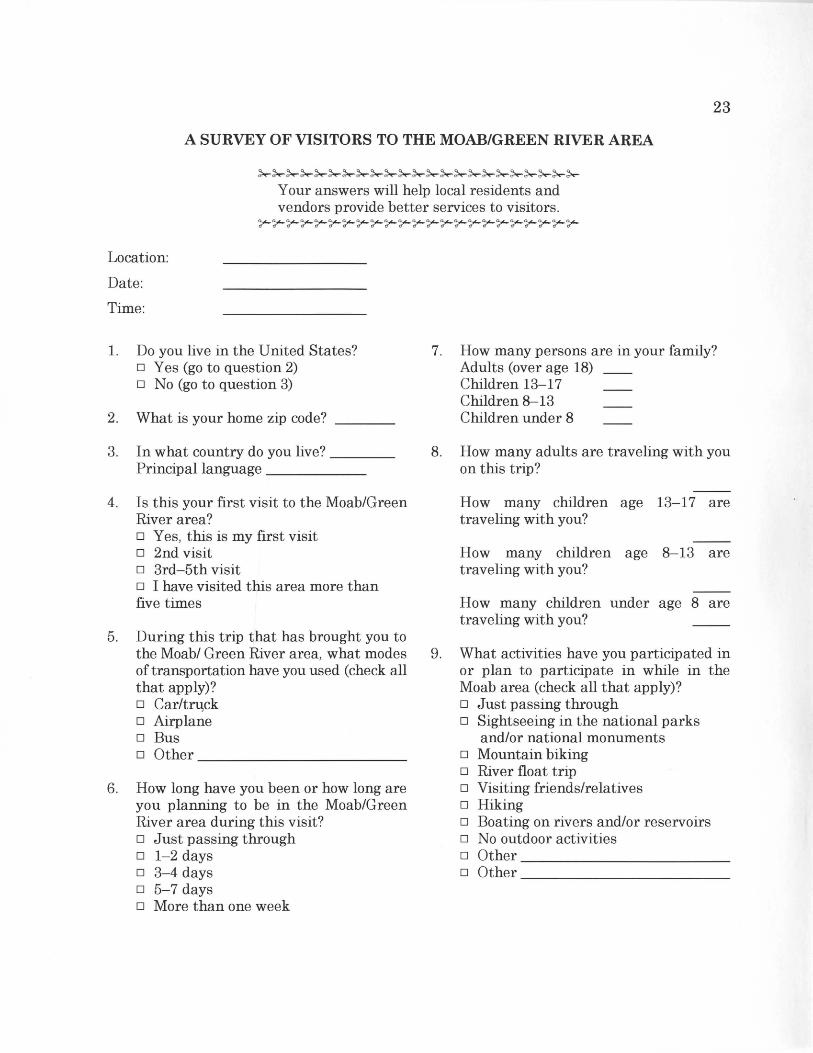
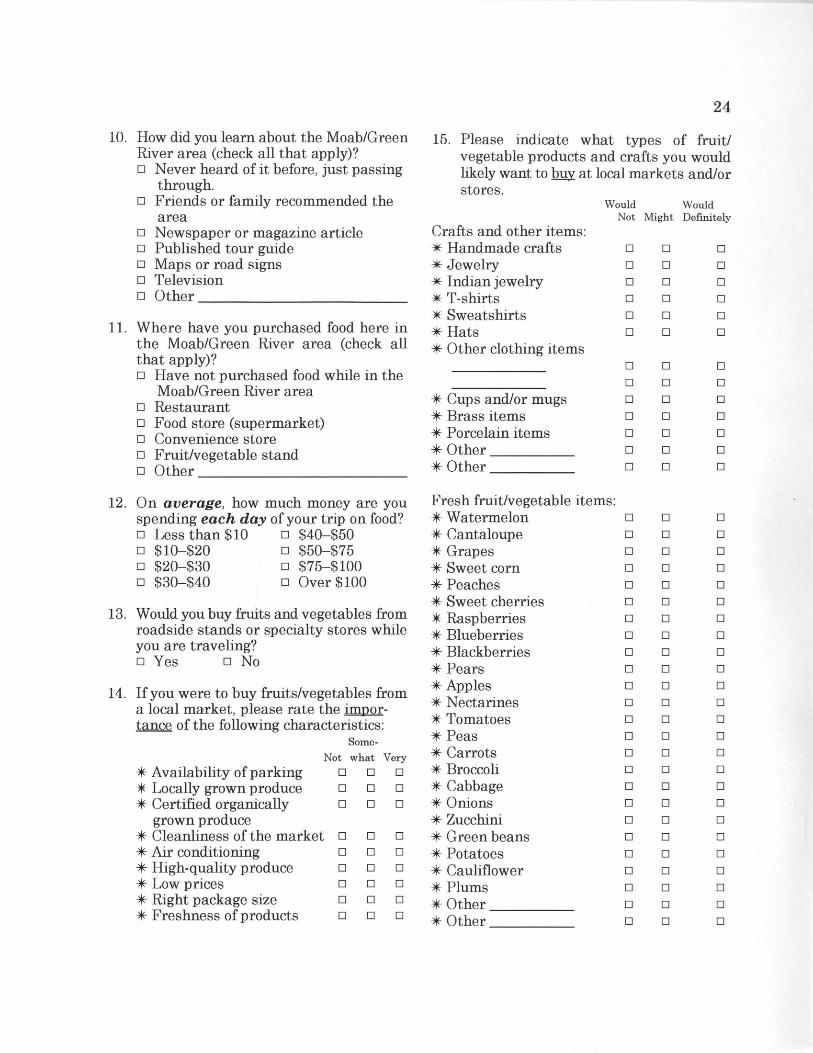
This analysis was undertaken in three parts. First, a survey was administered during September 1995 to visitors in both Moab and Green River to ascertain the types of fresh and processed fruit products they would like to buy. There were 308 surveys conducted at various outdoor locations in both Moab and Green River during the Labor Day weekend of 1995. Based on the responses from the survey, an analysis of the number of visitors to both locations (Moab and Green River) and the local growing season for different fruit and vegetable crops was completed to estimate the demand for different fresh fruits and vegetables and processed fruit products. Finally, a financial analysis was conducted for a small processing plant for jams and jellies based on the estimated demand for these products.
SURVEY OF VISITORS TO GREEN RIVERIMOAB
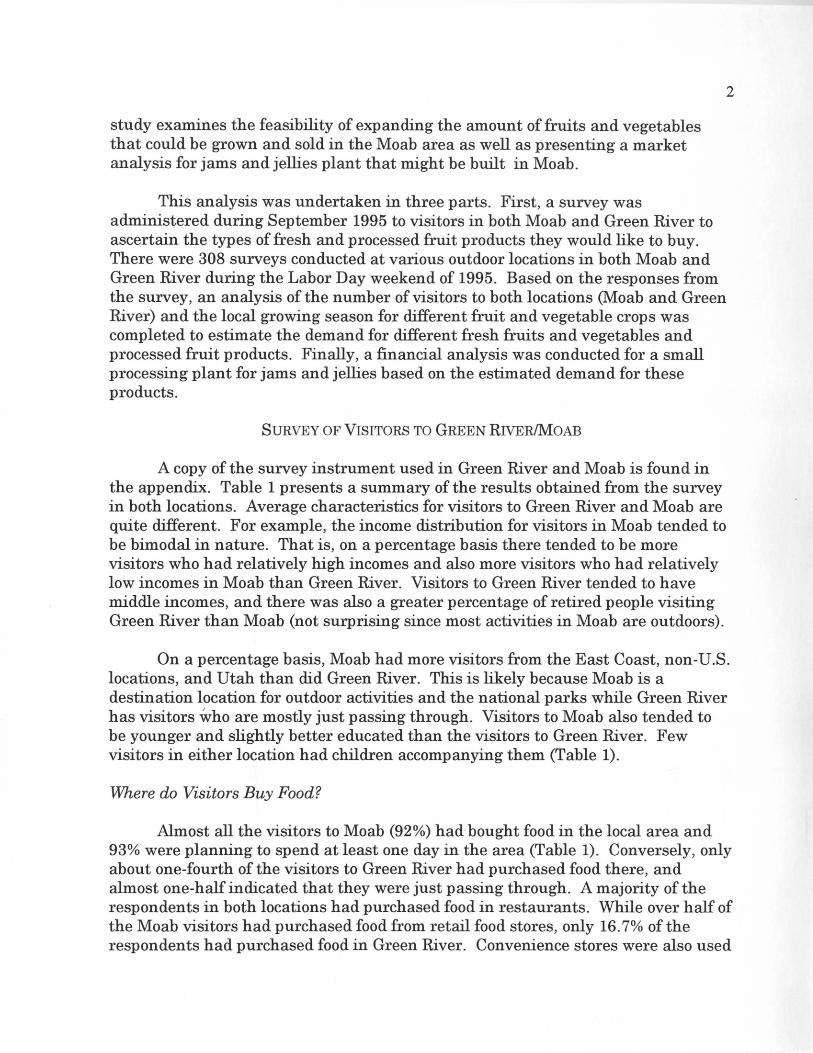
A copy of the survey instrument used in Green River and Moab is found in the appendix. Table 1 presents a summary of the results obtained from the survey in both locations. Average characteristics for visitors to Green River and Moab are quite different. For example, the income distribution for visitors in Moab tended to be bimodal in nature. That is, on a percentage basis there tended to be more visitors who had relatively high incomes and also more visitors who had relatively low incomes in Moab than Green River. Visitors to Green River tended to have middle incomes, and there was also a greater percentage of retired people visiting Green River than Moab (not surprising since most activities in Moab are outdoors).
2
On a percentage basis, Moab had more visitors from the East Coast, non-U.S. locations, and Utah than did Green River. This is likely because Moab is a destination location for outdoor activities and the national parks while Green River has visitors who are mostly just passing through. Visitors to Moab also tended to be younger and slightly better educated than the visitors to Green River. Few visitors in either location had children accompanying them (Table 1).
"Where do Visitors Buy Food?
Almost all the visitors to Moab (92%) had bought food in the local area and 93% were planning to spend at least one day in the area (Table 1). Conversely, only about one-fourth of the visitors to Green River had purchased food there, and almost one-half indicated that they were just passing through. A majority of the respondents in both locations had purchased food in restaurants. While over half of the Moab visitors had purchased food from retail food stores, only 16.7% of the respondents had purchased food in Green River. Convenience stores were also used
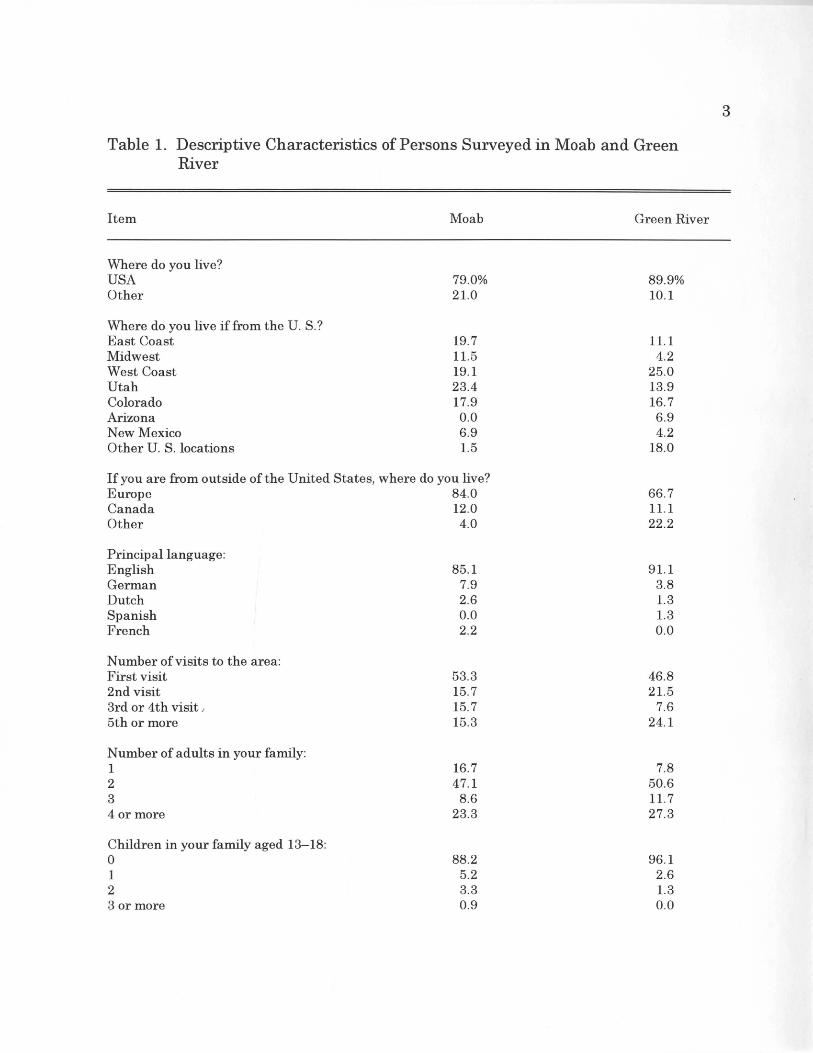
Table 1. Descriptive Characteristics of Persons Surveyed in Moab and Green River
Item
Where do you live? USA Other
Where do you live if from the U . S.? East Coast Midwest West Coast Utah Colorado Arizona New Mexico Other U. S. locations
Moab
79.0% 21.0
19.7 11.5 19.1 23.4 17.9 0.0 6.9 1.5
If you are from outside of the United States, where do you live? Europe 84.0 Canada 12.0 Other 4.0
Principal language: English German Dutch Spanish French
N umber of visits to the area: First visit 2nd visit 3rd or 4th visit / 5th or more
Number of adults in your family: 1 2 3 4 or more
Children in your family aged 13-18: o 1 2 3 or more
85.1 7.9 2.6 0.0 2.2
53.3 15.7 15.7 15.3
16.7 47.1
8.6 23.3
88.2 5.2 3.3 0.9
Green River
89.9% 10.1
11.1 4. 2
25.0 13.9 16.7 6.9 4.2
18.0
66.7 11.1 22.2
91.1 3.8 1.3 1.3 0.0
46.8 21.5
7.6 24.1
7.8 50.6 11.7 27.3
96.1 2.6 1.3 0.0
3
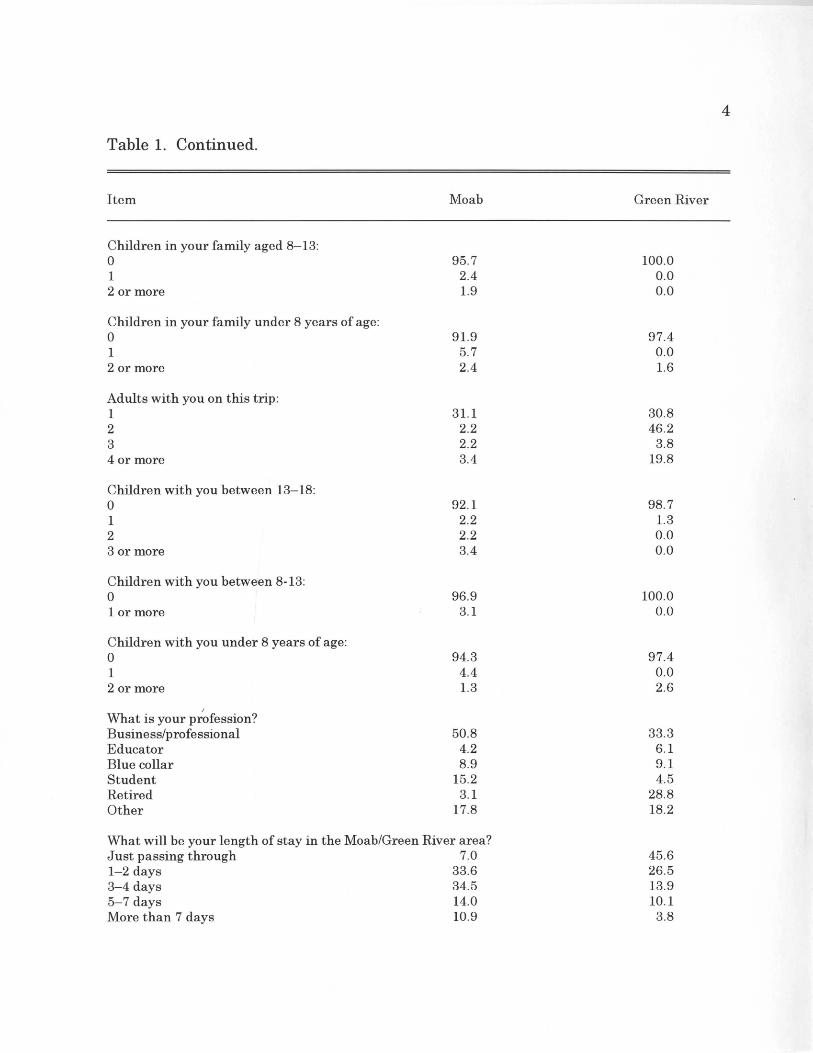
Table 1. Continued.
Item
Children in your family aged 8-13: o 1 2 or more
Children in your family under 8 years of age: o 1 2 or more
Adults with you on this trip : 1 2 3 4 or more
Children with you between 13-18: o 1 2 3 or more
Children with you between 8-13: o lor more
Children with you under 8 years of age: o 1 2 or more
What is your p~ofession? Business/professional Educator Blue collar Student Retired Other
Moab
95.7 2.4 1.9
91.9 5.7 2.4
31.1 2.2 2.2 3.4
92.1 2.2 2.2 3.4
96.9 3.1
94.3 4.4 1.3
50.8 4.2 8.9
15.2 3.1
17.8
What will be your length of stay in the Moab/Green River area? Just passing through 7.0 1-2 days 33.6 3-4 days 34.5 5-7 days 14.0 More than 7 days 10.9
Green River
100.0 0.0 0.0
97.4 0.0 1.6
30.8 46.2
3.8 19.8
98.7 1.3 0.0 0.0
100.0 0.0
97.4 0.0 2.6
33.3 6.1 9.1 4.5
28.8 18.2
45.6 26.5 13.9 10.1
3.8
4
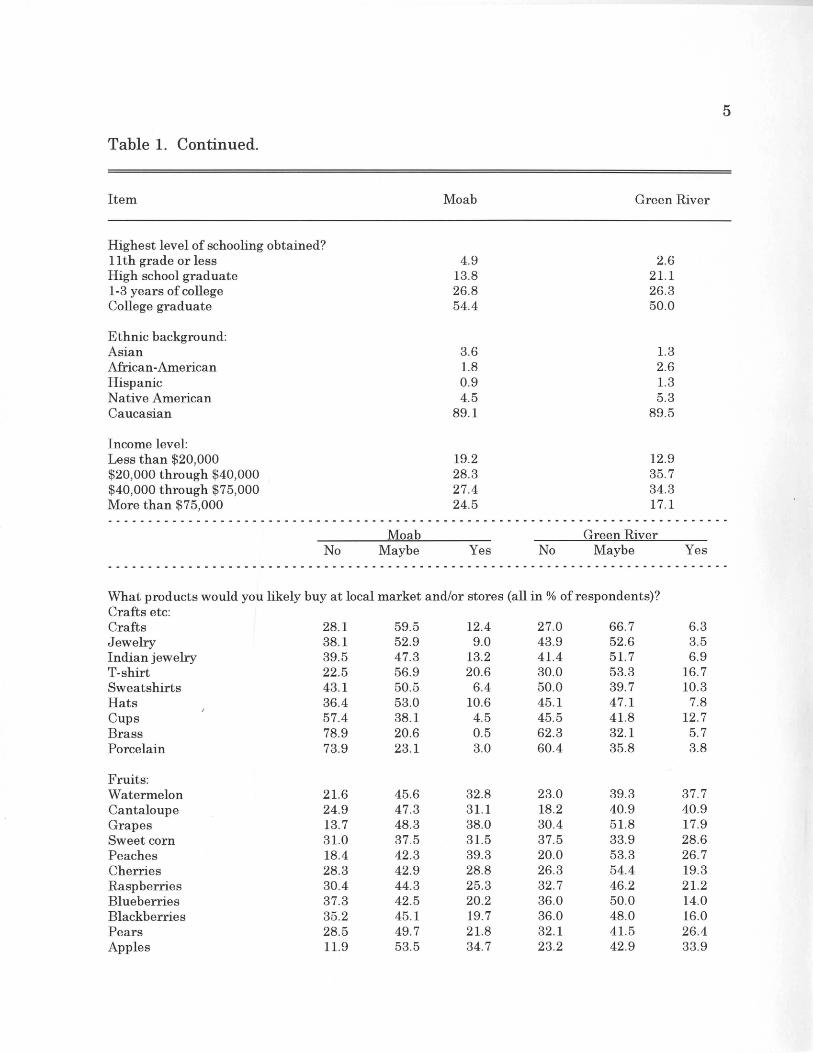
Table 1. Continued.
Item
Highest level of schooling obtained? 11 th grade or less High school graduate 1-3 years of college College graduate
Ethnic background: Asian African -American Hispanic Native American Caucasian
Income level: Less than $20,000 $20,000 through $40,000 $40,000 through $75,000 More than $75,000
5
Moab Green River
4.9 2.6 13.8 21.1 26.8 26.3 54.4 50.0
3.6 1.3 1.8 2.6 0.9 1.3 4.5 5.3
89.1 89.5
19.2 12.9 28.3 35.7 27.4 34.3 24.5 17.1
------------------------------------------------------------------------------Moab Green River
No Maybe Yes No Maybe Yes ------------------------------------------------------------------------------
What products would you likely buy at local market and/or stores (all in % of respondents)? Crafts etc: Crafts 28.1 59.5 12.4 27.0 66.7 6.3 Jewelry 38.1 52.9 9.0 43.9 52.6 3.5 Indian jewelry 39.5 47.3 13.2 41.4 51.7 6.9 T-shirt 22.5 56.9 20.6 30.0 53.3 16.7 Sweatshirts 43.1 50.5 6.4 50.0 39.7 10.3 Hats 36.4 53.0 10.6 45.1 47.1 7.8 Cups 57.4 38.1 4.5 45.5 41.8 12.7 Brass 78.9 20.6 0.5 62.3 32.1 5.7 Porcelain 73.9 23.1 3.0 60.4 35.8 3.8
Fruits: Watermelon 21.6 45.6 32.8 23.0 39.3 37.7 Cantaloupe 24.9 47.3 31.1 18.2 40.9 40.9 Grapes 13.7 48.3 38.0 30.4 51.8 17.9 Sweet corn 31.0 37.5 31.5 37.5 33.9 28.6 Peaches 18.4 42.3 39.3 20.0 53.3 26.7 Cherries 28.3 42 .9 28.8 26.3 54.4 19.3 Rasp berries 30.4 44.3 25.3 32.7 46.2 21.2 Blueberries 37.3 42.5 20.2 36.0 50.0 14.0 Blackberries 35.2 45.1 19.7 36.0 48.0 16.0 Pears 28.5 49.7 21.8 32.1 41.5 26.4 Apples 11.9 53.5 34.7 23.2 42.9 33.9
6
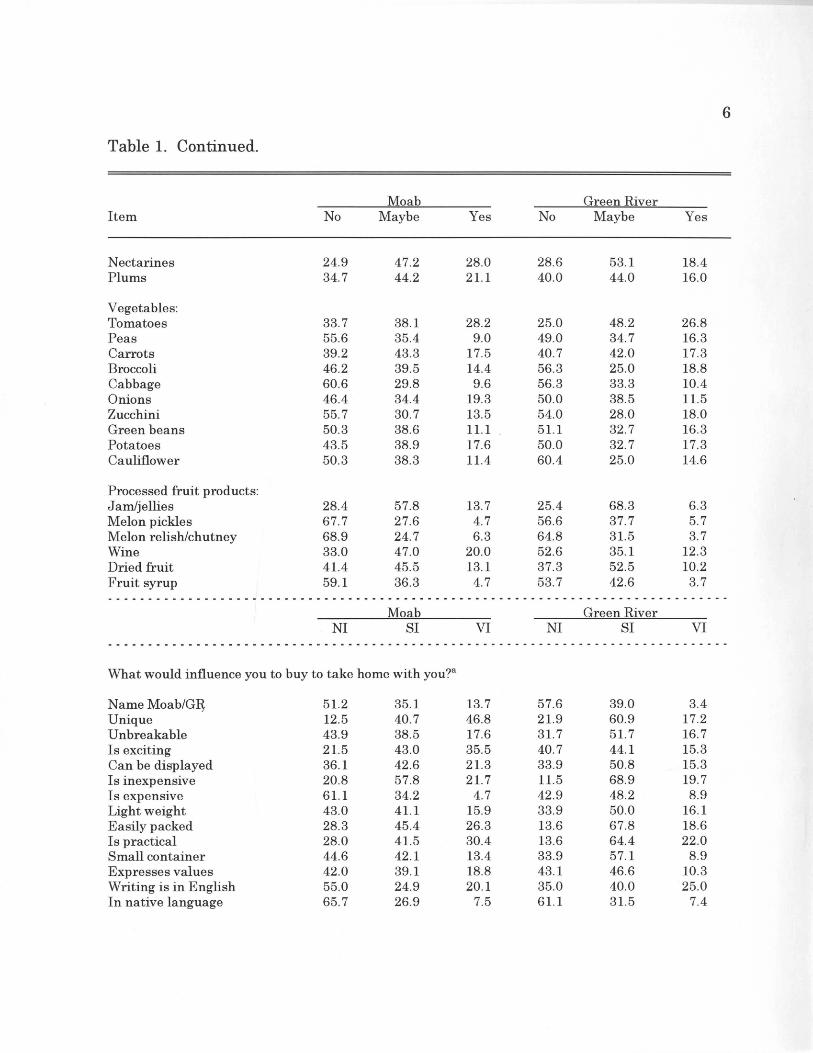
Table 1. Continued.
Moab Green River Item No Maybe Yes No Maybe Yes
Nectarines 24.9 47.2 28.0 28.6 53.1 18.4 Plums 34.7 44.2 21.1 40.0 44.0 16.0
Vegetables: Tomatoes 33.7 38.1 28.2 25.0 48.2 26.8 Peas 55.6 35.4 9.0 49.0 34.7 16.3 Carrots 39.2 43.3 17.5 40.7 42.0 17.3 Broccoli 46.2 39.5 14.4 56.3 25.0 18.8 Cabbage 60.6 29.8 9.6 56.3 33.3 10.4 Onions 46.4 34.4 19.3 50.0 38.5 11.5 Zucchini 55.7 30.7 13.5 54.0 28.0 18.0 Green beans 50.3 38.6 11.1 51.1 32.7 16.3 Potatoes 43.5 38.9 17.6 50.0 32.7 17.3 Cauliflower 50.3 38.3 11.4 60.4 25.0 14.6
Processed fruit products: Jam/jellies 28.4 57.8 13.7 25.4 68.3 6.3 Melon pickles 67.7 27.6 4.7 56.6 37.7 5.7 Melon relish/chutney 68.9 24.7 6.3 64.8 31.5 3.7 Wine 33.0 47.0 20.0 52.6 35.1 12.3 Dried fruit 41.4 45.5 13.1 37.3 52.5 10.2 Fruit syrup 59.1 36.3 4.7 53.7 42.6 3.7 -_ ........ _-----------_ .. ------_ .... _-----_ ...... -----_ .... _----------------_ .. _--_ .. _------
Moab Green River NI SI VI NI SI VI
-------------------------------------------------_ .. _--------------------------
What would influence you to buy to take home with you?a
Name Moab/Gl) 51.2 35.1 13.7 57.6 39.0 3.4 Unique 12.5 40.7 46.8 21.9 60.9 17.2 Unbreakable 43.9 38.5 17.6 31.7 51.7 16.7 Is exciting 21.5 43.0 35.5 40.7 44.1 15.3 Can be displayed 36.1 42.6 21.3 33.9 50.8 15.3 Is inexpensive 20.8 57.8 21.7 11.5 68.9 19.7 Is expensive 61.1 34.2 4.7 42.9 48.2 8.9 Light weight 43.0 41.1 15.9 33.9 50.0 16.1 Easily packed 28.3 45.4 26.3 13.6 67.8 18.6 Is practical 28.0 41.5 30.4 13.6 64.4 22.0 Small container 44.6 42.1 13.4 33.9 57.1 8.9 Expresses values 42.0 39.1 18.8 43.1 46.6 10.3 Writing is in English 55.0 24.9 20.1 35.0 40.0 25.0 In native language 65.7 26.9 7.5 61.1 31.5 7.4
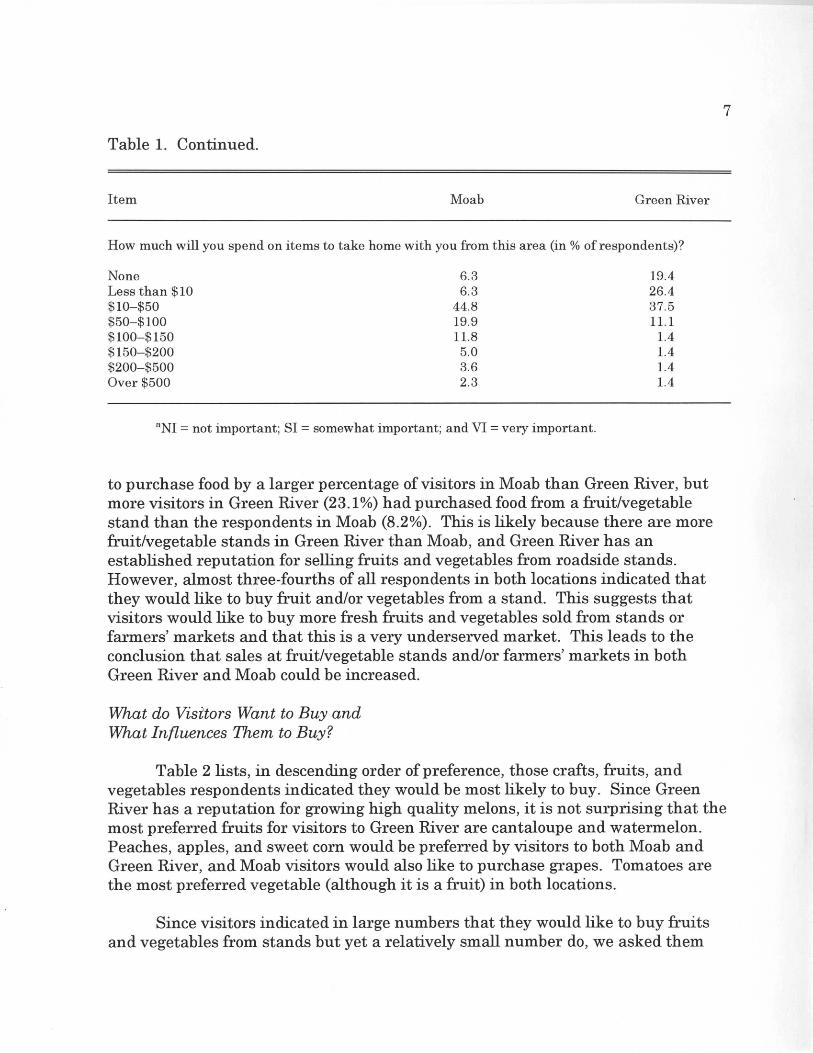
Table 1. Continued.
Item Moab Green River
How much will you spend on items to take home with you from this area (in % of respondents)?
None Less than $10 $10-$50 $50-$100 $100-$150 $150-$200 $200-$500 Over $500
6.3 6.3
44.8 19.9 11.8
5.0 3.6 2.3
aNI = not important; 81 = somewhat important; and VI = very important.
19.4 26.4 37.5 11.1
1.4 1.4 1.4 1.4
to purchase food by a larger percentage of visitors in Moab than Green River, but more visitors in Green River (23.1 %) had purchased food from a fruit/vegetable stand than the respondents in Moab (8.2%). This is likely because there are more fruit/vegetable stands in Green River than Moab, and Green River has an established reputation for selling fruits and vegetables from roadside stands. However, almost three-fourths of all respondents in both locations indicated that they would like to buy fruit and/or vegetables from a stand. This suggests that visitors would like to buy more fresh fruits and vegetables sold from stands or farmers' markets and that this is a very underserved market. This leads to the conclusion that sales at fruit/vegetable stands and/or farmers' markets in both Green River and Moab could be increased.
What do Visitors Want to Buy and What Influences Them to Buy?
7
Table 2 lists, in descending order of preference, those crafts, fruits, and vegetables respondents indicated they would be most likely to buy. Since Green River has a reputation for growing high quality melons, it is not surprising that the most preferred fruits for visitors to Green River are cantaloupe and watermelon. Peaches, apples, and sweet corn would be preferred by visitors to both Moab and Green River, and Moab visitors would also like to purchase grapes. Tomatoes are the most preferred vegetable (although it is a fruit) in both locations.
Since visitors indicated in large numbers that they would like to buy fruits and vegetables from stands but yet a relatively small number do, we asked them
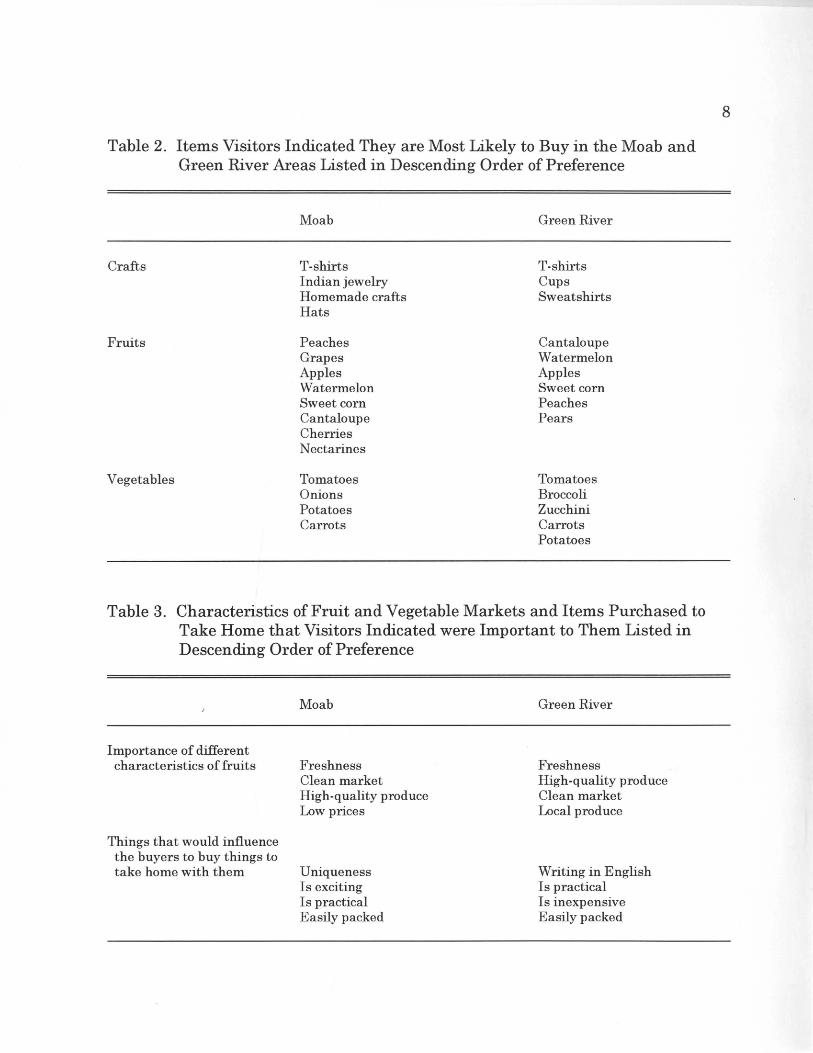
Table 2. Items Visitors Indicated They are Most Likely to Buy in the Moab and Green River Areas Listed in Descending Order of Preference
Moab Green River
Crafts T-shirts T-shirts Indian jewelry Cups Homemade crafts Sweatshirts Hats
Fruits Peaches Cantaloupe Grapes Watermelon Apples Apples Watermelon Sweet corn Sweet corn Peaches Cantaloupe Pears Cherries Nectarines
Vegetables Tomatoes Tomatoes Onions Broccoli Potatoes Zucchini Carrots Carrots
Potatoes
Table 3. Characteristics of Fruit and Vegetable Markets and Items Purchased to Take Home that Visitors Indicated were Important to Them Listed in Descending Order of Preference
Importance of different characteristics of fruits
Things that would influence the buyers to buy things to take home with them
Moab
Freshness Clean market High-quality produce Low prices
Uniqueness Is exciting Is practical Easily packed
Green River
Freshness High-quality produce Clean market Local produce
Writing in English Is practical Is inexpensive Easily packed
8
9
what they thought were important characteristics for stands and other types of direct markets (Table 3). Fresh and high quality produce, along with a clean market, were the overwhelming choices for characteristics that would entice people to shop and at fruit/vegetable markets. Local produce was also important in Green River to more than 50% of the respondents there. These results suggest that roadside stand operators need to take special care to convey a good image to buyers of freshness and quality. The appearance of a clean market is also critical to enticing people to want to shop at a particular market.
ESTIMATED SALES FOR A FRESH FRUITNEGETABLE MARKET IN MOAB
Based on visitors' average length of stay, food expenditures per day (Table 1), and the number of visitors during 1995, if a fresh fruit/vegetable market were able to capture 5% of the Moab food market between May 1 and October 1, its sales would be slightly less than $1 million. Since different fruits and vegetables are produced in Green River and Moab at different times of the year, an analysis was completed of the number of visitors, a proportion saying they would definitely buy particular types of fruits/vegetables, and the time these fruits/vegetables would be ripe in the Moab area. The Moab area was emphasized for the analysis dealing with fresh fruits and vegetables, since the principal question to be address for Green River dealt with processed fruit products.
We developed the analysis assuming that imported as well as local produce would be offered for sale at a local fruit/vegetable market. This would extend the season of the market and allow for a larger number of sales. This should not be a problem, since the majority of respondents to the Moab survey indicated no strong preference for locally grown fruits and vegetables, but rather only that they be high quality no matter where they were grown.
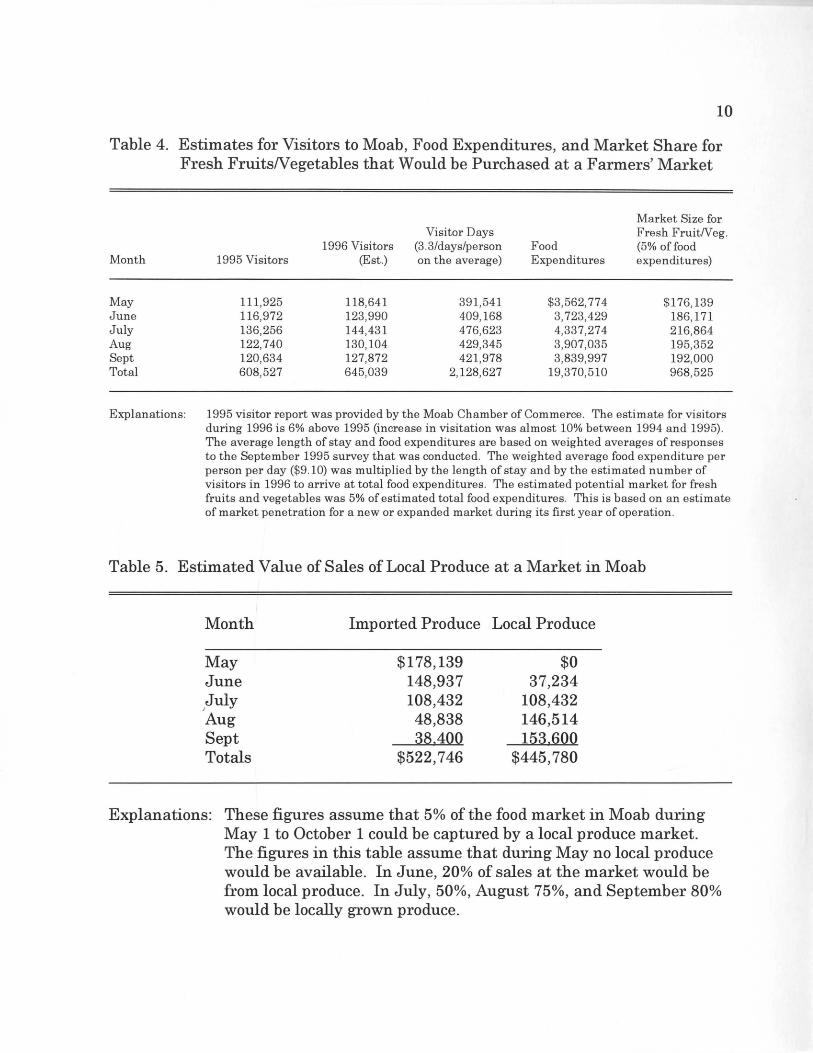
It was necessary to make some assumption about the proportion of produce sold at a local market that would be locally produced. The total sales for the market were based on the assumption that 5% of the food sales market in Moab could be captured during the summer months (Table 4). The figure of 5% may be a conservative estimate, since approximately 23% of consumer food expenditures are for fruits and vegetables, on the average. Consequently, a 5% market share of all food expenditures by visitors to Moab between May 1 and October 1 would indicate that the local fresh fruit/vegetable market would need to capture about 22% of all expenditures by visitors on fresh fruits and vegetables during that period (5%/23%).1
IThis suggests that the estimated total sales for all fresh fruits and vegetables to visitors between May 1 and October 1 would be about $4.5 million.
10
Table 4. Estimates for Visitors to Moab, Food Expenditures, and Market Share for Fresh FruitsN egetables that Would be Purchased at a Farmers' Market
Month
May June July Aug Sept Total
1995 Visitors
111,925 116,972 136,256 122,740 120,634 608,527
1996 Visitors (Est.)
118,641 123,990 144,431 130,104 127,872 645,039
Visitor Days (3.3/days/person on the average)
391,541 409,168 476,623 429,345 421,978
2,128,627
Market Size for Fresh FruitNeg.
Food (5% of food Expenditures expenditures)
$3,562,774 $176,139 3,723,429 186,171 4,337,274 216,864 3,907,035 195,352 3,839,997 192,000
19,370,510 968,525
Explanations: 1995 visitor report was provided by the Moab Chamber of Commerce . The estimate for visitors during 1996 is 6% above 1995 (increase in visitation was almost 10% between 1994 and 1995). The average length of stay and food expenditures are based on weighted averages of responses to the September 1995 survey that was conducted. The weighted average food expenditure per person per day ($9 .10) was multiplied by the length of stay and by the estimated number of visitors in 1996 to arrive at total food expenditures. The estimated potential market for fresh fruits and vegetables was 5% of estimated total food expenditures. This is based on an estimate of market penetration for a new or expanded market during its first year of operation.
Table 5. Estimated Value of Sales of Local Produce at a Market in Moab
Month Imported Produce Local Produce
May $178,139 $0 June 148,937 37,234 ;July 108,432 108,432 Aug 48,838 146,514 Sept 38,400 153~600
Totals $522,746 $445,780
Explanations: These figures assume that 5% of the food market in Moab during May 1 to October 1 could be captured by a local produce market. The figures in this table assume that during May no local produce would be available. In June, 20% of sales at the market would be from local produce. In July, 50%, August 75%, and September 80% would be locally grown produce.
11
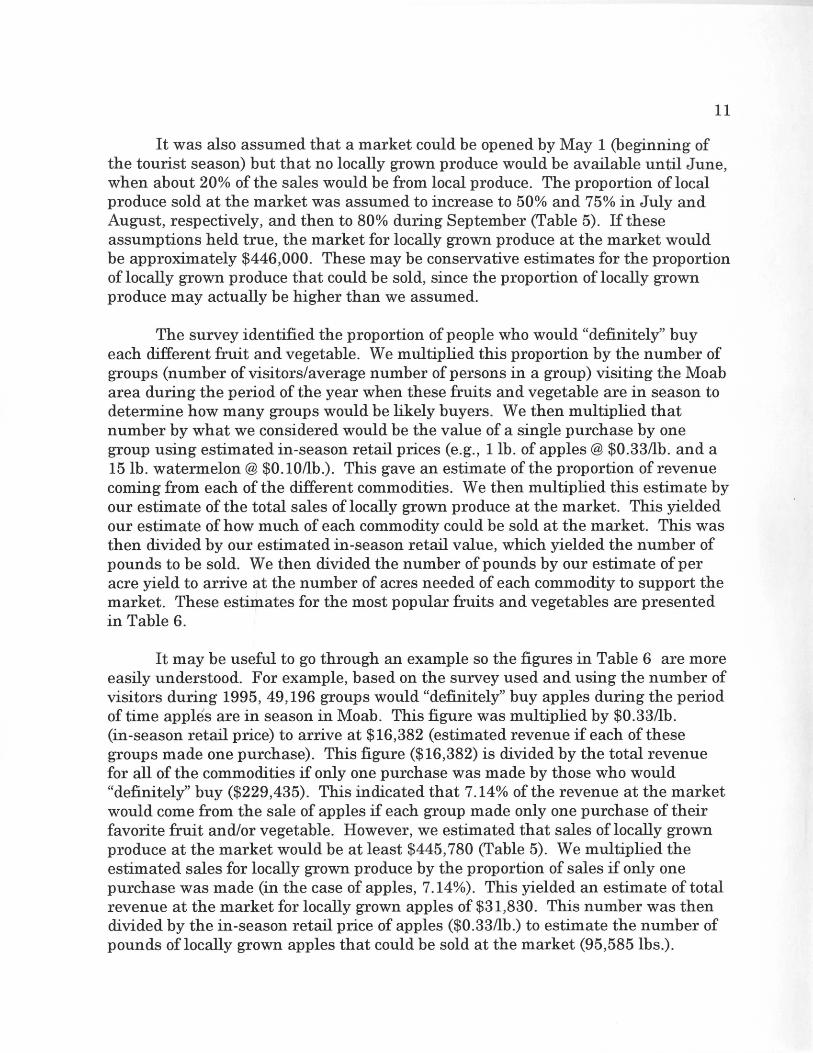
It was also assumed that a market could be opened by May 1 (beginning of the tourist season) but that no locally grown produce would be available until June, when about 20% of the sales would be from local produce. The proportion of local produce sold at the market was assumed to increase to 50% and 75% in July and August, respectively, and then to 80% during September (Table 5). If these assumptions held true, the market for locally grown produce at the market would be approximately $446,000. These may be conservative estimates for the proportion of locally grown produce that could be sold, since the proportion of locally grown produce may actually be higher than we assumed.
The survey identified the proportion of people who would "definitely" buy each different fruit and vegetable. We multiplied this proportion by the number of groups (number of visitors laver age number of persons in a group) visiting the Moab area during the period of the year when these fruits and vegetable are in season to determine how many groups would be likely buyers. We then multiplied that number by what we considered would be the value of a single purchase by one group using estimated in-season retail prices (e.g., lIb. of apples @ $0.33/lb. and a 15 lb. watermelon @ $0.10/lb.). This gave an estimate of the proportion of revenue coming from each of the different commodities. We then multiplied this estimate by our estimate of the total sales of locally grown produce at the market. This yielded our estimate of how much of each commodity could be sold at the market. This was then divided by our estimated in -season retail value, which yielded the number of pounds to be sold. We then divided the number of pounds by our estimate of per acre yield to arrive at the number of acres needed of each commodity to support the market. These estimates for the most popular fruits and vegetables are presented in Table 6.
It may be useful to go through an example so the figures in Table 6 are more easily understood. For example, based on the survey used and using the number of visitors during 1995, 49,196 groups would "definitely" buy apples during the period of time apples are in season in Moab. This figure was multiplied by $0.33/lb. (in-season retail price) to arrive at $16,382 (estimated revenue if each of these groups made one purchase). This figure ($16,382) is divided by the total revenue for all of the commodities if only one purchase was made by those who would "definitely" buy ($229,435). This indicated that 7.14% of the revenue at the market would come from the sale of apples if each group made only one purchase of their favorite fruit and/or vegetable. However, we estimated that sales of locally grown produce at the market would be at least $445,780 (Table 5). We multiplied the estimated sales for locally grown produce by the proportion of sales if only one purchase was made (in the case of apples, 7.14%). This yielded an estimate of total revenue at the market for locally grown apples of $31,830. This number was then divided by the in-season retail price of apples ($0.33/lb.) to estimate the number of pounds of locally grown apples that could be sold at the market (95,585Ibs.).
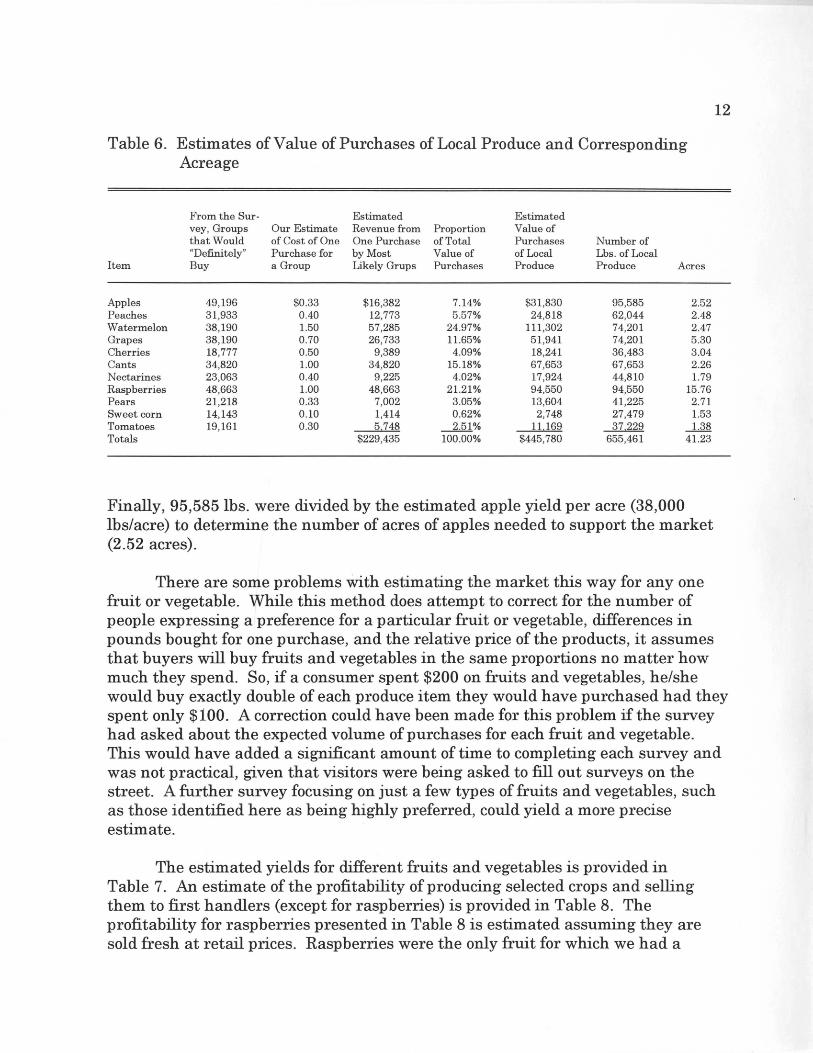
Table 6. Estimates of Value of Purchases of Local Produce and Corresponding Acreage
From the Sur· Estimated Estimated vey, Groups Our Estimate Revenue from Proportion Value of that Would of Cost of One One Purchase of Total Purchases Number of "Definitely" Purchase for by Most Value of of Local Lbs . of Local
Item Buy a Group Likely Grups Purchases Produce Produce Acres
Apples 49,196 $0.33 $16,382 7.14% $31,830 95,585 2.52 Peaches 31,933 0.40 12,773 5.57% 24,818 62,044 2.48 Watermelon 38,190 1.50 57,285 24.97% 111,302 74,201 2.47 Grapes 38,190 0.70 26,733 11.65% 51 ,941 74,201 5.30 Cherries 18,777 0.50 9,389 4.09% 18,241 36,483 3.04 Cants 34,820 1.00 34,820 15.18% 67,653 67,653 2.26 Nectarines 23,063 0.40 9,225 4.02% 17,924 44,810 1.79 Raspberries 48,663 1.00 48,663 21.21 % 94,550 94,550 15.76 Pears 21,218 0.33 7,002 3.05% 13,604 41,225 2.71 Sweet corn 14,143 0.10 1,414 0.62% 2,748 27,479 1.53 Tomatoes 19,161 0.30 5748 ~% 11169 37229 1.38 Totals $229,435 100.00% $445,780 655,461 41.23
Finally, 95,585Ibs. were divided by the estimated apple yield per acre (38,000 lbs/acre) to determine the number of acres of apples needed to support the market (2.52 acres).
12
There are some problems with estimating the market this way for anyone fruit or vegetable. While this method does attempt to correct for the number of people expressing a preference for a particular fruit or vegetable, differences in pounds bought for one purchase, and the relative price of the products, it assumes that buyers will buy fruits and vegetables in the same proportions no matter how much they spend. So, if a consumer spent $200 on fruits and vegetables, he/she would buy exactly double of each produce item they would have purchased had they spent only $100. A correction could have been made for this problem if the survey had asked about the expected volume of purchases for each fruit and vegetable. This would have added a significant amount of time to completing each survey and was not practical, given that visitors were being asked to fill out surveys on the street. A further survey focusing on just a few types of fruits and vegetables, such as those identified here as being highly preferred, could yield a more precise estimate.
The estimated yields for different fruits and vegetables is provided in Table 7. An estimate of the profitability of producing selected crops and selling them to first handlers (except for raspberries) is provided in Table 8. The profitability for raspberries presented in Table 8 is estimated assuming they are sold fresh at retail prices. Raspberries were the only fruit for which we had a
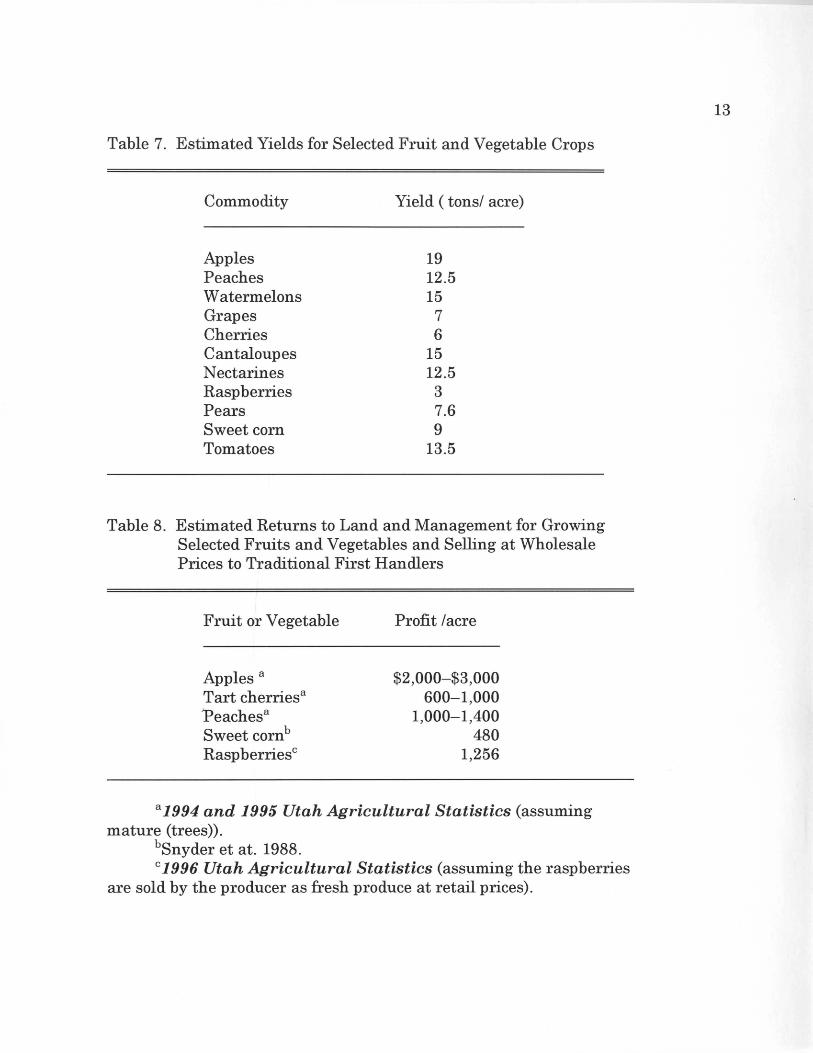
Table 7. Estimated Yields for Selected Fruit and Vegetable Crops
Commodity
Apples Peaches Watermelons Grapes Cherries Cantaloupes Nectarines Rasp berries Pears Sweet corn Tomatoes
Yield ( tons/ acre)
19 12.5 15
7 6
15 12.5 3 7.6 9
13.5
Table 8. Estimated Returns to Land and Management for Growing Selected Fruits and Vegetables and Selling at Wholesale Prices to Traditional First Handlers
Fruit or Vegetable
Apples a
Tart cherriesa
Peachesa
Sweet cornb
Raspberriesc
Profit / acre
$2,000-$3,000 600-1,000
1,000-1,400 480
1,256
a 1994 and 1995 Utah Agricultural Statistics (assuming mature (trees».
bSnyder et at. 1988. c 1996 Utah Agricultural Statistics (assuming the raspberries
are sold by the producer as fresh produce at retail prices).
13

14
reliable estimate of profitability through retail. The other crops sold fresh at retail will also add value to the produce if the price markup and volume sales are large enough to more than cover the additional marketing costs incurred when selling the produce through a retail market such as a stand or farmers' market.
SUMMARY AND CONCLUSIONS REGARDING FRESH FRUITNEGETABLE MARKET IN MOAB
The results indicate that a fresh fruit and vegetable market with sales of about $1 million per year could likely be developed in the Moab area. Growers and potential growers may wish to consider different marketing strategies to develop this market. One strategy is to sell directly to local food stores. Another would be to build roadside stands, and another could be developing a farmers' market. A combination of these alternatives could also be considered. Producers may consider a farmers' market that could take place during the evening when temperatures drop and visitors are seeking entertainment. The farmers' market could serve as a diversion for visitors and could be a magnet for other types of evening activities in Moab.
Visitors to both Moab and Green River would be willing to buy more locally grown fruits and vegetables than are currently offered. To expand this market, producers will need to provide high-quality produce in a market environment which is clean and makes visitors feel comfortable.
ANALYSIS OF JAM/JELLY PLANT IN GREEN RIVER AND MOAB
The market for local jams and jellies was estimated by asking visitors in Green River and Moab how much they expected to spend on items they planned to take home with them. The average expenditure per person on take-home items in Green River and Moab was $15.94 and $35.12, respectively (Table 9). Multiplying this by the estimated number of visitors to Green River and Moab yielded an estimate of take-home expenditures of approximately $5 million in Green River and $32.6 million in Moab.
We estimated the market for locally grown jams/jellies in two ways. First, we estimated the amount of potential expenditures by visitors on jams/jellies based on a proportion of what visitors indicated they would be willing to spend on items they were taking home with them. Second, we simply multiplied the proportion of visitors who said they were definitely interested in buying locally produced jams/jellies by the number of groups of visitors to the Moab area. The first method may overestimate or underestimate purchases, since we are uncertain of the precise ''bundle'' of take-home items desired by visitors. The second method may
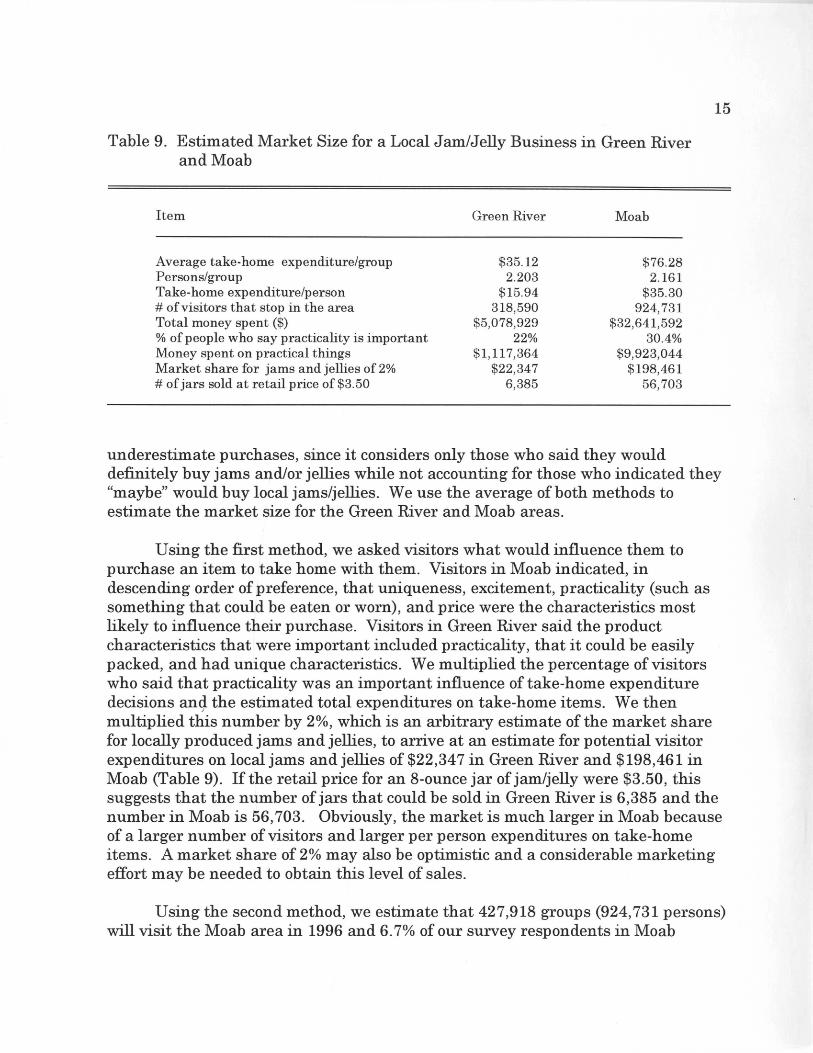
Table 9. Estimated Market Size for a Local Jam/Jelly Business in Green River and Moab
Item
Average take-home expenditure/group Persons/group Take-home expenditure/person # of visitors that stop in the area Total money spent ($) % of people who say practicality is important Money spent on practical things Market share for jams and jellies of 2% # of jars sold at retail price of $3.50
Green River
$35.12 2.203
$15.94 318,590
$5,078,929 22%
$1,117,364 $22,347
6,385
Moab
$76.28 2.161
$35.30 924,731
$32,641,592 30.4%
$9,923,044 $198,461
56,703
15
underestimate purchases, since it considers only those who said they would definitely buy jams and/or jellies while not accounting for those who indicated they "maybe" would buy local jams/jellies. We use the average of both methods to estimate the market size for the Green River and Moab areas.
Using the first method, we asked visitors what would influence them to purchase an item to take home with them. Visitors in Moab indicated, in descending order of preference, that uniqueness, excitement, practicality (such as something that could be eaten or worn), and price were the characteristics most likely to influence their purchase. Visitors in Green River said the product characteristics that were important included practicality, that it could be easily packed, and had unique characteristics. We multiplied the percentage of visitors who said that practicality was an important influence of take-home expenditure decisions and the estimated total expenditures on take-home items. We then
/
multiplied this number by 2%, which is an arbitrary estimate of the market share for locally produced jams and jellies, to arrive at an estimate for potential visitor expenditures on local jams and jellies of $22,347 in Green River and $198,461 in Moab (Table 9). If the retail price for an 8-ounce jar of jam/jelly were $3.50, this suggests that the number of jars that could be sold in Green River is 6,385 and the number in Moab is 56,703. Obviously, the market is much larger in Moab because of a larger number of visitors and larger per person expenditures on take-home items. A market share of 2% may also be optimistic and a considerable marketing effort may be needed to obtain this level of sales.
Using the second method, we estimate that 427,918 groups (924,731 persons) will visit the Moab area in 1996 and 6.7% of our survey respondents in Moab
indicated they would buy locally produced jams/jellies (Table 1). If only one bottle were purchased per group, this suggests that 28,671 jars could be sold in Moab (427,918 x 0.067).
16
Average daily traffic exiting off 1-70 into Green River during 1993 was 2,645 cars. When this is multiplied by the average number of persons per group (from our survey), we estimate that an average of 5,827 visitors are in Green River each day (2,645 x 2.203). This suggests that approximately 2,126,855 persons are travelling through Green River every year (5,827 x 365).2 Obviously, only a portion of these cars will stop to buy food and other items. If 15% of these visitors stop and buy something in Green River, it suggests the market is 318,590 persons (15% x 2,126,855) or 144,616 groups (318,590/2.203).
The survey in Green River indicated that 13.7% of the respondents would be willing to buy locally produced jams and/or jellies. This suggests the market size in Green River, if each group of interested buyers purchased one jar, is 19,812 jars (144,616 x .137). Taking the average of both estimation methods, we can estimate the market size in Moab to be 42,687 jars «56,703 + 28,671)/2) and 13,099 jars in Green River «6,385 + 19,812)/2). The estimated market for both locations combined would be 55,786 jars (42,697 + 13,099).
Fixed and Variable Costs
The estimated fixed and variable costs, including names and telephone numbers where the information was obtained, are presented in Table 10. We considered different levels of production for a small jam/jelly plant to complete the financial analysis. Because the market is smaller in Green River than Moab, a smaller plant is considered there, which could produce up to 30,000 jars per year. We considered a plant that could produce up to 70,000 jars per year in Moab. For the financial analysis, we assumed that if over 30,000 jars were produced in the Green River plant, then a building the same size as the one considered for Moab would be needed and costs in the financial analysis reflect the same building, equipment, and labor costs as Moab. However, even though the plant would be the same size at both locations, land costs were much less in Green River ($200/acre) than in Moab ($25,000/acre) resulting in different financial returns for the two operations at levels of production above 30,000 jars/year.
Estimated costs of production per year in Green River and Moab were calculated at 10,000 jar intervals between 10,000 and 70,000 jars/year (Tables 11
2Green River Economic Development estimates that 20,000 person come to Melon Days each year and about 40,000 visit the J. Wesley Powell Museum.
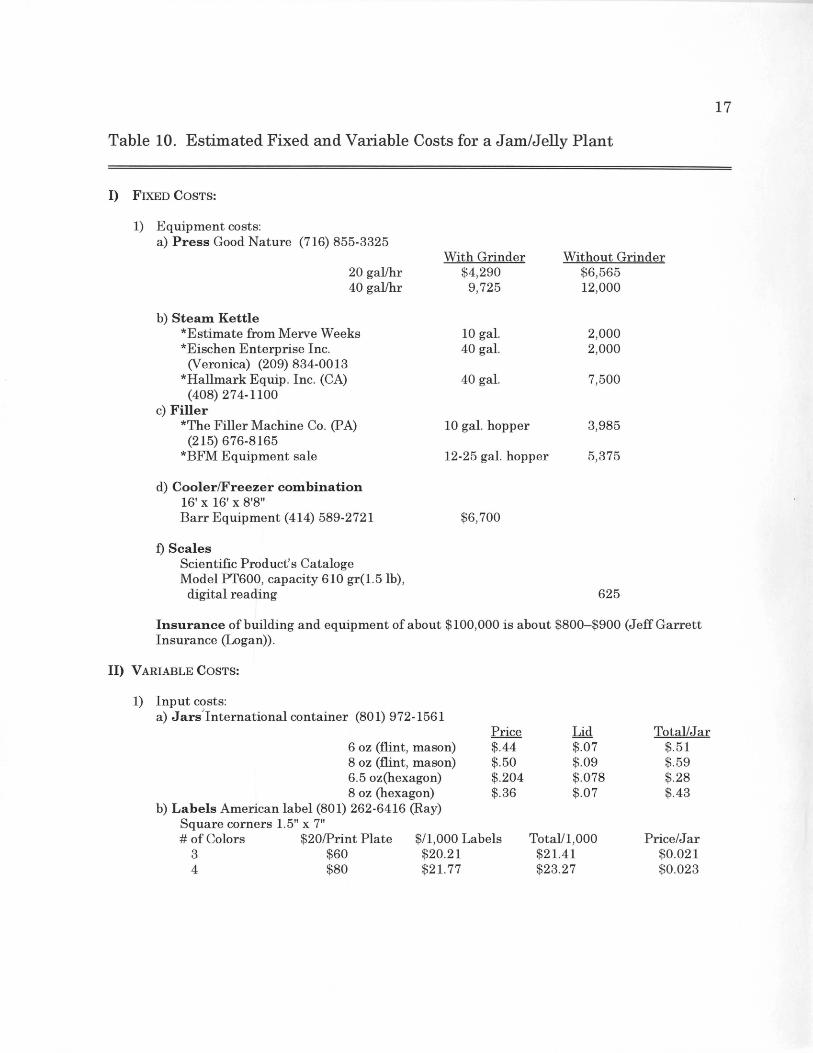
Table 10. Estimated Fixed and Variable Costs for a Jam/Jelly Plant
I) FIXED COSTS:
1) Equipment costs: a) Press Good Nature (716) 855-3325
20 gal/hr 40 gal/hr
With Grinder $4,290
9,725
Without Grinder $6,565
b) Steam Kettle *Estimate from Merve Weeks *Eischen Enterprise Inc.
(Veronica) (209) 834-0013 *Hallmark Equip . Inc. (CA)
(408) 274-1100 c) Filler
*The Filler Machine Co. (FA) (215) 676-8165
*BFM Equipment sale
d) Cooler/Freezer combination 16' x 16' x 8'8" Barr Equipment (414) 589-2721
f) Scales Scientific Product's Cataloge Model PT600, capacity 610 gr(l.5lb),
digital reading
10 gal. 40 gal.
40 gal.
10 gal. hopper
12-25 gal. hopper
$6,700
12,000
2,000 2,000
7,500
3,985
5,375
625
Insurance of building and equipment of about $100,000 is about $800-$900 (Jeff Garrett Insurance (Logan».
II) VARIABLE COSTS:
1) Input costs: a) Jars' International container (801) 972-1561
6 oz (flint, mason) 8 oz (flint, mason) 6.50z(hexagon) 8 oz (hexagon)
b) Labels American label (801) 262-6416 (Ray) Square corners l.5" x 7"
Price $.44 $.50 $.204 $.36
# of Colors $20lPrint Plate $/1,000 Labels 3 $60 $20.21 4 $80 $21.77
Lid $.07 $.09 $.078 $.07
Total/1 ,000 $2l.41 $23.27
Total/Jar $.51 $.59 $.28 $.43
Price/Jar $0.021 $0.023
17

Table 10. Continued
c) Boxes Packaging corporation (801) 359-8681 Size of box (4" x 10" x 12") 12 jars/box
d) Fruit $0.10/lb
$1 .00/box $0.083/jar
Each pound of fruit produces about 1.5 cups of juice Each 8 oz jar of jelly needs about 0.5 cups of fruit juice So each 8 oz jar uses 0.33lbs of fruit $0.033/jar
e) Sugar Smith's $16/50 lb. sacks 0.77 cups/jar or 0.25lb./jar
f) Pectin Smith's $1.40/box of 24 pack 0.20 of a pack/jar
g) Syrup $22/5 gal (80 cups) $0.27/cup Need about 0.37 cups/jar
h) Utilities $300/months ($3,600/year) Based on $40,000 jars
I) Transportation $4,000, based on 40,000 jars
$0.082/jar
$O.Olljar
$O.Olljar
$0.09/jar
$O. lIjars
Table 11. Estimated Costs per Year for Selected Variable Inputs at Different Levels of Production for the Green River Plant ($)
/ 10,000 20,000 30,000 40,000 50,000 60,000 70,000 Input Jars Jars Jars Jars Jars Jars Jars
Labor 30,150 30,150 30,150 45,000 49,500 54,000 58,500 Utilities 1,800 2,700 3,600 3,600 3,960 4,320 4,680 Truck expense 2,000 3,000 4,000 4,000 4,400 4,800 5,200 Marketing 1,200 1,800 2,400 3,000 3,600 4,200 4,800 Office expense and misc. 1,200 1,800 2,400 3,000 3,600 4,200 4,800
18

19
Table 12. Estimated Costs per Year for Selected Variable Inputs at Different Levels of Production for the Moab Plant ($)
10,000 20,000 30,000 40,000 50,000 60,000 70,000 Input Jars Jars Jars Jars Jars Jars Jars
Labor 45,000 45,000 45,000 45,000 49,500 54,000 58,500 Utilities 1,800 2,700 3,600 3,600 3,960 4,320 4,680 Truck expense 2,000 3,000 4,000 4,000 4,400 4,800 5,200 Marketing 1,200 1,800 2,400 3,000 3,600 4,200 4,800 Office expense
and misc. 1,200 1,800 2,400 3,000 3,600 4,200 4,800
and 12). Labor costs in Green River for the small operation (30,000 jars or less) were considered to be less than in Moab because of relative opportunities for employment, especially during off-season months. However, at the 40,000 jar level and above, we assumed that much more intensive management and marketing would be needed and labor costs would be the same as the plant in Moab. Labor costs, utilities, and truck expenses were increased by 10%, 20%, and 30% over the 40,000 jar level for the 50,000; 60,000; and 70,000 jar levels, respectively. Marketing and office expenses were assumed to be $1,200/year for the 10,000 jar level at the smaller Green River plant and to increase by $600/year for each additional 10,000 jars produced. Truck (Pickup) expenses were assumed to be $0.30/mile.
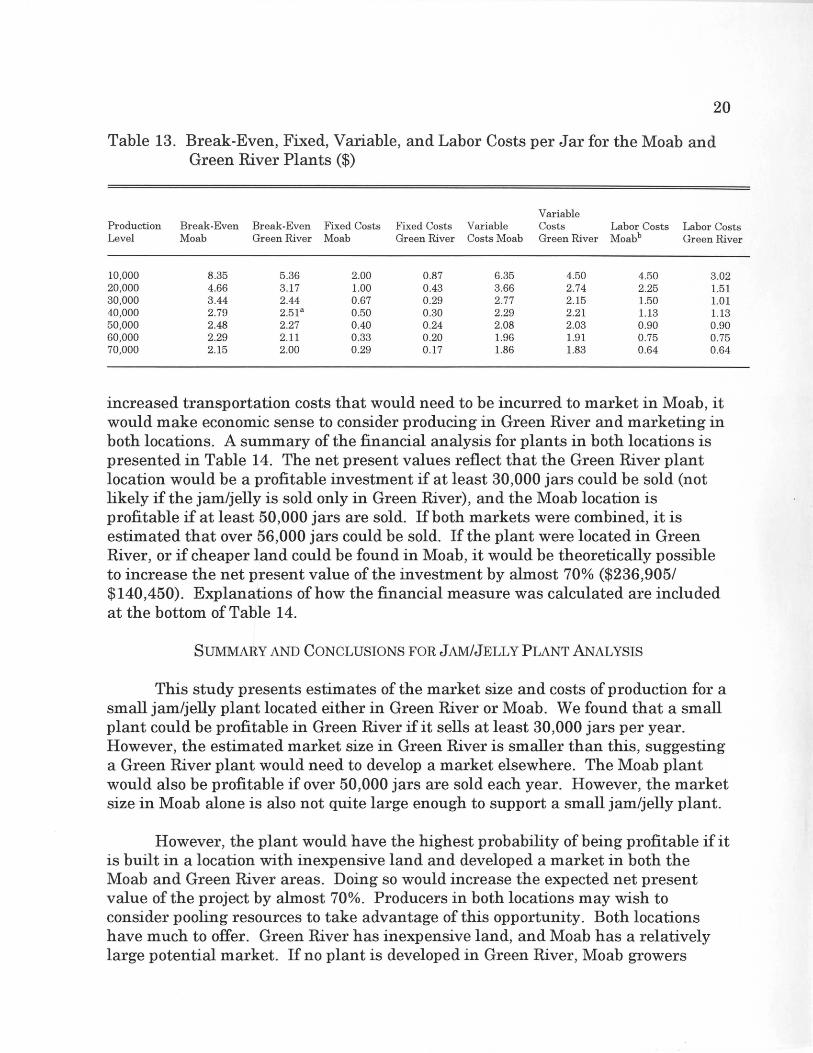
Estimated Break-Even Prices and Financial Analysis
The break-even prices are broken down into the different components of fixed and variable costs and are presented in Table 13 for the Green River and Moab plants. If the wholesale price of a jar of jam or jelly were $2.70, then the Green River plant could begin to be profitable if at least 30,000 jars are sold and the Moab plant could be profitable if at least 50,000 jars are sold. Again, the difference between Green River and Moab at those levels of production (30,000 in Green River and 50,000 in Moab) is land costs and the smaller plant in Green River. However, the market analysis indicated that only about 13,099 jars of jam/jelly could be sold in Green River. The market size in Moab was estimated to exceed 42,000 jars, suggesting that the market is not quite large enough in Moab to support a small jam/jelly plant such as described here. However, the combined market of almost 56,000 jars is large enough to support a plant in either location.
However, given these results one must ask if it would not be more profitable to place the plant in Green River and sell the product in both locations. Even with
20
Table 13. Break-Even, Fixed, Variable, and Labor Costs per Jar for the Moab and Green River Plants ($)
Variable Production Break-Even Break-Even Fixed Costs Fixed Costs Variable Costs Labor Costs Labor Costs Level Moab Green River Moab Green River Costs Moab Green River Moabb Green River
10,000 8.35 5.36 2.00 0.87 6.35 4.50 4.50 3.02 20,000 4.66 3.17 1.00 0.43 3.66 2.74 2.25 1.51 30,000 3.44 2.44 0.67 0.29 2.77 2.15 1.50 1.01 40,000 2.79 2.51a 0 .50 0.30 2.29 2.21 1.13 1.13 50,000 2.48 2.27 0.40 0.24 2.08 2.03 0.90 0.90 60,000 2.29 2.11 0.33 0.20 1.96 1.91 0 .75 0.75 70,000 2.15 2.00 0.29 0.17 1.86 1.83 0.64 0.64
increased transportation costs that would need to be incurred to market in Moab, it would make economic sense to consider producing in Green River and marketing in both locations. A summary of the financial analysis for plants in both locations is presented in Table 14. The net present values reflect that the Green River plant location would be a profitable investment if at least 30,000 jars could be sold (not likely if the jam/jelly is sold only in Green River), and the Moab location is profitable if at least 50,000 jars are sold. If both markets were combined, it is estimated that over 56,000 jars could be sold. If the plant were located in Green River, or if cheaper land could be found in Moab, it would be theoretically possible to increase the net present value of the investment by almost 70% ($236,905/ $140,450). Explanations of how the financial measure was calculated are included at the bottom of Table 14.
SUMMARY AND CONCLUSIONS FOR JAM/JELLY PLANT ANALYSIS
This study presents estimates of the market size and costs of production for a small jam/jelly plant located either in Green River or Moab. We found that a small plant could be profitable in Green River if it sells at least 30,000 jars per year. However, the estimated market size in Green River is smaller than this, suggesting a Green River plant would need to develop a market elsewhere. The Moab plant would also be profitable if over 50,000 jars are sold each year. However, the market size in Moab alone is also not quite large enough to support a small jam/jelly plant.
However, the plant would have the highest probability of being profitable if it is built in a location with inexpensive land and developed a market in both the Moab and Green River areas. Doing so would increase the expected net present value of the project by almost 70%. Producers in both locations may wish to consider pooling resources to take advantage of this opportunity. Both locations have much to offer. Green River has inexpensive land, and Moab has a relatively large potential market. If no plant is developed in Green River, Moab growers
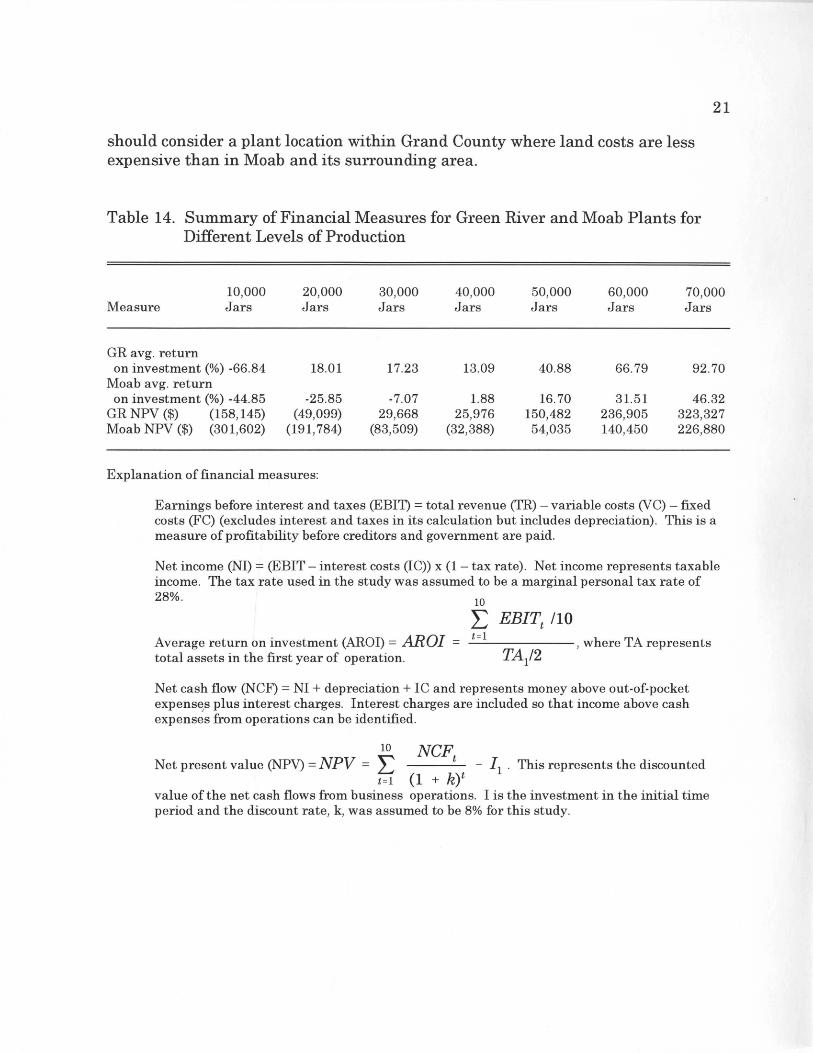
should consider a plant location within Grand County where land costs are less expensive than in Moab and its surrounding area.
Table 14. Summary of Financial Measures for Green River and Moab Plants for Different Levels of Production
21
10,000 20,000 30,000 40,000 50,000 60,000 70,000 Measure Jars Jars Jars Jars Jars Jars Jars
GR avg. return on investment (%) -66.84 18.01 17.23 13.09 40.88 66.79 92 .70
Moab avg. return on investment (%) -44.85 -25.85 -7.07 1.88 16.70 31.51 46.32
GRNPV ($) (158,145) (49,099) 29,668 25,976 150,482 236,905 323,327 Moab NPV ($) (301,602) (191,784) (83,509) (32,388) 54,035 140,450 226,880
Explanation of financial measures:
Earnings before interest and taxes (EBIT) = total revenue (TR) - variable costs (VC) - fixed costs (FC) (excludes interest and taxes in its calculation but includes depreciation) . This is a measure of profitability before creditors and government are paid.
Net income (NI) = (EBIT - interest costs (IC» x (1- tax rate) . Net income represents taxable Income. The tax rate used in the study was assumed to be a marginal personal tax rate of 28% . 10
L EBITt /10 Average return on investment (AROI) = ABO! = _t_=I ______ , where TA represents total assets in the first year of operation. TA/2
Net cash flow (NCF) = NI + depreciation + IC and represents money above out-of-pocket expens~s plus interest charges. Interest charges are included so that income above cash expenses from operations can be identified.
10 NCF Net present value (NPV) = NPV = L t - II . This represents the discounted
t=1 (1 + kY value of the net cash flows from business operations. I is the investment in the initial time period and the discount rate, k, was assumed to be 8% for this study.
22
APPENDIX
23
A SURVEY OF VISITORS TO THE MOAB/GREEN RIVER AREA
~~~~~~~~~~~~~~~~~~~~~~~
Your answers will help local residents and vendors provide better services to visitors.
~~~~~~~~~~~~~~~~~~~~~~~
Location:
Date:
Time:
1. Do you live in the United States? o Yes (go to question 2) o No (go to question 3)
2. What is your home zip code? ___ _
3. In what country do you live? ___ _ Principal language _____ _
4. Is this your first visit to the Moab/Green River area? DYes, this is my first visit o 2nd visit o 3rd-5th visit o I have visited this area more than five times
5. During this trip that has brought you to the Moab/ Green River area, what modes of transportation have you used (check all that apply)? o Car/tr~ck o Airplane o Bus o Other ____________ _
6. How long have you been or how long are you planning to be in the Moab/Green River area during this visit? o Just passing through o 1-2 days o 3-4 days o 5-7 days o More than one week
7. How many persons are in your family? Adults (over age 18) Children 13-17 Children 8-13 Children under 8
8. How many adults are traveling with you on this trip?
How many children age 13-17 are traveling with you?
How many children age 8-13 are traveling with you?
How many children under age 8 are traveling with you?
9. What activities have you participated in or plan to participate in while in the Moab area (check all that apply)? o Just passing through o Sightseeing in the national parks
and/or national monuments o Mountain biking o River float trip o Visiting friends/relatives o Hiking o Boating on rivers and/or reservoirs o No outdoor activities o Other ____________ _ o Other ____________ _
10. How did you learn about the Moab/Green River area (check all that apply)? o Never heard of it before, just passing
through. o Friends or family recommended the
area o Newspaper or magazine article o Published tour guide o Maps or road signs o Television o Other ______________________ __
11. Where have you purchased food here in the Moab/Green River area (check all that apply)? o Have not purchased food while in the
Moab/Green River area o Restaurant o Food store (supermarket) o Convenience store o Fruit/vegetable stand o Other ______________________ __
12. On average, how much money are you spending each day of your trip on food? o Less than $10 0 $40-$50 o $10-$20 0 $50-$75 o $20-$30 0 $75-$100 o $30-$40 0 Over $100
13. Would you buy fruits and vegetables from roadside stands or specialty stores while you are traveling? DYes 0 No
14. If you were to buy fruits/vegetables from a local market, please rate the importance of the following characteristics:
Some-
Not what Very * Availability of parking 0 0 0 * Locally grown produce 0 0 0 * Certified organically 0 0 0
grown produce * Cleanliness of the market 0 0 0 * Air conditioning 0 0 0 * High-quality produce 0 0 0 * Low prices 0 0 0 * Right package size 0 0 0 * Freshness of products 0 0 0
24
15. Please indicate what types of fruit/ vegetable products and crafts you would likely want to buy at local markets and/or stores.
Would Would Not Might Definitely
Crafts and other items: * Handmade crafts * Jewelry * Indian jewelry * T-shirts * Sweatshirts * Hats * Other clothing items
* Cups and/or mugs * Brass items * Porcelain items * Other _____ _ * Other ____ _
Fresh fruit/vegetable items:
o o o o o o
o o o o o o o
* Watermelon 0 * Cantaloupe 0 * Grapes 0 * Sweet corn 0 * Peaches 0 * Sweet cherries 0 * Raspberries 0 * Blueberries 0 * Blackberries 0 * Pears 0 * Apples 0 * Nectarines 0 * Tomatoes 0 * Peas 0 * Carrots 0 * Broccoli 0 * Cabbage 0 * Onions 0 * Zucchini 0 * Green beans 0 * Potatoes 0 * Cauliflower 0 * Plums 0 * Other 0 * Other 0
o o o o o o
o o o o o o o
o o o o o o o o o o o o o o o o o o o o o o o o o
o o o o o o
o o o o o o o
o o o o o o o o o o o o o o o o o o o o o o o o o
Would Not
Would Might Definitely
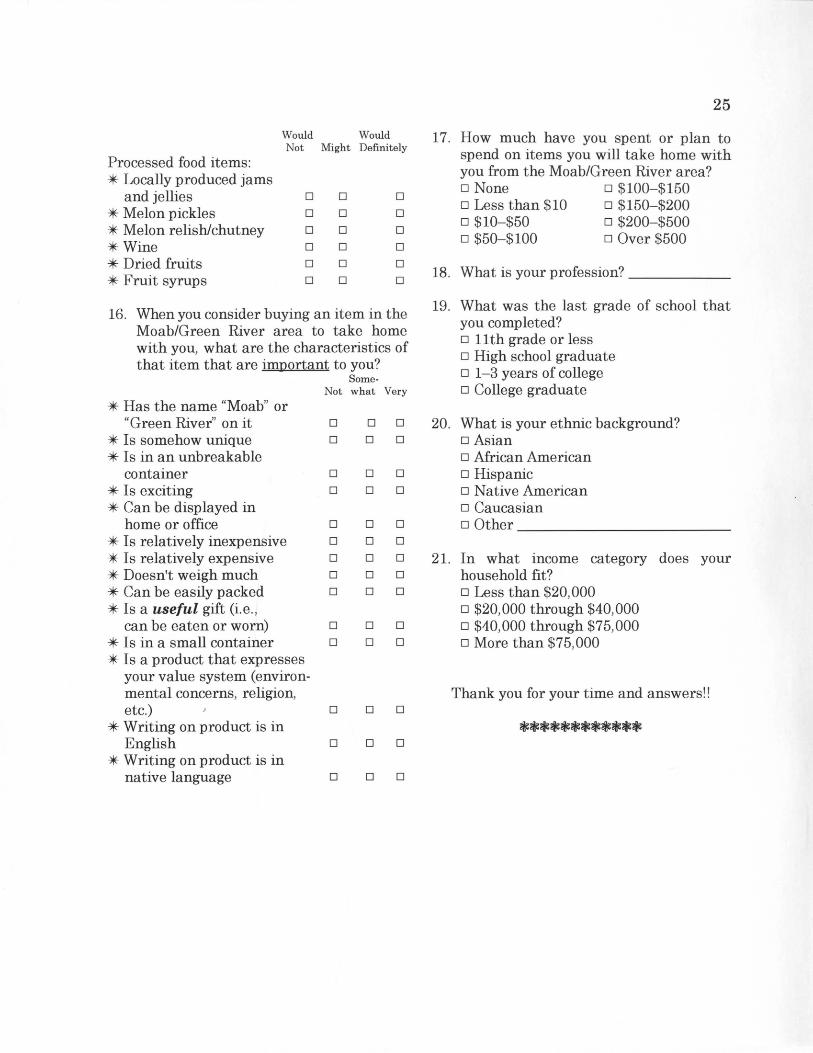
Processed food items: * Locally produced jams and jellies * Melon pickles * Melon relish/chutney
* Wine * Dried fruits * Fruit syrups
o o o o o o
o 0
o 0
o 0
o 0
o 0
o 0
16. When you consider buying an item in the Moab/Green River area to take home with you, what are the characteristics of that item that are important to you?
Some-Not what Very * Has the name "Moab" or
"Green River" on it 0 * Is somehow unique 0 * Is in an unbreakable container 0 * Is exciting 0 * Can be displayed in home or office 0 * Is relatively inexpensive 0 * Is relatively expensive 0 * Doesn't weigh much 0 * Can be easily packed 0 * Is a useful gift (i.e. , can be eaten or worn) 0 * Is in a small container 0 * Is a product that expresses your value system (environmental concerns, religion, etc.) 0 * Writing on product is in English 0 * Writing on product is in native language 0
o 0
o 0
o 0
o 0
o 0
o 0
o 0
o 0
o 0
o 0
o 0
o 0
o 0
o 0
25
17. How much have you spent or plan to spend on items you will take home with you from the Moab/Green River area? o None 0 $100-$150 o Less than $10 0 $150-$200 o $10-$50 0 $200-$500 o $50-$100 0 Over $500
18. What is your profession? _____ _
19. What was the last grade of school that you completed? o 11th grade or less o High school graduate o 1-3 years of college o College graduate
20. What is your ethnic background? o Asian o African American o Hispanic o Native American o Caucasian DOther ___________ __
21. In what income category does your household fit? o Less than $20,000 o $20,000 through $40,000 o $40,000 through $75,000 o More than $75,000
Thank you for your time and answers!!
Related Documents