W&M ScholarWorks W&M ScholarWorks Reports 7-1-1981 Feasibility of Crab Meal Processing in the Chesapeake Bay Region Feasibility of Crab Meal Processing in the Chesapeake Bay Region Thomas J. Murray Virginia Institute of Marine Science William D. DuPaul Virginia Institute of Marine Science Follow this and additional works at: https://scholarworks.wm.edu/reports Part of the Marine Biology Commons Recommended Citation Recommended Citation Murray, T. J., & DuPaul, W. D. (1981) Feasibility of Crab Meal Processing in the Chesapeake Bay Region. Special Reports in Applied Marine Science and Ocean Engineering (SRAMSOE) No. 248. Virginia Institute of Marine Science, College of William and Mary. https://doi.org/10.21220/V5WT8R This Report is brought to you for free and open access by W&M ScholarWorks. It has been accepted for inclusion in Reports by an authorized administrator of W&M ScholarWorks. For more information, please contact [email protected].

Welcome message from author
This document is posted to help you gain knowledge. Please leave a comment to let me know what you think about it! Share it to your friends and learn new things together.
Transcript
W&M ScholarWorks W&M ScholarWorks
Reports
7-1-1981
Feasibility of Crab Meal Processing in the Chesapeake Bay Region Feasibility of Crab Meal Processing in the Chesapeake Bay Region
Thomas J. Murray Virginia Institute of Marine Science
William D. DuPaul Virginia Institute of Marine Science
Follow this and additional works at: https://scholarworks.wm.edu/reports
Part of the Marine Biology Commons
Recommended Citation Recommended Citation Murray, T. J., & DuPaul, W. D. (1981) Feasibility of Crab Meal Processing in the Chesapeake Bay Region. Special Reports in Applied Marine Science and Ocean Engineering (SRAMSOE) No. 248. Virginia Institute of Marine Science, College of William and Mary. https://doi.org/10.21220/V5WT8R
This Report is brought to you for free and open access by W&M ScholarWorks. It has been accepted for inclusion in Reports by an authorized administrator of W&M ScholarWorks. For more information, please contact [email protected].

Thomas J. Murray
William D. DuPaul
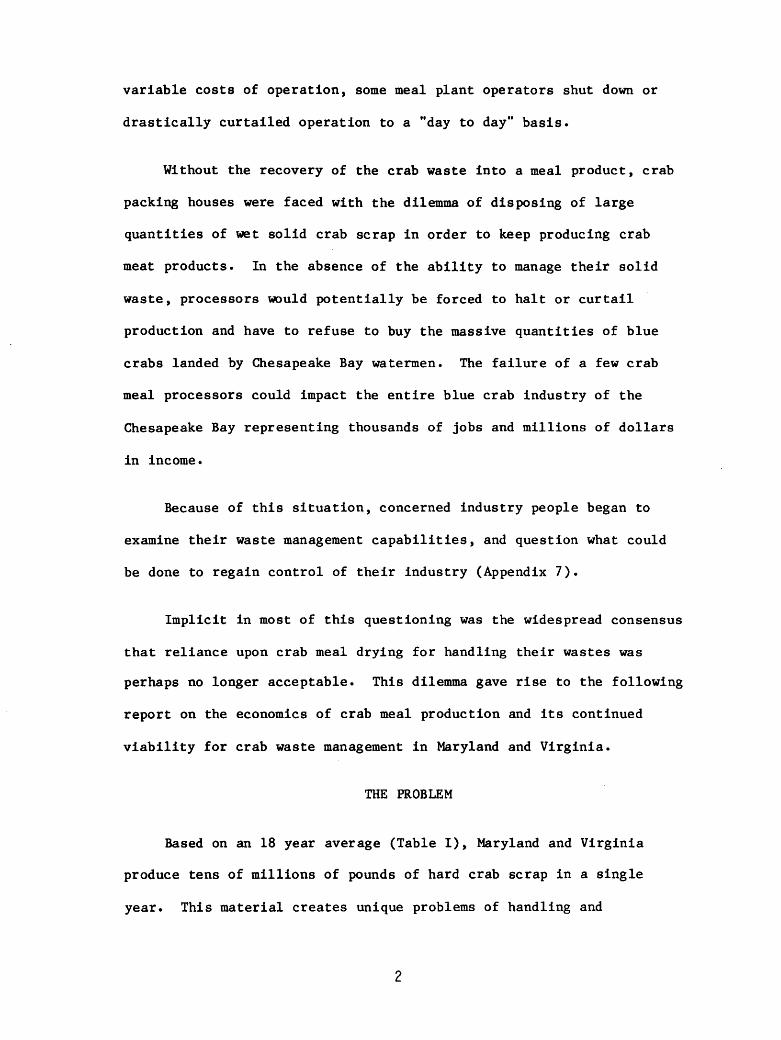
FEASIBILITY OF CRAB MEAL PROCESSING
IN THE CHESAPEAKE BAY REGION
. . . . . . . . . . . . . . .... . . . . . . . . . . . . . . : . . . . . . . . . . . . . . . . . . . . . . . . . . . . . . . . . . . . . .. . :.·.:·. ·.: .......... . . . . . . . . . . . . .... . . . . . . . . . . . . .
Crab Ktiste from Picking Houses
Dryer
To Mix•r for Auort«J FNds
SPECIAL REPORT IN APPLIED MARINE SCIENCE AND OCEAN ENGINEERING NO. 248 Virginia Sea Grant Program, Virginia Institute of Marine Science, College of William and Mary, Gloucester Point, VA 23062

Feasibility of Crab Meal Processing in the Chesapeake Bay Region
Thomas J. Murray Associate Marine Scientist
and
William D. DuPaul Senior Marine Scientist
Virginia Institute of Marine Science College of William and Mary Gloucester Point, Virginia
Special Report in Applied Marine Science and Ocean Engineering No. 248, July, 1981 Virginia Institute of Marine Science, Gloucester Point, Virginia 23062.
Contract Report No. 10-01-08080, Mid Atlantic Fisheries Development Foundation, Inc. Annapolis, MD 21401

This research was supported by Contract No. 10-01-08080 of the
Mid-Atlantic Fisheries Development Foundation, Annapolis, MD and the
Virginia Sea Grant Program, Marine Advisory Services at the Virginia
Institute of Marine Science, Gloucester Pt., Va.
This data report is the result of tax-supported research and as
such is not copyrightable. It may be freely reprinted with the
customary crediting of the source.

ACKNOWLEDGEMENTS
This study could have not been completed without significant
contributions from numerous individuals and institutions.
Particular credit, however, is due the Mid-Atlantic Fisheries
Development Foundation and the Sea Grant Program at the Virginia
Institute of Marine Science for funding the study. Special thanks to
Mr. Weston Conley, RCV Seafood, Inc., Morattico, Virginia, for acting
as the Foundation's liaison on this project and whose assistance was
invaluable.
Drafts and final copy of this report were prepared by the
Virginia Institute of Marine Science Report Center.

INTRODUCTION
The disposal of hard crab waste generated by Chesapeake Bay blue
crab picking operations became an acute industry problem in early
1980. Historically, this very unstable processing scrap had been
collected from picking houses, transported to commercial drying
facilities and used to produce a dried meal product. Reduced and
stabilized crab meal is marketed to producers of livestock feeds as a
protein source in a variety of feed products. As an additive to these
feed formulas, the crab meal is a marketable recovered waste product
(Appendix 2).
In 1980 some crab meal processors had experienced problems in the
rendering of hard crab scrap into meal. Reportedly the traditional
market for crab meal had become no longer profitable as competitive
meal products (principally soybean meal) experienced marked decreases
in price. This change in relative prices reportedly caused a shift by
feed companies away from crab meal to the relatively cheaper grains.1
Crab meal plant operators were faced with a resulting decrease in
final price for their crab meal in conjunction with increases in their
operating expenses (principally energy). Unable to meet even the
l1arge feed corporations rely upon computerized formulas to frequently substitute different meal products in feed mixes to minimize costs for protein and other requirements. This is critical because fulfilling animal nutrient requirements is a major economic consideration in livestock enterprises. For example, approximately 80% of the variable costs of feedlot beef, 55-60% in swine and 50-60% in dairy and poultry are due to feed costs.
1
variable costs of operation, some meal plant operators shut down or
drastically curtailed operation to a "day to day" basis.
Without the recovery of the crab waste into a meal product, crab
packing houses were faced with the dilemma of disposing of large
quantities of wet solid crab scrap in order to keep producing crab
meat products. In the absence of the ability to manage their solid
waste, processors would potentially be forced to halt or curtail
production and have to refuse to buy the massive quantities of blue
crabs landed by Chesapeake Bay watermen. The failure of a few crab
meal processors could impact the entire blue crab industry of the
Chesapeake Bay representing thousands of jobs and millions of dollars
in income.
Because of this situation, concerned industry people began to
examine their waste management capabilities, and question what could
be done to regain control of their industry (Appendix 7).
Implicit in most of this questioning was the widespread consensus
that reliance upon crab meal drying for handling their wastes was
perhaps no longer acceptable. This dilemma gave rise to the following
report on the economics of crab meal production and its continued
viability for crab waste management in Maryland and Virginia.
THE PROBLEM
Based on an 18 year average (Table I), Maryland and Virginia
produce tens of millions of pounds of hard crab scrap in a single
year. This material creates unique problems of handling and
2

treatment due to its odor, physical and chemical nature, pest
attraction, quantity and limitation of disposal methods (Cato, et al.
1977).
Additional problems arise because of the seasonality and location
of landings (Figures 1, 2, 3) and Table II.
TABLE 1
Total Annual Blue Crab Landings in Lbs. for Virginia and Maryland by Month
Month Virginia Maryland Total
September 5,069,589 4,215,256 9,284,845
October 4,776,336 3,047,887 7,824,223
November 2,202,381 896,099 3,098,480
December 4,199,626 99,133 4,298,759
January 2,705,689 1,133 2,706,822
February 2,040,510 793 2,041,303
March 1,402,438 1,384 1,403,822
April 2,402,127 377,972 2,780,099
May 3,652,328 1,159,042 4,811,370
June 4,677,860 3,028,147 7,706,007
July 5,317,491 5,082,731 10,400,222
August 5,666,528 5,124,676 10,791,204
TOTAL 44,112,903 23,034,253 67,147,156
Source: VIMS Unpublished Data File (1960-1978 Averaged)
Personal Communication: w. A. Van Engel
3
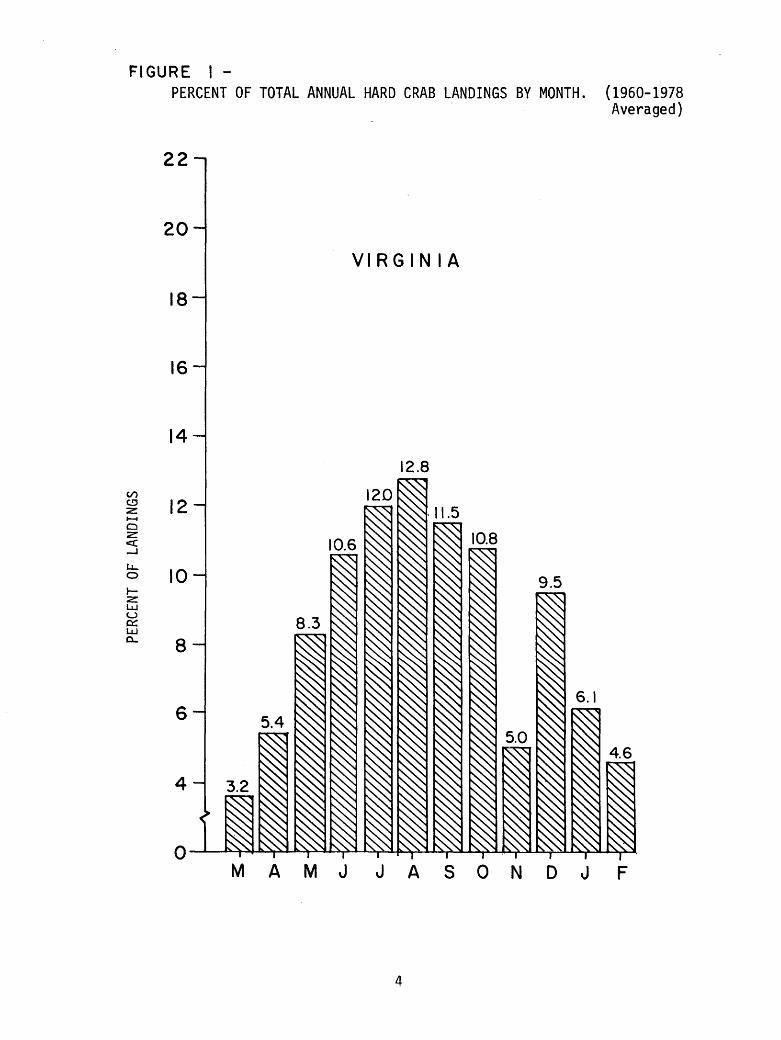
FIGURE I -
V') C!l z ~
C)
z c:( _J
LL. 0
J-z LL.I u 0:: LL.I 0...
PERCENT OF TOTAL ANNUAL HARD CRAB LANDINGS BY MONTH. (1960-1978 Averaged)
22
20
VIRGINIA
18
16
14
12.8
12
10
8
MAMJ JASON DJ F
4

FIGURE 2 -PERCENT OF TOTAL ANNUAL HARD GRAB LANDINGS BY MONTH. (1960-1978
Averaged)
22 22.1 22.2
20
18
MARYLAND 16
14 (/") ~. z -0 12 z c:( _J
1.1.. 0
J-z 10 l.1..1 u 0::: l.1..1 0..
8
6
4
0 0 0 0 0
MAMJJASONDJFM
5

FAtRFAX
Figure 3
% Hard Blue Crab Landings by County (1963 ~ 1977 Average)*
CHURCH
ARLINGTON CO.
* This characterizes the location of Virginia's landings but probably does not accurately reflect the actual processing locations and therefore the true concentrations of hard crab wastes.
6

TABLE II
DISTRIBUTION OF CRAB PROCESSORS IN MARYLAND BY COUNTY
COUNTY
ANNE ARUNDEL Annapolis
CAROLINE Goldsboro
DORCHESTER Crapo Cambridge Wingate Toddville Fishing Creek Hoopersville Crocheron
QUEEN ANNE'S Grasonville
SOMERSET Crisfield
ST. MARY'S Mechanicsville
TALBOT Sherwood McDaniel Wittman St. Michaels
Bellevue
WORCESTER Stockton
STATE TOTAL
Source: Maryland Marine
NUMBER
2
1
1 3 2 3 4 2 1
16
4
13
1
1 1 1 2
1 6
1
44
Advisory
7
Service.
% TOTAL WASTE
.5
2
36
9
30
2
14
2

ENTERPRISE BUDGET FOR CRAB MEAL DRYING FACILITIES
Underlying the crab waste disposal problem has been the jl
widespread assumption that the cost of operating a crab meal
production unit and the problems of a limited market disqualify crab
meal production as a viable waste treatment option. Because of this
assumption, the first section of this report considers the costs and
returns of a model crab meal production enterprise.
The budget developed herein depicts: the fixed CO$tS of required
drying equipment, buildings, etc.; projected annual costs of operation
of three different production levels; summary of the costs, returns
and earnings for such an enterprise over one year.
The Heil SD 75-22 dryer (Appendix 1) was selected for this
analysis among various sizes and manufacturers for the following
reasons:
1. A facility using this same model is in operation in Virginia
and therefore management information (not a part of the
manufacturer's specifications) would improve budget
estimations.
2. This particular drying system is capable of rendering the
large quantities of scrap generated at industry centers such
as Crisfield and Cambridge, MD and Hampton, VA.
Estimates were made of total fixed costs of operation for the
complete dryer system, manufacturer's installation, and a tractor to
facilitate scrap handling at the plant site (Table III). The building
8

TABLE III
Fixed Costs for Crab Meal Plant Prices for August, 1980
Heil SD 75-22 Dryer Complete (see attached)
Feeder and Infeed Conveyor Jacobsen Hammer Mill Rotary Air Lock Output and Loading Screw Conveyors Vapor Recycling Duct Refractory Material
Total Equipment
Mfg. Installation
Total Drying Unit
Front End Loader (Ford "Bobcat")
Total Equipment
Bldg. and Groundsl
Labor
60' X 80' X 20' (Mitchell) Metal Bldg. 4800 sq. ft. Concrete Slab Taxes and Insurance
Total Bldg. and Grounds
TOTAL FIXED COSTS
Salary and Fringe Benefits
$- 42,114.00
19,188.00 4,128.00 4,025.00 9,600.00 s,000.00 2,300.00
$ 86,355.00
$ 35,040.00
$121,395.00
$ 9,500.00
$130,895.00
$ 24,000.00 4,800.00 4,000.00
$ 32,800.00
$163,695.00
$17,000.00
!Industry sources indicate a possible need for additional covered meal storage capacity at larger production levels.
9

and grounds expenses were estimated by contractors in the Tidewater
Virginia area.
Taxes and insurance annual carrying costs, figured at fourteen
mills and $10/$1000 respectively, are believed reasonable. Tax rates
will vary by location and insurance rates will change with a number of
factors such as building materials used, number of personnel, location
and age of physical plant.
Fixed labor costs at $17,000 is considered a reasonable salary
for a plant manager who will be the primary operator of the drying
enterprise. Manufacturer's specifications and processor information
indicate that this particular unit is highly automated and may be
operated by a single individual. However, annual variable labor costs
include an additional worker to supplement the plant operation (Table
IV).
10
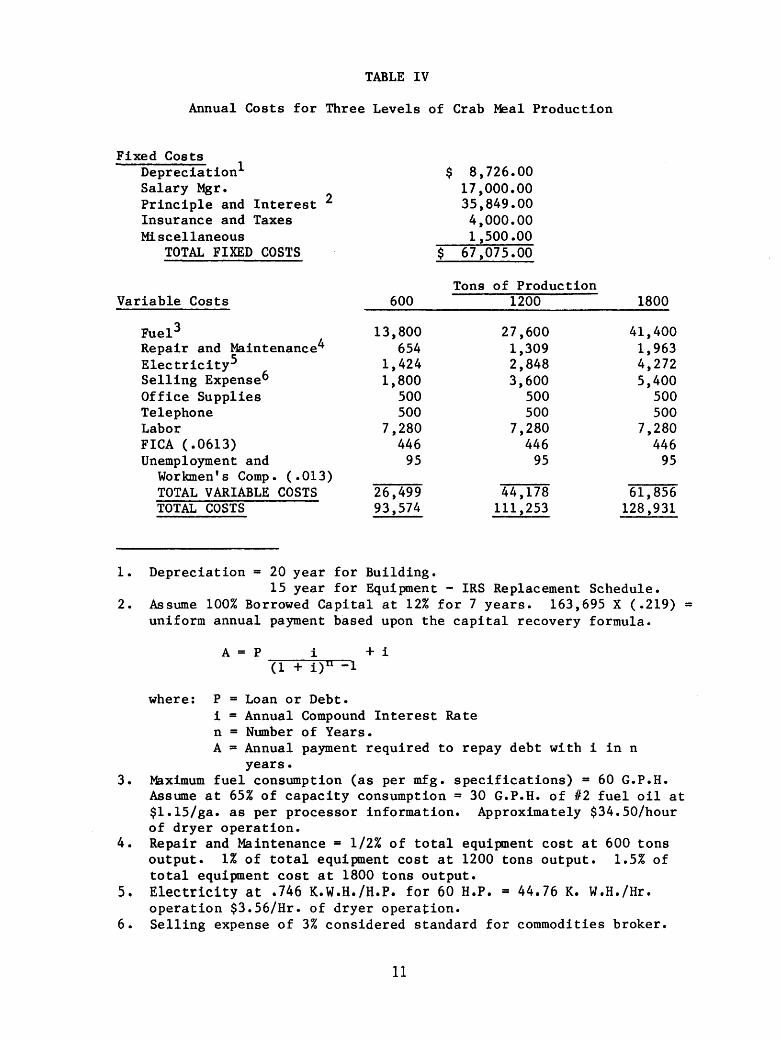
TABLE IV
Annual Costs for Three Levels of Crab Meal Production
Fixed Costs Depreciation1 Salary Mgr. Principle and Interest 2 Insurance and Taxes Miscellaneous
TOTAL FIXED COSTS
Variable Costs
Fuel3 Repair and Maintenance4 Electricity5 Selling Expense6 Office Supplies Telephone Labor FICA (.0613) Unemployment and
Workmen's Comp. (.013) TOTAL VARIABLE COSTS TOTAL COSTS
600
13,800 654
1,424 1,800
500 500
7,280 446
95
26,499 93,574
1. Depreciation= 20 year for Building.
$ 8,726.00 17,000.00 35,849.00 4,000.00 1,500.00
$ 67,075.00
Tons of Production 1200
27,600 1,309 2,848 3,600
500 500
7,280 446
95
44,178 111,253
1800
41,400 1,963 4,272 5,400
500 500
7,280 446
95
61,856 128,931
15 year for Equipment - IRS Replacement Schedule. 2. Assume 100% Borrowed Capital at 12% for 7 years. 163,695 X (.219) =
uniform annual payment based upon the capital recovery formula.
A = P i + i (1 + i)li -1
where: P = Loan or Debt. i = Annual Compound Interest Rate n = Number of Years. A= Annual payment required to repay debt with i inn
years. 3. Maximum fuel consumption (as per mfg. specifications)= 60 G.P.H.
Assume at 65% of capacity consumption= 30 G.P.H. of #2 fuel oil at $1.15/ga. as per processor information. Approximately $34.50/hour of dryer operation.
4. Repair and Maintenance= 1/2% of total equipment cost at 600 tons output. 1% of total equipment cost at 1200 tons output. 1.5% of total equipment cost at 1800 tons output.
s. Electricity at .746 K.w.H./H.P. for 60 H.P.= 44.76 K. w.H./Hr. operation $3.56/Hr. of dryer operation.
6. Selling expense of 3% considered standard for commodities broker.
11

Average costs for repair and maintenance quoted by the ·
manufacturer were not utilized but rather more pessimistic estimates
for repair rates were used herein. Discussions with existing plant
operators indicate the graduated rates are reasonable. The simple
assumption is that wear and tear on the unit will increase
proportionally with use. Repair costs of such a unit depend upon a
number of conditions such as quality of operating personnel and
equipment maintenance records. Rates used are proportionate to hours
of dryer activity.
In annualizing the fixed costs of operation, depreciation was
figured using the IRS replacement schedule (20 years for building,
15 years for equipment) using straight line depreciation and assuming
a zero salvage value.
The annual principle and interest expenses were figured by
assuming all capital required is borrowed at 12% for seven years. The
amortization payment of $35,849.00 was figured based upon the capital
recovery formula:
A = p i +1
P(l-i)n -1
Where: p = Loan or Debt. i = Annual Compound Interest Rate. n = Number of years. A = Annual payment required to repay debt with interest
"i" in It n It years.
Interest is charged for all capital needed irrespective of whether it
is borrowed or not. Therefore on any equity the 12% interest
represents an "opportunity cost" or foregone return on the capital in
some other use.
12
Projected fuel consumption includes a reported 5-10% reduction in
fuel use by installation of the budgeted vapor recycling duct, which
also significantly reduces particulate emissions from the facility.
The Heil SD 75-22 Dryer can be adapted for natural gas.
According to officials at Virginia Electric and Power Company (VEPCO)
use of natural gas would cut the fuel costs by an estimated 35%.
However, natural gas is not available at all locations and energy
experts expect substantial increases in the cost of natural gas as
federal controls are removed, which will theoretically ultimately
equalize relative energy input costs.
Because fuel costs have been widely identified as a source of
investment risk in a commercial drying operation, further analysis of
fuel cost variability and financial impact are considered later in.
this report. Electrical costs were also figured on an hourly basis as
per manufacturer's horsepower specifications. The cost of electricity
to run the various motors used by the drying system (totalling
60 h.p.) were figured at .75 K.W.H./H.P.H. and$ .08/K.H.W. (VEPCO).
One element that has been omitted from plant costs is land. Land
costs have been ignored because of the following factors:
* The great variability in land values surrounding the
Chesapeake Bay. For example, acreages available in Tidewater
Virginia, although two miles apart, are being offered at
$25,000/acre (waterfront) and $3200/acre inland.
* In terms of total fixed costs, this value will probably be
relatively minor and can be an appreciable asset.
13

The total fixed costs are translated into annualized values along
with the strictly operational (variable) costs of production. The
fixed and variable costs represent the yearly expenses of producing
different volumes of meal.
Enterprise cost data were estimated on the basis of hourly costs
of operation by combining the manufacturer's specifications with
actual plant data. Production figures derived from actual plant data
are projected for operating the plant at 65% of plant capacity
(Appendix 1). At this level, 1.5 tons of meal would be produced per
hour from approximately 3.5 tons of scrap. Processor derived estimate
of a 43% yield of meal from wet scrap was used to specify plant output
at the 65% capacity level.1
lExact yields of meal from wet crab scrap vary considerably depending upon a number of factors such as the physical state of the animal, method of picking, and efficiency of the dryer. More complete drying of scrap material reduces the moisture content of the meal product and thus the yield (conversion factor) decreases. However, because crab meal is valued for its protein, a more thoroughly dried meal having a higher protein content would receive a higher price.
For example, processor information indicates that at a 30-35% conversion rate the meal's protein content would be over 40% and thus the meal would command a higher price.
Generally the conversion factor and protein content will vary inversely. The assumption herein is that percentage changes in meal conversion rates are offset by opposite changes in the total revenue generated from the higher value product.
Thus for the sake of revenue projections herein, 43% conversion to 31% protein meal is considered reasonable.
14

The costs for fuel, electricity, and maintenance were also
figured on an hourly basis. Fuel consumption was budgeted at 65% of
the unit's maximum fuel consumption which is rated at 60 g.p.h.
Processor information indicates a burn rate of about 30 gallons per
hour at 65% capacity.
Fifty three percent of the annual fixed costs are comprised of
payments to principle and interest (Table IV). The size of actual
cash capital expenses will vary greatly depending upon a number of
factors such as actual loan sources and terms as well as the amount of
equity capital available (for example: 75% financing at the terms
budgeted reduces the average fixed cost expenditure per ton for the
smallest scale operation by $30.00 to $82.00).
The model crab meal production facility is characterized by
substantial economies of scale with decreasing average total costs per
ton throughout the relevant range of production levels (Table IV,
Appendix 6, Figure 5). Firms locating in areas without the
availability of substantial quantities of crab scrap could consider
handling other scrap products locally available to more fully utilize
the production capacity of this particular plant. Most modern dryers
are adaptable for all grains, agricultural products, meat and seafood
products. A smaller scale operation and the availability of used
drying equipment would significantly reduce the capital investment.
The processing system budgeted in this report was chosen because of
its capability to render the great quantities of crab scrap generated
15
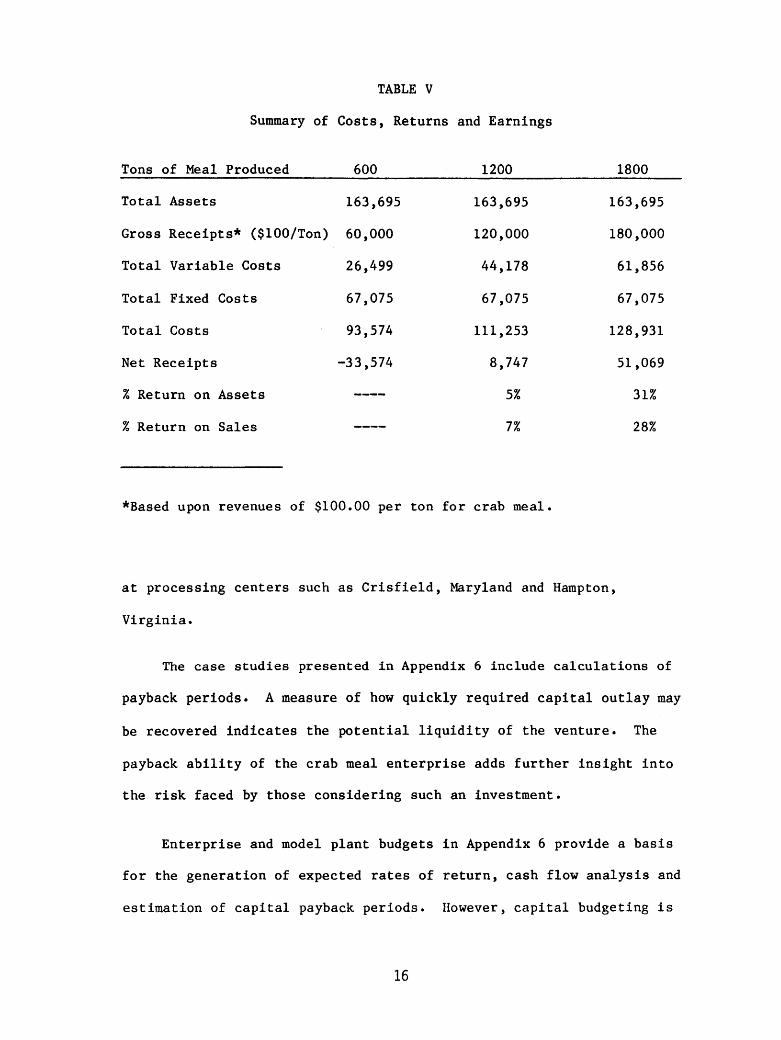
TABLE V
Summary of Costs, Returns and Earnings
Tons of Meal Produced 600 1200 1800
Total Assets 163,695 163,695 163,695
Gross Receipts* ($100/Ton) 60,000 120,000 180,000
Total Variable Costs 26,499 44,178 61,856
Total Fixed Costs 67,075 67,075 67,075
Total Costs 93,574 111,253 128,931
Net Receipts -33,574 8,747 51,069
% Return on Assets 5% 31%
% Return on Sales 7% 28%
*Based upon revenues of $100.00 per ton for crab meal.
at processing centers such as Crisfield, Maryland and Hampton,
Virginia.
The case studies presented in Appendix 6 include calculations of
payback periods. A measure of how quickly required capital outlay may
be recovered indicates the potential liquidity of the venture. The
payback ability of the crab meal enterprise adds further insight into
the risk faced by those considering such an investment.
Enterprise and model plant budgets in Appendix 6 provide a basis
for the generation of expected rates of return, cash flow analysis and
estimation of capital payback periods. However, capital budgeting is
16

~erely a logical method used in business decision-making. The main
limitations to such budgeting techniques arise from variables not
easily forecast. The following sections deal briefly with some of
these variables or the so-called "real world risks" of crab meal
production. To date the major problem areas perceived have included:
1. Product marketability and price fluctuations.
2. Energy prices.
3. Transportation costs of scrap from processing plants to the
dryer site.
4. Air quality problems.
5. Variability of blue crab abundance.
Product Marketability and Price
Crab meal price, on any given day, is determined relative to the
cash price of soybean meal as listed by the Chicago Board of Trade.
Industry sources have indicated slightly varying ratios of crab meal
prices to soybean meal prices. This is consistent with feed industry
representatives who value crab meal for its percentage protein content
by weight relative to 44% protein soybean meal. This protein ratio
may vary from producer to producer. According to USDA's Feed
Regulatory Division, crab meal must contain not less than 25% crude
protein (Appendix 2) in order to be acceptable as a feed additive.
Crab meal protein content will usually vary from 31% to 44% depending
upon the method of crab picking, the natural state of the animal and
the efficiency of the dryer.
17

Communication with feed blenders and commodity brokers have
indicated a willingness to utilize meal at the right price. However,
there are presently few feed blenders utilizing shellfish meal
products in their formulas. The existing market for the product is in
relatively small feed blending companies. Minimal quantities of crab
meal available limit its use in large scale feed industries; however,
to date, all meal produced is marketed.
Commodity brokers familiar with crab meal indicate that
increasing the quantity and availability of crab meal will expand its
market. Cooperative product storage/marketing by small crab meal
producers could improve the marketability of the product and maximize
revenues by stabilizing supply and increasing the quantities
available. Crab meal will generally comprise a very small additive in
standard feed blends, usually 2-3% in laying hen rations. Crab meal
should be available in quantity over a reasonably predictable period
of time to be included in a feed formulation. Only by being able to
rely on an amount and timing of delivery can a blender justify
changing his feed formulation to utilize the product as a relatively
cheaper source of protein in his feed products.
In addition to the limited available markets for crab meal,
chronic price fluctuations are often cited as a serious factor for
potential investment in crab meal production facilities. Any product
that is priced directly to agricultural commodity prices will face
market price fluctuations. Because of the relatively fixed
relationship between soybean meal and crab meal, the price path for
18

crab meal will closely follow that of soybean meal (Fig. 4). An
investor in such an enterprise must be aware of the potential for
price extremes in selling his product. The seasonal price
relationships once assumed in feed grain industries may no longer be a
certainty. Historically, producers could expect supply induced
increases or decreases in soybean meal prices. However, with today's
complex market structure, these expected "preharvest upward trends"
and "post harvest downward trends" do not always appear. High protein
feed grains like soybean meal are important components of
international trade and the price functions for these products often
reflect "political" parameters in addition to strict supply related
phenonema. Classic examples of politically related price changes are
the "Russian Wheat Deal" in the early 1970's and the more recent
Soviet Grain Embargo of 1980.
The past two years have represented one of the most volatile
periods for the commodities industry. The imposition of the Soviet
Grain Embargo caused the price of soybeans, soybean meal (and as a
result crab meal) to plummet to historic lows through March, April and
May of 1980. Countering this reduced foreign demand was the prolonged
drought of the summer of 1980 which restricted agricultural harvests
and served to bring soybean prices from their low levels. Prices hit
historic highs in November 1980 as the poor harvests were realized
(Fig. 4).
There were other significant forces at work in the commodity
pricing process and sufficient analysis of this price determination is
19

N 0
300
250
z 200 0 t-...... Cl)
a:: <( ...J 150 ...J 0 0
100
FIGURE 4
MONTHLY AVERAGE PRICES
JANUARY 1980 - MARCH 1981
Ai-SOYBEAN MEAL $ I TON
.......... .0., ,#'CRAB MEAL ,..IY , $ I TON
a'"" 'h ,"" 1..:..,-- -o--. ., .... o.. ...... ...... r.'\
,.--0' ~--o ,,er .O·······O· .,, ..
0-- --0-- - ..... 0- 0-· - r:·/'' 0 .... "" - -o--- ~ 0~······.. '\SOYBEANS
··o ....... . Q ...... 0 ·········0
./ $/BUSHEL .. O·······O... ..··
·····o .o········O ·······o·······
8 ...J w ::c Cl)
7 ::> al ......
6 ~ <( _J
_.__ ______ ~--~-,.~--,.-~,-~-,-~-,-~--,-~-,~~~~--.-~-,-~--,-~--.~5 ~ 50 0 F M A M J J A S O N D J F M J
t-------------1980------------+---l 981--
beyond the scope of this report. The investor may view this period as
atypical, but indicative of what may happen to the market for crab
meal products.
Crab meal presently faces an elastic demand and producers of this
product take whatever price is dictated by the commodity situation.
However, from an investor's point of view there may also be a
substantial benefit in this relationship with soybean meal.
Processed soybean meal prices fluctuate generally along with the
price of soybeans (over 90% of the value of a crushed ton of soybean
meal is in whole soybeans, Grain Market News, Fig. 4, Table VI).
Although soybeans also fluctuate widely in price they do enjoy a price
floor or minimum price guaranteed by the USDA. Soybean producers are
somewhat protected by these loan guarantee prices. The price support
loan rate serves as a government guaranteed buying price if the "free
market" equilibrium price drops to the loan level. Farmers who
participate in acreage controls and other supply control programs are
eligible for these loans. If the loan is not repaid the government
takes ownership of the commodity as the security to the loan. The net
effect is a price guarantee below which the product (in this case
soybeans) price need not fall.
Implicit in this relationship may be a derived price floor for
soybean meal even though processed agricultural products may not
directly receive loan guarantees. The stabilizing influence on
soybean prices would presumably be transferred to the crushed soybean
21
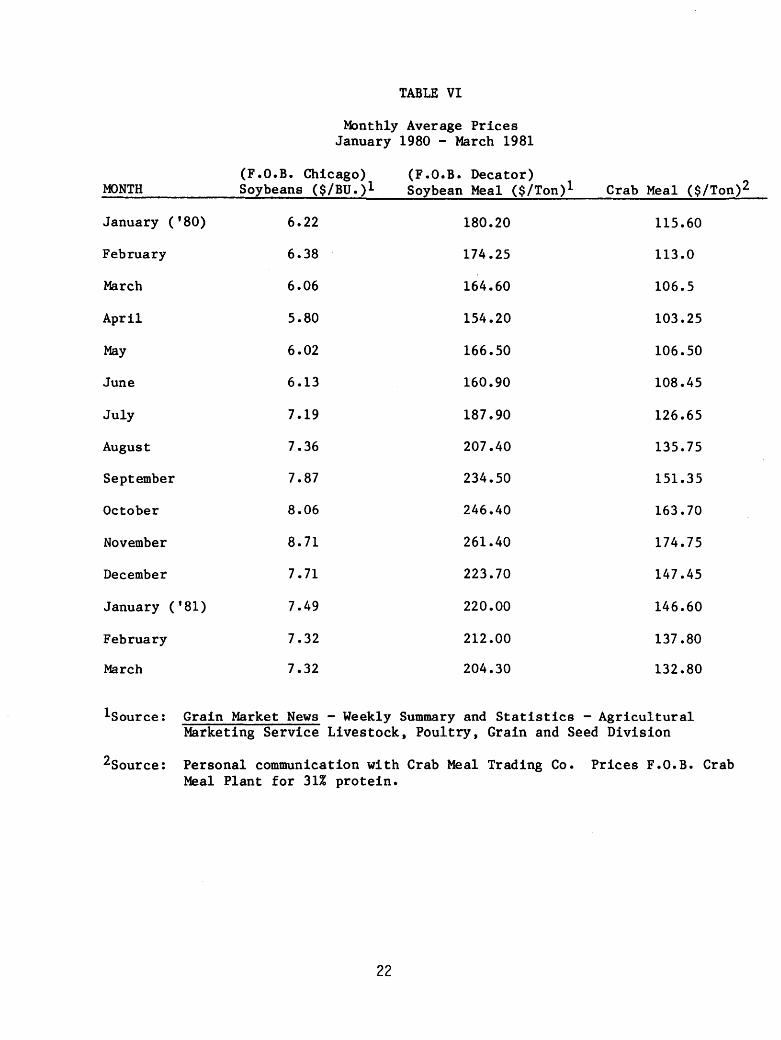
TABLE VI
Monthly Average Prices January 1980 - March 1981
(F.O.B. Chicago) (F.O.B. Decator) Meal ($/Ton)2 MONTH Soybeans ($/Bu.)1 Soybean Meal ($/Ton)l Crab
January ('80) 6.22 180.20 115.60
February 6.38 174.25 113.0
March 6.06 164.60 106.5
April 5.80 154.20 103.25
May 6.02 166.50 106.50
June 6.13 160.90 108.45
July 7.19 187.90 126.65
August 7.36 207.40 135. 7 5
September 7.87 234.50 151.35
October 8.06 246.40 163.70
November 8. 71 261.40 174.75
December 7. 71 223.70 147.45
January ('81) 7.49 220.00 146.60
February 7.32 212.00 137.80
March 7.32 204.30 132.80
lsource: Grain Market News - Weekly Summary and Statistics - Agricultural Marketing Service Livestock, Poultry, Grain and Seed Division
2source: Personal communication with Crab Meal Trading Co. Prices F.O.B. Crab Meal Plant for 31% protein.
22

meal product and thus there probably is some derived or "spin off"
lower limit for crab meal.
An investor will face fluctuations in product prices, however for
the sake of planning and revenue projections, some lower level of
prices may be presumed for the crab meal product. The investor should
be aware of this lower limit of revenue and measure the processing
plant's feasibility at or around that price level.
Because crab meal is a relatively unique feed additive, some
marketing expertise is required to maintain a consistent market demand
for the product. Crab meal has found a viable market with laying-hen
feed producers and it is highly favored by some of these blenders.
However, the investor may do well to use an agent/broker familiar with
agricultural commodities for marketing the crab meal product. The
added expense of commissions for sale of this product may be
insignificant in return for a consistent outlet for a small volume
product. Complexities of the commodity market suggest the guidance of
a commodities specialist in selling the product.
The rising costs of protein and improved markets for crustacean
meals in the aquaculture industry increase the potential use for a
product such as blue crab meal. Developmental aspects of crab meal
product forms may continue to increase the value of this crab
processing by-product. For example, the original producers of crab
meal (Hunt Crab Meal Company of Hampton, Virginia and Quinn Company of
Crisfield, Maryland) marketed this product solely for the fertilizer
industry in the late 1930's. Since that time, pioneering work by Mr.
23

Theodore S. Reinke has served to increase the value of crab meal. By
more refined handling and milling practices, Mr. Reinke's Crisfield
Dehydrating Company began to produce a better quality of crab meal
product acceptable to the animal feed industry. These advancements
created a more lucrative market for the byproduct and, for the last 35
years, most crab meal has continued to be marketed in this same feed
blending sector. Continuing improvement in crab meal quality, coupled
with a growing interest in specialized product forms (tropical fish
foods, aquaculture feeds, etc.), indicates that crab meal may be
entering a new stage in its evolution as a specialized feed additive.
Long valued solely for its protein content, recent research by food
scientists has focused greater attention on other qualities of
crustacean waste meals such as carotenoid pigments and trace elements
{Meyers 1980).
Further development and increased supplies of crab meal may serve
to advance the byproduct to a more specialized market not directly
tied to the feed grain sector of the economy.
Most of the limitations discussed above result from pricing and
delivering at the time of production - i.e. selling in the spot
market. This situation relegates the producer to being strictly a
price-taker and has, in some instances, resulted in product storage
expenses because of a lack of a ready market. Although there are
advantages to such marketing, a new enterprise may wish to-consider
some type of forward contracting. The crab meal producer may
guarantee his market access by contracting in advance for at least a
24

portion of his production. Advance contracting insulates the producer
from the risk of volatile product price fluctuation at the time of
delivery. The main disadvantage of contracting (advantage of the spot
market) is that it reduces the producer's flexibility and one may be
unable to take advantage of higher prices prevailing at the time of
delivery (Niles, 1979).
25
Energy Costs
Fuel costs constitute the major component of variable costs for a
crab meal drying facility. Fuel represents 52%, 62%, and 67%
respectively of variable costs at the three scales of production
budgeted {Table IV).
Projecting fuel price increases has become a widely practiced
form of forecasting, however, most "official" projections are based
simply upon linear trend extrapolations. There is little guidance in
these for someone interested in a fuel intensive process such as a
drying facility. A fuel price matrix has been developed to display
relative impacts of fuel price increases on the variable costs of
operation and the average total cost of production of a ton of meal at
three levels of production (Table VII). For purposes of analysis, the
price of fuel was estimated at $1.15 per gallon. An additional
$.18/gallon increase in fuel cost increases the average variable cost
of production per ton by about $4.00. The matrix demonstrates the
"sensitivity" of production costs to fuel price increases at
increments of $.33/gallon. For each $.33/gallon increase in fuel
costs, the average variable and average total costs of production
increase by about $7.00 per ton of meal produced.*
*Differences in cost increments are due to rounding.
26

Fuel
1.15
1.33
1.66
2.00
2.33
Fuel
1.15
1.33
1.66
2.00
2.33
TABLE VII
Effect of Fuel Price Increases on the Cost of Crab Meal Production at Three Levels of Production
$/gal.
of
$/gal.
Average Operating/Variable Costs Per Ton of Output
600 1200 1800 tons
44 37 34
48 40 38
54 47 45
61 54 51
68 60 58
Average Fixed Costs Per Ton Output (Total Annual Fixed Cost = 67,075)
600 1200 1800 tons
122 56 37
Average Total Cost Per Ton of Output at Different Production
and Fuel Price Levels
600 1200 1800 tons
156 93 72
160 96 75
166 103 82
173 110 89
180 116 95
27

A doubling of fuel prices ($2.33/gal.) without an accompanying
increase in the price received for crab meal would impact the smaller
producer most acutely. However, even at these drastically higher fuel
costs and at the lower production levels, the variable costs of
operating the dryer would be reclaimed.
There may be a tendency for soybean and crab meal price levels to
increase along with the guarantee rates for soybean. Presumably,
increases in fuel costs would also be reflected in USDA's loan
guarantee rates which are, in part, based on costs of production.
Fuel and petrochemical products are a significant component of
production costs (fuel and fertilizer comprise about 25% of the
production cost of soybeans in the southeast; Westbury, personal
communication). Although fuel prices are widely presumed to increase,
the values of human protein sources (to which crab meal is related)
are also increasing (Appendix 3, 4).
Fuel costs represent the single most significant source of risk
for a crab scrap dehydration facility. It is of interest that many of
the newer drying systems are adaptable for alternative sources of
energy (coal, wood, natural gas). Presumably, this adaptability will
at least allow the investor to substitute fuel forms efficiently as
energy prices increase in the future.
28
Scrap Transportation Costs
To this point in the analysis, expenses estimated for the model
crab meal enterprise have related solely to those "inside the plant
gate" costs of capital and operation. The budget is based upon the
assumption that the crab scrap input is available at no cost to the
enterprise.
The collection and movement of scrap material to a central drying
facility can entail substantial costs. Presently these costs are
borne by the crab processors. Whether the scrap is being hauled to
landfills or farm land, the processors are paying to have it removed.
Irrespective of the form of ownership of the crab meal facility,
the costs of waste pickup will probably continue to be paid by those
generating the scrap. Estimates of these costs should be based upon
specific plant location which is beyond the scope of this paper.
However, in reviewing the costs of transporting scrap to the meal
plant, the following should be considered:
1. Processors should view the projected costs relative to those
presently being paid for waste removal. Projected costs of
scrap transport to the meal plant should not be interpreted
as an unambiguous (net) increase in processing operating
costs. ·To analyze these "new costs," one must consider how
much they will increase or decrease over present waste
hauling expenses. It can be argued that it is more feasible
to proximally locate a drying facility to minimize
transportation costs than it is a new landfill or farmland.
29
2. Any net revenues, dividends, patronage fees, etc. realized as
a partner, stockholder, coop member, etc. of the new drying
facility should be subtracted from these transportation
costs.
3. Benefits derived by having access to a continually
operational waste disposal site should be considered by those
paying transportation costs. Though these 'returns' may be
difficult to quantify they are clearly significant or
industry would not find itself in its present situations.
For more discussion on this subject see the section on waste
disposal alternatives.
Careful consideration of the above points will assist the
potential processor/investor in assessing the real changes in
profitability as a result of delivering scrap to a crab meal drying
facility as opposed to its present destination.
Air Quality Problems
There has been a great deal of discussion regarding the odor and
particulate emissions from some existing and recently closed crab meal
drying facilities. The greatest problems have arisen from meal plants
located in recently urbanized areas. Plants with these problems are
typically very old and have no specific air quality control features.
Discussion with representatives of the Virginia State Air Control
Board (VSACB) have substantiated these problems, but have also pointed
30

toward relatively reasonable solutions. Advice from appropriate state
agencies would be helpful to the potential investor in trying to avoid
air quality problems.
According to officials from the VSACB the principle air quality
problems stem from two types of emissions:
1. particulates
2. odor
1. Particulate emissions can be reasonably controlled (reduced
to meet State and EPA tolerance levels) by the installation
of various devices available with modern drying equipment.
The enterprise budget presented in this report includes
installation of a "vapor recycling duct." In addition to the
fuel savings realized, such a duct significantly reduces
particulate emission to within permissible levels.
2. Odor problems have been more difficult to control according
to VSACB officials because of the nature of the emission.
Odor is measurable only subjectively as there are no
thresholds or norms as in other types of pollution.
Reportedly, odor pollution has only been a problem for plants
located close to residential areas. The vapor recycling duct
serves to reduce some of the odor in the drying process.
However, to avoid problems of odor, VSACB personnel suggest a
rural location might be the best preventive step for the
potential investor. Reportedly, locating at least a mile
from housing developments would be the most judicious
31

solution to the odor problem. Expedient collection and
drying of scrap materials can also serve to greatly reduce
the odors at the plant.
Air quality standards need not be a significant source of risk or
uncertainty to a crab meal enterprise if the investors will consult
the appropriate regulatory -agencies for necessary permits and advice
prior to location decision-making.
32

Variability of Blue Crab Abundance
Potentially impacting the crab meal processing firm are the often
significant fluctuations in blue crab landings in the Chesapeake Bay.
The 1979 data used for projecting landings and waste loads present a
relatively low production year for the Chesapeake Bay area. The
1960-1978 averages for the Bay were approximately 67.1 million pounds
landed which was somewhat larger than that reported by NMFS for 1979
(64.2 million lbs). Of this total, Maryland landings were above its
historic level, (24.8 vs. 23.0 million lbs) and Virginia's was below
(39.4 vs. 44.1 million lbs).
The probability of an abnormal production year both above and
below the historical average may be expressed statistically (Appendix
8). Annual average landings and variations from the average are
important parameters that should be considered in assessing risk
factors related to fluctuations of natural resource abundance. The
investor may wish to review these fluctuations in blue crab abundance
for impacts on projected cash flow, dryer loading, storage capacity,
marketing and pay-back periods.
33
WASTE DISPOSAL ALTERNATIVES
The feasibility of any potential business investment should be
measured relative to alternative capital investments and their
expected rates of return. Results of capital budgeting herein provide
necessary (though perhaps not totally sufficient) information for the
potential investor. Ultimately, feasibility is in the mind of the
investor.
Economic theory suggests that profit maximizing behavior is the
motivating factor in such decisions, however, in this case subjective
valuations may differ from conclusions based upon formal capital
budgeting.
Not all potential investors have the same perspective. Economic
theory assumes the freedom/ability to choose between alternatives in
seeking the investment yielding the greatest rate of return. For
those actually experiencing crab waste disposal problems the proforma
statements provided should probably be viewed in a different context
or with a somewhat different set of assumptions.
Crab processors do not have the same field of choices as an
outside or "neutral" investor considering the accompanying budgets.
One of the alternatives available to the "neutral" investor is to do
nothing. Crab processors with waste disposal problems are not
permitted that option.
34

Major "alternatives" to crab meal processing as a method of waste
disposal management include a fairly limited spectrum. To date those
options considered by industry have been:
1. Ocean Dumping
2. Sanitary Landfills
3. Direct farmland application
For a complete review of these methods and an excellent summary
of seafood waste management see Otwell (1980).
A brief outline of the more salient aspects of these disposal
methods will provide the background for evaluating crab meal
production as a waste management alternative.
Ocean Dumping/Barging
While such handling would avoid chronic problems of landfill
availability there have been several attempts that document problems
associated with such handling, generally:
1. Barging is very expensive in terms of obtaining adequate
barge and tugboat time.
2. Towboat and barge access points to land are very limited.
3. Weather conditions and sea state dictate ability to transport
scrap to the dump site. This dependency makes barging a very
undependable disposal technique.
4. Dumping may result in excessively high levels of oxygen
demand and turbidity plumes at the dump site.
35

5. In addition to substantial tug and barge ownership, leasing
and operating costs, there are "hidden costs" associated with
the required permitting process including analytical
requirements, site monitoring and bioassay costs (Champ,
1980).
Sanitary Landfills
Possible advantages:
a. County/local control of crab waste management
b. Known technology
c. Avoid multiple systems with dual management, overhead costs.
Disadvantages:
a. Few suitable landfill sites in coastal areas where crab processing
takes place.
b. Need for special handling procedures at the landfill. For
example, crab waste requires both a more frequent and thicker
cover, smaller waste cells, and requires trench lines of clay or
some other material that will resist leaking.
c. Landfill personnel object to nature of waste and the timing of its
delivery (mostly at night after a day of crab picking is
complete).
d. Reportedly, coastal landfills are presently discouraging crab
waste disposal and many have indicated that they will soon refuse
to handle crab scrap.
36

Direct Application to Farmland
Advantages:
a. Extensive areas potentially available with a possible improvement
in soil nutrition for field crops.
Disadvangates:
a. Weather dictates access to farmland, and thus may not afford a
consistent and timely disposal alternative.
b. Location of a farmland disposal site is critical because of odor
problems associated with decaying crab scrap.
c. Potential health hazards from adulteration of ground water, and
significant rodent attraction.
Although some of these alternatives may be feasible in specific
areas and for relatively small quantities of waste, they are clearly
not realistic for the great quantities of waste generated at the three
industry centers studied.
In addition to the technical uncertainties alluded to above,
experience to date further bears out the unacceptability of these
methods of waste disposal. They represent not only very risky short
term alternatives but also very expensive options with no possibility
of financial return. In short, they represent at best net economic
waste and great sources of uncertainty for the crab processor.
37

In view of such alternatives, the perspective of crab processors
considering investment in a crab meal production facility differs from
that of the "neutral" outside investor.
In the enterprise budget significant "opportunity costs" are
reflected in the expenses of capitalization. It may be that these
costs would be different for crab processors investing in the drying
facility. Clearly, with their present waste disposal dilemma,
opportunities are fewer and it can be reasoned that these lower (or
nonexistent) opportunity costs would further enhance the financial
feasibility of investment in such an enterprise for crab processors.
The enterprise budgets developed also have implications for the
profitability of existing blue crab processing firms. Aside from the
net profitability of a crab meal facility, processors may also derive
additional economies in their processing enterprises resulting from
decreased operating costs and/or increased revenues generated by more
efficient and dependable processing waste management.
The budgetary analysis herein clearly demonstrates the economic
feasibility of crab meal production as an investment opportunity.
Reviewing this data in the context of other waste management options,
may significantly add to the investment's attractiveness from a crab
processors' point of view.
38

Literature Cited
Bartholomew, David. "Will there be enough Soybeans?" Article
appeared in J.A.c.o.s. Journal of America Oil Chemists Society,
Vol. 57, #10. 10/80, 754-A-755A.
Boulding, Kenneth E. "Economic Analysis Volume I Microeconomics."
Harper and Row, Publishers, N.Y., 1966.
Cato, J.C., Clayton, K. et al. "Report on Alternatives For
Managing Solid Crab Waste in Wakulla County." Unpublished
reports by Marine Advisory Program, University of Florida, 1977.
Champ, M. A., 0 'Connor, T. P., Pat, P. K. "Ocean Dumping of Seafood
Waste As A Management Alternative." Paper presented at the
Conference on Seafood Waste Management in the 1980's. September
1980, Orlando, Florida.
Grain Market News: Weekly Summary and Statistics. Agriculture
Marketing Service Livestock, Poultry, Grain and Feed Division,
U.S.D.A. Washington~ D.C.
Kal Homer, Jukka. "Fish Meal: International Market Situation and
the Future." Marine Fisheries Review MFR Paper 1044, Vol. 36,
No. 3, Mar. 1974. pp. 36-40.
Mendenhall, M.A. "Utilization and Disposal of Crab and Shrimp
Wastes." University of Alaska Sea Grant Marine Advisory Bulletin
No. 2, 1971.

Meyers, Samuel P. "Utilization of Shrimp Processing Wastes in Diets
For Fish and Crustacea." Paper presented at the Conference on
Seafood Waste Management in the 1980's. September 1980, Orlando,
Florida.
Murray, Thomas J. "Seafood Waste Management in Virginia." Paper
presented at the Conference on Seafood Waste Management in the
1980's. September 1980, Orlando, Florida.
Niles, James A. "Pricing at Delivery." Florida Cooperative Extension
Service FRE 18. University of Florida, 1979.
Otwell, w. Steven. "Seafood Waste Management in 1980's: Conference
Proceedings Report #40. Florida. Sea Grant College, February,
1981.
Paperella, Mike. "Information Tips - To Improve the Processing of
Seafood." Marine Products Laboratory, Crisfield, Maryland, 1978.
Perkins, Gary B. "Economic Feasibility Analysis of a Shrimp Waste
Processing Plant." Unpublished report for the Extension Food and
Fiber Center, University of Mississippi, 1979.
Roberts, Ken. "A Blue Crab Picking Plant Feasibility Analysis For
the Blufton, s. C. Oyster Cooperative." Unpublished report.
Schultz, Raymond G. and Robert E. "Basic Financial Management."
Educational Publishers, N.Y., 1972.

Tomek, w. G. and Robinson K. L. Agricultural Product Prices. Cornell
University Press, Ithaca, N.Y., 1972.
Westbury, George o. "Enterprise Budgets: What, How and Why?" Staff
Paper 131, Food and Resource Economics Dept., University of
Florida, Gainesville Florida, 1979.
Ibid. "Production Costs for Corn and Soybeans" Staff Paper 132, 1979.

Appendix 1
THE HEIL CO. 3000 W. MONTANA ST., P.O. BOX 583. MILWAUKEE. WISCONSIN 53201. U.S.A. TELEPHONE (414) 847-3333 • CABLE AOORESS: HEILCO • TELEX: 026-631
June 23, 1980
Mr. Tom Murray Marine Advisory Service Virginia Institute of Marine Science Gloucester Point, Virginia 23062
Dear Tom:
TOM KNOX 7624 Bennington Drive Knoxville, TN 37919
Telephone (615)~~!)11
We certainly appreciate your inquiry concerning our Heil equipment for your crab processing project.
Considering the information we discussed, I am pleased to quote you the following:
HEIL SD 75-22 Dryer:
Including - Burner (gas), furnace, drum, bases, 40 hp fan, ductwork, cyclone, and electric controls
Dryer Complete. Feeder and Infeed Conveyor .. . Jacobson Hammermill ...... . Rotary Airlock ...... .
Installation (no buildings and concrete)
TOTAL
. $ 41.,114.00 19,188.00
4,127.76 4,025.00
35,040.00
$10f-,494.00
You will note this does not include buildings or concrete. This would probably be done by a local contractor.
I will be in touch with you and if we may be of any service in the meantime, please do not hesitate to call.
Sincerely,
~% Tom Knox, Dis~anager
Dehydration Systems
TK:arnk
Enclosures

Appendix 1 Date. December 1 _ 1976
HYDRATI
THE HEIL CO. ·Milwaukee,· Wisconsin 53201
DIMENSIONS:
CAPACITY:
FURNACE & BURNER:
CONVEYOR:
FEEDER:
DRUM:
MODELSD7~22DEHYDRATOR
7'8" wide x 10'0" high x 53'6" l~ng. See dimension drawing A630F46 for details.
Maximum water evaporation rate is 6000# per hour. Rate will vary depending on heat sensitivity of product, its density, original moisture content, uniformity of feed & elevation above sea level. Capacity reduced approximately 6% for each 1000' above 3000'. Dry product capacity estimated on request.
Gas Fired - Direct, end fired, horizontal, cylindrical housing with two support stanchions & material inlet chute. Furnace direct coupled to drum through rotating labyrinth seal. Refractory lining material furnished loose but not installed. Cast-in-place refractory supplied in burner & furnace discharge housing. Four atmospheric venturi type gas burners with 11 M BTU capacity, modulating fuel valve, manual & solenoid shutoff valves, main & pilot lines & pressure gage. Maximum gas consumption Jj~Q...Q_(:fh of 1000 BTU/cu. ft. natural gas. Gas source 15 psi minimum at furnace connection & must be uniform.
Oil Fired (Optional) - High pressure air or steam atomizing gun type main & pilot burners. Includes modulating main fuel valve, manual & solenoid operated shut-off valves, pressure regulating valve & pressure gages. Maximum oil consumption is.§.Q..JlP..h., All grades of oil can be utilized (standard set up for #2 fuel oil). Heavy grades require preheating & Bunker "C" requires steam atomization. 3/4 HP oil pump, oil filter & 7-1/2 HP compressor furnished.
Dual Fuel - Available on request.
Furnished by Others - Fuel supply lines to furnace connections, storage tanks & gas pressure regulator.
Double chain type with steel flights in steel housing sealed against air leaks into furnace, powered from clutch shaft of feeder.
Semi-automatic, 8'0" x 8'0" floor. Provides uniform feed to dryer. Powered from dryer line shaft. Maximum capacity 700 cu. ft. per hour. Live bottom, variable speed, manually adjusted, feed for handling finely chopped or granular non~corrosive materials having a bulk density less than 60#/cu. ft. Equipped with metal flights on two strand chain, levelling rake & feed reel & collecting screw conveyor with center discharge.
Steel three pass type, 7-1 /2' dia. x 22' long, with compound showering flights formed integral with drum shells, positive chain drive, rotary air seal, machined steel running
bands.

DRUM BASES:
PRIMARY AIR SYSTEM:
INSTRUMENTS & CONTROLS:
POWER REQUIREMENTS: (Motor starters by others)
APPROXIMATE NET WEIGHTS
Fabricated steel with cast iron rollers & ball bearing self-aligning pillow blocks. Drive base equipped with counter shaft, drive & idler SPfOCkets, speed reduction unit & flanged roller for fixed drum alignment. Idler base is equipped with flat rollers for drum expansion.
Induced draft, 34" dia. x 16" wide fan wheel. Fan inlet duct equipped with gravity type .tramp metals trap. Cyclone collector·up-draft type with support & 18" sq. duct between fan & collector.
Temperature Control --- Outlet air temperature monitored by thermocouple controlling fuel metering valve. Controller is time proportioning constant modulating type.
Safety Control ~ Ultraviolet flame failure detector controlling fuel supply, combustion blower air pressure detector, main fan draft detector, high outlet temperature detector.
Indicators Inlet & outlet air temperature, thermocouple type.
Drip proof general purpose ball bearing 3 phase, 60 hertz, 230/460 volt electric motors furnished standard as follows: Primary Air System -
Drum, Feeder & Conveyor
Furnace Air Compressor (Optional)
Oil Pump (Optional)
Drum Conveyor Drum Bases Dryer Collector Firebrick Main Fan Furnace Housing Feeder Miscellaneous
40 HP
5 HP
1800 RPM
1800 RPM Powered by line shaft originating at drum drive base. Common drive through I ine shaft.
7-1 /2 HP 3600 RPM (Oil fired units)
3/4 HP 1200 RPM (Oil fired units)
10,000# 485#
1,200# 900#
6,000# 2, 175# 3,000# 2,455# 1,560#
(OPTIONAL) SECONDARY AIR SYSTEM
Dual fan unit in lieu of single primary fan. Single fan base incorporates both primary and secondary fans, driven by one shaft. Fan base encloses motor and V-belt drive.
Primary fan has 34 dia. by 16 wide material handling type wheel, secondary fan has 30" dia. by 6 wide material handling wheel. Fan housings have replaceable liners. Fan inlet has tramp material trap. System includes primary & secondary collector and necessary ducting.
Note milling type secondary fan has 34% dia. x 6" wide fan wheel.
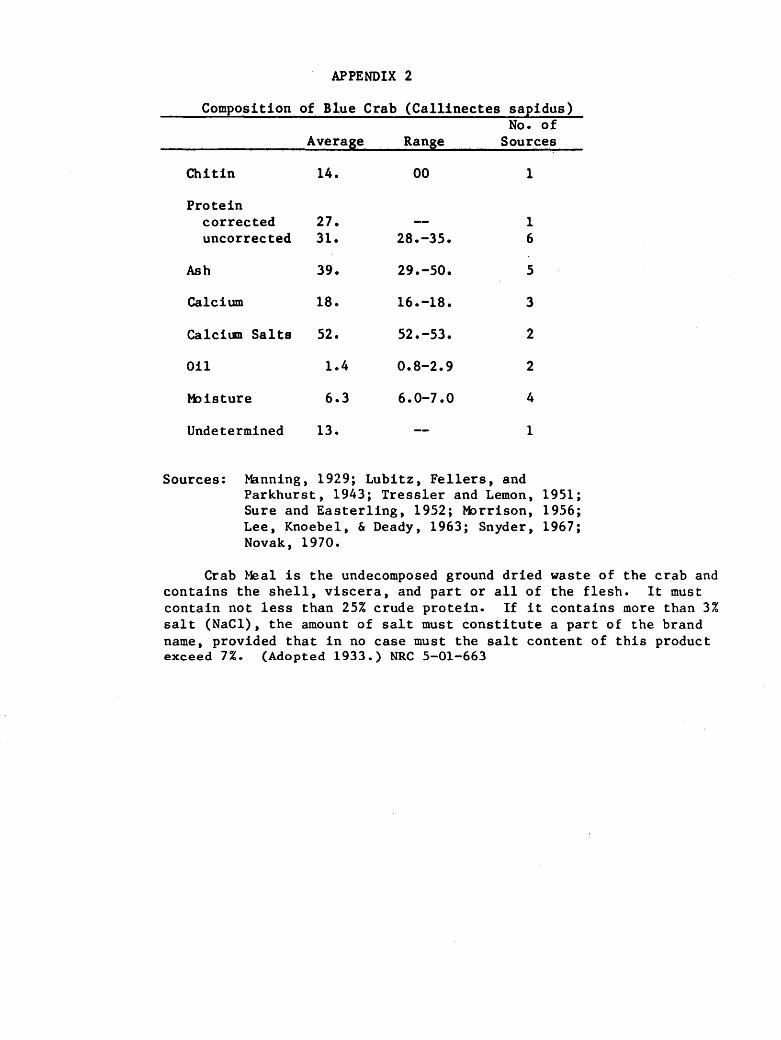
APPENDIX 2
Composition of Blue Crab (Callinectes sapidus) No. of
Average Range Sources
Chitin 14. 00 1
Protein corrected 27. 1 uncorrected 31. 28.-35. 6
Ash 39. 29.-50. 5
Calcium 18. 16.-18. 3
Calciun Salts 52. 52.-53. 2
Oil 1.4 0.8-2.9 2
M:>isture 6.3 6.0-7.0 4
Undetermined 13. l
Sources: Manning, 1929; Lubitz, Fellers, and Parkhurst, 1943; Tressler and Lemon, 1951; Sure and Easterling, 1952; M:>rrison, 1956; Lee, Knoebel, & Deady, 1963; Snyder, 1967; Novak, 1970.
Crab ~eal is the undecomposed ground dried waste of the crab and contains the shell, viscera, and part or all of the flesh. It must contain not less than 25% crude protein. If it contains more than 3% salt (NaCl), the amount of salt must constitute a part of the brand name, provided that in no case must the salt content of this product exceed 7%. (Adopted 1933.) NRC 5-01-663

YEAR SEP OCT NOV
1974-75 757 833 758
1975-76 555 497 470
1976-77 659 623 658
1977-78 521 505 577
1978-79 647 676 666
1979-80 704 652 638
1980-81 787 806 871
APPENDIX 3
Soybeans - No. 1 Yellow Chicago - Source Grain Market News
DEC JAN FEB MAR APR MAY
Cents per Bushel
728 633 568 556 576 523
459 465 474 466 471 521
686 708 725 833 974 950
587 565 557 653 681 709
679 685 729 746 730 716
640 6.221 638 606 580 602
771 749 732 732
JUN JUL AUG AVG
515 558 597 634
625 664 630 525
818 629 566 736
679 654 643 611
767 749 717 709
613 719 736 646
YEAR
1974-75
1975-76
1976-77
1977-78
1978-79
1979-80
1980-81
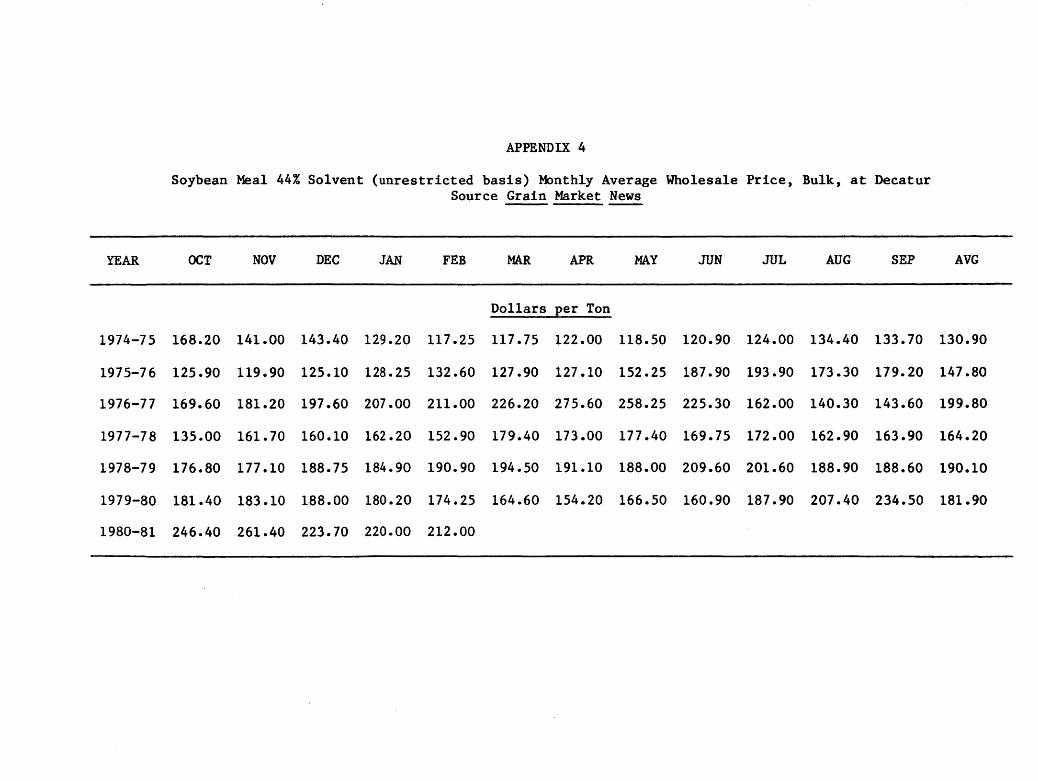
APPENDIX 4
Soybean Meal 44% Solvent (unrestricted basis) Monthly Average Wholesale Price, Bulk, at Decatur Source Grain Market News
OCT NOV DEC JAN FEB MAR APR MAY JUN JUL AUG SEP
Dollars per Ton
168.20 141.00 143.40 129.20 117. 25 117.75 122.00 118.50 120.90 124.00 134.40 133.70
125.90 119.90 125.10 128. 25 132.60 127.90 127.10 152.25 187.90 193.90 173.30 179.20
169.60 181.20 197.60 207.00 211.00 226.20 275.60 258.25 225.30 162.00 140.30 143.60
135.00 161.70 160.10 162. 20 152.90 179.40 173.00 177.40 169.75 172.00 162.90 163.90
176.80 177 .10 188.75 184.90 190.90 194.50 191.10 188.00 209.60 201.60 188.90 188.60
181.40 183.10 188.00 180. 20 174.25 164.60 154.20 166.50 160.90 187.90 207.40 234.50
246.40 261.40 223.70 220.00 212.00
AVG
130.90
147.80
199.80
164.20
190.10
181.90

APPiNDIX 5
Pounds of picked crabmeat from various areas as reported to National Marine Fisheries Service for the year of 1979. These poundage figures have been translated into live weight pounds and then to solid scrap waste pounds.
Live Pounds Meat Pounds Solid Waste Pounds
Crisfield 5,860,400 703,248 4,102,280
Lower Dorchester 7,537,700 904,533 5,276,390
Cambridge 4,572,250 548,896 3,200,575
Talbot County 1,250,000 150,000 875,000
Totals 19,220,350 2,306,677 13,454,245
Source: Office of Seafood Marketing, Maryland Dept. of Economic and Community Development

APPENDIX 6
The following annual operating budgets have been developed for
model crab scrap processing plants in the Hampton, Virginia; Cambridge
and Crisfield Maryland areas.
The budgets were developed in a similar manner to that presented
in Table II. The scales of operation are based upon the actual
availability and seasonality of hard crab waste generated in these
industry centers for 1979 (Appendix 5).
The crab meal prices quoted are those which the firms would have
received F.O.B. the meal plants for 1980 had they been in operation
(Table VI). Fuel costs were estimated at $1.15/gallon which
approximates the price at the end of the 1980 production year and thus
may be overstated.
Principle and interest payments are similar to those in Table VI.
Although 100% financing is probably not possible for such a facility,
the overstatement represents the opportunity cost of any equity
capital invested. Opportunity cost represents a foregone return on
this capital in another use and as such, is a real cost of operation
though not purely an "out of pocket expense." For a further
discussion of opportunity cost, see the section on Waste Disposal
Alternatives.
The three model scrap processing plant budgets provide some
hindsight as to what potential investors would have experienced had

they made the decison to invest in such construction in the
winter/spring of 1980 when the crab waste problem was at its peak.
The production of these model plants is based upon the rendering
of 100% of the scrap reportedly generated at these industry centers.
These projections are based upon scrap generation for processing
plants only and exclude the reportedly significant unprocessed whole
crab production in these areas.
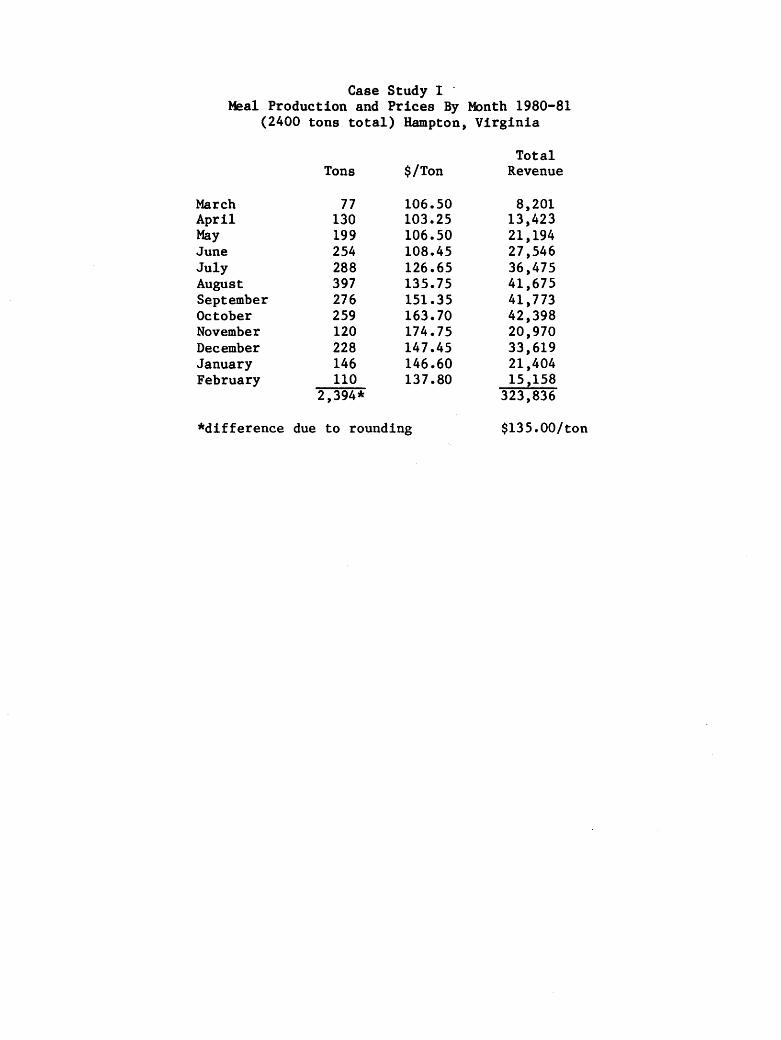
Case Study I · Meal Production and Prices By Month 1980-81
(2400 tons total) Hampton, Virginia
Total Tons $/Ton Revenue
March 77 106.50 8,201 April 130 103.25 13,423 May 199 106.50 21,194 June 254 108.45 27,546 July 288 126.65 36,475 August 397 135.75 41,675 September 276 151.35 41,773 October 259 163.70 42,398 November 120 174.75 20,970 December 228 147.45 33,619 January 146 146.60 21,404 February 110 137.80 15,158
2,394* 323,836
*difference due to rounding $135.00/ton
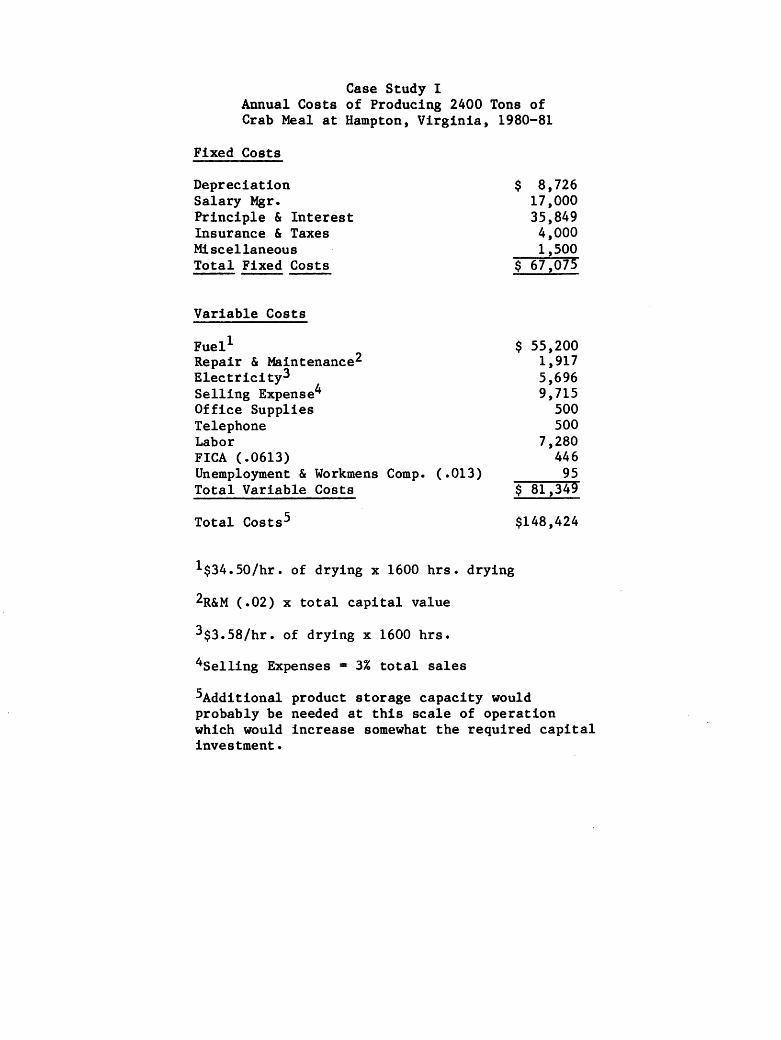
Case Study I Annual Costs of Producing 2400 Tons of Crab Meal at Hampton, Virginia, 1980-81
Fixed Costs
Depreciation Salary Mgr. Principle & Interest Insurance & Taxes Miscellaneous Total Fixed Costs
Variable Costs
Fuel1 Repair & Maintenance2 Electricity3 Selling Expense4 Office Supplies Telephone Labor FICA ( .0613) Unemployment & Workmens Comp. (.013) Total Variable Costs
Total Costs5
1$34.50/hr. of drying x 1600 hrs. drying
2R&M (.02) x total capital value
3$3.58/hr. of drying x 1600 hrs.
4selling Expenses= 3% total sales
$ 8,726 17,000 35,849
4,000 1,500
$ 67,075
$ 55,200 1,917 5,696 9,715
500 500
7,280 446 95
$ 81,349
$148,424
5Additional product storage capacity would probably be needed at this scale of operation which would increase somewhat the required capital investment.

Case Study I Summary of Costs Returns & Earnings
Hampton, Virginia 1980-81
Total Assets 163,695 Gross Receipts 323,836 Total Variable Costs 81,349 Total Fixed Costs 67,075 Total Costs 148,424 Net Receipts Before 175,412 Taxes (including ·Depreciation)
lTaxes (Assume Cooperative ownership)
Depreciation Annual Cash Inflow
0
8,726 184,138
Payback Period= Net Cash Outlay Annual Net Cash Inflow
.89 yrs. 163,695 =
184,138
1Because of the complexities of accurately estimating alternative federal and state tax rates, investment tax credits, for specific forms of ownership, etc, a cooperative form of ownership is assumed eliminating income taxes paid by the enterprise. Taxes would be paid on the dispersal of earnings as patronage dividends to coop members/sponsors. Tax assessments would reduce the annual cash flow and extend computed payback period despite significant business investment tax credits and depreciation allowances.
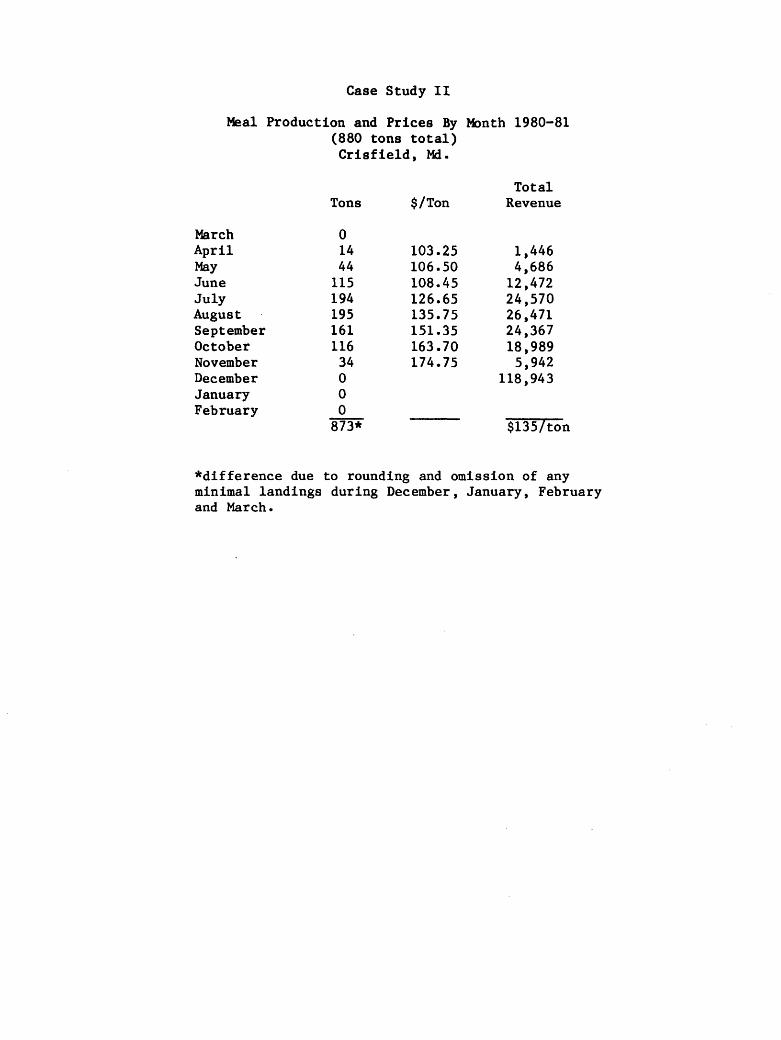
Case Study II
Meal Production and Prices By Month 1980-81 (880 tons total) Crisfield, Md.
Total Tons $/Ton Revenue
March 0 April 14 103.25 1,446 May 44 106.50 4,686 June 115 108.45 12,472 July 194 126.65 24,570 August 195 135.75 26,471 September 161 151.35 24,367 October 116 163.70 18,989 November 34 174.75 5,942 December 0 118,943 January 0 February 0
873* $135/ton
*difference due to rounding and omission of any minimal landings during December, January, February and March.

Case Study II Annual Costs of Producing 880 Tons of
Crab Meal at Crisfield, Md. 1980-81
Fixed Costs
Depreciation Salary Mgr. Principle & Interest Insurance & Taxes Miscellaneous Total Fixed Costs
Variable Costs
Fuel Repair & Maintenance Electricity Selling Expense Office Supplies Telephone Labor FICA Unemployment & Workmens Comp. Total Variable Costs
Total Costs
8,726 17,000 35,849
4,000 1,500
$ 67,075
20,252 719
2,101 3,568
500 500
7,280 446
95 $ 35,461
$102,536

Case Study II Summary of Costs Returns and Earnings
Crisfield, MD 1980-81
Total.Assets Gross Receipts Total Variable Costs Total Fixed Costs Total Costs Net Receipts Before Taxes (including Depreciation)
Taxes (Assume Cooperative ownership)
Depreciation Annual Cash Inflow
163,695 118,943 35,461 67,075
102,536 16,407
0
8,726 $25,133
Payback Period= Net Cash Outlay Annual Net Cash Inflow
6.5 yrs. 163,695 = -------
25,133

Case Study III Meal Production and Prices By Month 1980-81
(2010 tons total) Cambridge, MD
Total Tons $/Ton Revenue
March 0 0 April 32 103.25 3,304 May 101 106.50 10,757 June 263 108.45 28,522 July 444 126.65 56,233 August 446 135.75 60,545 September 368 151.35 55,697 October 265 163.70 43,381 November 78 174.75 13,631 December 0 0 January 0 0 February 0 0
1,997* 0 $272,070
X = $135
*difference due to rounding and omission of very minimal landings during December, January, February and March 1st quarter of 1980.

Case Study III Annual Costs of Producing 2010 Tons of
Crab Meal at Cambridge, MD, 1980-81
Fixed Costs
Depreciation Salary Mgr. Principle & Interest Insurance & Taxes Miscellaneous Total Fixed Costs
Variable Costs
Fuel Repair & Maintenance Electricity Selling Expense Office Supplies Telephone Labor FICA (.0613) Unemployment & Workmen's Comp. (.013) Total Variable Cost
Total Costs
8,726 17,000 35,849 4,000 1,500
$ 67,075
$ 46,230 1,917 4,797 8,162
500 500
7,280 446
95 $ 69,927
$137,002

Case Study III Summary of Cost Returns and Earnings
Cambridge, Maryland 1980-81
Total Assets Gross Receipts Total Variable Costs Total Fixed Costs Total Costs Net Receipts Before
Taxes
Taxes (Assume Cooperative Ownership)
Depreciation Annual Cash Inflow
$163,695 272,070 69,927 67,075
$137,002 $135,068
0
8,726 143,794
Payback Period= Net Cast Outlay Annual Net Cash Inflow
163,695 1.14 yrs.=~--~-143,794

z 0 ~
' U)
a:: <l .....J .....J 0 0
FIGURE 5
RELATIONSHIP BETWEEN LEVEL OF PRODUCTION AND FIRM COSTS
160
140
120
100
80
60
40
20
er _J w
w g t a: t-
~ m ~ 00 ~ ~ ~ ~ ~ U U I
l : : AVERAGE -t- -- -- - ----- - - - -- - - REVENUE
~ ~AVERAGE TOTAL \ COST \
AVERAGE.......-\ FIXED COST \
\
\ \
\ : " : '-.. I I
' I I •••••• ' I I •••••• ' I
··········• 'a I I ························~·t············• \AVERAGE : ----.
VARIABLE COST .: : I I I I
I I I I I I I I I I
/TON -1980
0 -'-------....----r--"'L-r----,r-----r-----.-~--r'--~--.
0 400 800 1200 1600 2000 2400
TONS OUTPUT
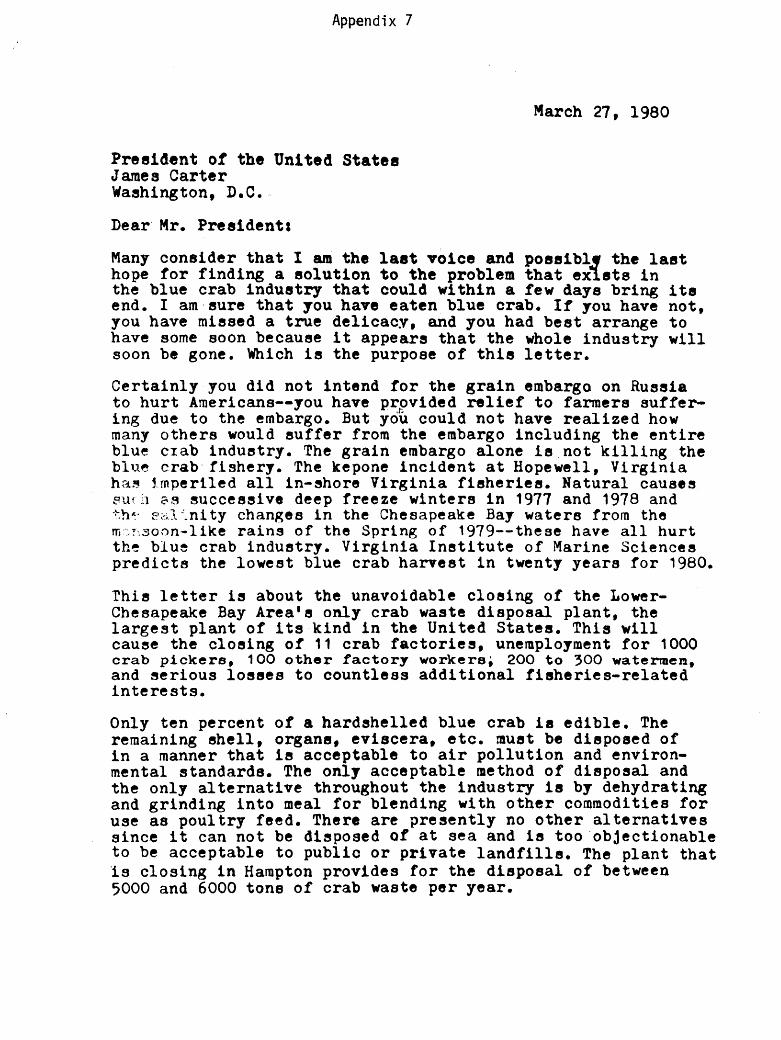
Appendix 7
President of the United States James Carter Washington, D.C •.
Dear· Mr. Presidents
March 27, 1980
Many consider that I am the last voice and poss1bl~ the last hope for finding a solution to the problem that exists in the blue crab industry that could within a few days bring its end. I am·eure that you have eaten blue crab. If you have not, you have mieaed a true delicacy, and you had best arrange to have some soon because it appears that the whole industry will soon be gone. Which is the purpose of this letter.
Certainly you did not intend !or the grain embargo on Russia to hurt Americans--you have provided relief to farmers suffer-
,!";.
ing due to the embargo. But you could not have realized how many others would suffer from the embargo including the entire blue crab induetry. The grain embargo alone le.not killing the blue crab· fishery. The kepone incident at Hopewell, Virginia ha~ tmpertled all in-ehore Virginia fisheriee. Natural causee 8Uf i1 2'8 eucceeeive deep freeze winters in 1977 and 1978 and th":· ~~~-1 :_ni ty changes in the Chesapeake Bay waters from the m--~:i--.soon-like rains of the Spring of 1979--these have all hurt the blue crab industry. Virginia Inetitute of Marine Science8 predicts the lowest blue crab harvest in twenty years for 1980.
rhi8 letter is about the unavoidable closing of the LowerCheeapeake Bay Area's only crab waste disposal plant, the large5t plant of its kind in the United States. This will cauee the closing of 11 crab factories, unemployment for 1000 crab pickers, 100 other factory workers, 200 to 300 watermen, and ~erious losses to countless additional fisheries-related interests.
Only ten percent of a hardshelled blue crab ia edible. The remaining shell, organs, eviacera, etc. must be disposed of in a manner that ie acceptable to air pollution and environmental standards. The only acceptable method of disposal and the only alternative throughout the industry is by dehydrating and grinding into meal for blending with other commodities for use as poultry feed. There are presently no other alternatives since it can not be disposed of at sea and ie too ·objectionable to be acceptable to public or private landfills. The plant that ls closing in Hampton provides for the disposal of between 5000 and 6000 tone of crab waste per year.
Since processed waste (crab meal) compriaea only a small fraction of the total poultry teed ingredients it is eliminated from poultry teed formulae under certain commodities market conditions. The Russian grain embargo has caused this condition now and has depressed the market to a level that is much below processing costs for crab meal even if demand existed.
Although this is a problem that confronts all crab fisheries throughout the Atlantic and Gulf States, it is of disaster proportions to the blue crab industry in the Greater-Chesapeake Bay since it is-the largest blue crab fishery in the world.
For more than forty years Hunt Crab Meal Company has provided crab waste disposal service to the Virginia Peninsula blue crab industry. In the past the company has been able to generate modest profits or, at least, perform on a break-even basis. In recent years due to economic conditions and added expenses involved in complying with increasingly stringent pollution control and safety compliance regulations, the company has continued to operate but only through the benevolence and dedication of ita owners for the perpetuation of the blue crab industry. Although no less dedicated than ever, the owner's benevolence has now exceeded all bounds that justify or pe~it sustaining such philanthropy.
Vithin the past four yeare Hunt Crab Meal Company owners have ~ponsored research in other potential by-products from crab wef:3t~-- The results have been encouraging and, but !or the presence of kepone, could have developed into a revolutionary ? .. '~ ternative that would eliminate total dependence upon the ~ommodities market.
This Ha~pton blue crab waste disposal plant must be suetained during the grain embargo in order to save the industry and to permit development of other by-products and alternatives.
My meetings and communications with local, state and federal authorities, deepite their grave concern, show no promise as yet of poaeible remedies or the availability o! emergency aeaistance. ·
Hunt Crab Meal Company will cease providing servicee to crab factories on 15 April 1980 per their letter dated March 24 and hand delivered to all eleven crab faotoriea on March 26.
Any attention that may be given to any conceivable source of emergency funding with your administration will be appreciated by countless eeafood and fisheries participants and many involved in related interests.
Sincerely,
Kimball P. Brown Manager, Hunt Crab Meal Co./Bo~ 262/Hampton, VA 23669 Tel. Bue. 804 722 5921-----Rea. 804 72~ 1550

APPENDIX 8
Annual landings (millions of lbs.), Range, Standard Deviation of yearly landings and Coefficient of Variation of Blue Crab Landings, 1960-1978.
Maryland Virginia Total
1961 27.6 43.5 70.6 1962 27.6 53.6 81.3 1963 16.9 46.1 63.0 1964 22.5 51.5 74.1 1965 31.9 50.5 82.5 1966 30.3 63.7 94 .1 1967 24.5 54.8 79.4 1968 9.3 44.8 54.1 1969 23.0 33.6 56.6 1970 24.9 42.4 67.3 1971 26.0 47.8 73.8 1972 23.4 48.5 72 .o 1973 19.5 36.7 56.2 1974 24.6 40.8 66.5 1975 24.2 34.8 59.0 1976 19.4 24.7 45.2 1977 19.2 37.2 56.4 1978 16.6 36.0 52.6
Average 23.0 44.1 67.1
Range 9.3-27.2 25.7-63.7 45.2-94.1
Standard Deviation 5.3 9.2 12.7 (SD)
Coefficient of Variation 20.9% 23.0% 18.9% (CV)

The College of
•
~~s GRANT
. PROGRAM
Related Documents