Feasibility of Bus Rapid Transit Within the Mid-Atlantic Region By BERNARD DWORSKY MARCIA SCOTT WILLIAM DeCOURSEY TODD FRANZEN Institute for Public Administration College of Arts and Sciences June 2009 Delaware Center for Transportation University of Delaware 355 DuPont Hall Newark, Delaware 19716 (302) 831-1446 DCT 234

Welcome message from author
This document is posted to help you gain knowledge. Please leave a comment to let me know what you think about it! Share it to your friends and learn new things together.
Transcript
Feasibility of Bus Rapid Transit Within the Mid-Atlantic Region
By
BERNARD DWORSKY
MARCIA SCOTT WILLIAM DeCOURSEY
TODD FRANZEN
Institute for Public Administration
College of Arts and Sciences
June 2009
Delaware Center for Transportation University of Delaware
355 DuPont Hall Newark, Delaware 19716
(302) 831-1446
DCT 234
The Delaware Center for Transportation is a university-wide multi-disciplinary research unit reporting to the Chair of the
Department of Civil and Environmental Engineering, and is co-sponsored by the University of Delaware and the Delaware
Department of Transportation.
DCT Staff
Ardeshir Faghri Jerome Lewis
Director Associate Director
Ellen Pletz Earl “Rusty” Lee Matheu Carter Sandra Wolfe
Business Administrator I T2 Program Coordinator T² Engineer Event Coordinator
DCT Policy Council
Natalie Barnhart, Co-Chair
Chief Engineer, Delaware Department of Transportation
Babatunde Ogunnaike, Co-Chair
Dean, College of Engineering
Delaware General Assembly Member
Chair, Senate Highways & Transportation Committee
Delaware General Assembly Member
Chair, House of Representatives Transportation/Land Use & Infrastructure Committee
Ajay Prasad
Professor, Department of Mechanical Engineering
Harry Shenton
Chair, Civil and Environmental Engineering
Michael Strange
Director of Planning, Delaware Department of Transportation
Ralph Reeb
Planning Division, Delaware Department of Transportation
Stephen Kingsberry
Executive Director, Delaware Transit Corporation
Shannon Marchman
Representative of the Director of the Delaware Development Office
James Johnson
Executive Director, Delaware River & Bay Authority
Holly Rybinski
Project Manager-Transportation, AECOM
Delaware Center for Transportation
University of Delaware
Newark, DE 19716
(302) 831-1446
Feasibility ofBus Rapid
Transit Withinthe Mid-Atlantic
Region
Institute for Public AdministrationCollege of Education & Public PolicyUniversity of Delaware
www.ipa.udel.eduin cooperation with the Delaware Center for Transportationand the Wilmington Metropolitan Area Planning Council
and funded by the Delaware Department of Transportation
serving the public good,shaping tomorrow’s leaders
JUNE 2009
authorsMarcia Scott
William DeCourseyTodd Franzen
principal investigatorBernard Dworsky
project advisorEdward O’Donnell
Feasibility ofBus Rapid Transit
Within theMid-Atlantic Region
JUNE 2009
authorsMarcia Scott
William DeCourseyTodd Franzen
principal investigatorBernard Dworsky
project advisorEdward O’Donnell
prepared by the
Institute for Public AdministrationCollege of Education & Public Policy
University of Delaware
www.ipa.udel.edu
in cooperation with the Delaware Center for Transportationand the Wilmington Metropolitan Area Planning Council
and funded by the Delaware Department of Transportation
Feasibility of Bus Rapid Transit Within the Mid-Atlantic Region June 2009
i
PREFACE
As the director of the Institute for Public Administration (IPA) at the University of Delaware, I am pleased to provide this report, Feasibility of Bus Rapid Transit Within the Mid-Atlantic Region. Located at the heart of the Northeast Corridor, Delaware’s roadways are experiencing increasing traffic congestion and delays, capacity constraints, and transportation-mobility problems. Initially, the research project focused on the viability of bus rapid transit (BRT) as new mode of transportation in Delaware to help meet travel-capacity needs, particularly along the I-95 corridor. As the study progressed, the research team realized that BRT should be considered one component in a comprehensive, multi-modal transportation system to enhance regional public transportation and mobility options. This report begins to articulate a broader vision of regional mobility from a public-transportation standpoint—one that will begin to address regional transportation needs and challenges that transcend geopolitical boundaries, institutional complexities, and segregated modes of transit. This report should serve as the conceptual basis for pursuing a mega-modal approach to transportation planning, which develops a vision for seamless, regional mobility and accessibility within and among multiple modes of transportation. This report concludes an extensive process that included a comprehensive literature review; interviews and discussions with regional transportation planning and transit officials; analysis of regional demographic, transportation, and commuting patterns; evaluation and geographic information systems (GIS) mapping of potential bus rapid transit (BRT) routes; drafting of an online briefing paper; and planning and execution of a forum for transportation stakeholders. I would like to take this opportunity to thank the individuals and entities that cooperated on this project. The Delaware Transit Corporation (DTC) and the Delaware Department of Transportation expressed support for the project, which was funded by the Delaware Center for Transportation and the Wilmington Metropolitan Area Planning Council (WILMAPCO). Special thanks go to DTC Planning Manager Catherine Dennis Smith, who co-managed the project with IPA’s Bernard Dworsky. WILMAPCO planners Dave Gula and Dan Blevins provided considerable input, expertise, and customization of transit-scoring methodology. Policy Scientist and project manager Bernard Dworsky directed the project, oversaw the production of the report, coordinated meetings among transportation officials, and planned and led the BRT forum. Associate Policy Scientist Marcia Scott, Policy Specialist William DeCoursey, and UD-UTC graduate fellow Todd Franzen conducted the literature review, research analysis, and wrote the document. Mr. DeCoursey also spearheaded the production of GIS maps of BRT routes. Policy Scientist Edward O’Donnell spent considerable time serving as project advisor, providing planning expertise, addressing the Delaware Transportation Energy Use Work Group, and preparing for the BRT forum presentation in collaboration with Dworsky, Scott, DeCoursey, and Franzen. Special thanks go to Assistant Policy Scientist Mark Deshon who designed the forum webpage, provided editorial support, managed production of the final report, and designed its cover. Jerome R. Lewis, Ph.D. Director, Institute for Public Administration
Feasibility of Bus Rapid Transit Within the Mid-Atlantic Region June 2009
ii
ACKNOWLEDGEMENTS Principal Investigators Bernard Dworsky, IPA Policy Scientist Catherine Dennis Smith, DTC Planning Manager Authors and Researchers Marcia Scott, IPA Associate Policy Scientist William DeCoursey, IPA Policy Specialist Todd Franzen, UD-UTC Graduate Fellow Project Advisor Edward O’Donnell, AICP, IPA Policy Scientist Editor and Professional Support Mark Deshon, IPA Assistant Policy Scientist The IPA project team gratefully acknowledges the professionals and colleagues who have been involved in the project since its inception and provided a broad spectrum of regional perspectives, interests, resources, and expertise regarding the viability of a regional BRT concept. We appreciate the time that the following individuals took to meet with the IPA research team. Their input contributed to a broader vision of the need for regional transportation improvements, which includes BRT as one of many components in a comprehensive, multi-modal transportation system. Dan Blevins, WILMAPCO Dave Gula, WILMAPCO Wayne Henderson, Delaware Transit Corporation (DTC) Mike Herron, Chester County Transportation Management Association Glenn Hoge, Maryland Transit Administration Jim Johnson, Delaware River and Bay Authority Stephen Kingsberry, DART First State Bill Osborne, Transportation Management Association of Delaware Kennard Potts, DTC Ralph Reeb, Delaware Department of Transportation Catherine Dennis Smith, DTC Joe Watson, formerly of DTC Tigist Zegeye, WILMAPCO
Feasibility of Bus Rapid Transit Within the Mid-Atlantic Region June 2009
iii
TABLE OF CONTENTS Executive Summary...............................................................................................................1
What is BRT?..........................................................................................................................4
Other High-Speed Transit Options ...................................................................................13
Why is BRT Important to the Region?.............................................................................18
Delaware-Region Transit Issues .......................................................................................23
Analysis of BRT Potential in the Region .......................................................................40
Funding Sources and Strategies .......................................................................................49
Conceptual Framework to Move toward BRT ..............................................................70 Appendices ............................................................................................................................77
A. Matrix of BRT Systems ............................................................................................78 B. Case Study—Maryland Transit Administration Commuter Bus.................................79 C. Maps.........................................................................................................................85
DART FIRST STATE TRANSIT ROUTES—NORTHERN DELAWARE ........................86 PUBLIC TRANSPORTATION SERVING CHESTER COUNTY .......................................87 TRANSIT SEGMENT CAPACITY.............................................................................88 AVERAGE ANNUAL DAILY TRAFFIC ....................................................................89 2008 CONGESTION MANAGEMENT STUDY—IDENTIFIED CORRIDORS ...................90 DVRPC CONGESTED AND EMERGING CORRIDORS ..............................................91 PENNSYLVANIA CMP CORRIDOR 4: I-95 ............................................................92
PENNSYLVANIA CMP CORRIDOR 8 .....................................................................93 EXISTING AND FUTURE CMS NEEDS FOR SALEM COUNTY ...................................94
POPULATION DENSITY .......................................................................................95 2008 TRANSIT SCORE BASED ON DVRPC “PORTABLE” TRANSIT-SCORING METHOD...............................................................................96 D. BRT Funding Matrix ................................................................................................97 E. List of Potential Regional Stakeholders .....................................................................98 F. List of BRT Forum Attendees.................................................................................. 101 G. Regional BRT Concept—Follow-Up Questionnaire................................................ 102 H. Response to Questionnaire...................................................................................... 103 I. Forum PowerPoint Presentation Slides ..................................................................... 106 J. Forum Proceedings .................................................................................................. 112 K. Citations ................................................................................................................. 120
Feasibility of Bus Rapid Transit Within the Mid-Atlantic Region June 2009
1
1.0 EXECUTIVE SUMMARY 1-1. Overview Is bus rapid transit (BRT) a viable transit option in Delaware? The original title of this research study, funded by the Delaware Center for Transportation, was “A Feasibility Study of Bus Rapid Transit (BRT) in Delaware.” The initial research done by the University of Delaware Institute for Public Administration (IPA) consisted of a review of BRT literature, functioning BRT systems, local demographic information, transit data, and commuting patterns. Based on the analysis of these data and subsequent meetings with local transportation officials, the scope of work evolved from examining the feasibility of deployment of BRT in Delaware to exploring the viability of a regional BRT system. Findings of IPA research indicate that a regional BRT system is indeed worthy of further consideration. An assessment of domestic BRT systems and operations reveal substantial progress towards solidifying the position of BRT as a viable transit mode. The strength of the mode lies in its ability to develop incrementally, respond to regional mobility needs, adjust to budget constraints, and its potential to attract choice riders for a relatively low capital cost. Research indicates that BRT systems also have advantages over light rail. Depending on its design, capital costs of a BRT system can be lower than light-rail systems but offer similar passenger capacity, performance, amenities, and service levels. Most BRT systems can be planned and implemented more quickly, expand in stages, and provide greater operating flexibility than comparable light-rail systems. However, BRT is not an either-or option. BRT should be implemented as a comprehensive mobility strategy and integrated with other existing modes of transit and enhanced rail systems. To achieve a fully integrated BRT system, connections should be planned to existing local bus, rail, and transit modes to provide regional mobility, congestion relief, and economic improvements. BRT has proven to serve as a mechanism for sustainable land-use and development patterns. Transportation and land-use planners recognize the potential for transit-oriented development (TOD) to attract high-density, mixed-used development served by high-quality transit. Finally, BRT shows promise in addressing a transportation-mobility gap between Perryville, Md., and New Castle County, Del., and serving transportation needs related to defense-related job growth in Aberdeen, Md. This report begins first with an overview of BRT, including a definition, description of major attributes, and identification of successful BRT systems—both domestic and international. Next, the report highlights why BRT is important to the region in its potential to help mitigate traffic congestion, spur the economy, improve air quality, and promote energy-efficient land-use patterns. Information on regional demographics, commuting patterns, transit demand and gaps serves as a basis for the analysis of BRT potential within the region. Several potential pilot BRT routes/corridors are identified, mapped, and evaluated based on a “portable” transit-scoring methodology. Funding sources and strategies are described within the report. Finally, the report suggests a conceptual framework for moving towards the planning and development of a regional BRT system. A BRT forum hosted by IPA at the University of Delaware’s Newark Campus Clayton Hall in November 2008 underscores the need to involve and engage a multitude of stakeholders from Delaware, Maryland, Pennsylvania, and New Jersey to further explore the viability of a regional BRT system.
Feasibility of Bus Rapid Transit Within the Mid-Atlantic Region June 2009
2
1-2. Problem Statement Our transportation infrastructure is under stress. Roadways that were designed and constructed decades ago are congested, outdated, and strain to meet capacity needs. Metropolitan-area growth trends are aggravating roadway conditions to the extent that many infrastructure improvement projects, either underway or planned, are unable to meet current or projected travel demand. This stress comes at a time when the Federal Highway Trust Fund is faltering and state trust funds are being stretched thin by a backlog of transportation infrastructure projects. The volume of freight and automobile traffic has ballooned in the past two decades. The Federal Highway Administration expects that trend to continue, as more metropolitan areas experience non-peak periods of traffic congestion and become regarded as “chokepoint” regions (Federal Highway Administration, n.d). So why should Delaware and its neighboring states care? Travel and freight-movement problems are tied to related issues of traffic congestion, economic competitiveness, and environment. The concept of planning for mega-regions—clusters of neighboring large metropolitan centers that share economic activity and transportation—is gaining favor. The concept suggests that, “with the economic, environmental, and social fortunes of nearby urban areas increasingly linked, there is growing interest in developing new strategies for large-scale regional planning” (The Lincoln Institute of Land Policy, 2007). The Philadelphia area is already considered part of the larger Washington-Boston corridor. Justification for a regional BRT system includes congestion relief, regional improvements in mobility, and economic growth. First and foremost is the need to mitigate traffic congestion. It is no longer cost-effective to increase roadway capacity by simply constructing new or expanding existing highways. To address traffic congestion, comprehensive transportation demand-management strategies are needed. Such strategies include enhancing mobility options through transit, instituting value pricing to variably set toll rates based on demand, controlling access to give preferential treatment to emergency vehicles and transit, and using intelligent transportation systems (ITS) to respond to real-time traffic conditions. Greater transit use can improve air quality, reduce greenhouse-gas emissions, facilitate efficient land-use patterns, and save fuel. While there is no “one-size-fits-all” approach to BRT, it can provide an alternative to driving and provide more mobility options to commuters and travelers. BRT can promote a more efficient transportation system by supplementing existing transit services, improving the reliability of public transportation, and providing linkages to other modes of transportation such as bus or rail. Clearly, choice-rider attraction is critical if BRT is to be successful in mitigating congestion and addressing regional mobility problems. To fight the perception that only economically disadvantaged people ride buses, BRT systems must be branded to convey a clean, efficient, modern, and high-quality transportation service. It is extremely important to develop a unique brand identity to distinguish BRT from regular transit service. This can be achieved through sleek styling of vehicles, branded exteriors that are consistent with transit stations and other physical components, and a strong customer-service orientation. BRT also supports regional economic development goals. The Mid-Atlantic segment of the I-95 corridor is one of the nation’s busiest freeways and serves as a vital link for commerce and
Feasibility of Bus Rapid Transit Within the Mid-Atlantic Region June 2009
3
travel. Meeting travel-capacity needs, maintaining good transportation infrastructure, promoting mobility, and providing travel alternatives for access to jobs are critical to the economic viability of the entire Philadelphia metropolitan area. When accompanied by complementary land-use policies, BRT can promote smart growth practices that enhance job creation, promote transit-oriented development, and spur economic growth. BRT can stimulate economic growth of the region by efficiently transporting people to jobs, connecting major centers of commerce and employment, providing transportation linkages that cross state lines, and promoting transit-supportive land development. The need to provide a comprehensive transportation system, which includes regional roadway-network improvements and transit options, cannot be ignored in light of the anticipated surge of Aberdeen Proving Ground commuters by fall 2011. 1-3. Purpose of DCT Research Project The purpose of this project is to explore the feasibility of BRT in the Mid-Atlantic region immediately adjacent to Delaware’s I-95 corridor. During the course of research on BRT, it became clear why many communities are jumping on the BRT bandwagon. As a transit strategy, BRT is designed to improve mobility, reduce travel times, increase service predictability, and attract increased ridership. BRT also provides customer amenities such as faster service due to fewer stops and signal prioritization, real-time travel information, and improved passenger comfort and convenience. However, despite these benefits, it is unclear as to whether a regional BRT system can be practically implemented and deployed. Research brought to the forefront complex issues regarding how BRT can be funded, deployed and grow incrementally, integrate with existing transit modes, meet regional transportation demands, and transcend political and transit operational lines. For BRT to succeed, regionalism is needed. First, there needs to be a regional vision for enhanced mobility and an understanding that BRT is not an either-or option. BRT is not proposed to replace the well-run and -utilized local bus services operated by DART First State, Southeastern Pennsylvania Transportation Authority (SEPTA), New Jersey (NJ) Transit, or the Maryland Transit Administration (MTA). Nor is BRT proposed to thwart plans to address the lack of commuter-rail service between Newark, Del., and Perryville, Md. Instead, the study recognizes the need for a long-term vision to integrate and provide seamless, regional multi-modal transit connections among commuter rail, express bus services, park-and-ride lots, local bus service, and BRT. This “full system” transit vision will represent significant progress toward meeting regional transportation, economic-development, and growth-management goals. Unless regional stakeholders build consensus and advocate for this long-term vision, the status quo will remain. Second, stronger regional alliances and cross-jurisdictional support for multistate transportation planning initiatives are needed. Intermodal issues that impact mobility do not stop at, but rather transcend, state lines. To strengthen the region’s competitive position in the global economy, it is critical to build support for multistate transportation planning, policy development, and investment strategies. A majority of respondents to a questionnaire, distributed to participants of the November 13, 2008, BRT Forum of Transportation Stakeholders, indicate that the concept of a regional BRT system should be explored further and they would be interested in serving on a further project steering committee for more in-depth planning at the regional level.
Feasibility of Bus Rapid Transit Within the Mid-Atlantic Region June 2009
4
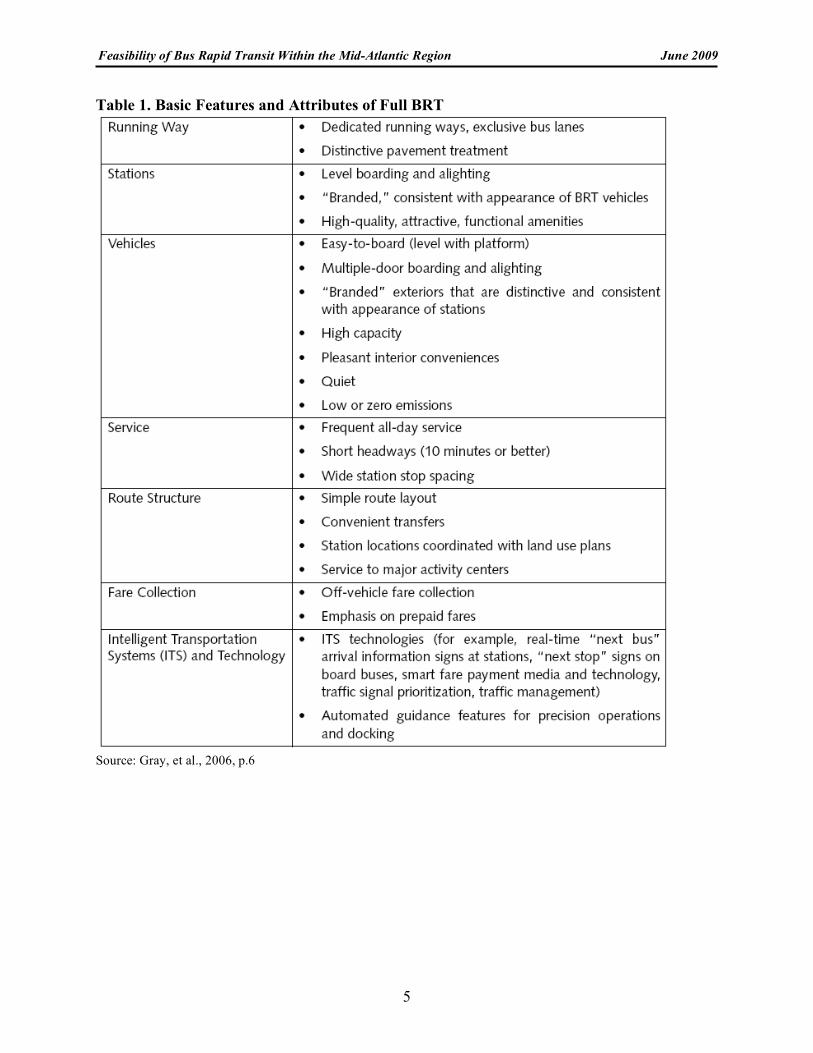
2.0 WHAT IS BRT? 2-1. Definitions/Major Elements of BRT Bus Rapid Transit, otherwise known as “BRT,” is increasing in popularity as a remedy to the need for efficient, cost-effective public transportation. BRT combines the flexibility of traditional bus service with the best features of rail service. The Transportation Research Board defines BRT as “a flexible, rubber-tired rapid-transit mode that combines stations, vehicles, services, running ways, and Intelligent Transportation System (ITS) elements into an integrated system with a strong positive identity that evokes a unique image” (Levinson et al., 2003, p.1). BRT is further defined as, “a high-quality, bus-based transit system that delivers fast, comfortable, and cost-effective urban mobility through the provision of segregated right-of-way infrastructure, rapid and frequent operations, and excellence in marketing and customer service” (Institute for Transportation & Development Policy, 2007, p. 11). Finally, according to the 2006 report from the Mineta Transportation Institute, “BRT is universally accepted, offers a potentially cost-effective transportation mode that bridges a capital cost gap between regular bus service and light rail transit, and can deliver services with features that normally are found only with rail service” (Gray, et al.,, 2006, p. 3). The objective of BRT is to elevate bus-based transit to an experience that closely approximates rail-based transit, providing high-quality service through the provision of reducing transit travel time, increasing trip reliability, improving transit connections and providing more direct service, decreasing station-stop dwell and waiting times, enhancing system identity, increasing travel comfort, and enhancing safety and security (Gray, et al.,, 2006). While BRT and conventional bus service both offer flexible transportation modes, they do not share the same features. A full BRT system does not operate as a conventional bus service with a few small aesthetic alterations. Further, BRT should not be mistaken for a conventional bus using bus lanes (Institute for Transportation and Development Policy, 2007). A key component of successful BRT systems is the utilization of running ways, including variations such as dedicated bus lanes or segregated running ways. More importantly, as the definitions describe, BRT is a different transportation mode that combines the best elements of conventional bus service with those of rail service. Table 1 summarizes common features of full BRT systems. Although BRT systems are often adapted to meet the demands of their unique environment, the most successful systems have most or all of these features.
Feasibility of Bus Rapid Transit Within the Mid-Atlantic Region June 2009
5
Table 1. Basic Features and Attributes of Full BRT
Source: Gray, et al., 2006, p.6
Feasibility of Bus Rapid Transit Within the Mid-Atlantic Region June 2009
6
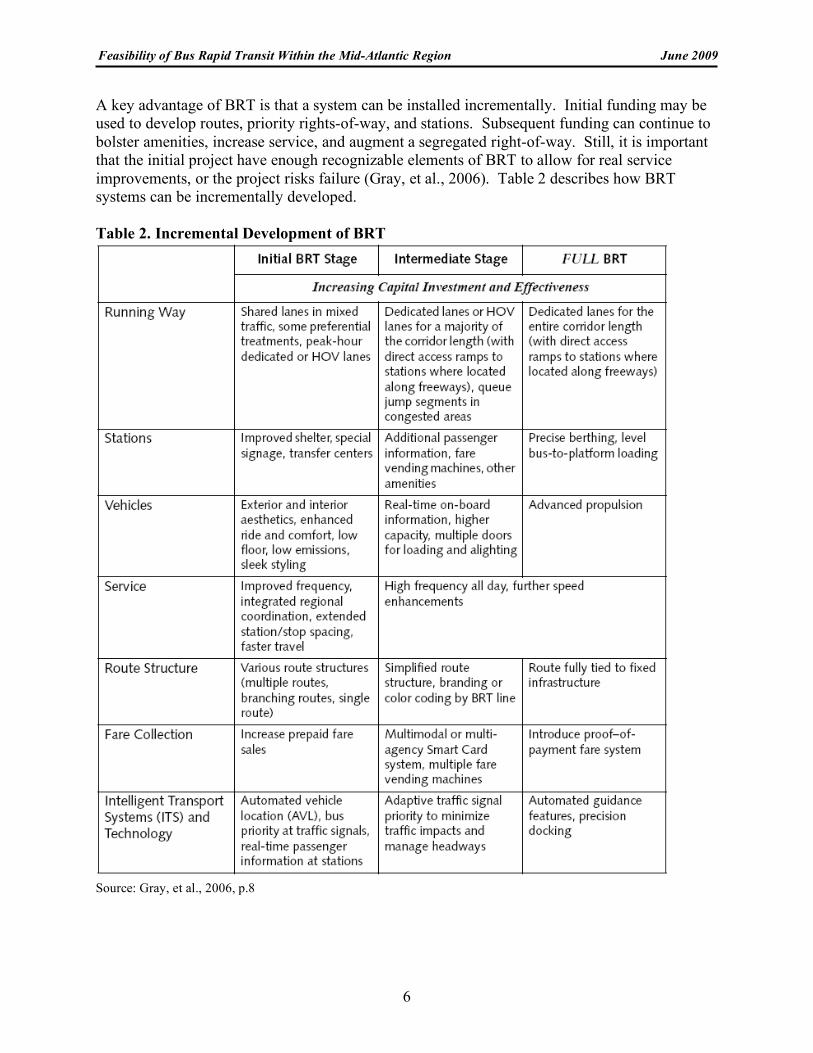
A key advantage of BRT is that a system can be installed incrementally. Initial funding may be used to develop routes, priority rights-of-way, and stations. Subsequent funding can continue to bolster amenities, increase service, and augment a segregated right-of-way. Still, it is important that the initial project have enough recognizable elements of BRT to allow for real service improvements, or the project risks failure (Gray, et al., 2006). Table 2 describes how BRT systems can be incrementally developed. Table 2. Incremental Development of BRT
Source: Gray, et al., 2006, p.8
Feasibility of Bus Rapid Transit Within the Mid-Atlantic Region June 2009
7
2-1-1. COST OF IMPLEMENTATION Capital cost effectiveness and operating efficiency are among the reasons why many transit agencies are choosing to integrate BRT into their overall transportation systems. Because of their flexibility and scalability, BRT systems are generally able to increase the overall efficiency of transit systems that incorporate them. Measures such as passengers per revenue hour, subsidy per passenger mile, and subsidy per passenger typically improve effectiveness. This efficiency also has the effect of freeing up transit resources (FTA, 2004). Further, a BRT system will typically cost 4 to 20 times less than a tram or light rail transit (LRT) system and 10 to 100 times less than a metro system (Institute for Transportation & Development Policy, 2007). 2-1-2. KEY CONSIDERATIONS FOR IMPLEMENTATION When planning a BRT project, there are important factors that contribute to the long-term success of the project. Implementation of BRT systems will generally be more efficient and effective when the following criteria are met (Levinson et al., 2003, p.8-9):
• Early and continuous community support from elected leaders and citizens • Incremental development of BRT • Parking policies that complement, rather than undercut BRT • Early integration of BRT and land-use planning in station areas • Transfer of key attributes of rail transit to BRT • Service of BRT to demonstrated transit markets • Matching of markets with rights-of-way • Utilization of separate rights-of-way to enhance speed, reliability, safety, and identity • Coordination of vehicle design, station design, and fare collection procedures
2-1-3. WHERE TO CONSIDER BRT BRT lends itself to a variety of areas. It can provide rail-like volume of service in high-density areas but can also provide a lower level of service where such densities do not exist or are not desirable. There is a tradeoff between permanence and flexibility. Whereas the perceived permanence of rail has been shown to promote desirable development, bus-based systems are able to respond to changing geographies and commuter patterns at a much lower cost (Currie, 2006). This flexibility is often attractive to communities comparing the similar functional features of BRT and rail. There are general guidelines for implementation of BRT. Ideally, an area considering BRT should have (Kittelson & Associates, et al., 2007):
• A large urban area where peak-period and all-day passenger flows warrant frequent service
• One or more strong anchors, like a city center • An area population that exceeds 750,000 • A central area of employment of at least 50,000 • Presence of a large university or other major activity center • Streets and corridors with existing long, heavily traveled bus routes
Feasibility of Bus Rapid Transit Within the Mid-Atlantic Region June 2009
8
2-1-4. DEDICATED LANES The flexibility of BRT allows usage of a variety of running ways. A BRT system can utilize mixed-traffic lanes, curb-bus lanes on city streets, median busways, reserved lanes on freeways, or bus-only roads along designated routes (Levinson et al., 2003). In a 2004 report by the Federal Transit Administration (FTA), segregated rights-of-way were shown as the key factor in travel time for successful BRT systems. “BRT projects with more exclusive running ways generally experienced the greatest travel time savings compared to the local bus route.” Systems running on more-exclusive transitways proved to be the most reliable. They demonstrated less schedule variability and bunching of vehicles (FTA, 2004, ES-5). 2-1-5. BUS LANES VS. BUSWAYS
A desirable feature of BRT to increase efficiency and overall performance is dedicated lanes. There is an important difference between bus lanes and busways. Bus lanes are integrated with other lanes and identified with signs, paintings, or other markings. They do little to enhance the efficiency of public transport. Other modes of transportation, including private vehicles, sometimes use the same lanes. Busways are segregated lanes used only for public transportation. The busways have limited access points and are removed from other traffic by a wall, cones, or curbing. Successful BRT systems frequently utilize busways (Institute for Transportation & Development Policy, 2007). Delays are reduced when running ways are segregated, leading to increased reliability and elimination of traditional traffic delays such as congestion and accidents. 2-2. Domestic BRT Operations Many municipal areas in the United States already utilize BRT as an integral component of their transit systems. To provide perspectives of the various operations, several successful systems are highlighted below. These particular systems were chosen either for their relevance to Delaware based on their population base or due to their flourishing operations. A matrix that provides a summary and comparison of domestic BRT systems has also been prepared in conjunction with this report (Appendix A). 2-2-1. EUGENE, OREGON, “EMERALD EXPRESS—EMX” The Emerald Express BRT system, more commonly known as “EmX,” is the BRT system that serves the Eugene and Springfield areas in the Emerald Valley of Oregon. Eugene and Springfield have a combined estimated 2006 population of 205,596. Lane County, where the cities are located, has a population of 322,959 (2000 census). The system is operated by the Lane Transit District (LTD). This system is used for comparison purposes based on the population of the area the system serves and the recency of its launch. The initial line of the EmX system, the Green Line, was launched on January 15, 2007. Community events, design workshops, and advertising campaigns were all used to inform the public about the new transportation system. The Green Line operates along the highest-ridership corridor of the transit system serving the region. The Green Line is a four-mile route that uses dedicated single and dual bus lanes for about 60 percent of the route. For the remaining 40
Feasibility of Bus Rapid Transit Within the Mid-Atlantic Region June 2009
9
percent of the route, buses operate in mixed traffic, relying on signal priority and queue-jump lanes to maneuver through other vehicle traffic. There are ten stops along the route, with eight enhanced stations every half-mile. Currently, passengers do not pay a fare for the service, but plans exist to implement off-board fare collection machines as the EmX system expands. Weekday headways for the Green Line are ten minutes, with evening and weekend headways of 15-20 minutes. Since the system was launched, corridor ridership increased by almost 50 percent, with average daily boardings of 4,700. The total construction cost for the Green Line was $23.5 million, which is approximately $6 million per mile. Officials secured $19.2 million of FTA’s Section 5307 and 5309 funds to fund the Green Line. Six articulated low-floor buses were purchased for the system, at a cost of $960,000 each. Before the implementation of BRT, the transportation district had considered light rail but dismissed it because of the high expense. LTD envisions the EmX of the future to be a comprehensive system of BRT corridors. There are immediate plans to extend the system, with one 7.8-mile extension route anticipated to open in 2010. As ridership demands increase and funding becomes available, additional routes will be developed (Lane Transit District, 2007 and The Bus Rapid Transit Policy Center, 2007). 2-2-2. LAS VEGAS, NEVADA, “METROPOLITAN AREA EXPRESS, MAX” The Metropolitan Area Express (“MAX”) line launched in June 2004 and runs along the Las Vegas Boulevard. MAX was designed to resemble a futuristic, rail-like system, using sleek vehicles, attractively designed stations, and unique coloring and logos. MAX operates along a 7.8-mile route that follows one of the area’s busiest bus routes. During the first five months of operation, total transit ridership in the corridor increased by 25 percent. Las Vegas has a 2006 estimated metropolitan population of 1,777,539. The route has 4.5 miles of semi-dedicated lanes, with BRT sharing lanes with other transit and right-turning vehicles. The other three miles of the route use mixed-traffic lanes. There is one queue-jump lane at a congested intersection. MAX buses use traffic-signal priority at more than 20 intersections to shorten red lights or extend green lights. Stations are approximately one mile apart, with 11 stations in each direction. MAX operates seven days a week from 5 a.m. to 10 p.m. Headways are 12 minutes from 5 a.m. to 7 p.m., and 15 minutes from 7 p.m. to 10 p.m. Fare collection is off-board; the current fare is the same as the conventional bus service—$1.25. Ten articulated diesel-electric buses operate on the route, with total capacity of 120 passengers. Eight of the low-level boarding buses are in operation at a time. The total capital cost of MAX was $20.3 million, or $2.8 million per mile. Project funds originated from federal, state, and local sources. Based on the success of the initial line, other corridors are being considered for possible expansion of the MAX system (Regional Transportation Commission. 2007 and The Bus Rapid Transit Policy Center, 2007). 2-2-3. PITTSBURGH, PENNSYLVANIA, “BUSWAYS” Pittsburgh, Pa. has an estimated population of 2.4 million (2000 Census). The Port Authority of Allegheny County runs three BRT lines for Pittsburgh and the surrounding region: the South, East, and West busways. Each of the busways has similar characteristics, such as the use of traffic-light synchronization and route termination in the central business district of Pittsburgh.
Feasibility of Bus Rapid Transit Within the Mid-Atlantic Region June 2009
10
This system was selected for comparison because it has been in operation much longer than other systems and uses multiple dedicated busways. The South Busway opened in 1977 and is the oldest operating busway in the United States. The busway is 4.3 miles long, and 14 bus routes operate on all or part of the South Busway’s two exclusive bus lanes. Construction costs for the busway totaled $27 million or $6 million per mile. There are nine stops along the busway. The Martin Luther King, Jr. East Busway opened in February 1983. Construction costs for the 6.8-mile busway totaled $115 million. In June 2003, a 2.3-mile extension was added at a construction cost of $68 million. FTA paid 80 percent of the extension costs, with the other 20 percent originating from state and county funds. There are nine stations along the busway, and 34 bus routes use at least part of the busway. Headways range from 12 minutes during peak hours to 20 minutes on Sundays. Fare collection is on the vehicle. The West Busway launched in September 2000 and is a five-mile exclusive roadway along an unused railroad right-of-way. Eight bus routes operate along the West Busway, which also serves the airport. There are six stations located along the West Busway. Capital construction costs were $275 million, the high amount due to rail-tunnel rehabilitation and the hilly terrain (Port Authority of Allegheny County, n.d. and The Bus Rapid Transit Policy Center, 2007). 2-3. International BRT Operations BRT is being implemented not just in the United States, but all over the world. Successful BRT systems are in operation in Australia, South America, and Europe. Despite geographical differences, two established models are being highlighted for comparison based on their successful operations. 2-3-1. CURITIBA, BRAZIL, “INTEGRATED TRANSPORT NETWORK” Curitiba has a metro population of 2.7 million people and is located in Southern Brazil. Using its 1965 Master Plan as a guide, the city focused development into five high-density, transit-friendly, corridors for the latter part of the 20th century. In these five corridors, there are now 54km (33.5 miles) of exclusive bus lanes. The approach has proven to be successful, with approximately 70 percent of all commuters in the region using the transit system on a daily basis. Transit ridership is more than 50 times as much today as it was in the 1970s.
Contrary to most American transit systems, Curitiba’s public transportation is provided by 16 private bus companies. To rectify any competition problems, the city pays companies based on number of bus miles traveled rather than the number of passengers served. This method provides incentive to the companies to serve lesser-populated neighborhoods. Daily, in excess of 1,900 buses make more than 14,000 trips. BRT buses utilize traffic-signal manipulation and have headways as short as 90 seconds. Fares are collected off-board. While BRT buses are the backbone of the transit system, Curitiba has five levels of service, including conventional, feeder, inter-neighborhood circulators, direct lines, and express lines. The five types have different marketing, branding, and vehicles but operate as one service.
Feasibility of Bus Rapid Transit Within the Mid-Atlantic Region June 2009
11
There are no additional costs to transfer between the different levels of service, and since the system is integrated, wait times between buses is minimal (The Bus Rapid Transit Policy Center, 2007, and Diaz and Schneck, 2000). 2-3-2. OTTAWA, ONTARIO, CANADA, “TRANSITWAY” Ottawa’s Transitway is a 25.8km bus-only roadway, built by the city in phases, with the initial leg having opened in 1983. In addition to the bus-only roadway, the system has 35.3km of dedicated lanes on freeways and arterial roads. The BRT system has three routes, which operate along a grade-separated roadway, predominantly using a railroad right-of-way. The lines have headways of four to eight minutes during the daytime and 25-30 minutes during early morning and late night times. The Transitway is mostly two lanes, but at stations it expands to four lanes to allow express buses to bypass the stations. BRT vehicles utilize ITS through signal priority and vehicle-location identification. Fares are collected off-board, and buses have level boarding. Some stations show real-time bus information on displays. In addition to the three main BRT routes, the Transitway accommodates express bus routes, which serve the surrounding residential neighborhoods during peak times. Conventional buses also use part of the Transitway. Daily on average, the Transitway serves 200,000 riders among all the different lines. Buses using the Transitway provide an intermodal connection with the light rail O-Train. Of the construction costs for the Transitway, 75 percent were funded by the Province of Ontario. The city has not received continued funding from the Province of Ontario in the past decade, so little expansion or system improvement has been accomplished during that time. Plans exist to expand the transit system to accommodate higher ridership and areas of population growth. Future plans incorporate the introduction of smart-card technology for fare collection (The Bus Rapid Transit Policy Center, 2007, and Diaz and Schneck, 2000).
2-4. Characteristics of Successful Domestic BRT Systems 2-4-1. COMMON CHARACTERISTICS Subsection 2 of this report defined BRT, common elements of full BRT systems, and listed basic features and attributes in Table 1. While BRT can be customized to satisfy unique local demands or to accommodate varied resources, there is a general list of features that are commonly found with successful BRT systems. These features include (Institute for Transportation & Development Policy, 2007 and Levinson et al., 2003):
• Dedicated running ways such as segregated busways or bus-only roadways • An integrated network of routes and corridors • Attractive stations that are convenient, comfortable, secure, and weather-protected, with
available level-boarding • Pre-board fare collection and fare verification • Fare-integration between routes, corridors, and feeder services • Low-emission and low-noise vehicle technologies • Utilization of Intelligent Transportation Systems (ITS) • Signal priority or grade separation at intersections • Integration with other mobility options
Feasibility of Bus Rapid Transit Within the Mid-Atlantic Region June 2009
12
• Distinct maps, signage, and real-time information • Distinctive easy-to-board vehicles. • Frequent all-day service
2-4-2. BRANDING/MARKETING The ability to brand a transportation service is paramount in any effort to build and retain a loyal ridership. Passenger surveys were referenced in a 2004 report by FTA to gauge public perception of BRT systems. The surveys indicated that more successful BRT systems were able to achieve a distinct identity and position in their region and among other available transit services. In addition BRT passengers expressed, in general, high levels of satisfaction with the service in comparison to the parallel local bus routes (Diaz et al., 2004).
Feasibility of Bus Rapid Transit Within the Mid-Atlantic Region June 2009
13
3.0 OTHER HIGH-SPEED TRANSIT OPTIONS 3.1 Light Rail Light rail is defined as “an electric railway system, characterized by its ability to operate single or multiple car consists (trains) along exclusive rights-of-way at ground level, on aerial structures, in subways or in streets, able to board and discharge passengers at station platforms or at street, track, or car-floor level and normally powered by overhead electrical wires” (Light Rail Central, 2008). Light rail usually operates in urban settings in mixed-traffic streets. Light rail comprises trolleys, streetcars, or trams. BRT systems have several advantages over light-rail systems. Depending on the design of the system, capital costs of a BRT system can be lower than light-rail systems but offer similar passenger capacity, performance, and service levels. Most BRT systems can be planned and implemented more quickly than comparable light-rail systems. Light rail does not offer the flexibility of a BRT system. Once light rail is built, there is permanence to the routes, unlike BRT routes, which can adapt to changing ridership demands or population shifts. In summary, BRT systems can be developed incrementally, developed in stages, and provide operating flexibility in terms of route adjustments. Compared to BRT, light rail is more costly to develop, with average start-up costs of anywhere from $15 million per mile to over $100 million per mile (Light Rail Now, 2008). According to Breakthrough Technologies Institute, the cost of constructing a heavy-rail system in the U.S. averages over $200 million per mile, while the cost of a light-rail system averages over $70 million per mile. In contrast, most BRT systems in the U.S. cost less than $25 million per mile to construct. 3.2 Ridesharing Programs
Ridesharing programs involve sharing rides in a vehicle between the driver and one or more passengers, typically for commuting. Carpooling, where driving is shared among private-vehicle owners, reduces peak-period vehicle trips and reduces overall fuel usage (Victoria Transport Policy Institute, n.d.).
Vanpooling is a ridesharing program that provides a transportation alternative for commuters traveling long distances to a major employer. There are three types of vanpools—third-party vanpools that are owned and operated by a for-profit vendor, employer-sponsored vanpools, where participation is limited to employers of one company, and owner-operator vanpools, where the vehicle is owned by a commuter or through a corporation to share liability. The cost of a vanpool is determined by a number of factors, including the type of vanpool, number of participating commuters, distance traveled, and total gas costs. Many employers offer incentives for vanpooling, such as pre-tax transit benefits, transit subsidies, reserved parking spaces for vanpools. Some vanpool vehicles are eligible for an EZ-Pass for use on toll roads and bridges. In some states, such as New Jersey, public-transit providers sponsor vanpools in areas where public transportation is neither available nor feasible (NJ Transit).
Feasibility of Bus Rapid Transit Within the Mid-Atlantic Region June 2009
14
Park-and-ride lots are areas that enable commuters to park vehicles while using public transit or participating in carpools or vanpools. There are several designated park and ride lots in the region that provide convenient and accessible parking and serve as a meeting location for commuters who carpool or vanpool together.
There are several examples of active regional ridesharing programs. RideShare Delaware is a service of DART First State dedicated to helping commuters find and use alternative modes of transportation. The program offers free ride-matching services for commuters working in Delaware, parents of Delaware school students, vanpooling services, and transportation-benefit assistance to Delaware employers. Funded through a combination of federal and state funds, the goal of the program is to reduce the number of single-occupant vehicles (SOVs) traveling on Delaware’s roadways and improve ambient air quality. The Home Free Guarantee program ensures RideShare participants a free ride home in the event of an emergency (RideShare Delaware).
The Delaware Valley Regional Planning Commission (DVRPC) sponsors a Mobility Alternatives Program (MAP) to help southeastern Pennsylvania employers establish alternative commutes for employees. Share-A-Ride is a computer-based ride-match program open to work commuters and employers located in southeastern Pennsylvania. In conjunction with MAP, an Emergency Ride Home service has been established to provide a free ride in the event of an emergency for registered commuters working in southeastern Pennsylvania who share their ride to work (DVRPC, “Mobility Alternatives Program”).
The New Jersey Department of Transportation (NJDOT), in collaboration with area Transportation Management Associations, sponsors a ridesharing program. Prospective ride- share participants complete an online Matchlist application to determine local ridesharing options. MTA provides a comprehensive online resource guide for commuting options—Commuter Choice Maryland. Online ridesharing options are provided for carpools, vanpools, county ridesharing programs, park-and-ride locations, car sharing, preferred parking, and programs offered by Transportation Management Associations. MTA’s Commuter Assistance Office also provides an online ridesharing application to match commuters with available carpools or vanpools (MTA, “Maryland Ridesharing”).
3.3 High–Occupancy-Vehicle and High-Occupancy-Toll Lanes High-occupancy-vehicle lanes (HOV) are lanes restricted for the use only of carpools, vanpools, or buses. The primary purpose of an HOV lane is to increase the total number of people moved through a congested corridor during peak-travel times. There is evidence that, as ridership on HOV lanes increases, there is a rise in travel-time savings. This suggests that more commuters are willing to carpool or ride on a bus or an HOV lane as congestion on a corridor grows. To address the continued growth of congestion, travel demand is being managed through value- pricing or congestion-pricing programs. The value-pricing strategy enables travel demand to be managed by setting prices for roadway usage use during peak periods. Among the various pricing schemes, variably priced lanes such, as high-occupancy-toll (HOT) lanes,-are part of a broader managed-lanes concept that employs market forces to help optimize use of the facilities. Toll rates for users of HOT lane change dynamically in response to levels of traffic congestion and peak periods of demand. In locations where HOV lanes are underutilized or have excess
Feasibility of Bus Rapid Transit Within the Mid-Atlantic Region June 2009
15
capacity, HOV lanes can be converted to HOT lanes. HOT lanes allow single-occupancy or lower-occupancy vehicles to use an HOV lane for a fee, while qualifying HOVs travel free. Prior to the passage of SAFETEA-LU, HOT lanes were piloted under the Value Pricing Pilot Program (VPPP). The reauthorization of SAFETEA-LU has enabled all states to establish HOT facilities such as the following facilities successfully operating in the United States (FHWA, Freeway Management Program):
• I-15 in San Diego, Calif. • I-394 in Minneapolis, Minn. • I-25 in Denver, Colo. • I-10 Katy Freeway in Houston, Tex. • US Rt. 290 in Houston, Tex. • I-15 in Salt Lake City, Utah • SR 167 in Seattle, Wash.
3.4 Commuter Buses There are several examples of commuter bus services that operate within the region. In Delaware, DART First State’s #301 provides service for commuters traveling between Dover and Wilmington. Stops along the route between Dover and Wilmington include Smyrna, Middletown, Christiana Mall, Rodney Square, and Wilmington’s Amtrak Station. There has been a steady growth in ridership—an increase of 42,155 riders (48) percent between FY 2001 and FY 2006. In just one year (FY 2005 to FY 2006) the DART #301 experienced a 7.8 percent ridership increase (Delaware Transit Corporation).
In Chester County, Pa., the Beeline commuter express service runs during peak-commuting periods on weekdays from Coatesville to the Great Valley Corporate Center via Exton via U.S. Rts. 30 and 202. Major stops on the Beeline route include major towns, apartment complexes, housing subdivisions, SEPTA's R5 train station in Downingtown, the Exton Square Mall, The Commons at Great Valley, Siemens Medical Systems, Wyeth Pharmaceuticals, and The Vanguard Group. In February 2007, SEPTA began operating a new #306 service between the Brandywine Town Center (BTC) Park & Ride (located at the intersection of U.S. Rt. 202 and Delaware Rt. 92) in Wilmington and the Commons at Great Valley and Main Line Industrial Park (via U.S. Rt. 202 through West Chester) in Chester County, Pa. This service enables transit riders to make a SEPTA R2 connection at the Claymont, Del. station by using DART #61 (Transit Management Association of Chester County).
MTA’s Commuter Bus provides express transit service to commuters at a premium price within the Baltimore, Md. and Washington, D.C., metropolitan areas. Commuter buses operate to peak-travel destinations during peak-travel times on weekdays only. Commuters are able to access the express lines on a first-come, first-served basis from park–and-ride lots throughout the two metropolitan areas. MTA contracts for express bus service through four private transportation providers—Dillon Bus Service, Eyre Bus Service, Keller Transportation, and Veolia Transportation.
Demand for the commuter bus service is at an all-time high. MTA’s Commuter Bus service between Washington, D.C., and southern, western, and central Maryland has seen double-digit ridership increases within the past year. Due to its success, an additional $3.36 million was approved in May 2008 to expand and improve the commuter bus program throughout Maryland
Feasibility of Bus Rapid Transit Within the Mid-Atlantic Region June 2009
16
(MDOT, “Governor O’Malley”). On January 16, 2008, IPA conducted a site visit to MTA and interview with Glenn Hoge, MTA Commuter Bus Service Acting Manager. IPA conducted a case study on MTA’s Commuter Bus Service, which includes a summary of the interview with Hoge and insights into how MTA is planning to expand commuter express-bus services with the advent of new transit needs stemming from the Base Realignment and Closure (BRAC) transition in Aberdeen, Md. (Appendix B).
3.5 A Hybrid Approach BRT systems are not a one-size-fits-all approach but offer a continuum of approaches that share the basic features and attributes of rapid transit. These approaches, which can be implemented on an incremental basis, capture the benefits of both conventional bus and light rail—greater operating flexibility, better-quality transit experience, potential for increased ridership, added seating capacity, faster and more reliable travel times, increased safety and security, better environmental stewardship, and enhanced technologies. BRT solutions range from those systems that operate in general-purpose travel lanes that use traffic-signal prioritization, those that benefit from the exclusive use of traffic shoulders on congested roadways, to full-fledged systems on dedicated running ways with exclusive bus lanes. 3-5-1. POTENTIAL FOR INCREMENTAL DEVELOPMENT According to a Transit Cooperative Research Program report, BRT systems can be incrementally developed in stages based on demand for service and funding. Improvements can be implemented in phases to achieve improved bus speed, travel time, and ridership capacity. An initial stage of BRT may exhibit low-cost attributes by operating on shared roadways with traffic-signal priority and preferential treatment during peak hours. As more funds become available, an intermediate-level BRT system may operate on dedicated or high-occupancy-vehicle (HOV) lanes within congested roadway segments. A fully funded, full-service BRT system will expand to include full-service attributes (e.g., the use of exclusive running ways for the entire length of a corridor, advanced technologies, and enhanced vehicle and passenger amenities). An incremental approach may initially include special routes within a bus system where point-to-point service is provided during peak-commuting times with fewer stops. Incremental improvements can transform the service to a hybrid system that provides a shorter limited-dwell time at limited-stop locations, utilizes existing roadways, and employs technology that provides traffic-signal preferences at major intersections. Over time, the system may develop into a fully-integrated BRT system that operates on exclusive running ways and HOV/express-toll lanes, integrates with feeder transportation services, and incorporates advanced intelligent-transportation systems such as global positioning systems and automated fare-collection systems (Transportation Cooperative Research Board, 2003). 3-5-2. BRT AS A PLACEHOLDER FOR LIGHT RAIL BRT systems have also been designed as a cost-effective “place holder” for future light-rail service. The Transportation Cooperative Research Program report indicates that “BRT can be used to reserve right-of-way, build transit markets, spur transit-oriented development, and build community support” (Transportation Cooperative Research Board, 2003, pp. 9-14). Bus Rapid
Feasibility of Bus Rapid Transit Within the Mid-Atlantic Region June 2009
17
Transit compares favorably with Light Rail systems in terms of operating speed and ridership. A major advantage of BRT is its flexibility—buses can be rerouted to accommodate changing traffic patterns and can operate on busways, high-occupancy-vehicle lanes, and city arterial streets.
There are several BRT systems that are being planning in the U.S. that will serve as placeholders for future light-rail service. The Almeda—Contra Costa Transit District (AC Transit), which serves the Oakland—San Francisco Bay, Calif., area is planning a “rail-ready BRT” system. The proposed center-running BRT will be designed to the physical dimensions required to accommodate a future light-rail vehicle. To plan for a future conversion, BRT route construction would potentially include installing the rails, sub-surface electrical work, relocating utilities, and building longer platforms that could accommodate light-rail vehicles. The Metropolitan Transit Authority (Metro) in the Houston, Tex. metropolitan area had originally planned five light-rail lines as the locally preferred alternative to alleviate congested freeways and streets. While one light-rail line was implemented, plans for the other lines were switched to BRT due to issues concerning costs, projected revenue, and ridership numbers. Construction of Metro’s BRT fixed guide-paths will include the laying of tracks to enable the eventual conversion to a light-rail system as ridership numbers increase. The Charlotte Area Transit System in Charlotte, N.C., initiated a 9.6-mile LYNX light-rail service in 2007. The 2030 Transit Corridor System Plan, adopted by the Metropolitan Transit Commission, calls for an integrated mass-transit system that includes light rail, commuter rail, streetcars, and bus rapid transit (The Bus Rapid Policy Center, 2007).
The Boston (MBTA) Silver Line illustrates the proper way transportation should be integrated into areas not yet ready to be serviced by regular rail transit. The Silver line will eventually create an “Urban Transit Ring” connecting much of the transit in the city of Boston and establishing BRT to service areas that could greatly benefit from regular fixed transit. The buses on the Silver Line operate using engines on regular streets but electrical power (transferred by overhead wires) when operating in tunnels or streets with existing electrical infrastructure (similar to streetcars and light rail transit). The eventual objective of the Silver Line is to serve as a placeholder for future rail expansion while cultivating proper transit-oriented development and ridership along the route (The Bus Rapid Policy Center, 2007).
Feasibility of Bus Rapid Transit Within the Mid-Atlantic Region June 2009
18
4.0 WHY IS BRT IMPORTANT TO THE REGION? Transportation influences the regional economy, environment, communities, and quality of life. BRT is one component in a multi-modal transportation system that can enhance public transportation and mobility options. While there is no “one-size-fits-all” approach to BRT, this transportation mode can provide an alternative to driving and provide more transportation options to commuters. BRT can promote a more efficient transportation system by supplementing existing transit services, improving the reliability of public transportation, and providing linkages to other modes of transportation such as bus or rail. BRT will encourage economic development by efficiently transporting people to jobs, connecting major centers of commerce and employment, providing transportation linkages that cross state lines, and promoting transit-supportive land development. The concept of BRT is also consistent with regional transportation management-demand strategies and policy focus. In the Mid-Atlantic region, increased pressures on public transit systems and the growing costs of capital investments are forcing states to develop comprehensive strategies to manage transportation demand. Tactics to enhance mobility include tighter coordination between land-use and transportation decision-making, congestion management, planning at a regional level, directing growth to infill areas, roadway improvements, and use of state-of-the-art, integrated transportation system-management strategies and tools. 4-1. Traffic Congestion According to the 2007 Urban Mobility Report, congestion is increasingly a multi-faceted problem. The report indicates that congestion “caused urban Americans to travel 4.2 billion hours more and to purchase an extra 2.9 billion gallons of fuel for a congestion cost of $78 billion. This was an increase of 220 million hours, 140 million gallons and $5 billion from 2004” (Schrank and Lomax, p. 1). During the past two decades, increases in the volume of freight have strained the transportation network and heightened conflicts between auto and freight travel. Recent growth in international trade has placed greater pressure on traffic corridors and gateways, which become bottlenecks for the movement of freight. The Federal Highway Administration expects continued growth of auto travel and freight transport. Total vehicle miles traveled (VMT) is expected to increase by more than 2.5 percent annually between 1998 and 2020. Truck VMT is projected to grow by more than 3 percent annually over the same period. Increases in travel and freight movement mean crippling roadway congestion, soaring peak-period congestion, and high-volume truck traffic along major corridors. It is estimated that 69 percent of urban interstates will carry more than 10,000 trucks in 2020, compared with 27 percent in 1998 (FHWA, n.d). While mobility data indicate that the Philadelphia area (Pa.-N.J.-Del.-Md.) fares better than other similar-sized urban areas, traffic congestion is still costly. In 2005, motorists in the Philadelphia urban area experienced over 111,704 hours in delays annually and wasted over 70,902 gallons of fuel per year at a total cost of over $2 million annually (Schrank and Lomax, p. 34). High levels of traffic congestion have an adverse impact on the economy, environment, quality of life, and public health of the region.
Feasibility of Bus Rapid Transit Within the Mid-Atlantic Region June 2009
19
Because Delaware is at the crossroads of the Northeast Corridor, it is heavily utilized and referred to as “The East Coast’s Main Street.” The 24-mile stretch of I-95, which runs through Delaware between Maryland and Pennsylvania, is one of the nation’s busiest freeways and a vital link for commerce and travel throughout the Mid-Atlantic region. Each day, approximately 230,000 vehicles travel through Delaware on I-95. A major traffic bottleneck in Delaware is identified as the I-95/SR 1 interchange. With more than 199,677 vehicles passing this location daily, traffic volume at this location resulted in more than 1,256,000 hours of delays in 2002 alone (American Highway Users Alliance). In July 2008, Delaware Congressman Mike Castle proposed legislation—the National Highway Congestion Relief Act—to address congestion in the Northeast Corridor. The legislation calls for the establishment of “national chokepoint regions” and would require the U.S. Secretary of Transportation to develop a plan to allocate funds to eligible highway projects (I-95 Coalition). In July 2008, the Wilmington Metropolitan Area Planning Council (WILMAPCO) released a congestion-management report to identify and address congestion in the region. Using a systems-management approach, existence of congestion in the transportation system was examined from more of a regional context and illustrated how slight changes at specific locations can impact the operation of the transportation system as a whole. Four performance measures were used to delineate specific congested corridors: roadway level of service (LOS), intersection LOS, travel speeds, and transit LOS. Using these measures, the WILMAPCO map (Appendix C-5) identifies Congestion Management System (CMS) corridor locations in New Castle County, Del. and Cecil County, Md. (WILMAPCO, 2008).
2008 CMS Corridor Locations Corridor #1 - City of Newark Corridor #2 – Md. Rt. 213, Elkton Corridor #3 – U.S. Rt. 301, Middletown Corridor #4 - Polly Drummond/Red Mill Rd. Corridor #5 – SR 2, Kirkwood Highway Corridor #6 - SR 41, Pa. Line to Prices Corner Corridor #7 - SR 273, Harmony Rd. to Airport Rd. Corridor #8 - I-95, SR 273 to Wilmington Corridor #9 - City of Wilmington Corridor #10 - Marsh & Silverside Rds. 4-2. Economic Impacts Economists have studied the economic impact of public investment in surface transportation over the past several decades and have concluded that U.S. businesses derive direct economic benefits from investment in highways, roads, and public transit. Findings of a recent report indicate that U.S. businesses and individuals receive over $788 billion annually in direct economic benefits from using public transit and roads to transport goods and commute to work. The report also insisted that more investment in highways and public transportation systems would boost the benefits obtained by both businesses and individuals (Shapiro and Hassett, 2005). The region’s transportation network is indispensible to the local, state, regional, and national economy. It serves both local traffic and through traffic in the Northeast Corridor and provides essential linkages to multi-modal transportation options, population hubs, and principal
Feasibility of Bus Rapid Transit Within the Mid-Atlantic Region June 2009
20
employment centers. Public transportation helps alleviate peak-period congestion, connects people to jobs, and provides mobility to individuals without other means of transportation. Addressing the congestion problems can generate economic benefits in terms of reduced fuel consumption and travel-time savings. As gas prices continue to rise, more people are opting to forego travel by car and use public transit. While the Philadelphia metropolitan area has not been immune to the economic recession, business leaders believe that its regional economy is faring better than other areas in the nation. At an April 2009 roundtable of Philadelphia-area leaders, hosted by the Economy League of Greater Philadelphia, there was a consensus that the strengths of the regional economy include business diversity, higher education institutions, and research hospitals (“eds and meds”), and life sciences (Kelsey, 2009). According to a biotechnology-industry study conducted in 2009 by the Milken Institute, the greater Philadelphia life-sciences sector ranks first in the “current impact” category; it found that one in six jobs in the Philadelphia region is connected to life sciences (Philadelphia Business Journal, 2009). Transporting commuters to educational, training, and job opportunities is critical if the region is to remain competitive in a global economy. An Army-base realignment (BRAC) will move major national defense and intelligence facilities from Fort Monmouth, N.J. to Aberdeen Proving Ground (APG) in Aberdeen, Md. As a result, a large influx of both military and civilian defense-related jobs will shift to the region. Approximately 8,200 direct jobs and 7,500–10,000 indirect jobs are anticipated to transfer to the region by 2011 (APG-CSSC Regional BRAC Office). A Chesapeake Science and Security Corridor (CSSC) partnership has been formed to ensure a successful BRAC implementation, transition of Army civilian jobs and small business/contractor opportunities, and good quality of life for those living and working in the defense community. Eight jurisdictions in three states form the CSSC—including Harford County, Cecil County, Baltimore County, and Baltimore City, in Md., York and Lancaster Counties in Pa., and New Castle County in Del. While this unprecedented job growth will positively impact the regional economy, the economic advantage may be tempered unless regional transportation improvements are made. Infrastructure changes, primarily north of Baltimore, are underway to mitigate the strain on the region’s transportation network. In addition, A Multimodal Transportation Center Feasibility Study is being funded by the Department of Defense to explore the location and functionality of a transportation hub in the Aberdeen area to accommodate rail, commuter bus, and shuttle service (APG-CSSC Regional BRAC Office). An ongoing BRAC Commuter Bus Service study has been proposed by MDOT as an interim alternative to the extension of the MARC commuter rail from Perryville, Md. to Newark, Del. While these and other transportation initiatives are a step in the right direction, more interjurisdictional discussion is needed to plan for long-term, multi-modal transportation investments to better connect the greater Baltimore and Philadelphia area. 4-3. Environmental Benefits 4-3-1. AIR QUALITY BRT has the potential to reduce traffic congestion, which in turn reduces carbon-monoxide emissions and improves air quality. In April 2005, the Environmental Protection Agency (EPA) designated 126 areas of the country as “non-attainment” for attainment of non-particle National
Feasibility of Bus Rapid Transit Within the Mid-Atlantic Region June 2009
21
Ambient Air Quality Standard (NAAQS). The Philadelphia-Wilmington, PA-NJ-DE area was designated by EPA as a non-attainment area (NAA). In Delaware, Wilmington is a NAA for ozone. On April 1, 2008, Delaware submitted a revised State Implementation Plan (SIP) for the attainment of non-particle NAAQS (DNREC Secretary’s Order 2008-A-0011). NAAQS, for which transportation sources are significant, includes carbon monoxide, particulate matter, and ozone—including ground-level ozone contained in automobile exhaust emissions (FHWA, “CMAQ”). The transportation sector accounts for more than 30 percent of all greenhouse-gas emissions in the United States, with over 88 percent of all trips being made by car. One way to reduce carbon-dioxide emissions is to divert trips by automobile to public transit. According to a report by the American Public Transit Association (APTA), public transit saves about 1.4 billion gallons of gas, negating 14 million tons of carbon-dioxide emissions, annually (APTA). BRT shows promise over other forms of public transit for reducing transportation-related carbon-dioxide emissions. A recent study by the Breakthrough Technologies Institute found that a BRT system in a medium-size city in the United States could cut emissions by as much as 654,000 tons over 20 years. Since electric transit systems obtain energy from fossil fuel-burning power plants, BRT may provide a better potential than heavy or light rail to reduce emissions over the long term (Breakthrough Technologies Institute). Moreover, new clean propulsion technologies such as battery-electric, hybrid-electric, and fuel cells are providing options for cleaner, more efficient transit bus fleets. Hybrid-electric buses, which use less fuel and emit fewer gases, have reached commercial production and are being deployed by the following BRT systems:
• The Regional Transit Commission of Southern Nevada (MAX – operating in Las Vegas) • Central Florida Regional Transportation Authority (Lynx Lymmo – operating in Orlando) • Lane Transit District (EmX – operating in Eugene, Oregon) • Puget Sound Regional Council (Swift – operating in Seattle and Snohomish County,
Washington) • Los Angeles County Metropolitan Transit Authority (Metro Rapid – operating in Los
Angeles County) • Greater Cleveland Regional Transit Authority (Euclid Corridor Silver Line – connecting
the Cleveland Central Business District and the University Circle area by 2009) • The Massachussetts Bay Transit Authority (Silver Line Phase I – compressed natural gas;
Silver Line Phase II and III– low sulfur, diesel-electric) 4-3-2. CONGESTION MITIGATION The primary purpose of the federal Congestion Mitigation and Air Quality (CMAQ) program is to fund projects and programs for designated “non-attainment” areas for air quality and maintenance standards, including those that reduce transportation emissions. Among the strategies identified to mitigate congestion, and therefore improve ambient air quality, include:
• Tolling: Managing highway resources in a manner that promotes free-flow traffic conditions through congestion pricing or variable-toll strategies.
• Transit: Creating, expanding, and facilitating rapid deployment of innovative, high-performance BRT operations in major corridors to increase transit ridership.
• Telecommuting: Promoting increased use of telecommuting and flexible work scheduling, in order to reduce peak-period commuting and shift some commuting travel to “shoulder” or off-peak hours.
Feasibility of Bus Rapid Transit Within the Mid-Atlantic Region June 2009
22
• Technology & Operations: Using cutting-edge technological and operational approaches to improve transportation-system performance.
4-3-3. ENERGY-EFFICIENT LAND USE PATTERNS When public transit is combined with higher-density land-use patterns, it has the potential to enhance mobility, reduce driving distances, minimize dependency on automobiles, save fuel, and reduce the collective carbon footprint of a community or region. Transit-oriented development (TOD) is a design tool that creates land-use patterns that supports development. TOD communities allow higher-density, mixed-use development, which effectively places residents closer to housing, shopping, employment, and public-transportation options. BRT should be fully integrated with land-use policies in order to ensure TOD around transit hubs and/or stations. An APTA report indicates that in TOD communities, where public transportation has an overarching effect on land use, the indirect “leverage effect” can reduce VMT growth, ease congestion, support more efficient land-use patterns, and cut harmful carbon-dioxide emissions by 37 million metric tons annually (APTA). Pennsylvania has established authorizing legislation that enables local governments, transit authorities, and public or private transportation providers to enter into formal partnerships to create Transit Revitalization Investment Districts (TRIDs). The TRID legislation is designed to promote economic development, community revitalization, and increased transit ridership. TRIDs are intended to facilitate TODs, or development concentrated around and oriented to transit stations. While the TRIDs established in southeastern Pennsylvania are oriented to regional rail stations, the concept could easily be applied to development near BRT stations (Bickel and Hacker). NJ Transit's transit-friendly communities program encourages growth and development where public transportation already exists. Benefits of the program include community revitalization, reduced traffic congestion, and improved air quality. New Jersey’s branded program with respect to TOD is called the Transit Village Initiative. Created by the New Jersey Department of Transportation and NJ Transit, the Transit Village Initiative provides incentives to municipalities that adopt transit-friendly, smart-growth land-use practices that allow for mixed-use development in close proximity to passenger rail or bus facilities. Again, while most of New Jersey’s 19 Transit Villages are oriented towards rail, the initiative could be applied to a BRT system, where transit would serve as the focal point for mixed-use development (Bickel and Hacker).
Feasibility of Bus Rapid Transit Within the Mid-Atlantic Region June 2009
23
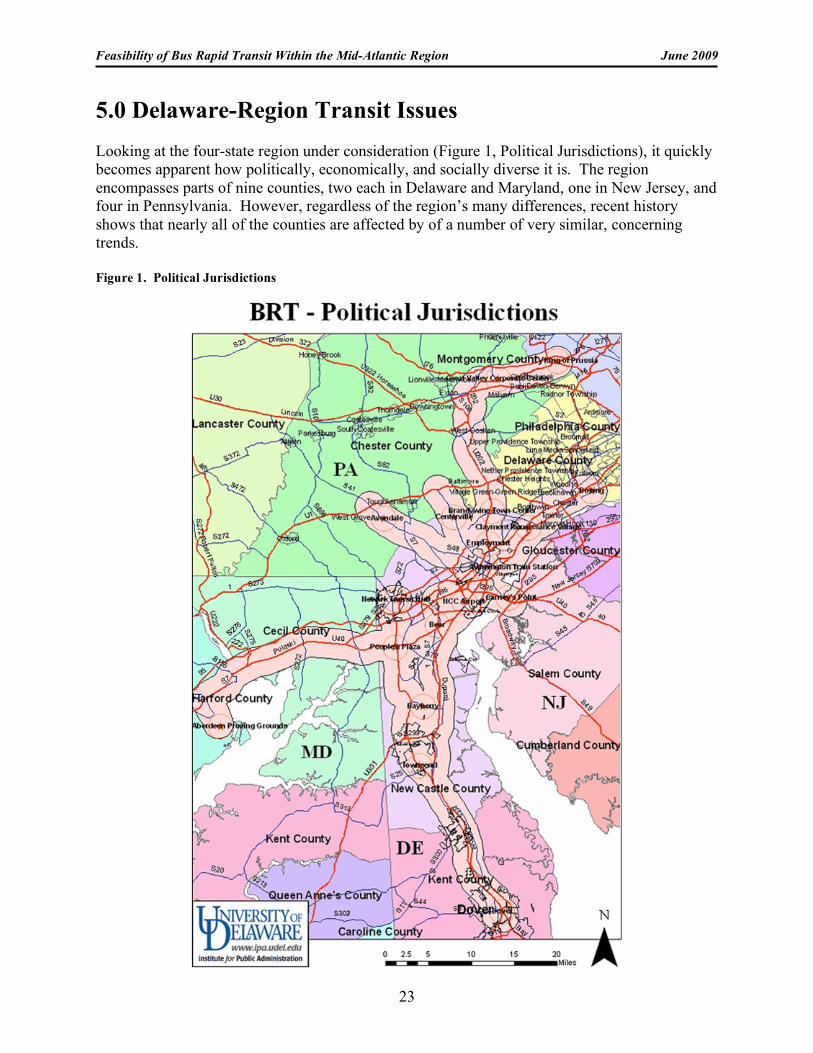
5.0 Delaware-Region Transit Issues Looking at the four-state region under consideration (Figure 1, Political Jurisdictions), it quickly becomes apparent how politically, economically, and socially diverse it is. The region encompasses parts of nine counties, two each in Delaware and Maryland, one in New Jersey, and four in Pennsylvania. However, regardless of the region’s many differences, recent history shows that nearly all of the counties are affected by of a number of very similar, concerning trends. Figure 1. Political Jurisdictions
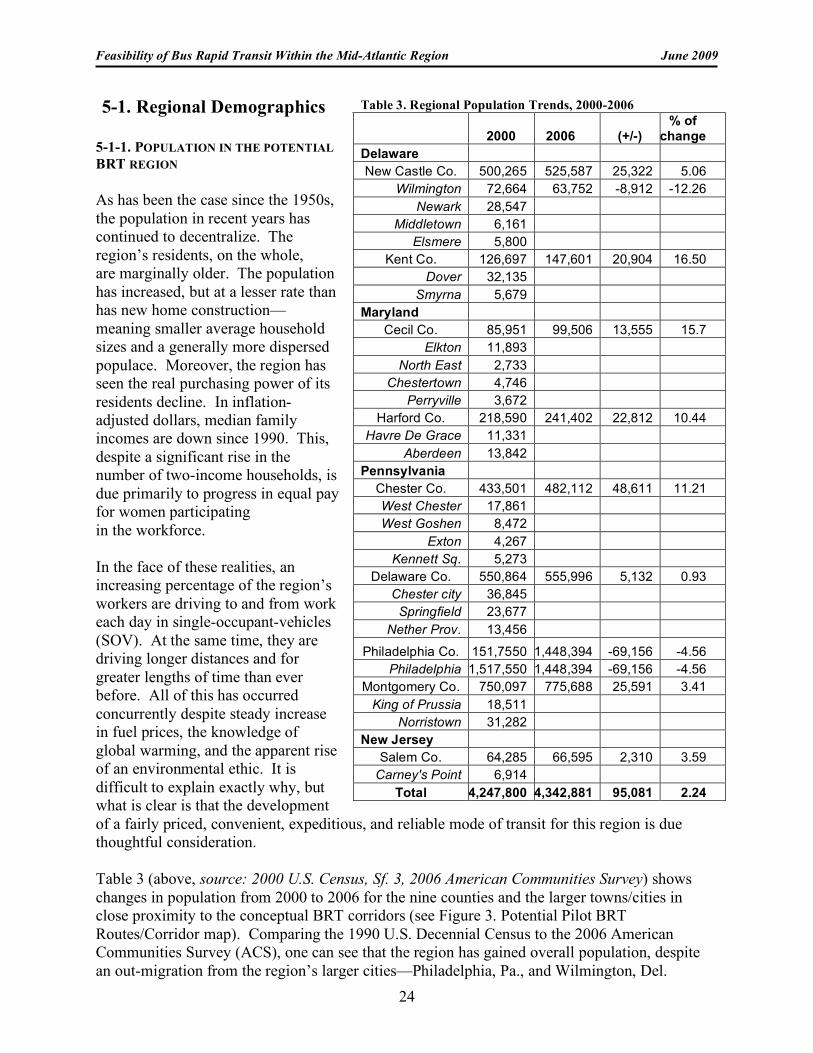
Feasibility of Bus Rapid Transit Within the Mid-Atlantic Region June 2009
24
5-1. Regional Demographics 5-1-1. POPULATION IN THE POTENTIAL BRT REGION As has been the case since the 1950s, the population in recent years has continued to decentralize. The region’s residents, on the whole, are marginally older. The population has increased, but at a lesser rate than has new home construction—meaning smaller average household sizes and a generally more dispersed populace. Moreover, the region has seen the real purchasing power of its residents decline. In inflation-adjusted dollars, median family incomes are down since 1990. This, despite a significant rise in the number of two-income households, is due primarily to progress in equal pay for women participating in the workforce. In the face of these realities, an increasing percentage of the region’s workers are driving to and from work each day in single-occupant-vehicles (SOV). At the same time, they are driving longer distances and for greater lengths of time than ever before. All of this has occurred concurrently despite steady increase in fuel prices, the knowledge of global warming, and the apparent rise of an environmental ethic. It is difficult to explain exactly why, but what is clear is that the development of a fairly priced, convenient, expeditious, and reliable mode of transit for this region is due thoughtful consideration. Table 3 (above, source: 2000 U.S. Census, Sf. 3, 2006 American Communities Survey) shows changes in population from 2000 to 2006 for the nine counties and the larger towns/cities in close proximity to the conceptual BRT corridors (see Figure 3. Potential Pilot BRT Routes/Corridor map). Comparing the 1990 U.S. Decennial Census to the 2006 American Communities Survey (ACS), one can see that the region has gained overall population, despite an out-migration from the region’s larger cities—Philadelphia, Pa., and Wilmington, Del.
Table 3. Regional Population Trends, 2000-2006
2000 2006 (+/-) % of
change Delaware New Castle Co. 500,265 525,587 25,322 5.06
Wilmington 72,664 63,752 -8,912 -12.26 Newark 28,547
Middletown 6,161 Elsmere 5,800
Kent Co. 126,697 147,601 20,904 16.50 Dover 32,135
Smyrna 5,679 Maryland
Cecil Co. 85,951 99,506 13,555 15.7 Elkton 11,893
North East 2,733 Chestertown 4,746
Perryville 3,672 Harford Co. 218,590 241,402 22,812 10.44
Havre De Grace 11,331 Aberdeen 13,842
Pennsylvania Chester Co. 433,501 482,112 48,611 11.21 West Chester 17,861 West Goshen 8,472
Exton 4,267 Kennett Sq. 5,273
Delaware Co. 550,864 555,996 5,132 0.93 Chester city 36,845
Springfield 23,677 Nether Prov. 13,456
Philadelphia Co. 151,7550 1,448,394 -69,156 -4.56 Philadelphia 1,517,550 1,448,394 -69,156 -4.56
Montgomery Co. 750,097 775,688 25,591 3.41 King of Prussia 18,511
Norristown 31,282 New Jersey
Salem Co. 64,285 66,595 2,310 3.59 Carney's Point 6,914
Total 4,247,800 4,342,881 95,081 2.24
Feasibility of Bus Rapid Transit Within the Mid-Atlantic Region June 2009
25
According to the U.S. Census and ACS, Wilmington lost nearly 9,000 residents between 2000 and 2006 (12.26%). Philadelphia’s population dipped by roughly the size of Wilmington—approximately 70,000 people (4.56%). Kent County, Del., showed the highest rate of growth (16.5%)—nearly 21,000 people. It was followed closely by Cecil County, Md., (15.7%, 13,555 people) and Chester County, Pa., (11.2%, 48,611 people). Harford County, Md., also grew significantly (10.44%, 22,812 people), in advance of the base realignment that is expected to draw a significant number of new jobs and residents to the region. Regional Demographic Trends A May 2007 WILMAPCO data report examines regional population trends and household growth projections between 2000 and 2030. The report provides regional comparisons of population change in the 16 counties surrounding the WILMAPCO region, including the nine counties that are being considered in this regional BRT study. Significant regional population trends, as indicated by the WILMAPCO report, are summarized below (WILMAPCO, 2007).
• By 2030, New Castle and Kent Counties in Delaware; Cecil and Harford Counties in Maryland; Salem County, New Jersey; and Philadelphia, Chester, Montgomery, and Delaware counties in Pennsylvania may reach a combined population of over 4.8 million.
• By 2030, the WILMAPCO region (New Castle County, Del., and Cecil County, Md.) is anticipated to have a combined population of 761,293.
• Within the study area, six of the nine jurisdictions are projected to experience double-digit population growth between 2000 and 2030. These include the Delaware counties of New Castle (19.8%) and Kent (49.1%), Maryland counties of Cecil (86.1%) and Harford (29.9%), and Pennsylvania counties of Chester (31.9%) and Montgomery (17.1%).
• Of these jurisdictions, Kent County, Del., Cecil and Harford Counties, Md., and Chester County, Pa., are expected to grow faster than the 28.9 percent rate projected for the United States between 2000 and 2030.
• Delaware County, Pa., and Philadelphia are projected to lose population, by 0.7 percent and 0.8 percent respectively, between 2000 and 2030.
5-1-2. HOUSING GROWTH IN THE POTENTIAL BRT REGION Cecil County, Md., and Kent County, Del., also outstripped the region in the addition of new housing units (see Table 4 below). Cecil County added over 15,000 homes to its inventory (60%). During the same time frame, Kent County added over 20,000 homes, better than a 52 percent increase. Harford County, Md., also showed remarkable growth (50%), adding nearly 32,000 homes. Philadelphia and Delaware Counties saw the slowest growth. Each saw housing growth under ten percent.
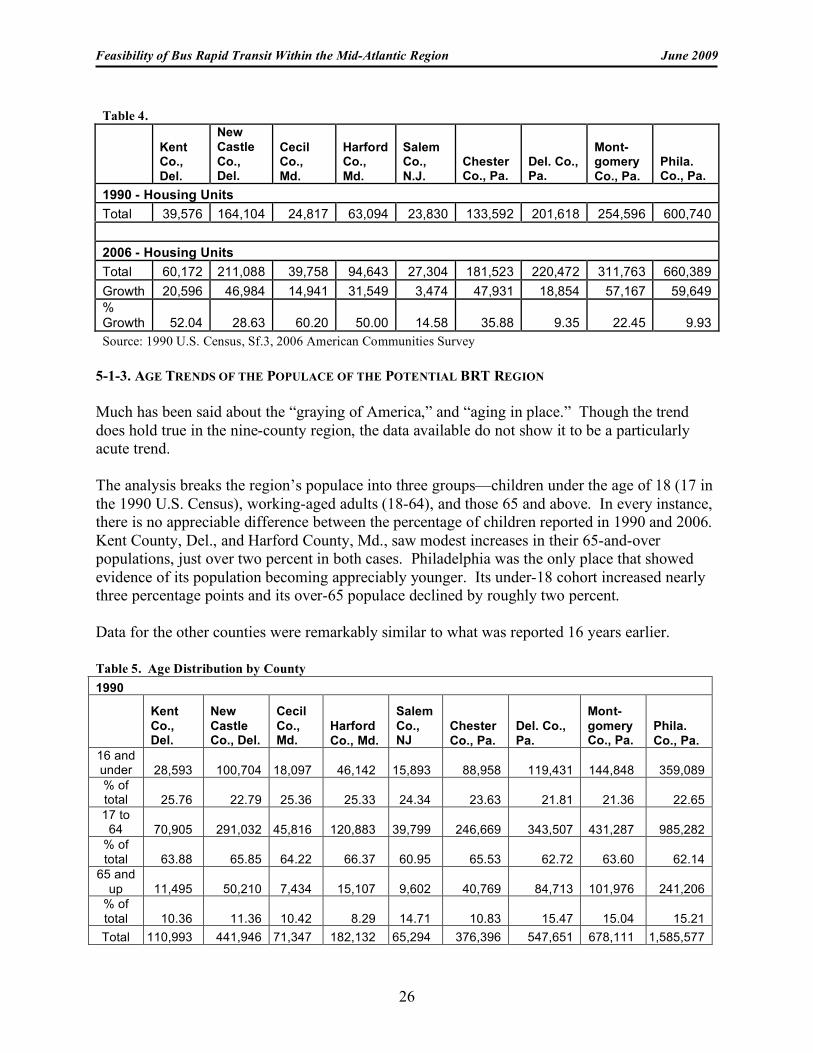
Feasibility of Bus Rapid Transit Within the Mid-Atlantic Region June 2009
26
5-1-3. AGE TRENDS OF THE POPULACE OF THE POTENTIAL BRT REGION Much has been said about the “graying of America,” and “aging in place.” Though the trend does hold true in the nine-county region, the data available do not show it to be a particularly acute trend. The analysis breaks the region’s populace into three groups—children under the age of 18 (17 in the 1990 U.S. Census), working-aged adults (18-64), and those 65 and above. In every instance, there is no appreciable difference between the percentage of children reported in 1990 and 2006. Kent County, Del., and Harford County, Md., saw modest increases in their 65-and-over populations, just over two percent in both cases. Philadelphia was the only place that showed evidence of its population becoming appreciably younger. Its under-18 cohort increased nearly three percentage points and its over-65 populace declined by roughly two percent. Data for the other counties were remarkably similar to what was reported 16 years earlier.
Table 4.
Kent Co., Del.
New Castle Co., Del.
Cecil Co., Md.
Harford Co., Md.
Salem Co., N.J.
Chester Co., Pa.
Del. Co., Pa.
Mont- gomery Co., Pa.
Phila. Co., Pa.
1990 - Housing Units Total 39,576 164,104 24,817 63,094 23,830 133,592 201,618 254,596 600,740 2006 - Housing Units Total 60,172 211,088 39,758 94,643 27,304 181,523 220,472 311,763 660,389 Growth 20,596 46,984 14,941 31,549 3,474 47,931 18,854 57,167 59,649 % Growth 52.04 28.63 60.20 50.00 14.58 35.88 9.35 22.45 9.93 Source: 1990 U.S. Census, Sf.3, 2006 American Communities Survey
Table 5. Age Distribution by County 1990
Kent Co., Del.
New Castle Co., Del.
Cecil Co., Md.
Harford Co., Md.
Salem Co., NJ
Chester Co., Pa.
Del. Co., Pa.
Mont-gomery Co., Pa.
Phila. Co., Pa.
16 and under 28,593 100,704 18,097 46,142 15,893 88,958 119,431 144,848 359,089 % of total 25.76 22.79 25.36 25.33 24.34 23.63 21.81 21.36 22.65 17 to
64 70,905 291,032 45,816 120,883 39,799 246,669 343,507 431,287 985,282 % of total 63.88 65.85 64.22 66.37 60.95 65.53 62.72 63.60 62.14
65 and up 11,495 50,210 7,434 15,107 9,602 40,769 84,713 101,976 241,206
% of total 10.36 11.36 10.42 8.29 14.71 10.83 15.47 15.04 15.21 Total 110,993 441,946 71,347 182,132 65,294 376,396 547,651 678,111 1,585,577
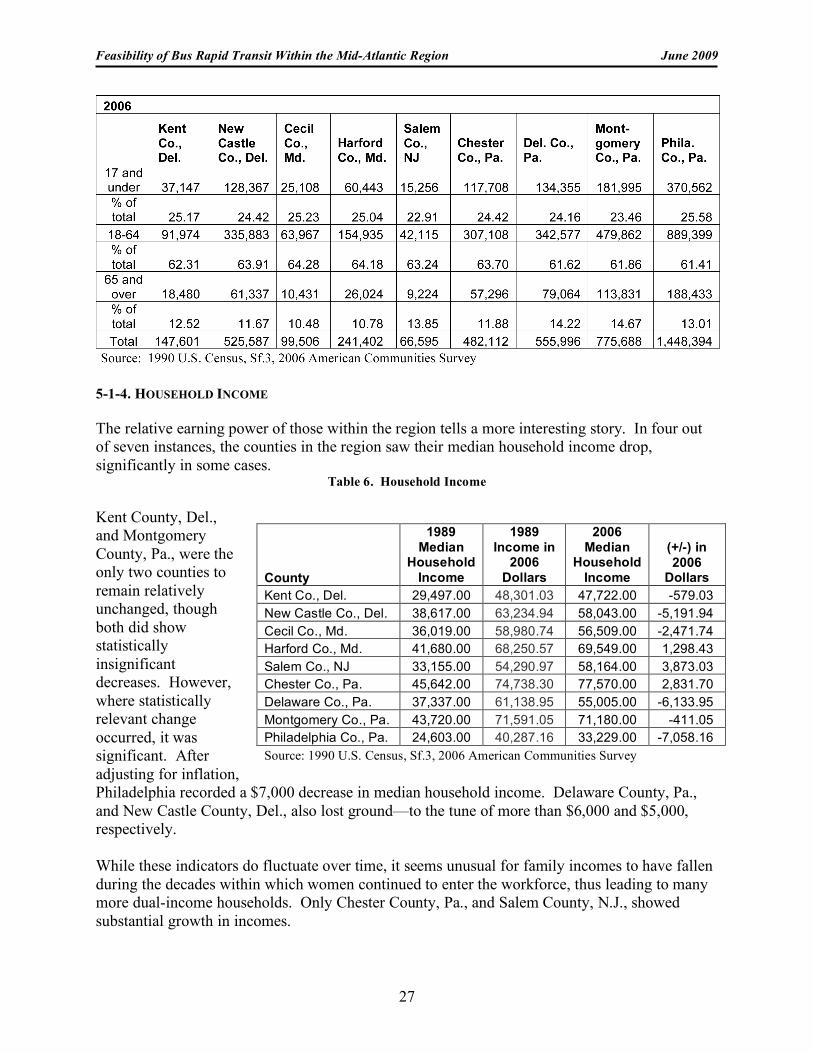
Feasibility of Bus Rapid Transit Within the Mid-Atlantic Region June 2009
27
5-1-4. HOUSEHOLD INCOME The relative earning power of those within the region tells a more interesting story. In four out of seven instances, the counties in the region saw their median household income drop, significantly in some cases.
Table 6. Household Income Kent County, Del., and Montgomery County, Pa., were the only two counties to remain relatively unchanged, though both did show statistically insignificant decreases. However, where statistically relevant change occurred, it was significant. After adjusting for inflation, Philadelphia recorded a $7,000 decrease in median household income. Delaware County, Pa., and New Castle County, Del., also lost ground—to the tune of more than $6,000 and $5,000, respectively. While these indicators do fluctuate over time, it seems unusual for family incomes to have fallen during the decades within which women continued to enter the workforce, thus leading to many more dual-income households. Only Chester County, Pa., and Salem County, N.J., showed substantial growth in incomes.
County
1989 Median
Household Income
1989 Income in
2006 Dollars
2006 Median
Household Income
(+/-) in 2006
Dollars Kent Co., Del. 29,497.00 48,301.03 47,722.00 -579.03 New Castle Co., Del. 38,617.00 63,234.94 58,043.00 -5,191.94 Cecil Co., Md. 36,019.00 58,980.74 56,509.00 -2,471.74 Harford Co., Md. 41,680.00 68,250.57 69,549.00 1,298.43 Salem Co., NJ 33,155.00 54,290.97 58,164.00 3,873.03 Chester Co., Pa. 45,642.00 74,738.30 77,570.00 2,831.70 Delaware Co., Pa. 37,337.00 61,138.95 55,005.00 -6,133.95 Montgomery Co., Pa. 43,720.00 71,591.05 71,180.00 -411.05 Philadelphia Co., Pa. 24,603.00 40,287.16 33,229.00 -7,058.16 Source: 1990 U.S. Census, Sf.3, 2006 American Communities Survey
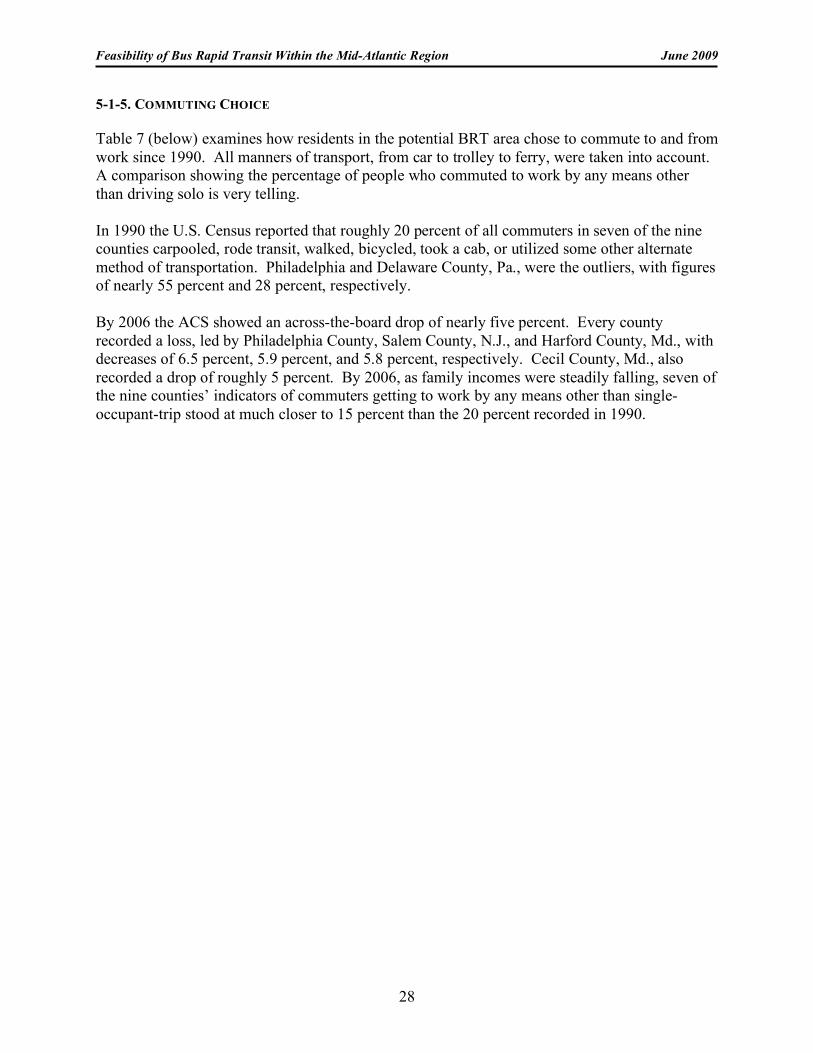
Feasibility of Bus Rapid Transit Within the Mid-Atlantic Region June 2009
28
5-1-5. COMMUTING CHOICE Table 7 (below) examines how residents in the potential BRT area chose to commute to and from work since 1990. All manners of transport, from car to trolley to ferry, were taken into account. A comparison showing the percentage of people who commuted to work by any means other than driving solo is very telling. In 1990 the U.S. Census reported that roughly 20 percent of all commuters in seven of the nine counties carpooled, rode transit, walked, bicycled, took a cab, or utilized some other alternate method of transportation. Philadelphia and Delaware County, Pa., were the outliers, with figures of nearly 55 percent and 28 percent, respectively. By 2006 the ACS showed an across-the-board drop of nearly five percent. Every county recorded a loss, led by Philadelphia County, Salem County, N.J., and Harford County, Md., with decreases of 6.5 percent, 5.9 percent, and 5.8 percent, respectively. Cecil County, Md., also recorded a drop of roughly 5 percent. By 2006, as family incomes were steadily falling, seven of the nine counties’ indicators of commuters getting to work by any means other than single-occupant-trip stood at much closer to 15 percent than the 20 percent recorded in 1990.
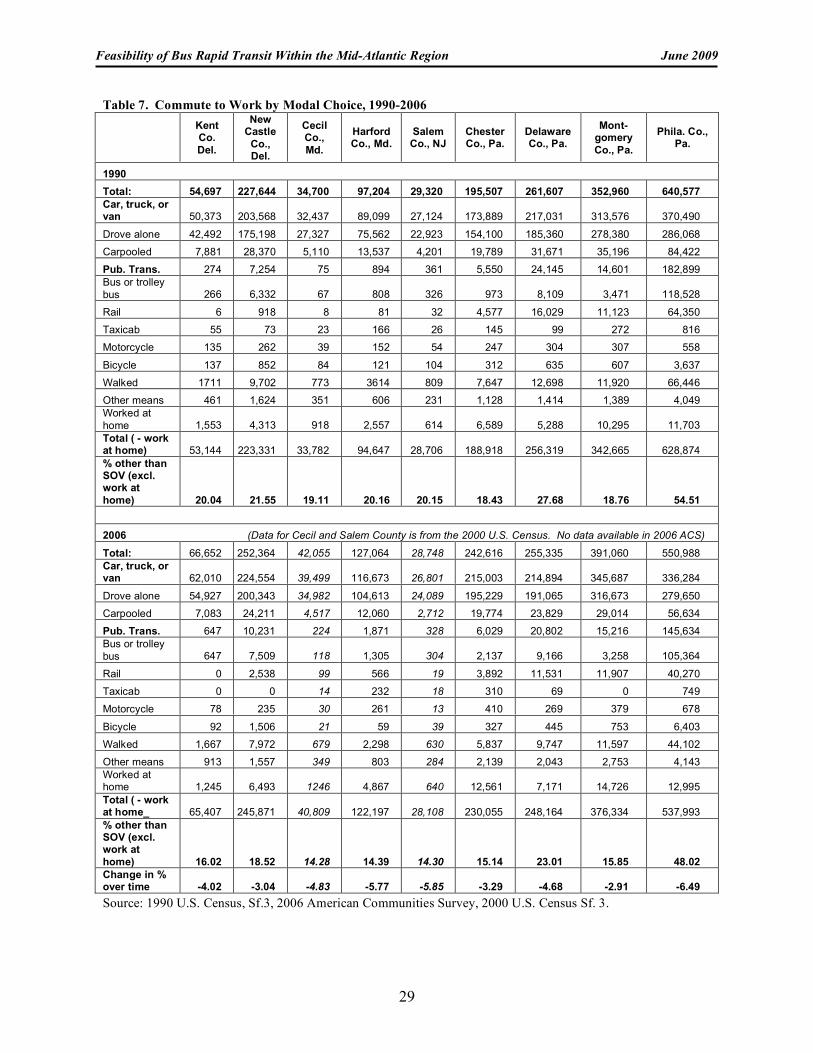
Feasibility of Bus Rapid Transit Within the Mid-Atlantic Region June 2009
29
Table 7. Commute to Work by Modal Choice, 1990-2006
Kent Co. Del.
New Castle
Co., Del.
Cecil Co., Md.
Harford Co., Md.
Salem Co., NJ
Chester Co., Pa.
Delaware Co., Pa.
Mont-gomery Co., Pa.
Phila. Co., Pa.
1990 Total: 54,697 227,644 34,700 97,204 29,320 195,507 261,607 352,960 640,577 Car, truck, or van 50,373 203,568 32,437 89,099 27,124 173,889 217,031 313,576 370,490
Drove alone 42,492 175,198 27,327 75,562 22,923 154,100 185,360 278,380 286,068
Carpooled 7,881 28,370 5,110 13,537 4,201 19,789 31,671 35,196 84,422
Pub. Trans. 274 7,254 75 894 361 5,550 24,145 14,601 182,899 Bus or trolley bus 266 6,332 67 808 326 973 8,109 3,471 118,528
Rail 6 918 8 81 32 4,577 16,029 11,123 64,350
Taxicab 55 73 23 166 26 145 99 272 816
Motorcycle 135 262 39 152 54 247 304 307 558
Bicycle 137 852 84 121 104 312 635 607 3,637
Walked 1711 9,702 773 3614 809 7,647 12,698 11,920 66,446
Other means 461 1,624 351 606 231 1,128 1,414 1,389 4,049 Worked at home 1,553 4,313 918 2,557 614 6,589 5,288 10,295 11,703 Total ( - work at home) 53,144 223,331 33,782 94,647 28,706 188,918 256,319 342,665 628,874 % other than SOV (excl. work at home) 20.04 21.55 19.11 20.16 20.15 18.43 27.68 18.76 54.51
2006 (Data for Cecil and Salem County is from the 2000 U.S. Census. No data available in 2006 ACS)
Total: 66,652 252,364 42,055 127,064 28,748 242,616 255,335 391,060 550,988 Car, truck, or van 62,010 224,554 39,499 116,673 26,801 215,003 214,894 345,687 336,284
Drove alone 54,927 200,343 34,982 104,613 24,089 195,229 191,065 316,673 279,650
Carpooled 7,083 24,211 4,517 12,060 2,712 19,774 23,829 29,014 56,634
Pub. Trans. 647 10,231 224 1,871 328 6,029 20,802 15,216 145,634 Bus or trolley bus 647 7,509 118 1,305 304 2,137 9,166 3,258 105,364
Rail 0 2,538 99 566 19 3,892 11,531 11,907 40,270
Taxicab 0 0 14 232 18 310 69 0 749
Motorcycle 78 235 30 261 13 410 269 379 678
Bicycle 92 1,506 21 59 39 327 445 753 6,403
Walked 1,667 7,972 679 2,298 630 5,837 9,747 11,597 44,102
Other means 913 1,557 349 803 284 2,139 2,043 2,753 4,143 Worked at home 1,245 6,493 1246 4,867 640 12,561 7,171 14,726 12,995 Total ( - work at home_ 65,407 245,871 40,809 122,197 28,108 230,055 248,164 376,334 537,993 % other than SOV (excl. work at home) 16.02 18.52 14.28 14.39 14.30 15.14 23.01 15.85 48.02 Change in % over time -4.02 -3.04 -4.83 -5.77 -5.85 -3.29 -4.68 -2.91 -6.49 Source: 1990 U.S. Census, Sf.3, 2006 American Communities Survey, 2000 U.S. Census Sf. 3.
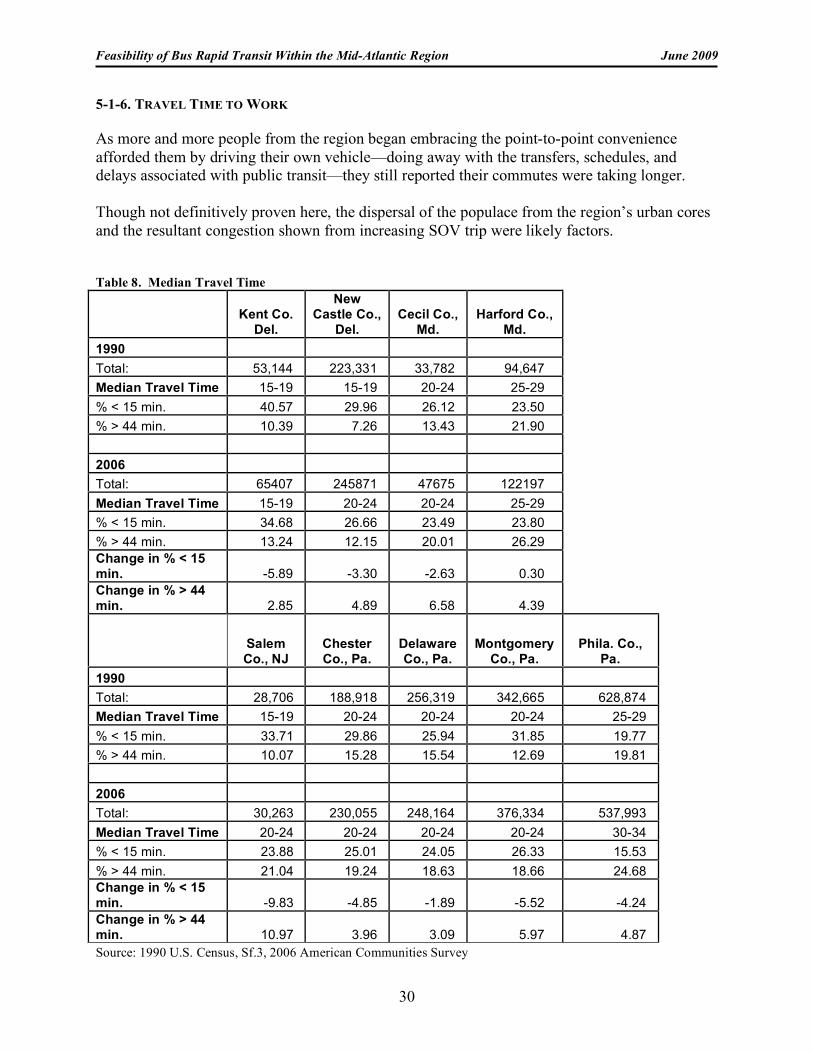
Feasibility of Bus Rapid Transit Within the Mid-Atlantic Region June 2009
30
5-1-6. TRAVEL TIME TO WORK As more and more people from the region began embracing the point-to-point convenience afforded them by driving their own vehicle—doing away with the transfers, schedules, and delays associated with public transit—they still reported their commutes were taking longer. Though not definitively proven here, the dispersal of the populace from the region’s urban cores and the resultant congestion shown from increasing SOV trip were likely factors.
Table 8. Median Travel Time
Kent Co.
Del.
New Castle Co.,
Del. Cecil Co.,
Md. Harford Co.,
Md. 1990 Total: 53,144 223,331 33,782 94,647 Median Travel Time 15-19 15-19 20-24 25-29 % < 15 min. 40.57 29.96 26.12 23.50 % > 44 min. 10.39 7.26 13.43 21.90 2006 Total: 65407 245871 47675 122197 Median Travel Time 15-19 20-24 20-24 25-29 % < 15 min. 34.68 26.66 23.49 23.80 % > 44 min. 13.24 12.15 20.01 26.29 Change in % < 15 min. -5.89 -3.30 -2.63 0.30 Change in % > 44 min. 2.85 4.89 6.58 4.39
Salem Co., NJ
Chester Co., Pa.
Delaware Co., Pa.
Montgomery Co., Pa.
Phila. Co., Pa.
1990 Total: 28,706 188,918 256,319 342,665 628,874 Median Travel Time 15-19 20-24 20-24 20-24 25-29 % < 15 min. 33.71 29.86 25.94 31.85 19.77 % > 44 min. 10.07 15.28 15.54 12.69 19.81 2006 Total: 30,263 230,055 248,164 376,334 537,993 Median Travel Time 20-24 20-24 20-24 20-24 30-34 % < 15 min. 23.88 25.01 24.05 26.33 15.53 % > 44 min. 21.04 19.24 18.63 18.66 24.68 Change in % < 15 min. -9.83 -4.85 -1.89 -5.52 -4.24 Change in % > 44 min. 10.97 3.96 3.09 5.97 4.87 Source: 1990 U.S. Census, Sf.3, 2006 American Communities Survey
Feasibility of Bus Rapid Transit Within the Mid-Atlantic Region June 2009
31
Table 8 (above) shows the median travel time reported by residents in the 1990 U.S Census and the 2006 ACS. It also shows the percentage of commuters that fell into the “under 15 minutes” and “over 45 minutes” categories of travel time. In eight of the nine counties studied, the percentage of commuters reporting a trip shorter than 15 minutes dropped, significantly in most cases. Even more remarkable, every county showed an increase in the percentage of commuters reporting trips of over 45 minutes. The trend was significant enough to slightly increase the median travel time up a measure in New Castle County, Del., Salem County, N.J., and Philadelphia County. 5-2. Delaware/Region Transportation and Commuting Patterns 5-2-1. INFLOW AND EGRESS OF COMMUTERS IN THE STUDY AREA The most readily accessible data regarding commuting patterns comes from the 2000 U.S. Census Transportation Planning Package. In July of 2005, WILMAPCO authored an Analysis of Commuter Flows to and from the WILMAPCO Region 1990-2000, in large part based on this data. The report found that New Castle County, Del., is a net importer of commuter traffic. In fact, commuter in-flows to New Castle County are greater than outbound residents New Castle County for every county it borders. The disparity is most profound in relation to Chester County, Pa., and Cecil County, Md. For Chester County, Pa., the 2000 U.S. Census showed nearly 13,000 workers were entering New Castle County, compared to about 5,000 leaving, on a given day. Similarly, it showed over 14,000 commuters from Cecil County, Md., to New Castle County, and roughly 3,400 traveling in the other direction. In Kent County, Del., Salem County, N.J., and Gloucester County, N.J., outflows to New Castle County were, on average, a little less than double the reported number of New Castle County residents commuting to those counties. The data showed relative parity between New Castle County and Delaware County, Pa. The WILMAPCO analysis concluded that “between 1990 and 2000, the total number of workers that commute into New Castle County on a daily basis has risen from 45,200 in 1990 to 59,500 in 2000. This is an increase of 31 percent over the decade” (WILMAPCO, 2005). The report also noted that 22 percent of New Castle County’s commuting workforce resides in other counties. Within New Castle County, the data suggest an overall commuting pattern on the north/south plane. The county sees roughly 45,000 total in-commuters from Kent County, Del. (to the south), Chester County Pa., and Delaware County, Pa. (both to the north). Cecil was the only county to share a large volume of commuters with New Castle County on the east/west plane. Cecil County, Md., on the other hand, showed a daily egress of roughly 20,000 commuters, as opposed to roughly 6,000 incoming. The flows are also strikingly on the east/west plane. More than 14,000 Cecil County residents reported commuting to New Castle County and nearly 4,500 reported traveling to Harford County, Md. Roughly 1,600 Harford County residents commuted east into Cecil County. The reported north/south flows—between Cecil County, Md., Kent County, Del., Lancaster County, Pa., and Chester County, Pa.—were nearly negligible. The WILMAPCO analysis concluded that “more than half (56.1%) of all Cecil County workers are
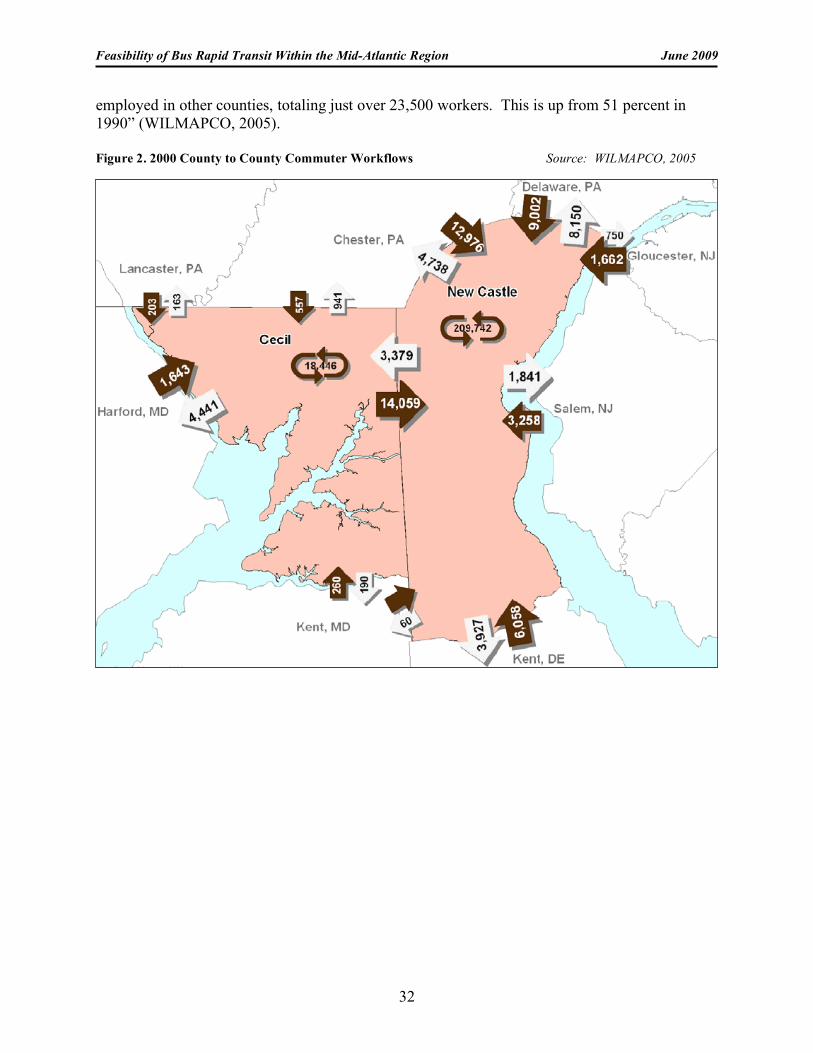
Feasibility of Bus Rapid Transit Within the Mid-Atlantic Region June 2009
32
employed in other counties, totaling just over 23,500 workers. This is up from 51 percent in 1990” (WILMAPCO, 2005). Figure 2. 2000 County to County Commuter Workflows Source: WILMAPCO, 2005
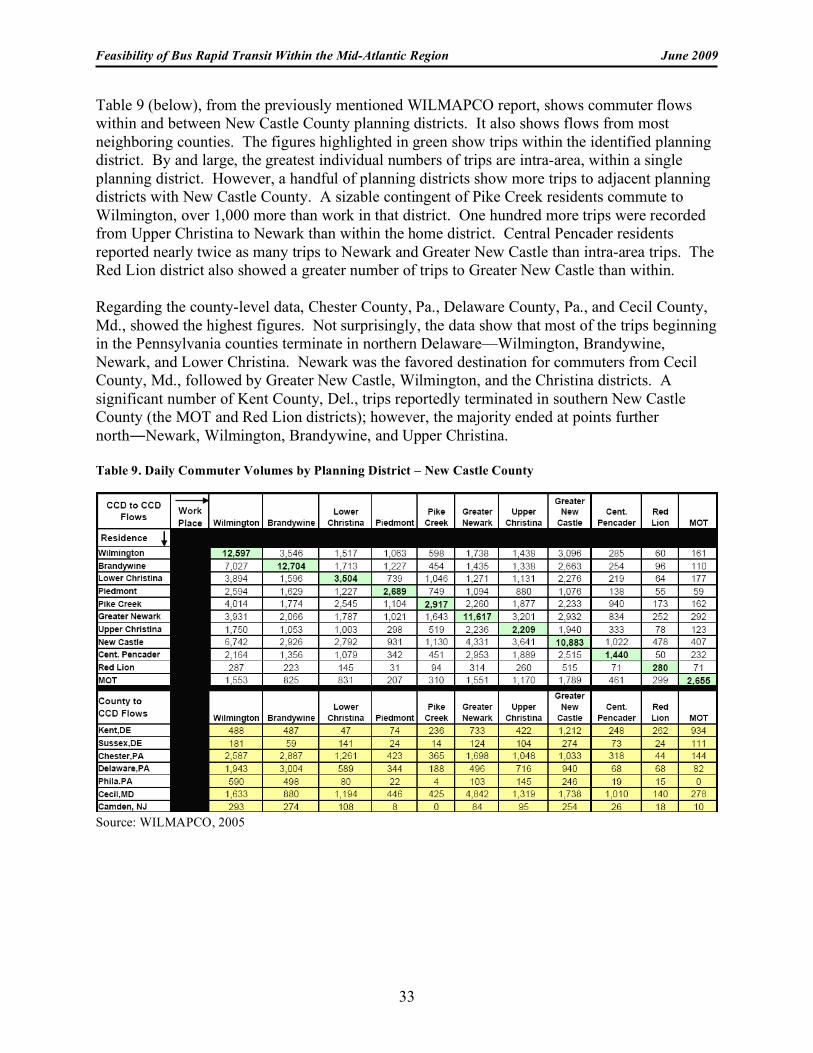
Feasibility of Bus Rapid Transit Within the Mid-Atlantic Region June 2009
33
Table 9 (below), from the previously mentioned WILMAPCO report, shows commuter flows within and between New Castle County planning districts. It also shows flows from most neighboring counties. The figures highlighted in green show trips within the identified planning district. By and large, the greatest individual numbers of trips are intra-area, within a single planning district. However, a handful of planning districts show more trips to adjacent planning districts with New Castle County. A sizable contingent of Pike Creek residents commute to Wilmington, over 1,000 more than work in that district. One hundred more trips were recorded from Upper Christina to Newark than within the home district. Central Pencader residents reported nearly twice as many trips to Newark and Greater New Castle than intra-area trips. The Red Lion district also showed a greater number of trips to Greater New Castle than within. Regarding the county-level data, Chester County, Pa., Delaware County, Pa., and Cecil County, Md., showed the highest figures. Not surprisingly, the data show that most of the trips beginning in the Pennsylvania counties terminate in northern Delaware—Wilmington, Brandywine, Newark, and Lower Christina. Newark was the favored destination for commuters from Cecil County, Md., followed by Greater New Castle, Wilmington, and the Christina districts. A significant number of Kent County, Del., trips reportedly terminated in southern New Castle County (the MOT and Red Lion districts); however, the majority ended at points further north―Newark, Wilmington, Brandywine, and Upper Christina. Table 9. Daily Commuter Volumes by Planning District – New Castle County
Source: WILMAPCO, 2005
Feasibility of Bus Rapid Transit Within the Mid-Atlantic Region June 2009
34
5-3. Overview of Existing Bus Transit Services 5-3-1. REGIONAL CONNECTIONS Generally speaking, the area under consideration is fairly well served by public transit. Regional connections exist between New Castle County, Del., Chester County, Pa., Delaware County, Pa., Montgomery County, Pa., Salem County, N.J., Cecil County, Md., and Kent County, Del., sufficient enough for the savvy, determined commuter to use. However, with the exception of the DART/SEPTA commuter rail from Newark, Del., to Wilmington, Del., and on to Philadelphia, Pa., and bus service on U.S. Rt. 202 (DART and SEPTA), the connections tend to require a number of transfers, modal changes, and more than one fare. Additionally, connections between New Castle County, Salem County, and Cecil County are fairly limited. In the case of Cecil County, there is no direct linkage to the remainder of the MTA system. Regional connections, DART, SEPTA, NJ Transit, and MTA provide abundant local and express bus and train services, serving individuals within their respective jurisdictions. Transit providers that serve an urban center provided more frequent and robust services. Cecil and Harford County, Md., Connections The only connection between New Castle County and Cecil County is DART Route 65 (Appendix C-1, DART Transit Routes – Northern Delaware). The route runs weekdays from just before 6:00 a.m. until just after 8:00 p.m. The route connects downtown Elkton, Union Hospital, some government offices, a technology park with the Newark Train Station, the new Newark bus hub, and on as far as Bank of America’s Deerfield offices. From these locations, one can easily access the rest of the DART system. However, there is currently no way to travel further south or west on public transit from Elkton. The Maryland Rail Commuter (MARC) and the Maryland Transit Administration (MTA) routes stop short of connecting to the DART service. MTA #410, 411, and 412 follow I-95 only as far north as Bel Air, Md. MTA #420 follows U.S. Rt. 40 only as far as Havre De Grace. The closest any service gets to Elkton is a somewhat infrequent Amtrak train (Monday, Wednesday, and Friday evenings), which runs only as far as Perryville. Salem County, N.J. The connection between New Castle County and Salem County is fairly limited. Of the three NJ Transit routes with connections to Carney’s Point, only one (#423) crosses the bridge and connects to Wilmington. The route runs twice on weekday mornings, roughly between 7:00 and 9:00, and twice during the evening rush, shortly before 5:00 until nearly 6:00. The morning run’s only Delaware connection is at the Wilmington bus terminal. During the evenings, it also makes a pickup at Rodney Square. Two other NJ Transit routes (#402 and #468) provide connections south and east to the bulk of New Jersey’s system. Rodney Square and the Wilmington Bus Terminal serve as the major hubs to the DART system. Kent County, Del. DART #301 is the only bus connection between Kent County, Del., and New Castle County (see the DART Transit Routes – Northern Delaware map in the appendix). Running in both directions, it runs as far north as the junction of Delaware Avenue and Adams Street in Wilmington. The route intersects major hubs at Rodney Square, the Market Street Amtrak
Feasibility of Bus Rapid Transit Within the Mid-Atlantic Region June 2009
35
Station, the Christiana Mall, the Smyrna rest stop, The Dover Mall, Wesley College (in Dover), and on to its terminus adjacent to the DART and DelDOT offices in Dover. DART #301 offers two express runs in either direction during peak-weekday travel times. Local service runs weekdays from 4:30 a.m. until nearly 9:00 p.m. Though DART #301 is not one of the most heavily trafficked, it has grown in ridership faster than any other route and is often at, or near, capacity (see Table 10). Chester and Montgomery Counties, Pa. Three bus routes primarily connect New Castle County with Chester County. DART #2 is one of the busiest, running from the Wilmington Train Station north on U.S. Rt. 202 as far as the Brandywine Town Center Park-and-Ride. Northbound service begins shortly after 5:00 a.m. on weekdays and lasts until nearly 10:00 p.m. Southbound service, originating from the Brandywine Park-and-Ride, commences around 8:00 a.m. and continues until 10:30 p.m. At the Brandywine Park-and-Ride, the route connects with SEPTA’s #306 (Appendix C-2, Public Transportation Serving Chester County map). Passengers at the hub may choose among four departure times between 6:40 a.m. and 10:40 a.m. every hour. Five return trips are available, arriving shortly after 2:00 p.m. and continuing until shortly after 7:00 p.m. SEPTA #306 provides access to the remainder of the SEPTA system in the region. It continues as far northeast as the Great Valley Corporate Center. SEPTA #306 can be used to connect to SEPTA #92. It roughly follows SR 7, allowing Delaware-based riders to traverse Chester County, ending at the King of Prussia Mall in Montgomery County, Pa. Passengers could also use SEPTA #306 to access SEPTA’s R5 commuter-rail line to points east as far as Philadelphia or transfer to the trolley/subway to go as far north as Norristown. Looking at the map (Appendix C-2), however, there are two potential links further west that are currently not served. DART #10 and #20 each follow SR Rt. 52 north towards Longwood Gardens, but both stop short of the state line. The SCCOOT bus, a service of TMACC in Chester County, Pa. serves the West Chester Transportation center with connections to SEPTA #92, #104, #314. While it has stops in West Grove, Kennett Square, and Longwood Gardens, it does not connect to DART buses serving nearby SR Rt. 52. Delaware County and Philadelphia, Pa. The DART/SEPTA R2 commuter-rail line is the best-known and heavily used transit option from Delaware, through Delaware County, Pa., to Philadelphia. In Wilmington, northbound service begins at 6:00 a.m. It offers 18 trips, ending shortly before 11:00 p.m. on weekdays. Service from Newark, Del., begins 20 minutes later, comprises ten trips, and ends just before 7:30 p.m. From the Philadelphia end, service begins before 5 a.m. The first departures bound for Wilmington and Newark leave about 5:30 a.m. Nine trips are scheduled for weekdays. The last train in the evening arrives at Wilmington at approximately 6:40 p.m. and just less than 20 minutes later in Newark. SEPTA #111 can also be used to access central Delaware County from SEPTA #306, following a transfer from DART #2. The western most stop is at the Chadds Ford Business Campus, near Painter’s Crossroads, at the junction of U.S. Rt. 202 and U.S. Rt. 1. Fifteen eastbound departures begin at 6:30 a.m. and end just after 11:00 p.m. However, evening trips (westbound) are more
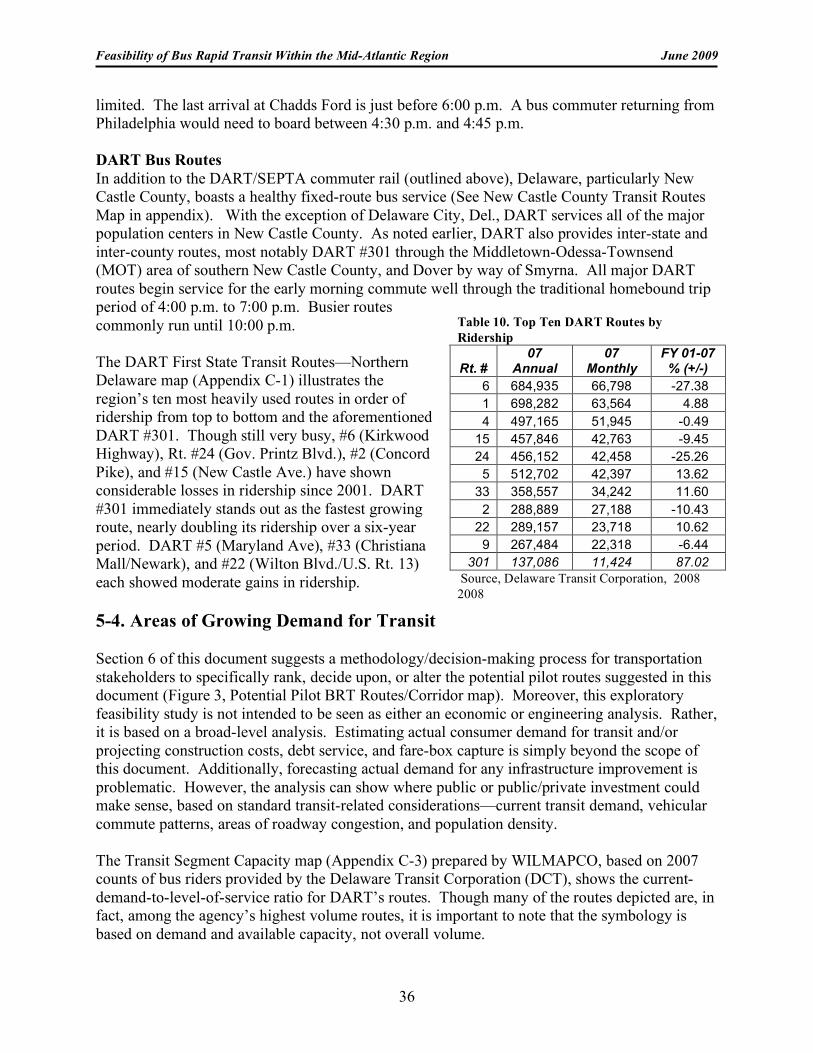
Feasibility of Bus Rapid Transit Within the Mid-Atlantic Region June 2009
36
limited. The last arrival at Chadds Ford is just before 6:00 p.m. A bus commuter returning from Philadelphia would need to board between 4:30 p.m. and 4:45 p.m. DART Bus Routes In addition to the DART/SEPTA commuter rail (outlined above), Delaware, particularly New Castle County, boasts a healthy fixed-route bus service (See New Castle County Transit Routes Map in appendix). With the exception of Delaware City, Del., DART services all of the major population centers in New Castle County. As noted earlier, DART also provides inter-state and inter-county routes, most notably DART #301 through the Middletown-Odessa-Townsend (MOT) area of southern New Castle County, and Dover by way of Smyrna. All major DART routes begin service for the early morning commute well through the traditional homebound trip period of 4:00 p.m. to 7:00 p.m. Busier routes commonly run until 10:00 p.m. The DART First State Transit Routes—Northern Delaware map (Appendix C-1) illustrates the region’s ten most heavily used routes in order of ridership from top to bottom and the aforementioned DART #301. Though still very busy, #6 (Kirkwood Highway), Rt. #24 (Gov. Printz Blvd.), #2 (Concord Pike), and #15 (New Castle Ave.) have shown considerable losses in ridership since 2001. DART #301 immediately stands out as the fastest growing route, nearly doubling its ridership over a six-year period. DART #5 (Maryland Ave), #33 (Christiana Mall/Newark), and #22 (Wilton Blvd./U.S. Rt. 13) each showed moderate gains in ridership. 5-4. Areas of Growing Demand for Transit Section 6 of this document suggests a methodology/decision-making process for transportation stakeholders to specifically rank, decide upon, or alter the potential pilot routes suggested in this document (Figure 3, Potential Pilot BRT Routes/Corridor map). Moreover, this exploratory feasibility study is not intended to be seen as either an economic or engineering analysis. Rather, it is based on a broad-level analysis. Estimating actual consumer demand for transit and/or projecting construction costs, debt service, and fare-box capture is simply beyond the scope of this document. Additionally, forecasting actual demand for any infrastructure improvement is problematic. However, the analysis can show where public or public/private investment could make sense, based on standard transit-related considerations—current transit demand, vehicular commute patterns, areas of roadway congestion, and population density. The Transit Segment Capacity map (Appendix C-3) prepared by WILMAPCO, based on 2007 counts of bus riders provided by the Delaware Transit Corporation (DCT), shows the current- demand-to-level-of-service ratio for DART’s routes. Though many of the routes depicted are, in fact, among the agency’s highest volume routes, it is important to note that the symbology is based on demand and available capacity, not overall volume.
Table 10. Top Ten DART Routes by Ridership
Rt. # 07
Annual 07
Monthly FY 01-07
% (+/-) 6 684,935 66,798 -27.38 1 698,282 63,564 4.88 4 497,165 51,945 -0.49
15 457,846 42,763 -9.45 24 456,152 42,458 -25.26
5 512,702 42,397 13.62 33 358,557 34,242 11.60
2 288,889 27,188 -10.43 22 289,157 23,718 10.62
9 267,484 22,318 -6.44 301 137,086 11,424 87.02
Source, Delaware Transit Corporation, 2008 2008
Feasibility of Bus Rapid Transit Within the Mid-Atlantic Region June 2009
37
A quick comparison between the Transit Segment Capacity map and the Potential Pilot BRT Routes/Corridor map (Figure 3) reveals a number of parallels. The Transit Segment Capacity map shows near-capacity ridership between Newark, Del., and Wilmington, Del. (on SR 2 and I-95) and over 50 percent capacity on U.S. Rt. 40 before redlining again at U.S. Rt. 40’s merger with U.S. Rt. 13 north towards Wilmington and Philadelphia. U.S. Rt. 202 (north towards Chester and Montgomery Counties, Pa.), is also near capacity. Also of note is that DART #301 is clearly in highest demand. The Average Annual Daily Traffic map (Appendix C-4) tells a similar, if somewhat less pronounced, story. It symbolizes the region’s major roadways according to traffic counts overseen by a region’s Department of Transportation. In this case, the map does not show demand vs. supply, such as number of lanes or congestion. It serves primarily as a simple illustration of where the region’s drivers are going and which roadways they tend to use. Because cities such as Philadelphia and Baltimore are part of the regional traffic-count databases, the relatively smaller areas in the immediate study area tend not to stand out as much as they would otherwise. Still, the map tells a similar story. Traffic between Newark and Wilmington, particularly on I-95, is plainly visible. U.S. Rt. 13 north of Wilmington shows activity headed into Delaware County, Pa. and shows steady use headed south to Dover. U.S. Rt. 202 shows moderate travel, increasing at its junction with U.S. Rt. 30 headed toward King of Prussia. Also interesting is the relatively high volume of traffic on I-95 headed west through Cecil and Harford Counties in Maryland; as the transit-capacity map showed that route in the bottom quartile of demand vs. capacity. The 2008 CMS (Congestion Management Study)—Identified Corridors map (Appendix C-5) prepared by WILMAPCO is more the equivalent of the Transit Segment Capacity map. It illustrates bottlenecks in the surface-road network in two ways—areas where the roadway and traffic control devices are not adequate to accommodate peak-hour traffic and in terms of average travel speeds as compared to the posted speed limit. In both cases, only levels of service (LOS) “E” and “F” are shown as failing. Many drivers can become annoyed in conditions akin to LOS “C” and “D”; however, according to WILMAPCO staff, illustrating those levels as well would result in the vast majority of New Castle County’s roads being highlighted (WILMAPCO, 2008). Again, this map tells a similar story. U.S. Rt. 202 shows slow travel speeds north from Wilmington, as does Kirkwood Highway, I-95, and U.S. Rt. 40 in the heart of New Castle County. Additionally, SR Rt. 48, toward Chester County, Pa., shows as an identified, failing CMS corridor, as does a stretch of U.S. Rt. 40 headed west toward Elkton and Aberdeen, Md. Aside from a stretch of road headed north from Middletown, Del., the north/south routes between northern New Castle County and Dover (DART #301) are relatively uncongested, not to say that fuel costs may not be a motivating factor for Kent County Del., commuters. The Delaware Valley Regional Planning Council’s report, DVRPC Congestion Management Process: Limiting Traffic Congestion and Achieving Regional Goals, includes regional and two corridor-specific maps relevant to the study area. The DVRPC Congested and Emerging Corridors map (Appendix C-6) shows a wide view of Chester, Delaware, Montgomery, and Philadelphia Counties, Pa. One quickly notices that most of all the major thoroughfares leaving Delaware fall into one identified congested, or soon to be congested, classification or another. U.S. Rt. 13, for example, nearly covers the spectrum of classifications headed toward
Feasibility of Bus Rapid Transit Within the Mid-Atlantic Region June 2009
38
Philadelphia, alternatively being classified as “grid,” “freeway,” “suburban network,” and “developed arterial.” I-95 and U.S. Rt. 202 share many of the same classifications and were specifically identified in the above-mentioned report. The I-95 corridor (Appendix C-7, Pa. CMP Corridor 4: I-95 map) between the Delaware state line and the Philadelphia International Airport is classified by DVRPC as “Freeway.” The DVRPC report lists “very appropriate” and “secondary appropriate” strategies for the various types of corridors it identifies. DVRPC concluded, among other things, that park and ride lots and interregional transportation coordination were “very appropriate.” Some of the secondary strategies included computerized traffic signals (to allow for priority treatment of transit), shuttle service to bus stations, express transit services, high-occupancy-vehicle (HOV) treatments, and BRT with exclusive right-of-way bus lanes (DVRPC, 2006). The U.S. Rt. 202/30 corridor was also specifically identified in the report (Appendix C-8, Pa. CMP Corridor 8 map). Exiting Delaware northbound to U.S. Rt. 30, the roadway is classified as “developing arterial” and “main street.” Headed east on U.S. Rt. 30, the corridor is identified alternatively as “freeway” and “main street” on its way toward the Great Valley Corporate Center and the King of Prussia mall (DVRPC, 2006). Again, concerning the developing arterial classification, the report lists computerized traffic signals, park-and-ride lots, and extensions in transit routes as “very appropriate.” New bus routes and signal prioritization for transit are listed as secondary strategies (DVRPC, 2006). Similar to the I-95 corridor, the “freeway” portion of U.S. Rt. 202 calls primarily for demand-responsive transit services. HOV lanes, BRT lanes, and computerized traffic signals are secondary strategies. The “developing arterial” and “main street” classifications call for many similar, but less intense, solutions. In 2003 the South Jersey Transportation Planning Organization (SJTPO), released a document entitled, SJTPO Congestion Management System: Phase II Update, Final Report and Technical Memorandum. Though not as specific, the document’s maps for existing and future CMS needs for Salem County (Appendix C-9) clearly indicate that SJTPO deems the area around Carney’s Point as its primary area in need of transportation enhancements, now and in the future. Population density serves as a final illustrative consideration in the potential demand for BRT (Appendix C-10, Population Density map). Conventional wisdom says that where there are a lot of people, the people will be more willing to ride transit. By extension, perhaps where there are a lot of people far away from other concentrations of people, they may wish to spare themselves the drive. The Population Density map largely reinforces what has been shown by the other maps in the series. Based on the 2000 U.S. Census, it reduces the number of people in each census block into the number of people-per-acre. As was the case with the traffic map, the larger cities’ (Philadelphia and Baltimore) proximity to the study area produces a visually underwhelming result. Still, it is clear where the majority of the region’s populace lives. Again, the analysis supports the U.S. Rt. 202 corridor, and portions of a possible SR 52 BRT route. Though they do run through some barren stretches, the U.S. Rt. 40 corridor and the potential U.S. Rt. 301 route connect major population centers east/west and north/south, respectively.
Feasibility of Bus Rapid Transit Within the Mid-Atlantic Region June 2009
39
5-5. Commuter-Rail Gap A 20-mile commuter-rail gap exists between the Perryville, Md. and Newark, Del.—the only breach in service along the 460-mile Northeast Corridor area between Richmond, Va. and New London, Conn. Currently, MARC’s Penn Line service terminates at Perryville and SEPTA’s R2 regional rail service ends at Newark. Several feasibility studies have been conducted that confirm the need for seamless rail service in this region to provide greater travel choices, meet growing commuter needs, provide enhanced connectivity and mobility, address freight-service chokepoints, and improve ambient air quality through reduction of vehicle travel. A Mid-Atlantic Rail Operations Study, conducted by the I-95 Corridor Coalition, advocates regional rail-system improvements to reduce highway investments, highway congestion, economic costs, emissions, and fuel use. The study states that “solving these problems in the coming decade will require a willingness to plan and fund transportation-system improvements across boundaries—across the jurisdictional boundaries between states and cities, across the interest boundaries between the public agencies and private firms, and across the financial boundaries between highway and rail programs. (Cambridge Systematics, Inc. and Parsons Brinckerhoff Quade and Douglas, Inc., p.2).
WILMAPCO is currently conducting a commuter- and freight-rail feasibility study to examine ridership and economic-development potential, as well as the engineering feasibility, of extending Track A from Elkton to Perryville, Maryland. In light of plans to relocate major national defense and intelligence facilities in the Maryland corridor between Aberdeen and Fort Meade, it is clear that the region’s transportation infrastructure will be significantly impacted and multi-modal transportation improvements are needed. Clearly, the need to improve regional commuter-rail and bus services is not an either-or option. The overarching need is to plan for a well-conceived and -integrated transportation system that links automobile, bus, and commuter-rail traffic across jurisdictional, political, and financial-interest boundaries.
Feasibility of Bus Rapid Transit Within the Mid-Atlantic Region June 2009
40
6.0 ANALYSIS OF BRT POTENTIAL IN THE REGION Section 5 of this document examined the general demographics of the region and outlined the major features of the currently available transit systems. It illustrated historic commuter patterns among the nine counties and provided a broad-brush analysis of where transit enhancements, such as BRT, could be applicable, based on a wide range of factors. They included existing transit demand, traffic on the region’s roadways, identified congested corridors, and population density. With these factors in mind and following a series of meetings with regional transportation officials (the Delaware Transit Corporation, DART First State, transportation management associations, WILMAPCO, DelDOT, and the Delaware River and Bay Authority), the following potential pilot corridor and routes have been put forward by IPA staff for further consideration. This preliminary feasibility study is neither intended to act as an economic-viability assessment nor as an engineering schematic. It is being put forth as a preliminary step in hopes of beginning a dialogue concerning regional BRT and/or commuter bus service. The hope is that this first step will help focus the discussion and narrow the many potential routes down to a plausible corridor. This section will describe the potential BRT routes in terms of distance and parallel or overlapping transit services. It will also compare potential routes with the most thorough regional analysis to date—DVRPC’s Portable Transit-Scores for 2008 and 2030 methodology, graciously applied to the entire study region by WILMAPCO. Finally, it will present some preliminary thoughts on primary vs. secondary routes for development and attempt to produce a “ballpark estimate” of a potential range of costs. 6-1. Potential Pilot System Overview The Potential Pilot BRT Routes/Corridor map (Figure 3) illustrates the scope of the potential BRT corridor in the four-state region comprising Delaware, New Jersey, Pennsylvania, and Maryland. The Political Jurisdictions map (Figure 1) more clearly illustrates the potentially involved towns, cities, and counties. The beige overlay on the pilot-routes map shows, in broader terms, potential areas and corridors potentially suitable for some level of BRT service. The darker thick lines, eight in all, represent potential road-routes for high-amenity buses running within the corridors. The orange circle/stars represent likely hubs, transfers, stops, or destinations.

Feasibility of Bus Rapid Transit Within the Mid-Atlantic Region June 2009
41
Figure 3. Potential Pilot BRT Routes/Corridor map
Feasibility of Bus Rapid Transit Within the Mid-Atlantic Region June 2009
42
301 NORTH/SOUTH MAIN LINE AND I-95 AND U.S. RT. 13 SPURS TO WILMINGTON, DEL. This potential BRT route/corridor is based on the very popular DART # 301. Stretching some 40.4 miles, it is envisioned to originate in Dover near the DART and DelDOT offices, mirror the existing DART route north on U.S. Rt. 13 and SR 1. DART fixed-route buses would feed into and serve the BRT system that could make possible stops in Smyrna and the Middletown-Odessa-Townsend (MOT) area, then continue up SR 1 until it splits with U.S. Rt. 13. From that point, due east of Bear, Del., passengers could either take DART #301 to the Christiana Mall via SR 1, or continue on U.S. Rt. 13, by the New Castle County Airport, on to the Wilmington Train Station. Passengers choosing either destination would find themselves at one or the other major hubs of the DART transit network. Though this pilot route predominantly follows the DART #301, it also runs concurrent and with portions of and could be fed by DART routes #25, 22, 17, 41, 40, 62, 55, 42, 33, 16, and 23. RT. 301-POINTS WEST This route is envisioned as an alternate, time-saving, route for commuters from points south to connect to the proposed 40 BRT line, who may work at Aberdeen Proving Ground. The route is just less than 17 miles long. It would branch off of U.S. Rt. 301 at SR 299/896, just south of Townsend, Del. This BRT route/corridor could potentially make stops in Townsend, Middletown, and near Bayberry before terminating at People’s Plaza. Representatives from MTA indicated that their agency had considered People’s Plaza as a terminus for a commuter-bus run from Maryland. Connections could be made to the U.S. Rt. 40 BRT route to carry passengers into downtown Newark and its new transit hub, thus providing centralized access to DART’s fixed-route system. DART currently offers no parallel service on SR 896. RT. 40 This route is envisioned to serve two purposes. First, it would provide enhanced service along the U.S. Rt. 40 corridor east from People’s Plaza, through the heavily traveled and congested areas of New Castle County, terminating at or near the New Castle County Airport. From this location, passengers could access BRT Route 301 (near Bear) to proceed to the Christiana Mall, or continue from the airport and access BRT Route 13 and the Wilmington Train Station and bus terminal, thereby providing access to all the northern BRT routes and the entirety of DART’s fixed-route buses and commuter-rail services. Second, the route would to provide a missing link between New Castle County, points west of Elkton, in Cecil County, Md., and the Aberdeen Proving Ground. Currently, DART bus service ends in Elkton. This east/west connection is seen as a key component to a truly interstate transit system. Moreover, the short spur from People’s Plaza, due north/south on SR 896, could provide a more direct and expeditious transit option for commuters who would prefer not to be delayed or detoured through Christiana Mall to head towards the MOT region and Dover, via the Rt. 301 BRT. From east to west, the Rt. 40 BRT traverses approximately 37 miles. The short spur (5.25 miles) to the Newark Bus Hub puts the total at 42.25 miles. Feeder services could be provided by DART #65 and a DART U.S. Rt. 40/Glasgow/Elkton shuttle, in each instance as far as Elkton. Additional feeder buses may include DART #42 and #55 as well as DART routes #64, 40, 41, 54, 22, and 25 heading northeast from People’s Plaza.
Feasibility of Bus Rapid Transit Within the Mid-Atlantic Region June 2009
43
RT. 202 This proposed route would provide express/high-amenity service to the numerous commuters between Chester and Montgomery Counties, Pa., and the northern portions of New Castle County. However, a commuter could choose to proceed as far west as Aberdeen on the Rt. 40 BRT, or as far south as Dover on the Rt. 301 BRT. The route would originate from the Wilmington Train Station (near the Wilmington Bus Terminal) and proceed north on U.S. Rt. 202, through the employment centers in the northern part of the county. It could potentially stop at the Brandywine Town Center (the current junction between DART #2 and SEPTA #306). The route would continue to follow U.S. Rt. 202 with possible stops at the Great Valley Corporate Center and the King of Prussia Mall. The route would extend about 33 miles. Fixed-route bus feeder services may include DART #2, 28, and 35. In addition to SEPTA #306, feeder services may include SEPTA “A” (Coatesville to West Chester via Exton), which serves part of U.S. Rt. 202 north of West Chester. SEPTA #204, 92, 206, and 124 may provide feeder services in the vicinity of the Great Valley Corporate Center and the King of Prussia. RT. 13 Envisioned to begin at the New Castle County Airport and extend approximately 22 miles northeast to connect northern New Castle County with the Boeing employment centers in Delaware County, Pa., this route would also likely provide service to the Wilmington Train Station and the Claymont Renaissance Village—its entire length on U.S. Rt. 13. A shuttle or feeder services may provide additional linkages to the Philadelphia International Airport, DART #1 (Philadelphia Pike) and DART’s R2 commuter-rail service to Philadelphia. RT. 295-NJ This route is designed to facilitate a logical, regional connection with New Jersey. Beginning at or near the New Castle County Airport, this short (4.7-mile) route could provide a solid link between the fixed-route-bus systems of the two states, providing a significant upgrade over the very limited service currently offered (NJ Transit #423). It could potentially also reduce peak-hour automotive traffic on I-295 over the bridge. The route would run entirely on I-295, ending in the vicinity of Carney’s Point, N.J. There, commuters could access the rest of the New Jersey System via NJ Transit #402 and #468. LANCASTER PIKE ROUTE Envisioned as a potential park-and-ride-based commuter route, the Lancaster Pike BRT Route would originate or terminate at the Wilmington Train Station. Headed northwest, it would follow SR 48 to U.S. Rt. 41 through Hockessin, Del., to Avondale, Pa., and end at U.S. Rt. 1. This 15-mile route could be served partially by DART #20, 4, and 36 could provide fixed-route-bus feeder connections within this 15-mile route. Currently, SEPTA does not offer a corresponding fixed-route bus service. PENNSYLVANIA AVE. RT. 52 The Pennsylvania Avenue BRT route is envisioned to attract those who commute from Chester County, Pa., to Wilmington and New Castle County, Del. The potential 11-mile BRT route/corridor would provide service between the Wilmington Train Station and U.S. Rt. 1 in Pennsylvania, following Pennsylvania Avenue/Kennett Pike (Rt. 52) for its duration. Possible connections to the proposed BRT route may be achieved by feeder services from DART #10 (Delaware Ave./Kennett Pike) and #20 (Lancaster Pike). SEPTA offers no service on Rt. 52.
Feasibility of Bus Rapid Transit Within the Mid-Atlantic Region June 2009
44
6-2. Evaluation Criteria for Potential Priority Areas A detailed economic and engineering analysis will be required to make any final determination concerning route feasibility. However, in addition to guidelines for implementation (discussed in Section 2 of this document), additional criteria should be considered when evaluating potential BRT route/corridor priority areas. The Transit Research suggests BRT works best in areas where the following conditions are present:
• High employment and population densities • The presence of an intensively developed downtown area, characterized by limited street
capacity and high parking costs • A long-term reliance on public transportation • Limited or congested highway capacity at the approaches to the urban center(s) • Major physical barriers constrict road access to the central business district
The report specifically cites the need for three minimum criteria:
• The proposed area should be (or include) a large city with a strong central business district or similarly urbanized area or activity center with dense patterns that facilitate transit use.
• The incidence of existing, high passenger flows potentially capable of supporting higher service frequencies characteristic of BRT (10- to 20-minute headways).
• A sufficient presence of buses where bus lanes or busways are being considered. The report indicates that the service area should have at least 750,000 residents, living primarily in an urban setting (400,000 in a central city setting), with at least one regional employment center. According to the Transit Research Board, high service frequencies are essential to the viability of BRT. It recommends eight- to ten-minute headways, at the most, during peak-travel times and no more than 12 to 15 minutes off-peak. It contends that such headways equate roughly 5,000 riders per day on any one route (excluding local, fixed-route passengers) (Transportation Cooperative Research Board, 2003). Though the proposed region does demonstrate some of these characteristics (total, regional population, significant employment centers, and the historic presence of transit) none of Delaware’s existing bus routes approach 5,000 daily riders. The very busiest routes show less than half that number. Also, unless one was to count the Philadelphia and Baltimore metropolitan areas as full contributors to the system, the region falls well short of the 400,000 standard for population as an urban center. Section 7.0 of this document makes the case for a context-sensitive, regionally appropriate blend of textbook BRT and creative commuter solutions marketed toward riders of choice. To begin to consider which routes may be feasible to realize this hybrid, incrementally developed BRT system, the prescriptive standards for full BRT implementation in a highly urbanized area must be taken more as a guideline or goal than a determining factor. Still, the basic premises of these standards are sound. Though on a different scale, the requirements are the same. Routes or corridors being considered could be judged or ranked against each other based on the following:
Feasibility of Bus Rapid Transit Within the Mid-Atlantic Region June 2009
45
• Density – In terms of population and employment. Routes in proximity to or running between regional centers of population, commerce, magnet institutions, and employment should draw higher ridership.
• A demonstrated demand for transit – BRT, whether a full treatment or a hybrid approach, is a significant transit enhancement to local, fixed-route bus service. The presence and viability of existing bus routes, with the potential for feeder services to BRT, could indicate a market for augmented service.
• Demonstrated commuter flows and/or congestion – The traveling/commuting public (whether they typically choose to ride transit or drive their own vehicle) demonstrates a demand to move people from point to point over a given section of roadway. Congestion and delays further show where commuters may be willing to consider a change in mode, should it be attractive and reliable enough.
• Areas with a potential for transit-oriented development (TOD) – Much is said about the thresholds necessary to achieve sustainable BRT. As is the case with rail, less is written about BRT’s ability to encourage growth and density along its service area.
• Areas where growth is anticipated to occur – Any transit system is more simply and cost-effectively conceived, designed, and implemented before congestion and development require extensive engineering work to accommodate it, to say nothing of resistance from residents.
The maps in the appendix (C-10 Population Density, C-4 Annual Average Daily Traffic, and C-1 DART Transit Routes) and the congestion-management plans for the region begin to address these issues, as does the itemization of parallel transit routes in Section 6-2 above. 6-3. Evaluation Two draft maps (Appendix C-11, 2005 Transit Score Based on DVRPC “Portable” Transit-Scoring Methodology and Figure 3, 2030 Transit Score Based on DVRPC “Portable” Transit-Scoring Methodology), are based on a methodology employed by DVRPC and were graciously customized to the nine-county area by WILMAPCO. They offer a composite view of the important requisites for various intensities of transit service and assign a value or score to traffic-analysis zones for current conditions and those expected in the future.
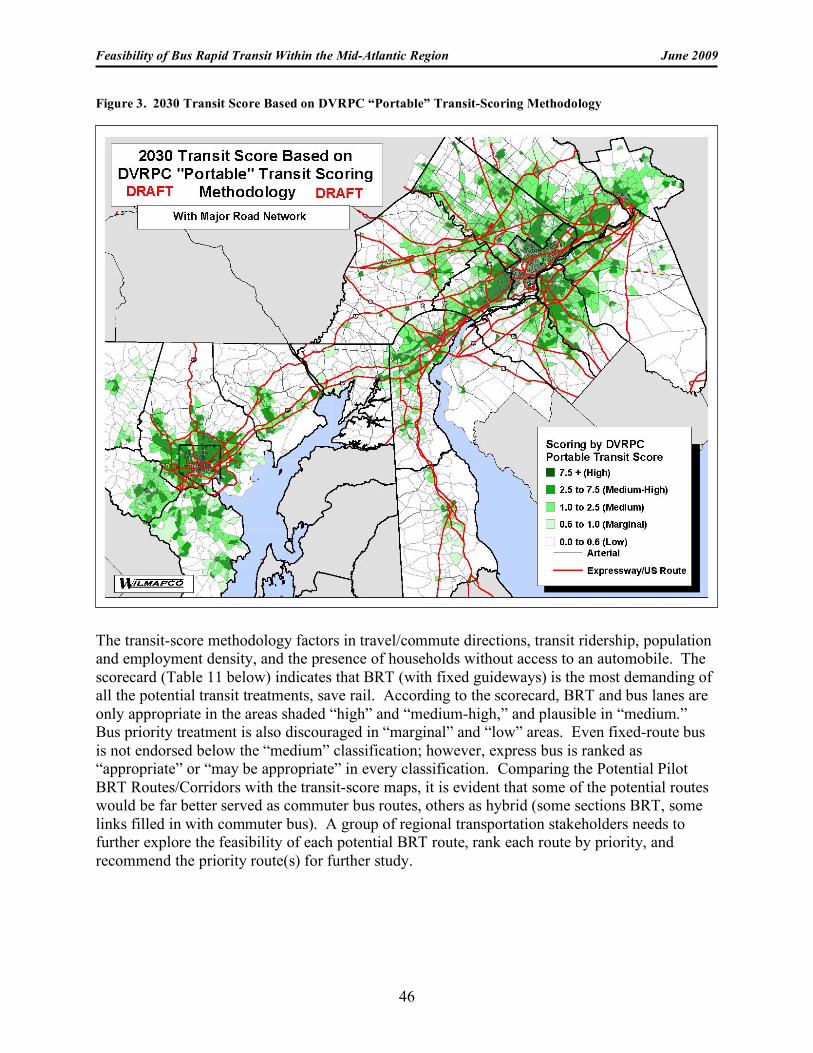
Feasibility of Bus Rapid Transit Within the Mid-Atlantic Region June 2009
46
Figure 3. 2030 Transit Score Based on DVRPC “Portable” Transit-Scoring Methodology
The transit-score methodology factors in travel/commute directions, transit ridership, population and employment density, and the presence of households without access to an automobile. The scorecard (Table 11 below) indicates that BRT (with fixed guideways) is the most demanding of all the potential transit treatments, save rail. According to the scorecard, BRT and bus lanes are only appropriate in the areas shaded “high” and “medium-high,” and plausible in “medium.” Bus priority treatment is also discouraged in “marginal” and “low” areas. Even fixed-route bus is not endorsed below the “medium” classification; however, express bus is ranked as “appropriate” or “may be appropriate” in every classification. Comparing the Potential Pilot BRT Routes/Corridors with the transit-score maps, it is evident that some of the potential routes would be far better served as commuter bus routes, others as hybrid (some sections BRT, some links filled in with commuter bus). A group of regional transportation stakeholders needs to further explore the feasibility of each potential BRT route, rank each route by priority, and recommend the priority route(s) for further study.
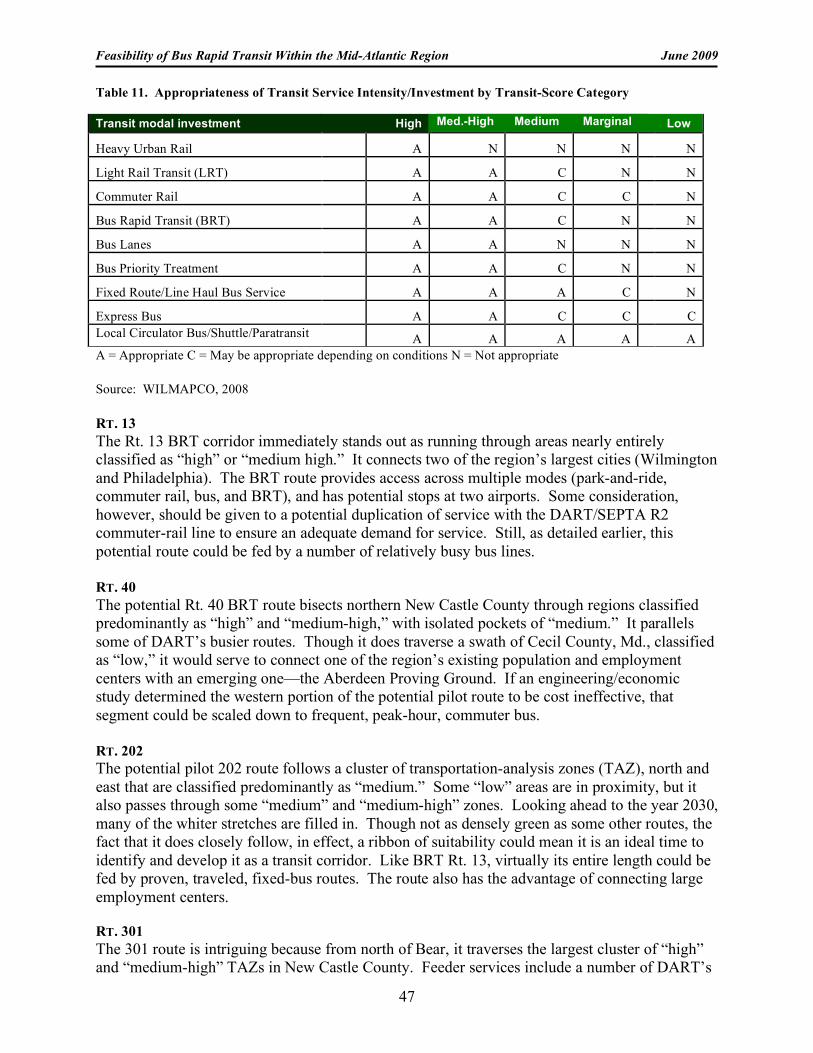
Feasibility of Bus Rapid Transit Within the Mid-Atlantic Region June 2009
47
RT. 13 The Rt. 13 BRT corridor immediately stands out as running through areas nearly entirely classified as “high” or “medium high.” It connects two of the region’s largest cities (Wilmington and Philadelphia). The BRT route provides access across multiple modes (park-and-ride, commuter rail, bus, and BRT), and has potential stops at two airports. Some consideration, however, should be given to a potential duplication of service with the DART/SEPTA R2 commuter-rail line to ensure an adequate demand for service. Still, as detailed earlier, this potential route could be fed by a number of relatively busy bus lines. RT. 40 The potential Rt. 40 BRT route bisects northern New Castle County through regions classified predominantly as “high” and “medium-high,” with isolated pockets of “medium.” It parallels some of DART’s busier routes. Though it does traverse a swath of Cecil County, Md., classified as “low,” it would serve to connect one of the region’s existing population and employment centers with an emerging one—the Aberdeen Proving Ground. If an engineering/economic study determined the western portion of the potential pilot route to be cost ineffective, that segment could be scaled down to frequent, peak-hour, commuter bus. RT. 202 The potential pilot 202 route follows a cluster of transportation-analysis zones (TAZ), north and east that are classified predominantly as “medium.” Some “low” areas are in proximity, but it also passes through some “medium” and “medium-high” zones. Looking ahead to the year 2030, many of the whiter stretches are filled in. Though not as densely green as some other routes, the fact that it does closely follow, in effect, a ribbon of suitability could mean it is an ideal time to identify and develop it as a transit corridor. Like BRT Rt. 13, virtually its entire length could be fed by proven, traveled, fixed-bus routes. The route also has the advantage of connecting large employment centers. RT. 301 The 301 route is intriguing because from north of Bear, it traverses the largest cluster of “high” and “medium-high” TAZs in New Castle County. Feeder services include a number of DART’s
Table 11. Appropriateness of Transit Service Intensity/Investment by Transit-Score Category
Transit modal investment High Med.-High Medium Marginal Low Heavy Urban Rail A N N N N
Light Rail Transit (LRT) A A C N N
Commuter Rail A A C C N
Bus Rapid Transit (BRT) A A C N N
Bus Lanes A A N N N
Bus Priority Treatment A A C N N
Fixed Route/Line Haul Bus Service A A A C N
Express Bus A A C C C Local Circulator Bus/Shuttle/Paratransit A A A A A A = Appropriate C = May be appropriate depending on conditions N = Not appropriate
Source: WILMAPCO, 2008
Feasibility of Bus Rapid Transit Within the Mid-Atlantic Region June 2009
48
more successful routes and could provide a link to the two major DART hubs in the state (the Christiana Mall and the Wilmington Train Station and Bus Terminal) via a significant transit upgrade. As the route continues south, it would link the state’s two largest cities while making stops in and around southern New Castle County (the fastest growing area in the Delaware portion of the study region). Additionally, the route could provide added capacity and supplement DART’s fastest-growing and in-demand routes. Looking ahead to the year 2030, more and more TAZs begin to register as “medium.” It is up for discussion as to whether this potential pilot route should best be considered as a BRT route only in its northern reaches and running the southern parts as a commuter bus. An interesting option would be to consider adding the infrastructure for full BRT at the onset to assist New Castle and Kent Counties’ attempts to focus growth. LANCASTER PIKE This route, beginning in Wilmington, initially passes through a very dense (but very brief) cluster of TAZs ranked as “high.” However, it quickly enters medium and marginal areas. In Delaware, it would supplement an existing, busy fixed-bus route, but Rt. 41 is classified entirely as “marginal” and “low” in Pennsylvania, and SEPTA does not support the roadway with transit. Also, its relatively short distance could mean that little time-savings would be gained through the implementation of a BRT line. DTC data indicate that the parallel DART route is running at less than 50 percent capacity. Should the route become increasingly congested, it could be a candidate for a commuter-bus spur. PENNSYLVANIA AVE. RT. 52 Pennsylvania Avenue does not appear to be a good candidate for BRT implementation. Though it would run along an existing DART route, DTC data indicate that route to be in the bottom 25 percent of capacity vs. ridership. The areas it traverses, both in Delaware and Pennsylvania, are almost entirely classified as “low,” and SEPTA offers no connecting service. RT. 301-POINTS WEST The advisability of this route as a potential pilot depends somewhat on which approach is taken with the proposed 301 BRT route. If the 301 BRT route is operated as an express bus/commuter solution, it may well be that potential passengers would lose nearly as much time at the hubs for this service as they might save because of its more direct connection. Should the main 301 route prove to be a runaway success, the Rt. 301-Points West route could be considered in the future. The route’s direct connection between the MOT area and Newark (via People’s Plaza and BRT Rt. 40) could be very desirable. Even so, DART currently operates no fixed-route service that far south on SR 896. 295-NJ This route also is very interesting since it passes through heavily congested and favorably ranked areas within Delaware. The route follows I-295, a congested roadway, but meets with very few suitable areas in Salem County, N.J. Moreover, the only existing bus service (offered by NJ Transit) runs less than a handful of routes each day. The trip is so short and has so few potential stops that it is difficult to see what benefit would come of any upgrade aside from offering a more respectable fixed-route service.
Feasibility of Bus Rapid Transit Within the Mid-Atlantic Region June 2009
49
7.0 FUNDING SOURCES AND STRATEGIES 7-1. Federal SAFETEA-LU Program The passage of SAFETEA-LU in 2005 provides $6.6 billion in New Starts funding through 2009, including $600 million specifically for Small Starts projects. The requirements of the New Starts and Small Starts programs are detailed in Section 3011 of the 2005 legislation, codified as law at 49 U.S.C. § 3509. Funding for the New Starts and Small Starts programs is provided in the form of capital-investment grants (CIG). The Federal Transit Administration (FTA) is charged with managing the application process, evaluating proposals, and entering into grant agreements with state and local authorities. Under the CIG program, which includes both programs, the Secretary of the FTA can provide grants to state and local authorities for:
• New fixed-guideway capital projects including purchase of rolling stock, rights-of-way and relocation
• Projects that modernize existing fixed guideway systems • Capital projects to replace, rehabilitate, and purchase buses and related equipment • Capital projects that develop corridors for dedicated bus lanes or high-occupancy vehicle
lanes According to the legislation, a new fixed-guideway system is defined as, “a minimum operable segment of a capital project for a new fixed-guideway system or extension to an existing fixed-guideway system” (P.L. 109-59 2005. Title III, Sec. 3011, (a) (3)). All transportation-investment projects in metropolitan areas must emerge from a regional, multi-modal planning process. Projects are subject to either New Starts or Small Starts program requirements based on the scope of the transit investment project and grant amount sought. New Starts projects are those with a total cost that exceeds $250 million and requires more than $75 million in Section 5309 CIG funding. Until recently, projects are eligible for funding up to 80 percent of total project construction costs. However, due to high demand for funding, requests for more than 50 percent of the project budget are now discouraged. The Small Starts program provides funding for major transit-investment projects with that project cost of less than $250 million and require no more than $75 million in Section 5309 CIG (not to exceed 80 percent of total project cost). FTA has introduced a subcategory of funding within the Small Starts program called Very Small Starts, which provides funding for low-risk, low-cost transit-investment projects. These projects qualify for a simpler evaluation and rating process by FTA (FTA, “Introduction to New Starts,” n.d.). For both “New” and “Small Starts” the core grant requirements are virtually identical:
• Project must be part of an approved transportation plan and program. • Applicant has the legal, financial, and technical capacity to implement the project. • Satisfactory continuing control over use of equipment and facilities. • Capability and willingness to maintain facilities (P.L. 109-59 2005, Sec. 3011, (c) (1)).
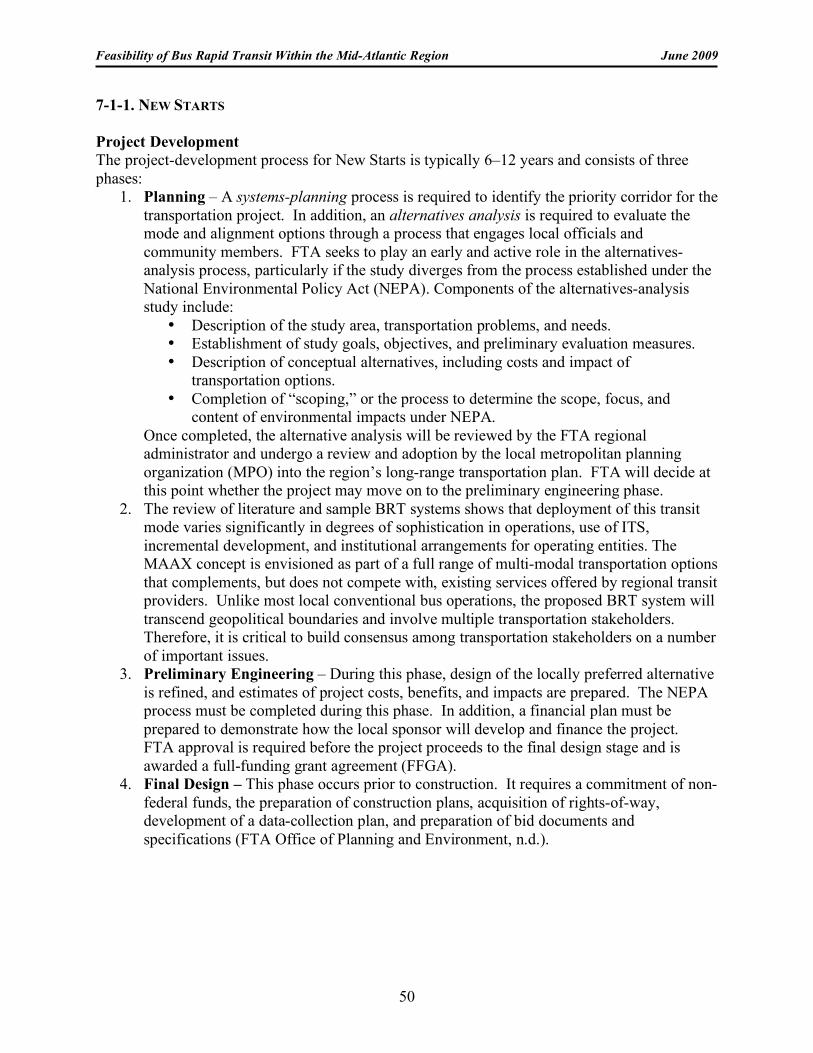
Feasibility of Bus Rapid Transit Within the Mid-Atlantic Region June 2009
50
7-1-1. NEW STARTS Project Development The project-development process for New Starts is typically 6–12 years and consists of three phases:
1. Planning – A systems-planning process is required to identify the priority corridor for the transportation project. In addition, an alternatives analysis is required to evaluate the mode and alignment options through a process that engages local officials and community members. FTA seeks to play an early and active role in the alternatives-analysis process, particularly if the study diverges from the process established under the National Environmental Policy Act (NEPA). Components of the alternatives-analysis study include:
• Description of the study area, transportation problems, and needs. • Establishment of study goals, objectives, and preliminary evaluation measures. • Description of conceptual alternatives, including costs and impact of
transportation options. • Completion of “scoping,” or the process to determine the scope, focus, and
content of environmental impacts under NEPA. Once completed, the alternative analysis will be reviewed by the FTA regional administrator and undergo a review and adoption by the local metropolitan planning organization (MPO) into the region’s long-range transportation plan. FTA will decide at this point whether the project may move on to the preliminary engineering phase.
2. The review of literature and sample BRT systems shows that deployment of this transit mode varies significantly in degrees of sophistication in operations, use of ITS, incremental development, and institutional arrangements for operating entities. The MAAX concept is envisioned as part of a full range of multi-modal transportation options that complements, but does not compete with, existing services offered by regional transit providers. Unlike most local conventional bus operations, the proposed BRT system will transcend geopolitical boundaries and involve multiple transportation stakeholders. Therefore, it is critical to build consensus among transportation stakeholders on a number of important issues.
3. Preliminary Engineering – During this phase, design of the locally preferred alternative is refined, and estimates of project costs, benefits, and impacts are prepared. The NEPA process must be completed during this phase. In addition, a financial plan must be prepared to demonstrate how the local sponsor will develop and finance the project. FTA approval is required before the project proceeds to the final design stage and is awarded a full-funding grant agreement (FFGA).
4. Final Design – This phase occurs prior to construction. It requires a commitment of non-federal funds, the preparation of construction plans, acquisition of rights-of-way, development of a data-collection plan, and preparation of bid documents and specifications (FTA Office of Planning and Environment, n.d.).
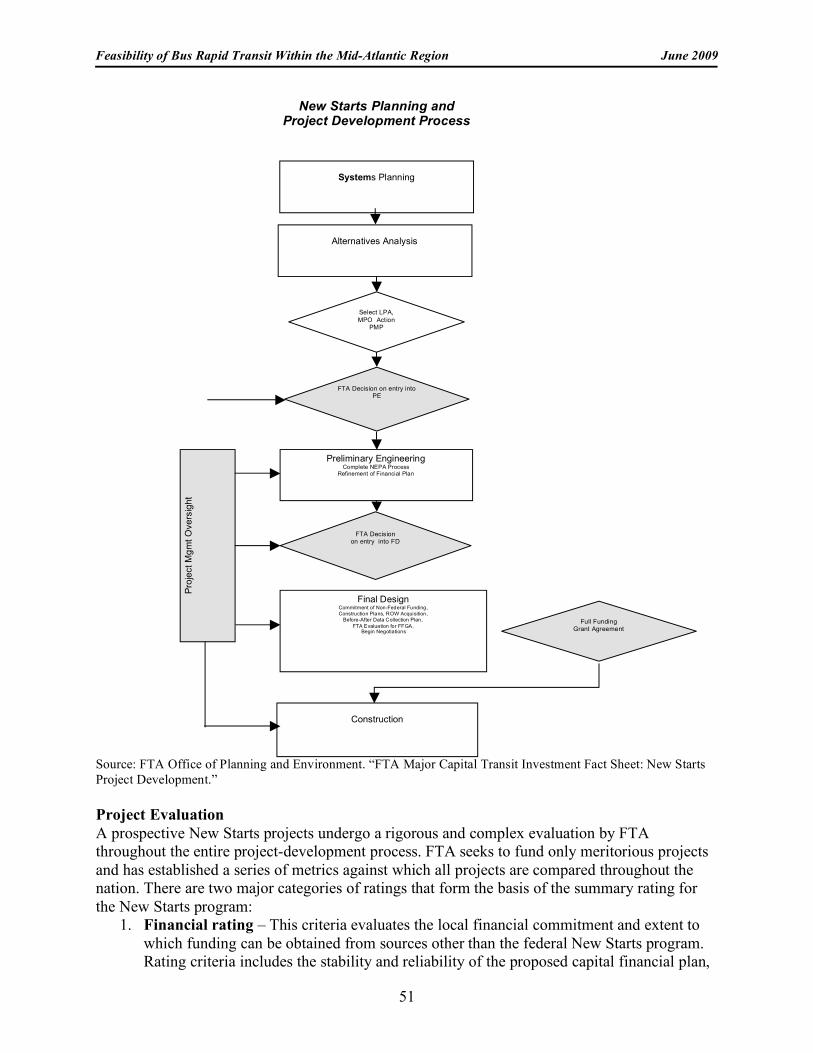
Feasibility of Bus Rapid Transit Within the Mid-Atlantic Region June 2009
51
Source: FTA Office of Planning and Environment. “FTA Major Capital Transit Investment Fact Sheet: New Starts Project Development.”
Project Evaluation A prospective New Starts projects undergo a rigorous and complex evaluation by FTA throughout the entire project-development process. FTA seeks to fund only meritorious projects and has established a series of metrics against which all projects are compared throughout the nation. There are two major categories of ratings that form the basis of the summary rating for the New Starts program:
1. Financial rating – This criteria evaluates the local financial commitment and extent to which funding can be obtained from sources other than the federal New Starts program. Rating criteria includes the stability and reliability of the proposed capital financial plan,
Full Funding Grant Agreement
Alternatives Analysis
Final Design Commitment of Non-Federal Funding, Construction Plans, ROW Acquisition,
Before-After Data Collection Plan, FTA Evaluation for FFGA,
Begin Negotiations
Proj
ect M
gmt O
vers
ight
Construction
Preliminary Engineering Complete NEPA Process
Refinement of Financial Plan
Select LPA, MPO Action
PMP
FTA Decision on entry into PE
FTA Decision on entry into FD
New Starts Planning and Project Development Process
Systems Planning
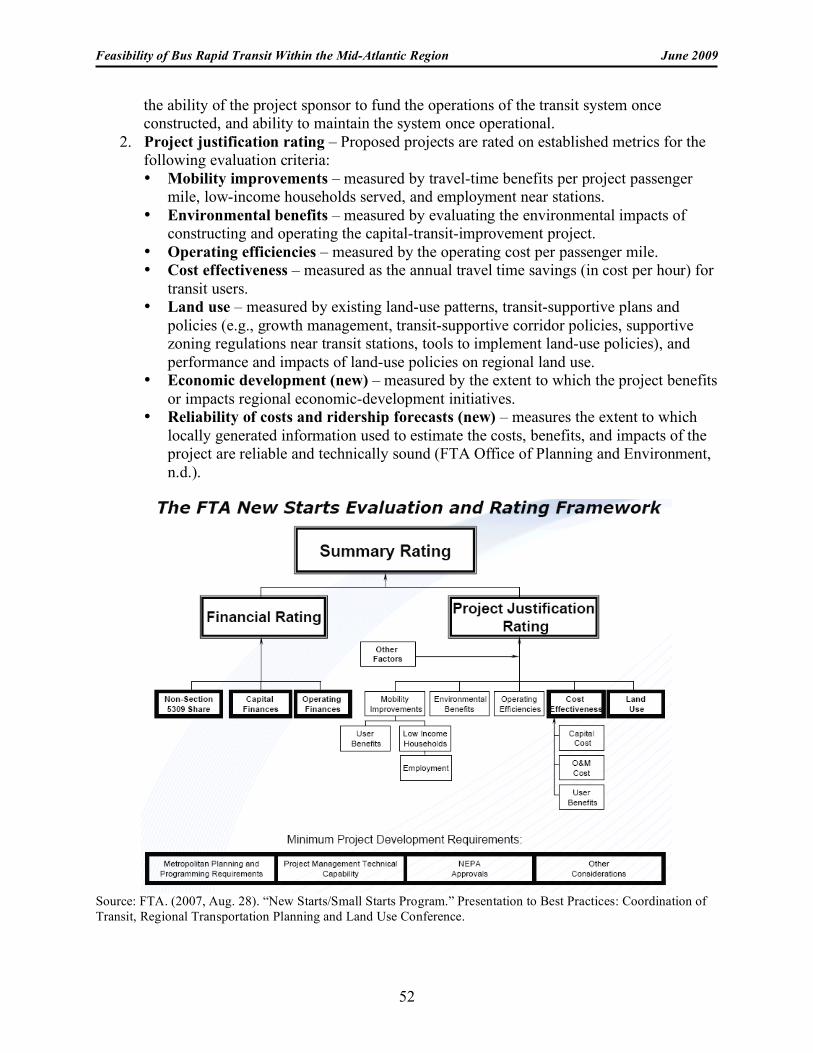
Feasibility of Bus Rapid Transit Within the Mid-Atlantic Region June 2009
52
the ability of the project sponsor to fund the operations of the transit system once constructed, and ability to maintain the system once operational.
2. Project justification rating – Proposed projects are rated on established metrics for the following evaluation criteria: • Mobility improvements – measured by travel-time benefits per project passenger
mile, low-income households served, and employment near stations. • Environmental benefits – measured by evaluating the environmental impacts of
constructing and operating the capital-transit-improvement project. • Operating efficiencies – measured by the operating cost per passenger mile. • Cost effectiveness – measured as the annual travel time savings (in cost per hour) for
transit users. • Land use – measured by existing land-use patterns, transit-supportive plans and
policies (e.g., growth management, transit-supportive corridor policies, supportive zoning regulations near transit stations, tools to implement land-use policies), and performance and impacts of land-use policies on regional land use.
• Economic development (new) – measured by the extent to which the project benefits or impacts regional economic-development initiatives.
• Reliability of costs and ridership forecasts (new) – measures the extent to which locally generated information used to estimate the costs, benefits, and impacts of the project are reliable and technically sound (FTA Office of Planning and Environment, n.d.).
Source: FTA. (2007, Aug. 28). “New Starts/Small Starts Program.” Presentation to Best Practices: Coordination of Transit, Regional Transportation Planning and Land Use Conference.
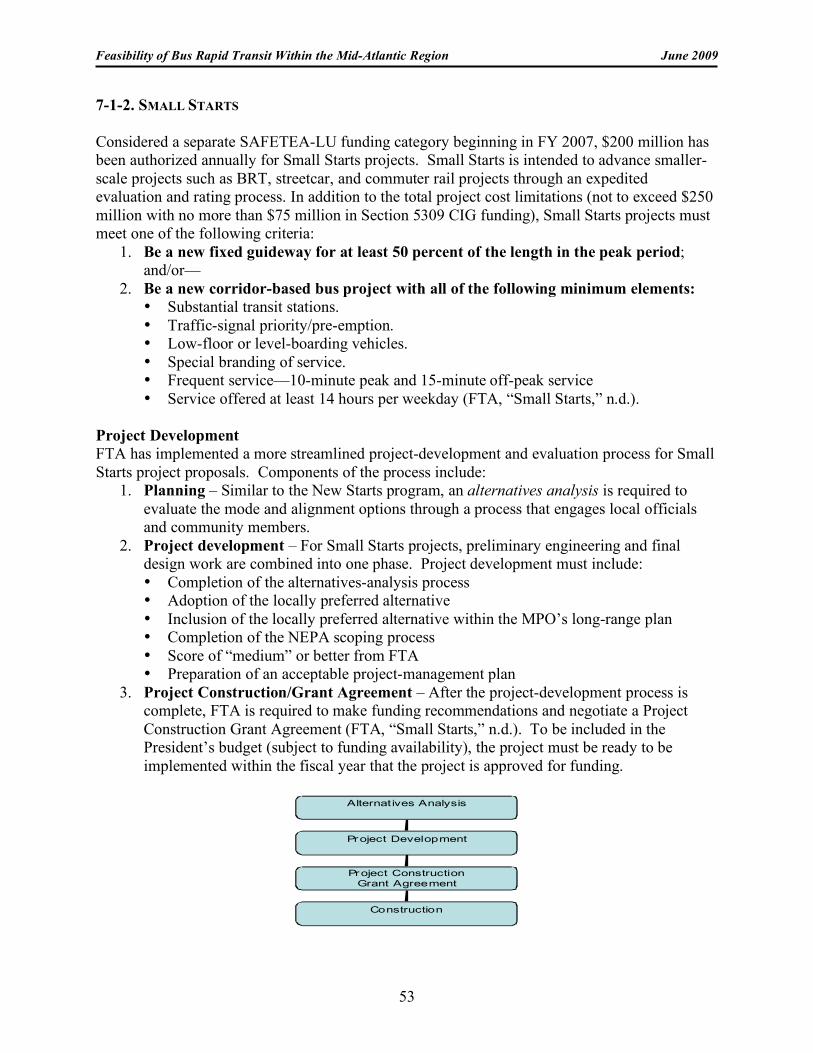
Feasibility of Bus Rapid Transit Within the Mid-Atlantic Region June 2009
53
7-1-2. SMALL STARTS Considered a separate SAFETEA-LU funding category beginning in FY 2007, $200 million has been authorized annually for Small Starts projects. Small Starts is intended to advance smaller-scale projects such as BRT, streetcar, and commuter rail projects through an expedited evaluation and rating process. In addition to the total project cost limitations (not to exceed $250 million with no more than $75 million in Section 5309 CIG funding), Small Starts projects must meet one of the following criteria:
1. Be a new fixed guideway for at least 50 percent of the length in the peak period; and/or—
2. Be a new corridor-based bus project with all of the following minimum elements: • Substantial transit stations. • Traffic-signal priority/pre-emption. • Low-floor or level-boarding vehicles. • Special branding of service. • Frequent service—10-minute peak and 15-minute off-peak service • Service offered at least 14 hours per weekday (FTA, “Small Starts,” n.d.).
Project Development FTA has implemented a more streamlined project-development and evaluation process for Small Starts project proposals. Components of the process include:
1. Planning – Similar to the New Starts program, an alternatives analysis is required to evaluate the mode and alignment options through a process that engages local officials and community members.
2. Project development – For Small Starts projects, preliminary engineering and final design work are combined into one phase. Project development must include: • Completion of the alternatives-analysis process • Adoption of the locally preferred alternative • Inclusion of the locally preferred alternative within the MPO’s long-range plan • Completion of the NEPA scoping process • Score of “medium” or better from FTA • Preparation of an acceptable project-management plan
3. Project Construction/Grant Agreement – After the project-development process is complete, FTA is required to make funding recommendations and negotiate a Project Construction Grant Agreement (FTA, “Small Starts,” n.d.). To be included in the President’s budget (subject to funding availability), the project must be ready to be implemented within the fiscal year that the project is approved for funding.
Alternatives Analysis
Project Development
Project Construction
Grant Agreement
Construction
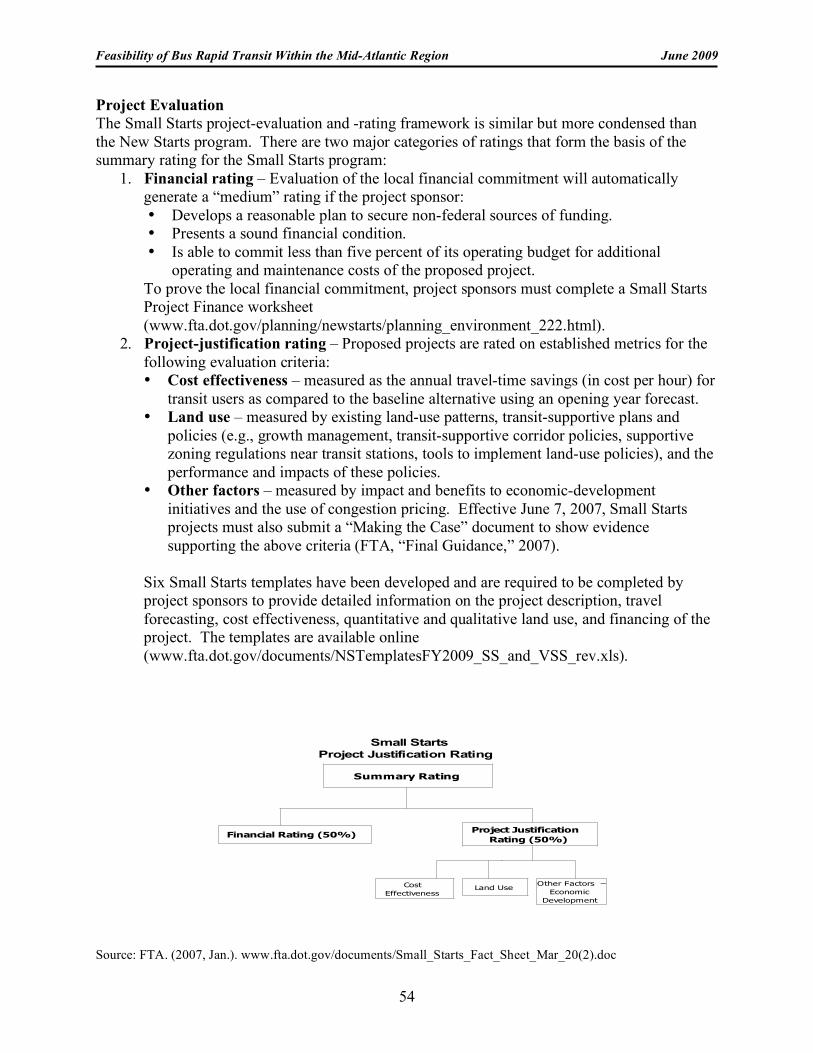
Feasibility of Bus Rapid Transit Within the Mid-Atlantic Region June 2009
54
Project Evaluation The Small Starts project-evaluation and -rating framework is similar but more condensed than the New Starts program. There are two major categories of ratings that form the basis of the summary rating for the Small Starts program:
1. Financial rating – Evaluation of the local financial commitment will automatically generate a “medium” rating if the project sponsor: • Develops a reasonable plan to secure non-federal sources of funding. • Presents a sound financial condition. • Is able to commit less than five percent of its operating budget for additional
operating and maintenance costs of the proposed project. To prove the local financial commitment, project sponsors must complete a Small Starts Project Finance worksheet (www.fta.dot.gov/planning/newstarts/planning_environment_222.html).
2. Project-justification rating – Proposed projects are rated on established metrics for the following evaluation criteria: • Cost effectiveness – measured as the annual travel-time savings (in cost per hour) for
transit users as compared to the baseline alternative using an opening year forecast. • Land use – measured by existing land-use patterns, transit-supportive plans and
policies (e.g., growth management, transit-supportive corridor policies, supportive zoning regulations near transit stations, tools to implement land-use policies), and the performance and impacts of these policies.
• Other factors – measured by impact and benefits to economic-development initiatives and the use of congestion pricing. Effective June 7, 2007, Small Starts projects must also submit a “Making the Case” document to show evidence supporting the above criteria (FTA, “Final Guidance,” 2007).
Six Small Starts templates have been developed and are required to be completed by project sponsors to provide detailed information on the project description, travel forecasting, cost effectiveness, quantitative and qualitative land use, and financing of the project. The templates are available online (www.fta.dot.gov/documents/NSTemplatesFY2009_SS_and_VSS_rev.xls).
Small Starts
Project Justification Rating
Financial Rating (50%)Project Justification
Rating (50%)
Cost
EffectivenessLand Use
Other Factors –
Economic
Development
Summary Rating
Source: FTA. (2007, Jan.). www.fta.dot.gov/documents/Small_Starts_Fact_Sheet_Mar_20(2).doc
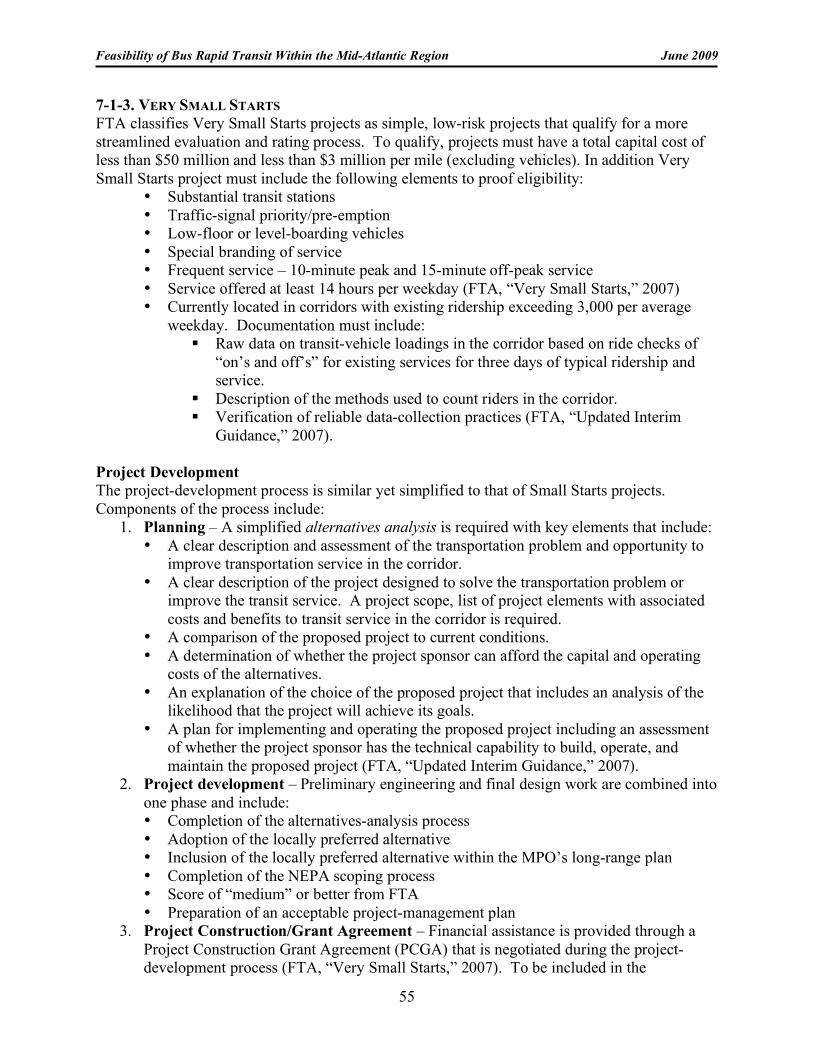
Feasibility of Bus Rapid Transit Within the Mid-Atlantic Region June 2009
55
7-1-3. VERY SMALL STARTS FTA classifies Very Small Starts projects as simple, low-risk projects that qualify for a more streamlined evaluation and rating process. To qualify, projects must have a total capital cost of less than $50 million and less than $3 million per mile (excluding vehicles). In addition Very Small Starts project must include the following elements to proof eligibility:
• Substantial transit stations • Traffic-signal priority/pre-emption • Low-floor or level-boarding vehicles • Special branding of service • Frequent service – 10-minute peak and 15-minute off-peak service • Service offered at least 14 hours per weekday (FTA, “Very Small Starts,” 2007) • Currently located in corridors with existing ridership exceeding 3,000 per average
weekday. Documentation must include: Raw data on transit-vehicle loadings in the corridor based on ride checks of
“on’s and off’s” for existing services for three days of typical ridership and service.
Description of the methods used to count riders in the corridor. Verification of reliable data-collection practices (FTA, “Updated Interim
Guidance,” 2007). Project Development The project-development process is similar yet simplified to that of Small Starts projects. Components of the process include:
1. Planning – A simplified alternatives analysis is required with key elements that include: • A clear description and assessment of the transportation problem and opportunity to
improve transportation service in the corridor. • A clear description of the project designed to solve the transportation problem or
improve the transit service. A project scope, list of project elements with associated costs and benefits to transit service in the corridor is required.
• A comparison of the proposed project to current conditions. • A determination of whether the project sponsor can afford the capital and operating
costs of the alternatives. • An explanation of the choice of the proposed project that includes an analysis of the
likelihood that the project will achieve its goals. • A plan for implementing and operating the proposed project including an assessment
of whether the project sponsor has the technical capability to build, operate, and maintain the proposed project (FTA, “Updated Interim Guidance,” 2007).
2. Project development – Preliminary engineering and final design work are combined into one phase and include: • Completion of the alternatives-analysis process • Adoption of the locally preferred alternative • Inclusion of the locally preferred alternative within the MPO’s long-range plan • Completion of the NEPA scoping process • Score of “medium” or better from FTA • Preparation of an acceptable project-management plan
3. Project Construction/Grant Agreement – Financial assistance is provided through a Project Construction Grant Agreement (PCGA) that is negotiated during the project-development process (FTA, “Very Small Starts,” 2007). To be included in the
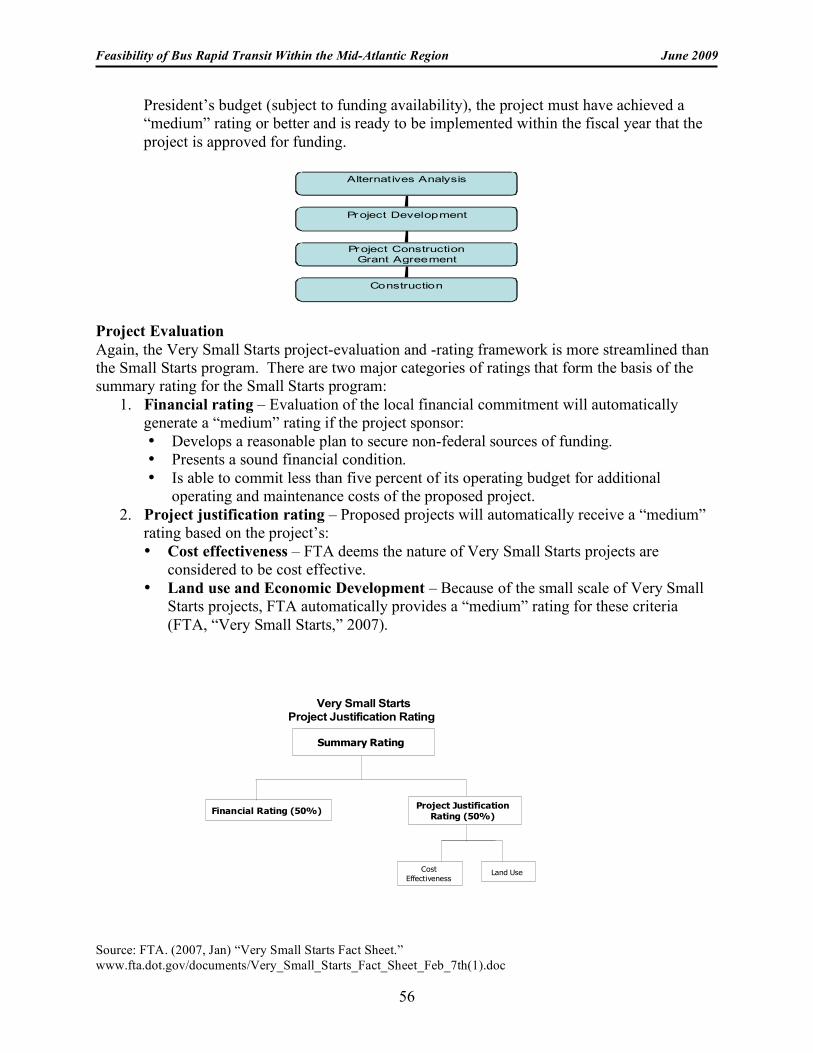
Feasibility of Bus Rapid Transit Within the Mid-Atlantic Region June 2009
56
President’s budget (subject to funding availability), the project must have achieved a “medium” rating or better and is ready to be implemented within the fiscal year that the project is approved for funding.
Alternatives Analysis
Project Development
Project Construction
Grant Agreement
Construction
Project Evaluation Again, the Very Small Starts project-evaluation and -rating framework is more streamlined than the Small Starts program. There are two major categories of ratings that form the basis of the summary rating for the Small Starts program:
1. Financial rating – Evaluation of the local financial commitment will automatically generate a “medium” rating if the project sponsor: • Develops a reasonable plan to secure non-federal sources of funding. • Presents a sound financial condition. • Is able to commit less than five percent of its operating budget for additional
operating and maintenance costs of the proposed project. 2. Project justification rating – Proposed projects will automatically receive a “medium”
rating based on the project’s: • Cost effectiveness – FTA deems the nature of Very Small Starts projects are
considered to be cost effective. • Land use and Economic Development – Because of the small scale of Very Small
Starts projects, FTA automatically provides a “medium” rating for these criteria (FTA, “Very Small Starts,” 2007).
Very Small Starts
Project Justification Rating
Financial Rating (50%)Project Justification
Rating (50%)
Cost
EffectivenessLand Use
Summary Rating
Source: FTA. (2007, Jan) “Very Small Starts Fact Sheet.” www.fta.dot.gov/documents/Very_Small_Starts_Fact_Sheet_Feb_7th(1).doc
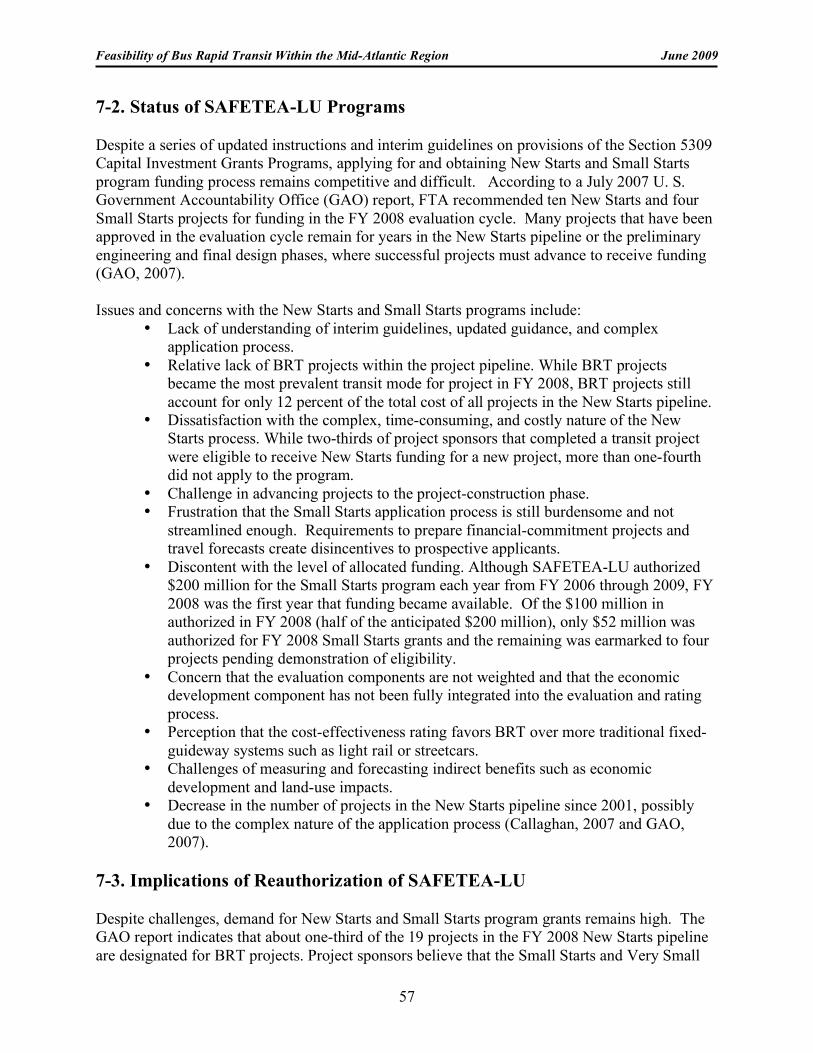
Feasibility of Bus Rapid Transit Within the Mid-Atlantic Region June 2009
57
7-2. Status of SAFETEA-LU Programs Despite a series of updated instructions and interim guidelines on provisions of the Section 5309 Capital Investment Grants Programs, applying for and obtaining New Starts and Small Starts program funding process remains competitive and difficult. According to a July 2007 U. S. Government Accountability Office (GAO) report, FTA recommended ten New Starts and four Small Starts projects for funding in the FY 2008 evaluation cycle. Many projects that have been approved in the evaluation cycle remain for years in the New Starts pipeline or the preliminary engineering and final design phases, where successful projects must advance to receive funding (GAO, 2007). Issues and concerns with the New Starts and Small Starts programs include:
• Lack of understanding of interim guidelines, updated guidance, and complex application process.
• Relative lack of BRT projects within the project pipeline. While BRT projects became the most prevalent transit mode for project in FY 2008, BRT projects still account for only 12 percent of the total cost of all projects in the New Starts pipeline.
• Dissatisfaction with the complex, time-consuming, and costly nature of the New Starts process. While two-thirds of project sponsors that completed a transit project were eligible to receive New Starts funding for a new project, more than one-fourth did not apply to the program.
• Challenge in advancing projects to the project-construction phase. • Frustration that the Small Starts application process is still burdensome and not
streamlined enough. Requirements to prepare financial-commitment projects and travel forecasts create disincentives to prospective applicants.
• Discontent with the level of allocated funding. Although SAFETEA-LU authorized $200 million for the Small Starts program each year from FY 2006 through 2009, FY 2008 was the first year that funding became available. Of the $100 million in authorized in FY 2008 (half of the anticipated $200 million), only $52 million was authorized for FY 2008 Small Starts grants and the remaining was earmarked to four projects pending demonstration of eligibility.
• Concern that the evaluation components are not weighted and that the economic development component has not been fully integrated into the evaluation and rating process.
• Perception that the cost-effectiveness rating favors BRT over more traditional fixed-guideway systems such as light rail or streetcars.
• Challenges of measuring and forecasting indirect benefits such as economic development and land-use impacts.
• Decrease in the number of projects in the New Starts pipeline since 2001, possibly due to the complex nature of the application process (Callaghan, 2007 and GAO, 2007).
7-3. Implications of Reauthorization of SAFETEA-LU Despite challenges, demand for New Starts and Small Starts program grants remains high. The GAO report indicates that about one-third of the 19 projects in the FY 2008 New Starts pipeline are designated for BRT projects. Project sponsors believe that the Small Starts and Very Small
Feasibility of Bus Rapid Transit Within the Mid-Atlantic Region June 2009
58
Starts address a critical need to fund smaller-scale transit capital-investment projects like BRT. In FY 2008, FTA approved one Small Starts BRT project and three Very Small Starts rapid-bus projects (GAO, 2007). In addition, the Very Small Starts program is attracting new project sponsors that previously had not applied for SAFETEA-LU funding. Project sponsors continue to urge FTA to further abridge the application process and provide more technical assistance for the Small Starts program. Congressional leaders, dissatisfied with the maze of current program policies and regulations, are pressuring FTA to simplify the overall SAFETEA-LU process and accelerate project delivery. The reauthorization of SAFETEA-LU is slated to expire in 2009. It is expected that a new authorization and significant program changes will take place. While a new authorization may not result in immediate changes to policies and procedures, it is hoped that new legislation will address the need to:
• Simplify the planning and project-development phases of the New Starts program. • Provide flexibility in program requirements to accommodate alternative-project-delivery
mechanism and funding arrangements. • Increase emphasis on the land-use and economic-development project-evaluation criteria. • Make funding decisions that are oriented to developing transit systems rather than single
projects (Vazzalo, 2008). 7-4. Other Federal Programs 7-4-1. FEDERAL HIGHWAY ADMINISTRATION (FHWA) PROGRAMS UNDER SAFETEA-LU Bus and Bus Facilities Program (Section 5309) This program provides public-transit providers with funds to replace, rehabilitate, and purchase buses and construct bus-related facility projects. Eligible capital projects include the acquisition of new or replacement buses for fleet and service expansion, bus maintenance and administrative facilities, transfer facilities, transportation centers, intermodal terminals, park-and-ride stations, bus rebuilds, bus preventive maintenance, accessory equipment such as fare boxes or computers, passenger amenities such as bus stop shelters or signage, and bus maintenance equipment. Under the 2005 SAFETEA-LU reauthorization, private bus companies and private nonprofit entities that engage in public transportation are eligible to apply as subrecipients of program funds (Federal Register, 2005). Highway Funds or Flexible Funds Congestion Mitigation and Air Quality Improvement Program (CMAQ) The CMAQ program, jointly administered by FTA and FHWA, was reauthorized in 2005 under SAFETEA-LU. States and partnering transit agencies may apply for CMAQ grants as a flexible source of funding for transportation projects and programs that help meet the requirements of the Clean Air Act. Funding is available for areas that do not meet the National Ambient Air Quality Standards (nonattainment areas) as well as former nonattainment areas that are now in compliance (maintenance areas). CMAQ funds are available for transportation projects such as public-transportation improvements, transportation-demand management, traffic flow improvements, alternative-fuel projects, and intelligent-transportation systems. CMAQ funds are desirable because they are flexible in use, require only a small local share (less than 12 percent of total project costs), and can be used for all phases of a transit capital project (FHWA, 2005).
Feasibility of Bus Rapid Transit Within the Mid-Atlantic Region June 2009
59
Surface-Transportation Program (STP) STP provides flexible funding to states and local governments for projects on any federally aided highways. Examples of transportation capital projects that may be funded include public bus terminals and facilities, public transit, and corridor parking facilities (FHWA, 2005). Urbanized Area Formula Grants (Section 5307) The Urbanized Area Formula Program provides transit capital to urbanized areas with a population of 200,000 or more and operating expenses to areas under 200,000 in population. The program provides federal funding at 80 percent of the total capital project costs and requires a 20 percent match, which may consist of a local share and non-DOT federal funds. Under the program reauthorized in 2005, the basic formula was enhanced to add a small transit-intensive-cities formula and a new growing-states and high-density-states formula. The program funds capital activities such as bus and bus-related activities, fixed-use guideway systems, leasing of capital projects, capital maintenance costs, joint development activities, and transit-related technology or intelligent transportation systems (FTA, 2005). Value Pricing Pilot Program Renewed with the passage of SAFETEA-LU, the goal of the Value Pricing Pilot Program was to enlist up to 15 state governments to establish, maintain, and monitor local value-pricing pilot programs. The program was designed to leverage the principles of supply and demand to manage traffic congestion by setting user fees by time of day or “dynamically,” based on increases or decreases in traffic volumes. The pilot program provided financial support to pilot programs in states that instituted value pricing by using new tolling strategies and technology. Instead of a fixed-toll charge, the new technology would facilitate the collection of variable tolls through the use of transponders, Global Positioning Systems (GPS), or cameras. While $12 million was authorized for each of FYs 2006 through 2009, there are no available Value Pricing Funds for 2007–2009 as these funds were awarded to Urban Partnership projects (FHWA, “Value Pricing Pilot Program, n.d.). 7-4-1. U.S. DEPARTMENT OF TRANSPORTATION (DOT) Urban Partnership Agreements In May 2006, the U.S. DOT announced its National Strategy to Reduce Congestion on America’s Transportation Network, or Congestion Initiative, to reduce congestion on the nation’s roads, rails, runways, and waterways. One major component of this initiative is the Urban Partnership Agreement. The U.S. DOT issued a solicitation for metropolitan areas to apply for discretionary funding by April 30, 2007, to demonstrate strategies to address congestion. The innovative Urban Partnership is designed to encourage communities to embrace new approaches to reduce congestion through tolling, transit, telecommuting, and technology. Five urban partners were announced in August 2007: Miami, Minneapolis/St. Paul, New York City, San Francisco, and Seattle. These partners received a total of $853 million in federal discretionary grants to institute congestion-mitigation measures such as instituting high-occupancy-toll (HOT) lanes, implementing priced “dynamic” shoulder lanes, providing additional transit service, adding capacity in key corridors, constructing new park-and-ride facilities, implementing Intelligent Transportation Systems technology for congestion management and traffic-signal coordination, and providing real-time communication systems and dynamic signs to help drivers avoid congested areas (U.S. DOT, “Urban Partnerships,” n.d.).
Feasibility of Bus Rapid Transit Within the Mid-Atlantic Region June 2009
60
The U.S. DOT has indicated that additional cities may participate in the Urban Partnerships program to receive federal discretionary grants in FY 2008. To date, there has been no Federal Register Notice to solicit new participants. 7-5. Congressional Earmarks According to the U.S. Office of Management and Budget, earmarks are “funds provided by Congress for projects or programs where the congressional direction (in bill or report language) circumvents the merit-based or competitive allocation process, or specifies the location or recipient, or otherwise curtails the ability of the Executive Branch to properly manage funds.” Congressional earmarks to a federal agency may be included in appropriation bills and/or in authorization bills (U.S. Office of Management and Budget, 2008).
At the request of Senator Tom Coburn (R-Okla.), the U.S. DOT Office of Inspector General issued a recent report that analyzed earmarks within DOT programs. The report identified over 8,000 earmarked projects within DOT programs totaling more than $8.5 billion for FY 2006. Earmarks within projects administered by FHWA, FTA, and the Federal Aviation Administration (FAA) accounted for 99 percent of the earmarks for FY 2006, both in dollar amount and number. In FY 2006, FHWA had the highest number of earmarked projects, while FTA had the highest percentage of earmarked appropriations. Moreover, the SAFETEA-LU program accounted for 6,474—or 80 percent—of DOT’s 8,056 earmarked projects for FY 2006. In addition, while the Bus and Bus Facilities program is supposed to be a discretionary grant program, there has been a long-standing practice to award congressional earmarks from this funding source. For FY 2006, Congress earmarked 96 percent of Bus and Bus Facilities appropriations and circumvented the established selection process (U.S. DOT, 2007).
Normally, before a capital project is deemed eligible to receive DOT funding, it must go through a lengthy planning and rigorous, multi-level review process. A transportation project vying for federal funding must be part of a Transportation Improvement Program (TIP) that is prepared by the local/regional Metropolitan Planning Organization (MPO) in cooperation with state departments of transportation, transit operators, and local governments. DOT selects projects for discretionary funding on a competitive basis relative to their merits and projects for formula funding based on outcomes of the local TIP process. However, the recent study concludes that earmarked transportation projects are neither subject to nor undermine the normal planning and review process. Some low-priority or otherwise ineligible transportation projects have sidestepped the established review and selection process to receive congressional earmarks. At a value of more than $3.8 billion, 1,615 of the 7,724 earmarks in FY 2006 were not subject to a review and merit-based selection process by FHWA, FTA, and FAA (U.S. DOT, 2007).
While there has been pressure to reform congressional earmarks, it is likely that the practice will continue. According to the Office of Management and Budget in FY 2008 there were more than 11,500 earmarks totaling over $16.6 billion for appropriations accounts (U.S. OMB, “List of Agencies,” n.d.). Therefore, congressional earmarks should not be discounted as a viable source of transportation project funding. While congressional earmarks are a reality, it should be cautioned that this funding mechanism generally provides a lump-sum amount rather than multi-year or multi-phased project funding.
Feasibility of Bus Rapid Transit Within the Mid-Atlantic Region June 2009
61
7-6. Other Funding Strategies 7-6-1. VALUE PRICING OR TOLL-ROAD FINANCING Value pricing, also referred to as congestion pricing or peak-period pricing, involves instituting user charges that vary by time of day and demand during peak periods of travel. To institute this concept, vehicles are equipped with electronic transponders, which are read by overhead antennas. Toll rates may be either established based on peak periods of demand or be set “dynamically” to respond to changing levels of traffic congestion. The value-pricing concept corresponds to the supply and demand theory in economics. Currently, most toll roads charge users flat fees that are paid based on entering and exiting a roadway. Value pricing is designed to equalize demand and respond to market forces. Roadway users are charged at a variable rate based on their impact in terms of congestion or traffic volume. There are four types of value-pricing strategies:
• Variably priced lanes – such as variable tolls on express toll lanes or HOT lanes. • Variable tolls on entire roadways. • Variable or fixed charges imposed on drivers while traveling within designated congested
or metropolitan areas. • Per-mile charges within an area, which vary by level of congestion.
There are several benefits associated with value pricing. First, it provides incentives for drivers to travel at non-peak times, on less congested roadways, or on alternative modes of travel such as ridesharing or transit. Second, fees are assessed electronically to eliminate backups at manual-toll-collection facilities. Third, fees are more equitably applied to users who make the greatest negative impact on a roadway in terms of congestion, traffic delays, higher emissions, and increased accidents. Finally, value pricing helps allocate transportation-investment resources to high-demand roadways (U.S. DOT, “Electronic Tolling/Congestion Pricing”). In April 2007, New York City Mayor Bloomberg proposed a pilot congestion-pricing system in congested areas within Manhattan. The price-based traffic-mitigation plan, designed to leverage federal Urban Partnership Agreement funds, called for measures to reduce traffic and fees to generate revenue for regional transit enhancements (“Report to the Traffic Congestion Mitigation Commission”).
In April 2008, the New York State Legislature failed to approve congestion pricing for New York City and lost its opportunity to receive $352 million in federal funds. Instead, Chicago was awarded $153 million of New York City’s federal money for traffic-mitigation plans that include the creation of a new BRT network, bus-only dedicated lanes on four major city corridors, new traffic-signalization technology, and the installation of variable-rate parking meters (Naparstek).
7-6-2. PUBLIC FUNDS State and Local Funds While federal, state, and local governments are partners in funding public transportation, many public-transit projects heavily rely on local sources because of the lengthy and meticulous process of securing federal funds. States vary greatly in funding public transportation.
Feasibility of Bus Rapid Transit Within the Mid-Atlantic Region June 2009
62
According to a 2005 Survey of State Funding for Public Transportation, the most utilized local sources of funding for transit in the United States are the general fund, motor-fuel taxes, motor vehicle/rental car sales taxes, bond proceeds, motor-vehicle registration/document/license fees, and the general sales tax. About 44 percent of the state funding for transit in FY 2004 was designated for operating assistance only, about 17 percent was for capital purposes only, and the remaining 37 percent could be used for capital or operating purposes (U.S. DOT, 2006). Other local sources in the patchwork of public-transportation funding include the state transportation trust fund, state general fund, lottery revenue, and dedicated funds such as income taxes, property taxes, local sales taxes, fare revenues, appropriations from local jurisdictions, and highway tolls.
Since there are no sales taxes in Delaware, this source of funding is not an option. Due to skyrocketing fuel prices, raising motor-fuel taxes is not a political reality for most states. Oregon has piloted a vehicle miles traveled (VMT) fee as a gas-tax alternative. The VMT fee is administered using an on-board computer and global positioning system (GPS) system, which track motorists’ mileage and assesses fees at the gas pump. Numerous states are also considering a state-to-state mileage fee as a substitute for the gas tax (Reed, 2008). Delaware has addressed transportation-funding challenges by approving in FY 2008, with various effective dates, an increase in the registration fees for all vehicle classes, driver’s license fees, vehicle-documentation fees, title fees, surcharges on traffic fines, tolls for all vehicle classes on I-95 and specified tools on SR 1.
Other specific local funding strategies, which have financed transit projects, are discussed below.
Tax-Increment Financing (TIF) Districts Tax-increment financing was originally developed over 30 years ago as a method to meet the local match requirements of federal grant programs. With the reduction in federal funds available for local projects, however, tax-increment financing stands on its own as a method to finance local redevelopment. TIF may serve as a tool for local governments to finance current development, redevelopment, or public-infrastructure improvements by using the anticipated increases in future tax revenue. Enabling legislation allows local governments to create TIF districts. All states except Arizona have passed TIF laws. The Municipal Tax Increment Financing Act was passed by the Delaware General Assembly in 2003 and permits local governments to create special TIF districts and utilize TIFs to fund costs related to development and redevelopment (Delaware Code, “Municipal Tax Increment Financing Act,” n.d.).
TIFs work by capturing all new property-tax revenues from a specific area and re-investing them in that area. In most cases, TIFs dollars can be used to fund public-transit infrastructure, but not operating expenses. In cases where TIF funds have been used to fund public-transit infrastructure, there has been a clear link between public transit and transit-oriented development within a downtown area. For example, the City of Chicago has used TIF funds to revitalize and enhance transit in several commercial, industrial, and residential areas (Neighborhood Capital Budget Group, 2005).
Benefit-Assessment or Special-Development Districts A benefit assessment is a special charge levied on all property owners within a specific geographic area to pay for public improvements within that district. The reasoning behind benefit assessments (also known as special assessments or special-development districts) is to
Feasibility of Bus Rapid Transit Within the Mid-Atlantic Region June 2009
63
link the cost of public improvements to property owners that will benefit from those improvements. The amount of the assessment levied on each property owner directly correlates to the amount of benefit that their property will receive from the improvement, the cost of improvement, and other factors. The fee levied can be a one-time charge or a recurring cost. The revenue produced from a benefit-assessment district may finance the public improvement or repay the bonds that were issued to finance the infrastructure project (Transportation Cooperative Research Board, 2003). Delaware law authorizes local governments to establish special-development districts to finance the costs of public-infrastructure improvements, including transit facilities. In Delaware, the creation of a special development district must be consistent with the comprehensive plan, be subject to adoption of a resolution by the governing body, and be approved by a two-thirds majority of property owners within the special-development district (Delaware Code, “Special-Development Districts,” n.d.). Issuance of Bonds Project-specific bonds are used by state and local governments to fund major capital projects, including transit projects. State and local governments have various options for financing large capital projects by issuing bonds or another form of debt. However, current market conditions have impacted the viability of public financing for many public-infrastructure projects. Circumstances that have made the stakes high in publicly financing capital infrastructure include a slowed growth in government revenue streams, competing capital priorities, narrowing of the gap between public and private financing, funding gaps between project cost and available financing, and repayment terms that may exceed the useful life of the capital asset (Williams, n.d.). In Delaware, DelDOT has overall responsibility for coordinating and developing transportation planning and policy for the state, while the Delaware Transportation Authority is charged with assisting in the implementation of this policy. The Delaware General Assembly authorized the creation of a Transportation Trust Fund in 1987 to finance the state’s transportation, operating, and capital expenditures. The Transportation Trust Fund Act also gave the Delaware Transportation Authority the power to issue bonds that are payable from Trust Fund revenues (KPMG, 2005 and 2006). While larger municipalities in Delaware have powers to issue bonds and incur debt for capital projects within the limits of state and local laws, public transportation is generally not within the purview of most local governments. 7-6-3. TRANSPORTATION INFRASTRUCTURE FINANCE AND INNOVATION ACT (TIFIA) The Transportation Infrastructure Finance and Innovation Act is designed to provide credit assistance on flexible terms directly to public-private sponsors of major surface-transportation projects to assist them in gaining access to the capital markets. Three forms of credit assistance are available to eligible applicants—secured (direct) loans, guaranteed loans, and lines of credit. The goal of the program is to leverage federal funds by attracting substantial private and other non-federal co-investment in critical improvements to the nation’s surface-transportation system. Eligible applicants include state departments of transportation, transit operators, special authorities, local governments, and private entities (U.S. DOT, “TIFIA,” n.d.).
Feasibility of Bus Rapid Transit Within the Mid-Atlantic Region June 2009
64
7-6-4. STATE INFRASTRUCTURE BANKS (SIB)
SAFETEA-LU established a new State Infrastructure Bank (SIB) program. Under this program, state DOTs may enter into cooperative agreements with the U.S. DOT to create SIBs, which are revolving loan funds for transportation projects. Any eligible private or public entity may apply for SIB assistance if the project is classified as a highway project, transit capital project, or bikeway or pedestrian-access project on a highway right-of-way. The size of SIBs varies by state (FHWA, “Innovative Finance,” 2005). Delaware’s SIB was funded with a $4.8 million grant from FHWA and $1.2 million match from the Delaware Transportation Authority Transportation Trust Fund. Delaware’s SIB program has provided loans to help leverage costs of major transportation projects. As of June 30, 2005, the Trust Fund balance was $569,333 (KPMG, 2006).
7-6-5. PUBLIC-PRIVATE PARTNERSHIPS
FHWA defines public-private partnerships (PPPs) as “contractual agreements formed between a public agency and private-sector entity that allow for greater private-sector participation in the delivery of transportation projects” (FHWA, “Public-Private Partnerships,” 2008). While there are risks involved in forming PPPs, the advantages include the ability to leverage resources, realize cost savings, expedite project implementation and execution, access greater private capital, and maximize resources such as specialized expertise and advanced technology.
The state of Delaware has passed enabling legislation that provides a public-private initiatives program for transportation projects. The law authorizes and encourages PPPs as an alternative to public revenue sources for public-transportation projects. Specifically, the Delaware Code “permits private entities to undertake all or a portion of the study, planning, design, development, financing, acquisition, installation, construction, improvement, expansion, repair, operation and maintenance of public transportation projects for the citizens of Delaware in exchange for the right to lease or own the facilities for an agreed-upon period and earn a reasonable rate of return through tolls or user fees” (Delaware Code, Title 20).
Examples of strategies or programs that may be implemented under a PPP are detailed in the remainder of this section (7.6.5).
Transit Joint-Development Partnerships Many jurisdictions are recognizing that transit-oriented-development (TOD) projects can offer win-win prospects for public and private entities. TOD projects generally encompass multiple city blocks and are usually directed by a public agency. Transit joint-development projects are distinct in that they are directed to a specific real estate project within a specific geographic area and are developed through a partnership of public and private interests. Benefits of transit joint development to the public include the:
• Capability to share risks and costs of developing costly capital infrastructure. • Ability to leverage private-sector investment and expertise. • Prospect of realizing public goals such as economic growth for the community. • Optimal use of infill areas where existing infrastructure exists. • Potential to use transit as the focal point of development. • Creation of centers of community activity with mixed-use development. • Development of an advocacy base for mass-transit ridership.
Feasibility of Bus Rapid Transit Within the Mid-Atlantic Region June 2009
65
• Enhanced use of property such as existing transit stations and park-and-ride lots. Transit joint-development partnerships are also mutually beneficial to private-sector investors. Advantages to the private sector include the:
• Ability to have a substantial role in the planning, financing, design, construction, operation, and maintenance of a transportation facility.
• Return on investments accrued through higher rents or occupancy. • Potential to market the TOD to attract residential and commercial property owners and
tenants. • Ability to leverage federal funding for a joint-development project through a public
agency or transit sponsor. Federal transit law authorizes the FTA to fund a public-transportation-improvement project that enhances economic development or incorporates private investment (49 U.S.C. 5302 (a) (1) (G)). Federal SAFETEA-LU reauthorization specifically allows public agencies to leverage private funds for joint-development transit-oriented and transportation projects (72 FR 5788). Public transit agencies or their designees, in partnership with the private sector, may use federal transit and flexible highway funds for development at or near mass-transit hubs and stations. Funds may be used for most project work that is physically or functionally related to transit and promotes transit investment. Eligible activities joint-development projects under the federal transit law include:
• Commercial and residential development. • Pedestrian and bicycle access to a public transportation facility. • Construction, renovation, and improvement of intercity bus and rail facilities. • Renovation and improvement of historic-transportation facilities (Blakesley).
An example of a transit joint-evelopment project is the Scelsi Intermodal Transportation Center in Pittsfield, Mass., which opened in 2004. Made possible by a partnership between the Berkshire Regional Transit Authority and a private entity, the $11 million center has commercial and office space and links local and intercity bus lines with rail, paratransit, and taxi services (Williams, n.d.). In the Washington, D.C., area, it was proposed that the Silver Spring Metro Station be redeveloped into a multi-modal transit center. The plan is a cooperative venture among Montgomery County Md., Washington Metropolitan Area Transit Authority, Maryland Transit Administration, and a private partner—Fougler Pratt. The facility will serve the Silver Spring Central Business district and region as a major transit hub. Transportation facilities will provide links to local and regional bus services, Metrorail, MARC Rail, and a future connection to the proposed Purple Line bi-county transitway. Transit-oriented development will feature retail shops, residential dwelling units, and a hotel (Montgomery County Planning, n.d.). Private-Activity Bonds (PABs) To encourage more private sector involvement in the finance, design, construction, and operations of U.S. transportation infrastructure, highway facilities, SAFETEA-LU adds highway and freight-transfer facilities to the types of privately developed and operated projects for which qualified private-activity bonds (PABs) may be issued. This change allows additional private activity on these types of projects while maintaining the tax-exempt status of the bonds (FHWA, “Innovative Financing,” 2005).
Feasibility of Bus Rapid Transit Within the Mid-Atlantic Region June 2009
66
Providing private developers and operators with access to tax-exempt interest rates lowers capital costs and enhances investment prospects. Increasing the involvement of private investors in highway and freight projects generates new sources of money, ideas, and efficiency.
The law limits the total amount of PABs to $15 billion in exempt facility bonds, not subject to the state volume caps. Eligible projects include surface-transportation projects, international bridges or tunnels, or facilities used for truck or rail freight transfers. As of January 15, 2008, U.S. DOT has approved, but has not issued, a total of $3.288 billion in PAB allocations for a total of five projects (FHWA, “Public-Private Partnerships,” 2008).
Private-Company Support States have increasingly encouraged private-sector involvement in the operation of public-transportation services, particularly commuter shuttle buses. There are several private companies in Delaware that provide commuter shuttle bus services to their employees (e.g., AstraZeneca and Bank of America).
Several transportation-management associations (TMAs) and councils of governments are garnering private-company support to alleviate congestion during peak commuter times. The Greater Valley Forge Transportation Management Association (GVFTMA) partners with local Pennsylvania municipalities, corporations and government agencies to provide transit to their employees and residents. GVFTMA administers PennDOT's Intercorporate Shuttle service, which provides executive-style front-door service to businesses from train stations, transit centers, and park-and-ride facilities along the U.S. Rt. 202 Corridor. Also, the Transportation Management Association of Chester County (TMACC) began offering a Beeline bus service in spring 2008 to address traffic congestion along U.S. Route 202 due to a major reconstruction project. The Beeline provides weekday service during peak-commuting periods from the Coatesville, Downingtown, and Exton areas along U.S. Route 30 to Great Valley, Pa. on U.S. Route 202 (PennDOT, 2008).
In New Jersey, Cross County Connection TMA has forged partnerships with NJ Transit and other the transportation stakeholders, including business leaders and local governments. Cross County Connection has teamed up to establish shuttle bus service for employers in areas of Burlington, Atlantic, Camden, and Gloucester Counties that are not otherwise served by public transit. All shuttle services connect with NJ Transit bus routes or rail lines (Mathis, 2003).
In New York City, Transportation Commissioner Janette Sadik-Khan has garnered private donations to support transportation initiatives. Since coming to office in May 2007, Sadik-Khan has received between one and two million dollars for innovative transportation projects. One example is a $300,000 private foundation donation from the J.M. Kaplan Fund for pedestrian plazas at Times Square and Madison Square Park (Schuerman).
In the greater Washington, D.C. metropolitan area, the Metropolitan Washington Council of Governments is coordinating Commuter Connections, a regional network of transportation organizations. Commuter Connections also helps employers establish commuter-benefits and -assistance programs. Located in Virginia about 25 miles southwest of Washington, D.C., the Potomac and Rappahannock Transportation Commission (PRTC) provides commuter bus service along the busy I-95 and I-66 corridors to points north (OmniRide). PRTC is a multi-jurisdictional
Feasibility of Bus Rapid Transit Within the Mid-Atlantic Region June 2009
67
agency representing Prince William and Stafford Counties and the cities of Manassas, Manassas Park, and Fredericksburg, Va.
Fee-Based Contract Services Some BRT or commuter-bus operations are unique in that their operations are awarded contractually to private-transportation providers. In the Las Vegas area, the Regional Transportation Commission of Southern Nevada (RTC), serves a dual role as the region’s metropolitan planning organization and transit operator for the MAX BRT line. RTC contracts with Veolia Transportation, the largest private-transportation provider in the United States, to operate the MAX. Ten MAX buses carry more than 9,800 passengers per day in a corridor that connects the Downtown Transportation Center and North Las Vegas. In Toronto, Canada, Veolia Transportation operates the VIVA BRT system to connect Toronto’s metro system with the York, Ontario metropolitan area. Operating since 2005, VIVA’s 85 articulated buses carry 17,000 passengers per day (Annual Report). Examples of other entities that contract with private-transportation providers for either commuter bus or BRT service include:
• Loudoun County Transit (in Virginia) contracts with Yellow Transportation to maintain county-owned buses and operate commuter transit service between Loudoun County and the Arlington, Va., and Washington, D.C., areas.
• Maryland Transit Administration (MTA) contracts with Dillon Bus, Eyre Bus, Keller Transportation, and Veolia Transportation for commuter bus service in the Baltimore region, Washington, D.C., metropolitan area, and southern Maryland.
• Metropolitan Transportation Authority New York City Transit contracts with seven private-transportation providers to provide commuter bus service to four boroughs of New York City outside Manhattan.
• The state of Massachusetts has purchased commuter buses with federal money earmarked to reduce traffic congestion along the I-93 corridor to Boston. A private-transportation provider Concord Coach, and its subsidiary Boston Express, has a long-term contract with the state to run the terminals and commuter buses.
• In the state of Washington, Community Transit is contracted to operate commuter transit routes from Snohomish County to King County and downtown Seattle. In 2009 Community Transit will partner with the Puget Sound Regional Council to provide the Swift BRT system service.
7-7. Potential Costs of BRT 7-7-1. CAPITAL COSTS Capital costs of a new BRT system vary but may include costs of design and engineering; required pre-construction studies; amount and availability of right-of-way, roadway and infrastructure improvements; the construction of running ways, stations, park-and-ride facilities or improvements, and storage facilities; vehicle procurement; and ITS. As the table below illustrates, the cost per mile of a BRT system also depends upon the type of system built. Systems that operate on separate, exclusive busways, such as the Pittsburgh, Pa. Busways, generally incur the highest capital cost per mile. Systems where buses use HOV lanes have a lower capital cost per mile, while BRTs that operate on arterial streets without a dedicate
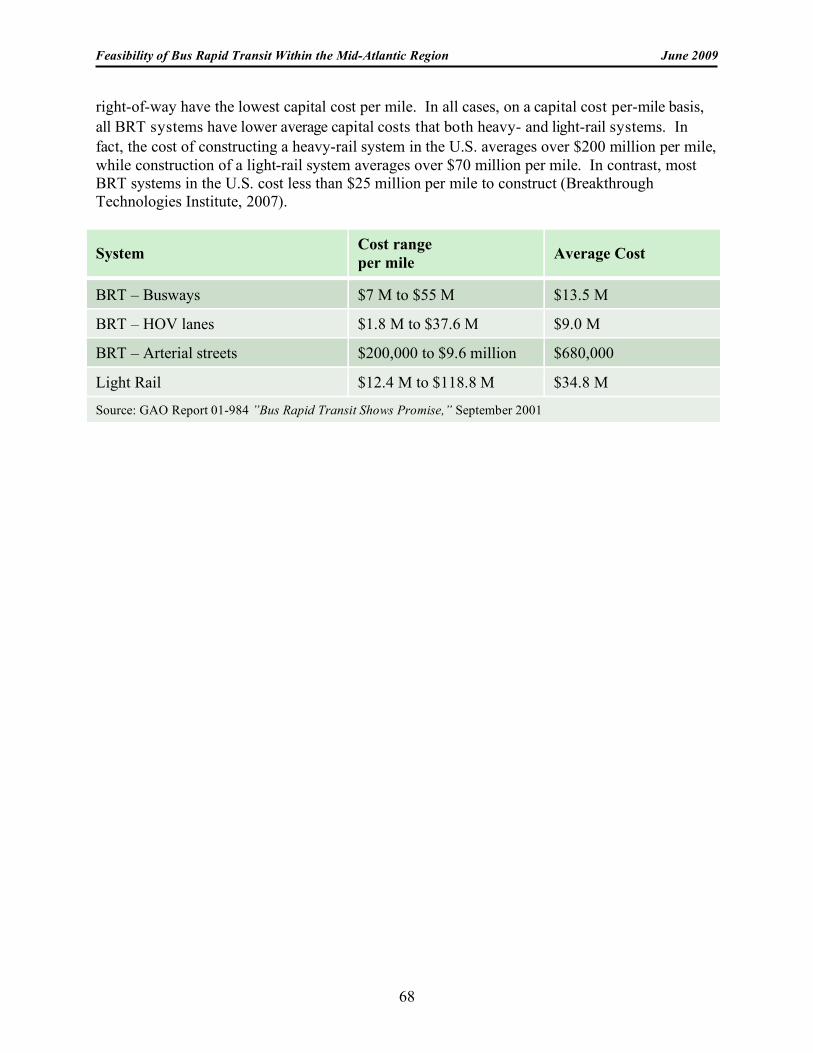
Feasibility of Bus Rapid Transit Within the Mid-Atlantic Region June 2009
68
right-of-way have the lowest capital cost per mile. In all cases, on a capital cost per-mile basis, all BRT systems have lower average capital costs that both heavy- and light-rail systems. In fact, the cost of constructing a heavy-rail system in the U.S. averages over $200 million per mile, while construction of a light-rail system averages over $70 million per mile. In contrast, most BRT systems in the U.S. cost less than $25 million per mile to construct (Breakthrough Technologies Institute, 2007).
System Cost range per mile Average Cost
BRT – Busways $7 M to $55 M $13.5 M
BRT – HOV lanes $1.8 M to $37.6 M $9.0 M
BRT – Arterial streets $200,000 to $9.6 million $680,000
Light Rail $12.4 M to $118.8 M $34.8 M
Source: GAO Report 01-984 ”Bus Rapid Transit Shows Promise,” September 2001
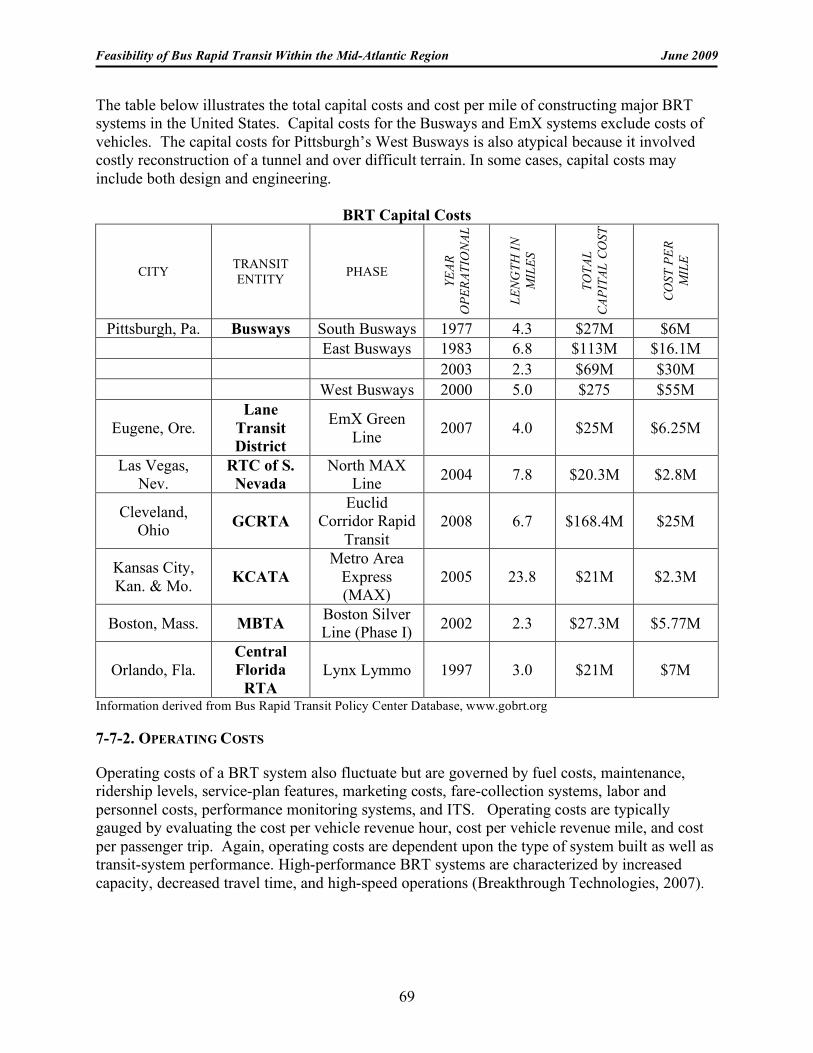
Feasibility of Bus Rapid Transit Within the Mid-Atlantic Region June 2009
69
The table below illustrates the total capital costs and cost per mile of constructing major BRT systems in the United States. Capital costs for the Busways and EmX systems exclude costs of vehicles. The capital costs for Pittsburgh’s West Busways is also atypical because it involved costly reconstruction of a tunnel and over difficult terrain. In some cases, capital costs may include both design and engineering.
BRT Capital Costs
CITY TRANSIT ENTITY PHASE
YEAR
O
PERA
TIO
NAL
LENG
TH IN
M
ILES
TOTA
L CA
PITA
L CO
ST
COST
PER
M
ILE
Pittsburgh, Pa. Busways South Busways 1977 4.3 $27M $6M East Busways 1983 6.8 $113M $16.1M 2003 2.3 $69M $30M West Busways 2000 5.0 $275 $55M
Eugene, Ore. Lane
Transit District
EmX Green Line 2007 4.0 $25M $6.25M
Las Vegas, Nev.
RTC of S. Nevada
North MAX Line 2004 7.8 $20.3M $2.8M
Cleveland, Ohio GCRTA
Euclid Corridor Rapid
Transit 2008 6.7 $168.4M $25M
Kansas City, Kan. & Mo. KCATA
Metro Area Express (MAX)
2005 23.8 $21M $2.3M
Boston, Mass. MBTA Boston Silver Line (Phase I) 2002 2.3 $27.3M $5.77M
Orlando, Fla. Central Florida
RTA Lynx Lymmo 1997 3.0 $21M $7M
Information derived from Bus Rapid Transit Policy Center Database, www.gobrt.org 7-7-2. OPERATING COSTS Operating costs of a BRT system also fluctuate but are governed by fuel costs, maintenance, ridership levels, service-plan features, marketing costs, fare-collection systems, labor and personnel costs, performance monitoring systems, and ITS. Operating costs are typically gauged by evaluating the cost per vehicle revenue hour, cost per vehicle revenue mile, and cost per passenger trip. Again, operating costs are dependent upon the type of system built as well as transit-system performance. High-performance BRT systems are characterized by increased capacity, decreased travel time, and high-speed operations (Breakthrough Technologies, 2007).
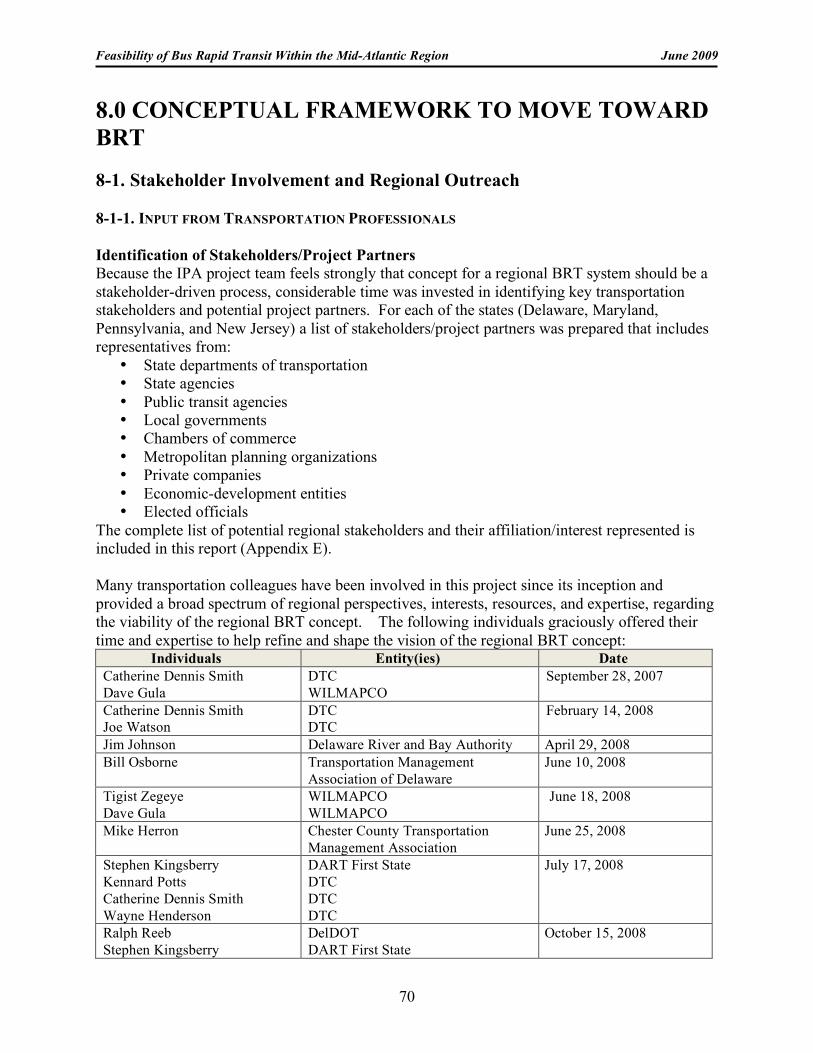
Feasibility of Bus Rapid Transit Within the Mid-Atlantic Region June 2009
70
8.0 CONCEPTUAL FRAMEWORK TO MOVE TOWARD BRT 8-1. Stakeholder Involvement and Regional Outreach 8-1-1. INPUT FROM TRANSPORTATION PROFESSIONALS Identification of Stakeholders/Project Partners Because the IPA project team feels strongly that concept for a regional BRT system should be a stakeholder-driven process, considerable time was invested in identifying key transportation stakeholders and potential project partners. For each of the states (Delaware, Maryland, Pennsylvania, and New Jersey) a list of stakeholders/project partners was prepared that includes representatives from:
• State departments of transportation • State agencies • Public transit agencies • Local governments • Chambers of commerce • Metropolitan planning organizations • Private companies • Economic-development entities • Elected officials
The complete list of potential regional stakeholders and their affiliation/interest represented is included in this report (Appendix E). Many transportation colleagues have been involved in this project since its inception and provided a broad spectrum of regional perspectives, interests, resources, and expertise, regarding the viability of the regional BRT concept. The following individuals graciously offered their time and expertise to help refine and shape the vision of the regional BRT concept:
Individuals Entity(ies) Date Catherine Dennis Smith Dave Gula
DTC WILMAPCO
September 28, 2007
Catherine Dennis Smith Joe Watson
DTC DTC
February 14, 2008
Jim Johnson Delaware River and Bay Authority April 29, 2008 Bill Osborne Transportation Management
Association of Delaware June 10, 2008
Tigist Zegeye Dave Gula
WILMAPCO WILMAPCO
J June 18, 2008
Mike Herron Chester County Transportation Management Association
June 25, 2008
Stephen Kingsberry Kennard Potts Catherine Dennis Smith Wayne Henderson
DART First State DTC DTC DTC
July 17, 2008
Ralph Reeb Stephen Kingsberry
DelDOT DART First State
October 15, 2008
Feasibility of Bus Rapid Transit Within the Mid-Atlantic Region June 2009
71
Presentation to Delaware Transportation Energy Use Work Group Another component of the outreach process involved a making a presentation on August 28, 2008, to the Delaware Transportation Energy Use Work Group, which is involved in preparing transportation recommendations for the Delaware Energy Plan. The presentation provided an overview of the BRT concept, vision of a regional system, “branded” identity, possible steps toward development of the concept, and need to enlist partners and stakeholders in project development. The work group acknowledged that providing alternative-transportation modes saves energy. Meeting notes included BRT as a “concept for potential recommendation” by the work group to reduce vehicle miles traveled as a means to reduce energy use. Site Visit to MTA In addition to interactive dialogue with transportation professionals, IPA conducted a site visit to MTA on January 16, 2008 (Appendix B). Following the interview, IPA was invited to attend a joint MTA and Maryland Department of Transportation (MDOT) meeting to plan for transportation impacts resulting from BRAC in Aberdeen, Md. IPA learned that:
• MTA’s Commuter Bus provides express transit service to commuters at a premium price within the Baltimore and Washington, D.C., metropolitan areas.
• Commuter bus operates to peak-travel destinations during peak-travel times on weekdays only. Commuters are able to access the express lines on a first-come, first-served basis from park-and-ride lots throughout the two metropolitan areas.
• MTA contracts for express bus service through four private-transportation providers—Dillon Bus Service, Eyre Bus Service, Keller Transportation, and Veolia Transportation.
• Demand for the commuter bus service is at an all-time high. MTA’s Commuter Bus service has seen double-digit percentage ridership increases within the past year.
• MTA/MDOT is exploring the feasibility of a future commuter bus service to provide transportation services to/from the Newark, Del., area and APG in Aberdeen, Md.
An ongoing BRAC Commuter Bus Service study has been undertaken by MTA to determine the feasibility of providing transit service to APG as an interim alternative to the extension of the MARC ommuter-rail line. An April 2008 “BRAC Transit Plan” provided information on possible transit routes and associated costs of commuter bus service to and from APG in Aberdeen. Two APG commuter bus service routes were recommended – Route 1: Downtown Baltimore City and Route 2: Churchman’s Crossing, Delaware. The estimated annual cost of a commuter bus for Route 2 was $712,000 (using MTA’s $12.24 per mile x 38 miles x six daily trips x 255 weekdays). Policy issues identified as part of this study include service across state lines, transit-vehicle access onto APG, payment of tolls, and need for agency cost sharing (information from Catherine Smith, DTC Planning Manager). 8-1-2. BRT FORUM OF TRANSPORTATION STAKEHOLDERS On November 13, 2008, IPA invited regional transportation stakeholders from Delaware, Maryland, Pennsylvania, and New Jersey to a forum at the University of Delaware to provide input on the concept of a regional BRT system as described in a briefing paper, Mid-Atlantic Area Express (MAAX): Exploring the Feasibility of a Bus Rapid Transit (BRT) System Within the Delaware Region. Thirty-four participants from various regional entities attended the forum (Appendix F). Topics of discussion focused on the need to obtain multi-jurisdictional support, establish a stakeholder-driven process, ascertain availability of future federal funding, leverage and maximize funding resources, develop strategic partnerships, and identify potential priority
Feasibility of Bus Rapid Transit Within the Mid-Atlantic Region June 2009
72
pilot route(s). Goals of the forum were to foster a regional perspective and approach to shape the vision for the concept, build consensus and collectively develop a vision for a regional, premium transit service, and determine interest in forming a steering committee to move forward on an action plan. The forum began with a video that highlighted two domestic BRT systems—Eugene, Oregon’s present EMX system and Fort Collins, Colorado’s proposed system within the Mason Transportation Corridor. IPA’s research team gave a presentation that provided a macro view of BRT system benefits, a synopsis of regional transportation needs, overview of IPA’s research, and financial aspects of BRT. Reactions and feedback were solicited on priorities for potential BRT routes via a map and route descriptions on display at the forum. A summary of forum proceedings was prepared (Appendix J). Forum attendees were provided with a follow-up questionnaire to obtain contact information and responses to three questions (Appendix H). Twelve of the 34 forum participants (35 percent) returned completed questionnaires. Below is a summary of responses:
1. Do you feel that the concept of a regional BRT system should be explored further? Yes – 11, No - 1
2. What do you feel are impediments to a regional BRT system? • Lack of achievable rights-of-way • Conflicting interests • Funding; organization structure • Addition of park-and-rides • Lack of sufficient density • Need to build new or use existing lanes solely for buses
3. If you feel a regional BRT system is viable, are you interested in serving on a project steering committee, or can you suggest someone in your organization who would be? Yes – 10, No – 1, Maybe - 1
8-2. Path Forward 8-2-1. CONCLUSION The review of literature and sample BRT systems shows that deployment of this transit mode varies significantly in degrees of sophistication in operations, use of ITS, incremental development, and institutional arrangements for operating entities. Successful BRT systems serve as a community asset that improve mobility and foster linkages among jobs, residential areas, centers of commerce, and regional travel destinations. Delaware and its neighboring states are situated at the heart of the Northeast Corridor and share considerable volume of surface transportation—both highway and rail. While a large amount of the transportation serves interstate purposes, there is also a mutual need to improve the regional transportation network by establishing a market for BRT, leveraging resources, and collaborating in long-term planning to achieve land-use and economic-development benefits. Development of a Mid-Atlantic Area Express (MAAX) BRT system could provide an opportunity for transportation stakeholders to become catalysts to address congestion, provide additional roadway capacity, and further unite the region as an economic force.
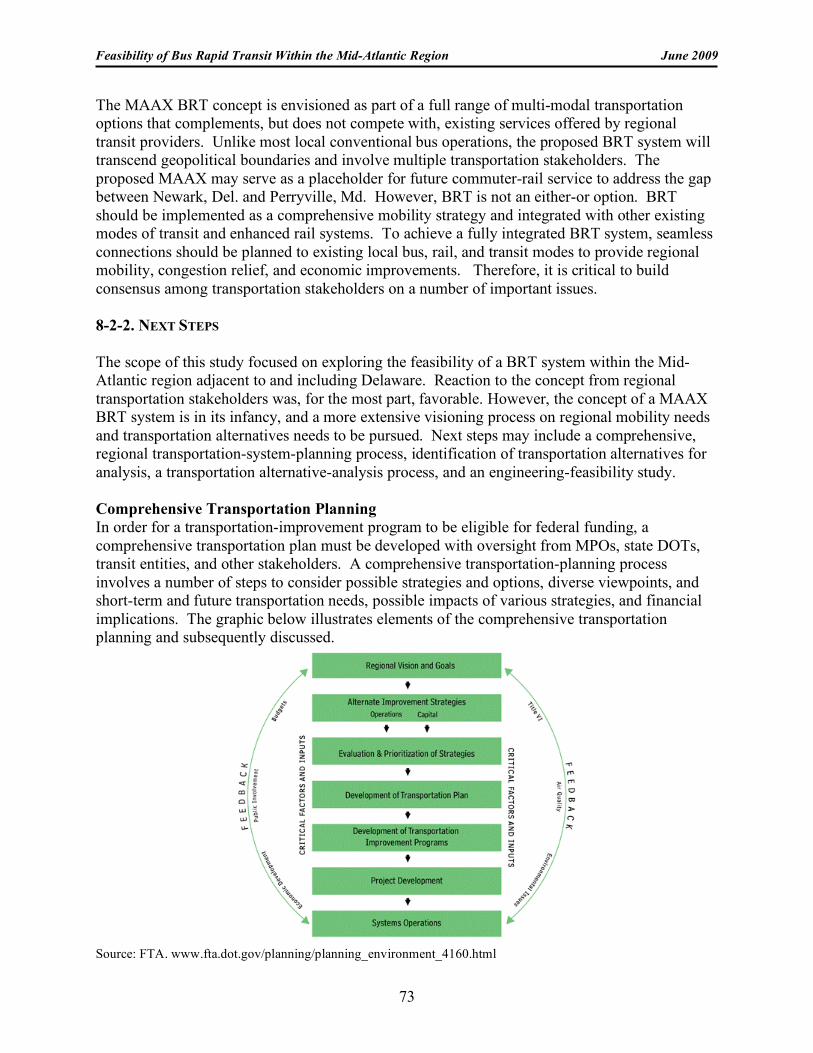
Feasibility of Bus Rapid Transit Within the Mid-Atlantic Region June 2009
73
The MAAX BRT concept is envisioned as part of a full range of multi-modal transportation options that complements, but does not compete with, existing services offered by regional transit providers. Unlike most local conventional bus operations, the proposed BRT system will transcend geopolitical boundaries and involve multiple transportation stakeholders. The proposed MAAX may serve as a placeholder for future commuter-rail service to address the gap between Newark, Del. and Perryville, Md. However, BRT is not an either-or option. BRT should be implemented as a comprehensive mobility strategy and integrated with other existing modes of transit and enhanced rail systems. To achieve a fully integrated BRT system, seamless connections should be planned to existing local bus, rail, and transit modes to provide regional mobility, congestion relief, and economic improvements. Therefore, it is critical to build consensus among transportation stakeholders on a number of important issues. 8-2-2. NEXT STEPS The scope of this study focused on exploring the feasibility of a BRT system within the Mid-Atlantic region adjacent to and including Delaware. Reaction to the concept from regional transportation stakeholders was, for the most part, favorable. However, the concept of a MAAX BRT system is in its infancy, and a more extensive visioning process on regional mobility needs and transportation alternatives needs to be pursued. Next steps may include a comprehensive, regional transportation-system-planning process, identification of transportation alternatives for analysis, a transportation alternative-analysis process, and an engineering-feasibility study. Comprehensive Transportation Planning In order for a transportation-improvement program to be eligible for federal funding, a comprehensive transportation plan must be developed with oversight from MPOs, state DOTs, transit entities, and other stakeholders. A comprehensive transportation-planning process involves a number of steps to consider possible strategies and options, diverse viewpoints, and short-term and future transportation needs, possible impacts of various strategies, and financial implications. The graphic below illustrates elements of the comprehensive transportation planning and subsequently discussed.
Source: FTA. www.fta.dot.gov/planning/planning_environment_4160.html
Feasibility of Bus Rapid Transit Within the Mid-Atlantic Region June 2009
74
Systems Planning Formation of a Regional-Transit Steering Committee As a stakeholder-driven process, the development of integrated, regional-transit strategy, which could include the BRT concept, should be directed by an executive steering committee that comprises a diverse group of regional leaders. The role of the steering committee is to engage stakeholders, refine the vision of the concept, consider the appropriate institutional setting for a regional transit system, and plan for a major investment study of the transportation corridor. Public Outreach and Involvement One of the first tasks of a regional-mobility steering committee and project team is to identify a broader group of stakeholders. The level of public involvement must be extensive to inform the public and solicit necessary input. An outreach plan should be prepared to effectively engage the public and/or involve the public through focus groups, task forces, or advisory committees. This process ensures that the process is open, transparent, and responsive to community needs. Public-private partnerships are needed to leverage funding support, develop an investment strategy, consider economic-development opportunities, and maximize funding resources. Visioning A more extensive visioning process, with public-input opportunities, is needed to incorporate the diverse views of regional stakeholders, decision-makers, and the public-at-large. A series of public meetings, stakeholder interviews, design workshops, and public presentations should be planned to undercover key issues, areas of concern, transportation-improvement opportunities, critical goals, and input on all aspects of a proposed integrated regional transit system. Goals of the visioning process are to consider elements of transit improvements that would:
• Attract choice riders who would normally travel by automobile. • Provide a cost-effective, efficient transit service. • Support transit-supportive land development. • Foster regional economic development. • Establish a new separate operating entity that would “brand” and “market” a new transit
service distinct from existing transit systems. • Begin as a pilot service and expand services incrementally. • Integrate and provide seamless connections with existing, regional transit systems.
Institutional Setting for a Regional Transportation System Increasingly, private-sector involvement has been encouraged in the operation of public-transportation services, particularly commuter shuttle buses. Several transportation-management associations (TMAs) and councils of governments are garnering private-company support to alleviate congestion during peak-commuter times. For example, the Regional Transportation Commission of Southern Nevada (RTC) serves a dual role as the region’s metropolitan planning organization and transit operator for the MAX BRT line. RTC contracts with Veolia Transportation, the largest private transportation provider in the U.S., to operate the MAX. The point is that there is not one ideal institutional setting for a regional transportation entity. A steering committee must consider the best institutional arrangement for a multi-jurisdictional system. From authority-like entities to multi-jurisdictional sponsorship, there are a number of ways to structure an operating entity. Private support is a critical component. The institutional setting must provide sustainability and reinforce the system’s hallmark of providing rapid,
Feasibility of Bus Rapid Transit Within the Mid-Atlantic Region June 2009
75
reliable, efficient, flexible, and quality service that transcends geopolitical boundaries and connects seamlessly to area transit services. Project Planning Alternatives-Analysis Process The federal project-development process requires an evaluation of transportation alternatives to determine the best transportation solution that meets mobility, social, and economic-development needs within a transportation corridor. The purpose of this process is to guide decision-making for planning, financing, and implementing major transportation projects. The analysis must consider all potentially viable transportation alternatives and strategies for the corridor and ensure consistency with regional transportation and land-use plans. Major components of the alternative analysis process include a description of the study area, transportation problems, and needs; establishment of study goals, objectives, and preliminary evaluation measures; description of short- and long-term conceptual alternatives and plans; assessment of costs, benefits, and financial feasibility; and estimation of community and environmental impacts. Public participation is a fundamental component of the process and ensures that recommended transportation-system improvements are responsive to the needs and preferences of stakeholders The outcome of the alternative-analysis process is a recommendation of a preferred mode of transportation, alignment or route of travel, proposed stations, an estimate of project costs, and projected future ridership. Presumably, a pilot route for the transportation mode (such as BRT) would be recommended for implementation as a demonstration project. At this point, further refinement and evaluation are needed to determine the physical and operating characteristics of the preferred transportation option. Engineering Feasibility Once the alternatives-analysis process is complete, the project planning continues with an engineering-feasibility study. This study is designed to refine the preferred transportation options, complete federal environmental-review requirements, and develop detailed capital and operating costs, ridership estimates, service and operations plans, financial plans, and a phased implementation and deployment strategy. In addition to traditional engineering strategies, innovative transit technologies will need to be incorporated to improve mobility along identified, regional transit corridors. 8-2-3. RECOMMENDATIONS The initiation of a subsequent regional, comprehensive transportation-planning process is strongly recommended. The primary purpose of an extensive planning, analysis, and public outreach process is to identify transportation solutions for the identified transit corridors in the Mid-Atlantic region adjacent to and including Delaware. Improved transit service will help alleviate traffic congestion, enhance mobility, and provide environmental benefits to the region. In addition, transit improvements will help address a transportation-mobility gap between Perryville, Md., and New Castle County, Del., and serve transportation needs for anticipated defense-related job growth in Aberdeen, Md. Moreover, transit improvements will also strengthen the economic viability of the region by efficiently transporting commuters, connecting major centers of business and employment, and promoting transit-supportive land development.
Feasibility of Bus Rapid Transit Within the Mid-Atlantic Region June 2009
76
The intended outcome of this proposed regional, comprehensive transportation-planning process is a strategy to provide and seamlessly integrate multi-modal transportation modes across state lines. BRT may or may not be implemented as part of this comprehensive mobility strategy. In any case, BRT should be strongly considered during the alternatives-analysis process for its potential to:
• Improve public-transit service by providing increase transit capacity and faster, convenient access throughout the region and across state lines.
• Enhance regional connectivity through expanded, interconnected transit services. • Accommodate future travel demand in the region and I-95 corridor by expanding modal
options. • Alleviate increasing traffic congestion and chokepoints within and adjacent to the I-95
corridor that passes through Delaware. • Improve regional air quality by reducing vehicle emissions. • Provide greater mobility options to commuters, residents, travelers, and transit-dependent
individuals within the region. • Promote transit-supportive land-use and economic-development goals.
APPENDICES
A. Matrix of BRT Systems
B. Case Study-Maryland Transit Administration Commuter Bus
C. Maps
D. BRT Funding Matrix
E. List of Potential Regional Stakeholders
F. List of BRT Forum Attendees
G. Regional BRT Concept - Follow-Up Questionnaire
H. Response to Questionnaire
I. Forum PowerPoint Presentation Slides
J. Forum Proceedings
K. Citations
Feasibility of Bus Rapid Transit Within the Mid-Atlantic Region June 2009
77
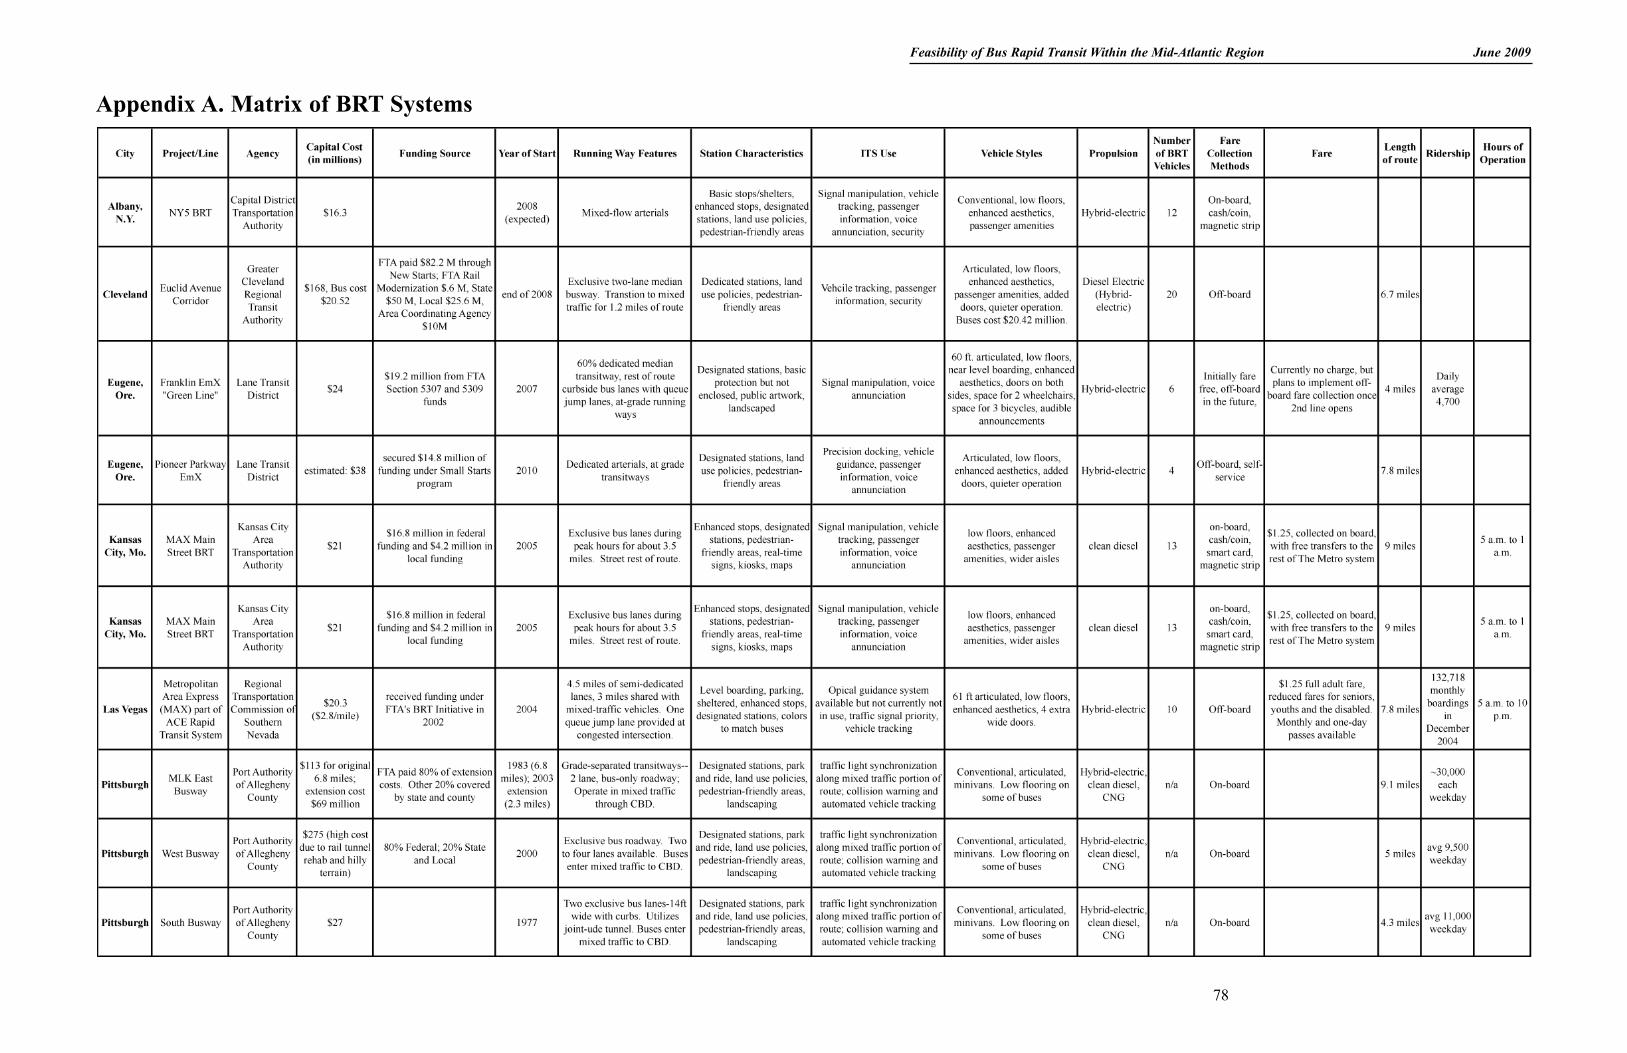
Appendix A. Matrix of BRT Systems
Feasibility of Bus Rapid Transit Within the Mid-Atlantic Region June 2009
78
Feasibility of Bus Rapid Transit Within the Mid-Atlantic Region June 2009
79
Appendix B. Case Study—Maryland Transit Administration Commuter Bus B-1. Interview and Site Visit: Maryland Transit Administration Name of Program: Maryland Transit Administration (MTA) Commuter Bus Implementing Agency: MTA, a modal agency of the Maryland Department of Transportation
(MDOT) Service Description: MTA owns, operates, and manages transit services in the Baltimore
region while overseeing contracted commuter bus, commuter rail, and paratransit services. The state participates as a managing and funding partner of transit in Baltimore and the Washington, D.C. region through its participation on the Washington Metropolitan Area Transit Authority (WMATA) Board of Directors.
B-1-1. BACKGROUND INFORMATION Transit in Maryland is funded through the state’s Transportation Trust Fund, a dedicated source of revenues for the MDOT. Transit receives approximately 35% of total MDOT expenditures annually, including operating and capital costs (Maryland Transit Funding Study Steering Committee, 59). MTA’s operating budget in FY 2008 totals $512M and represents about 36% of MDOT’s total FY 2008 operating budget of $1.4B. MTA’s 6-year FY 2008 – 2013 capital budget totals $1,432M and represents approximately 17% of MDOT’s total FY 2008 – 2013 capital budget of $8.5B (MDOT, Annual Attainment Report, 2008). MDOT is required by law to develop an annual performance report on the attainment of transportation goals and benchmarks for transportation system performance based on the amount of investment. Among MTA’s performance measures for productivity and quality are operating cost per passenger and operating cost per passenger mile. In 2006, MTA’s operating cost per passenger for Commuter Bus service was $10.44 and operating cost per passenger mile in 2006 for Commuter Bus service was $.35. Performance measure targets are to have both the operating cost per passenger and operating cost per passenger mile to increase at a rate no higher than the Consumer Price Index (MDOT, Annual Attainment Report, 2008). MTA contracts service on 27 commuter bus routes that use private contractors to operate over-the-road coaches to serve both Baltimore and Washington, D.C. bound commuters from suburban areas. The Commuter Bus service operates to peak travel destinations during peak commuter travel times on weekdays only. Currently, there are 22 routes that operate under eleven multi-year contracts (MTA, n.d.). MTA Commuter Bus service growth has doubled since 1995. From 1995 – 2000, Commuter Bus daily ridership was consistently less than 6,000. From 2001 to 2006, daily ridership on MTA Commuter Buses increased about 90% from 6,000 to 11,399. Daily Commuter Bus
Feasibility of Bus Rapid Transit Within the Mid-Atlantic Region June 2009
80
ridership in 2005 represented about 5.7% the over 200,000 daily trips taken in Maryland on MTA bus services (Maryland Transit Funding Study Steering Committee, 2007). B-1-2. MTA’S COMMUTER BUS PROGRAM IN BALTIMORE The Commuter Bus Program operates in the Baltimore metropolitan area as part of MTA bus service. The Commuter Bus provides express transit service at a premium price, connecting suburban residential areas to downtown Baltimore during peak travel times on weekdays only. Commuters access the express routes via several Park & Ride lots or other service points. There are seven commuter routes in the Baltimore area, which make 64 daily trips. Fares on the Commuter Bus are based on zones. Zone 1 fares apply for travel within a single fifteen-mile zone. Zone 2 fares apply for travel between any two adjacent fifteen-mile zones. Zone 3 fares apply for travel between zones 1 and 3. While plans for fare payment through a SmartCard are underway, currently fare media includes the cash purchase on the bus of a one-way fare or ten-trip ticket, or a monthly pass purchased through MTA. The ten-trip ticket option is the most popular fare media since it provides flexibility for part-time commuters or telecommuters. B-1-3. INTERVIEW WITH GLENN HOGE, MTA COMMUTER BUS SERVICE ACTING MANAGER IPA project team members William DeCoursey, Ed O’Donnell, and Marcia Scott met with and interviewed Glenn Hoge, MTA Commuter Bus Service Acting Manager on Wednesday, January 16 at the MTA office in Baltimore. According to Hoge, there are currently no BRT’s operating in the state of Maryland. However, a visioning process is underway for the “Purple Line,” a mass transit project slate to travel from Bethesda to New Carrollton in either the form of BRT or light rail. Hoge explained the differences between BRT and commuter express bus service. According to Hoge, BRT provides a high-capacity, upscale mode of transit to enhance urban mobility. BRT systems:
• Operate on a dedicated right-of-ways or segregated running ways. • Travel at a higher rate of speed than other bus transit service, typically an enhanced
travel time of two to three minutes on exclusive running ways. • Have fleets of upscale, 60’ articulated buses with three doors. • Feature a distinct brand identity, logo, and image different from the rest of the transit
operator’s bus fleet. • Provide off-board, electronic fare media and collection systems. • Offer frequent, all-day transit service within an urban, metropolitan area. • Have a substantial ridership base to support the service.
While commuter express buses also offer a high-capacity, upscale mode of transit travel these systems are geared towards serving commuters living in a suburban area and working in a downtown area or other major employment center. Commuter express bus systems:
• Operate on non-segregated running ways. • Provide cost savings to commuters traveling to work.
Feasibility of Bus Rapid Transit Within the Mid-Atlantic Region June 2009
81
• Provide service only Mondays - Fridays, during peak commute hours. • Provide one-way service during morning or evening peak hour flows. • Improves local service on a high-density corridor; induces riders from automotive travel.
B-1-4. PLANNING FOR NEW COMMUTER BUS ROUTES According to Hoge, the process for planning a new commuter bus route is more of a qualitative than quantitative process. Since it is difficult to predict ridership levels, MTA considers factors that influence investment in commuter service such as population growth trends, centers of employment/employment destinations, locations of growing “bedroom” communities, and ridership demand of existing commuter bus routes. The visioning process for new commuter bus routes includes several public hearings to obtain input from prospective riders at possible points of origin. A typical route averages about 30 miles, but could be as long as 60 miles. Most commuting times are less than an hour from point of origin to employment destinations. There are generally two to three stops at the point(s) of origin. For example, in Bel Air, Maryland there are two pick -ups in neighborhoods and the final pick-up location is a Park & Ride lot. There are multiple drop off locations in the downtown area, typically at least two stops within a five-block radius. All commuter express bus service is contracted by MTA. The parameters of the competitive bid process include level of service, vehicle configuration and characteristics, characteristics of service, route length, times of and frequency of service, and other performance criteria. Bids for contracted service are evaluated on a cost per mile basis. The contractor must include insurance costs in the bid and does not retain revenue from fare collection. In Southern Maryland, the average five-year contract for service currently ranges between $8.00 and $14.00 per mile, depending upon the route and level of service. In 2010, the average systemwide (Baltimore area) commuter express bus cost per mile is projected to be $12.25. B-1-5. TRANSIT FUNDING While MTA is a state agency that operates, manages, and funds transit, the state of Maryland is entirely responsible for funding transit. Fares for all modes of transit in Maryland are determined by government policy. The current fare structure for commuter bus services covers about half the cost of the service and the remainder is subsidized by state funds. While federal funding is an important source of revenue for Maryland’s transit system, federal funding is generally limited to capital investments and requires an 80 percent federal and 20 percent state split. Because commuter bus service is contracted, and buses are procured and owned by contractors, there are no federal subsidies that support commuter express service in Maryland. The state has also opted not to seek funding under the federal New Starts program because of the discretionary and competitive nature of this source of funding (The Maryland Transit Funding Steering Committee Report, 2007).
Feasibility of Bus Rapid Transit Within the Mid-Atlantic Region June 2009
82
B-1-6. SUCCESSES AND LESSONS LEARNED Based on our conversation with Glenn Hoge, it appears that a commuter express bus service is a more realistic transit alternative than BRT for Delaware. Commuter express bus service may be a more viable form of transit than BRT for Delaware since it is not dependent on a dedicated right of way, it not marketed to serve a high-density corridor, is a contractual service, and requires no capital expenditures. Successes and lessons learned from our site visit and interview with Glenn Hoge include:
• The planning and implementation process must include public input and support. • The market for commuter express bus service is riders commuting to/from the suburbs to
downtown employment areas/destinations; cost savings is a major attraction. • A differentiated branding identity is important. • Excessive wait time, transfers, and route stops are problematic. Ideally, the one-way
running time should be no more than one hour. • Park & Ride lots allow stations to attract passengers. Parking spaces leased from
shopping centers also serve as ideal origin stops. • Destination stops at downtown employment centers should have short headways.
B-2. BRAC Planning by MDOT and MTA One of MDOT’s priority initiatives is planning for the estimated 40,000 to 60,000 direct, indirect, and induced jobs coming to Maryland in the next ten years as a result of nationwide military Base Realignment and Closure (BRAC) recommendations. BRAC-related growth from Fort Meade (Laurel area), Aberdeen Proving Grounds, and the National Naval Medical Center (Bethesda) is anticipated to impact transportation and transit needs in the Baltimore-Washington metropolitan area. MDOT is using its experience from the Patuxent River Naval Air Station growth, during the previous BRAC, to develop a comprehensive, integrated response that connects land use and transportation needs. State funding allocations and new federal appropriations have earmarked nearly $450 million of additional improvements related to BRAC. While most of these improvements will be targeted to augment MARC rail service, enhancements to MTA’s commuter bus service are also planned (Maryland Department of Transportation, 2008). B-2-1. BRAC MEETING IPA was invited to attend a meeting on January 16, 2008 at MTA in Baltimore to learn about the status of BRAC planning and plans for enhanced MARC and MTA commuter bus services. Discussion relevant to MTA’s BRAC-related commuter bus study, specifically possible service to Aberdeen is summarized below:
• The BRAC commuter bus study required a heavily involved stakeholder interview process, which included BRAC coordinators, transit operators, regional planning agencies, government officials, local jurisdictions, and transportation officials and planners. Timing of warranted transportation services resulting from BRAC is 2011.
• The challenge of planning future commuter bus services is not knowing where people will ultimately relocate to as a result of BRAC.
Feasibility of Bus Rapid Transit Within the Mid-Atlantic Region June 2009
83
• A lesson learned from Patuxent River Naval Air Station BRAC was that while housing was cheaper near the base, there were better paying jobs in the Washington, D.C. metropolitan area. As a result, 150 – 200 commuter bus trips (10 buses) were added.
• Experience has shown that the more transit transfers are required, the less people are receptive to that mode of travel.
• Expansion of MARC deadhead morning trains to Perryville in service to Aberdeen is a possibility. Utilizing available capacity on Amtrak trains for MARC passengers, would however require negotiation and additional cost to MTA.
B-2-2. PRELIMINARY BRAC TRANSIT PLAN – ABERDEEN COMMUTER BUS SERVICE PLANS Plans for enhanced commuter bus service to Aberdeen call for five, contracted commuter bus express trips in the morning and evening. The projected cost for a contracted commuter bus service 2010 is approximately $12.25 per mile. Several possible Aberdeen service alternatives for commuter bus service were discussed at the meeting.
• Commuter Bus Express Service from Baltimore City via I-95 to Aberdeen Concept described as a reverse MTA Commuter Bus 420 line. Goal to limit number of stops and have direct access to base. Possible stop at White Marsh.
• Commuter Bus Express Route that links Lutherville Light Rail Station with Cromwell Bridge Road to Aberdeen
Concept to run a reverse peak service, similar to the 420 line, which runs from suburban areas of Baltimore to APG.
Limited local stops with express service to Aberdeen. • Commuter Bus Express Service from Newark, Delaware Amtrak Station via I-95 to
Aberdeen Preferred due to parking and connectivity, and quick ride on I-95 (it was noted to
MTA representatives that parking availability at Fairplay Station/Delaware Park is more favorable than in Newark).
Stop at Park ’N Ride lots in Elkton area, bowling alley across from old station. Cost of this option is estimated to be $1.3 - $1.5M and would be more favorable if
a cost sharing agreement is arranged between MDOT and DelDOT. Also considered was a Rt. 40 commuter bus express service to Aberdeen via Rt. 40 from People’s Plaza. This option was considered a duplicative service to the Newark alternative and was less favorable due to travel speeds on Rt. 40. B-2-3. COORDINATION AND POLICY ISSUES Several coordination and policy issues were noted regarding an expansion of commuter express bus services and/or implementation of BRT transcending Maryland and Delaware. These include:
• Service transcending the Maryland/Delaware state line. • Joint funding agreement with DelDOT/DTC for Newark commuter bus service is
desirable. • Transit vehicle access to military base.
Feasibility of Bus Rapid Transit Within the Mid-Atlantic Region June 2009
84
• Newark service as a possible MARC place holder+ service in the short term. • Toll recovery (currently billed by contractors for commuter express bus tolls). • Funding sources. • TDM program implementation at Aberdeen (impact of van/carpooling on transit
demand). B-2-4. NEXT STEPS FOR MTA BRAC TRANSIT PLANNING – ABERDEEN To make commuter express bus service to Aberdeen a reality, MTA indicates that they need to:
• Finalize prospective commuter bus routes. • Finalize demand estimates. • Finalize cost estimates. • Prepare a final summary.
Feasibility of Bus Rapid Transit Within the Mid-Atlantic Region June 2009
85
Appendix C. Maps C-1. DART/First State Transit Routes–Northern Delaware
C-2. Public Transportation Serving Chester County
C-3. Transit Segment Capacity
C-4. Average Annual Daily Traffic
C-5. 2008 CMS (Congestion Management Study)-Identified Corridors
C-6. DVRPC Congested and Emerging Corridors
C-7. Pennsylvania CMP Corridor 4: I-95
C-8. Pennsylvania CMP Corridor 8
C-9. Existing and Future CMS Needs for Salem County
C-10. Population Density
C-11. 2005 Transit Score Based on DVRPC “Portable” Transit-Scoring Method
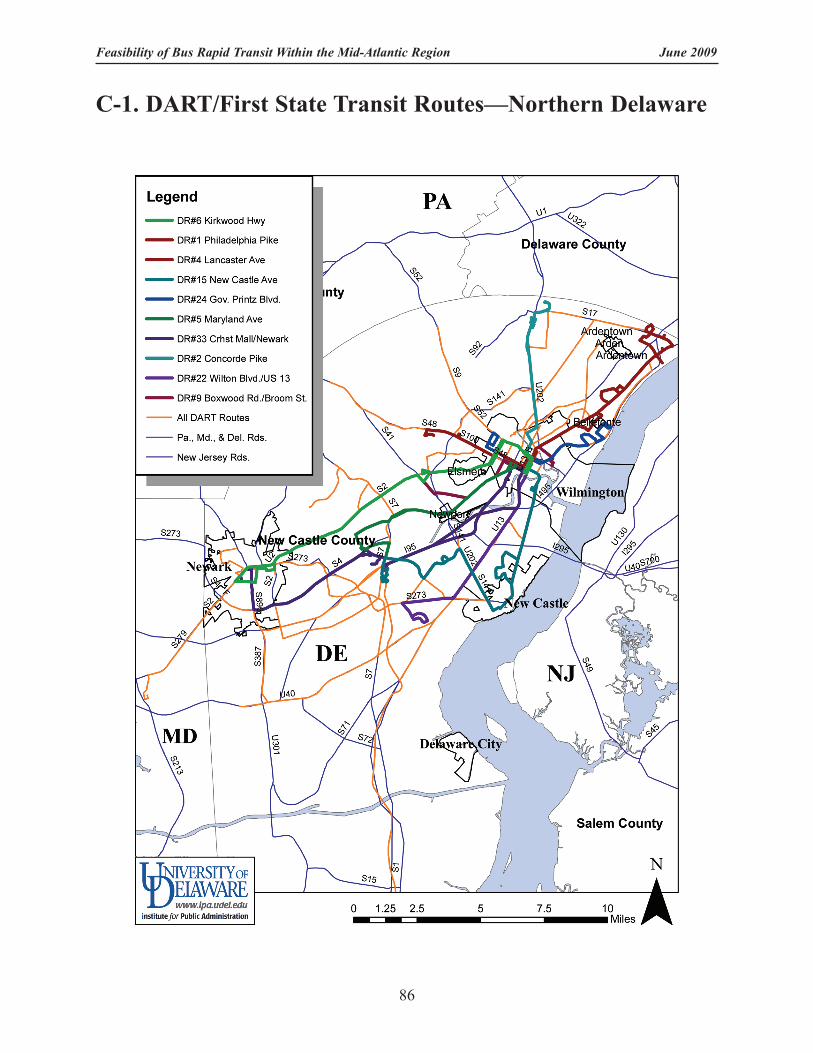
C-1. DART/First State Transit Routes—Northern Delaware
Feasibility of Bus Rapid Transit Within the Mid-Atlantic Region June 2009
86
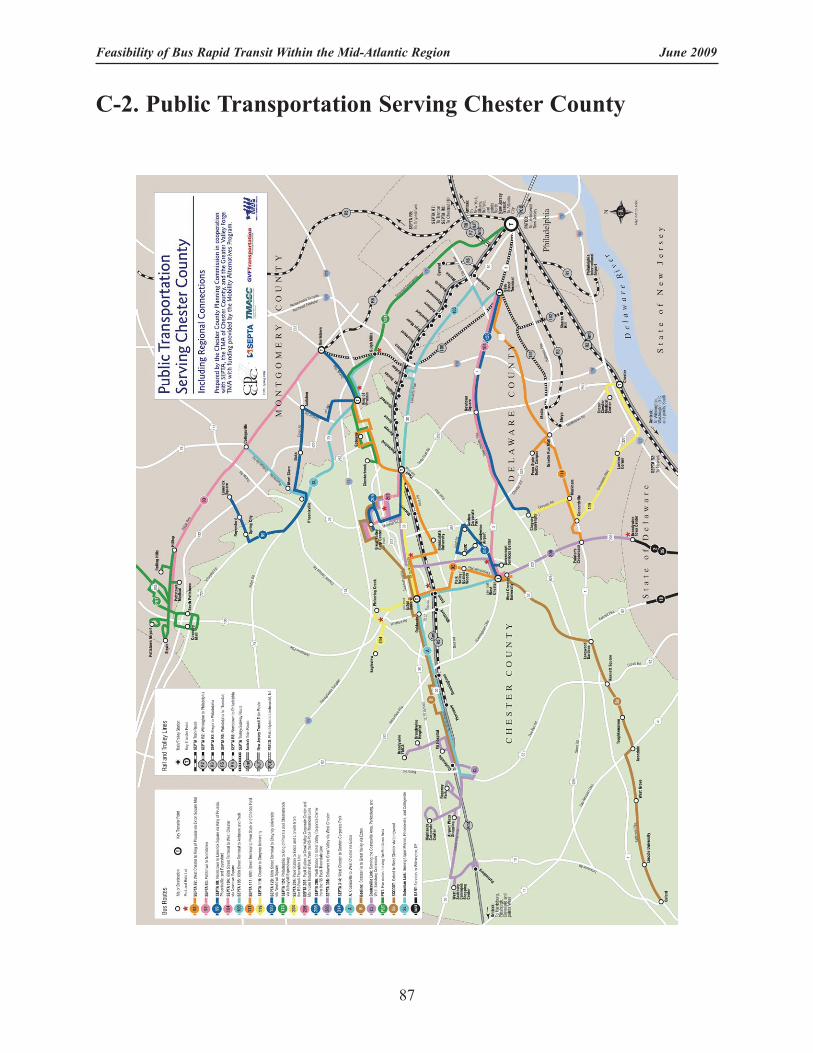
C-2. Public Transportation Serving Chester County
Feasibility of Bus Rapid Transit Within the Mid-Atlantic Region June 2009
87
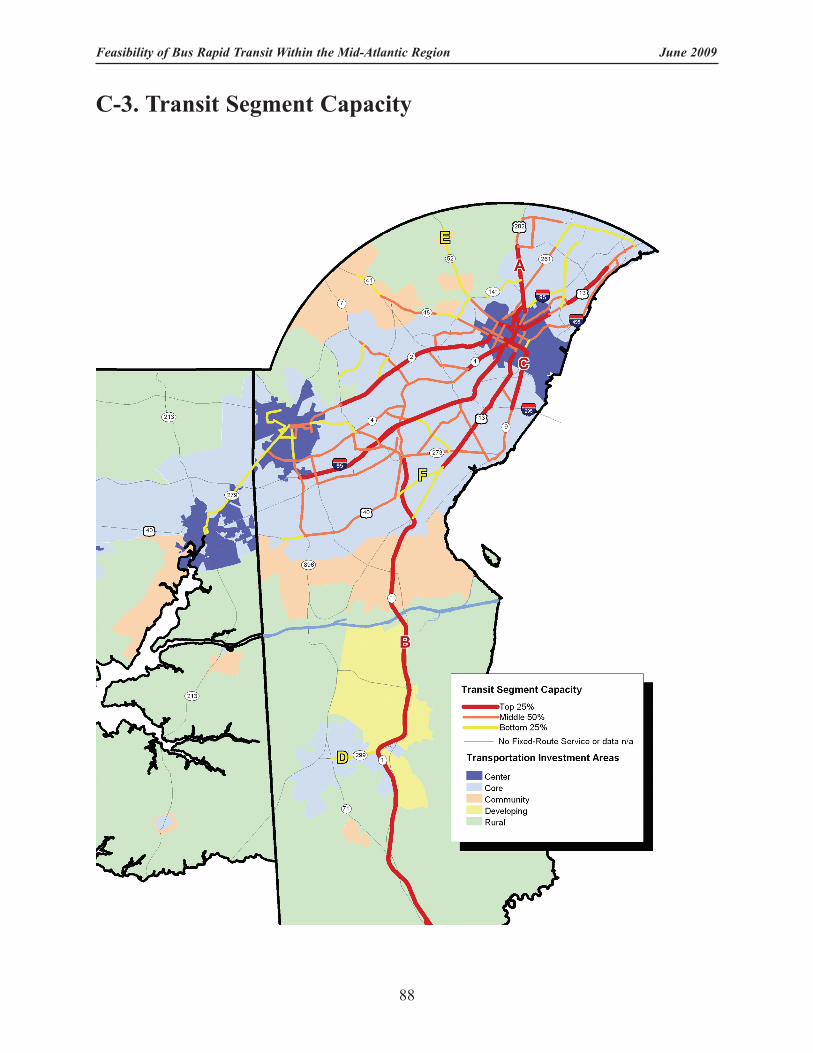
C-3. Transit Segment Capacity
Feasibility of Bus Rapid Transit Within the Mid-Atlantic Region June 2009
88
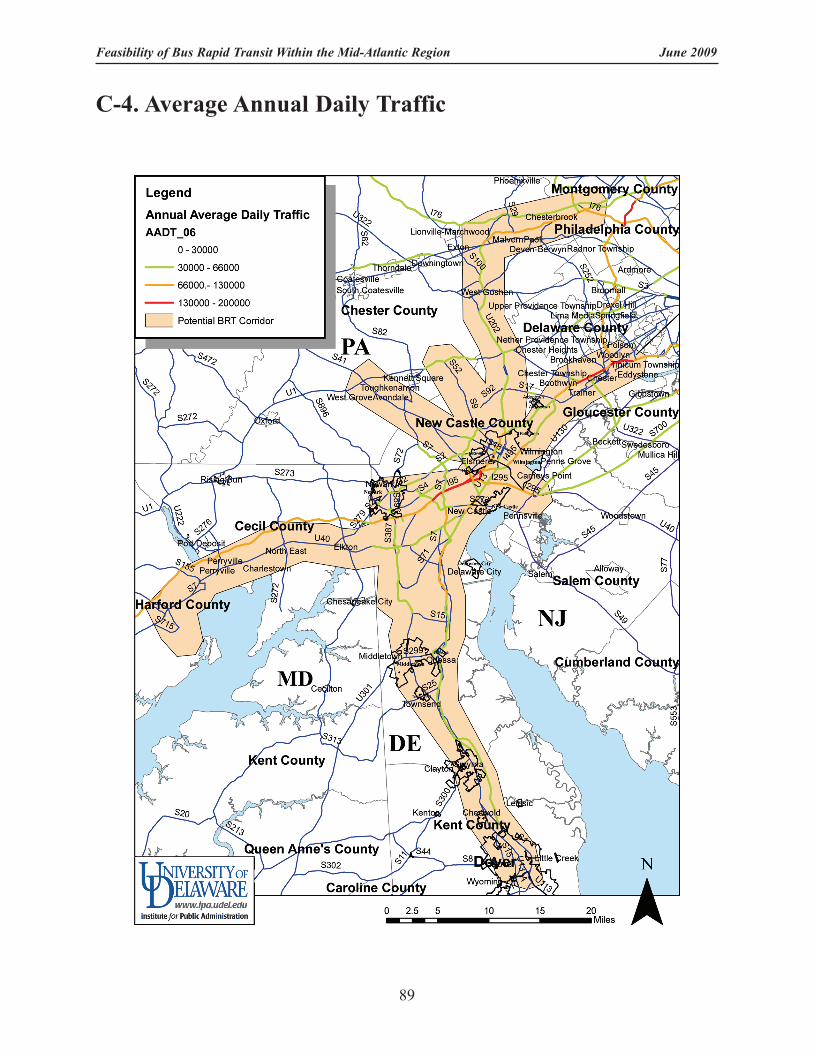
C-4. Average Annual Daily Traffic
Feasibility of Bus Rapid Transit Within the Mid-Atlantic Region June 2009
89
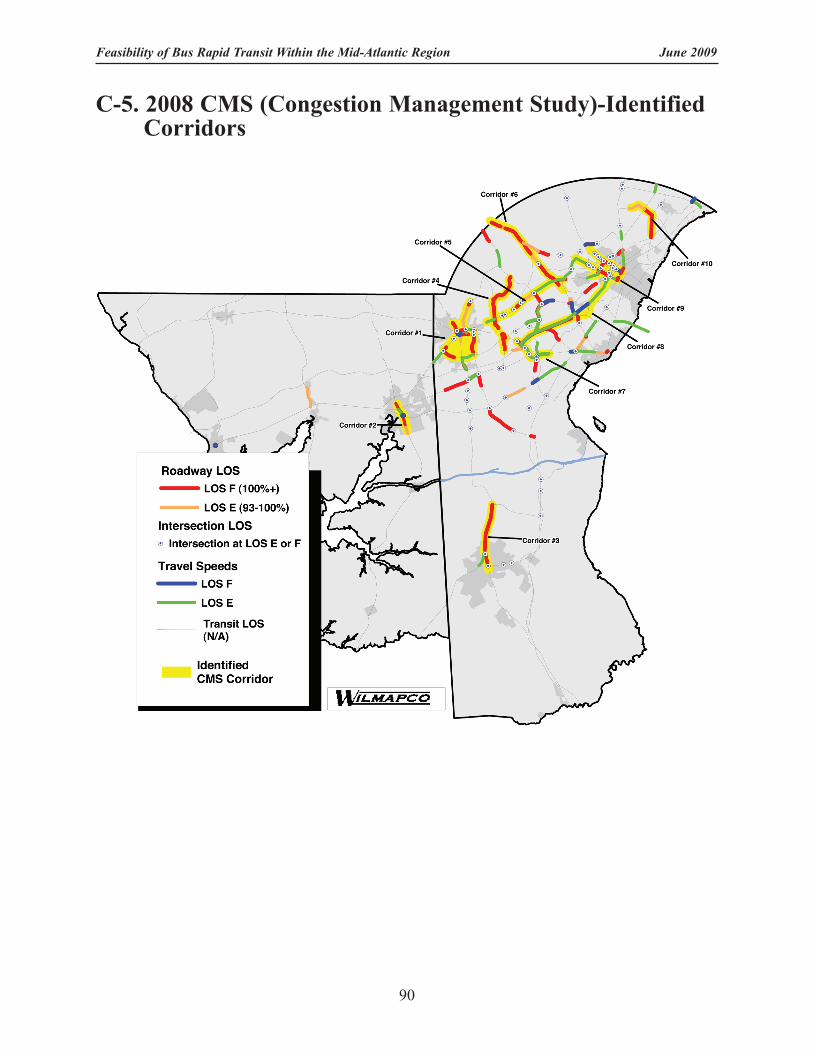
C-5. 2008 CMS (Congestion Management Study)-Identified Corridors
Feasibility of Bus Rapid Transit Within the Mid-Atlantic Region June 2009
90
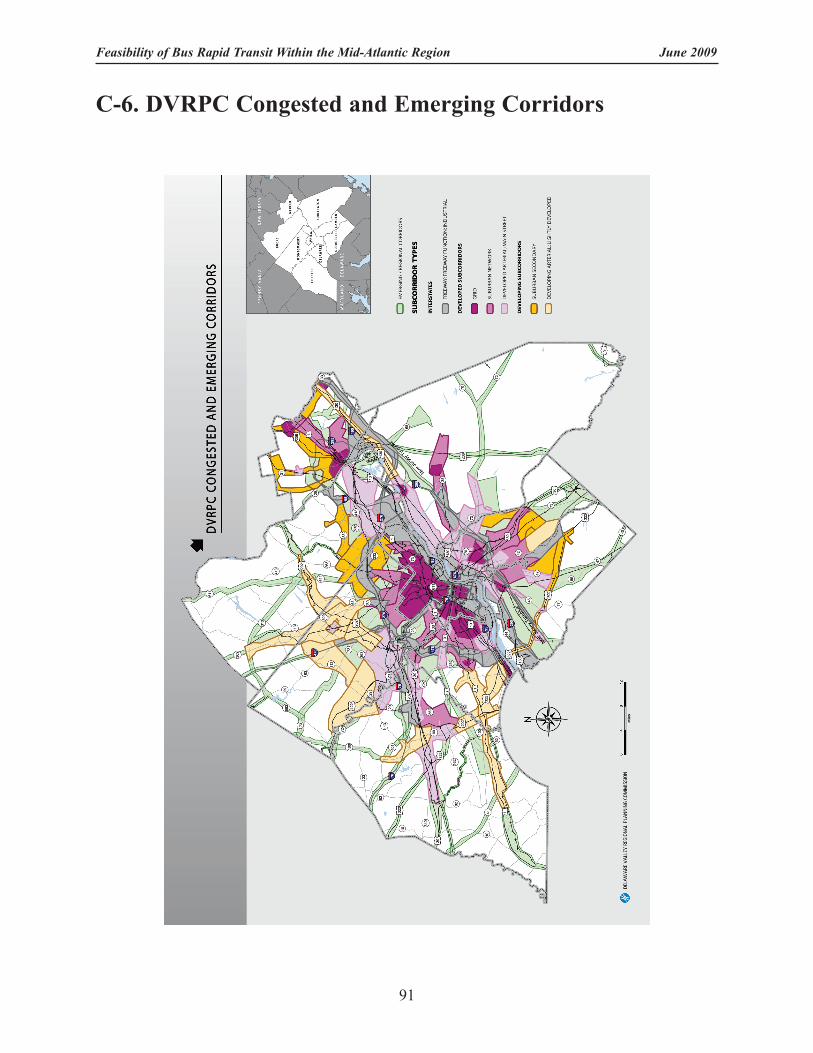
C-6. DVRPC Congested and Emerging Corridors
Feasibility of Bus Rapid Transit Within the Mid-Atlantic Region June 2009
91
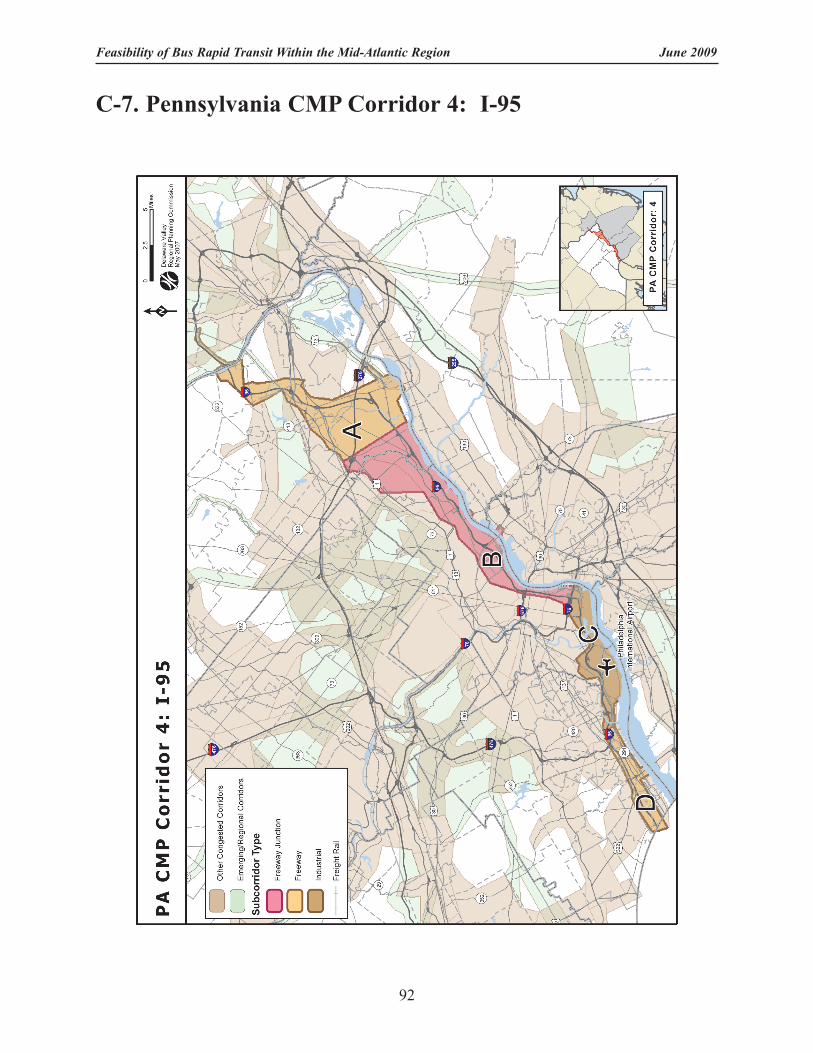
C-7. Pennsylvania CMP Corridor 4: I-95
Feasibility of Bus Rapid Transit Within the Mid-Atlantic Region June 2009
92
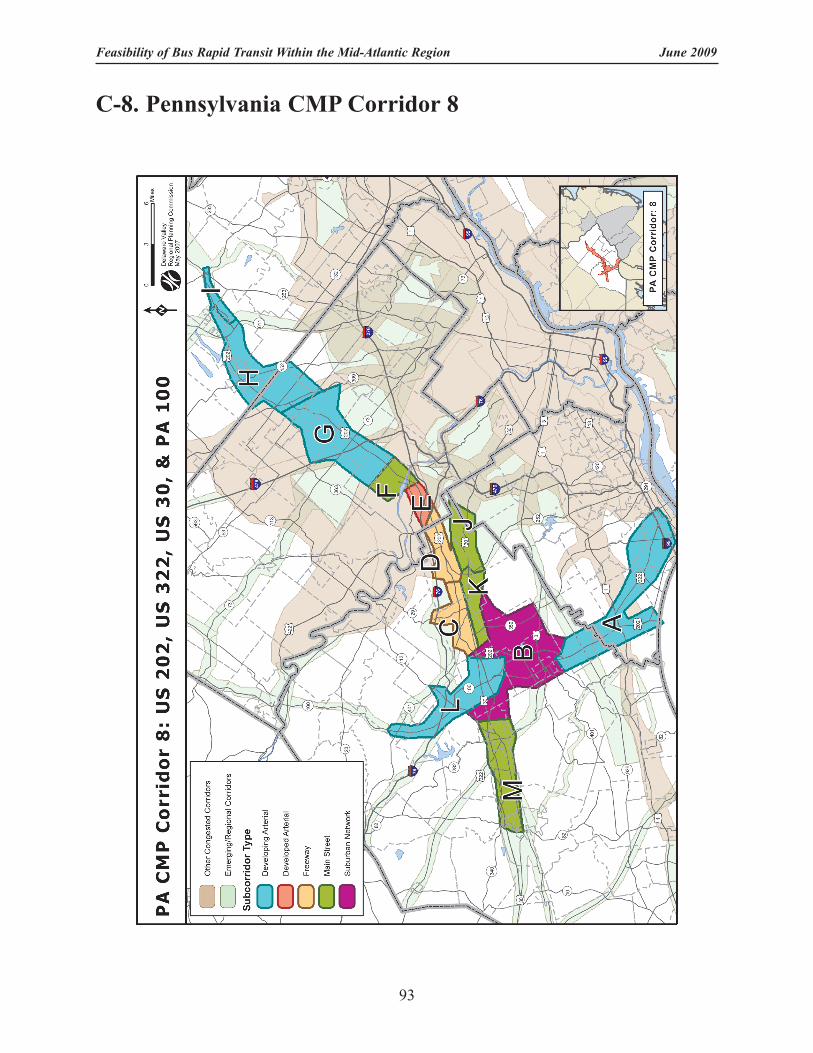
C-8. Pennsylvania CMP Corridor 8
Feasibility of Bus Rapid Transit Within the Mid-Atlantic Region June 2009
93
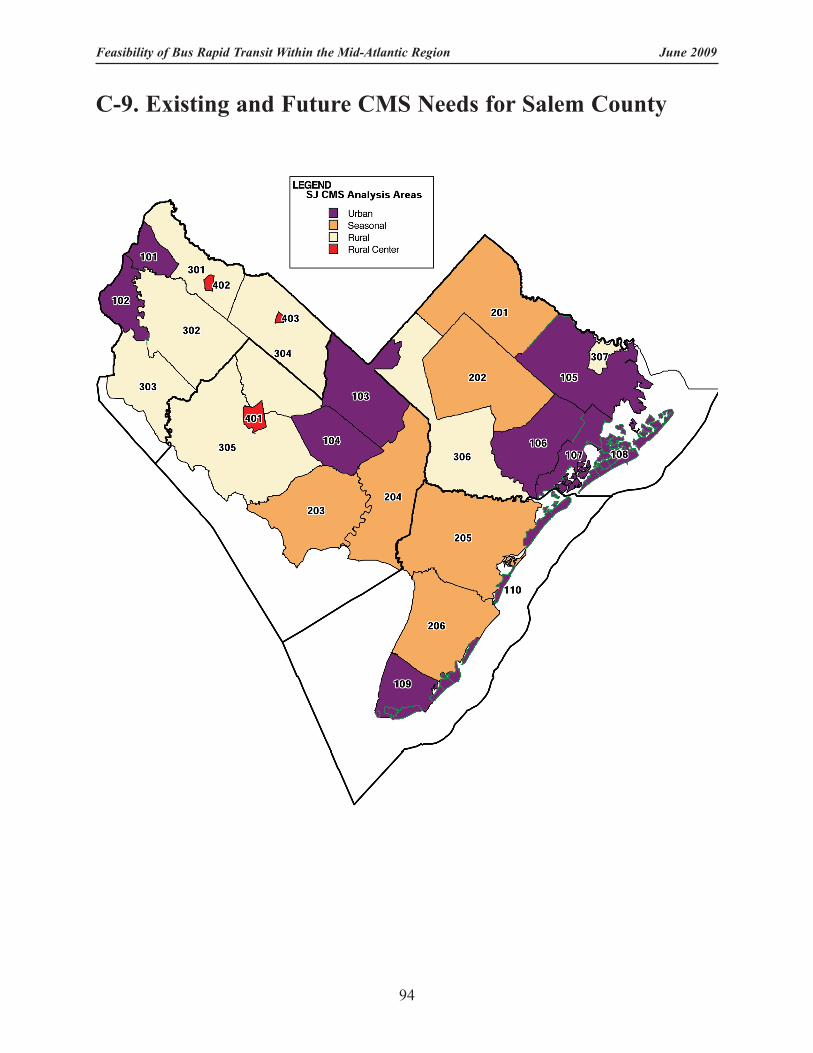
C-9. Existing and Future CMS Needs for Salem County
Feasibility of Bus Rapid Transit Within the Mid-Atlantic Region June 2009
94
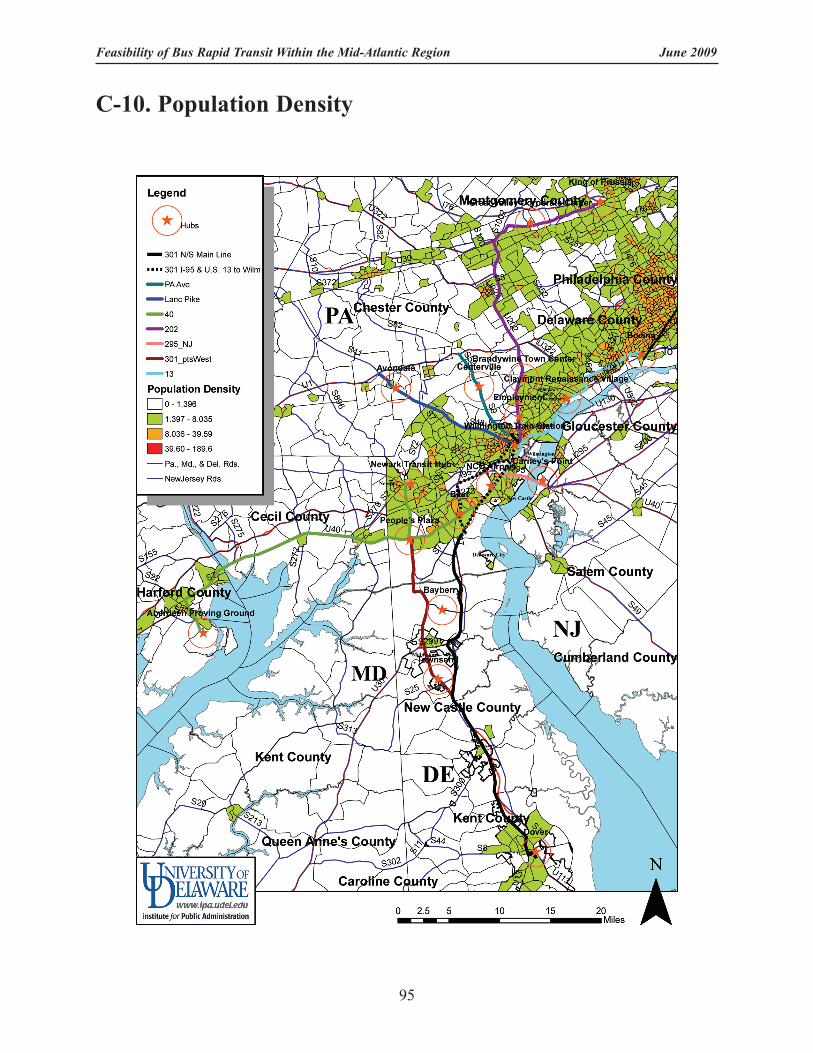
C-10. Population Density
Feasibility of Bus Rapid Transit Within the Mid-Atlantic Region June 2009
95
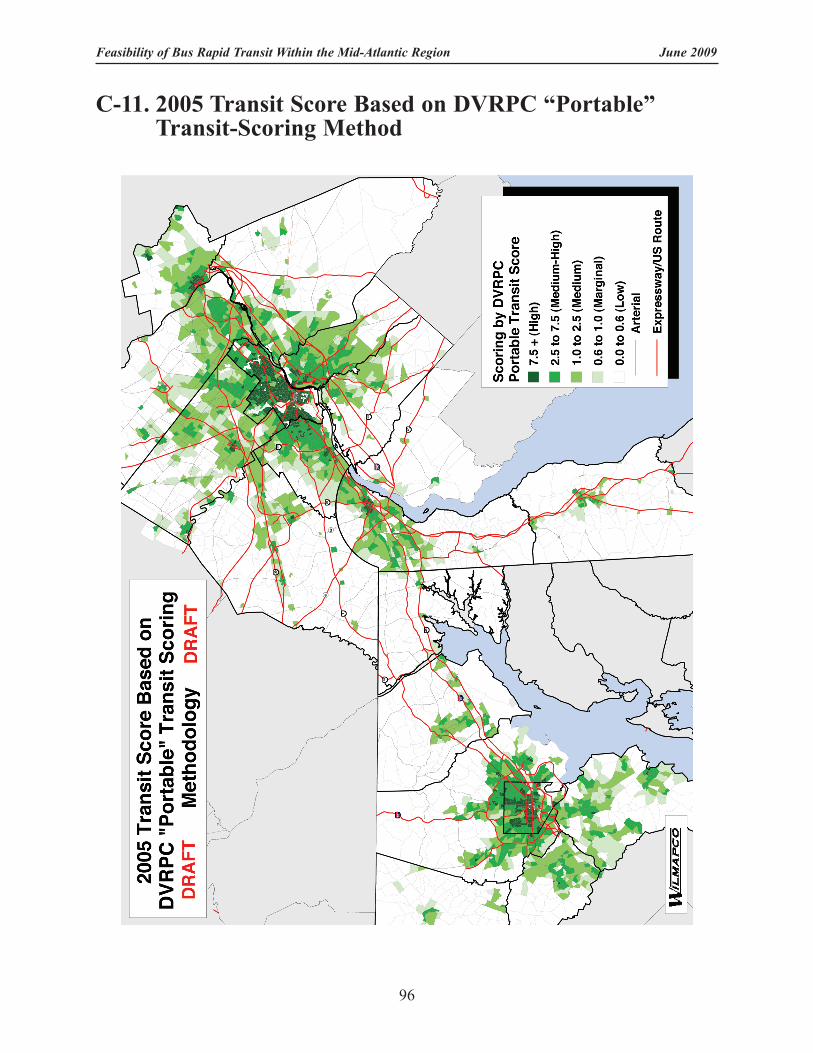
C-11. 2005 Transit Score Based on DVRPC “Portable” Transit-Scoring Method
Feasibility of Bus Rapid Transit Within the Mid-Atlantic Region June 2009
96
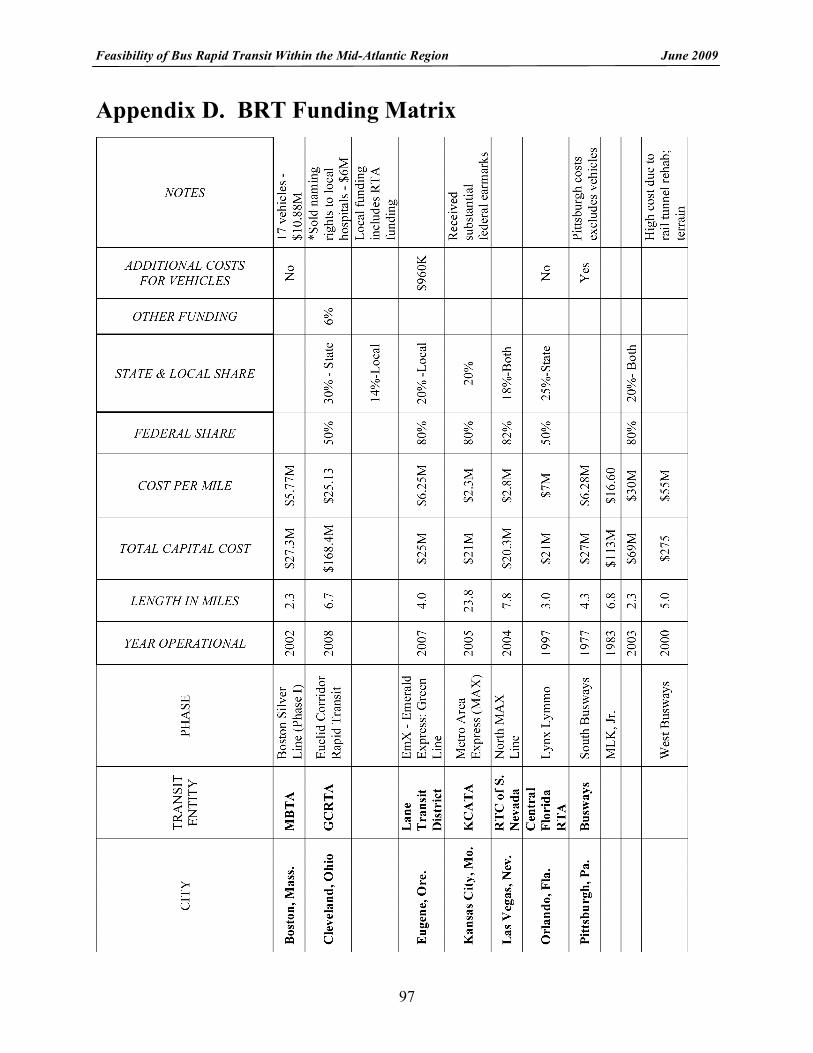
Feasibility of Bus Rapid Transit Within the Mid-Atlantic Region June 2009
97
Appendix D. BRT Funding Matrix
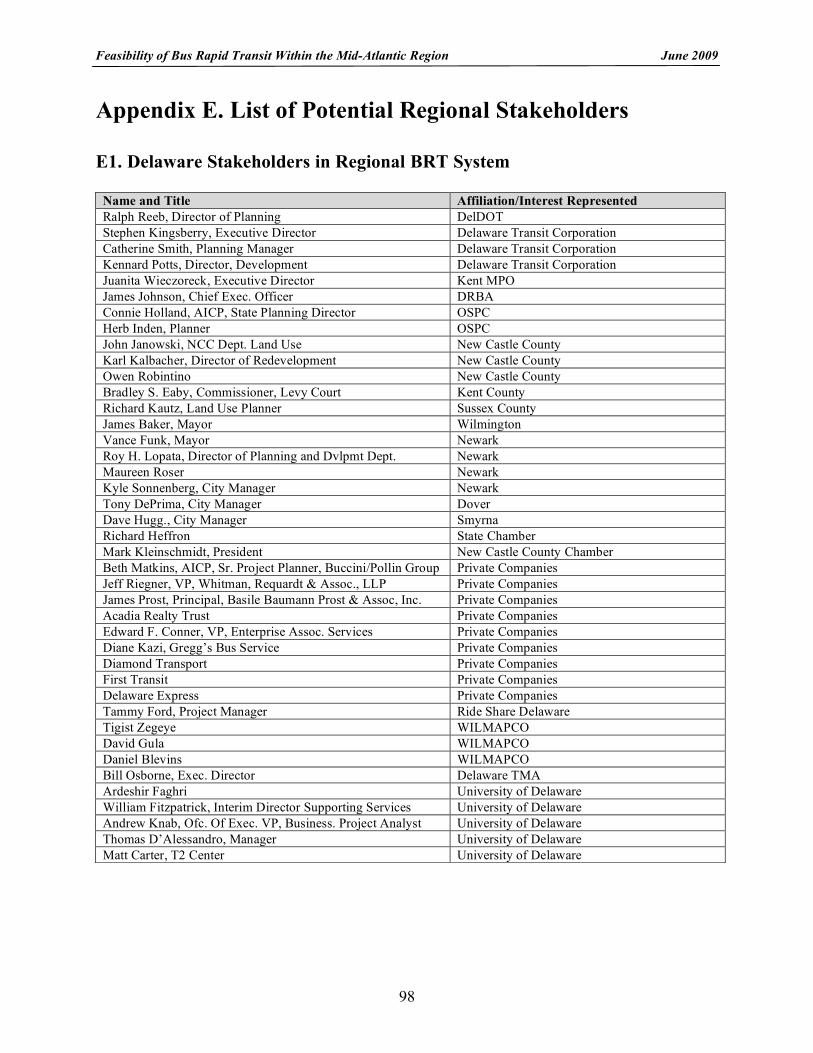
Feasibility of Bus Rapid Transit Within the Mid-Atlantic Region June 2009
98
Appendix E. List of Potential Regional Stakeholders E1. Delaware Stakeholders in Regional BRT System
Name and Title Affiliation/Interest Represented Ralph Reeb, Director of Planning DelDOT Stephen Kingsberry, Executive Director Delaware Transit Corporation Catherine Smith, Planning Manager Delaware Transit Corporation Kennard Potts, Director, Development Delaware Transit Corporation Juanita Wieczoreck, Executive Director Kent MPO James Johnson, Chief Exec. Officer DRBA Connie Holland, AICP, State Planning Director OSPC Herb Inden, Planner OSPC John Janowski, NCC Dept. Land Use New Castle County Karl Kalbacher, Director of Redevelopment New Castle County Owen Robintino New Castle County Bradley S. Eaby, Commissioner, Levy Court Kent County Richard Kautz, Land Use Planner Sussex County James Baker, Mayor Wilmington Vance Funk, Mayor Newark Roy H. Lopata, Director of Planning and Dvlpmt Dept. Newark Maureen Roser Newark Kyle Sonnenberg, City Manager Newark Tony DePrima, City Manager Dover Dave Hugg., City Manager Smyrna Richard Heffron State Chamber Mark Kleinschmidt, President New Castle County Chamber Beth Matkins, AICP, Sr. Project Planner, Buccini/Pollin Group Private Companies Jeff Riegner, VP, Whitman, Requardt & Assoc., LLP Private Companies James Prost, Principal, Basile Baumann Prost & Assoc, Inc. Private Companies Acadia Realty Trust Private Companies Edward F. Conner, VP, Enterprise Assoc. Services Private Companies Diane Kazi, Gregg’s Bus Service Private Companies Diamond Transport Private Companies First Transit Private Companies Delaware Express Private Companies Tammy Ford, Project Manager Ride Share Delaware Tigist Zegeye WILMAPCO David Gula WILMAPCO Daniel Blevins WILMAPCO Bill Osborne, Exec. Director Delaware TMA Ardeshir Faghri University of Delaware William Fitzpatrick, Interim Director Supporting Services University of Delaware Andrew Knab, Ofc. Of Exec. VP, Business. Project Analyst University of Delaware Thomas D’Alessandro, Manager University of Delaware Matt Carter, T2 Center University of Delaware
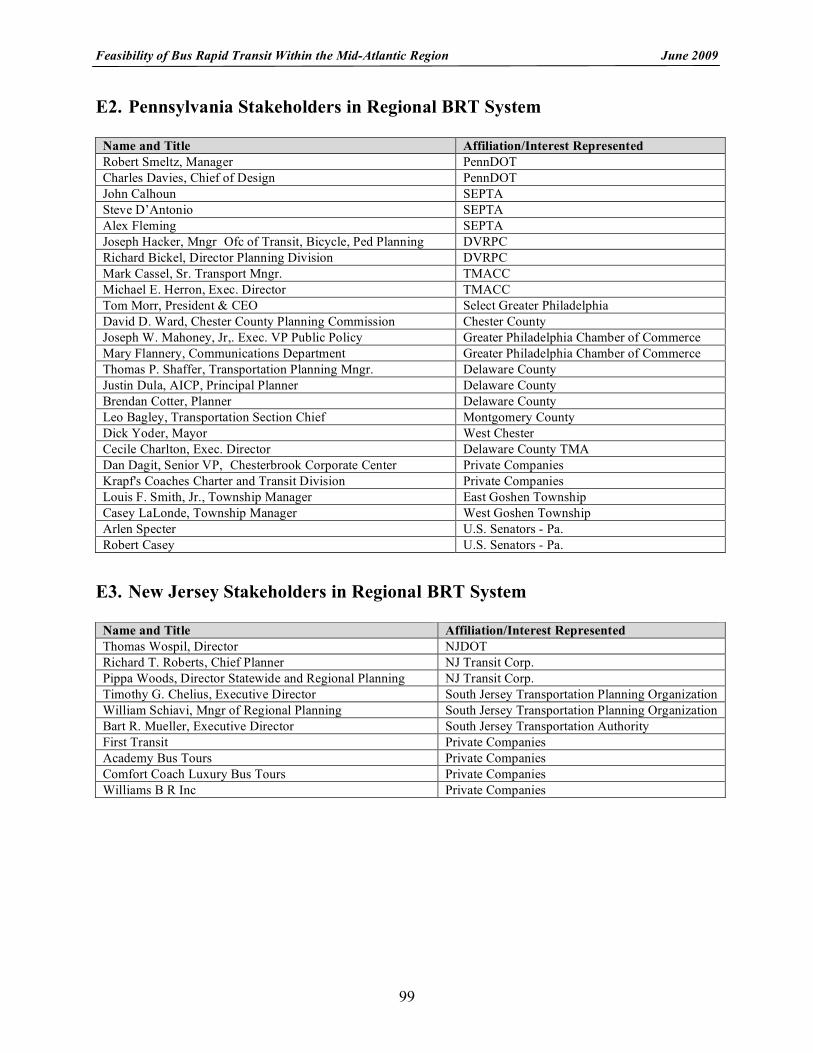
Feasibility of Bus Rapid Transit Within the Mid-Atlantic Region June 2009
99
E2. Pennsylvania Stakeholders in Regional BRT System
E3. New Jersey Stakeholders in Regional BRT System
Name and Title Affiliation/Interest Represented Robert Smeltz, Manager PennDOT Charles Davies, Chief of Design PennDOT John Calhoun SEPTA Steve D’Antonio SEPTA Alex Fleming SEPTA Joseph Hacker, Mngr Ofc of Transit, Bicycle, Ped Planning DVRPC Richard Bickel, Director Planning Division DVRPC Mark Cassel, Sr. Transport Mngr. TMACC Michael E. Herron, Exec. Director TMACC Tom Morr, President & CEO Select Greater Philadelphia David D. Ward, Chester County Planning Commission Chester County Joseph W. Mahoney, Jr,. Exec. VP Public Policy Greater Philadelphia Chamber of Commerce Mary Flannery, Communications Department Greater Philadelphia Chamber of Commerce Thomas P. Shaffer, Transportation Planning Mngr. Delaware County Justin Dula, AICP, Principal Planner Delaware County Brendan Cotter, Planner Delaware County Leo Bagley, Transportation Section Chief Montgomery County Dick Yoder, Mayor West Chester Cecile Charlton, Exec. Director Delaware County TMA Dan Dagit, Senior VP, Chesterbrook Corporate Center Private Companies Krapf's Coaches Charter and Transit Division Private Companies Louis F. Smith, Jr., Township Manager East Goshen Township Casey LaLonde, Township Manager West Goshen Township Arlen Specter U.S. Senators - Pa. Robert Casey U.S. Senators - Pa.
Name and Title Affiliation/Interest Represented Thomas Wospil, Director NJDOT Richard T. Roberts, Chief Planner NJ Transit Corp. Pippa Woods, Director Statewide and Regional Planning NJ Transit Corp. Timothy G. Chelius, Executive Director South Jersey Transportation Planning Organization William Schiavi, Mngr of Regional Planning South Jersey Transportation Planning Organization Bart R. Mueller, Executive Director South Jersey Transportation Authority First Transit Private Companies Academy Bus Tours Private Companies Comfort Coach Luxury Bus Tours Private Companies Williams B R Inc Private Companies
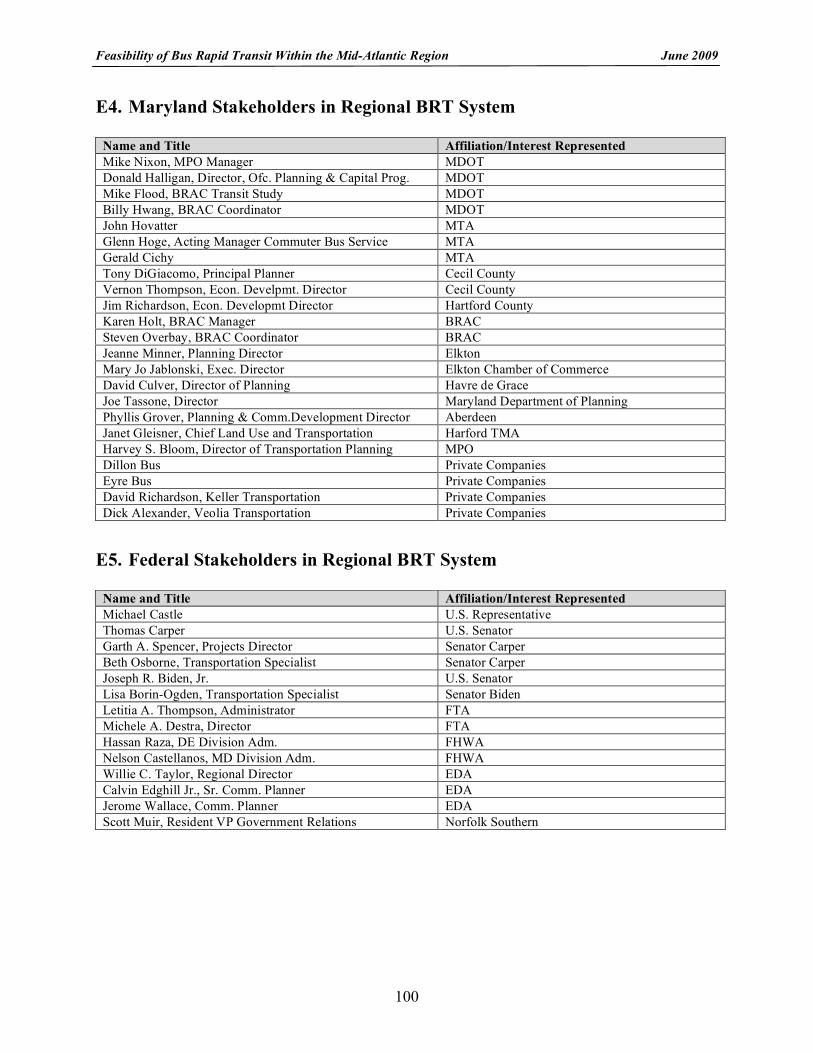
Feasibility of Bus Rapid Transit Within the Mid-Atlantic Region June 2009
100
E4. Maryland Stakeholders in Regional BRT System
E5. Federal Stakeholders in Regional BRT System
Name and Title Affiliation/Interest Represented Mike Nixon, MPO Manager MDOT Donald Halligan, Director, Ofc. Planning & Capital Prog. MDOT Mike Flood, BRAC Transit Study MDOT Billy Hwang, BRAC Coordinator MDOT John Hovatter MTA Glenn Hoge, Acting Manager Commuter Bus Service MTA Gerald Cichy MTA Tony DiGiacomo, Principal Planner Cecil County Vernon Thompson, Econ. Develpmt. Director Cecil County Jim Richardson, Econ. Developmt Director Hartford County Karen Holt, BRAC Manager BRAC Steven Overbay, BRAC Coordinator BRAC Jeanne Minner, Planning Director Elkton Mary Jo Jablonski, Exec. Director Elkton Chamber of Commerce David Culver, Director of Planning Havre de Grace Joe Tassone, Director Maryland Department of Planning Phyllis Grover, Planning & Comm.Development Director Aberdeen Janet Gleisner, Chief Land Use and Transportation Harford TMA Harvey S. Bloom, Director of Transportation Planning MPO Dillon Bus Private Companies Eyre Bus Private Companies David Richardson, Keller Transportation Private Companies Dick Alexander, Veolia Transportation Private Companies
Name and Title Affiliation/Interest Represented Michael Castle U.S. Representative Thomas Carper U.S. Senator Garth A. Spencer, Projects Director Senator Carper Beth Osborne, Transportation Specialist Senator Carper Joseph R. Biden, Jr. U.S. Senator Lisa Borin-Ogden, Transportation Specialist Senator Biden Letitia A. Thompson, Administrator FTA Michele A. Destra, Director FTA Hassan Raza, DE Division Adm. FHWA Nelson Castellanos, MD Division Adm. FHWA Willie C. Taylor, Regional Director EDA Calvin Edghill Jr., Sr. Comm. Planner EDA Jerome Wallace, Comm. Planner EDA Scott Muir, Resident VP Government Relations Norfolk Southern
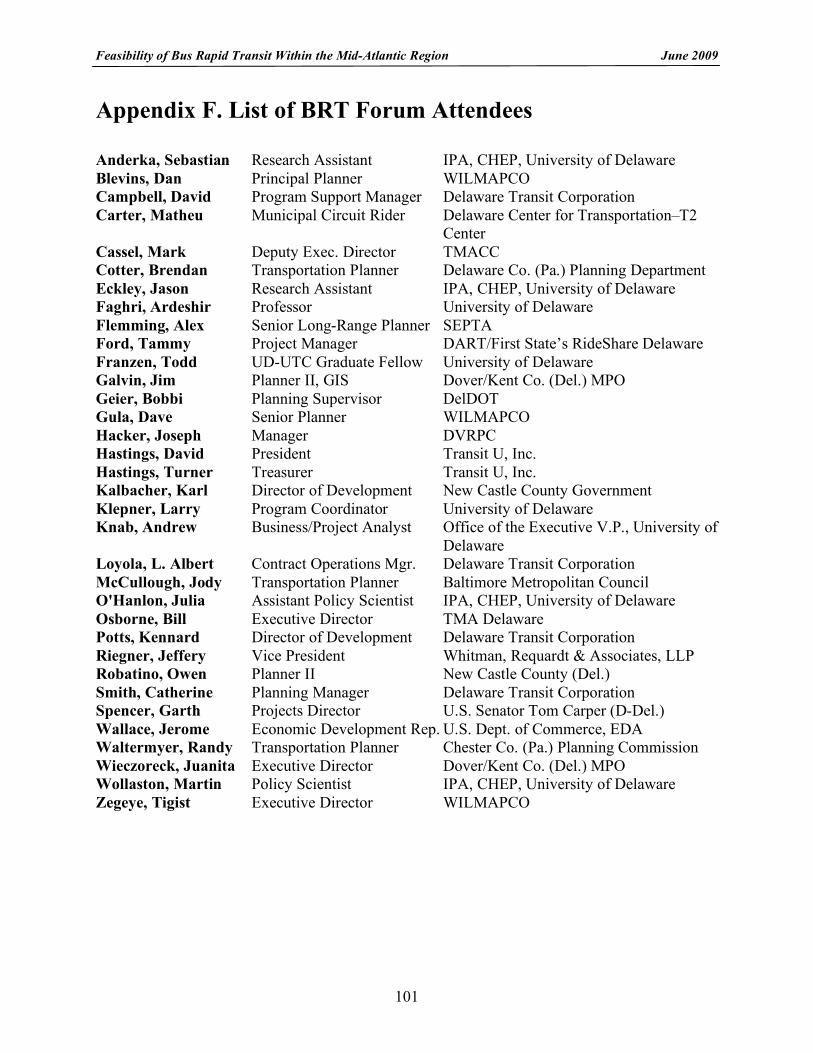
Feasibility of Bus Rapid Transit Within the Mid-Atlantic Region June 2009
101
Appendix F. List of BRT Forum Attendees Anderka, Sebastian Research Assistant IPA, CHEP, University of Delaware Blevins, Dan Principal Planner WILMAPCO Campbell, David Program Support Manager Delaware Transit Corporation Carter, Matheu Municipal Circuit Rider Delaware Center for Transportation–T2 Center Cassel, Mark Deputy Exec. Director TMACC Cotter, Brendan Transportation Planner Delaware Co. (Pa.) Planning Department Eckley, Jason Research Assistant IPA, CHEP, University of Delaware Faghri, Ardeshir Professor University of Delaware Flemming, Alex Senior Long-Range Planner SEPTA Ford, Tammy Project Manager DART/First State’s RideShare Delaware Franzen, Todd UD-UTC Graduate Fellow University of Delaware Galvin, Jim Planner II, GIS Dover/Kent Co. (Del.) MPO Geier, Bobbi Planning Supervisor DelDOT Gula, Dave Senior Planner WILMAPCO Hacker, Joseph Manager DVRPC Hastings, David President Transit U, Inc. Hastings, Turner Treasurer Transit U, Inc. Kalbacher, Karl Director of Development New Castle County Government Klepner, Larry Program Coordinator University of Delaware Knab, Andrew Business/Project Analyst Office of the Executive V.P., University of Delaware Loyola, L. Albert Contract Operations Mgr. Delaware Transit Corporation McCullough, Jody Transportation Planner Baltimore Metropolitan Council O'Hanlon, Julia Assistant Policy Scientist IPA, CHEP, University of Delaware Osborne, Bill Executive Director TMA Delaware Potts, Kennard Director of Development Delaware Transit Corporation Riegner, Jeffery Vice President Whitman, Requardt & Associates, LLP Robatino, Owen Planner II New Castle County (Del.) Smith, Catherine Planning Manager Delaware Transit Corporation Spencer, Garth Projects Director U.S. Senator Tom Carper (D-Del.) Wallace, Jerome Economic Development Rep. U.S. Dept. of Commerce, EDA Waltermyer, Randy Transportation Planner Chester Co. (Pa.) Planning Commission Wieczoreck, Juanita Executive Director Dover/Kent Co. (Del.) MPO Wollaston, Martin Policy Scientist IPA, CHEP, University of Delaware Zegeye, Tigist Executive Director WILMAPCO
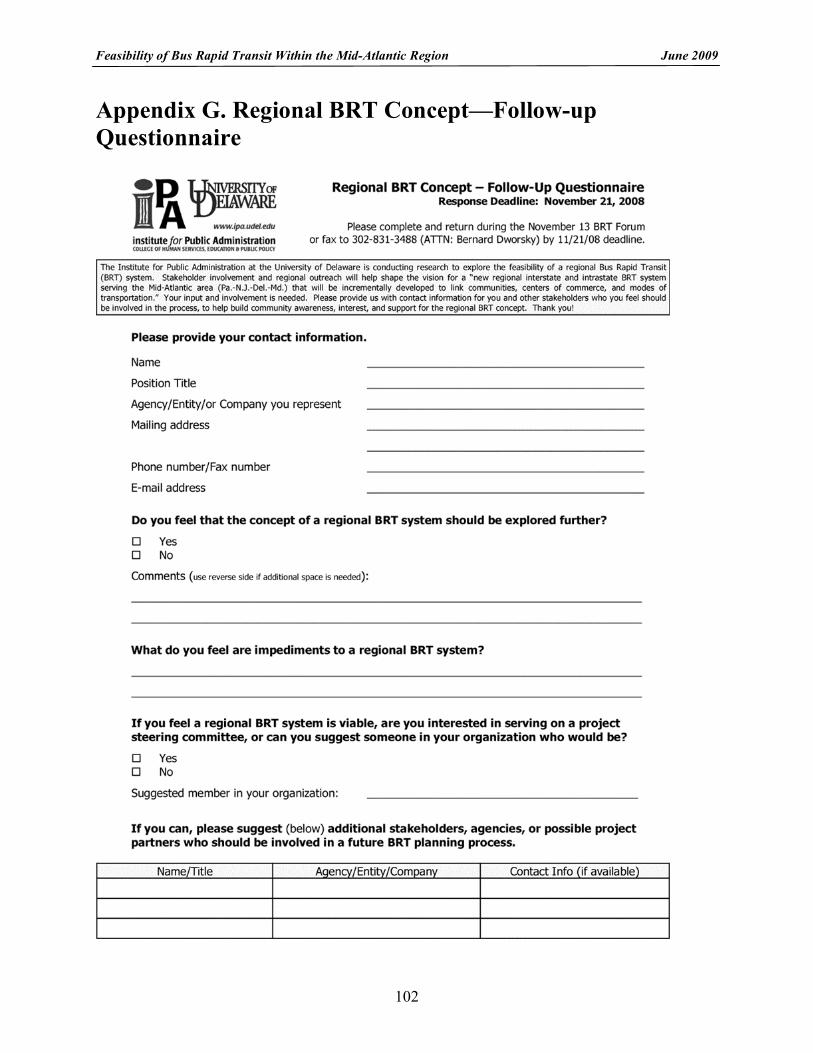
Feasibility of Bus Rapid Transit Within the Mid-Atlantic Region June 2009
102
Appendix G. Regional BRT Concept—Follow-up Questionnaire
Feasibility of Bus Rapid Transit Within the Mid-Atlantic Region June 2009
103
Appendix H. Response to Questionnaire Questionnaire Respondents: 15 Do you feel that the concept of a regional BRT system should be explored further? Yes 14 No 0 No Response: 1 Comments: Don't get locked in too early to one vision of a "regional BRT system." BRT comprises a variety of operating modes. We need to identify specific modes and services which will best meet our needs. Well BRT or something. How this fits in with the DE/MD/NJ/PA strategic transportation planning really answers this. This needs more brainstorming among stakeholders, like today. Focus should be quickly placed on an expressway corridor and one arterial corridor where a pilot project could move more quickly. Always thinking ahead to future projects is key. Coordination on regional level will increase the economic vitality of the region. Yes, but I would suggest identifying mobility needs before committing so early on to a particular mode. Also instead of a 'visionary' regional network, it might be better to select shorter candidate corridors. I agree that an inventory needs to be done on existing service that is essentially working and what the true needs of a BRT service. An extended study is fine, but some indication of broader support or will to implement is necessary. Suggest a BRT route for APG (Newark Train Station to Elkton Rd to I-95 to APG). NCC expects around 3,000-5,000 new residents by 2011 because of APG BRAC. I think the best venue to do so is in the framework of existing corridor studies (i.e., Blue Ball, Route 40, Route 13). BRT route selection should prefer corridors without decent parallel rail lines. Good rail service can carry more people more cost effectively than buses. Transit service from Delaware to Aberdeen Proving Ground can be done best with readily deployed express buses -- not BRT. I suggest a route starting in downtown Wilmington (for local bus connections), with a few stops at park-and-ride lots en route to APG. This route may be used by some Army employees who relocate to Delaware. When the Army relocated some employees from Center City Philadelphia
Feasibility of Bus Rapid Transit Within the Mid-Atlantic Region June 2009
104
to Fort Monmouth in the 1970s, four daily commuter buses carried some of them to work at Fort Monmouth from the Philadelphia area. But those people eventually retired, so by the late 1980s, only one daily bus made that trip. So transit demand from Delaware to Aberdeen may be heavy at first, but drop off over time. Due to the 2005 BRAC decision, the Mid-Atlantic region will be experiencing a rapid population expansion. The need for regional BRT has never been more critical. Start with low cost/no cost cooperation agreements for connecting service between regions and cities. What do you feel are impediments to a regional BRT system? If by "regional BRT system" we mean a whole new institution planning and running transit service, there is not so much an impediment as a lack of clearly identified need for something which duplicates existing arrangements. The focus should be on "regional BRT service" rather than a particular structure. Lack of achievable ROW within proposed corridors for busways. Length of corridors with different jurisdictions (esp. in PA, the traffic signals are owned by the municipalities), conflicting interests. Funding; changing the public's notion of BRT & mass transit; coordination between multi-jurisdictional. Gaining exclusive right-of-way a must for this BRT approach. I also doubt that there are sufficient densities to support a regional BRT system. Addition of park & rides - which is currently an issue, especially in Kent Co. Are we assured that enough capacity is available moving forward. Organization structure and lack of funds. Funding, space to build. Lack of sufficient density in suburban population/jobs. Mainly, building new road lanes or using existing lanes solely for buses. Will the motoring public accept that? Communications across jurisdictional and state lines. Funding; Delaware's growth policy, which tends to embrace the concept of a north-south linear city along the DE1/US13 corridor, is out of synch with other states and counties whose sustainable growth policies tend rather to embrace the concept of a southwest to northeast growth
Feasibility of Bus Rapid Transit Within the Mid-Atlantic Region June 2009
105
corridor with Amtrak/I-95/NJTP as its core infrastructure spine; and a meaning (sic) role for the DRBA. Funding. If you feel a regional BRT system is viable, are you interested in serving on a project steering committee, or can you suggest someone in your organization who would be? Yes: 13 No: 1 Maybe: 1 Suggested member of your organization: Yes, But the charter or authority of such a committee needs to be established before it starts meeting or taking action. Self; I would like to contribute info from the public commuter perspective on demands, use, and commuter patterns that could support this effort should it move forward. No, Limited staff time will likely preclude County involvement, but others like WILMAPCO can be involved and coordinate with us. If you can, please suggest (below) additional stakeholders, agencies, or possible project partners who should be involved in a future BRT planning process. Tony DiGiacomo, Principal Planner, Cecil Co. Planning Office; Clark Turner Signature Homes, Hartford Co. Cecile Charlton, DE County TMA; Jack Weber, Southern Chester Co. Org. on Transportation, Dee Durham, S.A.V.E., Rob Henry, Ex. Dir. Greater Valley Forge TMA (if this extends into that territory) DEDO, Gov's Ofc, City of Newark Rail passenger associations, who are also interested in bus service Dave Gula, WILMAPCO; Mike Kelly, BMC, City of Wilmington, Dept. Public Works/Transportation
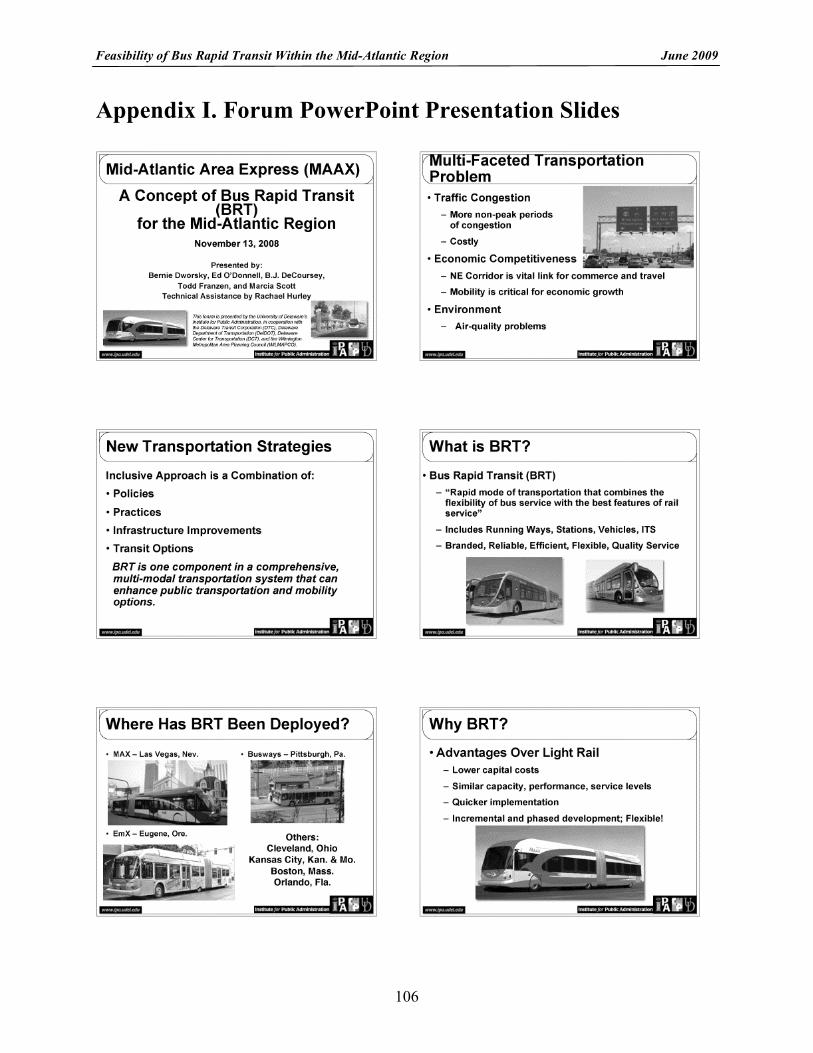
Feasibility of Bus Rapid Transit Within the Mid-Atlantic Region June 2009
106
Appendix I. Forum PowerPoint Presentation Slides
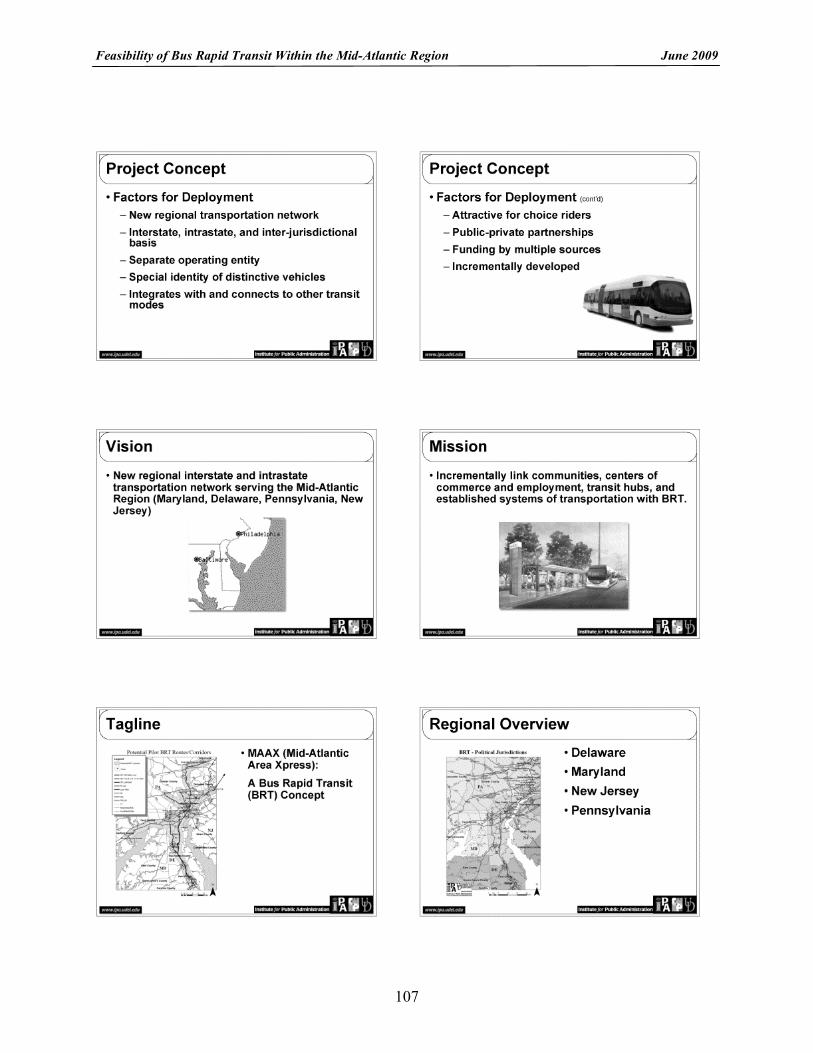
Feasibility of Bus Rapid Transit Within the Mid-Atlantic Region June 2009
107
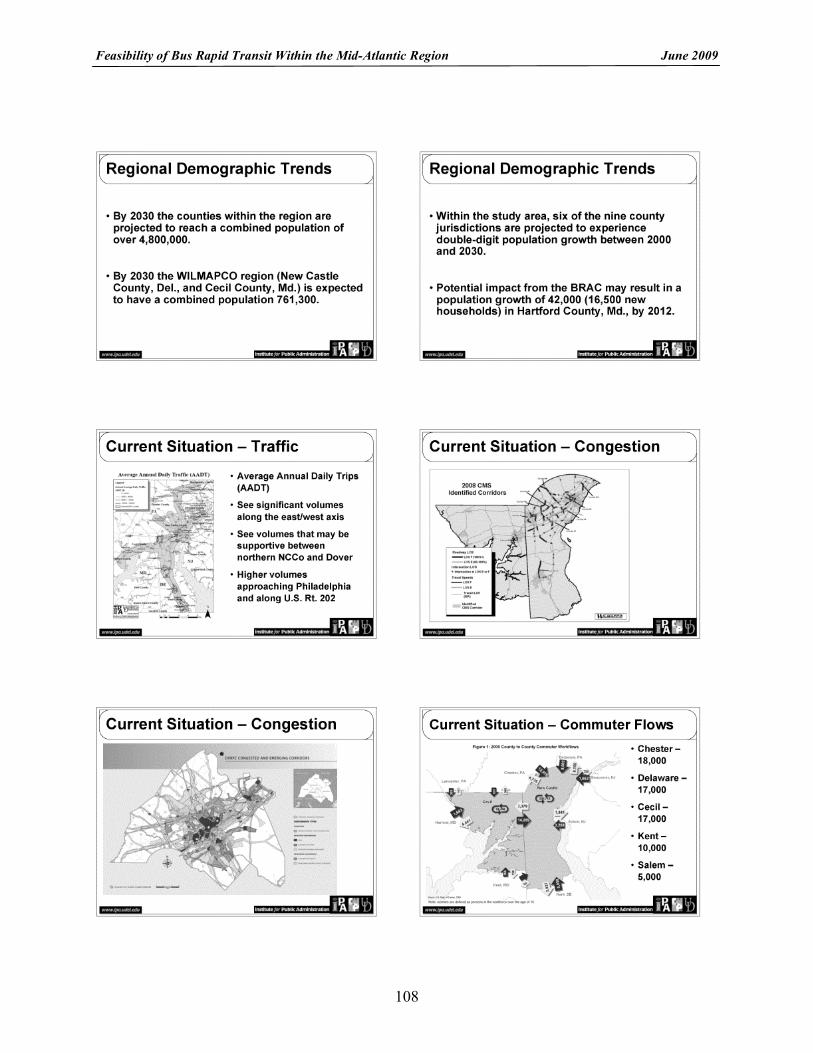
Feasibility of Bus Rapid Transit Within the Mid-Atlantic Region June 2009
108
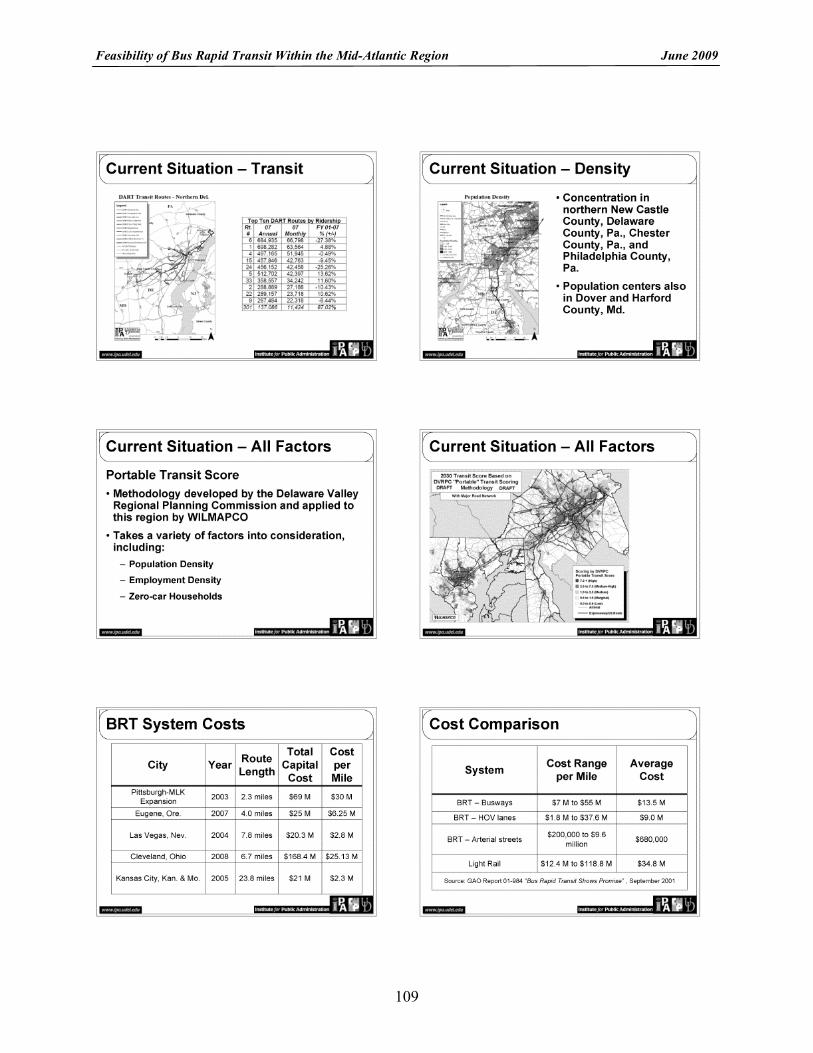
Feasibility of Bus Rapid Transit Within the Mid-Atlantic Region June 2009
109
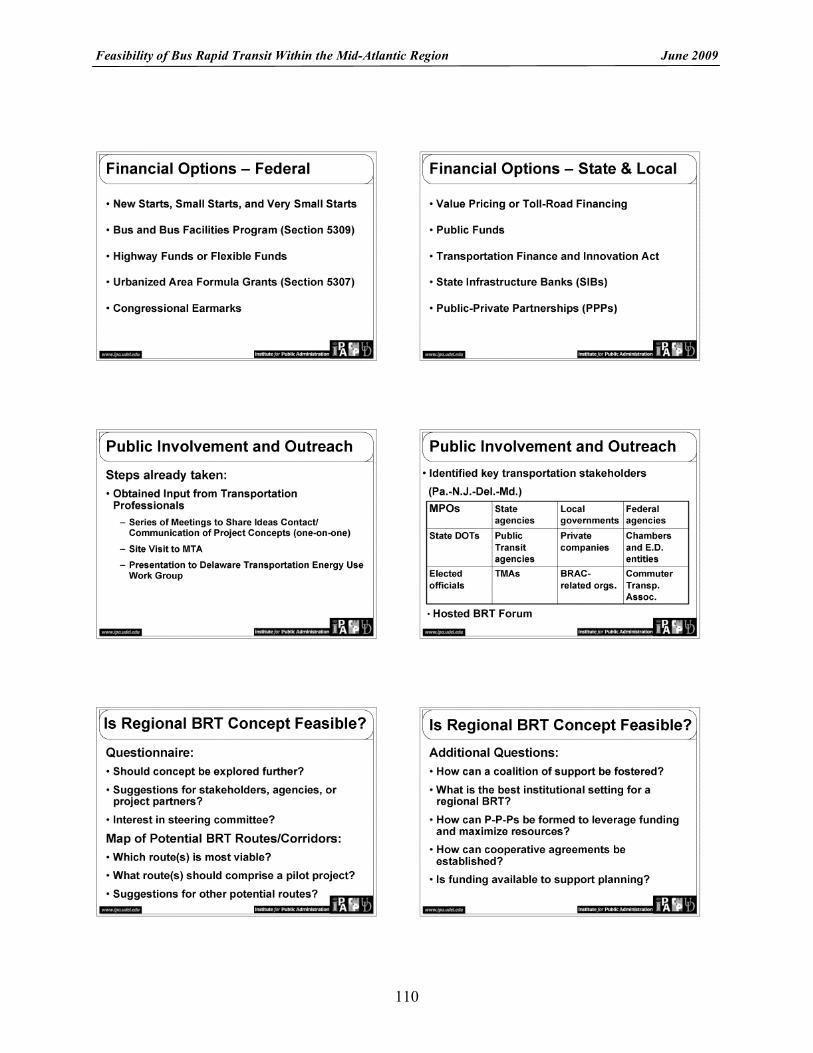
Feasibility of Bus Rapid Transit Within the Mid-Atlantic Region June 2009
110
Feasibility of Bus Rapid Transit Within the Mid-Atlantic Region June 2009
111
Feasibility of Bus Rapid Transit Within the Mid-Atlantic Region June 2009
112
Appendix J. Forum Proceedings Forum: “A Concept of Bus Rapid Transit for the Mid-Atlantic Region”
presented by the
Institute for Public Administration, University of Delaware in cooperation with the
Delaware Transit Corporation, Delaware Department of Transportation, and Wilmington Metropolitan Area Planning Council
and funded by the Delaware Center for Transportation
University of Delaware
John M. Clayton Hall Conference Center Thursday, November 13, 2008
Forum Proceedings – Group Discussion Moderator: Bernard Dworsky, Policy Scientist, Assistant Professor, and Project Manager Institute for Public Administration Opening remarks were made by Bernard Dworsky. This was followed by two videos that highlighted the concept of Bus Rapid Transit and planning/deployment of two systems in the United States. A PowerPoint presentation, “A Concept of Bus Rapid Transit for the Mid-Atlantic Region” was conducted by Bernard Dworsky, Edward O’Donnell, William J. DeCoursey, Todd Franzen, and Marcia Scott. A break period provided participants the opportunity to review a map of political jurisdictions, a WILMAPCO map of 2030 Transit Score based on DVRPC “Portable” Transit Scoring Methodology, a map of potential pilot BRT routes/corridors, and a description of the mapped routes/corridors. A “Regional BRT Concept – Follow-up Questionnaire” was provided to capture written input on the regional BRT concept, interest in serving on a future steering committee, and suggestions for additional stakeholders, agencies, or project partners. The group discussion focused on general reactions/feedback on the regional BRT concept, issues related to planning for regional mobility improvements and reaction/feedback on the map of potential pilot BRT routes/corridors. The following is an edited summary that captures the essence of the discussion. Mark Cassel (Transportation Management Association of Chester County [TMACC]) – What is the build out year for a BRT system or the time period for implementation. Bernard Dworsky (IPA) – I don’t think we’re at the stage where we can talk about a build out period. Generally, a preliminary planning phase can take at least two years. We’re happy to see representation today from TMAs and hope they can take a role in the planning process.
Feasibility of Bus Rapid Transit Within the Mid-Atlantic Region June 2009
113
Todd Franzen (IPA) – The case studies suggest that it can take several years from planning to engineering to implementation, depending on the size of the system. For example, one of the examples highlighted in the video today was the Euclid Corridor in the Greater Cleveland area. Planning began in around 1997 and the system became operational this fall. Dave Gula (WILMAPCO) – How do you envision the infrastructure for such a system? Ed O’Donnell (IPA) – It may be possible to pilot a route on an existing highway. Another possibility is the use of Norfolk Southern rail rights-of-ways to construct new dedicated highways. Dworsky –It is essential to have an interstate agreement in place to move forward with planning. An interstate agreement could tie the region together. David Campbell (Delaware Transit Corporation) – Aren’t you putting the cart before the horse? Transportation needs should be assessed before a plan for BRT is developed. It seems like IPA has already developed a vision for BRT. Dworsky – The scope of our project was to explore the feasibility of BRT in Delaware. Once we started conducting research, we quickly saw how BRT could address regional mobility needs. The purpose is not for IPA to develop the vision, but to explore whether BRT is a viable concept and should be explored further, possibly by a steering committee made up of regional leaders. Marcia Scott (IPA) – I think we need to assess the viability of the concept before planning moves forward. If IPA receives favorable feedback from participants of this forum on the concept, then it may be feasible to move forward into a preliminary planning phase. This phase is known as an Alternatives Analysis process that involves visioning, determining the best transit modal option or options, conceptual engineering for that option, looking at the institutional setting, and planning for financing and phased development. BRT is just one transit mode that may be considered to improve mobility. William DeCoursey (IPA) – In our research, the data shows that there is not enough existing density to support a light rail system, unless such a system is build to use as part of a focused economic development plan for the area. Jody McCullough (Baltimore Metropolitan Planning Council) – If this is a regional network, how long will the route be? It looks like a 200-mile area is under consideration to implement a BRT system. Is this the scope of the project? Dworsky – IPA considered a number of factors and data to propose some potential routes within the corridor. At this point, we don’t know which will be considered priority routes. Because of Delaware’s central location within the region, it can serve as a catalyst or linchpin to help make connections among transit service providers and modes of transit. It is important to look for regional transportation solutions to build the region as an economic force. The question is how do we fashion it to achieve this goal? However, it is not for IPA to decide, we would like to see
Feasibility of Bus Rapid Transit Within the Mid-Atlantic Region June 2009
114
a steering committee continue the preliminary planning process to decide the scope of transit improvements. Jeff Riegner (Whitman, Requardt & Associates, LLP) – Traditionally, BRT is not seen as a regional system. Most often, it serves commuters from suburbs of a metropolitan area and does not make regional connections. It seems that a regional system is being proposed without understanding if the regional need is there. I don’t think that BRT should be regarded as a regional solution to transportation problems. Todd Franzen (IPA) – The case studies showed that BRT can start small and be built incrementally. In the video example of Fort Collins, Colorado, the BRT system has been planned to serve the immediate area with the potential for phased development and expansion south to the Loveland and Denver areas. Owen Robatino (New Castle County Planning) – I share the concerns of other participants that BRT is being proposed as the only transit solution. I think that the focus should be to pursue BRT where rail is not a viable option such as along U.S. Route 202. Plans have been considered to enhance passenger rail along the North East Corridor and downstate in Delaware. If BRT is implemented, plans for better rail service may not happen. Dworsky – We have to keep out of this “either/or” scenario. BRT is being considered as part of the solution to solve regional mobility problems. BRT is just one aspect of a family of regional, multi-modal transit options that includes filling gaps of Amtrak service, light rail, commuter bus, and traditional transit. Ed O’Donnell (IPA) –In many cases, BRT has served has a placeholder for future light rail service that can’t be implemented as quickly or cheaply as BRT. Randy Waltermyer (Chester County Planning Commission) – It may make sense to adjust the title of the project to “Exploring Mobility Alternatives to Driving in the Region,” so it is not assumed that BRT is the only solution. [U.S. Route] 202 has undergone extensive construction to improve mobility and full implementation of BRT may never happen. While the ideal would be to improve transit services along [U.S. Route] 202, signal prioritization is the only aspect of BRT that may happen along that corridor. Karl Kalbacher (New Castle County Office of Redevelopment) – The conditions are right to consider BRT. The Maryland Transportation Agency (MTA) is not waiting to make regional mobility improvements; they are working proactively to make these improvements happen. MTA is looking at transportation implications resulting from the base realignment (BRAC) and redeployment of personnel from Fort Monmouth, New Jersey to Aberdeen, Maryland. MTA has already proposed a new commuter express bus route alignment to/from Aberdeen, Maryland to Newark/Christiana, Delaware. The estimated cost to run that line was $700,000. New Castle County surveyed the Monmouth military personnel and found that about one-third are planning to move to New Castle County, Delaware during the BRAC implementation period through 2012. We need to act now if we want to capture those residents.
Feasibility of Bus Rapid Transit Within the Mid-Atlantic Region June 2009
115
Mike Herron (TMACC) – Planners have talked about rail, cross county connections, regional transportation improvements. People will continue to talk and not get anywhere. It has to start with some kind of a vision. BRT can be a placeholder for BRT. I believe that the [U.S. Route] 202 corridor is an ideal candidate for BRT. We need to pick a corridor and focus improvements on it as a pilot area. Another problem is Coatesville, Pennsylvania. It has a viable rail infrastructure and it is possible to expand regional light rail in Chester County from that point. We need to look at the range of solutions and focus on what can be done in the short term and what should be done in the long term. Jerry Wallace (Economic Development Administration) – I’m just an ordinary transit rider. I’m kicking it down a notch. I’m just trying to get to work [and travel to/from Wilmington and Philadelphia]. One priority is to look at transit gaps and make regional connections among existing transit service and regional providers. We need to get DVRPC, SEPTA, DART, and WILLMAPCO all in agreement. Dworsky – We met with Stephen Kingsberry about the new service. O’Donnell – BRT could have the potential to serve as a feeder system and connect existing transit service. If we make transit improvements, the emphasis can’t be on competing systems but making seamless connections among existing and future transit services for all modes. Scott – This is one reason why MTA did not seek federal funding to implement transit improvements. They identified a need for commuters within the Baltimore Metropolitan Area and moved forward with implementation of a commuter express bus service. William DeCoursey – The focus needs to concentrate on which routes are most appropriate for mobility improvements, not just for BRT implementation. Reigner – Again, the process seems premature. The need should be identified then planning should be based on the need. Why don’t you look for a group that is undertaking a similar study including a BRT option and find out how they went about their planning process? The focus of the group should be advocacy for current planning initiatives rather than just BRT. Joseph Hacker (Delaware Valley Regional Planning Commission) – Are we thinking too much like planners? If you let federal financing guide your decision to move forward with the concept, forget it. There is no way that you’ll get more than 50 percent in federal funding for this initiative if you get any at all. We should be thinking more like business investors. A committee should be comprised of developers, business people, realtors – not just planners. Those are the people who will invest in improvements. Let’s ask – if we were going to make money on this, whom would we involve? We want to engage people who have a vested interest in transportation improvements and build a system around them. Herron – Unfortunately, we [TMACC] have been subject to the pitfall of promises of support from major companies in the area. Chester County is home to some of the largest U.S. based corporations and major national developers. But transit and mobility improvements are a tough sell to these large companies. The reality is that we will need a combination of federal, state,
Feasibility of Bus Rapid Transit Within the Mid-Atlantic Region June 2009
116
local, and private investment to move forward with improvements like BRT. I would strongly recommend that we engage private businesses and potential investors in the planning process, but not rely on them to fund transit and transportation improvements. Tigist Zegeye (WILMAPCO) – I would suggest looking at transportation improvements as a whole on a regional level rather than just concentrating on BRT. The federal government is changing its investment criteria to look at transportation needs in general, not just implementation of one transportation mode. We need to frame the problem based on regional transportation issues, performance measures, and needs such as mobility or congestion. This approach is similar to the way the I-95 Corridor Coalition frames its issues then proposes regional comprehensive solutions. I would also suggest costing out what it would cost to finance one mile of highway to include with your comparison of BRT and LRT. Bobbi Geier (Delaware Department of Transportation) – I concur that the federal government will be taking a new direction on transportation investments. We need to look at integrating all modes of transit and take advantage of this flexibility of funding. Cassel – Eugene, Oregon and other BRT systems seem to have peak commuting and other needs that support development of BRT. We need to have companies help identify future workforce access issues. In other words, where do commuters reside, and where will they work? It’s hard to make that case now given today’s economy. We need to have access to long-term business planning data to understand commuting needs 20- to 30-years out. This may the hook to get them engaged in the planning process. Also, good employment projections of top area employers are needed. Kennard Potts (Delaware Transit Corporation) – There are examples of successful interjurisdictional transit agreements that may serve as models for a regional BRT system. A successful bi-state operation in rail exists between SEPTA and DART First State (R2 line) which has been in existence since 1989. SEPTA also will have in February two bus routes that transcend the state line into Delaware. DART First State operates in Elkton, Maryland and is supported by MTA. Ocean City, Maryland’s transit service extends into Fenwick Island, Delaware. Astra Zeneca is an example of a private company that provides a shuttle service for its employees. There are numerous examples of transit entities that have gone forth and now operate transit service for choice riders on a regional basis. My problem is that existing transit agencies will be reticent about establishing a separate operating entity because it will be competing for limited federal funding. While the concept of BRT is highly desirable and is endorsed by DART First State, transit agencies do not want to be put in a position to compete for funding. We should also continue to press for commuter rail to address the gap between Wilmington, Delaware and Washington, D.C. O’Donnell – Have you sensed reticence on the part of transit agencies? Potts – Because of the current economic landscape, the reality is that it will be difficult to propose a separate operating entity that is vying for federal funds. It makes more sense for an
Feasibility of Bus Rapid Transit Within the Mid-Atlantic Region June 2009
117
existing transit agency to propose an expansion of service across state lines and have the adjacent state transit agency support a portion of costs [e.g. commuter rail or commuter express bus]. Waltermyer – It should be noted that some of the corridors identified for BRT service, such as SR 42 and SR 52 don’t even have transit now. A helpful exercise would be to look at each corridor and determine the spectrum of what transit exists and at what level. Identification of gaps in transit service and needs is a first step. A second step may then be to develop a logical progression of transit needs for each identified corridor. Quite frankly, “the pot is yet to be boiling” for many of the potential corridors identified on the map. Another need is to identify gaps in basic transportation infrastructure, such as crosswalks, that need to be in place before transit improvements can be considered. Hacker – We need to turn the equation around backwards. Transit nodes can’t be a first consideration. Land use policies must be considered and married with transit use. The principles of Transit Oriented Development must come into play. A developer should be willing to support transit investments concurrently to planning for development. Riegner – That would be a way to create a win-win situation by capturing value in TOD. That approach would also avoid the hassels with federal involvement. Dan Blevins (WILMAPCO) – The transit score methodology considers levels of appropriateness for each different transportation mode. If we want to pursue funding, we need to prove the case through long-range planning, showing that based on this methodology, the transportation mode will affect land-use and congestion in this manner. Geyer – Some of this integrated planning is already underway. In Delaware, sub-area planning is part of the overall planning process as it incorporates transportation planning with land use planning. In Middletown, developers came together with the comprehensive plan to initiate sub planning. Larry Klepner (University of Delaware) – It is essential that land use planners be involved proactively in transportation planning, such as increasing density through less parking. The ideal is a symbiosis of planners working in tandem with transportation planners. Cassel – A first step or quick win may be to get information out and educate municipal governments about BRT and that “your corridor has been identified as an area for transportation improvement.” Then provide a list of the land-use policies that should be considered in order to implement a system such as BRT. O’Donnell – Local governments should be informed that a transportation corridor(s) has been identified of which BRT may be a solution. Local governments need to consider land use policies that are transit supportive. DeCoursey – This suggests the need for a steering committee that has authority to issue such as statement.
Feasibility of Bus Rapid Transit Within the Mid-Atlantic Region June 2009
118
Dworsky –Part of what we want from this discussion today is a statement of interest from you to carry this project forward. Herron – IPA doesn’t have the political clout to issue a directive to local governments. This points to the need for a multi-state committee to issue press releases and publicity on the planning process. Dworsky – On the other hand, IPA is regarded as a neutral entity that does not have a personal stake in a regional planning process. IPA’s role is to serve as a catalyst to explore the concept and could have a future role to support a steering committee, convene stakeholders, and direct a public engagement process. Al Loyola (Delaware Transit Corporation) – We would like to see more money for operating transit, especially if we’re thinking about operating a separate entity. Delaware Transit Corporate has a good recovery rate for public transit. We would like to see more information on operation costs. Nationally, what are other systems recovering for cost? Can an analysis be conducted on recovery costs of BRT systems? Brendan Cotter (Delaware County, Pennsylvania Planning Department) – I don’t think that we should embark on an analysis until this of the mode of travel that results from an Alternatives Analysis study. Unless there is a “thumbs up” from us today to move forward I don’t think a more in-depth analysis should be conducted. I would like to receive more detailed information or statistics on existing and proposed BRT systems. Dworsky – Yes, that’s the sense that we’d like to get today. Is it worth pursing this concept and moving forward with additional studies? Waltermyer –We should do the homework on this and proceed cautiously. Klepner – Would this system charge premium fares, or are the fares the same as regular transit? Franzen – Most of the other systems that we researched used the same fares for their BRT service because the service was integrated with the transit system and not viewed as separate. Robatino – How is BRT different than conventional bus service. I don’t want to create confusion between BRT service and long-distance express service. Dworsky – BRT systems have much more limited stops all the routes than conventional bus services. McCullough – I believe that it would be valuable to conduct an inventory of what transit is currently available in the region, where there is a lack of connection points, and where transit transfer points are available or needed. This will help us to define the need for regional transportation improvements – what are the missing pieces in providing regional transit?
Feasibility of Bus Rapid Transit Within the Mid-Atlantic Region June 2009
119
Wallace – That is my point. Kick it down a notch. Connection needs should be identified. For example, when Septa’s R2 doesn’t run, what are the available transit options ensure mobility for those who rely on transit? Gula – The idea of branding something that is a higher level of service is a good idea. Where transit ridership and demand exists, beef up the service level. The analysis is already in place – we should consider what do transit riders need that there is a lack of funding to support? Serving a regional need is good; establishing a premium service is good – the pay off could be there if public-private-partnerships are established. Blevins – We also need to good data to justify the need for transit service enhancements. For example, predicting ridership to and from employment areas is essential for service planning. Is the 2010 Census going to provide reliable data? We need to know origin-destination data by zip code that can’t be obtained from public sources. Alex Flemming (SEPTA) – Where is the gap in rail service? How far up does the MARC service go? Dworsky – The MARC service stops in Perryville, Maryland. There is presently a 20-mile gap in passenger rail service between Newark, Delaware and Perryville, Maryland. [The presence of Bill Osborne of the Transportation Management Association of Delaware (TMA of DE) is acknowledged]. Can TMA of DE take the lead on this? Bill Osbourne (TMA of DE) – Since DTC supports the concept, TMA of DE and TMACC can share the lead! Herron – As a step forward, let’s develop an e-mail distribution system to keep everyone in the loop. Wrap Up by Dworsky: Please complete the questionnaire to provide us with your contact information, input on the BRT concept, and whether you or another individual from your organization would like to be involved in a steering committee. Please put the completed questionnaires in the box out front or fax it back to IPA. The discussion was valuable and we appreciate your time here today.
Feasibility of Bus Rapid Transit Within the Mid-Atlantic Region June 2009
120
Appendix K. Citations Aberdeen Proving Ground-CSSC Regional BRAC Office. “BRAC & Aberdeen Proving
Ground.” Retrieved August 11, 2008, from www.apg-ccs.com American Highway Users Alliance. Unclogging America’s Arteries 1999-2004. Retrieved July
10, 2008, from www.highways.org/pdfs/bottleneck2004.pdf American Public Transportation Association. (2008). “Public Transportation Reduces
Greenhouse Gases and Conserves Energy.” Retrieved August 5, 2008, from www.apta.com/research/info/online/documents/greenhouse_brochure.pdf
Bickel, Richard and Hacker, Joseph. (2008, April 16). “Transit Oriented Development in the
Philadelphia Region.” Presentation at Transit Oriented Development Interagency Meeting at University of Delaware.
Blakesley, Jayme. (2007, August 7). “Transit Joint Development.” Presentation to 2007 State
Public Transit Partnerships Conference. Retrieved August 11, 2008, from www.railvolution.com/rv2007_pdfs/rv2007_203b.pdf
Breakthrough Technologies Institute. (2007, March). “Go BRT! High Quality Rapid Transit for
the 21st Century.” Retrieved August 6, 2008, from www.gobrt.org/BTIBRTFactSheet.pdf BRT Policy Center. (n.d.). “Funding BRT in the U.S.” Retrieved September 20, 2007, from
www.gobrt.org/funding2.html Callaghan (2007, November 15). “Funding Bus Rapid Transit in the U.S.” Washington, D.C.:
Breakthrough Technologies Institute. “Castle Bill Aims to Keep Americans from Wasting Billions of Gallons of Fuel in Traffic.”
(2008, July 8). Retrieved August 5, 2008, from www.i95coalition.org/PDF/Whatsnew/Castle%20Bill%20-%20HR%206435.pdf
Currie, G. (2006). Bus Transit Oriented Development – Strengths and challenges relative to rail.
Journal of Public Transportation 9 (4). Delaware Code. Title 20, Transportation. Chapter 20, “Public-Private Initiatives Program in
Transportation.” Retrieved August 11, 2008, from http://delcode.delaware.gov/title2/c020/index.shtml#TopOfPage
Delaware Code. Title 22, Municipalities. Chapter 17, “Municipal Tax Increment Financing Act.”
Retrieved July 21, 2008, from http://delcode.delaware.gov/title22/c017/index.shtml#TopOfPage
Feasibility of Bus Rapid Transit Within the Mid-Atlantic Region June 2009
121
Delaware Code. Title 22, Municipalities. Chapter 18, “Special Development Districts.” Retrieved July 21, 2008, from http://delcode.delaware.gov/title22/c018/index.shtml#TopOfPage
Delaware Department of Transportation (DelDOT), State of Delaware. (2007). Traffic Counts
data, 1990-2007. Delaware Transit Corporation. (2007). Delaware Area Rapid Transit (DART) Routes and
Ridership Data, 2001-2007. Delaware Valley Regional Planning Commission. (2006). Congestion Management Process,
“Limiting Traffic Congestion and Achieving Regional Goals.” Retrieved October 12, 2008, from www.dvrpc.org/transportation/longrange/CMP.htm
Delaware Valley Regional Planning Commission. (2007). Creating a Regional Transit Score
Protocol: Full Report. Retrieved September 29, 2008, from www.dvrpc.org/asp/pubs/reports/07005.pdf
Delaware Valley Regional Planning Commission. (n.d.) “Traffic Congestion.” Retrieved
September 29, 2008, from www.dvrpc.org/planning/longrange/indicators/past/traffic.htm. Diaz, R. and D. Schneck. (2000). American Public Transportation Association’s 2000 Bus &
Paratransit Conference Proceedings paper. “Innovative Service Design among Bus Rapid Transit Systems in the Americas.”
DNREC Secretary’s Order 2008-A-0011. (2008, April 1). “RE: Approval as Final Plan the
Proposed Revisions to the State Implementation Plan for the Attainment of Fine Particle for National Ambient Air Quality Standard.” www.dnrec.delaware.gov/Info/Documents/2008A0011.pdf
Federal Highway Administration (FHWA). (n.d.) “CMAQ Congestion Brochure.” Retrieved
August 5, 2008, from www.fhwa.dot.gov/environment/cmaq/problem.htm Federal Highway Administration (FHWA). (2005, Fall). “Innovative Finance Quarterly.”
Retrieved July 7, 2008, from www.fhwa.dot.gov/innovativefinance/ifq1101.htm Federal Highway Administration (FHWA). (n.d.) “Key Transportation Challenges.” Retrieved
August 4, 2008, from www.ops.fhwa.dot.gov/freight/freight_analysis/freight_story/congest.htm
Federal Highway Administration (FHWA). (2008). “Public-Private Partnerships.” Retrieved
from July 23, 2008, from www.fhwa.dot.gov/ppp/private_activity_bonds.htm Federal Highway Administration (FHWA). (2005, August 25). Safe, Accountable, Flexible,
Efficient Transportation Equity Act: A Legacy for Users—A Summary of Highway Provisions.
Feasibility of Bus Rapid Transit Within the Mid-Atlantic Region June 2009
122
Federal Highway Administration (FHWA). (2008, August). Freeway Management Program.
“Federal-Aid Highway Program Guidance on HOV Lanes.” Retrieved September 9, 2008, from www.ops.fhwa.dot.gov/freewaymgmt/hovguidance/chapter2.htm#chp2a
Federal Highway Administration (FHWA). (n.d.) “Value Pricing Pilot Program.” Retrieved July
14, 2008, from www.ops.fhwa.dot.gov/tolling_pricing/value_pricing/ Federal Register (2005, November 30). “FTA Transit Program Changes, Authorized Funding
Levels and Implementation of the Safe, Accountable, Flexible, Efficient Transportation Equity Act: A Legacy for Users; Notice.”
Federal Transit Administration (FTA). (2005, September). “Authorized Fact Sheet: Urbanized
Area Formula Grants.” Retrieved April 17, 2008, from www.fta.dot.gov/documents/FTA_Urbanized_Formula_Fact_Sheet_Sept05.pdf
Federal Transit Administration (FTA). (n.d.). “Bus Rapid Transit.” (n.d.). Retrieved August 11,
2008, from www.fta.dot.gov/assistance/technology/research_4240.html Federal Transit Administration (FTA). (2007, June 8). Final Guidance on New Starts/Small
Starts Policies and Procedures. Federal Transit Administration (FTA). (n.d.). “Introduction to New Starts.” Retrieved January
15, 2008, from www.fta.dot.gov/printer_friendly/planning_environment_2608.html Federal Transit Administration (FTA). (2007, January). “Small Starts Fact Sheet.” Retrieved
January 15, 2008 from www.fta.dot.gov/documents/Small_Starts_Fact_Sheet_Mar_20.doc
Federal Transit Administration (FTA). (2007, July 20). Updated Interim Guidance and
Instructions: Small Starts Provision of the Section 5309 Capital Investment Grants Program.
Federal Transit Administration (FTA). (2007, January). “Very Small Starts Fact Sheet.”
Retrieved January 15, 2008, from www.fta.dot.gov/documents/Very_Small_Starts_Fact_Sheet_Feb_7th(1).doc
Federal Transit Administration (FTA). (n.d.). Office of Planning and Environment. “FTA Major
Capital Transit Investment Fact Sheet: New Starts Project Development.” Retrieved July 7, 2008, from www.fta.dot.gov/documents/New_Starts_PD_Fact_Sheet_9-18-07(1).doc
Federal Transit Administration. (FTA) (2004). Office of Research, Demonstration and
Innovation. “Characteristics of Bus Rapid Transit for Decision-Making (CBRT)”. Washington, D.C.
Feasibility of Bus Rapid Transit Within the Mid-Atlantic Region June 2009
123
Gray, George, N. Kelley, and T. Larwin. (2006). Bus Rapid Transit: A Handbook for Partners. Mineta Transportation Institute (MTI) Report 06-02, San Jose State University, CA.
I-95 Coalition. (2008, July 8). “Castle Bill Aims to Keep Americans from Wasting Billions of
Gallons of Fuel in Traffic.” Retrieved July 9, 2008, from www.i95coalition.org/PDF/whatsnew/Castle%20Bill
Institute for Transportation & Development Policy. (2007). Bus Rapid Transit Planning Guide.
New York, NY. Kittelson & Associates, Inc., Herbert S. Levinson Transportation Consultants and
DMJM+Harris. (2007) Transit Cooperative Research Program, Report 118, “Bus Rapid Transit: Practitioner’s Guide.”
KPMG. (2006 and 2005, June 30). “Delaware Transportation Authority Transportation Trust
Fund: Financial Statement and Independent Auditor’s Report.” Retrieved on July 23, 2008, from http://auditor.delaware.gov/Audits/FY2006/Financial%20and%20Compliance/FY06_FS_DETTF.pdf
Lane Transit District. (2007). Retrieved September 19, 2007, from
www.ltd.org/search/showresult.html?versionthread=a1cbe9cb209dc731de6c63f6c40ace93. Levinson, Herbert, et al. (2003) Transit Cooperative Research Program, Report 90, Bus Rapid
Transit. “Volume 1: Case Studies in Bus Rapid Transit.” Light Rail Central. (2008). Retrieved May 31, 2008, from www.lightrail.com. Light Rail Now: Light Rail Progress. (2008) Retrieved May 23, 2008, from
www.lightrailnow.org. Maryland Department of Transportation (MDOT). (2008). 2008 Annual Attainment Report.
Retrieved January 15, 2008, from www.mdot.state.md.us/Planning/Plans%20Programs%20Reports/Reports/Attainment%20Reports/2008%20Attainment%20Report.pdf
Maryland Department of Transportation (MDOT). (2008). Consolidated Transportation
Program (CTP) FY 2008-2013. Retrieved January 15, 2008, from www.e-mdot.com/Planning/Plans%20Programs%20Reports/Programs/CTP%2008-
13/Cover_ToC/CTP%2008%20Introduction.pdf Maryland Department of Transportation (MDOT). (2008, May 21). “Governor O’Malley, BPW
Fuel Expansion of Successful Commuter Bus Program.” Retrieved August 12, 2008, from www.mdot.state.md.us/News/2008/May%202008/Commuter%20Bus%20Program
Feasibility of Bus Rapid Transit Within the Mid-Atlantic Region June 2009
124
Maryland Department of Transportation (MDOT), State of Maryland. (2006). Traffic Count Data.
Maryland Transit Administration. (n.d.). MTA Commuter Bus Service. Retrieved January 17,
2008, from www.mtamaryland.com/services/commuterbus/ Mathis, Mike. (2003, June 30). “Improved Traffic Flow a Goal of Cross County.” Philadelphia
Business Journal. Retrieved August 15, 2008, from http://philadelphia.bizjournals.com/philadelphia/stories/2003/06/23/focus3.html?page=1
Montgomery County Planning (n.d.). “Public & Private Project: Silver Spring Transit Center/Air
Rights Development.” Retrieved August 7, 2008, from www.mc-mncppc.org/silverspring/private_projects/ss_transit.shtm Naparstek, Aaron. (2008, April 29). “Chicago Gets NYC’s Congestion Pricing Money.” Livable
Streets Network. Retrieved August 11, 2008, from www.streetsblog.org/2008/04/29/chicago-gets-nycs-congestion-pricing-money/
Neighborhood Capital Budget Group (2005). “Transit and TIFs.” Retrieved July 21, 2008, from www.ncbg.org/transit/transit_tifs.htm New Jersey Department of Transportation (NJDOT). (2007). Traffic Count Data. Pennsylvania Department of Transportation (PennDOT). (2008). “Public
Transit/Carpooling/Shuttle Services.” Retrieved July 21, 2008, from www.us202.com/us202-construction/public-transit-carpooling-shuttle-services.aspx
Pennsylvania Department of Transportation (PennDOT). (2006). Traffic Count Data. P.L. 109-59 2005. Safe, Accountable, Flexible, Efficient Transportation Equity Act: A Legacy for
Users. Title III, Sec. 3011, (a), subsection (3) New Fixed Guideway Capital Project. P.L. 109-59 2005. Safe, Accountable, Flexible, Efficient Transportation Equity Act: A Legacy for
Users. Title III, Sec. 3011, (c) subsection (1) Grant Requirements. Port Authority of Allegheny County. (2007). Retrieved September 24, 2007, from
www.portauthority.org/PAAC/CustomerInfo/BuswaysandT/tabid/111/Default.aspx. Ratledge, Edward. (2005, September). “Comprehensive Economic Development Strategy:
Economic and Demographic Overview.” Newark, Delaware: UD Center for Applied Demography and Survey Research.
Reed, James B. (2008, February). “The State Surface Transportation Funding Crisis.” National Conference of State Legislatures: Legisbrief (Vol. 16, No. 8)
Feasibility of Bus Rapid Transit Within the Mid-Atlantic Region June 2009
125
Regional Transportation Commission of Southern Nevada. (2007). Retrieved October 3, 2007, from www.rtcsouthernnevada.com/max.
Report to the Traffic Congestion Mitigation Commission and Recommended Implementation
Plan. (2008, January 31). Retrieved August 11, 2008, from www.nysdot.gov/portal/page/portal/programs/repository/TCMC-Final-Report.pdf
Sage Policy Group, Inc. (September 2007) Aberdeen Proving Ground BRAC: Impacts on Seven Jurisdictions. Schrank, D. and Lomax, T. (2007, September). 2007 Urban Mobility Report. Texas
Transportation Institute. Retrieved July 31, 2008, from http://tti.tamu.edu/documents/mobility_report_2007.pdf
Schuerman, Matthew. (2008. September 1). “Private Donations Up to Department of
Transportation.” Retrieved September 3, 2008, from www. wnyc.org/news/articles/107625?printable South Jersey Tranportation Planning Organization. Congestion Management System: Phase II
Update, Final Report and Technical Memorandum. www.sjtpo.org/CMS-Final%20Report-June2003.pdf. The Bus Rapid Transit Policy Center. (2007). Retrieved October 10, 2007 from www.gobrt.org. The Lincoln Institute of Land Policy (March 2007). “Megaregions, the U.S. and Europe.” Retrieved September 18, 2008, from
www.lincolninst.edu/news/atlincolnhouse.asp?alh_id=7 The Maryland Transit Funding Study Steering Committee. (2007). Committee Report. Retrieved
January 17, 2008, from www.dot.state.md.us/Planning/Transit%20Funding%20Study/January2007 CommitteeReport.pdf
Transportation Cooperative Research Board (2003). Bus Rapid Transit, Volume 2:
Implementation Guidelines. Retrieved May 27, 2008, from http://onlinepubs.trb.org/Onlinepubs/tcrp/tcrp_rpt_90v2.pdf
United States Government Accountability Office (GAO). (2007, July). Review of Future
Demand for Transit New Starts and Small Starts Programs. www.gao.gov/cgi-bin/getrpt?GAO-07-917. United States Department of Transportation (DOT) - Federal Highway Administration, Freeway
Management Program. (2008). Retrieved May 29, 2008, from http://ops.fhwa.dot.gov/freewaymgmt/faq.htm#faq1.
Feasibility of Bus Rapid Transit Within the Mid-Atlantic Region June 2009
126
United States Department of Transportation (DOT). (2006, May 1). 2005 Survey of State Funding for Public Transportation. Retrieved July 17, 2008, from www.apta.com/research/info/online/documents/survey_of_state_funding_05.pdf
United States Department of Transportation (DOT). (2007, September 7). “Review of
Congressional Earmarks within Department of Transportation Programs.” Washington, D.C.: Report Number AV-2007-066. Retrieved July 21, 2008, from www.oig.dot.gov/StreamFile?file=/data/pdfdocs/Congressial_Earmarks-_AV-2007-66----508_Compliant.pdf
United States Department of Transportation (DOT). (n.d.). “Electronic Tolling/Congestion
Pricing.” Retrieved June 25, 2008, from www.etc.dot.gov. United States Department of Transportation (DOT). (2008). “The Transportation Infrastructure
Finance and Innovation Act (TIFIA).” Retrieved June 25, 2008, from http://tifia.fhwa.dot.gov
United States Department of Transportation (DOT). (n.d.). “Urban Partnerships.” Retrieved July
14, 2008, from www.upa.dot.gov. United States Office of Management and Budget (OMB). (n.d.). “List of Agencies and their
Certification Status—2008 Appropriations.” Retrieved July 23, 2008, from http://earmarks.omb.gov/2008-appropriations-by-agency/summary.html
United States Office of Management and Budget (OMB). (2008, July 7). “What is an Earmark?”
Retrieved July 23, 2008, from http://earmarks.omb.gov United States Census Bureau, Department of Commerce. 1990 and 2000 Decennial Census,
summary file 1 & 3. United States Census Bureau, Department of Commerce. 2006 American Communities Survey,
summary file 4. Vazzolo, David. (2008, February) “Updated Guidance for Project Sponsor Considering New
Starts and Small Starts Projects.” TransitLine. Veolia Transport. (2006). Annual Report.
www.veoliatransportation.com/pdf/VT_Annual_Report_2006.pdf Victoria Transport Policy Institute: Ridesharing. (2007). Retrieved May, 30, 2007, from
www.vtpi.org/tdm/tdm34.htm. Williams, John. (n.d) “Development Partnerships: Sharing Risk and Rewards on Publicly
Sponsored Projects.” The National Council for Public-Private Partnerships. Retrieved August 7, 2008, from www.ncppp.org/resources/papers/development-
Williams.pdf
Feasibility of Bus Rapid Transit Within the Mid-Atlantic Region June 2009
127
Wilmington Area Planning Council (WILMAPCO) (2008, July). 2008 WILMAPCO Congestion
Management System Summary. Retrieved September 5, 2008, from www.wilmapco.org Wilmington Area Planning Council (WILMAPCO) (2005). “An Analysis of Commuter Flows
to and from the WILMAPCO Region, 1990-2000.” Retrieved October 8, 2007, from www.wilmapco.org/data/Publication3_JTW.pdf
Wilmington Area Planning Council (WILMAPCO) (2008). Portable Transit Score for the
Delaware Region. Provided by agency. Wilmington Area Planning Council (WILMAPCO) (May 2007). “Regional Population and
Household Changes 2000 – 2030.” WILMAPCO Data Report #4.
An Equal Opportunity/Affirmative Action EmployerThe University of Delaware is committed to assuring equal opportunity to all persons and does not discriminate on the basis of race, creed, color,gender, genetic information, age, religion, national origin, veteran or disability status, or sexual orientation in its educational programs, activities,admissions or employment practices as required by Title IX of the Educational Amendments of 1972, Section 504 of the Rehabilitation Act of 1973,Title VII of the Civil Rights Act of 1964, and other applicable statutes. Inquiries concerning Section 504 compliance and information regarding campusaccessibility should be referred to the Office of Disability Support Services (DSS), (302) 831-4643, located at 119 Alison Hall. Inquiries concerning TitleVII and Title IX should be referred to the Office of the Assistant Vice President for Affirmative Action, (302) 831-8735, located at 124 Hullihen Hall.
Institute for Public AdministrationCollege of Education & Public Policy
University of Delaware180 Graham Hall
Newark, DE 19716-7380
phone: 302-831-8971 e-mail: [email protected] fax: 302-831-3488
www.ipa.udel.edu
The University of Delaware’s Institute for Public Administration (IPA) addresses the policy, planning,and management needs of its partners through the integration of applied research, professionaldevelopment, and the education of tomorrow’s leaders.
Delaware Center for Transportation University of Delaware Newark,
Delaware 19716
AN EQUAL OPPORTUNITY/AFFIRMATIVE ACTION EMPLOYER To the extent permitted by applicable State and Federal laws, the University of Delaware is committed to assuring equal opportunity to all persons and does not discriminate on the basis of race, creed, color, sex, age, religion, national origin, veteran or handicapped status, or gender identity and expression, or sexual orientation in its educational programs, activities, admissions, or employment practices as required by Title IX of the Educational Amendments of 1972, Section 504 of the Rehabilitation Act of 1973, Title VII of the Civil Rights Act of 1964, and other applicable statutes. The University of Delaware has designated Karen Mancini, Director of the Office of Disabilities Support Services, as its ADA/Section 504 Coordinator under Federal law. Inquiries concerning Americans with Disabilities Act compliance, Section 504 compliance, campus accessibility, and related issues should be referred to Karen Mancini (302-831-4643) in the Office of Disabilities Support Services. Inquiries concerning Title VII and Title IX compliance and related issues should be referred to the Director of the Office of Equity and Inclusion, Becki Fogerty (302-831-8063).
Related Documents