University of Central Florida University of Central Florida STARS STARS Harrison "Buzz" Price Papers Digital Collections 9-1992 Feasibility Analysis of the World of Oz Theme Park Feasibility Analysis of the World of Oz Theme Park Harrison Price Company Part of the Tourism and Travel Commons Find similar works at: https://stars.library.ucf.edu/buzzprice University of Central Florida Libraries http://library.ucf.edu This Report is brought to you for free and open access by the Digital Collections at STARS. It has been accepted for inclusion in Harrison "Buzz" Price Papers by an authorized administrator of STARS. For more information, please contact [email protected]. Recommended Citation Recommended Citation Harrison Price Company, "Feasibility Analysis of the World of Oz Theme Park" (1992). Harrison "Buzz" Price Papers. 183. https://stars.library.ucf.edu/buzzprice/183

Welcome message from author
This document is posted to help you gain knowledge. Please leave a comment to let me know what you think about it! Share it to your friends and learn new things together.
Transcript

University of Central Florida University of Central Florida
STARS STARS
Harrison "Buzz" Price Papers Digital Collections
9-1992
Feasibility Analysis of the World of Oz Theme Park Feasibility Analysis of the World of Oz Theme Park
Harrison Price Company
Part of the Tourism and Travel Commons
Find similar works at: https://stars.library.ucf.edu/buzzprice
University of Central Florida Libraries http://library.ucf.edu
This Report is brought to you for free and open access by the Digital Collections at STARS. It has been accepted for
inclusion in Harrison "Buzz" Price Papers by an authorized administrator of STARS. For more information, please
contact [email protected].
Recommended Citation Recommended Citation Harrison Price Company, "Feasibility Analysis of the World of Oz Theme Park" (1992). Harrison "Buzz" Price Papers. 183. https://stars.library.ucf.edu/buzzprice/183

FEASIBILITY ANALYSIS OF THE WORLD OF OZ THEME PARK
Kansas City, Kansas
Prepared for
OZ RESORTS & ENTERTAINMENT, INC.
September 1992
Prepared by
HARRISON PRICE COMPANY 970 West 190th Street, Suite 580
Torrance, CA 90502 Phone: (310) 715-6654
FAX: (310) 715-6957

"How dear to my heart are the scenes of my childhood,
When fond recollection presents them to view!"
--Samuel Wordsworth [1785-1842] The Old Oaken Bud<et

TABLE OF CONTENTS
Section ~
1. INTRODUCTION ........................................................................................ 1-1
2. EXECUTIVE SUMMARY ............................................................................ 2-1
3. CONCEPT AND SITE EVALUATION ........................................................ 3-1
CONCEPT OF THE WORLD OF OZ .................................................... 3-1
Market Orientation ............................................................................ 3-1
Principal Entertainment. ................................................................... 3-2
Old Time Kansas ........................................................................ 3-2
Munchkinland ............................................................................. 3-2
Enchanted Land of the East ....................................................... 3-5
Emerald City ............................................................................... 3-5
Wicked Land of the West. ........................................................... 3-5
Glinda's Kingdom of the North .................................................... 3-5
EVALUATION OF THE SITE ENVIRONMENT ..................................... 3-6
Locational Characteristics ................................................................ 3-6
Weather Conditions ......................................................................... 3-8
Locational Attractions Inventory ..................................................... 3-12
4. MARKET SUPPORT ANAL VSIS .. ............................................................. 4-1
AVAILABLE RESIDENT MARKET ........................................................ 4-1
Population ........................................................................................ 4-1
Age and Income Characteristics ...................................................... 4-3
AVAILABLE TOURIST MARKET .......................................................... 4-7
Estimated Market Size ..................................................................... 4-7
Visitor Characteristics ...................................................................... 4-9
Convention Activity ........................................................................ 4-15

Section
TABLE OF CONTENTS
(continued)
Airport Traffic Volume ................................................................... .4-15
Highway Traffic Volume on l-70 .................................................... .4-19
AGGREGATE MARKET SUPPORT ................................................... 4-25
5. ATTENDANCE ANALYSIS AND PHYSICAL
PLANNING GUIDELINES ..................................................................... 5-1
POTENTIAL MARKET CAPTURE AND ATTENDANCE ...................... 5-1
National Trends in the Theme Park Industry ................................... 5-2
Experience of Comparable Attractions .......................................... 5-14
Attendance Models for the World of Oz ......................................... 5-14
ILLUSTRATIVE PHYSICAL PLANNING GUIDELINES ............. ......... 5-19
Operating Schedule ....................................................................... 5-21
Design Day .................................................................................... 5-21
Entertainment Capacity Requirements .......................................... 5-24
Food Service Requirements ........................................................... 5-28
Merchandise Sales Space Requirements ...................................... 5-28
Estimated Parking Requirements .................................................. 5-31
Total Land Area Requirements ...................................................... 5-31
6. PRELIMINARY FINANCIAL ANALYSIS .................................................... 6-1
POTENTIAL OPERATING REVENUE .................................................. 6-1
Admissions Revenue ....................................................................... 6-1
Food, Merchandise, and Miscellaneous Expenditures .................... 6-4
Parking Expenditures ....................................................................... 6-7
Revenue Summary .......................................................................... 6-7
ii

Section
TABLE OF CONTENTS
( continued)
PRO FOR MA FINANCIAL ANALYSIS .................................................. 6-7
Illustrative Operating Expense Budget.. ........................................... 6-7
Potential Net Operating lncome ....................................................... 6-9
Estimated Breakeven Point. ............................................................. 6-9
Ten-Year Revenue and Expense Statement.. ............................... 6-11
CAPITAL INVESTMENT PARAMETERS ............................................ 6-11
LIST OF TABLES
Table ~
1. ENVISIONED ENTERTAINMENT COMPONENTS FOR THE
WORLD OF OZ - Phase 1 .......................................................................... 3-3
2. WEATHER CHARACTERISTICS OF THE KANSAS CITY AREA
(30-Year Average) .................................................................................... 3-10
3. COMPARATIVE WEATHER CHARACTERISTICS FOR
SELECTED THEME PARK LOCATIONS ................................................. 3-11
4. EXISTING INVENTORY OF VISITOR ATTRACTIONS IN THE
KANSAS CITY AREA-1992 .................................................................... 3-13
5. POPULATION TRENDS IN THE KANSAS CITY RESIDENT
MARKET AREA - 1980 - 1995 .................................................................... 4-2
6. AGE CHARACTERISTICS OF THE KANSAS CITY RESIDENT
MARKET AREA - 1990 ............................................................................... 4-4
7. INCOME CHARACTERISTICS OF THE KANSAS CITY RESIDENT
MARKET AREA - 1990 ............................................................................... 4-5
8. COMPARATIVE AGE AND INCOME CHARACTERISTICS OF
SELECTED U.S. METRO AREAS .............................................................. 4-6
9. ESTIMATION OF THE KANSAS CITY TOURIST MARKET - 1990 ........... 4-8
iii

LIST OF TABLES
(continued)
Table fag§
10. SELECTED CHARACTERISTICS OF TRAVELERS TO
MISSOURI - 1991 ..................................................................................... 4-10
11. ACTIVITIES ENJOYED BY MISSOURI TOURISTS BY LENGTH
OF STAY - 1991 ....................................................................................... 4-13
12. DISTRIBUTION OF EXPENDITURES BY TRAVELERS TO
MISSOURI - 1991 ..................................................................................... 4-14
13. CONVENTION ACTIVITY IN KANSAS CITY, MISSOURI 1982-1991 ..... 4-16
14. CONVENTION ACTIVITY IN KANSAS CITY, KANSAS 1990-1991 ........ 4-17
15. PASSENGER TRAFFIC THROUGH KANSAS CITY
INTERNATIONAL AIRPORT 1981-1990 .................................................. 4-18
16. MONTHLY DISTRIBUTION OF PASSENGER TRAFFIC THROUGH
KANSAS CITY INTERNATIONAL AIRPORT 1989-1991 ......................... 4-20
17. AVERAGE DAILY TRAFFIC VOLUME ON 1-70 NEAR THE
SUBJECT SITE - 1980-1990 .................................................................... 4-21
18. SEASONAL INDEX OF TRAFFIC VOLUME ON 1-70 NEAR THE
SUBJECT SITE - 1990 ............................................................................. 4-23
19. ESTIMATED RECREATIONAL TRAFFIC ON 1-70 NEAR THE
SUBJECT SITE - 1990 ............................................................................. 4-24
20. AGGREGATE MARKET SUPPORT AVAILABLE TO THE
WORLD OF OZ - 1990-2010 ................................................................... 4-26
21. COMPARATIVE SIZE OF SELECTED U.S. METRO AREA
MARKETS 1990 ....................................................................................... 4-27
22. COMPARATIVE POPULATION WITHIN 500 MILES OF MAJOR
THEME PARKS - 1990 ............................................................................. 4-29
23. CHARACTERISTICS OF SELECTED U.S. THEME PARKS 1992 ............ 5-3
24. NATIONAL TRENDS IN THEME PARK ATTENDANCE 1985-1990 .......... 5-9
25. MARKET CAPTURE RATES OF SELECTED U.S. THEME PARKS ....... 5-15
26. ILLUSTRATIVE ATTENDANCE MODELS FOR WORLD OF OZ
Stabilized Year .......................................................................................... 5-17
27. ILLUSTRATIVE OPERATING SCHEDULE FOR THE
WORLD OF 02 ......................................................................................... 5-22
iv

LIST OF TABLES
(continued)
Table ~
28. MONTHLY DISTRIBUTION OF ATTENDANCE FOR THEME
PARKS IN THE CENTRAL UNITED STATES 1990-191 Average ........... 5-23
29. DESIGN DAY PLANNING PARAMETERS FOR THE WORLD
OF OZ - Stabilized Year ........................................................................... 5-25
30. ILLUSTRATIVE HOURLY ARRIVAL AND DEPARTURE
PATTERNS FOR THE WORLD OF OZ ON DESIGN DAY ...................... 5-26
31. ESTIMATED FOOD SERVICE REQUIREMENTS FOR
THE WORLD OF OZ - Stabilized Year ..................................................... 5-29
32. ESTIMATED MERCHANDISE SPACE REQUIREMENTS
FOR THE WORLD OF OZ - Stabilized Year ............................................ 5-30
33. ESTIMATED PARKING REQUIREMENTS FOR THE WORLD
OF OZ - Stabilized Year ........................................................................... 5-32
34. ESTIMATED LAND AREA REQUIREMENTS FOR THE
WORLD OF OZ - Stabilized Year ............................................................. 5-33
35. ADMISSION PRICE SCHEDULE FOR SELECTED MAJOR
THEME PARKS - SUMMER 1992 .............................................................. 6-2
36. ESTIMATED OPERATING REVENUE FOR THE WORLD OF OZ
Stabilized Year; Constant 1992 Dollars ...................................................... 6-5
37. COMPOSITE FINANCIAL DATA FOR MAJOR THEME
PARKS - 1991 ............................................................................................ 6-6
38. PRO FORMA FINANCIAL ANALYSIS FOR THE WORLD OF
OZ - Stabilized Year; Constant 1992 Dollars .............................................. 6-8
39. ILLUSTRATIVE CAPITAL INVESTMENT PARAMETERS
FOR THE WORLD OF OZ - Stabilized Year; Constant 1992 Dollars ....... 6-12
40. TEN-YEAR INCOME AND EXPENSE STATEMENT FOR
THE WORLD OF OZ 1996-2005 (Current Dollars) ................................... 6-13
41. ILLUSTRATIVE CAPITAL INVESTMENT PARAMETERS FOR
THE WORLD OF OZ ................................................................................ 6-14
V

LIST OF FIGURES
Figure ~
1. REGIONAL ORIENTATION MAP FOR THE WORLD OF 02 .................... 3-7
2. PROPOSED SITE FOR THE WORLD OF OZ ........................................... 3-9
3. COMPARATIVE 500-MILE MARKET AREAS .......................................... 4-28
4. U.S. THEME PARKS WITH ATTENDANCE OF 1 MILLION
OR MORE ................................................................................................... 5-6
KEY TO FIGURE 4 ..................................................................................... 5-7
5. U.S. THEME PARK ATTENDANCE TRENDS ......................................... 5-11
6. U.S. THEME PARK MARKET CAPTURE TRENDS ................................ 5-12
7. MARKET SHARES OF U.S. THEME PARKS .......................................... 5-13
8. ESTIMATED ATTENDANCE ORIGIN FOR THE WORLD OF 02 ........... 5-20
9. DESIGN DAY ARRIVAL AND DEPARTURE PATTERNS
FOR THE WORLD OF OZ ........................................................................ 5-27
10. THEORETICAL BREAKEVEN POINT FOR THE WORLD OF OZ
(Constant 1992 Dollars) ............................................................................ 6-10
vi

Section 1
INTRODUCTION
L. Frank Baum, author of the timeless story of a young Kansas farm girl who journeys
"over the rainbow" to the fabulous Land of Oz, is one of the luminaries of children's
literature. Baum chronicled Dorothy's adventures in Oz in a series of books produced
from 1900 until his death in 1919, books which have enchanted millions of children
and equally impressed parents with the traditional values and homespun wisdom so
artfully conveyed. The story is perhaps best remembered as adapted for the movie
screen in the 1939 Judy Garland classic "The Wizard of Oz." Superbly cast and
endowed with an unforgettable musical score, this film created the visual images of the
Land of Oz as well as of Dorothy and her companions in adventure--her little dog Toto,
the Scarecrow, the Tin Man, the Cowardly Lion and, of course, the Wizard himself--that
have endured for more than 50 years. Every Christmas holiday season, the movie has
wide television exposure, bringing to new generations the story's reassuring message
that "there's no place like home."
Recognizing the wide popularity and durability of the Oz fable, a Kansas City-based
consortium known as Oz Resorts & Entertainment, Inc. has proposed the development
of a major themed amusement park called the Wonderful World of Oz, to be fittingly
located in Kansas where the story takes place. The company has acquired the rights
to use the characters and images from the film in articulating the park's physical and
entertainment content, and an endorsement has also been secured from The Baum
Trust to draw on additional material in the Oz books. Landmark Entertainment Group
has been retained to design the park on a site in Wyandotte County just to the west of
downtown Kansas City, where it will be the focal point of a resort complex that will
ultimately also include overnight accommodations and a golf course surrounding a
large manmade lake. To determine the potential attendance and financial outlook for
the central theme park element and to assist the park's designers in sizing basic
entertainment and visitor service facilities, Oz Resorts & Entertainment retained
Harrison Price Company (HPC) to conduct a feasibility and planning analysis, the
findings of which are presented in this report.
1-1

Following this introduction, Section 2 contains a brief summary of major conclusions
and recommendations resulting from the research. The World of Oz concept and an
evaluation of its site environment are the subject of Section 3, while Section 4
addresses the market available to the project, including resident and tourist support.
Section 5 then develops illustrative attendance models and translates these models
into physical sizing guidelines for major project components. The report concludes
with an assessment of potential economic performance in Section 6.
The conclusions delineated in this report are based on HPC's research of the Kansas
City area marketplace, knowledge of the recreation industry, and meetings with the
client group during which certain information was presented to HPC that is integral to
the outlook for the World of Oz theme park. HPC has no responsibility to update this
analysis for events or circumstances occurring after the submittal of this report. As in
all studies of this type, projected results are contingent on estimates and assumptions
developed in conjunction with the market analysis. Some of these assumptions
inevitably will not materialize, and unanticipated events and circumstances may occur.
Other data or assumptions are inherently subject to interpretation with varying degrees
of reliability and confidence, particularly at this early stage of planning. Therefore,
actual results achieved during the period covered by this analysis will vary from the
estimates contained herein, and these variations may be material. Further, HPC has
not been engaged to evaluate the effectiveness of management and is not responsible
for future marketing efforts and other management actions on which actual results will
depend. The study presumes no significant change in competitive position from that
set forth here and makes no allowance for possible government restrictions on the
development or the possible effect of changes in the national economy. This report is
intended for the internal use of the client group and presentations to lending
institutions or potential management companies. Without HPC's prior written consent,
the report, its contents, or reference to HPC may not be included in any press release,
registration statement, prospectus, loan, appraisal, or other agreement or document.
HPC wishes to express its appreciation to the many organizations and individuals
contacted during the course of this assignment who provided data or commentary
about various aspects of the analysis.
1-2
Section 2
EXECUTIVE SUMMARY
Major conclusions of HPC's analysis of the proposed World of Oz theme park are briefly
highlighted in this section of the report. Other than specifying certain critical
assumptions, no attempt is made here to describe findings or rationale in detail or to
present supporting documentation, which are fully contained in the main body of the
report.
• The Oz theme and the conceptual plan for the park developed by Landmark
Entertainment will appeal to a broad market base. Given a well-orchestrated
marketing campaign including wide media advertising in conjunction with
television presentations of the "Wizard of Oz" movie, an enthusiastic public
response can be expected. The proposed concept should be capable of
generating visitor stay times of five to seven hours, or six hours on average.
• The site proposed for the attraction is well suited to major theme park
development. It has excellent accessibility via Interstates 70 and 435, and
surrounding land uses are compatible. Weather conditions indicate that the
World of Oz will necessarily be a seasonal operation, but there is an opportunity
for short-term operation outside the core Memorial Day to Labor Day period,
including weekends during the spring and fall "shoulder" months and during the
Christmas holidays.
• The World of Oz will be complementary to the bulk of the existing attractions
inventory in the Kansas City area. There is competition from Worlds of Fun but,
by virtue of its appealing concept and envisioned scope, the subject park will be
well positioned to have an appreciable impact on the available market.
• By 1995, the total market available to the project will approximate 7.6 million
persons, including some 2.6 million people residing within 100 miles of the site
and an estimated Kansas City tourist market of 5 million overnight visitors. The
market has no qualitative deficiencies.
2-1

• The aforementioned overnight visitor market represents "normal" tourism that
does not encompass induced visitation that may occur as a result of the World of
Oz. In this regard, it is significant that Kansas City is strategically located in the
central United States where a very large population base of some 54 million is
available within 500 miles, or 50 percent more than live within a comparable
radius of Disneyland in Southern California and almost twice as many as reside
within 500 miles of the Disney World complex in Orlando. Heavy marketing in
this area should greatly assist in generating tourist support for the attraction.
• Among key assumptions underlying attendance models for the World of Oz are
that it will be developed to the highest standards of construction, entertainment
programming, and aesthetic amenities; that adequate public funds and
institutional sponsorships will be available to supplement conventional financing
as needed to develop the attraction to the quality standard required to have a
major impact on the market; that the park will be aggressively promoted on a
national scale, most importantly including direct tie-ins with the "Wizard of Oz"
movie; that the entertainment program of the attraction will incorporate periodic
change sufficient to stimulate an ongoing cycle of repeat visitation; and that the
execution of the attraction and the effectiveness of the marketing and promotion
program will enable the park to induce substantial tourist visitation above and
beyond the normal overnight base.
• Based on the foregoing assumptions, the experience of comparable attractions,
and other considerations delineated in this report, the assumed gross market
capture rate of the World of Oz is between 29 and 35 percent of combined
resident and tourist support, including induced tourism on the order of 1 million to
1.25 million visitors. These figures are well in excess of industry norms and are
very close to the Disney experience, underscoring the imperativeness of expert
management, aggressive marketing, and high-quality development standards.
• Capture rates of this magnitude translate into a total absolute volume at
stabilization (third of fourth full year of operation) of between 2.5 million and 3.1
million. The mid-range attendance model calls for an attendance of 2.8 million .
Tourists, whether part of the normal overnight base or the induced increment,
comprise some 80 percent of total visitation and are crucial to the success of the
park.
2-2

• An operating schedule totaling 165 days has been assumed in this analysis.
Expected patterns of attendance suggest that the average maximum number of
people in the park at the peak hour of operation (a typical weekend afternoon in
August) will amount to 22,100 visitors under the mid-range model. This figure
represents the simultaneous holding capacity requirement of the attraction -- the
sum of all entertainment and visitor service facilities, general circulation, and
other spaces open to the public.
• Application of typical planning factors reveals a need for 32,000 hourly
entertainment units -- aggregate hourly capacity of all rides, shows, and other
featured attractions -- as a first-phase program.
• On the mid-range attendance model, food service area requirements are on the
order of 60,000 square feet, while required merchandise sales space amounts to
57,000 square feet. Some 7,750 auto parking spaces (including employee
parking) and 100 bus spaces will also be needed to accommodate this level of
attendance. Total land area required for the initial development comes to roughly
155 acres; an expansion reserve, however, should be considered in the master
development plan for the site.
• An adult admission fee of $23.95 (1992 dollars) is a reasonable planning target ,
with scaled-down prices for children and senior citizens. Allowing for the
probable mix of attendance, group and promotional discounts, and a certain
incidence of complimentary admissions, net admissions revenue is estimated at
$16. 75 per capita.
• An average visitor expenditure of $6.50 per capita should be an achievable goal
for food sales given the envisioned six-hour mean visitor stay time and a high
level of operating efficiency. Merchandise spending is aggressively targeted at
$7.00 per capita predicated on a Disney-quality retail component that makes full
use of the Oz theme and characters as well as the historical popularity of these
characters. The spending model for games and other miscellaneous outlays is
$2.00 per capita. A $4.00 per car parking fee has further been assumed, which
translates into per capita parking revenue of $1 .05.
2-3

• Based on the preceding itemization, the aggregate average per capita
expenditure would amount to $33.30 in 1992 dollars, roughly half of which will
derive from ticket sales. Accordingly, total gross revenue on the 2.8 million
attendance model is approximately $93 million per year. Deducting the cost of
food, merchandise, and miscellaneous goods sold, net revenue comes to $76
million.
• An annual operating budget on the order of $52 million is preliminarily estimated
as a mid-range goal. When combined with the cost of goods sold, overall
operating expenses would amount to about $69 million, or $24.80 per visitor,
equivalent to 75 percent of assumed total gross revenue. An expense ratio of
this general description is consistent with experience at well-managed successful
theme parks.
• A net operating income of slightly less than $24 million in constant dollars at
stabilization is thus potentially attainable by the World of Oz. Assuming that 45
percent of total operating expense is fixed and 55 percent varies with attendance
volume, the theoretical breakeven point in operations occurs at an annual
patronage of approximately 1.6 million visitors.
• If net operating income, or EBDIT (earnings before depreciation, interest, and
income taxes) is capitalized at 10 percent, a sum of $238 million would represent
private debt and equity financing . HPC understands that the Landmark concept
for the park is geared to a minimum capital cost, including construction and all
"soft" costs, of $275 million for the first phase of development and may exceed
$300 million with a more elaborate execution. To meet this investment level, this
analysis has further assumed that the project will obtain an economic
development grant in the amount of $50 million and will also be able to attract
institutional sponsorships totaling another $12 million. In total, then, some $300
million in overall investment is the indicated initial, mid-range model.
• Application of a 50 percent debt ratio on private financing together with an 11.6
percent debt service constant (fully amortized rate) results in an annual loan
payment of roughly $14 million. The implied coverage ratio on this sum vis-a-vis
EBDIT is 1. 72.
2-4

• A ten-year income and expense demonstration on a current-dollar basis reveals
that potential annual net operating income, after adjusting for inflation, will rise
from an initial $21 million to more than $44 million by the tenth year of operation.
Cumulative net operating income will grow to $104 million by 1999, $207 million
by 2002, and $330 million by 2005. Adequate funds should accordingly be
generated to support debt service and required reinvestment.
• In conclusion, the World of Oz can meet acceptable standards of economic
feasibility given adherence to the critical assumptions on attendance volume and
other aspects of the project that have been described in this report.
2-5

Section 3
CONCEPT AND SITE EVALUATION
Major influences on the attendance potential of the World of Oz theme park are the
general scope and content of the attraction--its "critical mass"--and the characteristics
of the locational environment. To provide an overall context for the market and
financial analysis to follow, therefore, this section of the report describes the facility
and program components envisioned for the project. The proposed site location is
then evaluated from the standpoint of suitability for the type of development planned.
CONCEPT OF THE WORLD OF OZ
Subsequent paragraphs highlight the market orientation and general conceptual
parameters of the World of Oz project. It is recognized that the exact content of the
attraction is still evolving and may ultimately differ in major or minor respects from the
guidelines presented here.
Market Orientation
As noted in the introduction to this report, the thematic content of the World of Oz
theme park will be based on the characters and situations encountered by the heroine
Dorothy during her mythical travels in the Land of Oz. These story elements have a
solid family orientation that will appeal to a broad market base--children, certainly, who
are just now beginning to read and enjoy the Oz books and movie, along with adults
for whom the story is a familiar part of their own childhood. The high recognition factor
of the Oz name and the sustained popularity of the movie suggests that, given high
quality development in tandem with a concerted marketing campaign, an enthusiastic
public response to the concept can be expected from residents and tourists alike.
Annual television presentations of the classic film meanwhile furnish a ready vehicle
for advertising on a national scale, which is imperative to generating the level of
attendance necessary to support the project.
3-1
In this context, it is pertinent to consider the Branson phenomenon. The Branson area
of southwestern Missouri, approximately 175 miles from Kansas City, or within a three
to four-hour drive, has been catapulted into a major tourist destination by a huge music
show business featuring entertainers of national or international reputation. The
boom began in the 1980s and significantly gathered steam during the past three
years. Tourist visitation to this area is currently estimated at between 4 and 5 million,
70 percent of which originates within about a 300-mile radius, and projections call for
as many as 11 million by the year 2000 on the basis of announced plans to expand
the music show offering. Branson is accordingly drawing heavily from throughout the
central Midwest region, and the World of Oz will have exposure to at least some--and
perhaps an appreciable share--of this traffic as it passes through or within negotiable
distance of Kansas City enroute to the music palaces. Because a substantial portion
of this traffic is family-oriented (families comprise an estimated 40 percent of Branson
patronage), another promising opportunity is presented to market the World of Oz as a
second destination providing a different kind of entertainment experience within this
general region.
Principal Entertainment Components
Conceptual plans for the World of Oz prepared by Landmark Entertainment Group call
for a total of six interrelated theme areas, highlighted in Table 1. These areas are
briefly described below:
•
•
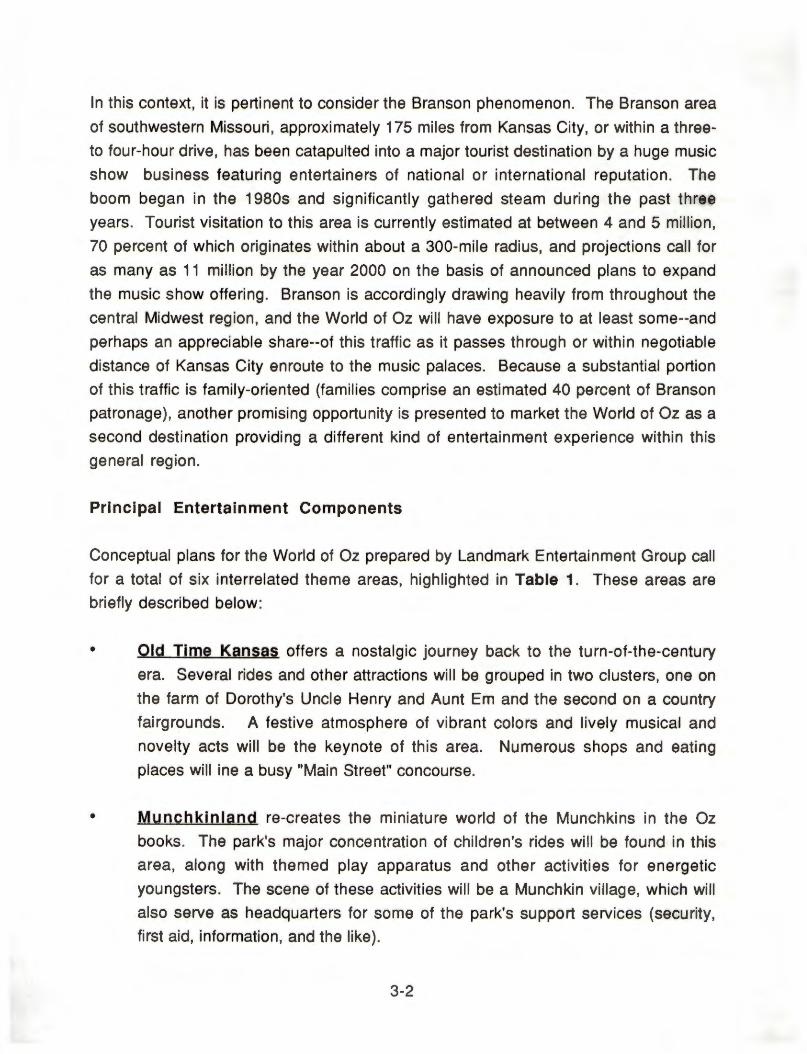
Old Time Kansas offers a nostalgic journey back to the turn-of-the-century
era. Several rides and other attractions will be grouped in two clusters, one on
the farm of Dorothy's Uncle Henry and Aunt Em and the second on a country
fairgrounds. A festive atmosphere of vibrant colors and lively musical and
novelty acts will be the keynote of this area. Numerous shops and eating
places will ine a busy "Main Street" concourse.
Munchkinland re-creates the miniature world of the Munchkins in the Oz
books. The park's major concentration of children's rides will be found in this
area, along with themed play apparatus and other activities for energetic
youngsters. The scene of these activities will be a Munchkin village, which will
also serve as headquarters for some of the park's support services (security,
first aid, information, and the like).
3-2
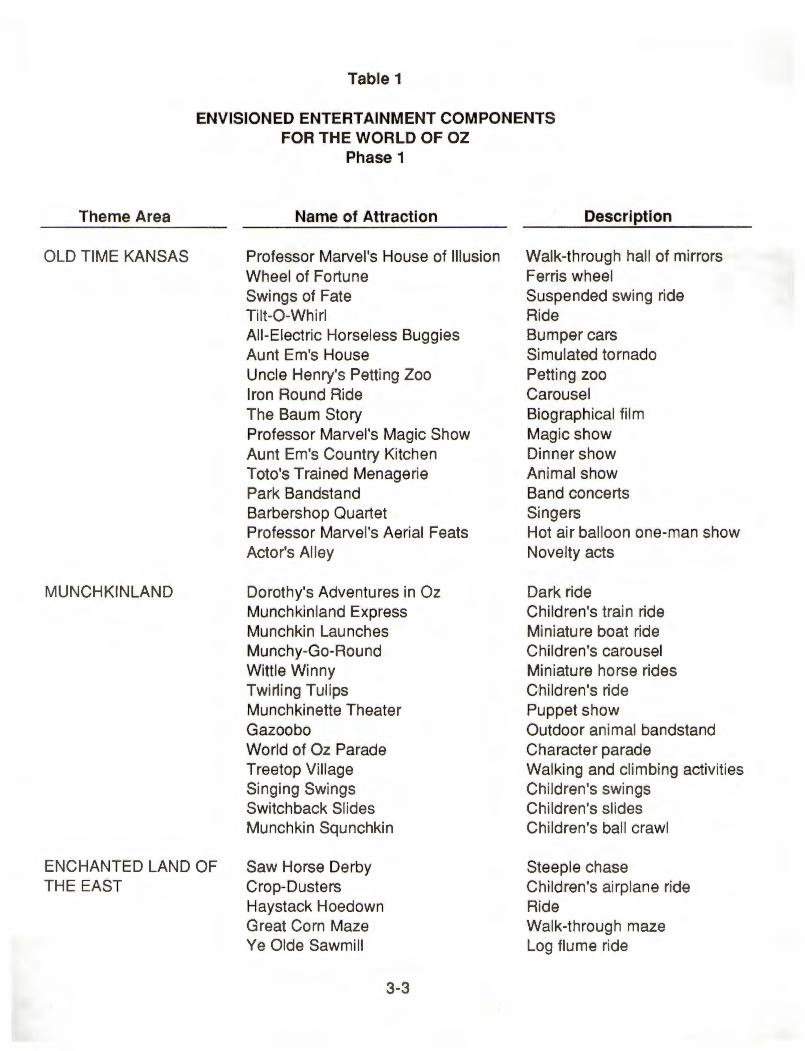
Table 1
ENVISIONED ENTERTAINMENT COMPONENTS FOR THE WORLD OF OZ
Theme Area
OLD TIME KANSAS
MUNCHKINLAND
ENCHANTED LAND OF THE EAST
Phase 1
Name of Attraction
Professor Marvel's House of Illusion Wheel of Fortune Swings of Fate Tilt-O-Whirl All-Electric Horseless Buggies Aunt Em's House Uncle Henry's Petting Zoo Iron Round Ride The Baum Story Professor Marvel's Magic Show Aunt Em's Country Kitchen Toto's Trained Menagerie Park Bandstand Barbershop Quartet Professor Marvel's Aerial Feats Actor's Alley
Dorothy's Adventures in Oz Munchkinland Express Munchkin Launches Munchy-Go-Rou nd Wittie Winny Twirling Tulips Munchkinette Theater Gazoobo World of Oz Parade Treetop Village Singing Swings Switchback Slides Munchkin Squnchkin
Saw Horse Derby Crop-Dusters Haystack Hoedown Great Corn Maze Ye Olde Sawmill
3-3
Description
Walk-through hall of mirrors Ferris wheel Suspended swing ride Ride Bumper cars Simulated tornado Petting zoo Carousel Biographical film Magic show Dinner show Animal show Band concerts Singers Hot air balloon one-man show Novelty acts
Dark ride Children's train ride Miniature boat ride Children's carousel Miniature horse rides Children's ride Puppet show Outdoor animal bandstand Character parade Walking and climbing activities Children's swings Children's slides Children's ball crawl
Steeple chase Children's airplane ride Ride Walk-through maze Log flume ride

Theme Area
EMERALD CITY
WICKED LAND OF THE WEST
GLINDA'S KINGDOM OF THE NORTH
Table 1
(Continued)
Name of Attraction
Cowardly's Show of Courage Pumpkin Patch Picnic Metal Mouth Revue Corn Row Theater Oz Zoo
Key to the City Grand Oz Carousel Aerial Adventure of Oz Imperial Wonder Show City Gates Live Stage GEMS Fountain and Topiary Show World of Oz Parade Emerald Nights Magnificent Wizard Works
Winged Monkeys Caverns of Doom Torture Chamber Dungeon of Forbidden Magic Haunted Forest Changing of the Winkie Guards
Blizzard Glinda's Fairytale Ride Shoot the Chutes Wizard on Ice Santa's Workshop Winter Carnival Christmas Parade
Source: Landmark Entertainment Group.
3-4
Description
Dark ride Spinning barrel ride Animatronic show Children's musical show Animated character show
Mine train ride Double-deck carousel Simulated balloon ride Magic and illusion show Musical show Dance pavilion Dancing waters show Character parade Fireworks show Games and video arcade
Suspended roller coaster Water rapids ride Barrel ride Magic show Pathway to castle Live show
Toboggan roller coaster Children's boat ride Boat ride Ice skating show Animatronic show Year-round festival Seasonal parade

•
•
•
•
Enchanted Land of the East is a fantasy environment of whimsy and make
believe. Several rides and animatronic shows would be presented in this area,
which is divided into three sections--an Enchanted Forest, a Fantasy Farmland,
and the Tinsmith's Village.
Emerald City. the park's central theme area, is dominated by the resplendent
Towers of Oz, home of the Wizard. Three major rides will be located in this
area, which will also be the principal venue for major shows, parades, and a
nightly fireworks spectacular. Emerald City will also contain a games and video
arcade, together with the park's main concentration of gift shops. A banquet
and meeting hall and an upscale Tower Restaurant will also be provided here.
Wicked Land of the West. surrounding the castle of the Wicked Witch, features the park's major thrill rides in a lighthearted treatment of Gothic villainy.
A Dungeon Magic Show, a Haunted Forest, and a twice-daily Changing of the
Winkie Guards will also be presented in this area.
Glinda's Kingdom of the North, the home of the "good witch," evokes the
atmosphere of a permanent winter carnival with an Ice Palace skating show,
Santa's Village and Workshop, and another major concentration of retail
facilities, including a year-round Christmas store. An elaborate Christmas
parade would be staged in this area each year.
A variety of themed food and merchandise facilities will be dispersed throughout all of
the park areas described above. Internal transportation systems providing access
within or between these areas encompass a park-wide train, an aerial tram, a
monorail, trolley cars, and horse-drawn carriages. Meanwhile, the "Yellow Brick Road"
will lead from the highway to the park entrance. The foregoing represents a Phase I
program estimated to require a total capital investment on the order of $250 to $300
million. Conceptual sketches and supporting documents prepared by Landmark
Entertainment provide a full description of the envisioned content of the World of Oz,
but the preceding is representative of the basic design program. The various
entertainment activities at the site should in the aggregate generate visitor stay times
ranging from five to seven hours, with the overall average estimated at approximately
six hours.
3-5

EVALUATION OF THE SITE ENVIRONMENT
Location is a fundamental and critical ingredient in the success of any recreation
attraction . Key locational characteristics of the World of Oz project are consequently
examined in subsequent paragraphs, including accessibility, weather conditions, and
the existing inventory of complementary and competitive facilities.
Locational Characteristics
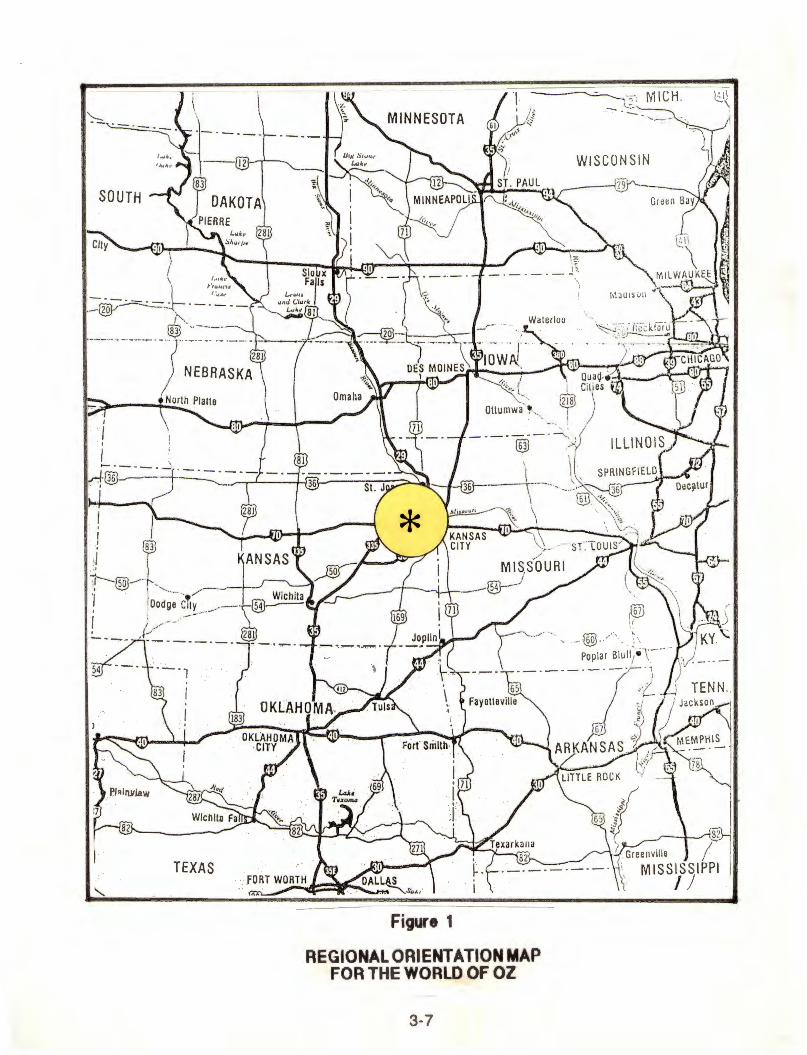
As shown in Figure 1, Kansas City is situated at the confluence of the Missouri and
Kansas Rivers on the eastern border of the state of Kansas. It lies near the exact
geographic center of the coterminous 48 states (located at a point two miles northwest
of Lebanon in north central Kansas), and is also near the population center of the
Lower 48 (as of the 1990 Census, located 1 O miles northwest of Steelville in east
central Missouri). Several major metropolitan areas are found within 500 miles of
Kansas City, including the following:
Distance In Metropolitan Area Hiahwav MIies
Des Moines 200 Omaha 200 Wichita 200 St. Louis 250 Tulsa 250 Memphis 450 Mlnneapolls 450 Dallas 490 Chicago 500
Strategically positioned, Kansas City enjoyed a thriving economy based on outfitting
travelers rolling west along the Oregon and Santa Fe Trails prior to the Civil War.
When the first railroad reached the area in 1869, things began to change as the city
became an important transcontinental rail hub and the nation's most important cattle
trading center. It soon became a center for trade in grain as well, and considerable
industrial development followed . Today, Kansas City is a major distributing point for
the vast midwestern agricultural region.
3-6
TEXAS
Figure 1
REGIONAL ORIENTATION MAP FOR THE WORLD OF OZ
3-7
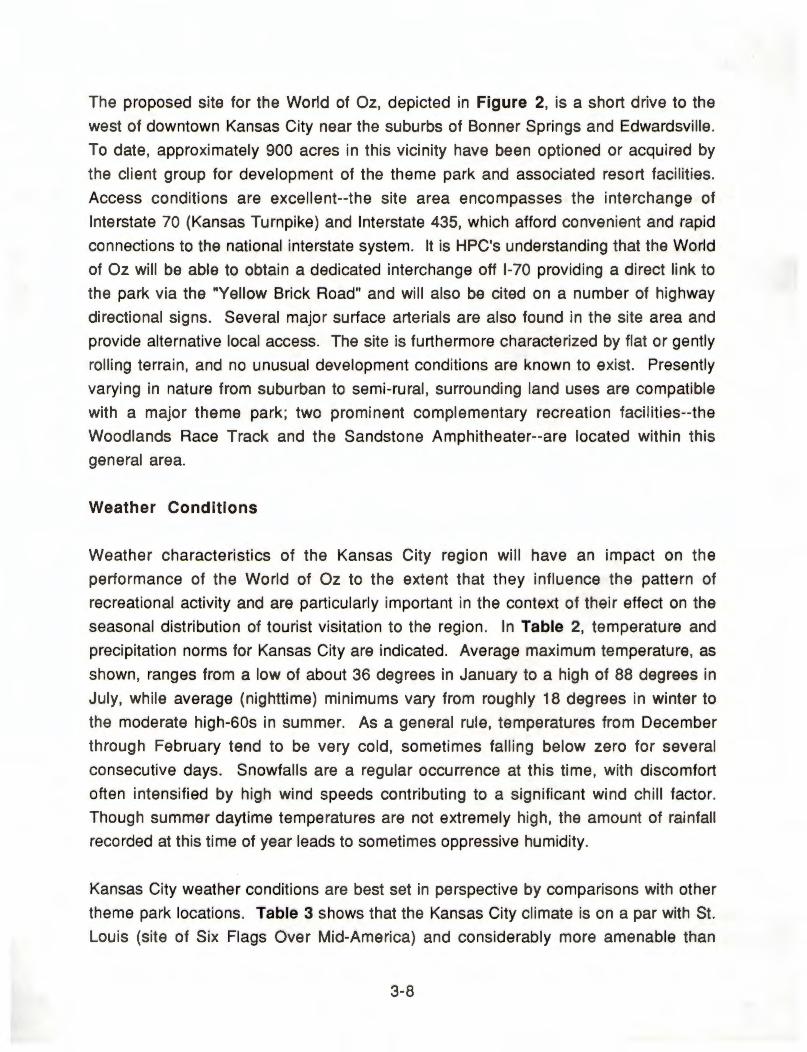
The proposed site for the World of Oz, depicted in Figure 2, is a short drive to the
west of downtown Kansas City near the suburbs of Bonner Springs and Edwardsville.
To date, approximately 900 acres in this vicinity have been optioned or acquired by
the client group for development of the theme park and associated resort facilities.
Access conditions are excellent--the site area encompasses the interchange of
Interstate 70 (Kansas Turnpike) and Interstate 435, which afford convenient and rapid
connections to the national interstate system. It is HPC's understanding that the World
of Oz will be able to obtain a dedicated interchange off 1-70 providing a direct link to
the park via the "Yellow Brick Road" and will also be cited on a number of highway
directional signs. Several major surface arterials are also found in the site area and
provide alternative local access. The site is furthermore characterized by flat or gently
rolling terrain, and no unusual development conditions are known to exist. Presently
varying in nature from suburban to semi-rural, surrounding land uses are compatible
with a major theme park; two prominent complementary recreation facilities--the
Woodlands Race Track and the Sandstone Amphitheater--are located within this
general area.
Weather Conditions
Weather characteristics of the Kansas City region will have an impact on the
performance of the World of Oz to the extent that they influence the pattern of
recreational activity and are particularly important in the context of their effect on the
seasonal distribution of tourist visitation to the region. In Table 2, temperature and
precipitation norms for Kansas City are indicated. Average maximum temperature, as
shown, ranges from a low of about 36 degrees in January to a high of 88 degrees in
July, while average (nighttime) minimums vary from roughly 18 degrees in winter to
the moderate high-60s in summer. As a general rule, temperatures from December
through February tend to be very cold, sometimes falling below zero for several
consecutive days. Snowfalls are a regular occurrence at this time, with discomfort
often intensified by high wind speeds contributing to a significant wind chill factor.
Though summer daytime temperatures are not extremely high, the amount of rainfall
recorded at this time of year leads to sometimes oppressive humidity.
Kansas City weather conditions are best set in perspective by comparisons with other
theme park locations. Table 3 shows that the Kansas City climate is on a par with St.
Louis (site of Six Flags Over Mid-America) and considerably more amenable than
3-8

u) I
c.o
Proposed Site Vicinity
Figure 2
PROPOSED SITE FOR THE WORLD OF OZ
- Woodlands Race Track.a

Month
January
February
March
April
May
June
July
August
September
October
November
December
Annual
T means trace.
Table 2
WEATHER CHARACTERISTICS OF THE KANSAS CITY AREA
(30-Vear Average)
Temperature (°F) Precipitation (inches) Average Average Snow/
Maximum Minimum Rain Ice Pellets
35.7 18.4 1.3 5.7
41.4 23.1 1.3 5.9
50.7 30.6 2.6 3.8
64.7 43.7 3.5 0.7
74.2 53.9 4.3 T
82.8 63.2 5.6 0
88.1 66.9 4.4 0
87.2 65.8 3.8 0
78.8 57.1 4.2 0
68.2 46.9 3.2 T
51.4 33.1 1.5 1 .1
~ 23.3 Ll 4.4
63.5 43.8 37.2 21.6
Source: National Oceanic and Atmospheric Administration.
3-10
Average Wind Speed
{mph)
10.9
11.9
12.4
11.9
9.7
9.5
8.4
8.9
8.6
9.7
11.1
m.9
10.3

Table 3
COMPARATIVE WEATHER CHARACTERISTICS FOR SELECTED THEME PARK LOCATIONS
(30-Year Averages)
Kansas City St. Louis Nashville Minneapolis Atlanta ~ Orlando Los Angeles
Temperature (°F) Average Annual Maximum 64 66 70 54 70 77 81 74 Average Annual Minimum 44 46 49 34 51 54 62 55
Range of Summer Maximum 83-88 85-88 88-90 77-82 85-87 91-96 89-90 77-84 Range of Winter Maximum 36-41 40-44 48-51 21-27 51-55 56-60 71-72 67-68
w Record High 107 106 103 101 103 109 102 110 I
Record Low -13 -14 -6 -34 -3 4 20 28 ~
~
Mean Number of Days With Maximum Temperature <32° 34 27 8 83 2 0 0 0
Precipitation (inches) Average Annual Rainfall 37 36 46 26 48 32 51 14 Average Annual Snowfall 22 18 11 46 2 3 T T
Mean Number of Days With >0.01 Inches 102 109 119 113 116 78 117 34
Mean Annual Windspeed (mph) 10.3 9.5 7.9 10.6 9.1 10.9 8.7 6.2
T means trace.
Source: National Oceanic and Atmospheric Administration.

Minneapolis (site of Valleyfair). On the other hand, it is substantially less agreeable
than other locations shown (notably the Disney park sites in Orlando and Los
Angeles), especially during winter months. These data suggest that the World of Oz
will necessarily be a seasonal operation; as will be discussed later in this report,
however, there are opportunities for short-term operation outside the core Memorial
Day to Labor Day season, provided that the park design includes facilities affording
visitor protection from the elements during inclement weather. HPC understands that
the Landmark concept has taken the weather factor into account and will incorporate
indoor or otherwise sheltered entertainment venues capable of ensuring visitor
comfort as needed.
Local Attractions Inventory
The inventory of leisure-oriented attractions in the Kansas City area presently
embraces a major theme park, a large (and soon to be redeveloped) zoo, and a
number of cultural attractions and historic sites. The characteristics of existing
attractions with an attendance volume exceeding 50,000 per year are summarized in
Table 4. Currently the most heavily attended leisure destination is the Worlds of Fun
theme park and its companion water park Oceans of Fun, which together record some
1.4 million visitors per year. Other significant attendance generators include the
Kansas City Zoo, with an attendance volume of about 535,000, the Nelson-Atkins
Museum of Art, with 412,000 visitors currently, and the Liberty Memorial Museum, with
208,000 visitors at the present time. Other attractions listed in the table fall below
200,000 in annual attendance.
The proposed World of Oz theme park will be complementary to the bulk of the existing
attractions inventory, most of which can be expected to benefit from the spin-off
recreational traffic generated by a major theme park destination. The chief potential
exception is Worlds of Fun/Oceans of Fun, which caters to the same market and offers
similar entertainment experiences. This well-managed operation, which has
expanded and improved over the years in recognition of the ongoing need to provide
fresh content encouraging repeat visitation, has enjoyed a loyal following for two
decades and must be acknowledged as a competitive factor in the marketplace. The
cumulative capital value of the Worlds of Fun complex is probably on the order of $100
million, not an inconsequential figure. Two factors, however, suggest that the
relationship of Worlds of Fun with the World of Oz may be at least partially synergistic
3-12

u) I
....I.
u)
Attraction
Worlds of Fun (Kansas City, MO)
Kansas City Zoo (Kansas City, MO)
Table 4
EXISTING INVENTORY OF VISITOR ATTRACTIONS IN THE KANSAS CITY AREA
1992
Adult Year Governing Admission 1990
Opened Authority Price Attendance
1973 Commercial $21.95 1,171,000
1909 City 3.00 535,000
Nelson-Atkins Museum of Art 1933 Private 4.00 412,000 (Kansas City, MO) nonprofit
Kansas City Museum 1939 Private 3.50 304,000 (Kansas City, MO) nonprofit
Oceans of Fun 1982 Commercial 14.95 265,000 (Kansas City, MO)
Liberty Memorial Museum 1926 City 1.00 208,000 (Kansas City, MO)
Harry S. Truman Library 1957 Federal 2.00 155,000 (Independence, MO)
Description
Themed amusement park
Zoological park
Art museum
History and science museum
Water park
World War I museum
Presidential library
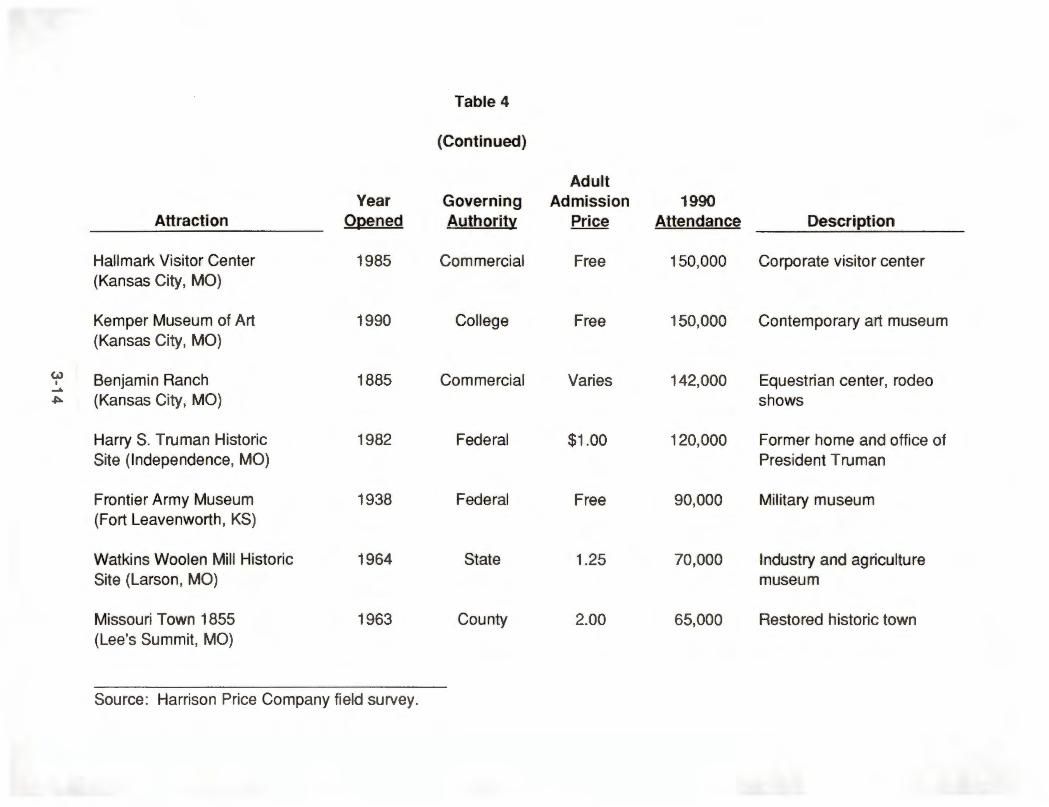
Table 4
(Continued)
Adult Year Governing Admission 1990
Attraction Opened Authority Price Attendance Description
Hallmark Visitor Center 1985 Commercial Free 150,000 Corporate visitor center (Kansas City, MO)
Kemper Museum of Art 1990 College Free 150,000 Contemporary art museum (Kansas City, MO)
(.,J Benjamin Ranch 1885 Commercial Varies 142,000 Equestrian center, rodeo I -A.
~ (Kansas City, MO) shows
Harry S. Truman Historic 1982 Federal $1.00 120,000 Former home and office of Site (Independence, MO) President Truman
Frontier Army Museum 1938 Federal Free 90,000 Military museum (Fort Leavenworth, KS)
Watkins Woolen Mill Historic 1964 State 1.25 70,000 Industry and agriculture Site (Larson, MO) museum
Missouri Town 1855 1963 County 2.00 65,000 Restored historic town (Lee's Summit, MO)
Source: Harrison Price Company field survey.

as opposed to competitive: 1) the fact that Worlds of Fun is more of a "thrill ride" park
than the Landmark concept for the World of Oz, which will emphasize live shows,
animatronics, and other "soft" entertainment programming; and 2) a fundamental
thematic difference, whereby Worlds of Fun deals with simulated international
environments having no emotional association for most people, while the World of Oz
will be based on an author and characterizations that are personally remembered and
admired.
While two obvious parallels exist in the recreation industry -- Los Angeles and
Orlando -- Kansas City will be the first moderately sized market to attempt support of
multiple theme parks. In the large markets, synergism among attractions of
appreciably different content and investment levels is observable, which is not to say
that these parks do not compete with one another. A certain level of synergy is
maintained only because competing parks are enough dissimilar in entertainment
approach and, more importantly, tend to match each other in adding new attractions,
thereby constantly enlarging the overall magnet that constitutes the incentive to visit a
given destination area. In short, while the proposed project will unavoidably compete
with the existing Worlds of Fun to an indeterminate extent, the potential exists to foster
a complementary relationship that capitalizes on the market niche each attraction
occupies.
3-15

Section 4
MARKET SUPPORT ANAL VSIS
An examination of the magnitude and quality of available market support is a
necessary prerequisite to a determination of attendance volume at the World of Oz.
The two components of the market available to the project are the regional resident
population and the nonresident tourist population, the size and characteristics of which
are analyzed in this section of the report.
AVAILABLE RESIDENT MARKET
In the recreation industry, a standard definition of the effective resident market for a
major theme park is a 100-mile radius of the site, or about two hours in driving time
given typical urban traffic conditions, with attendees originating beyond this limit
classed as tourists (including excursionists within a day's drive and long-distance
travelers usually remaining overnight or longer). This definition, while somewhat
arbitrary, has been utilized in this analysis. Because industry experience not
surprisingly reveals a strong inverse relationship between propensity to attend and
travel distance, this market has been further subdivided into two parts: a local, or
primary, segment extending up to about 50 miles, and a regional, or secondary,
segment comprising the balance of the 100-mile area. The paragraphs to follow
describe the principal characteristics of this market.
Population
Regional resident population within 100 miles of Kansas City, an area embracing the
1 a-county, bi-state Kansas City metropolitan area plus the Lawrence and Topeka
metro areas in Kansas, the St. Joseph metro area in Missouri, and contiguous
counties in both states, amounted to some 2.3 million in 1980 and increased modestly
to 2.5 million as of the 1990 Census, as shown in Table 5. The near-term projection
to 1995 reveals that this population base is expected to remain essentially stable at
about 2.6 million; tentative longer-term forecasts by the U.S. Bureau of Economic
Analysis suggest a total population of 2.7 million by 2010. The primary market
segment (0-50 miles), which extends through Kansas City, Lawrence, and St. Joseph,
4-1

~ I
I'\)
Primary Market (0-50 miles)
Secondary Market (50-100 miles)
Subtotal
Tertiary Market (100-200 miles) 1/
Total
n/c means no change.
Table 5
POPULATION TRENDS IN THE KANSAS CITY RESIDENT MARKET AREA
1980-1995
Total Population (thousands)
Projected 1980 1990 1995
1,648 1,804 1,868
690 691 691
2,338 2,495 2,559
4,485 4,688 4,781
6,823 7,183 7,340
1 / Represents outlying market support contributing to the pool of potential induced visitation.
Source: Urban Decision Systems, Inc. and Harrison Price Company.
Average Annual Rate of Increase
1980-1990 1990-1995
0. 9% 0. 7%
n/c n/c
0. 7% 0. 5%
0.4 0. 4
0. 5% 0. 4%

contains roughly 1.8 million residents currently. A comparatively small population
base of some 690,000 is found in the secondary market segment (50-100 miles),
which encompasses low-density suburbs on the fringe of metropolitan Kansas City as
well as many rural counties. No increase has taken place in the secondary market
area population since 1980 and none of consequence is expected through 1995.
The table also shows a tertiary market segment reaching out to a 200-mile radius.
This area takes in major sections of eastern Kansas (including Wichita) and western
Missouri together with portions of Iowa (including Des Moines) and Nebraska
(including Omaha and Lincoln), and reaches almost to St. Louis and Tulsa. A
relatively large population of 4. 7 million currently resides in this outer ring. People
living in the tertiary market area, however, undoubtedly generate a substantial share of
tourist visitation to Kansas City (to be discussed subsequently), thus raising a serious
risk of double-counting if treated as a source of resident support. This analysis has
accordingly not addressed a tertiary market per se, but rather has taken this base into
account in estimates of Kansas City tourism, including that potentially induced by the
subject attraction. In the latter regard, it is worth noting that excellent access is
available from this outlying area via Interstates 29, 35 and 70 (refer to Figure 1 ).
Age and Income Characteristics
Age characteristics of the Kansas City market, set forth in Table 6, reveal a current
overall median of about 33 years, with the primary segment somewhat younger on
average (median of 32 years) than the secondary segment (median of 36 years).
Roughly 20 percent of the total population is comprised of children under 14 years of
age, and an approximately equal percentage is represented by persons over 55 years
of age. A current household income profile for the area is presented in Table 7 and
reveals an overall median of some $28,500 annually, with the primary segment
reporting nearly $31,000 per year in contrast to a modest $23,000 per year in the
secondary segment.
In Table 8, a comparison has been made of age and income medians in the Kansas
City primary resident market with those of other theme park locations. Figures in this
table, it should be noted, refer to the metropolitan area and thus vary slightly from the
primary market data in Tables 6 and 7, which were based on a 50-mile radius. Median
age in Kansas City, as indicated, is just slightly below the national average and does
not differ significantly from other cities. Median household income in Kansas City,
4-3

Table 6
AGE CHARACTERISTICS OF THE KANSAS CITY RESIDENT MARKET AREA
1990
Resident Market Segment Primary Secondary
<0-50 miles} (50-1 oo miles}
Total Population (thousands) 1,804 691
Percent Distribution by Age Group:
Less Than 1 4 Years 20. 6% 19. 8%
14-20 Years 9. 3 9. 4
21-34 Years 24.9 20. 1
35-54 Years 25.3 23. 9
55 Years or More 19.:.-9 26.:...8
Total 100. 0% 100. 0%
Median Age (years) 32.4 35.6
Source: Urban Decision Systems, Inc. and Harrison Price Company.
4-4
Total
2,495
20. 4%
9. 3
23.5
25.0
2-La
100. 0%
32. 7

Table 7
INCOME CHARACTERISTICS OF THE KANSAS CITY RESIDENT MARKET AREA
1990
Resident Market Segment Primary Secondary
{0-50 miles} {50-100 mi les}
Number of Households (thousands) 692 269
Percent Distribution by Income Category:
Less Than $15,000 23. 3% 32.1%
$15,000-$24,999 17. 5 21.8
$25, 000-$34, 999 15.6 16. 1
$35,000-$49,999 19. 1 15. 6
$50,000-$7 4,999 16.4 10.2
$75,000 or More a.J.. 4. 2
Total 100. 0% 100. 0%
Median Household Income $30,872 $23,121
Source: Urban Decision Systems, Inc. and Harrison Price Company.
4-5
Total
961
25. 7%
18. 7
15.8
18. 0
14.8
LQ
100. 0%
$28,544

Table 8
COMPARATIVE AGE AND INCOME CHARACTERISTICS OF SELECTED U.S. METRO AREAS
1990
Median Median Age Household
Metro Area <years}
San Francisco Bay Area 33.6
Los Angeles-Anaheim 30.9
Chicago-Gary 32.5
Minneapolis-St. Paul 31.8
Atlanta 31.6
KANSAS CITY 32.9 111
St. Louis 33.2
Dallas-Ft. Worth 30.7
Houston-Galveston 30.4
Cincinnati 32.3
Nashville 32.5
Orlando 32.3
U.S. Average 33.1
1 / Figures refer to metropolitan area and thus differ from those in Tables 6 and 7, which refer to a 50-mile radius.
Income
$39,032
34,135
34,122
33,773
32,838
31,212
31,099
31,078
30,581
29,086
28,687
28,067
$27,912
Source: Sales Management, "1991 Survey of Buying Power;" and Harrison Price Company.
4-6
11 /

meanwhile, is above the national average, although below several of the other cities
listed. The subject market may hence be described as moderately young and
moderately affluent--nothing exceptional but, on the other hand, nothing suggesting
weakness in the qualitative sense.
AVAILABLE TOURIST MARKET
Endowed with an impressive inventory of historic sites, fine cultural institutions, several
commercial entertainment attractions, excellent shopping, and a jazz tradition rivaling
that of New Orleans, Kansas City is a popular tourist destination. Subsequent
paragraphs describe key aspects of the regional visitor industry, including estimated
total volume and salient visitor characteristics.
Estimated Market Size
No official estimates of visitation to the Kansas City area are available. Measurement
of tourist activity in any area is an imprecise exercise at best owing to varying
definitions of who constitutes a "tourist," gaps or inconsistencies in the data base
needed to derive visitor numbers, and other factors that hamper and sometimes
prevent a confident estimate. It is possible, however, to determine the general
magnitude of the market through an extrapolation from hotel capacity, which is
presented in Table 9. As shown, a total of some 18,000 hotel/motel rooms were
available in the area as of 1990. Applying factors relative to average annual
occupancy, number of persons per room, and mean length of hotel/motel stay as
evidenced by various tourist surveys and interviews with local visitor industry
authorities, the table calculates hotel-based visitation at approximately 2.5 million
people. Data from the Convention and Visitors Bureau of Greater Kansas City
suggests that hotel visitors comprise slightly more than half of the total overnight base,
yielding an aggregate overnight market (including visitors staying in other types of
accommodations) on the order of 4.5 million people.
There is considerable uncertainty as to the size of the day-visit and pass-through or
transient market--surveys from different tourist agencies in the region report a wide
variance, from as little as 1 O or 15 percent of the overall market to as much as 50
percent. Visitor origin data to be described momentarily, however, attest to the sizable
number of arrivals from nearby points in the central United States. Given the fact that
4-7

Table 9
ESTIMATION OF THE KANSAS CITY TOURIST MARKET 1990
Number of Hotel/Motel Rooms in Metro Area 1 /
Average Annual Occupancy Rate
Number of Occupied Rooms
Annual Occupied Room-Nights (at 365 days)
Average Number of Persons Per Room
Annual Person-Nights
Average Hotel/Motel Length of Stay (nights)
Annual Number of Hotel/Motel Visitors
Estimated Percent of Overnight Visitors in Hotels/Motels
Annual Number of Overnight Visitors
Rounded to
Overnight Visitors as Percent of Total
Total Annual Number of Visitors
Rounded to
1 / Five-county Kansas-Missouri area.
Number or Factor
18,055
61%
11,086
4,046,306
1.4
5,664,828
2.3
2,462,969
55%
4,478,125
4,500,000
71%
6,338,028
6,300,000
Source: Kansas Travel and Tourism Development Division, Convention & Visitors Bureau of Greater Kansas City, HotelMotel Association of Greater Kansas City, Pannell Kerr Forster, and Harrison Price Company.
4-8

many of these visitors (such as those residing in the "tertiary" market 100 to 200 miles
away) can fairly easily undertake a day-trip, HPC suspects that a proportionately large
day-visit market is the reality. Assuming that day-trippers account for about 30 percent
of total tourist visitation, the magnitude of the overall market appears to be in the
neighborhood of 6.3 million, as Table 9 concludes. This estimate may be conservative
and is intended only as an order-of-magnitude figure viewed as reasonable for
attendance planning purposes. Day-trippers, it should be recognized, are not
ordinarily a strong source of support for a major theme park entailing an average
length of stay of more than one-half day, especially if they are simply passing through
enroute to another destination. Instead, the day segment should be regarded as part
of the available base from which to induce expanded overnight visitation, whereby
stay times in Kansas City are commensurate with the time required to enjoy a major
attraction.
Review of long-term trends in travel to the central United States as revealed by U.S.
Travel Data Center studies indicates sustained moderate growth in the neighborhood
of 2 percent annually. Tourism in most areas of the country has been on a downslide
since 1989 given the persistent national recession, the Persian Gulf War, and other
factors. There are signs that conditions have begun to improve, which should produce
a turnaround in the recreational travel market this year and thereafter. Based on a 2
percent annual growth rate, total overnight visitation to the Kansas City area should
reach about 5 million by 1995 and about 6. 7 million within 15 years. These
projections represent "normal" growth and exclude consideration of appreciable
inducements that may occur as a result of enhanced destination infrastructure,
including the World of Oz, the Branson music show complex, and other as-yet
unidentified developments in this general region.
Visitor Characteristics
Tourist promotion agencies in the state of Kansas have to date undertaken only limited
studies detailing the demographic and trip characteristics of Kansas visitors. A
comprehensive survey effort, however, was recently undertaken in neighboring
Missouri, which in part reflects travel to the greater Kansas City area and thus
furnishes useful data. Table 10 contains a summary of this 1991 survey's findings.
With respect to main purpose of trip, the table reveals that vacation or pleasure was
the most common reason for visiting Missouri , representing 47 percent of total
4-9

Table 10
SELECTED CHARACTERISTICS OF TRAVELERS TO MISSOURI
1991
Percent of Total Responses 1/ Missouri Out-of-State Weighted
Residents Visitors Average
Main Purpose of Visit Vacation/Pleasure 44. 4% 49. 4% 47. 0% Business/Convention 14.3 14.2 14. 2 Visit Friends/Relatives 11. 8 15.8 13.9 Passing Through 5. 6 10. 0 7. 9 Bus Tour 2. 1 3. 2 2. 7 Other 21.8 7. 6 14. 3
Average Length of Stay Day Only 43. 0% 16. 4% 29. 4% 1-3 Nights 42.5 52.5 47.6 4-5 Nights 8. 8 17.5 13.2 6 or More Nights 5. 7 13.6 9. 8
Average (nights) 1.73 2.92 2.34
Travel Party Size 1 Person 14. 3% 9. 3% 11. 8% 2 Persons 37.9 41.9 39.9 3 Persons 14.9 14.2 14. 6 4 Persons 17.0 18.9 17.9 5 or More Persons 15.9 15. 7 15. 8
Average (persons) 2.82 2.90 2.86
Travel Party Composition Individual 23. 4% 15. 8% 19. 6% Family (Couple Under 50 Years
of Age With Children) 35.2 34.6 34.9 Couple Under 50 Years of
Age, No Children) 30. 8 31. 7 31.2 Couple Over 50 Years of Age 10. 6 17.9 14. 3
4-10

Table 10
(Continued)
Percent of Total Responses 1/ Missouri Out-of-State Weighted
Residents Visitors Average
Accommodations Used by Overnight or Longer Visitors
Hotel/Motel Campground/RV Park Homes of Friends/Relatives Other
Leading Visitor Origin Areas Missouri Illinois Kansas Iowa Texas Oklahoma Arkansas Nebraska
Activities Enjoyed Outdoor Recreation/Sports Cultural/Historical Attractions Shopping General Sightseeing Concerts/Nightclubs Theme Parks Spectator Sports Other
n/a means not applicable.
45. 3% 27.4 13. 1 14.2
n/a n/a n/a n/a n/a n/a n/a n/a
35. 0% 17.6 13.4 12.2 5.4 5. 6 1. 7 9. 1
60. 7% 14.4 16.2 8. 7
n/a n/a n/a n/a n/a n/a n/a n/a
22. 9% 24.5 13.2 12.6 7. 8 6. 7 2.5 9. 8
1 / Based on a survey of approximately 18,000 tourists during the periods May 24-27, July 26-29, and September 27-30, 1991, conducted by the Missouri Division of Tourism.
Source: Missouri Division of Tourism, "Traveler Intercept Study, 3 Waves, 1991 ;" and Harrison Price Company.
4-11
54. 7% 19.5 15.0 10.8
48. 5% 10.2 6.0 2.8 2. 8 2. 5 2. 2 1. 9
28. 0% 21. 7 13.3 12.4 6.8 6. 3 2.2 9. 3

responses. Business and visits to friends or relatives were next in significance, each
at some 14 percent of the total. Tourist length of stay averages roughly 2.3 nights,
while travel party size has a mean of approximately 2.9 persons. Slightly more than
one-third of all travel parties are family groups, and a similar proportion are comprised
of young couples without accompanying children. Some 55 percent of all visitors stay
in commercial accommodations; campgrounds are also popular at 20 percent of the
market. Missouri residents vacationing within the state account for nearly half of total
visitation, with other significant origin points including nearby Illinois, Kansas, Iowa,
Texas, Oklahoma, Arkansas, and Nebraska. Missouri and the latter states together
contribute more than three-fourths of all visitor arrivals.
Outdoor recreation and participant sports is the chief type of activity enjoyed by
Missouri visitors, mentioned by 28 percent of all respondents, followed by visits to
cultural and historical sites, at 22 percent, shopping at 13 percent, and general
sightseeing at 12 percent. Some 6 percent of all respondents cited visits to theme
parks as a preferred activity. Greater detail on activity preferences is presented in
Table 11, which distinguishes responses by day-trippers from those of longer-stay
visitors. Differences are not radical, but shopping nevertheless ranks higher among
day-visitors than overnighters and outdoor recreation conversely ranks higher among
the overnight contingent. More out-of-state visitors go to theme parks, it will be noted,
than do Missouri residents.
A distribution of median daily per capita expenditures by travelers to Missouri is shown
in Table 12. Total expenditures by Missouri residents amount to some $119 per
person daily, whereas out-of-state tourists spend about $178 daily per capita, both of
which are appreciable figures suggesting a generally affluent tourist market. Food and
beverage spending represents the highest outlay among Missourians, accounting for
25 percent of the total, while lodging represents the largest share of the travel dollar for
out-of-staters at 28 percent of total spending. Expenditures on transportation are
comparatively high for both visitor groups; however, these data include the cost of
travel to and within the state, which encompasses airfares and other relatively high
cost items such as taxi fares.
4-12

Table 11
ACTIVITIES ENJOYED BY MISSOURI TOURISTS BY LENGTH OF ST A Y
1991
Percent of Total Responses 1/ Missouri Out-of-State
Residents Visitors
Activities Enjoyed On Day Trips Cultural/Historical Attractions 23. 2% 29.1% Outdoor Recreation/Sports 23. 1 15.3 Shopping 18. 4 16.2 General Sightseeing 12.5 13.0 Theme Parks 6. 6 8. 7 Concerts/Nightclubs 3.8 3. 7 Spectator Sports 1. 6 2. 7 Other 10.8 11. 3
Activities Enjoyed On Overnight or Longer Trips
Outdoor Recreation/Sports 38. 7% 22. 4% Cultural/Historical Attractions 14. 5 23.5 General Sightseeing 12.4 12.2 Shopping 10.5 12.9 Concerts/Nightclubs 6.2 8. 5 Theme Parks 5.5 7. 0 Spectator Sports 1. 5 2. 4 Other 10. 7 11. 1
1 / Based on a survey of approximately 18,000 tourists during the periods May 24-27, July 26-29, and September 27-30, 1991, conducted by the Missouri Division of Tourism.
Source: Missouri Division of Tourism, "Traveler Intercept Study, 3 Waves, 1991 ;" and Harrison Price Company.
4-13
Weighted Average
24. 6% 21. 1 17. 8 12.6 7. 1 3.8 1. 9
11. 1
28.1% 20.4 12.2 12.0 7. 7 6.5 2. 1 11. 0

Table 12
DISTRIBUTION OF EXPENDITURES BY TRAVELERS TO MISSOURI
1991
Median Daily Per Capita Expenditure 1/
Missouri Out-of-State Expenditure Category Residents Visitors
Lodging
Food and Beverages
Admissions
Transportation 2/
Retail Goods and Other
Total
$29.59
31.89
17.17
1,7.67
~
$118.62
1 / Based on a survey of approximately 18,000 tourists during the periods May 24-27, July 26-29, and September 27-30, 1991, conducted by the Missouri Division of Tourism.
2/ Includes airfares and local transportation.
Source: Missouri Division of Tourism, "Traveler Intercept Study, 3 Waves, 1991 ;" and Harrison Price Company.
4-14
$49.69
44.21
27.14
22.89
~
$177.79

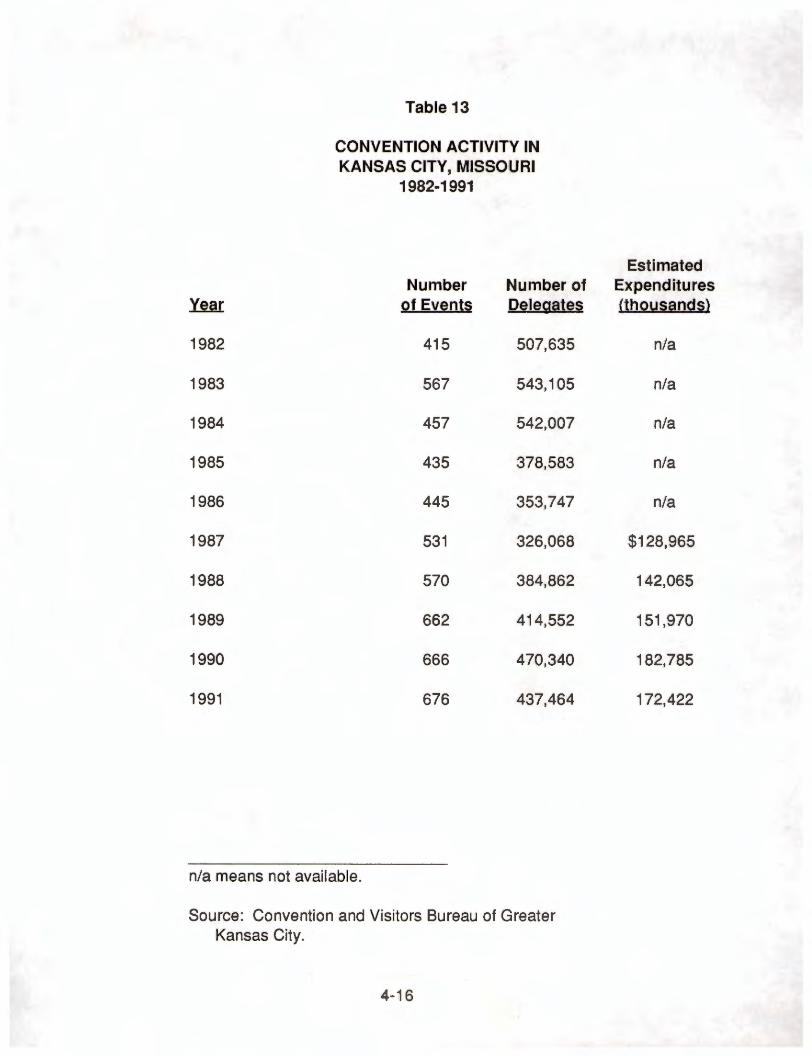
Convention Activity
Of interest to this analysis in the context of the overall tourist market is convention trade
in greater Kansas City, which is among the nation's top convention venues. Because
convention delegates are usually a reliable source of support for the entertainment
offerings of any city they visit, especially in light of recent industry studies revealing
that more and more delegates are bringing along their spouses, this submarket
warrants attention in the present analysis. Recent convention experience in Kansas
City, Missouri, is highlighted in Table 13. As of 1991, the delegate count stood at
some 437,000 people spread over nearly 700 separate events. It is noteworthy that
meeting activity exhibited a trend counter to that of the national tourist market during
the past few years, with noticeable growth occurring in 1989 and 1990; only in 1991
did the market experience a small downturn. Table 14 summarizes recent
convention trade in Kansas City, Kansas. Due to a limited hotel/motel plant (only
about 1,000 rooms out of the 18,000 metropolitan total) and a modest assembly facility
inventory, delegate volume on the Kansas side of the river is much smaller, totaling
80,000 delegates in 1990 at 200 different events and 74,000 in 1991 at 255 events.
Most of these meetings--44 percent of the total--are district (western Kansas/eastern
Missouri) gatherings, indicating that the Kansas side of the city caters to a more locally
oriented convention trade than does the Missouri side, where roughly half of all
meetings are national or international in scope.
Combined convention activity in the metropolitan area as a whole amounts to a 1991
total of more than 900 events and in excess of 500,000 delegates. Conservatively
estimating that 40 percent of all delegates are accompanied by a spouse (the average
for large cities now being on the order of 60 percent), overall convention-related
visitation amounts to at least 700,000 people and represents yet another marketing
opportunity for the World of Oz. HPC understands, moreover, that plans have recently
been approved to expand Kansas City's (Missouri) main convention center, Bartle
Hall. Available exhibit space in the center will more than double to a total of some
410,000 square feet. An analysis prepared by students in the Graduate Program in
Urban Planning at the University of Kansas (April 1991) suggests that an incremental
increase in delegate volume of roughly 150,000 to 190,000 may result from the
expansion project coupled with associated hotel development, thus strengthening
Kansas City's position as an important convention venue.
4-15
~
1982
1983
1984
1985
1986
1987
1988
1989
1990
1991
Table 13
CONVENTION ACTIVITY IN KANSAS CITY, MISSOURI
1982-1991
Number Number of of Events Delegates
415 507,635
567 543,105
457 542,007
435 378,583
445 353,747
531 326,068
570 384,862
662 414,552
666 470,340
676 437,464
n/a means not available.
Source: Convention and Visitors Bureau of Greater Kansas City.
4-16
Estimated Expenditures <thousands}
n/a
n/a
n/a
n/a
n/a
$128,965
142,065
151,970
182,785
172,422

Number of Events Citywide
District
State
Regional
National
Total
Number of Delegates
Table 14
CONVENTION ACTIVITY IN KANSAS CITY, KANSAS
1990 and 1991
~
34
69
16
65
la
202
80,126
Source: Kansas City Area Convention and Visitors Bureau.
4-17 . ;J
1li1
49
112
19
51
24
255
73,871

Table 15
PASSENGER TRAFFIC THROUGH KANSAS CITY INTERNATIONAL AIRPORT
1981-1990
Total Passengers (thousands) Enplaned Origin and
and Deplaned Destination 1 /
1981
1982
1983
1984
1985
1986
1987
1988
1989
1990 2/
1991
Average Annual Rate of Increase
1981-1989 1981-1991
4,530
5,005
5,011
6,458
7,239
8,299
9,433
9,481
9,351
6,944
6,947
9. 5% 4. 4
1 / Passengers beginning or ending their trip in Kansas City; excludes connecting passengers.
2/ Braniff Airlines, an important traffic generator in Kansas City, ceased operations in 1990.
Source: Kansas City Aviation Department and Harrison Price Company.
4-18
3,252
3,607
3,817
4,578
4,984
5,237
5,723
6,007
6,026
6,143
5,958
8. 0% 6. 2
Airport Traffic Volume
Another subset of the overall Kansas City tourist market consists of air arrivals through
Kansas City International Airport. In Table 15, it can be seen that total passenger
volume amounted to 4.5 million in 1981, reached a peak of 9.5 million in 1988, and
has more recently declined--with the demise in 1990 of the important regional carrier
Braniff Airlines--to 6.9 million currently. Airport officials note that origin and destination
figures, as opposed to gross passenger volume as just cited, provide a more accurate
reflection of the traffic growth pattern at this airport, since these data factor out
connecting passengers who are merely passing through and presumably do not leave
the airport between planes. Total origin and destination traffic has grown from about
3.3 million in 1981 to roughly 6 million currently, representing a robust growth rate of
more than 6 percent annually over the past 1 0 years as compared to a 4 percent
average annual increase in overall passenger volume including transients.
Airport passenger volume largely reflects travel in and out of Kansas City by local
residents, together with a nonlocal air component that is presumably heavily oriented
to business visitors given the city's prominence as an agricultural, wholesale/retail
trade, and manufacturing center. This suggestion is confirmed by the monthly
distribution of passenger arrivals presented in Table 16, where only moderate
seasonal variation is apparent--the mild summer peak is as much a barometer of
outgoing vacation travel by Kansas City residents as it is a measure of in-bound tourist
traffic. The high rate of growth in origin and destination volume is thus not extendible
to air tourist arrivals as a discernible market segment. Moreover, somewhat dated, but
probably still valid studies concerning usual tourist mode of arrival in the Kansas City
area reveal that more than 90 percent of all visitors arrive by auto. Airport volume,
accordingly, is significant mainly as evidence of the fact that Kansas City is an
established regional hub that offers convenient connections with metropolitan areas
throughout the country, thus underscoring the area's eligibility to support potential
increases in air arrivals that may result from a national advertising campaign for the
World of Oz.
Highway Traffic Volume on 1-70
As a basis for determining the extent of tourist usage of the key Interstate 70/Kansas
Turnpike arterial, Table 17 presents average annual daily traffic volumes since 1980
4-19

Month
January
February
March
April
May
June
July
August
September
October
November
December
Table 16
MONTHLY DISTRIBUTION OF PASSENGER TRAFFIC THROUGH KANSAS CITY INTERNATIONAL AIRPORT
1989-1991
Total Passengers Enplaned and Deplaned (thousands)
Three-Year 1989 1990 1991 Total
726 489 478 1,693
694 473 456 1,623
869 609 558 2,036
815 547 531 1,893
880 621 611 2,112
953 653 644 2,250
949 645 633 2,227
948 669 674 2,291
752 539 570 1,861
657 575 625 1,857
561 567 568 1,696
547 ~ ~ 12Q5
Total 9,351 6,945 6,948 23,244
Source: Kansas City Aviation Department and Harrison Price Company.
4-20
Average Percent of Total
7. 3%
7. 0
8. 7
8. 1
9. 1
9. 7
9. 6
9. 9
8. 0
8. 0
7. 3
L..3.
100. 0%

Table 17
AVERAGE DAILY TRAFFIC VOLUME ON 1-70 NEAR THE SUBJECT SITE
1980-1990
Average Daily Traffic 1/
Vear <Both Directions)
1980 12,013
1981 11,988
1982 12,251
1983 12,106
1984 12,942
1985 13,012
1986 12,546
1987 13,885
1988 14,996
1989 16,047
1990 17,230
Average Annual Rate of Increase
n/a means not available. 1 / Based on counts taken at a point between the
Bonner Springs and 1-435 interchanges.
Source: Kansas Department of Transportation and Harrison Price Company.
4-21
Percent Change From
Prior Vear
n/a
(0. 2)%
2. 2
(1. 2)
6. 9
0.5
(3. 6)
10. 7
8. 0
7. 0
7. 4
3. 7%

for a point near the site for the World of Oz (an official counter located on 1-70 between
the Bonner Springs and 1-435 interchanges). Figures shown in the table refer to
combined eastbound and westbound traffic. As of 1990, total average daily volume
amounted to roughly 17,000 vehicles, up from some 12,000 vehicles in 1980. The
average annual rate of increase over the decade amounted to a substantial 3.7
percent. Year-to-year variations may reflect a number of factors, including weather
(and hence driving) conditions at different times of the year, temporary lane or road
closures for repairs or construction, gasoline prices (which can affect discretionary
travel), and so on.
Table 18 highlights the seasonal pattern of highway traffic in this vicinity. Volume
can be seen to vary from a low of 13,000 vehicles daily in January to a high of nearly
21,000 vehicles daily in August. From the indicated monthly means, HPC developed
the seasonal index shown in the table, which expresses average daily volume in each
month as a function of the annual average. In the low month of January, for example,
average daily traffic volume amounts to 77 percent of the overall annual average.
Conversely, in the high month of August, average daily traffic exceeds the overall
annual average by 21 percent, illustrating the seasonal surge in recreational travel
during the summer, including tourist vehicles as well as recreational trips by local
residents.
In Table 19, the aforementioned monthly variations have been used to estimate the
total volume of recreational traffic recorded at this location. In this analysis, it has been
assumed that the low month of January represents the baseline--primarily commuter
and other local traffic and only nominal tourist traffic. HPC first adjusted average daily
traffic counts to exclude commercial vehicles (trucks and other heavy vehicles with
more than two axles), which state transportation authorities estimate at approximately
19 percent of total traffic in this vicinity. Deducting the 19 percent commercial
component from each monthly figure leaves a balance representing noncommercial
traffic--from the previous Table 18, for example, the total monthly count of 13,196
vehicles in January less 19 percent equals 10,689 noncommercial vehicles daily.
The baseline January figure was then subtracted from average daily volume in each
subsequent month to yield a net daily increment assumed to be attributable to
recreational traffic. In June, for instance, total calculated average daily traffic of 16,291
noncommercial vehicles less the 10,689 January baseline results in an increment of
4-22

Table 18
SEASONAL INDEX OF TRAFFIC VOLUME ON 1-70 NEAR THE SUBJECT SITE
1990
Average Daily Traffic 1/
Month (Both Directions}
January 13,196
February 13,493
March 15,657
April 16,113
May 17,868
June 20,112
July 20,306
August 20,767
September 18,422
October 17,044
November 16,636
December 16,857
Annual 17,230
1 / Based on counts taken at a point between the Bonner Springs and 1-435 interchanges.
Source: Kansas Department of Transportation and Harrison Price Company.
4-23
Seasonal Index (Annual Average
ADT = 100}
77
78
91
94
104
117
118
121
107
99
97
~
100
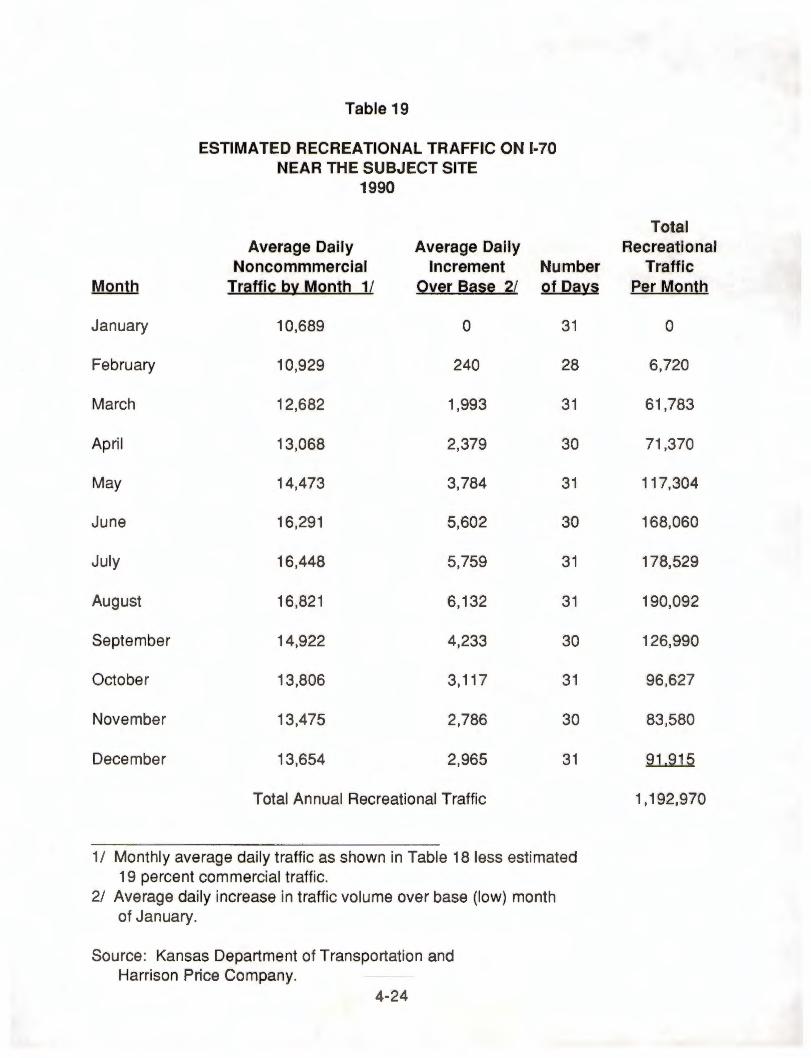
Table 19
ESTIMATED RECREATIONAL TRAFFIC ON 1-70 NEAR THE SUBJECT SITE
1990
Average Daily Average Daily Noncommmercial Increment Number
Month Traffic by Month 11 Over Base 2/ of Days
January 10,689 0 31
February 10,929 240 28
March 12,682 1,993 31
April 13,068 2,379 30
May 14,473 3,784 31
June 16,291 5,602 30
July 16,448 5,759 31
August 16,821 6,132 31
September 14,922 4,233 30
October 13,806 3,117 31
November 13,475 2,786 30
December 13,654 2,965 31
Total Annual Recreational Traffic
1 / Monthly average daily traffic as shown in Table 18 less estimated 19 percent commercial traffic.
2/ Average daily increase in traffic volume over base (low) month of January.
Source: Kansas Department of Transportation and Harrison Price Company.
4-24
Total Recreational
Traffic Per Month
0
6,720
61,783
71,370
117,304
168,060
178,529
190,092
126,990
96,627
83,580
91,915
1,192,970
5,602 daily recreational traffic. Finally, multiplying by the number of days in the month,
the total monthly recreational volume was estimated--5,602 vehicles times 30 days
equals a total increment of 168,060 vehicles for the month of June. The table thus
shows that for the year as a whole, recreational traffic in the site vicinity is on the order
of 1.2 million vehicles, including tourists and recreational traffic generated by local
residents.
A reasonable average car occupancy factor for recreational trips would be on the
order of three persons. On this basis, approximately 3.6 million leisure-motivated
people pass through the World of Oz vicinity annually. Visits to theme parks are not
ordinarily impulse decisions; rather, most people tend to plan such trips well in
advance and do not simply pull off the highway when passing a destination of interest.
However, these data offer evidence that the proposed attraction will have exposure to
a large volume of leisure travelers circulating through the area who, on seeing the
park, may be inspired to return another day.
AGGREGATE MARKET SUPPORT
A summary of aggregate resident and tourist market support available to the World of
Oz is contained in Table 20. Overall market size, as shown, will approximate 7.6
million persons by 1995, with longer-term forecasts calling for about 9.4 million by
2010. Given a basically static resident population base, tourists comprise more than
two-thirds of the total available market and can be expected to contribute substantially
to the attendance mix at the subject attraction. The Kansas City market is compared to
that of other theme park cities in Table 21. As indicated, Kansas City is the smallest
of the 12 markets listed. Paralleling the situation in Kansas City, both Dallas and
Houston have small secondary (50-100 miles) market segments; however, in the
Texas examples, these low secondary market totals are offset by a primary (0-50
miles) resident market that is roughly twice as populated as that of Kansas City.
Relatively small market size under the definition employed in this analysis is mitigated
by the fact that Kansas City is strategically positioned in the center of the country and
on the edge of densely populated areas to the east of the Mississippi River. To
illustrate, Figure 3 and Table 22 indicate the geographic expanse and population
containment, respectively, of the area within 500 miles of Kansas City versus that of
the two Disney park sites in Southern California and Florida. Roughly 54 million
4-25

Market Segment
Resident Market Primary (0-50 miles)
Secondary (50-100 miles)
Subtotal
Table 20
AGGREGATE MARKET SUPPORT AVAILABLE TO THE WORLD OF OZ
1990-2010 (thousands)
Actual Projected 19.aQ ~
1,804 1,868
Q.91 Q.91
2,495 2,559
Tourist Market (Overnight Base) ~ M.Q.Q
Total 6,995 7,559
Source: Urban Decision Systems, Inc., University of Kansas Institute for Public Policy and Business Research, University of Missouri College of Business and Public Administration Research Center, and Harrison Price Company.
4-26
2010
1,983
712
2,695
22QQ
9,395

Metro Area
Los Angeles-Anaheim
Orlando
San Francisco Bay Area
Chicago-Gary
Dallas-Ft. Worth
Atlanta
Houston-Galveston
Minneapolis-St. Paul
Cleveland-Akron
St. Louis
Nashville
KANSAS CITY
Table 21
COMPARATIVE SIZE OF SELECTED U.S. METRO AREA MARKETS
1990 (thousands)
Resident Market 0-50 Miles 50-100 Miles Total
13,321 3,902 17,223
2,494 3,408 5,902
7,693 3,229 10,922
7,221 4,383 11,604
4,056 820 4,876
3,233 2,057 5,290
3,762 809 4,571
2,782 1,054 3,836
3,950 3,738 7,688
2,457 1,291 3,748
1,247 1,162 2,409
1,804 691 2,495
Source: Sales Management, "1991 Survey of Buying Power;" Urban Decision Systems, Inc.; and Harrison Price Company.
4-27
Estimated Overnight Total Visitors Market
19,000 36,223
24,500 30,402
12,000 22,922
11,000 22,604
12,000 16,876
10,200 15,490
8,800 13,371
9,200 13,036
3,600 11,288
7,000 10,748
6,000 8,409
4,500 6,995
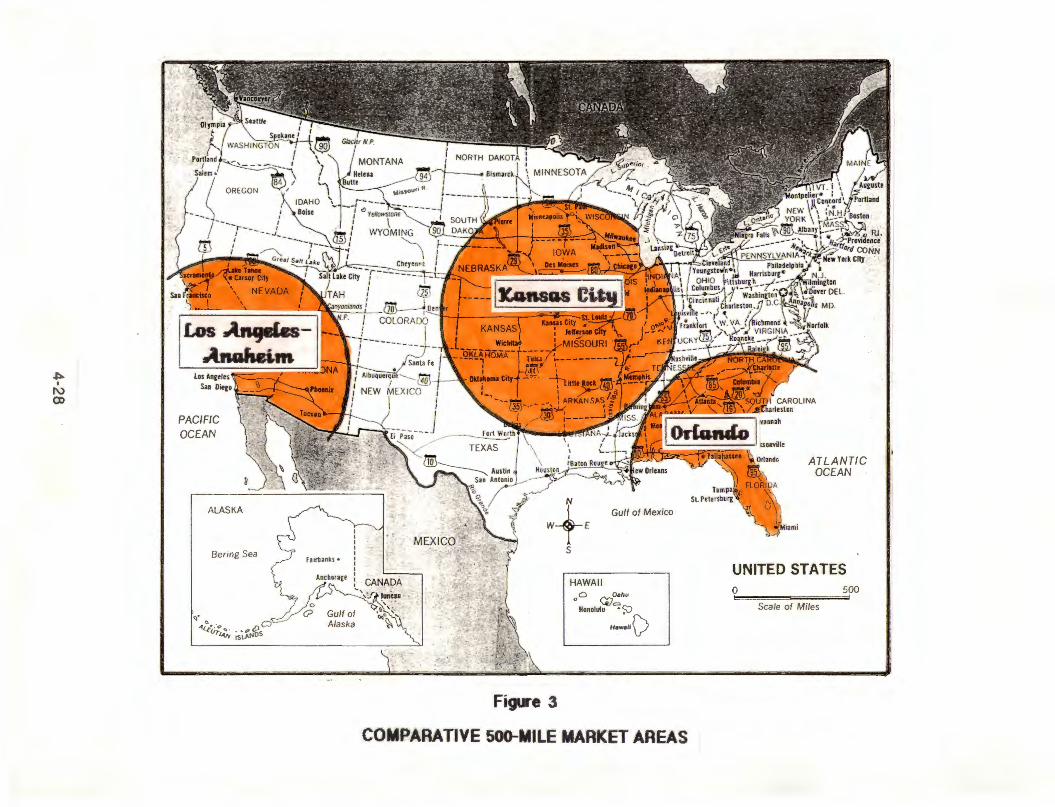
PACIFIC OCEAN
ALASKA
Bering Sea
Gulf of Mexico
HAWAII
0 0 G:;°:,hu Honolulu • S)
Hawe/iv
Figure 3
COMPARATIVE 500-MILE MARKET AREAS
ATLANTIC OCEAN
UNITED STATES 0 500 ~======= =
Scale of Miles

Table 22
COMPARATIVE POPULATION WITHIN 500 MILES OF MAJOR THEME PARKS
1990
Market Area
KANSAS CITY Alabama (part) Arkansas Colorado (part) Illinois Indiana (part) Iowa Kentucky (part) Kansas Louisiana (part) Minnesota (part) Mississippi (part) Missouri Nebraska (part) Oklahoma Tennessee (part) South Dakota (part) Texas (part) Wisconsin (part)
Total
LOS ANGELES-ANAHEIM Arizona (part) California (part) Nevada (part) Utah (part)
Total
ORLANDO Alabama (part) Florida Georgia Mississippi (part) North Carolina (part) South Carolina
Total
Source: U.S. Bureau of the Census and Harrison Price Company.
4-29
Total Population
(thousands)
242 2,358 122
11,449 4,571 2,770 1,682 2,491 833
3,708 883
5,145 1,528 3,143 2,682 495
5,814
~
53,939
3,571 29,962 1,196 ill
34,844
3,106 13,219 6,587 381
3,359 Mil
30,173

people--more than one-fifth of the national total--reside with 500 miles of Kansas City,
or 50 percent more than live within a comparable radius of Los Angeles and 80
percent more than reside within 500 miles of Orlando.
This differential is important and highly favorable to the World of Oz because it signals
a much larger market available within a reasonable travel distance. Studies by the
U.S. Travel Data Center and others reveal that in the United States, there is an
emerging trend among Americans to take shorter, more frequent trips rather than a
single annual vacation of two or three weeks--instead, trips of four days to one week
are becoming more common, undertaken several times per year. Shorter trips
generally mean shorter distances given the cost of long-range travel and the desire to
maximize leisure dollars available at the destination rather than spend them
disproportionately on the means of getting there. The present national recession has
been a major influence in this trend, but there are other, sociological factors
suggesting that it will likely persist--the substantial number of two-career households,
for example, for whom it is often difficult to synchronize extended vacations, and the
pervasive stress of modern lifestyles, which create a desire for more frequent periods
of rest and relaxation. Intensive marketing of the World of Oz within the 500-mile zone
as a convenient and relatively inexpensive destination should greatly assist in
generating tourist support.
4-30

Section 5
ATTENDANCE ANALYSIS AND PHYSICAL PLANNING GUIDELINES
Preceding sections of this report have described the site and competitive environment
for the World of Oz and evaluated available market support. Findings with respect to
these factors can now be combined with an examination of comparable market
capture experience to arrive at a potential range of attendance for the subject
attraction. This section accordingly contains the attendance analysis, followed by a
determination of associated sizing guidelines for major project elements.
POTENTIAL MARKET CAPTURE AND ATTENDANCE
Attendance volume achieved by a recreation attraction is a function of several
interrelated variables, including market size and socioeconomic characteristics, the
quality and scope of development, location, the length of the operating season, pricing
policy vis-a-vis entertainment value offered, extent of direct competition in the
marketplace, management efficiency, and the aggressiveness of the marketing and
promotion effort. As noted earlier in this report, the Kansas City market is of limited
size compared to other major destination areas in the United States, although it lies
within reasonable distance of a very large population base from which additional
tourist support can be induced. In HPC's opinion, the strength of the Oz theme and the
quality and scope of the Landmark conceptual plan suggest a park with outstanding
drawing power. The proposed site, meanwhile, is well suited to development of the
type and scale proposed. Weather will be a factor in the operating schedule, and it is
likely that the park will be closed during the coldest months of the year, with the
exception of the Christmas holiday period. Finally, there is competition from Worlds of
Fun, but by virtue of its appealing concept and envisioned scope, the World of Oz will
be well positioned to have an appreciable impact on the available market. On the
basis of these considerations and other assumptions to be set forth momentarily,
subsequent paragraphs develop appropriate attendance targets for the World of Oz.
5-1

National Trends in the Theme Park Industry
To establish a broad perspective on the outlook for the World of Oz, it is instructive to
review theme park attendance trends on a national scale. As a first step in this
process, Table 23 summarizes the principal characteristics of a representative
sample of existing theme parks, including the preeminent Disney attractions and other
popular parks throughout the country. Among the sample, the Disney facilities in
Southern California and Florida, the two Universal Studios attractions, and Knott's
Berry Farm are currently the only daily year-round operations; Six Flags Magic
Mountain near Los Angeles is open on a weekend-only basis outside its daily summer
schedule but should be regarded, for practical purposes, as an all-year park since it
does not completely shut down for the winter.
The information in Table 23 is provided mainly as a general measure of the scope of
physical development and entertainment programming, with specific reference to the
admission prices commanded in the various instances. The locations of the parks
listed in the table along with other parks drawing more than 1 million visitors per year,
coded by attendance volume, are depicted in Figure 4; the following page provides a
key to the individual attractions. Five theme parks in the 1 million-plus category are
found within a 500-mile radius of Kansas City--Worlds of Fun locally, plus Six Flags
Over Mid-America near St. Louis, Silver Dollar City in southwestern Missouri,
Valleyfair near Minneapolis, and Six Flags Great America near Chicago. Combined
attendance volume of these five attractions amounted to some 8.3 million in 1990, up
from 7 million in 1985, equivalent to a total gain over the five-year period of 19 percent
and an aggregate annual increase of about 3.5 percent. It is noteworthy, however, that
80 percent of the absolute attendance growth recorded by this group of five attractions
is accounted for by Silver Dollar City, which is within the impact area of the Branson
"explosion." Excluding Silver Dollar City, the average annual attendance increase for
the remaining four attractions amounts to 1.7 percent.
Attendance trends for a larger theme park sample encompassing facilities now
recording more than 500,000 visits per year are delineated in Table 24. These data
indicate that there has been a steady increase in the combined capture rate of the 50-
odd attractions included in this demonstration. In the aggregate, attendance at these
parks has grown from 106 million in 1985 to 136 million in 1990, while the combined
capture rate has risen from 43 percent of the total U.S. market in 1985 to 51 percent in
1990.
5-2

Attraction
Disney World Complex 2/
Disneyland
0,
w Universal Studios Florida
Universal Studios Hollywood
Knott's Berry Farm
Six Flags Magic Mountain
Six Flags Over Texas
Six Flags Great America (Illinois)
Table 23
CHARACTERISTICS OF SELECTED U.S. THEME PARKS 1992
Developed Number of Adult Year Area Major Admission
Opened (acres) Attractions 1/ Price Operating Schedule
1971 650 100+ $35.90 3/ Daily year-round
1955 80 35 28.75 Daily year-round
1990 440 15 33.00 4/ Daily year-round
1965 420 11 26.00 Daily year-round
1920 150 19 22.95 Daily year-round
1971 260 29 25.00 Daily Mem Day to Lab Day Weekends rest of year
1961 205 30 23.95 Daily May thru Oct Weekends Apr and Nov Closed rest of year
1976 200 34 24.00 Daily mid-May thru Aug Weekends early May, Sep, Oct Closed rest of year

Table 23
(Continued)
Developed Number of Adult Year Area Major Admission
Attraction Opened (acres) Attractions 1/ Price Operating Schedule
Six Flags Over Georgia 1967 330 30 $24.00 Daily Mem Day thru Aug Weekends Mar, May, Sep, Oct Closed rest of year
Great America (Santa Clara) 1976 100 27 22.95 Daily Mem Day to Lab Day Weekends Mar, Apr, Sep, Oct
01 Closed rest of year I
~
Opryland 1972 120 24 22.95 Daily Mem Day to Lab Day Weekends Apr, May, Sep, Oct Closed rest of year
Astra World 1968 n/a 20 23.75 Daily Mem Day to Lab Day Weekends Mar, Apr, May Closed rest of year
Six Flags Over Mid-America 1971 200 20 21.95 Daily mid-May to Lab Day Weekends Apr, Sep, Oct Closed rest of year
Worlds of Fun 1973 170 19 21.95 Daily Mem Day to Lab Day Weekends Apr, Sep Oct Closed rest of year

0, I
0,
Year Attraction Opened
Valley Fair 1976
Geauga Lake 1888
n/a means not available.
Developed Area
(acres}
70
n/a
Table 23
(Continued)
Number of Major
Attractions 1/
21
31
1 / Includes major rides, shows, and other featured attractions.
Adult Admission
Price
$17.50
15.95
2/ Includes Magic Kingdom, EPCOT, MGM Studios, Typhoon Lagoon, and Pleasure Island. 3/ Single-day, one-park price. 4/ Single-day price.
Source: American Automobile Association, "Guide to North America's Theme Parks;" Amusement Business, "1991 Funparks Directory;" and Harrison Price Company.
Operating Schedule
Daily Mem Day thru Aug Weekends Sep Closed rest of year
Daily Mem Day to Lab Day Weekends May, Sep Closed rest of year

0, I
O')
0
N
W+E Gulf of Mexico
> 1 .. Att1nd1ne1 MEXICO
s 3-IM Att1nunc1 I
D HAWAII
0 ({,)Oahu 0
Z-3M Allendlnct c:::,
Honolulu • S)
Hew~/{) 1-2M Altentlance
-
Figure 4
U.S. THEME PARKS WITH ATTENDANCE OF 1 MILLION OR MORE
UNITED STATES 0 500
Scale of Miles

KEV TO FIGURE 4
Mega-Parks (> 1 o Million Attendance)
Disneyland (Anaheim, CA)
Disney World/EPCOT/MGM Studios (Orlando, FL)
Other Large Parks (3-6 MIiiion Attendance)
Busch Gardens Dark Continent (Tampa, FL)
Cedar Point (Sandusky, OH)
King's Island (Cincinnati, OH)
Knott's Berry Farm (Buena Park, CA)
Sea World of California (San Diego, CA)
Sea World of Florida (Orlando, FL)
Six Flags Magic Mountain (Valencia, CA)
Spaceport USA (Cape Canaveral, FL)
Universal Studios Florida (Orlando, FL)
Universal Studios Hollywood (Universal City, CA)
Middle Tier Parks (2-3 MIiiion Attendance)
Busch Gardens Old Country (Williamsburg, VA)
Great America (Santa Clara, CA)
King's Dominion (Doswell, VA)
Opryland (Nashville, TN)
Santa Cruz Beach Boardwalk (Santa Cruz, CA)
Six Flags Great Adventure (Jackson, NJ)
Six Flags Great America (Gurnee, IL)
Six Flags Over Georgia (Atlanta, GA)
Six Flags Over Texas (Arlington, TX)
5-7
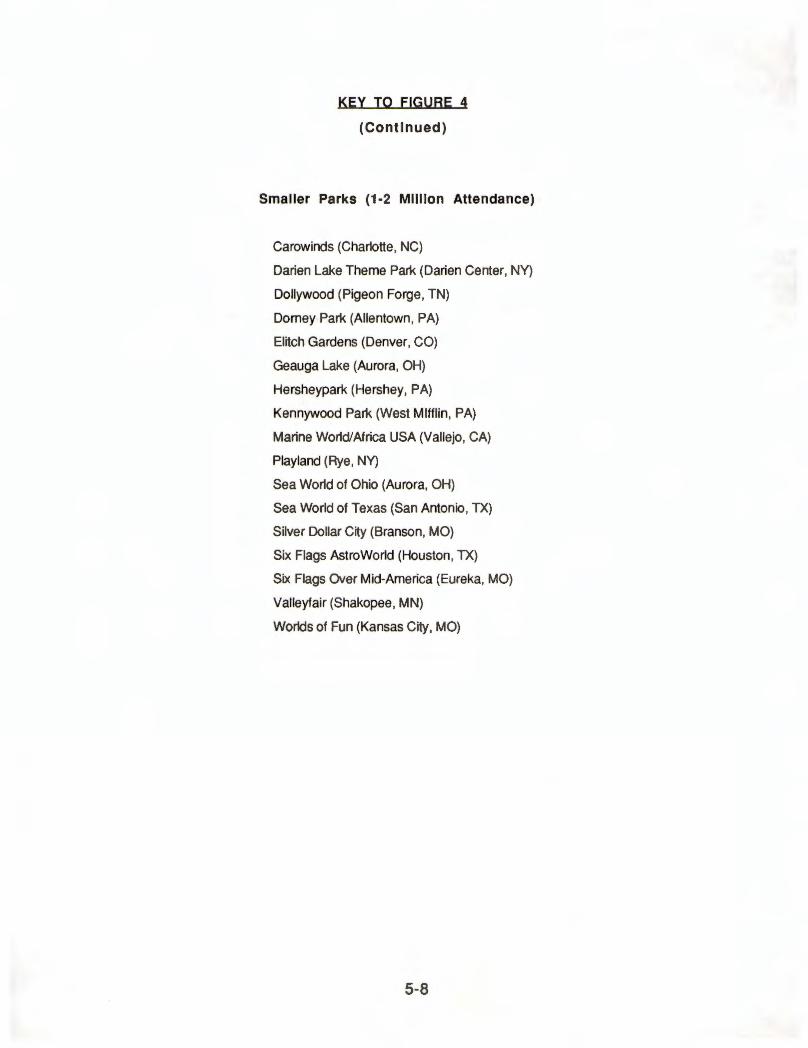
KEY TO FIGURE 4 (Continued)
Smaller Parks (1-2 MIiiion Attendance)
Carowinds (Charlotte, NC)
Darien Lake Theme Park (Darien Center, NY)
Dollywood (Pigeon Forge, TN)
Dorney Park (Allentown, PA)
Elitch Gardens (Denver, CO)
Geauga Lake (Aurora, OH)
Hersheypark (Hershey, PA)
Kennywood Park (West Mlfflin, PA)
Marine World/Africa USA (Vallejo, CA)
Playland (Rye, NY)
Sea World of Ohio (Aurora, OH)
Sea World of Texas (San Antonio, TX)
Silver Dollar City (Branson, MO)
Six Flags AstroWorld (Houston, TX)
Six Flags Over Mid-America (Eureka, MO)
Valleyfair (Shakopee, MN)
Worlds of Fun (Kansas City, MO)
5-8

Table 24
NATIONAL TRENDS IN THEME PARK ATTENDANCE 1985-1990
U.S. Market Size (thousands) Total Total
Foreign Theme Park Theme Park Total Visitor Attendance Market
Year Population Arrivals 1/ Total <thousands) Capture
1985 238,741 8,903 247,644 106,201 42. 9%
1986 241,107 10,265 251,372 109,813 43. 7
1987 243,419 11,639 255,058 118,346 46.4
1988 244,534 13,804 258,338 121,327 47.0
1989 246,820 15,099 261,919 127,983 48.9
1990 249,466 16,908 266,374 135,783 51.0
1 / Excludes day visitation across Canada and Mexico borders.
Source: U.S. Bureau of Economic Analysis and Harrison Price Company.
5-9
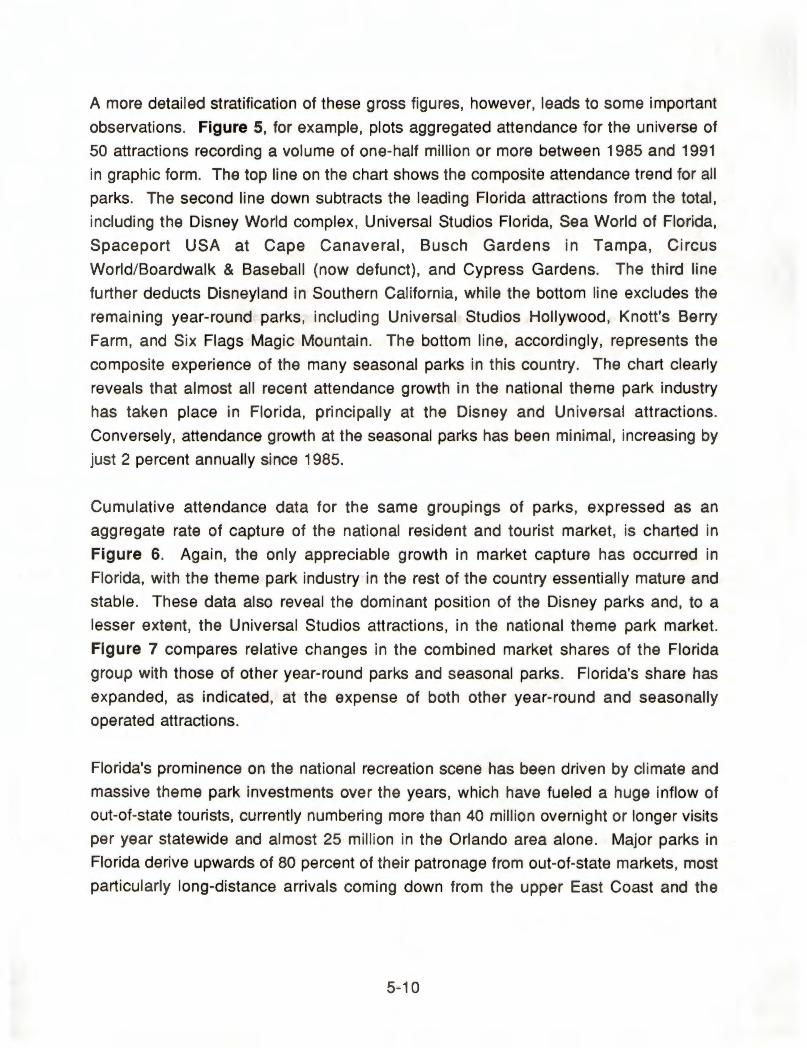
A more detailed stratification of these gross figures, however, leads to some important
observations. Figure 5, for example, plots aggregated attendance for the universe of
50 attractions recording a volume of one-half million or more between 1985 and 1991
in graphic form. The top line on the chart shows the composite attendance trend for all
parks. The second line down subtracts the leading Florida attractions from the total,
including the Disney World complex, Universal Studios Florida, Sea World of Florida,
Spaceport USA at Cape Canaveral, Busch Gardens in Tampa, Circus
World/Boardwalk & Baseball (now defunct), and Cypress Gardens. The third line
further deducts Disneyland in Southern California, while the bottom line excludes the
remaining year-round parks, including Universal Studios Hollywood, Knott's Berry
Farm, and Six Flags Magic Mountain. The bottom line, accordingly, represents the
composite experience of the many seasonal parks in this country. The chart clearly
reveals that almost all recent attendance growth in the national theme park industry
has taken place in Florida, principally at the Disney and Universal attractions.
Conversely, attendance growth at the seasonal parks has been minimal, increasing by
just 2 percent annually since 1985.
Cumulative attendance data for the same groupings of parks, expressed as an
aggregate rate of capture of the national resident and tourist market, is charted in
Figure 6. Again, the only appreciable growth in market capture has occurred in
Florida, with the theme park industry in the rest of the country essentially mature and
stable. These data also reveal the dominant position of the Disney parks and, to a
lesser extent, the Universal Studios attractions, in the national theme park market.
Figure 7 compares relative changes in the combined market shares of the Florida
group with those of other year-round parks and seasonal parks. Florida's share has
expanded, as indicated, at the expense of both other year-round and seasonally
operated attractions.
Florida's prominence on the national recreation scene has been driven by climate and
massive theme park investments over the years, which have fueled a huge inflow of
out-of-state tourists, currently numbering more than 40 million overnight or longer visits
per year statewide and almost 25 million in the Orlando area alone. Major parks in
Florida derive upwards of 80 percent of their patronage from out-of-state markets, most
particularly long-distance arrivals coming down from the upper East Coast and the
5-10

0, I
...J.
...J.
-o:-AH Parks
i A n t t T e h n o d u a S
n a C n e d
s
140.000
120.000
100.000
80.000
60.000
40.000
20.000
0
1985
* All Ex Florida
1986 1987
a- All Ex Florida and 0·1and
Figure 5
1988
Year
1989
U .. S .. THEME PARK ATTENDANCE TRENDS
-a- A11 Ex Florida. 0·1and. USH. and KBF
1990 1991

-6:- AH Parks
60Z
50Z G C r a 0 p 40Z s t
01 s u I --4
r\) r 30Z M e 8
r R k 8 2oz e t t e
1oz
oz
1985
* AH Ex F1orida
1986 1987
o- A 11 Ex F1orida and 0·1and
1988
Year
Figure 6
U.S. THEME PARK MARKET CAPTURE TRENDS
-a- AH Ex Florida. 0·1and. USH. and KBF
1989 1990

10oz
90Z
80Z M
A 8 70Z r
g k
g 60Z e
r t e 50Z g s 8 h 40Z t
8 e 30Z r
e 2oz
1oz
oz
~ Seasona1 Parks D Other Year-Round Parks II F1orida Parks
1985 1986 1987 1988
Year
Figure 7
1989
MARKET SHARES OF U.S. THEME PARKS
............ ............. ............ ························· ·.·.·······•······•·•·•·• :::::::::::::::::::::::::
t:tIII: ::::::::::::::::::::::::: ~:!:!:!: !:~:!:!:!:!:!:~:~ ::::::::::::::::::::::::: :■:■: ■:■:■:■: ■: ■:■:■:■:■:
::::i:ll~lll:llillllllll
1990
::::::::::::::::::::::::: ·••··••·•••••····••·•••·· ::::::::::::::::::::::::: :-:•:-:■:■:■:■:■:-:■:■:■: •:-:■:■:-:-:-:•:•:•:•:•:• :-:■:■: ■: ■: ■: ■:■:■:■:■:■:
i~~i~~ ~i~~~~i~ !~~~~~~!~!~ ,:■:■:■:■:■:■:■:■:■:■:■:■
:::;:::;::::::::::::::::: :-:■:-:■:■:■:■: ■: ■:■:■: ■: ,:■:■:■:■:■:■:■:■:■:■: ■: ■
·.·.········•·······•····
rrrrmmm :::::::::::::::::::::::::
1991

Midwest. As a result, however, Florida is highly vulnerable to increases in travel costs
and, in concert, is also susceptible to previously noted changes in American travel
patterns now apparently trending toward shorter, less ambitious trips.
Florida and Southern California will persevere as the nation's leading tourist
destinations owing to the accumulated size of the visitor magnet in these areas and an
amenable climate that encourages visitation during times of the year when most
destinations languish. However, a "window" of sorts may be opening for attractions in
other areas with the marketing expertise to capitalize on the emerging preference for
high-quality entertainment experiences closer to home. When coupled with significant
investments in entertainment facilities and supporting tourist infrastructure--the
Branson phenomenon being a sterling case in point--the World of Oz has at least the
opportunity of providing an alternative destination of great appeal to a large regional
market in the central United States.
Experience of Comparable Attractions
A more specific treatment of comparable experience is delineated in Table 25.
Excluding the anomalous Disney parks, the range of market penetration extends from
a low of 9 percent of the combined resident and tourist markets available (at Magic
Mountain and Valleyfair) to a high of 25 percent at Opryland; the average for the non
Disney sample is 14 percent. As to the Disney attractions, the Disney World complex
(referring to the three major components--Magic Kingdom, EPCOT, and MGM Studios)
achieves a singular 1-27 percent gross capture of an enormous available market;
adjusting for cross-visitation between the three parks, the mean capture rate for each
of the three component parks is on the order of 39 percent. In Southern California,
meanwhile, Disneyland also reports a very high capture of 36 percent of the largest
metropolitan recreation market in the country.
Attendance Models for the World of Oz
Based on the foregoing review of industry trends and the experience of comparable
attractions, an illustrative range of market capture and attendance volume for the
World Oz is presented in Table 26. The following specific assumptions are integral to
these models:
5-14
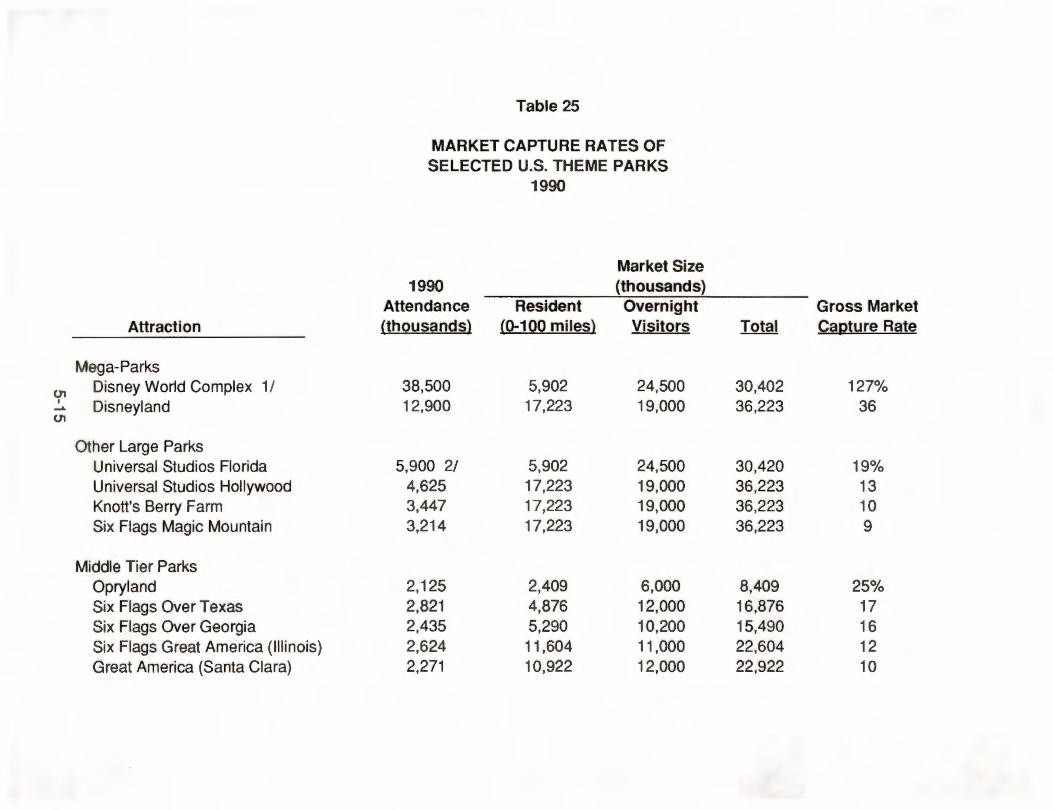
Attraction
Mega-Parks
01 Disney World Complex 1/ I Disneyland ~
01
Other Large Parks Universal Studios Florida Universal Studios Hollywood Knott's Berry Farm Six Flags Magic Mountain
Middle Tier Parks Opryland Six Flags Over Texas Six Flags Over Georgia Six Flags Great America (Illinois) Great America (Santa Clara)
Table 25
MARKET CAPTURE RATES OF SELECTED U.S. THEME PARKS
1990
Market Size 1990 (thousands)
Attendance Resident Overnight (thousands} (0-100 miles} Visitors
38,500 5,902 24,500 12,900 17,223 19,000
5,900 2/ 5,902 24,500 4,625 17,223 19,000 3,447 17,223 19,000 3,214 17,223 19,000
2,125 2,409 6,000 2,821 4,876 12,000 2,435 5,290 10,200 2,624 11,604 11,000 2,271 10,922 12,000
Gross Market Total Capture Rate
30,402 127% 36,223 36
30,420 19% 36,223 13 36,223 10 36,223 9
8,409 25% 16,876 17 15,490 16 22,604 12 22,922 10
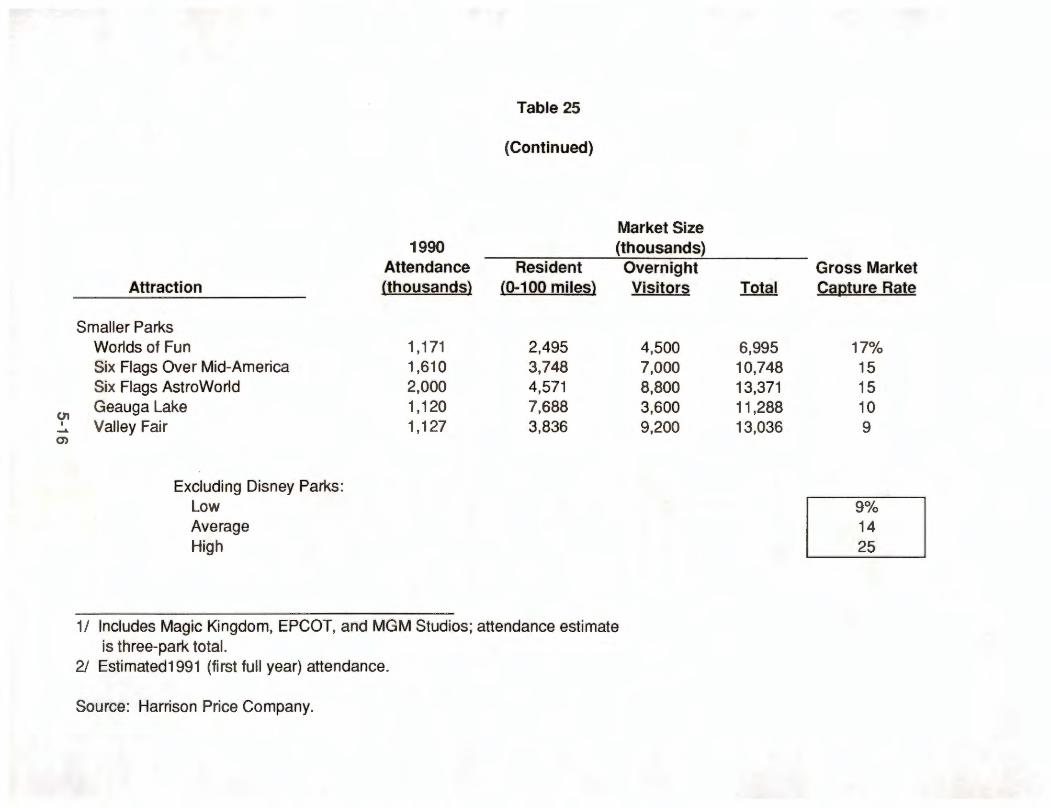
0, I _.
O')
1990 Attendance
Attraction (thousands)
Smaller Parks Worlds of Fun 1,171 Six Flags Over Mid-America 1,610 Six Flags AstroWorld 2,000 Geauga Lake 1,120 Valley Fair 1,127
Excluding Disney Parks: Low Average High
Table 25
(Continued)
Resident (0-100 miles)
2,495 3,748 4,571 7,688 3,836
Market Size (thousands) Overnight Visitors
4,500 7,000 8,800 3,600 9,200
1/ Includes Magic Kingdom, EPCOT, and MGM Studios; attendance estimate is three-park total.
2/ Estimated1991 (first full year) attendance.
Source: Harrison Price Company.
Gross Market Total Capture Rate
6,995 17% 10,748 15 13,371 15 11,288 10 13,036 9
9% 14 25
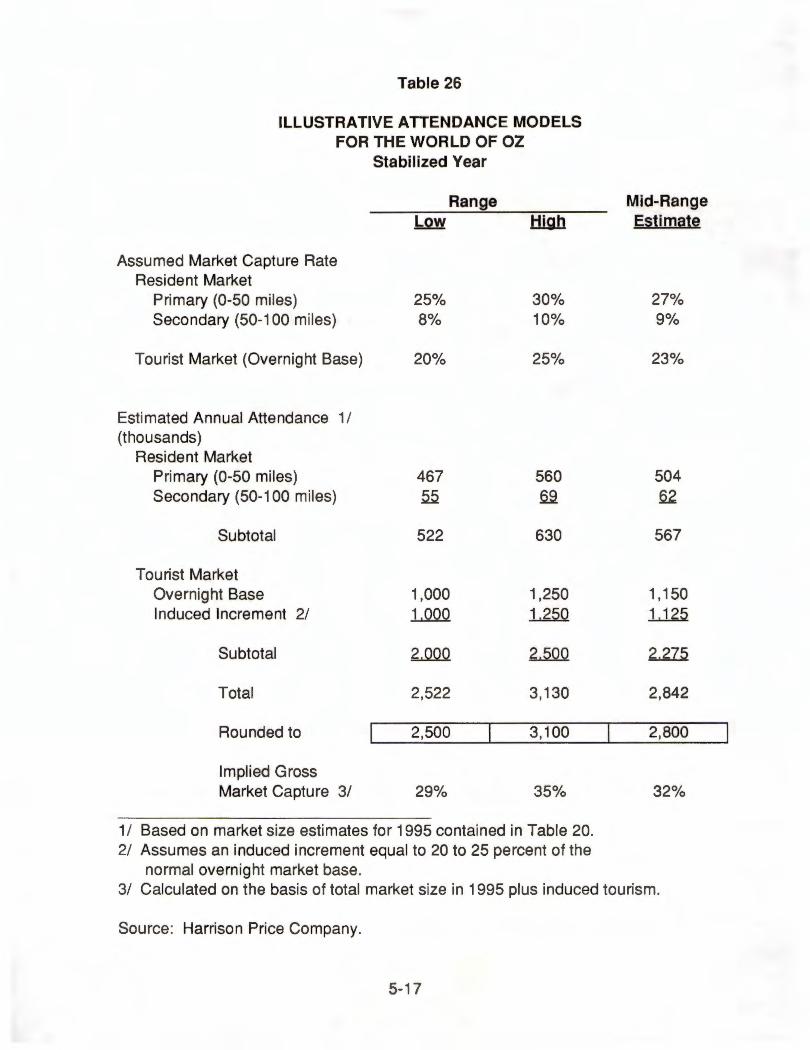
Table 26
ILLUSTRATIVE ATTENDANCE MODELS FOR THE WORLD OF OZ
Stabilized Vear
Range
Assumed Market Capture Rate Resident Market
Primary (0-50 miles) 25% 30% Secondary (50-100 miles) 8% 10%
Tourist Market (Overnight Base) 20% 25%
Estimated Annual Attendance 1/ (thousands)
Resident Market Primary (0-50 miles) 467 560 Secondary (50-100 miles) ~ 2.9
Subtotal 522 630
Tau rist Market Overnight Base 1,000 1,250 Induced Increment 2/ Ll2QQ 12fill
Subtotal 2.m.Q 2.i.5.Q.Q
Total 2,522 3,130
Rounded to 2,500 3,100
Implied Gross Market Capture 3/ 29% 35%
1 / Based on market size estimates for 1995 contained in Table 20. 2/ Assumes an induced increment equal to 20 to 25 percent of the
normal overnight market base.
Mid-Range Estimate
27% 9%
23%
504 62
567
1,150 1.J..25
2,275
2,842
2,800
32%
3/ Calculated on the basis of total market size in 1995 plus induced tourism.
Source: Harrison Price Company.
5-17

•
•
•
•
•
That the World of Oz represents a multi-million dollar capital investment
and will be developed to the highest standards of construction,
entertainment programming, and aesthetic amenities.
That sufficient public funds and/or private sponsorships will be available
to supplement conventional financing as needed to develop the
attraction to the quality standard required to have a major impact on the
market.
That the park will be aggressively promoted on a national scale, most
importantly including heavy use of mass media and, specifically, direct
tie-ins with television presentations of the "Wizard of Oz" movie.
That the entertainment program of the attraction will incorporate periodic
change sufficient to stimulate an ongoing cycle of repeat visitation-
experience of other attractions plainly demonstrates that it is relatively
easy to draw visitors the first time around but very difficult to keep them
coming back without regular injections of fresh program content (and
related capital investment).
That the execution of the attraction and the effectiveness of the marketing
and promotion program will enable the park to induce substantial tourist
visitation above and beyond the normal overnight base.
Given the above assumptions and other considerations noted earlier in this report,
Table 26 indicates that capture of the primary resident market (0-50 miles) has been
modeled on a range of 25 to 30 percent, while secondary market penetration (50-100
miles) is assumed at 8 to 10 percent. Capture of the available overnight tourist base
may range from 20 to 25 percent. Based on market size estimates for 1995 previously
presented in Table 20 and adding an allowance for induced tourism, these capture
rates translate into a potential absolute attendance volume of 2.5 million to 3.1 million,
with a mid-range target of 2.8 million. These goals refer to a stabilized year, usually
meaning the third or fourth full year of operation.
5-18
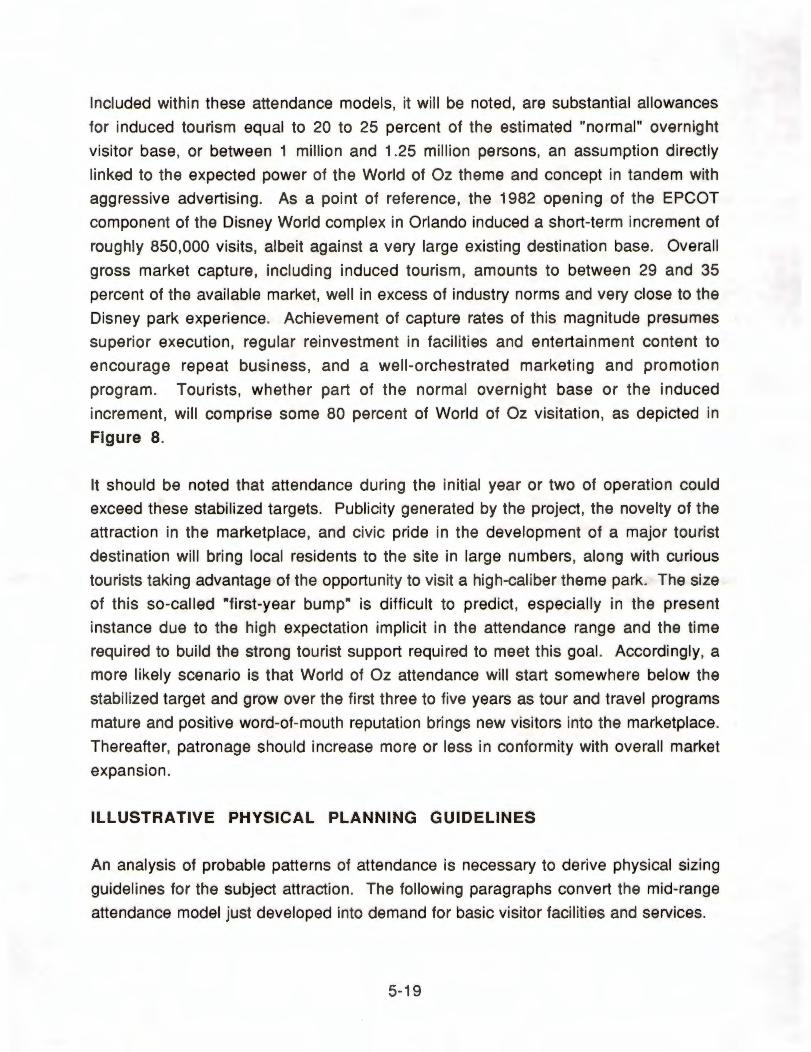
Included within these attendance models, it will be noted, are substantial allowances
for induced tourism equal to 20 to 25 percent of the estimated "normal" overnight
visitor base, or between 1 million and 1.25 million persons, an assumption directly
linked to the expected power of the World of Oz theme and concept in tandem with
aggressive advertising. As a point of reference, the 1982 opening of the EPCOT
component of the Disney World complex in Orlando induced a short-term increment of
roughly 850,000 visits, albeit against a very large existing destination base. Overall
gross market capture, including induced tourism, amounts to between 29 and 35
percent of the available market, well in excess of industry norms and very close to the
Disney park experience. Achievement of capture rates of this magnitude presumes
superior execution, regular reinvestment in facilities and entertainment content to
encourage repeat business, and a well-orchestrated marketing and promotion
program. Tourists, whether part of the normal overnight base or the induced
increment, will comprise some 80 percent of World of Oz visitation, as depicted in
Figure 8.
It should be noted that attendance during the initial year or two of operation could
exceed these stabilized targets. Publicity generated by the project, the novelty of the
attraction in the marketplace, and civic pride in the development of a major tourist
destination will bring local residents to the site in large numbers, along with curious
tourists taking advantage of the opportunity to visit a high-caliber theme park. The size
of this so-called "first-year bump" is difficult to predict, especially in the present
instance due to the high expectation implicit in the attendance range and the time
required to build the strong tourist support required to meet this goal. Accordingly, a
more likely scenario is that World of Oz attendance will start somewhere below the
stabilized target and grow over the first three to five years as tour and travel programs
mature and positive word-of-mouth reputation brings new visitors into the marketplace.
Thereafter, patronage should increase more or less in conformity with overall market
expansion.
ILLUSTRATIVE PHYSICAL PLANNING GUIDELINES
An analysis of probable patterns of attendance is necessary to derive physical sizing
guidelines for the subject attraction. The following paragraphs convert the mid-range
attendance model just developed into demand for basic visitor facilities and services.
5-19
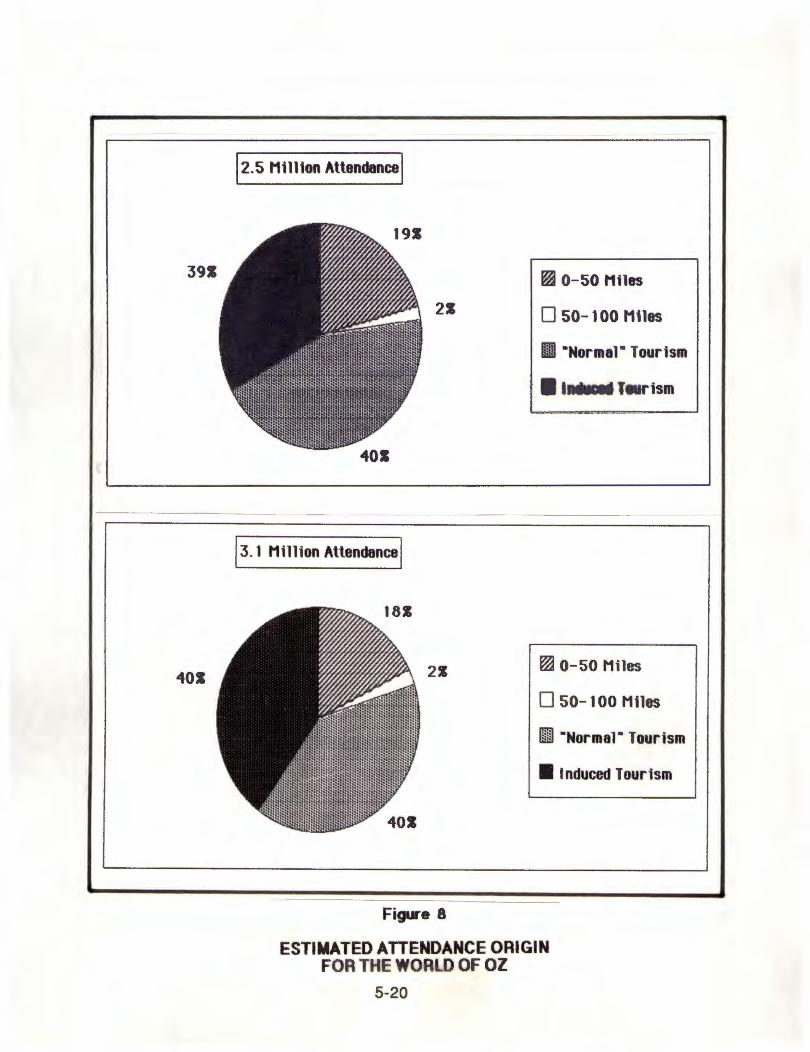
391
401
12.s Million Attendance I
..
~,1,:l~i~~1~~1 :;<lnt:l:Rt:tr,,,:1,,-: '>-lt't~:l~ili
-1~!1H!lttWm1ilm~~tlk\~i11~w , •:1 \t"t''1'i'':''flti11:l11qs•,g:'•tf1"',:fi
·'iii!h~U.il!l!illlr,'ll!l~!liil!iU.~!llllil~i~V ,,:~t~~itl~~~F·•·•, ·:§k.'iWhit:!:l:{::~f!:1:1:1:1l:\;~.!H:i:•· ·•:::•:1::.;:1:ttl:,1:.1::~.:::1,•
, ·lit;liilttttlBUlt, "' . t . ,
13.1 Mi11ion Attendance j
21
21
Figure 8
fa 0-50 Miles
D 50-100 Miles
Ill •Normar Tourism
■ ••-•Tturism
~ 0-50 M i1es
D 50- 100 Miles
lillll ·Normar Tourism
■ Induced Tourism
ESTIMATED ATTENDANCE ORIGIN FOR THE WOR D OF OZ
5-20

Operating Schedule
The typical schedule for seasonal parks in the United States (refer to Table 23) is daily
operation from Memorial Day through Labor Day, with weekend operation in the
"shoulder" months of April, May, September, and October. A schedule of this
description results in approximately 120 operating days per year depending on
holiday placement and other factors. A number of parks have been successful in
increasing the number of operating days by opening on a limited basis during the
Christmas holidays, thereby adding 12 to 18 days to the schedule. It has been noted
that the World of Oz is expected to have broad market appeal and hence the ability to
attract tourists during the spring and fall shoulder seasons, particularly senior citizens
and other "empty-nesters;" it should also have strong appeal during the Christmas
holidays when the movie is a television tradition. Accordingly, HPC developed a
preliminary operating schedule for the park, presented in Table 27, which provides
for 165 operating days, including 73 weekends and holidays and 92 weekdays.
Design Day
Except for parking, it is neither economical nor necessary to plan a physical plant to
accommodate absolute peaks in attendance; rather, a good balance is achieved if
facilities are planned for the "design day," a term referring to the average of attendance
on the top 15 t~ 20 days of the year. The result is a facility large enough to handle the
heavy volume of visitors on the three or four highest days, albeit with some crowding,
but at the same time, the facility is not so large as to appear empty during the slack
periods that inevitably occur. As a first step in calculating design day requirements,
Table 28 presents the monthly distribution of attendance at selected theme parks in
the central United States. A summer peak is characteristic of all of these operations,
due not only to weather and the schedule observed by the park, but also to the typical
concentration of tourism and family leisure activity in summer months. The indicated
July or August peak for these attractions ranges from 20 to 38 percent of the annual total.
HPC expects that the World of Oz will experience less peaking than highly seasonal
parks such as Opryland and Valleyfair due primarily to the longer operating schedule
envisioned and the surmised ability to generate substantial shoulder-month
patronage. For planning purposes, it is assumed that the peak month, which will
5-21
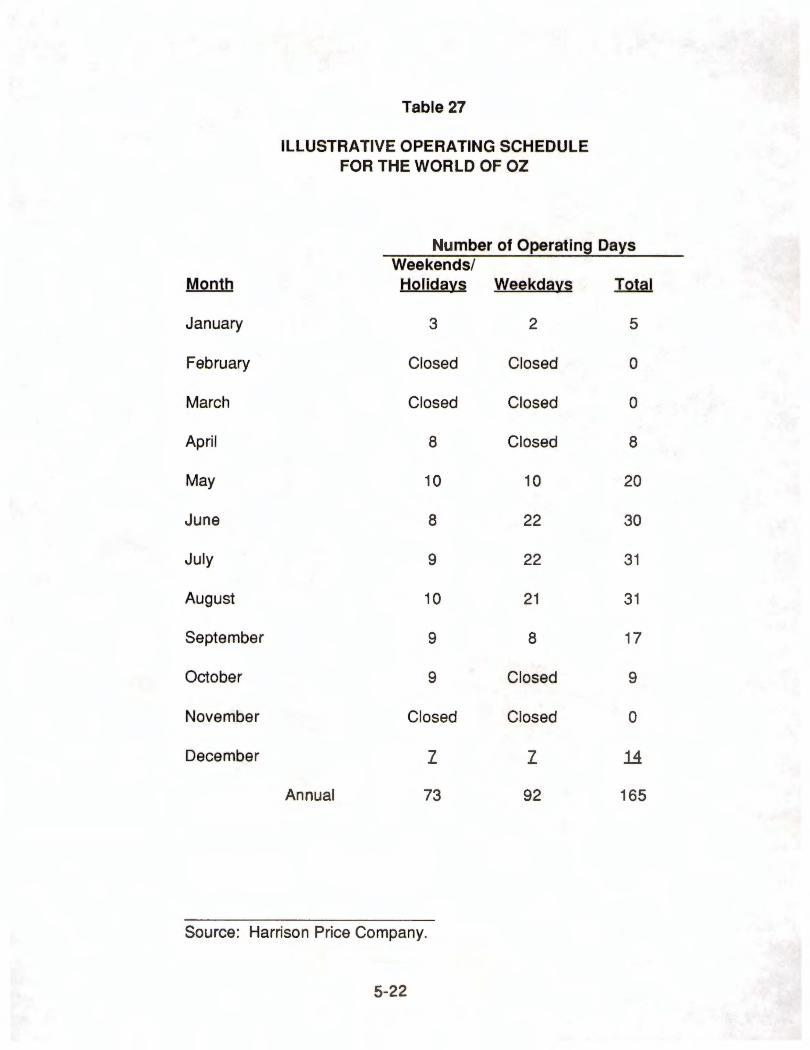
Table 27
ILLUSTRATIVE OPERATING SCHEDULE FOR THE WORLD OF OZ
Number of Operating Days Weekends/
Month Holidays Weekdays IQ1fil
January 3 2 5
February Closed Closed 0
March Closed Closed 0
April 8 Closed 8
May 10 10 20
June 8 22 30
July 9 22 31
August 10 21 31
September 9 8 17
October 9 Closed 9
November Closed Closed 0
December z z 14
Annual 73 92 165
Source: Harrison Price Company.
5-22
0, I
r\) u)
Month
January February March April May June July August September October November December
Total
n/o means not open.
Table 28
MONTHLY DISTRIBUTION OF ATTENDANCE FOR THEME PARKS IN THE CENTRAL UNITED STATES
1990-1991 Average
Distribution of Attendance b~ Month Worlds Six Flags Over Silver Dollar of Fun Mid-America City Opryland
(Kansas City) (St. Louis) (Branson) (Nashville)
n/o n/o n/o n/o n/o n/o n/o n/o n/o n/o n/o n/o 7% 4% 3% 2% 10 11 9 6 25 25 20 22 22 22 18 26 23 23 18 32 9 8 11 6 4 7 12 6
n/o n/o 3 n/o nLQ nLQ 2 nLQ
100% 100% 100% 100%
Source: Above attractions and Harrison Price Company.
Valley Fair King's Island (Minneapolis) (Cincinnati)
n/o n/o n/o n/o n/o n/o n/o 4% 7% 9 16 19 30 29 38 22 9 8
n/o 2 n/o n/o nLQ z
100% 100%
probably be August, will account for 25 percent of annual volume. On this basis,
Table 29 shows that average weekly volume during the peak month would amount to
some 158,000 visitors on the mid-range attendance model of 2.8 million. Experience
at existing theme parks further suggests that the average high day (design day, or the
typical weekend day in August) will be equivalent to 20 percent of the peak week,
which in turn implies a design day capacity requirement of 31,600 persons as a mid
range target.
It was mentioned earlier in this report that the concept of the World of Oz should
generate visitor stay times ranging from five to seven hours, with six hours considered
to be a reasonable average. Further assuming that an 11-hour daily operating
schedule is established during peak attendance periods, Table 30 contains
illustrative arrival and departure patterns for design day; these are presented
graphically in Figure 9. As indicated, the on-site crowd typically increases quite
rapidly during the first several hours of operation and, with a six-hour average stay,
would reach a peak of about 70 percent of the day's total between 2 and 3 pm. Since
most visitors already have arrived at this hour (81 percent) and relatively few have
departed (11 percent), the mid-afternoon hours are the period of greatest strain on
facilities. Based on a peak on-site factor equal to 70 percent, the average maximum
number of people on site at the highest hour would amount to approximately 22,100
persons under the mid-range model. This represents the simultaneous holding
capacity requirement of the attraction--the sum of all entertainment and visitor service
facilities, general circulation, and other spaces open to the public. A longer average
stay time, it should be recognized, would increase the on-site count, whereas
extended operating hours would marginally reduce the on-site crowd (many large
theme parks remain open for as long as 15 or 16 hours on peak days).
Entertainment Capacity Requirements
All rides, shows, and other attractions within a theme park may be rated in terms of the
number of visitors they are theoretically able to handle per hour. This theoretical
hourly capacity is referred to as "entertainment units." It is HPC's observation that
parks of the size and program scope of the World of Oz should be planned to offer an
average of between 1.3 and 1.5 guest experiences per hour. These factors have been
applied to the on-site crowd estimate in Table 29 and indicate a total entertainment
capacity requirement ranging from 29,000 to 33,000 hourly entertainment units. The
5-24
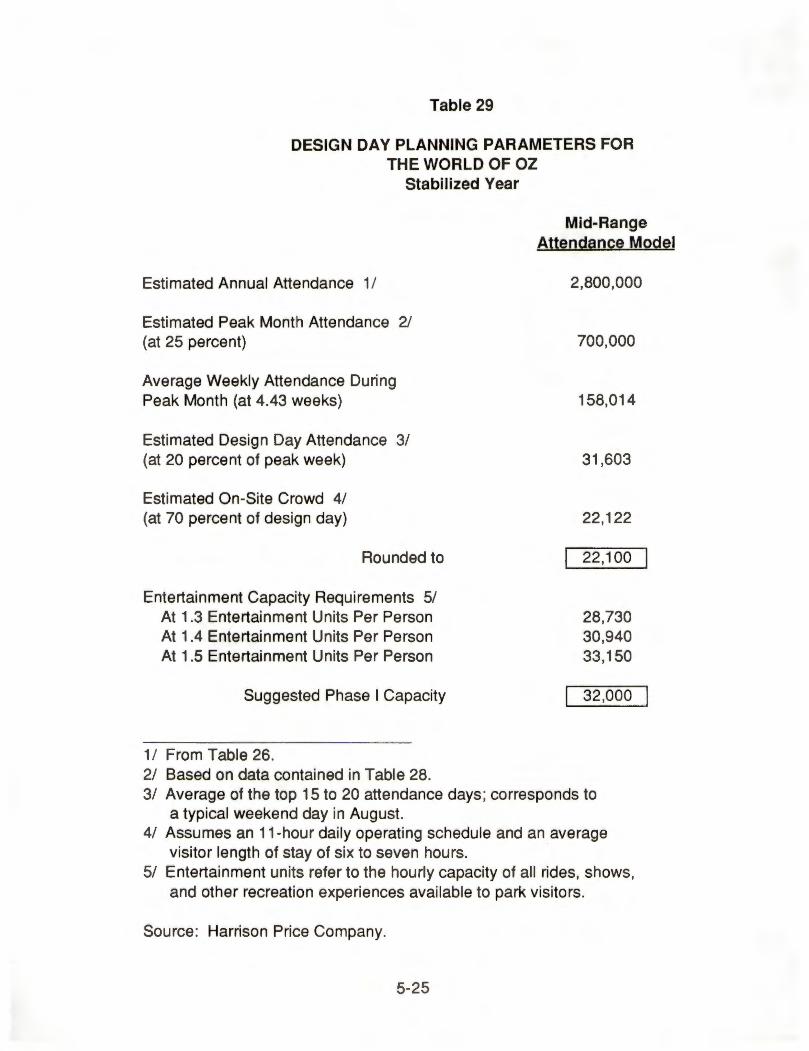
Table 29
DESIGN DAV PLANNING PARAMETERS FOR THE WORLD OF OZ
Stabilized Year
Estimated Annual Attendance 1 /
Estimated Peak Month Attendance 2/ (at 25 percent)
Average Weekly Attendance During Peak Month (at 4.43 weeks)
Estimated Design Day Attendance 3/ (at 20 percent of peak week)
Estimated On-Site Crowd 4/ (at 70 percent of design day)
Rounded to
Entertainment Capacity Requirements 5/ At 1.3 Entertainment Units Per Person At 1.4 Entertainment Units Per Person At 1.5 Entertainment Units Per Person
Suggested Phase I Capacity
1 / From Table 26. 2/ Based on data contained in Table 28.
Mid-Range Attendance Model
2,800,000
700,000
158,014
31 ,603
22,122
22,100
28,730 30,940 33,150
32,000
3/ Average of the top 15 to 20 attendance days; corresponds to a typical weekend day in August.
4/ Assumes an 11-hour daily operating schedule and an average visitor length of stay of six to seven hours.
5/ Entertainment units refer to the hourly capacity of all rides, shows, and other recreation experiences available to park visitors.
Source: Harrison Price Company.
5-25

Table 30
ILLUSTRATIVE HOURL V ARRIVAL AND DEPARTURE PATTERNS FOR THE WORLD OF OZ ON DESIGN DAY 1/
Percent of Design Day Attendance 2/ Hourly Cumulative Hourly Cumulative
Time of Day Arrivals Arrivals Departures Departures
Opening 4 4 0 0
10-11 am 20 24 0 0
11-12 Noon 23 47 0 0
12-1 pm 15 62 1 1
1-2 pm 11 73 4 5
2-3 pm 8 81 6 11
3-4 pm 7 88 11 22
4-5 pm 5 93 14 36
5-6 pm 4 97 20 56
6-7 pm 2 99 17 73
7-8 pm 1 100 13 86
8-9 pm 0 100 9 95
Closing 0 100 5 100
1 / Corresponds to a typical weekend in August. 2/ Assumes a 10 am to 9 pm operating schedule during peak periods
and an average visitor length of stay of approximately six hours. 3/ Cumulative arrivals less cumulative departures.
Source: Harrison Price Company.
5-26
On-Site Crowd 3/
4
24
47
61
68
70
66
57
41
26
14
5
0

-•- Cumulative Arrivals D- Cumulative Departures
10oz ■---■
■-------90Z -~ 80Z ./
-~ p D 70Z / e e ./ r s 60Z 11oz I C i / 01
I e g r\) sos ""' n n • 1 I
t l
/
~ 40Z I
D I o a /
/ f y 30Z I I •
2oz I
I 1oz // oz
OP 1 1 12 1 2 3 4 5 6 7 8 9 CL
Time of Day
Figwe 9
DESIGN DAY ARRIVAL AND DEPARTURE PATTERNS FOR THE WORLD OF OZ I

recommended opening-year capacity target is 32,000 capacity units, which should
ensure adequate entertainment value that will be perceived as commensurate with the
price of admission.
Food Service Requirements
Design day planning parameters indicate demand for food service facilities at the
World of Oz as delineated in Table 31. Highest demand for food service will logically
occur between about 11 am and 2 pm. Assuming that 75 percent of all visitors on-site
during these hours wish to eat at the park and, further, that this demand will be more or
less evenly spread over the three-hour period, maximum hourly demand would be
equivalent to 25 percent of the on-site population at midday (75 percent divided by
three hours equals 25 percent), or some 5,500 meals or snacks each hour under the
mid-range attendance model. It has also been assumed that this demand will be
allocated between three basic types of food service facilities--full-service restaurants
(15 percent of total), self-service cafeteria or convenience food facilities (55 percent of
total), and various snack stands dispensing beverages, ice cream, hot dogs, and other
minimal-preparation items (30 percent of total). This distribution is subject to fine
tuning as park plans are finalized, but will suffice for preliminary planning purposes.
Using seat turnover ratios of one turn per hour for restaurants, two turns per hour for
convenience food operations, and 3.5 turns per hour for snack stands as consistent
with industry experience, restaurant capacity required is estimated at about 830 seats,
while roughly 1,520 cafeteria seats will be required along with around 475 snack
stand seats. These seating requirements translate into building area of roughly
21,000 square feet for restaurants, 32,000 square feet for convenience food facilities,
and about 7,100 square feet for snack stands. Rounded total requirements are on the
order of 60,000 square feet.
Merchandise Sales Space Requirements
Table 32 estimates merchandise sales space requirements for the World of Oz at the
mid-range attendance target. The financial analysis in the next section of this report
will establish that potential visitor spending on retail items at the subject attraction are
expected to average some $7.00 per capita (constant 1992 dollars). Given the 2.8
million annual attendance model, total gross merchandise sales will accordingly come
5-28

Table 31
ESTIMATED FOOD SERVICE REQUIREMENTS FOR THE WORLD OF OZ
Stabilized Year
Estimated Design Day, Peak On-Site Attendance 1/
Maximum Hourly Demand for Food Service (at 25 percent) 2/
Estimated Distribution of Hourly Demand by Type of Service
Restaurant (at 15 percent) Cafeteria (at 55 percent) Snack Stands (at 30 percent)
Seating Capacity Required Restaurant (at 1 turn per hour) Cafeteria (at 2 turns per hour) Snack Stands (at 3.5 turns per hour)
Food Service Area Required (square feet) Restaurant (at 25 square feet per seat) Cafeteria (at 21 square feet per seat) Snack Stands (at 15 square feet per seat)
Total
Rounded to
1 / From Table 29.
Mid-Range Attendance Model
22,100
5,525
829 3,039 1,658
829 1,519 474
20,719 31,907 7,104
59,729
60,000
2/ Based on 75 percent of the on-site crowd desiring food service over a three-hour period from 11 am to 2 pm (75% + 3 hours = 25%).
Source: Harrison Price Company.
5-29
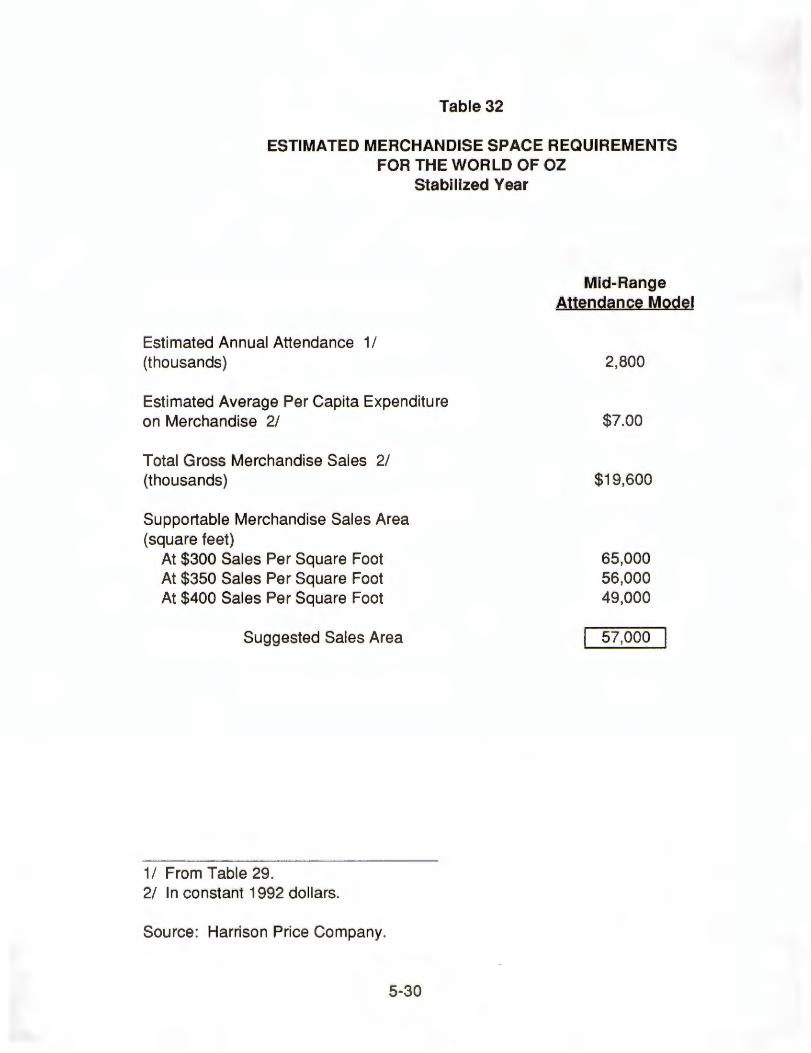
Table 32
ESTIMATED MERCHANDISE SPACE REQUIREMENTS FOR THE WORLD OF OZ
Estimated Annual Attendance 1 / (thousands)
Stabilized Year
Estimated Average Per Capita Expenditure on Merchandise 2/
Total Gross Merchandise Sales 2/ (thousands)
Supportable Merchandise Sales Area (square feet)
At $300 Sales Per Square Foot At $350 Sales Per Square Foot At $400 Sales Per Square Foot
Suggested Sales Area
1 / From Table 29. 2/ In constant 1992 dollars.
Source: Harrison Price Company.
5-30
Mid-Range Attendance Model
2,800
$7.00
$19,600
65,000 56,000 49,000
57,000
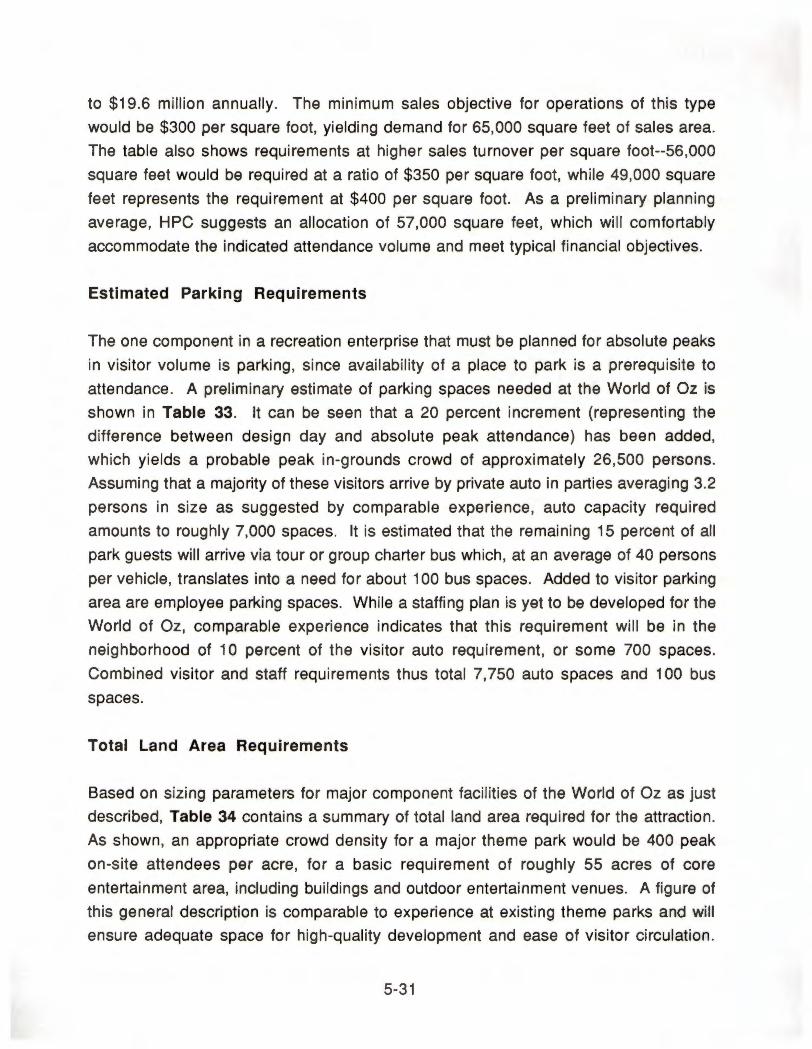
to $19.6 million annually. The minimum sales objective for operations of this type
would be $300 per square foot, yielding demand for 65,000 square feet of sales area.
The table also shows requirements at higher sales turnover per square foot--56,000
square feet would be required at a ratio of $350 per square foot, while 49,000 square
feet represents the requirement at $400 per square foot. As a preliminary planning
average, HPC suggests an allocation of 57,000 square feet, which will comfortably
accommodate the indicated attendance volume and meet typical financial objectives.
Estimated Parking Requirements
The one component in a recreation enterprise that must be planned for absolute peaks
in visitor volume is parking, since availability of a place to park is a prerequisite to
attendance. A preliminary estimate of parking spaces needed at the World of Oz is
shown in Table 33. It can be seen that a 20 percent increment (representing the
difference between design day and absolute peak attendance) has been added,
which yields a probable peak in-grounds crowd of approximately 26,500 persons.
Assuming that a majority of these visitors arrive by private auto in parties averaging 3.2
persons in size as suggested by comparable experience, auto capacity required
amounts to roughly 7,000 spaces. It is estimated that the remaining 15 percent of all
park guests will arrive via tour or group charter bus which, at an average of 40 persons
per vehicle, translates into a need for about 100 bus spaces. Added to visitor parking
area are employee parking spaces. While a staffing plan is yet to be developed for the
World of Oz, comparable experience indicates that this requirement will be in the
neighborhood of 10 percent of the visitor auto requirement, or some 700 spaces.
Combined visitor and staff requirements thus total 7,750 auto spaces and 100 bus
spaces.
Total Land Area Requirements
Based on sizing parameters for major component facilities of the World of Oz as just
described, Table 34 contains a summary of total land area required for the attraction.
As shown, an appropriate crowd density for a major theme park would be 400 peak
on-site attendees per acre, for a basic requirement of roughly 55 acres of core
entertainment area, including buildings and outdoor entertainment venues. A figure of
this general description is comparable to experience at existing theme parks and will
ensure adequate space for high-quality development and ease of visitor circulation.
5-31

Table 33
ESTIMATED PARKING REQUIREMENTS FOR THE WORLD OF OZ
Stabilized Year
Estimated Design Day, Peak On-Site Attendance 1 /
Add: Allowance for Absolute Peak in Attendance (at 20 percent)
Estimated Distribution by Mode of Arrival
Auto (at 85 percent) Tour Bus (at 15 percent)
Number of Parking Spaces Required Auto (at 3.2 persons per car) Tour Bus (at 40 persons per bus)
Add: Employee Parking (at 1 O percent of visitor auto spaces)
Rounded Total Requirements Auto Spaces Bus Spaces
1 / From Table 29.
Source: Harrison Price Company.
5-32
Mid-Range Attendance Model
22,100
26,520
22,542 3,978
7,044 99
704
7,750 100
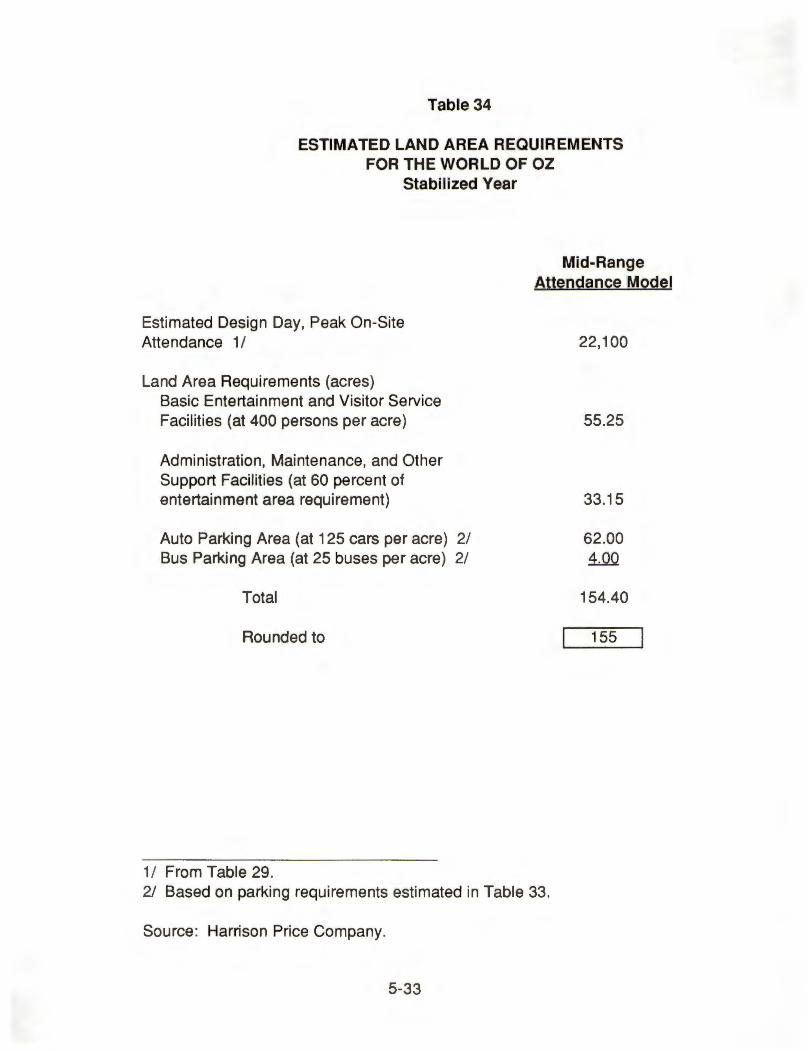
Table 34
ESTIMATED LAND AREA REQUIREMENTS FOR THE WORLD OF OZ
Stabilized Year
Estimated Design Day, Peak On-Site Attendance 1/
Land Area Requirements (acres) Basic Entertainment and Visitor Service Facilities (at 400 persons per acre)
Administration, Maintenance, and Other Support Facilities (at 60 percent of entertainment area requirement)
Auto Parking Area (at 125 cars per acre) 2/ Bus Parking Area (at 25 buses per acre) 2/
Total
Rounded to
1 / From Table 29.
Mid-Range Attendance Model
22,100
55.25
33.15
62.00 ~
154.40
155
2/ Based on parking requirements estimated in Table 33.
Source: Harrison Price Company.
5-33
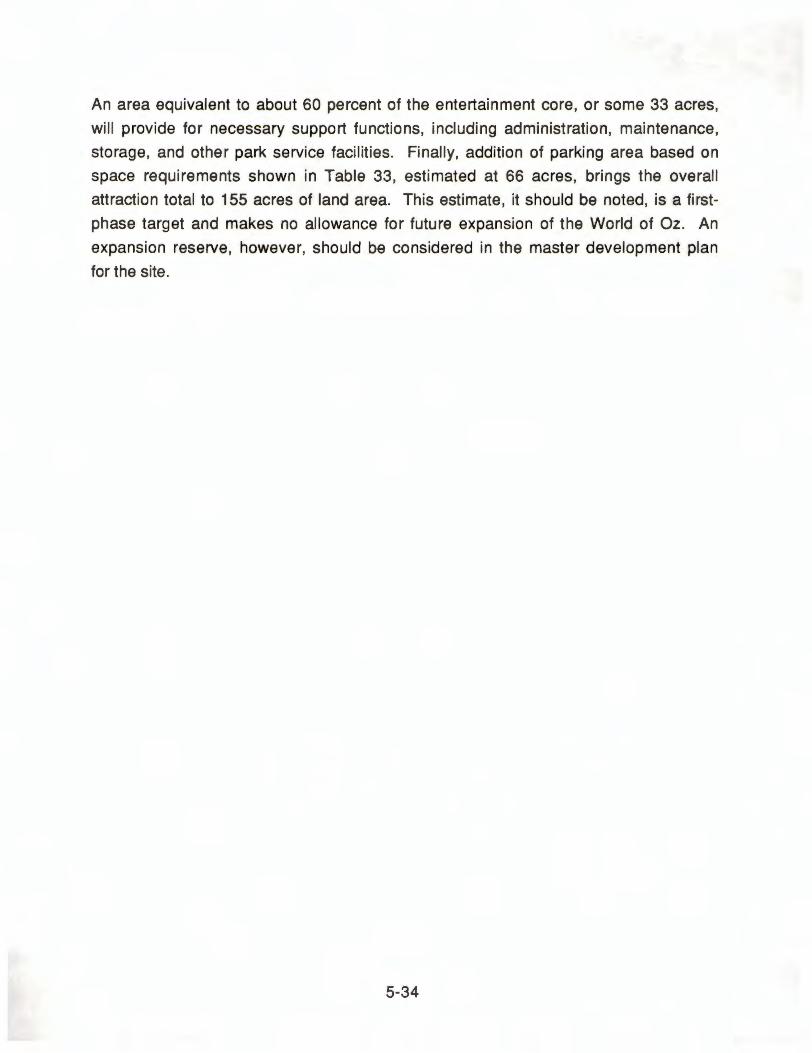
An area equivalent to about 60 percent of the entertainment core, or some 33 acres,
will provide for necessary support functions, including administration, maintenance,
storage, and other park service facilities. Finally, addition of parking area based on
space requirements shown in Table 33, estimated at 66 acres, brings the overall
attraction total to 155 acres of land area. This estimate, it should be noted, is a first
phase target and makes no allowance for future expansion of the World of Oz. An
expansion reserve, however, should be considered in the master development plan
for the site.
5-34

Section 6
PRELIMINARY FINANCIAL ANALYSIS
The financial implications of the World of Oz project are assessed in this section of the
report, incorporating the mid-range attendance model set forth in the preceding
section. Except where indicated, all amounts, are expressed in constant 1992 dollars
and do not take into account inflation. While every effort has been made to ensure a
conservative, realistic appraisal of the project's economic performance, certain
independent assumptions have nevertheless been made that influence financial
results. These assumptions, described where applicable as the analysis unfolds, are
subject to change and/or refinement as planning reaches successively more definitive
stages.
POTENTIAL OPERATING REVENUE
Operating revenues at the World of Oz will be generated primarily from visitor
expenditures at the site. There may be opportunities for certain kinds of ancillary
revenue, such as rental of the park for convention or other group events or as a film or
television location. However, these supplementary sources of operating income will
be far less significant than visitor-derived revenues, and it is in any case premature to
attempt an estimate of the possible contribution of these extra-curricular activities.
Accordingly, this analysis will be concerned only with spending by World of Oz
attendees on admissions, food and beverages, merchandise, parking, and
miscellaneous items.
Admissions Revenue
Admission tickets represent the largest single source of revenue at the subject
attraction. To provide a frame of reference on an appropriate pricing structure, Table
35 shows the current admission price schedule at major theme parks in the United
States. In light of these data and the conceptual plan for the World of Oz, HPC
considers an adult admission fee of $23.95 (exclusive of applicable sales tax) to be a
reasonable planning target that will be acceptable in the marketplace and
commensurate with the entertainment value that the park is presumed to deliver.
6-1

Table 35
ADMISSION PRICE SCHEDULE FOR SELECTED MAJOR THEME PARKS
Summer 1992
Admission Price 1/ Child
Theme Park Adult <Age Range)
Disney World Complex 2/ $35.90 $28.50 (3-9) (Orlando, Florida)
Universal Studios Florida 3/ 33.00 26.00 (3-9) (Orlando, Florida)
Disneyland 3/ 28.75 23.00 (3-11) (Anaheim, California)
Universal Studios Hollywood 26.00 20.00 (3-11) (Los Angeles, California)
Six Flags Magic Mountain 25.00 14.00 (<48 inches (Valencia, California) tall)
Six Flags Great America 24.00 20.00 ( 4-10) (Gurnee, Illinois)
Six Flags Over Georgia 24.00 18.00 (3-9) (Atlanta, Georgia)
Six Flags Over Texas 23.95 17.95 (<48 inches (Arlington, Texas) tall)
King's Dominion 23.95 15.95 (3-6) (Doswell, Virginia)
AstroWorld 23.75 17.25 (<54 inches (Houston, Texas) tall)
Opryland 22.95 1 2. 9 5 ( 4-11 ) (Nashville, Tennessee)
6-2
Senior Parking Citizen <Per Car}
n/o $4.00
n/o 4.00
$23.00 5.00
20.00 5.00
16.00 5.00
14.00 4.00
12.00 4.00
17.95 4.00
18.95 3.00
12.90 4.00
n/o 3.00

Theme Park
Great America (Santa Clara, California)
King's Island (Cincinnati, Ohio)
Knott's Berry Farm (Buena Park, California)
Cedar Point (Sandusky, Ohio)
Six Flags Over Mid-America (Eureka, Missouri)
Worlds of Fun (Kansas City, Missouri)
Valley Fair (Shakopee, Minnesota)
Geauga Lake (Aurora, Ohio)
n/o means not offered.
Table 35
(Continued)
Admission Price Child
Adult (Age Range}
$22.95 $11.45 (3-6)
22.95 11.45 (3-6)
22.95 9.95 (3-11)
22.95 4.95 (< 48 inches tall)
21.95 16.95(3-11)
21.95 1 4. 9 5 ( 4-11 )
17.50 9.95 (<48 inches tall)
1/
15.95 15.95 (<42 inches tall admitted free)
Senior Citizen
$15.95
11.45
15.95
12.50
10.95
14.95
9.95
9.50
1 / Regular daytime prices exclusive of sales tax; evening prices may vary. 2/ Includes Magic Kingdom, EPCOT, MGM Studios, Typhoon Lagoon,
and Pleasure Island; single-day, one-park price. 3/ Single-day price.
Source: Harrison Price Company.
6-3
Parking <Per Car}
$4.00
4.00
3.00
3.50
4.00
3.00
3.00
3.00
Scaled-down prices would be made available for children under 12 years of age and
for senior citizens. Allowing for the probable mix of tickets between adult, child, and
senior and further taking into account group and promotional discounts and a certain
incidence of complimentary admissions, the effective yield on the adult price is
estimated at 70 percent, or $16.75 per capita, as presented in Table 36. A net
revenue ratio of this magnitude is comfortably within the range for major commercial
entertainment attractions. The estimate refers to the first-phase program; if the park is
expanded in future years in a manner that the entertainment value is measurably
enhanced, an increase in admission fees over and above cost-of-doing-business
adjustments may be justified.
Food, Merchandise, and Miscellaneous Expenditures
Visitor spending on food, beverages, and merchandise will be another major revenue
source for the World of Oz. Prevailing rates of spending at theme parks drawing more
than 2 million visitors per year are highlighted in Table 37. Typical food spending, as
indicated, ranges from about $4.50 per visitor to more than $9.00, with an average of
$6.15. Parks reporting near the upper end of the range have long average visitor stay
times and an excellent food service program. Merchandise quality and salesmanship
play a part in the level of retail spending achieved. The indicated range for major
parks is between $3.00 and about $6.00 per capita, and the average amounts to
roughly $4.50 per visitor. Finally, miscellaneous spending on games, vending, and
rentals (strollers, wheelchairs, cameras, and so on) varies from a modest 40 cents per
capita to nearly $4.00 at major theme parks, with the average amounting to roughly
$2.25.
Based on a six-hour average visitor stay time on-site, the envisioned food service
content of the World of Oz as set forth in conceptual plans by Landmark Entertainment,
and further assuming a high level of operational efficiency, HPC considers an average
visitor expenditure of $6.50 to be an achievable goal for food service. Merchandise
spending, meanwhile, is more aggressively targeted at $7.00 per capita. Attainment of
the latter average is predicated on a Disney-quality retail component that makes full
use of the Oz theme and characters and implies substantial merchandising skill. The
spending model for games and other miscellaneous outlays is $2.00 per capita on the
basis of arcade and games activities called for in the park concept together with a
normal allowance for rentals.
6-4

Table 36
ESTIMATED OPERATING REVENUE FOR THE WORLD OF OZ
Stabilized Year; Constant 1992 Dollars
Estimated Annual Attendance 1 / (thousands)
Estimated Per Capita Revenue Admissions 2/
Food and Beverages Merchandise Games and Other 3/ Parking 4/
Total
Total Gross Revenue (thousands) Admissions Food and Beverages Merchandise Games and Other Parking
Total
Less: Cost of Goods Sold (thousands)
Food and Beverages 5/ Merchandise 6/ Games and Other 7/
Total
Total Net Revenue (thousands)
1/ From Table 26.
Mid-Range
Attendance Model
2,800
$16.75 6.50 7.00 2.00
1Jl.5
$33.30
$46,900 18,200 19,600 5,600
~
$93,240
$5,460 9,800
u.6.0.
$17,220
$76,020
2/ Based on an adult admission price of $23.95 adjusted for attendance mix, discounts and complimentary admissions.
3/ Includes games, vending, and rentals (strollers, wheelchairs, cameras, and so on). 4/ Based on a parking fee of $4.00 per car, 85 percent arrivals by car, and 3.2 persons
per vehicle. 5/ At 30 percent of gross food sales. 6/ At 50 percent of gross merchandise sales. 71 At 35 percent of games and other sales.
Source: Harrison Price Company. 6-5

Table 37
COMPOSITE FINANCIAL DATA FOR MAJOR THEME PARKS 1/
1991
Range Low High
Per Capita Revenue Admissions $12.57 $17.81 Food and Beverages 4.52 9.11 Merchandise 3.28 6.25 Games and Other 0.43 3.85 Parking Q&2 Ml
Total $21.42 $37.89
Cost of Goods Sold As Percent of Applicable Gross Sales
Food and Beverages 27% 54% Merchandise 37 59 Games and Other 19 83
Operating Expenses As Percent of Total Operating Revenue
Wages, Salaries, Benefits 22% 34% Advertising and Promotion 5 11 Repairs, Maintenance, and
Supplies 5 10 Other 6 16
EBDIT As Percent of Total Operating Revenue 2/ 20% 31%
Average
$14.55 6.15 4.62 2.28 o.:.18
$28.38
35% 48 39
30% 7
7 11
26%
1 / Composite data for parks with 2 million or more annual attendance. 2/ EBDIT means earnings before depreciation, interest, and taxes.
Source: International Association of Amusement Parks and Aquariums and Harrison Price Company.
6-6

Parking Expenditures
Parking fees at major theme parks currently range from $3.00 to $5.00 per car (refer to
Table 35), and translate into average revenue on the order of 80 cents per capita (refer
to Table 37). For planning purposes, HPC has used a parking charge of $4.00 per car
at the World of Oz (which compares to a prevailing fee of $3.00 per car at the
competing Worlds of Fun). Allowing for the previously estimated 85 percent visitor
arrivals by car and 3.2 persons per vehicle, per capita parking revenue would amount
to $1.05. This figure has not been adjusted for free parking provided to certain VIP
guests and parking discounts to groups and should thus be regarded as a maximum
attainable objective.
Revenue Summary
Based on the preceding itemization of visitor spending, the aggregate average per
capita expenditure would amount to $33.30, as indicated in Table 36, or within the
$21.00 to $38.00 range for major theme parks (refer to Table 37). Roughly half of this
total revenue will accrue from admission tickets. Table 36 also indicates that per
capita spending of this magnitude translates into total gross revenue of slightly more
than $93 million on the mid-range, 2.8-million attendance model. To arrive at net
revenues, the cost of food, merchandise, and miscellaneous goods sold must be
deducted from this gross amount. Cost of sales ratios employed in this analysis--30
percent of food sales, 50 percent of merchandise sales, and 35 percent of games and
other sales--are drawn from typical experience at commercial attractions. Total net
operating revenues after subtraction of sales costs therefore amount to $76 million.
PRO FORMA FINANCIAL ANALYSIS
The paragraphs to follow address the expense side of the financial equation, including
the potential size of the annual operating budget, net operating income, and the implied breakeven point in operations.
Illustrative Operating Expense Budget
Table 38 contains an illustrative operating budget for the World of Oz based on the
composite experience of major theme parks. It is cautioned that actual operating costs
6-7

Table 38
PRO FORMA FINANCIAL ANAL VSIS FOR THE WORLD OF OZ
Stabilized Vear; Constant 1992 Dollars
Estimated Net Operating Revenue 1 / (thousands)
Estimated Operating Expenses (thousands)
Wages, Salaries, and Benefits 2/ Marketing and Promotion 3/ Repairs, Maintenance, and Supplies 4/ Other 5/
Total
Total Net Operating lncome/EBDIT 6/ (thousands)
Ratio of EBDIT to Total Gross Revenue
1 / From Table 36. 2/ At 30 percent of total gross revenue. 3/ At 1 O percent of total gross revenue. 4/ At 7 percent of total gross revenue.
Mid-Range Attendance Model
$76,020
$27,972 9,324 6,527
~
$52,214
1 $23,ao6 1
25%
5/ At 9 percent of total gross revenue; includes insurance, utilities, real property taxes, miscellaneous operating expenses, and contingency.
6/ EBDIT means earnings before depreciation, interest, and income taxes.
Source: Harrison Price Company.
6-8
at the subject attraction may vary--perhaps substantially--from this pro forma analysis,
which is intended only for financial planning purposes and should be updated once
more is known about staffing requirements and other critical items in park operation.
The sophisticated concept proposed for the park, which emphasizes state-of-the-art
animatronics together with labor-intensive live entertainment productions, suggests a
substantial operating budget requirement. Moreover, to achieve the induced tourism
necessary to meet the attendance objective and the concomitant need for wide media
exposure, the marketing budget alone will be a substantial item. With these factors in
mind, HPC preliminarily estimates approximately $52 million in direct operating
expense on the 2.8 million attendance model. When combined with the cost of goods
sold, overall operating expenses would amount to about $69 million, or $24.80 per
visitor, equivalent to 75 percent of estimated total gross revenue. An expense ratio of
this general description is consistent with experience at well-managed, successful
theme parks.
Potential Net Operating Income
Table 38 also indicates net operating income potentially attainable at the World of Oz.
For the first-phase, mid-range scenario, a net income of approximately $24 million per
year is estimated. This sum represents "EBDIT," or earnings before depreciation,
interest, and income taxes. The ratio of EBDIT to total gross revenue is accordingly 25
percent, which compares to a typical range of 20 to 40 percent at mature, successful
existing attractions of this type.
Estimated Breakeven Point
The World of Oz will have a fairly high incidence of fixed operating costs, although it is
difficult to be precise at this stage of planning. General and administrative expenses
(including basic marketing), an appreciable amount of operating labor, real property
taxes, and essential building and grounds maintenance are among principal fixed
costs. For demonstration purposes, HPC estimates that the distribution of the $69
million in total operating expense will be approximately 45 percent fixed and 55
percent variable, the latter expenses encompassing cost of goods sold, the balance of
operating payroll, insurance, most energy costs, and other items that are sensitive to
volume. On this basis, Figure 10 calculates the theoretical breakeven point for the
operation, which is shown to occur at an annual attendance of about 1.6 million.
6-9

R e y i e n n u M
0)
i I e -4
0 I 1 E 1 X i p 0
e n n s s e
$120
$100
$80
$60
$40
$20
so
- -.,
- Gross Revenue - Fixed Expense
Breakeven Point
,- - .,,-.,, - -
- .... .. -- - ..
-- .,
__ ;_.,,,.;-
- - Variable Expense
, - -- - .,.
.,, - - ;
~ - -__ ,,,. __ .,,,--
0 0.25 0.50 0. 75 1.00 1.25 1.50 1. 75 2.00 2.25 2.50 2. 75 3.00 3.25
Attendance in Mi 11 ions
Figm-e 10
THEORETICAL BREAKEVEN POINT FOR THE WORLD OF OZ (Constant 1992 Dollars)

Ten-Vear Revenue and Expense Statement
As a further aid in financial planning, Table 39 contains an illustrative ten-year
income and expense statement for the subject attraction in constant dollars, showing
the possible build-up in attendance from opening (assumed to take place in 1996)
through and beyond the point of stabilization. Net operating income, as indicated, will
rise from some $18 million in the first operating year to slightly less than $30 million by
the tenth year. The demonstration assumes that regular reinvestments in facilities and
attractions will be made to sustain the growth curve over time. As a rule of thumb, an
amount equal to between 4 and 6 percent of initial capital investment--$11 to $17
million in this case given a $275 million original project cost--should be set aside for
these improvements, with major capital projects scheduled about every three years.
Table 40 presents the same data in current dollars. Based on forecasts recently
issued by the Economics-Policy Research Department of the Bank of America, overall
price inflation in the United States is expected to subside from the current 4 percent
plus range to 3.4 percent in 1993 and 3.2 percent in 1994. HPC has further assumed
a continued decrease to 3 percent per year thereafter and has held this rate constant
from 1996 onward. On a current-dollar basis, therefore, annual net operating income
is shown to increase from an initial $21 million to more than $44 million by the tenth
year of operation. Depending on specific financing terms arranged, adequate funds
should accordingly be generated to support debt service and required reinvestment.
By 1999, for example, when the first reinvestment would presumably be made,
cumulative net operating income will amount to $104 million. Cumulative net income
will rise to roughly $207 million by 2002 and to $330 million by 2005.
CAPITAL INVESTMENT PARAMETERS
Estimated net operating income, or EBDIT, for the World of Oz provides a basis for
setting realistic targets concerning the level of initial capital investment that the project
can support. HPC understands that the Landmark concept for the park is geared to a
minimum capital cost, including construction and all "soft costs," on the order of $275
million for the first phase of development and may exceed $300 million with a more
elaborate execution. In Table 41, estimated EBDIT has been capitalized at 10
percent, or $238 million, which is assumed to represent private debt and equity
financing. To meet the investment level entailed in the concept plan, it is further
6-11

Year
1996
1997
1998
1999
2000
2001
2002
2003
2004
2005
Table 39
TEN-YEAR INCOME AND EXPENSE STATEMENT FOR THE WORLD OF OZ 1/
1996-2005 (Constant 1992 Dollars)
Annual Total Gross Total Operating Attendance Revenues Expenses (thousands} <thousands} (thousands}
2,500 $83,250 $65,100
2,700 89,910 67,854
2,800 93,240 69,434
2,800 93,240 69,434
2,900 96,570 70,596
2,900 96,570 70,596
2,900 96,570 70,596
3,000 99,900 71,970
3,000 99,900 71,970
3,100 103,230 73,344
1 / Based on data contained in Tables 36 and 38.
Source: Harrison Price Company.
6-12
Net Operating Income
(thousands}
$18,150
22,056
23,806
23,806
25,974
25,974
25,974
27,930
27,930
29,886
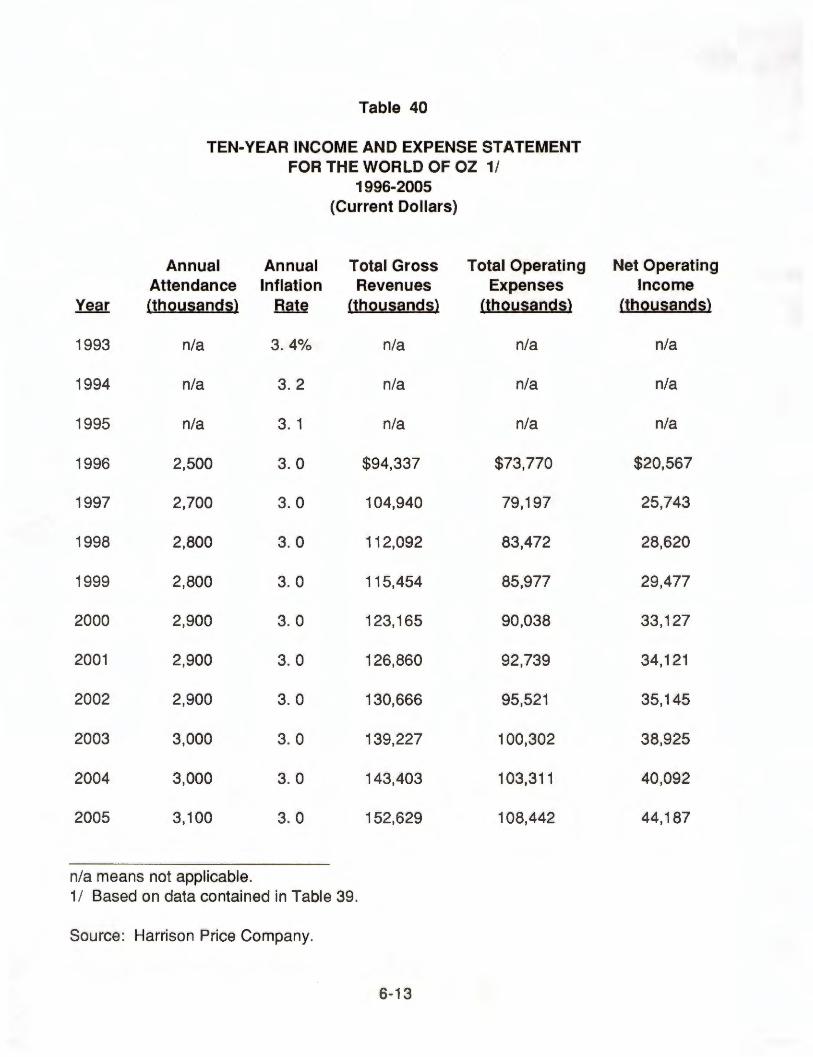
Table 40
TEN-YEAR INCOME AND EXPENSE STATEMENT FOR THE WORLD OF OZ 1/
1996-2005 (Current Dollars)
Annual Annual Total Gross Total Operating Attendance Inflation Revenues Expenses
Year <thousands) Rate <thousands) <thousands)
1993 n/a 3. 4% n/a n/a
1994 n/a 3. 2 n/a n/a
1995 n/a 3. 1 n/a n/a
1996 2,500 3. 0 $94,337 $73,770
1997 2,700 3. 0 104,940 79,197
1998 2,800 3. 0 112,092 83,472
1999 2,800 3. 0 115,454 85,977
2000 2,900 3. 0 123,165 90,038
2001 2,900 3. 0 126,860 92,739
2002 2,900 3. 0 130,666 95,521
2003 3,000 3.0 139,227 100,302
2004 3,000 3. 0 143,403 103,311
2005 3,100 3. 0 152,629 108,442
n/a means not applicable. 1 / Based on data contained in Table 39.
Source: Harrison Price Company.
6-13
Net Operating Income
<thousands)
n/a
n/a
n/a
$20,567
25,743
28,620
29,477
33,127
34,121
35,145
38,925
40,092
44,187

Table 41
ILLUSTRATIVE CAPITAL INVESTMENT PARAMETERS FOR THE WORLD OF OZ
Stabilized Year; Constant 1992 Dollars
Estimated EBDIT 1 /
Supportable Capital Investment (thousands)
Private Financing 2/ Economic Development Grant Institutional Sponsorships
Total
Memo: Financing Parameters Equity (thousands) 3/ Debt (thousands)
Annual Loan Payment 4/ Coverage Ratio 5/
Mid-Range Attendance Model
$23,806
$238,060 50,000 12,000
1 $300,060 1
$119,030 119,030
$13,807 1.72
1 / From Table 38; EBDIT means earnings before depreciation, interest, and income taxes.
2/ EBDIT capitalized at 1 0 percent. 3/ At a 50 percent debt/equity ratio for private financing. 4/ Based on an 11 .6 percent debt service constant. 5/ EBDIT divided by annual loan payment.
Source: Harrison Price Company.
6-14
assumed that the project will qualify for and be able to obtain an economic
development grant in the amount of $50 million from state government. Lastly, some
$12 million has been assumed in institutional sponsorships, which presumes a very
aggressive effort to attract such support and a success rate comparable to that of the
Disney operations. In total, then, some $300 million in overall investment is the
indicated initial, mid-range model.
Also shown in the table are illustrative financing assumptions, including a 50 percent
debt ratio on private financing which, at an 11.6 percent debt service constant, (fully
amortized rate) translates into an annual loan payment of roughly $14 million. The
implied coverage ratio on this sum vis-a-vis EBDIT is 1.72. In conclusion, the World of
Oz can meet acceptable standards of economic feasibility given adherence to the
critical assumptions on attendance volume and other factors that have been described
in this report.
6-15
Related Documents