The text that follows is a PREPRINT. Please cite as: Fearnside, P.M. 1997. Wood density for estimating forest biomass in Brazilian Amazonia. Forest Ecology and Management 90(1): 59-89. ISSN: 0378-1127 Copyright: Elsevier The original publication is available at: http://www.elsevier.com.nl

Welcome message from author
This document is posted to help you gain knowledge. Please leave a comment to let me know what you think about it! Share it to your friends and learn new things together.
Transcript

The text that follows is a PREPRINT. Please cite as: Fearnside, P.M. 1997. Wood density for estimating forest biomass in Brazilian Amazonia.
Forest Ecology and Management 90(1): 59-89. ISSN: 0378-1127 Copyright: Elsevier The original publication is available at: http://www.elsevier.com.nl

WOOD DENSITY FOR ESTIMATING FOREST BIOMASS IN BRAZILIAN AMAZONIA Philip M. Fearnside National Institute for Research in the Amazon (INPA) C.P. 478 69011-970 Manaus, Amazonas BRAZIL Fax: 55 - 92 - 642-3028 236-3088 Email: [email protected] 7 Jan. 1995 1 Feb. 1995 27 Sept. 1995 23 Sept. 1996 30 Sept. 1996

TABLE OF CONTENTS Table of Contents List of Tables ABSTRACT ..................................................... ii INTRODUCTION ................................................. 1 AVAILABLE DATA ON WOOD DENSITY Types of density .............................................. 4 Data from surveys of wood properties .......................... 9 POTENTIAL SOURCES OF BIAS .................................... 11 ADJUSTMENTS NEEDED FOR USE IN BIOMASS ESTIMATES Hollow trees ................................................. 13 Heartwood and sapwood density ................................ 14 Bark density ................................................. 17 WEIGHTING AVERAGES BY SPECIES OCCURRENCE ..................... 19 CONCLUSIONS .................................................. 24 NOTES ........................................................ 25 ACKNOWLEDGMENTS .............................................. 26 REFERENCES ................................................... 27 Figure Legend ................................................. Figure ........................................................

2
LIST OF TABLES Table 1.Scientific names, synonyms and Brazilian common names of
tree species included in wood density data sets. Table 2.Basic density of trees in Brazilian Amazonia. Table 3.Heartwood and sapwood density of trees in Brazilian
Amazonia. Table 4.Relative volume of heartwood, sapwood and bark. Table 5.Forest vegetation types in the Brazilian Legal Amazon
(IBAMA classification). Table 6. Basic density of wood weighted by volume present for
different forest types. Table 7. Basic density of wood: volume-weighted means by
vegetation zone, vegetation type and state. List of Figures Figure 1.Brazil's Legal Amazon region (with locations mentioned
in the text).

1
ABSTRACT Reliable estimates of biomass of Amazonian forests are needed for calculations of greenhouse gas emissions from deforestation. Interpretation of forest volume data for the region is the most practical means of obtaining representative biomass estimates. The density of the wood used in converting volume data to biomass is a key factor affecting estimates of biomass and of emissions. Interpreting density data for biomass purposes, which is different from the normal use of these data for commercial timber uses, is complicated by a variety of factors. There is variability among individuals of a given species, among geographic locations, and within the vertical and radial dimensions of individual trees. Considerable confusion has resulted from the variety of ways that densities are reported with respect to humidity at times of weight and of volume measurements used in calculating the density value. The most appropriate measure for biomass is basic density, or oven-dry weight divided by wet volume. Corrections for hollow trees and the position of samples within trunks are also needed. Here, available data are brought together for 268 species of trees, with an unweighted mean basic density of 0.65 (range = 0.14 to 1.21). Weighting the mean by the volume of wood of each species in a sample of vegetation types, and weighting the means of the vegetation types by the extent of each in the region, yields a mean density of 0.69. Greenhouse gas emissions from deforestation depend strongly on the biomass of the forests cleared; emissions estimates should therefore be reduced by approximately this percentage. More importantly, the weighted mean density calculated here has a much firmer empirical basis than previously available estimates for this parameter. Uncertainty is still considerable, particularly as a result of doubt concerning taxonomic identifications in the forestry surveys. Were the wood density of a small but botanically well-studied plot near Manaus to apply to the region as a whole, Brazil's 1990 emissions of greenhouse gases would be higher by an amount equivalent to two-thirds of the country's annual emission from fossil fuels.

1
INTRODUCTION The question of greenhouse gas emissions from tropical deforestation, particularly deforestation in Amazonia, is fraught with uncertainties, including estimates of rates of deforestation, biomass of vegetation being cleared, fate of carbon in cleared vegetation, and fate of the landscape in cleared areas subsequent to clearing (Fearnside, 1992a). Because of the global importance of greenhouse gas (GHG) contributions from this source, reducing uncertainties in emissions calculations is a high priority. Wood density is an important factor in converting forest volume data to biomass. Among items contributing to uncertainty in biomass estimates is the density of wood for trees in Brazil's Legal Amazon region (Figure 1). Although clearing in Brazil's Legal Amazon region makes a significant contribution to GHG emissions from deforestation today, the much greater area of remaining forest in this region compared with other parts of the tropics means that the potential for future emissions from Brazil greatly exceeds that of other tropical countries. (Figure 1 here) Basic density information is needed as one of the conversion factors for obtaining biomass estimates using forest volume data from surveys done in Brazilian Amazonia by the Food and Agriculture Organization of the United Nations (FAO) and by the RADAMBRASIL Project (Heinsdijk, 1957, Heinsdijk, 1958a, Heinsdijk, 1958b, Heinsdijk, 1958c; Glerum, 1960; DNPM, 1983). The density information presented here serves as a basis for biomass calculations from these data sets (Fearnside, 1996a). Brown and Lugo (1984, p. 1291) estimated 155.1 t ha-1 as the average total biomass (including below-ground) in undisturbed productive broadleafed closed forests of the New World tropics--less than half that found by direct measurements of biomass in Amazonia. Brown et al. (1989, pp. 897-898) later found errors in the conversion factors used by Brown and Lugo (1984) to calculate biomass from volume, resulting in an increase in the estimate by 28-47%. Among the changes that account for this are a 10% increase in the value used to account for trees in the size range between 10 cm diameter at breast height (DBH, 1.3 m above the ground or above the highest buttress) and the 25 cm minimum in the FAO forest inventories (volume expansion factor of 1.2 used by Brown and Lugo (1984, p. 1292) versus 1.22 used by Brown and Lugo (1992)), and an 11% increase in the average wood density (from 0.62 g cm-3 used by Brown and Lugo (1984, p. 1291) to 0.69 used by Brown and Lugo (1992)). "Wood density" refers to "basic specific gravity," or oven-dry weight divided by wet volume. The 0.62 g cm-3 density value (Brown and Lugo, 1984, p. 1292) was based on 162 broadleaf tree species listed for tropical America by Chudnoff (1980). The 0.69 g cm-3 value was calculated from

2
basic density information (range 0.20-1.05) in a file maintained by the Institute of Tropical Forestry (ITF), Rio Piedras, Puerto Rico (Brown et al., 1989). For Brazilian Amazonia, the data set in the present paper allows more species to be matched than does that of Brown et al. (1989): for a 0.16 ha sample area near Manaus, where all trees at least 5 cm DBH were identified by Prance et al. (1976), Brown et al. (1989, p. 889) were able to match basic density data for 29% of the stems, whereas the current data set provides densities for 65% of the stems. Because of differences in the abundance of tree species in different density classes, variation exists among locations and forest types within Amazonia, and between Amazonia and other parts of the tropics. Trees are generally denser in Amazonia than in the tropical forests of southeast Asia (Whitmore and Silva, 1990). This is one of the factors contributing to the greater commercial value and market volume for Asian tropical timbers. Very dense timbers are not suitable for peeled veneer, among other common uses. There is also geographical variation in wood density within any given species. For example, mean basic density of Carapa guianensis (a common species) ranges from 0.43 g cm-3 at Balbina (INPA, 1991) to 0.59 g cm-3 at the Tapajós National Forest (Do Nascimento, 1993) (Table 1). At a given location there is variation between individuals, and there is variation within a single individual. These variations may be due to the varying needs of trees for structural support under different circumstances. Wood density is known to be a strong indicator of successional state in tropical trees, with pioneer species being lighter than mature forest species (Denslow, 1980). The lighter species have great variation in density within the trunks of individual trees (Wiemann and Williamson, 1988). Pioneer trees grow quickly at first, producing low-density wood, and later add structural support by adding a shell of harder wood (Rueda and Williamson, 1992). The controlling factor for adding the harder wood is the age of the tree, rather than the diameter (De Castro et al., 1993). The occurrence of pith-to-bark gradients in wood density in tropical trees parallels elevational and latitudinal gradients in species diversity, with greatest changes in wood density being found in the lowland tropical forests where species diversity is highest (Williamson, 1984; Wiemann and Williamson, 1989). 2. AVAILABLE DATA ON WOOD DENSITY 2.1. Types of density Density is reported in a variety of ways. The type of density needed for deriving biomass estimates from forest volume data is "basic density" or "basic specific gravity", calculated as oven-dry weight divided by wet volume. The wet condition, in practice, usually refers to wood samples that have been soaked in

3
water until saturation in the laboratory. This is only an approximation of the natural "fresh" condition in the forest that would be the best volume measure for density values for biomass conversions. Trees in the forest vary in moisture content depending on water availability and their state of physiological stress. Tree trunks swell and contract to a certain extent depending on water availability, for example, between the wet and dry seasons. Unfortunately, correction for these differences at the time of the timber volume measurements available in the literature is not possible. The fresh volume basic density (needed for biomass calculations) could theoretically be obtained from standard basic density measurements (which have volume measured in saturated wood samples) by correcting for the presumably small average amount of volumetric expansion that would occur with the increase in water content in wood samples between the fresh condition at the time the trunk diameter measurements are made and the saturated condition after soaking in the laboratory. "Fresh" or "green" density, or the green weight divided by the green volume is important in determining whether or not a log will float. This is one of the most critical factors in logging systems where wood is transported in rafts (as in the western part of Brazilian Amazonia). Logs of many Amazonian tree species do not float in water. Only 40% of terra firme (dry land) and 75% of várzea (floodplain) species float, according to Richard Bruce (personal communication, 1993). Bruce is a timber industry expert in Itacoatiara, Amazonas, whose experience undoubtedly greatly exceeds the information available in the published literature. The prevalence of trees that do not float raises the possibility that an area-weighted mean basic density of 0.69 g cm-3 may be too low. However, floating is determined by fresh rather than basic density, and the discrepancy could be greatly reduced or eliminated if basic density information was available for the same group of species. For example, Brown et al. (1995) measured mean fresh density (fresh weight/fresh volume) at DBH height in six unidentified trees immediately after felling at the Samuel Hydroelectric Dam in Rondonia. In this case the "fresh" condition is really the fresh condition in the field, rather than the "wet" surrogate virtually universally used of wood samples being soaked in water until saturated. Five of the six were heavier than water (mean ± SD 1.10 ± 0.14 g cm-3, N = 6). The study also measured density as dry weight/fresh volume for the same trees (I.F. Brown, personal communication, 1993), which I will call "fresh volume basic density"; these data yield a mean (±SD) of 0.67 ± 0.11 g cm-3, N=6). It should be remembered that the different density measures do not bear constant relationships to each other: for example, the ratio of fresh density to fresh volume basic density in the six trees varied from 1.46 to 1.94.
4
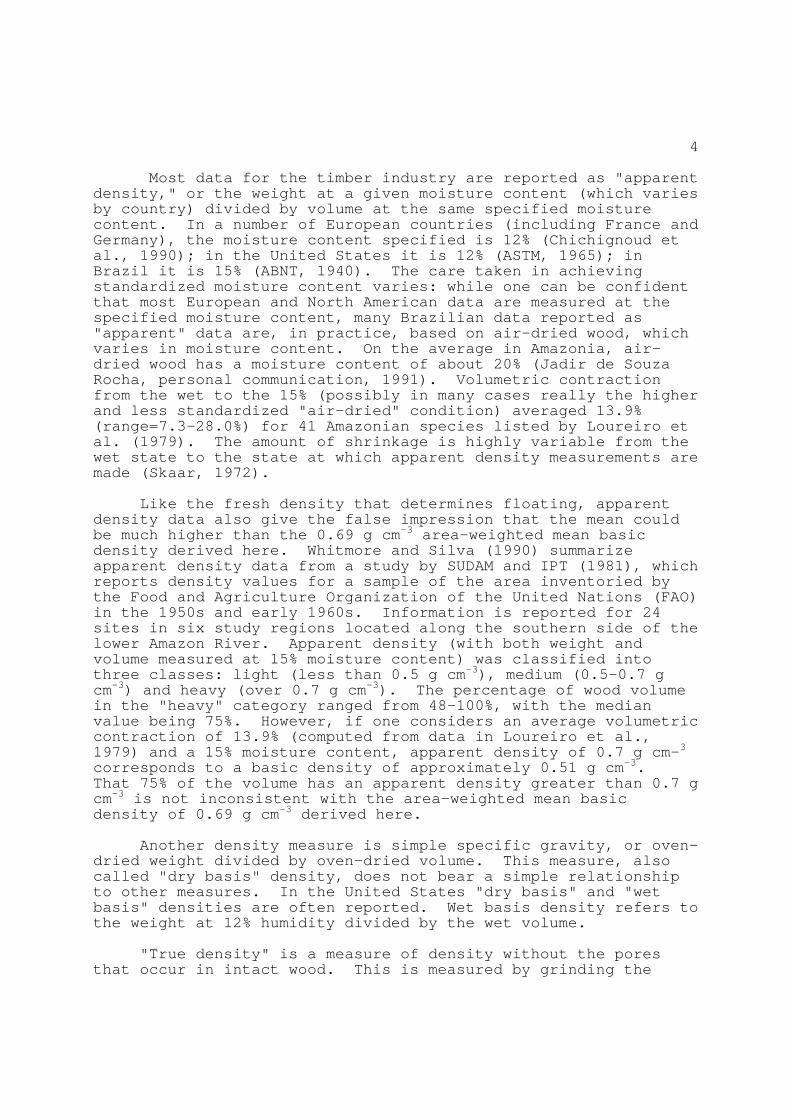
Most data for the timber industry are reported as "apparent density," or the weight at a given moisture content (which varies by country) divided by volume at the same specified moisture content. In a number of European countries (including France and Germany), the moisture content specified is 12% (Chichignoud et al., 1990); in the United States it is 12% (ASTM, 1965); in Brazil it is 15% (ABNT, 1940). The care taken in achieving standardized moisture content varies: while one can be confident that most European and North American data are measured at the specified moisture content, many Brazilian data reported as "apparent" data are, in practice, based on air-dried wood, which varies in moisture content. On the average in Amazonia, air-dried wood has a moisture content of about 20% (Jadir de Souza Rocha, personal communication, 1991). Volumetric contraction from the wet to the 15% (possibly in many cases really the higher and less standardized "air-dried" condition) averaged 13.9% (range=7.3-28.0%) for 41 Amazonian species listed by Loureiro et al. (1979). The amount of shrinkage is highly variable from the wet state to the state at which apparent density measurements are made (Skaar, 1972). Like the fresh density that determines floating, apparent density data also give the false impression that the mean could be much higher than the 0.69 g cm-3 area-weighted mean basic density derived here. Whitmore and Silva (1990) summarize apparent density data from a study by SUDAM and IPT (1981), which reports density values for a sample of the area inventoried by the Food and Agriculture Organization of the United Nations (FAO) in the 1950s and early 1960s. Information is reported for 24 sites in six study regions located along the southern side of the lower Amazon River. Apparent density (with both weight and volume measured at 15% moisture content) was classified into three classes: light (less than 0.5 g cm-3), medium (0.5-0.7 g cm-3) and heavy (over 0.7 g cm-3). The percentage of wood volume in the "heavy" category ranged from 48-100%, with the median value being 75%. However, if one considers an average volumetric contraction of 13.9% (computed from data in Loureiro et al., 1979) and a 15% moisture content, apparent density of 0.7 g cm-3 corresponds to a basic density of approximately 0.51 g cm-3. That 75% of the volume has an apparent density greater than 0.7 g cm-3 is not inconsistent with the area-weighted mean basic density of 0.69 g cm-3 derived here. Another density measure is simple specific gravity, or oven-dried weight divided by oven-dried volume. This measure, also called "dry basis" density, does not bear a simple relationship to other measures. In the United States "dry basis" and "wet basis" densities are often reported. Wet basis density refers to the weight at 12% humidity divided by the wet volume. "True density" is a measure of density without the pores that occur in intact wood. This is measured by grinding the
5
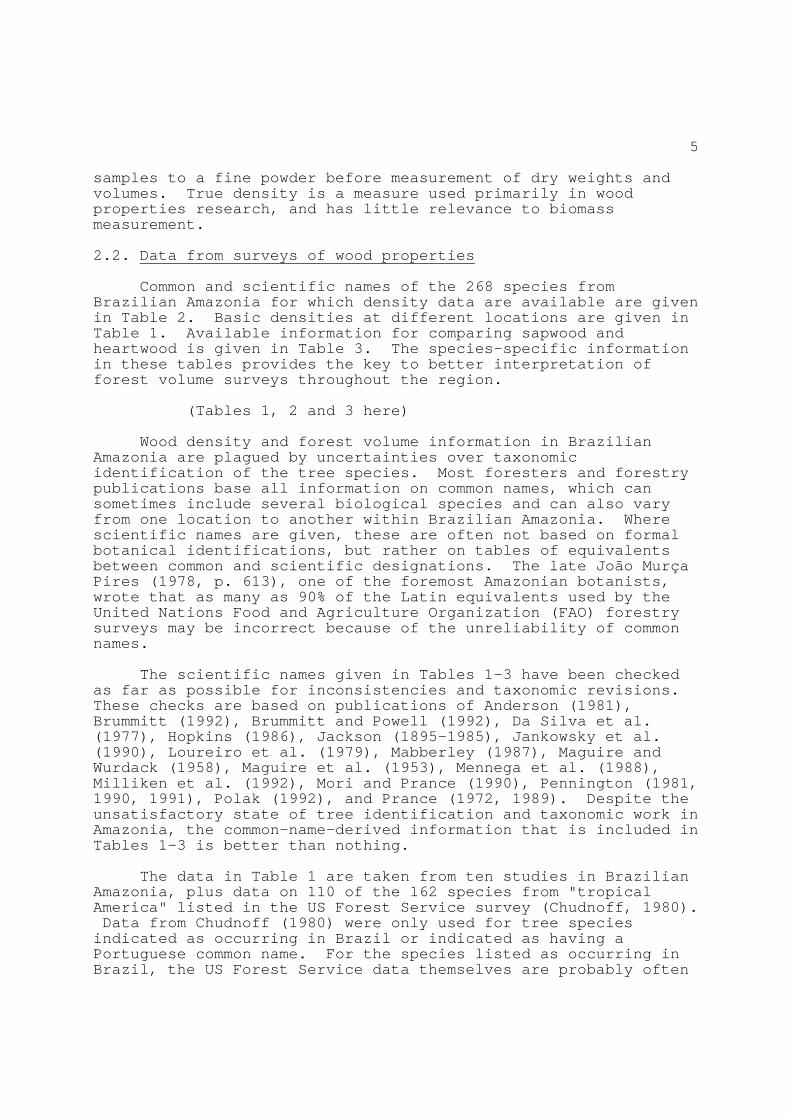
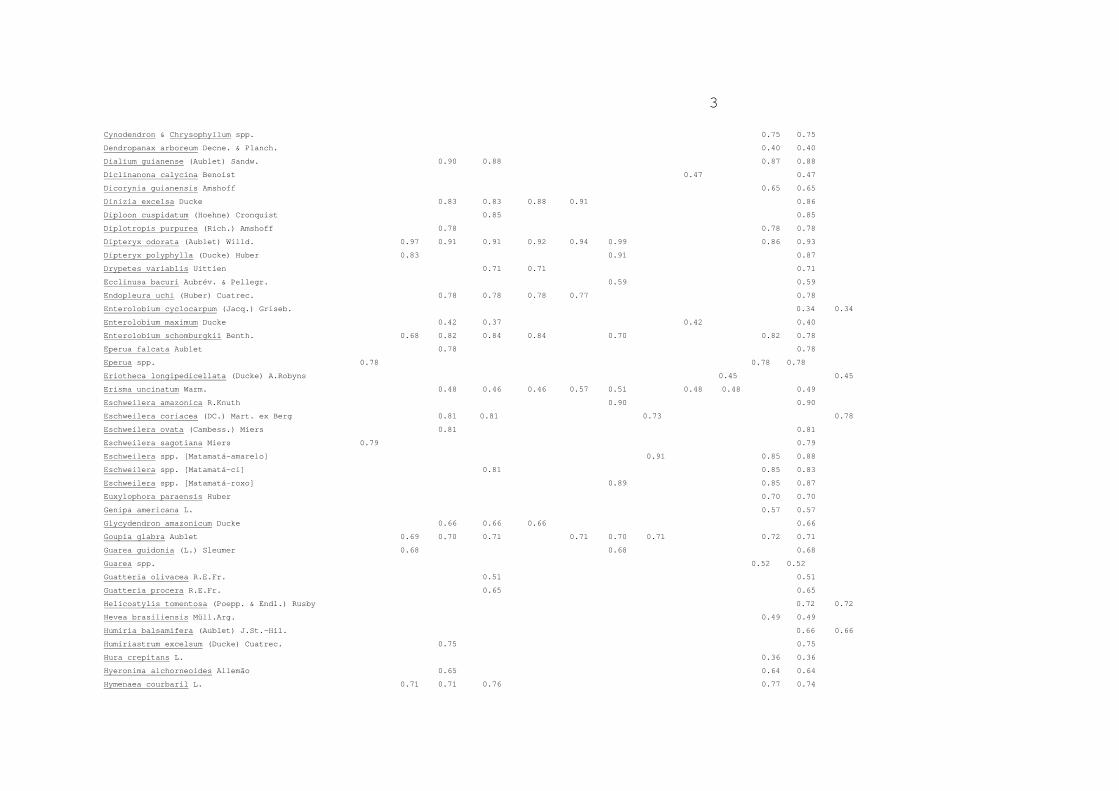
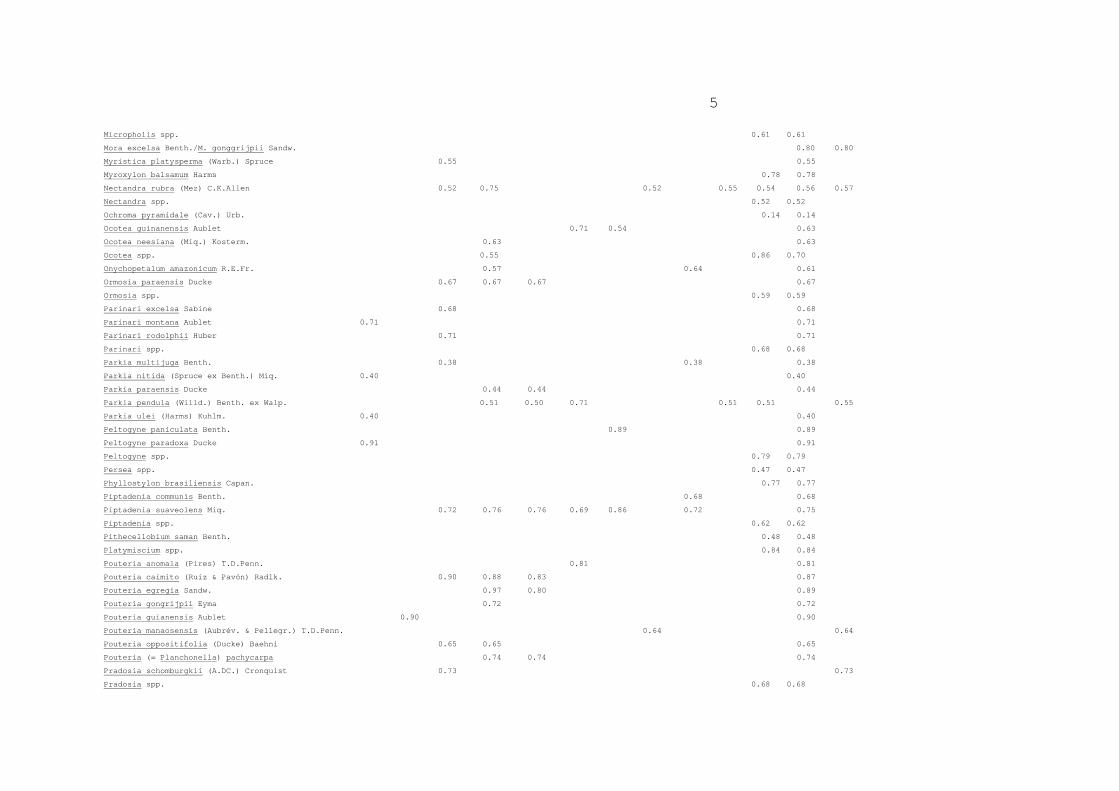
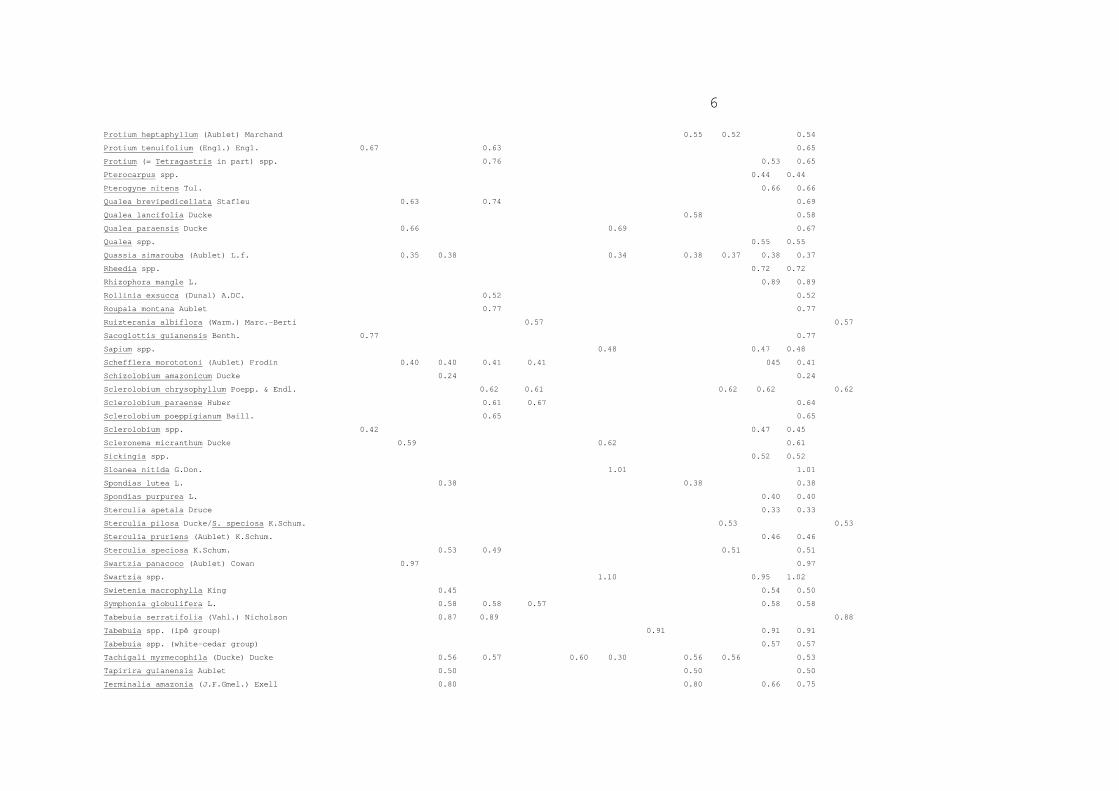
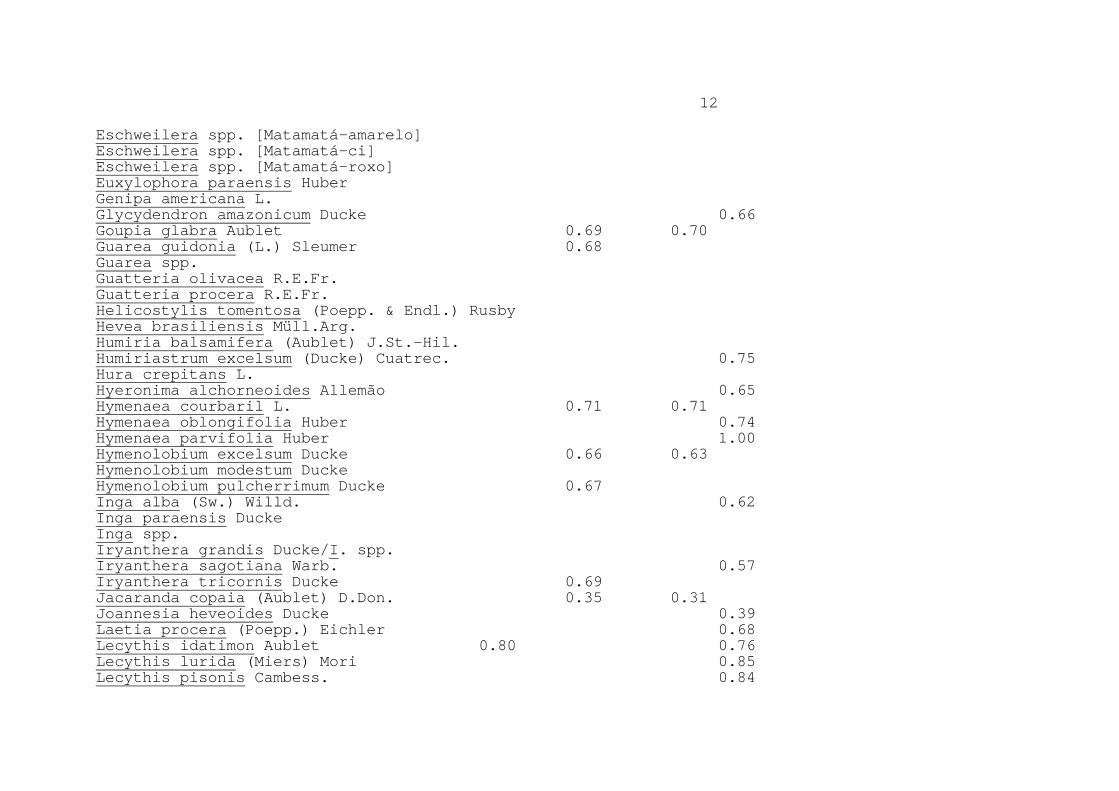
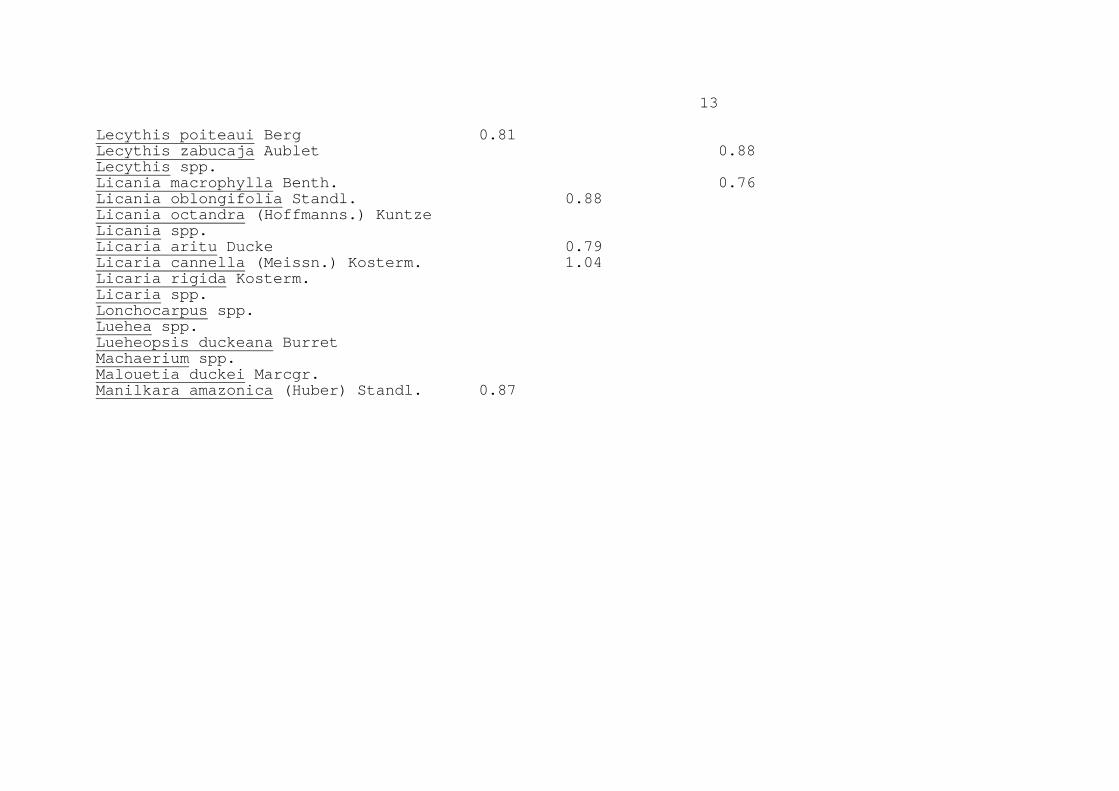
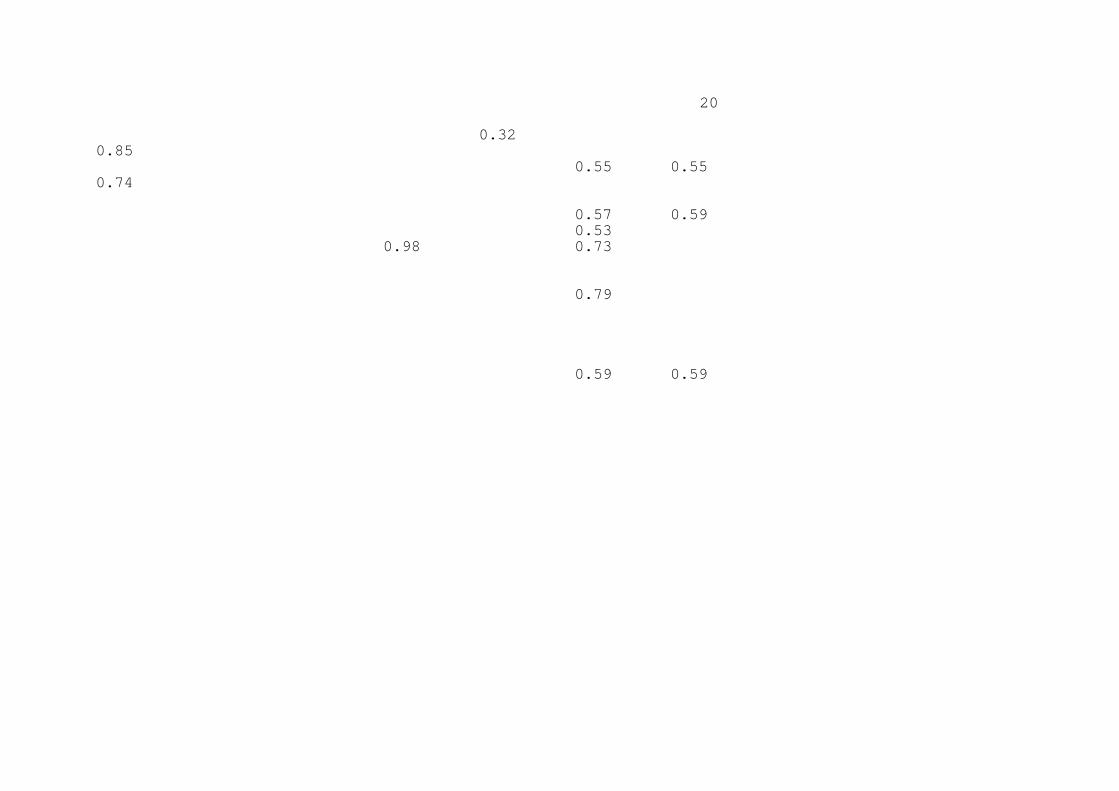
samples to a fine powder before measurement of dry weights and volumes. True density is a measure used primarily in wood properties research, and has little relevance to biomass measurement. 2.2. Data from surveys of wood properties Common and scientific names of the 268 species from Brazilian Amazonia for which density data are available are given in Table 2. Basic densities at different locations are given in Table 1. Available information for comparing sapwood and heartwood is given in Table 3. The species-specific information in these tables provides the key to better interpretation of forest volume surveys throughout the region. (Tables 1, 2 and 3 here) Wood density and forest volume information in Brazilian Amazonia are plagued by uncertainties over taxonomic identification of the tree species. Most foresters and forestry publications base all information on common names, which can sometimes include several biological species and can also vary from one location to another within Brazilian Amazonia. Where scientific names are given, these are often not based on formal botanical identifications, but rather on tables of equivalents between common and scientific designations. The late João Murça Pires (1978, p. 613), one of the foremost Amazonian botanists, wrote that as many as 90% of the Latin equivalents used by the United Nations Food and Agriculture Organization (FAO) forestry surveys may be incorrect because of the unreliability of common names. The scientific names given in Tables 1-3 have been checked as far as possible for inconsistencies and taxonomic revisions. These checks are based on publications of Anderson (1981), Brummitt (1992), Brummitt and Powell (1992), Da Silva et al. (1977), Hopkins (1986), Jackson (1895-1985), Jankowsky et al. (1990), Loureiro et al. (1979), Mabberley (1987), Maguire and Wurdack (1958), Maguire et al. (1953), Mennega et al. (1988), Milliken et al. (1992), Mori and Prance (1990), Pennington (1981, 1990, 1991), Polak (1992), and Prance (1972, 1989). Despite the unsatisfactory state of tree identification and taxonomic work in Amazonia, the common-name-derived information that is included in Tables 1-3 is better than nothing. The data in Table 1 are taken from ten studies in Brazilian Amazonia, plus data on 110 of the 162 species from "tropical America" listed in the US Forest Service survey (Chudnoff, 1980). Data from Chudnoff (1980) were only used for tree species indicated as occurring in Brazil or indicated as having a Portuguese common name. For the species listed as occurring in Brazil, the US Forest Service data themselves are probably often
6
not Brazilian, as Chudnoff (1980) usually does not indicate where the wood samples were obtained for the densities reported. The 110 species referred to by Chudnoff (1980) have a mean density of 0.61 g cm-3, and their inclusion lowers the unweighted mean from 0.67 to 0.65. Of the 110 species for which Chudnoff (1980) data are included in Table 1, 77 have no data from the Brazilian sources that are also in the table. 3. POTENTIAL SOURCES OF BIAS Unfortunately, no density data are available for many Amazonian tree species, making use of average values necessary--at least for the substantial portion of the forest that is composed of species of unknown density. Most of the available data sets on wood density contain an inherent downward bias because one of the criteria used for inclusion of species in the surveys is wood density being in a range preferred by the timber industry. This is explicitly mentioned in the case of surveys done by the Brazilian Institute for Forestry Development (IBDF) in the Curuá-Una and Tapajós areas in the State of Pará. In the Tapajós survey, "species with values between 0.30 and 0.70 g cm-3 were selected" although "some species with density greater than 0.70 g cm-3 were also considered, due to their frequent occurrence" (IBDF, 1981, p. 15). By deliberately excluding species with high densities, the average is artificially low. It is possible that this generic problem affects the US Forest Service data set (Chudnoff, 1980) that served as the source of most of the density values in a number of recent estimates (e.g., Brown and Lugo, 1984, 1992; Brown et al., 1989). There may also be bias in the opposite direction, due to omission of very low-density trees from the available data sets. In surveys for woods in Central American forests, there are often no secondary succession species included (G.B. Williamson, personal communication, 1993). Natural treefall gaps appear in any mature tropical forest, so a representative survey would have to include at least some individuals of early successional species. On the other hand, early successional species often never reach the minimum diameter included in forest volume surveys, such as the 31.8-cm DBH minimum in the RADAMBRASIL surveys. Inclusion, for example, of Cecropia (basic density 0.30 g cm-3) and balsawood (Ochroma: basic density 0.14 g cm-3) has the effect of introducing a downward bias in the unweighted mean for use with forest volume survey data. The smaller trees are included in biomass estimates as a correction based on percentage by weight, not by volume (Fearnside, 1996a). The inclusion of Ochroma lowers the unweighted mean basic density from 0.66 to 0.65 g cm-3 (2%) in the current data set. Bias from this source is minimized in the calculation method adopted here for deriving a regional estimate, with volume-weighted means calculated for each sample, which are then combined in an area-weighted mean for the region's forests.

7
4. ADJUSTMENTS NEEDED FOR USE IN BIOMASS ESTIMATES 4.1. Hollow trees Large trees are frequently hollow. Certain species, such as angelim (Dinizia excelsa), are nearly always hollow. Biomass is usually calculated (e.g. Brown and Lugo, 1992) by multiplying volume by wood density (as determined from small samples of solid wood). In forests near Manaus, Niro Higuchi and co-workers (N. Higuchi, personal communication, 1991) have found 27% of the trees with DBH greater than 40 cm to be hollow (N = 486 trees); when a tree is hollow, about 30% of its stem volume is either air or light material such as debris from termite activity. Weighting the hollow percentage by the volume in each size class leads to the conclusion that the overestimate as a whole from this factor is 9.2% for the RADAMBRASIL data set.(a) For comparison, Martinelli et al. (1988, p. 35) and Brown et al., (1995) examined 53 stumps in a clearing near the Samuel Reservoir in Rondônia and found 20% to be hollow, with an average of 20% of the cross-sectional area empty in the hollow stumps (i.e. 4% of the total cross-sectional area and presumed volume). Rodrigues and Valle (1964) found 32% of 145 trees over 10 cm DBH to be hollow in a 0.3 ha plot near Manaus; hollow trees were determined at a height of 0.7 m above the ground, but no estimate of the percentage of the volume was made. 4.2. Heartwood and sapwood density Published density measurements almost invariably refer to the density of heartwood, as this is of most interest to the timber industry and is where almost all wood samples are taken (Jadir de Souza Rocha, personal communication, 1991). Most of the sapwood (alburnum) is lost when logs are squared in preparation for sawing into lumber. In making biomass estimates for greenhouse gas emissions calculations, however, the density of the sapwood is also important. Unlike many temperate zone trees, the sapwood of Amazonian trees is, on average, lighter than the heartwood. Radial variation in eight species near Manaus was studied by Amorim (1991), who found the lowest densities nearest the bark for all but one species (ucuúba, Virola surinamensis). When measurements are at the DBH level (or at the nearest available measurement point in two cases where wood defects prevented density determination at the DBH level), the pith-to-bark differential in basic density observed at the DBH height applied to other portions of the trunk except for one species (cupiúba, Goupia glabra), where the pattern was reversed at the highest point measured. Considering measurements at the DBH height, the mean basic density at the edge (0.758 g cm-3) was 11.7% lower than the mean at the center (0.858 g cm-3).

8
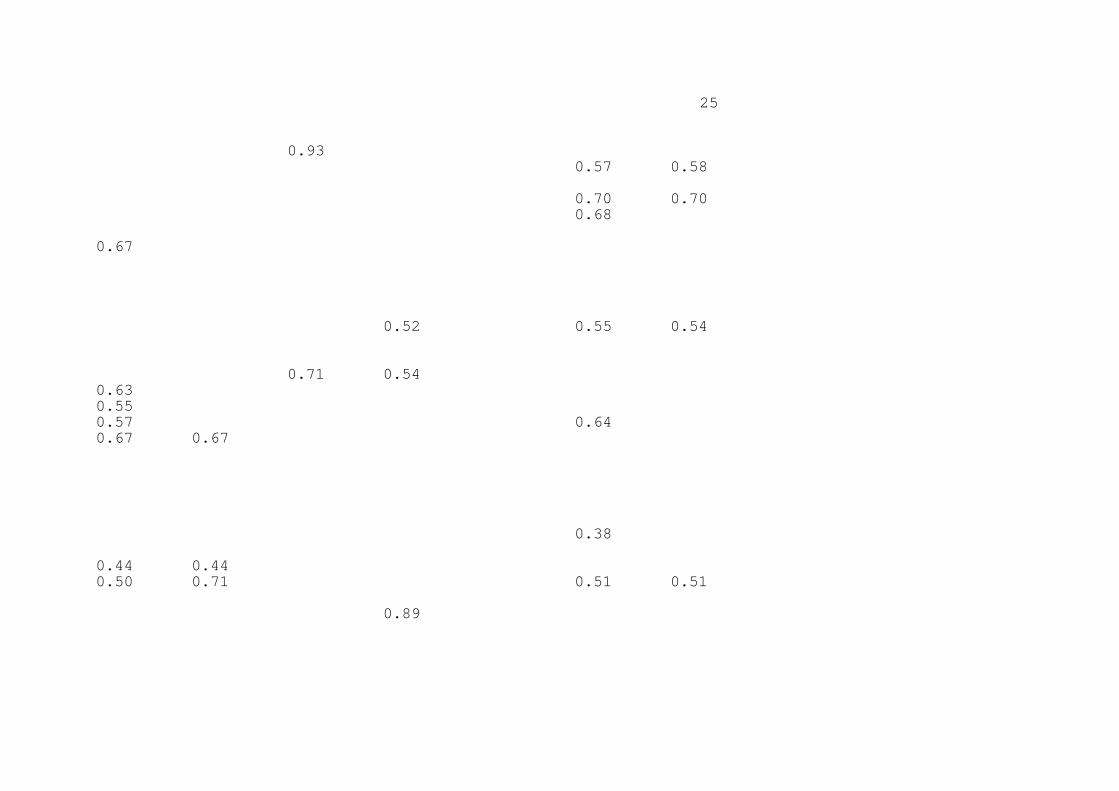
Variation in density along the length of trunks is a potential source of bias in biomass estimates, as most density samples come from only one point along the length of the trunk (normally the DBH level). Data from a study of 12 species near Manaus (De Macedo, 1991) indicate higher basic density at the DBH height than at the top of the commercial bole (just below the first branch) in all cases, with the average basic density being 9.7% lower (0.725 vs. 0.803 g cm-3). Considering the measurement made at the midpoint of the commercial bole, the average basic density is 7.1% lower than the average measured at the DBH height. Biomass measurements based on the DBH height density determination may therefore be overestimates by approximately this amount. Sapwood and heartwood densities are available for 33 species of trees in Brazilian Amazonia (Table 3). Mean sapwood density is 94.7% of the corresponding heartwood density. Some species can have larger differences between sapwood and heartwood density. Trugilho et al. (1989) found jatobá (Hymenaea courbaril) near Manaus to have sapwood with basic density 24.4% lower than heartwood (mean of the three best density determination methods tested by these authors). The thickness and relative proportion of sapwood varies greatly among individuals of the same species, being generally greater for younger trees and where soil fertility is higher (Roland Vetter, personal communication, 1991). Using the volumes in size classes greater than 31.8 cm DBH (the minimum of the RADAMBRASIL data set) that were measured in INPA's Model Basin (Niro Higuchi and coworkers, unpublished data, c. 1991), the diameter of the tree at the point accounting for a cumulative total of 50% of the wood volume corresponds to 50.2 cm DBH. In 14 species for which sapwood thickness and diameter data are reported for the Tapajós National Forest (IBDF, 1988), sapwood averaged 13.5% of the cross-sectional area (and presumed volume). The diameters of trees in the Tapajós survey averaged 58.4 cm DBH, slightly higher than the 50.2 cm DBH that the volume distribution at INPA's Model Basin near Manaus would indicate as the size most representative of the forest for purposes of the needed adjustment for sapwood volume. At the Curuá-Una Experimental Station, sapwood averaged 9.8% of the cross-sectional area in 43 species surveyed (IBDF, 1981), with an average diameter in the survey of 60.5 cm DBH. The larger diameters make the estimate of sapwood percentage conservative. Considering these data sets (Table 4), sapwood thickness is available for 57 species. Sapwood represents a mean of 9.7% of the commercial volume. (Table 4 here)

9
The correction for sapwood, considering the average percentage of the volume (9.7%) represented by sapwood and the average basic density of sapwood as a percentage of heartwood density (94.7%), lowers the biomass estimate by only 0.52%. The adjustment would be greater for trees below the size range included in the RADAMBRASIL forest volume surveys, but data are unavailable for making this adjustment. 4.3. Bark density If the forest volume estimates used in a biomass calculation refer to the volume under bark, then the value for the basic density of wood need not be adjusted for bark--but a separate addition must be made for the estimated bark biomass. Forest volume estimates used in biomass calculations often refer to volume over bark, and, if these volumes are used directly, then an adjustment would have to be made in the value used for density. The estimate made by Brown and Lugo (1992) of biomass in Brazilian Amazonia omits bark, although it is not clear whether what has been omitted is only a small adjustment for the difference between wood and bark density, or a larger factor representing all bark biomass. These authors state that the RADAMBRASIL volume data they used refer to VOB (volume over bark), but do not indicate that any correction was applied for the difference in density between bark and wood. Most results are presented in the summary tables of the original RADAMBRASIL publications as volume without bark; if the source from which Brown and Lugo worked (a letter to FAO summarizing the RADAMBRASIL results) reproduced the results in this form, then an adjustment to the results they report would be needed for the full volume of the bark (an increase of 7.69% with respect to the volume without bark, using the standard adopted by the RADAMBRASIL project for deriving the volumes without bark from the original over-bark measurements). The basic density of bark averages about 80% of that of the wood, based on approximately 40 trees near Manaus (Dimas Agostinho da Silva, personal communication, 1991). The percent of above-ground live dry-weight biomass represented by bark averaged 7.22% in dense forest destructive sampling plots at four hydroelectric reservoir sites in the region: 6.32% in dense riparian forest at Belo Monte (Kararaô) (Revilla Cardenas, 1987, p. 51), 6.57% in dense riparian forest at Babaquara (Revilla Cardenas, 1988, p. 76), 4.58% in terra firme forest at Babaquara (Revilla Cardenas, 1988, p. 77), and 11.41% in dense terra firme forest at Samuel (Revilla Cardenas, 1986, p. 39). These values include bark from branches, except for fine twigs. For comparison, RADAMBRASIL reports the volume of commercial boles without bark calculated by lowering the form factor from 0.70 to 0.65 (equivalent to 7.1% of the volume being bark) (DNPM, 1980,

10
Vol 20, Annex 4, p. 15). In San Carlos de Río Negro (Venezuela), Jordan and Uhl (1978) found 9.7% of stem biomass to be bark (trees at this site are generally thinner than those in Brazilian Amazonia, which would make the proportion of bark found there overestimate this factor for Brazil). Considering the average of the hydroelectric reservoir studies of dense forest, adjustment for density and volume of bark would reduce the above-ground live biomass by 1.44%. At the Tapajós National Forest (IBDF, 1988), bark averaged 4.9% of the cross-sectional area (and presumed volume) in 47 tree species (Table 4). This corresponds to a reduction of 0.93% in biomass calculated from commercial volume. 5. WEIGHTING AVERAGES BY SPECIES OCCURRENCE Average wood density for use in estimating biomass should be weighted by the frequency of occurrence of each species. Species-specific density information allows correcting for any bias due to the relative abundance of trees in different density classes. For example, if trees with dense wood were more common than trees with lighter wood, use of a simple unweighted average of density values would overestimate the true value of the mean needed for calculating forest biomass. The present calculation uses the vegetation classification (Table 5) adopted by the Brazilian Institute of the Environment and Renewable Natural Resources (IBAMA) for its 1:5 000 000 scale vegetation map of Brazil (IBDF and IBGE, 1988). This map indicates 28 vegetation types in the Legal Amazon region, of which 19 are here considered to be forest (after Fearnside and Ferraz, 1995). For calculation purposes, vegetation types within each of the region's nine states are considered separately; these units (vegetation types within a state) are denominated "vegetation zones," of which there are 111; 78 of these are considered to be forest. (Table 5 here) Botanical identification of tree species is a major problem in Amazonia, and the data presented here contains a degree of uncertainty owing to possibility of misidentifications. The area of forest where formal botanical identifications have been done on all trees within the diameter classes included in forestry surveys is tiny. Nearly all forest volume surveys in the region are done by foresters rather than by botanists, and rely heavily on the common names in use at each location. This is also true of the data sets on wood densities. Density data are often given for a genus, or for an unidentified member of a genus. The individual matches of density values to volume measurements in the weighted means calculated here have therefore been classified by the degree of certainty in the species matching. The best situation is an exact match, with both the density and the volume information identified to species level. There are also matches

11
at the generic level, with one or both sides known only to genus. Congeneric matches have also been used when necessary, using information on trees known to be of different species but of the same genus. When generic-level information on density is used, the density value used is the mean for all members of the genus listed in Table 1. Table 6 gives the volume-weighted means of surveyed areas, indicating the percentage of the total volume identified to species level and the percentage identified at least to genus level. The sample of RADAMBRASIL data used here favors portions of the region with the most deforestation. (Table 6 here) The mean for each vegetation zone is the mean of the sampled areas weighted by the area of sample for each type. Although the forest volume data reported in RADAMBRASIL reports often include individual one-hectare survey plots from several related vegetation types (see Table 6), the total area of the sample is used in calculating the weighting for all of the listed types. These weighted means by vegetation zone appear in Table 7. The values in italics are based on the volume and density data, while the remaining values are assumed. If measured values are available for a given vegetation type in one or more states, then a mean of these measured values is used (33 vegetation zones). If no value is available for any state, then the values are assumed to have the mean applying to surveyed areas in the same general forest category (dense or non-dense forest) (17 vegetation zones). The samples in Table 6 provide density information for 30 vegetation zones, including one (Da-0 in Mato Grosso) that does not appear on the 1:5 000 000 IBAMA map. The vegetation zones sampled represent 78% of the originally forested area of Brazil's Legal Amazon region. At the level of IBAMA vegetation types (i.e. irrespective of state boundaries), Table 8 contains volume-weighted density information for 97% of the total originally forested area. (Table 7 here) In Table 7, the density values for the vegetation zones with survey data are weighted by the original area of the forest in that vegetation zone (from Fearnside and Ferraz, 1995), to produce an area-weighted mean for that vegetation type. These are then weighted by the area of each vegetation type to produce the area-weighted mean for the general forest category (dense or non-dense forest), and finally the weighted mean for the forest as a whole. This has a value of 0.69. This estimate contains considerable uncertainty, particularly as a result of doubt concerning taxonomic identifications in the forestry surveys. In Table 6, the fifth line refers to the 0.16-ha plot near Manaus studied by Prance et al. (1976), where trees of 15 cm DBH or greater were identified

12
by this highly qualified group of botanists. The volume-weighted mean basic density of the wood in this plot (0.74 g cm-3) is higher than any of the other 41 values in Table 6. The percentage of the wood volume identified to the species level (i.e. with a species-level match to density data in Table 1) is the lowest of any sample. The forestry surveys that make up the bulk of the data set undoubtedly tended to group species under common-name denominations that more frequently translated to one of the species for which density information is available. The density of the wood in the intensively studied plot is 10.4% higher than the 0.69 value calculated here for the region as a whole (based on surveys covering an area four times larger). Were this higher density value to apply to the region as a whole, the annual balance of net emissions from Brazil for 1990 would be increased by over 30 X 106 t of CO2-equivalent carbon, or two-thirds of the 50 X 106 t that Brazil emits annually from fossil fuels (Fearnside, 1996b). The suggestion that better taxonomic identifications could potentially result in a substantial upward revision of estimates of wood density and GHG emissions remains an intriguing possibility. The 0.69 value for area-weighted mean basic density calculated in the present paper is equal to or lower than other values that have been calculated for this parameter. Uhl et al. (1988, p. 668) calculated for 30 common species (SUDAM, 1979) a mean "wood specific gravity" (presumably basic density in this case) of 0.71. Brown and Lugo (1992) calculated a value of 0.69; Fearnside (1992a) also calculated a value of 0.69. The weighted mean density calculated here has a much firmer empirical basis than previously available estimates for this parameter. 6. CONCLUSIONS Care is necessary in interpreting wood density data for use in converting forest volume data to biomass estimates for use in greenhouse gas emissions calculations. Basic density (dry weight/wet volume) is the most appropriate measure for making the conversion. A variety of corrections are necessary to adjust for hollow trees, for bark, for differences between sapwood and heartwood density (radial variation), and for variation along the length of tree trunks. Basic density information available for 268 species allows calculation of a mean value weighted for frequency of occurrence of tree species in different forest types and by the extent of each forest type in the region. This yields a value of 0.69 g cm-3. This mean includes adjustments for variation within the tree, but not for hollowness. Hollow trees lower calculated biomass by 4%. This basic density mean is presently the most appropriate number for use in converting volume data to biomass.

13
NOTE (a) The upward bias in wood volume estimates resulting from hollow trees is calculated as follows. It is assumed that no trees below 40 cm DBH are hollow. For trees greater than 80 cm DBH it is assumed that the mean DBH is 90 cm. The basal area in each diameter class in the INPA Model Basin forestry management study area (Coic et al., 1991) is converted to volume using the equation: Volume = basal area X stem height X form factor. The height for each diameter class is derived using the DBH corresponding to the midpoint for each diameter class in the equation developed for tropical moist forest by Brown et al. (1989, p. 886): Height in meters = exp(1.0710 + 0.5677 ln DBH in cm). The form factors are specific to each diameter class as determined from field measurements in the study site by Higuchi and coworkers (N = 309 trees). The volume calculations of Brown and Lugo (1992) from the FAO data set are based on measured survey data for trees of at least 25 cm DBH, while those from the RADAMBRASIL data set are based on trees of at least 31.8 cm DBH. Since these volume values are then expanded to derive total live above-ground volumes for the stands, the overestimation for trees in the surveyed diameter classes will be passed on in the same proportion to the estimate as a whole. To derive volumes for trees of at least 25 cm DBH, it is assumed that half of the volume in the 20-30 cm DBH class is for trees 25-30 cm DBH. To derive the proportion of the volume in the surveyed DBH classes that is represented by hollow trees, the proportion of stem volume of trees in the surveyed diameter classes that is represented by each diameter class is multiplied by the proportion of trees in the class that are hollow. This is 27% for trees over 25 cm DBH (corresponding to the FAO data set) and 31% for trees over 31.8 cm DBH (corresponding to the RADAMBRASIL data set). The proportion of overestimation of volume is obtained by multiplying this by 0.30, resulting in a value of 8.1% for overestimation of stand volume (and biomass) for the FAO data set and 9.2% for the RADAMBRASIL data set. ACKNOWLEDGEMENTS The Pew Scholars Program in Conservation and the Environment provided funding. I thank N. Higuchi and R.E. Vetter for providing unpublished data on hollow trees and wood density. S.V. Wilson contributed greatly in checking taxonomic classifications and manipulating the RADAMBRASIL data. C.C. do Nascimento made helpful comments on the manuscript. S. Ferreira helped resolve taxonomic difficulties. Some portions of the discussions of hollow trees, heartwood and potential biases have been adapted from Fearnside (1992b).

14
REFERENCES ABNT, 1940. Ensaios físicos e mecânicos de madeiras. Método Brasileiro MB-26-40. Associação Brasileira de Normas Técnicas, Rio de Janeiro, RJ, Brazil, 15 pp. Amorim, L.C., 1991. Variação da densidade básica no sentido radial em madeiras tropicais da Amazônia. Relatório Final Período Abril/90-Março/91. (Iniciação Científica/Conselho Nacional de Desenvolvimento Científico e Tecnológico). Instituto Nacional de Pesquisas da Amazônia (INPA), Manaus, AM, Brazil, 24 pp. Anderson, W.R., 1981. Botany of the Guyana Highlands--Part XI. Malpighiaceae. Mem. N.Y. Bot. Gard., 32: 1-305. ASTM, 1965. Standard methods for testing small clear specimens of timber. ASTM Designation D-14352. American Society for Testing and Materials, Philadelphia, PA, pp. 51-73. Brown, S. and Lugo, A.E., 1984. Biomass of tropical forests: A new estimate based on forest volumes. Science, 223: 1290-1293. Brown, S. and Lugo, A.E., 1992. Aboveground biomass estimates for tropical moist forests of the Brazilian Amazon. Interciencia, 17(1): 8-18. Brown, S., Gillespie, A.J.R. and Lugo, A.E., 1989. Biomass estimation methods for tropical forests with applications to forest inventory data. For. Sci., 35(4): 881-902. Brown, I.F., Martinelli, L.A., Thomas, W.W., Moreira, M.Z., Ferreira, C.A.C. and Victoria, R.A., 1995. Studies of a southwestern Amazonia forest: Uncertainty in estimates of biomass. For. Ecol. Manage., in press. Brummitt, R.K. (Compiler), 1992. Vascular Plant Families and Genera. Royal Botanic Gardens, Kew, UK. Brummitt, R.K. and Powell, C.E. (Editors), 1992. Authors of Plant Names. Royal Botanic Gardens, Kew, UK. Chichignoud, M., Déon, G., Detienne, P., Parant, B. and Vantgomme, P., 1990. Atlas de Maderas Tropicales de América Latina. Centre Technique Forestier Tropical (CTFT), Nogeont-sur-Marne, France. Chudnoff, M., 1980. Tropical Timbers of the World. US Department of Agriculture, Forest Service, Forest Products Laboratory, Madison, WI, 831 pp. Coic, A., Higuchi, N. and Veloso, J., 1991. Comportamento após exploração florestal duma floresta densa úmida na Amazônia.

15
Instituto Nacional de Pesquisas da Amazônia (INPA), Manaus, AM, Brazil, 23 pp. (Unpublished report.) Da Silva, M.F., Lisboa, P.L.B. and Lisboa, R.C.L., 1977. Nomes Vulgares de Plantas Amazônicas. Conselho Nacional de Desenvolvimento Científico e Tecnológico/Instituto Nacional de Pesquisas da Amazônia, Manaus, AM, Brazil, 222 pp. De Castro, F., Williamson, G.B. and de Jesus, R.M., 1993. Radial variation in wood specific gravity of Joannesia princeps: the roles of age and diameter. Biotropica, 25(2): 176-182. De Macedo, C.S.M., 1991. Variação longitudinal de densidade básica e da composição química de madeiras e sua avaliação energética. Relatório Final, abril/1990-março/1991. (Iniciação Científica/Conselho Nacional de Desenvolvimento Científico e Tecnológico). Instituto Nacional de Pesquisas da Amazônia (INPA), Manaus, AM, Brazil, 18 pp. (Unpublished report.) Denslow, J.S., 1980. Gap partitioning among tropical rainforest trees. Biotropica, 12 (Suppl.): 23-30. DNPM, 1983. Projeto RADAMBRASIL, 1973-1983. Levantamento de Recursos Naturais, Vols. 1-23. Ministério das Minas e Energia, Departamento Nacional de Produção Mineral, Rio de Janeiro, RJ, Brazil. Do Nascimento, C.C., 1993. Variabilidade da Densidade Básica e de Propriedades Mecânicas de Madeiras da Amazônia. Masters thesis in Forestry Sciences, Universidade de São Paulo, Escola Superior de Agricultura "Luiz de Queiroz," Piracicaba, SP, Brazil, 129 pp. Fearnside, P.M., 1992a. Greenhouse gas emissions from deforestation in the Brazilian Amazon. Carbon emissions and sequestration in forests: case studies from developing countries. Vol. 2, LBL-32758, UC-402. Climate Change Division, Environmental Protection Agency (EPA), Washington, DC and Energy and Environment Division, Lawrence Berkeley Laboratory (LBL), University of California (UC), Berkeley, CA, 73 pp. Fearnside, P.M., 1992b. Forest biomass in Brazilian Amazonia: comments on the estimate by Brown and Lugo. Interciencia, 17(1): 19-27. Fearnside, P.M., 1996a. Biomass of Brazil's Amazonian forests (In preparation). Fearnside, P.M., 1996b. Amazonia and global warming: Annual balance of greenhouse gas emissions from land use change in the Brazil Amazon region. In: J. Levine (Editor), Biomass Burning and Global Change. MIT Press, Cambridge, MA, in press.

16
Fearnside, P.M. and Ferraz, J., 1995. A conservation gap analysis of Brazil's Amazonian vegetation. Conserv. Biol., 9(5): 1-14. Glerum, B.B., 1960. Report to the Government of Brazil on a Forestry Inventory in the Amazon Valley (Part Five) (Region between Rio Caete and Rio Maracassume). FAO Report No. 1250, Project No. BRA/FO, Food and Agriculture Organization of the United Nations, Rome, 67 pp. Heinsdijk, D., 1957. Report to the Government of Brazil on a Forest Inventory in the Amazon Valley (Region between Rio Tapajós and Rio Xingu). FAO Report No. 601, Project No. BRA/FO, Food and Agriculture Organization of the United Nations, Rome, 135 pp. Heinsdijk, D., 1958a. Report to the Government of Brazil on a Forest Inventory in the Amazon Valley (Part Three) (Region between Rio Tapajós and Rio Madeira). FAO Report No. 969, Project No. BRA/FO, Food and Agriculture Organization of the United Nations, Rome, 83 pp. Heinsdijk, D., 1958b. Report to the Government of Brazil on a Forest Inventory in the Amazon Valley (Part Four) (Region between Rio Tocantins and Rios Guamá and Capim). FAO Report No. 992, Project No. BRA/FO, Food and Agriculture Organization of the United Nations, Rome, 72 pp. Heinsdijk, D., 1958c. Report to the Government of Brazil on a Forestry Inventory in the Amazon Valley (Part Two) (Region between Rio Xingu and Rio Tapajós). FAO Report No. 949, Project No. BRA/FO, Food and Agriculture Organization of the United Nations, Rome, 94 pp. Higuchi, N. and de Carvalho, Jr., J.A. 1994. Fitomassa e conteúdo de carbono de espécies arbóreas da Amazônia. In: Anais do Seminário Emissão X Seqüestro de CO2. Companhia Vale do Rio Doce, Rio de Janeiro, RJ, Brazil, pp. 125-153. Hopkins, H.C.F., 1986. Parkia. Flora Neotropica Monograph No. 43. Published for the Organization for Flora Neotropica by the New York Botanical Garden, New York, NY. IBDF, 1981. Madeiras da Amazônia: Características e Utilização, Vol. 1: Floresta Nacional do Tapajós. Instituto Brasileiro de Desenvolvimento Florestal, Conselho Nacional de Desenvolvimento Científico e Tecnológico, Brasília, DF, Brazil, 113 pp. IBDF, 1983. Potencial madeireira do Grande Carajás. Instituto Brasileiro de Desenvolvimento Florestal, Brasília, DF, Brazil, 134 pp.

17
IBDF, 1988. Madeiras da Amazônia, Características e Utilização; Estação Experimental de Curuá-Una/Amazonian Timbers, Characteristics and Utilization; Curuá-Una Experimental Forest Station, Vol. 2. Instituto Brasileiro de Desenvolvimento Florestal, Departamento de Pesquisa, Laboratório de Produtos Florestais, Brasília, DF, Brazil, 236 pp. IBGE and IBDF, 1988. Mapa de Vegetação do Brasil. Scale 1:5 000 000. Instituto Brasileira de Geografia e Estatísticas and Instituto Brasileira de Desenvolvimento Florestal, Brasília, DF, Brazil. INPA, 1991. Catálogo de Madeiras da Amazônia. Instituto Nacional de Pesquisas da Amazônia, Coordenação de Pesquisas em Produtos Florestais, Manaus, AM, Brazil, 163 pp. Jackson, B.D. (Compiler), 1985. Index Kewensis, 1895-1985. Vols. I, II, & supplements I-XVIII. Clarendon Press, Oxford. Jankowsky, I.P., Chimela, J.P., Cavalcante, A.A., Galina, I.C.M. and Nagamura, J.C.S., 1990. Madeiras Brasileiras, Vol. I. Spectrum, Caxias do Sul, RS, Brazil, 172 pp. Jordan, C.F. and Uhl, C., 1978. Biomass of a "tierra firme" forest in the Amazon Basin. Oecologia Plantarum, 13(4): 387-400. Loureiro, A.A., da Silva, M.F. and Alencar, J. de C., 1979. Essências Madeireiras da Amazônia, Vols. I and II. Conselho Nacional de Desenvolvimento Científico e Tecnológico/Instituto Nacional de Pesquisas da Amazônia, Manaus, AM, Brazil, 245 pp. (Vol. I) and 187 pp. (Vol. II). Mabberley, D.J., 1987. The Plant Book: A Portable Dictionary of Higher Plants. Cambridge University Press, Cambridge, UK, 707 pp. Maguire, B. and Wurdack, J.J., 1958. Botany of the Guyana Highlands, Part III. Mem. N.Y. Bot. Gard., 10(1): 1-156. Maguire, B., Cowan, R.S. and Wurdack, J.J., 1953. Botany of the Guyana Highlands, Part I. Mem. N.Y. Bot. Gard., 8(2): 1-160. Martinelli, L.A., Victoria, R.L., Moreira, M.Z., Arruda, Jr., G., Brown, I.F., Ferreira, C.A.C., Coelho, L.F., Lima, R.P. and Thomas, W.W., 1988. Implantação de parcelas para monitoreamento de dinâmica florestal na Área de Proteção Ambiental, UHE Samuel, Rondônia. Relatório Preliminar. Centro de Energia Nuclear na Agricultura (CENA), Piracicaba, SP, Brazil, 72 pp. (Unpublished report.) Mennega, E.A., Tammens-de-Rooij, W.C.M. and Jansen-Jacobs, M.J., 1988. Check-List of Woody Plants of Guyana. Tropenbos Foundation, Ede, Netherlands, 281 pp.

18
Milliken, W., Miller, R.P., Pollard, S.R. and Wandelli, E.V., 1992. Ethnobotany of the Waimiri Atroari Indians of Brazil. Royal Botanic Gardens, Kew, UK, 146 pp. Mori, S.P. and Prance, G.T., 1990. Lecythidaceae Part II. The Zygomorphic-flowered New World genera (Couroupita, Corythophera, Bertholletia, Couratari, Eschweilera, and Lecythis). Flora Neotropica Monograph 21(II). New York Botanical Garden, New York, 375 pp. Pennington, T.D., 1981. Meliaceae. Flora Neotropica Monograph No. 28. Published for Organization for Flora Neotropica by New York Botanical Garden, New York. Pennington, T.D., 1990. Sapotaceae. Flora Neotropica Monograph No. 52. Published by Organization for Flora Neotropica by New York Botanical Garden, New York. Pennington, T.D., 1991. The Genera of Sapotaceae. Royal Botanic Gardens, Kew, UK and New York Botanical Garden, New York. Pires, J.M., 1978. The forest ecosystems of the Brazilian Amazon: Description, functioning and research needs. In: United Nations Educational, Scientific and Cultural Organization (UNESCO)/United Nations Environmental Programme (UNEP)/Food and Agriculture Organization of the United Nations (FAO), Tropical Forest Ecosystems: A State of Knowledge Report. UNESCO, Paris, pp. 607-627. Polak, A.M., 1992. Major Timber Trees of Guyana: a Field Guide. Tropenbos Foundation, Wageningen, Netherlands, 272 pp. Prance, G.T., 1972. Chrysobalanaceae. Flora Neotropica Monograph No. 9. Published for Organization for Flora Neotropica by Hafner Publishing Co., New York. Prance, G.T., 1989. Chrysobalanaceae. Flora Neotropica Monograph No. 9S. Published for Organization for Flora Neotropica by New York Botanical Garden, New York. Prance, G.T., Rodrigues, W.A. and da Silva, M.F., 1976. Inventário florestal de uma hectare de mata de terra firme km 30 Estrada Manaus-Itacoatiara. Acta Amazonica, 6(1): 9-35. Reid, Collins and Associates, Ltd., 1977. Jari Hog Fuel Study: Investigation of Moisture Content, Specific Gravity, Rate of Drying and other related properties of Indigenous Hardwood Species at Jari, Brazil. Progress Report, Dry Season Sampling and Results. Vancouver, 63 pp.
19
Revilla Cardenas, J.D., 1986. Estudos de ecologia e controle ambiental na região do reservatório da UHE de Samuel. Convênio: ELN/MCT/CNPq/INPA de 01.07.82. Relatório Setorial, Segmento: Estimativa da Fitomassa, Período julho-dezembro 1986. Instituto Nacional de Pesquisas da Amazônia, Manaus, AM, Brazil, 194 pp. Revilla Cardenas, J.D., 1987. Relatório: Levantamento e Análise da Fitomassa de Kararaô, Rio Xingu. Instituto Nacional de Pesquisas da Amazônia, Manaus, AM, Brazil, 181 pp. Revilla Cardenas, J.D., 1988. Relatório: Levantamento e Análise da Fitomassa de Babaquara, Rio Xingu. Instituto Nacional de Pesquisas da Amazônia, Manaus, AM, Brazil, 277 pp. Rodrigues, W.A. and Valle, R.C., 1964. Ocorrência de troncos ôcos em mata de baixio da região de Manaus, Amazonas. Pub. 16 Botânica, Instituto Nacional de Pesquisas da Amazônia, Manaus, AM, Brazil, 8 pp. Rueda, R. and Williamson, G.B., 1992. Radial and vertical wood specific gravity in Ochroma pyramidale (Cav. ex Lam.) Urb. (Bombacaceae). Biotropica, 24(4): 512-518. Skaar, C., 1972. Water in Wood. Syracuse University Press, Syracuse, NY, 218 pp. SUDAM, 1979. Pesquisas e Informações sobre Espécies Florestais da Amazônia. Superintendência do Desenvolvimento da Amazônia, Belém, PA, Brazil. SUDAM and IPT, 1981. Grupamento das Espécies Tropicais da Amazônia por Similaridade de Características Básicas e por Utilização. Superintendência do Desenvolvimento da Amazônia and Instituto de Pesquisas Tecnológicas, Belém, PA, Brazil, Trugilho, P.F., da Silva, D.A., Frazão, F.J.L. and de Matos, J.L.M., 1989. Comparação de métodos da determinação da densidade básica em madeiras. In: III Encontro Brasileiro em Madeiras e em Estruturas de Madeira, 26-28 julho 89, São Carlos, SP, Anais, Volume 3. Universidade de São Paulo, Escola de Engenharia de São Carlos, São Carlos, SP, Brazil, pp. 163-179. Uhl, C., Buschbacher, R. and Serrão, E.A.S., 1988. Abandoned pastures in Eastern Amazonia. I. Patterns of plant succession. J. Ecol., 76: 663-681. Whitmore, T.C. and Silva, J.N.M., 1990. Brazil rain forest timbers are mostly very dense. Commonw. For. Rev., 69(1): 87-90. Wiemann, M.C. and Williamson, G.B., 1988. Extreme radial changes in wood specific gravity in some tropical pioneers. Wood Fiber Sci., 20(3): 344-349.

20
Wiemann, M.C. and Williamson, G.B., 1989. Wood specific gravity gradients in tropical dry and montane rain forest trees. Amer. J. Bot., 76(6): 924-928. Williamson, G.B., 1984. Gradients in wood specific gravity of trees. Bull. Torrey Bot. Club, 111(1): 51-55.

21
FIGURE LEGEND Figure 1 -- Brazil's Legal Amazon region (showing locations mentioned in the text).

1
Table 1 Basic density of wood by species
Scientific name Amapá Balbina
Carajás
Curuá-Una
Curuá-Una
Jari Manaus
Manaus
Tapajós
Tapajós
Brazil
Average
(Do Nasci-mento, 1993)
(INPA, 1991)
(IBDF, 1983)
(IBDF, 1988)
(Do Nasci-mento, 1993)
(Reid, Collins & Asso-ciates, 1977)
(INPA, unpub-lished1981)
(Amorim 1981)
(IBDF, 1981)
(Do Nasci-mento, 1993)
(Chud-noff, 1980)
Agonandra brasiliensis Miers ex Benth. 0.74 0.74
Aldina heterophylla Benth. 0.73 0.73
Alexa grandiflora Ducke 0.53 0.60 0.60 0.61 0.59
Alexa imperatricis (R.H.Schomb.) Baill. 0.55 0.48 0.52
Anacardium excelsum Skeels 0.41 0.41
Anacardium giganteum Hancock ex Engl. 0.44 0.44
Anacardium spruceanum Benth. ex Engl. 0.42 0.42
Anadenanthera macrocarpa (Benth.) Brenan 0.86 0.86
Andira inermis (Wright) DC. 0.64 0.64
Andira parviflora Ducke 0.67 0.71 0.69
Aniba canelilla (H.B.K.) Mez 0.92 0.92 0.93 0.92
Aniba spp. 0.60 0.60
Apeiba petouma (Gaertn.) Aublet 0.36 0.36
Apeiba spp. 0.20 0.20
Apuleia molaris Spruce ex Benth. 0.76 0.76
Aspidosperma album (Vahl) Benoist 0.76 0.76
Aspidosperma obscurinervium Azambuja 0.86 0.86
Aspidosperma spp. 0.75 0.75
Astronium gracile Engl. 0.73 0.73
Astronium graveolens Jacq. 0.75 0.75
Astronium lecointei Ducke 0.75 0.79 0.77
Astronium ulei Mattick 0.71 0.71
Astronium urundeuva Engl. 1.21 1.21
Bagassa guianensis Aublet 0.70 0.68 0.69
Bertholletia excelsa Humb. & Bonpl. 0.63 0.62 0.63 0.63 0.59 0.62
Bixa arborea Huber 0.32 0.32 0.32
Bowdichia nitida Spruce ex Benth. 0.77 0.85 0.74 0.79
Brosimum acutifolium Huber 0.55 0.55 0.55

2
Brosimum alicastrum Sw. 0.74 0.64 0.69
Brosimum guianensis (Aublet) Huber 0.96 0.96
Brosimum parinarioides Ducke 0.57 0.57 0.59 0.58
Brosimum potabile Ducke 0.53 0.53 0.53
Brosimum rubescens Taubert 0.91 0.98 0.73 0.87
Brosimum spp. (utile group) 0.43 0.43
Buchenavia capitata Eichler 0.63 0.63
Buchenavia huberi Ducke 0.79 0.79 0.79
Buchenavia oxycarpa (DC.) Eichler 0.72 0.72
Byrsonima spicata (Cav.) DC. 0.61 0.61
Cabralea cangerana (Vell.) Mart. 0.55 0.55
Calophyllum brasiliense Cambess. 0.54 0.51 0.53
Carapa guianensis Aublet 0.43 0.59 0.59 0.59 0.56 0.55
Cariniana micrantha Ducke 0.64 0.64
Cariniana integrifolia Ducke 0.49 0.49
Cariniana spp. 0.46 0.46
Caryocar villosum (Aublet) C.H.Persoon 0.72 0.72
Cassia scleroxylon Ducke 1.01 1.01
Catostemma spp. 0.55 0.55
Cecropia peltata L. 0.30 0.30
Cedrela odorata L./Cedrela spp. 0.38 0.40 0.39
Cedrelinga catenaeformis Ducke 0.46 0.44 0.49 0.53 0.48
Ceiba pentandra (L.) Gaertn. 0.29 0.29 0.25 0.28
Centrolobium spp. 0.65 0.65
Chlorophora tinctoria (L.) Gaudich. 0.71 0.75 0.73
Clarisia racemosa Ruíz & Pavón 0.59 0.58 0.60 0.59 0.63 0.53 0.59
Clathrotropis spp. 0.89 0.89
Copaifera duckei Dwyer/C. reticulata Ducke 0.64 0.62 0.63
Copaifera reticulata Ducke 0.61 0.61
Copaifera spp. 0.55 0.55
Cordia bicolor A.DC. 0.49 0.49
Cordia goeldiana Huber 0.48 0.48 0.48
Cordia sagotii I.M.Johnston 0.50 0.50
Cordia spp. (gerascanthus group) 0.74 0.74
Cordia spp. (goeldiana group) 0.48 0.48
Corythophora rimosa W.Rodr. 0.84 0.85 0.84
Couma macrocarpa Barb.Rodr. 0.50 0.50
Couratari guianensis Aublet 0.51 0.52 0.52 0.62 0.54
Couratari multiflora (J.E.Smith) Eyma 0.47 0.47
Couratari oblongifolia Ducke & Knuth 0.50 0.49 0.49 0.49 0.49
Couratari stellata A.C.Smith 0.60 0.65 0.64 0.63
Couratari spp. 0.50 0.50
3
Cynodendron & Chrysophyllum spp. 0.75 0.75
Dendropanax arboreum Decne. & Planch. 0.40 0.40
Dialium guianense (Aublet) Sandw. 0.90 0.88 0.87 0.88
Diclinanona calycina Benoist 0.47 0.47
Dicorynia guianensis Amshoff 0.65 0.65
Dinizia excelsa Ducke 0.83 0.83 0.88 0.91 0.86
Diploon cuspidatum (Hoehne) Cronquist 0.85 0.85
Diplotropis purpurea (Rich.) Amshoff 0.78 0.78 0.78
Dipteryx odorata (Aublet) Willd. 0.97 0.91 0.91 0.92 0.94 0.99 0.86 0.93
Dipteryx polyphylla (Ducke) Huber 0.83 0.91 0.87
Drypetes variablis Uittien 0.71 0.71 0.71
Ecclinusa bacuri Aubrév. & Pellegr. 0.59 0.59
Endopleura uchi (Huber) Cuatrec. 0.78 0.78 0.78 0.77 0.78
Enterolobium cyclocarpum (Jacq.) Griseb. 0.34 0.34
Enterolobium maximum Ducke 0.42 0.37 0.42 0.40
Enterolobium schomburgkii Benth. 0.68 0.82 0.84 0.84 0.70 0.82 0.78
Eperua falcata Aublet 0.78 0.78
Eperua spp. 0.78 0.78 0.78
Eriotheca longipedicellata (Ducke) A.Robyns 0.45 0.45
Erisma uncinatum Warm. 0.48 0.46 0.46 0.57 0.51 0.48 0.48 0.49
Eschweilera amazonica R.Knuth 0.90 0.90
Eschweilera coriacea (DC.) Mart. ex Berg 0.81 0.81 0.73 0.78
Eschweilera ovata (Cambess.) Miers 0.81 0.81
Eschweilera sagotiana Miers 0.79 0.79
Eschweilera spp. [Matamatá-amarelo] 0.91 0.85 0.88
Eschweilera spp. [Matamatá-ci] 0.81 0.85 0.83
Eschweilera spp. [Matamatá-roxo] 0.89 0.85 0.87
Euxylophora paraensis Huber 0.70 0.70
Genipa americana L. 0.57 0.57
Glycydendron amazonicum Ducke 0.66 0.66 0.66 0.66
Goupia glabra Aublet 0.69 0.70 0.71 0.71 0.70 0.71 0.72 0.71
Guarea guidonia (L.) Sleumer 0.68 0.68 0.68
Guarea spp. 0.52 0.52
Guatteria olivacea R.E.Fr. 0.51 0.51
Guatteria procera R.E.Fr. 0.65 0.65
Helicostylis tomentosa (Poepp. & Endl.) Rusby 0.72 0.72
Hevea brasiliensis Müll.Arg. 0.49 0.49
Humiria balsamifera (Aublet) J.St.-Hil. 0.66 0.66
Humiriastrum excelsum (Ducke) Cuatrec. 0.75 0.75
Hura crepitans L. 0.36 0.36
Hyeronima alchorneoides Allemão 0.65 0.64 0.64
Hymenaea courbaril L. 0.71 0.71 0.76 0.77 0.74

4
Hymenaea oblongifolia Huber 0.74 0.74
Hymenaea parvifolia Huber 1.00 0.90 0.95
Hymenolobium excelsum Ducke 0.66 0.63 0.63 0.64
Hymenolobium modestum Ducke 0.65 0.65 0.65
Hymenolobium pulcherrimum Ducke 0.67 0.67
Inga alba (Sw.) Willd. 0.62 0.62 0.62 0.62
Inga paraensis Ducke 0.82 0.82
Inga spp. 0.58 0.58
Iryanthera grandis Ducke/I. spp. 0.63 0.46 0.55
Iryanthera sagotiana Warb. 0.57 0.57
Iryanthera tricornis Ducke 0.69 0.75 0.72
Jacaranda copaia (Aublet) D.Don. 0.35 0.31 0.32 0.31 0.31 0.35 0.33
Joannesia heveoides Ducke 0.39 0.39 0.39
Laetia procera (Poepp.) Eichler 0.68 0.68 0.68
Lecythis idatimon Aublet 0.80 0.76 0.76 0.77
Lecythis lurida (Miers) Mori 0.85 0.81 0.83
Lecythis pisonis Cambess. 0.84 0.84 0.84
Lecythis poiteaui Berg. 0.81 0.81
Lecythis zabucaja Aublet 0.88 0.84 0.86
Lecythis spp. 0.77 0.77
Licania macrophylla Benth. 0.76 0.76
Licania oblongifolia Standl. 0.88 0.88
Licania octandra (Hoffmanns.) Kuntze 0.77 0.77
Licania spp. 0.78 0.78
Licaria aritu Ducke 0.79 0.80 0.80
Licaria cannella (Meissn.) Kosterm. 1.04 1.04
Licaria rigida Kosterm. 0.73 0.73
Licaria spp. 0.82 0.82
Lonchocarpus spp. 0.69 0.69
Luehea spp. 0.50 0.50
Lueheopsis duckeana Burret 0.62 0.61 0.64 0.62
Machaerium spp. 0.70 0.70
Malouetia duckei Marcgr. 0.57 0.57
Manilkara amazonica (Huber) Standl. 0.87 0.83 0.85
Manilkara bidentata (A.DC.) A.Chev. 0.85 0.85
Manilkara huberi (Ducke) A.Chev. 0.92 0.93 0.93 0.93
Maquira sclerophylla (Ducke) C.C.Berg 0.57 0.57 0.58 0.57
Marmaroxylon racemosum (Ducke) Killip 0.81 0.81
Mezilaurus itauba (Meissn.) Taubert ex Mez 0.70 0.70 0.70 0.70 0.70
Mezilaurus lindaviana Schwacke & Mez 0.68 0.68
Micropholis guyanensis (A.DC.) Pierre 0.65 0.65
Micropholis venulosa (Mart. & Eichler) Pierre 0.66 0.67 0.67
5
Micropholis spp. 0.61 0.61
Mora excelsa Benth./M. gonggrijpii Sandw. 0.80 0.80
Myristica platysperma (Warb.) Spruce 0.55 0.55
Myroxylon balsamum Harms 0.78 0.78
Nectandra rubra (Mez) C.K.Allen 0.52 0.75 0.52 0.55 0.54 0.56 0.57
Nectandra spp. 0.52 0.52
Ochroma pyramidale (Cav.) Urb. 0.14 0.14
Ocotea guinanensis Aublet 0.71 0.54 0.63
Ocotea neesiana (Miq.) Kosterm. 0.63 0.63
Ocotea spp. 0.55 0.86 0.70
Onychopetalum amazonicum R.E.Fr. 0.57 0.64 0.61
Ormosia paraensis Ducke 0.67 0.67 0.67 0.67
Ormosia spp. 0.59 0.59
Parinari excelsa Sabine 0.68 0.68
Parinari montana Aublet 0.71 0.71
Parinari rodolphii Huber 0.71 0.71
Parinari spp. 0.68 0.68
Parkia multijuga Benth. 0.38 0.38 0.38
Parkia nitida (Spruce ex Benth.) Miq. 0.40 0.40
Parkia paraensis Ducke 0.44 0.44 0.44
Parkia pendula (Willd.) Benth. ex Walp. 0.51 0.50 0.71 0.51 0.51 0.55
Parkia ulei (Harms) Kuhlm. 0.40 0.40
Peltogyne paniculata Benth. 0.89 0.89
Peltogyne paradoxa Ducke 0.91 0.91
Peltogyne spp. 0.79 0.79
Persea spp. 0.47 0.47
Phyllostylon brasiliensis Capan. 0.77 0.77
Piptadenia communis Benth. 0.68 0.68
Piptadenia suaveolens Miq. 0.72 0.76 0.76 0.69 0.86 0.72 0.75
Piptadenia spp. 0.62 0.62
Pithecellobium saman Benth. 0.48 0.48
Platymiscium spp. 0.84 0.84
Pouteria anomala (Pires) T.D.Penn. 0.81 0.81
Pouteria caimito (Ruíz & Pavón) Radlk. 0.90 0.88 0.83 0.87
Pouteria egregia Sandw. 0.97 0.80 0.89
Pouteria gongrijpii Eyma 0.72 0.72
Pouteria guianensis Aublet 0.90 0.90
Pouteria manaosensis (Aubrév. & Pellegr.) T.D.Penn. 0.64 0.64
Pouteria oppositifolia (Ducke) Baehni 0.65 0.65 0.65
Pouteria (= Planchonella) pachycarpa 0.74 0.74 0.74
Pradosia schomburgkii (A.DC.) Cronquist 0.73 0.73
Pradosia spp. 0.68 0.68
6
Protium heptaphyllum (Aublet) Marchand 0.55 0.52 0.54
Protium tenuifolium (Engl.) Engl. 0.67 0.63 0.65
Protium (= Tetragastris in part) spp. 0.76 0.53 0.65
Pterocarpus spp. 0.44 0.44
Pterogyne nitens Tul. 0.66 0.66
Qualea brevipedicellata Stafleu 0.63 0.74 0.69
Qualea lancifolia Ducke 0.58 0.58
Qualea paraensis Ducke 0.66 0.69 0.67
Qualea spp. 0.55 0.55
Quassia simarouba (Aublet) L.f. 0.35 0.38 0.34 0.38 0.37 0.38 0.37
Rheedia spp. 0.72 0.72
Rhizophora mangle L. 0.89 0.89
Rollinia exsucca (Dunal) A.DC. 0.52 0.52
Roupala montana Aublet 0.77 0.77
Ruizterania albiflora (Warm.) Marc.-Berti 0.57 0.57
Sacoglottis guianensis Benth. 0.77 0.77
Sapium spp. 0.48 0.47 0.48
Schefflera morototoni (Aublet) Frodin 0.40 0.40 0.41 0.41 045 0.41
Schizolobium amazonicum Ducke 0.24 0.24
Sclerolobium chrysophyllum Poepp. & Endl. 0.62 0.61 0.62 0.62 0.62
Sclerolobium paraense Huber 0.61 0.67 0.64
Sclerolobium poeppigianum Baill. 0.65 0.65
Sclerolobium spp. 0.42 0.47 0.45
Scleronema micranthum Ducke 0.59 0.62 0.61
Sickingia spp. 0.52 0.52
Sloanea nitida G.Don. 1.01 1.01
Spondias lutea L. 0.38 0.38 0.38
Spondias purpurea L. 0.40 0.40
Sterculia apetala Druce 0.33 0.33
Sterculia pilosa Ducke/S. speciosa K.Schum. 0.53 0.53
Sterculia pruriens (Aublet) K.Schum. 0.46 0.46
Sterculia speciosa K.Schum. 0.53 0.49 0.51 0.51
Swartzia panacoco (Aublet) Cowan 0.97 0.97
Swartzia spp. 1.10 0.95 1.02
Swietenia macrophylla King 0.45 0.54 0.50
Symphonia globulifera L. 0.58 0.58 0.57 0.58 0.58
Tabebuia serratifolia (Vahl.) Nicholson 0.87 0.89 0.88
Tabebuia spp. (ipê group) 0.91 0.91 0.91
Tabebuia spp. (white-cedar group) 0.57 0.57
Tachigali myrmecophila (Ducke) Ducke 0.56 0.57 0.60 0.30 0.56 0.56 0.53
Tapirira guianensis Aublet 0.50 0.50 0.50
Terminalia amazonia (J.F.Gmel.) Exell 0.80 0.80 0.66 0.75

7
Tetragastris altissima (Aublet) Swart 0.74 0.74
Tetragastris panamensis (Engl.) Kuntze 0.74 0.77 0.76
Tetragastris (= Protium in part) spp. 0.71 0.71
Thyrsodium guianensis Aublet 0.63 0.63
Trattinickia cf. burserifolia Mart. 0.50 0.44 0.43 0.46
Trichilia lecointei Ducke 0.90 0.90 0.90
Triplaris spp. 0.56 0.56
Vantanea parviflora Lam. 0.86 0.86 0.86
Vatairea guianensis Aublet 0.70 0.70
Vatairea paraensis Ducke 0.78 0.78
Vatairea sericea Ducke 0.72 0.71 0.50 0.64
Vatairea spp. 0.60 0.60
Vataireopsis spp. 0.68 0.68
Virola michelii Heckel 0.50 0.50 0.50
Virola spp. 0.42 0.50 0.44 0.45
Vitex spp. 0.56 0.56
Vochysia guianensis Aublet 0.65 0.40 0.54 0.53
Vochysia maxima Ducke 0.46 0.49 0.46 0.47
Vochysia melinonii Beckmann 0.51 0.51
Vochysia obidensis Ducke 0.50 0.50
Vochysia surinamensis Stafleu 0.66 0.66
Vochysia spp. 0.40 0.40
Vouacapoua americana Aublet 0.79 0.79 0.79
Xylopia nitida Dunal 0.57 0.56 0.57
Abiurana 1.08 1.08
Castanho-sapucaia 0.87 0.87
Fava-vermelha 1.04 1.04
Macucu-fôfo 0.83 0.83
Piãozinho 0.88 0.88
Ucuúba-ratiel 0.43 0.43
--------- ------- ------- -------- -------- ------- ------ ------- ------- ------- ------ -------
Mean 0.67 0.69 0.65 0.69 0.70 0.71 0.70 0.86 0.54 0.55 0.62 0.65
Minimum 0.40 0.35 0.24 0.37 0.41 0.32 0.30 0.50 0.29 0.31 0.14 0.14
Maximum 0.91 1.04 1.21 1.01 0.93 0.94 1.10 1.08 0.80 0.70 0.96 1.21
Sample size 20 41 84 74 27 13 34 8 49 21 111 268

8
TABLE 2: BASIC DENSITY OF WOOD BY SPECIES Amapá Balbina Carajás -------------------------------------- (do Nas- (Brazil, (Brazil, cimento INPA, IBDF Scientific name 1993) CPPF 1983) 1991) ----------------------------------------------------------------- Agonandra brasiliensis Miers ex Benth. Aldina heterophylla Benth. 0.73 Alexa grandiflora Ducke 0.53 0.60 Alexa imperatricis (R.H.Schomb.) Baill. 0.55 Anacardium excelsum Skeels Anacardium giganteum Hancock ex Engl. 0.44 Anacardium spruceanum Benth. ex Engl. Anadenanthera macrocarpa (Benth.) Brenan Andira inermis (Wright) DC. Andira parviflora Ducke 0.67 Aniba canelilla (H.B.K.) Mez 0.92 Aniba spp. Apeiba petouma (Gaertn.) Aublet Apeiba spp. Apuleia molaris Spruce ex Benth. 0.76 Aspidosperma album (Vahl) Benoist 0.76 Aspidosperma obscurinervium Azambuja 0.86 Aspidosperma spp. Astronium gracile Engl. Astronium graveolens Jacq. Astronium lecointei Ducke 0.75 Astronium ulei Mattick Astronium urundeuva Engl. 1.21 Bagassa guianensis Aublet 0.70 Bertholletia excelsa Humb. & Bonpl. 0.63

9
Bixa arborea Huber 0.32 Bowdichia nitida Spruce ex Benth. 0.77 Brosimum acutifolium Huber Brosimum alicastrum Sw. Brosimum guianense (Aublet) Huber Brosimum parinarioides Ducke 0.57 Brosimum potabile Ducke 0.53 Brosimum rubescens Taubert 0.91 Brosimum spp. (utile group) Buchenavia capitata Eichler Buchenavia huberi Ducke 0.79 Buchenavia oxycarpa (DC.) Eichler 0.72 Byrsonima spicata (Cav.) DC. Cabralea canjerana (Vell.) Mart. Calophyllum brasiliense Cambess. 0.54 Carapa guianensis Aublet 0.43 0.59 Cariniana integrifolia Ducke 0.49

10
Cariniana micrantha Ducke Cariniana spp. Caryocar villosum (Aublet) C.H.Persoon Cassia scleroxylon Ducke Catostemma spp. Cecropia peltata L. Cedrela odorata L./Cedrela spp. 0.38 Cedrelinga catenaeformis Ducke 0.46 0.44 Ceiba pentandra (L.) Gaertn. 0.29 Centrolobium spp. Chlorophora tinctoria (L.) Gaudich. 0.71 Clarisia racemosa Ruíz & Pavón 0.59 0.58 Clathrotropis spp. Copaifera duckei Dwyer/C. reticulata Ducke 0.64 Copaifera reticulata Ducke Copaifera spp. Cordia bicolor A.DC. Cordia goeldiana Huber 0.48 Cordia sagotii I.M.Johnston Cordia spp. (gerascanthus gr.) Cordia spp. (goeldiana gr.) Corythophora rimosa W.Rodr. 0.84 Couma macrocarpa Barb.Rodr. Couratari guianensis Aublet 0.51 0.52 Couratari multiflora (J.E.Smith) Eyma 0.47 Couratari oblongifolia Ducke & Knuth Couratari stellata A.C.Smith 0.60 Couratari spp. Cynodendron & Chrysophyllum spp. Dendropanax arboreum Decne. & Planch. Dialium guianense (Aublet) Sandw. 0.90 Diclinanona calycina Benoist Dicorynia guianensis Amshoff Dinizia excelsa Ducke 0.83 Diploon cuspidatum (Hoehne) Cronquist

11
Diplotropis purpurea (Rich.) Amshoff 0.78 Dipteryx odorata (Aublet) Willd. 0.97 0.91 Dipteryx polyphylla (Ducke) Huber 0.83 Drypetes variabilis Uittien Ecclinusa bacuri Aubrév. & Pellegr. Endopleura uchi (Huber) Cuatrec. 0.78 Enterolobium cyclocarpum (Jacq.) Griseb. Enterolobium maximum Ducke 0.42 Enterolobium schomburgkii Benth. 0.68 0.82 Eperua falcata Aublet 0.78 Eperua spp. 0.78 Eriotheca longipedicellata (Ducke) A.Robyns Erisma uncinatum Warm. 0.48 Eschweilera amazonica R.Knuth Eschweilera coriacea (DC.) Mart. ex Berg 0.81 0.81 Eschweilera ovata (Cambess.) Miers 0.81 Eschweilera sagotiana Miers 0.79
12
Eschweilera spp. [Matamatá-amarelo] Eschweilera spp. [Matamatá-ci] Eschweilera spp. [Matamatá-roxo] Euxylophora paraensis Huber Genipa americana L. Glycydendron amazonicum Ducke 0.66 Goupia glabra Aublet 0.69 0.70 Guarea guidonia (L.) Sleumer 0.68 Guarea spp. Guatteria olivacea R.E.Fr. Guatteria procera R.E.Fr. Helicostylis tomentosa (Poepp. & Endl.) Rusby Hevea brasiliensis Müll.Arg. Humiria balsamifera (Aublet) J.St.-Hil. Humiriastrum excelsum (Ducke) Cuatrec. 0.75 Hura crepitans L. Hyeronima alchorneoides Allemão 0.65 Hymenaea courbaril L. 0.71 0.71 Hymenaea oblongifolia Huber 0.74 Hymenaea parvifolia Huber 1.00 Hymenolobium excelsum Ducke 0.66 0.63 Hymenolobium modestum Ducke Hymenolobium pulcherrimum Ducke 0.67 Inga alba (Sw.) Willd. 0.62 Inga paraensis Ducke Inga spp. Iryanthera grandis Ducke/I. spp. Iryanthera sagotiana Warb. 0.57 Iryanthera tricornis Ducke 0.69 Jacaranda copaia (Aublet) D.Don. 0.35 0.31 Joannesia heveoides Ducke 0.39 Laetia procera (Poepp.) Eichler 0.68 Lecythis idatimon Aublet 0.80 0.76 Lecythis lurida (Miers) Mori 0.85 Lecythis pisonis Cambess. 0.84
13
Lecythis poiteaui Berg 0.81 Lecythis zabucaja Aublet 0.88 Lecythis spp. Licania macrophylla Benth. 0.76 Licania oblongifolia Standl. 0.88 Licania octandra (Hoffmanns.) Kuntze Licania spp. Licaria aritu Ducke 0.79 Licaria cannella (Meissn.) Kosterm. 1.04 Licaria rigida Kosterm. Licaria spp. Lonchocarpus spp. Luehea spp. Lueheopsis duckeana Burret Machaerium spp. Malouetia duckei Marcgr. Manilkara amazonica (Huber) Standl. 0.87

14
Manilkara bidentata (A.DC.) A.Chev. Manilkara huberi (Ducke) A.Chev. 0.92 0.93 Maquira sclerophylla (Ducke) C.C.Berg 0.57 Marmaroxylon racemosum (Ducke) Killip 0.81 Mezilaurus itauba (Meissn.) Taubert ex Mez 0.70 0.70 Mezilaurus lindaviana Schwacke & Mez Micropholis guyanensis (A.DC.) Pierre 0.65 Micropholis venulosa (Mart. & Eichler) Pierre 0.66 Micropholis spp. Mora excelsa Benth./M. gonggrijpii Sandw. Myristica platysperma (Warb.) Spruce 0.55 Myroxylon balsamum Harms Nectandra rubra (Mez) C.K.Allen 0.52 0.75 Nectandra spp. Ochroma pyramidale (Cav.) Urb. Ocotea guianensis Aublet Ocotea neesiana (Miq.) Kosterm. Ocotea spp. Onychopetalum amazonicum R.E.Fr. Ormosia paraensis Ducke 0.67 Ormosia spp. Parinari excelsa Sabine 0.68 Parinari montana Aublet 0.71 Parinari rodolphii Huber 0.71 Parinari spp. Parkia multijuga Benth. 0.38 Parkia nitida (Spruce ex Benth.) Miq. 0.40 Parkia paraensis Ducke Parkia pendula (Willd.) Benth. ex Walp. 0.51 Parkia ulei (Harms) Kuhlm. 0.40 Peltogyne paniculata Benth. Peltogyne paradoxa Ducke 0.91 Peltogyne spp. Persea spp. Phyllostylon brasiliensis Capan.

15
Piptadenia communis Benth. Piptadenia suaveolens Miq. 0.72 Piptadenia spp. Pithecellobium saman Benth. Platymiscium spp. Pouteria anomala (Pires) T.D.Penn. Pouteria caimito (Ruíz & Pavón) Radlk. 0.90 Pouteria egregia Sandw. Pouteria gongrijpii Eyma Pouteria guianensis Aublet 0.90 Pouteria manaosensis (Aubrév. & Pellegr.) T.D.Penn. Pouteria oppositifolia (Ducke) Baehni 0.65 Pouteria (= Planchonella) pachycarpa Pradosia schomburgkii (A.DC.) Cronquist 0.73 Pradosia spp. Protium heptaphyllum (Aublet) Marchand Protium tenuifolium (Engl.) Engl. 0.67

16
Protium (= Tetragastris in part) spp. Pterocarpus spp. Pterogyne nitens Tul. Qualea brevipedicellata Stafleu 0.63 Qualea lancifolia Ducke Qualea paraensis Ducke 0.66 Qualea spp. Quassia simarouba (Aublet) L.f. 0.35 0.38 Rheedia spp. Rhizophora mangle L. Rollinia exsucca (Dunal) A.DC. Roupala montana Aublet Ruizterania albiflora (Warm.) Marc.-Berti Sacoglottis guianensis Benth. 0.77 Sapium spp. Schefflera morototoni (Aublet) Frodin 0.40 0.40 Schizolobium amazonicum Ducke 0.24 Sclerolobium chrysophyllum Poepp. & Endl. 0.62 Sclerolobium paraense Huber Sclerolobium poeppigianum Baill. Sclerolobium spp. 0.42 Scleronema micranthum Ducke 0.59 Sickingia spp. Sloanea nitida G.Don. Spondias lutea L. 0.38 Spondias purpurea L. Sterculia apetala Druce Sterculia pilosa Ducke/S. speciosa K.Schum. Sterculia pruriens (Aublet) K.Schum. Sterculia speciosa K.Schum. 0.53 Swartzia panacoco (Aublet) Cowan 0.97 Swartzia spp. Swietenia macrophylla King 0.45 Symphonia globulifera L. 0.58 Tabebuia serratifolia (Vahl) Nicholson 0.87 0.89

17
Tabebuia spp. (ipê group) Tabebuia spp. (white-cedar group) Tachigali myrmecophila (Ducke) Ducke 0.56 Tapirira guianensis Aublet 0.50 Terminalia amazonia (J.F.Gmel.) Exell 0.80 Tetragastris altissima (Aublet) Swart Tetragastris panamensis (Engl.) Kuntze 0.74 Tetragastris (= Protium in part) spp. Thyrsodium guianensis Aublet 0.63 Trattinnickia cf. burserifolia Mart. Trichilia lecointei Ducke Triplaris spp. Vantanea parviflora Lam. Vatairea guianensis Aublet 0.70 Vatairea paraensis Ducke Vatairea sericea Ducke 0.72 Vatairea spp.

18
Vataireopsis spp. 0.68 Virola michelii Heckel 0.50 Virola spp. Vitex spp. Vochysia guianensis Aublet 0.65 0.40 Vochysia maxima Ducke 0.46 Vochysia melinonii Beckmann Vochysia obidensis Ducke Vochysia surinamensis Stafleu Vochysia spp. Vouacapoua americana Aublet 0.79 Xylopia nitida Dunal 0.57 Abiurana Castanha-sapucaia Fava-vermelha Macucu-fôfo Piãozinho Ucuúba-ratiel ------------------------- Mean 0.67 0.69 0.65 Minimum 0.40 0.35 0.24 Maximum 0.91 1.04 1.21 Sample size 20 41 84

19
Curuá- Curuá- Jari Manaus Manaus Tapajós Tapajós Una Una (Reid, (Brazil, (do Collins (Brazil, (Amorim (Brazil, (do IBDF, Nasci- & Asso- INPA, 1991) IBDF Nasci- DPq, LPF mento ciates CPPF 1981) mento 1988) 1993) 1977) unpub.) 1993) ------------------------------------------------------------------- 0.74 0.60 0.61 0.42 0.71 0.92 0.93 0.36 0.73 0.79 0.71 0.62 0.63 0.63
20
0.32 0.85 0.55 0.55 0.74 0.57 0.59 0.53 0.98 0.73 0.79 0.59 0.59

21
0.64 1.01 0.49 0.29 0.60 0.59 0.63 0.62 0.61 0.49 0.48 0.50 0.85 0.52 0.62 0.50 0.49 0.49 0.49 0.65 0.64 0.88 0.47 0.83 0.88 0.91 0.85

22
0.91 0.92 0.94 0.99 0.91 0.71 0.71 0.59 0.78 0.78 0.77 0.37 0.42 0.84 0.84 0.70 0.45 0.46 0.46 0.57 0.51 0.48 0.48 0.90 0.73

23
0.91 0.81 0.89 0.66 0.66 0.71 0.71 0.70 0.71 0.68 0.51 0.65 0.76 0.90 0.65 0.65 0.62 0.62 0.82 0.58 0.63 0.75 0.32 0.31 0.31 0.39 0.68 0.76 0.84

24
0.84 0.77 0.80 0.73 0.62 0.61 0.64 0.57 0.83
25
0.93 0.57 0.58 0.70 0.70 0.68 0.67 0.52 0.55 0.54 0.71 0.54 0.63 0.55 0.57 0.64 0.67 0.67 0.38 0.44 0.44 0.50 0.71 0.51 0.51 0.89

26
0.68 0.76 0.76 0.69 0.86 0.72 0.81 0.88 0.83 0.97 0.80 0.72 0.64 0.65 0.74 0.74 0.55 0.52 0.63

27
0.76 0.74 0.58 0.69 0.34 0.38 0.37 0.52 0.77 0.57 0.48 0.41 0.41 0.61 0.62 0.62 0.61 0.67 0.65 0.62 1.01 0.38 0.53 0.49 0.51 1.10 0.58 0.57

28
0.91 0.57 0.60 0.30 0.56 0.56 0.50 0.80 0.74 0.77 0.50 0.44 0.43 0.90 0.90 0.86 0.86 0.78 0.71 0.50

29
0.50 0.42 0.50 0.54 0.49 0.46 0.51 0.50 0.66 0.56 1.08 0.87 1.04 0.83 0.88 0.43 ----------------------------------------------------------------- 0.69 0.70 0.71 0.70 0.86 0.54 0.55 0.37 0.41 0.32 0.30 0.50 0.29 0.31 1.01 0.93 0.94 1.10 1.08 0.80 0.70 74 27 13 34 8 49 21

30
Brazil Average (Chudnoff 1980) -------------------- 0.74 0.73 0.59 0.48 0.52 0.41 0.41 0.44 0.42 0.86 0.86 0.64 0.64 0.69 0.92 0.60 0.60 0.36 0.20 0.20 0.76 0.76 0.86 0.75 0.75 0.73 0.75 0.75 0.77 0.71 1.21 0.68 0.69 0.59 0.62

31
0.32 0.74 0.79 0.55 0.64 0.69 0.96 0.96 0.58 0.53 0.87 0.43 0.43 0.63 0.63 0.79 0.72 0.61 0.61 0.55 0.55 0.51 0.53 0.56 0.55 0.49 0.64 0.46 0.46 0.72 0.72 1.01 0.55 0.55 0.30 0.30 0.40 0.39 0.53 0.48 0.25 0.28 0.65 0.65 0.75 0.73 0.53 0.59 0.89 0.89 0.63 0.61 0.55 0.55 0.49 0.48
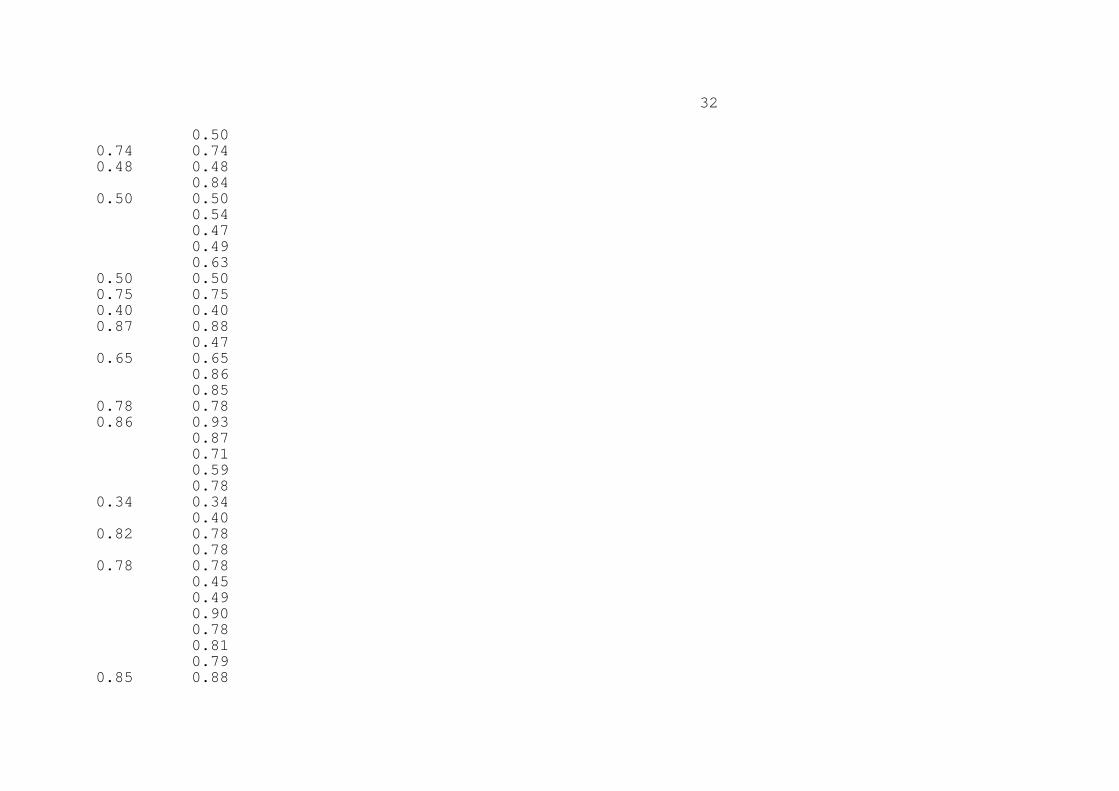
32
0.50 0.74 0.74 0.48 0.48 0.84 0.50 0.50 0.54 0.47 0.49 0.63 0.50 0.50 0.75 0.75 0.40 0.40 0.87 0.88 0.47 0.65 0.65 0.86 0.85 0.78 0.78 0.86 0.93 0.87 0.71 0.59 0.78 0.34 0.34 0.40 0.82 0.78 0.78 0.78 0.78 0.45 0.49 0.90 0.78 0.81 0.79 0.85 0.88

33
0.85 0.83 0.85 0.87 0.70 0.70 0.57 0.57 0.66 0.72 0.71 0.68 0.52 0.52 0.51 0.65 0.72 0.72 0.49 0.49 0.66 0.66 0.75 0.36 0.36 0.64 0.64 0.77 0.74 0.74 0.95 0.63 0.64 0.65 0.67 0.62 0.82 0.58 0.46 0.55 0.57 0.72 0.35 0.33 0.39 0.68 0.77 0.81 0.83 0.84 0.81

34
0.86 0.77 0.77 0.76 0.88 0.77 0.78 0.78 0.80 1.04 0.73 0.82 0.82 0.69 0.69 0.50 0.50 0.62 0.70 0.70 0.57 0.85 0.85 0.85 0.93 0.57 0.70 0.81 0.68 0.65 0.67 0.61 0.61 0.80 0.80 0.55 0.78 0.78 0.56 0.57 0.52 0.52 0.14 0.14 0.63 0.63 0.86 0.70 0.61

35
0.67 0.59 0.59 0.68 0.71 0.71 0.68 0.68 0.38 0.40 0.44 0.55 0.40 0.89 0.91 0.79 0.79 0.47 0.47 0.77 0.77 0.68 0.75 0.62 0.62 0.48 0.48 0.84 0.84 0.81 0.87 0.89 0.72 0.90 0.64 0.65 0.74 0.73 0.68 0.68 0.54 0.65 0.53 0.65

36
0.44 0.44 0.66 0.66 0.69 0.58 0.67 0.55 0.55 0.38 0.37 0.72 0.72 0.89 0.89 0.52 0.77 0.57 0.77 0.47 0.48 0.45 0.41 0.24 0.62 0.64 0.65 0.47 0.45 0.61 0.52 0.52 1.01 0.38 0.40 0.40 0.33 0.33 0.53 0.46 0.46 0.51 0.97 0.95 1.02 0.54 0.50 0.58 0.58 0.88 0.91 0.91

37
0.57 0.57 0.53 0.50 0.66 0.75 0.74 0.76 0.71 0.71 0.63 0.46 0.90 0.56 0.56 0.86 0.70 0.78 0.64 0.60 0.60 0.68 0.50 0.44 0.45 0.56 0.56 0.53 0.47 0.51 0.50 0.66 0.40 0.40 0.79 0.79 0.57 1.08 0.87 1.04 0.83 0.88 0.43 --------------------

38
0.62 0.65 0.14 0.14 0.96 1.21 111 268

39
TABLE 3: BASIC DENSITY OF SAPWOOD AND HEARTWOOD ================================================================= Manaus (Brazil, INPA, CPPF unpublished) Basic density ----------------------------------------------------------------- Species Sapwood Heartwood ----------------------------------------------------------------- Andira parviflora Ducke 0.63 0.71 Bertholletia excelsa Humb. & Bonpl. 0.70 0.98 Brosimum rubescens Taubert 0.46 0.49 Cedrelinga catenaeformis Ducke Dinizia excelsa Ducke Dipteryx odorata Willd. 0.78 0.91 Dipteryx polyphylla Huber Endopleura uchi Cuatrec. 0.65 0.70 Enterolobium schomburgkii Benth. 0.53 0.51 Erisma uncinatum Warm. Eschweilera spp. 0.68 0.70 Goupia glabra Aublet 0.68 0.68 Guarea guidonia Sleumer 0.60 0.75 Iryanthera tricornis Ducke Jacaranda copaia D.Don. 0.77 0.80 Licaria aritu Ducke Manilkara huberi Standl. Ocotea guinanensis Aublet 0.55 0.54 Ocotea spp. Piptadenia suaveolens Miq. 0.63 0.69 Pouteria anomala T.D.Penn. Qualea paraensis Ducke 0.58 0.62 Quassia simarouba L.f.

40
Scleronema micranthum Ducke 0.37 0.34 Tabebuia spp. (ipê group) Tachigalia myrmecophila Ducke Virola spp. 0.43 0.42 Vochysia surinamensis Stafleu 0.49 0.43 Abiurana Fava vermelha Macucu fôfo Piãozinho Ucuúba ratiel --------------------------------------------- Mean 0.60 0.64 Minimum 0.37 0.34 Maximum 0.78 0.98 Sample size 16 16

41
================================================== Manaus (Amorim 1991) Jari (Reid, Collins & Associates, Ltd. 1977) Basic density Basic density -------------------------------------------------- Sapwood Heartwood Sapwood Heartwood -------------------------------------------------- 0.60 0.62 0.86 0.91 0.88 0.94 0.75 0.77 0.712 0.912 0.636 0.714 0.56 0.57 0.69 0.71 0.37 0.32 0.77 0.93 0.72 0.71 0.74 0.69 0.76 0.81 0.898 0.906

42
0.536 0.500 0.65 0.60 0.62 0.66 0.912 1.080 0.828 1.043 0.775 0.833 0.763 0.875 -------------------------------------------------- 0.76 0.86 0.69 0.71 0.54 0.50 0.37 0.32 0.91 1.08 0.88 0.94 8 8 13 13

43
====================================== Average from all sites -------------------------------------- Basic density Sapwood ------------------ density Sapwood Heartwood as % of heartwood density -------------------------------------- 0.63 0.71 88.7 0.60 0.62 96.8 0.70 0.98 70.9 0.46 0.49 93.9 0.86 0.91 94.5 0.88 0.94 93.6 0.78 0.91 85.7 0.75 0.77 97.4 0.65 0.70 92.9 0.55 0.54 100.9 0.71 0.91 78.1 0.67 0.71 94.3 0.68 0.68 100.0 0.60 0.75 80.0 0.37 0.32 115.6 0.77 0.80 96.3 0.77 0.93 82.8 0.72 0.71 101.4 0.55 0.54 101.9 0.74 0.69 107.2 0.76 0.81 93.8 0.63 0.69 91.3 0.37 0.34 107.8
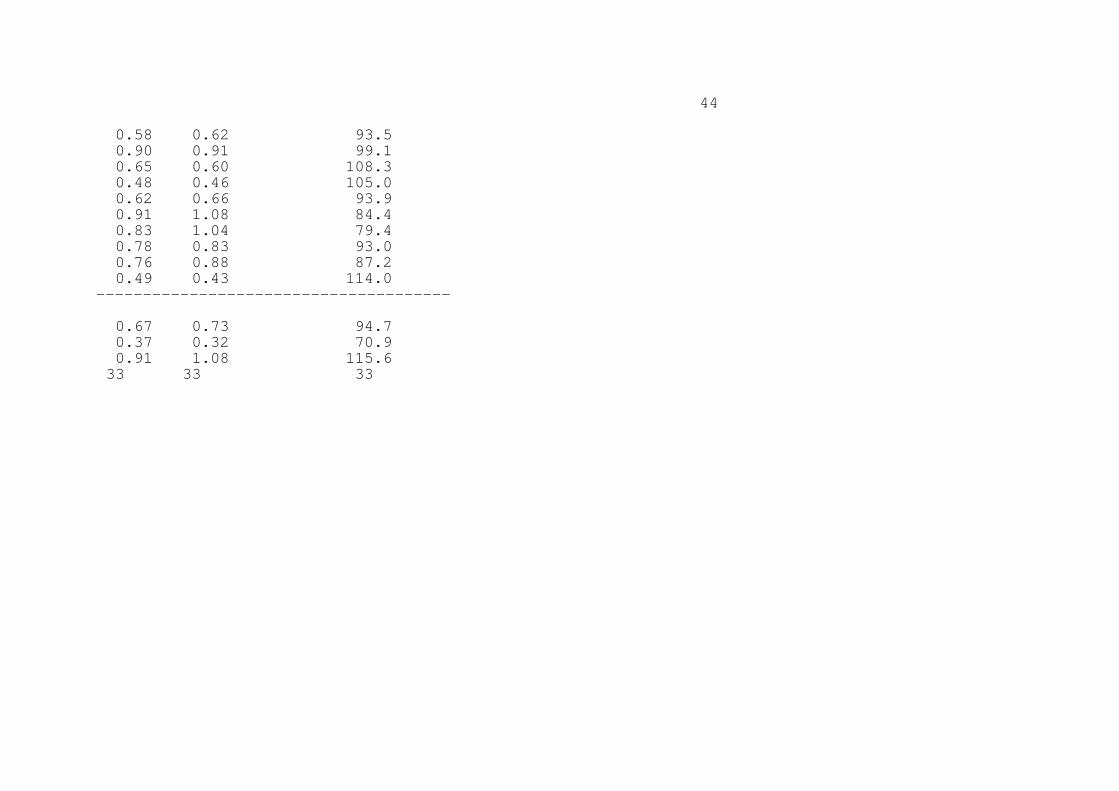
44
0.58 0.62 93.5 0.90 0.91 99.1 0.65 0.60 108.3 0.48 0.46 105.0 0.62 0.66 93.9 0.91 1.08 84.4 0.83 1.04 79.4 0.78 0.83 93.0 0.76 0.88 87.2 0.49 0.43 114.0 -------------------------------------- 0.67 0.73 94.7 0.37 0.32 70.9 0.91 1.08 115.6 33 33 33
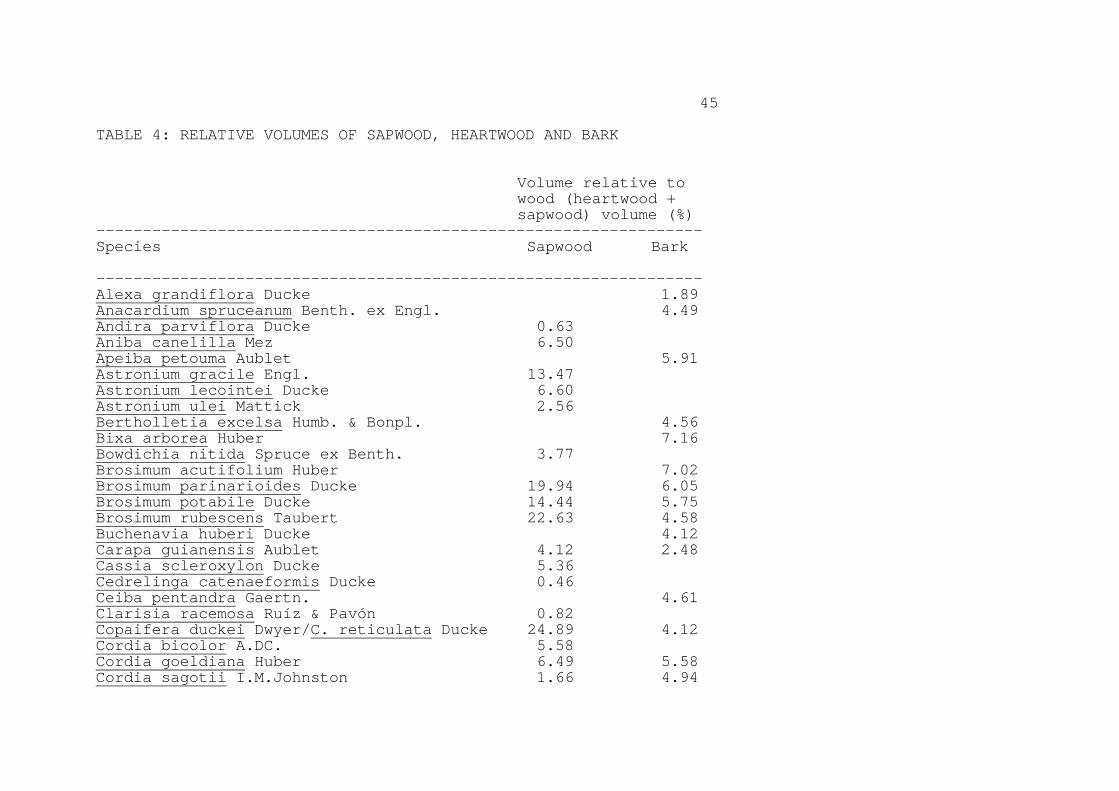
45
TABLE 4: RELATIVE VOLUMES OF SAPWOOD, HEARTWOOD AND BARK Volume relative to wood (heartwood + sapwood) volume (%) ----------------------------------------------------------------- Species Sapwood Bark ----------------------------------------------------------------- Alexa grandiflora Ducke 1.89 Anacardium spruceanum Benth. ex Engl. 4.49 Andira parviflora Ducke 0.63 Aniba canelilla Mez 6.50 Apeiba petouma Aublet 5.91 Astronium gracile Engl. 13.47 Astronium lecointei Ducke 6.60 Astronium ulei Mattick 2.56 Bertholletia excelsa Humb. & Bonpl. 4.56 Bixa arborea Huber 7.16 Bowdichia nitida Spruce ex Benth. 3.77 Brosimum acutifolium Huber 7.02 Brosimum parinarioides Ducke 19.94 6.05 Brosimum potabile Ducke 14.44 5.75 Brosimum rubescens Taubert 22.63 4.58 Buchenavia huberi Ducke 4.12 Carapa guianensis Aublet 4.12 2.48 Cassia scleroxylon Ducke 5.36 Cedrelinga catenaeformis Ducke 0.46 Ceiba pentandra Gaertn. 4.61 Clarisia racemosa Ruíz & Pavón 0.82 Copaifera duckei Dwyer/C. reticulata Ducke 24.89 4.12 Cordia bicolor A.DC. 5.58 Cordia goeldiana Huber 6.49 5.58 Cordia sagotii I.M.Johnston 1.66 4.94

46
Couratari guianensis Aublet 4.12 Couratari oblongifolia Ducke & Knuth 4.78 Couratari stellata A.C.Smith 3.74 Dialium guianense Sandw. 8.69 Diclinanona calycina Benoist 7.02 Dinizia excelsa Ducke 12.17 Dipteryx odorata Willd. 7.87 Endopleura uchi Cuatrec. 25.99 Enterolobium maximum Ducke 3.59 5.11 Enterolobium schomburgkii Benth. 24.07 Eriotheca longipedicellata A.Robyns 5.63 Erisma uncinatum Warm. 13.87 1.09 Glycydendron amazonicum Ducke 10.65 Hymenaea courbaril L. 10.96 Hymenaea parvifolia Huber 5.26 Hymenolobium modestum Ducke 12.62 Iryanthera grandis Ducke/I. spp. 20.49 4.94 Iryanthera tricornis Ducke 0.60 Jacaranda copaia D.Don. 5.71 Joannesia heveoides Ducke 6.05 Laetia procera Eichler 8.96 Lecythis pisonis Cambess. 13.16 Licania octandra Kuntze 15.51 Licaria aritu Ducke 0.77 Licaria rigida Kosterm. 1.91 Lueheopsis duckeana Burret 6.26 Manilkara amazonica Standl. 9.08 Maquira sclerophylla C.C.Berg 7.40 Mezilaurus itauba Taubert ex Mez 5.02 3.03 Mezilaurus lindaviana Schwacke & Mez 5.80 2.53 Micropholis venulosa Pierre 4.49 Nectandra rubra C.K.Allen 4.24 Ocotea neesiana Kosterm. 8.16 Ocotea spp. 5.80 Onychopetalum amazonicum R.E.Fr. 6.42

47
Ormosia paraensis Ducke 22.19 Parkia multijuga Benth. 2.71 Parkia pendula Benth. ex Walp. 30.51 Piptadenia communis Benth. 3.05 Piptadenia suaveolens Miq. 4.66 Pouteria caimito Radlk. 18.26 Protium heptaphyllum Marchand 4.75 Protium tenuifolium Engl. 14.10 Qualea brevipedicellata Stafleu 4.91 Qualea lancifolia Ducke 4.26 Qualea paraensis Ducke 0.63 Quassia simarouba L.f. 4.94 Roupala montana Aublet 4.57 Sclerolobium chrysophyllum Poepp. & Endl. 3.81 Sclerolobium paraense Huber 10.11 Spondias lutea L. 8.48 Sterculia pilosa Ducke/S. speciosa K.Schum. 4.58 Symphonia globulifera L. 4.07 Tapirira guianensis Aublet 7.16 Terminalia amazonia Exell 12.32 2.71 Tetragastris panamensis Kuntze 16.46 Trattinnickia cf. burserifolia Mart. 4.78 Trichilia lecointei Ducke 11.87 Vatairea paraensis Ducke 5.58 Vatairea sericea Ducke 12.39 Virola michelii Heckel 3.88 Vochysia guianensis Aublet 2.21 Vochysia maxima Ducke 10.97 3.20 Vochysia melinonii Beckmann 6.03 Vochysia obidensis Ducke 3.74 -------------------- Mean 9.68 4.87 Sample size 57 47 ------------------------------------------------------------------ Source: see text.

48
TABLE 5: FOREST VEGETATION TYPES IN THE BRAZILIAN LEGAL AMAZON --------------------------------------------------------------------------------------------------- Cate- Code Group Subgroup Class gory -------------------------------------------------------------------------------------------------- Dense Da-0 Ombrophilous forest Dense forest Alluvial Amazonian Forest Db-0 Ombrophilous forest Dense forest Lowland Amazonian Dm-0 Ombrophilous forest Dense forest Montane Amazonian Ds-0 Ombrophilous forest Dense forest Submontane Amazonian -------------------------------------------------------------------------------------------------- -------------------------------------------------------------------------------------------------- Non- Aa-0 Ombrophilous forest Open Alluvial dense Ab-0 Ombrophilous forest Open Lowland forest As-0 Ombrophilous forest Open Submontane Cs-0 Seasonal forest Deciduous Submontane Fa-0 Seasonal forest Semideciduous Alluvial Fs-0 Seasonal forest Semideciduous Submontane La-0 Woody oligotrophic vegetation of swampy & sandy areas Open arboreal Ld-0 Woody oligotrophic vegetation of swampy & sandy areas Dense arboreal Lg-0 Woody oligotrophic vegetation of swampy & sandy areas Grassy-woody LO-0 Areas of ecological tension and contact (ecotones) Woody oligotrophic vegetation of swampy & sandy areas- ombrophilous forest ON-0 Areas of ecological tension and contact (ecotones) Ombrophilous forest- seasonal forest Pf-0 Areas of pioneer formations (early succession) Fluvio-marine influence SM-0 Areas of ecological tension and contact (ecotones) Savanna-dense ombrophilous forest SN-0 Areas of ecological tension and contact (ecotones) Savanna-seasonal forest SO-0 Areas of ecological tension and contact (ecotones) Savanna-ombrophilous forest --------------------------------------------------------------------------------------------------
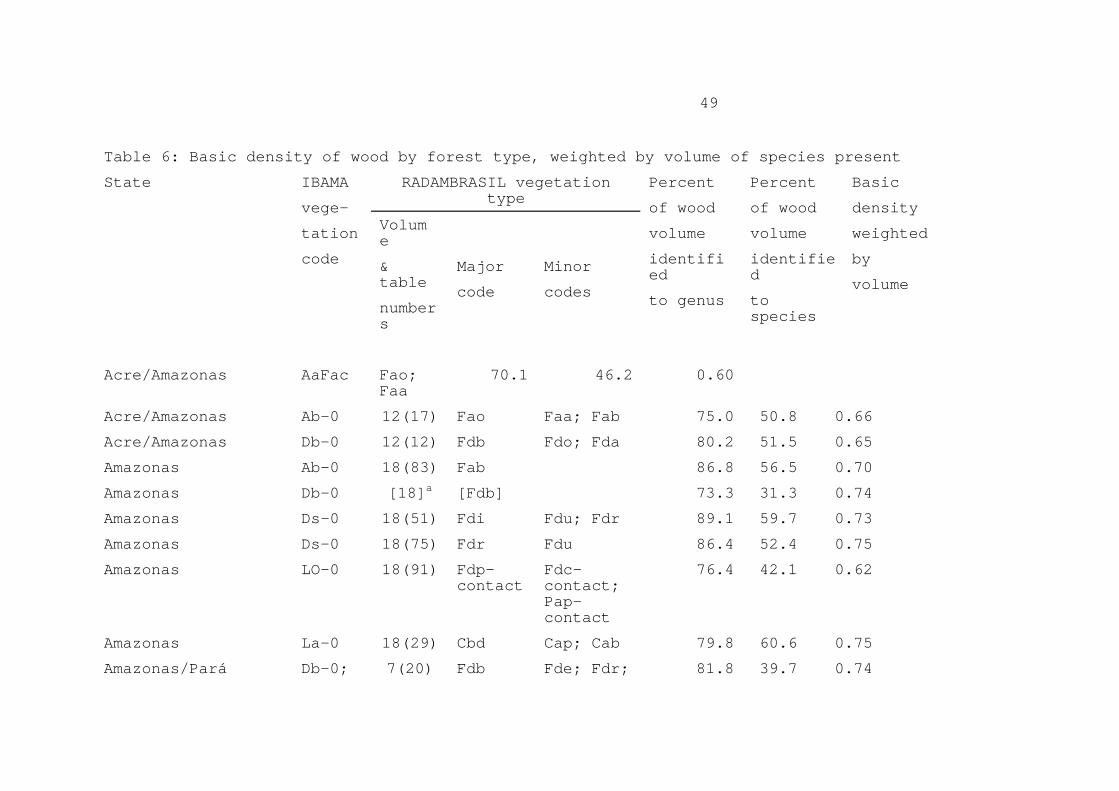
49
Table 6: Basic density of wood by forest type, weighted by volume of species present
State RADAMBRASIL vegetation type
Volume
& table
IBAMA
vege-
tation
code
numbers
Major
code
Minor
codes
Percent
of wood
volume
identified
to genus
Percent
of wood
volume
identified
to species
Basic
density
weighted
by
volume
Acre/Amazonas AaFac Fao; Faa
70.1 46.2 0.60
Acre/Amazonas Ab-0 12(17) Fao Faa; Fab 75.0 50.8 0.66
Acre/Amazonas Db-0 12(12) Fdb Fdo; Fda 80.2 51.5 0.65
Amazonas Ab-0 18(83) Fab 86.8 56.5 0.70
Amazonas Db-0 [18]a [Fdb] 73.3 31.3 0.74
Amazonas Ds-0 18(51) Fdi Fdu; Fdr 89.1 59.7 0.73
Amazonas Ds-0 18(75) Fdr Fdu 86.4 52.4 0.75
Amazonas LO-0 18(91) Fdp-contact
Fdc-contact; Pap-contact
76.4 42.1 0.62
Amazonas La-0 18(29) Cbd Cap; Cab 79.8 60.6 0.75
Amazonas/Pará Db-0; 7(20) Fdb Fde; Fdr; 81.8 39.7 0.74

50
Ds-0 Pa
Amazonas/Pará Ds-0 7(26) Fdr 83.3 42.0 0.74
Amazonas/Pará SO-0 7(14) Fdn-contact
Sd2-contact; Fam-contact
90.0 37.9 0.69
Amazonas/Rondônia As-0 12(22) Fas 94.7 50.1 0.66
Amazonas/Rondônia Ds-0 16(35) Fds Fdn 80.1 51.8 0.73
Amazonas/Roraima Da-0 18(37) Fdc Fdp; Fda 75.1 42.5 0.67
Amazonas/Roraima Db-0 18(43) Fdb Fda 86.2 61.4 0.67
Amazonas/Roraima Ds-0 18(67) Fdn Fds 90.4 61.9 0.72
Amazonas/Roraima Ds-0 18(59) Fdt 81.4 52.7 0.74
Amazonas/Roraima LO-0 18(97) Fdb-contact
b 84.4 51.4 0.68
Mato Grosso As-0 20(31) Asc 83.4 57.0 0.65
Mato Grosso Da-0 20(21) Dae 86.9 63.4 0.66
Mato Grosso Ds-0 20(26) Dse 85.1 63.2 0.67
Mato Grosso ON-0 20(50) Fse3-contact
Asc3-contact
81.7 52.3 0.65
Mato Grosso SN-0 20(46) Sd2-contact
Cse2-contact; Fse2-contact
87.5 57.3 0.63
Mato Grosso/Rondônia/Amazonas
As-0 16(64) Fai Far; Fal; Fau
79.1 49.2 0.70

51
Pará Ds-0 7(2) Fdt 86.2 57.4 0.72
Pará SO-0 7(38) Fdr-contact
91.3 35.7 0.74
Pará/Amazonas Ab-0 7(8) Fal Fam 82.4 41.1 0.68
Pará/Amazonas Ds-0 7(32) Fdr 86.6 48.4 0.74
Rondônia Aa-0 16(54) Fal 84.5 60.8 0.64
Rondônia Da-0 16(31) Fdp Fdc 80.2 58.3 0.65
Rondônia/Amazonas Ab-0 16(50) Fab Fao 81.0 50.9 0.69
Rondônia/Amazonas Ds-0 16(40) Fdt 72.3 45.4 0.68
Rondônia/Amazonas SO-0; SM-0
16(69) Fab-contact
c 80.4 48.7 0.67
Rondônia/Mato Grosso
Ds-0 16(45) Fdr Fdu 79.5 53.7 0.67
Rondônia/Mato Grosso/Amazonas
As-0 16(59) Fas Fan; Fas-contact
76.6 51.6 0.66
Roraima Dm-0 8(34) Fdm Fbm 72.8 49.9 0.67
Roraima Dm-0 8(39) Fbm 69.9 54.0 0.70
Roraima Ds-0 8(14) Fdt PFm 70.7 39.2 0.69
Roraima Ds-0d 8(29) Fdn Fdtd 79.5 51.2 0.69
Roraima ON-0 8(9) Fdn-contact
88.6 51.0 0.72
Roraima SN-0d 8(24) Fsd-contact
d 86.6 46.0 0.75
a This is from the hectare surveyed by Prance et al. (1976) to a minimum DBH of
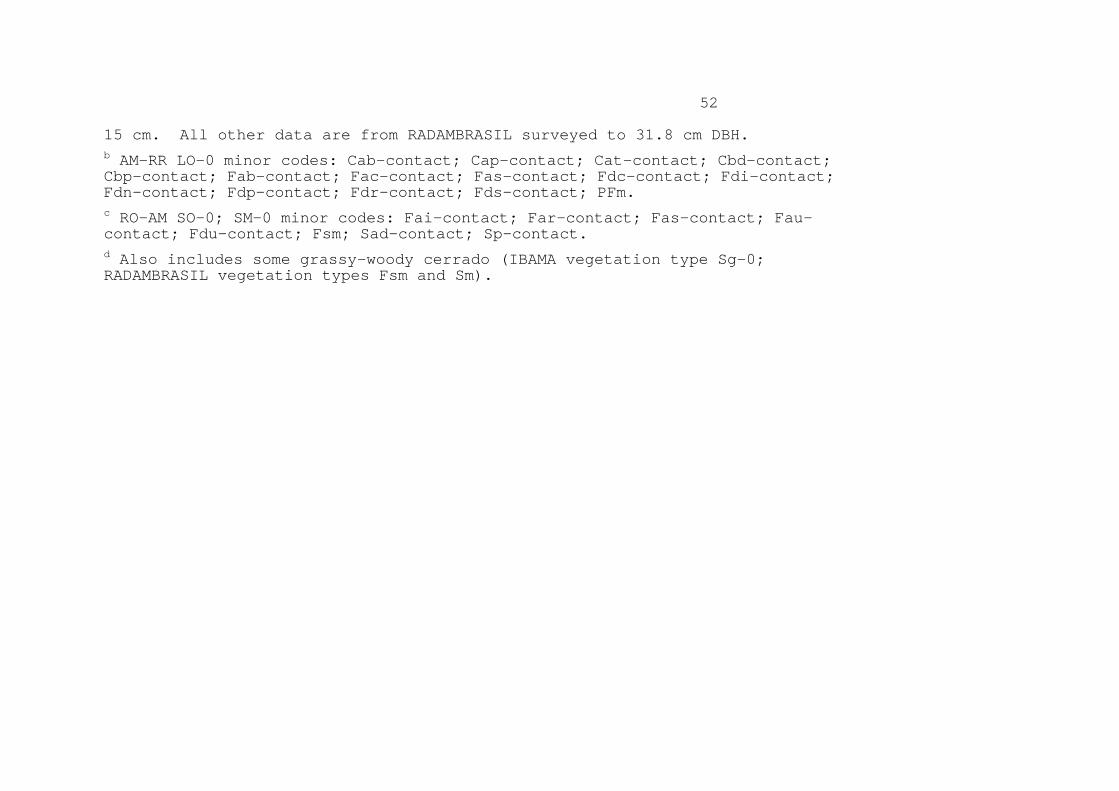
52
15 cm. All other data are from RADAMBRASIL surveyed to 31.8 cm DBH. b AM-RR LO-0 minor codes: Cab-contact; Cap-contact; Cat-contact; Cbd-contact; Cbp-contact; Fab-contact; Fac-contact; Fas-contact; Fdc-contact; Fdi-contact; Fdn-contact; Fdp-contact; Fdr-contact; Fds-contact; PFm. c RO-AM SO-0; SM-0 minor codes: Fai-contact; Far-contact; Fas-contact; Fau-contact; Fdu-contact; Fsm; Sad-contact; Sp-contact. d Also includes some grassy-woody cerrado (IBAMA vegetation type Sg-0; RADAMBRASIL vegetation types Fsm and Sm).

53
Table 7: Basic density of wood: volume-weighted means by vegetation zone, vegetation type and state (g cm-3)
Category Code Acre Amapá
Amazonas
Maranhão
Mato Grosso
Pará Rondônia
Roraima
Tocantins/ Goiás
Area- weighted mean
Dense forest
Da-0 0.67 0.67 0.66 0.67 0.65 0.67 0.67 0.67
Db-0 0.65 0.67 0.70 0.67 0.74 0.71 0.67 0.71
Dm-0 0.68 0.68 0.68 0.68 0.68
Ds-0 0.73 0.73 0.73 0.73 0.67 0.73 0.73 0.71 0.73 0.73
Dense forests 0.71
Non-ense Aa-0 0.60 0.60 0.60 0.60 0.60
forest Ab-0 0.66 0.68 0.67 0.67
As-0 0.66 0.65 0.65 0.65 0.65 0.65 0.65
Cs-0 0.66 0.66 0.66 0.66 0.66
Fa-0 0.66 0.66
Fs-0 0.66 0.66 0.66 0.66 0.66
La-0 0.75 0.75 0.75
Ld-0 0.66 0.66 0.66
Lg-0 0.66 0.66 0.66
LO-0 0.68 0.68 0.68
ON-0 0.65 0.65 0.65 0.72 0.65
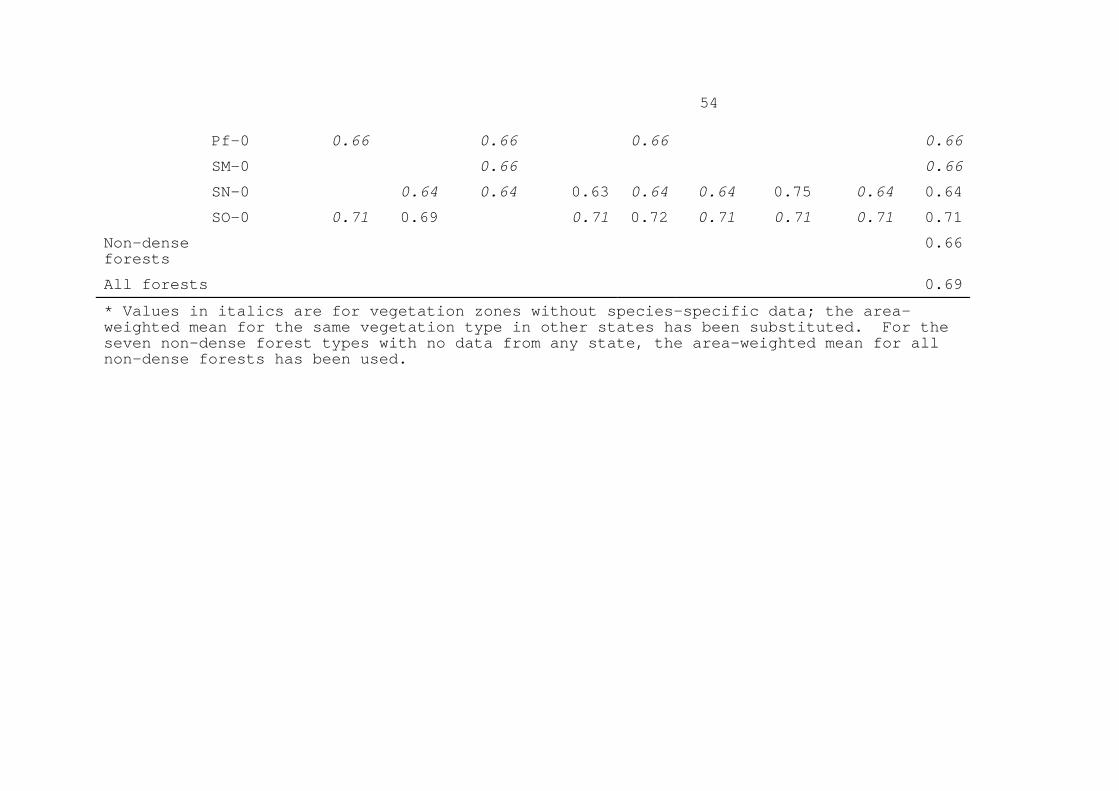
54
Pf-0 0.66 0.66 0.66 0.66
SM-0 0.66 0.66
SN-0 0.64 0.64 0.63 0.64 0.64 0.75 0.64 0.64
SO-0 0.71 0.69 0.71 0.72 0.71 0.71 0.71 0.71
Non-dense forests
0.66
All forests 0.69
* Values in italics are for vegetation zones without species-specific data; the area-weighted mean for the same vegetation type in other states has been substituted. For the seven non-dense forest types with no data from any state, the area-weighted mean for all non-dense forests has been used.
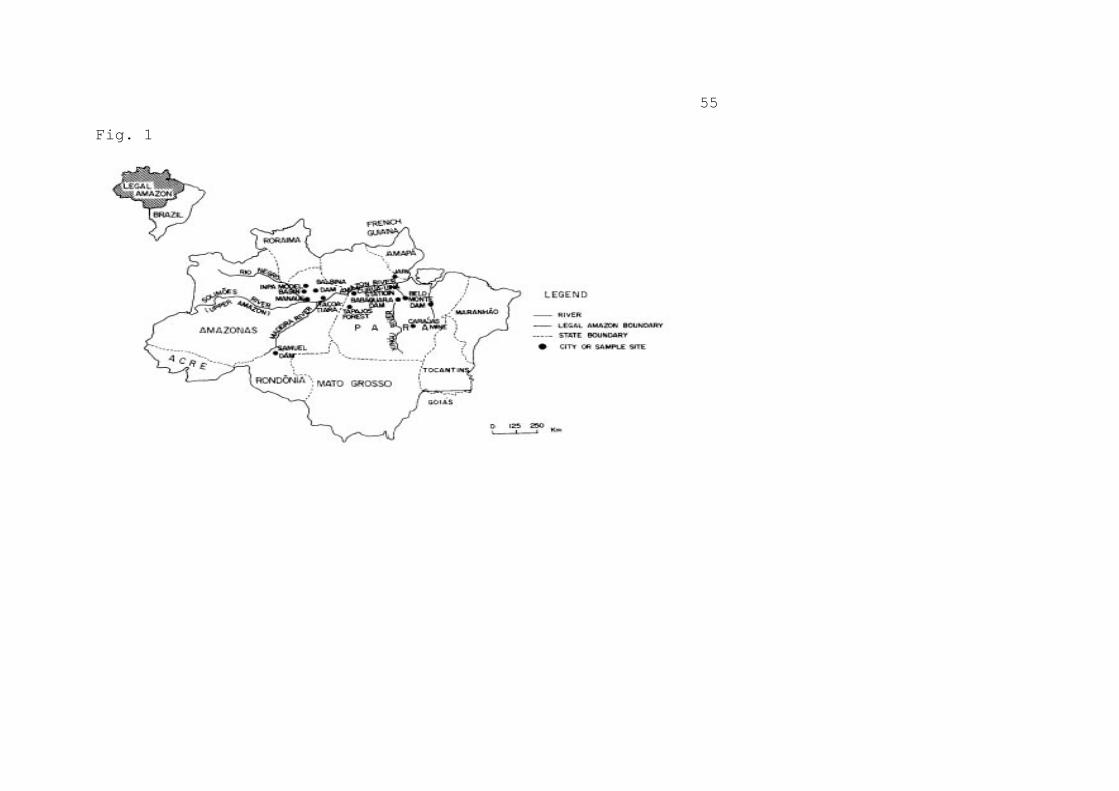
55
Fig. 1
Related Documents