FEAR OF CRIME: A SOCIO-CRIMINOLOGICAL INVESTIGATION BY FRANCES ANNE VAN VELZEN, MA (RAU) Submitted in fulfilment of the requirement for the degree of DOCTOR OF PHILOSOPHY in the Department of Criminal Justice University of Zululand Promoter: Prof PJ Potgieter Co-Promoter: Dr LP Mqadi Date of Submission: January 1998

Welcome message from author
This document is posted to help you gain knowledge. Please leave a comment to let me know what you think about it! Share it to your friends and learn new things together.
Transcript
FEAR OF CRIME:
A SOCIO-CRIMINOLOGICAL INVESTIGATION
BY
FRANCES ANNE VAN VELZEN, MA (RAU)
Submitted in fulfilment of the requirement for the degree of
DOCTOR OF PHILOSOPHY
in the Department of Criminal Justice
University of Zululand
Promoter: Prof PJ Potgieter
Co-Promoter: Dr LP Mqadi
Date of Submission: January 1998

NEITHER A MAN, NOR A CROWD NOR A NATION CAN BE
TRUSTED TO ACT HUMANELY OR TO THINK SANELY UNDER
THE INFLUENCE OF A GREAT FEAR
- Bertrand Russell
Dedicated to family and friends
II
DECLARATION
I declare that the thesis "Fear of Crime: a Socio-criminological investigation" is my own
work both in conception and iff execution. All the sources that I have used or quoted
from have been acknowledged by means of complete references.
,../}
J (J{N1 ~-FVANVELZEN
•
III
ACKNOWLEDGEMENTS
I wish to express my gratitude to the following organizations and persons:
eSD for their financial assistance. (The statements made in this document do
not reflect those of the eSD - but are those of the author);
University ofZululand fortheirfinancial assistance and administrative efficiency;
My promotor Professor PJ Potgieter for suggesting the study. His advise, pep
talks and guidance proved immeasurable - Dankie Pottie.
Nigel Bell and Dr Boughey for proof reading and Jill Thomas and Daniela Viljoen
for the typing of this document;
Friends and family - without whose harassment, support and motivational talks
I would never have finished this study; and
Doctor Langalibalele Prince Mqadi - for his guidance and assistance during this
study.
Ngiyabonga - Langa.
IV
TABLE OF CONTENTS
DEDICATION I
DECLARATION II
ACKNOWLEDGEMENT III
CONTENTS IV
TABLES XI
BIBLIOGRAPHY 261
ANNEXURE A 271
ANNEXURE B 282
ANNEXURE C 312
SUMMARY XV
OPSOMMING XVII
CHAPTER ONE: GENERAL ORIENTATION TO THE STUDY
1.1 INTRODUCTION 1
1.2 FACTORS AFFECTING THE FEAR OF CRIME 2
1.2.1 Vulnerability 2
1.2.1.1 Age 3
1.2.1.2 Gender 4
1.2.1.3 Socia-economic status 4
1.2.1.4 Race 5
1.2.2 Environmental Factors 7
1.2.2.1 Size of the community 7
1.2.2.2 Neighbourhood incivilities and housing conditions 7
1.2.2.3 Neighbourhood cohesion 9
1.2.3 Actual versus perceived risk of victimisation 10
1.2.4 Previous victimisation 11
1.2.5 Types of crime 12
1.2.6 Mass media 13
1.2.7 Effectiveness of the criminal justice system 14
v
1.2.8 Precautionary measures 15
1.3 MOTIVATION OF THE STUDY 15
1.4 AIMS OF THE STUDY 16
1.5 RESEARCH APPROACH 16
1.6 DELIMITATION OF STUDY 18
1.6.1 Spatial Delimitation 18
1.6.2 Qualitative Delimitation 19
1.6.3 Quantitative Delimitation 19
1.7 DEFINITION OF CONCEPTS 19
1.7.1 Socio-criminology 19
1.7.2 Crime 20
1.7.3 Fear 21
1.7.4 Fear of crime 22
1.8 ORGANISATION OF STUDY 23
1.9 SUMMARY 23
CHAPTER TWO: MODELS OF VICTIMOLOGY AND THE FEAR OF CRIME
2.1 INTRODUCTION 26
2.2 VICTIMISATION 26
2.2.1 Historical overview of victimology 26
2.2.2 Victim Typologies 29
2.2.2.1 Young-Rifai's victim typology 29
2.2.2.2 Mannheim's victim typology 30
2.2.2.3 Schafer's victim typology 31
2.2.2.4 Van der Westhuizen's victim typology 34
2.2.3 Theoretical perspectives of victimology 36
2.2.3.1 The "Synthesis" Approach of Fattah (1976) 37
2.2.3.2 The Routine Activity Approach by Cohen & Felson (1979) 37
2.2.3.3 Opportunity Theory of Cohen, Kleugel & Land (1981) 38
2.2.4 Victims and the fear of crime 39
2.3 MODELS OF FEAR OF CRIME 40
2.3.1 The Irrational Model 41
VI
2.3.1.1 Clemente and Kleiman (1979) 41
2.3.1.2 Garofalo (1979) 42
2.3.1.3 Warr (1990) 44
2.3.2 The Cognitive Model 46
2.3.2.1 Stafford and Galle (1984) 46
2.3.2.2 Baumer (1985) 46
2.3.2.3 The lifestyle model of Hindelang, Gottfredson and
Garofalo (1978) 48
2.3.3 The Social Control Model 52
2.3.3.1 Lewis and Maxfield (1980) 53
2.4 MEASUREMENT OF THE FEAR OF CRIME 56
2.5 SUMMARY 59
CHAPTER THREE: RESEARCH METHODOLOGY
3.1 INTRODUCTION 61
3.2 RESEARCH METHODelLOGY 61
3.3 RESEARCH METHODS 63
3.3.1 Method of case analysis 64
3.3.2 Method of mass observation 64
3.3.3 Analytical method 65
3.4 RESEARCH STRATEGY 66
3.4.1 Identification of the research problem 66
3.4.2 The Literature review 67
3.4.3 Conceptualization of the research problem 68
3.5 RESEARCH TECHNIQUES 68
3.5.1 Survey Method 68
3.5.1.1 The questionnaire 69
3.5.1.2 Scales of measurement 74
3.5.1.3 Validity and reliability of the measuring instrument 75
3.5.2 Sampling Procedures 80
3.5.2.1 Spatial delimitation of the sample group 81
3.5.2.2 Qualitative and quantitative delimitation of the sample group 83
VII
3.5.3 Statistical techniques 84
3.5.3.1 Frequency distribution 85
3.5.3.2 Spearman Rank Order Correlation Coefficient (rho) 85
3.5.3.3 Pearson's Correlation Coefficient (r) 86
3.5.3.4 F-distribution (F-test) 87
3.6 SUMMARY 87
CHAPTER FOUR: AGE, GENDER, HOUSEHOLD CHARACTERISTICS AND THE
FEAR OF CRIME
4.1 INTRODUCTION 89
4.2 AGE AND THE FEAR OF CRIME 90
4.2.1 General findings on age and the fear of crime 90
4.2.2 The elderly and the fear of crime 95
4.2.3 Inconsistent findings 97
4.2.4 Presentation and analysis of data 98
4.3 GENDER AND THE FEAR OF CRIME 102
4.3.1 General findings on gender and the fear of crime 103
4.3.2 Inconsistent findings 105
4.3.3 The presentation and analysis of data 105
4.4 HOUSEHOLD CHARACTERISTICS AND THE FEAR OF CRIME 109
4.4.1 General findings on household characteristics and fear of crime 109
4.4.2 Presentation and analysis of data 112
4.4.2.1 Household composition and the fear of crime 113
4.4.2.2 Types of housing and the fear of crime 117
4.5 SUMMARY 121
CHAPTER FIVE: PREVIOUS VICTIMISATION
5.1 INTRODUCTION 122
5.2 GENERAL FINDINGS ON PREVIOUS VICTIMISATION AND
FEAR OF CRIME 122
5.3 PRESENTATION AND ANALYSIS OF DATA 126
5.4 SUMMARY 148
VIII
CHAPTER SIX: CRIME AS A SOCIAL PROBLEM
6.1 INTRODUCTION 149
6.2 GENERAL FINDINGS ON CRIME AS A SOCIAL PROBLEM AND
THE FEAR OF CRIME 149
6.3 PRESENTATION AND ANALYSIS OF DATA 153
6.3.1 Fear of crime and crime as a social problem 157
6.3.2 Fear of crime, crime as a social problem and respondents'
opinion of police performance 161
6.4 SUMMARY 167
CHAPTER SEVEN: THE ROLE OF THE POLICE AND THE FEAR OF CRIME
7.1 INTRODUCTION 169
7.2 GENERAL FINDINGS 170
7.3 PRESENTATIONANDANALYSISOFDATA 173
7.3.1 Fear of crime and the role ofthe police 183
7.3.2 Gender differences and the role of the police 194
7.4 SUMMARY 199
CHAPTER EIGHT: RESPONSES TO THE FEAR OF CRIME
8.1 INTRODUCTION 201
8.2 INDIVIDUAL RESPONSES TO THE FEAR OF CRIME 201
8.2.1 Defensive responses to the fear of crime 202
8.2.2 Offensive responses to the fear of crime 203
8.3 COMMUNITY RESPONSES TO THE FEAR OF CRIME 204
8.3.1 Informal social control 205
8.3.2 Formal social control 206
8.4 CRIME PREVENTION STRATEGIES 209
8.4.1 Vigilantism 209
8.4.2 Civilian police patrols 211
8.4.3 Establishing residential security: O'Block (1981) 213
8.4.4 Neighbourhood Watch Programme 214
8.4.5 Citizen patrols 215
8.4.6
8.4.7
8.5
8.5.1
8.6
IX
Community Policing
The impact of social development programmes on crime
prevention
PRESENTATION AND ANALYSIS OF DATA
Involvement of the neighbourhood and the fear of crime
SUMMARY
216
218
219
225
233
CHAPTER NINE: FINDINGS, CONCLUSIONS AND RECOMMENDATIONS
9.1 INTRODUCTION 236
9.2 LIMITATIONS AND PROBLEMS ENCOUNTERED IN THIS
STUDY 236
9.3 TESTING HYPOTHESES 237
9.4 GENERALISATION AND DISCUSSION OF FINDINGS 248
9.4.1 Age, gender, household characteristics and fear of crime 248
9.4.1.1 Age and the fear of crime 248
9.4.1.2 Gender and the fear of crime 249
9.4.1.3 Household composition and fear of crime 250
9.4.1.4 Type of housing and fear of crime 251
9.4.2 Previous victimisation and fear of crime 251
9.4.3 Crime as a social problem and fear of crime 252
9.4.3.1 Crime as a social problem and respondents opinion of
police performance 253
9.4.4 Role ofthe police 253
9.4.4.1 Fear of crime and contact with the police 254
9.4.4.2 Reporting and non-reporting of crime and the fear of crime 254
9.4.4.3 Obligation to crime prevention and fear of crime 254
9.4.4.4 Public's opinion of police performance and visibility and fear
of crime 254
9.4.4.5 Gender differences in the respondents experience with the
police 255
9.4.5 Involvement in the neighbourhood and fear of crime 255
9.5 CONCLUSIONS 256
x
9.6 RECOMMENDATIONS
9.6.1 Recommendation for police-community relations
9.6.2 Future research
258
258
260
XI
LIST OF TABLES
TABLE PAGE
3.1 VALIDITY OF THE FEAR OF CRIME MEASURE 75
3.2 RELIABILITY OF THE FEAR OF CRIME MEASURE 77
3.3 RELIABILITY OF THE FEAR OF SPECIFIC CRIME SCALE 78
3.4 RELIABILITY OF THE RATING SCALE OF SOCIAL PROBLEMS 79
3.5 RELIABILITY OF THE MEASURE OF RESPONDENTS VIEW OF
POLICE SERVICE 80
4.1 AGE AND THE FEAR OF CRIME 100
4.2 AGE AND FEAR OF PERSONAL VICTIMISATION 101
4.3 AGE AND FEAR OF PROPERTY CRIME 102
4.4 GENDER AND THE FEAR OF CRIME 106
4.5 GENDER AND FEAR OF PERSONAL VICTIMISATION 107
4.6 GENDER AND FEAR OF PROPERTY CRIME 108
4.7 FREQUENCY DISTRIBUTION OF HOUSEHOLD COMPOSITION 113
4.8 HOUSEHOLD COMPOSITIONAND THE FEAR OF CRIME 114
4.9 HOUSEHOLD COMPOSITION AND FEAR OF PERSONAL
VICTIMISATION 115
4.10 HOUSEHOLD COMPOSITIONAND FEAR OF PROPERTY
CRIME 116
4.11 FREQUENCY DISTRIBUTION OF TYPE OF HOUSING 117
4.12 TYPE OF HOUSING AND THE FEAR OF CRIME 118
4.13 TYPE OF HOUSING AND FEAR OF PERSONAL VICTIMISATION 119
4.14 TYPE OF HOUSING AND FEAR OF PROPERTY CRIME 120
5.1 FREQUENCY DISTRIBUTION OF PREVIOUS VICTIMISATION 127
5.2 FREQUENCY DISTRIBUTION OF PREVIOUS PERSONAL
VICTIMISATION 128
XII
5.3 FREQUENCY DISTRIBUTION OF PREVIOUS PROPERTY
VICTIMISATION 129
5.4 SIGNIFICANT DIFFERENCES IN PREVIOUS PERSONAL
VICTIMISATION EXPERIENCE AND THE FEAR OF CRIME 131
5.5 SIGNIFICANT DIFFERENCES IN PREVIOUS PERSONAL
VICTIMISATION EXPERIENCE AND FEAR OF PERSONAL
VICTIMISATION 134
5.6 SIGNIFICANT DIFFERENCES IN PREVIOUS PERSONAL
VICTIMISATION EXPERIENCE AND FEAR OF PROPERTY
CRIME 137
5.7 SIGNIFICANT DIFFERENCES IN PREVIOUS PROPERTY
VICTIMISATION AND THE FEAR OF CRIME 140
5.8 SIGNIFICANT DIFFERENCES IN PREVIOUS PROPERTY
VICTIMISATION EXPERIENCE AND FEAR OF PERSONAL
VICTIMISATION 143
5.9 SIGNIFICANT DIFFERENCES IN PREVIOUS PROPERTY
VICTIMISATION EXPERIENCE AND FEAR OF PROPERTY
CRIME 146
6.1 FREQUENCY DISTRIBUTION OF RESPONDENT RATING OF
TYPES OF CRIME AS A SOCIAL PROBLEM IN THEIR AREA OF
RESIDENCE 155
6.2 FREQUENCY DISTRIBUTION OF THE INCREASE IN CRIME
RATE 157
6.3 STATUTORY CRIME AS A SOCIAL PROBLEM AND FEAR OF
CRIME 158
6.4 PERSONAL VICTIMISATION AS A SOCIAL PROBLEM AND
FEAR OF CRIME 159
6.5 PROPERTY CRIME AS A SOCIAL PROBLEM AND FEAR OF
CRIME 160
6.6 STATUTORY CRIME AS A SOCIAL PROBLEM AND POLICE
PERFORMANCE 162
XIII
6.7 PERSONAL VICTIMISATION AS A SOCIAL PROBLEM AND
POLICE PERFORMANCE 163
6.8 PROPERTY CRIME AS A SOCIAL PROBLEM AND POLICE•
PERFORMANCE 165
7.1 FREQUENCY DISTRIBUTION OF TYPE OF CONTACT WITH·
THE POLICE 174
7.2 FREQUENCY DISTRIBUTION OF THE REPORTING OF CRIME 175
7.3 FREQUENCY DISTRIBUTION OF REASONS FOR NOT
REPORTING CRIME 176
7.4 FREQUENCY DISTRIBUTION OF RESPONDENTS' ATIITUDE
TOWARD COMBATING CRIME 177
7.5 FREQUENCY DISTRIBUTION OF FEELINGS TOWARD
CONTACT WITH THE POLICE 178
7.6 FREQUENCY DISTRIBUTION OF RESPONDENTS' FEAR OF
POLICEMEN 179
7.7 FREQUENCY DISTRIBUTION OF PUBLIC'S OPINION OF
POLICE PERFORMANCE 180
7.8 FREQUENCY DISTRIBUTION OF THE PATROLLING OF THE
RESIDENTIAL AREAS 182
7.9 FEAR OF CRIME, CONTACT WITH THE POLICE AND CRIME
REPORTING 184
7.10 FEAR OF CRIME AND THE RESPONDENTS FEELINGS
TOWARD CONTACT WITH THE POLICE 187
7.11 FEAR OF CRIME AND THE PUBLIC'S OBLIGATION
TOWARDS CRIME PREVENTION 189
7.12 FEAR OF CRIME AND THE PUBLIC'S OPINION OF POLICE
PERFORMANCE 191
7.13 FEAR OF CRIME AND POLICE VISIBILITY 193
7.14 GENDER AND CONTACT WITH THE POLICE 195
7.15 GENDER AND FEELINGS TOWARDS CONTACT WITH POLICE 196
7.16 GENDER AND OBLIGATION TO COMBAT CRIME 197
XIV
7.17 GENDERAND PUBLIC'S OPINION OF POLICE PERFORMANCE 198
7.18 GENDERAND POLICE VISIBILITY 199
8.1 FREQUENCY DISTRIBUTION OF SECURITY MEASURES
TAKEN TO PROTECT PROPERTY 221
8.2 FREQUENCY DISTRIBUTION OF SECURITY MEASURES
TAKEN TO PROTECrPROPERTY 223
8.3 FREQUENCY DISTRIBUTION OF INVOLVEMENT OF
NEIGHBOURS AS A PROTECTIVE MEASURE 224
8.4 FREQUENCY DISTRIBUTION OF INVOLVEMENT IN A
NEIGHBOURHOOD WATCH PROGRAMME 225
8.5 SIGNIFICANT DIFFERENCES BETWEEN RESPONDENTS WHO
ARE INVOLVED/UNINVOLVED WITH THEIR NEIGHBOURS 228
8.6 SIGNIFICANT DIFFERENCES BETWEEN RESPONDENTS WHO
ARE INVOLVED/UNINVOLVED IN NEIGHBOURHOOD
WATCH PROGRAMMES 231
SUMMARY
Each individual's personal security is basic to the quality of life of a community. If the
quality of life is affected by crime or the fear of criminal victimisation, then both crime
and the fear of crime should be viewed as a social problem.
The fear of crime is the focus point of this study as it produces changes in the lifestyle
ofthe individual and the functioning ofthe community. Fear ofcrime generates feelings
of anxiety, general mistrust, alienation and suspicion. At a social level, it can lead to
a break down of social cohesion, the curtailment of normal activities and an
unwillingness to help others.
The study aims at bridging the gap in our substantive knowledge regarding the fear of
crime. Through the use of a questionnaire, the study further seeks to establish the
following:
*
*
*
*
Statistically measure and describe the nature and extent of fear of crime.
Determine the factors affecting fear of crime.
Account for the differences and variations in the fear of crime according to age,
gender, household composition and type of housing, previous victimisation,
crime as a social problem, role of the police and community neighbourhood
involvement.
Make non-prescriptive recommendations for the prevention of criminal
victimisation that might directly influence the quality of life.
Research techniques employed in the study included the following:
*
*
Literature study of research done on the fear ofcrime covering the 1970s, 1980s
and early 1990s.
A structured questionnaire consisting of demographical information and
questions pertaining to the factors influencing fear of crime.
XVI
Non-probability sampling techniques.
Statistical techniques to test the reliability of the measuring instrument and ten
formulated hypotheses.
The findings of the study indicate the following:
(a) Age is related to fear of crime.
(b) Gender is the strongest predictor offear.
(c) Household composition' is related to the fear of crime.
(d) No significant differences were found between the type of housing respondents
live in and fear of crime.
(e) In general, people who have been previously victimised are more fearful ofcrime
then those who have not.
(f) Concem about crime and fear of crime are related issues, as people who are
concemed about crime, generally fear crime.
(g) The role of the police has not proved to be a significant factor influencing the
fear of crime of respondents.
(h) Neighbourhood involvement tends to reduce levels of the community's fear of
crime.
The following non-prescriptive recommendations are made:
Improvement of the image of the South African Police Service (SAPS) is a
necessity to foster confidence in and respect for policing.
Increased role visibility of the police.
Promotion of effective NeighbOUrhood Watch Programmes.
Active involvement of citizens in community policing forums.

XVII
OPSOMMING
Elke individu se persoonlike veiligheid is afhanklik van die kwaliteit van lewe in 'n
gemeenskap. Indien hierdie kwaliteit van lewe deur misdaad of vrees vir kriminele
viktimisasie geaffekteer word, dan behoort misdaad en vrees vi~ misdaad as
maatskaplike probleme beskou te word.
Vrees vir misdaad vorm die fokuspunt van die onderhawige studie, aangesien dit lei tot
veranderinge in die lewenstyl van die individu en be"invloed ook die funksionering van
die gemeenskap. Vrees vir misdaad kweek gevoelens van angs, wantroue,
vervreemding en agterdog. Op maatskaplike vlak kan dit lei tot 'n ineenstorting van
sosiale kohesie, die inkorting van norrnale aktiviteite en 'n onbereidwilligheid am ander
te help.
Hierdie studie beoog am die gaping in ons kennis van vrees vir misdaad aan te vul.
Deur gebruik te maak van 'n gestruktureerde vraelys, beoog die studie verder om:
*
*
*
*
die aard en omvang van die vrees vir misdaad statisties te beskryf;
faktore te identifiseer wat vrees vir misdaad beinvloedJaffekteer;
die variasies en verskille in vrees vir misdaad te analiseer - spesifiek wat betref
ouderdom, geslag, hoeveelheid inwoners van 'n huis, en tipe behuising, vorige
viktimisasie ondervinding, misdaad as in maatskaplike probleem, rol van die
polisie en die gemeenskap se buurtbetrokkenheid;
nie-voorskriftelike voorkorninqsmaatreels aan die hand te doen wat 'n afuame
in die vrees vir misdaad tot gevolg kan he.
Navorsingstegnieke wat in hierdie studie gebruik word behels die volgende:
*
*
'n Literatuurstudie betreffende navorsing oar die vrees vir misdaad sedert die
sewentiger jare tot die vroee negentigs.
'n Gestruktureerde vraelys wat die demografiese gegewens van respondente en
*
*
XVIII
hulle response insluit betreffende faktore wat vrees vir misdaad beTnvloed.
Nie-waarskynlike steekproefneming.
Statistiese tegnieke om die geldigheid en betroubaarheid van die
meetinstrument en tien geformuleerde hipoteses te toets.
Die bevindings van die studie dui daarap dat:
(a) Ouderdom verband hou met vrees vir misdaad.
(b) Geslag die sterkste voorspellervan vrees vir misdaad is.
(c) Die hoeveelheid mense wat saamwoon verband hou met vrees vir misdaad.
(d) Geen beduidende verskille tussen die tipe behuising van 'n respondent en die
vrees vir misdaad voorkom nie.
(e) Respondente wat 'n vorige viktimisasie beleef het meer vreesbevange is as die
wat nooit vantevore gevitimiseer was nie.
(f) Besorgdheid oor misdaad en vrees vir misdaad hou verband met mekaar.
Respondente wat misdaad as 'n maatskaplike probleem in hul residensiele
gebiede beskou, vrees ook kriminele viktimisasie.
(g) Die ral van die polisie nie 'n beduidende invloed op die vrees vir misdaad gehad
het nie.
(h) Buurtbetrokkenheid tot 'n afname in die gemeenskap se vlakke van vrees lei.
Die volgende aanbevelings word voorgehou ten opsigte van die voorkoming van vrees
vir misdaad:
*
*
*
*
Verbetering van die beeld van die Suid-Afrikaanse Polisiediens om vertroue in
en respek vir polislertnq te bewerkstellig.
Rolsigbaarheid van die polisie moet verhoog word.
Doeltreffende buurtwagpragramme behoort bevorder te word.
Aktiewe deelname van inwonders in gemeenskapspolisieringsforums.
CHAPTER 1
GENERAL ORIENTATION
1.1 INTRODUCTION
South Africa is a society in transition. Through this process of change, tensions and
strains are being created which often take their overt form in crime and violence.
Each individual's personal security is basic to the quality of life of a community and
Conklin (1975:1) states that personal security is "... affected more by crime than by
anything else". If the quality of life experienced by the individual and community is
affected by crime, then crime itself can be viewed as a social problem. However, often
crime and violence are not experienced directly by either the individual or in the
community itself. Instead, via information obtained from the media, friends and/or
police, the individual and the community begin to view crime as a threat. They perceive
a risk of actually being a victim of crime. This threat, whether real or perceived,
promotes a fear ofcrime and this fear generates changes in the individual's lifestyle and
in the community at large. Fear of crime then becomes a social problem, and can be
recognised as an issue which is, according to Smith and Glanz (1989:54), "... separate
from crime itself".
The fear of crime and crime itself are perceived as social problems because they
threaten lives, security, property, the sense of well-being, social order and, most
importantly they reduce our quality of life (Garofalo 1979; Garofalo & Laub 1978 and
Maris 1987). Clemente and Kleiman (1977:520) claim that the fear of crime has had
severe consequences in that it has forced a change in our daily habits ".....as well as
.... negative psychological effects of living in a state of constant anxiety".
The consequences of fear of crime are varied and numerous, but two areas which are
severely affected by this fear are the psychological and social lives of people.
Psychologically, fear ofcrime generates feelings ofanxiety, general mistrust, suspicion,
alienation, dissatisfaction with life and, in some cases, mental illness (Box, Hale &
1
Andrews 1988; Glanz 1989; Liska, Sanchirico & Reed 1988).
Socially, the fear of crime holds the following consequences:
• breakdown of social cohesion and solidarity
• curtailment of normal activities
• perpetuation of the violent subculture
• avoidance of sites and situations associated with crime
• disappearance of sociability, mutual trust, willingness to help others
• avoidance of strangers (Box et al. 1988; Clemente &Kleiman 1979; Liska et al.
1988; Smith &Glanz 1989 and Warr 1990).
The social consequences of the fear of crime or victimization is what makes this fear
a major social problem. Some of the fear can be accounted for by the actual amount
of crime in the neighbourhood, but much of this fear is caused by subjective, perceptual
and sociostructural factors.
1.2 FACTORS AFFECTING THE FEAR OF CRIME
One of the most prominent factors affecting fear of crime is: vulnerability.
1.2.1 Vulnerability
Vulnerability to crime and victimisation can be approached on two distinct levels, the
physical and the social. Physical vulnerability refers to certain personal traits which
render the individual incapable of protecting himself or herself physically and
emotionally from victimisation and its consequences. Such traits include age and
gender (Baumer 1985; Box et al. 1988 and Toseland 1982). Social vulnerability refers
to circumstances such as being poor or belonging to an ethnic minority group which
makes it difficult for the individual to prevent victimisation (Smith & Glanz 1989;
Toseland 1982).
Vulnerability implies a sense of powerlessness on the part of individuals to protect
themselves from being victimised and to recover from the victimisation experience.
2
Being vulnerable also puts the individual at risk of possible victimisation, l.e. the
vulnerable are easy prey for criminals because of their inability to fight back. Crime
becomes a disturbing threat to those who are vulnerable, and the resulting fear ofcrime
can have debilitating consequences for their behaviour. Researchers (Box et al. 1988;
Baumer 1978; Baumer 1985; Clemente & Kleiman 1977 and Toseland 1982) have
identified four human groups which can be considered vulnerable, namely the elderly,
women, the poor, and ethnic minority groups. However, since age, gender, socio
economic status and ethnic groups are all factors influencing fear, the vulnerable will
be discussed within the framework of the broader categories.
1.2.1.1 Age
The influence that age has on the fear of crime is inconsistent. Research findings vary
from positive correlations between age and fear (Clemente & Kleiman 1977; Conklin
1975; Garofalo 1979 and Toseland 1982) to findings that indicate no relationship
between the two variables (Smith & Glanz 1989). Baumer (1985:256) is of the opinion
that there is a relationship between the fear of crime and age, i.e, there is a higher fear
of crime among respondents over the age of sixty. The question which now arises is
why the elderly are more fearful than other age categories. Several reasons have been
proposed by various authors (Baumer 1978; Box et al. 1988; Clemente &Kleiman 1977
and Toseland 1982). The most likely explanations given are that, firstly, the elderly are
more open to physical attack because their physical strength and agility is declining.
Secondly. they lack the resources to cope with victimisation • l.e, they are poorer so it
is difficult to replace that which is lost; they are frailer and minor injury can be
incapacitating and they quite often lack emotional support from friends and family. Box
et al. (1988:352) conclude that "... age gnaws the strongest spirit ...", making older men
and women equally vulnerable to the threat of criminal victimisation.
However. it has been noted by various researchers (Baumer 1985; Box et al. 1988 and
Toseland 1982) that although the elderly fearcrime. their actual victimisation rate is low.
Toseland (1982:205) found that older people, being more fearful, tend to reduce their
social activities and implement measures because they are fearful of crime. Le.
precautionary steps are taken by the elderly to reduce their risk of victimisation. The
3
elderly, knowing that the consequences of victimisation can affect their quality of life
markedly, change their lifestyle accordingly. The mere perception ofthe consequences
of victimisation may thus account for the high fear of crime experienced by the elderly.
1.2.1.2 Gender
Gender has emerged as the most powerful predictoroffear of personal crimes. Various
authors (Clemente & Kleiman 1977; Conklin 1975 and Garofalo 1978;) have found that
women are considerably more fearful of crime than men. The explanations for these
findings are firstly, that women as a group are more vulnerable as they lack physical
strength and fighting powers; secondly, they are targets for a larger range of personal
and life-threatening offences such as rape. Garofalo (1979:87) suggests that high
levels of fear among women may be due to passive sex-role socialisation, i.e. women
are taught to think of themselves as helpless and powerless.
However, Clemente and Kleiman (1977:522) note that women were less likely to be
victims of personal crime than men but that they reported more fear of crime than men.
Various authors (Clemente & Kleiman 1977; Garofalo 1979 and Toseland 1982) opine
that men are reluctant to admit to fear because of the expectations associated with the
masculine role, and this could be a reason why a disparity exists between the sexes.
Box et al. (1988:352) also point out that because women consider themselves
vulnerable to personal victimisation they have developed "... the subtle arts of offender
avoidance". That is, they tend to take precautionary steps to avoid victimisation.
Toseland (1982:205) notes that women avoid walking alone in the evenings. Women
perceive themselves as vulnerable to victimisation and thus their fear of crime
increases.
1.2.1.3 Socio-economic status
The socio-economic variable encompasses income, education and occupation. The
relationship between these factors and the fear of crime has varied from a definite
influence to no influence at all. Clemente and Kleiman (1977:523) found an inverse
relationship between socio-economic status and the personal victimisation rate, but the
4
reverse was true for property crimes. When fear of crime is considered, a negative
relationship develops with socio-economic status. Garofalo (1979:85) also reported
that fear of crime and rates of victimisation both decline as income increases. The
conclusion drawn may be that people with greater financial resources are able to
protect themselves from harm and are therefore less fearful of crime. People with low
incomes do not have the resources to replace that which is lost and therefore are more
fearful of crime.
Various authors (Baumer 1978; Clemente & Kleiman 1977 and Garofalo 1979) propose
that the relationship between fear of crime and socio-economic factors may be due to
the 'areal' effect. People who are the same tend to group together in a homogenous
neighbourhood. Thus, high crime areas are most often populated by lower income
groups. Higher income groups can afford to stay in safer neighbourhoods. Smith and
Glanz (1989:59) noted that within the South African context, socio-economic status (as
measured by education level) influenced the fear of crime. Among the white population
group, higher income ensures relative isolation from the risk of personal victimisation
and a greater ability to protect against property victimisation. Higher income residential
areas are also fairly isolated from high crime areas. Upper income coloured and indian
areas are close to high crime areas, and thus fear ofcrime can be expected to increase
as socio-economic status increases. Black residential areas are not segregated along
income lines, but residents in high income areas are targets of property victimisation.
Schurink and Prinsloo (1978:8) in their analysis ofthe fear of crime among black urban
residents, found that an increase in income led to an increase in fear of both male and
female respondents. Women were reported to fear crime more as their education level
increased, but men were found to be less fearful of crime.
Fear of crime, then, affects not only the well-educated, higher income person, but also
the less educated and lower income person (Tosetand 1982:207).
1.2.1.4 Race
Various researchers in the USA have proposed that a high fear of crime is associated
5
with being black, and having a low income and education level. Clemente and Kleiman
(1977:523) claim, however, that although empirical evidence suggests that blacks are
more afraid of victimisation than whites, their research indicates that race ranked fifth
out of six explanatory variables, and thus the effects are less than what has been
previously proposed. Parker and Ray (1990:37) reveal that in their study, black males
reported higher fear of crime than their female counterparts. The researchers suggest
that the reasons for this finding could be ascribed to black males beipq engaged in
activities which include risk of victimisation, and that the mass media shows them to be
victims of violent crimes. This creates the impression that they are targets for crime,
and increases their level of fear and perceived risk of victimisation.
Smith and Glanz (1989:59) noted that within the South African context, blacks are less
fearful of crime than other population groups. This is inconsistent with the high reported
rate of victimisation. The work of Conklin (1975) provided a reason for this as he
proposed that people who live in high crime areas tend to deny the high risk of
victimisation so that they can preserve a sense of security.
Garofalo (1979:86), as well as other authors (Baumer 1978; Clemente & Kleiman
1977), reported that the principle of homogeneity discussed within the socio-economic
status applied to race as well. That is, people tend to group together spatially according
to income and racial characteristics. This would imply that the fear of crime and the risk
of victimisation may be a reflection of the convergence of these factors in geographical
location. In contrast to Parker and Ray (1990:37), who claim that race is a powerful
predictor, Toseland (1982:204) opines that race is relatively unimportant as a predictor
of fear of crime. He found that although black respondents were more fearful of crime
than white respondents, the relationship was very weak. Thus contradictory evidence
exists with regard to race as a factor which influences the fear of crime.
Although contradictory evidence exists pertaining to the effect that vulnerability (either
age, gender, socio-economics or race) has on the fear of crime, it is important to note
that vulnerability must be considered in terms of the impact of crime on its victims: i.e,
how victims perceive crime and how it affects them. If people perceive themselves as
being vulnerable, their perceived risk of victimisation is high, and they will fear crime
6
and take preventative measures to combat it.
1.2.2 Environmental factors
Fearof crime affects not only the possible victim but also the community at large. Lewis
and Salem (1986:5) propose thatfear of crime can be approached in two ways, namely
by focusing on the individual (l.e, demographic factors), or by focusinq on an
assessment of the neighbourhood (Le. the environment) in which people live.
Characteristics of the environment include size of the community, neighbourhood
incivilities, housing conditions and neighbourhood cohesion.
1.2.2.1 Size of the community
The size of the community is related to fear of crime. Clemente and Kleiman
(1977:524) reported that the crime rate for personal crimes increases as one moves
from smaller towns to suburbs and into the central city. Baumer (1985:245) found that
residents of cities over 10,000 reported more fear than residents of suburbs or smaller
towns. This observation seems to confirm previous research which reported that urban
dwellers tend to be more fearful of crime than residents in other areas (Clemente &
Kleiman 1977; Lewis & Maxfield 1980). Toseland (1982:207) expressed the view that
the reason for this relationship is that urban dwellers are more exposed to crime than
residents of small towns or rural areas. Crime rates are known to be higher in urban
areas. The likelihood of being an actual witness to a criminal act is greater and the
chance of having friends who have been victims is also greater in urban areas. Conklin
(1975:139) claims that people in cities tend to 'expect crime', while those living in
suburbs, small towns and rural areas are less expectant of criminal victimisation.
1.2.2.2 Neighbourhood incivilities and housing conditions
When people view their neighbourhood as threatening, they may become fearful of
criminal victimisation. Box et al. (1988:541) argues that neighbourhoods which include
noisy neighbours, graffiti, gangs, vagrants, uncollected garbage and abandoned
buildings may be regarded as unpredictable, in a state of decline, and threatening.
7
Previous research by Lewis and Maxfield (1980) and Lewis and Salem (1986) indicated
that all of the above characteristics promotedfear. However, other characteristics such
as empty streets, drug use, vandalism, ethnic conflict and inadequate municipal
services also act as indicators of neighbourhood decay and incivility. Certain of the
abovementioned incivilities are, according to Lewis and Maxfield (1980:180), youth
related, i.e. drugs, vandalism, gang activity and teenagers hanging around.
Respondents living in neighbourhoods with a large number of teenagers reported
greater concem with youth-related incivilities than with crimes of assault and rape. The
authors concluded that fear of crime may be directly affected by concern for local
adolescents. Later research by Smith and Jarjoura (1989:682) confirmed the
relationship between victimisation and youth, as they concluded that neighbourhoods
with high victimisation rates can be characterized by"... greater family disruption,lower
socio-economic status, or a relatively larger population of youth".
Neighbourhood incivilities produce anxiety among neighbourhood residents and can
easily generate fear. Many of the incivilities are not criminal offences which can be
controlled bythe traditional criminal justice system. Although some ofthe incivilities will
attract police attention, e.g. gang activity, drug use or vandalism, police are not required
to deal with less offensive neighbourhood incivilities - such as abandoned buildings,
uncollected garbage or noisy neighbours. Kelling and Wilson (1982:29-38) proposed
that the police are responsible for eliminating such incivilities as rowdy teenagers,
drunkards appearing in public, panhandlers, etc. who create fear and lead to
neighbourhood decay. These authors coined the broken windows metaphor to refer to
neighbourhood deterioration - a sign that nobody cares. Once a window is broken and
left unrepaired, other windows are soon broken. Similarly (and analogous to this
viewpoint), once a 'social window' is broken and left unrepaired (such as vagrancy,
vandalism, loitering, and public drunkenness), Regoli and Hewitt (1996), state that "...
(t)his sets in motion a downward spiral of deterioration ... (g)radually, crime in the
neighbourhood increases" (Regoli & Hewitt 1996:231).
Incivilities define a perceived problem with social disorganisation in the neighbourhood
and in the community at large. Hunter (in Lewis &Salem 1986:9) views fear within the
8
urban environment as a fear of social disorder that "... results more from experiencing
incivility than from direct experiences with crime". Incivility then reflects circumstances
suggesting that the neighbourhood is unsafe and that the mechanisms for exercising
social control are no longer effective. Lewis and Maxfield (1980: 185), in their analysis
of fear in various neighbourhoods in Chicago, found that people who are concerned
about crime are also concerned about incivility and social order. Their evidence
suggests that it is a continuation of incivility and concern with crime that affects
neighbourhood fear levels. However, the belief is held by various authors (Box et al.
1988; Lewis & Maxfield 1980) that if a sense of community well-being and co-operation
can be developed, the fear of crime will be reduced. If order can be re-established, the
neighbourhood will become a safe place to live in once more.
1.2.2.3 Neighbourhood cohesion
Within neighbourhoods, certain conditions exist which provide the residents with
information regarding the safety of their environment. One of these conditions is
neighbourhood incivilities, and the other is the degree of cohesiveness (measured by
the amount of solidarity, integration, trust, support, involvement and co-operation)
present within the community.
In their analysis of the impact of social integration on fear of crime, Lewis and Salem
(1986:84) propose that in neighbourhoods where there is a high degree of social
integration, residents feel that they are part of the neighbourhood, and also tend to
develop a friendship network within their own community. Bonds of friendship are
established through informal neighbouring activities that increase over a period oftime.
Such integration provides a support system for neighbourhood residents. The support
involves a willingness to help each other, and this engenders feelings of security and
safety. Various researchers (Box et al. 1988; Hartnagel1979; Kennedy & Silverman
1985) are of the opinion that a lack of social support, friendship networks and co
operation could lead residents to feel isolated and afraid. Residents who are
uninvolved in their community tend to be more fearful of crime than those who are
involved. Conklin (1975:141) reported in this regard that areas with less crime showed
greatersocial solidarity, social interaction between neighbours, and participation in local
9
organisations.
Interaction between neighbours generates trust and interdependence. When
neighbours know each other they are able to guard each other from harm through
informal social control mechanisms. However, when there is limited contact between
neighbours, mistrust and lack of co-operation prevail and, consequently the informal
mechanisms of social control are not established. Lack of informal social control may
result in an increase in the crime rate and a resulting increase in the fear of crime.
Thus, if cohesiveness between neighbours and within the community is established,
the fear of crime is likely to be reduced (Box et al. 1988; Garofalo & Laub 1978;
Lewis &Salem 1986; Toseland 1982).
Particular emphasis is placed on informal mechanism for social control when reference
is made to cohesiveness. However, as this is both a consequence of, and a solution
to, the problem of fear of crime, greater attention will be paid to it in later chapters.
1.2.3 Actual versus perceived risk of victimisation
Various researchers (Baumer 1985; Clemente & Kleiman 1977; Garofalo 1979 and
Toseland 1982) have noted that discrepancies exist between the actual rate of
victimisation and the perceived risk of victimisation and, in tum, their relationship to the
fear of crime. A classic example of this discrepancy is that although the elderly have
a low rate of actual victimisation, they perceive their risk of victimisation as greater, and
are therefore more frightened than other age groups.
Conklin (1975:17) reports that people tend to react to their perception of social
problems rather than to the problems themselves. With regard to crime, perceptions
are influenced by officially reported rates of crime, but neither the perceptions nor the
reported rates reflect the actual amount of crime within the society. The information
individuals receive and the ideas they form about crime can create the impression that
crime is escalating. As individuals grow more anxious about the crime rate the more
fearful they become, as the perception is formed that crime is becoming a personal
threat. Lab (1988:7) opines that fear of crime is not related to actual levels of
10
victimisation. Rather, levels of fear increase faster and appear to exceed the actual
levels of victimisation. People then respond to factors which are not related to the
actual chance of being victimised. The imbalance between actual levels and perceived
risk of victimisation could be explained as follows:
• Direct knowledge about someone who has been victimized, or simply being told
by someone else about a harmful act, may elicit a sympathetic. reaction and
empathetic fear of crime. Indirect knowledge about crime may result from real
or dramatic depictions of crime in the mass media.
• Ordinate levels of fear may result from potential harm during victimisation
encounters. For example, the elderly and women are more fearful of
victimisation because of their vulnerability.
• Actual levels of crime in society also influence the level of fear through
sensational reporting of crime in the mass media (Lab 1988:8-9).
In conclusion, Baumer (1985:251) notes "... that overall fear is a response to
subjectively defined risk and personal vulnerability".
1.2.4 Previous victimisation
Knowledge of crime, whether directly or indirectly obtained, affects people's fear of
crime. Various authors (Skogan 1987, Baumer 1985; Garofalo 1978) agree that a
simplistic relationship does not exit between previous victimisation and fear. Rather,
any link between previous victimisation and fear of crime must take into account the
time-lapse between the victimisation and the research study, the type of victimisation
(Le.either property or personal), and possible precautionary measures instituted by the
victim after the victimisation experience.
Garofalo (1979:87) and Baumer (1985:250) stated that personal experience of
victimisation can only be used to explain the fear of crime if it occurred in a certain
reference period. Furthermore, Garofalo (1979:87) opined that "... victimizations that
occurred more than twelve months before the interview - unless they were extremely
serious - would have little affect on fear of crime at the time of the interview". These
11
authors also reported that victims are more fearful than non-victims. However, the
number of victims is relatively small compared to the number of non-victims, and thus
their higher level of fear does not affect the overall level of fear of the general
population.
Individuals who have suffered previous property victimisation are more fearful of crime
than those who have not been victimised (Toseland, 1982:106). This fear may be due
to the violation of a person's security, and the fear that the next time the person may
be present and become a victim of a personal crime.
In general, the findings tend to be inconclusive as to the relationship between previous
victimisation and fear of crime. It must be noted, however that victims will tend to take
more precautionary action than non-victims. This could alleviate fear and enable the
victim to neutralise his/her experience. Box et al. (1988:351) found that the effect of
knowing someone who has beenvictimised is likely to increase the level of fear for non
victims. They also linked previous victimisation to the level of incivility in the
neighbourhood. Victims who live in areas of high incivility generally have a higher level
of fear. The reverse is also true for victims living in areas of low incivility. The authors
propose that the victim in the latter case is able to neutralise his/her experience.
1.2.5 Types of crime
Assessment of the fear ofcrime must take into account the variety of crimes which exist
in society. A distinction can be drawn between property crimes and personal crimes.
Property crimes refer to crimes in which the cases accrued are due to loss or damage
to property, e.g. burglary, larceny and car theft. Personal crimes include attempted and
completed acts of assault, mugging, rape and murder. Ferraro and La Grange
(1987:80) suggest that not all criminal offences pose similar levels of threat to
individuals. However, it is generally agreed that offences such as robbery, rape and
aggravated assault (which are categorised under the heading of street crimes) tend to
evoke the greatestfearof all. Various authors (Garofalo & Laub 1978; Miethe, Stafford
&Long 1987) agree that street crime not only victimises individuals but prevents the
formation and maintenance of community life. Street crime reduces interaction and
12
levels of mutual trust, thus having an erosive effect on the quality of life. Thus it is the
individual's assessment of street crime that has a direct influence on the level of fear.
Toseland (1982:206) found that personal victimisation is associated with the fear of
crime. The level of fear experienced by victims of a burglary may be due to the person
feeling that the next time his or her residence is burgled he or she may be present, and
become a victim ofa personal crime. The author noted, however, that eviqence on the
effects of muggings, beatings and other crimes was inconclusive as less than 5 per
cent of his respondents had reported being victimised in this manner.
However, Ferraro and La Grange (1987:80) commentthat any attempt to measure fear
of crime should make "... explicit reference to crime". Specific victimisations must be
used to assess an individual's fear reaction. These sentiments were echoed by Smith
and Glanz (1989:89) who conclude that a shortcoming of their own study on fear of
crime is that no distinction had been drawn between fear of personal crime and fear of
property crime. Thus any future research should clarify this distinction.
1.2.6 Mass media
Sources of fear of crime are many and varied. As a victim, one's physical vulnerability
and environmental characteristics all seem to influence fear. However, most people
have neither been a victim nor a witness to crime. This implies that the perception of
crime that individuals develop may be due to indirect sources. One of these sources is
the mass media.
According to Conklin (1975:20), the climate of concem about crime can be generated
or reinforced by information from the mass media. This information can create the
impression that crime is a threat and result in an increase in fear. Baumer (1978:259)
indicates that media reports of crime tend to overemphasize serious crimes or those of
personal violence. Williams and Dickinson (1993:49) confirm these results in their
analysis of crime reporting in British newspapers. They concluded that people who
read newspapers which contain crime reports show more fear of crime. However, they
wamed that the causal link between newspapers and fear of crime is not clear.
13
Garofalo (1978:91) opines that media depictions of crime does have some effects on
the public's fear of crime, but that the effect of the media on fear of crime is difficult to
quantify.
When looking for a link between the mass media and fear of crime consideration must
be given to other influences as well and the compounded effect they may ~ave on fear
of crime.
1.2.7 Effectiveness of the criminal justice system
The nature of the image of the police is determined by their relationship with the public.
The image is based on the public's perception of police performance, l.e, their delivery
of a service. A positive image will promote willing participation by the community in
combating crime; while a negative image places powerstructure/orderofthe community
under suspicion (Van Heerden 1976:140).
Although the majority of the population never comes into direct contact with the police,
their knowledge of police activity is based on personal observation at street level and
media representations of the police.
The main goal of the police is to prevent crime (Van Heerden 1976:156). Crime
weakens the fabric of social life and also reduces the public's support for the law, their
willingness to report crime and increases the public's criticism of the police. If people
believe that the police are effective, that is, that they apprehend criminals, respond to
calls quickly and have a physical presence, then they are less likely to fear crime. The
findings of various authors (Baumer 1985; Box et al. 1988 and Conklin 1975) indicate
that individuals who have confidence in the functioning oftheir local police have a lower
level of fear than individuals who have no confidence in the police. Within the South
African context, Neser, Geldenhuys, Stevens, Grobbelaarand Ladikos (1993:41) found
that individuals who have a general fear of crime have little confidence in the police and
in the courts. When people lack confidence in the criminal justice system they will be
unwilling to report a crime or assist the police in any way. If this lack of support
14
becomes known to criminals, they are more likely to perpetrate crime, as their risk of
apprehension is lower. This in tum can lead to a higher crime rate, which produces an
increasing reliance on the police to combat crime and also increases people's fear of
crime.
1.2.8 Precautionary measures
Precautionary measures refer to those measures taken, before or after criminal
victimisation, to protect the person or property against any future victimisation. These
precautionary measures refer to defensive and offensive responses to crime and the
fear of crime. Defensive responses involve avoidance behaviour on the part of the
individual (e.g. not going out at night or alone) and offensive responses which involve
active measures of crime prevention (e.g. purchasing a firearm, installing burglar
proofing and joining a neighbourhood watch programme). These measures can
influence the individual's fear of crime, as they are implemented to make the individual
feel safer.
1.3 MOTIVATION OF THE STUDY
The study to be undertaken is regarded as necessary to our understanding and
management of the fear of criminal victimisation.
The following served as the motivation for the undertaking of this study:
(i) With the exception of Schurink and Strijdom (1976) and Schurink and Prinsloo
(1978), Glanz (1989), Smith and Glanz (1989), Pretorius (1994), Neser et al.
(1993) and Maree (1993) research on the fear of crime in South Africa is limited.
(ii) The physical area of the research is the developing area of Richards Bay and
Empangeni in Kwazulu-Natal. Although this area can be regarded as rural, its
growth and political background ensure that violence (whether politically or
criminally motivated) is a daily reality.
15
(iii) As crime is omnipresent, it is the opinion of the researcher that fear of crime is
pervasive in the Richards Bay and Empangeni community. A study of this social
phenomenon therefore becomes a necessity.
1.4. AIMS OF THE STUDY
Fear of crime is omnipresent. South Africans are confronted daily with news of criminal
activities and the actual experience of criminal victimisation. In the light of the violent
times we live in and which will, no doubt, continue for some time and possibly worsen,
it is the aim of the research study to highlight the fear of crime as it presently exists in
the Richards Bay and Empangeni area and to recommend what can be done to regain
a life of quality for those affected by the fear of crime.
For the purpose of the present study, the following objectives are formulated:-
(i) To bridge the gap in our substantive knowledge regarding the fear of crime.
(ii) To statistically measure and describe the nature and extent of the fear of crime.
(iii) To determine the factors influencing the fear of crime.
(iv) To account for differences and variations in the fear of crime according to age,
gender, household composition, type of housing, previous victimisation, crime
as a social problem, the role of the police and neighbourhood involvement.
(v) To statistically reflect on the ecological distribution of crime and the fear ofcrime.
(vi) To make recommendations for the prevention ofcriminal victimisation that might
directly influence the quality of life.
1.5 RESEARCH APPROACH
The nature of the research approach is exploratory, descriptive and comparative. The
research is exploratory in that it seeks to gather information and gain insight into the
phenomenon of the fear of crime, which is considered to be a major social problem. It
is descriptive in that it seeks to identify and verify the influence ofvarious factors on the
fear of crime. The research is also comparative in that it makes a systematic and
explicit comparison between the risk and the actual experience ofvictim isation, the age,
16
gender and race differences in the fear of crime, and other important variables.
The operational framework followed in this research included the following:
Firstly, a broad literature study was undertaken in order to ascertain the nature of the
fear ofcrime. This literature study included both intemational and national publications.
Research conducted by the following authors was closely scrutinised:
(i) Ferraro, K.F. and La Grange, R.L. 1987. The measurement of fear of crime.
Sociological Inquiry, 57:70-101.
(ii) Garofalo, T. 1978. Victimization and fear of crime. Journal ofResearch in Crime
and Delinquency, 16:80-97.
(iii) Glanz, L. 1989. Coping With Crime: The South African Public's Perception of
and Reaction to Crime. (Report ASS/BBS - 9). Pretoria: Human Sciences
Research Council.
(iv) Glanz, L. 1992. Fear of crime among the elderly in the Cape Peninsula. Acta
Criminologica, 5(2):16-26.
(v) Skogan, W.G. 1987. The impactofvictim isation on fear. Crime and Delinquency,
33:135-154.
Secondly, a precoded, structured questionnaire was developed to gather information
about people's fear of crime.
Thirdly, the questionnaire was distributed to a non-probability sample of residents in the
Richards Bay and Empangeni area.
Fourthly, the raw data was processed and presented in frequency distribution tables.
Lastly, the Spearman Rank-OrderCorrelation Coefficient (rho), the Pearson Correlation
17
Coefficient (r) and the F-test will be used to test the following hypotheses:
Hypothesis 1:
Hypothesis 2:
Hypothesis 3:
Hypothesis 4:
Hypothesis 5:
Hypothesis 6:
Hypothesis 7:
Hypothesis 8:
Hypothesis 9:
Hypothesis 10:
There is a relationship between age and the fear of crime.
There are significant differences between male and female
respondents and their fear of crime.
There is a relationship between household construction and the
fear of crime.
There are significant differences between the type of housing of a
respondent and the respondents fear of crime.
There are significant differences in the fear of crime between
respondents who have been victimised (victims) and those who
have not (non-victims).
There is a relationship between the respondents rating of crime as
a social problem and the fear of crime.
The opinion respondents have of the service rendered by police
will influence how they rate different crimes as a social problem in
their area of residence.
The role of the police influences the fear of crime.
There are significant differences between male and female
respondents and their experiences with the police.
There are significant differences in the fear of crime between
respondents who are involved in their neighbourhoods and those
who are uninvolved.
1.6 DELIMITATION OF RESEARCH
1.6.1 Spatial delimitation
For the purpose of the proposed study, it has been decided to limit the area of study to
the Richards Bay and Empangeni region of the KwaZulu-Natal province (also known
as North Zululand).
18
1.6.2 Qualitative delimitation
Respondents, irrespective of race, residing in the above-mentioned region will be
included in the study. Efforts will be made to secure respondents with households only,
so as to assess the impact of fear of crime and crime risk as far as property crimes are
concerned. Attempts will be made to ensure an equivalent distribution of gender by
requesting both male and female residents of households to complete the
questionnaire.
1.6.3 Quantitative delimitation
Respondents will be randomly selected and surveyed by means of approved scientific
sampling techniques. It is the intention of the researcher to select a group that will not
exceed one thousand (1 000) respondents.
1.7 DEFINITION OF CONCEPTS
The following concepts will be defined in this section, namely; socio criminology, crime,
fear and fear of crime.
1.7.1 Socio-criminology
The title of this study is Fear of Crime: A Socio-criminologicallnvestigation". Therefore,
it becomes necessary to highlight this field of study of criminology. Socio-criminology
approaches the study of crime and crime-related issues from a community and/or
cultural perspective. Causes and consequences ofcrime and crime-related issues are
sought in society, communal life and social conditions. Crime is a social phenomenon
and its explanation can be sought in the relationship between people, groups and
communities.
According to Van derWalt, Cronje and Smit (1982:44), socio-criminologygives attention
to the following, namely:
19
+ groups as factors in crime
+ social classes
+ race and culture
+ geographical elements
+ economic factors
+ mass communication
+ relationship between social problems
+ gender and age as factors in crime.
Crime thus is seen as part of the life world of persons, and this extends to the fear of
crime.
1.7.2 Crime
Crime can refer to a wide range of activities which include violent personal crime,
property crime, organised crime and political crime. Van der Walt et al. (1982:22)
distinguish between crime defined juridically and crime defined in a non- juridical sense.
Judicially, crime can be defined as •... a contravention ofthe law to which a punishment
is attached and imposed by the state" (Van der Walt et al. 1982:24). In other words,
crime is any act which is forbidden by law, and, if detected is likely to be punished.
Non-juridically, crime can be viewed as an act of anti-social behaviour, which
influences the quality of life of the individual, his/her community and society at large.
Van derWalt et al. (1982:31) define crime in a non juridical sense as •... an antisocial
act entailing a threat to and a breach or violation of the stability and security of a
community and its individual members".-'
Society is a network of interacting persons, groups and institutions. Interaction involves
establishing relations between these individuals, groups and institutions. Crime is an
act which violates these social relations, and it is this violation which harms the
individual and society at large. Therefore, crime in its non-juridical sense (l.e. when it
is perceived as a personal threat) leads to feelings of fear and mistrust.
20
1.7.3 Fear
The concept fear can be viewed from various points of view. Silberman (in Ferraro &
La Grange 1987:72) describes fear from a physiological point of view as "... a series of
complex changes in bodily functioning that alerts an individual to potential danger".
Fear can either stimulate the individual to perform major feats or it can incapacitate the
individual. However, there is also an internal reaction which Du Bow, McCabe and
Kaplan (in Ferraro & La Grange 1987:73) describe as feelings of violation,
hopelessness, anger, outrage and frustration.
Fear can also be considered as a response to certain stimuli encountered in the
environment. Warr (1990:892) refers to the work of Goffman in an attempt to clarify
how individuals respond to their environment when they encounterstimuli orcues which
signal danger. If no danger cues are perceived, the individual continues his/her normal
activities. Ifdangercues are perceived, however, the environment is viewed as unsafe,
which can result in feelings of vulnerability.
Vulnerability is also associated with a state of powerlessness. This implies that the
individual feels an inability to control his/her future, and a general anxiety about their
social environment prevails. This state of powerlessness can manifest itself in the fear
of crime.
Baumer (1985:251) states the following in regard to fear:
" overall fear is a response to subjectively defined risk and personal
vulnerability".
The consequences offear are efequal importance. Fear becomes dysfunctional to the
individual when the individual remains afraid regardless of the circumstances. Fear will
then affect the individual's ability to anticipate danger and estimate the risk of danger
in their environment. Once the individual is afraid, social relations become affected,
and this has implications for the community and society as a whole.
21
1.7.4 Fear of crime
Fear of crime has a wide range of meanings. Although each researcher defines the
concept to suit his/her research purpose, they all concur that fear itself remainsd~d
as anticipating the occurrence of a criminal event. Fear of crime then becomes a
consequence of the potential for victimisation.
Furstenberg (1971:603) differentiates between the fear of crime as ..... a measure of
self-perceived chances of victimisation..." and fear of crime as a concemed reaction to
crime. Fear, refers to the anxiety associated with perceived risk; while concern refers
to the cognitive consideration of the seriousness of crime as a social problem.
Keane (1992:217) uses the terms formless fear and concrete fear in a distinction
similar to Furstenberg's. Formless fear reflects a perception of vulnerability to crime
either of a physical or socio-economic nature or a generalised feeling that one is
unsafe. Concrete fear refers to the perceived risk ofvictimisation and the type of crime
likely to occur or fear of specific crimes.
According to Van Dijk (1979:72), fear of crime contains four components, namely:
• Cognitive component. This refers to the perceptions of personal risk of
victimisation and the crime rate in the neighbourhood.
• Normative component, which refers to the concern about personal safety and
the security of members of the community.
• Emotional component, which relates to feelings of anxiety.
• Behavioural component, which refers to actual steps taken for the protection of
life and property, and the adjustments made based on the impact of fear of
crime.
Ferraro and La Grange (1987:76) warn, however, that perceived risk of victimisation is
different from the feeling of fear of victimisation. Therefore they conclude that fear of
crime refers exclusively to the negative emotional reaction generated by crime or
symbols associated with crime. Warr (1990:891) also prefers the term "fear of criminal
victimisation" to the term "fear of crime". It is left, however, to Baumer (1985:242) who
22
describes fear of crime as ..... an essentially rational response to a subjectively defined
threat of harm". The most fearful, according to Baumer (1985), are those who:
• perceive a threat
+ are vulnerable to attack
+ have been victimised
+ have friends who are victims
+ live in dangerous neighbourhoods
+ lack social bonds
+ are physically or socially vulnerable (Baumer, 1985:243).
1.8 ORGANISATION OF STUDY
In Chapter 2, the various models of fear and the research findings which substantiate
these models are discussed.
In Chapter 3, the research methodology of this research study will be presented.
In Chapter 4, 5, 6 and 7 the hypotheses formulated in this chapter will be tested.
In Chapter 8, a description of the precautionary measures taken by the respondents will
be given
In Chapter 9, the conclusions and recommendations of this study will be presented.
1.9 SUMMARY
In this chapter, an attempt has been made to introduce the concept of fear of crime, to
highlight the factors which affect fear of crime, and outline the basic aims and research
methodology of the study. The factors affecting the fear of crime have been classified
undereight major headings, namely vulnerability, environmental conditions, actual and, ..,r
perceived risk of victimisation, previous victimisation, types of crime, mass media, the
effectiveness of the criminal justice system and precautionary measures taken by
individuals. Research has indicated that a few groups can be identified as being
23
vulnerable, namely the old, women, the poor and those belonging to ethnic minorities.
Reasons for this vulnerability include the inability of the vulnerable to react physically,
and to replace property which is lost. The vulnerable may also be unable to cope with
the effects of victimisation. People may also become fearful of victimisation because
they perceive their environments to be threatening. The size of the community is
related to fear of crime in that as the move is made from city centre to suburb to rural
areas, fear of crime decreases.
Neighbourhoods characterised by incivilities which include vandalism, drug use,
teenagers hanging around, abandoned houses, ethnic conflict, and lack of municipal
services have residents with high levels of fear of, and concern about, crime.
Neighbourhoods that lack cohesion also tend to intensify the residents' fear of crime.
Actual risk and perceived risk of victimisation are also related to fear of crime. It was
noticed that people who perceive themselves at high risk of victimisation are not
actually at risk. For example, the elderly actually have a low rate of victimisation, but
they perceive themselves to be more vulnerable and therefore have a high level of fear.
The level of fear is often unreliable in relation to the actual risk of victimisation, and is
thus based on the individual's subjective evaluation of vulnerability.
Little research has been done on the exact relationship between fear of crime and the
types of crime. A distinction can be made between personal crimes and property
crimes. Most research done has been based on personal crimes, which are viewed by
people as more threatening than property crimes. However, property crimes involve an
invasion of privacy and increased anxiety about a possible return of the offenders while
the offended is not home. This could lead to increased fear on the partofthe offended.
Previous victimisation has been noted as having a contradictory relationship with fear
ofcrime. Some results have indicated that knowledge about victirnisation increases the
level of fear. However, other research findings show that victims tend to negate the
effects of victimisation after a period of time, and become no more afraid than non
victims. Measurement problems abound because under normal circumstances, the
respondents of most research studies are mainly non-victims. One source of crime
24

information which might affect fear is the mass media. Media reports of crime tend to
be sensationalised, and too much emphasis is placed on serious crime. People who
react to newspapers whose content is crime related tend to be more fearful of crime.
However, researchers have noted that much work still has to be done on this topic.
When the criminal justice system is held to be efficient and effective in its protection of
citizens, fear of crime is lessened. However, when systems of formal control are unable
to protect their citizens this leads to the development of informal mechanisms of social
control. Mechanisms of social control, both formal or informal, will affect people's
perception of crime and fear of crime.
25
CHAPTER 2
MODELS OF VICTIMOLOGY AND THE FEAR OF CRIME
2.1 INTRODUCTION
Victimisation and the fear ofvictimisation damages the individual, families, businesses
and communities. and can be regarded as a societal problem.
Whenever a person is victimised by crime, the individual, his/her family, his/her friends,
colleagues and acquaintances are also victimised. as they are reminded that they too
are vulnerable (Trojanowicz & Bucqueroux 1990:130). Crime and the fear of crime
exact a toll, not only in active losses incurred by the victimised, their families and the
community but also in the necessitated change of behaviour and lifestyle that are forced
on victims and potential victims. Everyone is a potential victim of a criminal act and
therefore it is deemed necessary to expose the study of victims. potential or actual.
2.2 VICTIMISATION
Victimisation is defined by Cloete (in Cloete & Stevens 1990:39) as the intentional and
unlawful action ofa criminal toward an innocent person. It is by definition characterised
by physical, emotional and/or financial harm and represents an asymmetrical
relationship that is exploitative, parasitical, oppressive and alienating.
According to Karmen (1984:3), after many years of neglect, the study of victims has
been rediscovered by social scientists and the criminal justice system.
2.2.1 Historical overview of victimology
The systematic study of victims and victimisation only began in the USA in the 1940s.
The first scientific contribution towards victimology was the study by Von Hentig called
The CriminalandHis Victim (1948). This work suggested that some persons are prone
26
to victimisation as a result of their personality or demographic characteristics (Brown,
Esbensen & Geis 1991:32).
The work of Schafer, Victimology, The Victim and His Criminal (1977), also highlighted
the role of victims in the criminal process, especially the fact that their actions may
precipitate crime.
According to Karmen (1984:2), the plight of the victim was also rediscovered through
the influence of the following:
+ Mass Media: the experience of the victim is often sensationalised by the media.
Crime is portrayed as rampant in society, and the general public can read about,
view, listen to and empathise with the victims' suffering. However, the media
have a tendency to distort reality by creating false impressions of both the victim
and offender, by portraying life as violent and exploiting the "story" for
commercial gain. Karmen (1984:5) opines that avid viewers of television
become concemed about crime and wary of strangers, i.e, a relationship
between fear of crime and the mass media is possible.
+ Social Movements: victims differ in their life stories, but the Women's Movement,
Civil Rights Movement and the Law and Order Movement have contributed to
the growing awareness of the victim. In the U.SA, victims of rape, wife beating,
sexual harassment and incest were rediscovered by the Feminist Movement in
the early 1960s. These offences were viewed as oppressing all women and
caused by economic and racial disadvantages. The male-dominated criminal
justice system was viewed as being unsympathetic, and after concerted efforts
by the Women's Movement attention was finally given to the victims of male
versus female offences. Closely related to the Feminist Movement is the
Children's Rights Movement, Gay Rights Movement and Self-Help Movement.
In the USA, civil rights groups in the 1960, rallied to assist victims of racist
violence and protect victims ofpolice brutality, miscarriage ofjustice, and attacks
27
by the Ku Klux Klan. In the 1970s the plight of victims of black-on-black violence
was addressed as this form of crime was seen to be "... poisoning the quality of
life in black communities ... destroying houses, driving away jobs and closing
down services" (Karmen 1984:21). Fear levels were also reported as being
higher in the ghettos than in white neighbourhoods. The contribution of these
movements has been to promote increased police professionalism and
guarantee the equal protection of the law to all victims.
In the USA, the law and order movement in the mid 1960s campaigned for the
restoration of "law and order" and a crackdown on crime. The criminal justice
system was viewed as being "too soft" in its handling of criminals, and its critics
called for a victim-oriented criminal justice system.
• Social Scientists: although social scientists have been aware of the relationship
between criminal and victim, it was only in the 1940s that victimology finally
came into its own.
Similar trends have followed in South African society. Our mass media,
especially television, have sensationalised crime and violence. At present,
almost every news programme contains a report on crime and violence, and the
government's concern about these issues.
People Opposing Women Abuse (established originally as Rape Crisis South
Africa in 1977) has succeeded in highlighting the plight of women as victims of
violence within and outside the home setting. Child Line was established in
1983 in Durban by the Department of Health Services and Welfare as a method
of protecting children from all forms of abuse. The Child Protection Unit of the
South African Police was established in 1986 to handle child abuse cases. In
1994, South Africans of all races went to vote for a political system of their
choice. The hope was expressed that injustices, racial tension and police
brutality would cease. However, to what extent victims of racial violence exist
is unknown. Ethnic violence (clashes between rival ethnic and tribal groups)
28
persists.
The moratorium on the Death Penalty, introduced in 1995, has resulted in a
multitude of feelings. Many people feel that the criminal justice system is now
a farce, and that criminals are protected but not the victims. Others, especially
groups such as Lawyers for Human Rights, consider that the ban is justified.
Whatever the feelings are, the present situation must be analysed, as people's
perceptions of the validity and reliability of the criminal justice system directly
affect the fear of crime.
2.2.2 Victim typologies
The concept of victim can be traced back to ancient cultures. In the original meaning
of the term, a victim was a person or criminal that was put to death during a ceremony
in order to appease some supernatural power or deity. Today's usage of the term
victim encompasses many facets, and the victim typologies ofYoung-Rifai, Mannheim,
Schafer and Van der Westhuizen will be highlighted.
2.2.2.1 Young-Rifai's victim typology
Young-Rifai (in Schurink et al. 1992:38) suggests the following categorisation of victims:
• Victims who suffer from physical or mental handicap.
• Victims who have suffered owinq to a natural catastrophe, e.g. victims of floods.
• Victims who have suffered through interaction with their environment, e.g. air
pollution, water pollution.
• Victims who have suffered owing to the technological environment, e.g. in car
accidents.
• Victims who have suffered because ofthe social environment in which they have
found themselves e.g. crime victims.
It is the last type of victim who is of interest in this study. Karmen (1984:1) defines a
crime victim as a person or entity that has suffered because of illegal acts.
29
2.2.2.2 Mannheim's victim typology
Mannheim's typology of crime victims revolves around the criterion of involvement,
which is divided into direct, indirect and latent involvement of the victim in the crime
situation, thereby adhering to the demands or requirements of completeness,
universality and meaningfulness. However, this typology is not mutually exclusive,
because though a person may be regarded as a direct or indirect victim of crime. it does
not mean that he/she cannot at the same time be labelled a latent victim of crime. This
typology does not meet the requirement of pragmatism because it does not take into
account the share of guilt of the parties involved (criminal and victim) (Van der Walt et
al. 1985:11).
(i) Victims of crime (indirect victims)
These are victims who, by virtue of the unlawful actions ofothers, are maliciously
harmed. They include the following:
Firstly, the criminal who is the victim of a crime because he/she has to bear both
the penal and non-penal consequences of his/her own crime.
Secondly, the direct dependents of the person whose body, life, honour and
goods are affected by the criminal act are regarded as indirect victims of the
crime.
Thirdly, the rest of society, consisting of members ofthe criminal's family, his/her
group associates, his/hercommunity, etc. are also indirect victims (Van derWalt
et al. 1985:34).
30
(ii) Victims of the criminal (direct victims)
These types of victims are those whose body, life, honour and goods are
affected in the criminal situation. By definition, the criminal can therefore be
his/her own victim, as in the case of suicide. However, suicide does not qualify
as a crime in South Africa, and therefore a study of the direct victim of criminal
violence involves firstly, the criminal who murders a fellow-map, and then
commits suicide. (This person is regarded as being his/her own victim. An
example is family murders). Secondly, all those people who are, for example,
killed, robbed, bereaved, assaulted, maimed, etc. in the crime situation can be
depicted as the direct victims of the criminal.
(iii) Latent victims
Every member of society is a potential victim. Everyone in society runs the risk
of being robbed, bereaved, assaulted or even killed by criminals. Likewise,
certain other persons can be referred to as latent victims, such as:
+
+
2.2.2.3
Firstly, those persons who through the nature of their professions, are
regarded as more vulnerable than others, e.g. policemen, taxi drivers,
cashiers and clerks transporting large sums of money, petrol dispensers
and prostitutes.
Secondly, those persons suffering from personality deviance and who
consciously or unconsciously wish to be victims, for example those who
derive intense pleasure and satisfaction from pain.
Schafer's victim typology
Schafer (1977:45-47) classifies victims of crime in terms of responsibility. He regards
this concept as decisive in determining the criminal-victim relationship. In this regard,
his typology could be regarded as comprehensive because it can always be linked with
either the victim or the criminal, or both depending on the responsibility of each party.
31
With regard to the biologically and socially poorly-integrated victims in society, Schafer
argues that the ruling authority as well as the community are to be held responsible for
the victim's misfortune. This also applies to the criminal's unlawful action. He makes,
however, no mention anywhere of why these two categories of victim should not also
bear some measure of responsibility, given the fact that they could just as well be
regarded as precipitating victims. This would mean placing a distinct responsibility on
such people without abrogating the responsibility of the criminal and/or the community
or government. In this way, victims belonging to these two categories are reminded
that they should at least adopt some sort of responsibility for protecting themselves.
(i) The innocent victim
According to Schafer (1979:45) the innocent victim has no engagement with the
criminal- except for the crime committed against him/her. He regards the victim
as an accidental choice, for instance where the victim is involved in a crime
situation where he/she necessarily (but accidentally) becomes a victim, e.g.
during a bank robbery. The criminal has to bear the sole responsibility for the
crime.
(ii) The defiant victim
This type of victim does something to the criminal which forces the latter to
commit a crime against the victim. A broken promise, the grossest insult,
fonning a liaison with another's lover, or similar offences lead the offender to
cause the victim harm. In the case of this category, responsibility is largely
borne by both parties.
(iii) The precipitation victim
Precipitation victims are regarded as innocent, but might through their own
thoughtless actions taunt or entice the offender. Forexample those who wander
alone in a deserted and lonely place (Schafer 1977:46).
32
(iv) The biologically weak victim types
This type of victim's bodily condition and physical and mental attributes make the
victim susceptible to crime, e.g. children, the elderly, women, the disabled and
the mentally ill. According to Schafer (1977:46-47), these victims actually bring
crime upon themselves, but cannot avoid it, and forthis reason, responsibility for
the criminal act is apportioned as follows:
• On the one hand, the criminal has to bear the major portion of the guilt for
taking unlawful action
• On the other hand, society or its leaders are partially to be blamed for
having not made adequate provision to protect such people.
(v) The socially poorly-integrated victim
Normally, this type of victim is not accepted by others as a full and equal
member of society. Among these are the following victim types: immigrants,
ethnic minority groups (e.g. Hispanics in the United States), people who belong
to specific religious denominations, or who are of low social status. Schafer
(1977:47) contends that these victims are in fact gUiltless of the crimes
committed against them. Again, the responsibility ought to be equally divided
between the criminal and the community.
(vi) The victim who victimises himself/herself
This type of victim is regarded as his/her own "criminal". Victims who may be
classified in this category are drug addicts, alcoholics, homosexuals, gamblers
and masochists. These victims not only harm themselves, but also the interests
of the community. Responsibility for the crime rests, therefore, totally on the
shoulders of the victim himself (or herself).
33
(vii) The political victim
These victims suffer at the hands of their political opponents. In a certain sense,
the political victim himselfgives rise to his victimisation - especially by striving for
a particular position.
2.2.2.4 Van der Westhuizen's victim typology
Van derWesthuizen (1981:123-125) uses the susceptibility of the potential victim of
crime as criterion for the classification of victims. In terms of this criterion, the victim's
activities, predisposition, hereditary factors, personality traits, habits, religion, vices, life
philosophy and culture, are all considered in order to classify the victims in terms of
susceptibility. The typology is, however, not mutually exclusive and consists of the
following categories of victims:
(i) The Defenceless victims
Defenceless victims are those who are defenceless, physically, mentally and/or
totally, againstthe criminal. Examples are: women, children, the elderly, the ill,
disabled persons, the naive, people in mourning, the lonely, the emotionally
unstable and the dying.
(ii) Ostentatious victims
To this type of victim belong people who have an exaggerated desire to display
everything they possess, e.g. women who flaunt their jewellery, money,
possessions and even their bodies by means of meagre apparel.
(iii) Sensual victims
These victims are people who opt for devious sexual practices, for example,
love-making in deserted places, masochism, adultery, whoring, homosexual
34
activities, sexual orgies and sexual perversions.
(iv) Covetous victims
These victims are those who exploit their fellow-man out of greed, and as a
resultfall prey to it themselves. Crimes emanating from these situations go hand
in hand with financial malpractices such as extortion, cheating, frau.d, swindling,
blackmailing, and the embezzlement of trust funds.
(v) Aimless victims
This category comprises persons who lie about or wander aimlessly, e.g.
hoboes, beggars, tramps and army deserters.
(vi) Aggressive victims
These victims make themselves guilty of provoking the criminal by way ofgibes,
suggestions, insults, quarrelling, swearing, threatening and assaulting the
criminal. To this category belong mainly victims of crimes of violence such as
assault and murder.
(vii) Negligent victims
The negligent behaviour and habits of the victim make it easy for the criminal to
steal from him or her, or, in the case of a woman, to rape her. Other examples
include merchants who display their goods without proper protection, holiday
makers who leave their doors and windows unlocked, the careless victim who
leaves money, property or keys about - in other words, people who do not take
proper precautions against theft, fraud and housebreaking.
35

(viii) Occupational hazard victims
The occupations of these victims, especially those in the latent category, leave
them as open targets for the murderer, the robber, the assailant, the rapist, the
extortionist and the thief. Victims in this category include: criminal justice
practitioners, e.g. policemen and women, judges (remember those judges who
were killed by the drug cartels of Columbia in the United States .during 1990
1991), and correctional (prison) officials, night workers (doctors, nurses, shift
workers), travellers (e.g. travelling sales representatives and taxi drivers, isolated
people such as farmers and fieldworkers) and cashiers (especially in cases of
bank robbery and terrorism where they are held hostage).
(ix) Aberrant group-bound victims
These victims participate in, or are drawn into, hazardous and/or criminal group
activities, and include boozers, drug pedlars, brothel keepers, smugglers, crime
gang leaders, as well as members of mafia movements.
(x) Casual victims
Despite the fact that some people take reasonable precautions against crime.
or lead a fairly sheltered existence, they nevertheless fall prey to the criminal; for
example, the householder who notwithstanding a watchdog and burglar
proofing, is burgled, or passengers who are robbed or shot dead on a packed
train (Van der Walt et al. 1985:23-25; Van der Westhuizen 1981:12-125).
This typology serve to highlight possible factors precipitating actual victimisation or
contributing to the fear of victimisation. They are interesting, informative and
meaningful to our understanding of the victimisation experience and the fear of crime.
36
2.2.3 Theoretical perspectives of victimology
Although there is no single theoretical perspective which dominates contemporary
victimology, it is important to briefly examine four of the most relevant theories
pertaining to the fear of crime.
2.2.3.1 The "Synthesis" Approach of Fattah
Strydom and Schurink (in Schurink et al. 1992:40) review the work of Fattah (1976),
whose main contribution is "... to establish why certain individuals or organisations are
more popular targets than others, to focus on the role played by the victim in the
justification process and explain how this process is often used by the criminal as a
means of self-Iegitimisation". Fattah (in Schurink et al. 1992:40) hypothesises that the
potential forvictimisation depends on whether or notthe victim can be used as an agent
of self legitimation by the criminal. In other words, can the criminal make the victim
appear at fault? This self-Iegitimisation by the offender is an attempt at justifying the
criminal act, and also influences the choice of a victim.
Denial of the victim as a victim can be highlighted as an attempt at neutralising the
victim. An example is where, in the case of rape, a young girl is not viewed as a human
being, but rather as a sex object. Devaluing the victim entails using certain attributes
aboutthe victim as justification for the victimisation. An example would be the justifying
of rape on the grounds that the girl had been dressed in a sexually attractive manner.
Denying injury to the victim is also used to justify a criminal act. An example would be
vandalism and theft of property where the victim is viewed as being too rich to suffer.
Blaming the victim is another way of justifying a criminal act. The offender in this
instance is convinced ofthe victim's guilt. For example, where a black chooses a white
victim the act is legitimised as a retaliatory attack against whites for their exploitation.
Although the theory of Fatlah (1976) is viewed as being simplistic by Schurink et al.
(1992:40) he does manage to imply that certain categories of persons are potential
victims, namely women, the elderly, the rich and certain population groups. Being a
37
potential victim is also likely to affect the fear of crime felt by these groups.
2.2.3.2 The Routine Activity Approach by Cohen and Felson
Cohen and Felson (in Schurink et al. 1992:54) define routine activities as
..... any recurrent and prevalent activities which provide for basic population and
individual needs, whatever their biological or cultural origins".
These routine activities will thus include work, provision of food, shelter, sexual outlet,
leisure, social interaction, teaching and child rearing.
Using this approach, Lab (1988:57) points out that the normal movements and routine
activities of both potential offenders and victims playa role in the occurrence of crime.
There are three distinct criteria which must exist for a crime to occur, namely, a suitable
target, a motivated offender, and an absence of guardians. Routine daily activities,
therefore, will affect the likelihood of an attack on property and personal targets which
have a high visibility and accessibility at particular times. The timing of the criminal act
will be based on what the offender thinks he or she knows about the activity of the
target.
2.2.3.3 Opportunity Theory of Cohen, Kleugel and Land
Cohen et al. (1981:50) focused on the mediating role of five risk factors in criminal
victimisation, namely, exposure, guardianship, proximity to potential offenders,
attractiveness of potential targets and definitional properties of specific crimes.
• Exposure is defined as the physical visibility and accessibility of persons or
objects to potential offenders at any given time or place.
• Proximity refers to physical distance between areas where potential targets of
crime reside, and areas where large populations ofpotential offenders are found.
• Guardianship implies the effectiveness of persons or objects in preventing
38
violations from occurring, either by their presence or by direct or indirect action.
• Target attractiveness refers to the material or symbolic desirability of persons or
property to potential offenders as well as the perceived apathy of the target
toward illegal treatment. Target attractiveness can either be instrumental, i.e, the
offence is a means ofacquiring something, or expressive, which involves the act
of attacking a person or stealing property as the reward that is sought.
• Defectional properties of specific crimes which implies that constraints are
placed on instrumental action which limit the ability of the offender to act against
a target.
In their research, Cohen et al. (1981:520) report that exposure, guardianship and
proximity all have effects on the risk of victimisation. When dealing with proximity, the
researchers found that nearness to central city and low-income areas increases the risk
of victimisation.
Instrumental motives were largely implicated in property crimes, and the research
indicated that persons in higher income categories have a greater risk of victimisation.
The last risk factor, that of definitional properties of specific crimes, implied that the risk
of victimisation crimes would be higherwhere there are fewer constraints placed on the
criminal action. This was confirmed by the research, as theft outside the household is
more open to instrumental action, and the value of the property being stolen is more
visible to the offender.
According to the researchers, although there were measurement problems, they viewed
their efforts as ".... moving in the proper direction in our effort to predict and explain
criminal victimisation patterns in the United States" (Cohen et al. 1981:523).
The theoretical overview ofvictimisation has highlighted various factors which influence
crime, and thus are related to the fear of crime. But the risk of victimisation or actual
victimisation cannot be ignored as a factor influencing the fear of crime.
39
2.2.4 Victims and the fear of crime
Any individual can become a victim of crime. This victimisation can be either direct or
indirect. Direct victimisation refers to the actual losses incurred by the individual, i.e.
property damage, money stolen, injuries both physical and psychological, and also the
resulting changes in the victim's behaviour. The indirect cost refers to the fear that is
aroused by media reports on crime, contact with victims, or witnessinq criminal
behaviour. This indirect victimisation leads to changes in a person's behaviour, and
therefore has psychological consequences. Actual victimisation, or the possibility
thereof, will affect the person's attitude and behaviour patterns, and result in the fear
of crime.
Although victimology is the study of the relationship between victims and offenders, its
main concem is with the victims and their experiences. Being a victim, orthe possibility
of becoming a victim, depends on various factors. Briefly, these factors (taken from the
work of Cohen &Felson and Cohen et al.; Fattah, Hindeling et al.) can be highlighted
in question form, and include the following:
• Can the victim be used as an agent of self legitimisation by the criminal?
• Can the victim be neutralised and devalued?
• Can the victim be blamed for the crime?
• What is the lifestyle ofthe victim?
• What are the routine activities in which the victim engages?
• What are the demographic characteristics of the victim?
• Do the victims present opportunities to offenders to victimise them?
These questions in tum allow for the discovery of the factors which can be seen to
influence people's fear of crime, such as age, gender, income, education, activities,
neighbourhood conditions and risk of victimisation. These factors, and others which
directly influence the fear of crime, have already been discussed. However, being a
victim, or the threat of becoming a victim, has certain consequences.
40
2.3 MODELS OF FEAR OF CRIME
Theoretical developments relating to the study of fear of crime involve the development
of three models which attempt to explain the fear of crime, namely, the irrational, the
cognitive and the social control model. Each model, with substantiatlnq literature will
be discussed.
2.3.1 The irrational model
The irrational model views the fear of crime as an irrational response to a perceived
situation. In simpler terms, the fear of crime would appear to be disproportional to the
actual risk of victimisation (Glanz 1989:24).
There are certain sectors of the population that are least at risk of criminal victimisation
(women and the elderly) but who are more fearful of crime. Researchers claimed that
this proves that fear of crime is an irrational response to a perceived threat. Fear of
crime is also closely related to the fear of strangers in this model. In support of the
irrational model, the work of Clemente and Kleiman (1977) Garofalo (1979) and Warr
(1990) will be discussed.
2.3.1.1 Clemente and Kleiman (1977)
Clemente and Kleiman (1977:520) proposed a multivariable research approach to the
fear of crime so as to assess the independent affects of relevant variables. These
variables include those most often used in studies of victimisation and fear of
victimisation, namely: gender, race, age, socia-economic status and size of the
community.
As far as the gender variable is concemed, Clemente and Kleiman (1977:522) noted
that although females are unlikely to be victims of personal crimes, women are more
afraid of crime than men. The researchers warn, however, that it is not possible to
control for men's reluctance to admit to fear.
41
The second variable, race, highlights that blacks are more likely to be victims of
personal crime than whites, and therefore the evidence suggests that blacks are also
more afraid of victimisation. (It must be noted that the evidence is based on surveys
done in the United States of America.)
The relationship between the third variable, age and actual victimisation is, according
to Clemente and Kleiman (1977:503), inverse. Although the elderly hav~ low rates of
victimisation, they fear victimisation more than any other age cohort group.
The fourth variable, socio-economic status (SES), also has an inverse relationship with
victimisation for crimes against the person, but the reverse is true for property crimes.
However, Clemente and Kleiman (1977:523) note that a negative relationship exists
between SES and the fear of crime. The reason put forward for this relationship is that
people who have money are better able to protect themselves, and can afford to live
in safer neighbourhoods.
The last variable, size of the community, has been found to be directly related to the
crime rate. As one moves from the central city to suburbs, and to smaller towns and
rural areas, the crime rate decreases. The fear of crime seems to follow the same
tendency.
Clemente and Kleiman (1977), after having analysed their data, concluded as follows:
• Sex has an explanatory utility in the study of fear of crime
• Community size, although not as influential as sex, also can be used to explain
fear of crime
• Race, soclo-economlc status and age are less important as explanatory
variables in the study of fear of crime.
However, the authors noted the limitations of their study, especially the disjunction
between objective conditions and the subjective interpretation of those conditions.
42
2.3.1.2 Garofalo (1979)
Garofalo (1979:82) attempted to develop a working model of the influences on the fear
of crime. The reason proposed for the attempt is that fear not only leads people to
suffer psychological discomfort, but also leads many people to restrict their behaviour.
Therefore Garofalo (1979:83) says •... a better understanding ofthe fear ofcrime could
lead to action that will have the affect of improving the quality of life for m.any people".
Five general factors affecting crime are identified, and comprised the following:
Firstly, the actual risk of victimisation. Previous data has shown that several
personal characteristics are related more or less strongly to rates of victimisation and
the fear of crime, namely, age, sex, race and income. Age has a negative relationship
with victimisation rates and a positive relationship with the fear of crime, l.e, as age
goes up, victimisation rates decrease and fear of crime increases. The same occurs
for males and females, i.e. males show higher victimisation rates and females show
higher levels of fear. The data on race indicates that whites have a slightly lower rate
of victimisation and fear of crime levels than do blacks. As income goes up, so fear of
crime and rates of victimisation decline.
Secondly, experience with victimisation. Garofalo (1979:87) indicates that previous
experience of victimisation is related to the fear of crime. Within each age/sex group
non-victims express less fear of crime than do victims.
Thirdly, the socialisation processes connected to particular social roles. Garofalo
(1979:87) proposes that sex- and age-specific socialisation pattems are responsible for
the disjunction between fear and risk. Socialisation for the female sex role has
traditionally emphasised submissiveness and stressed assertiveness for males.
Accordingly, females are taught to fear crime - especially crime of a personal nature
and therefore females express more fear than males. Older people also experience
fear of crime, and this could be due to the combination of various factors which then
produce dependency, isolation and fear. Some ofthese factors could be the shift away
from the extended family structure, private retirement policies, physical changes, and
43
declining health. Garofalo (1979:88) notes that younger people and males might be
disinclined to tell the truth, l.e. admit fear, because of the expectations associated with
their roles.
Fourthly, the media presentations about crime and victimisation. Garofalo (1979:88)
reports that respondents who thought that crime was less serious than portrayed in the
media expressed less fear of crime than other respondents. However, few people
thought that the media were underestimating the seriousness of crime. The inference
can be made on the evidence available that the media's depiction of crime does have
some effect on the public's fear of crime, but the exact nature of the effects on their
quantification is difficult to specify.
Lastly, the effectiveness ofthe official barriers against crime. Garofalo (1979:92)
opines that in the modern urban environment, the task of insulating people from crime
tends to be the job of the police. Therefore the confidence people have in the police
should be related to their fear of crime. However, the relationship between the
evaluation of police performance and the fear of crime is weak in this author's study.
However, Garofalo (1979:76) concludes thatfear of crime is not a reflection of the risk
or experience of crime, but rather of social role expectations.
2.3.1.3 Warr (1990)
It is WarT's (1990:892) contention that certain cues exist in an individual's social and
physical environment which signal danger to individuals. The first is novelty or
unfamiliarity with environments, the second is fear of strangers; and the third is
reluctance to enter a new area. Warr (1990:893) proposes that novelty can provoke
fear in the following ways:
• The appearance of new cues or signs of danger that have not been assimilated
into the person's experience framework
• The realisation that old and taken for granted sights or situations have taken on
44
new meaning
• The feeling that the individual is not observing or interpreting accurately what
cues or signs of danger do exist in his or her environment
The second cue in the environment that could prove fear-provoking is the dark. Warr
(1990:94) uses the work of Goffman to clarify the effect of night-time on fear. Goffman
claims that as individuals move through their environment there are barriers, access
points, and lurk lines. The lurk lines demarcate zones that are beyond the individual's
line of sight, l.e. blind spots. Lurk lines include the area behind one's back, any
partitions that block visibility, e.g. drugsters in alleys, shrubbery, and parked vehicles
in the street. The one routine event that always transforms the outside world into a
variety of lines is darkness. The notion of night as a dangerous time and its effects on
individual behaviour has been studied previously (Du Bow, McCabe & Kaplan 1979;
Warr 1985).
The third cue from the environment which affects fear is the presence of others in the
individual's immediate environment. Once again, Goffman's work is used by Warr
(1990:895), although he notes that Goffman's arguments are incomplete. Goffman
stresses that an individual in the presence of others is vulnerable to them, so he or she
attempts to ascertain what the motives of the others are. But Goffman seems to
overlook the possibility that the presence of others can reassure individuals as well as
scare them. Warr (1990:895) contends that human beings form groups for safety, and
being alone in a dangerous environment" ... is the stuff of nightmares".
Previous research (Stafford & Galle 1984 and Warr 1984) indicated that fear of
victimisation is strongly related to age and gender. Warr (1990) therefore included
these two variables as controls in all models.
The following results were obtained. namely;
• darkness has an effect on fear
• novelty increases fear
• young males are the least fearful of being alonf
45
+ young females are more fearful of being alone than any other group
+ for young individuals, being alone and in the dark are two fear-provoking
situations
+ for older individuals, darkness and unfamiliarity with the locale are the two most
fear-provoking cues
+ the presence of others is a cue which can be both reassuring or frightening to
the individual (Warr, 1990:897).
Glanz (1989:24) reported that even if the actual amount of crime in society was
reduced, the irrational model claims that the fear of crime will not be automatically
reduced. Since the fear ofcrime is irrational in nature, reducing the level of fear will be
difficult to achieve.
2.3.2 The cognitive model
The cognitive model ofthe fear of crime proposes that the fear of crime is •... a rational
response to a perceived threat of harm" (Baumer 1985:241). Proponents of this model
contend that crime is perceived as a threat by those who are physically, and socially
vulnerable. It is therefore the perception of vulnerability which is the basis of the fear
felt by the elderly, women, the poor and certain ethnic groups.
The work ofStafford and Galle (1984), Baumer (1985) and Hindelang, Gottfredson and
Garofalo (1978) will be used to substantiate the claims of the cognitive model.
2.3.2.1 Stafford and Galle (1984)
According to Stafford and Galle (1984) there is a paradox between those who report
high levels of fear of crime and the low rate of victimisation of this group. Previous
research has indicated that men have a higher risk of victimisation but lower levels of
fear compared to women and that age is inversely related to personal victimisation but
positively related to fear of crime. Stafford and Galle (1984:179) therefore concluded
that the perception of risk of personal victimisation explains levels of fear in certain
46
groups.
2.3.2.2 Baumer (1985)
Baumer (1985:240) states that a general cognitivelvolitional model of the fear of crime
which views fear as a rational response to a perceived threat of harm has been
identified by various researchers (Garofalo 1979; Skogan &Maxfield 1981).
This general model consists of three basic areas, namely, individual characteristics
which indicate vulnerability, beliefs about and perceptions of the threat present in the
local environment, and knowledge about criminal events.
Individual characteristics, including age and sex, have been related to the fear of crime.
The effect has been attributed to the vulnerability of women and the elderly. There is
also evidence of a social vulnerability (Clemente & Kleiman 1977; Skogan & Maxfield
1981) which is indicated by income. Baumer (1985:241) acknowledges the social
predicament of the poor who live in more dangerous neighbourhoods, cannot secure
their homes and find it difficult to avoid dangerous areas. Their risk of victimisation and
fear of crime is therefore high.
Neighbourhood conditions include variables such as incivility, cohesion, social support
and perception of threat. Incivility is indicated by disorder, decay or disreputable
behaviour. Information about criminal events comes from three sources, namely,
personal experience, experiences of friends and neighbours, and news reports.
Baumer (1985:242) mentions that various authors have shown that the victimisation
experience affects both the victim and his or her friends (Baumer & Rosenbaum 1982;
Skogan & Maxfield 1981).
Those people who perceive a threat, who are physically and socially vulnerable to
attack, who have been victimised or who have friends/neighbours who have been
victimised and who live in a neighbourhood they perceive as dangerous, are the most
fearful.
47
Information conceming age, gender and income were obtained. Three measures of
perceived neighbourhood conditions were used: the dangerousness of the
respondents' own neighbourhoods compared to others in the city; the likelihood of
personal attack and robbery within the next year; and the perceived adequacy of police
protection in the respondents' neighbourhood.
Information conceming criminal events was obtained by two questions. The first,
concerned previous victimisation of the respondent, and the second question referred
to any member of the respondent's immediate family. Baumer (1985:245) noted that
neither of these questions was considered adequate. A third question, "How safe do
you feel or would you feel being out alone in our neighbourhood at night?" was also
asked.
Baumer (1985:245) claims that all eight independent variables are significantly related
to the measure of fear. The following particular results were obtained:
• Gender and age are both related to fear, l.e. women and the elderly are more
fearful of crime than men and younger respondents.
• Although previous victimisation and the other items testing for victimisation do
correlate with the fear of crime, their coefficients were extremely weak.
He concluded that overall fear of crime is a response to subjectively define risk and
personal vulnerability. To intervene and attempt a reduction in the fear of crime could
necessitate the following:
• Changing the character of the neighbourhood.
• Changing the perceived likelihood of robbery.
• Attempting a "community building" project.
• Increasing foot patrols by police.
• Supplying of informational programmes about precautionary measures that can
be taken (Baumer 1985:251).
48
2.3.2.3 The Lifestyle Model of Hindelang, Gottfredson and Garofalo (1978)
The theoretical model proposed by Hindelang et at. (1978:241) proposes that the
likelihood of an individual's becoming a victim depends on the concept of lifestyle.
Lifestyle relates to the daily routine activities of a vocational (work) and leisure nature.
Hindelang et al. (1978:242) postulate that role expectations and social structure
prescribe constraints to which people must adapt. Both these variables depend on the
demographic characteristics of the individual (i.e. age, gender, race, income, marital
status, education and occupation). Role expectations pertain to cultural norms which
define behaviour. Structural constraints which arise within the social structure refer to
the limitations on behaviour resulting from various institutional orders. An example
would be economic factors which limit an individual's choice of area of residence,
leisure activities, mode oftransportation and access to educational opportunities, which
in tum could affect his potential for victimisation. The role expectations and structural
constraints are reciprocally related, and have similar effects for people who share the
same demographic characteristics. Individuals continually adaptto structural constraint
and role expectations, and the result is a regular behavioural pattern, l.e, routine
activities or lifestyle. Variations in lifestyles occurwhich relate to the probability ofbeing
in a particular place at a particular time and coming into contact with persons who have
particularcharacteristics. The implication is that lifestyle differences are associated with
differences in exposure to situations that have high victimisation risk.
People with the same lifestyle interact. They share similar interests and associate with
one another. Offenders have certain characteristics, and thus associating with people
having these characteristics will increase exposure to personal victimisation.
Hindelang et al. (1978:247-250) discuss the following demographic variables affecting
lifestyle:
+ Age: Throughout one's lifetime, i.e. from early infancy to old age, role
expectations and structural constraints affect individuals. For example, in
49
infancy the child's existence is structured and constrained by parental
expectations, but as he/she grows older, he/she achieves greater autonomy. As
age increases there is a shift in attitudes, including an increased fear of crime.
The fear contributes to a change in lifestyle, e.g. a limiting of activities, mobility
and contact with strangers.
• Sex: Sex role socialisation differs for males and females. For example, females
spend a greater portion of their time inside the home, and as adults are more
likely to assume household responsibilities. It is noted by the authors, however,
that in pre-adolescent and post-retirement age groups, lifestyles tend to become
less different.
It is during these years that the role expectations and structural constraints
associated with age take precedence over those associated with gender. Fear
of crime is related to the gender role differences. According to Hindelang et at
(1978:188), the traditional role specialisation of women is one of passivity and
dependence, which could easily produce fear of victimisation. Men on the other
hand, are socialised not to display fear, and this could result in their not reporting
or expressing fear of crime. A further factor is the sheer physical differences
which could result in women feeling more vulnerable.
• Marital Status: Among adults, the lifestyles of married and unmarried persons
differ. People who are married (or cohabiting) are expected to spend more time
within the home, and pursue an increased number of at-home responsibilities.
Single persons are likely to spend their time outside the home, and are often
unaccompanied.
• Family Income and Race: The position a family has in the economic structure
also influences one's lifestyle. An increase in income allows an increase in
flexibility to choose one's area in which to live, the mode of transportation, the
time spent in private versus public surroundings, and the nature of leisure
activities one engages in.
50
Income also determines patterns of association, i.e, income will determine whom
one socialises with. Race is also related to income. Blacks tend to live in more
economically heterogeneous areas than do whites.
According to Hindelang et al. (1978:250), for personal victimisation to occur, several
conditions must be met. Firstly, the offender and victim must have an occasion to meet
in time and space. Secondly, there must be some dispute between the offender and
the victim forthe victim to be viewed as the object ofvictimisation. Thirdly, the offender
must be willing to use force, and fourthly, the circumstances must be advantageous to
the offender.
In order to highlight just how lifestyles have implications for exposure to personal
victimisation, Hindelang et al. (1978:251) formulate eight propositions.
Proposition One: The probability of suffering personal victimisation is directly related
to the amount oftime that a person spends in public places (e.g.
on the streets, in parks, etc.), and particularly in public places at
night.
Proposition Two: The probability of being in public places, particularly at night,
varies as a function of lifestyle.
Proposition Three: Social contacts and interactions occur disproportionately among
individuals who share similar lifestyles.
Proposition Four: An individual's chances of personal victimisation are dependent
upon the extent to which the individual shares demographic
characteristics with offenders.
Proposition Five: The proportion oftime that an individual spends among non-family
members varies as a function of lifestyle.
Proposition Six: The probability ofpersonal victimisation, particularly personal theft,
increases as a function of the proportion of time that an individual
spends among non-family members.
Proposition Seven: Variations in lifestyle are associated with variations in the ability of
individuals to isolate themselves from persons with offender
51
characteristics.
Proposition Eight: Variations in lifestyle are associated with variations in the
convenience, the desirability and vulnerability of the person as a
target for personal victimisation.
Hindelang et al. (1978:272) stated that the lifestyle/exposure model, as set out above,
is a step towards explaining personal victimisation.
Garofalo (in Schurink et al. 1992:53) made certain modifications to the
Lifestyle/Exposure model. He suggested the following:
• Factors such as ccnstraints imposed by the economic system and the housing
market must be taken into account. These factors often compel people to live
in close proximity to offenders, which in tum increases their exposure to and risk
of victimisation.
• Reactions to crime, which include fear of crime and beliefs about the nature and
prevalence of crime, can have an effect on the individual's lifestyle and thus on
his/her exposure to potential offenders.
• Target attractiveness and individual differences must be included since they
have a direct effect on the risk of victimisation.
Garofalo (in Schurink et al. 1992:53) noted further that the model is capable of being
modified and expanded further.
2.3.3 The social control model
Glanz (1989:27) claims that the social control model proposed by Lewis and Salem
(1981) could be considered to be one of the most recent theoretical developments in
the field of fear of crime.
The social control model has its roots in the social control theory formulated by the
Chicago school. Lewis and Salem (1986) argue that the irrational and rational models
52
fail to address all the anomalies that arise in research on the fear of crime. They
propose that the models on victimisation ..... fail to take account [of] the political and
social structures within which (such) fears are shaped and nourished" (Lewis & Salem
1986:X111). Fear of crime is seen as a consequence of the perceived erosion of social
control. This erosion of social control is based on the individuals' opinion that all is not
well in their community. This opinion, in tum, is founded on the existence of
• rowdy teenagers
• physical deterioration of homes
• intrusion of "different" population groups into the area
• increase in criminal activity e.g. drug use and vandalism.
These conditions elicit concern on the part of residents that the mechanisms of social
control are no longer effective. The order on which the residents had depended upon
has been violated in some way, making the neighbourhood an unsafe place to live.
The work of Lewis and Maxfield (1980) is used to further the claims of the social control
model.
2.3.3.1 lewis and Maxfield (1980)
lewis and Maxfield (1980:161) opined that fear of crime was not evenly distributed
throughout the city. Neighbourhood crime rates vary, as do the perceived risks of
victimisation by neighbourhood residents. Following previous research (e.g. Garofalo
1978) the authors propose that the fear of crime is affected not only by the actual
incidence of crime, but also by neighbourhood incivilities, i.e. signs of disorder, which
include abandoned buildings, vandalism, gangs, and drug peddling. These incivilities
create a sense of danger and decay, which increases individuals' perceived risk of
victimisation.
lewis and Maxfield (1980:161) explored the relationship between crime, perceptions
of crime, and incivilities in four Chicago neighbourhoods. Their information was
obtained from three sources, namely, field observations over a 14 - month period in
53
,
1976-1977, telephone surveysof random samples of respondents, and the official crime
rate for each neighbourhood. Further to the above, interviews were conducted with
residents, officials and community leaders to provide street-level knowledge of
neighbourhood problems and characteristics. Apart from the qualitative infonmation
obtained, Lewis and Maxfield (1980:162) compared the demographic characteristics
of the neighbourhood using data provided by residents during the telephone survey.
These characteristics included income, employment, number of children in the
household, race, age and ownership of home. Of the four neighbourhoods, Lincoln
Park, Wicker Park, Woodlawn and Back of the Yard, Back of the Yard was a stable
working-class community which included an ethnic mix of white, hispanic and black
families. This area has the highest degree of home-ownership and a large percentage
of the residents are young. Residents are aware of crime, but claim that it is a social
problem everywhere. There is no serious crime problem in this area. Lincoln Park is
considered to be a middle- to uppenmiddle-class area. Residents and police agree that
the crime problem is not serious, although daytime burglary and auto theft are a
problem in the area. There is a low level of fear.
Wicker Park is a neighbourhood of lowerworking-c1ass families, with a certain area
becoming gentrified. Friction exists between the English- and Spanish-speaking
residents. This area has many problems, including prostitution, drug-peddling, robbery
and purse-snatching. Residents expressed fear regarding the crime problem, and their
perceptions of the frequency of serious crime were accurate.
Woodlawn is a lower-class neighbourhood which was described by some residents as
a ghetto slum. The residents are predominantly black, with a high rate of
unemployment. A large percentage of residents are elderly (in comparison to the other
areas), and although Woodlawn is considered to be a high crime rate area, residents
did not agree with this. Police data show that Woodlawn has a high rate of crime, but
that it is limited to certain areas.
In their comparative analysis of the four neighbourhoods, Lewis and Maxfield (1980)
conclude as follows:
54
• Burglary: residents in Wicker Park and Woodlawn estimated that they have a
higher chance of being burgled than did residents in other neighbourhoods. The
actual crime rate in these areas was low.
• Robbery: residents view this form of crime as far more of a problem than
burglary, as robbery is viewed as a personal crime involving direct confrontation.
An interesting result was obtained as far as Lincoln Park and Back of the Yard
were concerned. Although both these areas had a high robbery rate, their
concern regarding this form of crime was low.
• Aggravated assault: few residents in Lincoln's Park and Back of the Yard saw
assault as a problem, but many people in Wicker Park expressed concern about
assault. Woodlawn residents also expressed concern about assault as a
problem. The perceived risk for all the neighbourhoods reflects the frequency
of actual assault.
• Rape and sexual assault: Woodlawn and Lincoln Park show the highest rape
rate, yet few residents viewed it as a problem. Fewer women in Lincoln Park
and Back of the Yard estimated that they would be victims of a sexual assault,
despite the higher rate of rape in Lincoln Park.
• Residents of Wicker Park expressed more concern about all crime types than
residents in other neighbourhoods.
• The conclusion drawn by Lewis and Maxfield (1980:179) was that •... official
crime rates and perceived risk are not related in any simple way'.
Many urban residents witness behaviour that can induce fear, e.g. loud noises being
made by teenagers or skidrow citizens, abandoned bUildings and empty streets. Lewis
and Maxfield (1980:180) opine that the attitudes of residents to crime is affected by the
ideas they have about what is going on in their community. One of the problems
perceived by residents is neighbourhood incivility. Respondents were asked to gauge
whether or notthe list of incivilities, which included groups hanging around, abandoned
buildings, vandalism, drug use and bumed-out buildings, were a problem. Residents
in Wicker Park scored higher than any ofthe other residents on each of the incivilities.
This community also expressed the most concern in regard to each crime. Wicker Park
has however a lower crime rate than the other neighbourhoods. Residents in Lincoln
55
Park - who expressed little concern for problems of crime and incivility - have higher
crime rates than the other neighbourhoods.
The question asked is why these results have occurred. Lewis and Maxfield (1980:184)
claim that Wicker Park and Back of the Yard are areas with the highest average of
young people - and as drug and vandalism are youth-related, this could account forthe
high concern for crime. One of the most important findings is that people who are
concerned about problems of incivility and social order are also concerned about crime.
Lewis and Maxfield (1980:187) conclude that it is important for policy-makers who are
concerned about crime to focus on neighbourhood-level approaches to reduce the fear
of crime. Most of the crime problems that concern people are problems over which the
traditional criminal justice system has no control. Incivility is a problem that has to be
solved by activities outside the criminal justice system.
Glanz (1989:27) noted that Lewis (1981) claimed that it was communities that produced
fear, not criminals. Therefore, it is the community which must be involved in crime
prevention strategies.
2.4 MEASUREMENT OF THE FEAR OF CRIME
In order to clarify how fear of crime can be measured it is necessary to look at past
measures ofthe fear of crime reported in previous research.
Ferraro and La Grange (1987:70) state that the purpose of their research is to critically
review and assess the measurement procedures that have been employed by various
researchers in the study of the fear of crime.
Fear of crime has been confused with risk of, or vulnerability to, crime. This confusion
has often resulted in researchers giving the assurance that, when judgement of risk is
measured, researchers' fear of crime is also being measured. The assumption is,
however, according to Ferraro and La Grange (1987:73) "... invalid and obscures the
56
processes that generate these perceptions". Fear of crime refers, then, to ..... a
negative emotional reaction generated by crime or symbols associated with crime and
is conceptually distinct from other judgements (risks) or concerns (values) about crime
(Ferraro & La Grange 1987:73). With reference to crime per se, the necessity arises
for the specification of the types of crime that the respondents fear. According to
Ferraro and La Grange (1987:74), this would provide the most valid and reliable
indicators offearof crime. The authors reviewedthe results of fifteen year~ of empirical
research on fear of crime.
The conclusions they drew included the following:
• Fear of crime has frequently been measured and analysed as a single item
indicator.
• This type of measurement strategy was questionable for certain types of
analyses. Preference is given to the use of multiple item indices when studying
the ..... rather complex concept of fear of crime ...".
• When measuring fear for specific types of crime, there are two methods to
follow. Firstly, a researcher may ask one question per type of crime, or
secondly, use multiple indicators for a given type of crime.
• Uttle attention has been paid to the range of emotional reaction to different
crimes.
• Most of the literature on fear of crime has been disqualified due to the distorted
meaning of the fear of crime concept. In illustration Ferraro and La Grange
(1987:76) analyse three of the major questions asked of respondents which
have been accepted as the major indicators of fear.
Firstly. "How do you feel walking alone at night in your neighbourhood?" This
question measures risk or the persons judgement about the likelihood of
becoming a victim. It is not related to the feeling of fear.
Secondly, "How safe do you feel or would you feel being out alone in your
neighbourhood at night?" According to Ferraro and La Grange (1987:76), this
item is inherently flawed because the word crime is not mentioned; the word
57
neighbourhood means different things to different people; the respondents are
asked about their perceived safety; and there is no differentiation between
objective risk judgement and emotional reaction.
Thirdly, the question "Is there any area right around here - that is, within a mile
where you would be afraid to walk alone at night?" is a single item indicator, and
is the most frequently used question. Although it is considered useful, Ferraro
and La Grange (1987:77) noted that the "... lack of specificity in the remainder
of the question overrides its apparent usefulness".
• Warrand Stafford (1983) provided the most useful measure of the fear of crime.
Their question "How afraid are you of becoming the victim of (sixteen separate
offences) in your everyday life?" involves a personal reference and a list of
specific crimes. According to Ferraro and La Grange (1987:79), both the risk of
victimisation and fear of victimisation are assessed for each of the sixteen
offences.
Ferraro and La Grange (1987:81), although recognising the problems related to the
measurement of the fear of crime, offer some suggestions for future research. Firstly,
the state of fear of crime should be tapped: e.g. "How afraid are you ..." is a useful
measurement to examine emotional reaction. Secondly, explicit references to crime
should be made, for without them the respondents' fear reactions are unreliable and
invalid. Thirdly, specific victimisation or categories of victimisation should be used to
assess an individual's fear reactions. Fourthly, questions measuring fear of crime
should be stated in non-hypothetical format. Avoid the word "would" in the formulation
of the question. Lastly, bring a touch of reality to the questions regarding the fear of
crime by specifying "in your everyday life".
Few of the studies reviewed by Ferraro and La Grange (1987) have succeeded in
meeting all the criteria mentioned previously. The authors hope that the awareness of
the problems experienced in the measurement of the fear of crime would lead to a
better understanding of the etiology of the fear of crime.
58
2.5 SUMMARY
Victimology is the systematic study of victims and victimisation which only began in the
USA in the 1940's.
Various typologies of victims exist, the most notable being those of Young-Rifai,
Mannheim, Schafer and Van der Westhuizen.
The models or perspectives in victimology include the "Synthesis" Approach of Fattah
(1976) the Opportunity Theory of Cohen et al. (1981), and Routine Activity Approach
by Cohen and Felson (1979).
Three models of the fear of crime have been identified:
+ Irrational model which viewed the fear of crime as an irrational response to a
perceived threat of criminal victimisation.
+ Cognitive model which opined that the fear of crime is based on rational
response to a subjectively defined threat of criminal victimisation.
+ Social control model which infered that of people perceive their environment as
unsafe, they are likely to fear crime.
In the analysis of the presented literature in substantiation of the three models, the
following conclusion can be drawn on the basis of factors affecting the fear of crime:
+ Demographic variables including age, gender, race, and socio-economic status
(measured by income and education levels) are the most importantfactors to be
used in measuring fear of crime.
+ Neighbourhood variables, which include cohesion; incivilities and size are also
often used in analysing the source of fear,
+ Previous experience of victimisation is used by three out of the ten authors in
their analysis of the factors affecting the fear of crime. Other factors of less
importance, include the quality of life, routine activities, actual risk of
victimisation, socialised vulnerability, the mass media, confidence in the police,
59
perceived risk of victimisation, number of persons residing with the respondent,
marital status, ownership of home, and health.
• Is there any area right around here - that is within a mile - where you would be
afraid to walk alone at night?
• How safe do you feel walking alone at night in your neighbourhood?
• How afraid are you of being alone in your neighbourhood at night?
However, Ferraro and La Grange (1987:75) believe that these questions are
inappropriate for the measurement of fear of crime. They prefer the question posed by
Warr and Stafford (1983): "How afraid are you of becoming a victim of (sixteen separate
offences) in your everyday life?" This type of question not only refers to fear of specific
types of crime, but also indicates the personal feelings of the respondent.
Ferraro and La Grange (1987:81) suggest that any attempt to measure fear, should
make explicit reference to the types of crime. Fear reactions vary as to the type of
crime. These reactions can vary from relatively diffuse states of anxiety to acute states
such as trauma. Ferraro and La Grange (1987:75) pointed out that little attention has
been paid to the range of reaction to fear, and this should be rectified.
In an attempt to bridge the gap between literature from the USA and South Africa, and
under the aegis of the criticisms of existing literature by Ferraro and La Grange (1987),
the present study will measure the fear of crime by using it as the dependent variable
and including, among the independent variables affecting crime, the following: age,
gender, household composition, type of housing, previous victimisation, concem about
crime (based on the rating of crime as a social problem), role of the police and
neighbourhood involvement. Specific questions relating to the fear of specific crimes
will be indicated. This is the first comprehensive study of the fear of crime in Northern
Kwazulu-Natal, which as a province has been exposed to crime and violence for
several decades.
60
CHAPTER 3
RESEARCH METHODOLOGY
3.1 INTRODUCTION
Social research can be defined as a human activity through which a social phenomenon
is studied in an objective manner in order to achieve an understanding of the social
phenomena. The intention is then to discover something about the world in which we
live and how the world is conceived in terms of basic concepts within the discipline.
Research is about asserting a theory; (I.e. ontological claim) but also explaining by what
procedures the theory was produced (I.e. epistemological questions); what other
evidence supports the theory and how the evidence was assembled.
If the aim of research is to produce scientific knowledge then the researcher must
masterthe methods and techniques ofsocial research. Once the research problem has
been identified, the particular research tool must be decided upon to provide the data
required. But every research tool or procedure is intricately embedded in commitments
to world views held by the researcher. The technique or method used is effective only
jf it has a philosophical justification i.e, research methods cannot be divorced from
theory as they operate within a given set of assumptions about the nature of the world
(Hughes 1980:12-14).
3.2 RESEARCH METHODOLOGY
Research methodology deals with the philosophy of the research process. This
philosophy, according to Bailey (1987:33), includes firstly, the assumptions and values
that serve as a rationale for the research; and secondly the standards the researcher
uses for interpreting data and reading conclusions. There are basically two general
approaches within the field of sociology and criminology, namely positivism and anti
positivism.
61
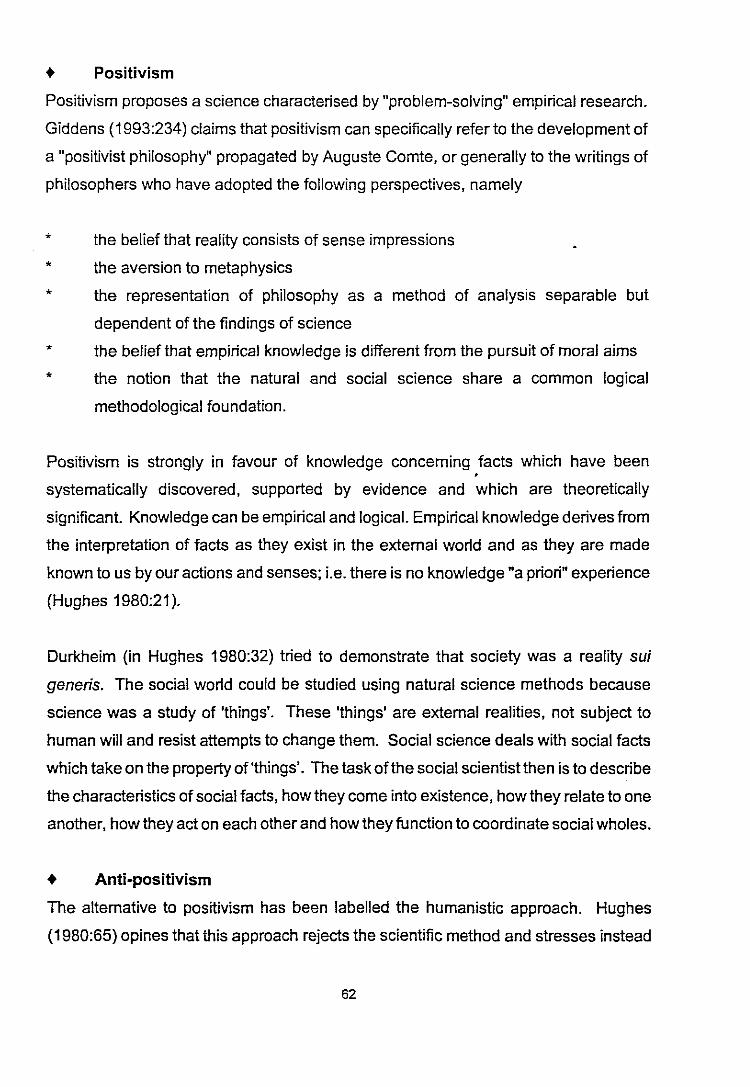
+ Positivism
Positivism proposes a science characterised by "problem-solving" empirical research.
Giddens (1993:234) claims that positivism can specifically refer to the development of
a "positivist philosophy" propagated by Auguste Comte, or generally to the writings of
philosophers who have adopted the following perspectives, namely
the belief that reality consists of sense impressions
the aversion to metaphysics
the representation of philosophy as a method of analysis separable but
dependent of the findings of science
the belief that empirical knowledge is different from the pursuit of moral aims
the notion that the natural and social science share a common logical
methodological foundation.
Positivism is strongly in favour of knowledge concerning facts which have been•
systematically discovered, supported by evidence and which are theoretically
significant. Knowledge can be empirical and logical. Empirical knowledge derives from
the interpretation of facts as they exist in the external world and as they are made
known to us by our actions and senses; i.e, there is no knowledge "a priori" experience
(Hughes 1980:21).
Durkheim (in Hughes 1980:32) tried to demonstrate that society was a reality sui
generis. The social world could be studied using natural science methods because
science was a study of 'things'. These 'things' are external realities, not subject to
human will and resist attempts to change them. Social science deals with social facts
which take on the property of 'things'. The task of the social scientist then is to describe
the characteristics of social facts, how they come into existence, how they relate to one
another, how they act on each other and how they function to coordinate social wholes.
+ Anti-positivism
The alternative to positivisrn has been labelled the humanistic approach. Hughes
(1980:65) opines that this approach rejects the scientific method and stresses instead
62
the role of interpretation, understanding and moral commentary as the proper way of
obtaining knowledge about subjective matters. The approach is adamant that social
life cannot be studied in the same way as natural sciences and that different methods
must be used. Max Weber (in Hughes 1980:69) proposed an "interpretative
understanding" as a means toward objective knowledge. This method proposes to
study human action on the basis of two principles, namely
*
*
value neutrality (the refl'aining from passing off value judgements as scientific
truths)
method of the ideal type/development of a typology which is conceptually pure
and according to which human behaviour can be judged.
The understanding becomes transformed into the construction of rational models.
The anti-positivist approach views the task of the social scientist as the development
of some or other theoretical account of social life. This requires empirical research
whereby data must be obtained from the lives of social actors. However, the meaning
that actors give to their environment must also be taken into account.
The research methodology to be used in this study is positivistic in nature as the fear
of crime is a reality which is perceived by the senses and these perceptions must be
examined, processed and transformed into a valuable scientific explanation of the
social phenomena.
3.3 RESEARCH METHODS
Research is based on the assumption that all behaviour and events are orderly and
have discoverable causes. In order to discover the facts influencing the fear of crime,
a formal intensive and systematic application of research methods is a prerequisite.
The aim of using research methods in the present study is to describe and explain the
factors influencing fear of crime.
63
Criminological research authorities have varying views about methods that can be used
in criminological research. Futrell and Roberson (1988:91-116) identify historical,
descriptive, analytical and experimental methods. Fitzgerald and Cox (1987:44-64)
emphasise descriptive, explanatory, and exploratory methods. Van der Walt et al.
(1985:167) identify three methods open for criminological research, namely the method
of case analysis, the method of mass observation and the analytical method. For the
purposes of the present study these three methods are considered.
3.3.1 Method of case analysis
The case analysis method in research is used when the researcher regards a
phenomenon, like juvenile delinquency, as an individual-human phenomenon. In social
science, generally, a "case" need not be an individual human being. A community may
be taken as a case, whereupon a comprehensive description ofits peculiarcomponents
may be studied with the aim of learning about its history, religious, political and racial
make-up (Babbie 1990:32-33). Thus a case study could involve an individual, a single
institution, community or social group.
The case analysis method in research wishes to demonstrate the structural or functional
factors responsible for the existence of a social phenomenon; determinate its relation
to other factors; gain new knowledge and testthe validity of existing hypotheses. Case
studies can also be used to produce typologies which define a social phenomenon.
3.3.2 The method of mass observation
Otherwise known as the statistical method, the method of mass observation is used
when the researcher regards a social phenomenon as a mass phenomenon. Within
criminological research, the value of statistics lies in the following:
+ Firstly, on the description and trends of crime.
+ Secondly, it enables the researcher to undertake comparative studies
+ Thirdly, through crime statistics, researchers can predict and symbolically control
64

crime, provide legislators with facts for policy formulations and provide a basis
through which the courts, police and correctional institutions can upgrade their
services.
The method of mass observation is also particularistic and involves designing research,
describing collected data and making decisions upon collected data (Futrell & Roberson
1988:151 ).
3.3.3 The analytical method
The analytical method is used when the researcher sees social phenomenon as a
combination of individual-human and social factors. Under the analytical method the
case analysis and statistical methods are synthesised and lose their status as methods
and become techniques of the analytical method (Van der Walt et al. 1985:174-175).
Whilst the method of mass observation is used to explain and apply the findings, in the
analytical method inferences about a population are made from the analysed samples
(Futrell & Roberson 1988:105).
Leedy (1985:173) says that in the analytical method, quantitative data is analysed by
means of statistical tools for the purpose of probing so that researchers may infer
certain meanings which lie hidden within the data. Further, in the analytical method, the
researcher is concemed with problems of estimation and the testing of statistically
based hypotheses.
In the analytical method statistics have the following functions, namely to
• determination of the centre ofthe data being measured
• determining the diversity of data
• determining how closely ordistantlycertain characteristics ofthe data are related
• determining the degree to which facts may have occurred by mere chance or if
there is a probability of it being influenced by some other force (Futrell &
Roberson 1988:106).
65
Van der Westhuizen (1982:3-4) identifies four general functions of the analytical
methods:
(i) Goal-achievement function. The analytical method is goal-directed, and
through relevant techniques it provides for descriptive and explanatory
investigations.
(ii) Adaptive function. Through the use of the analytical method the researcher
can lay down a meaningful relationship between a fact and a theory.
(iii) Integrative function. The analytical method is non-particularistic in nature. It
enables the researcher to be neutral and enables him to study crime
phenomenon on both group and individual-human level.
(iv) Patlem-maintenance function. The analytical method respects recognised
methodological principles and yet leaves room for change, refinement and
innovation.
Thus, in research, the social phenomenon to be studied must be recognised as an
individual-human-social phenomenon where factors such as age, sex, socio-economic
status, living conditions and perceptions of crime must be investigated. The social
phenomenon mustbe regarded as a mass phenomenon which, through using statistical
methods, can be described, measured and explained. The combination ofthe above
implies that the social phenomenon can be described, explained, predicted and
therefore controlled. It is in the analytical method that descriptive and inferential
statistics will be used.
3.4 RESEARCH STRATEGY
The research strategy is basically the steps that are followed by any researcher in their
attempt to describe, measure, explain, predict and control social phenomenon.
3.4.1 Identification of the research problem
The identification of the topic of research, fear of crime was influenced by the following
66
factors, namely
+ values and beliefs of the researcher
+ the attempt to resolve key problems associated with the fear of crime
+ attempt to explain fear of crime and its effects on society
+ the availability of finance for the project
+ the availability of existing data (Haralambos 1991:719).
3.4.2 The literature review
The literature review included the reading of documented material which is found in
libraries or elsewhere. The documents included reports, articles, periodicals, books,
diaries, biographies, autobiographies and unpublished material (Futrell & Roberson
1988:17 and Van der Walt et al. 1985:212-214).
According to Leedy (1985:69), reviewing literature has the following purposes:
+ Literature of similar investigations helps to show how identical situations were
handled
+ Through literature, methods and techniques of handling problematic situations
are revealed
+ Through literature review sources ofdata, their advantages and disadvantages,
are revealed
+ It introduces the researcher to significant research personalities in the field of
study
+ Through literature survey the study may be seen in historical and associational
perspective; and in relation to earlier and more primitive attacks to the problem
• Documents provide the researcher with new ideas and approaches
+ It assists the researcher to evaluate his/her efforts by comparing them to related
efforts of others.
The documented material utilised in this study is listed in alphabetical order in the
bibliographical section of this thesis.
67
3.4.3 Conceptualisation of the research problem
Any research problem is conveyed through the use of a set of concepts. These
concepts are converted into variables. Scientific explanations and predictions involve
relating the dependent variable to the independent variables, i.e, an attempt is made
to establish a covariation.
The variable that a researcher wishes to explain is the dependent variable. In this
research study it is the fear of crime. The variable(s) expected to produce change in
the dependent variable is referred to as an independent variable. The independent
variables include age, gender, household characteristics, previous victimisatlon, crime
as a social problem and the role of the police.
A hypothesis becomes a tentative answer to a research problem which is expressed
in the form of a relation between independent and dependent variables (Frankfort
Nachmias &Nachmias 1992:61). A hypothesis is proposed by a researcher and then
it is tested. If it is not supported, then another is proposed. If it is supported, it
becomes incorporated into the scientific body of knowledge. The hypotheses
formulated for this study were presented in Chapter One as part of the introduction.
Once the research problem has been identified and conceptualised, the decision must
then be taken on what techniques to use to obtain the necessary data for the testing
ofthe hypotheses.
3.5 RESEARCH TECHNIQUES
The techniques used in this investigation included the development of a questionnaire,
sampling and the techniques used for the analysing and interpretation of the data.
3.5.1 Survey method
Although the survey method includes mailed questionnaires, personal interviews and
68
telephonic interviews, forthe purpose ofthis research itwas decided to hand deliver the
questionnaires to respondents and collect them in a similar way. The advantages of
this method were that it was relatively cheap to administer, the absence of the
interviewer provided greateranonymity to respondents, the respondents completed the
questionnaire in their own time, and a wider range of possible respondents was
available. The disadvantages were that no account could be obtained of the nonverbal
behaviour of respondents; the researcher had no control over who. filled the
questionnaire in (although the request was made for both male and female residents
of a household to each complete a questionnaire) and the response rate could not be
controlled. (Although 800 questionnaires were distributed, the researcher only received
385 back).
Other problems associated with this method of research was that the researcher could
not compromise the promised anonymity of respondents by sending a reminder
postcard, nor could the researcher control for literacy and comprehension of the English
language on the part of the respondents.
3.5.1.1 The questionnaire
In the development of the questionnaire, use was made of closed-ended questions.
The reasons for this include:
+ Answers obtained make comparisons between respondents easier.
+ Answers are easier to code and analyse.
+ The meaning of closed-ended questions is clearer which minimises the chance
of respondents not answering questions.
+ Respondents have minimal writing to do which makes it easier to fill in the
questionnaire (Bailey 1987:118).
The questionnaire was developed in order to obtain information about the following:
69
+ Demographic characteristics of respondents
The demographic characteristics of respondents included gender (1 = male. 2 =
female); marital status (1 = married. 2 = widowed. 3 = divorced. 4 = separated and 5 =
single); age (1 = 18-24 years. 2 = 25-34 years. 3 = 35-44 years. 4 = 45-54 years, 5 =
55-64 years and 6 = over 65 years of age); ethnic group (1 = black. 2 = White);
educational qualifications (1 = below standard 8, 2 = standard 8. 3 = standard 9. 4 =
standard 10. 5 = diploma and 6 = degree); occupation (1 = unemployed. 2-= labourer,
3 = professional worker. 4 = technical and related worker. 5 = businessman. 6 =
administrative worker. 7 = student. 8 = service worker. 9 = armed forces. 10 =
agricultural worker, and 11 = self-employed); area of residence (1 = Empanqenl, 2 =
Richards Bay); type of housing (1 = brickhousing. 2 = connected housing, 3 =alternative housing forms); household composition (1 = single. 2 = two persons. 3 =
three persons. 4 = 4 persons. 5 = five or more persons).
+ Fear of crime (formless and concrete fear)
To measure formless fear the respondentswere asked to indicate their answers
(1= very safe. 2 = fairly safe. 3 = fairly unsafe and 4 = very unsafe) to the
following questions:
+ How safe do you feel walking alone at night in your neighbourhood? (abridged
to walking alone).
+ How safe do you feel alone in your home or apartment at night? (abridged to
home alone)
+ How safe do you feel in your neighbourhood when leaving from or arriving at
home? (abridged to leaving/arriving at home)
To measure concrete fear. the respondents were asked to indicate their fear (1 =not
fearful at all. 2 = a little fearful. 3 = quite fearful and 4 = very fearful) of personal
victimisation and property crimes. Personal victimisation included being raped while
alone at home (abridged to rape at home); being raped while away from home
70
(abridged to rape - away); being killed while at home (abridged to killed at home), being
killed away from home (abridged to killed - away) being robbed or mugged (abridged
to robbed/mugged); being assaulted (abridged to physical assault); being abducted
from your home (abridged to abduction); and being shot at with an AK47 or other
firearm (abridged to shot at).
Property crimes included having your house broken into (abridged to housebreaking);
having damage inflicted on your property (abridged to property damage); having your
house set alight (abridged to arson); having your motor vehicle broken into and
valuables stolen (abridged to vehicle broken into); and being ambushed while driving
a motor vehicle (abridged to hijacking).
+ Previous victimisation experience of respondents
The respondents were asked to indicate if they had experienced either personal
victimisation or property crimes against them in the past year. The list of types of
personal victimisation included sexual assault, robbery or mugging, being shot at while
driving a vehicle (abridged to shot at); and being stoned while driving a vehicle
(abridged to stoning). The list of property crimes included housebreaking, property
damage, vehicle broken into and valuables stolen (abridged to vehicle broken into) and
vehicle stolen.
+ Respondents were asked to rate whether certain types of crime were a social
problem in their area of residence. The list of crimes included statutory crimes
(traffic violations, driving under the influence of alcohol); crimes of a personal
nature (rape, robbery, assault, being killed and abduction) and property crimes
(housebreaking, theft of or out of vehicles, other fonms of theft, vandalism,
hijacking or bag snatching). (Their responses were coded 1 =no problem at all,
2= less of a problem, 3 = more of a problem and 4 = very problematic).
71
• Respondents' views and opinions on the role of the police.
The role of the police was divided into four categories, namely contact with the police;
the reporting and non-reporting of crime to the police; the public's views on their
obligation to help the police in combating crime; and the public's opinion of the service
rendered by police. In the first category, the respondents were asked to indicate what
type of contact they had had with the police (1 = accused and convicted, 2 = accused
but acquitted, 3 = suspect in a criminal case, 4 = complainant or victim, 5 :::; witness in
a criminal case, 6 =informant and 7 =no contact). The second category involved the
respondent's reporting of crime to the police in which they had been a victim and those
ofwhich they had no knowledge. (The response categories were 1 =always, 2 =often,
3 =sometimes and 4 =never). The reasons for not reporting a crime to the police
included: not wanting to bother the police (abridged to bother police), the case would
not receive property attention (abridged to no proper attention); the police do not react
promptly to emergency calls (abridged to not prompt); the case is unsolvable (abridged
to unsolvable case); inability of the police to solve case (abridged to police unable to
solve); not in the interest of society to report case (abridged to society uninterested);
the case can be settled personally (abridged to settled personally); case is of a personal
nature (abridged to personal nature); attending court is time consuming (abridged to
time consuming); hate getting involved in court case (abridged to dislike of
involvement); negative attitude and approach of the police when called out (abridged
to negative attitude); you are treated as the guilty party by police (abridged to guilty
party); partiality on the part of the police when crime is reported (abridged to partiality
of police); and fear of retaliation (unabridged).
In the third category, namely the public's opinion of their obligation in combating crime,
the respondents were requested to indicate if they had a duty to combat crime (the
response categories were 1 =undoubtedly, 2 =to a large extent; 3 =uncertain, 4 =to
a lesser extent and 5 =not at all). The respondents were then asked to indicate their
wil!ingness to assist the police in combating crime (the response categories were 1 =always, 2 =often, 3 =uncertain, 4 =sometimes and 5 =never). The last question in
this category was whether the respondent regarded himself/herselfas an important link
in the criminal justice system (the response categories were (1 =yes and 2 =no).
72
In the last category, the respondents were asked to indicate their agreement (the
response categories were 1 =strongly agree, 2 =agree, 3 =uncertain, 4 =disagree
and 5 = strongly disagree) on the following statements:
• The local police are doing a good job to prevent crime (abridged to good job).
• The local police should be given more powers to arrest and prosecute criminals
(abridged to more power).
• When called outto the scene, the local police are prompt, co-operative, friendly,
helpful, courteous or uninterested in the case.
The final question pertained to the visibility of the police and involved asking
respondents to indicate their opinion on how often the police actually patrol the
residential area of the respondents (the responses included 1 =monthly, 2 =weekly;
3 = daily, 4 =seldom and 5 =never).
• Security measures taken by respondents
The respondents were requested to indicate what steps they had taken to protect their
property and their person. The list of measures taken to protect property included
locking doors ofthe house (abridged to locked doors); acquiring a guard-dog (abridged
to guard dog); installing of an alarm system (abridged to alarm); adding extra outside
lights (abridged to extra lights); fixing of deadlocks to doors (abridged to fixed locks);
installing of burglar proofing (abridged to burglar proofing); engraving valuables
(abridged to engraving); installing security waming lights (abridged to security lights);
leaving the radiofTV and lights on when not at home (abridged to radiofTV and lights);
erecting walls (abridged to walling) and acquiring a fire-arm (abridged to firearm).
The list of measures taken to protect the person included not going out alone during the
night (abridged to not go out alone - night); not going out alone durinq the day (abridged
to not go out alone - day); carrying a personal alarm (abridged to carry alarm); taking
self defence classes (abridged to self defence classes); locking doors of vehicle while
driving (abridged to lock doors of car); notifying others of your whereabouts (abridged
to notify others); carrying a firearm on your person (abridged to carry firearm).
73
Since respondents do not live in a vacuum, they were asked to indicate their
involvement with their neighbours in regard to protection of their property and person.
The following questions were asked in this regard:
• During the past two (2) years have your asked a neighbour to keep a watchful
eye on your property while you were away? (abridged to asked neighbour).
• During the past two (2) years, has a neighbour asked you to keep a watchful eye
on their property while they were away? (abridged to asked by a neighbour)
• If you were being attacked at home, do you think your neighbour would come to
your assistance? (abridged to neighbour come to your aid).
The respondents were also asked to indicate their knowledge of and involvement in a
Neighbourhood Watch System in their residential area. Three questions were asked:
• Is there any Neighbourhood Watch system operating in the area where you live?
(abridged to Neighbourhood Watch exists)
• Are you a member of Neighbourhood Watch? (abridged to present member)
• Would you be willing to participate in such a system? (abridged to willingness to
be a member).
The response categories for all questions pertaining to precautionary measures was 1
=yes and 2 =no.
3.5.1.2 Scales of measurement
Social scientists often measure indications of concepts e.g. the fear of crime cannot be
observed directly but must be inferred from indicators such as feelings of safety, fear
ofspecific crimes being committed, perceived risk of victimisation and responses to the
fear of crime. These indicators must have numerals or numbers substituted for the
value of the indicators, to allow quantitative analysis of responses. This promotes the
different scales of measurement. Nominal scale implies a set of objects which can be
classified into exhaustive and mutually exclusive categories, l.e, gender, language,
74
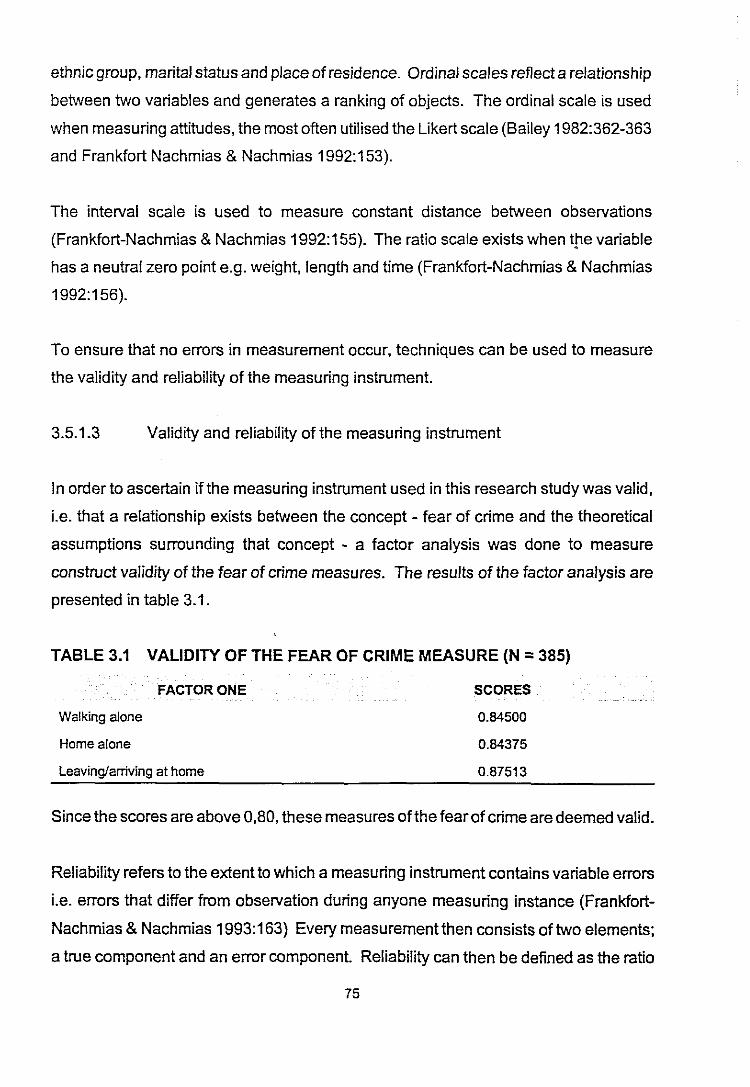
ethnic group, marital status and place of residence. Ordinal scales reflect a relationship
between two variables and generates a ranking of objects. The ordinal scale is used
when measuring attitudes, the most often utilised the Likert scale (Bailey 1982:362-363
and Frankfort Nachmias & Nachmias 1992:153).
The interval scale is used to measure constant distance between observations
(Frankfort-Nachmias &Nachmias 1992:155). The ratio scale exists when the variable
has a neutral zero point e.g. weight, length and time (Frankfort-Nachmias & Nachmias
1992:156).
To ensure that no errors in measurement occur, techniques can be used to measure
the validity and reliability of the measuring instrument.
3.5.1.3 Validity and reliability of the measuring instrument
In order to ascertain if the measuring instrument used in this research study was valid,
i.e. that a relationship exists between the concept - fear of crime and the theoretical
assumptions surrounding that concept - a factor analysis was done to measure
construct validity of the fear of crime measures. The results of the factor analysis are
presented in table 3.1.
TABLE 3.1 VALIDITY OF THE FEAR OF CRIME MEASURE (N =385)
FACTOR ONE
Walking alone
Home alone
Leaving/arriving at home
SCORES
0.84500
0.84375
0.87513
Since the scores are above 0,80, these measures ofthe fear ofcrime are deemed valid.
Reliability refers to the extent to which a measuring instrument contains variable errors
i.e, errors that differ from observation during anyone measuring instance (Frankfort
Nachmias & Nachmias 1993:163) Every measurement then consists of two elements;
a true component and an error component. Reliability can then be defined as the ratio
75
of the true score variance to the total variance in the scores as measured. The reliability
measure varies on a scale from 0 (measurement involves nothing but error), to 1 (no
variable error in measurement).
Reliability of the measuring instrument can be assessed in one of four ways, namely
test-retest method, alternative-form method, split-half method and internal consistency
method.
The test-retest method obtains a correlation between two repeated applications of the
same test to the same respondents. If a researcher obtains the same correlation result
on two administrations of the test, then the test would be reliable (Carmines &Zeller
1979:38). The test-retest method is limited in that any retest may be affected by
change of experience, reactivity and over-estimation by the respondent (Carmines &
Zeller 1979:40).
The alternative-form methodof assessing reliability ofa measuring instrument is similar
to the test-retest in that it also requires two testing situations and attainment of the
same correlation result. It differs from the test-retest method in that an alternative form
oftest is administered. The advantage ofthe alternative-form method is that it reduces
the extent to which the respondent's memory can inflate the reliability estimate. Its
limitation lies in the practical difficulty of constructing alternative forms that are parallel
(Carmines & Zeller 1979:40-41).
The split-half method differs from the test-retest and alternative-form methods in that
the test or measurement is administered once. The total set of items is then divided
into halves and the scores on each half are correlated to obtain an estimate reliability
(Carmines & Zeller 1979:41).
The internal consistency of assessing reliability also requires a single measurement
administration. It provides a unique estimate of reliability for a given test administration.
The most popular internal consistency method is the so-called Cronbach's Alpha
Individual Item Analysis (Carmines & Zeller 1979:44).
76
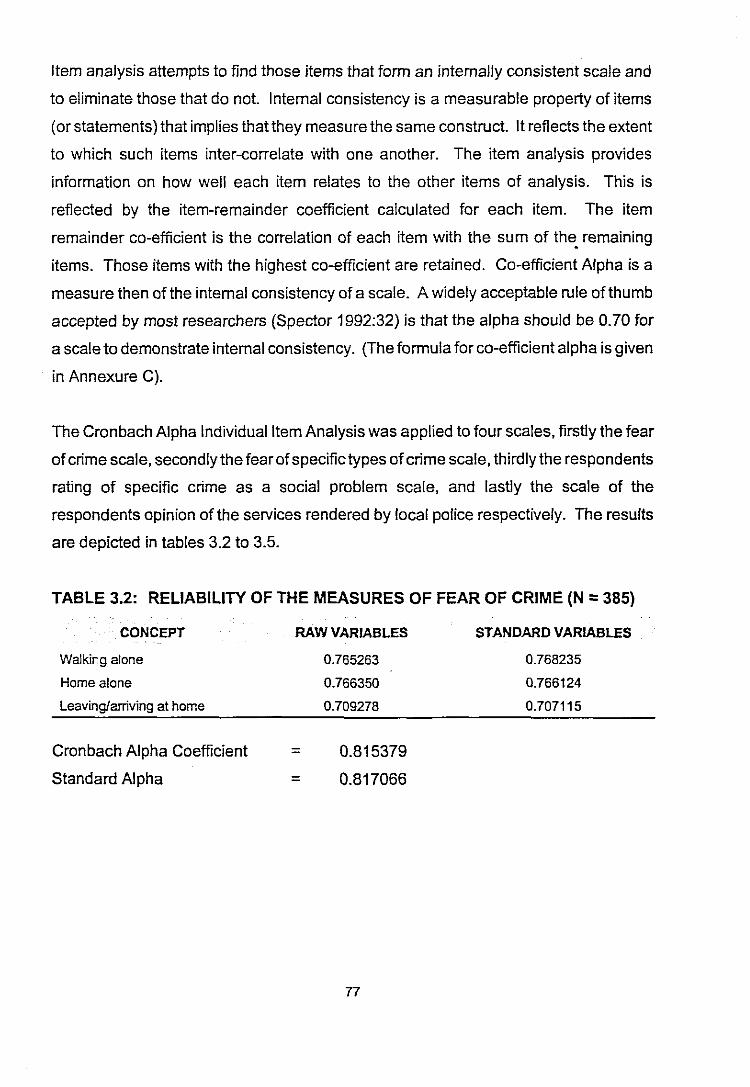
Item analysis attempts to find those items that form an intemally consistent scale and
to eliminate those that do not. Internal consistency is a measurable property of items
(or statements) that impliesthat they measure the same construct. It reflects the extent
to which such items inter-correlate with one another. The item analysis provides
information on how well each item relates to the other items of analysis. This is
reflected by the item-remainder coefficient calculated for each item. The item
remainder co-efficient is the correlation of each item with the sum of the: remaining
items. Those items with the highest co-efficient are retained. Co-efficient Alpha is a
measure then of the internal consistency of a scale. A widely acceptable rule of thumb
accepted by most researchers (Spector 1992:32) is that the alpha should be 0.70 for
a scale to demonstrate internal consistency. (The formula for co-efficient alpha is given
in Annexure C).
The Cronbach Alpha Individual Item Analysis was applied to four scales, firstly the fear
ofcrime scale, secondly the fear of specific types ofcrime scale, thirdly the respondents
rating of specific crime as a social problem scale, and lastly the scale of the
respondents opinion ofthe services rendered by local police respectively. The results
are depicted in tables 3.2 to 3.5.
TABLE 3.2: RELIABILITY OF THE MEASURES OF FEAR OF CRIME (N =385)
CONCEPT
Walkir,g alone
Home alone
leaving/arriving at home
RAW VARIABLES
0.765263
0.766350
0.709278
STANDARD VARIABLES
0.768235
0.766124
0.707115
Cronbach Alpha Coefficient
Standard Alpha
=
=
0.815379
0.817066
77
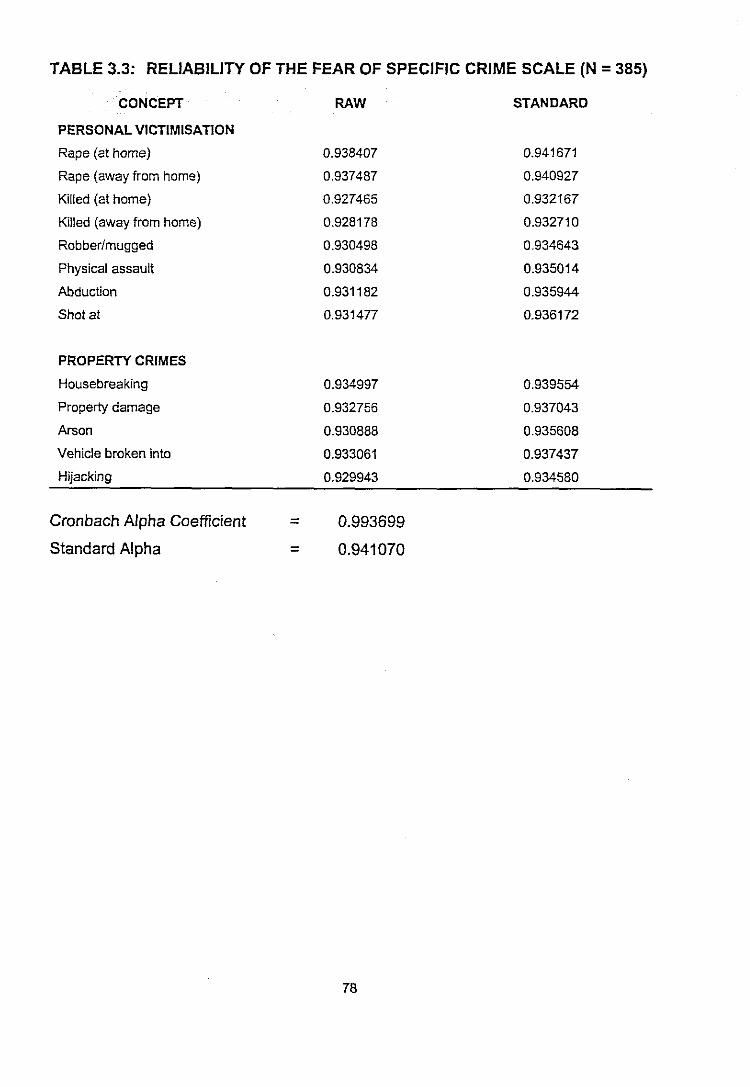
TABLE 3.3: RELIABILITY OF THE FEAR OF SPECIFIC CRIME SCALE (N =385)
CONCEPT
PERSONAL VICTIMISATION
Rape (at home)
Rape (away from home)
Killed (at home)
Killed (away from home)
Robber/mugged
Physical assault
Abduction
Shot at
PROPERTY CRIMES
Housebreaking
Property damage
Arson
Vehicle broken into
Hijacking
Cronbach Alpha Coefficient
Standard Alpha
RAW STANDARD
0.938407 0.941671
0.937487 0.940927
0.927465 0.932167
0.928178 0.932710
0.930498 0.934643
0.930834 0.935014
0.931182 0.935944
0.931477 0.936172
0.934997 0.939554
0.932756 0.937043
0.930888 0.935608
0.933061 0.937437
0.929943 0.934580
= 0.993699
= 0.941070
78
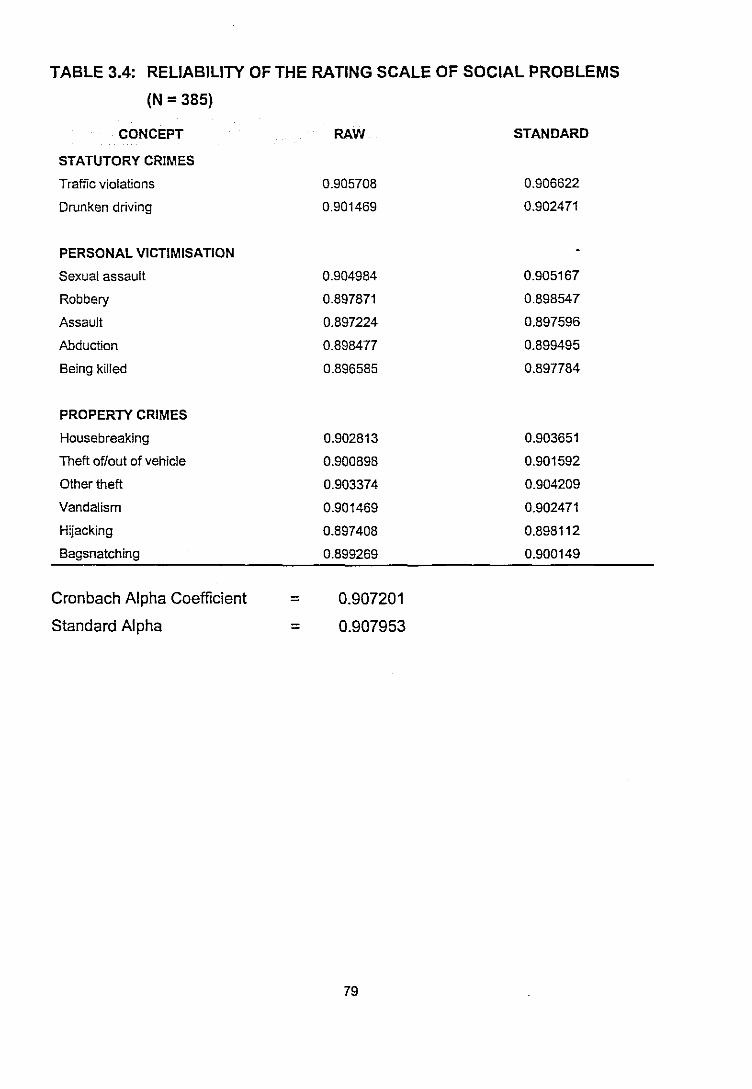
TABLE 3.4: RELIABILITY OF THE RATING SCALE OF SOCIAL PROBLEMS
(N = 385)
CONCEPT
STATUTORY CRIMES
Traffic violations
Drunken driving
PERSONAL VICTIMISATION
Sexual assault
Robbery
Assault
Abduction
Being killed
PROPERTY CRIMES
RAW
0.905708
0.901469
0.904984
0.897871
0.897224
0.898477
0.896585
STANDARD
0.906622
0.902471
0.905167
0.898547
0.897596
0.899495
0.897784
Housebreaking
Theft of/out of vehicle
Other theft
Vandalism
Hijacking
Bagsnatching
Cronbach Alpha Coefficient
Standard Alpha
0.902813 0.903651
0.900898 0.901592
0.903374 0.904209
0.901469 0.902471
0.897408 0.898112
0.899269 0.900149
= 0.907201
= 0.907953
79
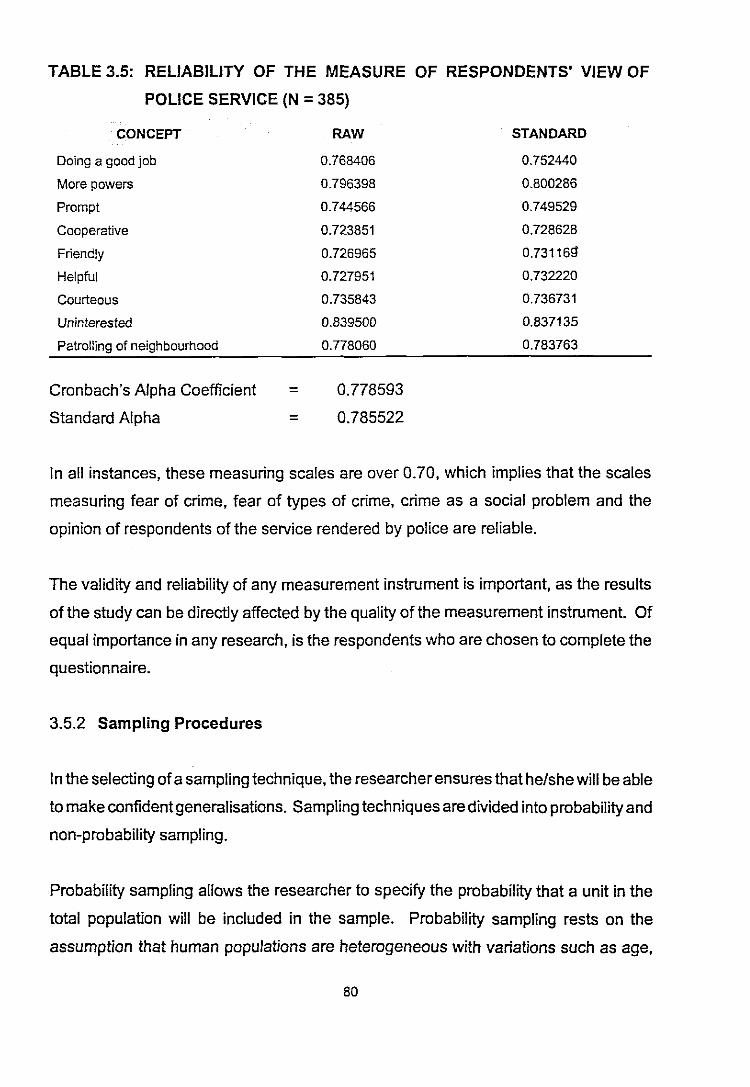
TABLE 3.5: RELIABILITY OF THE MEASURE OF RESPONDENTS' VIEW OF
POLICE SERVICE (N = 385)
CONCEPT RAW STANDARD
Doing a good job 0.768406 0.752440
More powers 0.796398 0.800286
Prompt 0.744566 0.749529
Cooperative 0.723851 0.728628
Friendly 0.726965 0.73116g
Helpful 0.727951 0.732220
Courteous 0.735843 0.736731
Uninterested 0.839500 0.837135
Patrolling of neighbourhood 0.778060 0.783763
Cronbach's Alpha Coefficient = 0.778593
Standard Alpha = 0.785522
In all instances, these rneasurinq scales are over 0.70, which implies that the scales
measuring fear of crime, fear of types of crime, crime as a social problem and the
opinion of respondents of the service rendered by police are reliable.
The validity and reliability of any measurement instrument is important, as the results
of the study can be directly affected by the quality of the measurement instrument. Of
equal importance in any research, is the respondents who are chosen to complete the
questionnaire.
3.5.2 Sampling Procedures
In the selecting of a sampling technique, the researcher ensures that he/shewill be able
to make confident generalisations. Sampling techniques are divided into probability and
non-probability sampling.
Probability sampling allows the researcher to specify the probability that a unit in the
total population will be included in the sample. Probability sampling rests on the
assumption that human populations are heterogeneous with variations such as age,
80
gender, socio-economic status, family structures etc. The selection of a sample by
chance can lead to conscious and unconscious bias. The sample chosen should be
limited to those characteristics that are relevant to the substantive interests of the study
(Babbie 1990:70-71).
Non-probability sampling techniques are employed when precise representativeness
is not necessary and also in situations in which sampling would be expensive. Non
probability sampling is non-random and is useful in pilot surveys. It is less expensive
and can be carried out on a spur-of-the-moment basis (Bailey 1987:92). Its obvious
disadvantage is that no representativeness of the sample can be claimed. The
following are examples of non-probability sampling techniques:
• Convenience samples which are obtained when a researcher selects whatever
sampling units are conveniently available.
• Purposive samples are where the sampling units are selected subjectively by the
researcher who is attempting to make the sample appear representative of the
population.
• Quota samples which involves the selection of a sample that is similar to the
sampling population.
3.5.2.1 Spatial delimitation of the sample group
For the purpose of sampling in the research, the following areas within the confines of
the Lower Umfolozi area have been included:-
• Richards Bay Transitional Local Council. This area includes Richards Bay and
the two large predominantly black townships situated south of Richards Bay.
namely Esikhawini and Vulindlela.
• Empangeni Transitional Local Council. This area includes the large
predominantly black residential township of Ngwelezane and the area of
Empangeni.
81
The researcher obtained maps of the Richards Bay and Empangeni Municipal areas
from the Technical Services of the respective councils. However, these council maps
proved to be unreliable and incomplete as they did not reflect the position of informal
settlements. For example, the researcher personally observed the existence of
numerous alternative housing units not appearing on the street maps. These informal
settlements were to be found close to the Richards Bay Harbour (the largest export
harbour in South Africa) as well as next to Green Hills Police Station in Ricj1ards Bay.
This influenced the sampling method, as Maxfield and Babbie (1995) issued a stem
warning when they stated "... [that]in strictly zoned urban regions, illegal housing units
are unlikely to appear on official records. As a result, such units would have no chance
for selection, and sampling findings could not be representative of those units, which
are often poorer and more overcrowded ... than the average" (Maxfield & Babbie
1995:196). Therefore it would be difficult, if not impossible, to eliminate bias resulting
from utilising street directories to effect sample representativeness between properly
zoned areas and informal settlements. On the basis of the abovementioned problems,
the researcher arbitrarily decided to implement a purposive or judgmental sampling
technique.
This approach enabled the researcher to eliminate research bias by inclUding the
informal settlements in the study, which would have been omitted or ignored if
probability sampling procedures had been implemented.
Maxfield and Babbie (1995:206-207) opined that •... occasionally it may be appropriate
to select a sample on the basis of [the researchers'] own knowledge of the population,
its elements, and the nature of [the] research aims - in short, based on the [the
researchers] judgement and the purpose of the study".
The research was conducted in March 1995.
82
3.5.2.2 Qualitative and quantitative delimitation of the sample group
Due to the inability to mail questionnaires to respondents, as certain residential areas
did not have a home delivery service but made use of post boxes, the decision was
made to hand deliver the questionnaires to households in the residential areas.
The original decision for the fieldwork to be done by the researcher was neqated due
to the work circumstances of said researcher. Field workers were then utilized. The
field workers were Honours students in the Department of Sociology at the University
of Zulu/and and numbered four. They were to distribute the questionnaires in
Vulindlela, Esikhawini and Ngwelezane. Before the distribution of the questionnaire,
the field workers underwent an instruction course which included the following:
.• In mapped residential areas (streets) and informal settlement areas (fareways),
every tenth dwelling was to be approached and the inhabitants asked to
complete the questionnaire.
• Wherever possible, both male and female members of a household were to be
asked to complete the questionnaire without undue consultation or influence
from each other.
• There was to be limited participation from the field workers in the respondents';
completion of the questionnaire. If approached to help translate the concepts
into Zulu, the field workers could participate, but must not influence the
respondent in any way.
Respondents, irrespective of race, residing in the abovementioned regions were
included in the study. (The demographic characteristics of the respondents are
represented in Annexure B). Although the attempt was made to ensure that both male
and female residents of a household completed the questionnaire, due to the poor
response from respondents, this attempt did not succeed.
83
The original number of respondents was not to exceed one thousand. Although 800
questionnaires were distributed to respondents by hand, only 385 were
collected/retumed, constituting a 48.13% response rate.
Problems associated with the sampling method included the following:
• The fieldworkers endeavoured to recover the questionnaires but they were met
with an unwillingness to cooperate by the original respondents.
• Many respondents voiced concern about the confidentiality of the information,
especially as the study was conducted by a student at the University of Zululand.
Respondents feared disclosing physical security measures for fear of this
knowledge being given to "undesirable elements" and used against them.
• The fieldworkers also feared being out at night in certain residential areas which
were known to be unsafe after dark.
Against the backdrop of the abovementioned difficulties and the "less-than-perfect
conditions" for research, the existence of informal settlements added further problems
to the chosen method of sampling as these informal settlements were not reflected in
the street directories obtained from the respective town councils.
Thus, the findings of the present research can be taken as representing only the
aggregation of respondents composing the sample group. The findings ofthis research
should by no means be regarded as a generalisation in terms of the total population
residing in the Lower UmfoJozi area.
3.5.3 Statistical techniques
In the interpretation of the data, statistics are used for descriptive purposes, l.e.
percentages, means, standard deviation and correlation coefficients, and make it
possible to reduce data to manageable proportions. Descriptive statistics are useful
84
when interrelationships between more than two variables are needed. The second
purpose of statistics is to enable the researcher to infer properties of a population on
the basis of sample results i.e. inferential statistics.
3.5.3.1 Frequency distributions
The first task, after data has been coded, is to construct frequency distributions to
examine the pattem of responses to each of the independent and dependent variables
under investigation. Frequency distributions contain the number of responses (n) and
their percentages. Percentages (%) are given to the nearest decimal and totals equal
exactly 100.00.
(The frequency distributions of responses to the scales offearof crime, fear of personal
victimisation and property crimes, previous victimisation, precautionary measures, crime
as a social problem and the role of the police are presented in Annexure B).
Frequency distribution is usually utilised in the summation of nominal scales. Interval
scales, however, require the use of different measures. The first is the use of the
arithmetic mean, which is the sum of the scores divided by the total number of cases
involved. The symbol x is used to indicate the mean. However, in research although
it is necessary to compare the measures of control tendencies, it is also important to
know about the dispersion in each group. For this purpose, the standard deviation is
used. To arrive at the standard deviation, the duration of each score from the mean is
taken, each difference is squared, the results are added up and divided by the number
of cases, and then the square root is taken. The formula for the standard deviation is
presented in Annexure C.)
3.5.3.2 Spearman Rank Order Correlation Coefficient (rho)
Once the researcher has summarised single variables and described their pattern of
distribution, the pattern of relationships between variables must be examined (Frankfort
Nachmias and Nachmias 1992:369). The measure which allows a researcherto assess
85
the extent of the relationship between two variables is called the correlation coefficient.
The correlation coefficient reflects the strength and the direction of the relationship
between two variables as well as the degree to which one variable predicts another.
The present research makes use of the Spearman Rank Order Correlation Coefficient
(rho) which measures two variables on an ordinal scale or compares the rankings on
the two sets of scores by taking the differences of ranks, squaring these differences and
then adding and finally multiplyinq the measure so that its value will be +1.9 whenever
the rankings are in perfect agreement, -1.0 if they are in perfect disagreement and zero
if there is no relationship between the variables. (The formula for rho is presented in
Annexure C).
The value of rho gives information about the strength and the direction of the
relationship. If rho is significant it has to be reasonably far from zero and based on a
reasonably large sample (Harris 1995:163).
(See Annexure B for the tables representing the use of Spearman Rank Order
Correlation Coefficient).
3.5.3.3 Pearson's Correlation Coefficient (r)
The Pearson Correlation Coefficient or r is also utilised in this research to measure
relationships between two interval or ratio level variables. (The formula used is
presented in Annexure C).
The r statistic is interpreted in a similar way to the rho of Spearman (Harris 1995:173).
Vito, Latessa and Wilson (1988) noted the following with reference to the magnitude of
the relationship between variables:-
• If the correlation coefficient is less than 0.20, the relationship is slight to
negligible.
86
• If the correlation coefficient is between 0.20 and 0.40, the relationship is small
but definite.
• If the correlation coefficient is between 0.40 and 0.70, the relationship is
moderate and substantive.
• If the correlation coefficient is between 0.70 and 0.90 the relationship is high and
strong.
• Ifthe correlation coefficient is 0.90, the relationship is very high and dspendable
(Vito et al. 1985:36-37).
Wherever necessary the magnitude of both r and rho will be discussed. (The composite
tables of correlation coefficient where the Pearson Coefficient (r) is used are presented
in Annexure B).
3.5.3.4 F distribution (f-test)
The F-test is the statistical procedure which is used to obtain the statistical significance
of differences among means. It is assumed that the data measured is on an interval
or ratio scale. (The formula used is presented in Annexure C).
The critical value at the 0.05 level is the value at the 0.025 level in the F-table with N,
-1 and Nz - 1 degrees of freedom. If F equals or exceeds this value, the variances will
differ siqnlficantty at the 0.05 level (Harris 1995:299).
(The composite tables of significant differences where the F-test was used as the
measuring instrument are presented in Annexure B).
3.6 SUMMARY
The present study adopts as its research methodology, the analytical method. Use is
made of both descriptive and inferential statistics.
To reach the desired goal, the following techniques were employed:
87
+ Firstly, a literature review was made which assisted in the designing of the
research method and establishing the theoretical foundation of the study.
+ Secondly, a closed-ended questionnaire was developed and administered. This
research instrument consisted of demographical information, a fear of crime
scale (for both formless and concrete fear), a previous victimisation scale, a
scale of the precautionary measures taken by respondents, a rating scale of
crime as a social problem, and a scale on the role of the police.
+ Thirdly, a non probability sampling method was used to select respondents.
+ Fourthly, statistical techniques were used to test the internal consistency of the
items through the Cronbach's CorrelationCoefficientAlpha. All the scales tested
proved to be reliable. Further, frequency distributions were presented for purely
descriptive purposes. The inferential statistical techniques used included
Spearman Rank Order Correlation Coefficient (rho), Pearson Correlation
Coefficient (r) and the F-test.
88
CHAPTER 4
AGE, GENDER AND HOUSEHOLD CHARACTERISTICS AND THE FEAR OF
CRIME
4.1 INTRODUCTION
Fear of crime is seen as a social problem affecting the life of the individual and the
community. The most consistent findings have indicated that fear of crime is highest
among those who are considered to be vulnerable; i.e. the elderly, females, the poor
and those belonging to minority ethnic groups.
The vulnerability to criminal victimisation can be approached on two distinct levels,
namely the physical and the social levels of vulnerability. Physical vulnerability refers
to certain personal characteristics ofthe individual which render the individual incapable
of protecting himself/herself physically and emotionally from victimisation and its
consequences. Such characteristics include age and gender (Baumer 1978; Box et al.
1988 and Toseland 1982).
Social vulnerability refers to circumstances such as being poor, belonging to an ethnic
minority group, and living in dangerous neighbourhoods which makes it difficult for an
individual to prevent victimisation (Smith & Glanz 1989 and Toseland 1982). Although
most of the literature (Baumer 1978; Box et al. 1988; Garofalo 1979 and Toseland
1982) focuses on the vulnerability factor, researchers such as Toseland (1982); Balkin
and Holden (1983); Liska et al, (1988); Smith and Jarjoura (1989) and Parker and Ray
(1990), to mention a few, include variables of an environmental nature.
Environmental characteristics refer to factors outside of the characteristics of the
individual respondent; for example, area of residence; household size; neighbourhood
conditions and type of dwelling.
Two specific variables that will be analysed in this chapter are household composition
89
and type of housing and their relationship to the fear of crime. Little information exists
with respect to the influence of the type of housing on the fear of crime and thus
mention will be made in the general discussion of findings related to this factor.
4.2 AGE AND THE FEAR OF CRIME
Research on the effect of age on the fear of crime (Baumer 1985; Garofalo 1979;
Keane 1992; La Grange & Ferraro 1991; Miethe et al. 1987; Ortega & Myles 1987;
Smith & Glanz 1989; Stafford & Galle 1984; Toseland 1982 and Yin 1982) has
produced interesting and inconsistent results. An overview of existing literature from
the 1970s to the early 1990s, was regarded as necessary to outline the effect of age
on the fear of crime. The findings of previous research pertaining specifically to age
and fear of crime will be documented in chronological order and with specific reference
to general findings, findings on the elderly and inconsistent findings.
4.2.1 General Findings on age and the fear of crime
Age is often used as one of the demographic variables affecting the fear of crime. The
following findings are the most important ones:
Garofalo (1979)
In his study on victimisation and the fear ofcrime, Garofalo (1979:82) sought to develop
a working model of the determinants offear ofcrime. Using the National Crime Survey
(NCS) and information gathered through interviews on attitudes toward criminal
victimisation, five general factors were identified to influence the fear of crime, namely:
actual risk ofvictimisation; previous victimisation experience; the socialisation process;
the media's representation of crime and the effectiveness of barriers to criminal
victimisation.
Through analysis of the NCS data, Garofalo (1979:84) identifies four characteristics
age, sex, race and income as also being related to the fear of crime. Using co-variance
and multiple regression techniques he found that the fear of crime was related to
90
victimisation rates and the four demographic characteristics of age, sex, race and
income. As far as age is concemed, Garofalo (1979:84) found a negative relationship
between age and victimisation rates and a positive relationship between age and the
fear of crime. In simpler terms, as age increases, victimisation rates decrease, but the
fear of crime increases. With regard to previous victimisation experience and its
relationship to fear of crime and age; non-victims expressed less fear than victims within
all age groups. Garofalo (1979:87) proposes that role socialisation can produce the
difference in expressed fear of crime. He maintains that: "Younger people and males
might be disinclined to admit fear to interviewers whether or not they feel fear - because
of the expectations associated with their roles".
When fear of crime, media representation of crime and age are studied, Garofalo
(1979:89) points out that the level of fear in the older age groups can be due to the
media's depiction of the elderly as helpless and vulnerable in the face of crime.
Toseland (1982)
Through implementing discriminant analysis, ToseJand (1982:203) found age to be an
important factor affecting the fear of crime. Persons of advanced age and persons
under the age of 24 years were found to be more fearful of crime than any other age
group. The increased level of fear for the younger age group could be due to the
follOWing factors:
• Use of public transport by younger age group
• Spending more time away from home
• A high portion of offenders and victims being juveniles.
The abovementioned factors increase the likelihood of possible victimisation and
indicate that previous victimisation or involvement in crime influences the level of fear.
Stafford and Galle (1984)
Stafford and Galle (1984) use Pearson's correlation coefficient and the t-testto analyse
the relationship between victimisation rates, exposure to risk and the fear of crime.
91
Their findings indicated that there is a positive relationship between fear of crime and
age which was significant at the 0.01 level (Stafford & Galle 1984:174).
Baumer (1985)
Baumer uses a multivariate regression model to analyse the interaction between fear
of crime, age, size of place and gender. The effect of age on the fear of crime was
found to be strongest in cities, less strong in suburbs and weakest in small towns and
rural areas. The relationship between age and gender showed that the effect of age
is stronger for males than females. Women tended to report higher levels of fear
regardless of age, while men's fear of crime increased with age. In general, Baumer
(1985:245) states that: "It appears that women and the elderly ... are more fearful than
men or younger residents". These findings are consistent with the findings of other
researchers (cf Garofalo 1979; Toseland 1982).
Miethe, Stafford and Long (1987)
Miethe et al. (1987:186) were concerned with the relationship between different types
of crime (violent or property crimes), demographic variables and type of activity (night
time activity or major daytime activity). Using a series of logit models, Miethe et al.
(1987) predicted the likelihood of violent and property victimisation given the
demographic variables. Their findings include the following:
• The risk of violent victimisation is higher among males, low income persons, the
unmarried and the young.
• The risk of property victimisation is higher in households headed by persons who
are male; black; unmarried; young and who have high incomes.
• Persons who stand the highest risk of violent victimisation are those who have
high night-time activities and whose daily activities occur in or nearthe home, l.e.
blacks, males, the unmarried and the young.
• Young persons have a high risk of property crimes as their daily activities and
night-time activities generally occur outside the home (Miethe et al. 1987:188).
92
Ortega and Myles (1987)
In their study, Ortega and Myles (1987) used multiple regression techniques to discover
the interaction between race, gender, age and the fear of crime. Theirfindings included
the following:
+ Older persons are more fearful than younger persons.
+ Whites are more fearful than blacks.
+ Females are more fearful than males.
+ Young black males are less fearful than older black females.
+ Fear of crime increases with age for black men as it does for black females.
+ Young black males are less fearful than young white males.
+ Fear of crime decreases with age for white males (Ortega & Myles 1987:138).
To clarify their findings, Ortega and Myles (1987:138) postulated that blacks and
younger persons tend to live in high crime neighbourhoods which could account for
their higher levels of fear. Blacks and older persons tend to have less income and
education than the other groups and thus have fewer resources to deal with the
problem of crime (Le. higher vulnerability).
Box, Hale and Andrews (1988)
Box et al. (1988:344) used multivariate analysis to investigate the relationship between
fear of crime, age and gender. In their findings on age, they reported that of the two
groups (the under sixties and the over sixties), it was the over sixties who indicated a
positive correlation with the fear of crime.
Warr(1990)
Using regression analysis Warr (1990:895) investigated the relationship between age,
gender and the fear of crime. This relationship is affected by cues from the
environment, novel or unfamiliar environment and the absence/presence of others in
the immediate vicinity.
The age variable was condensed into two groups persons under the age of 50 and
93
persons over 50 years of age. Gender was introduced into the age - fear correlation.
Warr (1990) found the following:
• Young males are the least fearful group.
• Older females are the most fearful group.
• The most fear producing experience for all age or gender groups was being in
an unfamiliar environment.
• Being alone at night is also a fear producing experience for all age and gender
groups, but especially for young females (Warr 1990:897).
Parker and Ray (1990)
Parker and Ray (1990) using Pearson's correlation coefficient sought to establish if
there was a relationship between the fear of crime and the variables of age, race,
gender, marital status and prior victimisation. In the establishment of the relationship
between the abovementioned variables they found the following:
• Younger person's fear of crime was increased if they had been previously
victimised, were black and if they were female.
• Middle-aged people who were black, and had been previously victimised were
fearful of crime.
• The highest level of fear occurred in the elderly, who were less educated, lived
in rural area and who had been previously victimised (Parker & Ray 1990:30).
Smith and Hill (1991)
Smith and Hill (1991) used multivariate analysis to examine the effects of gender, age,
education, income and household composition on the fear of crime. Two intervening
variables were introduced, namely victimisation experience and types of victimisation
(personal and property). Age and income were viewed as the most significant predictor
of victimisation, with younger and poorer respondents reporting more serious
victimisation experiences. The most significant predictors of fear of personal and
property crimes according to Smith and Hill (1991:233) are age and gender (both
significant at the 0,05 level). Smith and Hill (1991 :233) postulated that n ••• gender and
94
age effects are bound up in a sense of vulnerability .;." and that their findings are
consistent with previous research.
Keane (1992)
In his study on the fear of crime in Canada, Keane (1992:219) reported that young
respondents were inclined to perceive themselves as becoming victims of personal and
property crimes (concrete fear). As far as older respondents were concerned, they
reported feelings of insecurity in their neighbourhood i.e. they expressed a more
formless type of fear.
According to Baumer (1978:255) the effect of age on fear is inconsistent and
considerably weaker than that for gender. However he notes that ..... where a
relationship has been observed it is almost totally due to the significantly higher fear of
respondents over the age of 60". Therefore, the relationship between the elderly and
the fear of crime will be briefly discussed.
4.2.2 Findings on the Elderly and Fear of Crime
It must be stated that the present research study does not intend poaching on the
reserves of Glanz (1991) and Pretorius (1994). Both these researchers have done
extensive work in the field of fear of crime among the elderly in South Africa. Their
findlnqs will be briefly discussed chronologically, together with other research studies
done in the United States of America.
Yin (1982)
Using Multiple Classification Analysis, Yin (1982:242) investigated the relationship
between fear of crime, satisfaction with neighbourhood and the impact of fear on an
individual's sense ofwell being. Only 1% ofYin's (1982) respondents reported that fear
of crime was a personal problem or a worry for them. However, fear of crime was
related to the elderly's sense of well being, morale and could result in involuntary
isolation.
95
Akers, La Greca; Sellers and Cochran (1987)
Akers et al. (1987) looked at the relationship between fear of crime and the elderly.
Using bi-variate analysis, they reported that in their research the elderly were not as
fearful as was previously thought. According to Akers et al. (1987) what influenced
levels of fear in the elderly was previous victimisation. The elderly, regardless of
gender, who had been previously victimised, reported higher levels of fear (Akers et al.
1987:490-496).
Glanz (1991)
In her study on the crime and victimisation ofthe elderly in the Cape Peninsula, Glanz
(1991) reported on the differences in levels offearforwhite, coloured and black elderly
respondents. Higher levels of fear are associated with the following:
+ Perceptions of neighbourhood deterioration (all sample groups).
+ Views that the neighbourhood was dangerous (all sample groups).
+ Perceptions of an increase in crime offences in the neighbourhood (all sample
groups).
+ Greater avoidance behaviour (all sample groups).
+ Negative perceptions of the police (especially among coloured and white
samples)(GJanz 1991:81).
Pretorius (1994)
Pretorius (1994) attempted to devise an explanatory model to explain, on the basis of
certain determinants, the fear of victimisation among the elderly.
This researcher's findings included the following:
+ There is a significant relationship between fear of victimisation and personal
knowledge of a victim among the elderly.
+ The radio has an influence in fear of victimisation among the elderly.
+ There is a limited relationship between actual victimisation and the fear of
victimisation among the elderly.
+ The aging experience, with its increase in physical, financial and psychological
96
vulnerability, is related to the fear of crime among the elderly.
+ Leamed helplessness is a reality among the elderly and is related to their fear
of victimisation.
+ There is no correlation between social support and fear of victimisation among
the elderly.
+ There is a relationship between neighbourhood safety and the fear of crime
among the elderly.
+ The elderly employ avoidance behaviour in an attempt to prevent victimisation
(Pretorius 1994:188-192).
These findings are supported by a review of the literature referred to in this text. It must
be noted that several of these findings hold true for various age groups.
4.2.3 Inconsistent Findings
Although these findings are referred to as being inconsistent, they should be regarded
as presenting interesting opportunities to further investigate the relationship between
age and fear of crime.
La Grange and Ferraro (1989)
La Grange and Ferraro (1989) devised an analytical plan to study the relationship
between gender, age and the fear of crime. Firstly, they examined the bivariate
relationship among 11 indicators of fear, the National Crime Swvey measure, two risk
measures (personal and property), and age and gender. Secondly, they used factor
analysis to develop the best measurement model of fear of crime. Lastly, they tested
the structural effects of age, gender and other co-variates, in a model of fear of crime
(La Grange & Ferraro 1989:707).
Using Pearson's correlation coefficient, La Grange and Ferraro (1989:704) measured
the risk of personal and property crimes and the fear of crime. They concluded that all
persons who perceive themselves to be at risk of victimisation are more fearful.
However, when age is added to the correlation, they reported that younger persons
97
reported having greaterfearofvictimisation than older persons. La Grange and Ferraro
(1989:709) therefore concluded that ..... the relationship between age and fear of crime
is not consistently monotonic nor positive ... these data do not support the view that
older adults have exceptionally high levels of fear".
Smith and Glanz (1989)
In their study on the fear of crime among the South African public, Smith ~nd Glanz
(1989) used Multiple Classification Analysis (MCA) to investigate the relationship
between perceived likelihood of victimisation and various independent variables which
included race, age, gender, education level and area of residence. Their results show
little difference between the levels offear for the different categories ofthe age variable
(Smith & Glanz 1989:55).
In conclusion, the literature has indicated that multivariate statistical techniques are
generally used to analyse the relationship between age and the fear of crime. These
techniques include the use of Pearson's Correlation Coefficient, logistic regression,
discriminant analysis, Multiple Classification Analysis (MCA) and the t-test.
Fear of crime is in tum measured by variations of the question "How safe do you feel
when you go out alone in your neighbourhood after dark?"
Some research studies have included specific reference to fear of personal and/or
property crimes, as well as the analysis of victimisation rates.
4.2.4 Presentation and Analysis of Data
In the present study, the existence of a relationship between age and the fear of crime
was proposed in the following hypothesis -
Hypothesis 1: There is a relationship between age and fear of crime.
(The frequency distribution of the various age categories is given in Annexure B). The
98
age categories included 18-24; 25-34; 35-44; 45-54; 55-64; and 65 years of age and
over.
Fear of crime was based on th,e responses obtained to the following three questions:
• "How safe do you feel when walking alone at night in your neighbourhood?"
(abridged to walking alone)
• "How safe do you feel when alone in your home or apartment.at night?"
(abridged to home alone)
• "How safe do you feel in your neighbourhood when leaving or arriving at home
when it is dark?" (abridged to leaving/arriving at home).
Based on the recommendation by Ferraro and La Grange (1987:75) thatfear of specific
crimes be measured, a question relating to fear of personal and property crimes was
asked. The respondents were asked to indicate four levels of fear (not fearful at all; a
little fearful; quite fearful; very fearful) of personal victimisation (which included fear of
rape at home or away from home; being killed at home or away from home; being
robbed or mugged; being assaulted; being abducted; being shot at with an Ak47 rifle
(abridged to being shot at); and property crimes (which included housebreaking;
damage to property; arson; vehicles being broken into; being ambushed whilst driving
a car:hijacked)(abridged to hijacking).
Since the variable age and fear of crime are both on the interval level, the most
valuable measuring instrument is Pearson's Correlation Coefficient (r). Using r, age
was related to the three questions measuring fear of crime in general, and the fear of
personal or property crimes. (For the purpose of this study, the level of significance
was arbitrarily set at 0,05). The results ofthe correlations are presented in the following
tables:
99
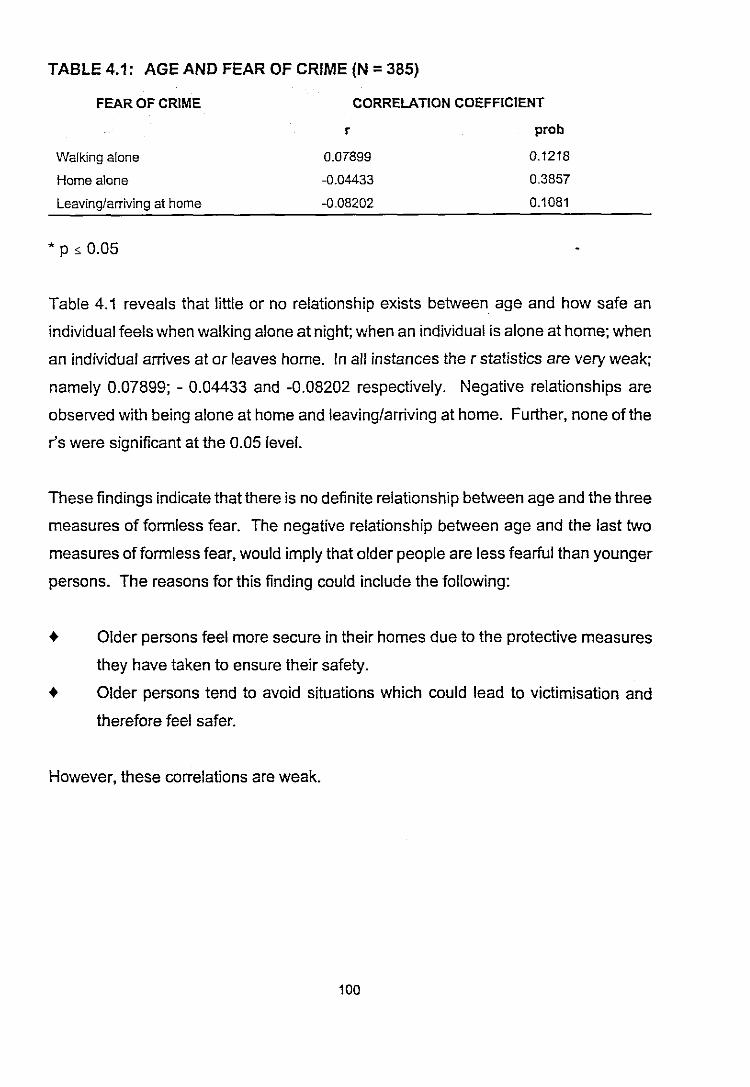
TABLE 4.1: AGE AND FEAR OF CRIME (N =385)
FEAR OF CRIME CORRELATION COEFFICIENT
r prob
Walking alone
Home alone
Leaving/arriving at home
* p ,; 0.05
0.07899
-0.04433
-0.08202
0.1218
0.3857
0.1081
Table 4.1 reveals that little or no relationship exists between age and how safe an
individual feels when walking alone at night; when an individual is alone at home; when
an individual arrives at or leaves home. In all instances the r statistics are very weak;
namely 0.07899; - 0.04433 and -0.08202 respectively. Negative relationships are
observed with being alone at home and leaving/arriving at home. Further, none of the
r's were significant at the 0.05 level.
These findings indicate that there is no definite relationship between age and the three
measures of formless fear. The negative relationship between age and the last two
measures of formless fear, would imply that older people are less fearful than younger
persons. The reasons for this finding could include the following:
• Older persons feel more secure in their homes due to the protective measures
they have taken to ensure their safety.
• Older persons tend to avoid situations which could lead to victimisation and
therefore feel safer.
However, these correlations are weak.
100
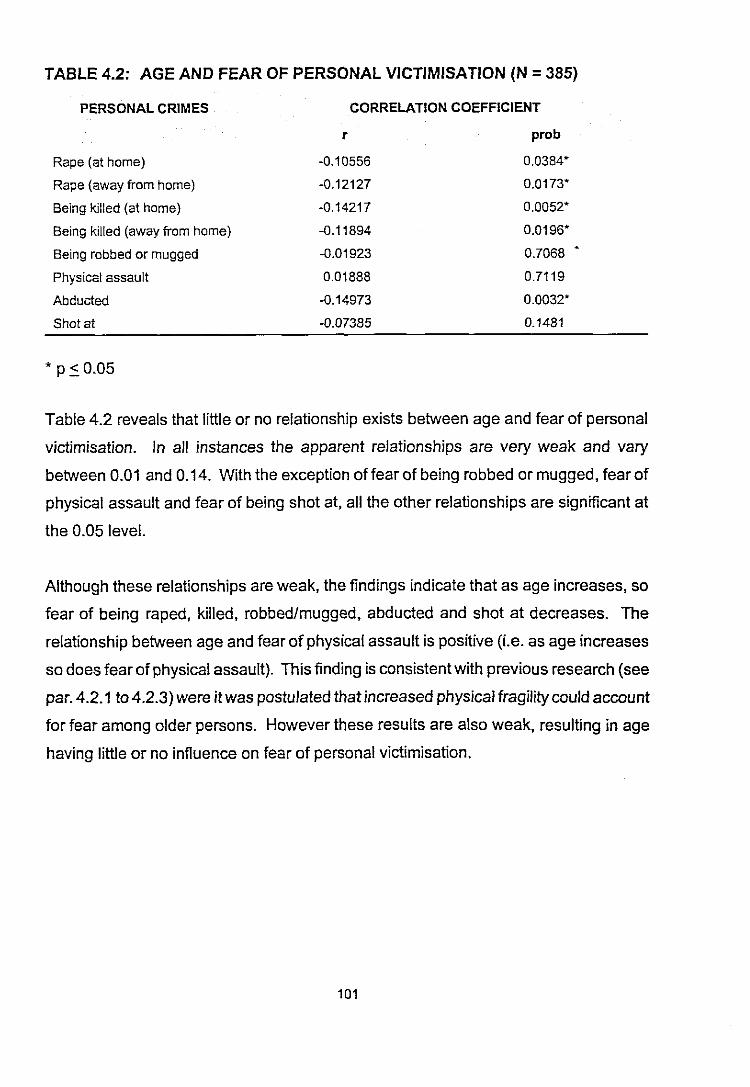
TABLE 4.2: AGE AND FEAR OF PERSONAL VICTIMISATlON (N = 385)
PERSONAL CRIMES CORRELATION COEFFICIENT
r prob
Rape (at home)
Rape (away from home)
Being killed (at home)
Being killed (away from home)
Being robbed or mugged
Physical assault
Abducted
Shot at
* p ~ 0.05
-0.10556
-0.12127
-0.14217
-0.11894
-0.01923
0.01888
-0.14973
-0.07385
0.0384"
0.0173"
0.0052"
0.0196"
0.7068 •
0.7119
0.0032"
0.1481
Table 4.2 reveals that little or no relationship exists between age and fear of personal
victimisation. In all instances the apparent relationships are very weak and vary
between 0.01 and 0.14. With the exception of fear of being robbed or mugged, fear of
physical assault and fear of being shot at, all the other relationships are significant at
the 0.05 level.
Although these relationships are weak, the findings indicate that as age increases, so
fear of being raped, killed, robbed/mugged, abducted and shot at decreases. The
relationship between age and fear of physical assault is positive (l.e, as age increases
so does fear of physical assault). This finding is consistent with previous research (see
par. 4.2.1 to 4.2.3) were itwas postulated that increased physical fragility could account
for fear among older persons. However these results are also weak, resulting in age
having little or no influence on fear of personal victimisation.
101
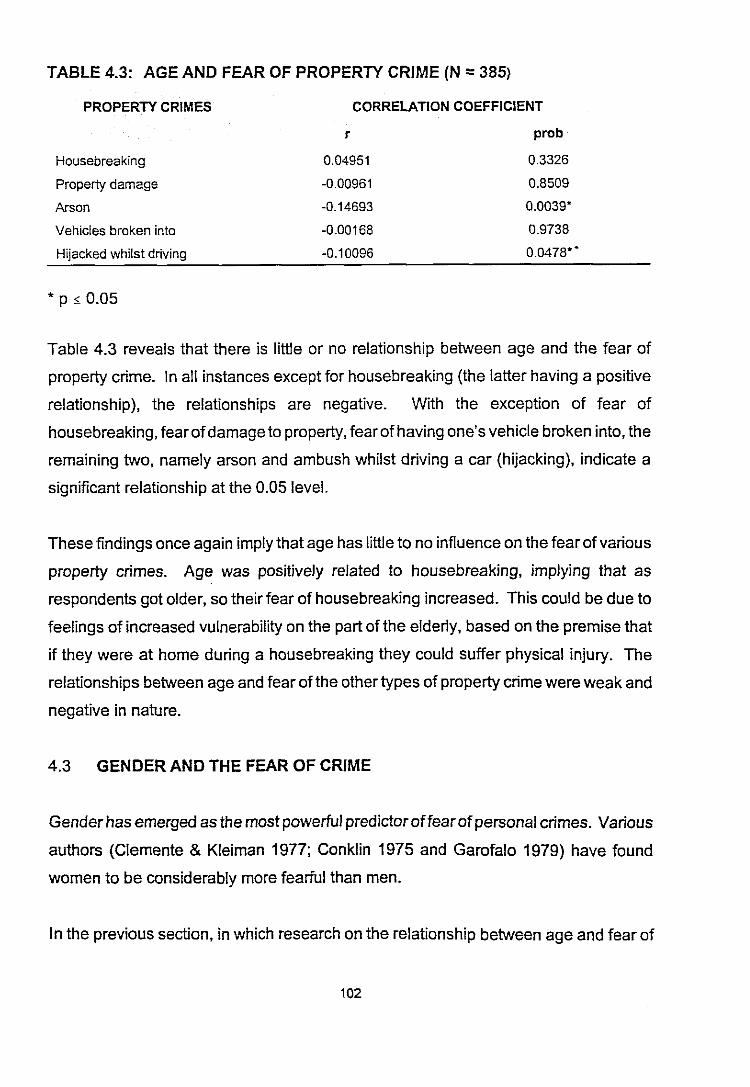
TABLE 4.3: AGE AND FEAR OF PROPERTY CRIME (N =385)
PROPERTY CRIMES CORRELATION COEFFICIENT
r prob
Housebreaking
Property damage
Arson
Vehicles broken into
Hijacked whilst driving
* P 50 0.05
0.04951
-0.00961
-0.14693
-0.00168
-0.10096
0.3326
0.8509
0.0039'
0.9738
0.0478"
Table 4.3 reveals that there is little or no relationship between age and the fear of
property crime. In all instances except for housebreaking (the latter having a positive
relationship), the relationships are negative. With the exception of fear of
housebreaking, fear ofdamage to property, fear of having one's vehicle broken into, the
remaining two, namely arson and ambush whilst driving a car (hijacking), indicate a
significant relationship at the 0.05 level.
These findings once again imply that age has little to no influence on the fear of various
property crimes. Age was positively related to housebreaking, implying that as
respondents got older, so their fear of housebreaking increased. This could be due to
feelings of increased vulnerability on the part of the elderly, based on the premise that
if they were at home during a housebreaking they could suffer physical injury. The
relationships between age and fear ofthe other types of property crime were weak and
negative in nature.
4.3 GENDER AND THE FEAR OF CRIME
Gender has emerged as the most powerful predictorof fear ofpersonal crimes. Various
authors (Clemente & Kleiman 1977; Conklin 1975 and Garofalo 1979) have found
women to be considerably more fearful than men.
In the previous section, in which research on the relationship between age and fear of
102
crime was documented, gender featured in most of the findings. Therefore, in this
section, only the findings pertaining to the relationship between gender and fear of
crime per se will be briefly stated.
4.3.1 General Findings on Gender and the Fear of Crime
Garofalo (1979)
Garofalo (1979:87) reported that women have higher levels of fear because of passive
sex role socialisation; i.e. women are taught to think of themselves as helpless and
powerless. He further conjectured that it is role socialisation which makes men
reluctant to admit to fear because of the expectations associated with the masculine
role. Role socialisation is therefore the reason forthe disparity between the level of fear
reported and gender.
Toseland (1982)
According to Toseland (1982:203) gender is the single most important predictor
affecting fear of crime.
"Femaies are more likely to be fearful than males as they feel powerless and
lack self defence skills. The perception of vulnerability will lead females into
avoidance behaviour, l.e. they will try to prevent getting involved in opportunities
which could lead to victimisation".
Stafford and Galle (1984)
These researchers correlated age, gender and fear of crime. Their findings indicated
that older females are more fearful of crime, which is in keeping with previous research
(Stafford & Galle 1984:179).
Box, Hale and Andrews (1988)
In keeping with previous results, Box et al. (1988:349) claimed that gender is "... clearly
the most important variable in explaining fear ..", It is viewed as having significant
negative interactions with age and perceived likelihood of being a victim of crime. Their
103
general findings on the interaction of the three variables includes the following:
+ women are more fearful than men in any age group
+ as men age, the gender-fear gap tends to narrow. (Reasons put forward to
explain this narrowing include increased physical fragility among men, less
experience in avoidance techniques and increased feelings ofvulnerability) (Box
et al. 1988:349).
La Grange and Ferraro (1989)
In their analysis of the relationship between gender and the fear of crime, La Grange
and Ferraro (1989:706) found that "regardless of how fear of crime is measured,
women tend to be significantly more fearful than men ...".
When looking at the gender differences in fear of specific crimes, women reported
greater levels of fear for housebreaking, rape and physical assault. These findings,
according to La Grange and Ferraro (1989), are not surprising as women perceive
themselves as vulnerable and at greater risk than men. These researchers also
suggest in conjunction with Warr (1984) that a high fear of crime for women may be fear
of male violence.
What is interesting in La Grange and Ferraro's (1989) study is that men are more likely
to be direct victims of crime than women. This implies that women's fear is largely of
indirect victimisation (l,e, risk of crime). These findings were consistent with previous
research.
Parker and Ray (1990)
In their study on gender differences in the fear of crime, Parker and Ray (1990) stated
that victimisation, age and community size had significant effects on fear of crime
among women. The reasons for the higher level of fear amongst women included the
following:
+ Women are the targets for a large range of personal and life threatening
offenses.
104
+ Women feel less capable of defending themselves against criminals who tend
to be physically stronger than them.
+ Media gives more attention to crimes involving women - which tends to sensitise
women to their vulnerability (Parker & Ray 1990:33).
Keane (1992)
Keane (1992) reported that there is a clear relationship between gender and the fear
of crime. Females see themselves as potential victims of property and personal crimes
and also express more formless fear (feelings of insecuritylunsafety) than males (Keane
1992:219).
4.3.2 Inconsistent Findings
The only article in the literature reviewed for this study that indicated an inconsistent
finding to all of the documented research was the study by Smith and Glanz (1988:56)
of fear of crime among the South African public.
They reported little difference between levels of fear with regard to gender. Smith and
Glanz (1988) claimed that the contrast in their findings was due to the disparity in
·measuring differences" between the Americans and their own research. In South
Africa, where crime is •... a salient feature of the environment personal characteristics
such as age have little effect on fear of crime as everyone is more afraid" (Smith &
Glanz 1988:58).
4.3.3 The Presentation and Analysis of Data
In the present study the relationship between gender and the fear of crime was
proposed in the following hypothesis
Hypothesis 2: There are significant differences between male and female
respondents and the fear of crime.
105
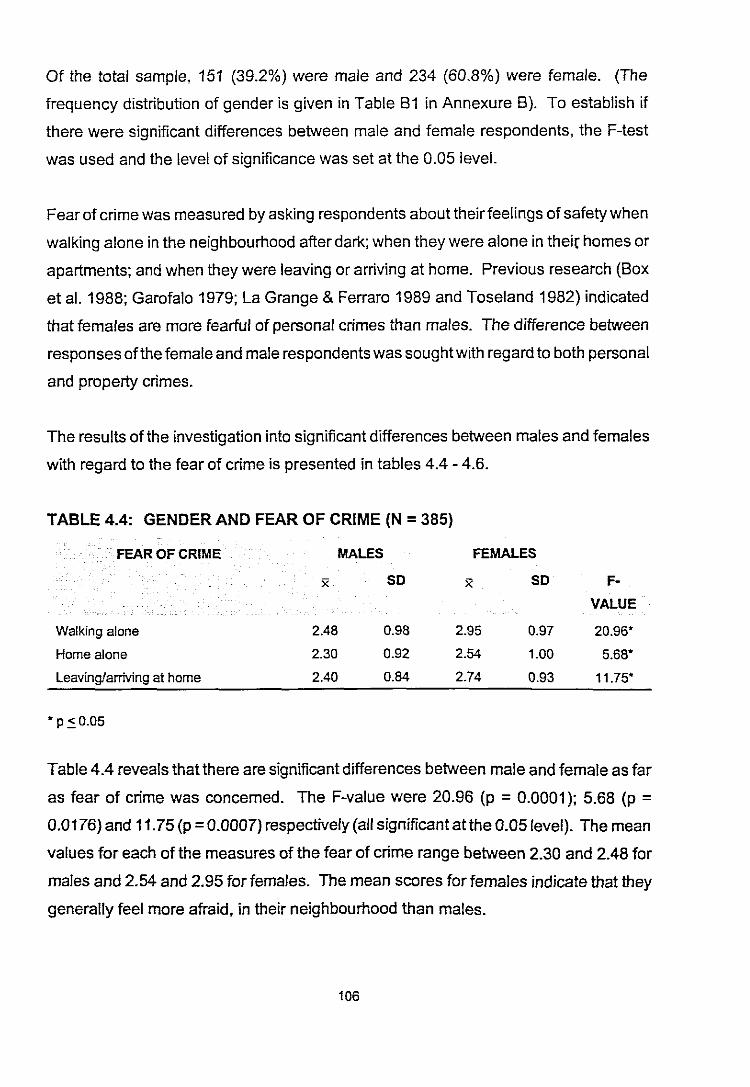
Of the total sample, 151 (39.2%) were male and 234 (60.8%) were female. (The
frequency distribution of gender is given in Table B1 in Annexure B). To establish if
there were significant differences between male and female respondents, the F-test
was used and the level of significance was set at the 0.05 level.
Fear of crime was measured by asking respondents about their feelings of safety when
walking alone in the neighbourhood after dark; when they were alone in their homes or
apartments; and when they were leaving or arriving at home. Previous research (Box
et al. 1988; Garofalo 1979; La Grange & Ferraro 1989 and Toseland 1982) indicated
that females are more fearful of personal crimes than males. The difference between
responses of the female and male respondents was sought with regard to both personal
and property crimes.
The results of the investigation into significant differences between males and females
with regard to the fear of crime is presented in tables 4.4 - 4.6.
TABLE 4.4: GENDER AND FEAR OF CRIME (N = 385)
FEAR OF CRIME
Walking alone
Home alone
leaving/arriving at home
MALES FEMALES
x SO x SO F·VALUE
2.48 0.98 2.95 0.97 20.96*
2.30 0.92 2.54 1.00 5.68*
2.40 0.84 2.74 0.93 11.75*
*p~0.05
Table 4.4 reveals that there are significant differences between male and female as far
as fear of crime was concerned. The F-value were 20.96 (p =0.0001); 5.68 (p =
0.0176) and 11.75 (p =0.0007) respectively (al/ significant atthe 0.05 level). The mean
values for each of the measures of the fear of crime range between 2.30 and 2.48 for
males and 2.54 and 2.95 for females. The mean scores for females indicate that they
generally feel more afraid, in their neighbourhood than males.
106
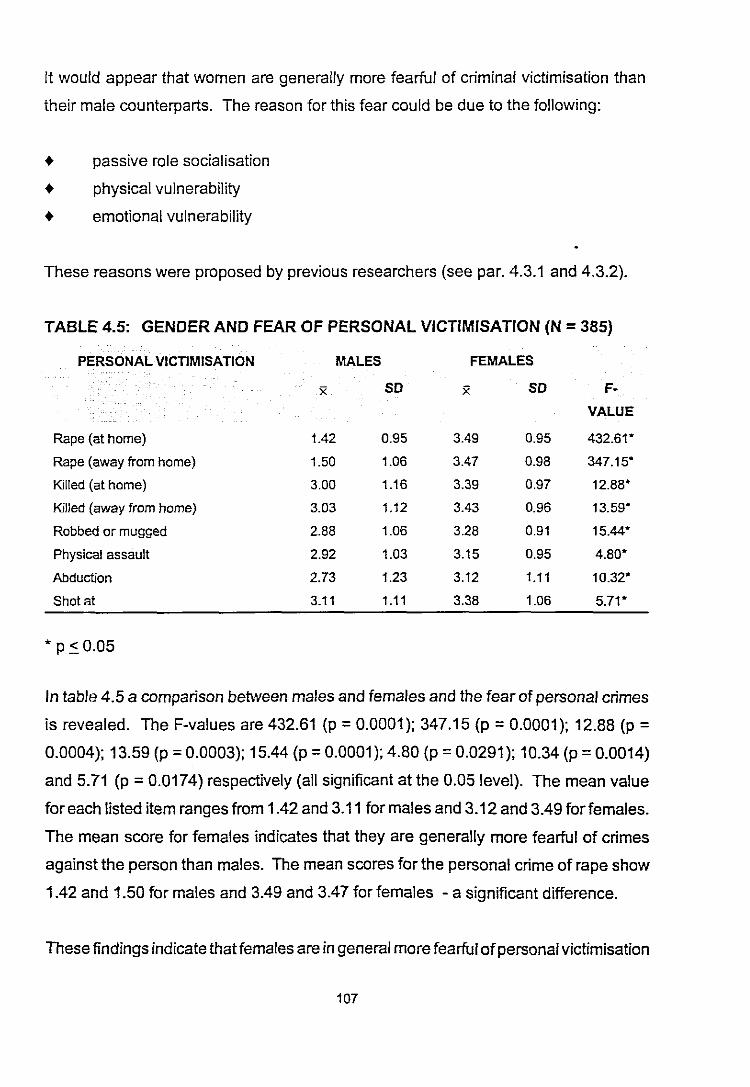
It would appear that women are generally more fearful of criminal victimisation than
their male counterparts. The reason for this fear could be due to the following:
• passive role socialisation
• physical vulnerability
• emotional vulnerability
These reasons were proposed by previous researchers (see par. 4.3.1 and 4.3.2).
TABLE 4.5: GENDER AND FEAR OF PERSONAL VICTIMISATION (N =385)
PERSONAL V1CTIMISATION MALES FEMALES
x SO x SO F-
VALUE
Rape (at home) 1.42 0.95 3.49 0.95 432.61*
Rape (away from home) 1.50 1.06 3.47 0.98 347.15*
Killed (at home) 3.00 1.16 3.39 0.97 12.88*
KiJled (away from home) 3.03 1.12 3.43 0.96 13.59*
Robbed or mugged 2.88 1.06 3.28 0.91 15.44*
Physical assault 2.92 1.03 3.15 0.95 4.80*
Abduction 2.73 1.23 3.12 1.11 10.32*
Shot at 3.11 1.11 3.38 1.06 5.71*
* P ~0.05
In table 4.5 a comparison between males and females and the fear of personal crimes
is revealed. The F-values are 432.61 (p =0.0001); 347.15 (p =0.0001); 12.88 (p =0.0004); 13.59 (p =0.0003); 15.44 (p =0.0001); 4.80 (p =0.0291); 10.34 (p =0.0014)
and 5.71 (p = 0.0174) respectively (all significant at the 0.05 level). The mean value
for each listed item ranges from 1.42 and 3.11 for males and 3.12 and 3.49 for females.
The mean score for females indicates that they are generally more fearful of crimes
against the person than males. The mean scores for the personal crime of rape show
1.42 and 1.50 for males and 3.49 and 3.47 for females - a significant difference.
These findings indicate that females are in general more fearful ofpersonal victimisation
107
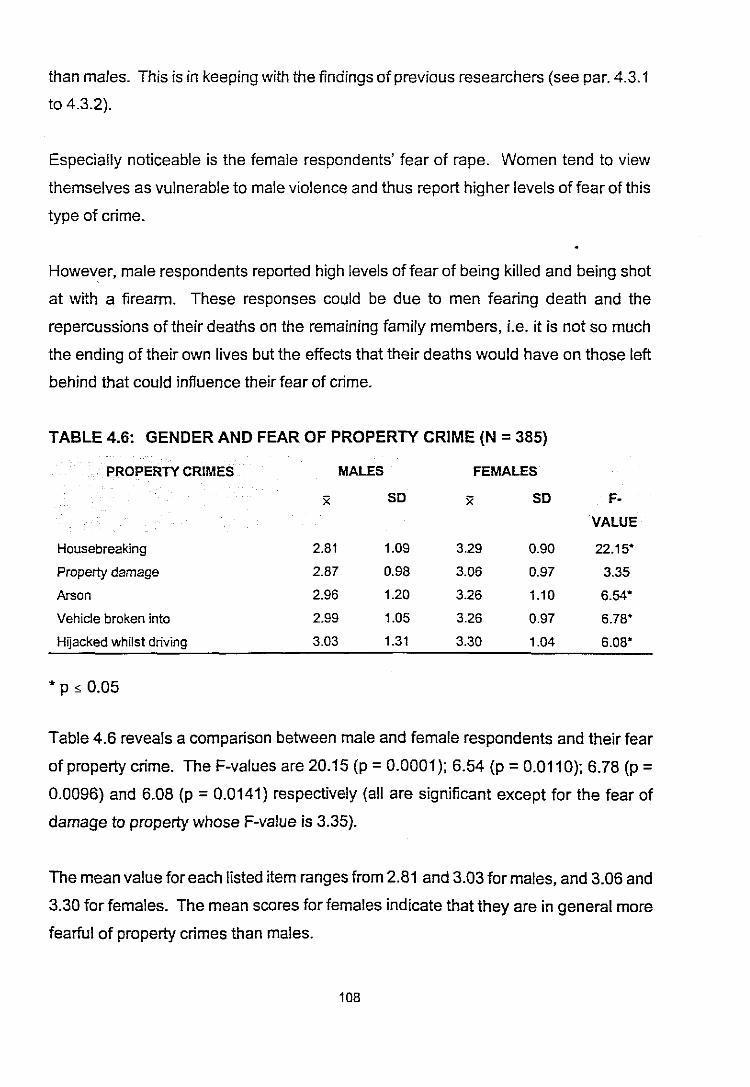
than males. This is in keeping with the findings of previous researchers (see par. 4.3.1
to 4.3.2).
Especially noticeable is the female respondents' fear of rape. Women tend to view
themselves as vulnerable to male violence and thus report higher levels of fear of this
type of crime.
However, male respondents reported high levels of fear of being killed and being shot
at with a firearm. These responses could be due to men fearing death and the
repercussions of their deaths on the remaining family members, i.e, it is not so much
the ending of their own lives but the effects that their deaths would have on those left
behind that could influence their fear of crime.
TABLE 4.6: GENDER AND FEAR OF PROPERTY CRIME (N = 385)
PROPERTY CRIMES
Housebreaking
Property damage
Arson
Vehicle broken into
Hijacked whilst driving
MALES FEMALES
x SO x SO F-
VALUE
2.81 1.09 3.29 0.90 22.15'
2.87 0.98 3.06 0.97 3.35
2.96 1.20 3.26 1.10 6.54'
2.99 1.05 3.26 0.97 6.78'
3.03 1.31 3.30 1.04 6.08'
* p s 0.05
Table 4.6 reveals a comparison between male and female respondents and their fear
of property crime. The F-values are 20.15 (p = 0.0001); 6.54 (p =0.0110); 6.78 (p =0.0096) and 6.08 (p = 0.0141) respectively (all are significant except for the fear of
damage to property whose F-value is 3.35).
The mean value for each listed item ranges from 2.81 and 3.03 for males, and 3.06 and
3.30 for females. The mean scores for females indicate that they are in general more
fearful of property crimes than males.
108
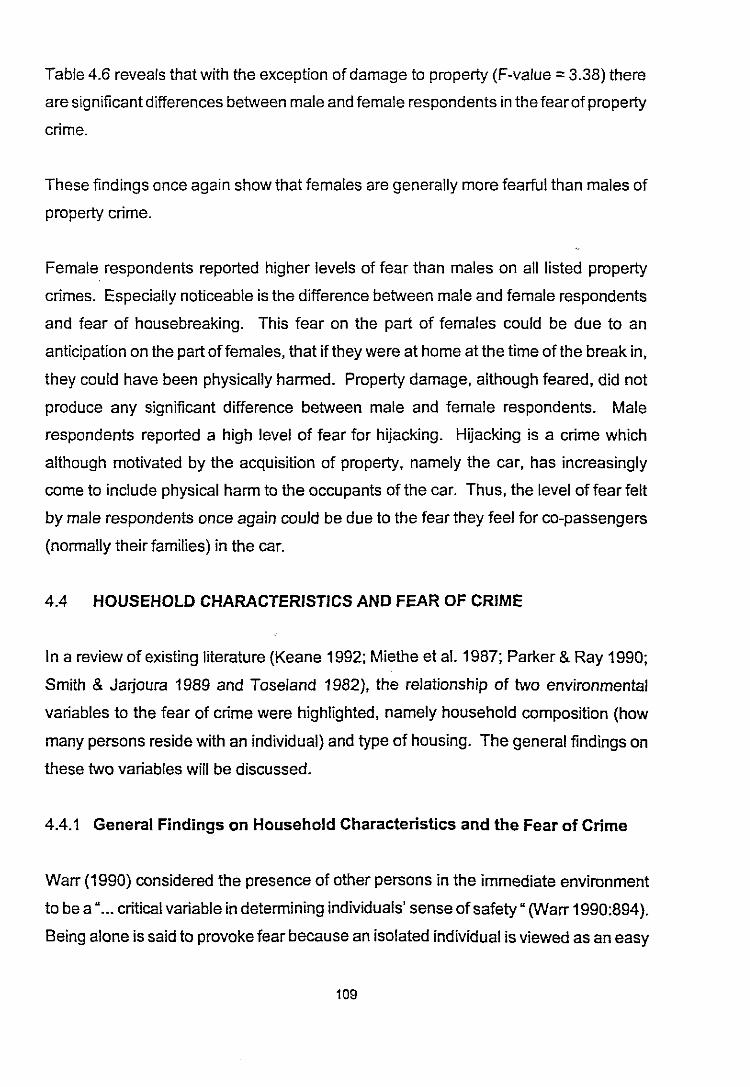
Table 4.6 reveals that with the exception of damage to property (F-value ::: 3.38) there
are significant differences between male and female respondents in the fear of property
crime.
These findings once again show that females are generally more fearful than males of
property crime.
Female respondents reported higher levels of fear than males on all listed property
crimes. Especially noticeable is the difference between male and female respondents
and fear of housebreaking. This fear on the part of females could be due to an
anticipation on the part of females, that if they were at home at the time of the break in,
they could have been physically harmed. Property damage, although feared, did not
produce any significant difference between male and female respondents. Male
respondents reported a high level of fear for hijacking. Hijacking is a crime which
although motivated by the acquisition of property, namely the car, has increasingly
come to include physical harm to the occupants of the car. Thus, the level of fear felt
by male respondents once again could be due to the fear they feel for co-passengers
(normally their families) in the car.
4.4 HOUSEHOLD CHARACTERISTICS AND FEAR OF CRIME
In a review of existinq literature (Keane 1992; Miethe et al. 1987; Parker & Ray 1990;
Smith & Jarjoura 1989 and Toseland 1982), the relationship of two environmental
variables to the fear of crime were highlighted, namely household composition (how
many persons reside with an individual) and type of housing. The general findings on
these two variables will be discussed.
4.4.1 General Findings on Household Characteristics and the Fear of Crime
WaIT(1990) considered the presence of other persons in the immediate environment
to be a •... critical variable in determining individuals' sense ofsafety" (WaIT1990:894).
Being alone is said to provoke fear because an isolated individual is viewed as an easy
109
target for victimisation; and individuals believe that if there are other people in the
immediate vicinity, they will come to one's aid in the event of an attack. The
characteristics of a household are therefore viewed as an important factor in
determining the fear of crime.
Toseland (1982)
Toseland (1982) used the number of persons living with the respondent as a
demographic variable in his analysis of the fear of crime. In the discriminant analysis,
this variable of household composition was found to be an important predictor of fear,
especially when used in conjunction with marital status. Toseland (1982) noted that
being unmarried or widowed and living alone are factors which contribute to the fear of
criminal victimisation. He therefore suggested that •... social isolation increases
respondents' fear of crime" (Toseland 1982:204).
Miethe, Stafford and Long (1987)
Miethe et al. (1987) in their investigation into the influence of routine activitiesllifestyle
on the fear of crime, used marital status to indicate household density •... since few
married persons lived alone". Using a series of logit models, Miethe et al. (1987)
wished to assess the mediational effects of activityllifestyle variables on the rest of
victimisation. The findings related to marital status are as follows:
+ Males, low-income persons, the unmarried and the young have a higher risk of
violent victimisation.
+ Households headed by persons who are male, black, unmarried, young and
have high incomes have a high risk of property victimisation.
Miethe et al. (1987) concluded that the likelihood of victimisation taking place increases
when "suitable targets who lack guardianship in proximity to motivated offenders" exist.
Thus it is the lack of guardianship which could influence a person's level of fear (Miethe
et al. 1987:192).
110
Smith and Jarjoura (1989)
Smith and Jarjoura (1989) used households as their units of analysis as they believed
that "respondents in victimisation surveys do not live in social vacuums" (Smith &
Jarjoura 1989:623).
Using bivariate analysis of the data gathered from 9006 households in 57 residential
neighbourhoods, Smith and Jarjoura (1989) hoped to establish an association between
the risk of burglary and the attributes of individual households.
Their analysis of the data indicated the following, namely
• single parent households are at risk of burglary
• household occupied by two unrelated males have a higher risk of burglary
• the least likely households to be victimised as those occupied by couples, single
females and two or more unrelated females
• as the number of persons living in a household increases so does the risk of
burglary
• the older the household members the less the risk for victimisation
• the risk of burglary is greater for persons occupying multiple family housing
This study did not attempt to relate risk of victimisation to the fear of crime in any way.
This is considered an oversight which will be remedied in the present study (Smith &
Jarjoura 1989:623).
Parker and Ray (1990)
Parker and Ray (1990) utilised data from a survey conducted by Department of
Sociology and Rural Life in Mississippi. Using Pearson's correlation coefficient (r), the
relationship between fear of crime and the various independent variables was sought.
The variable "living arrangement" was used to determine the relationship between
household density and the fear of crime. Their findings indicated that living
arrangements were not related to fear of crime (Parker & Ray 1990:31).
111
Smith and Hill (1991)
Smith and Hill (1991) identified five exogenous variables, namely gender, age,
education, family income and household composition which they used in their analysis
of the fear of crime. Their findings reflect those of Parker and Ray (1990) in that no
significant relationship was found between household composition and the fear ofcrime
(Smith & Hill 1991:223).
Keane (1992)
Keane (1992) used the variable "dwelling" as an independent variable. He coded single
detached, semi detached, row house and duplex as "house" 1, and low rise and high
rise apartments as "apartment" 2. Keane (1992) found that the relationship between
type of dwelling and fear of crime was not significant. With regard to formless fear
(feelings of safety), apartment dwellers were more likely to be fearful. Fear of specific
personal or property crimes (measure of concrete fear) was also related to type of
dwelling, and housedwellers expected more property damage and theft, while
apartment dwellers expected to be unaffected (Keane 1992:219).
Neser, Geldenhuys, Stevens, Grobbelaar and Ladikos (1993)
Neser et al, (1993) differentiated between houses and flats in their study on the fear of
crime in Pretoria, South Africa. Using discriminant analysis to investigate the
relationship between variables, they reported that people who reside in flats feel more
unsafe than people who reside in houses. They concluded that flat residents show a
higher general level of fear than house residents (Neser et al. 1993:35).
4.4.2 Presentation and Analysis of Data
Research studies (Keane 1992; Parker & Ray 1990 and Smith & Jarjoura 1989) have
produced varying results in the analysis of the relationship between fear of crime and
household composition. Further, there is an obvious dearth of such studies on the
effects of household composition and type of housing on the fear of crime, both in
South Africa and elsewhere.
112
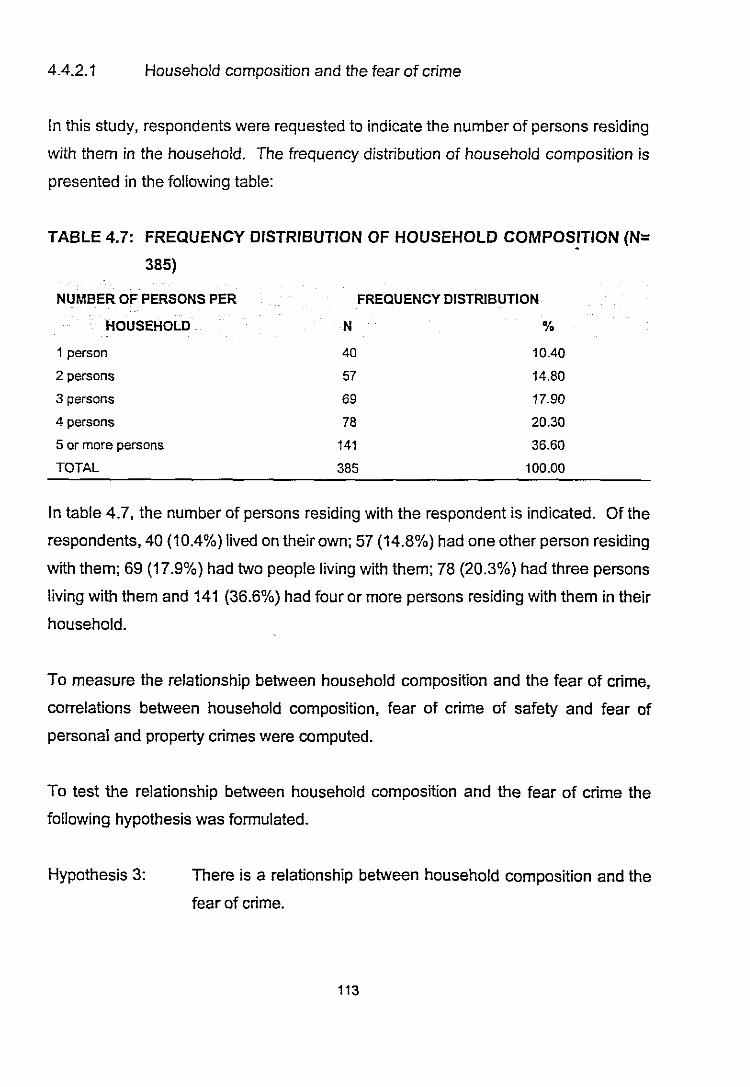
4.4.2.1 Household composition and the fear of crime
In this study, respondents were requested to indicate the number of persons residing
with them in the household. The frequency distribution of household composition is
presented in the following table:
TABLE 4.7: FREQUENCY DISTRIBUTION OF HOUSEHOLD COMPOS~TION (N=
385)
NUMBER OF PERSONS PER
HOUSEHOLD
FREQUENCY DISTRIBUTION
N %
1 person
2 persons
3 persons
4 persons
5 or more persons
TOTAL
40
57
69
78
141
385
10.40
14.80
17.90
20.30
36.60
100.00
In table 4.7, the number of persons residing with the respondent is indicated. Of the
respondents, 40 (10.4%) lived on their own; 57 (14.8%) had one other person residing
with them; 69 (17.9%) had two people living with them; 78 (20.3%) had three persons
living with them and 141 (36.6%) had four or more persons residing with them in their
household.
To measure the relationship between household composition and the fear of crime.
correlations between household composition, fear of crime of safety and fear of
personal and property crimes were computed.
To test the relationship between household composition and the fear of crime the
following hypothesis was formulated.
Hypothesis 3: There is a relationship between household composition and the
fear of crime.
113
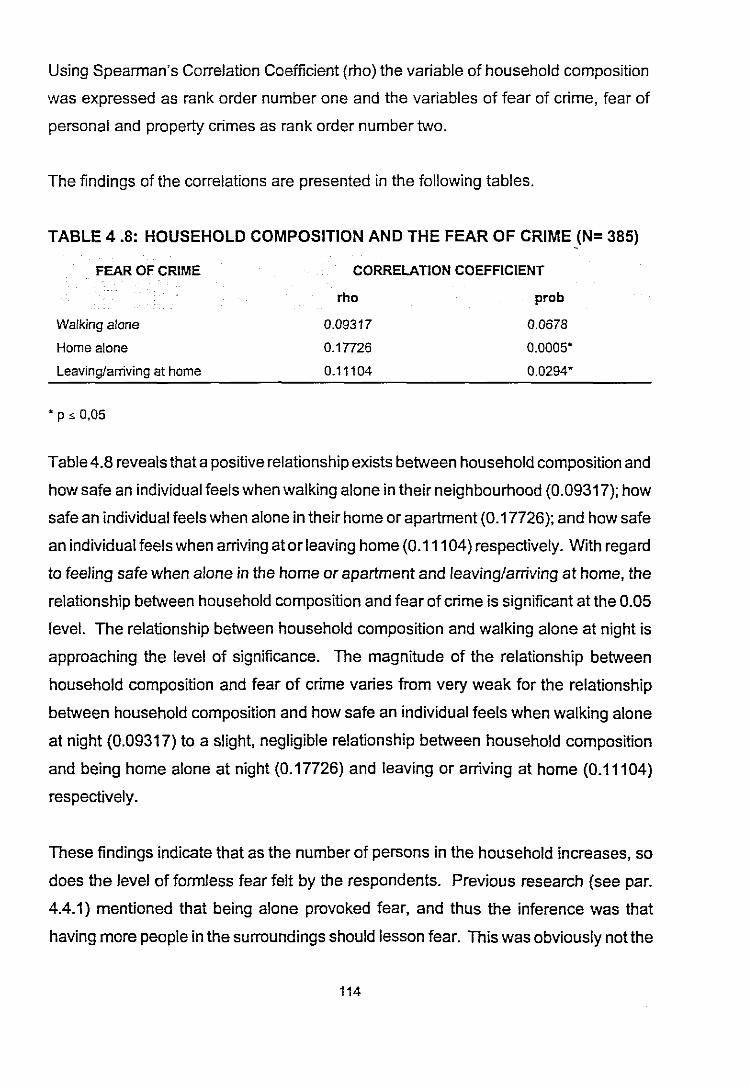
Using Spearman's Correlation Coefficient (rho) the variable of household composition
was expressed as rank order number one and the variables of fear of crime, fear of
personal and property crimes as rank order number two.
The findings of the correlations are presented in the following tables.
TABLE 4 .8: HOUSEHOLD COMPOSITION AND THE FEAR OF CRIME (N= 385)
FEAR OF CRIME CORRELATION COEFFICIENT
Walking alone
Home alone
Leaving/arriving at home
* p s 0,05
rho
0.09317
0.1n26
0.11104
prob
0.0678
0.0005*
0.0294*
Table 4.8 reveals that a positive relationship exists between household composition and
how safe an individual feels when walking alone in their neighbourhood (0.09317); how
safe an individual feels when alone in their home or apartment (0.17726); and how safe
an individual feels when arriving at or leaving home (0.111 04) respectively. With regard
to feeling safe when alone in the home or apartment and leaving/arriving at home, the
relationship between household composition and fear of crime is significant at the 0.05
level. The relationship between household composition and walking alone at night is
approaching the level of significance. The magnitude of the relationship between
household composition and fear of crime varies from very weak for the relationship
between household composition and how safe an individual feels when walking alone
at night (0.09317) to a slight, negligible relationship between household composition
and being home alone at night (0.17726) and leaving or arriving at home (0.11104)
respectively.
These findings indicate that as the number of persons in the household increases, so
does the level of formless fear felt by the respondents. Previous research (see par.
4.4.1) mentioned that being alone provoked fear, and thus the inference was that
having more people in the surroundings should lesson fear. This was obviously not the
114
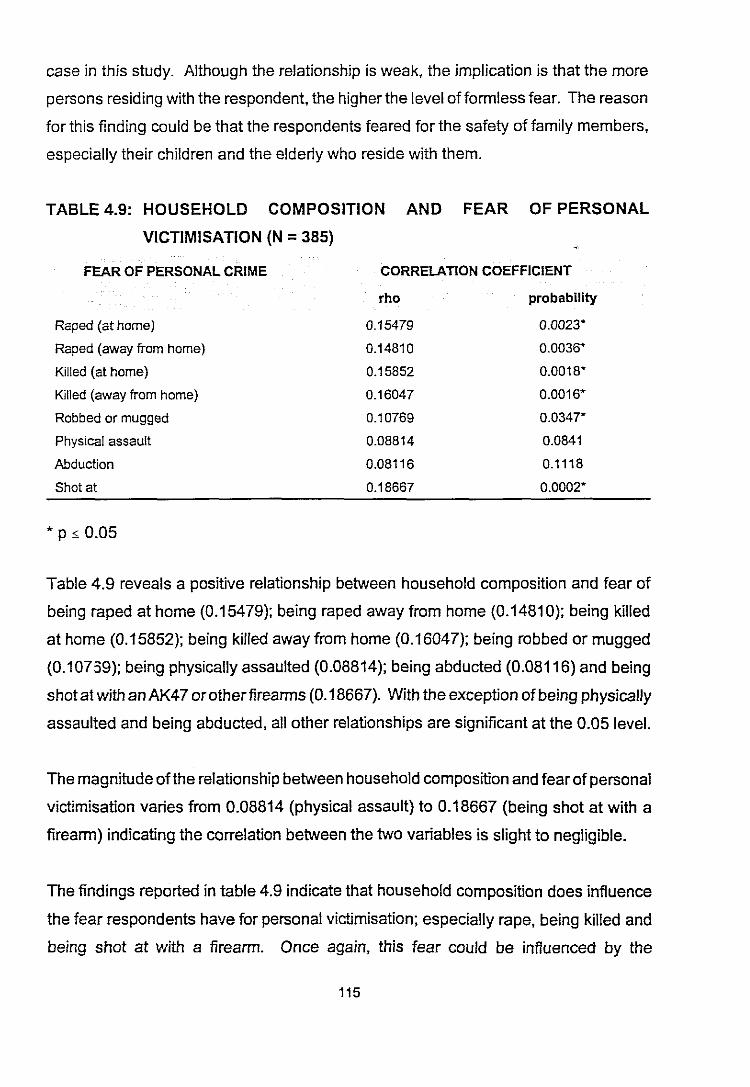
case in this study. Although the relationship is weak, the implication is that the more
persons residing with the respondent, the higher the level of formless fear. The reason
for this finding could be that the respondents feared for the safety of family members,
especially their children and the elderly who reside with them.
TABLE 4.9: HOUSEHOLD COMPOSITION AND FEAR OF PERSONAL
VICTIMISATION (N =385)
FEAR OF PERSONAL CRIME CORRELATION COEFFICIENT
Raped (at home)
Raped (away from home)
Killed (at home)
Killed (away from home)
Robbed or mugged
Physical assault
Abduction
Shot at
* p -: 0.05
rho
0.15479
0.14810
0.15852
0.16047
0.10769
0.08814
0.08116
0.18667
probability
0.0023*
0.0036*
0.0018*
0.0016*
0.0347*
0.0841
0.1118
0.0002*
Table 4.9 reveals a positive relationship between household composition and fear of
being raped at home (0.15479); being raped away from home (0.14810); being killed
at home (0.15852); being killed away from home (0.16047); being robbed or mugged
(0.10759); being physically assaulted (0.08814); being abducted (0.08116) and being
shot at with an AK47 orother firearms (0.18667). With the exception of being physically
assaulted and being abducted, all other relationships are significant at the 0.05 level.
The magnitude ofthe relationship between household composition and fear ofpersonal
victimisation varies from 0.08814 (physical assault) to 0.18667 (being shot at with a
firearm) indicating the correlation between the two variables is slight to negligible.
The findings reported in table 4.9 indicate that household composition does influence
the fear respondents have for personal victimisation; especially rape, being killed and
being shot at with a firearm. Once again, this fear could be influenced by the
115
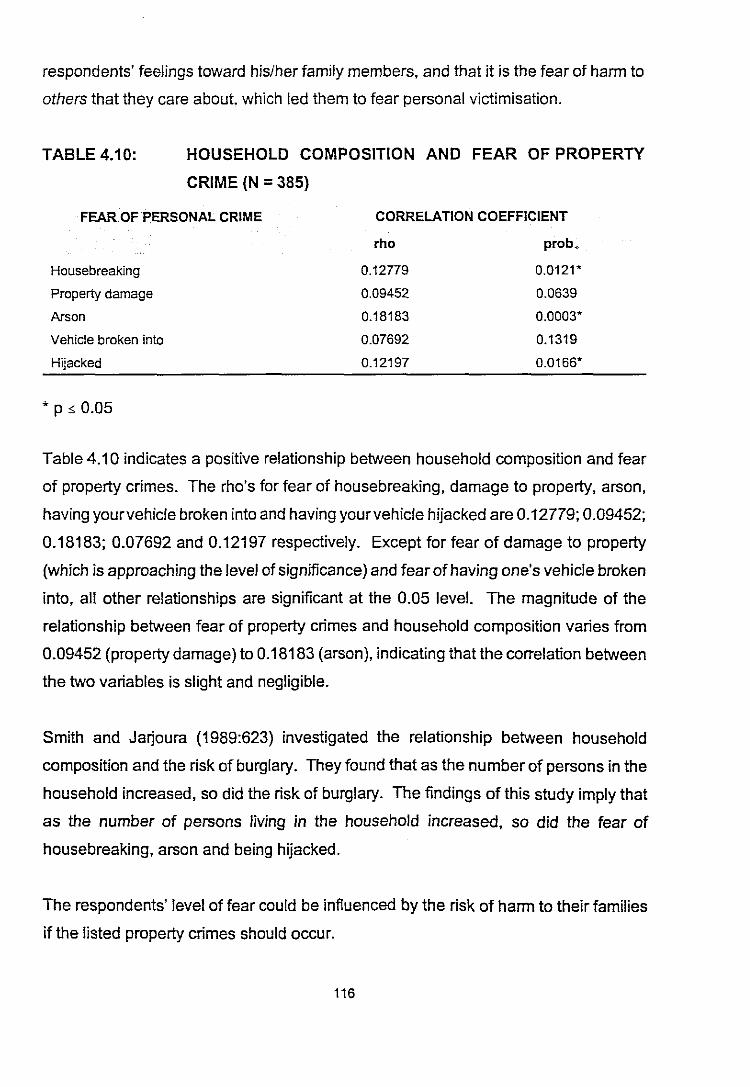
respondents' feelings toward his/her family members, and that it is the fear of harm to
others that they care about, which led them to fear personal victimisation.
TABLE 4.10: HOUSEHOLD COMPOSITION AND FEAR OF PROPERTY
CRIME (N =385)
FEAR OF PERSONAL CRIME CORRELATION COEFFICIENT
Housebreaking
Property damage
Arson
Vehicle broken into
Hijacked
* p ,; 0.05
rho
0.12779
0.09452
0.18183
0.07692
0.12197
prob,
0.0121*
0.0639
0.0003*
0.1319
0.0166*
Table 4.10 indicates a positive relationship between household composition and fear
of property crimes. The rho's for fear of housebreaking, damage to property, arson,
having yourvehicle broken into and having your vehicle hijacked are 0.12779; 0.09452;
0.18183; 0.07692 and 0.12197 respectively. Except for fear of damage to property
(which is approaching the level of significance) and fear of having one's vehicle broken
into, all other relationships are significant at the 0.05 level. The magnitude of the
relationship between fear of property crimes and household composition varies from
0.09452 (property damage) to 0.18183 (arson), indicating that the correlation between
the two variables is slight and negligible.
Smith and Jarjoura (1989:623) investigated the relationship between household
composition and the risk of burglary. They found that as the number of persons in the
household increased, so did the risk of burglary. The findings of this study imply that
as the number of persons living in the household increased, so did the fear of
housebreaking, arson and being hijacked.
The respondents' level of fear could be influenced by the risk of harm to their families
if the listed property crimes should occur.
116
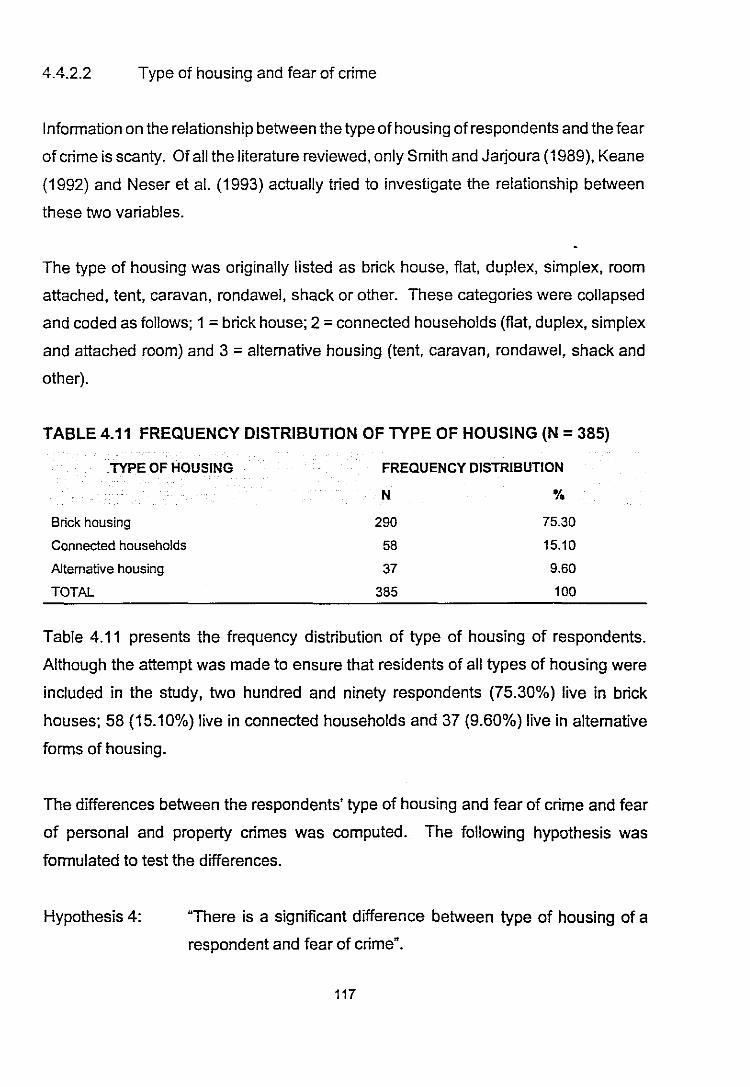
4.4.2.2 Type of housing and fear of crime
Information on the relationship between the type of housing of respondents and the fear
of crime is scanty. Of all the literature reviewed, only Smith and Jarjoura (1989), Keane
(1992) and Neser et al. (1993) actually tried to investigate the relationship between
these two variables.
The type of housing was originally listed as brick house, flat, duplex, simplex, room
attached, tent, caravan, rondawel, shack or other. These categories were collapsed
and coded as follows; 1 = brick house; 2 = connected households (flat, duplex, simplex
and attached room) and 3 = altemative housing (tent, caravan, rondawel, shack and
other).
TABLE 4.11 FREQUENCY DISTRIBUTION OF TYPE OF HOUSING (N =385)
TYPE OF HOUSING
Brick housing
Connected households
A1temative housing
TOTAL
FREQUENCY DISTRIBUTION
N %
290 75.30
58 15.10
37 9.60
385 100
Table 4.11 presents the frequency distribution of type of housing of respondents.
Although the attempt was made to ensure that residents of all types of housing were
included in the study, two hundred and ninety respondents (75.30%) live in brick
houses; 58 (15.10%) live in connected households and 37 (9.60%) live in altemative
forms of housing.
The differences between the respondents' type of housing and fear of crime and fear
of personal and property crimes was computed. The following hypothesis was
formulated to test the differences.
Hypothesis 4: "There is a significant difference between type of housing of a
respondent and fear of crime".
117
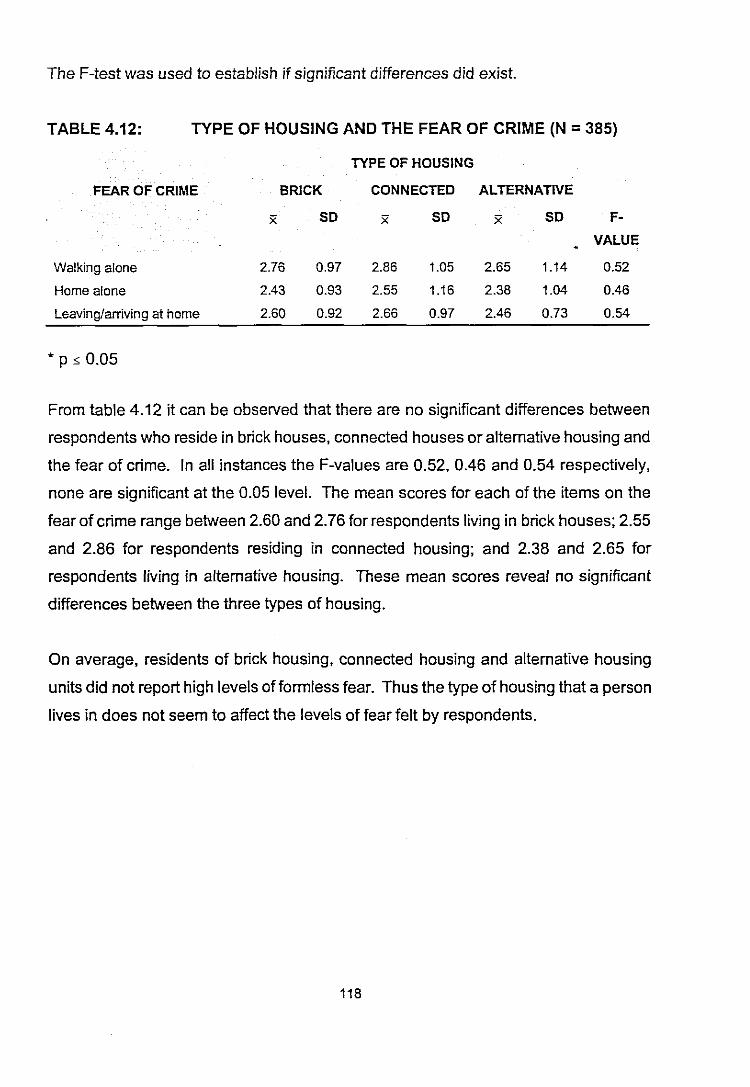
The F-test was used to establish if significant differences did exist.
TABLE 4.12: TYPE OF HOUSING AND THE FEAR OF CRIME (N =385)
FEAR OF CRIME
Walking alone
Home alone
Leaving/arriving at home
TYPE OF HOUSING
BRICK CONNECTED ALTERNATIVE
x: SO x: SO x SO F-
VALUE
2.76 0.97 2.86 1.05 2.65 1.14 0.52
2.43 0.93 2.55 1.16 2.38 1.04 0.46
2.60 0.92 2.66 0.97 2.46 0.73 0.54
* p ,; 0.05
From table 4.12 it can be observed that there are no significant differences between
respondents who reside in brick houses, connected houses or alternative housing and
the fear of crime. In all instances the F-values are 0.52, 0.46 and 0.54 respectively,
none are significant at the 0.05 level. The mean scores for each of the items on the
fear of crime range between 2.60 and 2.76 for respondents living in brick houses; 2.55
and 2.86 for respondents residing in connected housing; and 2.38 and 2.65 for
respondents living in alternative housing. These mean scores reveal no significant
differences between the three types of housing.
On average, residents of brick housing, connected housing and alternative housing
units did not report high levels of formless fear. Thus the type of housing that a person
lives in does not seem to affect the levels of fear felt by respondents.
118
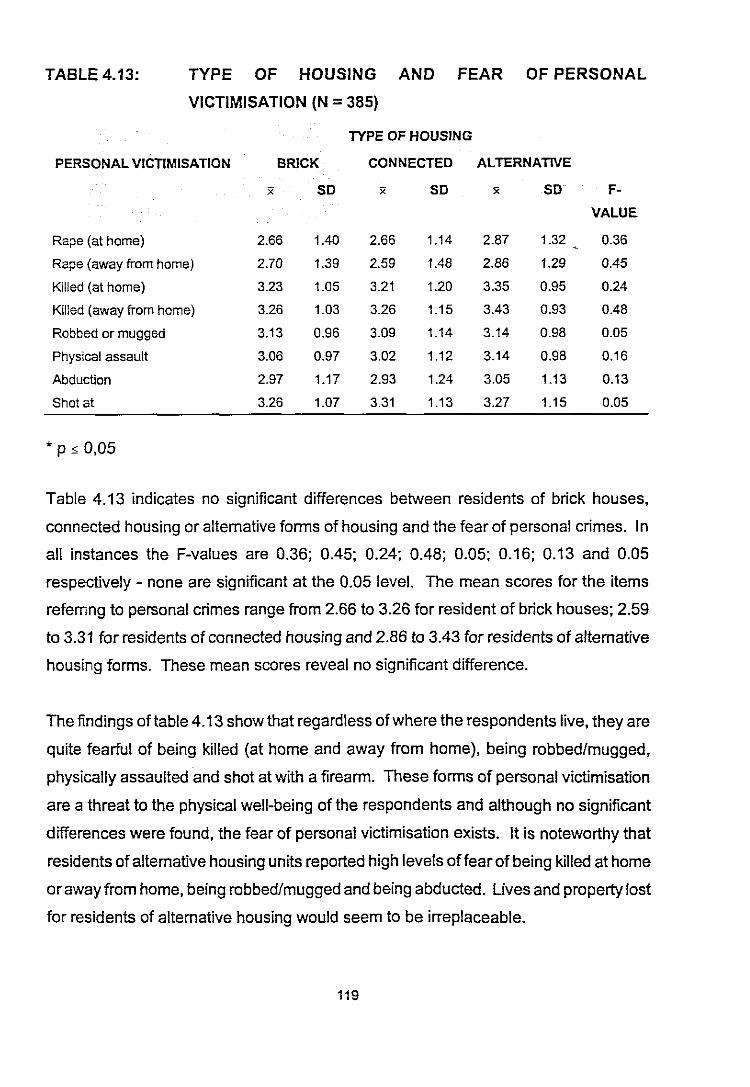
TABLE 4.13: TYPE OF HOUSING AND FEAR OF PERSONAL
VICTIMISATION (N =385)
TYPE OF HOUSING
PERSONAL VICTIMISATION BRICK CONNECTED ALTERNATIVE
x SO x SO x SO F-
VALUE
Rape (at home) 2.66 1.40 2.66 1.14 2.87 1.32 0.36
Rape (away from home) 2.70 1.39 2.59 1.48 2.86 1.29 0.45
Killed (at home) 3.23 1.05 3.21 1.20 3.35 0.95 0.24
Killed (away from home) 3.26 1.03 3.26 1.15 3.43 0.93 0.48
Robbed or mugged 3.13 0.96 3.09 1.14 3.14 0.98 0.05
Physical assault 3.06 0.97 3.02 1.12 3.14 0.98 0.16
Abduction 2.97 1.17 2.93 1.24 3.05 1.13 0.13
Shot at 3.26 1.07 3.31 1.13 3.27 1.15 0.05
* P " 0,05
Table 4.13 indicates no significant differences between residents of brick houses,
connected housing or alternative forms of housing and the fear of personal crimes. In
all instances the F-values are 0.36; 0.45; 0.24; 0.48; 0.05; 0.16; 0.13 and 0.05
respectively - none are significant at the 0.05 level. The mean scores for the items
refernng to personal crimes range from 2.66 to 3.26 for resident of brick houses; 2.59
to 3.31 for residents of connected housing and 2.86 to 3.43 for residents of alternative
housing forms. These mean scores reveal no significant difference.
The findings of table 4.13 show that regardless ofwhere the respondents live, they are
quite fearful of being killed (at home and away from home), being robbed/mugged,
physically assaulted and shot at with a firearm. These forms of personal victimisation
are a threat to the physical well-being of the respondents and although no significant
differences were found, the fear of personal victimisation exists. It is noteworthy that
residents of alternative housing units reported high levels of fear of being killed at home
or away from home, being robbed/mugged and being abducted. Uves and property lost
for residents of alternative housing would seem to be irreplaceable.
119
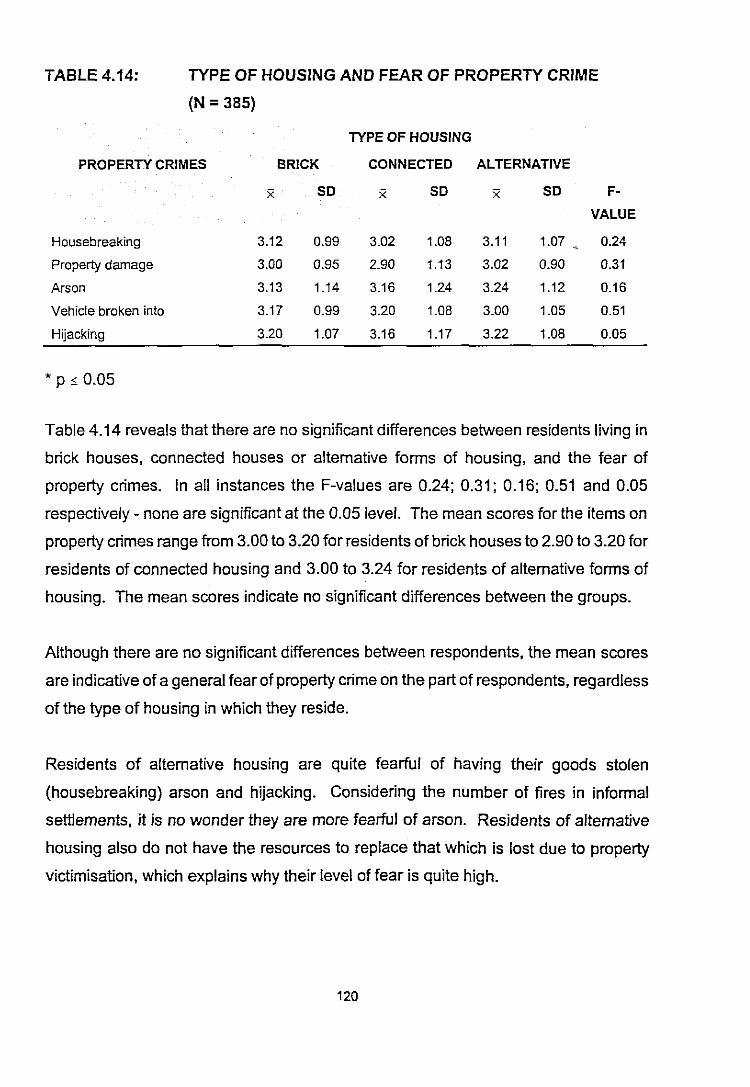
TABLE 4.14: TYPE OF HOUSING AND FEAR OF PROPERTY CRIME
(N = 385)
PROPERTY CRIMES
Housebreaking
Property damage
Arson
Vehicle broken into
Hijacking
TYPE OF HOUSING
BRICK CONNECTED ALTERNATIVE
X SD x SD X SD F-
VALUE
3.12 0.99 3.02 1.08 3.11 1.07 0.24
3.00 0.95 2.90 1.13 3.02 0.90 0.31
3.13 1.14 3.16 1.24 3.24 1.12 0.16
3.17 0.99 3.20 1.08 3.00 1.05 0.51
3.20 1.07 3.16 1.17 3.22 1.08 0.05
* p s 0.05
Table 4.14 reveals that there are no significant differences between residents living in
brick houses, connected houses or alternative forms of housing, and the fear of
property crimes. In all instances the F-values are 0.24; 0.31; 0.16; 0.51 and 0.05
respectively - none are significant at the 0.05 level. The mean scores for the items on
property crimes range from 3.00 to 3.20 for residents of brick houses to 2.90 to 3.20 for
residents of connected housing and 3.00 to 3.24 for residents of altemative forms of
housing. The mean scores indicate no significant differences between the groups.
Although there are no significant differences between respondents, the mean scores
are indicative of a general fear of property crime on the part of respondents, regardless
of the type of housing in which they reside.
Residents of altemative housing are quite fearful of having their goods stolen
(housebreaking) arson and hijacking. Considering the number of fires in informal
settlements, it is no wonder they are more fearful of arson. Residents of altemative
housing also do not have the resources to replace that which is lost due to property
victimisation, which explains why their level of fear is quite high.
120
4.5 SUMMARY
The chapter has sought to establish whether or not certain demographic variables,
namely age, gender, household composition and types of housing are related to or
influence the fear of crime.
The findings of previous research studies (Balkin & Houlden 1983; Baumer J 985; Box
et al. 1988; Garofalo 1979; Parker & Ray 1990; Pretorius 1994; Smith & Glanz 1989;
Smith & Jarjoura 1989 and Toseland 1982) were presented with regard to the
abovementioned demographic variables.
With regard to the present research, the following relationships were tested:
• Firstly, age and fear of crime. Using Pearson's Correlation Coefficient (r), age
was correlated with the three measures of fear of crime and the fear of personal
victimisation and property crimes respectively.
• Secondly, gender and fear of crime. Using the F-test, significant differences
were sought between male and female respondents and their fear of crime and
their fear of personal victimisation and property crimes respectively.
• Thirdly, household composition and the fear of crime. Using Spearman's Rank
Ordered Correlation Coefficient (rho), household composition was expressed as
rank order number one, and the variables of fear of crime and fear of personal
victimisation and property crimes as rank order number two.
• Lastly, type of housing and the fear of crime. Using the F-test, significant
differences were sought between type of housing and the fear of crime, and the
fear of personal victimisation and property crimes.
121
CHAPTERS
PREVIOUS VICTIMISATION
5.1 INTRODUCTION
Knowledge of crime whether directly or indirectly obtained can and does affect people's
fear of crime. Various authors (Baumer 1985; Garofalo 1979 and Skogan 1987) agreed
that a simplistic relationship between previous victimisation and fear of crime does not
exist. Factors which tend to affect the relationship between previous victimisation and
fear of crime include the following:
• the time lapse between the victimisation itself and the research study
• the types of victimisation (whether it is personal in nature or directed at property)
• the precautionary measures instituted by the victim after the victimisation
process.
The findings on the relationship between previous victimisation and fear of crime have
proved inconsistent. The format of this chapter will include a review of some of the
research undertaken, the presentation of the data and the analysis thereof and a
summary of the findings of this study.
5.2 GENERAL FINDINGS ON PREVIOUS VICTIMISATION AND FEAR OF CRIME
The general findings on the relationship between previous victimisation and fear of
crime are discussed below.
Garofalo (1979)
In his study on victimisation and the fear of crime Garofalo (1979) reports that being
victimised is related to the fear of crime, •... within each age/sex group, non-victims
express less fear than do victims" (Garofalo 1979:87). However Garofalo (1979) also
notes that the actual number of victims is relatively small compared to the number of
122
non-victims, and therefore the higher level of fear exhibited by previous victims of
criminal victimisation does not affect the overall fear of the general population. A
possible limitation of this study is that Garofalo (1979) only used personal victimisation
experience which had occurred over a twelve month period preceding his study. He
therefore assumed that "... victimization that occurred more than twelve months before
the interview - unless they were extremely serious - would have little effect on fear of
crime at the time of the interview" (Garofalo 1979:87).
Baumer (1985)
In his striving for a general model on the fear of crime, Baumer (1985) utilises the
cognitive model on fear of crime which views fear as a rational response to a perceived
threat of harm. One of the components of this model is the knowledge of criminal
events which is obtained either through personal experience, vicarious experiences of
friends and neighbours or by media representations. Baumer (1985:242) opines that
"... the victimization experience seems to affect both the victim and his or her friends".
In the study done by Baumer (1985) respondents were asked to indicate if they had
been a victim of a crime during the past year and if any member of their immediate
family had been victimised during the past year. According to Baumer (1985:245) "The
weakest correlations are between the victimization items and fear". Therefore, although
previous victimisation and knowledge of victimisation ofothers were related to fear, the
strength ofthe relationship was weak and meaningless. Baumer (1985) notes however
that the time lapse between actual victimisation experience and the research study may
influence the relationship, and that his research does not differentiate between personal
and property crimes.
Box, Hale and Andrews (1988)
Box et al. (1988) identify personal knowledge of crime and victimisation as a factor that
would appear to contribute to the fear of crime. They wam however that a simplistic
victimisailon leads to fear hypothesis is questionable, as victims tend to neutralise their
experience either through accepting their own culpability or by leaming effective ways
to avoid further victimisation. In their study they found the following:
123
+ The effect of knowing someone who has been victimised in the same area will
increase the probability of fear of crime.
+ Victims who live in residential areas which are "safe" have a smaller probability
offearthan non-victims. Victims in these areas have engaged in the process of
neutralisation of their victimisation experience which reduces their level of fear.
+ Victims living in residential areas which are regarded as "unsafe" will have a
higher probability of·fear. Victims in these areas perceive their environment as
dangerous and this keeps them worried and apprehensive about the safety of
their neighbourhood (Box et al. 1988:351).
Smith and Glanz (1989)
In a nationwide study in South Africa, Smith and Glanz (1989) assessed the fear of
crime ofall population groups. They measured the variable - experience of victim isation
- by asking respondents whether they or a close relative living with them had been a
victim of a property crime or a personal crime within the previous 18 months to the date
of their study. The variable experience of victimisation was dichotomised into those
who had experienced victimisation (either directly or indirectly) and those who had not.
Unfortunately, because the rate of personal victimisation was too low to yield
statistically meaningful results, the distinction between property and personal crimes
was not maintained.
Smith and Glanz (1989:56) reported that the sample of white respondents was the most
victimised subgroup with regard to property crime (47%) while the percentages were
31% for blacks; 27% for coloureds and 26% for indians. As far as personal crimes were
concemed, blacks reported the most personal victimisation (32,5%) followed by 18%
for coloureds; 10% for indians and 4% for whites. They concluded that •... overall
extent of victimization, according to the data, was greatest among Blacks" (Smith &
Glanz 1989:56).
Applying Multiple Classification Analysis (MCA) Smith and Glanz (1989:58) found that
the respondents who had been victims of crime or who had had contact with a victim,
were substantially more fearful than those who had no direct experience with crime.
124

Parker and Ray (1990)
Parker and Ray (1990) in their study on the fear of crime utilised the variable of
previous victimisation. Respondents were asked to indicate if they or a member of their
household had been a victim of vandalism, theft, violent crimes or had been threatened
with victimisation during a twelve month period prior to their study. Their results
indicated the following:
+ Victimisation was the strongest predictoroffear ofcrime followed by age, marital
status, race and gender.
+ High levels of fear of crime were found among the elderly, blacks and single
females who had been previously victimised (Parker &Ray 1990:33).
Although their findings confirmed gender, age and race as powerful predictors of fear
of crime, they concluded that •... victimization proved to be the most significant and
consistent predictor of fear of crime for the total sample and each subsample" (Parker
& Ray 1990:38).
Smith and Hill (1991)
Smith and Hill (1991) researched victimisation and the fear of crime in North Carolina,
USA. They sought to establish whether the victimisation experience affects fear of
crime and whether personal or property victimisation experiences have similar effects
on the far of crime.
Using age, gender, education, family income and household composition as control
variables, Smith and Hill (1991) reported the following results:
+ More serious forms of victimisation are reported by younger and poorer
respondents.
+ Victimisation experience is significantly related to fear of crime. The greater the
degree of victimisation, the more fearful are the respondents.
+ Being a victim of a property crime or of both property and personal crime is
positively associated with fear of crime (Smith & Hill 1991 :232).
125
However, Smith and Hill (1991) noted that the methodological problem of not
distinguishing between individual victimisation and household victimisation could have
influenced their results, especially with reference to personal victimisation having no
measurable effect on fear levels.
Neser, Geldenhuys, Stevens, Grobbelaar and Ladikos (1993)
In their study on fear of criminal victimisation in Sunnyside area in Preto!ia (South
Africa), Neser et al. (1993:34) used previous victimisation as a variable which could
influence levels of fear. The respondents were asked to indicate whether they or any
member of their household had been a victim of a crime, in the previous five years,
which was of a serious nature and which had been reported to the police. Neser et al.
(1993) reported the following results:
• Of the 530 respondents, 244 had previous experience of victimisation and 286
had no such experience.
• Higher levels of fear existed for those who formed part of a household that had
been previously victimised (39.35%) compared to (34.61%) those who had no
victimisation experience (Neser et al. 1993:35).
Based on the review ofthe findings on the influence of previous victimisation on the fear
of crime, it was thus deemed necessary to study this relationship.
5.3 PRESENTATION AND ANALYSIS OF DATA
In order to establish the relationship between previous victimisation and the fear of
crime, the following hypothesis was formulated:
Hypothesis 5: There are significant differences in the fear of crime between
respondents who have been previously victimised (victims) and
those who have not (non-victims).
In order to ascertain if the respondents had any previous vietimisation experience, the
126
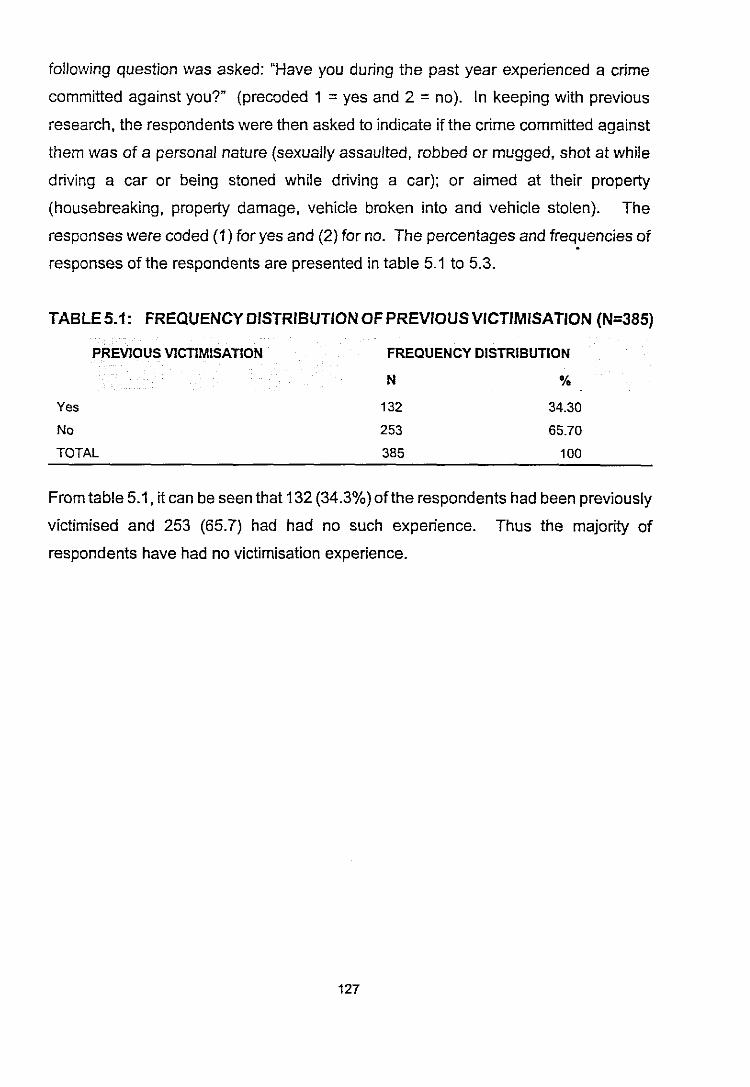
following question was asked: "Have you during the past year experienced a crime
committed against you?" (precoded 1 =yes and 2 =no). In keeping with previous
research, the respondents were then asked to indicate if the crime committed against
them was of a personal nature (sexually assaulted, robbed or mugged, shot at while
driving a car or being stoned while driving a car); or aimed at their property
(housebreaking, property damage, vehicle broken into and vehicle stolen). The
responses were coded (1) for yes and (2) for no. The percentages and frequencies of
responses of the respondents are presented in table 5.1 to 5.3.
TABLE 5.1: FREQUENCY DISTRIBUTION OF PREVIOUS VICTIMISATION (N=385)
PREVIOUS V1CTIMISATION
Yes
No
TOTAL
FREQUENCY DISTRIBUTION
N %
132 34.30
253 65.70
385 100
Fromtable 5.1, it can be seen that 132 (34.3%) of the respondents had been previously
victimised and 253 (65.7) had had no such experience. Thus the majority of
respondents have had no victimisation experience.
127
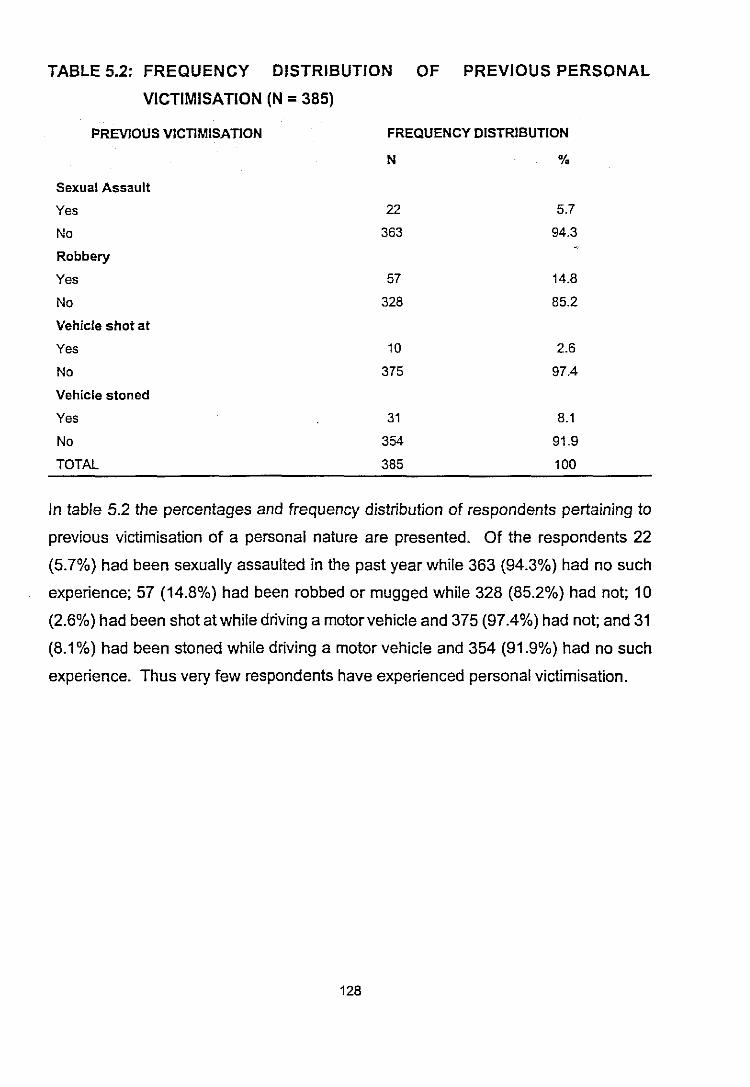
TABLE 5.2: FREQUENCY DISTRIBUTION OF PREVIOUS PERSONAL
VICTIMISATION (N = 385)
PREVIOUS V1CTlMISATlON FREQUENCY DISTRIBUTION
N %
Sexual Assault
Yes 22 5.7
No 363 94.3
Robbery
Yes 57 14.8
No 328 85.2
Vehicle shot at
Yes 10 2.6
No 375 97.4
Vehicle stoned
Yes 31 8.1
No 354 91.9
TOTAL 385 100
In table 5.2 the percentages and frequency distribution of respondents pertaining to
previous victimisation of a personal nature are presented. Of the respondents 22
(5.7%) had been sexually assaulted in the past year while 363 (94.3%) had no such
experience; 57 (14.8%) had been robbed or mugged while 328 (85.2%) had not; 10
(2.6%) had been shot at while driving a motor vehicle and 375 (97.4%) had not; and 31
(8.1%) had been stoned while driving a motor vehicle and 354 (91.9%) had no such
experience. Thus very few respondents have experienced personal victimisation.
128
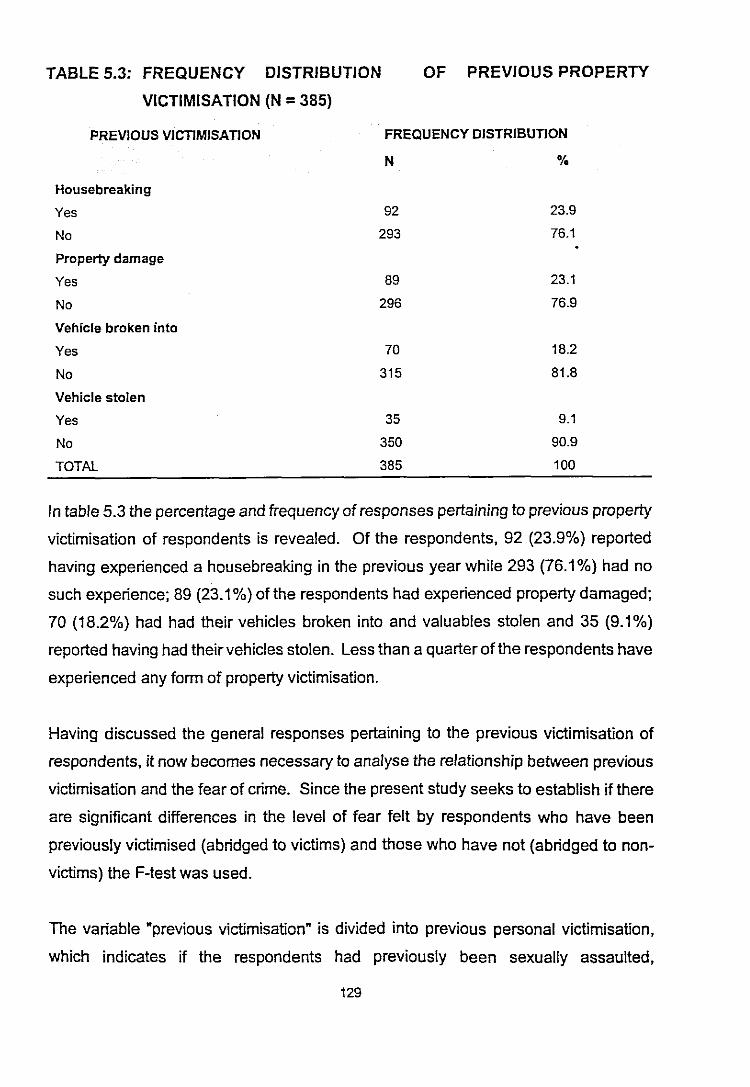
TABLE 5.3: FREQUENCY DISTRIBUTION
VICTIMISATION (N =385)
PREVIOUS VICTIMISATION
OF PREVIOUS PROPERTY
FREQUENCY DISTRIBUTION
N %
Housebreaking
Yes 92 23.9
No 293 76.1
Property damage
Yes 89 23.1
No 296 76.9
Vehicle broken into
Yes 70 18.2
No 315 81.8
Vehicle stolen
Yes 35 9.1
No 350 90.9
TOTAL 385 100
In table 5.3 the percentage and frequency of responses pertaining to previous property
victimisation of respondents is revealed. Of the respondents, 92 (23.9%) reported
having experienced a housebreaking in the previous year while 293 (76.1%) had no
such experience; 89 (23.1%) of the respondents had experienced property damaged;
70 (18.2%) had had their vehicles broken into and valuables stolen and 35 (9.1%)
reported having had their vehicles stolen. Less than a quarter of the respondents have
experienced any form of property victimisation.
Having discussed the general responses pertaining to the previous victimisation of
respondents. it now becomes necessary to analyse the relationship between previous
victimisation and the fear of crime. Since the present study seeks to establish if there
are significant differences in the level of fear felt by respondents who have been
previously victimised (abridged to victims) and those who have not (abridged to non
Victims) the F-test was used.
The variable "previous victimisation" is divided into previous personal victimisation,
which indicates if the respondents had previously been sexually assaulted,
129
robbed/mugged. shot at while driving a vehicle (abridged to shot at) and been stoned
while driving a vehicle (abridged to stoned); and previous property victimisation, which
indicates if the respondents has experienced a housebreaking, property damage,
having his/hervehicle broken into and valuables stolen (abridged to vehicle broken into)
and having a vehicle stolen.
The three fear of crime measures "How safe do you feel walking alone at ni,ght in your
neighbourhood?" (abridged to walking alone); "How safe do you feel alone in your home
at night?" (abridged to home alone); and "How safe do you feel in your neighbourhood
when leaving or arriving at home?" (abridged to leaving/arrived home) were used to test
for significant differences between those respondents who had experienced property
and personal victimisation. It was also hypothesised that if a respondent had been
previously victimised it would influence his/her fear of personal victimisation (rape;
murder; robbery; physical assault; abduction and being shot at) and property crimes
(housebreaking; property damage; arson; vehicle theft and hijacking). Therefore
significant differences were also sought between previous victimisation and fear of
personal victimisation and property crimes.
130
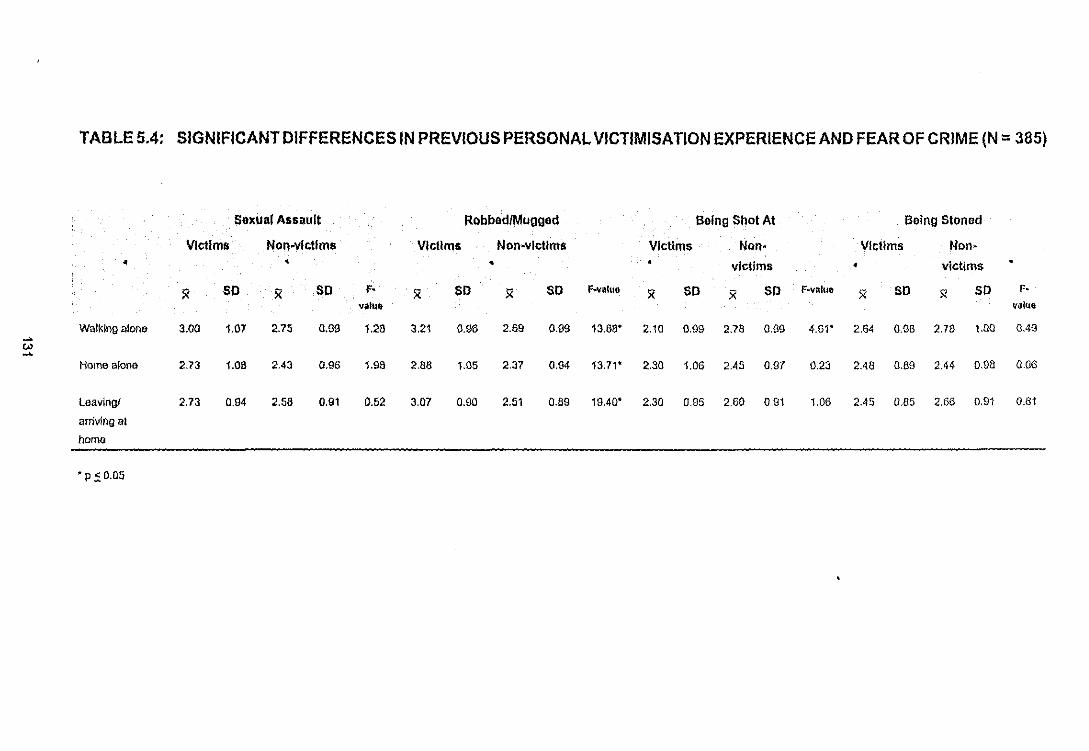
TABLE5.4: SIGNIFICANT DIFFERENCES INPREVIOUS PERSONAL VICTIMISATION EXPERIENCE AND FEAR OFCRIME (N =385)
Sexual Assault Robbed/Mugged Being Shot At Being Stoned
VIctims Non-victims Vlcllms Non-vlcllms Victims Non- Victims Non-
• , • • victims • victims
x SO 51 SO F· X SO X SO f..viS~UG X SO X SO F-value X SO X SO F·valu. valuG
Walkingalone 3.00 1.07 2.75 o.g9 1.28 3.21 0.96 2.69 0.99 13.68' 2.10 0.09 2.78 0.99 4.61' 2.64 0.98 2.18 1.00 0.49~
'"~Home alooa 2.73 1.08 2.43 0.96 1.98 2.88 1.05 2.37 0.94 13.71' 2.30 1.06 2.45 0.97 0.23 2.48 0.89 2.44 0.98 0.06
Leaving! 2.73 0.94 2.58 0.91 0.52 3.07 0.90 2.51 0.89 19.40' 2.30 0.95 2.60 0.91 1.06 2.45 D.B5 2.66 0.9j 0.81
arrivingal
homo
• p ~ 0.05
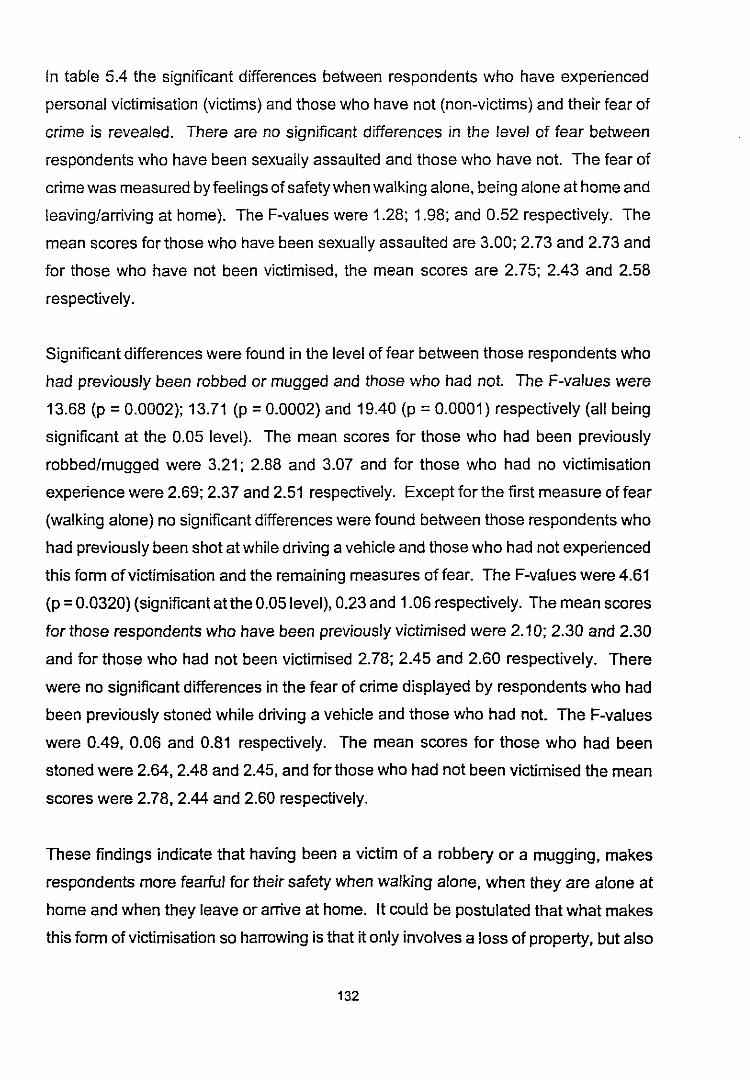
In table 5.4 the significant differences between respondents who have experienced
personal victimisation (victims) and those who have not (non-victims) and their fear of
crime is revealed. There are no significant differences in the level of fear between
respondents who have been sexually assaulted and those who have not. The fear of
crime was measured by feelings of safety when walking alone, being alone at home and
leaving/arriving at home). The F-values were 1.28; 1.98; and 0.52 respectively. The
mean scores for those who have been sexually assaulted are 3.00; 2.73 and 2.73 and
for those who have not been victimised, the mean scores are 2.75; 2.43 and 2.58
respectively.
Significant differences were found in the level of fear between those respondents who
had previously been robbed or mugged and those who had not. The F-values were
13.68 (p = 0.0002); 13.71 (p = 0.0002) and 19.40 (p = 0.0001) respectively (all being
significant at the 0.05 level). The mean scores for those who had been previously
robbed/mugged were 3.21; 2.88 and 3.07 and for those who had no victimisation
experience were 2.69; 2.37 and 2.51 respectively. Except for the first measure of fear
(walking alone) no significant differences were found between those respondents who
had previously been shot at while driving a vehicle and those who had not experienced
this form ofvictimisation and the remaining measures of fear. The F-values were 4.61
(p =0.0320) (significant at the 0.05 level), 0.23 and 1.06 respectively. The mean scores
for those respondents who have been previously victimised were 2.10; 2.30 and 2.30
and for those who had not been victimised 2.78; 2.45 and 2.60 respectively. There
were no significant differences in the fear of crime displayed by respondents who had
been previously stoned while driving a vehicle and those who had not. The F-values
were 0.49, 0.06 and 0.81 respectively. The mean scores for those who had been
stoned were 2.64, 2.48 and 2.45, and for those who had not been victimised the mean
scores were 2.78, 2.44 and 2.60 respectively.
These findings indicate that having been a victim of a robbery or a mugging, makes
respondents more fearful for their safety when walking alone, when they are alone at
home and when they leave or arrive at home. It could be postulated that what makes
this form of victimisation so harrowing is that it only involves a loss of property, but also
132
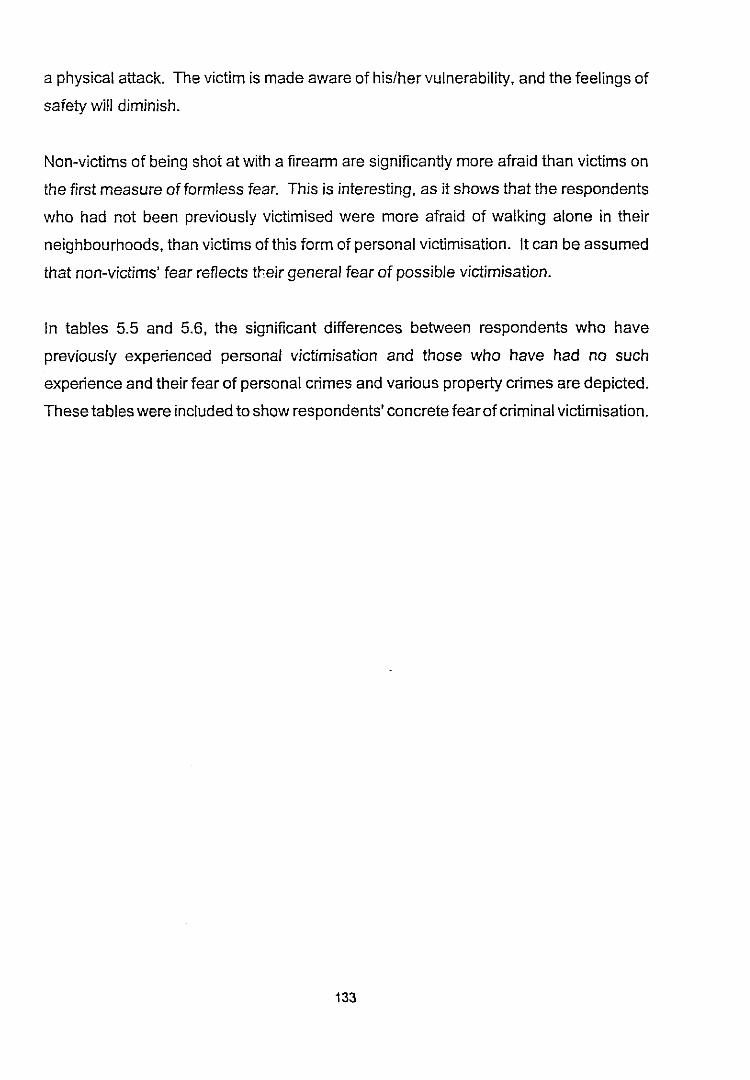
a physical attack. The victim is made aware of his/her vulnerability, and the feelings of
safety will diminish.
Non-victims of being shot at with a firearm are significantly more afraid than victims on
the first measure of formless fear. This is interesting, as it shows that the respondents
who had not been previously victimised were more afraid of walking alone in their
neighbourhoods, than victims of this form of personal victimisation. It can be assumed
that non-victims' fear reflects their general fear of possible victimisation.
In tables 5.5 and 5.6, the significant differences between respondents who have
previously experienced personal victimisation and those who have had no such
experience and their fear of personal crimes and various property crimes are depicted.
These tables were included to show respondents' concrete fear ofcriminal victimisation.
133
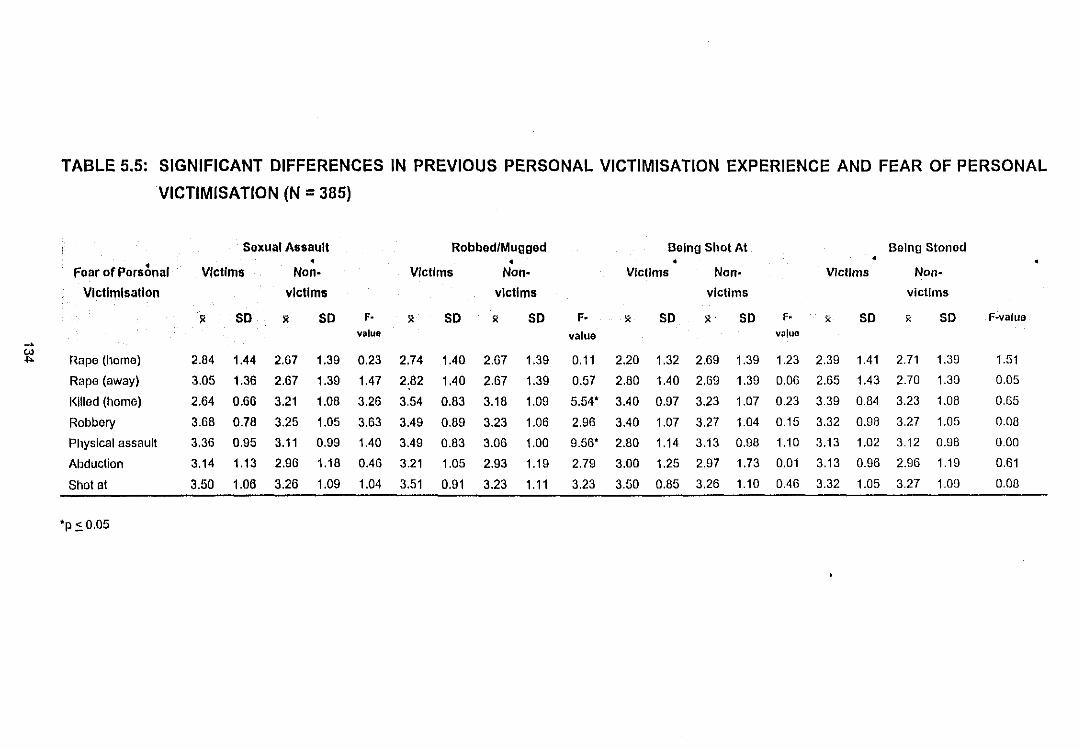
TABLE 5.5: SIGNIFICANT DIFFERENCES IN PREVIOUS PERSONAL VICTIMISATION EXPERIENCE AND FEAR OF PERSONAL
VICTlM1SATION (N =385)
Sexual Assault Robbed/Mugged Being Shot At Being Stoned• • •
Fear of Pors6nal Victims Non· Victims Non· Vlcl/ms Non- Vlcl/ms Non·
Vlctlmlsatlon victims victims vlcl/ms victims
SO ~ SO F· ~ SO ~ SO F· ~ SO ~. SO F· ~ SO x SO r-vatuevalue value value
~
~ Rape (home) 2.84 1.44 2.67 1.39 0.23 2.74 1.40 2.67 1.39 0.11 2.20 1.32 2.69 1.39 1.23 2.39 1.41 2.71 1.39 1.51
Rape (away) 3.05 1.36 2.67 1.39 1.47 2.82 1.40 2.67 1.39 0.57 2.80 1.40 2.69 1.39 0.06 2.65 1.43 2.70 1.39 0.05
I<lIled (home) 2.64 0.66 3.21 1.08 3.26 3.54 0.83 3.18 1.09 5.54' 3.40 0.97 3.23 1.07 0.23 3.39 0.84 3.23 1.08 0.65
Robbory 3.68 0.78 3.25 1.05 3.63 3.49 0.89 3.23 1.06 2.96 3.40 1.07 3.27 1.04 0.15 3.32 0.98 3.27 1.05 0.08
Physical assault 3.36 0.95 3.11 0.99 1.40 3.49 0.83 3.06 1.00 9.56' 2.80 1.14 3.13 0.98 1.10 3.13 1.02 3.12 0.98 0.00
Abduction 3.14 1.13 2.96 1.18 0.46 3.21 1.05 2.93 1.19 2.79 3.00 1.25 2.97 1.73 0.01 3.13 0.96 2.96 1.19 0.61
Shot at 3.50 1.06 3.26 1.09 1.04 3.51 0.91 3.23 1.11 3.23 3.50 0.85 3.26 1.10 0.46 3.32 1.05 3.27 1.09 0.08
'P::' 0.05
In table 5.5 the significant differences in the fear of personal victimisation and the
respondents' previous victimisation is revealed.
There are no significant differences between respondents who have been sexually
assaulted and those who have not and theirfearofpersonal victimisation which includes
rape (at home), rape (away from home) being killed (at home), robbery, physical assault,
abduction and being shot at with a firearm. The F-values are 0.23, 1.47, .3.26,2.63,
1.40, 0.46 and 1.04 respectively. The mean scores for respondents who have been
victimised range from 2.64 to 3.68 and from 2.67 to 3.26 for those who have not been
sexually assaulted.
Significant differences (at the 0.05 level) do exist between respondents who have been
robbed or mugged and those who have not and the fear of being killed at home (F-value
5.54, p :: 0.0191) and fear of physical assault (F-value 9.56, p > 0.0021). No other
significant differences were found between respondents who have previously been
robbed or mugged and those who have not and the fear of personal crimes. The mean
scores for respondents range from 2.74 to 3.54 for those who have been victimised and
2.67 to 3.23 for those who have not.
No significant differences were found in the fear of personal crimes between
respondents who had been shot at while driving a car and those who had not been
victimised in such a way. The F-values were 1.23, 0.06, 0.23, 0.15, 1.10, 0.01, 0.46
respectively. The mean scores ranged from 2.20 to 3.40 for respondents who had been
shot at while driving a vehicle, and 2.69 to 3.27 for those who had not been victimised.
A similar result was obtained for respondents who had been stoned while driving a car
and those who had not. The F-values were 1.51, 0.05, 0.65, 0.08, 0.00, 0.61 and 0.08
respectively. This indicates no significant differences in the fear of personal
victimisation for respondents who have been stoned and those who have not been
victimised in this manner.
135
In general victims of personal victimisation are more fearful of future personal
victimisation than non-victims. These findings are consistent with previous research
(see par. 5.2). Victims who have been robbed/mugged are significantly more fearful of
being killed (at home) and being physically assaulted. This could be due to past
experiences of injury which make the victim feel more vulnerable to future victimisation.
136
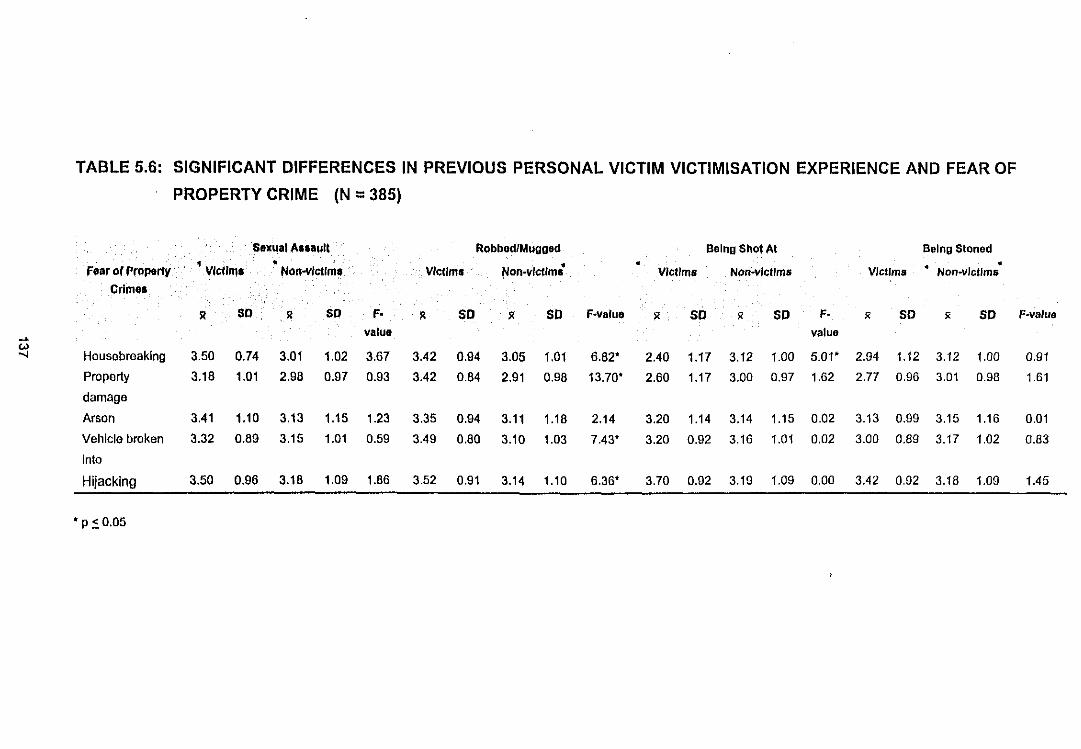
In table 5.6 the significant differences in fear of property crimes between respondents
who have experienced personal victimisation and those who have not are depicted.
No significant differences exist between respondents who have experienced sexual
assault and those who have not and the fear of housebreaking. The F-values are 3.67,
0.93, 1.23, 0.59 and 1.86 respectively. The mean scores range from 3.18 to 3.50 for
those who have been previously victimised and from 2.98 to 3.18 for those who have
not been previously victimised.
Significant differences exist between respondents who have been robbed or mugged
and those who have not and the fear of housebreaking (F-value 6.82, p = 0.0094),
property damage (F-value 13.70, P= 0.0002); vehicle broken into and valuables stolen
(F-value 7.43, p =0.0067), and being hijacked (F-value 6.36, p =0.0121) respectively.
No significant difference was obtained for the respondents' fear of arson (F-value 2.14).
The mean scores range from 3.35 to 3.52 for respondents who have been previously
victimised, and from 2.91 to 3.14 for those who have had no victimisation experience.
Respondents who have been shot at while driving a vehicle, displayed no significant
difference in their fear of property crimes (exceptfor fear of housebreaking ofwhich the
F-valus was 5.01, P = 0.0258) than those who have not been victimised in this way.
The F-values are 1.62, 0.02, 0.02 and 0.00 respectively. The mean scores range from
2.40 to 3.70 for respondents who have been victimised, and from 3.00 to 3.19 for those
who have not had any victimisation experience.
There are no significant differences between respondents who have been stoned while
driving a vehicle and those who have not and fear of property crimes. The F-values are
0.91, 1.61,0.01,0.83 and 1.45 respectively. The mean scores range from 2.77 to 3.42
for respondents who have been victimised, and from 3.01 to 3.18 for those who have
not been shot at while driving a vehicle.
Victims of personal victimisation are in general more fearful of property crime than non
victims. These findings are also consistent with previous research (see par. 5.2).
138
Victims of a robbery/mugging are significantly more fearful of housebreaking, property
damage, having their vehicle broken into and hijacking than non-victims. This could be
due to a sensitizing process, in which victims who have been hurt in a previous
experience with crime, generally fear any further criminal victimisation experience
because they are aware of the aftermath of victimisation.
Respondents who had not been shot at with a firearm were more afraid of
housebreaking than victims. This finding is interesting because it implies that being a
victim of a shooting lessens the fear of housebreaking, i.e. having experienced a form
of personal victimisation, property crime is less scary.
139
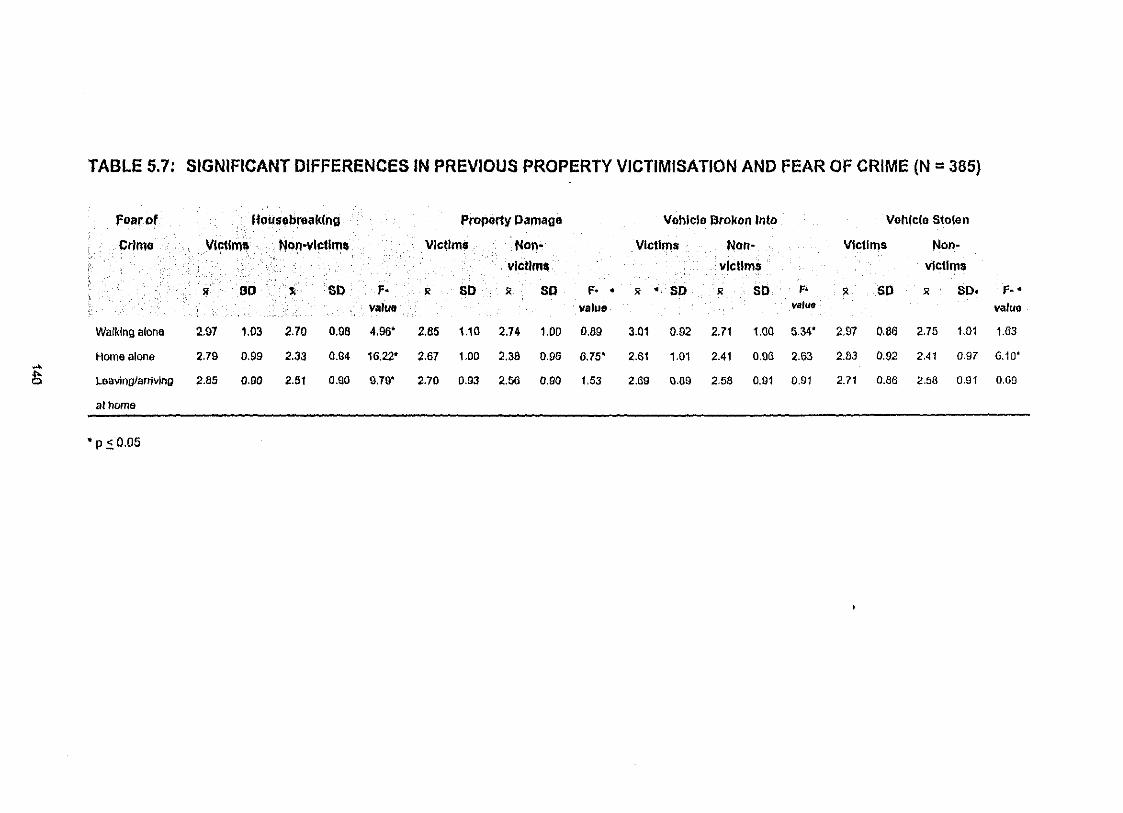
TABLE 5.7: SIGNIFICANT DIFFERENCES IN PREVIOUS PROPERTY VICTIMISATION AND FEAR OF CRIME (N =385)
Foarof Hotl,obrllaklnll Pro~rty parnallo Vllhlclo arokon Into Vohlclo Stolon
Crlrno Vlctlma Nc)O·vlctlma Vlcllms tlon- Victims Non- Victims Non-
victims victims victims
80 SO F- R SO R SO f· • Jl " SO Jl SO F. Jl SO Jl SO' f .. -value value value value
Walking alone 2.97 1.03 2.70 0.96 4.96' 2.65 1.10 2.74 1.00 0.89 3.01 0.92 2.71 1.00 5.34' 2.97 0.86 2.75 1.01 1.63
Home alone 2.79 0.99 2.33 0.94 16.22' 2.67 1.00 2.38 0.96 6.75' 2.61 1.01 2.41 0.96 2.63 2.83 0.92 2.41 0.97 6.10'....~ loavlngJarrlvlng 2.85 0.90 2.51 0.90 9.79' 2.70 0.93 2.56 0.90 1.53 2.69 0.89 2,58 0.91 0.91 2.71 0.86 2.58 0.91 0.69
al tlOme
• p:; 0.05
In table 5.7 the significant differences between respondents who have experienced
propertyvictimisation and those who have not and the fear ofcrime are revealed. There
are significant differences between the respondents who have experienced
housebreaking and those who have not and the three measures of fear of crime. The
F-values are 4.96 (p :::: 0.0001), 16.22 (p :::: 0.0001) and 9.79 (p = 0.0019) respectively.
All are significant at the 0.05 level. The mean scores are 2.97, 2.79 and 2.85
respectively for respondents who have previous victimisation experience, and 2.70,2.33
and 2.51 respectively for those that have not experienced a housebreaking.
Respondents who have experienced damage to their property do not display
significantly different levels of fear (except for the second measure of fear which has a
F-value of 6.75 and p =0.0107) than those who have not. The F-value for the first
measure of fear is 0.89 and for the last measure is 1.53. The mean scores range from
2.67 to 2.85 for respondents who have been victimised in this way, and 2.38 to 2.56 for
those who have not.
The only significant difference found between respondents who have had their vehicles
broken into and valuables stolen and those who have not experienced this form of
victimisation is to be found for the first measure of fear (walking alone). The F-value
was 5.34 (p = 0.0214) which is significant at the 0.05 level. For none of the other
measures offear ofcrime were significant differences found between respondents who
had been victimised in this manner and those that had not. The F-values were 2.63 and
0.91 respectively with mean scores ranging from 2.01 to 3.01 for respondents who had
been victimised, and from 2.41 to 2.71 for those who had not had their vehicles broken
into and valuables stolen.
A significant difference exists between respondents who have had their vehicle stolen
and those who have not and the second measure of fear (being home alone). The F
value was 6.10 (p = 0.0140) which is significant at the 0.05 level. For none of the other
measures of fear of crime were there significant differences between respondents who
had been victimised and those that had not. The F-values were 1.63 and 0.69
respectively. The mean scores ranged from 2.71 to 2.97 forthose respondents who had
141
been victimised, and from 2.41 to 2.75 for those who had not had their vehicles stolen.
These findings indicate that victims of a housebreaking are afraid for their safety,
whether it is in their neighbourhood or in their homes. Victims who have had their
property damaged, are more fearful than non-victims of being alone in their homes.
Victims who have had their vehicle broken into are more afraid than non-victims who are
walking alone in their neighbourhood, and victims of vehicle theft are more.afraid of
being home alone than non-victims. This implies that having been a victim of a property
crime, makes the victim cautious of his/her safety in and around his/her home.
142
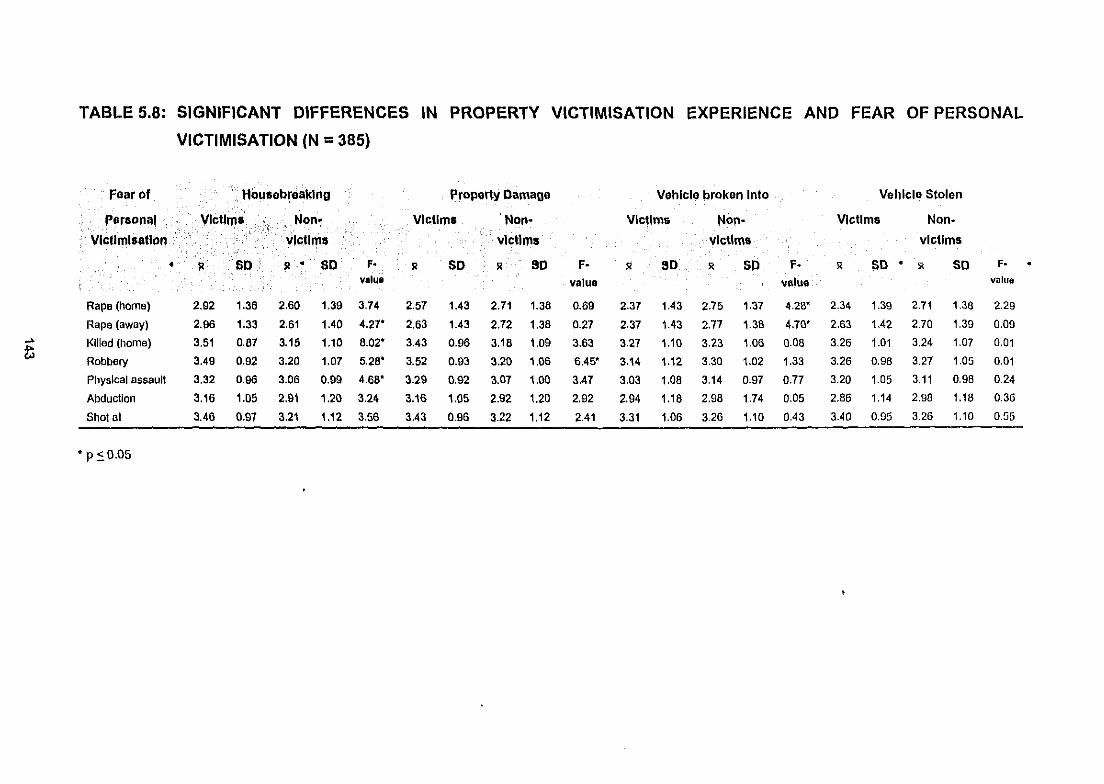
TABLE 5,8: SIGNIFICANT DIFFERENCES IN PROPERTY VICTIMISATION EXPERIENCE AND FEAR OF PERSONAL
VICTIMISATION (N =385)
Fear of HOllsebreaklng Property Damage Vehicle broken Into Vehicle Stolen
. Personal .• Victim•. Non' Victims '1'101'1' Victims Non' Victims Non.
Vlctlmlsatl°11 "'cUms vlcl1ms victims victims
• II SO st- SO F· R SO R' 90 F· R 90 R SO F· R SO ,R SO F·
valUI value value value
Rape(home) 2.92 1.36 2.60 1.39 3.74 2.57 1.43 2.71 1.36 0.69 2.37 1.43 2.75 1.37 4.28* 2.34 1.39 2.71 1.38 2.29
Rape(away) 2.96 1.33 2.61 1.40 4.27' 2.63 1.43 2.72 1.38 0.27 2.37 1.43 2.77 1.38 4.70' 2.63 1.42 2.70 1.39 0.09.... Killed (home) 3.51 0.87 3.15 1.10 8.02' 3.43 0.98 3.18 1.09 3.63 3.27 1.10 3.23 1.06 0.08 3.26 1.01 3.24 1.07 0.01~ Robbery 3.49 0.92 3.20 1.07 5.28' 3.52 0.93 3.20 1.06 6.45' 3.14 1.12 3.30 1.02 1.33 3.26 0.96 3.27 1.05 0.01
Physical assaull 3.32 0.96 3.06 0.99 4.68' 3.29 0.92 3.07 1.00 3.47 3.03 1.08 3.14 0.97 0.77 3.20 1.05 3.11 0.96 0.24
Abduction 3.16 1.05 2.91 1.20 3.24 3.16 1.05 2.92 1.20 2.92 2.94 1.18 2.98 1.74 0.05 2.86 1.14 2.98 1.18 0.36
Shol at 3.46 0.97 3.21 1.12 3.56 3.43 0.96 3.22 1.12 2.41 3.31 1.06 3.26 1.10 0.43 3.40 0.95 3.26 1.10 0.55
·p:OO.05
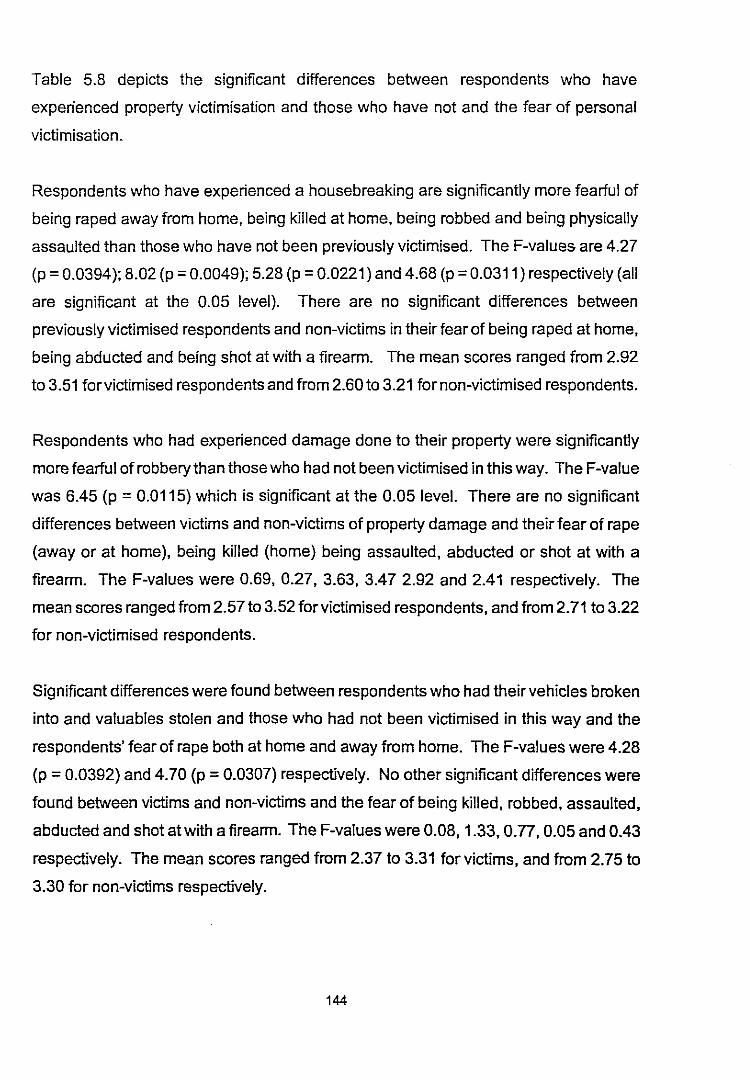
Table 5.8 depicts the significant differences between respondents who have
experienced property victimisation and those who have not and the fear of personal
victimisation.
Respondents who have experienced a housebreaking are significantly more fearful of
being raped away from home, being killed at home, being robbed and being physically
assaulted than those who have not been previously victimised. The F-value& are 4.27
(p = 0.0394); 8.02 (p = 0.0049); 5.28 (p = 0.0221) and 4.68 (p =0.0311) respectively (all
are significant at the 0.05 level). There are no significant differences between
previously victimised respondents and non-victims in their fear of being raped at home,
being abducted and being shot at with a firearm. The mean scores ranged from 2.92
to 3.51 for victimised respondents and from 2.60 to 3.21 for non-victimised respondents.
Respondents who had experienced damage done to their property were significantly
more fearful of robbery than those who had not been victimised in this way. The F-value
was 6.45 (p = 0.0115) which is significant at the 0.05 level. There are no significant
differences between victims and non-victims of property damage and their fear of rape
(away or at home), being killed (home) being assaulted, abducted or shot at with a
firearm. The F-values were 0.69, 0.27, 3.63, 3.47 2.92 and 2.41 respectively. The
mean scores ranged from 2.57to 3.52 for victimised respondents, and from 2.71 to 3.22
for non-victimised respondents.
Significant differences were found between respondents who had their vehicles broken
into and valuables stolen and those who had not been victimised in this way and the
respondents' fear of rape both at home and away from home. The F-values were 4.28
(p = 0.0392) and 4.70 (p = 0.0307) respectively. No other significant differences were
found between victims and non-victims and the fear of being killed, robbed, assaulted,
abducted and shot at with a firearm. The F-values were 0.08,1.33,0.77,0.05 and 0.43
respectively. The mean scores ranged from 2.37 to 3.31 for victims, and from 2.75 to
3.30 for non-victims respectively.
144
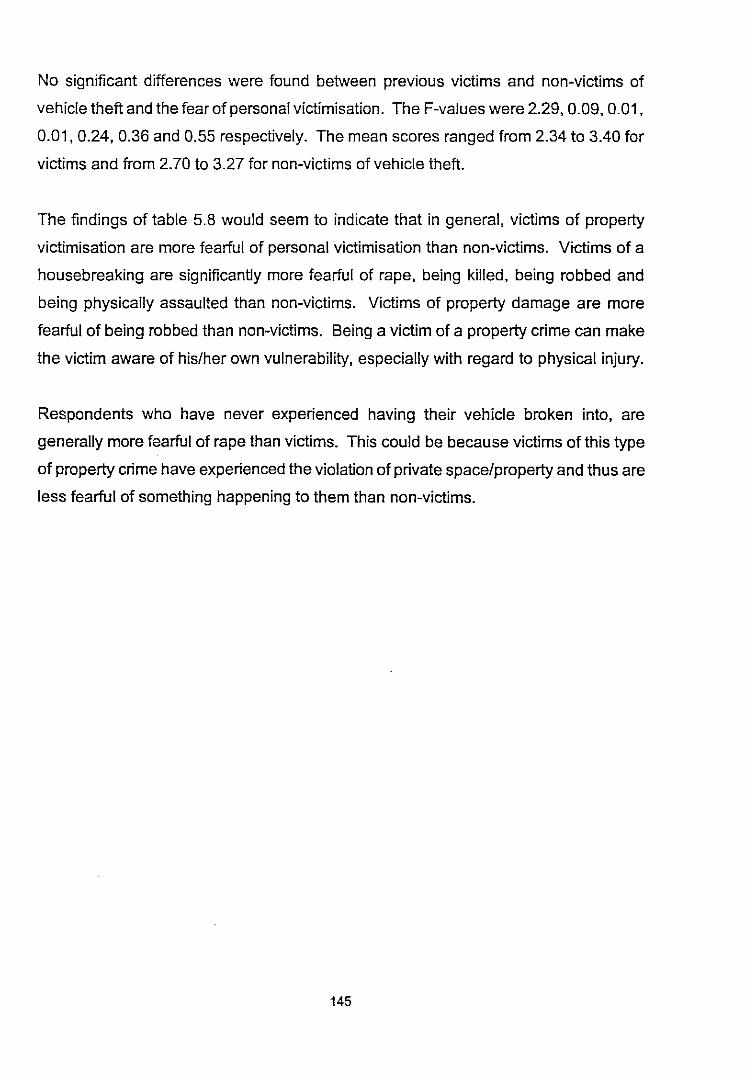
No significant differences were found between previous victims and non-victims of
vehicle theft and the fear of personal victimisation. The F-values were 2.29,0.09,0.01,
0.01, 0.24, 0.36 and 0.55 respectively. The mean scores ranged from 2.34 to 3.40 for
victims and from 2.70 to 3.27 for non-victims of vehicle theft.
The findings of table 5.8 would seem to indicate that in general, victims of property
victimisation are more fearful of personal victimisation than non-victims. Victims of a
housebreaking are significantly more fearful of rape, being killed, being robbed and
being physically assaulted than non-victims. Victims of property damage are more
fearful of being robbed than non-victims. Being a victim of a property crime can make
the victim aware of his/her own vulnerability, especially with regard to physical injury.
Respondents who have never experienced having their vehicle broken into, are
generally more fearful of rape than victims. This could be because victims of this type
of property crime have experienced the violation of private space/property and thus are
less fearful of something happening to them than non-victims.
145
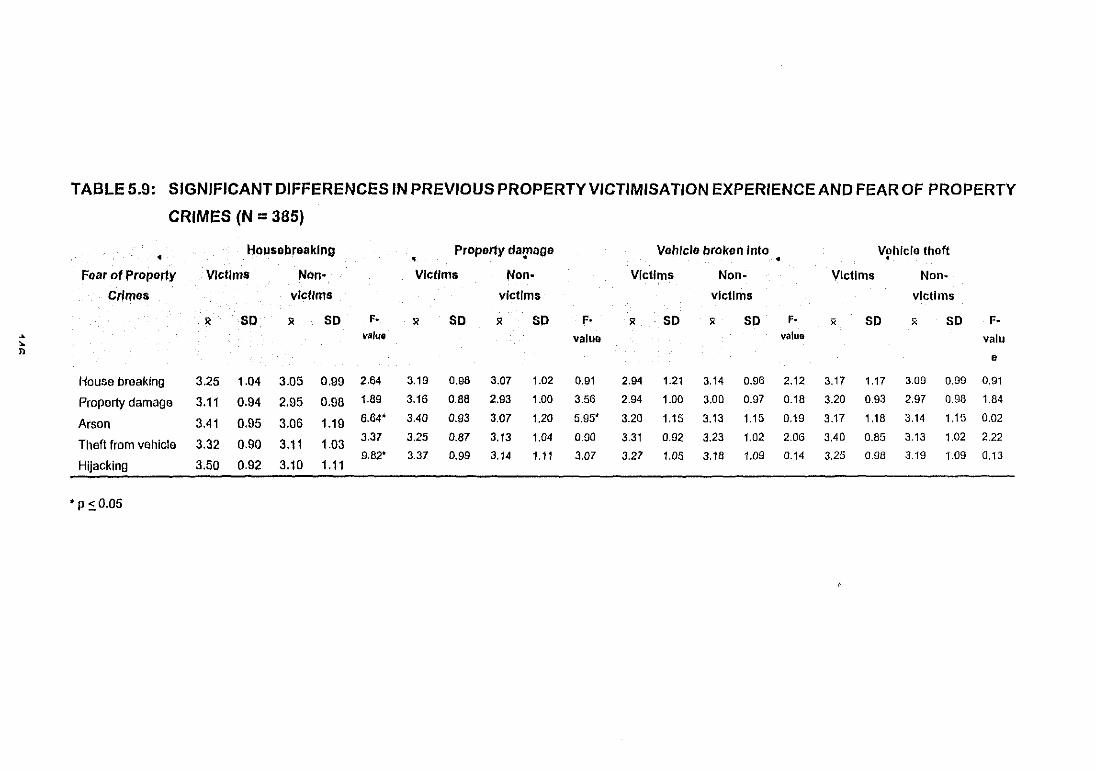
TABLE 5.9: SIGNIFICANT DIFFERENCES IN PREVIOUS PROPERTYVICTIMISATION EXPERIENCE AND FEAR OF PROPERTY
CRIMES (N =385)
• Housebreakino Property dar'age Vehicle broken Into Vahlcle theft• • •
Fear of Property Victims Non- VIctims Non- Victims Non- Victims Non·
Crimes victims victims victims victims
R SO R SO F· R SO R SO F' R SO 51 SO F, 51 SO x SO F·~ valu. vatua value vatu~
n a
House breaking 3.25 1.04 3.05 0.99 2.64 3.19 0.98 3.07 1.02 0.91 2.94 1.21 3.14 0.96 2.12 3.17 1.17 3.09 0.99 0.91
Property damage 3.11 0.04 2.05 0.08 1.89 3.16 0.88 2.93 1.00 3.56 2.94 1.00 3.00 0.97 0.18 3.20 0.93 2.97 0.98 1.84
Arson 3.41 0.05 3.06 1.19 8.64' 3.40 0.93 3.07 1.20 5.9Sot 3.20 1.15 3.13 1.15 0.19 3.17 1.18 3.14 1,15 0.Q2
Theft from vehicle 3.32 0.90 3.11 1.033.37 3.25 0.87 3.13 1.04 0.90 3.31 0.92 3.23 1.02 2.06 3.40 0.85 3.13 1.02 2.22
9.82' 3.37 0.99 3.14 1.11 3.07 3.27 1.05 3.18 1.09 0.14 3.25 0.9a 3.19 1.09 0.13Hijacking 3.50 0.92 3.10 1.11
• P :s 0.05
Table 5.9 depicts the significant differences between respondents who have
experienced property victimisation and those who have not, and the fear of property
crimes.
Significant differences exist between previous victims ofhousebreaking and non-victims
and the fear of arson (F-value 6.64, p = 0.0103) and the fear of hijacking (F-value 9.82,
p = 0.0019). No other significant differences were obtained between victims and non
victims of a housebreaking and fear of housebreaking, damage to property and vehicles
being broken into and valuables stolen. The F-values were 2.64, 1.89 and 3.37
respectively. The mean scores ranged from 3.11 to 3.50 for victims and from 2.95 to
3.11 for non-victims of a housebreaking.
The only significant difference found between previous victims of property damage and
non-victims was in their fear of arson. The F-value was 5.95 (p =0.0152 which is
significant at the 0.05 level). No other differences were found between victims and non
victims and the fear of other property crimes. The F-values were 0.91, 3.56, 0.90 and
3.07 respectively. The mean scores ranged from 3.16 to 3.40 victims and from 2.93 to
3.14 for non-victims of property damage.
No significant differences exist between respondents who have had their vehicles
broken into and valuables stolen and those who have not been victimised in such a way
and the fear of property crimes. None of the F-values were significant at the 0.05 level.
The mean scores ranged from 2.94 to 3.31 for victims and 3.40 to 3.23 for non-victims
of this type of property crime.
A similar finding occurred for previous victims and non-victims of vehicle theft. No
significant differences were found in the fear of property crimes between victims and
non-victims of vehicle theft. The F-values were 0.19, 1.84, 0.02, 2.22 and 0.13
respectively. The mean scores ranged from 3.17 to 3.40 for previous victims and from
2.97 to 3.19 for non-victims.
The findings in table 5.9 would seem to indicate that victims of housebreaking are more
147
fearful of arson and hijacking than non-victims. A possible reason is that victims fear
injuries which could be sustained in a fire and fear the loss of property and possible
physical injury from a hijacking.
Victims of property damage reported a significantly higher level of fear of arson than
non-victims. This could be due to fear of the destruction of property which would result
from arson. Having already experienced property damage, victims are fearful of the
results of arson.
In general it can be said that victims of either personal victimisation and property crimes
are more fearful than non-victims.
5.4 SUMMARY
Although authors such as Garofalo (1979) and Baumer (1985) found little evidence to
support a relationship between previous victimisation and fear of crime, the review of
existing literature presented in this chapter indicates that there is a relationship between
these two variables. Box et al. (1988), Smith and Glanz (1989), Parker and Ray (1990),
Smith and Hill (1991) and Neser et al. (1993) all indicated that in their research,
previous victimisation was indeed a factor that influenced the fear of crime.
In the present study the hypothesis was that significant differences would be found
between respondents who had been previously victimised (victims) and those that had
no such experience (non-victims) and the fear of crime. In order to testthe hypothesis,
previous personal victimisation (sexual assault, robbery, vehicle shot at while driving
and vehicle stoned while driving) and property victimisation (housebreaking, property
damage, vehicle broken into and valuables stolen and vehicle theft) were tested against
the measures of fear of crime (which test for fonmless fear) and fear of personal and
property crimes (which test for concrete fear). The findings were presented in tables 5.1
to 5.9 and each table was briefly discussed.
148
CHAPTER 6
CRIME AS A SOCIAL PROBLEM
6.1 INTRODUCTION
In South Africa, crime touches the lives of citizens either directly or indirectly every day.
Viewing the problem of crime, researchers have used two concepts, namely, the fear
of crime and concern about crime. The former refers to the perceived likelihood of
being victimised and the latter to the individuals perception of the seriousness of the
problem of crime in their residential area or in the country as a whole (Glanz 1989:9).
Using this distinction, it can be noted that an individual may be concerned about crime
but does not fear criminal victimisation and the inverse holds true, i.e, that a person
may fear criminal victimisation without considering crime to be a social problem.
In order to ascertain the relationship between fear of crime and concern about crime,
the general findings on crime as a social problem will be reviewed, the responses ofthe
respondents will be highlighted in frequency distribution tables and the correlation
between fear of crime and crime as a social problem will be sought by using
Spearman's correlation coefficient. The data obtained will be presented in tabular form.
6.2 GENERAL FINDINGS ON CRIME AS A SOCIAL PROBLEM AND FEAR OF
CRIME
Literature on the relationship between fear of crime and crime as a social problem is
limited. The studies related below indicate some of the major findings on the
relationship between the two variables.
Garofalo (1981)
In his article on the causes and consequences of the fear of crime, Garofalo (1981)
indicates that fear of crime is linked to the image the individual has ofcrime. The image
of crime held by the individual contains the following elements, namely
149
• the extent of crime (current and changed)
• the nature of crime (types of crime)
• characteristics of victims and offenders
• consequences of crime (Garofalo 1981:844).
These images inform the individual about the environment and the threat of crime to the
individual can then be inferred. Simply put, the existence of crime is likely to influence
the individual's assessment of the risk of criminal victimisation and influence the level
of fear felt by the individual.
Baumer (1985)
In his research, Baumer (1985) does not propose a direct link between crime as a social
problem and fear of crime. However, he does link knowledge of crime and fear, when
reporting that people who have knowledge of crime in their neighbourhood are more
fearful. He concludes that people rely on visible indicators in their neighbourhoods to
identify potential threats. Signs of disorder and decay become synonymous with crime
e.g. abandoned buildings, groups ofteenagers and disorderly behaviour; and therefore
become fear provoking (Baumer 1985:260).
Smith and Glanz (1989)
Smith and Glanz (1989) in their study on the fear of crime measured the perceived
seriousness of crime in the community by asking the individuals to rate crime as a
problem in their community and to indicate whether crime has increased, decreased or
remained the same over the past year.
The frequency and percentage distribution of the data was presented and the following
results were obtained for the four population groups in the nationwide study on the fear
of crime:
• Out of 1500 black respondents, 1151 (76.3%) saw crime as a serious problem,
and 349 (23.3%) claimed that it was not a serious problem. With regard to the
crime rate, 911 (60.7%) indicated that in their opinion crime had increased, 436
150
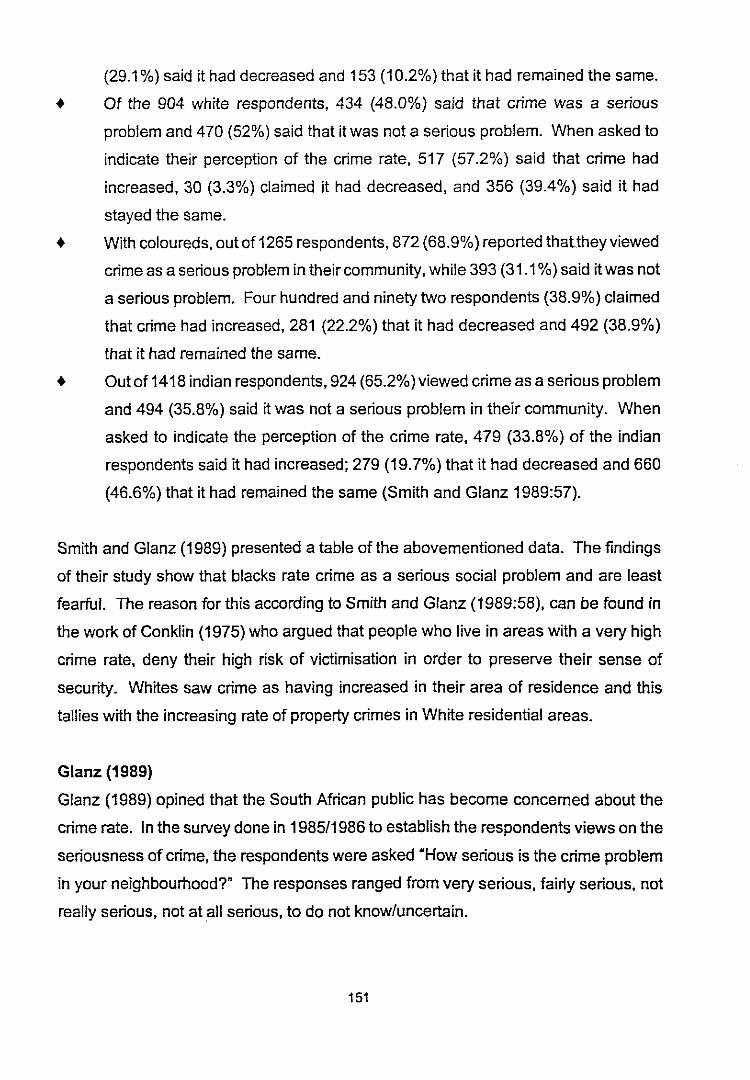
(29.1 %) said it had decreased and 153 (10.2%) that it had remained the same.
• Of the 904 white respondents, 434 (48.0%) said that crime was a serious
problem and 470 (52%) said that it was not a serious problem. When asked to
indicate their perception of the crime rate, 517 (57.2%) said that crime had
increased, 30 (3.3%) claimed it had decreased, and 356 (39.4%) said it had
stayed the same.
• With coloureds, out of 1265 respondents, 872 (68.9%) reported thatthey viewed
crime as a serious problem in their community, while 393 (31.1%) said itwas not
a serious problem. Four hundred and ninety two respondents (38.9%) claimed
that crime had increased, 281 (22.2%) that it had decreased and 492 (38.9%)
that it had remained the same.
• Outof1418 indian respondents, 924 (65.2%) viewed crime as a serious problem
and 494 (35.8%) said it was not a serious problem in their community. When
asked to indicate the perception of the crime rate, 479 (33.8%) of the indian
respondents said it had increased; 279 (19.7%) that it had decreased and 660
(46.6%) that it had remained the same (Smith and Glanz 1989:57).
Smith and Glanz (1989) presented a table of the abovementioned data. The findings
of their study show that blacks rate crime as a serious social problem and are least
fearful. The reason for this according to Smith and Glanz (1989;58), can be found in
the work of Conklin (1975) who argued that people who live in areas with a very high
crime rate, deny their high risk of victimisation in order to preserve their sense of
security. Whites saw crime as having increased in their area of residence and this
tallies with the increasing rate of property crimes in White residential areas.
Glanz (1989)
Glanz (1989) opined that the South African public has become concerned about the
crime rate. In the survey done in 1985/1986 to establish the respondents views on the
seriousness of crime, the respondents were asked "How serious is the crime problem
in your neighbourhood?" The responses ranged from very serious, fairly serious, not
really serious, not at all serious, to do not know/uncertain.
151
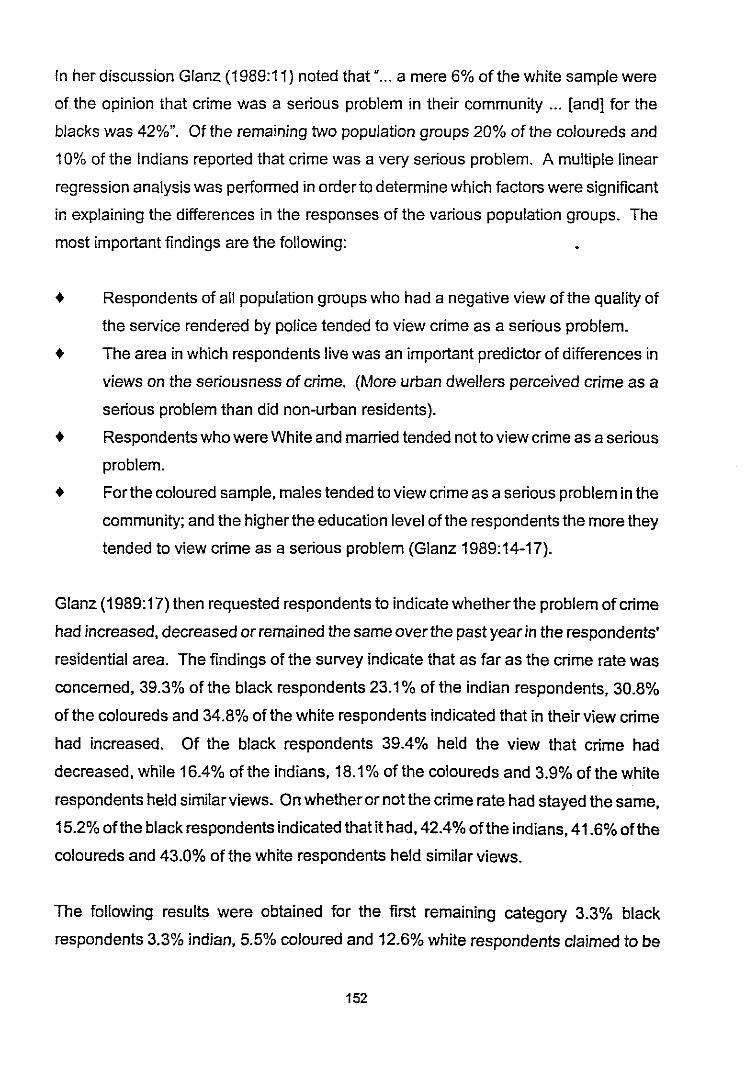
In her discussion Glanz (1989:11) noted that u ••• a mere 6% of the white sample were
of the opinion that crime was a serious problem in their community ... [and] for the
blacks was 42%". Of the remaining two population groups 20% of the coloureds and
10% of the Indians reported that crime was a very serious problem. A multiple linear
regression analysis was performed in order to determine which factors were significant
in explaining the differences in the responses of the various population groups. The
most important findings are the following:
+ Respondents of all population groups who had a negative view ofthe quality of
the service rendered by police tended to view crime as a serious problem.
+ The area in which respondents live was an important predictor of differences in
views on the seriousness of crime. (More urban dwellers perceived crime as a
serious problem than did non-urban residents).
+ Respondents who were White and married tended not to view crime as a serious
problem.
+ Forthe coloured sample, males tended to view crime as a serious problem in the
community; and the higher the education level of the respondents the more they
tended to view crime as a serious problem (Glanz 1989:14-17).
Glanz (1989:17) then requested respondents to indicate whether the problem of crime
had increased, decreased or remained the same over the past year in the respondents'
residential area. The findings of the survey indicate that as far as the crime rate was
concerned, 39.3% of the black respondents 23.1% of the indian respondents, 30.8%
of the coloureds and 34.8% of the white respondents indicated that in their view crime
had increased. Of the black respondents 39.4% held the view that crime had
decreased, while 16.4% of the indians, 18.1% of the coloureds and 3.9% of the white
respondents held similar views. On whether or not the crime rate had stayed the same,
15.2% ofthe black respondents indicated that it had, 42.4% ofthe indians, 41.6% ofthe
coloureds and 43.0% of the white respondents held similar views.
The following results were obtained for the first remaining category 3.3% black
respondents 3.3% indian, 5.5% coloured and 12.6% white respondents claimed to be
152
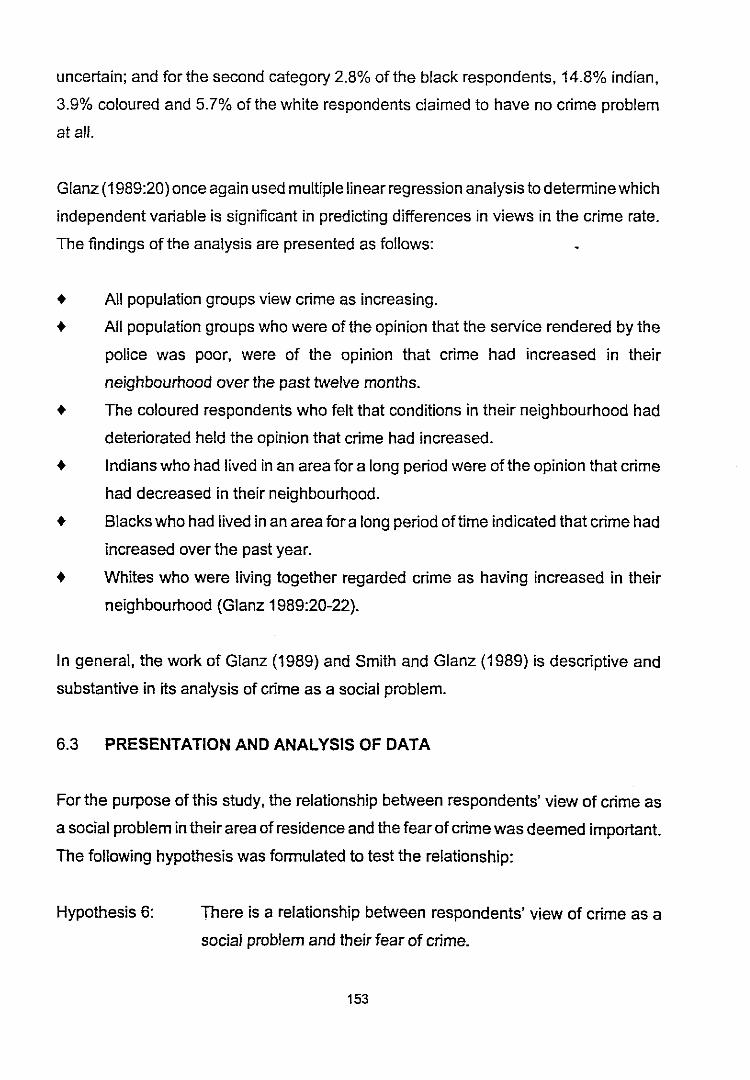
uncertain; and for the second category 2.8% of the black respondents, 14.8% indian,
3.9% coloured and 5.7% of the white respondents claimed to have no crime problem
at all.
Glanz (1989:20) once again used multiple linear regression analysis to determine which
independent variable is significant in predicting differences in views in the crime rate.
The findings of the analysis are presented as follows:
• All population groups view crime as increasing.
• All population groups who were of the opinion that the service rendered by the
police was poor, were of the opinion that crime had increased in their
neighbourhood over the past twelve months.
• The coloured respondents who felt that conditions in their neighbourhood had
deteriorated held the opinion that crime had increased.
• Indians who had lived in an area for a long period were of the opinion that crime
had decreased in their neighbourhood.
• Blacks who had lived in an area for a long period of time indicated that crime had
increased over the past year.
• Whites who were living together regarded crime as having increased in their
neighbourhood (Glanz 1989:20-22).
In general, the work of Glanz (1989) and Smith and Glanz (1989) is descriptive and
substantive in its analysis of crime as a social problem.
6.3 PRESENTATION AND ANALYSIS OF DATA
For the purpose of this study, the relationship between respondents' view of crime as
a social problem in their area of residence and the fear of crime was deemed important.
The following hypothesis was formulated to test the relationship:
Hypothesis 6: There is a relationship between respondents' view of crime as a
social problem and their fear of crime.
153
In order to test the hypothesis, Spearman's Rank Order Correlation Coefficient was
used with rank order one being fear of crime and rank order two, the types of crime
viewed as social problems by the respondents,
The types of crime viewed by respondents as social problems have been divided into
statutory crimes (traffic violations and driving under the influence of alcohol); crimes
against the person (designated personal victimisation and including rape, robbery,
physical assault, being shot and killed by firearms and abduction); and property crimes
(housebreaking, theft out of and of vehicles, other forms of theft, vandalism, hijacking
and bag snatching) respectively. The fear of crime was measured by responses to the
questions "How safe do you feel walking alone at night in your neighbourhood?"
(abridged to walking alone), "How safe do you feel when alone in your house or
apartment at night?" (abridged to home alone) and "How safe do you feel in your
neighbourhood when leaving or arriving at home when its dark?" (abridged to
leaving/arriving at home) respectively.
None of the previous research findings have indicated the differences in types of crime
as a social problem. In this study, the respondentswere asked to rate a list of statutory
crimes, personal crimes and property crimes as being no problem at all, less of a
problem, more of a problem or very problematic in their area of residence. The
responses of the respondents are presented in table 6.1.
154
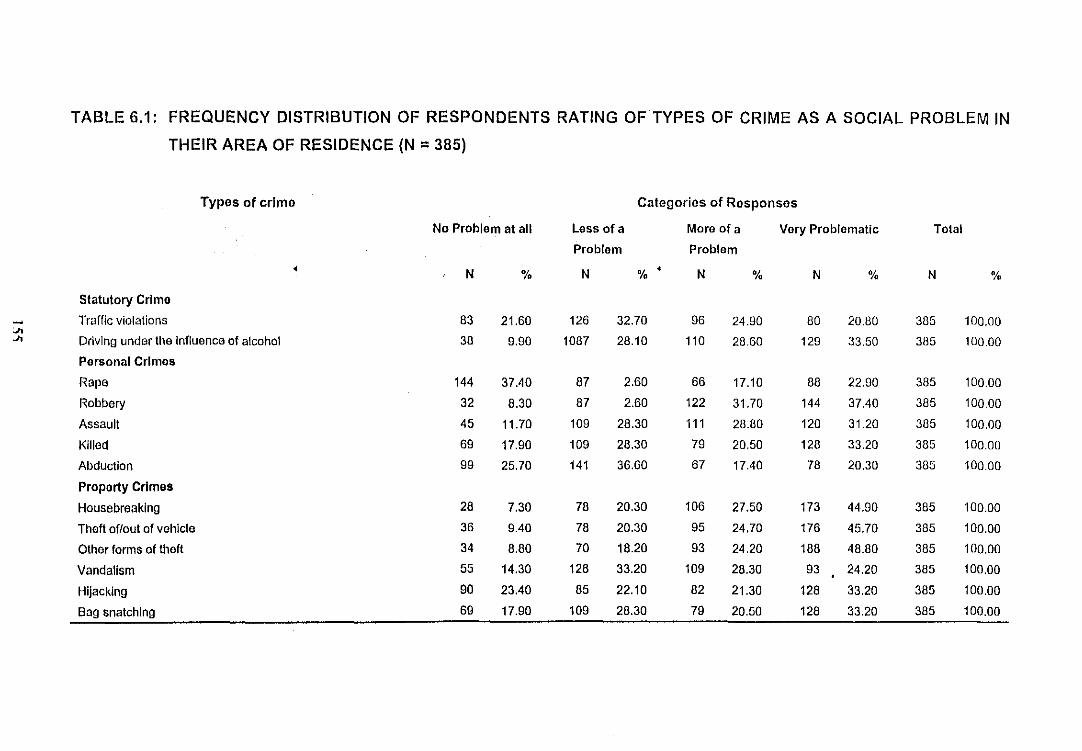
TABLE 6.1: FREQUENCY DISTRIBUTION OF RESPONDENTS RATING OF TYPES OF CRIME AS A SOCIAL PROBLEM IN
THEIR AREA OF RESIDENCE (N =385)
Types of crime Categories of Responses
No Problem at all Less of a More of a Very Problematic Total
Problem Problem
• N % N % • N % N % N %
Statutory Crime
Traffic violations 83 21.60 126 32.70 96 24.90 80 20.80 385 100.00CJ1CJ1 Driving under the Influence of alcohol 38 9.90 1087 28.10 110 28.60 129 33.50 385 100.00
Personal Crimes
Rape 144 37.40 87 2.60 66 17.10 88 22.90 385 100.00
Robbery 32 8.30 87 2.60 122 31.70 144 37.40 385 100.00
Assault 45 11.70 109 28.30 111 28.80 120 31.20 385 100.00
Killed 89 17.90 109 28.30 79 20.50 128 33.20 385 100.00
Abductlon 99 25.70 141 36.60 67 17.40 78 20.30 385 10000
Property Crimes
Housebreaking 28 7.30 78 20.30 106 27.50 173 44.90 385 100.00
Theft of/Dut of vehicle 36 9.40 78 20.30 95 24.70 176 45.70 385 100.00
Other forms of thoft 34 8.80 70 18.20 93 24.20 188 48.80 385 100.00
Vandalism 55 14.30 128 33.20 109 28.30 93 24.20 385 100.00
Hijacking 90 23.40 85 22.10 82 21.30 128 33.20 385 100.00
Bag snatching 69 17.90 109 28.30 79 20.50 128 33.20 385 100.00
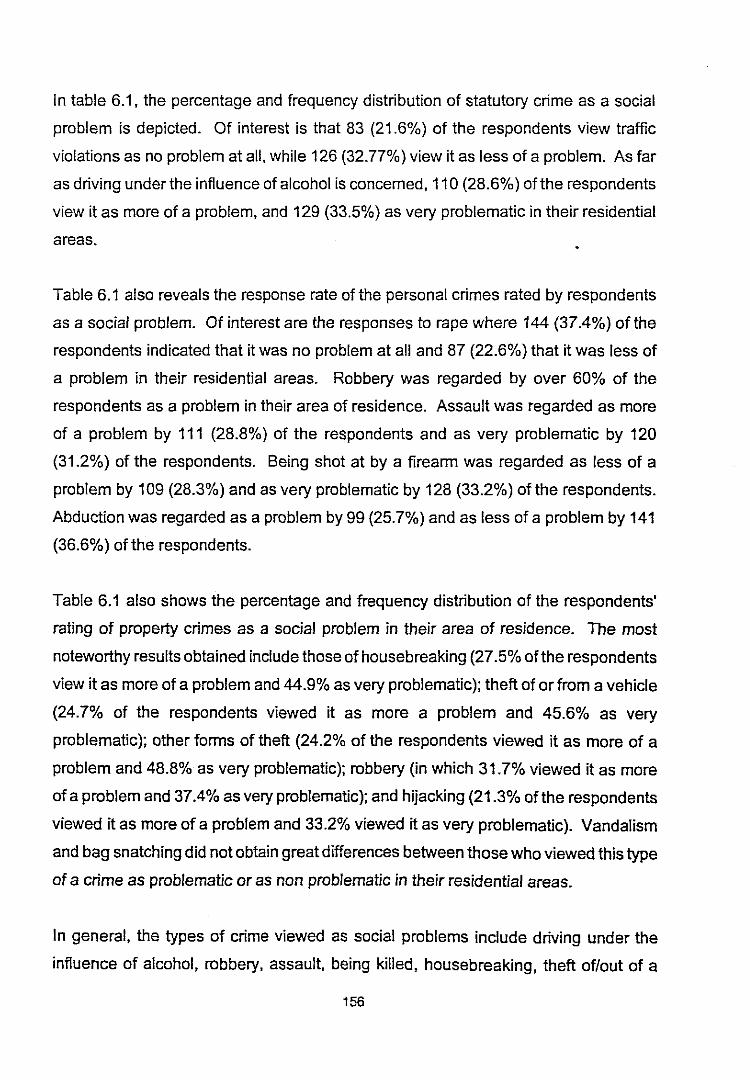
In table 6.1, the percentage and frequency distribution of statutory crime as a social
problem is depicted. Of interest is that 83 (21.6%) of the respondents view traffic
violations as no problem at all, while 126 (32.77%) view it as less of a problem. As far
as driving under the influence of alcohol is concerned, 110 (28.6%) of the respondents
view it as more of a problem, and 129 (33.5%) as very problematic in their residential
areas.
Table 6.1 also reveals the response rate of the personal crimes rated by respondents
as a social problem. Of interest are the responses to rape where 144 (37.4%) of the
respondents indicated that it was no problem at all and 87 (22.6%) that it was less of
a problem in their residential areas. Robbery was regarded by over 60% of the
respondents as a problem in their area of residence. Assault was regarded as more
of a problem by 111 (28.8%) of the respondents and as very problematic by 120
(31.2%) of the respondents. Being shot at by a firearm was regarded as less of a
problem by 109 (28.3%) and as very problematic by 128 (33.2%) of the respondents.
Abduction was regarded as a problem by 99 (25.7%) and as less of a problem by 141
(36.6%) of the respondents.
Table 6.1 also shows the percentage and frequency distribution of the respondents'
rating of property crimes as a social problem in their area of residence. The most
noteworthy results obtained include those of housebreaking (27.5% ofthe respondents
view it as more of a problem and 44.9% as very problematic); theft of or from a vehicle
(24.7% of the respondents viewed it as more a problem and 45.6% as very
problematic); other forms of theft (24.2% of the respondents viewed it as more of a
problem and 48.8% as very problematic); robbery (in which 31.7% viewed it as more
ofa problem and 37.4% as very problematic); and hijacking (21.3% of the respondents
viewed it as more of a problem and 33.2% viewed it as very problematic). Vandalism
and bag snatching did not obtain great differences between those who viewed this type
of a crime as problematic or as non problematic in their residential areas.
In general, the types of crime viewed as social problems include driving under the
influence of alcohol, robbery, assault, being killed, housebreaking, theft of/out of a
156
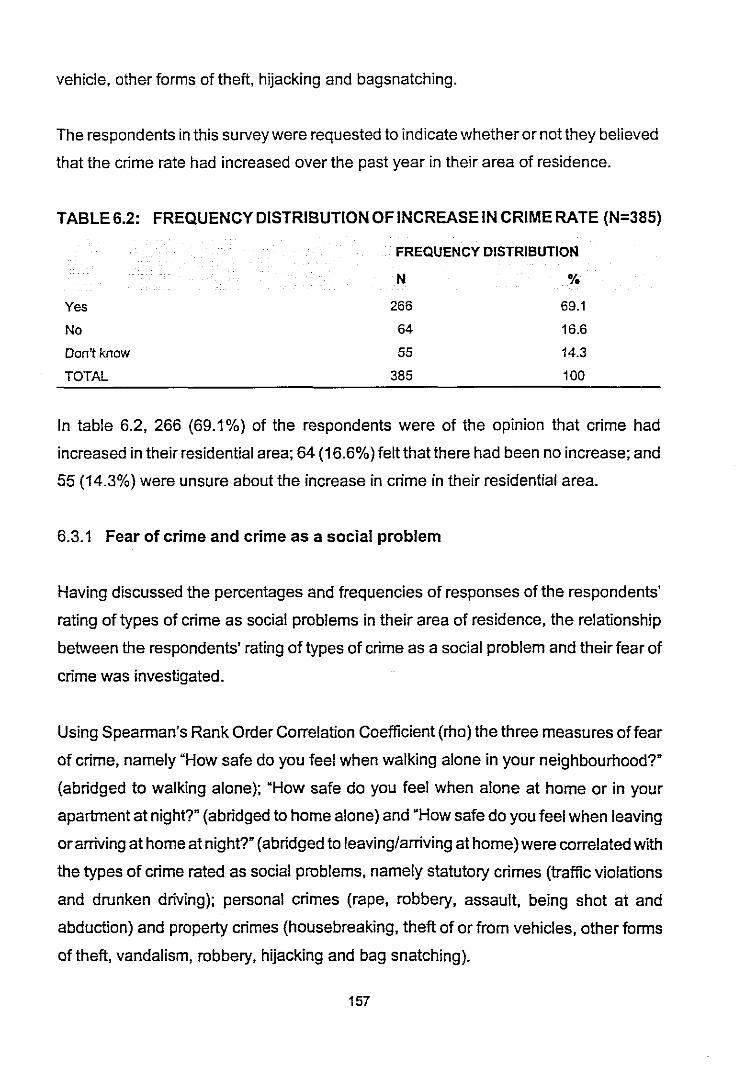
vehicle, other forms of theft, hijacking and bagsnatching.
The respondents in this survey were requested to indicate whether or not they believed
that the crime rate had increased over the past year in their area of residence.
TABLE 6.2: FREQUENCY DISTRIBUTION OF INCREASE IN CRIME RATE (N=385)
FREQUENCY DISTRIBUTION
Yes
No
Don't know
TOTAL
N
266
64
55
385
%
69.1
16.6
14.3
100
In table 6.2, 266 (69.1%) of the respondents were of the opinion that crime had
increased in their residential area; 64 (16.6%) felt thatthere had been no increase; and
55 (14.3%) were unsure about the increase in crime in their residential area.
6.3.1 Fear of crime and crime as a social problem
Having discussed the percentages and frequencies of responses of the respondents'
rating of types of crime as social problems in their area of residence, the relationship
between the respondents' rating of types of crime as a social problem and their fear of
crime was investigated.
Using Spearman's Rank Order Correlation Coefficient (rho) the three measures of fear
of crime, namely "How safe do you feel when walking alone in your neighbourhood?"
(abridged to walking alone); "How safe do you feel when alone at home or in your
apartment at night?" (abridged to home alone) and "How safe do you feel when leaving
orarriving at home at night?" (abridged to leaving/arriving at home) were correlated with
the types of crime rated as social problems, namely statutory crimes (traffic violations
and drunken driving); personal crimes (rape, robbery, assault, being shot at and
abduction) and property crimes (housebreaking, theft of or from vehicles, other forms
of theft, vandalism, robbery, hijacking and bag snatching).
157
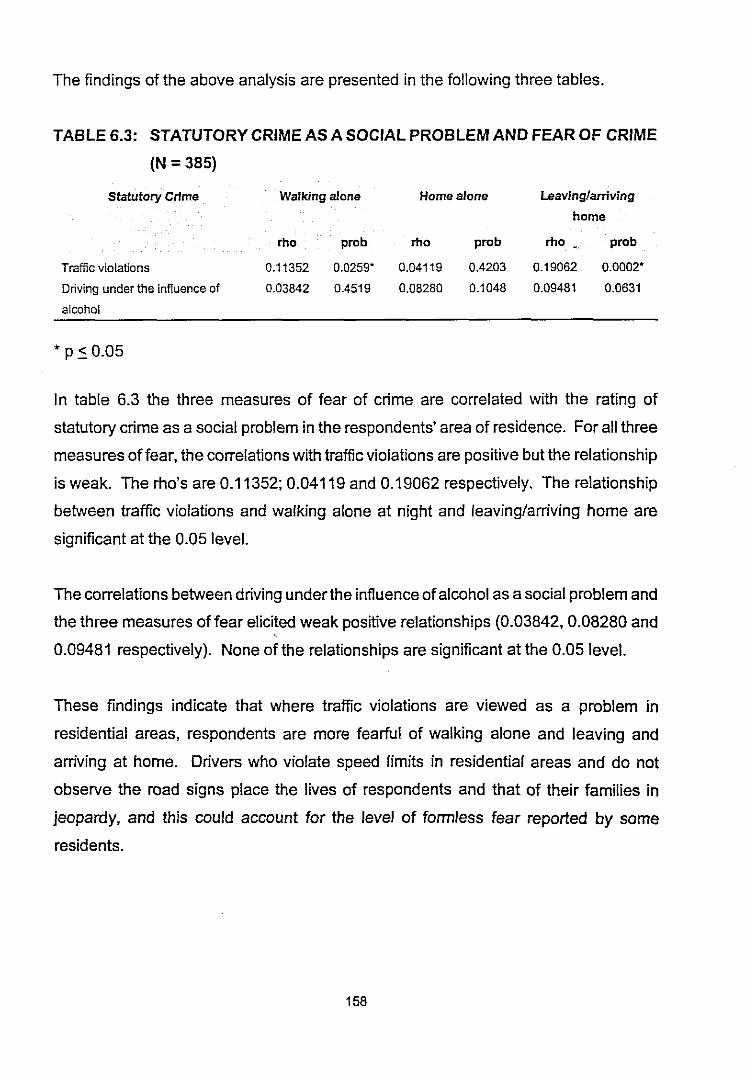
The findings of the above analysis are presented in the following three tables.
TABLE 6.3: STATUTORY CRIME AS A SOCIAL PROBLEM AND FEAR OF CRIME
(N = 385)
Statutory Crime Walking alone Home alone Leaving/arriving
home
Traffic violations
Driving under the influence of
alcohol
* p ~ 0.05
rho
0.11352
0.03842
prob
0.0259"
0.4519
rho
0.04119
0.08280
prob
0.4203
0.1048
rho
0.19062
0.09481
prob
0.0002"
0.0631
In table 6.3 the three measures of fear of crime are correlated with the rating of
statutory crime as a social problem in the respondents' area of residence. For all three
measures of fear, the correlations with traffic violations are positive but the relationship
is weak. The rho's are 0.11352; 0.04119 and 0.19062 respectively. The relationship
between traffic violations and walking alone at night and leaving/arriving home are
significant at the 0.05 level.
The correlations between driving under the influence of alcohol as a social problem and
the three measures of fear elicited weak positive relationships (0.03842, 0.08280 and
0.09481 respectively). None ofthe relationships are significant at the 0.05 level.
These findings indicate that where traffic violations are viewed as a problem in
residential areas, respondents are more fearful of walking alone and leaving and
arriving at home. Drivers who violate speed limits in residential areas and do not
observe the road signs place the lives of respondents and that of their families in
jeopardy, and this could account for the level of formless fear reported by some
residents.
158
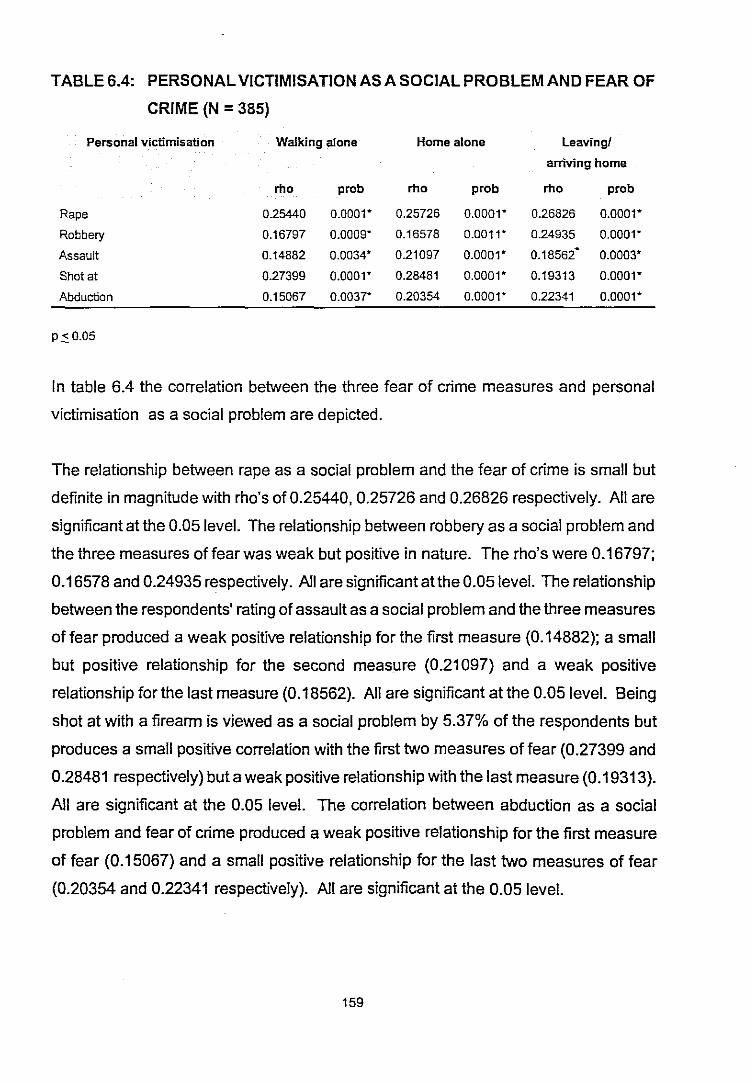
TABLE 6.4: PERSONAL VICTIMISATION AS A SOCIAL PROBLEM AND FEAR OF
CRIME (N =385)
Personal victimisation
Rape
Robbery
Assault
Shot at
Abduction
Walking alone Home alone leavingJ
arriving home
rho prob rho prob rho prob
0.25440 0.0001' 0.25726 0.0001' 0.26826 0.0001'
0.16797 0.0009' 0.16578 0.0011' 0.24935 0.0001'
0.14882 0.0034' 0.21097 0.0001' 0.18562.
0.0003'
0.27399 0.0001' 0.28481 0.0001' 0.19313 0.0001'
0.15067 0.0037* 0.20354 0.0001' 0.22341 0.0001'
p~0.05
In table 6.4 the correlation between the three fear of crime measures and personal
victimisation as a social problem are depicted.
The relationship between rape as a social problem and the fear of crime is small but
definite in magnitude with rho's of 0.25440,0.25726 and 0.26826 respectively. All are
significant at the 0.05 level. The relationship between robbery as a social problem and
the three measures of fear was weak but positive in nature. The rho's were 0.16797;
0.16578 and 0.24935 respectively. All are significant at the 0.05 level. The relationship
between the respondents' rating of assault as a social problem and the three measures
of fear produced a weak positive relationship for the first measure (0.14882); a small
but positive relationship for the second measure (0.21097) and a weak positive
relationship for the last measure (0.18562). All are significant at the 0.05 level. Being
shot at with a firearm is viewed as a social problem by 5.37% of the respondents but
produces a small positive correlation with the first two measures of fear (0.27399 and
0.28481 respectively) but a weak positive relationship with the last measure (0.19313).
All are significant at the 0.05 level. The correlation between abduction as a social
problem and fear of crime produced a weak positive relationship for the first measure
of fear (0.15067) and a small positive relationship for the last two measures of fear
(0.20354 and 0.22341 respectively). All are significant at the 0.05 level.
159
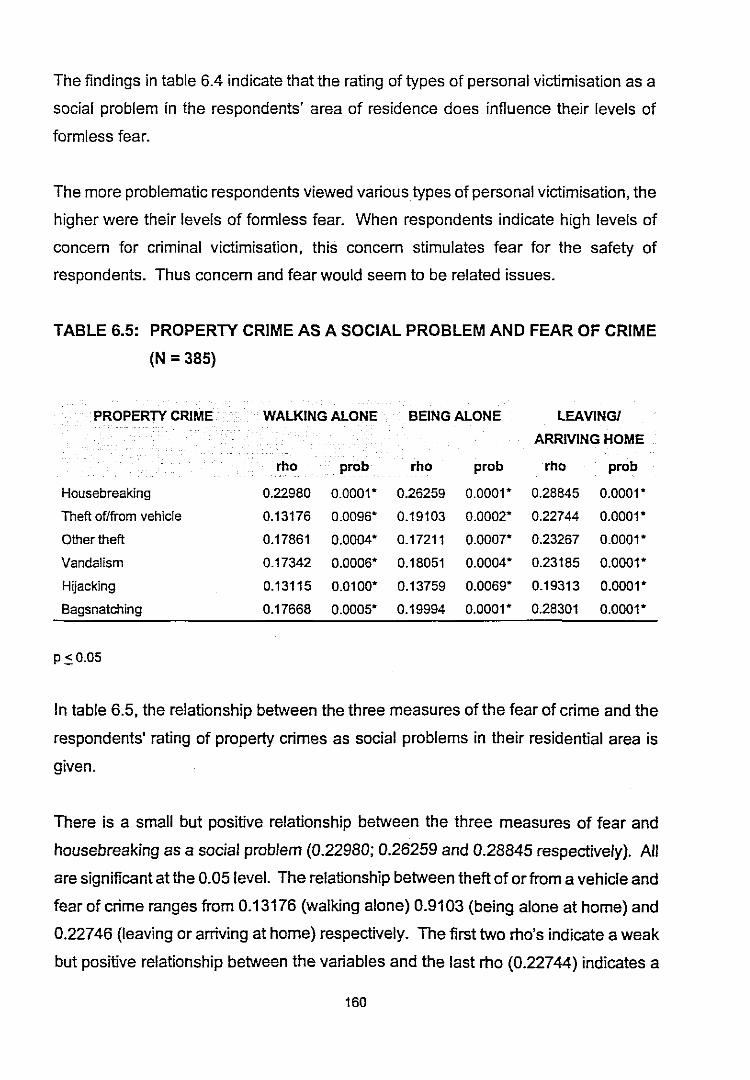
The findings in table 6.4 indicate that the rating of types of personal victimisation as a
social problem in the respondents' area of residence does influence their levels of
formless fear.
The more problematic respondents viewed varioustypes of personal victimisation, the
higher were their levels of formless fear. When respondents indicate high levels of
concem for criminal victimisation, this concern stimulates fear for the safety of
respondents. Thus concern and fear would seem to be related issues.
TABLE 6.5: PROPERTY CRIME AS A SOCIAL PROBLEM AND FEAR OF CRIME
(N =385)
PROPERTY CRIME
Housebreaking
Theft of/from vehicle
Other theft
Vandalism
Hijacking
Bagsnalching
WALKING ALONE BEING ALONE LEAVING!
ARRIVING HOME
rho prob rho prob rho prob
0.22980 0.0001* 0.26259 0.0001* 0.28845 0.0001*
0.13176 0.0096* 0.19103 0.0002* 0.22744 0.0001*
0.17861 0.0004* 0.17211 0.0007* 0.23267 0.0001*
0.17342 0.0006* 0.18051 0.0004* 0.23185 0.0001*
0.13115 0.0100* 0.13759 0.0069* 0.19313 0.0001*
0.17668 0.0005* 0.19994 0.0001* 0.28301 0.0001*
p~0.05
In table 6.5, the relationship between the three measures of the fear of crime and the
respondents' rating of property crimes as social problems in their residential area is
given.
There is a small but positive relationship between the three measures of fear and
housebreaking as a social problem (0.22980; 0.26259 and 0.28845 respectively). All
are significant at the 0.05 level. The relationship between theft of or from a vehicle and
fear of crime ranges from 0.13176 (walking alone) 0.9103 (being alone at home) and
0.22746 (leaving or arriving at home) respectively. The first two rho's indicate a weak
but positive relationship between the variables and the last rho (0.22744) indicates a
160
small but positive relationship between feelings of safety when leaving or arriving at
home and theft of or from a vehicle. All relationships are significant at the 0.05 level.
Similar relationships were found between the three measures of fear and other forms
of theft (0.17861, 0.17211 and 0.23267 respectively); vandalism (0.17342; 0.18051;
0.23185 respectively); bag snatching (0.17668, 0.19994 and 0.28301 respectively). All
relationships were significant at the 0.05 level. The relationship between the three
measures of fear of crime and hijacking as a social problem produced weak positive
relationships (0.13115; 0.13759 and 0.19313 respectively) which were all significant at
the 0.05 level.
The findings of table 6.5 indicate that the rating of property crime as a social problem
in the area of residence by the respondents and the fear of crime are positively related.
As respondents began to become more concerned about property crime so their fear
increased.
6.3.2 Crime as a social problem and respondents opinion of police performance
For the purpose of this investigation it was deemed necessary to investigate the link
between crime as a social problem and the opinion that respondents have of the
performance of their local police. In order to test this link, the following hypothesis was
formulated.
Hypothesis 7: The opinion respondents have of the service rendered by the
police will influence how they rate crime as a social problem in
their area of residence.
Using the Spearman Correlation Coefficient (rho) the relationship between crime as a
social problem and the opinion of respondents toward police performance was
measured.
The findings are depicted in the following tables:
161
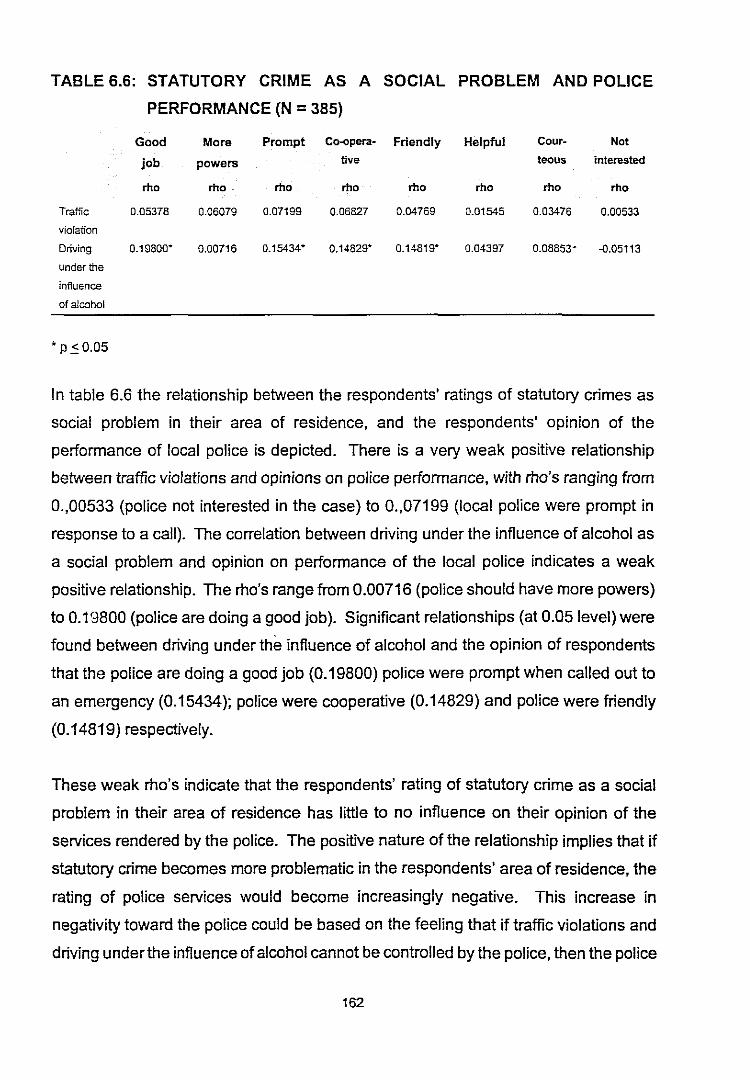
TABLE 6.6: STATUTORY CRIME AS A SOCIAL PROBLEM AND POLICE
PERFORMANCE (N =385)
Good More Prompt Co-opera- Friendly Helpful cour- Not
job powers tive teous interested
rho rho rho rho rho rho rho rho
Traffic 0.05378 0.06079 0.07199 0.06827 0.04769 0.01545 0.03476 0.00533
violation
Driving 0.19800" 0.00716 0.15434" 0.14829" 0.14819" 0.04397 0.08853' -0.05113
under the
influence
af alcohol
* p~O.05
In table 6.6 the relationship between the respondents' ratings of statutory crimes as
social problem in their area of residence, and the respondents' opinion of the
performance of local police is depicted. There is a very weak positive relationship
between traffic violations and opinions on police performance, with rho's ranging from
0.,00533 (police not interested in the case) to 0.,07199 (local police were prompt in
response to a call). The correlation between driving under the influence of alcohol as
a social problem and opinion on performance of the local police indicates a weak
positive relationship. The rho's range from 0.00716 (police should have more powers)
to 0.19800 (police are doing a good job). Significant relationships (at 0.05 level) were
found between driving under the influence of alcohol and the opinion of respondents
that the police are doing a good job (0.19800) police were prompt when called out to
an emergency (0.15434); police were cooperative (0.14829) and police were friendly
(0.14819) respectively.
These weak rho's indicate that the respondents' rating of statutory crime as a social
problem in their area of residence has little to no influence on their opinion of the
services rendered by the police. The positive nature of the relationship implies that if
statutory crime becomes more problematic in the respondents' area of residence, the
rating of police services would become increasingly negative. This increase in
negativity toward the police could be based on the feeling that if traffic violations and
driving underthe influence of alcohol cannot be controlled by the police, then the police
162
have become ineffective in combating crime In general and traffic violations in
particular.
TABLE 6.7: PERSONAL VICTIMISATION AS A SOCIAL PROBLEM AND POLICE
PERFORMANCE (N =385)
Good More Prompt Co-opera- Friendly Helpful Cour- Not
job powers tive teous, interested
rho rho rho rho rho rho rho rho
Rape 0.18041' 0.12111' 0.11428' 0.10988- 0.12899- 0.08101 0.14194- -0.03201
Robbery 0.29260' 0.07736 0.18421' 0.17781- 0.16127- 0.14324' 0.18911- -0.01158
Assault 027881- 0.09831 0.19308- 0.18825' 0.14142' 0.14312' 0.18311' 0.00432
Shot at 0.19515- 0.11970' 0.12213' 0.16206' 0.10722- 0.13865- 0.17759' -0.10720'
Abduction 0.17496- 0.09137 0.11228- 0.22135' 0.21522" 0.14340- 0.22312' -0.07503
'p~O.05
Table 6.7 reflects the correlation between respondents' ratings of personal victimisation
as a social problem in their area of residence and the respondents' opinion of the
perfonmanceof the local police.
There are weak positive relationships between the respondents' rating of rape as a
social problem in their area of residence and their opinion of the perfonmance of the
local police. The rho's for the.first variable of police perfonmance was 0.18041; for
police needing more powers 0.12111; for promptness 0.11428; for co-operation
0.10988; for friendliness 0.12899; for helpfulness 0.08101 and for courteousness
0.14194. The rho for the last variable on police performance, namely that the police
were uninterested in the case was -0.03201. indicating a very weak negative
relationship.
Similar rho's were obtained forthe correlation between robbery as a social problem and
the eight measures of police perfonmance (O.29260; 0.07736; 0.18421; 0.17781;
0.16127; 0.14324; 0.18911, -0.01158 respectively). These rho's indicate a weak
positive relationship between respondents' rating of robbery as a social problem in their
area of residence and residents' opinion that police needed more powers; local police
were prompt, cooperative, friendly, helpful and courteous. A small to definite positive
163
relationship was to be found between robbery and the respondents view that the local
police are doing a good job at combating crime. A very weak negative relationship
(-0.01158) was revealed when robbery as a social problem was correlated with the
opinions of respondents that local police were uninterested in the case.
The rho's obtained for the correlation between assault as a social problem and the eight
measures of police performance were 0.27881 (police doing a good job); 0.09831
(police need more powers); 0.19308 (police were prompt); 0.18825 (police were co
operative); 0.14142 (police were friendly); 0.14312 (police were helpful); 0.18317
(police were courteous) and 0.00432 (police were uninterested in the case). Except for
the correlation between assault and the opinion of the respondents that the police were
doing a good job at combating crime (small positive relationship) the relationships
between the remaining variables were positive but weak.
The relationship between the respondents' rating of being shot at with a firearm as a
social problem in their area of residence and their opinion of police performance
presented weak but positive correlation's for seven variables of police performance.
The rho's ranged from 0.10722 (police were friendly) to 0.19515 (police were doing a
good job at combating crime). The rho for the last variable of police performance
(police were uninterested in the case) was -0.10720 which although significant at the
0.05 level, is nevertheless a weak negative relationship.
The rho's obtained for the correlation between the respondents' rating of abduction as
a social problem and their opinion of the performance of the local police were 0.17496
(police were doing a good job); 0.09137 (the police need more powers); 0.11228 (the
police were prompt); 0.22135 (the police were co-operative); 0.21522 (the police were
friendly); 0.14340 (the police were helpful); 0.22312 (the police were courteous) and
0.07503 (police were uninterested. The relationship of the first seven variables varies
from weak to small but is positive. The relationships for the last variable is very weak
and negative.
Except for the correlations between rape, robbery, shot at and abduction and the
164
police's lack of interest in the case, the remaining correlations were positive. This
would imply that as the respondents came to rate these types of crimes as a social
problem in their area of residence, their opinion of police becomes increasingly
negative. The police, in other words, will be viewed as incapable of doing their job, not
prompt in their reactions, uncooperative, unfriendly, unhelpful and discourteous. The
respondents will also feel that police do not deserve to get more powers as they cannot
utilize those they already have. The interest shown by the police in the case will be
viewed by respondents as being minimal. However, these relationships are somewhat
weak.
TABLE 6.8: RATING OF PROPERTY CRIME AS A SOCIAL PROBLEM AND
POLICE PERFORMANCE (N =283)
Good More Prompt Co- Friendly Helpful Cour- Not
job powers opera- teous Interested
live
rho rho rho rho rho rho rho rho
Housebreaking 0.17101" 0.09358 0.18153"" 0.18114- 0.20718- 0.19628- 0.17160 -0.06952
Theft offaut of 0.23073- 0.11954- 0.16717" a.167ST 0.18245* 0.14774* O.15~ -0.04741
vehicle
Other theft O.20007*' 0.11458* 0.17a80· 020710· 0.22495- 0.23597" 0.20277"" -0.10700*
Vandalism 0.25387* 0.04739 0.21108* 0.24480· 0.25955- 0.17810· 0.20750' -0.12298*
Hijacking 0.22255" 0.12518" 0.20806' 0.2025T 0.21453" 0.16757" 0.15731· -0.08562
Bag snatdling 0.17158" 0.Q445(J 0.09614 0.11658" 0.14600" 0.08604 0.17175* -0.00329
·p~O.05
In table 6.8 the correlation coefficient of the rating of property crimes as a social
problem and police performance is revealed.
The rho's for the correlation between housebreaking as a social problem and the eight
variables of police performance were 0.17101 (police were doing a good job); 0.09358
(police need more power); 0.18153 (police were prompt); 0.18114 (police were co
operative); 0.20718 (police were friendly); 0.19628 (police were helpful): 0.17160
(police were courteous); and -0.06952 (police were uninterested). Except for the last
correlation, the previous seven indicate a weak but positive relationship between the
two variables.
165
The relationship between theft of or out of a vehicle as a social problem and police
performance produced weak but positive relationships. The rho's ranged from 0.23073
(police were doing a good job); 0.119564 (police need more powers); 0.16717 (police
were prompt); 0.16782 (police were co-operative); 0.18245 (police were friendly);
0.14774 (police were helpful); 0.15226 (police were courteous); to -0.04741 (police
were uninterested) which indicated a very weak negative relationship.
The correlation between the rating of other forms of theft as a social problem by
respondents and the opinion respondents have of the local police produced small
positive relationships between seven of the measures of police performance and a
weak negative relationship for the last measure of police performance. (The rho's were
0.20007; 0.11458; 0.17880; 0.20710; 0.22495; 0.23597; 0.20277 and -0.10796
respectively).
In the correlation between vandalism as a social problem and the performance of local
police the following rho's were obtained: 0.25387 (police were doing a good job);
0.04739 (police needed more power); 0.21108 (police were prompt); 0.24480 (police
were co-operative); 0.25955 (police were friendly); 0.17810 (police were helpful) and
0.20750 (police were courteous). These rho's indicate weak positive relationships
between the two variables. The last rho for vandalism was -0.12298 (police were
uninterested) which indicated a weak negative relationship.
When hijacking was correlated to the eight measures of police performance, the
following results were obtained: 0.22255 (police were doing a good job); 0.12518
(police needed more power); 0.20806 (police were prompt); 0.20252 (police were co
operative); 0.21453 (police were friendly); 0.16757 (police were helpful); and 0.15731
(police were courteous). These rho's indicate a weak positive relationship between the
two variables. The rho for hijacking and the last measure of police performance was
-0.08562 (police were uninterested) which indicated a very weak negative relationship.
Similar results were obtained for the respondents' rating of bag snatching as a social
problem and the opinion of respondents on the performance of local police. The rho's
166
were 0.17158 (police were doing a good job); 0.04450 (police needed more powers);
0.09614 (policewere prompt); 0.11658 (police were co-operative); 0,14600 (police were
friendly); 0,08604 (police were helpful); 0,17175 (police were courteous) and -0,06329
(police were uninterested). The relationship is thus weak and positive for bagsnatching
and the first seven measures of police performance; and very weak and negative for
the last measure of police performance and bagsnatching as a social problem.
Except for the correlation between types of property crimes and the police's lack of
interest, all the correlations are positive.
This would imply that as respondents come to rate property crime as social problems
in their area of residence, so their opinion of police performance declines. If crime
becomes a reality for respondents, the police will be seen to be losing control of the
crime situation and this will definitely influence the way respondents feel about the
police. However, these relationships are also somewhat weak.
6.4 SUMMARY
The general findings on the relationship between crime as a social problem, fear of
crime, and the role of the police is limited. Although extensive work has been done by
Glanz (1989) and Smith and Glanz (1989) it was felt that this research study should
also pursue the relationship between the three variables.
Firstly, the percentages and frequency distribution of responses pertaining to the
respondents' rating of statutory crimes (traffic violations and drunken drivinq), personal
victimisation (rape, robbery, assault, shot at with AK47 and abduction); and property
crimes (housebreaking, theft of or from vehicle; other forms of theft, vandalism,
hijacking and bag snatching) were given. The percentage and frequency distribution
ofthe responses pertaining to the respondents opinion on whether crime has increased
over the past year in their area of residence was also presented.
Secondly, the correlation between fear of crime and the respondents' rating ofstatutory
167
crimes, personal victimisation and property crimes as social problems was depicted in
tabular form.
Thirdly, using gender as a control variable, the three measures of fear of crime were
correlated with the three types of crime rated by respondents as social problems in their
area of residence.
Lastly, the respondents' opinion of the service rendered by their local police was
correlated with their rating of types of crime as a social problem in their area of
residence.
All the data was presented in tabular form with the discussion of findings following each
table.
168
CHAPTER 7
ROLE OF THE POLICE AND THE FEAR OF CRIME
7.1 INTRODUCTION
In 1651 Hobbes wrote that the fundamental aim of civil government was to establish
order and protect citizens from criminal attack that causes continual fear and danger
of violent death (Peak & Glensor 1996:36). In general, crime weakens the fabric of
social life and reduces the public's support for the law, their willingness to report crime
and increases the criticisms of the police and their ability to combat crime.
The findings of various authors (Baumer 1985; Box et al. 1988 and Conklin 1975)
indicate that individuals who have confidence in the functioning of their local police have
lower levels of fear than individuals who lack confidence in the police. When people
lack confidence in the police and the criminal justice system as a whole, they will be
unwilling to report crime or assist the police in any way. This lack of confidence on the
part of public can also ensure a perpetuation of crime as the perception develops that
the risk of apprehension of criminals is low.
The image the public has of the police is based on the public's perception of police
performance, i.e. the delivery of a service. Although the majority of the public never
come into direct contact with the police, their perceptions are based on personal
observation at street level and mass media representation of police performance.
Factors which influence the perception of the public include
• effectiveness of police at crime prevention
• honesty
• abuse of power and authority by police
• impartiality (or lack thereof)
• show of interest in the crime
• friendliness and courteousness
169
+ cooperation
+ helpfulness
+ bossiness and aggression (Van Heerden 1976: 140-156).
On the basis of these factors, the police are judged and the image of the police is
formed in the minds of the public.
In this chapter the general findings of previous studies will be briefly discussed before
an analysis of the frequency distributions of responses to questions pertaining to the
role of the police is given. This chapterwill also seek to discover if there is a correlation
between fear of crime and the role of the police; and if differences exist between male
and female respondents with regard to their image of the police.
7.2 GENERAL FINDINGS
The role of the police has seldom been used in research as a factor influencing the fear
of crime. However, since the police are intimately involved in the management of crime
and are most definitely part ofthe solution to crime and the fear of criminal victimisation,
an assessment of their performance and attitude toward the police is necessary.
Garofalo (1978)
In his research on victimisation and fear of crime Garofalo (1978) notes that in a
modern, impersonal urban environment, the police are relied upon to protect people
from criminal victimisation. His findings on the relationship between fear of crime and
the evaluation of police performance indicated a weak relationship between these two
variables. Garofalo (1978:95) opines that further research on the influence ofthe police
on the fear of crime was needed.
Balken and Houlden (1983)
These researchers speculated that three major cues associated with occupational
groupings will evoke an image of a non-threatening individual willing to intervene in a
crime, namely the presence or absence of a uniform; employment in public versus
170
private sector and a commitment to working environment. According to Balken and
Houlden (1983:17) persons in uniform are judged as trustworthy, reliable, helpful and
willing to intervene in case of a physical attack. Their findings indicated that persons
in uniform affected the respondents' feelings of safety positively. Thus a person's fear
of crime will be reduced when persons in uniform are in the environment.
Baumer (1985)
In his analysis of data obtained from a national sample of 1 454 non-institutionalized
adults in 1980, Baumer (1985:245) includes an item on the perceived adequacy of
police protection in the neighbourhood. Using a multivariate regression model, the
relationship between the fear of crime and adequate policing was investigated. A
significant interaction was recorded between perceived adequacy of police protection
and the subjective likelihood of being robbed in the next year. He concludes that "...
under conditions of high subjective risk the police have the greatest potential impact on
fear of crime" (Baumer, 1985:248). He also notes that various policing strategies can
also influence the level of fear, e.g. increased motorised patrols or foot patrols can
reduce levels of fear.
Box, Hale and Andrews (1988)
Box et al. (1988) propose that ifthe police are believed to be effective and efficient in
their handling of crime, then fear of crime is likely to be less. Confidence in the police
thus can influence the fear of crime. In the analysis of their data, Box et al. (1988:351)
reported that "... individuals who have confidence in the functioning of their local
constabulary have a lower probability of fear than similar respondents who do not".
They concluded that the police could become a crucial ally in the battle for order.
Klein, Luxenburg and King (1989)
Klein et al. (1989) state that the law enforcement agencies are normally delegated the
responsibility for protecting the general populace. The average citizen expects the
police to have a presence in the community. When the police are unable to maintain
a presence due to constraints of various natures, the solution to crime and the fear of
criminal victimisation must be sought elsewhere. This has led to a proliferation of
171
private policing companies, and alternative methods of policing, e.g. community
policing.
Glanz (1989)
In her research done on coping with crime, Glanz (1989:34) identifies the quality of
police services as an important factor that influences the South African public's
perception and reaction to crime. Making use of frequency and percentage-distribution
of responses and multiple linear regression analysis, Glanz (1989) reported the
following:
+ Whites tended to have the most positive attitude toward the police; followed by
blacks; coloureds and lastly indians.
+ Indians living in urban areas had a more negative attitude toward police than
those living in rural areas.
+ For the coloured group, older respondents tended to have a more positive
attitude toward the police than younger respondents.
+ For the black respondents, married respondents had a less positive attitude
toward the police than respondents ofother marital status. Education levels also
influenced attitude toward the police in so far as the higher the education level
of the respondent the more negative the attitude toward the police.
+ White respondents who viewed conditions in their neighbourhood as having
improved, tended to have a negative attitude toward the police; while blacks who
held similar views of neighbourhood conditions, had a positive attitude toward
the police (Glanz 1989:34-40).
Maree (1993)
In her study on residents' concern about crime and crime prevention, Maree (1993:56)
attempts to establish the respondents' respect for and quality of services rendered by
the police. Data from 150 households in Elardus Park was analysed. Fifty two per cent
of the respondents were positive about the quality of service rendered by the police in
protecting their residential area against crime; while 44.7% were uncertain about the
service rendered by the police. The issues raised by those who were uncertain
172
included uncertainty about whether or not the police had enough time and manpower
to carry out a proactive service. The visibility of the police was also questioned as 9.3
per cent of the respondents claimed to see the police daily, 40 per cent once a week,
5.3 per cent monthly, 39.4 per cent seldom and 6.0 per cent never. Maree (1993:58)
however does report that respondents who see police seldom or never ascribed itto the
fact that they work.
The delivery of a reactive service, was according to the majority of respondents in
Maree's (1993) study satisfactory.
In general Elardus Park residents were respectful of the police and valued the service
rendered by the police.
Neser, Geldenhuys, Stevens, Grobbelaar and Ladikos (1993)
In their study on fear of crime in the Sunnyside area of Pretoria, Neser et al. (1993)
utilize confidence in the police and courts as a measure of fear of crime. The following
questions were used to determine the degree of confidence in the police and courts:
+ How confident are you of the police in your own residential area?
+ How confident are you of the courts (Supreme court; Regional court and
Magistrate's court)?
The findings of Neser et al. (1993) indicate that 43.05 per cent of the respondents who
have little confidence in the police, feel unsafe in their residential area at night. The
respondents who have confidence in the police indicated less fear of crime. When
looking at fear of crime and confidence in the courts, similar results were obtained.
7.3 PRESENTATION AND ANALYSIS OF DATA
For the purpose of this study, the role of the police is viewed as an important factor
influencing the fear of crime.
173
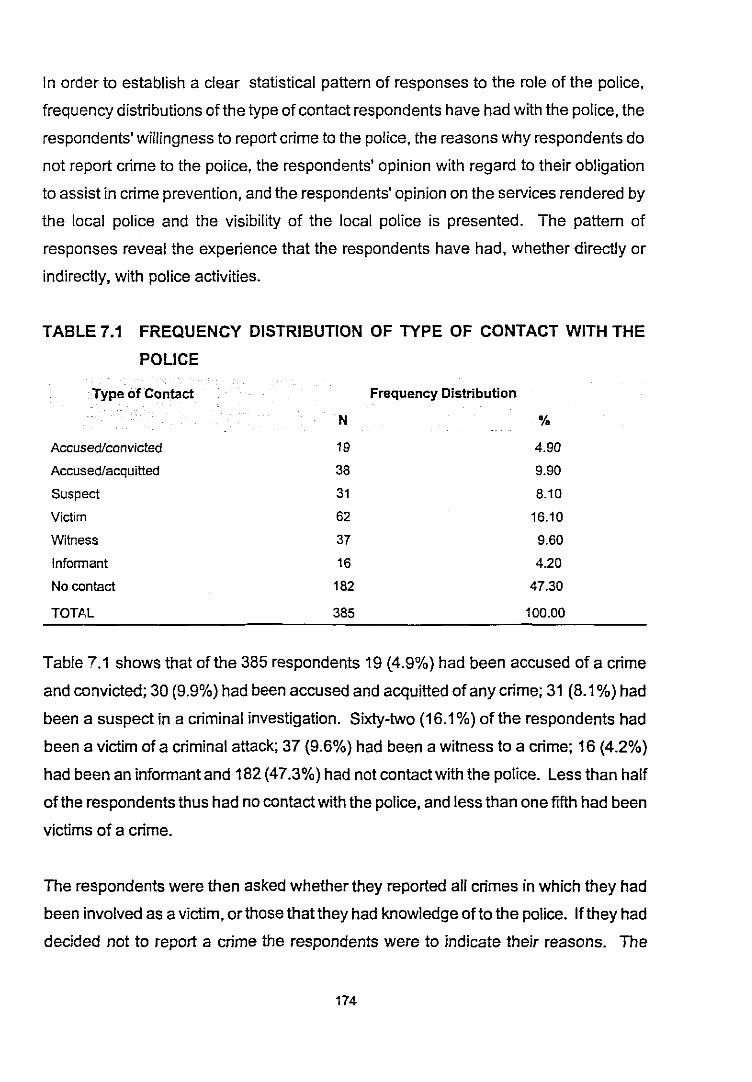
In order to establish a clear statistical pattern of responses to the role of the police,
frequency distributions of the type of contact respondents have had with the police, the
respondents' willingness to report crime to the police, the reasons why respondents do
not report crime to the police, the respondents' opinion with regard to their obligation
to assist in crime prevention, and the respondents' opinion on the services rendered by
the local police and the visibility of the local police is presented. The pattern of
responses reveal the experience that the respondents have had, whether directly or
indirectly, with police activities.
TABLE 7.1 FREQUENCY DISTRIBUTION OF TYPE OF CONTACT WITH THE
POLICE
Type of Contact Frequency Distribution
N %
Accused/convicted 19 4.90
Accused/acquitted 38 9.90
Suspect 31 8.10
Victim 62 16.10
Witness 37 9.60
Infonnant 16 4.20
No contact 182 47.30
TOTAL 385 100.00
Table 7.1 shows that ofthe 385 respondents 19 (4.9%) had been accused of a crime
and convicted; 30 (9.9%) had been accused and acquitted of any crime; 31 (8.1%) had
been a suspect in a criminal investigation. Sixty-two (16.1%) of the respondents had
been a victim of a criminal attack; 37 (9.6%) had been a witness to a crime; 16 (4.2%)
had been an informant and 182 (47.3%) had not contact with the police. Less than half
of the respondents thus had no contact with the police, and less than one fifth had been
victims of a crime.
The respondents were then asked whether they reported all crimes in which they had
been involved as a victim, or those that they had knowledge ofto the police. If they had
decided not to report a crime the respondents were to indicate their reasons. The
174
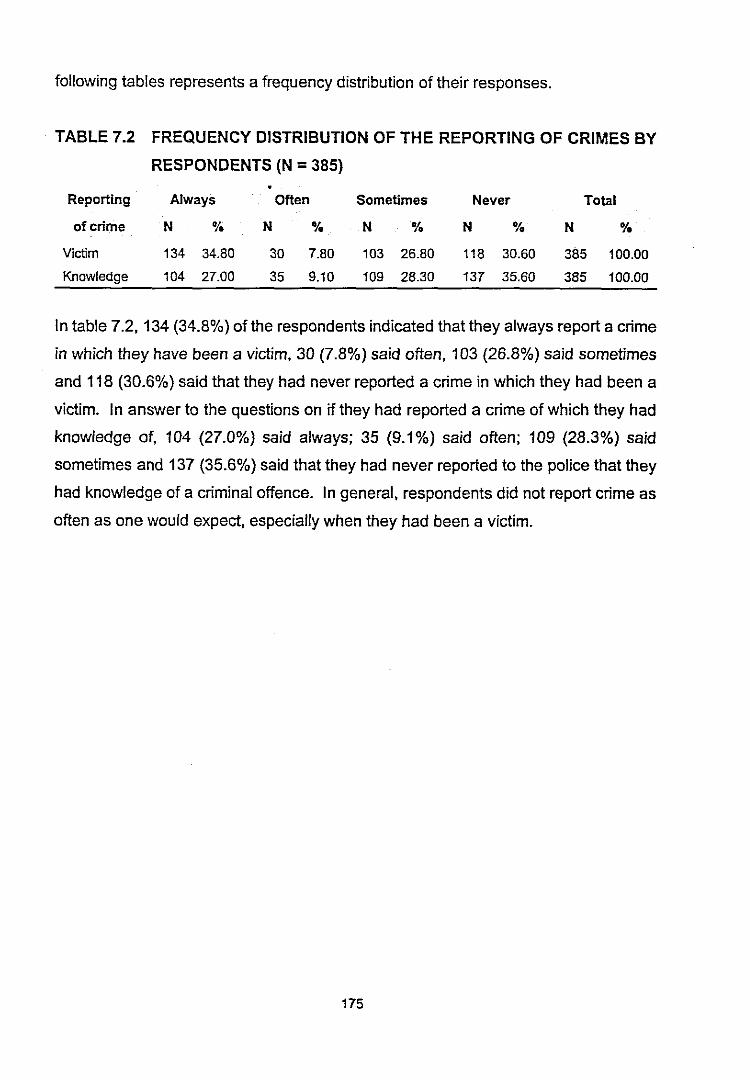
following tables represents a frequency distribution of their responses.
TABLE 7.2 FREQUENCY DISTRIBUTION OF THE REPORTING OF CRIMES BY
RESPONDENTS (N =385)
Reporting Always Often Sometimes Never Total
of crime N 0/. N "10 N "10 N % N %
Victim 134 34.80 30 7.80 103 26.80 118 30.60 385 100.00
Knowledge 104 27.00 35 9.10 109 28.30 137 35.60 385 100.00
In table 7.2, 134 (34.8%) ofthe respondents indicated that they always report a crime
in which they have been a victim, 30 (7.8%) said often, 103 (26.8%) said sometimes
and 118 (30.6%) said that they had never reported a crime in which they had been a
victim. In answer to the questions on if they had reported a crime of which they had
knowledge of, 104 (27.0%) said always; 35 (9.1%) said often; 109 (28.3%) said
sometimes and 137 (35.6%) said that they had never reported to the police that they
had knowledge of a criminal offence. In general, respondents did not report crime as
often as one would expect, especially when they had been a victim.
175
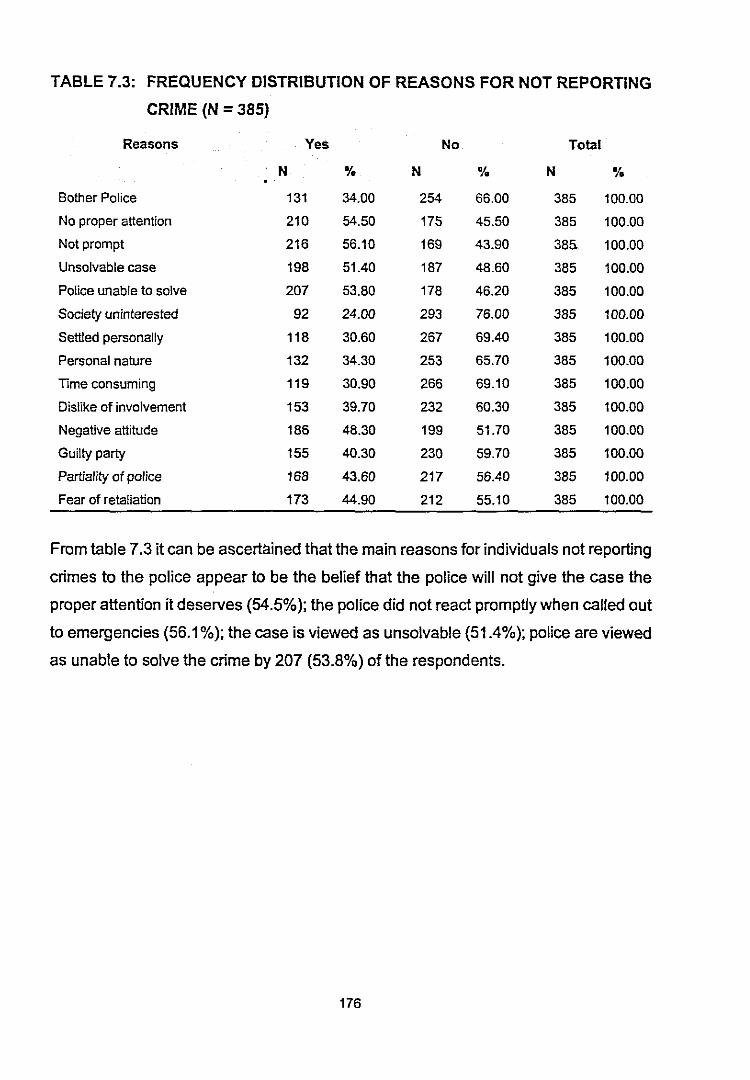
TABLE 7.3: FREQUENCY DISTRIBUTION OF REASONS FOR NOT REPORTING
CRIME (N =385)
Reasons Yes No Total
N % N % N %
Bother Police 131 34.00 254 66.00 385 100.00
No proper attention 210 54.50 175 45.50 385 100.00
Not prompt 216 56.10 169 43.90 385- 100.00
Unsolvable case 198 51.40 187 48.60 385 100.00
Police unable to solve 207 53.80 178 46.20 385 100.00
Society .uninterested 92 24.00 293 76.00 385 100.00
Settled personally 118 30.60 267 69.40 385 100.00
Personal nature 132 34.30 253 65.70 385 100.00
Time consuming 119 30.90 266 69.10 385 100.00
Dislike of involvement 153 39.70 232 60.30 385 100.00
Negative attitude 186 48.30 199 51.70 385 100.00
Guilty party 155 40.30 230 59.70 385 100.00
Partiality of police 168 43.60 217 56.40 385 100.00
Fear of retaliation 173 44.90 212 55.10 385 100.00
From table 7.3 it can be ascertained that the main reasons for individuals not reporting
crimes to the police appear to be the belief that the police will not give the case the
proper attention it deserves (54.5%); the police did not react promptly when called out
to emergencies (56.1%); the case is viewed as unsolvable (51.4%); police are viewed
as unable to solve the crime by 207 (53.8%) of the respondents.
176
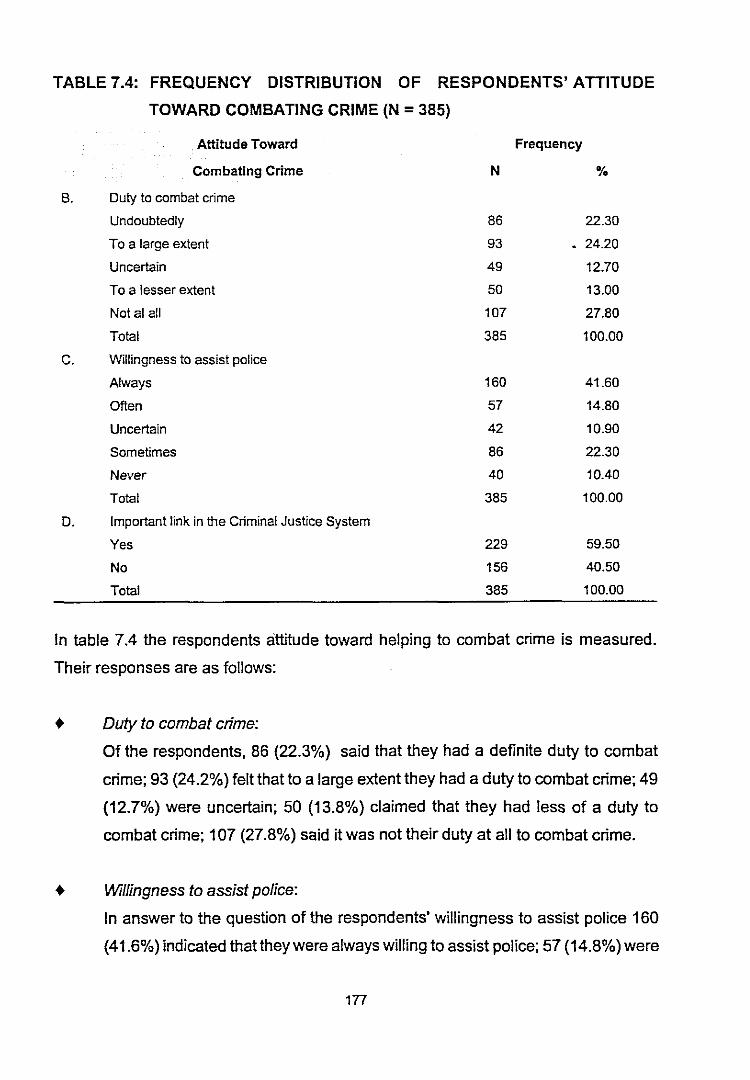
TABLE 7.4: FREQUENCY DISTRIBUTION OF RESPONDENTS' ATTITUDE
TOWARD COMBATING CRIME (N =385)
B.
C.
D.
Attitude Toward Frequency
Combating Crime N %
Duty to combat crime
Undoubtedly 86 22.30
To a large extent 93 24.20
Uncertain 49 12.70
To a lesser extent 50 13.00
Not al all 107 27.80
Total 385 100.00
Willingness to assist police
Always 160 41.60
Often 57 14.80
Uncertain 42 10.90
Sometimes 86 22.30
Never 40 10.40
Total 385 100.00
Important link in the Criminal Justice System
Yes 229 59.50
No 156 40.50
Total 385 100.00
In table 7.4 the respondents attitude toward helping to combat crime is measured.
Their responses are as follows:
• Duty to combat crime:
Of the respondents, 86 (22.3%) said that they had a definite duty to combat
crime; 93 (24.2%) felt that to a large extent they had a duty to combat crime; 49
(12.7%) were uncertain; 50 (13.8%) claimed that they had less of a duty to
combat crime; 107 (27.8%) said it was not their duty at all to combat crime.
• Willingness to assist police:
In answer to the question of the respondents' Willingness to assist police 160
(41.6%) indicated that they were always willing to assist police; 57 (14.8%) were
177
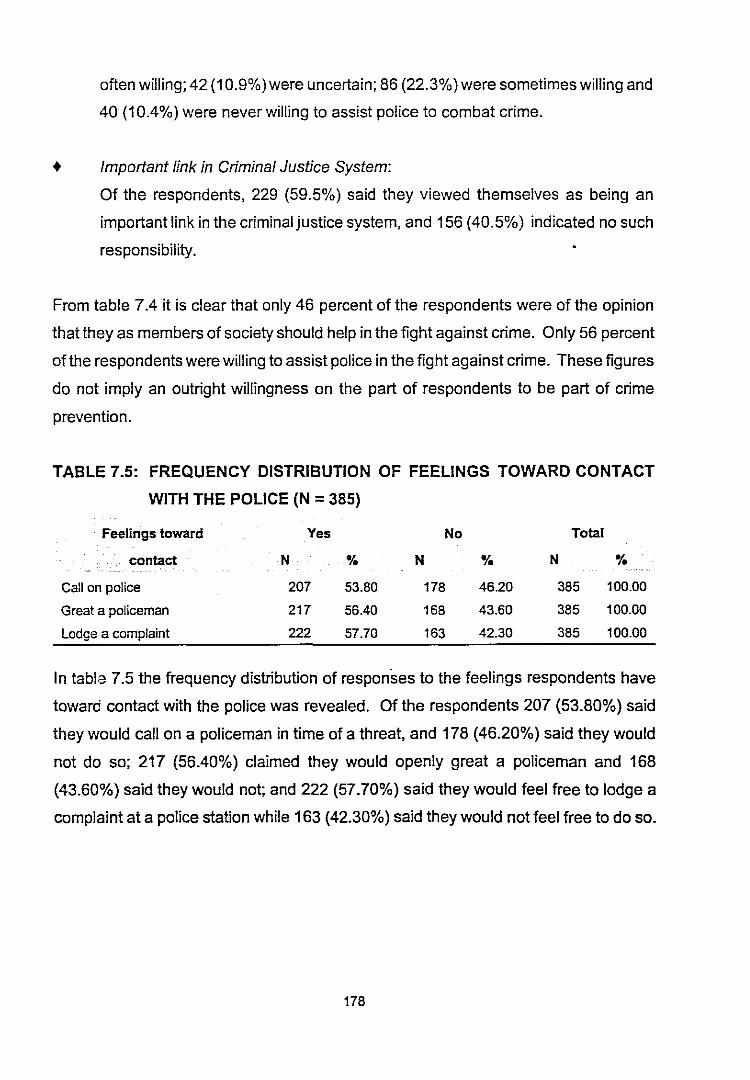
often willing; 42 (10.9%)were uncertain; 86 (22.3%) were sometimes willing and
40 (10.4%) were never willing to assist police to combat crime.
+ Important link in Criminal Justice System:
Of the respondents, 229 (59.5%) said they viewed themselves as being an
important link in the criminal justice system, and 156 (40.5%) indicated no such
responsibility.
From table 7.4 it is clear that only 46 percent of the respondents were of the opinion
that they as members of society should help in the fight against crime. Only 56 percent
of the respondents were willing to assist police in the fight against crime. These figures
do not imply an outright willingness on the part of respondents to be part of crime
prevention.
TABLE 7.5: FREQUENCY DISTRIBUTION OF FEELINGS TOWARD CONTACT
WITH THE POLICE (N = 385)
Feelings toward Yes No Total
contact N % N % N %
Call on police 207 53.80 178 46.20 385 100.00
Great a policeman 217 56.40 168 43.60 385 100.00
Lodge a complaint 222 57.70 163 42.30 385 100.00
In table 7.5 the frequency distribution of responses to the feelings respondents have
toward contact with the police was revealed. Of the respondents 207 (53.80%) said
they would call on a policeman in time of a threat, and 178 (46.20%) said they would
not do so; 217 (56.40%) claimed they would openly great a policeman and 168
(43.60%) said they would not; and 222 (57.70%) said they would feel free to lodge a
complaint at a police station while 163 (42.30%) said they would not feel free to do so.
178
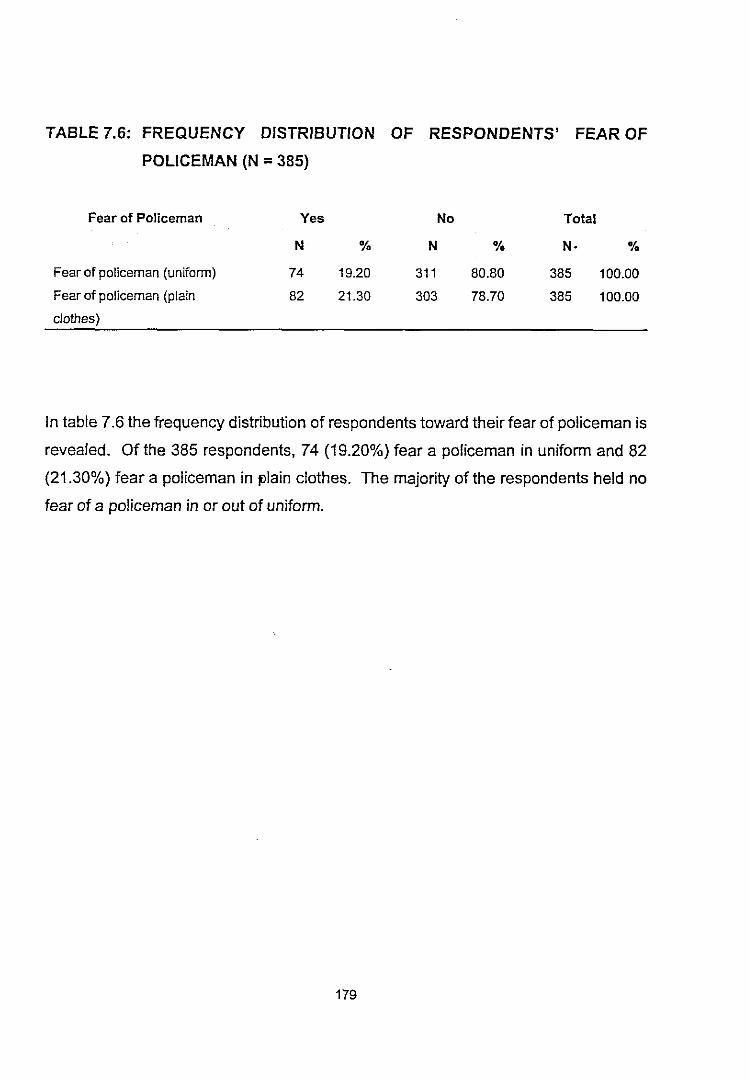
TABLE 7.6: FREQUENCY DISTRIBUTION OF RESPONDENTS' FEAR OF
POLICEMAN (N =385)
Fear of Policeman Yes No Total
N % N % N· %
Fear of policeman (uniform) 74 19.20 311 80.80 385 100.00
Fear of policeman (plain 82 21.30 303 78.70 385 100.00
clothes)
In table 7.6 the frequency distribution of respondents toward their fear of policeman is
revealed. Of the 385 respondents, 74 (19.20%) fear a policeman in uniform and 82
(21.30%) fear a policeman in plain clothes. The majority of the respondents held no
fear of a policeman in or out of uniform.
179
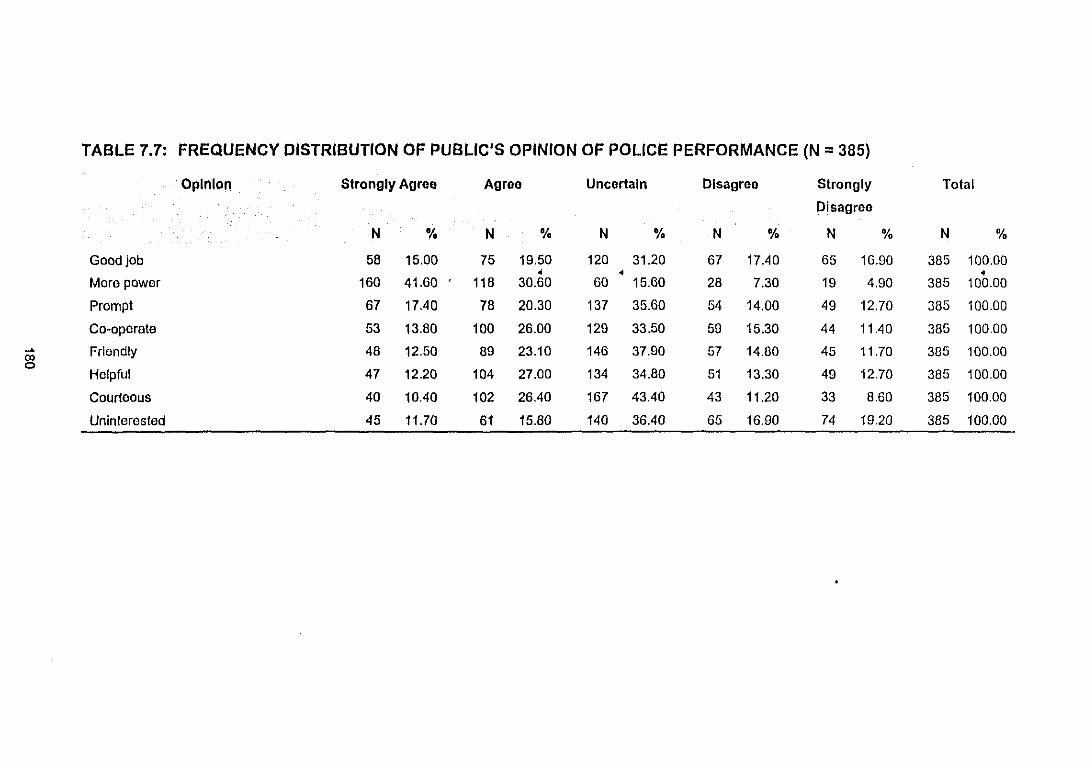
TABLE 7.7: FREQUENCY DISTRIBUTION OF PUBLIC'S OPINION OF POLICE PERFORMANCE (N =385)
Opinion Strongly Agree Agree Uncertain Disagree Strongly Total
Disagree
N % N % N % N % N % N %
Good Job 58 15.00 75 19.50 120 31.20 67 17.40 65 16.90 385 100.00• • •More power 160 41.60 118 30.60 60 15.60 28 7.30 19 4.90 385 100.00
Prompt 67 17.40 78 20.30 137 35.60 54 14,00 49 12.70 385 100.00
Co-operate 53 13.80 100 26.00 129 33.50 59 15.30 44 11.40 385 100,00~ Friendly 48 12.50 89 23.10 146 37.90 57 14.80 45 11.70 385 100.000>0
134 34.80Helpful 47 12.20 104 27.00 51 13.30 49 12.70 385 100.00
Courteous 40 10,40 102 26.40 167 43.40 43 11.20 33 8,60 385 100.00
Uninterested 45 11.70 61 15.80 140 36.40 65 16.90 74 19,20 385 100.00
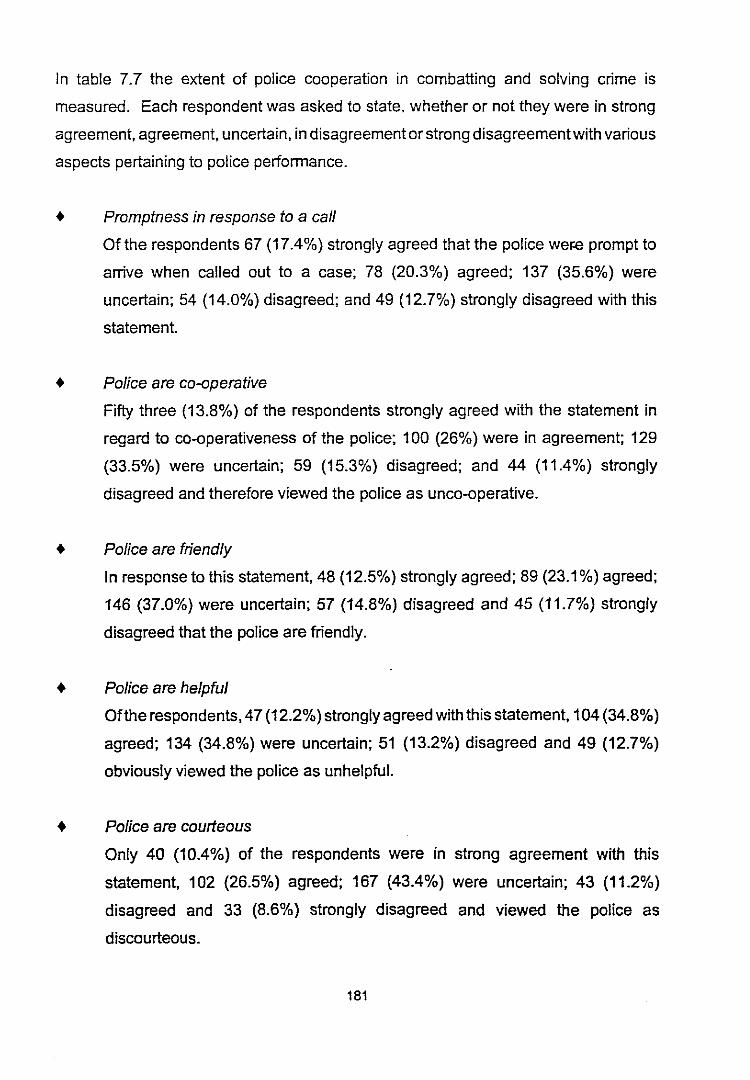
In table 7.7 the extent of police cooperation in combatting and solving crime is
measured. Each respondent was asked to state, whether or not they were in strong
agreement, agreement, uncertain, in disagreementor strong disagreementwith various
aspects pertaining to police performance.
• Promptness in response to a call
Of the respondents 67 (17.4%) strongly agreed that the police were prompt to
arrive when called out to a case; 78 (20.3%) agreed; 137 (35.6%) were
uncertain; 54 (14.0%) disagreed; and 49 (12.7%) strongly disagreed with this
statement.
• Police are co-operative
Fifty three (13.8%) of the respondents strongly agreed with the statement in
regard to co-operativeness of the police; 100 (26%) were in agreement; 129
(33.5%) were uncertain; 59 (15.3%) disagreed; and 44 (11.4%) strongly
disagreed and therefore viewed the police as unco-operative.
• Police are friendly
In response to this statement, 48 (12.5%) strongly agreed; 89 (23.1%) agreed;
146 (37.0%) were uncertain; 57 (14.8%) disagreed and 45 (11.7%) strongly
disagreed that the police are friendly.
• Police are helpful
Ofthe respondents, 47 (12.2%) strongly agreed with this statement, 104 (34.8%)
agreed; 134 (34.8%) were uncertain; 51 (13.2%) disagreed and 49 (12.7%)
obviously viewed the police as unhelpful.
• Police are courteous
Only 40 (10.4%) of the respondents were in strong agreement with this
statement, 102 (26.5%) agreed; 167 (43.4%) were uncertain; 43 (11.2%)
disagreed and 33 (8.6%) strongly disagreed and viewed the police as
discourteous.
181
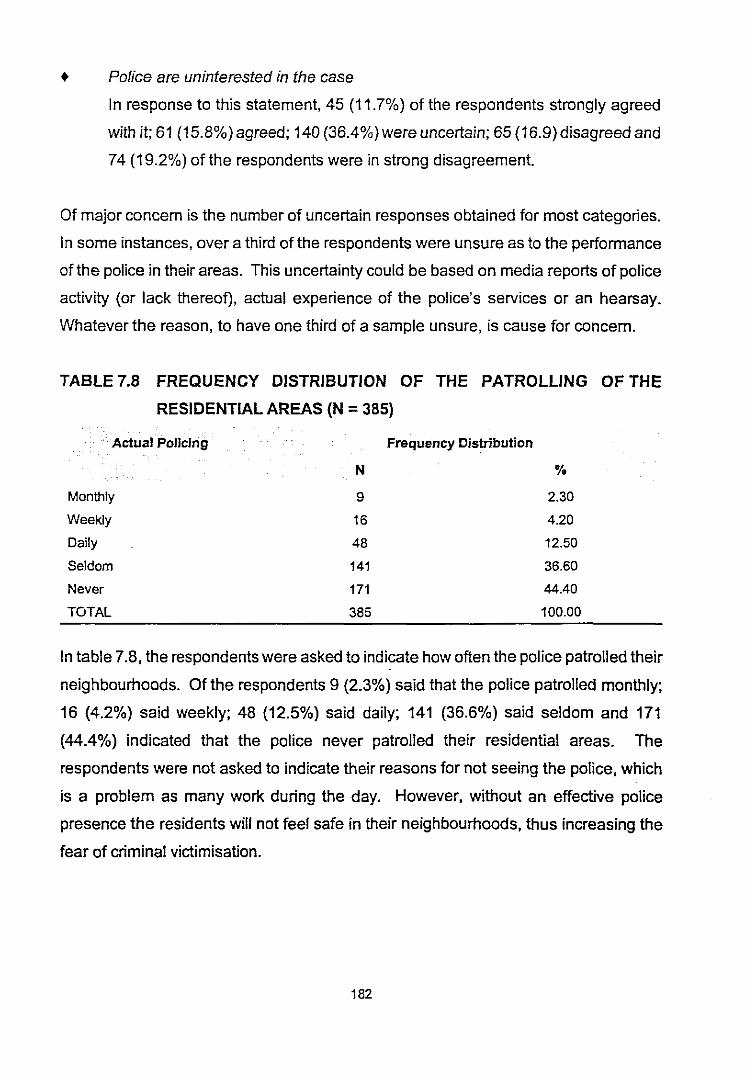
• Police are uninterested in the case
In response to this statement, 45 (11.7%) of the respondents strongly agreed
with it; 61 (15.8%) agreed; 140 (36.4%) were uncertain; 65 (16.9) disagreed and
74 (19.2%) of the respondents were in strong disagreement.
Of major concern is the number of uncertain responses obtained for most categories.
In some instances, over a third of the respondents were unsure as to the performance
of the police in their areas. This uncertainty could be based on media reports of police
activity (or lack thereof), actual experience of the police's services or an hearsay.
Whatever the reason, to have one third of a sample unsure, is cause for concern.
TABLE 7.8 FREQUENCY DISTRIBUTION OF THE PATROLLING OF THE
RESIDENTIALAREAS (N =385)
Actual Policing Frequency Distribution
N %
Monthly
Weekly
Daily
Seldom
Never
TOTAL
9
16
48
141
171
385
2.30
4.20
12.50
36.60
44.40
100.00
In table 7.8, the respondents were asked to indicate how often the police patrolled their
neighbourhoods. Of the respondents 9 (2.3%) said that the police patrolled monthly;
16 (4.2%) said weekly; 48 (12.5%) said daily; 141 (36.6%) said seldom and 171
(44.4%) indicated that the police never patrolled their residential areas. The
respondents were not asked to indicate their reasons for not seeing the police, which
is a problem as many work during the day. However, without an effective police
presence the residents will not feel safe in their neighbourhoods, thus increasing the
fear of criminal victimisation.
182
These findings imply weak correlations between the three measures of formless fear
and contact with the police.
7.3.1 Fear of crime and the role of the police
In order to establish the relationship between the fear of crime and the role of the
police, the following hypothesis was formulated:
Hypothesis 8: The role of the police influences the fear of crime.
The three fear of crime measures, namely: "How safe do you feel walking alone at
night in your neighbourhood?"; "How safe do you feel in your home or apartment at
night?" and "How safe do you feel when leaving or arriving at home after dark?" were
correlated with variables pertaining to contact with the police, willingness of
respondents to report crime to the police, the reasons why respondents don't report
crime to the police, the respondents' opinion on their obligation to assist in crime
prevention, and the respondents' opinion of the service rendered by police and the
visibility of the local police.
Using the Spearman's Rank-Order Correlation Coefficient, the correlation between the
role of the police and the fear of crime was sought. The findings of the correlations are
represented in tables 7.9 to 7.14 respectively.
183
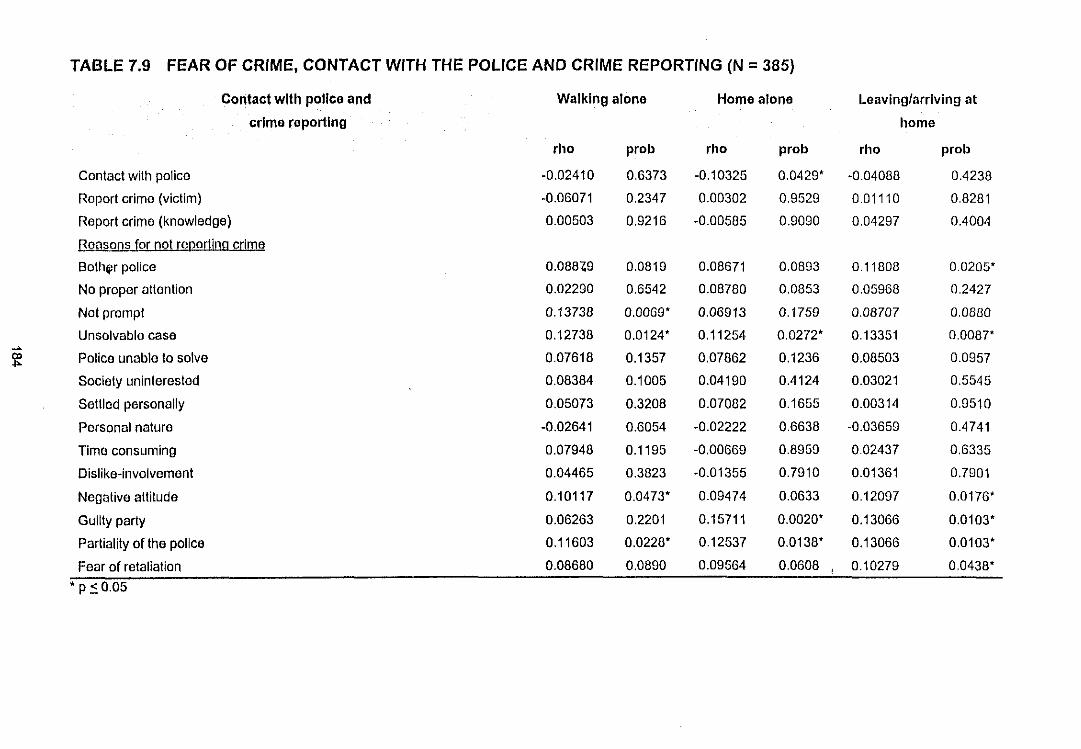
TABLE 7.9 FEAR OF CRIME, CONTACT WITH THE POLICE AND CRIME REPORTING (N = 385)
Contact with pollco and Walking alone Home alone Leaving/arriving at
crime reporting home
rho prob rho prob rho prob
Contact with police -0.02410 0.6373 -0.10325 0.0429' -0.04088 0.4238
Report crime (victim) -0.06071 0.2347 0.00302 0.9529 0.01110 0.8281
Report crime (knowledge) 0.00503 0.9216 -0.00585 0.9090 0.04297 0.4004
Reasons for not roporting crime
Bother police 0.08849 0.0819 0.08671 0.0893 0.11808 0.0205'
No proper attention 0.02290 0.6542 0.08780 0.0853 0.05968 0.2427
Not prompt 0.13738 0.0069' 0.06913 0.1759 0.08707 0.0880
Unsolvable case 0.12738 0.0124' 0.11254 0.0272' 0.13351 0.0087'~
~ Police unable to solve 0.07618 0.1357 0.07862 0.1236 0.08503 0.0957
Society uninterested 0.08384 0.1005 0.04190 0.4124 0.03021 0.5545
Sellled personally 0.05073 0.3208 0.07082 0.1655 0.00314 0.9510
Personal nature -0.02641 0.6054 -0.02222 0.6638 -0.03659 0.4741
Time consuming 0.07948 0.1195 -0.00669 0.8959 002437 0.6335
Dislike-involvement 0.04465 0.3823 -0.01355 0.7910 0.01361 0.7901
Negative altitude 0.10117 0.0473' 0.09474 0.0633 0.12097 0.0176'
Guilty party 0.06263 0.2201 0.15711 0.0020' 0.13066 0.0103'
Partiality of the police 0.11603 0.0228' 0.12537 0.0138' 0.13066 0.0103'
Fear of retaliation 0.08680 0.0890 0.09564 0.0608 , 0.10279 0.0438'
• P ~ 0.05
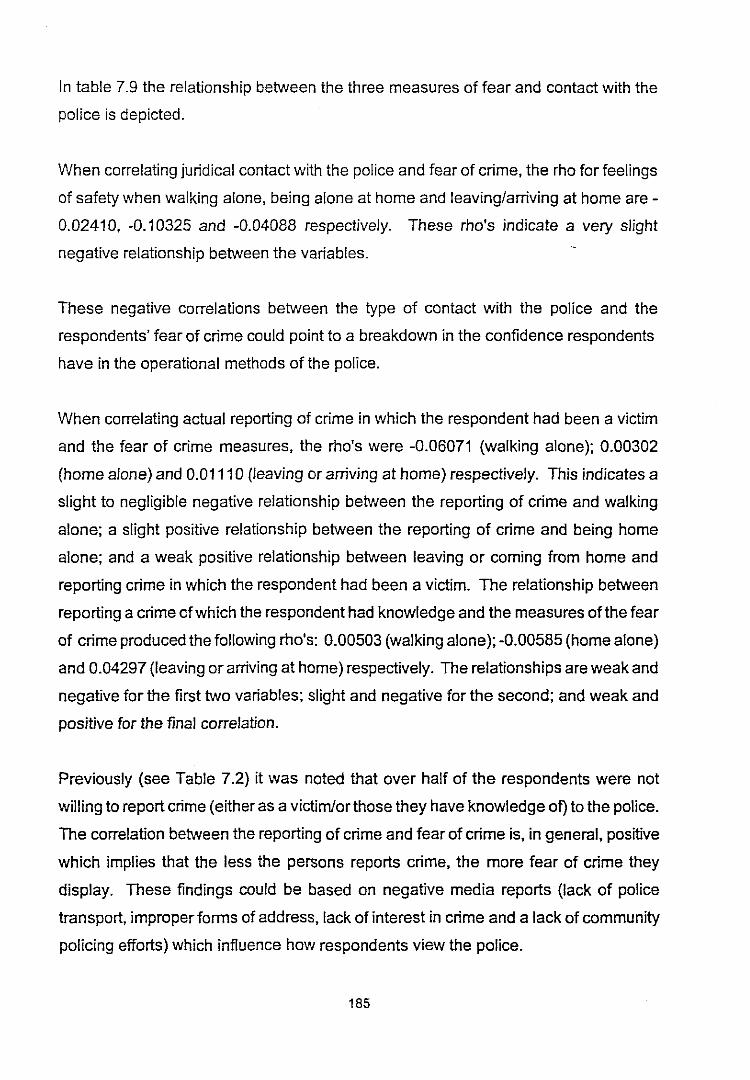
In table 7.9 the relationship between the three measures of fear and contact with the
police is depicted.
When correlating juridical contact with the police and fear of crime, the rho for feelings
of safety when walking alone, being alone at home and leaving/arriving at home are
0.02410, -0.10325 and -0.04088 respectively. These rho's indicate a very slight
negative relationship between the variables.
These negative correlations between the type of contact with the police and the
respondents' fear of crime could point to a breakdown in the confidence respondents
have in the operational methods of the police.
When correlating actual reporting of crime in which the respondent had been a victim
and the fear of crime measures, the rho's were -0.06071 (walking alone); 0.00302
(home alone) and 0.01110 (leaving or arriving at home) respectively. This indicates a
slight to negligible negative relationship between the reporting of crime and walking
alone; a slight positive relationship between the reporting of crime and being home
alone; and a weak positive relationship between leaving or coming from home and
reporting crime in which the respondent had been a victim. The relationship between
reporting a crime of which the respondent had knowledge and the measures of the fear
of crime produced the following rho's: 0.00503 (walking alone); -0.00585 (home alone)
and 0.04297 (leaving or arriving at home) respectively. The relationships are weak and
negative for the first 1'1/0 variables; slight and negative for the second; and weak and
positive for the final correlation.
Previously (see Table 7.2) it was noted that over half of the respondents were not
willing to report crime (either as a victirn/orthose they have knowledge of) to the police.
The correlation between the reporting of crime and fear of crime is, in general, positive
which implies that the less the persons reports crime, the more fear of crime they
display. These findings could be based on negative media reports (lack of police
transport, improper forms of address, lack of interest in crime and a lack of community
policing efforts) which influence how respondents view the police.
185
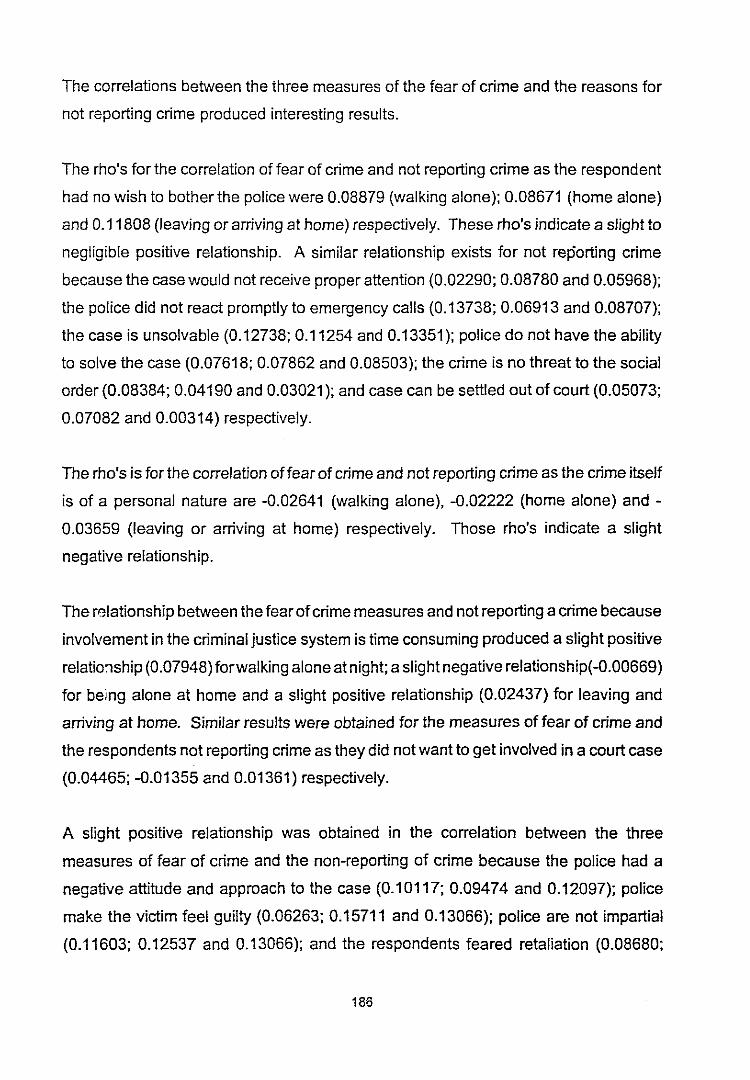
The correlations between the three measures of the fear of crime and the reasons for
not reporting crime produced interesting results.
The rho's for the correlation of fear of crime and not reporting crime as the respondent
had no wish to bother the police were 0.08879 (walking alone); 0.08671 (home alone)
and 0.11808 (leaving or arriving at home) respectively. These rho's indicate a slight to
negligible positive relationship. A similar relationship exists for not reporting crime
because the case would not receive proper attention (0.02290; 0.08780 and 0.05968);
the police did not react promptly to emergency calls (0.13738; 0.06913 and 0.08707);
the case is unsolvable (0.12738; 0.11254 and 0.13351); police do not have the ability
to solve the case (0.07618; 0.07862 and 0.08503); the crime is no threat to the social
order (0.08384; 0.04190 and 0.03021); and case can be settled out of court (0.05073;
0.07082 and 0.00314) respectively.
The rho's is for the correlation of fear of crime and not reporting crime as the crime itself
is of a personal nature are -0.02641 (walking alone), -0.02222 (home alone) and
0.03659 (leaving or arriving at home) respectively. Those rho's indicate a slight
negative relationship.
The relationship between the fear ofcrime measures and not reporting a crime because
involvement in the criminal justice system is time consuming produced a slight positive
relationship (0.07948) forwalking alone at night; a slight negative relationship(-o.00669)
for being alone at home and a slight positive relationship (0.02437) for leaving and
arriving at home. Similar results were obtained for the measures of fear of crime and
the respondents not reporting crime as they did not want to get involved in a court case
(0.04465; -0.01355 and 0.01361) respectively.
A slight positive relationship was obtained in the correlation between the three
measures of fear of crime and the non-reporting of crime because the police had a
negative attitude and approach to the case (0.10117; 0.09474 and 0.12097); police
make the victim feel guilty (0.06263; 0.15711 and 0.13066); police are not impartial
(0.11603; 0.12537 and 0.13066); and the respondents feared retaliation (0.08680;
186
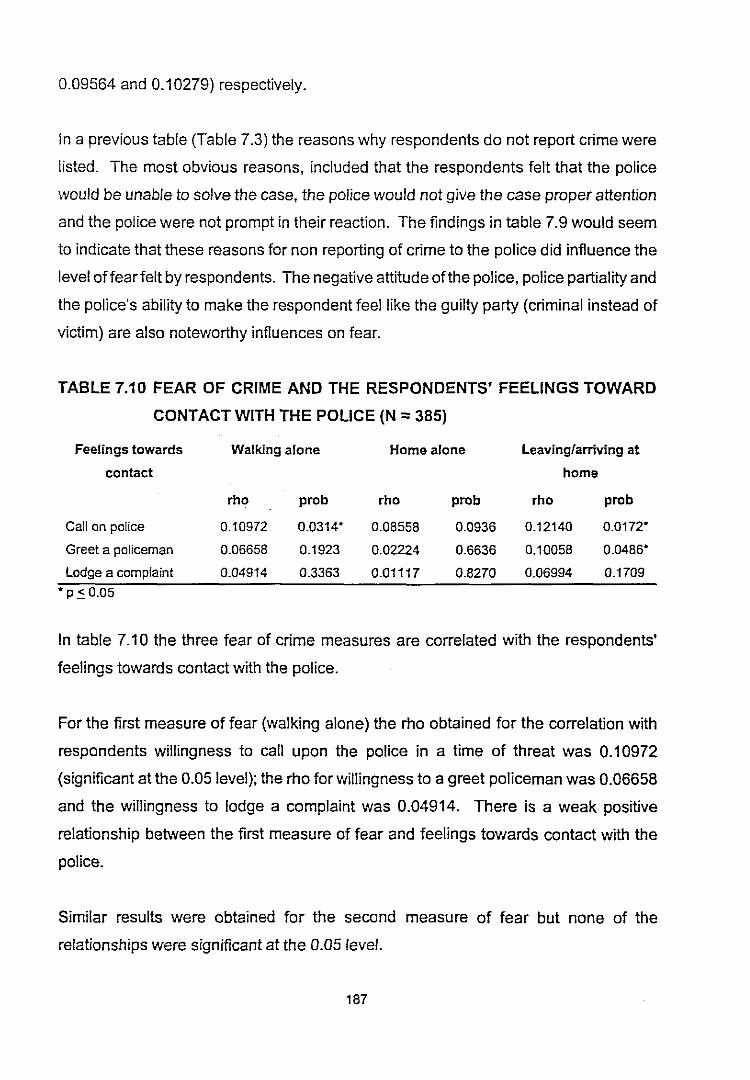
0.09564 and 0.10279) respectively.
In a previous table (Table 7.3) the reasons why respondents do not report crime were
listed. The most obvious reasons, included that the respondents felt that the police
would be unable to solve the case, the police would not give the case proper attention
and the police were not prompt in their reaction. The findings in table 7.9 would seem
to indicate that these reasons for non reporting of crime to the police did influence the
level offearfelt by respondents. The negative attitude of the police, police partiality and
the police's ability to make the respondent feel like the guilty party (criminal instead of
victim) are also noteworthy influences on fear.
TABLE 7.10 FEAR OF CRIME AND THE RESPONDENTS' FEELINGS TOWARD
CONTACT WITH THE POLICE (N = 385)
Feelings towards Walking alone Home alone Leaving/arriving at
contact home
rho prob rho prob rho prob
Call on police 0.10972 0.0314' 0.08558 0.0936 0.12140 0.0172'
Greet a policeman 0.06658 0.1923 0.02224 0.6636 0.10058 0.0486'
lodge a complaint 0.04914 0.3363 0.01117 0.8270 0.06994 0.1709'p ~ 0.05
In table 7.10 the three fear of crime measures are correlated with the respondents'
feelings towards contact with the police.
For the first measure of fear (walking alone) the rho obtained for the correlation with
respondents willingness to call upon the police in a time of threat was 0.10972
(significant at the 0.05 level); the rho for willingness to a greet policeman was 0.06658
and the willingness to lodge a complaint was 0.04914. There is a weak positive
relationship between the first measure of fear and feelings towards contact with the
police.
Similar results were obtained for the second measure of fear but none of the
relationships were significant at the 0.05 level.
187
The last measure of fear (leaving/arriving at home) produced weak positive
relationships with the respondents feelings towards contact with the police. The rho's
were 0.12140 and 0.10058 (significant at the 0.05 level) for willingness to call on the
police again and willingness to greet a policeman respectively, and 0.06994 for
willingness to lodge a complaint at a police station.
The rho's are all weak and positive in nature which implies that as fear of crime
increases, so the respondents feel more at liberty to have contact with the police. This
willingness to have contact with the police could be based on the perception
respondents have that the police can help them in time of need. Having observed that
there is a negative attitude toward crime reporting (Table 7.2 and 7.9) this finding is a
clear indication that the police are indeed looked upon as a last resource in combating
crime.
In support of these findings, Radelet and Carter (1994) proposed that if the police are
viewed as guardians of the community, their image would suffer if crime is seen as
rampant. But the public's opinion on the association between police activities and crime
varies. Radelet and Carter (1994) state that "... sometimes crime influences public's
opinion of police and sometimes it does not ... [C} certainly the public recognizes that
the police have crime prevention responsibilities but there is some tendency to give a
much strongerassociation to detecting and solving crime" (Radelet & Carter 1994:209).
This possibly explains why respondents do not report crime to the police, but when in
danger they would do so because they are aware that the case may be solved and the
perpetrators brought to justice.
188
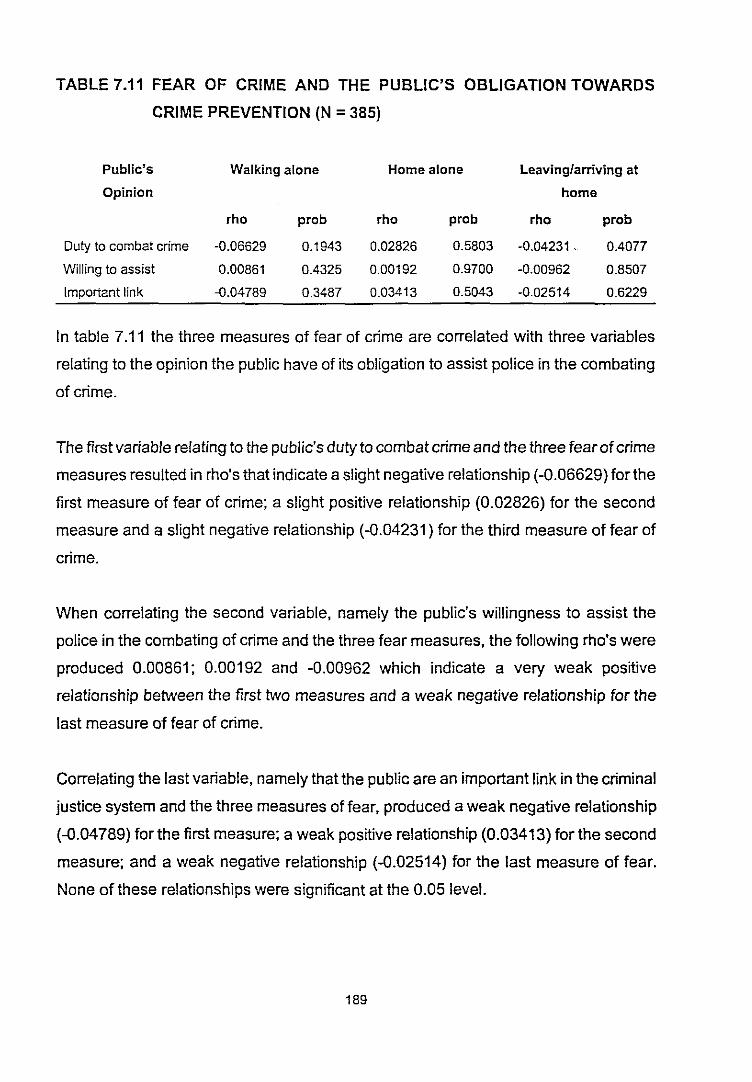
TABLE 7.11 FEAR OF CRIME AND THE PUBLIC'S OBLIGATION TOWARDS
CRIME PREVENTION (N =385)
Public's Walking alone Home alone Leaving/arriving at
Opinion home
rho prob rho prob rho prob
Duty to combat crime -0.06629 0.1943 0.02826 0.5803 -0.04231. 0.4077
Willing to assist 0.00861 0.4325 0.00192 0.9700 -0.00962 0.8507
Important link -0.04789 0.3487 0.03413 0.5043 -0.02514 0.6229
In table 7.11 the three measures of fear of crime are correlated with three variables
relating to the opinion the public have of its obligation to assist police in the combating
of crime.
The first variable relating to the public's duty to combat crime and the three fear ofcrime
measures resulted in rho's that indicate a slight negative relationship (-0.06629) for the
first measure of fear of crime; a slight positive relationship (0.02826) for the second
measure and a slight negative relationship (-0.04231) for the third measure of fear of
crime.
When correlating the second variable, namely the public's willingness to assist the
police in the combating of crime and the three fear measures, the following rho's were
produced 0.00861; 0.00192 and -0.00962 which indicate a very weak positive
relationship between the first two measures and a weak negative relationship for the
last measure of fear of crime.
Correlating the last variable, namely that the public are an important link in the criminal
justice system and the three measures of fear, produced a weak negative relationship
(-0.04789) forthe first measure; a weak positive relationship (0.03413) for the second
measure; and a weak negative relationship (-0.02514) for the last measure of fear.
None of these relationships were significant at the 0.05 level.
189

The findings of this correlation are interesting. It would imply that as fear of crime (as
measured by the three measures of formless fear) increases, so the respondents
become more duty bound to combat crime, and view themselves as being an important
link in the criminal justice system. The respondents seemed to be relatively willing to
assist the police in combating crime. However, the correlations are weak.
190
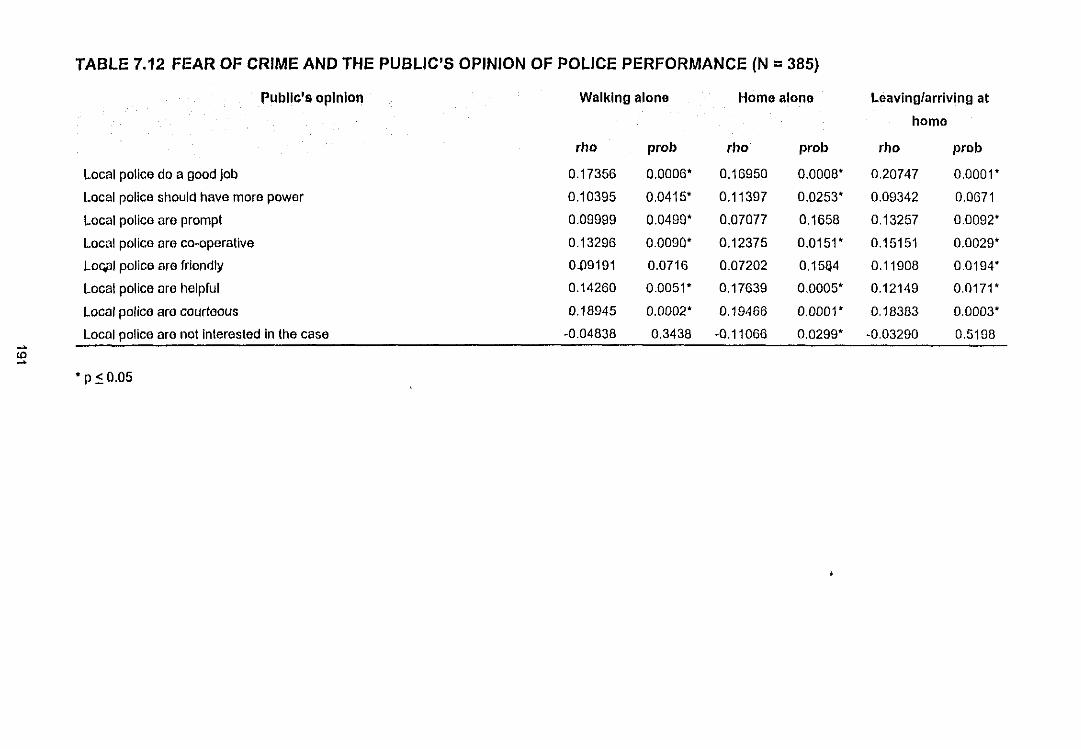
TABLE 7.12 FEAR OF CRIME AND THE PUBLIC'S OPINION OF POLICE PERFORMANCE (N =385)
Public's opinion
Local police do a good job
Local police should have more power
Local police are prompt
Local police are co-operative
LOqJI police are friendly
Local police are helpful
Local police are courteous
Local police are not Interested in the case
'p s 0.05
Walking alone Home alone Leaving/arriving at
home
rho prob rho prob rho prob
0.17356 0.0006' 0.16950 0.0008' 0.20747 0.0001'
0.10395 0.0415' 0.11397 0.0253' 0.09342 0.0671
0.09999 0.0499' 0.D7077 0.1658 0.13257 0.0092'
0.13296 0.0090' 0.12375 0.0151' 0.15151 0.0029'
0~9191 0.0716 0.07202 0.1504 0.11908 00194'
0.14260 0.0051' 0.17639 0.0005' 0.12149 0.0171'
0.18945 0.0002' 0.19466 0.0001' 0.18383 0.0003'
-0.04838 0.3438 -0.11066 0.0299' -0.03290 0.5198
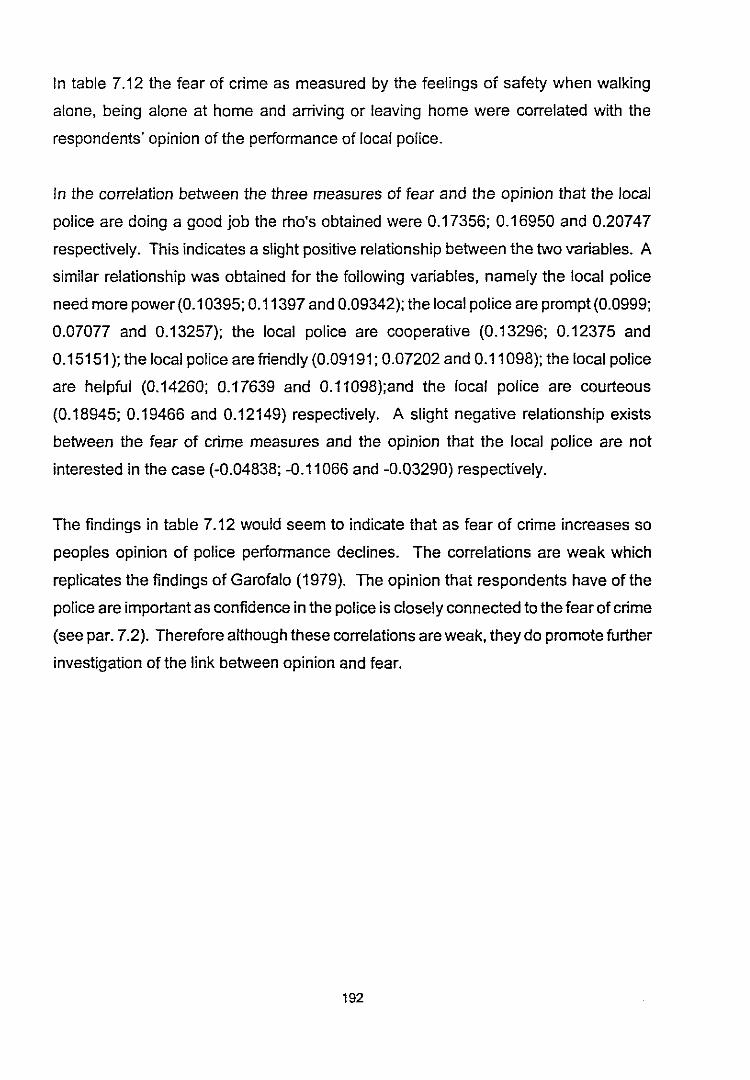
In table 7.12 the fear of crime as measured by the feelings of safety when walking
alone, being alone at home and arriving or leaving home were correlated with the
respondents' opinion of the performance of local police.
In the correlation between the three measures of fear and the opinion that the local
police are doing a good job the rho's obtained were 0.17356; 0.16950 and 0.20747
respectively. This indicates a slight positive relationship between the two variables. A
similar relationship was obtained for the following variables, namely the local police
need more power (0.10395; 0.11397 and 0.09342); the local police are prompt (0.0999;
0.07077 and 0.13257); the local police are cooperative (0.13296; 0.12375 and
0.15151); the local police are friendly (0.09191; 0.07202 and 0.11098); the local police
are helpful (0.14260; 0.17639 and 0.11098);and the local police are courteous
(0.18945; 0.19466 and 0.12149) respectively. A slight negative relationship exists
between the fear of crime measures and the opinion that the local police are not
interested in the case (-0.04838; -0.11066 and -0.03290) respectively.
The findings in table 7.12 would seem to indicate that as fear of crime increases so
peoples opinion of police performance declines. The correlations are weak which
replicates the findings of Garofalo (1979). The opinion that respondents have of the
police are important as confidence in the police is closely connected to the fear of crime
(see par. 7.2). Therefore although these correlations are weak, they do promote further
investigation of the link between opinion and fear.
192
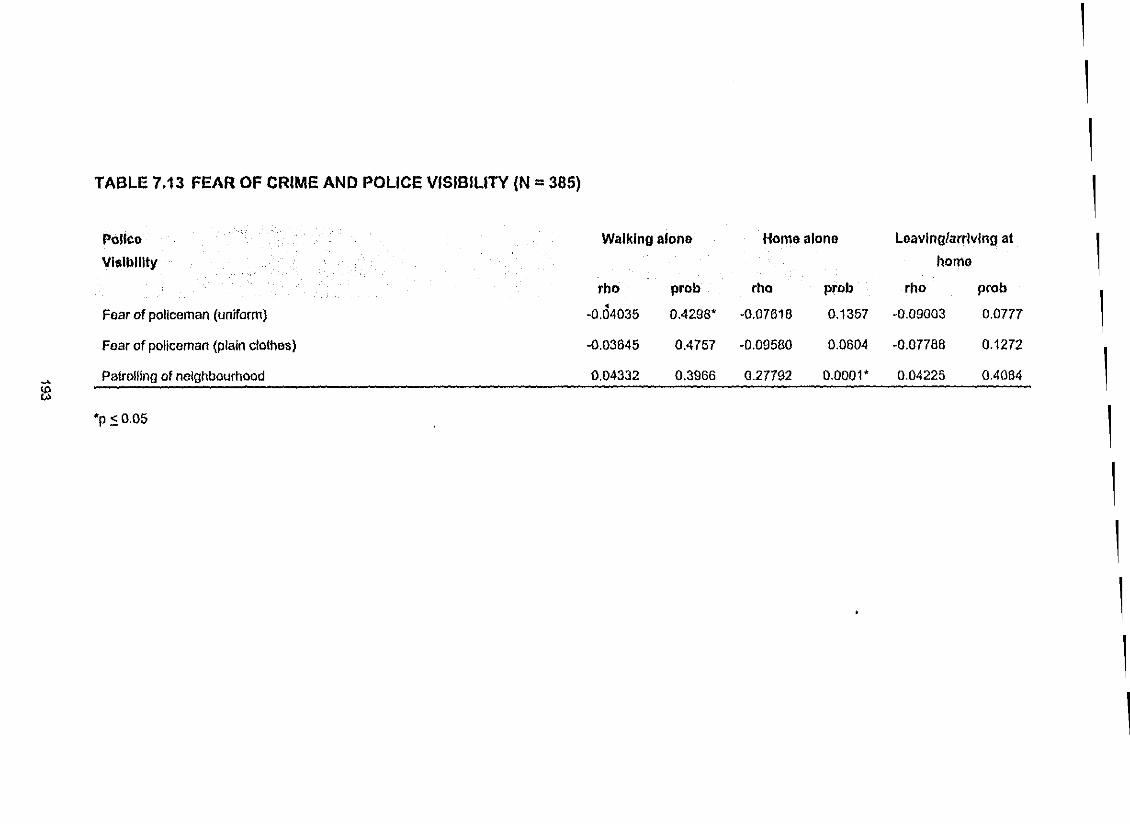
TABLE 7.13 FEAR OF CRIME AND POLICE VISIBILITY (N =385)
Police
Visibility
Fear of policeman (uniform)
Fear of policeman (plain clothes)
Patrolling of neighbourhood
'p ~ 0.05
Walking alone Home alone Leaving/arriving at
homo
rho prob rho Prob rho prob
•-0.04035 0.4298' -0.07618 0.1357 -0.09003 0.0777
-0.03645 0.4757 -0.09580 0.0604 -0.07788 0.1272
0.04332 0.3966 0.27792 0.0001' 0.04225 0.4084
1
1
1
1
1
1
1
1
1
1
1
1
1
From table 7.13 it can be inferred that there is a slight negative relationship between
the three measures of the fear of crime and police visibility as measured by fear of
policeman in uniform (-0.04035; -0.07618 and -0.09003) and fear of policeman in plain
cloths (-0.03645; -0.09580 and -0.07788) respectively. A slight to negligible positive
relationship between exists between actual patrolling of the neighbourhood and the
measures of fear (0.04332; 0.27792 and 0.04225) respectively.
The rho's for these correlations would imply that people who fear criminal victimisation
do not fear a policeman in or out of uniform. However, fear of crime is influenced by
police visibility. The lack of police omnipresence influenced the respondents' fear of
crime.
7.3.2 Gender Differences and the Role ofthe Police
As has already been established by research, gender influences the fear of crime. The
role of the police in combating crime has been investigated in the previous section and
it is now deemed necessary to establish to what extent gender differences exist in the
respondents' contact with the police, their reporting of crime to the police, their reasons
for not reporting crime to the police, their opinions on their obligation to combat crime,
and their opinions on the services rendered by the police (including police visibility).
The following hypothesis was formulated to test for significant differences:
Hypothesis 9: There are significant differences between male and female
respondents with regard to their experiences with the police.
The F-test will be used in order to establish whether significant differences do exist
between males and females and their view of the role of the police. The findings are
reflected in the tables 7.14 to 7.18.
194
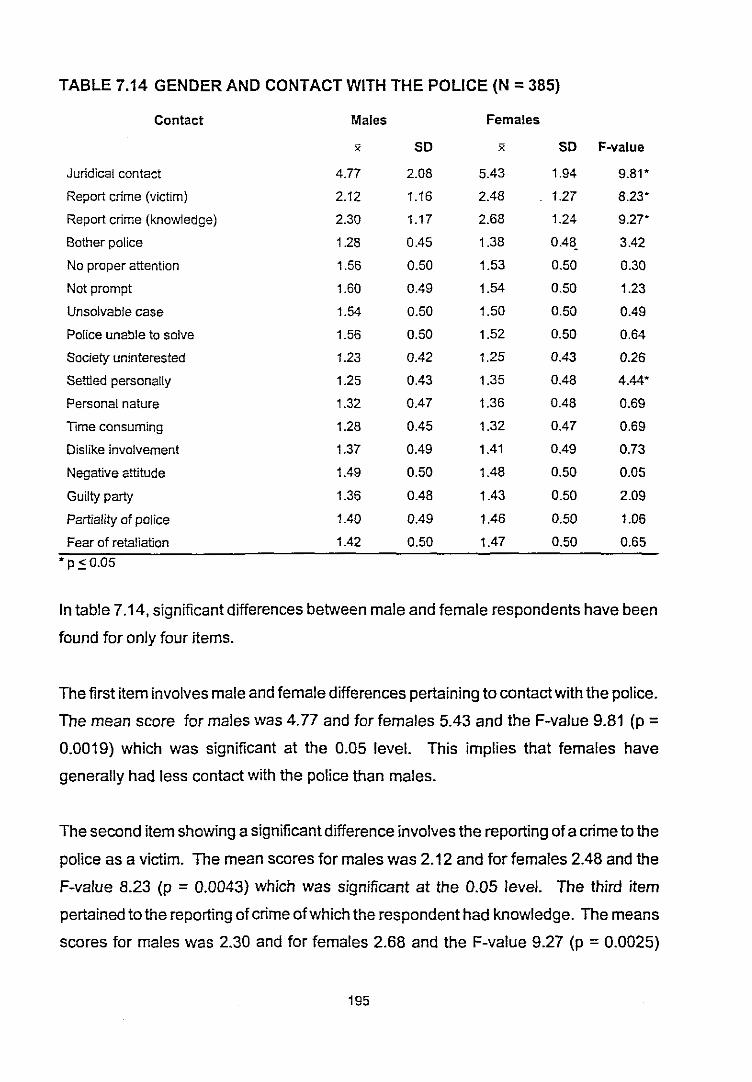
TABLE 7.14 GENDER AND CONTACT WITH THE POLICE (N =385)
Contact Males Females
x SO x SO F-value
Juridical contact 4.77 2.08 5.43 1.94 9.81*
Report crime (Victim) 2.12 1.16 2.48 1.27 8.23*
Report crime (knowledge) 2.30 1.17 2.68 1.24 9.27*
Bother police 1.28 0.45 1.38 0.48. 3.42
No proper attention 1.56 0.50 1.53 0.50 0.30
Not prompt 1.60 0.49 1.54 0.50 1.23
Unsolvable case 1.54 0.50 1.50 0.50 0.49
Police unable to solve 1.56 0.50 1.52 0.50 0.64
Society uninterested 1.23 0.42 1.25 0.43 0.26
Settled personally 1.25 0.43 1.35 0.48 4.44*
Personal nature 1.32 0.47 1.36 0.48 0.69
Time consuming 1.28 0.45 1.32 0.47 0.69
Dislike involvement 1.37 0.49 1.41 0.49 0.73
Negative attitude 1.49 0.50 1.48 0.50 0.05
Guilty party 1.36 0.48 1.43 0.50 2.09
Partiality of police 1.40 0.49 1.46 0.50 1.06
Fear of retaliation 1.42 0.50 1.47 0.50 0.65
* P ~ 0.05
In table 7.14, significant differences between male and female respondents have been
found for only four items.
The first item involves male and female differences pertaining to contact with the police.
The mean score for males was 4.77 and for females 5.43 and the F-value 9.81 (p =0.0019) which was significant at the 0.05 level. This implies that females have
generally had less contact with the police than males.
The second item showing a significant difference involves the reporting of a crime to the
police as a victim. The mean scores for males was 2.12 and for females 2.48 and the
F-value 8.23 (p = 0.0043) which was significant at the 0.05 level. The third item
pertained to the reporting of crime of which the respondent had knowledge. The means
scores for males was 2.30 and for females 2.68 and the F-value 9.27 (p = 0.0025)
195
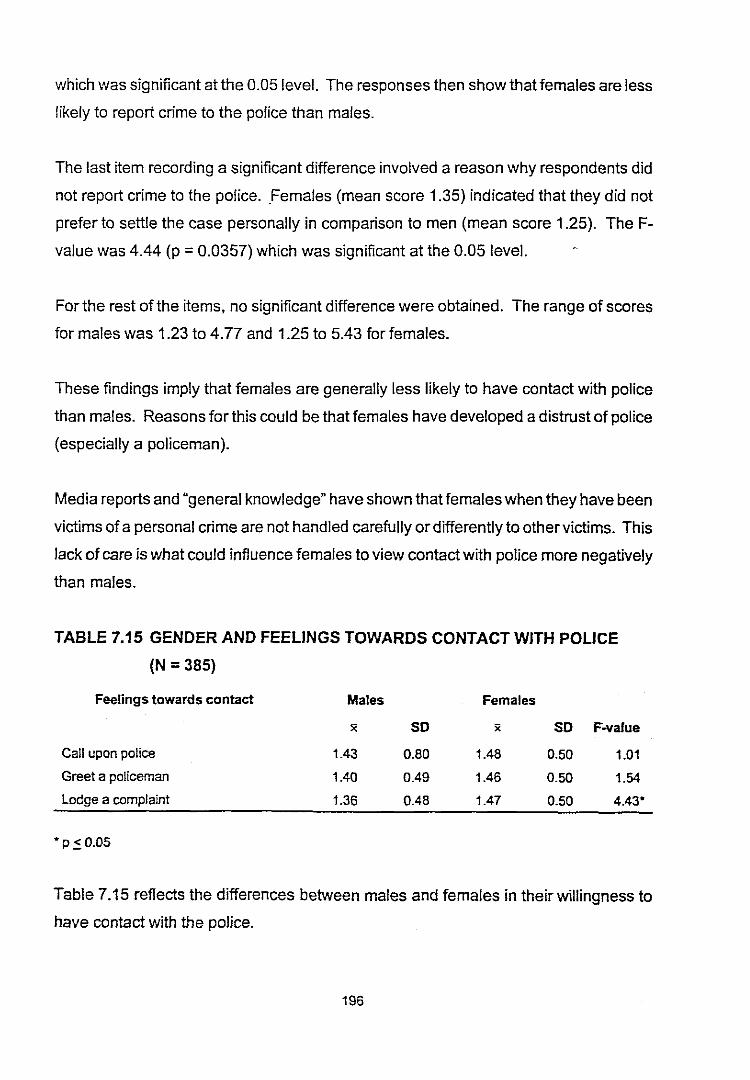
which was significant atthe 0.05 level. The responses then show thatfemales are less
likely to report crime to the police than males.
The last item recording a significant difference involved a reason why respondents did
not report crime to the police. Females (mean score 1.35) indicated that they did not
prefer to settle the case personally in comparison to men (mean score 1.25). The F
value was 4.44 (p =0.0357) which was significant at the 0.05 level.
For the rest of the items, no significant difference were obtained. The range of scores
for males was 1.23 to 4.77 and 1.25 to 5.43 for females.
These findings imply that females are generally less likely to have contact with police
than males. Reasons for this could be that females have developed a distrust of police
(especially a policeman).
Media reports and "general knowledge" have shown that females when they have been
victims of a personal crime are not handled carefully or differently to other victims. This
lack of care is what could influence females to view contact with police more negatively
than males.
TABLE 7.15 GENDER AND FEELINGS TOWARDS CONTACT WITH POLICE
(N =385)
Feelings towards contact Males Females
x SO x SO F-value
Call upon police 1.43 0.80 1.48 0.50 1.01
Greet a policeman 1.40 0.49 1.46 0.50 1.54
Lodge a complaint 1.36 0.48 1.47 0.50 4.43'
"p ~ 0.05
Table 7.15 reflects the differences between males and females in their willingness to
have contact with the police.
196
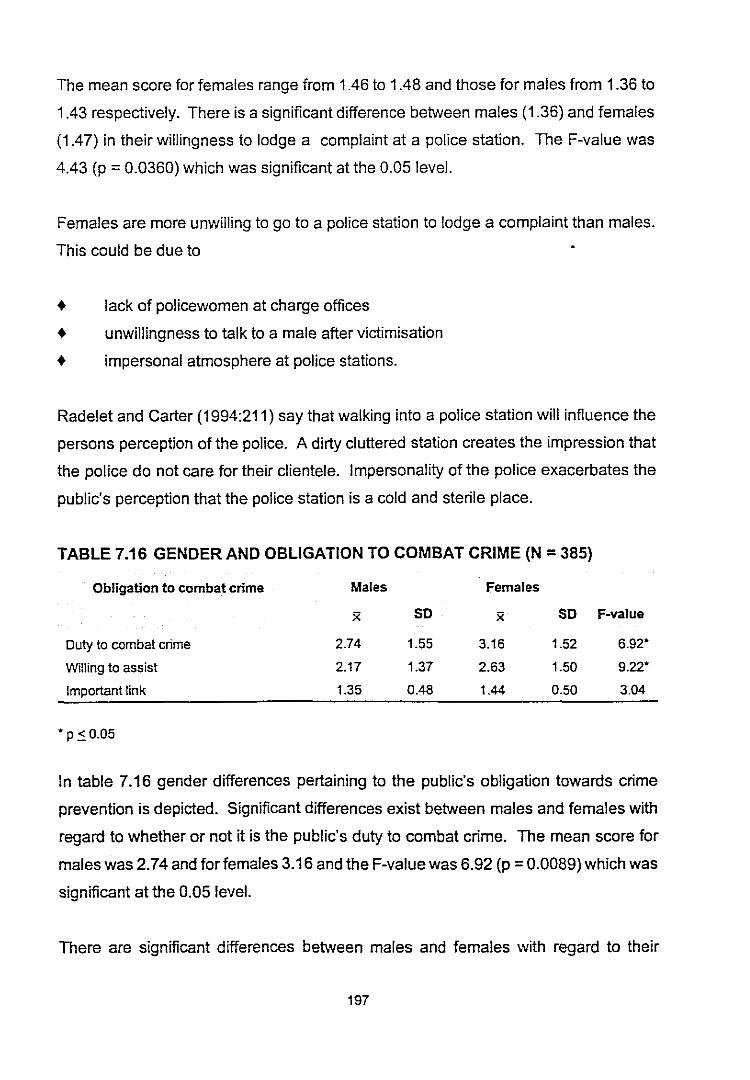
The mean score for females range from 1.46 to 1.48 and those for males from 1.36 to
1.43 respectively. There is a significant difference between males (1.36) and females
(1.47) in their willingness to lodge a complaint at a police station. The F-value was
4.43 (p = 0.0360) which was significant at the 0.05 level.
Females are more unwilling to go to a police station to lodge a complaint than males.
This could be due to
• lack of policewomen at charge offices
• unwillingness to talk to a male after victimisation
• impersonal atmosphere at police stations.
Radelet and Carter (1994:211) say that walking into a police station will influence the
persons perception of the police. A dirty cluttered station creates the impression that
the police do not care for their clientele. Impersonality of the police exacerbates the
public's perception that the police station is a cold and sterile place.
TABLE 7.16 GENDER AND OBLIGATION TO COMBAT CRIME (N =385)
Obligation to combat crime
Duty to combat crime
Willing to assist
Important link
Males Females
x SO x SO F-value
2.74 1.55 3.16 1.52 6.92'
2.17 1.37 2.63 1.50 9.22'
1.35 0.48 1.44 0.50 3.04
• P.'O 0.05
In table 7.16 gender differences pertaining to the public's obligation towards crime
prevention is depieted. Significant differences exist between males and females with
regard to whether or not it is the public's duty to combat crime. The mean score for
males was 2.74 and for females 3.16 and the F-valuewas 6.92 (p =0.0089) which was
significant at the 0.05 level.
There are significant differences between males and females with regard to their
197
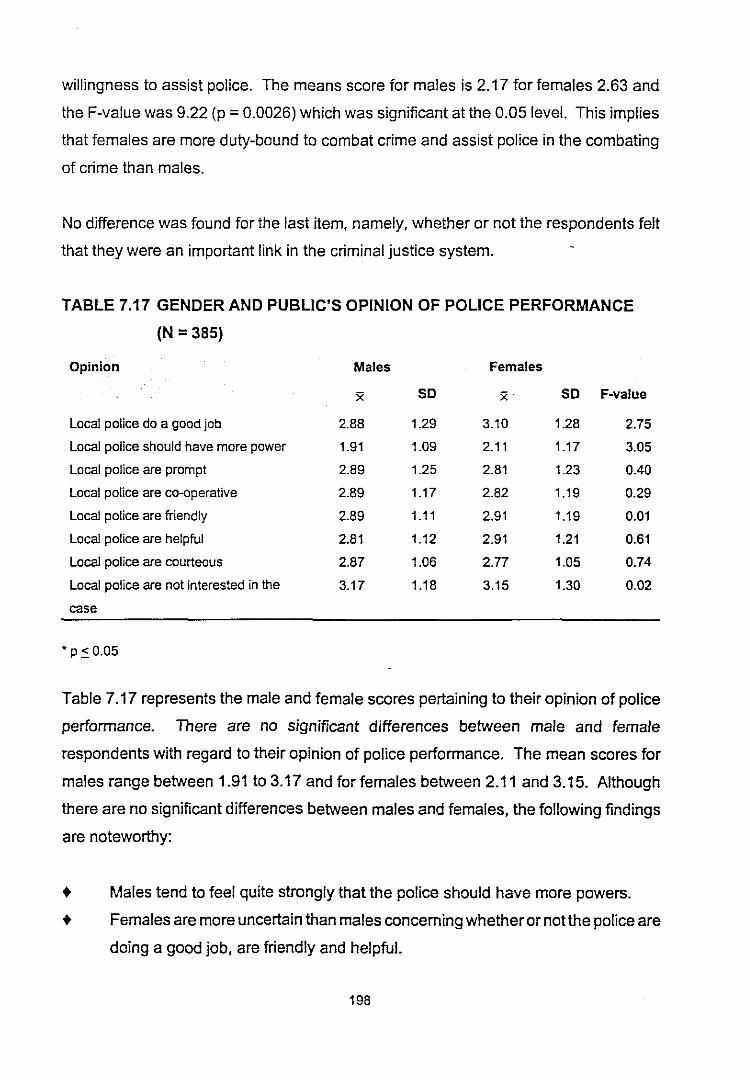
willingness to assist police. The means score for males is 2.17 for females 2.63 and
the F-value was 9.22 (p =0.0026) which was significant at the 0.05 level. This implies
that females are more duty-bound to combat crime and assist police in the combating
of crime than males.
No difference was found for the last item. namely. whether or not the respondents felt
that they were an important link in the criminal justice system.
TABLE 7.17 GENDER AND PUBLIC'S OPINION OF POLICE PERFORMANCE
(N =385)
Males Females
x SO x SO F-value
2.88 1.29 3.10 1.28 2.75
1.91 1.09 2.11 1.17 3.05
2.89 1.25 2.81 1.23 0.40
2.89 1.17 2.82 1.19 0.29
2.89 1.11 2.91 1.19 0.Q1
2.81 1.12 2.91 1.21 0.61
2.87 1.06 2.77 1.05 0.74
3.17 1.18 3.15 1.30 0.02
Local police do a good job
Local police should have more power
Local police are prompt
Local police are co-operative
Local police are friendly
Local police are helpful
Local police are courteous
Local police are not interested in the
case
Opinion
•p::: 0.05
Table 7.17 represents the male and female scores pertaining to their opinion of police
performance. There are no significant differences between male and female
respondents with regard to their opinion of police performance. The mean scores for
males range between 1.91 to 3.17 and for females between 2.11 and 3.15. Although
there are no significant differences between males and females, the following findings
are noteworthy:
• Males tend to feel quite strongly that the police should have more powers.
• Females are more uncertain than males conceming whetherornotthe police are
doing a good job, are friendly and helpful.
198
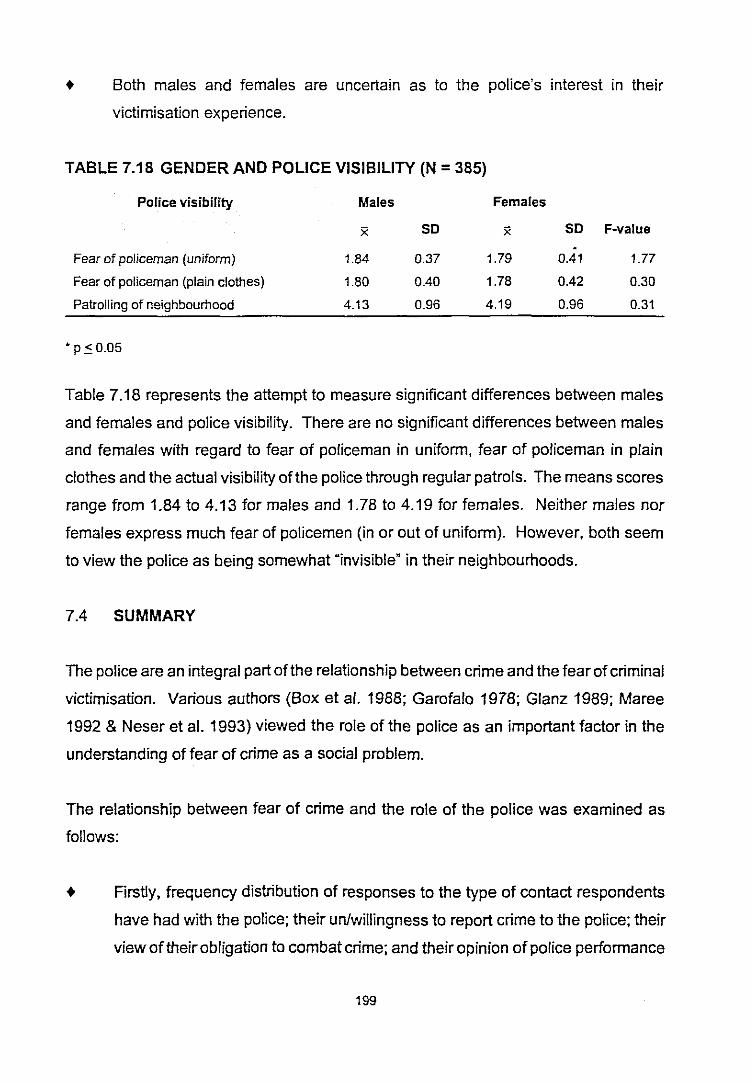
• Both males and females are uncertain as to the police's interest in their
victimisation experience.
TABLE 7.18 GENDER AND POLICE VISIBILITY (N =385)
Police visibility
Fear of policeman (uniform)
Fear of policeman (plain clothes)
Patrolling of neighbourhood
Males Females
x SO x SO F-value.
1.84 0.37 1.79 0.41 1.77
1.80 0.40 1.78 0.42 0.30
4.13 0.96 4.19 0.96 0.31
• p ~ 0.05
Table 7.18 represents the attempt to measure significant differences between males
and females and police visibility. There are no significant differences between males
and females with regard to fear of policeman in uniform, fear of policeman in plain
clothes and the actual visibility of the police through regular patrols. The means scores
range from 1.84 to 4.13 for males and 1.78 to 4.19 for females. Neither males nor
females express much fear of policemen (in or out of uniform). However, both seem
to view the police as being somewhat "invisible" in their neighbourhoods.
7.4 SUMMARY
The police are an integral part of the relationship between crime and the fear of criminal
victimisation. Various authors (Box et al. 1988; Garofalo 1978; Glanz 1989; Maree
1992 & Neser et al. 1993) viewed the role of the police as an important factor in the
understanding of fear of crime as a social problem.
The relationship between fear of crime and the role of the police was examined as
follows:
• Firstly, frequency distribution of responses to the type of contact respondents
have had with the police; their Un/willingness to report crime to the police; their
view of their obligation to combat crime; and their opinion of police performance
199
was reflected in tabular form.
• Secondly, using Spearman's Rank Order Correlation Coefficient, the fear of
crime measures were correlated with the four mentioned categories in order to
reveal the relationships between the two variables.
• Thirdly, the F-test was used to test for significant differences between males and
females and their interaction with, contact with and perception of the police.
All correlations and significant differences were set out in tabular form.
200
CHAPTERS
RESPONSES TO THE FEAR OF CRIME
8.1 INTRODUCTION
There is a tendency to view crime as the most potent threat to society. Conklin
(1975:3) viewed crime and the fear of crime as exacting a toll on the citizens of a
country. Karmen (1984:37) opined that victimisation is not just a loss but a burden:
"Something is left behind as well as taken away. Haunting memories, chilling
scenarios, nightmarish images and similar psychological scars are carried about
as a crushing mental load. They are oppressive, worrisome, anxiety provoking
and encumbering to those who bear them."
Thus, people who are confronted by the threat of criminal victimisation will do almost
anything to defend themselves. They may change their behaviour and activities, and
place barriers between themselves and the rest of the world. Glanz (1989:40) stated
that in extreme cases, people may become paralysed by fear and avoid going out
because they fear an attack on their person.
A distinction can be made between defensive responses to crime (e.g. avoidance
behaviour), and offensive responses (e.g. purchasing of a firearm). In both defensive
and offensive responses, the idea is to protect the person from any furthervictimisation.
8.2 INDIVIDUAL RESPONSES TO THE FEAR OF CRIME
Defensive and offensive responses to the fear of crime refer to action taken by the
individual to protect him- or herself against victimisation.
201
8.2.1 Defensive Responses to the Fear of Crime
The defensive response to the fear of crime can be characterised as an avoidance of
situations which could put the individual at risk. According to Conklin (1975:105),
people may reduce their contact with others and avoid situations that might lead to
theirvictimisation. Clemente and Kleiman (1979:519) are of the same opinion as they
state that: "People are forced to change their usual behavior. They stay Offthe streets
at night, avoid strangers, curtail activities and may even move to other neighborhoods."
People who are scared are less sociable, unwilling to help others, and tend to stay
behind the locked doors of their houses. Fear of crime generates distrust, insecurity,
dislike of one's neighbours, and social isolation. Toseland (1982:205) warned that
social isolation increased the level of fear. The undermining of social solidarity is also
enhanced by barriers erected by neighbours. These barriers, which serve to protect
against victimisation, also serve to prevent sociability, interaction between neighbours,
and cohesion. For example, a criminal may think twice before entering premises with
watchdogs, but so will children and neighbours.
Defensive behaviour is also common among people who perceive themselves to be
vulnerable. Conklin (1975:107) reported that following the murder of seven young
women in Boston, USA, in 1977, many young women refrained from hitchhiking, started
going out in groups, and made enquiries about self-defence lessons. Another group
that is likely to engage in defensive and avoidance behaviour is the elderly. This group
generally feels vulnerable because of age and weakness. In conclusion, then, those
that view themselves as vulnerable will refrain from entering situations which could put
them at risk of criminal victimisation.
Defensive responses also produce changes in urban commerce. Conklin (1975:111)
reported that shopkeepers kept their doors locked, and only opened for people
considered to be "safe" customers, and dosed up after dark. Not only does this reduce
business, but it also inconveniences shoppers. Closing early means that there will be
fewer people on the street at night. This in tum means less business for those stores
202
that are open, and less chance of social interaction. Thus defensive measures reduce
the quality of human life by minimising the chances for sociability, human contact and
the willingness to help others.
8.2.2 Offensive Responses to the Fear of Crime
Offensive responses can be characterised as reactions in which the 'individual or
community take active measures to combat the threat of crime. These active measures
can include the purchasing of firearms, acquiring ofwatchdogs and burglar alarms, and
joining a Neighbourhood Watch. These measures, according to Conklin (1975:290),
- often have a pathological aspect. For example, a gun accidentally kills a child, a dog
bites its owner, and burglar guards could prevent escape from a fire. These offensive
responses to the fear of crime could cause harm not only to the criminal but also to
innocent people.
The offensive responses have been labelled as mobilisation measures by various
authors (Conklin 1975 and Furstenberg 1972). These mobilisation methods include the
purchasing of anyone of
• locks and burglar guards
• alarms and panic buttons
• watch dogs
• firearms
• tear gas (mace)
• stun guns
• outside lighting
• self-defence lessons (can be paid for by individuals).
Acquiring ofthese mobilisation measures is normally preceded by an immediate threat
of victimisation and/or the use of such measures by one's neighbours. Often reports
in the mass media of a high crime rate are followed by an increase in the acquisition of
protective measures. Conklin (1975:119) reported that when fear of crime is great,
people become the willing purchasers of any security device, even though this
203
purchase does not offer total immunity from victimisation.
Furstenberg (in Conklin 1975:114) claims that protective measures are expensive,
resulting in fewer people taking such measures compared to those engaging in
avoidance behaviour. He concludes thatthe riskofvictimization does not cause people
to use security measures for self protection, rather, avoidance behaviour is related to
risk and fear of crime.
The fact remains, however, that many people have taken protective measures to
ensure their safety from victimisation. The result of these actions is reduced social
interaction, inconvenience to the individual and others, direct harm caused to innocent
people, and the placing of barriers to informal social control. Conklin (1975:125) stated
that "... attempts to prevent victimisation can make people prisoners in their own
houses". The lack of interaction, trust and attachment to neighbours weakens informal
control in the community. In a close-knit community, people watch over each other, i.e.
there is a high degree of surveillance. When this surveillance is jeopardised through
lack of interaction, the risk of crime is greater, and so too is fear. When the physical
measures taken to prevent crime and reduce the fear of crime fail, the community must
act against crime and the fear of crime.
8.3 COMMUNITY RESPONSES TO THE FEAR OF CRIME
Any social problem which affects community life must be solved or controlled. Crime
generates fear, suspicion and distrust and affects social interaction. As solidarity in the
community is weakened, so too are the social control mechanisms which were in use
in the community. Conklin (1975:131) stated in this regard that "As a community is
victimized, solidarity weakens and informal social control dissipates".
However, when people are confronted with crime, they normally assign full
responsibility for crime prevention to the police. When a government structure is
committed to fighting crime and protecting the citizens, then formal social control is
being asserted.
204
The section that follows wiil deal firstly with informal social control in its broadest sense,
formal social control, and finally, strategies for crime prevention and the reduction of
fear.
8.3.1 Informal Social Control
Within any group, norms and values will act as prescriptions for human behaviour.
These normswill delineate what is acceptable and what is not. These norms also exert
a restraining influence, and are particularly strong in primary groups where people are
in regular face to face contact.
When deviation from these norms occurs, and the deviant act is a direct challenge to
dominant norms, the demand for punishment will be made by the group. This is the
basis of informal social control, namely that the group members watch each other's
behaviour, and if necessary take corrective measures to ensure the solidarity of the
group. Conklin (1975:134) opined that a small homogenous community will pressurise
potential deviants to conform to the dominant norms: "... moral censure immediately
followed any observed deviance".
Within a community, informal social control operates through a network of social
relationships which develop over time. Trivial contacts will gradually generate a
network of trust and interdependence. When people know each other and interact
regularly, informal control is more effective. In a well-integrated community people will
know the normal patterns of social behaviour, and will notice strangers and behaviour
which can be labelled as threatening. In other words, surveillance of behaviour is a
high priority.
Conklin (1975:137) noted that although small towns were probably more tightly-knit
communities than large cities, large cities can incorporate a number ofwell-integrated
communities. Any community's level ofinformal social control will be determined by the
structure of social interaction and the social relations within it, and notby its size. In
plain terms, if there is social interaction, normative consensus and surveillance of
205
members' activities within a community, social control will be strong. If social control
is strong, there is less likelihood of crime and the development of the fear of crime.
Conklin (1975:142) suggested that social order is not created by the police (I.e. formal
mechanisms of social control), but "... by an intricate and nearly unconscious network
of involuntary controls by private citizens". These "controls" involve the presence of
people on the street, which ensures surveillance and enhances feelings ofsafety. This
idea is based on the premise that, when people fear crime, they withdraw from social
contacts. This implies that fewer people are on the streets, and people will be less
likely to watch the streets. This weakens social control, which in tum increases the fear
of crime. By creating a flow of human traffic on the streets however, informal control
in the community can be strengthened.
A further prerequisite for informal control is that a significant number of people must
have roots in the community; they must Jearn what constitutes unusual activity, and they
must know who is a stranger in the community. Having roots in the community implies
that patterns of interaction will develop between members of the community - which
strengthens solidarity. Knowing what is the usual activity, and who belongs to the
community and who does not, highlights the importance of surveillance.
However, Conklin (1975: 149) warned that surveillance by itselfwould have no effect on
crime or the fear of crime in a community, if action is not taken. Surveillance must then
be reinforced by the willingness to involve direct control, l.e. the use of formal
mechanisms of social control.
8.3.2 Formal Social Control
Formal social control refers to the enforcement of norms by an outside agency. The
criminal justice system is held to be responsible for the prevention of crime and the
maintenance of social order and control. However, the inability of the system to protect
people from crime and to control behaviour influences crime itself and the fear of crime.
When people experience fear of crime, it reduces their willingness to support the
206
criminal justice system, and increases the criticism of the police and courts as a whole.
Citizens of a country hold the police responsible for crime prevention. The police will
be viewed as effective ifthey are seen as apprehending criminals, responding promptly
to calls, and having a physical presence in the community. However, it must be stated
clearly that without the public's support and willingness to report crime, the
effectiveness of the police decreases.
Closely tied to the effectiveness of the criminal justice system is the assistance it offers
to victims. If the system is viewed as unsupportive of the victim, then few people will
be willing to proceed with crime reporting. This attitude will also affect people's fear of
possible victimisation as well as the communities' feelings of safety and security. When
individuals view themselves as being in an unsupportive and non-protective position by
the agencies which deal with social order and control, fear of victimisation will escalate.
To remedy this situation, proposals have been made about a victim service programme
which serves to meet the needs of the victim.
Snyman (in Schurink et al. 1992:475) discussed the work of Reeves (1985) in this
regard. There are, according to Reeves (in Schurink et al. 1992:475), six broad
categories of needs which must be satisfied. These are:
+ Emotional needs: Help should be offered to victims to come to terms with the
losses they have suffered. These emotional needs are extremely important and
if they are overlooked, they could have a permanent effect on the victim.
+ Acknowledgement needs: The victim should be offered reassurance and help
which will encourage feelings of security and trust, and reduce fear.
+ Practical needs: Victims need advice about the practical problems surrounding
the circumstances of their loss, e.g. locks and broken widows must be repaired,
stolen articles replaced, and, if a physical injury was incurred, there may have
to be visits to the doctor.
207
• Information needs: The victim must be informed on the progress ofthe case, the
court hearing date, the court process and the testifying process. Information on
crime prevention and resources in the community must also be made available.
• Need for understanding: The community and the criminal justice system has a
tendency to question the victim's involvement in the crime.
• The need for contact with the judicial process: Many victims have no knowledge
of this process. They therefore need guidance and support in this regard.
In South Africa, according to Snyman (in Schurink et al. 1992:477), it is only since 1977
that victim support programmes which meetthe above needs have come into existence.
Both the private and public sector have been involved in the development of the
programmes.
Contributors in the private sector have include:
• The Child and Family Welfare Society (1918)
• Life Line (1963)
• Rape Crisis South Africa (1977)(The Johannesburg branch has changed its
name to People Opposing Woman Abuse or POWA)
• Child line (1983)
• National Institute for Crime Prevention and the Rehabilitation of Offenders
(1987)
• Radio 702 Crisis Centre
State contributors include the following:
• The Child Protection Unit of the South African Police (1986)
• Rape Crisis and Child Abuse services at certain provincial hospitals
• State President's Fund (1983)
• Department of Health Services and Welfare
208
All in all, there would seem to be little support for victims of crime in South Africa. The
result of this lack of support could well be an increased fear of becoming a victim of
crime.
According to Conklin (1975: 185), a collective response to crime is relatively uncommon.
People tend to be apathetic, especially if the police do not take any action towards
preventing crime. However, people will engage in collective action if the threat is
sufficiently severe.
8.4 CRIME PREVENTION STRATEGIES
The prevention of crime and the personal safety of its members should be the aim of
any society. However, crime and the fear of crime have become major social problems
in our society. To prevent crime and reduce the fear ofcrime, it is necessary to develop
some form of strategy which could be implemented.
Conklin (1975:186) opined that people would engage in collective action to fight crime.
This action may vary from taking the law into their own hands, i.e. vigilantism, to civilian
police patrols, until finally some or other community-based prevention strategy is
enforced.
8.4.1 Vigilantism
When people have attempted to stop crime but have had no effect, they can either
resign themselves to crime, or move into a safer area, or they can take the law into their
own hands, i.e. become vigilantes. Vigilante action, according to Conklin (1975:187),
has a long history, and has usually occurred where formal means of law enforcement
were weak or non-existent People have then felt the need to take action themselves
so as to establish a stable and viable community. Conklin (1975:184), opined that
·vigilantism was a violent sanctification of the deeply cherished values of life and
property".
209
The aim of vigilantes is to apprehend the criminals, give them a formal but "illegal" trial
at which a defence is presented, and then convict and punish them. According to
Conklin (1975:190), there are three basic components of vigilantism, namely
• Self preservation ofthe members of the community through protection of life and
property.
• The right to revolution, or to strike against formal authority when it fails to
perform its duties.
• Popular sovereignty, or the belief in the right of the people to wield power in their
own interests.
In the South African context, the term vigilante connotes violent, organised, and
conservative groupings operating within the black communities. These groups were
used to neutralise those who opposed apartheid and its institutions (in Hanson & Van
Zyl-Smit 1990:63-64).
Informal civic management structures have existed in African townships since their
inception. The formal structures were seen to enforce laws that excluded the African
population. In the 1930s, civic associations took the form of street or ward committees
comp:ising residents elected by peers and living in the same street. These committees
settled disputes between neighbours, acted as spokespersons for residents, were
concerned about safety, and mobilised a neighbourhood police force to patrol the area.
However, after 1976 their influence dwindled, and the role of policing and disciplining
residents was taken over by youths. People's courts developed where crimes were
punished by the residents of a community. These courts also promoted political
awareness and responsibility. In the mid 1980s, these courts were smashed by police,
and the street committees consisting ofadults in the community made their appearance
again (in Hanson & Van Zyl-Smit 1990:64).
Vigilante movements can be socially constructive, i.e. when they deal with a particular
problem and then disband, or socially destructive, i.e. especially when leaders fail to
control the violent or sadistic tendencies of some of its members.
210
Vigilante groups may be substitutes for effective systems of law enforcement, but may
also act as parallel structures to existing law-enforcement agencies. When the groups
act as extensions of the police rather, than as their substitutes, then they can be called
civilian police patrols.
8.4.2 Civilian Police Patrols
The civilian police patrols are referred to as neovigilantes. According to Conklin
(1975:194), neovigilantism is a response to the perceived threat of crime and a feeling
that the criminal justice system could not protect the inhabitants of modem cities.
The civilian police patrols and juvenile gangs developed to protect the individual's and
community's security. These two groups dispensed justice and exercised "grass roots
police power". Their actions established a "defended neighbourhood", which is a
community within a distinct part of a city where informal social control regulates
movement and behaviour.
Conklin (1975:175) opined that a defended neighbourhood was an urban phenomenon,
as it emerged in cities which had become too large to exercise control as a single unit.
The attempt is made within the defended neighbourhood to control behaviour of
residents and outsiders - as outsiders are viewed as a threat to the community.
However, when gangs are relied upon to protect the community, it can have destructive
effects on that community. Some of these effects include
• reduction in informal social control
• the spreading of fear from their community to other areas
• reducing movement on the streets
• raising the crime rates
Under normal circumstances, neovigilantism in the USA is common in three distinctive
communities, namely
• Afro-American enclaves, where residents feel they need protection from violence
211
by whites and the police
+ white areas, where people feel threatened by the incursion of Afro-Americans
+ urban communities, where the fear of crime is high (Conklin 1975:176).
On the positive side, certain civilian police patrols have the following advantages,
namely
+ they do not take the law into their own hands, because usually they apprehend
the suspects and hand them over to the police
+ they deter crime by observing and reporting street crimes to the police
+ they patrol high crime-risk areas
+ they attempt to provide social control over youths
+ they escort elderly citizens to ensure their safety
+ they work as police informants
+ they provide inexpensive law enforcement for the community, i.e, they are
normally volunteers
+ they have open communication with the police
+ they attempt to give self-help classes to residents in the community
+ the increase the willingness of members of a community to become involved in
crime prevention (Conklin 1975:196-208).
The negative consequences of civilian police patrols include the following, namely
+ they can develop without a clear mandate from the community, i.e. they are
viewed as illegitimate
+ people do not support the group for fear of legal entanglements
+ patrols often represent cliques in the community rather than the population as
a whole
+ they lack acceptance by residents of the community, who see patrols as ordinary
citizens with no special powers
+ the patrols could recruit sadistic and violent members
+ residents of the community could impersonate group members in an attempt to
gain personal power
+ some patrol groups have used their power illegally and become involved in
212
criminal activities themselves
• some patrol groups are harassed by the police and thus cannot function
effectively (Conklin 1975:196-208).
Although vigilantism and civilian police patrols can be viewed as extreme forms of crime
prevention strategies, their main aim is always the prevention of crime and the
protection ofcitizens. Maree (1993:58) concluded in her study on crime prevention that
any reduction strategy should entail "... [ensuring that] residents are aware ofthe crime
problem, secure their properties, look after their neighbours' premises and care for each
other". Thus if people feel safe in their environment they will protect it, and this
protection can take various forms.
8.4.3 Establishing Residential Security: O'Block (1981)
One of the most relevant views pertaining to crime prevention is that crimes of a
personal nature or against property are the result of desire and opportunity. Therefore,
if the aim is to prevent crime, desire and opportunity should be blocked, i.e. obstacles
which could delay or deter the criminal should be implemented. O'Slock (1981:307)
stated in this regard that "... (a) defensible space is a living residential environment
which can be employed for the enhancement of their lives, while further providing
security for their families, neighbours and friends".
The concept of defensible space can be divided into four main categories, namely
• territoriality, which implies the maintenance of perceived boundaries, which in
tum promotes feelings of cohesiveness amongst residents
• natural surveillance, which indicates that residents should be able to observe the
public areas of their living areas
• image and milieu, which involves the reduction of the perception that houses
themselves are isolated
+ safe areas should be identified which increase observation abilities and random
surveillance by the police
213
Residential security, according to O'Block (1981:92-93), can be expressed in four
words: deter, delay, deny and detect. The deterrence of the criminal occurs when
there are physical banners which force the criminal to go elsewhere. If access to a
residential area is gained, then delaying tactics such as burglar-proofing could further
impede the crime. The next step is to deny the criminal access to valuable goods by
locking them in a safe area. The detection of the criminal could further be enhanced
by surveillance by the police and other residents.
The use of neighbours to watch over each others' property and lives indicates the
willingness of people within a community to become involved in the prevention of crime
and the reduction of fear. An example of a strategy which attempts to ensure
residential security is the "neighbourhood watch" system.
8.4.4 Neighbourhood Watch Programme
The idea which underlies the development of a Neighbourhood Watch Programme is
that people seek to gain control or order over their lives and their community. These
self-help groups foster the development of social solidarity and community
development.
The programme is based on the premises that crime can be reduced if the potential
offender can be made to believe that the likelihood of being caught is high. These
programmes are normally organised in cooperation with the police, and the residents
of neighbourhoods become the eyes and ears of the police. Examples of such
programmes include: Business Watch, Block Watch, citizen patrols, safe homes (where
certain houses are pinpointed to be a refuge if residents are threatened), block
parenting (where an adult is available for children to go to for protection), alarm
networks, and volunteers for escorting the elderly and children (Lab, 1988:37-38).
A recent development in the Neighbourhood Watch Programme is the establishment
ofcommunity policing stations which operate as mini police stations within communities.
These mini-police stations are at the service of local residents, and they handle most
214
of the communities' problems.
The following disadvantages of the Neighbourhood Watch Programme were noted,
namely
• the programmes reduce fear of crime, but have little impact on the reduction of
crime itself
• few residents are willing to become involved
• the programme will not work well in neighbourhoods where residents hardly
know each other
• the residential areas where programmes have been implemented are low risk
areas, and members become bored with mundane activities
• it is difficult to organise and implement this type of programme in areas of high
risk owing to high mobility and the socio-economic and political conditions
(Naude 1992 in Schurink et al. 1992:462).
8.4.5 Citizen Patrols
The aim of citizen patrols is to increase the surveillance within an area by the
systematic patrolling of residential areas by residents. These patrols are discouraged
from physically intervening in a criminal act. The idea is to observe and then call the
police, but not to take action (Lab 1988:38).
The citizen patrols depend on mutual reliance between the police and residents. They
are intended to supplement police activity and not replace the police. Both the patrols
and the police are required to encourage people to take part in the controlling of crime
and calling the police.
Citizen patrols encourage community involvement and cohesion. They promote better
relationships between the police and public (Lab 1988:40-41).
215
8.4.6 Community Policing
Manning (in Radelet 1986:486) claimed that the term community policing refers to the
ordering and regulating of an interacting group of persons within a given tenritory. The
term community implies the interacting group of people within a given environment who
share common norms and values. "Police" in this instance is a verb - to police - which
implies to order, to control or to maintain authority over someone.
All policing is community policing, as the emphasis is on maintaining social order.
According to Manning (in Radelett 1986:487), community policing entailed the following:
• The encouragement of community closeness.
• The motivation of conforming behaviour.
• Facilitating communication between legitimate structures and the community.
• The participation of all in establishing a crime-free community.
With limited manpower resources, the idea behind the involvement of the community
in policing is being encouraged by all concerned. Community involvement is voluntary
and without all participants' active involvement, crime and the fear of crime will not be
brought under control.
Trojanowicz and Bucqueroux (1990:10) discuss ten principles of community policing
which include:
• The encouragement of a working relationship between police and community
residents to solve problems of crime, fear of crime, physical and social disorder
and neighbourhood decay.
• The formulation ofan organisational strategy which focuses on both civilians and
police solving community problems.
• The creation of a Community Policing Officer (CPO) who acts as a direct link
between the police and the people in the community.
• The creating and sustaining of continuous contact between the CPO and law-
216
abiding citizens in the community.
• The acceptance of involvement by both the CPO and the community in solving
problems. This generates trust and will help to overcome apathy and restrain
vigilantism.
• Community policing adds a proactive element to fighting crime and the fear of
crime.
• The exploration of new ways to protect and enhance life.
• The promotion of the use of technology by police.
• The CPO is regarded as a specialist who bridges the gap between the
community and the police.
• The decentralization of the police force, which is based on the premise that
control and order cannot be improved from the outside, and that people must be
encouraged to engage in policing activity within their own community.
Thus community policing sets out to improve conditions which actas a magnet to crime.
The effort is made to set up face-to-face meetings with the average citizens and
community leaders. A challenge is then issued to the community to accept its share of
responsibility for reducing crime and disorder. According to Trojanowicz and
Bucqueroux (1990:93), these activities could include
• target hardening of stores and residences
• improved residential involvement
• shepherding senior citizens on their shopping trips
• engaging young people in activities within the community
• persuading businesses to provide resources for these effects.
Peak and Glensor (1996:71) claim that community policing has been successful at
combating crime and the fear of crime. Community policing addresses both concrete
and formless fear, the actual crime rate, and social and physical disorder. In this way
it provides for community action and development within a decentralised police
approach.
217

Trojanowiczand Bucqueroux (1990:158) mention that although community policing can
work and inspire positive action against crime by communities, there is a "downside",
If the community feels safe, it will start participating in daily life as usual, which in turn
could cause an increase in the opportunity for crime. However, communities cannot
lock themselves behind doors or allow themselves to be consumed by terror.
Community policing provides the community with a way of working within the system
and contributing to the calming of a violent climate within society (Trojanowicz &
Bucqueroux 1990:159).
The police are, however, unable to solve problems such as unemployment and poverty,
which influence crime and its insidious shadow, the fear of crime.
8.4.7 The Impact of Social Development Programmes on Crime Prevention
The social development programmes have as their main aim the control and prevention
of factors which contribute to crime and victimisation. The social environment of
offenders and victims must be studied, and problems within the environment identified
and solved. Some of the problems identified by Naude (1992:464) include
+ inadequate education
+ discrimination
+ poor housing
+ overpopulation
+ unemployment
+ poverty
+ slum conditions
+ inadequate parenting
These problems can contribute to deviant lifestyles, crime and victimisation. The social
programmes developed to improve educational standards (especially among the youth).
health care, employment opportunities, recreational facilities, after-school care and
parental guidance and counselling are thought to improve the social environment of
possible future offenders.
218
These programmes are normally undertaken by local and central govemment
authorities, with the assistance of recognised community leaders, welfare agencies, and
the community itself.
At the time that the study was conducted, no Community Policing Forums existed in the
Richards Bay and Empangeni area. Community Policing forums were only introduced
after the fieldwork had been completed. Therefore only precautionary measures taken
by the respondents and their involvement in Neighbourhood Watch programmes were
researched.
8.5 PRESENTATION AND ANALYSIS OF DATA
When people fear crime or criminal victimisation they are likely to change their
behaviour to protect themselves, their families and their property. These actions are
viewed as responses to the threat of criminal victimisation and comprise the following:
+ Precautionary measures taken to protect property against any type of crime.
These measures include the acquisition of a guard dog, installation of an alarm
system, putting up extra outside lights, fixing of deadlocks to doors, fixing of
burglar-proofing, engraving valuables, installation of security waming lights,
leaving the radio, TV and lights on while not at home; erection of concrete walls,
and acquisition of a firearm.
+ Precautionary measures taken to protect the person against any type of crime.
These measures include not going out alone at night, not going out alone during
the day, carrying a personal alarm, taking self defence classes, locking all doors
while driving a car, notifying others of your whereabouts and carrying a firearm.
+ Neighbourhood involvement which includes asking a neighbour to keep a
watchful eye on your property while you are away; (abridged to ask neighbour)
asked by a neighbour to keep a watchful eye on their property while they are
away; (abridged to asked by a neighbour); and judging the willingness of
219

neighbours to come to your rescue in time of need (abridged to neighbour
comes to the rescue).
• Involvement in a neighbourhood watch programme which includes knowledge
about such programmes, membership in such programmes and willingness to
be involved in such programmes.
The frequency distribution of responses to the questions pertaining to precautionary
measures are prescribed in tables 8.1 to 8.4 respectively.
220
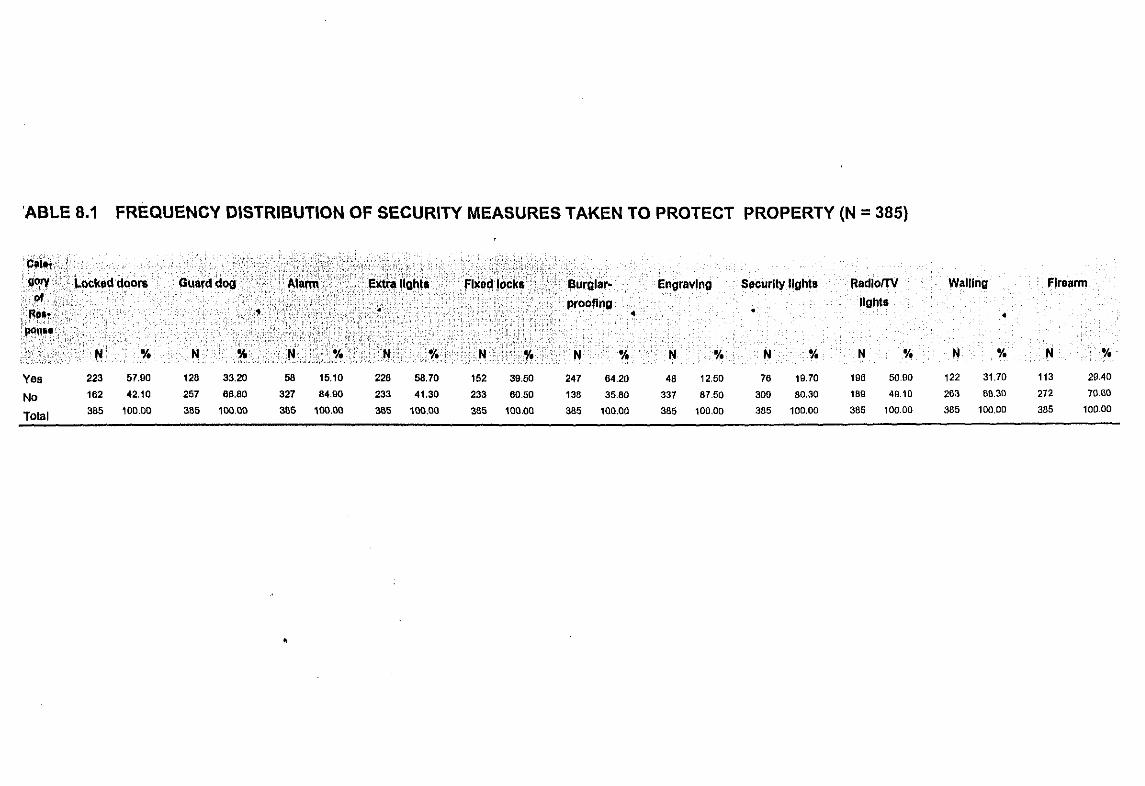
'ABLE 8.1 FREQUENCY DISTRIBUTION OF SECURITY MEASURES TAKEN TO PROTECT PROPERTY (N =385)
Engraving Security lights Radlonv Wailing flraarmlights
•
N % N V. N '10 N -t,
Yes 223 57.90 128 33.20 58 15.10 226 58.70 152 39.50 247 64.20 48 12.50 76 19.70 196 50.90 122 31.70 113 29.40
No 182 42.10 257 66.80 327 84.90 233 41.30 233 60.50 136 35.80 337 87.50 309 80.30 169 49.10 263 68.30 272 70.60
Total 365 100.00 385 100.00 3B5 100.00 385 100.00 385 100.00 385 100.00 365 100,00 385 100.00 3B5 100.00 365 100.00 365 100.00
•
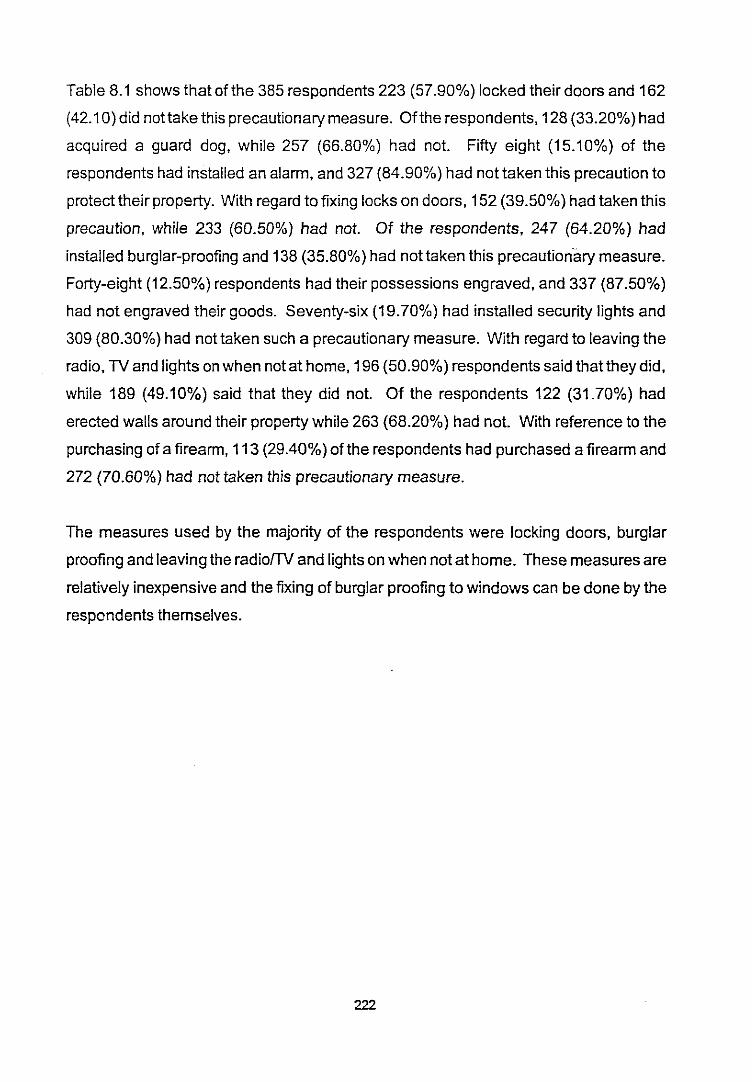
Table 8.1 shows that ofthe 385 respondents 223 (57.90%) locked their doors and 162
(42.10) did nottake this precautionary measure. Ofthe respondents, 128 (33.20%) had
acquired a guard dog, while 257 (66.80%) had not. Fifty eight (15.10%) of the
respondents had installed an alarm, and 327 (84.90%) had not taken this precaution to
protect their property. With regard to fixing locks on doors, 152 (39.50%) had taken this
precaution, while 233 (60.50%) had not. Of the respondents, 247 (64.20%) had
installed burglar-proofing and 138 (35.80%) had not taken this precautionary measure.
Forty-eight (12.50%) respondents had their possessions engraved, and 337 (87.50%)
had not engraved their goods. Seventy-six (19.70%) had installed security lights and
309 (80.30%) had not taken such a precautionary measure. With regard to leaving the
radio, TV and lights on when not at home, 196 (50.90%) respondents said that they did,
while 189 (49.10%) said that they did not. Of the respondents 122 (31.70%) had
erected walls around their property while 263 (68.20%) had not. With reference to the
purchasing of a firearm, 113 (29.40%) of the respondents had purchased a firearm and
272 (70.60%) had not taken this precautionary measure.
The measures used by the majority of the respondents were locking doors, burglar
proofing and leaving the radio!TV and lights on when not at home. These measures are
relatively inexpensive and the fixing of burglar proofing to windows can be done by the
respondents themselves.
222
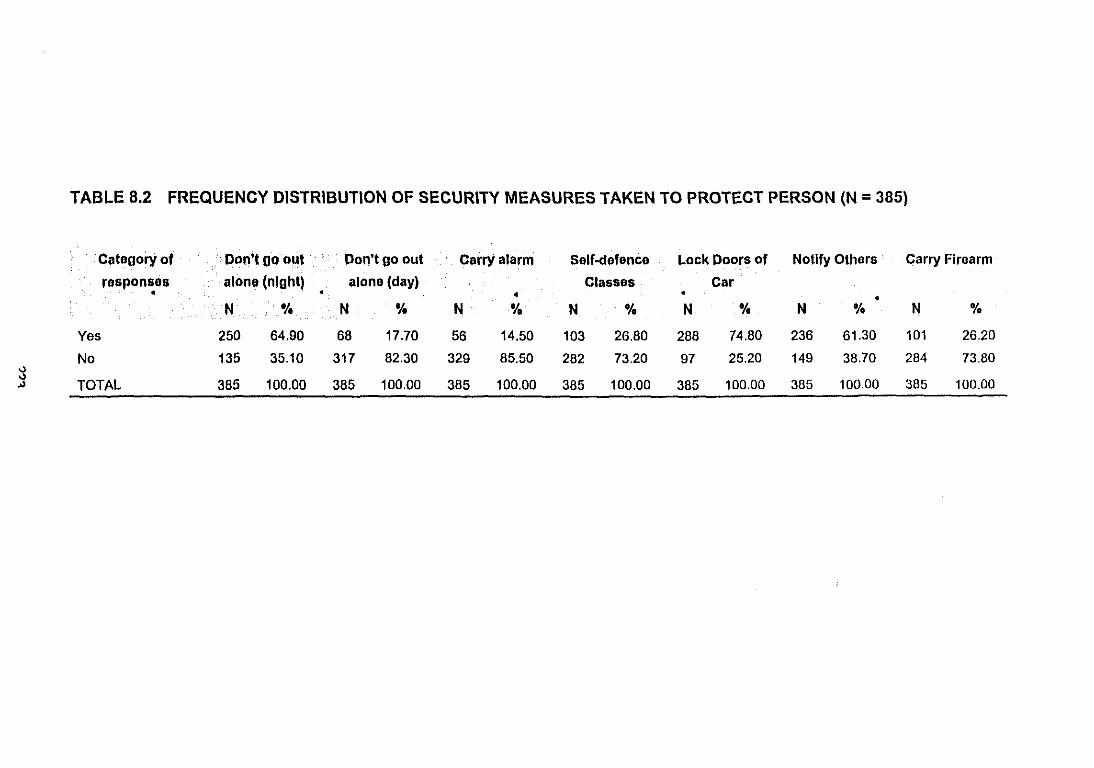
TABLE 8.2 FREQUENCY DISTRIBUTION OF SECURITY MEASURES TAKEN TO PROTECT PERSON (N =385)
Category of pen'tgo out Pon'tgo out Carryalarm Self-defence Lock peers of Notify Others Carry Firearm
responses atone (nIght) alone (day) Classes Car• • • • •
N "I. N "I. N % N % N % N % N %
Yes 250 64.90 68 17.70 56 14.50 103 26.80 288 74.80 236 61.30 101 26.20
No 135 35.10 317 82.30 329 85.50 282 73.20 97 25.20 149 38.70 284 73.80
"" TOTAL 385 100.00 385 100.00 385 100.00 385 100.00 100.00 385 100.00 385 100.00'" 385
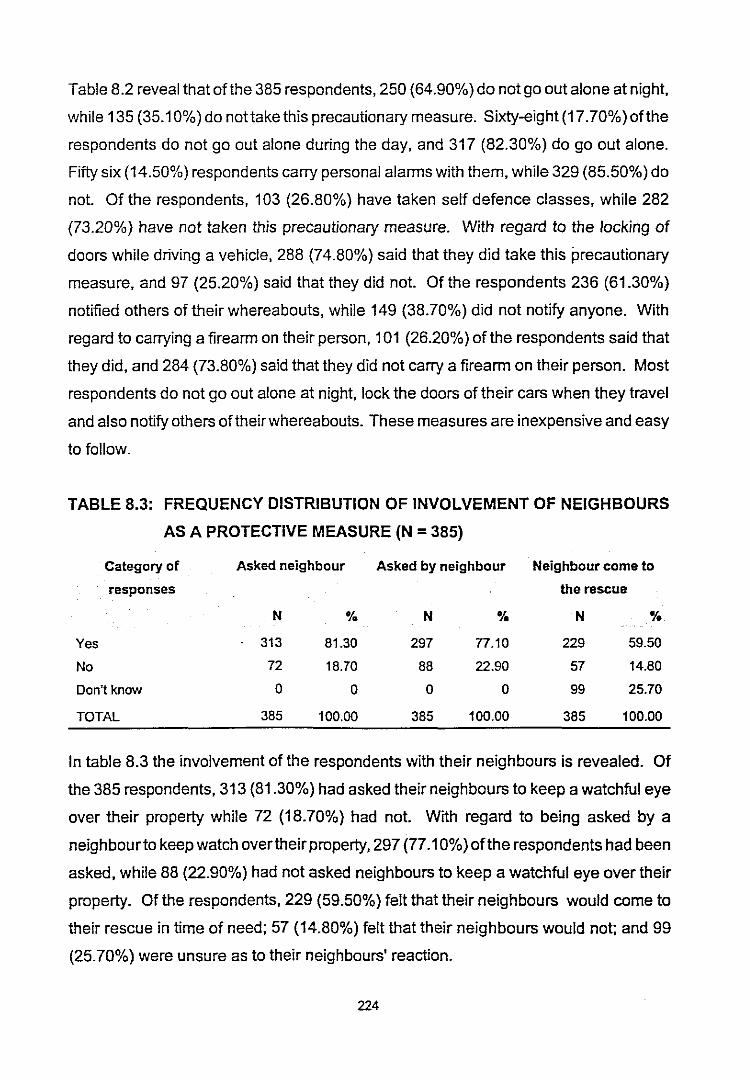
Table 8.2 reveal thatofthe 385 respondents, 250 (64.90%) do not go out alone at night,
while 135 (35.10%) do not take this precautionary measure. Sixty-eight (17.70%) of the
respondents do not go out alone during the day, and 317 (82.30%) do go out alone.
Fifty six (14.50%) respondents carry personal alarms with them, while 329 (85.50%) do
not. Of the respondents, 103 (26.80%) have taken self defence classes, while 282
(73.20%) have not taken this precautionary measure. With regard to the locking of
doors while driving a vehicle, 288 (74.80%) said that they did take this precautionary
measure, and 97 (25.20%) said that they did not. Of the respondents 236 (61.30%)
notified others of their whereabouts, while 149 (38.70%) did not notify anyone. With
regard to carrying a firearm on their person, 101 (26.20%) of the respondents said that
they did, and 284 (73.80%) said that they did not carry a firearm on their person. Most
respondents do not go out alone at night, lock the doors of their cars when they travel
and also notify others of their whereabouts. These measures are inexpensive and easy
to follow.
TABLE 8.3: FREQUENCY DISTRIBUTION OF INVOLVEMENT OF NEIGHBOURS
AS A PROTECTIVE MEASURE (N =385)
Category of
responses
Yes
No
Don't know
TOTAL
Asked neighbour Asked by neighbour Neighbour come to
the rescue
N '1'0 N 'l'. N %
313 81.30 297 77.10 229 59.50
72 18.70 88 22.90 57 14.80
0 0 0 0 99 25.70
385 100.00 385 100.00 385 100.00
In table 8.3 the involvement of the respondents with their neighbours is revealed. Of
the 385 respondents, 313 (81.30%) had asked their neighbours to keep a watchful eye
over their property while 72 (18.70%) had not. With regard to being asked by a
neighbourto keep watch overtheirproperty, 297 (77.10%) ofthe respondents had been
asked, while 88 (22.90%) had not asked neighbours to keep a watchful eye over their
property. Of the respondents, 229 (59.50%) felt that their neighbours would come to
their rescue in time of need; 57 (14.80%) felt that their neighbours would not; and 99
(25.70%) were unsure as to their neighbours' reaction.
224
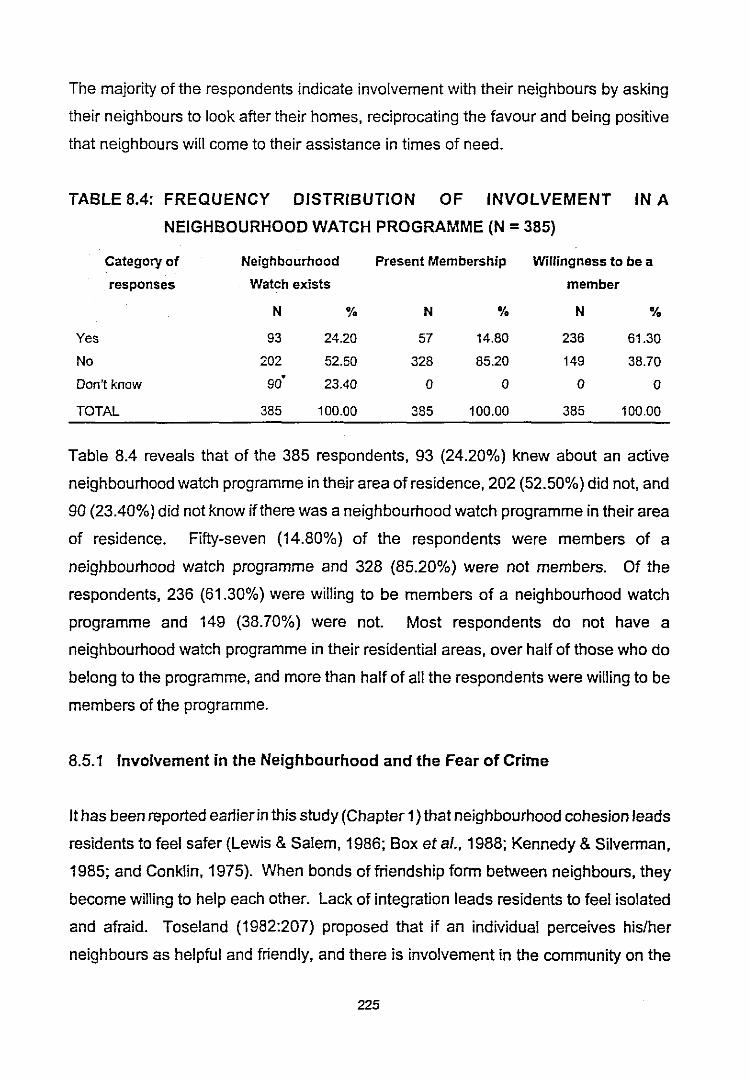
The majority of the respondents indicate involvement with their neighbours by asking
their neighbours to look after their homes, reciprocating the favour and being positive
that neighbours will come to their assistance in times of need.
TABLE 8.4: FREQUENCY DISTRIBUTION OF INVOLVEMENT IN A
NEIGHBOURHOOD WATCH PROGRAMME (N =385)
Category of Neighbourhood Present Membership Willingness to be a
responses Watch exists member
N % N % N %
Yes 93 24.20 57 14.80 236 61.30
No 202 52.50 328 85.20 149 38.70
Don't know 90· 23.40 0 0 0 0
TOTAL 385 100.00 385 100.00 385 100.00
Table 8.4 reveals that of the 385 respondents, 93 (24.20%) knew about an active
neighbourhood watch programme in their area of residence, 202 (52.50%) did not, and
90 (23.40%) did not know ifthere was a neighbourhood watch programme in their area
of residence. Fifty-seven (14.80%) of the respondents were members of a
neighbourhood watch programme and 328 (85.20%) were not members. Of the
respondents, 236 (61.30%) were willing to be members of a neighbourhood watch
programme and 149 (38.70%) were not. Most respondents do not have a
neighbourhood watch programme in their residential areas, over half of those who do
belong to the programme, and more than half of all the respondents were willing to be
members of the programme.
8.5.1 Involvement in the Neighbourhood and the Fear of Crime
It has been reported earlier in this study (Chapter 1) that neighbourhood cohesion leads
residents to feel safer (Lewis & Salem, 1986; Box et al., 1988; Kennedy & Silverman,
1985; and Conklin, 1975). When bonds of friendship form between neighbours, they
become willing to help each other. Lack of integration leads residents to feel isolated
and afraid. Toseland (1982:207) proposed that if an individual perceives his/her
neighbours as helpful and friendly, and there is involvement in the community on the
225
part of residents, the level of fear will be low.
In order to test the relationship between respondents' involvement in their
neighbourhood and the fear of crime, the following hypothesis was formulated:-
Hypothesis 10: There are significant differences between respondents who are
involved in their neighbourhoods and those who are uninvolved,
and their fear of crime.
The measurement of the respondents' involvement in their neighbourhood included the
following questions:
• During the past two years have you asked a neighbour to keep a watchful eye
on your property while you are away? (abridged to asked neighbour)
• During the past two years has a neighbour asked you to keep a watchful eye on
their property while they are away? (abridged to asked by neighbour)
• If you were being attacked while at home, do you think your neighbours would
come to your rescue? (abridged to neighbour comes to the rescue)
• Is there any neighbourhood watch programme operating in the area where you
live? (abridged to neighbourhood watch exists)
• Are you a member of this neighbourhood watch programme? (abridged to
present membership)
• Are you willing to participate in such a programme? (abridged to willingness to
be a member)
The measurement of fear of crime included the following:
• How safe do you feel walking alone at night? (abridged to walking alone)
• How safe do you feel when alone in your home or apartment? (abridged to home
alone)
• How safe do you feel when leaving or arriving at home? (abridged to
leaving/arriving home)
226

The F-test was used to establish the significant differences between respondents who
are involved in their neighbourhoods and neighbourhood watch programmes (abridged
to involved) and those who are not involved (abridged to un-involvement).
The findings are presented in table 8.5 and 8.6 respectively.
227
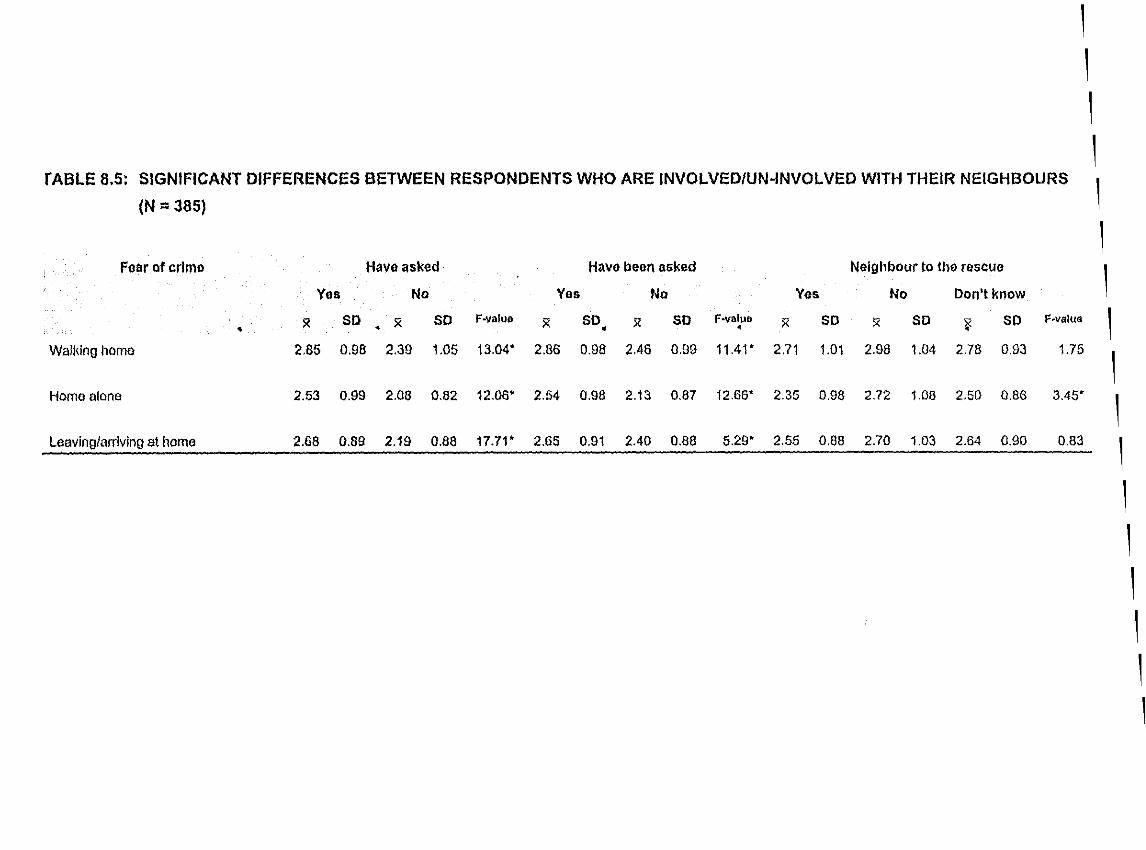
SIGNIFICANT DIFFERENCES BETWEEN RESPONDENTS WHO ARE INVOLVED/UN-INVOLVED WITH THEIR NEIGHBOURS
(N =385)
0.83
3.45*"
fABLE 8.5:
Fear of crime
Walldnghome
Horne alone
Leaving/arriving at home
Have asked Have been asked Neighbour to tho rescue
Yes No Yes No Ves No Don't know
S< SO x SO F-v.luo X SO x SO f ..value X SO X SO ~ SO• • • •2.85 0.98 2.39 1.05 13.04' 2.86 0.98 2.46 0.99 11.41' 2.71 1.01 2.98 1.04 2.78 0.93
2.53 0.99 2.08 0.82 12.06' 2.54 0.98 2.13 0.87 12.66' 2.35 0.98 2.72 1.08 2.50 0.86
2.68 0.89 2.19 0.88 17.71' 2.65 0.91 2.40 0.88 5.29' 2.55 0.88 2.70 1.03 2.64 0.90
1
1
1
1
1
1
1F·valua 1
1.75 1
1
1
1
1
1
1
1
1
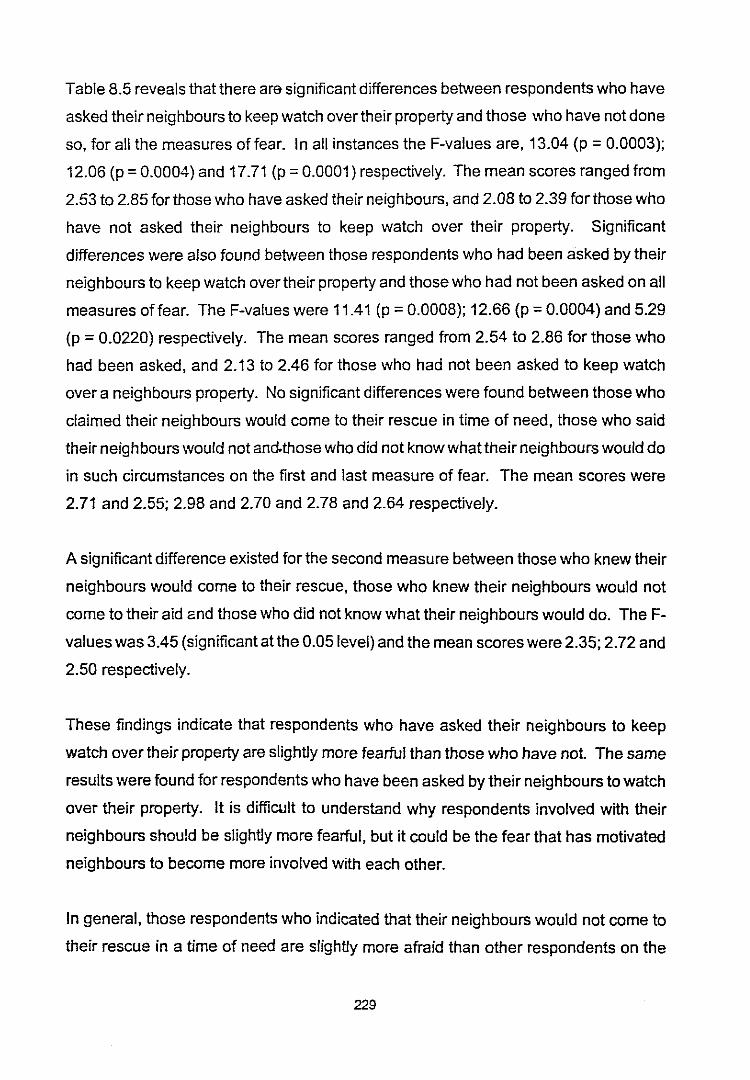
Table 8.5 reveals that there are significant differences between respondents who have
asked their neighbours to keep watch overtheir property and those who have not done
so, for all the measures offear. In all instances the F-values are, 13.04 (p =0.0003);
12.06 (p =0.0004) and 17.71 (p =0.0001) respectively. The mean scores ranged from
2.53 to 2.85 for those who have asked their neighbours, and 2.08 to 2.39 for those who
have not asked their neighbours to keep watch over their property. Significant
differences were also found between those respondents who had been asked by their
neighbours to keep watch over their property and those who had not been asked on all
measures of fear. The F-values were 11.41 (p =0.0008); 12.66 (p =0.0004) and 5.29
(p = 0.0220) respectively. The mean scores ranged from 2.54 to 2.86 for those who
had been asked, and 2.13 to 2.46 for those who had not been asked to keep watch
over a neighbours property. No significant differences were found between those who
claimed their neighbours would come to their rescue in time of need, those who said
their neighbours would not and.those who did not know what their neighbours would do
in such circumstances on the first and last measure of fear. The mean scores were
2.71 and 2.55; 2.98 and 2.70 and 2.78 and 2.64 respectively.
A significant difference existed for the second measure between those who knew their
neighbours would come to their rescue, those who knew their neighbours would not
come to their aid and those who did not know what their neighbours would do. The F
values was 3.45 (significant at the 0.05 level) and the mean scores were 2.35; 2.72 and
2.50 respectively.
These findings indicate that respondents who have asked their neighbours to keep
watch over their property are slightly more fearful than those who have not. The same
results were found for respondents who have been asked by their neighbours to watch
over their property. It is difficult to understand why respondents involved with their
neighbours should be slightly more fearful, but it could be the fear that has motivated
neighbours to become more involved with each other.
In general, those respondents who indicated that their neighbours would not come to
their rescue in a time of need are slightly more afraid than other respondents on the
229

second measure of formless fear (home alone). This finding is similar to the findings
on household composition, i.e. the presence of others should lesson fear but in fact the
presence of others does not make the respondent feel safer.
230
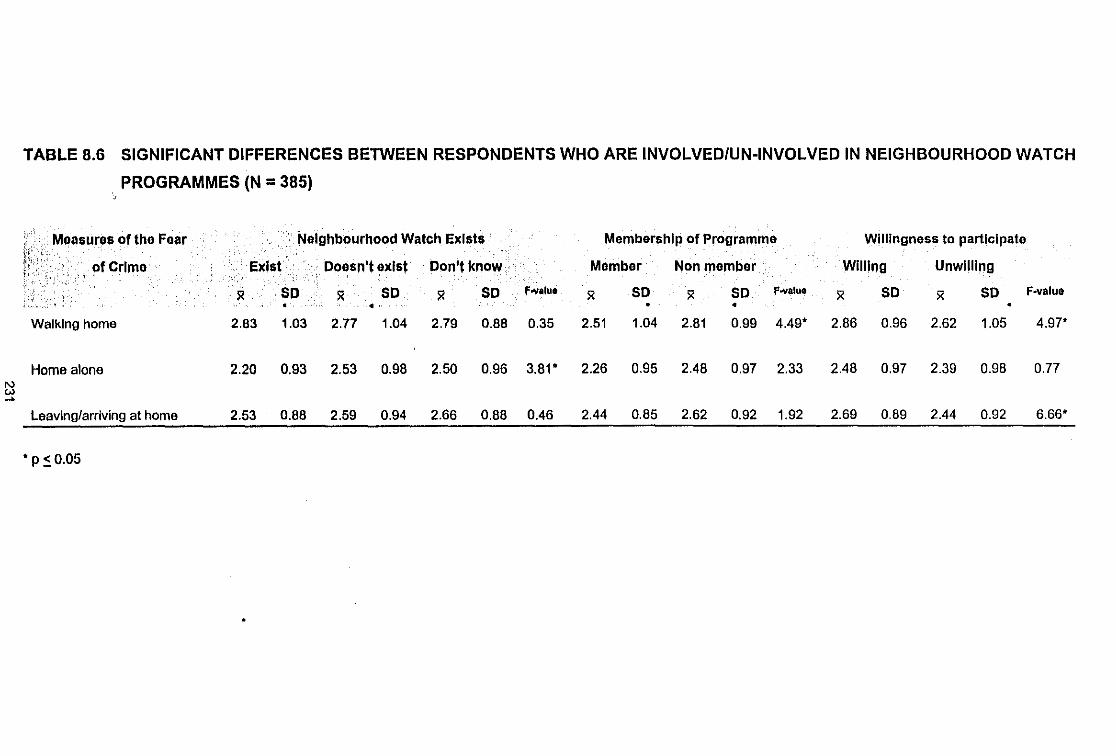
TABLE 8.6 SIGNIFICANT DIFFERENCES BETWEEN RESPONDENTS WHO ARE INVOLVED/UN-INVOLVED IN NEIGHBOURHOOD WATCH
. PROGRAMMES (N =385)
Me;asures of the Fear
of Crime
Walking home
Home alone
Leaving/arriving at home
*p:: 0.05
NelghbourhoQd Watch Exists Membership of Programme Willingness to participate
Ellist Doesn't exist Don't know· Member Nonmember Willing Unwilling"",.(
l< SO l< SO :R SO ' f....,.lue l< SO :R SO p.....alu. :R SO :R SO F-valuo.. ,. , • •2.63 1.03 2.77 1.04 2.79 0.66 0.35 2.51 1.04 2.61 0.99 4.49* 2.86 0.96 2.62 1.05 4.97*
2.20 0.93 2.53 0.98 2.50 0.96 3.81* 2.26 0.95 2.48 0.97 2.33 2.48 0.97 2.39 0.98 0.77
2.53 0.88 2.59 0.94 2.66 0.88 0.46 2.44 0.85 2.62 0.92 1.92 2.69 0.89 2.44 0.92 6.66*
Table 8.6 reveals no significant differences between those respondents who have
knowledge ofan operational neighbourhood watch in their area of residence and those
who had no such knowledge on the first and last measure of fear of crime (walking
alone and leaving/arriving at home). The mean scores were 2.83 and 2.53 for those
who knew about the existence of a neighbourhood watch programme, 2.77 and 2.59
for those who knew for certain that one didn't exist and 2.79 and 2.66 for those who did
not know if one existed or not. A significant difference was obtained for the second
measure of fear (home alone) between those who knew, those who knew that one did
not exist and those who did not know if one existed or not. The F-value was 3.81 (p =0.0229) which is significant at the 0.05 level. The mean scores ranged from 2.20 to
2.50 respectively.
There is a significant difference between those who are members of neighbourhood
watch and those who are not members on the first measure of fear (walking alone).
The F-value was 4.49 (p =0.0348) which is significant at the 0.05 level. The mean
scores are 2.51 for members and 2.81 for non members.
There are no significant differences between members and non-members of
neighbourhood watch programmes and the last two measures of fear (home alone and
leaving/arriving at home). The F-values are 2.33 and 1.92 respectively. The mean
scores are 2.26 and 2.44 for members; and 2.48 and 2.62 for non members
respectively.
Significant differences existed between those who were willing to participate in such a
programme and those who were unwilling with regard to the first and last measure of
fear (walking alone and leaving/arriving at home). The F-value were 4.97 (p =0.0264)
and 6.66 (p =0.0103) respectively (significant at the 0.05 level). The mean scores were
2.86 and 2.69 for those willing to join; and 2.62 and 2.44 for those who were unwilling
to join a neighbOUrhood watch programme.
No significant difference was found between those who were willing and those who
were unwilling on the second measure offear (home alone). The mean scores were
232
2.48 and 2.39 respectively.
The findings of table 8.6 indicate that where neighbourhood watch does not exist,
respondents are slightly more afraid of being home alone. Respondents who are not
members ofneighbourhood watch reported slightly more fear than members on the first
measure of formless fear (walking alone).
Respondents who are willing to be members of Neighbourhood Watch showed slightly
more fear than those who were unwilling to be members. It could be that people are
fearful but willing to be members in the hope that they will feel safer in their
neighbourhoods.
8.6 SUMMARY
When an assessment has been made of the threat to the individual, this individual
responds in various ways such as
• erection of barriers both physical and social between themselves and others
• avoidance of activities which could put them in jeopardy
• decrease in sociable activity
• purchasing firearms and any other form of weapon for protection
• engaging in self defence lessons
• purchasing any security device available.
When these responses fail, it is left to the community to attempt to provide safety and
security.
The community can react in various ways, namely
• pressurize potential deviants to conform to acceptable norms
• notice strangers and watch their behaviour
• watch out for any unusual activity
233
+ contact the police
+ become involved in community based crime prevention strategies.
Crime prevention strategies include the following:
+ Establishing residential security which is based on the concept of defending the
environment within which the community is based. This is done through erecting
physical barriers to keep criminals out; using delaying tactics to impede the
crime; and to detect criminals in a residential area through surveillance.
+ Neighbourhood Watch, which is based on the idea that crime can be reduced if
offenders knows that they could be caught. Normally this programme also
entails the establishment of mini-police stations in high risk areas which serve
the local residents.
+ Citizen patrols which involves increasing the surveillance within an area by
systematically patrolling residential or business areas. Residents do not
apprehend the criminals, but report the offence to the police. Within the
Richards Bay area at the main business complex there are attendants who
watch over cars while people do their shopping. If an attempt is made at
stealing the car. these attendants report to the mini police station established at
the complex.
+ Community Policing is the involvement of the community and the police in
ordering and regulating the interaction of persons within a given area. This form
of policing requires close co-operation between the community and the police
and leads to a better understanding between these two groups.
+ Social development programmes which attempt to improve the standards of
living ofpotential offenders. If education, health care, employment opportunities.
recreational facilities. after school care and guidance counselling for parents was
available. the social environment of the possible future offender could be better.
234
With regard to the precautionary measures taken by the respondents in this study, the
frequency distribution of the basic findings were presented in Table 8.1 to 8.4
respectively. The precautionary measures were divided into those taken to protect the
property of the respondent and those taken to protect the person against possible
future criminal victimisation.
The respondents were also asked to indicate their involvement in their neighbourhoods.
This involvement was measured by whether or not they had asked their neighbour to
keep watch over their property; whether or notthey had been asked to keep watch over
a neighbour's property; and whether or not they thought that their neighbours would
come to their rescue in the time of need. Since Neighbourhood Watch programmes are
a community based crime prevention strategy, the respondents were also asked if a
neighbourhood watch programme existed in their area, whether or not they were
members; and whether they would be willing to belong to such a programme.
In order to test if there were significant differences between those respondents who
were "involved" in their neighbourhood/community and those who were "uninvolved"
and their fear of crime, the F-test was conducted.
235
CHAPTER 9
FINDINGS, CONCLUSIONS AND RECOMMENDATIONS
9.1 INTRODUCTION
The primary aim of this study was to analyse the nature of the fear of crime.
In Chapter 2 of this study, a review of the socio-theoretical explanations/models of
victimology and the fear of crime are presented. The models on victimology include
those of Fattah (1976); Cohen and Felson (1979) and Cohen, Kleugel and Land (1981).
Those on the fear of crime included the irrational model, the cognitive model and the
social control model. Theoretical concept of the independent variables included
gender, age, household composition, type of housing, previous victimisation, rating of
crime as a social problem, the role of the police and involvement in the neighbourhood.
The dependentvariable includedthe three measures offormless fear and the measures
ofconcrete fear. Formlessfearwas measured by feelings of safety when walking alone
at night, when alone in the house or apartment at night, and when leaving or arriving
at home. Concrete fear was measured by the respondents' fear of personal
victimisation and property crimes. The statistical analysis of data is presented in
chapter 4, 5, 6, 7 and 8. Chapter 9 summarises the discussion on hypothesis testing
and fndings. It also details the limitations of this study and concludes with
recommendations.
9.2 LIMITATIONS AND PROBLEMS ENCOUNTERED WITH THIS STUDY
For ethical reasons it is necessary for a researcher to point out the limitations and
problems encountered during the course of this investigation. The limitations and
problems included the following:
+ Literature on the fear of crime in South Africa was limited to a few studies in the
1970s (Schurink & Strydom 1976 and Schurink & Prinsloo 1978); in the 19805
236
(Glanz 1989 and Smith & Glanz 1989); and in the 1990s (Glanz 1991; Maree
1993; Neser et af. 1993 and Pretorius 1994). These studies were conducted in
predominantly urban areas of Gauteng and Western Cape Province.
• The use of a non-probability sampling technique which does not allow for
generalisations. The extremely poor response of the sample also created
logistical and scientific problems.
• The questionnaire had to be translated to Zulu for some of the respondents.
Although care was taken not to influence the respondents, the possibility could
not be ruled out.
9.3 TESTING OF HYPOTHESES
Ten hypotheses were formulated for statistical testing. These hypotheses are based
on age, gender, household composition, type of housing, previous victimisation, crime
as a social problem, the role of the police and involvement in the neighbourhood.
Hypothesis 1: "There is a relationship between age and the fear of crime".
There is a very weak relationship between age and the fear of crime measures (both
formless and concrete fear of crime measures). The following aspects are especially
noticeable:
• The relationship between age and the fear of crime was positive for the first
measure of formless fear (i.e. walking alone at night); and for the fear of
housebreaking (Tables 4.1 to 4.3).
• The relationship between age and the other two measures offormless fear and
the fear of personal victimisation and property crimes was negative (Tables 4.1
to 4.3).
237
Although the statistical indications appear to be somewhat inconsistent, the above
hypothesis could not be rejected out of hand.
Hypothesis 2: ''There are significant differences between male and female
respondents and their fear of crime".
There were significant differences between the male and female respondents and their
fear of crime. The following are especially noticeable:
• Females were in general more fearful of crime (as measured by their feelings of
safety when walking alone, when they are home alone, and when they leave or
arrive at home), than males (Table 4.4).
• Females indicated more fear of personal victimisation than male respondents
(Table 4.5).
• Females were generally more fearful of property crimes than males (Table 4.6).
This hypothesis is accepted.
Hypothesis 3: "There is a relationship between household composition and the
fear of crime".
The relationship between household composition and the fear of crime is weak. The
following are especially noticeable:
• There was a weak positive relationship between all the formless fear of crime
measures (walking alone, home alone and leaving/arriving at home) and
household composition. The relationships between the last two measures and
household composition were statistically significant (Table 4.8).
238
• Weak, positive relationships existed between the fear of personal victimisation
and household composition. The rho's for fear of rape at home, rape away from
home, killed at home, killed away from home, robbed or mugged and being shot
at were all significant at the 0.05 level (Table 4.9).
• There was a weak positive relationship between fear of property crimes and
household composition. The rho's forfearofhousebreaking, arson'and hijacking
were statistically significant (Table 4.10).
Although the findings of this correlation are inconsistent, the hypothesis could not be
rejected, and is therefore partially accepted.
Hypothesis 4: ''There are significant differences between the type of housing of
respondents and the fear of crime".
The are no significant differences between the type of housing in which a respondent
lives and their fear of crime. The hypothesis is therefore rejected. On none of the fear
of formless crime measures nor on the fear of personal victimisation and fear of
property victimisation were any significant differences found (Table 4.12 to 4.14).
Hypothesis 5: "There are significant differences in the fear of crime between
respondents who have been victimised (victims) and those who
have not (non-victims).
The findings of the F-test with regard to this hypothesis are arbitrary. The following
discussion highlights some of the major findings:
• No significantdifferences were found between victims ofsexual assault and non
victims and the formless fear of crime measures (Table 5.4).
• Significant differences were found between victims of robbery and non-victims
and formless fear of crime measures (Table 5.5).
239
+ Respondents who had not been shot at while driving a vehicle indicated a higher
level of fear when walking alone in their neighbourhood than respondents who
had been victimised (Table 5.5).
+ No significant differences were found between victims of a stoning and non
victims and formless fear of crime measures (Table 5.5).
+ No significant differences occurred between victims of a sexual assault and non
victims and the fear of personal crime (Table 5.5).
+ Respondents who had been robbed/mugged showed greater fear for being
killed at home and physical assault than did non-victims (Tables 5.5).
+ No significant differences existed between respondents who had been shot at
while driving a car and those who had not and the fear of personal crimes (Table
5.5).
+ Respondents who had been sexually assaulted were not more fearful of property
crimes than non-victims (Table 5.6).
+ Respondents who had been robbed/mugged were more fearful of
housebreaking, property damage, vehicle broken into and hijacking than were
non-victims (Table 5.6).
+ Respondents who have been shot at while driving are more fearful of
housebreaking than non-victims (Table 5.6).
+ No significant differences between respondents who have been stoned while
driving a car and non-victims and fear of property crimes (Table 5.6).
+ Victims of housebreaking are more fearful of crime than non-victims (formless
fear measures) (Table 5.7).
240
• Victims of property damage had to be more fearful when alone at home than
non-victims (Table 5.7).
• Respondents who have had their vehicles broken into and valuables stolen are
more fearful of walking alone in their neighbourhoods than non-victims (Table
5.7).
• Victims of vehicle theft are more fearful of being home alone than non-victims
(Table 5.7).
• Victims of housebreaking are generally more fearful of rape (away from home).
being killed (at home). being robbed. and being physically assaulted than are
non-victims (Table 5.8).
• Victims of property damage are more fearful of robbery than non-victims (Table
5.8).
• Respondents who have not had their vehicle broken into are less fearful of rape
(at home) and rape (away from home) than victims (Table 5.8).
• No significant differences exist between victims of vehicle theft and non-victims
and fear of personal victimisation (Table 5.8).
• Victims of a housebreaking are more fearful of arson and hijacking than non
victims (Table 5.9).
• No significant differences exist between victims ofvehicle theft and non-victims
and the fear of property crime (Table 5.9).
The findings relating to the above hypothesis are somewhat variable. For this reason
the hypothesis is partially accepted.
241
Hypothesis 6: "There is a relationship between the respondents' rating of
crime as a social problem and the fear of crime".
The relationship between crime as a social problem and the fear of crime is
inconsistent. The following findings are especially noticeable:
• With regard to the relationship between the three measures offormless and
statutory crimes as a social problem, the relationship was found to be weak but
positive in nature. The relationship between traffic violations as a social problem
and two measures of formless fear (walking alone and leaving/arriving at home)
were statistically significant at the 0.05 level (Table 6.3).
• The relationship between personal victimisation as a social problem and fear of
crime was weak but positive in nature. All the relationships were statistically
significant at the 0.05 level.
• The relationship between the three measures of fear of crime and the six types
of property crimes (rated as social problems by the respondents) were all weak
but positive in nature. All these relationships were statistically significant at the
0.05 level (Table 6.5).
The hypothesis is therefore partially accepted.
Hypothesis 7: ''The opinion respondents have of the service rendered by the
police will influence how they rate different crimes as a social
problem in their area of residence.
The relationship between the respondents' opinion of police performance and their
rating of different crimes as a social problem is weak and arbitrary. The follOWing
findings were reported:
242
• The opinion of respondents on the service rendered by the police and the rating
of statutory crime as a social problem is generally weak but positive in nature
Table 6.9).
• The relationship between the rating of different types of personal victimisation
as a social problem and the service rendered by the police was generally weak
but positive in nature. For all types of personal victimisation, the police were
seen as doing a good job, prompt when called out, co-operative, friendly, helpful
and courteous (Table 6.10).
• The relationship between the rating of sexual assault, robbery, being killed and
abduction as social problems and the variable "Police were uninterested in the
case" was weak and negative (Table 6.11).
• The relationships between property crimes as a social problem and the service
rendered by the police was generally weak but positive in nature. For all types
of property crimes rated as a social problem, the police were seen as doing a
good job, prompt, co-operative, friendly, helpful and courteous (Table 6.11).
• The opinion of respondents thatthe police were uninterested in the case and the
rating of housebreaking. theft ofor out ofvehicle, other forms oftheft, vandalism,
hijacking and bag snatching as social problems in the respondents area of
residence was weak and negative in nature (Table 6.11)
Although these findings are inconsistent, the hypothesis cannot be rejected out ofhand,
and is therefore partially accepted..
Hypothesis 8: "The role of the police influences the fear of crime".
The relationship between the role of the police and the fear of crime was inconsistent.
The tables revealed the following findings:
243
• Fear of crime and contact with the police
The relationship between the three measures offormless fear and actual contact
with the police was very weak and negative (Table 7.9).
• Fear of crime and the reporting of crime to the police
The relationship between the three measures of fear and the reporting of crime
to the police ranged from a very weaknegative correlation (-0.00302) for feelings
of safety when home alone and the reporting of crime in which the respondent
had been a victim to a very weak positive relationship (0.04297) between
feelings of safety when leaving and arriving at home and reporting a crime of
which respondent had knowledge (Table 7.9).
• Fear of crime and the reasons for not reporting crime to the police
The relationship between the three measures of formless fear and the reasons
why respondents did not report crime to the police ranged from a very weak
negative relationship (-0.0669) between the second measure of fear and
respondents not reporting crime because involvement in the criminal justice
system is time consuming to a weak positive relationship (0.15711) between the
second measure offear and respondents not reporting crime because the police
make them feel like the guilty party (Table 7.9).
+ Fear of crime and feelings of respondents toward contact with the police
The relationship between fear ofcrime and the feelings of respondents towards
contact with the police are all weak and positive; varying from 0.01117 for the
second measure of fear and Willingness of the respondent to lodge a complaint
to 0.12140 for the third measure offear and willingness of the respondentto call
on the police when threatened (Table 7.10).
+ Fear of crime and the respondents obligation toward crime prevention
It is noticeable that the three measures of formless fear and respondents'
opinion or their obligation toward crime prevention various from an extremely
weak negative relationship between the last measure of formless fear
244
(leaving/arriving at home) and respondents' willingness to assist the police in
combating crime (-0.00962); to a weak positive relationship between the second
measure of fear (home alone) and respondents' view that they are an important
link in the criminal justice system (0.03413) (Table 7.11).
• Fear of crime and the public's opinion of police performance
The relationship between the measures of formless fear and the public's opinion
of police performance varies from a very weak negative relationship between the
third measure offear (leaving/arriving at home) and the respondents opinion that
the police are uninterested in the case (-0.03290) to a definite but small positive
relationship between the last measure of fear and respondents' opinion that the
police are doing a good job of combating crime (0.20747). In general the
findings are statistically significant at the 0.05 level (Table 7.12).
• Fear of crime and police visibility
The relationship between the three measures offormless fear and police visibility
ranged from weak and negative (-0.04332) forthe first measure of fear and fear
of policeman in plain clothes to a small but definite relationship (0.27792)
between the second measure of fear and the actual patrolling of the
respondents' neighbourhood by the police.
Hypothesis 8 cannot be completely rejected and therefore is partially accepted.
Hypothesis 9: "There are significant differences between male and female
respondents and their experience with the police".
The findings of the F-test were inconclusive. The following were obtained:
• Gender differences and contact with the police
There is a significant difference between male and female respondents and the
contact they had wrth the police (Table 7.14).
245
+ Gender differences in the reporting of crime to the police
There are significant differences between male and female respondents with
regard to reporting crime in which they have been a victim or of which they have
knowledge (Table 7.14).
+ Gender differences and reasons for not reporting crime to the police
The only gender difference in the list of reasons why respondents did not report
crime to the police was obtained for the females willingness to settle a case
personally (Table 7.14).
+ Gender differences and police visibility
There are no significant differences between male and female respondents with
regard to fear of policeman in uniform; fear of a plain clothes policeman and
actual patrolling by the police of residential neighbourhoods (Table 7.18).
+ Gender differences and feelings of respondents toward contact with the
police
The only significant difference between male and female respondents was
observed in the willingness to lodge a complaint at the police station (Table
7.15).
+ Gender differences and the opinion of respondents on police performance
No significant differences were obtained between male and female respondents
and their opinion of the performance of local police (Table 7.17).
+ Genderdifferences in the respondents' obligation toward crime prevention
Significant differences were found between male and female respondents with
regard to their obligation to combat crime. Females were far more willing to
combat crime and assist the local police (Table 7.16).
No significant differences were found between male and female respondents
and their view on being an important link in the criminal justice system (Table
246
7.16).
The statistical findings of the above hypothesis are inconclusive. Therefore the
hypothesis is partially accepted.
Hypothesis 10: ''There are significant differences in the fear of crime between
residents who are involved in their neighbourhoods and those who
are uninvolved.
The findings of the F-test with regard to significant differences was arbitrary. The
following discussion highlights the findings:
• There are significant differences between those respondents who are involved
in their neighbourhood (as measured by asking a neighbour to watch over your
property, and being asked by a neighbour to watch over their property) and
those who are uninvolved, on all three measures of formless fear (Table 8.5).
• In answer to the question pertaining to the opinion respondents have on their
neighbour being willing to come to their rescue in time of need, the only
significant difference was on the measure of formless fear (Table 8.5).
• No significant differences were found between those respondents who knew of
the existence of a neighbourhood watch programme and those who did not on
the three measures of formless fear (Table 8.6).
• A significant difference between those who are members of a neighbourhood
watch system and those who are not was found on the first measure of formless
fear of crime (walking alone)(Table 8.6).
• Significant differences in fear of crime (the measures being walking alone and
leaving/arriving at home) were found between those respondents who were
willing to participate in a neighbourhood watch programme and those who were
247
unwilling (Table 8.6).
The hypothesis is partially accepted.
9.4 DISCUSSION OF FINDINGS
The findings discussed in this section included the influence of age, gender and
household composition, previous victimisation, crime as a social problem, the role ofthe
police, involvement in the neighbourhood on the fear of crime.
9.4.1 Age, Gender, Household Characteristics and the Fear of Crime
The relationship between age, gender, household composition and fear of crime has
produced interesting results. Each variable and its relationship with the fear of crime
will be discussed.
9.4.1.1 Age and the fear of crime
Research on the effect of age on the fear of crime (Baumer 1985; Garofalo 1979;
Keane 1992; La Grange & Ferraro 1989; Miethe et at. 1978; Ortega & Myles 1987;
Smith & Glanz 1989; Stafford & Galle 1984; Toseland 1982 and Yin 1982 to mention
but a few) has produced inconsistent results. Generally, the findings have been that
age is positively related to the fear of crime. In other words, as age increased so did
the fear of crime. On the one hand, the elderly were viewed as being vulnerable to
personal victimisation and on the other hand, the young tended not to admit to fear.
However, La Grange and Ferraro (1989) found the relationship between age and the
fear of crime to be negative. These findings were that younger persons reported a
greater fear than older persons. Smith and Glanz (1989) claimed that there was little
difference in the levels of fear of the different categories of the age variable.
The findings of this research were congruent with that of La Grange and Ferraro (1989)
248
and Smith and Glanz (1989). The relationship between age and the first formless fear
measure was positive but weak. This implied that as age increased so did the fear of
walking alone in the neighbourhood. The rest of the measures of formless fear were
negatively related to age and the magnitude of the relationship was weak. This
indicated that as age increased. so fear of crime decreased. But these relationships
were extremely weak.
When age was correlated with the fear of personal victimisation and fear of property
crimes. except for age and the fear of housebreaking which was positively related. the
rest of the correlations were weak and negative. The negative correlations implied that
as age increased so fear of personal victimisation and fear of the remaining property
crimes decreased. but these correlations were weak. Thus. the findings of this study
can be viewed as somewhat inconsistent.
9.4.1.2 Gender and the fear of crime
Gender has emerged as the most powerful predictoroffear ofpersonal crimes. Various
authors (Clemente & Kleiman 1977; Conklin 1975 and Garofalo 1979) have found
women to be considerably more fearful than men.
La Grange and Ferraro (1989) stated that regardless of how fear of crime is measured.
women were significantly more fearful of criminal victimisation than men. Their findings
were consistent with those of Box et al. (1988); Toseland (1982); Stafford and Galle
(1984) and Garofalo (1979). However. Smith and Glanz (1989) in their study offearof
crime among the South African public, reported little difference between levels of fear
with regard to gender. The findings of this research clearly support previous findings
that women generally fear crime (whether formless or concrete fear) more than men.
The F-values for all the measures of formless and concrete fear are significant at the
O.05level. Especially significant was that women were extremely fearful of rape either
at home or away from home. This supports the suggestion by Warr (1984) that a higher
fear of crime for women may be fear of male violence. Also noteworthy, is the
difference in levels of fear shown by malesand females with regard to being robbed or
249
mugged and housebreaking. Robbery/mugging is a form of personal victimisation
which could account for the difference. As for housebreaking, the difference could be
based on the perception of the women that if she was at home or disturbed burglars by
coming home during the housebreaking, she could be raped or murdered. Thus, fear
of personal victimisation on the part of the women respondents in this study is high.
However, men showed high levels of fear of being killed at home or away from home,
being shot at and being hijacked. Thus, although there are gender differences in the
fear of crime, it can be stated that fear of criminal victimisation exists, regardless of
gender, for the respondents of this study.
9.4.1.3 Household composition and fear of crime
An individual's sense of safety is influenced by the presence of other persons in their
immediate environment. According to Warr (1990:894), being alone provokes fear as
the isolated individual is an easy target for victimisation and the absence of people
implies that there is no one to come to your aid in the event of an attack.
Various researchers used the number of persons residing with the respondent as a
demographic variable (Keane 1992; Miethe et al. 1987; Neser et al. 1993; Parker &Ray
1990; Smith & Hill 1991; Smith & Jarjoura 1989 and Toseland 1982).
Although a positive relationship existed between household composition and fear of
crime (i.e. the greater the number of persons who resided with the respondent, the
greater the fear) the relationship was weak.
Although these relationships were weak as far as this investigation is concerned, it is
interesting to note that two measures of formless fear (home alone and leaving and
arriving at home) and certain measures of concrete fear (fear of being raped at home,
rape away from home, killed at home, killed away from home, robbed/mugged, shot at,
housebreaking, arson, and hijacking) were significantly related to household
composition. This would imply that respondents who had people to care about
250
(families) were fearful of crimes in which their loved ones could be hurt.
9.4.1.4 Type of housing and fear of crime
Little research has been done on the relationship between type of housing and fear of
crime (Keane 1992; Neser et al. 1993 and Smith & Jarjoura 1989). Over seventy-five
percentofthe respondents resided in brick houses and the remaining respondents lived
in connected housing (duplex, simplex or flat) or alternative housing (shack, rented
room, tent or rondavel).
The research findings indicated no significant differences between type of housing and
the measures of formless and concrete fear of crime. However, the mean scores
ranges from 2.43 to 2.86 on the three measures of formless fear; 2.66 to 3.43 for fear
of personal victimisation and from 2.90 to 3.20 for fear of property crimes. These
scores indicate considerable fear of crime on the part of respondents, regardless of
their type of housing.
9.4.2 Previous Victimisation and Fear of Crime
In general, the findings of various authors (Baumer 1985; Box et al. 1988; Garofalo
1979; Neser et al. 1993; Parker & Ray 1990; Smith & Glanz 1989 and Smith & Hill
1991) have indicated that individuals who have been previously victimised are
SUbstantially more fearful of criminal victimisation than non-victims. Factors which
affect the fear of crime include the following:
+ The time lapse between the victimisation experience and the research study.
+ The type of victimisation, i.e. either personal or property.
+ The precautionary measures taken by victims and non-victims.
+ The perceived safety of the neighbourhood in which the individual lives.
+ The seriousness of the victimisation experience.
The general findings of this study indicated that individuals who had been robbed, were
251
more fearful of crime than non-victims. (The fear of crime measures included both
formless fear and fear of personal victimisation and property crimes). Respondents
who had not been shot at indicated a greater level of formless fear than victims, but
victims showed a higher fear qf property crimes than non-victims. Respondents who
had suffered property victimisation tended to report higher levels of fear (for both
formless fear of crime measures and concrete fear of crime measures). One noticeable
exception was victims of vehicle theft whose fear of personal victimisation and property
crimes did not differ substantially from non-victims' fear of crime.
Robbery is viewed as a serious crime by the respondents of this study, and being a
victim of a robbery influences the level of fear considerably. Robbery is also viewed as
a crime againstthe person which could accountforthese findings. The factthat victims
of property crimes are more fearful of crime than non-victims could be accounted for by
the fact that having already been victimised, the individual knows what to expect and
fears the outcome of future victimisation. A victim of a housebreaking could fear a
further victimisation aimed at the person instead of the property.
These results echo the findings of Smith and Hill (1991) who found that previous
personal victimisation has little effect on fear levels, but that previous property
vlctimisatlon or a combination of personal and property victimisation is positively
associated with fear (Smith &Hill 1991:232).
9.4.3 Crime as a Social Problem and Fear of Crime
In order to measure respondent's concern about crime, the individual's perception of
the seriousness of the problem of crime in their residential area was obtained.
Concern about crime is important as many male respondents in this study indicated
that they were concemed about crime but not fearful of it. Concern, also taps the image
the individual has of the environment in which he or she lives, and the threat of criminal
victimisation in that environment. In this study, concem with statutory crimes, crimes
of a persona! nature and property crimes was used as a measure.
252
The frequency distribution of responses indicates that the respondents viewed drunken
driving, assault, housebreaking, theft from vehicles, other forms of theft, robbery and
hijacking as problems in their area of residence.
The relationship between statutory crime as a social problem and the three formless
fear of crime measures was weak but positive. People who are concerned about
statutory crime, are more fearful of crime. The same findings for the relationship
between personal victimisation and property crime as a problem and the fear of crime
existed. All these relationships were significant at the 0.05 level. Respondents who
were concerned about personal victimisation and property crime (who viewed them as
a social problem) were more fearful of crime (as measured by formless fear of crime
measures).
9.4.3.1 Crime as a social problem and respondents' opinion of police
performance
Respondents' rating of personal victimisation as a social problem was positively related
to the opinion respondents have on police performance. A similar result was obtained
for property crimes as a social problem and the opinion of respondents. This implies
that the more problematic the crime is rated, the more negative the respondents'
opinion of the police's performance.
9.4.4 Role of the Police
The role of the police in combating crime is an important factor in the reduction of the
fear of criminal victimisation.
Little literature is available on the issue of the role of police, and the study of Glanz
(1989) was viewed as an important source of information. Good police-community
relations are important because the police depend on the public for information about
crime and to combat crime.
253
The role of the police was divided into four categories, namely contact with the police,
the reporting and non-reporting of crime to the police, the opinion of respondents on
their obligation towards crime prevention and the opinion of the conceming police
performance (services rendered) and police visibility.
9.4.4.1 Fear of crime and contact with the police
The type of contact that a respondent has had with the police was negatively related
to the fear of crime. If the type of contact was negative in nature, then respondents'
fear of crime would be influenced.
9.4.4.2 Reporting and non-reporting of crime and the fear of crime
The relationship between the reporting of crime in which a respondent has been a
victim and the fear of crime is negative in nature, l.e. if a victim reports crime his level
of fear is more than a victim who does not report a crime. Reporting a crime of which
a person has knowledge of will decrease the person's level of fear. In general, the
reasons why respondents did not report crimes were positively related to the fear of
crime (the measures of formless crime).
9.4.4.3 Obligation to crime prevention and fear of crime
The relationship between respondents' opinion of their obligation to crime prevention
and fear ofcrime is inconsistent. Respondents appear to be unwilling to assist in crime
prevention regardless of the high level of fear.
9.4.4.4 The Public's opinion of police performance and visibility and fear ofcrime
The weak positive relationship between the services rendered by the police and the fear
of crime (with the exception of the police being uninterested), indicates that the
respondents' fear of crime is not influenced by the performance of the police. These
findings can be explained by the fact that almost one third of the respondents were
254
uncertain with regard to the services rendered by the police, another third disagreed
with the statements regarding police performance, while another third agreed (Table
7.7). This group of uncertain respondents is large enough to cause concern about the
effectiveness of the police in crime prevention.
A positive relationship also existed between police visibility and the fear of crime. This
finding implied that, irrespective of a police presence, the fear of crime existed among
the respondents.
9.4.4.5 Gender differences in the respondents' experience with the police
Female respondents were less likely to report crime to the police in which they had
been a victim or of which they had knowledge, more than male respondents, and to
settle the cases in which they were involved personally, without police assistance.
Females were also more unwilling to lodge a complaint with the police, to combat crime
and assist the police, than males.
The unwillingness of women to get involved in crime prevention can be due to their
higher levels of fear. Men could also refrain from involvement in the criminal justice
system as to acknowledge fear is against the "masculine" image of South African men.
9.4.5 Involvement in the Neighbourhood and Fear of Crime
Fear ofcriminal victimisation can cause a break down in social cohesion and solidarity,
and lead to the disappearance of sociability, mutual trust and willingness to help others
(Box et al. 1988; Clemente & Kleiman 1977; Liska et al. 1988; Smith & Glanz 1989 and
Warr 1990).
The reaction of the individual to fear of crime includes defensive responses and
offensive responses. Defensive responses imply not going out, avoiding strangers and
keeping off the streets. Offensive responses to crime, imply that the individual actually
does something physically to protect their person or property against crime.
255
Of the defensive measures used by respondents of this study, not going out alone at
night, locking the doors while driving a vehicle, locking doors of home; notifying others
of their whereabouts and leaving the radio, TV and lights on when not at home figure
as the most important (Table 8.1 & 8.2). The offensive measures most often engaged
in included adding extra security lights, and installing burglar-proofing.
Within the community context, neighbours tend to watch over each other and enforce
informal social control. When neighbourhoods are well integrated, residents know each
other, and notice strangers or behaviours which are out of the ordinary. Crime
prevention strategies then have a community base. The most often used crime
prevention strategy in neighbourhoods is the neighbourhood watch programme and,
introduced later, the community policing forums.
In this study the respondents' involvement in his/her neighbourhood, and the
respondent's involvement in neighbOUrhood watch programmes were investigated.
Respondents who are involved in their neighbourhoods (who have asked neighbours
and have been asked by neighbours to watch over property) were more fearful of crime
than respondents who were uninvolved. Respondents who knew that their neighbours
would not come to their rescue were more fearful than those who knew that their
neighbours would assist them.
The respondents who were willing to join a Neighbourhood Watch programme indicated
more fear of crime than those who were unwilling. Respondents who were already
members of a neighbourhood watch programme were less fearful than those who were
not members.
These findings are interesting. Neighbours who are involved, could have become
involved with their neighbours after a victimisation experience. The willingness to join
a Neiqhbourhood Watch programme could be motivated by high levels of fear. In
general then, involvement in the neighbourhood could reduce levels of fear.
256
9.5 CONCLUSIONS
The following conclusions can be drawn from the empirical findings of this study:
(i) The relationship between age and fear of crime is inconsistent and necessitate
further investigation. It can be said that all age groups fear criminal victimisation.
However, the age categories of this study did not allow for a comprehensive
analysis of this relationship.
(ii) Gender emerges as a strong predictor of fear. Although females were generally
more fearful than males, males too were fearful of criminal victimisation. Thus,
fear of crime is a reality for both male and female respondents of this study.
(iii) Household composition is related to the fear of crime. However the relationship
was weak. The findings are interesting in that one would expect the relationship
to have been negative, i.e. the more isolated the individual, the more fearful they
are of criminal victimisation. Instead, respondents who had more people
residing with them were more fearful of crime.
(iv) There are no significant differences between the type of housing in which
respondents reside and the fear of crime. Although there are no significant
differences respondents' fear of crime is real.
(v) Previous victims of a robbery are generally more fearful of crime than non
victims. Having experienced property crimes also influences the level of fear of
the respondent. In general, previous victims are more fearful than non-victims.
(vi) Respondents who were concerned about statutory crimes, personal victimisation
and property crimes were fearful of crime. In this regard. concern about crime
influenced the respondents' fear of crime. Concern and fear are therefore
related issues.
207
(vii) The relationship between the role of the police and the respondents' fear of
crime is arbitrary. In general, the role of the police has little influence on
respondents' fear of crime. The respondents view their obligation to assist the
police as minimal, and they seem to be unsure as to the quality of services
rendered by the local police. Gender differences in respondents' image of the
police were minimal. Females were more willing to assist the police and to have
contact with the police than men.
(viii) People become involved with their neighbours in an attempt to reduce their fear
levels. Involvement in Neighbourhood Watch programmes also entails a
reduction in the level of fear felt by respondents. Neighbourhood cohesion is
according to the literature (Box et al. 1988; Conklin 1975 and Toseland 1982) an
important factor in any fear reduction strategy.
9.6 RECOMMENDATIONS
Although the emphasis of the present study is on the factors influencing the fear of
crime, a number of non-prescriptive recommendations can be made. The most
important aspect of the recommendations is on ways to reduce the fear of crime
amongst the respondents and the South African public in general. These
recommendations are two fold, namely, programmes or strategies to reduce fear and
recommendations for further research.
9.6.1 Recommendations for Police-Community Relations
• Improve the image of the police. Much has been done by the South African
Police Service to improve its image among the South African public since 1994.
In the postapartheid era, the formal structure of the police has been reorganised
in order to eliminate the paramilitary ranking used pre-1994. In Kwazulu-Natal,
the Kwazulu Police and the erstwhile South African Police have united to the
current South African Police Service (SAPS). The image of both have been
tarnished by media reports of police bias and police involvement in political
258
violence. This image needs to be rectified before the public will trust the police.
• Greater involvement of the local police at school level. Glanz (1989:66)
recommended that the police give talks, discussions and present videos on
crime prevention at a practical level at all schools. This recommendation is
supported by this researcher as it is perceived as a valuable educational tool to
improve the image of the SAPS and to make the police more user friendly.
• Increased foot patrols. Visibility of the police is a deterrent to criminal activity.
Greater visibility is needed. However, acknowledgement must be made of the
serious manpower shortage faced by the police. In Empangeni and Richards
Bay, foot patrols are seldom encountered in residential areas, but do occur in the
business area especially at the end of the month.
• Increase the awareness of the existence of the concept of Neighbourhood
Watch programmes. Although most white residents in Empangeni and Richards
Bay have knowledge ofwhat the Neighbourhood Watch programme entails, few
programmes have been initiated and fewer have survived. There is a lack of
commitment and a general apathy toward the actual activity of the programme.
Within the black residential areas, the concept of Neighbourhood Watch seldom
exists and might usefully be promoted.
• The establishment of community policing forums. Community policing entails
voluntary involvement on the part of the community in policing activity; and the
creation of a community policing officer (CPO) who acts as a direct link between
the police and the community. CPO's not only serve to combat crime but also
solve the particular problems experienced in the community. Community
policing is based on mutual trust between the police and the community, and its
major aim is to build a sense of community amongst residents.
Community policing addresses fear of crime, social and physical disorder and
community decay.
259
The implementation of community policing forums in Empangeni and Richards
Bay occurred in September 1995 - after the fieldwork was completed. However,
in the humble opinion of the researcher, community policing is the crime
prevention strategy most likely to effect any reduction in the level of fear.
9.6.2 Future Research
Future research on the following is recommended:
• It is necessary to initiate in the province of KwaZulu-Natal (and other provinces)
an official crime survey, as this would assist researchers in their endeavours.
• In the present climate of violence and increasing criminal victimisation, priority
should be given to a similar study amongst all population groups in KwaZulu
Natal.
• Research on crime prevention strategies and how they can be implemented,
should be prioritized.
In conclusion then. crime and the fear of crime is a daily reality for many residents in
KwaZulu-Natal. This problem must be addressed, as the quality of life of people in our
province is severely affected by crime and the threat of criminal victimisation.
260
REFERENCES
Akers, RL., La Greca, A.J., Sellers, C. &Cochran, J. 1987. Victimization and fear of
crime among the elderly in different types of community. Criminology, 25(3):487
505.
Akers, RL. 1985. Deviant behavior: A social learning approach (3rd ed.): Balmont
CA: Wadsworth.
Babbie, E. 1990. Survey research methods. Belmont, CA: Wadsworth.
Bailey, K.D. 1987. Methods ofsocial research (3rd ed.). New York: Free Press.
Baker, M.H., Weinstedt, B.C., Everett, RS. & McCleary, R 1983. The impact of
a crime wave: Perceptions, fear and confidence in the police. Law and Society
Review, 17(2):319-35.
Balkin, S. 1979. Victimization rates, safety, and the fear of crime. Social Problems,
26(3):343-357.
Balkin, S. &Houlden, P. 1983. Reducing fear ofcrime through occupational presence.
Criminal Justice and Behaviour, 19(1):13-33.
Baumer, T.L. 1978. Research on fear of crime in the United States. Vicflmology: An
Intemational Joumal, 3(3-4):254-264.
Baumer, T.L. 1985. Testing a general model of fear of crime: Data from a national
sample. Joumal ofResearch in Crime and Delinquency, 22(3):239-255.
Baumer, T. & Rosenbaum, D. 1982. "Fear of Crime: An empirical clarification of a
major problem." Presented at the annual APA conference, Washington. August
23-27, 1982.
Beyer, L. 1993. Communitypolicing: Lessons from Victoria. Australian Studies in Law,
Crime and Justice. Canberra, ACT: Australian Institute of Criminology.
Biderrnan, A. (Ed.). 1972. Crime and justice: a symposium. New York: Naelburg.
Blalock, H.M. 1981. Social statistics (2nd ed.). London: McGraw-HilI.
Block, C.R. & Block, RL. 1986. Crime definition, crime measurement, and victim
surveys. Journal ofSocial Issues, 40:137-160.
Block, RL. 1971. Fear of crime and fear ofthe police. Social Problems, 19:91-101.
Box, S., Hale, C. & Andrews, G. 1988. Explaining fear of crime. British Joumal of
Criminology, 28(3):240-356.
261
Braungart, M.H., Braungart, R.G. & Hayer, W.J. 1980. Age, sex and social factors in
fear of crime. Sociological Focus, 13(1):55-56.
Brooks, J. 1974. The fear of crime in the United States. Crime and Delinquency,
20:241-244.
Brown, S.E., Esbensen, FA &Geis, G. 1991. Criminology. Explaining crime and its
context. Cincinnati, Ohio: Anderson Publishing Company.
Brown, S.E., Esbensen, F. & Gels, G. 1996. Criminology. Explaining crime and its
context (2nd ed.). Cincinnati, Ohio: Anderson Publishing Company.
Carmines, E.G. &Zeller, RA. 1974. "On establishing the empirical dimensionality of
theoretical terms: An Analytic example: Political Methodology, 1:75-96.
Carmines, E.G. & Zeller, RA 1979. Reliability and validityassessment. London: Sage
Publications.
Clemente, F. &Kleiman, M.B. 1976. Fear of crime among the aged. Gerontologist, 16:
207-210.
Clemente, F. and Kleiman, M.B. 1977. Fear of crime in the United States: A
multivariate analysis. Social Forces, 56:519-531.
Cloete, M.G.T. & Stevens, R 1990. Criminology. Southern Book PUblishers. Halfway
House: Southern.
Cohen, E.C., Kleugel, J.R &Land, K.C. 1981. Social inequality and predatory criminal
victimization. An exposition and test of formal theory. American Sociological
Review, 49:505-524.
Cohen, L.E. & Felson, M. 1979. Social change and crime rate trends: A routine activity
approach. American Sociological Review. 44:588-608.
Cohen, L.E. & Felson, M. 1992. Social charge and crime rate trends: Structure activity
approach. In W.J. Schurink, I. Snyman, W.F. Krugel & L. Siabbert (Eds).
Victimization: Nature and trends. Pretoria: HSRC.
Conklin, J.E. 1975. The impact ofcrime. New York: MacMillan.
Drapkin, I. & Viano, E. (eds). 1974. Victimology. London: DC Heath.
Du Bow, F., McCabe, E. & Kaplan, G. 1987. Reactions to crime: A Critical review of
the literature. In K.F. Ferraro & RL. La Grange. The measurement of fear of
crime. Sociological Inquiry, 57:70-101.
262
Durkheim, E. 1980. The Rulesof Sociological method. In J. Hughes. The philosophy
of social research. London: Longman.
Eve, R.A. &Eve, S.B. 1984. The effects of powerlessness, fear of social change, and
social integration on fear of crime among the elderly. Victimology: An
Intemational Joumal, 9:290-295.
Fattah, E.A. 1979. Some recent theoretical developments in victimology. Victimology,
4:198.
Fattah, EA 1992. Some recent theoretical developments in victimology. In W.J.
Schurink, I. Snyman, W.F. Krugel &I. Siabbert (Eds). Victimization: Nature and
trends. Pretoria: HSRC.
Fattah, E.A. 1981. Becoming a victim: The victimization experience and its aftermath.
Victimology, 6(1):29-47.
Ferraro, K.F. & La Grange, R.L. 1987. The measurement of fear of crime. Sociological
Inquiry, 57:70-101.
Frankfort-Nachmias, C. & Nachmias, D. 1992. Research methods in the social
sciences. London: Edward Amold.
Fitzgerald, J.D. & Cox, C.M. 1987. Research methods in criminal justice: An
introduction. Chicago: Nelson-Hall.
Furstenberg, F.G. 1971. Public reaction to crime in the streets. American Scholar,
40(4):601-610.
Futrell, M. & Roberson, C. 1988. An introduction to Criminal Justice research.
Springfield, IL: Charles C Thomas.
Garofalo, J. 1979. Victimization and the fear of crime. Journal of Research in Crime
and Delinquency, 16:80-87.
Garofalo, J. 1981. The fear of crime: Causes and consequences. Journal ofCriminal
Law and Criminology, 82:839-857.
Garofalo, J. 1992. Reassessing the lifestyle model on criminal victimization. In W.J.
Schurick,l. Snyman, W.F. Krugel & L. Slabbert (Eds). Victimization: Nature and
trends. Pretoria: HSRC.
Garofalo, J. & Laub, J. 1978. The fear of crime: Broadening our own perspective.
Victimology, 2:242-253.
263
Giddens, A. 1993. Sociology: An introductory text. Cambridge: Cambridge University
Press.
Gibbs, J.J. & Hanrahan, K.J. 1993. Safety demand and supply: An alternative to fear
of crime. Justice Quarterly, 10(3):368-397.
Glanz, L. 1989. Coping with crime: The South African public's perceptions of and
reactions to crime. Pretoria: HSRC.
Glanz, L. 1991. Crime and victimization of the elderly in the Cape Peninsula. Pretoria:
HSRC.
Glanz, L. 1992. Fear of crime among the elderly in the Cape Peninsula. Acta
Criminologica, 5(2):16-26.
Haralambos, M. 1991. Sociology: Themes and perspectives (3rd ed.). London: Unwin
Hyam Limited.
Harris, M.B. 1995. Basic statistics for behavioural science research. Boston: Allyn &
Bacon.
Harris, R. 1969. The fear ofcrime. London: Frederick A. Praeger.
Hartnagel, T.F. 1979. The perception and fear of crime: Implications for
neighbourhood cohesion, social activity, and community affects. Social Forces,
58:176-193.
Hanson, J. &Van Zyl-Smit, O. 1990. Towardsjustice: Crime and state control in South
Africa. Cape Town: Oxford University Press.
Hindelang, M.J., Gottfredson, M.R. &Garofalo, J. 1978. Victims ofpersonal crime: An
empirical foundations for a theory of personal victimization. Cambridge:
Ballinger.
Hughes, J. 1980. The philosophy ofsocial research. London: Longman.
Hunter, A. 1986. Symbolic Communities: The persistence and change of Chicago's
local communities. In D.A Lewis &G. Salem. Fear of Crime: Incivility and the
production ofa social problem. Oxford: Transaction Books.
Jaycox, V. 1978. The elderly's fear of crime: Rational or irrational? Victimology, 3(3
4):329-334.
Karmen, A. 1984. Crime victims: An introduction to victimology. Monterey, CA:
Brooks/Cole.
264
Keane, C. 1992. April. Fear of crime in Canada: An examination of concrete and
formless fear of victimization. Canadian Joumal of Criminology. 215-224.
Kelling, G.L. & Wilson, J.Q. 1982. March. "Broken windows: The police and
neighbourhood safety." The At/antic Monthly. 29-38.
Kelling, G.L. & Coles, C.M. 1996. Fixing Broken Windows. New York: Martin Kessler.
Kennedy, L.W. & Silverman, R.A. 1985. "Significant others and fear of crime among
the elderly." Intemational Joumal on Ageing and Human Development,
20(4):241-256.
Klein, L., Luxenburg, J. & King, M. 1986. Perceived Neighbourhood Crime and the
impact of private security. Crime and Delinquency, 35(3):365-377.
Korinek, L. 1992. The awareness of crime and the sense of public security in Hungary.
Criminal Policy and The Rule of Law. Budapest: Hungarian Society for
Criminology.
La Grange, R.L. & Ferraro, K.F. 1989. Assessing age and gender differences in
perceived risk and fear of crime. Criminology, 27(4):697-717.
Lab, S.P. 1990. Citizen crime prevention: Domains and participation. Justice
Quarterly, 7(3):467-492.
Lab, S.P. 1988. Crime Prevention. Cincinnati, Ohio: Anderson Publishing Company.
Lasley, J.R. & Rosenbaum, J.L. 1988. Routine activities and multiple personal
victimization. SSR,73(1):47-50.
Leedy, P.O. 1985. Practical Research: Planning and design. New York: Macmillan.
Lewis, D.A. & Salem, G. 1986. Fear of crime: Incivility and the production ofa social
problem. Oxford: Transaction Books.
Lewis, D.A. & Maxfield, M.G. 1980. Fear in the neighbourhood: An investigation ofthe
impact of crime. Joumal of Research in Crime and Delinquency, 17:160-189.
Lewis, D.A. (Ed.). 1989. Reactions to crime. In L. Glanz. Coping with crime: The
South African public's perceptions ofand reactions to crime. Pretoria: HSRC.
Lin, N. 1976. Foundations ofsocial research. New York: McGraw-HilI.
Liska, A.E., Lawrence, J.J. & Sanchirico, A. 1982. Fear of crime as a social fact.
Social Forces, 60:760-770.
265
Liska, A.E., Sanchirico, A. & Reed, M.D. 1988. Fear of crime and constraint behaviour:
Specifying and estimating a reciprocal effects model. Social Forces, 66:827
837.
Mannheim, H. 1965. Comparative criminology, vol. 2. London: Routledge & Kegan
Paul.
Manning, P.K. 1986. The police and crime. In LA Radelet. The police and the
community. New York: Macmillan.
Maree, A. 1993. Inwoners se besorgdheid oor misdaad en misdaadnavorsing. Acta
Criminologica, 6(1 ):55-60.
Maris, R. 1987. Social Problems. New York: Macmillan.
Maxfield, M. 1984. The limitsof vulnerability in explaining fear of crime: A Comparative
neighbourhood analysis. Journal of Research in Crime and Delinquency,
21:233-250.
Maxfield, M.G. & Babbie, E. 1995. Research Methods for Criminal Justice and
Criminology. New York: Wadsworth.
Miethe, T.O., Stafford, M.C. and Long, J.S. 1987. Social differentiation in criminal
victirnisation: A test of routine activities/lifestyle theories. American Sociological
Review, 52:184-194.
Miethe, T.O. 1991. Citizen-based crime control activity and victimization risks: An
Examination of displacement and free-rider effects. Criminology, 29(3):419-441.
Miethe, T.O. &Lee, G.R. 1984. Fear of crime among older people: A Reassessment
of the predictive power of crime related factors. Sociological Quarterly, 25:395
415.
Mouton, J. &Marais, H.C. 1988. Metodologie van die geesteswetenskappe: Basiese
begrippe (2de uit.). Pretoria: RGN.
Mqadi, L.P. 1994. Juvenile delinquency among secondary school children with
reference to the influence of the family. A socio-eriminological study.
Unpublished O.Phil. thesis. University of Zululand, KwaDlangezwa.
Naude, C.M.B. 1992. Community-based prevention of crime: A Victimological
perspective. In W.J. Schurink, I. Snyman. W.F. Krugel & L. Siabbert (Eds).
Victimization: Nature and trends. Pretoria: HSRC.
266
Neser, J.J., Geldenhuys, S.F., Stevens, B., Grobbelaar, M.M. & Ladikos, A. 1993.
Vrees vir misdaad en die misdaadslagoffer in die Sunnyside-area in Pretoria.
Acta Criminologica, 6(2):29-42.
O'Block, R.L. 1981. Security and crime prevention. Boston: Butterworth Heinemann.
O'Block, R.L., Donnermeyer, J.F. & Doeren, S.E. 1991. Security and crime prevention
(2nd ed.). Boston: Butterworth Heinemann.
Ortega, S.T. & Myles, J.C. 1987. Race and gender effects on the fear of crime: An
Interaction model with age. Criminology, 25(1):133-152.
Parker, K.D. & Ray, M.G. 1990. Fear of crime: An Assessment of related factors.
Sociological Spectrum, 10:29-40.
Parker, KD. 1988. Black-white differences in perceptions of fear of crime.
International Joumal of Social Psychology, 28(4):48-494.
Peak, K.J. &Glensor, RW. 1996. Communitypolicing and problem-salving: Strategies
and practices. E glewood Cliffs NJ: Prentice Hall.
Pretorius, M. 1994. Bejaardes se persepsies van en vrees vir viktimisasie en die effek
daarvan op hulle lewenstyl. Ongepubliseerde D.Phil.-proefskrif. Universiteitvan
Pretoria, Pretoria.
Radelet, CA 1986. The police and the community. New York: Macmillan.
Radelet, LA & Carter, D.L. 1994. The Police and the Community. New York:
Macmillan.
Reeves, H. 1992. Victim support schemes. In W.J. Schurink, I. Snyman, W.F. Krugel
& L. Siabbert (Eds). Victimization: Nature and trends. Pretoria: HSRC.
Regoli, RM. & Hewitt, J.D. 1996. Criminal Justice. New York: Prentice Hall.
Riley, M.W. 1963. Sociological Research: a case approach. New York: Harcourt
Brace Jovanovich.
Reiner, R 1992. The politics of the police. London: Harvester Whealsheaf.
Rosenbaum, D.P. (Ed.). 1986. Community crime prevention: Does it work? Beverly
Hills: Sage.
Schafer, S. 1977. Victimology: The victim and his criminal. Reston, VA: Reston.
Schurink, W.J., Snyman, I., Krugel, WK & Siabbert, L. (Eds). 1992. Victimization:
Nature and trends. Pretoria: HSRC.
267
Schurink, W.J. &Prinsloo, K.K. 1978. Meerdoelige opname onderswartes in stedelike
gebiede - die vrees vir misdaad. Pretoria: RGN.
Schurink, W.J. & Strydom, H.G. 1976. Die vrees vir misdaad by die publiek van
Soweto, Pretoria: RGN.
Sherif, CW., Sherif, M. & Nebergal, R.E. 1965. Attitude and attitude change.
Philladelphia: WB Sauders.
Silberman, C. 1987. "Fear: In K.F. Ferraro & R.L. La Grange. The measurement of
fear of crime. Sociological Inquiry, 57:70-101.
Silverman, RA. & Kennedy, L.W. 1985. Loneliness, satisfaction and fear of crime.
Canadian Joumal of Criminology, 27(1):1-13.
Skogan, W.G. 1987. The impact of victimization on fear. Crime and Delinquency,
33(1):135-154.
Skogan, W.G. & Maxfield, M.G. 1981. Coping with crime: individual and
neighbourhood reactions. Beverly Hills, CA: Sage.
Smith, K. & Glanz, L. 1989. Fear of crime among the South African public. South
African Journal ofSociology, 20(1):53-60.
Smith, DA & Jarjoura, G.R 1989. Household characteristics, neighbourhood
composition and victimization risk. Social forces, 68(2):621-640.
Smith, L.N. & Hill, G. 1991. Victimization and fear of crime. Criminal Justice and
Behaviour, 18(2):217-239.
Snyman, R 1992. Victim support and a proposed model for rendering services to
victims of crime in South Africa. In W.J. Schurink, J. Snyman, W.F. Krugel & L.
Slabbert (Eds). Victimization: Nature and trends. Pretoria: HSRC.
Spector, P.E. 1992. Summated rating scale contribution: An introduction. London:
Sage.
Stafford, M.C. & Galle, OR 1984. Victimization rates, exposure to risk, and fear of
crime. Criminology, 22(2):173-185.
Stevens, R. & Cloete, M.G.T. 1996. Introduction to Criminology. Johannesburg:
Thomson Publishing.
Stevens, S.S. 1951. Handbook ofexperimental psychology. New York: John Wiley.
268
Strijdom, H.G. &Schurink, W.J. 1992. Theoretical perspectives in victimologywith brief
reference to contributions from a micro-antipositivistic and macropositivistic
approach. In W.J. Schurink, I. Snyman, W.F. Krugel & L. Siabbert (Eds).
Victimization: Nature and Trends. Pretoria: HSRC.
Taylor, RB. & Hale, M. 1986. Criminology: Testing the alternative models of fear of
crime. Joumal of Criminal Law and Criminology, 77(1 ):151-189.
Toseland, RW. 1982. Fear of crime: who is most vulnerable? Journal of Criminal
Justice, 10:199-209.
Trojanowicz, R & Bucqueroux, B. 1990. Community policing: A contemporary
perspective. Cincinnati, Ohio: Anderson Publishing Company.
Van der Walt, P.J. 1964. 'n Sosiologiese klassifikasie van misdade: 'n studie in die
misdaadstatistiek. Kaapstad: Nasau.
Van der Walt, P.J., Cronje, G. & Smit, B.F. 1985. Criminology: an introduction.
Pretoria: HAUM.
Van der Westhuizen, J. 1982. 'n Inleiding tot kriminologiese navorsing. Pretoria:
Unisa.
Van derWesthuizen, J. (ed.). 1982. Geweldsmisdaad in Suid Afrika. Pretoria: Unisa.
Van der Wurff, A., Van Staalduinen, L. & Slinger, P. 1985. Fear of crime in residential
environments: Testing a social psychological model. The Journal of Social
Psychology,. 129(2):141-160.
Van Dijk, J. 1979. The extent of public infonmation and the nature of public attitudes.
In public opinion on crime and criminal justice. Strasburg: Council of Europe.
Van Dijk, J. & Mayhew, P. 1992. Criminal victimization in the industrialized world.
Rome: Unicri.
Van Heerden, T.J. 1976. Inleiding tot die polisiekunde. Pretoria: Unisa.
Vito, G.F., Latessa, E.J. & Wilson, D.G. 1988. Introduction to Criminal Justice research
methods. Springfield, IL: Charles C Thomas.
WaIT, M. & Stafford, M. 1983. Fear ofvictimization: A look at proximate causes. Social
Forces, 61:633-1044.
WaIT, M. 1984. Fear of victimization: why are women and the elderly more afraid?
Social Science Quarterly, 65:681-702.
WaIT, M. 1985. Fear of rape among urban women. Social Problems, 32:238-250.
269
Warr, M. 1987. Fear of victimization and sensitivity to risk. Journal of Quantitative
Criminology, 3(1):29-46.
Warr, M. 1990. Fear of victimization. Social Forces, 68(3):89-907.
Weber, M. 1980. In J. Hughes. The philosophy ofsocial research. London: Longman.
Williams, P. and Dickinson, J. 1993. Fear of crime. Read all about it? British Journal
of Criminology, 33(1):33-56.
Yin, R.K. 1986. Community crime prevention: A synthesis of eleven evaluations. In
Rosenbaum, D.P (Ed.). Community crime prevention: Does it work? Beverly
Hills, CA: Sage.
Yin, P. 1982. Fear of crime as a problem for the elderly. Social Problems, 30(3):240
245.
Yin, R.P. 1980. Fear of crime among the elderly: Some issues and suggestions.
Social Problems, 27(4):492-503.
Yin, P.P. 1985. Victimization and the aged. Springfield, IL: Charles C. Thomas.
Young Rifai, M.A. 1992. Victimology: A theoretical framework. In W.J. Schurink, I.
Snyman, W.F. Krugel & L. Slabber! (Eds). Victimization: Nature and trends.
Pretoria: HSRC.
270
ANNEXURE "A"
UNIVERSITY OF ZULULAND
QUESTIONNAIRE: FEAR OF CRIME
Dear Respondent
Your assistance in this research project is of the utmost importance and is highlyappreciated.
All information supplied by you will be treated in the strictest confidence
Please ensure that you answer all the questions
Mark your answers with a cross (x).
271
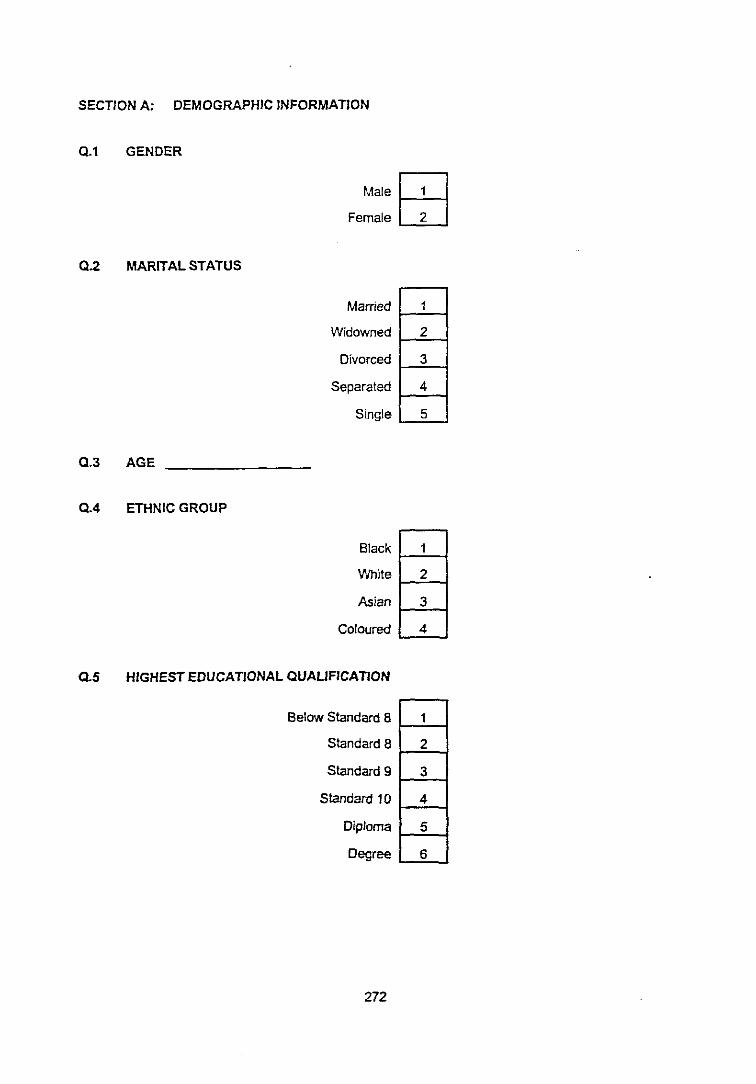
SECTlONA: DEMOGRAPHIC INFORMATION
0.1 GENDER
MaleEB
Female 2
0.2 MARITAL STATUS
Married 1
Widowned 2
Divorced 3
Separated 4
Single 5
0.3 AGE
0.4 ETHNIC GROUP
Black 1
White 2
Asian 3
Coloured 4
Q.5 HIGHEST EDUCATIONAL QUAUFICATION
Below Standard aStandard aStandard 9
Standard 10
Diploma
Degree
272
1
2
3
4
5
6
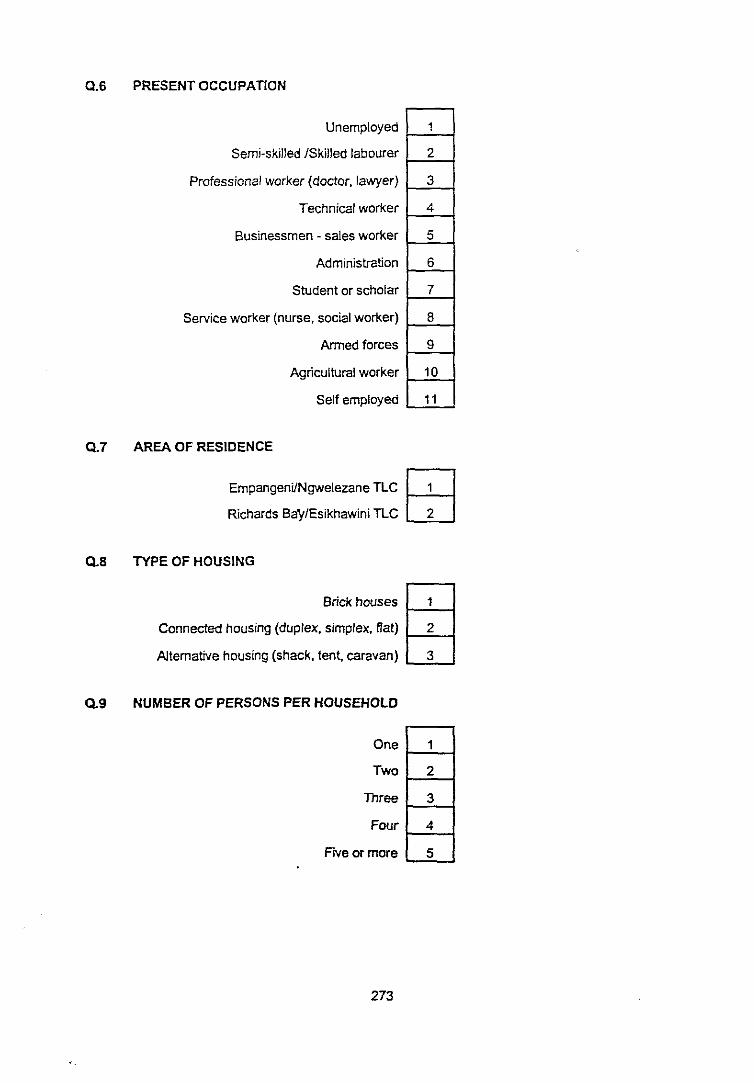
0.6 PRESENT OCCUPATION
Unemployed
Semi-skilled fSkiJled labourer
Professional worker (doctor. lawyer)
Technical worker
Businessmen - sales worker
Administration
Student or scholar
Service worker (nurse. social worker)
Armed forces
Agricultural worker
Self employed
0.7 AREA OF RESIDENCE
1
2
3
4
5
6
7
8
9
10
11
EmpangenUNgwelezane TLC~Richards Ba'y/Esikhawini TLC c:2J
0.8 TYPE OF HOUSING
Brick houses 1
Connected housing (duplex. simplex. flat) 2
Alternative housing (shack. tent. caravan) 3
0.9 NUMBER OF PERSONS PER HOUSEHOLD
One 1
Two 2
Three 3
Four 4
FIVe or more 5
273
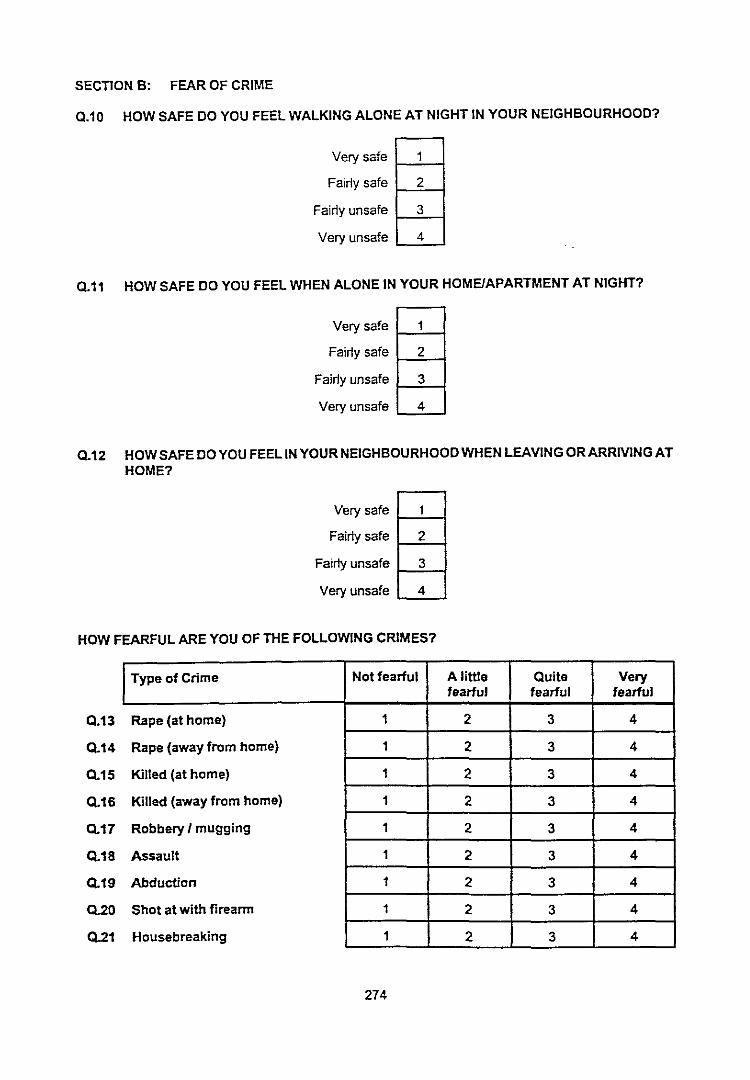
SECTION B: FEAR OF CRIME
Q.10 HOW SAFE DO YOU FEEL WALKING ALONE AT NIGHT IN YOUR NEIGHBOURHOOD?
Very safe 1
Fairly safe 2
Fairly unsafe 3
Very unsafe 4
Q.11 HOW SAFE DO YOU FEEL WHEN ALONE IN YOUR HOME/APARTMENT AT NIGHT?
Very safe 1
Fairly safe 2
Fairly unsafe 3
Very unsafe 4
0.12 HOWSAFE DO YOU FEEL INYOUR NEIGHBOURHOODWHEN LEAVING ORARRIVING ATHOME?
Very safe 1
Fairly safe 2
Fairly unsafe 3
Very unsafe 4
HOW FEARFUL ARE YOU OF THE FOLLOWING CRIMES?
Q.13
0.14
0.15
0.16
0.17
0.18
0.19
0.20
0.21
Type of Crime Notfearful A little Quite Veryfearful fearful fearful
Rape (at home) 1 2 3 4
Rape (away from home) 1 2 3 4
Killed (at home) 1 2 3 4
Killed (away from home) 1 2 3 4
Robbery I mugging 1 2 3 4
Assault 1 2 3 4
Abduction 1 2 3 4
Shot at with firearm 1 2 3 4
Housebreaking 1 2 3 4
274
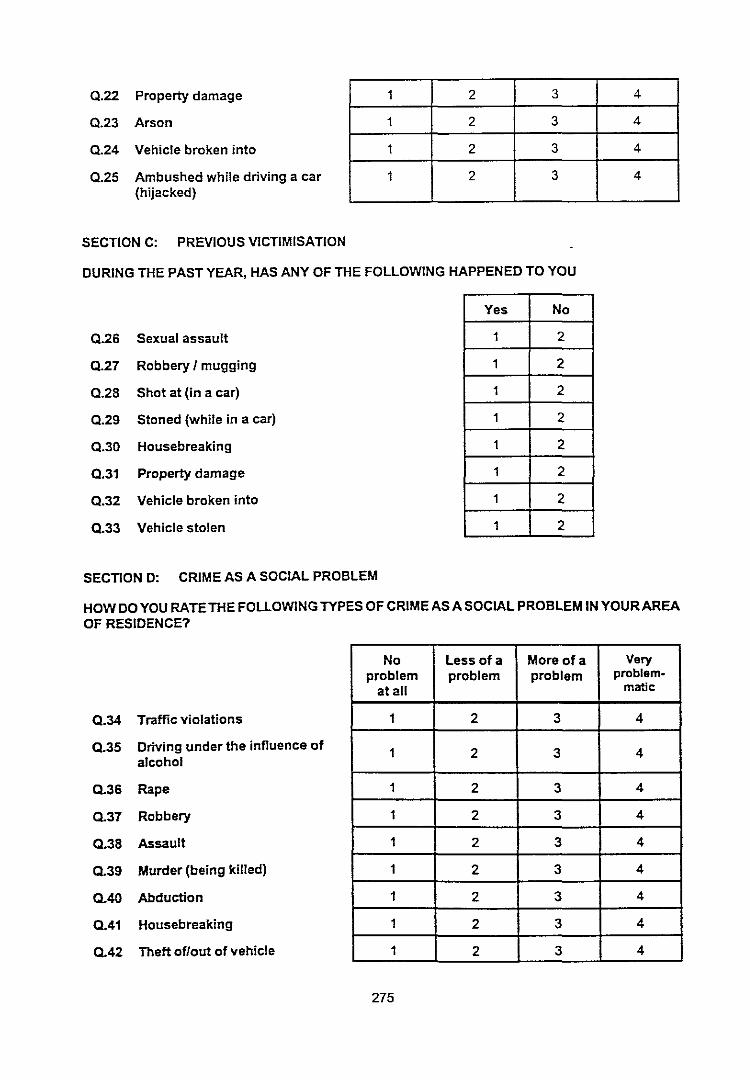
0.22 Property damage
0.23 Arson
0.24 Vehicle broken into
0.25 Ambushed while driving a car(hijacked)
SECTION C: PREVIOUS VICTIMISATION
1 2 3 4
1 2 3 4
1 2 3 4
1 2 3 4
DURING THE PAST YEAR, HAS ANY OF THE FOLLOWING HAPPENED TO YOU
0.26 Sexual assault
0.27 Robbery / mugging
0.28 Shot at (in a car)
0.29 Stoned (while in a car)
0.30 Housebreaking
0.31 Property damage
0.32 Vehicle broken into
0.33 Vehicle stolen
Yes No
1 2
1 2
1 2
1 2
1 2
1 2
1 2
1 2
SECTION 0: CRIME AS A SOCIAL PROBLEM
HOW DO YOU RATE THE FOLLOWING TYPES OF CRIME AS A SOCIAL PROBLEM IN YOUR AREAOF RESIDENCE?
0.34 Traffic violations
0.35 Driving under the influence ofalcohol
0.36 Rape
0.37 Robbery
0.38 Assault
0.39 Murder (being killed)
0.40 Abduction
0.41 Housebreaking
0.42 Theft of/ou1 of vehicle
No Less of a More of a Veryproblem problem problem problem-
at all matic
1 2 3 4
1 2 3 4
1 2 3 4
1 2 3 4
1 2 3 4
1 2 3 4
1 2 3 4
1 2 3 4
1 2 3 4
275
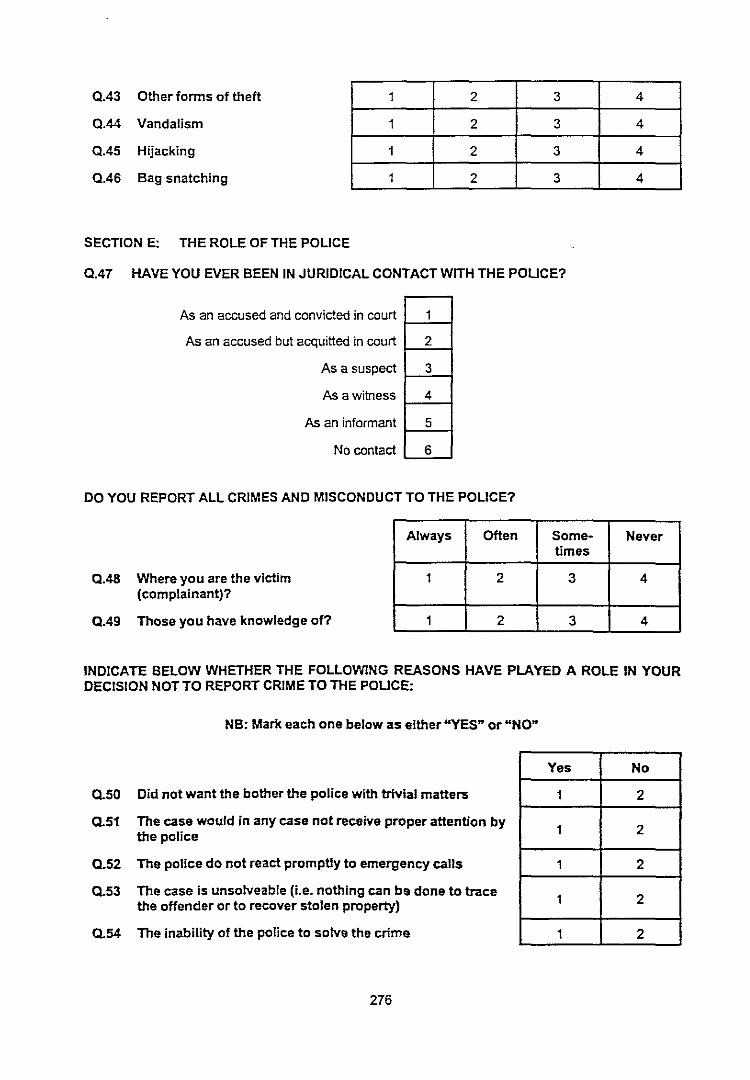
0.43 Other forms of theft
0.44 Vandalism
0.45 Hijacking
0.46 Bag snatching
1 2 3 4
1 2 3 4
1 2 3 4
1 2 3 4
SECTION E: THE ROLE OF THE POLICE
0.47 HAVE YOU EVER BEEN IN JURIDICAL CONTACT WITH THE POLICE?
As an accused and convicted in court
As an accused but acquitted in court
As a suspect
As a witness
As an informant
No contact
1
2
3
4
5
6
DO YOU REPORT ALL CRIMES AND MISCONDUCT TO THE POLICE?
0.48 Where you are the victim(complainant)?
0.49 Those you have knowledge of?
Always Often Some- Nevertimes
1 2 3 4
1 2 3 4
INDICATE BELOW WHETHER THE FOLLOWING REASONS HAVE PLAYED A ROLE IN YOURDECISION NOT TO REPORT CRIME TO THE POLlCE:
NB: Mark each one below as either "YES" or "NO"
0.50 Did not want the bother the police with trivial matters
0.51 The case would in any case not receive proper attention bythe police
0.52 The police do not react promptly to emergency calls
0.53 The case is unsolveable (i.e. nothing can be done to tracethe offender or to recover stolen property)
0.54 The inability of the police to solve the crime
276
Yes No
1 2
1 2
1 2
1 2
1 2
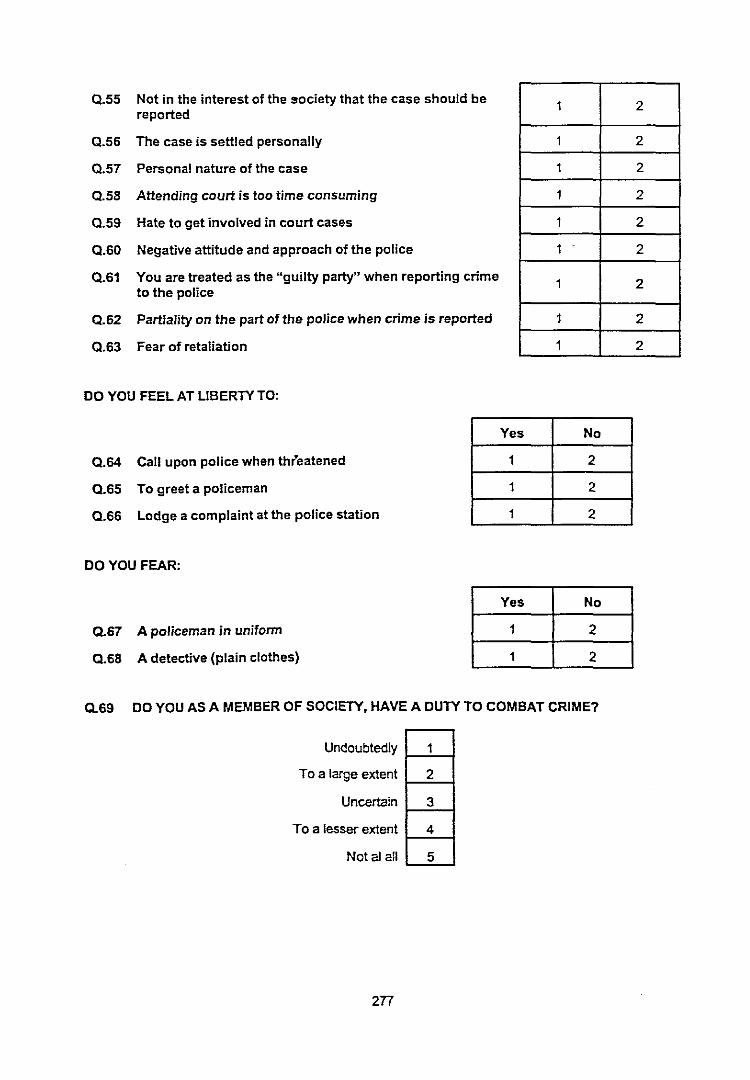
0.55 Not in the interest of the society that the case should bereported
0.56 The case is settled personally
0.57 Personal nature of the case
0.58 Attending court is too time consuming
0.59 Hate to get involved in court cases
0.60 Negative attitude and approach of the police
0.61 You are treated as the "guilty party" when reporting crimeto the police
0.62 Partiality on the part of the police when crime is reported
0.63 Fear of retaliation
DO YOU FEEL AT UBERTY TO:
1 2
1 2
1 2
1 2
1 2
1 2
1 2
1 2
1 2
0.64 Call upon police when threatened
0.65 To greet a policeman
0.66 Lodge a complaint at the police station
DO YOU FEAR:
0.67 A policeman in uniform
0.68 A detective (plain clothes)
Yes No
1 2
1 2
1 2
Yes No
1 2
1 2
0.69 DO YOU AS A MEMBER OF SOCIETY. HAVE A DUTY TO COMBAT CRIME?
Undoubtedly 1
To a large extent 2
Uncertain 3
To a lesser extent 4
Not aJ all 5
277
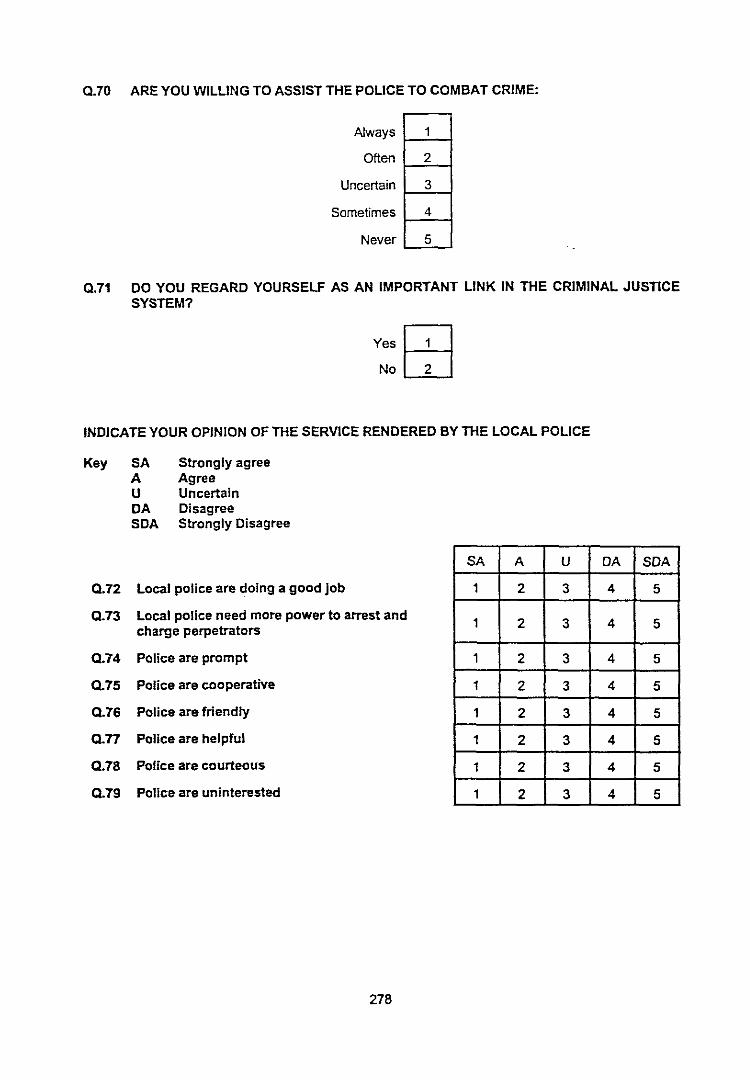
0.70 ARE YOU WILLING TO ASSIST THE POLICE TO COMBAT CRIME:
Always 1
Often 2
Uncertain 3
Sometimes 4
Never 5
0.71 DO YOU REGARD YOURSELF AS AN IMPORTANT LINK IN THE CRIMINAL JUSTICESYSTEM?
YesG]
NOG]
INDICATE YOUR OPINION OF THE SERVICE RENDERED BY THE LOCAL POLICE
Key SAAUDASDA
Strongly agreeAgreeUncertainDisagreeStrongly Disagree
0.72 Local police are doing a good job
0.73 Local police need more power to arrest andcharge perpetrators
0.74 Police are prompt
0.75 Police are cooperative
0.76 Police are friendly
0.77 Police are helpful
0.78 Police are courteous
0.79 Police are uninterested
278
SA A U DA SDA
1 2 3 4 5
1 2 3 4 5
1 2 3 4 5
1 2 3 4 5
1 2 3 4 5
1 2 3 4 5
1 2 3 4 5
1 2 3 4 5
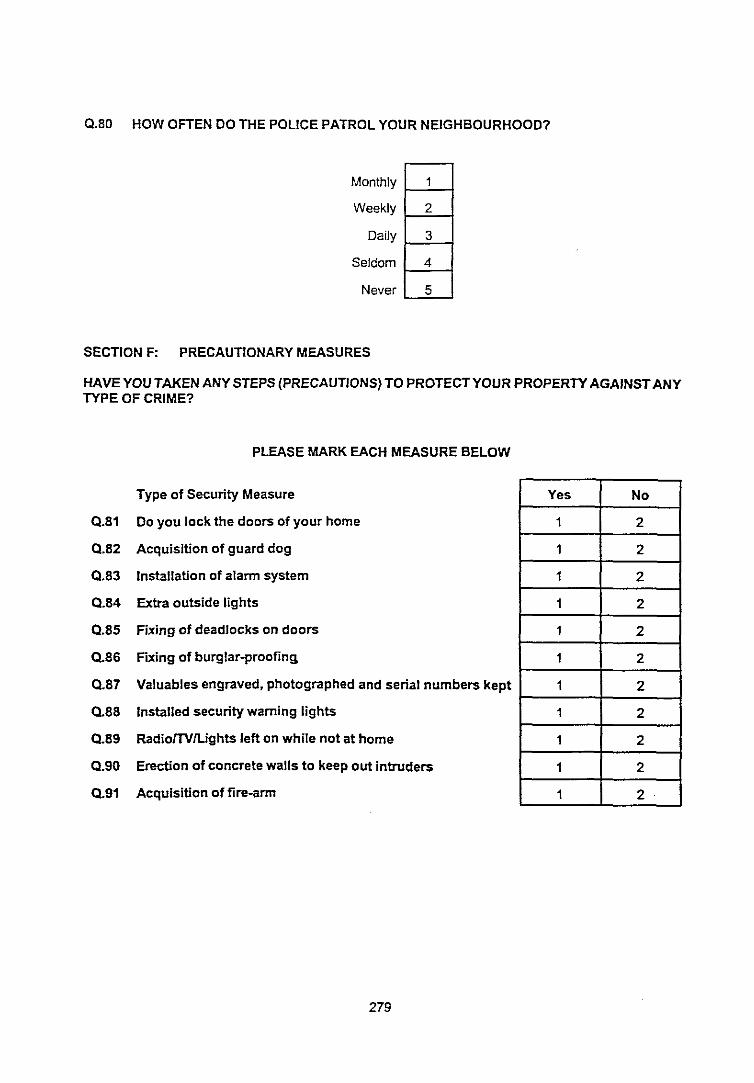
0.80 HOW OFTEN DO THE POLICE PATROL YOUR NEIGHBOURHOOD?
Monthly 1
Weekly 2
Daily 3
Seldom 4
Never 5
SECTION F: PRECAUTIONARY MEASURES
HAVE YOU TAKEN ANY STEPS (PRECAUTIONS) TO PROTECT YOUR PROPERTYAGAINST ANYTYPE OF CRIME?
PLEASE MARK EACH MEASURE BELOW
Type of Security Measure
0.81 Do you lock the doors of your home
0.82 Acquisition of guard dog
0.83 Installation of alarm system
0.84 Extra outside lights
0.85 Fixing of deadlocks on doors
0.86 Fixing of burglar-proofing
0.87 Valuables engraved. photographed and serial numbers kept
0.88 Installed security warning lights
0.89 RadiolTVlLights left on while not at home
0.90 Erection of concrete walls to keep out intruders
0.91 AcqUisition of fire-arm
279
Yes No
1 2
1 2
1 2
1 2
1 2
1 2
1 2
1 2
1 2
1 2
1 2
ARE THERE ANY PRECAUTIONS THAT YOU TAKE TO PROTECT YOURSELF AGAINST APHYSICAl ATTACK?
PLEASE MARK EACH MEASURE BELOW
Type of Precaution
Q.92 Do not go out alone at night
Q.93 Do not go out alone during the day
Q.94 Carry a personal alarm
0.95 Have done self-defence training
Q.96 Lock all doors whilst driving alone in my vehicle
0.97 Notify others about my movements
Q.98 Carry a fire-arm
Yes No
1 2
1 2
1 2
1 2
1 2
1 2
1 2
0.99 DURING THE PAST "TWO YEARS, HAVE YOU ASKED A NEIGHBOUR TO KEEP AWATCHFUL EYE ON YOUR PROPERTY WHILE YOU WERE AWAY?
YesG]
No [.LJ
0.100 DURING THE PAST "TWO (2) YEARS HAS A NEIGHBOUR ASKED YOU TO KEEP AWATCHFUL EYE ON HIS/HER PROPERTY WHILE HE/SHE WERE AWAY?
YesG]
No [.LJ
0.101 iF YOU WERE BEING ATTACKED AT HOME 00 YOU KNOW IF YOUR NEIGHBOURSWOULD COME TO YOUR ASSISTANCE
YesG]
No [.LJ
0.102 IS THERE ANY NEIGHBOURHOOD WATCH SYSTEM OPERATING IN THE AREA WHEREYOULJVE?
Yes 1
No 2
Donotknow 3
280

0.103 ARE YOU A MEMBER OF 1=HIS NEIGHBOURHOOD WATCH SYSTEM?
Yes~NeG]
0.104 WOULD YOU BE WILLING TO PARTICIPATE IN SUCH A SYSTEM?
Yes~NeG]
281
ANNEXURE B
FREQUENCY DISTRIBUTION OF RESPONDENTS TO ALL VARIABLES
TABLEB1: FREQUENCY DISTRIBUTION OF THE DEMOGRAPHIC CHARACTERISTICS OF THESAMPLE (N = 385)
FREQUENCY DISTRIBUTIONDEMOGRAPHIC
CHARACTERISTICS
GENDERMaleFemaleTOTAl
MARITAL STATUSMarriedWidowedDivorcedSeparatedSingleTOTAl
AGE18-2425-3435-4445-5455-6465>TOTAl
ETHNIC GROUPBlackWhiteTOTAl
N
151234385
1611524
2183385
8513810440153
385
285100385
39.2060.80
100.00
141.803.906.200.50
47.50100.00
22.1035.8027.0010.403.900.80
100.00
76.6023.40
100.00
EDUCATIONALQUAUFICATIONSBelow standard 8Standard 8Standard 9Standard 10DiplomaDegreeTOTAl
OCCUPATIONUnemployedSemi-skilled workerProfessional wor1<erTechnical/retated wor1<erBusinessman/salesAdministrative wor1<er
11 2.909 2.30
12 3.10155 60.30120 31.2078 20.30
385 100.00
40 10.4019 4.90
155 40.3021 5.4017 4.4041 10.70
282
Student 70 8.20Service worker 14 3.60Armed forces 6 1.60Agricultural worker 0 0.00Self-employed 2 0.50TOTAL 385 100.00
AREA OF RESIDENCEEmpangeni 180 6.8Richards Bay 205 53.2TOTAL 382 100.00
TYPE OF HOUSINGBrick housing 290 75.3Connected housing 88Alternative forms 7TOTAL 385 100.00
HOUSEHOLD COMPOSmONSingle 40 10.40Two persons 57 14.80Three persons 69 17.90Four persons 78 20.30Rve or more persons 141 36.60TOTAL 385 100.00
TABLEB2: FREQUENCY DISTRIBUTION OF RESPONSES ON FEAR OF CRIME (N = 385). ""~'''''''- .. ''''-
RESPONSE WALKING AlONE HOME ALONE LEAVlNGTARRMNG
CATEGORIES HOME
N % N ~. N %
Very safe 41 10.60 61 15.80 35 9.10
Fair1y safe 124 32.20 165 42.90 164 42.60
Fair1y unsafe 104 27.00 86 22.30 109 28.30
Very unsafe 116 30.10 73 19.00 77 20.00
TOTAL 385 100.00 385 100.00 385 100.00
283
TABLE B3: FREQUENCY DISTRIBUTION OF RESPONDENTS TO FEAR OF PERSONAL VICTIMISATION (N =385)
Response Rape (away) Rape (home) Killed (home) Killed (away) Robbery Assault Abduction Shot at
Categories N % N "10 N '10 N '10 N "10 N '10 N '10 N '10
Not fearful at all 140 36.40 140 36.40 40 10.40 37 9,60 32 8,30 35 9,1 68 17,70 48 12,50A lilliefearful 31 8,10 28 7,30 63 16.40 54 15,30 70 18,20 72 18,7 66 17,10 46 11,90Quite fearful 26 6,80 26 6,80 47 12,20 51 13,20 102 26,50 114 29,6 60 15,60 45 11,70Very fearful
188 48,80 191 49,60 235 61,00 238 61,80 181 47,00 164 42,6 191 49,60 246 63,90
TOTAL 385 100,00 385, 100,00 385 100,00 38,') 100,00 385 100~0 385 100,00 385 100,VO 385 100,00
'J
~ TABLE B4 FREQUENCY DISTRIBUTION OF RESPONDENTS TO FEAR OF PROPERTY CRIME
Response Categories Housebreaking Property Damage Arson Vehicle broken Hijacking
Into
N % N % N "10 N '10 N '10
Not fearful at all 35 9,10 37 9,60 59 15,30 37 9,60 48 12,50
A little fearful 73 19,00 74 19,20 53 13,80 58 15,10 51 13,20
Quite fearful 95 24,70 131 34,00 46 11,90 97 25,20 64 16,60
Very fearful 182 47.30 143 37.10 227 59.00 193 50.10 222 57.70
TOTAL 385 100.00 385 100,00 385 100.00 385 100.00 385 100.00
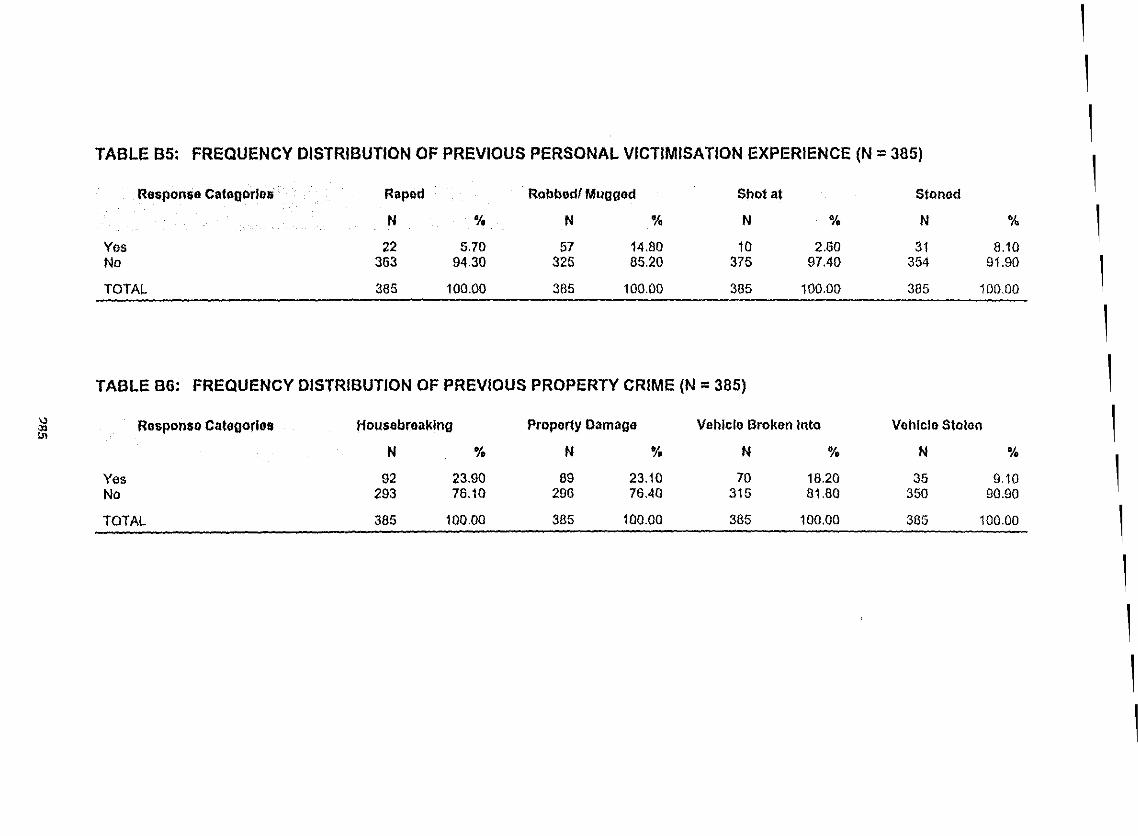
TABLE B5: FREQUENCY DISTRIBUTION OF PREVIOUS PERSONAL VICTIMISATION EXPERIENCE (N =385)
Responso Catllijorlllll Raped Robbedl Mugglld Shot at Stoned
N % N % N % N %
Yes 22 5.70 57 14.80 10 2.60 31 8.10No 363 94.30 325 85.20 375 97.40 354 91.90
TOTAL 385 100.00 385 100.00 385 100.00 385 10000
TABLE 86: FREQUENCY DISTRIBUTION OF PREVIOUS PROPERTY CRIME (N =385)
\)Rosponse Categories Housebreaking Property Damage Vehicle 13rokon into Vehicle Stolon:xl
'" N % N % N % N %
Yes 92 23.90 89 23.10 70 18.20 35 9.10No 293 76.10 296 76.40 315 81.80 350 90.90
TOTAL 385 100.00 385 100.00 385 100.00 305 100.00
1
1
1
1
1
1
1
1
1
1
1
1
1
1
1
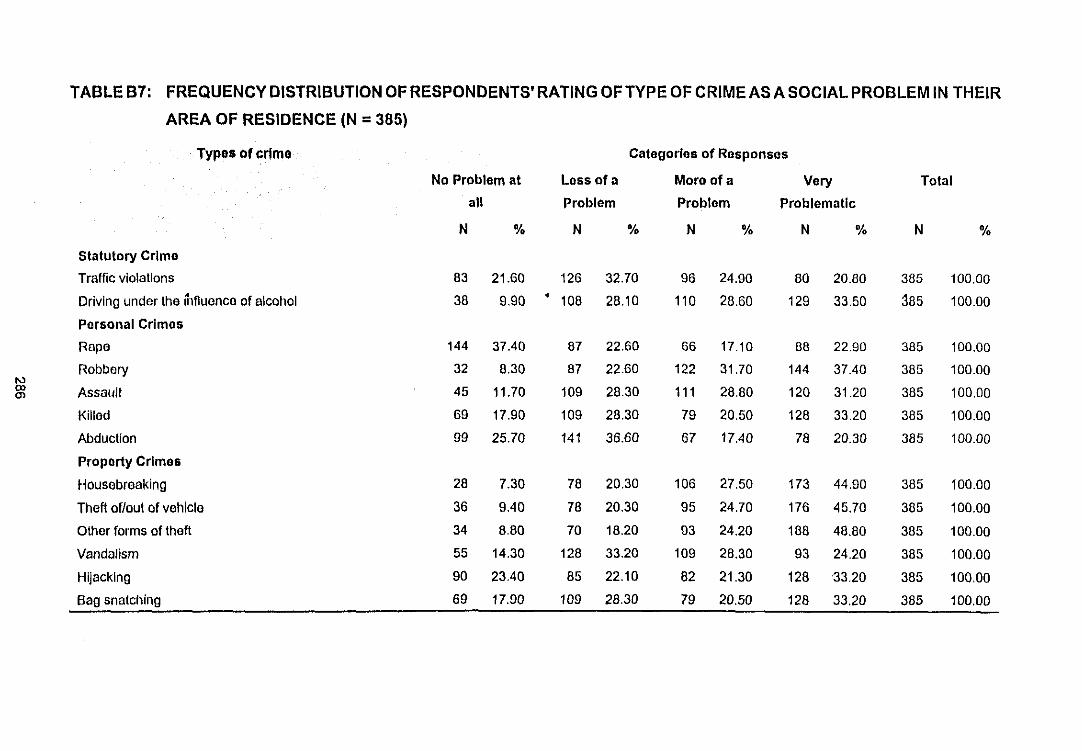
TABLEB7: FREQUENCY DISTRIBUTION OFRESPONDENTS' RATING OFTYPEOFCRIME AS A SOCIALPROBLEM IN THEIR
AREA OF RESIDENCE (N =385)
Types of crime Categories of Responses
No Problem at Less of a More of a Very Total
all Problem Problem Problematic
N % N % N % N % N %
Statutory Crime
Traffic violations 83 21.60 126 32.70 96 24.90 80 20.80 385 100.00
Driving undor the innuence of alcohol 38 9.90 108 28.10 110 28.60 129 33.50 285 100.00
Personal Crimes
Rape 144 37.40 87 22.60 66 17.10 88 22.90 385 100.00
Robbory 32 8.30 87 22.60 122 31.70 144 37.40 385 100.00NQ)
Assault 45 11.70 109 28.30 111 28.80 120 31.20 385 100.00(l)
Killed 69 17.90 109 28.30 79 20.50 128 33.20 385 100.00
Abduction 99 25.70 141 36.60 67 17.40 78 20.30 385 100.00
Property Crimes
Housebreaking 28 7.30 78 20.30 106 27.50 173 44.90 385 100.00
Theft oflout of vehicle 36 9.40 78 20.30 95 24.70 176 45.70 385 100.00
Other forms of theft 34 8.80 70 18.20 93 24.20 188 48.80 385 100.00
Vandalism 55 14.30 128 33.20 109 28.30 93 24.20 385 100.00
Hijacking 90 23.40 85 22.10 82 21.30 128 33.20 385 100.00
Bag snatching 69 17.90 109 28.30 79 20.50 128 33.20 385 100.00
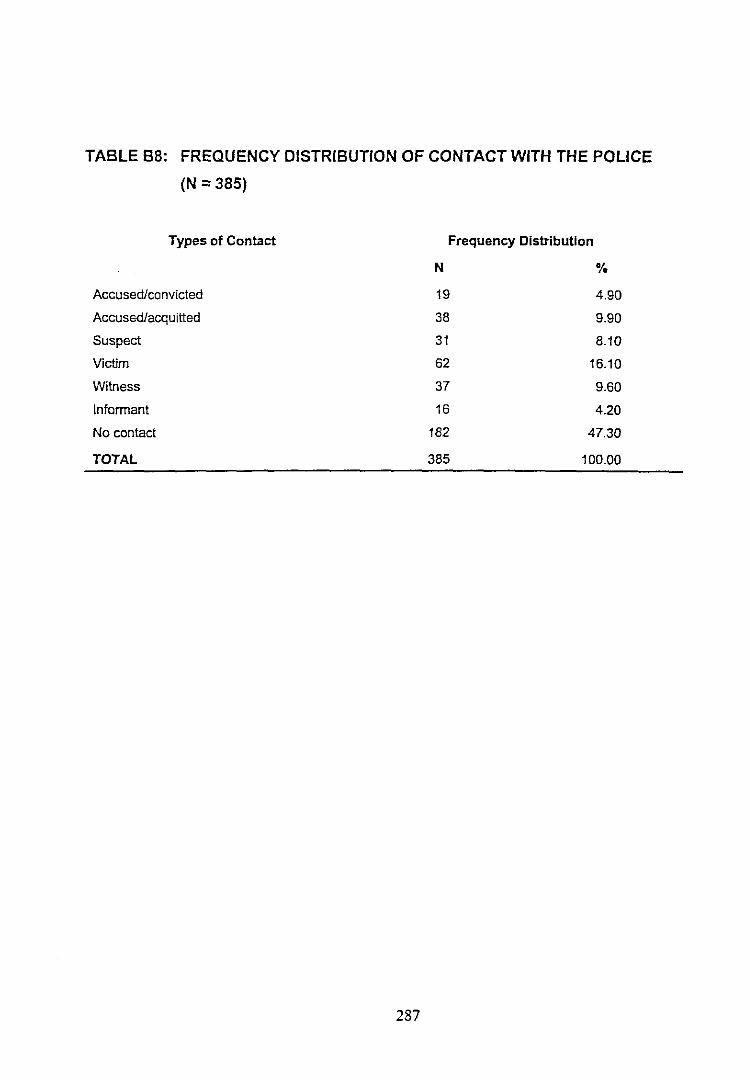
TABLE B8: FREQUENCY DISTRIBUTION OF CONTACT WITH THE POLICE
(N =385)
Types of Contact Frequency Distribution
N %
Accused/convicted 19 4.90
Accused/acquitted 38 9.90
Suspect 31 8.10
Victim 62 16.10
Witness 37 9.60
Informant 16 4.20
No contact 182 47.30
TOTAL 385 100.00
287
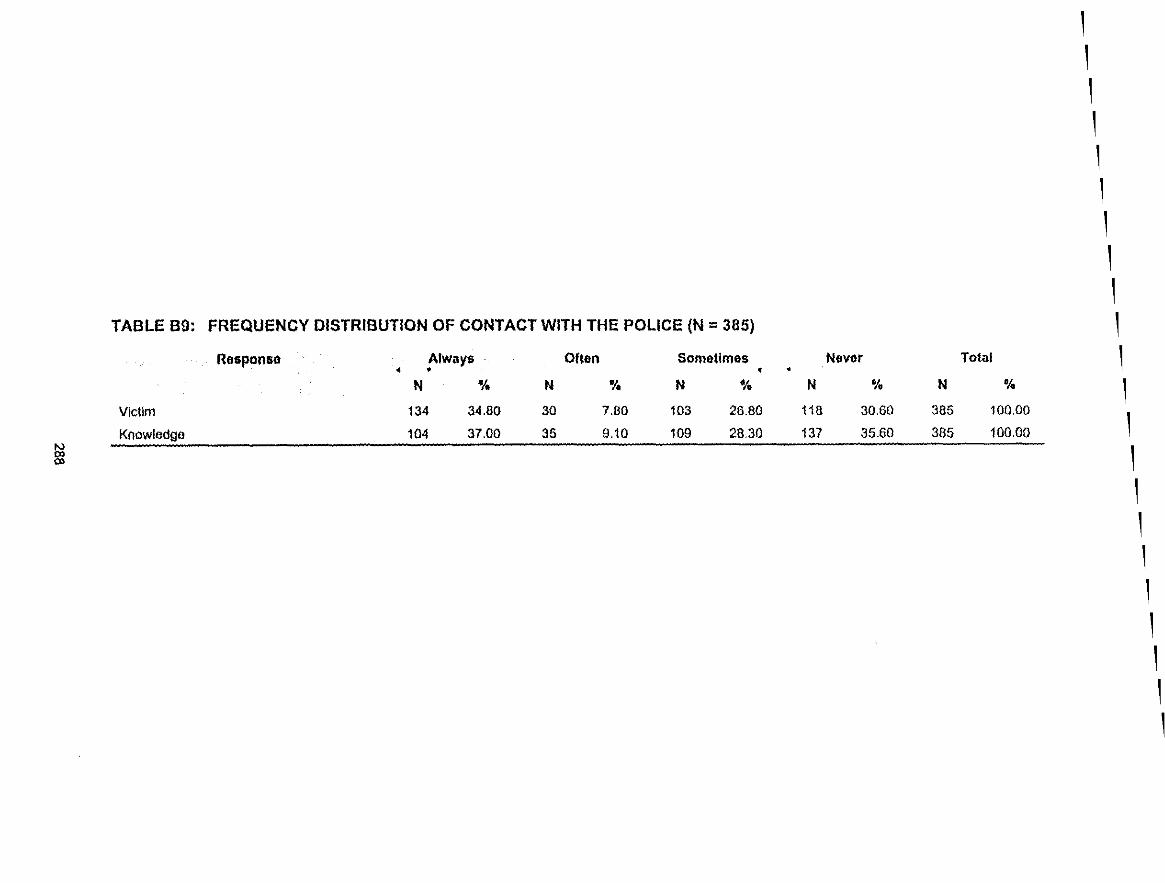
TABLE B9: FREQUENCY DISTRIBUTION OF CONTACT WITH THE POLICE (N '" 385)
Rosponse Always Often Sometimes Never Total• • • •
N % N % N % N % N %
Victim 134 34.80 30 7.80 103 26.80 118 30.60 385 100.00
Knowledge 104 37.00 35 9.10 109 2830 137 35.60 385 100.00N
~
1
1
1
1
1
1
1
1
1
1
1
1
1
1
1
1
1
1
1
1
1
1
TABLE B10: FREQUENCY DISTRIBUTION OF REASONS FOR NOT REPORTING CRIME (N =385)
Yes No Total
N % N % N %
Bother pollee 313 34.00 254 66.00 385 100.00
No proper attention 210 54.50 175 45.50 385 100.00
No prompt 216 56.10 169 43.90 385 100.00
Unsolvable case 198 51.40 • 187 48.60 385 100.00
Police unable to solve 207 53.80 178 46.20 385 100.00
Society uninterested 92 23.60 293 76.10 385 100.00
Settled personally 118 30.60 267 69.40 385 100.00l:il Personal nature 132 34.30 253 65.70 385 100.00to
Time consuming 119 30.90 266 69.10 385 100.00
Dislike of involvement 153 39.70 232 60.30 385 100.00
Negative altitude 186 48.30 199 51.70 385 100.00
GUilty party 155 40.30 230 59.70 385 100.00
Partiality of police 168 43.60 217 56.40 385 100.00
Fear of retaliation 173 44.90 212 55.10 385 100.00
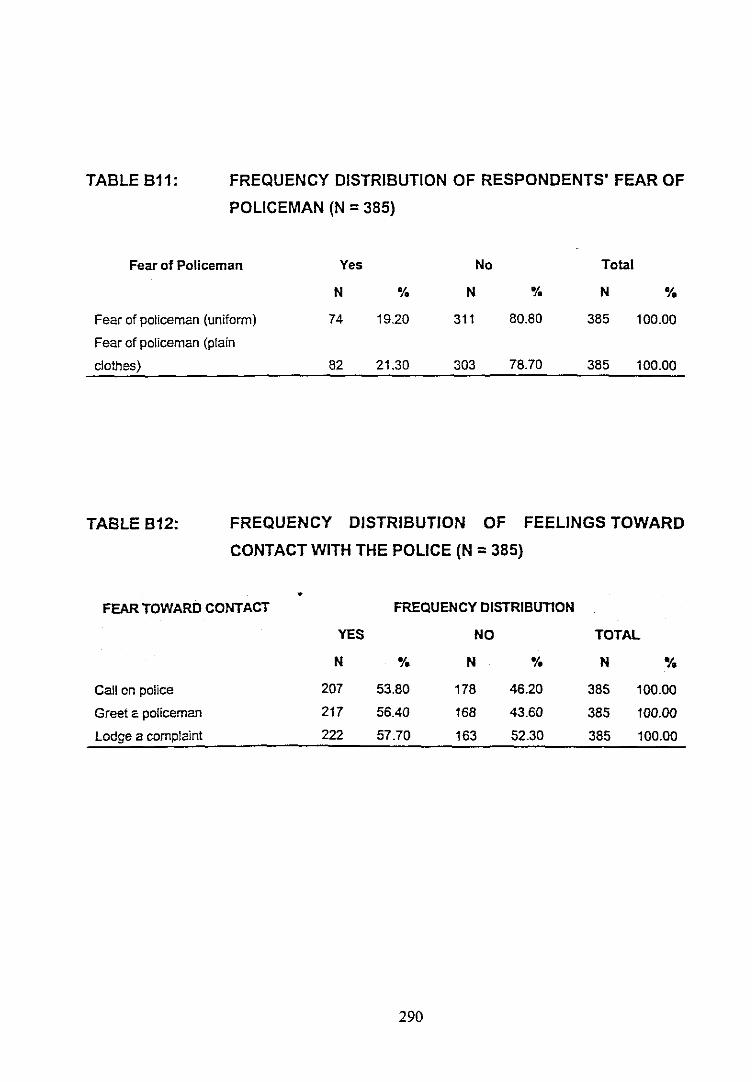
TABLE B11: FREQUENCY DISTRIBUTION OF RESPONDENTS' FEAR OF
POLICEMAN (N = 385)
Fear of Policeman Yes No Total
N % N % N %
Fear of policeman (uniform) 74 19.20 311 80.80 385 100.00
Fear of policeman (plain
clothes) 82 21.30 303 78.70 385 100.00
TABLE B12: FREQUENCY DISTRIBUTION OF FEELINGS TOWARD
CONTACT WITH THE POLICE (N =385)
•FEAR TOWARD CONTACT FREQUENCY DISTRIBUTION
YES NO TOTAL
N OJ. N % N 'Y.
Callan police 207 53.80 178 46.20 385 100.00
Greet a policeman 217 56.40 168 43.60 385 100.00
Lodge a complaint 222 57.70 163 52.30 385 100.00
290
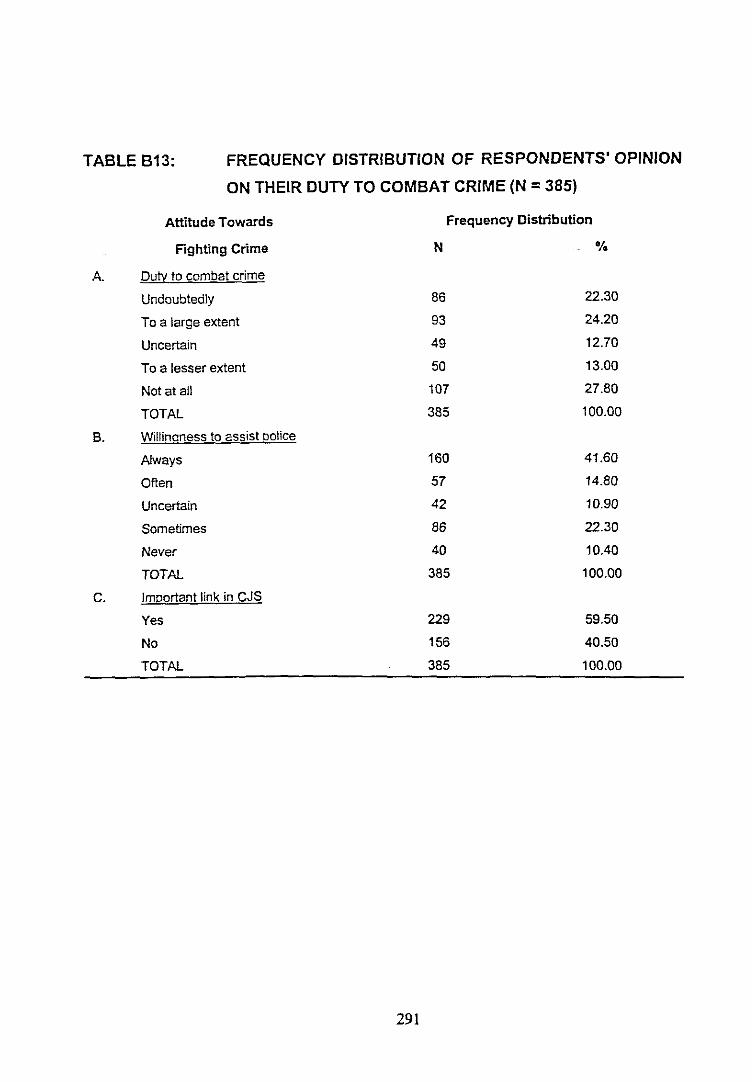
TABLE B13: FREQUENCY DISTRIBUTION OF RESPONDENTS' OPINION
ON THEIR DUTY TO COMBAT CRIME (N =385)
A.
B.
C.
Attitude Towards Frequency Distribution
Fighting Crime N %
DulY to combat crime
Undoubtedly 86 22.30
To a large extent 93 24.20
Uncertain 49 12.70
To a lesser extent 50 13.00
Not at all 107 27.80
TOTAL 385 100.00
Willinoness to assist oolice
PJways 160 41.60
Often 57 14.80
Uncertain 42 10.90
Sometimes 86 22.30
Never 40 10.40
TOTAL 385 100.00
Important link in CJS
Yes 229 59.50
No 156 40.50
TOTAL 385 100.00
291
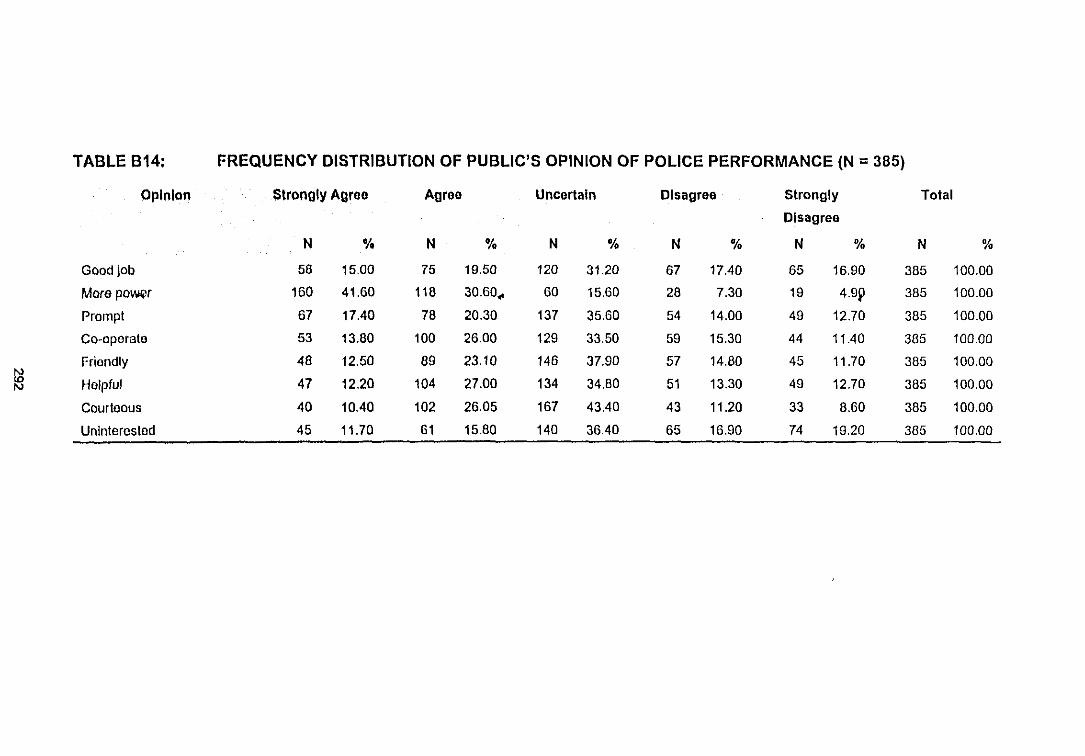
TABLE B14: FREQUENCY DISTRIBUTION OF PUBLIC'S OPINION OF POLICE PERFORMANCE (N =385)
Opinion Strongly Agree Agree Uncertain Disagree Strongly Total
Dlsagreo
N % N % N '10 N % N '10 N '10
Good job 58 15.00 75 19.50 120 31.20 67 17.40 65 16.90 385 100.00
Mora pow"r 160 41.60 118 30.60.. 60 15.60 28 7.30 19 499 385 100.00
Prompt 67 17.40 78 20.30 137 35.60 54 14.00 49 12.70 385 100.00
Co-operate 53 13.80 100 26.00 129 33.50 59 15.30 44 11.40 385 100.00
Friendly 48 12.50 89 23.10 146 37.90 57 14.80 45 11.70 385 100.00
~ Helpful 47 12.20 104 27.00 134 34.80 51 13.30 49 12.70 385 100.00
Courteous 40 10.40 102 26.05 167 43.40 43 11.20 33 8.60 385 100.00
Uninterested 45 11.70 61 15.80 140 36.40 65 16.90 74 19.20 385 100.00
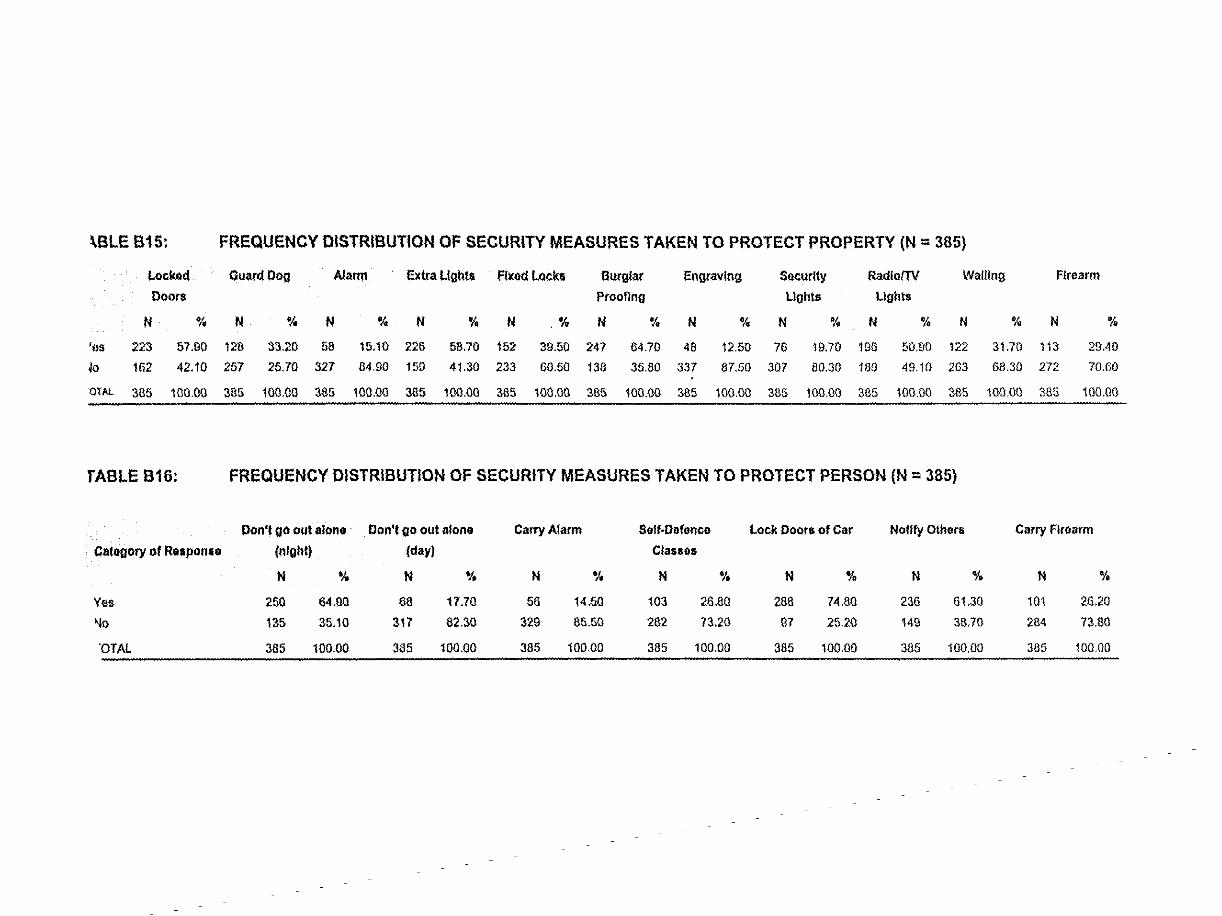
\BLE B15: FREQUENCY DISTRIBUTION OFSECURITY MEASURES TAKEN TO PROTECT PROPERTY (N =: 385}
Lock,ul GUllfd Dog Alarm Extra LIghts I'lxod Locks 6urglar EngravIng Socurlty RadlolTV WaUlng Flroarm
000111 Proofing Llghts l.lghts
N % N % N % N % N .% N % N % N % N % N % N %
'es 223 57.90 128 33.20 58 15.10 228 58.70 152 39.50 247 64.70 48 12.50 76 19.70 196 50.90 122 31.70 113 29.40
10 162 42.10 257 25]0 327 84.90 159 41.30 233 60.50 138 35.80 337 87.50 307 80.30 189 49.10 263 68.30 272 70.60
OTAL 385 100.00 385 100.00 :illS 100.00 365 100.00 365 100.00 365 100.00 385 100.00 385 100.00 365 100.00 :illS 10000 365 100.GO
TABLE B16: FREQUENCY DISTRIBUTION OF SECURITY MEASURES TAKEN TO PROTECT PERSON (N =: 385)
pon't go out alone Pon't go out alono Carry Alarm Self-Oofonce Lock Doors of Car Notify Others Carry Firearm
C/llegory of Response (nlghl) (day) Classos
N 'k N 'I, N ~, N % N % N % N %
Yes 250 64.90 68 11.70 56 14.50 103 26.aO 288 74.80 236 61.30 101 26.20
'10 135 35.10 317 82.30 329 85.50 282 73.20 97 25.20 149 36.70 284 73.60
'OrAL 385 100.00 385 100.00 385 100.00 385 100.00 385 100.00 385 100.00 385 100.00
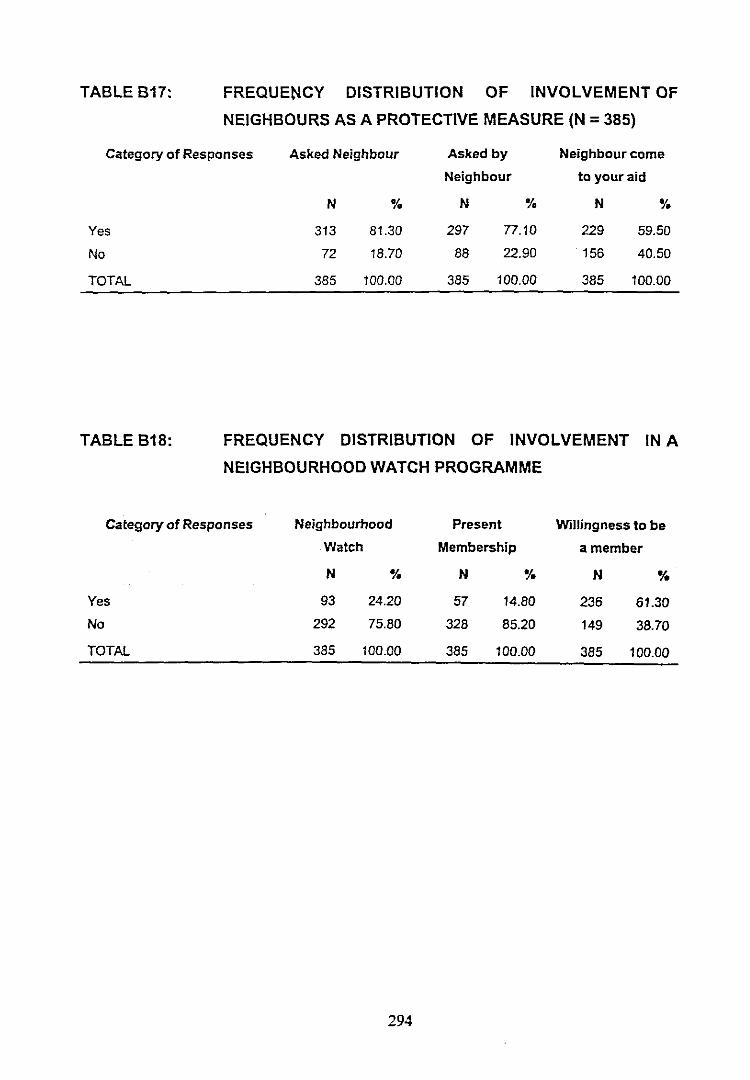
TABLE B17: FREQUENCY DISTRIBUTION OF INVOLVEMENT OF
NEIGHBOURS AS A PROTECTIVE MEASURE (N =385)
Category of Responses Asked Neighbour Asked by Neighbour come
Neighbour to your aid
N % N % N %
Yes 313 81.30 297 77.10 229 59.50
No 72 18.70 88 22.90 156 40.50
TOTAL 385 100.00 385 100.00 385 100.00
TABLE 818: FREQUENCY DISTRIBUTION OF INVOLVEMENT IN A
NEIGHBOURHOOD WATCH PROGRAMME
Category of Responses Neighbourhood Present Willingness to be
Watch Membership a member
N % N % N %
Yes 93 24.20 57 14.80 236 61.30
No 292 75.80 328 85.20 149 38.70
TOTAL 385 100.00 385 100.00 385 100.00
294
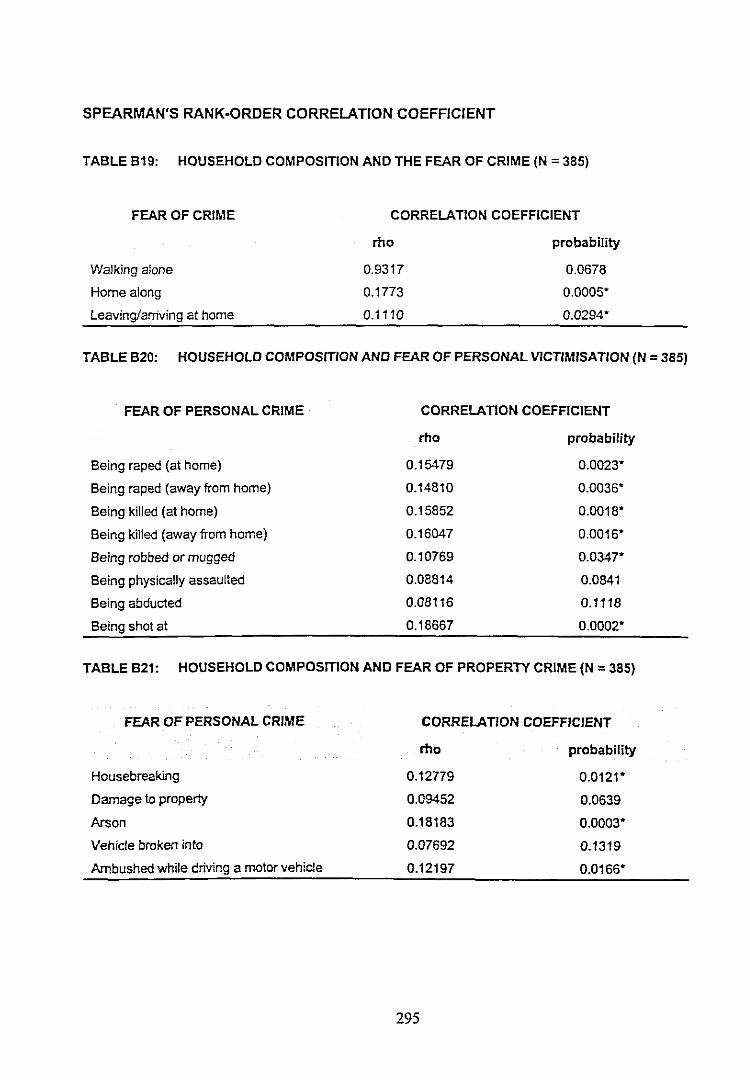
SPEARMAN'S RANK-QRDER CORRELATION COEFFICIENT
TABLE B19: HOUSEHOLD COMPOSITION AND THE FEAR OF CRIME (N = 385)
FEAR OF CRIME CORRELATION COEFFICIENT
Walking alone
Home along
Leaving/arriving at home
rho
0.9317
0.1773
0.1110
probability
0.0678
0.0005'
0.0294'
TABLE B20: HOUSEHOLD COMPOSITION AND FEAR OF PERSONAL VICTlMlSAT/ON (N = 385)
FEAR OF PERSONAL CRIME CORRELATION COEFFICIENT
Being raped (at home)
Being raped (away from home)
Being killed (at home)
Being killed (away from home)
Being robbed or mugged
Being physically assaulted
Being abducted
Being shot at
rho
0.15479
0.14810
0.15852
0.16047
0.10769
0.08814
0.08116
0.18667
probability
0.0023'
0.0036'
0.0018'
0.0016'
0.0347*
0.0841
0.1118
0.0002*
TABLE B21: HOUSEHOLD COMPOSITION AND FEAR OF PROPERTY CRIME (N =385)
FEAR OF PERSONAL CRIME CORRELATION COEFFICIENT
Housebreaking
Damage to property
Arson
Vehicle broken into
Ambushed while driving a motor vehicle
rho
0.12779
0.09452
0.18183
0.07692
0.12197
295
probability
0.0121*
0.0639
0.0003*
0.1319
0.0166*
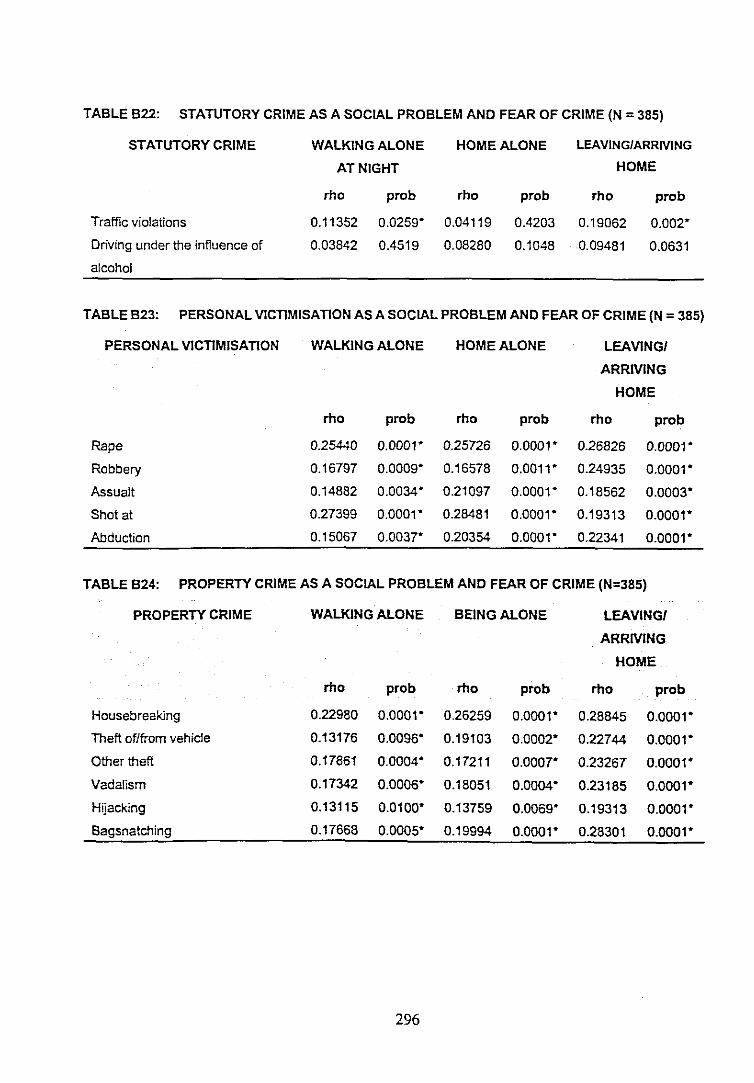
WALKING ALONE HOME ALONE LEAVING/ARRIVING
AT NIGHT HOME
rho prob rho prob rho prob
0.11352 0.0259" 0.04119 0.4203 0.19062 0.002"
0.03842 0.4519 0.08280 0.1048 0.09481 0.0631
Traffic violations
Driving under the influence of
alcohol
TABLE B22: STATUTORY CRIME AS A SOCIAL PROBLEM AND FEAR OF CRIME (N = 385)
STATUTORY CRIME
TABLE B23: PERSONAL VICTlMISATlON AS A SOCIAL PROBLEM AND FEAR OF CRIME (N = 385)
PERSONAL VICTlMISATlON WALKING ALONE HOME ALONE LEAVING/
ARRMNG
HOME
Rape
Robbery
Assualt
Shot at
Abduction
rho prob rho prob rho prob
0.25440 0.0001" 0.25726 0.0001" 0.26826 0.0001"
0.16797 0.0009" 0.16578 0.0011" 0.24935 0.0001"
0.14882 0.0034" 0.21097 0.0001" 0.18562 0.0003"
0.27399 0.0001" 0.28481 0.0001" 0.19313 0.0001"
0.15067 0.003r 0.20354 0.0001" 0.22341 0.0001"
WALKING ALONE BEING ALONE LEAVINGI
ARRIVING
HOME
rho prob rho prob rho prob
0.22980 0.0001" 0.26259 0.0001" 0.28845 0.0001"
0.13176 0.0096" 0.19103 0.0002" 0.22744 0.0001"
0.17861 0.0004" 0.17211 o.ooor- 0.23267 0.0001"
0.17342 0.0006" 0.18051 0.0004" 0.23185 0.0001"
0.13115 0.0100" 0.13759 0.0069" 0.19313 0.0001"
0.17668 0.0005" 0.19994 0.0001" 0.28301 0.0001"
Housebreaking
Theft of/from vehicle
Other theft
Vadalism
Hijacking
Bagsnatching
TABLE B24: PROPERTY CRIME AS A SOCIAL PROBLEM AND FEAR OF CRIME (N=385)
PROPERTY CRIME
296
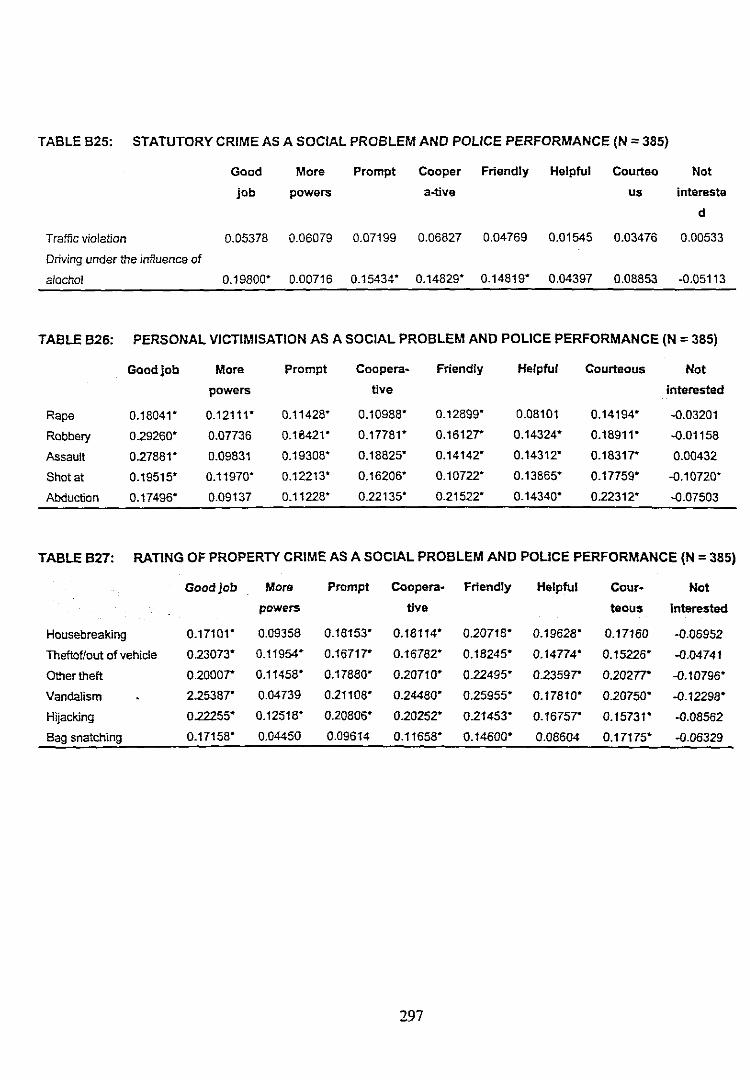
TABLEB25: STATUTORY CRIME AS A SOCIAL PROBLEM AND POLICE PERFORMANCE (N = 385)
Goad Mare Prompt Cooper Friendly Helpful Courteo Not
job powers a-tiva us intereste
d
Traffle violation 0.05378 0.06079 0.07199 0.06827 0.04769 0.01545 0.03476 0.00533
Driving underthe influence of
alochol 0.19800- 0.00716 0.15434- 0.14829- 0.14819- 0.04397 0.08853 -0.05113
TABLEB26: PERSONAL VICTIMISATION AS A SOCIAL PROBLEM AND POLICE PERFORMANCE (N = 385)
Good job More Prompt Coopera- Friendly Helpful Courteous Not
powers tive Interested
Rape 0.18041- 0.12111- 0.11428- 0.10988- 0.12899- 0.08101 0.14194- -0.03201
Robbery 0.29260- 0.07736 0.18421- 0.17781- 0.16127' 0.14324- 0.18911- -0.01158
Assault 0.27881- 0.09831 0.19308- 0.18825- 0.14142- 0.14312- 0.18317' 0.00432
Shot at 0.19515- 0.11970- 0.12213- 0.16206- 0.10722- 0.13865- 0.17759- -0.10720-
Abduction 0.17496- 0.09137 0.11228" 0.22135" 0.21522- 0.14340- 0.22312- -0.07503
TABLEB27: RATING OF PROPERTY CRIME AS A SOCIAL PROBLEM AND POLICE PERFORMANCE (N = 385)
Good job More Prompt Coopera- Friendly Helpful Cour- Not
powers tive teous Interested
Housebreaking 0.17101- 0.09358 0.18153- 0.18114- 0.20718- 0.19628- 0.17160 -0.06952
Theftoflout of vehicle 0.23073- 0.11954" 0.16717' 0.16782- 0.18245- 0.14774- 0.15226- -0.04741
Otherthefl 0.20007' 0.11458- 0.17880- 020710- 0.22495- 0.23597' 0.20277' -0.10796-
Vandalism 2.25387' 0.04739 021108- 0.24480" 0.25955- 0.17810- 0.20750- -0.12298-
Hijacking 0.22255- 0.12518- 0.20806- 020252- 0.21453- 0.16757' 0.15731" -0.08562
Bag snatching 0.17158- 0.04450 0.09614 0.11658- 0.14600- 0.08604 0.17175' -0.06329
297
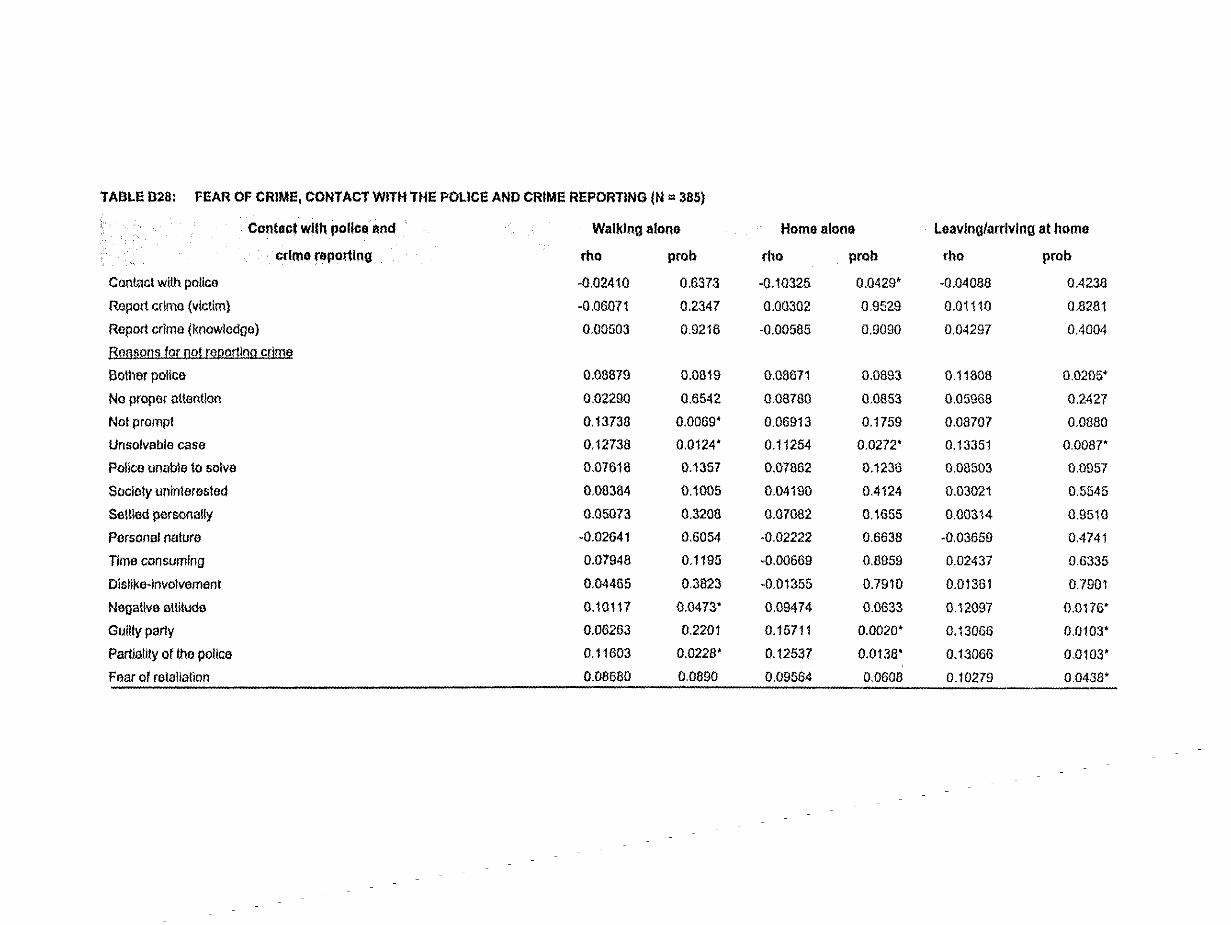
TABLE B28: FEAR OF CRIME, CONTACT WITHTHEPOLICE ANDCRIME REPORTING IN '"385)
Contllc~ with IloUce lind Walking alene Home alone LeavIng/arrIvIng athome
crime rellortlng mo prob rho prob rho prob
Contact wllh police -0.02410 0.6373 -0.10325 0.0429' -0.04088 0.4238
Report crlme (victim) -0.06071 0.2347 0.00302 0.9529 0.Q1110 0.8281
Raport crime(knowledge) 0.00503 0.9216 -0.00585 0.9090 0.04297 0.4004
Roasons We no! rpportlng crimo
Bother police 0.08679 0.0619 0.06671 0.0693 0.11608 0.0205*
No proper altentlon 0.02290 0.6542 0.08780 0.0853 0.05968 0.2427
Nol prompt 0.13738 0.0069* 0.06913 0.1759 0.08707 0.0880
Unsolvable case 0.12736 0.0124' 0.11254 0.0272* 0.13351 0.0087*
Poiice unable to solve 0.07616 0.1357 0.07862 0.1236 0.08503 0.0957
Socioty uninterested 0.06384 0.1005 0.04190 0.4124 0.03021 0.5545
SeWed personally 0.05073 0.3208 0.07082 0.1655 0.00314 0.9510
Personal nature -0.02641 0.6054 -0.02222 0.6638 -0.03659 0.4741
Time consuming 0.07948 0.1195 -0.00669 0.8959 0.02437 0.6335
Dlslike-Involvament 0.04465 0.3823 -0.01355 0.7910 0.01361 0.7901
Negatlve ellitude 0.10117 0.0473* 0.09474 0.0633 0.12097 0.0176*
Guiltyparty 0.06263 0.2201 0.15711 0.0020' 0.13066 0.0103'
Partiality of thepolice 0.11603 0.0228' 0.12537 0.0138' 0.13066 Om03'
Fearof retauanon 0.08680 0.0890 0.09564 0.0608 0.10279 0.0438'
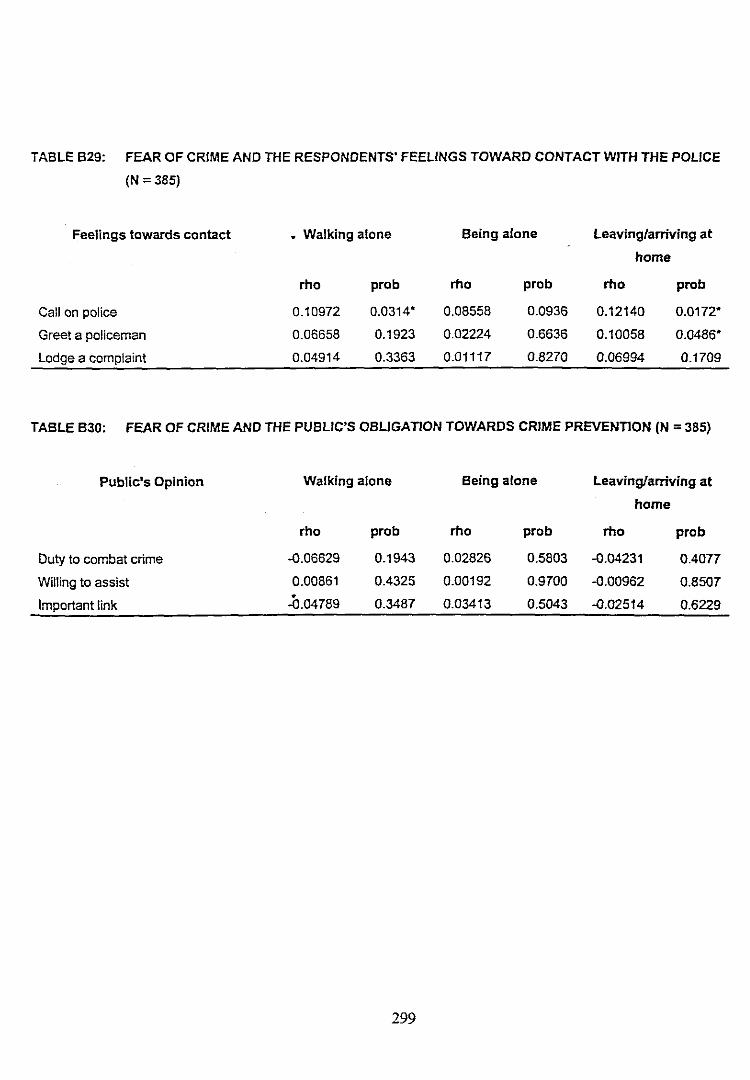
TABLE B29: FEAR OF CRIME AND THE RESPONDENTS' FEELINGS TOWARD CONTACT WITH THE POLICE
(N = 385)
Feelings towards contact , Walking alone Being alone Leaving/arriving at
home
rho prob rho prob rho prob
Call on police 0.10972 0.0314' 0.08558 0.0936 0.12140 0.0172'
Greet a policeman 0.06658 0.1923 0.02224 0.6636 0.10058 0.0486"
Lodge a complaint 0.04914 0.3363 0.01117 0.8270 0.06994 0.1709
TABLE B30: FEAR OF CRIME AND THE PU8L1C'S 08LIGATION TOWARDS CRIME PREVENTION (N = 385)
Public's Opinion
Duty to combat crime
Willing to assist
Important link
Walking alone Being alone Leaving/arriving at
home
rho prob rho prob rho prob
-0.06629 0.1943 0.02826 0.5803 -0.04231 0.40n
0.00861 0.4325 0.00192 0.9700 -0.00962 0.8507
..0.04789 0.3487 0.03413 0.5043 -0.02514 0.6229
299
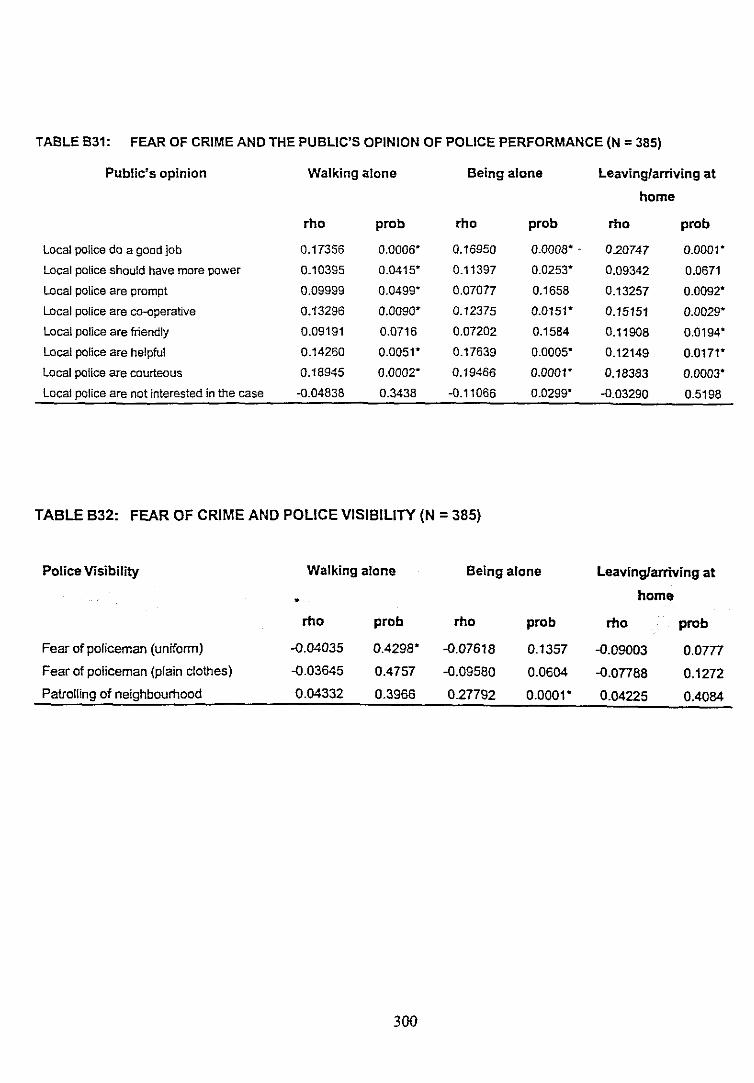
TA8LE831: FEAR OF CRIME AND THE PUBLIC'S OPINION OF POLICE PERFORMANCE (N = 385)
PUblic's opinion Walking alone Being alone Leaving/arriving at
home
rho prob rho prob rho prob
Localpolicedo a goodjob 0.17356 0.0006' 0.16950 O.OOOS' 0.20747 0.0001'
Localpoliceshould havemorepower 0.10395 0.0415' 0.11397 0.0253' 0.09342 0.0671
Localpoliceare prompt 0.09999 0.0499' 0.Q7077 0.1658 0.13257 0.0092'
Local policeare co-operative 0.13296 0.0090' 0.12375 0.0151' 0.15151 0.0029'
Locaipoliceare friendly 0.09191 0.0716 0.07202 0.1584 0.11908 0.0194'
Localpoliceare helpful 0.14260 0.0051' 0.17639 0.0005' 0.12149 0.0171'
Local policeare courteous 0.18945 0.0002' 0.19466 0.0001' 0.18383 0.0003'
Local police are not interested in the case -0.04838 0.3438 -0.11066 0.0299' -0.03290 0.5198
TABLE B32: FEAR OF CRIME AND POLlCE VISIBILITY (N =385)
Police Visibility Walking alone Being alone Leaving/arriving at
, home
rho prob rho prob rho prob
Fear of policeman (uniform) -{).04035 0.4298' -{).07618 0.1357 -{).09003 0.0777
Fear of policeman (plain clothes) -{).03645 0.4757 -{).09580 0.0604 -{).077aa 0.1272
Patrolling of neighbOUrhood 0.04332 0.3966 0.27792 0.0001' 0.04225 0.4084
300
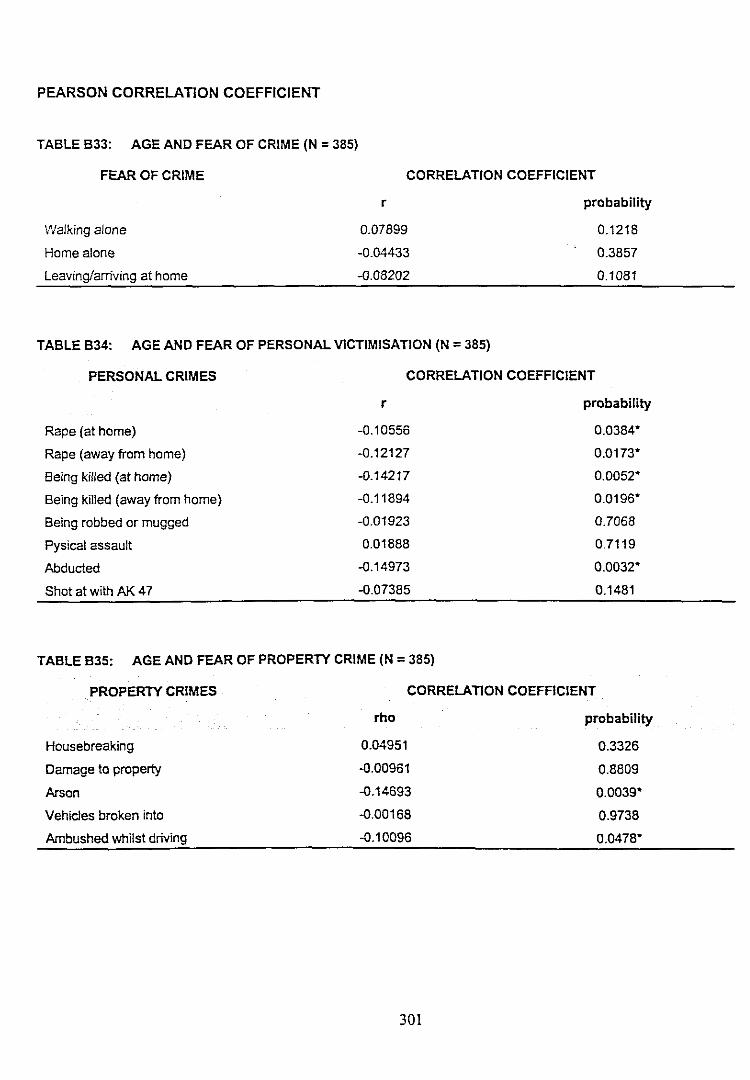
PEARSON CORRELATION COEFFICIENT
TABLE B33: AGE AND FEAR OF CRIME (N = 385)
FEAR OF CRIME CORRELATION COEFFICIENT
r probability
Walking alone
Home alone
Leaving/arriving at home
0.07899
-0.04433
-0.08202
0.1218
0.3857
0.1081
TABLE B34: AGE AND FEAR OF PERSONAL VICTIMISATION (N = 385)
PERSONAL CRIMES CORRELATION COEFFICIENT
r probability
Rape (at home)
Rape (away from home)
Being killed (at home)
Being killed (away from home)
Being robbed or mugged
Pysical assault
Abducted
Shot at with AI< 47
-0.10556
-0.12127
-0.14217
-0.11894
-0.01923
0.01888
-0.14973
-0.07385
0.0384"
0.0173"
0.0052"
0.0196"
0.7068
0.7119
0.0032"
0.1481
TABLE 835: AGE AND FEAR OF PROPERTY CRIME (N = 385)
PROPERTY CRIMES CORRELATION COEFFICIENT
rho probability
Housebreaking 0.04951 0.3326
Damage to property -0.00961 0.8809
Arson -0.14693 0.0039"
Vehicles broken into -0.00168 0.9738
Ambushed whilst driving -0.10096 0.0478"
301
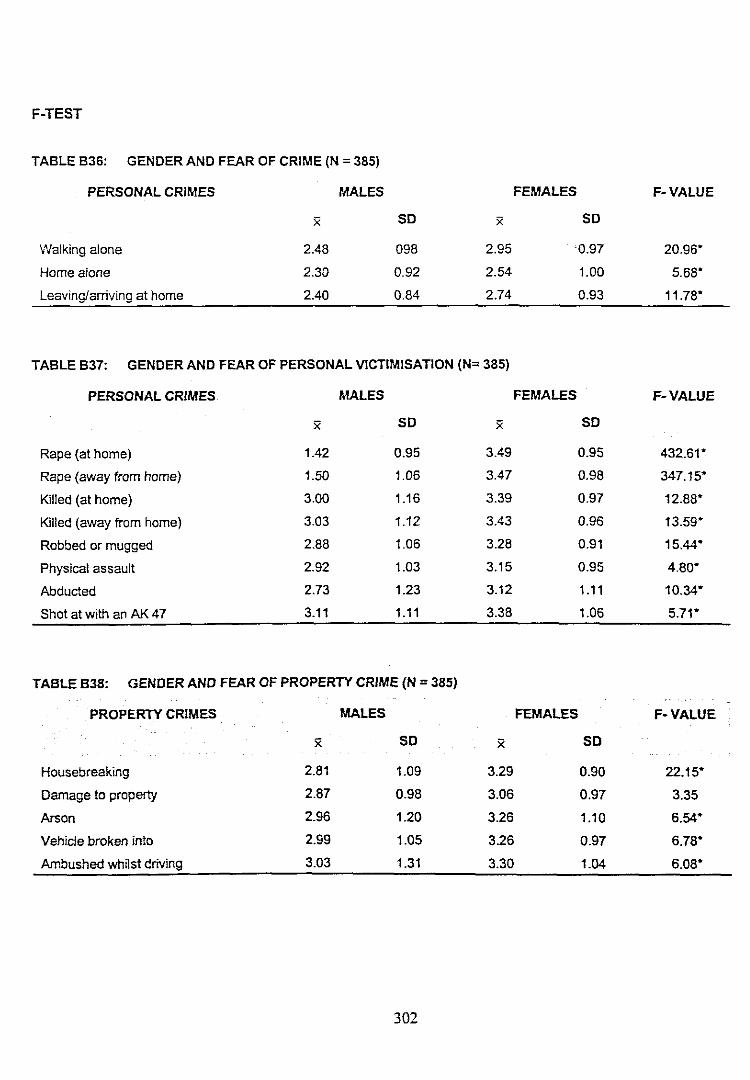
F·TEST
20.96'
5.68'
11.78'
F-VALUEMALES FEMALES
x SO x SO
2.48 098 2.95 0.97
2.30 0.92 2.54 1.00
2.40 0.84 2.74 0.93
Walking alone
Home alone
Leaving/arriving at home
TABLE B36: GENDER AND FEAR OF CRIME (N =385)
PERSONAL CRIMES
TABLEB37: GENDER ANO FEAR OF PERSONAL VICTIMISATION (N= 385)
PERSONAL CRIMES MALES FEMALES F-VALUE
x SO x SO
Rape (at home) 1.42 0.95 3.49 0.95 432.61'
Rape (away from home) 1.50 1.06 3.47 0.98 347.15'
Killed (at home) 3.00 1.16 3.39 0.97 12.88'
Killed (away from home) 3.03 1.12 3.43 0.96 13.59'
Robbed or mugged 2.88 1.06 3.28 0.91 15.44'
Physical assault 2.92 1.03 3.15 0.95 4.80'
Abducted 2.73 1.23 3.12 1.11 10.34'
Shot at with an AK 47 3.11 1.11 3.38 1.06 5.71'
TABLEB38: GENDER AND FEAR OF PROPERTY CRIME (N = 385)
PROPERTY CRIMES MALES FEMALES F-VALUE
x SO x SO
Housebreaking 2.81 1.09 3.29 0.90 22.15'
Damage to property 2.87 0.98 3.06 0.97 3.35
Arson 2.96 1.20 3.26 1.10 6.54'
Vehicle broken into 2.99 1.05 3.26 0.97 6.78'
Ambushed whilst driving 3.03 1.31 3.30 1.04 6.0S'
302
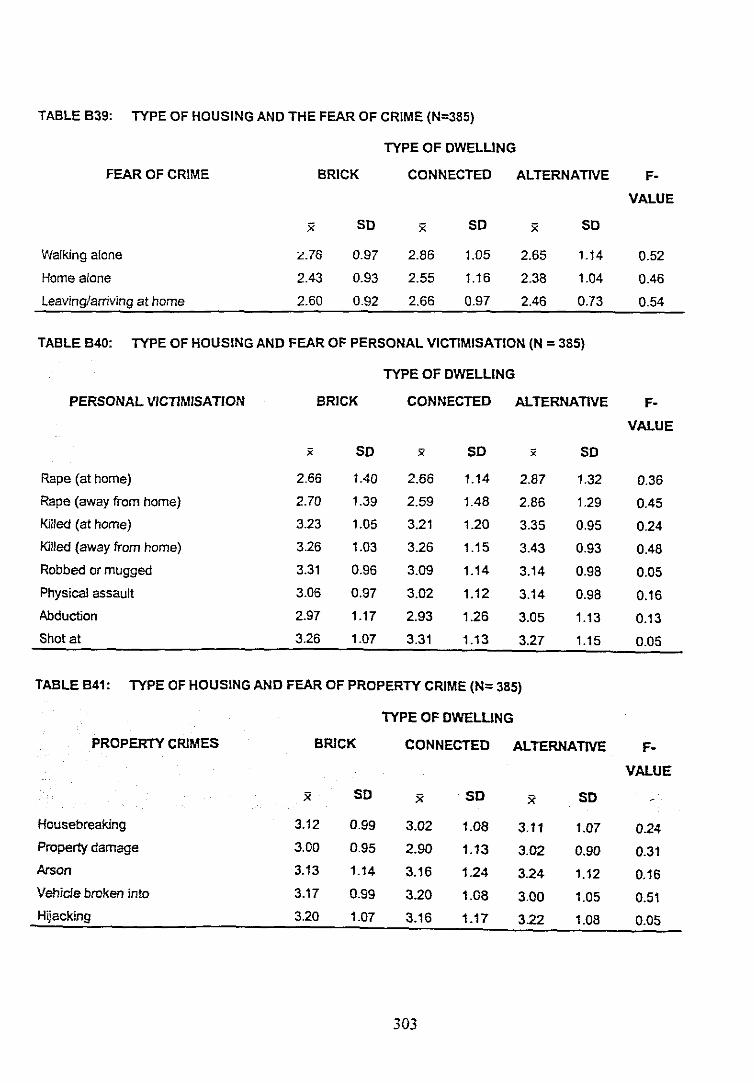
TABLE B39: TYPE OF HOUSING AND THE FEAR OF CRIME (N=385)
TYPE OF DWELUNG
FEAR OF CRIME BRICK CONNECTED ALTERNATIVE F-
VALUE
X SO X SO X SO
Walking alone "£.76 0.97 2.86 1.05 2.65 1.14 0.52
Home alone 2.43 0.93 2.55 1.16 2.38 1.04 0.46
Leaving/arriving at home 2.60 0.92 2.66 0.97 2.46 0.73 0.54
TABLEB40: TYPE OF HOUSING AND FEAR OF PERSONAL VICTIMISATION (N = 385)
TYPE OF DWELUNG
PERSONAL VICTIMISATION BRICK CONNECTED ALTERNATlVE F-
VALUE
x SD x SO x SO
Rape (at home) 2.66 1.40 2.66 1.14 2.87 1.32 0.36
Rape (away from home) 2.70 1.39 2.59 1.48 2.86 1.29 0.45
Killed (at home) 3.23 1.05 3.21 1.20 3.35 0.95 0.24
Killed (away from home) 3.26 1.03 3.26 1.15 3.43 0.93 0.48
Robbed or mugged 3.31 0.96 3.09 1.14 3.14 0.98 0.05
Physical assault 3.06 0.97 3.02 1.12 3.14 0.98 0.16
Abduction 2.97 1.17 2.93 1.26 3.05 1.13 0.13
Shot at 3.26 1.07 3.31 1.13 3.27 1.15 0.05
TABLEB41: TYPE OF HOUSING AND FEAR OF PROPERTY CRIME (N= 385)
TYPE OF DWELUNG
PROPERTY CRIMES BRICK CONNECTED ALTERNATIVE F-
VALUE
x SO x SO x SO
Housebreaking 3.12 0.99 3.02 1.08 3.11 1.07 0.24Property damage 3.00 0.95 2.90 1.13 3.02 0.90 0.31Arson 3.13 1.14 3.16 1.24 3.24 1.12 0.16Vehicle broken into 3.17 0.99 3.20 1.08 3.00 1.05 0.51Hijacking 3.20 1.07 3.16 1.17 3.22 1.08 0.05
303
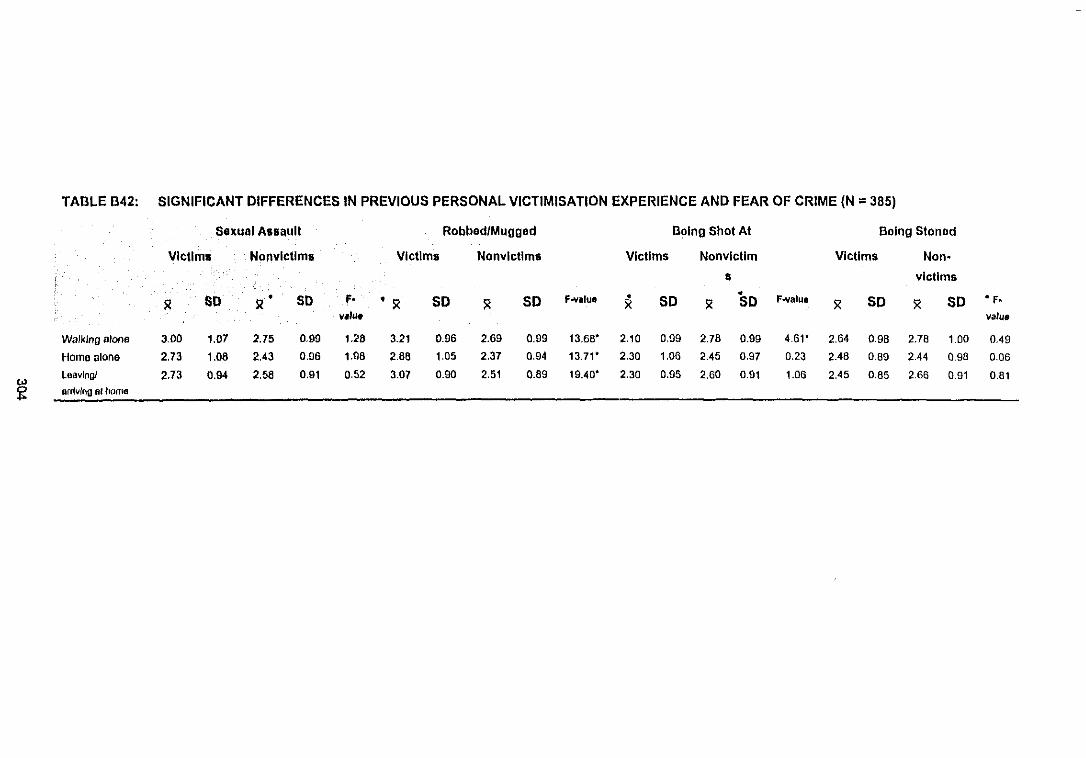
TABLE 1342: SIGNIFICANT DIFFERENCES IN PREVIOUS PERSONAL VICTIMISATION EXPERIENCE AND FEAR OF CRIME (N =385)
Sexual Auault Robbed/Mugged Being ShotAt Being Stoned
Vlcllms NOnvlctlms Victims Nonvlctlms Victims Nonvlctlm Victims Non-
s victims
SO • SO F· f..yllul • • F..valul • F.)l )l • )l
SO )l SO )( 50 5< SO 5< SO )l SOv,,~ va'ue
Walking alona 3.00 1.07 2.75 0.99 1.28 3.21 0.96 2.69 0.99 13.68" 2.10 0.99 2.78 0.99 4.61' 2.64 0.98 2.78 1.00 0.49
Home alone 2.73 1.08 2.43 0.96 1.98 2.88 1.05 2.37 0.94 13.71· 2.30 1.06 2.45 0.97 0.23 2.48 0.89 2.44 0.98 0.06
Leaving! 2.73 0.94 2.58 0.91 0.52 3.07 0.90 2.51 0.89 19.40· 2.30 0.95 2.60 0.91 1.06 2.45 0.85 2.66 0.91 0.81
'"~ arrivIng 01 flume
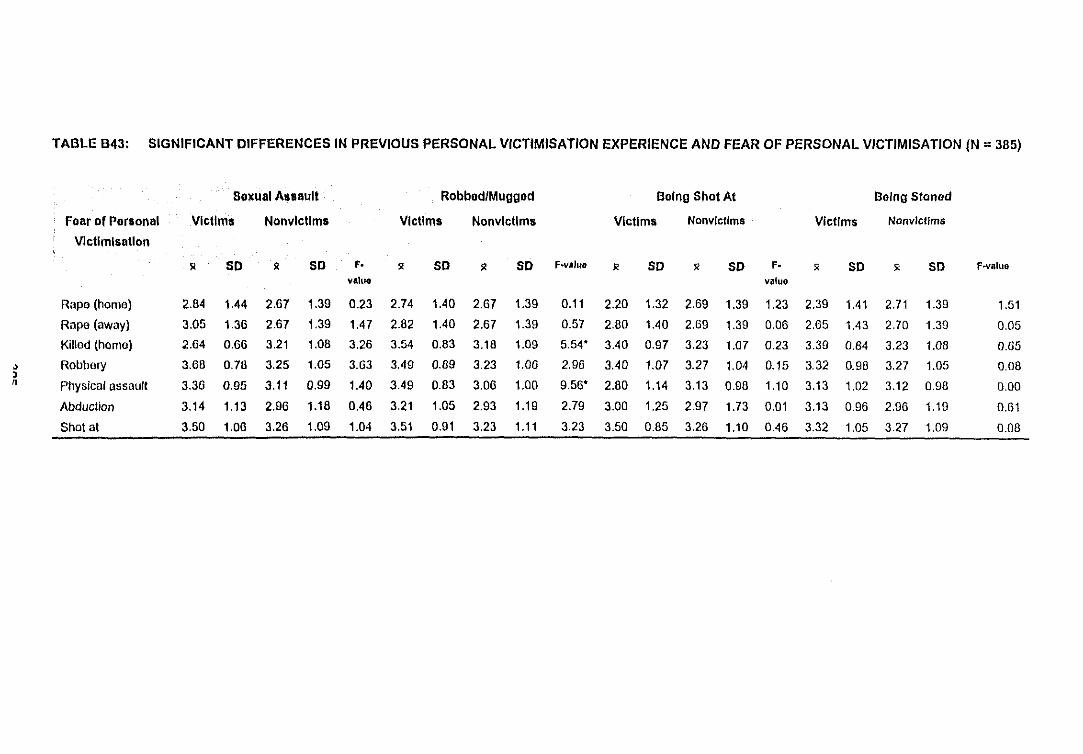
TABLE B43: SIGNIFICANT DIFFERENCES IN PREVIOUS PERSONAL VICTlMISATION EXPERIENCE AND FEAR OF PERSONAL VICTIMISATION IN = 385)
Snual Assault Robbod/Mugged Being Shot At Being Stoned
Foar of Personal Victims NonvlcUms Victims Nonvlctlms Victims Nanvletlm. Victim. Nonvlctlms
VlcUmlsaUon
~ SO ~ SO F· ~ SO ~ SO F-va'ult ~ SO 51 SO F· 51 SO 51 SO Pwafuevalue varue
Rapa (homo) 2.84 1.44 2.67 1.39 0.23 2.74 1,40 2.67 1.39 0.11 2.20 1.32 2.69 1.39 1.23 2.39 1.41 2.71 1.39 1,51
Rape (away) 3.05 1.36 2.67 1.39 1,47 2.82 1,40 2.67 1.39 0.57 2.60 1,40 2.69 1.39 0.06 2.65 1.43 2.70 1.39 0.05
Klllod (homo) 2.64 0.66 3.21 1.08 3.26 3.54 0.83 3.18 1.09 5.54' 3.40 0.97 3.23 1.07 0.23 3.39 0.84 3.23 1.08 0.65
> Robbory 3.68 0.78 3.25 1.05 3.63 3.49 0.89 3.23 1.06 2.96 3.40 1.07 3.27 1.04 0.15 3.32 0.98 3.27 1.05 0.08)n Physical assault 3.36 0.95 3.11 0.99 1.40 3.49 0.83 3.06 1.00 9.56' 2.80 1.14 3.13 0.98 1.10 3.13 1.02 3.12 0.98 0.00
Abducllon 3.14 1.13 2.96 1.18 0,46 3.21 1.05 2.93 1.19 2.79 3.00 1.25 2.97 1.73 0.01 3.13 0.96 2.96 1.19 0.61
Shot at 3.50 1.06 3.26 1.09 1.04 3.51 0.91 3.23 1.11 3.23 3.50 0.85 3.26 1.10 0,46 3.32 1.05 3.27 1.09 0.08
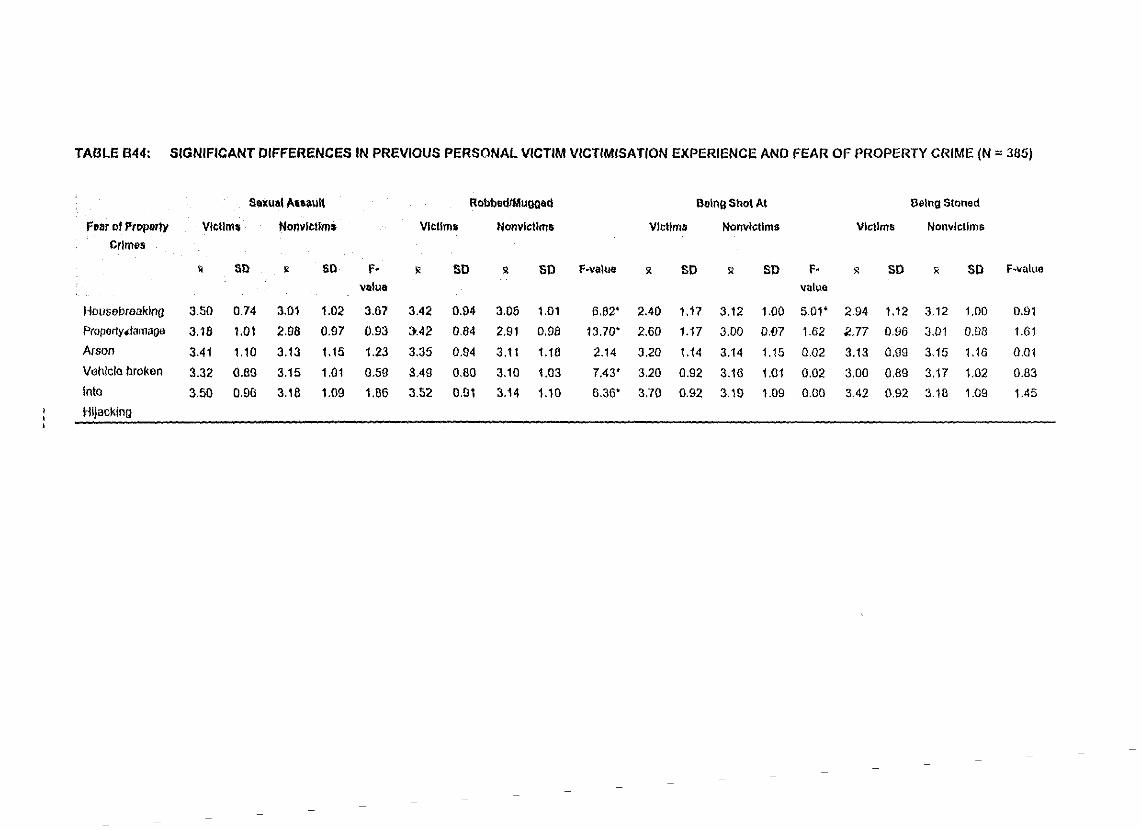
TABLE 844: SIGNIFICANT DIFFERENCES IN PREVIOUS PERSONAL VICTIM VICTIMISATION EXPERIENCE AND FEAR OF PROPERTY CRIME (N" 385)
S_xual An~ult RobbedlMuggect aelng Shot At aelng Stoned
fear ofProperlY Vlellm. Nonvletlma Vlellma Nanvlctlm. Victims Nanvlctlms Victims Nanvlctlm.erlm••
~ SD 2 SD f· ~ SO ~ SO f-val"e ~ SO ~ SO F· ~ SO ~ SO F-valuevalue value
HOllsebreaklng 3.50 0.74 3.01 1.02 3.67 3.42 0.94 3.05 1.01 6.82' 2.40 1.17 3.12 1.00 5.01' 2.94 1.12 3.12 1.00 0.91
Proporly<!amaga 3.18 1,01 2.98 0.97 0.93 30.42 0.84 2.91 0.98 13.70' 2.60 1,17 3.00 o.m 1.62 2.77 0.96 3.01 0.98 1.61
Arson 3.41 1.10 3.13 1.15 1.23 3.35 0.94 3.11 1.16 2.14 3.20 1.14 3.14 1.15 0.02 3.13 0.99 3.15 1.16 omVehiclebroken 3.32 0.8\1 3.15 1.01 0.59 3.49 0.80 3.10 1.03 7.43' 3.20 0.92 3.16 1.01 0.02 3.00 0.8\1 3.17 1.02 0.83
lnlo 3.50 0.96 3.18 1.09 1.80 3.52 0.91 3.14 1.10 6.30' 3.70 0.\12 3.19 1.09 0.00 3.42 0.92 3.18 1.09 1.45
HijacMng
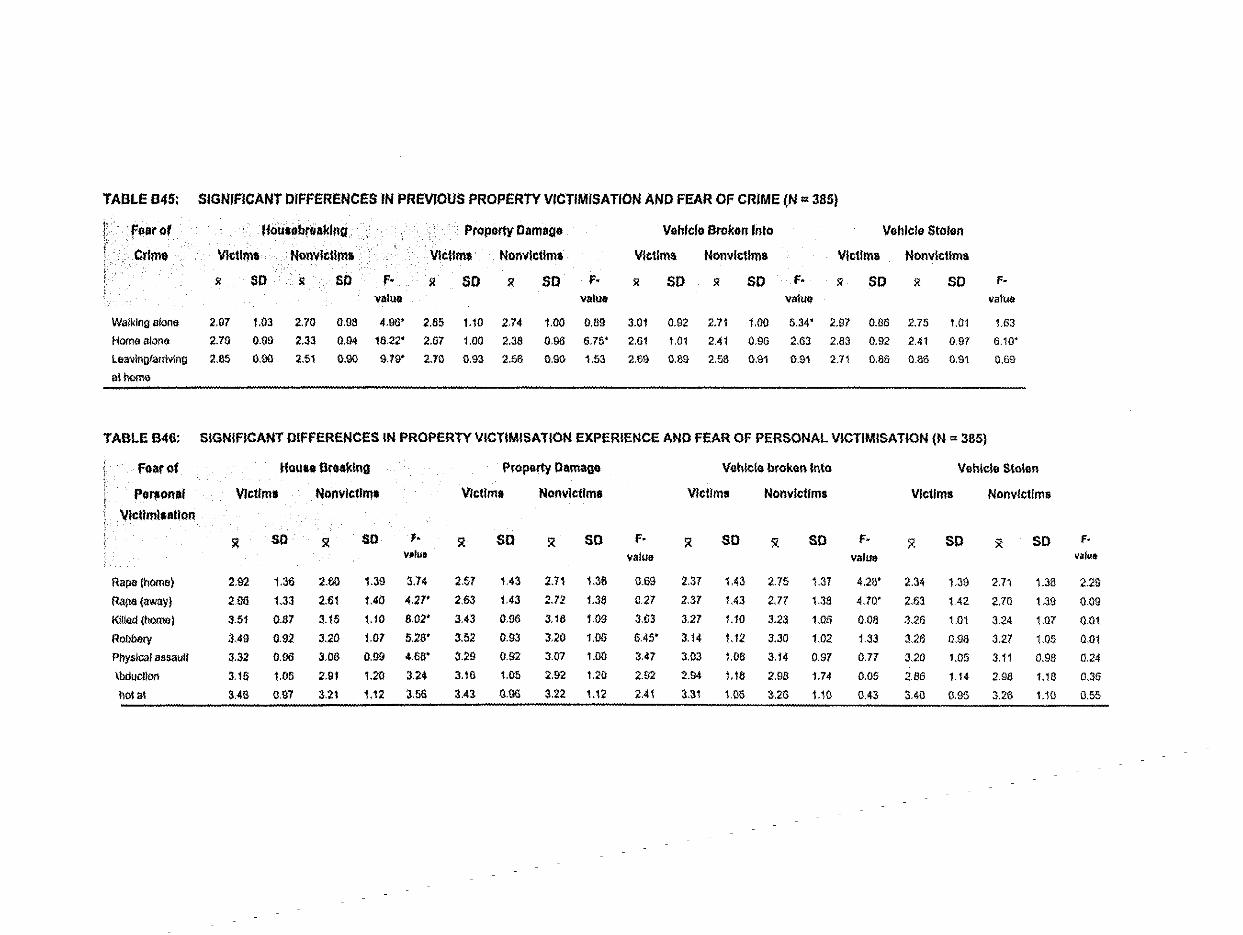
TABLE B45: SIGNIFICANT DIFFERENCES IN PREVIOUS PROPERTY VICTIMISAT/ON ANDFEAR OF CRIME (N" 385)
filar of Hou'lIbrlia~lnQ PropertY Damage VehIcle Broken Into Vehicle Stolen
Crlmt Vlctlma NOllvlcUma Vlcllmt Nonvlctlm. VIctims Nonvh:tlma Vlctlma NOllvlctllll$
~ SO ~ SO f' II SO II SO p. II SO II SO p. II SO i1 SO F·value value vatue vetue
Walking alana 2,97 1,03 2.70 0,98 4,00· 2.65 1.10 2.74 1.00 0,89 3.01 0.92 2,71 1.00 5,34' 2,97 0.88 2.75 1.01 1,83
Homealooe 2.79 0.09 2,33 0.04 18.22' 2.87 1.00 2.38 0.05 5.75' 2.51 1.01 2,41 0.95 2.63 2.83 0.92 2,41 097 6.10'
le"",lnolarmlng 2.85 0.00 2.51 0.00 9.70' 2.70 0.03 2.56 0.00 1.53 2.69 0.80 2,58 0.91 0.91 2,71 0.86 0.86 0.91 0.69
al !lcl<n«
TABLEB46: SIGNIFICANT DIFFERENCES IN PROPERTY VICTIMISATION EXPERIENCE AND FEAR OF PERSONAL VICTIMISATION (N" 385}
Filai' of 1101110 llrllDklllg PropertY OafllUgO Vohk:lo brokell IlIto Vehicle Slolon
Pll~ol\al VIctim. Nonvletlllll Vlctlm. NOllvlctlm. Vletlm. NOllvlet/ms Victims NOllvlet/msVleUmllallon
II SO SI SO ,.SI SO l< SO F· SI SO 5( SO F· 5( SO x SO f·
v.Jue valua valuo valu.
Rapalhoma) 2.92 1,36 2.60 1.39 3.14 2.57 U3 2.11 1.38 0.69 2.31 1,43 2.75 1.37 4,28' 2.34 1.39 2.71 1.38 2.20
Rape (away) 2.00 1.33 2.61 1.40 4.21' 2.63 1.43 2.72 1.38 0.27 2.37 1,43 2.77 1.38 4.70' 2.63 1,42 VO 1.39 0.09
K!11~d (hamal 3.51 0.81 3.15 1.10 8.02' 3,43 0,06 3,18 1.09 3.03 3.27 1.10 3.23 1,06 0.08 3,26 1.01 3.24 1.07 0.Q1
RolllllllY 3.49 0.92 3.20 1.07 5.28' 3.52 0.93 3,20 1.00 6.45' 3.14 1.12 3.30 1,02 1.33 326 0,98 3.27 1.05 amPhysical assaul! 3,32 0.06 3.00 0.99 4.68' 3.29 0.02 3.01 1.00 3.47 3.03 1.08 3,14 0.97 0.11 3,20 1.05 3.11 0.98 0.24
\bQuclioo 3,16 1.05 2.91 1.20 3.24 3,16 1.05 2.92 1.20 2.02 2.94 1.18 2.98 1.74 0.05 2.86 1.14 2.98 1.18 0.36
holal 3.46 0.97 3,21 1.12 3.56 3.43 0.00 3.22 1,12 2.41 3.31 1.06 3.26 1.10 0.43 3.40 0,95 3.26 1.10 0.55
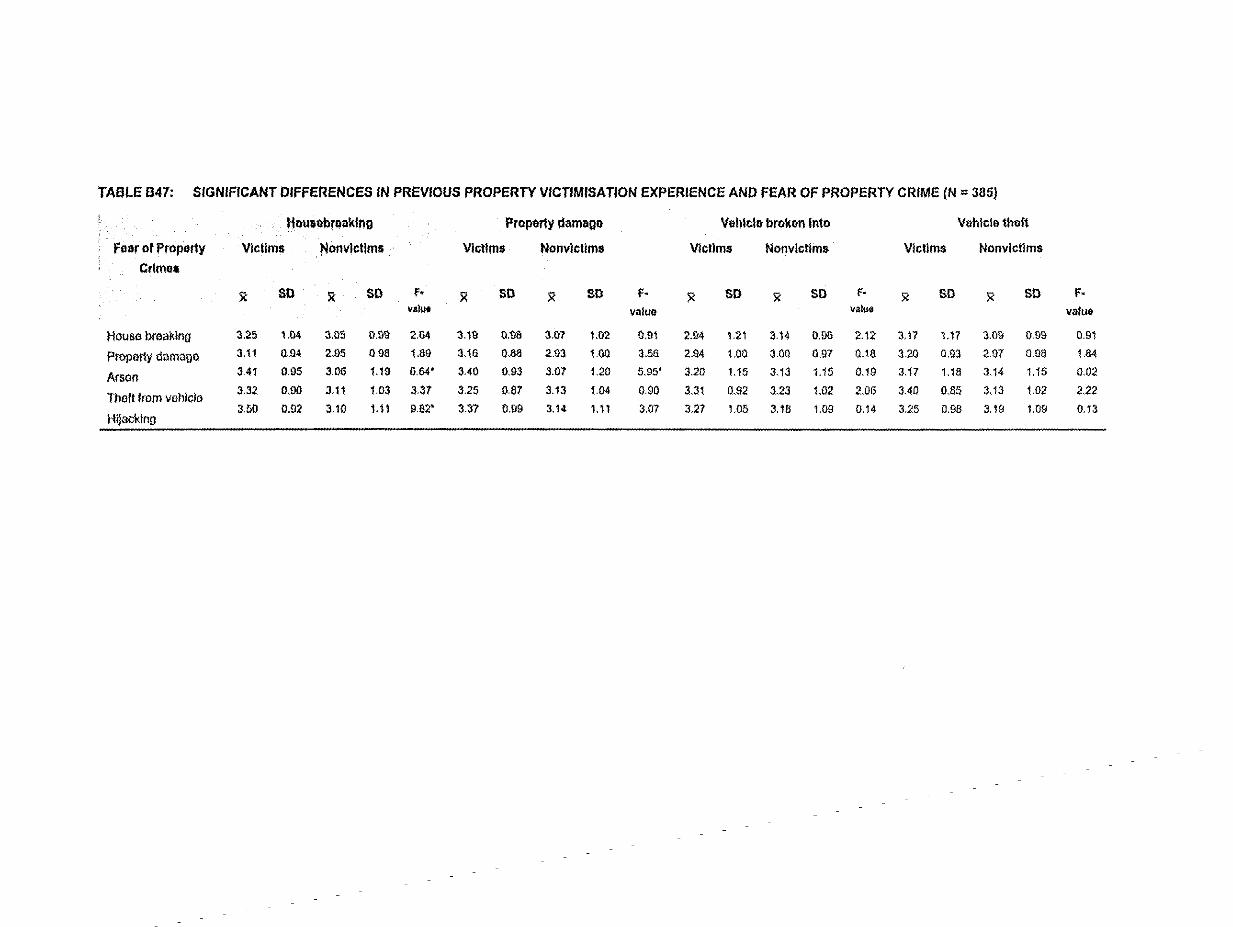
TAal-E a47: SIGNIFICANT DIFFERENCES IN PREVIOUS PROPERTY VICTlMISATlON EXPERIENCE AND FEAR OFPROPERTY CRIME (N=385)
Ilouilibrllllklno ProplirIY damago Vonlelo brokrm Into Vahlelo thaft
FOllr of Proporty Vlcllml tlonvlcllml Vlcllml Nonvlcllml Vlcllms Nonvlcllms Vlcllms Nonvicllms
CrimOli
x SO x so f· x so x SO F· X SO x SO F· x SO X SO F·v_lUi' value valu. value
HOUS6 brooking 3.25 1.04 3.05 0.99 2.64 3.19 o.lla 3.Q1 1.02 0.91 2.94 1.21 3.14 0.90 2.12 3.17 1.17 3.09 0.99 0.91
Property damago 3.11 0.04 2.95 0.011 1.119 3.16 0.88 2.93 1.00 3-59 2.04 1.00 300 0.07 0.1l1 :1.20 0.03 297 0.98 I.M
Arson 3.41 0.95 3.06 1.19 6.64' 3.40 0.93 3.07 1.20 5,95" 3.20 1.15 3.13 1.15 0.19 3.17 1.18 3.14 1.15 0.02
Thofllrom vohlcla 3.32 0.90 3.11 1.03 3.37 3.25 0.87 3.13 1.04 0.90 3.31 0.92 3.23 1.02 2.06 3.40 0.B5 3.13 1.02 2.22
3.5iJ 0.92 3.10 1.11 9.82' 3.37 0.99 3.14 l.ll 3.07 3.27 1.05 3.18 1.09 0.14 3.25 0.98 3.19 1.09 0.13Hijacking
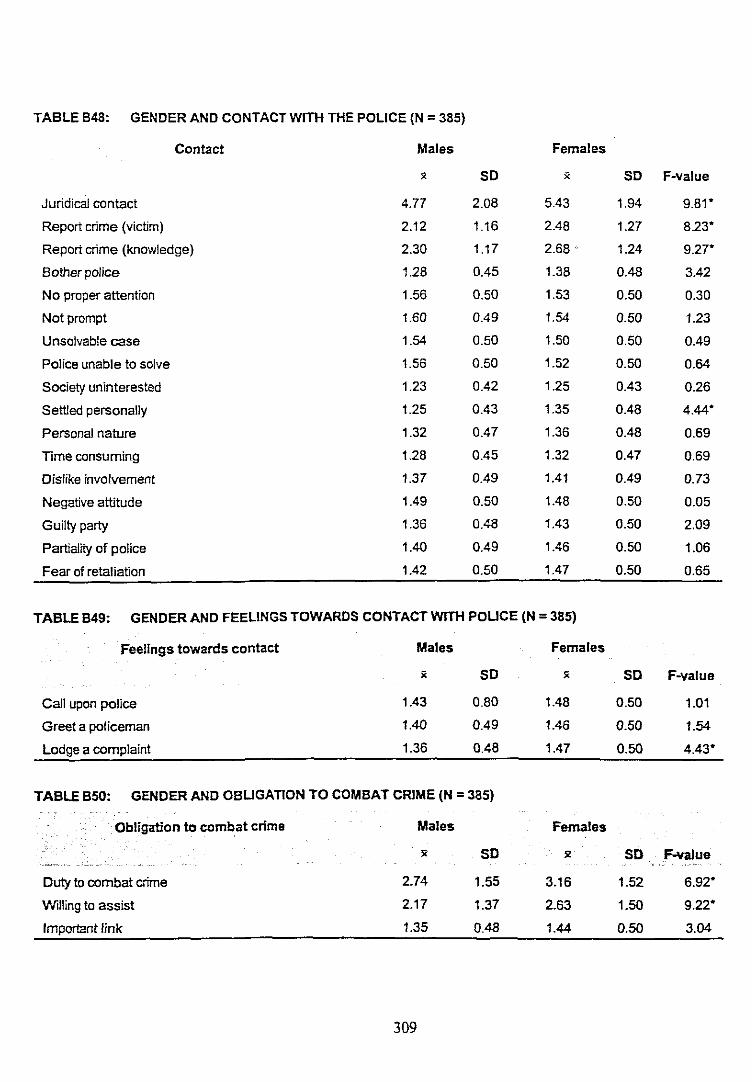
TABLE 848: GENDER AND CONTACT WITH THE POLICE (N = 385)
Contact Males Females
" SO " SO F-value
Juridical contact 4.77 2.08 5.43 1.94 9.81'
Report crime (victim) 2.12 1.16 2.48 1.27 8.23'
Report crime (knowledge) 2.30 1.17 2.68 ~ 1.24 9.27*
Bother police 1.28 0.45 1.38 0.48 3.42
No proper attention 1.56 0.50 1.53 0.50 0.30
Not prompt 1.60 0.49 1.54 0.50 1.23
Unsolvable case 1.54 0.50 1.50 0.50 0.49
Police unable to solve 1.56 0.50 1.52 0.50 0.64
Society uninterested 1.23 0.42 1.25 0.43 0.26
Settled personally 1.25 0.43 1.35 0.48 4.44'
Personal nature 1.32 0.47 1.36 0.48 0.69
Time consuming 1.28 0.45 1.32 0.47 0.69
Dislike involvement 1.37 0.49 1.41 0.49 0.73
Negative altitude 1.49 0.50 1.48 0.50 0.05
Guilty party 1.36 0.48 1.43 0.50 2.09
Partiality of police 1.40 0.49 1.46 0.50 1.06
Fear of retaliation 1.42 0.50 1.47 0.50 0.65
TABLE 849: GENDER AND FEELINGS TOWARDS CONTACT WITH POLICE (N = 385)
Feelings towards contact Males Females
" SO x SO F-value
Call upon police 1.43 0.80 1.48 0.50 1.01
Greet a policeman 1.40 0.49 1.46 0.50 1.54
Lodge a complaint 1.36 0.48 1.47 0.50 4.43'
TABLEB50: GENDER ANO OBLIGATION TO COMBAT CRIME (N = 385)
Obligation to combat crime Males Females
x SO 51 SO F-vaJue
Duty tocombat crime 2.74 1.55 3.16 1.52 6.92'
Willing to assist 2.17 1.37 2.63 1.50 9.22'
Important link 1.35 0.48 1.44 0.50 3.04
309
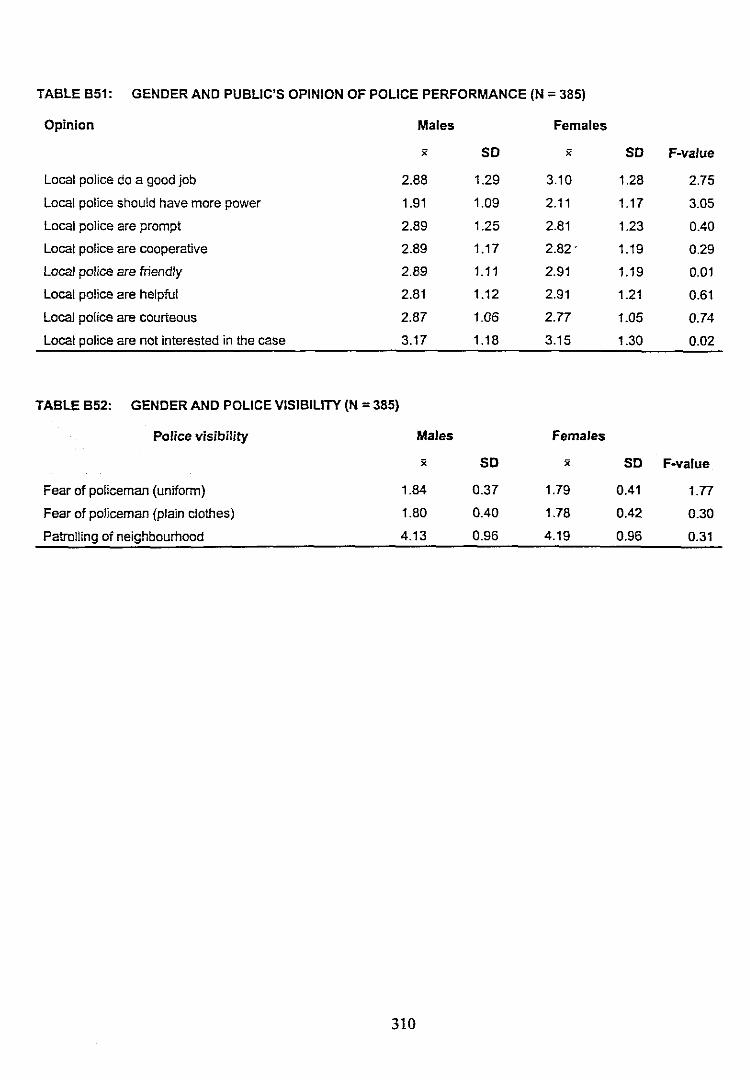
TABLE B51: GENDER AND PUBLIC'S OPINION OF POLICE PERFORMANCE (N = 385)
Opinion Males Females
" SO " SO F-value
Local police do a good job 2.88 1.29 3.10 1.28 2.75
Local police should have more power 1.91 1.09 2.11 1.17 3.05
Local police are prompt 2.89 1.25 2.81 1.23 0.40
Local police are cooperative 2.89 1.17 2.82· 1.19 0.29
Local police are friendly 2.89 1.11 2.91 1.19 0.01
Local police are helpful 2.81 1.12 2.91 1.21 0.61
Local police are courteous 2.87 1.06 2.77 1.05 0.74
Local police are not interested in the case 3.17 1.18 3.15 1.30 0.02
TABLEB52: GENDER AND POLICE VISIBILITY (N = 385)
Police visibility Males Females
" SO " SO F-value
Fear of policeman (uniform) 1.84 0.37 1.79 0.41 1.77
Fear of policeman (plain clothes) 1.80 0.40 1.78 0.42 0.30
Patrolling of neighbourhood 4.13 0.96 4.19 0.96 0.31
310
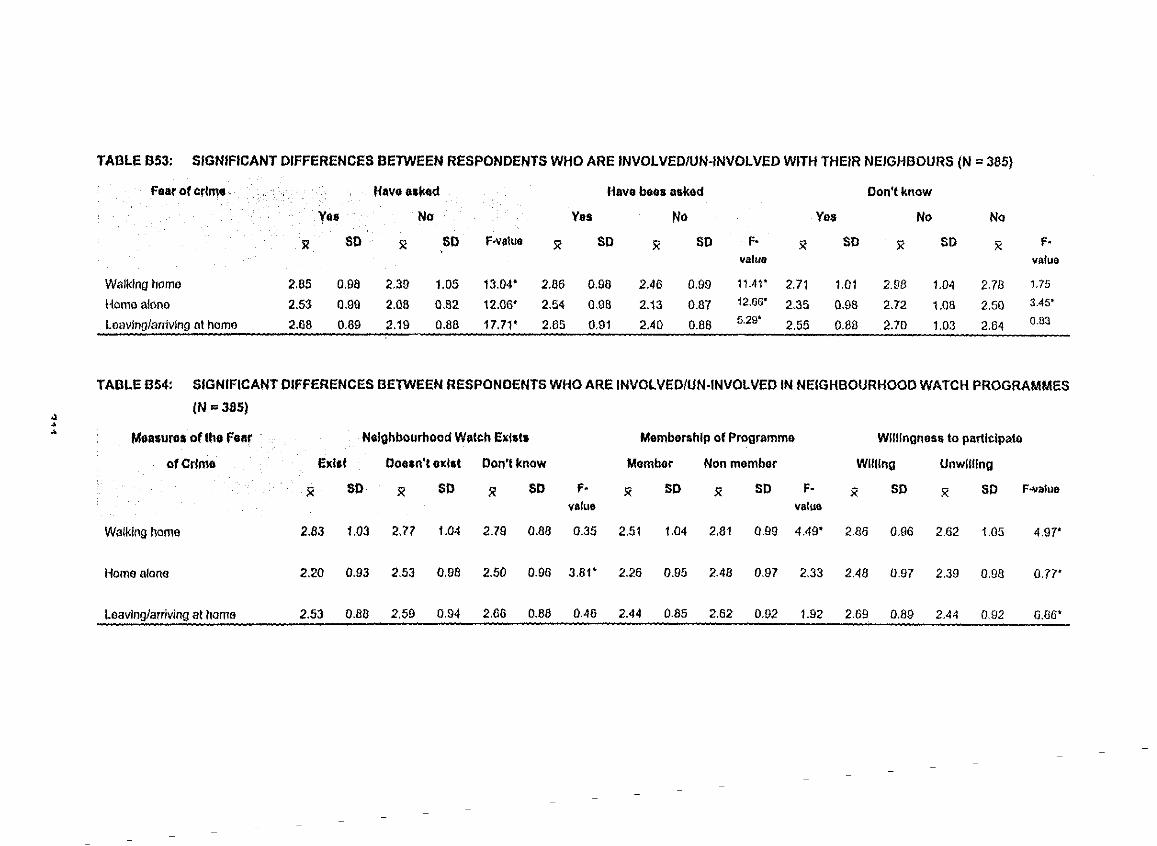
TADlE B53: SIGNIFICANTDIFFERENCES BETWEEN RESPONDENTS WHO ARE INVOLVED/UN-INVOLVED WITH THEIR NEIGHBOURS (N =385)
fear of crlmo ~ave aaklld Have bell. aaked Don'tknow
Yes No Yes No Yes No No
51 SO x SO F,valu8 x SO x SO F· x SO x SO x f·valu& value
Walking home 2,85 0.96 2.39 1.05 13,04' 2,86 0,98 2,46 0,99 11,41' 2,71 1.01 2.98 1,04 2.78 1.75
Homo alone 2,53 0,99 2,01l 0.1l2 12.00' 2.54 0.98 2,i3 0.87 12.00' 2.35 0,98 2.72 1,08 2,50 3.45'
Leaving/arriving at home 2.68 0.89 2,19 0,68 17,71' 2,65 0.91 2.40 0.88 5.29'" 2,55 0,86 2.70 1.03 2,54 0.83
TABLEB!i4: SIGNIFICANTDIFFERENCES BETWEENRESPONDENTS WHO ARE INVOLVED/UN·INVOlVED IN NEIGHBOURHOOD WATCH PROGRAMMES
~IN =385)
•• MOASuros of tho foar Neighbourhood Watch E~18ts MembershIp of Programme WIllingness to participate
of Crime E~llt Ooean'le~lst Don'tknow Member Nonmember Willing UnWilling
l< SO l( SO X SO f· X SO l( SO F· x SO X SO F·••luevalue valua
Walking homo 2,83 1.03 2.77 1.04 2,79 0.88 0.35 2.51 1,04 2.81 0.99 4,40' 2.86 0,00 2.62 1,05 4.97'
Homoslono 2.20 0.03 2.53 0,98 2.50 0.96 3,81' 2,26 0.95 2,48 0.97 2.33 2All 0.97 2.39 0.98 0.77'
Laavlng/arrlvlng at home 2,53 0.88 2,59 0.94 2,86 0,88 0.46 2.44 0.85 2,62 0,92 1.92 2.69 0,89 2.44 0,92 6.66'
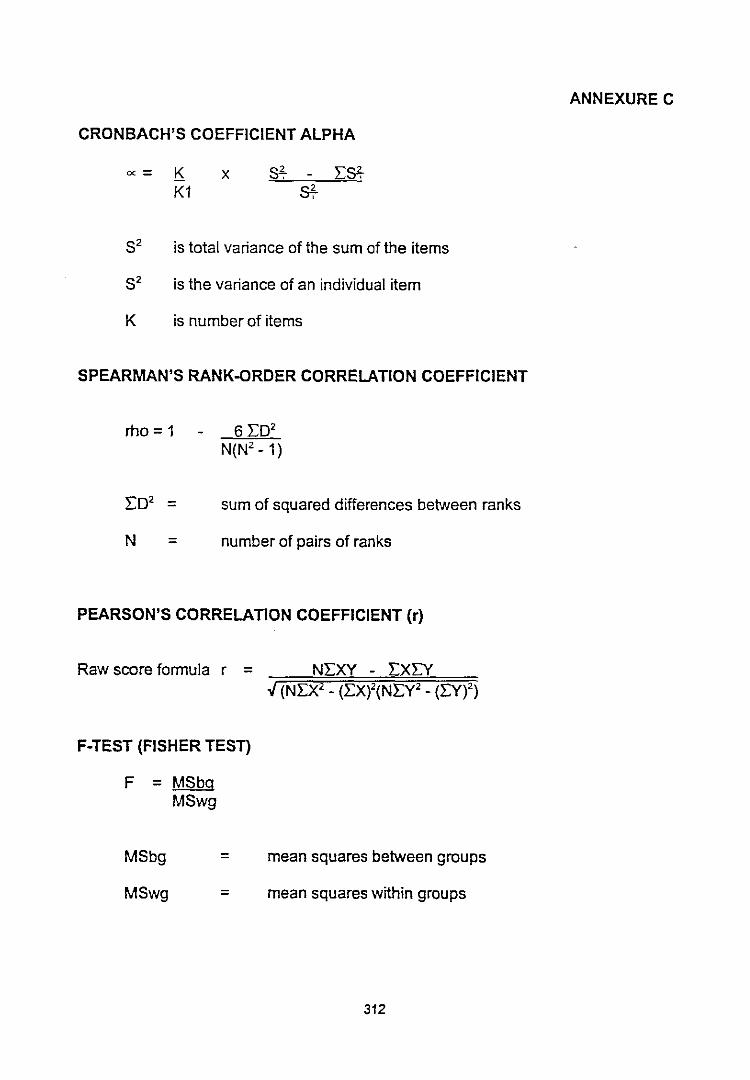
CRONBACH'S COEFFICIENT ALPHA
ANNEXURE C
oc= K xK1
S2 is total variance of the sum of the items
S2 is the variance of an individual item
K is number of items
SPEARMAN'S RANK-QRDER CORRELATION COEFFICIENT
rho =1
L02 =
6 L02
N(N2- 1)
sum of squared differences between ranks
N = number of pairs of ranks
PEARSON'S CORRELATION COEFFICIENT (r)
Raw score formula r = NI)(Y - LXLY..J (NLX2
- (LX)'(NLY2- (Ly)2)
F-TEST (FISHER TEST)
F = MSbgMSwg
MSbg
MSwg
=
=
mean squares between groups
mean squares within groups
312
Related Documents