FCO Report: Gold spot price $/oz Financial Crisis Observatory, ETH Zurich November 02, 2009 1 Data source We performed our analysis on the spot price of gold in USD/oz. We acquired the time series from a Bloomberg terminal for the range 2006-01-01 through 2009-10-27. 2 Input Parameters Date of last observation used in analysis 2009-10-27 Date of observed peak of data 2009-10-13 Number LPPL intervals found 118 Number total intervals tested 417 3 Forecast quantiles Low High 05/95 2009-10-13 2010-09-07 20/80 2009-11-05 2010-02-25 4 Plots of observations, fits and forecasts Guide to figures: • Observations appear as filled circles. • Shaded regions: – Lightest, hashed with circles: region of t 2 used in analysis – Mid-gray, hashed with horizontal lines: region of 5%/95% forecast quantiles of t c . – Darkest, hashed with diagonal lines: region of 20%/80% forecast quantiles of t c . • Lines: – Solid lines before final observation are LPPL fits to observations. – Lines after final observation are extrapolations. They are dashed lines except for within 20 days on either side of fit parameter t c . Successive figures are zoomed-in versions of previous figures. i

Welcome message from author
This document is posted to help you gain knowledge. Please leave a comment to let me know what you think about it! Share it to your friends and learn new things together.
Transcript

FCO Report: Gold spot price $/oz
Financial Crisis Observatory, ETH Zurich
November 02, 2009
1 Data source
We performed our analysis on the spot price of gold in USD/oz. We acquired the time series from a Bloombergterminal for the range 2006-01-01 through 2009-10-27.
2 Input Parameters
Date of last observation used in analysis 2009-10-27Date of observed peak of data 2009-10-13Number LPPL intervals found 118Number total intervals tested 417
3 Forecast quantiles
Low High05/95 2009-10-13 2010-09-0720/80 2009-11-05 2010-02-25
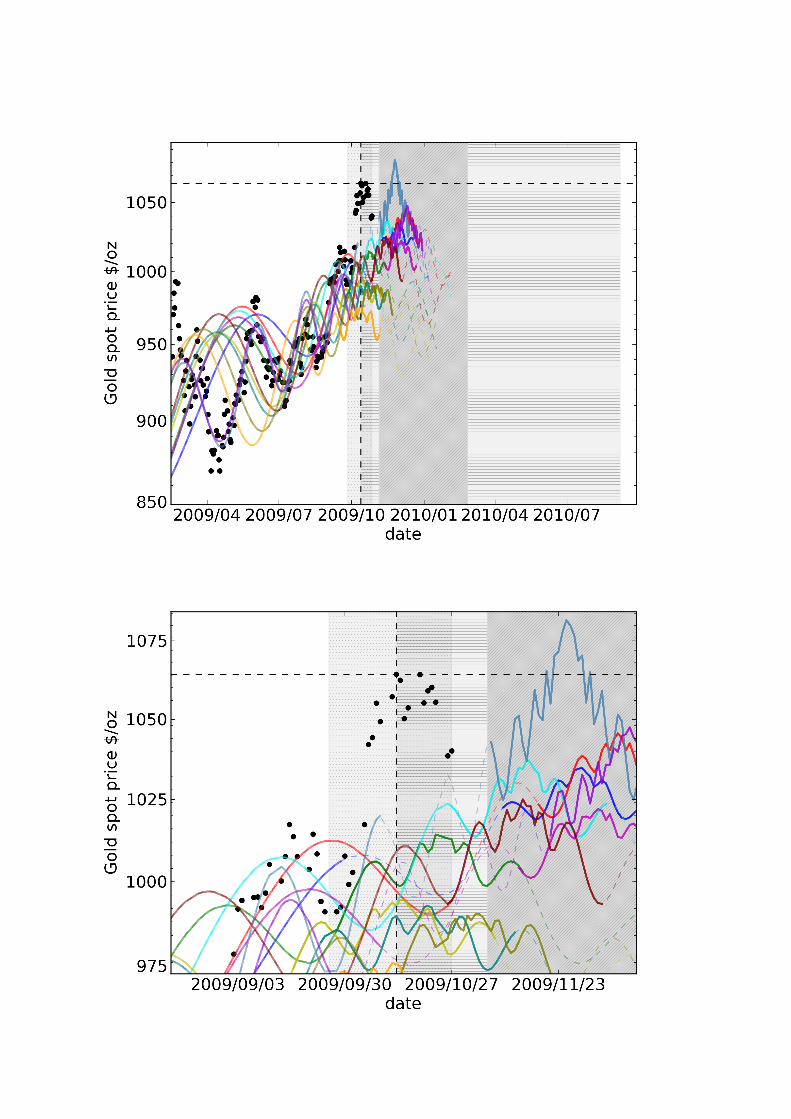
4 Plots of observations, fits and forecasts
Guide to figures:
• Observations appear as filled circles.
• Shaded regions:
– Lightest, hashed with circles: region of t2 used in analysis
– Mid-gray, hashed with horizontal lines: region of 5%/95% forecast quantiles of tc.
– Darkest, hashed with diagonal lines: region of 20%/80% forecast quantiles of tc.
• Lines:
– Solid lines before final observation are LPPL fits to observations.
– Lines after final observation are extrapolations. They are dashed lines except for within 20 days oneither side of fit parameter tc.
Successive figures are zoomed-in versions of previous figures.
i

Related Documents