INTERIM FINANCIAL REPORT 2015 Branch Hk Jozef Israelstraat and Kristalstraat (opening in November)

fb_half_year_report_2015_03082015_3
Aug 19, 2015
Welcome message from author
This document is posted to help you gain knowledge. Please leave a comment to let me know what you think about it! Share it to your friends and learn new things together.
Transcript

I n t e r I m F I n A n C I A L r e P O r t 2 0 1 5
B r a n c h H k J o z e f I s r a e l s t r a a t a n d K r i s t a l s t r a a t ( o p e n i n g i n n o v e m b e r )
InterIm FInAnCIAL rePOrt 2015 • • • •2
Contents
KEY FIGURES 2014-2015 03CORPORATE PHYLOSOPHY 04TO THE STAKEHOLdERS 05
MANAGEMENT REPORT 06 tHe mACrOeCOnOmIC AmBIent CLImAte 06 tHe FInAnCIAL POLICY AnD AnALYSIS OF tHe BAnK 07
CONdENSEd INTERIM FINANCIAL STATEMENTS 2015 12 COnDenSeD StAtement OF FInAnCIAL POSItIOn 13 COnDenSeD InCOme StAtement 14 COnDenSeD StAtement OF CHAnGeS In eQUItY 15 COnDenSeD StAtement OF CASH FLOWS 16 nOteS tO tHe COnDenSeD InterIm FInAnCIAL StAtementS 2015 17 nOteS tO tHe COnDenSeD StAtement OF FInAnCIAL POSItIOn 22 nOteS tO tHe COnDenSeD InCOme StAtement 24 OtHer nOteS 25
REVIEW REPORT 26
3
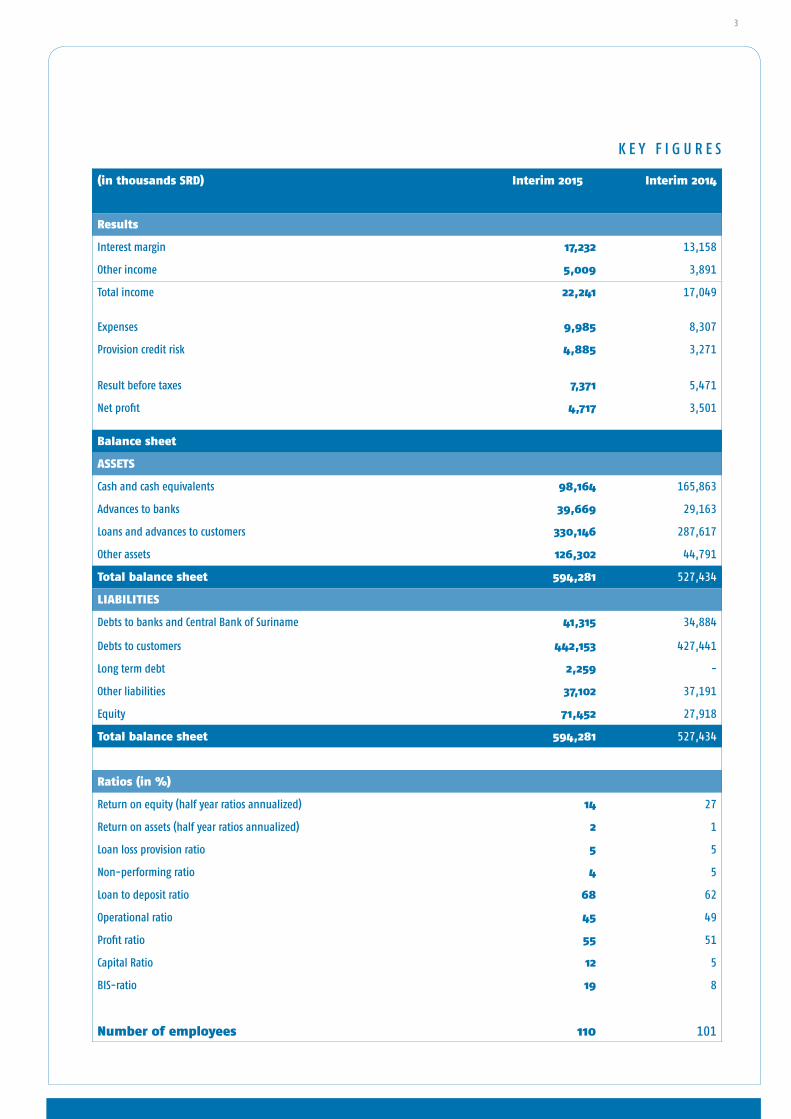
(in thousands SRD) Interim 2015 Interim 2014
Results
Interest margin 17,232 13,158
Other income 5,009 3,891
total income 22,241 17,049
expenses 9,985 8,307
Provision credit risk 4,885 3,271
result before taxes 7,371 5,471
net profit 4,717 3,501
Balance sheet
ASSetS
Cash and cash equivalents 98,164 165,863
Advances to banks 39,669 29,163
Loans and advances to customers 330,146 287,617
Other assets 126,302 44,791
total balance sheet 594,281 527,434
LIABILITIES
Debts to banks and Central Bank of Suriname 41,315 34,884
Debts to customers 442,153 427,441
Long term debt 2,259 -
Other liabilities 37,102 37,191
equity 71,452 27,918
total balance sheet 594,281 527,434
Ratios (in %)
return on equity (half year ratios annualized) 14 27
return on assets (half year ratios annualized) 2 1
Loan loss provision ratio 5 5
non-performing ratio 4 5
Loan to deposit ratio 68 62
Operational ratio 45 49
Profit ratio 55 51
Capital ratio 12 5
BIS-ratio 19 8
Number of employees 110 101
K e Y F I G U r e S
InterIm FInAnCIAL rePOrt 2015 • • • •4
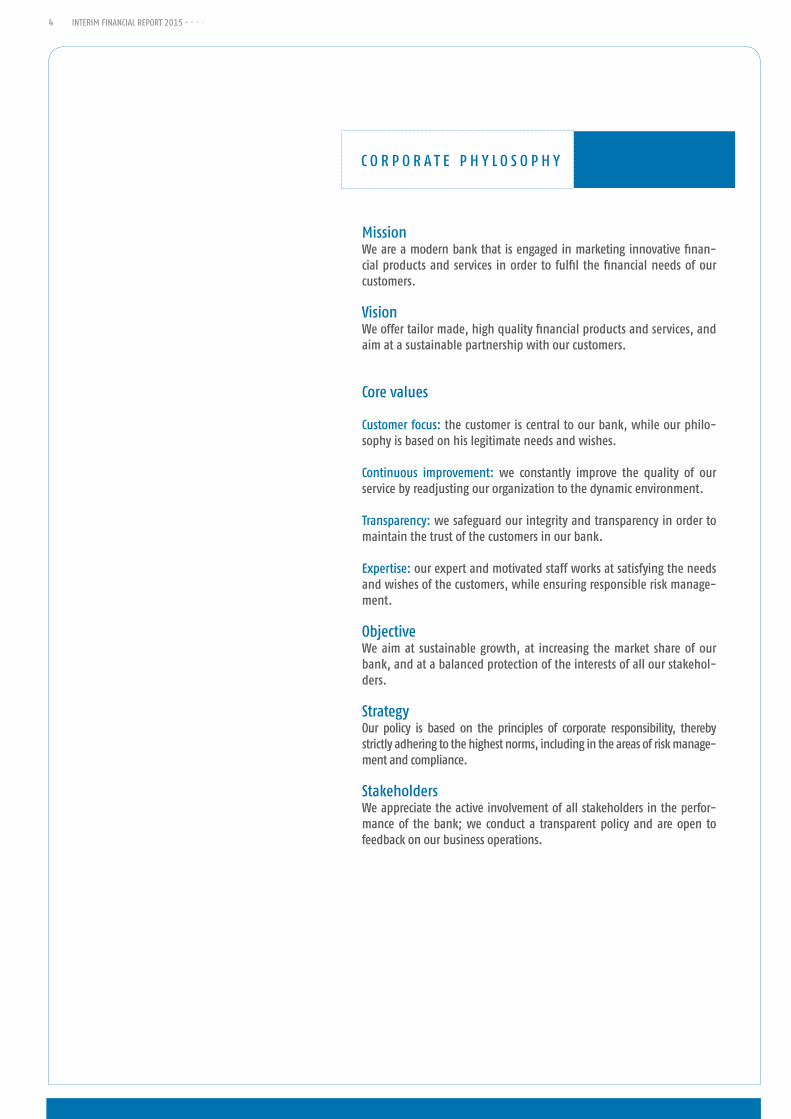
missionWe are a modern bank that is engaged in marketing innovative finan-cial products and services in order to fulfil the financial needs of our customers.
Vision We offer tailor made, high quality financial products and services, and aim at a sustainable partnership with our customers.
Core values
Customer focus: the customer is central to our bank, while our philo-sophy is based on his legitimate needs and wishes.
Continuous improvement: we constantly improve the quality of our service by readjusting our organization to the dynamic environment.
transparency: we safeguard our integrity and transparency in order to maintain the trust of the customers in our bank.
expertise: our expert and motivated staff works at satisfying the needs and wishes of the customers, while ensuring responsible risk manage-ment.
ObjectiveWe aim at sustainable growth, at increasing the market share of our bank, and at a balanced protection of the interests of all our stakehol-ders.
StrategyOur policy is based on the principles of corporate responsibility, thereby strictly adhering to the highest norms, including in the areas of risk manage-ment and compliance.
StakeholdersWe appreciate the active involvement of all stakeholders in the perfor-mance of the bank; we conduct a transparent policy and are open to feedback on our business operations.
C O r P O r A t e P H Y L O S O P H Y
5
tO tHe StAKeHOLDerS
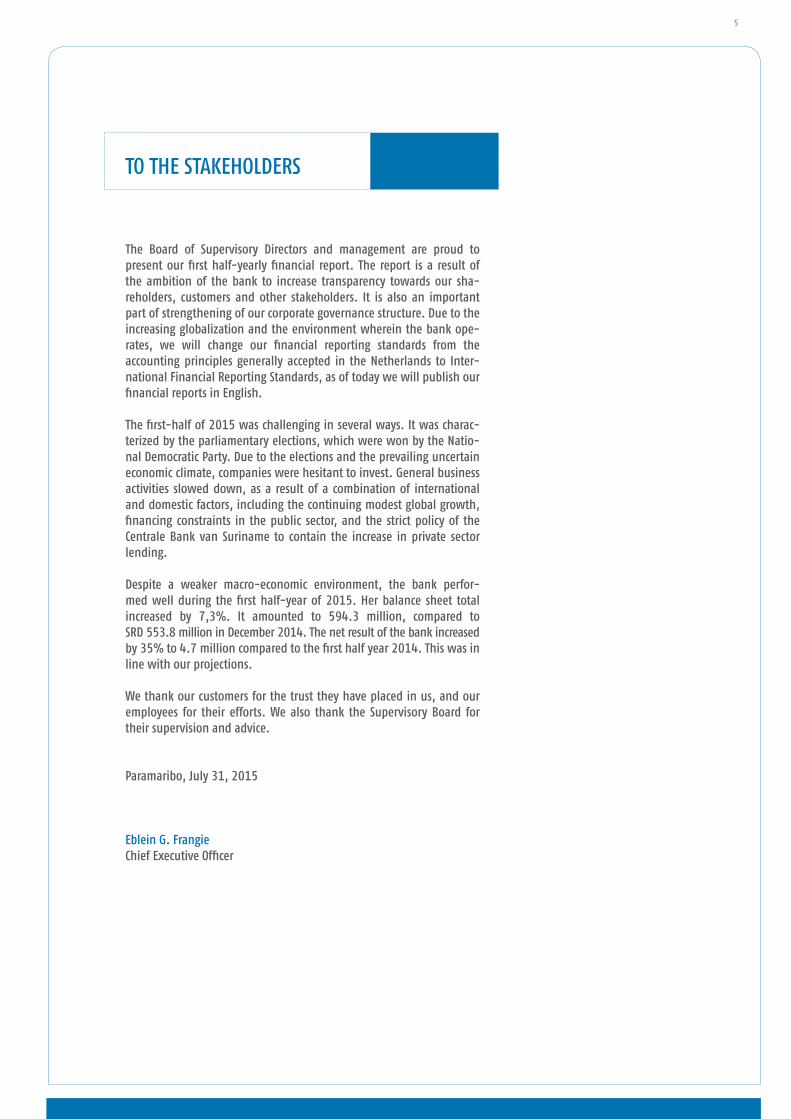
the Board of Supervisory Directors and management are proud to present our first half-yearly financial report. the report is a result of the ambition of the bank to increase transparency towards our sha-reholders, customers and other stakeholders. It is also an important part of strengthening of our corporate governance structure. Due to the increasing globalization and the environment wherein the bank ope-rates, we will change our financial reporting standards from the accounting principles generally accepted in the netherlands to Inter-national Financial reporting Standards, as of today we will publish our financial reports in english.
the first-half of 2015 was challenging in several ways. It was charac-terized by the parliamentary elections, which were won by the natio-nal Democratic Party. Due to the elections and the prevailing uncertain economic climate, companies were hesitant to invest. General business activities slowed down, as a result of a combination of international and domestic factors, including the continuing modest global growth, financing constraints in the public sector, and the strict policy of the Centrale Bank van Suriname to contain the increase in private sector lending.
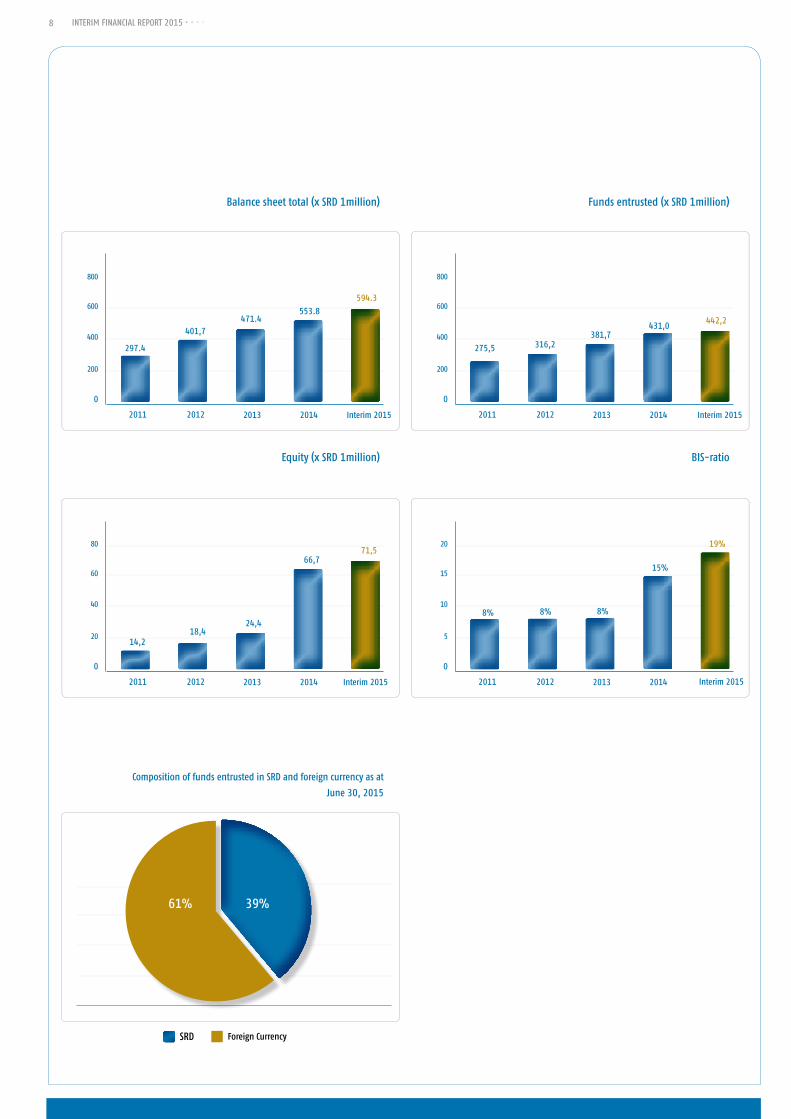
Despite a weaker macro-economic environment, the bank perfor-med well during the first half-year of 2015. Her balance sheet total increased by 7,3%. It amounted to 594.3 million, compared to SrD 553.8 million in December 2014. the net result of the bank increased by 35% to 4.7 million compared to the first half year 2014. this was in line with our projections.
We thank our customers for the trust they have placed in us, and our employees for their efforts. We also thank the Supervisory Board for their supervision and advice.
Paramaribo, July 31, 2015
eblein G. FrangieChief executive Officer
InterIm FInAnCIAL rePOrt 2015 • • • •6
tHe mACrOeCOnOmIC AmBIent CLImAte
During the reporting period, the situation in the advanced economies was characterized by a modest growth in general business activities. It resulted mainly from improving confidence of producers and consumers, from accommodating public policies, as well as from a low interest rate and inflation. However, growth in other groups of countries slowed down, par-ticularly due to financial and structural bottlenecks, and geopolitical factors. On balance, world output continued to grow at a disappointing rate of 3.3% on an annual basis.
the modest growth and the partly related excess supply of goods and services exerted downward pressure on world com-modity prices. In the reporting period, the price of Brent oil crumbled by 47% to an average of US$ 58 per barrel, compared to the first half-year of 2014. the gold price fell by 7% to US$ 1.206 per troy ounce, after declining strongly during 2013 and to a lesser extent in 2014. the price of aluminium continued to fluctuate around a low level compared to its cost price. the indicated price developments had an adverse effect on the mineral and oil industries in Suriname, which contribute for an ample 90% to exports and for about one third to government revenue.
the decreased performance of our export industry has a noticeable impact on the general business activities, also because this industry exerts strong radiation effects on the rest of the economy. this was only partly compensated for by the conti-nuing growth in spending by the government, consumers and domestic producers, which, however, proceeded at a slower pace than in the preceding years due to financing constraints. thus, the cyclical slowdown in growth in gross domestic product, which started in the course of 2013, will in all probability continue, and is expected to reach some 2% at the end of 2015. this percentage is still satisfactory when compared with the projected growth in Latin America and the Caribbean of a mere 0.5%.
the decreased performance of the export industry contributed to a decline in government revenue of 18% during the first five months of 2015, compared to the corresponding period of 2014. At the same time, current expenditure was raised further, while capital spending was postponed. total expenditure increased by 8%. On balance, the recorded cash deficit surged by 51% to SrD 540 million. this by itself too large deficit is flattering, partly because not all payment obligations to suppliers of goods and services are included in this amount. the cash deficit was financed by taking recourse to domestic
management report
Chief executive Officereblein G. Frangie m.Sc.

7
money creating institutions and by drawings on foreign loans.
this financing method coincided with an increase in debt to almost 36% of estimated domestic product. Government transactions contributed for SrD 179 million or for 51% to the money creation from domestic sources. the latter amount includes loans of the deposit creating institutions (excluding the Central Bank) to the government, which increased further, albeit at a much slower pace than in 2014, i.e., by 3% to SrD 1.0 billion. Other domestic sectors caused a money creation of SrD 175 million. the amount mainly comprises bank loans to the private sector, which grew somewhat faster than in the first five months of 2014, i.e., by 5% to SrD 4.9 billion, despite a mere one percent increase in deposits.
the mere increase in deposits contributed to an apparent scarcity of Surinamese currency that was accentuated by the outflow to abroad of part of the initial domestic money creation. the scarcity put some upward pressure on interest rates. net foreign assets of the money creating institutions shrank by SrD 469 million or by 12%. the international reserves held by the Central Bank, which are part of these assets, fell by almost 18% to US$ 515 million; equivalent to the internation-ally accepted minimum standard of 3 months of imports of goods and services. On balance, the domestic liquidity supply declined by 3% to SrD 9.2 billion or 51% of the estimated gross domestic product.
the decline in international reserves also resulted from the Central Bank’s policy aim to keep the exchange rate of our national currency vis-à-vis the United States dollar stable through market interventions. this policy also contributed to a rather strong increase in the Bank’s liabilities denominated in foreign currencies. eventually, the exchange rate on the free market remained manageable and fluctuated within a margin of maximum 3%.
the prevailing economic uncertainties contributed to acceleration in the consumer price index. In June 2015, the index was 5.2% higher than a year earlier, while the corresponding figure for 2014 was 2.1%. the annual average inflation rate went up from 2.9% to 3.2%. Domestic cost increases were only partly compensated for by on average favorable import prices. the government continued its policy to influence prices of necessities. there are indications that prices of other goods and services are rising faster.
In view of the remarks made above, it may be concluded that presently macroeconomic risks are dominating. After all, we do not expect commodity prices to soon increase materially, while it will take some time to alleviate existing internal structural and institutional constraints. Under such circumstances, we shall have to work with renewed élan to simulta- neously promote general business activities and to restore balanced financial conditions. Given the relative large impor-tance of the government within the economy, special attention should be paid to restructuring the public sector and its finances. Against this background, it is encouraging that in the meantime a broad based platform has been established that will formulate concrete advices in order to cope with the present economic and financial challenges.
tHe FInAnCIAL POLICY AnD AnALYSIS OF tHe BAnK
Our financial accounts are presently drafted in accordance with the accounting principles generally accepted in the nether-lands. It is the intention of the bank to start reporting on the basis of the International Financial reporting Standards effective January 2016, partly because of our ambition to broaden our international activities. the balance sheet total of the bank grew by SrD 40.5 million (7.3%) from SrD 553.8 million to SrD 594.3 million. the growth was mainly caused by an increase in the liabilities to other banks and to the Central Bank of Suriname, i.e., by 46.4% from SrD 28.2 million to SrD 41.3 million. Other liabilities also contributed to the increase of the balance sheet total. the funds entrusted to the bank increased by a modest 3% to SrD 442.2 million, mainly due to the scarcity of natio-nal currency in the market. the dollarization in the entrusted funds remained stable at 61%.
After a large extension in 2014, the equity of the bank increased by a further 7% from SrD 66.7 million to SrD 71.5 million, due to the profit made in the reporting period. the solvency was 19%, well above our internal benchmark of 15%, and the 10% norm determined by the Central Bank.
management report
8 InterIm FInAnCIAL rePOrt 2015 • • • •
Balance sheet total (x SrD 1million)
0
200
400
600
800
2011 2012 2013 2014 Interim 2015
594.3
297.4
401,7471.4
553.8
Funds entrusted (x SrD 1million)
0
200
400
600
800
2011 2012 2013 2014
442,2
275,5 316,2381,7
431,0
BIS-ratio
0
5
10
15
20
2011 2012 2013 2014
19%
8% 8% 8%
15%
Composition of funds entrusted in SrD and foreign currency as at
June 30, 2015
61% 39%
Interim 2015
equity (x SrD 1million)
0
20
40
60
80
2011 2012 2013 2014
71,5
14,218,4
24,4
66,7
Interim 2015 Interim 2015
9
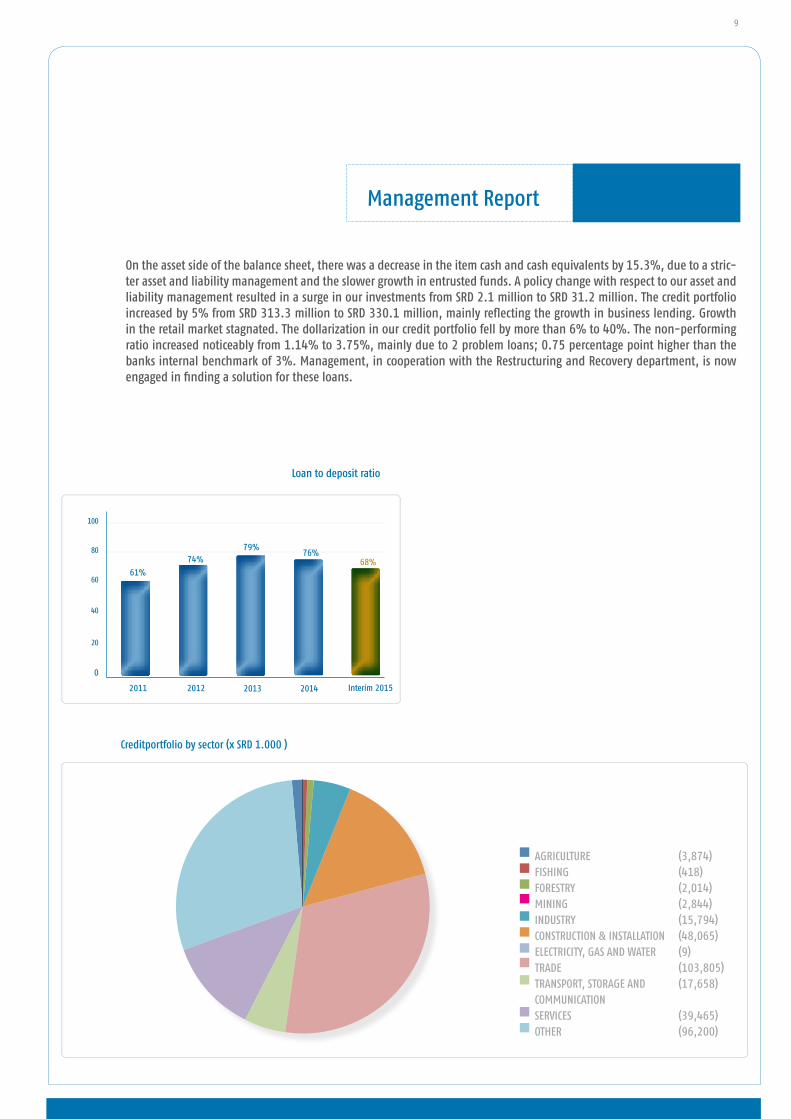
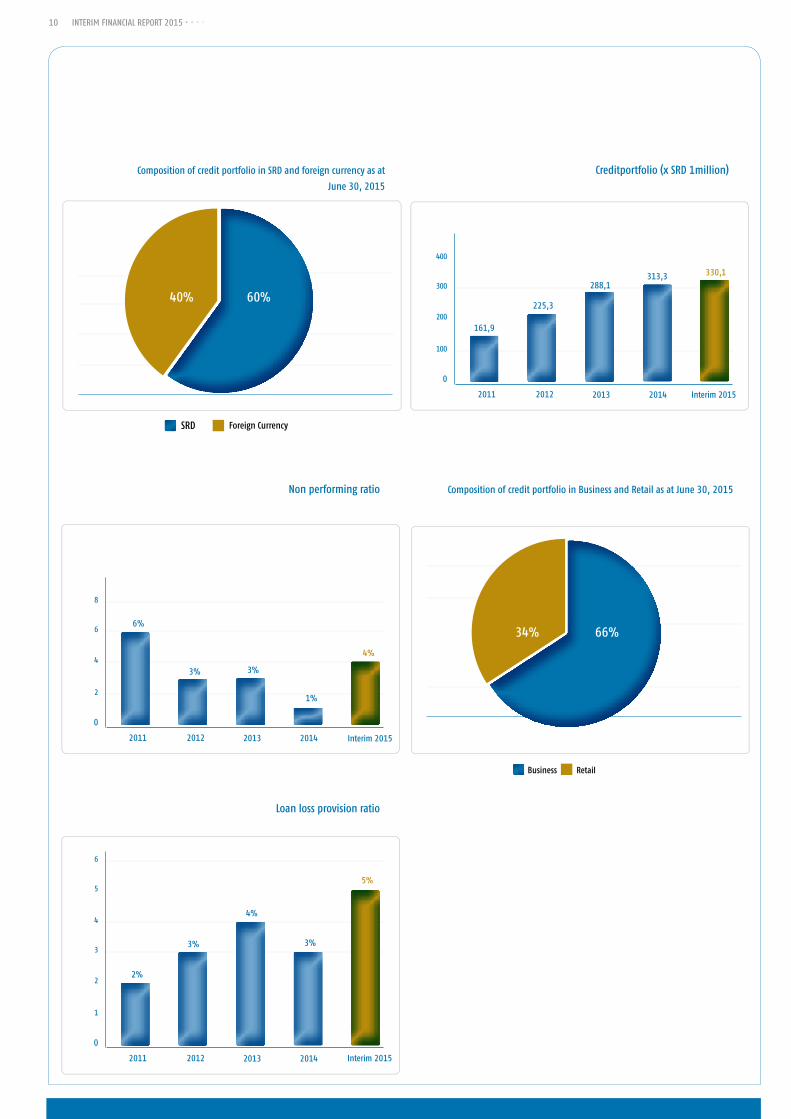
On the asset side of the balance sheet, there was a decrease in the item cash and cash equivalents by 15.3%, due to a stric-ter asset and liability management and the slower growth in entrusted funds. A policy change with respect to our asset and liability management resulted in a surge in our investments from SrD 2.1 million to SrD 31.2 million. the credit portfolio increased by 5% from SrD 313.3 million to SrD 330.1 million, mainly reflecting the growth in business lending. Growth in the retail market stagnated. the dollarization in our credit portfolio fell by more than 6% to 40%. the non-performing ratio increased noticeably from 1.14% to 3.75%, mainly due to 2 problem loans; 0.75 percentage point higher than the banks internal benchmark of 3%. management, in cooperation with the restructuring and recovery department, is now engaged in finding a solution for these loans.
management report
AGrICULtUre (3,874)FISHInG (418)FOreStrY (2,014)mInInG (2,844)InDUStrY (15,794)COnStrUCtIOn & InStALLAtIOn (48,065)eLeCtrICItY, GAS AnD WAter (9)trADe (103,805)trAnSPOrt, StOrAGe AnD (17,658)COmmUnICAtIOnSerVICeS (39,465)OtHer (96,200)
Creditportfolio by sector (x SrD 1.000 )
Loan to deposit ratio
2011 2012 2013 2014
68%61%
74%79%
76%
Interim 2015
0
20
40
60
80
100
InterIm FInAnCIAL rePOrt 2015 • • • •10
non performing ratio
0
2
4
6
8
2011 2012 2013 2014
4%
6%
3% 3%
1%
Interim 2015
Composition of credit portfolio in Business and retail as at June 30, 2015
34% 66%
Loan loss provision ratio
0
1
2
3
4
2011 2012 2013 2014
5%
2%
3%
4%
3%
5
6
Interim 2015
Composition of credit portfolio in SrD and foreign currency as at
June 30, 2015
40% 60%
Creditportfolio (x SrD 1million)
0
100
200
300
400
2011 2012 2013 2014
330,1
161,9
225,3
288,1313,3
Interim 2015
11
return on equity
0
5
10
15
20
2011 2012 2013 2014
14%
26% 27% 28%
17%
25
30
Interim 2015
0
1
2
3
4
return on assets
2011 2012 2013 2014
2%
1% 1% 1%
2%
5
Interim 2015
net profit (x SrD 1 million)
0
2
4
6
8
2011 2012 2013 2014
4,7
3,1
4,4
6,0
7,7
Interim 2015
management report
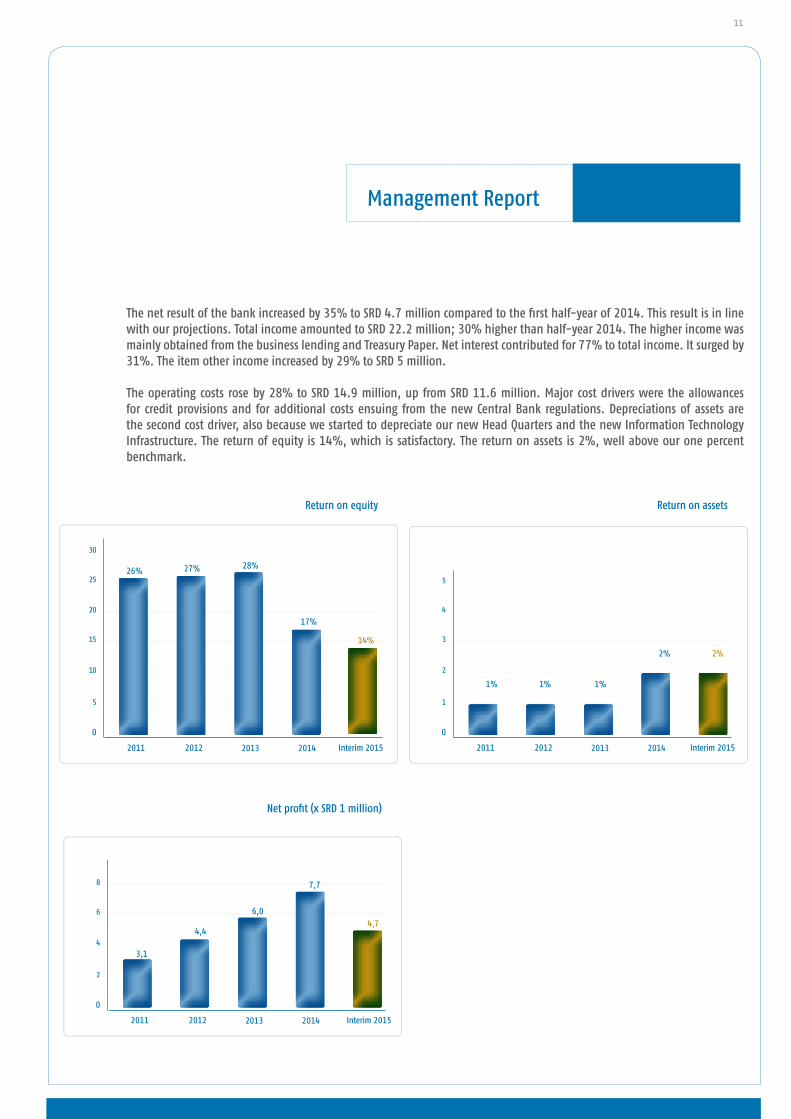
the net result of the bank increased by 35% to SrD 4.7 million compared to the first half-year of 2014. this result is in line with our projections. total income amounted to SrD 22.2 million; 30% higher than half-year 2014. the higher income was mainly obtained from the business lending and treasury Paper. net interest contributed for 77% to total income. It surged by 31%. the item other income increased by 29% to SrD 5 million.
the operating costs rose by 28% to SrD 14.9 million, up from SrD 11.6 million. major cost drivers were the allowances for credit provisions and for additional costs ensuing from the new Central Bank regulations. Depreciations of assets are the second cost driver, also because we started to depreciate our new Head Quarters and the new Information technology Infrastructure. the return of equity is 14%, which is satisfactory. the return on assets is 2%, well above our one percent benchmark.
12 13InterIm FInAnCIAL rePOrt 2015 • • • •
COnDenSeD InterIm FInAnCIAL StAtementS 2015
12 13
C O n D e n S e D S tAt e m e n t O F F I n A n C I A L P O S I t I O n
June 30, 2015 December 31, 2014
SRD SRD
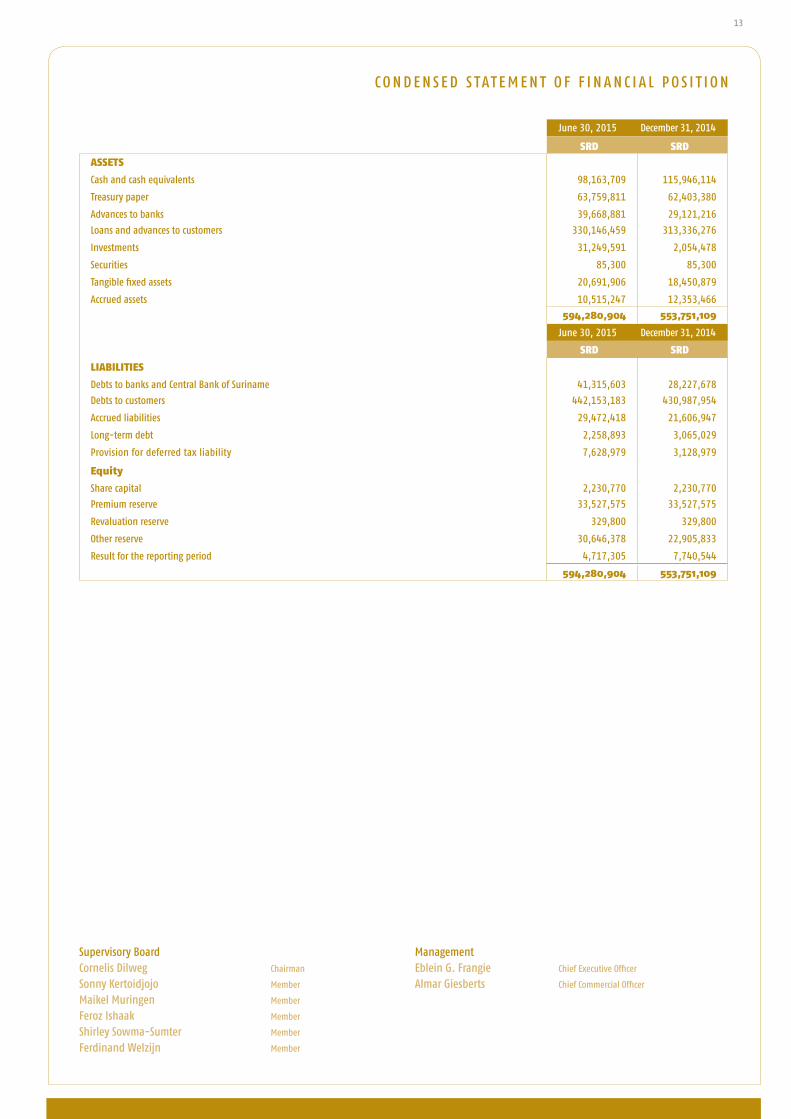
ASSetS
Cash and cash equivalents 98,163,709 115,946,114
treasury paper 63,759,811 62,403,380
Advances to banks 39,668,881 29,121,216
Loans and advances to customers 330,146,459 313,336,276
Investments 31,249,591 2,054,478
Securities 85,300 85,300
tangible fixed assets 20,691,906 18,450,879
Accrued assets 10,515,247 12,353,466
594,280,904 553,751,109
June 30, 2015 December 31, 2014
SRD SRD
LIABILItIeS
Debts to banks and Central Bank of Suriname 41,315,603 28,227,678
Debts to customers 442,153,183 430,987,954
Accrued liabilities 29,472,418 21,606,947
Long-term debt 2,258,893 3,065,029
Provision for deferred tax liability 7,628,979 3,128,979
equity
Share capital 2,230,770 2,230,770
Premium reserve 33,527,575 33,527,575
revaluation reserve 329,800 329,800
Other reserve 30,646,378 22,905,833
result for the reporting period 4,717,305 7,740,544
594,280,904 553,751,109
Supervisory BoardCornelis Dilweg Chairman
Sonny Kertoidjojo member
maikel muringen member
Feroz Ishaak member
Shirley Sowma-Sumter member
Ferdinand Welzijn member
managementeblein G. Frangie Chief executive Officer
Almar Giesberts Chief Commercial Officer
14 15InterIm FInAnCIAL rePOrt 2015 • • • •
C O n D e n S e D I n C O m e S t A t e m e n t
Six month period
ending June 30, 2015
Six month period
ending June 30, 2014
SRD SRD
INCOMe
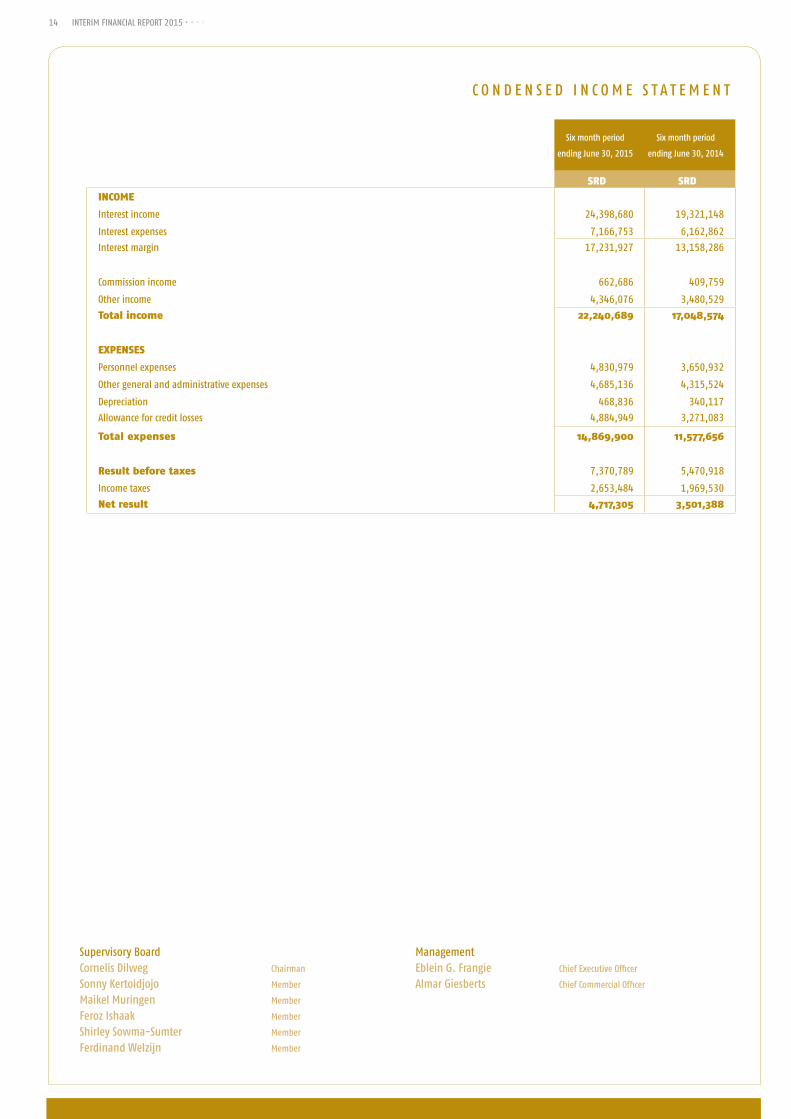
Interest income 24,398,680 19,321,148
Interest expenses 7,166,753 6,162,862
Interest margin 17,231,927 13,158,286
Commission income 662,686 409,759
Other income 4,346,076 3,480,529
total income 22,240,689 17,048,574
eXPeNSeS
Personnel expenses 4,830,979 3,650,932
Other general and administrative expenses 4,685,136 4,315,524
Depreciation 468,836 340,117
Allowance for credit losses 4,884,949 3,271,083
total expenses 14,869,900 11,577,656
Result before taxes 7,370,789 5,470,918
Income taxes 2,653,484 1,969,530
Net result 4,717,305 3,501,388
Supervisory BoardCornelis Dilweg Chairman
Sonny Kertoidjojo member
maikel muringen member
Feroz Ishaak member
Shirley Sowma-Sumter member
Ferdinand Welzijn member
managementeblein G. Frangie Chief executive Officer
Almar Giesberts Chief Commercial Officer
14 15
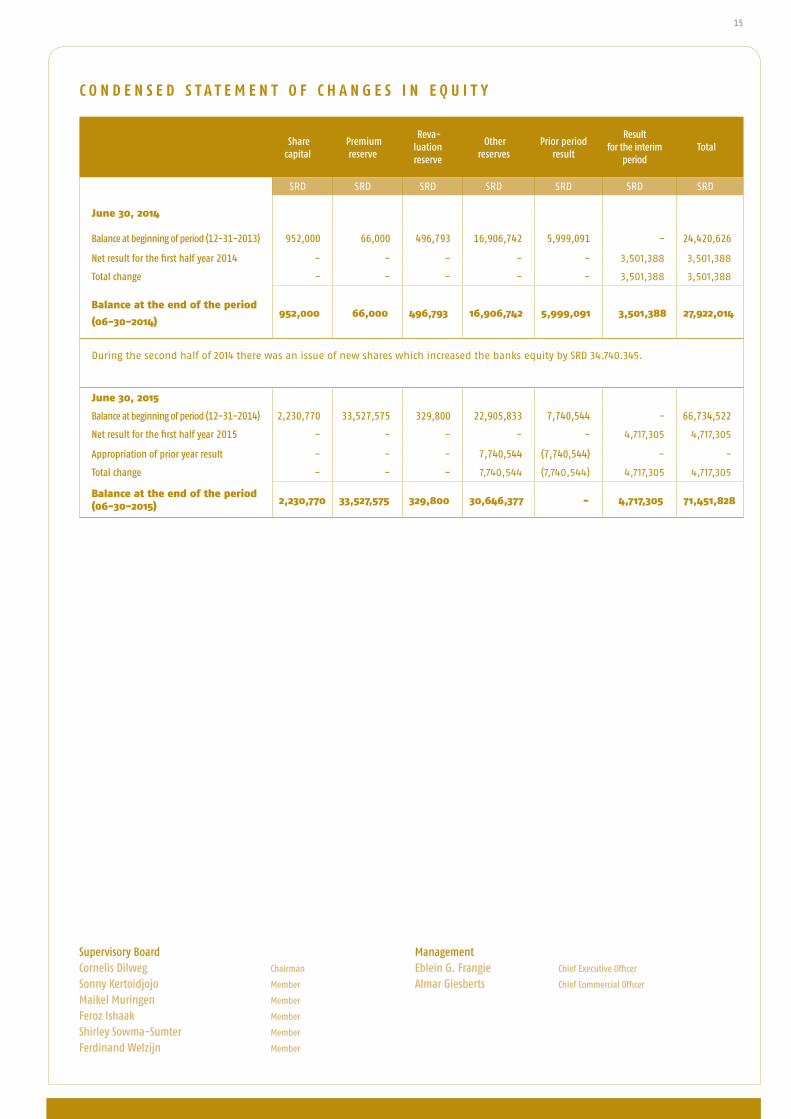
Share capital
Premium reserve
reva-luation reserve
Other reserves
Prior period result
result for the interim
period total
SRD SRD SRD SRD SRD SRD SRD
June 30, 2014
Balance at beginning of period (12-31-2013) 952,000 66,000 496,793 16,906,742 5,999,091 - 24,420,626
net result for the first half year 2014 - - - - - 3,501,388 3,501,388
total change - - - - - 3,501,388 3,501,388
Balance at the end of the period
(06-30-2014) 952,000 66,000 496,793 16,906,742 5,999,091 3,501,388 27,922,014
During the second half of 2014 there was an issue of new shares which increased the banks equity by SRD 34.740.345.
June 30, 2015
Balance at beginning of period (12-31-2014) 2,230,770 33,527,575 329,800 22,905,833 7,740,544 - 66,734,522
net result for the first half year 2015 - - - - - 4,717,305 4,717,305
Appropriation of prior year result - - - 7,740,544 (7,740,544) - -
total change - - - 7,740,544 (7,740,544) 4,717,305 4,717,305
Balance at the end of the period (06-30-2015) 2,230,770 33,527,575 329,800 30,646,377 - 4,717,305 71,451,828
C O N d E N S E d S T A T E M E N T O F C H A N G E S I N E Q U I T Y
Supervisory BoardCornelis Dilweg Chairman
Sonny Kertoidjojo member
maikel muringen member
Feroz Ishaak member
Shirley Sowma-Sumter member
Ferdinand Welzijn member
managementeblein G. Frangie Chief executive Officer
Almar Giesberts Chief Commercial Officer
16 1716 17InterIm FInAnCIAL rePOrt 2015 • • • •
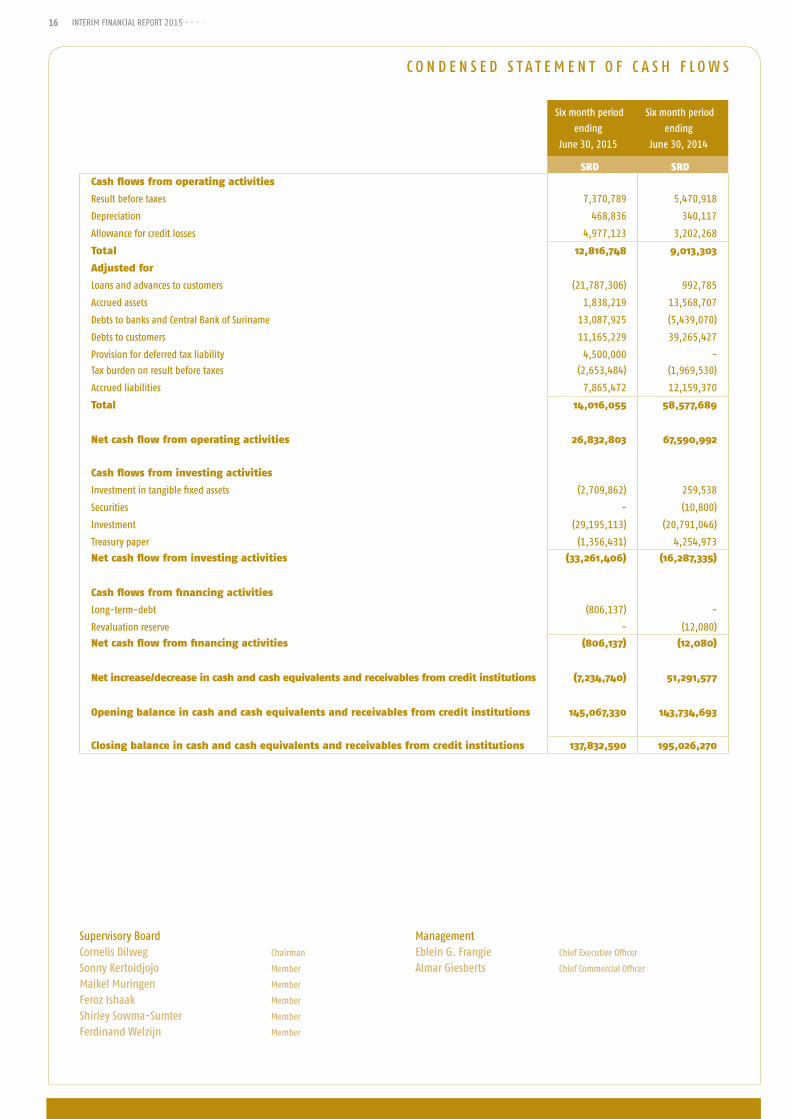
C O n D e n S e D S t A t e m e n t O F C A S H F L O W S
Six month period
ending
June 30, 2015
Six month period
ending
June 30, 2014
SRD SRD Cash flows from operating activities
result before taxes 7,370,789 5,470,918
Depreciation 468,836 340,117
Allowance for credit losses 4,977,123 3,202,268
total 12,816,748 9,013,303
Adjusted for
Loans and advances to customers (21,787,306) 992,785
Accrued assets 1,838,219 13,568,707
Debts to banks and Central Bank of Suriname 13,087,925 (5,439,070)
Debts to customers 11,165,229 39,265,427
Provision for deferred tax liability 4,500,000 -
tax burden on result before taxes (2,653,484) (1,969,530)
Accrued liabilities 7,865,472 12,159,370
total 14,016,055 58,577,689
Net cash flow from operating activities 26,832,803 67,590,992
Cash flows from investing activities
Investment in tangible fixed assets (2,709,862) 259,538
Securities - (10,800)
Investment (29,195,113) (20,791,046)
treasury paper (1,356,431) 4,254,973
Net cash flow from investing activities (33,261,406) (16,287,335)
Cash flows from financing activities
Long-term-debt (806,137) -
revaluation reserve - (12,080)
Net cash flow from financing activities (806,137) (12,080)
Net increase/decrease in cash and cash equivalents and receivables from credit institutions (7,234,740) 51,291,577
Opening balance in cash and cash equivalents and receivables from credit institutions 145,067,330 143,734,693
Closing balance in cash and cash equivalents and receivables from credit institutions 137,832,590 195,026,270
Supervisory BoardCornelis Dilweg Chairman
Sonny Kertoidjojo member
maikel muringen member
Feroz Ishaak member
Shirley Sowma-Sumter member
Ferdinand Welzijn member
managementeblein G. Frangie Chief executive Officer
Almar Giesberts Chief Commercial Officer
16 1716 17
General information
Finabank n.V. (hereafter; “Finabank” or “the Bank”), established on 24 April 1991 and located in Paramaribo, Suriname, is a limited liability company and is registered at the Chamber of Commerce in Suriname. the main activities of Finabank relate to the execution of general banking business in the broadest sense. All offices are located in Suri-name. the head office of Finabank is situated at 59-61, Dr. Sophie red-mondstraat in Paramaribo, Suriname. there are two branches; one in the nickerie district of Suriname at 72, Doerga Sawhstraat, and one at 49, mr. Jagernath Lachmonstraat, Paramaribo, Suriname. In the second half of 2015, a third branch will be opened in Paramaribo north, at the corner of Kristalstraat and Jozef Israelstraat.
reporting period and currency
the reporting period of Finabank is from 1 January up to and including 31 December. each half year (for the first time at June 30, 2015), con-densed interim accounts are published. Finabank drafts its accounts in Suriname dollar, which is its functional currency.
Principles applied
the annual and interim accounts are prepared in accordance with accounting principles generally accepted in the netherlands.
these accounts are drafted based on the assumption of going concern.
Comparison with previous years
the principles for valuation of assets and liabilities and for the calcu-lation of profit applied have not changed compared to the previous report year. the profit and loss period cover the period of January 1, up till June 30 for both 2014 and 2015.
Principles for the valuation of assets and liabilities
General
An asset is recognised in the balance sheet when it is likely that its future economic advantages will flow towards the company and its value can be reliably determined.
nOteS tO tHe COnDenSeD InterIm FInAnCIAL StAtementS 2015
18 19InterIm FInAnCIAL rePOrt 2015 • • • •
An asset is recognised in the balance sheet when it is likely that its future economic advantages will flow towards the company and its value can be reliably determined. A liability is recognised in the balance sheet when it is likely that the settlement will result in an outflow of means that may hold economic advantages and of which the size can be reliably determined.
Income is recognised in the profit and loss account when an increase of the economic potential, associated with an increase of an asset or a decrease of a liability, has occurred, of which the size can be reliably determined. expenses are recognised when a decrease of the economic potential, associated with a decrease of an asset or an increase of a liability has occurred, of which the size can be reliably determined.
When a transaction results in all or nearly all future economic advantages, and all or nearly all risks related to an asset or liability being transferred to a third party, the asset or the liability is no longer recognised in the balance sheet. Furthermore, assets and liabilities are no longer recognised in the balance sheet from the moment the con-ditions of likelihood of the future economic advantages and/or reliability of the valuation are no longer met. the income and costs are allocated to the period to which they relate. Income is recognised once all the key risks of the associated assets or liabilities have been transferred.
notes to the cash flow statementthe cash flow statement is drafted based on the indirect method. the liquid assets comprise cash and cash equivalents and receivables from banks.
Use of estimates the format of the annual and interim accounts requires management to express opinions, make estimates and assumpti-ons that affect the application of accounting principles and the reported value of assets and liabilities and of income and expenses. the actual results may deviate from these estimates. the estimates and underlying assumptions are continuously assessed by management. revisions of estimates are recognised in the period in which the estimate is reviewed and in future periods impacted by the revision.
Conversion of foreign currenciesFinabank uses the exchange rates (bills, cheques and transfers) published by the central bank of Suriname, officially named Centrale Bank van Suriname (CBvS).
the exchange rates as at balance sheet date of the relevant foreign currencies as mentioned by the CBvS are:
June 30, 2015 December 31, 2014 SrD SrDUSD 1 3,25 3,25euro 1 3,62 3,95
note: SrD = Surinam dollar; USD = United States dollar; eUr = euro.
transactions in foreign currency are converted at the time of first processing to SrD at the exchange rate that is applicable at the transaction date.
the monetary assets and liabilities in foreign currency have been converted at the exchange rates as at balance sheet date.
nOteS tO tHe COnDenSeD InterIm FInAnCIAL StAtementS 2015
18 19
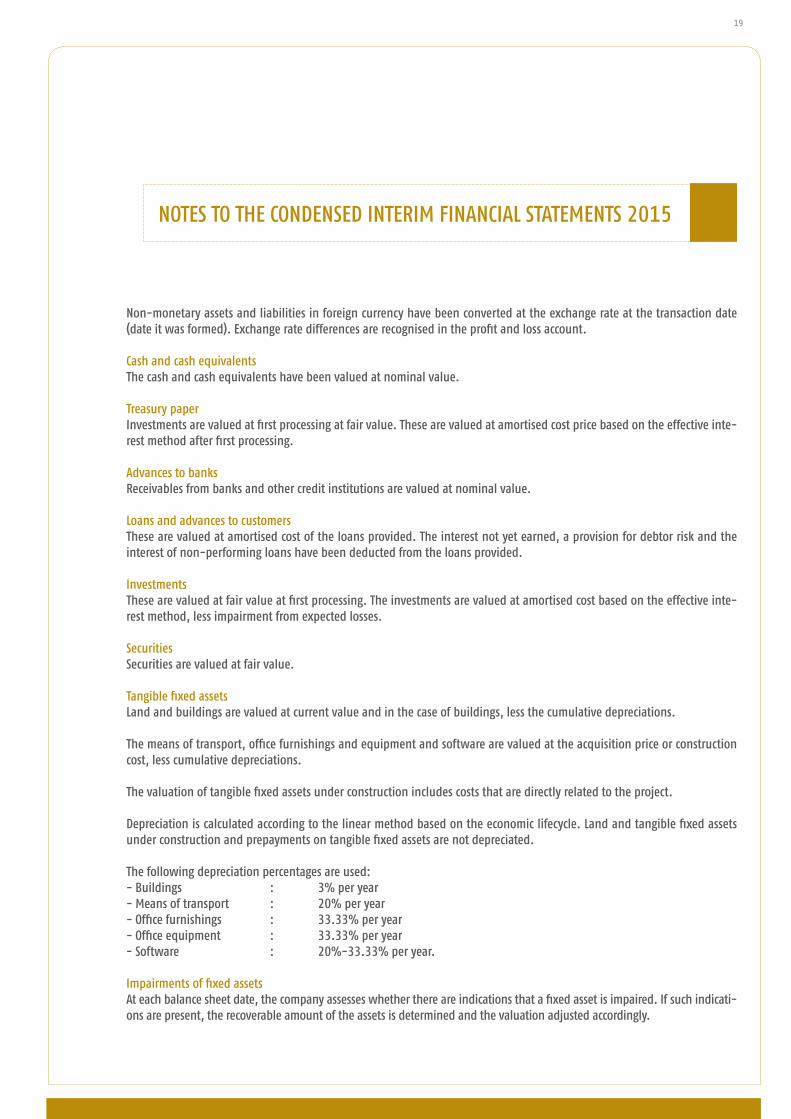
non-monetary assets and liabilities in foreign currency have been converted at the exchange rate at the transaction date (date it was formed). exchange rate differences are recognised in the profit and loss account.
Cash and cash equivalentsthe cash and cash equivalents have been valued at nominal value. treasury paperInvestments are valued at first processing at fair value. these are valued at amortised cost price based on the effective inte-rest method after first processing.
Advances to banksreceivables from banks and other credit institutions are valued at nominal value.
Loans and advances to customersthese are valued at amortised cost of the loans provided. the interest not yet earned, a provision for debtor risk and the interest of non-performing loans have been deducted from the loans provided.
Investmentsthese are valued at fair value at first processing. the investments are valued at amortised cost based on the effective inte-rest method, less impairment from expected losses.
SecuritiesSecurities are valued at fair value.
tangible fixed assetsLand and buildings are valued at current value and in the case of buildings, less the cumulative depreciations.
the means of transport, office furnishings and equipment and software are valued at the acquisition price or construction cost, less cumulative depreciations.
the valuation of tangible fixed assets under construction includes costs that are directly related to the project.
Depreciation is calculated according to the linear method based on the economic lifecycle. Land and tangible fixed assets under construction and prepayments on tangible fixed assets are not depreciated.
the following depreciation percentages are used: - Buildings : 3% per year- means of transport : 20% per year- Office furnishings : 33.33% per year- Office equipment : 33.33% per year- Software : 20%-33.33% per year.
Impairments of fixed assets At each balance sheet date, the company assesses whether there are indications that a fixed asset is impaired. If such indicati-ons are present, the recoverable amount of the assets is determined and the valuation adjusted accordingly.
nOteS tO tHe COnDenSeD InterIm FInAnCIAL StAtementS 2015
20 21InterIm FInAnCIAL rePOrt 2015 • • • •
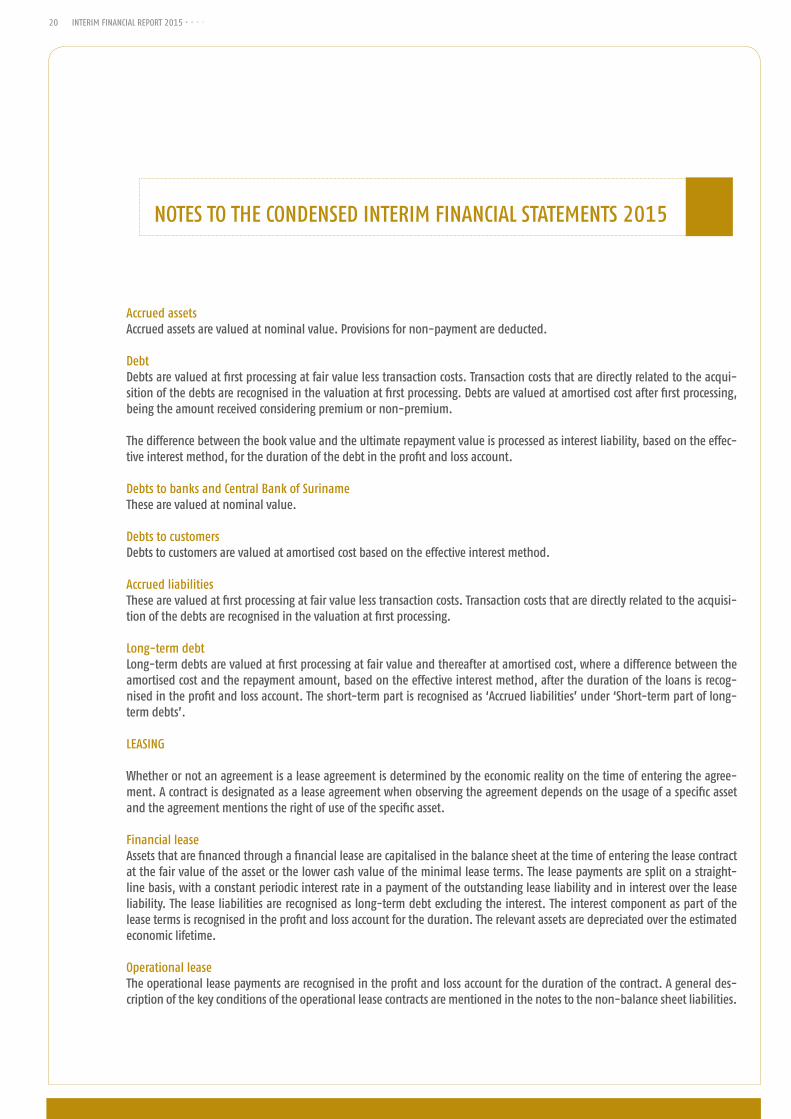
Accrued assetsAccrued assets are valued at nominal value. Provisions for non-payment are deducted.
DebtDebts are valued at first processing at fair value less transaction costs. transaction costs that are directly related to the acqui-sition of the debts are recognised in the valuation at first processing. Debts are valued at amortised cost after first processing, being the amount received considering premium or non-premium. the difference between the book value and the ultimate repayment value is processed as interest liability, based on the effec-tive interest method, for the duration of the debt in the profit and loss account.
Debts to banks and Central Bank of Surinamethese are valued at nominal value.
Debts to customersDebts to customers are valued at amortised cost based on the effective interest method.
Accrued liabilitiesthese are valued at first processing at fair value less transaction costs. transaction costs that are directly related to the acquisi-tion of the debts are recognised in the valuation at first processing.
Long-term debtLong-term debts are valued at first processing at fair value and thereafter at amortised cost, where a difference between the amortised cost and the repayment amount, based on the effective interest method, after the duration of the loans is recog-nised in the profit and loss account. the short-term part is recognised as ‘Accrued liabilities’ under ‘Short-term part of long-term debts’.
LeASInG
Whether or not an agreement is a lease agreement is determined by the economic reality on the time of entering the agree-ment. A contract is designated as a lease agreement when observing the agreement depends on the usage of a specific asset and the agreement mentions the right of use of the specific asset.
Financial leaseAssets that are financed through a financial lease are capitalised in the balance sheet at the time of entering the lease contract at the fair value of the asset or the lower cash value of the minimal lease terms. the lease payments are split on a straight-line basis, with a constant periodic interest rate in a payment of the outstanding lease liability and in interest over the lease liability. the lease liabilities are recognised as long-term debt excluding the interest. the interest component as part of the lease terms is recognised in the profit and loss account for the duration. the relevant assets are depreciated over the estimated economic lifetime.
Operational leasethe operational lease payments are recognised in the profit and loss account for the duration of the contract. A general des-cription of the key conditions of the operational lease contracts are mentioned in the notes to the non-balance sheet liabilities.
nOteS tO tHe COnDenSeD InterIm FInAnCIAL StAtementS 2015
20 21
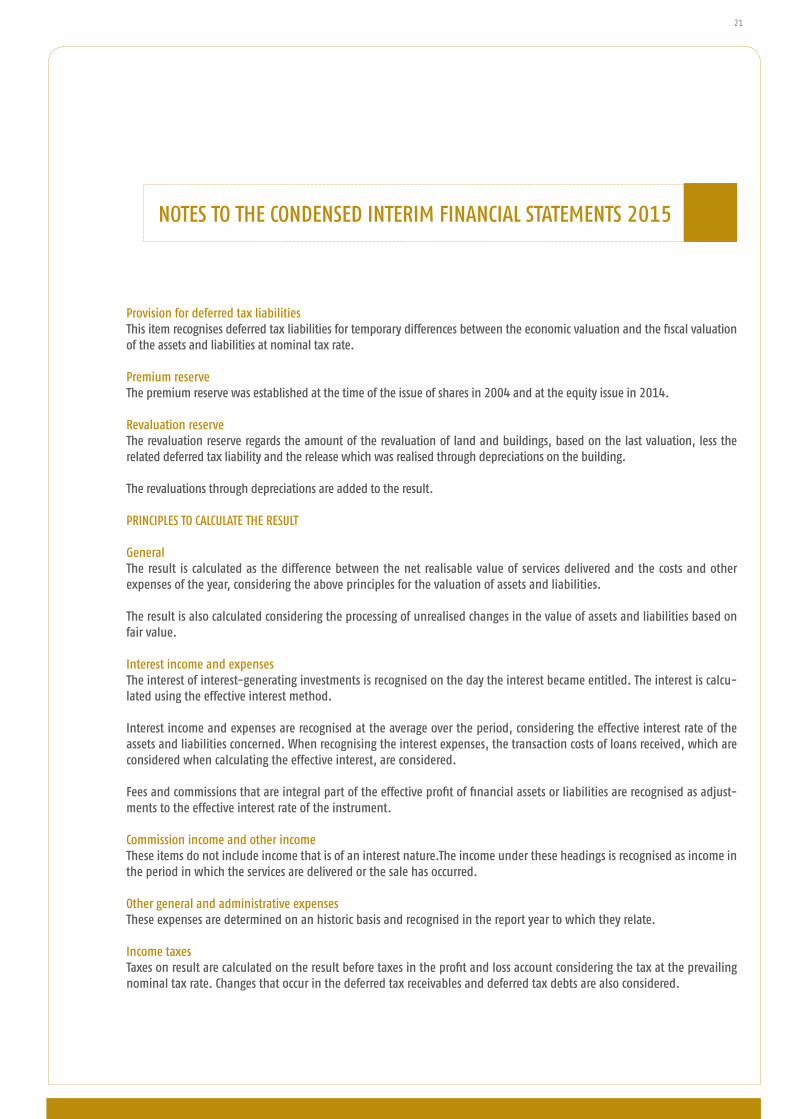
Provision for deferred tax liabilitiesthis item recognises deferred tax liabilities for temporary differences between the economic valuation and the fiscal valuation of the assets and liabilities at nominal tax rate.
Premium reserve the premium reserve was established at the time of the issue of shares in 2004 and at the equity issue in 2014.
revaluation reservethe revaluation reserve regards the amount of the revaluation of land and buildings, based on the last valuation, less the related deferred tax liability and the release which was realised through depreciations on the building.
the revaluations through depreciations are added to the result.
PrInCIPLeS tO CALCULAte tHe reSULt
Generalthe result is calculated as the difference between the net realisable value of services delivered and the costs and other expenses of the year, considering the above principles for the valuation of assets and liabilities.
the result is also calculated considering the processing of unrealised changes in the value of assets and liabilities based on fair value.
Interest income and expensesthe interest of interest-generating investments is recognised on the day the interest became entitled. the interest is calcu-lated using the effective interest method.
Interest income and expenses are recognised at the average over the period, considering the effective interest rate of the assets and liabilities concerned. When recognising the interest expenses, the transaction costs of loans received, which are considered when calculating the effective interest, are considered.
Fees and commissions that are integral part of the effective profit of financial assets or liabilities are recognised as adjust-ments to the effective interest rate of the instrument.
Commission income and other income these items do not include income that is of an interest nature.the income under these headings is recognised as income in the period in which the services are delivered or the sale has occurred.
Other general and administrative expensesthese expenses are determined on an historic basis and recognised in the report year to which they relate.
Income taxes taxes on result are calculated on the result before taxes in the profit and loss account considering the tax at the prevailing nominal tax rate. Changes that occur in the deferred tax receivables and deferred tax debts are also considered.
nOteS tO tHe COnDenSeD InterIm FInAnCIAL StAtementS 2015
22 23InterIm FInAnCIAL rePOrt 2015 • • • •
n O t e S t O t H e C O n D e n S e D S t A t e m e n t O F F I n A n C I A L P O S I t I O n
June 30, 2015 December 31, 2014
SRD SRD
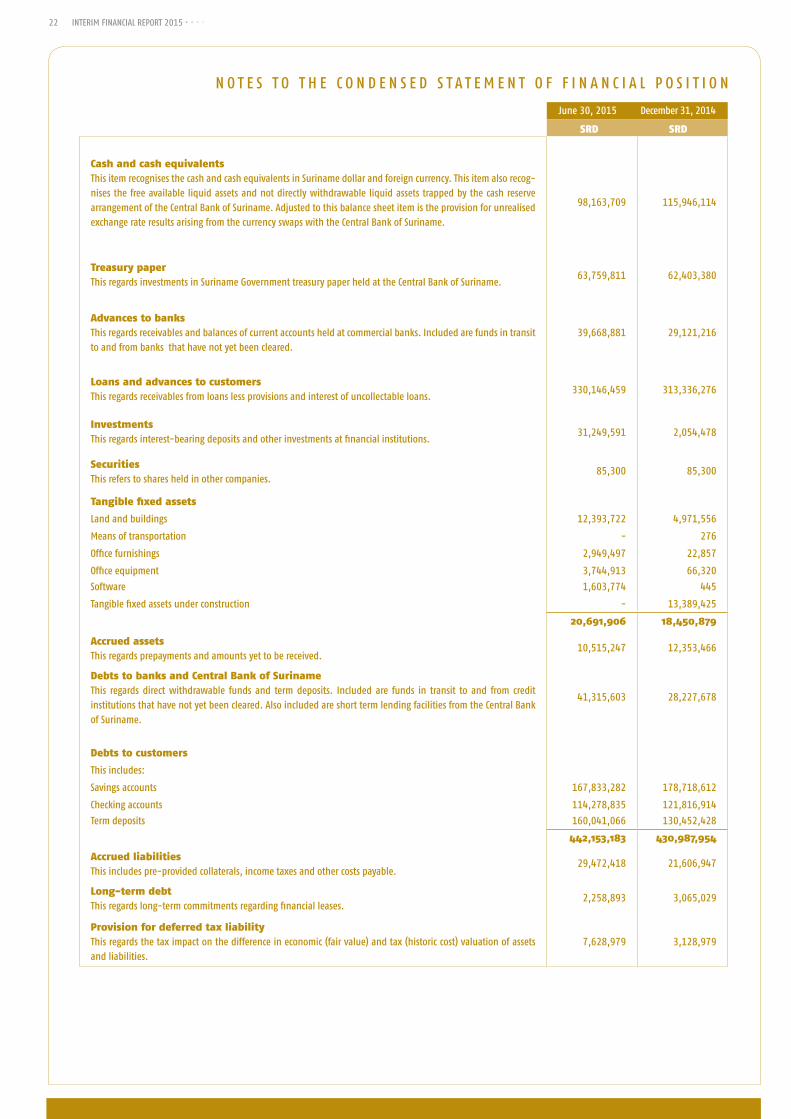
Cash and cash equivalentsthis item recognises the cash and cash equivalents in Suriname dollar and foreign currency. this item also recog-nises the free available liquid assets and not directly withdrawable liquid assets trapped by the cash reserve arrangement of the Central Bank of Suriname. Adjusted to this balance sheet item is the provision for unrealised exchange rate results arising from the currency swaps with the Central Bank of Suriname.
98,163,709 115,946,114
treasury paperthis regards investments in Suriname Government treasury paper held at the Central Bank of Suriname.
63,759,811 62,403,380
Advances to banksthis regards receivables and balances of current accounts held at commercial banks. Included are funds in transit to and from banks that have not yet been cleared.
39,668,881 29,121,216
Loans and advances to customersthis regards receivables from loans less provisions and interest of uncollectable loans.
330,146,459 313,336,276
Investmentsthis regards interest-bearing deposits and other investments at financial institutions.
31,249,591 2,054,478
Securitiesthis refers to shares held in other companies.
85,300 85,300
tangible fixed assets
Land and buildings 12,393,722 4,971,556
means of transportation - 276
Office furnishings 2,949,497 22,857
Office equipment 3,744,913 66,320
Software 1,603,774 445
tangible fixed assets under construction - 13,389,425
20,691,906 18,450,879
Accrued assets this regards prepayments and amounts yet to be received.
10,515,247 12,353,466
Debts to banks and Central Bank of Surinamethis regards direct withdrawable funds and term deposits. Included are funds in transit to and from credit institutions that have not yet been cleared. Also included are short term lending facilities from the Central Bank of Suriname.
41,315,603 28,227,678
Debts to customers
this includes:
Savings accounts 167,833,282 178,718,612
Checking accounts 114,278,835 121,816,914
term deposits 160,041,066 130,452,428
442,153,183 430,987,954
Accrued liabilitiesthis includes pre-provided collaterals, income taxes and other costs payable.
29,472,418 21,606,947
Long-term debtthis regards long-term commitments regarding financial leases.
2,258,893 3,065,029
Provision for deferred tax liabilitythis regards the tax impact on the difference in economic (fair value) and tax (historic cost) valuation of assets and liabilities.
7,628,979 3,128,979
22 23
June 30, 2015 December 31, 2014
SRD SRD
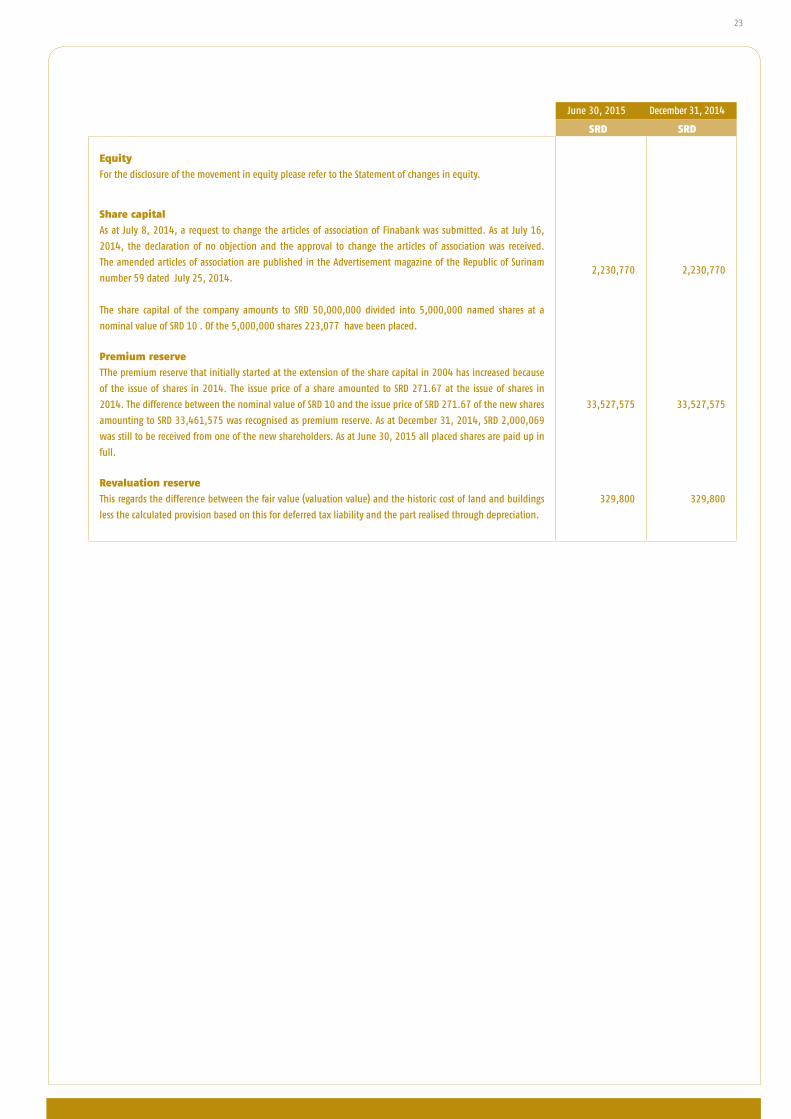
equity
For the disclosure of the movement in equity please refer to the Statement of changes in equity.
Share capital
As at July 8, 2014, a request to change the articles of association of Finabank was submitted. As at July 16,
2014, the declaration of no objection and the approval to change the articles of association was received.
the amended articles of association are published in the Advertisement magazine of the republic of Surinam
number 59 dated July 25, 2014.
the share capital of the company amounts to SrD 50,000,000 divided into 5,000,000 named shares at a
nominal value of SrD 10 . Of the 5,000,000 shares 223,077 have been placed.
2,230,770 2,230,770
Premium reserve
tthe premium reserve that initially started at the extension of the share capital in 2004 has increased because
of the issue of shares in 2014. the issue price of a share amounted to SrD 271.67 at the issue of shares in
2014. the difference between the nominal value of SrD 10 and the issue price of SrD 271.67 of the new shares
amounting to SrD 33,461,575 was recognised as premium reserve. As at December 31, 2014, SrD 2,000,069
was still to be received from one of the new shareholders. As at June 30, 2015 all placed shares are paid up in
full.
33,527,575 33,527,575
Revaluation reserve
this regards the difference between the fair value (valuation value) and the historic cost of land and buildings
less the calculated provision based on this for deferred tax liability and the part realised through depreciation.
329,800 329,800
24 25InterIm FInAnCIAL rePOrt 2015 • • • •
Six month period
ending June 30, 2015
Six month period
ending June 30, 2014
SRD SRD
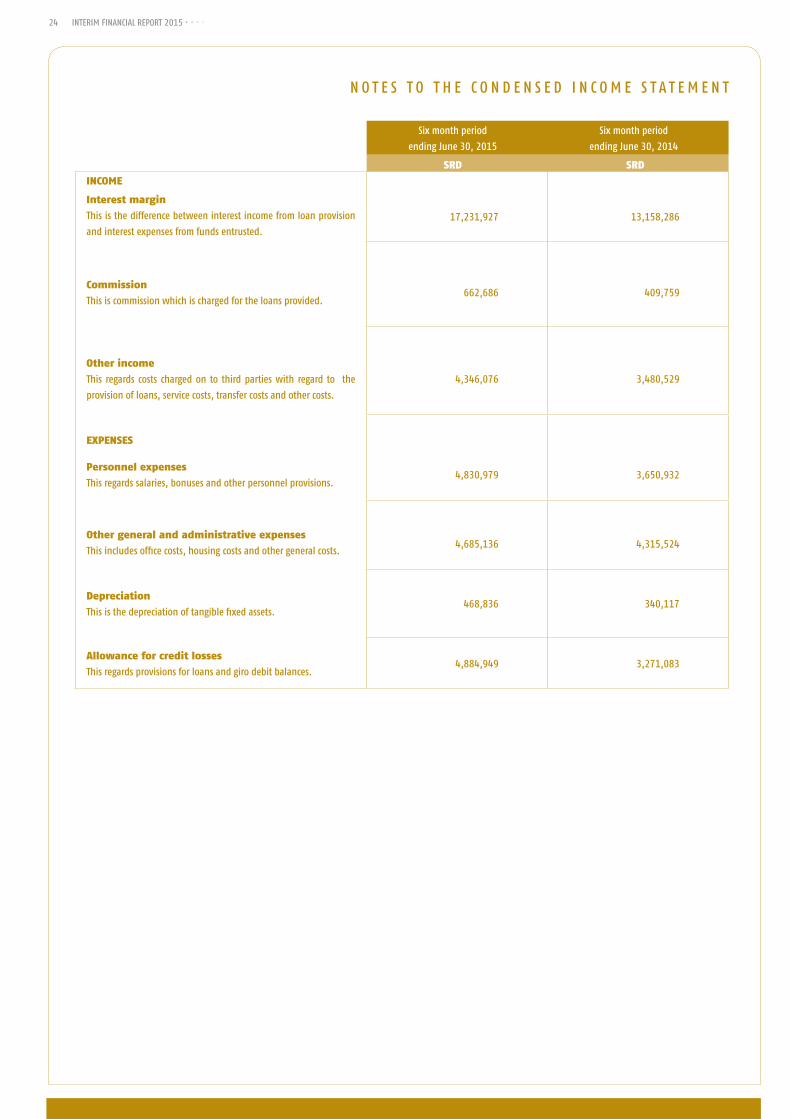
INCOMe
Interest margin
this is the difference between interest income from loan provision
and interest expenses from funds entrusted. 17,231,927 13,158,286
Commission
this is commission which is charged for the loans provided.662,686 409,759
Other income
this regards costs charged on to third parties with regard to the
provision of loans, service costs, transfer costs and other costs.
4,346,076 3,480,529
eXPeNSeS
Personnel expenses
this regards salaries, bonuses and other personnel provisions. 4,830,979 3,650,932
Other general and administrative expenses
this includes office costs, housing costs and other general costs. 4,685,136 4,315,524
Depreciation
this is the depreciation of tangible fixed assets. 468,836 340,117
Allowance for credit losses
this regards provisions for loans and giro debit balances. 4,884,949 3,271,083
n O t e S t O t H e C O n D e n S e D I n C O m e S t A t e m e n t
24 25
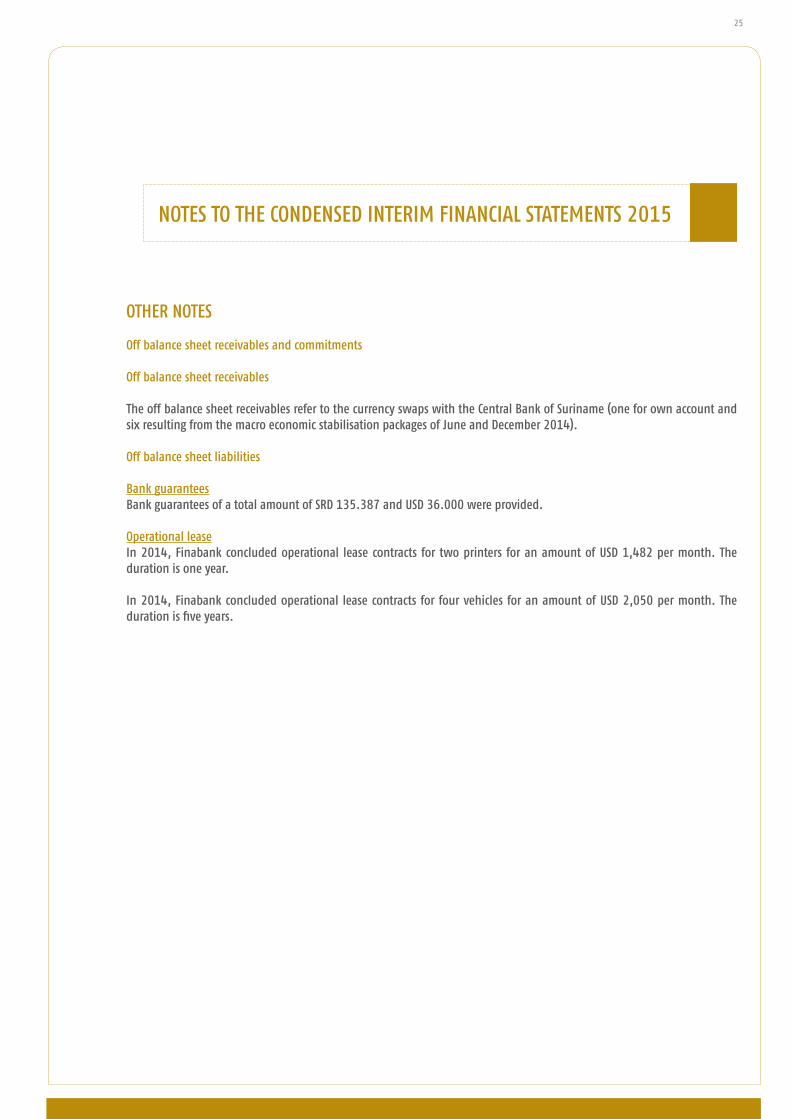
OtHer nOteS
Off balance sheet receivables and commitments
Off balance sheet receivables
the off balance sheet receivables refer to the currency swaps with the Central Bank of Suriname (one for own account and six resulting from the macro economic stabilisation packages of June and December 2014).
Off balance sheet liabilities
Bank guaranteesBank guarantees of a total amount of SrD 135.387 and USD 36.000 were provided.
Operational leaseIn 2014, Finabank concluded operational lease contracts for two printers for an amount of USD 1,482 per month. the duration is one year.
In 2014, Finabank concluded operational lease contracts for four vehicles for an amount of USD 2,050 per month. the duration is five years.
nOteS tO tHe COnDenSeD InterIm FInAnCIAL StAtementS 2015
26 27InterIm FInAnCIAL rePOrt 2015 • • • •
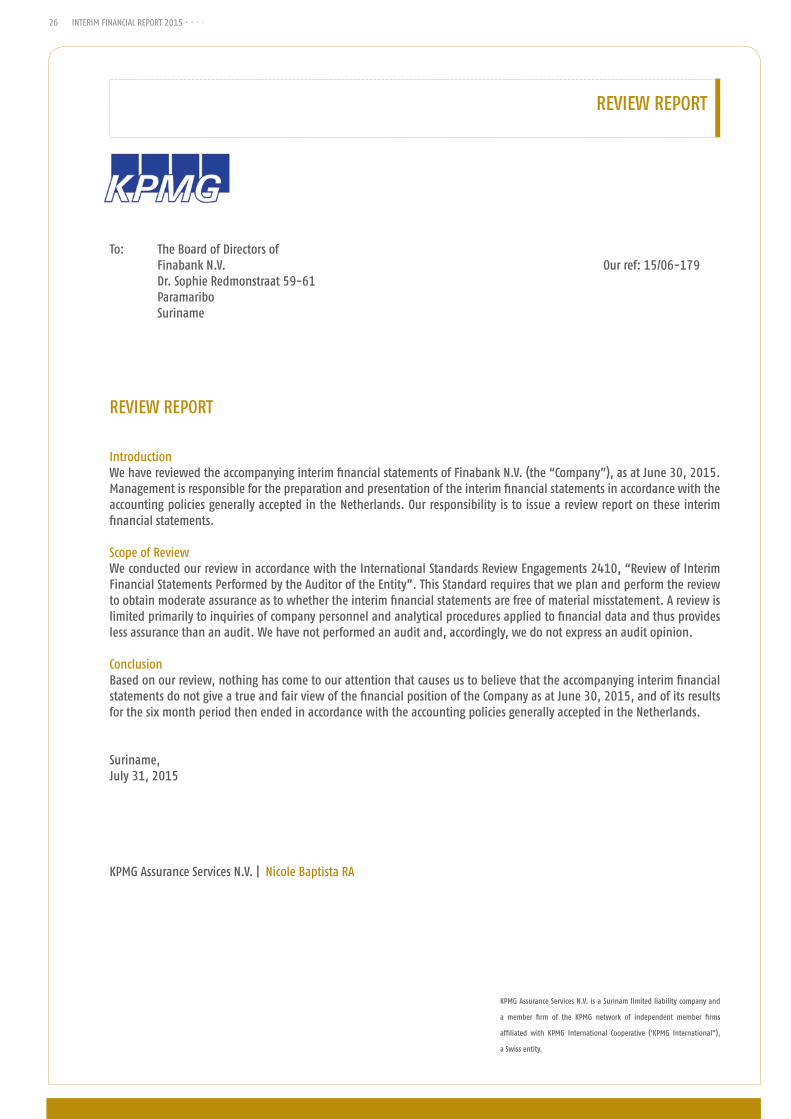
to: the Board of Directors of Finabank n.V. Our ref: 15/06-179 Dr. Sophie redmonstraat 59-61 Paramaribo Suriname
reVIeW rePOrt
IntroductionWe have reviewed the accompanying interim financial statements of Finabank n.V. (the “Company”), as at June 30, 2015. management is responsible for the preparation and presentation of the interim financial statements in accordance with the accounting policies generally accepted in the netherlands. Our responsibility is to issue a review report on these interim financial statements. Scope of reviewWe conducted our review in accordance with the International Standards review engagements 2410, “review of Interim Financial Statements Performed by the Auditor of the entity”. this Standard requires that we plan and perform the review to obtain moderate assurance as to whether the interim financial statements are free of material misstatement. A review is limited primarily to inquiries of company personnel and analytical procedures applied to financial data and thus provides less assurance than an audit. We have not performed an audit and, accordingly, we do not express an audit opinion.
ConclusionBased on our review, nothing has come to our attention that causes us to believe that the accompanying interim financial statements do not give a true and fair view of the financial position of the Company as at June 30, 2015, and of its results for the six month period then ended in accordance with the accounting policies generally accepted in the netherlands.
Suriname, July 31, 2015
KPmG Assurance Services n.V. | nicole Baptista rA
reVIeW rePOrt
KPmG Assurance Services n.V. is a Surinam limited liability company and
a member firm of the KPmG network of independent member firms
affiliated with KPmG International Cooperative (‘KPmG International”),
a Swiss entity.
26 27
Finabank Hoofdkantoor Dr. Sophie Redmondstraat 59-61 T.: 472266
Filialen:Mr. J. Lachmonstraat 49 T.: 430300Doerga Sawhstraat 72, Nw. Nickerie T.: 230032Hk Jozef Israelstraat and Kristalstraat (opening in November) Swift address: FBNASRPA