Faulting and earthquake triggering during the 1783 Calabria seismic sequence E. Jacques, 1, * C. Monaco, 2 P. Tapponnier, 1 L. Tortorici 2 and T. Winter 3 1 Laboratoire de Tectonique et Me ´canique de la Lithosphe `re UMR CNRS 7578, Institut de Physique du Globe de Paris, France. E-mails: [email protected]; [email protected] 2 Istituto di Geologia e Geofisica, Universita ` di Catania, Italy. E-mails: [email protected]; [email protected] 3 Bureau de Recherche Ge ´ologique et Minie `re, Orle ´ans, France Accepted 2001 May 17. Received 2001 April 19; in original form 1999 March 26 SUMMARY Between the 1783 February 5 and 1783 March 28, five earthquakes struck the southern part of Calabria. The main shock (February 5) and the first aftershock (February 6) devastated the region ENE of the Messina Strait. The greatest damage occurred along the foot of the Aspromonte Mountains south of San Giorgio Morgeto, and along the Tyrrhenian coast south of Palmi. A surface break about 18 km long, with several feet of downthrow to the west, formed along the Cittanova (Santa Cristina) Fault as a result of the main shock. On February 7, a third large shock ruined villages at the foot of the Serre Mountains north of San Giorgio Morgeto. Morphological and structural evidence, combined with a reassessment of observations made at the time of the earthquakes, suggest that these three shocks were shallow (j20 km) and related to slip on the west- dipping, NE-striking Cittanova–Sant’Eufemia, Palmi–Scilla and Serre normal faults, respectively, which juxtapose the basement of the Aspromonte and Serre mountains with the Pleistocene deposits of the Gioia Tauro and Mesima basins, and border the Palmi coastal high. The three faults belong to an active rift that stretches from northern Calabria to offshore the Ionian coast of Sicily. The spatial coupling between the 1783 events is investigated by resolving changes of Coulomb failure stress. The main shock (1783 February 5, My7), on the Cittanova and Sant’Eufemia faults, increased that stress by several bars on the Scilla Fault, triggering the 1783 February 6 earthquake (My6.5). The cumulative effect of these two shocks was to raise the Coulomb stress by more than 1 bar on the SW part of the Serre Fault, which was subsequently the site of the 1783 February 7 shock (My6.5). In turn, the first three events increased the stress by about 1 bar on the NE part of this latter fault, leading to the 1783 March 1 shock (My5.7). The gap between the 1783 February 7 and 1783 March 1 events may be related to the previous occurrence of an earthquake 124 yr before (1659 November 5, My6), which had already released stress locally. The occurrence of the last 1783 event (28 March) is not as simply accounted for by Coulomb modelling, in part because it remains unclear which fault slipped and how deep this event was. Overall, the 1783 sequence increased the Coulomb failure stress by several bars south of the Messina Strait and north of the epicentral region of the 1693 SE Sicily (Catania–Noto) earthquakes. 125 yr later, this same region was the site of the 1908 Messina earthquake, also a normal faulting event. Our study thus provides one convincing example in which Coulomb stress modelling brings insight into the spatial dynamics of seismic sequences. Key words: crustal deformation, earthquakes, Italy, normal faulting, stress distribution. * Now at: Equipe de Tectonique active et Pale ´osismologie, UMR CNRS 7516, Institut de Physique du Globe de Strasbourg, France. E-mail: [email protected] Geophys. J. Int. (2001) 147, 499–516 # 2001 RAS 499

Welcome message from author
This document is posted to help you gain knowledge. Please leave a comment to let me know what you think about it! Share it to your friends and learn new things together.
Transcript
Faulting and earthquake triggering during the 1783 Calabriaseismic sequence
E. Jacques,1,* C. Monaco,2 P. Tapponnier,1 L. Tortorici2 and T. Winter31 Laboratoire de Tectonique et Mecanique de la Lithosphere UMR CNRS 7578, Institut de Physique du Globe de Paris, France.
E-mails: [email protected]; [email protected] Istituto di Geologia e Geofisica, Universita di Catania, Italy. E-mails: [email protected]; [email protected] Bureau de Recherche Geologique et Miniere, Orleans, France
Accepted 2001 May 17. Received 2001 April 19; in original form 1999 March 26
SUMMARY
Between the 1783 February 5 and 1783 March 28, five earthquakes struck the southernpart of Calabria. The main shock (February 5) and the first aftershock (February 6)devastated the region ENE of the Messina Strait. The greatest damage occurred alongthe foot of the Aspromonte Mountains south of San Giorgio Morgeto, and along theTyrrhenian coast south of Palmi. A surface break about 18 km long, with several feet ofdownthrow to the west, formed along the Cittanova (Santa Cristina) Fault as a result ofthe main shock. On February 7, a third large shock ruined villages at the foot of the SerreMountains north of San Giorgio Morgeto. Morphological and structural evidence,combined with a reassessment of observations made at the time of the earthquakes,suggest that these three shocks were shallow (j20 km) and related to slip on the west-dipping, NE-striking Cittanova–Sant’Eufemia, Palmi–Scilla and Serre normal faults,respectively, which juxtapose the basement of the Aspromonte and Serre mountainswith the Pleistocene deposits of the Gioia Tauro and Mesima basins, and border thePalmi coastal high. The three faults belong to an active rift that stretches from northernCalabria to offshore the Ionian coast of Sicily. The spatial coupling between the 1783events is investigated by resolving changes of Coulomb failure stress. The main shock(1783 February 5, My7), on the Cittanova and Sant’Eufemia faults, increased thatstress by several bars on the Scilla Fault, triggering the 1783 February 6 earthquake(My6.5). The cumulative effect of these two shocks was to raise the Coulomb stress bymore than 1 bar on the SW part of the Serre Fault, which was subsequently the site ofthe 1783 February 7 shock (My6.5). In turn, the first three events increased the stressby about 1 bar on the NE part of this latter fault, leading to the 1783 March 1 shock(My5.7). The gap between the 1783 February 7 and 1783 March 1 events may be relatedto the previous occurrence of an earthquake 124 yr before (1659 November 5, My6),which had already released stress locally. The occurrence of the last 1783 event(28 March) is not as simply accounted for by Coulomb modelling, in part becauseit remains unclear which fault slipped and how deep this event was. Overall, the 1783sequence increased the Coulomb failure stress by several bars south of theMessina Straitand north of the epicentral region of the 1693 SE Sicily (Catania–Noto) earthquakes.125 yr later, this same region was the site of the 1908 Messina earthquake, also a normalfaulting event. Our study thus provides one convincing example in which Coulombstress modelling brings insight into the spatial dynamics of seismic sequences.
Key words: crustal deformation, earthquakes, Italy, normal faulting, stress distribution.
*Now at: Equipe de Tectonique active et Paleosismologie, UMR CNRS 7516, Institut de Physique du Globe de Strasbourg, France.
E-mail: [email protected]
Geophys. J. Int. (2001) 147, 499–516
# 2001 RAS 499

INTRODUCT ION
The Quaternary tectonics of the southern tip of Italy (Fig. 1)
are dominated by normal faulting (e.g. Tapponnier 1977;
Tapponnier et al. 1987; Westaway 1993; Tortorici et al. 1995;
Monaco et al. 1995, 1997). Normal faults follow the Tyrrhenian
side of Calabria and continue, across the Strait of Messina,
along the Ionian coast of Sicily forming the ‘Siculo-Calabrian
Fig. 8
Fig. 9
32
5
4
1
15˚
15˚
16˚
16˚
17˚
17˚
37˚ 37˚
38˚ 38˚
39˚ 39˚
M Pollino
Mt. Etna
Sila
M Pollino
Valle del Crati
Aspro
mon
te
Serre
GT
CC
M Pollino
Mt. Etna
Sila
CB
M Pollino
Valle del Crati
Aspro
mon
te
Serre
IsoleEolie
GT
MS
TYRRHENIAN
SEA
IONIAN
SEA
M
CC
Hyblean Plateau
Peloritani
GT = Goia Tauro BasinM = Mesima Basin
CB = Catanzaro Basin CC = Catena Costiera
MS = Messina Strait
5 ≤ M < 6 6 ≤ M < 77 ≤ M
Main Crustal Earthquakessince 1000 A.D.
Normal fault (arrow = Strike-slip component)
Direction of maximumextension
50 km
Siracusa
10˚
40˚
Cosenza
Catanzaro
Gioia Tauro
Reggio
Messina
Catania
Stromboli
5 kmN N
N
27.3.1638
4.10.1870
24.5.1184
28.3.1783
1.3.1783
7.2.1783
5.2.1783
5.11.1659
6.2.1783
27.3.1638
4.10.1870
24.5.118420.2.1980M=4.4
11.05.1947
20.2.1980M=4.3
28.3.17838.9.1905
1.3.1783
7.2.1783
5.2.17836.2.1783
11.1.1693
4.2.1169
19.8.1865
5.11.165913.10.1791
28.12.1908
15.4.1978
13.12.1990
16.1.1975M=4.7
Numbers refer to fault segments
1 Cittanova2 Sant’Eufemia3 Scilla 4 Galatro5 Serre
Figure 1. Seismotectonic map of the Calabrian Arc and eastern Sicily. Faults are mainly normal (barbs on downthrown block) and Pleistocene–
Holocene in age. Crustal seismicity (H<35 km) since 1000 AD (Postpischl 1985; Boschi et al. 1995) and focal mechanisms of instrumental
earthquakes (Gasparini et al. 1982; Cello et al. 1982; Anderson & Jackson 1987; Amato et al. 1995) are shown. Numbers refer to fault segments:
1, Cittanova; 2, Sant’Eufemia; 3, Scilla; 4, Galatro; 5, Serre. The events of the 1783 earthquake sequence are represented as black dots. Boxes indicate
the locations of Figs 8 and 9. Inset shows kinematic slip indicators on fault segments 1 and 2.
500 E. Jacques et al.
# 2001 RAS, GJI 147, 499–516

rift zone’ (Monaco et al. 1997). Several of the faults cut and
offset Upper Pleistocene to Holocene sediments along escarp-
ments with young morphology, which bound steep range fronts
(Catena costiera, Aspromonte, Serre, Peloritani). The high level
of crustal seismicity is attested by numerous instrumental and
historical earthquakes since 1000 AD. (Postpischl 1985; Boschi
et al. 1995) with magnitudes of up to 7.1 and intensities of up
to XI–XII MCS. Tectonic studies (e.g. Tapponnier et al. 1987;
Mazzuoli et al. 1995; Tortorici et al. 1995; Monaco et al. 1995,
1997) and fault plane solutions (Gasparini et al. 1982; Cello
et al. 1982; Anderson & Jackson 1987) show that, overall, the
direction of extension along the Quaternary Siculo-Calabrian
rift zone is roughly ESE–WNW.
In 1783, the southern part of Calabria was struck by one of
the most devastating earthquake sequences in Western Europe.
Five large shocks occurred along a zone about 100 km long in
less than two months. In this paper, we first identify the faults
that ruptured during the earthquakes. For this, we combine
a reassessment of the available historical information with
geological and geomorphological field evidence supported by
the analysis of 1:33 000 scale aerial photographs and SPOT
satellite images. After elucidating the pattern of interacting
fault segments that broke, we try to understand the spatial
coupling between the events of the sequence by resolving the
changes of Coulomb failure stress caused by each earthquake
rupture using a simple dislocation model in an elastic half-space
(King et al. 1994). In doing this, we follow studies performed in
California (e.g. Reasenberg & Simpson 1992; Stein et al. 1992;
King et al. 1994), in Afar (Jacques 1995; Jacques et al. 1996)
and in the Apennines (Nostro et al. 1997) that have shown that
modelling Coulomb failure stress changes induced by one or
more events can clarify the distribution of future events. The
stress changes are calculated on faults with given strikes, or on
optimally oriented faults, given the regional stress field. We
finally broaden the regional scope of our study by including
in the modelling all the large earthquakes that have occurred in
eastern Sicily and southern Calabria over the last 350 yr.
GEOLOGICAL AND STRUCTURALFRAMEWORK OF SOUTHWESTERNCALABRIA
The Aspromonte and Serre mountains (maximum elevation
1956 m at Montalto) form the structural backbone of SW
Calabria. They are composed of uplifted metamorphic base-
ment (chiefly gneisses and granites). The basement is a pile
of several thrust sheets, involving Cretaceous sediments in
the eastern, external part (e.g. Ogniben 1973). The mountains
slope rather gently towards the Ionian Sea to the east, but their
western edge is steeper and controlled by normal faults. The
faults dip west and bound a major Plio-Pleistocene trough
(Gioia Tauro and Mesima basins) (Fig. 2). The southern part
of the Gioia Basin is separated from the Tyrrhenian Sea by the
Palmi high (maximum elevation 593 m), along which basement
identical to that in the Aspromonte has been uplifted and tilted
by movement on another west-dipping, offshore normal fault
(Figs 2a and b). On this high, the basement is unconformably
covered by patches of calcareous sandstones and white marls of
Tortonian to Early Pliocene age (Figs 2a and b). The Gioia
Basin is filled by about 600 m of Plio-Pleistocene marine sedi-
ments (Fig. 2b). The basal deposits, visible near Sant’Eufemia
and San Giorgio Morgeto, are cross-bedded sands and
calcarenites with conglomeratic lenses of Late Pliocene–Early
Pleistocene age (#2 Ma), about 70 m thick (beach deposits,
Fig. 2a). They are overlain by a clay and silt sequence several
hundred metres thick. Pumice-rich horizons are found in the
upper part of the sequence. Bathyal and circalitoral micro-
faunal assemblages imply that, as for the analogous sequence
found south of Villa San Giovanni (Barrier 1987), the clays
were deposited between the Early and Middle Pleistocene
(1.8–0.5 Ma) in water depths of around 400 m. In much of the
Gioia Basin, 70 m cross-bedded beach sands cap, with slight
angular unconformity, the marine sequence. These sands onlap
the basement in the Delianova area (Fig. 2a). Near Molocchio
and Oppido Mamertina, coarser conglomeratic lenses inter-
finger with the sands, implying synsedimentary tectonic activity
along the edge of the Aspromonte (Fig. 2b). The upper beach
sands extend laterally to the Tyrrhenian coastal deposits, in
which the typical Strombus Bubonius fauna is found (Bonfiglio
& Berdar 1986). Given the probable westward progradation of
these deposits and westward migration of the coastline, how-
ever, the age of the upper beach sands in the Gioia Basin may
only be estimated to be between the upper Middle Pleistocene
(200 ka) and the Late Pleistocene (100 ka). Middle to Late
Pleistocene deposits are also found south of Villa San Giovanni
(Dumas et al. 1979; Barrier & Keraudren 1983; Barrier 1987)
(Fig. 2a), but with a different facies (Gilbert-type fan delta
conglomerates). Between Villa San Giovanni and Gioia Tauro,
as many as nine to 10 levels of Pleistocene marine terraces step
up to about 600 m on the Palmi–Bagnara coastal high (Gignoux
1913; Dumas et al. 1980, 1982; Ghisetti 1981) (Fig. 2a), attesting
to sustained recent uplift of this high relative to sea level.
The uppermost deposits in the Gioia Basin are continental
alluvial fanglomerates and sands, which cover unconformably
the Mid–Upper Pleistocene (200–100 ka) beach sands; Lower
Pleistocene deposits of similar facies cap directly the basement
on top of the flat Aspromonte planation surface (‘Piani’) at
elevations of 1000 m or more (Fig. 2).
Such stratigraphic and structural observations are in keep-
ing with the generally accepted tectonic evolution of the inner,
Tyrrhenian part of the southern Calabrian Apennines (e.g.
Boccaletti et al. 1974; Tapponnier 1977; Ghisetti & Vezzani 1982;
Rehault et al. 1984; Malinverno & Ryan 1986; Dewey et al.
1989). Here, much of the SE-directed overthrusting induced by
the subduction of the African–Apulian Plate under the growing
Tyrrhenian Plate stopped after the Tortonian. In the outer,
Ionian part of the belt, such overthrusting continued into the
Pleistocene, but, after the late Pliocene, the Tyrrhenian side of
the Aspromonte was affected by extensional faulting (Tortorici
et al. 1995; Monaco et al. 1996). The Gioia and Mesima basins
developed on the blocks tilted southeastwards by such faulting
during the Pleistocene.
THE 1 7 8 3 EARTHQUAKE SEQUENCE
From the beginning of February until the end of March 1783,
five large earthquakes devastated the southern part of Calabria
between Reggio di Calabria and Catanzaro (Fig. 3). This
remarkable sequence started with a catastrophic event at 12:45
local time on February 5 1783. Towns and villages located at the
western foot of the northern Aspromonte, such as Cittanova
(at the time Casalnuovo) Molochio, Oppido Mamertina,
1783 Calabria seismic sequence 501
# 2001 RAS, GJI 147, 499–516
Terranova and Santa Cristina, were completely destroyed. This
event also caused important damage in cities closer to the
Tyrrhenian coast (Palmi, Bagnara and Scilla) (Figs 2 and 3).
The area between Molochio and Santa Cristina was the site of
spectacular landslides that dammed valleys and created many
lakes (Vivenzio 1783; Hamilton 1783; Dolomieu 1784; Baratta
1901; Cotecchia et al. 1969).
On February 6 1783 at 01:06, a second large shock struck
mostly the coastal area between Scilla and Palmi, bringing the
cumulative damage in this area to a level almost comparable to
that in the Aspromonte piedmont. Major rockslides along the
cliff west of Scilla (part of Monte Paci and Campalla fell into
the sea) and a tidal wave (Fig. 3) that principally affected the
town of Scilla and the lowland of Punta Faro (on Capo Peloro,
Sicily’s northeasternmost cape) were triggered by the second
earthquake. Although Dolomieu (1784) and Baratta (1901),
among others, disagree on whether the wave was a mere
consequence of the rockslide or a small, earthquake-generated
tsunami, most chroniclers concur in locating the ‘centre’ of this
second shock offshore, not far from Scilla (Fig. 3).
On February 7 (at about 20:00), a third shock ruined the
small towns of Soriano (leading to the destruction of well-built
edifices, for example, the Benedictine convent rebuilt after
the 1659 earthquake, Dolomieu 1784), Sorianello, Gerocarne
and Pizzoni, at the western foot of the Serre Mountains, about
40 km northeast of the epicentral area of the catastrophic
February 5 event (Fig. 3) (Baratta 1901). Dolomieu (1784)
notes that this earthquake increased significantly the damage
T. Marro
T. Metramo
T. Vacale
T. Calderaro
T. Calabro
F. Petrace
Fra.
di Catona
5a5a5a
5b
Fluvial deposits lying on the cristalline basement - Lower Pleistocene
10 km
S. Cristina
S. Eufemia
0
Alluvial and beach deposits - Holocene
Marine terraces and continental deposits - Lower/Upper Pleistocene
Marine terraces - Lower/Upper Pleistocene
Conglomeratic fan delta - Middle Pleistocene
Beach deposits - Middle/Upper Pleistocene
Beach deposits - Upper Pliocene/ Lower Pleistocene
Tortonian/ Lower Pliocene sediments
Upper Cretaceous/ Early Miocene sediments
Cristalline basement
Faults 1783 surface break (Dolomieu, 1784)
Clay sediments - Lower/Middle Pleistocene
A
Scilla
Cittanova
Galatro
(b)
(a)
Cittanova FaultS. Eufemia FaultPalmi FaultPalmi Bagnara
HighGioia Basin
Figure 2. (a) Simplified geological map of the Gioia Tauro Basin and the western edge of Aspromonte. Only Plio-Pleistocene formations are
represented in detail. The Galatro, Cittanova (Santa Cristina) and Sant’Eufemia faults bring uplifted metamorphic basement against Pleistocene
terrigenous deposits. Another fault (the Scilla Fault) is responsible for basement uplift along the Palmi coastal high and sea cliff. View angle and
locations of Figs 5 and 7 are outlined by boxes. (b) Schematic cross-section along profile A–B in (a), no vertical exaggeration.
502 E. Jacques et al.
# 2001 RAS, GJI 147, 499–516
in cities such as San Giorgio Morgeto, situated in the north-
eastern part of the epicentral area of the February 5 event, as
did the shock of February 6 in the southwestern part of the
area, near the Tyrrhenian coast.
On March 1 1783 (at about 02:15), a fourth shock struck an
apparently smaller area near Polia (Baratta 1901), about 20 km
north of the February 7 epicentre (Fig. 3). Finally, onMarch 28
(at about 01:16), still further northeast (Fig. 3), the fifth and
last important shock of the sequence caused destruction in
the towns of Borgia and Girifalco (Baratta 1901), closer to the
Ionian sea.
In addition to the five major events described above,
hundreds of smaller aftershocks were felt, particularly in the
hours and days following the main February 5 event, and then
with decreasing frequency until the end of 1783 (Baratta 1901).
Baratta singles out one such aftershock, which brought signifi-
cant additional damage, mostly to Messina, Reggio di Calabria
and Scilla, in the evening of February 7 (at about 22:00), and
thus probably had its epicentre located at the southwesternmost
tip of the area strongly shaken by the main 1783 earthquakes.
Comparison and quantitative assessment of damage andmesoseismal effects due to the earthquakes
Among the five principal shocks, that on March 1 appears
to have been the weakest, and there is overwhelming evidence
that the first February 5 event was by far the strongest. All
chroniclers agree that the greatest destruction occurred just
west of the Aspromonte, in the Gioia Basin, and infer the
‘centre’ of this first and main shock to have been located under
it, near Oppido and Molochio (e.g. Dolomieu 1784; Hamilton
1783; Baratta 1901). To the surprise of many, Reggio di Calabria
and Messina were relatively undamaged (e.g. Hamilton 1783).
Dolomieu (1784) suspected some of the destruction in Messina
to have been related to the fact that many buildings there had
been weakened by the large 1693 earthquake (Fig. 1) and other
smaller shocks in the following 90 yr. Destruction in villages
and small towns along the Ionian coast of Calabria was
moderate compared to that on the Tyrrhenian side of the
Aspromonte (Baratta 1901). Dolomieu (1784) and Hamilton
(1783) stress the general fact that villages built on basement rocks
in the Aspromonte Mountains (e.g. San Giorgio) suffered
less than those built on the loosely consolidated alluvium of
the ‘plain’ below. The particularly disastrous destruction in the
plain was in part due to its peculiar morphology, characterized
by tabular mesas of uplifted Pleistocene clays and sands incised
by NW–SE river canyons up to 200 m deep and 1500 m wide
(Fig. 2a). In the territories of Santa Cristina and Oppido, the
steep edges of such valleys collapsed extensively. Both Hamilton
(1783) and Dolomieu (1784), and more recently Cotecchia
et al. (1969), describe how, on February 5, entire olive groves,
cultivated flats or parts of villages on the mesas slid several
hundred metres to up to a few kilometres down into the valleys.
In several instances, to the bewilderment of all, the top surface
C
C
AB
B
A
B
C
AB
C
A
B
C C
CAB
B
Catanzaro
Reggiodi Calabria
MessinaScillaScilla
S.GiorgioS.Giorgio
S. CristinaS. Cristina
Palmi5/2/1783~ 12h45
28/3/17831/3/1783
6/2/1783~ 1h06
XI-XII
5/2/1783~ 12h45
7/2/1783~ 20h
28/3/1783~ 1h16
1/3/1783~ 2h15
6/2/1783~ 1h06
XI-XII
6/2/17837/2/17831/3/1783
28/3/1783
5/2/1783Isoseismals from Baratta (1901) of shocks on
probable epicentral locations
Surface break of 5/2/1783 shock (Dolomieu, 1784)
A: epicentralB: disastrous zonesC: ruinous
16˚ 17˚
38˚
39˚
0
10
20
30
40
50
60
70
0 200 400 600 800 1000 1200
dist
ance
aw
ay fr
om
loca
tion
of fi
rst s
hock
(km
)
time from occurrence of first shock (hours)
6/2/1783(+~12hrs)
7/2/1783(+~55hrs)
1/3/1783(+25ds ~14hrs)
28/3/1783(+51ds ~12hrs)
5/2/1783
Figure 3. Mesoseismal areas of the five principal shocks of the 1783 earthquake sequence (after Baratta 1901). Stars correspond to probable
epicentral locations. Curves corresponding to approximate limits of epicentral (A), disastrous (B) and ruinous (C) zones, as defined by Baratta, are
shown. Inset shows distance away from location of first shock as a function of time from occurrence of first shock.
1783 Calabria seismic sequence 503
# 2001 RAS, GJI 147, 499–516
of these far-travelled slide-blocks remained mostly intact. On
the flat mesas, numerous cracks were observed to run parallel
to the edges of the canyons (e.g. Hamilton 1783). Compaction
of the permeable sediments of the ‘plain’ was widespread and
spectacular. Post-seismic elevation differences in the originally
level surface of cultivated fields and uplift of masonry foundations
relative to the ground surface reached up to 10 ft in places.
Sand fountains spurted water to heights of several feet. The
cones and craterlets left by such fountains were particularly
abundant in the valleys of larger rivers such as Mammella,
Metramo and Petrace (Hamilton 1783). All accounts indicate
that only the main February 5 event produced such strong
effects. Water flow in the Metramo was even reported to have
stopped during the climax of this event, to resume stronger and
muddier minutes later.
The ground shaking on February 5 was so strong that people
in the fields were thrown down. Trees swung so hard that the
tips of their branches touched the ground. Many were uprooted.
Others had their trunks broken near the base (Dolomieu 1784).
In Terranova, heavy pavement and foundation stones were
found dislodged from their original emplacement and upturned
(from Sarconi 1784, p.158 in Baratta 1901, p.272), an indication
of particularly strong vertical acceleration. In much of its epi-
central area the first shock was felt as a sudden, violent blast. Its
great force must have been the main cause of the particularly
thorough collapse of constructions. Although kilometric-scale
landslides contributed largely to the destruction of Terranova
and Molochio, they were a less important factor at Oppido and
Casalnuovo (Hamilton 1783; Dolomieu 1784). These latter
towns were nevertheless reduced to heaps of almost structure-
less ruins. Moreover, Casalnuovo had been built with particular
care with wide streets and low-level houses after the earthquake
of 1659 (Fig. 1) (Dolomieu 1784). Throughout the epicentral
region of the main shock, numerous well-built edifices (e.g.
convents, castles and palaces) were levelled to the ground
(Hamilton 1783; Dolomieu 1784).
The total number of fatalities was in excess of 30 000.
Official statistics differ by as much as 15 per cent, but fall short
of the qualitative assessments made by either Dolomieu or
Hamilton. While both estimated the earthquakes to have killed
at least 40 000 people, Vivenzio (1783) calculated that number
to be 35 160, and Baratta (1901) put it at 30 145. The accurate
population records kept in towns and villages of the Kingdom
of Naples, and the detailed report of damage and casualties
prepared by the team of naturalists and engineers that the
Royal Academy of Naples despatched to the site of the disaster
permit one to make precise estimates of the loss of life at a local
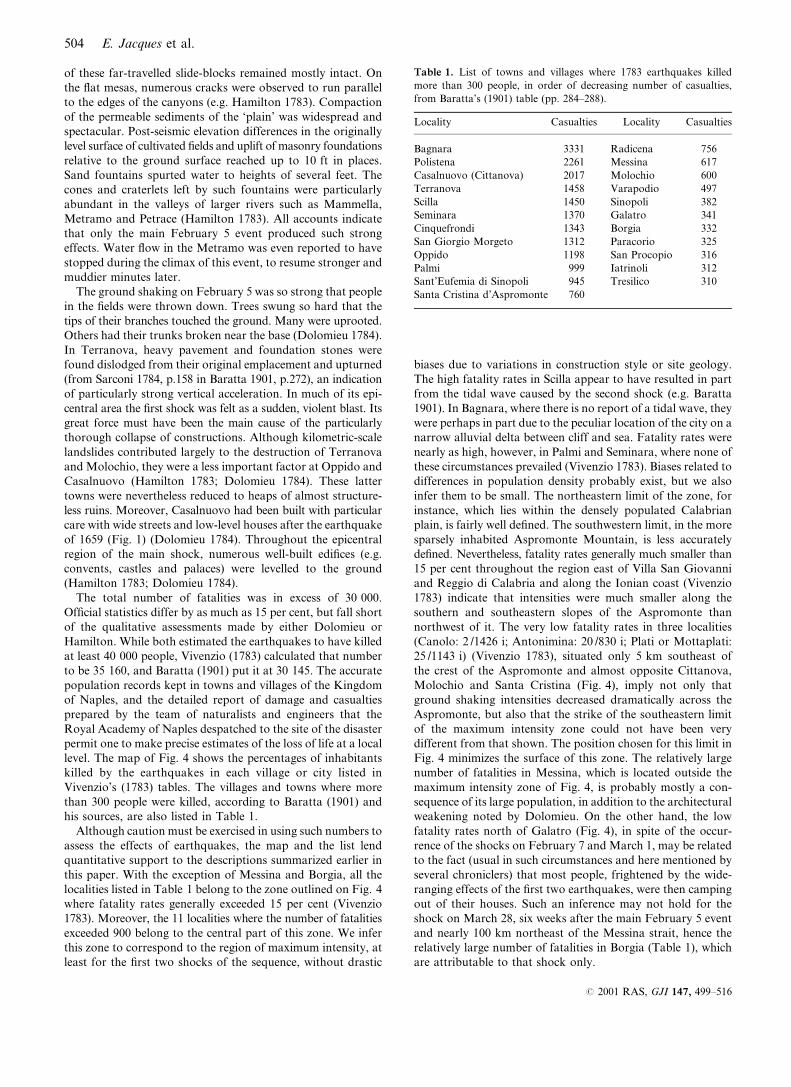
level. The map of Fig. 4 shows the percentages of inhabitants
killed by the earthquakes in each village or city listed in
Vivenzio’s (1783) tables. The villages and towns where more
than 300 people were killed, according to Baratta (1901) and
his sources, are also listed in Table 1.
Although caution must be exercised in using such numbers to
assess the effects of earthquakes, the map and the list lend
quantitative support to the descriptions summarized earlier in
this paper. With the exception of Messina and Borgia, all the
localities listed in Table 1 belong to the zone outlined on Fig. 4
where fatality rates generally exceeded 15 per cent (Vivenzio
1783). Moreover, the 11 localities where the number of fatalities
exceeded 900 belong to the central part of this zone. We infer
this zone to correspond to the region of maximum intensity, at
least for the first two shocks of the sequence, without drastic
biases due to variations in construction style or site geology.
The high fatality rates in Scilla appear to have resulted in part
from the tidal wave caused by the second shock (e.g. Baratta
1901). In Bagnara, where there is no report of a tidal wave, they
were perhaps in part due to the peculiar location of the city on a
narrow alluvial delta between cliff and sea. Fatality rates were
nearly as high, however, in Palmi and Seminara, where none of
these circumstances prevailed (Vivenzio 1783). Biases related to
differences in population density probably exist, but we also
infer them to be small. The northeastern limit of the zone, for
instance, which lies within the densely populated Calabrian
plain, is fairly well defined. The southwestern limit, in the more
sparsely inhabited Aspromonte Mountain, is less accurately
defined. Nevertheless, fatality rates generally much smaller than
15 per cent throughout the region east of Villa San Giovanni
and Reggio di Calabria and along the Ionian coast (Vivenzio
1783) indicate that intensities were much smaller along the
southern and southeastern slopes of the Aspromonte than
northwest of it. The very low fatality rates in three localities
(Canolo: 2 /1426 i; Antonimina: 20 /830 i; Plati or Mottaplati:
25 /1143 i) (Vivenzio 1783), situated only 5 km southeast of
the crest of the Aspromonte and almost opposite Cittanova,
Molochio and Santa Cristina (Fig. 4), imply not only that
ground shaking intensities decreased dramatically across the
Aspromonte, but also that the strike of the southeastern limit
of the maximum intensity zone could not have been very
different from that shown. The position chosen for this limit in
Fig. 4 minimizes the surface of this zone. The relatively large
number of fatalities in Messina, which is located outside the
maximum intensity zone of Fig. 4, is probably mostly a con-
sequence of its large population, in addition to the architectural
weakening noted by Dolomieu. On the other hand, the low
fatality rates north of Galatro (Fig. 4), in spite of the occur-
rence of the shocks on February 7 and March 1, may be related
to the fact (usual in such circumstances and here mentioned by
several chroniclers) that most people, frightened by the wide-
ranging effects of the first two earthquakes, were then camping
out of their houses. Such an inference may not hold for the
shock on March 28, six weeks after the main February 5 event
and nearly 100 km northeast of the Messina strait, hence the
relatively large number of fatalities in Borgia (Table 1), which
are attributable to that shock only.
Table 1. List of towns and villages where 1783 earthquakes killed
more than 300 people, in order of decreasing number of casualties,
from Baratta’s (1901) table (pp. 284–288).
Locality Casualties Locality Casualties
Bagnara 3331 Radicena 756
Polistena 2261 Messina 617
Casalnuovo (Cittanova) 2017 Molochio 600
Terranova 1458 Varapodio 497
Scilla 1450 Sinopoli 382
Seminara 1370 Galatro 341
Cinquefrondi 1343 Borgia 332
San Giorgio Morgeto 1312 Paracorio 325
Oppido 1198 San Procopio 316
Palmi 0999 Iatrinoli 312
Sant’Eufemia di Sinopoli 0945 Tresilico 310
Santa Cristina d’Aspromonte 0760
504 E. Jacques et al.
# 2001 RAS, GJI 147, 499–516
Locations, intensities and inferred magnitudes of thevarious shocks
The observations compiled in Fig. 4 yield a clear macroseismic
picture of the first two shocks of the 1783 sequence. They
complement and give firmer basis to inferences made in pre-
vious reports (e.g. Baratta 1901) and by those who visited the
area at the time. Two features of the zone of maximum ground
shaking intensity in Fig. 4 are robust. First, the zone has two
main lobes connected by a narrow isthmus near Sant’Eufemia.
The smaller lobe roughly coincides with the Palmi high along
the Tyrrhenian coast. The larger lobe is a 5–10 km wide, 35 km
long strip of the Gioia Basin along the steep northwestern edge
of the Aspromonte. Second, shaking intensities seem to have
decreased rapidly from peak values causing complete collapse
of all constructions and fatality rates of 50 per cent or more
along the axial zones of these two lobes to much smaller
values, sparing more than 85 per cent of the population less
than 10 km away from such paroxysmal zones. These two
features imply that the two shocks had distinct hypocentres at
shallow crustal depths (<20 km). The most likely locations
of the two hypocentres are clearly under the eastern part of
the Gioia Basin (probably between Oppido and Molochio)
for the main February 5 shock, and off the Tyrrhenian coast
(probably between Scilla and Bagnara) for the February 6 shock.
Such hypocentres correspond to the sites inferred to have
38°20' N
38°40' N
38°00' N3°30' E 4°00' E
45 < %D
25 < %D < 45
15 < %D < 25
%D < 15
%D: fatality rate
N
10 km
surface rupture of 5/02/1783 event(Dolomieu, 1784)
IX
X
XI
X
X XI
XI
X-XI
Dinami
Acquaro
Mileto
Gerocarne
Soriano CalabroSorianello
Pizzoni
S. Nicola Da Crissa
S. Giorgio Morgeto
Cinquefrondi
Galatro
Canolo
Antonimina
Platì
Scilla
Bagnara
Seminara
Palmi
Terranova
Molochio
(Iatrinoli)
Taurianova(Radicena) Cittanova
PolistenaGioia Tauro
S. EufemiaS. Procopio
Sinopoli vecchio
S. Cristina d'Aspromonte
Oppido Mamertino
TresilicoCastellace
Varapodio
Messina
Reggiodi Calabria
Villa S. Giovanni
Delianuova
Arena
Capo Peloro
Capo Vaticano
M
A
R
E
T
I
R
R
E
N
O
M
A
R
E
I
O
N
I
O
B A
C I
N
O
D
I
G
I
O
I A
STRETTO DI M
ESSINA
A
S
P
R
O
M
T
ES
E
R
R
E
BA
CI N
O
DE
L
ME
SI
MA
1423m
1260m
1099m
989m 1276m
1143m
967m
1006m
1572m1567m
1956m
1500m
Montalto
Figure 4. Percentage of population killed by 1783 earthquakes in cities and villages of southernmost Calabria (from numbers of inhabitants and
casualties listed by Vivenzio 1783). Solid lines delimit regions with most gravely struck population centres (highest fatality rates, see text for intensity
estimates). Fatalities in the area covered by the map, which does not include epicentral areas of the March 1 and 28 shocks (Fig. 3), resulted mostly
from shocks on February 5 and 6. Dotted lines represent the isoseismals IX, X and X–XI of the February 7 event according to Boschi et al. (1995).
1783 Calabria seismic sequence 505
# 2001 RAS, GJI 147, 499–516
been the ‘centres’ of the earthquakes (Fig. 3) at a time when
the physical nature of earthquakes was unclear (e.g. Hamilton
1783; Vivenzio 1783; Dolomieu 1784; Baratta 1901; see also
Postpischl 1985; Boschi et al. 1995). Both earthquakes had
pronounced effects on the regional morphology. The first
triggered numerous landslides of awesome proportions (referred
to as ‘sconvolgimento’) that dammed rivers to create 215 lakes,
five of which were 1 km or more in length (Vivenzio 1783;
Cotecchia et al. 1969). The second triggered a large, 2 km long
rockslide along the Tyrrhenian coastal cliff as well as a small
tsunami (Baratta 1901). The first shock also caused the wide-
spread occurrence of sand fountains. It is probable that, as
noted by Dolomieu and Baratta, the exceptional size and
pervasiveness of such effects was partly a result of the regional
geology and of a notably rainy winter. Nevertheless, effects of
this type are usually characteristic of intensities of at least X–XI
(corresponding to magnitudes i6.5 using the relationship
between magnitude and epicentral intensity I0 for the Italian
peninsula M=0.53I0+0.96; Armijo et al. 1986). Hence, it is
probably reasonable to infer that the continuous contours
drawn in Fig. 4 roughly follow the isoseismals X and XI or XI
and XII. The surface area of the zone within the outer contour
(intensity X or XI isoseismal) of the largest lobe suggests,
in turn, that the magnitude of the first, main February 5
shock was at least equal to 7, as implied by its large environ-
mental effects, corresponding to intensities of XI–XII (see also
Postpischl 1985; Boschi et al. 1995). Similarly, the second,
February 6 shock probably reached an intensity of about
X–XI, corresponding to a magnitude of at least 6.5.
Like the first two events, the two subsequent events of the
1783 Calabrian earthquake sequence were probably shallow
crustal events. They were smaller than the main February 5
shock. The February 7 earthquake was clearly larger than
the March 1 shock. As implied by the contours of the meso-
seismic area (Fig. 3), the February 7 event was located in the
southeastern part of the Mesima Basin, at the western foot of
the Serre Mountains, where it reduced to heaps of ruins all the
villages between Acquaro and Soriano Calabro, and caused
destruction between Pizzoni and Dinami (a distance of 15 km;
Fig. 4), with landslides in the vicinity of Soriano, Arena and
Mileto (e.g. Dolomieu 1784; see also Boschi et al. 1995). Note
that since most of the inhabitants were camping out of their
houses at this time, the percentage of casualties cannot be used
to assess the size of the earthquake. The March 1 event was
located along the northernmost edge of the Mesima Basin,
at the northwestern foot of the Serre Mountains, where it
caused more limited damage (Fig. 3, see also Postpischl 1985;
Boschi et al. 1995). Thus, while the February 7 shock could
have reached an intensity of X or slightly more (Fig. 4, see
also Boschi et al. 1995) and a magnitude of at most 6.5,
that on March 1 probably had an intensity of IX at most
(e.g. Postpischl 1985) and a magnitude smaller than 6. For
the March 28 event, the mesoseismal area (Fig. 3) suggests a
location in the Catanzaro Basin, near Borgia, about 20 km
WNW of the March 1 event. It may have reached an intensity
of XI (according to Boschi et al. 1995) and a magnitude of the
order of, or somewhat greater than, 6.5. However, this shock
appears to have been deeper than the previous ones. The
gradient defined by the isoseismals, which is less steep than that
associated with the main event of February 5 (Fig. 3), and the
fact it was felt at greater distances (Baratta 1901) attest to a
deeper rupture nucleation.
RECENT AND ACT IVE FAULTS OFSOUTHERN CALABRIA
The main normal fault system separating the South Calabrian
Upper Pliocene–Pleistocene basins from the uplifted mountain
ranges comprises chiefly, from north to south, the Serre Fault,
along the west side of the Serre Mountains, the Galatro,
Cittanova (Santa Cristina) and Sant’Eufemia faults, along
the northwest edge of the Aspromonte massif, and the Scilla
Fault, bounding the Palmi high along the Tyrrhenian Sea
(Figs 1 and 2).
Given the Plio-Quaternary geological framework, the infer-
ence drawn from the macroseismic observations that the 1783
February 5 and 6 earthquakes had their hypocentres at shallow
depths just west of the Aspromonte and Palmi highs (Figs 1
and 3) implies that these two earthquakes resulted from slip
on the west-dipping normal faults bounding these two base-
ment highs. Similarly, the February 7 andMarch 1 earthquakes
resulted from slip on the west-dipping normal fault separating
the Serre basement high from the Mesima Basin.
Morphological and structural evidence confirms these con-
clusions and yields first-order constraints on the kinematics and
rates of active faulting in this southernmost part of Calabria.
Surface break of the 1783 February 5 earthquake on theCittanova Fault
Alone among the scholars and engineers who visited southern
Calabria after the 1783 earthquakes, Deodat Gratet de Dolomieu
was a dedicated Earth Scientist. His description of the meso-
seismal area of the Calabrian earthquakes (Dolomieu 1784)
places the morphological effects of these earthquakes in a
geological framework that is clear and correct by modern
standards. Although Dolomieu did not understand the origin
of the earthquakes at the time, his accurate observations throw
definitive light on surface deformation. Two paragraphs of his
‘Memoire’ (Dolomieu 1784, p. 36 and p. 46), which we quote
fully below, provide the key:
‘Il s’ensuivit, que dans presque toute la longueur de la chaine,
les terreins, qui etoient appuyes contre le granit de la base des
monts Caulone, Esope, Sagra et Aspramonte, glisserent sur ce
noyeau solide, dont la pente est rapide, et descendirent un peu
plus bas. Il s’etablit alors une fente de plusieurs pieds de large,
sur une longueur de 9 a 10 milles, entre le solide et le terrein
sabloneux; et cette fente regne, presque sans discontinuite,
depuis Saint George, en suivant le contour des bases, jusque
derriere Sainte Cristine.’
‘Tout le sol de la plaine, qui entoure Casalnovo, s’est affaisse.
Cet abaissement est surtout fort aparent, au dessus du bourg,
au pied de la montagne. Tous les terreins inclines, apuyes
contre cette meme montagne, ont glisse plus bas; en laissant,
entre le terrein mouvant et le solide, des fentes de plusieurs
pieds de large, qui s’etendent a trois, ou quatre milles.’
[‘Along almost the entire length of the range, the rocks
that were standing against the granite at the base of Mts
Caulone, Esope, Sagra and Aspramonte slipped on that rigid
core, whose slope is steep, and descended a little lower. Thus
was established a fissure several feet wide, over a length of
9–10 miles between the solid rock and the sandy terrane, and
this fissure prevails, almost without discontinuity, from San
Giorgio, following the contour of the mountain base, as far as
behind Santa Christina.’
506 E. Jacques et al.
# 2001 RAS, GJI 147, 499–516

‘The floor of the whole plain around Casalnuovo fell down.
Such downthrow is mostly apparent above the village, at the
foot of the mountain. All the sloping terranes that stood
against this mountain slid down, leaving, between the solid
rock and the moving terrane, open fissures several feet wide
over a length of 3–4 miles.’]
The length, continuity and position of the zone of down-
throw and fissures, along the interface between bedrock and
Quaternary sediments, leave little doubt that Dolomieu, while
interpreting this zone as the trace of an exceptionally large
landslide, linked to regional compaction, was in fact the first to
describe the surface break of an earthquake.
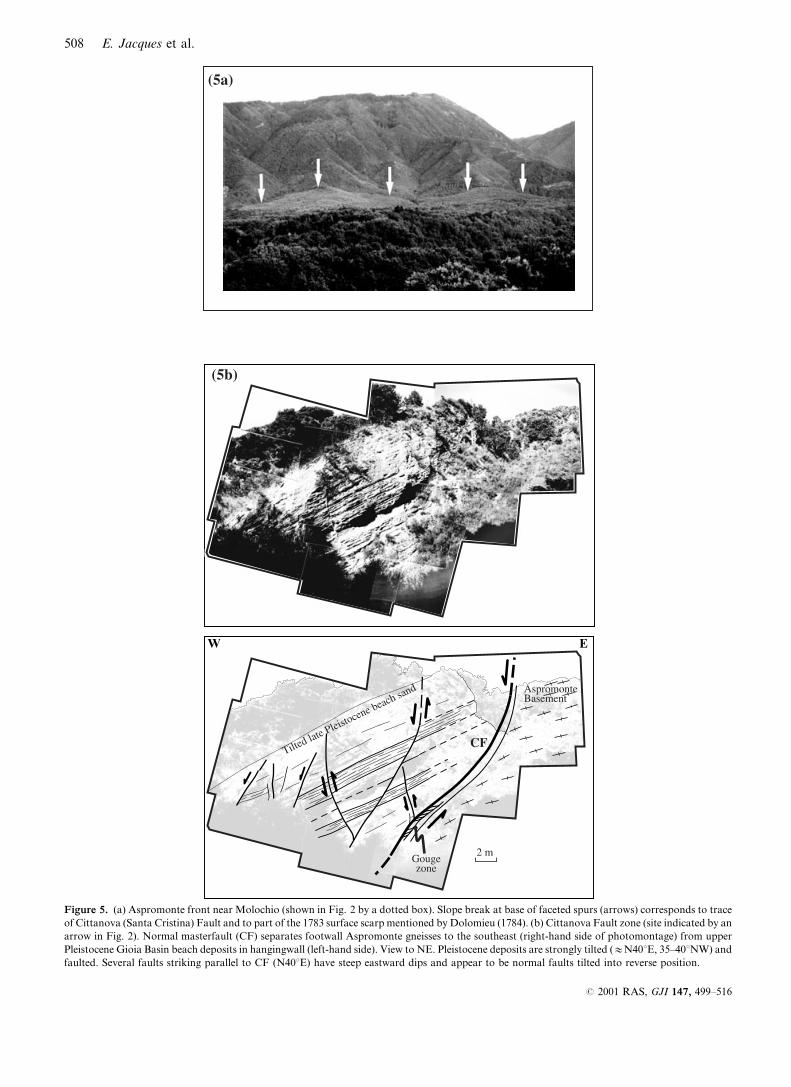
From Dolomieu’s observations, it was clearly the Cittanova
Fault that ruptured over a length of 18 km during the 1783
February 5 main shock. Seismic slip on the fault appears
to have been the largest between S. Giorgio and S. Cristina,
possibly with a maximum near Molochio. The presence of
open fissures at the base of the coseismic scarp is in keeping
with extensional faulting, with slip on the fault plane at depth
propagating more steeply near the surface, giving rise to cracks,
as commonly observed, for instance, in Afar (Jacques 1995).
The reported crack opening (several feet) was probably of the
order of 3–4 ft (>2), corresponding to a width=1 m (the foot
size used by Dolomieu was equal toy0.32 m). On a fault plane
dipping y70u near the surface, such a width would be con-
sistent with about 3 m slip. This motion clearly occurred along
the forested slope break still visible above the olive groves at
the range-front base near Molochio (Fig. 5a).
Geomorphological and structural evidence for activefaulting along the northwestern edge of the Aspromonteand Serre mountains
There is much structural and geomorphological evidence con-
firming recent, ongoing movement on the normal faults of
southern Calabria. The faults clearly cut and deform the Upper
Pleistocene beach sands deposits (Tortorici et al. 1995) and
control the regional topography (Figs 5 and 6) giving rise to
prominent range-front escarpments (Tapponnier et al. 1987),
along which other large earthquakes have destroyed towns and
villages in the past (e.g. 1659 and 1791, Fig. 1).
The 40 km long cumulative escarpment of the NNE–SSW-
trending, WNW-dipping Serre Fault is up to 200 m high
(Fig. 7a). The footwall basement rocks are overlain by two
terrace levels of Early Middle Pleistocene age (Ghisetti 1981).
Narrow V-shaped valleys separate well-developed triangular or
trapezoidal facets along the range front. The NNE-trending
Galatro Fault, within the left step between the Serre and
Cittanova faults, is only 6 km long, with a 150 m high cumu-
lative escarpment (Figs 1 and 7b). This short fault is probably
the northernmost segment of the y40 km long, NE-trending
Cittanova Fault, with which it may merge at depth.
Along the Cittanova Fault, the Upper Pleistocene sands
are strongly tilted westwards and cut by numerous secondary
faults, some of them rotated into reverse attitude (Fig. 5b). A
1–2 m wide gouge zone separates the sands from the crystalline
basement rocks. Mesostructural analysis of the gouge indicates
dip-slipmovement andN140uEt10u extension (Tapponnier et al.
1987; Tortorici et al. 1995). The morphology of the Cittanova
Fault escarpment varies along strike. The 10 km long south-
western stretch of the fault is marked by a cumulative scarp of
rather small height (100–150 m), while towards the northeast
this scarp (y30 km long) reaches a height of 400–700 m
(Figs 5a, 6 and 7c). This highest part of the escarpment is
shaped by three sets of triangular facets (Tortorici et al. 1995).
It is at the base of the lowest facets that Dolomieu described the
most prominent break of the main shock of the 1783 sequence
(Tapponnier et al. 1987), suggesting a relationship between
largest slip per event, fastest slip rate and greatest finite offset.
While the footwall to the southwest is overlain by only one
Lower Pleistocene terrace (Fig. 2), a second terrace level of
Mid-Pleistocene age (Ghisetti 1981; Dumas et al. 1982) exists in
the northeast (Figs 2a, 5a and 7c). Because Pleistocene marine
sedimentation reached the range front in the northeast, it is
likely that the different sets of facets and terrace levels there
correlate with climatic sea-level highstands. Stratigraphic and
geomorphological data suggest a minimum vertical slip rate
along the Cittanova Fault of 0.7 mm yrx1 in the last 125 kyr
(Tortorici et al. 1995). We interpret the smaller vertical throw
on the southwestern stretch of the Cittanova Fault as resulting
from a combination of strike change and slip transfer. The
more westerly strike of this stretch implies a sinistral com-
ponent of slip, as observed in the field (Tortorici et al. 1995)
(Fig. 1, inset). More importantly, extension is probably distri-
buted between this stretch and the nearby Sant’Eufemia Fault,
as commonly observed along overlapping normal fault systems
(e.g. Manighetti et al. 2001a,b).
West of the Delianuova right step, the 18 km long, ENE–
WSW-trending Sant’Eufemia Fault dips to the NNW, bounding
the southern sector of the Gioia Tauro Basin (Figs 1, 2 and 6).
The cumulative escarpment of this fault is up to 300 m high
(Fig. 7d). Its southwestern part, y10 km long, displays two sets
of triangular facets separated by wine-glass valleys (see Fig. 7
in Tortorici et al. 1995), with two distinct terrace levels of
Lower–Middle Pleistocene age on the uplifted footwall (Ghisetti
1981; Dumas et al. 1982). Shear planes in crystalline footwall
rocks show oblique slickensides (pitches of 35u–70u) consistentwith a left-lateral component of slip and a N135uEt5u exten-sion direction (Fig. 1, inset) (Tortorici et al. 1995). An uplift
rate of y0.7 mm yrx1 in the last 125 kyr, comparable to that
on the Cittanova Fault, has been estimated on this fault
(Tortorici et al. 1995).
Finally, the NW-dipping, NNE–SSW-trending Scilla Fault
bounds the Tyrrhenian shore of the Palmi high (Figs 1 and 2).
Southwest of Bagnara it veers to an ENE–WSW direction,
which it keeps onland to Villa San Giovanni. Between Bagnara
and Scilla, the escarpment forms a sea cliff up to 600 m high
(Fig. 7e). The crystalline rocks of the footwall are capped by a
Middle Pleistocene marine terrace, tilted towards the southeast
(Ghisetti 1981; Dumas et al. 1982). Southwest of Bagnara, up to
four levels of uplifted marine terraces (Figs 2 and 7e), reflecting
Middle–Upper Pleistocene sea-level highstands (Valensise &
Pantosti 1992; Westaway 1993; Tortorici et al. 1995), appear to
correspond to isotopic stages 11, 9, 7 and 5 (Bassinot et al.
1994). East of Villa San Giovanni, the 90 m offset of the lower
level (stage 5) is again consistent with a throw rate of about
0.7 mm yrx1 in the last 125 kyr.
MODELL ING OF STAT IC STRESSCHANGES INDUCED BY THE 1 7 8 3SE I SMIC SEQUENCE
Following the overall approach taken by Reasenberg &
Simpson (1992) and King et al. (1994), we model the faults as
1783 Calabria seismic sequence 507
# 2001 RAS, GJI 147, 499–516
W E
CFTilte
d late Pleistocene beach sand Aspromonte
Basement
Gougezone
2 m
(5b)
(5a)
Figure 5. (a) Aspromonte front near Molochio (shown in Fig. 2 by a dotted box). Slope break at base of faceted spurs (arrows) corresponds to trace
of Cittanova (Santa Cristina) Fault and to part of the 1783 surface scarp mentioned by Dolomieu (1784). (b) Cittanova Fault zone (site indicated by an
arrow in Fig. 2). Normal masterfault (CF) separates footwall Aspromonte gneisses to the southeast (right-hand side of photomontage) from upper
Pleistocene Gioia Basin beach deposits in hangingwall (left-hand side). View to NE. Pleistocene deposits are strongly tilted (#N40uE, 35–40uNW) and
faulted. Several faults striking parallel to CF (N40uE) have steep eastward dips and appear to be normal faults tilted into reverse position.
508 E. Jacques et al.
# 2001 RAS, GJI 147, 499–516
discontinuities in an elastic half-space. To study the effect of
stress changes caused by the successive ruptures of different
fault segments during the earthquake sequence, we calculate
the changes of the Coulomb failure stress sf on either opti-
mally oriented fault planes or fault planes with given strikes
(Dsf=DtxmkDsn, where Dsn and Dt are changes in normal
and shear stresses on the fault planes and mk is the effective
friction coefficient). Following King et al. (1994), optimum
fault angles are determined using the stress field obtained by
adding a regional stress field to that created by the seismic
dislocations and calculating the directions that maximize sf onthose planes. The areas where sf increases are those where
subsequent brittle failure is promoted. Where sf drops, faultingis less probable.
Parameters used for Coulomb modelling
From focal depth determinations of the 1908 and 1975Messina
Strait earthquakes (Gasparini et al. 1982; Cello et al. 1982;
Bottari et al. 1989), we infer the regional seismogenic thickness
to be y20 km. This is compatible with the maximum magni-
tude (y7) of known crustal events. We thus take the maximum
depth of seismic faulting to be 20 km. We show the results of
Coulomb stress calculations at a depth of 10 km (mid-depth
of the seismogenic crust), using a standard shear modulus of
3.3r1010 Pa and a friction coefficient of 0.75. Given the size
of the first three events, which implies a y15 km depth of
nucleation, the 10 km depth choice seems adequate. For the
probably shallower 1783 March 1 My5.7 event (y6 km), a
depth of 5 km was chosen to assess the triggering effects of
previous shocks. In any case, Dsf is not very sensitive to depth,
except close to faults, where small uncertainties in parameters
such as dip, strike, slip distribution, fault length and sinuosity
can lead to significant changes. Similarly, the choice of the
modulus only changes the absolute values of sf. Errors in
estimating the seismic moment only change sf amplitudes. The
value of the friction coefficient, which is also not very critical
(King et al. 1994), is selected to be consistent with observations,
as discussed below.
In southwestern Calabria, the recent extension direction
inferred from slickenside measurements is about N125uE (Cello
et al. 1982; Tortorici et al. 1995), compatible with the fault
plane solutions of five out of seven shallow events (December
1908, January 1975, April 1978 and February 1980) (Cello et al.
1982; Gasparini et al. 1982; Anderson & Jackson 1987). Three
solutions show dominant dip slip on N10uE–N50uE-strikingnormal faults. The other two are dominantly strike-slip on
either N30uE–N60uE-striking left-lateral planes or N120uE–N150uE-striking right-lateral planes. Leaving aside the 1947
and 1990 events, located on the outer fringe of the region of
interest, we thus take a N125uE regional extension direction for
modelling. In general, regional stress magnitudes are poorly
known. We use a low value (40 bar) for the regional deviatoric
extensional stress s3. The results would not be significantly
altered by choosing a higher value. Moreover, as pointed out
for strike-slip faulting by King et al. (1994), the Dsf distributionis relatively insensitive to the amplitude of the regional stress.
Except very close to the faults, the friction coefficient and
stress direction chosen yield optimum left-lateral faults orientated
N70uE and normal faults striking N35uE. This is compatible
with the observed direction of left-lateral (N45uE–N90uE) andnormal faults (N25uE–N45uE) in the field (Tortorici et al.
1995). The relatively high value of the friction coefficient (0.75)
chosen yields an optimum dip of y63u for the optimal normal
fault, consistent with the dips observed in the cross-sections
[Figs 1 (inset), 2 and 6] (Tortorici et al. 1995).
Seismic slip during the 1783 February 5 event
The location of the main 1783 February 5 shock (Fig. 3)
and the corresponding fatality distribution (Fig. 4) imply that
it resulted from rupture of three fault segments (Cittanova,
Sant’Eufemia and Galatro). Given the length of surface rupture
and maximum slip observed by Dolomieu, it is likely that the
entire northeasternmost 30 km of the Cittanova Fault, near
which the most extensive destruction occurred, slipped during
the main shock. The Sant’Eufemia Fault, along which damage
and casualties were similarly great on February 5, probably
slipped at about the same time over a minimum length of
y10 km. The 6 km long Galatro Fault, which extends beyond
the NE end of the Cittanova Fault did not generate a separate
event, but probably also slipped at the time of the main shock.
This interpretation brings the total length of faulting during the
February 5 event to y45 km. With a mean fault dip of y65u,the overall rupture area is about 1000 km2. The empirical magni-
tude versus rupture area relationship of Wells & Coppersmith
Cittanova Fault S. Eufemia Fault
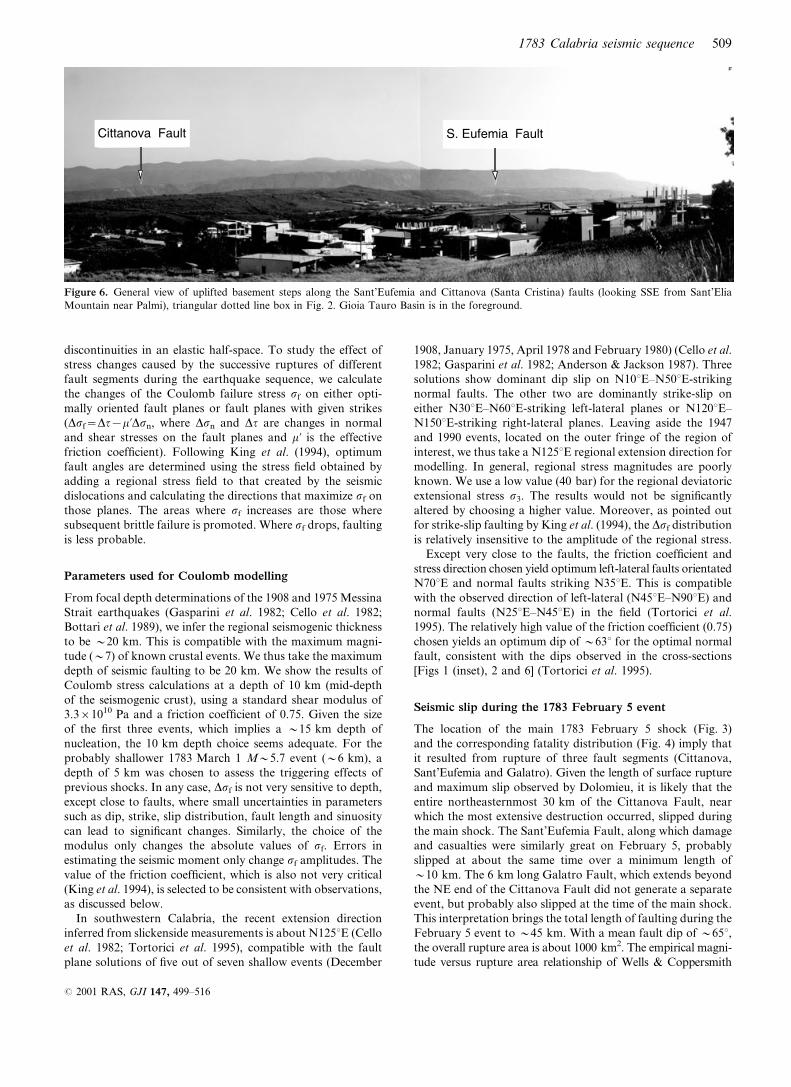
Figure 6. General view of uplifted basement steps along the Sant’Eufemia and Cittanova (Santa Cristina) faults (looking SSE from Sant’Elia
Mountain near Palmi), triangular dotted line box in Fig. 2. Gioia Tauro Basin is in the foreground.
1783 Calabria seismic sequence 509
# 2001 RAS, GJI 147, 499–516

(1994) would thus imply a magnitude ofy7 for this shock. Other
scaling laws (Scholz 1990; Jacques 1995) would yield a magni-
tude of about 7.2, or a seismic moment, M0, of y7r1019 Nm.
All these estimates are in agreement with the magnitude inferred
from discussion of the mesoseismal macroseismic effects. Finally,
an Mw magnitude ofy7.2 would imply an average slip ofy2 m
using the magnitude relationship Mw=(2 /3)log(mSDu)x6.03
of Kanamori (1977). This is also consistent with the maximum
slip of y3 m observed on the Cittanova Fault by Dolomieu
(1784), and with the empirical relationship between maximum
slip and magnitude of Wells & Coppersmith (1994).
Instead of using the same average slip value on the three fault
segments ruptured by the February 5 main shock, one may use
long-term geomorphological evidence to estimate the relative
amplitudes of average seismic slip on the Galatro, Sant’Eufemia
and Cittanova faults. We assume the average seismic slip (Du)
to be linearly related to the apparent cumulative vertical offset
(Cvo) on each fault (King et al. 1988) (Du=aCvo+b). a and b
can be derived from the values observed along the Cittanova
Fault (Duy2.5 m, between the average of 2 m and the maxi-
mum value of 3 m; Cvo=440 m) and from the condition that
the total moment resulting from coseismic slip on the three
faults is y7r1019 N m (Table 2). We obtain a=0.0054 and
b=0.0436 m. We also assume a uniform orientation of the slip
vector on the three faults, which yields dip values of 60u, 65uand 70u for the Cittanova, Galatro and Sant’Eufemia faults,
SW
0200400600800
1000
0 5
altit
ude
(m)
Projection distance along fault trace (km)
NE
(e)Scilla fault
(d)S. Eufemia faultWSW ENE
(c)Cittanova faultSW
(b)Galatro faultSSW NNE
(a)Serre faultSSW NNE
0 5 10 15 20 25
0200400600800
altit
ude
(m)
Projection distance along fault trace (km)
0200400600800
10001200
0 5 10 15 20 25
altit
ude
(m)
Projection distance along fault trace (km)
0200400600800
100012001400
0 5 10 15 20 25 30 35 40 45
altit
ude
(m)
Projection distance along fault trace (km)
0200400600800
1000
0 5 10 15 20 25 30 35 40
altit
ude
(m)
Projection distance along fault trace (km)
Figure 7. Projections, on appropriately oriented vertical planes, of topographic profiles along (a) the Serre (N30uE), (b) the Galatro (N20uE),(c) the Cittanova (N40uE), (d) the Sant’Eufemia (N70uE) and (e) the Scilla (N45uE) fault traces (crosses), and along the outer edges of terrace levels
(open squares, grey dots and black diamonds) preserved on footwalls (from IGM 1:25 000 topographic maps). Vertical exaggeration is 4. Minimum
cumulative vertical offset is between the upper terrace level (black diamonds) and the fault trace (crosses).
510 E. Jacques et al.
# 2001 RAS, GJI 147, 499–516

respectively (Table 2). Given the mean strike of the Cittanova
Fault (N40uE), which is nearly orthogonal to the regional
extension direction (N125uE), consistent with pure normal fault-
ing, this kinematic compatibility condition also yields pitches
of 95uN and 75uW on the Galatro and Sant’Eufemia faults,
respectively, in agreement with field observations (Fig. 1, inset)
(Tortorici et al. 1995). The final parameters used as inputs for
the Coulomb modelling on each fault segment are given in
Table 2.
Coulomb stress changes caused by the 1783 February 5main shock on the fault of the 1783 February 6 event
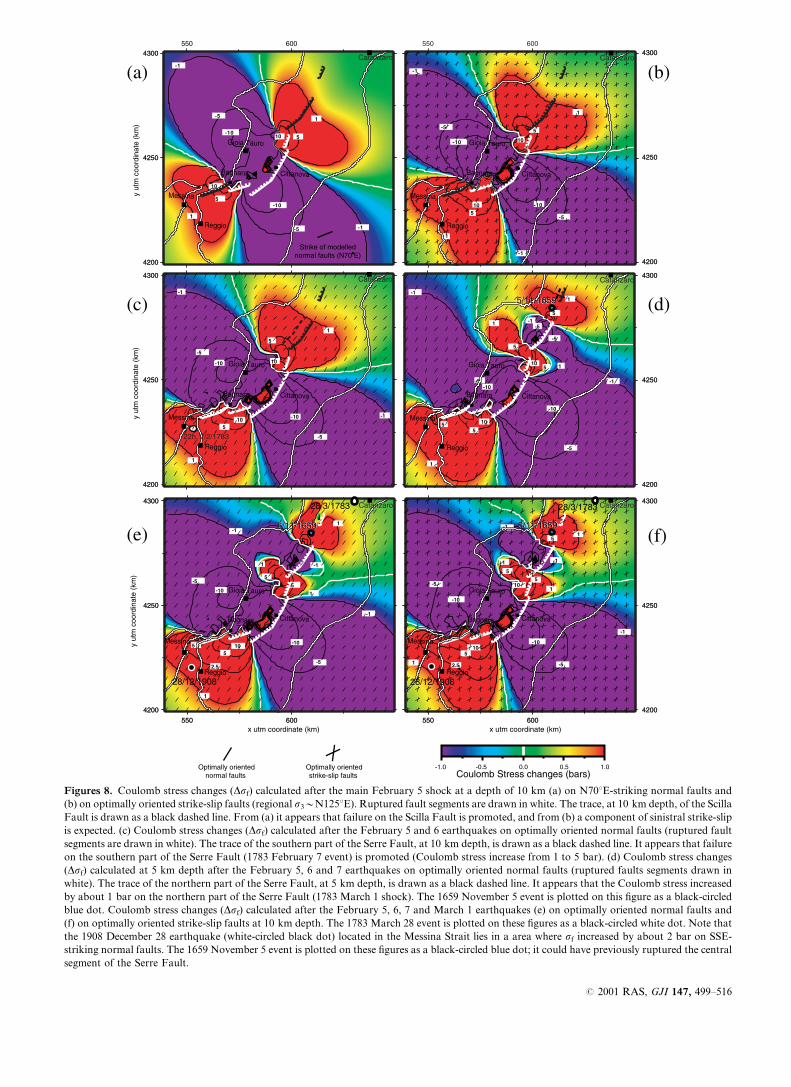
The main shock increased sf by more than 10 bar both north of
Galatro and west of Sant’Eufemia, whether on normal faults
striking N35uE and N70uE (Fig. 8a) or on optimally oriented
strike-slip faults (left-lateral, striking yN70uE, Fig. 8b).Thus, the February 5 earthquake most probably promoted
rupturing of the N70uE-trending, southwest part of the Scilla
Fault. Considering only static stress changes, the rupture might
have stopped near Bagnara (where the fault bends to a NNE
direction), but macroseismic observations (Fig. 4) suggest that
it propagated northeastwards to Palmi.
Seismic slip during the 1783 February 6 event
According to models of circular rupture (e.g. Scholz 1990) and
assuming a stress drop of 30 bar (an average value, Kanamori
1977), the rupture diameters of M=6–6.5 earthquakes range
between 11 and 19 km. With a mean dip of about 65u, suchruptures would cut the crust to depths of 10–17 km, falling
short of the base of the seismogenic layer, in keeping with the
use of such models.
The length of the Scilla Fault lying within the area of high
sf increase is about 14 km, suggesting a minimum equivalent
circular rupture surface of 16 km diameter. This corresponds
to a minimum seismic moment of y3.7r1018 Nm (average
minimum Du=0.55 m) and a minimum magnitude Mw ofy6.3.
This lower bound is compatible with the magnitude (i6.5)
derived from macroseismic observations, which suggest that the
rupture propagated to Palmi over a total length of y20 km. To
examine the effects of static stress change, we use a square
rupture with a side length of 14 km, keeping in mind that such
effects are minimized by this choice.
Because the macroseismic effects of the February 6 shock
include a tidal wave, we assume that the rupture reached the
surface. We take the fault dip to be y65u and the pitch or rake
of the slip vector to be identical to that on the Sant’Eufemia
Fault, almost parallel to the trace of the southwest part of the
Scilla Fault.
Coulomb stress changes caused by the February 5 and 6events on the fault of the 1783 February 7 event and inthe Messina Strait
After the February 5 and 6 shocks, sf rose by more than
1–5 bar on the southwest part of the Serre Fault where the
February 7 event took place (Fig. 8c). This fault is nearly
parallel to optimally oriented normal faults, suggesting that
the combined effects of the first two events promoted the
occurrence of the February 7 shock.
Another, smaller event occurred in the evening of February 7
(22:00 local time), about 2 hr after the third principal shock of
the sequence, and was destructive mostly at Messina and to a
lesser degree at Sant’Agata di Reggio. This earthquake was
probably located in the Messina Strait region (Baratta 1901)
within the area where the Coulomb stress rose by 1–5 bar south
of the Scilla and Sant’Eufemia faults (Figs 1, 8c and 8d).
Seismic slip during the 1783 February 7 and 1783March 1 events
The macroseismic effects of the February 7 event are con-
sistent with a magnitude of y6.5 and a seismic moment of
y6.2r1018 Nm. Using the circular rupture model and the
same assumption on stress drop as for the February 6 event, we
approximate the source by a square-shaped rupture with a side
length of 17 km centred on the area of maximum destruction.
As for the February 6 shock we assume a fault dip of 65u, andthat the rupture nearly reached the surface. The segment of
the Serre Fault activated by the February 7 earthquake (average
Du=0.65 m) lies fully within the area where sf increased
between 1 and 10 bar due to the previous 1783 events (Fig. 8c).
However, between the Galatro Fault, which we infer to have
slipped during the main shock, and the 17 km long segment of
the Serre Fault broken by the February 7 event, there still exists
a 4 km long stretch of the Serre Fault that seems not to have
ruptured (Figs 1 and 8d) although it lies in an area where sfrose by 5–10 bar. Other than an unreported fore- or aftershock,
or aseismic strain relaxation, one possible explanation for
this apparent rupture gap is that we have underestimated the
rupture length of the February 7 event.
The 1783 March 1 event appears to have also ruptured
the Serre Fault further north, but its macroseismic effects
imply a magnitude of only y5.7 and a seismic moment of
y3.9r1017 Nm. Using the same assumptions as for the
February 6 and 7 events, its source parameters (including
an average Du=0.30 m) may be approximated by a shallow
square-shaped rupture surface with a side length of y7 km
centred on the area of maximum destruction with a dip of 65uand reaching a depth of y6 km below the surface.
Coulomb stress changes caused by previous 1783 eventson the fault of the March 1 event
Fig. 8(d) shows the Dsf caused by the first three shocks of the
1783 sequence computed in this case on optimally oriented
normal faults at a depth of 5 km, near the bottom of the
inferred source of the March 1 event, consistent with the usual
nucleation depth of M>5 earthquakes. That the fault segment
that activated the March 1 earthquake is oriented nearly
parallel to the optimal normal faults and lies in an area where sf
Table 2. Fault parameters used in Coulomb modelling.
Fault segment: Galatro Cittanova Sant’Eufemia
Mean apparent cumulative
vertical offset (m)
150 450 300
Mean dip (u) 065 060 070
Surface of broken
segment (km2)
134 655 219
Seismic slip (m) 000.9 002.5 001.7
Pitch 095uN 090u 075uW
1783 Calabria seismic sequence 511
# 2001 RAS, GJI 147, 499–516
1
510
10
5
1
-1-5
-10
-10
-5
-1
4200
4250
4300
4200
4250
4300
4200
4250
4300
4200
4250
4300
-10
-5
-1
10
5
1
-10
-5
-1
105
1
(a)
(c)
(e)
(b)
(d)
(f)
Optimally orientedstrike-slip faults
Strike of modellednormal faults (N70 E)
y ut
m c
oord
inat
e (k
m)
10
5
1
-1
-5
-10
-1
-5
-10105
1
4200
4250
4300
4200
4250
4300
4200
4250
4300
4200
4250
4300
550 600
-10-5
-1
5
1
-5
-5-11
5
105 1
-1
-10
-5
1055
1
550 600
5/11/16595/11/1659
Optimally orientednormal faults
22h, 7/2/1783?
y ut
m c
oord
inat
e (k
m)
x utm coordinate (km) x utm coordinate (km)
-1.0 -0.5 0.0 0.5 1.0 Coulomb Stress changes (bars)
1
5
5
1
105
5
1
-5
-10
-10
-5
-1
-1
-1
1
2.5
-5
-10
51
-1
-1
1
5
105
1
-1
-5
-1010
5
1 2.5
4200
4250
4300
550 600
4200
4250
4300
550 600
4200
4250
4300
550 600
4200
4250
4300
550 600
5/11/1659
28/12/1908
28/3/1783
28/12/1908
28/3/1783
5/11/16595/11/16595/11/1659
y ut
m c
oord
inat
e (k
m)
Catanzaro
Bagnara
Reggio
Messina
Gioia Tauro
Cittanova
Catanzaro
Bagnara
Reggio
Messina
Gioia Tauro
Cittanova
Catanzaro
Bagnara
Reggio
Messina
Gioia Tauro
Cittanova
Catanzaro
Bagnara
Reggio
Messina
Gioia Tauro
Cittanova
Catanzaro
Bagnara
Reggio
Messina
Gioia Tauro
Cittanova
Catanzaro
Bagnara
Reggio
Messina
Gioia Tauro
Cittanova
Figures 8. Coulomb stress changes (Dsf) calculated after the main February 5 shock at a depth of 10 km (a) on N70uE-striking normal faults and
(b) on optimally oriented strike-slip faults (regional s3yN125uE). Ruptured fault segments are drawn in white. The trace, at 10 km depth, of the Scilla
Fault is drawn as a black dashed line. From (a) it appears that failure on the Scilla Fault is promoted, and from (b) a component of sinistral strike-slip
is expected. (c) Coulomb stress changes (Dsf) calculated after the February 5 and 6 earthquakes on optimally oriented normal faults (ruptured fault
segments are drawn in white). The trace of the southern part of the Serre Fault, at 10 km depth, is drawn as a black dashed line. It appears that failure
on the southern part of the Serre Fault (1783 February 7 event) is promoted (Coulomb stress increase from 1 to 5 bar). (d) Coulomb stress changes
(Dsf) calculated at 5 km depth after the February 5, 6 and 7 earthquakes on optimally oriented normal faults (ruptured faults segments drawn in
white). The trace of the northern part of the Serre Fault, at 5 km depth, is drawn as a black dashed line. It appears that the Coulomb stress increased
by about 1 bar on the northern part of the Serre Fault (1783 March 1 shock). The 1659 November 5 event is plotted on this figure as a black-circled
blue dot. Coulomb stress changes (Dsf) calculated after the February 5, 6, 7 and March 1 earthquakes (e) on optimally oriented normal faults and
(f) on optimally oriented strike-slip faults at 10 km depth. The 1783 March 28 event is plotted on these figures as a black-circled white dot. Note that
the 1908 December 28 earthquake (white-circled black dot) located in the Messina Strait lies in a area where sf increased by about 2 bar on SSE-
striking normal faults. The 1659 November 5 event is plotted on these figures as a black-circled blue dot; it could have previously ruptured the central
segment of the Serre Fault.
# 2001 RAS, GJI 147, 499–516
rose byy1 bar after the February 7 event is consistent with the
idea that this event was triggered by the first three events of
the 1783 sequence.
Effects of Coulomb stress changes caused by the firstfour shocks of the 1783 Calabria sequence and by the1659 and 1693 events on subsequent earthquakes
Although within a zone of strong sf increase (1–5 bar)
following the February 7 event, the central portion of the
Serre Fault apparently remained a rupture gap in 1783. We
suggest that this is because that stretch of the fault had already
ruptured 124 yr previously. Reports of damage and casualties,
which were extensive and serious (Baratta 1901), show that
the 1659 November 5 earthquake (I0=X, Boschi et al. 1995;
corresponding to My6) (Figs 1, 8e and 8f) was probably due
to slip on the central Serre Fault. This event probably ruptured
the middle 10 km long segment of the fault, causing on it a
decrease of sf that remained large enough, over a century later,
to prevent rupture.
Figs 8(e) and (f) show the Dsf caused by the first four
earthquakes of the 1783 sequence, at 10 km depth, on optimally
oriented normal or strike-slip faults. The largest increases, with
Dsf reaching more than 10 bar, occur south of the Scilla and
Sant’Eufemia faults and in the central overstep between the
Cittanova, Galatro and Serre faults. Along the northern part of
the Serre Fault, the sf increase is only slightly over 5 bar.
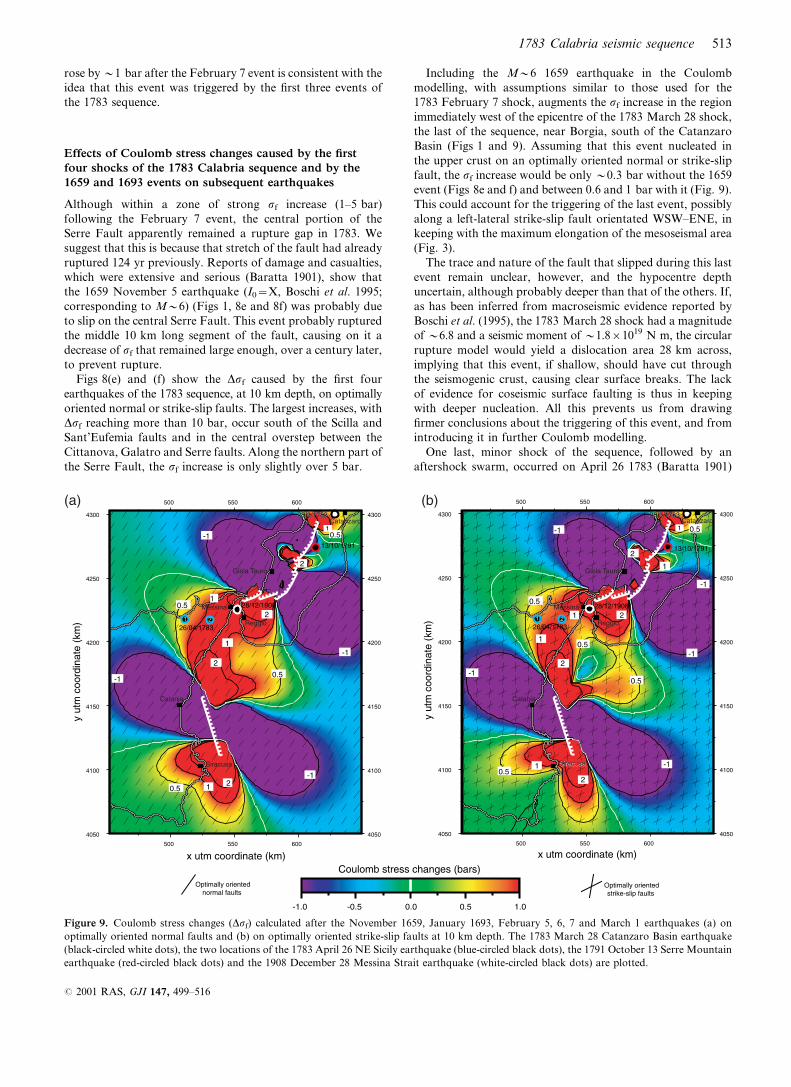
Including the My6 1659 earthquake in the Coulomb
modelling, with assumptions similar to those used for the
1783 February 7 shock, augments the sf increase in the region
immediately west of the epicentre of the 1783 March 28 shock,
the last of the sequence, near Borgia, south of the Catanzaro
Basin (Figs 1 and 9). Assuming that this event nucleated in
the upper crust on an optimally oriented normal or strike-slip
fault, the sf increase would be only y0.3 bar without the 1659
event (Figs 8e and f) and between 0.6 and 1 bar with it (Fig. 9).
This could account for the triggering of the last event, possibly
along a left-lateral strike-slip fault orientated WSW–ENE, in
keeping with the maximum elongation of the mesoseismal area
(Fig. 3).
The trace and nature of the fault that slipped during this last
event remain unclear, however, and the hypocentre depth
uncertain, although probably deeper than that of the others. If,
as has been inferred from macroseismic evidence reported by
Boschi et al. (1995), the 1783 March 28 shock had a magnitude
of y6.8 and a seismic moment of y1.8r1019 N m, the circular
rupture model would yield a dislocation area 28 km across,
implying that this event, if shallow, should have cut through
the seismogenic crust, causing clear surface breaks. The lack
of evidence for coseismic surface faulting is thus in keeping
with deeper nucleation. All this prevents us from drawing
firmer conclusions about the triggering of this event, and from
introducing it in further Coulomb modelling.
One last, minor shock of the sequence, followed by an
aftershock swarm, occurred on April 26 1783 (Baratta 1901)
-1
0.5
2
0.5
21
0.5
2
1
-1 1 0.5
-1
-1
2
10.5
-1
1
-1
0.5
2
0.51
-1
2
2
2
1
1
0.5
-1
-1
10.5
28/3/178328/3/1783
13/10/1791
28/12/1908
26/04/17831 2
13/10/1791
28/12/1908
26/04/17831 2
28/3/178328/3/1783
500 550 600
4050
4100
4150
4200
4250
4300
500 550 600
4050
4100
4150
4200
4250
4300
500 550 600
4050
4100
4150
4200
4250
4300
500 550 600
4050
4100
4150
4200
4250
4300
-1.0 -0.5 0.0 0.5 1.0
Coulomb stress changes (bars)x utm coordinate (km)
y ut
m c
oord
inat
e (k
m)
x utm coordinate (km)
y ut
m c
oord
inat
e (k
m)
Optimally orientedstrike-slip faults
Optimally orientednormal faults
Siracusa
Catanzaro
Gioia Tauro
Messina
Reggio
Catania
Siracusa
Catanzaro
Gioia Tauro
Messina
Reggio
Catania
Siracusa
(a) (b)
Figure 9. Coulomb stress changes (Dsf) calculated after the November 1659, January 1693, February 5, 6, 7 and March 1 earthquakes (a) on
optimally oriented normal faults and (b) on optimally oriented strike-slip faults at 10 km depth. The 1783 March 28 Catanzaro Basin earthquake
(black-circled white dots), the two locations of the 1783 April 26 NE Sicily earthquake (blue-circled black dots), the 1791 October 13 Serre Mountain
earthquake (red-circled black dots) and the 1908 December 28 Messina Strait earthquake (white-circled black dots) are plotted.
1783 Calabria seismic sequence 513
# 2001 RAS, GJI 147, 499–516
(I0yVI–VII, Boschi et al. 1995; probably corresponding to
My4.5). Although poorly located, it shook the region west of
Messina, probably where the sf increase following the entire
sequence was greater than y1 bar (Figs 8e and f). Although
Holocene normal fault scarps have been mapped in the
Peloritan Mountains west of the Sicilian coast and north of
Etna (Mount Kalfa Faults, Hippolyte & Bouillin 1999), the
evidence at hand is insufficient to link the April 26 event with
faults in that area.
Of the three moderate to large earthquakes that struck
southern Calabria and eastern Sicily in the following 125 yr,
two are difficult to reconcile with stress changes induced by
the 1783 normal faulting sequence. The 1791 October 13 earth-
quake (intensity IX) again shook the mesoseismal zone of the
1783 February 7 and 1659 November 5 events (Fig. 1) with an
epicentre either in the Serre Mountains between Soriano and
Spadola (Boschi et al. 1995) or along the coast (Postpischl
1985), northwest of the Mesima Basin (Figs 8e, 8f and 9). Both
positions, in areas of high 1659–1783 sf drop, are problematic,
which highlights either the difficulty of deriving locations
from macroseismic effects in areas where, 8 yr later, people
still lived in wooden huts in the wake of the 1783 disaster, or
uncertainties in the rupture parameters assigned to events prior
1791.
The 1905 September 8, My7, ‘Pizzo’ earthquake, which was
strongly felt throughout Calabria and caused extensive damage
in the region between Capo Vaticano and southwestern Sila
(Fig. 1), also seems to have ruptured a fault in an area of 1783
sf decrease. The spread of major isoseismals inland and the
observed tsunami imply an offshore location at a depth greater
than 10 km. However, both macroseismic (e.g. Baratta 1906;
Mercalli 1906; Boschi et al. 1995) and instrumental data (Cello
et al. 1982) show ambiguity on its epicentral location and
hypocentral depth. Besides, its focal mechanism (Cello et al.
1982), inconsistent with the regional stress field, suggests that it
occurred on a radically different fault system, still too poorly
understood to be included in any form of modelling.
The last large event, on the other hand, the Mw=7.1,
1908 December 28 Messina earthquake ruptured a fault in the
Messina Strait, fully within a zone of high 1783 sf rise, reachingy2 bar (Figs 8e and f). The focal mechanism, consistent with
north-trending, oblique normal faulting (Fig. 1), is compatible
with optimal fault orientations predicted by the Coulomb
modelling (Figs 8e and f). Such results are strengthened by
adding the effects of the large 1693 January 11 southeast Sicily
earthquake (Imax>XI, M=7–7.5) into the modelling. The fault
responsible for this earthquake (Bianca et al. 1997) appears
to be located offshore in the Ionian Sea southeast of Mount
Etna (Fig. 1; F4 of Hirn et al. 1997). Assuming a magnitude of
y7.2, corresponding to a seismic moment of y7r1019 N m,
and a y 45 km long dextral normal fault rupture, consistent
with WNW–ESE regional extension, would increase the Dsfin the Messina Strait (Fig. 9), near the epicentral location of
the 1908 Messina earthquake, by y2.5 bar.
SUMMARY AND CONCLUS IONS
Our study of the 1783 seismic sequence and associated
faults provides new, self-consistent information on current
regional tectonics, seismogenic faulting, source parameters
and stress triggering of large earthquakes in Calabria and
Sicily. Historical chronicles and geomorphological observations
concur to indicate that four of the main shocks of 1783 were
undoubtedly shallow (j20 km) and due to slip on the normal
60u–70uW-dipping Galatro–Cittanova–Sant’Eufemia faults
(February 5 event), Scilla Fault (February 6 event) and Serre
Fault (February 7 and March 1 events). Together, these stepping
faults bound the 100 km long western edge of Calabria’s
mountainous backbone (Serre and Aspromonte), with steep
cumulative escarpments up to 400–500 m high, and uplifted
Pleistocene marine terraces on their footwalls reflecting minimum
throw rates of 0.5–1 mm yrx1.
Analysis of the time sequence of and elastic stress coupling
between the 1783 and other events, by resolving the Coulomb
failure stress changes (Dsf) on faults with given strikes or
optimally oriented within the regional stress field (yN125uEextension), strengthens the interpretation that the faults belong
to a single, large-scale tectonic system. The first and largest
earthquake (1783 February 5, My7), which ruptured ‘simul-
taneously’ the Cittanova, Sant’Eufemia and Galatro faults,
triggered the second, 1783 February 6 earthquake (My6.3) on
the Scilla Fault by increasing sf by 5–10 bar. By increasing sfby>1–5 bar, these two shocks subsequently triggered the 1783
February 7 shock (My6.5) on the Serre Fault. The combined
effects of the first three events increased sf by about 1 bar
further north on the same fault, triggering the 1783 March 1
shock (My5.7). The gap between the 1783 February 7 and
1783 March 1 ruptures appears to result from a centennially
persistent stress release due to previous rupture of the Serre
Fault by the 1659 November 5 (My6) earthquake. The
modelling does not explain as clearly the triggering of the last
event of the 1783 sequence (March 28) and fails altogether
to account for the occurrences of the 1791 and 1905 earth-
quakes. Such failure, however, may be related to the fact that
the locations, depths and tectonic settings of all three events
are unclear. This notwithstanding, the final implication of our
modelling is that the y 2.5 bar sf increase resulting from the
entire 1783 Calabria sequence and the 1693 SE Sicily earthquake
triggered the disastrous 1908 Messina earthquake.
Over a period of about 250 yr (1659–1908), therefore, almost
the whole 200 km length of the Siculo-Calabrian rift zone
(Tapponnier et al. 1987; Tortorici et al. 1995; Monaco et al.
1997) ruptured, through normal faulting My7 earthquakes
and associated sequences of My5.5–6.5 shocks. This confirms
that the large earthquakes that strike southern Italy are related
to a process—transverse Quaternary rifting—radically different
from the subduction regime that presided until the end of
the Pliocene. Only one area appears to be characterized by the
occurrence of much more frequent, smaller shocks, the Timpe
normal fault zone at the foot of Mount Etna (Monaco et al.
1997). This is possibly due to the different thermal structure of
the crust, which, in the vicinity of this large, permanently active
rift volcano, should be hotter and thus weaker. Only one
very large earthquake prior to 1650 is recorded in historical
chronicles of the region: the 1169 February 4 event, which
killed more than 15 000 inhabitants in Catania (Baratta 1901)
and was strongly felt in Messina, Reggio and Siracusa (I=X,
Boschi et al. 1995). Although this event probably ruptured one
of the normal faults offshore the eastern coast of Sicily, it is
still unclear which. It is also unclear whether this event should
be included in a longer y1000 yr sequence of complete stress
release or whether it marks the end of a previous sequence.
Given the y1 mm yrx1 throw rate on the largest faults of the
514 E. Jacques et al.
# 2001 RAS, GJI 147, 499–516
system, a recurrence time of 2000 yr might be expected for events
comparable to those of 1783 February 5, 1693 January 11
or 1908 December 28. If the overall stretching rate across the
extensional belt were greater (e.g. y2 mm yrx1), however, or
varied along strike, the return time of large events might locally
be shorter (e.g. y1000 yr).
Be that as it may, the present study provides one con-
vincing example where the use of Coulomb stress modelling
brings fruitful insight into the spatial dynamics of seismic
sequences for which individual events are adequately located,
even when they occurred before the instrumental period, and
the corresponding faults and slip styles correctly identified.
Such modelling thus proves to be a powerful tool to assess
long-term earthquake hazard in tectonically active regions, as
recently demonstrated in other parts of the Mediterranean,
such as western Turkey (Stein et al. 1997; Hubert et al. 2000;
Parsons et al. 2000).
ACKNOWLEDGMENTS
We thank G. C. P. King, L. Dorbath and an anonymous
referee for constructive comments. Financial support was
provided by the Programme National des Risques Naturels,
INSU Contribution No. 295, CNRS and Program Faust
(project ENVA4 CT 970528) from the EEC. This is IPG Paris
contribution No. 1750.
REFERENCES
Amato, A., Azzara, R., Basili, A., Chiarabba, C., Cocco, M.,
Di Bona, M. & Selvaggi, G., 1995. Main shock and aftershocks of the
December 13, 1990 Eastern Sicily earthquake, Ann. Geofis., 38, 255–266.
Anderson, H. & Jackson, J., 1987. The deep seismicity of the
Tyrrhenian Sea, Geophys. J. R. astr. Soc., 91, 613–637.
Armijo, R., Dechamps, A. & Poirier, J.P., 1986. Carte Sismotectonique
de l’Europe et Du Bassin Mediterraneen, IPGP, Institut Geographique
National, Paris.
Baratta, M., 1901. I Terremoti d’Italia, Arnoldo Forni, Torino.
Barratta, M., 1906. Il grande terremoto Calabro dell’8 Settembre 1905,
Atti Della Societa Toscana Di Sciencze Naturali Di Pisa, Memorie, 22,
57–80.
Barrier, P., 1987. Stratigraphie de depots pliocenes et quaternaires du
Detroit de Messine, Doc. Trav. IGAL, Paris, 11, 59–81.
Barrier, P. & Keraudren, B., 1983. Mise en evidence d’un passage
stratigraphique continu entre une terrasse tyrrhenienne de la region
de Reggio de Calabria et un facies conglomeratique de comblement
du Detroit deMessine (Italie), C. R. Acad. Sci. Paris, 296, 1667–1670.
Bassinot, F.C., Labeyrie, L.D., Vincent, E., Quidelleur, X.,
Shackleton, N.J. & Lancelot, Y., 1994. The astronomical theory of
climate and the age of the Brunhes-Matuyama magnetic reversal,
Earth planet. Sci. Lett., 126, 91–108.
Bianca, M., Monaco, C., Tortorici, L. & Cernobori, L., 1997. Active
tectonics in eastern Sicily: the 1693 Hyblean earthquakes, Terra
Nova, 9, Abstract Suppl. 1, 305–306.
Boccaletti, M., Guazzone, G. & Manetti, P., 1974. Evoluzione
paleogeogrfica e geodinamica del Mediterraneo: i bacini marginali,
Mem. Soc. Geol. It., 13, 1–39.
Bonfiglio, L. & Berdar, A., 1986. Gli elefanti del Pleistocene superiore
di Archi (RC): nuove evidenze di insularita della Calabria meridionale
durante il ciclo Tirreniano, Boll. Soc. Paleont. It., 25, 9–34.
Boschi, E., Ferrari, G., Gasperini, P., Guidoboni, E., Smriglio, G. &
Valensise, G., 1995. Catalogo Dei Forti Terremoti in Italia Dal 461
A.C. Al 1980, Istituto Nazionale di Geofisica, S.G.A., Roma.
Bottari, A., Capuano, P., De Natale, G., Gasparini, P., Neri, G.,
Pingue, F. & Scarpa, R., 1989. Source parameters of earthquakes in
the Strait of Messina, Italy, during this century, Tectonophysics, 166,
221–234.
Cello, G., Guerra, I., Tortorici, L., Turco, E. & Scarpa, R., 1982.
Geometry of the neotectonic stress field in southern Italy: geological
and seismological evidence, J. struct. Geol., 4, 385–393.
Cotecchia, V., Travaglini, G. & Melidoro, G., 1969. I movimenti
franosi e gli sconvolgimenti della rete idrografica prodotti in Calabria
dal terremoto del 1783, Geol. appl. Idrogeol., 4, 1–24.
Dewey, J.F., Helman,M.L., Turco, E., Hutton, D.H.W. &Knott, S.D.,
1989. Kinematics of the western Mediterranean, in Alpine Tectonics,
eds Coward, M.P., Dietrich, D. & Park, R.G., Geol. Soc. Lond. Spec.
Publ., 45, 265–283.
Dolomieu, D., 1784. Memoire sur les Tremblemens de Terre de la
Calabre Pendant l’Annee 1783, Fulgoni, Rome.
Dumas, B., Gueremy, P., Lhenaff, R. & Raffy, J., 1979. Relief et
neotectonique de la facade orientale du Detroit de Messine (calabre,
Italie), Trav. RCP CNRS, 461, 95–125.
Dumas, B., Gueremy, P., Lhenaff, R. & Raffy, J., 1980. Terrasses
quaternaires soulevees sur la facade calabraise du Detroit de Messine
(Italie), C. R. Acad. Sci. Paris, 290, 739–742.
Dumas, B., Gueremy, P., Lhenaff, R. & Raffy, J., 1982. Le soulevement
quaternaire de la Calabre meridionale, Rev. Geol. Dyn. Geogr. Phys.,
23, 27–40.
Gasparini, C., Iannaccone, G., Scandone, P. & Scarpa, R., 1982.
Seismotectonics of the Calabrian Arc, Tectonophysics, 84, 267–286.
Ghisetti, F., 1981. Upper Pliocene-Pleistocene uplift rates as indicators
of neotectonic pattern: an example from southern Calabria (Italy),
Z. Geomorph. NF Suppl., 40, 93–118.
Ghisetti, F. & Vezzani, L., 1982. The recent deformation mechanisms
of the Calabrian Arc, Earth Evol. Sci., 3, 197–206.
Gignoux, M., 1913. Les formations marine pliocenes et quaternaires de
l’Italie du Sud et de la Sicilie, Ann. Univ. Lyon, 36, 1–369.
Hamilton, W., 1783. An Account of Earthquakes in Sicily and Calabria,
Royal Society, London.
Hippolyte, J.C. & Bouillin, J.P., 1999. Morphologie et cinematique
d’une faille holocene dans les monts Peloritains (Sicile); implication
geodynamique, C. R. Acad. Sci. Paris, 329, 741–747.
Hirn, A. et al., 1997. Roots of Etna volcano in faults of great
earthquakes, Earth planet. Sci. Lett., 148, 171–191.
Hubert-Ferrari, A., Barkat, A., Jacques, E., Nalbant, S.S., Meyer, B.,
Armijo, R., Tapponnier, P. & King, G.C.P., 2000. Seismic hazard in
the Marmara Sea following the 17 August 1999 Izmit earthquake,
Nature, 404, 269–272.
Jacques, E., 1995. Fonctionnement sismique et couplage elastique
des failles en Afar, PhD thesis, Universite de Paris VII, IPGP,
Paris.
Jacques, E., King, G.C.P., Tapponnier, P., Ruegg, J.C. &
Manighetti, I., 1996. Seismic activity triggered by the 1978 events
in the Asal Rift, Djibouti, Geophys. Res. Lett., 23, 2481–2484.
Kanamori, H., 1977. The energy release in great earthquakes,
J. geophys. Res., 82, 2981–2987.
King, G.C.P., Stein, R.S. & Rundle, J.B., 1988. The growth of
geological structures by repeated earthquakes 1, Conceptual frame-
work, J. geophys. Res., 93, 13 307–13 318.
King, G.C.P., Stein, R.S. & Lin, J., 1994. Static stress changes
and the triggering of earthquakes, Bull. seism. Soc. Am., 84,
935–953.
Malinverno, A. & Ryan, W.B.F., 1986. Extension in the Tyrrhenian
Sea and shortening in the Apennines as result of arc migration driven
by sinking of the lithosphere, Tectonics, 5, 227–245.
Manighetti, I., Tapponnier, P., Courtillot, V., Gallet, Y., Jacques, E.
& Gillot, P.Y., 2001a. Strain transfer between disconnected,
propagating rifts in Afar, J. geophys. Res., 106, 13 613–13 665.
Manighetti, I., King, G.C.P., Gaudemer, Y., Scholz, C. & Doubre, C.,
2001b. Slip accumulation and lateral propagation of active normal
faults in Afar, J. geophys. Res., 106, 13 667–13 696.
1783 Calabria seismic sequence 515
# 2001 RAS, GJI 147, 499–516

Mazzuoli, R., Tortorici, L. & Ventura, G., 1995. Oblique rifting in
Salina, Lipari and Vulcano islands (Aeolian Islands, Southern Italy),
Terra Nova, 7, 444–452.
Mercalli, G., 1906. Alcuni risultati ottenuti dallo studio del terromoto
calabrese dell’8 settembre 1905, Atti Dell’Academica Pontaniana, 36,
1–9.
Monaco, C., Petronio, L. & Romanelli, M., 1995. Tettonica estensionale
nel settore orientale del Monte Etna (Sicilia), Studi Geologici Camerti,
2, 363–374.
Monaco, C., Tortorici, L., Nicolich, R., Cernobori, L. & Costa, M.,
1996. From collisional to rifted basins: an example from the southern
Calabrian arc (Italy), Tectonophysics, 266, 233–249.
Monaco, C., Tapponnier, P., Tortorici, L. & Gillot, P.Y., 1997. Late
Quaternary slip rates on the Acireale Piedimonte normal faults
and tectonic origin of Mt. Etna (Sicily), Earth planet. Sci. Lett., 147,
125–139.
Nostro, C., Cocco, M. & Belardinelli, M.E., 1997. Static stress changes
in extensional regimes: an application to southern Apennines (Italy),
Bull. seism. Soc. Am., 87, 234–248.
Ogniben, L., 1973. Schema geologico della Calabria, in base ai dati
odierni, Geol. Romana, 12, 243–585.
Parson, T., Toda, S., Stein, R.S., Barka, A. & Dieterich, J.H., 2000.
Heightened odds of large earthquakes near Istanbul: an interaction-
based probability calculation, Science, 288, 661–665.
Postpischl, D., 1985. Catalogo Dei Terremoti Italiani Dall’anno 1000 Al
1980, CNR, PF Geodinamica, Graficcop, Bologna.
Reasenberg, P.A. & Simpson, R.W., 1992. Response of regional
seismicity to the static stress change produced by the Loma Prieta
earthquake, Science, 255, 1687–1690.
Rehault, J.P., Boillot, G. & Mauffret, A., 1984. The Western
Mediterranean basin geological evolution, Mar. Geol., 55, 447–477.
Sarconi, M., 1784. Istoria de’ fenomeni del tremuoto avvenuto nelle
Calabrie, e nel Valdemone nell’anno 1783 posta in luce dalla Reale
Accademia delle Scienze, e delle Belle Lettere di Napoli, Napoli.
Scholz, C.H., 1990. The Mechanics of Earthquakes and Faulting,
Cambridge University Press, Cambridge.
Stein, R.S., King, G.C.P. & Lin, J., 1992. Change in failure stress on the
southern San Andreas fault system caused by the 1992 magnitude=7.4 Landers earthquake, Science, 258, 1328–1332.
Stein, R.S., Barka, A.A. & Dieterich, J.H., 1997. Progressive failure on
the North Anatolian fault since 1939 by earthquake stress triggering,
Geophys. J. Int., 128, 594–604.
Tapponnier, P., 1977. Evolution tectonique du systeme alpin en
Mediterranee: poinconnement et ecrasement rigide-plastique, Bull.
Soc. Geol. Fr., 19, 437–460.
Tapponnier, P., Tortorici, L. & Winter, T., 1987. Faulting during the
1783 Calabria Earthquakes and tectonics of theMessina Strait, Terra
Abstract, Terra Cognita, 305.
Tortorici, L., Monaco, C., Tansi, C. & Cocina, O., 1995. Recent and
active tectonics in the Calabrian Arc (Southern Italy), Tectonophysics,
243, 37–55.
Valensise, G. & Pantosti, D., 1992. A 125 kyr-long geological
record of seismic source repeatability: the Messina Straits (southern
Italy) and the 1908 earthquake (M 7, 1 /2), Terra Nova, 4, 472–483.
Vivenzio, G., 1783. Istoria e Teoria dei Tremuoti in Generale ed in
Particolare di Quelli della Calabria e di Messina del 1783, Stamperia
Regale, Napoli.
Wells, D.L. & Coppersmith, K.J., 1994. New empirical relationships
among magnitude, rupture length, rupture width, rupture area and
surface displacement, Bull. seism. Soc. Am., 84, 974–1002.
Westaway, R., 1993. Quaternary uplift of Southern Italy, J. geophys.
Res., 98, 21 741–21 722.
516 E. Jacques et al.
# 2001 RAS, GJI 147, 499–516
Related Documents