Fault linkage and its controls on fault growth and basin evolution: Insights from analogue experiments 1 * Avila-Paez, Michael A. 1, 2,3 ; Quintana, G., R. 1, 2 ; Kammer, A. 1, 2 ; Saavedra, F. 1 1 National University of Colombia, Bogotá. Department of Geosciences. 2 Group of Applied Structural Geology and Tectonics. 3 Undergraduate geology student May 4 - 2020 *contact: [email protected] Discussion material for TS10.3 EGU2020-1213

Welcome message from author
This document is posted to help you gain knowledge. Please leave a comment to let me know what you think about it! Share it to your friends and learn new things together.
Transcript
Fault linkage and its controls on fault growth and basin evolution:
Insights from analogue experiments
1
*Avila-Paez, Michael A.1, 2,3 ; Quintana, G., R. 1, 2 ; Kammer, A. 1, 2; Saavedra, F.1
1National University of Colombia, Bogotá. Department of Geosciences.2 Group of Applied Structural Geology and Tectonics.
3 Undergraduate geology student
May 4 - 2020
*contact: [email protected]
Discussion material for TS10.3EGU2020-1213

Considering the linkage of two grabensegments: Do the bounding faults join by lateralpropagation, or do they maintain a stationaryposition? In the latter case: Do additional faultsaccommodate linkage?
With our modeling we address the questions of:
✓Fault growth model, and
✓Specific mechanisms of fault linkage
and aim to draw some conclusions about theevolution of depositional basins
2
Analogue models
Results
Conclusion
Reference
Fault grow and linkage process
Taken from Acocella et al., 1999.
Taken from Corti, 2012.

Two ways of looking at fault growth…
Extrapolating our model results toreal Earth, we have to decide whetherour observations apply to isolatedfaults (soft-linkage) or faults thatshare a common plane (hard linkage).Alternatively, initially isolated faultscould combine to form a hard-linkedarray of fault planes consisting of aset of branching faults.
In this growth process inheritedstructures (conceived as seeds in ourexperiments) may influence the finalfault pattern.
3
Analogue models
Results
Conclusion
Reference
Fault grow and linkage process
Figure 1. Two fault growth models. (a) Continuously growing faults depicted during three-time steps, in which (b) displacementand length correlate linearly, while in (c) faults maintain a constant length during an increase in displacement. Upper modelshows a hard linkage and lower one a soft linkage. (d) The latter model presumes a rapid increase in length and then an increasein displacement, while length is maintained constant. - Modified from Walsh et al., 2003 and Rotevatn et al., 2019.

A simplified picture of stress fields at fault tips…
Stress fields at fault tips areindependent of the fault area, asopposed to the velocity of fracturepropagation and stress drops.
Below a critical spacing, overlappingfaults curve and join, breaching theramps enclosed between them.
4
Analogue models
Results
Conclusion
Reference
Fault grow and linkage process
Figure 2. Processes involved in the linkage of faults. (a) Stress regimes associated to the tips oftwo fault planes. During successive growth stages the stress field remains constant, while thestress drop associated to fault growth increases with fault area. (b) Evolution of a relay rampbetween overlapping faults and the breaching of the ramp, as curved fault tips join theopposite fault traces.

5
Analogue models
Results
Conclusion
Reference
Fault grow and linkage process
Granular material
Grain composition Quartz sand
Grain size Less than 600 𝜇m
Model characteristics
Height 5 cm
Length 40 cm
Motion velocity 4 cm/h
Spacing seeds 5 cm , 10 cm, 15 cm and 20 cm
Total extension 4 cm
Figure 3. Sandbox model: (a) MOAM machine. Computerized motors move the walls with a user defined velocity. (b) Plan view of the shape of a basal plate
attached to the moveble wall. Differences in the offset of its edges (red lines) determined the spacing of the fault array. In order to enhance the interaction
between moving wall and sand layers, we attached a sandpaper to the moving wall. We kept the velocity discontinuity between stationary and moving plate at
90o to the movement direction (red arrow). Red arrow shows extension direction. (c) Plan view of experimental setting. The square grid measures 4 x 4 cm, d)
View of a profile.

6
Analogue models
Results
Conclusion
Reference
Fault grow and linkage process
Pictures show the deformed surface grid at intervals of 40% 60%and 95% of the total displacement. Conjugate faults define asegmented graben structure which mimics the offset imposedby the shape of the basal plate. The composite graben structureconsists of an internal (lower part) and external (upper part ofpicture) segment. White vectors represent an incrementaldisplacement field, as calculated by the PIVlab tool. Within thecentral transfer zone and the external graben segment thesevectors highlight a rotational component, as they tend to turninto an axis-parallel (or N-S) trend of the external grabensegment. At a high extension (60%) a stepped array of normalfaults links the internal fault of the upper graben structure withthe external fault of the lower graben structure. These faults arenot continuous but separated by a horst. Approaching the totalextension (95%), this array evolves into a single shortcut. Redboxes depict fault segments separated by ramps. The white boxdepicts the transfer zone.
In the lower part the localization of deformation shows how inthe first part is principally at rising bounded-faults, but thenchange to concentrate at transition zone.
7
Analogue models
Results
Conclusion
Reference
Fault grow and linkage process
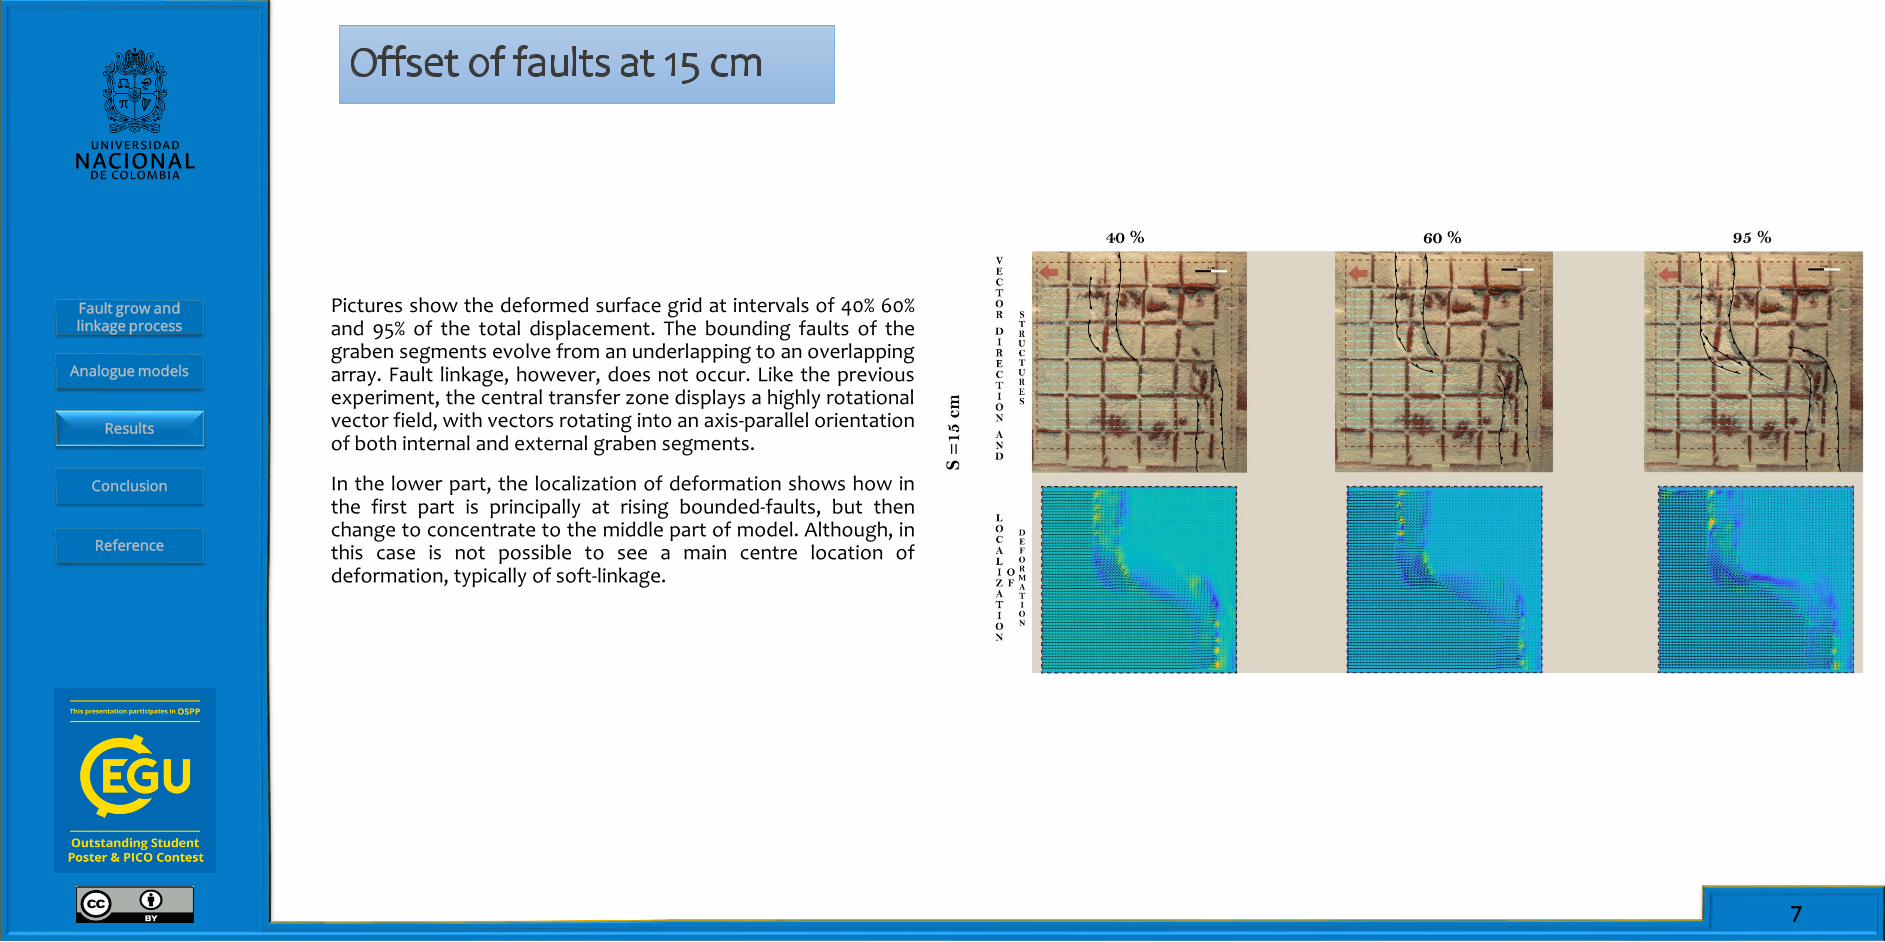
Pictures show the deformed surface grid at intervals of 40% 60%and 95% of the total displacement. The bounding faults of thegraben segments evolve from an underlapping to an overlappingarray. Fault linkage, however, does not occur. Like the previousexperiment, the central transfer zone displays a highly rotationalvector field, with vectors rotating into an axis-parallel orientationof both internal and external graben segments.
In the lower part, the localization of deformation shows how inthe first part is principally at rising bounded-faults, but thenchange to concentrate to the middle part of model. Although, inthis case is not possible to see a main centre location ofdeformation, typically of soft-linkage.

8
Analogue models
Results
Conclusion
Reference
Fault grow and linkage process
Model using a rigid based that simulated inheritedanisotropies with 20 cm the distance between each seed.In the upper part we can see the structures developed in40%, 60% and 95% of the total movement. In addition,vector directions calculated with PIVlab tool show therotation of the most central model, inside the basins,through out a faults with different movement directionbut in the middle part too.
The transition zone is characterised by the developed of alarge fault that in the late model moment, began to movewith a transcurrent component this zone.
In the lower part the localization of deformation showshow in the first part is principally at rising bounded-faults,but then change to concentrate at transition zone withthe different respect to other models that at the final anpossible transcurrent fault is dominant over basinbounded-faults.

9
Analogue models
Results
Conclusion
Reference
Fault grow and linkage process
Photos from different stages in a fault evolution. One fault begins its growth as a result of stress variations and spreads by means of interactionamong different planes (propagation fault model). Although, it is possible that the length increase will be forced to cease, in that moment it is whenpossibly a depth increase dominated over length increase.
Figure 5. Faults evolution with astep of 5 seconds. White box showramps, blue box show linkagezone. The green star show thefinal growth of fault and pinkarrow point out depth increase. a),b) and c) describe the momentwhen faults begin to grow andlinkage process can be possible tomake largest faults; e), f) and g)show how the normal faults stoptheir increase length and begin tobe dominated by depth increase.

10
Analogue models
Results
Conclusion
Reference
Fault grow and linkage process
Figure 6. Basin structural evolution. It has defined 3 different stages in which each of ones it is characterized by shows a specificphase related to fault grow and fault linkage.
We started today with these two questions : : Do the bounding faults joinby lateral propagation, or do they maintain a stationary position? In thelatter case: Do additional faults accommodate linkage?
As we saw, the propagation fault model takes a relevant position duringfault evolution but is not the only process involve. At first, a fault begins itspropagation, but then a cease of length grow is following by a depthincrease. We think that the fault located at transfer zone works in the sameway with the difference that linkage process cannot be present, whereas ahorst might be developed.
We propose three possible stages when a basin can be developed. Stage I isdominated by propagation fault model, Stage II presents a rampdevelopment and begin of fault linkage by means of breached ramps. Inthis second stage, the basin extends towards an interaction zone where istaken place a transition zone and the basin-bounded faults curve in a hookform. At the end, the Stage III does not involve more length increase andthe faults begins to taken place in a constant-length fault model where onlydepth increase.

• Acocella, V., Faccenna, C., Funiciello, R., Rossetti, F., 1999. Sand-box modelling of basement-controlled transfer zones inextensional domains. Terra Nova. 11, 4 , 149-156.
• Corti, G., 2012. Evolution and characteristics of continental rifting: Analog modelling-inspired view and comparison withexamples from the East African Rift System. Tectonophysics. 522-523, 1-33.
• Fossen, H., Rotevatn, A., 2016. Fault linkage and relay structures in extensional settings-A review. Earth-Science reviews.154, 14-28
• Grupta, A., Scholz, C.H., 2000. A model of normal fault interaction based on observations and theory. J.Struct.Geol. 22,865-879.
• Hus, R., Acocella, V., Funiciello, R., De Batist, M., 2005. Sandbox models of relay ramp structure and evolution.J.Struct.Geol. 27, 459-473.
• Kairanov, B., Marín, D., Escalona, A., Cardozo, N., 2019. Growth and linkage of a basin-bounding fault system: Insightsfrom the Early Cretaceous evolution of the northern Polhem Subplatform, SW Barents Sea. J. Struct.Geol. 124, 182-196.
• Rotevatn, A., Jackson C.A-L., Tvedt, A.B.M, Bell, R.E., Blækkan, I., 2019. How do normal faults grow?. J.Struct.Geol. 125,174-184.
• Walsh, J.J., Bailey, W.R., Childs, et al., 2003. Formation of segmented normal faults: a 3-D perspective. J. Struct. Geol. 25,1251–1262.
11
Analogue models
Results
Conclusion
Reference
Fault grow and linkage process
Thank you!
Related Documents