Fault Diagnostics of Planet Gears in Wind Turbine Using Auto- correlation-based Time Synchronous Averaging (ATSA) Jong Moon Ha 1 , Jungho Park 2 , Byeng D. Youn 3 and Yoong Ho Jung 4 1, 2, 3 Department of Mechanical and Aerospace Engineering, Seoul National University, Seoul, 151-919, Korea [email protected] [email protected] [email protected] 4 School of Mechanical Engineering, Pusan National University, Pusan, 609-717, Korea [email protected] ABSTRACT A planetary gearbox is widely used in various rotating systems because it can be used as a speed reducer or increaser without change in direction of shaft while transferring great driving power. Despite many attempts it is still challenging to diagnose potential faults of the planetary gearbox because of multiple contacts and axis rotation of planet gears resulting in complex vibration characteristics. This paper thus presents an original method to isolate vibration signals induced by the planet gears from the complex vibration signals for fault diagnostics of the planetary gearbox. First, an in-depth study on the vibration characteristics of planet gears is presented using the autocorrelation function of the vibration signal. The autocorrelation-based time synchronous averaging (ATSA) method is then developed for the isolation of the vibration signals produced by the planet gears. The vibration signals were utilized for extracting health related data which facilitate the efficient fault diagnostics of the planet gears. Case study with a wind turbine testbed showed that the proposed method can diagnose the root crack of the planet gears. 1. INTRODUCTION A planetary gearbox is widely used in wind turbines (WTs) because it transfers great driving power without change in direction of shaft. However, it is at high risk because downtime of the most planetary gearboxes are severely long. For example, NoordzeeWind (2008) reported that planetary gearbox has the most critical downtime loss in wind turbines. This necessitates diagnostics of gearbox to prevent catastrophic failure with significant economic loss. Despite many attempts, however, it is still challenging to diagnose potential faults of the planetary gearbox because of multiple contacts and axis rotation of planet gears resulting in complex vibration characteristics. For robust diagnostics of the gearbox, vibration produced by the planet gears in the gearbox should be isolated from the complex vibration signal. Widely used vibration isolation tool is time synchronous averaging (TSA). Principle of TSA is to divide the vibration signal into multiple segments whose length correspond to one rotation of the gear and conduct ensemble averaging for them. This requires very simple processing, however, TSA for planet gear requires more advanced approach because 1) the sensory signal is mixed up by multiple contacts in the planetary gearbox, and 2) rotating inner components change relative distance of the planet gears from a sensor because the vibration sensor is fixed on the top of the gearbox housing. To overcome the presented challenges, McFadden and Howard (1990) proposed to extract the signal only when the planet gear of interest passes the vibration sensor with the help of narrow-ranged Square window function. Likewise, most advanced TSA involves extraction of vibration when the planet gears of interest is adjacent to the vibration sensor. Various kinds of window functions were developed for advanced TSA. McFadden (1994) compared various kinds of window functions, and advanced the previous TSA (McFadden et al., 1990) by adopting narrow-ranged Hann window function. Samuel, Conroy and Pines (2004) adopted using narrow-ranged Tukey window which has flat top in shape pointing out that extracted signal with Hann window (McFadden, 1994) cannot represent the vibration signal of interest well because the Hann window does not have flat top which lead to distortion of the target signal. Although TSA with optimized size and shape of the window function can properly isolate the signal of interest for effective diagnostics, it cannot be used for planetary gearbox in WTs because stationary signal, which is necessary for TSA, is rarely Jong Moon Ha et al. This is an open-access article distributed under the terms of the Creative Commons Attribution 3.0 United States License, which permits unrestricted use, distribution, and reproduction in any medium, provided the original author and source are credited.

Welcome message from author
This document is posted to help you gain knowledge. Please leave a comment to let me know what you think about it! Share it to your friends and learn new things together.
Transcript
Fault Diagnostics of Planet Gears in Wind Turbine Using Auto-correlation-based Time Synchronous Averaging (ATSA)
Jong Moon Ha1, Jungho Park2, Byeng D. Youn3 and Yoong Ho Jung4
1, 2, 3 Department of Mechanical and Aerospace Engineering, Seoul National University, Seoul, 151-919, Korea [email protected] [email protected] [email protected]
4 School of Mechanical Engineering, Pusan National University, Pusan, 609-717, Korea [email protected]
ABSTRACT
A planetary gearbox is widely used in various rotating systems because it can be used as a speed reducer or increaser without change in direction of shaft while transferring great driving power. Despite many attempts it is still challenging to diagnose potential faults of the planetary gearbox because of multiple contacts and axis rotation of planet gears resulting in complex vibration characteristics. This paper thus presents an original method to isolate vibration signals induced by the planet gears from the complex vibration signals for fault diagnostics of the planetary gearbox. First, an in-depth study on the vibration characteristics of planet gears is presented using the autocorrelation function of the vibration signal. The autocorrelation-based time synchronous averaging (ATSA) method is then developed for the isolation of the vibration signals produced by the planet gears. The vibration signals were utilized for extracting health related data which facilitate the efficient fault diagnostics of the planet gears. Case study with a wind turbine testbed showed that the proposed method can diagnose the root crack of the planet gears.
1. INTRODUCTION
A planetary gearbox is widely used in wind turbines (WTs) because it transfers great driving power without change in direction of shaft. However, it is at high risk because downtime of the most planetary gearboxes are severely long. For example, NoordzeeWind (2008) reported that planetary gearbox has the most critical downtime loss in wind turbines. This necessitates diagnostics of gearbox to prevent catastrophic failure with significant economic loss. Despite many attempts, however, it is still challenging to diagnose
potential faults of the planetary gearbox because of multiple contacts and axis rotation of planet gears resulting in complex vibration characteristics.
For robust diagnostics of the gearbox, vibration produced by the planet gears in the gearbox should be isolated from the complex vibration signal. Widely used vibration isolation tool is time synchronous averaging (TSA). Principle of TSA is to divide the vibration signal into multiple segments whose length correspond to one rotation of the gear and conduct ensemble averaging for them. This requires very simple processing, however, TSA for planet gear requires more advanced approach because 1) the sensory signal is mixed up by multiple contacts in the planetary gearbox, and 2) rotating inner components change relative distance of the planet gears from a sensor because the vibration sensor is fixed on the top of the gearbox housing.
To overcome the presented challenges, McFadden and Howard (1990) proposed to extract the signal only when the planet gear of interest passes the vibration sensor with the help of narrow-ranged Square window function. Likewise, most advanced TSA involves extraction of vibration when the planet gears of interest is adjacent to the vibration sensor. Various kinds of window functions were developed for advanced TSA. McFadden (1994) compared various kinds of window functions, and advanced the previous TSA (McFadden et al., 1990) by adopting narrow-ranged Hann window function. Samuel, Conroy and Pines (2004) adopted using narrow-ranged Tukey window which has flat top in shape pointing out that extracted signal with Hann window (McFadden, 1994) cannot represent the vibration signal of interest well because the Hann window does not have flat top which lead to distortion of the target signal. Although TSA with optimized size and shape of the window function can properly isolate the signal of interest for effective diagnostics, it cannot be used for planetary gearbox in WTs because stationary signal, which is necessary for TSA, is rarely
Jong Moon Ha et al. This is an open-access article distributed under the terms of the Creative Commons Attribution 3.0 United States License, which permits unrestricted use, distribution, and reproduction in any medium, provided the original author and source are credited.
EUROPEAN CONFERENCE OF THE PROGNOSTICS AND HEALTH MANAGEMENT SOCIETY 2014
2
acquired in WTs. For example, a recent study which successfully performed diagnostics of planetary gearbox using a TSA with narrow-ranged Hann window used about 700 carrier cycles of data which corresponds to 40 minutes of typical WTs’ operation (Lewicki, Ehinger & Fetty, 2011). Because 40 minutes of stationary operation cannot occur in WTs, TSA with more wide-ranged window function is needed. Although wide-range window function was designed to prevent any loss of data by Forrester (2001), Samuel, Conroy and Pines (2004) pointed out that such excessive wide-ranged window can distort the natural vibration characteristics of the planet gears.
This paper proposes more advanced TSA for isolation of vibration produced by planet gears. Different from the previous studies, range of newly designed window function is in between range of narrow-range window function and that of wide-range window function. This paper suggests a guideline for determining range of window function of TSA with autocorrelation function. Developed TSA, thus, is referred to as autocorrelation-based TSA (ATSA). For demonstration of proposed ATSA, a testbed for planetary gearbox was designed. This testbed typically simulates a large scale of wind turbine with combination of two planetary gearboxes which have 20:1 and 4.08:1 of gear ratio respectively. A faulted planet gear was assembled to a gearbox with 4.08:1 of ratio to depict abnormal condition of the gearbox. Two kinds of health data were obtained from the results of ATSA, and they successfully classified condition of the normal and abnormal gearboxes.
This paper consists of three parts. First, vibration isolation methods for a spur gear and planet gear are briefly reviewed. Second, autocorrelation-based time synchronous averaging (ATSA) is proposed. Finally, proposed ATSA is validated in demonstration section.
2. REVIEW OF VIBRATION ISOLATION METHOD
Vibration isolation methods help to investigate nature characteristics of vibration produced by the gear of interest which is originally buried by the other kinds of vibration sources. Most widely used technique is time synchronous averaging (TSA). In this section, basic TSA which can be used for spur gears is introduced. And then, advanced TSA for planet gears will be presented based on the previous studies.
2.1. Time Synchronous Averaging for Spur Gears
Every measured signal has multiple coherent and non-coherent components from various sources. D. Hochmann and Sadok (2004) attempted to describe the synthesized sensory signal from the sensor with three main components: synchronous coherent signals ( 푆(푡) ), non-synchronous coherent signals (푁(푡)), and non-coherent random signals (푅(푡)).
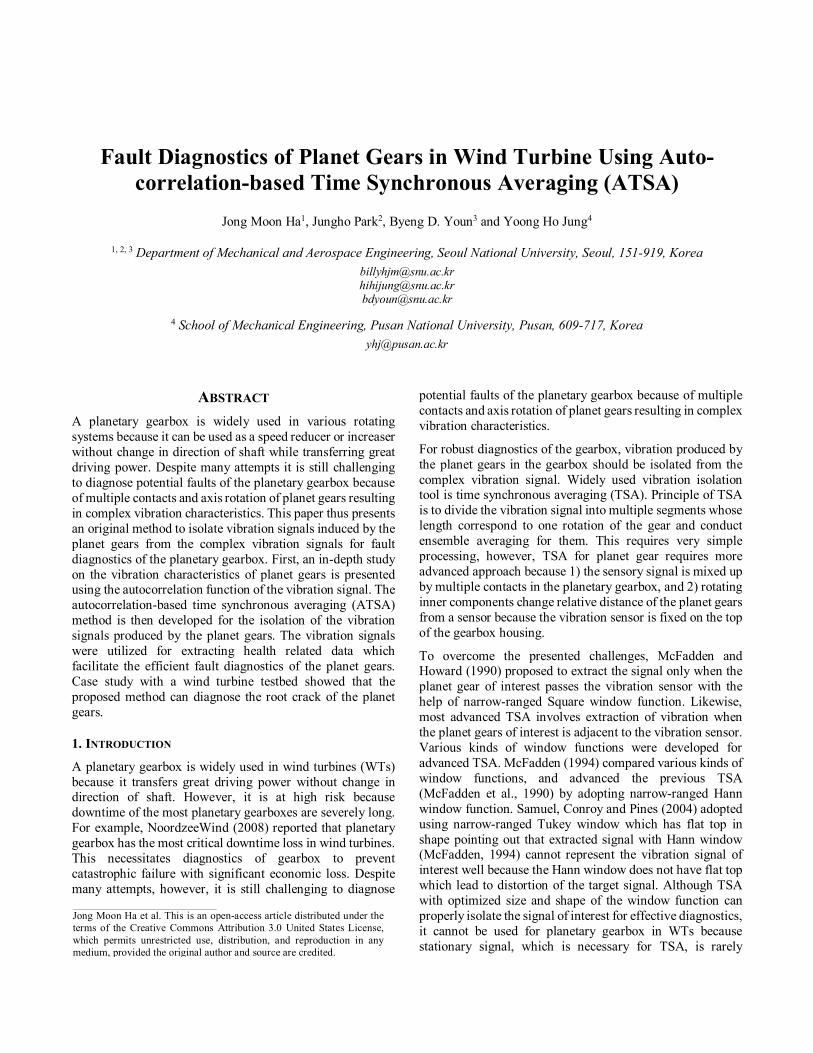
Figure 1. Procedures of time synchronous averaging
Time synchronous averaging (TSA) was developed to suppress the non-synchronous coherent signal and the non-coherent random signal, and to estimate approximated synchronous coherent signal (푆(푡)). Basic TSA is composed of three main steps as shown in Figure 1. The first step is to resample the vibration signal to have same number of samples per rotation of the gear, where 푓 in Figure 1 denotes the number of samples per rotation of the target gear (Blough, 2006). Linear interpolation method enables the resampling of signal by assigning constant number of samples per rotation of the target gear with the help of encoder (Decker & Zakrajsek, 1999). In second step, the vibration signal is divided into multiple segmented sets. Data length of every sets corresponds to one rotation of the gear. Third step is to perform ensemble averaging of the segmented sets. Because non-synchronous coherent signals (푁(푡)), and non-coherent random signals (푅(푡)) would have Gaussian noise characteristics, they converges to zero as the number of averaging increases. Whereas, synchronous coherent signals ( 푆(푡) ) remains its origin because each segmented sets correspond to one rotation of the gear which generate almost identical signal in respect to phase and magnitude. TSA resulting in the estimation of the synchronous coherent signal (푆(휃)) can be defined as (Barszca & Randall, 2009):
1
0
1( ) ( )N
rsi
S v i fN
(1)
2.2. Time Synchronous Averaging for Planet Gears
Planetary gearbox is composed of sun gear, ring gear, carrier and planet gears as shown in Figure 2. In WTs, ring gear is fixed on the gearbox housing to make planet gears rotate around the sun gear with the help of rotating carrier. In this case, carrier is connected to the low speed shaft with high level of torque, and sun gear is connected to the high speed shaft with low level of torque. Because vibration sensors are fixed on the surface of the gearbox housing, relative distance of the planet gears to the sensor varies. Therefore, planet gear which dominantly produce signals to the sensor shifts. When the whole acquired signal is considered at a time, thus,
( ) ( ) ( ) ( )v t S t N t R t (1)

EUROPEAN CONFERENCE OF THE PROGNOSTICS AND HEALTH MANAGEMENT SOCIETY 2014
3
(a) (b)
Figure 2. (a): Planetary gearbox, (b): Inner side of the gearbox
it is impossible to focus on diagnostics of a specific planet gear which lead to inaccuracy in diagnostics result. Therefore, TSA for planet gears involves the use of the window function for the purpose of extraction of vibration signal of interest. Various types of window function can serve as an extraction tool for TSA of the planet gears. Among them, Hann window (McFadden, 1994, Lewicki, Ehinger & Fetty, 2011, Hood & Darryll, 2011), Tukey window (Samuel et al., 2004, Smidt, 2009) and Cosine window (Forrester, 2001, Yu, 2011) were most widely used. Figure 3 illustrates the mentioned window functions. As can be seen through the figure, Hann and Tukey window covers just a few teeth of the gear whereas Cosine window covers entire range. After defining the window function, TSA can be conducted. Procedures of advanced TSA for the planet gears are illustrated in Figure 4. First, window function extracts the vibration made by the planet gear of interest. The principle of the first step is that window function gives weight to the signal only when the planet gear of interest passes the vibration sensor. Second, mapping of the extracted vibration signal is required because of the teeth sequence which is the natural characteristics of the planetary gearboxes. Teeth sequence of the planet gear, 푃 , (푛 ), is defined as a function of carrier rotation, which can be defined as (Samuel et al., 2004):
, ( ) mod( , ) 1n p c c r pP n n N N (2)
(a) (b)
Figure 3. Various types of window function
Figure 4. Procedures of TSA for planet gear
Where 푛 is the number of carrier rotation starting from location of the sensor, 푁 and 푁 is the number of teeth on the ring gear and planet gear respectively. Function of mod(푎, 푏) calculates the remainder of 푎/푏. Thus equation (2) derives teeth number of the planet gear which made the extracted vibration signal. With this information, the extracted vibration signal is transformed to the teeth domain as shown in Figure 4; Mapping to the teeth domain. In the final step, every transformed signals are aligned and averaged to make TSA signal.
3. AUTOCORRELATION-BASED TIME SYNCHRONOUS AVERAGING
In this section, autocorrelation function of sensory signal from the vibration sensor is introduced. It helps to understand vibration characteristics, and gives a guideline for defining efficient range of window function. For explanation of the proposed methods, a planetary gearbox with sun gear (31 teeth), ring gear (95 teeth), carrier and three planet gears (31teeth) was used as an example case.
3.1. In-depth Study on Vibration Characteristics Using Autocorrelation Function
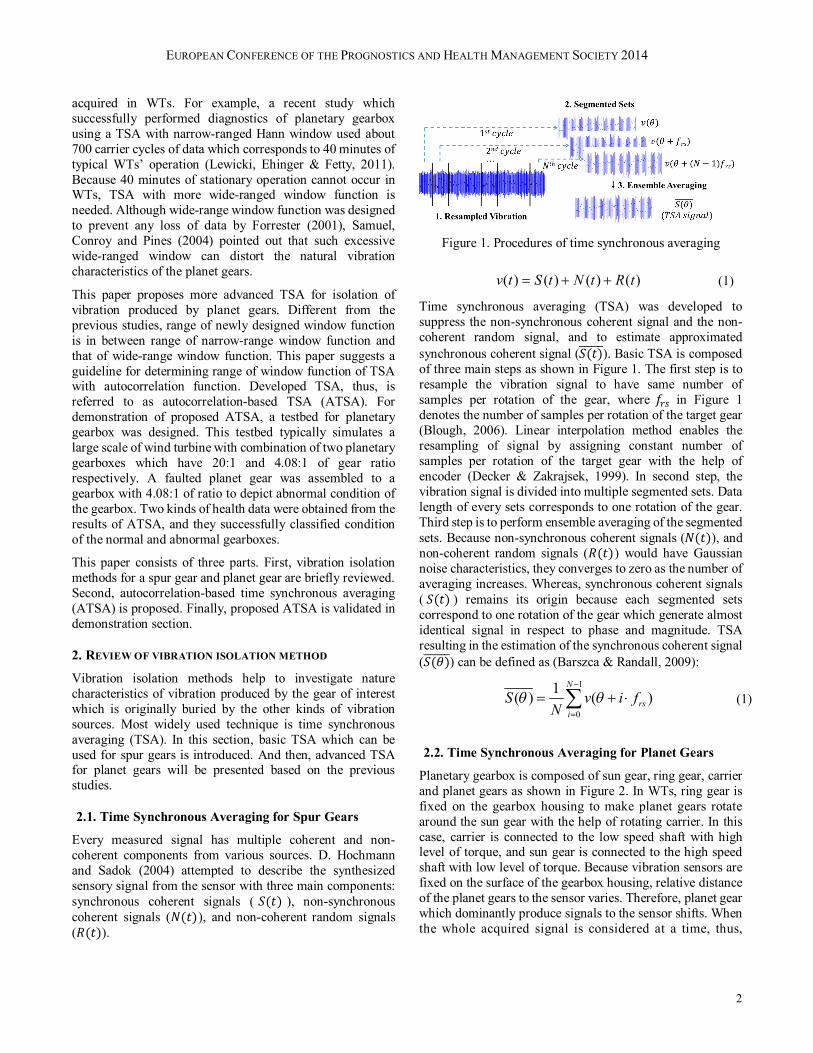
Autocorrelation function can be used to characterize vibration characteristics of the planetary gearbox. Before presenting detailed representation of the autocorrelation function, understanding intuitive operating characteristics of the planetary gearboxes would be helpful. Figure 5 illustrates what happens in the gearbox as the gearbox operates. Suppose that the gear of interest (G ) was located under the vibration sensor at the initial state where a diamond mark indicates meshing point (Figure 5 (a)). As carrier rotates counterclockwise, position of the planet gears also revolute counterclockwise as well. Since then, the planet gear of interest will recede from the sensor whereas another planet gear will approach the sensor. At one rotation of the planet gear (푛 = 1 ), vibration of G will dominate the sensor signal instead of the gear of interest because it will be almost under the sensor (Figure 5 (b)). Figure 5 (c) reveals that the planet gear of interest will be adjacent to the sensor by distance of two teeth to dominate the sensory signal again at
EUROPEAN CONFERENCE OF THE PROGNOSTICS AND HEALTH MANAGEMENT SOCIETY 2014
4
(a) (b) (c) (d)
Figure 5. Autocorrelation function of vibration signal
three rotation of the planet gear (푛 = 3). At 95 rotation of the planet gear (푛 = 95), every planet gears and meshing teeth will reset to the initial state as shown in Figure 5 (d). The minimum number of rotations for reset to the initial state is called as hunting tooth ratio (HTR) (Samuel, Conroy & Pines, 2004). Intuitively, it can be expected that vibration signal gathered from Figure 5 (a), Figure 5 (c) and Figure 5 (d) would have similarity in phase and magnitude because the meshing conditions are similar. Whereas, signal from Figure 5 (b) would have different vibration pattern without similarity and it can result in improper TSA. This kind of signals are the most challenging issue in using wide-range window function.
The task is to extend range of the window function for TSA while preventing similarity loss. Autocorrelation function can quantitatively characterize this phenomenon to define useful range for the window function. The definition of the sample autocorrelation function (푅 ) is mean of the signal (푣(푡)) multiplied by itself with time lag τ (푣(푡 + 휏)), defined as (Bendat & Piersol, 2010):
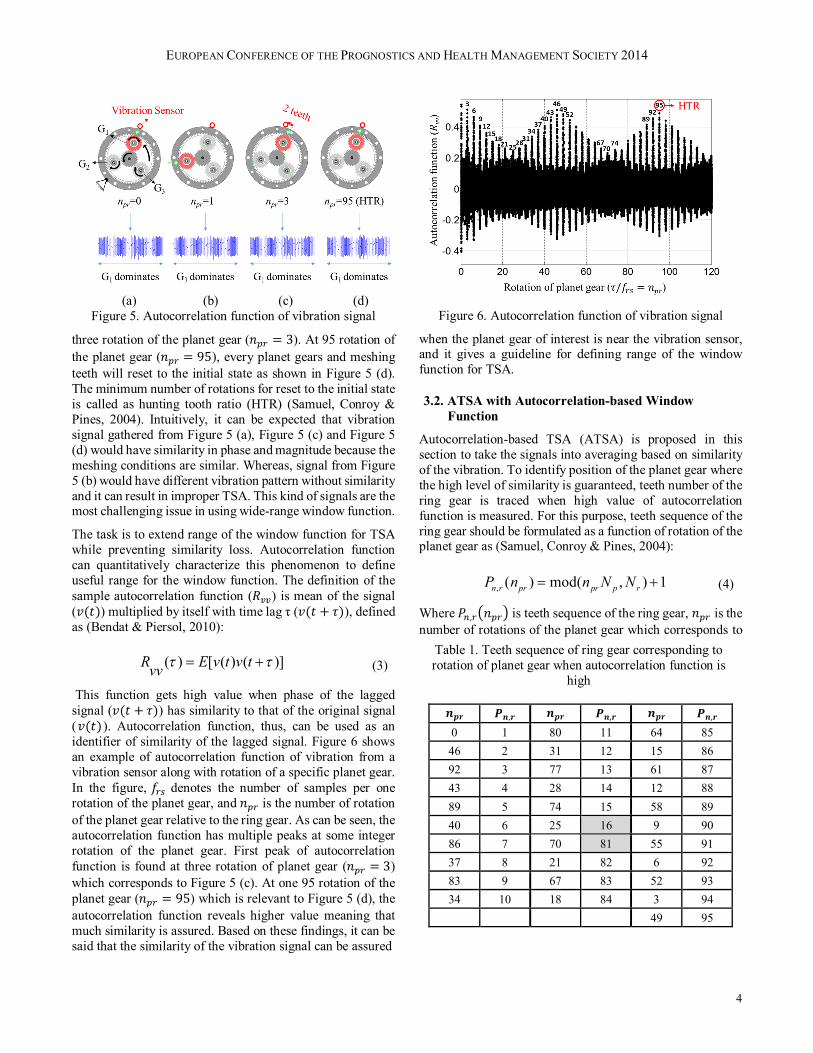
This function gets high value when phase of the lagged signal (푣(푡 + 휏)) has similarity to that of the original signal (푣(푡)). Autocorrelation function, thus, can be used as an identifier of similarity of the lagged signal. Figure 6 shows an example of autocorrelation function of vibration from a vibration sensor along with rotation of a specific planet gear. In the figure, 푓 denotes the number of samples per one rotation of the planet gear, and 푛 is the number of rotation of the planet gear relative to the ring gear. As can be seen, the autocorrelation function has multiple peaks at some integer rotation of the planet gear. First peak of autocorrelation function is found at three rotation of planet gear (푛 = 3) which corresponds to Figure 5 (c). At one 95 rotation of the planet gear (푛 = 95) which is relevant to Figure 5 (d), the autocorrelation function reveals higher value meaning that much similarity is assured. Based on these findings, it can be said that the similarity of the vibration signal can be assured
Figure 6. Autocorrelation function of vibration signal
when the planet gear of interest is near the vibration sensor, and it gives a guideline for defining range of the window function for TSA.
3.2. ATSA with Autocorrelation-based Window Function
Autocorrelation-based TSA (ATSA) is proposed in this section to take the signals into averaging based on similarity of the vibration. To identify position of the planet gear where the high level of similarity is guaranteed, teeth number of the ring gear is traced when high value of autocorrelation function is measured. For this purpose, teeth sequence of the ring gear should be formulated as a function of rotation of the planet gear as (Samuel, Conroy & Pines, 2004):
Where 푃 , 푛 is teeth sequence of the ring gear, 푛 is the number of rotations of the planet gear which corresponds to
( ) [ ( ) ( )]R E v t v tvv (3)
, ( ) mod( , ) 1n r pr pr p rP n n N N (4)
Table 1. Teeth sequence of ring gear corresponding to rotation of planet gear when autocorrelation function is
high
풏풑풓 푷풏,풓 풏풑풓 푷풏,풓 풏풑풓 푷풏,풓 0 1 80 11 64 85 46 2 31 12 15 86 92 3 77 13 61 87 43 4 28 14 12 88 89 5 74 15 58 89 40 6 25 16 9 90 86 7 70 81 55 91 37 8 21 82 6 92 83 9 67 83 52 93 34 10 18 84 3 94
49 95
EUROPEAN CONFERENCE OF THE PROGNOSTICS AND HEALTH MANAGEMENT SOCIETY 2014
5
Figure 7. ATSA with optimized range of window function
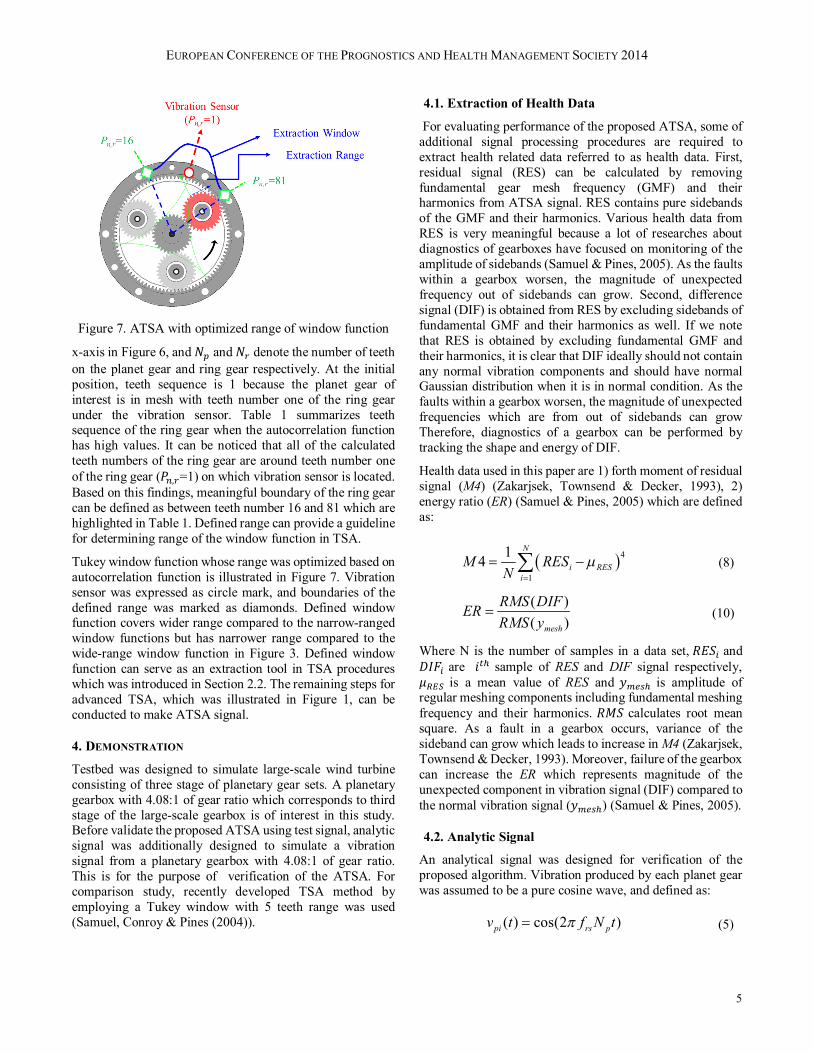
x-axis in Figure 6, and 푁 and 푁 denote the number of teeth on the planet gear and ring gear respectively. At the initial position, teeth sequence is 1 because the planet gear of interest is in mesh with teeth number one of the ring gear under the vibration sensor. Table 1 summarizes teeth sequence of the ring gear when the autocorrelation function has high values. It can be noticed that all of the calculated teeth numbers of the ring gear are around teeth number one of the ring gear (푃 , =1) on which vibration sensor is located. Based on this findings, meaningful boundary of the ring gear can be defined as between teeth number 16 and 81 which are highlighted in Table 1. Defined range can provide a guideline for determining range of the window function in TSA.
Tukey window function whose range was optimized based on autocorrelation function is illustrated in Figure 7. Vibration sensor was expressed as circle mark, and boundaries of the defined range was marked as diamonds. Defined window function covers wider range compared to the narrow-ranged window functions but has narrower range compared to the wide-range window function in Figure 3. Defined window function can serve as an extraction tool in TSA procedures which was introduced in Section 2.2. The remaining steps for advanced TSA, which was illustrated in Figure 1, can be conducted to make ATSA signal.
4. DEMONSTRATION
Testbed was designed to simulate large-scale wind turbine consisting of three stage of planetary gear sets. A planetary gearbox with 4.08:1 of gear ratio which corresponds to third stage of the large-scale gearbox is of interest in this study. Before validate the proposed ATSA using test signal, analytic signal was additionally designed to simulate a vibration signal from a planetary gearbox with 4.08:1 of gear ratio. This is for the purpose of verification of the ATSA. For comparison study, recently developed TSA method by employing a Tukey window with 5 teeth range was used (Samuel, Conroy & Pines (2004)).
4.1. Extraction of Health Data
For evaluating performance of the proposed ATSA, some of additional signal processing procedures are required to extract health related data referred to as health data. First, residual signal (RES) can be calculated by removing fundamental gear mesh frequency (GMF) and their harmonics from ATSA signal. RES contains pure sidebands of the GMF and their harmonics. Various health data from RES is very meaningful because a lot of researches about diagnostics of gearboxes have focused on monitoring of the amplitude of sidebands (Samuel & Pines, 2005). As the faults within a gearbox worsen, the magnitude of unexpected frequency out of sidebands can grow. Second, difference signal (DIF) is obtained from RES by excluding sidebands of fundamental GMF and their harmonics as well. If we note that RES is obtained by excluding fundamental GMF and their harmonics, it is clear that DIF ideally should not contain any normal vibration components and should have normal Gaussian distribution when it is in normal condition. As the faults within a gearbox worsen, the magnitude of unexpected frequencies which are from out of sidebands can grow Therefore, diagnostics of a gearbox can be performed by tracking the shape and energy of DIF.
Health data used in this paper are 1) forth moment of residual signal (M4) (Zakarjsek, Townsend & Decker, 1993), 2) energy ratio (ER) (Samuel & Pines, 2005) which are defined as:
Where N is the number of samples in a data set, 푅퐸푆 and 퐷퐼퐹 are 푖 sample of RES and DIF signal respectively, 휇 is a mean value of RES and 푦 is amplitude of regular meshing components including fundamental meshing frequency and their harmonics. 푅푀푆 calculates root mean square. As a fault in a gearbox occurs, variance of the sideband can grow which leads to increase in M4 (Zakarjsek, Townsend & Decker, 1993). Moreover, failure of the gearbox can increase the ER which represents magnitude of the unexpected component in vibration signal (DIF) compared to the normal vibration signal (푦 ) (Samuel & Pines, 2005).
4.2. Analytic Signal
An analytical signal was designed for verification of the proposed algorithm. Vibration produced by each planet gear was assumed to be a pure cosine wave, and defined as:
4
1
14N
i RESi
M RESN
(8)
( )( )mesh
RMS DIFERRMS y
(10)
( ) cos(2 )pi rs pv t f N t (5)

EUROPEAN CONFERENCE OF THE PROGNOSTICS AND HEALTH MANAGEMENT SOCIETY 2014
6
(a) (b)
Figure 8. Design of analytic signal (a) abnormality of teeth number 14 on the first planet gear, (b) Transfer path of the
first planet gear
where 푣 is vibration signal produced by 푖 planet gear, 푓 is the number of samples per one rotation of the planet gear, and 푁 denotes the number tooth of the planet gear which is 31 in this study. It was also assumed that an abnormality can be described as having a higher amplitude than a normal one when the faulty gear tooth meshes with other gears. In this study, abnormality was added to the tooth number 14 of planet 1 (푣 ) as shown in Figure 8 (a). There are three planet gears, and all the gears produce the same vibration at each position except for the faulted gear tooth. However, each planet gear has different transfer path. Transfer path of 푖 planet gear can be defined as:
Where 푓 is rotating frequency of the carrier, and 푖 is ranging from one to three which is the number of planet gears. Figure 8 (b) shows how the transfer path changes. The 푖 transfer path makes the sensory signal produced by the 푖 planet gear highest when it passes the vibration sensor. Whereas, the magnitude of 푖 transfer path decreases as the 푖 planet gear recedes from the sensor. Moreover, Gaussian noise was added to the signal to consider reality. After all factors are combined, analytic signal can be defined as:
Figure 9 and Figure 10 compares the residual signals (RES) came from TSA signal and ATSA signal using 1200 seconds of data and 60 seconds of data respectively. RES were calculated by excluding gear mesh frequencies from the TSA or ATSA. As can be seen from Figure 9, both RESs calculated from TSA and ATSA graphically distinct abnormality of the signal in the teeth domain. When the size of the data decreases, however, abnormality of the planet gear is invisible when the narrow-ranged window function was employed for TSA as shown in Figure 10 (a). In contrary, RES from ATSA reveals abnormality of the gear in teeth domain even if small amount of data was used for signal
(a) (b)
Figure 9. Residual signal using 1200 sec of data (a): TSA with 5 teeth range Tukey window, (b): ATSA with
optimized range of Tukey window
(a) (b)
Figure 10. Residual signal using 60 sec of data (a): TSA with 5 teeth range Tukey window, (b): ATSA with
optimized range of Tukey window
processing as shown in Figure 10 (b). This is because the ATSA employed wider range of extraction window function which lead to efficient use of the vibration data without loss while preventing data distortion.
4.3. Testbed Signal
Absence of normal and abnormal response data from WTs makes it difficult to achieve the objective of this research. Thus, a small-scale wind turbine testbed which has similarity to a 2.5MW WTs was designed for the research outlined in this paper. Gearbox 1, which has 3 stages of planetary gear set can be substituted with combination of gearboxes 2 and 3 which have simpler dynamics characteristics than gearbox 1. Gearbox 3 which has one stage of planetary gear set is of target system in this paper. The main considerations for designing the testbed were as follows. First, the composition is almost identical to that of gearbox in WTs so that the testbed has similarity to the WTs. Moreover the testbed can operate with a closed-loop controller which enables implementation of rotor speed and scaled torque measured from a WT to the testbed. And this testbed was designed to facilitate simple assembly of the gear units with defect into the gearbox. In this case, 1.17mm of crack with 0.05mm of width was machined with wire-cut electro discharge machining as shown in Figure 12 (Jung, Yun, Lee & Fu, 2012), and assembled to the gearbox 3. The gearbox rotated in 1600 rpm at sun gear with 4Nm of torque.
(1 cos(2 ( ( 1) / 3))) / 2pi ca f t i (6)
3
1
13analytic p pi i
iv v a noise
(7)
EUROPEAN CONFERENCE OF THE PROGNOSTICS AND HEALTH MANAGEMENT SOCIETY 2014
7
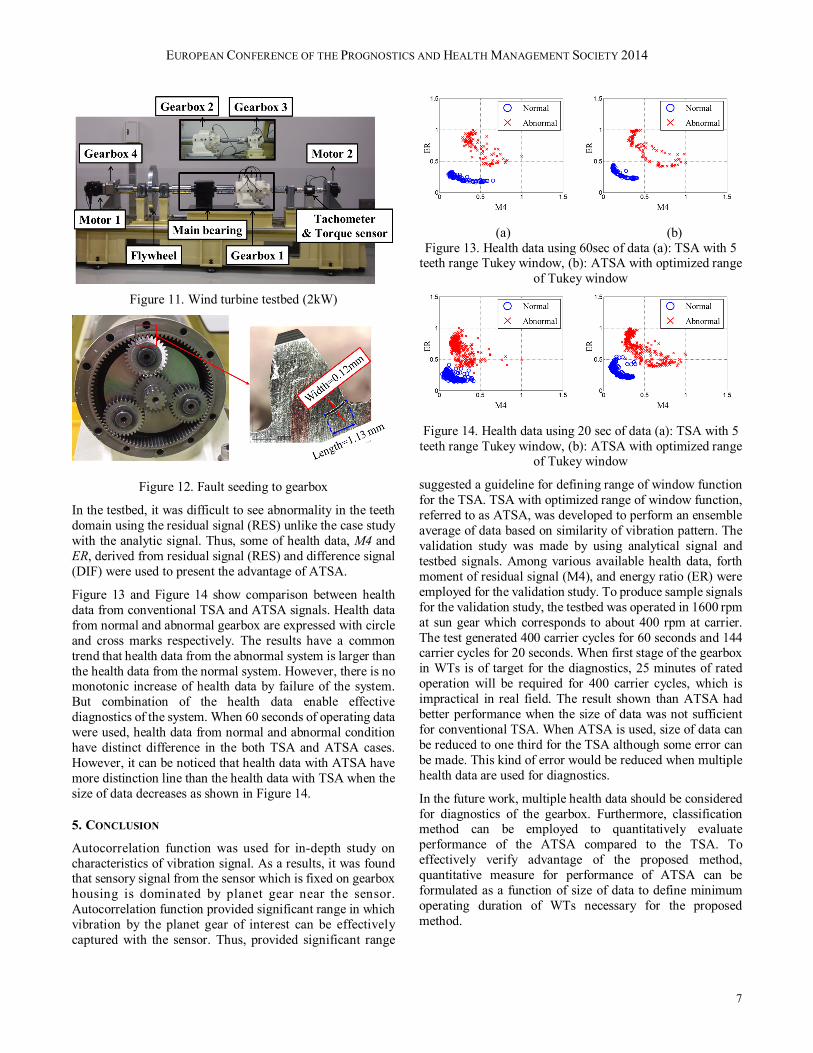
Figure 11. Wind turbine testbed (2kW)
Figure 12. Fault seeding to gearbox
In the testbed, it was difficult to see abnormality in the teeth domain using the residual signal (RES) unlike the case study with the analytic signal. Thus, some of health data, M4 and ER, derived from residual signal (RES) and difference signal (DIF) were used to present the advantage of ATSA.
Figure 13 and Figure 14 show comparison between health data from conventional TSA and ATSA signals. Health data from normal and abnormal gearbox are expressed with circle and cross marks respectively. The results have a common trend that health data from the abnormal system is larger than the health data from the normal system. However, there is no monotonic increase of health data by failure of the system. But combination of the health data enable effective diagnostics of the system. When 60 seconds of operating data were used, health data from normal and abnormal condition have distinct difference in the both TSA and ATSA cases. However, it can be noticed that health data with ATSA have more distinction line than the health data with TSA when the size of data decreases as shown in Figure 14.
5. CONCLUSION
Autocorrelation function was used for in-depth study on characteristics of vibration signal. As a results, it was found that sensory signal from the sensor which is fixed on gearbox housing is dominated by planet gear near the sensor. Autocorrelation function provided significant range in which vibration by the planet gear of interest can be effectively captured with the sensor. Thus, provided significant range
(a) (b)
Figure 13. Health data using 60sec of data (a): TSA with 5 teeth range Tukey window, (b): ATSA with optimized range
of Tukey window
Figure 14. Health data using 20 sec of data (a): TSA with 5
teeth range Tukey window, (b): ATSA with optimized range of Tukey window
suggested a guideline for defining range of window function for the TSA. TSA with optimized range of window function, referred to as ATSA, was developed to perform an ensemble average of data based on similarity of vibration pattern. The validation study was made by using analytical signal and testbed signals. Among various available health data, forth moment of residual signal (M4), and energy ratio (ER) were employed for the validation study. To produce sample signals for the validation study, the testbed was operated in 1600 rpm at sun gear which corresponds to about 400 rpm at carrier. The test generated 400 carrier cycles for 60 seconds and 144 carrier cycles for 20 seconds. When first stage of the gearbox in WTs is of target for the diagnostics, 25 minutes of rated operation will be required for 400 carrier cycles, which is impractical in real field. The result shown than ATSA had better performance when the size of data was not sufficient for conventional TSA. When ATSA is used, size of data can be reduced to one third for the TSA although some error can be made. This kind of error would be reduced when multiple health data are used for diagnostics.
In the future work, multiple health data should be considered for diagnostics of the gearbox. Furthermore, classification method can be employed to quantitatively evaluate performance of the ATSA compared to the TSA. To effectively verify advantage of the proposed method, quantitative measure for performance of ATSA can be formulated as a function of size of data to define minimum operating duration of WTs necessary for the proposed method.

EUROPEAN CONFERENCE OF THE PROGNOSTICS AND HEALTH MANAGEMENT SOCIETY 2014
8
ACKNOWLEDGEMENT
This work was supported by the International Collaborative Energy Technology R&D Program of the Korea Institute of Energy Technology Evaluation and Planning (KETEP) granted financial resource from the Ministry of Trade, Industry & Energy, Republic of Korea. (No. 20118520020010)
REFERENCES
Barszcz, T. & Randall, R.B., (2009). Application of spectral kurtosis for detection of a tooth crack in the planetary gear of a wind turbine. Mechanical Systems and Signal Processing, 23(4), pp.1352–1365.
Bendat, J.S. & Piersol, A.G., (2010). Random Data: Analysis and Measurement Procedures, 4th edition, Hoboken, NJ: John Wiley & Sons, Inc
Blough, J.R., (2006). Adaptive Resampling - Transforming From the Time to the Angle Domain. 2006 IMAC-XXIV: Conference & Exposition on Structural Dynamics.
Decker, H.J. & Zakrajsek, J.J., (1999). Comparison of Interpolation Methods as Applied to Time Synchronous Averaging, Cleveland, Ohio: NASA/TM—1999-209086, NASA Glenn Research Center.
Forrester, B.D., (2001). Method for the separation of epicyclic planet gear vibration signatures. US Patent, US 6,298,725 B1.
Hochmam, D. & Sadok, M., (2004). Theory of Synchronous Averaging. IEEE Aerospace Conference Proceedings. IEEE, pp. 3636–3653.
Hood, A. & Darryll, P., (2011). Sun Gear Fault Detection on an OH-58C Helicopter Transmission. American Helicopter Society 67th Annual Forum. American Helicopter Society, pp. 1664–1690.
Jung, Y.H. et al., (2012). Mechanical Fault Imbedding Process for Major Mechanical Parts of Offshore Wind Turbine. Proceedings of the Korean Society of Mechanical Engineers 2012 Spring Annual Meeting. pp. 159–160.
Lewicki, D.G., Ehinger, R.T. & Fetty, J., (2011). Planetary Gearbox Fault Detection Using Vibration Separation Techniques, Cleveland, Ohio: NASA/TM—2011-217127, NASA Glenn Research Center.
Martin, H.R., (1989). Statistical Moment Analysis as a Means of Surface Damage Detection. Proceedings of the 7th International Modal Analysis Conference.
McFadden, P.D., (1994). Window Functions for the Calculation of the Time Domain Averages of the Vibration of the Individual Planet Gears and Sun Gear in an Epicyclic Gearbox. Journal of Vibration and Acoustics, 116(2), pp.179–187.
McFadden, P.D. & Howard, I.M., (1990). The detection of Seeded Faults in an Epicyclic Gearbox by Signal Averaging of the Vibration, Austrailia: AR-006-087 / ARL-PROP-R-183, Commonwealth of Australia.
Samuel, P.D., Conroy, J.K. & Pines, D.J., (2004). Planetary Transmission Diagnostics, Cleveland, Ohio: NASA/CR-2004-213068, NASA Glenn Research Center.
Samuel, P.D. & Pines, D.J., (2005). A review of vibration-based techniques for helicopter transmission diagnostics. Journal of Sound and Vibration, 282(1-2), pp.475–508.
Yu, J., (2011). Early Fault Detection for Gear Shaft and Planetary Gear Based on Wavelet and Hidden Markov Modeling. Degree of Doctor of Philosophy, University of Toronto.
Zakarjsek, J.J., Townsend, D.P. & Decker, H.J., (1993). An Analysis of Gear Fault Detection Methods as Applied to Pitting, Cleveland, Ohio: NASA TM-105950 / AVSCOM 92-C-035, NASA Lewis Research Center.
Related Documents