Fatty acid metabolism studies of human epidermal cell cultures Cynthia L. Marcelo'** and William R. Dunham1 Department of Dermatology: University of Michigan Medical School, Kresge I, R-6649, Box 0528, Ann Arbor, MI 48109-0528, and Biophysics Research Division, t University of Michigan, Ann Arbor, MI 48109-2009 Abstract Adult human epidermal keratinocytes grow rapidly in medium that is essential fatty acid (EFA)-deficient. In this medium they exhibit decreased amounts of the fatty acids, 18:2, 20:3, 20:4, and contain increased amounts of monounsaturated fatty acids. [I%]- and [SHIacetate and radiolabeled fatty acids, 16:0, 18:2, and 20:4 were used to study the fatty acid metabolism of these cells. Label from acetate appeared in 14- to 20-carbon fatty acids, both saturated and monounsaturated. No label was seen in the essential fatty acid 18:2, 18:3, and 20:4. Radiolabel from [9, 10-3H]palmitic acid (16:O) was detected in 16:0, 16:1, 18:0, and 18:l. [14C]linoleic acid (18:2) was converted to 18:3, 20:2, 20:3, and 20:4, demonstrating A6 and A5 desaturase ac- tivity in keratinocytes. Label from acetate, 16:0, or 18:2 was found mostly in the cellular phospholipids while only one third of the label from [14C]arachidonic was found in the phos- pholipids. [l*C]acetate and [14C]18:2 time course data were used to construct a model of the metabolism of these reactants, using coupled, first-order differential equations. The data show that EFA-deficient keratinocytes metabolize fatty acids using pathways previously found in liver; they suggest the positioning of 18:2 desaturase and 18:3 elongase near the plasma membrane; they indicate that for the synthesis of nonessential fatty acids the formation of 18:O from 16:O is the rate-determining step; and they show that the conversion of 18:2 to 20:3 is rapid. These ex- periments demonstrate a method to study lipid enzyme kinetics in living cells.-MMarcelo, C. L., and W. R. Dunham. Fatty acid metabolism studies of human epidermal cell cultures. J. Lipid Res. 1993. 34: 2077-2090. Supplementary key words essential fatty acid deficiency keratinocytes Both classical and newer techniques for culturing primary epidermal basal cells (keratinocytes) use 10-15% serum in standard medium formulations (1-4). In culture medium, serum is usually the only source of essential and nonessential fatty acids. One system (5-7) uses serum- free, low-calcium growth medium MCDB 153 that allows the rapid growth of keratinocytes in vitro. Because the rapidly growing keratinocytes are in an essential fatty acid (EFA)-deficient environment, they show altered fatty acid compositions (8). Fatty acids are long hydrocarbon chains, with a car- boxyl group at one end. They are usually esterified to the sn-1 and sn-2 carbons of the glycerol backbone of phos- pholipids, to other amphipathic lipids, and to the carbons of glycerol, forming mono-, di-, and tri-acylglycerols (9). The human body can synthesize the saturated fatty acids (thus, nonessential) using cytosolic enzymes of the acetyl-coA carboxylase and fatty acid synthase complexes (lo), producing mainly 16:O (palmitic acid) and minor amounts of 18:O (stearic acid). Removal of two hydrogen atoms from a saturated fatty acid forms a monounsatu- rated fatty acid by direct oxidative desaturation. A A9 desaturase is the usual desaturation enzyme for produc- tion of monounsaturated fatty acids in human tissues (;.e., 16:l and 183) (11). Human tissue cannot introduce double bonds beyond the 9-position, thus 18:2 (A9, '*) and 20:4 (A5, "9 14) are not synthesized by mammalian cells and are supplied by the diet; Le., they are essential (11). Hypothetically, a keratinocyte growing in serum-free medium can adapt to the EFA-deficient growth condition in a number of ways. I) The cell can develop the capacity to desaturate beyond the 9-position, thus acquiring the ability to synthesize essential fatty acids; 2) the keratino- cyte can synthesize unusual fatty acids that can function- ally compensate for the EFA-deficient state; 3) the cell can adjust and flourish in a classically defined EFA-deficient state. We have studied keratinocyte de novo fatty acid syn- thesis, and elongation and desaturation of long chain es- sential and nonessential fatty acids using a number of radiolabeled substrates of fatty acid metabolism. Our studies have allowed kinetic descriptions of lipid metabolism in intact normal human cells. Abbreviations: FA, fatty acid; EFA, essential fatty acid; EGF, epider- mal growth factor; P, passage; TLC, thin-layer chromatography; GC, gas chromatography; HPLC, high performance liquid chromatography; FAMES, fatty acid methyl esters. Unless otherwise indicated, 18:2, 18:3, and 20:4 are of the n-6 series. 'To whom correspondence should be addressed. Journal of Lipid Research Volume 34, 1993 2077 by guest, on May 27, 2018 www.jlr.org Downloaded from

Welcome message from author
This document is posted to help you gain knowledge. Please leave a comment to let me know what you think about it! Share it to your friends and learn new things together.
Transcript

Fatty acid metabolism studies of human epidermal cell cultures
Cynthia L. Marcelo'** and William R. Dunham1
Department of Dermatology: University of Michigan Medical School, Kresge I, R-6649, Box 0528, Ann Arbor, MI 48109-0528, and Biophysics Research Division, t University of Michigan, Ann Arbor, MI 48109-2009
Abstract Adult human epidermal keratinocytes grow rapidly in medium that is essential fatty acid (EFA)-deficient. In this medium they exhibit decreased amounts of the fatty acids, 18:2, 20:3, 20:4, and contain increased amounts of monounsaturated fatty acids. [I%]- and [SHIacetate and radiolabeled fatty acids, 16:0, 18:2, and 20:4 were used to study the fatty acid metabolism of these cells. Label from acetate appeared in 14- to 20-carbon fatty acids, both saturated and monounsaturated. No label was seen in the essential fatty acid 18:2, 18:3, and 20:4. Radiolabel from [9, 10-3H]palmitic acid (16:O) was detected in 16:0, 16:1, 18:0, and 18:l. [14C]linoleic acid (18:2) was converted to 18:3, 20:2, 20:3, and 20:4, demonstrating A6 and A5 desaturase ac- tivity in keratinocytes. Label from acetate, 16:0, or 18:2 was found mostly in the cellular phospholipids while only one third of the label from [14C]arachidonic was found in the phos- pholipids. [l*C]acetate and [14C]18:2 time course data were used to construct a model of the metabolism of these reactants, using coupled, first-order differential equations. The data show that EFA-deficient keratinocytes metabolize fatty acids using pathways previously found in liver; they suggest the positioning of 18:2 desaturase and 18:3 elongase near the plasma membrane; they indicate that for the synthesis of nonessential fatty acids the formation of 18:O from 16:O is the rate-determining step; and they show that the conversion of 18:2 to 20:3 is rapid. These ex- periments demonstrate a method to study lipid enzyme kinetics in living cells.-MMarcelo, C. L., and W. R. Dunham. Fatty acid metabolism studies of human epidermal cell cultures. J. Lipid Res. 1993. 34: 2077-2090.
Supplementary key w o r d s essential fatty acid deficiency keratinocytes
Both classical and newer techniques for culturing primary epidermal basal cells (keratinocytes) use 10-15% serum in standard medium formulations (1-4). In culture medium, serum is usually the only source of essential and nonessential fatty acids. One system (5-7) uses serum- free, low-calcium growth medium MCDB 153 that allows the rapid growth of keratinocytes in vitro. Because the rapidly growing keratinocytes are in an essential fatty acid (EFA)-deficient environment, they show altered fatty acid compositions (8).
Fatty acids are long hydrocarbon chains, with a car- boxyl group at one end. They are usually esterified to the
sn-1 and sn-2 carbons of the glycerol backbone of phos- pholipids, to other amphipathic lipids, and to the carbons of glycerol, forming mono-, di-, and tri-acylglycerols (9).
The human body can synthesize the saturated fatty acids (thus, nonessential) using cytosolic enzymes of the acetyl-coA carboxylase and fatty acid synthase complexes (lo), producing mainly 16:O (palmitic acid) and minor amounts of 18:O (stearic acid). Removal of two hydrogen atoms from a saturated fatty acid forms a monounsatu- rated fatty acid by direct oxidative desaturation. A A9 desaturase is the usual desaturation enzyme for produc- tion of monounsaturated fatty acids in human tissues (;.e., 16:l and 183) (11). Human tissue cannot introduce double bonds beyond the 9-position, thus 18:2 (A9, '*) and 20:4 (A5, "9 14) are not synthesized by mammalian cells and are supplied by the diet; Le., they are essential (11).
Hypothetically, a keratinocyte growing in serum-free medium can adapt to the EFA-deficient growth condition in a number of ways. I ) The cell can develop the capacity to desaturate beyond the 9-position, thus acquiring the ability to synthesize essential fatty acids; 2) the keratino- cyte can synthesize unusual fatty acids that can function- ally compensate for the EFA-deficient state; 3) the cell can adjust and flourish in a classically defined EFA-deficient state. We have studied keratinocyte de novo fatty acid syn- thesis, and elongation and desaturation of long chain es- sential and nonessential fatty acids using a number of radiolabeled substrates of fatty acid metabolism. O u r studies have allowed kinetic descriptions of lipid metabolism in intact normal human cells.
Abbreviations: FA, fatty acid; EFA, essential fatty acid; EGF, epider- mal growth factor; P, passage; TLC, thin-layer chromatography; GC, gas chromatography; HPLC, high performance liquid chromatography; FAMES, fatty acid methyl esters. Unless otherwise indicated, 18:2, 18:3, and 20:4 are of the n-6 series.
'To whom correspondence should be addressed.
Journal of Lipid Research Volume 34, 1993 2077
by guest, on May 27, 2018
ww
w.jlr.org
Dow
nloaded from

MATERIALS AND METHODS
Materials
Tissue culture reagents were tissue culture grade and all organics were HPLC grade. Gas chromatography and HPLC fatty acid standards and 17:O were obtained from Nu-Chek-Prep, Inc., Elysian, MN. All medium compo- nents were obtained from Sigma, St. Louis, MO. Plastics were from Corning Laboratory Science Co., Corning, NY. Petroleum ether (30-60°C), benzene, HPLC water, and acetonitrile were purchased from Baker, Phillipsburg, NJ; methanol and chloroform were obtained from B & J Baxter, McGraw Park, IL. Thin-layer Silica gel 60 plates were obtained from Merck, Darmstadt, Germany. Frozen bovine pituitaries were from Pel-Freeze, Rogers, AR, and filters were obtained from Millipore, Corp., Bedford, MA. [14C]acetate, Na salt (51.6 mCi/mmol) and [SHIpalmitic acid (54 Ci/mmol) were purchased from Amersham Corp, Arlington Heights, IL; [SHIacetate, Na salt (3.6 Ci/mmol), [14C]linoleic acid (50 mCi/mmol), and [ 14C]arachidonic acid (54.4 mCi/mmol) were from NEN Research Products, DuPont, Boston, MA. The 14C-
labeled compounds were labeled at the 1-position, palmitic acid was labeled at the 9- and 10-positions, and the [3H]acetate was labeled at the 2-position.
Culture
The basic medium MCDB 153 was prepared as described by Boyce and Ham (5-7) and was sup- plemented with 0.6 x 10⁻⁶ M (0.218 pg/ml) hydrocorti- sone, 5 ng/ml EGF, 5 pg/ml insulin, 6 mg % bovine pituitary extract (6), and 0.15 mM CaC1, to form com- plete growth medium. Discarded human skin from mastectomy and abdominoplasty cosmetic surgery was processed as previously described (8). The cultures were fed every 48 h with serum-free MCDB 153 and reached - 70% confluence after 5-7 days. The monolayers were passaged every 3rd to 5th day, yielding an expanding cell strain from each piece of surgical tissue (5-8).
Radiolabeling studies
The radiolabeled substrates for fatty acid synthesis were evaporated under a N2 stream to dryness. These were resuspended in 10-50 p1 ethanol, and then enough 0.6% fatty acid-free bovine serum albumin was added (Sigma, St. Louis, MO) to yield a 0.02% fatty acid-free bovine serum albumin plus radiolabel dilution in com- plete growth medium. The radioactivity/ml of growth medium for the overnight labeling experiments was: 1,000,000 dpm/ml for [3H]16:0 (0.02 pM); 200,000 dpm/ml for ['4C]18:2 (4 pM); 100,000 dpm/ml for [l4C]20:4 (2 pM); and 2,000,000 dpm/ml for [3H]acetate (3.7 mM) (the parenthetical concentrations refer to total concentrations). In the [ 14C]acetate time-course study, the
medium contained 400,000 dpm/ml (3.7 p ~ ) , and the specific activity of the label in the [14C]18:2 time-course was 11,000 dpm/ml (4 gM) of growth medium. Each flask contained 10-12 ml radiolabeled medium. There were four to eight T-75 flasks for each time point. At the ap- propriate time points, the flasks were cooled to 4OC, the spent medium was decanted and pooled, and the flasks were rinsed twice with ice cold phosphate-buffered saline. One to two ml of cold methanol was added to each flask. The amount of radioactivity in an aliquot of the labeling medium and of the pooled, spent medium was recorded.
Lipid analysis
Rinsed T-75 flasks containing 1-2 ml methanol were scraped and the material was pooled by time point. These were extracted with a 1:2:1.5 ratio of methanol-chloro- form-0.1 M KCl in 50% methanol, and the organic phase was re-extracted with 2 . 5 ~ volume of 0.1 M KCl in 50% methanol (12). The precipitated protein and DNA were processed for protein and DNA analyses as previously described (2). The organic phase (containing the polar phospholipids, neutral lipids, complex polar lipids such as the sphingosine-based lipids, cholesterol and cholesteryl esters (13), and free fatty acids) was split into two aliquots and evaporated under a nitrogen stream. One aliquot was transmethylated to form fatty acid methyl esters (FAMEs) using 6% methanolic-HC1 for 2 h at 8OoC (14) with 50 pg of 17:O added as a time reference and quantitative stan- dard for gas chromatography (GC). The second aliquot, suspended in 50 pl of chloroform-methanol 1:1, was ap- plied to a TLC plate and chromatographed in one direc- tion using chloroform-methanol-acetic acid 90:8:1. Neu- tral lipids, including cholesterol, cholesteryl esters, and free fatty acids were separated from the phospholipids and other amphipathic lipids (15). The phospholipid fraction was scraped and the material was eluted from the silica during transmethylation with 6% methanolic-HC1 plus 50 pg 17:O. The FAMEs from the whole cell and TLC- separated aliquots were extracted into petroleum ether, evaporated to dryness and stored frozen in benzene. The FAMEs were re-suspended in 200 p1 of benzene and filtered through a 0.45 pm filter. The solvent was evapo- rated and the residue was re-suspended in either 12-30 pl filtered chloroform (for GC analysis) or 25 pl methanol (for HPLC analysis). One pl chloroform or 20 pl of methanol was used for analysis.
Analysis of FAMEs
The samples were analyzed using both GC and HPLC with Radiomatic instrumentation. FAMEs were analyzed using a Hewlett-Packard GC Model 5710A equipped with a J and W Scientific (Folsom, CA) fused silica Megabore DB225, 0.53 micron diameter column. The FAMEs were eluted with scrubbed helium at a flow rate of 2.79 ml/min
2078 Journal of Lipid Research Volume 34, 1993
by guest, on May 27, 2018
ww
w.jlr.org
Dow
nloaded from

at 215OC for 8 min, at a gradient of 4O/min to 23OOC and then isothermic for 25 min. The gas chromatograph was vented into a chemical hood and the effluent from the flame ionizer was trapped using an inverted 600 ml glass beaker containing a #1 Whatman paper filter, folded into a multilayered trap. The flame ionization detector output of the gas chromatograph was digitized by an IBM-PC computer interface (model AN-146, Alpha Products, Darien, CT).
Both the recording and data evaluation software were written by us in BASIC or FORTRAN. The recording software entered the digitized version of the chromato- gram into a computer He as a sequence of 10,500 num- bers. These files were later accessed by a FORTRAN rou- tine that allowed the researcher to work interactively with the data using a pointing device (Microsoft Mouse) and high resolution graphics (Hercules). The chromatogram was displayed on the screen (5000 points at a time), and the user was asked to locate peaks in overlapping clusters. The exact locations of the peaks were computed by curve fitting parabolas through the points nearest the Mouse lo- cation. After the peaks were located, the baseline was chosen as shown in Fig. 1. A trial curve shape was formed by joining two different parts of the chromatogram. The left side of the curve was defined by the curve A-B (minus the baseline). The right side of the curve was defined by scaling the curve D-E (minus baseline) so that it matched curve A-B at point B. The component curves (in the case shown in Fig. 1 there are three) were then formed by cen- tering the trial curves at each of the peaks: B, C, and D. The area determination thus reduces to fmding three coefficients, a;, in
3 Di a aj c$ji Eq. 1)
j =1
where Di are the data, and c$ji are the component curves. The least-squares solution to this problem involves a sin- gular value decomposition of a matrix, which was accom- plished by calls to MINFIT from the NAASA Library (16). The use of this computer code was found to increase the accuracy of our measurements of standard materials by approximately a factor of ten as compared to those us- ing an HP integrator (Model 3392A).
FAMES were also analyzed by C-18 reverse phase chro- matography with a Hewlett-Packard 1090M HPLC equipped with a diode array spectrometer. The initial sol- vent was 70% acetonitrile and 30% water adjusted to pH 3.6 with phosphoric acid. After 2 min, a continuous gra- dient of increasing percent acetonitrile was initiated, reaching 90% at 48 min, followed by a gradient to 95% acetonitrile at 49 min, and to 100% acetonitrile at 60 min. After HPLC analysis, the separated fatty acids were pumped into a Radiomatic Instrument, Tampa, FL, which quantitated the dpm (14C or 3H) per peak.
Retention Time
Fig. 1. Hypothetical gas chromatogram of three overlapping peaks. The three peaks are identified with a computer pointing device at loca- tions B, C, and D. The exact peak locations are determined by curve fitting parabolas to the datapoints near the abscissa values indicated by the pointing device. The baseline (dotted line A-E) is also identified by a pointing device. The areas of each peak are obtained by methods described in the text.
Analysis of labeled time-course studies
The results of the radiolabeled time-course experiments were analyzed using the theory for first-order kinetics reactions. When the radiolabel used was [1-14C]18:2, this theory gives rise to differential equations describing the various reactions depicted in Fig 2A. These chemical reactions conserve the amount of radioactive label as the products of the reactions all contain the [l-lCC]carbon of the added 18:2. To lay the groundwork for this approach, the solution for a typical first-order ordinary differential equation is reviewed. For the first reaction in Fig. 2A, the 18:2 elongation to 20:2, one can write
6 [18:2] = - k l A [18:2];
6 t
= -k-iA [20:2] 6 [20:2]
Assuming that initially (at t = 0), (18:2] = A and [20:2] = 0, then for a two-component system [20:2] = A - [18:2], and the two equations can be combined into a single differential equation with the solution:
k l A
[20:2] =
Therefore, the value of [20:2] approaches a steady-state value at large t and approaches at a rate equal to the sum
Marcel0 and Dunham Fatty acid metabolism 2079
by guest, on May 27, 2018
ww
w.jlr.org
Dow
nloaded from

A r 1
B
I 1 i 18:2 (medium) 1
5-- I k,N 1 0 'c 1.4
18: 2 e 2 0 : 2
1 k 3 A
18: 3 e 20: 3
I + 20: 4
I
Ac(medium) I
k3, - 14:O
Fig. 2. The essential, polyunsaturated fatty acids; and €3) the nonessential saturated and monounsaturated fatty acids.
Major pathways of fatty acid biosynthesis by desaturation and chain elongation in mammalian tissues. A)
of the two rate constants, klA and k-1A. Because [18:2] + [20:2] = A, the steady state asymptote of the ratio of the two compounds can be written:
where is the equilibrium constant for the reaction. Thus, for this simple two-state system, one has the con- cept of approach to equilibrium via a first-order exponen- tial decay process. A similar set of equations and reason- ing shows that a system at equilibrium, if not affected by the introduction of the radioactive component, gives the same solution as equation 3. However, the value of A, the initial radiolabel concentration, would be different in this case. The experiments described in this manuscript use trivially small amounts of radiolabeled components; therefore they measure the kinetic response of the cells to these substrates under normal conditions.
Uptake by keratinocytes of radioactive 18:2 Thirty two T-75 flasks were divided into sets of 8 each,
following the four time-point protocol of 1, 4, 8, and 24 h. The radioactively labeled medium contained a final concentration of 4 p M 18:2 and 10,000 dpm [I4C]l8:2/ml.
Warmed labeled medium was added to 16 T-75 flasks at To and incubated at 37OC. The other 16 T-75 flasks were fed medium containing only 4 p M 18:2 (no radiolabel) and incubated. After 1, 4, 8, and 24 h, 2 duplicate flasks were put on ice, the medium was decanted, the monolayers were rinsed and overlaid with 1 ml methanol. The spent radioactive medium from the second set of duplicate flasks was pooled and the labeled keratino- cyte monolayers were rinsed with nonradioactive spent medium. The [ 14C]18:2-labeled cells were then overlaid with 12 ml spent 4 p M 18:2 (nonlabeled) medium and cold-chased for an additional 1, 4, 8, or 24 h time period to determine the release of 14C label by the cells. The cell monolayers were scraped into 3 ml methanol. The medium and methanol cell slurries were counted. This ex- periment was done using three cell strains, P3 (n = 3) .
RESULTS
Fatty acid composition of cells grown in FA-deficient medium
Fig. 3 shows the fatty acid composition, obtained by GC, of keratinocyte strains (P2-P4) grown in serum- and fatty acid-free medium for 2-3 weeks. The cells contain
2080 Journal of Lipid Research Volume 34, 1993
by guest, on May 27, 2018
ww
w.jlr.org
Dow
nloaded from

50
40
30
20
10
0
Owhole Cell I T 6zs Phospholipids
140 141 16:O
Fatty Acids Fig. 3. Fatty acid composition of epidermal keratinocytes. Keratinocyte cultures were extracted as described in Methods and the fatty acids were analyzed by gas chromatography. The fatty acids found in the entire cell and in the phospholipid component of the cells are presented. The data (n = 17) are in mole percent.
small amounts of the essential fatty acids 18:2, 20:3, and 20:4 and contain increased amounts of the monounsatu- rated fatty acids (n = 17). Our previous studies (ref. 8, Fig. 3) have shown that snap-frozen epidermal biopsies and the trypsinized cell suspension used to initiate the cultures contained - 35% essential (18:2, 20:3, and 20:4) and -18% monounsaturated fatty acids while the cell percentages were -8% and -56%, respectively. The results are consistent with the hypothesis that the loss in essential polyunsaturated fatty acids is balanced by a gain in the monounsaturated fatty acids.
The EFA deficiency is seen in the composition of all the extracted fatty acid (whole cell material) and in the phos- pholipid component of the cells where >90% of the FA are found (8). It is not known whether this change [seen by the first passage (8)] results from a selection process by the EFA-deficient medium of an epidermal cell type al- ready expressing the EFA-deficient phenotype or whether the keratinocytes make a biochemical adjustment to the EFA-deficient environment.
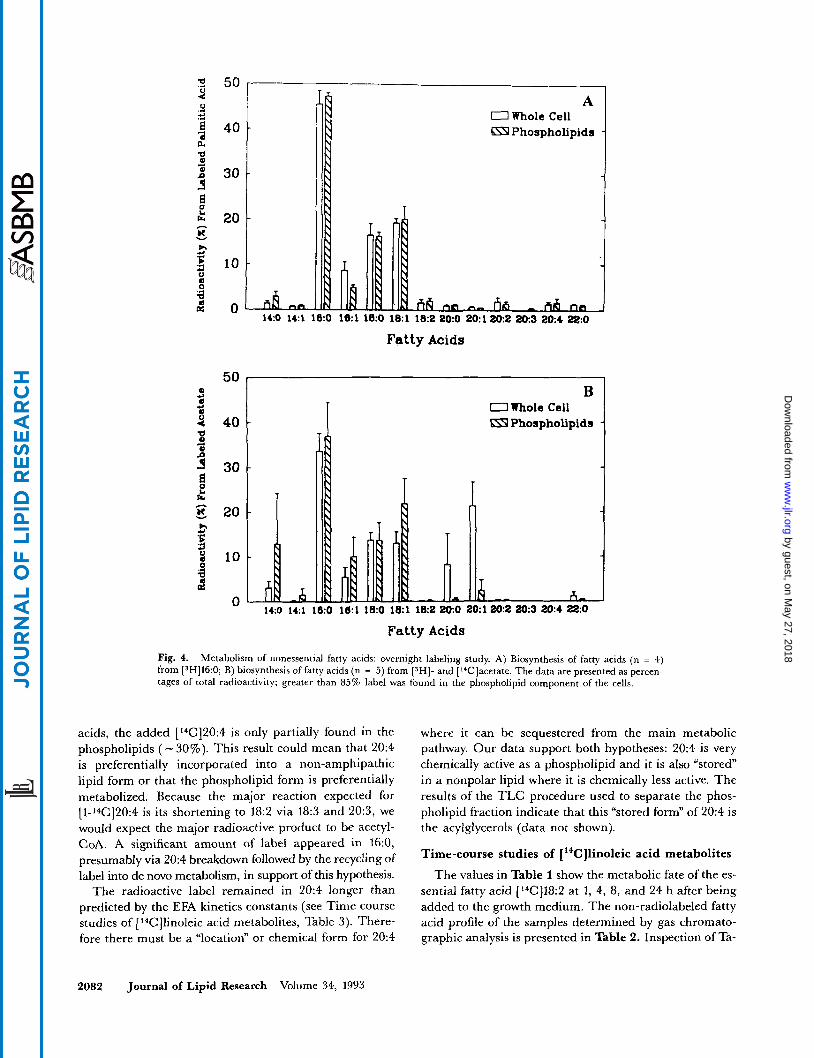
Overnight labeling studies: [14C]- and [3H]acetate The metabolism of nonessential fatty acids in EFA-
deficient keratinocytes was studied using both [ 14C]-and [SHIacetate (n = 4). The data, shown in Fig. 4A, indicate that the cells synthesize the saturated and monounsatu- rated fatty acids from acetyl-coA and malonyl-CoA, with 16:0, 18:0, 16:1, and 18:l being the major fatty acids formed. No label was seen in 18:2, 18:3, 20:3, and 20:4, indicating that the cells are not capable of synthesizing the essential fatty acids using the products of de novo metabolism as substrates. For the major fatty acids, 80%
of the label was found in the phospholipid fraction of the cells (data not presented).
Overnight labeling studies: [3H]palmitic acid Addition of [3H]palmitic acid (16:O) to the cultures
showed that the cells elongate 16:O to 18:0, and that 16:O and 18:O were metabolized to 16:l and 18:1, respectively, presumably via Ag desaturase activity, n = 4 (Fig. 4B). A trivial amount of label was seen in the polyunsaturated fatty acids and 75% of the label was found in the phos- pholipid fraction of the cells (data not presented).
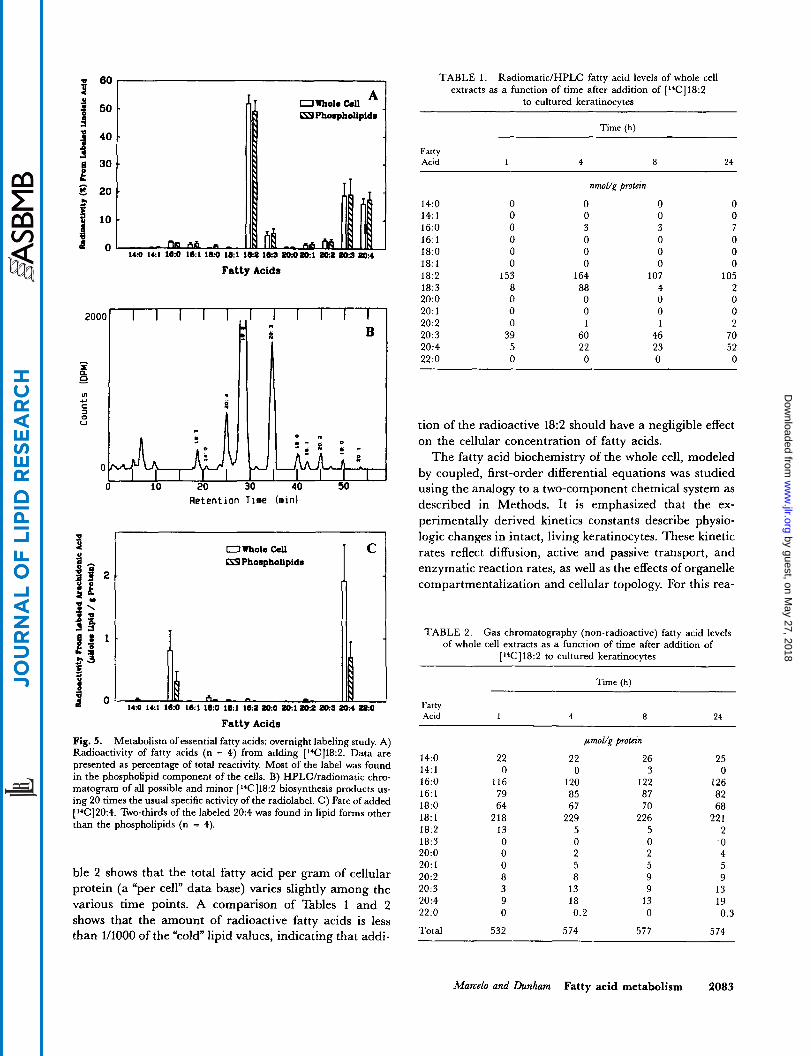
Overnight labeling studies: ['4C]linoleic acid The addition of [ I4C ]linoleic acid (18:2) to the medium
showed that the cells convert 18:2 to 20:3 and 20:4, n = 4 (Fig. 5A). Small amounts of 20:2 were also synthesized by the cells. Seventy to eighty percent of the label was in the phospholipid fraction (data not presented). Fig. 5B presents an HPLC chromatogram of a typical ['4C]18:2 experiment. Trace amounts of the saturated and monosaturated fatty acid were seen, indicating very little breakdown of [ 14C]18:2, which would liberate radioactive acetate for its subsequent reuse in de novo synthesis. There is also no evidence of cellular eicosanoid produc- tion, which elutes during the first 5 min of the chromatogram.
Overnight labeling studies: ['4C]arachidonic acid The results of studies to determine the metabolism of
added [14C]arachidonic acid (20:4) to cultures is presented in Fig. 5C (n = 4). The data, presented as pmol fatty acid/g protein, show that, unlike the other fatty
Marcel0 and Dunham Fatty acid metabolism 2081
by guest, on May 27, 2018
ww
w.jlr.org
Dow
nloaded from
0 Whole Cell 659 Phospholipids
18:O 161 18:O 18:l 162 20:O 20:l 202 203 204 m0
Fatty Acids
50 1
T I B
OWhole Cell 6TJ Phospholipids
Fatty Acids
Fig. 4. Metabolism of nonessential fatty acids: overnight labeling study. A) Biosynthesis of fatty acids (n = 4) from [3H]16:0; B) biosynthesis of fatty acids (n = 5) from ISH]- and [‘Clacetate. The data are presented as percen- tages of total radioactivity; greater than 85% label was found in the phospholipid component of the cells.
acids, the added [*4C]20:4 is only partially found in the phospholipids ( - 30%). This result could mean that 20:4 is preferentially incorporated into a non-amphipathic lipid form or that the phospholipid form is preferentially metabolized. Because the major reaction expected for [1-14C]20:4 is its shortening to 18:2 via 18:3 and 20:3, we would expect the major radioactive product to be acetyl- CoA. A significant amount of label appeared in 16:0, presumably via 20:4 breakdown followed by the recycling of label into de novo metabolism, in support of this hypothesis.
The radioactive label remained in 20:4 longer than predicted by the EFA kinetics constants (see Time course studies of [ 14Cllinoleic acid metabolites, Table 3) . There- fore there must be a “location” or chemical form for 20:4
where it can be sequestered from the main metabolic pathway. Our data support both hypotheses: 20:4 is very chemically active as a phospholipid and it is also “stored” in a nonpolar lipid where it is chemically less active. The results of the TLC procedure used to separate the phos- pholipid fraction indicate that this “stored form” of 20:4 is the acylglycerols (data not shown).
Time-course studies of [‘*C]linoleic acid metabolites
The values in Table I show the metabolic fate of the es- sential fatty acid [14C]18:2 at 1, 4, 8, and 24 h after being added to the growth medium. The non-radiolabeled fatty acid profile of the samples determined by gas chromato- graphic analysis is presented in Table 2. Inspection of Ta-
2082 Journal of Lipid Research Volume 34, 1993
by guest, on May 27, 2018
ww
w.jlr.org
Dow
nloaded from
B 40
e 30
3
8
E 20
I 0 B z .
I
1 10
4 0 L 140 141 160 161 160 18:l
A 1 owholecell A I Owhole cell Phompholipidm
tea ies mom1 ma m s mr tea ies mom1 ma m s mr Fatty Acids
20001 I I I I I . . I I I I I I 1
m L)
C
0 V
Retention Time (minl
Owhole Cell L19 Phompholipida I “ n
Fatty Acids Fig. 5. Metabolism of essential fatty acids: overnight labeling study. A) Radioactivity of fatty acids (n = 4) from adding [1*C]18:2. Data are presented as percentage of total reactivity. Most of the label was found in the phospholipid component of the cells. B) HPLCkadiomatic chro- matogram of all possible and minor [ 14C]18:2 biosynthesis products us- ing 20 times the usual specific activity of the radiolabel. C ) Fate of added [14C]20:4. Two-thirds of the labeled 20:4 was found in lipid forms other than the phospholipids (n = 4).
ble 2 shows that the total fatty acid per gram of cellular protein (a “per cell” data base) varies slightly among the various time points. A comparison of Tables 1 and 2 shows that the amount of radioactive fatty acids is less than 1/1000 of the “cold” lipid values, indicating that addi-
TABLE 1. Radiomatic/HPLC fatty acid levels of whole cell extracts as a function of time after addition of [“C]18:2
to cultured keratinocytes
Time (h)
Fatty Acid I 4 8 24
14:O 14:l 16:O 16: 1 18:O 18: 1 18:2 18:3 20:o 20: 1 20:2 20:3 20:4 22:o
0 0 0 0 0 0
153 8 0 0 0
39 5 0
nmol/g protein
0 0 0 0 3 3 0 0 0 0 0 0
164 107 88 4 0 0 0 0 1 1
60 46 22 23 0 0
0 0 7 0 0 0
105 2 0 0 2
70 52 0
tion of the radioactive 182 should have a negligible effect on the cellular concentration of fatty acids.
The fatty acid biochemistry of the whole cell, modeled by coupled, first-order differential equations was studied using the analogy to a two-component chemical system as described in Methods. It is emphasized that the ex- perimentally derived kinetics constants describe physio- logic changes in intact, living keratinocytes. These kinetic rates reflect diffusion, active and passive transport, and enzymatic reaction rates, as well as the effects of organelle compartmentalization and cellular topology. For this rea-
TABLE 2. Gas chromatography (non-radioactive) fatty acid levels of whole cell extracts as a function of time after addition of
[“C]18:2 to cultured keratinocytes
Time (h)
Fatty Acid 1 4
~~
8 24
14:O 14:l 16:O 16:l 18:O 18: 1 18:2 18:3 20:o 20: 1 20:2 20:3 20:4 22:o
Total
22 0
116 79 64
218 13 0 0 0 8 3 9 0
532
pmol/g protein
22 26 0 3
120 122 85 87 67 70
229 226 5 5 0 0 2 2 5 5 8 9
13 9 18 13 0.2 0
574 577
25 0
126 82 68
22 1 2 0 4 5 9
13 19 0.3
574
Marcel0 and Dunham Fatty acid metabolism 2083
by guest, on May 27, 2018
ww
w.jlr.org
Dow
nloaded from

son there is a distinction to be drawn between these rate constants and those normally associated with chemical ki- netics studies. Equation 4 shows that the ratio of the for- ward to backward rate constants is equal to the equilibrium constant, theoretically. However, our data will sometimes show discrepancies between the “cold” equilibrium ratios and the “kinetic equilibrium constants.” These represent equilibria reached over a time span much longer than the 24-h study period. For example, such a discrepancy could result from fatty acid interchange be- tween membrane phospholipids in the various organelles. To accentuate this observation, the ratios of kinetic rate constants will be referred to as “kinetic equilibrium cons- tants” in this manuscript. One significant conclusion of these observations is that not all of the fatty acids in the cell are available as substrates to the main reactions of fatty acid metabolism.
The method used to solve the eight differential equa- tions in Fig. 2A was a standard matrix approach to sys- tems of ordinary differential equations (17). This ap- proach was implemented in FORTRAN using the subroutines: ORTHES, ORTRAN, HQR2, SLUD, and SBS from the NAASA Library (16). The solution to a set of coupled, ordinary first-order differential equations is a set of linear combinations of the fatty acids (eigenvectors), each associated with a characteristic decay time (eigen- value). Evaluation of equations analogous to equation 3 yields the values of each fatty acid as a function of time. These values are compared to the experimental values via a “goodness-of-fit” criterion, in this case, a variance. The associated problem of choosing the best solution to this system was solved by iterative minimization of the vari- ance of the data simulation using the solution to the sys- tem to generate the trial component values at the various time points. The minimization method was a standard method (quadratic interpolation) developed in our laboratory for spectroscopic applications (18).
The numerical techniques that solve these coupled, differential equations are sensitive to errors in the FA de- terminations. The data as presented (FA per weight of protein) represent the amount of FA per keratinocyte. This assumption as well as the protein (or DNA) determi- nation is subject to errors that could dominate the numer- ical procedures. To control these errors, we measured the uptake of 18:2 by the keratinocytes over a 24-h time inter- val. Radiolabeled [l-’*C]18:2 was added to supplement the growth medium of keratinocytes. The keratinocyte cultures were scraped into methanol at various timepoints (Materials and Methods) and the cell slurries and spent medium were counted to determine the uptake of 18:2. Cold chase experiments determined that the amount of radioactivity released to the cold medium was less than 1% of the levels found in the cell slurries.
The radioactivity left in the medium after 24 h was not “zero” as would be predicted by the analysis of the uptake
kinetics of the data, but was substantially larger (5-10T of initial values, depending on the sample). Folch extrac- tion of the spent medium at the 24-h time-point deter- mined that all the radioactivity left in the medium was in the aqueous phase. None of the radioactivity was found in the lipid phase. Folch extraction of the To medium de- termined that 6% of the radioactivity was located in the aqueous phase. Thus, the residual radioactivity in the 24-h spent medium is a background level and was sub- tracted from the radioactive levels in the medium for the data analysis.
Because 18:2 is taken up from the medium but not released by the keratinocytes during these experiments, the uptake of 18:2 can be analyzed according to equation 3 where k - 1 ~ equals zero. The results are shown graphi- cally in Fig. 6 and are well fit by a value of 0.4 h for the rate of uptake of 18:2 by the keratinocytes. The determi- nation of the rate of uptake, k,,, allows us to keep this number constant during the following analysis and allows a rescaling of the data so that the total radioactivity in the keratinocytes exactly fits the numbers for the uptake. This rescaling process greatly reduces the errors inherent in the FA per protein determinations by constraining the total radioactivity in the keratinocytes to follow the rate of in- crease of FA calculated from the independent, radioactive 18:2 uptake experiments.
The results of the analysis of the individual FAs are shown in Fig. 7A with the “best fit” kinetic constants shown in Table 3. During the minimization process one may vary all eight parameters shown in Fig. 2A. However, the back-reactions (k-,) are simply related to the cor- responding forward-reactions (k,) through the equilibrium constants (equation 4), which can be estimated from the 24-h time-point (Table I). The values in Table 3 are the result from such a constrained fit.
ostrain 1 .strain 2 nstrain 3 -
a
5 -6 - C -
-8 -
-10 0 10 20 30
Time (hr)
Fig. 6. Analysis of the uptake of 18:2 by EFA-deficient keratinocytes. The semilogarithmic plot shows the time evolution of radioactivity in the keratinocytes (B) compared with the radioactivity of the lipids in the medium (A) for three cell strains. The argument for the ordinate can be obtained by taking the logarithm of a rearrangement of equation 3. The regression line has a slope of 0.4/h and an R value of 0.996.
2084 Journal of Lipid Research Volume 34, 1993
by guest, on May 27, 2018
ww
w.jlr.org
Dow
nloaded from

0 18:2, 20:2, ,I 18:3, A 20:3, 020:4 125 I I
- - - - - - I c c, 0 k c4 - 75 \
5 2 50
9 25
0
'8 100
m Q) 4
- 0 5 10 15 20 25
Time (hr)
3000
2500
2000
1500
1000
500
0 0 5 10 15 20 25
Time ( Hours) Fig. 7. Time evolution of radiolabeled fatty acids superimposed by computer simulations (lines). A) Essential fatty acid biosynthesis (the insert amplifies the y-axis to show the simulation of the 20:2 time evolution); and B) nonessen- tial saturated and monounsaturated fatty acid synthesis.
These constraints on the equilibrium constants reduce the number of free parameters to four, the forward reac- tion rates, and allow these rates to be determined to an ac- curacy of -30% (based on the uncertainty in the HPLWRadiomatic measurements). The values of klA, kZA, and k3A have a larger uncertainty if they are con- strained to changes that preserve their relative magni- tudes. If one of the reactions is so fast that it reaches steady state in 30 min or less, then the speed of the reac- tion is only important when compared to the other reac- tions in the scheme. The data can be fit equally well by any set of values for klA, kZA, and k3A that preserve the relative values shown in Table 3 in parentheses. For this reason, the kinetic constants in Table 3 are reported only with lower bounds for these three reactions. However, it is important to note that the set of equations that allows
a fit of the quality shown in Fig. 7A is much smaller than that implied by Table 3.
Twenty four hours after addition of 18:2, the reaction can be described as 182 becomes 20:4 because, by this time, the slowest reaction is 98% complete and the rela- tively small value of k4A dominates the system. There- fore, our choice of constraining the K E ~ S to their values at 24 h is justified because it can only lead to a maximum error of 2% in the rate constants.
The significance of the values in Table 3 can be empha- sized by pointing to several other features of these studies. The scheme in Fig. 2A is sufficient to predict every aspect of the data in Table 1. This is direct evidence that Fig. 2A describes the main pathway for essential fatty acids in these keratinocytes. The formation of 20:4 has a charac- teristic time (Table 3) of hours whereas the formations of
Marcdo and Dunham Fatty acid metabolism 2085
by guest, on May 27, 2018
ww
w.jlr.org
Dow
nloaded from

TABLE 3. Kinetic constants and “equilibrium constants” for the principal essential fatty acids in cultured keratinocytes
Kinetic Constants“
k , A + k - I A k2A + k - 2 A k3A + k - J A k4A + k-4 ,4
0.20/h > 4/h (3400) > 4/h (14) 0.44/h
Equilibrium Constants
Calculated from
Equilibrium Kinetic Cell Fatty Acid Constants Measurements Values (Fig. 3)
0.020 0.019
0.74 36
0.13 0.0
1.86 OD
“The values in parentheses resulted from “best fits” and were used to generate Fig. 7A.
18:3 and 20:3 reach steady state in minutes, when the primary substrate is 18:2. Therefore, the relatively high values of 18:3 in the kinetic experiment relative to the whole cell equilibrium (see ~~2 and K E ~ ~ in Table 3) show that 18:3 is in the main pathway in the formation of 20:4 from 18:2. This fact is not discernible from the whole cell equilibrium values for the fatty acids (Table 3) where the 18:3 level, being equal to zero, is not obviously in any pathway.
Comparison of the “kinetic equilibrium values” from Table 3 with those of the “cell fatty acid values” calculated from the values in Fig. 3, shows differences among some of the constants. The differences are due to elevated levels of [14C]18:3 and [l4C]20:3 in the kinetic study. When the Keqs generated from a kinetic study do not progress to the whole cell equilibrium constants, then the kinetic study is not monitoring the cellular system in its entirety. These differences suggest that the relatively high levels of 18:3 and 20:3 measured in our kinetic studies are reduced to “zero” in a time span of several days by a process that is much slower than the chemistry monitored by these experiments.
Time course studies of [ ‘*C]acetate metabolites
[ 14C]acetate was added to the cell medium; the labeled and “cold” fatty acids were quantified at 0.5, 1, 2, 4, 8, and 24 h, using HPLC (with Radiomatic Instrumentation) and GC. The labeled fatty acid levels are presented in Table 4. The “cold” fatty acid values (data not presented) are similar to those in Table 2 except that the total fatty acid pools increased during the time course of this study by 10% over 24 h. This increase was attributed to normal cell growth, but presented a problem to our data reduc- tion procedures because it implied that the numbers of cells changed during the experiment. Therefore, the radi- oactive data were normalized to equalize the total amounts of fatty acids and these data account for this ad- ded growth. Plots of the corrected data (Fig. 7B) show
that the data suggest second-order kinetics as I4C-label accumulation into fatty acids appears to increase quadrat- ically with time. The probability of any second-order ki- netics (yielding two radioactive carbons on the same fatty acid) is impossibly small because of the small specific ac- tivity of the radioactively labeled acetate. Therefore, these quadratic increases must result from a more complicated synthetic pattern than that used to analyze the essential fatty acid data (Fig. 2A). The reason for this added com- plication is that acetate is both the main source of carbon for the de novo pathway and also the carbon source for the elongation reaction to lengthen 16:O which is the end product of de novo synthesis.
Fig. 2B is a scheme showing the reactions of the nones- sential FA pathway that were measured in this experi- ment. “Ac(medium)” represents the radioactive acetate as added to the growth medium. “Ac(cel1)” represents the acetate level in the cytoplasm that is in chemical contact with the de novo synthesis and elongation reactions. In this model, the initial conditions are that Ac(medium) represents an “infinite” source of radioactive acetate over the duration of the experiment (24 h); all other concentra- tions are zero. Therefore, Ac(medium) stays almost at ini- tial values over the 24 h and Ac(cel1) and 14:O is “fed” uni- formly via the chemistry represented by klB. The main pathway for de novo synthesis of fatty acid is expected to proceed via k2B and is in chemical contact with the cytoplasmic acetate level and not in contact with the ace- tate level in the growth medium. The pathway in Fig. 2B denoted by k2B is a convenient way to model de novo syn- thesis as a continuous and constant supply of radioactive 14:O. Actually, both kZB and k3B represent different views of the same de novo pathway as will be elaborated below.
TABLE 4. Radiomatic/HPLC fatty acid levels of whole cell extracts as a function of time after addition of [I’CIacetate
to cultured keratinocytes
Time (h)
Fatty Acid 0.5 1 2 4 8 24
~~~~ ~ ~
nmoNg protein
14:O 1 5 23 91 214 939 14: 1 0 0 1 4 12 80 16:O 8 21 84 368 745 3472 16:l 1 2 24 136 304 1515 18:O 1 3 16 84 212 1272 18: 1 1 2 7 120 403 2518 18:2 0 0 3 29 53 40 18:3 0 0 0 0 0 0 20:o 0 2 3 13 32 206 20: 1 0 2 19 134 409 1971 20:2 0 2 1 9 0 92 20:3 0 0 0 0 0 0 20:4 0 0 0 0 0 0 22:o 0 0 1 13 13 114
2086 Journal of Lipid Research Volume 34, 1993
by guest, on May 27, 2018
ww
w.jlr.org
Dow
nloaded from
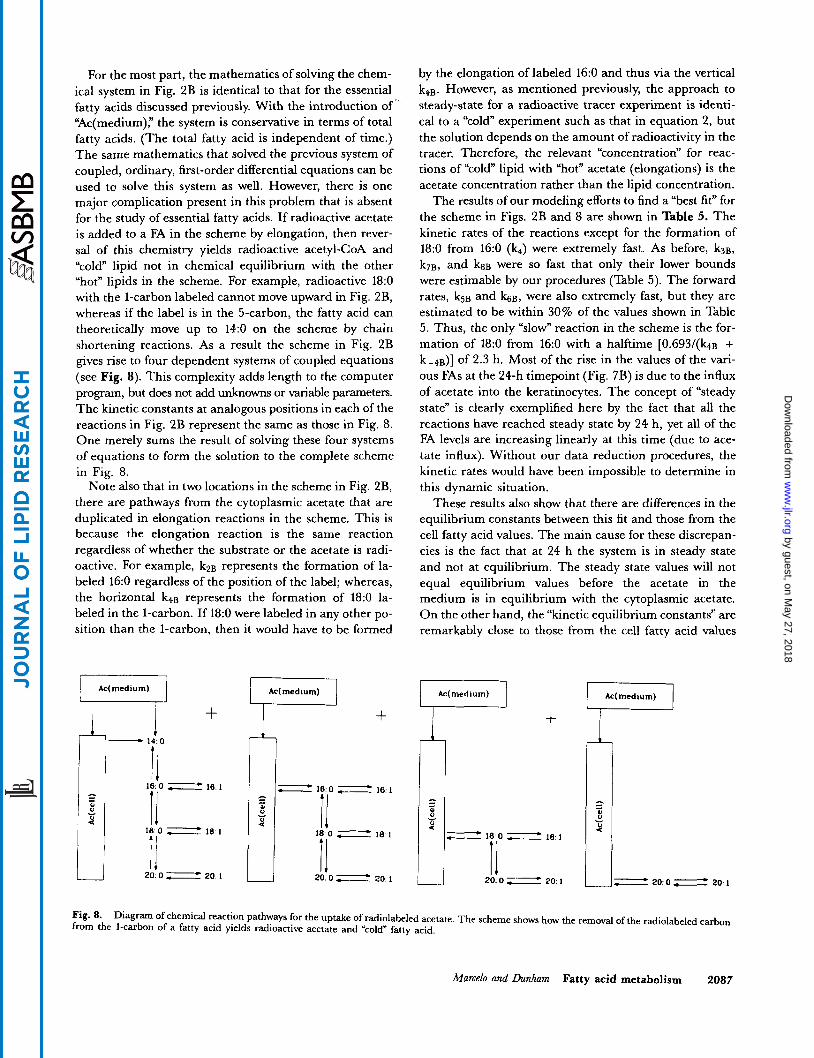
For the most part, the mathematics of solving the chem- ical system in Fig. 2B is identical to that for the essential fatty acids discussed previously. With the introduction of’ ‘Ac(medium),” the system is conservative in terms of total fatty acids. (The total fatty acid is independent of time.) The same mathematics that solved the previous system of coupled, ordinary, first-order differential equations can be used to solve this system as well. However, there is one major complication present in this problem that is absent for the study of essential fatty acids. If radioactive acetate is added to a FA in the scheme by elongation, then rever- sal of this chemistry yields radioactive acetyl-coA and “cold” lipid not in chemical equilibrium with the other “hot” lipids in the scheme. For example, radioactive 18:O with the 1-carbon labeled cannot move upward in Fig. 2B, whereas if the label is in the 5-carbon, the fatty acid can theoretically move up to 14:O on the scheme by chain shortening reactions. As a result the scheme in Fig. 2B gives rise to four dependent systems of coupled equations (see Fig. 8). This complexity adds length to the computer program, but does not add unknowns or variable parameters. The kinetic constants at analogous positions in each of the reactions in Fig. 2B represent the same as those in Fig. 8. One merely sums the result of solving these four systems of equations to form the solution to the complete scheme in Fig. 8.
Note also that in two locations in the scheme in Fig. 2B, there are pathways from the cytoplasmic acetate that are duplicated in elongation reactions in the scheme. This is because the elongation reaction is the same reaction regardless of whether the substrate or the acetate is radi- oactive. For example, kPB represents the formation of la- beled 16:O regardless of the position of the label; whereas, the horizontal k 4 ~ represents the formation of 18:O la- beled in the 1-carbon. If 18:O were labeled in any other po- sition than the l-carbon, then it would have to be formed
Ac( medium) a i 7
+
18.1
18 1
20 I
Ac(medium) i--1 +
II 20:0= 2 0 1
by the elongation of labeled 16:O and thus via the vertical k4B. However, as mentioned previously, the approach to steady-state for a radioactive tracer experiment is identi- cal to a “cold” experiment such as that in equation 2, but the solution depends on the amount of radioactivity in the tracer. Therefore, the relevant “concentration’’ for reac- tions of “cold” lipid with “hot” acetate (elongations) is the acetate concentration rather than the lipid concentration.
The results of our modeling efforts to find a “best fit” for the scheme in Figs. 2B and 8 are shown in Table 5. The kinetic rates of the reactions except for the formation of 18:O from 16:O (k4) were extremely fast. As before, k3B, kTB, and k8B were so fast that only their lower bounds were estimable by our procedures (Table 5). The forward rates, k5B and ksB, were also extremely fast, but they are estimated to be within 30% of the values shown in Table 5 . Thus, the only “slow” reaction in the scheme is the for- mation of 18:O from 16:O with a halftime [0.693/(k4~ + k_+B)] of 2.3 h. Most of the rise in the values of the vari- ous FAs at the 24-h timepoint (Fig. 7B) is due to the influx of acetate into the keratinocytes. The concept of “steady state” is clearly exemplified here by the fact that all the reactions have reached steady state by 24 h, yet all of the FA levels are increasing linearly at this time (due to ace- tate influx). Without our data reduction procedures, the kinetic rates would have been impossible to determine in this dynamic situation.
These results also show that there are differences in the equilibrium constants between this fit and those from the cell fatty acid values. The main cause for these discrepan- cies is the fact that at 24 h the system is in steady state and not at equilibrium. The steady state values will not equal equilibrium values before the acetate in the medium is in equilibrium with the cytoplasmic acetate. On the other hand, the “kinetic equilibrium constants” are remarkably close to those from the cell fatty acid values
+ A d medium) F
200- 2 0 1
Fig. 8. from the I-carbon of a fatty acid yields radioactive acetate and “cold” fatty acid.
Diagram of chemical reaction pathways for the uptake of radiolabeled acetate. The scheme shows how the removal of the radiolabeled carbon
Marcel0 and Dunham Fatty acid metabolism 2087
by guest, on May 27, 2018
ww
w.jlr.org
Dow
nloaded from

TABLE 5 . Kinetic constants and “equilibrium constants” lor the principal nonessential fatty acids in cultured keratinocytes
Kinetic Constants“
k,b + k-3, k+b + k-+l, k5b + k - 51, k,, + k.,b k,, + k.7, k,, + k-m, >0.5/h (0.6) 0.3/h 1.8ih 2.6/h >3/h (8.6) >3/h (33)
Equilibrium Constants
Calculated from
Equilibrium Constants
Kinetic Measurements
Cell Fatty Acid Values (fig. 3)
3.7 0.25 0.057 0.45 2.0 7.7
5.7 0.81 0.0037 0.70 2.6 5
“ T h e values in parentheses resulted from “best fits” and were used to generate Fig. 6B
in Table 5. The discrepancies can be attributed to the ob- servation that the formation of 18:O is rate-limiting at the steady state, thus creating an artificially high value for the ratio of 16:O to 18:O. Therefore, we interpret our values to indicate that we are observing the normal state of these cultured keratinocytes.
The value of klB is not important as it depends on the arbitrarily chosen value of Ac(medium) at To. This value is simply chosen to be high enough that it does not change appreciably in the first 24 h, in keeping with the ex- perimental facts. The value of k2B was determined, but its meaning is difficult to define. The rate (k2B) is meant to represent the de novo FA synthesis pathway. Because there are eight equivalents of acetate represented by the de novo synthesis of palmitate (16:0), the probability of in- corporation of radioactive acetate is theoretically eight times greater than for any other elongation in the reaction scheme. However, from the analysis of the kinetic data, it was found that this pathway (k2B in Fig. 2B) is unneces- sary; the solutions to the kinetic system were not affected by setting k2B to zero. The configuration itself in Fig. 8 contains several assumptions concerning FA metabolism. For example, 14:O is assumed to be a product of the de novo synthesis of 16:0, not an intermediate in that synthe- sis. This assumption is consistent with current ideas of FA metabolism (10). Some of its alternatives were tested com- putationally. However, we are not reporting these results because the role of 14:O is not well defined by the work reported here. Instead, the problem is highlighted and we report that at 24 h the radioactivity in the entire FA scheme reported here is 60% due to the scheme second from the left of Fig. 8, 23% from the second from the right scheme, and 16% from the right-hand scheme in Fig. 8. Therefore, even though 60% of the nonessential, radioactive FAs are products of de novo synthesis, the
study has provided much more information about elonga- tions and desaturations than on the details of de novo FA synthesis.
DISCUSSION
Minor changes in the fatty acid composition of cells grown in vitro have been reported by numerous investiga- tors. Because most culture systems contain serum, decreases in the amount of cellular 18:2 reflect a lower than tissue level amount of 18:2 in the serum (15, 19-21). Ponec et al. (19) reported very low amounts of 18:2, nor- mal levels of 20:4, and increased amounts of other fatty acids in neonatal keratinocyte cultures grown in serum and on feeder layers. The authors suggested that the very low amounts of cellular 18:2 resulted from the in vitro ac- tivation of the A5 and A6 desaturases, which are not found in vivo, thus converting all the 18:2 to maintain a tissue level of 20:4.
The data in this report show that essential fatty acid- deficient keratinocytes convert added 18:2 quickly ( - 0.4/h) to the other main essential polyunsaturated fatty acids, Le., 20:4 (Fig. 5A, Tables 1 and 3). Summa- tion of the nmol/g protein values for each time period in Table 1 established that the total amount of radioactivity shows no trend versus time. This conclusion was clarified by 18:2 uptake experiments that were able to document the rapid influx of FA from the medium. The scheme in Fig. 2A represents one main pathway (22) of metabolism for the added [l4C]18:2. This scheme allows radioactivity to be found only among the fatty acids depicted in Fig. 2A. Shortening of [1-’*C]18:2 would generate radioactive acetyl-coA, resulting in a loss in total radioactivity except for those instances where the [‘QCjacetyl-CoA re-entered the fatty acid pool through the de novo pathway (scheme
2088 Journal of Lipid Research Volume 34, 1993
by guest, on May 27, 2018
ww
w.jlr.org
Dow
nloaded from

in Fig. 2B). The data support the premise that [14C]18:2 enters the cell rapidly (k = 0.4/h) and, once inside the cell, stays (>96%) within the essential fatty acid pool. The evidence that the label stays within the pathway shown in Fig. 2A is the scarcity (< 2%) of 14C-labeled saturated fatty acids and by the radiolabeled 18:2 cold- chase experiments, which show that less than 1% of the radioactivity in the keratinocytes is released in 24 h.
In our studies, the radiolabeled fatty acid is initially at- tached to the carrier system in the medium. To reach the cytoplasmic carrier systems, the fatty acids must cross the plasma membrane. By comparing the data in Table 3, one can see that the results of the HPLWRadiomatic results differ from the GC results (whole cell averages) because the levels of 18:3 are elevated in the shorter time studies. This is surprising because the rate constants (k2 and k3) connecting 18:3 to the rest of the FA chain are the fastest in the entire set. If the elongase and desaturase for the for- mation of 18:3 and 20:3 are located in or very near the plasma membrane, then these reactions will be favored until diffusion equalizes the lipid levels to the “whole cell average” values. We, therefore, argue that the 18:2 desaturase and the 18:3 elongase are located near the plasma membrane.
In addition, the EFA-deficient membranes themselves may alter the rates of these enzymes. Both essential and nonessential fatty acids are found as part of the phos- pholipids that form mammalian cell membranes. The phospholipids have characteristic fatty acid profiles, with an unsaturated fatty acid, often 18:2 or 20:4, esterified at the sn-2 carbon of the glycerol molecule (9). The chain length and degree of unsaturation of the phospholipid fatty acids affect the fluidity and other physiochemical properties of the membranes (9). The degree of fluidity is postulated to affect membrane-associated proteins (23) which, besides being enzymes that reside in the lipid matrix of the cell membrane, are also hormone receptors and other components of signal transduction systems. Thus, we hypothesize that the EFA-deficient keratinocytes may demonstrate altered responses to regulatory signals; this may result from altered protein interaction(s) (altered fluidity) (24) and decreased substrate availability, 18:2 and 20:4, for some eicosanoid-associated steps in signal transduction systems (24).
Our previous studies reported that the essential fatty acids are not “essential” for the optimal growth of normal adult human epidermal cells (keratinocytes) in vitro (8). This present report describes a relatively large and com- plicated set of experiments on fatty acid metabolism in the EFA-deficient keratinocyte. To summarize our conclu- sions: I) These experiments demonstrate a method to study enzyme kinetics in lipid biochemistry in living hu- man cells. 2) These experiments provide clear-cut verification that the biochemistry of EFAs and non-EFAs as described by the schemes in Fig. 2 are valid for ker-
atinocytes cultured in an EFA-deficient medium. 3) These experiments provide a clear demonstration of the presence of A5 and A6 desaturases in cultured keratino- cytes. 4) Twenty four hours after 20:4 addition, 60-70% of the labeled 20:4 is found in a nonpolar (probably tria- cylglycerol) form. 5) For nonessential fatty acids, the for- mation of 18:O from 16:O is rate determining for their syn- thesis. 6) For the essential fatty acids, the reactions connecting 18:2 and 20:3 are very rapid. 7) Our data show that EFA-deficient keratinocytes exhibit the same fatty acid pathways as normal mammalian cells (no unusual fatty acids).
This work was supported by PHS awards AR26009 and GM 32785.
Manuscript receiued 10 December 1992 and in rcuisedfon 26 May 1993.
REFERENCES
1.
2.
3.
4.
5.
6.
7.
8.
9.
10.
11.
Lui, S., M. J. Eaton, and M. A. Karasak. 1979. Growth characteristics of human epidermal keratinocytes from newborn foreskin in primary and serial cultures. In Vitro.
Marcelo, C. L., Y. G. Kim, J. L. Kane, and J. J. Voorhees. 1978. Stratification, specialization and proliferation of primary keratinocyte cultures. J. Cell Biol. 79: 356-370. Hennings, H., D. Michael, C. Cheng, P. Steinert, K. Hol- brook, and S. Yuspa. 1980. Calcium regulation of growth and differentiation of mouse epidermal cells in culture. Cell.
Rheinwald, J. G., and H. Green. 1975. Serial cultivation of human epidermal keratinocytes: the formation of keratiniz- ing colonies from single cells. Cell. 19: 245-254. Boyce, S. T., and R. G. Ham. 1983. Calcium-regulated differentiation of normal human epidermal keratinocytes in chemically defined clonal culture and serum-free serial cul- ture. J. Invest. Dermutol. 81:(ruppl): 33s-40s. Boyce, S. T, and R. G. Ham. 1985. Normal human epider- mal keratinocytes. In In Vitro Models for Cancer Research. M. M. Weber and L. Sekely, editors. CRC Press, Boca Ra- ton, FL. 245-274. Boyce, S. T., and R. G. Ham. 1985. Cultivation, frozen storage, and clonal growth of normal human epidermal ker- atinocytes in serum-free medium. J. Tissue Culture Methods. 9: 83-93. Marcelo, C. L., E. A. Duell, L. M. Rhodes, and W. R. Dunham. 1992. An in vitro model of essential fatty acid deficiency. J. Invest. D m t o l . 99: 703-708. Cullis, P. R., and M. J. Hope. 1985. Physical properties and functional roles of lipids in membranes. In Biochemistry of Lipids and Membranes. D. E. Vance and J. E. Vance, edi- tors. BenjaminICummings Publishing Co., Menlo Park,
Goodridge, A. G. 1985. Fatty acid synthesis in eucaryotes. In Biochemistry of Lipids and Membranes. D. E. Vance and J. E. Vance, editors. BenjaminICummings Publishing Co., Menlo Park, CA. 147-148. Cook, H. W. 1985. Fatty acid desaturation and chain elon- gation in eucaryotes. In Biochemistry of Lipids and Mem- branes. D. E. Vance and J. E. Vance, editors. Benja- minICummings Publishing Co., Menlo Park, CA. 191-197.
15: 813-822.
19: 245-254.
CA. 25-30
Marcelo and Dunham Fatty acid metabolism 2089
by guest, on May 27, 2018
ww
w.jlr.org
Dow
nloaded from

12. Folch, J,, M. Lee, and G. H. Sloane Stanley. 1957. A simple method for the isolation and purification of total lipids from animal tissues. J Biol. Chem. 226: 497-509.
13. Williams, M. L., B. E. Brown, D. J. Monger, S. Grayson, and P. Elias. 1988. Lipid content and metabolism of human keratinocyte cultures grown at the air-medium interface. J Cell. Physiol. 135: 103-110. Chapkin, R. S., V. A. Ziboh, C. L. Marcelo, and J. J. Voorhees. 1986. Metabolism of essential fatty acids by hu- man epidermal enzyme preparations: evidence of chain elongation. J. Lipid Res. 27: 945-954.
15. Isseroff, R. R., D. T. Martinez, and V. A. Ziboh. 1985. Al- terations in fatty acid composition of murine keratinocytes with in vitro cultivation. J. Invest. Dermatol. 8: 131-134. Martin, M., and J. H. Wilkinson. 1971. Handbook for Au- tomated Computation. Vol. I1 - Linear Algebra. Springer- Verlag, New York. 339-358. Buck, R. C., and E. F. Buck. 1976. Introduction of Differential Equations. Houghton Mifflin Co., Boston, MA. 270 pp. W. R. Dunham, C. T. Wu, R. M. Polichar, R. H. Sands and L. J. Harding. 1977. Added precision in 57Fe Moess- bauer spectroscopy, Nucl. Instrumen. Metho&. 145: 537-553.
14.
16.
17.
18.
19. Ponec, M., A. Weerheim, J. Kempenaar, A. Mommaas, and D. Nugteren. 1988. Lipid composition of cultured hu- man keratinocytes in relation to their differentiation. J Lipid Res. 29: 949-961.
20. Stool, L., and A. Spector. 1984. Changes in serum influence the fatty acid composition of established cell lines. In Vitro.
Madison, K. C., P. W. Wertz, J. S. Stauss, and D. Down- ing. 1986. Lipid composition of cultured murine keratino- cytes. J. Invest. Dermatol. 87: 253-259.
22. Cook, H. W. 1985. Fatty acid desaturation and chain elon- gation in eucaryotes. In Biochemistry o f Lipids and Mem- branes. D. E. Vance and J. E. Vance, editors. Benja- min/Cummings Publishing Co., Menlo Park, CA. 199.
23. Cullis, P. R., and M. J. Hope. 1985. Physical properties and functional roles of lipids in membranes. In Biochemistry of Lipids and Membranes. D. E. Vance and J. E. Vance, edi- tors. BenjamidCummings Publishing Co., Menlo Park, CA. 62.
24. Dudley, D. T., D. E. MacFarlane, and A. A. Spector. 1987. Depletion of arachidonic acid from GH3 cells: effect on in- ositol phospholipid turnover and cellular activation. Bio- chem. J. 246: 669-680.
20: 732-738. 21.
2090 Journal of Lipid Research Volume 34, 1993
by guest, on May 27, 2018
ww
w.jlr.org
Dow
nloaded from
Related Documents