FATHER-SON RELATIONSHIP QUALITY AND ASSOCIATED ADOLESCENT RISKS LYNN AVRIL HENDRICKS STUDENT NUMBER: 264 2411 A mini-thesis submitted in partial fulfilment for the requirements for the degree of Magister Artium Psychologiae in the Department of Psychology University of the Western Cape Belville, Cape Town 2009 Supervisor: Prof. Charles Malcolm Co-supervisor: Dr. Catherine Ward brought to you by CORE View metadata, citation and similar papers at core.ac.uk provided by UWC Theses and Dissertations

Welcome message from author
This document is posted to help you gain knowledge. Please leave a comment to let me know what you think about it! Share it to your friends and learn new things together.
Transcript
FATHER-SON RELATIONSHIP QUALITY AND
ASSOCIATED ADOLESCENT RISKS
LYNN AVRIL HENDRICKS
STUDENT NUMBER: 264 2411
A mini-thesis submitted in partial fulfilment for the requirements for the
degree of
Magister Artium Psychologiae
in the Department of Psychology
University of the Western Cape
Belville, Cape Town
2009
Supervisor: Prof. Charles Malcolm
Co-supervisor: Dr. Catherine Ward
brought to you by COREView metadata, citation and similar papers at core.ac.uk
provided by UWC Theses and Dissertations
ii
FATHER-SON RELATIONSHIP QUALITY AND ASSOCIATED
ADOLESCENT RISKS
Lynn A. Hendricks
KEYWORDS:
Father
Adolescent
Boys
Contact
Communication
Connection
Relationship Quality
Residential Status
Risk Behaviours
iii
FATHER-SON RELATIONSHIP QUALITY AND ASSOCIATED
ADOLESCENT RISKS
Lynn A. Hendricks
M.A. Research Psych minithesis, Department of Psychology, University of the Western Cape
ABSTRACT
International research over the past two decades has advanced knowledge in the
study of fathers and the protective role they play in the prevention of adolescent risk
behaviours. Studies have often investigated parental relationships and their influence
on adolescent risk behaviours but rarely the specific role of the adolescents’
relationships with their fathers or father figures in prevention of risk behaviour.
Three main hypotheses were investigated: first, that the theoretically aligned
dimensions of relationship quality would be nomogically validated; second, that
there would be little significance difference in the dimensions of relationship quality
across groupings of father residential status; and third, that the quality of the father-
son relationship is a stronger predictor of risk behaviour than father’s residential
status (whether the adolescent lived with the father or not), or whether the “father” is
a biological father or not. Three samples of adolescents were included: a father-
resident group (biological fathers reside in the adolescents’ homes) (N = 196); a non-
resident group (biological fathers live elsewhere) (N = 72); and a father figure group
(no contact with biological father) (N = 58). The school-based sample of 331
participants all resided in a low-income area of Cape Town. Risk behaviours were
investigated using the Problem Oriented Screening Instrument for Teenagers
(POSIT). Human Immunodeficiency Virus (HIV) risk behaviour was assessed on a
POSIT sub-scale designed specifically for South Africa, the POSIT HIV/STD Risk
iv
Subscale. Paternal relationship quality was measured by the Acceptance subscale of
the revised Child Report of Parent Behavior Inventory, the Child-Parent
Communication Apprehension Scale for Use with Young Adults, and a measure of
paternal quality contact time that was developed for this study. After conducting a
factor analysis the Paternal Quality Contact Time Scale was found to have three
factors: the father’s availability, activities engaged in together, and the motivation of
the son to spend time with his father (including the son’s enjoyment of the time
spent). This provides an extension to past conceptualizations of father-son contact
which commonly assessed only the amount of time and activities engaged in. The
dimensions of paternal relationship quality were found to be strongly associated.
Linear regressions showed that father-son communication was the stronger predictor
of risk behaviours when compared to father residential status. Paternal
communication was a predictive factor for mental health risk, negative family
relations, educational under-attainment, aggressive and violent behaviour and
HIV/STD risk behaviours for adolescent boys. These findings confirm that fathers
play an important protective role with regard to the development of adolescent risk
behaviours. They also confirm that paternal relationship quality plays a more
significant role, specifically the dimension of communication between them, than
whether fathers live with their sons or are biologically related to them. The findings
suggest a need to address the issues of building relationships between at-risk youth
and their fathers (be they biological fathers or father figures) through community and
clinical interventions.
v
DECLARATION
I declare that Father-son relationship quality and associated adolescent risks is my
own work, and that it has not been submitted before for any degree or examination at
any other university, and that all the sources I have used or quoted have been
indicated and acknowledged by complete references.
Lynn Avril Hendricks
……………………………
Date: 12 November 2009

vi
ACKNOWLEDGEMENTS
First and foremost I am deeply indebted to my Maker for giving me the strength to
accomplish this task. In Him all things are possible.
This work would not have been possible without the support of Prof. Charles
Malcolm, under whose supervision I chose this topic and began this thesis.
I owe my deepest gratitude to Dr. Catherine Ward, my advisor in the final stages of
the work, who through her encouragement and perpetual enthusiasm was, and
continues to be, a constant source of motivation.
To those, whom this study would not have been possible without, the research
participants, their teachers and school principals, and the many others who assisted me
throughout the research process, a heartfelt sense of gratitude is expressed.
I am indebted to many of my friends, who from childhood until graduate school have
joined me in the discovery of the value of life and the beauty of friendship. I feel a
deep sense of appreciation for Denver, Karen, Jeidi, Tamarra, Tracy, Shaleen and
Carmen, my most avid supporters throughout the journey of this thesis.
I cannot end without thanking my family, who supported me and offered help
whenever it was needed. To my brother, Steven Hendricks, thank you for the example
you have displayed in your commitment to succeed against all costs. To my father,
Phillip Hendricks and my mother, Roslyn Hendricks, I hope to continue, through my
research, the noble mission to which you have given your lives.
7
CONTENTS
KEYWORDS ii
ABSTRACT iii
DECLARATION v
ACKNOWLEDGEMENTS vi
LIST OF TABLES 11
LIST OF EQUATIONS 12
LIST OF FIGURES 12
LIST OF APPENDICES 13
CHAPTER 1: INTRODUCTION 14
1.1. BACKGROUND 14
1.2. RATIONALE OF STUDY 18
1.3. SIGNIFICANCE OF STUDY 19
1.4. RESEARCH AIMS 19
1.5. RESEARCH QUESTION 20
1.6. RESEARCH HYPOTHESES 20
1.7. OVERVIEW OF CHAPTERS 21
CHAPTER 2: LITERATURE REVIEW 23
2.1. INTRODUCTION 23
2.2. THEORIES OF PATERNAL RELATIONSHIPS 23
2.3. ADOLESCENCE AND RISK-TAKING BEHAVIOURS 26
2.4. PATERNAL RELATIONSHIP QUALITY 30
2.4.1. Paternal Contact 31
2.4.2. Paternal Communication 33
8
2.4.3. Paternal Connection 34
2.5 FATHER’S BIOLOGICAL AND RESIDENTIAL STATUS 35
2.6. CONCLUSION 37
CHAPTER 3: RESEARCH METHODOLOGY 38
3.1. INTRODUCTION 38
3.2. RESEARCH DESIGN 38
3.3. SAMPLING 41
3.4. MEASURES 44
3.4.1. Demographic Questionnaire 46
3.4.2. Measure of Father-Son Quality Contact Time Scale 47
3.4.3. The Child-Parent Communication Apprehension Scale for Use
with Young Adults 48
3.4.4. Revised CRPBI Acceptance Subscale 49
3.4.5. Problem Oriented Screening Instrument for Teenagers 49
3.4.6. Pilot of Procedure and Research Measures 52
3.5. PROCEDURE 52
3.6. DATA ANALYSIS 54
3.6.1. Descriptive analysis 54
3.6.2. Correlation 55
3.6.3. Reliability 55
3.6.4. Validity 56
3.6.5. Factor Analysis 56
3.6.6. Multivariate Analysis of Variance 57
3.6.7. Post Hoc Tests 57
3.6.8. Multiple Linear Regression 58
9
3.7. ETHICS APPRAISAL 59
3.8. CONCLUSION 62
CHAPTER 4: PSYCHOMETRIC PROPERTIES OF THE
MEASURES AND STUDY VARIABLES 63
4.1. INTRODUCTION 63
4.2. DATA SCREENING PHASE 1 63
4.3. PSYCHOMETRIC PROPERTIES OF MEASURES 64
4.3.1. F-S, QCTS 65
4.3.2. C-PCA, YA 68
4.3.3. Revised CRPBI Acceptance Subscale 69
4.3.4. POSIT 71
4.3.4.1. Substance Abuse Risk Subscale 71
4.3.4.2. Physical Health Risk Subscale 71
4.3.4.3. Mental Health Risk Subscale 71
4.3.4.4. Negative Family Relations Risk Subscale 72
4.3.4.5. Negative Peer Relations Risk Subscale 72
4.3.4.6. Educational Under-Attainment Risk Subscale 73
4.3.4.7. Social Relations Risk Subscale 73
4.3.4.8. Leisure and Recreation Risk Subscale 74
4.3.4.9. Aggressive Behaviour and Delinquency Risk Subscale 74
4.3.4.10. HIV/STD Risk Subscale 75
4.4. DATA SCREENING PHASE 2 75
4.5. CONCLUSION 78
10
CHAPTER 5: RESULTS 80
5.1. INTRODUCTION 80
5.2. SAMPLE CHARACTERISTICS 80
5.3. TESTING OF HYPOTHESES 84
5.3.1. Hypothesis I 84
5.3.2. Hypothesis II 85
5.3.3. Hypothesis III 91
5.3.4. Hypothesis IV 93
5.3.5. Hypothesis V 99
5.4. CONCLUSION 103
CHAPTER 6: DISCUSSION OF FINDINGS AND
RECOMMENDATIONS 104
6.1. INTRODUCTION 104
6.2. DISCUSSION OF FINDINGS 104
6.2.1. Hypothesis I 105
6.2.2. Hypothesis II 106
6.2.3. Hypothesis III 107
6.2.4. Hypothesis IV 110
6.2.5. Hypothesis V 111
6.3. LIMITATIONS 114
6.4. CONCLUSION AND RECOMMENDATIONS 115
REFERENCES 118
11
LIST OF TABLES
Table 1: KMO and Bartlett’s Test – F-S, QCTS 65
Table 2: Factor Loadings from the Principal Components Analysis
With Varimax Rotation of F-S, QCTS Items 67
Table 3: Deleted Negatively Phrased Questions 69
Table 4: Item-total Statistics for Revised CRPBI Acceptance Subscale 70
Table 5: Skewness and Kurtosis Values for Continuous Study Variables 77
Table 6: Means, Standard Deviations, Items and Cronbach’s Alpha
Values of Final Study Measures 79
Table 7: Individual Characteristics of Participants 81
Table 8: Characteristics of Participants’ Parents 82
Table 9: Inter-correlations of the Dimensions of Paternal Relationship Quality 84
Table 10: Levene’s Test of Equality of Variance 87
Table 11: Multivariate Statistics – Pillai’s Trace 88
Table 12: Mean Differences (p Values) of Contact and Connection by
Father Residential Status 90
Table 13: Correlation Matrix for Contact, Communication and
Connection with Risk Outcomes 92
Table 14: Multivariate Regression Models Examining Father Residential
Status Influences on Adolescent Risks 98
Table 15: Multivariate Regression Models Paternal Examining Relationship
Quality and Residential Status Influences on Adolescent Risks 102
12
LIST OF EQUATIONS
Equation 1: Sample Size Estimation 42
Equation 2: Cochran’s Correction for Sample Size 42
LIST OF FIGURES
Figure 1: Dimensions of Relationship Quality across Groupings
of Father Residential Status 86
Figure 2: Adolescent Risks across Groupings of Father Residential Status 94
13
LIST OF APPENDICES
A – Letter to School Principal Requesting Permission 141
B –Consent and Assent Forms for Parent/Gaurdian and Learner in English and
Afrikaans 142
C – Practice Questions 146
D – Demographic Questionnaire 147
E – Father-Son Quality Contact Time Scale 150
F – Child-Parent Communication Apprehension Scale for Use
with Young Adults 152
G – Revised CRPBI Acceptance Subscale 154
H – Problem Orientated Screening Scale for Teenagers 156
I – Father-Son Quality Contact Time Scale: Exploratory Principal
Component Analysis 162
J – Father-Son Quality Contact Time Scale: Item-Total Statistics 163
K – Revised C-PCA, YA and Internal Consistency 164
L – Substance Abuse Risk Subscale: Item-Total Statistics 165
M – Physical Health Risk Subscale: Item-Total Statistics 166
N – Mental Health Risk Subscale: Item-Total Statistics 167
O – Negative Family Relations Subscale: Item-Total Statistics 168
P – Negative Peer Relations Risk Subscale: Item-Total Statistics 169
Q – Educational Under-Attainment Risk Subscale: Item-Total Statistics 170
R – Social Relations Risk Subscale: Item-Total Statistics 171
S – Leisure and Recreation Risk Subscale: Item-Total Statistics 172
T – Aggressive Behaviour and Delinquency Risk Subscale: Item-Total Statistics 173
U – HIV/STD Risk Behaviours Subscale: Item-Total Statistics 174
14
CHAPTER ONE
INTRODUCTION
1.1. BACKGROUND
One in every five persons in the world, 1.2 billion in number, is a young person
between the ages of 15-24 years and is in a transitional phase moving from
adolescence into adulthood (Population Reference Bureau, 2009). The current
population of 1.1 billion young people living in less developed countries is expected
to rise for the next 30 years (Population Reference Bureau, 2009). There are
25 635 900 children are under the age of 19 in South Africa and young men between
the ages of 15-19 years are more than 2.5 million in number (Statistics South Africa,
2009).
Social awareness, particularly of the difficulties young men are facing in our society,
has increased. Newspapers, police reports, government interventions and other media
documenting misdemeanours by and against young men are apparent. This has
contributed to the renewed interest in the attitudes and lives of young men, some of
whom are facing dire circumstances.
There are clear differences between how males and females negotiate the period of
adolescence and risk-taking behaviours, with boys engaging in more dangerous risk-
taking behaviours. Global homicide rates in 2000 showed rates for males were three
times more likely than females and highest in the 15-19 years category (Reddy et al.,
2003). Boys are more at risk than girls for unsafe sexual practices, multiple sex
partners, substance abuse (Parry et al., 2004) and all forms of criminal and anti social
15
behaviour. For South Africa, completed suicide rates, consistent with global trends,
report 4.7 male suicides for every female suicide (Reddy et al., 2003, p. 38).
Parry et al. (2002), in an epidemiological study of alcohol, found higher harmful
drinking patterns among high school students, in two South African cities - Durban
and Cape Town, than studies of representative samples in Australia, North America,
and Europe, which revealed that 30% to 40% of young people are binge drinkers
(Australian Institute of Health and Welfare, 2002; Federal, Provincial and Territorial
Advisory Committee on Population Health, 1999).
The challenges adolescent boys face in the wake of the transitional phase of
adolescence is apparent. A closer look at the correlates associated with adolescent
boys and their risk behaviours is critical in the examination of this issue. Correlates
of adolescent risk taking behaviour have been shown to be living in households or
communities with lower socio-economic status (Ramirez-Valles, Zimmerman &
Newcomb, 1998; Upchurch, Aneshensel, Sucoff & Levi-Storms, 1999; Brandt, Ward,
Dawes, & Flisher, 2005; de Visser, Rissel, Smith, & Richters, 2006), negative peer
influences (Keren & Hasida, 2007; Ward, Martin, Theron & Distiller, 2007; Ward &
Bakhuis, 2009) and weak parental relationships (Amato, 1997; Hawkins & Dollahite,
1997; Howard, Cross, Li & Huang., 1999; Brotherson, Yamamoto & Acock, 2003;
Luchetti, Powers & Love, 2002; Caldwell et al., 2004).
The wealth of research on fatherhood suggests that the father-son relationship has a
significant effect on the child’s development and well-being (Amato, 1997; Andry,
16
1960; Biller, 1993; Doherty, Kouneski & Erikson, 1998; Hawkins & Dollahite, 1997;
Richter & Morell, 2006). The quality of the father-son relationship has been found
to have an effect on the child’s health-promoting (Caldwell et al., 2004) as well as
risk behaviours (Howard, et. al., 1999). Past research reports that children who do
not have a positive paternal relationship may be more likely to be involved in risk
behaviours such as drug and alcohol use, academic under-achievement and
delinquency (Brotherson et al., 2003).
This study broadens the perimeter of risk factors most commonly studied (smoking,
alcohol abuse and HIV risk) to include substance use and abuse, mental health status,
family relations, peer relations, educational status, social skills, leisure and
recreation, violent and aggressive behaviour and HIV risk. The protective factor for
these risks, relationship quality, was measured through three specific constructs:
contact (Hofferth & Sandberg, 2001; Amato, 1997), connection (Brotherson et al.,
2003; Barber & Olsen, 1997; Hawkins & Dollahite, 1997) and communication
(Luchetti et al., 2002).
First in the triad of father-son relationship quality, contact, can be defined as the
amount of time the father and son spend together, the frequency of interactions and
the quality of interactions (Hofferth & Sandberg, 2001). Strong meaningful bonds are
more likely to be created through shared activities, which require spending time
together. Second, father-son relationships are significantly influenced by
communication quality. Many studies have been conducted on the negative impacts
of parent-child communication (Luchetti et al., 2002). One significant factor in
17
family communication is the amount of anxiety felt while communicating. Only a
few have studied communication anxiety in parent-child relationships; and even
fewer in father-son dyads specifically. Third, Barber and Olsen (1997) identify a
sense of connection in the parent-child relationship as one of the significant factors
that provides for the continual development of the child and his well-being.
Connection, in this study, was defined as the emotional attachment within the father-
son relationship (Harris, Furstenburg & Marmer, 1998).
A father, who has a ‘quality relationship’ with his son, as defined by this research, is
a father who is available to his son, engages in activities with his son, and his son
enjoys the time they spend together. He also communicates openly with his son and
shares an emotional connection. He may or may not live with the child’s mother, and
he may or may not be a biological father of the adolescent boy.
A father who is not the biological father of the adolescent boy is referred to in this
study as a father figure. Father figure types explored in this study included adoptive
fathers, step-fathers, older brothers, uncles, and an open ‘other’ category. The
majority of guardians who did not give permission for their son to participate in the
study did so because the adolescent had no contact with his biological father and did
not feel comfortable with the research topic. The ‘other’ category therefore may have
been indicated by those who did not have any father figure in their lives. Eight
participants chose this category1. Preliminary analyses were conducted to compare
1 Refer to Chapter Five for results of ANOVA comparing types of father figures across father-son
contact, communication and connection.
18
the types of father-figures across levels of father-son contact, communication and
connection before grouping all the types under the category of father figure.
Most research concerning paternal relationships investigates the father’s or mother’s
experiences and rarely that of the adolescent (Milkie, Simon & Powell, 1997).
Research that has investigated adolescents’ perspectives suggests that they may be
considerably different to their fathers’ reports of interaction and that parents tend to
make incorrect assumptions about what their children think or feel (Belle, 1999;
Sixsmith & Knowles, 1996). Larson (1993, p. 17) found father’s guesses of the level
of their children’s happiness as having ‘little relevance to what the child was feeling’.
Fathers reported spending a considerably larger amount of time with their adolescent
sons than reported by the adolescents themselves (Larson, 1993; Larson & Richards,
1991).
The thesis thus seeks to derive knowledge about the father-son relationship from a
primary source, the adolescent son. The influences of the quality of his relationship
with his father or father figure and their residential status on the adolescent’s
behavioural, social and health risks are the foci of this study.
1.2. RATIONALE OF STUDY
International and local studies reveal alarmingly high rates of adolescent risk
behaviours, some potentially life threatening. However, there are few local studies
that investigate the correlates of adolescent social and health risk behaviours. Even
fewer focus on paternal relationship quality, which has consistently been shown to be
19
an important support base for boys, during adolescence. Attention is also given to the
fathers’ residential status and whether this impacts on both the relationship with his
son and his sons’ risk behaviours. This necessitated the investigation into the
influences of paternal relationship quality and father residential status on adolescent
risk outcomes in South Africa.
1.3. SIGNIFICANCE OF STUDY
This study sought to explore current conceptualizations of the dimensions of father-
son relationship quality and to look at the role of the paternal relationship in the
development of the adolescent son. This study simultaneously investigates three
aspects of relationship quality: contact, communication apprehension and
connection. Finding no sufficient measure of father-son contact in the literature, a
measure was developed and tested in this study. The protective role that paternal
relationship quality plays in a wide range of adolescent risk behaviours is explored as
well as the effect that father residential status has on the father-son relationship
quality.
1.4. RESEARCH AIMS
The purpose of this study is to examine the effect of father-son relationship quality
(as perceived by the son) on specific health, social and behavioural outcomes of the
adolescent son. The primary aims of the study are as follows:
(i) to explore father-son contact, communication and connection as
dimensions of relationship quality.
20
(ii) to determine whether there is a statistically significant relationship
between father residential status and father–son relationship quality.
(iv) to investigate whether positive paternal relationship quality will
explain more of the variance in adolescent risk outcomes than father
residential status.
1.5. RESEARCH QUESTION
Based on the aims of the study, as stipulated above, the following research question
was formulated: Do the dimensions of father-son relationship quality (contact,
connection and communication) statistically explain more of the variance in risk
outcomes than father residential status for adolescent high school males?
1.6. RESEARCH HYPOTHESES
Hypothesis I
Father-son contact, communication and connection are significantly related to each
other and may be understood as dimensions of father-son relationship quality.
Hypothesis II
Biological fathers and father figures will not differ significantly in contact,
communication and connection with their adolescent sons but compared with
biological fathers, father figures will demonstrate lower quality interactions with
their sons.
21
Hypothesis III
Each of the dimensions of father-son relationship quality will have a significant
effect on adolescent risk outcomes.
Hypothesis IV
Boys with non-resident fathers, resident fathers or father-figures will exhibit equal
risk outcomes.
Hypothesis V
The dimensions of father-son relationship quality have a greater effect on risk
outcomes than father residential status.
1.7. OVERVIEW OF CHAPTERS
In this introductory chapter the context of the study was introduced, along with the
significance of the study, the research aims, questions, hypotheses and key constructs
of the study.
In the following chapter relevant literature will be examined. The focus will be
specifically on how paternal relationship quality impacts on adolescent behaviour.
Relationship quality will be examined through its dimensions of contact, connection
and communication. Risk behaviours explored in this study and its prevalence rates
amongst South African youth will be examined. An overview of the mediating effect
of father residential status on paternal relationship quality and adolescent risk factors
will be provided. Further to that, Lamb’s (1997) model of positive paternal
22
involvement, which is used to draw conceptual linkages from the relationship
quality, between the father and son, and specific adolescent sons’ behavioural, social
and health outcomes will be discussed.
Chapter Three will outline the research methodology of the study, including the
research design, sampling method, validity and reliability of the measuring
instruments, data collection and data analysis. The analysis of the pilot study and its
application to the main study will be explained. The ethics appraisal of the study is
provided within this chapter.
Chapter Four presents the study instruments and provides detailed insight into the
father-son contact measure as well as the internal consistency of all measures in the
study sample. A detailed look at data screening procedures will also be provided.
In Chapter Five the sample characteristics, the key findings of this study, including
descriptive statistics (mean and standard deviation, correlations and cross-
tabulations) and regression analysis will be presented.
The sixth and the final chapter will provide a discussion of the results obtained in this
study and the contributions the study can make to knowledge production in this field.
Limitations will be discussed and recommendations for future research will be made.
23
CHAPTER TWO
REVIEW OF THE LITERATURE
2.1. INTRODUCTION
This chapter will provide a review of the literature relevant to the research in the area
of father-son relationships and to the specific aspects of the relationship that are
under scrutiny in this study. The objective is to examine previous research
methodologies and results, and identify their implications for the current study.
The literature review will begin with the conceptualizations and theories that provide
a framework for this study. Next, a description of the period of adolescence and the
difficulties of this transitional developmental phase for boys will be discussed.
Following this the importance of paternal relationship quality and the role it plays in
protecting adolescent boys from risk behaviours is explored. Subsequently, the
fathering dimensions of contact, communication and connection are explained in
depth and relevant findings that link these dimensions to paternal relationship quality
are presented. Next the influence of biological fatherhood and residence status of
fathers or father figures on the ‘father-son’ relationship on adolescent risk behaviours
are presented. The final section of the literature review will identify the significance
of the current study and areas in which it has an impact.
2.2. THEORIES OF PATERNAL RELATIONSHIPS
A three-fold model of paternal involvement was formulated by Lamb, Pleck,
Charnov, and Levine (1985) and included the constructs engagement, availability
24
and responsibility. Further improvement of this tripartite model moved its focus from
father-child characteristics to the assessment of specific activities that the father and
child could engage in together (Brotherson et al., 2003; McBride, 1990; Radin,
1994). Pleck (1997) refers to this movement as the difference between paternal
involvement and positive paternal involvement. Most research concerning paternal
relationships investigates the father’s or mother’s experiences and rarely that of the
adolescent (Milkie et al., 1997). Research that has investigated adolescents’
perspectives suggests that they may be considerably different to their fathers’ reports
of interaction and that parents tend to make incorrect assumptions about what their
children think or feel (Belle, 1999; Sixsmith & Knowles, 1996). Lamb (1997)
suggests that the critical point of assessing positive paternal involvement in terms of
relationship quality between father and child is through evaluating the child’s
perception of the relationship.
Theories pertaining to fathers and children have progressed towards a focus on
contextual factors and specific dimensions of paternal relationships (Brotherson et
al., 2003). Some theoretical models are broad and highlight external influences
(Parke, 1996; Doherty et al., 1998) on the paternal relationship and give little
attention to the dynamics of the relationship itself. Lamb (1997) suggests that studies
of paternal involvement often ignore the emotional quality of paternal relationships.
Brotherson et al. (2003) points out that the quality of paternal relationships ‘deserves
serious attention as a mediating factor in how fathers influence child outcomes’ (p.
192).
25
Lamb’s threefold model of ‘positive paternal involvement’ is similar to Dollahite,
Hawkins, and Brotherson’s (1997) model which is built on Erikson’s (1959) lifespan
model of development. This theory of ‘generative fathering’ proposes that fathers
have an ethical obligation to meet the needs of the next generation. Dollahite et al.
(1997) presents ‘relationship work’ as one of the four key areas (ethical work,
developmental work, relationship work and stewardship work) fathers should be
involved in.
Pleck (1997) has suggested that ‘positive paternal involvement’ may be the essence
of what many have conceptualized as ‘generative fathering’ (p. 102). Specific
patterns of Lamb’s positive paternal involvement that link to satisfying the elements
of relationship work are identified as connection and communication between the
father and child (Dollahite et al., 1997; Brotherson et al., 2003). The ‘relationship
work’ model proposes conceptual constructs that represent specific dimensions of
paternal relationships and additionally suggests that children will benefit from this
type of involvement.
Lamb’s tripartite model of positive paternal involvement and elements of
relationship work of the generative fathering model overlap and allow for a further
development in the theoretical conceptualization of a quality paternal relationship.
This study further develops Lamb’s tripartite model by additionally taking into
account the motivation the child feels to spend time with his father and the
satisfaction or enjoyment of the time spent together while the father is engaged with
his child.
26
Therefore, a quality paternal relationship can be defined through its dimensions of
contact (availibility, engagement and satisfaction), communication and connection.
This new model proposed by this thesis draws conceptual linkages between aspects
of father involvement, dimensions of paternal relationship and children’s outcomes.
Using these concepts as a theoretical framework, this thesis explores the significance
of these concepts and their effect on father-child relationship quality and,
subsequently, adolescent outcomes.
2.3. ADOLESCENCE AND RISK-TAKING BEHAVIOURS
Capuzzi and Gross (2000, p. 9) suggest that adolescence is a period of ‘emerging’
behaviours that have been developing through the lifetime of the young person:
“At risk includes all youth regardless of age. All young people have the
potential for the development of at-risk behaviours…All young people may
move in and out of at-riskness depending on personal, social, educational,
and family dynamics. No one can be excluded”.
The turbulent period of adolescence has perplexed many parents and even
adolescents themselves. Adolescence is not a precisely defined age range within the
lifespan but rather a period of transition that may vary by individual. The relatively
continuous growth experienced during childhood is rapidly increased and may be
overwhelming for some. Adolescence is characterized as a time of emotional turmoil
(Fleming & Englar-Carlson, 2008). Although a few theorists dispute the inevitability
of the ‘storm and stress’, many still associate adolescence with vulnerability and a
27
highly emotionally charged phase of life. Steinberg (1996) identifies several
transitions that occur in adolescent young men: physiological development, cognitive
development, the formation of the masculinity identity and the development of
behavioural patterns in their social context, whether risk-filled or not.
The study of adolescent risk taking behaviours gained momentum in the 1980s when
it became evident that mortality and morbidity during this period was behavioural in
origin (Igra & Irwin, 1996). Risk behaviours can directly or indirectly compromise
adolescent well-being and result in negative outcomes for young people. Jessor
(1998) defines risk behaviours as a consideration of ‘risk factors for personally or
socially or developmentally undesirable outcomes’ (p. 2). Risk behaviours are
external manifestations and increases adverse consequences for the individual, which
‘can be short term or long term and can occur in the biological, social or
psychological domains’ (Flisher, 2007, p 111; de Visser et al., 2006).
Three studies with nationally representative samples have documented risk factors
and behaviours among South African adolescents (Shisana & Simbayi, 2002; Reddy
et al.,2003; Pettifor et al., 2004).
The Nelson Mandela/HSRC Study of HIV/AIDS (Shisana & Simbayi, 2002) was a
HIV/AIDS household-based survey. Data was elicited from all participants,
including a sub-sample of youth (15-24 years), regarding their sexual practices and
HIV testing of oral fluid was carried out. The results of this study suggested that, for
28
boys, prevalence of HIV was 4.7 per cent for the 15 to 18 year age group and 16.1%
were paternal orphans2.
A survey with similar findings to Shisana and Simbayi (2002) was conducted by
Pettifor et al. (2004) in 2003, with a national sample of 11 904 youth who were
between the ages of 15 to 24 years. Assessments were done face to face to obtain
information regarding HIV knowledge, sexual behaviour, contraceptive use and
perceived risk. HIV risk was reported to increase with age. Pettifor et al. (2004)
found that 31% of boys were significantly more likely to report sex under the
influence of alcohol as compared to 15% of girls and drug use was also more
common among boys than girls (18% vs. 3%)
Reddy et al. (2003) conducted the first national South African Youth Risk Behaviour
Survey (YRBS) which was based on the instrument used in the Youth Risk Behaviour
Surveillance System in the United States. Students in grades 8 to 11 from 23 schools
per province were assessed regarding risk behaviours in several domains including
violence, behaviours related to substance abuse, sexual behaviour, physical activity
and suicide risk. Reddy et al. (2003) reported significantly more males than females
had carried a knife in the past month (26% vs. 11%) or involved in physical
aggressive acts (37% vs. 25%). During the six months preceding this survey 18% of
males reported being involved in a gang. In a comparative study Reddy, Resnicow,
Omardien and Kambaran (2007) looked at the prevalence rates and correlates of
substance abuse among high schools students in South Africa and the United States
2 Paternal orphans refer to children who have lost a father to death.
29
using data from the South African 2002 YRBS (Reddy et al., 2003) and the United
States 2003 YRBS (Centers for Disease Control and Prevention, 2004). Rates of
alcohol and marijuana use were lower among South African students than US
students but higher for rates of illicit hard drug use (Reddy et al., 2007). In South
Africa, being female was a protective factor against tobacco, alcohol and marijuana
use.
Adolescents who are at risk for one type of behaviour are generally at risk for others
negative behaviours (Jessor, Collins & Jessor, 1972; MacDonald, 1999; Reid,
Lynskey & Copeland, 2000). Durant’s, Knight’s and Goodman’s (1997) findings
suggests that adolescents who engaged in more aggressive and delinquent behaviour
were more likely to use substances, engage in more risky sexual behaviour, and
report more mental health symptoms and problems with peer and family
relationships. The study of adolescent risk behaviours has often been confined to
behaviours that become normative, such as tobacco use, alcohol use and early sexual
debut, as the adolescent progresses in their life course. This study, like work by
Elizabeth Rahdert (1991) and others (Durant et al., 1997), used the POSIT to enlarge
the perimeter around risk factors to be inclusive of substance abuse, mental health,
educational under-attainment, negative family relations, negative peer relations,
social skills, leisure time, aggressive and delinquent behaviour, and HIV risk. Risk
factors promote risk behaviours and affect the well being of adolescents.
The challenges adolescent boys face during the transitional phase of adolescence are
apparent. A closer look at the correlates associated with adolescent boys’ risk
30
behaviours is critical in the examination of this issue. Correlates of adolescent risk
taking behaviour have shown to be living in households or communities with lower
socio-economic status (Ramirez-Valles et al., 1998; Upchurch et al., 1999; Brandt et
al., 2005; de Visser et al., 2006) and negative peer influences (Keren & Hasida,
2007; Ward et al., 2007; Ward & Bakhuis, 2009). Peer relationships are important in
the lives of adolescents and serious consideration should be given to the impact of
the paternal relationship on male adolescents. The literature highlights the significant
effect of weak parental relationships (Amato, 1997; Hawkins & Dollahite, 1997;
Howard et al., 1999; Brotherson et al., 2003; Luchetti et al., 2002; Caldwell et al.,
2004) on adolescent risk behaviours.
2.4. PATERNAL RELATIONSHIP QUALITY
International research with regard to father-son relationships has increased
dramatically in the last two decades (Caldwell et al., 2004; Hawkins & Dollahite,
1997; Lamb, 1981, 1997; Regnerus & Luchies, 2006). Past and contemporary
research on fatherhood suggests that the quality of the father-son relationship has a
significant effect on the child’s development and well-being (Amato, 1997; Andry,
1960; Biller, 1993; Doherty et al., 1998; Hawkins & Dollahite, 1997; Richter &
Morell, 2006). Boys with a quality paternal relationship may be able to better
negotiate the turbulent period of adolescence.
Paternal relationship quality can be defined through its dimensions that have been
shown to be influential on the risk-taking behaviours of adolescent boys, these are:
31
Contact (Amato, 1997), connection (Brotherson et al., 2003; Hawkins & Dollahite,
1997) and communication (Luchetti et al., 2002).
2.4.1. Paternal Contact
This thesis defined Paternal Contact as the amount of time the father and son spend
together, the availability of the father, activities engaged in, the motivation for the
son to spend time with his father and the enjoyment of their time spent together.
Most literature has focused on the frequency of contact, with more recent work
focusing on issues such as the parenting behaviours of father and the context of
parent child contact (Amato & Gilbreth, 1999).
Earlier research examining the relationship between contact and the child’s well-
being has been based on small observational studies (Marsiglio, 1995). In a study of
family time and emotion with a sample of 55 young adolescents from two Chicago
suburbs (Larson, 1993; Larson & Richards, 1991) fathers reported to be spending
time with their sons, however, most were merely in the vicinity of their sons and did
not have direct interaction. Additionally, mothers were present most of the time that
the father and son reported being together. Echoing findings of similar studies
paternal contact was found to be minimal and usually took place in a recreational or
leisurely manner.
Lower levels of contact with parents are expected as the child ages and adolescence
is a transitory period with the basic aim of individuation and separation from parents
(Constantine, 1987). Newer data, however, indicates that adolescents negotiate a
32
sense of autonomy and incorporate values that are central to their parents rather than
making a discreet break from their families (Donenberg, Paikoff & Pequegnat,
2006). This advocates for holistic study of paternal relationships - both the quantity
and the quality of paternal contact and other dimensions.
The quantity versus the quality of contact has been a topic of debate amongst social
researchers and policy makers, especially concerning children whose parents are
divorced or separated. Often quality of the time has taken precedence over the
quantity (Welsh, Buchanan, Flouri & Lewis, 2004). Although quality is crucial to the
adolescent’s wellbeing, insufficient quantity is often associated with poor quality.
Quantity and quality can therefore affect each other and can have interaction effects
(Burgess, 2008). Almedia, Wethington and McDonald (2001) found that fathers who
spent more time with their children were more likely to engage in supportive
interactions with their children. Adolescents want a close, sensitive relationship with
their fathers and the time used to cultivate these qualities is important.
This study broadens further the conceptualizations of paternal contact from the father
and son being in the vicinity of one another or having minimal contact to the
availability of the father, activities engaged in and the motivation of the son to spend
time with his father, including his enjoyment of the time spent. These three aspects
of paternal contact; availability, engagement and time enjoyment and motivation;
cannot stand on their own; rather, it is the interaction of these dimensions that
explain quality paternal contact time. The underlying assumption of the motivation
and enjoyment of time experienced by the son as a dimension of paternal contact
33
comes from literature on marriage (Gottman, 1979; Schaap, 1984). The premise is
that boys who experienced pleasure from and looked forward to spending time with
their fathers have a good paternal relationship.
In a qualitative study in Finland, Taanila, Laitinen, Moilanen and Jarvelin (2002)
found that children with non-residential fathers who had frequent contact but an
emotionally distant father were more likely to exhibit behaviour problems. Contact
alone is not a predictor of a quality paternal relationship but rather allows for time for
the father to communicate with his son and develop an emotional connection, which
all serve as protective factors against adolescent risk behaviours.
2.4.2. Paternal Communication
Many studies have been conducted on the negative impacts of parent-child
communication (Luchetti et al., 2002). One significant factor in family
communication is the amount of anxiety felt while communicating. This has a
significant effect on the quality of the relationship. According to Luchetti et al.
(2002, p. 110), “When a young adult’s communication apprehension restricts the
amount, accuracy, completeness, clarity, content, and honesty of his or her
communication in parent-child interactions, the relationship between these family
members is restricted”. Research into the area of communication apprehension in
relationships has grown over the years. Studies have explored communication
anxiety in marital partners (Floyd & Morman, 1998; Powers & Hitchinson, 1979);
physician-patient (Ayres, Cobly-Rotell, Wadleigh & Hopf, 1996) and superior-
subordinate (Lee, 1998). Only a few have studied communication anxiety in parent-
34
child relationships; and even fewer in father-son dyads specifically. Of those that
have, most studies have focused on parent-child communication in relation to sex
(Miller, Norton, Fan & Christopherson, 1998; Ream & Savin-Williams, 2005).
Speaking frequently about sex between parents and children has been shown to
decrease the likelihood of early sexual debut for the adolescent (East, 1996; Miller,
Benson, & Galbraith, 2001) while others report no relationship (Chewning &
Koningsveld, 1998; Rodgers, 1999); a few even reported a positive correlation
between parent-child communication and riskier sexual behaviour in adolescents
(Miller et al., 2001). Studies focusing on parent communication are usually focused
around sexual behaviours and little is known about the effect of paternal
communication with sons and other adolescent risk outcomes.
2.4.3. Paternal Connection
Connection can be defined as the emotional attachment within the father-son
relationship. Harris et al. (1998, p. 203) suggest that this emotional “dimension of
paternal involvement reflects the affective quality of the relationship as perceived by
the adolescent”. Barber and Olsen (1997) identify a sense of connection in the
parent-child relationship as one of the significant factors that provides for the
continual development of the child and their well-being. Paterson, Field and Pryor
(1994, p. 580) suggest that “optimal outcomes (are) associated with an attachment
relationship that is characterized by a confidence in the accessibility and
responsiveness to the caregiver”.
35
Sons are actively seeking to form bonds with their fathers (Johnson, 2006). They
have a need to be emotionally connected to their fathers and the knowledge that their
fathers are always accessible. Lamb (1997) has summarized, "Many of the studies
dealing with paternal influences show that the closeness of the father-child
relationship is a crucial determinant of the father's impact on child development and
adjustment" (p. 7). Previous research has focused on connection as the amount of
time spent with the child (Brotherson et al., 2003) or the emotional attachment of the
father in the context of the mother’s emotional attachment (Paterson et al., 1994).
Little research has been conducted on the nature of the connection between the father
and son and the effects of the relationship on the son’s risk behaviours.
2.5. FATHER’S BIOLOGICAL AND RESIDENTIAL STATUS
Paternal relationship quality may not be as significantly affected by the residential
status of the father if the time and effort are made to nurture it. The assessment of
paternal–adolescent relationships has not kept pace with the changes that have
occurred in family constellations. Biological fathers having a quality relationship
with their sons may be the ideal but societal circumstances are such that a large
percentage of young men live without access to their biological fathers (due to death,
divorce or living great distances apart). Approximately 35% of children in South
Africa are being taken care of by someone other than their biological parents
(Shisana, Richter & Simbayi, 2004).
In a study of 340 Xhosa students (Anderson, Kaplan, Lam & Lancaster, 1999) results
showed that resident biological fathers may spend more time with their children
36
because of proximity than non-residential fathers. Munsch, Woodward and Darling
(1995) compared perceptions of relationship quality of adolescents who resided with
their biological fathers and those who lived apart from the fathers. Findings
suggested that although residential status affected the likelihood of the father being
considered important in the life of the child, the general quality of the relationship
did not differ by residential status.
A father’s physical presence in the home is only one manifestation of a father’s
presence in a child’s life (Mott, 1990). Some young men reside with their biological
fathers but do not gain value from that relationship as the father may be detached or
emotionally distant. Others may not reside with their fathers and still a few have no
access to their biological fathers (Shisana et al., 2004). These young men are looking
to other men to fulfil their fathers’ role. Father figures can also provide a quality
relationship that may protect young men from certain risk behaviours.
Flouri (2007), using data from 435 fathers of adolescent children, found associations
between resident biological fathers’, non-resident biological fathers’ and father
figures’ involvement and children’s total difficulties, prosocial behaviour, emotional
symptoms, conduct problems and peer relations. Flouri (2007) found no effect for
non-resident biological fathers and when compared with resident biological fathers,
father figures reported more conduct problems in children. The study showed that
compared to their peers with biological resident fathers, adolescents with father
figures were perceived to be at higher risk of behaviour problems (Flouri, 2007).
37
The effect of father residential status on paternal relationship quality and adolescent
risk outcomes are the focus of this study. Based on the literature, this study posits
that residential status of the biological father will have an effect on adolescent risk
behaviours, and that the dimensions of paternal relationship quality will have a
greater effect.
2.6. CONCLUSION
This chapter provided clear conceptual linkages from the relationship quality
between the father and son and specific adolescent sons’ behavioural, social and
health outcomes as a background to this study. The perimeter of risk behaviours was
extended and the significance of paternal relationship quality and father residential
status examined in the literature.
The following chapter will provide an overview of the methodology of this current
study and detailed descriptions of the measures used to investigate the study
hypotheses.
38
CHAPTER THREE
RESEARCH METHODOLOGY
3.1. INTRODUCTION
In this chapter the selection of an appropriate research design located within the
quantitative paradigm will be discussed. A description of the population and methods
of sample selection, determination of sample size and representivity of the study
sample to the study population are given. Measures used in this research, data
collection procedures and data analysis techniques are also presented. Ethical
standards and considerations employed in the investigation of research hypotheses
are described as a conclusion to this chapter.
3.2. RESEARCH DESIGN
A continuing debate amongst social researchers is that of research methodology.
Pretorius (2007) suggests that the term methodology refers to the modus operandi of
doing the research. The purpose of empirical research is to answer questions about
human behaviour using a scientific method. A variety of methods and techniques are
used in empirical research and vary according to the tasks they perform. Methods of
research can be categorized into three broad methodological paradigms; the
quantitative, the qualitative and the action research paradigm (Babbie & Mouton,
2005). While the qualitative paradigm has been linked to phenomenology and action
research framed in metatheories, the quantitative paradigm embraces positivism.
Auguste Comte, the father of positivism, suggested that the positivist framework
embed scientific claims in empirical evidence (Pickering, 1993; Shariff, 1995). Burns
39
(2000, p. 8) states that “the main strengths lie in precision and control. Control is
achieved through the sampling and design; precision through quantitative and
reliable measurement”. An early positivist, Paul Lazarsfeld (1964) described four
basic steps necessary for concepts to be translated into empirical indices and which
should be ascribed to by all social researchers: (1) an initial imagery of the concept,
(2) specifications of dimensions, (3) the selection of observable indicators, and (4)
the combination of indicators and indices. Therefore, within the phenomenon of
fatherhood, by recognizing the existence of the theoretical constructs a link can be
drawn to observable measurements through operational definitions and the selection
of relevant indicators. A quantitative approach was best suited to measure the
indicators or dimensions of relationship quality and their associations to adolescent
risk behaviours. Considering time and financial constraints, a cross-sectional survey
design, using a non-probability cluster sampling approach, was deemed the best
design to investigate the hypotheses of this research study.
Cross-sectional research assesses subjects at a single point in their lives. Risk of
attrition or maturation is little to none and this type of design allows for the study of
a larger sample quickly and feasibly. Causality is often difficult to determine in cross
sectional research as data is collected only at one point in time. Notwithstanding this
shortcoming, the variables being measured in this study are ‘long-term’ variables and
not easily altered overnight. For instance, father-son relationship quality is a latent
variable accrued over time. Also the measures of adolescent risk behaviours are
retrospective in nature and little would change about the way past behaviours
actually exhibit other than the possible influences of social desirability on the
40
reporting of these behaviours by the participants themselves. Long term variables are
stable and therefore amendable to measurement in a cross-sectional study because
they do not easily fluctuate. The two possible threats are those located in the act of
measurement itself: social desirability and response bias. These threats are common
when collecting personal information from participants that may make them feel
vulnerable or in the minority (Babbie & Mouton, 2005). The researcher was aware
that this may have occurred. To help avoid the negative influence of social
desirability on the data, confidentiality and anonomynity were emphasized prior to
administering the surveys to participants.
Survey research is one of the oldest and most frequently used methods of observation
in social science research. Surveys may be used for exploratory, explanatory or
descriptive purposes and may be seen as the best available method to the researcher
interested in collecting original data for a population that is too large to observe. A
review article in the South African Journal of Sociology (Van Staden & Visser, 1991)
identified surveys as the most common ‘types of study’. However, in South Africa,
researchers have to be especially careful as South Africa has a diverse array of
cultures and contexts. Surveys used to determine the attitudes, beliefs or behaviours
of respondents can be particularly challenging. The sample selection and the
development of culturally and contextually valid and reliable instruments are at the
crux of the research design. Instruments were carefully selected based on their
theoretical underpinnings and statistical reporting of previous studies. Prior to
proceeding with the analyses and hypotheses testing each instrument was carefully
screened and tested for internal consistency within the South African youth sample.
41
3.3. SAMPLING
Cluster sampling was used to recruit a school-based sample drawn from the Grade 11
learner population in a previously disadvantaged community in Cape Town. Cluster
sampling involves the sampling of ‘entire natural groups’ rather than individuals.
The principle of randomness is maintained and allows a research design manageable
by the researcher, especially when the population is spread widely across
geographical areas (Burns, 2000, p. 90). Although not as reliable as simple random
or stratified sampling, cluster sampling is often the only possible approach (Melville
& Goddard, 1996, p. 33). The efficiency of cluster sampling depends on the size and
quantity of the clusters used; one or two large clusters are likely to increase sampling
error whereas a large number of small clusters could lead to simple random sampling
(Burns, 2000, p. 91) from the population.
According to Neuman (2006, p. 224) a population refers to a “concretely specified
large group of many cases that the researcher chooses to focus on…from which a
researcher draws a sample and to which results from the sample are generalized”.
This grade level was chosen because it includes a wide age range, and the intention
was to include as wide an age range as possible, given that it was not financially
feasible to sample learners in all grade levels. Learners in Grade 11 generally have an
age dispersion of 16 – 19 years. The population from which the sample was drawn
consisted of 783 Grade 11 male learners who were enrolled in public schools in
Cape Town in 2008 (Western Cape Education Department, 2008).
42
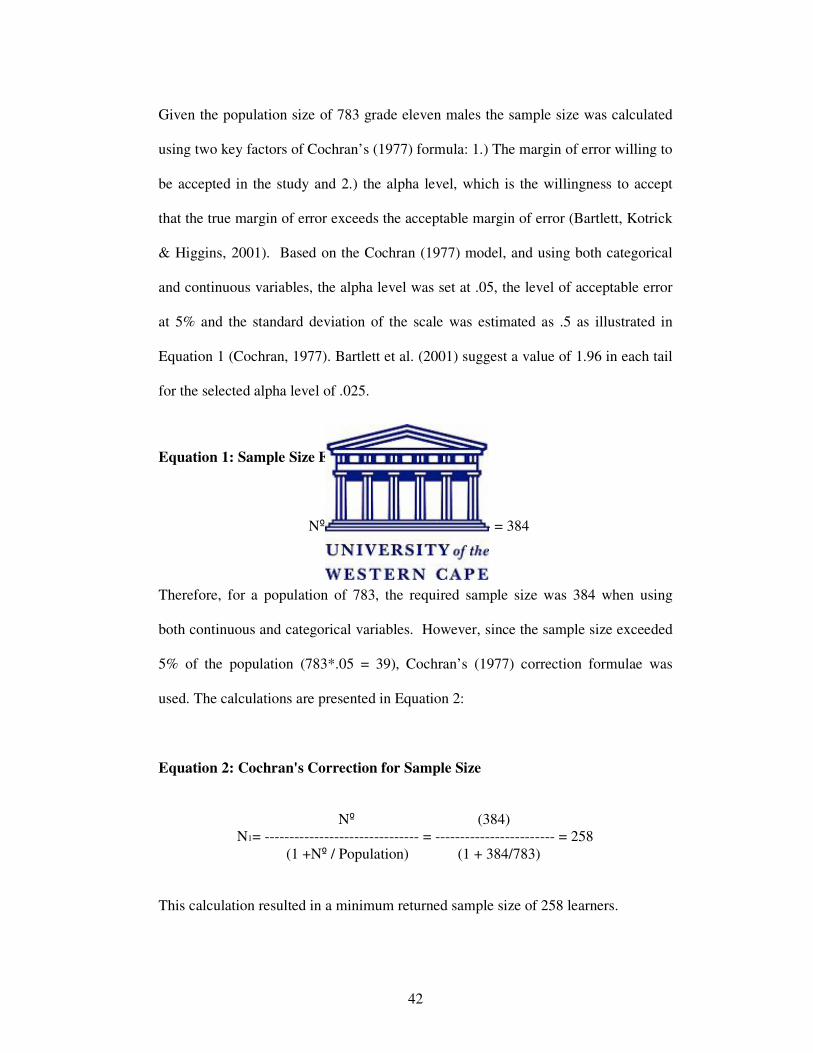
Given the population size of 783 grade eleven males the sample size was calculated
using two key factors of Cochran’s (1977) formula: 1.) The margin of error willing to
be accepted in the study and 2.) the alpha level, which is the willingness to accept
that the true margin of error exceeds the acceptable margin of error (Bartlett, Kotrick
& Higgins, 2001). Based on the Cochran (1977) model, and using both categorical
and continuous variables, the alpha level was set at .05, the level of acceptable error
at 5% and the standard deviation of the scale was estimated as .5 as illustrated in
Equation 1 (Cochran, 1977). Bartlett et al. (2001) suggest a value of 1.96 in each tail
for the selected alpha level of .025.
Equation 1: Sample Size Estimation
(1.96)² (.5) (.5)
Nº = ------------------------------ = 384
(.05)²
Therefore, for a population of 783, the required sample size was 384 when using
both continuous and categorical variables. However, since the sample size exceeded
5% of the population (783*.05 = 39), Cochran’s (1977) correction formulae was
used. The calculations are presented in Equation 2:
Equation 2: Cochran's Correction for Sample Size
Nº (384)
N1= ------------------------------- = ------------------------ = 258
(1 +Nº / Population) (1 + 384/783)
This calculation resulted in a minimum returned sample size of 258 learners.
43
A list of 13 public high schools in one school district in Cape Town was obtained
from the Western Cape Education Department’s Education Management Information
System (EMIS) website (Western Cape Education Department, 2008). The high
schools were located in eight different areas of the school district and a
representative school was randomly selected from each area. If there were more than
two schools in the area, one school was randomly selected from that area (this
occurred three times). The principals of two of randomly selected schools refused
any type of research at their schools as they were having internal crises at the time.
Fortunately, these schools were able to be replaced by another school from their
respective areas.
The principals of the final sample of eight schools provided their verbal permission
(see Appendix A) for the research to be conducted at their schools and this allowed
all their Grade 11 male learners an equal chance of participating in the study. This
procedure yielded a sample of 523 learners. Over sampling was necessary as it was
expected that not all learners would return their parental consent letters (see
Appendix B) or their own assent forms (see Appendix B). A total of 351 learners
returned their parental consent letters, with permission to participate in the study, and
their informed assent form and were recruited into the study. Boys were immediately
removed from the sample if an unsigned consent form was returned to the researcher
(N = 19).
On the day of data collection, 17 learners were absent from their school and therefore
did not participate in the research even though they returned consent and assent
44
forms and this reduced the study sample to 334 learners. During the data collection
process three learners, at three different schools, chose not to complete the
questionnaires. These learners were excused from the venue without any penalty.
The final sample used for the data analyses and hypothesis testing was 331 learners
with a mean age of 16.62 years (15 years – 19 years, SD = .93).
3.4. MEASURES
The instruments used in this study were four self-administered measures, completed
in a school classroom setting and only reflected the perceptions of the participants
and not that of their families. Self-administered questionnaires can survey many
participants at the same time and may be administered in a variety of locations. The
most important advantage to using self-administered questionnaires is the assurance
of anonymity and this helps the respondent be honest in their answers (Bless &
Higson–Smith, 2000, p. 109). The added advantages of this method include easier
standardization and low strain on time and finances whilst reaching larger
proportions of the population (Bless & Higson–Smith, 2000, p. 109). The researcher
was present at the time of administration and according to Mitchell and Jolley (1996,
p. 442), “a major advantage to having the investigator present is that the investigator
can clarify questions for the respondent. In addition, the investigator’s presence
encourages the participants to respond”.
Five instruments, as presented below, were included in this research.
(i) The demographic questionnaire (see Appendix D)
45
(ii) The Father-Son Quality Contact Time Scale (FS-QCTS) (see
Appendix E);
(iii) the Child–Parent Communication Apprehension Scale for Use With
Young Adults (CPCA-YA; Lucchetti et al., 2002) (see Appendix F);
(iv) the 10-item Acceptance Subscale from the 30-item revision of the
Child Report of Parent Behavior Inventory (CRPBI; Barber 1996;
Schaefer, 1965) (see Appendix G);
(v) and the Problem Orientated Screening Instrument for Teenagers
(POSIT; Radhert, 1991) which included the Human
Immunodeficiency Virus (HIV) Risk Behaviour subscale that was
developed in South Africa as an addition to the POSIT (Jamara et al.,
2006) (Appendix H).
Three (the CPCA–YA, the CRPBI Acceptance Subscale and the POSIT) of the five
measures were developed in the United States and had performed well when
reviewing measures of internal consistency. With the exception of the revised
POSIT, none had previously been translated into Afrikaans or isiXhosa. For the
purposes of this study the CPCA–YA and the CRPBI Acceptance Subscale were
translated into Afrikaans, the language of some of the learners, and the translation
checked by back translation. The FS-QCTS measure was developed for the purpose
of this study and details of the statistical analyses of the measure will be provided in
Chapter Four.
46
3.4.1. Demographic Questionnaire
The demographic questionnaire collected information regarding the age, race, socio-
economic status, residential status of biological mother and father, marital status of
parents and relationship to father figure if there was no biological father present (see
Appendix D). The demographic questionnaire collected information on both
descriptive and theoretical variables. The variables are described below:
Age was measured in years and participants reported their current age at the time of
the study.
Race was used as a descriptor variable and not a theoretical variable and therefore
was not used as a part of the analyses. During the Apartheid years all South Africans
were classified in accordance with the Population Registration Act of 1950 into
‘racial groups’. The provision of services occurred across these racially segregated
lines and the disproportionate provision of services led to inequalities (McIntyre,
2000). Although some advocate for the removal of race as a variable in research, it
addresses these inequalities and provides a platform to give the reader a better
understanding of the study sample. The race of the participant was not required to be
reported and in no way does the author subscribe to these classifications.
Socio-economic Status was measured using a 5-point Likert scale ranging from 1 (No
food money) to 5 (Money for luxury goods and extra things). This method of
measurement was appropriate to use as most participants would not have knowledge
of their actual household income.
47
Parent’s Marital Status was used as a descriptor variable. Participants could report
their parents as Married, Divorced, Never Married or Separated.
Mother Residential Status and Father Residential Status were used as dichotomous
items with participants either reporting ‘Yes’ or ‘No’ to “Do you live with your
biological mother?” and “Do you live with your biological father?” respectively. The
variables were used in the statistical analyses of the study. The residential status of
the biological parents of the adolescent boy was important to the interpretation of the
study findings.
Father Residential Status was further disaggregated into three categories: Biological
Resident Father, Biological Non-Resident Father and Father Figure for boys with no
biological father present in their lives. This was done by transposing the Father
Residential Status item and the Relationship to Father item. The study hypotheses
weigh heavily on this variable: the importance of relationship quality and father
residential status in protecting adolescent boys from risk behaviours are the focus of
this study.
3.4.2. Father-Son Quality Contact Time Scale
Paternal contact was measured using the Father-Son Quality Contact Time Scale (F-
S, QCTS; see Appendix E), which was developed for the purpose of this study. A
review of the available literature gave no evidence of an existing measure to assess
father-son contact holistically. A holistic approach to measuring contact would
involve the assessment of availability of the father and time spent together, activities
48
engaged in between father and son, and the son’s desire to spend time with his father.
Most instruments measured only physical contact, not interaction time; or only
activities engaged in. This study includes a crucial part of the construct of father-son
contact; the motivation of the son to spend time with his father and the sons’
enjoyment of the time spent; an area almost entirely ignored in previous research.
The response format of the scale required learners to circle the number
corresponding to the answer they chose. One question (Over the past month did your
father and you…) which assessed activities participated in over the past month had
multiple selections and learners checked as many as applied to them. One other
question “How often do you see your father?” used reverse scoring. The highest
possible score calculated for this measure is 38, with higher scores representing more
quality contact time between the father and the son.
A factor analysis was conducted in this measure to test the dimensionality and
internal consistency. The results of the analyses conducted on this measure are
presented in the following chapter, Chapter Four.
3.4.3. The Child–Parent Communication Apprehension Scale for Use with
Young Adults
Paternal communication was measured using the Child–Parent Communication
Apprehension Scale for Use with Young Adults (C-PCA, YA; Lucchetti et al., 2002)
(see Appendix F). This scale investigates a young adult’s apprehensions about
engaging in communication with his or her parents. Luchetti et al. (2002) indicated
49
that the 12-item C-PCA, YA measure was a reliable measure and reported
Cronbach’s reliability coefficient to be equal to .90 for boys reporting about their
fathers. The scale uses a 5-point Likert-type response pattern from 1 (strongly
disagree) to 5 (strongly agree). Higher scores relate to less communication
apprehension experienced by the son when talking with his father. The highest score
attainable on this measure totalled a value of 44. Four questions (question 31, 33-35)
used reverse order scoring.
3.4.4. Revised CRPBI Acceptance Subscale
Paternal connection was measured using the 10-item Acceptance subscale (see
Appendix G) from the 30-item revision of the Child Report of Parent Behaviour
Inventory (CRPBI; Barber, 1996; Schaefer, 1965). The measure was originally
developed for use of both male and female children reporting on both parents
behaviours. Adolescents rated each parent on a 3-point Likert-like scale from 1 (Not
like him) through 3 (A lot like him). Sample items include: “makes me feel better
after talking over my worries with him” and “enjoys doing things with me”. The 10-
item sub-scale reported an average alpha of .89 when used in a cross national study
conducted in nine countries (Barber, Stolz & Olsen, 2005; Stolz et al., 2004). Alphas
ranged from .86 for South Africa high school learners to .93 for American learners
(Bradford et al., 2003).
3.4.5. Problem Oriented Screening Instrument for Teenagers
Adolescent risk behaviours were measured using the Problem Oriented Screening
Instrument for Teenagers (POSIT), developed by Elizabeth Rahdert (1991) in the
50
United States, for the assessment and referral of adolescents exhibiting risk
behaviours upon admission into a clinical setting.
The POSIT consists of 139 yes/no questions which are sub-divided into 10 sub-
scales: Substance Abuse (17 items), Physical Health (10 items), Mental Health (22
items), Family Relationships (11 items), Peer Relationships (10 items), Educational
Status (26 items), Social Skills (11 items), Leisure and Recreation (12 items),
Aggressive Behaviour and Delinquency (16 items), and Vocational Status (18 items).
The validity of the POSIT subscales has been tested in a number of studies, and
while internal consistency and other validity tests have varied in strength, most have
found good reliability and validity results (Knight, Goodman, Pulerwitz, & Durant,
2001; Melchior, Rahdert & Huba, 1994; McLaney, Del Boca & Babor, 1994).
The U.S. scoring system included two empirically-based cut-off scores that indicate
low, medium, or high risk for each of the problem areas (Radhert, 1991). This study
used the scores as continuous variables as the cut-off scores were developed in the
US and may not have been suitable for the South African context. No special
qualifications were necessary to administer POSIT and administration time takes 20-
25 minutes. The POSIT may be scored in approximately 2-5 minutes when using the
scoring templates placed over the paper and pencil version.
A South African study using the POSIT (Plüddemann, Flisher, McKetin, Parry,
Lombard, 2009) used a representative sample of the Grade 8, 9 and 10 students in the
Southern Educational District in Cape Town. The POSIT was translated into South
51
African English, Afrikaans and isiXhosa. Reliability analysis showed good results
for some of the POSIT scales, while others were less satisfactory. The Cronbach’s
alpha values were good for: Substance Use/Abuse – 0.86, Mental Health – 0.80,
Aggressive Behaviour – 0.75, and Educational Status – 0.72, somewhat low for
Family Relationships – 0.67, Physical Health – 0.61 and Peer Relationships – 0.53,
but poor for Social Skills – 0.30 and Leisure/Recreation – 0.10.
Subsequently, an HIV/STD risk-of-exposure screen (Rahdert, Young, &
Langenbucher, 2005; Young & Rahdert, 2000), also configured to the same
prototype as the POSIT (Rahdert, 1991) was developed. The scale estimate of
internal consistency was .78 (Rahdert et al., 2005) and was added as the eleventh
problem area on the POSIT (Rahdert, 1991). Piloting of this measure was conducted
in South Africa and a final 12-item measure was developed for use in a South
African sample. English, Afrikaans and Xhosa versions of the POSIT HIV/STD scale
was found to be internally consistent (alpha=.80) for the entire sample and alphas
ranging from .77 to .83 across languages (Jamara et al., unpublished manuscript).
The selected subscales of the POSIT used for this study consisted of 131 items.
Domains included: Substance Abuse, Physical Health, Mental Health, Negative
Family Relations, Negative Peer Relationships, Educational Under-Attainment,
Social Skills, Leisure and Recreation, Aggressive Behaviour and Delinquency and
HIV/STD Risk Behaviour. The Vocational Status subscale was omitted as the sample
was attending high school and most learners do not work at regular jobs.
52
3.4.6. Pilot of Procedure and Research Measures
All measures were piloted at one high school in Cape Town to assess the time it
would take to complete the questionnaires and if there were any questions that were
difficult to understand or ambiguous. The questionnaire contained practice questions
on the first page (see Appendix C) that would help the learners accustom themselves
to the different response formats.
A feedback session was conducted after all learners had completed the
questionnaires. Learners were asked which questions they felt were most difficult
and which were easier and the majority mentioned that the questions were easy to
understand. However, three learners felt that the instructions provided by the
researcher should be more explicit, specifically as to how to complete the different
types of question with their varying response formats (check box, circle number and
yes or no questions). Since they did get clarification from the researcher during the
administration of the measures and this was sufficient, no adjustments were made to
the measures. Learners took approximately thirty minutes to one hour to complete
the questionnaires3.
3.5. PROCEDURE
Permission was requested from the Western Cape Education Department to conduct
the study at the eight selected schools. Once permission was given by the Education
Department the principals were contacted and appointments were made for
individual face-to-face meetings. The meeting served as a briefing session about the
3 Questionnaires of the leaners at the pilot study school were included in the main sample analyses and
hyopotheses testing as no changes were made to the questionnaires following the pilot study.
53
study with the aim of acquiring verbal consent from the principal. Consent was
required from principals, parents and learners as the data collection took place during
school hours with minors.
The schools provided class registers for all grade eleven learners with the male
learners clearly indicated. All male grade eleven learners then received a letter
explaining the aims and procedure of the research (see Appendix B), together with a
parental/guardian consent and informed consent form, which was to be returned and
sealed in the provided unmarked envelope.
Times, venues and dates to conduct the research were made with either the principal
or the grade coordinator. Most schools used their halls and others used larger
classrooms. Learners were all seated at individual desks and completed the
questionnaires at the same time. Once all learners were seated, the questionnaires and
stationery pack (containing a pen, pencil, eraser, ruler and sharpener), were
distributed. Participants were informed at the beginning of the study that the
stationary packs were not barter for a completed questionnaire and they were allowed
to keep the packs even if they did not complete the questionnaires.
The researcher then affirmed consent and assent procedures, reminded the
participants that participation was voluntary, explained the various type of questions
and the response formats in the questionnaires, and stressed the importance of
honesty as all the questionnaires where anonymous and information strictly
confidential. In an effort to reduce reporting inconsistencies, prevalent when
54
collecting self report data on sexual activities, an explanation of how the results
would be used to improve the lives of the participants and other youth was stressed
(Palen, Smith, Caldwell, Flisher, Wegner & Vergnani, 2008).
On completing the questionnaires, participants dropped their questionnaires into a
box and signed a register confirming that they had taken part in the study. All
questionnaires were coded, scored and captured. All data analysis was performed in
the Statistical Package for the Social Sciences (SPSS) version 17 (SPSS, 2009).
3.6. DATA ANALYSIS
The major tools of statistical data analysis were descriptive statistics; correlation
statistics; reliability analysis using Cronbach’s co-efficient alpha; measures of
validity, including factor analysis; multiple analyses of variance (MANVOA); and
linear regression.
3.6.1. Descriptive Statistics
Descriptive statistics were used to describe the sample characteristics. Descriptive
statistics provide a description of the data through percentages, modes, means,
frequency distribution, kurtosis, standard error of the mean and standard deviations
(Bohrnstedt & Knoke, 1988, p. 492). Descriptive statistics entail the use of tables,
graphs and numerical techniques to condense and summarise data (Burns, 2000, p.
43).
55
3.6.2. Correlation
The most common correlation coefficient is Pearson product-moment correlation
coefficient, commonly symbolized as r. The Pearson correlation can range from -1.00
to +1.00. A score closer to negative or positive 1.00 is an indication of stronger
relationship and the positive and negative signs provide information about the
direction of the relationship. Correlation was used to assess the association and the
strength of the relationship between the dimensions of relationship quality (paternal
contact, connection and communication).
3.6.3. Reliability
Assuming that what is being measured does not change, a measure is considered
reliable if it repeatedly and consistently produces the same results. One of the
specific methods involved in the assessment of reliability is internal consistency
reliability (Burns, 2000, p. 341; Cozby, 2001, p. 94). Internal consistency estimates
the reliability of an instrument administered to a group of people on one occasion.
Two indicators of internal consistency are split–half reliability and Cronbach’s α
(Cronbach, 1951). Cronbach’s α is a more efficient mathematical equivalent of the
average of all possible split-half estimates (Burns, 2000, p.343). Cronbach’s α was
chosen to measure the internal consistency for the study instruments due to the
limited access to learners and the efficacy of using it as a method of reliability. For
internal consistency, an α of 0.70 and above is desirable (Santos, 1999) and the item-
total correlation should be between 0.20–0.80, as higher than 0.80 is an indication of
a redundant item (de Wit, Pouwer, Gemke, Delemarre-van der Waal & Snoek, 2007).
56
The internal consistency of each measure used in this study is presented in, the
following chapter, Chapter Four.
3.6.4. Validity
The validity of an instrument is established when the instrument is shown to measure
what it intended to measure (Cozby, 2001, p. 96). Validity may be measured through
a variety of methods with the simplest method being that of face validity. Face
validity is the principle that the measure appears to reflect the construct being
measured. However, this is not sufficient to conclude that a measure is valid as
appearance is not a good indicator of accuracy. Foxcroft and Roodt (2005) assert that
a more stringent way of measuring validity would be to use the methodology of
construct validity. Another type of validity is nomological validity, which is defined
as ‘the degree to which predictions from a theoretical network containing the concept
under scrutiny are confirmed’ (Netemeyer, Bearden & Sharma, 2003, p. 13). It uses
correlation to evaluate the degree to which measures that are theoretically related are
also empirically related.
3.6.5. Factor Analysis
Factor analysis was used for assessing the validity of the Paternal Quality Contact
Time Scale. It is a ‘statistical technique for analysing the interrelationships of
variables’ (Foxcroft & Roodt, 2005, p. 35). The objective is to determine the
dimensions of a set of variables. By doing so the common variance between the
dimensions are identified and variables that are moderately to highly correlated with
each other are grouped together to form a factor (Burns, 2000, p. 272).
57
3.6.6. Multivariate Analysis of Variance
Multivariate Analysis of Variance (MANOVA) is an extension of the Analysis of
Variance (ANOVA). ANOVA also called the F-test, is a statistical method for
comparing two or more groups in terms of another variable and testing the
significance of the observed differences (Pretorius, 2007, p. 214). A MANOVA is
applicable when there is ‘one independent variable with more than two levels and
several dependant variables’ (Pretorius, 2007, p. 299). An important aspect of a
measuring instrument is that of its variance (Huysamen, 1980). If each person
obtained the same score on a test, this would yield zero variance, and the test would
be of no use as it would not be able to discriminate between individuals who have
varying amounts of the attributes being measured. The effect of father residential
status on the dimensions of contact, communication and connection were evaluated
using a MANOVA.
3.6.7. Post Hoc Tests
Because of the number of analyses that typically occur in an MANOVA, post hoc
tests were used to expose Type I and Type II errors that may have occurred during
the analyses. Type I error is the mistake of falsely rejecting the null hypothesis when
it is true (Burns, 2000, p. 117). However, sometimes the significance level has been
set too high and the risk of falsely accepting the null hypothesis is more than
probable. In this instance, there would be a risk of possibly committing a Type II
error (Burns, 2000, p. 116).
58
A number of post hoc tests have been developed that attempt to minimize Type I
error and the statistical power of multivariate analyses. The most commonly used
post hoc tests include the Bonferonni Correction, the Scheffé test, and the Tukey
honestly significant difference (HSD) test (Meyers, Gamst & Guarino, 2006, p. 427).
The Bonferonni Correction is a multiple-comparison correction, used when several
dependent or independent statistical analyses are being performed simultaneously.
To reduce the possibility of a lot of spurious positives the alpha level is lowered to
account for the number of comparisons being performed. The adjustment entails
dividing the alpha level (usually .05) by the number of dependent variables (Meyers
et al., 2006, p. 373). The Scheffé test is a conservative procedure which conducts ‘a
simultaneous pairwise comparison of all means using the F distribution’ (Meyers, et
al., 2006, p. 427). Similarly, the Tukey HSD considers all pairwise comparisons but
uses the standard error of the mean and the range distribution (Meyers et al., 2006).
3.6.8. Multiple Linear Regression
The data presented contains multiple continuous independent variables (namely,
father–son contact, father–son communication apprehension and father–son
connection) and multiple continuous dependant variables (all sub-categories
measured on the POSIT). Multiple regression involves several variables on one side
of the equation, which combine to form one single predictor variable and a single
variable on the other side. The highest correlation is sought between the predictor
variable and the single variable (Tabachnick & Fidell, 1996, p.195). It is therefore a
method of investigating the individual and collective contributions of several
59
independent variables on the dependant variable (Pretorius, 2007, p. 253). Multiple
regressions were used to investigate the effect of father-son relationship quality and
father residential status on adolescent risk outcomes.
3.7. ETHICS APPRAISAL
The word ethics finds it roots in the Greek word ethos which means a person’s
character or disposition. Ethics is not only a person’s character but also how one
treats others. Ethical decisions were made throughout the research process from
initial planning stages to final reporting of the results. An intricate balance between
the production of meaningful results and the responsibility to respect participants’
rights (Goodwin, 1995) was maintained throughout the research process.
The study entailed administering questionnaires to Grade 11 male learners in Cape
Town. Permission was sought from school principals to ask learners for their
voluntary participation in completion of anonymous questionnaires. In conducting
ethical research, the welfare and the rights of all participants must be protected
(Terre Blanche & Durrheim, 1999). The participants were fully informed about the
nature of research, its area of inquiry, the aims and objectives of the study, as well as
the intended procedure (Terre Blanche & Durrheim, 1999). They were informed as
to who may have access to the data (e.g. research supervisors) and what their
intentions would be with the findings. It was stressed that participation was free and
voluntary, the questionnaires they completed would remain anonymous and they had
the freedom to leave the study at any point, without any penalty, if they wished to do
so.
60
Due to the content and nature of the questions, active consent was acquired from
parents and learners, prior to questionnaire administration at the schools. The consent
and assent forms stressed that they understood that:
(i) The learner participated voluntarily in the study;
(ii) The learner was able to leave the study at any time;
(iii) The learner was not coerced to participate; and
(iv) All information provided would be anonymous and be held in the
strictest confidence by the researcher.
Scott-Jones (2000) advises that researchers need to find a balance between the
responsibility for the welfare of participants and the concern for scientific reliability.
Voluntary participation is threatened when it comes to vulnerable groups such as
children, students, patients, military personnel, or prisoners; as well as in individuals
that have very low social status, are uneducated, or unfamiliar with social research
(Mouton, 2005). Learners may have felt pressurized to enrol into the study by the
peers or teachers and were therefore requested to obtain parental consent and to
additionally provide their informed consent or assent, depending on their age. A
learner could exclude himself from the study, even when receiving parental consent,
by not signing his portion of the reply slip or stating on the slip that he refused to
participate. The reply slips were returned in the provided unmarked envelopes and
only the researcher had knowledge of those who had or had not given consent to
participate.
61
Questionnaires were only administered to those who had completed both portions
(parent and learner) of the reply slip. The principal was informed as to the names of
the learners who were to complete the questionnaires on the day of administration,
for the purpose of relocating those learners to a venue, prepared specifically for the
study. The rooms contained desks or tables spread apart so that learners could
complete their questionnaires privately to maintain participant confidentiality.
Learners were asked not to write their name or the name of their school on the
questionnaires. On completion, the learners immediately dropped their
questionnaires into a box so that no association could be made between learner and
questionnaire.
Before commencement of the study it was decided that boys who might approach the
researcher with personal issues as a result of completing or not completing the
questionnaire would be referred to counsellors at the University of the Western Cape.
There were no participants who made such requests and therefore no referrals were
made during the study.
After data collection, ethical responsibilities were upheld in the data analysis and
reporting of the findings. Goodwin (1995) states that the main forms of scientific
fraud are plagiarism and data falsification. Data falsification comes in many forms:
an entire study may be discarded because it did not come out in the expected way;
researchers may create their own data sets; some data may be distorted or absent to
improve results; or missing data may be generated by speculation (Goodwin, 1995).
No changes were made to the observations of learners responses in the study or to the
62
data set, unless prompted by data screening and cleaning techniques. Plagiarism is
the deliberate capturing of someone else’s ideas and presenting them as your own
(Goodwin, 1995). Any source that was consulted in the writing up of this research,
whether it was used directly (through a quote) or indirectly (Mouton, 2005) has been
acknowledged.
Brief reports based on the findings of this research were made available to the
principals. These reports did not contain the names of the schools which participated
nor was the data disaggregated by school. A copy of the thesis will also be made
available to the Western Cape Education Department, as per the requirement for
receiving permission to conduct research within the schools.
3.8. CONCLUSION
This chapter presented the research methodology of this study. A detailed account of
the research design, sampling procedures, and ethics upheld in this study was
provided. Data analysis techniques which are used in Chapter Four and Chapter Five
are explained and the importance of the relevant techniques in testing the study
hypotheses validated. The selection of study instruments was substantiated by their
proven usefulness in previous studies.
The next chapter will evaluate the psychometric properties of the study instruments
and confirm their statistical power on the study sample.
63
CHAPTER FOUR
PSYCHOMETRIC PROPERTIES OF THE MEASURES AND
STUDY VARIABLES
4.1. INTRODUCTION
This chapter presents the psychometric properties of the measures and the data
screening procedures used to evaluate the study variables. Data screening was done
in two phases: First, the preliminary screening of the data and then, using only the
final study instruments (as determined by internal consistency analyses), data
screening procedures commenced further to include analysis of means, standard
deviation, skewness and kurtosis.
4.2. DATA SCREENING PHASE 1
The data was screened using the frequencies analytical function and descriptive
statistics function in SPSS to ensure that there were no anomalies, missing or
incorrectly inputted data.
Screening of the descriptive statistics of the categorical variables (Mother Residential
Status, Socio-Economic Status and Father Residential Status) revealed no code
violations or input errors. No missing values were detected for the variables except
Socio-Economic Status which had 13 missing variables. List wise deletion was used
when including the variable Socio-Economic Status in the analysis.
A scan of the descriptive statistics of the continuous variables resulted in the
identification of 5 cases with missing data for three or more of the study instruments.
64
These cases were excluded from further analyses. The second phase of the data
screening procedures is presented after the psychometric properties of the measures.
4.3. PSYCHOMETRIC PROPERTIES OF MEASURES
The reliability of the study instruments4 was measured using a two-step process.
First, a measurement’s inter-item corrected correlation totals were screened and
items with correlations less than 0.20 were not included in the data analysis as those
items are generally “considered to be the minimum acceptable discrimination value
to use when it comes to item selection” (Foxcroft & Roodt, 2005, p. 53). Item-total
correlation can be performed between the score on an item and performance on the
total measure. Positive and negative item-total correlations differentiate between
those who do well and poorly on a measure and items with poor discriminatory
powers respectively (Foxcroft & Roodt, 2005, p. 53). Second, the internal
consistency of the measures was assessed using Cronbach’s coefficient alpla (α).
Measures used in this study included: The Father-Son Quality Contact Time Scale
(FS-QCTSS) (see Appendix E for a list of items); the Child–Parent Communication
Apprehension Scale for Use With Young Adults (CPCA-YA) (Lucchetti et al., 2002)
(see Appendix F); the revised CRPBI Acceptance Subscale (Barber, 1996; Schaefer,
1965) (see Appendix G); and the Problem Orientated Screening Instrument for
Teenagers (POSIT) (Rahdert, 1991) with the recently developed supplementary HIV
Risk Behaviour subscale (Jamara, et al., 2006) (see Appendix H).
4 Students had the choice of answering the measures in English or Afrikaans as these were both
available. All participants indicated that they preferred to answer the measure in English.
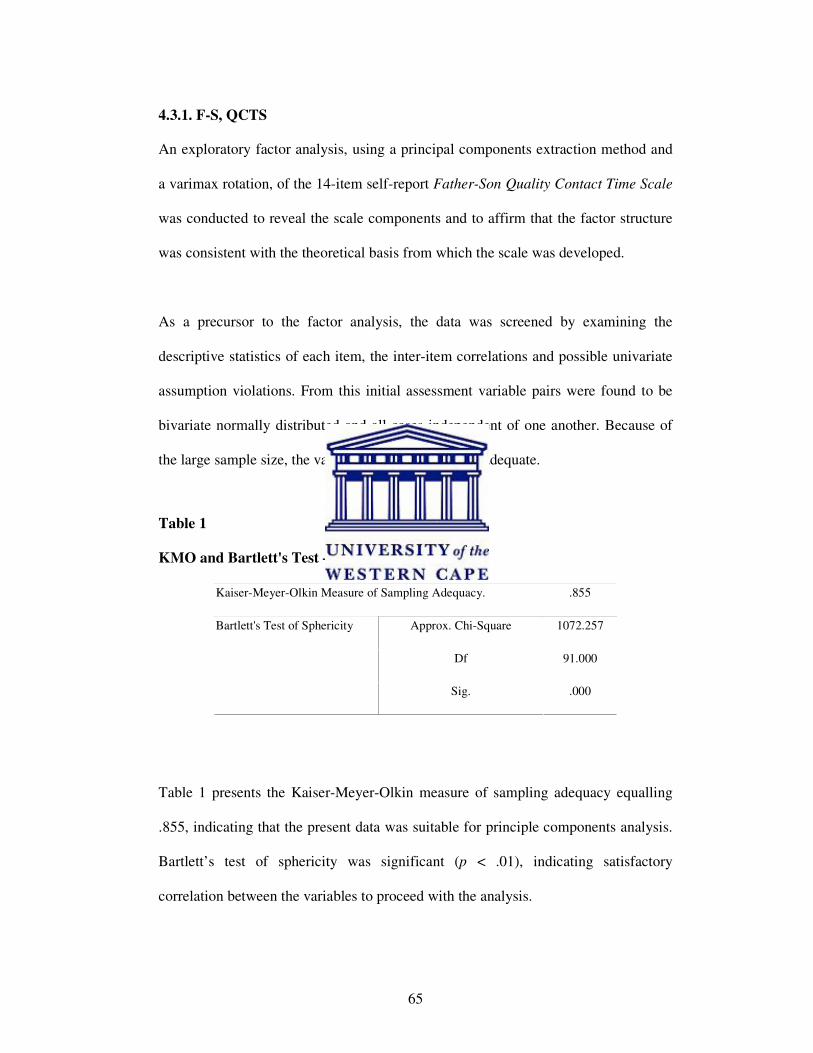
65
4.3.1. F-S, QCTS
An exploratory factor analysis, using a principal components extraction method and
a varimax rotation, of the 14-item self-report Father-Son Quality Contact Time Scale
was conducted to reveal the scale components and to affirm that the factor structure
was consistent with the theoretical basis from which the scale was developed.
As a precursor to the factor analysis, the data was screened by examining the
descriptive statistics of each item, the inter-item correlations and possible univariate
assumption violations. From this initial assessment variable pairs were found to be
bivariate normally distributed and all cases independent of one another. Because of
the large sample size, the variables-to-cases ratio was adequate.
Table 1
KMO and Bartlett's Test – F-S, QCTS
Kaiser-Meyer-Olkin Measure of Sampling Adequacy. .855
Approx. Chi-Square 1072.257
Df 91.000
Bartlett's Test of Sphericity
Sig. .000
Table 1 presents the Kaiser-Meyer-Olkin measure of sampling adequacy equalling
.855, indicating that the present data was suitable for principle components analysis.
Bartlett’s test of sphericity was significant (p < .01), indicating satisfactory
correlation between the variables to proceed with the analysis.
66
The factor analysis proceeded and using the Kaiser-Guttman retention criterion of
eigenvalues greater than 1.0, a three-factor solution provided the clearest extraction.
The three factors, which accounted for 53% of the total variance of the Father-Son
Quality Contact Time total, were identified. They were named following the
recommendations of Comrey and Lee (1992) and Rummel (1970) in which sorted
factor weights in excess of .65 were used to label and interpret each factor. The
three-factor model and item factor loadings are presented in Appendix I.
Babbie and Mouton (2005, p. 473) state that the generation of factors ‘has no
reference to the meaning of the variables, only to their empirical associations’. This
fact must be taken into account when evaluating results of a factor analysis. They
further assert that two criteria must be taken into account when generating factors.
First, a factor must explain a larger portion of the variance found in the study
variables. Second, every factor must be relatively independent of other factors
(Babbie and Mouton, 2005, p. 473). Independence of factors for the Father-Son
Quality Contact Time Scale is presented in Table 2.
Factor 1: Time and Availability (eigenvalue = 4.91) accounted for 35% of the
variance and had seven items; Factor 2: Activities (eigenvalue = 1.3) accounted for
9.4% of the variance and had four items; and Factor 3: Enjoyment and Motivation
(eigenvalue = 1.2) accounted for 8.7% of the variance and had three items.
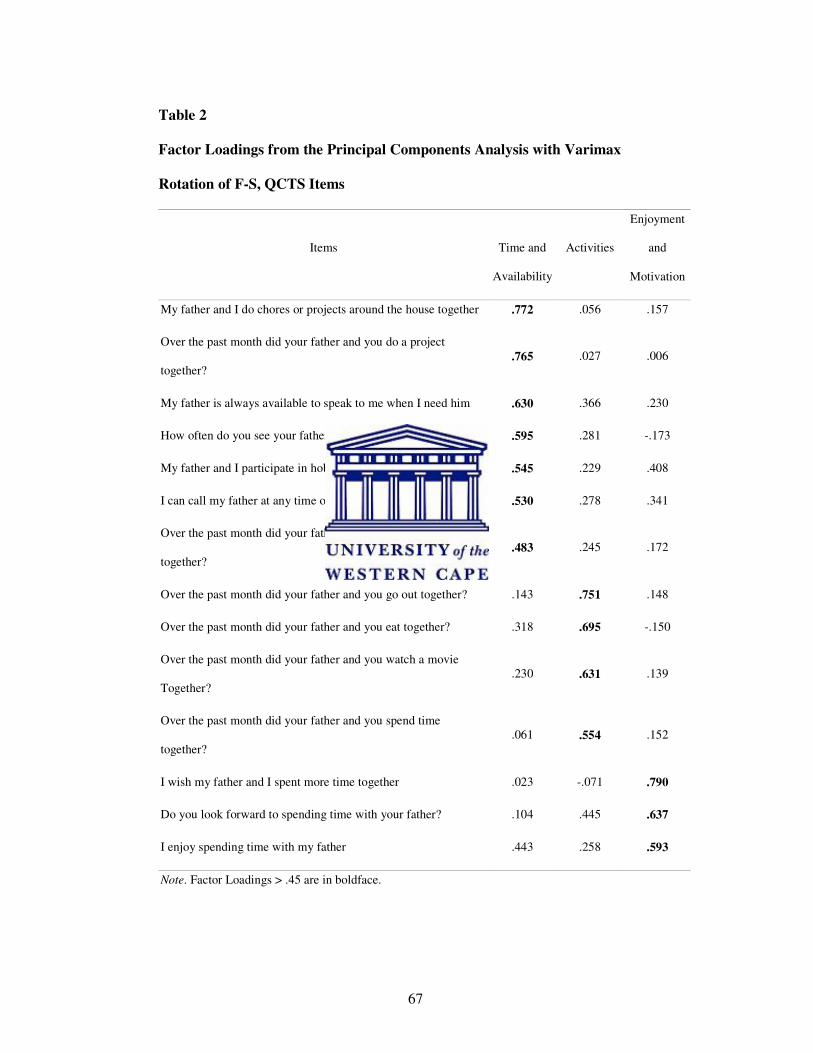
67
Table 2
Factor Loadings from the Principal Components Analysis with Varimax
Rotation of F-S, QCTS Items
Items Time and
Availability
Activities
Enjoyment
and
Motivation
My father and I do chores or projects around the house together .772 .056 .157
Over the past month did your father and you do a project
together? .765 .027 .006
My father is always available to speak to me when I need him .630 .366 .230
How often do you see your father? .595 .281 -.173
My father and I participate in hobbies and activities together .545 .229 .408
I can call my father at any time of day if I need to speak to him .530 .278 .341
Over the past month did your father and you play a sport
together?
.483 .245 .172
Over the past month did your father and you go out together? .143 .751 .148
Over the past month did your father and you eat together? .318 .695 -.150
Over the past month did your father and you watch a movie
Together?
.230 .631 .139
Over the past month did your father and you spend time
together?
.061 .554 .152
I wish my father and I spent more time together .023 -.071 .790
Do you look forward to spending time with your father? .104 .445 .637
I enjoy spending time with my father .443 .258 .593
Note. Factor Loadings > .45 are in boldface.
68
Next, the inter-item total correlations of the measure of father-son contact examined
and no items with correlations lower than 0.20 were evidenced (see Appendix K for
list of items and their inter-item correlations). Cronbach’s α indicated a relatively
high estimate of internal consistency (α = .819) for the whole scale. The results of the
factor analysis and the internal consistency analyses indicate the father-son contact
measure to be suitable for use amongst adolescents (15-19 years).
4.3.2. C-PCA, YA
It was evident, according to the inter-item correlation (r) statistic, that negatively
phrased questions did not perform well on the scale: ‘I’m afraid to come out and tell
my father exactly what I mean’ (r = -.003); ‘I am tense when developing in depth
conversations with my father’ (r = -.003); ‘I feel strained when anticipating talks
with my father’ (r = .010); ‘In casual conversation I feel tense and must guard what I
say’ (r = -.043). However, dimensions that were measured by the questions deleted
were measured by similar remaining questions that were phrased differently. Table 3
presents the four negatively phrased items that were removed, as well as the similar
items measuring the same dimensions. Items were reversed scored before
calculating any statistics.
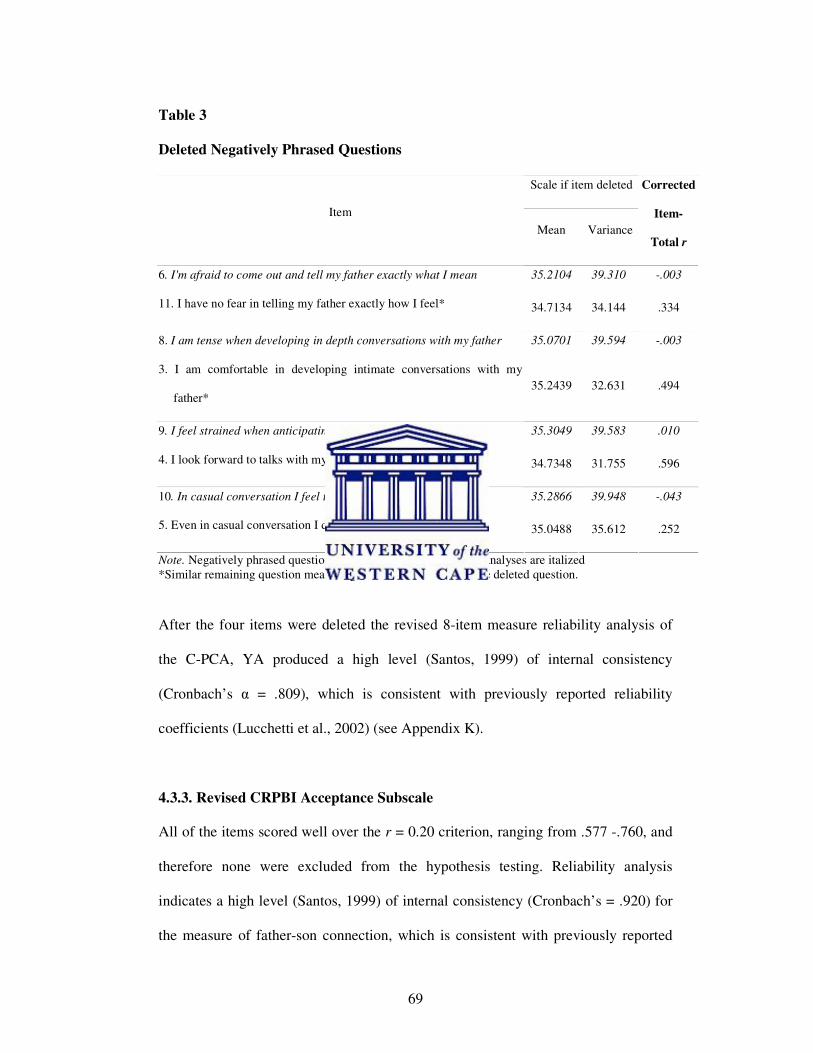
69
Table 3
Deleted Negatively Phrased Questions
Scale if item deleted
Item
Mean Variance
Corrected
Item-
Total r
35.2104 39.310 -.003 6. I'm afraid to come out and tell my father exactly what I mean
11. I have no fear in telling my father exactly how I feel* 34.7134 34.144 .334
35.0701 39.594 -.003 8. I am tense when developing in depth conversations with my father
3. I am comfortable in developing intimate conversations with my
father* 35.2439 32.631 .494
35.3049 39.583 .010 9. I feel strained when anticipating talks with my father
4. I look forward to talks with my father* 34.7348 31.755 .596
35.2866 39.948 -.043 10. In casual conversation I feel tense and must guard what I say
5. Even in casual conversation I don't have to guard what I say* 35.0488 35.612 .252
Note. Negatively phrased questions that were not included in the analyses are italized
*Similar remaining question measuring the same dimension as the deleted question.
After the four items were deleted the revised 8-item measure reliability analysis of
the C-PCA, YA produced a high level (Santos, 1999) of internal consistency
(Cronbach’s α = .809), which is consistent with previously reported reliability
coefficients (Lucchetti et al., 2002) (see Appendix K).
4.3.3. Revised CRPBI Acceptance Subscale
All of the items scored well over the r = 0.20 criterion, ranging from .577 -.760, and
therefore none were excluded from the hypothesis testing. Reliability analysis
indicates a high level (Santos, 1999) of internal consistency (Cronbach’s = .920) for
the measure of father-son connection, which is consistent with previously reported
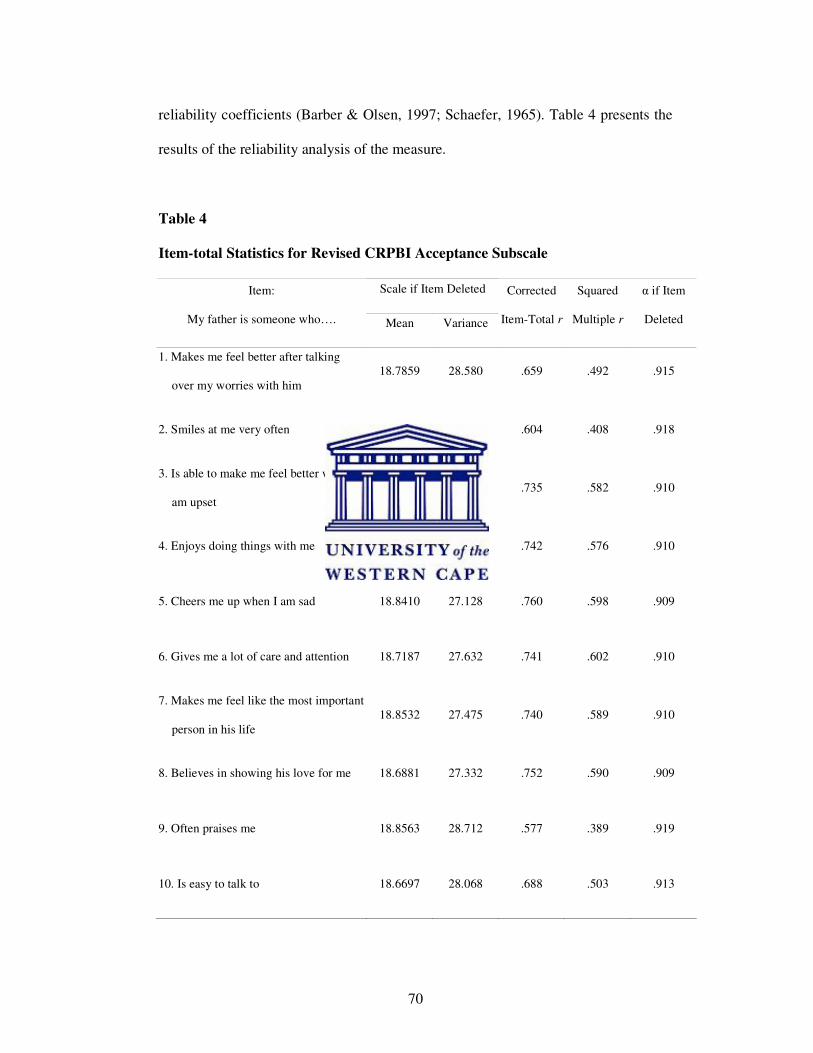
70
reliability coefficients (Barber & Olsen, 1997; Schaefer, 1965). Table 4 presents the
results of the reliability analysis of the measure.
Table 4
Item-total Statistics for Revised CRPBI Acceptance Subscale
Scale if Item Deleted Item:
My father is someone who…. Mean Variance
Corrected
Item-Total r
Squared
Multiple r
α if Item
Deleted
1. Makes me feel better after talking
over my worries with him
18.7859 28.580 .659 .492 .915
2. Smiles at me very often 18.7248 28.783 .604 .408 .918
3. Is able to make me feel better when I
am upset
18.8349 27.543 .735 .582 .910
4. Enjoys doing things with me 18.7064 27.607 .742 .576 .910
5. Cheers me up when I am sad 18.8410 27.128 .760 .598 .909
6. Gives me a lot of care and attention 18.7187 27.632 .741 .602 .910
7. Makes me feel like the most important
person in his life
18.8532 27.475 .740 .589 .910
8. Believes in showing his love for me 18.6881 27.332 .752 .590 .909
9. Often praises me 18.8563 28.712 .577 .389 .919
10. Is easy to talk to 18.6697 28.068 .688 .503 .913
71
4.3.4. POSIT
4.3.4.1. Substance Abuse Risk Subscale
The 17-item Substance Abuse subscale presented one item, “Do you get into trouble
because you use drugs or alcohol at school?” that exhibited an inter-tem total
correlation of .189 (see Appendix L for list of items). This item was excluded from
any further analysis.
The revised 16-item measure of Risk for Substance Abuse yielded a relatively high
estimate of internal consistency (Cronbach’s α = .810).
4.3.4.2. Physical Health Risk Subscale
The initial analyses of the 10-item Physical Health subscale presented four items that
did not meet the .20 cut-off of the inter-item correlation (r) (see Appendix M for list
of items). The lowest being “Have you ever had sex with someone who injected
illegal drugs?” (r = 0.116), followed by “Have the whites of your eyes ever turned
yellow?” (r = 0.157), “Have you ever had sex without using a condom?”(r = 0.175)
and “Do people pick on you because of the way you look?” (r = 0.181).
Even when deleting items with inter-item total correlations less than .20 a low
internal consistency was found (Cronbach’s α = .514). This subscale was removed
from any further analysis.
4.3.4.3. Mental Health Risk Subscale
The 22-item Mental Health Risk subscale had three items did not meet the inter-item
72
correlation criteria of .20 (see Appendix N for list of items) and were not included in
the analysis: “Have you been absent from school for 5 or more than 5 days in the past
year?” (r =.187); “Have you ever had sex with someone who injected illegal drugs?”
(r =.144) and “Do you have so much energy you don’t know what to do with it?” (r
=.137).
The revised 19-item measure of Mental Health Risk yielded a relatively good
internal consistency (Cronbach’s α = .770).
4.3.4.4. Negative Family Relations Risk Subscale
The 11-item measure of Negative Family Relations risk had item-total correlations
ranging from the lowest .047 to the highest .436 (see Appendix O for list of items).
One item “Do your parents or guardians have rules about what you can and can’t
do?” (r =.047) was discarded during the screening of inter-item total correlations.
A higher internal consistency of .710 was found for the revised 10-item Family Risk
subscale compared to the somewhat low alpha value (r =.670) found in Plüddemann
et al. (2006).
4.3.4.5. Negative Peer Relations Risk Subscale
The Negative Peer Relations Risk subscale consisted of 10 items, four of which were
discarded because the inter-item total correlations were less than .20 (see Appendix P
for list of items). These items were: “Do your parents or guardians like your
friends?” (r =.179); “Do you feel alone most of the time?” (r =.120); “Are most of

73
your friends younger than you?” (r = 0.48) and “Are most of your friends older than
you?” (r = 0.33).
The reliability of the revised 6-item Negative Peer Relations Risk subscale was
somewhat low (Cronbach’s α = .626) and the subscale was therefore not used further
in the study.
4.3.5.6. Educational Under-Attainment Risk Subscale
The Educational Under-Attainment Risk Subscale is the largest subscale of the
POSIT and has 26 items (see Appendix Q). Six items were evidenced with low item-
total correlations. These included: “Have you ever read a book cover to cover for
your own enjoyment?” (r =.052); “Do you have so much energy you don’t know
what to do with it?” (r =.120); “Are you good at talking your way out of trouble?” (r
=.121); “Are you a good reader?” (r =.165); “Do you get good marks in some
subjects and fail others?” (r =.166) and “Have you ever been told you are
hyperactive?” (r =.183).
Reliability analysis indicated a relatively high estimate of internal consistency
(Cronbach’s α = 0.740) for the revised 20-item Educational Under-Attainment risk
subscale.
4.3.5.7. Social Relations Risk Subscale
The Social Relations Risk subscale included 11 items (See Appendix R), only two of
which were above the inter-item total correlation of 0.20: “Do people your own age
74
like and respect you?” (r =.252) and “Do you enjoy doing things with people your
own age?” (r =.264). Due to unsatisfactory findings for inter-item correlations the
entire subscale was excluded from any further analysis.
4.3.5.8. Leisure and Recreation Risk Subscale
Similarly to the Social Relations Risk subscale, the 12-item Leisure and Recreation
subscale (see Appendix S), performed very poorly. Only 4 out of the 12 items were
just above the 0.20 inter-item total correlation parameter. These items included: “Do
you participate in team sports?” (r =.247); “Do you want to be a member of any
organized group, team or club?” (r =.233); “Do you usually exercise or do activities
to keep fit for a half-hour or more at least once a week?” (r =.211) and “Do you have
a hobby that you are really interested in?” (r =.201).
Consistent with previous findings for this subscale in South Africa (Plűddemann et
al., 2006), reliability analysis indicated a poor level of internal consistency
(Cronbach’s α = .490) and was therefore not used in the hypotheses testing.
4.3.5.9. Aggressive Behaviour and Delinquency Risk Subscale
The Aggressive Behaviour and Delinquency subscale (see Appendix T) evidenced
only one item, “Do you brag?”, with a low inter-item total correlation (r =.147). This
item was therefore deleted.
Reliability analysis indicated a good internal consistency for the Aggressive
Behaviour and Delinquency subscale (Cronbach’s α = .716).
75
4.3.5.10. HIV/STD Risk Subscale
No items on the supplementary HIV Risk behaviours subscale (see Appendix U)
were found to have inter-item total correlations lower than 0.20. The lowest
evidenced item “During the past two weeks have you used any drugs other than
alcohol to get high?” yielded an inter-item total correlation of .279.
Reliability analysis indicated a high internal consistency for the HIV Risk subscale
(Cronbach’s α = .791), consistent with previous results (Jamara et al., 2006).
4.4. DATA SCREENING PHASE 2
Next5, the frequencies analytical function was used in SPSS to investigate the
skewness and kurtosis for each continuous variable that would be used in the
analysis. These variables included Contact, Communication, Connection, Substance
Abuse Risk, Mental Health Risk, Negative Family Relations Risk, Education Under-
Attainment Risk, Aggression and Violent Behaviour Risk and HIV/STD Risk
behaviours.
The data was investigated for univariate and multivariate outliers that might
influence the hypothesis testing. Outliers can be defined as cases with extreme values
on a single variable (univariate) or on a combination of variables (multivariate)
(Meyers et al., 2006, p. 64).
5 Phase 2 of the data screening procedures commenced once all study instruments psychometric
properties had been analysed.
76
Univariate outliers were detected by investigating the extreme values output and the
stem and leaf plots. Stem-and-leaf plots indicated that Contact, Connection, Mental
Health Risk and Aggression and Violent Behaviour Risk had no univariate outliers.
Communication (n = 3), Negative Family Relations Risk (n = 2), Educational Under-
Attainment Risk (n = 1) and HIV/STD Risk behavior (n = 2) had a few outliers. The
Substance Abuse Risk variable had 9 extreme cases as candidates for deletion. Five
cases were identified with missing values for either three or more of the study
instruments. Cases with outliers (N = 17) were not included in the analyses from this
point.
After inspecting the data for any univariate outliers an assessment for multivariate
outliers was conducted by computing the Mahalanobis distance statistic D², which
measures the multivariate distance between each case and the multivariate mean or
centroid (Meyers et al., 2006, p. 67). Variables (N = 10) were evaluated with the
Table of Critical Values for chi-square at a stringent alpha level set at p < .001.
Therefore, any case with a Mahalanobis distance value equal to or greater than
29.588 was considered a multivariate outlier, of which none were found.
The assumption of normality is critical to hypotheses testing. To address the issue of
normality the skewness and the kurtosis of the variables were examined. When one
or more of these assumptions are violated statistical results may become biased or
distorted (Meyers et al., 2006, p. 67). The data appeared to be sufficiently normally
distributed for the Contact variable which was associated with a negative skewness (-
.440) and negative kurtosis (-.532) and for the variable Communication which was
77
associated with a positive skewness (.446) and a negative kurtosis (-.293). Skewness
and kurtosis values within the +1.0 and -1.0 range are generally considered
acceptable for analysis (Meyers et al., 2006, p. 88). Results are presented in Table 5.
Table 5
Skewness and Kurtosis of Continuous Study Variables
Continuous Variables Skewness Kurtosis
Father–Son Contact -.440 -.532
Father–Son Communication .446 -.293
Father–Son Connection -.298 -1.004
Substance Abuse Risk 1.135 .354
Mental Health Risk .660 -.153
Negative Family Relations Risk .669 -.129
Educational Under-Attainment Risk .238 -.459
Aggressive Behaviour and Delinquency .308 -.456
HIV/STD Risk Behaviours .431 -.685
Two variables did not satisfy these criteria: The Connection variable was associated
with a negative skewness and a negative kurtosis. The Substance Abuse Risk
variable exhibited a positive skewness and a positive kurtosis. These two variables
(Connection and Substance Abuse Risk) were therefore good candidates for
transformation using the square root function (Osborne, 2002). The transformation
successfully decreased the skewness and kurtosis values of Connection (-.507, -.791)
and the new values fell within the +1.00 and -1.00 parameter (Appendix K).
78
However, the Substance Abuse Risk variable continued to display an extreme
negative kurtosis (.221, -1.192). The Substance Abuse Risk subscale was therefore
removed from all hypothesis testing.
4.5. CONCLUSION
The internal consistencies of the measures, after any items with inter-tem
correlations less than .20 were deleted, were found to be high for the Father-Son
Quality Contact Time Scale, the Child–Parent Communication Apprehension Scale
for Use with Young Adults, and the CRPBI Acceptance Subscale. The revised
POSIT subscales had varying results of reliability analysis. Using Cronbach’s alpha
as a measure of internal consistency values were high for the following subscales:
Substance Abuse, Mental Health, Negative Family Relations, Educational Under-
Attainment, Aggressive and Delinquency and the South African HIV/STD risk
behaviour subscale. These findings, with the exception of the Negative Family
Relations Risk subscale, which performed well in this study, are similar to
Plüddemann et al (2006) findings: they reported good Cronbach’s alphas for only the
Substance Use/Abuse – 0.86, Mental Health – 0.80, Aggressive Behaviour – 0.75,
and Educational Status – 0.72 subscales. Conversely, the Physical Health, Negative
Peer Relations, Social Relations and Leisure and Recreation subscales were not
found to be internally consistent and were excluded from further analyses. Data
screening procedures showed the Substance Abuse scale to have extremely negative
kurtosis and this POSIT subscale was excluded from hypotheses testing.
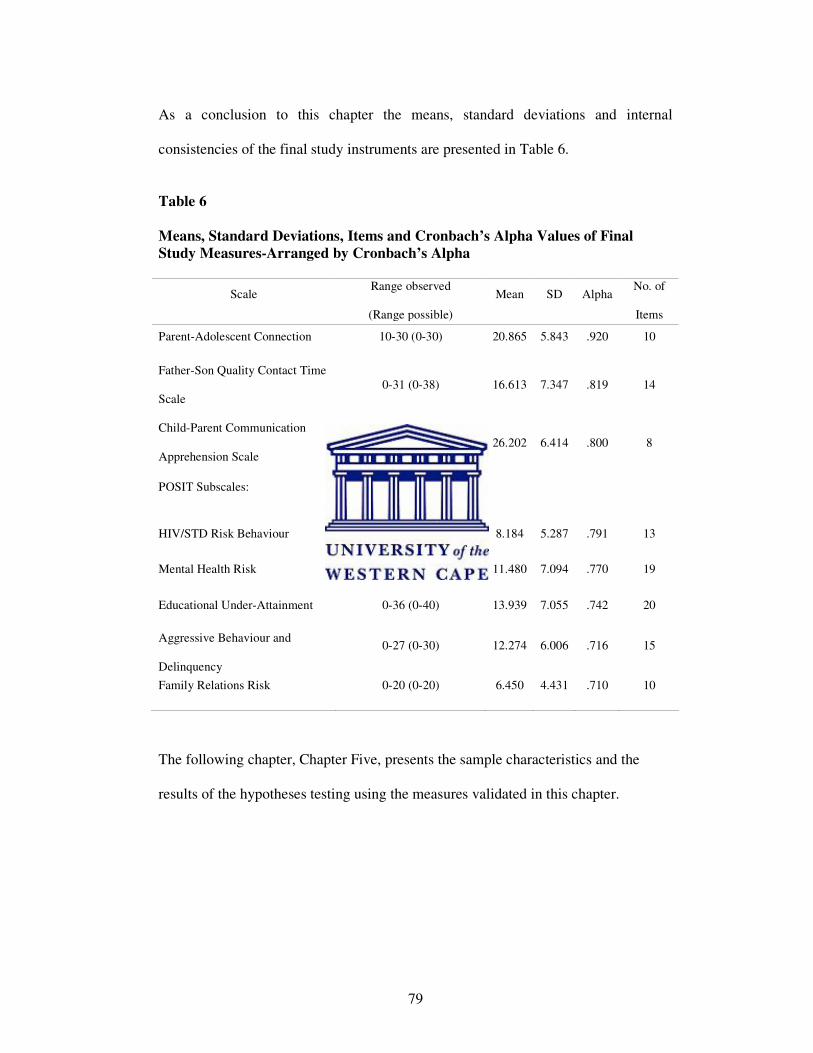
79
As a conclusion to this chapter the means, standard deviations and internal
consistencies of the final study instruments are presented in Table 6.
Table 6
Means, Standard Deviations, Items and Cronbach’s Alpha Values of Final
Study Measures-Arranged by Cronbach’s Alpha
Scale Range observed
(Range possible)
Mean SD Alpha No. of
Items
Parent-Adolescent Connection 10-30 (0-30) 20.865 5.843 .920 10
Father-Son Quality Contact Time
Scale
0-31 (0-38) 16.613 7.347 .819 14
Child-Parent Communication
Apprehension Scale
8-39 (0-44) 26.202 6.414 .800 8
POSIT Subscales:
Higher scores indicate
more risk for POSIT
HIV/STD Risk Behaviour 0-26 (0-26) 8.184 5.287 .791 13
Mental Health Risk 0-32 (0-38) 11.480 7.094 .770 19
Educational Under-Attainment 0-36 (0-40) 13.939 7.055 .742 20
Aggressive Behaviour and
Delinquency
0-27 (0-30) 12.274 6.006 .716 15
Family Relations Risk 0-20 (0-20) 6.450 4.431 .710 10
The following chapter, Chapter Five, presents the sample characteristics and the
results of the hypotheses testing using the measures validated in this chapter.
80
CHAPTER FIVE
RESULTS
5.1. INTRODUCTION
The focus of this chapter is on presentation of sample demographics and the findings
from the investigation of the five study hypotheses. Results of the hypothesis testing
are presented through inferential statistics in the form of correlation, MANOVA and
multiple regression analysis.
5.2. SAMPLE CHARACTERISTICS
Frequency tables are often a ‘convenient way to summarize the obtained values for
variables that contain a small number of different values of attributes’ (Meyers, et
al., 2006, p. 45). Table 7 and Table 8 present a description of the sample’s (N = 331)
individual characteristic variables and parents’ characteristics, respectively, as a
frequency tables.
Age: Although the 16-year-old participants dominated the group (n =157, 47.4%),
17-year-olds were not far behind (n = 97, 29.3%). They were followed by 18-year-
olds (n = 44, 13.3%), and a few 15-year-olds (n = 19, 5.7%), who were turning 16 in
that year, and some 19-year-olds (n = 14, 4.2%). The sample reported a mean age of
16.62 years (range = 15-19 years, SD = .93).
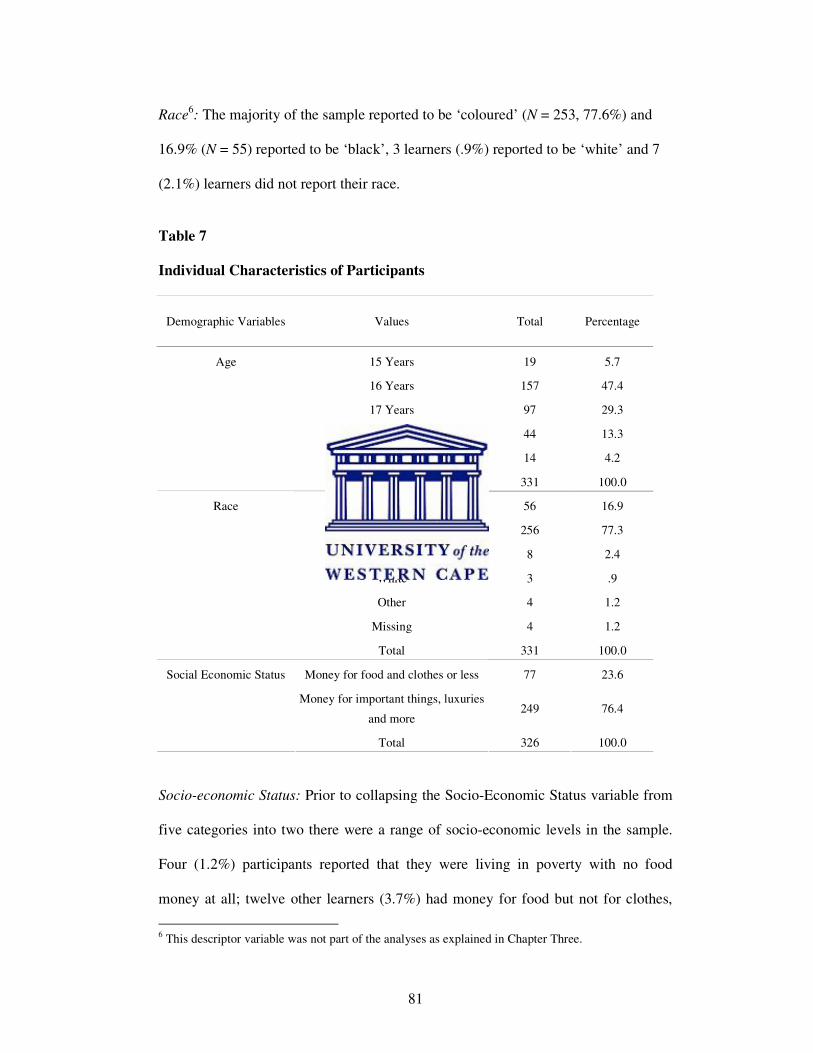
81
Race6: The majority of the sample reported to be ‘coloured’ (N = 253, 77.6%) and
16.9% (N = 55) reported to be ‘black’, 3 learners (.9%) reported to be ‘white’ and 7
(2.1%) learners did not report their race.
Table 7
Individual Characteristics of Participants
Demographic Variables Values Total Percentage
15 Years 19 5.7
16 Years 157 47.4
17 Years 97 29.3
18 Years 44 13.3
19 Years 14 4.2
Age
Total 331 100.0
Black 56 16.9
Coloured 256 77.3
Indian 8 2.4
White 3 .9
Other 4 1.2
Missing 4 1.2
Race
Total 331 100.0
Money for food and clothes or less 77 23.6
Money for important things, luxuries
and more 249 76.4
Social Economic Status
Total 326 100.0
Socio-economic Status: Prior to collapsing the Socio-Economic Status variable from
five categories into two there were a range of socio-economic levels in the sample.
Four (1.2%) participants reported that they were living in poverty with no food
money at all; twelve other learners (3.7%) had money for food but not for clothes,
6 This descriptor variable was not part of the analyses as explained in Chapter Three.
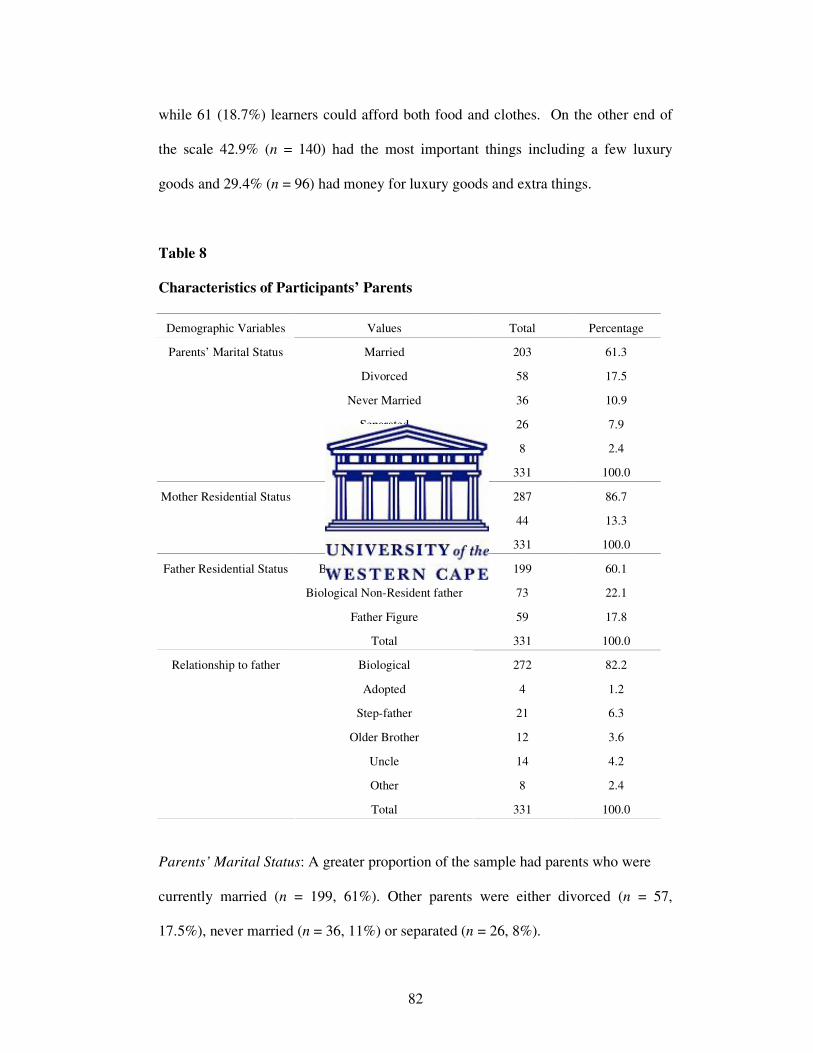
82
while 61 (18.7%) learners could afford both food and clothes. On the other end of
the scale 42.9% (n = 140) had the most important things including a few luxury
goods and 29.4% (n = 96) had money for luxury goods and extra things.
Table 8
Characteristics of Participants’ Parents
Demographic Variables Values Total Percentage
Married 203 61.3
Divorced 58 17.5
Never Married 36 10.9
Separated 26 7.9
Missing 8 2.4
Parents’ Marital Status
Total 331 100.0
Yes 287 86.7
No 44 13.3
Mother Residential Status
Total 331 100.0
Biological Resident father 199 60.1
Biological Non-Resident father 73 22.1
Father Figure 59 17.8
Father Residential Status
Total 331 100.0
Biological 272 82.2
Adopted 4 1.2
Step-father 21 6.3
Older Brother 12 3.6
Uncle 14 4.2
Other 8 2.4
Relationship to father
Total 331 100.0
Parents’ Marital Status: A greater proportion of the sample had parents who were
currently married (n = 199, 61%). Other parents were either divorced (n = 57,
17.5%), never married (n = 36, 11%) or separated (n = 26, 8%).
83
Mother Residential Status: Less than an eighth of the sample (n = 44, 13.5%) did not
reside with their biological mothers. A great proportion of learners lived with both
their biological parents (n = 181; 64.2%). However, this does not imply that their
parents are married as they may be spending alternate weekends with each parent. 29
(65.9%) of learners who did not live with their biological mothers did not live with
their biological fathers either.
Father Residential Status: More than half of the sample (n = 196, 60.1%) had a
biologically resident father, 22.1% (n = 72) a biological non-resident father and
17.8% (n = 58) had no contact with their biological father but had a father figure.
Relationship to father: A more detailed look at the persons who are fulfilling the role
of father, when there was no biological father, to adolescent young men provides
some interesting insight. The father figures, of the 17.8% (n = 59) of boys who did
not have contact with their biological fathers, included step-fathers (n = 21, 6.3%),
uncles (n = 14, 4.2%), older brothers (n = 12, 3.6%), adoptive fathers (n = 4, 1.2%)
and other men not specified by the learners (n = 8, 2.4%). Careful interrogation into
the comparisons of means of contact, communication and connection between the
adolescents (who had no contact with their biological fathers) and their father figures
presented no significant (p < 0.01) difference between groups for contact (p = .122),
communication (p = .210) and connection (p = .035), when using a one-way
ANOVA. These father figures were therefore grouped together for hypotheses testing
when compared to biological resident father and biological non-resident father
groups.
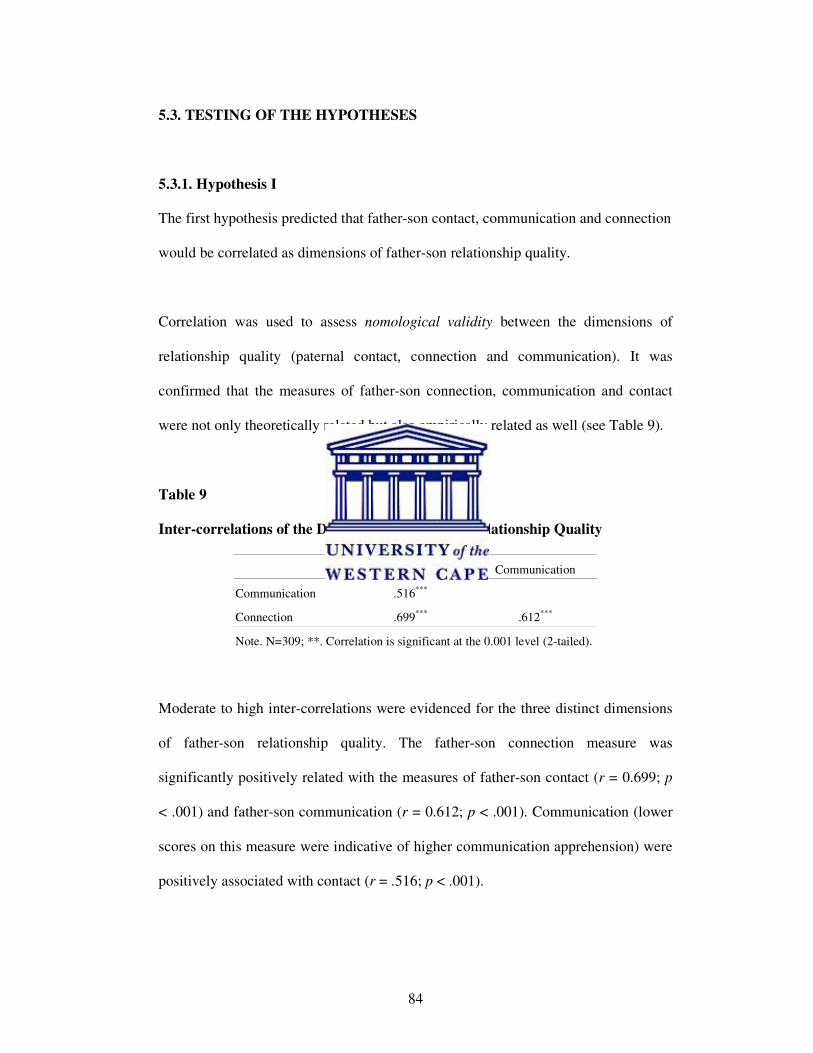
84
5.3. TESTING OF THE HYPOTHESES
5.3.1. Hypothesis I
The first hypothesis predicted that father-son contact, communication and connection
would be correlated as dimensions of father-son relationship quality.
Correlation was used to assess nomological validity between the dimensions of
relationship quality (paternal contact, connection and communication). It was
confirmed that the measures of father-son connection, communication and contact
were not only theoretically related but also empirically related as well (see Table 9).
Table 9
Inter-correlations of the Dimensions of Paternal Relationship Quality
Contact Communication
Communication .516***
Connection .699***
.612***
Note. N=309; **. Correlation is significant at the 0.001 level (2-tailed).
Moderate to high inter-correlations were evidenced for the three distinct dimensions
of father-son relationship quality. The father-son connection measure was
significantly positively related with the measures of father-son contact (r = 0.699; p
< .001) and father-son communication (r = 0.612; p < .001). Communication (lower
scores on this measure were indicative of higher communication apprehension) were
positively associated with contact (r = .516; p < .001).
85
The results of the correlation analyses indicated that the theoretically aligned, father
son connection, communication and contact were all significantly related dimensions
of father-son relationship quality. The null hypothesis was rejected as sufficient
evidence was presented when measuring father-son connection, communication and
contact, male adolescents are in fact reporting aspects of their relationships with their
fathers.
5.3.2. Hypothesis II
The second hypothesis proposed that the residential status of the father would have a
significant effect on the dimensions (contact, communication and connection) of
relationship quality.
Father Residential Status had three categories: Biological Residential Father (n =
196), Biological Non-Residential Father (n = 72) and Father Figure (n = 58). The
effect of father residential status on the dimensions of contact, communication and
connection – as presented in Hypothesis I - were evaluated using a Multivariate
Analysis of Variance (MANOVA) with a post hoc Scheffé test, assuming equal
variance, by comparing means using the F distribution at the 0.5 level of
significance.
The means and standard deviations for the different relationship quality variables by
father residential status groups were calculated. An initial evaluation of the means
across groups (see Figure 1) indicates a generally low variance in relationship quality
with regards to father residential status, with the exception of father-son contact.
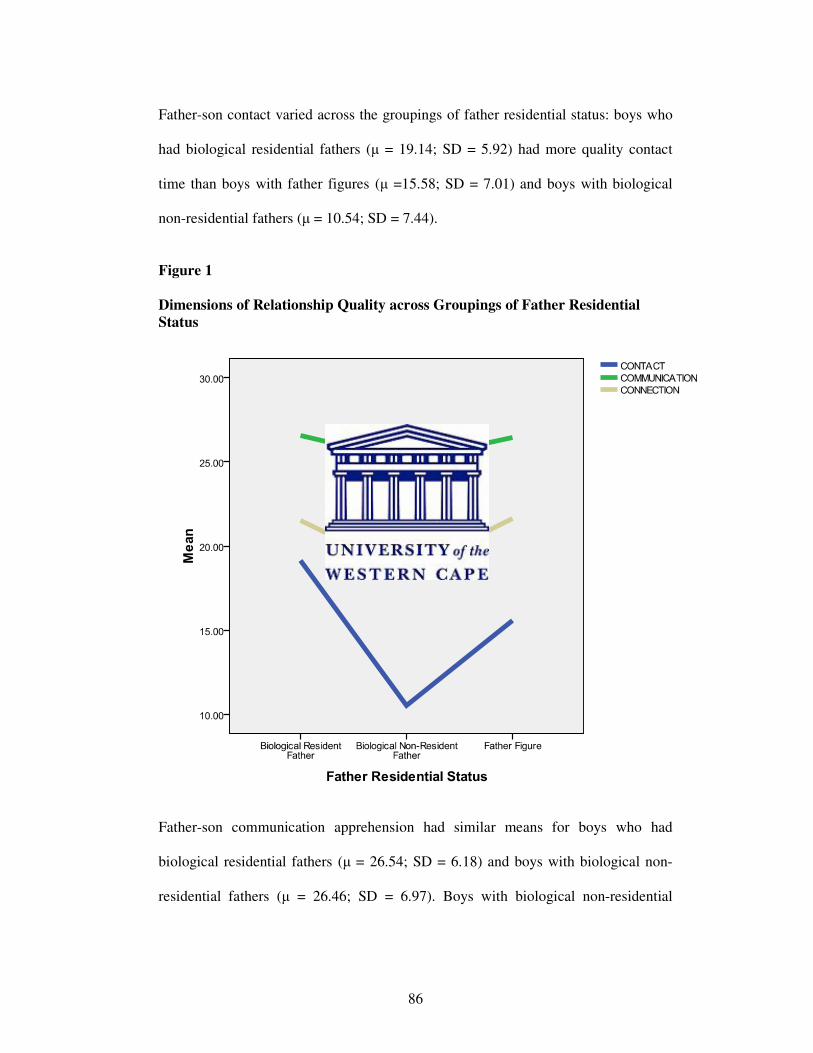
86
Father-son contact varied across the groupings of father residential status: boys who
had biological residential fathers (µ = 19.14; SD = 5.92) had more quality contact
time than boys with father figures (µ =15.58; SD = 7.01) and boys with biological
non-residential fathers (µ = 10.54; SD = 7.44).
Figure 1
Dimensions of Relationship Quality across Groupings of Father Residential
Status
Father-son communication apprehension had similar means for boys who had
biological residential fathers (µ = 26.54; SD = 6.18) and boys with biological non-
residential fathers (µ = 26.46; SD = 6.97). Boys with biological non-residential
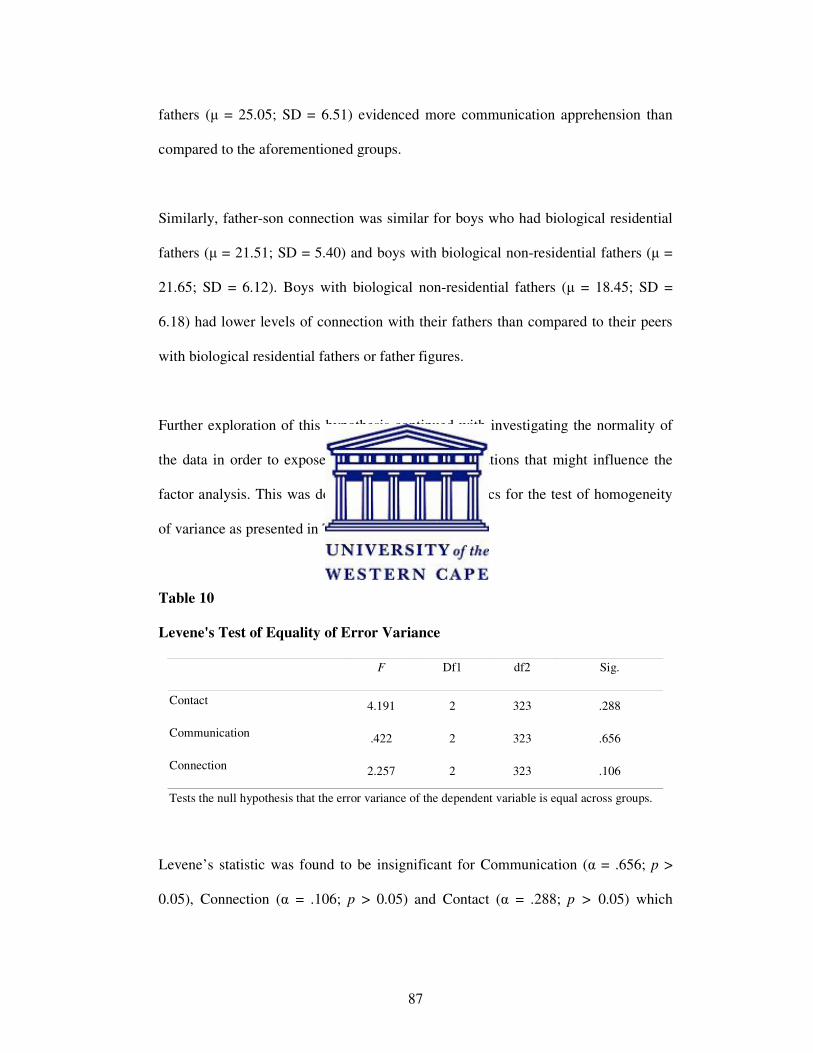
87
fathers (µ = 25.05; SD = 6.51) evidenced more communication apprehension than
compared to the aforementioned groups.
Similarly, father-son connection was similar for boys who had biological residential
fathers (µ = 21.51; SD = 5.40) and boys with biological non-residential fathers (µ =
21.65; SD = 6.12). Boys with biological non-residential fathers (µ = 18.45; SD =
6.18) had lower levels of connection with their fathers than compared to their peers
with biological residential fathers or father figures.
Further exploration of this hypothesis continued with investigating the normality of
the data in order to expose possible assumption violations that might influence the
factor analysis. This was done using Levene’s Statistics for the test of homogeneity
of variance as presented in Table 10.
Table 10
Levene's Test of Equality of Error Variance
F Df1 df2 Sig.
Contact 4.191 2 323 .288
Communication .422 2 323 .656
Connection 2.257 2 323 .106
Tests the null hypothesis that the error variance of the dependent variable is equal across groups.
Levene’s statistic was found to be insignificant for Communication (α = .656; p >
0.05), Connection (α = .106; p > 0.05) and Contact (α = .288; p > 0.05) which
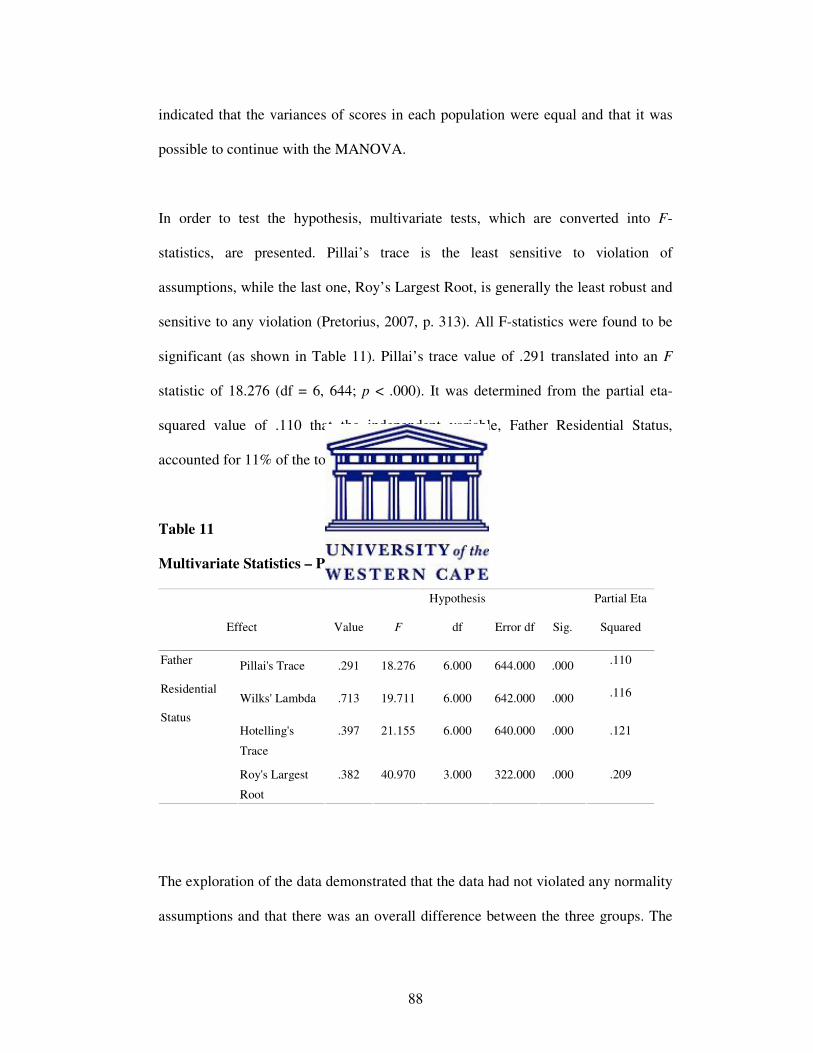
88
indicated that the variances of scores in each population were equal and that it was
possible to continue with the MANOVA.
In order to test the hypothesis, multivariate tests, which are converted into F-
statistics, are presented. Pillai’s trace is the least sensitive to violation of
assumptions, while the last one, Roy’s Largest Root, is generally the least robust and
sensitive to any violation (Pretorius, 2007, p. 313). All F-statistics were found to be
significant (as shown in Table 11). Pillai’s trace value of .291 translated into an F
statistic of 18.276 (df = 6, 644; p < .000). It was determined from the partial eta-
squared value of .110 that the independent variable, Father Residential Status,
accounted for 11% of the total variance.
Table 11
Multivariate Statistics – Pillai’s Trace
Effect Value F
Hypothesis
df Error df Sig.
Partial Eta
Squared
Pillai's Trace .291 18.276 6.000 644.000 .000 .110
Wilks' Lambda .713 19.711 6.000 642.000 .000 .116
Hotelling's
Trace
.397 21.155 6.000 640.000 .000 .121
Father
Residential
Status
Roy's Largest
Root
.382 40.970 3.000 322.000 .000 .209
The exploration of the data demonstrated that the data had not violated any normality
assumptions and that there was an overall difference between the three groups. The
89
testing of the hypotheses proceeded with an examination of the separate F tests with
Bonferroni adjustments to the operational p levels (.05/2 = 0.25). The Bonferroni
Correction is a multiple-comparison correction, used when several dependent or
independent statistical analyses are being performed simultaneously. The adjustment
entails dividing the p level (usually .05) by the number of dependent variables
(Meyers et al., 2006, p. 373). Due to the number of analyses, a Bonferroni
Correction was essential to avoid spurious positives and the risk of possibly
committing a Type II error.
Two out of the three dependant variables had statistically significant univariate F
tests (Contact: F = 47.30, p < .000, partial η²= .188 and Connection: F = 6.76, p <
.000, partial η² = .040). This indicates that the dependant variables ‘contact’ and
‘connection’ contributed to the significant multivariate effect. The null hypothesis
was rejected for the dimensions of father-son contact and connection, as they varied
across the groupings of father residential status. Father-son communication
apprehension was the only dimension which did not vary across groupings.
As the independent variable, Father Residential Status, contained more than two
levels and statistically significant univariate Fs were observed. This called for a
Scheffé post hoc multiple comparisons test to be computed for the dependant
measures (contact and connection). The Scheffé test is a conservative procedure
which conducts ‘a simultaneous pairwise comparison of all means using the F
distribution’ (Meyers et al., 2006, p. 427).
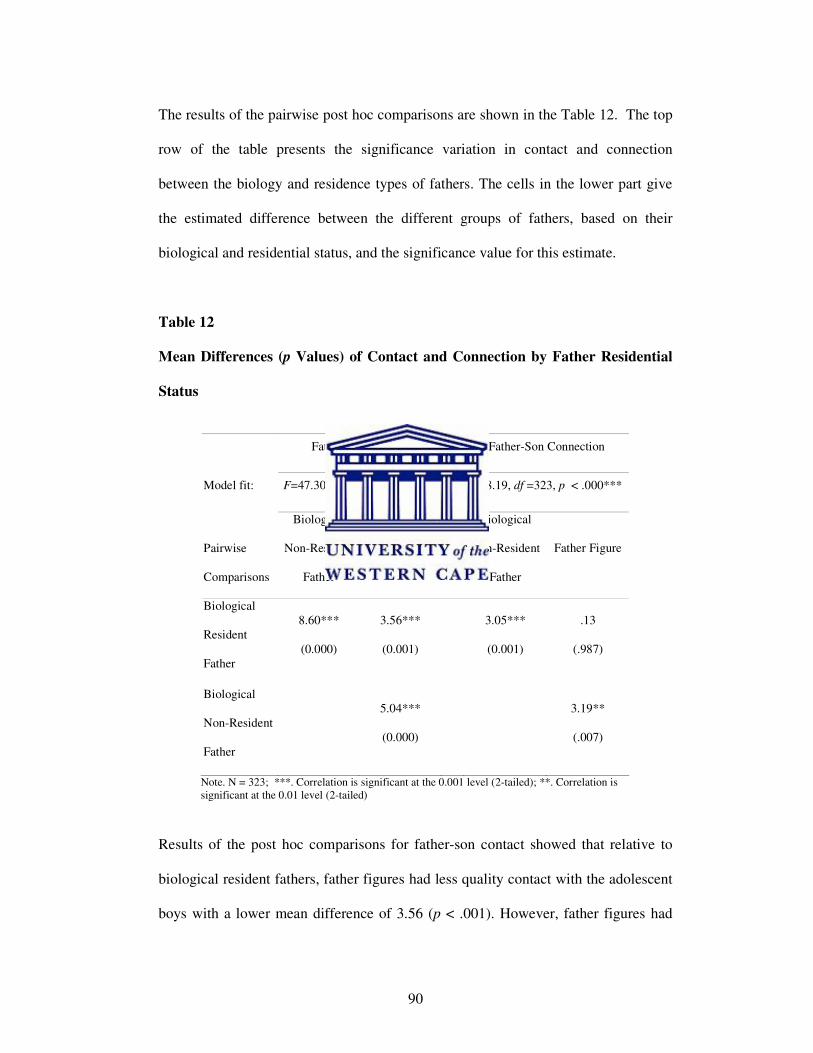
90
The results of the pairwise post hoc comparisons are shown in the Table 12. The top
row of the table presents the significance variation in contact and connection
between the biology and residence types of fathers. The cells in the lower part give
the estimated difference between the different groups of fathers, based on their
biological and residential status, and the significance value for this estimate.
Table 12
Mean Differences (p Values) of Contact and Connection by Father Residential
Status
Father-Son Contact Father-Son Connection
Model fit: F=47.30, df =323, p < .000*** F=8.19, df =323, p < .000***
Pairwise
Comparisons
Biological
Non-Resident
Father
Father Figure
Biological
Non-Resident
Father
Father Figure
Biological
Resident
Father
8.60***
(0.000)
3.56***
(0.001)
3.05***
(0.001)
.13
(.987)
Biological
Non-Resident
Father
5.04***
(0.000)
3.19**
(.007)
Note. N = 323; ***. Correlation is significant at the 0.001 level (2-tailed); **. Correlation is
significant at the 0.01 level (2-tailed)
Results of the post hoc comparisons for father-son contact showed that relative to
biological resident fathers, father figures had less quality contact with the adolescent
boys with a lower mean difference of 3.56 (p < .001). However, father figures had
91
more contact with the boys than biological non-resident fathers (indicated by a
higher mean difference of 5.04, (p < .000). Post hoc comparisons for father-son
connection showed that relative to biological resident father, biological non-resident
fathers exhibited a lower mean difference of 3.05 (p < .001) and father figures had
relatively no significant difference (mean difference = .13, p > .05). Father figures
exhibited a significant (p < .01) father-son connection mean difference of 3.19 when
compared non-resident biological fathers and their sons.
The results of the multivariate analyses indicated that the null hypothesis failed to be
rejected for father-son communication. For the dimensions of father-son contact and
connection the null hypothesis was rejected and concluded that father residential
status influenced these two dimensions of paternal relationship quality.
5.3.3. Hypothesis III
The third hypothesis focused on the dimensions of relationship quality (contact,
communication and connection) and their relationship to adolescent risk behaviours.
It was proposed that father-son contact, communication and connection would be
negatively associated with behavioural, social and health risk outcomes of the
adolescent son.
Significant negative correlations were evident for all dimensions of paternal
relationship quality and adolescent risk factors. The correlation matrix in presented
in Table 13.
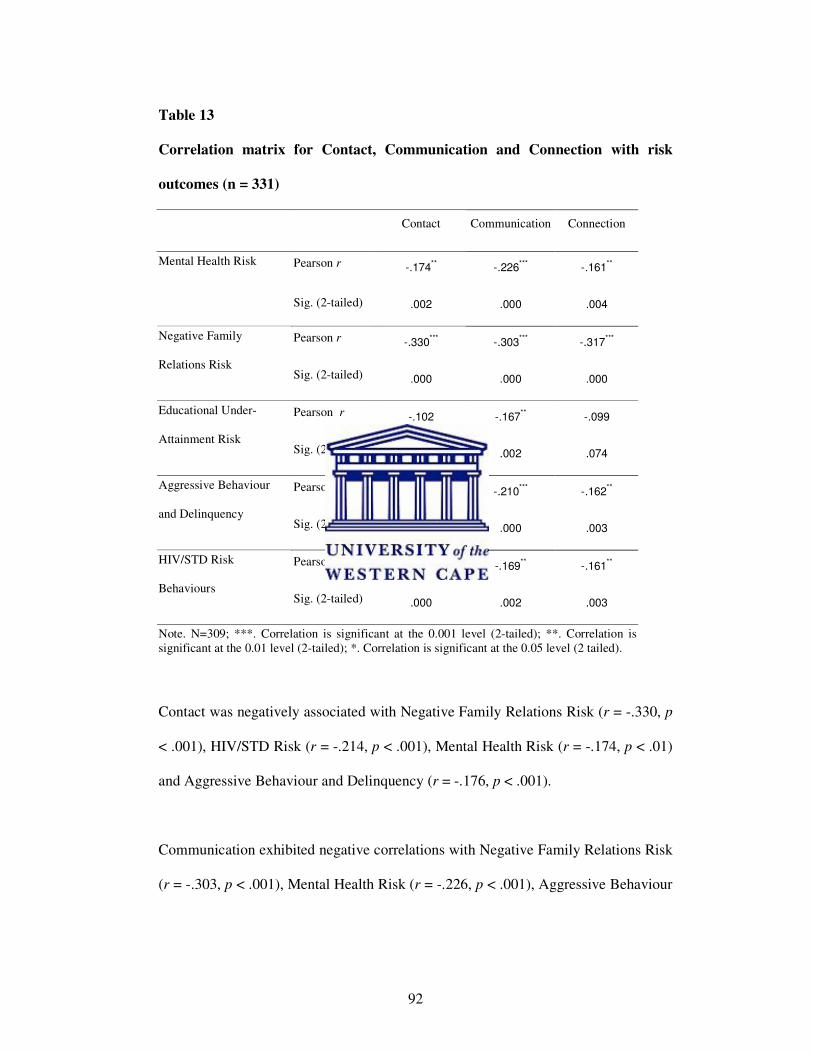
92
Table 13
Correlation matrix for Contact, Communication and Connection with risk
outcomes (n = 331)
Contact Communication Connection
Pearson r -.174** -.226
*** -.161**
Mental Health Risk
Sig. (2-tailed) .002 .000 .004
Pearson r -.330***
-.303***
-.317***
Negative Family
Relations Risk Sig. (2-tailed) .000 .000 .000
Pearson r -.102 -.167** -.099
Educational Under-
Attainment Risk Sig. (2-tailed) .065 .002 .074
Pearson r -.176***
-.210***
-.162**
Aggressive Behaviour
and Delinquency Sig. (2-tailed) .001 .000 .003
Pearson r -.214***
-.169** -.161
**
HIV/STD Risk
Behaviours Sig. (2-tailed) .000 .002 .003
Note. N=309; ***. Correlation is significant at the 0.001 level (2-tailed); **. Correlation is
significant at the 0.01 level (2-tailed); *. Correlation is significant at the 0.05 level (2 tailed).
Contact was negatively associated with Negative Family Relations Risk (r = -.330, p
< .001), HIV/STD Risk (r = -.214, p < .001), Mental Health Risk (r = -.174, p < .01)
and Aggressive Behaviour and Delinquency (r = -.176, p < .001).
Communication exhibited negative correlations with Negative Family Relations Risk
(r = -.303, p < .001), Mental Health Risk (r = -.226, p < .001), Aggressive Behaviour
93
and Delinquency (r = -.210, p < .001), Educational Under-Attainment Risk (r = -
.167, p < .01) and HIV/STD Risk behaviours (r = -.169, p < .01).
Connection was negatively correlated with Negative Family Relations Risk (r = -
.317, p < .001), Mental Health Risk (r = -.161, p < .010), Aggressive Behaviour and
Delinquency (r = -.162, p < .01) and HIV/STD Risk (r = -.161, p < .01).
Educational Under-Attainment Risk did not show any significant relationship with
father-son contact (r = -.072, p > .05) or father-son connection (r = -.084, p > .05).
The null hypothesis was rejected because higher levels of father-son contact,
communication and connection were associated with lower levels of adolescent risk
factors.
5.3.4. Hypothesis IV
The fourth hypothesis suggests that father residential status will have an effect on
adolescent risk outcomes.
Figure 2 provides a visual representation of the associations between the dimensions
of relationship quality and adolescent risk factors.
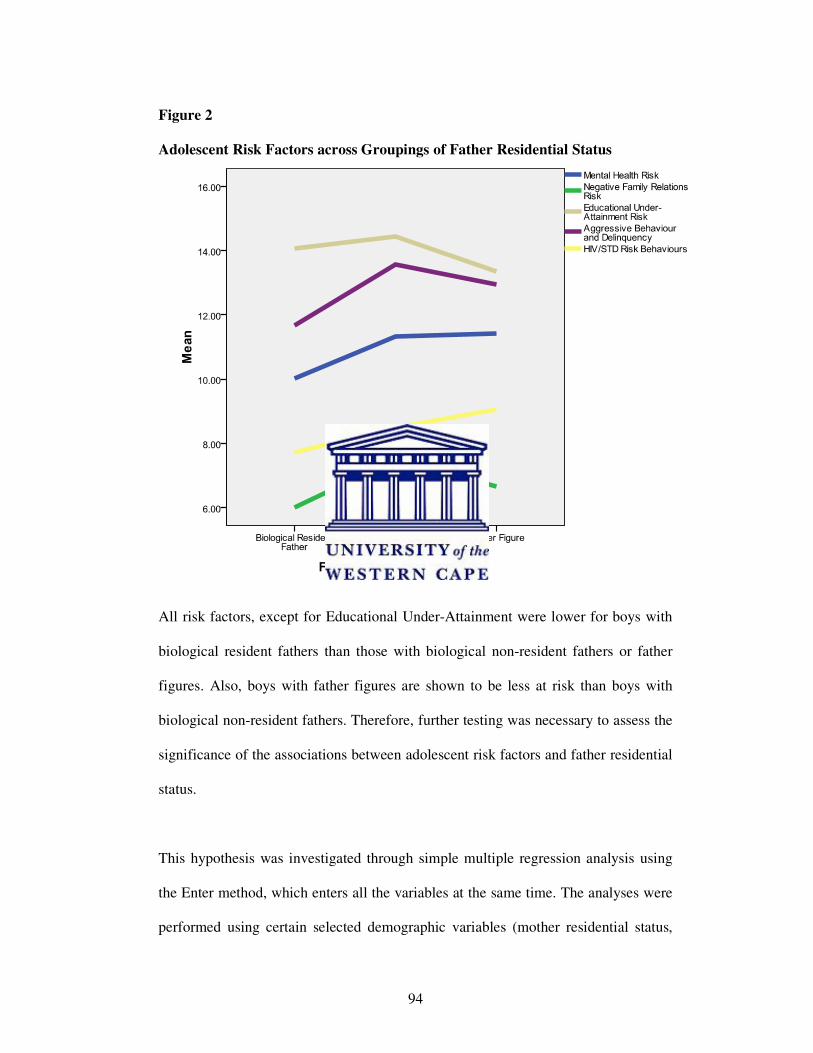
94
Figure 2
Adolescent Risk Factors across Groupings of Father Residential Status
All risk factors, except for Educational Under-Attainment were lower for boys with
biological resident fathers than those with biological non-resident fathers or father
figures. Also, boys with father figures are shown to be less at risk than boys with
biological non-resident fathers. Therefore, further testing was necessary to assess the
significance of the associations between adolescent risk factors and father residential
status.
This hypothesis was investigated through simple multiple regression analysis using
the Enter method, which enters all the variables at the same time. The analyses were
performed using certain selected demographic variables (mother residential status,
95
age and socio-economic status) and father residential status as independent variables.
Separate regressions were run for each dependant risk variable: Mental Health,
Negative Family Relations, Educational Under-Attainment Risk, Aggressive
Behaviour and Delinquency, and HIV/STD Risk Behaviours.
Father Residential Status had three levels (Biological Resident Father, Biological
Non-Resident Father and Father Figure) and therefore two degrees of freedom were
necessary for making comparisons. Since Father Residential Status had three levels,
two dummy variables were developed. Biological Residential Father was chosen as
reference group for the regression analysis. According to Lewis-Beck (1993, p. 76)
the “choice of reference group is arbitrary assuming one follows appropriate
procedures of interpretation and inference”. One dummy variable represented Non-
Biological Resident Father (and was coded “1” where a child had a biological non-
resident father and “0” otherwise); and a second dummy variable, Father Figure, was
coded “1” where a child had no biological father but a father figure instead, and “0”
otherwise. (see Table 14 for results of regression analyses).
Mental Health Risk
The regression model yielded no significant predictors for mental health risk
(R²=.017, p = .357) and accounted for little over 1.7% of the variance in Mental
Health Risk. The null hypothesis failed to be rejected when predicting an effect for
father residential status on adolescent Mental Health risk.
96
Negative Family Relations
Biological Non-Residential Father (relative or compared to Residential Father) (t =
1.990; p < .05) and Mother Residential Status (t = 3.273; p < .001) emerged as the
only significant predicators of Negative Family Relations (R²=.057, p < .01). The
model explained 5.7% of the variance for Negative Family Relations. The null
hypothesis was rejected when predicting an effect of father residential status on
adolescent negative family relations.
Educational Under-Attainment Risk
The regression model presented no significant predictors for Educational Under-
Attainment Risk and the model accounted for 1.5% of the variance. The null
hypothesis failed to be rejected when predicting an effect of father residential status
on Educational Under-Attainment Risk.
Aggressive Behaviour and Delinquency
The regression model presented Biological Non-Resident Father (t = 2.094; p < .05)
as the only significant predictor for Aggressive Behaviour and Delinquency and
accounted for 2.5% of the variance. The null hypothesis was rejected when
predicting an effect of father residential status on Aggressive Behaviour and
Delinquency.
HIV/STD Risk Behaviours
Age (t = 5.858; p < .000) emerged as a strong significant predicator of HIV/STD
Risk and this model accounted for 11% of the variance in HIV/STD Risk (R²=.110, p
97
< .000). The null hypothesis failed to be rejected when predicting an effect of father
residential status on adolescent HIV/STD Risk Behaviours.
Results showed that Father Residential Status had a significant effect Negative
Family Relations and Aggressive Behaviour and Delinquency; thus the null
hypothesis was rejected for these two risk outcomes. Age emerged as the only
significant predictor of HIV/STD Risk Behaviours and therefore the null hypothesis
failed to be rejected for Father Residential Status. No significant predictors emerged
when testing the effect of Father Residential Status on Mental Health and
Educational Under-Attainment Risk; and the null hypothesis failed to be rejected.
The next hypothesis proceeded to test for a greater effect of the dimensions of
paternal relationship quality than father residential status on adolescent risk
outcomes.
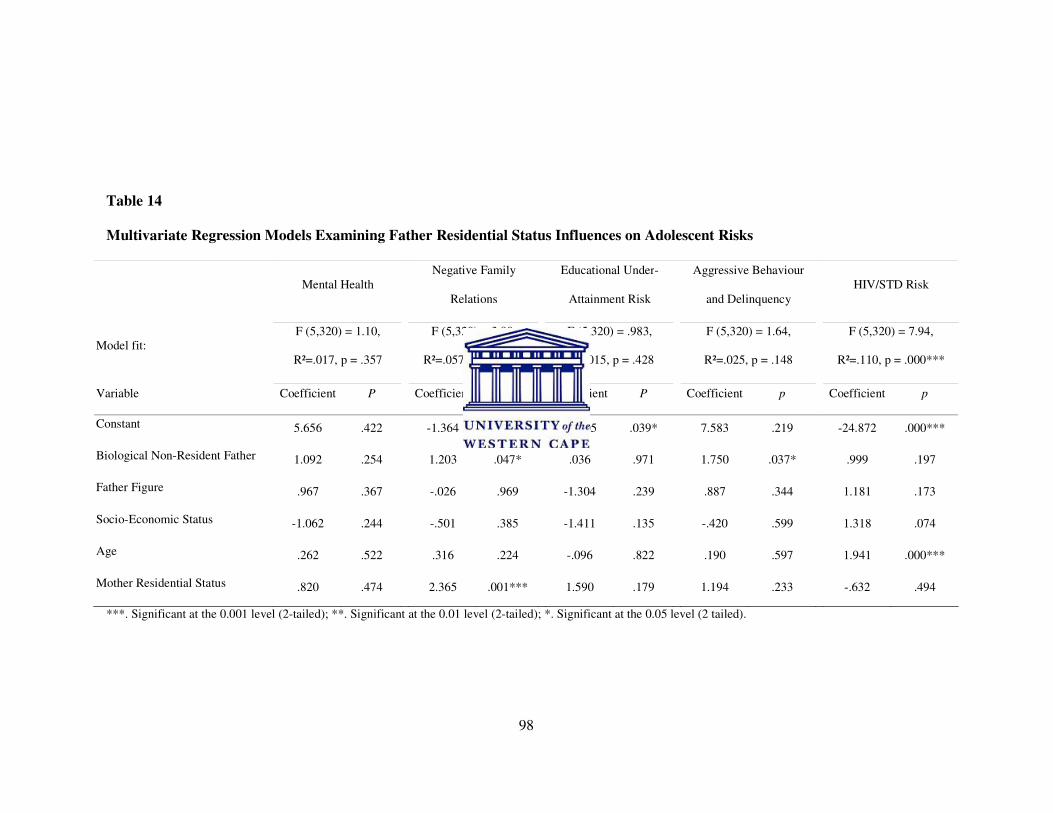
98
Table 14
Multivariate Regression Models Examining Father Residential Status Influences on Adolescent Risks
Mental Health
Negative Family
Relations
Educational Under-
Attainment Risk
Aggressive Behaviour
and Delinquency
HIV/STD Risk
Model fit:
F (5,320) = 1.10,
R²=.017, p = .357
F (5,320) = 3.90,
R²=.057, p = .002**
F (5,320) = .983,
R²=.015, p = .428
F (5,320) = 1.64,
R²=.025, p = .148
F (5,320) = 7.94,
R²=.110, p = .000***
Variable Coefficient P Coefficient p Coefficient P Coefficient p Coefficient p
Constant 5.656 .422 -1.364 .760
15.105 .039*
7.583 .219
-24.872 .000***
Biological Non-Resident Father 1.092 .254 1.203 .047* .036 .971 1.750 .037* .999 .197
Father Figure .967 .367 -.026 .969
-1.304 .239
.887 .344
1.181 .173
Socio-Economic Status -1.062 .244 -.501 .385
-1.411 .135
-.420 .599
1.318 .074
Age .262 .522 .316 .224
-.096 .822
.190 .597
1.941 .000***
Mother Residential Status .820 .474 2.365 .001*** 1.590 .179 1.194 .233 -.632 .494
***. Significant at the 0.001 level (2-tailed); **. Significant at the 0.01 level (2-tailed); *. Significant at the 0.05 level (2 tailed).
99
5.3.5. Hypothesis V
The fifth hypothesis investigates whether relationship quality will have a more
significant effect on risky behaviours than father residential status. This was
evaluated through multiple regression analysis.
The predictive effect of relationship quality as opposed to father residential status on
adolescent risk behaviours was measured through a multiple regression analysis
using the Enter method. The analyses were performed using certain selected
demographic variables (mother residential status, and socio-economic status) as well
as indicators of paternal relationship quality (contact, communication and
connection) and father residential status as independent variables.
Separate regressions were run for each dependent risk variable (Mental Health,
Negative Family Relations, Educational Under-Attainment Risk, Aggressive and
Delinquent behaviour and HIV/STD Risk Behaviours). Dummy coding was
maintained from the previous analyses. (See Table 15 for results of regression
analyses).
Mental Health Risk
Father-son Communication (t = 3.20; p < .01) emerged as the only significant
predicator of Mental Health Risk. The model accounted for 7.5% of the variance in
Mental Health risk. Multiple R for regression was statistically significant, F (8, 299)
= 2.83, p < .01, adjusted R² = .050. The null hypothesis was rejected when predicting
100
a higher effect of father-son communication as compared to father residential status
on adolescent Mental Health Risk behaviours.
Negative Family Relations
The model (R²=.185, p = .000) accounted for 18.5% of the variance in Negative
Family Relations Risk and yielded two significant predictors: Father-son
Communication (t = 2.51; p < .05) and Mother Residential Status (t = 4.45; p < .000).
The null hypothesis was rejected when predicting a higher effect of father-son
communication as compared to father residential status on adolescent Negative
Family Relations.
Educational Under-Attainment Risk
The model accounted for 5.7% of the variance in Educational Under-Attainment
Risk and yielded two significant predictors: Father-son Communication (t = 2.91; p <
.01) and Mother Residential Status (t = 1.99; p < .05). Multiple R for regression was
statistically significant, F (8, 299) = 2.26, p < .05, adjusted R² = .032. The null
hypothesis was rejected when predicting a higher effect of father-son communication
as compared to father residential status on adolescent Educational Under-Attainment
Risk.
Aggression Behaviour and Delinquency
Father-son communication (t = 3.17; p < .01) proved a more significant predictor of
adolescent risk for aggressive behaviour and delinquency than father residential
status for boys who had Non-Residential Biological fathers (t = 2.04; p < .05). The
101
model accounted for 7.4% of the variance in Aggressive Behaviour and Delinquency.
Multiple R for regression was statistically significant, F (8, 300) = 3.02, p < .01,
adjusted R² = .050. The null hypothesis was rejected when predicting a higher effect
of father-son communication as compared to father residential status for adolescent
Aggressive Behaviour and Delinquency.
HIV/STD Risk Behaviours
Father-Son Communication (t = -1.43; p < .05) and Age (t = 5.53; p < .000) emerged
as the only significant predicators of HIV/STD Risk Behaviours. The model
accounted for 13.8% of the variance in HIV/STD Risk Behaviours (R²=.138,
p=.000).
Results showed that risk factors for Mental Health, Education Under-Attainment
Risk, Negative Family Relations, Aggressive and Delinquent Behaviour and
HIV/STD risk behaviours were more significantly influenced by dimensions of
relationship quality than Father Residential Status and therefore the null hypothesis
was rejected. The dimension of Father-son Communication was the most significant
predictor of risk factors for adolescent boys, when compared to other dimensions of
relationship quality.
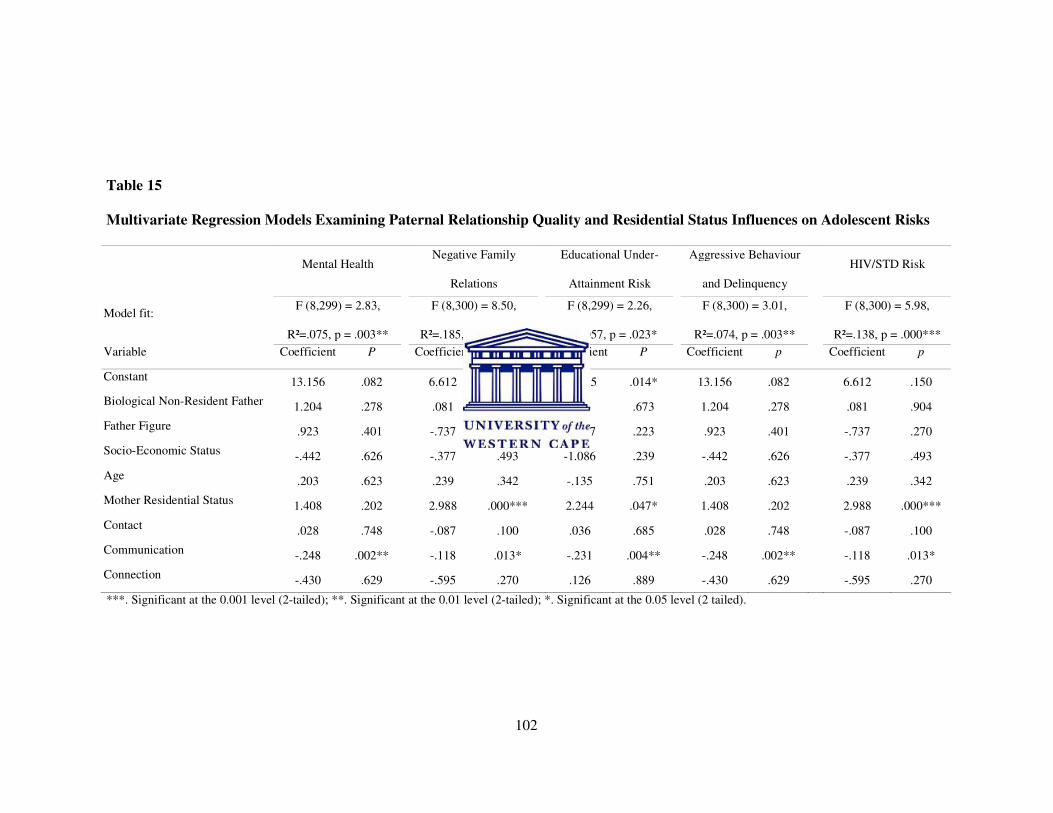
102
Table 15
Multivariate Regression Models Examining Paternal Relationship Quality and Residential Status Influences on Adolescent Risks
Mental Health
Negative Family
Relations
Educational Under-
Attainment Risk
Aggressive Behaviour
and Delinquency
HIV/STD Risk
Model fit: F (8,299) = 2.83,
R²=.075, p = .003**
F (8,300) = 8.50,
R²=.185, p = .000***
F (8,299) = 2.26,
R²=.057, p = .023*
F (8,300) = 3.01,
R²=.074, p = .003**
F (8,300) = 5.98,
R²=.138, p = .000***
Variable Coefficient P Coefficient p Coefficient P Coefficient p Coefficient p
Constant 13.156 .082 6.612 .150 19.115 .014* 13.156 .082 6.612 .150
Biological Non-Resident Father 1.204 .278
.081 .904
.476 .673
1.204 .278
.081 .904
Father Figure .923 .401
-.737 .270
-1.367 .223
.923 .401
-.737 .270
Socio-Economic Status -.442 .626
-.377 .493
-1.086 .239
-.442 .626
-.377 .493
Age .203 .623
.239 .342
-.135 .751
.203 .623
.239 .342
Mother Residential Status 1.408 .202
2.988 .000***
2.244 .047*
1.408 .202
2.988 .000***
Contact .028 .748
-.087 .100
.036 .685
.028 .748
-.087 .100
Communication -.248 .002**
-.118 .013*
-.231 .004**
-.248 .002**
-.118 .013*
Connection -.430 .629
-.595 .270
.126 .889
-.430 .629
-.595 .270
***. Significant at the 0.001 level (2-tailed); **. Significant at the 0.01 level (2-tailed); *. Significant at the 0.05 level (2 tailed).
103
5.4. CONCLUSION
In this chapter a description of the sample of 331 participants was presented. The
dimensions of father-son contact, communication and connection were nomologically
validated as dimensions of relationship quality. Father residential status explained
some of the variance in negative family relations and aggression. However, when
looking at the interaction between dimensions of relationship quality and father
residential status, a greater predictor of risk behaviour was father-son communication
and age. Communication apprehension was a predictive factor for mental health risk,
negative family relations, educational under-attainment, aggressive and violent
behaviour and HIV/STD risk.
The next chapter provides a discussion of the results and compares findings to
previous studies, thus highlighting any new findings and the implications thereof.
104
CHAPTER SIX
DISCUSSION OF FINDINGS AND RECOMMENDATIONS
6.1. INTRODUCTION
The main focus of this chapter is to present a discussion of the findings of hypotheses
tested in this study. A brief overview of the limitations of the study is given. The
significance of the study findings and recommendations for future research are
presented as a conclusion to this thesis.
6.2. DISCUSSION OF FINDINGS
Through self-reports of adolescent boys, their involvement in risk activities and their
perceptions of their relationship with their fathers were examined. Risk behaviours
were investigated using the POSIT. HIV/STD risk behaviours were assessed on a
POSIT-type subscale designed specifically for South Africa, the POSIT HIV/STD
Risk Subscale. A measure of paternal quality contact time was developed for this
study and was found to have three factors: the father’s availability, activities engaged
in together and the motivation of the son to spend time with his father (including the
son’s enjoyment of the time spent). This provided an extension to past
conceptualizations of father-son contact which commonly assessed only the amount of
time and activities engaged in. Dimensions of paternal relationship quality were
nomologically validated to include contact, communication and connection. Bivariate
correlations showed dimensions of paternal relationship quality to vary across
groupings for father residential status. Linear regressions showed that father-son
105
communication was the stronger predictor of risk behaviours when compared to father
residential status.
6.2.1. HYPOTHESIS I
This first hypothesis found that both quantity and quality of contact time, less
communication apprehension and increased emotional connection between father and
son were nomologically validated as dimensions of a quality paternal relationship.
This study further developed Lamb’s tripartite model of paternal involvement (Lamb
et al., 1985) by additionally taking into account the motivation the child feels to spend
time with his father and the satisfaction or enjoyment of the time spent together while
the father is engaged with his child. The new model validated by this thesis introduced
the theoretical conceptualization of a quality paternal relationship and excluded
previously emphasised external factors such as the father’s financial contributions
(Brooks-Gunn, Britto & Brady, 1999; Duncan & Brooks-Gunn, 1997).
An essential part in this new conceptualization of paternal relationship quality was the
development of a new measure of father-son contact. Through an exploratory factor
analysis the measure of Father-Son Quality Contact Time Scale was analyzed into
three factors of time and availability, engagement, and motivation and time
enjoyment. The measure, although analyzed through factor analysis and measures of
internal consistency, needs to be developed further and tested on other populations.
Future research is needed to explore the factors that help or hinder paternal contact,
communication and connection.
106
6.2.2. HYPOTHESIS II
The second hypothesis proposed that the residential status of the father would have a
significant effect on the dimensions (contact, communication and connection) of
relationship quality. Findings confirmed Flouri’s (2007) results which found that
biological non-resident fathers reported less contact, communication and connection
than resident fathers or father figures. Explorations of these differences revealed father
residential status to have a significant effect on father-son contact and connection, but
no significant effect was found for paternal communication apprehension. Echoing the
findings of Munsch, Woodward and Darling (1995), this study suggests that although
residential status affected the likelihood of the father being considered important in
the life of the child, the general quality of the relationship did not differ by residential
status.
Findings for paternal contact were consistent with previous research suggesting that
resident biological fathers may spend more time with their children because of
proximity than non-residential fathers (Anderson, Kaplan, Lam & Lancaster, 1999).
Mott’s (1990) work posits that a father who resides in the home is a mere
manifestation of the father’s presence in the life of the child. Presence is only one
indicator of the fathers’ involvement in the life of his son. Relationship quality and his
role in the family environment, together with emotional and financial contributions to
the household account for his presence in the home. In view of this a father figure may
take the place of a biological father. Boys with father figures reported slightly lower
levels of contact, communication and connection than those with biological resident
fathers. Although previous research suggests that biological family members have
107
different obligations to each other than do non-family members, active father figures
have a key role to play in reducing risk behaviours in boys. Further research with a
specific focus on the role of father figures in the lives of young men is especially
important in a period when a vast majority of young men are living in absent-father
homes.
6.2.3. HYPOTHESIS III
The third hypothesis explored the effect of the dimension of paternal relationship
quality on adolescent risk behaviours. Paternal contact and connection was found to
be significantly and negatively related to all adolescent risk outcomes, with the
exception of educational under-attainment – which was only significantly associated
with paternal communication. Not surprisingly, boys with higher levels of paternal
contact, communication and connection were found to be less likely to report negative
family relations.
Boys who spent quality contact time reported lower mental health risk, lower
aggressive and delinquent behaviours and lower HIV/STD risk behaviours. These
findings are significant because it highlights the need for fathers to invest quality time
with their sons and not merely spend time in the vicinity of their sons. Both the
quantity and the quality of the interactions are important for adolescent development
(Welsh et al., 2004). Like Almedia et al. (2001), this study found that fathers who
spent more time with their children were more likely to engage in supportive
interactions with their children. Adolescents want a close, sensitive relationship with
their fathers and the time used to cultivate these qualities is important. Further studies
108
should explore the time periods that fathers and sons spend engaging in activities and
how fathers and sons feel about those times would extend knowledge in this area.
Daily diary methods may be one helpful methodology for these purposes.
Paternal communication was the only dimension which showed a significant negative
correlation with educational under-attainment as well as other risk behaviours. High
school is a significant developmental phase (Gregory & Weinstein, 2004) in which
learners prepare for the academic trajectory. Important decisions with long-term
effects are made, such as whether to drop out, finish high school or pursue tertiary
education. The study findings suggest that sons who can communicate openly with
their fathers are less likely to report educational difficulties. Future research is needed
to determine the areas of the son’s high school education that benefit most from
paternal communication.
Talking to fathers can also be interpreted to be a significant contributor to reducing
adolescent mental health risk and aggressive behaviour outcomes. Boys at risk for
aggression may be less likely to talk to their fathers and may be more likely to
externalize behaviours.
Like paternal communication, connection was significantly and negatively associated
with adolescent HIV/STD risk behaviours. The importance of the paternal relationship
to the social concern of the spread of HIV has been highlighted. Paternal connection’s
significant negative association with adolescent mental health is consistent with Gray
and Steinberg’s (1999) findings and it appears that when adolescent boys perceive
109
their fathers as accepting and supportive they are at lower risk for mental health
problems. This can have long-term effects on the adolescent by affecting his
emotional stability as well as job opportunities, thereby putting him at risk for
delinquent behaviour (Gray & Steinberg, 1999). The findings also show that boys with
a greater sense of connection to their fathers are less likely to be at risk for aggressive
or delinquent behaviour.
Interestingly, Herman, Dornbusch, Herron and Herting (1997) found no association
between paternal connection and delinquency in a sample of European American
youth. Given the stressful environment that South African children in lower income
communities live in (Ward et al., 2007), paternal connection may be more crucial to
them. Youth in lower income communities may not receive the high amounts of social
support that European youths may receive at school or through other socializing
agents (Bean, Barber & Crane, 2006). Paternal connection plays a crucial to youth
living in lower-economic environments in the protection of youth from risk
behaviours.
Even though the correlation analysis could not determine whether dimensions of
relationship quality contributed to adolescent risk outcomes or vice versa, clear
associations were drawn between father-son contact, communication and connection
and various adolescent risk factors. Additional research is needed to better understand
the way in which paternal relationship quality serves as a buffer to protect adolescent
boys from risk behaviours, as well as extraneous factors that might mediate the effect
of paternal relationship quality.
110
6.2.4. HYPOTHESIS IV
The fourth hypothesis examined the effect of paternal residential status on adolescent
risk outcomes. Father residential status was a significant predictor of negative family
relations and aggression for boys with non-residential fathers, relative to boys with
resident fathers. The finding that father residential status influences family relations is
not surprising. Based on the premise that non-resident fathers are more likely to have
separated because of divorce or separation, inter-parental conflict could be
significantly affected by father residential status, thereby leading to greater negative
family relations. Mother residential status was also a significant predictor of negative
family relations. Research indicates that living with biological parents gives children
an advantage over other types of two-parent families, including one biological and one
step-parent, and one biological parent with a cohabiting partner. Children living in the
latter types of two-parent families appear to have outcomes that are more similar to
children living in single-parent families (Anderson-Moore, Jekielek, & Emig, 2002).
Having a non-resident father emerged as the only significant predictor of aggressive
and delinquent behaviour. Thomas, Farrell & Barnes (1996) report that involvement
of non-resident fathers resulted in more delinquent behaviour from sons and state the
cause to be the lack of parenting skills of some non-resident fathers. According to
Valois, MacDonald, Bretous, Fischer & Wanzer Drane (2002) it is not family
structure itself that explains aggression and violent behaviour but rather some other
factor that may explain why that structure is present. This study finding is significant
as adolescent may be at risk for aggression and delinquency prior to parental
separation or divorce due to inter-parental conflicts.
111
Fathers (and mothers) need to be cautious in the renegotiation of family relationships
and roles when separations do occur as this may have long-term effects on adolescent
well-being. This study suggests that being born into a single parent family is not as
monolithic a risk as has been assumed in some areas of the literature (see, for instance,
Valois et al., 2002), but rather is more nuanced. The presence of a father figure was
not found to be a significant predictor of any risk outcomes. Findings confirm Flouri’s
(2007) hypothesis that father figures can also provide a quality relationship that may
protect young men from risk behaviours such as aggression and delinquency.
Another significant finding was the predictive significant effect of age on adolescent
HIV/STD risk behaviours. Although the age of adolescence has been clearly
associated with risk taking behaviours the direct effect of age is hard to determine.
Age cannot be measured as a definitive construct as each individual progresses
through the developmental phases differently. This study findings show that as the
adolescent ages their risk for practicing unsafe sexual practices also increase. Further
research focusing on a similar age range, however a bigger sample for each age
category, may be beneficial to knowledge production and assist in the determination
of the effect of age on adolescent risk outcomes.
6.2.5. HYPOTHESIS V
The fifth hypothesis investigates whether relationship quality will have a more
significant effect on risky behaviours than father residential status. An interesting
significant effect was found for paternal communication and no effect for paternal
contact and connection or father residential status when looking at the interaction
112
between dimensions of relationship quality and father residential status. The
hypothesis was therefore supported and findings showed paternal communication to
be a predictive factor for mental health risk, and aggressive and delinquent behaviour.
Paternal communication and mother residential status were both significant predictors
of negative family relations, educational under-attainment and HIV/STD risk
behaviours.
Paternal communication has been supported in the literature as a protective factor for
adolescents against aggressive and delinquent behaviour (Howard et al., 1999). There
has been little investigation into the association between paternal relationship quality
and adolescent aggression and delinquency. Of those studies identified, parent-child
communication has been singled out as one of the mechanisms that are associated
with less violent behaviour (Caldwell et al., 2004; Griffin, Botvin, Scheier, Diaz &
Miller, 2000). The results of hypothesis testing showed a strong predictive effect for
paternal communication on adolescent mental health. This finding is noteworthy as
little evidence is available in current literature to support his finding. This study
therefore furthered knowledge in with regards to adolescent mental health and
delinquent behaviour by looking specifically at the relationship quality between the
father and son.
The regression analysis in hypothesis four showed boys with non-resident fathers and
resident mothers were more at risk for negative family relations. Interestingly, the
results of this regression analysis (hypothesis five) showed paternal communication as
well as mother residential status to be predictive of negative family relations, with no
113
effect for father residential status. Negative family relations put adolescents at risk for
other negative behaviours. It cannot be determined whether the negative family
relationships were formed because of adolescent’s delinquent behaviours or lack of
paternal communication, or whether living with the mother was attributed to increased
negative family relations. Future research into the area of the family should provide a
deeper understanding of the home environment and inter-parental and family
relationships. Controlling for the home environment will assist researchers to achieve
clearer insights into the effects of the paternal relationship on adolescent risk
outcomes.
In the previous correlation analysis (hypothesis three) paternal communication was the
only dimension with a significant negative association to adolescent educational
under-attainment risk. Using regression analysis (hypothesis five) results showed
paternal communication and mother residential status as strong predictors of boy’s
educational difficulties. Jones (2004) found strong positive correlations, for boys with
resident and non-resident fathers, between paternal relationship quality and adolescent
academic achievement; and no effects were found regarding the mother’s residential
status.
Similarly, mother residential status was also found to be a predictor of adolescent
HIV/STD risk behaviours. Study findings supports literature reporting that speaking
frequently about sex between parents and children has been shown to decrease the
likelihood of early sexual debut for the adolescent (East, 1996; Howard et al., 1999;
Miller, Benson, & Galbraith, 2001). Chewning and Koningsveld (1998) found no
114
relationship between paternal communication and adolescent HIV risk. Miller et al.
(2001) reported a positive correlation between parent-child communication and riskier
sexual behaviour in adolescents. Future studies are needed, that include into the
investigation of paternal relationship quality on adolescent risk behaviours, the role of
maternal relationship quality and residential status. Findings suggest a strong
influence of mother residential status and paternal communication in the protection of
adolescent boys.
No effect was found for father residential status on adolescent risk outcomes. This
finding is significant as it provides evidence that fathers, whether residential or not or
whether biologically related or not, can form quality relationships with their sons and
help protect their sons form risk behaviours. Past and contemporary research on
fatherhood suggests that the quality of the father-son relationship has a significant
effect on the child’s development and well-being (Amato, 1997; Andry, 1960; Biller,
1993; Doherty et al., 1998; Hawkins & Dollahite, 1997; Richter & Morell, 2006).
Boys with a quality paternal relationship may be able to better negotiate the turbulent
period of adolescence. Father residential status alone has little to do with the
adolescent’s risk-taking behaviours, when compared to the enormous effect that the
paternal relationship has on adolescent young men.
6.3. LIMITATIONS
The findings of this study should be viewed in the light of its limitations. First, the
study used a cross-sectional research design and therefore causality claims cannot be
made. It is not possible to determine whether paternal relationship quality contributes
115
to increased adolescent risk behaviours or whether adolescent risk behaviours
contribute towards lowered paternal relationship quality. Second, this study
investigated the links between father-son relationship quality and male adolescent risk
behaviours, and therefore results may not be applicable to females or children of other
ages. Third, the amounts of variance in adolescent risk behaviours explained by
variables in the models were generally modest, ranging from 1.5% (Educational
Under-Attainment) to 18.7% (Negative Family Relations). Fourth, maternal
relationship quality or inter-parental conflict was not controlled for, only the
residential status of the mother. The potential effects of the maternal relationship or
mother figures in lives of adolescent boys and the relationships between the child’s
parents were not explored in this study and future research is needed to investigate the
tripartite relationship between the son, mother and father.
6.4. CONCLUSION AND RECOMMENDATIONS
Despite these limitations, this study showed that paternal relationship quality plays a
more significant role, specifically the dimension of communication, than whether
fathers live with their sons or are biologically related to them, in the protection of
adolescent boys from risk behaviours. Biological non-resident fathers have a
responsibility to ensure that they are available to their sons and to create open
channels of communication. Father figures also have the added responsibility of
taking on the role of the biological father to boys who are generally more at risk for
behavioural problems.
116
Research on paternal relationship quality must move beyond demonstrations of
association between father’s behaviours and adolescent outcomes to specific
dimensions of the relationship and their effect on adolescent risk behaviours. Previous
literature has focused mainly on fathers who are physically absent from the home but
has given little attention to fathers who may be psychologically absent. Fatherhood is
not a unidimensional construct that can be measured by a father’s physical presence
but rather it is the holistic context that fathers create, participate in and are involved
with their families and children. This thesis provides the platform to investigate
further the reasons or contexts that allow for a paternal relationship to positively affect
adolescent wellbeing. While financial contributions are important to the well-being of
children’s needs, too much emphasis has been given to the financial contributions of
fathers - especially non-resident fathers and too little to the relationships that men may
foster with their sons.
These findings suggest a need to address the issues of building relationships between
at-risk youth and their fathers (be they biological fathers or father figures) through
community and clinical interventions. Detailed validation studies of the dimensions of
contact, communication and connection and a single measure of relationship quality
would be beneficial to the new conceptualization of paternal relationship quality.
Promoting effective parenting skills amongst fathers could be beneficial in preventing
risk behaviours amongst adolescent boys. Future research is needed to explore the
factors that help or hinder paternal contact, communication and connection. Special
attention should be given to the role of father figures in the lives of young men is
117
especially important in a period when a vast majority of young men are living in
absent-father homes.
This thesis draws special attention to the importance of open and frequent
communication between fathers and sons. Intervention programmes equipping fathers
with the knowledge of health and social concerns of youth, strategies for creating open
channels of communication, and the skills to talk to the sons should be at the fore in
the protection of adolescent boys.
118
REFERENCES
Almeida, D. M., Wethington, E., & McDonald, D. A. (2001). Daily variation in
paternal engagement and negative mood: implications for emotionally supportive and
conflictual interactions. Journal of Marriage and Family, 63, 417-429.
Amato, P. R. (1997). Contact with non-custodial fathers and children’s wellbeing.
Family Matters, 36, 32-34.
Amato, P. R. & Gilbreth, J. G. (1999). Nonresident fathers and children’s well-being:
A meta-analysis. Journal of Marriage and the Family, 61, 557-573.
Anderson, K. G., Kaplan, H., Lam., D., & Lancaster, J. (1999). Paternal care by
genetic fathers and stepfathers II: Reports by Xhosa high school students. Evolution
and Human Behavior, 20, 433-451.
Anderson-Moore, K., Jekielek, S. M., & Emig, C. (2002). Marriage from a Child’s
Perspective: How Does Family Structure Affect Children, and What Can We Do
About It? Child Trends Research Brief: Child Trends. Available at
www.childtrends.org
Andry, G. R. (1960). Faulty paternal and maternal child relationships, affection and
delinquency. British Journal of Delinquency, 97, 329-340.
119
Australian Institute of Health and Welfare. (2002). 2001 National Drug Strategy
Household Survey: Detailed findings. Canberra, Australia: Author.
Ayres, J., Colby-Rotell, N., Wadleigh, P. M., & Hopf, T. (1996). Measuring patients’
communication apprehension about interacting with physicians: Instrument
development. Communication Research Reports, 13(1), 86–93.
Babbie, E., & Mouton, J. (Eds.) (2005). The Practice of Social Research. Cape Town:
Oxford University Press.
Barber, B. K. (1996). Parental psychological control: Revisiting a neglected construct.
Child Development, 67, 3296-3319.
Barber, B. K., & Olsen, J. A. (1997). Socialization in context: Connection, regulation,
and autonomy in the family, school, and neighborhood and with peers. Journal of
Adolescent Research, 12(2), 287-315.
Barber, B. K., Stolz, H. E., & Olsen, J. A. (2005). Parental support, psychological
control and behavioral control: Assessing relevance across time, method, and culture.
Monographs of the Society for Research in Child Development, 70(4, Serial No. 284).
Bartlett, J. E., Kotrick, J. W., & Higgins, C. C. (2001). Organizational research:
Determining appropriate sample size in survey research. Information Technology,
Learning, and Performance Journal, 19(1), 43-50.
120
Bean, R. A., Barber, B. K., & Crane, D. R. (2006). Parental support, behavioral
control, and psychological control among African American youth. Journal of Family
Issues, 27(10), 1335-1355.
Belle, D. (1999). The after-school lives of children: Alone and with others while
parents work. Mahwah, NJ: Lawrence Erlbaum Associates.
Biller, H. B. (1993). Fathers and families: Paternal factors in child development.
Westport, CT: Auburn House.
Bless, C., & Higson-Smith, C. (2000). Fundamentals of social research methods-An
African perspective (3rd
ed.). Lansdowne: Juta Education.
Bohrnstedt, G. W., & Knoke, D. (1988). Statistics for Social data analysis (2nd
ed.).
Illinois: F.E. Peacock Publishers, Inc.
Bradford, K., Barber, B. K., Olsen, J. A., Maughan, S. L., Erickson, L. D., Ward, D.,
& Stolz, H. E. (2003). A multi-national study of interparental conflict, parenting, and
adolescent functioning: South Africa, Bangladesh, China, India, Bosnia, Germany,
Palestine, Colombia, and the United States. Marriage and Family Review, 35(3-4),
107-137.
121
Brandt, R., Ward, C., Dawes, A., & Flisher, A. (2005). Epidemiological measurement
of children's and adolescents' exposure to community violence: Working with the
current state of the science. Clinical Child and Family Psychology Review, 8(4), 327-
342.
Brooks-Gunn, J., Britto, P. R., & Brady, C. (1999). Struggling to make ends meet:
Poverty and child development. In M. E. Lamb (Ed.), Parenting and child
development in ‘‘nontraditional’’ families (pp. 279-304). Mahwah, NJ: Erlbaum.
Brotherson, S. E., Yamamoto, T., & Acock, A. C. (2003). Connection and
communication in father-child relationships and adolescent child well-being.
Fathering: A Journal of Theory, Research, and Practice about Men as Fathers, 1(3),
191-124.
Burgess, A. (2008). The costs and benefits of active fatherhood: Evidence and insights
to inform the development of policy and practice. United Kingdom: Fathers Direct.
Burns, R. B. (2000). Introduction to research methods. California: Sage Publications.
Caldwell, C. H., Wright, J. C., Zimmerman, M. A., Walsemann, K. M., Williams, D.,
& Isichei, P. A. (2004).Enhancing adolescent health behaviors through strengthening
non-resident father-son relationships: A model for intervention with African-
American families. Health Education Research: Theory and Practice, 19(6), 644-
656.
122
Capuzzi, D., & Gross, D. R. (2000). Youth at risk: A prevention resource for
counselors, teachers, and parents. Alexandria, VA: American Counseling Association.
Centers for Disease Control and Prevention. (2004). Youth risk behaviour
surveillance-United States, 2003. Morbidity and Mortality Weekly Report 52(SS-2), 1-
96.
Chewning, B., & Koningsveld, R. V. (1998). Predicting adolescent's initiation of
intercourse and contraceptive use. Journal of Applied Social Psychology, 28, 1245–
1285.
Cochran, W. G. (1977). Sampling techniques (3rd
ed.). New York: John Wiley & Sons.
Constantine, L. L. (1987). Adolescent processes and family organization: A model of
development as a function of family paradigm. Journal of Adolescent Research, 2,
349-365.
Cozby, P. C. (2001). Methods in behavioral research (7th
ed.). California: Mayfield.
Publishing Company.
Cronbach, L. J. (1951). Coefficient alpha and the internal structure of tests.
Psychometrika. 16, 297-334.
123
de Visser, R. O., Rissel, C. E., Smith, M. A., & Richters, J. (2006).
Sociodemographic correlates of selected health risk behaviors in a representative
sample of Australian young people. International Journal of Behavioral Medicine,
13(2), 153-162.
de Wit, M., Pouwer, F., Gemke, R. J., Delemarre-van der Waal, H. A., & Snoek, F. J.
(2007). Validation of the WHO-5 well-being index (WHO-5) in adolescents with
Type 1 Diabetes. Diabetes Care, 30(8), 2003-2006.
Doherty, W. J., Kouneski, E. F., & Erickson, M. F. (1998). Responsible fathering: An
overview and conceptual framework. Journal of Marriage and the Family, 60, 277-
292.
Dollahite, D. C., Hawkins, A. J., & Brotherson, S. E. (1997). Fatherwork: A
conceptual ethic of fathering as generative work. In A. J. Hawkins & D. C. Dollahite
(Eds.), Generative fathering: Beyond deficit perspectives (pp. 17-35). Thousand Oaks,
CA: Sage Publications.
Donenberg, G. R., Paikoff. R., & Pequegnat, W. (2006). Introduction to the special
section on families, youth, and HIV/STD: Family-based intervention studies. Journal
of Pediatric Psychology, 31(9), 869-873.
Duncan, G. J., & Brooks-Gunn, J. (1997). Consequences of growing up poor.
NewYork: Russell Sage Foundation Press.
124
Durant, R., Knight, J., & Goodman, E. (1997). Factors associated with aggressive and
delinquent behaviors among patients attending an adolescent medicine clinic. Journal
of Adolescent Mental Health, 21, 303-308.
East, P. L. (1996). The younger sisters of childbearing adolescents: Their attitudes,
expectations, and behaviors. Child Development, 67, 267–282.
Erikson, E. H. (1959). Identity and the life cycle. New York: Norton.
Federal, Provincial and Territorial Advisory Committee on Population Health. (1999).
Statistical report on the health of Canadians. Ontario, Canada: Health Canada.
Fleming M. C., & Englar-Carlson, M. (2008). Examining depression and suicidality in
boys and male adolescents: An overview and clinical observations. In M. Kiselica, M.
Englar-Carlson, & A. Horne (Eds.), Counseling troubled boys: A guidebook for
professionals (pp. 125-162). New York: Routledge.
Flisher, A. J. (2007). Monitoring child and adolescent mental health, risk behaviour
and substance abuse. In A. Dawes, R. Bray, & A. Van der Merwe (Eds.), Monitoring
child well-being: A South African rights-based approach (pp. 111-127). Cape Town:
HSRC Press.
125
Flouri, E. (2007). Fathering and adolescents’ psychological adjustment: The role of
fathers’ involvement, residence and biology status. Child: Care, Health and
Development, 34(2), 152-161.
Floyd, K., & Morman, M. T. (1998). The measurement of affectionate
communication. Communication Quarterly, 46(2), 144-162.
Foxcroft, C., & Roodt, G. (2005). Introduction to psychological assessment in a South
African context. South Africa: Oxford University Press.
Goodwin, C. J. (1995). Research in psychology: Methods and design. Canada: John
Wiley & Sons.
Gottman, J. M. (1979). Marital interaction: Experimental investigations. New York:
Academic Press.
Gray, M. R. & Steinberg, L. (1999). Unpacking authoritative parenting: Reassessing a
multidimensional construct. Journal of Marriage and the Family, 61, 574-587.
Gregory, A. & Weinstein, R. S. (2004). Connection and regulation at home and in
school: Predicting growth in achievement for adolescents. Journal of Adolescent
Research, 19, 405-427.
126
Griffin, K. W., Botvin, G. L., Scheier, L. M., Diaz, T., & Miller, N. L. (2000).
Parenting practices as predictors of substance use, delinquency and aggression among
urban minority youth: Moderating effects of family structure and gender. Psychology
of Addictive Behaviors, 14, 174-184.
Harris, K. M., Furstenburg, F. F., & Marmer, J. K. (1998). Paternal involvement with
adolescents in intact families: The influence of father’s over the life course.
Demography, 35(2), 201-216.
Hawkins, A. J., & Dollahite, D. C. (Eds.). (1997). Generative fathering: Beyond
deficit perspectives. California: Sage Publications.
Herman, M. R., Dornbusch, S. M., Herron, M. C. & Herting, J. R. (1997). The
influence of family regulation, connection and psychological autonomy on six
measures of adolescent functioning. Journal of Adolescent Research, 12, 34-67.
Hofferth, S., & Sandberg, J. F. (2001). How American children spend their time.
Journal of Marriage and Family, 63, 295-308.
Howard, D. E., Cross, S. I., Li, X., & Huang, W. (1999) Parent- youth concordance
regarding violence exposure: Relationship to youth psychosocial functioning. Journal
of Adolescent Health, 25, 396–406.
Huysamen, G. K. (1980). Psychological testing in South Africa. Pretoria: Academica.
127
Igra, V., & Irwin, C. E. (1996). Theories of adolescent risk taking behaviour. In R. J.
DiClemente, W. Hanse, & L. Ponton (Eds.), Handbook of adolescent health risk
behaviour (pp. 35-51). New York, NY: Plenum Press.
Jamara, S. L., Parillo, K. M., Townsend, L., Mathews, C., Rahdert, E., Young, P. A.
Stultz, N. A, & Snyder, F. R. (2006). An HIV/STD Risk screen for South African
adolescents. Unpublished manuscript, NOVA Research Company, University of
Cape Town and University of Bergen.
Jessor, R. (1998). New perspectives on adolescent risk behavior. New York:
Cambridge University Press.
Jessor, R., Collins, M., & Jessor S. (1972). On becoming a drinker: Social
psychological aspects of an adolescent transition. Annals of the New York Academy of
Sciences, 197, 199–213
Johnson, R. (2006). Better dads, stronger sons: How fathers can guide boys to become
men of character. Michigan: Fleming H. Revell.
Jones, K. (2004). Assessing psychological separation and academic performance in
nonresident-father and resident-father adolescent boys. Child and Adolescent Social
Work Journal, 21(4), 333-354.
Keren, M., & Hasida, B-Z. (2007). Risk-taking among adolescents: Associations with
social and affective factors. Journal of Adolescence, 30(1), 17-31.
128
Knight, J. R., Goodman, E., Pulerwitz, T., & Durant, R. H. (2001). Reliability of the
Problem Oriented Screening Instrument for Teenagers (POSIT) in adolescent medical
practice. Journal of Adolescent Health, 29(2),125-30.
Lamb, M. E. (Ed.). (1981). The role of the father in child development (2nd
ed.). New
York: Wiley.
--. (1997). The role of the father in child development (3rd
ed.). New York: Wiley.
Lamb, M. E., Pleck, J. H., Charnov, E. L., & Levine, J. A. (1985). Paternal behavior in
humans. American Zoologist, 25, 883-894.
Larson, R. W. (1993). Finding time for fatherhood: The emotional ecology of
adolescent-father interactions. New Directions for Child Development, 62, 7-19.
Larson, R. W., & Richards, M. H. (1991). Daily companionship in late childhood and
early adolescence: Changing developmental contexts. Child Development, 62, 284-
300.
Lazarsfeld, P. (1964). Concept formation and measurement in the behavioral sciences:
Some historical observations. In G. J. Direnzo (1966) (Ed.), Concepts, theory, and
explanation in the behavioral sciences (pp. 144-202). New York: Random House Inc.
129
Lee, J. (1998). Effective maintenance communication in superior–subordinate
relationships. Western Journal of Communication, 62, 181–208.
Lewis-Beck, M. S. (1993). Regression analysis: International handbook of
quantitative applications in the social sciences (Vol. 2). California: Sage Publications.
Luchetti, A. E., Powers, W. G., & Love, D. E. (2002). The empirical development of
the child-parent communication apprehension scale for use with young adults. The
Journal of Family Communication 2(3), 109-131.
MacDonald, Z. (1999). Illicit drug use in the UK. British Journal of Criminology, 39,
585–609.
Marsiglio, W. (1995). Fatherhood: Contemporary theory, research, and social policy.
California: Sage Publications.
McBride, B. A. (1990). The effects of a parent education/play group program on
father involvement in child rearing. Family Relations, 39, 250-256.
McIntyre, D., Muirhead, D., Gilson, L., Govender, V., Mbatsha, S., Goudge, J., &
Wadee, P.N. (2000). Geographic patterns of deprivation and health inequities in
South Africa: Informing pubic resource allocation strategies. Centre for Health
Policy, University of the Witwatersrand and Health Economics and Financing
Programme, London School of Hygiene and Tropical Medicine.
130
McLaney, M. A., Del Boca, F., & Babor, T. (1994). A validation study of the Problem
Oriented Screening Instrument for Teenagers (POSIT). Journal of Mental Health, 3,
363-376.
Melchior, L. A., Rahdert, E., & Huba, G. J. (1994). Reliability and validity evidence
for the Problem Oriented Screening Instruments for Teenagers (POSIT). Washington,
DC: American Public Health Association.
Melville, S., & Goddard, W. (1996). Research Methodology. Kenwyn: Juta.
Meyers, L. S., Gamst, G., & Guarimo, A. J. (2006). Applied multivariate research:
Design and interpretation. California: Sage Publications
Milkie, M. A., Simon, R. W., & Powell, B. (1997). Through the eyes of children:
Youth’s perceptions and evaluations of maternal and paternal roles. Social Psychology
Quarterly, 60, 218-237.
Miller, B. C., Benson, B., & Galbraith, K. A. (2001). Family relationships and
adolescent pregnancy risk: A research synthesis. Developmental Review, 21, 1–38.
Miller, B. C., Norton, M. C., Fan, X., & Christopherson, C. R. (1998). Pubertal
development, parent communication, and sexual values in relation to adolescent
sexual behaviors. Journal of Early Adolescence, 18, 27-52.
131
Mitchell, M., & Jolley, J. (1996). Research design explained. (3rd
ed.). Fort Worth:
Harcourt Brace College Publishers.
Mott, F. L. (1990). When is a father really gone? Paternal-child contact in father-
absent homes. Demography, 27(4), 499-517.
Mouton, J. (2005). How to succeed in your master’s and doctoral studies: A South
African guide and resource Book. Pretoria: Van Schaik Publishers.
Munsch, J., Woodward, J., & Darling, N. (1995). Children’s perceptions of their
relationships with coresiding and non-custodial fathers. Journal of Divorce and
Remarriage, 23, 39-54.
Netemeyer, R. G., Bearden, W. O., & Sharma, S. (2003). Scaling procedures. London:
Sage Publications.
Neuman, W. L. (2006). Basics of social research: Qualitative and quantitative
approaches (2nd
ed). Boston: Allyn & Bacon.
Osborne, J. (2002). Notes on the use of data transformations. Practical Assessment,
Research & Evaluation, 8(6). Available at http://PAREonline.net/getvn.asp?v=8&n=6
132
Palen, L. A., Smith, E. A., Caldwell, L. L., Flisher, A. J., Wegner, L., & Vergnani, T.
(2008). Inconsistent reports of sexual intercourse among South African high school
students. Journal of Adolescent Health, 42, 221-227.
Parke, R. D. (1996). Fatherhood. Cambridge, MA: Harvard University Press.
Parry, C. D., Bhana, A., Myers, B., Plűddemann, A., Flisher, A. J., Peden, M. M., &
Morojele, N. K. (2002). Alcohol use in South Africa: Findings from the South African
Community Epidemiology Network on Drug Use (SACENDU) Project. Journal of
Studies on Alcohol, 63(4), 430-5.
Parry, C. D., Meyers, B., Morojele, N. K., Flisher, A. J., Bhana, A., Donson, H., &
Plűddemann, A. (2004). Trends in adolescent alcohol and other drug use: Findings
from three sentinel sites in South Africa (1997-2001). Journal of Adolescence, 27,
429-440.
Paterson, J. E., Field, J., & Pryor, J. (1994). Adolescents’ perception of their
attachment relationships with their mothers, fathers, and friends. Journal of Youth and
Adolescence, 23(5), 579-600.
Pettifor, A. E., Rees, H. V., Steffenson, A., Hlongwa-Madikizela, L., MacPhail, C.,
Vermaak, K., & Kleinschmidt, L. (2004). HIV/STD and sexual behaviour among
young South Africans: A national survey of 15-24 year olds. Johannesburg:
Reproductive Health Research Unit, University of Witswatersrand.
133
Pickering, M. (1993). Auguste Comte: An intellectual biography. New York:
Cambridge University Press.
Pleck, J. H. (1997). Paternal involvement: Levels, sources, and consequences. In M.
E. Lamb (Ed.), The role of the father in child development (3rd ed.) (pp. 66-103). New
York: Wiley.
Plüddemann,A. Flisher, A.J., McKetin, R., Parry, C. and Lombard, C. (2009).
Methamphetamine use, aggressive behaviour and mental health among school going
adolescents in Cape Town, South Africa. Unpublished manuscript, Medical Research
Council and the University of Cape Town.
Population Reference Bureau. (2009). 2009 World Population Data Sheet. Available
at http://www.prb.org/en/Publications/Datasheets/2009/2009wpds.aspx.
Powers, W. G., & Hutchinson, K. (1979). The measurement of communication
apprehension in the marriage relationship. Journal of Marriage and the Family, 41,
89–95.
Pretorius, T. B. (2007). Inferential data analysis – Hypothesis testing and decision
making. Wandsbeck, South Africa: Reach Publishers.
134
Radin, N. (1994). Primary-care giving fathers in intact families. In A.E. Gottfried &
A.W. Gottfried (Eds.), Redefining families: Implications for children's development
(pp. 55-97). New York: Plenum.
Rahdert, E. (Ed.). (1991). The Adolescent Assessment/Referral System Manual.
Rockville, MD: U.S. Department of Health and Human Services, National Institute on
Drug Abuse. DHHS pub No. (ADM) 91-1735.
Rahdert, E., Young, P., & Langenbucher, J. (2005). [The newly developed POSIT-
related HIV/STD risk-of-future exposure scale]. Unpublished raw data.
Ramirez-Valles, J., Zimmerman, M. A., & Newcomb, M. D. (1998). Sexual risk
behavior among youth: Modeling the influence of pro-social activities and
socioeconomic factors. Journal of Health and Social Behaviors, 39, 237–253.
Ream, G. L., & Savin-Williams, R. C. (2005). Reciprocal associations between
adolescent sexual activity and quality of youth-parent interactions. Journal of Family
Psychology, 19(2), 171-179.
Reddy, S. P., Panday, S., Swart, D., Jinabhai, C. C., Amosun, S. L., James, S.,
Monyeki, K. D., Stevens, G., Morejele, N., Kambaran, N. S., Omardien, R. G., & Van
den Borne, H. W. (2003). Umthenthe Uhlaba Usamila – The South African Youth Risk
Behaviour Survey 2002. Cape Town: South African Medical Research Council.
135
Reddy, S. P., Resnicow, K., Omardien, R., & Kamnaran, N. (2007). Prevalence and
correlates of substance use among high school students in South Africa and the United
States. American Journal of Public Health, 97(10), 1859-1864.
Reid, A., Lynskey, M., & Copeland, J. (2000). Cannabis use among Australian
adolescents: Findings of the 1998 National Drug Strategy Household Survey.
Australian&New Zealand Journal of Public Health, 24, 596–602.
Regnerus, M. D., & Luchies, L. B. (2006). The parent-child relationship and
opportunities for adolescents’ first sex. Journal of Family Issues, 27(2), 159–183.
Richter, L. M., & Morell, R. (Eds.). (2006). Baba: Men and fatherhood in South
Africa. Cape Town: Human Science Research Council.
Rodgers, K. B. (1999). Parenting processes related to sexual risk-taking behaviors of
adolescent males and females. Journal of Marriage and the Family, 61, 99–109.
Santos, J. R. (1999). Cronbach’s Alpha : A tool for assessing the reliability of scales.
Journal of Extension, 37(2). Available at http://joe.org/joe/1999april/tt3.html.
Schaap, C. (1984). A comparison of the interaction of distressed and nondistressed
married couples in a laboratory situation: Literature survey, methodological issues,
and an empirical investigation. In K. Hahlweg & N. Jacobsen (Eds.), Marital
interaction: Analysis and modification (pp. 133-158). New York: Guilford Press.
136
Schaefer, E. S. (1965). Children’s reports of parental behaviour: An inventory. Child
Development, 36(2), 413-424.
Scott-Jones, D. (2000). Recruitment of research participants. In B.D. Sales, & S.
Folkman (Eds). Ethics in Research with Human Participants (pp. 27 – 34).
Washington: American Psychological Association.
Shisana, O., Richter, L., & Simbayi, L.C. (2004). The National Household HIV
Prevalence and Risk Survey of South African Children. Cape Town: HSRC
Publishers.
Shisana, O., & Simbayi, L. C. (Eds). (2002). Nelson Mandela/HSRC study of
HIV/AIDS: South African national HIV prevalence, behavioural risks and mass
media: Household survey 2002. Cape Town: HSRC Publishers.
Shariff, R. C. (1995). Comte after Positivism. New York: Cambridge University Press.
Sixsmith, J., & Knowles, K. (1996). Home life in the traditional family. In M. Moore,
J. Sixsmith, & K. Knowles (Eds.), Children's Reflections on Family Life (pp. 12-28).
London: Falmer.
SPSS Inc. (2009). SPSS Base 17.0 for Windows user's guide. Chicago, IL: SPSS Inc.
137
Statistics South Africa. (2009). Mid-year population estimates, 2009. Available at
http://www.statssa.gov.za/publications/statsdownload.asp?PPN=P0302&SCH=4437
Steinberg, L. (1996). Beyond the classroom: Why school reform has failed and what
parents need to do. New York: Simon & Schuster. (ERIC Document No. ED398346)
Stolz, H. E., Barber, B. K., Olsen, J. A., Erickson, L. D., Bradford, K. P., Maughan, S.
L., et al. (2004). Family and school socialization and adolescent academic
achievement: A cross-national dominance analysis of achievement predictors.
Marriage and Family Review, 36(1-2), 7-34.
Taanila, A., Laitinen, E., Moilinen, I., & Jarvelin, M. (2002). Effects of family
interaction on the child’s behaviour in single parents or reconstructed families. Family
Process, 41, 693-708.
Tabachnick, B. G., & Fidell, L. S. (1996). Using multivariate statistics (3rd ed.). New
York: Harper Collins.
Terre Blanche, M., & Durrheim, K. (Eds). (1999). Research in practice: Applied
methods for the social sciences. Cape Town: University of Cape Town Press.
Thomas, G., Farrell, M. P., & Barnes, G. M. (1996). The effects of single-mother
families and nonresident and resident fathers on delinquency and substance abuse in
Black and White adolescents. Journal of Marriage and the Family, 58, 884-894.
138
Upchurch, D. M., Aneshensel, C. S., Sucoff, C. A., & Levi-Storms, L. (1999).
Neighborhood and family contexts of adolescent sexual activity. Journal of Marriage
and the Family, 61, 920–933.
Valois, R. F., MacDonald, J. M., Bretous, L., Fischer, M. A., & Wanzer Drane, J.
(2002). Risk factors and behaviors associated with adolescent violence and aggression.
American Journal of Health Behavior, 26(6), 454-464.
Van Staden, F. J., & Visser, J. D. (1991). The South African Journal of Sociology
during the eighties: An analysis of theoretical and empirical contributions. South
African Journal of Sociology, 22(2), 33-43.
Ward, C., & Bakhuis, K. (2009). Intervening in children’s involvement in gangs:
Views of Cape Town’s young people. Children & Society. Online: 1-18.
Ward, C., Martin, E., Theron, C., & Distiller, G. B. (2007). Factors affecting resilience
in children exposed to violence. South African Journal of Psychology, 37(1), 165-187.
Welsh, E., Buchanan, A., Flouri, E., & Lewis, J. (2004). Involved fathering and child
well-being: Fathers’ involvement with secondary school age children. Journal of
Happiness Studies, 5, 335-358.
139
Western Cape Education Department Directorate: Knowledge Management. (2008).
Education Management Information System. Available at
http://wcedemis.wcape.gov.za/wced/findaschool.html.
Young, P., & Rahdert, E. (2000). Development of a POSIT-related HIV/STD risk scale.
Bethesda, MA: NOVA Research Company.

140
APPENDEXES (A – U)
141
Appendix A: Letter to School Principal Requesting Permission
Private Bag X17 Bellville 7535 South Africa
Telephone: +27 21 959 2631/2746
Fax: +27 21 959 2755
E-mail: [email protected]@uwc.ac.za
FACULTY OF COMMUNITY AND HEALTH SCIENCES
The Principal and staff: Name of School 1 March 2008
Re: Research Project on adolescent males and risk-taking behaviours
My name is Lynn Hendricks and I am a Masters Psychology student at the
University of the Western Cape. I am currently doing research on adolescent boys’
and their potential for risk behaviours. I am also looking at how their relationship
with their fathers (with whom the adolescent deems as his father) protects them
against these risk behaviours. This thesis is being supervised by Prof. C. Malcolm of
the Psychology Department.
This proposal has been accepted and passed through the Senate, the Ethical
Clearance Board and the Higher Degrees Committee of the University of the
Western Cape. The Western Cape Education Department has approved this research
within the Cape Town public school community. I am writing to request your
permission to conduct research at your school. My research team would like to visit
the school during the months of January-March 2008 for two-three days.
We would require you to provide a group of 60 (or more as determined by the
number enrolled for 2008) male learners who are in grade eleven and between the
ages of 16-19 years old. The learners would be required to be available for one
meeting of 2 hours or two meetings of 1 hour each. All data will be collected in the
form of questionnaires. Research methodology can be reviewed in the attached
executive summary. We will be happy to share our findings with you through a
written or verbal report. However, the actual data will be highly confidential to
protect the participants and in order to adhere to research ethics.
We hope you will be able to participate in this research project. Your assistance is
greatly appreciated.
Sincerely,
Student Researcher Supervisor
Lynn Hendricks Charles Malcolm PhD.
076 305 6843 (021) 959 2454
e-mail: [email protected] e-mail: [email protected]
142
Appendix B: Consent and Assent Forms for Parent/Guardian and
Learners in English and Afrikaans
Private Bag X17 Bellville 7535 South Africa
Telephone: +27 21 959 2631/2746
Fax: +27 21 959 2755
E-mail: [email protected]@uwc.ac.za
FACULTY OF COMMUNITY AND HEALTH SCIENCES
Dear Sir/ Madam
Re: Research project on adolescent males and risk-taking behaviours
My name is Lynn Hendricks and I am a Masters Psychology student at the
University of the Western Cape. I am currently doing research on adolescent boys’
and their potential for risk behaviours. I am also looking at how their relationship
with their fathers (with whom the adolescent deems as his father) protects them
against these risk behaviours. This thesis is being supervised by Prof. C. Malcolm of
the Psychology Department.
Your son is one of the 350 young people that have been chosen to take part in my
research. I am writing this letter to ask you, the parent/guardian, permission for your
son to participate in this research project. Your son will be asked to fill in a
questionnaire which will ask him about his likelihood to engage in risk behaviour
and feelings about the relationship with his father.
Please let me assure you that your son will not be asked to write his name, surname
or even the name of his school. The name of the child should be included in this
reply slip so that the researcher may know who has received permission from their
parent/guardian to participate in the study. All information will be treated in the
strictest confidentiality.
Please place your signature on the space, seal the letter in the envelope provided and
give to your son to return it to me as soon as possible.
Sincerely,
Sincerely,
Student Researcher Supervisor
Lynn Hendricks Charles Malcolm PhD.
076 305 6843 (021) 959 2454
e-mail: [email protected] e-mail: [email protected]

143
PLEASE RETURN THIS REPLY SLIP AS SOON AS POSSIBLE
PARENT/GUARDIAN
I, hereby give permission for my son _________________________to take part in
the research conducted by Lynn Hendricks. I understand that all the information
gathered by Lynn Hendricks will be strictly confidential and the identity of my son
or my family will not be revealed.
Signature _____________________
Date_______________________
LEARNER
I, ___________________________ hereby consent to participating in the research
study conducted by Lynn Hendricks. I understand that I am under no obligation to
participate and may leave the study at any time. I understand that all information
gathered by Lynn Hendricks will be strictly confidential and the identity of my
family or me will not be revealed.
Signature _____________________ Date_______________________
144
FAKULTEIT VAN GEMEENSKAP EN GESONDHEID WETENSKAP
Geagte Heer/ Dame
Navorsing projek oor jeugdige seuns en risiko gedrag
My naam is Lynn Hendricks en ek is ‘n Meesters Psigologiese student by die
Universiteit van Wes Kaap. Ek doen heidiglik navorsing oor jeudige seuns en hulle
potensiaal vir risiko gedrag. Ek stel ook belang in hoe hul verhouding met hul
vaders (wie die jeugdige beskou as sy vader) teen risiko gedrag beskerm word. Prof.
C. Malcolm van die Psigologiese Departement sal toesig hê oor hierdie tesis.
U seun is een van die 350 jeugdiges wat gekies is om deel te neem aan my navorsing.
Ek skryf hierdie brief aan u, die ouer/ oppasser, om te vra of u seun kan deel neem in
hierdie studie. U seun sal gevra word om a vraelys in te vul. Hierdie vraelys sal vra
of daar ‘n moontlikheid is dat hy in risiko gedrag sal deel neem en sy gevoellens oor
sy verhouding met sy vader.
Laat ek u die versekering gee dat u seun nie gevra sal word om sy naam, van, of die
naam van sy skool hoef te skryf nie. Die naam van die kind moet in die terugvoering
ingesluit word sodat die narvorser kan kennis dra van wie toestemming gekry het van
sy ouers/ oppassers om deel te neem in die studie. Alle informasie sal met die
hoogste geheimhouding hanteer word.
Plaas asseblief u handtekening op die spasie en maak die brief toe in die koevert wat
voorsien is. Gee die geslote brief aan u seun wie dit aan my so gou as moontlik sal
oorhandig.
Die uwe,
Navorser Opsigter
Lynn Hendricks Charles Malcolm PhD.
076 305 6843 (021) 959 2454
e-pos: [email protected] e-pos: [email protected]
Private Bag X17 Bellville 7535 South Africa
Telephone: +27 21 959 2631/2746
Fax: +27 21 959 2755
E-mail: [email protected]
145
STUUR HEIRDIE TERUGVOERING AS GOU AS MOONTLIK TERUG
OUER/OPPASSER:
Ek gee hiermee toestemming vir my seun, __________________________ ,om deel
te neem in die navorsing wat deur Lynn Hendricks beheer word. Ek verstaan dat alle
informasie wat deur Lynn Hendricks versamel is sal in die hoogste geheimhouding
hanteer word. Die idetiteit van my seun of my familie sal nie openbaar word nie
Handtekening ____________________ Datum _________________
LEERLING:
Ek, _______________________________, gee hiermee toestemming om deel te
neem in die navorsing wat deur Lynn Hendricks onderneem word. Ek verstaan dat
ek onder geen verpligting is om deel te neem nie en mag die studie ter enige tyd
verlaat. Ek verstaan dat alle informasie in die hoogste geheimhouding sal hanteer
word. Die identiteit van my familie en ek sal nie openbaar word nie.
Handtekening ____________________ Datum __________________

146
Appendix C: Practice Questions
1.a. Please enter today’s date __/__/____ (mm/dd/ yyyy)
1.b. Please enter the questionnaire language you are using 1 Afrikaans
2 English
TUTORIAL
You are going to start by practicing some responses. Please answer the following
questions about yourself by circling the number that best indicates your answer. These
next 4 questions are only for practice.
Jy gaan begin deur eers ‘n paar antwoorde te oeffen. Antwoord asseblief die volgende vrae
oor jouself deur die nommer te maak wat jou antwoord beste beskryf. Die volgende 4 vrae is
net vir oeffening.
2. I like to watch television.
Ek hou van televiesie te kyk.
1 Yes/ Ja
2 No/ Nee
9 Don’t Know/Weet nie
3. My friends are fun to be around (Choose one).
Dis lekker om met my vriende (tjommies) te wees.
1 Yes/ Ja
2 No/ Nee
9 Don’t Know/Weet nie
4. In the past 12 months, how many sports have you participated in? (Choose one)
In die afgelope 12 maande, aan hoeveel sport het jy deelgeneem?
1 None/ Geen
2
3
4
5
9 Dont’ Know/ Weet nie
5. I walk to school (Choose one).
Ek stap skool toe.
1 Never or almost never/ Nooit of amper nooit
2 Sometimes/ Somtyds
3 Often/ Dikwels
4 All the time/ Altyd
9 Don’t know/ Weet nie

147
Appendix D: Demographic Questionnaire
Now, lets move on to the real thing. Please answer the following questions about
yourself by circling the number that best indicates your answer.
Kom ons begin met die eintlike vrae. Antwoord asseblief die volgende vrae oor jouself deur
die nommer wat jou antwoord die beste beskryf te sirkel.
6. How old are you? (Choose one)
Hoe oud is jy?
01 15 years/ jaar
02 16 years/ jaar
03 17 years/ jaar
04 18 years/ jaar
05 19 years/ jaar
06 Older than 19 years/ Ouer as 19 jaar
9 Don’t Know/ Weet nie
7. What grade are you in? (Choose one)
In watter graad is jy?
1 Grade 10/Graad 10
2 Grade 11/ Graad11
3 Grade 12/ Graad 12
9 Don’t Know/ Weet nie
8. How would you identify yourself? (Choose one)
Hoe identifiseer jy jouself?
1 Black/ Swart
2 Coloured/ Kleurling
3 Indian/ Indiaan
4 White/ Wit
5 Other/ Andere
9 Don’t Know/ Weet nie
9. Do you live with your biological mother? (Choose one)
Lewe jy met jou biologiese (eie) ma?
1 Yes/ Ja
2 No/ Nee
9 Don’t Know/ Weet nie
10. Do you live with your biological father? (Choose one)
Lewe jy met jou biologiese (eie) pa?
1 Yes/ Ja
2 No/ Nee
9 Don’t Know/ Weet nie

148
11. Are your parents… (Choose one)
Is jou ouers..
1 Married/ Getrou
2 Divorced/ Geskei
3 Never Married/ Nooit getroud nie
4 Separated/ Bly nie saam nie
9 Don’t Know/ Weet nie
12. Which of the following describes your home best? (Choose one)
Wat van die volgende beskyf jou huis die beste?
1 Shack/ Pandokkie
2 Wendy house or backyard dwelling/ Wendy huis of agteplaas
woning
3 Tent or traditional dwelling/ Tent of traditionele woning
4 Brick house or flat/ Bakseen huis of woonstel
5 Other/ Andere
9 Don’t Know/ Weet nie
13. Which of these items do you have in your home? (Mark as many as necessary)
Wat van die volgende ietems het jy in jou huis? (merk soveel as toepaslik)
__ Television/ Televisie
__ Electricity/ Eletrieseteit
__ Tap Water/ Kraan water
__ Motorcar/ Motorkar
__ Telephone/ Telefoon
__ Bicycle/ Fiets
__ Don’t Know/ Weet nie
__ None
14. Which ONE of the following best describes how things are in your home?
Water EEN van die volgende beskryf die beste hoe dinge is in jou huis?
1 We don’t have enough money for food.
Ons het nie genoeg geld vir kos nie
2 We have enough money for food, but not for other basic items
such as clothes. Ons het genoeg geld vir kos, maar nie vir basiese ietems soos klere
nie
3 We have enough money for food and clothes but are short of
many other things. Ons het genoeg geld vir kos en klere, maar kort baie ander dinge
4 We have the most important things, but few luxury goods. Ons het die belangrikste dinge, maar min lekkernye
5 We have money for luxury goods and extra things.
Ons het geld vir lekkernye en nog ander dinge

149
15. How are you and your father related? (Choose one)
Wat is die verhouding tussen jou en jou vader? (Kies een)
1 Biological / Biologiese
2 Adopted / Aangeneem
3 Stepdad/ Steefpa
4 Older Brother / Ouer broer
5 Uncle / Oom
6 Other / Ander
9 Don’t Know / Weet nie

150
Appendix E: Father-Son Quality Contact Time Scale
Now we are going to ask you a few questions about your father (the person who fills the
role of a father in your life). Remember all questions are answered anonymously. Do
not be afraid to answer honestly. Circle the number that best describes your answer.
Nou gaan ons ‘n paar vrae oor jou vader (die persoon wat die rol van ʼn vader in jou lewe is)
vra. Onthou dat all vra woord met die konfidentialiteit beantwoord. Moet nie bang wees nie
om eerlik te wees. Maak ‘n kring rond die nommer wat jou aantwoord die beste beskryf.
16. How often do you see your father? (Choose one)
Hoe gereeld sien jy jou vader? (Kies een)
1 Every day / Elke dag
2 A few days a week / ʼn Paar dae ʼn week
3 Once a week / Eenkeer ʼn week
4 Once a month / Eenkeer ʼn maand
5 Every few months / Elke paar maande
6 Once a year / Eenkeer ʼn jaar
7 Less than once a year / Minder as eenkeer ʼn jaar
9 Don’t Know / Weet nie
17. I can call my father at any time of the day if I need to speak to him. (Choose
one) Ek kan my vader eenige tyd van die dag bel as ek met hom moet praat. (Kies een)
1 Never or almost never / Nooit of amper nooit
2 Sometimes / Somtyds
3 Often / Dikwels
4 All the time / Altyd
9 Don’t know / Weet nie
18. I enjoy spending time with my father (Choose one)
Ek geniet dit met my vader tyd te spandeer. (Kies een)
1 Never or almost never / Nooit of amper nooit
2 Sometimes / Somtyds
3 Often / Dikwels
4 All the time / Altyd
9 Don’t know / Weet nie
19. I wish my father and I spent more time together. (Choose one)
Ek wens dat my vader en ek meer tyd saam kan spandeer. (Kies een)
1 Never or almost never / Nooit of amper nooit
2 Sometimes / Somtyds
3 Often / Dikwels
4 All the time / Altyd
9 Don’t know / Weet nie
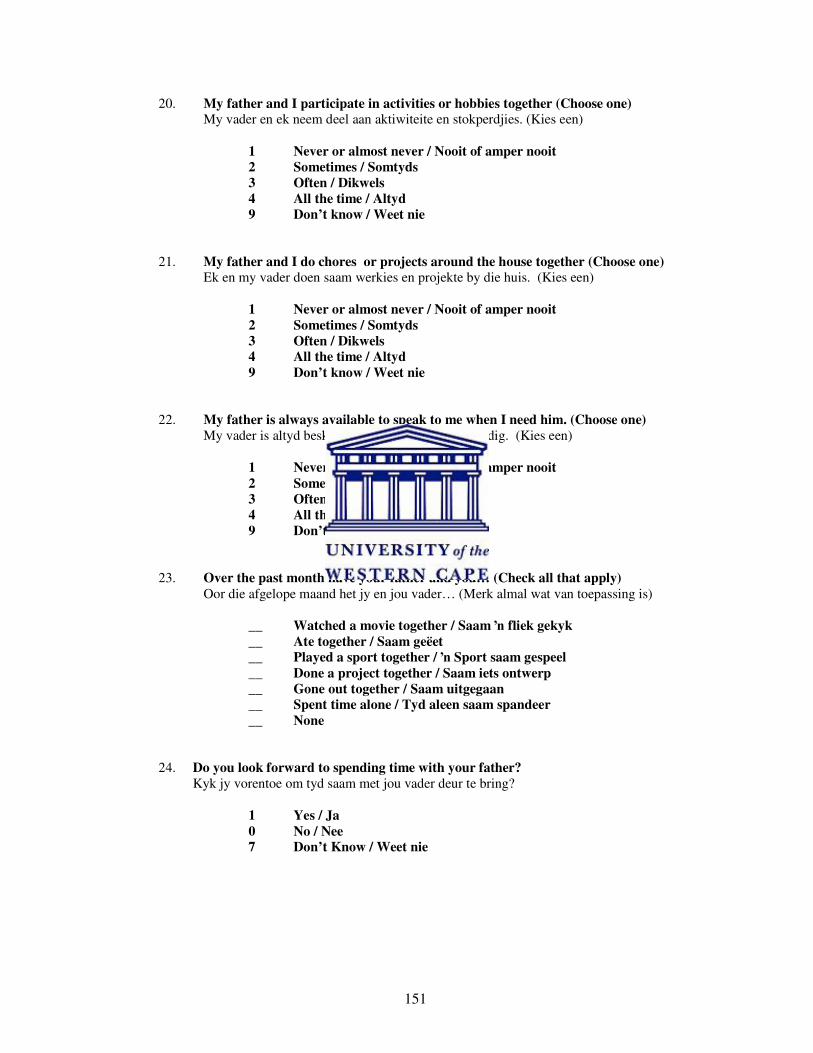
151
20. My father and I participate in activities or hobbies together (Choose one)
My vader en ek neem deel aan aktiwiteite en stokperdjies. (Kies een)
1 Never or almost never / Nooit of amper nooit
2 Sometimes / Somtyds
3 Often / Dikwels
4 All the time / Altyd
9 Don’t know / Weet nie
21. My father and I do chores or projects around the house together (Choose one)
Ek en my vader doen saam werkies en projekte by die huis. (Kies een)
1 Never or almost never / Nooit of amper nooit
2 Sometimes / Somtyds
3 Often / Dikwels
4 All the time / Altyd
9 Don’t know / Weet nie
22. My father is always available to speak to me when I need him. (Choose one)
My vader is altyd beskikbaar wanneer ek hom benodig. (Kies een)
1 Never or almost never / Nooit of amper nooit
2 Sometimes / Somtyds
3 Often / Dikwels
4 All the time / Altyd
9 Don’t know / Weet nie
23. Over the past month have your father and you… (Check all that apply)
Oor die afgelope maand het jy en jou vader… (Merk almal wat van toepassing is)
__ Watched a movie together / Saam ʼn fliek gekyk
__ Ate together / Saam geëet
__ Played a sport together / ʼn Sport saam gespeel
__ Done a project together / Saam iets ontwerp
__ Gone out together / Saam uitgegaan
__ Spent time alone / Tyd aleen saam spandeer
__ None
24. Do you look forward to spending time with your father?
Kyk jy vorentoe om tyd saam met jou vader deur te bring?
1 Yes / Ja
0 No / Nee
7 Don’t Know / Weet nie
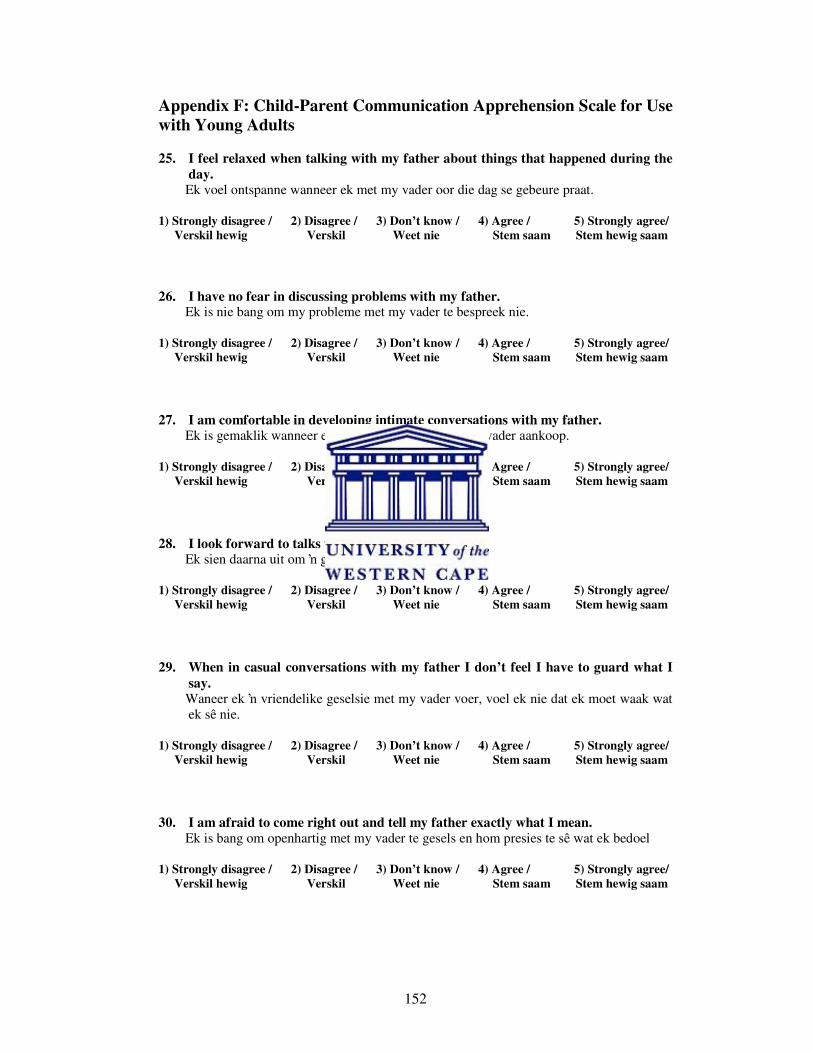
152
Appendix F: Child-Parent Communication Apprehension Scale for Use
with Young Adults
25. I feel relaxed when talking with my father about things that happened during the
day. Ek voel ontspanne wanneer ek met my vader oor die dag se gebeure praat.
1) Strongly disagree / 2) Disagree / 3) Don’t know / 4) Agree / 5) Strongly agree/
Verskil hewig Verskil Weet nie Stem saam Stem hewig saam
26. I have no fear in discussing problems with my father. Ek is nie bang om my probleme met my vader te bespreek nie.
1) Strongly disagree / 2) Disagree / 3) Don’t know / 4) Agree / 5) Strongly agree/
Verskil hewig Verskil Weet nie Stem saam Stem hewig saam
27. I am comfortable in developing intimate conversations with my father. Ek is gemaklik wanneer ek ʼn intieme gesprek met my vader aankoop.
1) Strongly disagree / 2) Disagree / 3) Don’t know / 4) Agree / 5) Strongly agree/
Verskil hewig Verskil Weet nie Stem saam Stem hewig saam
28. I look forward to talks with my father. Ek sien daarna uit om ʼn gesprek met my vader te hê.
1) Strongly disagree / 2) Disagree / 3) Don’t know / 4) Agree / 5) Strongly agree/
Verskil hewig Verskil Weet nie Stem saam Stem hewig saam
29. When in casual conversations with my father I don’t feel I have to guard what I
say. Waneer ek ʼn vriendelike geselsie met my vader voer, voel ek nie dat ek moet waak wat
ek sê nie.
1) Strongly disagree / 2) Disagree / 3) Don’t know / 4) Agree / 5) Strongly agree/
Verskil hewig Verskil Weet nie Stem saam Stem hewig saam
30. I am afraid to come right out and tell my father exactly what I mean.
Ek is bang om openhartig met my vader te gesels en hom presies te sê wat ek bedoel
1) Strongly disagree / 2) Disagree / 3) Don’t know / 4) Agree / 5) Strongly agree/
Verskil hewig Verskil Weet nie Stem saam Stem hewig saam
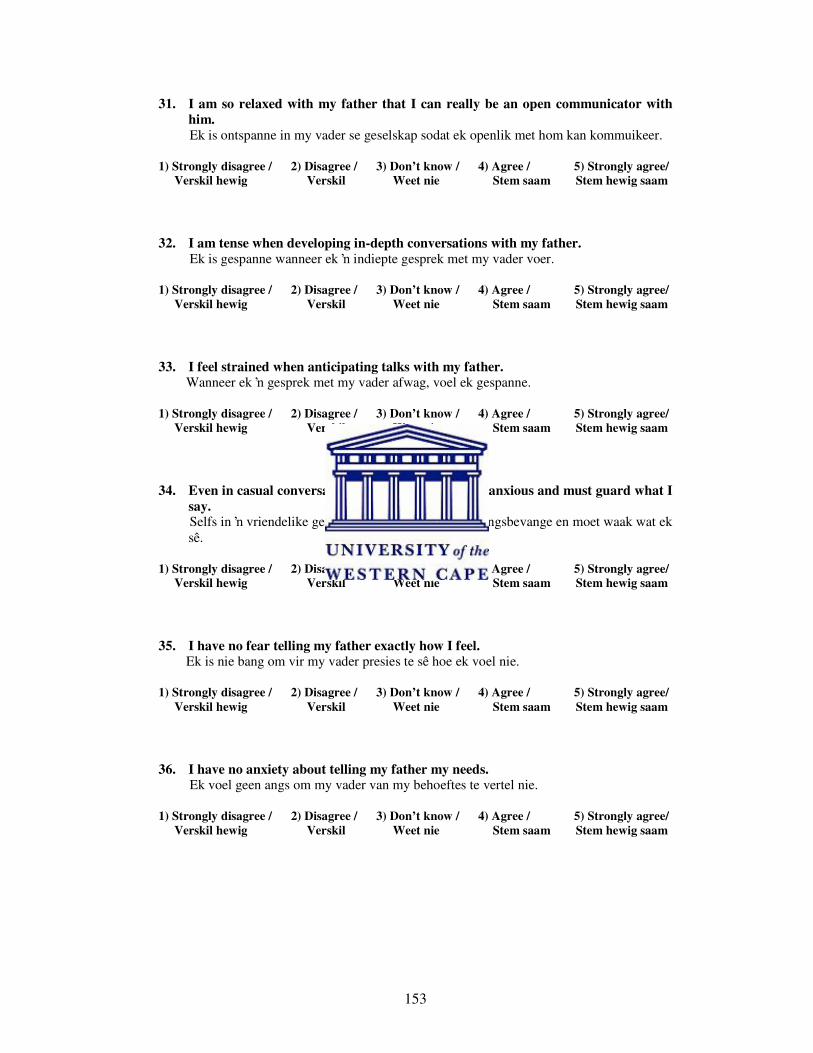
153
31. I am so relaxed with my father that I can really be an open communicator with
him.
Ek is ontspanne in my vader se geselskap sodat ek openlik met hom kan kommuikeer.
1) Strongly disagree / 2) Disagree / 3) Don’t know / 4) Agree / 5) Strongly agree/
Verskil hewig Verskil Weet nie Stem saam Stem hewig saam
32. I am tense when developing in-depth conversations with my father.
Ek is gespanne wanneer ek ʼn indiepte gesprek met my vader voer.
1) Strongly disagree / 2) Disagree / 3) Don’t know / 4) Agree / 5) Strongly agree/
Verskil hewig Verskil Weet nie Stem saam Stem hewig saam
33. I feel strained when anticipating talks with my father. Wanneer ek ʼn gesprek met my vader afwag, voel ek gespanne.
1) Strongly disagree / 2) Disagree / 3) Don’t know / 4) Agree / 5) Strongly agree/
Verskil hewig Verskil Weet nie Stem saam Stem hewig saam
34. Even in casual conversations with my father, I feel anxious and must guard what I
say. Selfs in ʼn vriendelike geselsie met my vader voel ek angsbevange en moet waak wat ek
sê.
1) Strongly disagree / 2) Disagree / 3) Don’t know / 4) Agree / 5) Strongly agree/
Verskil hewig Verskil Weet nie Stem saam Stem hewig saam
35. I have no fear telling my father exactly how I feel. Ek is nie bang om vir my vader presies te sê hoe ek voel nie.
1) Strongly disagree / 2) Disagree / 3) Don’t know / 4) Agree / 5) Strongly agree/
Verskil hewig Verskil Weet nie Stem saam Stem hewig saam
36. I have no anxiety about telling my father my needs. Ek voel geen angs om my vader van my behoeftes te vertel nie.
1) Strongly disagree / 2) Disagree / 3) Don’t know / 4) Agree / 5) Strongly agree/
Verskil hewig Verskil Weet nie Stem saam Stem hewig saam

154
Appendix G: Revised CRPBI Acceptance Subscale
My father is a person who . . . My vader is iemand wat…
37. makes me feel better after talking over my worries with her/him. my beter laat voel nadat ek my kwellings met hom megedeel het.
(1) Not like him / (2) Somewhat like him / (3) A lot like him /
Nie soos hy nie ʼn Bietjie soos hy Baie soos hy
38. smiles at me very often. gereeld vir my glimlag
(1) Not like him / (2) Somewhat like him / (3) A lot like him /
Nie soos hy nie ʼn Bietjie soos hy Baie soos hy
39. is able to make me feel better when I am upset.
my beter laat voel wanneere ek onsteld is.
(1) Not like him / (2) Somewhat like him / (3) A lot like him /
Nie soos hy nie ʼn Bietjie soos hy Baie soos hy
40. enjoys doing things with me.
dit geniet om dinge met my te doen
(1) Not like him / (2) Somewhat like him / (3) A lot like him /
Nie soos hy nie ʼn Bietjie soos hy Baie soos hy
41. cheers me up when I am sad. my bemoedig wanneer ek treurig voel
(1) Not like him / (2) Somewhat like him / (3) A lot like him /
Nie soos hy nie ʼn Bietjie soos hy Baie soos hy
42. gives me a lot of care and attention. vir my baie sorg en aandag gee
(1) Not like him / (2) Somewhat like him / (3) A lot like him /
Nie soos hy nie ʼn Bietjie soos hy Baie soos hy
43. makes me feel like the most important person in her/his life. my laat voel dat ek die belangrikste persoon in sy lewe is.
(1) Not like him / (2) Somewhat like him / (3) A lot like him /
Nie soos hy nie ʼn Bietjie soos hy Baie soos hy

155
My father is a person who . . .
My vader is iemand wat…
44. believes in showing his love for me.
glo daaraan om vir my sy liefde te toon
(1) Not like him / (2) Somewhat like him / (3) A lot like him /
Nie soos hy nie ʼn Bietjie soos hy Baie soos hy
45. often praises me. dikwels vir my prys.
(1) Not like him / (2) Somewhat like him / (3) A lot like him /
Nie soos hy nie ʼn Bietjie soos hy Baie soos hy
46. is easy to talk to ek maklik mee kan gesels.
(1) Not like him / (2) Somewhat like him / (3) A lot like him /
Nie soos hy nie ʼn Bietjie soos hy Baie soos hy
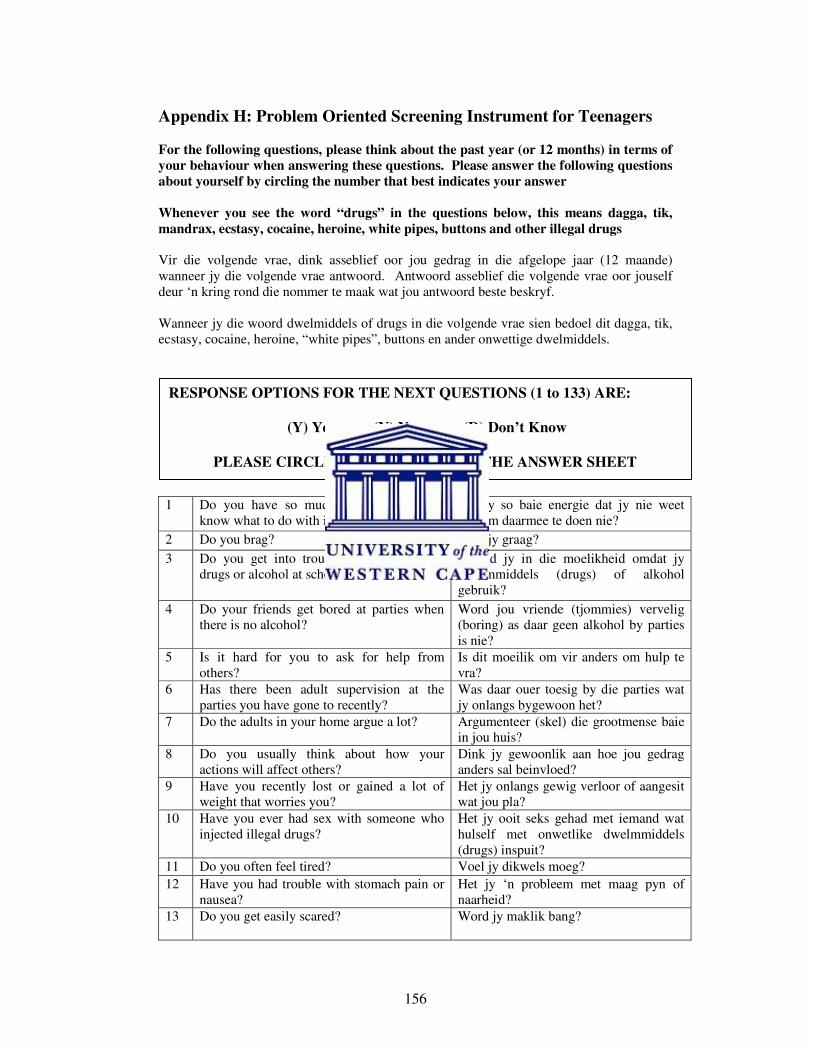
156
Appendix H: Problem Oriented Screening Instrument for Teenagers
For the following questions, please think about the past year (or 12 months) in terms of
your behaviour when answering these questions. Please answer the following questions
about yourself by circling the number that best indicates your answer
Whenever you see the word “drugs” in the questions below, this means dagga, tik,
mandrax, ecstasy, cocaine, heroine, white pipes, buttons and other illegal drugs
Vir die volgende vrae, dink asseblief oor jou gedrag in die afgelope jaar (12 maande)
wanneer jy die volgende vrae antwoord. Antwoord asseblief die volgende vrae oor jouself
deur ‘n kring rond die nommer te maak wat jou antwoord beste beskryf.
Wanneer jy die woord dwelmiddels of drugs in die volgende vrae sien bedoel dit dagga, tik,
ecstasy, cocaine, heroine, “white pipes”, buttons en ander onwettige dwelmiddels.
1 Do you have so much energy you don’t
know what to do with it?
Het jy so baie energie dat jy nie weet
wat om daarmee te doen nie?
2 Do you brag? Brag jy graag?
3 Do you get into trouble because you use
drugs or alcohol at school?
Beland jy in die moelikheid omdat jy
dwelmmiddels (drugs) of alkohol
gebruik?
4 Do your friends get bored at parties when
there is no alcohol?
Word jou vriende (tjommies) vervelig
(boring) as daar geen alkohol by parties
is nie?
5 Is it hard for you to ask for help from
others?
Is dit moeilik om vir anders om hulp te
vra?
6 Has there been adult supervision at the
parties you have gone to recently?
Was daar ouer toesig by die parties wat
jy onlangs bygewoon het?
7 Do the adults in your home argue a lot? Argumenteer (skel) die grootmense baie
in jou huis?
8 Do you usually think about how your
actions will affect others?
Dink jy gewoonlik aan hoe jou gedrag
anders sal beinvloed?
9 Have you recently lost or gained a lot of
weight that worries you?
Het jy onlangs gewig verloor of aangesit
wat jou pla?
10 Have you ever had sex with someone who
injected illegal drugs?
Het jy ooit seks gehad met iemand wat
hulself met onwetlike dwelmmiddels
(drugs) inspuit?
11 Do you often feel tired? Voel jy dikwels moeg?
12 Have you had trouble with stomach pain or
nausea?
Het jy ‘n probleem met maag pyn of
naarheid?
13 Do you get easily scared? Word jy maklik bang?
RESPONSE OPTIONS FOR THE NEXT QUESTIONS (1 to 133) ARE:
(Y) Yes (N) No (D) Don’t Know
PLEASE CIRCLE YOUR ANSWER ON THE ANSWER SHEET
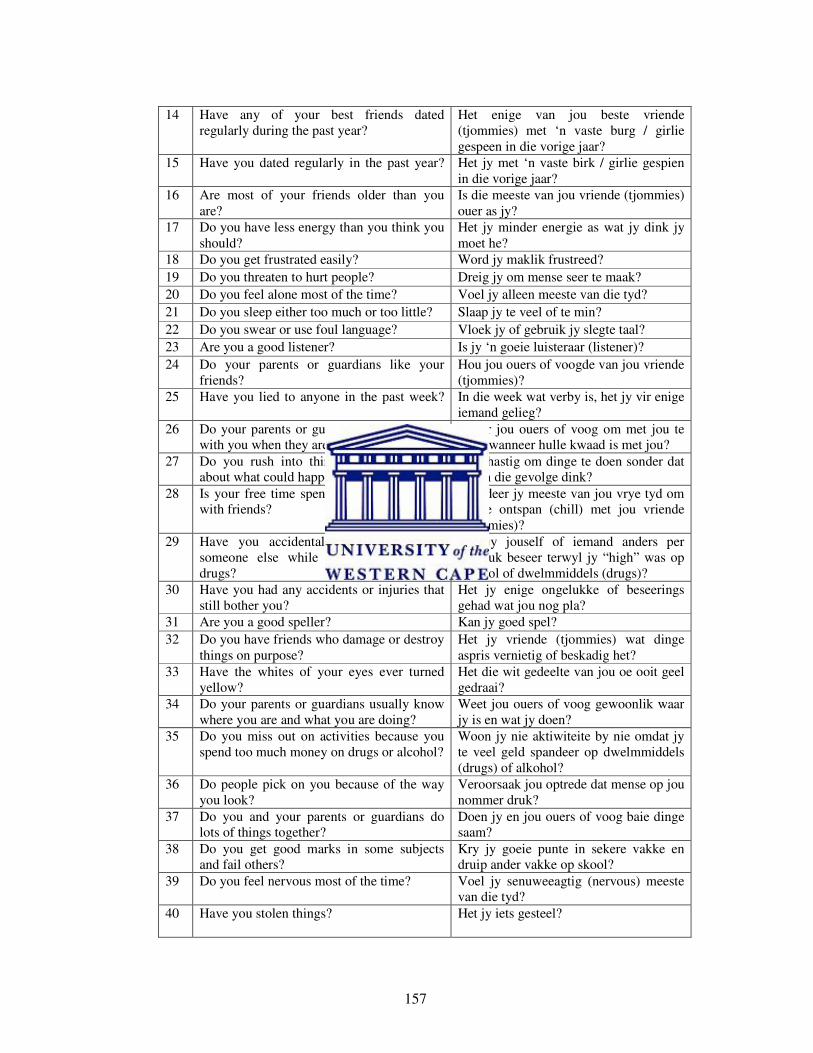
157
14 Have any of your best friends dated
regularly during the past year?
Het enige van jou beste vriende
(tjommies) met ‘n vaste burg / girlie
gespeen in die vorige jaar?
15 Have you dated regularly in the past year?
Het jy met ‘n vaste birk / girlie gespien
in die vorige jaar?
16 Are most of your friends older than you
are?
Is die meeste van jou vriende (tjommies)
ouer as jy?
17 Do you have less energy than you think you
should?
Het jy minder energie as wat jy dink jy
moet he?
18 Do you get frustrated easily? Word jy maklik frustreed?
19 Do you threaten to hurt people? Dreig jy om mense seer te maak?
20 Do you feel alone most of the time? Voel jy alleen meeste van die tyd?
21 Do you sleep either too much or too little? Slaap jy te veel of te min?
22 Do you swear or use foul language? Vloek jy of gebruik jy slegte taal?
23 Are you a good listener? Is jy ‘n goeie luisteraar (listener)?
24 Do your parents or guardians like your
friends?
Hou jou ouers of voogde van jou vriende
(tjommies)?
25 Have you lied to anyone in the past week?
In die week wat verby is, het jy vir enige
iemand gelieg?
26 Do your parents or guardians refuse to talk
with you when they are angry with you?
Weier jou ouers of voog om met jou te
praat wanneer hulle kwaad is met jou?
27 Do you rush into things without thinking
about what could happen?
Is jy hastig om dinge te doen sonder dat
jy aan die gevolge dink?
28 Is your free time spent mainly hanging out
with friends?
Spandeer jy meeste van jou vrye tyd om
net te ontspan (chill) met jou vriende
(tjommies)?
29 Have you accidentally hurt yourself or
someone else while high on alcohol or
drugs?
Het jy jouself of iemand anders per
ongeluk beseer terwyl jy “high” was op
alkohol of dwelmmiddels (drugs)?
30 Have you had any accidents or injuries that
still bother you?
Het jy enige ongelukke of beseerings
gehad wat jou nog pla?
31 Are you a good speller? Kan jy goed spel?
32 Do you have friends who damage or destroy
things on purpose?
Het jy vriende (tjommies) wat dinge
aspris vernietig of beskadig het?
33 Have the whites of your eyes ever turned
yellow?
Het die wit gedeelte van jou oe ooit geel
gedraai?
34 Do your parents or guardians usually know
where you are and what you are doing?
Weet jou ouers of voog gewoonlik waar
jy is en wat jy doen?
35 Do you miss out on activities because you
spend too much money on drugs or alcohol?
Woon jy nie aktiwiteite by nie omdat jy
te veel geld spandeer op dwelmmiddels
(drugs) of alkohol?
36 Do people pick on you because of the way
you look?
Veroorsaak jou optrede dat mense op jou
nommer druk?
37 Do you and your parents or guardians do
lots of things together?
Doen jy en jou ouers of voog baie dinge
saam?
38 Do you get good marks in some subjects
and fail others?
Kry jy goeie punte in sekere vakke en
druip ander vakke op skool?
39 Do you feel nervous most of the time? Voel jy senuweeagtig (nervous) meeste
van die tyd?
40 Have you stolen things? Het jy iets gesteel?
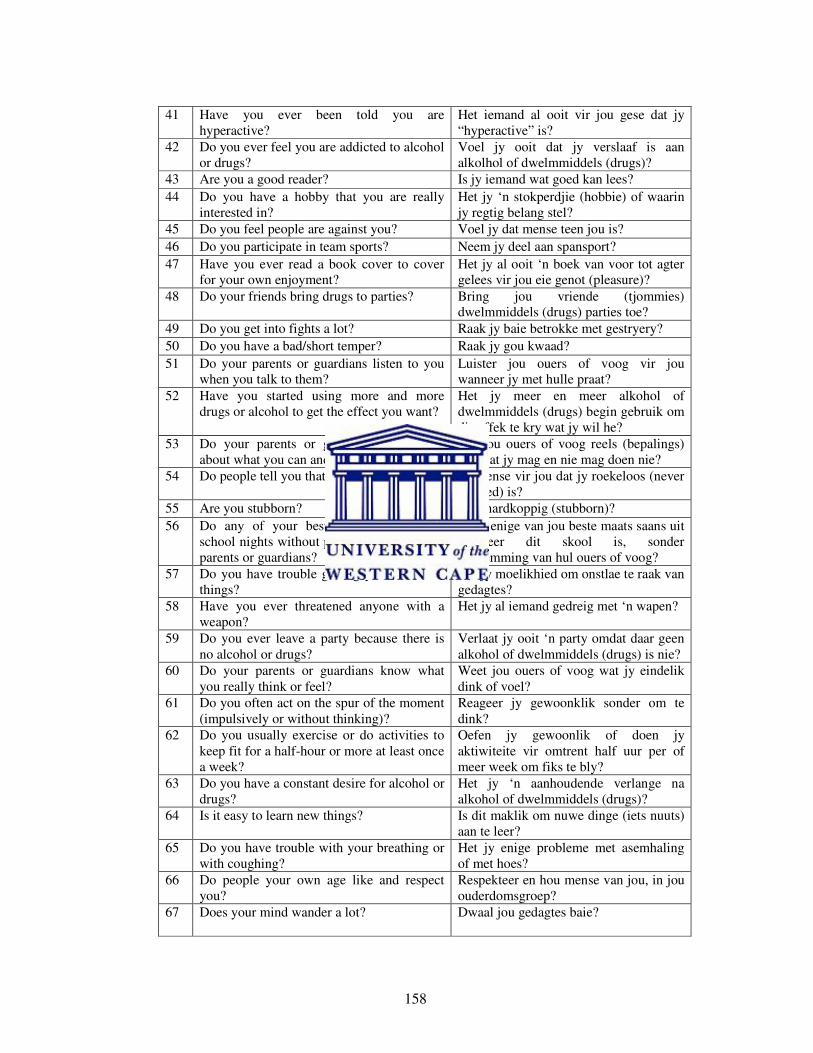
158
41 Have you ever been told you are
hyperactive?
Het iemand al ooit vir jou gese dat jy
“hyperactive” is?
42 Do you ever feel you are addicted to alcohol
or drugs?
Voel jy ooit dat jy verslaaf is aan
alkolhol of dwelmmiddels (drugs)?
43 Are you a good reader? Is jy iemand wat goed kan lees?
44 Do you have a hobby that you are really
interested in?
Het jy ‘n stokperdjie (hobbie) of waarin
jy regtig belang stel?
45 Do you feel people are against you? Voel jy dat mense teen jou is?
46 Do you participate in team sports? Neem jy deel aan spansport?
47 Have you ever read a book cover to cover
for your own enjoyment?
Het jy al ooit ‘n boek van voor tot agter
gelees vir jou eie genot (pleasure)?
48 Do your friends bring drugs to parties? Bring jou vriende (tjommies)
dwelmmiddels (drugs) parties toe?
49 Do you get into fights a lot? Raak jy baie betrokke met gestryery?
50 Do you have a bad/short temper? Raak jy gou kwaad?
51 Do your parents or guardians listen to you
when you talk to them?
Luister jou ouers of voog vir jou
wanneer jy met hulle praat?
52 Have you started using more and more
drugs or alcohol to get the effect you want?
Het jy meer en meer alkohol of
dwelmmiddels (drugs) begin gebruik om
die effek te kry wat jy wil he?
53 Do your parents or guardians have rules
about what you can and can’t do?
Het jou ouers of voog reels (bepalings)
oor wat jy mag en nie mag doen nie?
54 Do people tell you that you are careless? Se mense vir jou dat jy roekeloos (never
minded) is?
55 Are you stubborn? Is jy hardkoppig (stubborn)?
56 Do any of your best friends go out on
school nights without permission from their
parents or guardians?
Gaan enige van jou beste maats saans uit
wanneer dit skool is, sonder
toestemming van hul ouers of voog?
57 Do you have trouble getting your mind off
things?
Het jy moelikhied om onstlae te raak van
gedagtes?
58 Have you ever threatened anyone with a
weapon?
Het jy al iemand gedreig met ‘n wapen?
59 Do you ever leave a party because there is
no alcohol or drugs?
Verlaat jy ooit ‘n party omdat daar geen
alkohol of dwelmmiddels (drugs) is nie?
60 Do your parents or guardians know what
you really think or feel?
Weet jou ouers of voog wat jy eindelik
dink of voel?
61 Do you often act on the spur of the moment
(impulsively or without thinking)?
Reageer jy gewoonklik sonder om te
dink?
62 Do you usually exercise or do activities to
keep fit for a half-hour or more at least once
a week?
Oefen jy gewoonlik of doen jy
aktiwiteite vir omtrent half uur per of
meer week om fiks te bly?
63 Do you have a constant desire for alcohol or
drugs?
Het jy ‘n aanhoudende verlange na
alkohol of dwelmmiddels (drugs)?
64 Is it easy to learn new things? Is dit maklik om nuwe dinge (iets nuuts)
aan te leer?
65 Do you have trouble with your breathing or
with coughing?
Het jy enige probleme met asemhaling
of met hoes?
66 Do people your own age like and respect
you?
Respekteer en hou mense van jou, in jou
ouderdomsgroep?
67 Does your mind wander a lot?
Dwaal jou gedagtes baie?
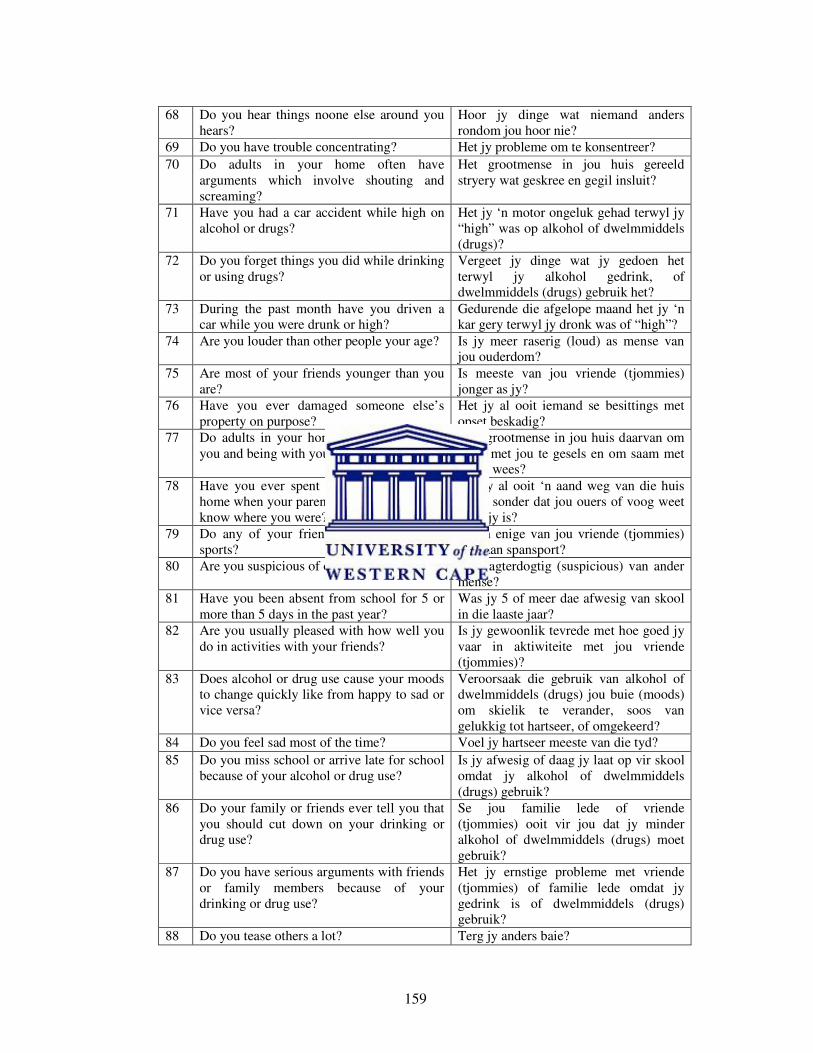
159
68 Do you hear things noone else around you
hears?
Hoor jy dinge wat niemand anders
rondom jou hoor nie?
69 Do you have trouble concentrating? Het jy probleme om te konsentreer?
70 Do adults in your home often have
arguments which involve shouting and
screaming?
Het grootmense in jou huis gereeld
stryery wat geskree en gegil insluit?
71 Have you had a car accident while high on
alcohol or drugs?
Het jy ‘n motor ongeluk gehad terwyl jy
“high” was op alkohol of dwelmmiddels
(drugs)?
72 Do you forget things you did while drinking
or using drugs?
Vergeet jy dinge wat jy gedoen het
terwyl jy alkohol gedrink, of
dwelmmiddels (drugs) gebruik het?
73 During the past month have you driven a
car while you were drunk or high?
Gedurende die afgelope maand het jy ‘n
kar gery terwyl jy dronk was of “high”?
74 Are you louder than other people your age? Is jy meer raserig (loud) as mense van
jou ouderdom?
75 Are most of your friends younger than you
are?
Is meeste van jou vriende (tjommies)
jonger as jy?
76 Have you ever damaged someone else’s
property on purpose?
Het jy al ooit iemand se besittings met
opset beskadig?
77 Do adults in your home like chatting with
you and being with you?
Hou grootmense in jou huis daarvan om
saam met jou te gesels en om saam met
jou te wees?
78 Have you ever spent the night away from
home when your parents or guardians didn’t
know where you were?
Het jy al ooit ‘n aand weg van die huis
gebly sonder dat jou ouers of voog weet
waar jy is?
79 Do any of your friends take part in team
sports?
Neem enige van jou vriende (tjommies)
deel aan spansport?
80 Are you suspicious of other people? Is jy agterdogtig (suspicious) van ander
mense?
81 Have you been absent from school for 5 or
more than 5 days in the past year?
Was jy 5 of meer dae afwesig van skool
in die laaste jaar?
82 Are you usually pleased with how well you
do in activities with your friends?
Is jy gewoonlik tevrede met hoe goed jy
vaar in aktiwiteite met jou vriende
(tjommies)?
83 Does alcohol or drug use cause your moods
to change quickly like from happy to sad or
vice versa?
Veroorsaak die gebruik van alkohol of
dwelmmiddels (drugs) jou buie (moods)
om skielik te verander, soos van
gelukkig tot hartseer, of omgekeerd?
84 Do you feel sad most of the time? Voel jy hartseer meeste van die tyd?
85 Do you miss school or arrive late for school
because of your alcohol or drug use?
Is jy afwesig of daag jy laat op vir skool
omdat jy alkohol of dwelmmiddels
(drugs) gebruik?
86 Do your family or friends ever tell you that
you should cut down on your drinking or
drug use?
Se jou familie lede of vriende
(tjommies) ooit vir jou dat jy minder
alkohol of dwelmmiddels (drugs) moet
gebruik?
87 Do you have serious arguments with friends
or family members because of your
drinking or drug use?
Het jy ernstige probleme met vriende
(tjommies) of familie lede omdat jy
gedrink is of dwelmmiddels (drugs)
gebruik?
88 Do you tease others a lot? Terg jy anders baie?
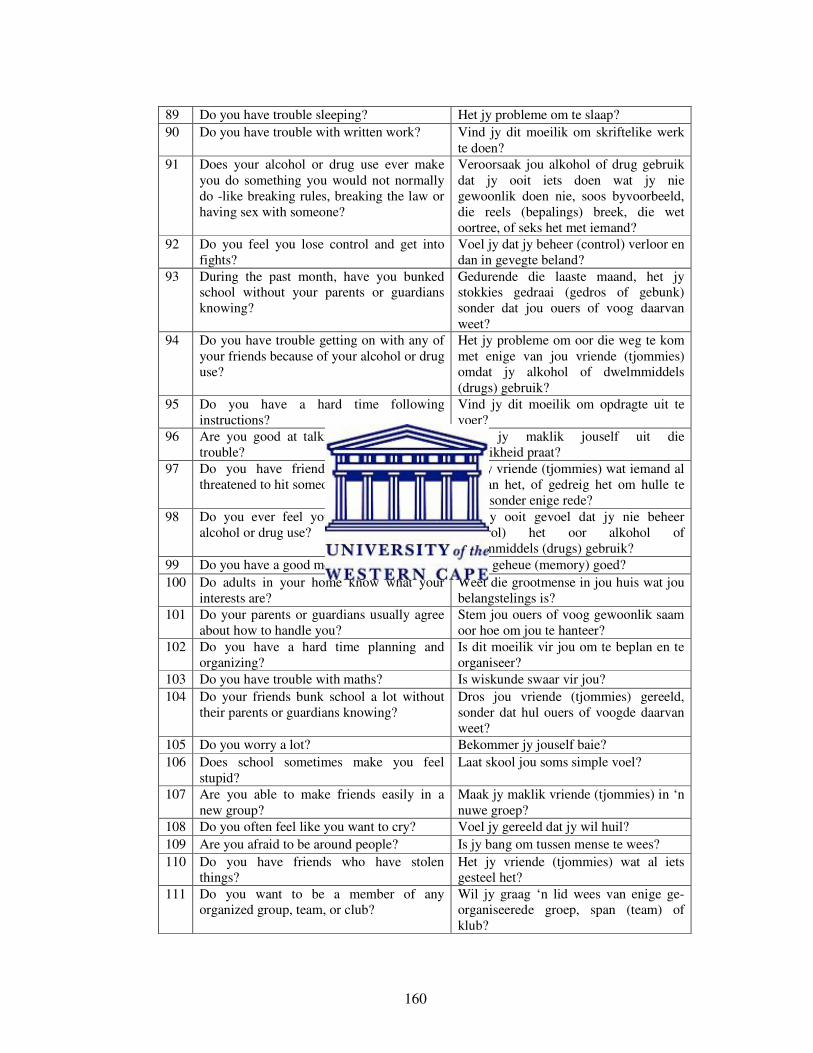
160
89 Do you have trouble sleeping? Het jy probleme om te slaap?
90 Do you have trouble with written work? Vind jy dit moeilik om skriftelike werk
te doen?
91 Does your alcohol or drug use ever make
you do something you would not normally
do -like breaking rules, breaking the law or
having sex with someone?
Veroorsaak jou alkohol of drug gebruik
dat jy ooit iets doen wat jy nie
gewoonlik doen nie, soos byvoorbeeld,
die reels (bepalings) breek, die wet
oortree, of seks het met iemand?
92 Do you feel you lose control and get into
fights?
Voel jy dat jy beheer (control) verloor en
dan in gevegte beland?
93 During the past month, have you bunked
school without your parents or guardians
knowing?
Gedurende die laaste maand, het jy
stokkies gedraai (gedros of gebunk)
sonder dat jou ouers of voog daarvan
weet?
94 Do you have trouble getting on with any of
your friends because of your alcohol or drug
use?
Het jy probleme om oor die weg te kom
met enige van jou vriende (tjommies)
omdat jy alkohol of dwelmmiddels
(drugs) gebruik?
95 Do you have a hard time following
instructions?
Vind jy dit moeilik om opdragte uit te
voer?
96 Are you good at talking your way out of
trouble?
Kan jy maklik jouself uit die
moeilikheid praat?
97 Do you have friends who have hit or
threatened to hit someone for nothing?
Het jy vriende (tjommies) wat iemand al
geslaan het, of gedreig het om hulle te
slaan sonder enige rede?
98 Do you ever feel you can’t control your
alcohol or drug use?
Het jy ooit gevoel dat jy nie beheer
(control) het oor alkohol of
dwelmmiddels (drugs) gebruik?
99 Do you have a good memory? Is jou geheue (memory) goed?
100 Do adults in your home know what your
interests are?
Weet die grootmense in jou huis wat jou
belangstelings is?
101 Do your parents or guardians usually agree
about how to handle you?
Stem jou ouers of voog gewoonlik saam
oor hoe om jou te hanteer?
102 Do you have a hard time planning and
organizing?
Is dit moeilik vir jou om te beplan en te
organiseer?
103 Do you have trouble with maths? Is wiskunde swaar vir jou?
104 Do your friends bunk school a lot without
their parents or guardians knowing?
Dros jou vriende (tjommies) gereeld,
sonder dat hul ouers of voogde daarvan
weet?
105 Do you worry a lot? Bekommer jy jouself baie?
106 Does school sometimes make you feel
stupid?
Laat skool jou soms simple voel?
107 Are you able to make friends easily in a
new group?
Maak jy maklik vriende (tjommies) in ‘n
nuwe groep?
108 Do you often feel like you want to cry? Voel jy gereeld dat jy wil huil?
109 Are you afraid to be around people? Is jy bang om tussen mense te wees?
110 Do you have friends who have stolen
things?
Het jy vriende (tjommies) wat al iets
gesteel het?
111 Do you want to be a member of any
organized group, team, or club?
Wil jy graag ‘n lid wees van enige ge-
organiseerede groep, span (team) of
klub?
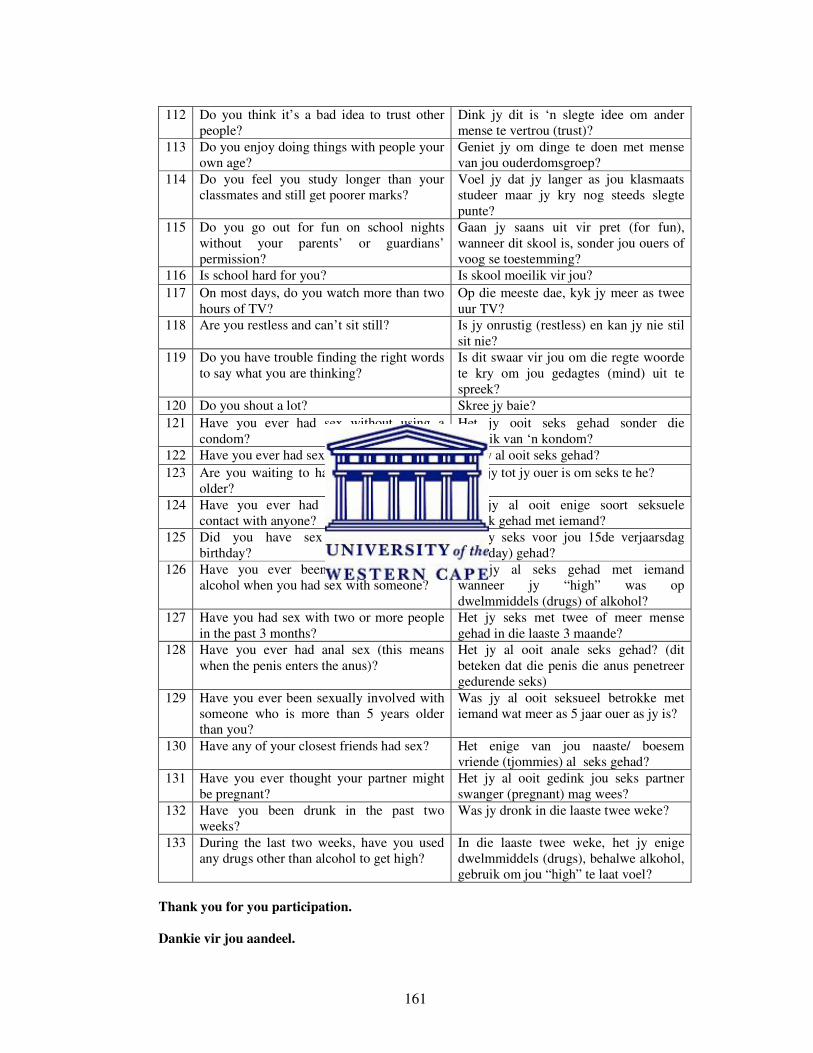
161
112 Do you think it’s a bad idea to trust other
people?
Dink jy dit is ‘n slegte idee om ander
mense te vertrou (trust)?
113 Do you enjoy doing things with people your
own age?
Geniet jy om dinge te doen met mense
van jou ouderdomsgroep?
114 Do you feel you study longer than your
classmates and still get poorer marks?
Voel jy dat jy langer as jou klasmaats
studeer maar jy kry nog steeds slegte
punte?
115 Do you go out for fun on school nights
without your parents’ or guardians’
permission?
Gaan jy saans uit vir pret (for fun),
wanneer dit skool is, sonder jou ouers of
voog se toestemming?
116 Is school hard for you? Is skool moeilik vir jou?
117 On most days, do you watch more than two
hours of TV?
Op die meeste dae, kyk jy meer as twee
uur TV?
118 Are you restless and can’t sit still? Is jy onrustig (restless) en kan jy nie stil
sit nie?
119 Do you have trouble finding the right words
to say what you are thinking?
Is dit swaar vir jou om die regte woorde
te kry om jou gedagtes (mind) uit te
spreek?
120 Do you shout a lot? Skree jy baie?
121 Have you ever had sex without using a
condom?
Het jy ooit seks gehad sonder die
gebruik van ‘n kondom?
122 Have you ever had sex? Het jy al ooit seks gehad?
123 Are you waiting to have sex until you are
older?
Wag jy tot jy ouer is om seks te he?
124 Have you ever had any kind of sexual
contact with anyone?
Het jy al ooit enige soort seksuele
kontak gehad met iemand?
125 Did you have sex before your 15th
birthday?
Het jy seks voor jou 15de verjaarsdag
(birthday) gehad?
126 Have you ever been high on drugs or
alcohol when you had sex with someone?
Het jy al seks gehad met iemand
wanneer jy “high” was op
dwelmmiddels (drugs) of alkohol?
127 Have you had sex with two or more people
in the past 3 months?
Het jy seks met twee of meer mense
gehad in die laaste 3 maande?
128 Have you ever had anal sex (this means
when the penis enters the anus)?
Het jy al ooit anale seks gehad? (dit
beteken dat die penis die anus penetreer
gedurende seks)
129 Have you ever been sexually involved with
someone who is more than 5 years older
than you?
Was jy al ooit seksueel betrokke met
iemand wat meer as 5 jaar ouer as jy is?
130 Have any of your closest friends had sex? Het enige van jou naaste/ boesem
vriende (tjommies) al seks gehad?
131 Have you ever thought your partner might
be pregnant?
Het jy al ooit gedink jou seks partner
swanger (pregnant) mag wees?
132 Have you been drunk in the past two
weeks?
Was jy dronk in die laaste twee weke?
133 During the last two weeks, have you used
any drugs other than alcohol to get high?
In die laaste twee weke, het jy enige
dwelmmiddels (drugs), behalwe alkohol,
gebruik om jou “high” te laat voel?
Thank you for you participation.
Dankie vir jou aandeel.
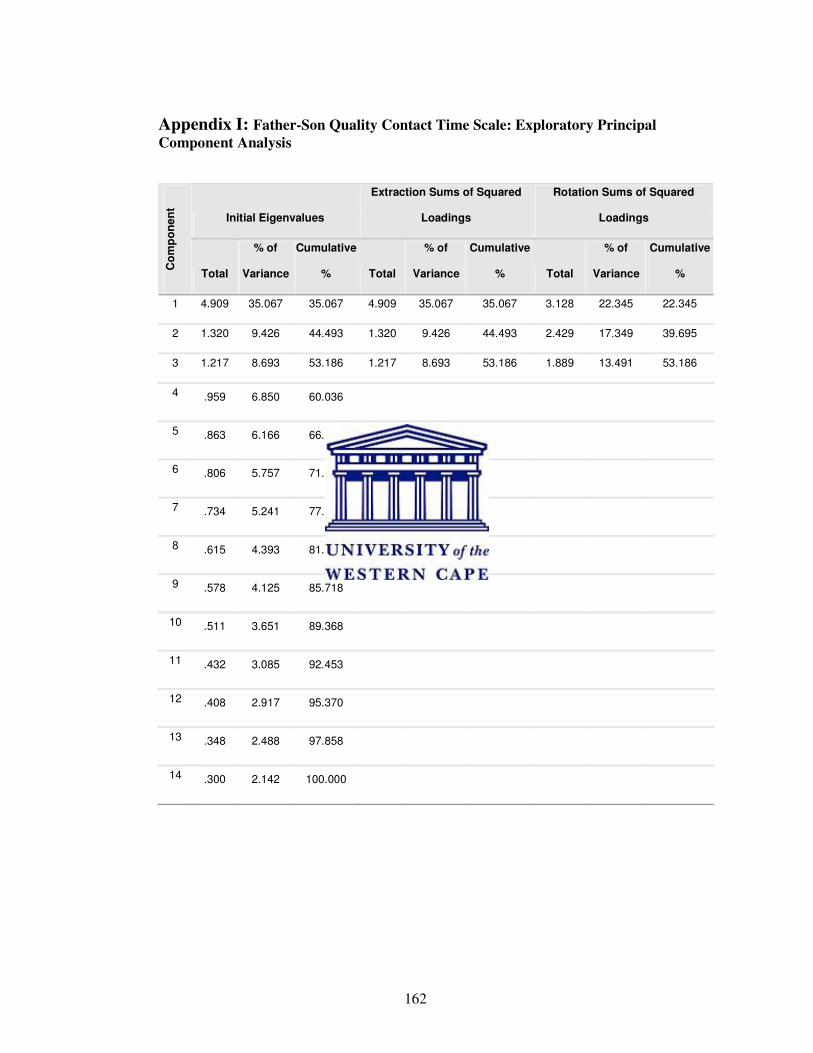
162
Appendix I: Father-Son Quality Contact Time Scale: Exploratory Principal
Component Analysis
Initial Eigenvalues
Extraction Sums of Squared
Loadings
Rotation Sums of Squared
Loadings
Co
mp
on
en
t
Total
% of
Variance
Cumulative
% Total
% of
Variance
Cumulative
% Total
% of
Variance
Cumulative
%
1 4.909 35.067 35.067 4.909 35.067 35.067 3.128 22.345 22.345
2 1.320 9.426 44.493 1.320 9.426 44.493 2.429 17.349 39.695
3 1.217 8.693 53.186 1.217 8.693 53.186 1.889 13.491 53.186
4 .959 6.850 60.036
5 .863 6.166 66.202
6 .806 5.757 71.959
7 .734 5.241 77.199
8 .615 4.393 81.592
9 .578 4.125 85.718
10 .511 3.651 89.368
11 .432 3.085 92.453
12 .408 2.917 95.370
13 .348 2.488 97.858
14 .300 2.142 100.000
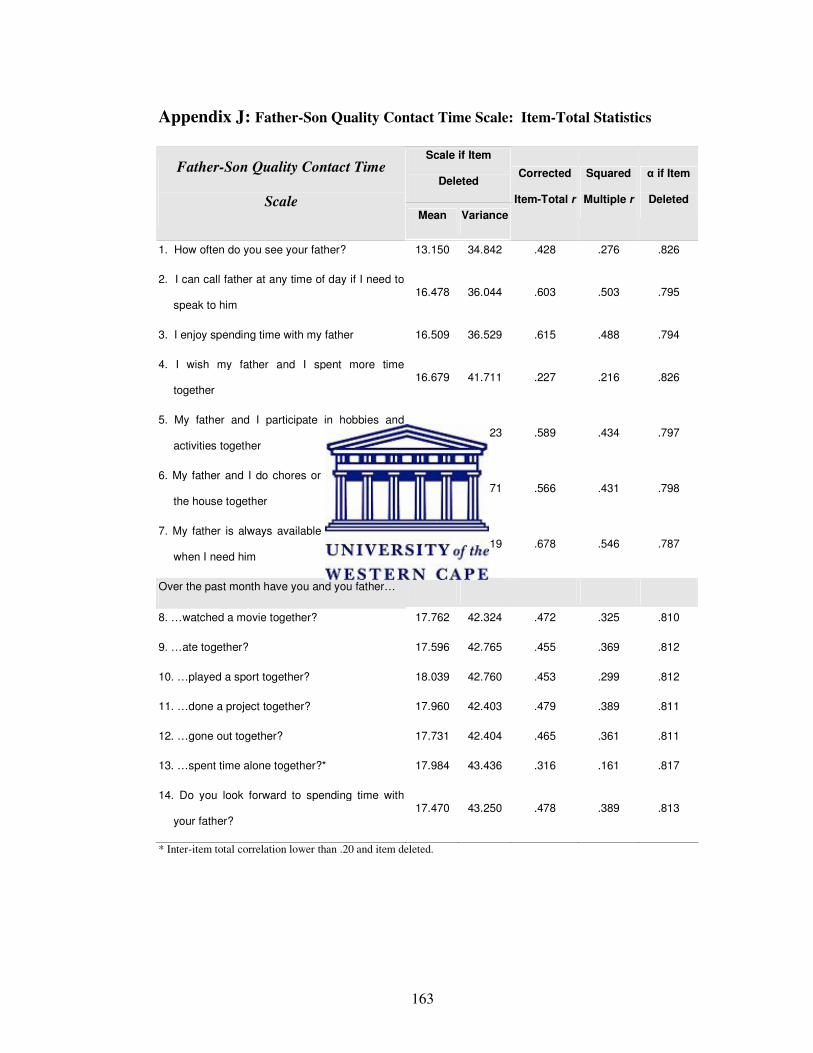
163
Appendix J: Father-Son Quality Contact Time Scale: Item-Total Statistics
Scale if Item
Deleted Father-Son Quality Contact Time
Scale
Mean Variance
Corrected
Item-Total r
Squared
Multiple r
α if Item
Deleted
1. How often do you see your father? 13.150 34.842 .428 .276 .826
2. I can call father at any time of day if I need to
speak to him 16.478 36.044 .603 .503 .795
3. I enjoy spending time with my father 16.509 36.529 .615 .488 .794
4. I wish my father and I spent more time
together 16.679 41.711 .227 .216 .826
5. My father and I participate in hobbies and
activities together 17.253 37.523 .589 .434 .797
6. My father and I do chores or projects around
the house together 17.173 37.271 .566 .431 .798
7. My father is always available to speak to me
when I need him 16.371 35.219 .678 .546 .787
Over the past month have you and you father…
8. …watched a movie together? 17.762 42.324 .472 .325 .810
9. …ate together? 17.596 42.765 .455 .369 .812
10. …played a sport together? 18.039 42.760 .453 .299 .812
11. …done a project together? 17.960 42.403 .479 .389 .811
12. …gone out together? 17.731 42.404 .465 .361 .811
13. …spent time alone together?* 17.984 43.436 .316 .161 .817
14. Do you look forward to spending time with
your father? 17.470 43.250 .478 .389 .813
* Inter-item total correlation lower than .20 and item deleted.
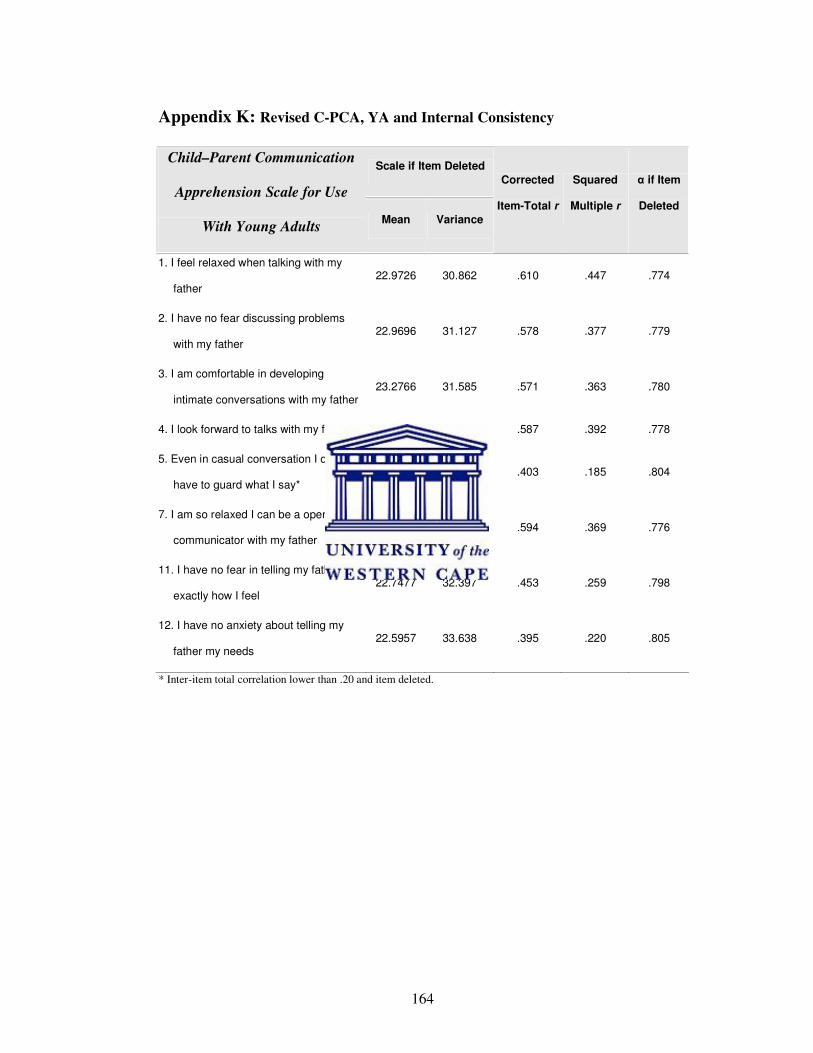
164
Appendix K: Revised C-PCA, YA and Internal Consistency
Scale if Item Deleted Child–Parent Communication
Apprehension Scale for Use
With Young Adults
Mean Variance
Corrected
Item-Total r
Squared
Multiple r
α if Item
Deleted
1. I feel relaxed when talking with my
father 22.9726 30.862 .610 .447 .774
2. I have no fear discussing problems
with my father 22.9696 31.127 .578 .377 .779
3. I am comfortable in developing
intimate conversations with my father 23.2766 31.585 .571 .363 .780
4. I look forward to talks with my father 22.7629 31.755 .587 .392 .778
5. Even in casual conversation I don't
have to guard what I say* 23.0821 33.466 .403 .185 .804
7. I am so relaxed I can be a open
communicator with my father 23.2523 31.043 .594 .369 .776
11. I have no fear in telling my father
exactly how I feel 22.7477 32.397 .453 .259 .798
12. I have no anxiety about telling my
father my needs 22.5957 33.638 .395 .220 .805
* Inter-item total correlation lower than .20 and item deleted.
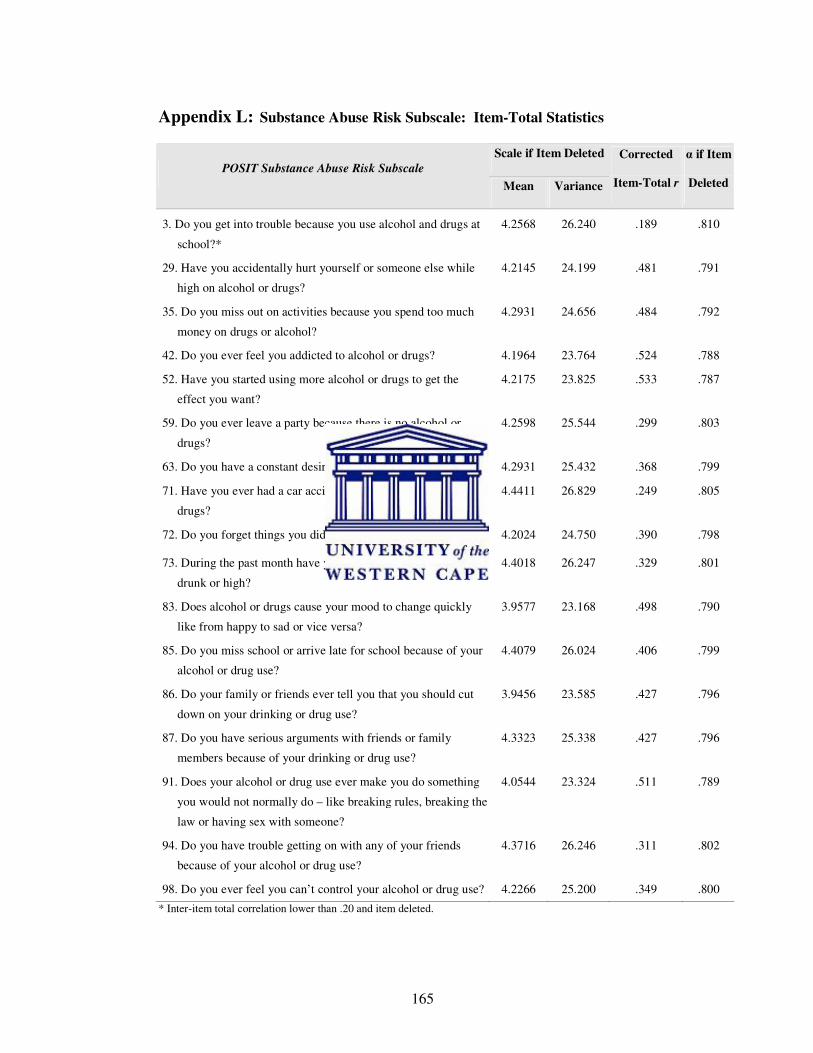
165
Appendix L: Substance Abuse Risk Subscale: Item-Total Statistics
Scale if Item Deleted
POSIT Substance Abuse Risk Subscale
Mean Variance
Corrected
Item-Total r
α if Item
Deleted
3. Do you get into trouble because you use alcohol and drugs at
school?*
4.2568 26.240 .189 .810
29. Have you accidentally hurt yourself or someone else while
high on alcohol or drugs?
4.2145 24.199 .481 .791
35. Do you miss out on activities because you spend too much
money on drugs or alcohol?
4.2931 24.656 .484 .792
42. Do you ever feel you addicted to alcohol or drugs? 4.1964 23.764 .524 .788
52. Have you started using more alcohol or drugs to get the
effect you want?
4.2175 23.825 .533 .787
59. Do you ever leave a party because there is no alcohol or
drugs?
4.2598 25.544 .299 .803
63. Do you have a constant desire for drugs or alcohol? 4.2931 25.432 .368 .799
71. Have you ever had a car accident while high on alcohol or
drugs?
4.4411 26.829 .249 .805
72. Do you forget things you did while drinking or using drugs? 4.2024 24.750 .390 .798
73. During the past month have you driven a car while you were
drunk or high?
4.4018 26.247 .329 .801
83. Does alcohol or drugs cause your mood to change quickly
like from happy to sad or vice versa?
3.9577 23.168 .498 .790
85. Do you miss school or arrive late for school because of your
alcohol or drug use?
4.4079 26.024 .406 .799
86. Do your family or friends ever tell you that you should cut
down on your drinking or drug use?
3.9456 23.585 .427 .796
87. Do you have serious arguments with friends or family
members because of your drinking or drug use?
4.3323 25.338 .427 .796
91. Does your alcohol or drug use ever make you do something
you would not normally do – like breaking rules, breaking the
law or having sex with someone?
4.0544 23.324 .511 .789
94. Do you have trouble getting on with any of your friends
because of your alcohol or drug use?
4.3716 26.246 .311 .802
98. Do you ever feel you can’t control your alcohol or drug use? 4.2266 25.200 .349 .800
* Inter-item total correlation lower than .20 and item deleted.
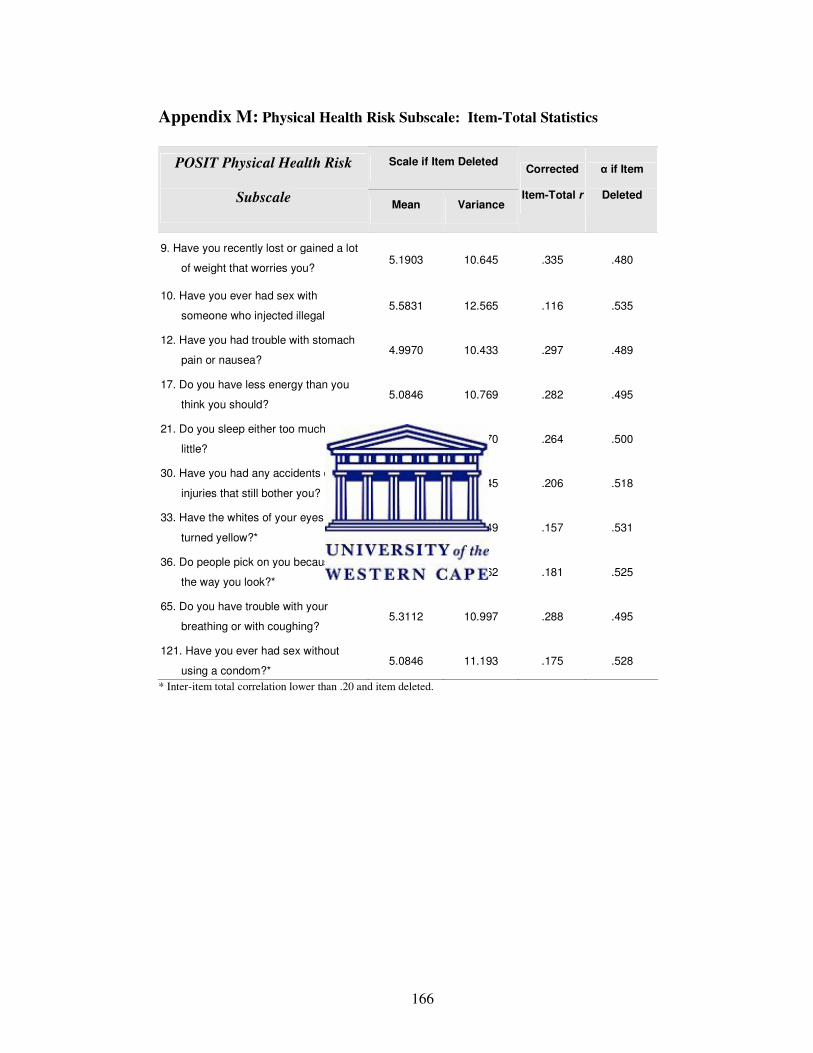
166
Appendix M: Physical Health Risk Subscale: Item-Total Statistics
Scale if Item Deleted POSIT Physical Health Risk
Subscale Mean Variance
Corrected
Item-Total r
α if Item
Deleted
9. Have you recently lost or gained a lot
of weight that worries you? 5.1903 10.645 .335 .480
10. Have you ever had sex with
someone who injected illegal 5.5831 12.565 .116 .535
12. Have you had trouble with stomach
pain or nausea? 4.9970 10.433 .297 .489
17. Do you have less energy than you
think you should? 5.0846 10.769 .282 .495
21. Do you sleep either too much or too
little? 4.5408 10.770 .264 .500
30. Have you had any accidents or
injuries that still bother you? 5.0967 11.045 .206 .518
33. Have the whites of your eyes ever
turned yellow?* 5.1903 11.549 .157 .531
36. Do people pick on you because of
the way you look?* 5.0665 11.262 .181 .525
65. Do you have trouble with your
breathing or with coughing? 5.3112 10.997 .288 .495
121. Have you ever had sex without
using a condom?* 5.0846 11.193 .175 .528
* Inter-item total correlation lower than .20 and item deleted.
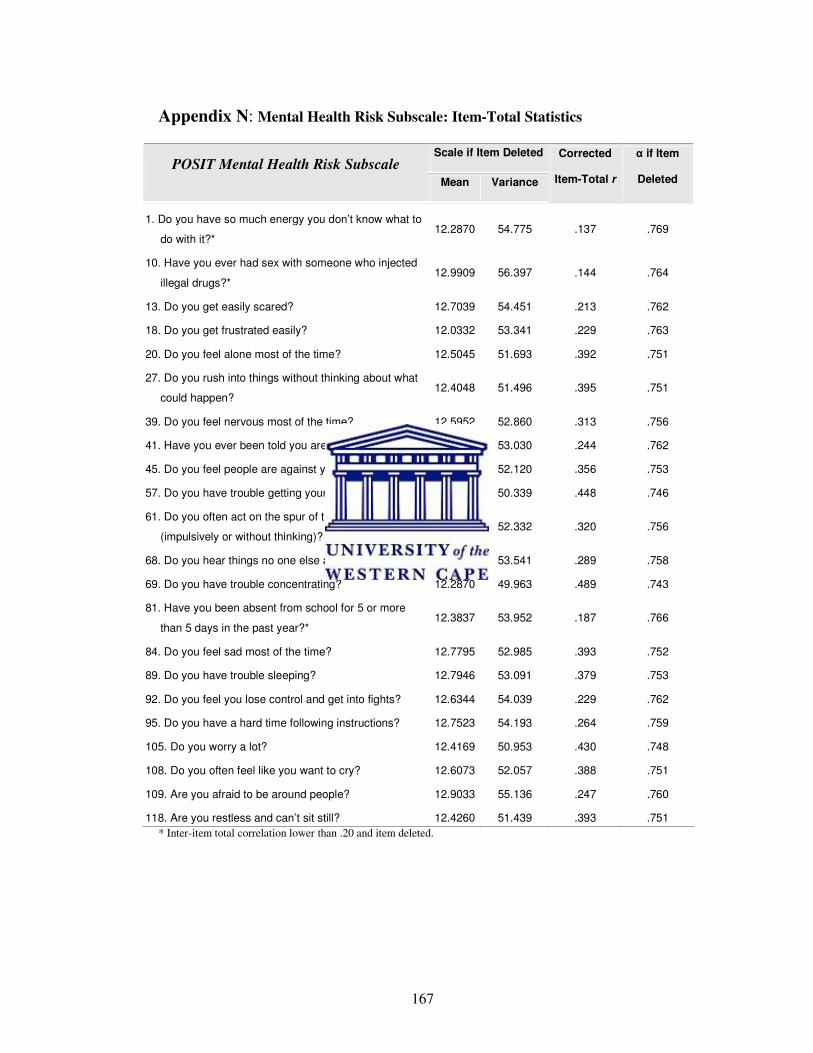
167
Appendix N: Mental Health Risk Subscale: Item-Total Statistics
Scale if Item Deleted POSIT Mental Health Risk Subscale
Mean Variance
Corrected
Item-Total r
α if Item
Deleted
1. Do you have so much energy you don’t know what to
do with it?* 12.2870 54.775 .137 .769
10. Have you ever had sex with someone who injected
illegal drugs?* 12.9909 56.397 .144 .764
13. Do you get easily scared? 12.7039 54.451 .213 .762
18. Do you get frustrated easily? 12.0332 53.341 .229 .763
20. Do you feel alone most of the time? 12.5045 51.693 .392 .751
27. Do you rush into things without thinking about what
could happen? 12.4048 51.496 .395 .751
39. Do you feel nervous most of the time? 12.5952 52.860 .313 .756
41. Have you ever been told you are hyperactive? 12.1480 53.030 .244 .762
45. Do you feel people are against you? 12.4048 52.120 .356 .753
57. Do you have trouble getting your mind off things? 12.0060 50.339 .448 .746
61. Do you often act on the spur of the moment
(impulsively or without thinking)? 12.2024 52.332 .320 .756
68. Do you hear things no one else around you hears? 12.6375 53.541 .289 .758
69. Do you have trouble concentrating? 12.2870 49.963 .489 .743
81. Have you been absent from school for 5 or more
than 5 days in the past year?* 12.3837 53.952 .187 .766
84. Do you feel sad most of the time? 12.7795 52.985 .393 .752
89. Do you have trouble sleeping? 12.7946 53.091 .379 .753
92. Do you feel you lose control and get into fights? 12.6344 54.039 .229 .762
95. Do you have a hard time following instructions? 12.7523 54.193 .264 .759
105. Do you worry a lot? 12.4169 50.953 .430 .748
108. Do you often feel like you want to cry? 12.6073 52.057 .388 .751
109. Are you afraid to be around people? 12.9033 55.136 .247 .760
118. Are you restless and can’t sit still? 12.4260 51.439 .393 .751
* Inter-item total correlation lower than .20 and item deleted.
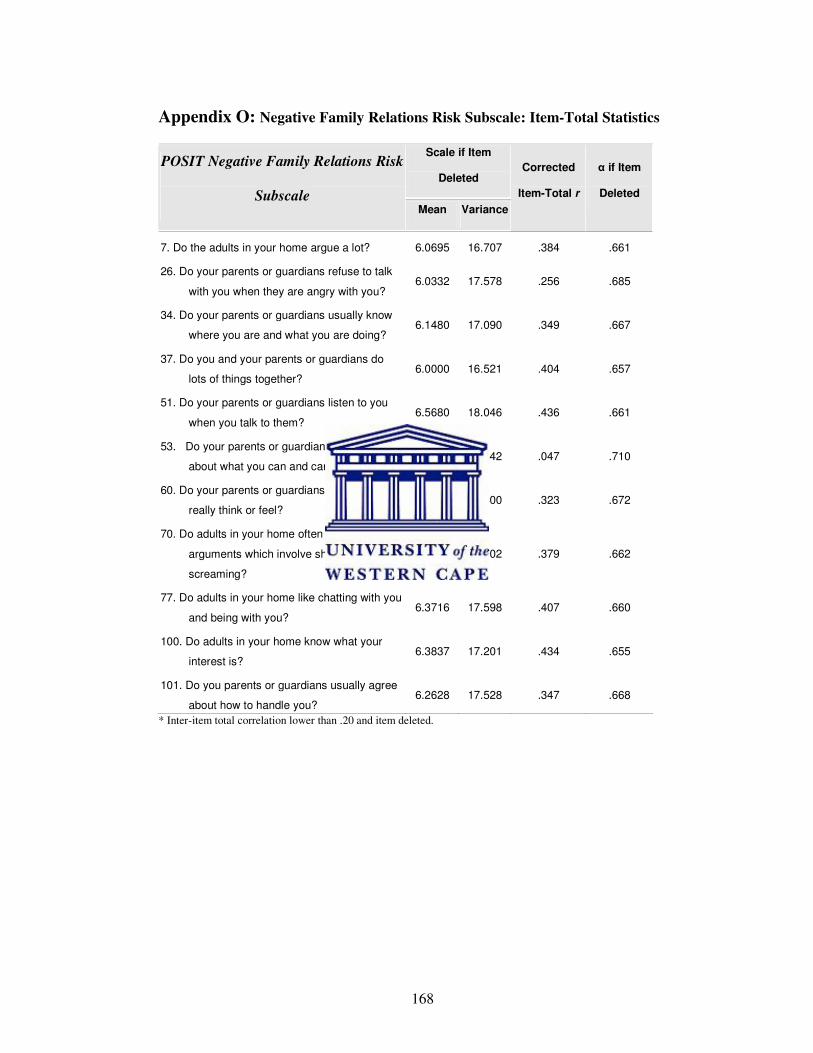
168
Appendix O: Negative Family Relations Risk Subscale: Item-Total Statistics
Scale if Item
Deleted
POSIT Negative Family Relations Risk
Subscale Mean Variance
Corrected
Item-Total r
α if Item
Deleted
7. Do the adults in your home argue a lot? 6.0695 16.707 .384 .661
26. Do your parents or guardians refuse to talk
with you when they are angry with you? 6.0332 17.578 .256 .685
34. Do your parents or guardians usually know
where you are and what you are doing? 6.1480 17.090 .349 .667
37. Do you and your parents or guardians do
lots of things together? 6.0000 16.521 .404 .657
51. Do your parents or guardians listen to you
when you talk to them? 6.5680 18.046 .436 .661
53. Do your parents or guardians have rules
about what you can and can’t do?* 6.4502 19.642 .047 .710
60. Do your parents or guardians know what you
really think or feel? 5.5438 17.400 .323 .672
70. Do adults in your home often have
arguments which involve shouting and
screaming?
6.0846 16.702 .379 .662
77. Do adults in your home like chatting with you
and being with you? 6.3716 17.598 .407 .660
100. Do adults in your home know what your
interest is? 6.3837 17.201 .434 .655
101. Do you parents or guardians usually agree
about how to handle you? 6.2628 17.528 .347 .668
* Inter-item total correlation lower than .20 and item deleted.
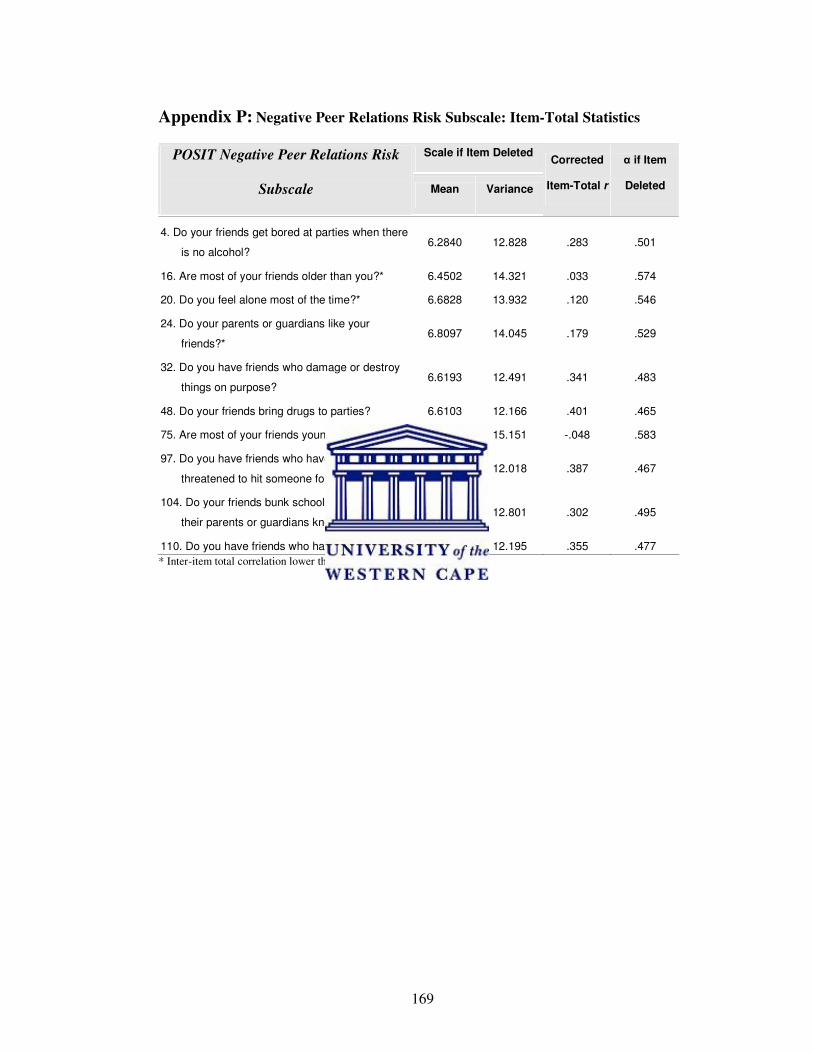
169
Appendix P: Negative Peer Relations Risk Subscale: Item-Total Statistics
Scale if Item Deleted POSIT Negative Peer Relations Risk
Subscale Mean Variance
Corrected
Item-Total r
α if Item
Deleted
4. Do your friends get bored at parties when there
is no alcohol? 6.2840 12.828 .283 .501
16. Are most of your friends older than you?* 6.4502 14.321 .033 .574
20. Do you feel alone most of the time?* 6.6828 13.932 .120 .546
24. Do your parents or guardians like your
friends?* 6.8097 14.045 .179 .529
32. Do you have friends who damage or destroy
things on purpose? 6.6193 12.491 .341 .483
48. Do your friends bring drugs to parties? 6.6103 12.166 .401 .465
75. Are most of your friends younger than you?* 6.8248 15.151 -.048 .583
97. Do you have friends who have hit or
threatened to hit someone for nothing? 6.4532 12.018 .387 .467
104. Do your friends bunk school a lot without
their parents or guardians knowing? 6.5347 12.801 .302 .495
110. Do you have friends who have stolen things? 6.1511 12.195 .355 .477
* Inter-item total correlation lower than .20 and item deleted.
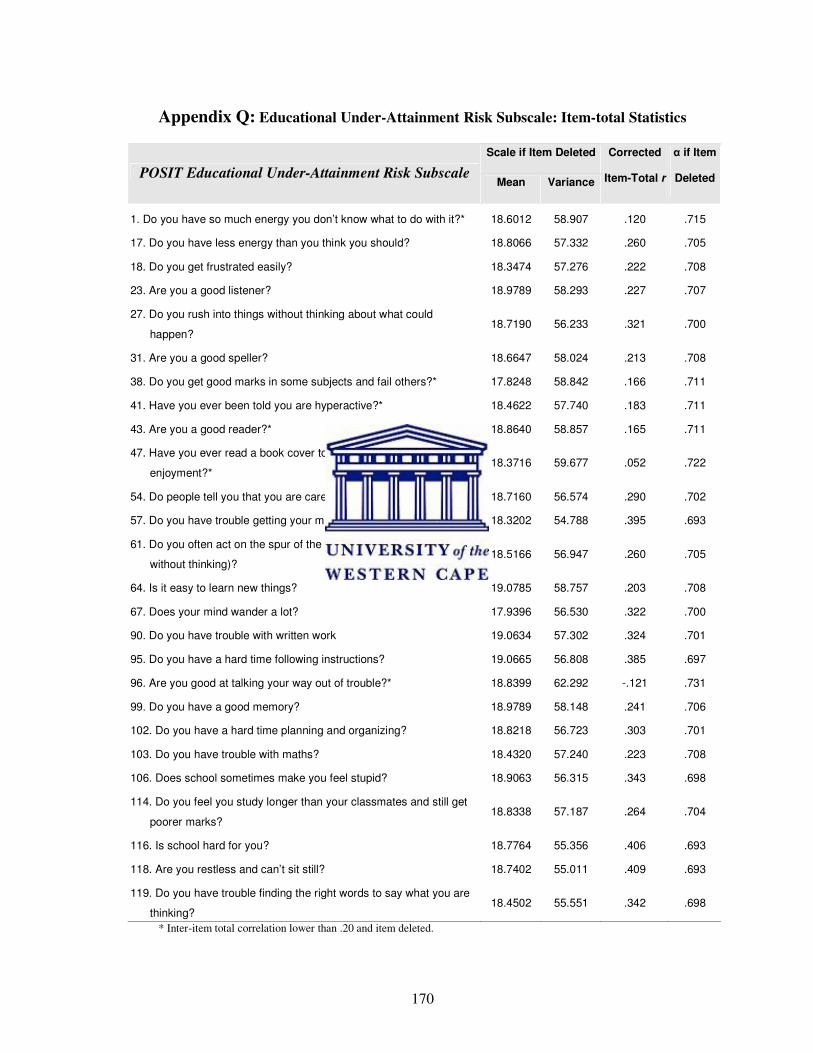
170
Appendix Q: Educational Under-Attainment Risk Subscale: Item-total Statistics
Scale if Item Deleted
POSIT Educational Under-Attainment Risk Subscale Mean Variance
Corrected
Item-Total r
α if Item
Deleted
1. Do you have so much energy you don’t know what to do with it?* 18.6012 58.907 .120 .715
17. Do you have less energy than you think you should? 18.8066 57.332 .260 .705
18. Do you get frustrated easily? 18.3474 57.276 .222 .708
23. Are you a good listener? 18.9789 58.293 .227 .707
27. Do you rush into things without thinking about what could
happen? 18.7190 56.233 .321 .700
31. Are you a good speller? 18.6647 58.024 .213 .708
38. Do you get good marks in some subjects and fail others?* 17.8248 58.842 .166 .711
41. Have you ever been told you are hyperactive?* 18.4622 57.740 .183 .711
43. Are you a good reader?* 18.8640 58.857 .165 .711
47. Have you ever read a book cover to cover for your own
enjoyment?* 18.3716 59.677 .052 .722
54. Do people tell you that you are careless? 18.7160 56.574 .290 .702
57. Do you have trouble getting your mind off things? 18.3202 54.788 .395 .693
61. Do you often act on the spur of the moment (impulsively or
without thinking)? 18.5166 56.947 .260 .705
64. Is it easy to learn new things? 19.0785 58.757 .203 .708
67. Does your mind wander a lot? 17.9396 56.530 .322 .700
90. Do you have trouble with written work 19.0634 57.302 .324 .701
95. Do you have a hard time following instructions? 19.0665 56.808 .385 .697
96. Are you good at talking your way out of trouble?* 18.8399 62.292 -.121 .731
99. Do you have a good memory? 18.9789 58.148 .241 .706
102. Do you have a hard time planning and organizing? 18.8218 56.723 .303 .701
103. Do you have trouble with maths? 18.4320 57.240 .223 .708
106. Does school sometimes make you feel stupid? 18.9063 56.315 .343 .698
114. Do you feel you study longer than your classmates and still get
poorer marks? 18.8338 57.187 .264 .704
116. Is school hard for you? 18.7764 55.356 .406 .693
118. Are you restless and can’t sit still? 18.7402 55.011 .409 .693
119. Do you have trouble finding the right words to say what you are
thinking? 18.4502 55.551 .342 .698
* Inter-item total correlation lower than .20 and item deleted.
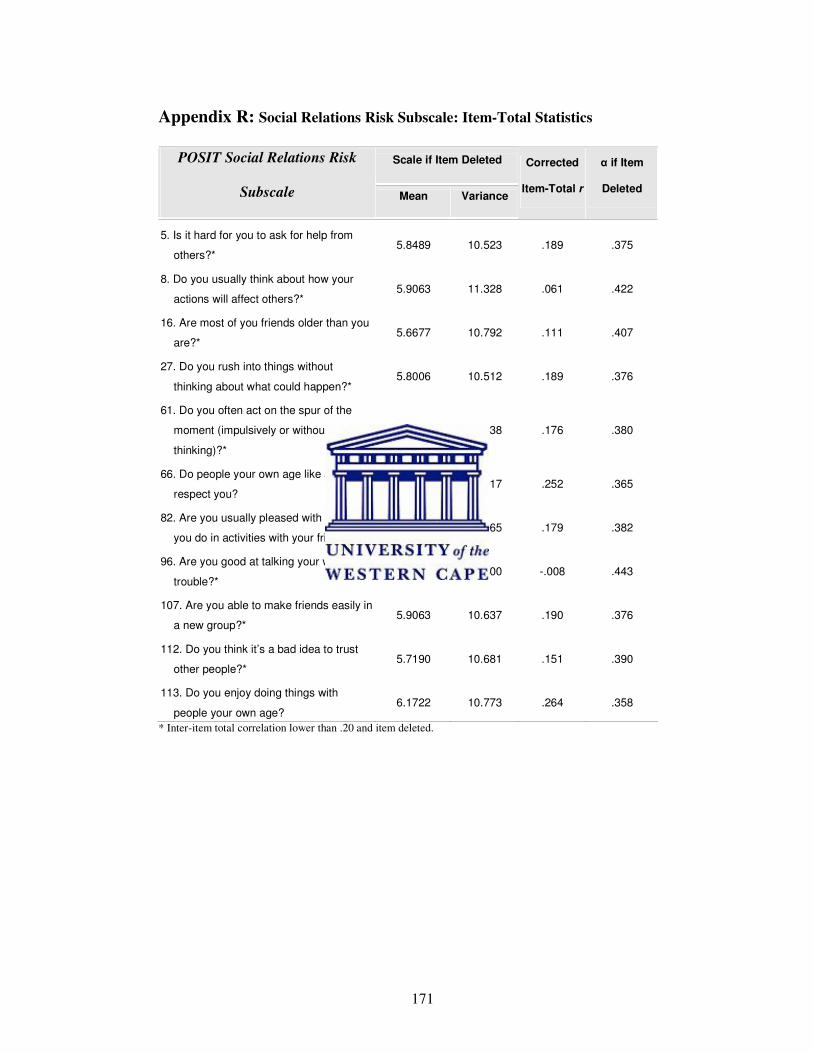
171
Appendix R: Social Relations Risk Subscale: Item-Total Statistics
Scale if Item Deleted POSIT Social Relations Risk
Subscale Mean Variance
Corrected
Item-Total r
α if Item
Deleted
5. Is it hard for you to ask for help from
others?* 5.8489 10.523 .189 .375
8. Do you usually think about how your
actions will affect others?* 5.9063 11.328 .061 .422
16. Are most of you friends older than you
are?* 5.6677 10.792 .111 .407
27. Do you rush into things without
thinking about what could happen?* 5.8006 10.512 .189 .376
61. Do you often act on the spur of the
moment (impulsively or without
thinking)?*
5.5982 10.538 .176 .380
66. Do people your own age like and
respect you? 6.1843 11.017 .252 .365
82. Are you usually pleased with how well
you do in activities with your friends?* 6.1390 11.065 .179 .382
96. Are you good at talking your way out of
trouble?* 5.9215 11.800 -.008 .443
107. Are you able to make friends easily in
a new group?* 5.9063 10.637 .190 .376
112. Do you think it’s a bad idea to trust
other people?* 5.7190 10.681 .151 .390
113. Do you enjoy doing things with
people your own age? 6.1722 10.773 .264 .358
* Inter-item total correlation lower than .20 and item deleted.
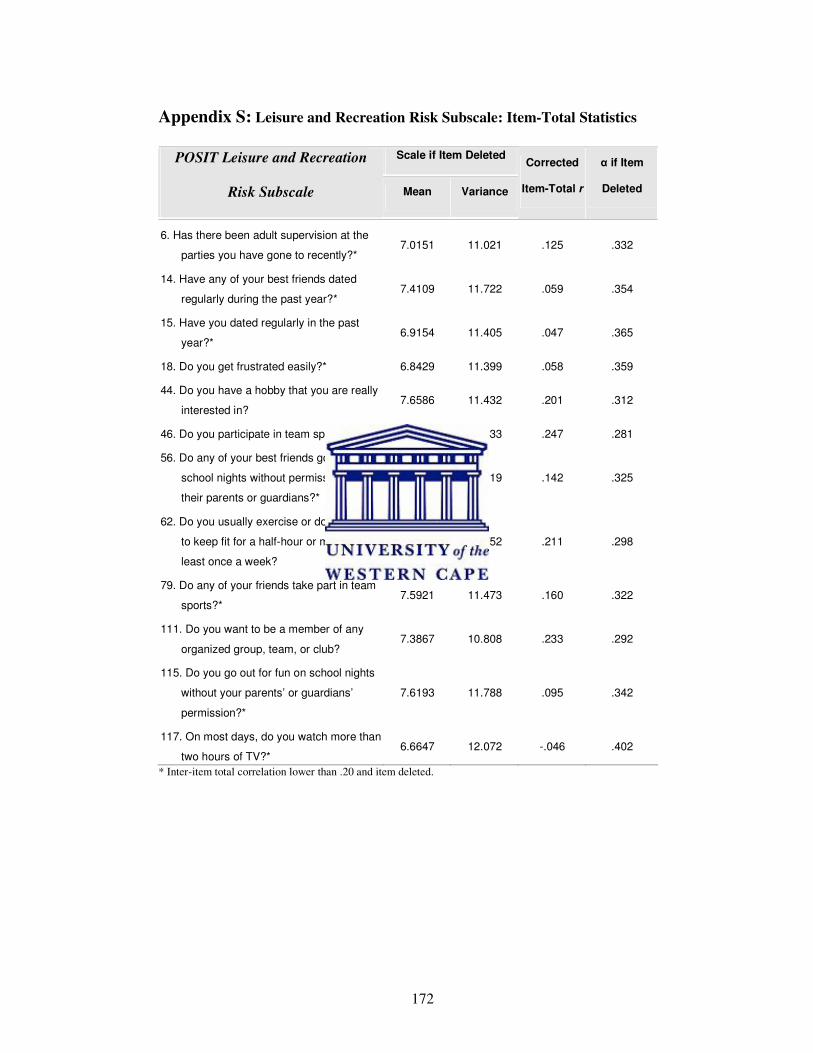
172
Appendix S: Leisure and Recreation Risk Subscale: Item-Total Statistics
Scale if Item Deleted POSIT Leisure and Recreation
Risk Subscale Mean Variance
Corrected
Item-Total r
α if Item
Deleted
6. Has there been adult supervision at the
parties you have gone to recently?* 7.0151 11.021 .125 .332
14. Have any of your best friends dated
regularly during the past year?* 7.4109 11.722 .059 .354
15. Have you dated regularly in the past
year?* 6.9154 11.405 .047 .365
18. Do you get frustrated easily?* 6.8429 11.399 .058 .359
44. Do you have a hobby that you are really
interested in? 7.6586 11.432 .201 .312
46. Do you participate in team sports? 7.3112 10.433 .247 .281
56. Do any of your best friends go out on
school nights without permission from
their parents or guardians?*
7.1057 11.119 .142 .325
62. Do you usually exercise or do activities
to keep fit for a half-hour or more at
least once a week?
7.3807 10.752 .211 .298
79. Do any of your friends take part in team
sports?* 7.5921 11.473 .160 .322
111. Do you want to be a member of any
organized group, team, or club? 7.3867 10.808 .233 .292
115. Do you go out for fun on school nights
without your parents’ or guardians’
permission?*
7.6193 11.788 .095 .342
117. On most days, do you watch more than
two hours of TV?* 6.6647 12.072 -.046 .402
* Inter-item total correlation lower than .20 and item deleted.
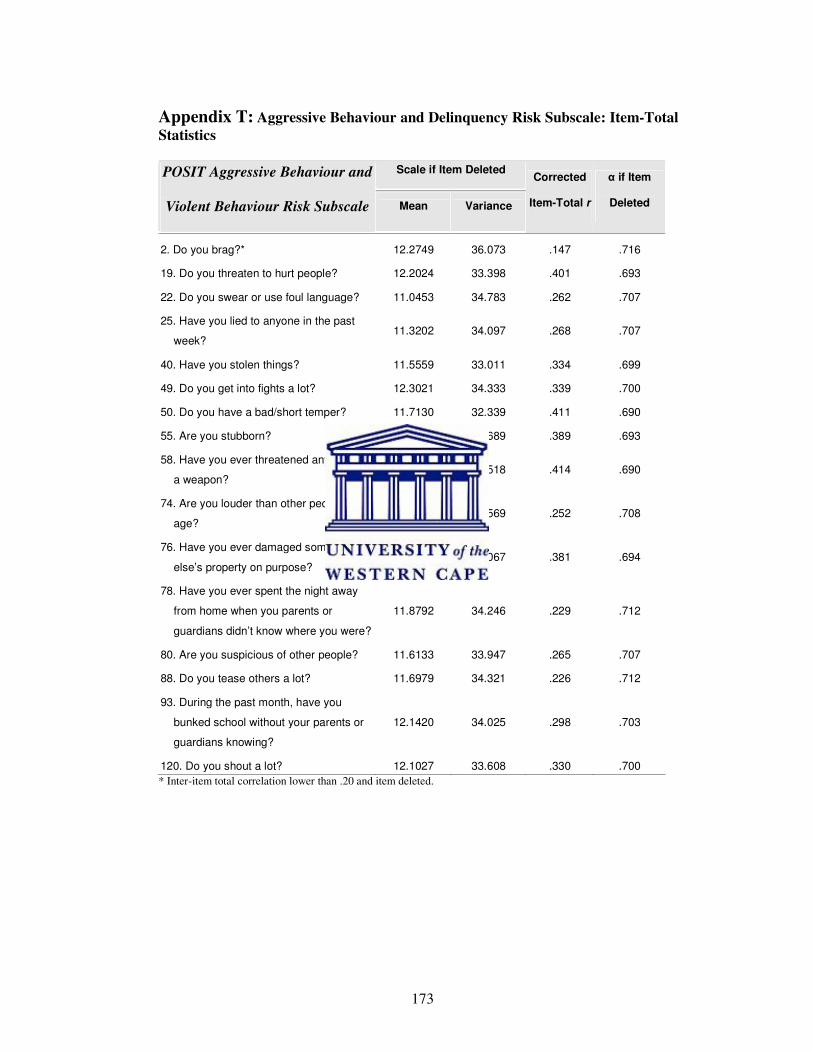
173
Appendix T: Aggressive Behaviour and Delinquency Risk Subscale: Item-Total
Statistics
Scale if Item Deleted POSIT Aggressive Behaviour and
Violent Behaviour Risk Subscale Mean Variance
Corrected
Item-Total r
α if Item
Deleted
2. Do you brag?* 12.2749 36.073 .147 .716
19. Do you threaten to hurt people? 12.2024 33.398 .401 .693
22. Do you swear or use foul language? 11.0453 34.783 .262 .707
25. Have you lied to anyone in the past
week? 11.3202 34.097 .268 .707
40. Have you stolen things? 11.5559 33.011 .334 .699
49. Do you get into fights a lot? 12.3021 34.333 .339 .700
50. Do you have a bad/short temper? 11.7130 32.339 .411 .690
55. Are you stubborn? 11.7160 32.689 .389 .693
58. Have you ever threatened anyone with
a weapon? 11.9970 32.518 .414 .690
74. Are you louder than other people your
age? 12.0574 34.569 .252 .708
76. Have you ever damaged someone
else’s property on purpose? 12.0785 33.067 .381 .694
78. Have you ever spent the night away
from home when you parents or
guardians didn’t know where you were?
11.8792 34.246 .229 .712
80. Are you suspicious of other people? 11.6133 33.947 .265 .707
88. Do you tease others a lot? 11.6979 34.321 .226 .712
93. During the past month, have you
bunked school without your parents or
guardians knowing?
12.1420 34.025 .298 .703
120. Do you shout a lot? 12.1027 33.608 .330 .700
* Inter-item total correlation lower than .20 and item deleted.
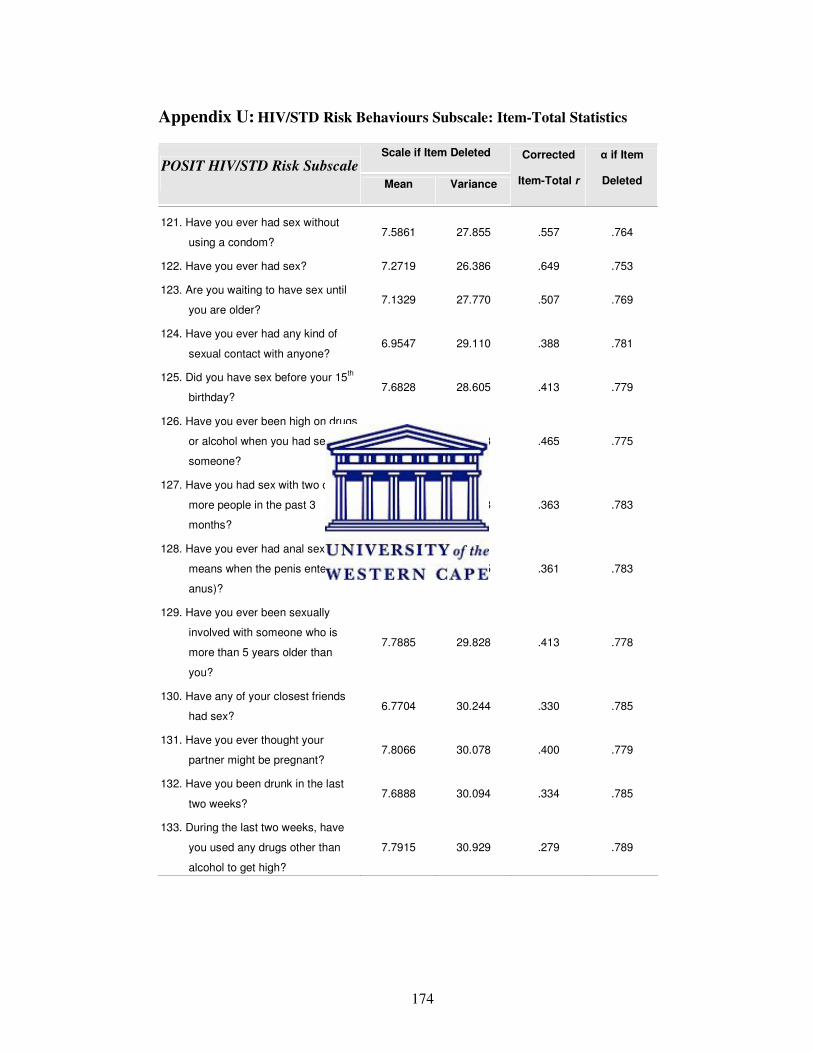
174
Appendix U: HIV/STD Risk Behaviours Subscale: Item-Total Statistics
Scale if Item Deleted
POSIT HIV/STD Risk Subscale
Mean Variance
Corrected
Item-Total r
α if Item
Deleted
121. Have you ever had sex without
using a condom? 7.5861 27.855 .557 .764
122. Have you ever had sex? 7.2719 26.386 .649 .753
123. Are you waiting to have sex until
you are older? 7.1329 27.770 .507 .769
124. Have you ever had any kind of
sexual contact with anyone? 6.9547 29.110 .388 .781
125. Did you have sex before your 15th
birthday? 7.6828 28.605 .413 .779
126. Have you ever been high on drugs
or alcohol when you had sex with
someone?
7.9003 29.993 .465 .775
127. Have you had sex with two or
more people in the past 3
months?
7.9758 31.218 .363 .783
128. Have you ever had anal sex (this
means when the penis enters the
anus)?
7.8610 30.575 .361 .783
129. Have you ever been sexually
involved with someone who is
more than 5 years older than
you?
7.7885 29.828 .413 .778
130. Have any of your closest friends
had sex? 6.7704 30.244 .330 .785
131. Have you ever thought your
partner might be pregnant? 7.8066 30.078 .400 .779
132. Have you been drunk in the last
two weeks? 7.6888 30.094 .334 .785
133. During the last two weeks, have
you used any drugs other than
alcohol to get high?
7.7915 30.929 .279 .789
Related Documents