ARTICLE Fat depot-related differences in gene expression, adiponectin secretion, and insulin action and signalling in human adipocytes differentiated in vitro from precursor stromal cells S. Perrini & L. Laviola & A. Cignarelli & M. Melchiorre & F. De Stefano & C. Caccioppoli & A. Natalicchio & M. R. Orlando & G. Garruti & M. De Fazio & G. Catalano & V. Memeo & R. Giorgino & F. Giorgino Received: 3 August 2007 / Accepted: 3 September 2007 / Published online: 25 October 2007 # Springer-Verlag 2007 Abstract Aim/hypothesis The distinct metabolic properties of viscer- al and subcutaneous adipocytes may be due to inherent characteristics of the cells that are resident in each fat depot. To test this hypothesis, human adipocytes were differenti- ated in vitro from precursor stromal cells obtained from visceral and subcutaneous fat depots and analysed for genetic, biochemical and metabolic endpoints. Methods Stromal cells were isolated from adipose tissue depots of nondiabetic individuals. mRNA levels of adipocyte- specific proteins were determined by real-time RT-PCR. Insulin signalling was evaluated by immunoblotting with specific antibodies. Glucose transport was measured by a 2-deoxy-glucose uptake assay. Adiponectin secretion in the adipocyte-conditioned medium was determined by a specific RIA. Results With cell differentiation, mRNA levels of PPARG, C/EBPα (also known as CEBPA), AP2 (also known as GTF3A), GLUT4 (also known as SLC2A4) were markedly upregulated, whereas GLUT1 (also known as SLC2A1) mRNA did not change. However, expression of C/EBPα, AP2 and adiponectin was higher in subcutaneous than in visceral adipocytes. By contrast, adiponectin was secreted at threefold higher rates by visceral than by subcutaneous adipocytes while visceral adipocytes also showed two- to threefold higher insulin-stimulated glucose uptake. Insulin- induced phosphorylation of the insulin receptor, IRS proteins, Akt and extracellular signal-regulated kinase-1/2 was more rapid and tended to decrease at earlier time-points in visceral than in subcutaneous adipocytes. Conclusions/interpretation Subcutaneous and visceral adi- pocytes, also when differentiated in vitro from precursor stromal cells, retain differences in gene expression, adipo- nectin secretion, and insulin action and signalling. Thus, the precursor cells that reside in the visceral and subcutaneous fat depots may already possess inherent and specific metabolic characteristics that will be expressed upon completion of the differentiation programme. Keywords Adiponectin . Akt . Erk . Extracellular signal-regulated kinase . Glucose uptake . Insulin signalling . Subcutaneous fat . Visceral fat Diabetologia (2008) 51:155–164 DOI 10.1007/s00125-007-0841-7 Electronic supplementary material The online versin of this article (doi:10.1007/s00125-007-0841-7) contains supplementary material, which is available to authorised users. S. Perrini : L. Laviola : A. Cignarelli : M. Melchiorre : F. De Stefano : C. Caccioppoli : A. Natalicchio : M. R. Orlando : G. Garruti : R. Giorgino : F. Giorgino Department of Emergency and Organ Transplantation, Section of Internal Medicine, Endocrinology and Metabolic Diseases, University of Bari School of Medicine, Bari, Italy M. De Fazio : G. Catalano : V. Memeo Department of Emergency and Organ Transplantation, Section of General Surgery, University of Bari School of Medicine, Bari, Italy F. Giorgino (*) Department of Emergency and Organ Transplantation, Section of Internal Medicine, Endocrinology and Metabolic Diseases, University of Bari, Piazza Giulio Cesare, 11, I-70124 Bari, Italy e-mail: [email protected]

Welcome message from author
This document is posted to help you gain knowledge. Please leave a comment to let me know what you think about it! Share it to your friends and learn new things together.
Transcript

ARTICLE
Fat depot-related differences in gene expression, adiponectinsecretion, and insulin action and signalling in human adipocytesdifferentiated in vitro from precursor stromal cells
S. Perrini & L. Laviola & A. Cignarelli & M. Melchiorre &
F. De Stefano & C. Caccioppoli & A. Natalicchio &
M. R. Orlando & G. Garruti & M. De Fazio &
G. Catalano & V. Memeo & R. Giorgino & F. Giorgino
Received: 3 August 2007 /Accepted: 3 September 2007 / Published online: 25 October 2007# Springer-Verlag 2007
AbstractAim/hypothesis The distinct metabolic properties of viscer-al and subcutaneous adipocytes may be due to inherentcharacteristics of the cells that are resident in each fat depot.To test this hypothesis, human adipocytes were differenti-ated in vitro from precursor stromal cells obtained fromvisceral and subcutaneous fat depots and analysed forgenetic, biochemical and metabolic endpoints.Methods Stromal cells were isolated from adipose tissuedepots of nondiabetic individuals. mRNA levels of adipocyte-specific proteins were determined by real-time RT-PCR.
Insulin signalling was evaluated by immunoblotting withspecific antibodies. Glucose transport was measured by a2-deoxy-glucose uptake assay. Adiponectin secretion in theadipocyte-conditioned medium was determined by a specificRIA.Results With cell differentiation, mRNA levels of PPARG,C/EBPα (also known as CEBPA), AP2 (also known asGTF3A), GLUT4 (also known as SLC2A4) were markedlyupregulated, whereas GLUT1 (also known as SLC2A1)mRNA did not change. However, expression of C/EBPα,AP2 and adiponectin was higher in subcutaneous than invisceral adipocytes. By contrast, adiponectin was secretedat threefold higher rates by visceral than by subcutaneousadipocytes while visceral adipocytes also showed two- tothreefold higher insulin-stimulated glucose uptake. Insulin-induced phosphorylation of the insulin receptor, IRSproteins, Akt and extracellular signal-regulated kinase-1/2was more rapid and tended to decrease at earlier time-pointsin visceral than in subcutaneous adipocytes.Conclusions/interpretation Subcutaneous and visceral adi-pocytes, also when differentiated in vitro from precursorstromal cells, retain differences in gene expression, adipo-nectin secretion, and insulin action and signalling. Thus, theprecursor cells that reside in the visceral and subcutaneousfat depots may already possess inherent and specificmetabolic characteristics that will be expressed uponcompletion of the differentiation programme.
Keywords Adiponectin . Akt . Erk .
Extracellular signal-regulated kinase . Glucose uptake .
Insulin signalling . Subcutaneous fat . Visceral fat
Diabetologia (2008) 51:155–164DOI 10.1007/s00125-007-0841-7
Electronic supplementary material The online versin of this article(doi:10.1007/s00125-007-0841-7) contains supplementary material,which is available to authorised users.
S. Perrini : L. Laviola :A. Cignarelli :M. Melchiorre :F. De Stefano :C. Caccioppoli :A. Natalicchio :M. R. Orlando :G. Garruti :R. Giorgino : F. GiorginoDepartment of Emergency and Organ Transplantation, Sectionof Internal Medicine, Endocrinology and Metabolic Diseases,University of Bari School of Medicine,Bari, Italy
M. De Fazio :G. Catalano :V. MemeoDepartment of Emergency and Organ Transplantation, Sectionof General Surgery, University of Bari School of Medicine,Bari, Italy
F. Giorgino (*)Department of Emergency and Organ Transplantation, Sectionof Internal Medicine, Endocrinology and Metabolic Diseases,University of Bari,Piazza Giulio Cesare, 11,I-70124 Bari, Italye-mail: [email protected]
AbbreviationsC/EBPα CCAAT/enhancer binding protein (C/EBP),
alphaErk extracellular signal-regulated kinaseIR insulin receptorPTEN phosphatase and tensin homologue (mutated
in multiple advanced cancers 1)PTP-1B protein tyrosine phosphatase 1BSHIP-2 SH2 containing inositol phosphatase
Introduction
By regulating triacylglycerol metabolism and secreting avariety of cytokines and hormones with pleiotropic effectson multiple tissues, adipose tissue has an enormouscapacity to regulate fuel utilisation, energy homeostasisand cardiovascular function. Dysfunctional adipose tissue,clinically evident as excessive fat mass (obesity) orabnormally reduced fat (lipodystrophy), leads to impairedglucose and lipid metabolism, insulin resistance and type 2diabetes, as well as to increased risk of cardiovasculardisease. Indeed, the distribution of body fat appears to bemore important than the total amount of fat. Abdominal,and in particular visceral, adiposity shows the closestassociation with metabolic and cardiovascular diseases [1,2]. An excess of visceral fat may promote decreased insulineffects on glucose uptake, NEFA re-esterification andinhibition of lipolysis [3]. Conversely, surgical eliminationof visceral fat resulted in dramatic improvements in insulinsensitivity in rodents [4] and humans [5], while removal ofsubcutaneous fat did not prevent insulin resistance andmetabolic abnormalities [6, 7].
The adverse metabolic impact of visceral fat has beenattributed to distinct biological properties of adipocytes inthis particular fat depot compared with those in other sites,including differences in metabolic responses, gene expres-sion, adipokine secretion and insulin action [8, 9]. Forexample, the lipolytic effect of catecholamines was shownto be more pronounced and the anti-lipolytic effect ofinsulin weaker in omental than in subcutaneous adipocytes[10]. Differences in the secretion of cytokines, such asadiponectin, plasminogen activator inhibitor, type I (PAI-1),IL-6 and leptin, between the two abdominal fat compart-ments have also been extensively described [9, 11].Recently, we investigated insulin signalling in different fatdepots in humans in vivo and demonstrated higher, morerapid and transient activation of the insulin signallingcascade in visceral than in subcutaneous fat [12]. Theseobservations are in line with the reportedly greater effectof insulin in stimulation of glucose uptake in visceral fat,both in humans in vivo [13] and in isolated humanadipocytes in vitro [14].
It should be recognised, however, that information on themetabolic properties of adipose tissue largely derives fromstudies in whole fat tissue in vivo, adipose tissue fragments exvivo or isolated mature adipocytes in vitro, thus probablyreflecting the influence of environmental factors in the tissueof origin. These experimental conditions cannot clarifywhether the depot-related specificity of adipose cells is dueto their innate characteristics or, alternatively, to extrinsicfactors, such as tissue microenvironment, local circulation,local innervation and/or heterogeneity in cellularity. In thisstudy, we used adipocytes differentiated in vitro from visceraland subcutaneous precursor stromal cells to investigatewhether these cells retain the depot-related differences ingene expression, adiponectin secretion, and insulin action andsignalling that are seen in intact adipose tissue and freshlyisolated adipocytes.
Methods
Individuals and adipose tissue biopsies Paired abdominalsubcutaneous and omental fat biopsies were obtained from13 non-obese individuals with normal glucose tolerance(seven men, six women; aged 45±1 years; weight 68.4±3.4 kg; height, 167±3 cm), who underwent elective openabdominal surgery for nonmalignant diseases (i.e. cholecys-tectomy, inguinal hernia, hysterectomy). They were allotherwise healthy and not taking any regular medication.All participants gave their informed consent before thesurgical procedure. The study protocol was approved by theIndependent Ethical Committee at the Azienda Ospedaliero-Universitaria Policlinico Consorziale, University of BariSchool of Medicine. Anthropometric and metabolic charac-terisation, including both height and weight measurementsand fasting blood chemistry, were performed 2 to 3 daysbefore the surgical procedure; see Electronic supplementarymaterial (ESM) for additional details.
Isolation and differentiation of adipocyte precursor cellsHuman preadipocytes were isolated according to the methodof Rodbell [15], with minor modifications, and differentiatedfor about 30 days in DMEM/F-12 medium supplementedwith insulin, dexamethasone, triiodothyronine and rosiglita-zone, in line with recently published methods for differen-tiation of human preadipocytes [16]; for further details onpreadipocyte isolation and differentiation, see ESM. Differ-entiation of cells into adipocytes was assessed throughmorphological analysis and Oil-Red-O staining. Cells inthree wells were fixed with 3.7% (vol./vol.) formaldehyde inPBS, and their triacylglycerol content was stained with 0.3%(wt/vol.) Oil-Red-O in 60% (vol./vol.) isopropanol. Afterrepeatedly washing with water, the differentiated adipocyteswere estimated by direct counting under light microscope.
156 Diabetologia (2008) 51:155–164

Cells were defined as differentiated when their cytoplasm wascompletely filled with multiple fat droplets. All experimentalanalyses on adipocytes were carried out following culture for2 days in washout DMEM/F-12 medium without insulin,dexamethasone, triiodothyronine and rosiglitazone.
RNA extraction and real-time PCR Total RNA was isolatedfrom preadipocytes, mature adipocytes and whole adiposetissue using kits (RNeasy Mini and RNeasy Lipid TissueMini, respectively; Qiagen, Hilden, Germany). The mRNAlevels of multiple proteins were analysed by quantitativereal-time RT-PCR using a 7500 real-time PCR system(Applied Biosystems, Foster City, CA, USA), as previouslydescribed [17] (see ESM for primer sequences). The mRNAlevel of each target gene was normalised using 18S asinternal control.
Measurement of adiponectin secretion and glucose up-take Adipocytes were starved for 12 h in serum-free DMEM/F10 medium containing 0.2% (wt/vol.) BSA and thenincubated for 2 h in fresh medium. A fraction of the culturemedium was removed for subsequent adiponectin evaluationby RIA using a specific assay kit (Linco Research, St Charles,MO, USA). The kit intra-assay and inter-assay CVs were 6.21and 6.90%, respectively. Adiponectin secretion is reported as
ng/ml of culture medium per μg of cell protein. Glucosetransport measurements in human adipocytes were performedas previously described [18] (see ESM).
Analysis of insulin signalling Subcutaneous and omentaladipocytes were incubated for 3 h in serum-free mediumcontaining 0.5% (wt/vol.) BSA and then stimulated with10 nmol/l insulin for the indicated times or left untreated.Then the cells were rapidly processed and analysed byimmunoblotting, as described previously [12, 18] (see ESM).
Statistical analyses Differences between the two groupswere analysed by the Student’s t test for independentsamples. For the evaluation of changes in the phosphory-lation profiles of the proteins investigated, one-wayANOVA and Tukey’s post hoc test were used. All dataare expressed as mean±SE. p values <0.05 were consideredto represent statistical significance.
Results
Adipocyte differentiation Adipocyte differentiation wasevaluated by both morphological analysis under lightmicroscopy and Oil-Red-O staining. No lipid droplets were
Subcutaneous Omental
b
c
d
ae f g
h i j
SC O0
1
3
4
2
5
SC O
Adipo
necti
n/18S
mRN
A
*
*SC O
GLUT4
/18S
mRNA
SC O0.0
1.0
2.0
3.0 **
*
0.00
0.02
1.00
2.00
3.00
SC O SC O
4.00
PPAR
γ/18S
mRN
A *
0
2
4
6
8
10
SC O SC O
GLUT1
/18S
mRNA
0.00
0.02
1.00
2.00
3.00
SC O
SC O
AP2/
18S
mRNA
*
0.0
0.4
0.8
1.2
1.6
2.0
2.4
SC O
C/EBP
α/18
S mR
NA
*
SC O
**
Fig. 1 Morphological and biochemical characteristics and geneexpression patterns of human subcutaneous (SC) and omental (O)preadipocytes and adipocytes. a–d Primary human subcutaneous andomental preadipocytes were grown to confluence and then treated withdifferentiation-inducing medium as described in the Materials andmethods section. Cells from one representative participant are shown.a Subcutaneous and omental preadipocytes, magnification, ×40; b, ccells treated with differentiation-inducing medium for 30 days,magnification, ×40 and ×10, respectively; d adipocytes stained with
Oil-Red-O, magnification, ×40. e–j Expression of fat-specific genes inpreadipocytes (white bars) and mature adipocytes (black bars). TotalRNA was extracted from preadipocytes and adipocytes, and mRNAexpression levels of PPARγ (e), C/EBPα (f), AP2 (g), adiponectin (h),GLUT4 (i) and GLUT1 (j) were determined by quantitative real-timeRT-PCR. The mRNA level was normalised for each target geneagainst 18S ribosomal RNA as internal control. Values are means±SEof cells from five independent participants performed in triplicate.*p<0.05 vs preadipocytes; †p<0.05 vs omental adipocytes
Diabetologia (2008) 51:155–164 157
present in untreated preadipocytes (Fig. 1a). However,following exposure to the differentiation medium, cellsgradually accumulated large multilocular lipid droplets(Fig. 1b–d). Lipid accumulation was clearly evident insubcutaneous and omental adipocytes, and did not differapparently between the two cell cultures (Fig. 1b–d).
mRNA levels of adipocyte transcription factors, adiponectinand glucose transporters The mRNA expression levels of
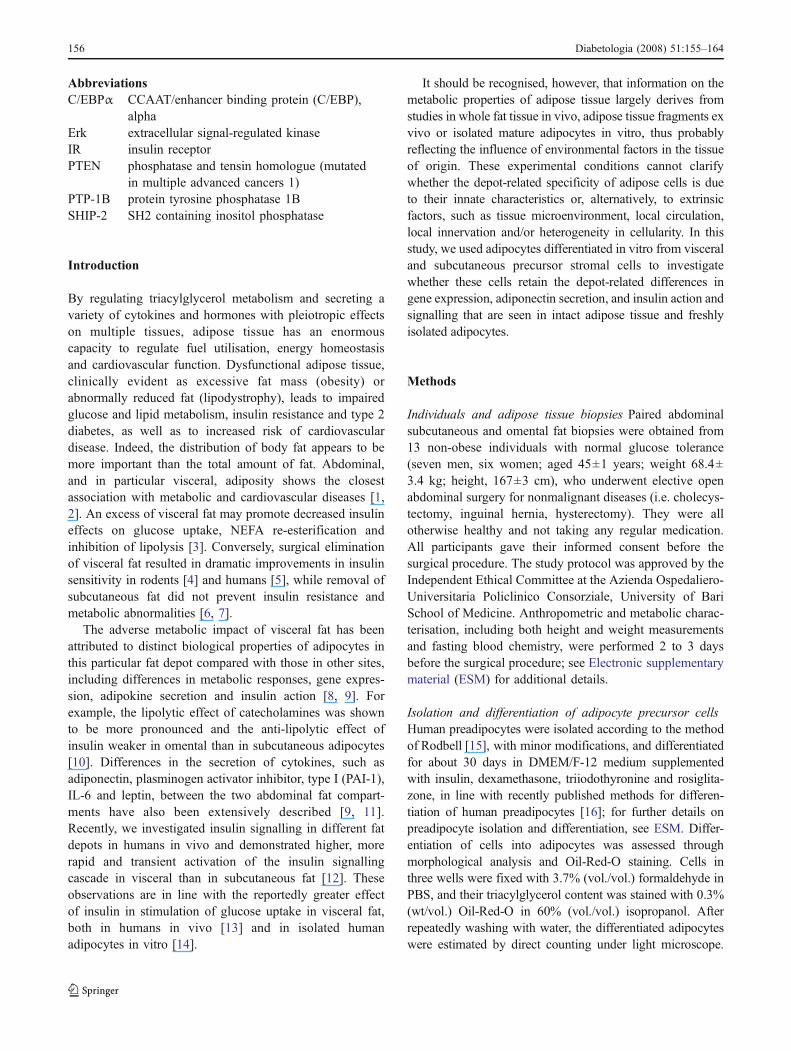
PPARγ (also known as PPARG), C/EBPα (also known asCEBPA), AP2 (also known as GTF3A), GLUT4 (alsoknown as SLC2A4) and adiponectin were undetectable insubcutaneous and omental precursor stromal cells, but werefound to be increased by several fold following differenti-ation (Fig. 1e–i). In contrast, GLUT1 (also known asSLC2A1) showed similar mRNA expression levels inundifferentiated and differentiated cells (Fig. 1j). When theexpression levels of these genes were examined in thedifferentiated adipocytes according to their fat depot-specificorigin, AP2, C/EBPα and adiponectin mRNAs were found tobe 2.0-, 1.5- and 2.8-fold more abundant, respectively, insubcutaneous than in omental adipocytes (p=0.021, p=0.029 and p=0.036 vs omental cells for AP2, C/EBPα andadiponectin, respectively) (Figs 1e–j and 2a–f). By contrast,PPARγ, GLUT4 and GLUT1 mRNA expression was foundat comparable levels in subcutaneous and omental adipo-cytes (p=0.417, p=0.164 and p=0.194 for PPARγ, GLUT4and GLUT1, respectively) (Figs 1e–j and 2a–f). Geneexpression of fat-specific genes was also analysed in freshlyisolated subcutaneous and omental adipose tissue. ThemRNAexpression levels of AP2 and adiponectin were significantlyhigher in subcutaneous than in omental adipose tissue(p=0.003 and p=0.005 vs omental tissue, respectively)(Fig. 2g,h), while those of PPARγ and GLUT4 were foundto be similarly expressed in the two fat depots (p=0.980 andp=0.993 vs omental tissue, respectively) (Fig. 2i,j).
Adiponectin secretion To determine whether depot-specificdifferences in adiponectin secretion could also be demonstrat-ed in fat cells differentiated in vitro, adiponectin concen-trations were measured in the culture medium of pairedsubcutaneous and omental cells from each participant aftercompletion of the differentiation process. Basal adiponectinrelease over 2 h was approximately threefold higher inomental than in subcutaneous adipocytes (p=0.001) (Fig. 3a).
Glucose uptake To evaluate the effects of insulin onglucose transport, subcutaneous and omental mature adipo-cytes were incubated with 10 nmol/l insulin for varioustimes, and glucose transport was measured by determiningthe rates of 2-deoxy-D-[3H]glucose uptake. Basal glucoseuptake was not different in subcutaneous and omentaladipocytes (p=0.850) (Fig. 3b). In subcutaneous adipo-cytes, a statistically significant increase in insulin-stimulat-ed glucose uptake was evident after 30 min (p=0.017 vsbasal), with a maximum effect after 60 min (Fig. 3b,c). Inomental adipocytes, a significant increase in insulin-induced glucose transport was detected at all time pointsevaluated (p=0.0001 vs basal), with a maximum effect after60 min of hormone stimulation. In addition, at the 15, 30and 60 min time-points, the magnitude of glucose transportstimulation by insulin was significantly and markedly
PPAR
γ/18S
mRN
A
01234567
SC O
*
0.0
0.4
0.8
1.2
1.6
2.0
2.4
SC O
C/EBP
α/18
S mR
NA
SC O0
1
2
3
4
5
*
AP2/
18S
mRNA
0.00.51.01.52.02.53.03.5
SC O0
2
46
8
10
12
SC OSC O01
2
3
4
5
6
*
Adipo
necti
n/18S
mRN
A
GLUT1
/18S
mRNA
GLUT4
/18S
mRNA
0.00.10.30.50.70.91.11.31.5
SCT OT
PPAR
γ/18S
mRN
A
012345678
SCT OT
aP2/
18S
mRNA
a b c
d e f
g h
i j
*
0.00.51.01.52.02.53.0
SCT OT
GLUT4
/18S
mRNA
Ad
ipone
ctin/1
8S m
RNA
0
12
3
45
SCT OT
*
Fig. 2 mRNA expression levels of fat-specific genes. a–f Quantita-tion of PPARγ (a), C/EBPα (b), AP2 (c), adiponectin (d), GLUT4 (e)and GLUT1 (f) mRNA levels was carried out by real-time RT-PCR inhuman subcutaneous (SC, circles) and omental (O, squares) adipo-cytes differentiated in vitro from precursor stromal cells, as describedin the Materials and methods section. g–j Quantitation of AP2 (g),adiponectin (h), PPARγ (i) and GLUT4 (j) mRNA levels in pairedbiopsies of human subcutaneous (SCT, circles) and omental (OT,squares) fat. mRNA levels were normalised to 18S ribosomal RNA asinternal control. The data are plotted with lines connecting the mRNAlevels of subcutaneous and omental samples from the same partic-ipants. Mean values for the overall group of subcutaneous or omentaladipocytes (n=5) and biopsies (n=8) are also indicated (horizontalbars). *p<0.05 vs omental samples
158 Diabetologia (2008) 51:155–164

greater in omental than in subcutaneous adipocytes (sixfoldvs twofold, respectively, p<0.05) (Fig. 3b,c). Next, glucosetransport was determined in subcutaneous and omentaladipocytes following incubation with various concentra-tions of insulin for 60 min. In both cell types, insulinelicited an increase in glucose transport rates with statisti-cally significant effects at 0.1 to 100 nmol/l insulin (p=0.02
and p=0.001 vs basal, for subcutaneous and omental cells,respectively) (Fig. 3d,e). All insulin doses were found toraise glucose transport to greater levels in omental than insubcutaneous adipocytes (five- to sixfold vs approximatelytwofold, respectively, p<0.05) (Fig. 3e). Furthermore,omental adipocytes showed a greater sensitivity to insulinstimulation, since an initial significant effect was evident at0.1 nmol/l insulin, whereas in subcutaneous adipose cellsglucose transport increased significantly only with 1 nmol/linsulin (Fig. 3d,e).
Insulin receptor and IRS proteins Under basal conditions,tyrosine phosphorylation of the insulin receptor (IR) β-subunit was not significantly different in subcutaneous andomental adipocytes (p=0.96) (Fig. 4a). Stimulation withinsulin resulted in a time-dependent increase in IR tyrosinephosphorylation in both fat cell types (Fig. 4a,b). Insubcutaneous adipocytes, insulin-induced IR tyrosine phos-phorylation was increased 4.2-fold at 5 min (p=0.011 vsbasal) and reached a maximum at 15 min (5.5-fold), thengradually declining towards basal levels at 120 min(Fig. 4a,b). In contrast, insulin-stimulated IR tyrosine phos-phorylation showed a rapid 5.8-fold peak at 5 min(p=0.001 vs basal), followed by a more rapid decline inomental adipocytes (Fig. 4a,b). The total amount of IRprotein, determined by immunoblotting with anti-IR anti-bodies, was similar in subcutaneous and omental fat cells(p=0.805) (Fig. 4a; and data not shown).
IRS tyrosine phosphorylation, collectively evaluated bydirect anti-phosphotyrosine immunoblotting, was not sta-tistically different in subcutaneous and omental adipocytesin the basal state (p=0.95) (Fig. 4c). Insulin markedlystimulated IRS tyrosine phosphorylation in the subcutane-ous adipocytes, in which a peak was observed at 15 min;then, IRS tyrosine phosphorylation showed a gradualdecrease, even though it remained above basal levels forup to 120 min (p=0.017 vs basal) (Fig. 4c,d). In omentaladipocytes, by contrast, insulin-induced IRS tyrosinephosphorylation exhibited a maximum increase after5 min (p=0.008 vs basal), returning to basal levels after120 min (Fig. 4c,d). Therefore, IRS tyrosine phosphorylationwas significantly lower in omental than in subcutaneousadipocytes after 120 min of insulin stimulation (p=0.017 vssubcutaneous cells) (Fig. 4d). IRS-1 protein levels were notsignificantly different in the two experimental cell cultures(p=0.45) (Fig. 4c; and data not shown). IRS-2 protein levelscould not be measured, because they were below thedetection threshold of the immunoblotting analysis in humanadipocytes (data not shown).
To assess whether the depot-specific phosphorylationkinetics of the IR and IRS proteins could be associated withdifferent cellular levels of tyrosine phosphatases, the totalprotein content of protein tyrosine phosphatase 1B (PTP-
05
1015202530
0 15 30 60 120Insulin (min)0
5
10
15
20
25
0 0.1 1 10 100Insulin (nmol/l)
**
* *
*
* * * ** * *
012345678
15 30 60 120Insulin (min)012345678
0.1 1 10 100Insulin (nmol/l)
Fold
of ins
ulin s
timula
tion
Fold
of ins
ulin s
timula
tion
*
b d
c e
0
1
2
3
4
5
Adipo
necti
n sec
retio
n rate
(ng m
l−1 [p
g pro
tein]−1
) *
SC O
a2-
DG (p
mol [m
g pr
otein
]−1 m
in−1)
2-DG
(pmo
l [mg
prot
ein]−1
min−1
)
Fig. 3 Basal adiponectin secretion (a), and basal and insulin-stimulated 2-deoxy-D-[3H]glucose (2-DG) uptake (b, d) in humansubcutaneous (SC, circles) and omental (O, squares) adipocytesdifferentiated in vitro from precursor stromal cells. a Adiponectinconcentrations were measured in duplicate 2 h after incubation inserum-free DMEM/F10 medium containing 0.2% (wt/vol.) BSA, asdescribed in the Materials and methods section. The data are plottedwith lines connecting the levels of adiponectin released from pairedsubcutaneous and omental adipocytes of independent participants (n=6). Mean values for the overall group of subcutaneous or omentaladipocytes are also indicated (horizontal bars). *p<0.05 vs SCadipocytes. b Time-course of glucose uptake rates in the absence orpresence of 10 nmol/l insulin. Experiments from six independentparticipants were carried out in triplicate. Data are expressed as mean±SE. *p<0.05 vs basal; †p<0.05 vs SC. c Fold-stimulation of glucosetransport by insulin for the time-course studies. †p<0.05 vs SC; ‡p<0.05 vs all other time-points. d Glucose uptake rates in the absence orpresence of various concentrations of insulin for 60 min. Experimentsfrom six independent participants were carried out in triplicate. Dataare expressed as means±SE. *p<0.05 vs basal; †p<0.05 vs SC. eFold-stimulation of glucose transport by insulin for the dose–responsestudies. †p<0.05 vs SC
Diabetologia (2008) 51:155–164 159

1B), SH2 containing inositol phosphatase (SHIP-2) andphosphatase and tensin homologue (mutated in multipleadvanced cancers 1) (PTEN) was determined. However,PTP-1B, SHIP-2 and PTEN protein levels were found to besimilar in subcutaneous and omental adipocytes (p=0.67,p=0.72 and p=0.81, respectively) (ESM Fig. 1).
Akt and extracellular signal-regulated kinase Basal Aktphosphorylation on Ser473 was not significantly different insubcutaneous and omental cells (p=0.95) (Fig. 5). Insulinincreased Akt phosphorylation on Ser473 by several fold insubcutaneous and omental adipocytes (p=0.001 and p=0.009vs basal in subcutaneous and omental cells, respectively)(Fig. 5a,b). However, in subcutaneous adipocytes, phosphor-ylation of Akt remained significantly higher than basal bothafter 60 and 120 min of insulin stimulation (Fig. 5a,b). Incontrast, in omental adipocytes Akt phosphorylation peakedat 15 min, returning to basal levels by 120 min (Fig. 5b).Therefore, insulin-stimulated Akt phosphorylation was higherin subcutaneous than in omental adipocytes both at 60 and120 min (p=0.032 and p=0.036 vs omental cells at thenamed time-points, respectively) (Fig. 5b). The levels of Aktphosphorylation on Thr308 were below the detection thresholdof the analysis in subcutaneous and omental adipocytes. Aktprotein levels were similar in subcutaneous and omentaladipocytes (p=0.92) (Fig. 5a,c).
Under basal conditions, phosphorylation of extracellularsignal-regulated kinase (Erk)-1/2 on Thr202 and Tyr204 was notdifferent in the subcutaneous and omental fat cell cultures(p=0.97) (Fig. 6). In adipocytes derived from subcutaneousstromal cells, the increase in Erk-1 and Erk-2 phosphorylationin response to insulin reached a tenfold peak after 15 min(p=0.001 vs basal for both Erk-1 and Erk-2), graduallydecreasing toward basal levels after 120 min (Fig. 6a,b). Bycontrast, in omental adipocytes, insulin stimulation induced amore rapid and transient increase of Erk phosphorylation,which peaked at 5 min (p=0.001 vs basal for both Erk-1 andErk-2) and then returned to basal levels at 120 min (Fig. 6a,b).Consequently, in omental compared with subcutaneous
ph-Tyr
Insulin (min) 0 5 15 30 60 120 0 5 15 30 60 120 Insulin (min) 0 5 15 30 60 120 0 5 15 30 60 120
0100200300400500600700
% of
basa
l
0 5 15 30 60 120Insulin (min)
*
a
b
0100200300400500600700800
0 5 15 30 60 120Insulin (min)
IR
SC O SC O
IRS-1
% of
basa
l
ph-Tyr
c
d
**
* * *
** *
*
*
*
Fig. 4 Insulin receptor and IRS tyrosine phosphorylation and proteincontent in human subcutaneous (SC, circles) and omental (O, squares)adipocytes differentiated in vitro from precursor stromal cells.Adipocytes were studied in the basal state and after insulin stimulationfor the indicates times. Cell lysates were subjected to immunoblottingwith specific antibodies, as described in the Materials and methodssection. (a) Representative immunoblots of tyrosine phosphorylationand protein content of IR. b Quantitation of IR tyrosine phosphory-lation in multiple experiments. *p<0.05 vs basal;
§p<0.05 vs 15 min
time-point in SC adipocytes;‡p<0.05 vs 5 min time-point in omental
adipocytes. (c) Representative immunoblots of tyrosine phosphoryla-tion of IRS proteins and protein content of IRS-1. d Quantitation ofIRS phosphorylation in multiple experiments. *p<0.05 vs basal;
†p<
0.05 vs corresponding time-point in omental adipocytes;§p<0.05 vs
15 min time-point in SC adipocytes;‡p<0.05 vs 5 min time-point in
omental adipocytes. Data (b, d) are expressed as mean±SE of pairedsubcutaneous and omental adipocytes from nine independent partic-ipants, analysed in duplicate
% of
basa
l
Insulin (min) 0 5 15 30 60 1200
10
20
30
40
50
SC O
Arbit
rary
units
0
50
100
150
200
Insulin (min) 0 5 15 30 60 120 0 5 15 30 60 120
ph-Akt (Ser473)
Akt
SC Oa
b
** *
* *
**
c
Fig. 5 Insulin stimulation of Akt phosphorylation in subcutaneousand omental adipocytes differentiated in vitro from precursor stromalcells. Subcutaneous (SC, white bars/circles) and omental (O, blackbars/squares) adipocytes were studied in the absence or presence of10 nmol/l insulin for the indicated times. Akt phosphorylation onSer
473and protein content, respectively, were evaluated by immuno-
blotting with specific antibodies, as described in the Materials andmethods section. Representative immunoblots (a) and the quantitationof Akt phosphorylation (b) and Akt protein content (c) are shown. Fordetermination of total Akt protein levels, values of basal and insulin-stimulated samples were pooled together. Data are expressed as mean±SE of paired subcutaneous and omental adipocytes from nineindependent participants, analysed in duplicate. *p<0.05 vs respectivebasal;
†p<0.05 vs corresponding time-point in omental adipocytes;
‡p<0.05 vs 15 min time-point in omental adipocytes
160 Diabetologia (2008) 51:155–164
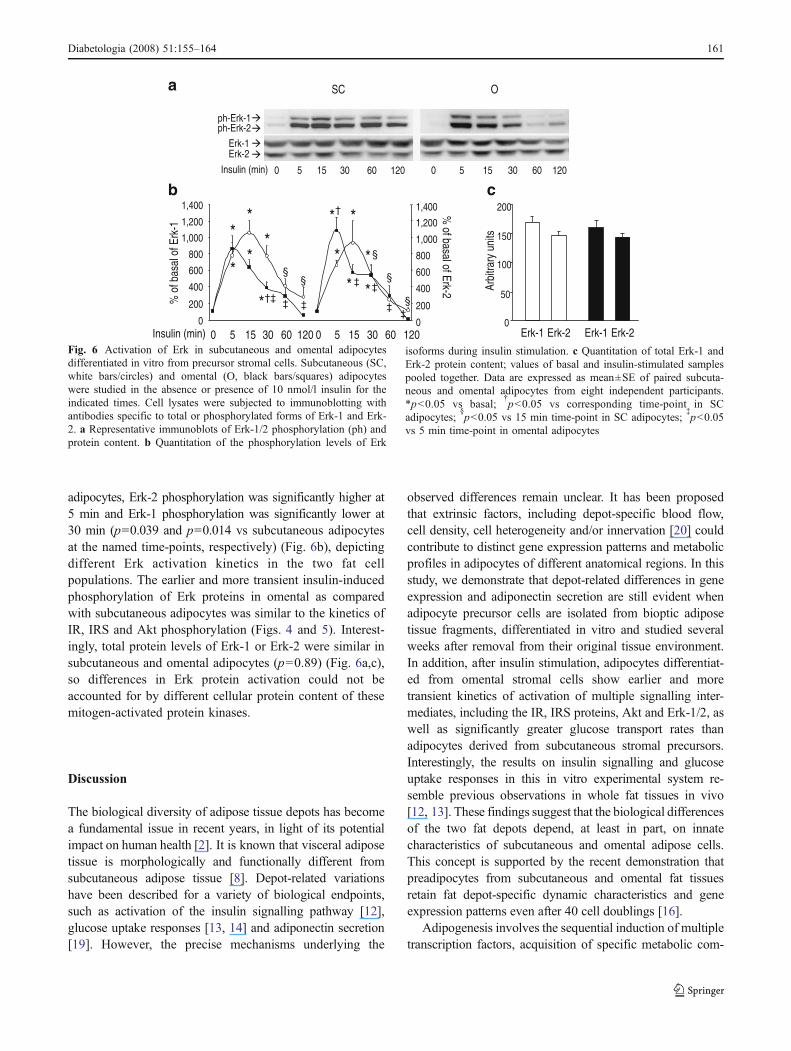
adipocytes, Erk-2 phosphorylation was significantly higher at5 min and Erk-1 phosphorylation was significantly lower at30 min (p=0.039 and p=0.014 vs subcutaneous adipocytesat the named time-points, respectively) (Fig. 6b), depictingdifferent Erk activation kinetics in the two fat cellpopulations. The earlier and more transient insulin-inducedphosphorylation of Erk proteins in omental as comparedwith subcutaneous adipocytes was similar to the kinetics ofIR, IRS and Akt phosphorylation (Figs. 4 and 5). Interest-ingly, total protein levels of Erk-1 or Erk-2 were similar insubcutaneous and omental adipocytes (p=0.89) (Fig. 6a,c),so differences in Erk protein activation could not beaccounted for by different cellular protein content of thesemitogen-activated protein kinases.
Discussion
The biological diversity of adipose tissue depots has becomea fundamental issue in recent years, in light of its potentialimpact on human health [2]. It is known that visceral adiposetissue is morphologically and functionally different fromsubcutaneous adipose tissue [8]. Depot-related variationshave been described for a variety of biological endpoints,such as activation of the insulin signalling pathway [12],glucose uptake responses [13, 14] and adiponectin secretion[19]. However, the precise mechanisms underlying the
observed differences remain unclear. It has been proposedthat extrinsic factors, including depot-specific blood flow,cell density, cell heterogeneity and/or innervation [20] couldcontribute to distinct gene expression patterns and metabolicprofiles in adipocytes of different anatomical regions. In thisstudy, we demonstrate that depot-related differences in geneexpression and adiponectin secretion are still evident whenadipocyte precursor cells are isolated from bioptic adiposetissue fragments, differentiated in vitro and studied severalweeks after removal from their original tissue environment.In addition, after insulin stimulation, adipocytes differentiat-ed from omental stromal cells show earlier and moretransient kinetics of activation of multiple signalling inter-mediates, including the IR, IRS proteins, Akt and Erk-1/2, aswell as significantly greater glucose transport rates thanadipocytes derived from subcutaneous stromal precursors.Interestingly, the results on insulin signalling and glucoseuptake responses in this in vitro experimental system re-semble previous observations in whole fat tissues in vivo[12, 13]. These findings suggest that the biological differencesof the two fat depots depend, at least in part, on innatecharacteristics of subcutaneous and omental adipose cells.This concept is supported by the recent demonstration thatpreadipocytes from subcutaneous and omental fat tissuesretain fat depot-specific dynamic characteristics and geneexpression patterns even after 40 cell doublings [16].
Adipogenesis involves the sequential induction of multipletranscription factors, acquisition of specific metabolic com-
Insulin (min) 0 5 15 30 60 120 0 5 15 30 60 120
ph-Erk-1 ph-Erk-2
0200400600800
1,0001,200
0 5 15 30 60 120Insulin (min)
% o
f bas
al of
Erk-
1
1,400 % of basal of Erk-2
0 5 15 30 60 12002004006008001,0001,2001,400
SC O
Erk-1 Erk-2
Arbit
rary
units
0
50
100
150
200
Erk-1
a
b
*
**
**
*
* *
* ** *
Erk-2 Erk-1 Erk-2
c
Fig. 6 Activation of Erk in subcutaneous and omental adipocytesdifferentiated in vitro from precursor stromal cells. Subcutaneous (SC,white bars/circles) and omental (O, black bars/squares) adipocyteswere studied in the absence or presence of 10 nmol/l insulin for theindicated times. Cell lysates were subjected to immunoblotting withantibodies specific to total or phosphorylated forms of Erk-1 and Erk-2. a Representative immunoblots of Erk-1/2 phosphorylation (ph) andprotein content. b Quantitation of the phosphorylation levels of Erk
isoforms during insulin stimulation. c Quantitation of total Erk-1 andErk-2 protein content; values of basal and insulin-stimulated samplespooled together. Data are expressed as mean±SE of paired subcuta-neous and omental adipocytes from eight independent participants.*p<0.05 vs basal;
†p<0.05 vs corresponding time-point in SC
adipocytes;§p<0.05 vs 15 min time-point in SC adipocytes;
‡p<0.05
vs 5 min time-point in omental adipocytes
Diabetologia (2008) 51:155–164 161

petences and ability to synthesise and secrete fat-specificproteins. In our experimental system, both subcutaneous andvisceral adipocytes exhibited accumulation of cytoplasmictriacylglycerol droplets and markedly increased expression ofPPARγ, C/EBPα, AP2, adiponectin and GLUT4 mRNAs, ascompared with precursor stromal cells, in line with previousreports [16]. Altogether, these findings indicate that thesubcutaneous and visceral cells completed the differentiationprocess into mature adipocytes.
C/EBPα, AP2 and PPARγ cross-regulate each other’sexpression and govern the entire adipogenic programme, bycoordinating the expression of lipogenic enzymes and otheradipocyte-specific genes [21, 22], including glycerophos-phate dehydrogenase, adiponectin and GLUT4 [23]. Incontrast to C/EBPβ (also known as CEBPB) and C/EBPδ(also known as CEBPD), whose mRNA levels increasetransiently at the onset of adipocyte differentiation,C/EBPα is induced at a subsequent phase and remainsexpressed at high levels in mature adipocytes [23].Adiponectin mRNA levels rise immediately after theincrease of C/EBPα, remaining at high levels in matureadipocytes. In this study, mRNA levels of C/EBPα andAP2 were expressed at higher levels in subcutaneousadipocytes than in omental adipose cells, in line with aprevious report [16]; adiponectin mRNA levels were alsohigher in subcutaneous adipocytes and in subcutaneous fatbiopsies (Fig. 2). This result is in contrast with the results ofothers [24], who found no differences in adiponectin geneexpression in freshly isolated subcutaneous and omentalhuman adipocytes. However, it should be noted thatsubjects in that study had a mean BMI of 46.4±2.0 kg/m2
(range, 32–58.4 kg/m2). Since CCAAT/enhancer bindingprotein (C/EBP), alpha (C/EBPα) is an important transcrip-tion factor for the human adiponectin gene [25], thedifferences in adiponectin gene expression in subcutaneouscompared with omental adipocytes may be related to thedifferent levels of C/EBPα mRNA.
Using RT-PCR primers that do not discriminate betweenthe two isoforms of peroxisome proliferator-activatedreceptor gamma (PPARγ), i.e. γ1 and γ2, PPARγ mRNAlevels were found to be similar in subcutaneous andomental adipocytes, in line with results obtained in bothwhole fat tissue specimens and isolated adipocytes in thisstudy and elsewhere [26–28]. This finding is apparently incontrast with the reportedly higher levels of PPARγ foundin subcutaneous compared with visceral adipocytes differ-entiated in vitro in the study by Tchkonia et al. [16].However, in that previous study adipocytes were analysed15 days after induction of differentiation, whereas in thisstudy they were studied after a longer time.
Similarly to PPARγ, mRNA expression levels of GLUT1and GLUT4 did not vary significantly between omental andsubcutaneous adipocytes. However,GLUT4 mRNAwas found
to be slightly higher in subcutaneous than in omentaladipocytes, even though this difference was not statisticallysignificant, a finding which is analogous to previousobservations in adipose tissue fragments isolated fromsubcutaneous and omental fat depots [29]. On the other hand,GLUT1 was already expressed at high levels in preadipocytesand did not show prominent changes with differentiation, inline with similar observations in 3T3-L1 cells [30].
In previous studies on isolated fat cells, visceraladipocytes exhibited a higher adiponectin release thansubcutaneous adipocytes, both in the basal state (althoughnot significantly) and following insulin or thiazolidinedioneincubation [19]. In this study, the rates of adiponectinsecretion were approximately threefold higher in theadipocytes differentiated from omental than from subcuta-neous precursors. The apparent discrepancy betweenchanges in adiponectin mRNA expression, which wasfound to be higher in subcutaneous-derived adipocytesand in subcutaneous fat biopsies (Fig. 2), and changes inadiponectin protein release in the culture medium, whichwas higher in omental cells (Fig. 3a), suggests thatadiponectin gene expression and protein secretion may beregulated differently in specific fat depots. Indeed, adipo-nectin gene expression is under the transcriptional controlof C/EBPα [25], which was found to be expressed at higherlevels in subcutaneous than in omental adipocytes (Fig. 2a),whereas adiponectin secretion can be regulated by otherfactors, including insulin, as shown in 3T3-L1 adipocytes[31, 32]. Whether more rapid insulin signalling responses,as observed in omental compared with subcutaneousadipocytes, may result in faster adiponectin secretion rateswill be the focus of future studies. Additionally, it has beenrecently demonstrated that the intracellular deacetylasesirtuin (silent mating type information regulation 2 homo-logue) 1 (S. cerevisiae) (SIRT1) stimulates adiponectin genetranscription by cooperating with forkhead box O1(FOXO1) and C/EBPα [33], while it suppresses adiponec-tin secretion [34]. Thus, it will also be interesting toinvestigate whether SIRT1 may be differently expressedand/or activated in visceral than in subcutaneous fat depots.
Insulin-stimulated glucose transport was also found to behigher, by approximately two- to threefold, in omental thanin subcutaneous adipocytes. This finding is again inaccordance with earlier studies in whole fat tissues inhumans in vivo [13] and isolated human adipocytes in vitro[14], which demonstrated twofold greater rates of insulin-stimulated glucose uptake in the visceral fat depot. Thus,regional variations between visceral and subcutaneousadipocytes, including differences in adiponectin releaseand glucose metabolism, appear to be preserved in culturesof stromal cells differentiated into mature adipocytes invitro, suggesting the existence of intrinsic traits ofsubcutaneous- and visceral-oriented fat cells.
162 Diabetologia (2008) 51:155–164

In omental adipocytes, insulin induced a more rapid andtransient activation of IR, IRS proteins, Akt and Erk-1/2compared with subcutaneous cells, in which activation ofthese proteins was more gradual and somewhat sustained.These results strikingly recall the distinct temporal profileof activation of the same insulin signalling proteinsobserved in human omental and subcutaneous fat depotsin response to insulin administration intravenously in vivo[12]. In that previous study, omental fat showed maximumincreases in IR, Akt and Erk phosphorylation 6 min afterinsulin injection, with subsequent decreases at 30 min,whereas in subcutaneous fat activation of insulin signallingreached its maximum 30 min after insulin stimulation [12].The phosphorylation levels of specific signalling proteins,such as the IR and Erk-1/2, were found to be higher inomental than in subcutaneous fat in the in vivo study [12],whereas in this study the omental and subcutaneousadipocytes differentiated in vitro exhibited different tempo-ral profiles but similar magnitude of activation of allsignalling reactions. It should be noted, however, thatomental fat tissue as a whole is characterised by higherprotein content of IR and Erk-1/2 than that found insubcutaneous fat and that the differences in the extent ofphosphorylation between the two fat depots are minimisedwhen they are normalised per amount of protein [12]. Themore rapid and less persistent phosphorylation profile of theIR and downstream signalling molecules in response toinsulin stimulation in omental adipocytes could be potentiallyexplained by higher levels of specific phosphotyrosinephosphatases. However, we found comparable protein con-tent of PTP-1B, SHIP-2 or PTEN in subcutaneous vs omentaladipocytes (see ESM Fig. 1). It is possible that differences inspecific phosphatase activities and/or the involvement ofother, as yet unknown phosphatases, may contribute to thedifferent signalling kinetics in the two fat cell types.
In conclusion, even when differentiated in vitro, subcu-taneous and omental adipose cells retain fat depot-specificcharacteristics in gene expression, adiponectin release, andinsulin signalling and action. It is tempting to speculate thatthere may be an early commitment of fat precursor stromalcells towards a depot-oriented differentiation, which mayprecede and be independent of extrinsic influences from thetissue environment. Additional studies are needed toelucidate how extrinsic and environmental factors interactwith the innate properties of adipocytes under normalconditions and in disease states.
Acknowledgements This work was supported by grants from theMinistero dell’Università e Ricerca (Italy), the Cofinlab 2000—Centrodi Eccellenza ‘Genomica comparata: geni coinvolti in processifisiopatologici in campo biomedico e agrario’ (Italy) and grants fromPfizer Italia (ARADO Programme) and Novo Nordisk (LIBRAProgramme) to F. Giorgino.
Duality of interest The authors declare that there is no duality ofinterest associated with this manuscript.
References
1. Evans DJ, Hoffmann RG, Kalkhoff RK, Kissebah AH (2001)Relationship of body fat topography to insulin sensitivity andmetabolic profiles in premenopausal women. Metabolism 33:68–75
2. Despres JP (2001) Health consequences of visceral obesity. AnnMed 33:534–541
3. Gastaldelli A, Miyazaki Y, Pettiti M et al (2001) Metabolic effectsof visceral fat accumulation in type 2 diabetes. J Clin EndocrinolMetab 87:5098–5103
4. Gabriely I, Ma XH, Yang XM et al (2002) Removal of visceral fatprevents insulin resistance and glucose intolerance of aging: anadipokine-mediated process? Diabetes 51:2951–2958
5. Thorne A, Lonnqvist F, Apelman J, Hellers G, Arner P (2002) Apilot study of long-term effects of a novel obesity treatment:omentectomy in connection with adjustable gastric banding. Int JObes Relat Metab Disord 26:193–199
6. Cases JA, Barzilai N (2000) The regulation of body fatdistribution and the modulation of insulin action. Int J Obes RelatMetab Disord 24:S63–S66
7. Klein S, Fontana L, Young VL et al (2004) Absence of an effectof liposuction on insulin action and risk factors for coronary heartdisease. N Engl J Med 350:2549–2557
8. Wajchenberg BL (2000) Subcutaneous and visceral adipose tissue:their relation to the metabolic syndrome. Endocr Rev 21:697–738
9. Giorgino F, Laviola L, Eriksson JW (2005) Regional differencesof insulin action in adipose tissue: insights from in vivo and invitro studies. Acta Physiol Scand 183:13–30
10. Zierath JR, Livingston JN, Thorne A et al (1998) Regionaldifference in insulin inhibition of non-esterified fatty acid releasefrom human adipocytes: relation to insulin receptor phosphoryla-tion and intracellular signalling through the insulin receptorsubstrate-1 pathway. Diabetologia 41:1343–1354
11. Sjoholm K, Palming J, Olofsson LE et al (2005) A microarraysearch for genes predominantly expressed in human omentaladipocytes: adipose tissue as a major production site of serumamyloid A. J Clin Endocrinol Metab 90:2233–2239
12. Laviola L, Perrini S, Cignarelli A et al (2006) Insulin signaling inhuman visceral and subcutaneous adipose tissue in vivo. Diabetes55:952–961
13. Virtanen KA, Lonnroth P, Parkkola R et al (2002) Glucose uptakeand perfusion in subcutaneous and visceral adipose tissue duringinsulin stimulation in nonobese and obese humans. J ClinEndocrinol Metab 87:3902–3910
14. Lundgren M, Buren J, Ruge T, Myrnas T, Eriksson JW (2004)Glucocorticoids down-regulate glucose uptake capacity andinsulin-signaling proteins in omental but not subcutaneous humanadipocytes. J Clin Endocrinol Metab 89:2989–2997
15. RodbellM (1964)Metabolism of isolated fat cells. Effects of hormoneson glucose metabolism and lipolysis. J Biol Chem 239:375–380
16. Tchkonia T, Giorgadze N, Pirtskhalava T et al (2006) Fat depot-specific characteristics are retained in strains derived from singlehuman preadipocytes. Diabetes 55:2571–2578
17. Kramer DK, Al-Khalili L, Perrini S et al (2005) Direct activationof glucose transport in primary human myotubes after activationof peroxisome proliferator-activated receptor delta. Diabetes54:1157–1163
18. Perrini S, Natalicchio A, Laviola L et al (2004) Dehydroepian-drosterone stimulates glucose uptake in human and murineadipocytes by inducing GLUT1 and GLUT4 translocation to theplasma membrane. Diabetes 53:41–52
Diabetologia (2008) 51:155–164 163

19. Motoshima H, Wu X, Sinha MK et al (2000) Differentialregulation of adiponectin secretion from cultured human omentaland subcutaneous adipocytes: effects of insulin and rosiglitazone.J Clin Endocrinol Metab 87:5662–5667
20. Hausman GJ, Hausman DB (2006) Search for the preadipocyteprogenitor cell. J Clin Invest 116:3103–3106
21. Rosen ED, Walkey CJ, Puigserver P, Spiegelman BM (2000)Transcriptional regulation of adipogenesis. Genes Dev 14:1293–1307
22. Gregoire FM, Smas CM, Sul HS (1998) Understanding adipocytedifferentiation. Physiol Rev 78:783–809
23. Tang QQ, Zhang JW, Lane DM (2004) Sequential gene promoterinteractions by C/EBPbeta, C/EBPalpha, and PPARgamma duringadipogenesis. Biochem Biophys Res Commun 318:213–218
24. Degawa-Yamauchi M, Moss KA, Bovenkerk JE et al (2005)Regulation of adiponectin expression in human adipocytes: effectsof adiposity, glucocorticoids, and tumor necrosis factor alpha.Obes Res 13:662–669
25. Qiao L, Maclean PS, Schaack J et al (2005) C/EBPalpha regulateshuman adiponectin gene transcription through an intronic enhancer.Diabetes 54:1744–1754
26. Quinkler M, Bujalska IJ, Tomlinson JW, Smith DM, Stewart PM(2006) Depot-specific prostaglandin synthesis in human adipose tissue:a novel possible mechanism of adipogenesis. Gene 380:137–143
27. Bower JF, Davis JM, Hao E, Barakat HA (2006) Differences intransport of fatty acids and expression of fatty acid transporting
proteins in adipose tissue of obese black and white women. Am JPhysiol Endocrinol Metab 290:E87–E91
28. Montague CT, Prins JB, Sanders L et al (1998) Depot-related geneexpression in human subcutaneous and omental adipocytes.Diabetes 47:1384–1391
29. Marette A, Mauriege P, Marcotte B et al (1997) Regional variationin adipose tissue insulin action and GLUT4 glucose transporterexpression in severely obese premenopausal women. Diabetologia40:590–598
30. Weiland M, Schermann A, Schmidt WE et al (1990) Developmentof the hormone-sensitive glucose transport activity in differenti-ating 3T3 L1 murine fibroblasts. Role of the two transporterspecies and their subcellular localization. Biochem J 270:331–336
31. Scherer PE, Williams S, Fogliano M et al (1995) A novel serumprotein similar to C1q, produced exclusively in adipocytes. J BiolChem 270:26746–26749
32. Bogan JS, Lodish HF (1999) Two compartments for insulin-stimulated exocytosis in 3T3-L1 adipocytes defined by endoge-nous ACRP30 and GLUT4. J Cell Biol 146:609–620
33. Qiao L, Shao J (2006) SIRT1 regulates adiponectin geneexpression through Foxo1-C/enhancer-binding protein alphatranscriptional complex. J Biol Chem 281:39915–39924
34. Qiang L, Wang H, Farmer SR (2007) Adiponectin secretion isregulated by SIRT1 and the endoplasmic reticulum oxidoreductaseEro1-L alpha. Mol Cell Biol 27:4698–4707
164 Diabetologia (2008) 51:155–164
Related Documents

![Involvement of adiponectin in age-related increases in ... · adiponectin levels in humans [12]. Adiponectin is a 30-kDa multimeric protein that is mainly secreted by white adipose](https://static.cupdf.com/doc/110x72/5fd0b8fc0e3ec754280fd3af/involvement-of-adiponectin-in-age-related-increases-in-adiponectin-levels-in.jpg)