M.Sandoval October 29, 2012 Fast Food Commercials & Nutrition familyconsumersciences.com/2012/10/fast-food-commercials-nutrition/ This lesson compels students to analyze fast food marketing practices specifically the marketing efforts aimed at children and teenagers. Using Neilsen commercial data, students answer a variety of questions and draw their own conclusions. Time Frame: 1 Block + homework Objective Analyze current trends in food product development and marketing targeted to children & teenagers. 14.1 Analyze factors that influence nutrition and wellness practices across the life span. Set Have students work in pairs to answer the fast food nutrition quiz questions. Go over the answers as a class asking for any correct answer(s) that surprised students. Materials Neilsen Fast Food Facts Marketing Rankings Fast Food Baby Activities Watch Fast Food Baby Documentary (you can watch this for free on YouTube in multiple parts) Students should read through the Neilsen fast food facts marketing rankings and answer the questions on the “Fast Food Worksheet.” Evaluation Homework: Fast Food Commercials Assignment. Have students watch 2 hours of television and track & analyze the food commercials. Chart provided in the assignment document. Extensions Have students create an infographic chart ranking fast food restaurant’s use and proficiency in social media. To give you an idea of what this looks like check out one version on the Huffington Post. Attachments

Welcome message from author
This document is posted to help you gain knowledge. Please leave a comment to let me know what you think about it! Share it to your friends and learn new things together.
Transcript

M.Sandoval October 29, 2012
Fast Food Commercials & Nutritionfamilyconsumersciences.com/2012/10/fast-food-commercials-nutrition/
This lesson compels students to analyze fast food marketingpractices specifically the marketing efforts aimed at childrenand teenagers. Using Neilsen commercial data, students answer a variety of questions and draw their ownconclusions.
Time Frame: 1 Block + homework
Objective
Analyze current trends in food product development and marketing targeted to children & teenagers.
14.1 Analyze factors that influence nutrition and wellness practices across the life span.
Set
Have students work in pairs to answer the fast food nutrition quiz questions. Go over the answers as a classasking for any correct answer(s) that surprised students.
Materials
Neilsen Fast Food Facts Marketing Rankings
Fast Food Baby
Activities
Watch Fast Food Baby Documentary (you can watch this for free on YouTube in multiple parts)
Students should read through the Neilsen fast food facts marketing rankings and answer the questions onthe “Fast Food Worksheet.”
Evaluation
Homework: Fast Food Commercials Assignment. Have students watch 2 hours of television and track &analyze the food commercials. Chart provided in the assignment document.
Extensions
Have students create an infographic chart ranking fast food restaurant’s use and proficiency in social media.To give you an idea of what this looks like check out one version on the Huffington Post.
Attachments
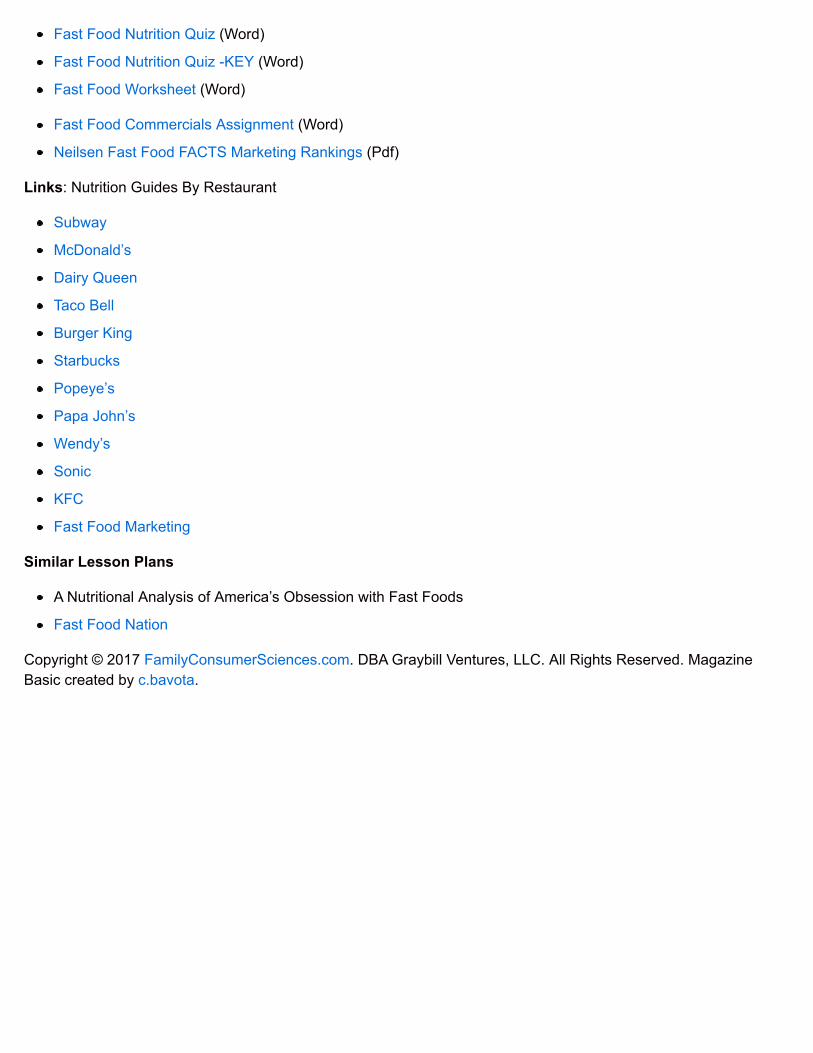
Fast Food Nutrition Quiz (Word)
Fast Food Nutrition Quiz -KEY (Word)
Fast Food Worksheet (Word)
Fast Food Commercials Assignment (Word)
Neilsen Fast Food FACTS Marketing Rankings (Pdf)
Links: Nutrition Guides By Restaurant
Subway
McDonald’s
Dairy Queen
Taco Bell
Burger King
Starbucks
Popeye’s
Papa John’s
Wendy’s
Sonic
KFC
Fast Food Marketing
Similar Lesson Plans
A Nutritional Analysis of America’s Obsession with Fast Foods
Fast Food Nation
Copyright © 2017 FamilyConsumerSciences.com. DBA Graybill Ventures, LLC. All Rights Reserved. MagazineBasic created by c.bavota.
2012 Page1
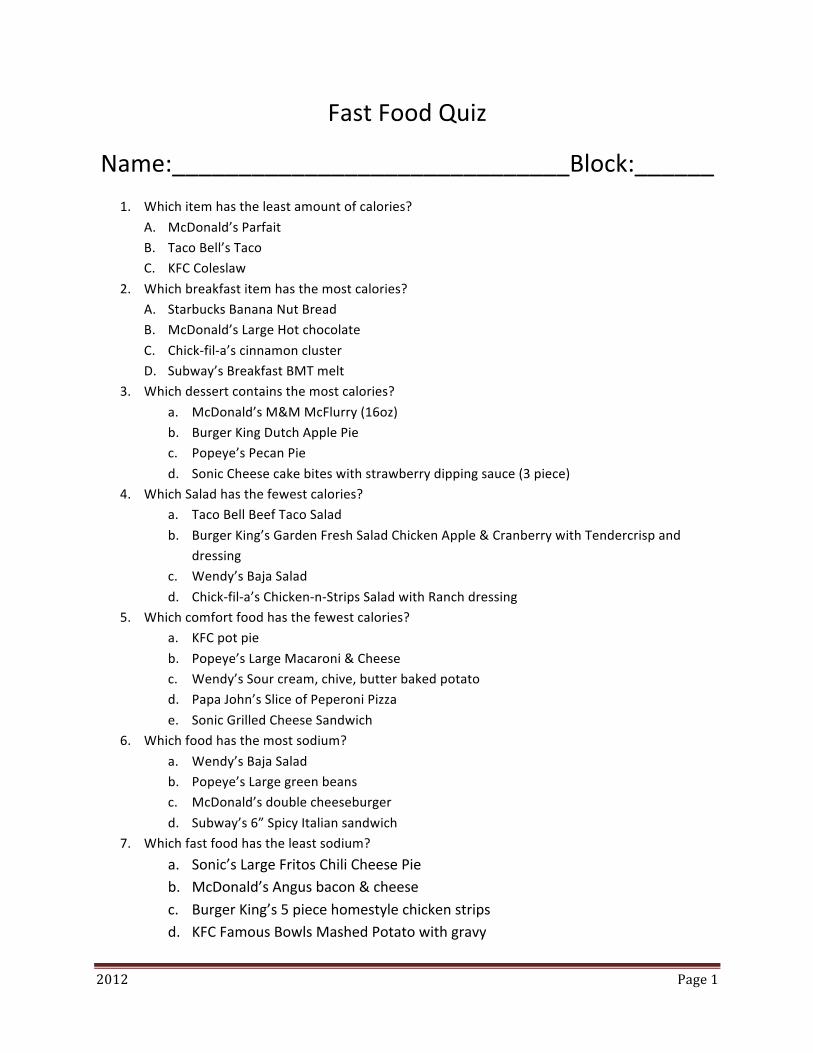
FastFoodQuiz
Name:______________________________Block:______1. Whichitemhastheleastamountofcalories?
A. McDonald’sParfaitB. TacoBell’sTacoC. KFCColeslaw
2. Whichbreakfastitemhasthemostcalories?A. StarbucksBananaNutBreadB. McDonald’sLargeHotchocolateC. Chick-fil-a’scinnamonclusterD. Subway’sBreakfastBMTmelt
3. Whichdessertcontainsthemostcalories?a. McDonald’sM&MMcFlurry(16oz)b. BurgerKingDutchApplePiec. Popeye’sPecanPied. SonicCheesecakebiteswithstrawberrydippingsauce(3piece)
4. WhichSaladhasthefewestcalories?a. TacoBellBeefTacoSaladb. BurgerKing’sGardenFreshSaladChickenApple&CranberrywithTendercrispand
dressingc. Wendy’sBajaSaladd. Chick-fil-a’sChicken-n-StripsSaladwithRanchdressing
5. Whichcomfortfoodhasthefewestcalories?a. KFCpotpieb. Popeye’sLargeMacaroni&Cheesec. Wendy’sSourcream,chive,butterbakedpotatod. PapaJohn’sSliceofPeperoniPizzae. SonicGrilledCheeseSandwich
6. Whichfoodhasthemostsodium?a. Wendy’sBajaSaladb. Popeye’sLargegreenbeansc. McDonald’sdoublecheeseburgerd. Subway’s6”SpicyItaliansandwich
7. Whichfastfoodhastheleastsodium?a. Sonic’sLargeFritosChiliCheesePieb. McDonald’sAngusbacon&cheesec. BurgerKing’s5piecehomestylechickenstripsd. KFCFamousBowlsMashedPotatowithgravy

2012 Page2
8. Rankthesesandwichesfromleasttomostcalories:
a. Subway6”BigPhillycheesesteakb. BurgerKing’sveggieburgerwithcheesec. McDonald’sBigMacd. Wendy’sJuniorBaconCheeseburgere. DairyQueen1/4lbGrillburgerwithcheesef. Sonic’sCheeseburgerwithMayo
9. Rankthesebeveragesfromleasttogreatestgramsofsugar?
a. SonicLargeHotfudgeShakeb. Wendy’sLargeChocolateFrostyShakec. Popeye’s22ozMountainDewd. BurgerKing’sLargeRaspberrySmoothiee. McDonald’sMinuteMaidOrangeJuice(16oz)f. Starbuck’sVentiIcedCarmelMacchiattog. DairyQueenLargeCoca-colah. Chick-fil-a’sSmalllemonade
10. Whichcompany’ssmallsoftserveicecreamconecontainsthesmallestportionby
weight?a. McDonald’sb. DairyQueenc. BurgerKingd. Sonic
11. Whatisyourfavoritefastfoodmeal?Howmanycaloriesdoyouthinkeachitemhasand
howmanyintotal?

2012 Page1
FastFoodQuiz-KEY
Name:______________________________Block:______1. Whichitemhastheleastamountofcalories?
A. McDonald’sParfait(150)B. TacoBell’sTaco(170)C. KFCColeslaw(180)
2. Whichbreakfastitemhasthemostcalories?A. StarbucksBananaNutBread(490)B. McDonald’sLargeHotchocolate(460)C. Chick-fil-a’scinnamoncluster(430)D. Subway’sBreakfastBMTmelt(240)
3. Whichdessertcontainsthemostcalories?a. McDonald’sM&MMcFlurry(16oz)(930)b. BurgerKingDutchApplePie(340)c. Popeye’sPecanPie(410)d. SonicCheesecakebiteswithstrawberrydippingsauce(3piece)(500)
4. WhichSaladhasthefewestcalories?a. TacoBellBeefTacoSalad(780)b. BurgerKing’sGardenFreshSaladChickenApple&CranberrywithTendercrispand
dressing(700)c. Wendy’sBajaSalad(720)d. Chick-fil-a’sChicken-n-StripsSaladwithRanchdressing(560)
5. Whichcomfortfoodhasthefewestcalories?a. KFCpotpie(790)b. Popeye’sLargeMacaroni&Cheese(600)c. Wendy’sSourcream,chive,butterbakedpotato(370)d. PapaJohn’sSliceofPeperoniPizza(330)e. SonicGrilledCheeseSandwich(410)
6. Whichfoodhasthemostsodium?a. Wendy’sBajaSalad(1600)b. Popeye’sLargegreenbeans(1260)c. McDonald’sdoublecheeseburger(1120)d. Subway’s6”SpicyItaliansandwich(1520)
7. Whichfastfoodhastheleastsodium?a. Sonic’sLargeFritosChiliCheesePie(1780)b. McDonald’sAngusbacon&cheese(2070)c. BurgerKing’s5piecehomestylechickenstrips(2340)d. KFCFamousBowlsMashedPotatowithgravy(2130)

2012 Page2
8. Rankthesesandwichesfromleasttomostcalories:
a. Subway6”BigPhillycheesesteak(600)5b. BurgerKing’sveggieburgerwithcheese(450)2c. McDonald’sBigMac(550)4d. Wendy’sJuniorBaconCheeseburger(400)1e. DairyQueen1/4lbGrillburgerwithcheese(540)3f. Sonic’sCheeseburgerwithMayo(800)6
9. Rankthesebeveragesfromleasttogreatestgramsofsugar?
a. SonicLargeHotfudgeShake(168)8b. Wendy’sLargeChocolateFrostyShake(148)7c. Popeye’s22ozMountainDew(77)4d. BurgerKing’sLargeRaspberrySmoothie(87)6e. McDonald’sMinuteMaidOrangeJuice(16oz)(39)1f. Starbuck’sVentiIcedCarmelMacchiatto(46)3g. DairyQueenLargeCoca-cola(85)5h. Chick-fil-a’sSmalllemonade(43)2
10. Whichcompany’ssmallsoftserveicecreamconecontainsthesmallestportionby
weight?a. McDonald’s(105g)b. DairyQueen(142g)c. BurgerKing(100g)d. Sonic(133g)
11. Whatisyourfavoritefastfoodmeal?Howmanycaloriesdoyouthinkeachitemhasand
howmanyintotal?
www.FamilyConsumerSciences.com
Fast Food Worksheet Directions:UsingtheNielsenstudyanswerthequestionsbelow
1. Whichrestaurant’swebsitehadthemostvisitsbykids2-11yearsold?
2. WhichrestaurantadvertisesthemostonSpanishtelevisionchannels?
3. Whichrestaurantisadvertisestheproductcategory“healthyoptions”themosttoteensages12-17?
4. Whatproductismostadvertisedtokidsages2-5yearsold?
5. Whataretheconsequencesofadvertisingtochildren?Docompanieshaveanymoralresponsibilityinwhattheyadvertisetochildren?
6. Whatareyourrecommendationstofastfoodrestaurantsasitrelatestoprovidinghealthychoices?
7. Ifyouwereafoodscientist/productdeveloperateachofthefollowingfastfoodchainswhathealthyoptionswouldyouoffercustomers?
TacoBell:
Wendy’s:
KFC:
8. Inyouropinionwhatisthehealthiestfastfoodoptionoutthere?Whatchainandwhatdoyouorder?Whatishealthyaboutyourrecommendedoption?(e.g.fat,sodium,calories,fiber,etc)

www.FamilyConsumerSciences.com
FastFoodCommercialsAssignment:Canthisreallybehomework?
Watchtwohoursoftelevision(preferablyonestation).Usingthechartbelowtallythenumberoffoodcommercialspayingcloseattentiontothetargetaudience(gender,age,ethnicity,income,etc.)andthemessageeachcommercialissending.
Name:_________________________________Block:_______________TheChanelIwatchedwas:__________________________________
StartTime:______________________ EndTime:_________________________
Company/Product TargetAge TargetGender TargetEthnicityand/orIncomeLevel
Underlyingmessage TallyNumberoftimesshownin2hours

FAST FOOD MARKETING RANKINGS
Fast food restaurants use many different forms of marketing to advertise their products. Find out how the restaurants rank on these specific types of marketing.
Click on the links belowto find out which restaurants are the best and worst
offenders when it comes to various types of marketing.
TV Advertising Exposure: Children & Teens
TV Advertising Exposure: African American and Hispanic Youth
Restaurant Website Exposure
Internet Banner Advertising Exposure
Social Media Exposure
Radio Advertising Exposure

Fast Food FACTS 153
Ranking Table 5
Television advertising exposure to children by product categoryRanking by ads viewed for children (ages 6-11 years)
Includes average number of advertisements viewed by children in 2009 on national (network, cable and syndicated) television
advertising exposure: advertising exposure: Targeted ratio: Targeted ratio: Rank Restaurant Product type Preschoolers 2-5 years Children 6-11 years Preschoolers to adults Children to adults
1 McDonald’s Kids’meals 169 192 4.73 5.40
2 BurgerKing Kids’meals 102 125 4.09 5.00
3 McDonald’s Brandingonly 61 70 2.58 2.99
4 PizzaHut Lunch/dinneritems 39 49 0.35 0.43
5 TacoBell Lunch/dinneritems 36 49 0.35 0.49
6 KFC Value/combomeals 38 48 0.34 0.44
7 Domino’s Lunch/dinneritems 36 47 0.38 0.51
8 BurgerKing Lunch/dinneritems 34 43 0.35 0.45
9 Wendy’s Lunch/dinneritems 33 42 0.36 0.46
10 Subway Kids’meals 25 32 5.60 7.23
11 McDonald’s Lunch/dinneritems 23 31 0.48 0.64
12 Subway Value/combomeals 23 30 0.35 0.48
13 Subway Healthyoptions 19 26 0.47 0.64
14 Sonic Value/combomeals 15 20 0.36 0.50
15 DairyQueen Snacks 11 15 0.44 0.63
16 McDonald’s Coffeedrinks 11 15 0.34 0.46
17 McDonald’s Value/combomeals 12 15 0.36 0.44
18 Subway Lunch/dinneritems 11 15 0.38 0.50
19 KFC Lunch/dinneritems 11 14 0.33 0.45
20 PizzaHut Value/combomeals 8 11 0.39 0.53
21 BurgerKing Value/combomeals 7 8 0.33 0.43
22 Wendy’s Value/combomeals 7 8 0.41 0.50
23 Dunkin’Donuts Snacks 6 8 0.27 0.35
24 Subway Promotiononly 6 8 0.38 0.53
25 Sonic Snacks 5 8 0.37 0.52
26 BurgerKing Promotiononly 5 7 0.37 0.58
27 DairyQueen Value/combomeals 5 7 0.37 0.48
28 McDonald’s Promotiononly 6 7 0.40 0.50
29 Domino’s Snacks 5 6 0.51 0.68
30 Sonic Lunch/dinnerItems 4 5 0.36 0.52
Most
continued

Fast Food FACTS 154
Ranking Table 5
Least
continued
advertising exposure: advertising exposure: Targeted ratio: Targeted ratio: Rank Restaurant Product type Preschoolers 2-5 years Children 6-11 years Preschoolers to adults Children to adults
31 TacoBell Value/combomeals 4 5 0.36 0.50
32 Wendy’s Snacks 4 5 0.34 0.41
33 KFC Healthyoptions 4 5 0.43 0.49
34 TacoBell Snacks 3 4 0.42 0.63
35 McDonald’s Breakfast 4 4 0.39 0.45
36 BurgerKing Snacks 2 3 0.35 0.48
37 Dunkin’Donuts Coffeedrinks 3 3 0.27 0.35
38 McDonald’s Snacks 2 3 0.38 0.48
39 Dunkin’Donuts Breakfast 2 3 0.29 0.38
40 BurgerKing Breakfast 2 3 0.34 0.45
41 McDonald’s Healthyoptions 1 2 1.82 2.17
42 Dunkin’Donuts Healthyoptions 1 1 0.25 0.32
43 DairyQueen Lunch/dinneritems 1 1 0.47 0.71
44 Subway Snacks 1 1 0.50 0.69
45 Starbucks Coffeedrinks 1 1 0.25 0.27
46 TacoBell Healthyoptions 0 1 0.40 0.62
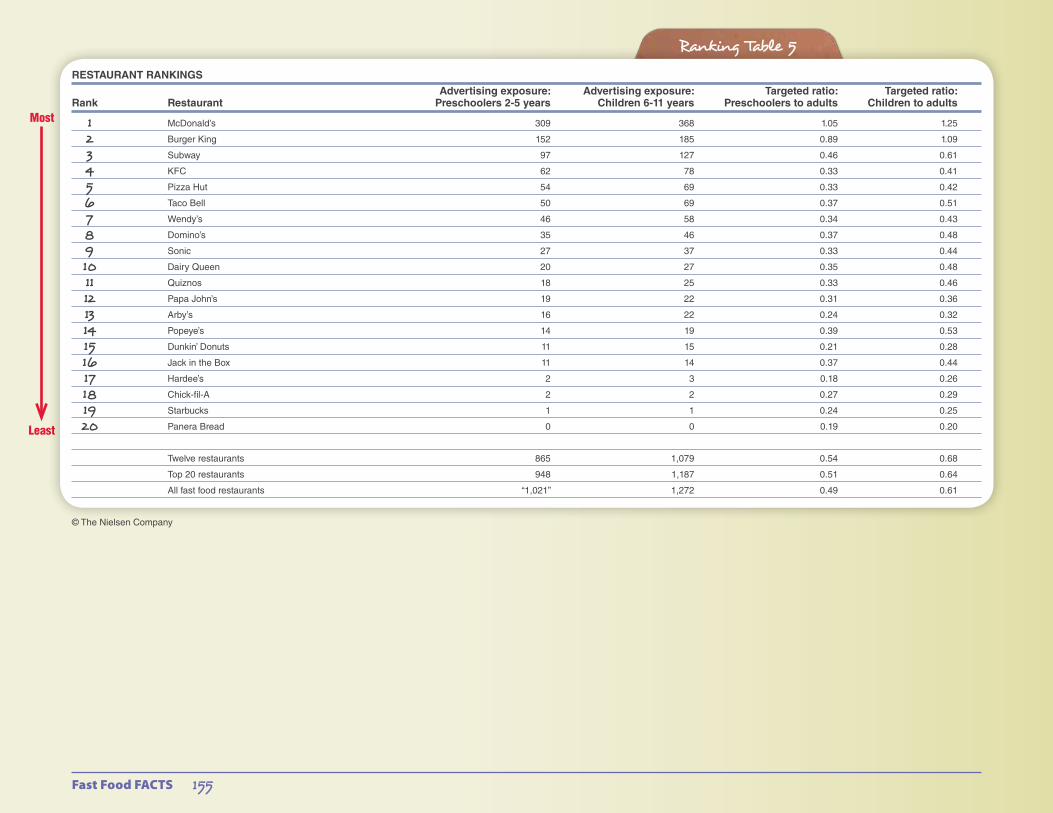
Fast Food FACTS 155
Ranking Table 5
Most
Least
ReSTauRaNT RaNkINgS
advertising exposure: advertising exposure: Targeted ratio: Targeted ratio: Rank Restaurant Preschoolers 2-5 years Children 6-11 years Preschoolers to adults Children to adults
1 McDonald’s 309 368 1.05 1.25
2 BurgerKing 152 185 0.89 1.09
3 Subway 97 127 0.46 0.61
4 KFC 62 78 0.33 0.41
5 PizzaHut 54 69 0.33 0.42
6 TacoBell 50 69 0.37 0.51
7 Wendy’s 46 58 0.34 0.43
8 Domino’s 35 46 0.37 0.48
9 Sonic 27 37 0.33 0.44
10 DairyQueen 20 27 0.35 0.48
11 Quiznos 18 25 0.33 0.46
12 PapaJohn’s 19 22 0.31 0.36
13 Arby’s 16 22 0.24 0.32
14 Popeye’s 14 19 0.39 0.53
15 Dunkin’Donuts 11 15 0.21 0.28
16 JackintheBox 11 14 0.37 0.44
17 Hardee’s 2 3 0.18 0.26
18 Chick-fil-A 2 2 0.27 0.29
19 Starbucks 1 1 0.24 0.25
20 PaneraBread 0 0 0.19 0.20
Twelverestaurants 865 1,079 0.54 0.68
Top20restaurants 948 1,187 0.51 0.64
Allfastfoodrestaurants “1,021” 1,272 0.49 0.61
©TheNielsenCompany
Fast Food FACTS 156
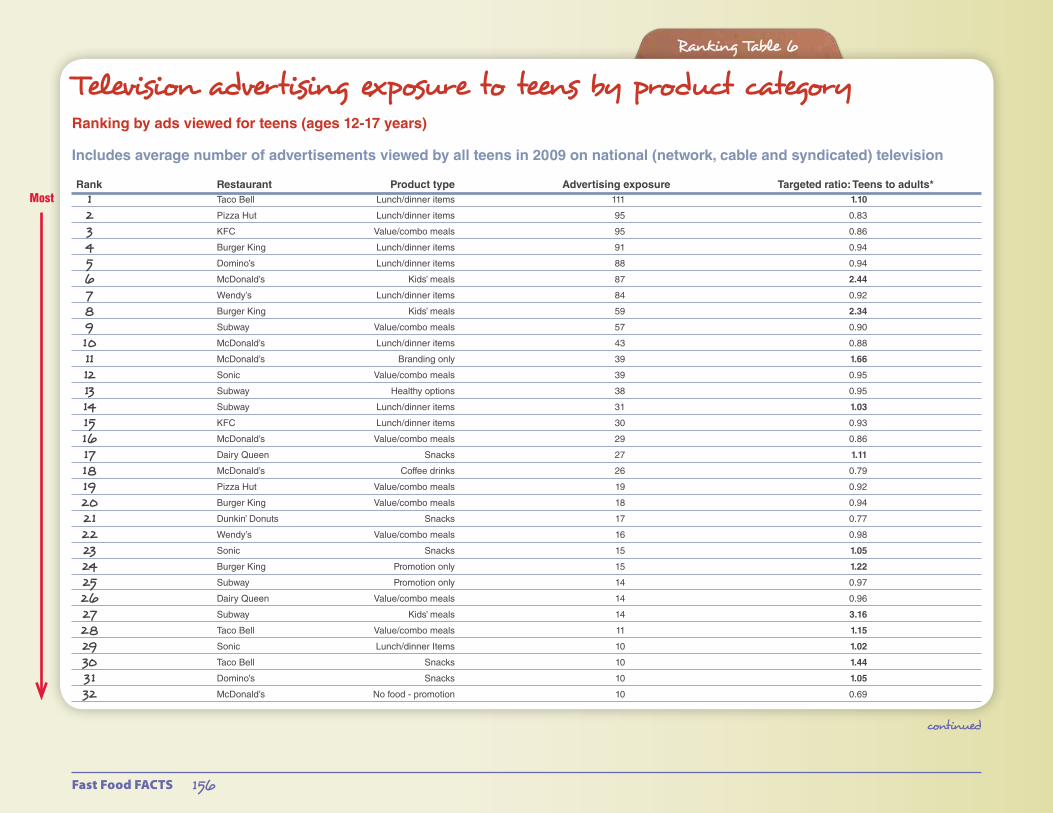
Ranking Table 6
Television advertising exposure to teens by product categoryRanking by ads viewed for teens (ages 12-17 years)
Includes average number of advertisements viewed by all teens in 2009 on national (network, cable and syndicated) television
Rank Restaurant Product type advertising exposure Targeted ratio: Teens to adults* 1 TacoBell Lunch/dinneritems 111 1.10
2 PizzaHut Lunch/dinneritems 95 0.83
3 KFC Value/combomeals 95 0.86
4 BurgerKing Lunch/dinneritems 91 0.94
5 Domino’s Lunch/dinneritems 88 0.94
6 McDonald’s Kids’meals 87 2.44
7 Wendy’s Lunch/dinneritems 84 0.92
8 BurgerKing Kids’meals 59 2.34
9 Subway Value/combomeals 57 0.90
10 McDonald’s Lunch/dinneritems 43 0.88
11 McDonald’s Brandingonly 39 1.66
12 Sonic Value/combomeals 39 0.95
13 Subway Healthyoptions 38 0.95
14 Subway Lunch/dinneritems 31 1.03
15 KFC Lunch/dinneritems 30 0.93
16 McDonald’s Value/combomeals 29 0.86
17 DairyQueen Snacks 27 1.11
18 McDonald’s Coffeedrinks 26 0.79
19 PizzaHut Value/combomeals 19 0.92
20 BurgerKing Value/combomeals 18 0.94
21 Dunkin’Donuts Snacks 17 0.77
22 Wendy’s Value/combomeals 16 0.98
23 Sonic Snacks 15 1.05
24 BurgerKing Promotiononly 15 1.22
25 Subway Promotiononly 14 0.97
26 DairyQueen Value/combomeals 14 0.96
27 Subway Kids’meals 14 3.16
28 TacoBell Value/combomeals 11 1.15
29 Sonic Lunch/dinnerItems 10 1.02
30 TacoBell Snacks 10 1.44
31 Domino’s Snacks 10 1.05
32 McDonald’s Nofood-promotion 10 0.69
Most
continued
Fast Food FACTS 157
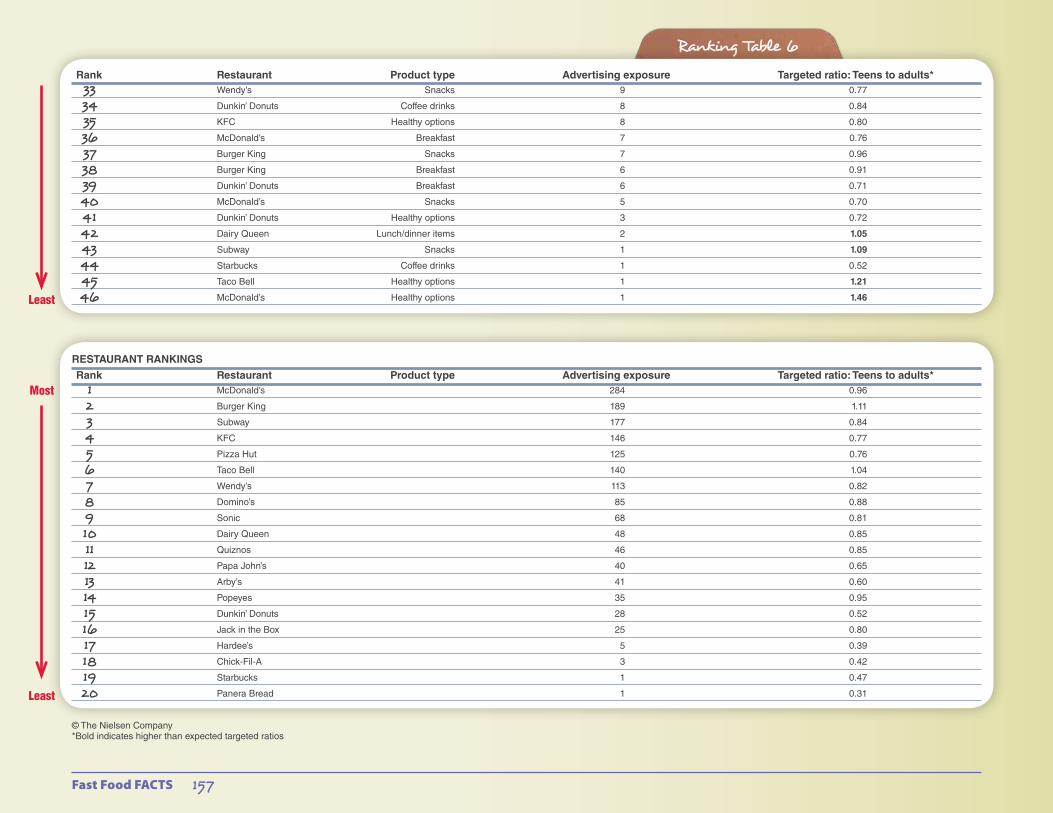
Ranking Table 6
Rank Restaurant Product type advertising exposure Targeted ratio: Teens to adults* 33 Wendy’s Snacks 9 0.77
34 Dunkin’Donuts Coffeedrinks 8 0.84
35 KFC Healthyoptions 8 0.80
36 McDonald’s Breakfast 7 0.76
37 BurgerKing Snacks 7 0.96
38 BurgerKing Breakfast 6 0.91
39 Dunkin’Donuts Breakfast 6 0.71
40 McDonald’s Snacks 5 0.70
41 Dunkin’Donuts Healthyoptions 3 0.72
42 DairyQueen Lunch/dinneritems 2 1.05
43 Subway Snacks 1 1.09
44 Starbucks Coffeedrinks 1 0.52
45 TacoBell Healthyoptions 1 1.21
46 McDonald’s Healthyoptions 1 1.46
ReSTauRaNT RaNkINgS
Rank Restaurant Product type advertising exposure Targeted ratio: Teens to adults* 1 McDonald’s 284 0.96
2 BurgerKing 189 1.11
3 Subway 177 0.84
4 KFC 146 0.77
5 PizzaHut 125 0.76
6 TacoBell 140 1.04
7 Wendy’s 113 0.82
8 Domino’s 85 0.88
9 Sonic 68 0.81
10 DairyQueen 48 0.85
11 Quiznos 46 0.85
12 PapaJohn’s 40 0.65
13 Arby’s 41 0.60
14 Popeyes 35 0.95
15 Dunkin’Donuts 28 0.52
16 JackintheBox 25 0.80
17 Hardee’s 5 0.39
18 Chick-Fil-A 3 0.42
19 Starbucks 1 0.47
20 PaneraBread 1 0.31
©TheNielsenCompany*Boldindicateshigherthanexpectedtargetedratios
Most
Least
Least
Fast Food FACTS 158
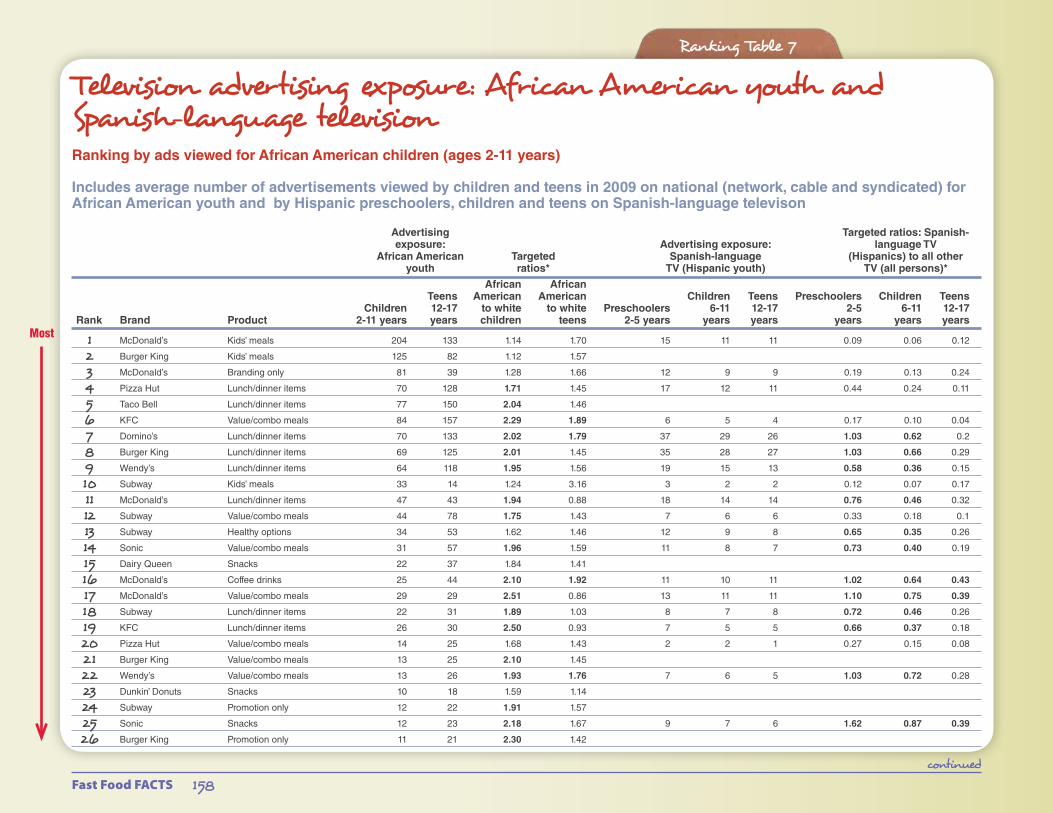
Ranking Table 7
Television advertising exposure: African American youth and Spanish-language televisionRanking by ads viewed for african american children (ages 2-11 years)
Includes average number of advertisements viewed by children and teens in 2009 on national (network, cable and syndicated) for african american youth and by Hispanic preschoolers, children and teens on Spanish-language televison
advertising Targeted ratios: Spanish- exposure: advertising exposure: language TV african american Targeted Spanish-language (Hispanics) to all other youth ratios* TV (Hispanic youth) TV (all persons)*
african african Teens american american Children Teens Preschoolers Children Teens Children 12-17 to white to white Preschoolers 6-11 12-17 2-5 6-11 12-17 Rank Brand Product 2-11 years years children teens 2-5 years years years years years years
1 McDonald’s Kids’meals 204 133 1.14 1.70 15 11 11 0.09 0.06 0.12
2 BurgerKing Kids’meals 125 82 1.12 1.57
3 McDonald’s Brandingonly 81 39 1.28 1.66 12 9 9 0.19 0.13 0.24
4 PizzaHut Lunch/dinneritems 70 128 1.71 1.45 17 12 11 0.44 0.24 0.11
5 TacoBell Lunch/dinneritems 77 150 2.04 1.46
6 KFC Value/combomeals 84 157 2.29 1.89 6 5 4 0.17 0.10 0.04
7 Domino’s Lunch/dinneritems 70 133 2.02 1.79 37 29 26 1.03 0.62 0.2
8 BurgerKing Lunch/dinneritems 69 125 2.01 1.45 35 28 27 1.03 0.66 0.29
9 Wendy’s Lunch/dinneritems 64 118 1.95 1.56 19 15 13 0.58 0.36 0.15
10 Subway Kids’meals 33 14 1.24 3.16 3 2 2 0.12 0.07 0.17
11 McDonald’s Lunch/dinneritems 47 43 1.94 0.88 18 14 14 0.76 0.46 0.32
12 Subway Value/combomeals 44 78 1.75 1.43 7 6 6 0.33 0.18 0.1
13 Subway Healthyoptions 34 53 1.62 1.46 12 9 8 0.65 0.35 0.26
14 Sonic Value/combomeals 31 57 1.96 1.59 11 8 7 0.73 0.40 0.19
15 DairyQueen Snacks 22 37 1.84 1.41
16 McDonald’s Coffeedrinks 25 44 2.10 1.92 11 10 11 1.02 0.64 0.43
17 McDonald’s Value/combomeals 29 29 2.51 0.86 13 11 11 1.10 0.75 0.39
18 Subway Lunch/dinneritems 22 31 1.89 1.03 8 7 8 0.72 0.46 0.26
19 KFC Lunch/dinneritems 26 30 2.50 0.93 7 5 5 0.66 0.37 0.18
20 PizzaHut Value/combomeals 14 25 1.68 1.43 2 2 1 0.27 0.15 0.08
21 BurgerKing Value/combomeals 13 25 2.10 1.45
22 Wendy’s Value/combomeals 13 26 1.93 1.76 7 6 5 1.03 0.72 0.28
23 Dunkin’Donuts Snacks 10 18 1.59 1.14
24 Subway Promotiononly 12 22 1.91 1.57
25 Sonic Snacks 12 23 2.18 1.67 9 7 6 1.62 0.87 0.39
26 BurgerKing Promotiononly 11 21 2.30 1.42
continued
Most

Fast Food FACTS 159
Ranking Table 7
advertising Targeted ratios: Spanish- exposure: advertising exposure: language TV african american Targeted Spanish-language (Hispanics) to all other youth ratios* TV (Hispanic youth) TV (all persons)*
african african Teens american american Children Teens Preschoolers Children Teens Children 12-17 to white to white Preschoolers 6-11 12-17 2-5 6-11 12-17 Rank Brand Product 2-11 years years children teens 2-5 years years years years years years
27 DairyQueen Value/combomeals 11 20 1.87 1.48
28 McDonald’s Promotiononly 11 16 1.87 1.88 4 3 3 0.64 0.46 0.31
29 Domino’s Snacks 9 15 1.95 1.77 3 2 2 0.66 0.39 0.24
30 Sonic Lunch/dinnerItems 8 14 2.13 1.72 7 6 5 2.00 1.07 0.5
31 TacoBell Value/combomeals 7 14 2.03 1.42
32 Wendy’s Snacks 7 12 1.75 1.37
33 KFC Healthyoptions 8 14 2.09 2.30 2 1 1 0.37 0.22 0.14
34 TacoBell Snacks 7 13 2.38 1.45
35 McDonald’s Breakfast 7 13 1.96 2.05 3 2 2 0.78 0.52 0.31
36 BurgerKing Snacks 5 9 2.00 1.31
37 Dunkin’Donuts Coffeedrinks 4 9 1.76 1.16
38 McDonald’s Snacks 5 7 1.69 1.81 2 2 2 0.80 0.53 0.38
39 Dunkin’Donuts Breakfast 4 6 1.48 1.14
40 BurgerKing Breakfast 4 7 1.74 1.40
41 McDonald’s Healthyoptions 2 2 1.46 1.99
42 Dunkin’Donuts Healthyoptions 2 3 1.46 1.10
43 DairyQueen Lunch/dinneritems 1 2 1.80 1.57
44 Subway Snacks 1 2 1.60 1.33
45 Starbucks Coffeedrinks 1 2 1.50 1.68
46 TacoBell Healthyoptions 1 2 1.93 1.48
ReSTauRaNT RaNkINgS
1 McDonald’s 414 420 1.33 1.75 68 46 47 0.20 0.15 0.18
2 BurgerKing 219 254 1.40 1.46 41 29 29 0.19 0.13 0.12
3 Subway 147 216 1.53 1.40 38 24 25 0.24 0.16 0.13
4 KFC 119 223 2.16 1.76 17 11 11 0.20 0.13 0.07
5 TacoBell 95 181 2.03 1.37
6 PizzaHut 85 154 1.76 1.43 26 16 14 0.27 0.17 0.09
7 Wendy’s 84 156 1.87 1.59 25 18 16 0.36 0.26 0.13
8 Domino’s 70 133 1.76 1.46 25 17 15 0.51 0.39 0.24
9 Sonic 49 90 1.94 1.44 20 13 12 0.42 0.29 0.17
10 DairyQueen 34 58 1.65 1.16
11 Dunkin’Donuts 12 23 2.12 1.46
12 Starbucks 1 2 1.84 1.22
*Boldtargetedratiosindicatehigherthanexpectedexposureforthisgroup©TheNielsenCompany
Most
Least
Least
Fast Food FACTS 161
Ranking Table 8
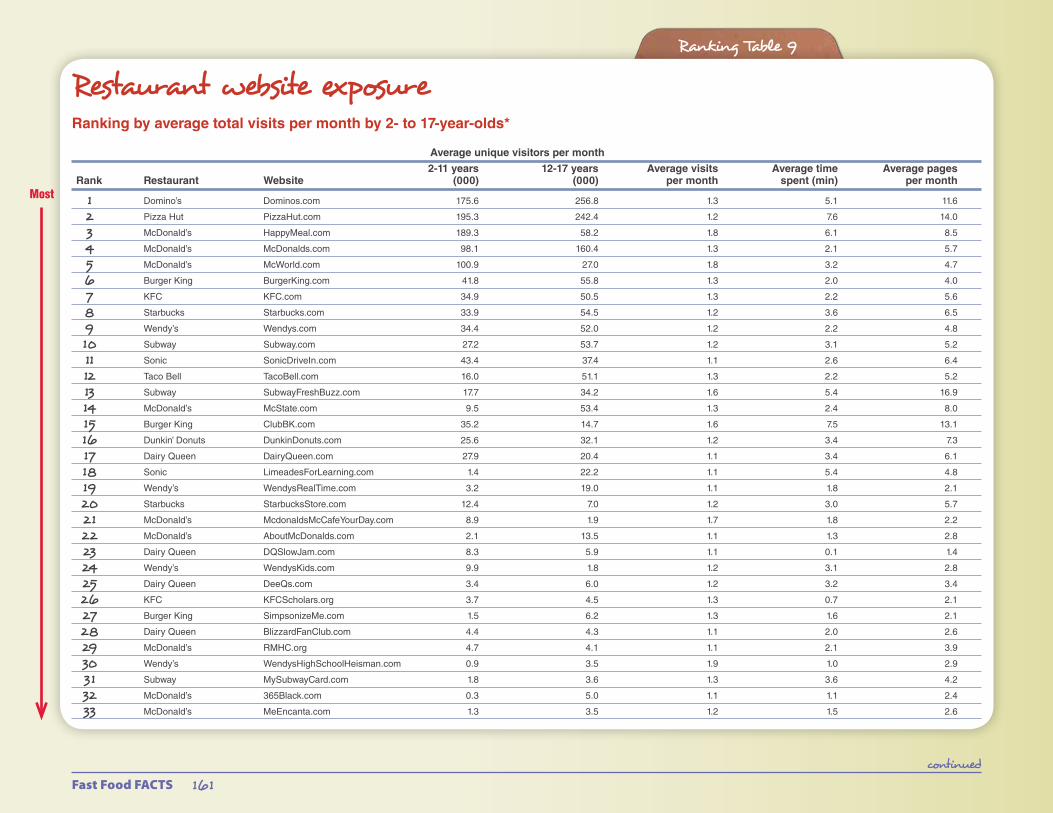
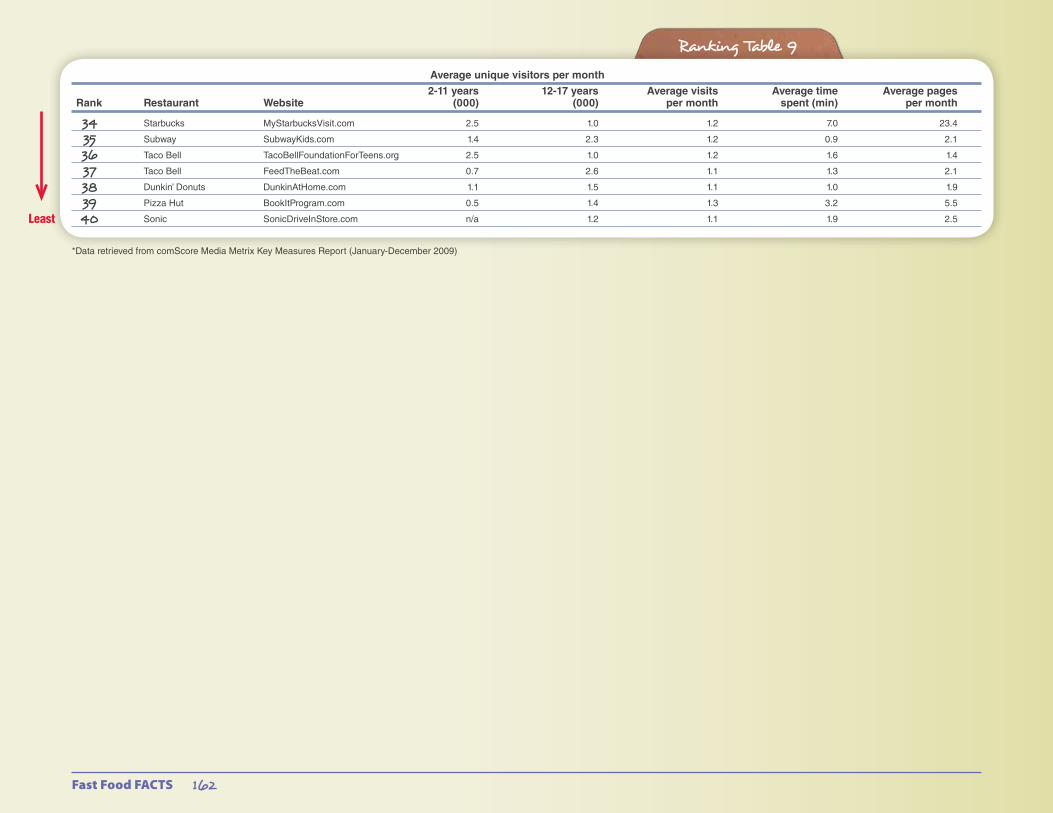
Ranking Table 9
Restaurant website exposureRanking by average total visits per month by 2- to 17-year-olds*
average unique visitors per month
2-11 years 12-17 years average visits average time average pages Rank Restaurant Website (000) (000) per month spent (min) per month
1 Domino’s Dominos.com 175.6 256.8 1.3 5.1 11.6
2 PizzaHut PizzaHut.com 195.3 242.4 1.2 7.6 14.0
3 McDonald’s HappyMeal.com 189.3 58.2 1.8 6.1 8.5
4 McDonald’s McDonalds.com 98.1 160.4 1.3 2.1 5.7
5 McDonald’s McWorld.com 100.9 27.0 1.8 3.2 4.7
6 BurgerKing BurgerKing.com 41.8 55.8 1.3 2.0 4.0
7 KFC KFC.com 34.9 50.5 1.3 2.2 5.6
8 Starbucks Starbucks.com 33.9 54.5 1.2 3.6 6.5
9 Wendy’s Wendys.com 34.4 52.0 1.2 2.2 4.8
10 Subway Subway.com 27.2 53.7 1.2 3.1 5.2
11 Sonic SonicDriveIn.com 43.4 37.4 1.1 2.6 6.4
12 TacoBell TacoBell.com 16.0 51.1 1.3 2.2 5.2
13 Subway SubwayFreshBuzz.com 17.7 34.2 1.6 5.4 16.9
14 McDonald’s McState.com 9.5 53.4 1.3 2.4 8.0
15 BurgerKing ClubBK.com 35.2 14.7 1.6 7.5 13.1
16 Dunkin’Donuts DunkinDonuts.com 25.6 32.1 1.2 3.4 7.3
17 DairyQueen DairyQueen.com 27.9 20.4 1.1 3.4 6.1
18 Sonic LimeadesForLearning.com 1.4 22.2 1.1 5.4 4.8
19 Wendy’s WendysRealTime.com 3.2 19.0 1.1 1.8 2.1
20 Starbucks StarbucksStore.com 12.4 7.0 1.2 3.0 5.7
21 McDonald’s McdonaldsMcCafeYourDay.com 8.9 1.9 1.7 1.8 2.2
22 McDonald’s AboutMcDonalds.com 2.1 13.5 1.1 1.3 2.8
23 DairyQueen DQSlowJam.com 8.3 5.9 1.1 0.1 1.4
24 Wendy’s WendysKids.com 9.9 1.8 1.2 3.1 2.8
25 DairyQueen DeeQs.com 3.4 6.0 1.2 3.2 3.4
26 KFC KFCScholars.org 3.7 4.5 1.3 0.7 2.1
27 BurgerKing SimpsonizeMe.com 1.5 6.2 1.3 1.6 2.1
28 DairyQueen BlizzardFanClub.com 4.4 4.3 1.1 2.0 2.6
29 McDonald’s RMHC.org 4.7 4.1 1.1 2.1 3.9
30 Wendy’s WendysHighSchoolHeisman.com 0.9 3.5 1.9 1.0 2.9
31 Subway MySubwayCard.com 1.8 3.6 1.3 3.6 4.2
32 McDonald’s 365Black.com 0.3 5.0 1.1 1.1 2.4
33 McDonald’s MeEncanta.com 1.3 3.5 1.2 1.5 2.6
Most
continued
Fast Food FACTS 162
Ranking Table 8
Ranking Table 9
Least
average unique visitors per month
2-11 years 12-17 years average visits average time average pages Rank Restaurant Website (000) (000) per month spent (min) per month
34 Starbucks MyStarbucksVisit.com 2.5 1.0 1.2 7.0 23.4
35 Subway SubwayKids.com 1.4 2.3 1.2 0.9 2.1
36 TacoBell TacoBellFoundationForTeens.org 2.5 1.0 1.2 1.6 1.4
37 TacoBell FeedTheBeat.com 0.7 2.6 1.1 1.3 2.1
38 Dunkin’Donuts DunkinAtHome.com 1.1 1.5 1.1 1.0 1.9
39 PizzaHut BookItProgram.com 0.5 1.4 1.3 3.2 5.5
40 Sonic SonicDriveInStore.com n/a 1.2 1.1 1.9 2.5
*DataretrievedfromcomScoreMediaMetrixKeyMeasuresReport(January-December2009)
Fast Food FACTS 163
Ranking Table 8
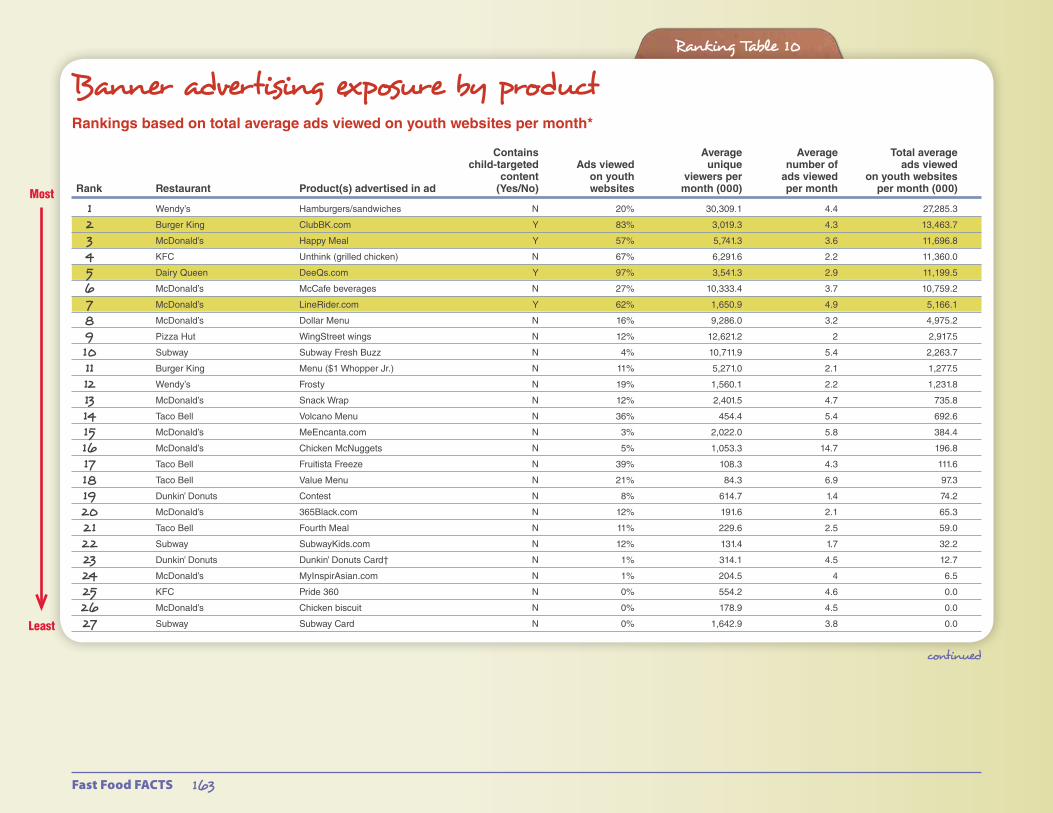
Ranking Table 10
Most
continued
Least
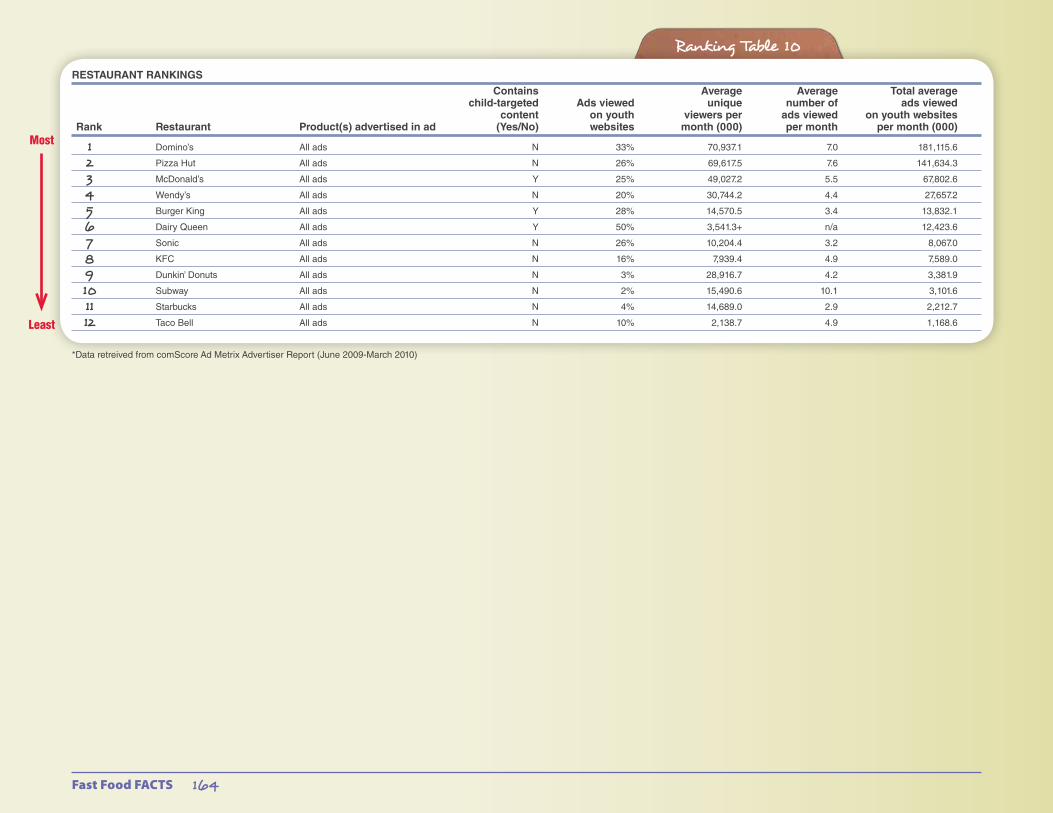
Banner advertising exposure by productRankings based on total average ads viewed on youth websites per month*
Contains average average Total average child-targeted ads viewed unique number of ads viewed content on youth viewers per ads viewed on youth websites Rank Restaurant Product(s) advertised in ad (Yes/No) websites month (000) per month per month (000)
1 Wendy’s Hamburgers/sandwiches N 20% 30,309.1 4.4 27,285.3
2 BurgerKing ClubBK.com Y 83% 3,019.3 4.3 13,463.7
3 McDonald’s HappyMeal Y 57% 5,741.3 3.6 11,696.8
4 KFC Unthink(grilledchicken) N 67% 6,291.6 2.2 11,360.0
5 DairyQueen DeeQs.com Y 97% 3,541.3 2.9 11,199.5
6 McDonald’s McCafebeverages N 27% 10,333.4 3.7 10,759.2
7 McDonald’s LineRider.com Y 62% 1,650.9 4.9 5,166.1
8 McDonald’s DollarMenu N 16% 9,286.0 3.2 4,975.2
9 PizzaHut WingStreetwings N 12% 12,621.2 2 2,917.5
10 Subway SubwayFreshBuzz N 4% 10,711.9 5.4 2,263.7
11 BurgerKing Menu($1WhopperJr.) N 11% 5,271.0 2.1 1,277.5
12 Wendy’s Frosty N 19% 1,560.1 2.2 1,231.8
13 McDonald’s SnackWrap N 12% 2,401.5 4.7 735.8
14 TacoBell VolcanoMenu N 36% 454.4 5.4 692.6
15 McDonald’s MeEncanta.com N 3% 2,022.0 5.8 384.4
16 McDonald’s ChickenMcNuggets N 5% 1,053.3 14.7 196.8
17 TacoBell FruitistaFreeze N 39% 108.3 4.3 111.6
18 TacoBell ValueMenu N 21% 84.3 6.9 97.3
19 Dunkin’Donuts Contest N 8% 614.7 1.4 74.2
20 McDonald’s 365Black.com N 12% 191.6 2.1 65.3
21 TacoBell FourthMeal N 11% 229.6 2.5 59.0
22 Subway SubwayKids.com N 12% 131.4 1.7 32.2
23 Dunkin’Donuts Dunkin’DonutsCard† N 1% 314.1 4.5 12.7
24 McDonald’s MyInspirAsian.com N 1% 204.5 4 6.5
25 KFC Pride360 N 0% 554.2 4.6 0.0
26 McDonald’s Chickenbiscuit N 0% 178.9 4.5 0.0
27 Subway SubwayCard N 0% 1,642.9 3.8 0.0
Fast Food FACTS 164
Ranking Table 8
Ranking Table 10
Most
ReSTauRaNT RaNkINgS
Contains average average Total average child-targeted ads viewed unique number of ads viewed content on youth viewers per ads viewed on youth websites Rank Restaurant Product(s) advertised in ad (Yes/No) websites month (000) per month per month (000)
1 Domino’s Allads N 33% 70,937.1 7.0 181,115.6
2 PizzaHut Allads N 26% 69,617.5 7.6 141,634.3
3 McDonald’s Allads Y 25% 49,027.2 5.5 67,802.6
4 Wendy’s Allads N 20% 30,744.2 4.4 27,657.2
5 BurgerKing Allads Y 28% 14,570.5 3.4 13,832.1
6 DairyQueen Allads Y 50% 3,541.3+ n/a 12,423.6
7 Sonic Allads N 26% 10,204.4 3.2 8,067.0
8 KFC Allads N 16% 7,939.4 4.9 7,589.0
9 Dunkin’Donuts Allads N 3% 28,916.7 4.2 3,381.9
10 Subway Allads N 2% 15,490.6 10.1 3,101.6
11 Starbucks Allads N 4% 14,689.0 2.9 2,212.7
12 TacoBell Allads N 10% 2,138.7 4.9 1,168.6
*DataretreivedfromcomScoreAdMetrixAdvertiserReport(June2009-March2010)
Least
Fast Food FACTS 165
Ranking Table 8
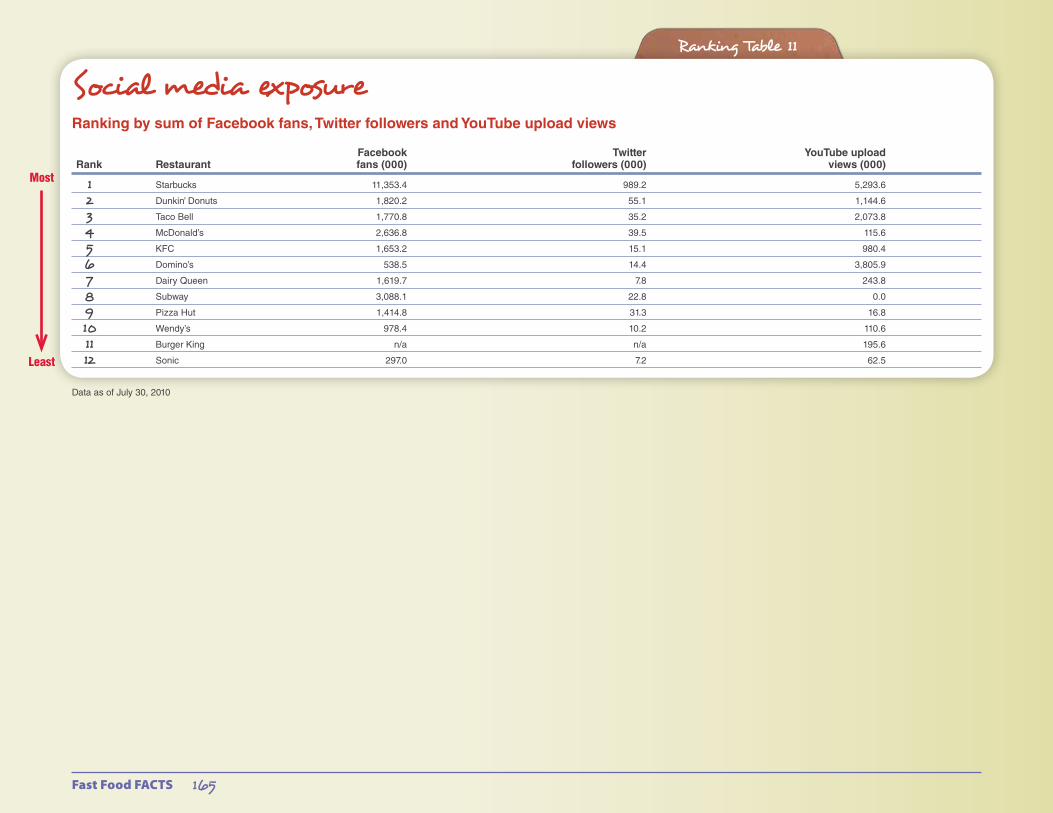
Ranking Table 11
Social media exposureRanking by sum of Facebook fans, Twitter followers and YouTube upload views
Facebook Twitter YouTube upload Rank Restaurant fans (000) followers (000) views (000)
1 Starbucks 11,353.4 989.2 5,293.6
2 Dunkin’Donuts 1,820.2 55.1 1,144.6
3 TacoBell 1,770.8 35.2 2,073.8
4 McDonald’s 2,636.8 39.5 115.6
5 KFC 1,653.2 15.1 980.4
6 Domino’s 538.5 14.4 3,805.9
7 DairyQueen 1,619.7 7.8 243.8
8 Subway 3,088.1 22.8 0.0
9 PizzaHut 1,414.8 31.3 16.8
10 Wendy’s 978.4 10.2 110.6
11 BurgerKing n/a n/a 195.6
12 Sonic 297.0 7.2 62.5
DataasofJuly30,2010
Most
Least

Fast Food FACTS 160
Ranking Table 8Ranking Table 8
Radio advertising exposureRanking by advertising exposure for teens
advertising exposure Targeted ratio
Number of markets Teens Young adults adults Teens to Restaurant with advertising* 12-17 years 18-24 years 25-49 years adults
McDonald’s 39 108 159 147 0.73
TacoBell 34 30 40 27 1.12
BurgerKing 38 29 42 38 0.76
Wendy’s 39 28 40 38 0.74
Subway 39 25 38 37 0.68
Dunkin’Donuts 23 24 33 37 0.66
DairyQueen 5 10 15 18 0.56
Sonic 20 8 14 13 0.58
KFC 23 8 11 10 0.73
Domino’s 29 3 5 5 0.70
PizzaHut 14 2 3 4 0.62
Starbucks 13 2 3 3 0.68
*Marketswithaminimumof100GRPsforatleastoneagegroup(maximum39markets)
Most
Least
Related Documents