Soft Computing https://doi.org/10.1007/s00500-019-04011-5 METHODOLOGIES AND APPLICATION Fast curvelet transform through genetic algorithm for multimodal medical image fusion Muhammad Arif 1 · Guojun Wang 1 © Springer-Verlag GmbH Germany, part of Springer Nature 2019 Abstract Currently, medical imaging modalities produce different types of medical images to help doctors to diagnose illnesses or injuries. Each modality of images has its specific intensity. Many researchers in medical imaging have attempted to combine redundancy and related information from multiple types of medical images to produce fused medical images that can provide additional concentration and image diagnosis inspired by the information for the medical examination. We propose a new method and method of fusion for multimodal medical images based on the curvelet transform and the genetic algorithm (GA). The application of GA in our method can solve the suspicions and diffuse existing in the input image and can further optimize the characteristics of image fusion. The proposed method has been tested in many sets of medical images and is also compared to recent medical image fusion techniques. The results of our quantitative evaluation and visual analysis indicate that our proposed method produces the best advantage of medical fusion images over other methods, by maintaining perfect data information and color compliance at the base image. Keywords Ridgelet transform · Curvelet transform · Genetic algorithm · Mutual information · Image fusion 1 Introduction Multimodal medical image fusion facilitates the diagnosis and treatment of, hemorrhage, neuroepilepsy, tumor, and other complicated diseases (Bhateja et al. 2015), illnesses by combining redundant and related information of functional and morphological data from multimodal source images in order to attain detail and complete descriptions of the medical image for accurate analysis (Sui et al. 2011). X-rays, MRI, CT, and ultrasonic images consist of morphological data, while atomic medicine and certain MRI sequences consist of functional data (Sui et al. 2011; Ziran 2017; Peng and Wang 2017; Dai and Wang 2018; Dai et al. 2018). Multi- modal combination of medical images assists in biomedical examination and improves clinical diagnosis (Daneshvar and Ghassemian 2010; He et al. 2010). As imaging mechanism Communicated by V. Loia. B Guojun Wang [email protected] Muhammad Arif [email protected] 1 School of Computer Science and Cyber Engineering, Guangzhou University, Guangzhou 510006, China and human tissues structure are complicated and distinctive in nature, different modalities of images provide legitimate information in a complementally but non-overlapping way (Javaid 2018; Muhammad and Guojun 2017; Javaid et al. 2016a, b). CT, MRI, and MR angiography provide superior information on bone tissues, soft tissues, and vasculatures, respectively (Tang and Rahmim 2009). Combining this com- plementary visual information increases their informational values to clinicians. The accurately fused medical image can assist clinicians in analyzing and estimating patients condi- tion and consequently improves the competence of clinical analyses and treatment. Current studies have concentrated on developing method- ology that blends curative information from various securing procedures without counterbalancing the advantages of fur- ther information, and it also needs security and privacy to secure the patients data (Singh et al. 2015; Arif et al. 2018, a, b; Arif 2018). In restorative fusion, information from various images is combined into single image without loss of any content or information from the source images. However, this process is not possible in practice (Wang et al. 2014). Another option is to integrate the very important and mutual information from the source images. Researchers have used different methods to realize medical image fusion (Guanqun 123

Welcome message from author
This document is posted to help you gain knowledge. Please leave a comment to let me know what you think about it! Share it to your friends and learn new things together.
Transcript

Soft Computinghttps://doi.org/10.1007/s00500-019-04011-5
METHODOLOGIES AND APPL ICAT ION
Fast curvelet transform through genetic algorithm for multimodalmedical image fusion
Muhammad Arif1 · Guojun Wang1
© Springer-Verlag GmbH Germany, part of Springer Nature 2019
AbstractCurrently, medical imaging modalities produce different types of medical images to help doctors to diagnose illnesses orinjuries. Each modality of images has its specific intensity. Many researchers in medical imaging have attempted to combineredundancy and related information from multiple types of medical images to produce fused medical images that can provideadditional concentration and image diagnosis inspired by the information for the medical examination. We propose a newmethod and method of fusion for multimodal medical images based on the curvelet transform and the genetic algorithm(GA). The application of GA in our method can solve the suspicions and diffuse existing in the input image and can furtheroptimize the characteristics of image fusion. The proposed method has been tested in many sets of medical images and is alsocompared to recent medical image fusion techniques. The results of our quantitative evaluation and visual analysis indicatethat our proposed method produces the best advantage of medical fusion images over other methods, by maintaining perfectdata information and color compliance at the base image.
Keywords Ridgelet transform · Curvelet transform · Genetic algorithm · Mutual information · Image fusion
1 Introduction
Multimodal medical image fusion facilitates the diagnosisand treatment of, hemorrhage, neuroepilepsy, tumor, andother complicated diseases (Bhateja et al. 2015), illnesses bycombining redundant and related information of functionaland morphological data from multimodal source images inorder to attain detail and complete descriptions of the medicalimage for accurate analysis (Sui et al. 2011). X-rays, MRI,CT, and ultrasonic images consist of morphological data,while atomic medicine and certain MRI sequences consistof functional data (Sui et al. 2011; Ziran 2017; Peng andWang 2017; Dai and Wang 2018; Dai et al. 2018). Multi-modal combination of medical images assists in biomedicalexamination and improves clinical diagnosis (Daneshvar andGhassemian 2010; He et al. 2010). As imaging mechanism
Communicated by V. Loia.
B Guojun [email protected]
Muhammad [email protected]
1 School of Computer Science and Cyber Engineering,Guangzhou University, Guangzhou 510006, China
and human tissues structure are complicated and distinctivein nature, different modalities of images provide legitimateinformation in a complementally but non-overlapping way(Javaid 2018; Muhammad and Guojun 2017; Javaid et al.2016a, b). CT, MRI, and MR angiography provide superiorinformation on bone tissues, soft tissues, and vasculatures,respectively (Tang and Rahmim 2009). Combining this com-plementary visual information increases their informationalvalues to clinicians. The accurately fused medical image canassist clinicians in analyzing and estimating patients condi-tion and consequently improves the competence of clinicalanalyses and treatment.
Current studies have concentrated on developing method-ology that blends curative information from various securingprocedures without counterbalancing the advantages of fur-ther information, and it also needs security and privacyto secure the patients data (Singh et al. 2015; Arif et al.2018, a, b; Arif 2018). In restorative fusion, information fromvarious images is combined into single image without loss ofany content or information from the source images. However,this process is not possible in practice (Wang et al. 2014).Another option is to integrate the very important and mutualinformation from the source images. Researchers have useddifferent methods to realize medical image fusion (Guanqun
123
M. Arif, G. Wang
et al. 2004). An example of these methods is wavelet analysis.The wavelet transform modulus maxima approach improvesnoise rejection capability. Medical image fusion methodsbased on wavelet analysis are widely used due to their multi-resolution, anisotropic, and multi-directional characteristics(Yi et al. 2009).
However, by making comparison among image fusiontechnique through wavelet transform with those whichdeliver the fused images with high spectral quality, draw-backs are more evident. As a result, the fused medicalimages generated by wavelet transforms have less spatialinformation as compared to those generated by the intensity–hue–saturation (I–H–S) and principle component analysis(PCA) techniques. Nevertheless, spatial and spectral infor-mation in fused images is equally important as it providesmorphological information to assist in diagnosis. Anotherdrawback of wavelet technique is in regard to streak arti-facts in medical image fusion (Park et al. 2015; Sisniegaet al. 2015). Additionally, selecting a suitable multi-scaledecomposition tool to support medical image fusion is achallenging issue, and the wavelet transform technique onlydecomposes an image to three high-frequency sub-bands invertical, diagonal, and horizontal directions. To address theshortcomings of the wavelet transform function, a previousstudy has reconstructed the curvelet basis function and theother multi-scale systems that are different from wavelet-like systems which include ridgelet transform and curvelettransform (Cands and Donoho 1999; Candès and Donoho2000). These techniques have high anisotropy and high direc-tional of sensitivity. Curvelet transform is a new techniqueof a signal analysis (Himanshi et al. 2015). It is a momen-tous in images dispensation and the other submissions (Ganget al. 2005). Curvelet transform complements multi-scaleedge enhancement and exhibits improved edge representa-tion in image fusion (Starck et al. 2002).
In our paper, we proposed a novel medical images fusiontechnique for multimodal medical images using curvelettransforms and inherent algorithm known as GA. The incor-poration of GA is to eliminate any uncertainties and ambigui-ties that may arise during the fusion process. The reminder ofthe paper is composed of five sections. Section 2 reviews theliterature of the background of the work. The framework ofthe proposed methodology is elaborated in Sect. 3. The exper-iments are discussed in Sect. 4. The results are discussed inSect. 5. Section 6 concludes the research work.
2 Related work
In medical imaging research, multimodal image fusion is oneof the emerging research areas (Wang et al. 2014; Xu 2014).Various medical images fusions approaches are proposed,and the approaches are categorized into three stages: pixel,
decision, and feature. Pixel-based image fusion techniqueproduces the fused images in which data connected throughevery pixel are chosen from the set of pixels in input image.The feature level fusion technique necessitates the miningof salient environment-dependent relative features, includ-ing pixels intensities, the edges, texture, or surfaces. Thedecision-level image fusion techniques engage integration ofthe information at an advanced level of the abstraction, cumu-lating the consequences from numerous methods to producethe ultimate fused decisions. Image fusion at the decision andfeature level is based on a concessioner between the requiredspatial improvement and uniformity. Among the existingimage fusion methods, the following methods are the mostwidely adopted: I–H–S (Daneshvar and Ghassemian 2010),PCA (Du et al. 2013; Yang et al. 2011), dissimilar arithmeticcoalescence (e.g., Hermitian transform) (Escalante-Ramrez2008), multi-resolution analysis (MRA), for example, pyra-mid algorithms, wavelet transform, and contourlet transform,and neural network (NN) (Liu et al. 2014; Zhao et al. 2014).The fusion in medical images at the level of pixels, the easiesttechnique is to compute the average of images pixels to pro-duce a fused version. This approach degrades the brightnessof the input images to a large extent (Yang et al. 2011). Toreduce the negative impact of the approach, I–H–S exchangeslow-resolution color images from the R–G–B space in the I–H–S space. The intensities band of I–H–S is similar to anMRI image. Therefore, most researchers resample the inten-sity band to maintain the same resolution as the MRI image.A reverse I–H–S transform is then presented on the incipientintensity band along with hue and saturation bands, resultingin an I–H–S-fused image. Medical image fusion algorithmsat the pixel level have been extensively utilized for com-paratively simple fusion schemes. He et al. (2010) coupledI–H–S with PCA to improve the qualities of the fused medi-cal images. However, this technique has several drawbacks.First, pixel-level fusion techniques are highly susceptible tothe registration precision. Secondly, the color channels ofthe input SPECT image should be less or equivalent to threein I–H–S transform. Lastly, I–H–S-based methods reducethe brightness of the original color features (Daneshvar andGhassemian 2010; Du et al. 2013; He et al. 2010; Yang et al.2011). Garcia et al. (2010) proposed a pixel-based averagingstrategy for depth sensor data.
Wang et al. (2014) have recently utilized incipient meth-ods such as shearlet transform to decrease color distortions.Li and Wang et al. combined the variable weight concept withnon-sub-samples contourlet transforms (NSCT) to evade theinsufficiency of the traditional pixel-based fusion techniquesfor fusing SPECT and MR images (Da Cunha et al. 2006;Li and Wang 2012). The NSCT technique is able to extractthe edges of the images contours information, but it weaklycaptures the images details and it fails to sustain the localcharacteristic of source images (Chang et al. 2013; Da Cunha
123
Fast curvelet transform through genetic algorithm for multimodal medical image fusion
et al. 2006; Li and Wang 2012). MRA-based fusion meth-ods such as the pyramid transformations have utilized forapproximately 30 years. The medical image fusion basedon pyramid has been developed from transformed and cus-tomized Gaussian pyramids. Well-kenned multi-resolutionschemes include filter–subtract–decimate (Anderson 1988),gradient (Burt 1992), Laplacian (Burt and Kolczynski 1993),morphological (Toet 1989a), ratio pyramid (Toet 1989b), andcontrast pyramid (Toet et al. 1989). However, contrast pyra-mid fusion loses an excessive amount of source informationin obtaining a clear fused image. The ratio pyramid tech-nique generates considerable erroneous information in thefused image (Burt and Kolczynski 1993; Toet 1989b). Like-wise, the morphological pyramid technique produces largernumbers of artifacts that do not exist in source images.
Wavelet methods and their relative transforms are alsoextensively used for fusion of medical images. Waveletsdecomposed the image into coarse and multi-level res-olutions sub-bands. Li et al. (1995) proposed discretewavelet-based fusion method. However, the method has adrawback of shift variant that has been eliminated by employ-ing shift-invariant wavelet transforms (Rockinger 1997).Li et al. (2010) presented an approach based on duplicatewavelets transforms to surmount the shift-variant quandaryand increase the reliabilities of the fusion results. Singhet al. (2009) utilized the same technologies to fuse the brainmedical images from the different source images. Li et al. fur-ther compared discrete wavelet transform (DWT), stationarywavelet transform, and dual tree intricate wavelet transformin diverse image fusion situations (Li et al. 2011; Danesh-var and Ghassemian 2010; Li et al. 2002; Wan et al. 2009).Normally, wavelet union can be obviously minimized thecolor alteration and noises from the images. However, limitsare linked with the procedure computational intricacy andharm of spectral content and lastly concluded the sustain-able parameters values. Chang et al. (2013) have proposed anew wavelets sub-band assortment scheme for medical imagefusion based on parameterized logarithmic image processing(PLIP). The drawbacks of this approach include its inabilityto minimize color distortion and noise, and the brightnessof the image is also reduced. Their proposed coefficients forimage fusion rules directly influence the speeds and qual-ities of the fusion process and thus degrade the accuracyand quality of the fused image. To attain favorable fusionresults, various wavelet-predicted fusion methods have testedincluding those based on curvelet and contourlet transforms(Daneshvar and Ghassemian 2010; Li et al. 2011; Candeset al. 2006; Mahyari and Yazdi 2009; Nencini et al. 2007;Tessens et al. 2007; Da Cunha et al. 2006; Yang et al. 2010;Zhang and Guo 2009). Wavelet transforms have good time–frequency characteristics making it suitable for numerousimage processing scenarios, but their one-dimensional prop-erties cannot be applied to multi-dimensional scenarios. In
such cases, wavelet transform displays very low directivity.Additional limitation occurs with respect to the demonstra-tion of rounded edges in which if there is any break alongthe rounded edge then it will infect all the coefficients ofwavelet. Curvelet transform is used in such cases as cumu-lated contourlet contrast quantifications with other fusionrules, similar to local energy, weighted averages, and cull,to improve the qualities of the fused images from medical(Yang et al. 2008).
Complicated wavelet fusion algorithms may improve theperformance results but sacrifice computational complex-ity and parameterization. Several neural network approacheshave been presented in this regard (Zhang et al. 2001; Wanget al. 2010; Chai et al. 2010).
3 Materials andmethods
In this section, we describe our novel method for medicalimage fusion. Our method is based on curvelet transform toovercome the drawback of wavelet transform in processingcontour or curvy shapes of objects that are often dominatingthe medical images. To promote and improve the perfor-mance of our proposed idea, we apply GA to optimize pixelvector analysis so that mutual information (MI) of the inputmedical images and the computational performance of thetechnique can be maximized (Arif et al. 2014).
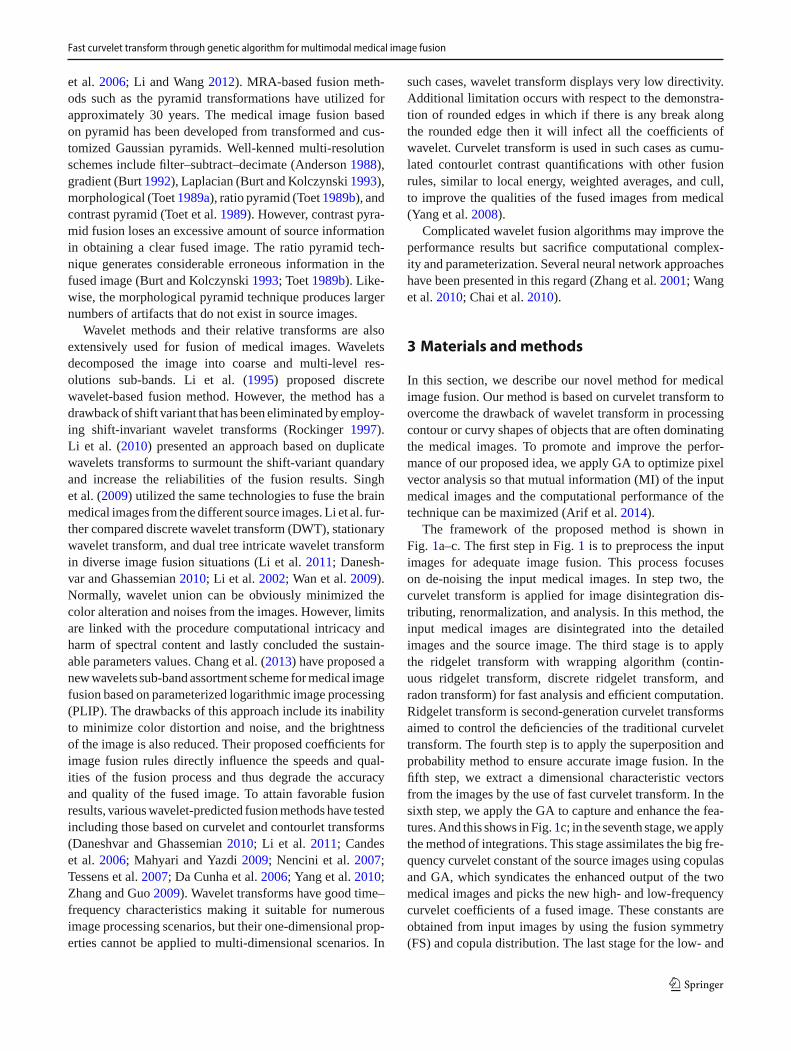
The framework of the proposed method is shown inFig. 1a–c. The first step in Fig. 1 is to preprocess the inputimages for adequate image fusion. This process focuseson de-noising the input medical images. In step two, thecurvelet transform is applied for image disintegration dis-tributing, renormalization, and analysis. In this method, theinput medical images are disintegrated into the detailedimages and the source image. The third stage is to applythe ridgelet transform with wrapping algorithm (contin-uous ridgelet transform, discrete ridgelet transform, andradon transform) for fast analysis and efficient computation.Ridgelet transform is second-generation curvelet transformsaimed to control the deficiencies of the traditional curvelettransform. The fourth step is to apply the superposition andprobability method to ensure accurate image fusion. In thefifth step, we extract a dimensional characteristic vectorsfrom the images by the use of fast curvelet transform. In thesixth step, we apply the GA to capture and enhance the fea-tures. And this shows in Fig. 1c; in the seventh stage, we applythe method of integrations. This stage assimilates the big fre-quency curvelet constant of the source images using copulasand GA, which syndicates the enhanced output of the twomedical images and picks the new high- and low-frequencycurvelet coefficients of a fused image. These constants areobtained from input images by using the fusion symmetry(FS) and copula distribution. The last stage for the low- and
123

M. Arif, G. Wang
Pre -Processing
Curve Let Transform
Ridgelet Transform
Genetic Algorithm
Fusion Process
Inverse Curve Let Transform
Completion Criteria Met?
Final Fused Image
Partially Processed
Image
Input Image
1
Input Image
2
Feature Selection
YES
No
(a) Flow design of proposed work
Sub-Band Decomposition
Renormalization
Ridge let Analysis
Smooth Portioning
Curve let Transform Sub-Processes
(b) Curve let Transform Sub-Process
Population
Crossover
Mutation
Evaluation
Fitness Value Reproduction
GA Search Process
(c) GA Sub-Process
Fig. 1 Framework of the proposed method
high-pass curvelet constants is to communicate the inversecurvelet transform. These constants are united to acquire themerged details and source medical images according to somesynthesis rules to create the final medical merged, fused out-put image.
To enhance the accuracy of the fusion of various slicemedical images with curvelet transform, we also apply GA.The main idea for images fusion using the curvelet trans-forms is the fusion of the coefficient rules. Therefore, newcurvelet coefficient fusion rules with ridgelet transform areintroduced in Sects. 3.5–3.7 because ridgelet analysis ofcurvelet requires onerous computations. Curvelet transformcan be decomposed into four steps: sub-band decomposi-tions (SD), smooth partitioning, renormalization, and theridgelet analysis. When curvelet transforms process is com-pleted, GA is applied to find the optimized MI and FS forimage fusion. The original signal can be restructured intoinverse curvelet transform by reversing the step sequencewith mathematic revision. Figure 1a–c shows the flow designof recommended work. Figure 1a shows the complete flowwork of the proposed system; however, parts (b) and (c) showthe sub-processes of curvelet and GA algorithms.
3.1 Curvelet transform
This section elaborates the review of the curvelet transformsfor image fusion and describes the wrapping algorithms forefficient computation in Sects. 3.2–3.4. Time and frequencyanalysis in curvelet transform decays a signal into numerousorthogonal cores. From the summations of dissimilar baseswith dissimilar constants, a signal can be quantized,
f = ∑
kakbk, (1)
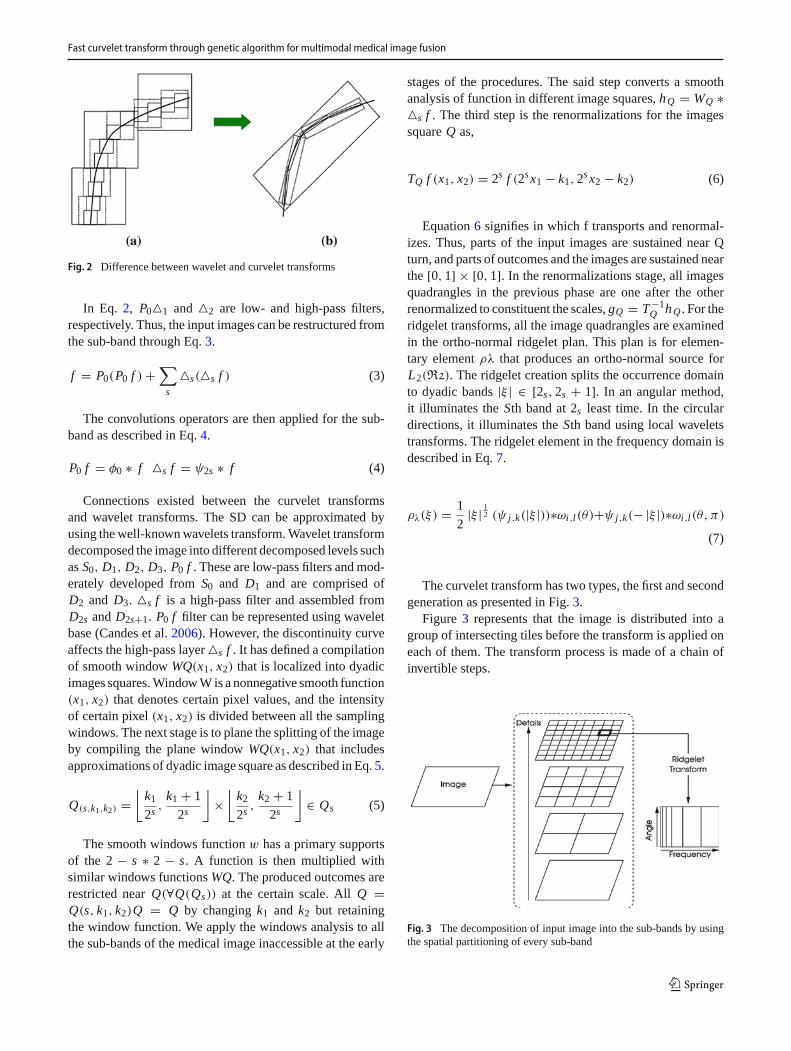
where the coefficient is ak , bk is the frame and k is thelocation of the coefficient. Although wavelet can efficientlyhandle point discontinuation, it is not optimal. This is becausewavelet is isotropic; therefore, it relies on the bend to computeedges and bend directions but the curve takes the larger num-bers of the coefficient to account for edges (Fig. 2) (Candsand Donoho 1999). As shown in Fig. 2a, the wavelet tech-nique required many wavelets coefficients to interpret theedges and singularities along the curves and lines. As shownin Fig. 2b, the curvelet approach needs only a small numberof coefficients to account for edges.
We have described the sub-band filters P,�s, s > 0 ofentities filters from the sub-bands. This stage divides the med-ical image into the frequent resolution surface. Each layercontains the detail on diverse frequency as expressed in Eq.(2).
f → (P0 f , �1 f , �2 f , . . .) (2)
123
Fast curvelet transform through genetic algorithm for multimodal medical image fusion
Fig. 2 Difference between wavelet and curvelet transforms
In Eq. 2, P0�1 and �2 are low- and high-pass filters,respectively. Thus, the input images can be restructured fromthe sub-band through Eq. 3.
f = P0(P0 f ) +∑
s
�s(�s f ) (3)
The convolutions operators are then applied for the sub-band as described in Eq. 4.
P0 f = φ0 ∗ f �s f = ψ2s ∗ f (4)
Connections existed between the curvelet transformsand wavelet transforms. The SD can be approximated byusing the well-known wavelets transform. Wavelet transformdecomposed the image into different decomposed levels suchas S0, D1, D2, D3, P0 f . These are low-pass filters and mod-erately developed from S0 and D1 and are comprised ofD2 and D3. �s f is a high-pass filter and assembled fromD2s and D2s+1. P0 f filter can be represented using waveletbase (Candes et al. 2006). However, the discontinuity curveaffects the high-pass layer �s f . It has defined a compilationof smooth window WQ(x1, x2) that is localized into dyadicimages squares. Window W is a nonnegative smooth function(x1, x2) that denotes certain pixel values, and the intensityof certain pixel (x1, x2) is divided between all the samplingwindows. The next stage is to plane the splitting of the imageby compiling the plane window WQ(x1, x2) that includesapproximations of dyadic image square as described in Eq. 5.
Q(s,k1,k2) =⌊
k1
2s,
k1 + 1
2s
⌋
×⌊
k2
2s,
k2 + 1
2s
⌋
∈ Qs (5)
The smooth windows function w has a primary supportsof the 2 − s ∗ 2 − s. A function is then multiplied withsimilar windows functions WQ. The produced outcomes arerestricted near Q(∀Q(Qs)) at the certain scale. All Q =Q(s, k1, k2)Q = Q by changing k1 and k2 but retainingthe window function. We apply the windows analysis to allthe sub-bands of the medical image inaccessible at the early
stages of the procedures. The said step converts a smoothanalysis of function in different image squares, hQ = WQ ∗�s f . The third step is the renormalizations for the imagessquare Q as,
TQ f (x1, x2) = 2s f (2s x1 − k1, 2s x2 − k2) (6)
Equation 6 signifies in which f transports and renormal-izes. Thus, parts of the input images are sustained near Qturn, and parts of outcomes and the images are sustained nearthe [0, 1] × [0, 1]. In the renormalizations stage, all imagesquadrangles in the previous phase are one after the otherrenormalized to constituent the scales, gQ = T −1
Q hQ . For theridgelet transforms, all the image quadrangles are examinedin the ortho-normal ridgelet plan. This plan is for elemen-tary element ρλ that produces an ortho-normal source forL2(R2). The ridgelet creation splits the occurrence domainto dyadic bands |ξ | ∈ [2s, 2s + 1]. In an angular method,it illuminates the Sth band at 2s least time. In the circulardirections, it illuminates the Sth band using local waveletstransforms. The ridgelet element in the frequency domain isdescribed in Eq. 7.
ρλ(ξ) = 1
2|ξ | 1
2 (ψ j,k(|ξ |))∗ωi,l(θ)+ψ j,k(− |ξ |)∗ωi,l(θ, π)
(7)
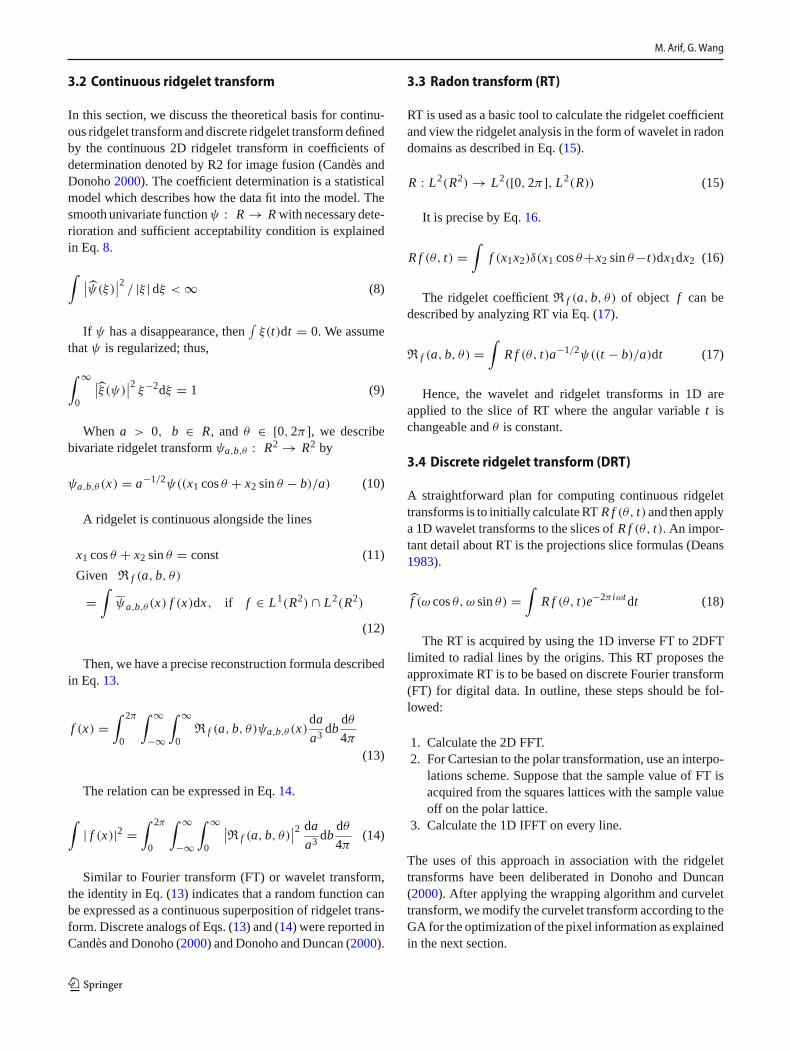
The curvelet transform has two types, the first and secondgeneration as presented in Fig. 3.
Figure 3 represents that the image is distributed into agroup of intersecting tiles before the transform is applied oneach of them. The transform process is made of a chain ofinvertible steps.
Fig. 3 The decomposition of input image into the sub-bands by usingthe spatial partitioning of every sub-band
123
M. Arif, G. Wang
3.2 Continuous ridgelet transform
In this section, we discuss the theoretical basis for continu-ous ridgelet transform and discrete ridgelet transform definedby the continuous 2D ridgelet transform in coefficients ofdetermination denoted by R2 for image fusion (Candès andDonoho 2000). The coefficient determination is a statisticalmodel which describes how the data fit into the model. Thesmooth univariate function ψ : R → R with necessary dete-rioration and sufficient acceptability condition is explainedin Eq. 8.
∫∣∣ψ̂(ξ)
∣∣2 / |ξ | dξ < ∞ (8)
If ψ has a disappearance, then∫
ξ(t)dt = 0. We assumethat ψ is regularized; thus,
∫ ∞
0
∣∣̂ξ(ψ)
∣∣2 ξ−2dξ = 1 (9)
When a > 0, b ∈ R, and θ ∈ [0, 2π ], we describebivariate ridgelet transform ψa,b,θ : R2 → R2 by
ψa,b,θ (x) = a−1/2ψ((x1 cos θ + x2 sin θ − b)/a) (10)
A ridgelet is continuous alongside the lines
x1 cos θ + x2 sin θ = const (11)
Given R f (a, b, θ)
=∫
ψa,b,θ (x) f (x)dx, if f ∈ L1(R2) ∩ L2(R2)
(12)
Then, we have a precise reconstruction formula describedin Eq. 13.
f (x) =∫ 2π
0
∫ ∞
−∞
∫ ∞
0R f (a, b, θ)ψa,b,θ (x)
da
a3 dbdθ
4π
(13)
The relation can be expressed in Eq. 14.
∫
| f (x)|2 =∫ 2π
0
∫ ∞
−∞
∫ ∞
0
∣∣R f (a, b, θ)
∣∣2 da
a3 dbdθ
4π(14)
Similar to Fourier transform (FT) or wavelet transform,the identity in Eq. (13) indicates that a random function canbe expressed as a continuous superposition of ridgelet trans-form. Discrete analogs of Eqs. (13) and (14) were reported inCandès and Donoho (2000) and Donoho and Duncan (2000).
3.3 Radon transform (RT)
RT is used as a basic tool to calculate the ridgelet coefficientand view the ridgelet analysis in the form of wavelet in radondomains as described in Eq. (15).
R : L2(R2) → L2([0, 2π ], L2(R)) (15)
It is precise by Eq. 16.
R f (θ, t) =∫
f (x1x2)δ(x1 cos θ+x2 sin θ−t)dx1dx2 (16)
The ridgelet coefficient R f (a, b, θ) of object f can bedescribed by analyzing RT via Eq. (17).
R f (a, b, θ) =∫
R f (θ, t)a−1/2ψ((t − b)/a)dt (17)
Hence, the wavelet and ridgelet transforms in 1D areapplied to the slice of RT where the angular variable t ischangeable and θ is constant.
3.4 Discrete ridgelet transform (DRT)
A straightforward plan for computing continuous ridgelettransforms is to initially calculate RT R f (θ, t) and then applya 1D wavelet transforms to the slices of R f (θ, t). An impor-tant detail about RT is the projections slice formulas (Deans1983).
f̂ (ω cos θ, ω sin θ) =∫
R f (θ, t)e−2π iωtdt (18)
The RT is acquired by using the 1D inverse FT to 2DFTlimited to radial lines by the origins. This RT proposes theapproximate RT is to be based on discrete Fourier transform(FT) for digital data. In outline, these steps should be fol-lowed:
1. Calculate the 2D FFT.2. For Cartesian to the polar transformation, use an interpo-
lations scheme. Suppose that the sample value of FT isacquired from the squares lattices with the sample valueoff on the polar lattice.
3. Calculate the 1D IFFT on every line.
The uses of this approach in association with the ridgelettransforms have been deliberated in Donoho and Duncan(2000). After applying the wrapping algorithm and curvelettransform, we modify the curvelet transform according to theGA for the optimization of the pixel information as explainedin the next section.
123

Fast curvelet transform through genetic algorithm for multimodal medical image fusion
3.5 GAwith curvelet transform
GA with curvelet transforms is used for exact pixel-basedcombinations of multi-slice medical images. Thus, to obtainhighly competent image fusion methods, divergences mea-sure is depicted from the algorithm described in Eq. 19 (Choiet al. 2004).
DK L(P ‖ Q) =∫
XP(X) log
p(x)
q(x)dx (19)
The deviations measure, Eq. (19), can be rewritten as
DK L(P ‖ Q) = E p
[
logpx
qx
]
(20)
where
E(px ) = x1 p1 + x2 p2 + · · · + xk pk (21)
E(qx ) = x1q1 + x2q2 + · · · + xkqk (22)
px andqx are probability density functions of the X and the Y ,correspondingly. The information based on the deviation canbe acknowledged as the remarkable case of the divergenceamong goods of marginal possibility of density functions andjoint possibility function.
The values of the E(px ) and the E(px ) as well as the prob-abilities of p and q will yield a flow of the data for medicalimage fusion with GA. The equation values advantage direc-tional features with curvelet transform. Equation (17) createsthe directions, multi-slice fusion, and its solution underthe GA to minimize the fusion symmetry value. Curvelettransforms have the directional characteristic and its basessupporting sessions convinces substance anisotropies rela-tions, excluding multi-scale wavelet transforms and the localdescriptions.
3.6 Superpositionmethod for medical images
To realize accurate and aligned image fusion, the near-est neighbor for image superposition should be determinedbecause each neighbor of an image produces a problem tobe solved. Therefore, using meta-heuristic GA and curvelettransform divergence measures [Eq. (19)], we modify theequation for MI and the modified equation is
IM I (x, y) = Dkl(PXY (x, y)||qx (x)qy(y))
=∫∫
x,yP XY (X , Y )
Px,y(X , Y )
qx (x)qy(y)dxdy (23)
where PXY (x, y) is the combined probability density func-tions of the x and y and qx (x) and qy(y) are the respectivemarginal density functions of variables x and y.
3.7 Probability for curvelet transform
Curvelet transform is used to transform an image in sub-bands and to determine the real probability of image fusion.Images that are generated from medical devices are some-times rotated or transformed. These properties of medicalimages produce many issues in fusion, for example, lostof visual information and morphological characteristics andlow-contrast and poor edge representation. These issues canbe resolved with curvelet transform and copula distribution.
Bright patterns are significant in all medical images. Anideal option is to register the combined images to a pixel-by-pixel requisition of most extreme operators (openingand closing). Our methodology is expanded by presentingmorphological operators, namely opening and closing. Oneprovision is the utilization of a restrictive morphologicaloperator by using exceptionally solid core information inboth input images while using the prospective information inonly one input image. This methodology is further amplifiedthrough image variable-based mathematics which representshigh levels of arithmetical broadening of image morphology(Sui et al. 2011).
In image polynomial mathematics, values and coordi-nate sets are important to combine distinctive resolutions ofimages and formats. Algebraic mathematics of images hasbeen connected in a non-specific manner to consolidate med-ical images. Multi-variant circulations that accommodate thetypes of minor conveyance are predictable. A copula repre-sents scientific relationships between point conveyance andminor dispersions of irregular variable [Eq. (24)]. A 2D cop-ula is a bivariate combined dispersion capacity with uniformsnegligible dispersions on the intervals (0, 1) (Henson et al.2010; Satpathy et al. 2010; Sui et al. 2011). This relationshipcan be elaborated as:
C(c, u) = FXY (F−1X (u), F−1
Y (v)) (24)
where C(c, u) is the copulas distributions functions and theu = F X(x) and v = FY (y) are the respective secondarycumulative probability distribution of the X and Y . C(u, v)
is expressed as
C (u, v) = ∂2C(u, v)
∂u∂v= ∂2C(Fx (x), Fy(y))
∂u∂v(25)
where FXY is the cooperative probability mass function of Xand Y . fx (x) and fy(y) are the respective marginal probabil-ity mass functions of X and Y , respectively. The MI betweenimages is calculated using Gaussian assumptions and copula-based methods. The copula parameter is approximated usingGA.
123
M. Arif, G. Wang
3.8 GA sub-process
GA is the nonlinear optimization method that discovers anoptimum explanation by defining the cost function controlledby a set of the parameters. To get an optimum explanation,instead of doing a regular search, GA uses multiple findingpaths, which reduces the time and space. GA has six stepswhich are given as follows:
• Cost Function• Initial Population• Natural Selection• Mating• Mutation• Next Generation
The Cost function is minimized with respect to floatingpoint variables or parameters known as chromosomes. Everychromosome is characterized with an N -dimensional vectorP = [p1, p2, . . . , pN ]. Since the GA is an optimizationmethod, there should be some limitations on defined vari-ables. In order to start GA, there is a need to define an initialpopulation matrix with dimensions of N×Npop, where Npoprefers to population size. Cost function is used to evaluateeach chromosome. Afterward, these are ranked with respectto costs and only strong chromosomes having desired charac-teristics are retained for mating step while rest are discarded.There are several approaches in the literature for mating pro-cess between the carefully chosen chromosomes. One of thesimplest methods for this purpose is random selection ofcrossover point followed by swapping of all the genes thatare to the right of chosen point. Subsequently, GA may con-verge to non-global minima; alterations or mutations in thevariables are brought together for annulment of stuck at alocal minimum. Thereafter, a ranking is carried out for ini-tial population and the best chromosomes would be selectedfor subsequent population, whereas low-ranked ones substi-tuted with chromosomes those were discarded earlier. Thisprocess lasts until the GA congregates to a global minimum.
3.9 GA for feature optimization and fusion
The genetic algorithm, by contrast, does not attempt eachpossible arrangement and select the most optimal and suitablesolution intelligently.
At the definite scale, let di = (1, . . . , T ) denote the detailsof the images and dF denotes the medical fused images. Forcalculation, we use the cany operator ei of di . Then directby ei , and dF is resolute by the following ways and dF iscalculated as
dF(x, y) =∑
i ei ∈ φ |∇di (x, y)| di (x, y)∑
i ei ∈ φ |∇di (x, y)| (26)
Then, we use maximum value of the fused medical imagegiven as follows:
dF(x, y) = max(d1(x, y), . . . , dT (x, y)) (27)
After image decomposition and analysis, we use GA toselect and optimize the MI from the every disintegratedregion. At the initial step, gray-level medical images arepreprocessed and disintegrated into the sub-bands and thencurvelet transform is applied in each sub-band. Subsequently,we compute the copula distribution and probability to obtainthe graphic representation of each image.
Let hg[I ] be the information vector where the pixelinformation is stored, where I = I1, I2, . . . , Ik . Geneticalgorithm is used to conclude the anticipated mutual infor-mation with their appreciated fusion symmetry. The geneticalgorithm is proposed to optimize the mutual informationfrom the k sub-band regions. R1, R2, . . . , Rk are the sets ofthe pixels information values I = I1, I2, . . . , Ik .
Here, I1 is the first sub-band regions with the pixel infor-mation and the Ik is the nth sub-band regions with the pixelsinformation values. Let k be the chosen sub-band regionsof the pixels and Dis[k] be the discrepancy quantity amonginnovative and the chosen regions. The genetic algorithm fit-ness function is used to enhance the features as the numberk. This function is elaborated in the given equation,
Fit = ρ√
Dis[k] + (log(k))2 (28)
where the ρ is a positively weighted constant. GA determinesthe optimal MI k∗, such that
Fit[k∗] = min[k] (29)
k belongs to L+ j where L j+ = {1, 2, . . . , L j }. The discrep-
ancy term is Dis[k] = σ 2T −σ 2
B[k], where σ 2T and σ 2
B representthe variances between the original and fused classes.
Here, N denotes the total numbers of the pixels in themedical input images. In this procedure, the best strings aremarked as the best solutions and copied to the neighbor-ing values. That is, t1 is copied to ti−1 and ti+1. The beststring value can be tested for possible improvements observ-ing these neighborhoods. The characteristic values diagnosedby genetic algorithm are obtained by compact features, andthese values are expanded to their innovative space. Everyfeature ti is increased by a factor of 2 j . Subsequent to theextension, a modification procedure is applied to gain thegood and exact region of interest. In this procedure, the meancharacteristic of class Ci , where i = 1, 2, . . . , k −1, is deter-mined, where r signifies time repetition and ti [r ] is updatedby the equation given as follows:
ti [r + 1]mi [r ] + mi+1[r ]2
(30)
123

Fast curvelet transform through genetic algorithm for multimodal medical image fusion
These steps are continual until the repetitions converge,that is, ti [r + 1] = ti [r ] for i = 1, 2, . . . , k − 1. After deter-mining the characteristic and their values, the optimizationis confirmed by applying the equation B(x, y) = i if tt−1 ≤f (x, y) ≤ ti , where i = 1, 2, 3, . . . , k. f (x, y) denotes theoriginal medical image and B(x, y) signifies the MI of sub-band division. We consider the ordinary GA by randomlycreating its early populations. Solutions are merged throughcrossover operators to generate offspring and thus expand thepresent population of solution. The individuals in the pop-ulation are then estimated through a fitness function. Theless-fitted individuals are removed to return the populationto its original size. The crossover, evaluation, and selectionprocesses are repeated for a pre-arranged number of gen-erations. A mutation operator is commonly applied to eachgeneration to enhance variation. In the feature selection ofGA, individuals are composed of chromosomes.
By contrast, the GA does not effort each possible settle-ment (Bhuvaneswari et al. 2014). It attempts the appropriatecombinations and wisely reaches the optimum solution. Theoptimization of the big numbers of the variables is the wasteof the time. To attain the optimum solutions in a time-efficientmethod, FS by curvelet transform is implemented with a highprobability for the nearest neighbor in pixel fusion. This pro-cedure is supported by the fact that fusions in the pixel withprobability produce an issue of time and the precise loopingfor the best solutions with the GA and the curvelet transforms.We express the mutual results in pixel ratios. We use FS withthe help of the Gaussian and GA which can be expressed inEq. 31.
FS = abs
(IF X (F, X)
IF X (F, X) + IFY (F, Y )− 0.5
)
(31)
where IF X (F, X) shows customized computation of mutualinformation for divergence-based information. The quality ofimage fusion depends on fusion symmetry. Smaller the fusionsymmetry means best image fusion performance (Yuan et al.2009). FS is apparently better than FF (Kumar and Sharma2011). Hence, only the FS measure is considered. Informa-tion of Eqs. 1, 4–8, and 11–16 is used in GA to find bestsolutions without the high repetition probabilities. The cop-ula distribution function and secondary cumulative entropiesand their probabilities will help GA in finding the best solu-tion.
3.10 Inverse curvelet transform
Once the medical image fusion procedure is finished, inversecurvelet is then used to reproduce or reconstruct the image.Inverse curvelet transform used the ridgelet synthesis andmathematic revision and reorganized each image square fromthe ortho-normal ridgelet grouping. Renormalization means
that the image squares that result in the preceding stages arerenormalized to their corresponding image squares. Planecombination means that we will reverse the windows investi-gation to all the windows reassemble in the previous phase ofthe image. In sub-band recompound, we inverse the bank ofsub-band strainers to gain the sum of all sub-bands describedin Eq. 32.
f = P0(P0 f ) +∑
s
�s(�s f ) (32)
4 Experiments
In the given section, we report the experimental process forthe medical image fusion by using the fast curvelet trans-form and the GA. To confirm the proposed fusion system,we conducted the experiments over the several varieties ofthe input medical images including CT, MRI, PET, MRA, andSPECT. We used medical dataset acquired from CMH Hos-pital Rawalpindi. The dataset was approved by the medicalethics committee. We also used datasets obtained from Har-vard University repository (http://www.med.harvard.edu/AANLIB/home.html). These medical images are visiblehuman standard images. Seven groups of brain images(Figs. 4, 5, 6, 7, 8, 9, and 10) are used for comparison.Each group contains two medical images from differentmultimodal devices. These images have a resolution of256,256 and 512,512. The matching pixels in the sourceimages are perfectly co-aligned. To accomplish the perfectco-alignment, we use superposition method to determinethe nearest neighbor pixels in the image followed by GAto optimize the relevant features. The process is technicallyexplained in Sects. 3.6 and 3.8. To evaluate the algorithms,we utilize MATLAB image fusion toolbox.
For the purpose of benchmarking, we chose the followingseven baseline methods in our experiments: pixel weightedaverage (PWA) (Garcia et al. 2010), Laplacian pyramid (LP)(Burt and Kolczynski 1993), principal component analy-sis (PCA) (Du et al. 2013), non-sub-sampled contourletTransform (NSCT) (Zhang and Guo 2009), discrete wavelettransform (DWT) (Singh et al. 2009), PLIP, and PCNN. Theexperimental platform is MATLAB 2013a. The computerclock is 3.50 core i5 with 8 GB memory.
We used eight objective evaluation and estimation mea-sures which are mutual information (MI), quality index (QAB/F) (Toet 1989a), Shannon Entropy (SE), cross-entropy(CE), fusion symmetry (FS), structural similarity index mea-surement (SSIM) (Wang et al. 2004), NIQE, and spectrumdifference, to quantitatively assess fusion performance of themethods.
123

M. Arif, G. Wang
4.1 MI
MI is the sum of the information among the source and theresulted fused images (Li et al. 2011). The mutual informa-tion is used to measure the degree of the confidence of inputimages. MI is 0 when input images 1 and 2 are independentto each other. Higher MI values indicate better image fusionresult with the lower fusion symmetry values. The presenceof the divergence in the images verifies the maximum proba-bility of MI; otherwise, the curvelet transforms will continueto transform the images and obtain the probability value forthe fusion. The formula for mutual information is given asfollows:
IMI(x, y) = Dkl(PXY (x, y)||qx (x)qy(y)) (33)
4.2 QAB/F
Measure is used to evaluate the fusion level in transportinginput of mutual information into fused images. This measureis proposed by (Toet 1989a). Quality indexes are also usedto measure the quality of fused medical image by compar-ing it with the source images. Higher quality index denoteshigher quality of image fusion. The procedure of calculationof quality index is given as follows:
Q AB/F =∑X
x=1∑Y
y=1
(Q AF (x, y)wA(x, y) + QBF (x, y)wB(x, y)
)
∑Xx=1
∑Yy=1(w
A(x, y) + wB(x, y))
(34)
4.3 FSSIM
We use the definition of SSIM to derive fused structural sim-ilarity index measurement (FSSIM) as FSSIMAB/F = 0 :5(SSIMAF + SSIMBF) (Wang et al. 2004).
Here, image A and image B are original input medicalimages and F is the fused medical image. FSSIM indexmethod is used for similarity measurement among fused andinput images.
4.4 NIQE
Mittal et al. introduced NIQE, a blind image quality analy-sis model to calculate image excellence without precedingknowledge of human opinions. Higher NIQE means lowerimage quality. The formula for NIQE is given in Mittal et al.(2013).
4.5 CE
Regular number of pixels is required to identify an occurrenceor event from a set of possibilities, and an occurrence can be
measured by using CE between two probability distributions.When a true probability p is replaced by another probabilityq, the CE for p and q over the same probability space isexpressed in Chen et al. (2012). We use CE to measure theimage fusion quality; lower CE means higher image fusionquality. The CE is calculated by the equation given as follows:
H(p, q) = E p[− log q] = H(p) + DK L(p||q) (35)
4.6 FS
FS is the custom-made calculations of the MI for division-based information. As mentioned earlier, the quality of imagefusion depends on FS. Smaller FS means superior imagefusion presentation. FS can be calculated by using the fol-lowing equation:
FS = abs
(IF X (F, X)
IF X (F, X) + IFY (F, Y )− 0.5
)
(36)
4.7 SE
SE of an image gives the information gratified of the images(Kotwal and Chaudhuri 2013). If the SE is high, it shows thatfused image contains more MI and gives more details to thephysician for analysis.
4.8 Spectrum difference
Spectrum difference is used to measure the spectral preserva-tion of original and the fused medical image (Lia and Zhangb2008).
5 Results and discussion
This section reports our experimental results followed bydiscussion on the findings. Image fusion results for our exper-iments are demonstrated in Figs. 4, 5, 6, 7, 8, 9, 10, 11, 12,and 13. The objective evaluation and estimation measuresare then applied on both fused and source images to cal-culate the presentation of our offered method opposite theidentified baseline procedure, and the quantitative results aredisplayed in Tables 1, 2, 3, 4, 5, 6, 7, 8, 9, and 10.
The best result in each column is shown in boldfacein Tables 1, 2, 3, 4, 5, 6, 7, 8, 9, and 10. By defini-tion, the best medical image fusion result should have thelargest values of SE, MIAB,F, FSSIM, and Q AB,F and thesmallest values of CE, FS, NIQE, and spectrum difference.Tables 1, 2, 3, 4, 5, 6, 7, 8, 9, and 10 show that our proposedtechnique is dominant in terms of these indicating values.This experimental result denotes that the performance of our
123
Fast curvelet transform through genetic algorithm for multimodal medical image fusion
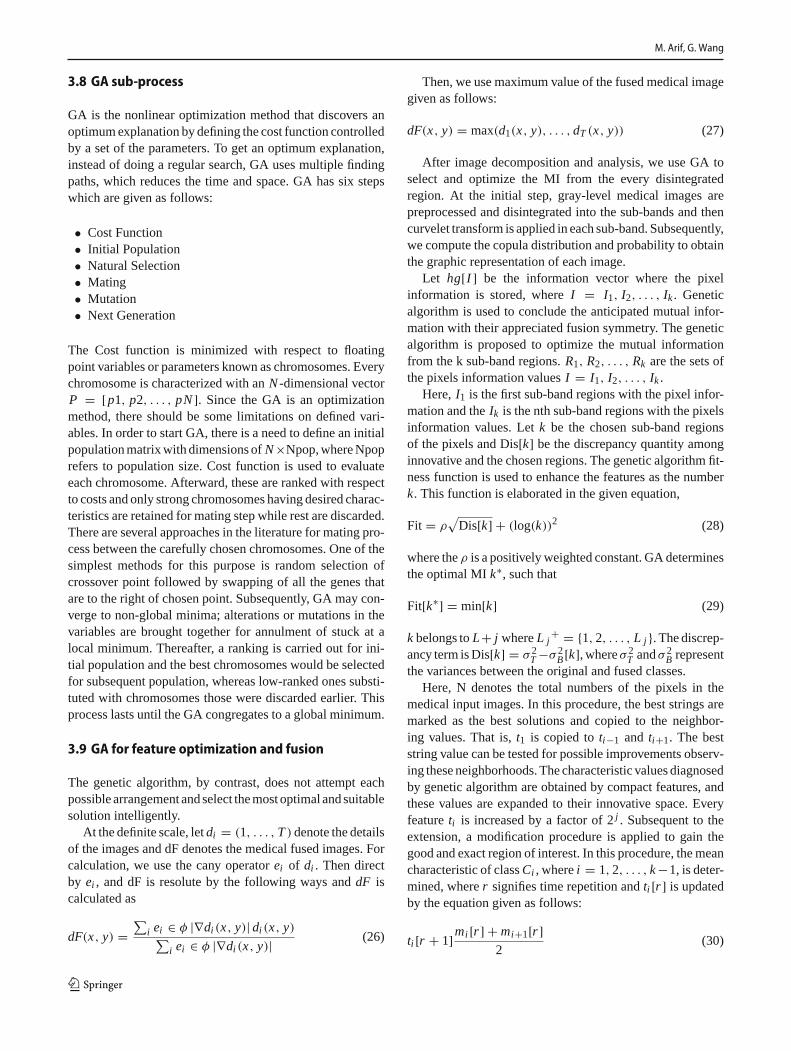
Fig. 4 Comparative results using seven baseline methods and our method. Group 1 medical images for experiment: a and b the CT and MRI inputsource images, c–j the resulted output images
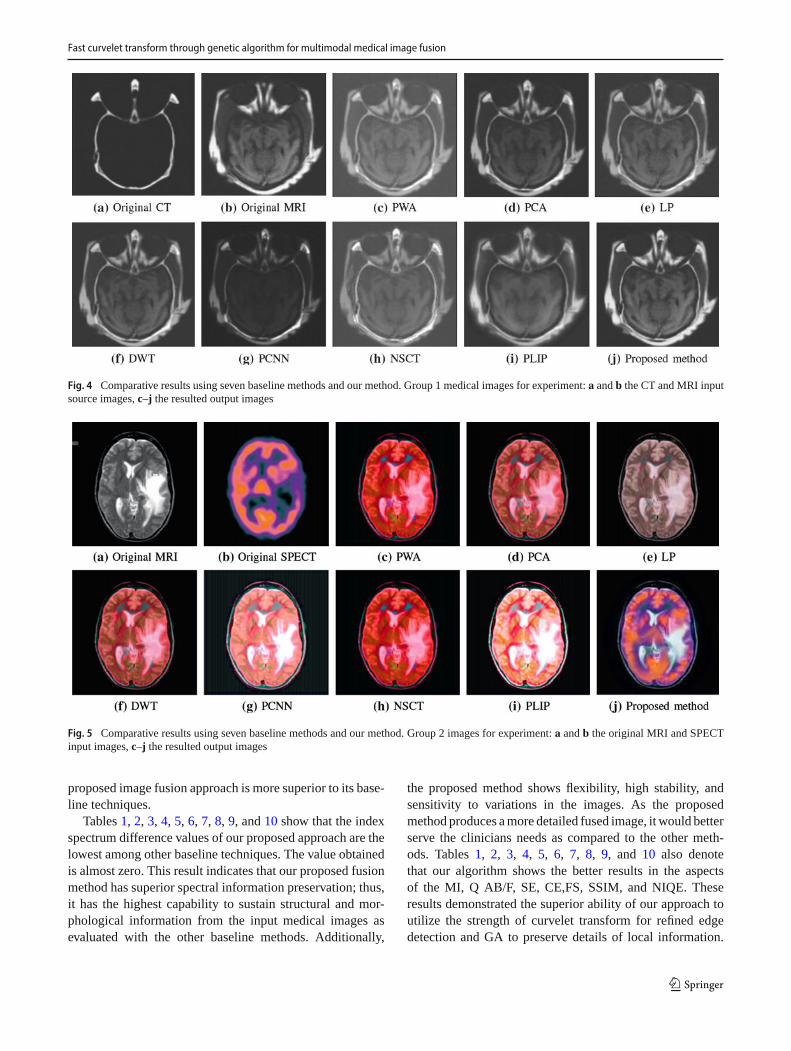
Fig. 5 Comparative results using seven baseline methods and our method. Group 2 images for experiment: a and b the original MRI and SPECTinput images, c–j the resulted output images
proposed image fusion approach is more superior to its base-line techniques.
Tables 1, 2, 3, 4, 5, 6, 7, 8, 9, and 10 show that the indexspectrum difference values of our proposed approach are thelowest among other baseline techniques. The value obtainedis almost zero. This result indicates that our proposed fusionmethod has superior spectral information preservation; thus,it has the highest capability to sustain structural and mor-phological information from the input medical images asevaluated with the other baseline methods. Additionally,
the proposed method shows flexibility, high stability, andsensitivity to variations in the images. As the proposedmethod produces a more detailed fused image, it would betterserve the clinicians needs as compared to the other meth-ods. Tables 1, 2, 3, 4, 5, 6, 7, 8, 9, and 10 also denotethat our algorithm shows the better results in the aspectsof the MI, Q AB/F, SE, CE,FS, SSIM, and NIQE. Theseresults demonstrated the superior ability of our approach toutilize the strength of curvelet transform for refined edgedetection and GA to preserve details of local information.
123

M. Arif, G. Wang
Fig. 6 Comparative results of seven baseline methods and our method. Group 3 images for experiment: a and b the MRI input images, c–j theresulted output images
Fig. 7 Comparative results using seven baseline methods and our method. Group 4 images for experiment: a and b the original MRI and PET inputimages, c–j the resulted output images
The PWA method only outperforms ours in FS measure inTables 3, 4, and 5. The visual outcomes of the fusion methodsin Figs. 4, 5, 6, 7, 8, 9, and 10 reveal that the other fusion meth-ods such as DWT, PWA, LP, and PCA add noise in the imageand apparently lack certain degree of image contrast. On con-trary, the proposed technique produces the highest visual andgraphical quality of resulted fused medical images. Our pro-posed fusion method realistically preserves and enhances thesignificant images structures, morphological characteristics,and color information from the input images without creat-
ing any reconstruction artifact. From Figs. 4, 5, 6, 7, 8, 9,and 10, we can clearly visualize the content of the fusedimage, including both the normal and abnormal content fea-tures. The information about normal and abnormal content ofthe images is obtained from the ground-truth information pro-vided by the radiologist and doctors. For example, in Fig. 7athe red circle of the MRI image indicates an abnormal con-tent, and in Fig. 7j, this information is clearly preserved andenhanced. Other valuable and important information such as
123
Fast curvelet transform through genetic algorithm for multimodal medical image fusion
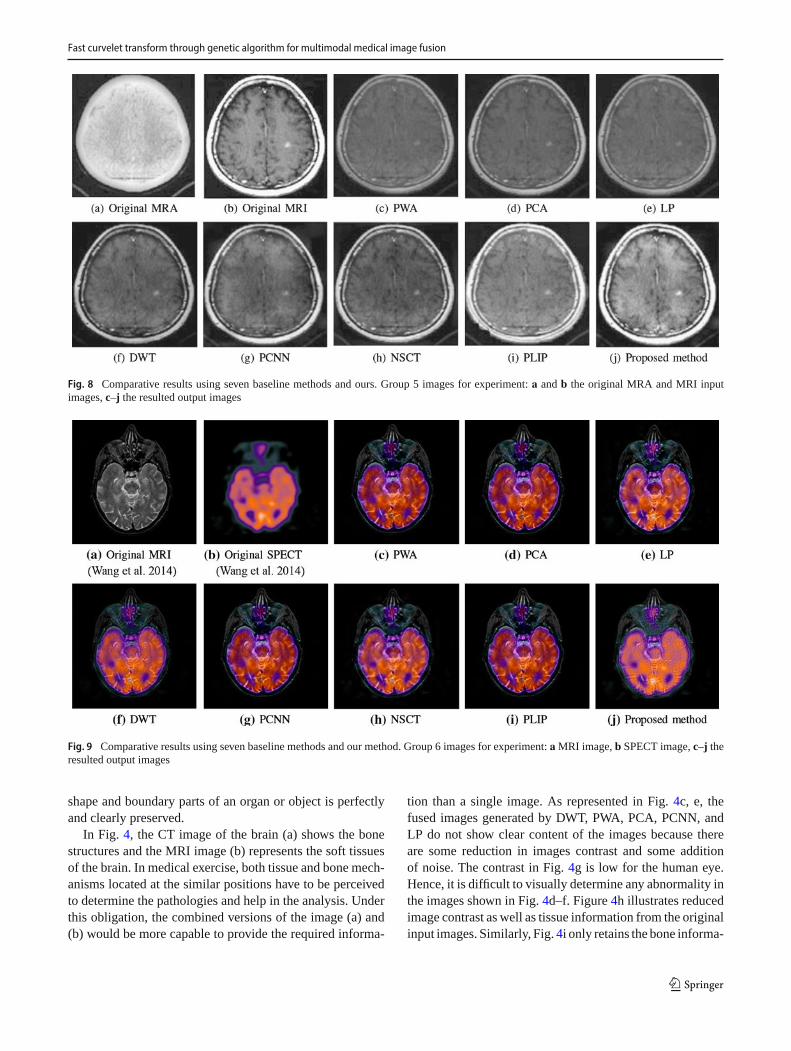
Fig. 8 Comparative results using seven baseline methods and ours. Group 5 images for experiment: a and b the original MRA and MRI inputimages, c–j the resulted output images
Fig. 9 Comparative results using seven baseline methods and our method. Group 6 images for experiment: a MRI image, b SPECT image, c–j theresulted output images
shape and boundary parts of an organ or object is perfectlyand clearly preserved.
In Fig. 4, the CT image of the brain (a) shows the bonestructures and the MRI image (b) represents the soft tissuesof the brain. In medical exercise, both tissue and bone mech-anisms located at the similar positions have to be perceivedto determine the pathologies and help in the analysis. Underthis obligation, the combined versions of the image (a) and(b) would be more capable to provide the required informa-
tion than a single image. As represented in Fig. 4c, e, thefused images generated by DWT, PWA, PCA, PCNN, andLP do not show clear content of the images because thereare some reduction in images contrast and some additionof noise. The contrast in Fig. 4g is low for the human eye.Hence, it is difficult to visually determine any abnormality inthe images shown in Fig. 4d–f. Figure 4h illustrates reducedimage contrast as well as tissue information from the originalinput images. Similarly, Fig. 4i only retains the bone informa-
123

M. Arif, G. Wang
Fig. 10 Comparative results using seven baseline methods and our method. Group 7 images for experiment: a and b the original MRA and MRIT1W input images, c–j the resulted output images
Fig. 11 Comparative results using seven baseline methods and our method. Group 7 images for experiment: a and b the original MRI and MRIinput images, c–j the resulted output images
tion without the tissues information in image, and the fusedimage also has poor distinction and brightness. On the otherhand, our fused image shown in Fig. 4j demonstrates the bestresult with good image contrast and is able to retain the keyvisual information at accurate image positions with the samebrightness in accordance with the original input images (a)and (b).
In our next example, we present the experimental resultsof image fusion for the MRI and SPECT images, as repre-sented in Fig. 5. The presented images belong to a 50-year-old
woman who has difficulties in memorizing and orientingherself in a new environment. Figure 5a shows that the hemi-spheric sulci are extended, particularly in the parietal lobes,and there is a serious occurrence of hypo-metabolism. Theimage in Fig. 5c shows low contrast and color distortion.Figure 5e, f, and i illustrates clear block artifacts in the tex-ture feature and very low image contrast, resulting in poorimage quality that may be difficult for medical diagnosis.The wavelet domain and PLIP method improve the perfor-mance of fusion, but block artifacts still exist in the images.
123

Fast curvelet transform through genetic algorithm for multimodal medical image fusion
Fig. 12 Comparative results using seven baseline methods and our method. Group 7 images for experiment: a and b the original CT and MRAinput images, c–j the resulted output images
Fig. 13 Comparative results using seven baseline methods and our method. Group 7 images for experiment: a and b the original MRI and MRIinput images, c–j the resulted output images
These results can be attributed to the fact that the wavelet andPLIP cannot successfully handle texture features and edges inlow-quality medical images. In Fig. 5 d, g, and h, the imagesgenerated by PCA, PCNN, and NSCT are blurred with a highdegree of noise and low contrast and do not contain all thenecessary information found in the original images a andb. Our proposed method in Fig. 5j demonstrates better rep-resentation of the fused image in which the morphologicalinformation and colors of both original sources are accuratelymaintained.
The experimental result for our third group of brain imagesis displayed in Fig. 6. The original image (a) is a MRI med-ical image, while image (b) represents a MRI medical brainimage. The bonded images that are produced by the base-line procedures and ours are shown in Fig. 6c, j. The bondedimage in Fig. 6c misplaces most of information from image(b). The fused images in Fig. 6d–g have poor image contrast,and this is evident from the corresponding values of the quan-titative measures. For instance, these images have very lowMI but high SD values. Figure 6h and i shows the similar
123
M. Arif, G. Wang
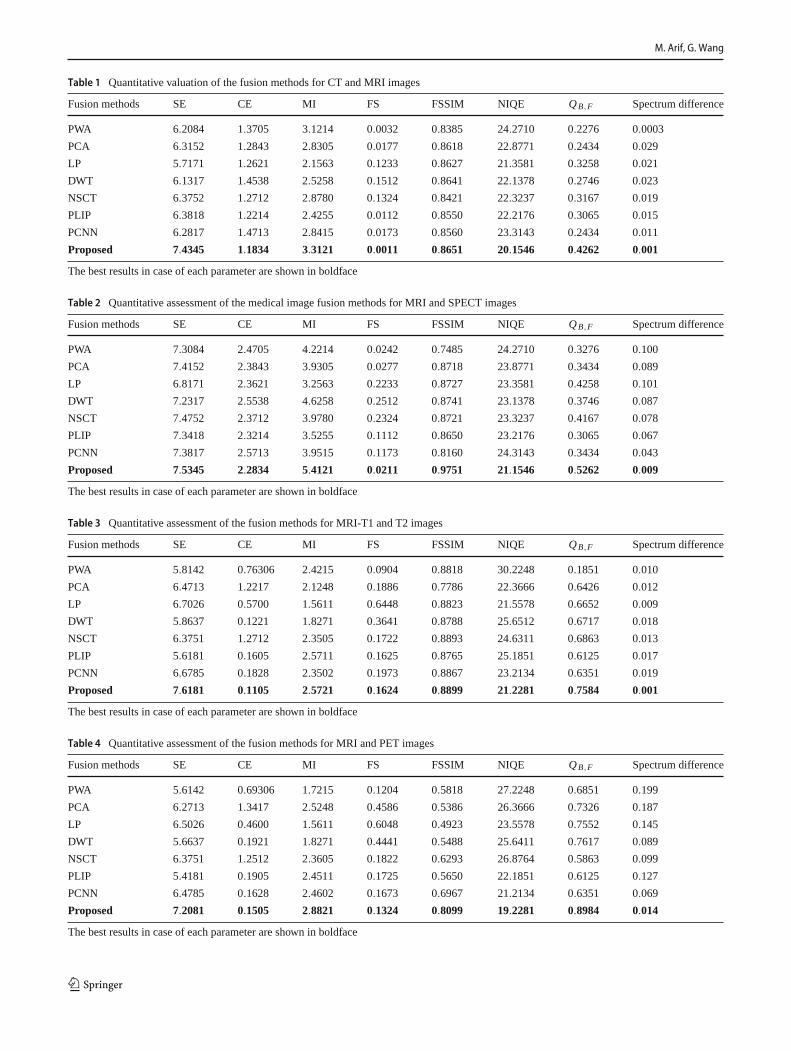
Table 1 Quantitative valuation of the fusion methods for CT and MRI images
Fusion methods SE CE MI FS FSSIM NIQE QB,F Spectrum difference
PWA 6.2084 1.3705 3.1214 0.0032 0.8385 24.2710 0.2276 0.0003
PCA 6.3152 1.2843 2.8305 0.0177 0.8618 22.8771 0.2434 0.029
LP 5.7171 1.2621 2.1563 0.1233 0.8627 21.3581 0.3258 0.021
DWT 6.1317 1.4538 2.5258 0.1512 0.8641 22.1378 0.2746 0.023
NSCT 6.3752 1.2712 2.8780 0.1324 0.8421 22.3237 0.3167 0.019
PLIP 6.3818 1.2214 2.4255 0.0112 0.8550 22.2176 0.3065 0.015
PCNN 6.2817 1.4713 2.8415 0.0173 0.8560 23.3143 0.2434 0.011
Proposed 7.4345 1.1834 3.3121 0.0011 0.8651 20.1546 0.4262 0.001
The best results in case of each parameter are shown in boldface
Table 2 Quantitative assessment of the medical image fusion methods for MRI and SPECT images
Fusion methods SE CE MI FS FSSIM NIQE QB,F Spectrum difference
PWA 7.3084 2.4705 4.2214 0.0242 0.7485 24.2710 0.3276 0.100
PCA 7.4152 2.3843 3.9305 0.0277 0.8718 23.8771 0.3434 0.089
LP 6.8171 2.3621 3.2563 0.2233 0.8727 23.3581 0.4258 0.101
DWT 7.2317 2.5538 4.6258 0.2512 0.8741 23.1378 0.3746 0.087
NSCT 7.4752 2.3712 3.9780 0.2324 0.8721 23.3237 0.4167 0.078
PLIP 7.3418 2.3214 3.5255 0.1112 0.8650 23.2176 0.3065 0.067
PCNN 7.3817 2.5713 3.9515 0.1173 0.8160 24.3143 0.3434 0.043
Proposed 7.5345 2.2834 5.4121 0.0211 0.9751 21.1546 0.5262 0.009
The best results in case of each parameter are shown in boldface
Table 3 Quantitative assessment of the fusion methods for MRI-T1 and T2 images
Fusion methods SE CE MI FS FSSIM NIQE QB,F Spectrum difference
PWA 5.8142 0.76306 2.4215 0.0904 0.8818 30.2248 0.1851 0.010
PCA 6.4713 1.2217 2.1248 0.1886 0.7786 22.3666 0.6426 0.012
LP 6.7026 0.5700 1.5611 0.6448 0.8823 21.5578 0.6652 0.009
DWT 5.8637 0.1221 1.8271 0.3641 0.8788 25.6512 0.6717 0.018
NSCT 6.3751 1.2712 2.3505 0.1722 0.8893 24.6311 0.6863 0.013
PLIP 5.6181 0.1605 2.5711 0.1625 0.8765 25.1851 0.6125 0.017
PCNN 6.6785 0.1828 2.3502 0.1973 0.8867 23.2134 0.6351 0.019
Proposed 7.6181 0.1105 2.5721 0.1624 0.8899 21.2281 0.7584 0.001
The best results in case of each parameter are shown in boldface
Table 4 Quantitative assessment of the fusion methods for MRI and PET images
Fusion methods SE CE MI FS FSSIM NIQE QB,F Spectrum difference
PWA 5.6142 0.69306 1.7215 0.1204 0.5818 27.2248 0.6851 0.199
PCA 6.2713 1.3417 2.5248 0.4586 0.5386 26.3666 0.7326 0.187
LP 6.5026 0.4600 1.5611 0.6048 0.4923 23.5578 0.7552 0.145
DWT 5.6637 0.1921 1.8271 0.4441 0.5488 25.6411 0.7617 0.089
NSCT 6.3751 1.2512 2.3605 0.1822 0.6293 26.8764 0.5863 0.099
PLIP 5.4181 0.1905 2.4511 0.1725 0.5650 22.1851 0.6125 0.127
PCNN 6.4785 0.1628 2.4602 0.1673 0.6967 21.2134 0.6351 0.069
Proposed 7.2081 0.1505 2.8821 0.1324 0.8099 19.2281 0.8984 0.014
The best results in case of each parameter are shown in boldface
123
Fast curvelet transform through genetic algorithm for multimodal medical image fusion
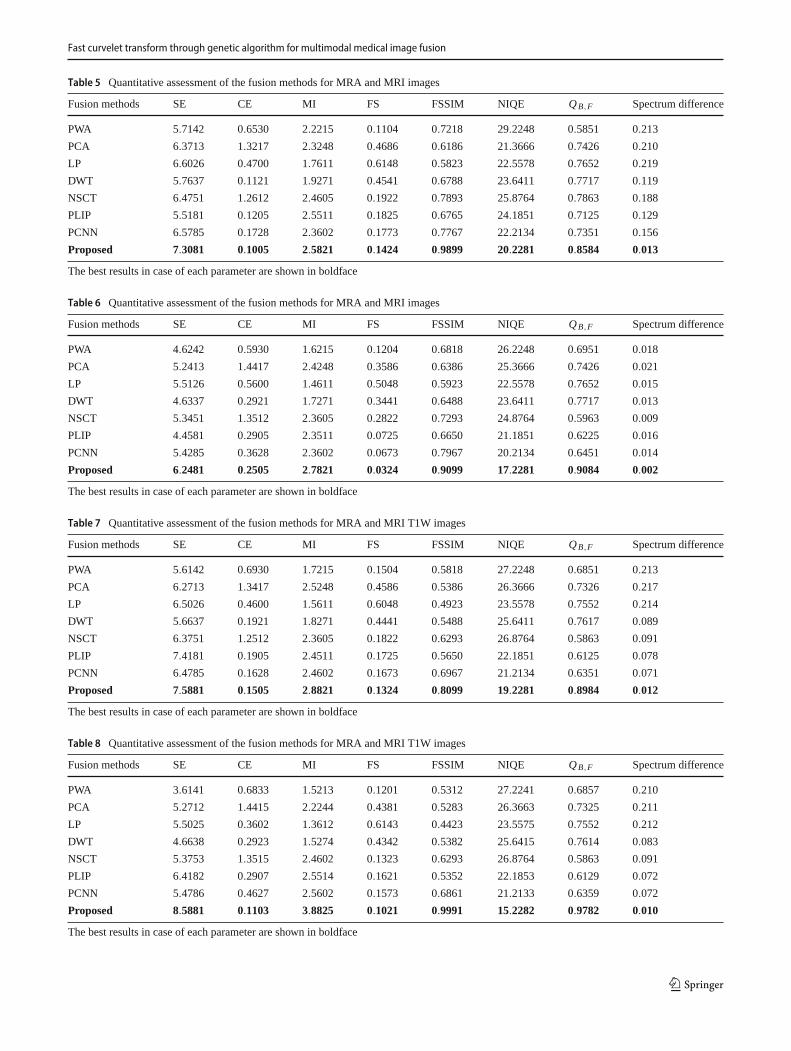
Table 5 Quantitative assessment of the fusion methods for MRA and MRI images
Fusion methods SE CE MI FS FSSIM NIQE QB,F Spectrum difference
PWA 5.7142 0.6530 2.2215 0.1104 0.7218 29.2248 0.5851 0.213
PCA 6.3713 1.3217 2.3248 0.4686 0.6186 21.3666 0.7426 0.210
LP 6.6026 0.4700 1.7611 0.6148 0.5823 22.5578 0.7652 0.219
DWT 5.7637 0.1121 1.9271 0.4541 0.6788 23.6411 0.7717 0.119
NSCT 6.4751 1.2612 2.4605 0.1922 0.7893 25.8764 0.7863 0.188
PLIP 5.5181 0.1205 2.5511 0.1825 0.6765 24.1851 0.7125 0.129
PCNN 6.5785 0.1728 2.3602 0.1773 0.7767 22.2134 0.7351 0.156
Proposed 7.3081 0.1005 2.5821 0.1424 0.9899 20.2281 0.8584 0.013
The best results in case of each parameter are shown in boldface
Table 6 Quantitative assessment of the fusion methods for MRA and MRI images
Fusion methods SE CE MI FS FSSIM NIQE QB,F Spectrum difference
PWA 4.6242 0.5930 1.6215 0.1204 0.6818 26.2248 0.6951 0.018
PCA 5.2413 1.4417 2.4248 0.3586 0.6386 25.3666 0.7426 0.021
LP 5.5126 0.5600 1.4611 0.5048 0.5923 22.5578 0.7652 0.015
DWT 4.6337 0.2921 1.7271 0.3441 0.6488 23.6411 0.7717 0.013
NSCT 5.3451 1.3512 2.3605 0.2822 0.7293 24.8764 0.5963 0.009
PLIP 4.4581 0.2905 2.3511 0.0725 0.6650 21.1851 0.6225 0.016
PCNN 5.4285 0.3628 2.3602 0.0673 0.7967 20.2134 0.6451 0.014
Proposed 6.2481 0.2505 2.7821 0.0324 0.9099 17.2281 0.9084 0.002
The best results in case of each parameter are shown in boldface
Table 7 Quantitative assessment of the fusion methods for MRA and MRI T1W images
Fusion methods SE CE MI FS FSSIM NIQE QB,F Spectrum difference
PWA 5.6142 0.6930 1.7215 0.1504 0.5818 27.2248 0.6851 0.213
PCA 6.2713 1.3417 2.5248 0.4586 0.5386 26.3666 0.7326 0.217
LP 6.5026 0.4600 1.5611 0.6048 0.4923 23.5578 0.7552 0.214
DWT 5.6637 0.1921 1.8271 0.4441 0.5488 25.6411 0.7617 0.089
NSCT 6.3751 1.2512 2.3605 0.1822 0.6293 26.8764 0.5863 0.091
PLIP 7.4181 0.1905 2.4511 0.1725 0.5650 22.1851 0.6125 0.078
PCNN 6.4785 0.1628 2.4602 0.1673 0.6967 21.2134 0.6351 0.071
Proposed 7.5881 0.1505 2.8821 0.1324 0.8099 19.2281 0.8984 0.012
The best results in case of each parameter are shown in boldface
Table 8 Quantitative assessment of the fusion methods for MRA and MRI T1W images
Fusion methods SE CE MI FS FSSIM NIQE QB,F Spectrum difference
PWA 3.6141 0.6833 1.5213 0.1201 0.5312 27.2241 0.6857 0.210
PCA 5.2712 1.4415 2.2244 0.4381 0.5283 26.3663 0.7325 0.211
LP 5.5025 0.3602 1.3612 0.6143 0.4423 23.5575 0.7552 0.212
DWT 4.6638 0.2923 1.5274 0.4342 0.5382 25.6415 0.7614 0.083
NSCT 5.3753 1.3515 2.4602 0.1323 0.6293 26.8764 0.5863 0.091
PLIP 6.4182 0.2907 2.5514 0.1621 0.5352 22.1853 0.6129 0.072
PCNN 5.4786 0.4627 2.5602 0.1573 0.6861 21.2133 0.6359 0.072
Proposed 8.5881 0.1103 3.8825 0.1021 0.9991 15.2282 0.9782 0.010
The best results in case of each parameter are shown in boldface
123

M. Arif, G. Wang
Table 9 Quantitative assessment of the fusion methods for MRA and MRI T1W images
Fusion methods SE CE MI FS FSSIM NIQE QB,F Spectrum difference
PWA 6.4245 0.6430 1.6215 0.1604 0.5518 28.2248 0.6951 0.214
PCA 7.2813 1.3317 2.4248 0.4486 0.5386 27.3666 0.7226 0.216
LP 7.5222 0.4200 1.4611 0.6148 0.4823 25.5578 0.7652 0.215
DWT 6.6123 0.1621 1.7271 0.4341 0.5588 25.6411 0.7717 0.088
NSCT 6.3454 1.1512 2.2605 0.1722 0.6193 26.8764 0.5963 0.092
PLIP 8.4534 0.1805 2.3511 0.1625 0.5450 23.1851 0.6225 0.079
PCNN 7.7656 0.1528 2.3602 0.1573 0.6867 22.2134 0.6451 0.072
Proposed 9.5881 0.1405 2.9821 0.1224 0.8199 18.2281 0.9984 0.011
The best results in case of each parameter are shown in boldface
Table 10 Quantitative assessment of the fusion methods for MRA and MRI T1W images
Fusion methods SE CE MI FS FSSIM NIQE QB,F Spectrum difference
PWA 4.6152 0.6031 1.2211 0.1201 0.7632 29.2243 0.6152 0.211
PCA 2.27133 1.3512 2.2241 0.4881 0.4987 28.3664 0.7623 0.211
LP 7.5126 0.4701 1.6612 0.6942 0.4533 27.5572 0.7251 0.215
DWT 3.6537 0.2822 1.1272 0.4244 0.5189 26.6413 0.7112 0.082
NSCT 6.3451 1.2613 2.2604 0.1121 0.5654 24.8762 0.5469 0.095
PLIP 4.4381 0.2103 2.3513 0.1227 0.5666 23.1855 0.6021 0.071
PCNN 4.4685 0.1921 2.3601 0.1471 0.7575 22.2133 0.6159 0.051
Proposed 8.6565 0.1604 3.1822 0.0923 0.9090 16.2298 0.8185 0.013
The best results in case of each parameter are shown in boldface
pictorial quality problem. Our proposed method in Fig. 6jshows the most accurate visual and morphological informa-tion of the source images. Figure 7a is an MRI image thatshows a brain organ with a tumor situated at the left temporalindicated by the red circle. On the other hand, Fig. 7b is acolor-coded PET image that represents the functional con-dition of the brain organ. The PCA-fused image in Fig. 7dyields clear color distortion, while the fused image in Fig. 7eshows very low contrast in lesion regions, and the DWT-fused image contains clear block artifacts. The images inFig. 7g–i show low distinction and color misrepresentationand noise articles in the image. Figure 7c, d, and f showsthe clear block artefacts in texture feature and edges and thebrightness is reduced. The PCNN and NSCT can improvethe performance of fusion, but color distortion still exists inthe images, thus reducing their accuracy. Figure 7j showsthe finest performance in positions of correlating pictorialdetails, including the morphological and functional informa-tion. Color, brightness, and edges are also well conservedby the recommended method. The quantifiable assessmentof our proposed method supersedes the performance of otherbaseline methods except for the FS objective measure againstPWA with slim difference. In our proposed approach, thelow-pass sub-band rules can avoid reducing the image con-trast. Normalization competently transfers the image feature
and structure information and captured all the dependencyinformation into the final fusion results.
Figure 8 shows the original MRI and MRA images. Thefused images in Fig. 8c–e show low contrast, high degreeof color misrepresentation, and noise artefacts. Figure 8f–hshows clear block artefacts in texture feature and edges. TheDWT, PCNN, and NSCT can improve the performance offusion, but block artefacts and color distortion still exist onthe edges. Figure 8i shows a better performance, and thisresult can be attributed to the fact that the PLIP can handlethe visual features and edges in the image. Out method inFig. 8j shows the best fusion presentation in positions ofcomplete assembly of pictorial and morphological features,no color misrepresentation, and well clear ends with sameillumination and detail. Additionally, our fused image hasno blurring effect and contains higher resolution than otherfused images.
Figure 9a and b shows MRI and SPECT images of nor-mal brain aging, correspondingly. MRI shows soft braintissue with great detail of the image anatomical structures.A SPECT image shows the blood flow and tissues of thebrain organ. Figure 9j clearly illustrates that the structureand the visual content of the brain are fully preserved innon-functional area, and the color information in the SPECTimage is also well placed in the functional area. When com-
123

Fast curvelet transform through genetic algorithm for multimodal medical image fusion
pared with other methods, the proposed method can obtainmore functional information from the SPECT and thus sup-presses color distortion. The images fused using the othermethods look darker, indicating color distortion. In addition,according to the quantitative metrics in Table 6, our methodobtained the best values in all the assessment metrics.
Finally, image (a) of Fig. 10 represents the MRA image. Itis produced by an MRI technique that specifically evaluatesvessels such as arteries. The T1W image (b) shows soft braintissue, and it gives greater detail of anatomical structures. Inmedical practice, both image contents at the same positionare carefully observed and investigated to determine the nec-essary pathology which is crucial in imaging diagnosis. Asshown in Fig. 10c–e, the fused images generated by PWA,PCA, and LP methods do not contain all the key informa-tion of images (a) and (b). Additionally, the fused imagesare blurry and highly affected with noise. The image con-trast in Fig. 10d–g is low, which resulted in unclear image.Similarly, images in Fig. 10h, i have low contrast and lostsome key information from the original. Our fused image ofFig. 10j shows a better contrast than the images fused withthe other methods. Most importantly, it accurately retainsthe key visual information of the source images at their exactpositions, with the same brightness.
The experimental result for our eighth group of brainimages is displayed in Fig. 11. The original image (a) isa coronal MRI image, while image (b) represents a coronalMRI image. The bonded images that are produced by thebaseline procedures and ours are shown in Fig. 6c, j. Thebonded image in Fig. 11c misplaces most of the informa-tion from image (b). The fused images in Fig. 11d–g havepoor image contrast, and this is evident from the correspond-ing values of the quantitative measures. For instance, theseimages have very low MI but high SD values. Figure 11h and ishows the similar pictorial quality problem. Our proposedmethod in Fig. 11j shows the most accurate visual and mor-phological information of the source images.
Figure 12a is a CT image that shows a brain organ witha tumor situated at the left temporal indicated by the redcircle. On the other hand, Fig. 12b is a MRA image thatrepresents the functional condition of the brain organ. ThePCA-fused image in Fig. 12d yields clear color distortion,while the fused image in Fig. 12e shows very low contrastin lesion regions, and the DWT-fused image contains clearblock artifacts. The images in Fig. 12g–i show low distinctionand color misrepresentation and noise articles in the image.Figure 12c, d, and f shows the clear block artefacts in tex-ture feature and edges and the brightness is reduced. ThePCNN and NSCT can improve the performance of fusionbut color distortion still exists in the images, thus reducingtheir accuracy. Figure 12j shows the finest performance inpositions of correlating pictorial details, including the mor-phological and functional information. Color, brightness, and
edges are also well conserved by the recommended method.The quantifiable assessment of our proposed method super-sedes the performance of other baseline methods except forthe FS objective measure against PWA with slim difference.In our proposed approach, the low-pass sub-band rules canavoid reducing the image contrast. Normalization compe-tently transfers the image feature and structure informationand captures all the dependency information into the finalfusion results.
In our next example, we present the experimental resultsof image fusion for the MRI and MRI images, as shownin Fig. 13. The presented images belong to a 40-year-oldman. Figure 13a and b shows the abnormalities. The imagein Fig. 13c shows low contrast and color distortion. Fig-ure 13e, f, and i illustrates clear block artifacts in the texturefeature and very low image contrast, which resulted in poorimage quality that may be difficult for medical diagnosis.The wavelet domain and PLIP method improve the perfor-mance of fusion, but block artifacts still exist in the images.These results can be attributed to the fact that the wavelet andPLIP cannot successfully handle texture features and edgesin low-quality medical images. Figure 13d, g, and h showsthe images generated by PCA, PCNN, and NSCT are blurredwith high degree of noise and low contrast and do not containall the necessary information found in the original images aand b. Our proposed method in Fig. 13j demonstrates betterrepresentation of the fused image in which the morphologicalinformation and colors of both original sources are accuratelymaintained.
As a conclusion, our proposed method demonstrates thebest visuals, and morphological and functional characteris-tics of the fused medical image as compared to other baselinemethods. This is because our method uses curvelet trans-forms for the best image and edge representations whichare deemed appropriate as most of medical images havecurvy shapes. Additionally, with the integration of the GAfor feature optimization, probability for curvelet transform,and the superposition method, both morphological and func-tional information of the source images can be preciselyretained including the exact locations of the crucial arte-facts in the images. The quality of the medical image fusionis not the only condition to evaluate the performance ofimage fusion methods. Evaluation of image fusion in termsof computational cost is also necessary to assess their per-formances. When compared with the PWA, PCA, LP, DWT,and NSCT methods, an advantage of the fast curvelet trans-form is that there is no restriction in the number of directionsfor decomposition, construction, supports, or directional fil-ters, because we optimize the directions features based onGA. The inversion of the curvelet only needs summations ofthe filters rather than the inverting the directional filter bankwhich results in implementations that are more computation-ally efficient.
123

M. Arif, G. Wang
6 Conclusion and future direction
In our paper, we propose a new image fusion techniqueusing GA and curvelet transforms with the help of wrappingalgorithm including ridgelet transform. This new techniqueutilizes curvelet transform for well frequency disintegra-tion. The GA aptness function is reformed according to thecurvelet transform for feature optimization. A new wrappingalgorithm is also used for merging low- and high-frequencycurvelet coefficients. Discrete ridgelet transform is used toseparately analyze each image square. This study is the first todefine the superposition method and probability for curvelettransform. The main idea is to excerpt an aspects featurevector by curvelet transform with wrapping algorithm. Wealso used the genetic algorithm in our opinion to resolvethe current ambiguity and vagueness in the plane region ofthe source input medical image. Moreover, GA is used tooptimize the feature for image fusion to achieve fast compu-tation process. The high-frequency curvelet constant of thebasis images is integrated by using copulas and GA, whichcombined the elevated output of the two images. The newlow and high frequencies of the curvelet coefficients for thefused images are selected from the input images by using FF,FS, and copula distribution. Lastly, inverse curvelet trans-form is applied for the low- and high-pass curvelet constantsto produce the final fused images. The experimental resultsconfirm that our proposed approach outperforms the exist-ing baseline methods in fusing the multimodal medical brainimages. The proposed approach can also be used for the otherimage processing domains, such as detail enhancement andimage abstraction. In the future, we will enhance our methodto adaptively determine the level of the decomposition.
Acknowledgements This work was supported in part by the NationalNatural Science Foundation of China under Grants 61632009, 61472451in part by the Guangdong Provincial Natural Science Foundation underGrant 2017A030308006, and in part by the High-Level Talents Programof Higher Education in Guangdong Province under Grant 2016ZJ01.
Compliance with ethical standards
Conflict of interest The authors declare that they have no conflict ofinterest.
References
Anderson CH (1988) Filter-subtract-decimate hierarchical pyramidsignal analyzing and synthesizing technique. U.S. Patent No.4,718,104
Arif M et al (2018) SDN-based secure VANETs communication withfog computing. In: International conference on security, pri-vacy and anonymity in computation, communication and storage.Springer, Cham
Arif M, Wang G, Balas VE (2018) Secure VANETs: trusted commu-nication scheme between vehicles and infrastructure based on fogcomputing. Stud Inform Control 27(2):235–246
Arif M, Abdullah NA, Phalianakote SK, Ramli N, Elahi M (2014) Max-imizing Information of Multimodality Brain Image Fusion UsingCurvelet Transform with Genetic Algorithm. In: Paper presented atthe international conference on computer assisted system in health(CASH), 2014
Arif M, Wang G, Chen S (2018a) Deep learning with non-parametricregression model for traffic flow prediction. In: 2018 IEEE 16thinternational conference on dependable, autonomic and securecomputing, 16th international conference on pervasive intelligenceand computing, 4th international conference on big data intelli-gence and computing and cyber science and technology congress(DASC/PiCom/DataCom/CyberSciTech). IEEE
Arif M, Wang G, Peng T (2018b) Track me if you can? Query based duallocation privacy in VANETs for V2V and V2I. In: 2018 17th IEEEinternational conference on trust, security and privacy in comput-ing and communications/12th IEEE international conference onbig data science and engineering (TrustCom/BigDataSE). IEEE
Bhateja V, Patel H, Krishn A, Sahu A, Lay-Ekuakille A (2015)Multimodal medical image sensor fusion framework using cas-cade of wavelet and contourlet transform domains. IEEE Sens J15(12):6783–6790
Bhuvaneswari C, Aruna P, Loganathan D (2014) A new fusion model forclassification of the lung diseases using genetic algorithm. EgyptInform J 15:69–77
Burt PJ, Kolczynski RJ (1993) Enhanced image capture through fusion.In: Paper presented at the proceedings of the fourth internationalconference on computer vision, 1993
Burt PJ (1992) A gradient pyramid basis for pattern-selective imagefusion. Proc Soc Inf Disp 1992:467–470
Candès EJ, Donoho DL (2000) Curvelets: a surprisingly effective non-adaptice representation for objects with edges. In: Rabut C, CohenA, Schumaker LL (eds) Curves and surfaces. Vanderbilt UniversityPress, Nashville TN
Candes E, Demanet L, Donoho D, Ying L (2006) Fast discrete curvelettransforms. Multiscale Model Simul 5(3):861–899
Cands EJ, Donoho DL (1999) Ridgelets: A key to higher-dimensionalintermittency? Philos Trans R Soc Lond Ser A Math Phys Eng Sci357(1760):2495–2509
Chai Y, Li H, Qu J (2010) Image fusion scheme using a novel dual-channel PCNN in lifting stationary wavelet domain. Opt Commun283(19):3591–3602
Chang B, Fan W, Deng B (2013) Medical images fusion using parame-terized logarithmic image processing model and wavelet sub-bandselection schemes. In: Emerging technologies for information sys-tems, computing, and management. Springer, pp 469–477
Chen X, Kar S, Ralescu DA (2012) Cross-entropy measure of uncertainvariables. Inf Sci 201:53–60
Choi M, Kim RY, Kim M-G (2004) The curvelet transform for imagefusion. Int Soc Photogramm Remote Sens ISPRS 2004(35):59–64
Da Cunha AL, Zhou J, Do MN (2006) The nonsubsampled contourlettransform: theory, design, and applications. IEEE Trans Image Pro-cess 15(10):3089–3101
Dai Y, Wang G (2018) Analyzing tongue images using a conceptualalignment deep autoencoder. IEEE Access 6:5962–5972
Dai Y, Wang G, Li K-C (2018) Conceptual alignment deep neural net-works. J Intell Fuzzy Syst 34(3):1631–1642
Daneshvar S, Ghassemian H (2010) MRI and PET image fusion bycombining IHS and retina-inspired models. Inf Fusion 11(2):114–123
Deans S (1983) The radon transform and some of its applications.Krieger Publishing Company, Florida
123

Fast curvelet transform through genetic algorithm for multimodal medical image fusion
Donoho DL, Duncan MR (2000) Digital curvelet transform: strat-egy, implementation, and experiments. In: Paper presented at theAeroSense 2000
Du P, Liu S, Xia J, Zhao Y (2013) Information fusion techniques forchange detection from multi-temporal remote sensing images. InfFusion 14(1):19–27
Escalante-Ramrez B (2008) The Hermite transform as an efficientmodel for local image analysis: an application to medical imagefusion. Comput Electr Eng 34(2):99–110
Gang L, Lei X, Xuequan C (2005) Overview of the applicationsof curvelet transform in image processing. J Comput Res Dev8:1331–1337
Garcia F, Mirbach B, Ottersten B, Grandidier F, Cuesta A (2010) Pixelweighted average strategy for depth sensor data fusion. In: Paperpresented at the 17th IEEE International Conference on ImageProcessing (ICIP), 2010
Guanqun T, Dapeng L, Guanghua L (2004) Application of waveletanalysis in medical image fusion. J Xidian Univ 31(1):82–86
He C, Liu Q, Li H, Wang H (2010) Multimodal medical image fusionbased on IHS and PCA. Procedia Eng 7:280–285
Henson RN, Flandin G, Friston KJ, Mattout J (2010) A parametricempirical Bayesian framework for fMRI-constrained MEG/EEGsource reconstruction. Hum Brain Mapp 31(10):1512–1531
Himanshi BV, Krishn A, Sahu A (2015) Medical image fusion incurvelet domain employing PCA and maximum selection rule. In:Paper presented at the proceedings of the (Springer) 2nd interna-tional conference on computers and communication technologies(IC3T-2015), Hyderabad, India
Javaid Q et al (2016a) Efficient facial expression detection by using theAdaptive-Neuro-Fuzzy-Inference-System and the Bezier curve.Sindh Univ Res J-SURJ (Sci Ser) 48(3):595–600
Javaid Q, Arif M, Talpur S (2016b) Segmentation and classification ofcalcification and hemorrhage in the brain using fuzzy C-mean andadaptive neuro-fuzzy inference system, Quaid-e-Awam Univ ResJ Eng Sci Technol 15(1):50–63
Javaid Q et al (2018) A hybrid technique for De-Noising multi-modalitymedical images by employing cuckoo’s search with curvelet trans-form. Mehran Univ Res J Eng Technol 37(1):29
Kotwal K, Chaudhuri S (2013) A novel approach to quantitativeevaluation of hyperspectral image fusion techniques. Inf Fusion14(1):5–18
Kumar S, Sharma YK (2011) Curvelet based multi-focus medical imagefusion technique: comparative study with wavelet based approach
Li T, Wang Y (2012) Multiscaled combination of MR and SPECTimages in neuroimaging: a simplex method based variable-weightfusion. Comput Methods Programs Biomed 105(1):31–39
Li H, Manjunath B, Mitra SK (1995) Multisensor image fusion using thewavelet transform. Graph Models Image Process 57(3):235–245
Li S, Kwok JT, Wang Y (2002) Using the discrete wavelet frame trans-form to merge Landsat TM and SPOT panchromatic images. InfFusion 3(1):17–23
Li X, He M, Roux M (2010) Multifocus image fusion based on redun-dant wavelet transform. IET Image Process 4(4):283–293
Li S, Yang B, Hu J (2011) Performance comparison of different multi-resolution transforms for image fusion. Inf Fusion 12(2):74–84
Lia W, Zhangb Q (2008) Study on data fusion methods with optimalinformation preservation between spectral and spatial based onhigh resolution imagery. Int Arch Photogramm Remote Sens Spa-tial Inf Sci 36(1):1227–1232
Liu Z, Yin H, Chai Y, Yang SX (2014) A novel approach for multimodalmedical image fusion. Expert Syst Appl 41:7425–7435
Mahyari AG, Yazdi M (2009) A novel image fusion method usingcurvelet transform based on linear dependency test. In: Paper pre-sented at the international conference on digital image processing,2009
Mittal A, Soundararajan R, Bovik AC (2013) Making a completely blindimage quality analyzer. IEEE Signal Process Lett 20(3):209–212
Muhammad A, Guojun W (2017) Segmentation of calcification andbrain hemorrhage with midline detection.” 2017 IEEE interna-tional symposium on parallel and distributed processing withapplications and 2017 IEEE international conference on ubiqui-tous computing and communications (ISPA/IUCC). IEEE
Nencini F, Garzelli A, Baronti S, Alparone L (2007) Remote sensingimage fusion using the curvelet transform. Inf Fusion 8(2):143–156
Park PC, Schreibmann E, Roper J, Elder E, Crocker I, Fox T, Zhu XR,Dong L, Dhabaan A (2015) MRI-based computed tomographymetal artifact correction method for improving proton range cal-culation accuracy. Int J Radiat Oncol* Biol* Phys 91(4):849–856
Peng Z, Wang G (2017) A novel ECG eigenvalue detection algorithmbased on wavelet transform. BioMed Res Int 2017:1–12
Rockinger O (1997) Image sequence fusion using a shift-invariantwavelet transform. In: Paper presented at the proceedings of theinternational conference on image processing, 1997
Satpathy A, Jiang X, Eng H-L (2010) Extended histogram of gradientsfeature for human detection. In: Paper presented at the 17th IEEEinternational conference on image processing (ICIP), 2010
Singh S, Gupta D, Anand R, Kumar V (2015) Nonsubsampled shearletbased CT and MR medical image fusion using biologically inspiredspiking neural network. Biomed Signal Process Control 18:91–101
Singh R, Vatsa M, Noore A (2009) Multimodal medical image fusionusing redundant discrete wavelet transform. In: Paper presented atthe seventh international conference on advances in pattern recog-nition, 2009. ICAPR’09
Sisniega A, Zbijewski W, Xu J, Dang H, Stayman J, Yorkston J, Siew-erdsen J (2015) High-fidelity artifact correction for cone-beam CTimaging of the brain. Phys Med Biol 60(4):1415
Starck J-L, Cands EJ, Donoho DL (2002) The curvelet transform forimage denoising. IEEE Trans Image Process 11(6):670–684
Sui J, Pearlson G, Caprihan A, Adali T, Kiehl KA, Liu J, CalhounVD (2011) Discriminating schizophrenia and bipolar disorder byfusing fMRI and DTI in a multimodal CCA+ joint ICA model.Neuroimage 57(3):839–855
Tang J, Rahmim A (2009) Bayesian PET image reconstruction incorpo-rating anato-functional joint entropy. Phys Med Biol 54(23):7063
Tessens L, Ledda A, Pizurica A, Philips W (2007) Extending the depthof field in microscopy through curvelet-based frequency-adaptiveimage fusion. Paper presented at the IEEE international conferenceon acoustics, speech and signal processing, 2007. ICASSP 2007
Toet A (1989) A morphological pyramidal image decomposition. Pat-tern Recognit Lett 9(4):255–261
Toet A (1989) Image fusion by a ratio of low-pass pyramid. PatternRecognit Lett 9(4):245–253
Toet A, Van Ruyven LJ, Valeton JM (1989) Merging thermal and visualimages by a contrast pyramid. Opt Eng 28(7):287789–287789
Wan T, Canagarajah N, Achim A (2009) Segmentation-driven imagefusion based on alpha-stable modeling of wavelet coefficients.IEEE Trans Multimed 11(4):624–633
Wang Z, Bovik AC, Sheikh HR, Simoncelli EP (2004) Image qual-ity assessment: from error visibility to structural similarity. IEEETrans Image Process 13(4):600–612
Wang Z, Ma Y, Gu J (2010) Multi-focus image fusion using PCNN.Pattern Recognit 43(6):2003–2016
Wang L, Li B, Tian L-F (2014) Multi-modal medical image fusionusing the inter-scale and intra-scale dependencies between imageshift-invariant shearlet coefficients. Inf Fusion 19:20–28
Wang L, Li B, Tian L (2014) Multi-modal medical volumetric datafusion using 3D discrete shearlet transform and global-to-localrule. IEEE Trans Biomed Eng 61(1):197–206
Xu Z (2014) Medical image fusion using multi-level local extrema. InfFusion 19:38–48
123
M. Arif, G. Wang
Yang L, Guo B, Ni W (2008) Multimodality medical image fusionbased on multiscale geometric analysis of contourlet transform.Neurocomputing 72(1):203–211
Yang S, Wang M, Jiao L, Wu R, Wang Z (2010) Image fusion based ona new contourlet packet. Inf Fusion 11(2):78–84
Yang J, Han F, Zhao D (2011) A block advanced PCA fusion algorithmbased on PET/CT. In: Paper presented at the international con-ference on Intelligent Computation Technology and Automation(ICICTA), 2011
Yi S, Labate D, Easley GR, Krim H (2009) A shearlet approach to edgeanalysis and detection. IEEE Trans Image Process 18(5):929–941
Yuan Q, Dong C, Wang Q (2009) An adaptive fusion algorithm based onANFIS for radar/infrared system. Expert Syst Appl 36(1):111–120
Zhang Q, Guo B (2009) Multifocus image fusion using the nonsubsam-pled contourlet transform. Signal Process 89(7):1334–1346
Zhang Z, Sun S, Zheng F (2001) Image fusion based on median filtersand SOFM neural networks: a three-step scheme. Signal Process81(6):1325–1330
Zhao Y, Zhao Q, Hao A (2014) Multimodal medical image fusion usingimproved multi-channel PCNN. Bio-med Mater Eng 24(1):221–228
Ziran PENG et al (2017) Research and improvement of ECG compres-sion algorithm based on EZW. Comput Methods Programs Biomed145:157–166
Publisher’s Note Springer Nature remains neutral with regard to juris-dictional claims in published maps and institutional affiliations.
123
Related Documents


![GU 主讲人:王国军 教授ieee-trustcom.org/faculty/~csgjwang/GUcoursedownload/oop/...3:C++ Primer Plus(第6版)中文版,[美]Stephen Prata 著, 人民邮电出版社,2012年7月。教材1](https://static.cupdf.com/doc/110x72/614a280212c9616cbc693ba6/gu-eic-ieee-csgjwanggucoursedownloadoop-3ic-primer.jpg)