BioMed Central Page 1 of 14 (page number not for citation purposes) BioData Mining Open Access Research Fast approximate hierarchical clustering using similarity heuristics Meelis Kull* 1,2 and Jaak Vilo* 1,2 Address: 1 Institute of Computer Science, University of Tartu, Liivi 2, 50409 Tartu, Estonia and 2 Quretec Ltd. Ülikooli 6a, 51003 Tartu, Estonia Email: Meelis Kull* - [email protected]; Jaak Vilo* - [email protected] * Corresponding authors Abstract Background: Agglomerative hierarchical clustering (AHC) is a common unsupervised data analysis technique used in several biological applications. Standard AHC methods require that all pairwise distances between data objects must be known. With ever-increasing data sizes this quadratic complexity poses problems that cannot be overcome by simply waiting for faster computers. Results: We propose an approximate AHC algorithm HappieClust which can output a biologically meaningful clustering of a large dataset more than an order of magnitude faster than full AHC algorithms. The key to the algorithm is to limit the number of calculated pairwise distances to a carefully chosen subset of all possible distances. We choose distances using a similarity heuristic based on a small set of pivot objects. The heuristic efficiently finds pairs of similar objects and these help to mimic the greedy choices of full AHC. Quality of approximate AHC as compared to full AHC is studied with three measures. The first measure evaluates the global quality of the achieved clustering, while the second compares biological relevance using enrichment of biological functions in every subtree of the clusterings. The third measure studies how well the contents of subtrees are conserved between the clusterings. Conclusion: The HappieClust algorithm is well suited for large-scale gene expression visualization and analysis both on personal computers as well as public online web applications. The software is available from the URL http://www.quretec.com/HappieClust Background Various types of biological data resulting from high- throughput experiments require analysis, often consisting of many steps. The first steps tend to be unsupervised and require little or no input from the user, while the further steps need more human-computer interaction. One possi- ble starting point of interaction is showing an overview of the data to the user, frequently achieved using clustering. Partitioning-based clustering methods like K-means split the data into non-overlapping clusters [1]. In this article, we concentrate on hierarchical methods that model the data in a tree structure and thus leave more freedom to the user. Probably the most well-known hierarchical clustering method is agglomerative hierarchical clustering (AHC). To begin with, AHC treats each data object as a separate cluster. The following agglomeration steps iteratively merge the two nearest clusters. Simultaneously, the clus- tering tree (dendrogram) is built from leaves towards root, where merging of clusters is depicted as a common parent Published: 22 September 2008 BioData Mining 2008, 1:9 doi:10.1186/1756-0381-1-9 Received: 8 April 2008 Accepted: 22 September 2008 This article is available from: http://www.biodatamining.org/content/1/1/9 © 2008 Kull and Vilo; licensee BioMed Central Ltd. This is an Open Access article distributed under the terms of the Creative Commons Attribution License (http://creativecommons.org/licenses/by/2.0 ), which permits unrestricted use, distribution, and reproduction in any medium, provided the original work is properly cited.

Welcome message from author
This document is posted to help you gain knowledge. Please leave a comment to let me know what you think about it! Share it to your friends and learn new things together.
Transcript
BioMed CentralBioData Mining
ss
Open AcceResearchFast approximate hierarchical clustering using similarity heuristicsMeelis Kull*1,2 and Jaak Vilo*1,2Address: 1Institute of Computer Science, University of Tartu, Liivi 2, 50409 Tartu, Estonia and 2Quretec Ltd. Ülikooli 6a, 51003 Tartu, Estonia
Email: Meelis Kull* - [email protected]; Jaak Vilo* - [email protected]
* Corresponding authors
AbstractBackground: Agglomerative hierarchical clustering (AHC) is a common unsupervised dataanalysis technique used in several biological applications. Standard AHC methods require that allpairwise distances between data objects must be known. With ever-increasing data sizes thisquadratic complexity poses problems that cannot be overcome by simply waiting for fastercomputers.
Results: We propose an approximate AHC algorithm HappieClust which can output a biologicallymeaningful clustering of a large dataset more than an order of magnitude faster than full AHCalgorithms. The key to the algorithm is to limit the number of calculated pairwise distances to acarefully chosen subset of all possible distances. We choose distances using a similarity heuristicbased on a small set of pivot objects. The heuristic efficiently finds pairs of similar objects and thesehelp to mimic the greedy choices of full AHC. Quality of approximate AHC as compared to fullAHC is studied with three measures. The first measure evaluates the global quality of the achievedclustering, while the second compares biological relevance using enrichment of biological functionsin every subtree of the clusterings. The third measure studies how well the contents of subtreesare conserved between the clusterings.
Conclusion: The HappieClust algorithm is well suited for large-scale gene expression visualizationand analysis both on personal computers as well as public online web applications. The software isavailable from the URL http://www.quretec.com/HappieClust
BackgroundVarious types of biological data resulting from high-throughput experiments require analysis, often consistingof many steps. The first steps tend to be unsupervised andrequire little or no input from the user, while the furthersteps need more human-computer interaction. One possi-ble starting point of interaction is showing an overview ofthe data to the user, frequently achieved using clustering.
Partitioning-based clustering methods like K-means splitthe data into non-overlapping clusters [1]. In this article,
we concentrate on hierarchical methods that model thedata in a tree structure and thus leave more freedom to theuser.
Probably the most well-known hierarchical clusteringmethod is agglomerative hierarchical clustering (AHC).To begin with, AHC treats each data object as a separatecluster. The following agglomeration steps iterativelymerge the two nearest clusters. Simultaneously, the clus-tering tree (dendrogram) is built from leaves towards root,where merging of clusters is depicted as a common parent
Published: 22 September 2008
BioData Mining 2008, 1:9 doi:10.1186/1756-0381-1-9
Received: 8 April 2008Accepted: 22 September 2008
This article is available from: http://www.biodatamining.org/content/1/1/9
© 2008 Kull and Vilo; licensee BioMed Central Ltd. This is an Open Access article distributed under the terms of the Creative Commons Attribution License (http://creativecommons.org/licenses/by/2.0), which permits unrestricted use, distribution, and reproduction in any medium, provided the original work is properly cited.
Page 1 of 14(page number not for citation purposes)
BioData Mining 2008, 1:9 http://www.biodatamining.org/content/1/1/9
for two subtrees. Finally, the user is shown the dendro-gram, possibly together with data objects visualized ateach leaf. There are different versions of AHC, dependingon how the distance between clusters is measured. It canbe defined as the distance between the closest or furthestobjects, resulting in single or complete linkage AHC,respectively. Other known strategies include UPGMA(unweighted pair-group method using arithmetic aver-ages) and WPGMA (weighted pair-group method usingarithmetic averages) clustering. For a more detailed expo-sition refer to Legendre & Legendre [2].
AHC is often used to visualize microarray gene expressiondata. Originally suggested by Eisen et al. [3], there nowexist many tools for performing AHC of gene expressiondata, e.g. Cluster 3.0 [4] coupled with Java Treeview [5],MultiExperiment Viewer (MeV 4.0) [6], and EP:NG [7]with clustering tools from EPCLUST 1.0 [8]. An importantissue of using this simple and intuitive procedure is itsspeed. Some of the best implementations can achievequadratic speed in the number of data objects [9]. At leastquadratic running time is required for general distancemeasures, as exemplified by the need of first finding a sin-gle closest pair of objects from all possible candidatepairs.
As will be shown in the Results section, full AHC of genesin medium-sized expression datasets can be performed ina couple of minutes on a workstation computer. Cluster-ing large datasets with 20000+ genes and several thou-sands of conditions can already take several hours. Onepossible workaround involves decreasing the size of thedataset by filtering out the genes that change too little overthe conditions. However, dropping a large set of data in avery early stage of study might be undesirable. Secondly,when the number of experimental conditions is large,almost all genes show some differential expression.Another possibility is to first run K-means and then applyAHC on the centers of obtained clusters. The downside isthat K-means is inherently limited in the choice of the dis-tance measure. K-medoids is free from this constraint, buthas quadratic complexity [10].
To our knowledge, significant speedups to AHC have onlybeen achieved in specialized computational environ-ments, such as parallel computing [11] and graphics hard-ware acceleration [12]. Another direction of research hasinvolved the development of hierarchical clustering meth-ods in a different framework, such as DIANA [10] or SOTA[13]. Both of these are divisive hierarchical clusteringalgorithms as opposed to AHC. There is a clear need forfast AHC for interactive tools, web services and otherapplications, running on personal and workstation com-puters or servers with many simultaneous users.
The speed problem is caused by the fact that all pairwisecomparisons have to be performed between the dataobjects. Each comparison involves a distance calculationusing the distance measure specified by the user, whereshort distances correspond to more similar objects. Not asingle pair can be omitted, because already in the first iter-ation AHC uses each of the pairwise distances to find theclosest pair. In the following we take the only route to asignificant speedup and drop the requirement of calculat-ing all pairwise distances. This certainly affects the den-drogram and the conclusions that can be drawn from it. Inthis article, we present a fast approximate hierarchicalclustering algorithm which uses similarity heuristics toretain high quality of clustering.
Our approximate hierarchical clustering algorithm firstcalculates a subset of pairwise distances and then per-forms agglomerative clustering based on these distances.The logic of the agglomeration part is straightforward –make merging decisions based on the known distancesonly. The quality of the resulting clustering depends heav-ily on the subset of distances chosen in the first step.Therefore, we use heuristics to rapidly find pairs of similardata objects. The heuristics are based on the observationthat if two objects are close enough to each other then thedistance to any third object from both of these is approx-imately the same. We turn this observation upside downand look for pairs of objects which are approximately atthe same distance from several other objects (which werefer to as pivots). These pairs are more probably similarand form the subset of pairs for which the distance is cal-culated. Experiments show that adding a random set ofpairs to the pool further raises the quality of clustering.Pivots have earlier been used in the database communityfor several similarity search algorithms [14].
The running time of the HappieClust algorithm can beeasily controlled by choosing the number of distances thatare to be calculated and used in the clustering. Such a fea-ture is very useful in web-based applications where usersexpect fast response time.
The experiments to evaluate speed and quality of Happie-Clust have been carried out using two datasets: DNAmicroarray survey of gene expression in normal humantissues [15] and human gene expression atlas of publicmicroarray data [16] (accession E-TABM-185 of ArrayEx-press [17]).
MethodsApproximate hierarchical clusteringSuppose we have a dataset X with n data objects, X = (x1,x2,...,xn) and a user-defined distance measure d(xi, xj) tostate how similar the two objects xi and xj are, for any i andj. We assume the distance measure to be a semi-metric, i.e.
Page 2 of 14(page number not for citation purposes)
BioData Mining 2008, 1:9 http://www.biodatamining.org/content/1/1/9
it must be non-negative and symmetric and the distancefrom an object to itself must be 0:
The dataset can have duplicate objects and we do notrequire the triangle inequality d(xi, xj) ≤ d(xi, xk) + d(xk, xj).
Standard agglomerative hierarchical clustering starts offclustering this data by putting each of the data objects xi in
a singleton cluster C{i} = {xi} and then keeps on joining
the closest pair of clusters C{i} ∪ C{j} = C{i, j} until there is
only one large cluster C{1,2,...,n}. The distance between clus-
ters and can be measured
in several ways. Three popular methods are single, com-plete and average linkage:
where |C| denotes the number of objects in cluster C. It isseen that the distance between clusters is the minimum(or maximum or average) of the distances between oneobject from the first and another from the second cluster.
It is important to note that the distances to a newlymerged cluster C' ∪ C" can be easily calculated using dis-tances to the clusters C' and C":
Standard agglomerative hierarchical clustering algorithmcan be translated into the language of graphs by represent-ing clusters as nodes and distances between them as edges.When put this way, hierarchical clustering starts off with acomplete graph with all the possible pairwise distances,looks for the shortest edge (pair of most similar clusters),and joins the end nodes (clusters) of this edge. Whiledoing so, the distances to other nodes are recalculatedusing the formulas given above. The algorithm keeps onfinding the shortest edge and joining respective nodesuntil there is only one node left.
Our approximate hierarchical clustering works exactly thesame way except that the graph is not required to be com-plete, i.e. the algorithm works even if only a subset of pair-wise distances is known. This is a clear advantage in caseof large datasets and/or complex distance measures.Therefore, we redefine the distance between clusters to bethe minimum (or maximum or average) of only theknown distances measured between the objects of the twoclusters. If no distances are known at some point in thealgorithm, i.e. the distance graph is not connected, tworandomly chosen clusters are joined. This situation can beavoided by calculating enough distances because almostall graphs with n nodes and at least n log n edges are con-nected [18]. When all distances are known, approximatehierarchical clustering coincides with the standard hierar-chical clustering.
We have developed a simple algorithm (see Algorithm 1)for performing approximate hierarchical clustering. Step 1of this algorithm takes (m) time, steps 3, 8, 9 take
(log m) time [19], and steps 4, 6, 12 take (1) time,where m is the number of known distances. As steps 8 and9 are repeated at most m times, the overall time complex-ity is (m log m). The largest data structure which needsto be stored by the algorithm is the heap H, so therequired memory is (m).
Algorithm 1 Approximate hierarchical clustering using agiven subset of pairwise distances
Require: m distances between n data objects (a graph withn nodes and m edges), linkage method.
1: build a heap H of all edges
2: while H is not empty do
3: (u, v) ⇐ H {take the shortest edge from the heap}
4: swap u and v if u has more outgoing edges than v
5: for all edges (u, x) going out from u do
6: change (u, x) into (v, x), keep the same length
7: if (v, x) is a duplicate edge then
8: calculate new length of (v, x) from old lengths
9: remove the duplicate from graph and heap
10: end if
11: end for
d x x i j n
d x x d x x i j n
d x x i
i j
i j j i
i i
( , ) , , , ;
( , ) ( , ) , , , ;
( , )
≥ = …= = …=
0 1
1
0 == …1, , .n
C C i i ir= …{ , , , }1 2
′ = …C C j j js{ , , , }1 2
d C C d x y
d C Cx C y C
x C y C
min,
max,
( , ) min ( , ) ( )
( , ) max
′ =
′ =∈ ∈ ′
∈ ∈ ′
single
dd x y
d C CC C
d x yx C y C
( , ) ( )
( , )| || |
( , ),
complete
(averaave ′ =⋅ ′
∈ ∈ ′∑1
gge),
d C C C d C C d C C
d C C Cmin min min
max
( , ) min( ( , ), ( , ))
( , ) m
′ ∪ ′′ = ′ ′′′ ∪ ′′ = aax( ( , ), ( , ))
( , )| | ( , )
max maxd C C d C C
d C C CC d C C
′ ′′
′ ∪ ′′ =′ ⋅ ′ +
aveave || | ( , )
| |.
′′ ⋅ ′′′∪ ′′
C d C CC C
ave
Page 3 of 14(page number not for citation purposes)
BioData Mining 2008, 1:9 http://www.biodatamining.org/content/1/1/9
12: remove node u
13: end while
Similarity heuristicsNot all distances are of equal importance to the result ofhierarchical clustering. Many distances can be omittedfrom the distance graph while the dendrogram structurewill remain exactly the same. But, for example, removingthe shortest distance will unavoidably lead to a differentchoice at the first join and thus to a different dendrogram.This gives a clear hint that if we cannot afford to calculateall pairwise distances, the distances we choose should bebiased towards shorter distances. At the same time, somelong distances should be known, in order to have the "bigpicture" of data. For example, in case of several large clus-ters we still need to know which of these are closer to eachother, in order to get the dendrogram right. In the follow-ing, we calculate some of the distances randomly andsome using the similarity heuristics which we describenext.
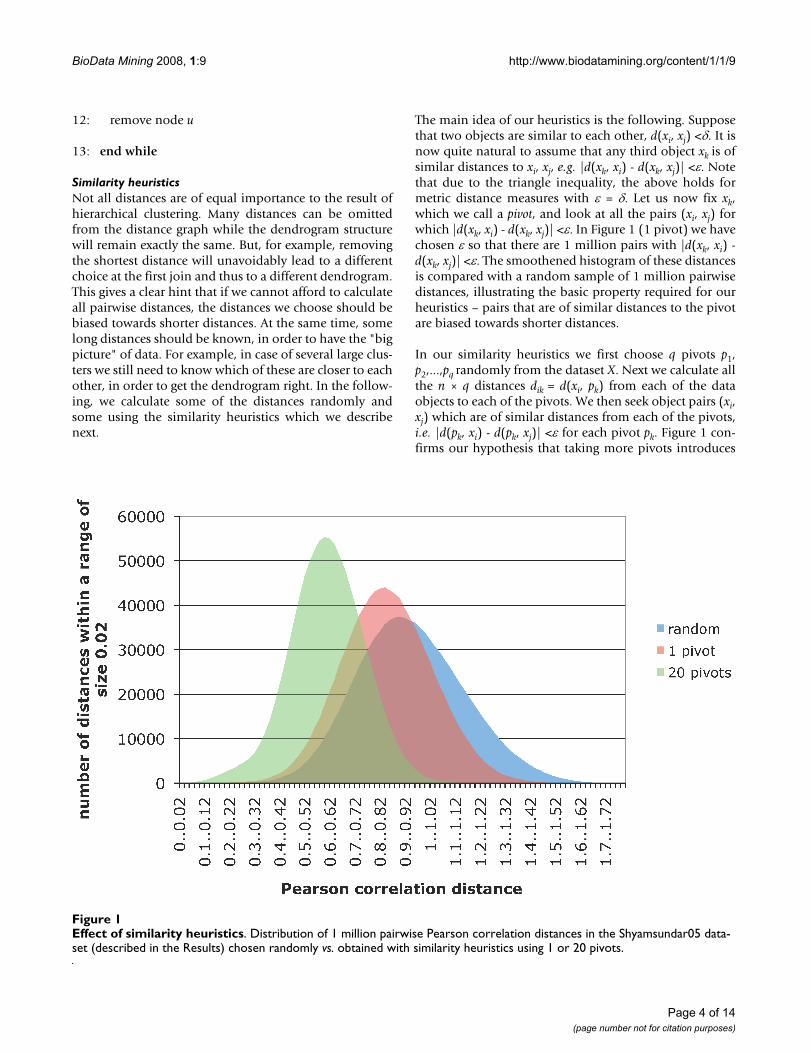
The main idea of our heuristics is the following. Supposethat two objects are similar to each other, d(xi, xj) <δ. It isnow quite natural to assume that any third object xk is ofsimilar distances to xi, xj, e.g. |d(xk, xi) - d(xk, xj)| <ε. Notethat due to the triangle inequality, the above holds formetric distance measures with ε = δ. Let us now fix xk,which we call a pivot, and look at all the pairs (xi, xj) forwhich |d(xk, xi) - d(xk, xj)| <ε. In Figure 1 (1 pivot) we havechosen ε so that there are 1 million pairs with |d(xk, xi) -d(xk, xj)| <ε. The smoothened histogram of these distancesis compared with a random sample of 1 million pairwisedistances, illustrating the basic property required for ourheuristics – pairs that are of similar distances to the pivotare biased towards shorter distances.
In our similarity heuristics we first choose q pivots p1,p2,...,pq randomly from the dataset X. Next we calculate allthe n × q distances dik = d(xi, pk) from each of the dataobjects to each of the pivots. We then seek object pairs (xi,xj) which are of similar distances from each of the pivots,i.e. |d(pk, xi) - d(pk, xj)| <ε for each pivot pk. Figure 1 con-firms our hypothesis that taking more pivots introduces
Effect of similarity heuristicsFigure 1Effect of similarity heuristics. Distribution of 1 million pairwise Pearson correlation distances in the Shyamsundar05 data-set (described in the Results) chosen randomly vs. obtained with similarity heuristics using 1 or 20 pivots.
Page 4 of 14(page number not for citation purposes)
BioData Mining 2008, 1:9 http://www.biodatamining.org/content/1/1/9
stronger bias towards shorter distances. The conditions|d(pk, xi) - d(pk, xj)| <ε can be rewritten as
On the left side of the inequality we can recognize theChebyshev distance between q-dimensional vectors di =(di1,...,diq) and dj = (dj1,...,djq). We denote this distance byc(di, dj). Thus we can rewrite the inequality as c(di, dj) <ε.To avoid confusion, we refer to d(xi, xj) as the distance andc(di, dj) as the pseudo-distance between objects xi and xj. Oursimilarity heuristic requires all pairs (xi, xj) for which thepseudo-distance is less than ε. These pairs can be fetchedusing a similarity join, for which we use the algorithmEpsilon Grid Order (EGO) [20]. EGO splits the q-dimen-sional space into hypercubes of side-length ε – any twoobjects in the same hypercube are similar, any two objectsmore than one hypercube apart are dissimilar, and objectsin neighbouring hypercubes can be either. The hyper-cubes are sorted in a specific manner called epsilon gridorder in order to prune the search tree.
HappieClustWe now have the required notions to describe our approx-imate hierarchical clustering algorithm HappieClust(Algorithm 2). It requires 5 input parameters: distancemeasure; joining linkage method (single, average or com-plete); number of pivots, 0 ≤ q; number of distances to cal-culate, 0 ≤ m ≤ (n - 1)n/2; and the proportion of similarityheuristics based distances, 0 ≤ s ≤ 1. The proportion s isachieved by HappieClust only approximately, using theestimation of ε in step 1d of Algorithm 2.
Algorithm 2 HappieClust – approximate hierarchicalclustering using similarity heuristics
Require: dataset (size n), distance measure, linkagemethod, number of pivots (q), proportion of similarityheuristics based distances (s), number of distances to cal-culate (m).
1. Initialization:
(a) choose q pivots p1, p2,...,pq randomly among the dataobjects
(b) calculate distances from every data object to all pivots
(c) calculate the pseudo-distances between n randomlysampled pairs of objects
(d) estimate ε based on the pseudo-distances in the sam-ple such that approximately s·m out of all (n - 1)n/2 pair-wise pseudo-distances would be less than ε
2. Distances based on similarity heuristics:
(a) find all pairs with pseudo-distance less than ε (usingEGO)
(b) calculate actual distances between pairs from the pre-vious step
3. Random distances:
(a) calculate about (1 - s)·m additional distances betweenrandom pairs of objects to achieve m distances in total
4. Approximate hierarchical clustering:
(a) run approximate hierarchical clustering (Algorithm 1)on distances from steps 2 and 3
The two first parameters are shared with full hierarchicalclustering. As shown in the Results section, values q = 20and s = 0.5 seem to work well in all conditions and do nothave to be ever changed. Hence, HappieClust has onlyone additional parameter compared to full hierarchicalclustering. This parameter m is required to specify the levelof approximation and can be estimated from the giventime constraints. HappieClust gives the best qualityapproximation it is able to reach within the given timeframe.
ResultsThe experimental work of this study is divided into threeparts. First, we examine the running time of three full hier-archical clustering tools and HappieClust. Next, we showhow the quality of approximation depends on the param-eters of HappieClust. Finally, we give results of applyingHappieClust on a large gene expression dataset.
As a medium-sized dataset we have chosen a DNA micro-array survey of gene expression in normal human tissues[15], hereafter referred to as data=Shyamsundar05. Itinvolves expression values for 15521 genes in 123 condi-tions. The large dataset is from a study to build a humangene expression atlas of public microarray data [16],data=Lukk08, with 22283 probes in 5896 conditions(accession E-TABM-185 of ArrayExpress [17]). In bothcases we have chosen to use average linkage hierarchicalclustering with Pearson correlation distance, a commonchoice for microarray gene expression data.
Running time experimentsRunning time experiments were performed on a laptopcomputer (MacBook with 2.0 GHz Intel Core Duo proces-sor and 2 GB RAM) and a workstation (64-bit Linux com-puter with four 2.0 GHz AMD dual core processors and 32GB RAM). Note that our algorithm has not been parallel-
max | | .k
q
ik jkd d=
− <1
ε
Page 5 of 14(page number not for citation purposes)
BioData Mining 2008, 1:9 http://www.biodatamining.org/content/1/1/9
ised to use multiple processors. We measured separatelythe time spent on the distance matrix calculation and thetime spent on agglomeration. Each measurement wasrepeated three times and the median was reported.
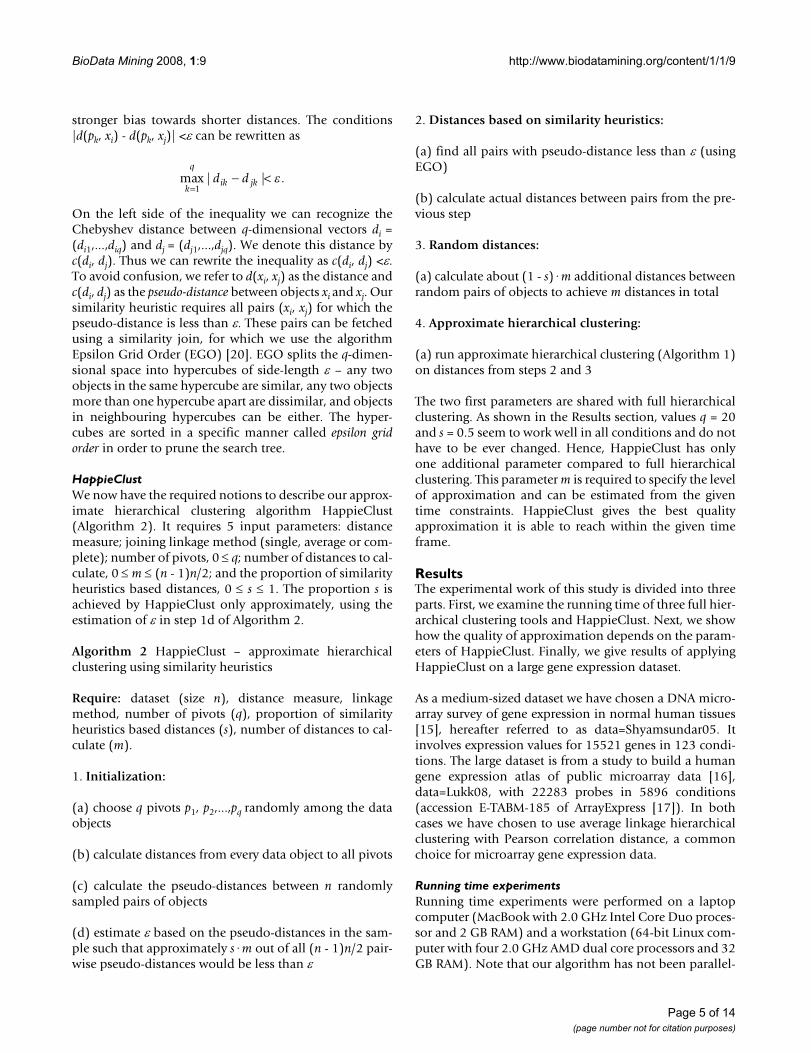
First, we measured the speed of tools Cluster 3.0 [4], MeV4.0 [6], and EPCLUST 1.0 [8] in order to later compareHappieClust with the fastest tool. The agglomerationtimes on the laptop with n = 1000, 2000,...,15000 ran-domly generated vectors are plotted in Figure 2 and showthat MeV 4.0 is slightly faster than EPCLUST 1.0 whileCluster 3.0 is much slower. Calculation of 100 millionPearson correlation distances between vectors of length ltook about 5·l seconds with MeV, 1·l seconds with Clus-ter 3.0, and 0.5·l seconds with EPCLUST 1.0. Summingup the times of distance calculations and agglomerationwe see that EPCLUST 1.0 is the fastest tool. For example,hierarchical clustering of 15000 vectors of length 10 takesabout 30 + 0.5·10 = 35 seconds with EPCLUST 1.0 andabout 20 + 5·10 = 70 seconds with MeV 4.0.
Next, the running time of HappieClust using differentparameters with data=Shyamsundar05 and data=Lukk08was measured on the workstation computer. As a compar-ison, we ran EPCLUST 1.0, which clustered
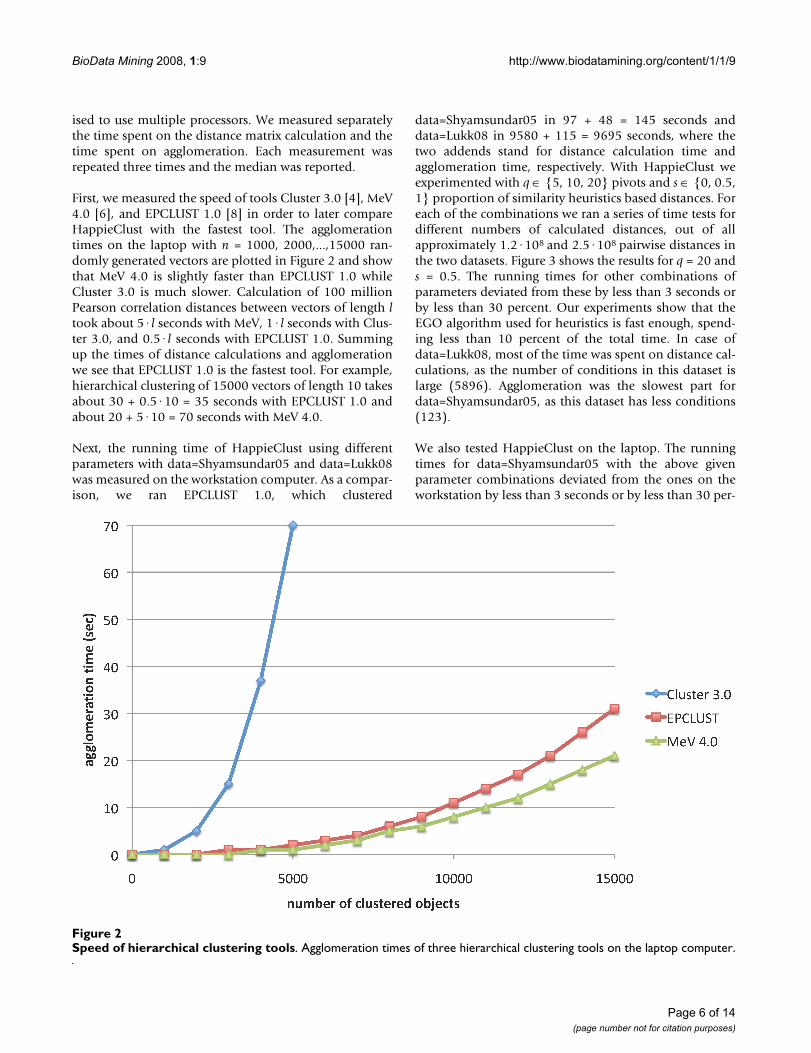
data=Shyamsundar05 in 97 + 48 = 145 seconds anddata=Lukk08 in 9580 + 115 = 9695 seconds, where thetwo addends stand for distance calculation time andagglomeration time, respectively. With HappieClust weexperimented with q ∈ {5, 10, 20} pivots and s ∈ {0, 0.5,1} proportion of similarity heuristics based distances. Foreach of the combinations we ran a series of time tests fordifferent numbers of calculated distances, out of allapproximately 1.2·108 and 2.5·108 pairwise distances inthe two datasets. Figure 3 shows the results for q = 20 ands = 0.5. The running times for other combinations ofparameters deviated from these by less than 3 seconds orby less than 30 percent. Our experiments show that theEGO algorithm used for heuristics is fast enough, spend-ing less than 10 percent of the total time. In case ofdata=Lukk08, most of the time was spent on distance cal-culations, as the number of conditions in this dataset islarge (5896). Agglomeration was the slowest part fordata=Shyamsundar05, as this dataset has less conditions(123).
We also tested HappieClust on the laptop. The runningtimes for data=Shyamsundar05 with the above givenparameter combinations deviated from the ones on theworkstation by less than 3 seconds or by less than 30 per-
Speed of hierarchical clustering toolsFigure 2Speed of hierarchical clustering tools. Agglomeration times of three hierarchical clustering tools on the laptop computer.
Page 6 of 14(page number not for citation purposes)
BioData Mining 2008, 1:9 http://www.biodatamining.org/content/1/1/9
Page 7 of 14(page number not for citation purposes)
Speed of HappieClustFigure 3Speed of HappieClust. HappieClust running times for q = 20, s = 0.5 on the workstation, (A) data=Shyamsundar05; (B) data=Lukk08. The running times for full hierarchical clustering using EPCLUST 1.0 are 97 + 48 = 145 seconds and 9580 + 115 = 9695 seconds, respectively.
BioData Mining 2008, 1:9 http://www.biodatamining.org/content/1/1/9
cent. EPCLUST 1.0 clustered this dataset in 81 + 37 = 118seconds, which is 20 percent faster than on the worksta-tion. As data=Lukk08 did not fit in the main memory ofthe laptop, times for this dataset were not compared.
In conclusion, the experiments have shown that the run-ning times of HappieClust (as well as full AHC) dependalmost linearly on the number of calculated distances andvery little on other factors. In order to evaluate the qualityof approximate clustering, we use two differentapproaches. The first is a mathematical measure, while thesecond evaluates whether we lose any important biologi-cal information if we cluster gene expression data approx-imately. The third measure shows how large overlap wecan expect from the subtrees of approximate and full AHCdendrograms.
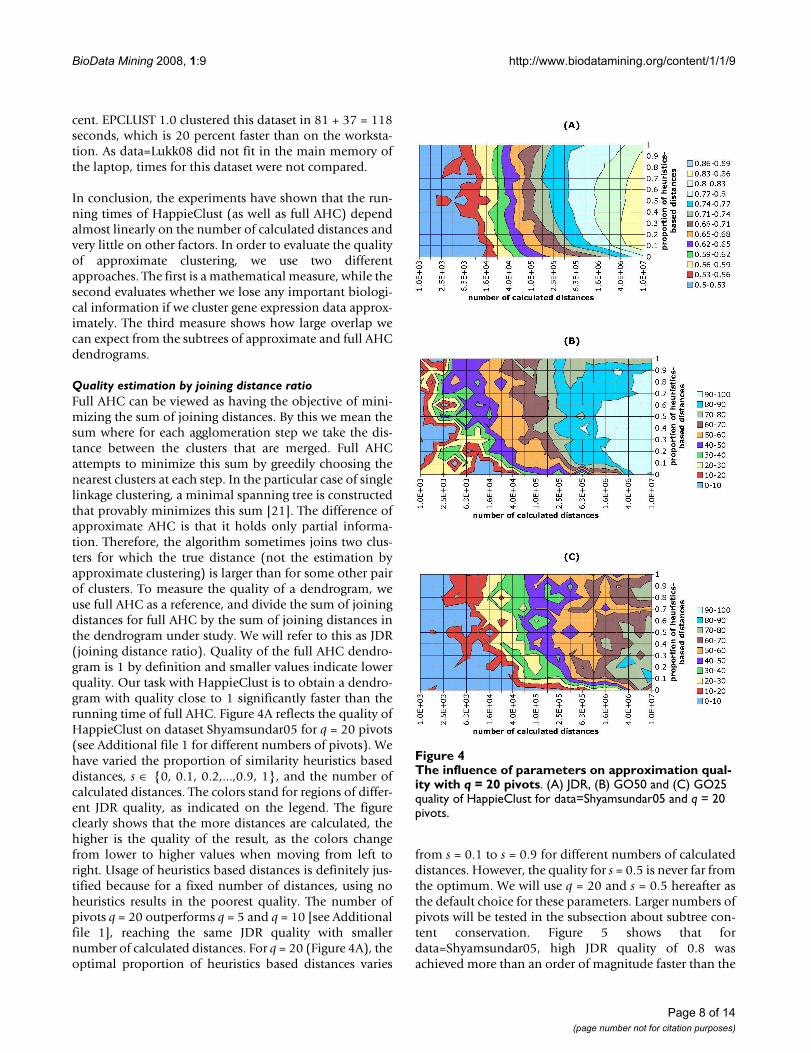
Quality estimation by joining distance ratioFull AHC can be viewed as having the objective of mini-mizing the sum of joining distances. By this we mean thesum where for each agglomeration step we take the dis-tance between the clusters that are merged. Full AHCattempts to minimize this sum by greedily choosing thenearest clusters at each step. In the particular case of singlelinkage clustering, a minimal spanning tree is constructedthat provably minimizes this sum [21]. The difference ofapproximate AHC is that it holds only partial informa-tion. Therefore, the algorithm sometimes joins two clus-ters for which the true distance (not the estimation byapproximate clustering) is larger than for some other pairof clusters. To measure the quality of a dendrogram, weuse full AHC as a reference, and divide the sum of joiningdistances for full AHC by the sum of joining distances inthe dendrogram under study. We will refer to this as JDR(joining distance ratio). Quality of the full AHC dendro-gram is 1 by definition and smaller values indicate lowerquality. Our task with HappieClust is to obtain a dendro-gram with quality close to 1 significantly faster than therunning time of full AHC. Figure 4A reflects the quality ofHappieClust on dataset Shyamsundar05 for q = 20 pivots(see Additional file 1 for different numbers of pivots). Wehave varied the proportion of similarity heuristics baseddistances, s ∈ {0, 0.1, 0.2,...,0.9, 1}, and the number ofcalculated distances. The colors stand for regions of differ-ent JDR quality, as indicated on the legend. The figureclearly shows that the more distances are calculated, thehigher is the quality of the result, as the colors changefrom lower to higher values when moving from left toright. Usage of heuristics based distances is definitely jus-tified because for a fixed number of distances, using noheuristics results in the poorest quality. The number ofpivots q = 20 outperforms q = 5 and q = 10 [see Additionalfile 1], reaching the same JDR quality with smallernumber of calculated distances. For q = 20 (Figure 4A), theoptimal proportion of heuristics based distances varies
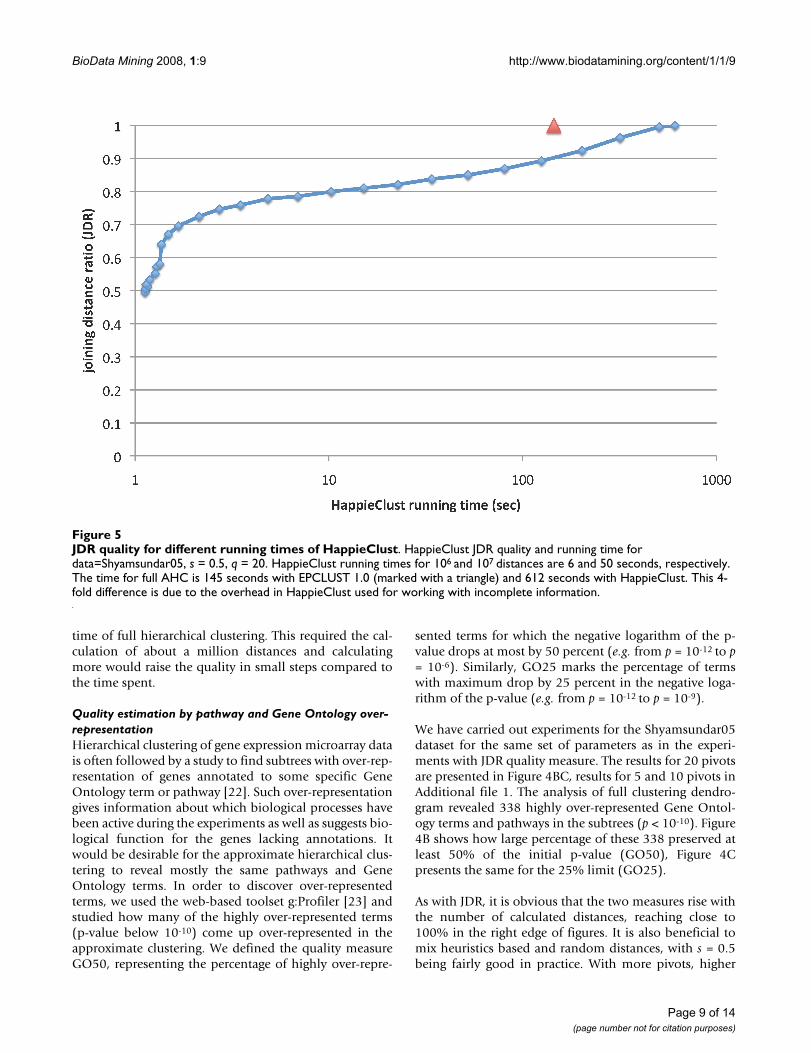
from s = 0.1 to s = 0.9 for different numbers of calculateddistances. However, the quality for s = 0.5 is never far fromthe optimum. We will use q = 20 and s = 0.5 hereafter asthe default choice for these parameters. Larger numbers ofpivots will be tested in the subsection about subtree con-tent conservation. Figure 5 shows that fordata=Shyamsundar05, high JDR quality of 0.8 wasachieved more than an order of magnitude faster than the
The influence of parameters on approximation quality with q = 20 pivotsFigure 4The influence of parameters on approximation qual-ity with q = 20 pivots. (A) JDR, (B) GO50 and (C) GO25 quality of HappieClust for data=Shyamsundar05 and q = 20 pivots.
Page 8 of 14(page number not for citation purposes)
BioData Mining 2008, 1:9 http://www.biodatamining.org/content/1/1/9
time of full hierarchical clustering. This required the cal-culation of about a million distances and calculatingmore would raise the quality in small steps compared tothe time spent.
Quality estimation by pathway and Gene Ontology over-representationHierarchical clustering of gene expression microarray datais often followed by a study to find subtrees with over-rep-resentation of genes annotated to some specific GeneOntology term or pathway [22]. Such over-representationgives information about which biological processes havebeen active during the experiments as well as suggests bio-logical function for the genes lacking annotations. Itwould be desirable for the approximate hierarchical clus-tering to reveal mostly the same pathways and GeneOntology terms. In order to discover over-representedterms, we used the web-based toolset g:Profiler [23] andstudied how many of the highly over-represented terms(p-value below 10-10) come up over-represented in theapproximate clustering. We defined the quality measureGO50, representing the percentage of highly over-repre-
sented terms for which the negative logarithm of the p-value drops at most by 50 percent (e.g. from p = 10-12 to p= 10-6). Similarly, GO25 marks the percentage of termswith maximum drop by 25 percent in the negative loga-rithm of the p-value (e.g. from p = 10-12 to p = 10-9).
We have carried out experiments for the Shyamsundar05dataset for the same set of parameters as in the experi-ments with JDR quality measure. The results for 20 pivotsare presented in Figure 4BC, results for 5 and 10 pivots inAdditional file 1. The analysis of full clustering dendro-gram revealed 338 highly over-represented Gene Ontol-ogy terms and pathways in the subtrees (p < 10-10). Figure4B shows how large percentage of these 338 preserved atleast 50% of the initial p-value (GO50), Figure 4Cpresents the same for the 25% limit (GO25).
As with JDR, it is obvious that the two measures rise withthe number of calculated distances, reaching close to100% in the right edge of figures. It is also beneficial tomix heuristics based and random distances, with s = 0.5being fairly good in practice. With more pivots, higher
JDR quality for different running times of HappieClustFigure 5JDR quality for different running times of HappieClust. HappieClust JDR quality and running time for data=Shyamsundar05, s = 0.5, q = 20. HappieClust running times for 106 and 107 distances are 6 and 50 seconds, respectively. The time for full AHC is 145 seconds with EPCLUST 1.0 (marked with a triangle) and 612 seconds with HappieClust. This 4-fold difference is due to the overhead in HappieClust used for working with incomplete information.
Page 9 of 14(page number not for citation purposes)
BioData Mining 2008, 1:9 http://www.biodatamining.org/content/1/1/9
quality can be achieved with the same number of dis-tances. To conclude, these measurements suggest using q= 20 pivots and s = 0.5 proportion of similarity heuristicsbased distances.
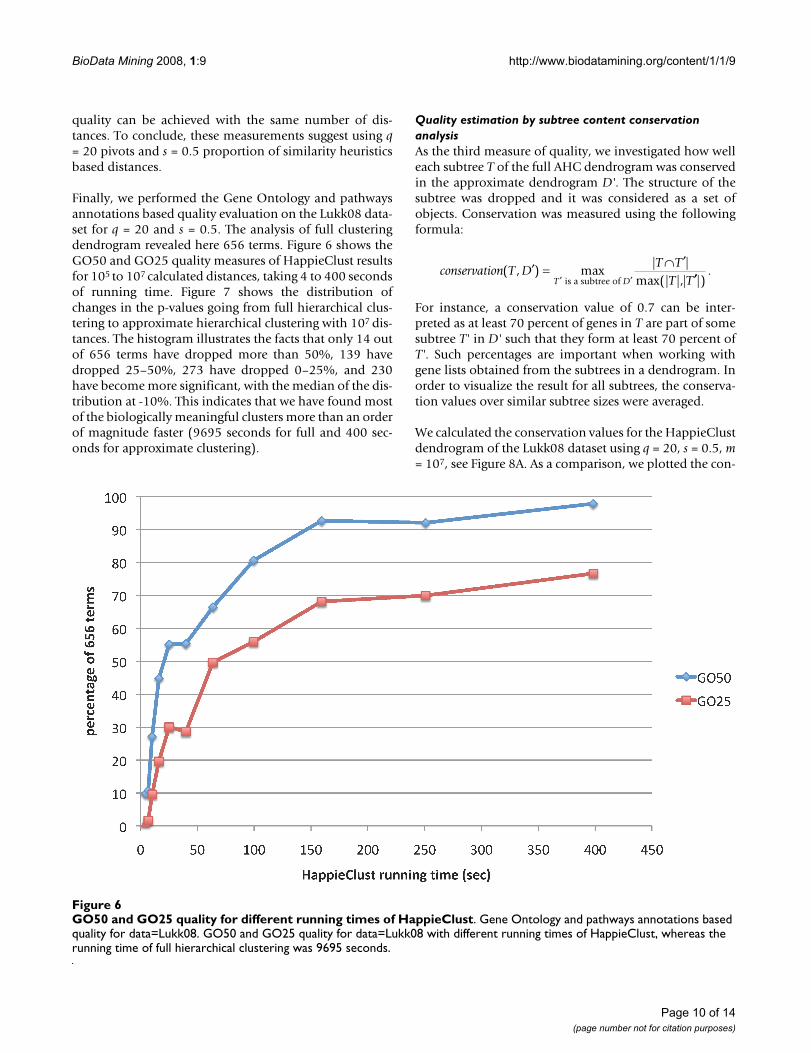
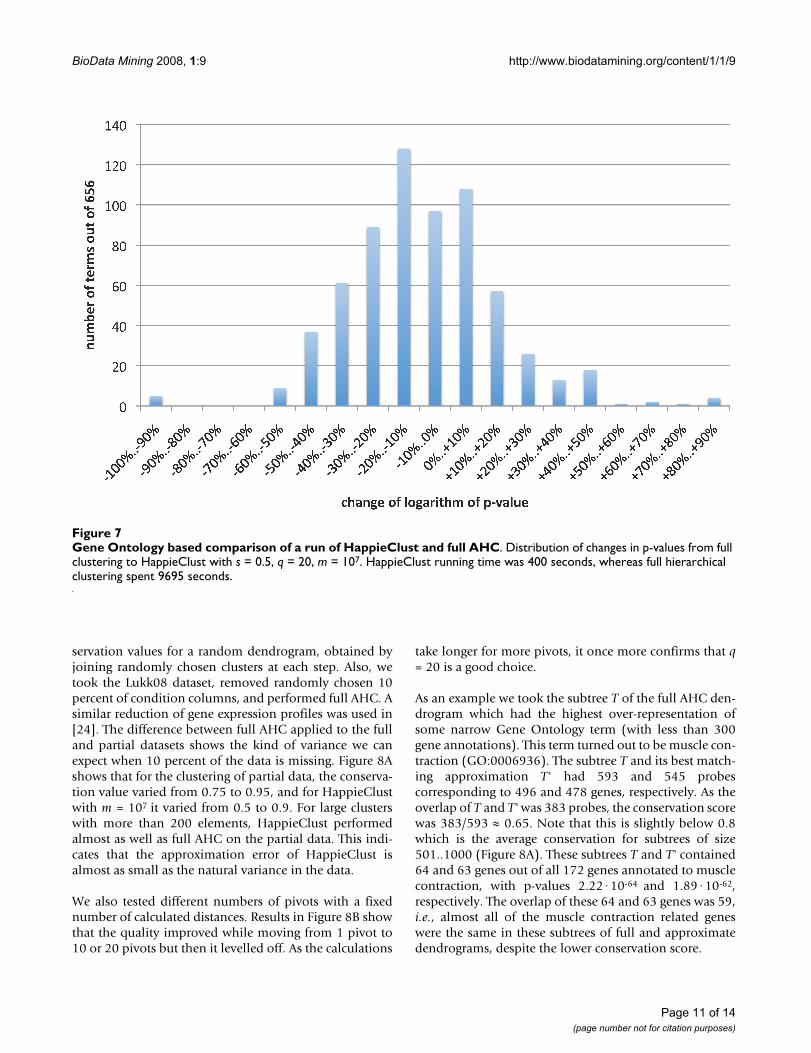
Finally, we performed the Gene Ontology and pathwaysannotations based quality evaluation on the Lukk08 data-set for q = 20 and s = 0.5. The analysis of full clusteringdendrogram revealed here 656 terms. Figure 6 shows theGO50 and GO25 quality measures of HappieClust resultsfor 105 to 107 calculated distances, taking 4 to 400 secondsof running time. Figure 7 shows the distribution ofchanges in the p-values going from full hierarchical clus-tering to approximate hierarchical clustering with 107 dis-tances. The histogram illustrates the facts that only 14 outof 656 terms have dropped more than 50%, 139 havedropped 25–50%, 273 have dropped 0–25%, and 230have become more significant, with the median of the dis-tribution at -10%. This indicates that we have found mostof the biologically meaningful clusters more than an orderof magnitude faster (9695 seconds for full and 400 sec-onds for approximate clustering).
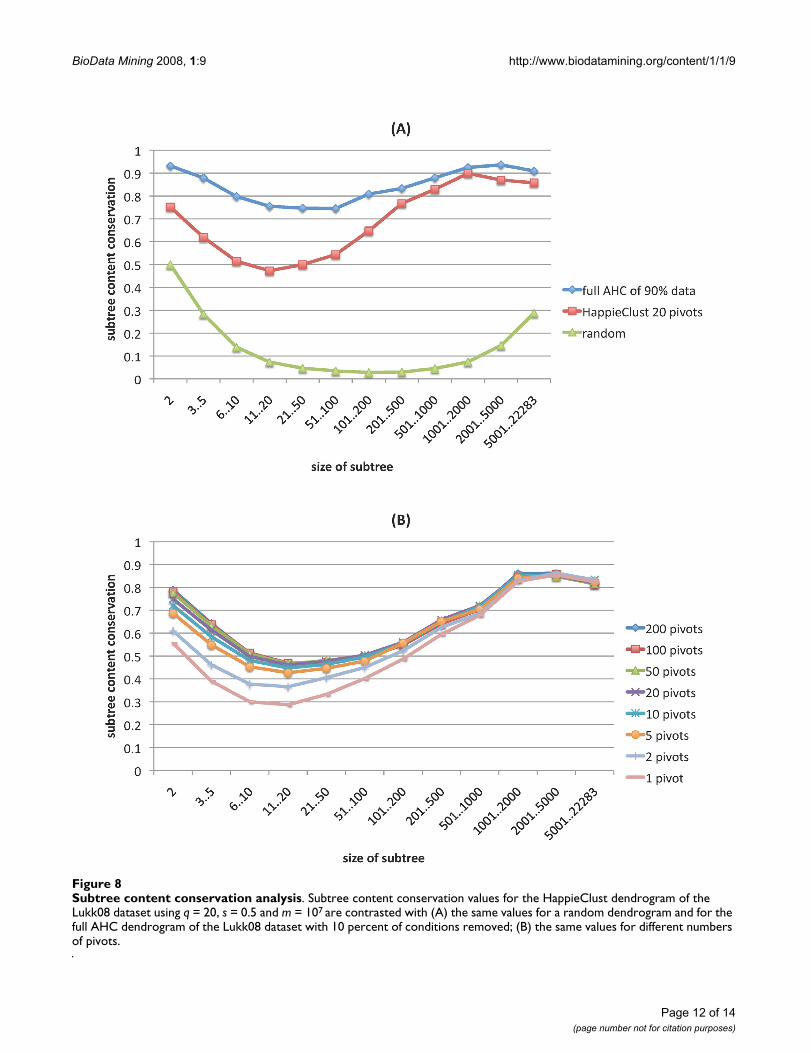
Quality estimation by subtree content conservation analysisAs the third measure of quality, we investigated how welleach subtree T of the full AHC dendrogram was conservedin the approximate dendrogram D'. The structure of thesubtree was dropped and it was considered as a set ofobjects. Conservation was measured using the followingformula:
For instance, a conservation value of 0.7 can be inter-preted as at least 70 percent of genes in T are part of somesubtree T' in D' such that they form at least 70 percent ofT'. Such percentages are important when working withgene lists obtained from the subtrees in a dendrogram. Inorder to visualize the result for all subtrees, the conserva-tion values over similar subtree sizes were averaged.
We calculated the conservation values for the HappieClustdendrogram of the Lukk08 dataset using q = 20, s = 0.5, m= 107, see Figure 8A. As a comparison, we plotted the con-
conservation T DT T
TT D( , ) max
| |max(| |,|
′ = ∩ ′′ ′ is a subtree of ′′T |)
.
GO50 and GO25 quality for different running times of HappieClustFigure 6GO50 and GO25 quality for different running times of HappieClust. Gene Ontology and pathways annotations based quality for data=Lukk08. GO50 and GO25 quality for data=Lukk08 with different running times of HappieClust, whereas the running time of full hierarchical clustering was 9695 seconds.
Page 10 of 14(page number not for citation purposes)
BioData Mining 2008, 1:9 http://www.biodatamining.org/content/1/1/9
servation values for a random dendrogram, obtained byjoining randomly chosen clusters at each step. Also, wetook the Lukk08 dataset, removed randomly chosen 10percent of condition columns, and performed full AHC. Asimilar reduction of gene expression profiles was used in[24]. The difference between full AHC applied to the fulland partial datasets shows the kind of variance we canexpect when 10 percent of the data is missing. Figure 8Ashows that for the clustering of partial data, the conserva-tion value varied from 0.75 to 0.95, and for HappieClustwith m = 107 it varied from 0.5 to 0.9. For large clusterswith more than 200 elements, HappieClust performedalmost as well as full AHC on the partial data. This indi-cates that the approximation error of HappieClust isalmost as small as the natural variance in the data.
We also tested different numbers of pivots with a fixednumber of calculated distances. Results in Figure 8B showthat the quality improved while moving from 1 pivot to10 or 20 pivots but then it levelled off. As the calculations
take longer for more pivots, it once more confirms that q= 20 is a good choice.
As an example we took the subtree T of the full AHC den-drogram which had the highest over-representation ofsome narrow Gene Ontology term (with less than 300gene annotations). This term turned out to be muscle con-traction (GO:0006936). The subtree T and its best match-ing approximation T' had 593 and 545 probescorresponding to 496 and 478 genes, respectively. As theoverlap of T and T' was 383 probes, the conservation scorewas 383/593 ≈ 0.65. Note that this is slightly below 0.8which is the average conservation for subtrees of size501..1000 (Figure 8A). These subtrees T and T' contained64 and 63 genes out of all 172 genes annotated to musclecontraction, with p-values 2.22·10-64 and 1.89·10-62,respectively. The overlap of these 64 and 63 genes was 59,i.e., almost all of the muscle contraction related geneswere the same in these subtrees of full and approximatedendrograms, despite the lower conservation score.
Gene Ontology based comparison of a run of HappieClust and full AHCFigure 7Gene Ontology based comparison of a run of HappieClust and full AHC. Distribution of changes in p-values from full clustering to HappieClust with s = 0.5, q = 20, m = 107. HappieClust running time was 400 seconds, whereas full hierarchical clustering spent 9695 seconds.
Page 11 of 14(page number not for citation purposes)
BioData Mining 2008, 1:9 http://www.biodatamining.org/content/1/1/9
Page 12 of 14(page number not for citation purposes)
Subtree content conservation analysisFigure 8Subtree content conservation analysis. Subtree content conservation values for the HappieClust dendrogram of the Lukk08 dataset using q = 20, s = 0.5 and m = 107 are contrasted with (A) the same values for a random dendrogram and for the full AHC dendrogram of the Lukk08 dataset with 10 percent of conditions removed; (B) the same values for different numbers of pivots.
BioData Mining 2008, 1:9 http://www.biodatamining.org/content/1/1/9
DiscussionOur experiments show that HappieClust achieves verysimilar results to the full hierarchical clustering more thanan order of magnitude faster. In the following, we discusssome ideas that may further improve HappieClust.
Pivots are currently chosen randomly. However, there aretwo things one could try to avoid. First, if two pivots aresimilar to each other, then they filter out about the samesubset of pairs. Therefore, one might try to choose the piv-ots to be pairwise non-similar. Second, if a pivot is an out-lier in the dataset, then all the objects in the dataset mightbe of similar distance from it and the pivot would notwork as a filter. This encourages to experiment with pivotchoice strategies in the future.
Another point of possible advancement is the choice ofdistances. Once a sub-cluster is formed in the hierarchicalclustering process, the distances between the objectsinside the cluster do not matter anymore. This suggests adifferent strategy for the whole workflow. Instead of calcu-lating all the distances at once, the algorithm might inter-leavingly calculate distances and perform merging steps.The technique of pivots could also be potentially usedmore than once in the process.
ConclusionAgglomerative hierarchical clustering is a technique oftenused in the analysis of large high-dimensional datasets.Current agglomerative hierarchical clustering algorithmsdepend on the calculation of all pairwise distances in thedataset. For many possible applications this process is tooslow as the number of distances is quadratic in thenumber of objects to be clustered.
This inspired us to develop a new approach, approximatehierarchical clustering, for which we have implemented afast algorithm HappieClust. According to our experi-ments, it achieves very similar results to the full hierarchi-cal clustering more than an order of magnitude faster.HappieClust makes use of similarity heuristics to quicklyfind many pairs of similar data objects, without calculat-ing all pairwise distances. The heuristics are based on piv-ots, a technique which is often used in the similaritysearch community [14]. The technique could possibly beused also for other clustering methods and data analysisapart from agglomerative hierarchical clustering.
The running time of HappieClust can be easily controlledand it achieves a better approximation when given moretime. This is useful in interactive and web-based applica-tions where users expect fast response and unknown run-ning time is undesirable. The majority of datasets can beclustered with HappieClust on personal computers, as theminimal required amount of main memory is the size of
the initial dataset. We measured the quality of Happie-Clust approximation using three methods. The first, join-ing distance ratio, showed that approximation gets closeto minimizing the same function that is greedily mini-mized by the full clustering algorithm. The second appliedto clustering of gene expression data and studied the over-representation of gene ontology terms and pathways inthe subtrees of the dendrogram. It showed that almost allhighly over-represented terms in the full hierarchical clus-tering dendrogram are still over-represented in theapproximate dendrogram, whereas the p-values do notlose strength too much. This indicates that biologicallyrelevant clusters are formed and biological interest canstill be evaluated. The third measure studied the subtreecontent conservation. It pointed out that the subtrees ofapproximate and full AHC dendrograms are similar, andthus, the corresponding gene lists have high overlap.
HappieClust is intuitive and truly unsupervised. The onlynew parameter compared to full hierarchical clustering ism, the number of distances to be calculated. Higher valuesof m result in better approximations of full hierarchicalclustering. As the running time of HappieClust is linear inm, it is possible to choose m according to the given timeconstraints. If needed, more elaborate analysis techniquescan be used upon gaining the first insights from approxi-mate hierarchical clustering.
Competing interestsThe authors declare that they have no competing interests.
Authors' contributionsMK developed and implemented the HappieClust algo-rithm, carried out the computational experiments andwrote the draft of the article. JV directed the project andwas involved in revising the manuscript. Both authorsread and approved the final manuscript.
Additional material
AcknowledgementsAuthors wish to thank Dr. Alvis Brazma, Dr. Sven Laur and Jüri Reimand for fruitful discussions and Ilja Livenson for technical support. Financial sup-port has been provided by Estonian Science Foundation ETF 5722 and 5724, University of Tartu, and EU NoE ENFIN (LSHG-CT-2005-518254). MK
Additional file 1The influence of parameters on approximation quality. Figures illustrating the influence of the number of pivots on the JDR, GO50 and GO25 qual-ity measures.Click here for file[http://www.biomedcentral.com/content/supplementary/1756-0381-1-9-S1.pdf]
Page 13 of 14(page number not for citation purposes)
BioData Mining 2008, 1:9 http://www.biodatamining.org/content/1/1/9
Publish with BioMed Central and every scientist can read your work free of charge
"BioMed Central will be the most significant development for disseminating the results of biomedical research in our lifetime."
Sir Paul Nurse, Cancer Research UK
Your research papers will be:
available free of charge to the entire biomedical community
peer reviewed and published immediately upon acceptance
cited in PubMed and archived on PubMed Central
yours — you keep the copyright
Submit your manuscript here:http://www.biomedcentral.com/info/publishing_adv.asp
BioMedcentral
acknowledges Estonian Information Technology Foundation for partly financing his doctoral studies.
References1. Jain AK, Murty MN, Flynn PJ: Data clustering: a review. ACM Com-
puting Surveys 1999, 31(3):264-323.2. Legendre P, Legendre L: Numerical ecology Elsevier New York; 1998. 3. Eisen MB, Spellman PT, Brown PO, Botstein D: Cluster analysis
and display of genome-wide expression patterns. Proc NatlAcad Sci USA 1998, 95(25):14863-8.
4. de Hoon MJL, Imoto S, Nolan J, Miyano S: Open source clusteringsoftware. Bioinformatics 2004, 20(9):1453-4.
5. Saldanha AJ: Java Treeview – extensible visualization of micro-array data. Bioinformatics 2004, 20(17):3246-8.
6. Saeed A, Sharov V, White J, Li J, Liang W, Bhagabati N, Braisted J,Klapa M, Currier T, Thiagarajan M, Sturn A, Snuffin M, Rezantsev A,Popov D, Ryltsov A, Kostukovich E, Borisovsky I, Liu Z, Vinsavich A,Trush V, Quackenbush J: TM4: a free, open-source system formicroarray data management and analysis. Biotechniques 2003,34(2):374-8.
7. Kapushesky M, Kemmeren P, Culhane AC, Durinck S, Ihmels J, Körn-er C, Kull M, Torrente A, Sarkans U, Vilo J, Brazma A: ExpressionProfiler: next generation-an online platform for analysis ofmicroarray data. Nucleic Acids Res 2004:W465-70.
8. Vilo J, Kapushesky M, Kemmeren P, Sarkans U, Brazma A: The Analysisof Gene Expression Data: Methods and Software, 2003 chap. ExpressionProfiler Springer Verlag, New York, NY.
9. Eppstein D: Fast hierarchical clustering and other applicationsof dynamic closest pairs. J Exp Algorithmics 2000, 5:1.
10. Kaufmann L, Rousseeuw P: Finding Groups in Data – An Introduction toCluster Analysis New York: J Wiley & Sons; 1990.
11. Du Z, Lin F: A novel parallelization approach for hierarchicalclustering. Parallel Computing 2005, 31(5):523-527.
12. Zhang Q, Zhang Y: Hierarchical clustering of gene expressionprofiles with graphics hardware acceleration. Pattern Recogni-tion Letters 2006, 27(6):676-681.
13. Herrero J, Valencia A, Dopazo J: A hierarchical unsupervisedgrowing neural network for clustering gene expression pat-terns. Bioinformatics 2001, 17(2):126-136.
14. Zezula P: Similarity Search: the metric space approach. Springer 2006.15. Shyamsundar R, Kim YH, Higgins JP, Montgomery K, Jorden M,
Sethuraman A, Rijn M van de, Botstein D, Brown PO, Pollack JR: ADNA microarray survey of gene expression in normalhuman tissues. Genome Biol 2005, 6(3):R22.
16. Lukk M, Nikkila J, Kapushesky M, Parkinson H, Ukkonen E, Brazma A:Analysis of human gene expression in 5372 samples repre-senting 363 different biological conditions. 2008 in press.
17. Parkinson H, Kapushesky M, Shojatalab M, Abeygunawardena N,Coulson R, Farne A, Holloway E, Kolesnykov N, Lilja P, Lukk M, ManiR, Rayner T, Sharma A, William E, Sarkans U, Brazma A: ArrayEx-press-a public database of microarray experiments and geneexpression profiles. Nucleic Acids Res 2007:D747-50.
18. Erdös P, Renyi A: The Evolution of Random Graphs. Publ MathInst Hungar Acad Sci 1960, 5:17-61.
19. Cormen T, Leiserson C, Rivest R: Introduction to Algorithms MIT Press,Cambridge, MA; 2001.
20. Böhm C, Braunmüller B, Krebs F, Kriegel H: Epsilon grid order: analgorithm for the similarity join on massive high-dimensionaldata. SIGMOD Rec 2001, 30(2):379-388.
21. Gower JC, Ross GJS: Minimum Spanning Trees and SingleLinkage Cluster Analysis. Applied Statistics 1969, 18:54-64.
22. Ashburner M, Ball CA, Blake JA, Botstein D, Butler H, Cherry JM,Davis AP, Dolinski K, Dwight SS, Eppig JT, Harris MA, Hill DP, Issel-Tarver L, Kasarskis A, Lewis S, Matese JC, Richardson JE, Ringwald M,Rubin GM, Sherlock G: Gene ontology: tool for the unificationof biology. The Gene Ontology Consortium. Nat Genet 2000,25:25-9.
23. Reimand J, Kull M, Peterson H, Hansen J, Vilo J: g:Profiler-a web-based toolset for functional profiling of gene lists from large-scale experiments. Nucleic Acids Res 2007:W193-200.
24. Datta S, Datta S: Methods for evaluating clustering algorithmsfor gene expression data using a reference set of functionalclasses. BMC Bioinformatics 2006, 7:397.
Page 14 of 14(page number not for citation purposes)
http://www.ncbi.nlm.nih.gov/entrez/query.fcgi?cmd=Retrieve&db=PubMed&dopt=Abstract&list_uids=9843981
Related Documents