Special Report 1073-E Revised July 2008 When Things Don’t W ork: Some Insights into Wh y Farmers’ Markets Close

Welcome message from author
This document is posted to help you gain knowledge. Please leave a comment to let me know what you think about it! Share it to your friends and learn new things together.
Transcript
8/12/2019 Farmer's Markets: When Things Don't Work
http://slidepdf.com/reader/full/farmers-markets-when-things-dont-work 1/26
Special Report 1073-E
Revised July 2008
When Things Don’t Work:
Some Insights into WhyFarmers’ Markets Close

8/12/2019 Farmer's Markets: When Things Don't Work
http://slidepdf.com/reader/full/farmers-markets-when-things-dont-work 2/26
This publication is available online at
http://extension.oregonstate.edu/catalog/pdf/sr/sr1073-e.pdf
8/12/2019 Farmer's Markets: When Things Don't Work
http://slidepdf.com/reader/full/farmers-markets-when-things-dont-work 3/26
Special Report 1073-E Originally published December 2006 and revised July 2008
July 2008
When Things Don’t Work:
Some Insights into Why
Farmers’ Markets Close
Garry Stephenson
Associate Professor
Extension small farms specialist
Department of Crop and Soil Science
Larry Lev
Professor
Extension marketing specialistDepartment of Agricultural & Resource Economics
Linda Brewer
Faculty Research Assistant
Department of Horticulture
This research was supported by funds from the Initiative for the Future of
Agriculture and Food Systems grant number 2000-52101-9692 through
United States Department of Agriculture, Cooperative State Research,
Education and Extension Service. Additional support was provided by theExtension Agriculture Program of the College of Agricultural Sciences,
Oregon State University.
PHOTO CREDITS
Cover: Lynn Ketchum, Extension and Experiment Station Communications
Page 3: Garry Stephenson, Department of Crop and Soil Science
Page 7: Garry Stephenson
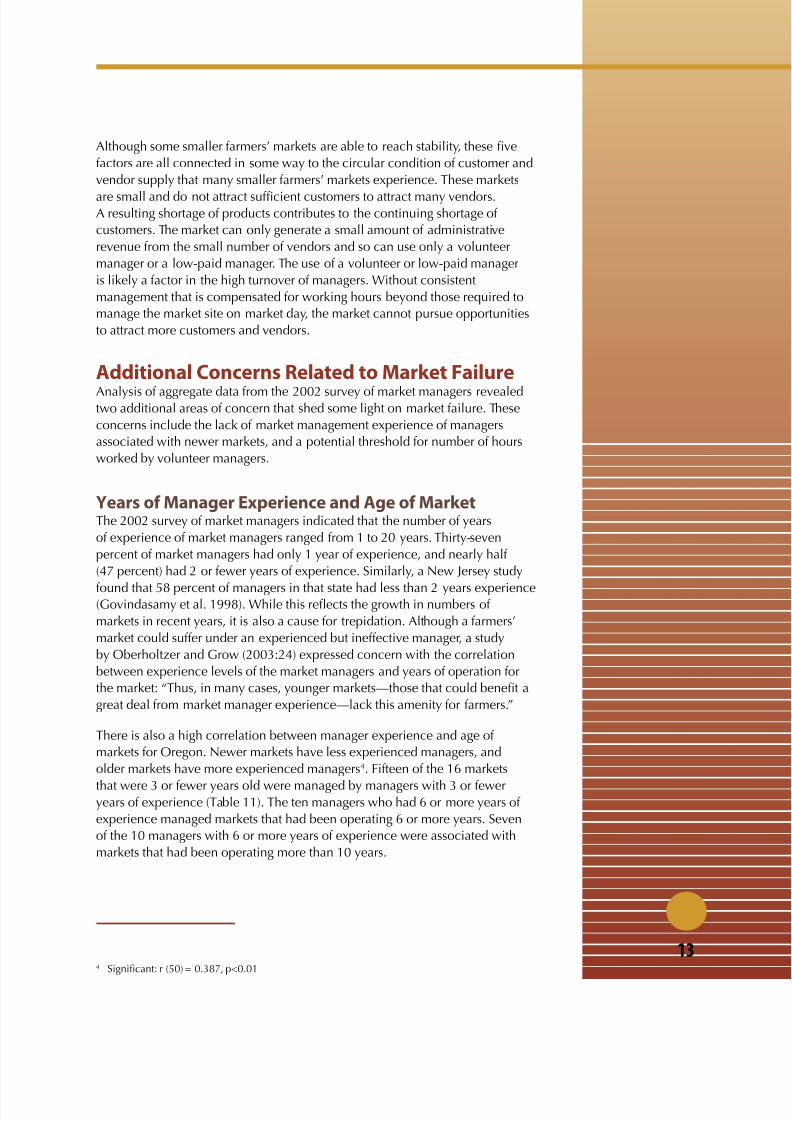
Page 14: Lynn Ketchum
Page 21: Lynn Ketchum
8/12/2019 Farmer's Markets: When Things Don't Work
http://slidepdf.com/reader/full/farmers-markets-when-things-dont-work 4/26
CONTENTS
Methods ................................................................................ 2Market Dynamics .................................................................. 2
How Market Resources Inuence Success and Failure ........... 5
A Few Insights into Markets that Fail .................................... 10
Additional Concerns Related to Market Failure .................... 13
Characterizing Markets in Decline ....................................... 17
Summary, Areas of Risk, and Recommendations .................. 18
References Cited .................................................................. 21
8/12/2019 Farmer's Markets: When Things Don't Work
http://slidepdf.com/reader/full/farmers-markets-when-things-dont-work 5/26
1
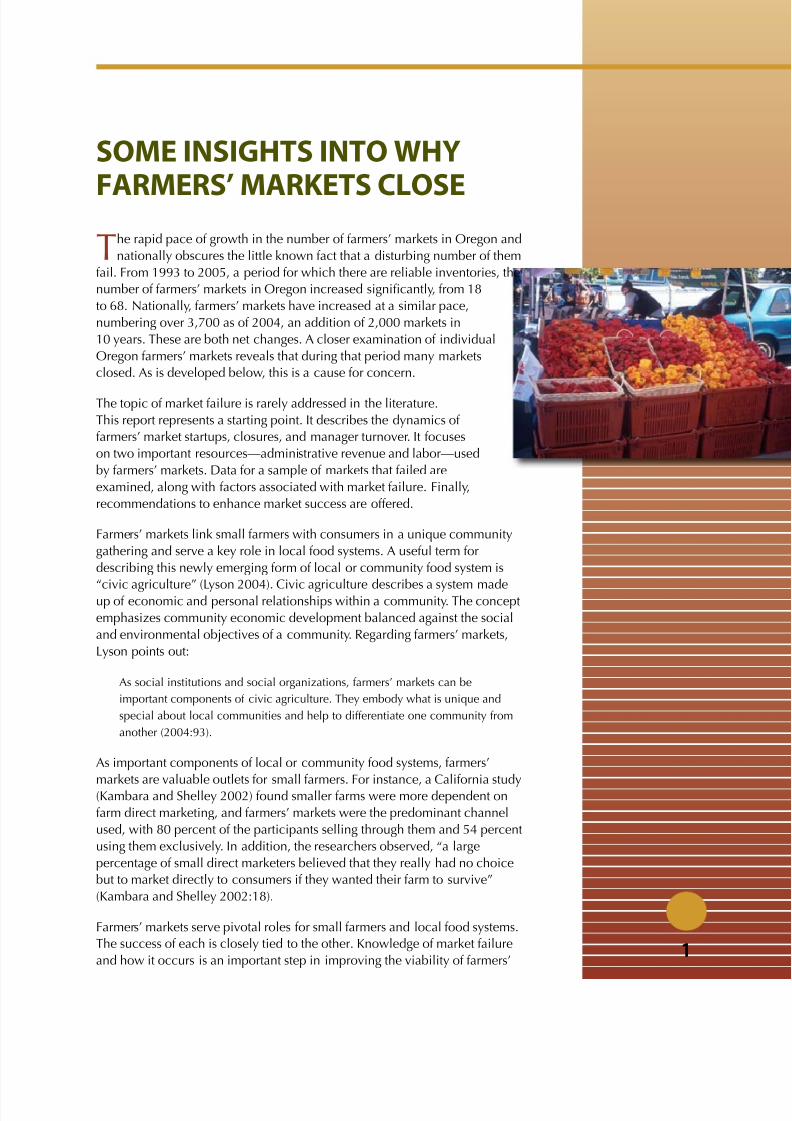
The rapid pace of growth in the number of farmers’ markets in Oregon and
nationally obscures the little known fact that a disturbing number of them
fail. From 1993 to 2005, a period for which there are reliable inventories, the
number of farmers’ markets in Oregon increased signicantly, from 18
to 68. Nationally, farmers’ markets have increased at a similar pace,
numbering over 3,700 as of 2004, an addition of 2,000 markets in
10 years. These are both net changes. A closer examination of individual
Oregon farmers’ markets reveals that during that period many markets
closed. As is developed below, this is a cause for concern.
The topic of market failure is rarely addressed in the literature.
This report represents a starting point. It describes the dynamics of
farmers’ market startups, closures, and manager turnover. It focuses
on two important resources—administrative revenue and labor—used
by farmers’ markets. Data for a sample of markets that failed are
examined, along with factors associated with market failure. Finally,
recommendations to enhance market success are offered.
Farmers’ markets link small farmers with consumers in a unique community
gathering and serve a key role in local food systems. A useful term for
describing this newly emerging form of local or community food system is
“civic agriculture” (Lyson 2004). Civic agriculture describes a system madeup of economic and personal relationships within a community. The concept
emphasizes community economic development balanced against the social
and environmental objectives of a community. Regarding farmers’ markets,
Lyson points out:
As social institutions and social organizations, farmers’ markets can be
important components of civic agriculture. They embody what is unique and
special about local communities and help to differentiate one community from
another (2004:93).
As important components of local or community food systems, farmers’
markets are valuable outlets for small farmers. For instance, a California study(Kambara and Shelley 2002) found smaller farms were more dependent on
farm direct marketing, and farmers’ markets were the predominant channel
used, with 80 percent of the participants selling through them and 54 percent
using them exclusively. In addition, the researchers observed, “a large
percentage of small direct marketers believed that they really had no choice
but to market directly to consumers if they wanted their farm to survive”
(Kambara and Shelley 2002:18).
Farmers’ markets serve pivotal roles for small farmers and local food systems.
The success of each is closely tied to the other. Knowledge of market failure
and how it occurs is an important step in improving the viability of farmers’
SOME INSIGHTS INTO WHY
FARMERS’ MARKETS CLOSE
8/12/2019 Farmer's Markets: When Things Don't Work
http://slidepdf.com/reader/full/farmers-markets-when-things-dont-work 6/26
2
markets and therefore, maintaining and expanding a marketing channel for
small farmers, and enhancing community food systems.
MethodsThe data presented here were collected between 2002 and 2005. Both
quantitative and qualitative research methods were used, including a survey
questionnaire administered by telephone, interviews, focus groups, and a
project advisory committee consisting of market managers.
To obtain information from a full season of operation from individual farmers’
markets, the survey questionnaire focused on the 53 farmers’ markets operating
in Oregon during 2002 that had operated during the 2001 season. The
questionnaire explored market fee structures, sources of revenue, market site
amenities, typical products, and common management structures. Fifty of the
53 eligible farmers’ markets participated in the survey. This 94 percent responserate strengthens the validity of a research study drawn from a numerically small
population.
Following a preliminary analysis of the quantitative and qualitative data, six
focus groups of farmers’ market managers were organized and conducted on
a regional basis during 2004. A total of 29 managers participated, representing
33 farmers’ markets. The focus groups provided a two-way exchange of
information between researchers and practitioners and added vital data to the
project. A nal step involved using the project advisory committee to review
and critique the research ndings during late 2004.
Directories of Oregon farmers’ markets for 1998 through 2005 were usedas an important secondary data source. The directories are published by the
Oregon Farmers’ Market Association (OFMA) and the Oregon Department of
Agriculture (ODA) and have been produced annually since 1998. The OFMA/
ODA directories list the markets operating for each year of the publication,
their location, contact information, and other information. These directories
were used to identify the year markets began operating and ceased operating
and to track manager turnover.
Quantitative data from the survey questionnaire were organized and analyzed
using Statistical Package for the Social Sciences (SPSS) version 11.5. Statistical
analysis was conducted with consultative support from the Survey Research
Center at Oregon State University.
Market DynamicsEconomists associated with the USDA periodically inventory and analyze
farmers’ markets in the United States. Several such reports have been published
during the period of growth of U.S. farmers’ markets from the 1990s to the
present (Johnson and Bragg 1994; Burns and Johnson 1996; Johnson et al.
1996; Payne 2002). These reports documented a signicant expansion in the
number of farmers’ markets nationwide. Although they largely focused on the
growth of farmers’ market numbers, the authors also recognized that there
were other processes taking place. Burns and Johnson (1996:12) noted, “Not
8/12/2019 Farmer's Markets: When Things Don't Work
http://slidepdf.com/reader/full/farmers-markets-when-things-dont-work 7/26
3
all farmers’ markets are successful and only anecdotal information exists on
why some have failed.” Later, Payne (2002:9) pointed out, “While farmers’
markets have shown that they are benecial to farmers, customers, and local
communities, many areas of study remain. One of the most important areasthat merits further study is why markets fail.”
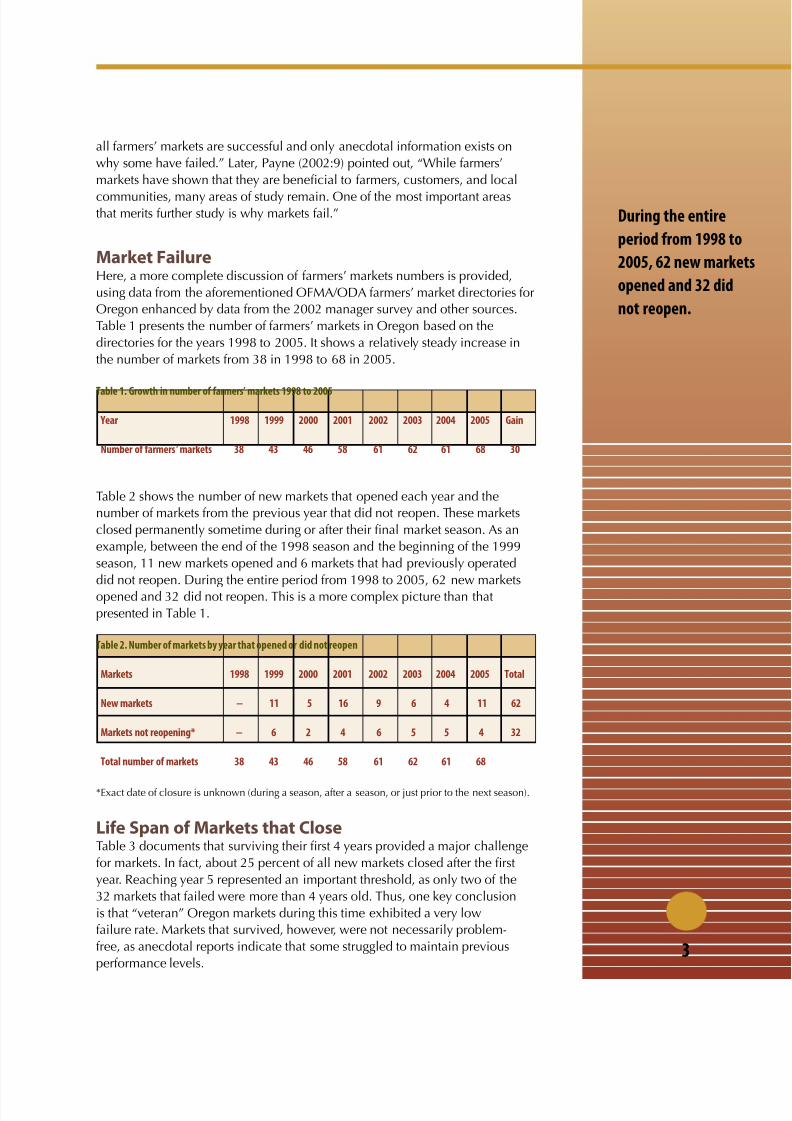
Market FailureHere, a more complete discussion of farmers’ markets numbers is provided,
using data from the aforementioned OFMA/ODA farmers’ market directories for
Oregon enhanced by data from the 2002 manager survey and other sources.
Table 1 presents the number of farmers’ markets in Oregon based on the
directories for the years 1998 to 2005. It shows a relatively steady increase in
the number of markets from 38 in 1998 to 68 in 2005.
Table 1. Growth in number of farmers’ markets 1998 to 2005
Year 1998 1999 2000 2001 2002 2003 2004 2005 Gain
Number of farmers ’ markets 38 43 46 58 61 62 61 68 30
Table 2 shows the number of new markets that opened each year and the
number of markets from the previous year that did not reopen. These markets
closed permanently sometime during or after their nal market season. As an
example, between the end of the 1998 season and the beginning of the 1999
season, 11 new markets opened and 6 markets that had previously operated
did not reopen. During the entire period from 1998 to 2005, 62 new markets
opened and 32 did not reopen. This is a more complex picture than that
presented in Table 1.
Table 2. Number of markets by year that opened or did not reopen
Markets 1998 1999 2000 2001 2002 2003 2004 2005 Total
New markets − 11 5 16 9 6 4 11 62
Markets not reopening* − 6 2 4 6 5 5 4 32
Total number of markets 38 43 46 58 61 62 61 68
*Exact date of closure is unknown (during a season, after a season, or just prior to the next season).
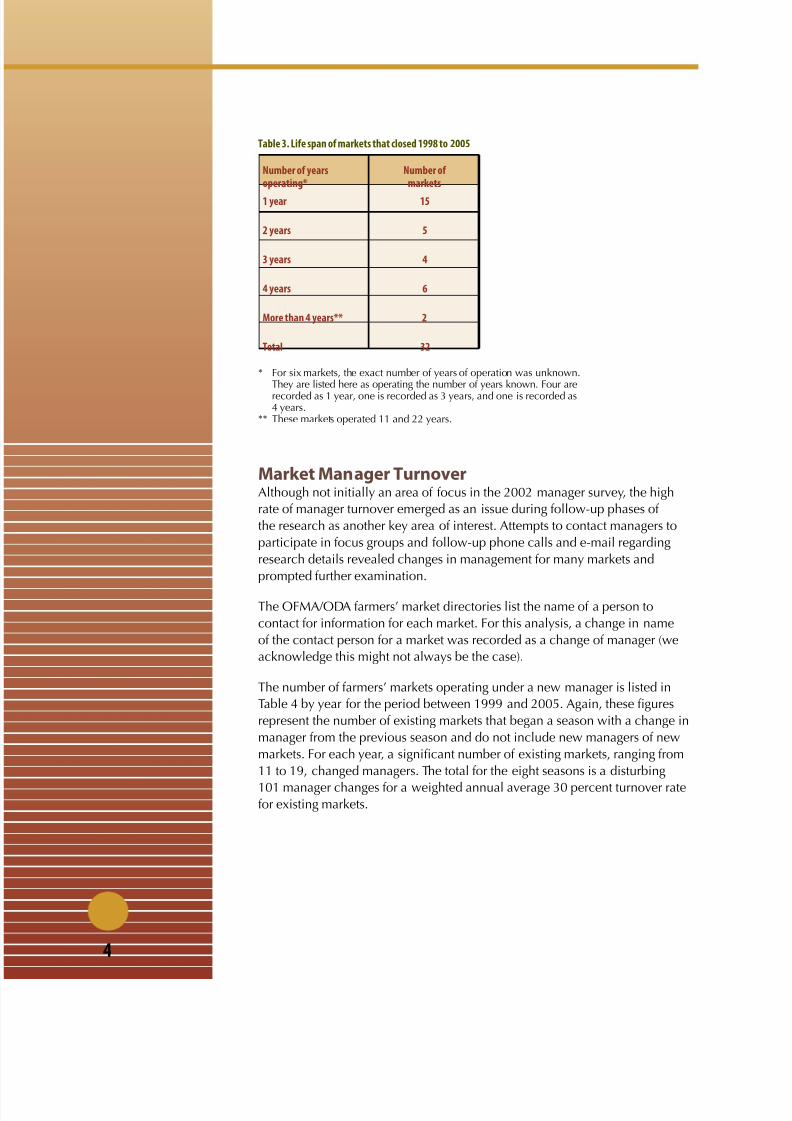
Life Span of Markets that CloseTable 3 documents that surviving their rst 4 years provided a major challenge
for markets. In fact, about 25 percent of all new markets closed after the rst
year. Reaching year 5 represented an important threshold, as only two of the
32 markets that failed were more than 4 years old. Thus, one key conclusion
is that “veteran” Oregon markets during this time exhibited a very low
failure rate. Markets that survived, however, were not necessarily problem-
free, as anecdotal reports indicate that some struggled to maintain previous
performance levels.
During the entire
period from 1998 to
2005, 62 new marke
opened and 32 did
not reopen.
8/12/2019 Farmer's Markets: When Things Don't Work
http://slidepdf.com/reader/full/farmers-markets-when-things-dont-work 8/26
4
Table 3. Life span of markets that closed 1998 to 2005
Number of years Number ofoperating* markets
1 year 15
2 years 5
3 years 4
4 years 6
More than 4 years** 2
Total 32
* For six markets, the exact number of years of operation was unknown.They are listed here as operating the number of years known. Four arerecorded as 1 year, one is recorded as 3 years, and one is recorded as4 years.
** These markets operated 11 and 22 years.
Market Manager TurnoverAlthough not initially an area of focus in the 2002 manager survey, the high
rate of manager turnover emerged as an issue during follow-up phases of
the research as another key area of interest. Attempts to contact managers to
participate in focus groups and follow-up phone calls and e-mail regarding
research details revealed changes in management for many markets and
prompted further examination.
The OFMA/ODA farmers’ market directories list the name of a person to
contact for information for each market. For this analysis, a change in name
of the contact person for a market was recorded as a change of manager (we
acknowledge this might not always be the case).
The number of farmers’ markets operating under a new manager is listed in
Table 4 by year for the period between 1999 and 2005. Again, these gures
represent the number of existing markets that began a season with a change in
manager from the previous season and do not include new managers of new
markets. For each year, a signicant number of existing markets, ranging from
11 to 19, changed managers. The total for the eight seasons is a disturbing
101 manager changes for a weighted annual average 30 percent turnover ratefor existing markets.
8/12/2019 Farmer's Markets: When Things Don't Work
http://slidepdf.com/reader/full/farmers-markets-when-things-dont-work 9/26
5
Table 4. Number of existing markets operating under a new manager
Existing markets 1999 2000 2001 2002 2003 2004 2005 Totals
New manager 14 11 13 17 15 19 12
Returning manager 18 30 29 35 41 38 45 −
Percent manager turnover* 44% 27% 31% 33% 27% 33% 21% Average 30%
*Rounded to whole numbers.
Manager turnover is not necessarily negative. A change may improve a
market or reect a better opportunity for a manager. But, clearly, the very
high rate of turnover documented here cannot be all positive. Even under the
best of conditions, a change in manager produces some stress for a market
organization.
How Market Resources InfluenceSuccess and FailureThe sections that follow examine the revenue generated by farmers’ markets
and the labor resources they use. Markets vary greatly for both of these
resources. Local supplies of customers and products play a role in what
revenue may be generated by a farmers’ market. Market revenues can be used
to pay for personnel to manage market operations. If these tasks are carried
out effectively, they sustain the market by continuing the cycle of attracting
sufcient customers and farmers.
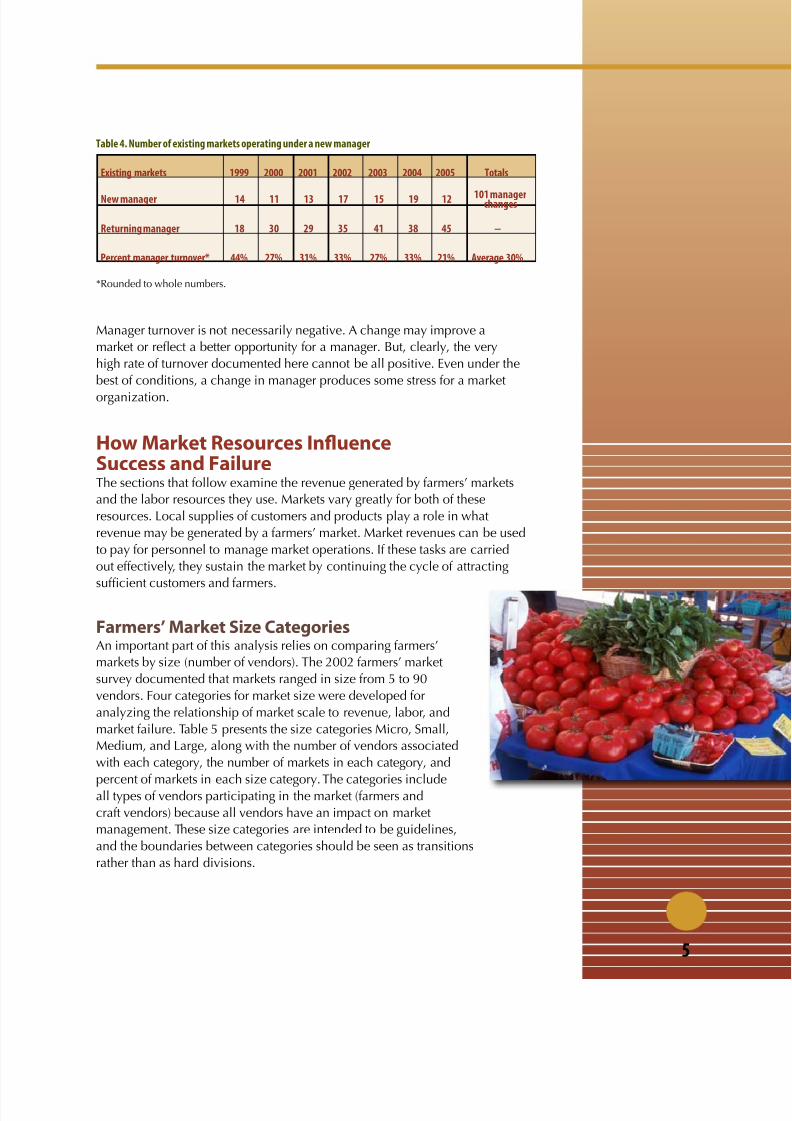
Farmers’ Market Size CategoriesAn important part of this analysis relies on comparing farmers’
markets by size (number of vendors). The 2002 farmers’ market
survey documented that markets ranged in size from 5 to 90
vendors. Four categories for market size were developed for
analyzing the relationship of market scale to revenue, labor, and
market failure. Table 5 presents the size categories Micro, Small,
Medium, and Large, along with the number of vendors associated
with each category, the number of markets in each category, and
percent of markets in each size category. The categories includeall types of vendors participating in the market (farmers and
craft vendors) because all vendors have an impact on market
management. These size categories are intended to be guidelines,
and the boundaries between categories should be seen as transitions
rather than as hard divisions.
101 managerchanges
8/12/2019 Farmer's Markets: When Things Don't Work
http://slidepdf.com/reader/full/farmers-markets-when-things-dont-work 10/26
6
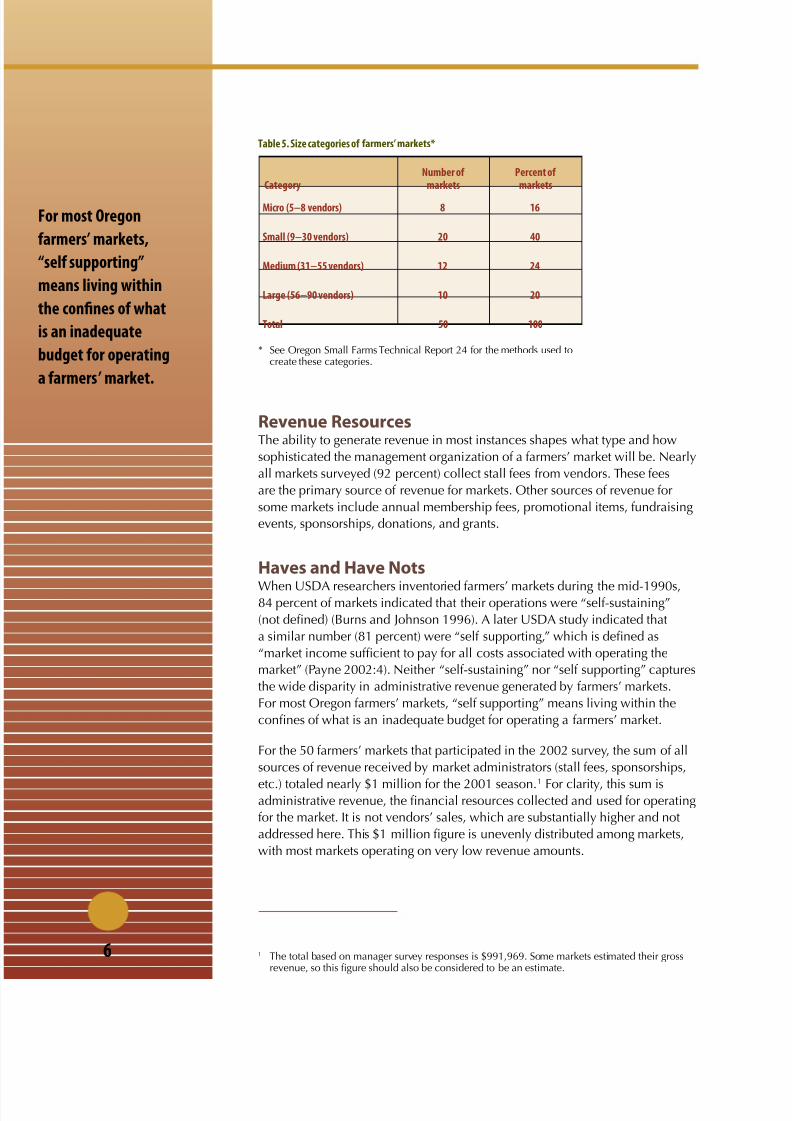
Table 5. Size categories of farmers’ markets*
Number of Percent ofCategory markets markets
Micro (5−8 vendors) 8 16
Small (9−30 vendors) 20 40
Medium (31−55 vendors) 12 24
Large (56−90 vendors) 10 20
Total 50 100
* See Oregon Small Farms Technical Report 24 for the methods used tocreate these categories.
Revenue ResourcesThe ability to generate revenue in most instances shapes what type and how
sophisticated the management organization of a farmers’ market will be. Nearly
all markets surveyed (92 percent) collect stall fees from vendors. These fees
are the primary source of revenue for markets. Other sources of revenue for
some markets include annual membership fees, promotional items, fundraising
events, sponsorships, donations, and grants.
Haves and Have Nots
When USDA researchers inventoried farmers’ markets during the mid-1990s,84 percent of markets indicated that their operations were “self-sustaining”
(not dened) (Burns and Johnson 1996). A later USDA study indicated that
a similar number (81 percent) were “self supporting,” which is dened as
“market income sufcient to pay for all costs associated with operating the
market” (Payne 2002:4). Neither “self-sustaining” nor “self supporting” captures
the wide disparity in administrative revenue generated by farmers’ markets.
For most Oregon farmers’ markets, “self supporting” means living within the
connes of what is an inadequate budget for operating a farmers’ market.
For the 50 farmers’ markets that participated in the 2002 survey, the sum of all
sources of revenue received by market administrators (stall fees, sponsorships,
etc.) totaled nearly $1 million for the 2001 season.1
For clarity, this sum isadministrative revenue, the nancial resources collected and used for operating
for the market. It is not vendors’ sales, which are substantially higher and not
addressed here. This $1 million gure is unevenly distributed among markets,
with most markets operating on very low revenue amounts.
1 The total based on manager survey responses is $991,969. Some markets estimated their grossrevenue, so this gure should also be considered to be an estimate.
For most Oregon
farmers’ markets,
“self supporting”
means living within
the confines of what
is an inadequate
budget for operating
a farmers’ market.
8/12/2019 Farmer's Markets: When Things Don't Work
http://slidepdf.com/reader/full/farmers-markets-when-things-dont-work 11/26
7
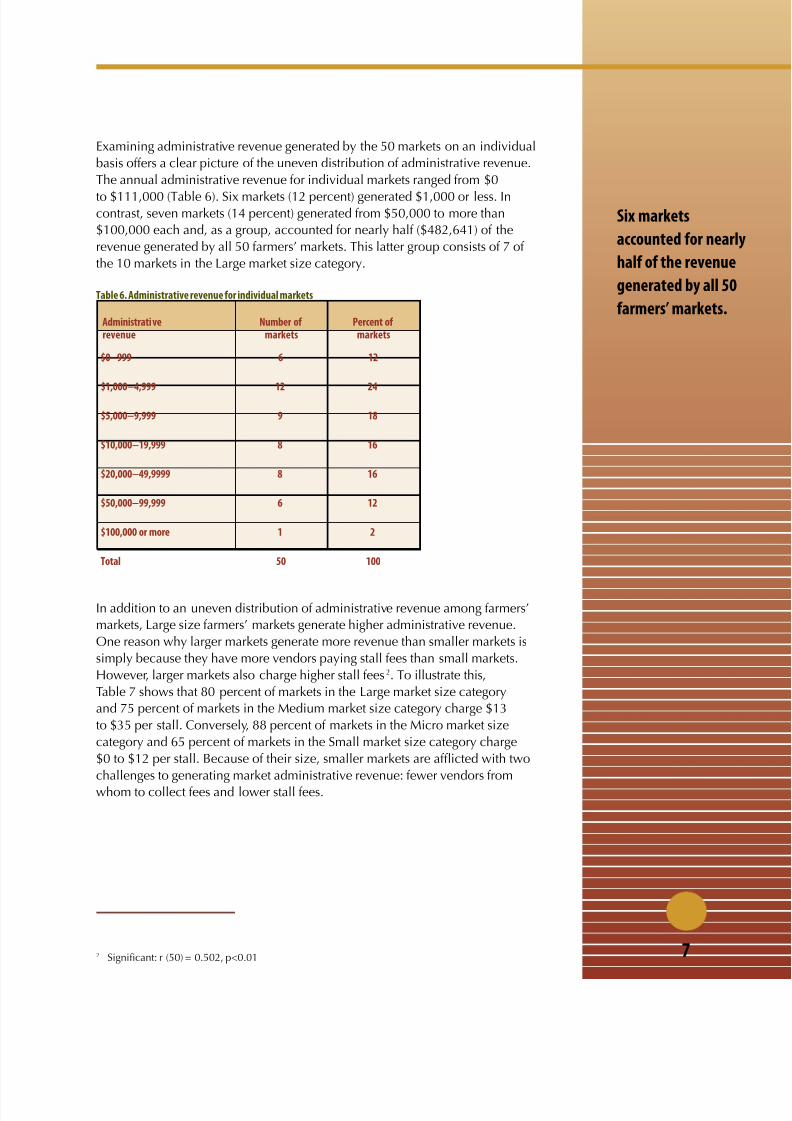
Examining administrative revenue generated by the 50 markets on an individual
basis offers a clear picture of the uneven distribution of administrative revenue.
The annual administrative revenue for individual markets ranged from $0
to $111,000 (Table 6). Six markets (12 percent) generated $1,000 or less. Incontrast, seven markets (14 percent) generated from $50,000 to more than
$100,000 each and, as a group, accounted for nearly half ($482,641) of the
revenue generated by all 50 farmers’ markets. This latter group consists of 7 of
the 10 markets in the Large market size category.
Table 6. Administrative revenue for individual markets
Administrative Number of Percent ofrevenue markets markets
$0−999 6 12
$1,000−4,999 12 24
$5,000−9,999 9 18
$10,000−19,999 8 16
$20,000−49,9999 8 16
$50,000−99,999 6 12
$100,000 or more 1 2
Total 50 100
In addition to an uneven distribution of administrative revenue among farmers’
markets, Large size farmers’ markets generate higher administrative revenue.
One reason why larger markets generate more revenue than smaller markets is
simply because they have more vendors paying stall fees than small markets.
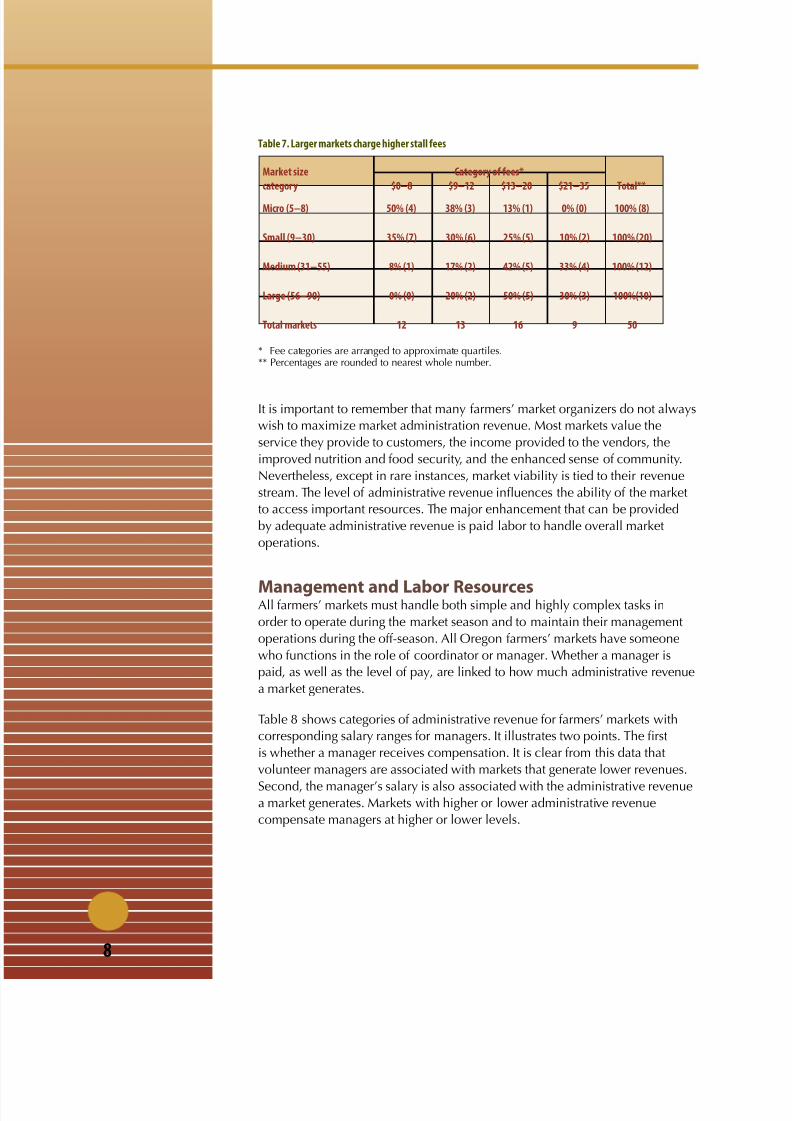
However, larger markets also charge higher stall fees2. To illustrate this,
Table 7 shows that 80 percent of markets in the Large market size category
and 75 percent of markets in the Medium market size category charge $13
to $35 per stall. Conversely, 88 percent of markets in the Micro market size
category and 65 percent of markets in the Small market size category charge
$0 to $12 per stall. Because of their size, smaller markets are aficted with two
challenges to generating market administrative revenue: fewer vendors from
whom to collect fees and lower stall fees.
2 Signicant: r (50) = 0.502, p<0.01
Six markets
accounted for nearly
half of the revenue
generated by all 50
farmers’ markets.
8/12/2019 Farmer's Markets: When Things Don't Work
http://slidepdf.com/reader/full/farmers-markets-when-things-dont-work 12/26
8
Table 7. Larger markets charge higher stall fees
Market size Category of fees*
category $0−8 $9−12 $13−20 $21−35 Total**
Micro (5−8) 50% (4) 38% (3) 13% (1) 0% (0) 100% (8)
Small (9−30) 35% (7) 30% (6) 25% (5) 10% (2) 100% (20)
Medium (31−55) 8% (1) 17% (2) 42% (5) 33% (4) 100% (12)
Large (56−90) 0% (0) 20% (2) 50% (5) 30% (3) 100%(10)
Total markets 12 13 16 9 50
* Fee categories are arranged to approximate quartiles.** Percentages are rounded to nearest whole number.
It is important to remember that many farmers’ market organizers do not always
wish to maximize market administration revenue. Most markets value the
service they provide to customers, the income provided to the vendors, the
improved nutrition and food security, and the enhanced sense of community.
Nevertheless, except in rare instances, market viability is tied to their revenue
stream. The level of administrative revenue inuences the ability of the market
to access important resources. The major enhancement that can be provided
by adequate administrative revenue is paid labor to handle overall market
operations.
Management and Labor ResourcesAll farmers’ markets must handle both simple and highly complex tasks in
order to operate during the market season and to maintain their management
operations during the off-season. All Oregon farmers’ markets have someone
who functions in the role of coordinator or manager. Whether a manager is
paid, as well as the level of pay, are linked to how much administrative revenue
a market generates.
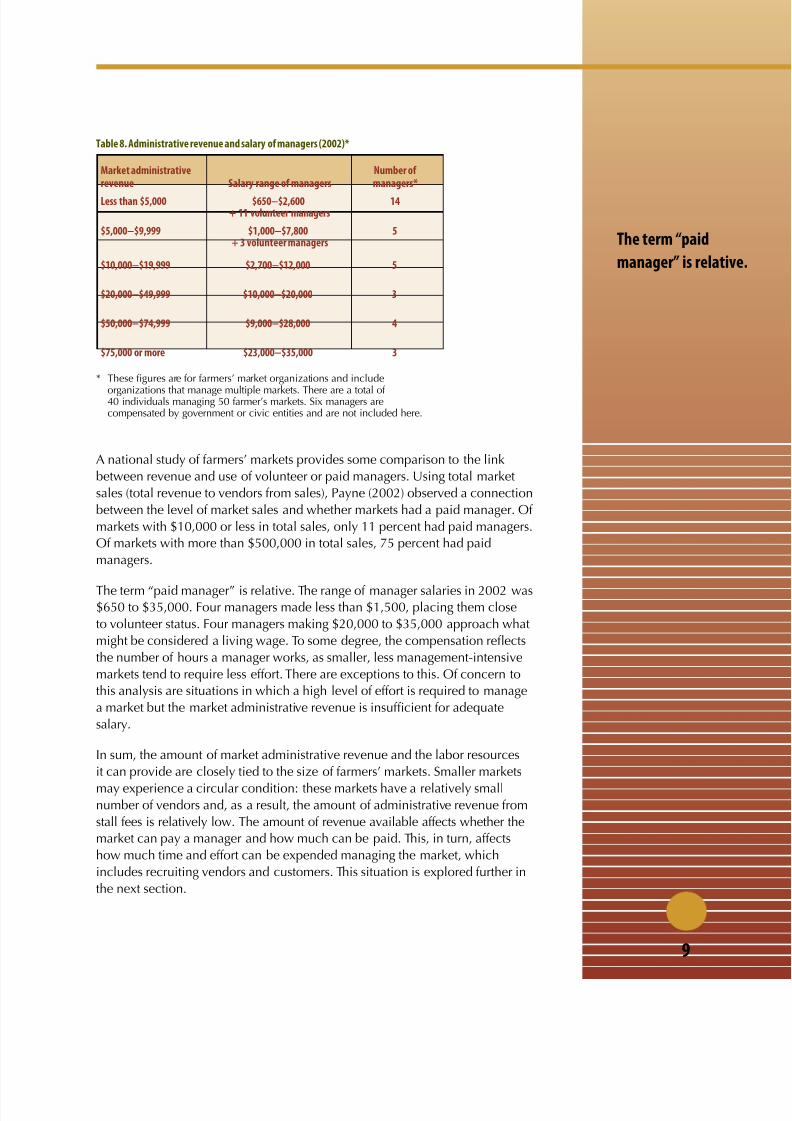
Table 8 shows categories of administrative revenue for farmers’ markets with
corresponding salary ranges for managers. It illustrates two points. The rst
is whether a manager receives compensation. It is clear from this data that
volunteer managers are associated with markets that generate lower revenues.
Second, the manager’s salary is also associated with the administrative revenuea market generates. Markets with higher or lower administrative revenue
compensate managers at higher or lower levels.
8/12/2019 Farmer's Markets: When Things Don't Work
http://slidepdf.com/reader/full/farmers-markets-when-things-dont-work 13/26
9
Table 8. Administrative revenue and salary of managers (2002)*
Market administrative Number of revenue Salary range of managers managers*
Less than $5,000 $650−$2,600 14+ 11 volunteer managers
$5,000−$9,999 $1,000−$7,800 5 + 3 volunteer managers
$10,000−$19,999 $2,700−$12,000 5
$20,000−$49,999 $10,000−$20,000 3
$50,000−$74,999 $9,000−$28,000 4
$75,000 or more $23,000−$35,000 3
* These gures are for farmers’ market organizations and include
organizations that manage multiple markets. There are a total of40 individuals managing 50 farmer’s markets. Six managers arecompensated by government or civic entities and are not included here.
A national study of farmers’ markets provides some comparison to the link
between revenue and use of volunteer or paid managers. Using total market
sales (total revenue to vendors from sales), Payne (2002) observed a connection
between the level of market sales and whether markets had a paid manager. Of
markets with $10,000 or less in total sales, only 11 percent had paid managers.
Of markets with more than $500,000 in total sales, 75 percent had paid
managers.
The term “paid manager” is relative. The range of manager salaries in 2002 was$650 to $35,000. Four managers made less than $1,500, placing them close
to volunteer status. Four managers making $20,000 to $35,000 approach what
might be considered a living wage. To some degree, the compensation reects
the number of hours a manager works, as smaller, less management-intensive
markets tend to require less effort. There are exceptions to this. Of concern to
this analysis are situations in which a high level of effort is required to manage
a market but the market administrative revenue is insufcient for adequate
salary.
In sum, the amount of market administrative revenue and the labor resources
it can provide are closely tied to the size of farmers’ markets. Smaller markets
may experience a circular condition: these markets have a relatively smallnumber of vendors and, as a result, the amount of administrative revenue from
stall fees is relatively low. The amount of revenue available affects whether the
market can pay a manager and how much can be paid. This, in turn, affects
how much time and effort can be expended managing the market, which
includes recruiting vendors and customers. This situation is explored further in
the next section.
The term “paid
manager” is relative
8/12/2019 Farmer's Markets: When Things Don't Work
http://slidepdf.com/reader/full/farmers-markets-when-things-dont-work 14/26
10
A Few Insights into Markets that FailPresented in this section is what can be gleaned from a small sample of
farmers’ markets that have closed. The data are from three sources: the
2002 survey of farmers’ market managers, the OFMA/ODA farmers’ marketdirectories for 1998 to 2005, and interviews with managers of closed markets
and other farmers’ market managers. Nine markets that were operating at
the time of the survey of market managers (2002) closed sometime after the
survey was conducted and prior to 20053. The 2002 survey of market managers
includes data on seven of these nine farmers’ markets (two markets did not
participate in the survey). The OFMA/ODA farmers’ market directories provide
limited but important information on all nine of the closed markets. Again,
this is a small sample of markets, but the analysis sheds some light on the
phenomenon of market closures. In fact, this may be the only data extant on
failed markets. Work is still needed in this area.
The Market Dynamics section above analyzed market failure and managerturnover on an aggregate basis. Here the focus is specically on the nine
markets that closed after the 2002 survey. Presented here is some background
on the nine markets as a group followed by ve factors associated with their
failure and comments on the process of failure.
Eight of the nine markets that closed were community-based markets operated
as grass-roots organizations. The ninth market was sponsored by a business that
provided space for vendors but did not collect fees and provided only a basic
level of management. Two of the community-based markets were associated
with market organizations that managed more than one market. In these
instances the markets closed but the market organizations continued operating
and managing other markets. One market was in a highly urban setting. Four
were in rural settings. In addition to their setting, at least four markets were
in communities with sufcient population to support a market in general and
perhaps even a market of moderate size. All of the markets were located in the
western part of Oregon within reasonable distances of product supply (farmers).
Again, seven of the markets participated in the 2002 manager survey. The two
not included in the survey did not respond when the survey was conducted but
information from the OFMA/ODA directories and interviews with managers
provided some additional background on these markets.
Five Factors Associated with Farmers’ Markets that FailFactor 1: Small SizeAll nine of the markets that closed were in the Micro or Small size categories.
This is based on 2002 survey data for the seven markets and information from
interviews with market managers for the two markets that did not participate in
the survey. Five markets fall into the Micro size category and 4 markets fall into
the Small size category.
Survey data indicate the number of vendors for total market size (including
3 To clarify, Table 2 shows a total of 10 markets closing during 2003 and 2004. One of thesemarkets opened in 2002 and was not eligible to participate in the survey. Therefore, nine marketsare included here.
All nine of the
markets that closed
were in the Micro or
Small size categories.
8/12/2019 Farmer's Markets: When Things Don't Work
http://slidepdf.com/reader/full/farmers-markets-when-things-dont-work 15/26
11
craft vendors) ranged from 5 to 20. The number of farmer vendors (source
of food products) was 4 to 13. Because the survey was conducted during
2002 (based on vendor numbers from the 2001 season) and the markets
closed sometime between that year and 2005, the actual number of vendorsparticipating during the nal season of the market is not known. There is some
indication from information presented below that one aspect of a market’s
decline is a loss of vendors, so these markets may have been even smaller just
prior to closing.
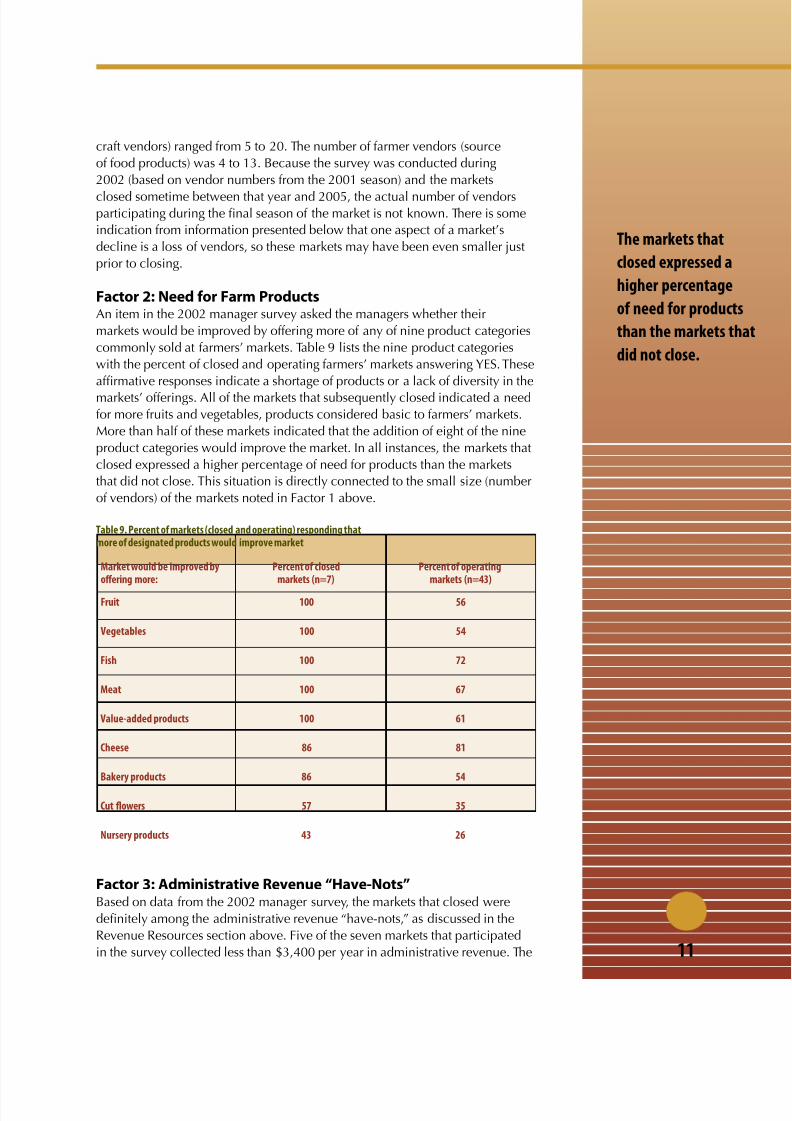
Factor 2: Need for Farm ProductsAn item in the 2002 manager survey asked the managers whether their
markets would be improved by offering more of any of nine product categories
commonly sold at farmers’ markets. Table 9 lists the nine product categories
with the percent of closed and operating farmers’ markets answering YES. These
afrmative responses indicate a shortage of products or a lack of diversity in the
markets’ offerings. All of the markets that subsequently closed indicated a needfor more fruits and vegetables, products considered basic to farmers’ markets.
More than half of these markets indicated that the addition of eight of the nine
product categories would improve the market. In all instances, the markets that
closed expressed a higher percentage of need for products than the markets
that did not close. This situation is directly connected to the small size (number
of vendors) of the markets noted in Factor 1 above.
Table 9. Percent of markets (closed and operating) responding thatmore of designated products would improve market
Market would be improved by Percent of closed Percent of operating offering more: markets (n=7) markets (n=43)
Fruit 100 56
Vegetables 100 54
Fish 100 72
Meat 100 67
Value-added products 100 61
Cheese 86 81
Bakery products 86 54
Cut flowers 57 35
Nursery products 43 26
Factor 3: Administrative Revenue “Have-Nots”Based on data from the 2002 manager survey, the markets that closed were
denitely among the administrative revenue “have-nots,” as discussed in the
Revenue Resources section above. Five of the seven markets that participated
in the survey collected less than $3,400 per year in administrative revenue. The
The markets that
closed expressed a
higher percentage
of need for products
than the markets th
did not close.
8/12/2019 Farmer's Markets: When Things Don't Work
http://slidepdf.com/reader/full/farmers-markets-when-things-dont-work 16/26
12
range in administrative revenue without temporary grants was $0 to $8,000.
With grants included, one market’s total administrative revenue was $20,000.
This situation was temporary, and the market was forced to close when the
grant ran out and the market was not sustainable based on vendor fees alone.
Factor 4: Manager was Volunteer or Paid a Low SalaryAs noted in the discussion regarding market revenue and labor resources, for
the majority of markets there is a direct connection between the amount of
money the market collects as administrative revenue and the amount spent
on labor to support the market. Given the situation described as Factor 3, it
follows that the markets that closed are often those that depended on volunteer
managers or that paid managers a low salary.
Four of the seven managers were volunteers or were paid low
wages. Of these four managers, two were volunteers and two were
paid between $1,040 and $2,000 per year. One manager wasassociated with a market organization that managed three markets
and was paid $20,000. One manager was compensated by the
private business that sponsored the market. One manager was
paid $12,000 per year through grant funds. Again, this market was
not self-sustaining when grant funds were no longer available.
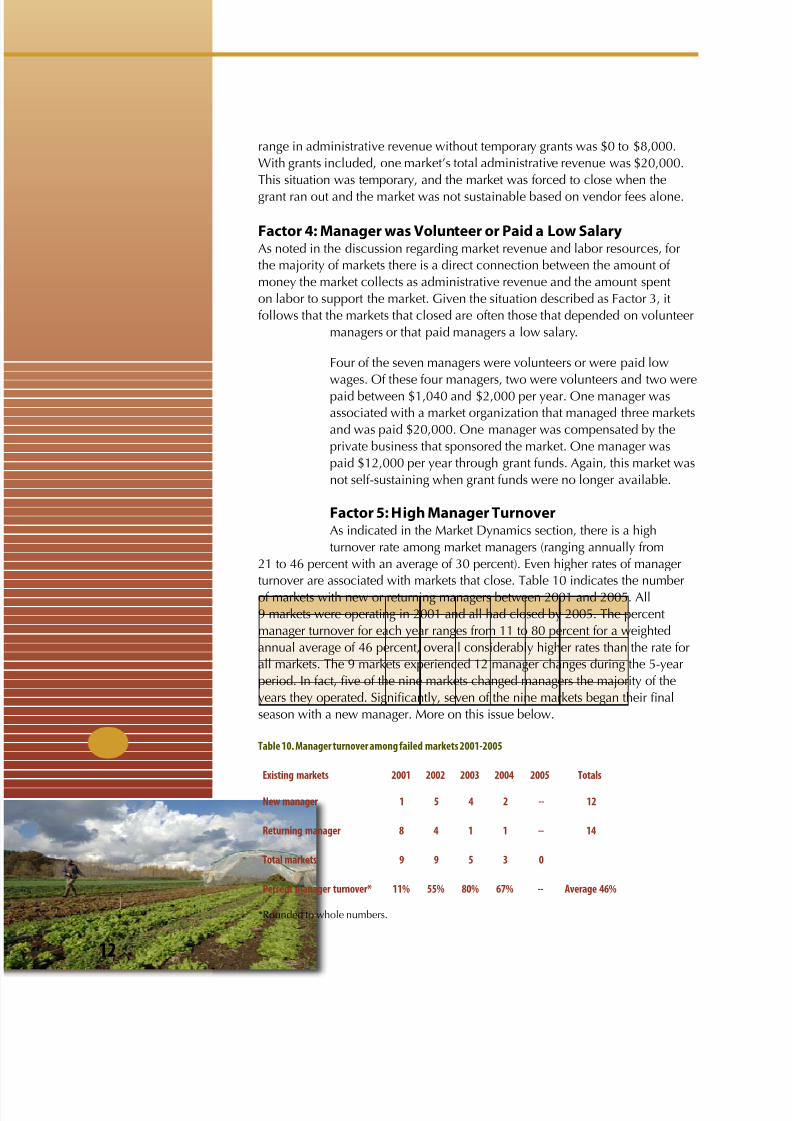
Factor 5: High Manager TurnoverAs indicated in the Market Dynamics section, there is a high
turnover rate among market managers (ranging annually from
21 to 46 percent with an average of 30 percent). Even higher rates of manager
turnover are associated with markets that close. Table 10 indicates the number
of markets with new or returning managers between 2001 and 2005. All
9 markets were operating in 2001 and all had closed by 2005. The percent
manager turnover for each year ranges from 11 to 80 percent for a weighted
annual average of 46 percent, overall considerably higher rates than the rate for
all markets. The 9 markets experienced 12 manager changes during the 5-year
period. In fact, ve of the nine markets changed managers the majority of the
years they operated. Signicantly, seven of the nine markets began their nal
season with a new manager. More on this issue below.
Table 10. Manager turnover among failed markets 2001-2005
Existing markets 2001 2002 2003 2004 2005 Totals
New manager 1 5 4 2 -- 12
Returning manager 8 4 1 1 -- 14
Total markets 9 9 5 3 0
Percent manager turnover* 11% 55% 80% 67% -- Average 46%
*Rounded to whole numbers.
8/12/2019 Farmer's Markets: When Things Don't Work
http://slidepdf.com/reader/full/farmers-markets-when-things-dont-work 17/26
13
Although some smaller farmers’ markets are able to reach stability, these ve
factors are all connected in some way to the circular condition of customer and
vendor supply that many smaller farmers’ markets experience. These markets
are small and do not attract sufcient customers to attract many vendors.A resulting shortage of products contributes to the continuing shortage of
customers. The market can only generate a small amount of administrative
revenue from the small number of vendors and so can use only a volunteer
manager or a low-paid manager. The use of a volunteer or low-paid manager
is likely a factor in the high turnover of managers. Without consistent
management that is compensated for working hours beyond those required to
manage the market site on market day, the market cannot pursue opportunities
to attract more customers and vendors.
Additional Concerns Related to Market FailureAnalysis of aggregate data from the 2002 survey of market managers revealedtwo additional areas of concern that shed some light on market failure. These
concerns include the lack of market management experience of managers
associated with newer markets, and a potential threshold for number of hours
worked by volunteer managers.
Years of Manager Experience and Age of MarketThe 2002 survey of market managers indicated that the number of years
of experience of market managers ranged from 1 to 20 years. Thirty-seven
percent of market managers had only 1 year of experience, and nearly half
(47 percent) had 2 or fewer years of experience. Similarly, a New Jersey study
found that 58 percent of managers in that state had less than 2 years experience(Govindasamy et al. 1998). While this reects the growth in numbers of
markets in recent years, it is also a cause for trepidation. Although a farmers’
market could suffer under an experienced but ineffective manager, a study
by Oberholtzer and Grow (2003:24) expressed concern with the correlation
between experience levels of the market managers and years of operation for
the market: “Thus, in many cases, younger markets—those that could benet a
great deal from market manager experience—lack this amenity for farmers.”
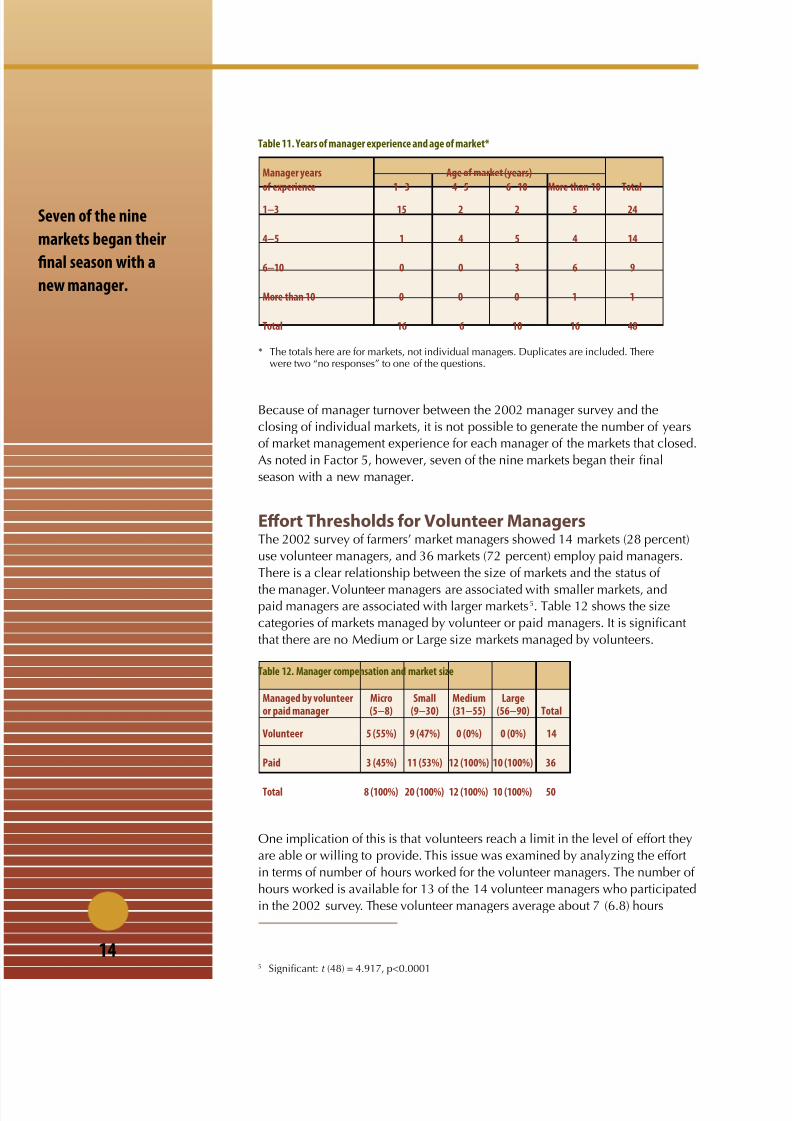
There is also a high correlation between manager experience and age of
markets for Oregon. Newer markets have less experienced managers, and
older markets have more experienced managers4. Fifteen of the 16 markets
that were 3 or fewer years old were managed by managers with 3 or feweryears of experience (Table 11). The ten managers who had 6 or more years of
experience managed markets that had been operating 6 or more years. Seven
of the 10 managers with 6 or more years of experience were associated with
markets that had been operating more than 10 years.
4 Signicant: r (50) = 0.387, p<0.01
8/12/2019 Farmer's Markets: When Things Don't Work
http://slidepdf.com/reader/full/farmers-markets-when-things-dont-work 18/26
14
Table 11. Years of manager experience and age of market*
Manager years Age of market (years)
of experience 1−3 4−5 6−10 More than 10 Total
1−3 15 2 2 5 24
4−5 1 4 5 4 14
6−10 0 0 3 6 9
More than 10 0 0 0 1 1
Total 16 6 10 16 48
* The totals here are for markets, not individual managers. Duplicates are included. Therewere two “no responses” to one of the questions.
Because of manager turnover between the 2002 manager survey and the
closing of individual markets, it is not possible to generate the number of years
of market management experience for each manager of the markets that closed.
As noted in Factor 5, however, seven of the nine markets began their nal
season with a new manager.
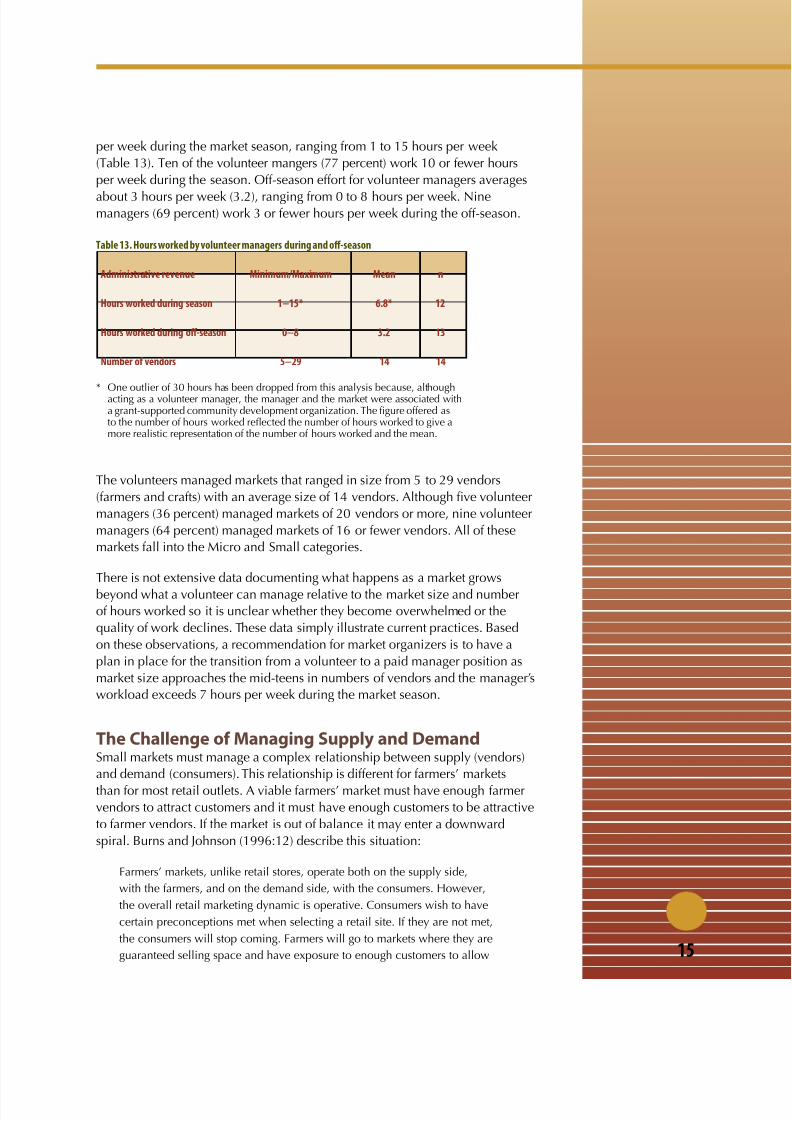
Effort Thresholds for Volunteer ManagersThe 2002 survey of farmers’ market managers showed 14 markets (28 percent)
use volunteer managers, and 36 markets (72 percent) employ paid managers.
There is a clear relationship between the size of markets and the status of
the manager. Volunteer managers are associated with smaller markets, andpaid managers are associated with larger markets5. Table 12 shows the size
categories of markets managed by volunteer or paid managers. It is signicant
that there are no Medium or Large size markets managed by volunteers.
Table 12. Manager compensation and market size
Managed by volunteer Micro Small Medium Large or paid manager (5−8) (9−30) (31−55) (56−90) Total
Volunteer 5 (55%) 9 (47%) 0 (0%) 0 (0%) 14
Paid 3 (45%) 11 (53%) 12 (100%) 10 (100%) 36
Total 8 (100%) 20 (100%) 12 (100%) 10 (100%) 50
One implication of this is that volunteers reach a limit in the level of effort they
are able or willing to provide. This issue was examined by analyzing the effort
in terms of number of hours worked for the volunteer managers. The number of
hours worked is available for 13 of the 14 volunteer managers who participated
in the 2002 survey. These volunteer managers average about 7 (6.8) hours
5 Signicant: t (48) = 4.917, p<0.0001
Seven of the nine
markets began their
final season with a
new manager.
8/12/2019 Farmer's Markets: When Things Don't Work
http://slidepdf.com/reader/full/farmers-markets-when-things-dont-work 19/26
15
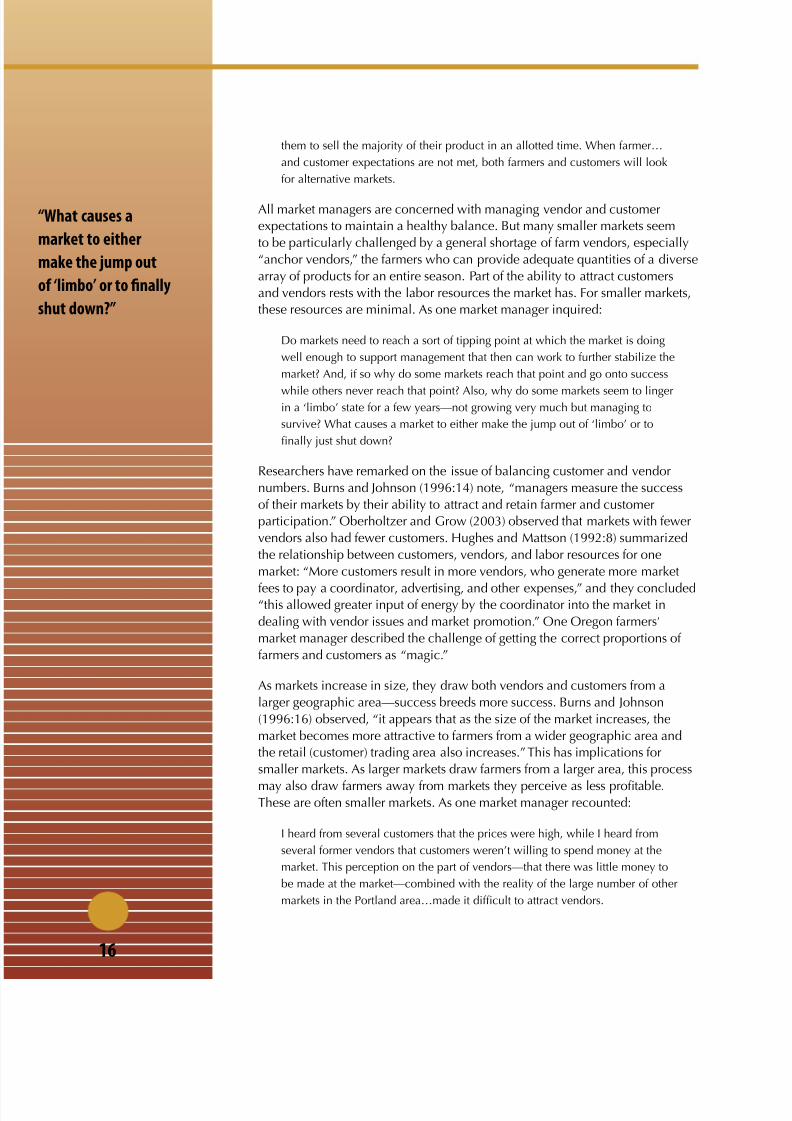
per week during the market season, ranging from 1 to 15 hours per week
(Table 13). Ten of the volunteer mangers (77 percent) work 10 or fewer hours
per week during the season. Off-season effort for volunteer managers averages
about 3 hours per week (3.2), ranging from 0 to 8 hours per week. Ninemanagers (69 percent) work 3 or fewer hours per week during the off-season.
Table 13. Hours worked by volunteer managers during and off-season
Administrative revenue Minimum/Maximum Mean n
Hours worked during season 1−15* 6.8* 12
Hours worked during off-season 0−8 3.2 13
Number of vendors 5−29 14 14
* One outlier of 30 hours has been dropped from this analysis because, althoughacting as a volunteer manager, the manager and the market were associated witha grant-supported community development organization. The gure offered asto the number of hours worked reected the number of hours worked to give amore realistic representation of the number of hours worked and the mean.
The volunteers managed markets that ranged in size from 5 to 29 vendors
(farmers and crafts) with an average size of 14 vendors. Although ve volunteer
managers (36 percent) managed markets of 20 vendors or more, nine volunteer
managers (64 percent) managed markets of 16 or fewer vendors. All of these
markets fall into the Micro and Small categories.
There is not extensive data documenting what happens as a market grows
beyond what a volunteer can manage relative to the market size and numberof hours worked so it is unclear whether they become overwhelmed or the
quality of work declines. These data simply illustrate current practices. Based
on these observations, a recommendation for market organizers is to have a
plan in place for the transition from a volunteer to a paid manager position as
market size approaches the mid-teens in numbers of vendors and the manager’s
workload exceeds 7 hours per week during the market season.
The Challenge of Managing Supply and DemandSmall markets must manage a complex relationship between supply (vendors)
and demand (consumers). This relationship is different for farmers’ markets
than for most retail outlets. A viable farmers’ market must have enough farmervendors to attract customers and it must have enough customers to be attractive
to farmer vendors. If the market is out of balance it may enter a downward
spiral. Burns and Johnson (1996:12) describe this situation:
Farmers’ markets, unlike retail stores, operate both on the supply side,
with the farmers, and on the demand side, with the consumers. However,
the overall retail marketing dynamic is operative. Consumers wish to have
certain preconceptions met when selecting a retail site. If they are not met,
the consumers will stop coming. Farmers will go to markets where they are
guaranteed selling space and have exposure to enough customers to allow
8/12/2019 Farmer's Markets: When Things Don't Work
http://slidepdf.com/reader/full/farmers-markets-when-things-dont-work 20/26
16
them to sell the majority of their product in an allotted time. When farmer…
and customer expectations are not met, both farmers and customers will look
for alternative markets.
All market managers are concerned with managing vendor and customer
expectations to maintain a healthy balance. But many smaller markets seem
to be particularly challenged by a general shortage of farm vendors, especially
“anchor vendors,” the farmers who can provide adequate quantities of a diverse
array of products for an entire season. Part of the ability to attract customers
and vendors rests with the labor resources the market has. For smaller markets,
these resources are minimal. As one market manager inquired:
Do markets need to reach a sort of tipping point at which the market is doing
well enough to support management that then can work to further stabilize the
market? And, if so why do some markets reach that point and go onto success
while others never reach that point? Also, why do some markets seem to lingerin a ‘limbo’ state for a few years—not growing very much but managing to
survive? What causes a market to either make the jump out of ‘limbo’ or to
nally just shut down?
Researchers have remarked on the issue of balancing customer and vendor
numbers. Burns and Johnson (1996:14) note, “managers measure the success
of their markets by their ability to attract and retain farmer and customer
participation.” Oberholtzer and Grow (2003) observed that markets with fewer
vendors also had fewer customers. Hughes and Mattson (1992:8) summarized
the relationship between customers, vendors, and labor resources for one
market: “More customers result in more vendors, who generate more market
fees to pay a coordinator, advertising, and other expenses,” and they concluded“this allowed greater input of energy by the coordinator into the market in
dealing with vendor issues and market promotion.” One Oregon farmers’
market manager described the challenge of getting the correct proportions of
farmers and customers as “magic.”
As markets increase in size, they draw both vendors and customers from a
larger geographic area—success breeds more success. Burns and Johnson
(1996:16) observed, “it appears that as the size of the market increases, the
market becomes more attractive to farmers from a wider geographic area and
the retail (customer) trading area also increases.” This has implications for
smaller markets. As larger markets draw farmers from a larger area, this process
may also draw farmers away from markets they perceive as less protable.These are often smaller markets. As one market manager recounted:
I heard from several customers that the prices were high, while I heard from
several former vendors that customers weren’t willing to spend money at the
market. This perception on the part of vendors—that there was little money to
be made at the market—combined with the reality of the large number of other
markets in the Portland area…made it difcult to attract vendors.
“What causes a
market to either
make the jump out
of ‘limbo’ or to finally
shut down?”
8/12/2019 Farmer's Markets: When Things Don't Work
http://slidepdf.com/reader/full/farmers-markets-when-things-dont-work 21/26
17
Characterizing Markets in DeclineTo better understand the process of market decline, here are some brief
descriptions based on interviews and focus group sessions that reveal some of
the issues associated with the decline and closing of a farmers’ market. In therst, a market manager describes the nal season of a western Oregon farmers’
market. The market manager participated in the 2002 survey and, at that time,
listed the size of the market as 20 vendors.
The market was located downtown and took place on [a weekday] evening.
There were parking problems and tensions with nearby businesses. It was
an evening market so it required picking and selling in the heat of the day.
Then there was no prot for vendors. Where I would make $120 on Saturday
I would only make $30 to $40 [at this market]. The market dropped down to
three to four vendors then just stopped.
This account identies some of the problems that can contribute to eventualclosure—lack of parking for customers, tension with local businesses, and
choice of market day and time. These problems reduced customer numbers,
which reduced vendor sales, which in turn reduced vendor numbers. In
addition, the closing of a Medium or Large size market seems to be rare, but
we could assume that the number of vendors participating will drop off until
the market becomes a smaller size just prior to its failure. This situation is
illustrated here with the market dropping from 20 vendors to just 3 or 4 prior to
closing permanently. It had been a Small size market that became a Micro size
market.
This market manager describes a lack of community support as a cause in the
eventual closing of a market:
Early in my involvement with the market, I held a meeting for community
members. My goal was to nd some volunteers who would help out in
various aspects of the market. Despite advertising the meeting only 1 potential
volunteer showed up. This proved to be symptomatic of the community’s
lack of direct support for the market. Although many people professed to
appreciating having a local farmers’ market, hardly anyone except the existing
board members were willing to lend any time or support to the market.
Internal issues within a market may have an impact on its relationship with
the community. For instance, during focus group discussions one manager
commented that issues within the market affect its mood:
When there is stress between the manager and the board, all the manager’s
energy goes there. It denes the tone. The customers will know if the
governance of the market is distressed.
Lastly, a market manager recounted the inertia among market organizers that
contributed to the market closing permanently:
In the end, I grew frustrated with the lack of support and I could see that
the market’s problems were not going to be solvable without some fairly
substantial changes which the board was unwilling to make.
8/12/2019 Farmer's Markets: When Things Don't Work
http://slidepdf.com/reader/full/farmers-markets-when-things-dont-work 22/26
18
Summary, Areas of Risk, and RecommendationsFarmers’ markets are growing rapidly. Yet this research indicates that in Oregon
high numbers of markets fail even while the overall number of markets is
expanding. Markets that close have short life spans. Nearly 25 percent of allnew markets close after their rst year. Markets over four years old are more
resilient but some may not be performing well. The turnover rate for all market
managers is high, with 101 manager changes between 1998 and 2005.
A key issue for farmers’ markets is obtaining resources. Market administrative
revenue is unevenly distributed among markets. Seven large size markets
receive nearly half the total administrative revenue for all markets. “Have-
not” markets may struggle to hire labor to perform functions that help grow
and sustain markets. Whether labor is paid or volunteer is linked to the
administrative revenue that markets generate. Larger markets not only take in
more administrative revenue based on their size (number of vendors), but they
also charge higher stall fees than smaller markets.
Because they are at the nexus of supply (farmers) and demand (customers),
all markets are challenged to attain and sustain a balance. Smaller markets
often experience a circular condition in which they cannot attract
sufcient customers because they do not have sufcient vendors,
but cannot attract sufcient vendors because they do not have
sufcient customers. From the data available, ve interconnected
factors were identied that characterize markets that fail: small
size, high need for products, low administrative revenue,
volunteer or low-paid manager, and high manager turnover.
The analysis revealed two additional concerns related to market
failure: a correlation between new markets and inexperienced
managers, and potential effort thresholds for volunteer managers.
The factors presented here are interconnected and prevalent for
the markets that failed. Some of these factors such as small size
and low administrative revenue also exist among some markets
that continue to operate. The accounts from managers of markets that failed
suggest there may be combinations of issues unique to each of the markets that
ultimately triggered their downward spiral.
Areas of Risk The connection between administrative revenue and the ability to hirepersonnel is a theme throughout this report. What follows is a summary of
areas of risk broadly associated with characteristics of markets and market
managers. Market organizers should be concerned about these areas of risk,
particularly if they are present in combinations.
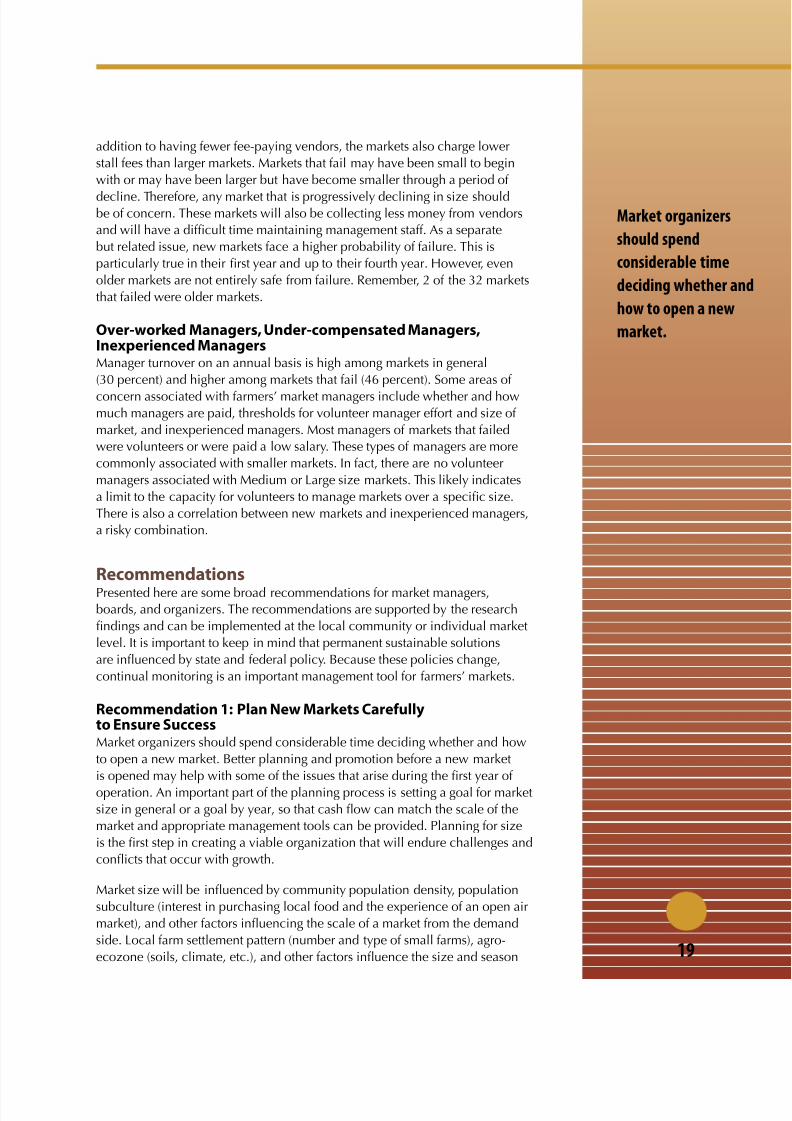
Small Markets, Markets Becoming Smaller, and New MarketsSmaller markets are more at risk of failure than larger markets. Since they have
fewer vendors, smaller markets are vulnerable to descending quickly into a
crisis by a drop in vendor numbers and, therefore, suffering the repercussions
of a lack of products, fewer customers, and less administrative revenue. In
8/12/2019 Farmer's Markets: When Things Don't Work
http://slidepdf.com/reader/full/farmers-markets-when-things-dont-work 23/26
19
addition to having fewer fee-paying vendors, the markets also charge lower
stall fees than larger markets. Markets that fail may have been small to begin
with or may have been larger but have become smaller through a period of
decline. Therefore, any market that is progressively declining in size shouldbe of concern. These markets will also be collecting less money from vendors
and will have a difcult time maintaining management staff. As a separate
but related issue, new markets face a higher probability of failure. This is
particularly true in their rst year and up to their fourth year. However, even
older markets are not entirely safe from failure. Remember, 2 of the 32 markets
that failed were older markets.
Over-worked Managers, Under-compensated Managers,Inexperienced ManagersManager turnover on an annual basis is high among markets in general
(30 percent) and higher among markets that fail (46 percent). Some areas of
concern associated with farmers’ market managers include whether and howmuch managers are paid, thresholds for volunteer manager effort and size of
market, and inexperienced managers. Most managers of markets that failed
were volunteers or were paid a low salary. These types of managers are more
commonly associated with smaller markets. In fact, there are no volunteer
managers associated with Medium or Large size markets. This likely indicates
a limit to the capacity for volunteers to manage markets over a specic size.
There is also a correlation between new markets and inexperienced managers,
a risky combination.
RecommendationsPresented here are some broad recommendations for market managers,boards, and organizers. The recommendations are supported by the research
ndings and can be implemented at the local community or individual market
level. It is important to keep in mind that permanent sustainable solutions
are inuenced by state and federal policy. Because these policies change,
continual monitoring is an important management tool for farmers’ markets.
Recommendation 1: Plan New Markets Carefullyto Ensure SuccessMarket organizers should spend considerable time deciding whether and how
to open a new market. Better planning and promotion before a new market
is opened may help with some of the issues that arise during the rst year of
operation. An important part of the planning process is setting a goal for market
size in general or a goal by year, so that cash ow can match the scale of the
market and appropriate management tools can be provided. Planning for size
is the rst step in creating a viable organization that will endure challenges and
conicts that occur with growth.
Market size will be inuenced by community population density, population
subculture (interest in purchasing local food and the experience of an open air
market), and other factors inuencing the scale of a market from the demand
side. Local farm settlement pattern (number and type of small farms), agro-
ecozone (soils, climate, etc.), and other factors inuence the size and season
Market organizers
should spend
considerable time
deciding whether an
how to open a new
market.
8/12/2019 Farmer's Markets: When Things Don't Work
http://slidepdf.com/reader/full/farmers-markets-when-things-dont-work 24/26
20
of the market from the supply side. Organizers should carefully assess whether
there is sufcient population to support a market and whether there are
sufcient farmers and/or market gardeners to support a market.
Training programs for new managers and boards of directors may reduce the
number of markets that close after a brief life and reduce manager turnover in
operating markets. In some instances, volunteer labor can substitute for paid
labor, resulting in lower operating expense for the market. There are limitations
to volunteer labor. As noted previously, a good recommendation for organizers
is to have a plan in place for the transition from a volunteer to a paid manager
position as market size approaches the mid-teens in numbers of vendors and as
growth requires the manager to work more than 7 hours per week during the
market season.
Recommendation 2: Some Markets Should Pursue Community
Financial SupportSome markets will always have difculty generating sufcient administrative
revenue to support a paid manager and other important market functions.
Some markets may be viable only through nancial or labor resources provided
through other civic or government entities. There are precedents for this in
Oregon. The Oregon market manager survey data indicated that in 2002 six
markets were connected with government and non-government organizations.
These organizations support their farmers’ markets by providing a salaried
staff member for management and other amenities. Farmers’ markets are an
important part of a local economy and enhance the quality of community
life. There is justication for government and economic development sector
support.
Faith, environmental, and health organizations are other potential community
sponsors. For instance, the Ecumenical Ministries of Oregon have demonstrated
their interest in community food security through production of local food
guides and a recent grant-funded effort to link church members with local food
production through community-supported agriculture and farmers’ market
coupons. Many environmental organizations point to locally produced food as
good for the environment but likely are not directly involved in the nancial
support of individual farmers’ markets. The current operation of a farmers’
market by health care provider Kaizer Permanente in the Portland area offers a
model for private sector support that holds some potential for providing start-up
resources for markets in some communities. Seeking this type of support may
be the only option for a stable market in some communities with insufcient
population and funding to support a manager and other basic organizational
structures.
Access to nancial and other resources is a national policy-related issue with
signicant impacts on farmers’ markets, particularly small markets. Small
markets are expected to be self-sustaining, while other publicly delivered
services do not have a similar expectation. Public funds support services that
enhance the global trade of food products, but a similar level of support is not
made available to support local agricultural markets. This is a political decision.
8/12/2019 Farmer's Markets: When Things Don't Work
http://slidepdf.com/reader/full/farmers-markets-when-things-dont-work 25/26
21
References Cited
Burns, Arthur F. and Denny N. Johnson. 1996. “Farmers’ Market Survey
Report.” Washington, DC: U.S. Department of Agriculture, AgricultureMarketing Service, Transportation and Marketing Division, Wholesale andAlternative Markets Program.
Govindasamy, Ramu, Marta Zurbriggen, John Italia, Adesoji Adelaja,Peter Nitzsche, Richard VanVranken. 1998. Farmers Markets: ManagerCharacteristics and Factors Affecting Market Organization. New JerseyAgricultural Experiment Station P-02137-8-98. Rutgers, The State University ofNew Jersey, New Brunswick.
Hughes, Megan Elizabeth and Richard H. Mattson. 1992. “Farmers’ Markets inKansas: A Prole of Vendors and Market Organization.” Report of Progress 658,Agricultural Experiment Station, Kansas State University.
Johnson, Denny N. and Errol R. Bragg. 1994. 1994 National Farmers’ Market
Directory. Washington, DC: USDA. Johnson, Denny N., Lisa Lewis, and Errol R. Bragg. 1996. 1996 NationalFarmers’ Market Directory. Washington, DC: USDA.
Kambara, Kenneth M. and Crispin L. Shelley. 2002. The California AgriculturalDirect Marketing Study. USDA AMS and California Institute of Rural Studies.Davis, CA.
Lyson, Thomas A. 2004. Civic Agriculture: Reconnecting Farm, Food, andCommunity. Medford, MA: Tufts University Press.
Oberholtzer, Lydia and Shelly Grow. 2003. Fresh from the Farm: Overview andCharacteristics of Producer-Only Markets in the Mid-Atlantic Region. Henry A.Wallace Center for Agricultural and Environmental Policy, Arlington, VA.
ODA 1998. Oregon’s Farmers’ Markets. Oregon Department of Agriculture.Salem, Oregon.
ODA 1999. Oregon’s Farmers’ Markets. Oregon Department of Agriculture.Salem, Oregon.
ODA 2000. Oregon’s Farmers’ Markets. Oregon Department of Agriculture.Salem, Oregon
ODA/OFMA 2001. Oregon’s Farmers’ Markets. Oregon Farmers’ MarketAssociation and Oregon Department of Agriculture. Portland, Oregon.
OFMA/ODA 2002. Oregon’s Farmers’ Markets. Oregon Farmers’ MarketAssociation and Oregon Department of Agriculture. Portland, Oregon.
OFMA/ODA 2003. Oregon’s Farmers’ Markets. Oregon Farmers’ MarketAssociation and Oregon Department of Agriculture. Portland, Oregon.
OFMA/ODA 2004. Oregon’s Farmers’ Markets. Oregon Farmers’ MarketAssociation and Oregon Department of Agriculture. Portland, Oregon.
OFMA/ODA 2005. Oregon’s Farmers’ Markets. Oregon Farmers’ MarketAssociation and Oregon Department of Agriculture. Portland, Oregon.
Payne, Tim. 2002. U.S. Farmers Markets—2000, A Study of Emerging Trends.Washington, DC: U.S. Department of Agriculture, Agriculture MarketingService, Transportation and Marketing Division, Marketing Services Branch.
8/12/2019 Farmer's Markets: When Things Don't Work
http://slidepdf.com/reader/full/farmers-markets-when-things-dont-work 26/26
© 2008 Oregon State University. This publication may be photocopied or reprinted in itsentirety for noncommercial purposes. Produced and distributed in furtherance of the Acts ofCongress of May 8 and June 30, 1914. Extension work is a cooperative program of OregonState University, the U.S. Department of Agriculture, and Oregon counties. Oregon StateUniversity Extension Service offers educational programs, activities, and materials withoutdiscrimination based on age, color, disability, gender identity or expression, marital status,national origin, race, religion, sex, sexual orientation, or veteran’s status. Oregon StateUniversity Extension Service is an Equal Opportunity Employer.
Related Documents


